UNITED STATES
SECURITIES AND EXCHANGE COMMISSION
Washington, D.C. 20549
FORM N-CSR
CERTIFIED SHAREHOLDER REPORT OF REGISTERED
MANAGEMENT INVESTMENT COMPANIES
Investment Company Act file number | 811-8059 |
|
Cohen & Steers Realty Focus Fund, Inc. |
(Exact name of registrant as specified in charter) |
|
280 Park Avenue, New York, NY | | 10017 |
(Address of principal executive offices) | | (Zip code) |
|
Adam M. Derechin Cohen & Steers Capital Management, Inc. 280 Park Avenue New York, New York 10017 |
(Name and address of agent for service) |
|
Registrant’s telephone number, including area code: | (212) 832-3232 | |
|
Date of fiscal year end: | December 31 | |
|
Date of reporting period: | June 30, 2006 | |
| | | | | | | | |
Item 1. Reports to Stockholders.
COHEN & STEERS REALTY FOCUS FUND, INC.
August 9, 2006
To Our Shareholders:
We are pleased to submit to you our report for the six months ended June 30, 2006. The net asset values per share at that date were $64.58, $64.41, and $64.45 for Class A, Class B and Class C shares, respectively. Class I shares had a net asset value of $64.79. In addition, a dividend was declared for shareholders of record on June 22, 2006 and paid on June 23, 2006 to all four classes of shares. The dividends were as follows: Class A—$0.775 per share, Class B—$0.57 per share, Class C—$0.57 per share and Class I—$0.887 per share.a
Investment Review
The total return, including income and change in net asset value, for Cohen & Steers Realty Focus Fund and the comparative benchmarks were:
| | | Six Months Ended
6/30/06 | |
| Cohen & Steers Realty Focus Fund—Class A | | | 11.01 | % | |
| Cohen & Steers Realty Focus Fund—Class B | | | 10.66 | % | |
| Cohen & Steers Realty Focus Fund—Class C | | | 10.66 | % | |
| Cohen & Steers Realty Focus Fund—Class I | | | 11.21 | % | |
| FTSE NAREIT Equity REIT Indexb | | | 12.90 | % | |
| S&P 500 Indexb | | | 2.71 | % | |
The performance data quoted represent past performance. Past performance is no guarantee of future results. The investment return and the principal value of an investment will fluctuate and shares, if redeemed, may be worth more or less than their original cost. Current performance may be lower or higher than the performance data quoted. Total returns of the fund current to the most recent month-end can be obtained by visiting our Web site at cohenandsteers.com.
a Please note that distributions paid by the fund to shareholders are subject to recharacterization for tax purposes. The final tax treatment of these distributions is reported to shareholders after the close of each fiscal year.
b The FTSE NAREIT Equity REIT Index is an unmanaged, market capitalization weighted index of all publicly traded REITs that invest predominantly in the equity ownership of real estate. The index is designed to reflect the performance of all publicly traded equity REITs as a whole. The S&P 500 Index is an umanaged index of common stocks that is frequently used as a general measure of stock market performance.
1
COHEN & STEERS REALTY FOCUS FUND, INC.
Investment Review
Strong fundamentals propelled real estate stocks to new highs in the first quarter, easily outpacing the broader markets. When concerns about inflation, Fed tightening and potentially slower economic growth spooked investors across markets, REITs also retrenched briefly. By June 30, however, the continued drumbeat of positive developments in fundamentals for U.S. real estate drove U.S. REIT stocks back to within a couple of percentage points of their first-quarter closing levels.
We believe the broader stock market has been concerned that accelerating inflationary pressures would necessitate more Federal Reserve monetary tightening than previously expected, increasing the possibility of slower economic growth—a condition we have been forecasting for some time. Interestingly, while a slowdown in economic growth and higher inflation are generally viewed as negatives for stock returns, we believe the current real estate recovery should progress quite nicely. Ongoing demand for real estate in an environment of moderate economic growth should, in our view, continue to outstrip the historically modest levels of new supply. In the past, inflation, an unequivocal negative for financial assets, has been a net positive for real property, and therefore REITs, relative to most other financial assets. It is not surprising, then, that real estate stocks fared better than the broader market this year.
It is also noteworthy that during the first half of 2006, the yield on the 10-year U.S. Treasury bond increased from 4.4% to 5.1%. During this same period, REITs generated a total return of 12.9%, further confounding the many financial pundits who repeatedly mischaracterize REITs as interest-rate-sensitive stocks in the face of continued evidence to the contrary. While quantitative evidence has shown REITs historically to have had a low long-term correlation to interest rates, that perception still exists.
Many REIT stocks continued to respond to improving real estate fundamentals in the six months ending June 30. The top-performing sectors for the period were apartment (21.0% total return), office (19.8%) and hotel (17.2%), and the three sectors that have benefited most from the real estate recovery. The hotel sector continued to benefit from strong demand from both the business and leisure travel segments, combined with negligible new construction.
Office properties also benefited from strong corporate profit growth, which typically manifests itself in corporations hiring new employees and filling up office space. Two large transactions in the first half of the year underscored that. In March, the Blackstone Group paid $5.6 billion for CarrAmerica Realty. The price implied a capitalization rate (the unleveraged initial yield) on CarrAmerica's real estate of 6.7%, better than the 7.5% assumed rate that most analysts had been using to value the company.
Then, on June 5, Trizec Properties announced that it was being acquired by Brookfield Properties (one of our holdings, with a total return of 10.7%) and the Blackstone Group for $8.9 billion—the largest REIT buyout since General Growth Properties purchased the Rouse Company in 2004. The 18% stock price premium offered for Trizec was larger than the average premium in recent quarters, and reiterated to investors that most office REITs were trading at discounts to the value of their underlying office building assets. The sheer size of the transaction also implied that in the current environment, few if any REITs are too large to be acquired, provided the stock price looks attractive to a potential buyer. The fund's performance benefited from its overweight position in the office sector—in particular,
2
COHEN & STEERS REALTY FOCUS FUND, INC.
Glenborough Realty (22.5%). However, this fund did not hold SL Green Realty (45.0%), the index's top performer, or Trizec (26.8%). Our position in American Financial Realty Trust (–15.1%) also detracted from performance.
The apartment sector continued to advance, as weakness in the for-sale housing markets continued to accrue to the benefit of apartment owners. The lack of affordability of owned housing in many U.S. markets today has forced more households to choose renting as an alternative to buying a home. With reports of more children of baby boomers and an expanding workforce moving into apartments and fewer first-time home buyers moving out, apartment rents accelerated forcefully in the first quarter. We believe that second-quarter rent growth will be even stronger. Three of our top performers benefited from these trends: AvalonBay Communities (25.7%), Archstone-Smith (23.7%) and Education Realty Trust (34.6%).
The self storage sector (11.3%) took a break from recent strong advances. The fund's positions in U-Store-It Trust (–7.8%) and Extra Space Storage (8.6%) detracted from relative performance.
Manufactured housing (–0.2%), the worst-performing sector, continued to underperform as the long-awaited recovery remained elusive. Free standing retail (2.6%) turned in a weak, but positive, performance. Regional malls (3.6%) was one of the weakest-performing sectors. Mills Corporation (–34.6%), our worst performer, continued to struggle to meet the obligations of a public company to its shareholders.
Investment Outlook
During the second quarter, as it became apparent that rising inflation was going to require the Fed to slow U.S. GDP growth, the specter of "stagflation" reared its ugly head in the financial press for the first time since the 1970s. Indeed, recent days have marked the first time the market has had to face the combination of accelerating inflation and a potentially slower economy since that economically notorious decade. What might this imply for real estate stocks?
Land, the primary component of real estate that is responsible for the differentiated return that real estate has provided, is a unique asset class. Habitable urban land commands an economic rental payment that is based primarily on the proximity it provides to other economic activity—that is, its location. Unlike capital and labor—the other two inputs to economic production, whose pricing power erodes further into an economic cycle as excess capacity is created to accommodate expanding demand—land's value has typically continued to increase as long as the surrounding economic activity has increased, regardless of what happened to the monetary price level. In other words, inflation historically has not harmed land values the way it can harm financial assets like bonds and (other) stocks. Witness the net contraction of REIT multiples during the disinflationary 1980s and 1990s, and the expansion of REIT multiples since deflation ary fears evaporated in 2003. Historically, landowners have enjoyed inflationary times. Note that, while past performance is not necessarily indicative of future results, since the beginning of the modern REIT era in 1993, REIT stocks on average have increased their dividends at levels greater than the rate of inflation in every single year.
3
COHEN & STEERS REALTY FOCUS FUND, INC.
As a result, given our view of the state of relative balance of most real estate markets in the United States, we believe that modest reflation is a net positive for real estate stocks relative to most other financial assets. Of course, galloping inflation would increase uncertainty in the economy and could eventually severely curtail economic growth, which would not help real estate values or the REIT market. However, our belief is that the Federal Reserve knows how to do its job of maintaining relative price stability, and that the imbalances in the economy are manageable and do not represent significant structural impediments to its execution of what we believe will be a typical mid-cycle slowdown.
We are experiencing a transitory overlap of higher inflation and slower economic growth. Without large structural impediments to free-market economic flexibility, these two phenomena are generally incompatible. The Fed's job is to decide which of the two is less harmful to the overall economy. From a real estate standpoint, neither slightly higher inflation nor slightly lower economic growth (we estimate the 2% range) should, in our view, derail the steady real estate recovery that has thus far driven cash flow and dividend growth in the U.S. REIT sector.
Sincerely,
 | |  | |
|
| MARTIN COHEN | | ROBERT H. STEERS | |
|
| Co-chairman | | Co-chairman | |
|
 | |  | |
|
| JOSEPH M. HARVEY | | JAMES S. CORL | |
|
| Portfolio Manager | | Portfolio Manager | |
|
The views and opinions in the preceding commentary are as of the date stated and are subject to change. This material represents an assessment of the market environment at a specific point in time, should not be relied upon as investment advice and is not intended to predict or depict performance of any investment.
Visit Cohen & Steers online at cohenandsteers.com
For more information about any of our funds, visit cohenandsteers.com, where you'll find daily net asset values, fund fact sheets and portfolio highlights. You can also access newsletters, education tools and market updates covering REIT, utility and preferred securities sectors.
In addition, our Web site contains comprehensive information about our firm, including our most recent press releases, profiles of our senior investment professionals, and an overview or our investment approach.
4
COHEN & STEERS REALTY FOCUS FUND, INC.
Performance Review
Average Annual Total Returns — For the Periods Ended June 30, 2006
| | | Class A Shares | | Class B Shares | | Class C Shares | | Class I Shares | |
| 1 Year (with sales charge) | | | 11.90 | %a | | | 11.41 | %b | | | 15.44 | %d | | | — | | |
| 1 Year (without sales charge) | | | 17.17 | % | | | 16.41 | % | | | 16.44 | % | | | 17.59 | % | |
| 5 Years (without sales charge) | | | — | | | | — | | | | — | | | | 22.16 | % | |
Since Inceptione (with sales
charge) | | | 21.77 | %a | | | 22.19 | %c | | | 24.19 | % | | | — | | |
Since Inceptione (without sales
charge) | | | 25.02 | % | | | 24.15 | % | | | 24.19 | % | | | 15.37 | % | |
The performance data quoted represent past performance. Past performance is no guarantee of future results. The investment return and principal value of an investment will fluctuate and shares, when redeemed, may be worth more or less than their original cost. Current performance may be lower or higher than the performance data quoted. Performance information current to the most recent month-end can be obtained by visiting our Web site at cohenandsteers.com. The performance table does not reflect the deduction of taxes that a shareholder would pay on fund distributions or the redemption of fund shares.
Through December 31, 2006, the fund's advisor has contractually agreed to waive certain fees and/or reimburse the fund for expenses. Absent such arrangements, returns would have been lower.
a Reflects a 4.50% front-end sales charge.
b Reflects a contingent deferred sales charge of 5%.
c Reflects a contingent deferred sales charge of 4%.
d Reflects a contingent deferred sales charge of 1%.
e Inception dates: September 30, 2004 for Class A, Class B and Class C and May 8, 1997 for Class I.
5
COHEN & STEERS REALTY FOCUS FUND, INC.
Expense Example (Unaudited)
As a shareholder of the fund, you incur two types of costs: (1) transaction costs, including sales charges (loads) on purchase payments and redemption fees; and (2) ongoing costs including management fees; distribution and/or service (12b-1) fees; and other fund expenses. This example is intended to help you understand your ongoing costs (in dollars) of investing in the fund and to compare these costs with the ongoing costs of investing in other mutual funds.
The example is based on an investment of $1,000 invested at the beginning of the period and held for the entire period 01/01/06 – 06/30/06.
Actual Expenses
The first line of the table below provides information about actual account values and expenses. You may use the information in this line, together with the amount you invested, to estimate the expenses that you paid over the period. Simply divide your account value by $1,000 (for example, an $8,600 account value divided by $1,000 = 8.6), then multiply the result by the number in the first line under the heading entitled "Expenses Paid During Period" to estimate the expenses you paid on your account during this period.
Hypothetical Example for Comparison Purposes
The second line of the table below provides information about hypothetical account values and hypothetical expenses based on the fund's actual expense ratio and an assumed rate of return of 5% per year before expenses, which is not the fund's actual return. The hypothetical account values and expenses may not be used to estimate the actual ending account balance or expenses you paid for the period. You may use this information to compare the ongoing cost of investing in the fund and other funds. To do so, compare this 5% hypothetical example with the 5% hypothetical examples that appear in the shareholder reports of the other funds.
Please note that the expenses shown in the table are meant to highlight your ongoing costs only and do not reflect any transactional costs, such as sales charges (loads) and redemption fees. Therefore, the second line of the table is useful in comparing ongoing costs only, and will not help you determine the relative total costs of owning different funds. In addition, if these transactional costs were included, your costs would have been higher.
6
COHEN & STEERS REALTY FOCUS FUND, INC.
Expense Example (Unaudited)—(Continued)
| | | Beginning
Account Value
January 01, 2006 | | Ending
Account Value
June 30, 2006 | | Expenses Paid
During Period*
January 01, 2006–
June 30, 2006 | |
| Class A | |
| Actual (11.01% return) | | $ | 1,000.00 | | | $ | 1,110.10 | | | $ | 8.06 | | |
| Hypothetical (5% annual return before expenses) | | $ | 1,000.00 | | | $ | 1,017.16 | | | $ | 7.70 | | |
| Class B | |
| Actual (10.66% return) | | $ | 1,000.00 | | | $ | 1,106.60 | | | $ | 11.44 | | |
| Hypothetical (5% annual return before expenses) | | $ | 1,000.00 | | | $ | 1,013.93 | | | $ | 10.94 | | |
| Class C | |
| Actual (10.66% return) | | $ | 1,000.00 | | | $ | 1,106.60 | | | $ | 11.44 | | |
| Hypothetical (5% annual return before expenses) | | $ | 1,000.00 | | | $ | 1,013.93 | | | $ | 10.94 | | |
| Class I | |
| Actual (11.21% return) | | $ | 1,000.00 | | | $ | 1,112.10 | | | $ | 6.18 | | |
| Hypothetical (5% annual return before expenses) | | $ | 1,000.00 | | | $ | 1,018.94 | | | $ | 5.91 | | |
* Expenses are equal to the fund's Class A, Class B, Class C and Class I annualized expense ratio of 1.54%, 2.19%, 2.19% and 1.18%, respectively, multiplied by the average account value over the period,multiplied by 181/365 (to reflect the one-half year period). If the fund had borne all of its expenses that were assumed by the advisor, the annualized expense ratios would have been 1.58%, 2.23%, 2.23% and 1.22%, respectively.
7
COHEN & STEERS REALTY FOCUS FUND, INC.
JUNE 30, 2006
Top Ten Holdings
(Unaudited)
| Security | | Market
Value | | % of
Net
Assets | |
| 1. Equity Office Properties Trust | | $ | 10,310,387 | | | | 6.2 | % | |
| 2. AvalonBay Communities | | | 10,121,730 | | | | 6.1 | | |
| 3. Brookfield Properties Corp. | | | 9,591,486 | | | | 5.8 | | |
| 4. Equity Residential | | | 8,364,510 | | | | 5.1 | | |
| 5. Vornado Realty Trust | | | 8,311,260 | | | | 5.0 | | |
| 6. Forest City Enterprises | | | 7,002,373 | | | | 4.2 | | |
| 7. Entertainment Properties Trust | | | 6,754,545 | | | | 4.1 | | |
| 8. Glenborough Realty Trust | | | 6,679,554 | | | | 4.0 | | |
| 9. BRE Properties | | | 6,589,000 | | | | 4.0 | | |
| 10. Apartment Investment and Management Co. | | | 6,569,640 | | | | 4.0 | | |
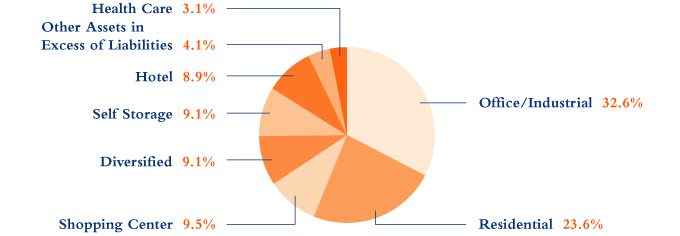
Sector Breakdown
(Based on Net Assets)
(Unaudited)
8
COHEN & STEERS REALTY FOCUS FUND, INC.
SCHEDULE OF INVESTMENTS
June 30, 2006 (Unaudited)
| | | | | Number
of Shares | | Value | |
| COMMON STOCK | | | 95.9 | % | | | | | | | | | |
| DIVERSIFIED | | | 9.1 | % | | | | | | | | | |
| Entertainment Properties Trust | | | | | | | 156,900 | | | $ | 6,754,545 | | |
| Vornado Realty Trust | | | | | | | 85,200 | | | | 8,311,260 | | |
| | | | | | | | 15,065,805 | | |
| HEALTH CARE | | | 3.1 | % | | | | | | | | | |
| Ventas | | | | | | | 148,800 | | | | 5,041,344 | | |
| HOTEL | | | 8.9 | % | | | | | | | | | |
| Hilton Hotels Corp. | | | | | | | 58,700 | | | | 1,660,036 | | |
| Host Hotels & Resorts | | | | | | | 256,953 | | | | 5,619,562 | | |
| Starwood Hotels & Resorts Worldwide | | | | | | | 60,500 | | | | 3,650,570 | | |
| Strategic Hotels & Resorts | | | | | | | 181,900 | | | | 3,772,606 | | |
| | | | | | | | 14,702,774 | | |
| OFFICE | | | 32.6 | % | | | | | | | | | |
| Alexandria Real Estate Equities | | | | | | | 64,300 | | | | 5,702,124 | | |
| Boston Properties | | | | | | | 64,400 | | | | 5,821,760 | | |
| Brookfield Properties Corp. | | | | | | | 298,150 | | | | 9,591,486 | | |
| Equity Office Properties Trust | | | | | | | 282,399 | | | | 10,310,387 | | |
| Forest City Enterprises | | | | | | | 140,300 | | | | 7,002,373 | | |
| Glenborough Realty Trust | | | | | | | 310,100 | | | | 6,679,554 | | |
| Mack-Cali Realty Corp. | | | | | | | 134,000 | | | | 6,153,280 | | |
| Thomas Properties Group | | | | | | | 225,200 | | | | 2,648,352 | | |
| | | | | | | | 53,909,316 | | |
| RESIDENTIAL | | | 23.6 | % | | | | | | | | | |
| APARTMENT | | | 21.9 | % | | | | | | | | | |
| Apartment Investment & Management Co. | | | | | | | 151,200 | | | | 6,569,640 | | |
| AvalonBay Communities | | | | | | | 91,500 | | | | 10,121,730 | | |
| BRE Properties | | | | | | | 119,800 | | | | 6,589,000 | | |
| Equity Residential | | | | | | | 187,000 | | | | 8,364,510 | | |
| Essex Property Trust | | | | | | | 40,900 | | | | 4,566,894 | | |
| | | | | | | | 36,211,774 | | |
See accompanying notes to financial statements.
9
COHEN & STEERS REALTY FOCUS FUND, INC.
SCHEDULE OF INVESTMENTS—(Continued)
June 30, 2006 (Unaudited)
| | | | | Number
of Shares | | Value | |
| MANUFACTURED HOME | | | 1.7 | % | | | | | | | | | |
| Sun Communities | | | | | | | 87,000 | | | $ | 2,830,110 | | |
| TOTAL RESIDENTIAL | | | | | | | | | | | 39,041,884 | | |
| SELF STORAGE | | | 9.1 | % | | | | | | | | | |
| Extra Space Storage | | | | | | | 310,100 | | | | 5,036,024 | | |
| Public Storage | | | | | | | 35,800 | | | | 2,717,220 | | |
| Shurgard Storage Centers | | | | | | | 43,000 | | | | 2,687,500 | | |
| U-Store-It Trust | | | | | | | 244,800 | | | | 4,616,928 | | |
| | | | | | | | 15,057,672 | | |
| SHOPPING CENTER | | | 9.5 | % | | | | | | | | | |
| COMMUNITY CENTER | | | 5.7 | % | | | | | | | | | |
| Federal Realty Investment Trust | | | | | | | 60,600 | | | | 4,242,000 | | |
| Inland Real Estate Corp. | | | | | | | 173,100 | | | | 2,575,728 | | |
| Tanger Factory Outlet Centers | | | | | | | 81,800 | | | | 2,647,866 | | |
| | | | | | | | 9,465,594 | | |
| REGIONAL MALL | | | 3.8 | % | | | | | | | | | |
| Macerich Co. | | | | | | | 60,900 | | | | 4,275,180 | | |
| Mills Corp. | | | | | | | 73,510 | | | | 1,966,393 | | |
| | | | | | | | 6,241,573 | | |
| TOTAL SHOPPING CENTER | | | | | | | | | | | 15,707,167 | | |
| TOTAL COMMON STOCK (Identified cost—$138,555,611) | | | | | | | | | | | 158,525,962 | | |
| | | | | Principal
Amount | |
| COMMERCIAL PAPER | | | 3.6 | % | | | | | | | | | |
New Center Asset Trust, 4.15%, due 7/3/06
(Identified cost—$5,995,617) | | | | | | $ | 5,997,000 | | | | 5,995,617 | | |
| TOTAL INVESTMENTS (Identified cost—$144,551,228) | | | 99.5 | % | | | | | | | 164,521,579 | | |
| OTHER ASSETS IN EXCESS OF LIABILITIES | | | 0.5 | % | | | | | | | 805,215 | | |
| NET ASSETS | | | 100.0 | % | | | | | | $ | 165,326,794 | | |
Note: Percentages indicated are based on the net assets of the fund.
See accompanying notes to financial statements.
10
COHEN & STEERS REALTY FOCUS FUND, INC.
STATEMENT OF ASSETS AND LIABILITIES
June 30, 2006 (Unaudited)
| ASSETS: | |
| Investments in securities, at value (Identified cost—$144,551,228) | | $ | 164,521,579 | | |
| Receivable for investment securities sold | | | 4,523,123 | | |
| Dividends receivable | | | 682,306 | | |
| Receivable for fund shares sold | | | 171,864 | | |
| Other assets | | | 5,667 | | |
| Total Assets | | | 169,904,539 | | |
| LIABILITIES: | |
| Payable for investment securities purchased | | | 4,293,837 | | |
| Payable to investment advisor | | | 91,998 | | |
| Payable for fund shares redeemed | | | 56,950 | | |
| Payable for directors' fees | | | 7,160 | | |
| Payable to administrator | | | 2,652 | | |
| Other liabilities | | | 125,148 | | |
| Total Liabilities | | | 4,577,745 | | |
| NET ASSETS | | $ | 165,326,794 | | |
| NET ASSETS consist of: | |
| Paid-in capital | | $ | 141,682,703 | | |
| Dividends in excess of net investment income | | | (1,981,939 | ) | |
| Accumulated undistributed net realized gain on investments | | | 5,655,679 | | |
| Net unrealized appreciation on investments | | | 19,970,351 | | |
| | | $ | 165,326,794 | | |
See accompanying notes to financial statements.
11
COHEN & STEERS REALTY FOCUS FUND, INC.
STATEMENT OF ASSETS AND LIABILITIES—(Continued)
June 30, 2006 (Unaudited)
| CLASS A SHARES: | |
| NET ASSETS | | $ | 39,881,660 | | |
| Shares issued and outstanding ($0.001 par value common stock outstanding) | | | 617,524 | | |
| Net asset value and redemption price per share | | $ | 64.58 | | |
| Maximum offering price per share ($64.58 ÷ 0.955)a | | $ | 67.62 | | |
| CLASS B SHARES: | |
| NET ASSETS | | $ | 2,344,841 | | |
| Shares issued and outstanding ($0.001 par value common stock outstanding) | | | 36,405 | | |
| Net asset value and offering price per shareb | | $ | 64.41 | | |
| CLASS C SHARES: | |
| NET ASSETS | | $ | 24,399,081 | | |
| Shares issued and outstanding ($0.001 par value common stock outstanding) | | | 378,569 | | |
| Net asset value and offering price per shareb | | $ | 64.45 | | |
| CLASS I SHARES: | |
| NET ASSETS | | $ | 98,701,212 | | |
| Shares issued and outstanding ($0.001 par value common stock outstanding) | | | 1,523,366 | | |
| Net asset value, offering and redemption price per share | | $ | 64.79 | | |
a On investments of $100,000 or more, the offering price is reduced.
b Redemption price per share is equal to the net asset value per share less any applicable deferred sales charge which varies with the length of time shares are held.
See accompanying notes to financial statements.
12
COHEN & STEERS REALTY FOCUS FUND, INC.
STATEMENT OF OPERATIONS
For the Six Months Ended June 30, 2006 (Unaudited)
| Investment Income: | |
| Dividend income (net of $15,389 of foreign withholding tax) | | $ | 1,078,407 | | |
| Interest income | | | 90,461 | | |
| Total Income | | | 1,168,868 | | |
| Expenses: | |
| Investment advisory fees | | | 691,739 | | |
| Distribution fees—Class A | | | 43,676 | | |
| Distribution fees—Class B | | | 7,392 | | |
| Distribution fees—Class C | | | 76,729 | | |
| Professional fees | | | 57,196 | | |
| Transfer agent fees | | | 50,516 | | |
| Shareholder servicing fees—Class A | | | 17,471 | | |
| Shareholder servicing fees—Class B | | | 2,464 | | |
| Shareholder servicing fees—Class C | | | 25,576 | | |
| Registration and filing fees | | | 35,295 | | |
| Administration fees | | | 34,292 | | |
| Directors' fees and expenses | | | 26,736 | | |
| Reports to shareholders | | | 19,594 | | |
| Custodian fees and expenses | | | 12,639 | | |
| Line of credit fees and expenses | | | 1,608 | | |
| Miscellaneous | | | 8,323 | | |
| Total Expenses | | | 1,111,246 | | |
| Reduction of Expenses | | | (27,335 | ) | |
| Net Expenses | | | 1,083,911 | | |
| Net Investment Income | | | 84,957 | | |
| Net Realized and Unrealized Gain on Investments: | |
| Net realized gain on investments | | | 5,957,576 | | |
| Net change in unrealized appreciation on investments | | | 9,519,249 | | |
| Net realized and unrealized gain on investments | | | 15,476,825 | | |
| Net Increase in Net Assets Resulting from Operations | | $ | 15,561,782 | | |
See accompanying notes to financial statements.
13
COHEN & STEERS REALTY FOCUS FUND, INC.
STATEMENT OF CHANGES IN NET ASSETS (Unaudited)
| | | For the
Six Months Ended
June 30, 2006 | | For the
Year Ended
December 31, 2005 | |
| Change in Net Assets: | |
| From Operations: | |
| Net investment income | | $ | 84,957 | | | $ | 337,363 | | |
| Net realized gain on investments | | | 5,957,576 | | | | 14,063,024 | | |
Net change in unrealized appreciation (depreciation)
on investments | | | 9,519,249 | | | | (1,286,611 | ) | |
| Net increase in net assets resulting from operations | | | 15,561,782 | | | | 13,113,776 | | |
| Dividends to Shareholders from: | |
| Net investment income: | |
| Class A | | | (495,220 | ) | | | (354,529 | ) | |
| Class B | | | (21,334 | ) | | | (19,499 | ) | |
| Class C | | | (211,968 | ) | | | (185,829 | ) | |
| Class I | | | (1,338,374 | ) | | | (2,016,279 | ) | |
| Net realized gain on investments: | |
| Class A | | | — | | | | (41,929 | ) | |
| Class B | | | — | | | | (2,507 | ) | |
| Class C | | | — | | | | (26,558 | ) | |
| Class I | | | — | | | | (151,725 | ) | |
| Total dividends to shareholders | | | (2,066,896 | ) | | | (2,798,855 | ) | |
| Capital Stock Transactions: | |
| Increase in net assets from fund share transactions | | | 19,402,293 | | | | 45,018,903 | | |
| Total increase in net assets | | | 32,897,179 | | | | 55,333,824 | | |
| Net Assets | |
| Beginning of period | | | 132,429,615 | | | | 77,095,791 | | |
| End of perioda | | $ | 165,326,794 | | | $ | 132,429,615 | | |
a Includes dividends in excess of net investment income of $1,981,939 and $0, respectively.
See accompanying notes to financial statements.
14
COHEN & STEERS REALTY FOCUS FUND, INC.
FINANCIAL HIGHLIGHTS (Unaudited)
The following table includes selected data for a share outstanding throughout each period and other performance information derived from the financial statements. It should be read in conjunction with the financial statements and notes thereto.
| | | Class A | |
| Per Share Operating Performance: | | For the
Six Months Ended
June 30, 2006 | | For the
Year Ended
December 31, 2005 | | For the Period
September 30, 2004a
through
December 31, 2004 | |
| Net asset value, beginning of period | | $ | 58.90 | | | $ | 52.96 | | | $ | 45.82 | | |
| Income from investment operations: | |
| Net investment incomeb | | | 0.01 | | | | 0.49 | | | | 0.22 | | |
| Net realized and unrealized gain on investments | | | 6.44 | | | | 6.74 | | | | 7.53 | | |
| Total income from investment operations | | | 6.45 | | | | 7.23 | | | | 7.75 | | |
| Less dividends and distributions to shareholders from: | |
| Net investment income | | | (0.78 | ) | | | (1.26 | ) | | | (0.61 | ) | |
| Net realized gain on investments | | | — | | | | (0.10 | ) | | | — | | |
| Total dividends and distributions to shareholders | | | (0.78 | ) | | | (1.36 | ) | | | (0.61 | ) | |
| Redemption fees retained by the fund | | | 0.01 | | | | 0.07 | | | | — | | |
| Net increase in net assets | | | 5.68 | | | | 5.94 | | | | 7.14 | | |
| Net asset value, end of period | | $ | 64.58 | | | $ | 58.90 | | | $ | 52.96 | | |
| Total investment returnc | | | 11.01 | %d | | | 13.87 | % | | | 16.93 | %d | |
| Ratios/Supplemental Data: | |
| Net assets, end of period (in millions) | | $ | 39.9 | | | $ | 25.7 | | | $ | 3.1 | | |
| Ratio of expenses to average daily net assets (before expense reduction) | | | 1.58 | %e | | | 1.84 | % | | | 3.07 | %e | |
| Ratio of expenses to average daily net assets (net of expense reduction) | | | 1.54 | %e | | | 1.65 | % | | | 1.65 | %e | |
Ratio of net investment income to average daily net assets
(before expense reduction) | | | 0.00 | %e | | | 0.67 | % | | | 0.31 | %e | |
Ratio of net investment income to average daily net assets
(net of expense reduction) | | | 0.04 | %e | | | 0.87 | % | | | 1.73 | %e | |
| Portfolio turnover rate | | | 50 | %d | | | 158 | % | | | 180 | %d | |
a Initial offering of shares.
b Calculated based on average shares outstanding during the period.
c Does not reflect sales charges, which would reduce return.
d Not annualized.
e Annualized.
See accompanying notes to financial statements.
15
COHEN & STEERS REALTY FOCUS FUND, INC.
FINANCIAL HIGHLIGHTS (Unaudited)—(Continued)
| | | Class B | |
| Per Share Operating Performance: | | For the
Six Months Ended
June 30, 2006 | | For the
Year Ended
December 31, 2005 | | For the Period
September 30, 2004a
through
December 31, 2004 | |
| Net asset value, beginning of period | | $ | 58.74 | | | $ | 52.92 | | | $ | 45.82 | | |
| Income from investment operations: | |
| Net investment income (loss)b | | | (0.20 | ) | | | (0.22 | ) | | | 0.20 | | |
| Net realized and unrealized gain on investments | | | 6.43 | | | | 7.03 | | | | 7.47 | | |
| Total income from investment operations | | | 6.23 | | | | 6.81 | | | | 7.67 | | |
| Less dividends and distributions to shareholders from: | |
| Net investment income | | | (0.57 | ) | | | (0.94 | ) | | | (0.57 | ) | |
| Net realized gain on investments | | | — | | | | (0.10 | ) | | | — | | |
| Total dividends and distributions to shareholders | | | (0.57 | ) | | | (1.04 | ) | | | (0.57 | ) | |
| Redemption fees retained by the fund | | | 0.01 | | | | 0.05 | | | | — | | |
| Net increase in net assets | | | 5.67 | | | | 5.82 | | | | 7.10 | | |
| Net asset value, end of period | | $ | 64.41 | | | $ | 58.74 | | | $ | 52.92 | | |
| Total investment returnc | | | 10.66 | %d | | | 12.99 | % | | | 16.77 | %d | |
| Ratios/Supplemental Data: | |
| Net assets, end of period (in millions) | | $ | 2.3 | | | $ | 1.5 | | | $ | 0.7 | | |
| Ratio of expenses to average daily net assets (before expense reduction) | | | 2.23 | %e | | | 2.56 | % | | | 4.07 | %e | |
| Ratio of expenses to average daily net assets (net of expense reduction) | | | 2.19 | %e | | | 2.30 | % | | | 2.30 | %e | |
Ratio of net investment loss to average daily net assets
(before expense reduction) | | | (0.67 | )%e | | | (0.65 | )% | | | (0.19 | )%e | |
Ratio of net investment income (loss) to average daily net assets
(net of expense reduction) | | | (0.63 | )%e | | | (0.39 | )% | | | 1.58 | %e | |
| Portfolio turnover rate | | | 50 | %d | | | 158 | % | | | 180 | %d | |
a Initial offering of shares.
b Calculated based on average shares outstanding during the period.
c Does not reflect sales charges, which would reduce return.
d Not annualized.
e Annualized.
See accompanying notes to financial statements.
16
COHEN & STEERS REALTY FOCUS FUND, INC.
FINANCIAL HIGHLIGHTS (Unaudited)—(Continued)
| | | Class C | |
| Per Share Operating Performance: | | For the
Six Months Ended
June 30, 2006 | | For the
Year Ended
December 31, 2005 | | For the Period
September 30, 2004a
through
December 31, 2004 | |
| Net asset value, beginning of period | | $ | 58.78 | | | $ | 52.93 | | | $ | 45.82 | | |
| Income from investment operations: | |
| Net investment income (loss)b | | | (0.19 | ) | | | (0.19 | ) | | | 0.15 | | |
| Net realized and unrealized gain on investments | | | 6.42 | | | | 7.03 | | | | 7.53 | | |
| Total income from investment operations | | | 6.23 | | | | 6.84 | | | | 7.68 | | |
| Less dividends and distributions to shareholders from: | |
| Net investment income | | | (0.57 | ) | | | (0.94 | ) | | | (0.57 | ) | |
| Net realized gain on investments | | | — | | | | (0.10 | ) | | | — | | |
| Total dividends and distributions to shareholders | | | (0.57 | ) | | | (1.04 | ) | | | (0.57 | ) | |
| Redemption fees retained by the fund | | | 0.01 | | | | 0.05 | | | | — | | |
| Net increase in net assets | | | 5.67 | | | | 5.85 | | | | 7.11 | | |
| Net asset value, end of period | | $ | 64.45 | | | $ | 58.78 | | | $ | 52.93 | | |
| Total investment returnc | | | 10.66 | %d | | | 13.07 | % | | | 16.77 | %d | |
| Ratios/Supplemental Data: | |
| Net assets, end of period (in millions) | | $ | 24.4 | | | $ | 15.9 | | | $ | 3.0 | | |
| Ratio of expenses to average daily net assets (before expense reduction) | | | 2.23 | %e | | | 2.54 | % | | | 3.78 | %e | |
| Ratio of expenses to average daily net assets (net of expense reduction) | | | 2.19 | %e | | | 2.30 | % | | | 2.30 | %e | |
Ratio of net investment loss to average daily net assets
(before expense reduction) | | | (0.65 | )%e | | | (0.57 | )% | | | (0.31 | )%e | |
Ratio of net investment income (loss) to average daily net assets
(net of expense reduction) | | | (0.61 | )%e | | | (0.33 | )% | | | 1.17 | %e | |
| Portfolio turnover rate | | | 50 | %d | | | 158 | % | | | 180 | %d | |
a Initial offering of shares.
b Calculated based on average shares outstanding during the period.
c Does not reflect sales charges, which would reduce return.
d Not annualized.
e Annualized.
See accompanying notes to financial statements.
17
COHEN & STEERS REALTY FOCUS FUND, INC.
FINANCIAL HIGHLIGHTS (Unaudited)—(Continued)
| | | Class I | |
| | | For the Six
Months Ended | | For the Year Ended December 31, | |
| Per Share Operating Performance: | | June 30, 2006 | | 2005 | | 2004 | | 2003 | | 2002 | | 2001 | |
| Net asset value, beginning of period | | $ | 59.09 | | | $ | 53.00 | | | $ | 38.55 | | | $ | 27.50 | | | $ | 26.63 | | | $ | 26.60 | | |
| Income from investment operations: | |
| Net investment income | | | 0.10 | a | | | 0.20 | a | | | 0.41 | a | | | 0.64 | | | | 0.73 | | | | 0.69 | | |
Net realized and unrealized
gain on investments | | | 6.48 | | | | 7.24 | | | | 15.16 | | | | 12.06 | | | | 1.29 | | | | 0.49 | | |
Total income from
investment operations | | | 6.58 | | | | 7.44 | | | | 15.57 | | | | 12.70 | | | | 2.02 | | | | 1.18 | | |
| Less dividends to shareholders from: | |
| Net investment income | | | (0.89 | ) | | | (1.40 | ) | | | (1.18 | ) | | | (1.67 | ) | | | (1.21 | ) | | | (0.52 | ) | |
| Net realized gain on investments | | | — | | | | (0.10 | ) | | | — | | | | — | | | | — | | | | — | | |
| Tax return of capital | | | — | | | | — | | | | — | | | | — | | | | — | | | | (0.63 | ) | |
Total dividends and
distributions to
shareholders | | | (0.89 | ) | | | (1.50 | ) | | | (1.18 | ) | | | (1.67 | ) | | | (1.21 | ) | | | (1.15 | ) | |
| Redemption fees retained by the fund | | | 0.01 | | | | 0.15 | | | | 0.06 | | | | 0.02 | | | | 0.06 | | | | — | | |
| Net increase in net assets | | | 5.70 | | | | 6.09 | | | | 14.45 | | | | 11.05 | | | | 0.87 | | | | 0.03 | | |
| Net asset value, end of period | | $ | 64.79 | | | $ | 59.09 | | | $ | 53.00 | | | $ | 38.55 | | | $ | 27.50 | | | $ | 26.63 | | |
| Total investment return | | | 11.21 | %b | | | 14.41 | %d | | | 40.98 | % | | | 46.89 | % | | | 7.67 | % | | | 4.39 | % | |
| Ratios/Supplemental Data: | |
| Net assets, end of period (in millions) | | $ | 98.7 | | | $ | 89.3 | | | $ | 70.2 | | | $ | 28.5 | | | $ | 18.2 | | | $ | 20.2 | | |
Ratio of expenses to average daily net
assets (before expense reduction) | | | 1.22 | %c | | | 1.57 | % | | | 1.89 | % | | | 1.99 | % | | | 2.09 | % | | | 1.83 | % | |
Ratio of expenses to average daily net
assets (net of expense reduction) | | | 1.18 | %c | | | 1.30 | % | | | 1.43 | % | | | 1.50 | % | | | 1.50 | % | | | 1.83 | % | |
Ratio of net investment income to
average daily net assets
(before expense reduction) | | | 0.27 | %c | | | 0.09 | % | | | 0.45 | % | | | 1.33 | % | | | 1.96 | % | | | 2.16 | % | |
Ratio of net investment income to
average daily net assets
(net of expense reduction) | | | 0.31 | %c | | | 0.36 | % | | | 0.92 | % | | | 1.82 | % | | | 2.55 | % | | | 2.16 | % | |
| Portfolio turnover rate | | | 50 | %b | | | 158 | % | | | 180 | % | | | 181 | % | | | 179 | % | | | 108 | % | |
a Calculated based on average shares outstanding during the period.
b Not annualized.
c Annualized.
d Without the benefit of the redemption fees, the total investment return would have been 14.12%.
See accompanying notes to financial statements.
18
COHEN & STEERS REALTY FOCUS FUND, INC.
NOTES TO FINANCIAL STATEMENTS (Unaudited)
Note 1. Significant Accounting Policies
Cohen & Steers Realty Focus Fund, Inc. (the fund) was incorporated under the laws of the State of Maryland on February 14, 1997 and is registered under the Investment Company Act of 1940, as amended, as a nondiversified, open-end management investment company. The fund's investment objective is maximum capital appreciation. The authorized shares of the fund are divided into four classes designated Class A, B, C, and I shares. Each of the fund's shares has equal dividend, liquidation and voting rights (except for matters relating to distributions and shareholder servicing of such shares). Class B shares automatically convert to Class A shares at the end of the month which precedes the eighth anniversary of the purchase date.
The following is a summary of significant accounting policies consistently followed by the fund in the preparation of its financial statements. The policies are in conformity with accounting principles generally accepted in the United States of America (GAAP). The preparation of the financial statements in accordance with GAAP requires management to make estimates and assumptions that affect the reported amounts of assets and liabilities at the date of the financial statements and the reported amounts of income and expenses during the reporting period. Actual results could differ from those estimates.
Portfolio Valuation: Investments in securities that are listed on the New York Stock Exchange are valued, except as indicated below, at the last sale price reflected at the close of the New York Stock Exchange on the business day as of which such value is being determined. If there has been no sale on such day, the securities are valued at the mean of the closing bid and asked prices for the day or, if no asked price is available, at the bid price.
Securities not listed on the New York Stock Exchange but listed on other domestic or foreign securities exchanges or admitted to trading on the National Association of Securities Dealers Automated Quotations, Inc. (Nasdaq) national market system are valued in a similar manner. Securities traded on more than one securities exchange are valued at the last sale price on the business day as of which such value is being determined as reflected on the tape at the close of the exchange representing the principal market for such securities.
Readily marketable securities traded in the over-the-counter market, including listed securities whose primary market is believed by Cohen & Steers Capital Management, Inc. to be over-the-counter, but excluding securities admitted to trading on the Nasdaq National List, are valued at the official closing prices as reported by Nasdaq, the National Quotation Bureau, or such other comparable sources as the Board of Directors deems appropriate to reflect their fair market value. If there has been no sale on such day, the securities are valued at the mean of the closing bid and asked prices for the day, or if no asked price is available, at the bid price. Where securities are traded on more than one exchange and also over-the-counter, the securities will generally be valued using the quotations the Board of Directors believes most closely reflect the value of such securities.
19
COHEN & STEERS REALTY FOCUS FUND, INC.
NOTES TO FINANCIAL STATEMENTS (Unaudited)—(Continued)
Securities for which market prices are unavailable, or securities for which the advisor determines that bid and/or asked prices price does reflect market value, will be valued at fair value pursuant to procedures approved by the fund's Board of Directors. Circumstances in which market prices may be unavailable include, but are not limited to, when trading in a security is suspended, the exchange on which the security is traded is subject to an unscheduled close or disruption or material events occur after the close of the exchange on which the security is principally traded. In these circumstances, the fund determines fair value in a manner that fairly reflects the market value of the security on the valuation date based on consideration of any information or factors it deems appropriate. These may include recent transactions in comparable securities, information relating to the specific security and developments in the markets.
The fund's use of fair value pricing may cause the net asset value of fund shares to differ from the net asset value that would be calculated using market quotations. Fair value pricing involves subjective judgments and it is possible that the fair value determined for a security may be materially different than the value that could be realized upon the sale of that security.
Short-term debt securities, which have a maturity date of 60 days or less, are valued at amortized cost, which approximates value.
Security Transactions and Investment Income: Security transactions are recorded on trade date. Realized gains and losses on investments sold are recorded on the basis of identified cost. Interest income is recorded on the accrual basis. Discounts are accreted and premiums are amortized over the life of the respective securities. Dividend income is recorded on the ex-dividend date. The fund records distributions received in excess of income from underlying investments as a reduction of cost of investments and/or realized gain. Such amounts are based on estimates if actual amounts are not available and actual amounts of income, realized gain and return of capital may differ from the estimated amounts. The fund adjusts the estimated amounts of the components of distributions (and consequently its net investment income) as an increase to unrealized appreciation/(depre ciation) and realized gain/(loss) on investments as necessary once the issuers provide information about the actual composition of the distributions. Income, expenses (other than expenses attributable to a specific class), and realized and unrealized gains or losses on investments are allocated to each class of shares based on its relative net assets.
Dividends and Distributions to Shareholders: Dividends from net investment income and capital gain distributions are determined in accordance with U.S. federal income tax regulations, which may differ from GAAP. Dividends from net investment income are declared and paid semi-annually. Net realized capital gains, unless offset by any available capital loss carryforward, are distributed to shareholders annually. Dividends and distributions to shareholders are recorded on the ex-dividend date and are automatically reinvested in full and fractional shares of the fund based on the net asset value per share at the close of business on the ex-dividend date unless the shareholder has elected to have them paid in cash.
20
COHEN & STEERS REALTY FOCUS FUND, INC.
NOTES TO FINANCIAL STATEMENTS (Unaudited)—(Continued)
Distributions paid by the fund are subject to recharacterization for tax purposes. Based upon the results of operations for the six months ended June 30, 2006, the advisor considers it likely that a portion of the dividends will be reclassified to return of capital and distributions of net realized capital gains upon the final determination of the fund's taxable income for the year.
Federal Income Taxes: It is the policy of the fund to continue to qualify as a regulated investment company, if such qualification is in the best interest of the shareholders, by complying with the requirements of Subchapter M of the Internal Revenue Code applicable to regulated investment companies, and by distributing substantially all of its taxable earnings to its shareholders. Accordingly, no provision for federal income or excise tax is necessary.
Note 2. Investment Advisory and Administration Fees and Other Transactions with Affiliates
Investment Advisory Fees: Cohen & Steers Capital Management, Inc. (the advisor) serves as the fund's investment advisor pursuant to an investment advisory agreement (the advisory agreement). Under the terms of the advisory agreement, the advisor provides the fund with the day-to-day investment decisions and generally manages the fund's investments in accordance with the stated policies of the fund, subject to the supervision of the fund's Board of Directors. For the services provided to the fund, the advisor receives a fee, accrued daily and paid monthly, at the annual rate of 0.90% of the average daily net assets of the fund.
For the six months ended June 30, 2006 and through December 31, 2006, the advisor has contractually agreed to waive its fee and/or reimburse the fund for expenses incurred to the extent necessary to maintain the fund's operating expenses at 1.65% for Class A shares, 2.30% for Class B and Class C shares and 1.30% for Class I shares.
Administration Fees: The fund has entered into an administration agreement with the advisor under which the advisor performs certain administrative functions for the fund and receives a fee, accrued daily and paid monthly, at the annual rate of 0.02% of the fund's average daily net assets. For the six months ended June 30, 2006, the fund paid the advisor $15,372 in fees under this administration agreement. Additionally, the fund has retained State Street Bank and Trust Company as sub-administrator under a fund accounting and administration agreement.
Distribution Fees: Shares of the fund are distributed by Cohen & Steers Securities, LLC (the distributor), an affiliated entity of the advisor. The fund has adopted a distribution plan (the plan) pursuant to Rule 12b-1 under the Investment Company Act of 1940. The plan provides that the fund will pay the distributor a fee, accrued daily and paid monthly, at an annual rate of up to 0.25% of the average daily net assets attributable to the Class A shares and up to 0.75% of the average daily net assets attributable to the Class B and Class C shares.
For the six months ended June 30, 2006, the fund has been advised that the distributor received $15,380 in sales commissions from the sale of Class A shares and that the distributor also received $891 and $6,296 of
21
COHEN & STEERS REALTY FOCUS FUND, INC.
NOTES TO FINANCIAL STATEMENTS (Unaudited)—(Continued)
contingent deferred sales charges relating to redemptions of Class B and Class C shares, respectively. The distributor has advised the fund that proceeds from the contingent deferred sales charge on the Class B and C shares are paid to the distributor and are used by the distributor to defray its expenses related to providing distribution-related services to the fund in connection with the sale of the Class B and C shares, including payments to dealers and other financial intermediaries for selling Class B and C shares and interest and other financing costs associated with Class B and C shares.
Shareholder Servicing Fees: The fund has adopted a shareholder services plan which provides that the fund may obtain the services of qualified financial institutions to act as shareholder servicing agents for their customers. For these services, the fund may pay the shareholder servicing agent a fee, accrued daily and paid monthly, at an annual rate of up to 0.10% of the average daily net asset value of the fund's Class A shares and up to 0.25% of the average daily net asset value of the fund's Class B and C shares.
Directors' and Officers' Fees: Certain directors and officers of the fund are also directors, officers, and/or employees of the advisor. The fund does not pay compensation to any affiliated directors and officers except for the Chief Compliance Officer, who received $1,171 from the fund for the six months ended June 30, 2006.
Note 3. Purchases and Sales of Securities
Purchases and sales of securities, excluding short-term investments, for the six months ended June 30, 2006 totaled $90,466,016 and $75,149,104 respectively.
Note 4. Income Tax Information
As of June 30, 2006, the federal tax cost and net unrealized appreciation were as follows:
| Cost for federal income tax purposes | | $ | 144,551,228 | | |
| Gross unrealized appreciation | | $ | 21,579,390 | | |
| Gross unrealized depreciation | | | (1,609,039 | ) | |
| Net unrealized appreciation | | $ | 19,970,351 | | |
22
COHEN & STEERS REALTY FOCUS FUND, INC.
NOTES TO FINANCIAL STATEMENTS (Unaudited)—(Continued)
Note 5. Capital Stock
The fund is authorized to issue 50 million shares of capital stock, at a par value of $0.001 per share. The Board of Directors of the fund may increase or decrease the aggregate number of shares of common stock that the fund has authority to issue. Transactions in fund shares were as follows:
| | | For the
Six Months Ended
June 30, 2006 | | For the
Year Ended
December 31, 2005 | |
| | | Shares | | Amount | | Shares | | Amount | |
| Class A: | |
| Sold | | | 253,564 | | | $ | 15,922,017 | | | | 425,527 | | | $ | 24,214,195 | | |
| Issued as reinvestment of dividends | | | 6,021 | | | | 373,098 | | | | 5,036 | | | | 293,591 | | |
| Redeemed | | | (78,454 | ) | | | (4,965,348 | ) | | | (52,977 | ) | | | (2,882,747 | ) | |
| Redemption fees retained by the funda | | | — | | | | 3,758 | | | | — | | | | 11,758 | | |
| Net increase | | | 181,131 | | | $ | 11,333,525 | | | | 377,586 | | | $ | 21,636,797 | | |
| Class B: | |
| Sold | | | 12,299 | | | $ | 774,224 | | | | 18,141 | | | $ | 1,010,429 | | |
| Issued as reinvestment of dividends | | | 247 | | | | 15,271 | | | | 246 | | | | 14,214 | | |
| Redeemed | | | (2,260 | ) | | | (141,369 | ) | | | (6,271 | ) | | | (340,218 | ) | |
| Redemption fees retained by the funda | | | — | | | | 212 | | | | — | | | | 838 | | |
| Net increase | | | 10,286 | | | $ | 648,338 | | | | 12,116 | | | $ | 685,263 | | |
| Class C: | |
| Sold | | | 141,874 | | | $ | 8,913,471 | | | | 241,405 | | | $ | 13,421,544 | | |
| Issued as reinvestment of dividends | | | 2,230 | | | | 137,939 | | | | 2,412 | | | | 139,677 | | |
| Redeemed | | | (36,046 | ) | | | (2,246,604 | ) | | | (30,636 | ) | | | (1,675,841 | ) | |
| Redemption fees retained by the Funda | | | — | | | | 2,213 | | | | — | | | | 7,742 | | |
| Net increase | | | 108,058 | | | $ | 6,807,019 | | | | 213,181 | | | $ | 11,893,122 | | |
| Class I: | |
| Sold | | | 245,555 | | | $ | 15,431,780 | | | | 726,972 | | | $ | 39,571,623 | | |
| Issued as reinvestment of dividends | | | 18,206 | | | | 1,131,528 | | | | 32,167 | | | | 1,855,492 | | |
| Redeemed | | | (251,557 | ) | | | (15,960,234 | ) | | | (572,605 | ) | | | (30,829,569 | ) | |
| Redemption fees retained by the funda | | | — | | | | 10,337 | | | | — | | | | 206,175 | | |
| Net increase | | | 12,204 | | | $ | 613,411 | | | | 186,534 | | | $ | 10,803,721 | | |
a The fund may charge a 1% redemption fee on shares sold within six months of the time of purchase.
23
COHEN & STEERS REALTY FOCUS FUND, INC.
NOTES TO FINANCIAL STATEMENTS (Unaudited)—(Continued)
Note 6. Borrowings
The fund, in conjunction with other Cohen & Steers funds, is a party to a $150,000,000 syndicated credit agreement (the credit agreement) with State Street Bank and Trust Company, as administrative agent and operations agent, and the lenders identified in the credit agreement, which expires December 2006. The fund pays a commitment fee of 0.125% per annum on its proportionate share of the unused portion of the credit agreement.
During the six months ended June 30, 2006, the fund did not utilize the line of credit.
Note 7. Other
In the normal course of business, the fund enters into contracts that provide general indemnifications. The fund's maximum exposure under these arrangements is dependent on claims that may be made against the fund in the future and, therefore, cannot be estimated; however, based on experience, the risk of material loss from such claims is considered remote.
In July 2006, the Financial Accounting Standards Board (FASB) issued Interpretation 48, Accounting for Uncertainty in Income Taxes – an interpretation of FASB Statement 109 (FIN 48). FIN 48 clarifies the accounting for income taxes by prescribing the minimum recognition threshold a tax position must meet before being recognized in the financial statements. FIN 48 is effective for fiscal years beginning after December 15, 2006. The fund will adopt FIN 48 during 2007 and the impact to the fund's financial statements, if any, is currently being assessed.
24
COHEN & STEERS REALTY FOCUS FUND, INC.
OTHER INFORMATION
A description of the policies and procedures that the fund uses to determine how to vote proxies relating to portfolio securities is available (i) without charge, upon request, by calling 800-330-7348, (ii) on our Web site at cohenandsteers.com or (iii) on the Securities and Exchange Commission's Web site at http://www.sec.gov. In addition, the fund's proxy voting record for the most recent 12-month period ended June 30 is available (i) without charge, upon request, by calling 800-330-7348 or (ii) on the SEC's Web site at http://www.sec.gov.
The fund files its complete schedule of portfolio holdings with the SEC for the first and third quarters of each fiscal year on Form N-Q. The fund's Forms N-Q are available (i) without charge, upon request by calling 800-330-7348, or (ii) on the SEC's Web site at http://www.sec.gov. In addition, the Forms N-Q may be reviewed and copied at the SEC's Public Reference Room in Washington, DC. Information on the operation of the Public Reference Room may be obtained by calling 800-SEC-0330.
Please note that the distributions paid by the fund to shareholders are subject to recharacterization for tax purposes. The fund may also pay distributions in excess of the fund's net investment company taxable income and this excess would be a tax-free return of capital distributed from the fund's assets. To the extent this occurs, the fund's shareholders of record will be notified of the estimated amount of capital returned to shareholders for each such distribution and this information will also be available at cohenandsteers.com. The final tax treatment of all distributions is reported to shareholders on their 1099-DIV forms, which are mailed after the close of each calendar year. Distributions of capital decrease the fund's total assets and, therefore, could have the effect of increasing the fund's expense ratio. In addition, in order to make these distributions, the fund may have to sell portfolio securities at a less than opportune ti me.
25
COHEN & STEERS REALTY FOCUS FUND, INC.
APPROVAL OF INVESTMENT ADVISORY AGREEMENT
The board of directors of the fund, including a majority of the directors who are not parties to the fund's Investment Advisory Agreement, or interested persons of any such party ("Independent Directors"), has the responsibility under the 1940 Act to approve the fund's Investment Advisory Agreement for its initial two year term and its continuation annually thereafter at a meeting of the board called for the purpose of voting on the approval or continuation. At a meeting held in person on March 7, 2006, the Investment Advisory Agreement was discussed and was unanimously continued for a one-year term by the fund's board, including the Independent Directors. The Independent Directors were represented by independent counsel who assisted them in their deliberations during the Board meeting and executive session.
In considering whether to continue the Investment Advisory Agreement, the board reviewed materials provided by the fund's investment advisor (the "Advisor") and Fund counsel which included, among other things, fee, expense and performance information compared to peer funds prepared by Morningstar Associates LLC ("Morningstar"), supplemental performance and summary information prepared by the Advisor, sales and redemption data for the fund and memoranda outlining the legal duties of the board. The board also spoke directly with representatives of Morningstar and met with investment advisory personnel from the Advisor. The board considered factors relating to both the selection of the Advisor and the approval of the advisory fee when reviewing the Investment Advisory Agreement. In particular, the board considered the following:
(i) The nature, extent and quality of services to be provided by the Advisor: The directors reviewed the services that the Advisor provides to the fund, including, but not limited to, making the day-to-day investment decisions for the fund, and generally managing the fund's investments in accordance with the stated policies of the fund. The directors also discussed with officers and portfolio managers of the fund the amount of time the Advisor dedicated to the fund during the last year and the types of transactions that were being done on behalf of the fund. The directors also considered a presentation by the Advisor on its investment philosophy with respect to, and the investment outlook for, the fund. Additionally, the directors took into account the services provided by the Advisor to its other funds, including those that invest substantially in real estate sec urities and have investment objectives and strategies similar to the fund.
In addition, the board considered the education, background and experience of the Advisor's personnel. The directors also took into consideration the favorable history and reputation of the portfolio managers for the fund, finding that this has had, and would likely continue to have, a favorable impact on the success of the fund. The board noted that the Advisor's experience in investing in real estate securities generally helped further the fund's objectives. Lastly, the directors noted the Advisor's ability to attract quality and experienced personnel. The directors concluded that the nature, quality and extent of services provided by the Advisor, including compliance with investment restrictions and tax reporting requirements, are adequate and appropriate.
(ii) Investment performance of the fund and the Advisor: The directors reviewed the past investment performance of the fund, as well as the past investment performance of the fund's peer group. In particular, they
26
COHEN & STEERS REALTY FOCUS FUND, INC.
focused on materials provided by Morningstar. The directors noted that the fund had superior performance during the past five years relative to its peer group. In particular, the directors noted that, according to Morningstar, among its peer group funds in the specialty-real estate category, the fund ranked first in total returns for the 3- and 5-year periods, and had above median total returns for the 1-year period. The directors also noted that the fund was currently outperforming its benchmark.
The directors reviewed the Advisor's performance for other open-end real estate funds. In particular, the directors noted that the Advisor managed other real estate funds, in addition to the fund, that were outperforming their benchmark indices and their peer groups. The directors determined that the Advisor would continue to be an appropriate investment adviser for the fund and that the fund's performance was satisfactory.
(iii) Cost of the services to be provided and profits to be realized by the Advisor from the relationship with the fund: Next, the directors considered the cost of the services provided by the Advisor. As part of their analysis, the directors gave substantial consideration to the fee and expense ratio analyses provided by Morningstar and comparisons to peer group funds selected by Morningstar. The directors noted that under the Investment Advisory Agreement, the fund pays the Advisor a monthly investment advisory fee computed at the annual rate of 0.90% of the average daily net assets of the fund. The directors noted, however, that the Advisor had waived 0.26% of its fees during the reporting period, resulting in a net advisory fee of 0.64% and a net management fee (including both advisory and administrative fees) of 0.66%.
In reviewing the investment advisory fee, the directors considered the investment advisory fees of the peer group and noted that the fund's contractual fee was above the peer group median (though, after the Advisor's waiver, the fee was substantially below the peer group median). The directors also noted that the fund's total expense ratio had historically been slightly above its peer group median, although the total expense ratio was now below the peer group median. It was pointed out that the fund's relatively smaller size had been the primary reason for the higher expense ratio and that the Advisor expects the expense ratio would continue to decline with additional assets. The directors concluded that the fund's expense structure is competitive in the peer group.
The directors also reviewed information regarding the profitability to the Advisor of its relationship with the fund. The board considered the level of the Advisor's profits and whether the profits were reasonable for the Advisor. The directors noted that the Advisor was currently waiving fees and/or reimbursing expenses for the fund. The directors took into consideration other benefits to be derived by the Advisor in connection with the Investment Advisory Agreement, noting particularly the research and related services, within the meaning of Section 28(e) of the Securities Exchange Act of 1934, as amended, that the Advisor receives by allocating the fund's brokerage transactions. The directors also considered the fees received by the Advisor under the Administration Agreement, but noted the significant services received, such as operational services and furnishing office space and facilities for the fund, and providing persons satisfactory to the board to serve as officers of the fund, and that these services were beneficial to the fund. The directors concluded that the profits realized by the Advisor from its administrative relationship with the fund were reasonable and consistent with fiduciary duties.
27
COHEN & STEERS REALTY FOCUS FUND, INC.
(iv) The extent to which economies of scale would be realized as the fund grows and whether fee levels would reflect such economies of scale: The directors noted that the fund's advisory fee schedule does not contain any breakpoints. The directors considered the fund's asset size and determined that there were not at this time significant economies of scale that were not being shared with shareholders, but to the extent in the future it were determined that material economies of scale were not being shared, the directors would seek to do so.
(v) Comparison of services rendered and fees paid to those under other investment advisory contracts, such as contracts of the same and other investment advisers or other clients: As discussed above in (i) and (iii), the directors compared both the services rendered and the fees paid under the Investment Advisory Agreement to those under other investment advisory contracts of other investment advisers managing peer group funds. The directors were provided with an industry study analyzing differences between funds and institutional accounts and the services and fees associated with each and compared both the services rendered and the fees paid under the Investment Advisory Agreement to the Advisor's other advisory contracts with institutional and other clients.
No single factor was cited as determinative to the decision of the board. Rather, after weighing all of the considerations and conclusions discussed above, the board, including the Independent Directors, unanimously approved the continuation of the Investment Advisory Agreement.
28
COHEN & STEERS REALTY FOCUS FUND, INC.
Meet the Cohen & Steers family of open-end funds:

• Designed for investors seeking maximum total return, investing primarily in REITs
• Symbol: CSRSX

• Designed for institutional investors seeking maximum total return, investing primarily in REITs
• Symbol: CSRIX

• Designed for investors seeking high current income, investing primarily in REITs
• Symbols: CSEIX, CSBIX, CSCIX, CSDIX

• Designed for investors seeking maximum capital appreciation, investing in a limited number of REITs and other real estate securities
• Symbols: CSFAX, CSFBX, CSFCX, CSSPX

• Designed for investors seeking maximum total return, investing primarily in international real estate securities
• Symbols: IRFAX, IRFCX, IRFIX

• Designed for investors seeking maximum total return, investing primarily in utilities
• Symbols: CSUAX, CSUBX, CSUCX, CSUIX

• Designed for investors seeking high current income and long-term growth of income and capital appreciation, investing primarily in dividend paying common stocks and preferred stocks.
• Symbols: DVFAX, DVFCX, DVFIX

• Designed for investors seeking maximum total return, investing primarily in real estate securities located in the Asia Pacific region
• Symbols: APFAX, APFCX, APFIX
Please consider the investment objectives, risks, charges and expenses of the fund carefully before investing. A prospectus containing this and other information can be obtained by calling 800-330-7348 or by visiting cohenandsteers.com. Please read the prospectus carefully before investing.
Cohen & Steers Securities, LLC, Distributor
29
COHEN & STEERS REALTY FOCUS FUND, INC.
OFFICERS AND DIRECTORS
Robert H. Steers
Director and co-chairman
Martin Cohen
Director and co-chairman
Bonnie Cohen
Director
George Grossman
Director
Richard E. Kroon
Director
Richard J. Norman
Director
Frank K. Ross
Director
Willard H. Smith Jr.
Director
C. Edward Ward, Jr.
Director
Adam M. Derechin
President and chief executive officer
Joseph M. Harvey
Vice president
James S. Corl
Vice president
Lawrence B. Stoller
Secretary
Jay J. Chen
Treasurer and chief financial officer
Lisa D. Phelan
Chief compliance officer
John E. McLean
Assistant secretary
KEY INFORMATION
Investment Advisor
Cohen & Steers Capital Management, Inc.
280 Park Avenue
New York, NY 10017
(212) 832-3232
Fund Subadministrator and Custodian
State Street Bank and Trust Company
225 Franklin Street
Boston, MA 02110
Transfer Agent
Boston Financial Data Services, Inc.
2 Heritage Drive
North Quincy, MA 02171
(800) 437-9912
Legal Counsel
Stroock & Stroock & Lavan LLP
180 Maiden Lane
New York, NY 10038
Distributor
Cohen & Steers Securities, LLC
280 Park Avenue
New York, NY 10017
Nasdaq Symbol: Class A—CSFAX
B—CSFBX
C—CSFCX
I— CSSPX
Web site: cohenandsteers.com
This report is authorized for delivery only to shareholders of Cohen & Steers Realty Focus Fund, Inc. unless accompanied or preceded by the delivery of a currently effective prospectus setting forth details of the fund. Past performance of course, is no guarantee of future results and your investment may be worth more or less at the time you sell.
30
COHEN & STEERS
REALTY FOCUS FUND
280 PARK AVENUE
NEW YORK, NY 10017

SEMIANNUAL REPORT
JUNE 30, 2006
Item 2. Code of Ethics.
Not applicable.
Item 3. Audit Committee Financial Expert.
Not applicable.
Item 4. Principal Accountant Fees and Services.
Not applicable.
Item 5. Audit Committee of Listed Registrants.
Not applicable.
Item 6. Schedule of Investments.
Included in Item 1 above.
Item 7. Disclosure of Proxy Voting Policies and Procedures for Closed-End Management Investment Companies.
Not applicable.
Item 8. Portfolio Managers of Closed-End Management Investment Companies.
Not applicable.
Item 9. Purchases of Equity Securities by Closed-End Management Investment Company and Affiliated Purchasers.
Not applicable.
Item 10. Submission of Matters to a Vote of Security Holders.
None.
Item 11. Controls and Procedures.
(a) The registrant’s principal executive officer and principal financial officer have concluded, based upon their evaluation of the registrant’s disclosure controls and procedures as conducted
within 90 days of the filing date of this report, that these disclosure controls and procedures provide reasonable assurance that material information required to be disclosed by the registrant in the report it files or submits on Form N-CSR is recorded, processed, summarized and reported within the time periods specified in the Securities and Exchange Commission’s rules and forms and that such material information is accumulated and communicated to the registrant’s management, including its principal executive officer and principal financial officer, as appropriate, in order to allow timely decisions regarding required disclosure.
(b) There were no changes in the registrant’s internal control over financial reporting that occurred during the second fiscal quarter of the period covered by this report that have materially affected, or are reasonably likely to materially affect, the registrant’s internal control over financial reporting.
Item 12. Exhibits.
(a)(1) Not applicable.
(a) (2) Certifications of principal executive officer and principal financial officer as required by Rule 30a-2(a) under the Investment Company Act of 1940.
(a)(3) Not applicable.
(b) Certifications of principal exe cutive officer and principal financial officer as required by Rule 30a- 2(b) under the Investment Company Act of 1940.
SIGNATURES
Pursuant to the requirements of the Securities Exchange Act of 1934 and the Investment Company Act of 1940, the registrant has duly caused this report to be signed on its behalf by the undersigned, thereunto duly authorized.
COHEN & STEERS REALTY FOCUS FUND, INC.
| | | |
| By: | /s/ Adam M. Derechin | |
| | Name: Adam M. Derechin |
| | Title: President and Chief Executive Officer |
| | |
| Date: August 28, 2006 |
Pursuant to the requirements of the Securities Exchange Act of 1934 and the Investment Company Act of 1940, this report has been signed below by the following persons on behalf of the registrant and in the capacities and on the dates indicated.
| | | |
| By: | /s/ Adam M. Derechin | |
| | Name: | Adam M. Derechin |
| | Title: | President and Chief Executive Officer
(principal executive officer) |
| | | |
| By: | /s/ Jay J. Chen | |
| | Name: | Jay J. Chen |
| | Title: | Treasurer
(principal financial officer) |
| | | |
| | | |
| Date: August 28, 2006 |
| | | | |