UNITED STATES
SECURITIES AND EXCHANGE COMMISSION
Washington, D.C. 20549
FORM N-CSR
CERTIFIED SHAREHOLDER REPORT OF REGISTERED
MANAGEMENT INVESTMENT COMPANIES
Investment Company Act file number | 811-8059 |
|
Cohen & Steers Realty Focus Fund, Inc. |
(Exact name of registrant as specified in charter) |
|
280 Park Avenue, New York, NY | | 10017 |
(Address of principal executive offices) | | (Zip code) |
|
Adam M. Derechin
Cohen & Steers Capital Management, Inc.
280 Park Avenue
New York, New York 10017 |
(Name and address of agent for service) |
|
Registrant’s telephone number, including area code: | (212) 832-3232 | |
|
Date of fiscal year end: | December 31 | |
|
Date of reporting period: | June 30, 2007 | |
| | | | | | | | |
Item 1. Reports to Stockholders.
COHEN & STEERS REALTY FOCUS FUND, INC.
August 9, 2007
To Our Shareholders:
We are pleased to submit to you our report for the six months ended June 30, 2007. The net asset values per share at that date were $64.72, $64.52, $64.57 and $64.95 for Class A, Class B, Class C and Class I shares, respectively. In addition, a dividend was declared for shareholders of record on June 28, 2007 and paid on June 29, 2007 to all four classes of shares. The dividends were as follows: Class A—$0.663 per share, Class B—$0.427 per share; Class C—$0.427 per share and Class I—$0.786 per share.a
The total return, including income and change in net asset value, for Cohen & Steers Realty Focus Fund and the comparative benchmarks were:
| | | Six Months Ended
June 30, 2007 | |
| Cohen & Steers Realty Focus Fund—Class A | | | –6.46 | % | |
| Cohen & Steers Realty Focus Fund—Class B | | | –6.78 | % | |
| Cohen & Steers Realty Focus Fund—Class C | | | –6.76 | % | |
| Cohen & Steers Realty Focus Fund—Class I | | | –6.32 | % | |
| FTSE NAREIT Equity REIT Indexb | | | –5.89 | % | |
| S&P 500 Indexb | | | 6.96 | % | |
The performance data quoted represent past performance. Past performance is no guarantee of future results. The investment return and the principal value of an investment will fluctuate and shares, if redeemed, may be worth more or less than their original cost. Current performance may be lower or higher than the performance data quoted. Total returns of the fund current to the most recent month-end can be obtained by visiting our Web site at cohenandsteers.com. Performance quoted does not reflect the deduction of the maximum 4.5% initial sales charge on Class A shares or the 5% and 1% maximum contingent deferred sales charge on Class B and Class C shares, respectively. If such charges were included, returns would have been lower.
a Please note that distributions paid by the fund to shareholders are subject to recharacterization for tax purposes. The final tax treatment of these distributions is reported to shareholders after the close of each fiscal year.
b The FTSE NAREIT Equity REIT Index is an unmanaged, market capitalization weighted index of all publicly traded REITs that invest predominantly in the equity ownership of real estate. The index is designed to reflect the performance of all publicly traded equity REITs as a whole. The S&P 500 Index is an unmanaged index of common stocks that is frequently used as a general measure of stock market performance.
1
COHEN & STEERS REALTY FOCUS FUND, INC.
Investment Review
Following four years of strong absolute and relative performance, including a 35% total return in 2006 (as measured by the FTSE NAREIT Equity REIT Index), and seven years of positive returns, REITs had generally negative returns in the first half of 2007. REITs began the year on a positive note, buoyed by a January bidding contest between Vornado and The Blackstone Group for control of Equity Office Properties (EOP). Blackstone prevailed, purchasing EOP at a sizable premium, prompting investors at that time to raise valuation estimates for publicly traded real estate securities.
REITs struggled over the remainder of the period, however, declining nearly 20% from their February highs. This reflected concerns over rising interest rates and uncertainty about whether asset pricing would suffer. Expectations for Federal Reserve monetary easing were pushed back as economic growth continued and inflation fears persisted. The possibility that the Fed might in fact raise rates entered the picture, and the yield on the 10-year Treasury bond in June climbed to 5.26%, its highest level in five years; the yield retreated to 5.03% by period end.
Growth rates for real estate companies generally stabilized, after accelerating in the past few years. This signaled an end to the stock-multiple expansion phase of the real estate cycle, and set expectations for more normalized returns for REITs. Put another way, capitalization rate compression for real estate assets is likely over (a cap rate is the inverse of the earnings multiple).
Most property sectors declined. Among the poorest performing sectors were self storage, due to concerns that a slowing economy might materially affect demand; and health care, as these companies are typically more sensitive to rising interest rates, due to the long-term nature of their leases.
Apartments stage partial recovery
Apartments initially underperformed on concerns about the weakening housing market. However, the group's performance improved late in the period when Archstone-Smith, a leading apartment REIT, agreed to be acquired by a partnership sponsored by Tishman Speyer and Lehman Brothers for $22.2 billion, a 22.7% premium to the stock price before a rumor of the deal was published on May 24, 2007. This deal underscored for the market the overall positive prospects for apartment fundamentals and the sustainability of apartment asset pricing. The sector outperformed for the period as a whole.
Merger activity stimulated the hotel sector's relative performance. Late in the quarter, Equity Inns, the third-largest hotel REIT as measured by the number of hotels owned, announced that it would be acquired by an affiliate of Whitehall Street Global Real Estate in a transaction valued at $2.2 billion. This represented a 19% premium to the stock's previous day closing price.
Relative performance hindered by self storage, aided by health care
The fund underperformed its benchmark, hindered by our overweight in the self storage sector (although this was partly offset by stock selection), which fell on concerns over slowing economic growth. Our underweight in regional malls also detracted from performance, as the sector outperformed despite a poor second quarter. Other
2
COHEN & STEERS REALTY FOCUS FUND, INC.
factors that hampered the fund included our underweight in the specialty sector and overweight and stock selection in the apartment sector. Factors that aided the fund's relative performance included good stock selection in the office sector, our overweight and stock selection in the hotel sector, underweight and stock selection in health care and underweight in shopping centers.
Investment Outlook
Before REITs can manage a sustainable performance recovery, investors may require more clarity on inflation and economic growth. In our opinion, if the economy gains momentum, it would likely benefit real estate companies; however, it might cause the Fed to raise interest rates, unsettling stock prices, including REITs. A cooling economy, on the other hand, would likely prompt the Fed to cut rates, which could lift stocks, as a rate reduction is not currently expected by the market.
We believe that a fair degree of pessimism has now been priced into REITs, including the possibility of some decline in property asset values. We believe REITs, on the whole, are attractively valued, with many trading at compelling discounts (more than 20% in some cases) to their underlying net asset values, compared with their long-term average of a 5% premium to NAV. The private equity market continues to value REITs more aggressively than the public market, as evidenced by the continued privatizations of real estate companies.
From a property sector perspective we continue to favor apartments, and believe that recent events underscore our view that a downward trend in owner-occupied housing prices, coupled with tightening credit standards, are clear positives for the sector. In our view, uncertainty in the housing market should ultimately result in lower overall home ownership rates in the next five years, which in turn should benefit apartment owners. We also like the self-storage and office sectors on a stock-specific basis, and believe that the market has taken too negative a view of these sectors.
3
COHEN & STEERS REALTY FOCUS FUND, INC.
Sincerely,
 | |  | |
|
| MARTIN COHEN | | ROBERT H. STEERS | |
|
| Co-chairman | | Co-chairman | |
|
 | |  | |
|
| JOSEPH M. HARVEY | | JAMES S. CORL | |
|
| Portfolio Manager | | Portfolio Manager | |
|
The views and opinions in the preceding commentary are as of the date stated and are subject to change. This material represents an assessment of the market environment at a specific point in time, should not be relied upon as investment advice and is not intended to predict or depict performance of any investment.
Visit Cohen & Steers online at cohenandsteers.com
For more information about any of our funds, visit cohenandsteers.com, where you'll find daily net asset values, fund fact sheets and portfolio highlights. You can also access newsletters, education tools and market updates covering REIT, utility and preferred securities sectors.
In addition, our Web site contains comprehensive information about our firm, including our most recent press releases, profiles of our senior investment professionals, and an overview or our investment approach.
4
COHEN & STEERS REALTY FOCUS FUND, INC.
Performance Review (Unaudited)
Average Annual Total Returns—For the Periods Ended June 30, 2007
| | | Class A Shares | | Class B Shares | | Class C Shares | | Class I Shares | |
| 1 Year (with sales charge) | | | 6.32 | %a | | | 5.60 | %b | | | 9.62 | %d | | | — | | |
| 1 Year (without sales charge) | | | 11.33 | % | | | 10.60 | % | | | 10.62 | % | | | 11.71 | % | |
| 5 Years (without sales charge) | | | — | | | | — | | | | — | | | | 21.88 | % | |
| 10 Years (without sales charge) | | | — | | | | — | | | | — | | | | 14.23 | % | |
Since Inceptione (with sales
charge) | | | 17.89 | %a | | | 18.23 | %c | | | 19.10 | % | | | — | | |
Since Inceptione (without sales
charge) | | | 19.89 | % | | | 19.07 | % | | | 19.10 | % | | | 15.00 | % | |
The performance data quoted represent past performance. Past performance is no guarantee of future results. The investment return and principal value of an investment will fluctuate and shares, when redeemed, may be worth more or less than their original cost. Current performance may be lower or higher than the performance data quoted. Performance information current to the most recent month-end can be obtained by visiting our Web site at cohenandsteers.com. The performance table does not reflect the deduction of taxes that a shareholder would pay on fund distributions or the redemption of fund shares.
Through December 31, 2007, the fund's advisor has contractually agreed to waive certain fees and/or reimburse the fund for expenses. Absent such arrangements, returns would have been lower.
a Reflects a 4.50% front-end sales charge.
b Reflects a contingent deferred sales charge of 5%.
c Reflects a contingent deferred sales charge of 3%.
d Reflects a contingent deferred sales charge of 1%.
e Inception dates: September 30, 2004 for Class A, B, and C and May 8, 1997 for Class I.
5
COHEN & STEERS REALTY FOCUS FUND, INC.
Expense Example (Unaudited)
As a shareholder of the fund, you incur two types of costs: (1) transaction costs, including sales charges (loads) on purchase payments and redemption fees; and (2) ongoing costs including management fees; distribution and/or service (12b-1) fees; and other fund expenses. This example is intended to help you understand your ongoing costs (in dollars) of investing in the fund and to compare these costs with the ongoing costs of investing in other mutual funds.
The example is based on an investment of $1,000 invested at the beginning of the period and held for the entire period 01/01/07 – 06/30/07.
Actual Expenses
The first line of the table below provides information about actual account values and expenses. You may use the information in this line, together with the amount you invested, to estimate the expenses that you paid over the period. Simply divide your account value by $1,000 (for example, an $8,600 account value divided by $1,000 = 8.6), then multiply the result by the number in the first line under the heading entitled "Expenses Paid During Period" to estimate the expenses you paid on your account during this period.
Hypothetical Example for Comparison Purposes
The second line of the table below provides information about hypothetical account values and hypothetical expenses based on the fund's actual expense ratio and an assumed rate of return of 5% per year before expenses, which is not the fund's actual return. The hypothetical account values and expenses may not be used to estimate the actual ending account balance or expenses you paid for the period. You may use this information to compare the ongoing cost of investing in the fund and other funds. To do so, compare this 5% hypothetical example with the 5% hypothetical examples that appear in the shareholder reports of the other funds.
Please note that the expenses shown in the table are meant to highlight your ongoing costs only and do not reflect any transactional costs, such as sales charges (loads) and redemption fees. Therefore, the second line of the table is useful in comparing ongoing costs only, and will not help you determine the relative total costs of owning different funds. In addition, if these transactional costs were included, your costs would have been higher.
6
COHEN & STEERS REALTY FOCUS FUND, INC.
Expense Example (Unaudited)—(Continued)
| | | Beginning
Account Value
January 1, 2007 | | Ending
Account Value
June 30, 2007 | | Expenses Paid
During Period*
January 1, 2007–
June 30, 2007 | |
| Class A | |
| Actual (–6.46% return) | | $ | 1,000.00 | | | $ | 935.40 | | | $ | 7.25 | | |
| Hypothetical (5% annual return before expenses) | | $ | 1,000.00 | | | $ | 1,017.31 | | | $ | 7.55 | | |
| Class B | |
| Actual (–6.78% return) | | $ | 1,000.00 | | | $ | 932.20 | | | $ | 10.35 | | |
| Hypothetical (5% annual return before expenses) | | $ | 1,000.00 | | | $ | 1,014.08 | | | $ | 10.79 | | |
| Class C | |
| Actual (–6.76% return) | | $ | 1,000.00 | | | $ | 932.40 | | | $ | 10.35 | | |
| Hypothetical (5% annual return before expenses) | | $ | 1,000.00 | | | $ | 1,014.08 | | | $ | 10.79 | | |
| Class I | |
| Actual (–6.32% return) | | $ | 1,000.00 | | | $ | 936.80 | | | $ | 5.57 | | |
| Hypothetical (5% annual return before expenses) | | $ | 1,000.00 | | | $ | 1,019.04 | | | $ | 5.81 | | |
* Expenses are equal to the fund's Class A, Class B, Class C and Class I annualized expense ratio of 1.51%, 2.16%, 2.16% and 1.16%, respectively, multiplied by the average account value over the period, multiplied by 181/365 (to reflect the one-half year period).
7
COHEN & STEERS REALTY FOCUS FUND, INC.
JUNE 30, 2007
Top Ten Holdings
(Unaudited)
| Security | | Market
Value | | % of
Net
Assets | |
| Public Storage | | $ | 12,913,442 | | | | 6.4 | % | |
| Parkway Properties | | | 11,157,369 | | | | 5.5 | | |
| Macerich Co. | | | 10,368,436 | | | | 5.2 | | |
| SL Green Realty Corp. | | | 10,121,813 | | | | 5.0 | | |
| Equity Residential | | | 10,024,911 | | | | 5.0 | | |
| Federal Realty Investment Trust | | | 9,943,362 | | | | 4.9 | | |
| Boston Properties | | | 9,886,184 | | | | 4.9 | | |
| Thomas Properties Group | | | 9,448,974 | | | | 4.7 | | |
| BRE Properties | | | 9,261,098 | | | | 4.6 | | |
| AvalonBay Communities | | | 9,106,208 | | | | 4.5 | | |
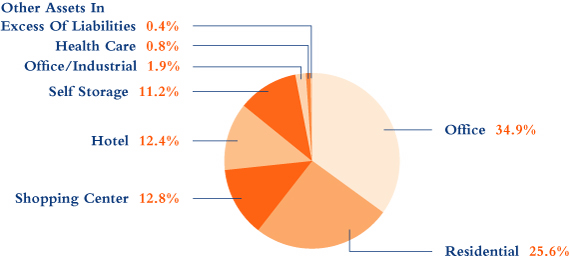
Sector Breakdown
(Based on Net Assets)
(Unaudited)
8
COHEN & STEERS REALTY FOCUS FUND, INC.
SCHEDULE OF INVESTMENTS
June 30, 2007 (Unaudited)
| | | | | Number
of Shares | | Value | |
| COMMON STOCK | | | 99.6 | % | | | | | | | | | |
| HEALTH CARE | | | 0.8 | % | | | | | | | | | |
| Senior Housing Properties Trust | | | | | | | 79,652 | | | $ | 1,620,919 | | |
| HOTEL | | | 12.4 | % | | | | | | | | | |
| Hilton Hotels Corp. | | | | | | | 201,249 | | | | 6,735,804 | | |
| LaSalle Hotel Properties | | | | | | | 121,800 | | | | 5,288,556 | | |
| Starwood Hotels & Resorts Worldwide | | | | | | | 89,900 | | | | 6,029,593 | | |
| Strategic Hotels & Resorts | | | | | | | 309,600 | | | | 6,962,904 | | |
| | | | | | | | 25,016,857 | | |
| OFFICE | | | 34.9 | % | | | | | | | | | |
| BioMed Realty Trust | | | | | | | 284,800 | | | | 7,154,176 | | |
| Boston Properties | | | | | | | 96,800 | | | | 9,886,184 | | |
| Brookfield Properties Corp. | | | | | | | 263,025 | | | | 6,394,138 | | |
| Forest City Enterprises | | | | | | | 78,500 | | | | 4,826,180 | | |
| Kilroy Realty Corp. | | | | | | | 61,600 | | | | 4,363,744 | | |
| Maguire Properties | | | | | | | 199,300 | | | | 6,841,969 | | |
| Parkway Properties | | | | | | | 232,300 | | | | 11,157,369 | | |
| SL Green Realty Corp. | | | | | | | 81,700 | | | | 10,121,813 | | |
| Thomas Properties Group | | | | | | | 591,300 | | | | 9,448,974 | | |
| | | | | | | | 70,194,547 | | |
| OFFICE/INDUSTRIAL | | | 1.9 | % | | | | | | | | | |
| EastGroup Properties | | | | | | | 84,892 | | | | 3,719,967 | | |
| RESIDENTIAL | | | 25.6 | % | | | | | | | | | |
| APARTMENT | | | 24.4 | % | | | | | | | | | |
| Apartment Investment & Management Co. | | | | | | | 116,700 | | | | 5,884,014 | | |
| AvalonBay Communities | | | | | | | 76,600 | | | | 9,106,208 | | |
| BRE Properties | | | | | | | 156,200 | | | | 9,261,098 | | |
| Camden Property Trust | | | | | | | 66,000 | | | | 4,420,020 | | |
| Equity Residential | | | | | | | 219,700 | | | | 10,024,911 | | |
| Mid-America Apartment Communities | | | | | | | 82,200 | | | | 4,313,856 | | |
| UDR | | | | | | | 225,160 | | | | 5,921,708 | | |
| | | | | | | | 48,931,815 | | |
See accompanying notes to financial statements.
9
COHEN & STEERS REALTY FOCUS FUND, INC.
SCHEDULE OF INVESTMENTS—(Continued)
June 30, 2007 (Unaudited)
| | | | | Number
of Shares | | Value | |
| MANUFACTURED HOME | | | 1.2 | % | | | | | | | | | |
| Equity Lifestyle Properties | | | | | | | 46,900 | | | $ | 2,447,711 | | |
| TOTAL RESIDENTIAL | | | | | | | | | | | 51,379,526 | | |
| SELF STORAGE | | | 11.2 | % | | | | | | | | | |
| Extra Space Storage | | | | | | | 297,000 | | | | 4,900,500 | | |
| Public Storage | | | | | | | 168,100 | | | | 12,913,442 | | |
| U-Store-It Trust | | | | | | | 283,500 | | | | 4,646,565 | | |
| | | | | | | | 22,460,507 | | |
| SHOPPING CENTER | | | 12.8 | % | | | | | | | | | |
| COMMUNITY CENTER | | | 7.7 | % | | | | | | | | | |
| Developers Diversified Realty Corp. | | | | | | | 104,100 | | | | 5,487,111 | | |
| Federal Realty Investment Trust | | | | | | | 128,700 | | | | 9,943,362 | | |
| | | | | | | | 15,430,473 | | |
| REGIONAL MALL | | | 5.1 | % | | | | | | | | | |
| Macerich Co. | | | | | | | 125,800 | | | | 10,368,436 | | |
| TOTAL SHOPPING CENTER | | | | | | | | | | | 25,798,909 | | |
| TOTAL INVESTMENTS (Identified cost—$201,238,898) | | | 99.6 | % | | | | | | | 200,191,232 | | |
| OTHER ASSETS IN EXCESS OF LIABILITIES | | | 0.4 | % | | | | | | | 859,330 | | |
| NET ASSETS | | | 100.0 | % | | | | | | $ | 201,050,562 | | |
Note: Percentages indicated are based on the net assets of the fund.
See accompanying notes to financial statements.
10
COHEN & STEERS REALTY FOCUS FUND, INC.
STATEMENT OF ASSETS AND LIABILITIES
June 30, 2007 (Unaudited)
| ASSETS: | |
| Investments in securities, at value (Identified cost—$201,238,898) | | $ | 200,191,232 | | |
| Receivable for investment securities sold | | | 2,810,911 | | |
| Dividends receivable | | | 829,658 | | |
| Receivable for fund shares sold | | | 609,003 | | |
| Other assets | | | 936 | | |
| Total Assets | | | 204,441,740 | | |
| LIABILITIES: | |
| Payable for investment securities purchased | | | 1,573,400 | | |
| Payable for fund shares redeemed | | | 669,523 | | |
| Payable for dividends declared | | | 435,423 | | |
| Due to custodian | | | 383,064 | | |
| Payable for investment advisory fees | | | 158,421 | | |
| Payable for directors' fees | | | 7,465 | | |
| Payable for distribution fees | | | 3,895 | | |
| Payable for administration fees | | | 3,520 | | |
| Payable for shareholder servicing fees | | | 1,385 | | |
| Other liabilities | | | 155,082 | | |
| Total Liabilities | | | 3,391,178 | | |
| NET ASSETS | | $ | 201,050,562 | | |
| NET ASSETS consist of: | |
| Paid-in-capital | | $ | 178,588,314 | | |
| Dividends in excess of net investment income | | | (2,026,076 | ) | |
| Accumulated undistributed net realized gain on investments | | | 25,535,990 | | |
| Net unrealized depreciation on investments | | | (1,047,666 | ) | |
| | | $ | 201,050,562 | | |
See accompanying notes to financial statements.
11
COHEN & STEERS REALTY FOCUS FUND, INC.
STATEMENT OF ASSETS AND LIABILITIES—(Continued)
June 30, 2007 (Unaudited)
| CLASS A SHARES: | |
| NET ASSETS | | $ | 62,391,438 | | |
| Shares issued and outstanding ($0.001 par value common stock outstanding) | | | 964,021 | | |
| Net asset value and redemption price per share | | $ | 64.72 | | |
| Maximum offering price per share ($64.72 ÷ 0.955)a | | $ | 67.77 | | |
| CLASS B SHARES: | |
| NET ASSETS | | $ | 3,591,660 | | |
| Shares issued and outstanding ($0.001 par value common stock outstanding) | | | 55,666 | | |
| Net asset value and offering price per shareb | | $ | 64.52 | | |
| CLASS C SHARES: | |
| NET ASSETS | | $ | 38,188,180 | | |
| Shares issued and outstanding ($0.001 par value common stock outstanding) | | | 591,443 | | |
| Net asset value and offering price per shareb | | $ | 64.57 | | |
| CLASS I SHARES: | |
| NET ASSETS | | $ | 96,879,284 | | |
| Shares issued and outstanding ($0.001 par value common stock outstanding) | | | 1,491,548 | | |
| Net asset value, offering, and redemption price per share | | $ | 64.95 | | |
a On investments of $100,000 or more, the offering price is reduced.
b Redemption price per share is equal to the net asset value per share less any applicable deferred sales charge which varies with the length of time shares are held.
See accompanying notes to financial statements.
12
COHEN & STEERS REALTY FOCUS FUND, INC.
STATEMENT OF OPERATIONS
For the Six Months Ended June 30, 2007 (Unaudited)
| Investment Income: | |
| Dividend income (net of $10,327 of foreign withholding tax) | | $ | 1,650,843 | | |
| Interest income | | | 78,624 | | |
| Total Income | | | 1,729,467 | | |
| Expenses: | |
| Investment advisory fees | | | 1,035,646 | | |
| Distribution fees—Class A | | | 83,619 | | |
| Distribution fees—Class B | | | 14,884 | | |
| Distribution fees—Class C | | | 158,364 | | |
| Shareholder servicing fees—Class A | | | 33,448 | | |
| Shareholder servicing fees—Class B | | | 4,961 | | |
| Shareholder servicing fees—Class C | | | 52,788 | | |
| Administration fees | | | 79,801 | | |
| Transfer agent fees and expenses | | | 61,674 | | |
| Registration and filing fees | | | 39,415 | | |
| Professional fees | | | 34,128 | | |
| Directors' fees and expenses | | | 30,675 | | |
| Custodian fees and expenses | | | 26,846 | | |
| Shareholder reporting expenses | | | 18,820 | | |
| Line of credit fees | | | 1,843 | | |
| Miscellaneous | | | 8,648 | | |
| Total Expenses | | | 1,685,560 | | |
| Net Investment Income | | | 43,907 | | |
| Net Realized and Unrealized Gain (Loss) on Investments: | |
| Net realized gain on investments | | | 25,632,167 | | |
| Net change in unrealized appreciation on investments | | | (40,160,742 | ) | |
| Net realized and unrealized loss on investments | | | (14,528,575 | ) | |
| Net Decrease in Net Assets Resulting from Operations | | $ | (14,484,668 | ) | |
See accompanying notes to financial statements.
13
COHEN & STEERS REALTY FOCUS FUND, INC.
STATEMENT OF CHANGES IN NET ASSETS (Unaudited)
| | | For the
Six Months Ended
June 30, 2007 | | For the
Year Ended
December 31, 2006 | |
| Change in Net Assets: | |
| From Operations: | |
| Net investment income | | $ | 43,907 | | | $ | 1,134,676 | | |
| Net realized gain on investments | | | 25,632,167 | | | | 19,404,919 | | |
| Net change in unrealized appreciation on investments | | | (40,160,742 | ) | | | 28,661,974 | | |
Net increase (decrease) in net assets resulting
from operations | | | (14,484,668 | ) | | | 49,201,569 | | |
| Dividends and Distributions to Shareholders from: | |
| Net investment income: | |
| Class A | | | (633,092 | ) | | | (256,441 | ) | |
| Class B | | | (23,648 | ) | | | — | | |
| Class C | | | (250,852 | ) | | | (258 | ) | |
| Class I | | | (1,162,391 | ) | | | (914,107 | ) | |
| Net realized gain on investments: | |
| Class A | | | — | | | | (5,030,435 | ) | |
| Class B | | | — | | | | (299,894 | ) | |
| Class C | | | — | | | | (3,213,032 | ) | |
| Class I | | | — | | | | (10,600,754 | ) | |
| Tax return of capital: | |
| Class A | | | — | | | | (453,053 | ) | |
| Class B | | | — | | | | (26,783 | ) | |
| Class C | | | — | | | | (278,052 | ) | |
| Class I | | | — | | | | (1,003,522 | ) | |
| Total dividends and distributions to shareholders | | | (2,069,983 | ) | | | (22,076,331 | ) | |
| Capital Stock Transactions: | |
Increase (decrease) in net assets from fund share
transactions | | | (7,703,763 | ) | | | 65,754,123 | | |
| Total increase (decrease) in net assets | | | (24,258,414 | ) | | | 92,879,361 | | |
| Net Assets: | |
| Beginning of period | | | 225,308,976 | | | | 132,429,615 | | |
| End of perioda | | $ | 201,050,562 | | | $ | 225,308,976 | | |
a Includes dividends in excess of net investment income of $2,026,076 and $0, respectively.
See accompanying notes to financial statements.
14
COHEN & STEERS REALTY FOCUS FUND, INC.
FINANCIAL HIGHLIGHTS (Unaudited)
The following table includes selected data for a share outstanding throughout each period and other performance information derived from the financial statements. It should be read in conjunction with the financial statements and notes thereto.
| | | Class A | |
| | | For the
Six Months
Ended | | For the Year Ended December 31, | | For the Period
September 30, 2004a
through | |
| Per Share Operating Performance: | | June 30, 2007 | | 2006 | | 2005 | | December 31, 2004 | |
| Net asset value, beginning of period | | $ | 69.88 | | | $ | 58.90 | | | $ | 52.96 | | | $ | 45.82 | | |
| Income (loss) from investment operations: | |
| Net investment income | | | 0.01 | | | | 0.42 | | | | 0.49 | b | | | 0.22 | b | |
| Net realized and unrealized gain (loss) on investments | | | (4.53 | ) | | | 18.12 | | | | 6.74 | | | | 7.53 | | |
| Total from investment operations | | | (4.52 | ) | | | 18.54 | | | | 7.23 | | | | 7.75 | | |
| Less dividends and distributions to shareholders from: | |
| Net investment income | | | (0.66 | ) | | | (0.42 | ) | | | (1.26 | ) | | | (0.61 | ) | |
| Net realized gain on investments | | | — | | | | (6.51 | ) | | | (0.10 | ) | | | — | | |
| Tax return of capital | | | — | | | | (0.64 | ) | | | — | | | | — | | |
Total dividends and distributions to
shareholders | | | (0.66 | ) | | | (7.57 | ) | | | (1.36 | ) | | | (0.61 | ) | |
| Redemption fees retained by the fund | | | 0.02 | | | | 0.01 | | | | 0.07 | | | | — | | |
| Net increase (decrease) in net asset value | | | (5.16 | ) | | | 10.98 | | | | 5.94 | | | | 7.14 | | |
| Net asset value, end of period | | $ | 64.72 | | | $ | 69.88 | | | $ | 58.90 | | | $ | 52.96 | | |
| Total investment returnc | | | –6.46 | %d | | | 32.14 | % | | | 13.87 | % | | | 16.93 | %d | |
| Ratios/Supplemental Data: | |
| Net assets, end of period (in millions) | | $ | 62.4 | | | $ | 60.3 | | | $ | 25.7 | | | $ | 3.1 | | |
Ratio of expenses to average daily net assets
(before expense reduction) | | | 1.51 | %e | | | 1.61 | % | | | 1.84 | % | | | 3.07 | %e | |
Ratio of expenses to average daily net assets
(net of expense reduction) | | | 1.51 | %e | | | 1.61 | % | | | 1.65 | % | | | 1.65 | %e | |
Ratio of net investment income to average daily net
assets (before expense reduction) | | | 0.03 | %e | | | 0.59 | % | | | 0.67 | % | | | 0.31 | %e | |
Ratio of net investment income to average daily net
assets (net of expense reduction) | | | 0.03 | %e | | | 0.59 | % | | | 0.87 | % | | | 1.73 | %e | |
| Portfolio turnover rate | | | 104 | %d | | | 109 | % | | | 158 | % | | | 180 | %d | |
a Initial offering of shares.
b Calculation based on average shares outstanding.
c Does not reflect sales charges, which would reduce return.
d Not annualized.
e Annualized.
See accompanying notes to financial statements.
15
COHEN & STEERS REALTY FOCUS FUND, INC.
FINANCIAL HIGHLIGHTS (Unaudited)—(Continued)
| | | Class B | |
| | | For the
Six Months
Ended | | For the Year Ended December 31, | | For the Period
September 30, 2004a
through | |
| Per Share Operating Performance: | | June 30, 2007 | | 2006 | | 2005 | | December 31, 2004 | |
| Net asset value, beginning of period | | $ | 69.65 | | | $ | 58.74 | | | $ | 52.92 | | | $ | 45.82 | | |
| Income (loss) from investment operations: | |
| Net investment income (loss) | | | (0.22 | ) | | | — | | | | (0.22 | )b | | | 0.20 | b | |
| Net realized and unrealized gain (loss) on investments | | | (4.50 | ) | | | 18.04 | | | | 7.03 | | | | 7.47 | | |
| Total from investment operations | | | (4.72 | ) | | | 18.04 | | | | 6.81 | | | | 7.67 | | |
| Less dividends and distributions to shareholders from: | |
| Net investment income | | | (0.43 | ) | | | — | | | | (0.94 | ) | | | (0.57 | ) | |
| Net realized gain on investments | | | — | | | | (6.51 | ) | | | (0.10 | ) | | | — | | |
| Tax return of capital | | | — | | | | (0.64 | ) | | | — | | | | — | | |
Total dividends and distributions to
shareholders | | | (0.43 | ) | | | (7.15 | ) | | | (1.04 | ) | | | (0.57 | ) | |
| Redemption fees retained by the fund | | | 0.02 | | | | 0.02 | | | | 0.05 | | | | — | | |
| Net increase (decrease) in net asset value | | | (5.13 | ) | | | 10.91 | | | | 5.82 | | | | 7.10 | | |
| Net asset value, end of period | | $ | 64.52 | | | $ | 69.65 | | | $ | 58.74 | | | $ | 52.92 | | |
| Total investment returnc | | | –6.78 | %d | | | 31.29 | % | | | 12.99 | % | | | 16.77 | %d | |
| Ratios/Supplemental Data: | |
| Net assets, end of period (in millions) | | $ | 3.6 | | | $ | 3.6 | | | $ | 1.5 | | | $ | 0.7 | | |
Ratio of expenses to average daily net assets
(before expense reduction) | | | 2.16 | %e | | | 2.26 | % | | | 2.56 | % | | | 4.07 | %e | |
Ratio of expenses to average daily net assets
(net of expense reduction) | | | 2.16 | %e | | | 2.26 | % | | | 2.30 | % | | | 2.30 | %e | |
Ratio of net investment income (loss) to average daily net
assets (before expense reduction) | | | (0.62 | )%e | | | 0.00 | % | | | (0.65 | )% | | | (0.19 | )%e | |
Ratio of net investment income (loss) to average daily net
assets (net of expense reduction) | | | (0.62 | )%e | | | 0.00 | % | | | (0.39 | )% | | | 1.58 | %e | |
| Portfolio turnover rate | | | 104 | %d | | | 109 | % | | | 158 | % | | | 180 | %d | |
a Initial offering of shares.
b Calculation based on average shares outstanding.
c Does not reflect sales charges, which would reduce return.
d Not annualized.
e Annualized.
See accompanying notes to financial statements.
16
COHEN & STEERS REALTY FOCUS FUND, INC.
FINANCIAL HIGHLIGHTS (Unaudited)—(Continued)
| | | Class C | |
| | | For the
Six Months
Ended | | For the Year Ended December 31, | | For the Period
September 30, 2004a
through | |
| Per Share Operating Performance: | | June 30, 2007 | | 2006 | | 2005 | | December 31, 2004 | |
| Net asset value, beginning of period | | $ | 69.68 | | | $ | 58.78 | | | $ | 52.93 | | | $ | 45.82 | | |
| Income (loss) from investment operations: | |
| Net investment income (loss) | | | (0.22 | ) | | | — | | | | (0.19 | )b | | | 0.15 | b | |
| Net realized and unrealized gain (loss) on investments | | | (4.48 | ) | | | 18.04 | | | | 7.03 | | | | 7.53 | | |
| Total from investment operations | | | (4.70 | ) | | | 18.04 | | | | 6.84 | | | | 7.68 | | |
| Less dividends and distributions to shareholders from: | |
| Net investment income | | | (0.43 | ) | | | (0.01 | ) | | | (0.94 | ) | | | (0.57 | ) | |
| Net realized gain on investments | | | — | | | | (6.51 | ) | | | (0.10 | ) | | | — | | |
| Tax return of capital | | | — | | | | (0.64 | ) | | | — | | | | — | | |
Total dividends and distributions to
shareholders | | | (0.43 | ) | | | (7.16 | ) | | | (1.04 | ) | | | (0.57 | ) | |
| Redemption fees retained by the fund | | | 0.02 | | | | 0.02 | | | | 0.05 | | | | — | | |
| Net increase (decrease) in net asset value | | | (5.11 | ) | | | 10.90 | | | | 5.85 | | | | 7.11 | | |
| Net asset value, end of period | | $ | 64.57 | | | $ | 69.68 | | | $ | 58.78 | | | $ | 52.93 | | |
| Total investment returnc | | | –6.76 | %d | | | 31.28 | % | | | 13.07 | % | | | 16.77 | %d | |
| Ratios/Supplemental Data: | |
| Net assets, end of period (in millions) | | $ | 38.2 | | | $ | 38.2 | | | $ | 15.9 | | | $ | 3.0 | | |
Ratio of expenses to average daily net assets
(before expense reduction) | | | 2.16 | %e | | | 2.26 | % | | | 2.54 | % | | | 3.78 | %e | |
Ratio of expenses to average daily net assets
(net of expense reduction) | | | 2.16 | %e | | | 2.26 | % | | | 2.30 | % | | | 2.30 | %e | |
Ratio of net investment income (loss) to average daily net
assets (before expense reduction) | | | (0.64 | )%e | | | 0.00 | % | | | (0.57 | )% | | | (0.31 | )%e | |
Ratio of net investment income (loss) to average daily net
assets (net of expense reduction) | | | (0.64 | )%e | | | 0.00 | % | | | (0.33 | )% | | | 1.17 | %e | |
| Portfolio turnover rate | | | 104 | %d | | | 109 | % | | | 158 | % | | | 180 | %d | |
a Initial offering of shares.
b Calculation based on average shares outstanding.
c Does not reflect sales charges, which would reduce return.
d Not annualized.
e Annualized.
See accompanying notes to financial statements.
17
COHEN & STEERS REALTY FOCUS FUND, INC.
FINANCIAL HIGHLIGHTS (Unaudited)—(Continued)
| | | Class I | |
| | | For the Six
Months Ended | | For the Year Ended December 31, | |
| Per Share Operating Performance: | | June 30, 2007 | | 2006 | | 2005 | | 2004 | | 2003 | | 2002 | |
| Net asset value, beginning of period | | $ | 70.14 | | | $ | 59.09 | | | $ | 53.00 | | | $ | 38.55 | | | $ | 27.50 | | | $ | 26.63 | | |
Income (loss) from investment
operations: | |
| Net investment income | | | 0.13 | | | | 0.65 | | | | 0.20 | a | | | 0.41 | a | | | 0.64 | | | | 0.73 | | |
Net realized and unrealized
gain (loss) on investments | | | (4.55 | ) | | | 18.19 | | | | 7.24 | | | | 15.16 | | | | 12.06 | | | | 1.29 | | |
Total from investment
operations | | | (4.42 | ) | | | 18.84 | | | | 7.44 | | | | 15.17 | | | | 12.70 | | | | 2.02 | | |
Less dividends and distributions to
shareholders from: | |
| Net investment income | | | (0.79 | ) | | | (0.65 | ) | | | (1.40 | ) | | | (1.18 | ) | | | (1.67 | ) | | | (1.21 | ) | |
| Net realized gain on investments | | | — | | | | (6.51 | ) | | | (0.10 | ) | | | — | | | | — | | | | — | | |
| Tax return of capital | | | — | | | | (0.64 | ) | | | — | | | | — | | | | — | | | | — | | |
Total dividends and
distributions to
shareholders | | | (0.79 | ) | | | (7.80 | ) | | | (1.50 | ) | | | (1.18 | ) | | | (1.67 | ) | | | (1.21 | ) | |
| Redemption fees retained by the fund | | | 0.02 | | | | 0.01 | | | | 0.15 | | | | 0.06 | | | | 0.02 | | | | 0.06 | | |
Net increase (decrease)
in net asset value | | | (5.19 | ) | | | 11.05 | | | | 6.09 | | | | 14.45 | | | | 11.05 | | | | 0.87 | | |
| Net asset value, end of period | | $ | 64.95 | | | $ | 70.14 | | | $ | 59.09 | | | $ | 53.00 | | | $ | 38.55 | | | $ | 27.50 | | |
| Total investment return | | | –6.32 | %c | | | 32.62 | % | | | 14.41 | %b | | | 40.98 | % | | | 46.89 | % | | | 7.67 | % | |
| Ratios/Supplemental Data: | |
| Net assets, end of period (in millions) | | $ | 96.9 | | | $ | 123.3 | | | $ | 89.3 | | | $ | 70.2 | | | $ | 28.5 | | | $ | 18.2 | | |
Ratio of expenses to average daily net
assets (before expense reduction) | | | 1.16 | %d | | | 1.25 | % | | | 1.57 | % | | | 1.89 | % | | | 1.99 | % | | | 2.09 | % | |
Ratio of expenses to average daily net
assets (net of expense reduction) | | | 1.16 | %d | | | 1.25 | % | | | 1.30 | % | | | 1.43 | % | | | 1.50 | % | | | 1.50 | % | |
Ratio of net investment income to
average daily net assets
(before expense reduction) | | | 0.31 | %d | | | 0.84 | % | | | 0.09 | % | | | 0.45 | % | | | 1.33 | % | | | 1.96 | % | |
Ratio of net investment income to
average daily net assets
(net of expense reduction) | | | 0.31 | %d | | | 0.85 | % | | | 0.36 | % | | | 0.92 | % | | | 1.82 | % | | | 2.55 | % | |
| Portfolio turnover rate | | | 104 | %c | | | 109 | % | | | 158 | % | | | 180 | % | | | 181 | % | | | 179 | % | |
a Calculation based on average shares outstanding.
b Without the benefit of the redemption fees, the total investment return would have been 14.12%.
c Not annualized.
d Annualized.
See accompanying notes to financial statements.
18
COHEN & STEERS REALTY FOCUS FUND, INC.
NOTES TO FINANCIAL STATEMENTS (Unaudited)
Note 1. Significant Accounting Policies
Cohen & Steers Realty Focus Fund, Inc. (the fund) was incorporated under the laws of the State of Maryland on February 14, 1997 and is registered under the Investment Company Act of 1940, as amended, as a nondiversified, open-end management investment company. The fund's investment objective is maximum capital appreciation. The authorized shares of the fund are divided into four classes designated Class A, B, C, and I shares. Effective May 1, 2007, Class B shares are no longer offered except through dividend reinvestment and permitted exchanges by existing Class B shareholders. Each of the fund's shares has equal dividend, liquidation and voting rights (except for matters relating to distributions and shareholder servicing of such shares). Class B shares automatically convert to Class A shares at the end of the month which precedes the eighth anniversary of the purchase date.
The following is a summary of significant accounting policies consistently followed by the fund in the preparation of its financial statements. The policies are in conformity with accounting principles generally accepted in the United States of America (GAAP). The preparation of the financial statements in accordance with GAAP requires management to make estimates and assumptions that affect the reported amounts of assets and liabilities at the date of the financial statements and the reported amounts of income and expenses during the reporting period. Actual results could differ from those estimates.
Portfolio Valuation: Investments in securities that are listed on the New York Stock Exchange are valued, except as indicated below, at the last sale price reflected at the close of the New York Stock Exchange on the business day as of which such value is being determined. If there has been no sale on such day, the securities are valued at the mean of the closing bid and asked prices for the day or, if no asked price is available, at the bid price.
Securities not listed on the New York Stock Exchange but listed on other domestic or foreign securities exchanges or admitted to trading on the National Association of Securities Dealers Automated Quotations, Inc. (Nasdaq) national market system are valued in a similar manner. Securities traded on more than one securities exchange are valued at the last sale price on the business day as of which such value is being determined as reflected on the tape at the close of the exchange representing the principal market for such securities.
Readily marketable securities traded in the over-the-counter market, including listed securities whose primary market is believed by Cohen & Steers Capital Management, Inc. (the advisor) to be over-the-counter, but excluding securities admitted to trading on the Nasdaq National List, are valued at the official closing prices as reported by Nasdaq, the National Quotation Bureau, or such other comparable sources as the Board of Directors deems appropriate to reflect their fair market value. If there has been no sale on such day, the securities are valued at the mean of the closing bid and asked prices for the day, or if no asked price is available, at the bid price. Where securities are traded on more than one exchange and also over-the-counter, the securities will generally be valued using the quotations the Board of Directors believes most closely reflect the value of such securities.
Securities for which market prices are unavailable, or securities for which the advisor determines that bid and/or asked prices price does reflect market value, will be valued at fair value pursuant to procedures approved
19
COHEN & STEERS REALTY FOCUS FUND, INC.
NOTES TO FINANCIAL STATEMENTS (Unaudited)—(Continued)
by the fund's Board of Directors. Circumstances in which market prices may be unavailable include, but are not limited to, when trading in a security is suspended, the exchange on which the security is traded is subject to an unscheduled close or disruption or material events occur after the close of the exchange on which the security is principally traded. In these circumstances, the fund determines fair value in a manner that fairly reflects the market value of the security on the valuation date based on consideration of any information or factors it deems appropriate. These may include recent transactions in comparable securities, information relating to the specific security and developments in the markets.
The fund's use of fair value pricing may cause the net asset value of fund shares to differ from the net asset value that would be calculated using market quotations. Fair value pricing involves subjective judgments and it is possible that the fair value determined for a security may be materially different than the value that could be realized upon the sale of that security.
Short-term debt securities, which have a maturity date of 60 days or less, are valued at amortized cost, which approximates value.
Security Transactions and Investment Income: Security transactions are recorded on trade date. Realized gains and losses on investments sold are recorded on the basis of identified cost. Interest income is recorded on the accrual basis. Discounts are accreted and premiums are amortized over the life of the respective securities. Dividend income is recorded on the ex-dividend date. The fund records distributions received in excess of income from underlying investments as a reduction of cost of investments and/or realized gain. Such amounts are based on estimates if actual amounts are not available and actual amounts of income, realized gain and return of capital may differ from the estimated amounts. The fund adjusts the estimated amounts of the components of distributions (and consequently its net investment income) as an increase to unrealized appreciation/(depre ciation) and realized gain/(loss) on investments as necessary once the issuers provide information about the actual composition of the distributions. Income, expenses (other than expenses attributable to a specific class), and realized and unrealized gains or losses on investments are allocated to each class of shares based on its relative net assets.
Dividends and Distributions to Shareholders: Dividends from net investment income and capital gain distributions are determined in accordance with U.S. federal income tax regulations, which may differ from GAAP. Dividends from net investment income are declared and paid semi-annually. Net realized capital gains, unless offset by any available capital loss carryforward, are distributed to shareholders annually. Dividends and distributions to shareholders are recorded on the ex-dividend date and are automatically reinvested in full and fractional shares of the fund based on the net asset value per share at the close of business on the ex-dividend date unless the shareholder has elected to have them paid in cash.
Distributions paid by the fund are subject to recharacterization for tax purposes. Based upon the results of operations for the six months ended June 30, 2007, the advisor considers it likely that a portion of the dividends
20
COHEN & STEERS REALTY FOCUS FUND, INC.
NOTES TO FINANCIAL STATEMENTS (Unaudited)—(Continued)
will be reclassified to return of capital and distributions of net realized capital gains upon the final determination of the fund's taxable income for the year.
Federal Income Taxes: It is the policy of the fund to continue to qualify as a regulated investment company, if such qualification is in the best interest of the shareholders, by complying with the requirements of Subchapter M of the Internal Revenue Code applicable to regulated investment companies, and by distributing substantially all of its taxable earnings to its shareholders. Accordingly, no provision for federal income or excise tax is necessary.
Note 2. Investment Advisory and Administration Fees and Other Transactions with Affiliates
Investment Advisory Fees: The advisor serves as the fund's investment advisor pursuant to an investment advisory agreement (the advisory agreement). Under the terms of the advisory agreement, the advisor provides the fund with the day-to-day investment decisions and generally manages the fund's investments in accordance with the stated policies of the fund, subject to the supervision of the fund's Board of Directors. For the services provided to the fund, the advisor receives a fee, accrued daily and paid monthly, at the annual rate of 0.90% of the average daily net assets of the fund.
For the six months ended June 30, 2007 and through December 31, 2007, the advisor has contractually agreed to waive its fee and/or reimburse the fund for expenses incurred to the extent necessary to maintain the fund's operating expenses at 1.65% for Class A shares, 2.30% for Class B and Class C shares and 1.30% for Class I shares.
Administration Fees: The fund has entered into an administration agreement with the advisor under which the advisor performs certain administrative functions for the fund and receives a fee, accrued daily and paid monthly, at the annual rate of 0.02% of the fund's average daily net assets. For the six months ended June 30, 2007, the fund paid the advisor $23,014 in fees under this administration agreement. Additionally, the fund has retained State Street Bank and Trust Company as sub-administrator under a fund accounting and administration agreement.
Distribution Fees: Shares of the fund are distributed by Cohen & Steers Securities, LLC (the distributor), an affiliated entity of the advisor. The fund has adopted a distribution plan (the plan) pursuant to Rule 12b-1 under the Investment Company Act of 1940. The plan provides that the fund will pay the distributor a fee, accrued daily and paid monthly, at an annual rate of up to 0.25% of the average daily net assets attributable to the Class A shares and up to 0.75% of the average daily net assets attributable to the Class B and Class C shares.
For the six months ended June 30, 2007, the fund has been advised that the distributor received $24,747 in sales commissions from the sale of Class A shares and that the distributor also received $673, $11,632 and $10,948 of contingent deferred sales charges relating to redemptions of Class A, Class B and Class C shares, respectively. The distributor has advised the fund that proceeds from the contingent deferred sales charge on the Class B and C shares are paid to the distributor and are used by the distributor to defray its expenses related to providing
21
COHEN & STEERS REALTY FOCUS FUND, INC.
NOTES TO FINANCIAL STATEMENTS (Unaudited)—(Continued)
distribution-related services to the fund in connection with the sale of the Class B and C shares, including payments to dealers and other financial intermediaries for selling Class B and C shares and interest and other financing costs associated with Class B and C shares.
Shareholder Servicing Fees: The fund has adopted a shareholder services plan which provides that the fund may obtain the services of qualified financial institutions to act as shareholder servicing agents for their customers. For these services, the fund may pay the shareholder servicing agent a fee, accrued daily and paid monthly, at an annual rate of up to 0.10% of the average daily net asset value of the fund's Class A shares and up to 0.25% of the average daily net asset value of the fund's Class B and C shares.
Directors' and Officers' Fees: Certain directors and officers of the fund are also directors, officers, and/or employees of the advisor. The fund does not pay compensation to any affiliated directors and officers except for the Chief Compliance Officer, who received $1,171 from the fund for the six months ended June 30, 2007, all of which was reimbursed by the advisor.
Note 3. Purchases and Sales of Securities
Purchases and sales of securities, excluding short-term investments, for the six months ended June 30, 2007 totaled $236,509,497 and $233,249,262, respectively.
Note 4. Income Tax Information
As of June 30, 2007, the federal tax cost and net unrealized depreciation were as follows:
| Cost for federal income tax purposes | | $ | 201,238,898 | | |
| Gross unrealized appreciation | | $ | 12,962,776 | | |
| Gross unrealized depreciation | | | (14,010,442 | ) | |
| Net unrealized depreciation | | $ | (1,047,666 | ) | |
22
COHEN & STEERS REALTY FOCUS FUND, INC.
NOTES TO FINANCIAL STATEMENTS (Unaudited)—(Continued)
Note 5. Capital Stock
The fund is authorized to issue 50 million shares of capital stock, at a par value of $0.001 per share. The Board of Directors of the fund may increase or decrease the aggregate number of shares of common stock that the fund has authority to issue. Transactions in fund shares were as follows:
| | | For the
Six Months Ended
June 30, 2007 | | For the
Year Ended
December 31, 2006 | |
| | | Shares | | Amount | | Shares | | Amount | |
| Class A: | |
| Sold | | | 285,381 | | | $ | 20,552,653 | | | | 568,663 | | | $ | 38,229,225 | | |
Issued as reinvestment of dividends
and distributions | | | 6,916 | | | | 447,609 | | | | 67,465 | | | | 4,561,743 | | |
| Redeemed | | | (190,653 | ) | | | (13,487,701 | ) | | | (210,144 | ) | | | (14,537,094 | ) | |
Redemption fees retained by
the funda | | | — | | | | 22,363 | | | | — | | | | 6,806 | | |
| Net increase | | | 101,644 | | | $ | 7,534,924 | | | | 425,984 | | | $ | 28,260,680 | | |
| Class B: | |
| Sold | | | 11,180 | | | $ | 808,596 | | | | 26,254 | | | $ | 1,748,080 | | |
Issued as reinvestment of dividends
and distributions | | | 242 | | | | 15,499 | | | | 3,386 | | | | 228,553 | | |
| Redeemed | | | (6,794 | ) | | | (474,275 | ) | | | (4,721 | ) | | | (311,770 | ) | |
Redemption fees retained by
the funda | | | — | | | | 1,326 | | | | — | | | | 553 | | |
| Net increase | | | 4,628 | | | $ | 351,146 | | | | 24,919 | | | $ | 1,665,416 | | |
| Class C: | |
| Sold | | | 161,647 | | | $ | 11,653,312 | | | | 307,048 | | | $ | 20,567,536 | | |
Issued as reinvestment of dividends
and distributions | | | 2,648 | | | | 171,010 | | | | 35,590 | | | | 2,406,049 | | |
| Redeemed | | | (121,448 | ) | | | (8,514,169 | ) | | | (64,553 | ) | | | (4,281,540 | ) | |
Redemption fees retained by
the funda | | | — | | | | 14,099 | | | | — | | | | 5,799 | | |
| Net increase | | | 42,847 | | | $ | 3,324,252 | | | | 278,085 | | | $ | 18,697,844 | | |
23
COHEN & STEERS REALTY FOCUS FUND, INC.
NOTES TO FINANCIAL STATEMENTS (Unaudited)—(Continued)
| | | For the
Six Months Ended
June 30, 2007 | | For the
Year Ended
December 31, 2006 | |
| | | Shares | | Amount | | Shares | | Amount | |
| Class I: | |
| Sold | | | 196,523 | | | $ | 14,296,843 | | | | 501,779 | | | $ | 33,880,836 | | |
Issued as reinvestment of dividends
and distributions | | | 15,378 | | | | 998,797 | | | | 159,186 | | | | 10,777,390 | | |
| Redeemed | | | (477,715 | ) | | | (34,248,267 | ) | | | (414,765 | ) | | | (27,551,007 | ) | |
Redemption fees retained by
the funda | | | — | | | | 38,542 | | | | — | | | | 22,964 | | |
| Net increase (decrease) | | | (265,814 | ) | | $ | (18,914,085 | ) | | | 246,200 | | | $ | 17,130,183 | | |
a The fund may charge a 1% redemption fee on shares sold within six months of the time of purchase.
Note 6. Borrowings
The fund, in conjunction with other Cohen & Steers funds, is a party to a $150,000,000 syndicated credit agreement (the credit agreement) with State Street Bank and Trust Company, as administrative agent and operations agent, and the lenders identified in the credit agreement, which expires December 2007. The fund pays a commitment fee of 0.10% per annum on its proportionate share of the unused portion of the credit agreement.
During the six months ended June 30, 2007, the fund did not utilize the line of credit.
Note 7. Other
In the normal course of business, the fund enters into contracts that provide general indemnifications. The fund's maximum exposure under these arrangements is dependent on claims that may be made against the fund in the future and, therefore, cannot be estimated; however, based on experience, the risk of material loss from such claims is considered remote.
Note 8. New Accounting Pronouncements
In July 2006, the Financial Accounting Standards Board (FASB) issued Interpretation 48, Accounting for Uncertainty in Income Taxes—an interpretation of FASB Statement 109 (FIN 48). FIN 48 clarifies the accounting for income taxes by prescribing the minimum recognition threshold a tax position must meet before being recognized in the financial statements. FIN 48 is effective for fiscal years beginning after December 15, 2006. An
24
COHEN & STEERS REALTY FOCUS FUND, INC.
NOTES TO FINANCIAL STATEMENTS (Unaudited)—(Continued)
assessment of the fund's tax positions has been made and it has been determined that there is no impact to the fund's financial statements.
In September 2006, Statement of Financial Accounting Standards No. 157, Fair Value Measurements (SFAS 157), was issued and is effective for fiscal years beginning after November 15, 2007. SFAS 157 defines fair value, establishes a framework for measuring fair value and expands disclosures about fair value measurements. Management is currently evaluating the impact the adoption of SFAS 157 will have on the fund's financial statements.
Note 9. Subsequent Events
On June 12, 2007, the Board of Directors of the Fund has approved, effective September 28, 2007, changing the name of the fund to Cohen & Steers Global Realty Shares, Inc. and will be changing the fund's policy with respect to the investment of at least 80% of its net assets to provide that, the fund will invest at least 80%, and normally substantially all, of its net assets in common stocks and other equity securities issued by U.S. and non-U.S. real estate companies.
Effective September 28, 2007, the redemption fee charged by the fund will be 2% on shares redeemed or exchanged within 60 days of the time of purchase.
25
COHEN & STEERS REALTY FOCUS FUND, INC.
OTHER INFORMATION
A description of the policies and procedures that the fund uses to determine how to vote proxies relating to portfolio securities is available (i) without charge, upon request, by calling 800-330-7348, (ii) on our Web site at cohenandsteers.com or (iii) on the Securities and Exchange Commission's Web site at http://www.sec.gov. In addition, the fund's proxy voting record for the most recent 12-month period ended June 30 is available (i) without charge, upon request, by calling 800-330-7348 or (ii) on the SEC's Web site at http://www.sec.gov.
The fund files its complete schedule of portfolio holdings with the SEC for the first and third quarters of each fiscal year on Form N-Q. The fund's Forms N-Q are available (i) without charge, upon request by calling 800-330-7348, or (ii) on the SEC's Web site at http://www.sec.gov. In addition, the Forms N-Q may be reviewed and copied at the SEC's Public Reference Room in Washington, DC. Information on the operation of the Public Reference Room may be obtained by calling 800-SEC-0330.
Please note that the distributions paid by the fund to shareholders are subject to recharacterization for tax purposes. The fund may also pay distributions in excess of the fund's net investment company taxable income and this excess would be a tax-free return of capital distributed from the fund's assets. The final tax treatment of all distributions is reported to shareholders on their 1099-DIV forms, which are mailed after the close of each calendar year.
26
COHEN & STEERS REALTY FOCUS FUND, INC.
APPROVAL OF INVESTMENT ADVISORY AGREEMENT
The board of directors of the fund, including a majority of the directors who are not parties to the fund's Management Agreement, or interested persons of any such party ("Independent Directors"), has the responsibility under the 1940 Act to approve the fund's Management Agreement for its initial two year term and its continuation annually thereafter at a meeting of the board called for the purpose of voting on the approval or continuation. At a meeting held in person on March 6, 2007, the Management Agreement was discussed and was unanimously continued for a one-year term by the fund's board, including the Independent Directors. The Independent Directors were represented by independent counsel who assisted them in their deliberations during the meeting and executive session.
In considering whether to continue the Management Agreement, the board reviewed materials provided by the fund's investment manager (the "Investment Manager") and fund counsel which included, among other things, fee, expense and performance information compared to peer funds ("Peer Funds") prepared by an independent data provider, supplemental performance and summary information prepared by the Investment Manager, sales and redemption data for the fund and memoranda outlining the legal duties of the board. The board also spoke directly with representatives of the independent data provider and met with investment advisory personnel. In addition, the board considered information provided from time to time by the Investment Manager throughout the year at meetings of the board, including presentations by portfolio managers relating to the investment performance of the fund and the investment strategies used in pursuing the fund's objective. In p articular, the board considered the following:
(i) The nature, extent and quality of services to be provided by the Advisor: The board reviewed the services that the Investment Manager provides to the fund, including, but not limited to, making the day-to-day investment decisions for the fund, and generally managing the fund's investments in accordance with the stated policies of the fund. The board also discussed with officers and portfolio managers of the fund the amount of time the Investment Manager dedicates to the fund and the types of transactions that were being done on behalf of the fund. Additionally, the board took into account the services provided by the Investment Manager to its other funds, including those that invest substantially in real estate securities and have investment objectives and strategies similar to the fund.
The board next considered the education, background and experience of the Investment Manager's personnel, noting particularly that the favorable history and reputation of the portfolio managers for the fund, has had, and would likely continue to have, a favorable impact on the success of the fund. The board further noted the Investment Manager's ability to attract quality and experienced personnel. After consideration of the above factors, among others, the board concluded that the nature, quality and extent of services provided by the Investment Manager are adequate and appropriate.
27
COHEN & STEERS REALTY FOCUS FUND, INC.
(ii) Investment performance of the fund and the Advisor: The board considered the investment performance of the fund compared to Peer Funds and compared to a relevant benchmark. The board noted that the fund compared favorably to the Peer Funds and benchmark during the three and five-year periods, but lagged its Peer Funds and benchmark during the one-year period. In particular, the board noted that among the Peer Funds, the fund ranked fourth in total returns for the three-year period and first in total returns for the five-year period, placing the fund in the second and first quartile, respectively, among its Peer Funds. The board also considered the Investment Manager's performance in managing other real estate funds. The board then determined that fund performance, in light of all considerations noted above, was satisfactory.
(iii) Cost of the services to be provided and profits to be realized by the Advisor from the relationship with the fund: Next, the board considered the advisory fees and administrative fees payable by the fund, as well as total expense ratios. As part of their analysis, the board gave substantial consideration to the fee and expense analyses provided by the independent data provider. The board noted that the advisory fee and total expense ratio (on a gross and net basis) were at or above the median versus the Peer Funds. The board considered the fund's small size as having been the primary reason for the higher expense ratios, and that the expense ratios have declined significantly from last year as assets of the fund have grown and that the Investment Manager expects the expense ratio to continue to decline with additional assets. The board further noted that the administrative fees payable by the fund were below the Peer Fund median. In light of the considerations above, the board concluded that the fund's expense structure was competitive in the peer group.
The board also reviewed information regarding the profitability to the Investment Manager of its relationship with the fund. The board considered the level of the Investment Manager's profits and whether the profits were reasonable for the Investment Manager. The board took into consideration other benefits to be derived by the Investment Manager in connection with the Management Agreement, noting particularly the research and related services, within the meaning of Section 28(e) of the Securities Exchange Act of 1934, as amended, that the Investment Manager receives by allocating the fund's brokerage transactions. The board also considered the fees received by the Investment Manager under the Administration Agreement, but noted the significant services received, such as operational services and furnishing office space and facilities for the fund, and providing persons satisfactory to the board to serve as officers of the fund, and that thes e services were beneficial to the fund. The directors concluded that the profits realized by the Investment Manager from its administrative relationship with the fund were reasonable and consistent with fiduciary duties.
(iv) The extent to which economies of scale would be realized as the fund grows and whether fee levels would reflect such economies of scale: The board noted that the fund's advisory fee schedule does not contain any breakpoints. The board considered the fund's asset size and determined that there were not at this time significant economies of scale that were not being shared with stockholders.
28
COHEN & STEERS REALTY FOCUS FUND, INC.
(v) Comparison of services rendered and fees paid to those under other investment advisory contracts, such as contracts of the same and other investment advisers or other clients: As discussed above in (i) and (iii), the board compared both the services rendered and the fees paid under the Management Agreement to those under other investment advisory contracts of other investment advisers managing Peer Funds. The board was also provided with an industry study analyzing differences between funds and institutional accounts and the services and fees associated with each and compared the services rendered, fees paid and profitability under the Management Agreement to the Investment Manager's other advisory contracts with institutional and other clients with similar investment mandates. The board determined that on a comparative basis the fees under the Management Agre ement were reasonable in relation to the services provided.
No single factor was cited as determinative to the decision of the board. Rather, after weighing all of the considerations and conclusions discussed above, the board, including the Independent Directors, unanimously approved the continuation of the Management Agreement.
29
COHEN & STEERS REALTY FOCUS FUND, INC.
Meet the Cohen & Steers family of open-end funds:
COHEN & STEERS
REALTY SHARES
• Designed for investors seeking maximum total return, investing primarily in REITs
• Symbol: CSRSX
COHEN & STEERS
REALTY INCOME FUND
• Designed for investors seeking high current income, investing primarily in REITs
• Symbols: CSEIX, CSBIX, CSCIX, CSDIX
COHEN & STEERS
INTERNATIONAL REALTY FUND
• Designed for investors seeking maximum total return, investing primarily in international real estate securities
• Symbols: IRFAX, IRFCX, IRFIX
COHEN & STEERS
DIVIDEND VALUE FUND
• Designed for investors seeking high current income and long-term growth of income and capital appreciation, investing primarily in dividend paying common stocks and preferred stocks
• Symbols: DVFAX, DVFCX, DVFIX
COHEN & STEERS
INSTITUTIONAL GLOBAL REALTY SHARES
• Designed for investors seeking maximum total return, investing primarily in global real estate securities
• Symbol: GRSIX
COHEN & STEERS
INSTITUTIONAL REALTY SHARES
• Designed for institutional investors seeking maximum total return, investing primarily in REITs
• Symbol: CSRIX
COHEN & STEERS
REALTY FOCUS FUND
• Designed for investors seeking maximum capital appreciation, investing in a limited number of REITs and other real estate securities
• Symbols: CSFAX, CSFBX, CSFCX, CSSPX
COHEN & STEERS
UTILITY FUND
• Designed for investors seeking maximum total return, investing primarily in utilities
• Symbols: CSUAX, CSUBX, CSUCX, CSUIX
COHEN & STEERS
ASIA PACIFIC REALTY SHARES
• Designed for investors seeking maximum total return, investing primarily in real estate securities located in the Asia Pacific region
• Symbols: APFAX, APFCX, APFIX
COHEN & STEERS
EUROPEAN REALTY SHARES
• Designed for investors seeking maximum total return, investing primarily in real estate securities located in Europe
• Symbols: EURAX, EURCX, EURIX
Please consider the investment objectives, risks, charges and expenses of the fund carefully before investing. A prospectus containing this and other information can be obtained by calling 800-330-7348 or by visiting cohenandsteers.com. Please read the prospectus carefully before investing.
Cohen & Steers Securities, LLC, Distributor
30
COHEN & STEERS REALTY FOCUS FUND, INC.
OFFICERS AND DIRECTORS
Robert H. Steers
Director and co-chairman
Martin Cohen
Director and co-chairman
Bonnie Cohen
Director
George Grossman
Director
Richard E. Kroon
Director
Richard J. Norman
Director
Frank K. Ross
Director
Willard H. Smith Jr.
Director
C. Edward Ward, Jr.
Director
Adam M. Derechin
President and chief executive officer
Joseph M. Harvey
Vice president
James S. Corl
Vice president
John E. McLean
Secretary
James Giallanza
Treasurer and chief financial officer
Lisa D. Phelan
Chief compliance officer
KEY INFORMATION
Investment Advisor
Cohen & Steers Capital Management, Inc.
280 Park Avenue
New York, NY 10017
(212) 832-3232
Fund Subadministrator and Custodian
State Street Bank and Trust Company
One Lincoln Street
Boston, MA 02111
Transfer Agent
Boston Financial Data Services, Inc.
2 Heritage Drive
North Quincy, MA 02171
(800) 437-9912
Legal Counsel
Stroock & Stroock & Lavan LLP
180 Maiden Lane
New York, NY 10038
Distributor
Cohen & Steers Securities, LLC
280 Park Avenue
New York, NY 10017
Nasdaq Symbol: Class A—CSFAX
B—CSFBX
C—CSFCX
I— CSSPX
Web site: cohenandsteers.com
This report is authorized for delivery only to shareholders of Cohen & Steers Realty Focus Fund, Inc. unless accompanied or preceded by the delivery of a currently effective prospectus setting forth details of the fund. Past performance of course, is no guarantee of future results and your investment may be worth more or less at the time you sell.
31
COHEN & STEERS
REALTY FOCUS FUND
280 PARK AVENUE
NEW YORK, NY 10017

SEMIANNUAL REPORT
JUNE 30, 2007
Item 2. Code of Ethics.
Not applicable.
Item 3. Audit Committee Financial Expert.
Not applicable.
Item 4. Principal Accountant Fees and Services.
Not applicable.
Item 5. Audit Committee of Listed Registrants.
Not applicable.
Item 6. Schedule of Investments.
Included in Item 1 above.
Item 7. Disclosure of Proxy Voting Policies and Procedures for Closed-End Management Investment Companies.
Not applicable.
Item 8. Portfolio Managers of Closed-End Management Investment Companies.
Not applicable.
Item 9. Purchases of Equity Securities by Closed-End Management Investment Company and Affiliated Purchasers.
Not applicable.
Item 10. Submission of Matters to a Vote of Security Holders.
None.
Item 11. Controls and Procedures.
(a) The registrant’s principal executive officer and principal financial officer have concluded, based upon their evaluation of the registrant’s disclosure controls and procedures as conducted within 90 days of the filing date of this report, that these disclosure controls and procedures provide reasonable assurance that material information required to be disclosed by the registrant in the report it files or submits on Form N-CSR is recorded, processed, summarized and reported within the time periods specified in the Securities and Exchange Commission’s rules and forms
and that such material information is accumulated and communicated to the registrant’s management, including its principal executive officer and principal financial officer, as appropriate, in order to allow timely decisions regarding required disclosure.
(b) There were no changes in the registrant’s internal control over financial reporting that occurred during the second fiscal quarter of the period covered by this report that have materially affected, or are reasonably likely to materially affect, the registrant’s internal control over financial reporting.
Item 12. Exhibits.
(a)(1) Not applicable.
(a) (2) Certifications of principal executive officer and principal financial officer as required by Rule 30a-2(a) under the Investment Company Act of 1940.
(a)(3) Not applicable.
(b) Certifications of principal exe cutive officer and principal financial officer as required by Rule 30a- 2(b) under the Investment Company Act of 1940.
SIGNATURES
Pursuant to the requirements of the Securities Exchange Act of 1934 and the Investment Company Act of 1940, the registrant has duly caused this report to be signed on its behalf by the undersigned, thereunto duly authorized.
COHEN & STEERS REALTY FOCUS FUND, INC.
| By: | /s/ Adam M. Derechin | |
| | Name: Adam M. Derechin |
| | Title: President and Chief Executive Officer |
| | | |
| Date: August 29, 2007 |
| | | | | |
Pursuant to the requirements of the Securities Exchange Act of 1934 and the Investment Company Act of 1940, this report has been signed below by the following persons on behalf of the registrant and in the capacities and on the dates indicated.
| By: | /s/ Adam M. Derechin | |
| | Name: | Adam M. Derechin |
| | Title: | President and Chief Executive Officer |
| | | (principal executive officer) |
| | | | | |
| By: | /s/ James Giallanza | |
| | Name: | James Giallanza |
| | Title: | Treasurer |
| | | (principal financial officer) |
| | | |
| |
| Date: August 29, 2007 |
| | | | | |