UNITED STATES
SECURITIES AND EXCHANGE COMMISSION
WASHINGTON, D.C. 20549
_________________________
Form 10-K
_________________________
(Mark One)
x ANNUAL REPORT PURSUANT TO SECTION 13 OR 15(d) OF THE SECURITIES EXCHANGE ACT OF 1934
For the fiscal year ended December 31, 2010
OR
o TRANSITION REPORT PURSUANT TO SECTION 13 or 15(d) OF THE SECURITIES EXCHANGE ACT OF 1934
For the transition period from _____ to _____
Commission File Number: 000-22283
_________________________

STELLARONE CORPORATION
(Exact name of registrant as specified in its charter)
_________________________
| VIRGINIA | 54-1829288 |
| (State or other jurisdiction | (I.R.S. Employer |
| of incorporation or organization) | Identification No.) |
| 590 Peter Jefferson Parkway, Suite 250, Charlottesville, Virginia 22911 | |
| (Address of principal executive offices, including zip code) | |
| (434) 964-2211 | |
| (Registrant’s telephone number, including area code) | |
Securities registered pursuant to Section 12(b) of the Act:
| Title of each class | Name of each exchange on which registered | |
| Common Stock, par value $1.00 per share | The NASDAQ Global Select Market |
Securities registered pursuant to section 12 (g) of the Act:
None
(Title of Class)
Indicate by check mark if the registrant is a well-known seasoned issuer, as defined in Rule 405 of the Securities Act. Yes o No x
Indicate by check mark if the registrant is not required to file reports pursuant to Section 13 or Section 15(d) of the Exchange Act. Yeso No x
Indicate by check mark whether the registrant (1) has filed all reports required to be filed by Section 13 or 15 (d) of the Securities Exchange Act of 1934 during the preceding 12 months (or for such shorter period that the registrant was required to file such reports), and (2) has been subject to such filing requirements for the past 90 days. Yesx No o
Indicate by check mark if disclosure of delinquent filers pursuant to Item 405 of Regulation S-K is not contained herein, and will not be contained, to the best of the registrant’s knowledge, in the definitive proxy or information statements incorporated by reference in Part III of this Form 10-K or any amendment to this Form 10-K. x
Indicate by check mark whether the registrant is a large accelerated filer, an accelerated filer, a non-accelerated file or a smaller reporting company. See the definitions of “large accelerated filer”, “accelerated filer” and “smaller reporting company” in Rule 12b-2 of the Exchange Act (Check one):
Large accelerated filer o Accelerated Filer x Non-accelerated filer o Smaller reporting company o
(Do not check if a smaller Reporting company)
Indicate by check mark whether the registrant is a shell company (as defined in Rule 12b-2 of the Act). oYes xNo
As of June 30, 2010, the aggregate market value of the voting and non-voting common equity held by non-affiliates computed by reference to the price at which the common equity was last sold, or the average bid and asked price of such common equity, as of the last business day of the registrant’s most recently completed second fiscal quarter, was $292,278,866.
There were 22,969,197 shares of common stock outstanding as of March 3, 2011.
Documents Incorporated by Reference:
Portions of the Proxy Statement for the Company’s Annual Meeting of Shareholders to be held on May 17, 2011 are incorporated by reference in Part III hereof.
| CROSS REFERENCE INDEX | ||
| ITEM | PAGE | |
| PART I | ||
| Item 1. | 3 | |
| Item 1A. | 9 | |
| Item 1B. | Unresolved Staff Comments | 13 |
| Item 2. | 14 | |
| Item 3. | 14 | |
| Item 4. | 14 | |
| PART II | ||
| Item 5. | 14 | |
| Item 6. | 16 | |
| Item 7. | 17 | |
| Item 8. | Financial Statements: | |
| 38 | ||
| 39 | ||
| 40 | ||
| 42 | ||
| 43 | ||
| 44 | ||
| Item 9. | 77 | |
| Item 9A. | 77 | |
| Item 9B. | Other Information | 79 |
| PART III | ||
| Item 10. | 79 | |
| Item 11. | 79 | |
| Item 12. | 79 | |
| Item 13. | 79 | |
| Item 14. | 79 | |
| PART IV | ||
| Item 15. | 80 | |
| 81 | ||
PART I
OVERVIEW
StellarOne Corporation (“Company”) is a single bank holding company based in Charlottesville, Virginia. StellarOne Bank is the Company’s subsidiary bank, which is headquartered in Christiansburg, Virginia. StellarOne Corporation is a result of a merger that occurred on February 28, 2008, between Virginia Financial Group, Inc. (“VFG”) and FNB Corporation (“FNB”), in which FNB and its subsidiary FNB Bank merged with and into VFG, with VFG as the surviving corporation and changing its name to StellarOne Corporation. This transaction created one of the largest independent commercial bank holding companies headquartered in Virginia.
For 2008, the Company’s year to date operating results include the former VFG for the entire period, but results from FNB are only included from February 28, 2008 forward, representing the period subsequent to consummation of the merger of equals transaction between VFG and FNB.
The Company’s subsidiary bank is community-oriented, offering services customarily provided by full-service banks, including individual and commercial demand and time deposit accounts, commercial and consumer loans, residential mortgages, credit card services and deposit services. In addition, the Company’s subsidiary bank, through its commercial banking segment, offers internet banking access for banking services, and online bill payment for both consumers and commercial customers. Lending is focused on individuals and small to middle-market businesses in the local markets of the Company's subsidiary bank. The bank, through its wealth management segment, provides a variety of wealth management and personal trust services including estate administration, employee benefit plan administration and planning specifically addressing the investment and financial management needs of its customers. The Company’s mortgage banking segment engages primarily in the origination and acquisition of residential mortgages for sale into the secondary market on a best-efforts basis. For additional information on segments, please refer to Item 7. Management’s Discussion and Analysis of Financial Condition and Results of Operations. Utilizing a “super-community” banking strategy, the Company’s subsidiary bank is run autonomously as a community bank. At December 31, 2010, StellarOne Corporation had consolidated total assets of $2.9 billion and was one of the largest independent bank holding companies headquartered in the Commonwealth of Virginia. The Company’s deposit market share at June 30, 2010 represented approximately 1.13% of the total banking deposits in the Commonwealth of Virginia.
The Company’s operating strategy is to generate interest income, fees and other revenue growth through business lines that emphasize higher yielding assets funded by core deposits. This strategy includes partnering with clients while providing excellent service through branches that are open six days a week, automated teller machine (“ATM”) networks and telephone and internet banking. The Company’s growth strategies include new branch expansion, acquisitions and the development of new products and services. New products and services are designed to build on existing businesses and expand into complementary products and services through strategic initiatives.
The Company’s lending strategy is to originate high credit quality, primarily secured and owner occupied, loans. The Company’s largest core lending business is its commercial and residential real estate loan operation, which offers variable-rate loans and lines of credit secured by real estate properties. These loans are generally made on local properties or to local customers within the Company’s markets.
Commercial real estate loans. These loans are generally extended for acquisition, development or construction of commercial properties. The loans are underwritten with an emphasis on the viability of the project, the borrower’s ability to meet certain minimum debt service requirements and an analysis and review of the collateral and guarantors, if any.
Real estate mortgage loans. The Company originates adjustable and fixed-rate residential mortgage loans. These mortgage loans are generally originated under terms and conditions consistent with secondary market guidelines. Some of these loans will be placed in the Company’s loan portfolio; however, a majority are sold to the secondary mortgage market. The residential real estate mortgage loans that are included in the Company’s loan portfolio are usually owner-occupied and generally amortized over a 10 to 20 year period with three to five year maturity or repricing.
Commercial and industrial loans. General commercial and industrial loans consist of loans made primarily to manufacturers, wholesalers and retailers of goods, service companies and other industries. These loans are made for acquisition, expansion and working capital purposes, and may be secured by accounts receivable, inventory, equipment, personal guarantees or other assets. The Company monitors these loans by requesting submission of corporate and personal financial statements and income tax returns. The Company has also generated loans which are guaranteed by the US Small Business Administration (“SBA”). SBA loans are generally underwritten in the same manner as conventional loans generated for the Company’s portfolio. Management believes that making such loans helps the local community and also provides the Company with a source of income and solid future lending relationships as such businesses grow and prosper. The primary repayment risk for commercial loans is the failure of the business due to economic or financial factors.
Consumer loans. Consumer loans include motor vehicle, home improvement, home equity and small personal credit lines. The terms of these loans typically range from 12 to 60 months and vary based upon the nature of collateral and size of the loan. These loans are generally secured by various assets owned by the consumer.
StellarOne Bank owns a 14.2% interest in Banker’s Insurance, LLC and a 24.5% interest in Virginia Title Center, LLC. Bankers Insurance, LLC is a full-service, independent insurance agency headquartered in Richmond, Virginia that was established in 1999 and has a total of 12 offices. Through partnerships with many of the major insurance companies, Bankers Insurance, LLC is able to offer complete insurance packages, whether commercial, personal, or life and health, at competitive prices. Based in Roanoke, Virginia, Virginia Title Center, LLC has been providing title insurance products and related services in Virginia, Tennessee, North Carolina, South Carolina, and West Virginia since 1989. Virginia Title Center, LLC underwrites through Investors Title Insurance Company headquartered in Chapel Hill, North Carolina. Investors Title Insurance Company is recognized nationally for its innovative products, flexible underwriting, and competitive pricing.
EMPLOYEES
At December 31, 2010, the Company had 838 full time equivalent employees. No employees are represented by any collective bargaining unit. The management of the Company considers relations with its employees to be good.
COMPETITION
The Company and its subsidiaries face strong competition in each of its primary markets from large regional and national financial institutions, savings and loans, credit unions and other community banking organizations. In addition, consumer finance companies, asset managers and mortgage companies all provide competition. Out-of-state bank holding companies are providing increased competition through merger with, and acquisition of, Virginia banks. Competition for deposits is influenced by rates paid, customer loyalty factors, product offerings and convenience of branch network.
The competition in the industry has also increased as a result of the passage of the Gramm-Leach-Bliley Act of 1999 (the “Act”), which drew new lines between the types of activities that are financial in nature and permitted for banking organizations, and those activities that are commercial in nature and not permitted. The Act imposes Community Reinvestment requirements on financial service organizations that seek to qualify for the expanded powers to engage in broader financial activities and affiliations with financial companies that are permitted.
The Act created a new form of financial organization called a financial holding company that may own banks, insurance companies and securities firms. A financial holding company is authorized to engage in any activity that is financial in nature, incidental to an activity that is financial in nature, or is a complimentary activity. These activities may include insurance, securities transactions, and traditional banking related activities. The Act establishes a consultative and cooperative procedure between the Federal Reserve and the Secretary of the Treasury for purposes of determination as to the scope of activities permitted by the Act. The Company did not elect to be treated as a financial holding company.
No material part of the business of the subsidiary bank is dependent upon a single or a few customers and the loss of one or more customers would not have a materially adverse effect upon the business of the bank. Management is not aware of any indications that the business of the bank or material portion thereof is, or may be, seasonal.
REGULATION, SUPERVISION AND GOVERNMENT POLICY
The Company is extensively regulated under federal and state law. Generally, these laws and regulations are intended to protect depositors and not shareholders. The description below summarizes the current regulatory structure in which the Company operates. The regulatory structure can change, and if changed, could have an effect on the financial condition or results of operations of the Company. In the event the regulatory structure changes significantly, the structure of the Company and the products and services it offers could also change significantly as a result.
The Dodd-Frank Act
On July 21, 2010, financial regulatory reform legislation entitled the “Dodd-Frank Wall Street Reform and Consumer Protection Act” (the “Dodd-Frank Act”) was signed into law. The Dodd-Frank Act implements far-reaching changes across the financial regulatory landscape, including provisions that, among other things, will:
| · | Centralize responsibility for consumer financial protection by creating a new agency, the Consumer Financial Protection Bureau, responsible for implementing, examining and enforcing compliance with federal consumer financial laws. |
| · | Apply the same leverage and risk-based capital requirements that apply to insured depository institutions to most bank holding companies, which, among other things, will require the Company to deduct, over three years beginning January 1, 2013, all trust preferred securities from the Company’s Tier 1 capital. |
| · | Require holding companies, such as StellarOne Corporation, to be well capitalized and well managed as of July 21, 2011. |
| · | Permanently increases the deposit insurance coverage to $250 thousand and allows depository institutions to pay interest on business checking accounts starting July 2011. |
| · | Change the assessment base for federal deposit insurance from the amount of insured deposits to consolidated assets less tangible capital, eliminate the ceiling on the size of the Deposit Insurance Fund (“DIF”) and increase the floor of the DIF. |
Bank Holding Company
The Company is registered as a bank holding company under the Bank Holding Corporation Act of 1956 (“BHCA”), as amended, and is subject to supervision and regulation by the Board of Governors of the Federal Reserve System (the “Federal Reserve Board”) and Virginia State Corporation Commission (“SCC”). As a bank holding company, the Company is required to furnish to the Federal Reserve Board an annual report of its operations at the end of each fiscal year and to furnish such additional information as the Federal Reserve Board may require pursuant to the BHCA. The Federal Reserve Board and SCC conduct examinations of the Company and its subsidiary on an alternate year basis.
The BHCA requires prior approval of the Federal Reserve Board before a bank holding company can acquire direct or indirect ownership or control of more than 5% of the voting shares of another bank; or merge or consolidate with another bank holding company. Under the BHCA, a bank holding company is prohibited, with limited exceptions, from engaging, directly or indirectly, in any business unrelated to the businesses of banking or managing and controlling banks. Bank holding companies wishing to participate in an expanded list of financial activities must file an election with the Federal Reserve Board to be treated as a financial holding company. The Company has not filed such an election, nor does it plan to in the future.
Under the Federal Reserve Board policy, the Company is expected to act as a source of financial strength for its banking subsidiaries and to commit support to them. This support may be required at times when, absent such policy, the Company might not otherwise provide such support.
Capital Purchase Program
On December 19, 2008, as part of the Capital Purchase Program (“CPP”) established by the U.S. Department of the Treasury (“Treasury”) under the Emergency Economic Stabilization Act of 2008 (the “EESA”), the Company entered into a Purchase Agreement with the Treasury pursuant to which the Company issued and sold to the Treasury 30,000 shares of the Company’s Fixed Rate Cumulative Perpetual Preferred Stock, Series A, having a liquidation preference of $1,000 per share (the “Series A Preferred Stock”), and a ten-year warrant to purchase up to 302,622 shares of the Company’s common stock, par value $1.00 per share, at an initial exercise price of $14.87 per share, for an aggregate purchase price of $4.5 million.
Cumulative dividends on the Series A Preferred Stock accrue on the liquidation preference at a rate of 5% per annum for the first five years, and at a rate of 9% per annum thereafter. The Series A Preferred Stock has no maturity date and ranks senior to the Company’s common stock (and pari passu with the Company’s other authorized series of preferred stock) with respect to the payment of dividends and distributions and amounts payable upon liquidation, dissolution, and winding up of the Company. The Series A Preferred Stock generally is non-voting. The American Reinvestment and Recovery Act of 2009 (“ARRA”) amends certain provisions of EESA and includes a provision that, subject to consultation with the appropriate Federal banking agency, directs the Treasury to permit financial institutions from whom the Treasury purchased preferred stock to redeem such preferred stock at par upon approval by its primary regulator.
Under the CPP, the Company and the Named Executive Officers amended certain employment agreements and benefit plans and arrangements to the extent necessary to be in compliance with the executive compensation and corporate governance requirements of Section 111(b) of the EESA as implemented by any guidance or regulation under Section 111(b) of EESA that was issued and in effect as of the closing date of the amendments. Section 7001 of ARRA amends Section 111 of the EESA to provide that participants in the CPP are subject to the standards established by the Secretary of the Treasury, and directs the Secretary to require each CPP recipient to meet appropriate standards for executive compensation and corporate governance. On June 15, 2009, the Treasury issued an interim final rule, Troubled Asset Relief Program Standards For Compensation and Corporate Governance, to provide guidance on the executive compensation and corporate governance provisions of the EESA as amended by the ARRA.
Capital Requirements
The Company is subject to various regulatory capital requirements administered by federal banking agencies. Failure to meet minimum capital requirements can initiate certain mandatory and possibly additional discretionary actions by regulators that, if undertaken, could have a direct material effect on the Company’s financial statements. Under capital adequacy guidelines and the regulatory framework for prompt corrective action, the Company must meet specific capital requirements that involve quantitative measures of the Company’s assets, liabilities, and certain off-balance-sheet items as calculated under regulatory accounting practices. The Company’s capital amounts and classifications are also subject to qualitative judgments by the regulators about components, risk weightings, and other factors.
Quantitative measures established by regulation to ensure capital adequacy require the Company to maintain minimum amounts and ratios of total and Tier 1 capital (as defined in the regulations) to risk-weighted assets, and of Tier 1 capital to average assets. As of December 31, 2010, the Company and its subsidiary bank met all capital adequacy requirements to which it is subject.
The most recent notification from the Federal Reserve Bank of Richmond categorized the Company’s subsidiary bank as “well capitalized” under the regulatory framework for prompt corrective action under the Federal Deposit Insurance Act of 1991. To be categorized as “well capitalized,” the Company must maintain minimum total risk-based, Tier 1 risk-based, and Tier 1 leverage ratios. There are no conditions or events since notification that management believes have changed the Company’s category.
Dividends
It is the policy of the Federal Reserve Board that bank holding companies should pay cash dividends on common stock only from income available as defined, and only from prospective earnings retention consistent with the organization’s expected future needs and financial condition. The policy provides that the bank holding companies should not maintain a level of cash dividends that undermines the ability to serve as a source of strength to the banking subsidiary.
The Company is a bank holding company separate and apart from its subsidiary, and thus has liquidity needs that are funded primarily by the income of its subsidiary. The holding company’s cash outflows consist of dividends to shareholders, interest on borrowings and unallocated corporate expenses. The main sources of funding for the holding company are the management fees and dividends it receives from its banking subsidiary. Under the current supervisory regulation, prior approval from certain agencies is required if the subsidiary bank pays cash dividends that exceed certain levels as defined. During 2010, the banking subsidiary paid $28.2 million in management fees and $9.2 million in dividends to the Company.
USA Patriot Act
The Company’s subsidiary bank is subject to the requirements of the USA Patriot Act (“Patriot Act”), which provides for the facilitation of information sharing among governmental entities and financial institutions for the purpose of combating terrorism and money laundering. The Patriot Act places a significantly increased reporting responsibility and regulatory oversight on financial institutions to share information with the federal government concerning activities that may involve money laundering or terrorist activities. The Patriot Act is considered a significant banking law in terms of information disclosure regarding certain customer transactions. Certain provisions of the Patriot Act impose the obligation to establish anti-money laundering programs, including the development of a customer identification program, and the screening of all customers against any government lists of known or suspected terrorists. The Company is in compliance with the requirements of the Patriot Act.
Deposit Insurance Premiums
On November 9, 2010, the Federal Deposit Insurance Corporation (“FDIC”) issued a Final Rule implementing section 343 of the Dodd-Frank Act that provides for unlimited insurance coverage of certain non-interest bearing accounts. Beginning December 31, 2010, through December 31, 2012, all non-interest bearing transaction accounts are fully insured, regardless of the balance of the account, at all FDIC-insured institutions. The unlimited insurance coverage is available to all depositors, including consumers, businesses, and government entities. This unlimited insurance coverage is separate from, and in addition to, the insurance coverage provided to a depositor’s other deposit accounts held at an FDIC-insured institution.
The FDIC has set a designated reserve ratio of 1.35% ($1.35 for each $100 of insured deposits) for the Deposit Insurance Fund (“DIF”). The Federal Deposit Insurance Act of 2005 (“FDIC Act”) provides the FDIC Board of Directors the authority to set the designated reserve ratio between 1.15% and 1.50% . The FDIC must adopt a restoration plan when the reserve ratio falls below 1.15% and begin paying dividends when the reserve ratio exceeds 1.35%. There is no requirement to achieve a specific ratio within a given timeframe. The DIF reserve ratio calculated by the FDIC at September 30, 2010 was a negative .15% and therefore, the FDIC needs to increase premiums charged to banks.
In 2010, the annual insurance premiums on bank deposits insured by the DIF varied between $.07 per $100 of deposits for banks classified in the highest capital and supervisory evaluation categories to $.78 per $100 of deposits for banks classified in the lowest capital and supervisory evaluation categories.
The amount of FDIC assessments paid by each DIF member institution is based on its relative risk of default as measured by regulatory capital ratios and other supervisory factors. Since 2008, there have been higher levels of bank failures, which has dramatically increased resolution costs of the FDIC and depleted the DIF. In order to maintain a strong funding position and restore reserve ratios of the DIF, the FDIC has increased assessment rates of insured institutions and may continue to do so in the future. As of December 31, 2010, the Company’s subsidiary bank’s assessment rate averaged $.198 cents per $100 in assessable deposits.
On November 12, 2009, the FDIC adopted a final rule requiring depository institutions to prepay their estimated quarterly insurance premium for fourth quarter 2009 and all of 2010, 2011 and 2012. On December 31, 2009, the Company pre-paid estimated assessments of $15.0 million for the years 2010-2012 and $8.9 million remained as a prepaid balance at December 31, 2010. The expense related to this prepayment is anticipated to be recognized over the next two years based on actual calculations of quarterly premiums.
The FDIC has redefined its deposit insurance premium assessment base to be an institution’s average consolidated total assets minus average tangible equity as required by the Dodd-Frank Act and revised deposit insurance assessment rate schedules in light of the changes to the assessment base. The proposed rate schedule and other revisions to the assessment rules, which were adopted by the FDIC Board of Directors on February 7, 2011, will become effective April 1, 2011 and will be used to calculate the June 30, 2011 assessment.
Incentive Compensation
In June 2010, the Federal Reserve, OCC and FDIC issued comprehensive final guidance on incentive compensation policies intended to ensure that the incentive compensation policies of banking organizations do not undermine the safety and soundness of such organizations by encouraging excessive risk-taking. The guidance, which covers all employees that have the ability to materially affect the risk profile of an organization, either individually or as part of a group, is based upon the key principles that a banking organization’s incentive compensation arrangements should (i) provide incentives that do not encourage risk-taking beyond the organization’s ability to effectively identify and manage risks, (ii) be compatible with effective internal controls and risk management, and (iii) be supported by strong corporate governance, including active and effective oversight by the organization’s Board of Directors.
The Federal Reserve will review, as part of the regular, risk-focused examination process, the incentive compensation arrangements of banking organizations, such as the Company, that are not “large, complex banking organizations.” These reviews will be tailored to each organization based on the scope and complexity of the organization’s activities and the prevalence of incentive compensation arrangements. The findings of the supervisory initiatives will be included in reports of examination. Deficiencies will be incorporated into the organization’s supervisory ratings, which can affect the organization’s ability to make acquisitions and take other actions. Enforcement actions may be taken against a banking organization if its incentive compensation arrangements, or related risk-management control or governance processes, pose a risk to the organization’s safety and soundness and the organization is not taking prompt and effective measures to correct the deficiencies. At December 31, 2010, the Company had not been made aware of any instances of non-compliance with the new guidance.
Community Reinvestment Act
The Company’s subsidiary bank is subject to the requirements of the Community Reinvestment Act of 1977 (“CRA”). The CRA imposes on financial institutions an affirmative and ongoing obligation to meet the credit needs of the local communities, including low and moderate income neighborhoods. If the Company’s bank subsidiary receives a rating from the Federal Reserve of less than satisfactory under the CRA, restrictions on operating activities would be imposed. The subsidiary bank currently has a satisfactory CRA rating.
Privacy Legislation
Several new regulations issued by federal banking agencies also provide new protections against the transfer and use of customer information by financial institutions. A financial institution must provide to its customers information regarding its policies and procedures with respect to the handling of customers’ personal information. Each institution must conduct an internal risk assessment of its ability to protect customer information. These privacy provisions generally prohibit a financial institution from providing a customer’s personal financial information to unaffiliated parties without prior notice and approval from the customer.
Consumer Laws and Regulations
The Company’s subsidiary bank is also subject to certain consumer laws and regulations that are designed to protect consumers in transactions with banks. While the list set forth herein is not exhaustive, these laws and regulations include the Truth in Lending Act, the Truth in Savings Act, the Electronic Funds Transfer Act, the Expedited Funds Availability Act, the Equal Credit Opportunity Act, Real Estate Settlement Procedures Act, Home Mortgage Disclosure Act, the Fair Credit Reporting Act and the Fair Housing Act, among others. These laws and regulations mandate certain disclosure requirements and regulate the manner in which financial institutions transact business with customers. The Company’s subsidiary bank must comply with the applicable provisions of these consumer protection laws and regulations as part of its ongoing customer relations.
ACCESS TO FILINGS
The Company files annual reports on Form 10-K, quarterly reports on Form 10-Q, current reports on Form 8-K and other filings with the SEC. The public may read and copy any documents the Company files at the SEC’s Public Reference Room at 100 F Street, N.E., Washington, D.C. 20549. The public may obtain information on the operation of the Public Reference Room by calling the SEC at 1-800-SEC-0330. The Company’s SEC filings can also be obtained on the SEC’s website on the internet at http://www.sec.gov. Annual reports on Form 10-K, quarterly reports on Form 10-Q, current reports on Form 8-K and amendments to those reports are posted on the Company’s website at http://www.stellarone.com under the “Investor Relations” tab as soon as reasonably practical after filing electronically with the SEC.
In the normal course of business, the Company is exposed to various risks. Management balances the Company’s strategic goals, including revenue and profitability objectives, with the associated risks.
This section highlights specific risks that could affect the Company and its business. Although current key factors are discussed, please be aware that other risks may prove to be important in the future. New risks may emerge at any time and the Company cannot predict such risks or estimate the extent to which they may affect financial performance. This listing should not be considered all-inclusive. If any of the following risks were to occur, the Company may not be able to conduct business as currently planned and financial condition or operating results could be negatively impacted. These matters could cause the trading price of the Company’s common stock to decline in future periods.
Recent negative developments in the financial services sector and U.S. and global credit markets may negatively impact operations and results.
The U.S. economy was in recession from December 2007 through June 2009. Business activity across a broad range of industries and regions in the U. S. was greatly reduced. Although economic conditions have begun to improve, certain sectors, such as real estate, remain weak and unemployment remains high. Local governments and many businesses are still in serious difficulty due to lower consumer spending and the lack of liquidity in the credit markets.
Market conditions also played a role in the failure or merger of several prominent financial institutions and numerous regional and community-based financial institutions. These failures, as well as projected future failures, have had a significant negative impact on the capitalization level of the deposit insurance fund of the FDIC, which in turn, has led to a significant increase in deposit insurance premiums paid by financial institutions.
The Company’s financial performance generally, and in particular the ability of borrowers to pay interest on and repay principal of outstanding loans and the value of collateral securing those loans, as well as demand for loans and other products and services the Company offers, is highly dependent upon on the business environment in the markets where the Company operates, in the Commonwealth of Virginia and in the United States as a whole. A favorable business environment is generally characterized by, among other factors, economic growth, efficient capital markets, low inflation, low unemployment, high business and investor confidence, and strong business earnings. Unfavorable or uncertain economic and market conditions can be caused by declines in economic growth, business activity or investor or business confidence, limitations on the availability or increases in the cost of credit and capital, increases in inflation or interest rates, high unemployment, natural disasters, or a combination of these or other factors.
Overall, during 2010, the business environment has been adverse for many households and businesses in the United States and worldwide. While economic conditions in the Commonwealth of Virginia, the United States and worldwide have begun to improve, there can be no assurance that this improvement will continue. Such conditions could adversely affect the credit quality of the Company’s loans, results of operations and financial condition.
The Company is subject to credit risk.
There are inherent risks associated with the Company’s lending activities. These risks include, among other things, the impact of changes in interest rates and changes in the economic conditions in the markets where the Company operates as well as those across the Commonwealth of Virginia and the United States. Increases in interest rates and/or weakening economic conditions could adversely impact the ability of borrowers to repay outstanding loans or the value of the collateral securing these loans. The Company is also subject to various laws and regulations that affect its lending activities. Failure to comply with applicable laws and regulations could subject the Company to regulatory enforcement action that could result in the assessment of significant civil monetary penalties against the Company.
As of December 31, 2010, approximately 56% of the Company’s loan portfolio consisted of commercial and industrial, construction and commercial real estate mortgage loans. These types of loans are generally viewed as having more risk of default than residential real estate loans or consumer loans. These types of loans are also typically larger than residential real estate loans and consumer loans. Because the Company’s loan portfolio contains commercial and industrial, construction and commercial real estate loans with relatively large individual balances, the deterioration of one or a few of these loans could cause a significant increase in non-performing loans. An increase in non-performing loans could result in a net loss of earnings from these loans, an increase in the provision for possible loan losses and an increase in loan charge-offs, all of which could have a material adverse effect on the Company’s financial condition and results of operations.
The Company is subject to interest rate risk.
The Company’s earnings and cash flows are largely dependent upon its net interest income. Net interest income is the difference between interest income earned on interest-earning assets such as loans and securities and interest expense paid on interest-bearing liabilities such as deposits and borrowed funds. Interest rates are highly sensitive to many factors that are beyond the Company’s control, including general economic conditions and policies of various governmental and regulatory agencies and, in particular, the Federal Open Market Committee. Changes in monetary policy, including changes in interest rates, could influence not only the interest the Company receives on loans and securities and the amount of interest it pays on deposits and borrowings, but such changes could also affect (i) the Company’s ability to originate loans and obtain deposits, (ii) the fair value of the Company’s financial assets and liabilities, and (iii) the average duration of the Company’s mortgage-backed securities portfolio. If the interest rates paid on deposits and other borrowings increase at a faster rate than the interest rates received on loans and other investments, the Company’s net interest income, and therefore earnings, could be adversely affected. Earnings could also be adversely affected if the interest rates received on loans and other investments fall more quickly than the interest rates paid on deposits and other borrowings.
Although management believes it has implemented effective asset and liability management strategies, including the use of derivatives as hedging instruments, to reduce the potential effects of changes in interest rates on the Company’s results of operations, any substantial, unexpected, prolonged change in market interest rates could have a material adverse effect on the Company’s financial condition and results of operations.
If the allowance for loan losses becomes inadequate, results of operations may be adversely affected.
The Company maintains an allowance for loan losses that it believes is adequate to absorb estimated incurred losses inherent in the loan portfolio. Through a periodic review and consideration of the loan portfolio, management determines the amount of the allowance for loan losses by considering current general market conditions, credit quality of the loan portfolio and performance of customers relative to their financial obligations. The amount of future losses is susceptible to changes in economic, operating and other conditions, including changes in interest rates that may be beyond the Company’s control and these losses may cause the loan loss provision to vary widely from recent levels. Although management believes the allowance for loan losses is adequate to absorb probable incurred losses in the loan portfolio, it is an estimate subject to revision as losses are confirmed. Higher levels of loan losses in the future could have a material adverse impact on financial performance. Federal and state regulators, as an integral part of their supervisory function, periodically review the allowance for loan losses. These regulatory agencies may require the Company to increase the provision for loan losses or to recognize further loan charge offs based upon their judgments, which may be different from management’s. Any increase in the allowance for loan losses required by these regulatory agencies could have a negative effect on the Company’s financial condition and results of operations.
The Company’s profitability depends significantly on local economic conditions.
The Company’s success depends primarily on the general economic conditions of the markets in which it operates. Unlike larger banks that are more geographically diversified, the Company provides banking and financial services to customers primarily in Northern, Central and Western Virginia. The local economic conditions in these areas have a significant impact on the Company’s business, real estate and construction loans, the ability of the borrowers to repay these loans and the value of the collateral securing these loans. A significant decline in general economic conditions, caused by inflation, recession, acts of terrorism, an outbreak of hostilities or other international or domestic calamities, unemployment or other factors beyond the Company’s control, could impact these local economic conditions and could result in, among other things, a deterioration in credit quality or a reduced demand for credit, including a resultant effect on the loan portfolio and allowance the loan and lease losses.
The Company is subject to extensive government regulation and supervision.
The Company is subject to extensive federal and state regulation and supervision. Banking regulations are primarily intended to protect depositors’ funds, federal deposit insurance funds and the banking system as a whole, not security holders. These regulations affect the Company’s lending practices, capital structure, investment practices, dividend policy and growth, among other things. Congress and federal regulatory agencies continually review banking laws, regulations and policies for possible changes. The Dodd-Frank Act, enacted in July 2010, instituted major changes to the banking and financial institutions regulatory regimes in light of the recent performance of and government intervention in the financial services sector. Other changes to statutes, regulations or regulatory policies, including changes in interpretation or implementation of statutes, regulations or policies, could affect the Company in substantial and unpredictable ways. Such changes could subject the Company to additional costs, limit the types of financial services and products the Company may offer and/or increase the ability of non-banks to offer competing financial services and products, among other things. Failure to comply with laws, regulations or policies could result in sanctions by regulatory agencies, civil money penalties and/or reputation damage, which could have a material adverse effect on the Company’s business, financial condition and results of operations.
The recent repeal of federal prohibitions on payment of interest on demand deposits could increase the Company’s interest expense.
All federal prohibitions on the ability of financial institutions to pay interest on demand deposit accounts were repealed as part of the Dodd-Frank Act. As a result, beginning on July 21, 2011, financial institutions could commence offering interest on demand deposits to compete for clients. The Company does not yet know what interest rates other institutions may offer. The Company’s interest expense will increase and its net interest margin will decrease if it begins offering interest on demand deposits to attract additional customers or maintain current customers, which could have a material adverse effect on the Company’s business, financial condition and results of operations.
Continued growth may require the need for additional capital and further regulatory approvals which, if not obtained, could adversely impact profitability and implementation of current strategic initiatives.
To ensure continued growth, the Company will need to provide sufficient capital through earnings generation, additional equity or trust preferred offerings or borrowed funds or any combination of these funding sources. For certain amounts or types of indebtedness, the Company may be required to obtain certain regulatory approvals beforehand. The ability to raise additional capital, if needed, will depend on the Company’s financial performance, as well as conditions in the capital markets at that time, which are outside the Company’s control. Accordingly, the Company cannot assure its ability to raise additional capital if needed on acceptable terms. If the Company cannot raise additional capital when needed, its ability to further expand and grow operations and attain long-term profitability goals could be materially impacted.
The Company’s subsidiary bank’s ability to pay dividends is subject to regulatory limitations which, to the extent the Company requires such dividends in the future, may affect its ability to pay obligations and dividends.
The Company is a separate legal entity from the subsidiary bank, and thus does not have significant revenue sources of its own. It currently depends on the subsidiary bank’s cash and liquidity as well as dividends from the banking subsidiary to pay operating expenses and dividends to shareholders. No assurance can be made that in the future the subsidiary bank will have the capacity to pay the necessary dividends or that the Company will not require dividends from the subsidiary bank to satisfy the Company’s obligations. The availability of dividends from the subsidiary bank is limited by various statutes and regulations. Depending upon the financial condition of the Company and other factors, it is possible that the Federal Reserve Board could limit the payment of dividends or other payments by the subsidiary bank. In the event the subsidiary bank is unable to pay dividends sufficient to satisfy the Company's obligations, it may not be able to service its obligations as they become due, or pay dividends on the Company's common stock. Consequently, the inability to receive dividends from the subsidiary bank could adversely affect financial condition, results of operations and cash flows.
The Company’s profitability may suffer because of rapid and unpredictable changes in the highly regulated environment in which it operates.
The Company is subject to extensive supervision by several governmental regulatory agencies at the federal and state levels. Recently enacted, proposed and future banking legislation and regulations have had, will continue to have, or may have a significant impact on the financial services industry. These regulations, which are intended to protect depositors and not shareholders, and the interpretation and application of them by federal and state regulators, are beyond the Company’s control, may change rapidly and unpredictably and can be expected to influence earnings and growth. The Company’s success depends on its continued ability to maintain compliance with these regulations. Some of these regulations may increase costs and thus place other financial institutions that are not subject to similar regulations in stronger, more favorable competitive positions.
Concentration in loans secured by real estate may increase loan losses, which would negatively affect financial results.
The Company offers a variety of secured loans, including commercial lines of credit, commercial term loans, real estate, construction, home equity, consumer and other loans. Many loans are secured by real estate (both residential and commercial) in the Company’s market area. At December 31, 2010, approximately 36% and 24% of the $2.10 billion loans receivable portfolio were secured by commercial and residential real estate, respectively. Continued pressures on the real estate markets, such as deterioration in the value of this collateral and the current recession in national and local economies, could adversely affect customers' ability to pay these loans, which in turn could impact the Company. Risk of loan defaults and foreclosures are unavoidable in the banking industry, and the Company tries to limit exposure to this risk by monitoring extensions of credit carefully. The Company cannot fully eliminate credit risk, and as a result credit losses may occur in the future.
The value of the Company’s goodwill and other intangible assets may decline in the future.
As of December 31, 2010, the Company had $113.7 million of goodwill and $14.5 million of other intangible assets. A significant decline in the Company’s expected future cash flows, a significant adverse change in the business climate, slower growth rates or a significant and sustained decline in the price of the Company’s common stock may necessitate taking charges in the future related to the impairment of the Company’s goodwill and other intangible assets. If the Company were to conclude that a future write-down of goodwill and other intangible assets is necessary, the Company would record the appropriate charge, which could have a material adverse effect on the Company’s financial condition and results of operations.
The Company depends on the services of key personnel, and a loss of any of those personnel may disrupt operations and result in reduced revenues.
The Company’s success depends upon the continued service of the senior management team and upon the Company’s ability to attract and retain qualified financial services personnel. Competition for qualified employees is intense. In the Company’s experience, it can take a significant period of time to identify and hire personnel with the combination of skills and attributes required in carrying out strategy. If the Company loses the services of key personnel, or is unable to attract additional qualified personnel, the business, financial condition, results of operations and cash flows could be materially adversely affected.
The Company is subject to executive compensation restrictions because of its participation in the Treasury’s Capital Purchase Program.
The Company is subject to TARP rules and standards governing executive compensation, which generally apply to the Chief Executive Officer, Chief Financial Officer and the three next most highly compensated senior executive officers and, with recent amendments, to a number of other employees. The standards include (i) a requirement to recover any bonus payment to senior executive officers or certain other employees if payment was based on materially inaccurate financial statements or performance metric criteria; (ii) a prohibition on making any golden parachute payments to senior executive officers and certain other employees; (iii) a prohibition on paying or accruing any bonus payment to certain employees, except as otherwise permitted by the rules; (iv) a prohibition on maintaining any plan for senior executive officers that encourages such officers to take unnecessary and excessive risks that threaten the Company’s value; (v) a prohibition on maintaining any employee compensation plan that encourages the manipulation of reported earnings to enhance the compensation of any employee; and (vi) a prohibition on providing tax gross-ups to senior executive officers and certain other employees. These restrictions and standards could limit the Company’s ability to recruit and retain executives.
The securities purchase agreement between the Company and Treasury permits Treasury to impose additional restrictions retroactively.
The securities purchase agreement the Company entered into with Treasury permits Treasury to unilaterally amend the terms of the securities purchase agreement to comply with any changes in federal statutes after the date of its execution. ARRA imposed additional executive compensation and expenditure limits on all current and future TARP recipients, including the Company, until it has repaid Treasury. These additional restrictions may impede the Company’s ability to attract and retain qualified executive officers. ARRA also permits TARP recipients to repay the Treasury without penalty or requirement that additional capital be raised, subject to Treasury’s consultation with the Company’s primary federal regulator while the securities purchase agreement required that, for a period of three years, the Series B preferred stock could generally only be repaid if the Company raised additional capital to repay the securities and such capital qualified as Tier 1 capital. Additional unilateral changes in the securities purchase agreement could have a negative impact on the Company’s financial condition and results of operations.
While the Company’s common stock is currently traded on the NASDAQ Stock Market’s Global Select Market, it has less liquidity than stocks for larger companies quoted on a national securities exchange.
The trading volume in the Company’s common stock on the NASDAQ Global Select Market has been relatively low when compared with larger companies listed on the NASDAQ Global Select Market or other stock exchanges. Although the Company has experienced increased liquidity in the stock, it cannot say with any certainty that a more active and liquid trading market for its common stock will continue to develop. Because of this, it may be more difficult for shareholders to sell a substantial number of shares for the same price at which shareholders could sell a smaller number of shares.
The Company cannot predict the effect, if any, that future sales of its common stock in the market, or the availability of shares of common stock for sale in the market, will have on the market price of its common stock. The Company can give no assurance that sales of substantial amounts of common stock in the market, or the potential for large amounts of sales in the market, would not cause the price of its common stock to decline or impair its future ability to raise capital through sales of its common stock.
The market price of the Company’s common stock has fluctuated significantly, and may fluctuate in the future. These fluctuations may be unrelated to its performance. General market or industry price declines or overall market volatility in the future could adversely affect the price of the Company’s common stock, and the current market price may not be indicative of future market prices.
The Company’s business is technology dependent, and an inability to invest in technological improvements may adversely affect results of operations and financial condition.
The financial services industry is undergoing rapid technological changes with frequent introductions of new technology-driven products and services. In addition to better customer service, the effective use of technology increases efficiency and results in reduced costs. The Company’s future success will depend in part upon its ability to create synergies in its operations through the use of technology, particularly in light of its past and projected growth strategy. Many competitors have substantially greater resources to invest in technological improvements. The Company cannot make assurances that technological improvements will increase operational efficiency or that it will be able to effectively implement new technology-driven products and services or be successful in marketing these products and services to its customers.
The Company may be adversely affected by the soundness of other financial institutions.
Financial services institutions are interrelated as a result of trading, clearing, counterparty, or other relationships. The Company has exposure to many different industries and counterparties, and routinely executes transactions with counterparties in the financial services industry, including commercial banks, brokers and dealers, investment banks, and other institutional clients. Many of these transactions expose the Company to credit risk in the event of a default by a counterparty or client. In addition, the Company’s credit risk may be exacerbated when the collateral held by the Company cannot be realized or is liquidated at prices not sufficient to recover the full amount of the credit or derivative exposure due to the Company. Any such losses could have a material adverse effect on the Company’s financial condition and results of operations.
The Company’s operations rely on certain external vendors.
The Company is reliant upon certain external vendors to provide products and services necessary to maintain day-to-day operations of the Company. Accordingly, the Company’s operations are exposed to risk that these vendors will not perform in accordance with the contracted arrangements under service level agreements. The Company maintains a system of comprehensive policies and a control framework designed to monitor vendor risks including, among other things, (i) changes in the vendor’s organizational structure, (ii) changes in the vendor’s financial condition, (iii) changes in the vendor’s support for existing products and services and (iv) changes in the vendor’s strategic focus. While the Company believes these policies and procedures help to mitigate risk, the failure of an external vendor to perform in accordance with the contracted arrangements under service level agreements could be disruptive to the Company’s operations, which could have a material adverse impact on the Company’s business and, in turn, the Company’s financial condition and results of operations.
None.
The Company’s headquarters is a leased space located at 590 Peter Jefferson Parkway, Suite 250, Charlottesville, Virginia. The subsidiary bank owns an executive office at 105 Arbor Drive, Christiansburg, Virginia.
The Company’s subsidiary bank operates fifty-six branch locations. The Company owns forty-six branches and leases the remaining ten. Three additional locations are owned by the subsidiary bank to facilitate operations and loan production. Additional information regarding lease commitments can be found in Note 18 of the Notes to Consolidated Financial Statements.
All of the premises are located in Virginia, throughout the New River Valley, Roanoke Valley, Shenandoah Valley, Central Virginia and North Central Virginia. All of the Company’s properties are in good operating condition and are adequate for the Company’s present needs.
There are no material proceedings to which the Company or its subsidiaries are a party or by which, to the Company’s knowledge, it, or its subsidiaries, are threatened. All legal proceedings presently pending or threatened against the Company or its subsidiaries involve routine litigation incidental to the business of the Company or the subsidiaries involved and are not material in respect to the amount in controversy.
PART II
The Company’s stock is traded on the NASDAQ Global Select Market under the trading symbol STEL. As of March 3, 2011, there were approximately 8,000 shareholders of record and the closing sale price of the Company’s common stock was $14.89. There were no repurchases of stock conducted during 2010. Listed below are the high and low closing sale prices for the common stock, as reported by NASDAQ, and dividends paid for each quarter in the two year period ended December 31, 2010. Restrictions on the ability of the Company to pay cash dividends or possible diminished earnings of the Company may limit the ability of the Company to pay dividends in the future to holders of its common stock.
| Dividend | ||||||||||||||||||||||||
| Closing Sales Price | Per Share | |||||||||||||||||||||||
| 2010 | 2009 | 2010 | 2009 | |||||||||||||||||||||
| High | Low | High | Low | |||||||||||||||||||||
| 1st Quarter | $ | 14.41 | $ | 9.52 | $ | 17.17 | $ | 8.18 | $ | 0.04 | $ | 0.16 | ||||||||||||
| 2nd Quarter | 15.90 | 12.42 | 14.74 | 11.23 | 0.04 | 0.04 | ||||||||||||||||||
| 3rd Quarter | 14.18 | 10.18 | 15.76 | 11.78 | 0.04 | 0.04 | ||||||||||||||||||
| 4th Quarter | 15.91 | 12.17 | 14.91 | 9.03 | 0.04 | 0.04 | ||||||||||||||||||
Refer to Note 12 in the Notes to Consolidated Financial Statements for information pertaining to securities authorized for issuance under equity compensation plans.
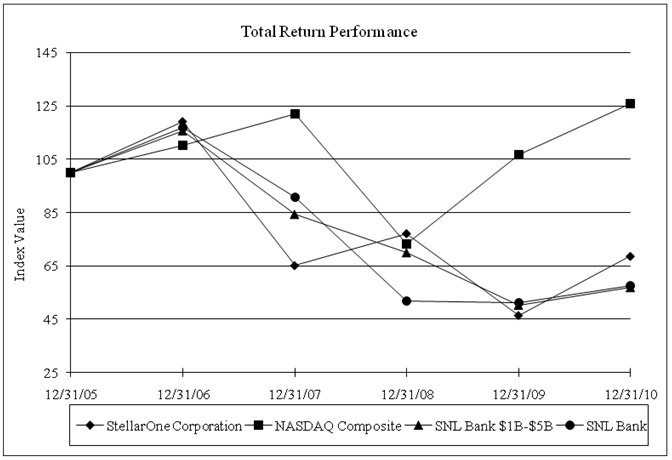
STOCK PERFORMANCE GRAPH
The following graph compares the Company’s annual percentage change in cumulative total return on common stock over the past five years with the cumulative total return of companies comprising the NASDAQ Composite Index, the SNL $1-$5 Billion Bank Index and SNL Composite Bank Index. The SNL indexes are indexes published by SNL Financial, LC. The Bank indexes are, in the opinion of management, a more relevant standard by which to compare performance, because the peer groups are more similar in terms of size and business profiles.
| Period Ending | ||||||||||||||||||||||||
| Index | 12/31/05 | 12/31/06 | 12/31/07 | 12/31/08 | 12/31/09 | 12/31/10 | ||||||||||||||||||
| StellarOne Corporation | 100.00 | 119.21 | 65.14 | 77.16 | 46.44 | 68.63 | ||||||||||||||||||
| NASDAQ Composite | 100.00 | 110.39 | 122.15 | 73.32 | 106.57 | 125.91 | ||||||||||||||||||
| SNL Bank $1B-$5B | 100.00 | 115.72 | 84.29 | 69.91 | 50.11 | 56.81 | ||||||||||||||||||
| SNL Bank | 100.00 | 116.98 | 90.90 | 51.87 | 51.33 | 57.52 | ||||||||||||||||||
This presentation assumes that $100 was invested in shares of the relevant issuers on December 31, 2005, and that dividends received were immediately invested in additional shares. The graph plots the value of the initial investment at one-year intervals for the fiscal years shown.
There can be no assurance that the Company’s stock performance in the future will continue with the same or similar trends depicted in the graph above.
We are not affiliated with, nor has any investment in SNL Financial, LC.
The following is selected financial data for the Company for the last five years.
| As of and for the Years Ended December 31, | ||||||||||||||||||||
| (In thousands, except per share data) | 2010 | 2009 | 2008 | 2007 | 2006 | |||||||||||||||
| Statement of Operations Data: | ||||||||||||||||||||
| Interest Income | $ | 127,922 | $ | 139,709 | $ | 156,236 | $ | 99,159 | $ | 95,627 | ||||||||||
| Interest Expense | 33,912 | 50,512 | 57,821 | 41,390 | 35,482 | |||||||||||||||
| Net Interest Income | 94,010 | 89,197 | 98,415 | 57,769 | 60,145 | |||||||||||||||
| Provision for Loan Losses | 22,850 | 37,800 | 20,787 | 2,040 | 750 | |||||||||||||||
| Total Noninterest Income | 33,269 | 26,140 | 24,291 | 16,967 | 15,485 | |||||||||||||||
| Total Noninterest Expense | 92,959 | 93,661 | 88,860 | 48,841 | 46,918 | |||||||||||||||
| Net Income (Loss) | 9,765 | (8,530 | ) | 9,411 | 17,002 | 19,497 | ||||||||||||||
| Performance Ratios: | ||||||||||||||||||||
| Return on Average Assets | 0.33 | % | -0.28 | % | 0.33 | % | 1.07 | % | 1.24 | % | ||||||||||
| Return on Average Equity | 2.29 | % | -1.99 | % | 2.59 | % | 10.92 | % | 13.57 | % | ||||||||||
| Net Interest Margin | 3.65 | % | 3.39 | % | 4.03 | % | 4.08 | % | 4.25 | % | ||||||||||
Efficiency Ratio (1) | 70.47 | % | 77.51 | % | 71.64 | % | 57.84 | % | 59.55 | % | ||||||||||
| Per Share Data: | ||||||||||||||||||||
| Net Income - Basic | $ | 0.35 | $ | (0.46 | ) | $ | 0.45 | $ | 1.58 | $ | 1.81 | |||||||||
| Net Income - Diluted | 0.35 | (0.46 | ) | 0.45 | 1.57 | 1.80 | ||||||||||||||
| Cash Dividends | 0.16 | 0.28 | 0.64 | 0.64 | 0.61 | |||||||||||||||
| Book Value | 18.75 | 18.57 | 19.18 | 15.08 | 13.97 | |||||||||||||||
| Market Price Per Share | 14.54 | 9.96 | 16.90 | 14.85 | 27.99 | |||||||||||||||
| Cash Dividend Payout Ratio | 52.83 | % | -92.03 | % | 134.03 | % | 40.68 | % | 34.03 | % | ||||||||||
| Balance Sheet Data: | ||||||||||||||||||||
| Assets | $ | 2,940,442 | $ | 3,033,101 | $ | 2,995,285 | $ | 1,594,818 | $ | 1,625,989 | ||||||||||
| Loans | 2,099,484 | 2,186,507 | 2,264,586 | 1,227,677 | 1,217,632 | |||||||||||||||
| Investment securities | 381,231 | 378,961 | 328,093 | 230,226 | 264,141 | |||||||||||||||
| Deposits | 2,386,102 | 2,436,120 | 2,323,108 | 1,142,547 | 1,318,281 | |||||||||||||||
| Total borrowings | 118,978 | 163,774 | 221,390 | 279,256 | 144,812 | |||||||||||||||
| Stockholders' Equity | 426,437 | 420,785 | 433,556 | 162,768 | 150,652 | |||||||||||||||
| Capital Ratios: | ||||||||||||||||||||
| Tier 1 Capital (to Average Assets) | 11.90 | % | 11.34 | % | 12.00 | % | 10.56 | % | 9.65 | % | ||||||||||
| Total Capital (to Risk Weighted Assets) | 15.44 | % | 14.46 | % | 15.37 | % | 13.22 | % | 12.44 | % | ||||||||||
| Asset Quality Ratios: | ||||||||||||||||||||
| Total allowance for loan losses to total loans outstanding | 1.79 | % | 1.84 | % | 1.35 | % | 1.23 | % | 1.19 | % | ||||||||||
| Non-performing assets to year-end loans and foreclosed assets | 2.58 | % | 3.03 | % | 2.17 | % | 0.57 | % | 0.25 | % | ||||||||||
1 Computed by dividing non-interest expense less amortization of intangibles, foreclosed property expense and goodwill impairments as a percent of the sum of net interest income on a tax equivalent basis and non-interest income excluding only gains on securities. This is a non-GAAP financial measure, which management believes provides investors with important information regarding operational efficiency. Comparison of the efficiency ratio with those of other companies may not be possible, because other companies may calculate the efficiency ratio differently. Management utilizes this ratio as a part of its strategic decision making process by evaluating the level of non-interest expense in relation to revenue streams.
The following is a discussion of the Company’s financial condition at December 31, 2010 and 2009 and results of operations for each of the years ended December 31, 2010, 2009 and 2008. The purpose of this discussion is to focus on information about the financial condition, results of operations, liquidity and capital resources of StellarOne Corporation and its subsidiary bank, which is not otherwise apparent from the consolidated financial statements. The following discussion and analysis should be read along with the consolidated financial statements and the related notes included elsewhere herein.
EXECUTIVE OVERVIEW
The slowly improving economic environment during 2010 positively impacted the Company’s financial performance as it realized net income of $9.8 million and net income available to common shareholders of $7.9 million, or $0.35 per common share, compared to a net loss of $8.5 million, or $(0.46) per common share in 2009. Key factors affecting full year 2010 results included expansion of net interest margin, decrease in non-performing assets as a percentage of total assets and elevated mortgage banking revenues, offset by the accelerated resolution of problem credits through charge-offs, increased write-downs of foreclosed assets and losses from mortgage indemnifications.
The Company recorded a provision for loan losses of $22.9 million for 2010, a decrease of $14.9 million compared to the $37.8 million recorded in 2009. The provision compares to net charge-offs of $25.4 million for the year. The allowance as a percentage of total loans decreased from 1.84% at December 31, 2009 to 1.79% at December 31, 2010, reflecting the Company’s continuing focus on resolving problem credits in its loan portfolio. While it is difficult to predict the impact or length of the recessionary economy, the Company anticipates continued improvement to the elevated levels of non-performing assets and net charge-offs in 2011.
Despite the challenging economic environment, the Company continues to operate in a position of strength and is focused on expanding revenue, building efficiencies, increasing the profitability of the balance sheet, investing for the future, and prudently managing credit. To this end, it remains acutely focused on clients, improving service quality and front-line execution, controlling expenses, and managing risk. During the year, loan demand was down, credit costs were higher, and asset quality was challenging. Continued economic weakness has reduced demand for loans as customers attempt to reduce debt and preserve capital. However, the Company has also experienced strong deposit growth, positive fee income growth, continued strong expense management, and credit trends and margin that improved during the last quarter of 2010. Specifically, in the last quarter of 2010, the Company experienced reduced net charge-offs and provisioning, and a stabilization of nonperforming assets. Management believes the strong capital position coupled with client-focused execution, will enable the Company to implement a leveraging strategy by seeking acquisition and merger partners in higher growth markets when the economic climate improves.
The Company began reporting segment information during the year ended December 31, 2010 and began tracking the related information for internal purposes during the year ended December 31, 2009. Therefore, there is no comparative data presented for the year ended December 31, 2008, as this data was not tracked by segment during this time period and is therefore unavailable.
The Company’s Commercial Bank segment recorded retail banking fee income of $16.2 million for 2010, a decrease of $200 thousand or 1.2% compared to $16.4 million for 2009. This sequential year decrease was attributable to a decrease of $1.2 million in consumer overdraft fees, which resulted from implementing the modifications to Regulation E that became effective during 2010 and was partially offset by an increase in interchange fee income of $908 thousand. Tax equivalent interest income for this segment increased $4.9 million or 5.3% to $96.6 million in 2010. This was driven by a 38 basis point increase in interest rate spread to 3.4% in 2010. The segment recorded a provision for loan losses of $22.9 million for 2010, a decrease of $15.0 million compared to the $37.8 million recorded in 2009. Due to the factors outlined above, income from this business segment totaled $10.1 million for the year ended December 31, 2010 and a loss of $7.0 million for the year ended December 31, 2009.
Revenues from the Company’s Mortgage Banking segment totaled $9.4 million for the year ended December 31, 2010, or up $2.0 million or 27.0% compared to $7.4 million for the year ended December 31, 2009. The mortgage revenue increase for 2010 was offset by $2.3 million in indemnification losses recognized, which compares to $1.1 million for 2009. During the current year $1.45 million of this expense was associated with a settlement that extinguished all outstanding and potential mortgage repurchase and make-whole claims arising out of alleged breaches of representations and warranties related to loans sold by StellarOne Corporation or its legacy companies to a primary investor prior to January 1, 2009. This settlement resolved approximately 80% of current claims outstanding with all investors and is anticipated to mitigate future off-balance sheet risk associated with repurchase and indemnifications. Due to the factors outlined above, net income from this business segment totaled $669 thousand and $1.1 million for the years ended December 31, 2010 and 2009, respectively.
The Company’s Wealth Management segment realized income of $547 thousand during 2010, an increase of $272 thousand or 98.9% compared to $275 thousand during 2009. Revenues from trust and brokerage fees for the 2010 were $4.8 million or up $595 thousand or 14.3% when compared to $4.2 million realized during 2009. Higher fee realizations and increased assets under management attributed to the revenue increase. Fiduciary and brokerage assets increased to $720.5 million at December 31 2010, compared to $655.6 million at December 31, 2009.
RESULTS OF OPERATIONS
NET INTEREST INCOME
The primary source of the Company’s traditional banking revenue is net interest income, which represents the difference between interest income on earning assets and interest expense on liabilities used to fund those assets. Earning assets include loans, securities, and federal funds sold. Interest bearing liabilities include deposits and borrowings. To compare the tax-exempt yields to taxable yields, amounts are adjusted to pretax equivalents based on a 35% federal corporate income tax rate.
Net interest income is affected by changes in interest rates, volume of interest bearing assets and liabilities, and the composition of those assets and liabilities. The “interest rate spread” and “net interest margin” are two common statistics related to changes in net interest income. The interest rate spread represents the difference between the yields earned on interest earning assets and the rates paid for interest bearing liabilities. The net interest margin is defined as the percentage of net interest income to average earning assets. Earning assets obtained through noninterest bearing sources of funds such as regular demand deposits and stockholders’ equity result in a net interest margin that is higher than the interest rate spread.
2010 Compared to 2009
Tax equivalent net interest income in 2010 was $96.6 million, an increase of $4.9 million or 5.3% compared to $91.7 million in 2009. Average interest earning assets decreased $63.3 million or 2.3% to $2.64 billion, while average loans decreased $109 million or 4.8% to $2.2 billion. The average interest rate spread was 3.41% in 2010, an increase of 38 basis points from 3.03% in 2009. The net interest margin was 3.65% in 2010, an increase of 26 basis points from 3.39% in 2009. The re-pricing sensitivity of interest bearing liabilities outpaced interest earning assets during 2010 as approximately $787.7 million or approximately 86.5% of the CD portfolio re-priced resulting in a decrease of 88 basis points and 91 basis points for time deposits less than $100 thousand and greater than $100 thousand, respectively. Additionally, the cost of funds associated with FHLB advances decreased 17 basis points as a few higher priced advances matured near the end of the year. The yield on average loans decreased 24 basis points in 2010, while the yield on investment securities decreased 69 basis points for the period. Interest expense as a percentage of average earning assets decreased to 1.28%, down 59 basis points from 1.87% in 2009, reflecting a 70 basis point decrease in average cost of retail deposits to 1.39%, and a 70 basis point decrease in average total funding cost to 1.52%.
2009 Compared to 2008
Tax equivalent net interest income in 2009 was $91.7 million, a decrease of $9.1 million or 9.0% compared to $100.8 million in 2008. Average interest earning assets increased $207 million or 8.3% to $2.71 billion, while average loans increased $151 million or 7.1% to $2.3 billion. These increases are primarily attributable to 2009 having a full-year effect on the average balances from the merger of equals transaction consummated in early 2008, while the 2008 amounts only included a ten month effect. Additionally, the increased liquidity provided by deposit growth during the year that was unable to be reinvested in the form of loans resulted in higher interest bearing deposits and fed funds sold balances. Margin for 2008 was positively impacted by the loan discount, CD premium and a borrowing premium associated with the VFG/FNB merger, all of which began amortizing during 2008. These premiums and discounts stem from adjusting assets and liabilities to their respective market values as part of the purchase adjustments associated with the merger. The effect of the purchase accounting items is an increase in net interest margin of approximately thirty basis points for 2008 with only a ten basis point effect on 2009 margin or a twenty basis point decrease related to purchase accounting adjustments year over year.
The average interest rate spread was 3.04% in 2009, down fifty-nine basis points from 3.63% in 2008. The net interest margin was 3.39% in 2009, down sixty-four basis points from 4.03% in 2008. The decrease in the Company’s net interest margin was attributable to a relatively high level of fixed rate re-pricing in the loan portfolio, the impact of an increased amount of loans in nonaccrual status and a higher level of short term liquidity in the balance sheet. The yield on average loans decreased one hundred five basis points in 2009, while the yield on investment securities decreased forty-four basis points for the period. Interest expense as a percentage of average earning assets decreased to 1.87%, down forty-four basis points from 2.31% in 2008, reflecting a forty-eight basis point decrease in average cost of retail deposits to 2.09%, and a forty-nine basis point decrease in average total funding cost to 2.22%.
Interest Sensitivity
Financial institutions can be exposed to several market risks that may impact the value or future earnings capacity of an organization. These risks involve interest rate risk, foreign currency exchange risk, commodity price risk and equity market price risk. The Company does not currently have any exposure to foreign currency exchange risk, commodity price risk or equity market price risk. The Company’s primary market risk is interest rate risk. Interest rate risk is inherent because as a financial institution, the Company derives a significant amount of its operating revenue from “purchasing” funds (customer deposits and borrowings) at various terms and rates. These funds are then invested into earning assets (loans, leases, investments, etc.) at various terms and rates. This risk is further discussed below.
Interest rate risk is the exposure to fluctuations in the Company’s future earnings (earnings at risk) and value (economic value at risk) resulting from changes in interest rates. This exposure results from differences between the amounts of interest earning assets and interest bearing liabilities that reprice within a specified time period as a result of scheduled maturities and repayment and contractual interest rate changes.
The primary objective of the Company’s asset/liability management process is to maximize current and future net interest income within acceptable levels of interest rate risk while satisfying liquidity and capital requirements. Management recognizes that a certain amount of interest rate risk is inherent and appropriate, yet if not properly managed can be detrimental to the Company’s long-term profitability. Thus the goal of interest rate risk management is to maintain a balance between risk and reward such that net interest income is maximized while risk is maintained at an appropriate level.
The Company assumes interest rate risk (the risk that general interest rate levels will change) as a result of its normal operations. As a result, the fair values of the Company's financial instruments will change when interest rate levels change and that change may be either favorable or unfavorable to the Company. Management attempts to match maturities of assets and liabilities to the extent believed necessary to minimize interest rate risk. However, borrowers with fixed rate obligations are less likely to prepay in a rising rate environment and more likely to prepay in a falling rate environment. Conversely, depositors who are receiving fixed rates are more likely to withdraw funds before maturity in a rising rate environment and less likely to do so in a falling rate environment. Management monitors rates and maturities of assets and liabilities and attempts to minimize interest rate risk by adjusting terms of new loans and deposits and by investing in securities with terms that mitigate the Company's overall interest rate risk.
Management endeavors to control the exposures to changes in interest rates by understanding, reviewing and making decisions based on its risk position. The corporate asset/liability committee is responsible for these decisions. The committee operates under management policies defining guidelines and limits on the level of acceptable risk. These policies are approved by the Boards of Directors of the Company and its banking subsidiary. The Company primarily uses the securities portfolios and FHLB advances to manage its interest rate risk position. Additionally, pricing, promotion and product development activities are directed in an effort to emphasize the loan and deposit term or repricing characteristics that best meet current interest rate risk objectives.
The Company uses simulation analysis to assess earnings at risk and Economic Value of Equity analysis to assess value at risk. These methods allow management to regularly monitor both the direction and magnitude of the Company’s interest rate risk exposure. These modeling techniques involve assumptions and estimates that inherently cannot be measured with complete precision. Key assumptions in the analyses include maturity and repricing characteristics of both assets and liabilities, prepayments on amortizing assets, other imbedded options, non-maturity deposit sensitivity and loan and deposit pricing. These assumptions are inherently uncertain due to the timing, magnitude and frequency of rate changes and changes in market conditions and management strategies, among other factors. However, the analyses are useful in quantifying risk and provide a relative gauge of the Company’s interest rate risk position over time.
Earnings at Risk
Simulation analysis evaluates the effect of upward and downward changes in market interest rates on future net interest income. The analysis involves changing the interest rates used in determining net interest income over the next twelve months. The resulting percentage change in net interest income in various rate scenarios is an indication of the Company’s shorter-term interest rate risk. The analysis utilizes a “static” balance sheet approach. The measurement date balance sheet composition (or mix) is maintained over the simulation time period with maturing and repayment dollars being rolled back into like instruments for new terms at current market rates. Additional assumptions are applied to modify volumes and pricing under the various rate scenarios. These include prepayment assumptions on mortgage assets, the sensitivity of non-maturity deposit rates, and other factors deemed significant.
The base net interest income simulation performed as of December 31, 2010, assumes interest rates are unchanged for the next 24 months. The simulation then assumes that rates are shocked up and down by 400 basis points in 100 basis point increments. The simulation analysis results are presented in the table below. These results indicate that the Company would expect net interest income to increase over the next twelve months by 8.3% assuming an immediate upward shift in market interest rates of 200 basis points and to increase by 1.6% if rates shifted downward by 100 basis points. While the Company was asset sensitive at December 31, 2010, simulation results indicate that net interest income would increase slightly in a down rate environment. This is attributable to the absolute low level of rates in the current economic cycle and floors being reached on assets as deposits continue to reprice down. Management also evaluates the impact on net interest income assuming a “most likely rate scenario” utilizing a rate forecast published by Global Insight. Under this scenario net interest income is anticipated to increase over the next twelve months by 1.5%. These profiles reflect a moderate interest rate risk position and are well within the guidelines set by policy.
| Change in Net Interest Income | ||||||||
| Percentage | Amount | |||||||
| Change in Yield Curve: | (In thousands) | |||||||
| +400 basis points | 16.06 | % | $ | 15,316 | ||||
| +300 basis points | 12.42 | % | $ | 11,847 | ||||
| +200 basis points | 8.32 | % | $ | 7,931 | ||||
| +100 basis points | 4.15 | % | $ | 3,954 | ||||
| Base case | - | - | ||||||
| -100 basis points | 1.60 | % | $ | 1,525 | ||||
| Most likely rate scenario | 1.45 | % | $ | 1,382 | ||||
Economic Value of Equity
The Economic Value of Equity (“EVE”) analysis provides information on the risk inherent in the balance sheet that might not be taken into account in the simulation analysis due to the shorter time horizon used in that analysis. The EVE of the balance sheet is defined as the discounted present value of expected asset cash flows minus the discounted present value of expected liability cash flows. The economic value simulation uses instantaneous rate shocks to determine the expected cash flows in various rate scenarios. The resulting percentage change in EVE is an indication of the longer term repricing risk and options embedded in the balance sheet.
The EVE analysis results are presented in the table below. These results as of December 31, 2010 indicate that the EVE would increase 12.9% assuming an immediate upward shift in market interest rates of 200 basis points and decrease 10.4% if rates shifted downward by 100 basis points. The Company’s risk position is outside the guidelines set by policy in the down 100 basis points scenario, but is considered manageable. This is attributable to the absolute low level of rates in the current economic cycle and floors being reached on assets as deposits continue to reprice down, which negatively impacts economic value.
| Change in EVE | ||||||||
| Percentage | Amount | |||||||
| Change in Yield Curve: | (In thousands) | |||||||
| +400 basis points | 23.22 | % | $ | 123,020 | ||||
| +300 basis points | 17.46 | % | $ | 92,480 | ||||
| +200 basis points | 12.87 | % | $ | 68,162 | ||||
| +100 basis points | 7.16 | % | $ | 37,941 | ||||
| Base case | - | - | ||||||
| -100 basis points | -10.39 | % | $ | (55,051 | ) | |||
The following table presents net interest income on a fully taxable equivalent basis, interest rate spread and net interest margin for the years ending December 31, 2010, 2009 and 2008.
| 2010 | 2009 | 2008 | ||||||||||||||||||||||||||||||||||
| Average | Income/ | Average | Average | Income/ | Average | Average | Income/ | Average | ||||||||||||||||||||||||||||
| (Dollars in thousands) | Balance | Expense | Rate | Balance | Expense | Rate | Balance | Expense | Rate | |||||||||||||||||||||||||||
| ASSETS | ||||||||||||||||||||||||||||||||||||
Loans receivable, net 1 2 | $ | 2,161,387 | $ | 115,025 | 5.32 | % | $ | 2,270,754 | $ | 126,214 | 5.56 | % | $ | 2,120,085 | $ | 140,097 | 6.61 | % | ||||||||||||||||||
| Investment securities | ||||||||||||||||||||||||||||||||||||
| Taxable | 264,632 | 8,475 | 3.16 | % | 233,375 | 9,655 | 4.08 | % | 250,134 | 11,991 | 4.75 | % | ||||||||||||||||||||||||
Tax exempt 2 | 111,296 | 6,720 | 5.96 | % | 100,362 | 6,165 | 6.06 | % | 87,849 | 5,517 | 6.18 | % | ||||||||||||||||||||||||
| Total investments | 375,928 | 15,195 | 3.99 | % | 333,737 | 15,820 | 4.68 | % | 337,983 | 17,508 | 5.12 | % | ||||||||||||||||||||||||
| Interest bearing deposits | 55,101 | 124 | 0.22 | % | 50,066 | 94 | 0.19 | % | 1,469 | 25 | 1.67 | % | ||||||||||||||||||||||||
| Federal funds sold | 52,001 | 127 | 0.24 | % | 53,157 | 115 | 0.21 | % | 41,018 | 943 | 2.26 | % | ||||||||||||||||||||||||
| Total interest earning assets | 2,644,417 | 130,471 | 4.93 | % | 2,707,714 | 142,243 | 5.25 | % | 2,500,555 | 158,573 | 6.34 | % | ||||||||||||||||||||||||
| Allowance for loan losses | (37,649 | ) | (40,172 | ) | (30,464 | ) | ||||||||||||||||||||||||||||||
| Total nonearning assets | 369,976 | 364,095 | 340,551 | |||||||||||||||||||||||||||||||||
| Total assets | $ | 2,976,744 | $ | 3,031,637 | $ | 2,810,642 | ||||||||||||||||||||||||||||||
| LIABLILITIES AND STOCKHOLDERS' EQUITY | ||||||||||||||||||||||||||||||||||||
| Interest-bearing deposits | ||||||||||||||||||||||||||||||||||||
| Interest checking | $ | 560,591 | $ | 3,363 | 0.60 | % | $ | 531,627 | $ | 5,243 | 0.99 | % | $ | 453,780 | $ | 6,137 | 1.35 | % | ||||||||||||||||||
| Money market | 400,210 | 4,579 | 1.14 | % | 293,211 | 4,407 | 1.50 | % | 195,061 | 3,488 | 1.78 | % | ||||||||||||||||||||||||
| Savings | 227,197 | 1,844 | 0.81 | % | 193,127 | 1,709 | 0.88 | % | 183,323 | 2,087 | 1.14 | % | ||||||||||||||||||||||||
| Time deposits: | ||||||||||||||||||||||||||||||||||||
| Less than $100,000 | 604,831 | 12,394 | 2.05 | % | 735,645 | 21,410 | 2.93 | % | 699,543 | 23,154 | 3.30 | % | ||||||||||||||||||||||||
| $100,000 and more | 290,421 | 6,763 | 2.33 | % | 330,277 | 10,714 | 3.24 | % | 326,407 | 13,073 | 3.99 | % | ||||||||||||||||||||||||
| Total interest-bearing deposits | 2,083,250 | 28,943 | 1.39 | % | 2,083,887 | 43,483 | 2.09 | % | 1,858,114 | 47,939 | 2.57 | % | ||||||||||||||||||||||||
| Federal funds purchased & repurchase agreements | 982 | 29 | 2.91 | % | 501 | 16 | 3.15 | % | 4,297 | 73 | 1.67 | % | ||||||||||||||||||||||||
| Federal Home Loan Bank advances | 113,315 | 3,866 | 3.36 | % | 160,904 | 5,756 | 3.53 | % | 205,810 | 7,207 | 3.44 | % | ||||||||||||||||||||||||
| Subordinated debt | 32,991 | 1,074 | 3.21 | % | 32,991 | 1,257 | 3.76 | % | 30,861 | 1,959 | 6.25 | % | ||||||||||||||||||||||||
| Other short-term borrowings | - | - | N/A | - | - | N/A | 24,714 | 643 | 2.60 | % | ||||||||||||||||||||||||||
| Total interest-bearing liabilities | 2,230,538 | 33,912 | 1.52 | % | 2,278,283 | 50,512 | 2.22 | % | 2,123,796 | 57,821 | 2.71 | % | ||||||||||||||||||||||||
| Demand deposits | 304,178 | 311,047 | 307,621 | |||||||||||||||||||||||||||||||||
| Other liabilities | 16,390 | 13,934 | 16,323 | |||||||||||||||||||||||||||||||||
| Total liabilities | 2,551,106 | 2,603,264 | 2,447,740 | |||||||||||||||||||||||||||||||||
| Stockholders' equity | 425,638 | 428,373 | 362,902 | |||||||||||||||||||||||||||||||||
| Total liabilities and stockholders' equity | $ | 2,976,744 | $ | 3,031,637 | $ | 2,810,642 | ||||||||||||||||||||||||||||||
Net interest income (tax equivalent) 3 | $ | 96,559 | $ | 91,731 | $ | 100,752 | ||||||||||||||||||||||||||||||
| Average interest rate spread | 3.41 | % | 3.03 | % | 3.63 | % | ||||||||||||||||||||||||||||||
| Interest expense as a percent of average earning assets | 1.28 | % | 1.87 | % | 2.31 | % | ||||||||||||||||||||||||||||||
| Net interest margin | 3.65 | % | 3.39 | % | 4.03 | % | ||||||||||||||||||||||||||||||
1 Includes nonaccrual loans.
2 Income and yields are reported on a taxable equivalent basis using a 35% tax rate.
3 The tax equivalent interest adjustments included in the yields presented above were $2.5 million, $2.4 million, and $2.3 million for each of the three years ended December 31.
The next table analyzes the changes in net interest income on a fully taxable equivalent basis for the periods broken down by their rate and volume components. The change in interest due to both rate and volume has been allocated proportionately to change due to volume versus change due to rate.
| Years Ended December 31, | ||||||||||||||||||||||||
| 2010 vs. 2009 | 2009 vs. 2008 | |||||||||||||||||||||||
| Increase (Decrease) | Increase (Decrease) | |||||||||||||||||||||||
| Due to changes in: | Due to changes in: | |||||||||||||||||||||||
| (Dollars in thousands) | Volume | Rate | Total | Volume | Rate | Total | ||||||||||||||||||
| Earning Assets: | ||||||||||||||||||||||||
| Loans | $ | (5,863 | ) | $ | (5,326 | ) | $ | (11,189 | ) | $ | 9,471 | $ | (23,354 | ) | $ | (13,883 | ) | |||||||
| Securities, taxable | 1,147 | (2,327 | ) | (1,180 | ) | (736 | ) | (1,600 | ) | (2,336 | ) | |||||||||||||
| Securities, tax-exempt | 657 | (102 | ) | 555 | 755 | (107 | ) | 648 | ||||||||||||||||
| Interest-bearing bank deposits | 14 | 16 | 30 | 110 | (41 | ) | 69 | |||||||||||||||||
| Federal funds sold | (4 | ) | 16 | 12 | 90 | (918 | ) | (828 | ) | |||||||||||||||
| Total Interest Earning Assets | $ | (4,049 | ) | $ | (7,723 | ) | $ | (11,772 | ) | $ | 9,690 | $ | (26,020 | ) | $ | (16,330 | ) | |||||||
| Interest Bearing Liabilities: | ||||||||||||||||||||||||
| Time and savings deposits: | ||||||||||||||||||||||||
| Interest checking | $ | 293 | $ | (2,173 | ) | $ | (1,880 | ) | $ | 910 | $ | (1,804 | ) | $ | (894 | ) | ||||||||
| Money market | 1,380 | (1,208 | ) | 172 | 1,546 | (627 | ) | 919 | ||||||||||||||||
| Savings | 278 | (143 | ) | 135 | 119 | (497 | ) | (378 | ) | |||||||||||||||
| Time deposits | ||||||||||||||||||||||||
| Less than $100,000 | (3,088 | ) | (5,751 | ) | (8,839 | ) | 1,052 | (2,973 | ) | (1,921 | ) | |||||||||||||
| $100,000 and more | (1,376 | ) | (2,752 | ) | (4,128 | ) | 95 | (2,277 | ) | (2,182 | ) | |||||||||||||
| Total interest bearing deposits | (2,513 | ) | (12,027 | ) | (14,540 | ) | 3,722 | (8,178 | ) | (4,456 | ) | |||||||||||||
| Federal funds and repurchase agreements | 14 | (1 | ) | 13 | (22 | ) | (35 | ) | (57 | ) | ||||||||||||||
| Federal Home Loan Bank advances | (1,628 | ) | (262 | ) | (1,890 | ) | (1,632 | ) | 181 | (1,451 | ) | |||||||||||||
| Subordinated Debt | (2 | ) | (181 | ) | (183 | ) | 112 | (814 | ) | (702 | ) | |||||||||||||
| Short-term borrowings | - | - | - | (643 | ) | - | (643 | ) | ||||||||||||||||
| Total Interest Bearing Liabilities | (4,129 | ) | (12,471 | ) | (16,600 | ) | 1,537 | (8,846 | ) | (7,309 | ) | |||||||||||||
| Net Interest Income | $ | 80 | $ | 4,748 | $ | 4,828 | $ | 8,153 | $ | (17,174 | ) | $ | (9,021 | ) | ||||||||||
NONINTEREST INCOME
The following table presents the components of noninterest income and the variance or percentage change:
| 2010 vs. 2009 | 2009 vs. 2008 | |||||||||||||||||||||||
| (In thousands) | 2010 | 2009 | % | 2009 | 2008 | % | ||||||||||||||||||
| Retail banking fees | $ | 16,237 | $ | 16,367 | -0.8 | % | $ | 16,367 | $ | 14,756 | 10.9 | % | ||||||||||||
| Commissions and fees from fiduciary activities | 3,264 | 2,960 | 10.3 | % | 2,960 | 3,677 | -19.5 | % | ||||||||||||||||
| Brokerage fee income | 1,492 | 1,203 | 24.0 | % | 1,203 | 1,269 | -5.2 | % | ||||||||||||||||
| Mortgage banking-related fees | 9,388 | 7,382 | 27.2 | % | 7,382 | 3,446 | >100% | |||||||||||||||||
| Gains (losses) on sale of premises and equipment | 199 | (76 | ) | >100% | (76 | ) | (124 | ) | -38.7 | % | ||||||||||||||
| Gains (losses) on mortgage indemnifications | (2,265 | ) | (1,098 | ) | >100% | (1,098 | ) | - | N/A | |||||||||||||||
| Impairments of securities available for sale | (110 | ) | (2,525 | ) | -95.6 | % | (2,525 | ) | (274 | ) | >100% | |||||||||||||
| Gains on securities available for sale | 1,268 | 45 | >100% | 45 | 186 | -75.8 | % | |||||||||||||||||
| Gain on sale of branch | 748 | - | N/A | - | - | N/A | ||||||||||||||||||
| Losses on sale of foreclosed assets | (1,147 | ) | (1,810 | ) | -36.6 | % | (1,810 | ) | (2,497 | ) | -27.5 | % | ||||||||||||
| Income from bank owned life insurance | 1,296 | 1,292 | 0.3 | % | 1,292 | 1,213 | 6.5 | % | ||||||||||||||||
| Other operating income | 2,899 | 2,400 | 20.8 | % | 2,400 | 2,639 | -9.1 | % | ||||||||||||||||
| $ | 33,269 | $ | 26,140 | 27.3 | % | $ | 26,140 | $ | 24,291 | 7.6 | % | |||||||||||||
2010 Compared to 2009
| · | Retail banking fees have remained stable predominantly due to approximately $909 thousand of growth in interchange fee income which was offset by $1.2 million of contraction in nonsufficient funds charges which amounted to $9.7 million in 2010 compared to $10.9 million in 2009. This nonsufficient funds fee decrease resulted from implementing the modifications to Regulation E that became effective during the third quarter of 2010. |
| · | Mortgage banking related fees were elevated due to a continuation of the favorable interest rate market, higher margin on loans sold due to refinance business comprising less of the loan mix in 2010 as compared to 2009. Additionally, volumes remained elevated as $525 million of retail and wholesale mortgages were originated during 2010 compared to $578 million originated in 2009. |
| · | Losses on mortgage indemnifications increased to $2.3 million in 2010, up from $1.1 million in 2009. These losses arise as third party investors identify problem loans previously sold with underwriting deficiencies. These losses are largely associated with wholesale originations made during 2006 and 2007. |
| · | Impairment of securities available for sale was impacted in the prior year due to the recognition of an other-than-temporary impairment charge of $2.32 million on five bank equity securities with an original cost basis of $2.93 million. Additionally, a $205 thousand impairment charge was taken on an investment in a private equity and venture capital firm during 2009. This compares to an impairment charge of $110 thousand taken during the second half of 2010 associated with bank equity securities. The position in these bank equities was liquidated prior to the end of 2010. |
| · | Gains on the sale of securities held for sale were elevated during 2010 as the par value of many mortgage backed securities amortized to levels at which the associated administrative costs become less favorable on a per security basis. When these levels are reached the related securities are sold in a “clean-up” transaction in order to reinvest in securities with higher par values in order to better manage the related administrative costs. |
| · | Losses on the sale of foreclosed assets remained historically high in 2010 due to the continuation of elevated levels of nonperforming assets encountered during 2010 and 2009. This was primarily due to poor real estate and general market conditions encountered during both years. |
| · | The increase in commissions and fees from fiduciary activities was due to higher market valuations for assets under management during 2010 as compared to 2009. |
2009 Compared to 2008
| · | Mortgage banking related fees were elevated due to $578 million of retail and wholesale mortgages being originated during 2009 compared to $112 million originated in 2008. These increased originations were primarily driven by the favorable interest rate environment in 2009 which encouraged borrowers to refinance existing loans. |
| · | Impairment of securities available for sale was impacted in 2009 due to the recognition of an other-than-temporary impairment charge of $2.32 million on five bank equity securities with an original cost basis of $2.93 million. Additionally, a $205 thousand impairment charge was taken on an investment in a private equity and venture capital firm during 2009. This compares to the sole impairment charge of $274 thousand recognized in 2008 which related to a small ownership in the stock of Fannie Mae. |
| · | Retail banking fees have increased predominantly due to approximately $1.0 million of growth in nonsufficient funds charges which amounted to $10.9 million in 2009 compared to $9.9 million in 2008. This was achieved through approximately $755 thousand of increased volume and an increased focus on managing the refunds of these fees which expanded the associated realization rate by approximately 3% year over year. |
| · | The decrease in commissions and fees from fiduciary activities was due to lower market valuations for assets under management during 2009. |
| · | Losses on mortgage indemnifications increased to $1.1 million in 2009 as third party investors identified loans previously sold with underwriting deficiencies. These losses are largely associated with wholesale originations made during 2006 and 2007. There were no such losses in 2008. |
| · | Losses on the sale of foreclosed assets remained high historically in 2009 due to the continuation of elevated levels of nonperforming assets encountered during both periods under comparison. This was primarily due to poor real estate and general market conditions encountered during both years. |
NONINTEREST EXPENSE
The following table presents the components of noninterest expense and the variance or percentage change:
| 2010 vs. 2009 | 2009 vs. 2008 | |||||||||||||||||||||||
| (In thousands) | 2010 | 2009 | % | 2009 | 2008 | % | ||||||||||||||||||
| Compensation and employee benefits | $ | 45,898 | $ | 44,564 | 3.0 | % | $ | 44,564 | $ | 44,747 | -0.4 | % | ||||||||||||
| Net occupancy | 8,389 | 8,578 | -2.2 | % | 8,578 | 7,113 | 20.6 | % | ||||||||||||||||
| Supplies and equipment | 8,401 | 8,735 | -3.8 | % | 8,735 | 7,910 | 10.4 | % | ||||||||||||||||
| Amortization - intangible assets | 1,651 | 1,730 | -4.6 | % | 1,730 | 1,568 | 10.3 | % | ||||||||||||||||
| Marketing | 1,146 | 1,276 | -10.2 | % | 1,276 | 2,184 | -41.6 | % | ||||||||||||||||
| State franchise taxes | 2,216 | 2,318 | -4.4 | % | 2,318 | 2,091 | 10.9 | % | ||||||||||||||||
| FDIC Insurance | 5,518 | 5,309 | 3.9 | % | 5,309 | 1,419 | >100% | |||||||||||||||||
| Data processing | 2,398 | 2,466 | -2.8 | % | 2,466 | 3,847 | -35.9 | % | ||||||||||||||||
| Professional fees | 2,600 | 2,856 | -9.0 | % | 2,856 | 2,000 | 42.8 | % | ||||||||||||||||
| Telecommunications | 1,686 | 1,857 | -9.2 | % | 1,857 | 1,761 | 5.5 | % | ||||||||||||||||
| Other operating expense | 13,056 | 13,972 | -6.6 | % | 13,972 | 14,220 | -1.7 | % | ||||||||||||||||
| $ | 92,959 | $ | 93,661 | -0.8 | % | $ | 93,661 | $ | 88,860 | 5.4 | % | |||||||||||||
2010 Compared to 2009
| · | Compensation and employee benefits increased by 3.0% when compared to 2009. The primary cause for the increase relates to acquisition of talent and increases in health care costs due to a higher claims experience rate in 2010. |
| · | FDIC insurance fee assessment rates increased during 2010. However, the expense remained in-line with 2009 levels due to a $1.4 million special assessment that was paid in June of 2009. |
| · | Professional fees decreased when compared to the prior year, but remain elevated as legal expenses associated with high volumes of customer work out agreements, foreclosures and settlements continued throughout both 2010 and 2009. |
| · | Moderate decreases in costs associated with supplies and equipment, data processing and telecommunications expenses during 2010 relate to a cost control program implemented during the latter portion of 2009. |
| · | Net occupancy and franchise taxes decreased 2.2% and 4.4%, respectively, compared to 2009 due to an effort to consolidate the Company’s branch network. The sale of one branch location took place during the second half of 2009 and one branch sale was completed during the first quarter of 2010. |
2009 Compared to 2008
| · | FDIC insurance increased considerably during 2009 compared to 2008 due to increases in the fee assessment rates during 2009 and a special assessment applied to all insured institutions as of June 30, 2009. The special assessment amounted to $1.4 million for the Company. |
| · | Data processing expense decreased significantly when compared to 2008 due to approximately $1.3 million in expenses associated with the merger transaction being recognized during 2008. The amount recognized in 2009 has normalized and does not contain such costs. |
| · | Professional fees are considerably higher in 2009 due to increased legal expenses associated with a higher volume of customer work out agreements, foreclosures and settlements. |
| · | Increases in amortization, supplies and equipment, state franchise taxes and telecommunications expense are all primarily attributable to 2009 including a full-year effect from the merger of equals transaction consummated in early 2008 on the income statement, while the 2008 amounts only included a ten month effect. |
| · | Decreased costs associated with marketing expenses during 2009 related to a cost control program implemented during the current year and inflated costs during 2008 associated with branding initiatives establishing the Company’s new brand across its entire footprint. |
INCOME TAXES
For the year ended December 31, 2010, income tax expense was $1.7 million, resulting in an effective tax rate of 14.9% compared to a $7.6 million benefit or (47.1)% effective rate in 2009 and $3.6 million of expense or 27.9% effective rate in 2008. The increase in the effective rate when comparing 2010 to 2009 is primarily due to the loss recognized in 2009. The tax preference items such as tax exempt interest income and earnings on BOLI are comparable between each year; however, in a loss year these differences have the effect of increasing the tax benefit rate and reducing the effective tax rate when applied to pretax earnings. The effective tax rate on a historical basis remains suppressed in 2010 due to lower than normal pretax earnings. The substantial increase in the effective tax rate when comparing 2009 to 2008 is a product of the pretax loss in 2009.
FINANCIAL CONDITION
ASSET QUALITY
The allowance for loan losses represents an estimate, in management’s judgment, of the amount needed to absorb losses incurred through the reporting date on existing loans in the portfolio. The following table represents the Company’s activity in its allowance for loan losses:
| December 31, | ||||||||||||||||||||
| (In thousands) | 2010 | 2009 | 2008 | 2007 | 2006 | |||||||||||||||
| Allowance for loan losses, January 1 | $ | 40,172 | $ | 30,464 | $ | 15,082 | $ | 14,500 | $ | 13,581 | ||||||||||
| Loans Charged Off: | ||||||||||||||||||||
| Real estate - construction | 10,158 | 18,017 | 8,575 | 1,130 | - | |||||||||||||||
| Real estate - mortgage | 9,406 | 4,796 | 3,094 | 79 | 30 | |||||||||||||||
| Commercial, financial and agricultural | 5,409 | 5,961 | 4,294 | 98 | 88 | |||||||||||||||
| Consumer loans | 2,605 | 2,173 | 2,228 | 455 | 284 | |||||||||||||||
| Total Loans Charged Off | 27,578 | 30,947 | 18,191 | 1,762 | 402 | |||||||||||||||
| Recoveries: | ||||||||||||||||||||
| Real estate - construction | 223 | 609 | 158 | - | - | |||||||||||||||
| Real estate - mortgage | 358 | 499 | 154 | 67 | 24 | |||||||||||||||
| Commercial, financial and agricultural | 714 | 607 | 424 | 121 | 83 | |||||||||||||||
| Consumer loans | 910 | 1,140 | 511 | 116 | 464 | |||||||||||||||
| Total Recoveries | 2,205 | 2,855 | 1,247 | 304 | 571 | |||||||||||||||
| Net Charge-offs (Recoveries) | 25,373 | 28,092 | 16,944 | 1,458 | (169 | ) | ||||||||||||||
| Allowance acquired via acquisition | - | - | 11,539 | - | - | |||||||||||||||
| Provision for Loan Losses | 22,850 | 37,800 | 20,787 | 2,040 | 750 | |||||||||||||||
| Allowance for loan losses, December 31 | $ | 37,649 | $ | 40,172 | $ | 30,464 | $ | 15,082 | $ | 14,500 | ||||||||||
| Ratio of allowance for loan losses to total loans outstanding at end of year | 1.79 | % | 1.84 | % | 1.35 | % | 1.23 | % | 1.19 | % | ||||||||||
| Ratio of net charge offs (recoveries) to average loans outstanding during the year | 1.17 | % | 1.24 | % | 0.80 | % | 0.12 | % | (0.01 | %) | ||||||||||
The following table summarizes the allocation of the allowance for loan losses by loan type:
| (In thousands) | December 31, | |||||||||||||||||||
| Allocation of allowance for | 2010 | 2009 | 2008 | 2007 | 2006 | |||||||||||||||
| loan losses, end of year | ||||||||||||||||||||
| Real estate - construction | $ | 11,037 | $ | 17,866 | $ | 14,821 | $ | 5,219 | $ | 2,514 | ||||||||||
| Real estate - mortgage | 11,192 | 9,754 | 6,788 | 7,137 | 7,792 | |||||||||||||||
| Commercial, financial and agricultural | 15,271 | 11,356 | 7,521 | 2,363 | 3,560 | |||||||||||||||
| Consumer Loans | 107 | 1,142 | 1,216 | 350 | 617 | |||||||||||||||
| All Other Loans | 42 | 54 | 118 | 13 | 17 | |||||||||||||||
| Total allowance for loan losses | $ | 37,649 | $ | 40,172 | $ | 30,464 | $ | 15,082 | $ | 14,500 | ||||||||||
| Ratio of loans to total year-end loans | ||||||||||||||||||||
| Real estate - construction | 12.16 | % | 13.57 | % | 15.84 | % | 16.25 | % | 16.30 | % | ||||||||||
| Real estate - mortgage | 77.66 | % | 74.62 | % | 70.94 | % | 70.92 | % | 71.82 | % | ||||||||||
| Commercial, financial and agricultural | 8.44 | % | 9.70 | % | 9.97 | % | 10.22 | % | 8.61 | % | ||||||||||
| Consumer Loans | 1.36 | % | 1.79 | % | 2.57 | % | 2.13 | % | 2.71 | % | ||||||||||
| All Other Loans | 0.38 | % | 0.32 | % | 0.68 | % | 0.48 | % | 0.56 | % | ||||||||||
| 100.00 | % | 100.00 | % | 100.00 | % | 100.00 | % | 100.00 | % | |||||||||||
The balance in the allowance and the allowance as a percentage of loans remains elevated on a historical basis, but began to decrease in 2010 when compared to its peak in 2009. The allowance as a percentage of loans in 2009 increased when compared to 2008 due to the continuation and worsening of already poor market conditions. Changes in the allowance are further explained below:
| · | Reserve factors related to acquisition / development loans, included in Real estate - construction above, increased during 2010. National and local housing trends were documented as materially deteriorating during 2009 and continued throughout 2010. As a part of the evaluation of the adequacy of the allowance, the Company monitors the number of building permits issued, median home sales prices, new homes in inventory, number of days on market, housing affordability, elevated levels of foreclosure activity, new mortgage originations and foreclosed asset levels. These metrics continue to indicate that a general cyclical decline in the residential real estate market has, and still is, occurring. The Company has reduced exposure to this loan class by $35 million or 12.8%, from $273 million to $238 million at December 31, 2009 and 2010, respectively. |
| · | Heightened risk associated with commercial real estate loans, included in Commercial, financial and agricultural and Real estate - construction above, continues. The Company has approximately $1.1 billion of commercial real estate loans outstanding at December 31, 2010. Of the $1.1 billion, approximately $238 million relates to the overall development / construction portfolio, $103 million is tied to multi-family secured income producing loans and $752 million is associated with commercial real estate. Due to the probability of an adverse impact to vacancy and lease rates due to the weakened economic environment, reduced consumer confidence levels and increased retail business failures, management addressed the additional inherent risk associated with this category of loans in 2010 in conjunction with the preparation of the allowance for loan losses calculation. |
| · | Exposure to Smith Mountain Lake Market, included in Real estate – construction above, has been reduced. At December 31, 2010, the Company had approximately $24.3 million in exposure in residential development and construction at Smith Mountain Lake, which compares to $43.5 million and $60.5 million at December 31, 2009 and 2008, respectively. This market caters to individuals who have high amounts of discretionary income and are purchasing a house as a retirement or a second home. This type of market is the first to contract and the last to return during an economic downturn. The subsidiary bank’s Smith Mountain Lake developments have seen minimal sales during the last four years. |
| · | Levels of classified loans and specific reserves remain elevated historically. The increased level of classified loans impacted the level of allocations required based upon historical loss experience resulting in increased provisioning and allowance levels during the last three years. Additionally, specific reserves have been elevated over this same time period amounting to $5.5 million, $7.8 million and $5.5 million at December 31, 2010, 2009 and 2008, respectively. |
| · | Net charge-offs were elevated compared to prior periods The elevated charge-off levels experienced in the current and prior year warrant a heightened level of provisioning and justify management’s use of higher historical charge-off factors when considering the losses currently inherent in the loan portfolio during the calculation of the allowance for loan losses. |
| · | Less than full employment levels in the Commonwealth of Virginia. Unemployment in the Company’s geographic footprint is approximately 7.5% which is above the ideal full employment level defined by the Commonwealth as an unemployment level of 5%. This unemployment level negatively impacts the ability of consumers within the Company’s footprint to curtail their debts and purchase goods and services. This general reduction in cash flow has a negative impact on all loan categories within the portfolio. |
| · | Non-traditional mortgage products still present indirect risk. While the Company’s subsidiary bank does not originate non-traditional mortgages within its own portfolio, the Company has risk associated with borrowers who have them. The allowance analysis has considered this and other qualitative factors. |
The loan portfolio mix indicates a shift away from Real estate - construction and an increase in the Real estate - mortgage category. This shift was driven predominately by the reduction in Smith Mountain Lake exposure as many of these problem credits were brought to final resolution through a combination of work-outs and charge-offs during 2010. The remaining exposure from this segment of the loan portfolio is considered to be minimal. The risk within the portfolio is reflected in the increase in the allowance allocation associated with the commercial, financial and agricultural category which represents 40.6% of the related balance at December 31, 2010. The increase in allocation to this category, which includes commercial loans secured by real estate, is also consistent with the decline in real estate values across the Company’s footprint, which leads to a greater severity of loss during collection efforts. The allocation to the real estate-construction loan portfolio represented approximately 29.3% and 44.5% of the allowance balance at December 31, 2010 and 2009, respectively. This decline is consistent with the reduction in Real estate - construction loan balances outstanding, which is a result of a deliberate initiative by the Company to reduce exposure in this area through the resolution of Smith Mountain Lake problem credits discussed previously. Additionally, unemployment across the Company’s service area has risen during 2010 and 2009, which has led to higher levels of charge-offs and the related allowance allocation to consumer loans as loan balances as a percentage of the portfolio have actually declined.
Non-performing assets consist of the Company’s non-accrual loans, troubled-debt restructurings, and other property owned. Loans are generally placed on non-accrual status when the collection of principal and interest is ninety days or more past due, or earlier, if collection is uncertain based on an evaluation of the net realizable value of the collateral and the financial strength of the borrower. As of December 31, 2010, the Company is not aware of any material performing loans with indications of possible credit problems that should be moved to non-accrual status. For those loans which are carried on non-accrual status, interest is generally recognized on a cash basis. The following table presents information concerning the aggregate amount of non-performing assets:
| December 31, | ||||||||||||||||||||
| (In thousands) | 2010 | 2009 | 2008 | 2007 | 2006 | |||||||||||||||
| Non-accrual loans: | ||||||||||||||||||||
| Real estate - construction | $ | 15,143 | $ | 28,816 | $ | 23,898 | $ | 1,267 | $ | 60 | ||||||||||
| Real estate - mortgage | 20,006 | 19,730 | 10,565 | 1,837 | 1,934 | |||||||||||||||
| Commercial, financial and agricultural | 4,277 | 7,994 | 9,492 | 459 | 544 | |||||||||||||||
| Consumer loans | 26 | 84 | 536 | 374 | 461 | |||||||||||||||
| Troubled debt restructurings | 3,508 | 2,678 | - | - | - | |||||||||||||||
| Mortgage loans held for sale | 514 | 936 | - | - | - | |||||||||||||||
| Foreclosed assets | 10,894 | 4,505 | 4,627 | 3,031 | 38 | |||||||||||||||
| Total non-performing assets | $ | 54,368 | $ | 64,743 | $ | 49,118 | $ | 6,968 | $ | 3,037 | ||||||||||
| Loans greater than 90 days still accruing | $ | - | $ | 1,511 | $ | 781 | $ | - | $ | - | ||||||||||
| Non-performing assets to total assets | 1.85 | % | 2.18 | % | 1.66 | % | 0.44 | % | 0.19 | % | ||||||||||
| Non-performing assets to year-end loans and foreclosed assets | 2.58 | % | 3.03 | % | 2.17 | % | 0.57 | % | 0.25 | % | ||||||||||
If interest on nonaccrual loans and nonperforming troubled debt restructurings had been accrued, such income would have approximated $1.4 million, $472 thousand, $806 thousand, $107 thousand and $181 thousand for each of the five years ended December 31, 2010, respectively. No interest income on nonaccrual and non-performing troubled debt restructurings was included in net income for any of the five years ended December 31, 2010.
Impaired loans totaled $62.4 million at December 31, 2010. This total includes $33.9 million individually evaluated for impairment and $28.5 million of impaired loans that were collectively evaluated for impairment. Interest is not typically accrued on impaired loans, however, all loans classified as troubled debt restructurings are considered impaired. At December 31, 2010, the Company had $43.2 million in loans under troubled debt restructuring terms (”TDRs”) and $39.7 million of these restructurings were accruing interest. Interest income recognized on these TDRs was $433 thousand, $693 thousand and $1.0 million for the years ended December 31, 2010, 2009 and 2008, respectively. On a cash basis, interest recognized on these TDRs was $476 thousand, $368 thousand and $1.3 million for the years ended December 31, 2010, 2009 and 2008, respectively. Other than these consumer real estate loans designated as TDRs, no interest income has been recognized on impaired loans subsequent to their classification as impaired for the years ended December 31, 2010, 2009 and 2008. The Company collectively evaluates smaller-balance homogenous loans for impairment, unless such loans are subject to a restructuring agreement. Collectively evaluated nonaccrual loans excluded from the impaired loan disclosure amounted to $23.1 million, $18.7 million and $12.5 million at December 31, 2010, 2009 and 2008, respectively.
At December 31, 2010, total non-performing assets totaled $54.4 million, a decrease of $10.4 million from 2009. Nonperforming assets remain at historically elevated levels and reflect actions taken to address the continuing challenges in the residential housing market and persisting credit quality issues in acquisition and development construction credits, commercial real estate credits and real estate mortgage loans. The decrease in the level of non-performing assets is a result of efforts to accelerate the identification and resolution of problem credits by the Company’s special assets group. This is also illustrated by proceeds from the sale of foreclosed assets of $6.5 million in 2010 which compares to proceeds of $3.0 million in 2009.
At December 31, 2009, total non-performing assets totaled $64.7 million, an increase of $15.6 million from 2008. The increased levels of nonperforming assets reflect actions taken to address the continuing challenges in the residential housing market and deterioration of credit quality in a limited number of acquisition and development construction credits. Additionally, much of the growth in these levels is also inherently attributable to the nonorganic growth associated with doubling in size from the merger of equals transaction and have been attributable to the deterioration in general market conditions.
INVESTMENT SECURITIES
The following table summarizes the carrying values of investment securities:
| (In thousands) | 2010 | 2009 | 2008 | |||||||||||||||||||||
| Available for Sale | Held to Maturity | Available for Sale | Held to Maturity | Available for Sale | Held to Maturity | |||||||||||||||||||
| U. S. Treasuries | $ | - | $ | - | $ | 20,203 | $ | - | $ | - | $ | - | ||||||||||||
| U. S. Government agencies | 103,253 | - | 63,415 | - | 69,548 | - | ||||||||||||||||||
| State and municipals | 136,823 | - | 113,184 | 426 | 86,765 | 894 | ||||||||||||||||||
| Corporate bonds | 6,904 | - | 6,934 | - | 7,462 | - | ||||||||||||||||||
| Collateralized mortgage obligations | 9,497 | - | 13,026 | - | 11,778 | - | ||||||||||||||||||
| Mortgage backed securities | 123,139 | - | 159,587 | 21 | 148,849 | 26 | ||||||||||||||||||
| Certificates of deposit | - | - | 685 | - | 747 | - | ||||||||||||||||||
| Equity securities | - | - | 1,469 | - | 2,015 | - | ||||||||||||||||||
| Other | 1,615 | - | 11 | - | 9 | - | ||||||||||||||||||
| Total investment securities | $ | 381,231 | $ | - | $ | 378,514 | $ | 447 | $ | 327,173 | $ | 920 | ||||||||||||
The following table shows the maturities of available for sale debt and equity securities at amortized cost and market value as of December 31, 2010 and approximate weighted average yields of such securities. Yields on state and political subdivision securities are shown on a tax equivalent basis, assuming a 35% federal income tax rate. The Company attempts to maintain diversity in its portfolio, maintain durations that are consistent with its asset/liability management and hold a significant allocation of securities in states and political subdivisions that provide tax benefits.
| Estimated | Weighted | Weighted | ||||||||||||||
| Book | Fair | Average | Average | |||||||||||||
(In thousands) | Value | Value | Maturity | TE Yield | ||||||||||||
| U.S. Government agencies | ||||||||||||||||
| Within one year | $ | 18,508 | $ | 18,650 | 0.25 | years | 1.48 | % | ||||||||
| After one year to five years | 83,356 | 84,603 | 2.25 | years | 1.69 | % | ||||||||||
| Total | 101,864 | 103,253 | 1.89 | years | 1.65 | % | ||||||||||
| State and municipals | ||||||||||||||||
| Within one year | $ | 5,082 | $ | 5,159 | 0.75 | years | 6.35 | % | ||||||||
| After one year to five years | 29,783 | 31,223 | 3.36 | years | 5.74 | % | ||||||||||
| After five years to ten years | 39,607 | 40,748 | 8.02 | years | 5.95 | % | ||||||||||
| After ten years | 59,993 | 59,693 | 13.09 | years | 5.76 | % | ||||||||||
| Total | 134,465 | 136,823 | 8.98 | years | 5.84 | % | ||||||||||
| Corporate bonds | ||||||||||||||||
| Within one year | $ | 1,004 | $ | 1,019 | 0.50 | years | 4.82 | % | ||||||||
| After one year to five years | 5,523 | 5,885 | 1.75 | years | 5.61 | % | ||||||||||
| Total | 6,527 | 6,904 | 1.56 | years | 5.49 | % | ||||||||||
| Collateralized mortgage obligations | ||||||||||||||||
| After ten years | $ | 9,294 | $ | 9,497 | 27.33 | years | 3.19 | % | ||||||||
| Total | 9,294 | 9,497 | 27.33 | years | 3.19 | % | ||||||||||
| Mortgage backed securities | ||||||||||||||||
| After one year to five years | $ | 2,431 | $ | 2,543 | 2.83 | years | 4.41 | % | ||||||||
| After five years to ten years | 20,913 | 21,543 | 8.83 | years | 3.55 | % | ||||||||||
| After ten years | 96,251 | 99,053 | 20.08 | years | 4.19 | % | ||||||||||
| Total | 119,595 | 123,139 | 17.77 | years | 4.08 | % | ||||||||||
| Total Fixed Income Securities | ||||||||||||||||
| Within one year | $ | 24,594 | $ | 24,828 | 0.36 | years | 2.62 | % | ||||||||
| After one year to five years | 121,093 | 124,254 | 2.51 | years | 2.92 | % | ||||||||||
| After five years to ten years | 60,520 | 62,291 | 8.30 | years | 5.12 | % | ||||||||||
| After ten years | 165,538 | 168,243 | 17.96 | years | 4.70 | % | ||||||||||
| Total | 371,745 | 379,616 | 10.19 | years | 4.05 | % | ||||||||||
| Other Securities | $ | 1,615 | $ | 1,615 | 0.50 | years | 0.00 | % | ||||||||
| Total Securities | $ | 373,360 | $ | 381,231 | 10.15 | years | 4.04 | % | ||||||||
There is no issuer of securities in which the aggregate book value of that issuer, other than securities of the U.S. Treasury and U.S. Government agencies, exceeds 10% of stockholders equity.
LOAN PORTFOLIO
At December 31, 2010, loans, net of unearned income and the allowance for loan losses, totaled $2.06 billion, a decrease of $90 million or 4.2% from $2.15 billion in 2009. The commercial real estate portfolio, which is a component of the real estate – mortgage portfolio, amounted to $751.7 million at December 31, 2010 and represents 36.5% the total portfolio. At December 31, 2010, off balance sheet unused loan commitments, standby letters of credit and mortgage loans sold with potential recourse amounted to $952.8 million, compared to $866.5 million at December 31, 2009. These commitments may be secured or unsecured. On December 31, 2010, the Company had no concentration of loans to any one industry in excess of 10% of its loan portfolio.
The following table summarizes the loan receivable portfolio by loan type:
| December 31, | ||||||||||||||||||||
| (In thousands) | 2010 | 2009 | 2008 | 2007 | 2006 | |||||||||||||||
| Real estate - construction | $ | 255,198 | $ | 274,280 | $ | 358,587 | $ | 199,281 | $ | 198,400 | ||||||||||
| Real estate - mortgage | 1,629,942 | 1,653,155 | 1,605,622 | 869,805 | 873,911 | |||||||||||||||
| Commercial, financial and agricultural | 177,134 | 211,903 | 225,637 | 125,410 | 104,709 | |||||||||||||||
| Consumer loans | 29,940 | 39,173 | 60,042 | 26,169 | 33,030 | |||||||||||||||
| All other loans | 6,682 | 7,027 | 13,403 | 5,924 | 6,768 | |||||||||||||||
| Total loans before deduction of unearned income | 2,098,896 | 2,185,538 | 2,263,291 | 1,226,589 | 1,216,818 | |||||||||||||||
| Plus: deferred costs | 588 | 969 | 1,295 | 1,088 | 814 | |||||||||||||||
| Total loans before allowance for loan losses | 2,099,484 | 2,186,507 | 2,264,586 | 1,227,677 | 1,217,632 | |||||||||||||||
| Less: allowance for loan losses | (37,649 | ) | (40,172 | ) | (30,464 | ) | (15,082 | ) | (14,500 | ) | ||||||||||
| Net loans receivable | $ | 2,061,835 | $ | 2,146,335 | $ | 2,234,122 | $ | 1,212,595 | $ | 1,203,132 | ||||||||||
The following tables set forth the contractual maturity of the loan portfolio as of December 31, 2010:
| After one | ||||||||||||||||
| One year | but less than | After five | ||||||||||||||
| (In thousands) | or less | five years | years | Total | ||||||||||||
| Real estate - construction | $ | 155,930 | $ | 79,178 | $ | 20,090 | $ | 255,198 | ||||||||
| Real estate - mortgage | 98,986 | 617,225 | 913,731 | 1,629,942 | ||||||||||||
| Commercial, financial and agricultural | 56,703 | 106,347 | 14,084 | 177,134 | ||||||||||||
| Consumer loans | 7,989 | 21,029 | 922 | 29,940 | ||||||||||||
| All other loans | 11 | 117 | 6,554 | 6,682 | ||||||||||||
Total loans1 | $ | 319,619 | $ | 823,896 | $ | 955,381 | $ | 2,098,896 | ||||||||
1 Excluding loans held for sale and before deduction of unearned income and allowance for loan losses.
| After one | ||||||||||||
| but less than | After five | |||||||||||
| five years | years | Total | ||||||||||
| For maturities over one year: | ||||||||||||
| Fixed rates | $ | 432,092 | $ | 466,662 | $ | 898,754 | ||||||
| Variable rates | 134,884 | 745,639 | 880,523 | |||||||||
| Total | $ | 566,976 | $ | 1,212,301 | $ | 1,779,277 | ||||||
DEPOSITS
Average deposits at December 31, 2010 and 2009 amounted to $2.39 billion. The deposit mix has shifted somewhat as a result of disciplined time deposit pricing, seen in the movement from time deposits less than $100 thousand to Money market. The overall cost of deposit funds decreased to 1.39% in 2010, compared to 2.09% in 2009, and 2.57% in 2008, reflecting the lower rate environment in 2010 and 2009 and the latter portion of 2008 despite increased competition for deposits in all years.
The following table illustrates average outstanding deposits and rates paid:
| 2010 | 2009 | 2008 | ||||||||||||||||||||||
| (In thousands) | Amount | Rate | Amount | Rate | Amount | Rate | ||||||||||||||||||
| Noninterest bearing demand deposits | $ | 304,890 | - | $ | 311,047 | - | $ | 307,621 | - | |||||||||||||||
| Interest-bearing deposits: | ||||||||||||||||||||||||
| Interest checking | 560,591 | 0.60 | % | 531,627 | 0.99 | % | 453,780 | 1.35 | % | |||||||||||||||
| Money market | 400,210 | 1.14 | % | 293,211 | 1.50 | % | 195,061 | 1.78 | % | |||||||||||||||
| Savings | 228,563 | 0.81 | % | 193,127 | 0.88 | % | 183,323 | 1.14 | % | |||||||||||||||
| Time deposits: | ||||||||||||||||||||||||
| Less than $100,000 | 603,465 | 2.05 | % | 735,645 | 2.89 | % | 699,543 | 3.30 | % | |||||||||||||||
| $100,000 and more | 290,421 | 2.34 | % | 330,277 | 3.30 | % | 326,407 | 3.99 | % | |||||||||||||||
| Total interest-bearing deposits | $ | 2,083,250 | 1.39 | % | $ | 2,083,887 | 2.09 | % | $ | 1,858,114 | 2.57 | % | ||||||||||||
| Total average deposits | $ | 2,388,140 | $ | 2,394,934 | $ | 2,165,735 | ||||||||||||||||||
Maturities of time deposits of $100,000 and over:
| (In thousands) | ||||
| At December 31, 2010 | ||||
| Within three months | $ | 66,464 | ||
| Three to six months | 30,388 | |||
| Six to twelve months | 54,053 | |||
| Over twelve months | 123,844 | |||
| $ | 274,750 | |||
BORROWINGS
Due to contraction in the loan portfolio experienced during 2010, the Company utilized its liquidity to repay maturing Federal Home Loan Bank borrowings. Federal Home Loan Bank borrowings were curtailed by $45.0 million or 34.6% during the year with no additional advances offsetting these repayments.
The following table presents the average net funding position for the years indicated:
| 2010 | 2009 | 2008 | ||||||||||||||||||||||
| (In thousands) | Amount | Rate | Amount | Rate | Amount | Rate | ||||||||||||||||||
| Federal funds sold | $ | 52,001 | 0.24 | % | $ | 53,157 | 0.21 | % | $ | 41,018 | 2.26 | % | ||||||||||||
| Federal funds purchased and repurchase agreements | (982 | ) | 2.91 | % | (501 | ) | 3.15 | % | (4,297 | ) | 1.67 | % | ||||||||||||
| Short term net funding position | $ | 51,019 | $ | 52,656 | $ | 36,721 | ||||||||||||||||||
The net funds sold position decreased in 2010 compared to 2009 primarily due to a decrease in outstanding loan balances which outpaced the decrease in deposits. The net funds position increased in 2009 compared to 2008 primarily due to deposit growth exceeding loan demand throughout the year.
The average balance outstanding of short-term borrowings did not exceed 30% of stockholders’ equity during the years ended December 31, 2010 or 2009.
CAPITAL ADEQUACY
The management of capital in a regulated financial services industry must properly balance return on equity to stockholders while maintaining sufficient capital levels and related risk-based capital ratios to satisfy regulatory requirements. Additionally, capital management must also consider acquisition opportunities that may exist, and the resulting accounting treatment. The Company’s capital management strategies have been developed to provide attractive rates of returns to stockholders, while maintaining its “well-capitalized” position at the banking subsidiary.
The primary source of additional capital to the Company is earnings retention, which represents net income less dividends declared. During 2010, the Company paid $5.2 million in dividends and retained $4.6 million, or 47.2% of its net income. Future dividends will be dependent upon the Company’s ability to generate earnings in future periods. Stockholders’ equity increased by $5.7 million, reflecting $9.8 million of income, $5.2 million in accrued and paid dividends and increases to additional paid in capital of $1.1 million associated with the exercise of stock options and stock based compensation.
The Company and its banking subsidiary are subject to various regulatory capital requirements administered by the federal banking agencies. Failure to meet minimum capital requirements can initiate certain mandatory and possibly additional discretionary actions by regulators that, if undertaken, could have a direct material effect on the Company and the subsidiary bank’s financial statements. Under capital adequacy guidelines and the regulatory framework for prompt corrective action under FDICIA, the Company and its banking subsidiary must meet specific capital guidelines that involve quantitative measures of their assets, liabilities and certain off-balance sheet items as calculated under regulatory accounting practices. The capital amounts and reclassifications are also subject to qualitative judgments by the regulators about components, risk weightings, and other factors.
Quantitative measures established by regulation to ensure capital adequacy require the Company and its banking subsidiary to maintain minimum amounts and ratios of total and Tier 1 capital to average assets. As of December 31, 2010, and 2009, the Company and its subsidiary bank met all minimum capital adequacy requirements to which they are subject and are categorized as “well capitalized,” based on the most recent notification from the Federal Reserve Bank of Richmond. These capital amounts and ratios are incorporated by reference to Note 23 of the Notes to Consolidated Financial Statements herein. There are no conditions or events since the notification that management believes have changed the subsidiary bank’s category.
LIQUIDITY
Liquidity is identified as the ability to generate or acquire sufficient amounts of cash when needed and at a reasonable cost to accommodate withdrawals, payments of debt, and increased loan demand. These events may occur daily or at other short-term intervals in the normal operation of the business. Experience helps management predict time cycles in the amount of cash required. In assessing liquidity, management gives consideration to relevant factors including stability of deposits, quality of assets, economic conditions in the market served, concentrations of business and industry, competition, and the Company’s overall financial condition. The Company’s bank subsidiary has available a $100 million line of credit with the Federal Home Loan Bank of Atlanta, uncollateralized, unused lines of credit totaling $70 million with nonaffiliated banks and access to the Federal Reserve discount window to support liquidity as conditions dictate.
The liquidity of the parent Company also represents an important aspect of liquidity management. The parent Company’s cash outflows consist of overhead associated with corporate expenses, executive management, finance, marketing, loan and deposit operations, information technology, human resources, audit, compliance and credit administration functions. It also includes outflows associated with dividends to shareholders. The main sources of funding for the parent Company are the management fees and dividends it receives from its banking subsidiary and availability on the equity market as deemed necessary. During 2010, the banking subsidiary paid $28.2 million in management fees and transferred $9.2 million in dividends to the Company. As of January 1, 2011, the aggregate amount of additional unrestricted funds, which could be transferred from the bank subsidiary to the Company without prior regulatory approval totaled $5.0 million or 1.2% of consolidated net assets. Loans and advances are limited to 10% of the banks’ common stock and capital surplus. As of December 31, 2010, funds available for loans or advances by the bank to the Company, which is limited by the amount of collateral the Company has available to pledge, were approximately $11.5 million. The parent Company generated approximately $10.6 million in cash flow from operating activities in 2010 and paid dividends to stockholders of $5.2 million.
CONTRACTUAL OBLIGATIONS
The impact of the Company's contractual obligations as of December 31, 2010 on liquidity and cash flow in future periods is as follows:
| Payments Due by Period | ||||||||||||||||||||
| Less than | More than | |||||||||||||||||||
| (In thousands) | Total | 1 year | 1-3 years | 3-5 years | 5 years | |||||||||||||||
| Certificates of Deposit | $ | 818,538 | $ | 452,705 | $ | 267,170 | $ | 98,663 | $ | - | ||||||||||
Subordinated Debt 1 | 32,991 | - | - | - | 32,991 | |||||||||||||||
| FHLB Borrowings | 85,000 | 25,000 | 30,000 | 10,000 | 20,000 | |||||||||||||||
| Operating Leases | 8,485 | 1,777 | 2,817 | 1,700 | 2,191 | |||||||||||||||
| Total | $ | 945,014 | $ | 479,482 | $ | 299,987 | $ | 110,363 | $ | 55,182 | ||||||||||
1 The Subordinated debt securities represent two issues maturing on June 26, 2033 and July 17, 2034, respectively. Both issues are currently callable.
| Commitment Expiration by Period | ||||||||||||||||||||
| Less than | More than | |||||||||||||||||||
| (In thousands) | Total | 1 year | 1-3 years | 3-5 years | 5 years | |||||||||||||||
| Commitments to extend credit | $ | 455,675 | $ | 166,418 | $ | 74,122 | $ | 60,999 | $ | 154,136 | ||||||||||
| Standby letters of credit | 51,486 | 50,113 | 716 | 657 | - | |||||||||||||||
| Mortgage loans sold with potential recourse | 350,781 | 350,781 | - | - | - | |||||||||||||||
| $ | 857,942 | $ | 567,312 | $ | 74,838 | $ | 61,656 | $ | 154,136 | |||||||||||
In the judgment of management, the Company maintains the ability to generate sufficient amounts of cash to cover normal requirements and any additional needs which may arise, within realistic limitations.
OFF-BALANCE SHEET ARRANGEMENTS
As of December 31, 2010, the Company has not participated in any material unconsolidated entities or financial partnerships, such as entities often referred to as structured finance or special purpose entities. The Company does have significant commitments to fund loans in the ordinary course of business.
At December 31, 2010 and 2009, the following financial instruments were outstanding whose contract amounts represent credit risk:
| 2010 | 2009 | |||||||
| Commitments to extend credit | $ | 550,019 | $ | 511,589 | ||||
| Standby letters of credit | 51,976 | 52,870 | ||||||
| Mortgage loans sold with potential recourse | 350,781 | 302,006 | ||||||
Commitments to extend credit are agreements to lend to a customer as long as there is no violation of any condition established in the contract. Commitments generally have fixed expiration dates or other termination clauses and may require payment of a fee.
The commitments for equity lines of credit may expire without being drawn upon. Therefore, the total commitment amounts do not necessarily represent future cash requirements. The amount of collateral obtained, if it is deemed necessary by the Company, is based on management’s credit evaluation of the customer.
Unfunded commitments under commercial lines of credit, revolving credit lines and overdraft protection agreements are commitments for possible future extensions of credit to existing customers. These lines of credit are usually uncollateralized and do not always contain a specified maturity date and may not be drawn upon to the total extent to which the Company is committed.
Standby letters of credit are conditional commitments issued by the Company to guarantee the performance of a customer to a third party. The credit risk involved in issuing letters of credit is essentially the same as that involved in extending loan facilities to customers. The Company generally holds collateral supporting those commitments, if deemed necessary.
The Company, through its banking subsidiaries, originates loans for sale to secondary market investors subject to contractually specified and limited recourse provisions. In 2010, the Company originated $525 million and sold $527 million to investors, compared to $578 million originated and $557 million sold in 2009. Most contracts with investors contain certain recourse language which may vary from 90 days up to nine months. The Company may have an obligation to repurchase a loan if the mortgagor has defaulted early in the loan term. Mortgages subject to recourse are collateralized by single family residences, have loan-to-value ratios of 80% or less, or have private mortgage insurance or are insured or guaranteed by an agency of the United States Government. At December 31, 2010, the Company had locked-rate commitments to originate mortgage loans amounting to approximately $95 million and loans held for sale of $52 million. The Company has entered into commitments, on a best-effort basis to sell loans of approximately $147 million. Risks arise from the possible inability of counterparties to meet the terms of their contracts. The Company does not expect any counterparty to fail to meet its obligations.
CRITICAL ACCOUNTING ESTIMATES
General
The Company’s financial statements are prepared in accordance with Accounting Principles Generally Accepted in the United States (“USGAAP”) as well as general practices within the banking industry. In connection with the application of those principles, management has made judgments and estimates which, in the case of the determination of the allowance for loan losses, mortgage indemnifications and repurchases, deferred tax assets, foreclosed assets and the assessment of impairment of the intangibles have been critical to the determination of the Company’s financial position and results of operations.
Management considers accounting estimates to be critical to reported financial results if (i) the accounting estimate requires management to make assumptions about matters that are highly uncertain and (ii) different estimates that management reasonably could have used for the accounting estimate in the current period, or changes in the accounting estimate that are reasonably likely to occur from period to period, could have a material impact on the Company’s financial statements.
Allowance for Loan Losses
The Company considers the allowance for loan and lease losses of $37.6 million appropriate to cover losses incurred in the loan and lease portfolios as of December 31, 2010. However, no assurance can be given that the Company will not, in any particular period, sustain loan and lease losses that are sizable in relation to the amount reserved, or that subsequent evaluations of the loan and lease portfolio, in light of factors then prevailing, including economic conditions, the Company’s ongoing credit review process or regulatory requirements, will not require significant changes in the allowance for loan and lease losses. Among other factors, a continued economic slowdown and/or a decline in commercial or residential real estate values in the Company’s markets may have an adverse impact on the current adequacy of the allowance for loan and lease losses by increasing credit risk and the risk of potential loss.
The total allowance for loan and lease losses is generally available to absorb losses from any segment of the portfolio. The allocation of the Company’s allowance for loan and lease losses disclosed in the asset quality table is subject to change based on the changes in criteria used to evaluate the allowance and is not necessarily indicative of the trend of future losses in any particular portfolio.
The discussion and analysis included in this section contains detailed information regarding the Company’s allowance for loan and lease losses, net charge-offs, non-performing assets, past due loans and leases and potential problem loans and leases. Included in this data are numerous portfolio ratios that must be carefully reviewed in relation to the nature of the underlying loan and lease portfolios before appropriate conclusions can be reached regarding the Company or for purposes of making comparisons to other banks. Most of the Company’s non-performing assets and past due loans are secured by real estate. Given the nature of these assets and the related mortgage foreclosure, property sale and, if applicable, mortgage insurance claims processes; it can take 12 months or longer for a loan to migrate from initial delinquency to final disposition. This resolution process generally takes much longer for loans secured by real estate than for unsecured loans or loans secured by other property primarily due to state real estate foreclosure laws.
The Company categorizes all business and commercial purpose loans into risk categories based on relevant information about the ability of borrowers to service their debt such as: current financial information, historical payment experience, credit documentation, public information, and current economic trends, among other factors. The Company analyzes loans individually by setting the risk grade at the inception of a loan through the approval process. The definitions used were refined in early 2010.
The risk grades are formally affirmed quarterly by loan officers. In addition, a certain percentage of business purpose dollars is reviewed each year through the Company’s loan review process. The risk rating process is inherently subjective and based upon management’s evaluation of the specific facts and circumstances for individual borrowers. As such, the assigned risk ratings are subject to change based upon changes in borrower status and changes in the external environment affecting the borrower. The Company uses the following definitions for risk ratings:
| · | Risk Grade 1 – Prime Risk. Loss potential is rated as none or extremely low. Loans fully secured by deposit accounts at the Company’s subsidiary bank will also be rated as Risk Grade 1. |
| · | Risk Grade 2 – Excellent Risk. Loss potential is demonstrably low. Loans have liquid financial statements or are secured by marketable securities or other liquid collateral. |
· | Risk Grade 3 – Good Risk. Loss potential is low. Asset quality and liquidity are considered good. Overall leverage and liquidity measures are better than the industry in which the borrower operates and they are stable. |
| · | Risk Grade 4 – Average Risk. Loss potential is low, but evidence of risk exists. Margins and cash flow generally equal or exceed industry norm and policy guidelines, but some inconsistency may be evident. Asset quality is average with liquidity comparable to industry norms. Leverage may be slightly higher than the industry, but is stable. |
| · | Risk Grade 5 – Marginal Risk. Loss potential is variable, but there is potential for deterioration. Asset quality is marginally acceptable. Leverage may fluctuate and is above normal for the industry. Cash flow is marginally adequate. |
| · | Risk Grade 6 – Special Mention. Loss potential moderate if corrective action not taken. Evidence of declining revenues or margins, inadequate cash flow, and possibly high leverage or tightening liquidity. |
| · | Risk Grade 7 – Substandard. Distinct possibility of loss to the bank, but no discernable impairment. Repayment ability of borrower is weak and the loan may have exhibited excessive overdue status, extension, or renewals. |
| · | Risk Grade 8 – Doubtful. Loss potential is extremely high. Ability of the borrower to service the debt is weak, constant overdue status, loan has been placed on non-accrual status and no definitive repayment schedule exists. |
| · | Risk Grade 9 – Loss. Loans are considered fully uncollectible and charged off. |
The Company utilizes its nine point grading system in order to evaluate the level of inherent risk in the loan portfolio as part of its allowance for loan losses methodology. Loans collectively evaluated for impairment are grouped by loan type and, in the case of commercial and construction loans, by risk rating. Each loan type is assigned an allowance factor based on risk grade, historical loss experience, economic conditions, overall portfolio quality including delinquency rates and commercial real estate loan concentrations (as applicable). Loans graded 5 or worse are assigned an additional reserve factor stated in basis points in order to account for the added inherent risk. Additional basis points are applied as a reserve factor to the loan balances as the corresponding loan grades indicate additional risk and increase from grade 5 to grade 8.
Accrued Losses Associated With Mortgage Indemnifications and Repurchases
When the Company is notified by an investor that there is an inherent loss and an underwriting exception associated with a mortgage loan previously sold by the Company to the investor, the Company goes through a process to determine if it is probable that the loss will need to be absorbed by the Company and if the loss is able to be estimated. The Company accrues the related loss if management determines that it is probable that the loss will be recognized by the Company and it is able to be estimated. Members of the Company’s management meet monthly to discuss outstanding notices received from its investors and documents the associated probability of loss being recognized and any estimation of the associated loss to determine the amount that should be accrued. At December 31, 2010, $360 thousand of losses associated with mortgage repurchases and indemnifications was accrued. Additionally, losses of $2.3 million and $1.1 million were recognized during the years ended December 31, 2010 and 2009, respectively. There were no such losses recognized during 2008.
Deferred Taxes
The Company uses the asset and liability method of accounting for income taxes. Under this method, deferred tax assets and liabilities are recognized for the future tax consequences attributable to differences between the financial statement carrying amounts of existing assets and liabilities and their respective tax bases. Deferred tax assets and liabilities are measured using enacted tax rates expected to apply to taxable income in the years in which those temporary differences are expected to be recovered or settled. If current available information raises doubt as to the realization of the deferred tax assets, a valuation allowance may be established. Management considers the determination of this valuation allowance to be a critical accounting policy due to the need to exercise significant judgment in evaluating the amount and timing of recognition of deferred tax liabilities and assets, including projections of future taxable income. These judgments and estimates are reviewed on a continual basis as regulatory and business factors change. A valuation allowance for deferred tax assets may be required if the amounts of taxes recoverable through loss carry backs decline, or if management projects lower levels of future taxable income. If such a valuation allowance is deemed necessary in the future, it would be established through a charge to income tax expense that would adversely affect operating results.
Foreclosed Assets
Foreclosed assets represent properties acquired through foreclosure or physical possession. Write-downs to fair value of foreclosed assets at the time of transfer are charged to allowance for loan losses. Subsequent to foreclosure, the Company periodically evaluates the value of foreclosed assets held for sale and records an impairment charge for any subsequent declines in fair value less selling costs. Subsequent declines in value are charged to operations. Fair value is based on an assessment of information available at the end of a reporting period and depends upon a number of factors, including historical experience, economic conditions, and issues specific to individual properties. The evaluation of these factors involves subjective estimates and judgments that may change.
Goodwill and Intangible Assets
The Company recorded the assets and liabilities of FNB Corporation as of February 28, 2008 at estimated fair value. Several third party specialists were engaged to assist in valuing certain financial assets and liabilities. The Company recorded approximately $99.5 million in goodwill associated with this transaction. Previously, legacy VFG recorded goodwill of $14.2 million in connection with the purchase of branches in the fall of 2003, resulting in an aggregate goodwill balance of $113.7 million.
For purposes of testing goodwill for impairment, the Company uses both the income and market approaches to value its reporting units. The income approach consists of discounting long-term projected future cash flows, which are derived from internal forecasts and economic expectations for the commercial banking segment. The Company engaged a third party to assist management in the testing for impairment of the goodwill and intangible assets as of the annual assessment date, which is September 30. The projected future cash flows are discounted using cost of capital metrics for the Company’s peer group or a build-up approach (such as the capital asset pricing model). The market approach applies a market multiple, based on observed purchase transactions and/or price/earnings of the Company’s peer group for the reporting unit, to the last twelve months of net income or earnings before income taxes, depreciation and amortization or price/tangible book value.
Testing goodwill for impairment is a two-step process. The first step (“Step One”) of the goodwill impairment test, which the Company has employed in its analysis, involves estimating the fair value of the equity of the reporting unit. For purposes of this assignment, fair value is defined as “the price that would be received to sell an asset or paid to transfer a liability in an orderly transaction between market participants at the measurement date.” This type of value reflects the premise of value of value-in-use. Value-in-use is derived from the on-going operations of the business.
The fair value is then compared to the reporting unit’s carrying value of equity. In the event a reporting unit’s carrying value exceeds its estimated fair value, evidence of potential impairment exists. In such a case, the second step (“Step Two”) of the impairment test is required, which involves allocating the fair value of the reporting unit to all of the assets and liabilities of that unit, with the excess of fair value over allocated net assets representing the fair value of its goodwill. An impairment loss is measured as the amount, if any, by which the carrying value of the reporting unit’s goodwill exceeds the estimated fair value of that goodwill.
In 2010, based on the results of Step One of the impairment test, the Company determined that the carrying amount of goodwill would have exceeded its estimated fair value at the valuation date. Because the carrying amount exceeded the fair value, the Company engaged a third party to assist management in performing Step Two of the goodwill impairment test as of September 30, 2010. With the assistance of a third party, the implied fair value of goodwill was determined by assigning the fair value to all of the assets and liabilities, including any unrecognized intangible assets, as if the Company’s commercial banking segment had been acquired in a business combination. The excess of the fair value of the commercial banking segment over the amounts assigned to its assets and liabilities is the implied fair value of goodwill. Based on the results of Step Two of the impairment test as of September 30, 2010, management determined that goodwill was not impaired.
Management reviewed the reports prepared by the third party as of September 30, 2010, considered the factors noted above that could lead to impairment between that date and December 31, 2010 and evaluated the trading level of the Company’s stock in relation to both its book value and tangible book value. Based on these inputs, management concluded that no indications of impairment were present. Should management determine in a future period that the goodwill recorded in connection with acquisitions has been impaired, then a charge to earnings will be recorded in the period such determination is made.
Long-lived assets, including purchased intangible assets subject to amortization, such as the core deposit intangible asset, are reviewed for impairment whenever events or changes in circumstances indicate that the carrying amount of an asset may not be recoverable. Recoverability of assets to be held and used is measured by a comparison of the carrying amount of an asset to estimated undiscounted future cash flows expected to be generated by the asset. If the carrying amount of an asset exceeds its estimated future cash flows, an impairment charge is recognized in the amount by which the carrying amount of the asset exceeds the fair value of the asset. Assets to be disposed of would be separately presented in the balance sheet and reported at the lower of the carrying amount or fair value less costs to sell, and are no longer depreciated. Management concluded that no circumstances indicating an impairment of these assets existed as of the balance sheet date.
NON-GAAP FINANCIAL MEASURES
This report refers to the efficiency ratio, which is computed by dividing noninterest expense less amortization of intangibles, foreclosed property expense, and goodwill impairments as a percent of the sum of net interest income on a tax equivalent basis and noninterest income excluding only gains on securities. The efficiency ratio is not a recognized reporting measure under USGAAP. Management believes this measure provides investors with important information regarding the Company’s operational efficiency. Management believes such financial information is meaningful to the reader in understanding operating performance, but cautions that such information not be viewed as a substitute for USGAAP. The Company, in referring to its net income, is referring to income under USGAAP. Comparison of the efficiency ratio with those of other companies may not be possible, because other companies may calculate the efficiency ratio differently.
This annual report on Form 10-K and other reports issued by the Company, including reports filed with the SEC, may contain “forward-looking” statements that deal with future results, plans or performance. In addition, the Company’s management may make such statements orally to the media, or to securities analysts, investors or others. Forward-looking statements deal with matters that do not relate strictly to historical facts. The Company’s future results may differ materially from historical performance and forward-looking statements about the Company’s expected financial results or other plans and are subject to a number of risks and uncertainties. These include, but are not limited to, continued or deepening deterioration in general economic and banking industry conditions; continued increases in unemployment in the Company’s primary banking markets; limitations on the Company’s ability to pay dividends at current levels or to increase dividends in the future because of financial performance deterioration, regulatory restrictions, or limitations imposed as a result of the Company’s participation in the U.S. Treasury Department’s Capital Purchase Program; increased deposit insurance premiums or other costs related to deteriorating conditions in the banking industry and the economic impact on banks of the Emergency Economic Stabilization Act or other related legislative and regulatory developments; the imposition of requirements with an adverse financial impact relating to the Company’s lending, loan collection and other business activities as a result of the EESA, the Company’s participation in the CPP, or other legislative or regulatory developments such as mortgage foreclosure moratorium laws; possible legislative changes and adverse economic, business and competitive developments such as shrinking interest margins, deposit outflows, an inability to increase the number of deposit accounts and the possibility that deposit account losses (fraudulent checks, etc.) may increase; impact of legislative, regulatory or other changes affecting customer account charges and fee income; legislative changes to bankruptcy laws which would result in the loss of all or part of the Company’s security interest due to collateral value declines (so-called “cramdown” provisions); reduced demand for financial services and loan and lease products; adverse developments affecting the Company’s banking relationships; changes in accounting standards or interpretations of existing standards; monetary, fiscal or tax policies of the federal or state governments, including adoption of state legislation that would increase state taxes; adverse findings in tax audits or regulatory examinations and resulting enforcement actions; changes in credit and other risks posed by the Company’s loan, lease, investment, and securities available for sale portfolios, including continuing declines in commercial or residential real estate values or changes in allowance for loan and lease losses methodology dictated by new market conditions or regulatory requirements; lack of or inadequate insurance coverage for claims against the Company; technological, computer related or operational difficulties or loss or theft of information; adverse changes in securities markets directly or indirectly affecting the Company’s ability to sell assets or to fund its operations; results of litigation; heightened regulatory practices, requirements or expectations, including but not limited to requirements related to the Bank Secrecy Act and anti-money laundering compliance activity; or other significant uncertainties.
Item 7A. QUANTITATIVE AND QUALITATIVE DISCLOSURE ABOUT MARKET RISK
The information required herein is incorporated by reference to the information included under the sub captions “Interest Sensitivity, ” “Earnings at Risk,” and “Economic Value of Equity” in the Management’s Discussion and Analysis of Financial Condition and Results of Operations section in this Form 10-K.
STELLARONE CORPORATION AND SUBSIDIARIES
| As of December 31 | ||||||||
| (Dollars in Thousands) | ||||||||
| 2010 | 2009 | |||||||
| Assets | ||||||||
| Cash and due from banks | $ | 35,144 | $ | 52,120 | ||||
| Federal funds sold | 55,643 | 44,244 | ||||||
| Interest-bearing deposits in banks | 49,099 | 56,562 | ||||||
| Cash and cash equivalents | 139,886 | 152,926 | ||||||
| Investment securities (fair value: 2010, $381,231; 2009, $378,964) | 381,231 | 378,961 | ||||||
| Mortgage loans held for sale | 51,722 | 44,165 | ||||||
| Loans receivable, net of allowance for loan losses, 2010, $37,649; 2009, $40,172 | 2,061,835 | 2,146,335 | ||||||
| Premises and equipment, net | 79,033 | 83,546 | ||||||
| Accrued interest receivable | 9,317 | 9,459 | ||||||
| Deferred income tax asset | 1,909 | 882 | ||||||
| Core deposit intangibles, net | 6,662 | 8,408 | ||||||
| Goodwill | 113,652 | 113,652 | ||||||
| Bank owned life insurance | 31,116 | 30,196 | ||||||
| Foreclosed assets | 10,894 | 4,505 | ||||||
| Other assets | 53,185 | 60,066 | ||||||
| Total assets | $ | 2,940,442 | $ | 3,033,101 | ||||
| Liabilities | ||||||||
| Deposits: | ||||||||
| Noninterest-bearing | $ | 322,924 | $ | 302,009 | ||||
| Interest-bearing | 2,063,178 | 2,134,111 | ||||||
| Total deposits | 2,386,102 | 2,436,120 | ||||||
| Short-term borrowings | 987 | 783 | ||||||
| Federal Home Loan Bank advances | 85,000 | 130,000 | ||||||
| Subordinated debt | 32,991 | 32,991 | ||||||
| Accrued interest payable | 2,278 | 3,626 | ||||||
| Other liabilities | 6,647 | 8,796 | ||||||
| Total liabilities | 2,514,005 | 2,612,316 | ||||||
| Stockholders' Equity | ||||||||
| Preferred stock; no par value; 5,000,000 shares authorized; no shares issued and outstanding; | - | - | ||||||
| Preferred stock; $1,000 per share liquidation preference; 30,000 shares issued and outstanding; | 28,763 | 28,398 | ||||||
| Common stock; $1 par value; 35,000,000 shares authorized; 2010: 22,748,062 shares issued and outstanding; 2009: 22,661,125 shares issued and outstanding; | 22,748 | 22,661 | ||||||
| Additional paid-in capital | 270,047 | 268,965 | ||||||
| Retained earnings | 101,188 | 96,947 | ||||||
| Accumulated other comprehensive income | 3,691 | 3,814 | ||||||
| Total stockholders' equity | 426,437 | 420,785 | ||||||
| Total liabilities and stockholders' equity | $ | 2,940,442 | $ | 3,033,101 | ||||
The accompanying notes are an integral part of these consolidated financial statements.
STELLARONE CORPORATION AND SUBSIDIARIES
| For the Years Ended December 31 | ||||||||||||
| (Dollars in Thousands, except per share data) | ||||||||||||
| 2010 | 2009 | 2008 | ||||||||||
| Interest and Dividend Income | ||||||||||||
| Loans, including fees | $ | 114,828 | $ | 125,837 | $ | 139,692 | ||||||
| Federal funds sold and deposits in other banks | 251 | 209 | 968 | |||||||||
| Investment securities: | ||||||||||||
| Taxable | 8,408 | 9,528 | 10,921 | |||||||||
| Tax-exempt | 4,368 | 4,008 | 3,585 | |||||||||
| Dividends | 67 | 127 | 1,070 | |||||||||
| Total interest income | 127,922 | 139,709 | 156,236 | |||||||||
| Interest Expense | ||||||||||||
| Deposits | 28,943 | 43,483 | 47,939 | |||||||||
| Federal funds repurchased and securities sold under agreements to repurchase | 29 | 16 | 73 | |||||||||
| Federal Home Loan Bank advances | 3,866 | 5,756 | 7,207 | |||||||||
| Subordinated debt | 1,074 | 1,257 | 1,959 | |||||||||
| Short-term borrowings | - | - | 643 | |||||||||
| Total interest expense | 33,912 | 50,512 | 57,821 | |||||||||
| Net interest income | 94,010 | 89,197 | 98,415 | |||||||||
| Provision for loan losses | 22,850 | 37,800 | 20,787 | |||||||||
| Net interest income after provision for loan losses | 71,160 | 51,397 | 77,628 | |||||||||
| Noninterest Income | ||||||||||||
| Retail banking fees | 16,237 | 16,367 | 14,756 | |||||||||
| Commissions and fees from fiduciary activities | 3,264 | 2,960 | 3,677 | |||||||||
| Brokerage fee income | 1,492 | 1,203 | 1,269 | |||||||||
| Mortgage banking-related fees | 9,388 | 7,382 | 3,446 | |||||||||
| Losses on mortgage indemnifications and repurchases | (2,265 | ) | (1,098 | ) | - | |||||||
| Gain on sale of financial center | 748 | - | - | |||||||||
| Gains (losses) on sale of premises and equipment | 199 | (76 | ) | (124 | ) | |||||||
| Impairments of equity securities available for sale | (110 | ) | (2,525 | ) | (274 | ) | ||||||
| Gains on sale of securities available for sale | 1,268 | 45 | 186 | |||||||||
| Losses on sale / impairment of foreclosed assets | (1,147 | ) | (1,810 | ) | (2,497 | ) | ||||||
| Income from bank owned life insurance | 1,296 | 1,292 | 1,213 | |||||||||
| Other operating income | 2,899 | 2,400 | 2,639 | |||||||||
| Total noninterest income | $ | 33,269 | $ | 26,140 | $ | 24,291 | ||||||
The accompanying notes are an integral part of these consolidated financial statements.
STELLARONE CORPORATION AND SUBSIDIARIES
| Consolidated Statements of Operations (continued) | ||||||||||||
| For the Years Ended December 31 | ||||||||||||
| (Dollars in Thousands, except per share data) | ||||||||||||
| 2010 | 2009 | 2008 | ||||||||||
| Non-interest Expense | ||||||||||||
| Compensation and employee benefits | $ | 45,898 | $ | 44,564 | $ | 44,747 | ||||||
| Net occupancy | 8,389 | 8,578 | 7,113 | |||||||||
| Supplies and equipment | 8,401 | 8,735 | 7,910 | |||||||||
| Amortization of intangible assets | 1,651 | 1,730 | 1,568 | |||||||||
| Marketing | 1,146 | 1,276 | 2,184 | |||||||||
| State franchise taxes | 2,216 | 2,318 | 2,091 | |||||||||
| FDIC insurance | 5,518 | 5,309 | 1,419 | |||||||||
| Data processing | 2,398 | 2,466 | 3,847 | |||||||||
| Professional fees | 2,600 | 2,856 | 2,000 | |||||||||
| Telecommunications | 1,686 | 1,857 | 1,761 | |||||||||
| Other operating expenses | 13,056 | 13,972 | 14,220 | |||||||||
| Total noninterest expense | 92,959 | 93,661 | 88,860 | |||||||||
| Income (loss) before income taxes | 11,470 | (16,124 | ) | 13,059 | ||||||||
| Income tax expense (benefit) | 1,705 | (7,594 | ) | 3,648 | ||||||||
| Net income (loss) | $ | 9,765 | $ | (8,530 | ) | $ | 9,411 | |||||
| Dividends and accretion on preferred stock | (1,865 | ) | (1,834 | ) | (53 | ) | ||||||
| Net income (loss) available to common shareholders | $ | 7,900 | $ | (10,364 | ) | $ | 9,358 | |||||
| Basic net income (loss) per common share available to common shareholders | $ | 0.35 | $ | (0.46 | ) | $ | 0.45 | |||||
| Diluted net income (loss) per common share available to common shareholders | $ | 0.35 | $ | (0.46 | ) | $ | 0.45 | |||||
The accompanying notes are an integral part of these consolidated financial statements.
STELLARONE CORPORATION AND SUBSIDIARIES
| For the Years Ended December 31 | ||||||||||||||||||||||||||||
| (Dollars in Thousands) | ||||||||||||||||||||||||||||
| Accumulated | ||||||||||||||||||||||||||||
| Additional | Other | |||||||||||||||||||||||||||
| Preferred | Common | Paid-In | Retained | Comprehensive | Comprehensive | |||||||||||||||||||||||
| Stock | Stock | Capital | Earnings | Income (Loss) | Income (Loss) | Total | ||||||||||||||||||||||
| Balance, December 31, 2007 | $ | - | $ | 10,796 | $ | 34,488 | $ | 117,009 | $ | 475 | $ | 162,768 | ||||||||||||||||
| Comprehensive income: | ||||||||||||||||||||||||||||
| Net income | - | - | - | 9,411 | - | $ | 9,411 | 9,411 | ||||||||||||||||||||
| Other comprehensive income, net of tax: | ||||||||||||||||||||||||||||
| Unrealized holding gains arising during the period (net of tax, $482) | - | - | - | - | - | 895 | - | |||||||||||||||||||||
| Reclassification adjustment (net of tax, $31) | - | - | - | - | - | (57 | ) | - | ||||||||||||||||||||
| Change in pension and post retirement liability (net of tax, $235) | - | - | - | - | - | (437 | ) | - | ||||||||||||||||||||
| Other comprehensive income | - | - | - | - | 401 | 401 | 401 | |||||||||||||||||||||
| Total comprehensive income | - | - | - | - | - | $ | 9,812 | - | ||||||||||||||||||||
| Cash dividends paid or accrued: | ||||||||||||||||||||||||||||
| Common ($.64 per share) | - | - | - | (12,614 | ) | - | (12,614 | ) | ||||||||||||||||||||
| Preferred cumulative 5% | - | - | - | (53 | ) | - | (53 | ) | ||||||||||||||||||||
| Common stock issued in merger (11,746,272 shares) | - | 11,746 | 230,247 | - | - | 241,993 | ||||||||||||||||||||||
| Stock-based compensation expense associated with merger (23,519 shares) | - | 24 | 1,088 | - | - | 1,112 | ||||||||||||||||||||||
| Issuance of 30,000 shares of preferred stock and 302,622 common stock warrants | 28,099 | - | 1,901 | - | - | 30,000 | ||||||||||||||||||||||
| Accretion on preferred stock discount | 22 | - | - | (22 | ) | - | - | |||||||||||||||||||||
| Stock-based compensation expense (7,018 shares) | - | 7 | 262 | - | - | 269 | ||||||||||||||||||||||
| Exercise of stock options (32,311 shares) | - | 32 | 307 | - | - | 339 | ||||||||||||||||||||||
| Cumulative effect of adoption of FASB ASC Topic 715 | - | - | - | (70 | ) | - | (70 | ) | ||||||||||||||||||||
| Balance, December 31, 2008 | $ | 28,121 | $ | 22,605 | $ | 268,293 | $ | 113,661 | $ | 876 | $ | 433,556 | ||||||||||||||||
| Comprehensive loss: | ||||||||||||||||||||||||||||
| Net loss | - | - | - | (8,530 | ) | - | $ | (8,530 | ) | (8,530 | ) | |||||||||||||||||
| Other comprehensive income, net of tax: | ||||||||||||||||||||||||||||
| Unrealized holding gains arising during the period (net of tax of $2,659) | - | - | - | - | - | 4,937 | - | |||||||||||||||||||||
| Reclassification adjustment (net of tax of $868) | - | - | - | - | - | (1,612 | ) | - | ||||||||||||||||||||
| Change in pension and post retirement liability (net of tax, $208) | - | - | - | - | - | (387 | ) | - | ||||||||||||||||||||
| Other comprehensive income | - | - | - | - | 2,938 | 2,938 | 2,938 | |||||||||||||||||||||
| Total comprehensive loss | - | - | - | - | - | $ | (5,592 | ) | - | |||||||||||||||||||
| Cash dividends paid or accrued: | ||||||||||||||||||||||||||||
| Common ($.28 per share) | - | - | - | (6,350 | ) | - | (6,350 | ) | ||||||||||||||||||||
| Preferred cumulative 5% | - | - | - | (1,500 | ) | - | (1,500 | ) | ||||||||||||||||||||
| Accretion on preferred stock discount | 334 | - | - | (334 | ) | - | - | |||||||||||||||||||||
| Preferred stock issuance costs | (57 | ) | - | - | - | - | (57 | ) | ||||||||||||||||||||
| Stock-based compensation expense (20,029 shares) | - | 20 | 464 | - | - | 484 | ||||||||||||||||||||||
| Exercise of stock options (36,033 shares) | - | 36 | 208 | - | - | 244 | ||||||||||||||||||||||
| Balance, December 31, 2009 | $ | 28,398 | $ | 22,661 | $ | 268,965 | $ | 96,947 | $ | 3,814 | $ | 420,785 | ||||||||||||||||
| Comprehensive income: | ||||||||||||||||||||||||||||
| Net income | - | - | - | 9,765 | - | $ | 9,765 | 9,765 | ||||||||||||||||||||
| Other comprehensive loss, net of tax: | ||||||||||||||||||||||||||||
| Unrealized holding gains arising during the period (net of tax of $429) | - | - | - | - | - | 797 | - | |||||||||||||||||||||
| Reclassification adjustment (net of tax of $405) | - | - | - | - | - | (753 | ) | - | ||||||||||||||||||||
| Change in pension and post retirement liability (net of tax, $125) | - | - | - | - | - | (231 | ) | - | ||||||||||||||||||||
| Change in cash flow hedge market value (net of tax, $34) | - | - | - | - | - | 64 | - | |||||||||||||||||||||
| Other comprehensive loss | - | - | - | - | (123 | ) | (123 | ) | (123 | ) | ||||||||||||||||||
| Total comprehensive income | - | - | - | - | - | $ | 9,642 | - | ||||||||||||||||||||
| Cash dividends paid or accrued: | ||||||||||||||||||||||||||||
| Common ($.16 per share) | - | - | - | (3,659 | ) | - | (3,659 | ) | ||||||||||||||||||||
| Preferred cumulative 5% | - | - | - | (1,500 | ) | - | (1,500 | ) | ||||||||||||||||||||
| Accretion on preferred stock discount | 365 | - | - | (365 | ) | - | - | |||||||||||||||||||||
| Stock-based compensation expense (26,615 shares) | - | 27 | 631 | - | - | 658 | ||||||||||||||||||||||
| Exercise of stock options (60,322 shares) | - | 60 | 451 | - | - | 511 | ||||||||||||||||||||||
| Balance, December 31, 2010 | $ | 28,763 | $ | 22,748 | $ | 270,047 | $ | 101,188 | $ | 3,691 | $ | 426,437 | ||||||||||||||||
The accompanying notes are an integral part of these consolidated financial statements.
STELLARONE CORPORATION AND SUBSIDIARIES
| For the Years Ended December 31 | ||||||||||||
| (Dollars in Thousands) | ||||||||||||
| 2010 | 2009 | 2008 | ||||||||||
| Cash Flows from Operating Activities | ||||||||||||
| Net income (loss) | $ | 9,765 | $ | (8,530 | ) | $ | 9,411 | |||||
| Adjustments to reconcile net income to net cash used in operating activities: | ||||||||||||
| Depreciation | 6,801 | 6,283 | 5,038 | |||||||||
| Amortization of intangible assets | 1,651 | 1,730 | 1,568 | |||||||||
| Provision for loan losses | 22,850 | 37,800 | 20,787 | |||||||||
| Deferred tax (benefit) expense | 271 | (3,195 | ) | 2,527 | ||||||||
| Employee benefit plan expense (benefit) | 178 | (25 | ) | 57 | ||||||||
| Stock-based compensation expense | 658 | 484 | 1,381 | |||||||||
| Losses / impairments on foreclosed assets | 1,147 | 1,810 | 2,497 | |||||||||
| (Gains) losses on sale of premises and equipment | (199 | ) | 76 | 124 | ||||||||
| Gain on sale of financial center | (748 | ) | - | - | ||||||||
| Gains on sale of securities available for sale | (1,268 | ) | (45 | ) | (186 | ) | ||||||
| Impairments of equity securities available for sale | 110 | 2,525 | 274 | |||||||||
| Mortgage banking-related fees | (9,388 | ) | (7,382 | ) | (3,446 | ) | ||||||
| Proceeds from sale of mortgage loans | 526,618 | 557,326 | 118,712 | |||||||||
| Origination of mortgage loans for sale | (524,787 | ) | (578,347 | ) | (111,848 | ) | ||||||
| Amortization of securities premiums and accretion of discounts, net | 1,672 | (1,206 | ) | (7,837 | ) | |||||||
| Income on bank owned life insurance | (1,296 | ) | (1,292 | ) | (1,213 | ) | ||||||
| Changes in assets and liabilities: | ||||||||||||
| Decrease in accrued interest receivable | 142 | 771 | 4,127 | |||||||||
| Decrease (increase) in other assets | 6,201 | (14,797 | ) | 3,955 | ||||||||
| Decrease in accrued interest payable | (1,348 | ) | (1,850 | ) | (1,605 | ) | ||||||
| Decrease in other liabilities | (2,149 | ) | (962 | ) | (23,529 | ) | ||||||
| Net cash provided (used) by operating activities | $ | 36,881 | $ | (8,826 | ) | $ | 20,794 | |||||
| Cash Flows from Investing Activities | ||||||||||||
| Proceeds from maturities and principal payments of securities available for sale | $ | 103,443 | $ | 82,243 | $ | 179,034 | ||||||
| Proceeds from sales and calls of securities available for sale | 53,305 | 39,404 | 27,225 | |||||||||
| Purchase of securities available for sale | (159,561 | ) | (170,614 | ) | (103,147 | ) | ||||||
| Proceeds from maturities and principal payments of securities held to maturity | 425 | - | 2,660 | |||||||||
| Net decrease in loans | 47,732 | 47,104 | 29,929 | |||||||||
| Proceeds from sale of premises and equipment | 1,014 | 1,161 | 1,243 | |||||||||
| Purchase of premises and equipment | (3,333 | ) | (4,163 | ) | (10,581 | ) | ||||||
| Proceeds from sale of foreclosed assets | 6,516 | 2,978 | 2,991 | |||||||||
| Cash acquired in merger | - | - | 45,146 | |||||||||
| Net cash provided (used) by investing activities | $ | 49,541 | $ | (1,887 | ) | $ | 174,500 | |||||
| Cash Flows from Financing Activities | ||||||||||||
| Net (decrease) increase in demand, money market and savings deposits | $ | 116,613 | $ | 224,348 | $ | 48,753 | ||||||
| Net decrease in certificates of deposit | (166,631 | ) | (111,206 | ) | (78,880 | ) | ||||||
| Net increase (decrease) in federal funds purchased and securities sold under agreements to repurchase | 204 | 84 | (21,064 | ) | ||||||||
| Proceeds from Federal Home Loan Bank advances | - | - | 119,600 | |||||||||
| Principal payments on Federal Home Loan Bank advances | (45,000 | ) | (57,700 | ) | (138,055 | ) | ||||||
| Net decrease in short-term borrowings | - | - | (69,637 | ) | ||||||||
| Proceeds from the issuance of preferred stock and common stock warrants | - | - | 30,000 | |||||||||
| Proceeds from exercise of stock options | 511 | 351 | 339 | |||||||||
| Payment of preferred stock issuance costs | - | (57 | ) | - | ||||||||
| Cash dividends paid | (5,159 | ) | (7,710 | ) | (12,614 | ) | ||||||
| Net cash (used) provided by financing activities | $ | (99,462 | ) | $ | 48,110 | $ | (121,558 | ) | ||||
| (Decrease) increase in cash and cash equivalents | $ | (13,040 | ) | $ | 37,397 | $ | 73,736 | |||||
| Cash and Cash Equivalents | ||||||||||||
| Beginning | 152,926 | 115,529 | 41,793 | |||||||||
| Ending | $ | 139,886 | $ | 152,926 | $ | 115,529 | ||||||
| Supplemental Disclosures of Cash Flow Information | ||||||||||||
| Cash (receipts) payments for: | ||||||||||||
| Interest | $ | 39,816 | $ | 52,362 | $ | 55,900 | ||||||
| Income taxes | $ | (2,300 | ) | $ | (3,563 | ) | $ | 6,000 | ||||
| Supplemental Schedule of Noncash Activities | ||||||||||||
| Stock issued in association with merger | $ | - | $ | - | $ | 203,222 | ||||||
| Foreclosed assets acquired in settlement of loans | $ | 14,052 | $ | 5,436 | $ | 5,712 | ||||||
The accompanying notes are an integral part of these consolidated financial statements.
43
STELLARONE CORPORATION AND SUBSIDIARIES
Notes to Consolidated Financial Statements
(Dollars in Thousands, except share data)
Nature of Operations and Consolidation
StellarOne Corporation (the “Company”) is a Virginia bank holding company headquartered in Charlottesville, Virginia. The Company’s sole banking subsidiary is StellarOne Bank (“Bank”) headquartered in Christiansburg, Virginia. Additional subsidiaries of the Company include VFG Limited Liability Trust and FNB (VA) Statutory Trust II, both of which are associated with the Company’s subordinated debt issuances and are not subject to consolidation. The Company collapsed all of its previous subsidiaries into StellarOne Bank on May 27, 2008. The previous subsidiaries included First National Bank (Christiansburg, Virginia), Second Bank & Trust (Fredericksburg, Virginia); Planters Bank & Trust Company of Virginia (Staunton, Virginia) and its subsidiary, Planters Insurance Agency, Inc.; and Virginia Commonwealth Trust Company (Culpeper, Virginia). The consolidated statements include the accounts of the Company and its wholly-owned subsidiaries. All significant intercompany accounts have been eliminated. The Company has evaluated subsequent events through the date of financial statement issue and has not noted anything material to its financial condition or results of operations.
On February 28, 2008, pursuant to the terms and conditions of the Agreement and Plan of Reorganization, dated as of July 26, 2007 (the “Merger Agreement”), between Virginia Financial Group, Inc. (“VFG”) and FNB Corporation (“FNB”), VFG and FNB completed the merger in which FNB and its subsidiary First National Bank merged with and into VFG with VFG, Inc. as the surviving corporation and changing its name to StellarOne Corporation.
The Company, through its subsidiary bank, provides a full array of banking services through fifty-six full-service financial centers in Central and Southwest Virginia. Among such services are those traditionally offered by banks including commercial and consumer demand and time deposit accounts, mortgage, comprehensive wealth management, financial and estate-planning services, and commercial and consumer loans. The Company also provides a network of automated transaction locations, phone banking and a transactional internet banking product.
Risks and Uncertainties
In its normal course of business, the Company encounters two significant types of risk: economic and regulatory. There are three main components of economic risk: interest rate risk, credit risk and market risk. The Company is subject to interest rate risk to the degree that its interest-bearing liabilities mature or reprice more rapidly or on a different basis than its interest-earning assets. Credit risk is the risk of default on the Company’s loan portfolio that results from the borrowers’ inability or unwillingness to make contractually required payments. Market risk reflects changes in the value of collateral underlying loans receivable, securities and the valuation of real estate held by the Company.
The determination of the allowance for loan losses and the valuation of real estate are based on estimates that are particularly susceptible to significant changes in the economic environment and market conditions. Management believes that, as of December 31, 2010, the allowance for loan losses is adequate and the valuation of real estate associated with specific reserves is appropriate based on information currently available. A worsening or protracted economic decline or substantial increase in interest rates would increase the likelihood of losses due to credit and market risks and could create the need for substantial increases in the allowance for loan losses.
The Company is subject to the regulations of various regulatory agencies, which can change significantly from year to year. In addition, the Company undergoes periodic examinations by regulatory agencies, which may subject it to further changes based on the regulators’ judgments about information available to them at the time of their examinations.
Basis of Presentation
The accounting and reporting policies of the Company conform to accounting principles generally accepted in the United States of America and to accepted practices within the banking industry. The following is a description of the more significant of those policies and practices.
Certain items in prior financial statements have been reclassified to conform to the current presentation.
44
STELLARONE CORPORATION AND SUBSIDIARIES
Notes to Consolidated Financial Statements
(Dollars in Thousands, except share data)
Accounting Standards Codification
The Financial Accounting Standards Board’s (“FASB”) Accounting Standards Codification (“ASC”) became effective on July 1, 2009. At that date, the ASC became the officially recognized source of authoritative Accounting Principles Generally Accepted in the United States (“USGAAP”) applicable to all public and non-public non-governmental entities, superseding existing FASB, American Institute of Certified Public Accountants, Emerging Issues Task Force, and related literature. Rules and interpretive releases of the Securities and Exchange Commission (“SEC”) under the authority of federal securities laws are also sources of authoritative GAAP for SEC registrants. All other accounting literature is considered non-authoritative. The switch to the ASC affects the way companies refer to USGAAP in financial statements and accounting policies. Citing particular content in the ASC involves specifying the unique numeric path to the content through the Topic, Subtopic, Section and Paragraph structure.
Cash and Cash Equivalents
For purposes of the consolidated statements of cash flows, cash and cash equivalents include cash on hand, amounts due from banks, federal funds sold and interest bearing deposits in other banks. Generally, federal funds are purchased and sold for one day periods.
Concentrations and Restrictions in Cash and Cash Equivalents
The Company maintains deposits with other financial institutions in amounts that exceed federal deposit insurance coverage. Furthermore, federal funds sold are essentially uncollateralized loans to other financial institutions. Management regularly evaluates the credit risk associated with the counterparties to these transactions. The Company was required to have $10.0 million and $11.0 million of cash on hand or on deposit with the Federal Reserve Bank to meet regulatory daily average reserve and clearing requirements for December 31, 2010 and 2009, respectively. These deposits with the Federal Reserve Bank do not earn interest.
Use of Estimates
In preparing consolidated financial statements in conformity with USGAAP, management is required to make estimates and assumptions that affect the reported amounts of assets and liabilities and disclosure of contingent assets and liabilities as of the date of the balance sheet and reported amounts of revenues and expenses during the reporting period. Actual results could differ from those estimates. Material estimates that are particularly susceptible to significant change in the near term relate to the determination of the allowance for loan losses, accrued mortgage indemnification losses, the valuation of foreclosed real estate, the recoverability of goodwill and intangible assets, the recoverability of deferred tax assets and the fair value of financial instruments.
Investment Securities
Debt securities that management has the positive intent and ability to hold to maturity are classified as “held to maturity” and recorded at amortized cost. Securities not classified as held to maturity, including equity securities with readily determinable fair values, are classified as “available for sale” and recorded at fair value. Except for realized losses charged to earnings for other-than-temporary-impairment deemed to be credit-related, unrealized holding gains and losses, net of the related tax effect, are excluded from earnings and are included in accumulated other comprehensive income (loss) in stockholders’ equity until realized. The initial classification of securities is determined at the date of purchase. The Company does not have any pooled or private label trust preferred securities.
Purchase premiums and discounts are recognized in interest income using the interest method over the terms of the securities. Declines in the fair value of held to maturity and available for sale securities below their cost that are deemed to be other than temporary are reflected in earnings as realized losses. In estimating other-than-temporary impairment losses, management considers (1) the length of time and the extent to which the fair value has been less than cost, (2) the financial condition and near term prospects of the issuer, and (3) the intent and ability of the Company to retain its investment in the issuer for a period of time sufficient to allow for any anticipated increase in fair value.
Management has determined that other-than-temporary impairment exists for equity securities and should be recorded (1) if the fair value of an equity security represents less than 70% of the book value of a security regardless of loss period; or (2) if the loss period has been more than 18 months regardless of the fair value’s relationship to carrying value. If either of these conditions does not exist, but management becomes aware of possible impairment outside of this scope, management will conduct additional research to determine if market price recoveries can reasonably be expected to occur within an acceptable forecast period. For purposes of this analysis, a near term recovery period has been defined as 3-6 months.
The Company recorded an impairment charge of $110 thousand, $2.5 million and $274 thousand associated with equity securities classified as available for sale investments during 2010, 2009 and 2008, respectively. The impairment charge is included in Impairments of equity securities available for sale on the Statement of Operations.
The Company, through its banking subsidiary, is a member of the Federal Reserve Bank and the Federal Home Loan Bank and is required to hold stock in each institution. These equity securities are restricted from trading and are recorded in other assets at a cost of $22.8 million and $23.1 million at December 31, 2010 and 2009, respectively. These are considered cost basis securities for which the associated cost approximates fair value.
Management evaluates the restricted stock for impairment in accordance with authoritative accounting guidance under ASC Topic 320, “Accounting by Certain Entities (Including Entities with Trade Receivables) That Lend to or Finance the Activities of Others.” Management’s determination of whether these investments are impaired is based on their assessment of the ultimate recoverability of the cost rather than by recognizing temporary declines in value. The determination of whether a decline affects the ultimate recoverability of the cost of an investment is influenced by criteria such as (1) the significance of the decline in net assets of the issuing bank as compared to the capital stock amount for that bank and the length of time this situation has persisted, (2) commitments by the issuing bank to make payments required by law or regulation and the level of such payments in relation to the operating performance of that bank, and (3) the impact of legislative and regulatory changes on institutions and, accordingly, on the customer base of the issuing bank.
Based on evaluation of criteria under ASC Topic 320, management believes that no impairment charge in respect of the restricted stock is necessary as of December 31, 2010.
Gains and losses on the sale of securities are recorded on the trade date and are determined using the specific identification method.
45
STELLARONE CORPORATION AND SUBSIDIARIES
Notes to Consolidated Financial Statements
(Dollars in Thousands, except share data)
Loans Held For Sale
Loans originated and intended for sale in the secondary market are carried at the lower of aggregate cost or fair value, as determined by aggregate outstanding commitments from investors or current investor yield requirements. Net unrealized losses are recognized through a valuation allowance by charges to income.
Mortgage loans held for sale are generally sold with the mortgage servicing rights released by the Company. Gains or losses on sales of mortgage loans are recognized based on the difference between the selling price and the carrying value of the related mortgage loans sold.
The Company accounts for the transfer of financial assets in accordance with authoritative accounting guidance which is based on consistent application of a financial-components approach that recognizes the financial and servicing assets it controls and the liabilities it has incurred, derecognizes financial assets when control has been surrendered and derecognizes liabilities when extinguished. The guidance provides consistent guidelines for distinguishing transfers of financial assets from transfers that are secured borrowings.
As is customary in such sales, the Company provides indemnifications to the buyers under certain circumstances. These indemnifications may include the repurchase of loans by the Company. Repurchases and losses during the last two years have been elevated, but have historically been rare, and currently no provision is made for losses at the time of sale.
The Company enters into commitments to originate loans whereby the interest rate on the loan is determined prior to funding (rate lock commitments). Rate lock commitments on mortgage loans that are intended to be sold are considered to be derivatives. Time elapsing between issuance of a loan commitment and closing and sale of the loan generally ranges from 5 to 20 days. The Company protects itself from changes in interest rates through the use of best efforts forward delivery contracts, whereby the
Company commits to sell a loan at the time the borrower commits to an interest rate with the intent that the buyer has assumed interest rate risk on the loan. As a result, the Company is not exposed to losses nor will it realize significant gains related to its rate lock commitments due to changes in interest rates.
The market value of rate lock commitments and best efforts contracts is not readily ascertainable with precision because rate lock commitments and best efforts contracts are not actively traded in stand-alone markets. The Company determines the fair value of rate lock commitments and best efforts contracts by measuring the change in the value of the underlying asset while taking into consideration the probability that the rate lock commitments will close. Due to high correlation between rate lock commitments and best efforts contracts, no significant gains or losses have occurred on the rate lock commitments for the years ended December 31, 2010, 2009 or 2008.
46
STELLARONE CORPORATION AND SUBSIDIARIES
Notes to Consolidated Financial Statements
(Dollars in Thousands, except share data)
Loans
The Company, through its banking subsidiary, grants mortgage, commercial and consumer loans to customers, all of which are considered financing receivables. A substantial portion of the loan portfolio is represented by mortgage loans. The ability of the Company’s debtors to honor their contracts is dependent upon the real estate and general economic conditions in the Company’s market area.
Loans that management has the intent and ability to hold for the foreseeable future or until maturity or pay-off generally are reported at their outstanding unpaid principal balances adjusted for charge-offs, the allowance for loan losses and any deferred fees or costs on originated loans. Interest income is accrued on the unpaid principal balance. Loan origination fees, net of certain direct origination costs, are deferred and recognized as an adjustment of the related loan yield using the interest method. These amounts are generally being amortized over the contractual life of the loan.
The accrual of interest on construction and land development, mortgage and commercial loans is generally discontinued at the time the loan is 90 days delinquent unless the credit is well-secured and in process of collection. Deposit overdrafts and other loans are typically charged off no later than 120 days past due. Consumer installment loans are typically charged off no later than 180 days past due. In all cases, loans are placed on nonaccrual or charged-off at an earlier date if collection of principal or interest is considered doubtful.
All interest accrued but not collected for loans that are placed on nonaccrual or charged-off is reversed against interest income. The interest on these loans is accounted for on the cash-basis or cost-recovery method, until qualifying for return to accrual. Loans are returned to accrual status when all the principal and interest amounts contractually due are brought current and future collection of principal and interest are reasonably assured.
Allowance for Loan Losses
The allowance for loan losses (“ALLL”) is established as losses are estimated to have occurred through a provision for loan losses charged to earnings. Loan balances are charged off against the allowance when management believes a loan balance is confirmed uncollectable. Subsequent recoveries, if any, are credited to the allowance.
The Company conducts an analysis of the loan portfolio on a regular basis. This analysis is used in assessing the sufficiency of the allowance for loan losses and in the determination of the necessary provision for loan losses. The review process generally begins with the identification of problem loans to be reviewed on an individual basis for impairment. When a loan has been identified as impaired, a specific reserve may be established based on the Company’s calculation of the loss embedded in the individual loan. In addition to specific reserves on impaired loans, the Company has a nine point grading system for each non-homogeneous loan in the portfolio to reflect the risk characteristic of the loan. The loans identified and measured for impairment are segregated from risk-rated loans within the portfolio. Loans are then grouped by loan type and, in the case of commercial and construction loans, by risk rating. Each loan type is assigned an allowance factor based on historical loss experience, economic conditions, overall portfolio quality including delinquency rates and commercial real estate loan concentrations. The ALLL is an accounting estimate and as such there is uncertainty associated with the estimate due to the level of subjectivity and judgment inherent in performing the calculation. Management’s evaluation of the ALLL also includes considerations of existing general economic and business conditions affecting the key lending areas of the Company, credit quality trends, collateral values, loan volumes and concentrations, seasoning of the loan portfolio, specific industry conditions within portfolio segments, recent loss experience in particular segments of the portfolio, duration of the current business cycle, bank regulatory examination results and findings of the Company's outsourced loan review consultants. The total of specific reserves required for impaired classified loans and the calculated reserves comprise the allowance for loan losses.
A loan is considered impaired when, based on current information and events, it is probable that the Company will be unable to collect the scheduled payments of principal and interest when due according to the contractual terms of the loan agreement. Factors considered by management in determining whether a loan is impaired include payment status, collateral value, and the probability of collecting scheduled principal and interest payments when due. Additionally, management’s policy is generally to evaluate only those loans greater than $500 thousand for impairment. Loans that experience insignificant payment delays and payment shortfalls generally are not classified as impaired. Management determines the significance of payment delays and payment shortfalls on a case-by-case basis, taking into consideration all of the circumstances surrounding the loan and the borrower, including the length of the delay, the reasons for the delay, the borrower’s prior payment record, and the amount of the shortfall in relation to the principal and interest owed. Impairment is measured on a loan-by-loan basis by either the present value of expected future cash flows discounted at the loan’s effective interest rate, the loan’s obtainable market price, or the fair value of the collateral if the loan is collateral dependent.
Larger groups of smaller balance homogeneous loans are collectively evaluated for impairment. Accordingly, the Company does not separately identify individual consumer and residential loans for impairment.
While management utilizes its best judgment and information available, the ultimate adequacy of the allowance is dependent upon a variety of factors beyond the Company’s control, including the performance of the Company’s loan portfolio, the economy, changes in interest rates and the view of the regulatory authorities toward loan classifications.
47
STELLARONE CORPORATION AND SUBSIDIARIES
Notes to Consolidated Financial Statements
(Dollars in Thousands, except share data)
Premises and Equipment
Land is carried at cost. Premises and equipment are stated at cost less accumulated depreciation and amortization. Premises and equipment are depreciated over their estimated useful lives ranging from three years to thirty-nine years; leasehold improvements are amortized over the lives of the respective leases or the estimated useful life of the leasehold improvement, whichever is less. Software is amortized over three years. Depreciation and amortization are recorded on the straight-line method. The Company did not record any impairment of long-lived assets for the years ended December 31, 2010, 2009, and 2008.
Goodwill and Intangible Assets
The Company recorded the assets and liabilities of FNB as of February 28, 2008 at estimated fair value. Several third party specialists were engaged to assist in valuing certain financial assets and liabilities. The Company recorded approximately $99.5 million in goodwill associated with this transaction. Previously, legacy VFG recorded goodwill of $14.2 million in connection with the purchase of branches in the fall of 2003, resulting in an aggregate goodwill balance of $113.7 million.
For purposes of testing goodwill for impairment, the Company uses both the income and market approaches to value its reporting units. The income approach consists of discounting long-term projected future cash flows, which are derived from internal forecasts and economic expectations for the commercial banking segment. The Company engaged a third party to assist management in the testing for impairment of the goodwill and intangible assets as of the annual assessment date, which is September 30. The projected future cash flows are discounted using cost of capital metrics for the Company’s peer group or a build-up approach (such as the capital asset pricing model). The market approach applies a market multiple, based on observed purchase transactions and/or price/earnings of the Company’s peer group for the reporting unit, to the last twelve months of net income or earnings before income taxes, depreciation and amortization or price/tangible book value.
Testing goodwill for impairment is a two-step process. The first step (“Step One”) of the goodwill impairment test, which the Company has employed in its analysis, involves estimating the fair value of the equity of the reporting unit. For purposes of this assignment, fair value is defined as “the price that would be received to sell an asset or paid to transfer a liability in an orderly transaction between market participants at the measurement date.” This type of value reflects the premise of value of value-in-use. Value-in-use is derived from the on-going operations of the business.
The fair value is then compared to the reporting unit’s carrying value of equity. In the event a reporting unit’s carrying value exceeds its estimated fair value, evidence of potential impairment exists. In such a case, the second step (“Step Two”) of the impairment test is required, which involves allocating the fair value of the reporting unit to all of the assets and liabilities of that unit, with the excess of fair value over allocated net assets representing the fair value of its goodwill. An impairment loss is measured as the amount, if any, by which the carrying value of the reporting unit’s goodwill exceeds the estimated fair value of that goodwill.
In 2010, based on the results of Step One of the impairment test, the Company determined that the carrying amount of goodwill would have exceeded its estimated fair value at the valuation date. Because the carrying amount exceeded the fair value, the Company engaged a third party to assist management in performing Step Two of the goodwill impairment test as of September 30, 2010. With the assistance of a third party, the implied fair value of goodwill was determined by assigning the fair value to all of the assets and liabilities, including any unrecognized intangible assets, as if the Company’s commercial banking segment had been acquired in a business combination. The excess of the fair value of the commercial banking segment over the amounts assigned to its assets and liabilities is the implied fair value of goodwill. Based on the results of Step Two of the impairment test as of September 30, 2010, management determined that goodwill was not impaired.
Management reviewed the reports prepared by the third party as of September 30, 2010, considered the factors noted above that could lead to impairment between that date and December 31, 2010 and evaluated the trading level of the Company’s stock in relation to both its book value and tangible book value. Based on these inputs, management concluded that no indications of impairment were present. Should management determine in a future period that the goodwill recorded in connection with acquisitions has been impaired, then a charge to earnings will be recorded in the period such determination is made.
Long-lived assets, including purchased intangible assets subject to amortization, such as the core deposit intangible asset, are reviewed for impairment whenever events or changes in circumstances indicate that the carrying amount of an asset may not be recoverable. Recoverability of assets to be held and used is measured by a comparison of the carrying amount of an asset to estimated undiscounted future cash flows expected to be generated by the asset. If the carrying amount of an asset exceeds its estimated future cash flows, an impairment charge is recognized in the amount by which the carrying amount of the asset exceeds the fair value of the asset. Assets to be disposed of would be separately presented in the balance sheet and reported at the lower of the carrying amount or fair value less costs to sell, and are no longer depreciated. Management concluded that no circumstances indicating an impairment of these assets existed as of the balance sheet date.
48
STELLARONE CORPORATION AND SUBSIDIARIES
Notes to Consolidated Financial Statements
(Dollars in Thousands, except share data)
Bank Owned Life Insurance
The Company has purchased bank owned life insurance (“BOLI”). The proceeds are used to help defray employee benefit costs. The Company is the owner and beneficiary of the policies. BOLI is recorded on the consolidated balance sheets at its cash surrender value and changes in the cash surrender value are recorded in noninterest income. BOLI income is tax-exempt.
Income Taxes
Deferred income tax assets and liabilities are determined using the liability (or balance sheet) method. Under this method, the net deferred tax asset or liability is determined based on the tax effects of the temporary differences between the book and tax bases of the various balance sheet assets and liabilities and gives current recognition to changes in tax rates and laws.
A tax position is recognized as a benefit only if it is “more likely than not” that the tax position would be sustained in a tax examination, with a tax examination being presumed to occur. The amount recognized is the largest amount of tax benefit that is greater than 50% likely of being realized on examination. For tax positions not meeting the “more likely than not” test, no tax benefit is recorded. Management has not taken any tax positions that it deems to be considered uncertain.
It is the Company’s policy to recognize interest and/or penalties related to income tax matters in income tax expense. The Company and its wholly-owned subsidiary file a consolidated income tax return. Each entity provides for income taxes based on its contribution to income or loss of the consolidated group.
Retirement Plans
The Company has a noncontributory, defined benefit pension plan covering certain of its employees meeting certain age and service requirements. The plan has not been offered to employees hired after June, 2002. The Company froze the pension plan at the current benefit levels as of December 31, 2008, at which time the accrual of future benefits for eligible employees ceased. All retirement benefits earned in the pension plan as of December 31, 2008 have been preserved and all participants are fully vested in their benefit. The Company does not anticipate making any contributions to the plan during 2011.
An employer is required to recognize the overfunded or underfunded status of a defined benefit postretirement plan as an asset or liability in its statement of financial position and to recognize through comprehensive income changes in that funded status in the year in which the changes occur. The asset related to the funded status recognized in the balance sheet was $43 thousand and $389 thousand at December 31, 2010 and 2009, respectively and is included in Other Assets in the accompanying Consolidated Balance Sheets.
Prior to the merger and subsequent formation of the Company, FNB maintained an employee stock ownership plan for the benefit of certain employees. On February 28, 2008, the Company became the Plan Sponsor as a result of the merger. Effective January 1, 2008, participation in the plan was limited to those who were qualified employees as of December 31, 2007. Beginning on January 1, 2009, contributions to the plan ceased and no further contributions shall be made to the Plan for plan years subsequent to the 2008 plan year. Due to the discontinuance of contributions to the Plan all shares became fully vested effective January 1, 2009.
Compensation expense related to the ESOP totaled $544 thousand for the year ended December 31, 2008, with none being recognized for the years ended December 31, 2009 or 2010.
Stock-Based Compensation
The Company has a stock-based employee compensation plan under which nonqualified stock options may be granted periodically to certain employees. The Company’s stock options typically have an exercise price equal to at least the fair value of the stock on the date of grant, and vest based on continued service with the Company for a specified period, generally from one to five years.
The authoritative guidance requires that new awards to employees eligible for retirement prior to the award becoming fully vested be recognized as compensation cost over the period through the date that the employee first becomes eligible to retire and is no longer required to provide service to earn the award.
The fair value of each option grant issued equal to fair market value is estimated on the date of the grant using the Black-Scholes option-pricing model with the following weighted average assumptions:
| Year Ended December 31, | ||||||||
| 2009 | 2008 | |||||||
| Dividend yield | 4.4 | % | 4.1 | % | ||||
| Expected life | 6.5 yrs | 6.2 yrs | ||||||
| Expected volatility | 42.9 | % | 26.0 | % | ||||
| Risk-free interest rate | 1.9 | % | 2.8 | % | ||||
There were no options granted during 2010.
The fair value of each option grant issued during 2008 above fair market value was estimated on the date of the grant using the Lattice option-pricing model with the following weighted average assumptions:
Year Ended December 31, | ||||
| 2008 | ||||
| Dividend yield | 3.7 | % | ||
| Expected life | 4.5 yrs | |||
| Expected volatility | 24.3 | % | ||
| Risk free interest rate | 2.1 | % | ||
| Post-vest cancellation rate | 1.0 | % | ||
There were no options granted during 2010 or 2009 that were valued using the Lattice option pricing model.
49
STELLARONE CORPORATION AND SUBSIDIARIES
Notes to Consolidated Financial Statements
(Dollars in Thousands, except share data)
Earnings (Loss) Per Common Share
Earnings (loss) per common share represents net income available to common stockholders, which represents net income (loss) less dividends paid or payable to preferred stock shareholders, divided by the weighted-average number of common shares outstanding during the period. For diluted earnings per common share, net income available to common shareholders is divided by the weighted average number of common shares issued and outstanding for each period plus amounts representing the dilutive effect of stock options and restricted stock, as well as any adjustment to income that would result from the assumed issuance. The effects of restricted stock and stock options are excluded from the computation of diluted earnings per common share in periods in which the effect would be antidilutive. Potential common shares that may be issued by the Company relate solely to outstanding stock options and restricted stock and are determined using the treasury stock method.
Dividend Reinvestment Plan
The Company has a Dividend Reinvestment Plan, which provides an automatic conversion of dividends into common stock for enrolled stockholders. It is based on the stock's fair market value on each dividend record date, and allows for voluntary contributions to purchase stock.
Foreclosed Assets
Real estate acquired through, or in lieu of, foreclosure is held for sale and is initially recorded at fair value at the date of foreclosure, establishing a new cost basis. Subsequent to foreclosure, valuations are periodically performed by management and the assets are carried at the lower of the carrying amount or fair value less cost to sell. Revenues and expenses from operations and changes in the valuation are included in other operating expenses.
Advertising
The Company follows the policy of charging the costs of advertising to expense as incurred. Advertising expense of $1.1 million, $1.3 million, and $2.2 million were incurred in 2010, 2009 and 2008, respectively. This expense is included as the marketing line item on the consolidated Statement of Operations.
Segment Information
Public business enterprises are required to report information about operating segments in annual financial statements and selected information in interim financial reports issued to shareholders. Operating segments are components of an enterprise about which separate financial information is available that is evaluated regularly by the chief operating decision maker in deciding how to allocate resources and assess performance.
Management has determined that the Company has three reportable segments, Commercial Banking, Mortgage Banking and Wealth Management. Please see Note 22 for more information on the Company’s reportable segments.
Derivative Financial Instruments
The Company’s hedging policies permit the use of various derivative financial instruments to manage interest rate risk or to hedge specified assets and liabilities. All derivatives are recorded at fair value on the Company’s balance sheet. The Company may be required to recognize certain contracts and commitments as derivatives when the characteristics of those contracts and commitments meet the definition of a derivative. To qualify for hedge accounting, derivatives must be highly effective at reducing the risk associated with the exposure being hedged and must be designated as a hedge at the inception of the derivative contract. The Company considers a hedge to be highly effective if the change in fair value of the derivative hedging instrument is within 80% to 125% of the opposite change in the fair value of the hedged item attributable to the hedged risk. If derivative instruments are designated as hedges of fair values, and such hedges are highly effective, both the change in the fair value of the hedge and the hedged item are included in current earnings. Fair value adjustments related to cash flow hedges are recorded in other comprehensive income and are reclassified to earnings when the hedged transaction is reflected in earnings. Ineffective portions of hedges are reflected in earnings as they occur. Actual cash receipts and/or payments and related accruals on derivatives related to hedges are recorded as adjustments to the interest income or interest expense associated with the hedged item. During the life of the hedge, the Company formally assesses whether derivatives designated as hedging instruments continue to be highly effective in offsetting changes in the fair value or cash flows of hedged items. If it is determined that a hedge has ceased to be highly effective, the Company will discontinue hedge accounting prospectively. At such time, previous adjustments to the carrying value of the hedged item are reversed into current earnings and the derivative instrument is reclassified to a trading position recorded at fair value.
Fair Value Measurement
The Company records certain of its assets and liabilities at fair value. Fair value is defined as the exchange price that would be received for an asset or paid to transfer a liability (an exit price) in the principal or most advantageous market for the asset or liability in an orderly transaction between market participants on the measurement date. Fair value measurements are classified within one of three levels in a valuation hierarchy based upon the transparency of inputs to the valuation of an asset or liability as of the measurement date. The three levels are defined as follows:
Level 1 — inputs to the valuation methodology are quoted prices (unadjusted) for identical assets or liabilities in active markets.
Level 2 — inputs to the valuation methodology include quoted prices for similar assets and liabilities in active markets, and inputs that are observable for the asset or liability, either directly or indirectly, for substantially the full term of the financial instrument.
Level 3 — inputs to the valuation methodology are unobservable and significant to the fair value measurement. A financial instrument’s categorization within the valuation hierarchy is based upon the lowest level of input that is significant to the fair value measurement.
Please see the fair value tables in Note 21.
50
STELLARONE CORPORATION AND SUBSIDIARIES
Notes to Consolidated Financial Statements
(Dollars in Thousands, except share data)
New Authoritative Accounting Guidance
Accounting Standards Codification. As discussed above, the Financial Accounting Standards Board’s Accounting Standards Codification became effective on July 1, 2009. At that date, the ASC became FASB’s officially recognized source of authoritative USGAAP applicable to all public and non-public non-governmental entities, superseding existing FASB, American Institute of Certified Public Accountants, Emerging Issues Task Force and related literature. Rules and interpretive releases of the SEC under the authority of federal securities laws are also sources of authoritative USGAAP for SEC registrants. All other accounting literature is considered non-authoritative. The switch to the ASC affects the way companies refer to USGAAP in financial statements and accounting policies. Citing particular content in the ASC involves specifying the unique numeric path to the content through the Topic, Subtopic, Section and Paragraph structure. The adoption of FASB ASC had no impact on the Company’s consolidated financial statements.
FASB ASC Topic 310, “Receivables.” New authoritative accounting guidance was issued under ASC Topic 310 surrounding the disclosures about the credit quality of financing receivables and the allowance for credit losses. The main objective of the new disclosure requirements is to provide users of financial statements greater transparency about credit losses and credit quality of financing receivables. The Company adopted the new disclosure guidance during the period ended December 31, 2010. There was no impact from the adoption of new guidance on the Company’s consolidated financial statements. The additional disclosures can be found in Note 5.
FASB ASC Topic 810, “Consolidations.” ASU No. 2009-17, “Consolidations (Topic 810)—Improvements to Financial Reporting by Enterprises Involved with Variable Interest Entities” amends prior guidance to change how a company determines when an entity that is insufficiently capitalized or is not controlled through voting (or similar rights) should be consolidated. The determination of whether a company is required to consolidate an entity is based on, among other things, an entity’s purpose and design and a company’s ability to direct the activities of the entity that most significantly impact the entity’s economic performance. ASU 2009-17 requires additional disclosures about the reporting entity’s involvement with variable-interest entities and any significant changes in risk exposure due to that involvement as well as its affect on the entity’s financial statements. ASU No. 2010-10, “Consolidations (Topic 810)—Amendments for Certain Investment Funds,” deferred the effective date of ASU 2009-17 for a reporting entity’s interests in investment companies. The provisions of ASU 2009-17 became effective on January 1, 2010 and did not have a significant impact on the Corporation’s financial statements.
FASB ASC Topic 820, “Fair Value Measurements and Disclosures.” ASU 2010-06 requires expanded disclosures related to fair value measurements including (i) the amounts of significant transfers of assets or liabilities between Levels 1 and 2 of the fair value hierarchy and the reasons for the transfers, (ii) the reasons for transfers of assets or liabilities in or out of Level 3 of the fair value hierarchy, with significant transfers disclosed separately, (iii) the policy for determining when transfers between levels of the fair value hierarchy are recognized and (iv) for recurring fair value measurements of assets and liabilities in Level 3 of the fair value hierarchy, a gross presentation of information about purchases, sales, issuances and settlements. ASU 2010-06 further clarifies that (i) fair value measurement disclosures should be provided for each class of assets and liabilities (rather than major category), which would generally be a subset of assets or liabilities within a line item in the statement of financial position and (ii) company’s should provide disclosures about the valuation techniques and inputs used to measure fair value for both recurring and nonrecurring fair value measurements for each class of assets and liabilities included in Levels 2 and 3 of the fair value hierarchy. The disclosures related to the gross presentation of purchases, sales, issuances and settlements of assets and liabilities included in Level 3 of the fair value hierarchy will be required for the Company beginning January 1, 2011. The remaining disclosure requirements and clarifications made by ASU 2010-06 became effective for the Company on January 1, 2010. See Note 21 for additional disclosures.
FASB ASC Topic 855, “Subsequent Events.” New authoritative accounting guidance under ASC Topic 855 provides guidance related to the date through which subsequent events have been evaluated and the disclosure of that date. The Company, as a defined SEC filer will evaluate subsequent events through the date the financial statements are issued. The Company will not specifically disclose that date in the Notes to Consolidated Financial Statements. The new authoritative accounting guidance under ASC Topic 855 became effective for the Company’s consolidated financial statements upon issuance of the final update in February 2010.
FASB ASC Topic 860, “Transfers and Servicing.” — ASU No. 2009-16, “Transfers and Servicing (Topic 860)—Accounting for Transfers of Financial Assets” amends prior accounting guidance to enhance reporting about transfers of financial assets, including securitizations, and where companies have continuing exposure to the risks related to transferred financial assets. The new authoritative accounting guidance eliminates the concept of a “qualifying special-purpose entity” and changes the requirements for derecognizing financial assets. The new guidance also requires additional disclosures about all continuing involvements with transferred financial assets including information about gains and losses resulting from transfers during the period. The Company adopted the new authoritative accounting guidance under ASC Topic 860 effective January 1, 2010. It did not have a significant impact on the Company’s consolidated financial statements.
51
STELLARONE CORPORATION AND SUBSIDIARIES
Notes to Consolidated Financial Statements
(Dollars in Thousands, except share data)
Note 2. Business Combinations
On February 28, 2008, pursuant to the terms of the Agreement and Plan of Reorganization, dated as of July 26, 2007 (the “Merger Agreement”), by and between Virginia Financial Group, Inc. (“VFG”) and FNB Corporation (“FNB”), each share of FNB outstanding common stock was converted into 1.5850 shares of the merged company’s common stock. VFG, as the surviving corporation, changed its name to StellarOne Corporation (“Company”). The Company issued 11,746,272 shares, or approximately $242 million, of its common stock to FNB shareholders, based on 7,412,576 shares of FNB common stock outstanding as of February 27, 2008 and the closing price of the Company’s common stock on the same date.
The merger transaction was accounted for under the purchase method of accounting and qualifies as a tax-free reorganization under Section 368(a) of the Internal Revenue Code. The merger resulted in $99.5 million of goodwill and $8.6 million of core deposit intangible. The goodwill acquired is not tax deductible. The core deposit intangible was based on an independent valuation and is being amortized over the estimated life of the core deposits of 7.75 years, based on undiscounted cash flows.
A summary of the fair values of assets and liabilities acquired are as follows:
| Cash and cash equivalents | $ | 45,146 | ||
| Loans receivable, net of allowance for loan losses | 1,070,023 | |||
| Investment securities | 202,538 | |||
| Premises and equipment | 48,090 | |||
| Core deposit intangible | 8,608 | |||
| Goodwill | 99,457 | |||
| Other assets | 62,975 | |||
| Deposits | (1,213,949 | ) | ||
| Borrowings | (52,598 | ) | ||
| Other liabilities | (28,297 | ) | ||
| Net assets acquired | $ | 241,993 |
For the year ended December 31, 2008 the Company’s consolidated financial statements include the results of operations of FNB only from the date of acquisition. The following unaudited summary presents the consolidated results of operations of the Company on a pro forma basis for the year ended December 31, 2008, as if FNB had been acquired on January 1, 2008. The pro forma summary information does not necessarily reflect the results of operations that would have occurred if the acquisition had occurred at the beginning of the period presented, or of results which may occur in the future.
A summary of pro forma combined financial statements is as follows:
| Year Ended December 31, | ||||
| 2008 | ||||
| (unaudited) | ||||
| Net interest income | $ | 113,003 | ||
| Provision for credit losses | 20,678 | |||
| Non-interest income | 26,507 | |||
| Non-interest expense | 93,822 | |||
| Income before income taxes | 25,010 | |||
| Income taxes | 8,241 | |||
| Net income | $ | 16,769 | ||
| Basic earnings per common share | $ | 0.81 | ||
Note 3. Participation in U.S. Treasury Capital Purchase Program
On December 19, 2008, the Company issued 30,000 shares of preferred stock to the U.S. Treasury for $30 million pursuant to the Capital Purchase Program (“CPP”). Additionally, the Company issued 302,622 common stock warrants to the U.S. Treasury as a condition to its participation in the CPP. The warrants are immediately exercisable, expire 10 years from the date of issuance and have an exercise price of $14.87 per share. Proceeds from this sale of the preferred stock have been used for general corporate purposes, including supporting the continued, anticipated growth of the Company. The CPP preferred stock is non-voting, other than having class voting rights on certain matters, and pays cumulative dividends quarterly at a rate of 5% per annum for the first five years and 9% thereafter. The Company may redeem the preferred shares with the approval of the Federal Reserve during the first three years at par value plus accrued and unpaid dividends and thereafter without restriction.
A value of $1.9 million was assigned to the common stock warrants based on their relative fair value, accordingly, $28.1 million has been assigned to the Series A preferred stock. The discount is being accreted up to the redemption amount of $30 million over a five year term.
52
STELLARONE CORPORATION AND SUBSIDIARIES
Notes to Consolidated Financial Statements
(Dollars in Thousands, except share data)
Note 4. Investment Securities
No securities were classified as held to maturity as of December 31, 2010. The amortized cost and estimated fair value of the securities being held to maturity, with gross unrealized gains and losses, as of December 31, 2009, are as follows:
| 2009 | ||||||||||||||||
| Gross | Gross | Estimated | ||||||||||||||
| Amortized | Unrealized | Unrealized | Fair | |||||||||||||
| Cost | Gains | (Losses) | Value | |||||||||||||
| State and municipal | $ | 426 | $ | 2 | $ | - | $ | 428 | ||||||||
| Agency mortgage backed securities | 21 | 1 | - | �� | 22 | |||||||||||
| Total | $ | 447 | $ | 3 | $ | - | $ | 450 | ||||||||
Amortized cost and estimated fair value of securities available for sale, with gross unrealized gains and losses as of December 31, 2010 and 2009 are as follows:
| 2010 | ||||||||||||||||
| Gross | Gross | Estimated | ||||||||||||||
| Amortized | Unrealized | Unrealized | Fair | |||||||||||||
| Cost | Gains | (Losses) | Value | |||||||||||||
| U. S. Government agencies | $ | 101,864 | $ | 1,389 | $ | - | $ | 103,253 | ||||||||
| State and municipals | 134,465 | 3,248 | (890 | ) | 136,823 | |||||||||||
| Corporate bonds | 6,527 | 377 | - | 6,904 | ||||||||||||
| Collateralized mortgage obligations | 9,294 | 203 | - | 9,497 | ||||||||||||
| Agency mortgage backed securities | 119,595 | 3,587 | (43 | ) | 123,139 | |||||||||||
| Other | 1,615 | - | - | 1,615 | ||||||||||||
| Total | $ | 373,360 | $ | 8,804 | $ | (933 | ) | $ | 381,231 | |||||||
| 2009 | ||||||||||||||||
| Gross | Gross | Estimated | ||||||||||||||
| Amortized | Unrealized | Unrealized | Fair | |||||||||||||
| Cost | Gains | (Losses) | Value | |||||||||||||
| U. S. Treasuries | $ | 20,168 | $ | 35 | $ | - | $ | 20,203 | ||||||||
| U. S. Government agencies | 62,612 | 823 | (20 | ) | 63,415 | |||||||||||
| State and municipals | 109,431 | 3,921 | (168 | ) | 113,184 | |||||||||||
| Corporate bonds | 6,560 | 374 | - | 6,934 | ||||||||||||
| Collateralized mortgage obligations | 13,172 | 117 | (263 | ) | 13,026 | |||||||||||
| Agency mortgage backed securities | 156,588 | 3,862 | (863 | ) | 159,587 | |||||||||||
| Certificates of deposit | 685 | - | - | 685 | ||||||||||||
| Equity securities | 1,484 | 7 | (22 | ) | 1,469 | |||||||||||
| Other | 11 | - | - | 11 | ||||||||||||
| Total | $ | 370,711 | $ | 9,139 | $ | (1,336 | ) | $ | 378,514 | |||||||
Other securities available for sale consisted of investments in money market mutual funds. The book value of securities pledged to secure deposits and for other purposes amounted to $156.3 million and $155.4 million at December 31, 2010 and 2009, respectively.
The amortized cost and estimated fair value of the securities available for sale as of December 31, 2010, by contractual maturity, are shown below. Expected maturities may differ from contractual maturities because issuers may have the right to call or prepay obligations without any penalties.
| 2010 | ||||||||
| Amortized | Estimated | |||||||
| Cost | Fair Value | |||||||
| Due in one year or less | $ | 24,594 | $ | 24,828 | ||||
| Due after one year through five years | 121,093 | 124,254 | ||||||
| Due after five years through ten years | 60,520 | 62,291 | ||||||
| Due after ten years | 165,538 | 168,243 | ||||||
| Other | 1,615 | 1,615 | ||||||
| Total | $ | 373,360 | $ | 381,231 | ||||
Information pertaining to sales and calls of securities available for sale is as follows:
| Twelve Months Ended | ||||||||||||
| December 31, | ||||||||||||
| 2010 | 2009 | 2008 | ||||||||||
| Proceeds from sales/calls | 53,305 | 39,404 | 27,225 | |||||||||
| Gross realized gains | 1,423 | 50 | 744 | |||||||||
| Gross realized losses | (155 | ) | (5 | ) | (558 | ) | ||||||
| Tax provision (benefit) | 444 | 16 | (31 | ) | ||||||||
53
STELLARONE CORPORATION AND SUBSIDIARIES
Notes to Consolidated Financial Statements
(Dollars in Thousands, except share data)
Information pertaining to securities with gross unrealized losses at December 31, 2010, and 2009 aggregated by investment category and length of time that individual securities have been in a continuous loss position follows.
| Less than 12 months | 12 months or more | Total | ||||||||||||||||||||||
| Estimated | Unrealized | Estimated | Unrealized | Estimated | Unrealized | |||||||||||||||||||
| Description of Securities | Fair Value | Losses | Fair Value | Losses | Fair Value | Losses | ||||||||||||||||||
| 2010 | ||||||||||||||||||||||||
| Agency mortgage backed securities | $ | 9,723 | $ | 43 | $ | - | $ | - | $ | 9,723 | $ | 43 | ||||||||||||
| State and municipals | 40,133 | 890 | - | - | 40,133 | 890 | ||||||||||||||||||
| Collateralized mortgage obligations | - | - | - | - | - | - | ||||||||||||||||||
| Total temporarily impaired securities | $ | 49,856 | $ | 933 | $ | - | $ | - | $ | 49,856 | $ | 933 | ||||||||||||
| Less than 12 months | 12 months or more | Total | ||||||||||||||||||||||
| Estimated | Unrealized | Estimated | Unrealized | Estimated | Unrealized | |||||||||||||||||||
| Description of Securities | Fair Value | Losses | Fair Value | Losses | Fair Value | Losses | ||||||||||||||||||
| 2009 | ||||||||||||||||||||||||
| U. S. Government Agencies | $ | 8,544 | $ | 20 | $ | - | $ | - | $ | 8,544 | $ | 20 | ||||||||||||
| Agency mortgage backed securities | 45,487 | 863 | - | - | 45,487 | 863 | ||||||||||||||||||
| State and municipals | 7,624 | 141 | 879 | 27 | 8,503 | 168 | ||||||||||||||||||
| Collateralized mortgage obligations | 2,920 | 61 | 2,623 | 202 | 5,543 | 263 | ||||||||||||||||||
| Subtotal debt securities | 64,575 | 1,085 | 3,502 | 229 | 68,077 | 1,314 | ||||||||||||||||||
| Equity securities | 167 | 22 | - | - | 167 | 22 | ||||||||||||||||||
| Total temporarily impaired securities | $ | 64,742 | $ | 1,107 | $ | 3,502 | $ | 229 | $ | 68,244 | $ | 1,336 | ||||||||||||
There are no securities that have unrealized losses greater than twelve months as of December 31, 2010. There were a total of 8 securities that had unrealized losses greater than twelve months as of December 31, 2009, 2 municipal securities and 6 CMO securities. Declines in the fair value of held-to-maturity and available-for-sale securities below their cost that are deemed to be other than temporary are reflected in earnings as realized losses to the extent the impairment is related to credit losses. The amount of the impairment related to other factors, which is mainly changes in market rates, is recognized in other comprehensive income. In estimating other-than-temporary impairment losses, management considers, among other things, (i) the length of time and the extent to which the fair value has been less than cost; (ii) the financial condition and near-term prospects of the issuer; and (iii) the intent and ability of the Company to retain its investment in the issuer for a period of time sufficient to allow for any anticipated recovery in cost.
As of December 31, 2010, management does not have the intent to sell any of the securities classified as available for sale in the table above and believes that it is more likely than not that the Company will not have to sell any such securities before a recovery of cost given the current liquidity position. The unrealized losses are largely due to increases in market interest rates over the yields available at the time the underlying securities were purchased. The fair value is expected to recover as the bonds approach their maturity date or repricing date or if market yields for such investments decline. Management does not believe such securities are other-than-temporarily impaired due to reasons of credit quality.
The Company recorded an impairment charge of $110 thousand, $2.5 million and $274 thousand associated with equity securities classified as available for sale investments during 2010, 2009 and 2008, respectively. These impairment charges are included in Impairments of securities available for sale on the income statement. As of December 31, 2010, the Company held no equity securities in its investment portfolio.
54
STELLARONE CORPORATION AND SUBSIDIARIES
Notes to Consolidated Financial Statements
(Dollars in Thousands, except share data)
Note 5. Loans and Allowance for Loan Losses
A summary of year-end loans follows:
| December 31, | ||||||||
| 2010 | 2009 | |||||||
| Construction and land development | $ | 237,632 | $ | 272,585 | ||||
| Commercial real estate: | ||||||||
| Commercial real estate | 751,670 | 758,890 | ||||||
| Farmland | 17,561 | 22,207 | ||||||
| Multifamily, nonresidential and junior liens | 103,641 | 83,304 | ||||||
| Total commercial real estate | 872,872 | 864,401 | ||||||
| Consumer real estate: | ||||||||
| Home equity lines | 264,961 | 246,444 | ||||||
| Secured by 1-4 family residential, secured by first deeds of trust | 457,243 | 486,564 | ||||||
| Secured by 1-4 family residential, secured by second deeds of trust | 46,108 | 52,594 | ||||||
| Total consumer real estate | 768,312 | 785,602 | ||||||
| Commercial and industrial loans (except those secured by real estate) | 177,020 | 209,898 | ||||||
| Consumer and other: | ||||||||
| Consumer installment loans | 28,703 | 38,275 | ||||||
| Deposit overdrafts | 1,396 | 976 | ||||||
| All other loans | 12,961 | 13,801 | ||||||
| Total consumer and other | 43,060 | 53,052 | ||||||
| Total loans | 2,098,896 | 2,185,538 | ||||||
| Deferred loan costs | 588 | 969 | ||||||
| Allowance for loan losses | (37,649 | ) | (40,172 | ) | ||||
| Net loans | $ | 2,061,835 | $ | 2,146,335 | ||||
Changes in the allowance for loan losses for the years ended December 31, 2010, 2009 and 2008 were as follows:
| 2010 | 2009 | 2008 | ||||||||||
| Balance, beginning of year | $ | 40,172 | $ | 30,464 | $ | 15,082 | ||||||
| Provisions for loan losses | 22,850 | 37,800 | 20,787 | |||||||||
| Loans charged off | (27,578 | ) | (30,947 | ) | (18,191 | ) | ||||||
| Recoveries | 2,205 | 2,855 | 1,247 | |||||||||
| Net charge-offs | (25,373 | ) | (28,092 | ) | (16,944 | ) | ||||||
| Allowance acquired via acquisition | - | - | 11,539 | |||||||||
| Balance, end of year | $ | 37,649 | $ | 40,172 | $ | 30,464 | ||||||
The balance in the allowance for loan losses and the recorded investment in loans by portfolio segment and based on the impairment method for the years ended December 31, 2010 and 2009 were as follows:
| Construction and Land Development | Commercial Real Estate | Consumer Real Estate | Commercial and Industrial Loans (Except those Secured by Real Estate) | Consumer and Other | Total Loans | |||||||||||||||||||
| 2010 | ||||||||||||||||||||||||
| Allowance for loan losses: | ||||||||||||||||||||||||
| Individually evaluated for impairment | 1,607 | 886 | 364 | 2,667 | - | 5,524 | ||||||||||||||||||
| Collectively evaluated for impairment | 9,430 | 7,325 | 10,500 | 4,721 | 149 | 32,125 | ||||||||||||||||||
| Total ending allowance | $ | 11,037 | $ | 8,211 | $ | 10,864 | $ | 7,388 | $ | 149 | $ | 37,649 | ||||||||||||
| Loans: | ||||||||||||||||||||||||
| Individually evaluated for impairment | $ | 13,538 | $ | 10,209 | $ | 4,403 | $ | 5,703 | $ | - | $ | 33,853 | ||||||||||||
| Collectively evaluated for impairment | 224,094 | 862,663 | 763,909 | 171,317 | 43,060 | 2,065,043 | ||||||||||||||||||
| Total loans | $ | 237,632 | $ | 872,872 | $ | 768,312 | $ | 177,020 | $ | 43,060 | $ | 2,098,896 | ||||||||||||
| 2009 | ||||||||||||||||||||||||
| Allowance for loan losses: | ||||||||||||||||||||||||
| Individually evaluated for impairment | 3,476 | 660 | 1,569 | 2,123 | - | 7,828 | ||||||||||||||||||
| Collectively evaluated for impairment | 14,389 | 3,551 | 7,676 | 5,532 | 1,196 | 32,344 | ||||||||||||||||||
| Total ending allowance | $ | 17,865 | $ | 4,211 | $ | 9,245 | $ | 7,655 | $ | 1,196 | $ | 40,172 | ||||||||||||
| Loans: | ||||||||||||||||||||||||
| Individually evaluated for impairment | $ | 25,673 | $ | 9,875 | $ | 4,804 | $ | 6,234 | $ | - | $ | 46,586 | ||||||||||||
| Collectively evaluated for impairment | 246,912 | 854,526 | 780,798 | 203,664 | 53,052 | 2,138,952 | ||||||||||||||||||
| Total loans | $ | 272,585 | $ | 864,401 | $ | 785,602 | $ | 209,898 | $ | 53,052 | $ | 2,185,538 | ||||||||||||
55
STELLARONE CORPORATION AND SUBSIDIARIES
Notes to Consolidated Financial Statements
(Dollars in Thousands, except share data)
Impaired loans totaled $62.4 million at December 31, 2010. Included in the $62.4 million is $43.2 million of loans classified as troubled debt restructurings (“TDRs”). A modification of a loan’s terms constitutes a TDR if the creditor grants a concession to the borrower for economic or legal reasons related to the borrower’s financial difficulties that it would not otherwise consider. All TDRs are considered impaired.
Interest is not typically accrued on impaired loans. For loans classified as TDRs, the Company further evaluates the loans as performing or non-performing. If, at the time of restructure, the loan is not considered non-accrual, it will be classified as performing. At December 31, 2010, $39.7 million of TDRs were accruing interest as they were classified as performing. Interest income recognized on performing TDRs was $433 thousand, $693 thousand and $1.0 million for the years ended December 31, 2010, 2009 and 2008. On a cash basis, interest recognized on performing TDRs was $476 thousand, $368 thousand and $1.3 million for the years ended December 31, 2010, 2009 and 2008, respectively. Other than these TDRs, no interest income has been recognized on impaired loans subsequent to their classification as impaired.
In order to quantify the value of impairment, the Company evaluates loans either individually or in collective pools. Collective pools consist of smaller balance, homogenous loans that are not subject to a restructuring agreement. Of the $62.4 million of impaired loans, $28.5 million was collectively evaluated for impairment and $33.9 million was individually evaluated for impairment. The detail of loans individually evaluated for impairment, which includes $14.7 million of TDRs, is presented below:
| Recorded investment | Unpaid contractual principal balance | Allocated allowance | Average recorded investment | |||||||||||||
| 2010 | ||||||||||||||||
| Loans without a specific valuation allowance: | ||||||||||||||||
| Construction and land development | $ | 3,414 | $ | 3,420 | $ | - | $ | 7,091 | ||||||||
| Commercial real estate | 7,160 | 7,185 | - | 6,341 | ||||||||||||
| Consumer real estate | 3,200 | 3,855 | - | 1,459 | ||||||||||||
| Commercial and industrial loans (except those secured by real estate) | - | - | - | 880 | ||||||||||||
| Consumer and other | - | - | - | - | ||||||||||||
| Loans with a specific valuation allowance: | ||||||||||||||||
| Construction and land development | 10,124 | 11,574 | 1,607 | 13,126 | ||||||||||||
| Commercial real estate | 3,049 | 4,041 | 886 | 3,095 | ||||||||||||
| Consumer real estate | 1,203 | 1,216 | 364 | 2,814 | ||||||||||||
| Commercial and industrial loans (except those secured by real estate) | 5,703 | 7,008 | 2,667 | 7,158 | ||||||||||||
| Consumer and other | - | - | - | - | ||||||||||||
| Total | $ | 33,853 | $ | 38,299 | $ | 5,524 | $ | 41,964 | ||||||||
In 2009, the Company had $65.7 million of impaired loans, with $19.1 million collectively evaluated for impairment and $46.6 million individually evaluated for impairment, which is shown below:
| Recorded investment | Unpaid contractual principal balance | Allocated allowance | Average recorded investment | |||||||||||||
| 2009 | ||||||||||||||||
| Loans without a specific valuation allowance: | ||||||||||||||||
| Construction and land development | $ | 15,679 | $ | 23,418 | $ | - | $ | 11,097 | ||||||||
| Commercial real estate | 3,976 | 3,976 | - | 2,322 | ||||||||||||
| Consumer real estate | 122 | 122 | - | 262 | ||||||||||||
| Commercial and industrial loans (except those secured by real estate) | - | - | - | 366 | ||||||||||||
| Consumer and other | - | - | - | - | ||||||||||||
| Loans with a specific valuation allowance: | ||||||||||||||||
| Construction and land development | 9,995 | 12,324 | 3,476 | 20,784 | ||||||||||||
| Commercial real estate | 5,899 | 5,899 | 660 | 2,650 | ||||||||||||
| Consumer real estate | 4,681 | 4,725 | 1,569 | 4,312 | ||||||||||||
| Commercial and industrial loans (except those secured by real estate) | 6,234 | 7,507 | 2,123 | 6,802 | ||||||||||||
| Consumer and other | - | - | - | - | ||||||||||||
| Total | $ | 46,586 | $ | 57,971 | $ | 7,828 | $ | 48,595 | ||||||||
The following table presents the recorded investment in nonaccrual and loans past due more than 90 days still accruing by portfolio segment as of December 31:
| Nonaccrual | Loans Past Due Over 90 Days Still Accruing | |||||||||||||||
| 2010 | 2009 | 2010 | 2009 | |||||||||||||
| Construction and land development | $ | 15,443 | $ | 28,816 | $ | 937 | 975 | |||||||||
| Commercial real estate | 8,060 | 7,910 | 531 | - | ||||||||||||
| Consumer real estate | 15,154 | 14,498 | - | 497 | ||||||||||||
| Commercial and industrial loans (except those secured by real estate) | 4,277 | 7,994 | 423 | 6 | ||||||||||||
| Consumer and other | 26 | 84 | 19 | 33 | ||||||||||||
| Total | $ | 42,960 | $ | 59,302 | $ | 1,910 | $ | 1,511 | ||||||||
If interest had been earned on non-accrual loans, such income would have approximated $1.4 million, $472 thousand and $806 thousand for the years ended December 31, 2010, 2009, and 2008, respectively.
56
STELLARONE CORPORATION AND SUBSIDIARIES
Notes to Consolidated Financial Statements
(Dollars in Thousands, except share data)
The following table presents the aging of the recorded investment in past due loans as of December 31, 2010 by portfolio segment:
| 30-59 Days Past Due | 60-89 Days Past Due | Greater than 90 Days Past Due | Non-accrual | Total Past Due | Current | Total Loans | ||||||||||||||||||||||
| 2010 | ||||||||||||||||||||||||||||
| Construction and land development | $ | 7,467 | $ | 1,064 | $ | 937 | $ | 15,443 | $ | 24,911 | $ | 212,721 | $ | 237,632 | ||||||||||||||
| Commercial real estate | 7,586 | 4,685 | 531 | 8,060 | 20,862 | 852,010 | 872,872 | |||||||||||||||||||||
| Consumer real estate | 22,586 | 6,805 | - | 15,154 | 44,545 | 723,767 | 768,312 | |||||||||||||||||||||
| Commercial and industrial loans (except those secured by real estate) | 791 | 1,139 | 423 | 4,277 | 6,630 | 170,390 | 177,020 | |||||||||||||||||||||
| Consumer and other | 513 | 147 | 19 | 26 | 705 | 42,355 | 43,060 | |||||||||||||||||||||
| Total loans | $ | 38,943 | $ | 13,840 | $ | 1,910 | $ | 42,960 | $ | 97,653 | $ | 2,001,243 | $ | 2,098,896 | ||||||||||||||
Credit Quality Indicators
The Company categorizes all business and commercial purpose loans into risk categories based on relevant information about the ability of borrowers to service their debt such as: current financial information, historical payment experience, credit documentation, public information, and current economic trends, among other factors. The Company analyzes loans individually by setting the risk grade at the inception of a loan through the approval process. The definitions used were last updated in early 2010. The risk grades are formally affirmed quarterly by loan officers. In addition, a certain percentage of loan dollars is reviewed each year through the Company’s loan review process. The risk rating process is inherently subjective and based upon management’s evaluation of the specific facts and circumstances for individual borrowers. As such, the assigned risk ratings are subject to change based upon changes in borrower status and changes in the external environment affecting the borrower. The Company uses the following definitions for risk ratings:
| · | Risk Grade 1 – Prime Risk. Loss potential is rated as none or extremely low. Loans fully secured by deposit accounts at the Company’s subsidiary bank will also be rated as Risk Grade 1. |
| · | Risk Grade 2 – Excellent Risk. Loss potential is demonstrably low. Loans have liquid financial statements or are secured by marketable securities or other liquid collateral. |
| · | Risk Grade 3 – Good Risk. Loss potential is low. Asset quality and liquidity are considered good. Overall leverage and liquidity measures are better than the industry in which the borrower operates and they are stable. |
| · | Risk Grade 4 – Average Risk. Loss potential is low, but evidence of risk exists. Margins and cash flow generally equal or exceed industry norm and policy guidelines, but some inconsistency may be evident. Asset quality is average with liquidity comparable to industry norms. Leverage may be slightly higher than the industry, but is stable. |
| · | Risk Grade 5 – Marginal Risk. Loss potential is variable, but there is potential for deterioration. Asset quality is marginally acceptable. Leverage may fluctuate and is above normal for the industry. Cash flow is marginally adequate. |
| · | Risk Grade 6 – Special Mention. Loss potential moderate if corrective action not taken. Evidence of declining revenues or margins, inadequate cash flow, and possibly high leverage or tightening liquidity. |
| · | Risk Grade 7 – Substandard. Distinct possibility of loss to the bank. Repayment ability of borrower is weak and the loan may have exhibited excessive overdue status, extension, or renewals. |
| · | Risk Grade 8 – Doubtful. Loss potential is extremely high. Ability of the borrower to service the debt is weak, constant overdue status, loan has been placed on non-accrual status and no definitive repayment schedule exists. |
| · | Risk Grade 9 – Loss. Loans are considered fully uncollectible and charged off. |
57
STELLARONE CORPORATION AND SUBSIDIARIES
Notes to Consolidated Financial Statements
(Dollars in Thousands, except share data)
The Company utilizes its nine point grading system in order to evaluate the level of inherent risk in the loan portfolio as part of its allowance for loan losses methodology. Loans collectively evaluated for impairment are grouped by loan type and, in the case of commercial and construction loans, by risk rating. Each loan type is assigned an allowance factor based on risk grade, historical loss experience, economic conditions, overall portfolio quality including delinquency rates and commercial real estate loan concentrations (as applicable). Loans graded 5 or worse are assigned an additional reserve factor stated in basis points in order to account for the added inherent risk. Additional basis points are applied as a reserve factor to the loan balances as the corresponding loan grades indicate additional risk and increase from grade 5 to grade 8.
Loans listed as not rated are either commercial loans less than $25 thousand, consumer purpose loans or are included in groups of homogenous loans. As of December 31, and based on the most recent analysis performed, the risk category of loans by class of loans is as follows:
| Risk Grade | ||||||||||||||||||||||||||||||||||||
| 1 | 2 | 3 | 4 | 5 | 6 | 7 | 8 | 9 | ||||||||||||||||||||||||||||
| 2010 | ||||||||||||||||||||||||||||||||||||
| Construction and land development | $ | - | $ | 275 | $ | 2,481 | $ | 79,613 | $ | 31,468 | $ | 12,588 | $ | 59,301 | $ | 4,464 | $ | - | ||||||||||||||||||
| Commercial real estate | - | 1,957 | 102,520 | 451,984 | 178,279 | 55,178 | 82,232 | 624 | 98 | |||||||||||||||||||||||||||
| Consumer real estate | - | 991 | 12,533 | 121,066 | 53,867 | 11,627 | 28,238 | 1,301 | - | |||||||||||||||||||||||||||
| Commercial and industrial loans (except those secured by real estate) | 1,190 | 1,901 | 26,915 | 105,294 | 20,622 | 8,342 | 9,662 | 3,094 | - | |||||||||||||||||||||||||||
| Consumer and other | - | 873 | 3,404 | 6,406 | 2,278 | - | - | - | - | |||||||||||||||||||||||||||
| Total | $ | 1,190 | $ | 5,997 | $ | 147,853 | $ | 764,363 | $ | 286,514 | $ | 87,735 | $ | 179,433 | $ | 9,483 | $ | 98 | ||||||||||||||||||
| 2009 | ||||||||||||||||||||||||||||||||||||
| Construction and land development | $ | - | $ | 289 | $ | 17,961 | $ | 78,548 | $ | 51,091 | $ | 10,007 | $ | 61,451 | $ | 13,935 | $ | - | ||||||||||||||||||
| Commercial real estate | - | 10,905 | 132,355 | 496,083 | 113,860 | 38,506 | 66,993 | 5,699 | - | |||||||||||||||||||||||||||
| Consumer real estate | - | 1,696 | 22,097 | 153,341 | 42,137 | 5,974 | 36,138 | 4,002 | - | |||||||||||||||||||||||||||
| Commercial and industrial loans (except those secured by real estate) | 1,162 | 3,703 | 23,670 | 111,849 | 33,816 | 15,139 | 20,344 | 215 | - | |||||||||||||||||||||||||||
| Consumer and other | - | 910 | 6,031 | 6,860 | - | - | - | - | ||||||||||||||||||||||||||||
| Total | $ | 1,162 | $ | 17,503 | $ | 202,114 | $ | 846,681 | $ | 240,904 | $ | 69,626 | $ | 184,926 | $ | 23,851 | $ | - | ||||||||||||||||||
The Company considers the performance of the loan portfolio and its impact on the allowance for loan losses. For smaller-balance homogenous residential and consumer loans, the Company also evaluates credit quality based on the aging status of the loan, which was previously presented, and by payment activity. The following table presents the recorded investment in residential and consumer loans based on payment activity as of December 31:
| Consumer real estate | Consumer and other | |||||||||||||||
| 2010 | 2009 | 2010 | 2009 | |||||||||||||
| Performing | $ | 577,388 | $ | 551,529 | $ | 30,073 | $ | 39,167 | ||||||||
| Nonperforming | 8,743 | 7,991 | 26 | 84 | ||||||||||||
| Total | $ | 586,131 | $ | 559,520 | $ | 30,099 | $ | 39,251 | ||||||||
Purchased Loans
The Company evaluates all mortgage loans at the time of repurchase for evidence of deteriorated credit quality. All loans are recorded at estimated realizable value at the time of purchase.
Concentrations of Credit
Most of the Company’s lending activity occurs within Central and Southwest Virginia. The majority of the Company’s loan portfolio consists of consumer and commercial real estate loans. As of December 31, 2010 and 2009, there were no concentrations of loans related to any single industry in excess of 10% of total loans.
58
STELLARONE CORPORATION AND SUBSIDIARIES
Notes to Consolidated Financial Statements
(Dollars in Thousands, except share data)
Note 6. Goodwill and Core Deposit Intangibles
At both December 31, 2010 and 2009, goodwill totaled $113.7 million. The gross carrying amounts and accumulated amortization of core deposit intangibles as of December 31, 2010 and 2009 are as follows:
| December 31, 2010 | December 31, 2009 | |||||||||||||||
| Gross Carrying Amount | Accumulated Amortization | Gross Carrying Amount | Accumulated Amortization | |||||||||||||
| Core deposit intangibles | $ | 14,549 | $ | (7,887 | ) | $ | 14,855 | $ | (6,447 | ) | ||||||
Amortization expense related to all intangible assets charged to operations was $1.7 million, $1.7 million and $1.6 million in 2010, 2009 and 2008, respectively.
The following table sets forth the actual and estimated pre-tax amortization expense of core deposit intangibles as of December 31, 2010:
| 2011 | $ | 1,651 | ||
| 2012 | 1,549 | |||
| 2013 | 1,244 | |||
| 2014 | 1,200 | |||
| 2015 | 1,018 | |||
| $ | 6,662 |
Note 7. Premises and Equipment
A summary of the cost and accumulated depreciation and amortization of bank premises, equipment and software follows:
| Estimated Useful Lives | 2010 | 2009 | |||||||
| Land | Indefinite | $ | 16,160 | $ | 16,587 | ||||
| Buildings and leasehold improvements | Lease term - 39 years | 65,198 | 65,437 | ||||||
| Furniture, equipment and software | 3 - 7 years | 42,219 | 39,373 | ||||||
Construction in progress 1 | 1,551 | 1,697 | |||||||
| 125,128 | 123,094 | ||||||||
| Less accumulated depreciation and amortization | 46,095 | 39,548 | |||||||
| $ | 79,033 | $ | 83,546 | ||||||
1 Construction in progress is not depreciated until placed in service.
Depreciation and amortization expense amounted to $6.8 million, $6.3 million, and $5.0 million in 2010, 2009 and 2008, respectively.
59
STELLARONE CORPORATION AND SUBSIDIARIES
Notes to Consolidated Financial Statements
(Dollars in Thousands, except share data)
Note 8. Deposits
Deposits are summarized as follows at December 31, 2010 and 2009:
| 2010 | 2009 | |||||||||||||||
| Amount | % | Amount | % | |||||||||||||
| Type of Account: | ||||||||||||||||
| Noninterest bearing | $ | 322,924 | 13.53 | % | $ | 302,009 | 12.40 | % | ||||||||
| NOW | 576,000 | 24.14 | % | 583,989 | 23.97 | % | ||||||||||
| Money market | 413,426 | 17.33 | % | 377,867 | 15.51 | % | ||||||||||
| Savings | 265,891 | 11.14 | % | 197,763 | 8.12 | % | ||||||||||
| Time deposits | 807,861 | 33.86 | % | 974,492 | 40.00 | % | ||||||||||
| Total Deposits | $ | 2,386,102 | 100.00 | % | $ | 2,436,120 | 100.00 | % | ||||||||
The aggregate amount of time deposits in denominations greater than $100,000 at December 31, 2010 and 2009 was $268.1 million and $320.2 million, respectively.
At December 31, 2010, the scheduled maturities of time deposits were as follows:
| 2011 | $ | 442,028 | ||
| 2012 | 175,157 | |||
| 2013 | 79,365 | |||
| 2014 | 12,649 | |||
| 2015 | 98,470 | |||
| Thereafter | 192 | |||
| $ | 807,861 |
Brokered certificates of deposit, consisting entirely of certificates of deposit originated through a Certificate of Deposit Account Registry Service program totaled $10.1 million and $14.8 million at December 31, 2010 and 2009, respectively.
Note 9. Federal Home Loan Bank Advances
The Company had advances outstanding with the Federal Home Loan Bank of Atlanta of $85 million at December 31, 2010 maturing through 2018. At December 31, 2009, $130 million of advances were outstanding. At December 31, 2010 and 2009, the interest rates on this debt ranged from 2.57% to 4.81% and from 0.27% to 6.69%, respectively. The weighted average interest rate at December 31, 2010 and 2009 was 3.16% and 3.53%, respectively. The average balance outstanding during 2010 and 2009 was $113.3 million and $160.9 million, respectively. The advance structures employed by the Company include $45.0 million in convertible credits and $40.0 million in fixed rate credits. Each structure requires quarterly interest payments.
The banking subsidiary has available a $204.0 million line of credit with the Federal Home Loan Bank of Atlanta. Advances on the line are secured by securities and a blanket lien on StellarOne Bank’s loan portfolio. The blanket lien covers one to four family dwelling loans, multifamily loans, and home equity loans. As of December 31, 2010 and 2009, the book value of loans pledged as collateral totaled $630.5 million and $515 million, respectively, and consisted of one to four family, multifamily, and home equity loans.
At December 31, 2010, the contractual maturities of the advances are as follows:
| Due in 2011 | $ | 25,000 | ||
| Due in 2012 | 5,000 | |||
| Due in 2013 | 25,000 | |||
| Due in 2014 | - | |||
| Due in 2015 | 10,000 | |||
| Thereafter | 20,000 | |||
| Total | $ | 85,000 |
Note 10. Subordinated Debt
The Company has two unconsolidated wholly-owned finance subsidiaries that were formed for the purpose of issuing redeemable capital securities (also referred to as subordinated debt).
In 2004, VFG Limited Liability Trust (“VFG”) issued $20.0 million of trust preferred securities through a private transaction. VFG issued $619 thousand in common equity to the Company. The securities have a LIBOR-indexed floating rate of interest which adjusts, and is payable, quarterly. The interest rate at December 31, 2010 was 3.02% and at December 31, 2009 was 2.98%. The securities became redeemable at par beginning in June 2009 and continue to be redeemable each quarterly anniversary of such date until the securities mature on June 17, 2034. The principal asset of the VFG is $20.6 million of StellarOne Corporation’s junior subordinated debt securities with like maturities and like interest rates to the capital securities.
In 2003, FNB (VA) Statutory Trust II (“FNB”), issued $12.0 million of trust preferred securities through a private transaction. FNB issued $372 thousand in common equity to the Company. The securities have a LIBOR-indexed floating rate of interest which adjusts, and is payable, quarterly. The interest rate at December 31, 2010 was 3.39% and at December 31, 2009 was 3.35%. The securities became redeemable at par in June 2008 and continue to be redeemable each quarterly anniversary of such date until the securities mature on June 26, 2033. The principal asset of FNB is $12.4 million of the StellarOne Corporation’s junior subordinated debt securities with like maturities and like interest rates to the capital securities.
In September 2010, the Company entered into an interest rate swap contract on the junior subordinated debt securities that will effectively fix the interest rate for a period of three years beginning September 30, 2011. See Note 15 for more information.
The Company may include the subordinated debt in Tier 1 for regulatory capital adequacy determination purposes up to 25% of Tier I capital after its inclusion. The portion of the subordinated debt not considered as Tier I capital may be included in Tier II capital. All outstanding subordinated debt as of both December 31, 2010 and 2009 was included in Tier I capital.
The obligations of the Company with respect to the issuance of the capital securities constitute a full and unconditional guarantee by the Company of VFG’s and FNB’s obligations with respect to the capital securities. Subject to certain exceptions and limitations, the Company may elect from time to time to defer interest payments on the junior subordinated debt securities, which would result in a deferral of distribution payments on the related capital securities.
60
STELLARONE CORPORATION AND SUBSIDIARIES
Notes to Consolidated Financial Statements
(Dollars in Thousands, except share data)
Note 11. Short-Term Borrowings
Securities sold under agreements to repurchase, which are classified as short-term borrowings, generally mature within one to four days from the transaction date. Securities sold under agreements to repurchase are reflected at the amount of cash received in connection with the transaction. Additional collateral may be required based on the fair value of the underlying securities. The outstanding balances at December 31, 2010 and 2009 were $986.9 thousand and $782.9 thousand, respectively, and were collateralized by investment securities controlled by the Company with a market value of $1.6 million and $1.0 million, respectively.
The Company, through its subsidiary bank, has uncollateralized, unused lines of credit totaling $70 million with nonaffiliated banks at December 31, 2010.
The average balance outstanding of short-term borrowings did not exceed 30 percent of stockholders’ equity during the year ended December 31, 2010 and 2009.
Note 12. Stock-Based Compensation
Under the Company’s incentive stock option plan, the Company may grant options to purchase common stock or restricted share awards to its directors, officers and employees of up to 1,125,000 newly issued shares of the Company’s common stock. The Company’s stock options typically have an exercise price equal to at least the fair value of the stock on the date of grant, and vest based on continued service with the Company for a specified period, generally from one to five years and will expire in no more than ten years after the date of grant.
At December 31, 2010, the Company has one stock-based employee compensation plan. Share-based compensation expense of $658 thousand, $484 thousand and $1.4 million in the aggregate was recognized for the years ended December 31, 2010, 2009 and 2008, respectively. Pursuant to meeting change in control provisions under equity compensation expense for both FNB and VFG, an acceleration adjustment of $1.1 million related to the merger is included in expense for the year ended December 31, 2008. The Company expenses the fair value of stock awards determined at the grant date on a straight-line basis over the vesting period of the award.
For the years ended December 31, 2010, 2009 and 2008, the Company recognized $62 thousand, $59 thousand and $614 thousand, respectively, in compensation expense related to the vesting of stock options. A summary of the stock option plan at December 31, 2010, 2009 and 2008 and changes during the years ended on those dates is as follows:
| 2010 | 2009 | 2008 | ||||||||||||||||||||||
| Weighted | Weighted | Weighted | ||||||||||||||||||||||
| Number | Average | Number | Average | Number | Average | |||||||||||||||||||
| of | Exercise | of | Exercise | of | Exercise | |||||||||||||||||||
| Shares | Price | Shares | Price | Shares | Price | |||||||||||||||||||
| Outstanding at beginning of year | 575,046 | $ | 18.93 | 614,198 | $ | 18.58 | 239,671 | $ | 23.37 | |||||||||||||||
| Acquired via merger | - | - | - | - | 311,606 | 14.02 | ||||||||||||||||||
| Granted | - | - | 17,392 | 12.78 | 123,061 | 18.27 | ||||||||||||||||||
| Forfeited | (3,876 | ) | 13.65 | (12,373 | ) | 16.61 | (4,893 | ) | 19.81 | |||||||||||||||
| Expired | (12,674 | ) | 22.79 | (8,138 | ) | 22.92 | (22,936 | ) | 16.05 | |||||||||||||||
| Exercised | (60,322 | ) | 9.78 | (36,033 | ) | 9.77 | (32,311 | ) | 10.68 | |||||||||||||||
| Outstanding at end of year | 498,174 | $ | 19.98 | 575,046 | $ | 18.93 | 614,198 | $ | 18.58 | |||||||||||||||
| Exercisable at end of year | 423,051 | 470,991 | 493,337 | |||||||||||||||||||||
| Weighted-average fair value per option of options granted during the year | N/A | $ | 3.54 | $ | 2.42 | |||||||||||||||||||
As of December 31, 2010, the intrinsic value of the options outstanding was $258 thousand and the intrinsic value of options exercised during the year was $224 thousand. The intrinsic value represents the total pre-tax intrinsic value (the difference between the Company’s closing stock price on the last trading day of the year ended December 31, 2010 and the exercise price, multiplied by the number of options outstanding). The intrinsic value of shares exercisable at December 31, 2010 was $239 thousand. The weighted average remaining contractual life is 3.1 years with a weighted average exercise price of $20.39 for exercisable options at December 31, 2010.
As of December 31, 2010, there was $143 thousand of total unrecognized compensation expense related to nonvested options, which will be recognized over a weighted-average period of approximately 1.7 years.
The actual tax benefit realized for the tax deductions from option exercises under the plan for the twelve months ended December 31, 2010, 2009 and 2008 was $63 thousand, $65 thousand and $14 thousand, respectively. The impact of these cash receipts is included in financing activities in the accompanying consolidated statements of cash flows.
The incentive stock option plan also allows for the issuance of restricted share awards. Restricted stock awards are independent of option grants and are generally subject to forfeiture if employment terminates prior to the release of the restrictions, generally three to five years from the date of grant. Restricted stock has dividend rights equal to the cumulative cash dividend accrued during the restriction period, which are paid during the vesting period. Restricted shares do not have the voting rights of common stock until the restriction expires and the shares are issued. The Company expenses the cost of the restricted stock awards, determined to be the fair value of the shares at the date of grant, ratably over the period of the restriction. Compensation expense associated with such awards amounted to $595 thousand, $425 thousand and $767 thousand for the years ended December 31, 2010, 2009 and 2008, respectively. The Company had 152,091 shares of restricted stock awarded and nonvested at December 31, 2010 with total unrecognized compensation expense of $1.3 million, which will be recognized over a weighted-average period of approximately 2.0 years.
The following table summarizes activity related to nonvested restricted shares:
| Nonvested Shares | Number of Shares | Weighted Average Grant-Date Fair Value | Total Intrinsic Value | |||||||||
| Nonvested at December 31, 2007 | 30,537 | $ | 24.37 | $ | 453 | |||||||
| Acquired via merger | 16,356 | 17.30 | ||||||||||
| Granted | 35,701 | 16.31 | ||||||||||
| Vested and exercised | (46,893 | ) | 21.90 | $ | 795 | |||||||
| Forfeited | (300 | ) | 15.65 | |||||||||
| Nonvested at December 31, 2008 | 35,401 | $ | 16.31 | $ | 598 | |||||||
| Granted | 56,821 | 13.09 | ||||||||||
| Vested and exercised | (20,029 | ) | 16.26 | $ | 253 | |||||||
| Forfeited | (1,257 | ) | 13.24 | |||||||||
| Nonvested at December 31, 2009 | 70,936 | $ | 13.80 | $ | 707 | |||||||
| Granted | 114,594 | 11.45 | ||||||||||
| Vested and exercised | (26,615 | ) | 13.25 | $ | 359 | |||||||
| Forfeited | (6,824 | ) | 11.74 | |||||||||
| Nonvested at December 31, 2010 | 152,091 | $ | 12.21 | $ | 2,211 | |||||||
61
STELLARONE CORPORATION AND SUBSIDIARIES
Notes to Consolidated Financial Statements
(Dollars in Thousands, except share data)
Note 13. Employee Benefit Plans
The Company and its banking subsidiary maintain several qualified and non-qualified employee benefit plans for employees, which are described below.
The Company has a noncontributory pension plan which conforms to the Employee Retirement Income Security Act of 1974. The amount of benefits payable under the plan is determined by an employee's period of credited service. The amount of normal retirement benefit will be determined based on a Pension Equity Credit formula. The employee receives credits based on their age and years of service. The plan provides for early retirement for participants with five years of service and the attainment of age 55. A participant who terminates employment with 2 or more years of service will be entitled to a benefit. The benefits are payable in single or joint/survivor annuities as well as a lump sum payment upon retirement or separation of service. The Company froze participation in this plan during 2002, and has approximately 82 participants remaining in the plan. The Company froze the pension plan at the current benefit levels as of December 31, 2008, at which time the accrual of future benefits for eligible employees ceased. All retirement benefits earned in the pension plan as of December 31, 2008 have been preserved and all participants are fully vested in their benefits. All amounts related to the pension plan are included in the Other Asset line item on the Consolidated Balance Sheet.
Prior to the merger and subsequent formation of the Company, FNB maintained a nonqualified post retirement benefit plan that contributed to the medical benefits of legacy FNB employees who retired prior to December 31, 2008. The Company froze participation in this plan during 2008 to include only participants that retired on or prior to December 31, 2008. These remaining participants are fully vested in their benefits. The accrual of future benefits for previously eligible participants ceased during 2008 and a gain of $1.3 million was recognized in conjunction with the curtailment of this plan during the year ended December 31, 2008. As of December 31, 2010, the remaining benefit obligation associated with this plan was $711 thousand.
Utilizing a measurement date of December 31, 2010 and 2009 for the 2010 and 2009 plan years, respectively, information about the defined benefit pension plan follows:
| 2010 | 2009 | |||||||
| Change in Benefit Obligation | ||||||||
| Benefit obligation, beginning | $ | 3,678 | $ | 3,355 | ||||
| Interest cost | 193 | 214 | ||||||
| Actuarial loss | 171 | 518 | ||||||
| Benefits paid | (139 | ) | (409 | ) | ||||
| Benefit obligation, ending | $ | 3,903 | $ | 3,678 | ||||
| Change in Plan Assets | ||||||||
| Fair value of plan assets, beginning | $ | 4,067 | $ | 4,315 | ||||
| Actual return on plan assets | 18 | 161 | ||||||
| Benefits paid | (139 | ) | (409 | ) | ||||
| Fair value of plan assets, ending | $ | 3,946 | $ | 4,067 | ||||
| Funded status | $ | 43 | $ | 389 | ||||
| Unrecognized net actuarial loss | 2,181 | 2,013 | ||||||
| Prepaid benefit cost included on balance sheet | $ | 2,224 | $ | 2,402 | ||||
| Accumulated benefit obligation | $ | 3,903 | $ | 3,678 | ||||
| 2010 | 2009 | |||||||
| Amount Recognized in Consolidated Balance Sheets | ||||||||
| Funded status asset | $ | 43 | $ | 389 | ||||
| Deferred tax asset | 763 | 705 | ||||||
| Accumulated other comprehensive income, net | 1,418 | 1,308 | ||||||
| Net amount recognized | $ | 2,224 | $ | 2,402 | ||||
| Information for penstion plans with a projected benefit obligation in excess of plan assets | ||||||||
| Projected benefit obligation | $ | 3,903 | $ | 3,678 | ||||
| Accumulated benefit obligation | $ | 3,903 | $ | 3,678 | ||||
| Fair value of plan assets | $ | 3,946 | $ | 4,067 | ||||
| Components of Net Periodic Benefit Cost | 2010 | 2009 | 2008 | |||||||||
| Service cost | $ | - | $ | - | $ | 180 | ||||||
| Interest cost | 193 | 214 | 326 | |||||||||
| Expected return on plan assets | (156 | ) | (346 | ) | (451 | ) | ||||||
| Amortization of prior service cost | - | - | 40 | |||||||||
| Recognized net actuarial gain | 141 | 107 | 28 | |||||||||
| Amount recognized due to curtailment | - | - | (66 | ) | ||||||||
| Net periodic benefit cost (benefit) | $ | 178 | $ | (25 | ) | $ | 57 | |||||
| Other changes in Plan Assets and Benefit Obligations Recognized in Other Comprehensive Income: | 2010 | 2009 | ||||||
| Net actuarial loss | $ | 323 | $ | 457 | ||||
| Amortization of net gain | (91 | ) | (70 | ) | ||||
| Accumulated other comprehensive income | $ | 231 | $ | 387 | ||||
62
STELLARONE CORPORATION AND SUBSIDIARIES
Notes to Consolidated Financial Statements
(Dollars in Thousands, except share data)
The Company assumes the expected long-term rate of return on assets in consultation with its investment advisors and actuary. This rate is intended to reflect the average rate of earnings expected to be earned on the funds invested or to be invested to provide plan benefits. Historical performance is reviewed, especially with respect to real rates of return (net of inflation), for the major asset classes held or anticipated to be held by the trust, and for the trust itself. Undue weight is not given to recent experience that may not continue over the measurement period, with higher significance placed on current forecasts of future long-term economic conditions.
Because the pension plan assets are held in a qualified trust, anticipated returns are not reduced for taxes. Further, solely for this purpose, the plan is assumed to continue in force and not terminate during the period during which assets are invested. However, consideration is given to the potential impact of current and future investment policy, cash flow into and out of the trust, and expenses (both investment and non-investment) typically paid from plan assets (to the extent such expenses are not explicitly estimated within periodic cost).
Historically, the long-term investment policy and strategies for the pension plan assets were best described as a capital growth with current cash income strategy. The target allocation for equities was 75% of the total portfolio through the use of large and mid-size capitalization companies. The remaining asset allocation was to fixed income investments and money market funds. The portfolio was diversified by limiting the holding in any one equity issue to no more than 5% of total equities and one industry to no more than 25%. Asset allocations at December 31, 2010 and 2009 are materially different than that of the historical long-term investment strategy due to the current challenging economic conditions and the cessation of the accrual of plan benefits, which included moving all investments to cash equivalents in late 2009 and leaving them invested in money markets and equivalents during 2010. All fixed income investments are rated as investment grade with the majority of the assets in corporate issues. The assets are managed by StellarOne Bank’s Wealth Management Division. The portfolio does not include any position in StellarOne Corporation. All categories of assets in the Company’s pension plan at December 31, 2010 and 2009 were categorized as Level 1 when considering the valuation inputs within the fair value hierarchy established by FASB ASC Topic 820 (see Note 20) utilized to measure fair value.
The Company does not anticipate making any contributions to the plan during 2011.
Estimated future benefit payments are as follows:
| 2011 | $ | 198 | ||
| 2012 | 220 | |||
| 2013 | 305 | |||
| 2014 | 283 | |||
| 2015 | 236 | |||
| 2016-2020 | 1,766 | |||
| $ | 3,008 |
The estimated net loss cost that will be amortized from accumulated other comprehensive income as a component of net periodic pension cost for the fiscal year ended December 31, 2011 are $164 thousand.
Defined Contribution Plans
The Company has a non-qualified Directors Deferred Compensation Plan. This plan allows for the deferral of pre-tax income associated with payment of director fees. Directors may elect to defer all or a portion of their annual fees. Monthly board fees are contributed directly to a trust with various investment options, and are held until such time the director is entitled to receive a distribution.
During 2009, the Company had a 401(k) Savings Plan eligible to legacy VFG employees with matching contributions equal to 100% of the first 4% of salary reduction contributions made by the employee. During 2008, the contribution methodology was equal to 100% of the first 3% and 50% of the next 2% of salary reduction contributions made by the employee. The Company contributed matching contributions of $630 thousand and $571 thousand for the years ended December 31, 2009 and 2008, respectively. In addition to matching contributions, the Company also makes an annual discretionary contribution. Annual discretionary contributions were $795 thousand and $588 thousand for the years ended December 31, 2009 and 2008, respectively.
Additionally, during 2009 the Company had a 401(k) Savings Plan eligible to legacy FNB employees with matching contributions equal to 100% of the first 4% of salary reduction contributions made by the employee. During 2008, the contribution methodology was equal to 200% of the first 1% and 100% of the next 2% of salary reduction contributions made by the employee. The Company contributed matching contributionsof $579 thousand and $557 thousand for the years ended December 31, 2009 and 2008, respectively. Effective January 1, 2009, the FNB legacy 401(k) plan was amended to add a discretionary contribution provision similar to that in the Company plan referenced above. For the year ended December 31, 2009, the Company made discretionary contributions to the plan in the amount of $694 thousand.
During 2010, the Company combined the legacy 401(k) plans into a single plan for all eligible StellarOne employees. Participation in the plan is eligible to all full-time employees with matching contributions equal to 100% of the first 4% of salary reduction contributions made by the employee. The Company contributed a matching contribution of $1.1 million and no discretionary contribution for the year ended December 31, 2010.
Deferred Compensation Plan
The Company also has a non-qualified Executive Deferred Compensation Plan for key employees. Pursuant to the plan, the President and any other employees selected by the Board of Directors may defer receipt of a certain amount of pre-tax income and cash incentive compensation for a period of no less than three years or until retirement, subject to termination of employment or certain other events, including an imminent change in control. The Board may make contributions at its discretion. The balance in this plan is recorded in both other assets and other liabilities on the Company’s Consolidated Balance Sheet. The deferred compensation charged to expense totaled $56 thousand, $56 thousand, and $59 thousand for the years ended December 31, 2010, 2009 and 2008, respectively.
63
STELLARONE CORPORATION AND SUBSIDIARIES
Notes to Consolidated Financial Statements
(Dollars in Thousands, except share data)
ESOP Plan
Prior to the merger and subsequent formation of the Company, FNB maintained an employee stock ownership plan for the benefit of certain employees. The plan was for the benefit of, and covered, all full-time employees and certain part-time employees following the completion of one year of service, the attainment of age 21 and meeting a predetermined minimum yearly hour requirement. On February 28, 2008, the Company became the Plan Sponsor as a result of the merger. The ESOP invests substantially in the Company’s stock. The amount of shares allocated to each participant under the ESOP is based on a combination of the employee’s annual compensation and years of service. As of December 31, 2010, 488,993 shares were held by the ESOP with no shares being unearned or unreleased. Compensation expense related to the ESOP totaled $544 thousand for the year ended December 31, 2008, with none being recognized for the years ended December 31, 2009 or 2010.
For purposes of EPS computations, ESOP shares are treated as outstanding if they have been allocated to participants, released, or committed to be released. Forfeited shares are used to restore forfeited amounts, correct errors and pay for plan and trust administrative expenses. Effective January 1, 2008, participation in the plan was limited to those who were qualified employees as of December 31, 2007. Beginning on January 1, 2009, contributions to the plan ceased and no further contributions shall be made to the Plan for plan years subsequent to the 2008 plan year. Due to the discontinuance of contributions to the Plan all shares became fully vested effective January 1, 2009.
Note 14. Income Taxes
The components of the net deferred tax asset, included in the Consolidated Balance Sheets, are as follows:
| December 31, | ||||||||
| 2010 | 2009 | |||||||
| Deferred tax assets: | ||||||||
| Allowance for loan losses | $ | 13,177 | $ | 14,060 | ||||
| Nonaccrual loan interest | 853 | 620 | ||||||
| Deferred compensation and personnel liabilities | 1,306 | 1,409 | ||||||
| Pension liability | 802 | 677 | ||||||
| Accrued stock compensation | 486 | 515 | ||||||
| Other | 647 | - | ||||||
| 17,271 | 17,281 | |||||||
| Deferred tax liabilities: | ||||||||
| Merger related fair value adjustments | 6,942 | 7,257 | ||||||
| Accrued pension asset | 838 | 838 | ||||||
| Securities available for sale | 2,755 | 2,731 | ||||||
| Premises and equipment | 623 | 933 | ||||||
| Deferred gain on property exchange "like kind" | 404 | 404 | ||||||
| Goodwill | 2,351 | 2,026 | ||||||
| Core deposit intangible | 1,449 | 1,878 | ||||||
| Other | - | 332 | ||||||
| 15,362 | 16,399 | |||||||
| Net deferred tax asset | $ | 1,909 | $ | 882 | ||||
Income tax expense charged to operations for the years ended December 31, 2010, 2009 and 2008 consists of the following:
| 2010 | 2009 | 2008 | ||||||||||
| Current tax expense (benefit) | $ | 1,434 | $ | (4,399 | ) | $ | 1,121 | |||||
| Deferred tax expense (benefit) | 271 | (3,195 | ) | 2,527 | ||||||||
| $ | 1,705 | $ | (7,594 | ) | $ | 3,648 | ||||||
Income tax expense (benefit) differs from the amount of income tax determined by applying the U.S. federal income tax rate to pretax income due to the following:
| 2010 | 2009 | 2008 | ||||||||||||||||||||||
| Amount | Rate | Amount | Rate | Amount | Rate | |||||||||||||||||||
| Computed "expected" tax expense (benefit) | $ | 4,015 | 35.0 | % | $ | (5,643 | ) | -35.0 | % | $ | 4,571 | 35.0 | % | |||||||||||
| (Decrease) increase in income taxes resulting from: | ||||||||||||||||||||||||
| Tax-exempt interest income, net | (1,546 | ) | -13.5 | % | (1,354 | ) | -9.1 | % | (1,238 | ) | -9.5 | % | ||||||||||||
| Earnings on cash surrender value, BOLI | (463 | ) | -4.0 | % | (471 | ) | -2.7 | % | (403 | ) | -3.1 | % | ||||||||||||
| Nondeductible merger expenses | - | - | - | - | 412 | 3.2 | % | |||||||||||||||||
| Other | (301 | ) | -2.6 | % | (126 | ) | -0.3 | % | 306 | 2.3 | % | |||||||||||||
| $ | 1,705 | 14.9 | % | $ | (7,594 | ) | -47.1 | % | $ | 3,648 | 27.9 | % | ||||||||||||
The Company and its subsidiaries are subject to U.S. federal income tax as well as to Virginia bank franchise taxes. The Company has concluded all U.S. federal income tax matters for years through 2005, including acquisitions.
64
STELLARONE CORPORATION AND SUBSIDIARIES
Notes to Consolidated Financial Statements
(Dollars in Thousands, except share data)
Note 15. Derivative Financial Instruments
The Company uses derivatives to manage exposure to interest rate risk through the use of interest rate swaps, caps and floors to mitigate exposure to interest rate risk and service the needs of its customers. The Company’s objectives for utilizing these derivative instruments are described below.
Interest rate swaps involve the exchange of fixed and variable rate interest payments between two counterparties, based on a common notional principal amount and maturity date with no exchange of underlying principal amounts. During 2010, the Company entered into an interest rate swap contract on its subordinated debt which qualifies as a cash flow hedge. The Company’s cash flow hedge effectively modifies the Company’s exposure to interest rate risk by converting floating rate subordinated debt to a fixed rate with a maturity in 2013.
Under the swap, which has a forward start date of September 30, 2011, the Company will begin paying a weighted average fixed rate of 1.245% and receive a variable interest rate of three-month LIBOR on a total notional amount of $32.0 million, with quarterly settlements. Beginning in September of 2011, this swap will effectively fix the interest rate on the subordinated debt at 4.0% for the three year swap term. At December 31, 2010, the cash flow hedge had a fair value of $98 thousand and is recorded in Other Assets. The cash flow hedge was fully effective at December 31, 2010 and therefore the change in fair value on the cash flow hedge was recognized as a component of other comprehensive income, net of deferred income taxes.
The Company has entered into certain interest rate swap contracts that are not designated as hedging instruments. These derivative contracts relate to transactions in which the Company enters into an interest rate swap with a customer while at the same time entering into an offsetting interest rate swap with another financial institution. In connection with each swap transaction, the Company agrees to pay interest to the customer on a notional amount at a variable interest rate and receive interest from the customer on a similar notional amount at a fixed interest rate. At the same time, the Company agrees to pay the counterparty the same fixed interest rate on the same notional amount and receive the same variable interest rate on the same notional amount. The transaction allows the Company’s customer to effectively convert a variable rate loan to a fixed rate. Because the Company acts as an intermediary for its customer, changes in the fair value of the underlying derivative contracts for the most part offset each other and do not significantly impact the Company’s results of operations. The aggregate notional amount of these swap agreements with counterparties was $14.1 million as of December 31, 2010.
Note 16. Related Party Transactions
In the ordinary course of business, the Bank grants loans to principal officers, directors and subsidiaries of the Company.
Aggregate loan transactions with related parties were as follows:
| 2010 | 2009 | |||||||
| Beginning balance | $ | 13,265 | $ | 15,001 | ||||
| New loans | 7,392 | 9,904 | ||||||
| Repayments | (9,390 | ) | (11,640 | ) | ||||
| Ending balance | $ | 11,267 | $ | 13,265 | ||||
Total related party deposits held at the Company’s banking subsidiary were $3.3 million and $6.0 million at December 31, 2010 and 2009, respectively.
65
STELLARONE CORPORATION AND SUBSIDIARIES
Notes to Consolidated Financial Statements
(Dollars in Thousands, except share data)
Note 17. Earnings (Loss) Per Common Share
The following shows the weighted average number of shares used in computing earnings per common share and the effect on weighted average number of shares of diluted potential common stock. Potential dilutive common stock had no effect on income (loss) available to common stockholders.
| 2010 | 2009 | 2008 | ||||||||||
| Earnings (loss) per common share | ||||||||||||
| Net income (loss) | $ | 9,765 | $ | (8,530 | ) | $ | 9,411 | |||||
| Preferred stock dividends and accretion | (1,865 | ) | (1,834 | ) | (53 | ) | ||||||
| Net income (loss) available to common shareholders | 7,900 | (10,364 | ) | 9,358 | ||||||||
| Weighted average common shares issued and outstanding | 22,721,246 | 22,644,931 | 20,725,650 | |||||||||
| Earnings (loss) per common share | $ | 0.35 | $ | (0.46 | ) | $ | 0.45 | |||||
| Diluted earnings (loss) per common share | ||||||||||||
| Net income (loss) available to common shareholders | $ | 7,900 | $ | (10,364 | ) | $ | 9,358 | |||||
| Weighted average common shares issued and outstanding | 22,721,246 | 22,644,931 | 20,725,650 | |||||||||
| Restricted stock | 46,962 | - | 19,380 | |||||||||
| Stock options | 11,376 | - | 49,097 | |||||||||
| Total diluted weighted average common shares issued and outstanding | 22,779,584 | 22,644,931 | 20,794,127 | |||||||||
| Diluted earnings (loss) per common share | $ | 0.35 | $ | (0.46 | ) | $ | 0.45 | |||||
Stock options and restricted stock representing 484,192 shares and 349,559 at December 31, 2010 and 2008, respectively, were not included in the calculation of earnings per common share as their effect would have been anti-dilutive. Due to the loss available to common shareholders during the year ended December 31, 2009, all unvested restricted stock and stock options would have been anti-dilutive and were not included in the calculation for 2009. Additionally, at December 31, 2010, 2009 and 2008, outstanding warrants to purchase 302,622 shares of common stock associated with the U.S. Treasury Capital Purchase Program, were considered anti-dilutive and thus have not been considered in the fully-diluted share calculations.
66
STELLARONE CORPORATION AND SUBSIDIARIES
Notes to Consolidated Financial Statements
(Dollars in Thousands, except share data)
Note 18. Commitments and Contingent Liabilities
The Company has noncancellable leases covering certain premises and equipment, primarily for facilities.
Total rent expense applicable to operating leases was $1.9 million, $1.9 million and $1.7 million for 2010, 2009 and 2008, respectively, and was included in occupancy expense.
The following is a schedule by year of future minimum lease requirements required under the long-term noncancellable lease agreements:
| 2011 | $ | 1,777 | ||
| 2012 | 1,481 | |||
| 2013 | 1,336 | |||
| 2014 | 859 | |||
| 2015 | 841 | |||
| Thereafter | 2,191 | |||
| Total | $ | 8,485 |
There are no material proceedings to which the Company or its bank subsidiary are a party or by which, to the Company’s knowledge, it, or its bank subsidiary, are threatened. All legal proceedings presently pending or threatened against the Company or its subsidiary involve routine litigation incidental to the business of the Company or the subsidiary involved and are not material in respect to the amount in controversy.
In the normal course of business there are outstanding various commitments and contingent liabilities, which are not reflected in the accompanying financial statements. Management does not anticipate any material losses as a result of these transactions.
See Note 20 with respect to financial instruments with off-balance sheet risk.
Note 19. Restrictions on Transfers to Parent
Federal and state banking regulations place certain restrictions on dividends paid and loans or advances made by the subsidiary bank to the Company. Prior regulatory approval is required if dividends to be declared in any year would exceed net earnings of the current year plus retained net profits for the preceding two years. During 2010, the banking subsidiary paid $9.2 million in dividends to the Company. As of January 1, 2011, the aggregate amount of additional unrestricted funds, which could be transferred from the bank subsidiary to the Company without prior regulatory approval totaled $5 million or 1.2% of consolidated net assets. Loans and advances are limited to 10% of the Bank's common stock and capital surplus. As of December 31, 2010, funds available for loans or advances by the Bank to the Company, which is limited by the amount of collateral the Company has available to pledge, were approximately $11.5 million. In addition, dividends paid by the subsidiary bank to the Company would also be prohibited if the effect thereof would cause the subsidiary bank’s capital to be reduced below applicable minimum capital requirements.
Note 20. Financial Instruments with Off-Balance-Sheet Risk
The Company, through its banking subsidiary, is party to credit related financial instruments with off-balance-sheet risk in the normal course of business to meet the financing needs of its customers. These financial instruments include commitments to extend credit and standby letters of credit. These instruments involve, to varying degrees, elements of credit risk and interest rate risk in excess of the amount recognized in the balance sheet. The contract amount of those instruments reflects the extent of involvement the Company has in particular classes of financial instruments.
The Company’s exposure to credit loss in the event of nonperformance by the other party to the financial instrument for commitments to extend credit and standby letters of credit is represented by the contractual amount of those instruments. The Company uses the same credit policies in making commitments and conditional obligations as it does for on-balance-sheet instruments.
At December 31, 2010 and 2009, the following financial instruments were outstanding whose contract amounts represent credit risk:
| 2010 | 2009 | |||||||
| Commitments to extend credit | $ | 550,019 | $ | 511,589 | ||||
| Standby letters of credit | 51,976 | 52,870 | ||||||
| Mortgage loans sold with potential recourse | 350,781 | 302,006 | ||||||
Commitments to extend credit are agreements to lend to a customer as long as there is no violation of any condition established in the contract. Commitments generally have fixed expiration dates or other termination clauses and may require payment of a fee. The commitments for equity lines of credit may expire without being drawn upon. Therefore, the total commitment amounts do not necessarily represent future cash requirements. The amount of collateral obtained, if it is deemed necessary by the Company, is based on management’s credit evaluation of the customer.
Unfunded commitments under commercial lines of credit, revolving credit lines and overdraft protection agreements are commitments for possible future extensions of credit to existing customers. These lines of credit are usually uncollateralized and do not always contain a specified maturity date and may not be drawn upon to the total extent to which the Company is committed.
Standby letters of credit are conditional commitments issued by the Company to guarantee the performance of a customer to a third party. The credit risk involved in issuing letters of credit is essentially the same as that involved in extending loan facilities to customers. The Company generally holds collateral supporting those commitments, if deemed necessary.
The Company, through its banking subsidiary, originates loans for sale to secondary market investors subject to contractually specified and limited recourse provisions. In 2010, the Company originated $525 million and sold $527 million to investors, compared to $578 million originated and $557 million sold in 2009 and $112 million originated and $119 million sold in 2008. Most contracts with investors contain certain recourse language which may vary from 90 days up to nine months. The Corporation may have an obligation to repurchase a loan if the mortgagor has defaulted early in the loan term. Mortgages subject to recourse are collateralized by single family residences, have loan-to-value ratios of 80% or less, or have private mortgage insurance or are insured or guaranteed by an agency of the United States government. At December 31, 2010, the Company had locked-rate commitments to originate mortgage loans amounting to approximately $95 million and loans held for sale of $52 million. The Company has entered into commitments, on a best-effort basis to sell loans of approximately $147 million. Risks arise from the possible inability of counterparties to meet the terms of their contracts. The Company does not expect any counterparty to fail to meet its obligations.
The Company maintains cash accounts in other commercial banks. The amount on deposit at December 31, 2010 exceeded the insurance limits of the Federal Deposit Insurance Company by $1.5 million.
67
STELLARONE CORPORATION AND SUBSIDIARIES
Notes to Consolidated Financial Statements
(Dollars in Thousands, except share data)
Note 21. Fair Value of Financial Instruments and Interest Rate Risk
The fair value of an asset or liability is the price that would be received to sell that asset or paid to transfer that liability (an exit price) in an orderly transaction occurring in the principal market (or most advantageous market in the absence of a principal market) for such asset or liability. In estimating fair value, the Company utilizes valuation techniques that are consistent with the market approach, the income approach and/or the cost approach. Such valuation techniques are consistently applied. Inputs to valuation techniques include the assumptions that market participants would use in pricing an asset or liability. FASB ASC Topic 820 establishes a fair value hierarchy for valuation inputs that gives the highest priority to quoted prices in active markets for identical assets or liabilities and the lowest priority to unobservable inputs.
The Company groups assets and liabilities at fair value in three levels, based on the markets in which the assets and liabilities are traded and the reliability of the assumptions used to determine fair value. An adjustment to the pricing method used within either Level 1 or Level 2 inputs could generate a fair value measurement that effectively falls in a lower level in the hierarchy. These levels are:
Level 1: Quoted prices (unadjusted) for identical assets or liabilities in active markets that the entity has the ability to access as of the measurement date.
Level 2: Significant other observable inputs other than Level 1 prices, such as quoted prices for similar assets or liabilities, quoted prices in markets that are not active, and other inputs that are observable or can be corroborated by observable market data.
Level 3: Valuations for assets and liabilities that are derived from other valuation methodologies, including option pricing models, discounted cash flow models and similar techniques, and not based on market exchange, dealer, or broker traded transactions. Level 3 valuations incorporate certain assumptions and projections in determining the fair value assigned to such assets or liabilities.
The following is a description of valuation methodologies used for assets and liabilities recorded at fair value. The determination of where an asset or liability falls in the hierarchy requires significant judgment. The Company evaluates its hierarchy disclosures each quarter and based on various factors, it is possible that an asset or liability may be classified differently from quarter to quarter. However, the Company expects changes in classifications between levels will be rare. There were no transfers between levels in 2010 and 2009.
Assets and Liabilities Measured on a Recurring Basis
Securities: Investment securities are recorded at fair value on a recurring basis. Fair value measurement is based upon quoted prices, if available. If quoted prices are not available, fair values are measured using matrix pricing, which is a mathematical technique used widely in the industry to value debt securities without relying exclusively on quoted prices for the specific securities but rather by relying on the securities’ relationship to other benchmark quoted securities. Level 1 securities include those traded on nationally recognized securities exchanges, U.S. Treasury securities, and money market funds. Level 2 securities include U.S. Agency securities, mortgage-backed securities issued by government sponsored entities, municipal bonds and corporate debt securities. Securities classified as Level 3 include asset-backed securities in less liquid markets.
Deferred compensation plans: Liabilities associated with deferred compensation plans are recorded at fair value on a recurring basis as Level 1 based on the fair value of the underlying securities. Fair value measurement is based upon the fair value of the securities as described above.
Assets and liabilities measured at fair value on a recurring basis as of December 31, 2010 and 2009 are summarized below.
| Fair Value Measurements at | ||||||||||||||||
| December 31, 2010 | ||||||||||||||||
| Using | ||||||||||||||||
| Level 1 | Level 2 | Level 3 | ||||||||||||||
| Total | (Quoted Prices) | (Significant Other Observable Inputs) | (Significant Unobservable Inputs) | |||||||||||||
| Investment securities available-for-sale | ||||||||||||||||
| U. S. Government agencies | $ | 103,253 | $ | - | $ | 103,253 | $ | - | ||||||||
| State and municipals | 136,823 | - | 136,823 | - | ||||||||||||
| Corporate bonds | 6,904 | - | 6,904 | - | ||||||||||||
| Collateralized mortgage obligations | 9,497 | - | 9,497 | - | ||||||||||||
| Mortgage backed securities | 123,139 | - | 123,139 | - | ||||||||||||
| Other | 1,615 | 1,615 | - | - | ||||||||||||
| Total assets at fair value | $ | 381,231 | $ | 1,615 | $ | 379,616 | $ | - | ||||||||
| Cash flow hedge | $ | 98 | $ | - | $ | 98 | $ | - | ||||||||
Other liabilities 1 | - | - | - | - | ||||||||||||
| Total liabilities at fair value | $ | 98 | $ | - | $ | 98 | $ | - | ||||||||
1 Includes liabilities associated with deferred compensation plans | ||||||||||||||||
| Fair Value Measurements at | ||||||||||||||||
| December 31, 2009 | ||||||||||||||||
| Using | ||||||||||||||||
| Level 1 | Level 2 | Level 3 | ||||||||||||||
| Total | (Quoted Prices) | (Significant Other Observable Inputs) | (Significant Unobservable Inputs) | |||||||||||||
| Investment securities available-for-sale | ||||||||||||||||
| U. S. Treasuries | $ | 20,203 | $ | 20,203 | $ | - | $ | - | ||||||||
| U. S. Government agencies | 63,415 | - | 63,415 | - | ||||||||||||
| State and municipals | 113,184 | - | 113,184 | - | ||||||||||||
| Corporate bonds | 6,934 | - | 6,934 | - | ||||||||||||
| Collateralized mortgage obligations | 13,026 | - | 13,026 | - | ||||||||||||
| Mortgage backed securities | 159,588 | - | 159,588 | - | ||||||||||||
| Certificates of deposit | 685 | - | 685 | - | ||||||||||||
| Equity securities | 1,469 | 1,469 | - | - | ||||||||||||
| Other | 10 | 10 | - | - | ||||||||||||
| Total assets at fair value | $ | 378,514 | $ | 21,682 | $ | 356,832 | $ | - | ||||||||
Other liabilities 1 | $ | 2,882 | $ | 2,882 | $ | - | $ | - | ||||||||
| Total liabilities at fair value | $ | 2,882 | $ | 2,882 | $ | - | $ | - | ||||||||
1 Includes liabilities associated with deferred compensation plans | ||||||||||||||||
The Company had no recurring level 3 assets or liabilities at any time during 2010 or 2009.
68
STELLARONE CORPORATION AND SUBSIDIARIES
Notes to Consolidated Financial Statements
(Dollars in Thousands, except share data)
Assets and Liabilities Measured on a Nonrecurring Basis
The Company may be required, from time to time, to measure certain assets at fair value on a nonrecurring basis in accordance with USGAAP. These include assets that are measured at the lower of cost or market that were recognized at fair value below cost at the end of the period.
Loans held for sale: The fair value of loans held for sale is determined, when possible, using quoted secondary-market prices. If no such quoted price exists, the fair value of a loan is determined using quoted prices for a similar asset or assets, adjusted for the specific attributes of that loan. As such, the Company classifies loans subjected to nonrecurring fair value adjustments as Level 2.
Loans: The Company does not record loans at fair value on a recurring basis. However, from time to time, a loan is considered impaired and an allowance for loan losses is established. Loans for which it is probable that payment of interest and principal will not be made in accordance with the contractual terms of the loan agreement are considered impaired. The fair value of impaired loans is estimated using one of several methods, including collateral value, market value of similar debt, enterprise value, liquidation value and discounted cash flows. Those impaired loans not requiring an allowance represent loans for which the fair value of the expected repayments or collateral exceed the recorded investments in such loans. At December 31, 2010 and 2009, substantially all of the total impaired loans were evaluated based on the fair value of the collateral. Impaired loans where an allowance is established based on the fair value of collateral require classification in the fair value hierarchy. When the fair value of the collateral is based on an observable market price or a current appraised value, the Company records the impaired loan as nonrecurring Level 2. When an appraised value is not available or management determines the fair value of the collateral is further impaired below the appraised value and there is no observable market price, the Company records the impaired loan as nonrecurring Level 3.
Foreclosed assets: Foreclosed assets are initially recorded at fair value less costs to sell upon transfer of the loans to foreclosed assets. Subsequently, foreclosed assets are carried at the lower of carrying value or net realizable value. Fair value is based upon independent market prices, appraised values of the collateral or management’s estimation of the value of the collateral. As such, the Company records the foreclosed asset as nonrecurring Level 3.
Assets measured at fair value on a nonrecurring basis as of December 31, 2010 and 2009 are included in the table below:
| Fair Value Measurements at | ||||||||||||||||
| December 31, 2010 | ||||||||||||||||
| Using | ||||||||||||||||
| Level 1 | Level 2 | Level 3 | ||||||||||||||
| Total | (Quoted Prices) | (Significant Other Observable Inputs) | (Significant Unobservable Inputs) | |||||||||||||
| Loans - impaired loans | $ | 62,397 | $ | - | $ | 15,121 | $ | 47,276 | ||||||||
| Loans held for sale - mortgage | 51,722 | - | 51,722 | - | ||||||||||||
| Loans held for sale - other assets | 514 | - | - | 514 | ||||||||||||
| Foreclosed assets | 10,894 | - | - | 10,894 | ||||||||||||
| Total assets at fair value | $ | 125,527 | $ | - | $ | 66,843 | $ | 58,684 | ||||||||
| Total liabilities at fair value | $ | - | $ | - | $ | - | $ | - | ||||||||
| Fair Value Measurements at | ||||||||||||||||
| December 31, 2009 | ||||||||||||||||
| Using | ||||||||||||||||
| Level 1 | Level 2 | Level 3 | ||||||||||||||
| Total | (Quoted Prices) | (Significant Other Observable Inputs) | (Significant Unobservable Inputs) | |||||||||||||
| Loans - impaired loans | $ | 65,672 | $ | - | $ | 22,182 | $ | 43,490 | ||||||||
| Loans held for sale - mortgage | 44,165 | - | 44,165 | - | ||||||||||||
| Loans held for sale - other assets | 936 | - | - | 936 | ||||||||||||
| Foreclosed assets | 4,505 | - | - | 4,505 | ||||||||||||
| Total assets at fair value | $ | 115,278 | $ | - | $ | 66,347 | $ | 48,931 | ||||||||
| Total liabilities at fair value | $ | - | $ | - | $ | - | $ | - | ||||||||
69
STELLARONE CORPORATION AND SUBSIDIARIES
Notes to Consolidated Financial Statements
(Dollars in Thousands, except share data)
The methodologies for estimating the fair value of financial assets and financial liabilities that are measured at fair value on a recurring or non-recurring basis are discussed above. The estimated fair value approximates carrying value for cash and cash equivalents, accrued interest and the cash surrender value of life insurance policies. The methodologies for other financial assets and financial liabilities are discussed below:
Loans: For variable-rate loans that re-price frequently and with no significant changes in credit risk, fair values are based on carrying values. The fair values for other loans were estimated using discounted cash flow analyses, using interest rates currently being offered. An overall valuation adjustment is made for specific credit risks as well as general portfolio credit risk.
Deposit Liabilities: The fair value of demand deposits, savings accounts, and certain money market deposits is the amount payable on demand at the reporting date. The fair value of fixed-maturity certificates of deposit is estimated using the rates currently offered for deposits of similar remaining maturities.
Short-Term Borrowings: The carrying amounts of federal funds purchased, borrowings under repurchase agreements, and other short-term borrowings maturing within 90 days approximate their fair values. Fair values of other short-term borrowings are estimated using discounted cash flow analyses on the Company’s current incremental borrowing rates for similar types of borrowing arrangements.
Federal Home Loan Bank Advances: The fair values of the Company’s Federal Home Loan Bank advances are estimated using discounted cash flow analyses based on the Company’s current incremental borrowing rates for similar types of borrowing arrangements.
Subordinated Debt: The values of the Company’s subordinated debt are variable rate instruments that reprice on a quarterly basis, therefore, carrying value is adjusted for the three month repricing lag in order to approximate fair value.
Off-Balance-Sheet Financial Instruments: The fair value of commitments to extend credit is estimated using the fees currently charged to enter into similar agreements, taking into account the remaining terms of the agreements and the present creditworthiness of the counterparties. For fixed-rate loan commitments, fair value also considers the difference between current levels of interest rates and the committed rates. The fair value of stand-by letters of credit is based on fees currently charged for similar agreements or on the estimated cost to terminate them or otherwise settle the obligations with the counterparties at the reporting date. At December 31, 2010, and 2009, the fair value of loan commitments and stand-by letters of credit was immaterial.
| 2010 | 2009 | |||||||||||||||
| Carrying | Fair | Carrying | Fair | |||||||||||||
| Amount | Value | Amount | Value | |||||||||||||
| Financial assets: | ||||||||||||||||
| Cash and cash equivalents | $ | 139,886 | $ | 139,886 | $ | 152,926 | $ | 152,926 | ||||||||
| Investment securities | 381,231 | 381,231 | 378,961 | 378,964 | ||||||||||||
| Mortgage loans held for sale | 51,722 | 51,722 | 44,165 | 44,165 | ||||||||||||
| Loans, net | 2,061,835 | 1,794,267 | 2,146,335 | 1,817,535 | ||||||||||||
| Accrued interest receivable | 9,317 | 9,317 | 9,459 | 9,459 | ||||||||||||
| Financial liabilities: | ||||||||||||||||
| Deposits | $ | 2,386,102 | $ | 2,394,156 | $ | 2,436,120 | $ | 2,446,354 | ||||||||
| Federal funds purchased and securities sold under agreements to repurchase | 987 | 987 | 783 | 783 | ||||||||||||
| Federal Home Loan Bank advances | 85,000 | 86,363 | 130,000 | 134,321 | ||||||||||||
| Subordinated debt | 32,991 | 32,945 | 32,991 | 32,807 | ||||||||||||
| Accrued interest payable | 2,278 | 2,278 | 3,626 | 3,626 | ||||||||||||
70
STELLARONE CORPORATION AND SUBSIDIARIES
Notes to Consolidated Financial Statements
(Dollars in Thousands, except share data)
Note 22. Segment Information
The Company began reporting segment information during the year ended December 31, 2010 and began tracking the related information for internal purposes during the year ended December 31, 2009. Therefore, there is no comparative data presented for the year ended December 31, 2008, as this data was not tracked by segment during this time period and is therefore unavailable.
The Company operates in three business segments, organized around the different products and services offered:
| · | Commercial Banking |
| · | Mortgage Banking |
| · | Wealth Management |
Commercial Banking includes commercial, business and retail banking. This segment provides customers with products such as commercial loans, small business loans, real estate loans, business financing and consumer loans. In addition, this segment provides customers with several choices of deposit products including demand deposit accounts, savings accounts and certificates of deposit. Mortgage Banking engages primarily in the origination and acquisition of residential mortgages for sale into the secondary market on a best-efforts basis. Wealth Management provides investment and financial advisory services to businesses and individuals, including financial planning, retirement planning, estate planning, trust and custody services, investment management, escrows, and retirement plans.
Information about the reportable segments and reconciliation of this information to the consolidated financial statements at and for the twelve months ended December 31, 2010 and 2009 is as follows:
| At and for the Twelve Months Ended December 31, 2010: | ||||||||||||||||||||||||
| Commercial | Mortgage | Wealth | Intersegment | |||||||||||||||||||||
| Bank | Banking | Management | Other | Elimination | Consolidated | |||||||||||||||||||
| Net interest income | $ | 93,535 | $ | 1,549 | $ | - | $ | (1,074 | ) | $ | - | $ | 94,010 | |||||||||||
| Provision for loan losses | 22,850 | - | - | - | - | 22,850 | ||||||||||||||||||
| Noninterest income | 24,976 | 7,101 | 4,757 | 720 | (4,285 | ) | 33,269 | |||||||||||||||||
| Noninterest expense | 83,442 | 7,695 | 3,975 | 2,132 | (4,285 | ) | 92,959 | |||||||||||||||||
| Provision for income taxes | 2,130 | 286 | 234 | (945 | ) | - | 1,705 | |||||||||||||||||
| Net income (loss) | $ | 10,089 | $ | 669 | $ | 548 | $ | (1,541 | ) | $ | - | $ | 9,765 | |||||||||||
| Total Assets | $ | 2,870,097 | $ | 52,788 | $ | 473 | $ | 462,991 | $ | (445,907 | ) | $ | 2,940,442 | |||||||||||
| Average Assets | $ | 2,919,816 | $ | 39,790 | $ | 174 | $ | 462,758 | $ | (445,794 | ) | $ | 2,976,744 | |||||||||||
| At and for the Twelve Months Ended December 31, 2009: | ||||||||||||||||||||||||
| Commercial | Mortgage | Wealth | Intersegment | |||||||||||||||||||||
| Bank | Banking | Management | Other | Elimination | Consolidated | |||||||||||||||||||
| Net interest income | $ | 88,664 | $ | 1,784 | $ | - | $ | (1,251 | ) | $ | - | $ | 89,197 | |||||||||||
| Provision for loan losses | 37,800 | - | - | - | - | 37,800 | ||||||||||||||||||
| Noninterest income | 21,569 | 6,240 | 4,162 | (1,628 | ) | (4,203 | ) | 26,140 | ||||||||||||||||
| Noninterest expense | 85,948 | 6,417 | 3,770 | 1,729 | (4,203 | ) | 93,661 | |||||||||||||||||
| Provision for income taxes | (6,505 | ) | 482 | 118 | (1,689 | ) | - | (7,594 | ) | |||||||||||||||
| Net income (loss) | $ | (7,010 | ) | $ | 1,125 | $ | 274 | $ | (2,919 | ) | $ | - | $ | (8,530 | ) | |||||||||
| Total Assets | $ | 2,967,536 | $ | 47,140 | $ | 610 | $ | 457,860 | $ | (440,045 | ) | $ | 3,033,101 | |||||||||||
| Average Assets | $ | 2,929,668 | $ | 41,850 | $ | 467 | $ | 426,444 | $ | (405,580 | ) | $ | 2,992,849 | |||||||||||
71
STELLARONE CORPORATION AND SUBSIDIARIES
Notes to Consolidated Financial Statements
(Dollars in Thousands, except share data)
Note 23. Regulatory Matters
The Company and its subsidiary bank are subject to various regulatory capital requirements administered by the federal banking agencies. Failure to meet minimum capital requirements can initiate certain mandatory and possibly additional discretionary actions by regulators that, if undertaken, could have a direct material effect on the Company's and subsidiary bank’s financial statements. Under capital adequacy guidelines and the regulatory framework for prompt corrective action under FDICIA, the Company and its subsidiary bank must meet specific capital guidelines that involve quantitative measures of their assets, liabilities, and certain off-balance-sheet items as calculated under regulatory accounting practices. The capital amounts and classification are also subject to qualitative judgments by the regulators about components, risk weightings, and other factors. Prompt corrective action provisions are not applicable to bank holding companies.
Quantitative measures established by regulation to ensure capital adequacy require the Company and its subsidiary bank to maintain minimum amounts and ratios of total and Tier 1 capital to risk-weighted assets, and of Tier 1 capital to average assets. Total capital, Tier 1 capital, risk-weighted assets and average assets are all defined in the regulations. As of December 31, 2010 and 2009, the Company and its subsidiary bank met all capital adequacy requirements to which they are subject.
As of December 31, 2010, the most recent notification from the Federal Reserve Bank and the Federal Deposit Insurance Corporation categorized the subsidiary bank as well capitalized under the regulatory framework for prompt corrective action. To be categorized as well capitalized, the institution must maintain minimum total risk-based, Tier 1 risk-based, and Tier 1 leverage ratios as set forth in the following tables. There are no conditions or events since the notification that management believes have changed the Company’s category.
| Minimum To Be Well | ||||||||||||||||||||||||
| Capitalized Under | ||||||||||||||||||||||||
| Minimum | Prompt Corrective | |||||||||||||||||||||||
| Actual | Capital Requirement | Action Provisions | ||||||||||||||||||||||
| Amount | Ratio | Amount | Ratio | Amount | Ratio | |||||||||||||||||||
| As of December 31, 2010: | ||||||||||||||||||||||||
| Total Capital (to Risk Weighted Assets): | ||||||||||||||||||||||||
| Consolidated | $ | 365,019 | 15.44 | % | $ | 189,123 | 8.00 | % | N/A | N/A | ||||||||||||||
| StellarOne Bank | $ | 343,634 | 14.63 | % | $ | 187,870 | 8.00 | % | $ | 234,838 | 10.00 | % | ||||||||||||
| Tier 1 Capital (to Risk Weighted Assets): | ||||||||||||||||||||||||
| Consolidated | $ | 335,368 | 14.19 | % | $ | 94,562 | 4.00 | % | N/A | N/A | ||||||||||||||
| StellarOne Bank | $ | 314,177 | 13.38 | % | $ | 93,935 | 4.00 | % | $ | 140,903 | 6.00 | % | ||||||||||||
| Tier 1 Capital (to Average Assets): | ||||||||||||||||||||||||
| Consolidated | $ | 335,368 | 11.90 | % | $ | 112,736 | 4.00 | % | N/A | N/A | ||||||||||||||
| StellarOne Bank | $ | 314,177 | 11.20 | % | $ | 112,218 | 4.00 | % | $ | 140,272 | 5.00 | % | ||||||||||||
| As of December 31, 2009: | ||||||||||||||||||||||||
| Total Capital (to Risk Weighted Assets): | ||||||||||||||||||||||||
| Consolidated | $ | 361,148 | 14.46 | % | $ | 199,766 | 8.00 | % | N/A | N/A | ||||||||||||||
| StellarOne Bank | $ | 310,595 | 12.52 | % | $ | 198,402 | 8.00 | % | $ | 248,003 | 10.00 | % | ||||||||||||
| Tier 1 Capital (to Risk Weighted Assets): | ||||||||||||||||||||||||
| Consolidated | $ | 329,824 | 13.21 | % | $ | 99,883 | 4.00 | % | N/A | N/A | ||||||||||||||
| StellarOne Bank | $ | 279,481 | 11.27 | % | $ | 99,201 | 4.00 | % | $ | 148,802 | 6.00 | % | ||||||||||||
| Tier 1 Capital (to Average Assets): | ||||||||||||||||||||||||
| Consolidated | $ | 329,824 | 11.34 | % | $ | 116,348 | 4.00 | % | N/A | N/A | ||||||||||||||
| StellarOne Bank | $ | 279,481 | 9.67 | % | $ | 115,590 | 4.00 | % | $ | 144,488 | 5.00 | % | ||||||||||||
72
STELLARONE CORPORATION AND SUBSIDIARIES
Notes to Consolidated Financial Statements
(Dollars in Thousands, except share data)
Note 24. Parent Corporation Only Financial Statements
| STELLARONE CORPORATION | ||||||||
| (Parent Company Only) | ||||||||
| Balance Sheets | ||||||||
| As of December 31 | ||||||||
| 2010 | 2009 | |||||||
| Assets | ||||||||
| Cash and due from banks | $ | 8,040 | $ | 32,362 | ||||
| Securities available for sale | 517 | 608 | ||||||
| Investment in subsidiaries | 437,823 | 405,683 | ||||||
| Premises and equipment, net | 5,187 | 6,685 | ||||||
| Bank owned life insurance | 4,485 | 4,298 | ||||||
| Deferred income tax asset | 1,299 | 653 | ||||||
| Other assets | 5,641 | 7,571 | ||||||
| Total assets | $ | 462,992 | $ | 457,860 | ||||
| Liabilities | ||||||||
| Subordinated debt | $ | 32,991 | $ | 32,991 | ||||
| Other liabilities | 3,564 | 4,084 | ||||||
| Total liabilities | 36,555 | 37,075 | ||||||
| Stockholders' Equity | ||||||||
| Preferred stock | 28,763 | 28,398 | ||||||
| Common stock | 22,748 | 22,661 | ||||||
| Additional paid-in capital | 270,047 | 268,965 | ||||||
| Retained earnings | 101,188 | 96,947 | ||||||
| Accumulated other comprehensive income, net | 3,691 | 3,814 | ||||||
| Total stockholders' equity | 426,437 | 420,785 | ||||||
| Total liabilities and stockholders' equity | $ | 462,992 | $ | 457,860 | ||||
73
STELLARONE CORPORATION AND SUBSIDIARIES
Notes to Consolidated Financial Statements
(Dollars in Thousands, except share data)
| STELLARONE CORPORATION | ||||||||||||
| (Parent Company Only) | ||||||||||||
| Statements of Operations | ||||||||||||
| Years Ended December 31 | ||||||||||||
| 2010 | 2009 | 2008 | ||||||||||
| Income | ||||||||||||
| Dividends from subsidiaries | $ | 9,200 | $ | 5,500 | $ | 18,000 | ||||||
| Interest on investments | ||||||||||||
| Taxable | 32 | 38 | 966 | |||||||||
| Nontaxable | - | - | 169 | |||||||||
| Dividends | - | 5 | 24 | |||||||||
| Management fee income | 28,235 | 26,729 | 26,030 | |||||||||
| Gains (losses) on sale of fixed assets | - | 9 | (22 | ) | ||||||||
| Gains (losses) on sale of securities | 7 | - | 185 | |||||||||
| Impairments of equity securities available for sale | (110 | ) | (2,320 | ) | - | |||||||
| Miscellaneous income | 790 | 645 | 352 | |||||||||
| Total income | 38,154 | 30,606 | 45,704 | |||||||||
| Expenses | ||||||||||||
| Compensation and employee benefits | 18,423 | 16,251 | 18,370 | |||||||||
| Supplies and equipment | 4,003 | 3,899 | 3,085 | |||||||||
| Professional fees | 2,299 | 2,316 | 1,342 | |||||||||
| Director fees | 99 | 220 | 352 | |||||||||
| Interest | 1,074 | 1,257 | 2,595 | |||||||||
| Other operating expenses | 5,541 | 5,771 | 7,715 | |||||||||
| Total expenses | 31,439 | 29,714 | 33,459 | |||||||||
| Income before income tax benefit and undistributed equity in subsidiary | 6,715 | 892 | 12,245 | |||||||||
| Income tax benefit | 945 | 1,689 | 1,141 | |||||||||
| Income before undistributed equity in subsidiary | 7,660 | 2,581 | 13,386 | |||||||||
| Undistributed equity in subsidiary | 2,105 | (11,111 | ) | (3,975 | ) | |||||||
| Net (loss) income | $ | 9,765 | $ | (8,530 | ) | $ | 9,411 | |||||
| Basic net (loss) income per common share available to common shareholders | $ | 0.35 | $ | (0.46 | ) | $ | 0.45 | |||||
| Diluted net (loss) income per common share available to common shareholders | $ | 0.35 | $ | (0.46 | ) | $ | 0.45 | |||||
74
STELLARONE CORPORATION AND SUBSIDIARIES
Notes to Consolidated Financial Statements
(Dollars in Thousands, except share data)
| STELLARONE CORPORATION | ||||||||||||
| (Parent Company Only) | ||||||||||||
| Statements of Cash Flows | ||||||||||||
| Years Ended December 31 | ||||||||||||
| 2010 | 2009 | 2008 | ||||||||||
| Cash Flows from Operating Activities | ||||||||||||
| Net (loss) income | $ | 9,765 | $ | (8,530 | ) | $ | 9,411 | |||||
| Adjustments to reconcile net income to net cash provided by operating activities: | ||||||||||||
| Depreciation | 1,790 | 1,809 | 1,622 | |||||||||
| Deferred tax (benefit) expense | (561 | ) | (417 | ) | 49 | |||||||
| Employee benefit plan (benefit) expense | 126 | (19 | ) | 14 | ||||||||
| Stock-based compensation expense | 658 | 484 | 1,381 | |||||||||
| (Gains) losses on sale of premises and equipment | - | (9 | ) | 22 | ||||||||
| Gain on sales of securities available for sale | 7 | - | (185 | ) | ||||||||
| Impairments of equity securities available for sale | 110 | 2,320 | - | |||||||||
| Amortization of security premiums and accretion of discounts, net | 33 | 33 | 1 | |||||||||
| Equity in undistributed income of subsidiary(ies) | (2,105 | ) | 11,111 | 3,975 | ||||||||
| Income on bank owned life insurance | (187 | ) | (195 | ) | (192 | ) | ||||||
| Decrease (increase) in taxes receivable | - | - | 481 | |||||||||
| Decrease (increase) in accrued interest receivable | - | - | 552 | |||||||||
| Decrease (increase) in other assets | 1,665 | 1,999 | 556 | |||||||||
| Decrease in other liabilities | (679 | ) | (1,320 | ) | (2,273 | ) | ||||||
| Net cash provided by operating activities | 10,622 | 7,266 | 15,414 | |||||||||
| Cash Flows from Investing Activities | ||||||||||||
| Proceeds from sales of securities available for sale | - | - | 185 | |||||||||
| Proceeds from maturities and principal payments of securities available for sale | - | - | 54,286 | |||||||||
| Purchase of securities available for sale | (5 | ) | (2 | ) | (4 | ) | ||||||
| Purchase of premises and equipment | (545 | ) | (1,476 | ) | (1,897 | ) | ||||||
| Proceeds from sale of premises and equipment | 254 | 21 | 43 | |||||||||
| Proceeds from the sale of investment | - | 631 | - | |||||||||
| Capital contributed to subsidiary | (30,000 | ) | - | - | ||||||||
| Cash acquired in merger | - | - | 5,615 | |||||||||
| Net cash (used) provided by investing activities | (30,296 | ) | (826 | ) | 58,228 | |||||||
| Cash Flows from Financing Activities | ||||||||||||
| Net (decrease) increase in commercial paper | - | - | (68,745 | ) | ||||||||
| Proceeds from issuance of preferred stock | - | - | 30,000 | |||||||||
| Proceeds from exercise of stock options | 511 | 351 | 339 | |||||||||
| Payment of preferred stock issuance costs | - | (57 | ) | - | ||||||||
| Cash dividends paid | (5,159 | ) | (7,710 | ) | (12,614 | ) | ||||||
| Net cash (used) provided by financing activities | (4,648 | ) | (7,416 | ) | (51,020 | ) | ||||||
| (Decrease) increase in cash and cash equivalents | (24,322 | ) | (976 | ) | 22,622 | |||||||
| Cash and Cash Equivalents | ||||||||||||
| Beginning | 32,362 | 33,338 | 10,716 | |||||||||
| Ending | $ | 8,040 | $ | 32,362 | $ | 33,338 | ||||||
75
STELLARONE CORPORATION AND SUBSIDIARIES
Notes to Consolidated Financial Statements
(Dollars in Thousands, except share data)
Note 25. Unaudited Interim Financial Information
The results of operations for each of the quarters during the two years ended December 31, 2010 and 2009 are summarized below:
| 2010 | ||||||||||||||||
| Quarter Ended | ||||||||||||||||
| March 31, | June 30, | September 30, | December 31, | |||||||||||||
| Interest income | $ | 32,480 | $ | 32,150 | $ | 31,582 | $ | 31,710 | ||||||||
| Interest expense | 9,982 | 8,932 | 8,048 | 6,950 | ||||||||||||
| Net interest income | 22,498 | 23,218 | 23,534 | 24,760 | ||||||||||||
| Provision for loan losses | 6,700 | 7,350 | 3,500 | 5,300 | ||||||||||||
| Total net interest income after provision | 15,798 | 15,868 | 20,034 | 19,460 | ||||||||||||
| Non interest income | 8,815 | 8,380 | 8,247 | 7,827 | ||||||||||||
| Non interest expense | 22,547 | 22,791 | 23,665 | 23,956 | ||||||||||||
| Income before income taxes | 2,066 | 1,457 | 4,616 | 3,331 | ||||||||||||
| Provision for income taxes (benefit) | 211 | (96 | ) | 1,088 | 502 | |||||||||||
| Net income | $ | 1,855 | $ | 1,553 | $ | 3,528 | $ | 2,829 | ||||||||
| Preferred stock dividends | (370 | ) | (374 | ) | (378 | ) | (378 | ) | ||||||||
| Accretion of preferred stock discount | (88 | ) | (91 | ) | (92 | ) | (94 | ) | ||||||||
| Net income available to common shareholders | $ | 1,397 | $ | 1,088 | $ | 3,058 | $ | 2,357 | ||||||||
| Net income per share | ||||||||||||||||
| basic | $ | 0.07 | $ | 0.05 | $ | 0.13 | $ | 0.10 | ||||||||
| diluted | $ | 0.07 | $ | 0.05 | $ | 0.13 | $ | 0.10 | ||||||||
| 2009 | ||||||||||||||||
| Quarter Ended | ||||||||||||||||
| March 31, | June 30, | September 30, | December 31, | |||||||||||||
| Interest income | $ | 35,979 | $ | 35,191 | $ | 34,433 | $ | 34,106 | ||||||||
| Interest expense | 13,580 | 13,259 | 12,473 | 11,200 | ||||||||||||
| Net interest income | 22,399 | 21,932 | 21,960 | 22,906 | ||||||||||||
| Provision for loan losses | 7,750 | 6,500 | 20,050 | 3,500 | ||||||||||||
| Total net interest income after provision | 14,649 | 15,432 | 1,910 | 19,406 | ||||||||||||
| Non interest income | 7,129 | 7,814 | 5,900 | 5,540 | ||||||||||||
| Non interest expense | 22,224 | 24,057 | 22,748 | 24,875 | ||||||||||||
| (Loss) income before income taxes | (446 | ) | (811 | ) | (14,938 | ) | 71 | |||||||||
| Income tax benefit | (592 | ) | (485 | ) | (6,043 | ) | (474 | ) | ||||||||
| Net income (loss) | $ | 146 | $ | (326 | ) | $ | (8,895 | ) | $ | 545 | ||||||
| Preferred stock dividends | (370 | ) | (374 | ) | (378 | ) | (378 | ) | ||||||||
| Net loss available to common shareholders | (74 | ) | (85 | ) | (86 | ) | (88 | ) | ||||||||
| Net (loss) income per share | $ | (298 | ) | $ | (785 | ) | $ | (9,359 | ) | $ | 79 | |||||
| basic | ||||||||||||||||
| diluted | $ | (0.01 | ) | $ | (0.03 | ) | $ | (0.42 | ) | $ | - | |||||
| $ | (0.01 | ) | $ | (0.03 | ) | $ | (0.42 | ) | $ | - | ||||||
Not applicable.
Disclosure Controls and Procedures. The Company, under the supervision and with the participation of the Company’s management, including the Company’s Chief Executive Officer and the Chief Financial Officer, has evaluated the effectiveness of the Company’s disclosure controls and procedures as of the end of the period covered by this report. Based on that evaluation, the Chief Executive Officer and the Chief Financial Officer have concluded that as of December 31, 2010, the Company’s disclosure controls and procedures were effective to ensure that information required to be disclosed by the Company in reports that it files or submits under the Securities Exchange Act of 1934 is recorded, processed, summarized and reported within the time periods specified in Securities and Exchange Commission rules and regulations and that such information is accumulated and communicated to the Company’s management, including the Company’s Chief Executive Officer and Chief Financial Officer, as appropriate to allow timely decisions regarding required disclosure. Because of the inherent limitations in all control systems, no evaluation of controls can provide absolute assurance that the Company’s disclosure controls and procedures will detect or uncover every situation involving the failure of persons within the Company or its subsidiaries to disclose material information otherwise required to be set forth in the Company’s periodic reports.
Management’s Report on Internal Control over Financial Reporting. Management of the Company is responsible for establishing and maintaining adequate internal control over financial reporting as defined in Rule 13a-15(f) under the Securities Exchange Act of 1934. The Company’s internal control over financial reporting is designed to provide reasonable assurance to the Company’s management and board of directors regarding the reliability of financial reporting and the preparation of financial statements for external purposes in accordance with generally accepted accounting principles.
Because of its inherent limitations, internal control over financial reporting may not prevent or detect misstatements. Therefore, even those systems determined to be effective can provide only reasonable assurance with respect to financial statement preparation and presentation.
Management assessed the effectiveness of the Company’s internal control over financial reporting as of December 31, 2010. In making this assessment, management used the criteria set forth by the Committee of Sponsoring Organizations of the Treadway Commission in Internal Control – Integrated Framework. Based on our assessment, we believe that, as of December 31, 2010, the Company’s internal control over financial reporting was effective based on those criteria.
Changes in Internal Control Over Financial Reporting.
There has been no change in the Company’s internal control over financial reporting during the fiscal year ended December 31, 2010 that has materially affected, or is reasonably likely to materially affect, the Company’s internal control over financial reporting.
Not applicable.
PART III
The information with respect to the directors of the Company is contained in the Company’s 2011 Proxy Statement under the caption, “Election of Directors”, and is incorporated herein by reference. The information regarding the Section 16(a) reporting requirements of the directors and executive officers is contained in the 2011 Proxy Statement under the caption, “Section 16(a) Beneficial Ownership Reporting Compliance,” and is incorporated herein by reference. Information with respect to the Company’s Audit and Compliance Committee, its audit committee financial expert and executive officers are contained in the Company’s 2011 Proxy Statement under the caption “Corporate Governance and Other Matters,” and is incorporated herein by reference.
The Company has adopted a code of ethics for its principal executive officer and chief financial officer as well as a Directors Code of Professional Conduct for its directors. These documents can be found under corporate “Investor Relations - Governance Documents” at http://www.stellarone.com. Stockholders may request a free printed copy of each from:
StellarOne Corporation
Attention: Investor Relations
590 Peter Jefferson Parkway, Suite 250
Charlottesville, Virginia 22911
Audit and Compliance Committee Financial Expert
The Board of Directors has determined that Jan S. Hoover, Vice Chairperson of the Audit and Compliance Committee, and Steve Irvin, member of the Audit and Compliance Committee, are financial experts and are independent under the rules of the Securities Exchange Act of 1934 and NASDAQ Stock Market, Inc. as currently in effect.
Information regarding executive and director compensation is set forth under the caption “Executive Compensation” in the 2011 Proxy Statement, and is incorporated herein by reference.
Information regarding security interest of certain beneficial owners and management is set forth under the caption “Stock Ownership of Directors and Executive Officers” in the 2011 Proxy Statement, and is incorporated herein by reference. The information in the 2011 Proxy Statement under the caption “Securities Authorized for Issuance under Equity Compensation Plans” is incorporated herein by reference.
Information regarding certain relationships and related transactions is set forth under “Certain Relationships and Related Transactions” in the 2011 Proxy Statement, and is incorporated herein by reference. Information on director independence is set forth under “Director Independence” section in the 2011 Proxy Statement, and is incorporated herein by reference.
Information regarding principal auditor fees and services is set forth under “Principal Accountant Fees and Services” in the 2011 Proxy Statement, and is incorporated herein by reference.
PART IV
The following documents are filed as part of this report:
(a)(1) Financial Statements
The financial statements are filed as part of this report under Item 8 – “Financial Statements and Supplementary Data.”
(a)(2) Financial Statement Schedules
All schedules are omitted since they are not required, are not applicable, or the required information is shown in the consolidated financial statements or notes thereto.
(a)(3) Exhibits
The following exhibits are either filed as part of this Report or are incorporated herein by reference:
| Exhibit No. | Description of Exhibit | |
| 2.1 | Agreement and Plan of Reorganization, dated as of July 26, 2007, between Virginia Financial Group, Inc. and FNB Corporation. (incorporated by reference to Exhibit 2.1 to Current Report on Form 8-K filed on July 30, 2007) | |
| 3.1 | Articles of Incorporation of StellarOne Corporation, as amended. (incorporated by reference to Exhibit 3.1 to Current Report on Form 8-K filed on May 10, 2010) | |
| 3.2 | Bylaws of StellarOne Corporation, as amended and restated. (incorporated by reference to Exhibit 3.2 to Current Report on Form 8-K filed on May 28, 2010) | |
| 4.1 | Warrant to Purchase up to 302,623 shares of Common Stock. (incorporated by reference to Exhibit 4.1 to Form 8-K filed on December 23, 2008) | |
| 10.1 | Employment Agreement between StellarOne Corporation and O. R. Barham, Jr., dated January 1, 2011. (incorporated by reference to Exhibit 10.1 to Current Report on Form 8-K filed on January 4, 2011) | |
| 10.2 | Employment Agreement between StellarOne Corporation and Litz H. Van Dyke, dated January 1, 2011. (incorporated by reference to Exhibit 10.2 to Current Report on Form 8-K filed on January 4, 2011) | |
| 10.3 | Employment Agreement between StellarOne Corporation and Jeffrey W. Farrar, dated January 1, 2011. (incorporated by reference to Exhibit 10.3 to Current Report on Form 8-K filed on January 4, 2011) | |
| 10.4 | StellarOne Corporation Stock Incentive Plan, dated January 18, 2002. (incorporated by reference to Exhibit 99.0 to Form S-8 filed on February 26, 2002) | |
| 10.5 | Non-Qualified Directors Deferred Compensation Plan. (incorporated by reference to Exhibit 10.9 to Form 10-K filed on March 15, 2005) | |
| 10.6 | Non-Qualified Executive Deferred Compensation Plan. (incorporated by reference to Exhibit 10.10 to Form 10-K filed on March 15, 2005) | |
| 10.7 | StellarOne Corporation Executive Incentive Plan dated March 1, 2005. (incorporated by reference to Exhibit 10.11 to Form 10-K filed on March 15, 2005) | |
| 10.8 | Schedule of StellarOne Corporation Non-Employee Directors’ Annual Compensation. (incorporated by reference to the 2011 Proxy Statement) | |
| 10.9 | Schedule of Base Salaries for Named Executive Officers of StellarOne Corporation. (incorporated by reference to the 2011 Proxy Statement) | |
| 10.10 | Letter Agreement, dated December 19, 2008, including the Securities Purchase Agreement – Standard Terms incorporated by reference therein, between the Company and the United States Department of the Treasury. (incorporated by reference to Exhibit 10.1 to Form 8-K filed on December 23, 2008) | |
| 11.0 | Computation of per share earnings, incorporated by reference to note 1 of the consolidated financial statements incorporated by reference herein. | |
| 23.1 | Consent of Independent Registered Public Accounting Firm | |
Pursuant to the requirements of Section 13 or 15(d) of the Securities Exchange Act of 1934, the registrant has duly caused this report to be signed on its behalf by the undersigned thereunto duly authorized.
| StellarOne Corporation | StellarOne Corporation |
| Charlottesville, Virginia | Charlottesville, Virginia |
| /s/ O.R. Barham, Jr. | /s/ Jeffrey W. Farrar |
| O.R. Barham, Jr. | Jeffrey W. Farrar |
| President and Chief Executive Officer | Executive Vice President and Principal Accounting Officer |
| Date: March 11, 2011 | Date: March 11, 2011 |
Pursuant to the requirements of the Securities Exchange Act of 1934, this report has been signed below by the following persons on behalf of the registrant in the capacities and on the dates indicated below.
| /s/ Raymond D. Smoot, Jr. | Chairman of the | March 11, 2011 |
| Raymond D. Smoot, Jr. | Board of Directors | |
| /s/ O.R. Barham, Jr. | President and | March 11, 2011 |
| O.R. Barham, Jr. | Chief Executive Officer | |
| /s/ Jeffrey W. Farrar | Executive Vice President | March 11, 2011 |
| Jeffrey W. Farrar | and Principal Accounting Officer | |
| /s/ Lee S. Baker | Director | March 11, 2011 |
| Lee S. Baker | ||
| /s/ H.C. Stuart Cochran | Director | March 11, 2011 |
| H.C. Stuart Cochran | ||
| /s/ Glen C. Combs | Director | March 11, 2011 |
| Glen C. Combs | ||
| /s/ Beverly E. Dalton | Director | March 11, 2011 |
| Beverly E. Dalton | ||
| /s/ Gregory L. Fisher | Director | March 11, 2011 |
| Gregory L. Fisher | ||
| /s/ Christopher M. Hallberg | Director | March 11, 2011 |
| Christopher M. Hallberg | ||
| /s/ F. Courtney Hoge | Director | March 11, 2011 |
| F. Courtney Hoge | ||
| /s/ Jan S. Hoover | Director | March 11, 2011 |
| Jan S. Hoover | ||
| /s/ Steven D. Irvin | Director | March 11, 2011 |
| Steven D. Irvin | ||
| /s/ P. William Moore, Jr. | Director | March 11, 2011 |
| P. William Moore, Jr. | ||
| /s/ Alan W. Myers | Director | March 11, 2011 |
| Alan W. Myers | ||
| /s/ H. Wayne Parrish | Director | March 11, 2011 |
| H. Wayne Parrish | ||
| /s/ Charles W. Steger | Director | March 11, 2011 |
| Charles W. Steger | ||
| /s/ Joe J. Thompson | Director | March 11, 2011 |
| Joe J. Thompson | ||
| /s/ Keith L. Wampler | Director | March 11, 2011 |
| Keith L. Wampler | ||
82