UNITED STATES
SECURITIES AND EXCHANGE COMMISSION
Washington, D.C. 20549
FORM N-CSR
CERTIFIED SHAREHOLDER REPORT OF REGISTERED
MANAGEMENT INVESTMENT COMPANIES
Investment Company Act file number | 811-08189 |
|
J.P. Morgan Fleming Mutual Fund Group, Inc. |
(Exact name of registrant as specified in charter) |
|
522 Fifth Avenue New York, NY | | 10036 |
(Address of principal executive offices) | | (Zip code) |
|
Stephen M. Benham 522 Fifth Avenue New York, NY 10036 |
(Name and address of agent for service) |
|
Registrant’s telephone number, including area code: | (800) 480-4111 | |
|
Date of fiscal year end: | December 31 | |
|
Date of reporting period: | January 1, 2005 to December 31, 2005 | |
| | | | | | | | | |
Form N-CSR is to be used by management investment companies to file reports with the Commission not later than 10 days after the transmission to stockholders of any report that is required to be transmitted to stockholders under Rule 30e-1 under the Investment Company Act of 1940 (17 CFR 270.30e-1). The Commission may use the information provided on Form N-CSR in its regulatory, disclosure review, inspection, and policymaking roles.
A registrant is required to disclose the information specified by Form N-CSR, and the Commission will make this information public. A registrant is not required to respond to the collection of information contained in Form N-CSR unless the Form displays a currently valid Office of Management and Budget (“OMB”) control number. Please direct comments concerning the accuracy of the information collection burden estimate and any suggestions for reducing the burden to Secretary, Securities and Exchange Commission, 450 Fifth Street, NW, Washington, DC 20549-0609. The OMB has reviewed this collection of information under the clearance requirements of 44 U.S.C. Section 3507.
ITEM 1. REPORTS TO STOCKHOLDERS.
The following is a copy of the report transmitted to shareholders pursuant to Rule 30e-1 under the Investment Company Act of 1940 (17 CFR 270.30e-1).
ANNUAL REPORT DECEMBER 31, 2005
JPMorgan Funds
U.S. Equity
Mid/Small Cap
Funds
JPMorgan Capital Growth Fund
JPMorgan Dynamic Small Cap Fund
JPMorgan Growth Advantage Fund
JPMorgan Micro Cap Fund
JPMorgan Mid Cap Equity Fund
JPMorgan Mid Cap Value Fund
JPMorgan Small Cap Core Fund
JPMorgan Small Cap Equity Fund
JPMorgan U.S. Small Company Fund
JPMorgan Value Advantage Fund

CONTENTS
| President's Letter | | | 1 | | |
|
| Fund Commentaries: | |
|
| JPMorgan Capital Growth Fund | | | 3 | | |
|
| JPMorgan Dynamic Small Cap Fund | | | 6 | | |
|
| JPMorgan Growth Advantage Fund | | | 9 | | |
|
| JPMorgan Micro Cap Fund | | | 12 | | |
|
| JPMorgan Mid Cap Equity Fund | | | 15 | | |
|
| JPMorgan Mid Cap Value Fund | | | 18 | | |
|
| JPMorgan Small Cap Core Fund | | | 21 | | |
|
| JPMorgan Small Cap Equity Fund | | | 24 | | |
|
JPMorgan U.S. Small Company
Fund | | | 27 | | |
|
| JPMorgan Value Advantage Fund | | | 30 | | |
|
| Schedules of Portfolio Investments | | | 33 | | |
|
| Financial Statements | | | 85 | | |
|
| Financial Highlights | | | 110 | | |
|
| Notes to Financial Statements | | | 130 | | |
|
| Report of Independent Registered Public Accounting Firm | | | 144 | | |
|
| Trustees | | | 145 | | |
|
| Officers | | | 147 | | |
|
| Schedule of Shareholder Expenses | | | 149 | | |
|
| Board Approval of Renewal of Investment Advisory Agreement | | | 153 | | |
|
| Tax Letter | | | 159 | | |
|
Highlights
• U.S. equity market overcame several challenges
• FOMC raised rates at a measured pace
• Outlook for equity markets somewhat mixed
Investments in a Fund are not bank deposits or obligations of, or guaranteed or endorsed by, any bank and are not insured or guaranteed by the FDIC, the Federal Reserve Board or any other government agency. You could lose money if you sell when the Fund's share price is lower than when you invested.
Past performance is no guarantee for future performance. The general market views expressed in this report are opinions based on current market conditions and are subject to change without notice. These views are not intended to predict the future performance of a Fund or the securities markets. References to specific securities and their issuers are for illustrative purposes only and are not intended to be, and should not be interpreted as, recommendations to purchase or sell such securities. Such views are not meant as investment advice and may not be relied on as an indication of trading intent on behalf of any Fund.
Prospective investors should refer to the Fund's prospectus for a discussion of the Fund's investment objective, strategies and risks. Call JPMorgan Funds Service Center at (800) 480-4111 for a prospectus containing more complete information about a Fund, including management fees and other expenses. Please read it carefully before investing.
JPMorgan
U.S. Equity Mid and Small Cap Funds
PRESIDENT'S LETTER JANUARY 10, 2006 (Unaudited)
"The U.S. equity market overcame several challenges during the reporting period..."

Dear Shareholder:
We are pleased to present this annual report for the JPMorgan U.S. Equity Mid/Small Cap Funds. Inside, you'll find information detailing the performance of the Funds for the 12 months ended December 31, 2005, along with reports from the portfolio managers.
Stocks Produce Modest Gains
The U.S. equity market overcame several challenges during the reporting period, including rising interest rates, surging oil prices, a devastating hurricane season and geopolitical issues. While these factors often overshadowed solid corporate profit growth, the overall market ultimately produced positive returns during the year.
As expected, the Federal Open Market Committee (FOMC) continued to raise interest rates at a measured pace in an attempt to ward off inflation. After five rate hikes in 2004, the FOMC raised rates eight additional times in 2005. All told, short-term rates moved to 4.25% by the end of the period. Despite these actions and the destruction inflicted by hurricanes Katrina, Rita and Wilma, the U.S. economy continued to expand at a brisk pace in 2005. U.S. gross domestic product (GDP) was 3.8% in the first quarter of the year. Higher oil prices, which surpassed $70 a barrel, were cited as a reason for a fall in GDP to 3.1% in the second quarter of 2005. However, the economy demonstrated its resiliency by expanding 4.1% in the third quarter.
Mixed Stock Performance
The broad stock market, as measured by the S&P 500 Index, returned 4.91% during the 12-month period ended December 31, 2005. While there were hopes for another strong rally in the fourth quarter of the year—similar to the 12.18% and 9.23% returns in the fourth quarters of 2003 and 2004, respectively—this did not come to pass in 2005. Concerns over further rate hikes by the FOMC and inflationary pressures tempered the market's gains at the end of the year. Elsewhere during the 12-month period, mid-capitalization stocks generated significant returns, with the Russell Midcap Index gaining 12.65%. Large-capitalization stocks outperformed their small-capitalization counterparts over the period, as the Russell 1000 Index and Russell 2000 Index returned 6.27% and 4.55%, respectively.
Outlook
As we begin the new year, the outlook for equity markets is somewhat mixed. Positives include a solid economy, relatively lower oil prices and the possibility of the FOMC ending its rate hike campaign. On the other hand, corporate profits are expected to decelerate in 2006. In addition, should inflation increase, the FOMC may continue to raise rates. Given these uncertainties, investors should take a long-term approach to investments and maintain a diversified portfolio.
JPMorgan
U.S. Equity Mid and Small Cap Funds
CONTINUED (Unaudited)
On behalf of us all at JPMorgan Asset Management, thank you for your confidence and the continued trust you have placed in us. We look forward to serving your investment needs for many years to come. Should you have any questions, please feel free to contact the JPMorgan Funds Service Center at 1-800-480-4111.
Sincerely yours,

George C.W. Gatch
President
JPMorgan Funds
JPMORGAN U.S. EQUITY MID/SMALL CAP FUNDS2
JPMorgan
Capital Growth Fund
AS OF DECEMBER 31, 2005 (Unaudited)
| FUND FACTS | |
| Fund Inception | | 9/23/87 | |
| Fiscal Year End | | December 31 | |
Net Assets as of 12/31/2005
(In Thousands) | | $785,480 | |
| Primary Benchmark | | Russell Midcap
Growth Index | |
Q: HOW DID THE FUND PERFORM?
A: The JPMorgan Capital Growth Fund, which seeks capital growth over the long term,* returned 9.77% (A Shares) over the 12 months ended December 31, 2005, compared to the 12.10% return of the Russell Midcap Growth Index over the same period.
Q: WHY DID THE FUND PERFORM IN THIS WAY?
A: U.S. equity markets were dominated by interest rate concerns in 2005, as economic data was closely observed for signs that the Federal Open Market Committee's (FOMC) tightening cycle was winding down. Although there were bumps in the road, most particularly slowed growth and increased inflation following the hurricanes of late summer, the economy was generally supportive of equity gains in 2005. Equity markets were also supported by continued strength in corporate profits.
Despite posting a solid absolute return for the year, the Fund underperformed its benchmark due to overall stock selection in the consumer discretionary and information technology sectors. For most of the year, consumers faced headwinds of rising interest rates, increasing winter heating costs and a softening U.S. housing market. At the individual stock level, Flir System Inc. and VeriSign Inc. were large detractors from performance. Flir Systems Inc., a manufacturer of thermal imaging and infrared camera systems, announced that third-quarter earnings would not meet expectations due to disappointing results in its imaging business and European thermography division. The company reduced its full-year outlook as it did not expect to make up the third-quarter earnings and revenue shortfall in the fourth quarter. VeriSign Inc., an Internet and telecommunication infrastructure provider, experienced mixed results as second-quarter sal es decreased in its ring tone business divisions. Other parts of the company's business remain on track.
The Fund was positively impacted by overall stock selection in the energy and industrials sectors. Individual holdings, such as Grant Prideco Inc. and Omnicare Inc., were among the top individual contributors to performance. Grant Prideco Inc., an international provider of energy exploration products, generated strong results, stemming from increased production and strong energy prices. Omnicare Inc., a leading provider of pharmaceutical care for the elderly, acquired rival provider NeighborCare Inc., offering cost savings and improved purchasing power, which could lead to accelerated earnings growth.
Q: HOW WAS THE FUND MANAGED?
A: We employ a bottom-up approach to stock selection, constructing portfolios based on company fundamentals, quantitative screening and proprietary fundamental analysis. Our aim is designed to identify dominant franchises with predictable business models deemed capable of achieving sustained growth. We sought to maintain significant sector diversification in the Fund to avoid any large allocations contingent on macroeconomic or sector trends.
* The advisor seeks to achieve the Fund's objective. There can be no guarantee it will be achieved.
JPMORGAN U.S. EQUITY MID/SMALL CAP FUNDS3
JPMorgan
Capital Growth Fund
CONTINUED
(Unaudited)
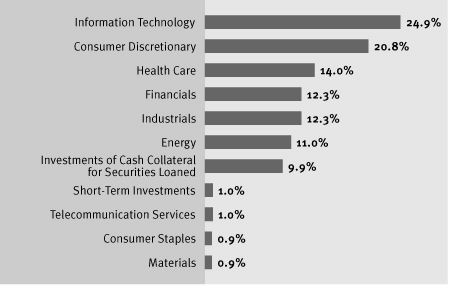
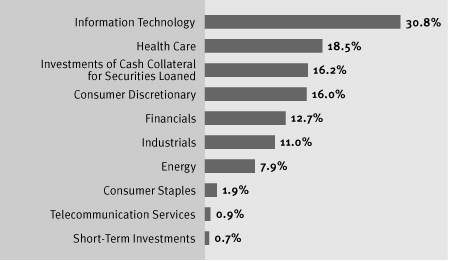
PORTFOLIO COMPOSITION*
TOP TEN EQUITY HOLDINGS
OF THE PORTFOLIO* | |
| 1. West Corp. | | | 2.3 | % | |
| 2. Amphenol Corp. | | | 2.2 | % | |
| 3. Sherwin-Williams Co. (The) | | | 1.5 | % | |
| 4. Polo Ralph Lauren Corp. | | | 1.5 | % | |
| 5. Seagate Technology | | | 1.5 | % | |
| 6. Zions Bancorp | | | 1.5 | % | |
| 7. Jabil Circuit, Inc. | | | 1.5 | % | |
8. J.B.Hunt Transport
Services, Inc. | | | 1.5 | % | |
| 9. Microchip Technology, Inc. | | | 1.4 | % | |
| 10. Alliance Data Systems Corp. | | | 1.4 | % | |
* Percentages indicated are based on net assets as of December 31, 2005. The portfolio's composition is subject to change.
JPMORGAN U.S. EQUITY MID/SMALL CAP FUNDS4
ANNUAL REPORT DECEMBER 31
2005
(Unaudited)
AVERAGE ANNUAL TOTAL RETURNS AS OF DECEMBER 31, 2005
| | | 1 YEAR | | 5 YEARS | | 10 YEARS | |
| CLASS A SHARES | |
| Without Sales Charge | | | 9.77 | % | | | 3.71 | % | | | 9.59 | % | |
| With Sales Charge* | | | 4.01 | % | | | 2.60 | % | | | 9.00 | % | |
| CLASS B SHARES | |
| Without CDSC | | | 9.23 | % | | | 3.20 | % | | | 9.15 | % | |
| With CDSC** | | | 4.23 | % | | | 2.84 | % | | | 9.15 | % | |
| CLASS C SHARES | |
| Without CDSC | | | 9.26 | % | | | 3.17 | % | | | 8.95 | % | |
| With CDSC*** | | | 8.26 | % | | | 3.17 | % | | | 8.95 | % | |
| SELECT CLASS SHARES | | | 10.08 | % | | | 4.20 | % | | | 10.05 | % | |
* Sales charge for class A shares is 5.25%.
** Assumes 5% CDSC (contingent deferred sales charge) for the one year period, 2% CDSC for the five year period and 0% CDSC for the ten year period.
*** Assumes a 1% CDSC for the one year period and 0% CDSC thereafter.
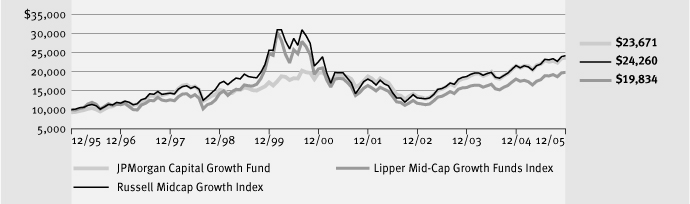
TEN YEAR PERFORMANCE (12/31/95 TO 12/31/05)
Source: Lipper, Inc. The performance quoted is past performance and is not a guarantee of future results. Mutual funds are subject to certain market risk. Investment returns and principal value of an investment will fluctuate so that an investor's shares, when redeemed, may be worth more or less than their original cost. Current performance may be higher or lower than the performance data shown. For up-to-date month-end performance information please call 1-800-480-4111.
The Fund commenced operations on 9/23/87.
Returns for the Select Class Shares prior to 1/25/96 (offering date of the Select Class Shares) are calculated using the historical expenses of the Class A Shares, which are higher than the expenses of the Select Shares.
Returns for the Class C Shares prior to 1/2/98 (offering date of the Class C Shares) are calculated using the historical expenses of the Class A Shares. During this period, the actual returns of Class C Shares would have been lower than shown because Class C Shares have higher expenses than Class A Shares.
The graph illustrates comparative performance for $10,000 invested in Class A Shares of the JPMorgan Capital Growth Fund, Russell Midcap Growth Index, and Lipper Mid-Cap Growth Funds Index from December 31, 1995 to December 31, 2005. The performance of the Fund assumes reinvestment of all dividends and capital gains and includes a sales charge. The performance of the indices does not include expenses or a sales charge and has been adjusted to reflect reinvestment of all dividends and capital gains of the securities included in the benchmark. The Russell Midcap Growth Index measures the performance of those Russell Midcap companies with higher price-to-book ratios and higher financial growth values. The Lipper Mid-Cap Growth Funds Index represents the total returns of the funds in the indicated category, as defined by Lipper, Inc. Investors cannot invest directly in an index.
Class A shares have a $1,000 minimum initial investment and carry a 5.25% sales charge.
Performance may reflect the waiver and reimbursement of the Fund's fees/expenses for certain periods since the inception date. Without these waivers and reimbursements performance would have been lower. Also, performance shown in this section does not reflect the deduction of taxes that a shareholder would pay on fund distributions or redemption of fund shares.
JPMORGAN U.S. EQUITY MID/SMALL CAP FUNDS5
JPMorgan
Dynamic Small Cap Fund
AS OF DECEMBER 31, 2005 (Unaudited)
| FUND FACTS | |
| Fund Inception | | 5/19/97 | |
| Fiscal Year End | | December 31 | |
Net Assets as of 12/31/2005
(In Thousands) | | $182,344 | |
| Primary Benchmark | | Russell 2000 Growth Index | |
Q: HOW DID THE FUND PERFORM?
A: The JPMorgan Dynamic Small Cap Fund, which seeks capital growth over the long term,* returned 5.29% (A Shares) over the 12 months ended December 31, 2005, compared to the 4.15% return of the Russell 2000 Growth Index over the same period.
Q: WHY DID THE FUND PERFORM IN THIS WAY?
A: U.S. equity markets were dominated by interest rate concerns in 2005, as economic data was closely observed for signs that the Federal Open Market Committee's (FOMC) tightening cycle was winding down. Although there were bumps in the road, most particularly slowed growth and increased inflation following the hurricanes of late summer, the economy was generally supportive of equity gains in 2005. Equity markets were also supported by continued strength in corporate profits.
The Fund outperformed the benchmark due primarily to stock selection in the materials and healthcare sectors. At the individual stock level, VeriFone Holdings Inc. and Chemed Corp. were positive contributors to performance. VeriFone Holdings Inc., a leading global provider of electronic payment technology, reported strong financial results and consistently raised earnings guidance. Chemed Corp., which operates VITAS Healthcare Corporation, a provider of end-of-life care, and Roto-Rooter, a plumbing and drain cleaning service provider, reported strong earnings growth resulting from increased revenues across business segments.
The Fund was negatively impacted by overall stock selection in the energy sector and an underweight in information technology. Avocent Corp. and Lions Gate Entertainment Corp. were among top individual detractors from performance. Avocent Corp., a computer equipment maker, experienced mixed results. The company slashed its first-quarter revenue guidance due to lower sales, the launch of its DSView 3 software and greater-than-expected seasonal softness. Lions Gate Entertainment Corp., an independent producer of motion pictures, television programming and family entertainment, lowered the company's earnings outlook for its fiscal year ending March 31, 2006, citing softness in home entertainment products, direct-to-video releases and disappointment in box office sales.
Q: HOW WAS THE FUND MANAGED?
A: We employ a bottom-up approach to stock selection, constructing portfolios based on company fundamentals, quantitative screening and proprietary fundamental analysis. Our aim is to identify growth companies with leading competitive positions, run by highly motivated and talented management that can sustain growth over a period of many years. Potential investments are subjected to rigorous financial analysis and a disciplined approach to valuation. Late in the third quarter of 2005, the Fund's strategy was slightly modified to include a lower number of holdings, allowing us to focus on companies where we possess a greater degree of conviction in their fundamentals.
* The advisor seeks to achieve the Fund's objective. There can be no guarantee it will be achieved.
JPMORGAN U.S. EQUITY MID/SMALL CAP FUNDS6
ANNUAL REPORT DECEMBER 31
2005
(Unaudited)
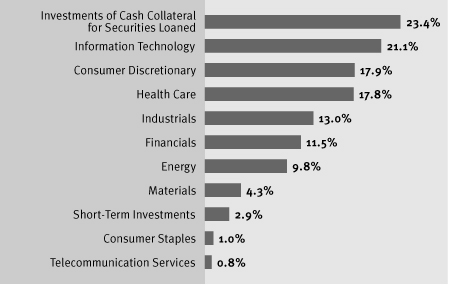
PORTFOLIO COMPOSITION*
TOP TEN EQUITY HOLDINGS
OF THE PORTFOLIO* | |
1. Marlin Business
Services, Inc. | | | 2.4 | % | |
| 2. Oshkosh Truck Corp. | | | 2.4 | % | |
| 3. Charming Shoppes, Inc. | | | 2.3 | % | |
| 4. Chemed Corp. | | | 2.3 | % | |
5. Foundation Coal
Holdings, Inc. | | | 2.3 | % | |
| 6. Champion Enterprises, Inc. | | | 2.2 | % | |
| 7. General Cable Corp. | | | 2.2 | % | |
| 8. Hyperion Solutions Corp. | | | 2.2 | % | |
9. Affiliated Managers
Group, Inc. | | | 2.1 | % | |
| 10. Epicor Software Corp. | | | 2.0 | % | |
* Percentages indicated are based on net assets as of December 31, 2005. The portfolio's composition is subject to change.
JPMORGAN U.S. EQUITY MID/SMALL CAP FUNDS7
JPMorgan
Dynamic Small Cap Fund
CONTINUED
(Unaudited)
AVERAGE ANNUAL TOTAL RETURNS AS OF DECEMBER 31, 2005
| | | 1 YEAR | | 5 YEARS | | SINCE
INCEPTION
(5/19/97) | |
| CLASS A SHARES | |
| Without Sales Charge | | | 5.29 | % | | | 1.16 | % | | | 10.31 | % | |
| With Sales Charge* | | | (0.23 | %) | | | 0.07 | % | | | 9.63 | % | |
| CLASS B SHARES | |
| Without CDSC | | | 4.66 | % | | | 0.53 | % | | | 9.63 | % | |
| With CDSC** | | | (0.34 | %) | | | 0.13 | % | | | 9.63 | % | |
| CLASS C SHARES | |
| Without CDSC | | | 4.67 | % | | | 0.53 | % | | | 9.59 | % | |
| With CDSC*** | | | 3.67 | % | | | 0.53 | % | | | 9.59 | % | |
| SELECT CLASS SHARES | | | 5.70 | % | | | 1.58 | % | | | 10.64 | % | |
* Sales charge for class A shares is 5.25%.
** Assumes 5% CDSC (contingent deferred sales charge) for the one year period, 2% CDSC for the five year period and 0% CDSC for the period since inception.
*** Assumes a 1% CDSC for the one year period and 0% CDSC thereafter.
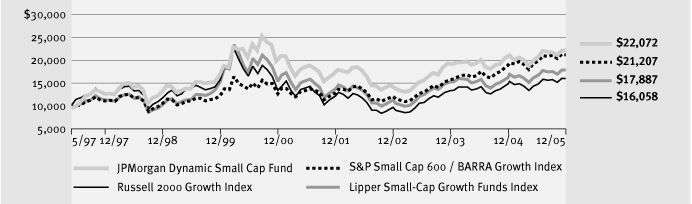
LIFE OF FUND PERFORMANCE (5/19/97 TO 12/31/05)
Source: Lipper, Inc. The performance quoted is past performance and is not a guarantee of future results. Mutual funds are subject to certain market risk. Investment returns and principal value of an investment will fluctuate so that an investor's shares, when redeemed, may be worth more or less than their original cost. Current performance may be higher or lower than the performance data shown. For up-to-date month-end performance information please call 1-800-480-4111.
The Fund commenced operations on 5/19/97.
Returns for the Select Class Shares prior to 4/5/99 (offering date of the Select Class Shares) are calculated using the historical expenses of the Class A Shares, which are higher than the expenses of the Select Shares. Returns for the Class C Shares prior to 1/7/98 (offering date of the Class C Shares) are calculated using the historical expenses of the Class B Shares, which are similar to the expenses of the Class C Shares.
The graph illustrates comparative performance for $10,000 invested in Class A Shares of the JPMorgan Dynamic Small Cap Fund, Russell 2000 Growth Index, S&P SmallCap 600/BARRA Growth Index, and Lipper Small-Cap Growth Funds Index from May 19, 1997 to June 30, 2005. The performance of the Fund assumes reinvestment of all dividends and capital gains and includes a sales charge. The performance of the indices reflects an initial investment at the end of the month following the Fund's inception. The performance of the indices does not include expenses or a sales charge and has been adjusted to reflect reinvestment of all dividends and capital gains of the securities included in the benchmark. The Russell 2000 Growth Index is an unmanaged, capitalization weighted price only index, which is comprised of 2000 of the smallest stocks (on the basis of capitalization) in the Russell 3000 Index. The S&P SmallCap 600/ BARRA Growth Ind ex is a capitalization-weighted index of all the stocks in the S&P SmallCap 600 Index with higher price-to-book ratios. The benchmark for the Fund was changed from the S&P SmallCap 600/BARRA Growth Index to the Russell 2000 Growth Index because the adviser believes the Russell 2000 Growth Index more accurately reflects the Fund's investment strategy. The Lipper Small-Cap Growth Funds Index represents the total returns of the funds in the indicated category, as defined by Lipper, Inc. Investors cannot invest directly in an index.
Class A Shares have a $1,000 minimum initial investment and carry a 5.25% sales charge.
Performance may reflect the waiver and reimbursement of the Fund's fees/expenses for certain periods since the inception date. Without these waivers and reimbursements performance would have been lower. Also, performance shown in this section does not reflect the deduction of taxes that a shareholder would pay on fund distributions or redemption of fund shares.
JPMORGAN U.S. EQUITY MID/SMALL CAP FUNDS8
JPMorgan
Growth Advantage Fund
AS OF DECEMBER 31, 2005 (Unaudited)
| FUND FACTS | |
| Fund Inception | | 10/29/99 | |
| Fiscal Year End | | December 31 | |
Net Assets as of 12/31/2005
(In Thousands) | | $56,096 | |
| Primary Benchmark | | Russell 3000 Growth Index, | |
Q: HOW DID THE FUND PERFORM?
A: The JPMorgan Growth Advantage Fund, which seeks to provide long-term capital growth,* returned 10.63% (A Shares)1 over the 12 months ended December 31, 2005, compared to the 5.17% return of the Russell 3000 Growth Index over the same period.
Q: WHY DID THE FUND PERFORM IN THIS WAY?
A: U.S. equity markets were dominated by interest rate concerns in 2005, as economic data was closely observed for signs that the Federal Open Market Committee's (FOMC) tightening cycle was winding down. Although there were bumps in the road, most particularly slowed growth and increased inflation following the hurricanes of late summer, the economy was generally supportive of equity gains in 2005.
The Fund was positively impacted by overall stock selection in the energy and technology sectors. Holdings, such as Apple Computer Inc. and Omnicare Inc., were among the top contributors. Apple Computer Inc., a manufacturer and marketer of personal computers, benefited from the expansion of its iPod digital music player business lines. Sales increased as the company introduced less expensive models, flash memory-based products and video playing versions. Omnicare Inc., a leading provider of pharmaceutical care for the elderly, acquired rival provider NeighborCare Inc., offering cost savings and improved purchasing power, which could lead to accelerated earnings growth.
Stock selection in consumer discretionary detracted from performance during the year. Exposure to OSI Pharmaceuticals Inc. and VeriSign Inc. detracted from performance. Shares of OSI Pharmaceuticals Inc. declined sharply after the company announced its acquisition of Eyetech Pharmaceuticals for a substantial premium. VeriSign Inc., an internet and telecommunication infrastructure provider, experienced mixed results as second-quarter sales decreased in its ring tone business divisions. Other parts of the company's business remain on track.
Q: HOW WAS THE FUND MANAGED?
A: Our focus remains on stock selection, believing that quality companies, regardless of their economic sector, trading at attractive valuations will outperform in the long term. Our aim is designed to identify companies with predictable and durable business models deemed capable of achieving sustained growth. We sought to maintain significant sector diversification in the Fund to avoid any large allocations contingent on macroeconomic or sector trends.
1 Effective August 17, 2005, the JPMorgan Mid Cap Growth Fund's name, investment objective, strategy and process changed to the current JPMorgan Growth Advantage Fund. Effective August 17, 2005, the funds benchmark was changed from the Russell Midcap® Growth Index to the Russell 3000 Growth Index.
* The advisor seeks to achieve the Fund's objective. There can be no guarantee it will be achieved.
JPMORGAN U.S. EQUITY MID/SMALL CAP FUNDS9
JPMorgan
Growth Advantage Fund
CONTINUED
(Unaudited)
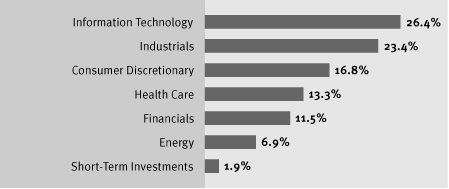
PORTFOLIO COMPOSITION*
TOP TEN EQUITY HOLDINGS
OF THE PORTFOLIO* | |
| 1. West Corp. | | | 2.3 | % | |
| 2. Amphenol Corp. | | | 2.2 | % | |
| 3. Sherwin-Williams Co. (The) | | | 1.6 | % | |
| 4. Seagate Technology | | | 1.5 | % | |
| 5. Norfolk Southern Corp. | | | 1.5 | % | |
| 6. Polo Ralph Lauren Corp. | | | 1.5 | % | |
| 7. Zions Bancorp | | | 1.5 | % | |
| 8. Jabil Circuit, Inc. | | | 1.5 | % | |
9. Alliance Data Systems
Corp. | | | 1.4 | % | |
| 10. McAfee, Inc. | | | 1.4 | % | |
* Percentages indicated are based on net assets as of December 31, 2005. The portfolio's composition is subject to change.
JPMORGAN U.S. EQUITY MID/SMALL CAP FUNDS10
ANNUAL REPORT DECEMBER 31
2005
(Unaudited)
AVERAGE ANNUAL TOTAL RETURNS AS OF DECEMBER 31, 2005
| | | 1 YEAR | | 5 YEARS | | SINCE
INCEPTION
(10/29/99) | |
| CLASS A SHARES1 | |
| Without Sales Charge | | | 10.63 | % | | | (2.09 | %) | | | (6.75 | %) | |
| With Sales Charge* | | | 4.79 | % | | | (3.14 | %) | | | (7.56 | %) | |
| CLASS B SHARES | |
| Without CDSC | | | 9.75 | % | | | (2.77 | %) | | | (7.41 | %) | |
| With CDSC** | | | 4.75 | % | | | (3.22 | %) | | | (7.41 | %) | |
1 Effective August 17, 2005, the JPMorgan Mid Cap Growth Fund's name, investment objective, strategy and process changed to the current JPMorgan Growth Advantage Fund.
* Sales charge for class A shares is 5.25%.
** Assumes 5% CDSC (contingent deferred sales charge) for the one year period, 2% CDSC for the five year period and 0% CDSC for the period since inception.
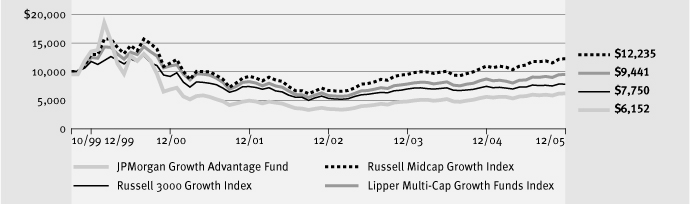
LIFE OF FUND PERFORMANCE (10/29/99 TO 12/31/05)
Source: Lipper, Inc. The performance quoted is past performance and is not a guarantee of future results. Mutual funds are subject to certain market risk. Investment returns and principal value of an investment will fluctuate so that an investor's shares, when redeemed, may be worth more or less than their original cost. Current performance may be higher or lower than the performance data shown. For up-to-date month-end performance information please call 1-800-480-4111.
The JPMorgan Growth Advantage Fund commenced operations on 10/29/99.
The graph illustrates comparative performance for $10,000 invested in Class A Shares of the JPMorgan Growth Advantage Fund, Russell 3000 Growth Index, Russell Midcap Growth Index, and Lipper Multi-Cap Growth Funds Index from October 29, 1999 to June 30, 2005. The performance of the Fund assumes reinvestment of all dividends and capital gains and includes a sales charge. The performance of the indices reflects an initial investment at the end of the month following the Fund's inception. The performance of the indices does not include expenses or a sales charge and has been adjusted to reflect reinvestment of all dividends and capital gains of the securities included in the benchmark. The Russell 3000 Growth Index measures the performance of those Russell 3000 Index companies with higher price-to-book ratios and higher forecasted growth values. The Russell Midcap Growth Index measures the performance of those Russell Midcap compan ies with higher price to-book ratios and higher forecasted growth values. The benchmark for the Fund was changed from the Russell Midcap Growth Index to the Russell 3000 Growth Index because the adviser believes the new Index more accurately reflects the Fund's investment strategy. The Lipper Multi-Cap Growth Funds Index represents the total returns of the funds in the indicated category, as defined by Lipper, Inc. Investors cannot invest directly in an index.
Class A Shares have a $1,000 minimum initial investment and carry a 5.25% sales charge.
Performance may reflect the waiver and reimbursement of the Fund's fees/expenses for certain periods since the inception date. Without these waivers and reimbursements performance would have been lower. Also, performance shown in this section does not reflect the deduction of taxes that a shareholder would pay on fund distributions or redemption of fund shares.
JPMORGAN U.S. EQUITY MID/SMALL CAP FUNDS11
JPMorgan
Micro Cap Fund
AS OF DECEMBER 31, 2005 (Unaudited)
| FUND FACTS | |
| Fund Inception | | 10/31/05 | |
| Fiscal Year End | | December 31 | |
Net Assets as of 12/31/2005
(In Thousands) | | $5,158 | |
| Primary Benchmark | | Russell Microcap Index | |
Q: HOW DID THE FUND PERFORM?
A: The JPMorgan Micro Cap Fund, which seeks capital growth over the long term,* returned 3.20% (Select Shares) since inception (10/31/05) ended December 31, 2005, compared to the 4.42% return of the Russell Microcap Index over the same period.
Q: WHY DID THE FUND PERFORM IN THIS WAY?
A: U.S. equity markets were dominated by interest rate concerns in 2005, as economic data was closely observed for signs that the Federal Open Market Committee's (FOMC) tightening cycle was winding down. Although there were bumps in the road, most particularly slowed growth and increased inflation following the hurricanes of late summer, the economy was generally supportive of equity gains in 2005. Equity markets were also supported by continued strength in corporate profits.
The Fund underperformed the benchmark due primarily to overall stock selection in the consumer discretionary and industrials sectors. Consumers were faced with the headwinds of rising interest rates, increasing winter heating costs and a softening U.S. housing market. At the individual stock level, Hudson Highland Group Inc. and Youbet.com Inc. were among the top detractors from performance. Hudson Highland Group Inc, a specialty staffing company, announced that 2005 results would be lower than expected due to hiring softness in New Zealand, Australia and North America. Youbet.com Inc., an operator of online horse race wagering, announced that revenue growth for the fourth quarter would be below expectations, as the number of race days were reduced due to disruptions caused by Hurricanes Rita and Katrina, and issues specific to a California race track.
The Fund was positively impacted by overall stock selection in the financial sector and a lack of exposure to the telecommunication services sector. Lo Jack Corp. and NMT Medical Inc. were among the top individual contributors to performance. Lo Jack Corp., a provider of theft assistance technology and services for automobiles, reported strong results as the company continues to penetrate both new and existing domestic markets. Additionally, the company posted a 45% increase in international sales. The stock of NMT Medical Inc., a developer of cardiac implant technologies, rose on the back of increased optimism toward the company's efforts to find a treatment for migraine headaches.
Q: HOW WAS THE FUND MANAGED?
A: We employ a bottom-up approach to stock selection, constructing portfolios based on company fundamentals, quantitative screening and proprietary fundamental analysis. Our aim is to identify micro cap companies with durable franchises and strong management that will, in our opinion, generate solid returns over the long term. Our research involves separating those with strong long-term prospects from those that exhibit deteriorating business fundamentals or experience deep cyclicality. Potential investments are subjected to rigorous financial analysis and a disciplined approach to valuation.
* The advisor seeks to achieve the Fund's objective. There can be no guarantee it will be achieved.
JPMORGAN U.S. EQUITY MID/SMALL CAP FUNDS12
ANNUAL REPORT DECEMBER 31
2005
(Unaudited)
PORTFOLIO COMPOSITION*
TOP TEN EQUITY HOLDINGS
OF THE PORTFOLIO* | |
| 1. Celebrate Express, Inc. | | | 3.4 | % | |
| 2. PDF Solutions, Inc. | | | 3.2 | % | |
| 3. Collectors Universe | | | 3.0 | % | |
| 4. FirstService Corp. (Canada) | | | 3.0 | % | |
| 6. Bankrate, Inc. | | | 2.5 | % | |
| 5. Lo Jack Corp. | | | 2.5 | % | |
| 7. Unica Corp. | | | 2.5 | % | |
8. American Dental
Partners, Inc. | | | 2.4 | % | |
| 9. Lufkin Industries, Inc. | | | 2.3 | % | |
| 10. Interface, Inc. | | | 2.2 | % | |
* Percentages indicated are based on net assets as of December 31, 2005. The portfolio's composition is subject to change.
JPMORGAN U.S. EQUITY MID/SMALL CAP FUNDS13
JPMorgan
Micro Cap Fund
CONTINUED
(Unaudited)
AVERAGE ANNUAL TOTAL RETURNS AS OF DECEMBER 31, 2005
| | | SINCE
INCEPTION
(10/31/05) | |
| CLASS A SHARES | |
| Without Sales Charge | | | 3.13 | % | |
| With Sales Charge* | | | (2.17 | %) | |
| CLASS C SHARES | |
| Without CDSC | | | 3.07 | % | |
| With CDSC** | | | 2.07 | % | |
| SELECT CLASS SHARES | | | 3.20 | % | |
| RUSSELL MICROCAP INDEX | | | 4.79 | % | |
* Sales charge for class A shares is 5.25%.
** Assumes a 1% CDSC for the one year period and 0% CDSC thereafter.
Source: Lipper, Inc. The performance quoted is past performance and is not a guarantee of future results. Mutual funds are subject to certain market risk. Investment returns and principal value of an investment will fluctuate so that an investor's shares, when redeemed, may be worth more or less than their original cost. Current performance may be higher or lower than the performance data shown. For up-to-date month-end performance information please call 1-800-480-4111.
The Fund commenced operations on 10/31/05.
The performance of the index does not include expenses or a sales charge and has been adjusted to reflect reinvestment of all dividends and capital gains of the securities included in the benchmark. The Russell Microcap Index is an unmanaged, capitalization weighed price only index, which is comprised of 1,000 of the smallest stocks (on the basis of capitalization) in the small-cap Russell 2000 Index plus the next 1,000 smallest securities. Investors cannot invest directly in an index.
Performance may reflect the waiver and reimbursement of the Fund's fees / expenses for certain periods since the inception date. Without these waivers and reimbursements performance would have been lower. Also, performance shown in this section does not reflect the deduction of taxes that a shareholder would pay on Fund distributions or redemption of Fund shares.
JPMORGAN U.S. EQUITY MID/SMALL CAP FUNDS14
JPMorgan
Mid Cap Equity Fund
AS OF DECEMBER 31, 2005 (Unaudited)
| FUND FACTS | |
| Fund Inception | | 1/1/97 | |
| Fiscal Year End | | December 31 | |
Net Assets as of 12/31/2005
(In Thousands) | | $268,582 | |
| Primary Benchmark | | Russell Midcap Index | |
Q: HOW DID THE FUND PERFORM?
A: The JPMorgan Mid Cap Equity Fund, whose objective is long-term capital growth,* returned 9.61% (Select Shares) over the 12 months ended December 31, 2005, compared to the 12.65% return of the Russell Midcap Index over the same period.
Q: WHY DID THE FUND PERFORM IN THIS WAY?
A: U.S. equity markets were dominated by interest rate concerns in 2005, as economic data was closely observed for signs that the Federal Open Market Committee's (FOMC) tightening cycle was winding down. Although there were bumps in the road, most particularly slowed growth and increased inflation following the hurricanes of late summer, the economy was generally supportive of equity gains in 2005. Equity markets were also supported by continued strength in corporate profits.
The Fund underperformed the benchmark due primarily to overall stock selection in the consumer discretionary and materials sectors, as consumers faced headwinds of rising interest rates, increasing winter heating costs and a softening U.S. housing market while many materials manufacturers faced increased costs associated with higher energy prices. At the individual stock level, IPC Holdings Ltd. and VeriSign Inc. were top detractors from performance. IPC Holdings Ltd., a provider of property catastrophe reinsurance, announced significant insured losses resulting from Hurricanes Katrina and Rita. Despite relatively stable operating results prior to the hurricanes, the storms negatively impacted the company's third-quarter financial results. VeriSign Inc., an Internet and telecommunication infrastructure provider, experienced mixed results as second-quarter sales decreased in its ring tone business divisions. Other parts of the co mpany's business remain on track.
The Fund was positively impacted by overall stock selection in industrials and an overweight in energy. Coventry Health Care Inc. and Burlington Resources Inc. were among the top contributors to performance. Coventry Health Care Inc., a managed healthcare company, experienced accelerated earning growth in 2005 due to improved margins and realized synergies from its acquisition of First Health Group Corporation. Burlington Resources Inc., an energy exploration and production company, reported strong results resulting from higher energy prices, growth in production and accelerated share repurchases. In addition, the stock strengthened in December as the company agreed to be acquired by ConocoPhillips.
Q: HOW WAS THE FUND MANAGED?
A: We employ a bottom-up approach to stock selection, constructing portfolios based on company fundamentals, quantitative screening and proprietary fundamental analysis. The research process is designed to identify companies with predictable and durable business models deemed capable of achieving sustainable growth. Above-average growth, sustainable cash flows and attractive valuations are characteristics of the investments in this portfolio. Potential investments are subjected to rigorous financial analysis and a disciplined approach to valuation.
* The advisor seeks to achieve the Fund's objective. There can be no guarantee it will be achieved.
JPMORGAN U.S. EQUITY MID/SMALL CAP FUNDS15
JPMorgan
Mid Cap Equity Fund
CONTINUED
(Unaudited)
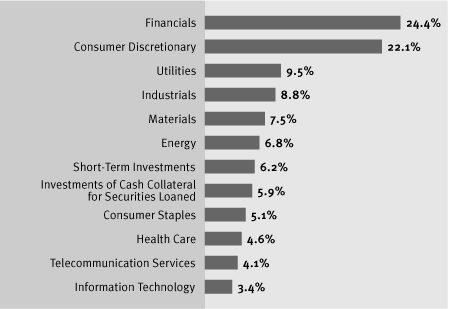
PORTFOLIO COMPOSITION*
TOP TEN EQUITY HOLDINGS
OF THE PORTFOLIO* | |
| 1. Coventry Health Care, Inc. | | | 1.5 | % | |
| 2. Amphenol Corp. | | | 1.5 | % | |
| 3. Sherwin-Williams Co. (The) | | | 1.3 | % | |
| 4. V.F. Corp. | | | 1.2 | % | |
| 5. Assurant, Inc. | | | 1.2 | % | |
| 6. West Corp. | | | 1.1 | % | |
| 7. Omnicare, Inc. | | | 1.1 | % | |
| 8. Burlington Resources, Inc. | | | 1.0 | % | |
| 9. M&T Bank Corp. | | | 1.0 | % | |
| 10. Zions Bancorp | | | 1.0 | % | |
* Percentages indicated are based on net assets as of December 31, 2005. The portfolio's composition is subject to change.
JPMORGAN U.S. EQUITY MID/SMALL CAP FUNDS16
ANNUAL REPORT DECEMBER 31
2005
(Unaudited)
AVERAGE ANNUAL TOTAL RETURNS AS OF DECEMBER 31, 2005
| | | 1 YEAR | | 5 YEAR | | 10 YEARS | |
| SELECT CLASS SHARES | | | 9.61 | % | | | 7.56 | % | | | 11.48 | % | |
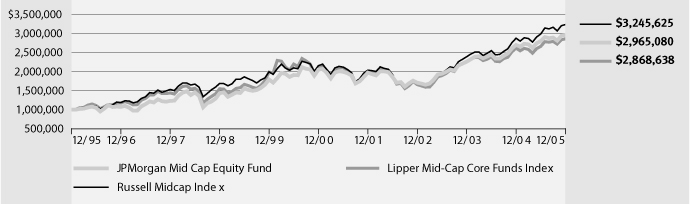
LIFE OF FUND PERFORMANCE (12/31/95 TO 12/31/05)
Source: Lipper, Inc. The performance quoted is past performance and is not a guarantee of future results. Mutual funds are subject to certain market risk. Investment returns and principal value of an investment will fluctuate so that an investor's shares, when redeemed, may be worth more or less than their original cost. Current performance may be higher or lower than the performance data shown. For up-to-date month-end performance information please call 1-800-480-4111.
The Fund commenced operations on 1/1/97.
Returns for the Fund prior to 1/1/97 (offering date of the Select Class Shares) are the returns of a common trust fund adjusted to reflect the Fund's expense levels (absent reimbursements) that were in place at the time the Fund recieved the common trust fund assets. The common trust fund was not registered with the SEC and was not subject to investment restrictions of registered mutual funds. If the common trust fund had been registered, performance may have been adversely affected.
The graph illustrates comparative performance for $1,000,000 invested in the JPMorgan Mid Cap Equity Fund, Russell Midcap Index, and Lipper Mid-Cap Core Funds Index from December 31, 1995 to June 30, 2005. The performance of the Fund assumes reinvestment of all dividends and capital gains. The performance of the indices does not include expenses and has been adjusted to reflect reinvestment of all dividends and capital gains of the securities included in the benchmark. The Russell Midcap Index measures the performance of the smallest 800 companies of the Russell 1000 Index, which represents approximately 25% of the total market capitalization of the Russell 1000 Index. The Lipper Mid-Cap Core Funds Index represents the total returns of the funds in the indicated category, as defined by Lipper, Inc. Investors cannot invest directly in an Index.
Select Class Shares have a $1,000,000 minimum initial investment and carry no sales charge.
Performance may reflect the waiver and reimbursement of the Fund's fees/expenses for certain periods since the inception date. Without these waivers and reimbursements performance would have been lower. Also, performance shown in this section does not reflect the deduction of taxes that a shareholder would pay on fund distributions or redemption of fund shares.
JPMORGAN U.S. EQUITY MID/SMALL CAP FUNDS17
JPMorgan
Mid Cap Value Fund
AS OF DECEMBER 31, 2005 (Unaudited)
| FUND FACTS | |
| Fund Inception | | 11/13/97 | |
| Fiscal Year End | | December 31 | |
Net Assets as of 12/31/2005
(In Thousands) | | $7,016,803 | |
| Primary Benchmark | | Russell Midcap Value Index | |
Q: HOW DID THE FUND PERFORM?
A: The JPMorgan Mid Cap Value Fund, which seeks growth from capital appreciation,* returned 9.42% (Institutional Shares) over the 12 months ended December 31, 2005, compared to the 12.65% return of the Russell Midcap Value Index over the same period.
Q: WHY DID THE FUND PERFORM IN THIS WAY?
A: U.S. equity markets were dominated by interest rate concerns in 2005, as economic data was closely observed for signs that the Federal Open Market Committee's (FOMC) tightening cycle was winding down. Although there were bumps in the road, most particularly slowed growth and increased inflation following the hurricanes of late summer, the economy was generally supportive of equity gains in 2005. Equity markets were also supported by continued strength in corporate profits.
The Fund underperformed the benchmark due primarily to overall stock selection in the consumer discretionary and materials sectors, as consumers faced headwinds of rising interest rates, increasing winter heating costs and a softening U.S. housing market while many materials manufacturers faced increased costs associated with higher energy prices. At the individual stock level, IPC Holdings Ltd. and Gannett Co. Inc. were among the top detractors from performance. IPC Holdings Ltd., a provider of property catastrophe reinsurance, announced significant insured losses resulting from Hurricanes Katrina and Rita. Despite relatively stable operating results prior to the hurricanes, the storms negatively impacted the company's third-quarter financial results. Gannett Co., Inc., a media conglomerate, experienced weaker revenues due to reduced ad sales.
The Fund was positively impacted by overall stock selection in the industrials and consumer staples sectors. Burlington Resources, Inc. and Coventry Health Care Inc. were among the top individual contributors to performance. Burlington Resources, Inc., an energy exploration and production company, reported strong results resulting from higher energy prices, growth in production and accelerated share repurchases. In addition, the stock strengthened in December as the company agreed to be acquired by ConocoPhillips. Coventry Health Care Inc., a managed health care company, experienced accelerated earning growth in 2005 due to improved margins and realized synergies from its acquisition of First Health Group Corporation.
Q: HOW WAS THE FUND MANAGED?
A: We employ a bottom-up approach to stock selection, constructing portfolios based on company fundamentals, quantitative screening and proprietary fundamental analysis. Our aim is to identify undervalued companies that have the potential to grow their intrinsic values per share and to purchase these companies at a discount. The research process is designed to identify companies with predictable and durable business models deemed capable of achieving sustainable growth. Potential investments are subjected to rigorous financial analysis and a disciplined approach to valuation.
* The advisor seeks to achieve the Fund's objective. There can be no guarantee it will be achieved.
JPMORGAN U.S. EQUITY MID/SMALL CAP FUNDS18
ANNUAL REPORT DECEMBER 31
2005
(Unaudited)
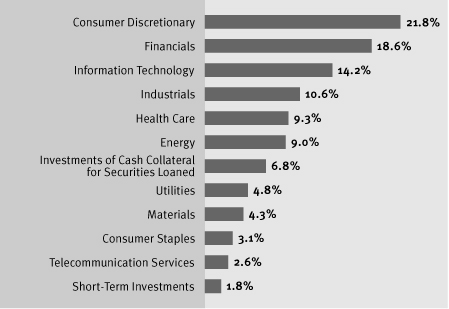
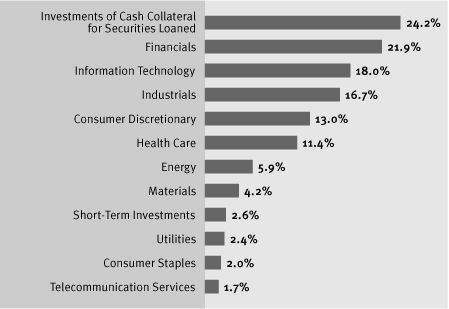
PORTFOLIO COMPOSITION*
TOP TEN EQUITY HOLDINGS
OF THE PORTFOLIO* | |
| 1. V.F. Corp. | | | 2.4 | % | |
| 2. Assurant, Inc. | | | 2.3 | % | |
| 3. Burlington Resources, Inc. | | | 2.0 | % | |
| 4. M&T Bank Corp. | | | 1.9 | % | |
| 5. Coventry Health Care, Inc. | | | 1.9 | % | |
| 6. Devon Energy Corp. | | | 1.8 | % | |
| 7. CenturyTel, Inc. | | | 1.8 | % | |
| 8. AutoZone, Inc. | | | 1.8 | % | |
| 9. North Fork Bancorp, Inc. | | | 1.7 | % | |
| 10. Kinder Morgan, Inc. | | | 1.7 | % | |
* Percentages indicated are based on net assets as of December 31, 2005. The portfolio's composition is subject to change.
JPMORGAN U.S. EQUITY MID/SMALL CAP FUNDS19
JPMorgan
Mid Cap Value Fund
CONTINUED
(Unaudited)
AVERAGE ANNUAL TOTAL RETURNS AS OF DECEMBER 31, 2005
| | | 1 YEAR | | 5 YEARS | | SINCE
INCEPTION
(11/13/97) | |
| CLASS A SHARES | |
| Without Sales Charge | | | 8.87 | % | | | 13.88 | % | | | 17.49 | % | |
| With Sales Charge* | | | 3.16 | % | | | 12.66 | % | | | 16.71 | % | |
| CLASS B SHARES | |
| Without CDSC | | | 8.31 | % | | | 13.18 | % | | | 17.04 | % | |
| With CDSC** | | | 3.31 | % | | | 12.94 | % | | | 17.04 | % | |
| CLASS C SHARES | |
| Without CDSC | | | 8.34 | % | | | 13.23 | % | | | 17.07 | % | |
| With CDSC*** | | | 7.34 | % | | | 13.23 | % | | | 17.07 | % | |
| SELECT CLASS SHARES | | | 9.16 | % | | | 14.18 | % | | | 17.68 | % | |
| INSTITUTIONAL CLASS SHARES | | | 9.42 | % | | | 14.43 | % | | | 17.83 | % | |
* Sales charge for class A shares is 5.25%.
** Assumes 5% CDSC (contingent deferred sales charge) for the one year period, 2% CDSC for the five year period and 0% CDSC for the period since inception.
*** Assumes a 1% CDSC for the one year period and 0% CDSC thereafter.
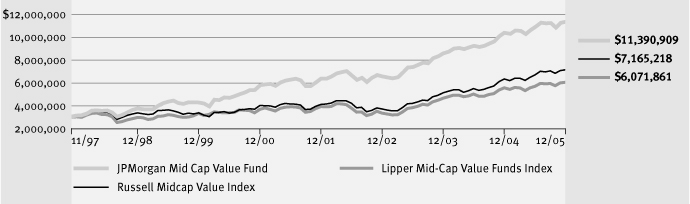
LIFE OF FUND PERFORMANCE (11/13/97 TO 12/31/05)
Source: Lipper, Inc. The performance quoted is past performance and is not a guarantee of future results. Mutual funds are subject to certain market risk. Investment returns and principal value of an investment will fluctuate so that an investor's shares, when redeemed, may be worth more or less than their original cost. Current performance may be higher or lower than the performance data shown. For up-to-date month-end performance information please call 1-800-480-4111.
The Fund commenced operations on 11/13/97.
Returns for the Select Class Shares prior to 10/31/01 (offering date of the Select Class Shares) are calculated using the historical expenses of the Institutional Class Shares. During the period, the actual returns of Select Class Shares would have been lower than shown because Select Class Shares have higher expenses Institutional Class Shares.
Returns for the Class A, Class B, and Class C Shares prior to 4/30/01 (offering date of the Class A, Class B, and Class C Shares) are calculated using the historical expenses of the Institutional Class Shares. During this period, the actual returns of Class A, Class B, and Class C Shares would have been lower than shown because Class A, Class B, and Class C Shares have higher expenses than Institutional Class Shares.
The graph illustrates comparative performance for $3,000,000 invested in Institutional Class Shares of the JPMorgan Mid Cap Value Fund, Russell Midcap Value Index, and Lipper Mid-Cap Value Funds Index from November 13, 1997 to June 30, 2005. The performance of the Fund assumes reinvestment of all dividends and capital gains. The performance of the indices reflects an initial investment at the end of the month following the Fund's inception. The performance of the indices does not include expenses or a sales charge and has been adjusted to reflect reinvestment of all dividends and capital gains of the securities included in the benchmark. The Russell Midcap Value Index is an unmanaged, capitalization weighted, price only index that measures the performance of those companies included in the Russell Midcap Index that have lower price-to-book ratios and lower forecasted growth rates. The Lipper Mid-Cap Value Funds Index represents the total returns of the funds in the indicated category, as defined by Lipper, Inc. Investors cannot invest directly in an index.
Institutional Class Shares have a $3,000,000 minimum initial investment and carry no sales charge.
Performance may reflect the waiver and reimbursement of the Fund's fees/expenses for certain periods since the inception date. Without these waivers and reimbursements performance would have been lower. Also, performance shown in this section does not reflect the deduction of taxes that a shareholder would pay on fund distributions or redemption of fund shares.
JPMORGAN U.S. EQUITY MID/SMALL CAP FUNDS20
JPMorgan
Small Cap Core Fund
AS OF DECEMBER 31, 2005 (Unaudited)
| FUND FACTS | |
| Fund Inception | | 1/1/97 | |
| Fiscal Year End | | December 31 | |
Net Assets as of 12/31/2005
(In Thousands) | | $815,905 | |
| Primary Benchmark | | Russell 2000
Index | |
Q: HOW DID THE FUND PERFORM?
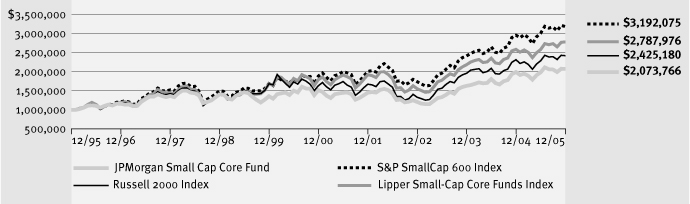
A: The JPMorgan Small Cap Core Fund, which seeks capital growth over the long term,* returned 3.90% (Select Shares) over the 12 months ended December 31, 2005, compared to the 4.55% return of the Russell 2000 Index over the same period.
Q: WHY DID THE FUND PERFORM THIS WAY?
A: U.S. equity markets produced solid returns in 2005. Concerns that a slowdown in the housing sector would cut the legs out from under consumer spending were more than offset by increased consumer confidence due primarily to rapidly falling gasoline prices in the third and fourth quarters.
Stock selection in the finance and pharmaceutical sectors primarily detracted from results. At the security level, a top detractor was R&G Financial Corp., a diversified financial services company, whose shares declined in April on the back of restated earnings for 2004. The company's shares also fell in sync with a major Puerto Rico-based lender that has undergone a formal accounting probe by the SEC. Another major detractor was Cypress Biosciences Inc., a biotechnology company. Shares of Cypress Biosciences Inc. fell at the end of September after the company and its drug development partner, Forest Laboratories Inc., announced early data from a Phase III clinical trial showing that the drug milnacipran was statistically ineffective in treating fibromyalgia, a condition causing chronic muscle pain and stiffness. Despite the setback, Forest Laboratories and Cypress Biosciences stated that they will continue to pursue two add itional Phase III clinical trials for the drug, but admitted their plan could change in the near future.
Although the Fund underperformed its benchmark, stock selection in the industrial cyclical and utility sectors aided performance. Among the top contributors were Dobson Communications Corp., an Oklahoma City-based provider of wireless communications services, and GUESS? Inc., an apparel retailer. In June, Dobson Communications Corp. shares benefited from positive earnings guidance due to increased revenue per subscriber. The company also initiated discussions with Cingular, the largest U.S. cell phone provider, aimed at setting up a roaming agreement. Additionally, the company agreed to buy the Cellular One brand from Alltel Corp., a telecommunications company, for $1.3 million. GUESS? Inc. shares increased after the company reported record revenues throughout the year, which were driven by the performance in its European business.
Q: HOW WAS THE FUND MANAGED?
A: The Fund strives to add value exclusively through stock selection rather than sector, style or theme bets. To minimize sector risk, we weight sectors in the Fund within +/-1% of the sector weights of the benchmark. We have found that minimizing sector bets is one of the most effective ways of reducing residual risk from a portfolio without reducing the ability to add performance. Finally, to control stock-specific risk, individual stock weights in the Fund are limited to +/-1% of the stock's weight in the Russell 2000 Index.
* The advisor seeks to achieve the Fund's objective. There can be no guarantee it will be achieved.
JPMORGAN U.S. EQUITY MID/SMALL CAP FUNDS21
JPMorgan
Small Cap Core Fund
CONTINUED
(Unaudited)
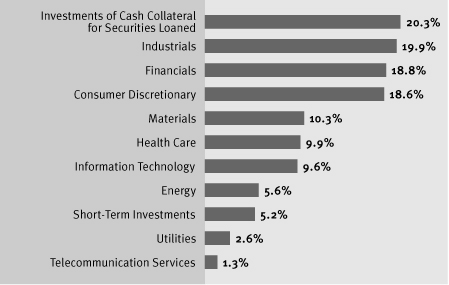
PORTFOLIO COMPOSITION*
TOP TEN EQUITY HOLDINGS
OF THE PORTFOLIO* | |
1. Applied Industrial
Technologies, Inc. | | | 1.1 | % | |
| 2. Houston Exploration Co. | | | 0.9 | % | |
| 3. Kilroy Realty Corp. | | | 0.9 | % | |
| 4. Aaron Rents, Inc. | | | 0.8 | % | |
5. Universal Forest Products,
Inc. | | | 0.8 | % | |
6. Mid-America Apartment
Communities, Inc. | | | 0.8 | % | |
| 7. Moog, Inc., Class A | | | 0.8 | % | |
| 8. Delphi Financial Group, Inc. | | | 0.8 | % | |
| 9. Commercial Metals Co. | | | 0.7 | % | |
10. Zenith National Insurance
Corp. | | | 0.7 | % | |
* Percentages indicated are based on net assets as of December 31, 2005. The portfolio's composition is subject to change.
JPMORGAN U.S. EQUITY MID/SMALL CAP FUNDS22
ANNUAL REPORT DECEMBER 31
2005
(Unaudited)
AVERAGE ANNUAL TOTAL RETURNS AS OF DECEMBER 31, 2005
| | | 1 YEAR | | 5 YEARS | | 10 YEARS | |
| SELECT CLASS SHARES | | | 3.90 | % | | | 6.42 | % | | | 7.57 | % | |
TEN YEAR FUND PERFORMANCE (12/31/95 TO 12/31/05)
Source: Lipper, Inc. The performance quoted is past performance and is not a guarantee of future results. Mutual funds are subject to certain market risk. Investment returns and principal value of an investment will fluctuate so that an investor's shares, when redeemed, may be worth more or less than their original cost. Current performance may be higher or lower than the performance data shown. For up-to-date month-end performance information please call 1-800-480-4111.
The Fund commenced operations on 1/1/97.
Returns for the Fund prior to 1/1/97 (offering date of the Select Class Shares) are the returns of a common trust fund adjusted to reflect the Fund's expense levels (absent reimbursements) that were in place at the time the Fund received the common trust fund assets. The common trust fund was not registered with the SEC and was not subject to investment restrictions of registered mutual funds. If the common trust fund had been registered, performance may have been adversely affected.
The graph illustrates comparative performance for $1,000,000 invested in the JPMorgan Small Cap Core Fund, Russell 2000 Index, S&P SmallCap 600/BARRA Index and Lipper Small-Cap Core Funds Index from June 30, 1995 to June 30, 2005.
The performance of the Fund assumes reinvestment of all dividends and capital gains and includes a sales charge. The performance of the indices does not include expenses and has been adjusted to reflect reinvestment of all dividends and capital gains of the securities included in the benchmark. The Russell 2000 Index is an unmanaged, capitalization weighted price only index, which is comprised of 2000 of the smallest stocks (on the basis of capitalization) in the Russell 3000 Index. The S&P SmallCap 600 Index includes 600 stocks of small U.S. Companies chosen for market size, liquidity, and industry group representation. During the year ended December 31, 2004, the Fund changed its benchmark from the S&P SmallCap 600 Index to the Russell 2000 Index, because the adviser believes the Russell 2000 Index more accurately reflects the Fund's investment strategy. The Lipper Small-Cap Core Funds Index represents the total return s of the funds in the indicated category, as defined by Lipper, Inc. Investor's cannot invest directly in an index.
Select Class Shares have a $1,000,000 minimum initial investment and carry no sales charge.
Performance may reflect the waiver and reimbursement of the Fund's fees/expenses for certain periods since the inception date. Without these waivers and reimbursements performance would have been lower. Also, performance shown in this section does not reflect the deduction of taxes that a shareholder would pay on fund distributions or redemption of fund shares.
JPMORGAN U.S. EQUITY MID/SMALL CAP FUNDS23
JPMorgan
Small Cap Equity Fund
AS OF DECEMBER 31, 2005 (Unaudited)
| FUND FACTS | |
| Fund Inception | | 12/20/94 | |
| Fiscal Year End | | December 31 | |
Net Assets as of 12/31/2005
(In Thousands) | | $480,542 | |
| Primary Benchmark | | Russell 2000
Index | |
Q: HOW DID THE FUND PERFORM?
A: The JPMorgan Small Cap Equity Fund, which seeks capital growth over the long term,* returned 12.39% (A Shares) over the 12 months ended December 31, 2005, compared to the 4.55% return of the Russell 2000 Index over the same period.
Q: WHY DID THE FUND PERFORM IN THIS WAY?
A: U.S. equity markets were dominated by interest rate concerns in 2005, as economic data was closely observed for signs that the Federal Open Market Committee's (FOMC) tightening cycle was winding down. Although there were bumps in the road, most particularly slowed growth and increased inflation following the hurricanes of late summer, the economy was generally supportive of equity gains in 2005. Equity markets were also supported by continued strength in corporate profits.
The Fund outperformed its benchmark due primarily to stock selection in the industrials and materials sectors. At the individual stock level, Southwestern Energy Co., an integrated energy company, and St. Mary Land & Exploration Co., a natural gas producer, were positive contributors to performance. Shares of Southwestern Energy Co. rose on significantly increased production volumes, higher natural gas prices and a capital investment program to fund exploration and production in 2006. St. Mary Land & Exploration Co. reported its fifth consecutive quarter of increased production. In addition, the company announced an increase in its 2005 forecast of exploration and development costs to sustain future growth.
The Fund was negatively impacted by overall stock selection in the telecommunication service and healthcare sectors. Georgia Gulf Corp. and Avocent Corp. were large detractors from performance. Georgia Gulf Corp., a manufacturer of chemical and plastic products, experienced decreased earnings growth due to industry-wide concerns of an economic slowdown and the effects of Hurricanes Rita and Katrina. Supply constraints and lowered inventories from hurricane-related activity disrupted business and contributed to reduced third-quarter earnings. Avocent Corp., a computer equipment maker, experienced mixed results. The company slashed its first-quarter revenue guidance due to lower sales, the launch of its DSView 3 software and greater-than-expected seasonal softness. Despite this lowered forecast, Avocent reported a rise in third-quarter profit, which was attributed to strong demand for digital and embedded products, and robust sale s in Asia.
Q: HOW WAS THE FUND MANAGED?
A: We employ a bottom-up approach to stock selection, constructing portfolios based on company fundamentals, quantitative screening and proprietary fundamental analysis. Our aim is to identify undervalued small-cap companies with leading competitive positions and strong management. The research process is designed to identify companies that exhibit sustainable free cash flow, high barriers to entry and a proven management team. Potential investments are subjected to rigorous financial analysis and a disciplined approach to valuation.
* The advisor seeks to achieve the Fund's objective. There can be no guarantee it will be achieved.
JPMORGAN U.S. EQUITY MID/SMALL CAP FUNDS24
ANNUAL REPORT DECEMBER 31
2005
(Unaudited)
PORTFOLIO COMPOSITION*
TOP TEN EQUITY HOLDINGS
OF THE PORTFOLIO* | |
1. Williams Scotsman
International, Inc. | | | 2.4 | % | |
| 2. United Bancshares, Inc. | | | 2.1 | % | |
| 3. ProAssurance Corp. | | | 2.0 | % | |
| 4. Scotts Miracle-Gro Co. (The) | | | 2.0 | % | |
5. St. Mary Land &
Exploration Co. | | | 2.0 | % | |
| 6. Watsco, Inc. | | | 1.9 | % | |
| 7. Alderwoods Group, Inc. | | | 1.8 | % | |
| 8. Jarden Corp. | | | 1.8 | % | |
| 9. Hudson Highland Group, Inc. | | | 1.7 | % | |
| 10. Waste Connections, Inc. | | | 1.6 | % | |
* Percentages indicated are based on net assets as of December 31, 2005. The portfolio's composition is subject to change.
JPMORGAN U.S. EQUITY MID/SMALL CAP FUNDS25
JPMorgan
Small Cap Equity Fund
CONTINUED
(Unaudited)
AVERAGE ANNUAL TOTAL RETURNS AS OF DECEMBER 31, 2005
| | | 1 YEAR | | 5 YEARS | | 10 YEARS | |
| CLASS A SHARES | |
| Without Sales Charge | | | 12.39 | % | | | 8.43 | % | | | 11.80 | % | |
| With Sales Charge* | | | 6.47 | % | | | 7.27 | % | | | 11.20 | % | |
| CLASS B SHARES | |
| Without CDSC | | | 11.85 | % | | | 7.67 | % | | | 11.14 | % | |
| With CDSC** | | | 6.85 | % | | | 7.37 | % | | | 11.14 | % | |
| CLASS C SHARES | |
| Without CDSC | | | 11.81 | % | | | 7.66 | % | | | 11.00 | % | |
| With CDSC*** | | | 10.81 | % | | | 7.66 | % | | | 11.00 | % | |
| SELECT CLASS SHARES | | | 12.98 | % | | | 9.02 | % | | | 12.34 | % | |
* Sales charge for Class A Shares is 5.25%.
** Assumes 5% CDSC (contingent deferred sales charge) for the one year period, 2% CDSC for the five year period and 0% CDSC for the ten year period.
*** Assumes a 1% CDSC for the one year period and 0% CDSC thereafter.
TEN YEAR PERFORMANCE (12/31/95 TO 12/31/05)
Source: Lipper, Inc. The performance quoted is past performance and is not a guarantee of future results. Mutual funds are subject to certain market risk. Investment returns and principal value of an investment will fluctuate so that an investor's shares, when redeemed, may be worth more or less than their original cost. Current performance may be higher or lower than the performance data shown. For up-to-date month-end performance information please call 1-800-480-4111.
The Fund commenced operations on 12/20/94.
Returns for the Select Class Shares prior to 5/7/96 (offering date of the Select Class Shares) are calculated using the historical expenses of the Class A Shares, which are higher than the expenses of the Select Class Shares.
Returns for the Class B Shares prior to 3/28/95 (offering date of the Class B Shares) are calculated using the historical expenses of the Class A Shares, which are lower than the expenses of the Class B Shares. In addition, returns for the Class C Shares prior to 2/19/05 (offering date of the Class C Shares) are calculated using the historical expenses of the Class B Shares, which are similar to the expenses of the Class C Shares. During this period, the actual returns of Class B and Class C Shares would have been lower than shown because Class B and Class C Shares have higher expenses than Class A Shares.
The graph illustrates comparative performance for $10,000 invested in Class A Shares of the JPMorgan Small Cap Equity Fund, Russell 2000 Index, S&P SmallCap 600 Index and Lipper
Small-Cap Core Funds Index from June 30, 1995 to June 30, 2005.
The performance of the Fund assumes reinvestment of all dividends and capital gains and includes a sales charge. The performance of the indices does not include expenses or a sales charge and has been adjusted to reflect reinvestment of all dividends and capital gains of the securities included in the benchmark. The Russell 2000 Index is an unmanaged, capitalization weighted price only index, which is comprised of 2000 of the smallest stocks (on the basis of capitalization) in the Russell 3000 Index. The S&P SmallCap 600 Index includes 600 stocks of small U.S. Companies chosen for market size, liquidity and industry group representation. The Lipper Small-Cap Core Funds Index represents the total returns of the funds in the indicated category, as defined by Lipper, Inc. Investors cannot invest directly in an index.
Class A Shares have a $1,000 minimum initial investment and carry a 5.25% sales charge.
Performance may reflect the waiver and reimbursement of the Fund's fees/expenses for certain periods since the inception date. Without these waivers and reimbursements performance would have been lower. Also, performance shown in this section does not reflect the deduction of taxes that a shareholder would pay on fund distributions or redemption of fund shares.
JPMORGAN U.S. EQUITY MID/SMALL CAP FUNDS26
JPMorgan
U.S. Small Company Fund
AS OF DECEMBER 31, 2005 (Unaudited)
| FUND FACTS | |
| Fund Inception | | 11/4/93 | |
| Fiscal Year End | | December 31 | |
Net Assets as of 12/31/2005
(In Thousands) | | $148,693 | |
| Primary Benchmark | | Russell 2000
Index | |
Q: HOW DID THE FUND PERFORM?
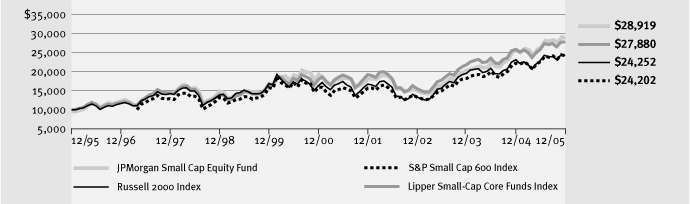
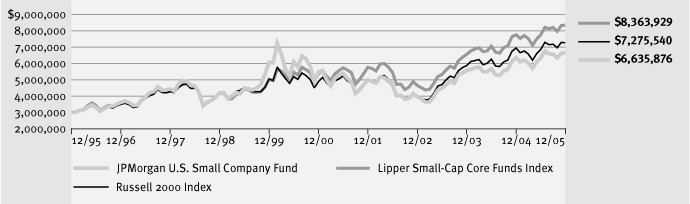
A: The JPMorgan U.S. Small Company Fund, which seeks to provide high total return from a portfolio of small-company stocks,* returned 4.18% (Institutional Shares) over the 12 months ended December 31, 2005, compared to the 4.55% return of the Russell 2000 Index over the same period.
Q: WHY DID THE FUND PERFORM THIS WAY?
A: U.S. equity markets produced solid returns in 2005. Concerns that a slowdown in the housing sector would cut the legs out from under consumer spending were more than offset by increased consumer confidence due primarily to rapidly falling gasoline prices in the third and fourth quarters.
Stock selection in the finance and pharmaceutical sectors primarily detracted from results. At the security level, a top detractor was R&G Financial Corp., a diversified financial services company, whose shares declined in April on the back of restated earnings for 2004. The company's shares also fell in sync with other major Puerto Rico lenders after Doral Financial Corp., the island's largest residential mortgage lender, disclosed that the SEC had changed an informal accounting probe into a formal one. Another major detractor was Cypress Biosciences Inc., a biotechnology company. Shares of Cypress Biosciences, Inc. fell at the end of September after the company and its drug development partner, Forest Laboratories Inc., announced early data from a Phase III clinical trial showing that the drug milnacipran was statistically ineffective in treating fibromyalgia, a condition causing chronic muscle pain and stiffness. Despite the setback, Forest Laboratories and Cypress Biosciences Inc. stated that they will continue to pursue two additional Phase III clinical trials for the drug, but admitted their plan could change in the near future.
Although the Fund underperformed its benchmark, stock selection in the industrial cyclical and utility sectors aided performance. Among the top contributors were Dobson Communications Corp., an Oklahoma City-based provider of wireless communications services, and GUESS? Inc., an apparel retailer. In June, Dobson Communications Corp. shares benefited from positive earnings guidance due to increased revenue per subscriber. The company also initiated discussions with Cingular, the largest U.S. cell phone provider, aimed at setting up a roaming agreement. Additionally, the company agreed to buy the Cellular One brand from Alltel Corp., a telecommunications company, for $1.3 million. GUESS? Inc. shares increased after the company reported record revenues throughout the year, which were driven by the performance in its European business.
Q: HOW WAS THE FUND MANAGED?
A: The Fund strives to add value exclusively through stock selection rather than sector, style or theme bets. To minimize sector risk, we weight sectors in the Fund within +/-1% of the sector weights of the benchmark. We have found that minimizing sector bets is one of the most effective ways of reducing residual risk from a portfolio without reducing the ability to add performance. Finally, to control stock-specific risk, individual stock weights in the Fund are limited to +/-1% of the stock's weight in the Russell 2000 Index.
* The advisor seeks to achieve the Fund's objective. There can be no guarantee it will be achieved.
JPMORGAN U.S. EQUITY MID/SMALL CAP FUNDS27
JPMorgan
U.S. Small Company Fund
CONTINUED
(Unaudited)
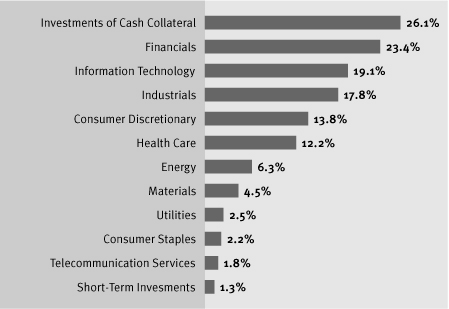
PORTFOLIO COMPOSITION*
TOP TEN EQUITY HOLDINGS
OF THE PORTFOLIO* | |
1. Applied Industrial
Technologies, Inc. | | | 1.2 | % | |
| 2. Houston Exploration Co. | | | 1.0 | % | |
| 3. Kilroy Realty Corp. | | | 0.9 | % | |
| 4. Aaron Rents, Inc. | | | 0.9 | % | |
5. Universal Forest
Products, Inc. | | | 0.9 | % | |
6. Mid-America Apartment
Communities, Inc. | | | 0.9 | % | |
| 7. Moog, Inc. | | | 0.8 | % | |
| 8. Delphi Financial Group, Inc. | | | 0.8 | % | |
| 9. Commercial Metals Co. | | | 0.8 | % | |
| 10. Todco | | | 0.7 | % | |
* Percentages indicated are based on net assets as of December 31, 2005. The portfolio's composition is subject to change.
JPMORGAN U.S. EQUITY MID/SMALL CAP FUNDS28
ANNUAL REPORT DECEMBER 31
2005
(Unaudited)
AVERAGE ANNUAL TOTAL RETURNS AS OF DECEMBER 31, 2005
| | | 1 YEAR | | 5 YEARS | | 10 YEARS | |
| SELECT CLASS SHARES | | | 3.93 | % | | | 3.64 | % | | | 8.08 | % | �� |
| INSTITUTIONAL CLASS SHARES | | | 4.18 | % | | | 3.81 | % | | | 8.25 | % | |
TEN YEAR FUND PERFORMANCE (12/31/95 TO 12/31/05)
Source: Lipper, Inc. The performance quoted is past performance and is not a guarantee of future results. Mutual funds are subject to certain market risk. Investment returns and principal value of an investment will fluctuate so that an investor's shares, when redeemed, may be worth more or less than their original cost. Current performance may be higher or lower than the performance data shown. For up-to-date month-end performance information please call 1-800-480-4111.
The Fund commenced operations on 11/4/93 and prior to 9/7/01, operated in a master feeder structure.
Returns for the Institutional Class Shares prior to 9/10/01 (offering date of the Institutional Class Shares) are calculated using the historical expenses of an institutional feeder, the J.P. Morgan Institutional U.S. Small Company Fund, whose expenses are substantially similar to the expenses of the Institutional Class Shares.
Returns for the Select Class Shares prior to 9/10/01 (offering date of the Select Class Shares) are calculated using the historical expenses of a retail feeder, the J.P. Morgan U.S. Small Company Fund, whose expenses are substantially similar to the expenses of the Select Class Shares.
The graph illustrates comparative performance for $3,000,000 invested in Institutional Class Shares of the JPMorgan U.S. Small Company Fund, Russell 2000 Index, and Lipper Small-Cap Core Funds Index from June 30, 1995 to June 30, 2005.
The performance of the Fund assumes reinvestment of all dividends and capital gains. The performance of the indices does not include expenses and has been adjusted to reflect reinvestment of all dividends and capital gains of the securities included in the benchmark. The Russell 2000 Index is an unmanaged, capitalization weighted price only index, which is comprised of 2000 of the smallest stocks (on the basis of capitalization) in the Russell 3000 Index. The Lipper Small-Cap Core Funds Index represents the total returns of the funds in the indicated category, as defined by Lipper, Inc. Investors cannot invest directly in an index.
Institutional Class Shares have a $3,000,000 minimum initial investment and carry no sales charge.
Performance may reflect the waiver and reimbursement of the Fund's fees/expenses for certain periods since the inception date. Without these waivers and reimbursements performance would have been lower. Also, performance shown in this section does not reflect the deduction of taxes that a shareholder would pay on fund distributions or redemptions of fund shares.
JPMORGAN U.S. EQUITY MID/SMALL CAP FUNDS29
JPMorgan
Value Advantage Fund
AS OF DECEMBER 31, 2005 (Unaudited)
| FUND FACTS | |
| Fund Inception | | 3/1/05 | |
| Fiscal Year End | | December 31 | |
Net Assets as of 12/31/2005
(In Thousands) | | $104,165 | |
| Primary Benchmark | | Russell 3000 Value Index | |
Q: HOW DID THE FUND PERFORM?
A: The JPMorgan Value Advantage Fund, which seeks to provide long-term total return from a combination of income and capital gains,* returned 7.46% (Class A Shares) since inception (2/28/05) ended December 31, 2005, compared to the 6.85% return of the Russell 3000 Value Index over the same period.
Q: WHY DID THE FUND PERFORM IN THIS WAY?
A: U.S. equity markets were dominated by interest rate concerns in 2005, as economic data was closely observed for signs that the Federal Open Market Committee's (FOMC) tightening cycle was winding down. Although there were bumps in the road, most particularly slowed growth and increased inflation following the hurricanes of late summer, the economy was generally supportive of equity gains in 2005. Equity markets were also supported by continued strength in corporate profits.
Stock selection in energy and materials primarily supported performance over the period. Cement manufacturer Cemex S.A. de C.V. was the largest contributor. The company benefited from strong industry trends, which enabled it to grow free cash flow and improve its balance sheet. In addition, management was able to increase cost savings from recent acquisitions. Devon Energy Corp. was another positive contributor. The oil and gas exploration company benefited from high energy prices, driven by strong demand and tight supply.
Consumer discretionary and telecommunication services hindered performance during the period. Gannett Co. Inc., a media conglomerate, was the largest detractor. The company experienced weaker revenues due to reduced ad sales. IPC Holdings Ltd., a provider of property catastrophe reinsurance, announced significant insured losses resulting from Hurricanes Katrina and Rita.
Q: HOW WAS THE FUND MANAGED?
A: Our investment philosophy is based on the premise that stock selection focused on undervalued companies with durable franchises and strong management will generate superior returns over the long term. We employ a bottom-up approach to stock selection, constructing portfolios based on company fundamentals, quantitative screening and proprietary fundamental analysis. Our aim is to identify undervalued companies within the income and capital-gain investment universe that have the potential to grow their intrinsic values per share and to purchase these companies at a discount.
* The advisor seeks to achieve the Fund's objective. There can be no guarantee it will be achieved.
JPMORGAN U.S. EQUITY MID/SMALL CAP FUNDS30
ANNUAL REPORT DECEMBER 31
2005
(Unaudited)
PORTFOLIO COMPOSITION*
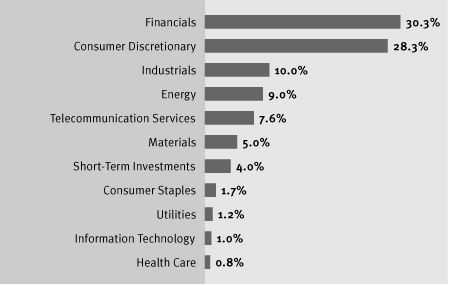
TOP TEN EQUITY HOLDINGS
OF THE PORTFOLIO* | |
| 1. Devon Energy Corp. | | | 4.8 | % | |
| 2. V.F. Corp. | | | 3.5 | % | |
3. Commonwealth Telephone
Enterprises, Inc. | | | 3.2 | % | |
| 4. AutoZone, Inc. | | | 3.1 | % | |
| 5. W.P. Carey & Co. LLC | | | 2.9 | % | |
| 6. Griffon Corp. | | | 2.9 | % | |
| 7. ProAssurance Corp. | | | 2.8 | % | |
8. Clear Channel
Communications, Inc. | | | 2.4 | % | |
| 9. Assurant, Inc. | | | 2.3 | % | |
| 10. Sears Holdings Corp. | | | 2.2 | % | |
* Percentages indicated are based on net assets as of December 31, 2005. The portfolio's composition is subject to change.
JPMORGAN U.S. EQUITY MID/SMALL CAP FUNDS31
JPMorgan
Value Advantage Fund
CONTINUED
(Unaudited)
AVERAGE ANNUAL TOTAL RETURNS AS OF DECEMBER 31, 2005
| | | SINCE
INCEPTION
(3/01/05) | |
| CLASS A SHARES | |
| Without Sales Charge | | | 7.46 | % | |
| With Sales Charge* | | | 1.82 | % | |
| CLASS C SHARES | |
| Without CDSC | | | 7.03 | % | |
| With CDSC** | | | 6.03 | % | |
| SELECT CLASS SHARES | | | 7.71 | % | |
| INSTITUTIONAL CLASS | | | 7.32 | % | |
* Sales charge for class A shares is 5.25%.
** Assumes a 1% CDSC for one year period and 0% CDSC thereafter.
LIFE OF FUND PERFORMANCE (3/01/05 TO 12/31/05)
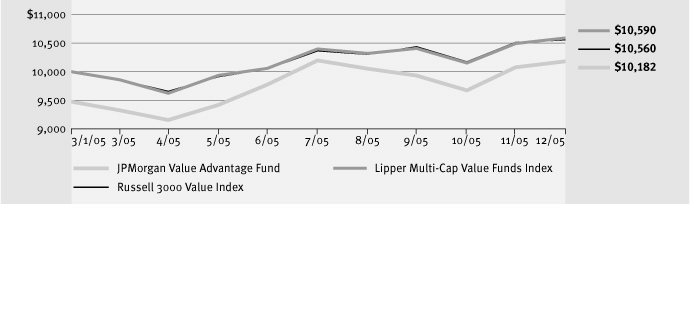
Source: Lipper, Inc. The performance quoted is past performance and is not a guarantee of future results. Mutual funds are subject to certain market risk. Investment returns and principal value of an investment will fluctuate so that an investor's shares, when redeemed, may be worth more or less than their original cost. Current performance may be higher or lower than the performance data shown. For up-to-date month-end performance information please call 1-800-480-4111.
The Fund commenced operations on 3/1/05.
The graph illustrates comparative performance for $10,000 invested in Class A Shares of the JPMorgan Value Advantage Fund, Russell 3000 Value Index and Lipper Multi-Cap Value Funds Index from March 1, 2005 to June 30, 2005. The performance of the Fund assumes reinvestment of all dividends and capital gains and includes a sales charge. The performance of the indices reflects an initial investment at the inception of the Fund. The performances of the indices does not include expenses or a sales charge and has been adjusted to reflect reinvestment of all dividends and capital gains of the securities included in the benchmark. The Russell 3000 Value Index is an unmanaged broad-based index that replicates the U.S. stock markets. The Lipper Multi-Cap Value Funds Index represents the total returns of the Fund in the category, as defined by Lipper, Inc. Investors cannot invest directly in an index.
Class A Shares have $1,000 minimum initial investment and carry 5.25% sales charge.
Performance may reflect the waiver and reimbursement of the Fund's fees/expenses for certain periods since the inception date. Without these waivers and reimbursements performance would have been lower. Also, performance shown in this section does not reflect the deduction of taxes that a shareholder would pay on fund distributions or redemption of fund shares.
JPMORGAN U.S. EQUITY MID/SMALL CAP FUNDS32
JPMorgan Capital Growth Fund
SCHEDULE OF PORTFOLIO INVESTMENTS AS OF DECEMBER 31, 2005
(Amounts in thousands)
| SHARES | | SECURITY DESCRIPTION | | VALUE | |
| Long-Term Investments — 98.1% | | | |
| | | Common Stocks — 98.1% | |
| | | Aerospace & Defense — 1.5% | |
| | 116 | | | Precision Castparts Corp. | | $ | 5,989 | | |
| | 122 | | | Rockwell Collins, Inc. | | | 5,663 | | |
| | | | 11,652 | | |
| | | Airlines — 0.9% | |
| | 451 | | | Southwest Airlines Co. | | | 7,402 | | |
| | | Biotechnology — 2.5% | |
| | 100 | | | Invitrogen Corp. (a) (c) | | | 6,691 | | |
| | 204 | | | MedImmune, Inc. (a) | | | 7,133 | | |
| | 206 | | | Protein Design Labs, Inc. | | | 5,863 | | |
| | | | 19,687 | | |
| | | Capital Markets — 3.3% | |
| | 83 | | | Affiliated Managers Group, Inc. (a) (c) | | | 6,677 | | |
| | 233 | | | Ameritrade Holding Corp. (a) (c) | | | 5,596 | | |
| | 192 | | | Federated Investors, Inc., Class B | | | 7,108 | | |
| | 92 | | | T. Rowe Price Group, Inc. | | | 6,594 | | |
| | | | 25,975 | | |
| | | Chemicals — 0.9% | |
| | 373 | | | Rockwood Holdings, Inc. (a) | | | 7,349 | | |
| | | Commercial Banks — 3.8% | |
| | 321 | | | Commerce Bancorp, Inc. (c) | | | 11,046 | | |
| | 186 | | | East-West Bancorp, Inc. (c) | | | 6,769 | | |
| | 157 | | | Zions Bancorp | | | 11,825 | | |
| | | | 29,640 | | |
| | | Commercial Services & Supplies — 3.2% | |
| | 127 | | | HNI Corp. | | | 6,971 | | |
| | 422 | | | West Corp. (a) | | | 17,766 | | |
| | | | 24,737 | | |
| | | Communications Equipment — 0.1% | |
| | 39 | | | Adtran, Inc. | | | 1,163 | | |
| | | Computers & Peripherals — 4.1% | |
| | 241 | | | NCR Corp. (a) | | | 8,176 | | |
| | 232 | | | Network Appliance, Inc. (a) | | | 6,251 | | |
| | 594 | | | Seagate Technology (Cayman Islands) (a) | | | 11,872 | | |
| SHARES | | SECURITY DESCRIPTION | | VALUE | |
| | | Computers & Peripherals — Continued | |
| | 1,359 | | | Sun Microsystems, Inc. (a) | | $ | 5,694 | | |
| | | | 31,993 | | |
| | | Construction & Engineering — 0.8% | |
| | 89 | | | Jacobs Engineering Group, Inc. (a) (c) | | | 6,047 | | |
| | | Consumer Finance — 0.8% | |
| | 234 | | | AmeriCredit Corp. (a) | | | 5,990 | | |
| | | Diversified Financial Services — 2.5% | |
| | 192 | | | CIT Group, Inc. | | | 9,957 | | |
| | 308 | | | Lazard Ltd. (Bermuda), Class A | | | 9,816 | | |
| | | | 19,773 | | |
| | | Electronic Equipment & Instruments — 5.1% | |
| | 136 | | | Ametek, Inc. | | | 5,781 | | |
| | 397 | | | Amphenol Corp., Class A | | | 17,558 | | |
| | 215 | | | Flir Systems, Inc. (a) (c) | | | 4,801 | | |
| | 318 | | | Jabil Circuit, Inc. (a) | | | 11,809 | | |
| | | | 39,949 | | |
| | | Energy Equipment & Services — 6.1% | |
| | 217 | | | BJ Services Co. | | | 7,972 | | |
| | 237 | | | ENSCO International, Inc. | | | 10,506 | | |
| | 213 | | | Grant Prideco, Inc. (a) (c) | | | 9,389 | | |
| | 123 | | | National Oilwell Varco, Inc. (a) | | | 7,712 | | |
| | 103 | | | Noble Corp. (Cayman Islands) | | | 7,237 | | |
| | 119 | | | Tidewater, Inc. (c) | | | 5,309 | | |
| | | | 48,125 | | |
| | | Health Care Equipment & Supplies — 1.7% | |
| | 71 | | | Bausch & Lomb, Inc. | | | 4,787 | | |
| | 152 | | | Mentor Corp. (c) | | | 7,000 | | |
| | 20 | | | Millipore Corp. (a) | | | 1,314 | | |
| | | | 13,101 | | |
| | | Health Care Providers & Services — 6.7% | |
| | 81 | | | Aetna, Inc. | | | 7,606 | | |
| | 133 | | | Caremark Rx, Inc. (a) | | | 6,898 | | |
| | 151 | | | Coventry Health Care, Inc. (a) | | | 8,587 | | |
| | 212 | | | DaVita, Inc. (a) | | | 10,736 | | |
| | 162 | | | LifePoint Hospitals, Inc. (a) | | | 6,060 | | |
SEE NOTES TO FINANCIAL STATEMENTS.
JPMORGAN U.S. EQUITY MID/SMALL CAP FUNDS 33
JPMorgan Capital Growth Fund
SCHEDULE OF PORTFOLIO INVESTMENTS AS OF DECEMBER 31, 2005
(Amounts in thousands)
(CONTINUED)
| SHARES | | SECURITY DESCRIPTION | | VALUE | |
| Long-Term Investments — continued | | | |
| | | Health Care Providers & Services — Continued | |
| | 135 | | | McKesson Corp. | | $ | 6,960 | | |
| | 97 | | | Medco Health Solutions, Inc. (a) | | | 5,390 | | |
| | | | 52,237 | | |
| | | Hotels, Restaurants & Leisure — 6.7% | |
| | 99 | | | Four Seasons Hotels, Inc. (Canada) (c) | | | 4,905 | | |
| | 91 | | | Harrah's Entertainment, Inc. | | | 6,498 | | |
| | 112 | | | Panera Bread Co., Class A (a) | | | 7,323 | | |
| | 217 | | | Royal Caribbean Cruises Ltd. (Liberia) | | | 9,796 | | |
| | 302 | | | Scientific Games Corp., Class A (a) | | | 8,247 | | |
| | 192 | | | Sonic Corp. (a) | | | 5,673 | | |
| | 80 | | | Station Casinos, Inc. | | | 5,424 | | |
| | 93 | | | Wynn Resorts Ltd. (a) (c) | | | 5,085 | | |
| | | | 52,951 | | |
| | | Household Durables — 1.2% | |
| | 147 | | | D.R. Horton, Inc. (c) | | | 5,252 | | |
| | 118 | | | Toll Brothers, Inc. (a) | | | 4,077 | | |
| | | | 9,329 | | |
| | | Household Products — 0.9% | |
| | 143 | | | Energizer Holdings, Inc. (a) (c) | | | 7,105 | | |
| | | Insurance — 1.9% | |
| | 80 | | | Everest Re Group Ltd. (Bermuda) | | | 7,998 | | |
| | 236 | | | HCC Insurance Holdings, Inc. | | | 7,010 | | |
| | | | 15,008 | | |
| | | Internet Software & Services — 2.6% | |
| | 411 | | | McAfee, Inc. (a) | | | 11,137 | | |
| | 223 | | | ValueClick, Inc. (a) | | | 4,038 | | |
| | 251 | | | VeriSign, Inc. (a) | | | 5,511 | | |
| | | | 20,686 | | |
| | | IT Services — 1.4% | |
| | 319 | | | Alliance Data Systems Corp. (a) (c) | | | 11,346 | | |
| | | Machinery — 2.3% | |
| | 94 | | | Harsco Corp. | | | 6,366 | | |
| | 59 | | | ITT Industries, Inc. | | | 6,041 | | |
| | 136 | | | Oshkosh Truck Corp. | | | 6,046 | | |
| | | | 18,453 | | |
| SHARES | | SECURITY DESCRIPTION | | VALUE | |
| | | Media — 3.8% | |
| | 70 | | | Getty Images, Inc. (a) | | $ | 6,222 | | |
| | 95 | | | R.H. Donnelley Corp. (a) (c) | | | 5,835 | | |
| | 379 | | | Regal Entertainment Group, Class A (c) | | | 7,205 | | |
| | 151 | | | Rogers Communications, Inc. (Canada),
Class B | | | 6,398 | | |
| | 147 | | | XM Satellite Radio Holdings, Inc.,
Class A (a) (c) | | | 4,008 | | |
| | | | 29,668 | | |
| | | Oil, Gas & Consumable Fuels — 4.9% | |
| | 147 | | | Consol Energy, Inc. | | | 9,552 | | |
| | 74 | | | EOG Resources, Inc. | | | 5,459 | | |
| | 122 | | | Newfield Exploration Co. (a) | | | 6,099 | | |
| | 212 | | | Range Resources Corp. (c) | | | 5,595 | | |
| | 152 | | | Southwestern Energy Co. (a) (c) | | | 5,477 | | |
| | 118 | | | Talisman Energy, Inc. (Canada) | | | 6,237 | | |
| | | | 38,419 | | |
| | | Pharmaceuticals — 3.2% | |
| | 39 | | | Allergan, Inc. | | | 4,200 | | |
| | 105 | | | Barr Pharmaceuticals, Inc. (a) | | | 6,528 | | |
| | 191 | | | Omnicare, Inc. | | | 10,917 | | |
| | 69 | | | Sepracor, Inc. (a) (c) | | | 3,563 | | |
| | | | 25,208 | | |
| | | Road & Rail — 2.8% | |
| | 516 | | | J.B. Hunt Transport Services, Inc. (c) | | | 11,682 | | |
| | 237 | | | Norfolk Southern Corp. | | | 10,629 | | |
| | | | 22,311 | | |
| | | Semiconductors & Semiconductor
Equipment — 7.0% | |
| | 136 | | | Broadcom Corp., Class A (a) | | | 6,403 | | |
| | 149 | | | KLA-Tencor Corp. | | | 7,355 | | |
| | 264 | | | Lam Research Corp. (a) | | | 9,434 | | |
| | 162 | | | Linear Technology Corp. | | | 5,827 | | |
| | 136 | | | Marvell Technology Group Ltd.
(Bermuda) (a) | | | 7,611 | | |
| | 354 | | | Microchip Technology, Inc. | | | 11,380 | | |
| | 184 | | | Nvidia Corp. (a) | | | 6,723 | | |
| | | | 54,733 | | |
SEE NOTES TO FINANCIAL STATEMENTS.
JPMORGAN U.S. EQUITY MID/SMALL CAP FUNDS34
ANNUAL REPORT DECEMBER 31
2005
SCHEDULE OF PORTFOLIO INVESTMENTS AS OF DECEMBER 31, 2005
(Amounts in thousands)
(CONTINUED)
| SHARES | | SECURITY DESCRIPTION | | VALUE | |
| Long-Term Investments — continued | | | |
| | | Software — 5.3% | |
| | 254 | | | Adobe Systems, Inc. | | $ | 9,395 | | |
| | 308 | | | Citrix Systems, Inc. (a) | | | 8,850 | | |
| | 234 | | | Computer Associates International, Inc. | | | 6,603 | | |
| | 583 | | | Compuware Corp. (a) | | | 5,229 | | |
| | 125 | | | NAVTEQ Corp. (a) | | | 5,466 | | |
| | 188 | | | Salesforce.com, Inc. (a) (c) | | | 6,032 | | |
| | | | 41,575 | | |
| | | Specialty Retail — 7.6% | |
| | 90 | | | AnnTaylor Stores Corp. (a) (c) | | | 3,110 | | |
| | 293 | | | Bed Bath & Beyond, Inc. (a) | | | 10,596 | | |
| | 451 | | | Circuit City Stores, Inc. | | | 10,179 | | |
| | 208 | | | Men's Wearhouse, Inc. (a) (c) | | | 6,135 | | |
| | 373 | | | Ross Stores, Inc. | | | 10,786 | | |
| | 267 | | | Sherwin-Williams Co. (The) | | | 12,118 | | |
| | 133 | | | Weight Watchers International, Inc. (a) (c) | | | 6,559 | | |
| | | | 59,483 | | |
| | | Textiles, Apparel & Luxury Goods — 1.5% | |
| | 212 | | | Polo Ralph Lauren Corp. | | | 11,919 | | |
| | | Wireless Telecommunication Services — 1.0% | |
| | 175 | | | NII Holdings, Inc. (a) | | | 7,648 | | |
| | | | | Total Common Stocks
(Cost $648,372) | | | 770,662 | | |
| Short-Term Investment — 1.0% | | | |
| | | Investment Company — 1.0% | |
| | 7,923 | | | JPMorgan Prime Money
Market Fund (b) (m)
(Cost $7,923) | | |
7,923
| | |
PRINCIPAL
AMOUNT | |
| Investments of Cash Collateral for Securities Loaned — 9.9% | | | |
| | | Certificates of Deposit — 1.6% | |
| $ | 3,400 | | | Credit Suisse First Boston LLC, FRN,
4.27%, 10/17/06 | | | 3,400 | | |
| | 3,000 | | | Manufacturers and Traders, FRN,
4.36%, 09/26/06 | | | 3,000 | | |
PRINCIPAL
AMOUNT | | SECURITY DESCRIPTION | | VALUE | |
| | | Certificates of Deposit — Continued | |
| $ | 3,250 | | | Royal Bank of Canada, FRN,
4.30%, 11/13/06 | | $ | 3,250 | | |
| | 3,000 | | | Wells Fargo Bank San Francisco,
4.30%, 01/27/06 | | | 3,000 | | |
| | | | 12,650 | | |
| | | Commercial Paper — 0.8% | |
| | 2,482 | | | HSBC Finance Corporation,
4.43%, 02/10/06 | | | 2,482 | | |
| | 3,500 | | | Morgan Stanley & Co., Inc., FRN,
4.33%, 04/17/06 | | | 3,500 | | |
| | | | 5,982 | | |
| | | Corporate Notes — 3.6% | |
| | 1,000 | | | Alliance and Leister plc, FRN,
4.33%, 01/30/07 | | | 1,000 | | |
| | 4,000 | | | American Express Credit Corp., FRN,
4.36%, 06/12/07 | | | 4,000 | | |
| | 3,800 | | | Bank of America N.A., FRN,
4.31%, 11/07/06 | | | 3,800 | | |
| | 3,400 | | | CDC Financial Products. Inc., FRN,
4.35%, 01/30/06 | | | 3,400 | | |
| | 4,652 | | | Citigroup Global Markets. Inc., FRN,
4.32%, 01/06/06 | | | 4,651 | | |
| | 1,000 | | | K2(USA) LLC, FRN, 4.35%, 02/15/06 | | | 1,000 | | |
| | 2,500 | | | Landsbanki Islands HF, FRN,
4.45%, 01/30/07 | | | 2,500 | | |
| | 1,000 | | | Liberty Lighthouse U.S. Capital, FRN,
4.34%, 10/24/06 | | | 1,000 | | |
| | 3,399 | | | Links Finance LLC, FRN, 4.37%, 10/15/07 | | | 3,399 | | |
| | 3,499 | | | Sigma Finance Inc., FRN,
4.37%, 10/24/07 | | | 3,499 | | |
| | | | 28,249 | | |
| | | Repurchase Agreements — 3.9% | |
| | 6,872 | | | Bank of America Securities LLC, 4.26%,
dated 12/30/05, due 01/03/06,
repurchase price $6,875, collateralized
by U.S. Government Agency Mortgages. | | | 6,872 | | |
SEE NOTES TO FINANCIAL STATEMENTS.
JPMORGAN U.S. EQUITY MID/SMALL CAP FUNDS35
JPMorgan Capital Growth Fund
SCHEDULE OF PORTFOLIO INVESTMENTS AS OF DECEMBER 31, 2005
(Amounts in thousands)
(CONTINUED)
PRINCIPAL
AMOUNT | | SECURITY DESCRIPTION | | VALUE | |
| Short-Term Investment — continued | |
| | | Repurchase Agreements — Continued | |
| $ | 12,000 | | | Lehman Brothers, Inc., 4.26%,
dated 12/30/05, due 01/03/06,
repurchase price $12,006,
collateralized by U.S. Government
Agency Mortgages. | | $ | 12,000 | | |
| | 12,000 | | | UBS Securities LLC, 4.26%,
dated 12/30/05, due 01/03/06,
repurchase price $12,006,
collateralized by U.S. Government
Agency Mortgages. | | | 12,000 | | |
| | | | 30,872 | | |
| | | Total Investments of Cash Collateral
for Securities Loaned
(Cost $77,753) | | |
77,753
| | |
| | Total Investments — 109.0%
(Cost $734,048) | | | $856,338
| | |
| | | Liabilities in Excess of Other
Assets — (9.0)% | | | (70,858 | ) | |
| | | NET ASSETS — 100.0% | | $ | 785,480 | | |
Percentages indicated are based on net assets.
SEE NOTES TO FINANCIAL STATEMENTS.
JPMORGAN U.S. EQUITY MID/SMALL CAP FUNDS36
JPMorgan Dynamic Small Cap Fund
SCHEDULE OF PORTFOLIO INVESTMENTS AS OF DECEMBER 31, 2005
(Amounts in thousands)
| SHARES | | SECURITY DESCRIPTION | | VALUE | |
| Long-Term Investments — 97.2% | | | |
| | | Common Stocks — 97.2% | |
| | | Aerospace & Defense — 1.0% | |
| | 61 | | | Argon ST, Inc. (a) | | $ | 1,880 | | |
| | | Airlines — 1.5% | |
| | 100 | | | Skywest, Inc. | | | 2,686 | | |
| | | Biotechnology — 2.8% | |
| | 47 | | | Alexion Pharmaceuticals, Inc. (a) (c) | | | 961 | | |
| | 73 | | | Myriad Genetics, Inc. (a) (c) | | | 1,519 | | |
| | 14 | | | United Therapeutics Corp. (a) (c) | | | 961 | | |
| | 95 | | | Viropharma, Inc. (a) | | | 1,760 | | |
| | | | 5,201 | | |
| | | Building Products — 0.8% | |
| | 43 | | | Simpson Manufacturing Co., Inc. (c) | | | 1,550 | | |
| | | Capital Markets — 2.1% | |
| | 48 | | | Affiliated Managers Group, Inc. (a) (c) | | | 3,812 | | |
| | | Commercial Banks — 2.8% | |
| | 99 | | | Columbia Banking System, Inc. | | | 2,835 | | |
| | 7 | | | Preferred Bank | | | 325 | | |
| | 70 | | | West Coast Bancorp (c) | | | 1,860 | | |
| | | | 5,020 | | |
| | | Commercial Services & Supplies — 3.4% | |
| | 85 | | | Chemed Corp. | | | 4,245 | | |
| | 114 | | | LECG Corp. (a) (c) | | | 1,987 | | |
| | | | 6,232 | | |
| | | Communications Equipment — 1.4% | |
| | 10 | | | Adtran, Inc. | | | 290 | | |
| | 85 | | | Avocent Corp. (a) | | | 2,310 | | |
| | | | 2,600 | | |
| | | Construction Materials — 1.6% | |
| | 25 | | | Eagle Materials, Inc. (c) | | | 3,010 | | |
| | | Diversified Financial Services — 3.1% | |
| | 34 | | | IntercontinentalExchange, Inc. (a) | | | 1,243 | | |
| | 185 | | | Marlin Business Services, Inc. (a) | | | 4,409 | | |
| | | | 5,652 | | |
| SHARES | | SECURITY DESCRIPTION | | VALUE | |
| | | Diversified Telecommunication Services — 0.8% | |
| | 136 | | | Cbeyond Communications, Inc. (a) | | $ | 1,400 | | |
| | | Electrical Equipment — 2.2% | |
| | 206 | | | General Cable Corp. (a) | | | 4,051 | | |
| | | Energy Equipment & Services — 4.4% | |
| | 74 | | | Hornbeck Offshore Services, Inc. (a) (c) | | | 2,417 | | |
| | 122 | | | Pioneer Drilling Co (a) (c) | | | 2,188 | | |
| | 162 | | | Superior Energy Services, Inc. (a) | | | 3,411 | | |
| | | | 8,016 | | |
| | | Food & Staples Retailing — 1.1% | |
| | 78 | | | Casey's General Stores, Inc. (c) | | | 1,924 | | |
| | | Health Care Equipment & Supplies — 3.6% | |
| | 74 | | | Arthrocare Corp. (a) (c) | | | 3,104 | | |
| | 99 | | | DJ Orthopedics, Inc. (a) | | | 2,736 | | |
| | 15 | | | Mentor Corp. (c) | | | 707 | | |
| | | | 6,547 | | |
| | | Health Care Providers & Services — 8.8% | |
| | 75 | | | Amedisys, Inc. (a) | | | 3,162 | | |
| | 14 | | | Brookdale Senior Living, Inc. (c) | | | 428 | | |
| | 56 | | | Covance, Inc. (a) | | | 2,726 | | |
| | 128 | | | Per-Se Technologies, Inc. (a) (c) | | | 2,981 | | |
| | 39 | | | Psychiatric Solutions, Inc. (a) (c) | | | 2,279 | | |
| | 97 | | | Symbion, Inc. (a) (c) | | | 2,241 | | |
| | 71 | | | United Surgical Partners International,
Inc. (a) | | | 2,267 | | |
| | | | 16,084 | | |
| | | Hotels, Restaurants & Leisure — 4.0% | |
| | 84 | | | California Pizza Kitchen, Inc. (a) (c) | | | 2,670 | | |
| | 98 | | | Orient-Express Hotels Ltd. (Bermuda) | | | 3,087 | | |
| | 58 | | | WMS Industries, Inc. (a) (c) | | | 1,464 | | |
| | | | 7,221 | | |
| | | Household Durables — 2.2% | |
| | 288 | | | Champion Enterprises, Inc. (a) (c) | | | 3,928 | | |
SEE NOTES TO FINANCIAL STATEMENTS.
JPMORGAN U.S. EQUITY MID/SMALL CAP FUNDS37
JPMorgan Dynamic Small Cap Fund
SCHEDULE OF PORTFOLIO INVESTMENTS AS OF DECEMBER 31, 2005
(Amounts in thousands)
(CONTINUED)
| SHARES | | SECURITY DESCRIPTION | | VALUE | |
| Long-Term Investments — continued | | | |
| | | Insurance — 3.6% | |
| | 17 | | | American Physicians Capital, Inc. (a) | | $ | 799 | | |
| | 65 | | | James River Group, Inc. (a) | | | 1,292 | | |
| | 58 | | | Navigators Group, Inc. (a) | | | 2,514 | | |
| | 39 | | | ProAssurance Corp. (a) | | | 1,897 | | |
| | | | 6,502 | | |
| | | Internet Software & Services — 2.9% | |
| | 244 | | | Digitas, Inc. (a) | | | 3,060 | | |
| | 65 | | | Marchex Inc., Class B (a) (c) | | | 1,455 | | |
| | 47 | | | ValueClick, Inc. (a) (c) | | | 857 | | |
| | | | 5,372 | | |
| | | Machinery — 2.4% | |
| | 99 | | | Oshkosh Truck Corp. | | | 4,408 | | |
| | | Media — 2.2% | |
| | 60 | | | Carmike Cinemas, Inc. (c) | | | 1,519 | | |
| | 316 | | | Lions Gate Entertainment Corp.
(Canada) (a) (c) | | | 2,423 | | |
| | | | 3,942 | | |
| | | Metals & Mining — 2.7% | |
| | 43 | | | Allegheny Technologies, Inc. | | | 1,551 | | |
| | 128 | | | Century Aluminum Co. (a) (c) | | | 3,347 | | |
| | | | 4,898 | | |
| | | Oil, Gas & Consumable Fuels — 5.4% | |
| | 112 | | | Foundation Coal Holdings, Inc. | | | 4,273 | | |
| | 56 | | | Newfield Exploration Co. (a) | | | 2,812 | | |
| | 75 | | | Remington Oil & Gas Corp. (a) | | | 2,752 | | |
| | | | 9,837 | | |
| | | Pharmaceuticals — 2.5% | |
| | 68 | | | Adolor Corp. (a) (c) | | | 993 | | |
| | 291 | | | AVANIR Pharmaceuticals, Class A (a) (c) | | | 1,002 | | |
| | 133 | | | Cypress Bioscience, Inc. (a) (c) | | | 771 | | |
| | 69 | | | Nastech Pharmaceutical Co., Inc. (a) (c) | | | 1,010 | | |
| | 37 | | | Theravance, Inc. (a) | | | 828 | | |
| | | | 4,604 | | |
| SHARES | | SECURITY DESCRIPTION | | VALUE | |
| | | Road & Rail — 0.9% | |
| | 81 | | | TAL International Group, Inc. (a) (c) | | $ | 1,666 | | |
| | | Semiconductors & Semiconductor
Equipment — 7.1% | |
| | 53 | | | ATMI, Inc. (a) (c) | | | 1,473 | | |
| | 170 | | | Cirrus Logic, Inc. (a) (c) | | | 1,136 | | |
| | 84 | | | Diodes, Inc. (a) (c) | | | 2,607 | | |
| | 107 | | | Microsemi Corp. (a) (c) | | | 2,972 | | |
| | 42 | | | Portalplayer, Inc. (a) (c) | | | 1,175 | | |
| | 46 | | | Sirf Technology Holdings, Inc. (a) (c) | | | 1,359 | | |
| | 52 | | | Varian Semiconductor Equipment
Associates, Inc. (a) | | | 2,291 | | |
| | | | 13,013 | | |
| | | Software — 9.6% | |
| | 264 | | | Epicor Software Corp. (a) | | | 3,723 | | |
| | 114 | | | Hyperion Solutions Corp. (a) | | | 4,099 | | |
| | 75 | | | Progress Software Corp. (a) | | | 2,119 | | |
| | 91 | | | Serena Software, Inc. (a) (c) | | | 2,141 | | |
| | 37 | | | Talx Corp. | | | 1,684 | | |
| | 81 | | | VeriFone Holdings, Inc. (a) | | | 2,049 | | |
| | 86 | | | Witness Systems, Inc. (a) (c) | | | 1,688 | | |
| | | | 17,503 | | |
| | | Specialty Retail — 6.4% | |
| | 319 | | | Charming Shoppes, Inc. (a) (c) | | | 4,205 | | |
| | 36 | | | Children's Place, Inc. (a) | | | 1,779 | | |
| | 93 | | | GameStop Corp. (c) | | | 2,964 | | |
| | 3 | | | GameStop Corp. (a) (c) | | | 86 | | |
| | 95 | | | Too, Inc. (a) | | | 2,671 | | |
| | | | 11,705 | | |
| | | Textiles, Apparel & Luxury Goods — 3.2% | |
| | 24 | | | Carter's, Inc. (a) | | | 1,389 | | |
| | 75 | | | Phillips-Van Heusen | | | 2,424 | | |
| | 133 | | | Skechers U.S.A., Inc., Class A (a) (c) | | | 2,035 | | |
| | | | 5,848 | | |
| | | Transportation Infrastructure — 0.7% | |
| | 40 | | | American Commercial Lines, Inc. (a) | | | 1,209 | | |
| | | | | Common Stocks
(Cost $154,556) | | | 177,321
| | |
SEE NOTES TO FINANCIAL STATEMENTS.
JPMORGAN U.S. EQUITY MID/SMALL CAP FUNDS38
ANNUAL REPORT DECEMBER 31
2005
SCHEDULE OF PORTFOLIO INVESTMENTS AS OF DECEMBER 31, 2005
(Amounts in thousands)
(CONTINUED)
| SHARES | | SECURITY DESCRIPTION | | VALUE | |
| Short-Term Investment — 2.9% | | | |
| | | Investment Company — 2.9% | |
| | 5,290
| | | JPMorgan Prime Money
Market Fund (b) (m)
(Cost $5,290) | | |
$5,290
| | |
PRINCIPAL
AMOUNT | |
| Investments of Cash Collateral for Securities Loaned — 23.4% | | | |
| | | Certificates of Deposit — 3.6% | |
| $ | 1,000 | | | Credit Suisse First Boston LLC, FRN,
4.27%, 10/17/06 | | | 1,000 | | |
| | 2,000 | | | Manufacturers and Traders, FRN,
4.36%, 09/26/06 | | | 2,000 | | |
| | 1,800 | | | Royal Bank of Canada, FRN,
4.30%, 11/13/06 | | | 1,800 | | |
| | 1,750 | | | Wells Fargo Bank San Francisco,
4.30%, 01/27/06 | | | 1,750 | | |
| | | | 6,550 | | |
| | | Commercial Paper — 2.2% | |
| | 2,000 | | | Morgan Stanley & Co., Inc., FRN,
4.33%, 04/17/06 | | | 2,000 | | |
| | 1,985 | | | HSBC Finance Corp., 4.43%, 02/10/06 | | | 1,985 | | |
| | | | 3,985 | | |
| | | Corporate Notes — 8.1% | |
| | 1,000 | | | Alliance and Leister plc, FRN,
4.33%, 01/30/07 | | | 1,000 | | |
| | 2,000 | | | American Express Credit Corp., FRN,
4.36%, 06/12/07 | | | 2,000 | | |
| | 2,000 | | | Bank of America, N.A., FRN,
4.31%, 11/07/06 | | | 2,000 | | |
| | 2,000 | | | CDC Financial Products, Inc., FRN,
4.35%, 01/30/06 | | | 2,000 | | |
| | 2,000 | | | Citigroup Global Markets, Inc., FRN,
4.32%, 01/06/06 | | | 2,000 | | |
| | 1,000 | | | K2(USA) LLC, FRN, 4.35%, 02/15/06 | | | 1,000 | | |
| | 1,900 | | | Liberty Lighthouse U.S. Capital, FRN,
4.34%, 10/24/06 | | | 1,900 | | |
| | 100 | | | Links Finance LLC, FRN, 4.29%, 10/06/06 | | | 100 | | |
| | 1,800 | | | Links Finance LLC, FRN, 4.37%, 10/15/07 | | | 1,800 | | |
PRINCIPAL
AMOUNT | | SECURITY DESCRIPTION | | VALUE | |
| | | Corporate Notes — Continued | |
| $ | 1,000 | | | Sigma Finance, Inc., FRN,
4.37%, 10/24/07 | | $ | 1,000 | | |
| | | | 14,800 | | |
| | | Repurchase Agreements — 9.5% | |
| | 2,808 | | | Bank of America Securities LLC, 4.26%,
dated 12/30/05, due 01/03/06,
repurchase price $2,809, collateralized
by U.S. Government Agency Mortgages. | | | 2,808 | | |
| | 8,000 | | | Lehman Brothers, Inc., 4.26%,
dated 12/30/05, due 01/03/06,
repurchase price $8,003, collateralized
by U.S. Government Agency Mortgages. | | | 8,000 | | |
| | 6,500 | | | UBS Securities LLC, 4.26%,
dated 12/30/05, due 01/03/06,
repurchase price $6,502, collateralized
by U.S. Government Agency Mortgages. | | | 6,500 | | |
| | | | 17,308 | | |
| | | | | Investments of Cash Collateral for
Securities Loaned
(Cost $42,643) | | | 42,643
| | |
| | | | | Investments — 123.5%
(Cost $202,489) | | | $225,254
| | |
| | | | | Liabilities in Excess of Other
Assets — (23.5)% | | | (42,910 | ) | |
| | | | | NET ASSETS — 100.0% | | $ | 182,344 | | |
Percentages indicated are based on net assets.
SEE NOTES TO FINANCIAL STATEMENTS.
JPMORGAN U.S. EQUITY MID/SMALL CAP FUNDS39
JPMorgan Growth Advantage Fund
SCHEDULE OF PORTFOLIO INVESTMENTS AS OF DECEMBER 31, 2005
(Amounts in thousands)
| SHARES | | SECURITY DESCRIPTION | | VALUE | |
| Long-Term Investments — 99.7% | | | |
| | | Common Stocks — 99.7% | |
| | | Aerospace & Defense — 1.4% | |
| | 8 | | | Precision Castparts Corp. | | $ | 404 | | |
| | 8 | | | Rockwell Collins, Inc. | | | 386 | | |
| | | | 790 | | |
| | | Biotechnology — 3.2% | |
| | 4 | | | Genentech, Inc. (a) | | | 389 | | |
| | 7 | | | Invitrogen Corp. (a) (c) | | | 476 | | |
| | 14 | | | MedImmune, Inc. (a) | | | 490 | | |
| | 15 | | | Protein Design Labs, Inc. (a) (c) | | | 412 | | |
| | | | 1,767 | | |
| | | Capital Markets — 3.1% | |
| | 6 | | | Affiliated Managers Group, Inc. (a) (c) | | | 458 | | |
| | 16 | | | Ameritrade Holding Corp. (a) | | | 384 | �� | |
| | 13 | | | Federated Investors, Inc., Class B | | | 474 | | |
| | 6 | | | T. Rowe Price Group, Inc. | | | 450 | | |
| | | | 1,766 | | |
| | | Commercial Banks — 3.7% | |
| | 22 | | | Commerce Bancorp, Inc. (c) | | | 767 | | |
| | 13 | | | East-West Bancorp, Inc. (c) | | | 460 | | |
| | 11 | | | Zions Bancorp | | | 839 | | |
| | | | 2,066 | | |
| | | Commercial Services & Supplies — 3.2% | |
| | 9 | | | HNI Corp. (c) | | | 472 | | |
| | 31 | | | West Corp. (a) | | | 1,305 | | |
| | | | 1,777 | | |
| | | Communications Equipment — 1.0% | |
| | 28 | | | Corning, Inc. (a) | | | 556 | | |
| | | Computers & Peripherals — 4.6% | |
| | 8 | | | Apple Computer, Inc. (a) | | | 597 | | |
| | 17 | | | NCR Corp. (a) | | | 565 | | |
| | 43 | | | Seagate Technology (Cayman Islands) (a) | | | 857 | | |
| | 130 | | | Sun Microsystems, Inc. (a) | | | 546 | | |
| | | | 2,565 | | |
| | | Construction & Engineering — 0.8% | |
| | 6 | | | Jacobs Engineering Group, Inc. (a) | | | 424 | | |
| SHARES | | SECURITY DESCRIPTION | | VALUE | |
| | | Consumer Finance — 0.7% | |
| | 16 | | | AmeriCredit Corp. (a) | | $ | 410 | | |
| | | Diversified Financial Services — 3.2% | |
| | 14 | | | CIT Group, Inc. | | | 699 | | |
| | 12 | | | IntercontinentalExchange, Inc. (a) | | | 418 | | |
| | 21 | | | Lazard Ltd. (Bermuda), Class A | | | 676 | | |
| | | | 1,793 | | |
| | | Electrical Equipment — 1.7% | |
| | 9 | | | Ametek, Inc. | | | 395 | | |
| | 28 | | | General Cable Corp. (a) (c) | | | 550 | | |
| | | | 945 | | |
| | | Electronic Equipment & Instruments — 4.7% | |
| | 27 | | | Amphenol Corp., Class A | | | 1,208 | | |
| | 22 | | | Jabil Circuit, Inc. (a) | | | 833 | | |
| | 25 | | | Lo Jack Corp. (a) (c) | | | 603 | | |
| | | | 2,644 | | |
| | | Energy Equipment & Services — 5.5% | |
| | 17 | | | ENSCO International, Inc. | | | 763 | | |
| | 13 | | | Grant Prideco, Inc. (a) | | | 552 | | |
| | 7 | | | Halliburton Co. | | | 409 | | |
| | 14 | | | Hornbeck Offshore Services, Inc. (a) (c) | | | 464 | | |
| | 8 | | | National Oilwell Varco, Inc. (a) | | | 527 | | |
| | 5 | | | Noble Corp. (Cayman Islands) | | | 377 | | |
| | | | 3,092 | | |
| | | Food & Staples Retailing — 1.0% | |
| | 21 | | | CVS Corp. | | | 555 | | |
| | | Health Care Equipment & Supplies — 3.1% | |
| | 5 | | | Bausch & Lomb, Inc. | | | 333 | | |
| | 14 | | | Baxter International, Inc. | | | 523 | | |
| | 14 | | | DJ Orthopedics, Inc. (a) (c) | | | 386 | | |
| | 10 | | | Mentor Corp. (c) | | | 479 | | |
| | | | 1,721 | | |
| | | Health Care Providers & Services — 7.4% | |
| | 6 | | | Aetna, Inc. | | | 552 | | |
| | 10 | | | Amedisys, Inc. (a) | | | 414 | | |
| | 9 | | | Caremark Rx, Inc. (a) | | | 471 | | |
SEE NOTES TO FINANCIAL STATEMENTS.
JPMORGAN U.S. EQUITY MID/SMALL CAP FUNDS40
ANNUAL REPORT DECEMBER 31
2005
SCHEDULE OF PORTFOLIO INVESTMENTS AS OF DECEMBER 31, 2005
(Amounts in thousands)
(CONTINUED)
| SHARES | | SECURITY DESCRIPTION | | VALUE | |
| Long-Term Investments — continued | | | |
| | | Health Care Providers & Services — Continued | |
| | 10 | | | Coventry Health Care, Inc. (a) | | $ | 587 | | |
| | 15 | | | DaVita, Inc. (a) | | | 738 | | |
| | 9 | | | McKesson Corp. | | | 475 | | |
| | 9 | | | Medco Health Solutions, Inc. (a) | | | 508 | | |
| | 18 | | | Per-Se Technologies, Inc. (a) (c) | | | 427 | | |
| | | | 4,172 | | |
| | | Hotels, Restaurants & Leisure — 5.1% | |
| | 7 | | | Four Seasons Hotels, Inc. (Canada) (c) | | | 333 | | |
| | 6 | | | Harrah's Entertainment, Inc. | | | 451 | | |
| | 8 | | | Panera Bread Co., Class A (a) | | | 499 | | |
| | 15 | | | Royal Caribbean Cruises Ltd. (Liberia) | | | 694 | | |
| | 21 | | | Scientific Games Corp., Class A (a) | | | 562 | | |
| | 6 | | | Wynn Resorts Ltd. (a) (c) | | | 346 | | |
| | | | 2,885 | | |
| | | Household Durables — 1.6% | |
| | 41 | | | Champion Enterprises, Inc. (a) (c) | | | 555 | | |
| | 10 | | | D.R. Horton, Inc. | | | 357 | | |
| | | | 912 | | |
| | | Household Products — 0.9% | |
| | 10 | | | Energizer Holdings, Inc. (a) | | | 488 | | |
| | | Industrial Conglomerates — 1.0% | |
| | 7 | | | 3M Co. | | | 543 | | |
| | | Insurance — 1.9% | |
| | 6 | | | Everest Re Group Ltd. (Bermuda) | | | 572 | | |
| | 16 | | | HCC Insurance Holdings, Inc. | | | 484 | | |
| | | | 1,056 | | |
| | | Internet Software & Services — 3.5% | |
| | 1 | | | Google, Inc., Class A (a) | | | 539 | | |
| | 29 | | | McAfee, Inc. (a) | | | 788 | | |
| | 16 | | | ValueClick, Inc. (a) (c) | | | 284 | | |
| | 17 | | | VeriSign, Inc. (a) | | | 373 | | |
| | | | 1,984 | | |
| | | IT Services — 1.4% | |
| | 22 | | | Alliance Data Systems Corp. (a) (c) | | | 799 | | |
| SHARES | | SECURITY DESCRIPTION | | VALUE | |
| | | Machinery — 1.5% | |
| | 6 | | | Harsco Corp. | | $ | 428 | | |
| | 9 | | | Oshkosh Truck Corp. (c) | | | 415 | | |
| | | | 843 | | |
| | | Media — 3.0% | |
| | 17 | | | Carmike Cinemas, Inc. (c) | | | 429 | | |
| | 5 | | | Getty Images, Inc. (a) | | | 419 | | |
| | 6 | | | R.H. Donnelley Corp. (a) | | | 394 | | |
| | 11 | | | Rogers Communications, Inc. (Canada),
Class B | | | 461 | | |
| | | | 1,703 | | |
| | | Oil, Gas & Consumable Fuels — 2.4% | |
| | 9 | | | Consol Energy, Inc. | | | 554 | | |
| | 5 | | | EOG Resources, Inc. | | | 389 | | |
| | 8 | | | Talisman Energy, Inc. (Canada) | | | 418 | | |
| | | | 1,361 | | |
| | | Pharmaceuticals — 4.9% | |
| | 4 | | | Allergan, Inc. | | | 421 | | |
| | 7 | | | Barr Pharmaceuticals, Inc. (a) | | | 449 | | |
| | 14 | | | Omnicare, Inc. | | | 772 | | |
| | 12 | | | Teva Pharmaceutical Industries Ltd.
(Israel) ADR (c) | | | 525 | | |
| | 12 | | | Wyeth | | | 557 | | |
| | | | 2,724 | | |
| | | Road & Rail — 1.5% | |
| | 19 | | | Norfolk Southern Corp. | | | 856 | | |
| | | Semiconductors & Semiconductor
Equipment — 10.6% | |
| | 9 | | | Broadcom Corp., Class A (a) | | | 438 | | |
| | 61 | | | Cirrus Logic, Inc. (a) (c) | | | 405 | | |
| | 21 | | | Diodes, Inc. (a) (c) | | | 651 | | |
| | 27 | | | Ikanos Communications, Inc. (a) (c) | | | 398 | | |
| | 31 | | | Intel Corp. | | | 761 | | |
| | 10 | | | KLA-Tencor Corp. | | | 506 | | |
| | 18 | | | Lam Research Corp. (a) | | | 649 | | |
| | 10 | | | Marvell Technology Group Ltd.
(Bermuda) (a) | | | 561 | | |
| | 17 | | | Microchip Technology, Inc. | | | 534 | | |
SEE NOTES TO FINANCIAL STATEMENTS.
JPMORGAN U.S. EQUITY MID/SMALL CAP FUNDS41
JPMorgan Growth Advantage Fund
SCHEDULE OF PORTFOLIO INVESTMENTS AS OF DECEMBER 31, 2005
(Amounts in thousands)
(CONTINUED)
| SHARES | | SECURITY DESCRIPTION | | VALUE | |
| Long-Term Investments — continued | | | |
| | | Semiconductors & Semiconductor
Equipment — Continued | |
| | 13 | | | Nvidia Corp. (a) | | $ | 461 | | |
| | 18 | | | Texas Instruments, Inc. | | | 561 | | |
| | | | 5,925 | | |
| | | Software — 5.0% | |
| | 17 | | | Adobe Systems, Inc. | | | 634 | | |
| | 20 | | | Computer Associates International, Inc. | | | 560 | | |
| | 40 | | | Compuware Corp. (a) | | | 354 | | |
| | 8 | | | Electronic Arts, Inc. (a) | | | 439 | | |
| | 9 | | | NAVTEQ Corp. (a) | | | 395 | | |
| | 13 | | | Salesforce.com, Inc. (a) (c) | | | 417 | | |
| | | | 2,799 | | |
| | | Specialty Retail — 4.7% | |
| | 6 | | | AnnTaylor Stores Corp. (a) | | | 221 | | |
| | 21 | | | Bed Bath & Beyond, Inc. (a) | | | 761 | | |
| | 8 | | | Best Buy Co., Inc. | | | 335 | | |
| | 15 | | | Men's Wearhouse, Inc. (a) | | | 436 | | |
| | 19 | | | Sherwin-Williams Co. (The) | | | 874 | | |
| | | | 2,627 | | |
| | | Textiles, Apparel & Luxury Goods — 1.5% | |
| | 15 | | | Polo Ralph Lauren Corp. | | | 845 | | |
| | | Wireless Telecommunication Services — 0.9% | |
| | 12 | | | NII Holdings, Inc. (a) | | | 520 | | |
| | | | | Total Common Stocks
(Cost $47,336) | | | 55,913
| | |
| Short-Term Investment — 0.7% | | | |
| | | Investment Company — 0.7% | |
| | 409
| | | JPMorgan Prime Money
Market Fund (b) (m)
(Cost $409) | | |
409
| | |
PRINCIPAL
AMOUNT | | SECURITY DESCRIPTION | | VALUE | |
| Investments of Cash Collateral for Securities Loaned — 16.2% | | | |
| | | Certificates of Cash Deposit — 1.8% | |
| $ | 300 | | | Credit Suisse First Boston LLC, FRN,
4.27%, 10/17/06 | | $ | 300 | | |
| | 300 | | | Royal Bank of Canada, FRN,
4.30. 11/13/06 | | | 300 | | |
| | 400 | | | Wells Fargo Bank San Francisco,
4.30%, 1/27/06 | | | 400 | | |
| | | | 1,000 | | |
| | | Commercial Paper — 0.5% | |
| | 300 | | | Morgan Stanley & Co., Inc., FRN,
4.33%, 4/17/06 | | | 300 | | |
| | | Corporate Notes — 4.0% | |
| | 300 | | | Alliance and Leister plc, FRN,
4.33%, 01/30/07 | | | 300 | | |
| | 400 | | | American Express Credit Corp., FRN,
4.36%, 06/12/07 | | | 400 | | |
| | 300 | | | Banc of America Securities LLC, FRN,
4.31%, 11/07/06 | | | 300 | | |
| | 380 | | | CDC Financial Products, Inc., FRN,
4.35%, 01/30/06 | | | 380 | | |
| | 59 | | | Citigroup Global Markets, Inc., FRN,
4.32%, 01/06/06 | | | 59 | | |
| | 200 | | | K2(USA) LLC, FRN, 4.35%, 02/15/06 | | | 200 | | |
| | 251 | | | Links Finance LLC, FRN, 4.29%, 10/06/06 | | | 251 | | |
| | 350 | | | Sigma Finance, Inc., FRN, 4.37%, 10/24/07 | | | 350 | | |
| | | | 2,240 | | |
| | | Repurchase Agreements — 9.9% | |
| | 322 | | | Bank of America Securities LLC, 4.26%,
date 12/30/05, due 01/03/06,
repurchase price $322, collateralized
by U.S. Government Agency Mortgages. | | | 322 | | |
| | 1,700 | | | Lehman Brothers, Inc., 4.26%,
date 12/30/05, due 01/03/06,
repurchase price $1,701, collateralized
by U.S. Government Agency Mortgages. | | | 1,700 | | |
| | 1,750 | | | Morgan Stanley & Co., Inc., 4.27%,
date 12/30/05, due 01/03/06,
repurchase price $1,751, collateralized
by U.S. Government Agency Mortgages. | | | 1,750 | | |
SEE NOTES TO FINANCIAL STATEMENTS.
JPMORGAN U.S. EQUITY MID/SMALL CAP FUNDS42
ANNUAL REPORT DECEMBER 31
2005
SCHEDULE OF PORTFOLIO INVESTMENTS AS OF DECEMBER 31, 2005
(Amounts in thousands)
(CONTINUED)
PRINCIPAL
AMOUNT | | SECURITY DESCRIPTION | | VALUE | |
| Investments of Cash Collateral for Securities Loaned — continued | |
| | | Repurchase Agreements — Continued | |
| $ | 1,750 | | | UBS Securities LLC, 4.26%,
date 12/30/05, due 01/03/06,
repurchase price $1,751, collateralized
by U.S. Government Agency Mortgages. | | $ | 1,750 | | |
| | | | 5,522 | | |
| | | Total Investments of Cash Collateral for
Securities Loaned
(Cost $9,062) | | |
9,062
| | |
| | | Total Investments — 116.6%
(Cost $56,807) | | | $65,384
| | |
| | | Liabilities in Excess of Other
Assets — (16.6)% | | | (9,288 | ) | |
| | | NET ASSETS — 100.0% | | $ | 56,096 | | |
Percentages indicated are based on net assets.
SEE NOTES TO FINANCIAL STATEMENTS.
JPMORGAN U.S. EQUITY MID/SMALL CAP FUNDS43
JPMorgan Micro Cap Fund
SCHEDULE OF PORTFOLIO INVESTMENTS AS OF DECEMBER 31, 2005
(Amounts in thousands)
| SHARES | | SECURITY DESCRIPTION | | VALUE | |
| Long-Term Investments — 98.3% | | | |
| | | Common Stocks — 98.3% | |
| | | Aerospace & Defense — 1.6% | |
| | 2 | | | Esterline Technologies Corp. (a) | | $ | 85 | | |
| | | Biotechnology — 2.7% | |
| | 6 | | | Illumina, Inc. (a) | | | 89 | | |
| | 3 | | | Myriad Genetics, Inc. (a) | | | 52 | | |
| | | | 141 | | |
| | | Building Products — 1.7% | |
| | 4 | | | Interline Brands, Inc. (a) | | | 89 | | |
| | | Commercial Banks — 7.0% | |
| | 2 | | | Alabama National Bancorp | | | 104 | | |
| | 3 | | | Preferred Bank | | | 111 | | |
| | 4 | | | Security Bank Corp. | | | 86 | | |
| | 2 | | | State National Bancshares, Inc., Class B (a) | | | 59 | | |
| | | | 360 | | |
| | | Commercial Services & Supplies — 14.1% | |
| | 10 | | | Collectors Universe (a) | | | 154 | | |
| | 7 | | | Cornell Cos., Inc. (a) | | | 92 | | |
| | 1 | | | CoStar Group, Inc. (a) | | | 46 | | |
| | 6 | | | FirstService Corp. (Canada) (a) | | | 156 | | |
| | 15 | | | Franklin Covey Co. (a) | | | 93 | | |
| | 5 | | | Hudson Highland Group, Inc. (a) | | | 87 | | |
| | 12 | | | SM&A Corp. (a) | | | 101 | | |
| | | | 729 | | |
| | | Distributors — 2.0% | |
| | 7 | | | Rush Enterprises, Inc., Class A (a) | | | 103 | | |
| | | Electrical Equipment — 1.5% | |
| | 4 | | | Fargo Electronics, Inc. (a) | | | 75 | | |
| | | Electronic Equipment & Instruments — 4.4% | |
| | 5 | | | Lo Jack Corp. (a) | | | 129 | | |
| | 2 | | | Scansource, Inc. (a) | | | 99 | | |
| | | | 228 | | |
| | | Energy Equipment & Services — 2.3% | |
| | 2 | | | Lufkin Industries, Inc. | | | 118 | | |
| SHARES | | SECURITY DESCRIPTION | | VALUE | |
| | | Health Care Equipment & Supplies — 2.4% | |
| | 2 | | | Neurometrix, Inc. (a) | | $ | 45 | | |
| | 5 | | | NMT Medical, Inc. (a) | | | 77 | | |
| | | | 122 | | |
| | | Health Care Providers & Services — 8.2% | |
| | 7 | | | Alderwoods Group, Inc. (a) | | | 110 | | |
| | 7 | | | American Dental Partners, Inc. (a) | | | 125 | | |
| | 14 | | | Five Star Quality Care, Inc. (a) | | | 110 | | |
| | 4 | | | Horizon Health Corp. (a) | | | 80 | | |
| | | | 425 | | |
| | | Hotels, Restaurants & Leisure — 4.4% | |
| | 3 | | | Ambassadors Group, Inc. | | | 59 | | |
| | 2 | | | Benihana, Inc., Class A (a) | | | 42 | | |
| | 5 | | | Friendly Ice Cream Corp. (a) | | | 44 | | |
| | 17 | | | Youbet.com, Inc. (a) | | | 81 | | |
| | | | 226 | | |
| | | Household Durables — 3.9% | |
| | 13 | | | Interface, Inc., Class A (a) | | | 111 | | |
| | 10 | | | Modtech Holdings, Inc. (a) | | | 91 | | |
| | | | 202 | | |
| | | Industrial Conglomerates — 1.6% | |
| | 2 | | | Freightcar America, Inc. | | | 80 | | |
| | | Insurance — 4.5% | |
| | 2 | | | American Physicians Capital, Inc. (a) | | | 82 | | |
| | 3 | | | James River Group, Inc (a) | | | 53 | | |
| | 2 | | | ProAssurance Corp. (a) | | | 97 | | |
| | | | 232 | | |
| | | Internet & Catalog Retail — 5.5% | |
| | 8 | | | Audible, Inc. (a) | | | 106 | | |
| | 13 | | | Celebrate Express, Inc. (a) | | | 176 | | |
| | | | 282 | | |
| | | Internet Software & Services — 9.3% | |
| | 4 | | | Bankrate, Inc. (a) | | | 129 | | |
| | 6 | | | Digitas, Inc. (a) | | | 81 | | |
| | 2 | | | Equinix, Inc. (a) | | | 69 | | |
| | 7 | | | iVillage, Inc. (a) | | | 54 | | |
SEE NOTES TO FINANCIAL STATEMENTS.
JPMORGAN U.S. EQUITY MID/SMALL CAP FUNDS44
ANNUAL REPORT DECEMBER 31
2005
SCHEDULE OF PORTFOLIO INVESTMENTS AS OF DECEMBER 31, 2005
(Amounts in thousands)
(CONTINUED)
| SHARES | | SECURITY DESCRIPTION | | VALUE | |
| Long-Term Investments — continued | | | |
| | | Internet Software & Services — Continued | |
| | 8 | | | PlanetOut, Inc. (a) | | $ | 73 | | |
| | 7 | | | Vocus, Inc. (a) | | | 73 | | |
| | | | 479 | | |
| | | IT Services — 1.0% | |
| | 3 | | | Dynamics Research Corp. (a) | | | 52 | | |
| | | Media — 1.0% | |
| | 5 | | | Knot, Inc. (The) (a) | | | 52 | | |
| | | Oil, Gas & Consumable Fuels — 4.6% | |
| | 3 | | | Bronco Drilling Co., Inc. (a) | | | 75 | | |
| | 2 | | | Edge Petroleum Corp. (a) | | | 55 | | |
| | 3 | | | Whiting Petroleum Corp. (a) | | | 106 | | |
| | | | 236 | | |
| | | Road & Rail — 1.9% | |
| | 6 | | | Marten Transport Ltd. (a) | | | 100 | | |
| | | Semiconductors & Semiconductor
Equipment — 3.2% | |
| | 10 | | | PDF Solutions, Inc. (a) | | | 163 | | |
| | | Software — 8.6% | |
| | 8 | | | Concur Technologies, Inc. (a) | | | 101 | | |
| | 12 | | | Magma Design Automation, Inc. (a) | | | 101 | | |
| | 57 | | | Manugistics Group, Inc. (a) | | | 100 | | |
| | 3 | | | Onyx Software Corp. (a) | | | 12 | | |
| | 11 | | | Unica Corp. | | | 127 | | |
| | | | 441 | | |
| | | Trading Companies & Distributors — 0.9% | |
| | 2 | | | Nuco2, Inc. (a) | | | 48 | | |
| | | | | Total Common Stocks
(Cost $4,942) | | | 5,068
| | |
| SHARES | | SECURITY DESCRIPTION | | VALUE | |
| Short-Term Investment — 1.9% | |
| | | Investment Company — 1.9% | |
| | 99 | | | JPMorgan Prime Money | | |
| | |
| | Market Fund (b) (m) | | $ | 99 | | |
| | (Cost $99) | | | | | |
| | | Total Investments — 100.2%
(Cost $5,041) | | | $5,167
| | |
| | | Liabilities in Excess of Other
Assets — (0.2)% | | | (9 | ) | |
| | | NET ASSETS — 100.0% | | $ | 5,158 | | |
Percentages indicated are based on net assets.
SEE NOTES TO FINANCIAL STATEMENTS.
JPMORGAN U.S. EQUITY MID/SMALL CAP FUNDS45
JPMorgan Mid Cap Equity Fund
SCHEDULE OF PORTFOLIO INVESTMENTS AS OF DECEMBER 31, 2005
(Amounts in thousands)
| SHARES | | SECURITY DESCRIPTION | | VALUE | |
| Long-Term Investments — 98.3% | | | |
| | | Common Stocks — 98.3% | |
| | | Aerospace & Defense — 0.7% | |
| | 20 | | | Precision Castparts Corp. | | $ | 1,026 | | |
| | 21 | | | Rockwell Collins, Inc. | | | 969 | | |
| | | | 1,995 | | |
| | | Airlines — 0.5% | |
| | 77 | | | Southwest Airlines Co. | | | 1,264 | | |
| | | Auto Components — 0.1% | |
| | 4 | | | BorgWarner, Inc. | | | 249 | | |
| | | Beverages — 0.6% | |
| | 13 | | | Brown-Forman Corp., Class B | | | 906 | | |
| | 24 | | | Constellation Brands, Inc., Class A (a) | | | 640 | | |
| | | | 1,546 | | |
| | | Biotechnology — 1.3% | |
| | 17 | | | Invitrogen Corp. (a) (c) | | | 1,146 | | |
| | 35 | | | MedImmune, Inc. (a) | | | 1,219 | | |
| | 35 | | | Protein Design Labs, Inc. (a) (c) | | | 1,003 | | |
| | | | 3,368 | | |
| | | Building Products — 0.5% | |
| | 34 | | | American Standard Cos., Inc. | | | 1,346 | | |
| | | Capital Markets — 2.8% | |
| | 14 | | | Affiliated Managers Group, Inc. (a) (c) | | | 1,140 | | |
| | 40 | | | Ameritrade Holding Corp. (a) | | | 956 | | |
| | 52 | | | E*Trade Financial Corp. (a) | | | 1,076 | | |
| | 33 | | | Federated Investors, Inc., Class B | | | 1,215 | | |
| | 19 | | | Northern Trust Corp. | | | 1,000 | | |
| | 30 | | | T. Rowe Price Group, Inc. | | | 2,143 | | |
| | | | 7,530 | | |
| | | Chemicals — 2.7% | |
| | 45 | | | Albemarle Corp. | | | 1,707 | | |
| | 26 | | | Ashland, Inc. | | | 1,476 | | |
| | 27 | | | PPG Industries, Inc. | | | 1,557 | | |
| | 64 | | | Rockwood Holdings, Inc. (a) (c) | | | 1,257 | | |
| | 20 | | | Sigma-Aldrich Corp. | | | 1,253 | | |
| | | | 7,250 | | |
| SHARES | | SECURITY DESCRIPTION | | VALUE | |
| | | Commercial Banks — 5.4% | |
| | 55 | | | Commerce Bancorp, Inc.(c) | | $ | 1,889 | | |
| | 23 | | | Cullen/Frost Bankers, Inc. | | | 1,251 | | |
| | 32 | | | East-West Bancorp, Inc.(c) | | | 1,157 | | |
| | 24 | | | M&T Bank Corp. | | | 2,661 | | |
| | 84 | | | North Fork Bancorp, Inc. | | | 2,305 | | |
| | 46 | | | TCF Financial Corp. | | | 1,240 | | |
| | 32 | | | Wilmington Trust Corp. | | | 1,253 | | |
| | 37 | | | Zions Bancorp | | | 2,807 | | |
| | | | 14,563 | | |
| | | Commercial Services & Supplies — 2.5% | |
| | 22 | | | HNI corp. (c) | | | 1,192 | | |
| | 31 | | | Pitney Bowes, Inc. | | | 1,310 | | |
| | 32 | | | Republic Services, Inc. | | | 1,190 | | |
| | 73 | | | West Corp. (a) | | | 3,081 | | |
| | | | 6,773 | | |
| | | Communications Equipment — 0.1% | |
| | 7 | | | Adtran, Inc. | | | 199 | | |
| | | Computers & Peripherals — 2.4% | |
| | 72 | | | NCR Corp. (a) | | | 2,452 | | |
| | 40 | | | Network Appliance, Inc. (a) | | | 1,068 | | |
| | 102 | | | Seagate Technology (Cayman Islands) (a) | | | 2,035 | | |
| | 236 | | | Sun Microsystems, Inc. (a) | | | 987 | | |
| | | | 6,542 | | |
| | | Construction & Engineering — 0.4% | |
| | 15 | | | Jacobs Engineering Group, Inc. (a) | | | 1,035 | | |
| | | Construction Materials — 0.6% | |
| | 25 | | | Vulcan Materials Co. | | | 1,667 | | |
| | | Consumer Finance — 0.4% | |
| | 40 | | | AmeriCredit Corp. (a) | | | 1,023 | | |
| | | Containers & Packaging — 0.5% | |
| | 36 | | | Ball Corp. | | | 1,410 | | |
| | | Distributors — 0.4% | |
| | 26 | | | Genuine Parts Co. | | | 1,159 | | |
SEE NOTES TO FINANCIAL STATEMENTS.
JPMORGAN U.S. EQUITY MID/SMALL CAP FUNDS46
ANNUAL REPORT DECEMBER 31
2005
SCHEDULE OF PORTFOLIO INVESTMENTS AS OF DECEMBER 31, 2005
(Amounts in thousands)
(CONTINUED)
| SHARES | | SECURITY DESCRIPTION | | VALUE | |
| Long-Term Investments — continued | | | |
| | | Diversified Financial Services — 1.5% | |
| | 33 | | | CIT Group, Inc. | | $ | 1,704 | | |
| | 53 | | | Lazard Ltd. (Bermuda), Class A | | | 1,679 | | |
| | 13 | | | Principal Financial Group | | | 607 | | |
| | | | 3,990 | | |
| | | Diversified Telecommunication Services — 1.7% | |
| | 32 | | | Alltel Corp. | | | 2,045 | | |
| | 74 | | | CenturyTel, Inc. | | | 2,437 | | |
| | | | 4,482 | | |
| | | Electric Utilities — 2.7% | |
| | 34 | | | American Electric Power Co., Inc. | | | 1,269 | | |
| | 46 | | | DPL, Inc. | | | 1,207 | | |
| | 15 | | | FirstEnergy Corp. | | | 715 | | |
| | 29 | | | PG&E Corp. | | | 1,091 | | |
| | 54 | | | PPL Corp. | | | 1,582 | | |
| | 58 | | | Westar Energy, Inc. | | | 1,251 | | |
| | | | 7,115 | | |
| | | Electrical Equipment — 1.4% | |
| | 54 | | | Ametek, Inc. | | | 2,306 | | |
| | 20 | | | Cooper Industries Ltd. (Bermuda), Class A | | | 1,489 | | |
| | | | 3,795 | | |
| | | Electronic Equipment & Instruments — 2.5% | |
| | 89 | | | Amphenol Corp., Class A | | | 3,926 | | |
| | 37 | | | Flir Systems, Inc. (a) (c) | | | 820 | | |
| | 56 | | | Jabil Circuit, Inc. (a) | | | 2,088 | | |
| | | | 6,834 | | |
| | | Energy Equipment & Services — 3.1% | |
| | 37 | | | BJ Services Co. | | | 1,364 | | |
| | 41 | | | ENSCO International, Inc. | | | 1,801 | | |
| | 36 | | | Grant Prideco, Inc. (a) | | | 1,608 | | |
| | 21 | | | National Oilwell Varco, Inc. (a) | | | 1,317 | | |
| | 18 | | | Noble Corp. (Cayman Islands) | | | 1,238 | | |
| | 20 | | | Tidewater, Inc.(c) | | | 907 | | |
| | | | 8,235 | | |
| | | Food Products — 1.0% | |
| | 31 | | | Dean Foods Co. (a) | | | 1,183 | | |
| | 80 | | | Del Monte Foods Co. (a) | | | 834 | | |
| SHARES | | SECURITY DESCRIPTION | | VALUE | |
| | | Food Products — Continued | |
| | 16 | | | Hormel Foods Corp. | | $ | 533 | | |
| | | | 2,550 | | |
| | | Gas Utilities — 0.9% | |
| | 39 | | | AGL Resources, Inc. | | | 1,340 | | |
| | 47 | | | UGI Corp. | | | 968 | | |
| | | | 2,308 | | |
| | | Health Care Equipment & Supplies — 0.8% | |
| | 12 | | | Bausch & Lomb, Inc. | | | 815 | | |
| | 26 | | | Mentor corp. (c) | | | 1,198 | | |
| | 3 | | | Millipore Corp. (a) | | | 224 | | |
| | | | 2,237 | | |
| | | Health Care Providers & Services — 5.2% | |
| | 14 | | | Aetna, Inc. | | | 1,302 | | |
| | 23 | | | Caremark Rx, Inc. (a) | | | 1,178 | | |
| | 72 | | | Coventry Health Care, Inc. (a) | | | 4,114 | | |
| | 36 | | | DaVita, Inc. (a) | | | 1,834 | | |
| | 7 | | | Henry Schein, Inc. (a) | | | 314 | | |
| | 28 | | | LifePoint Hospitals, Inc. (a) | | | 1,037 | | |
| | 29 | | | Manor Care, Inc. | | | 1,157 | | |
| | 23 | | | McKesson Corp. | | | 1,192 | | |
| | 17 | | | Medco Health Solutions, Inc. (a) | | | 924 | | |
| | 20 | | | Quest Diagnostics, Inc. | | | 1,045 | | |
| | | | 14,097 | | |
| | | Hotels, Restaurants & Leisure — 5.2% | |
| | 59 | | | Applebees International, Inc. | | | 1,331 | | |
| | 17 | | | Four Seasons Hotels, Inc. (Canada) (c) | | | 841 | | |
| | 16 | | | Harrah's Entertainment, Inc. | | | 1,109 | | |
| | 80 | | | Hilton Hotels Corp. | | | 1,919 | | |
| | 41 | | | Outback Steakhouse, Inc. | | | 1,698 | | |
| | 19 | | | Panera Bread Co., Class A (a) | | | 1,254 | | |
| | 38 | | | Royal Caribbean Cruises Ltd. (Liberia) (c) | | | 1,703 | | |
| | 52 | | | Scientific Games Corp., Class A (a) | | | 1,410 | | |
| | 33 | | | Sonic Corp. (a) (c) | | | 971 | | |
| | 14 | | | Station Casinos, Inc. | | | 925 | | |
| | 16 | | | Wynn Resorts Ltd. (a) (c) | | | 867 | | |
| | | | 14,028 | | |
SEE NOTES TO FINANCIAL STATEMENTS.
JPMORGAN U.S. EQUITY MID/SMALL CAP FUNDS47
JPMorgan Mid Cap Equity Fund
SCHEDULE OF PORTFOLIO INVESTMENTS AS OF DECEMBER 31, 2005
(Amounts in thousands)
(CONTINUED)
| SHARES | | SECURITY DESCRIPTION | | VALUE | |
| Long-Term Investments — continued | | | |
| | | Household Durables — 1.1% | |
| | 25 | | | D.R. Horton, Inc. | | $ | 897 | | |
| | 16 | | | Fortune Brands, Inc. | | | 1,264 | | |
| | 20 | | | Toll Brothers, Inc. (a) | | | 696 | | |
| | | | 2,857 | | |
| | | Household Products — 1.1% | |
| | 31 | | | Clorox Co. | | | 1,746 | | |
| | 24 | | | Energizer Holdings, Inc. (a) | | | 1,215 | | |
| | | | 2,961 | | |
| | | Industrial Conglomerates — 0.6% | |
| | 22 | | | Carlisle Cos., Inc. | | | 1,535 | | |
| | | Insurance — 4.7% | |
| | 73 | | | Assurant, Inc. | | | 3,153 | | |
| | 30 | | | Cincinnati Financial Corp. | | | 1,320 | | |
| | 14 | | | Everest Re Group Ltd. (Bermuda) | | | 1,375 | | |
| | 34 | | | Genworth Financial, Inc., Class A | | | 1,183 | | |
| | 40 | | | HCC Insurance Holdings, Inc. | | | 1,199 | | |
| | 35 | | | IPC Holdings Ltd. (Bermuda) | | | 961 | | |
| | 80 | | | Old Republic International Corp. | | | 2,110 | | |
| | 25 | | | Safeco Corp. | | | 1,418 | | |
| | | | 12,719 | | |
| | | Internet Software & Services — 1.3% | |
| | 70 | | | McAfee, Inc. (a) | | | 1,905 | | |
| | 39 | | | ValueClick, Inc. (a) (c) | | | 701 | | |
| | 43 | | | VeriSign, Inc. (a) | | | 941 | | |
| | | | 3,547 | | |
| | | IT Services — 1.2% | |
| | 20 | | | Affiliated Computer Services, Inc.,
Class A (a) | | | 1,190 | | |
| | 54 | | | Alliance Data Systems Corp. (a) (c) | | | 1,938 | | |
| | | | 3,128 | | |
| | | Machinery — 1.9% | |
| | 33 | | | Crane Co. | | | 1,157 | | |
| | 30 | | | Harsco Corp. | | | 2,002 | | |
| | 10 | | | ITT Industries, Inc. | | | 1,033 | | |
| | 23 | | | Oshkosh Truck corp. (c) | | | 1,034 | | |
| | | | 5,226 | | |
| SHARES | | SECURITY DESCRIPTION | | VALUE | |
| | | Media — 4.4% | |
| | 37 | | | Cablevision Systems New York Group,
Class A (a) | | $ | 873 | | |
| | 41 | | | Clear Channel Outdoor Holdings, Inc.,
Class A (a) | | | 830 | | |
| | 44 | | | Dex Media, Inc. | | | 1,184 | | |
| | 20 | | | Gannett Co., Inc. | | | 1,223 | | |
| | 12 | | | Getty Images, Inc. (a) | | | 1,062 | | |
| | 35 | | | Interactive Data Corp. (a) | | | 786 | | |
| | 15 | | | Knight Ridder, Inc. | | | 943 | | |
| | 16 | | | R.H. Donnelley Corp. (a) | | | 998 | | |
| | 65 | | | Regal Entertainment Group, Class A (c) | | | 1,231 | | |
| | 26 | | | Rogers Communications, Inc. (Canada),
Class B | | | 1,095 | | |
| | 1 | | | Washington Post Co. (The), Class B | | | 918 | | |
| | 25 | | | XM Satellite Radio Holdings, Inc.,
Class A (a) (c) | | | 685 | | |
| | | | 11,828 | | |
| | | Multi-Utilities — 1.3% | |
| | 32 | | | Energen Corp. | | | 1,177 | | |
| | 42 | | | Energy East Corp. | | | 953 | | |
| | 33 | | | SCANA Corp. | | | 1,280 | | |
| | | | 3,410 | | |
| | | Multiline Retail — 1.1% | |
| | 43 | | | Family Dollar Stores, Inc. | | | 1,059 | | |
| | 19 | | | Federated Department Stores, Inc. | | | 1,234 | | |
| | 32 | | | Tuesday Morning Corp. | | | 669 | | |
| | | | 2,962 | | |
| | | Oil, Gas & Consumable Fuels — 5.9% | |
| | 33 | | | Burlington Resources, Inc. | | | 2,802 | | |
| | 25 | | | Consol Energy, Inc. | | | 1,639 | | |
| | 40 | | | Devon Energy Corp. | | | 2,527 | | |
| | 13 | | | EOG Resources, Inc. | | | 932 | | |
| | 25 | | | Kinder Morgan, Inc. | | | 2,290 | | |
| | 15 | | | Marathon Oil Corp. | | | 944 | | |
| | 21 | | | Newfield Exploration Co. (a) | | | 1,044 | | |
| | 16 | | | Pioneer Natural Resources Co. | | | 825 | | |
| | 36 | | | Range Resources Corp. (c) | | | 956 | | |
| | 26 | | | Southwestern Energy Co. (a) | | | 934 | | |
| | 20 | | | Talisman Energy, Inc. (Canada) | | | 1,068 | | |
| | | | 15,961 | | |
SEE NOTES TO FINANCIAL STATEMENTS.
JPMORGAN U.S. EQUITY MID/SMALL CAP FUNDS48
ANNUAL REPORT DECEMBER 31
2005
SCHEDULE OF PORTFOLIO INVESTMENTS AS OF DECEMBER 31, 2005
(Amounts in thousands)
(CONTINUED)
| SHARES | | SECURITY DESCRIPTION | | VALUE | |
| Long-Term Investments — continued | | | |
| | | Paper & Forest Products — 0.4% | |
| | 42 | | | MeadWestvaco Corp. | | $ | 1,169 | | |
| | | Personal Products — 0.4% | |
| | 35 | | | Estee Lauder Cos., Inc. (The), Class A | | | 1,165 | | |
| | | Pharmaceuticals — 2.0% | |
| | 7 | | | Allergan, Inc. | | | 713 | | |
| | 18 | | | Barr Pharmaceuticals, Inc. (a) | | | 1,115 | | |
| | 51 | | | Omnicare, Inc. | | | 2,912 | | |
| | 12 | | | Sepracor, Inc. (a) | | | 611 | | |
| | | | 5,351 | | |
| | | Real Estate — 2.0% | |
| | 45 | | | Brookfield Properties Co. (Canada) | | | 1,315 | | |
| | 22 | | | Forest City Enterprises, Inc., Class A | | | 838 | | |
| | 18 | | | iStar Financial, Inc. REIT | | | 653 | | |
| | 25 | | | Rayonier, Inc. REIT | | | 993 | | |
| | 18 | | | Vornado Realty Trust REIT | | | 1,519 | | |
| | | | 5,318 | | |
| | | Road & Rail — 1.7% | |
| | 88 | | | J.B. Hunt Transport Services, Inc. | | | 2,001 | | |
| | 57 | | | Norfolk Southern Corp. | | | 2,560 | | |
| | | | 4,561 | | |
| | | Semiconductors & Semiconductor
Equipment — 3.5% | |
| | 23 | | | Broadcom Corp., Class A (a) | | | 1,096 | | |
| | 26 | | | KLA-Tencor Corp. | | | 1,258 | | |
| | 45 | | | Lam Research Corp. (a) | | | 1,613 | | |
| | 28 | | | Linear Technology Corp. | | | 996 | | |
| | 23 | | | Marvell Technology Group Ltd.
(Bermuda) (a) | | | 1,301 | | |
| | 60 | | | Microchip Technology, Inc. | | | 1,943 | | |
| | 31 | | | Nvidia Corp. (a) | | | 1,148 | | |
| | | | 9,355 | | |
| | | Software — 3.2% | |
| | 43 | | | Adobe Systems, Inc. | | | 1,604 | | |
| | 53 | | | Citrix Systems, Inc. (a) | | | 1,512 | | |
| | 93 | | | Computer Associates International, Inc. | | | 2,615 | | |
| | 100 | | | Compuware Corp. (a) | | | 893 | | |
| SHARES | | SECURITY DESCRIPTION | | VALUE | |
| | | Software — Continued | |
| | 21 | | | NAVTEQ Corp. (a) | | $ | 935 | | |
| | 32 | | | Salesforce.com, Inc. (a) (c) | | | 1,032 | | |
| | | | 8,591 | | |
| | | Specialty Retail — 7.0% | |
| | 16 | | | AnnTaylor Stores Corp. (a) | | | 542 | | |
| | 53 | | | Autonation, Inc. (a) | | | 1,152 | | |
| | 26 | | | AutoZone, Inc. (a) | | | 2,422 | | |
| | 50 | | | Bed Bath & Beyond, Inc. (a) | | | 1,817 | | |
| | 77 | | | Circuit City Stores, Inc. | | | 1,744 | | |
| | 64 | | | Limited Brands, Inc. | | | 1,430 | | |
| | 36 | | | Men's Wearhouse, Inc. (a) | | | 1,066 | | |
| | 65 | | | Ross Stores, Inc. | | | 1,884 | | |
| | 75 | | | Sherwin-Williams Co. (The) | | | 3,388 | | |
| | 22 | | | Tiffany & Co. | | | 823 | | |
| | 58 | | | TJX Cos., Inc. | | | 1,338 | | |
| | 23 | | | Weight Watchers International, Inc. (a) (c) | | | 1,120 | | |
| | | | 18,726 | | |
| | | Textiles, Apparel & Luxury Goods — 2.5% | |
| | 31 | | | Columbia Sportswear Co. (a) | | | 1,456 | | |
| | 37 | | | Polo Ralph Lauren Corp. | | | 2,071 | | |
| | 59 | | | V.F. Corp. | | | 3,282 | | |
| | | | 6,809 | | |
| | | Thrifts & Mortgage Finance — 1.8% | |
| | 33 | | | Golden West Financial Corp. | | | 2,205 | | |
| | 24 | | | MGIC Investment Corp. | | | 1,586 | | |
| | 24 | | | Webster Financial Corp. | | | 1,116 | | |
| | | | 4,907 | | |
| | | Trading Companies & Distributors — 0.4% | |
| | 27 | | | Hughes Supply, Inc. | | | 954 | | |
| | | Wireless Telecommunication Services — 0.9% | |
| | 30 | | | NII Holdings, Inc. (a) | | | 1,306 | | |
| | 31 | | | Telephone & Data Systems, Inc. | | | 1,083 | | |
| | | | 2,389 | | |
| | | | | Total Common Stocks
(Cost $213,957) | | | 264,019
| | |
SEE NOTES TO FINANCIAL STATEMENTS.
JPMORGAN U.S. EQUITY MID/SMALL CAP FUNDS49
JPMorgan Mid Cap Equity Fund
SCHEDULE OF PORTFOLIO INVESTMENTS AS OF DECEMBER 31, 2005
(Amounts in thousands)
(CONTINUED)
| SHARES | | SECURITY DESCRIPTION | | VALUE | |
| Short-Term Investment — 1.8% | | | |
| | | Investment Company — 1.8% | |
| | 4,875 | | | JPMorgan Prime Money | | |
| | |
| | | | | Market Fund (b) (m) | | $ | 4,875 | | |
| | | | | (Cost $4,875) | | | | | |
PRINCIPAL
AMOUNT | |
| Investments of Cash Collateral for Securities Loaned — 6.8% | | | |
| | | Certificates of Deposit — 1.5% | |
| $ | 900 | | | Credit Suisse First Boston LLC, FRN,
4.27%, 10/17/06 | | | 900 | | |
| | 1,000 | | | Manufacturers and Traders, FRN,
4.36%, 09/26/06 | | | 1,000 | | |
| | 1,000 | | | Royal Bank of Canada, FRN,
4.30%, 11/13/06 | | | 1,000 | | |
| | 1,000 | | | Wells Fargo Bank San Francisco,
4.30%, 01/27/06 | | | 1,000 | | |
| | | | 3,900 | | |
| | | Commercial Paper — 0.3% | |
| | 900 | | | Morgan Stanley & Co., Inc., FRN,
4.33%, 04/17/06 | | | 900 | | |
| | | Corporate Notes — 3.2% | |
| | 1,000 | | | Alliance and Leister plc, FRN,
4.33%, 01/30/07 | | | 1,000 | | |
| | 1,000 | | | American Express Credit Corp., FRN,
4.36%, 06/12/07 | | | 1,000 | | |
| | 1,000 | | | Banc of America Securities LLC, FRN,
4.31%, 11/07/06 | | | 1,000 | | |
| | 900 | | | CDC Financial Products, Inc., FRN,
4.35%, 01/30/06 | | | 900 | | |
| | 900 | | | Citigroup Global Markets, Inc., FRN,
4.32%, 01/06/06 | | | 900 | | |
| | 1,000 | | | K2(USA) LLC, FRN, 4.35, 02/15/06 | | | 1,000 | | |
| | 900 | | | Liberty Lighthouse U.S. Capital, FRN,
4.34%, 10/24/06 | | | 900 | | |
| | 903 | | | Links Finance LLC, FRN, 4.29%, 10/06/06 | | | 902 | | |
| | 900 | | | Sigma Finance, Inc., FRN,
4.37%, 10/24/07 | | | 900 | | |
| | | | 8,502 | | |
PRINCIPAL
AMOUNT | | SECURITY DESCRIPTION | | VALUE | |
| | | Repurchase Agreements — 1.8% | |
| $ | 1,418 | | | Bank of America Securities LLC,
4.26%, dated 12/30/05, due 01/03/06,
repurchase price $1,419, collateralized
by U.S. Government Agency Mortgages. | | $ | 1,418 | | |
| | 3,500 | | | UBS Securities LLC, 4.26%,
dated 12/30/05, due 01/03/06,
repurchase price $3,501, collateralized
by U.S. Government Agency Mortgages. | | | 3,500 | | |
| | | | 4,918 | | |
| | | Total Investments of Cash Collateral for
Securities Loaned
(Cost $18,220) | | |
18,220
| | |
| | | Total Investments — 106.9%
(Cost $237,052) | | | $287,114
| | |
| | | Liabilities in Excess of Other
Assets — (6.9)% | | | (18,532 | ) | |
| | | NET ASSETS — 100.0% | | $ | 268,582 | | |
Percentages indicated are based on net assets.
SEE NOTES TO FINANCIAL STATEMENTS.
JPMORGAN U.S. EQUITY MID/SMALL CAP FUNDS50
JPMorgan Mid Cap Value Fund
SCHEDULE OF PORTFOLIO INVESTMENTS AS OF DECEMBER 31, 2005
(Amounts in thousands)
| SHARES | | SECURITY DESCRIPTION | | VALUE | |
| Long-Term Investments — 96.3% | | | |
| | | Common Stocks — 96.3% | |
| | | Auto Components — 0.2% | |
| | 216 | | | BorgWarner, Inc. (c) | | $ | 13,066 | | |
| | | Beverages — 1.1% | |
| | 672 | | | Brown-Forman Corp., Class B | | | 46,592 | | |
| | 1,254 | | | Constellation Brands, Inc.,
Class A (a) | | | 32,893 | | |
| | | | 79,485 | | |
| | | Building Products — 0.9% | |
| | 1,653 | | | American Standard Cos., Inc. (c) | | | 66,021 | | |
| | | Capital Markets — 2.2% | |
| | 2,405 | | | E*Trade Financial Corp. (a) | | | 50,175 | | |
| | 995 | | | Northern Trust Corp. | | | 51,551 | | |
| | 723 | | | T. Rowe Price Group, Inc. (c) | | | 52,070 | | |
| | | | 153,796 | | |
| | | Chemicals — 4.3% | |
| | 2,288 | | | Albemarle Corp. (c) | | | 87,737 | | |
| | 1,308 | | | Ashland, Inc. | | | 75,716 | | |
| | 1,322 | | | PPG Industries, Inc. | | | 76,567 | | |
| | 1,020 | | | Sigma-Aldrich Corp. (c) | | | 64,562 | | |
| | | | 304,582 | | |
| | | Commercial Banks — 6.9% | |
| | 1,221 | | | Cullen/Frost Bankers, Inc. | | | 65,543 | | |
| | 1,251 | | | M&T Bank Corp. | | | 136,422 | | |
| | 4,335 | | | North Fork Bancorp, Inc. | | | 118,610 | | |
| | 2,343 | | | TCF Financial Corp. | | | 63,594 | | |
| | 1,555 | | | Wilmington Trust Corp. | | | 60,513 | | |
| | 523 | | | Zions Bancorp | | | 39,518 | | |
| | | | 484,200 | | |
| | | Commercial Services & Supplies — 1.9% | |
| | 1,627 | | | Pitney Bowes, Inc. | | | 68,733 | | |
| | 1,635 | | | Republic Services, Inc. | | | 61,394 | | |
| | | | 130,127 | | |
| | | Computers & Peripherals — 0.8% | |
| | 1,571 | | | NCR Corp. (a) | | | 53,303 | | |
| SHARES | | SECURITY DESCRIPTION | | VALUE | |
| | | Construction Materials — 1.2% | |
| | 1,268 | | | Vulcan Materials Co. (c) | | $ | 85,880 | | |
| | | Containers & Packaging — 1.0% | |
| | 1,839 | | | Ball Corp. (c) | | | 73,049 | | �� |
| | | Distributors — 0.7% | |
| | 1,178 | | | Genuine Parts Co. | | | 51,751 | | |
| | | Diversified Financial Services — 0.4% | |
| | 654 | | | Principal Financial Group (c) | | | 31,033 | | |
| | | Diversified Telecommunication Services — 3.3% | |
| | 1,673 | | | Alltel Corp. | | | 105,560 | | |
| | 3,763 | | | CenturyTel, Inc. (c) | | | 124,774 | | |
| | | | 230,334 | | |
| | | Electric Utilities — 5.2% | |
| | 1,801 | | | American Electric Power Co., Inc. (c) | | | 66,803 | | |
| | 2,445 | | | DPL, Inc. | | | 63,602 | | |
| | 753 | | | FirstEnergy Corp. | | | 36,904 | | |
| | 1,463 | | | PG&E Corp. | | | 54,288 | | |
| | 2,757 | | | PPL Corp. | | | 81,041 | | |
| | 3,020 | | | Westar Energy, Inc. | | | 64,922 | | |
| | | | 367,560 | | |
| | | Electrical Equipment — 2.1% | |
| | 1,656 | | | Ametek, Inc. | | | 70,442 | | |
| | 1,055 | | | Cooper Industries Ltd. (Bermuda),
Class A | | | 77,000 | | |
| | | | 147,442 | | |
| | | Electronic Equipment & Instruments — 0.7% | |
| | 1,064 | | | Amphenol Corp., Class A | | | 47,075 | | |
| | | Food Products — 1.9% | |
| | 1,621 | | | Dean Foods Co. (a) | | | 61,043 | | |
| | 4,235 | | | Del Monte Foods Co. (a) | | | 44,174 | | |
| | 821 | | | Hormel Foods Corp. | | | 26,824 | | |
| | | | 132,041 | | |
SEE NOTES TO FINANCIAL STATEMENTS.
JPMORGAN U.S. EQUITY MID/SMALL CAP FUNDS51
JPMorgan Mid Cap Value Fund
SCHEDULE OF PORTFOLIO INVESTMENTS AS OF DECEMBER 31, 2005
(Amounts in thousands)
(CONTINUED)
| SHARES | | SECURITY DESCRIPTION | | VALUE | |
| Long-Term Investments — continued | | | |
| | | Gas Utilities — 1.7% | |
| | 1,971 | | | AGL Resources, Inc. (c) | | $ | 68,593 | | |
| | 2,473 | | | UGI Corp. | | | 50,946 | | |
| | | | 119,539 | | |
| | | Health Care Providers & Services — 3.8% | |
| | 2,377 | | | Coventry Health Care, Inc. (a) (c) | | | 135,397 | | |
| | 372 | | | Henry Schein, Inc. (a) | | | 16,221 | | |
| | 1,518 | | | Manor Care, Inc. (c) | | | 60,371 | | |
| | 1,071 | | | Quest Diagnostics, Inc. | | | 55,145 | | |
| | | | 267,134 | | |
| | | Hotels, Restaurants & Leisure — 3.5% | |
| | 2,862 | | | Applebee's International, Inc. (c) | | | 64,662 | | |
| | 4,001 | | | Hilton Hotels Corp. | | | 96,457 | | |
| | 2,043 | | | Outback Steakhouse, Inc. (c) | | | 84,988 | | |
| | | | 246,107 | | |
| | | Household Durables — 0.9% | |
| | 830 | | | Fortune Brands, Inc. | | | 64,764 | | |
| | | Household Products — 1.3% | |
| | 1,581 | | | Clorox Co. | | | 89,966 | | |
| | | Industrial Conglomerates — 1.1% | |
| | 1,136 | | | Carlisle Cos., Inc. | | | 78,561 | | |
| | | Insurance — 7.5% | |
| | 3,732 | | | Assurant, Inc. (c) | | | 162,300 | | |
| | 1,525 | | | Cincinnati Financial Corp. | | | 68,118 | | |
| | 1,764 | | | Genworth Financial, Inc., Class A | | | 61,010 | | |
| | 1,806 | | | IPC Holdings Ltd. (Bermuda) (c) | | | 49,451 | | |
| | 4,121 | | | Old Republic International Corp. | | | 108,228 | | |
| | 1,305 | | | Safeco Corp. | | | 73,744 | | |
| | | | 522,851 | | |
| | | IT Services — 0.9% | |
| | 1,052 | | | Affiliated Computer Services, Inc.,
Class A (a) (c) | | | 62,275 | | |
| SHARES | | SECURITY DESCRIPTION | | VALUE | |
| | | Machinery — 1.5% | |
| | 1,684 | | | Crane Co. | | $ | 59,409 | | |
| | 695 | | | Harsco Corp. | | | 46,926 | | |
| | | | 106,335 | | |
| | | Media — 5.0% | |
| | 1,879 | | | Cablevision Systems New York
Group, Class A (a) | | | 44,102 | | |
| | 2,431 | | | Clear Channel Outdoor Holdings,
Inc. (a) | | | 48,749 | | |
| | 2,239 | | | Dex Media, Inc. | | | 60,652 | | |
| | 1,036 | | | Gannett Co., Inc. | | | 62,763 | | |
| | 1,631 | | | Interactive Data Corp. (a) | | | 37,033 | | |
| | 766 | | | Knight Ridder, Inc. (c) | | | 48,488 | | |
| | 61 | | | Washington Post Co. (The),
Class B (c) | | | 46,665 | | |
| | | | 348,452 | | |
| | | Multi-Utilities — 2.5% | |
| | 1,660 | | | Energen Corp. | | | 60,298 | | |
| | 2,193 | | | Energy East Corp. (c) | | | 49,996 | | |
| | 1,694 | | | SCANA Corp. | | | 66,714 | | |
| | | | 177,008 | | |
| | | Multiline Retail — 2.1% | |
| | 2,148 | | | Family Dollar Stores, Inc. (c) | | | 53,244 | | |
| | 894 | | | Federated Department Stores, Inc. | | | 59,276 | | |
| | 1,543 | | | Tuesday Morning Corp. (c) | | | 32,278 | | |
| | | | 144,798 | | |
| | | Oil, Gas & Consumable Fuels — 6.8% | |
| | 1,633 | | | Burlington Resources, Inc. (c) | | | 140,773 | | |
| | 2,066 | | | Devon Energy Corp. (c) | | | 129,227 | | |
| | 1,282 | | | Kinder Morgan, Inc. (c) | | | 117,852 | | |
| | 794 | | | Marathon Oil Corp. | | | 48,411 | | |
| | 830 | | | Pioneer Natural Resources Co. | | | 42,564 | | |
| | | | 478,827 | | |
| | | Paper & Forest Products — 0.9% | |
| | 2,165 | | | MeadWestvaco Corp. (c) | | | 60,682 | | |
SEE NOTES TO FINANCIAL STATEMENTS.
JPMORGAN U.S. EQUITY MID/SMALL CAP FUNDS52
ANNUAL REPORT DECEMBER 31
2005
SCHEDULE OF PORTFOLIO INVESTMENTS AS OF DECEMBER 31, 2005
(Amounts in thousands)
(CONTINUED)
| SHARES | | SECURITY DESCRIPTION | | VALUE | |
| Long-Term Investments — continued | | | |
| | | Personal Products — 0.8% | |
| | 1,780 | | | Estee Lauder Cos., Inc. (The),
Class A (c) | | $ | 59,598 | | |
| | | Pharmaceuticals — 0.8% | |
| | 935 | | | Omnicare, Inc. (c) | | | 53,512 | | |
| | | Real Estate — 3.9% | |
| | 2,306 | | | Brookfield Properties Co. (Canada) | | | 67,837 | | |
| | 1,134 | | | Forest City Enterprises, Inc.,
Class A (c) | | | 43,024 | | |
| | 942 | | | iStar Financial, Inc. REIT (c) | | | 33,593 | | |
| | 1,275 | | | Rayonier, Inc. REIT (c) | | | 50,815 | | |
| | 917 | | | Vornado Realty Trust REIT (c) | | | 76,517 | | |
| | | | 271,786 | | |
| | | Road & Rail — 0.6% | |
| | 869 | | | Norfolk Southern Corp. | | | 38,971 | | |
| | | Software — 1.1% | |
| | 2,699 | | | Computer Associates International,
Inc. (c) | | | 76,076 | | |
| | | Specialty Retail — 6.2% | |
| | 2,733 | | | Autonation, Inc. (a) (c) | | | 59,388 | | |
| | 1,352 | | | AutoZone, Inc. (a) (c) | | | 124,018 | | |
| | 3,300 | | | Limited Brands, Inc. (c) | | | 73,751 | | |
| | 1,485 | | | Sherwin-Williams Co. (The) | | | 67,458 | | |
| | 1,102 | | | Tiffany & Co. (c) | | | 42,188 | | |
| | 2,969 | | | TJX Cos., Inc. | | | 68,958 | | |
| | | | 435,761 | | |
| | | Textiles, Apparel & Luxury Goods — 3.5% | |
| | 1,564 | | | Columbia Sportswear Co. (a) (c) | | | 74,659 | | |
| | 3,085 | | | V.F. Corp. | | | 170,730 | | |
| | | | 245,389 | | |
| | | Thrifts & Mortgage Finance — 3.6% | |
| | 1,720 | | | Golden West Financial Corp. (c) | | | 113,546 | | |
| | 1,234 | | | MGIC Investment Corp. (c) | | | 81,215 | | |
| | 1,226 | | | Webster Financial Corp. | | | 57,481 | | |
| | | | 252,242 | | |
| SHARES | | SECURITY DESCRIPTION | | VALUE | |
| | | Trading Companies & Distributors — 0.7% | |
| | 1,359 | | | Hughes Supply, Inc. (c) | | $ | 48,712 | | |
| | | Wireless Telecommunication Services — 0.8% | |
| | 1,662 | | | Telephone & Data Systems, Inc. | | | 57,529 | | |
| | | | | Total Common Stocks
(Cost $6,020,664) | | | 6,757,620
| | |
| Short-Term Investment — 6.2% | | | |
| | | Investment Company — 6.2% | |
| | 434,249 |
| | JPMorgan Prime Money
Market Fund (b) (m)
(Cost $434,249) | | |
434,249
| | |
PRINCIPAL
AMOUNT | |
| Investments of Cash Collateral for Securities Loaned — 5.9% | | | |
| | | Certificates of Cash Deposits — 1.5% | |
| $ | 22,987 | | | Bank of Nova Scotia, FRN,
4.35%, 05/21/07 | | | 22,987 | | |
| | 15,000 | | | Credit Suisse First Boston LLC, FRN,
4.27%, 10/17/06 | | | 15,000 | | |
| | 7,000 | | | Credit Suisse First Boston LLC, FRN,
4.31%, 02/01/06 | | | 7,000 | | |
| | 18,001 | | | Deutsche Bank N.Y., FRN,
4.38%, 02/24/06 | | | 18,002 | | |
| | 12,498 | | | Manufacturers and Traders, FRN,
4.36%, 09/26/06 | | | 12,498 | | |
| | 10,000 | | | Royal Bank of Canada, FRN,
4.30%, 11/13/06 | | | 10,000 | | |
| | 6,000 | | | Wells Fargo Bank San Francisco,
4.30%, 01/27/06 | | | 6,000 | | |
| | 19,000 | | | Wells Fargo Bank San Francisco, FRN,
4.30%, 12/01/06 | | | 19,000 | | |
| | | | 110,487 | | |
| | | Commercial Paper — 1.6% | |
| | 24,822 | | | ASAP Funding Limited,
4.38%, 02/03/06 | | | 24,822 | | |
| | 12,455 | | | Bavaria TRR Corp.,
4.34%, 01/06/06 | | | 12,455 | | |
| | 24,815 | | | Corporate Receivables Corp.,
4.40%, 02/15/06 | | | 24,815 | | |
SEE NOTES TO FINANCIAL STATEMENTS.
JPMORGAN U.S. EQUITY MID/SMALL CAP FUNDS53
JPMorgan Mid Cap Value Fund
SCHEDULE OF PORTFOLIO INVESTMENTS AS OF DECEMBER 31, 2005
(Amounts in thousands)
(CONTINUED)
PRINCIPAL
AMOUNT | | SECURITY DESCRIPTION | | VALUE | |
| Short-Term Investment — continued | | | |
| | | Commercial Paper — Continued | |
| $ | 29,777 | | | HSBC Finance Corp.,
4.35%, 02/01/06 | | $ | 29,777 | | |
| | 17,000 | | | Morgan Stanley & Co., Inc., FRN,
4.33%, 04/17/06 | | | 17,000 | | |
| | | | 108,869 | | |
| | | Corporate Notes — 2.4% | |
| | 1,000 | | | Alliance and Leister plc, FRN,
4.33%, 01/30/07 | | | 1,000 | | |
| | 20,000 | | | Bank of America N.A., FRN,
4.31%, 11/07/06 | | | 20,000 | | |
| | 10,000 | | | CDC Financial Products, Inc., FRN,
4.35%, 01/30/06 | | | 10,000 | | |
| | 23,000 | | | Citigroup Global Markets, Inc., FRN,
4.32%, 01/06/06 | | | 23,000 | | |
| | 6,500 | | | Countrywide Financial Corp., FRN,
4.58%, 06/20/06 | | | 6,500 | | |
| | 25,000 | | | Dorada Finance, Inc., FRN,
4.38%, 11/15/07 | | | 25,000 | | |
| | 1,502 | | | General Electric Capital Corp., FRN,
4.30%, 05/12/06 | | | 1,502 | | |
| | 15,009 | | | General Electric Capital Corp., FRN,
4.29%, 12/08/06 | | | 15,008 | | |
| | 10,000 | | | Goldman Sachs Group, Inc., FRN,
4.41%, 12/28/07 | | | 10,000 | | |
| | 12,500 | | | K2(USA) LLC, FRN, 4.33%, 03/22/06 | | | 12,500 | | |
| | 5,000 | | | Landsbanki Islands HF, FRN,
4.45%, 01/30/07 | | | 5,000 | | |
| | 14,497 | | | Liberty Lighthouse U.S. Capital, FRN,
4.34%, 10/24/06 | | | 14,497 | | |
| | 1,003 | | | Links Finance LLC, FRN,
4.29%, 10/06/06 | | | 1,003 | | |
| | 14,997 | | | Links Finance LLC, FRN,
4.37%, 10/15/07 | | | 14,997 | | |
| | 10,075 | | | Pricoa Global Funding I, FRN,
4.23%, 10/05/06 | | | 10,075 | | |
| | 1,000 | | | Sigma Finance, Inc., FRN,
4.37%, 10/24/07 | | | 1,000 | | |
| | | | 171,082 | | |
PRINCIPAL
AMOUNT | | SECURITY DESCRIPTION | | VALUE | |
| | | Repurchase Agreements — 0.4% | |
| $ | 27,255 | | | Bank of America Securities LLC,
4.26%, dated 12/30/06,
due 01/03/06, repurchase price
$27,265, collateralized by U.S.
Government Agency Mortgages. | | $ | 27,255 | | |
| | | Total Investments of Cash Collateral
for Securities Loaned
(Cost $417,693) | | |
417,693
| | |
| | | Total Investments — 108.4%
(Cost $6,872,606) | | $ | 7,609,562 | | |
| | | Liabilities in Excess of Other
Assets — (8.4)% | | | (592,759 | ) | |
| | | NET ASSETS — 100.0% | | $ | 7,016,803 | | |
Percentages indicated are based on net assets.
SEE NOTES TO FINANCIAL STATEMENTS.
JPMORGAN U.S. EQUITY MID/SMALL CAP FUNDS54
JPMorgan Small Cap Core Fund
SCHEDULE OF PORTFOLIO INVESTMENTS AS OF DECEMBER 31, 2005
(Amounts in thousands)
| SHARES | | SECURITY DESCRIPTION | | VALUE | |
| Long-Term Investments — 97.2% | | | |
| | | Common Stocks — 97.2% | |
| | | Aerospace & Defense — 2.3% | |
| | 19 | | | AAR Corp. (a) (m) | | $ | 465 | | |
| | 28 | | | Armor Holdings, Inc. (a) (c) | | | 1,173 | | |
| | 76 | | | Aviall, Inc. (a) (c) | | | 2,197 | | |
| | 52 | | | BE Aerospace, Inc. (a) (c) | | | 1,142 | | |
| | 9 | | | Ceradyne, Inc. (a) (c) | | | 407 | | |
| | 11 | | | Curtiss-Wright Corp. (c) | | | 579 | | |
| | 81 | | | Esterline Technologies Corp. (a) | | | 3,020 | | |
| | 34 | | | Heico Corp. (c) | | | 877 | | |
| | 21 | | | Hexcel Corp. (a) (c) | | | 375 | | |
| | 43 | | | Kaman Corp., Class A | | | 849 | | |
| | 225 | | | Moog, Inc., Class A (a) | | | 6,373 | | |
| | 26 | | | Orbital Sciences Corp. (a) (c) | | | 339 | | |
| | 12 | | | Triumph Group, Inc. (a) | | | 436 | | |
| | 10 | | | United Industrial Corp. (c) | | | 426 | | |
| | | | 18,658 | | |
| | | Air Freight & Logistics — 0.1% | |
| | 28 | | | Hub Group, Inc., Class A (a) | | | 976 | | |
| | | Airlines — 1.5% | |
| | 76 | | | Alaska Air Group, Inc. (a) | | | 2,722 | | |
| | 180 | | | Continental Airlines, Inc., Class B (a) (c) | | | 3,830 | | |
| | 175 | | | ExpressJet Holdings, Inc. (a) | | | 1,419 | | |
| | 101 | | | Mesa Air Group, Inc. (a) (c) | | | 1,056 | | |
| | 91 | | | Pinnacle Airlines Corp. (a) (c) | | | 608 | | |
| | 88 | | | Skywest, Inc. | | | 2,369 | | |
| | — | (h) | | US Airways Group, Inc. (a) (c) | | | — | (h) | |
| | | | 12,004 | | |
| | | Auto Components — 0.5% | |
| | 28 | | | American Axle & Manufacturing
Holdings, Inc. (c) | | | 513 | | |
| | 51 | | | ArvinMeritor, Inc. (c) | | | 731 | | |
| | 14 | | | Sauer-Danfoss, Inc. | | | 260 | | |
| | 122 | | | Tenneco Automotive, Inc. (a) | | | 2,396 | | |
| | | | 3,900 | | |
| | | Automobiles — 0.5% | |
| | 59 | | | Fleetwood Enterprises, Inc. (a) (c) | | | 731 | | |
| | 73 | | | Thor Industries, Inc. (c) | | | 2,933 | | |
| | 12 | | | Winnebago Industries, Inc. (c) | | | 400 | | |
| | | | 4,064 | | |
| SHARES | | SECURITY DESCRIPTION | | VALUE | |
| | | Biotechnology — 3.3% | |
| | 32 | | | Abgenix, Inc. (a) | | $ | 678 | | |
| | 88 | | | Alexion Pharmaceuticals, Inc. (a) (c) | | | 1,784 | | |
| | 60 | | | Alkermes, Inc. (a) (c) | | | 1,145 | | |
| | 46 | | | Amylin Pharmaceuticals, Inc. (a) | | | 1,840 | | |
| | 35 | | | Applera Corp. — Celera Genomics
Group (a) | | | 384 | | |
| | 42 | | | Cell Genesys, Inc. (a) | | | 251 | | |
| | 83 | | | Cubist Pharmaceuticals, Inc. (a) (c) | | | 1,753 | | |
| | 22 | | | CV Therapeutics, Inc. (a) (c) | | | 554 | | |
| | 24 | | | Diversa Corp. (a) (c) | | | 115 | | |
| | 108 | | | Encysive Pharmaceuticals, Inc. (a) | | | 853 | | |
| | 12 | | | Exelixis, Inc. (a) (c) | | | 116 | | |
| | 64 | | | Genelabs Technologies (c) | | | 119 | | |
| | 43 | | | GTx, Inc. (a) (c) | | | 322 | | |
| | 24 | | | ICOS Corp. (a) (c) | | | 671 | | |
| | 72 | | | Incyte Corp. (a) (c) | | | 383 | | |
| | 66 | | | InterMune, Inc. (a) (c) | | | 1,107 | | |
| | 64 | | | Lifecell Corp. (a) (c) | | | 1,226 | | |
| | 31 | | | Martek Biosciences Corp. (a) (c) | | | 753 | | |
| | 78 | | | Medarex, Inc. (a) | | | 1,075 | | |
| | 70 | | | Myogen, Inc. (a) | | | 2,102 | | |
| | 70 | | | Myriad Genetics, Inc. (a) (c) | | | 1,456 | | |
| | 61 | | | Nektar Therapeutics (a) | | | 1,004 | | |
| | 40 | | | Panacos Pharmaceuticals, Inc. (a) | | | 276 | | |
| | 61 | | | Renovis, Inc. (a) (c) | | | 929 | | |
| | 55 | | | Seattle Genetics, Inc. (a) (c) | | | 259 | | |
| | 45 | | | Telik, Inc. (a) (c) | | | 768 | | |
| | 29 | | | United Therapeutics Corp. (a) (c) | | | 2,004 | | |
| | 66 | | | Vertex Pharmaceuticals, Inc. (a) (c) | | | 1,823 | | |
| | 46 | | | Viropharma, Inc. (a) | | | 848 | | |
| | | | 26,598 | | |
| | | Building Products — 1.9% | |
| | 31 | | | ElkCorp (c) | | | 1,050 | | |
| | 18 | | | Griffon Corp. (a) (c) | | | 436 | | |
| | 107 | | | Jacuzzi Brands, Inc. (a) (c) | | | 897 | | |
| | 144 | | | Lennox International, Inc. (c) | | | 4,055 | | |
| | 48 | | | NCI Building Systems, Inc. (a) (c) | | | 2,022 | | |
| | 123 | | | Universal Forest Products, Inc. (c) | | | 6,790 | | |
| | | | 15,250 | | |
SEE NOTES TO FINANCIAL STATEMENTS.
JPMORGAN U.S. EQUITY MID/SMALL CAP FUNDS55
JPMorgan Small Cap Core Fund
SCHEDULE OF PORTFOLIO INVESTMENTS AS OF DECEMBER 31, 2005
(Amounts in thousands)
(CONTINUED)
| SHARES | | SECURITY DESCRIPTION | | VALUE | |
| Long-Term Investments — continued | | | |
| | | Capital Markets — 0.4% | |
| | 112 | | | Knight Capital Group, Inc. Class A (a) | | $ | 1,106 | | |
| | 23 | | | National Financial Partners Corp. | | | 1,193 | | |
| | 35 | | | Waddell & Reed Financial, Inc. | | | 728 | | |
| | | | 3,027 | | |
| | | Chemicals — 1.3% | |
| | 77 | | | FMC Corp. (a) | | | 4,110 | | |
| | 26 | | | Georgia Gulf Corp. | | | 788 | | |
| | 10 | | | H.B. Fuller Co. | | | 305 | | |
| | 27 | | | Headwaters, Inc. (a) (c) | | | 943 | | |
| | 84 | | | Hercules, Inc. (a) | | | 949 | | |
| | 28 | | | Kronos Worlwide, Inc. (c) | | | 798 | | |
| | 29 | | | NewMarket Corp. (a) | | | 700 | | |
| | 130 | | | PolyOne Corp. (a) | | | 834 | | |
| | 39 | | | Terra Industries, Inc. (a) (c) | | | 218 | | |
| | 104 | | | W.R. Grace & Co. (a) (c) | | | 979 | | |
| | 54 | | | Wellman, Inc. (c) | | | 365 | | |
| | | | 10,989 | | |
| | | Commercial Banks — 6.1% | |
| | 33 | | | Amcore Financial, Inc. (c) | | | 997 | | |
| | 7 | | | AmericanWest Bancorp (a) (c) | | | 154 | | |
| | 15 | | | Ameris Bancorp (c) | | | 290 | | |
| | 7 | | | Associated Banc-Corp. | | | 219 | | |
| | 4 | | | BancFirst Corp. | | | 340 | | |
| | 77 | | | Bank of the Ozarks, Inc. (c) | | | 2,845 | | |
| | 10 | | | Capital Corp. of the West (c) | | | 332 | | |
| | 2 | | | Capital Crossing Bank (a) (c) | | | 73 | | |
| | 26 | | | Capitol Bancorp Ltd. (c) | | | 958 | | |
| | 16 | | | Cardinal Financial Corp. (c) | | | 177 | | |
| | 14 | | | Center Financial Corp. (c) | | | 342 | | |
| | 38 | | | Central Pacific Financial Corp. (c) | | | 1,351 | | |
| | 16 | | | Chemical Financial Corp. (c) | | | 514 | | |
| | 23 | | | City Holding Co. | | | 827 | | |
| | 23 | | | Columbia Banking System, Inc. | | | 645 | | |
| | 78 | | | Community Bank System, Inc. (c) | | | 1,748 | | |
| | 17 | | | Community Trust Bancorp, Inc. (c) | | | 516 | | |
| | 3 | | | Enterprise Financial Services Corp. (c) | | | 77 | | |
| | 92 | | | EuroBancshares, Inc. (a) | | | 1,302 | | |
| | 115 | | | First Bancorp (c) | | | 1,432 | | |
| | 2 | | | First Regional Bancorp (a) (c) | | | 122 | | |
| | 25 | | | First Republic Bank | | | 925 | | |
| SHARES | | SECURITY DESCRIPTION | | VALUE | |
| | | Commercial Banks — Continued | |
| | 73 | | | First State Bancorp, Inc. (c) | | $ | 1,761 | | |
| | 3 | | | FNB Corp. (c) | | | 86 | | |
| | 21 | | | Glacier Bancorp, Inc. (c) | | | 633 | | |
| | 66 | | | Gold Banc Corp., Inc. | | | 1,203 | | |
| | 39 | | | Greater Bay Bancorp (c) | | | 1,009 | | |
| | 53 | | | Hanmi Financial Corp. | | | 945 | | |
| | 68 | | | IBERIABANK Corp. (c) | | | 3,469 | | |
| | 52 | | | Independent Bank Corp. | | | 1,427 | | |
| | 93 | | | Irwin Financial Corp. (c) | | | 1,998 | | |
| | 6 | | | Macatawa Bank Corp. (c) | | | 231 | | |
| | 15 | | | MB Financial, Inc. | | | 517 | | |
| | 25 | | | Mercantile Bank Corp. (c) | | | 968 | | |
| | 24 | | | Nara Bancorp, Inc. (c) | | | 423 | | |
| | 40 | | | Oriental Financial Group (c) | | | 497 | | |
| | 34 | | | Pacific Capital Bancorp (c) | | | 1,192 | | |
| | 12 | | | Peoples Bancorp, Inc. (c) | | | 342 | | |
| | 6 | | | Premierwest Bancorp (c) | | | 78 | | |
| | 85 | | | PrivateBancorp, Inc. (c) | | | 3,023 | | |
| | 79 | | | Republic Bancorp, Inc. (c) | | | 940 | | |
| | 5 | | | Republic Bancorp, Inc., Class A (c) | | | 111 | | |
| | 7 | | | Santander Bancorp (c) | | | 163 | | |
| | 3 | | | Sierra Bancorp (c) | | | 75 | | |
| | 12 | | | Simmons First National Corp., Class A | | | 319 | | |
| | 9 | | | Southwest Bancorp, Inc. (c) | | | 170 | | |
| | 16 | | | Sterling Bancorp (c) | | | 307 | | |
| | 113 | | | Sterling Bancshares, Inc. (c) | | | 1,746 | | |
| | 110 | | | Summit Bancshares, Inc. (c) | | | 1,969 | | |
| | 11 | | | Sun Bancorp, Inc. (a) (c) | | | 212 | | |
| | 6 | | | Taylor Capital Group, Inc. | | | 226 | | |
| | 13 | | | TD Banknorth, Inc. | | | 386 | | |
| | 12 | | | TriCo Bancshares | | | 274 | | |
| | 20 | | | Umpqua Holdings Corp. | | | 568 | | |
| | 61 | | | West Coast Bancorp (c) | | | 1,611 | | |
| | 59 | | | Westamerica Bancorporation (c) | | | 3,115 | | |
| | 5 | | | Western Sierra Bancorp (a) | | | 196 | | |
| | 33 | | | Wilshire Bancorp, Inc. (c) | | | 564 | | |
| | 15 | | | Wintrust Financial Corp. (c) | | | 818 | | |
| | | | 49,758 | | |
| | | Commercial Services & Supplies — 2.8% | |
| | 113 | | | Angelica Corp. (c) | | | 1,861 | | |
| | 13 | | | Banta Corp. | | | 622 | | |
SEE NOTES TO FINANCIAL STATEMENTS.
JPMORGAN U.S. EQUITY MID/SMALL CAP FUNDS56
ANNUAL REPORT DECEMBER 31
2005
SCHEDULE OF PORTFOLIO INVESTMENTS AS OF DECEMBER 31, 2005
(Amounts in thousands)
(CONTINUED)
| SHARES | | SECURITY DESCRIPTION | | VALUE | |
| Long-Term Investments — continued | | | |
| | | Commercial Services & Supplies — Continued | |
| | 6 | | | Clean Harbors, Inc. | | $ | 158 | | |
| | 19 | | | Coinstar, Inc. (a) | | | 438 | | |
| | 53 | | | Corinthian Colleges, Inc. (a) (c) | | | 620 | | |
| | 5 | | | CRA International, Inc. (a) (c) | | | 258 | | |
| | 27 | | | DiamondCluster International, Inc. (a) | | | 211 | | |
| | 35 | | | Duratek, Inc. (a) (c) | | | 527 | | |
| | 20 | | | Escala Group, Inc. (c) | | | 404 | | |
| | 33 | | | Geo Group, Inc. (The) (a) | | | 745 | | |
| | 7 | | | Gevity HR, Inc. | | | 175 | | |
| | 39 | | | Heidrick & Struggles International, Inc. (a) | | | 1,247 | | |
| | 33 | | | Hudson Highland Group, Inc. (a) (c) | | | 566 | | |
| | 287 | | | IKON Office Solutions, Inc. | | | 2,988 | | |
| | 27 | | | Interpool, Inc. (c) | | | 512 | | |
| | 36 | | | John H. Harland Co. | | | 1,346 | | |
| | 24 | | | Kforce, Inc. (a) (c) | | | 264 | | |
| | 18 | | | Korn/Ferry International (a) (c) | | | 327 | | |
| | 72 | | | Labor Ready, Inc. (a) (c) | | | 1,501 | | |
| | 56 | | | Navigant Consulting, Inc. (a) (c) | | | 1,220 | | |
| | 19 | | | Pre-Paid Legal Services, Inc. (c) | | | 741 | | |
| | 30 | | | SOURCECORP, Inc. (a) | | | 710 | | |
| | 45 | | | Spherion Corp. (a) (c) | | | 451 | | |
| | 111 | | | TeleTech Holdings, Inc. (a) (c) | | | 1,333 | | |
| | 23 | | | Tetra Tech, Inc. (a) (c) | | | 354 | | |
| | 46 | | | United Rentals, Inc. (a) (c) | | | 1,069 | | |
| | 28 | | | United Stationers, Inc. (a) | | | 1,348 | | |
| | 6 | | | Vertrue, Inc. (a) | | | 198 | | |
| | 14 | | | Waste Connections, Inc. (a) (c) | | | 486 | | |
| | | | 22,680 | | |
| | | Communications Equipment — 2.7% | |
| | 143 | | | 3Com Corp. (a) | | | 513 | | |
| | 36 | | | Ariba, Inc. (a) (c) | | | 261 | | |
| | 106 | | | Arris Group, Inc. (a) | | | 1,008 | | |
| | 15 | | | Audiovox Corp. (a) | | | 211 | | |
| | 47 | | | Avocent Corp. (a) | | | 1,272 | | |
| | 18 | | | Bel Fuse, Inc., Class B (c) | | | 585 | | |
| | 31 | | | Black Box Corp. | | | 1,483 | | |
| | 31 | | | C-COR, Inc. (a) (c) | | | 153 | | |
| | 260 | | | CIENA Corp.(a) (c) | | | 772 | | |
| | 58 | | | CommScope, Inc. (a) | | | 1,171 | | |
| | 13 | | | Comtech Telecommunications Corp. (a) | | | 409 | | |
| | 21 | | | Ditech Communications Corp. (a) (c) | | | 179 | | |
| SHARES | | SECURITY DESCRIPTION | | VALUE | |
| | | Communications Equipment — Continued | |
| | 24 | | | Echelon Corp. (a) (c) | | $ | 190 | | |
| | 73 | | | Extreme Networks, Inc. (a) | | | 347 | | |
| | 30 | | | Finisar Corp. (a) (c) | | | 61 | | |
| | 64 | | | Foundry Networks, Inc. (a) (c) | | | 878 | | |
| | 61 | | | Glenayre Technologies, Inc. (a) | | | 197 | | |
| | 42 | | | Harmonic, Inc. (a) (c) | | | 206 | | |
| | 110 | | | Inter-Tel, Inc. (c) | | | 2,143 | | |
| | 10 | | | Interdigital Communications Corp. (a) | | | 178 | | |
| | 79 | | | MRV Communications, Inc. (a) (c) | | | 163 | | |
| | 34 | | | Netgear, Inc. (a) (c) | | | 653 | | |
| | 89 | | | Plantronics, Inc. (c) | | | 2,510 | | |
| | 15 | | | Polycom, Inc. (a) | | | 234 | | |
| | 111 | | | Powerwave Technologies, Inc. (a) (c) | | | 1,389 | | |
| | 28 | | | Redback Networks, Inc. (a) (c) | | | 391 | | |
| | 43 | | | SafeNet, Inc. (a) (c) | | | 1,372 | | |
| | 31 | | | Sonus Networks, Inc. (a) (c) | | | 114 | | |
| | 116 | | | Symmetricom, Inc. (a) (c) | | | 978 | | |
| | 50 | | | Tekelec (a) (c) | | | 698 | | |
| | 48 | | | Terayon Communication Systems, Inc. (a) | | | 110 | | |
| | 68 | | | Utstarcom, Inc. (a) (c) | | | 544 | | |
| | 72 | | | Westell Technologies, Inc., Class A (a) | | | 325 | | |
| | | | 21,698 | | |
| | | Computers & Peripherals — 1.7% | |
| | 79 | | | Adaptec, Inc. (a) (c) | | | 459 | | |
| | 35 | | | Advanced Digital Information Corp. (a) | | | 346 | | |
| | 221 | | | Brocade Communications Systems,
Inc. (a) | | | 900 | | |
| | 26 | | | Dot Hill Systems Corp. (a) (c) | | | 182 | | |
| | 12 | | | Electronics for Imaging, Inc. (a) (c) | | | 327 | | |
| | 83 | | | Gateway, Inc. (a) (c) | | | 208 | | |
| | 59 | | | Hutchinson Technology, Inc. (a) (c) | | | 1,664 | | |
| | 25 | | | Hypercom Corp. (a) | | | 162 | | |
| | 51 | | | Imation Corp. | | | 2,363 | | |
| | 36 | | | Intergraph Corp. (a) | | | 1,773 | | |
| | 57 | | | Komag, Inc. (a) (c) | | | 1,982 | | |
| | 180 | | | Maxtor Corp. (a) (c) | | | 1,248 | | |
| | 18 | | | Palm, Inc. (a) (c) | | | 560 | | |
| | 109 | | | Quantum Corp. (a) (c) | | | 332 | | |
| | 7 | | | Stratasys, Inc. (a) (c) | | | 173 | | |
| | 24 | | | Synaptics, Inc. (a) (c) | | | 598 | | |
| | 17 | | | UNOVA, Inc. (a) (c) | | | 585 | | |
| | | | 13,862 | | |
SEE NOTES TO FINANCIAL STATEMENTS.
JPMORGAN U.S. EQUITY MID/SMALL CAP FUNDS57
JPMorgan Small Cap Core Fund
SCHEDULE OF PORTFOLIO INVESTMENTS AS OF DECEMBER 31, 2005
(Amounts in thousands)
(CONTINUED)
| SHARES | | SECURITY DESCRIPTION | | VALUE | |
| Long-Term Investments — continued | | | |
| | | Construction & Engineering — 0.4% | |
| | 18 | | | Mastec, Inc. (a) (c) | | $ | 185 | | |
| | 38 | | | Quanta Services, Inc. (a) (c) | | | 506 | | |
| | 20 | | | URS Corp. (a) | | | 749 | | |
| | 29 | | | Washington Group International, Inc. | | | 1,552 | | |
| | | | 2,992 | | |
| | | Construction Materials — 0.4% | |
| | 15 | | | Ameron International Corp. | | | 679 | | |
| | 23 | | | Eagle Materials, Inc. (c) | | | 2,753 | | |
| | | | 3,432 | | |
| | | Consumer Finance — 1.3% | |
| | 15 | | | ACE Cash Express, Inc. (a) (c) | | | 341 | | |
| | 26 | | | Advanta Corp., Class B (c) | | | 853 | | |
| | 20 | | | Asta Funding, Inc. (c) | | | 552 | | |
| | 197 | | | Cash America International, Inc. | | | 4,562 | | |
| | 50 | | | CompuCredit Corp. (a) | | | 1,939 | | |
| | 14 | | | First Cash Financial Services, Inc. (a) | | | 408 | | |
| | 12 | | | United PanAm Financial Corp. (a) | | | 316 | | |
| | 55 | | | World Acceptance Corp. (a) (c) | | | 1,553 | | |
| | | | 10,524 | | |
| | | Containers & Packaging — 0.4% | |
| | 23 | | | Greif, Inc., Class A | | | 1,491 | | |
| | 49 | | | Silgan Holdings, Inc. | | | 1,785 | | |
| | | | 3,276 | | |
| | | Distributors — 0.2% | |
| | 38 | | | WESCO International, Inc. (a) (c) | | | 1,607 | | |
| | | Diversified Financial Services — 0.6% | |
| | 7 | | | Encore Capital Group, Inc. (a) (c) | | | 128 | | |
| | 15 | | | eSpeed, Inc., Class A (a) (c) | | | 113 | | |
| | 81 | | | GATX Corp. | | | 2,908 | | |
| | 51 | | | Nasdaq Stock Market, Inc. (a) | | | 1,791 | | |
| | | | 4,940 | | |
| | | Diversified Telecommunication Services — 1.2% | |
| | 40 | | | Broadwing Corp. (a) (c) | | | 242 | | |
| | 468 | | | Cincinnati Bell, Inc. (a) | | | 1,642 | | |
| | 63 | | | CT Communications, Inc. | | | 760 | | |
| | 27 | | | Golden Telecom, Inc. (Russia) | | | 704 | | |
| SHARES | | SECURITY DESCRIPTION | | VALUE | |
| | | Diversified Telecommunication
Services — Continued | |
| | 371 | | | Level 3 Communications, Inc. (a) (c) | | $ | 1,066 | | |
| | 454 | | | Premiere Global Services, Inc. (a) (c) | | | 3,687 | | |
| | 30 | | | Talk America Holdings, Inc. (a) | | | 261 | | |
| | 137 | | | Time Warner Telecom, Inc.,
Class A (a) (c) | | | 1,350 | | |
| | | | 9,712 | | |
| | | Electric Utilities — 0.8% | |
| | 24 | | | Black Hills Corp. | | | 838 | | |
| | 114 | | | El Paso Electric Co. (a) | | | 2,388 | | |
| | 18 | | | Idacorp, Inc. (c) | | | 524 | | |
| | 5 | | | MGE Energy, Inc. (c) | | | 163 | | |
| | 5 | | | UIL Holdings Corp. (c) | | | 248 | | |
| | 74 | | | Unisource Energy Corp. | | | 2,321 | | |
| | | | 6,482 | | |
| | | Electrical Equipment — 0.2% | |
| | 10 | | | Encore Wire Corp. (a) (c) | | | 219 | | |
| | 46 | | | Evergreen Solar, Inc. (a) (c) | | | 486 | | |
| | 58 | | | General Cable Corp. (a) (c) | | | 1,133 | | |
| | 23 | | | Power-One, Inc. (a) (c) | | | 136 | | |
| | 30 | | | Valence Technology, Inc. (a) (c) | | | 47 | | |
| | | | 2,021 | | |
| | | Electronic Equipment & Instruments — 2.2% | |
| | 60 | | | Aeroflex, Inc. (a) (c) | | | 640 | | |
| | 84 | | | Agilysis, Inc. | | | 1,525 | | |
| | 85 | | | Anixter International, Inc. (c) | | | 3,306 | | |
| | 59 | | | Bell Microproducts, Inc. (a) (c) | | | 449 | | |
| | 53 | | | Benchmark Electronics, Inc. (a) (c) | | | 1,769 | | |
| | 40 | | | Brightpoint, Inc. (a) (c) | | | 1,106 | | |
| | 29 | | | Checkpoint Systems, Inc. (a) | | | 710 | | |
| | 59 | | | CTS Corp. (c) | | | 647 | | |
| | 13 | | | Electro Scientific Industries, Inc. (a) (c) | | | 309 | | |
| | 7 | | | Faro Technologies, Inc. (a) (c) | | | 134 | | |
| | 81 | | | Global Imaging Systems, Inc (a) (c) | | | 2,815 | | |
| | 36 | | | Itron, Inc. (a) | | | 1,438 | | |
| | 25 | | | Lexar Media, Inc. (a) (c) | | | 208 | | |
| | 13 | | | MTS Systems Corp. | | | 450 | | |
| | 28 | | | Radisys Corp. (a) (c) | | | 477 | | |
| | 11 | | | Rofin-Sinar Technologies, Inc. (a) | | | 456 | | |
SEE NOTES TO FINANCIAL STATEMENTS.
JPMORGAN U.S. EQUITY MID/SMALL CAP FUNDS58
ANNUAL REPORT DECEMBER 31
2005
SCHEDULE OF PORTFOLIO INVESTMENTS AS OF DECEMBER 31, 2005
(Amounts in thousands)
(CONTINUED)
| SHARES | | SECURITY DESCRIPTION | | VALUE | |
| Long-Term Investments — continued | | | |
| | | Electronic Equipment & Instruments — Continued | |
| | 53 | | | Sypris Solutions, Inc. (c) | | $ | 529 | | |
| | 88 | | | TTM Technologies, Inc. (a) (c) | | | 830 | | |
| | | | 17,798 | | |
| | | Energy Equipment & Services — 2.8% | |
| | 199 | | | Grey Wolf, Inc. (a) | | | 1,538 | | |
| | 15 | | | Gulf Island Fabrication, Inc. | | | 372 | | |
| | 46 | | | Hanover Compressor Co. (a) (c) | | | 642 | | |
| | 22 | | | Hydril (a) | | | 1,352 | | |
| | 140 | | | Key Energy Services, Inc. (a) (c) | | | 1,887 | | |
| | 44 | | | Lone Star Technologies, Inc. (a) | | | 2,273 | | |
| | 9 | | | Lufkin Industries, Inc. | | | 454 | | |
| | 23 | | | NS Group, Inc. (a) | | | 962 | | |
| | 68 | | | Oceaneering International, Inc. (a) (c) | | | 3,365 | | |
| | 30 | | | Offshore Logistics, Inc. (a) | | | 876 | | |
| | 29 | | | Oil States International, Inc. (a) (c) | | | 916 | | |
| | 125 | | | Parker Drilling Co. (a) (c) | | | 1,348 | | |
| | 144 | | | Todco, Class A (a) | | | 5,481 | | |
| | 44 | | | Veritas DGC, Inc. (a) | | | 1,572 | | |
| | | | 23,038 | | |
| | | Food & Staples Retailing — 0.6% | |
| | 31 | | | Great Atlantic & Pacific Tea Co.,
Inc. (a) (c) | | | 975 | | |
| | 13 | | | Nash Finch Co. (c) | | | 334 | | |
| | 65 | | | Pantry, Inc. (The) (a) | | | 3,054 | | |
| | 32 | | | Pathmark Stores, Inc. (a) | | | 320 | | |
| | | | 4,683 | | |
| | | Food Products — 0.9% | |
| | 99 | | | Chiquita Brands International, Inc. | | | 1,983 | | |
| | 76 | | | Corn Products International, Inc. (c) | | | 1,818 | | |
| | 20 | | | Flowers Foods, Inc. (c) | | | 542 | | |
| | 14 | | | J & J Snack Foods Corp. (c) | | | 808 | | |
| | 74 | | | Sanderson Farms, Inc. (c) | | | 2,259 | | |
| | | | 7,410 | | |
| | | Gas Utilities — 1.0% | |
| | 41 | | | New Jersey Resources Corp. | | | 1,705 | | |
| | 41 | | | Nicor, Inc. (c) | | | 1,623 | | |
| | 30 | | | Northwest Natural Gas Co. (c) | | | 1,039 | | |
| | 35 | | | South Jersey Industries, Inc. | | | 1,014 | | |
| SHARES | | SECURITY DESCRIPTION | | VALUE | |
| | | Gas Utilities — Continued | |
| | 68 | | | Southwest Gas Corp. | | $ | 1,785 | | |
| | 46 | | | WGL Holdings, Inc. (c) | | | 1,377 | | |
| | | | 8,543 | | |
| | | Health Care Equipment & Supplies — 2.7% | |
| | 46 | | | Align Technology, Inc. (a) (c) | | | 300 | | |
| | 3 | | | Analogic Corp. | | | 158 | | |
| | 32 | | | Animas Corp. (a) | | | 773 | | |
| | 22 | | | Arrow International, Inc. | | | 626 | | |
| | 38 | | | Arthrocare Corp. (a) (c) | | | 1,593 | | |
| | 5 | | | Bio-Rad Laboratories, Inc., Class A (a) | | | 353 | | |
| | 23 | | | Biosite, Inc. (a) (c) | | | 1,267 | | |
| | 58 | | | Conmed Corp. (a) | | | 1,379 | | |
| | 31 | | | Diagnostic Products Corp. (c) | | | 1,500 | | |
| | 176 | | | Encore Medical Corp. (a) (c) | | | 869 | | |
| | 13 | | | EPIX Pharmaceuticals, Inc. (a) (c) | | | 54 | | |
| | 15 | | | Immucor, Inc. (a) | | | 359 | | |
| | 31 | | | Integra LifeSciences Holdings
Corp. (a) (c) | | | 1,089 | | |
| | 6 | | | Intuitive Surgical, Inc. (a) (c) | | | 669 | | |
| | 16 | | | Inverness Medical Innovations,
Inc. (a) (c) | | | 372 | | |
| | 21 | | | Kyphon, Inc. (a) (c) | | | 841 | | |
| | 38 | | | Mentor Corp. (c) | | | 1,742 | | |
| | 58 | | | Neurometrix, Inc. (a) (c) | | | 1,569 | | |
| | 14 | | | Palomar Medical Technologies,
Inc. (a) (c) | | | 487 | | |
| | 41 | | | PolyMedica Corp. (c) | | | 1,382 | | |
| | 114 | | | Steris Corp. | | | 2,842 | | |
| | 53 | | | SurModics, Inc. (a) (c) | | | 1,949 | | |
| | | | 22,173 | | |
| | | Health Care Providers & Services — 3.9% | |
| | 40 | | | Alderwoods Group, Inc. (a) | | | 633 | | |
| | 141 | | | Alliance Imaging, Inc. (a) (c) | | | 841 | | |
| | 20 | | | America Service Group, Inc. (a) (c) | | | 316 | | |
| | 77 | | | Andrx Corp. (a) | | | 1,271 | | |
| | 51 | | | Apria Healthcare Group, Inc. (a) | | | 1,234 | | |
| | 74 | | | Centene Corp. (a) (c) | | | 1,935 | | |
| | 59 | | | Computer Programs & Systems, Inc. (c) | | | 2,449 | | |
| | 10 | | | Dendrite International, Inc. (a) | | | 141 | | |
| | 25 | | | Genesis HealthCare Corp. (a) (c) | | | 924 | | |
SEE NOTES TO FINANCIAL STATEMENTS.
JPMORGAN U.S. EQUITY MID/SMALL CAP FUNDS59
JPMorgan Small Cap Core Fund
SCHEDULE OF PORTFOLIO INVESTMENTS AS OF DECEMBER 31, 2005
(Amounts in thousands)
(CONTINUED)
| SHARES | | SECURITY DESCRIPTION | | VALUE | |
| Long-Term Investments — continued | | | |
| | | Health Care Providers & Services — Continued | |
| | 67 | | | Kindred Healthcare, Inc. (a) (c) | | $ | 1,721 | | |
| | 41 | | | LCA Vision, Inc. (c) | | | 1,934 | | |
| | 80 | | | Owens & Minor, Inc. | | | 2,197 | | |
| | 51 | | | Pediatrix Medical Group, Inc. (a) | | | 4,553 | | |
| | 101 | | | Per-Se Technologies, Inc. (a) (c) | | | 2,362 | | |
| | 131 | | | PSS World Medical, Inc. (a) (c) | | | 1,941 | | |
| | 46 | | | Res-Care, Inc. (a) | | | 794 | | |
| | 38 | | | Symbion, Inc. (a) (c) | | | 865 | | |
| | 74 | | | Trizetto Group (a) | | | 1,250 | | |
| | 89 | | | United Surgical Partners International,
Inc. (a) (c) | | | 2,868 | | |
| | 70 | | | Ventiv Health, Inc. (a) | | | 1,653 | | |
| | | | 31,882 | | |
| | | Hotels, Restaurants & Leisure — 1.6% | |
| | 76 | | | Ameristar Casinos, Inc. (c) | | | 1,725 | | |
| | 98 | | | CKE Restaurants, Inc. (c) | | | 1,327 | | |
| | 54 | | | Domino's Pizza, Inc. | | | 1,309 | | |
| | 32 | | | Jack in the Box, Inc. (a) (c) | | | 1,100 | | |
| | 133 | | | Landry's Restaurants, Inc. (c) | | | 3,550 | | |
| | 49 | | | Multimedia Games, Inc. (a) (c) | | | 456 | | |
| | 22 | | | O'Charley's, Inc. (a) | | | 335 | | |
| | 25 | | | Rare Hospitality International, Inc. (a) (c) | | | 769 | | |
| | 94 | | | Ruby Tuesday, Inc. (c) | | | 2,439 | | |
| | 25 | | | Ryan's Restaurant Group, Inc. (a) (c) | | | 298 | | |
| | | | 13,308 | | |
| | | Household Durables — 1.2% | |
| | 1 | | | CSS Industries, Inc. (c) | | | 25 | | |
| | 38 | | | Jarden Corp. (a) (c) | | | 1,140 | | |
| | 51 | | | Levitt Corp., Class A | | | 1,167 | | |
| | 34 | | | Stanley Furniture Co., Inc. | | | 779 | | |
| | 109 | | | Technical Olympic USA, Inc. (c) | | | 2,302 | | |
| | 109 | | | Tupperware Corp. (c) | | | 2,439 | | |
| | 60 | | | WCI Communities, Inc. (a) (c) | | | 1,608 | | |
| | | | 9,460 | | |
| | | Industrial Conglomerates — 0.4% | |
| | 61 | | | Walter Industries, Inc. (c) | | | 3,033 | | |
| SHARES | | SECURITY DESCRIPTION | | VALUE | |
| | | Insurance — 2.9% | |
| | 16 | | | American Physicians Capital,
Inc. (a) (c) | | $ | 723 | | |
| | 36 | | | Argonaut Group, Inc. (a) | | | 1,193 | | |
| | 133 | | | Delphi Financial Group, Inc. | | | 6,115 | | |
| | 34 | | | Direct General Corp. (c) | | | 575 | | |
| | 31 | | | LandAmerica Financial Group, Inc. (c) | | | 1,928 | | |
| | 19 | | | Midland Co. (The) | | | 688 | | |
| | 2 | | | Navigators Group, Inc. (a) | | | 96 | | |
| | 218 | | | PMA Capital Corp., Class A (a) (c) | | | 1,994 | | |
| | 17 | | | Safety Insurance Group, Inc. | | | 694 | | |
| | 30 | | | Selective Insurance Group (c) | | | 1,572 | | |
| | 33 | | | Stewart Information Services Corp. (c) | | | 1,611 | | |
| | 14 | | | United Fire & Casualty Co. (c) | | | 550 | | |
| | 120 | | | Zenith National Insurance Corp. | | | 5,541 | | |
| | | | 23,280 | | |
| | | Internet & Catalog Retail — 0.3% | |
| | 21 | | | GSI Commerce, Inc. (a) (c) | | | 311 | | |
| | 44 | | | Insight Enterprises, Inc. (a) | | | 863 | | |
| | 33 | | | Netflix, Inc. (a) (c) | | | 885 | | |
| | 12 | | | Nutri/System, Inc. (a) (c) | | | 428 | | |
| | | | 2,487 | | |
| | | Internet Software & Services — 2.4% | |
| | 2 | | | aQuantive, Inc. (a) (c) | | | 48 | | |
| | 60 | | | AsiaInfo Holdings, Inc. (a) (c) | | | 238 | | |
| | 20 | | | Blue Coat Systems, Inc. (a) (c) | | | 910 | | |
| | 9 | | | Click Commerce, Inc. (a) (c) | | | 183 | | |
| | 339 | | | CMGI, Inc. (a) (c) | | | 514 | | |
| | 123 | | | CNET Networks, Inc. (a) (c) | | | 1,807 | | |
| | 25 | | | Digital Insight Corp. (a) | | | 810 | | |
| | 29 | | | Digital River, Inc. (a) (c) | | | 850 | | |
| | 109 | | | Digitas, Inc. (a) | | | 1,370 | | |
| | 201 | | | EarthLink, Inc. (a) | | | 2,227 | | |
| | 17 | | | Equinix, Inc. (a) (c) | | | 697 | | |
| | 49 | | | Infospace, Inc. (a) (c) | | | 1,275 | | |
| | 49 | | | Internet Security Systems (a) | | | 1,031 | | |
| | 6 | | | Interwoven, Inc. (a) (c) | | | 48 | | |
| | 37 | | | Ipass, Inc. (a) (c) | | | 239 | | |
| | 31 | | | j2 Global Communications, Inc. (a) (c) | | | 1,321 | | |
| | 38 | | | Openwave Systems, Inc. (a) (c) | | | 659 | | |
| | 40 | | | RealNetworks, Inc. (a) | | | 308 | | |
SEE NOTES TO FINANCIAL STATEMENTS.
JPMORGAN U.S. EQUITY MID/SMALL CAP FUNDS60
ANNUAL REPORT DECEMBER 31
2005
SCHEDULE OF PORTFOLIO INVESTMENTS AS OF DECEMBER 31, 2005
(Amounts in thousands)
(CONTINUED)
| SHARES | | SECURITY DESCRIPTION | | VALUE | |
| Long-Term Investments — continued | | | |
| | | Internet Software & Services — Continued | |
| | 63 | | | SupportSoft, Inc. (a) (c) | | $ | 267 | | |
| | 75 | | | United Online, Inc. | | | 1,064 | | |
| | 67 | | | ValueClick, Inc. (a) (c) | | | 1,219 | | |
| | 44 | | | WebEx Communications, Inc. (a) (c) | | | 941 | | |
| | 22 | | | webMethods, Inc. (a) | | | 169 | | |
| | 17 | | | Websense, Inc. (a) (c) | | | 1,109 | | |
| | | | 19,304 | | |
| | | Investment Companies — 0.2% | |
| | 103 | | | Technology Investment Capital Corp. | | | 1,561 | | |
| | | IT Services — 1.7% | |
| | 106 | | | Acxiom Corp. | | | 2,447 | | |
| | 445 | | | BearingPoint, Inc. (a) | | | 3,494 | | |
| | 122 | | | Ciber, Inc. (a) (c) | | | 803 | | |
| | 26 | | | Covansys Corp. (a) | | | 350 | | |
| | 37 | | | CSG Systems International, Inc. (a) | | | 828 | | |
| | 39 | | | Euronet Worldwide, Inc. (a) (c) | | | 1,093 | | |
| | 41 | | | Gartner, Inc., Class A (a) (c) | | | 530 | | |
| | 29 | | | Lionbridge Technologies (a) (c) | | | 203 | | |
| | 48 | | | Mantech International Corp., Class A (a) | | | 1,348 | | |
| | 83 | | | Perot Systems Corp., Class A (a) | | | 1,176 | | |
| | 30 | | | Startek, Inc. (c) | | | 533 | | |
| | 77 | | | Sykes Enterprises, Inc. (a) | | | 1,028 | | |
| | 30 | | | Tyler Technologies, Inc. (a) (c) | | | 259 | | |
| | | | 14,092 | | |
| | | Leisure Equipment & Products — 0.6% | |
| | 51 | | | JAKKS Pacific, Inc. (a) (c) | | | 1,074 | | |
| | 45 | | | K2, Inc. (a) (c) | | | 456 | | |
| | 33 | | | MarineMax, Inc. (a) (c) | | | 1,026 | | |
| | 57 | | | RC2 Corp. (a) (c) | | | 2,007 | | |
| | 28 | | | Steinway Musical Instruments,
Inc. (a) (c) | | | 709 | | |
| | | | 5,272 | | |
| | | Machinery — 3.7% | |
| | 66 | | | AGCO Corp. (a) (c) | | | 1,092 | | |
| | 48 | | | Astec Industries, Inc. (a) | | | 1,564 | | |
| | 58 | | | Barnes Group, Inc. (c) | | | 1,904 | | |
| | 50 | | | Briggs & Stratton Corp. (c) | | | 1,951 | | |
| | 31 | | | Cascade Corp. (c) | | | 1,431 | | |
| SHARES | | SECURITY DESCRIPTION | | VALUE | |
| | | Machinery — Continued | |
| | 71 | | | Crane Co. | | $ | 2,497 | | |
| | 17 | | | ESCO Technologies, Inc. (a) | | | 739 | | |
| | 50 | | | Flowserve Corp. (a) | | | 1,982 | | |
| | 31 | | | Greenbrier Cos., Inc. (c) | | | 872 | | |
| | 13 | | | Intevac, Inc. | | | 168 | | |
| | 54 | | | JLG Industries, Inc. | | | 2,484 | | |
| | 57 | | | Lincoln Electric Holdings, Inc. | | | 2,257 | | |
| | 50 | | | Manitowoc Co., Inc. | | | 2,486 | | |
| | 7 | | | Middleby Corp. (a) (c) | | | 631 | | |
| | 26 | | | NACCO Industries, Inc., Class A | | | 2,999 | | |
| | 40 | | | Reliance Steel & Aluminum Co. (c) | | | 2,439 | | |
| | 8 | | | Sun Hydraulics, Inc. (c) | | | 151 | | |
| | 11 | | | Tecumseh Products Co., Class A (c) | | | 247 | | |
| | 25 | | | Valmont Industries, Inc. (c) | | | 846 | | |
| | 38 | | | Wabash National Corp. (c) | | | 724 | | |
| | 32 | | | Watts Water Technologies, Inc.,
Class A (c) | | | 963 | | |
| | | | 30,427 | | |
| | | Marine — 0.1% | |
| | 16 | | | Kirby Corp. (a) | | | 814 | | |
| | | Media — 1.9% | |
| | 15 | | | Advo, Inc. | | | 411 | | |
| | 31 | | | Arbitron, Inc. (c) | | | 1,174 | | |
| | 27 | | | Catalina Marketing Corp. (c) | | | 679 | | |
| | 540 | | | Charter Communications, Inc.,
Class A (a) (c) | | | 659 | | |
| | 33 | | | Gray Television, Inc. | | | 325 | | |
| | 146 | | | Lodgenet Entertainment Corp. (a) (c) | | | 2,031 | | |
| | 29 | | | Media General, Inc., Class A | | | 1,450 | | |
| | 197 | | | Mediacom Communications Corp.,
Class A (a) (c) | | | 1,082 | | |
| | 54 | | | Playboy Enterprises, Inc., Class B (a) (c) | | | 746 | | |
| | 49 | | | ProQuest Co. (a) (c) | | | 1,356 | | |
| | 184 | | | Radio One, Inc., Class D (a) (c) | | | 1,900 | | |
| | 20 | | | Saga Communications, Inc., Class A (a) | | | 213 | | |
| | 42 | | | Scholastic Corp. (a) (c) | | | 1,203 | | |
| | 53 | | | Sinclair Broadcast Group, Inc., Class A | | | 487 | | |
| | 30 | | | Valassis Communications, Inc. (a) | | | 878 | | |
| | 70 | | | World Wrestling Entertainment, Inc. | | | 1,025 | | |
| | | | 15,619 | | |
SEE NOTES TO FINANCIAL STATEMENTS.
JPMORGAN U.S. EQUITY MID/SMALL CAP FUNDS61
JPMorgan Small Cap Core Fund
SCHEDULE OF PORTFOLIO INVESTMENTS AS OF DECEMBER 31, 2005
(Amounts in thousands)
(CONTINUED)
| SHARES | | SECURITY DESCRIPTION | | VALUE | |
| Long-Term Investments — continued | | | |
| | | Metals & Mining — 2.1% | |
| | 18 | | | Chaparral Steel Co. (a) | | $ | 532 | | |
| | 17 | | | Cleveland-Cliffs, Inc. | | | 1,532 | | |
| | 159 | | | Commercial Metals Co. | | | 5,965 | | |
| | 13 | | | Metal Management, Inc. | | | 291 | | |
| | 30 | | | NN, Inc. | | | 316 | | |
| | 23 | | | Oregon Steel Mills, Inc. (a) (c) | | | 683 | | |
| | 84 | | | Quanex Corp. (c) | | | 4,220 | | |
| | 62 | | | Ryerson Tull, Inc. (c) | | | 1,498 | | |
| | 57 | | | Steel Dynamics, Inc. (c) | | | 2,031 | | |
| | | | 17,068 | | |
| | | Multi-Utilities — 0.5% | |
| | 47 | | | Avista Corp. (c) | | | 825 | | |
| | 39 | | | NorthWestern Corp. | | | 1,212 | | |
| | 177 | | | Sierra Pacific Resources (a) | | | 2,312 | | |
| | | | 4,349 | | |
| | | Oil, Gas & Consumable Fuels — 3.0% | |
| | 31 | | | ATP Oil & Gas Corp. (a) (c) | | | 1,129 | | |
| | 17 | | | Callon Petroleum Co. (a) (c) | | | 302 | | |
| | 41 | | | Cimarex Energy Co. (a) | | | 1,763 | | |
| | 16 | | | Clayton Williams Energy, Inc. (a) | | | 672 | | |
| | 23 | | | Comstock Resources, Inc. (a) (c) | | | 702 | | |
| | 38 | | | Energy Partners Ltd. (a) | | | 817 | | |
| | 38 | | | Frontier Oil Corp. | | | 1,419 | | |
| | 18 | | | Giant Industries, Inc. (a) (c) | | | 940 | | |
| | 25 | | | Gulfmark Offshore, Inc. (a) | | | 743 | | |
| | 20 | | | Holly Corp. | | | 1,172 | | |
| | 145 | | | Houston Exploration Co. (a) | | | 7,645 | | |
| | 33 | | | KCS Energy, Inc. (a) | | | 792 | | |
| | 14 | | | Penn Virginia Corp. (c) | | | 809 | | |
| | 16 | | | Remington Oil & Gas Corp. (a) | | | 591 | | |
| | 53 | | | St. Mary Land & Exploration Co. (c) | | | 1,958 | | |
| | 35 | | | Stone Energy Corp. (a) (c) | | | 1,571 | | |
| | 31 | | | Swift Energy Co. (a) (c) | | | 1,384 | | |
| | 14 | | | World Fuel Services Corp. | | | 486 | | |
| | | | 24,895 | | |
| | | Personal Products — 0.1% | |
| | 8 | | | Parlux Fragrances, Inc. (a) (c) | | | 238 | | |
| | 69 | | | Playtex Products, Inc. (a) | | | 937 | | |
| | | | 1,175 | | |
| SHARES | | SECURITY DESCRIPTION | | VALUE | |
| | | Pharmaceuticals — 1.6% | |
| | 179 | | | Adolor Corp. (a) (c) | | $ | 2,611 | | |
| | 34 | | | Alpharma, Inc., Class A | | | 955 | | |
| | 99 | | | AtheroGenics, Inc. (a) (c) | | | 1,971 | | |
| | 583 | | | AVANIR Pharmaceuticals,
Class A (a) (c) | | | 2,005 | | |
| | 18 | | | Bentley Pharmaceuticals, Inc. (a) (c) | | | 297 | | |
| | 239 | | | Cypress Bioscience, Inc. (a) (c) | | | 1,382 | | |
| | 60 | | | Durect, Corp. (a) | | | 306 | | |
| | 43 | | | Medicis Pharmaceutical Corp.,
Class A (c) | | | 1,365 | | |
| | 8 | | | Par Pharmaceutical Cos, Inc. (a) (c) | | | 263 | | |
| | 13 | | | Salix Pharmaceuticals Ltd. (a) | | | 230 | | |
| | 59 | | | Theravance, Inc. (a) | | | 1,327 | | |
| | | | 12,712 | | |
| | | Real Estate — 7.4% | |
| | 101 | | | American Home Mortgage Investment
Corp. REIT (c) | | | 3,283 | | |
| | 103 | | | Anthracite Capital, Inc., REIT (c) | | | 1,082 | | |
| | 78 | | | Ashford Hospitality Trust, Inc. | | | 817 | | |
| | 28 | | | Bluegreen Corp. (a) (c) | | | 446 | | |
| | 18 | | | Boykin Lodging Co. REIT (a) (c) | | | 214 | | |
| | 21 | | | Brandywine Realty Trust REIT | | | 575 | | |
| | 43 | | | Entertainment Properties Trust REIT | | | 1,752 | | |
| | 93 | | | Equity Inns, Inc. REIT | | | 1,263 | | |
| | 66 | | | FelCor Lodging Trust, Inc. REIT | | | 1,131 | | |
| | 30 | | | First Potomac Realty Trust REIT (m) | | | 785 | | |
| | 46 | | | Glimcher Realty Trust REIT (c) | | | 1,114 | | |
| | 42 | | | Impac Mortgage Holdings, Inc. REIT (c) | | | 393 | | |
| | 203 | | | Innkeepers USA Trust REIT | | | 3,251 | | |
| | 34 | | | Jones Lang LaSalle, Inc. | | | 1,702 | | |
| | 115 | | | Kilroy Realty Corp. REIT (c) | | | 7,119 | | |
| | 24 | | | LaSalle Hotel Properties REIT (c) | | | 892 | | |
| | 151 | | | Lexington Corporate Properties
Trust REIT | | | 3,208 | | |
| | 123 | | | LTC Properties, Inc. REIT (c) | | | 2,580 | | |
| | 219 | | | Meristar Hospitality Corp. REIT (a) (c) | | | 2,054 | | |
| | 95 | | | MFA Mortgage Investments, Inc. REIT | | | 539 | | |
| | 135 | | | Mid-America Apartment Communities,
Inc. REIT | | | 6,528 | | |
| | 14 | | | National Health Investors, Inc. REIT (c) | | | 374 | | |
| | 34 | | | Novastar Financial, Inc. REIT (c) | | | 947 | | |
SEE NOTES TO FINANCIAL STATEMENTS.
JPMORGAN U.S. EQUITY MID/SMALL CAP FUNDS62
ANNUAL REPORT DECEMBER 31
2005
SCHEDULE OF PORTFOLIO INVESTMENTS AS OF DECEMBER 31, 2005
(Amounts in thousands)
(CONTINUED)
| SHARES | | SECURITY DESCRIPTION | | VALUE | |
| Long-Term Investments — continued | | | |
| | | Real Estate — Continued | |
| | 91 | | | Pennsylvania Real Estate Investment
Trust REIT (c) | | $ | 3,411 | | |
| | 107 | | | Post Properties, Inc. REIT | | | 4,259 | | |
| | 129 | | | RAIT Investment Trust REIT (c) | | | 3,346 | | |
| | 62 | | | Saul Centers, Inc. REIT | | | 2,235 | | |
| | 151 | | | Sunstone Hotel Investors, Inc. REIT | | | 4,020 | | |
| | 34 | | | Taubman Centers, Inc. REIT (c) | | | 1,195 | | |
| | | | 60,515 | | |
| | | Road & Rail — 1.8% | |
| | 17 | | | Amerco, Inc. (a) (c) | | | 1,211 | | |
| | 25 | | | Arkansas Best Corp. (c) | | | 1,096 | | |
| | 61 | | | Dollar Thrifty Automotive Group,
Inc. (a) (c) | | | 2,197 | | |
| | 8 | | | Frozen Food Express Industries (a) | | | 86 | | |
| | 77 | | | Genesee & Wyoming, Inc.,
Class A (a) (c) | | | 2,895 | | |
| | 10 | | | Marten Transport Ltd. (a) (c) | | | 183 | | |
| | 24 | | | Old Dominion Freight Line (a) (c) | | | 639 | | |
| | 80 | | | RailAmerica, Inc. (a) (c) | | | 883 | | |
| | 100 | | | SCS Transportation, Inc. (a) | | | 2,131 | | |
| | 62 | | | Sirva, Inc. (a) | | | 498 | | |
| | 53 | | | U.S. Xpress Enterprises, Inc.,
Class A (a) | | | 914 | | |
| | 10 | | | USA Truck, Inc. (a) (c) | | | 288 | | |
| | 80 | | | Werner Enterprises, Inc. (c) | | | 1,566 | | |
| | | | 14,587 | | |
| | | Semiconductors & Semiconductor
Equipment — 4.8% | |
| | 24 | | | Actel Corp. (a) (c) | | | 307 | | |
| | 32 | | | ADE Corp. (a) (c) (m) (c) | | | 763 | | |
| | 66 | | | Advanced Energy Industries, Inc. (a) (c) | | | 781 | | |
| | 99 | | | AMIS Holdings, Inc. (a) | | | 1,054 | | |
| | 154 | | | Amkor Technology, Inc. (a) (c) | | | 861 | | |
| | 106 | | | Applied Micro Circuits Corp. (a) | | | 273 | | |
| | 71 | | | Asyst Technologies, Inc. (a) (c) | | | 407 | | |
| | 299 | | | Atmel Corp. (a) | | | 923 | | |
| | 18 | | | ATMI, Inc. (a) (c) | | | 492 | | |
| | 40 | | | August Technology Corp. (a) | | | 439 | | |
| | 66 | | | Axcelis Technologies, Inc. (a) (c) | | | 313 | | |
| | 19 | | | Brooks Automation, Inc. (a) (c) | | | 236 | | |
| SHARES | | SECURITY DESCRIPTION | | VALUE | |
| | | Semiconductors & Semiconductor
Equipment — Continued | |
| | 37 | | | Cabot Microelectronics Corp. (a) (c) | | $ | 1,079 | | |
| | 107 | | | Cirrus Logic, Inc. (a) (c) | | | 715 | | |
| | 38 | | | Cohu, Inc. | | | 878 | | |
| | 345 | | | Conexant Systems, Inc. (a) | | | 780 | | |
| | 54 | | | Credence Systems Corp. (a) (c) | | | 372 | | |
| | 42 | | | Cymer, Inc. (a) | | | 1,474 | | |
| | 83 | | | Cypress Semiconductor Corp. (a) (c) | | | 1,176 | | |
| | 34 | | | Diodes, Inc. (a) (c) | | | 1,048 | | |
| | 23 | | | DSP Group, Inc. (a) (c) | | | 576 | | |
| | 74 | | | Entegris, Inc. (a) | | | 701 | | |
| | 21 | | | Exar Corp. (a) | | | 257 | | |
| | 37 | | | Fairchild Semiconductor International,
Inc. (a) | | | 627 | | |
| | 17 | | | Genesis Microchip, Inc. (a) (c) | | | 304 | | |
| | 45 | | | Integrated Device Technology, Inc. (a) | | | 595 | | |
| | 27 | | | Integrated Silicon Solutions, Inc. (a) (c) | | | 171 | | |
| | 61 | | | IXYS Corp. (a) | | | 707 | | |
| | 24 | | | Kopin Corp. (a) (c) | | | 127 | | |
| | 72 | | | Kulicke & Soffa Industries, Inc. (a) (c) | | | 639 | | |
| | 48 | | | Lattice Semiconductor Corp. (a) | | | 205 | | |
| | 56 | | | LTX Corp. (a) | | | 251 | | |
| | 62 | | | Mattson Technology, Inc. (a) (c) | | | 627 | | |
| | 84 | | | Micrel, Inc. (a) | | | 977 | | |
| | 62 | | | Microsemi Corp. (a) (c) | | | 1,720 | | |
| | 77 | | | MIPS Technologies, Inc. (a) (c) | | | 438 | | |
| | 18 | | | MKS Instruments, Inc. (a) | | | 329 | | |
| | 68 | | | Omnivision Technologies, Inc. (a) (c) | | | 1,351 | | |
| | 319 | | | ON Semiconductor Corp. (a) (c) | | | 1,765 | | |
| | 69 | | | Photronics, Inc. (a) (c) | | | 1,044 | | |
| | 35 | | | Pixelworks, Inc. (a) | | | 176 | | |
| | 95 | | | PMC-Sierra, Inc. (a) | | | 736 | | |
| | 18 | | | Power Integrations, Inc. (a) (c) | | | 419 | | |
| | 54 | | | Rambus, Inc. (a) (c) | | | 879 | | |
| | 180 | | | RF Micro Devices, Inc. (a) (c) | | | 972 | | |
| | 10 | | | Semitool, Inc. (a) (c) | | | 110 | | |
| | 45 | | | Semtech Corp. (a) | | | 829 | | |
| | 41 | | | Sigmatel, Inc. (a) (c) | | | 542 | | |
| | 87 | | | Silicon Image, Inc. (a) | | | 786 | | |
| | 38 | | | Silicon Laboratories, Inc. (a) | | | 1,400 | | |
| | 63 | | | Silicon Storage Technology, Inc. (a) (c) | | | 318 | | |
| | 124 | | | Skyworks Solutions, Inc. (a) (c) | | | 632 | | |
SEE NOTES TO FINANCIAL STATEMENTS.
JPMORGAN U.S. EQUITY MID/SMALL CAP FUNDS63
JPMorgan Small Cap Core Fund
SCHEDULE OF PORTFOLIO INVESTMENTS AS OF DECEMBER 31, 2005
(Amounts in thousands)
(CONTINUED)
| SHARES | | SECURITY DESCRIPTION | | VALUE | |
| Long-Term Investments — continued | | | |
| | | Semiconductors & Semiconductor
Equipment — Continued | |
| | 18 | | | Standard Microsystems Corp. (a) (c) | | $ | 508 | | |
| | 12 | | | Supertex, Inc. (a) (c) | | | 544 | | |
| | 29 | | | Tessera Technologies, Inc. (a) | | | 742 | | |
| | 9 | | | Ultratech, Inc. (a) (c) | | | 140 | | |
| | 23 | | | Varian Semiconductor Equipment
Associates, Inc. (a) | | | 988 | | |
| | 170 | | | Vitesse Semiconductor Corp. (a) (c) | | | 327 | | |
| | 26 | | | Zoran Corp. (a) | | | 423 | | |
| | | | 39,253 | | |
| | | Software — 2.5% | |
| | 7 | | | Ansoft Corp. (a) | | | 232 | | |
| | 22 | | | Ansys, Inc. (a) (c) | | | 952 | | |
| | 52 | | | Aspen Technology, Inc. (a) (c) | | | 406 | | |
| | 36 | | | Borland Software Corp. (a) | | | 234 | | |
| | 31 | | | Epicor Software Corp. (a) | | | 437 | | |
| | 26 | | | EPIQ Systems, Inc. (a) (c) | | | 478 | | |
| | 24 | | | Factset Research Systems, Inc. (c) | | | 973 | | |
| | 15 | | | Filenet Corp. (a) (c) | | | 396 | | |
| | 44 | | | Informatica Corp. (a) (c) | | | 526 | | |
| | 7 | | | Intervideo, Inc. (a) | | | 71 | | |
| | 13 | | | InterVoice, Inc. (a) (c) | | | 100 | | |
| | 33 | | | JDA Software Group, Inc. (a) | | | 563 | | |
| | 12 | | | Kronos, Inc. (a) (c) | | | 502 | | |
| | 16 | | | Macrovision Corp. (a) | | | 264 | | |
| | 37 | | | Magma Design Automation, Inc. (a) (c) | | | 309 | | |
| | 29 | | | Manhattan Associates, Inc. (a) | | | 592 | | |
| | 30 | | | Mapinfo Corp. (a) (c) | | | 381 | | |
| | 56 | | | Mentor Graphics Corp. (a) | | | 577 | | |
| | 19 | | | MicroStrategy, Inc. (a) (c) | | | 1,589 | | |
| | 17 | | | MRO Software, Inc. (a) | | | 243 | | |
| | 273 | | | Parametric Technology Corp. (a) | | | 1,663 | | |
| | 7 | | | Pegasystems, Inc. (a) (c) | | | 52 | | |
| | 66 | | | Phoenix Technologies Ltd. (a) (c) | | | 412 | | |
| | 89 | | | Progress Software Corp. (a) | | | 2,531 | | |
| | 7 | | | Quality Systems, Inc. (a) (c) | | | 522 | | |
| | 23 | | | Quest Software, Inc. (a) | | | 328 | | |
| | 133 | | | Secure Computing Corp. (a) | | | 1,631 | | |
| | 6 | | | SPSS, Inc. (a) | | | 173 | | |
| | 17 | | | Talx Corp. (c) | | | 793 | | |
| | 38 | | | TIBCO Software, Inc. (a) | | | 285 | | |
| SHARES | | SECURITY DESCRIPTION | | VALUE | |
| | | Software — Continued | |
| | 11 | | | TradeStation Group, Inc. (a) (c) | | $ | 140 | | |
| | 46 | | | Transaction Systems Architechs,
Inc. (a) | | | 1,313 | | |
| | 52 | | | Wind River Systems, Inc. (a) (c) | | | 768 | | |
| | | | 20,436 | | |
| | | Specialty Retail — 5.2% | |
| | 326 | | | Aaron Rents, Inc. (c) | | | 6,874 | | |
| | 95 | | | Asbury Automotive Group, Inc. (a) | | | 1,559 | | |
| | 20 | | | Big 5 Sporting Goods Corp. | | | 427 | | |
| | 21 | | | Build-A-Bear Workshop, Inc. (a) (c) | | | 614 | | |
| | 15 | | | Building Material Holding Corp. (c) | | | 1,030 | | |
| | 12 | | | Burlington Coat Factory
Warehouse Corp. | | | 487 | | |
| | 392 | | | Charming Shoppes, Inc. (a) (c) | | | 5,177 | | |
| | 39 | | | Children's Place Retail Stores, Inc.
(The) (a) | | | 1,942 | | |
| | 73 | | | Dress Barn, Inc. (a) (c) | | | 2,834 | | |
| | 8 | | | GameStop Corp. (c) | | | 253 | | |
| | 44 | | | Genesco, Inc. (a) | | | 1,703 | | |
| | 129 | | | Guess?, Inc. (a) | | | 4,578 | | |
| | 35 | | | HOT Topic, Inc. (a) (c) | | | 492 | | |
| | 49 | | | Lithia Motors, Inc., Class A (c) | | | 1,531 | | |
| | 53 | | | Movie Gallery, Inc. (c) | | | 298 | | |
| | 99 | | | Pacific Sunwear of California, Inc. (a) | | | 2,467 | | |
| | 52 | | | Petco Animal Supplies, Inc. (a) (c) | | | 1,141 | | |
| | 47 | | | Select Comfort Corp. (a) (c) | | | 1,286 | | |
| | 20 | | | Sonic Automotive, Inc. | | | 450 | | |
| | 13 | | | Sports Authority, Inc. (The) (a) (c) | | | 405 | | |
| | 46 | | | Stage Stores, Inc. | | | 1,367 | | |
| | 99 | | | Stein Mart, Inc. (c) | | | 1,793 | | |
| | 89 | | | Too, Inc. (a) | | | 2,522 | | |
| | 24 | | | United Auto Group, Inc. (c) | | | 928 | | |
| | | | 42,158 | | |
| | | Textiles, Apparel & Luxury Goods — 1.0% | |
| | 18 | | | Brown Shoe Co., Inc. | | | 772 | | |
| | 10 | | | Deckers Outdoor Corp. (a) (c) | | | 287 | | |
| | 18 | | | DHB Industries, Inc. (a) | | | 82 | | |
| | 70 | | | K-Swiss, Inc., Class A | | | 2,284 | | |
| | 43 | | | Kenneth Cole Productions, Inc., Class A | | | 1,099 | | |
| | 42 | | | Movado Group, Inc. (c) | | | 761 | | |
SEE NOTES TO FINANCIAL STATEMENTS.
JPMORGAN U.S. EQUITY MID/SMALL CAP FUNDS64
ANNUAL REPORT DECEMBER 31
2005
SCHEDULE OF PORTFOLIO INVESTMENTS AS OF DECEMBER 31, 2005
(Amounts in thousands)
(CONTINUED)
| SHARES | | SECURITY DESCRIPTION | | VALUE | |
| Long-Term Investments — continued | | | |
| | | Textiles, Apparel & Luxury Goods — Continued | |
| | 9 | | | Oxford Industries, Inc. (c) | | $ | 470 | | |
| | 21 | | | Russell Corp. (c) | | | 287 | | |
| | 70 | | | Skechers U.S.A., Inc., Class A (a) | | | 1,065 | | |
| | 36 | | | Unifirst Corp. | | | 1,132 | | |
| | | | 8,239 | | |
| | | Thrifts & Mortgage Finance — 3.1% | |
| | 44 | | | Accredited Home Lenders Holding
Co. (a) (c) | | | 2,196 | | |
| | 161 | | | BankAtlantic Bancorp, Inc., Class A (c) | | | 2,257 | | |
| | 19 | | | Commercial Capital Bancorp, Inc. (c) | | | 330 | | |
| | 86 | | | Corus Bankshares, Inc. (c) | | | 4,851 | | |
| | 21 | | | Dime Community Bancshares (c) | | | 300 | | |
| | 6 | | | Federal Agricultural Mortgage Corp.,
Class C (c) | | | 168 | | |
| | 77 | | | First Niagara Financial Group, Inc. (c) | | | 1,113 | | |
| | 12 | | | First Place Financial Corp. (c) | | | 291 | | |
| | 19 | | | FirstFed Financial Corp. (a) (c) | | | 1,030 | | |
| | 47 | | | Flagstar Bancorp, Inc. (c) | | | 678 | | |
| | 69 | | | Fremont General Corp. (c) | | | 1,591 | | |
| | 29 | | | Gibraltar Industries, Inc. | | | 661 | | |
| | 14 | | | ITLA Capital Corp. (a) (c) | | | 664 | | |
| | 88 | | | Partners Trust Financial Group, Inc. (c) | | | 1,059 | | |
| | 85 | | | Provident New York Bancorp (c) | | | 938 | | |
| | 140 | | | R&G Financial Corp., Class B (c) | | | 1,847 | | |
| | 57 | | | Sterling Financial Corp. | | | 1,424 | | |
| | 261 | | | W Holding Co., Inc. | | | 2,150 | | |
| | 29 | | | WSFS Financial Corp. (c) | | | 1,770 | | |
| | | | 25,318 | | |
| | | Tobacco — 0.4% | |
| | 172 | | | Alliance One International, Inc. (c) | | | 670 | | |
| | 64 | | | Universal Corp. | | | 2,766 | | |
| | | | 3,436 | | |
| | | Trading Companies & Distributors — 1.5% | |
| | 271 | | | Applied Industrial Technologies, Inc. | | | 9,115 | | |
| | 84 | | | Hughes Supply, Inc. | | | 2,994 | | |
| | 16 | | | Nuco2, Inc. (a) (c) | | | 454 | | |
| | | | 12,563 | | |
| SHARES | | SECURITY DESCRIPTION | | VALUE | |
| | | Wireless Telecommunication Services — 0.5% | |
| | 79 | | | Centennial Communications
Corp. (a) (c) | | $ | 1,232 | | |
| | 359 | | | Dobson Communications Corp. (a) | | | 2,691 | | |
| | 24 | | | InPhonic, Inc. (a) (c) | | | 212 | | |
| | | | 4,135 | | |
| | | | | Total Common Stocks
(Cost $719,079) | | | 793,473
| | |
| Short-Term Investments — 2.6% | | | |
| | | Investment Company — 2.4% | |
| | 19,411 | | | JPMorgan Prime Money
Market Fund (b) (m) | | | 19,411 | | |
PRINCIPAL
AMOUNT | |
| | | U.S. Treasury Obligation — 0.2% | |
| $ | 1,250 | | | U.S. Treasury Note,
2.88%, 11/30/06 (k) | | | 1,233 | | |
| | | | | Total Short-Term Investments
(Cost $20,644) | | | 20,644
| | |
| Investments of Cash Collateral for Securities Loaned — 24.2% | | | |
| | | Certificates of Cash Deposits — 3.3% | |
| | 9,200 | | | Credit Suisse First Boston LLC, FRN,
4.27%, 10/17/06 | | | 9,200 | | |
| | 8,500 | | | Royal Bank of Canada, FRN,
4.30, 11/13/06 | | | 8,500 | | |
| | 9,000 | | | Wells Fargo Bank San Francisco,
4.30%, 01/27/06 | | | 9,000 | | |
| | | | 26,700 | | |
| | | Commercial Paper — 1.8% | |
| | 4,964 | | | ASAP Funding Limited,
4.38%, 02/03/06 | | | 4,965 | | |
| | 10,000 | | | Morgan Stanley & Co., Inc., FRN,
4.33%, 04/17/06 | | | 10,000 | | |
| | | | 14,965 | | |
SEE NOTES TO FINANCIAL STATEMENTS.
JPMORGAN U.S. EQUITY MID/SMALL CAP FUNDS65
JPMorgan Small Cap Core Fund
SCHEDULE OF PORTFOLIO INVESTMENTS AS OF DECEMBER 31, 2005
(Amounts in thousands)
(CONTINUED)
PRINCIPAL
AMOUNT | | SECURITY DESCRIPTION | | VALUE | |
| Short-Term Investment — continued | | | |
| | | Corporate Notes — 13.3% | |
| $ | 5,000 | | | Alliance and Leister plc, FRN,
4.33%, 01/30/07 | | $ | 5,000 | | |
| | 9,500 | | | Bank of America, FRN,
4.31%, 11/07/06 | | | 9,500 | | |
| | 9,000 | | | CDC Financial Products, Inc., FRN,
4.35%, 01/30/06 | | | 9,000 | | |
| | 9,000 | | | Citigroup Global Markets, Inc., FRN,
4.32%, 01/06/06 | | | 9,000 | | |
| | 8,761 | | | General Electric Capital Corp., FRN,
4.30%. 05/12/06 | | | 8,761 | | |
| | 5,000 | | | Goldman Sachs Group, Inc., FRN,
4.41%, 12/28/07 | | | 5,000 | | |
| | 8,501 | | | K2(USA) LLC, FRN, 4.35%. 02/15/06 | | | 8,501 | | |
| | 7,500 | | | Landsbanki Islands HF, FRN,
4.45%, 01/30/07 | | | 7,500 | | |
| | 8,898 | | | Liberty Lighthouse U.S. Capital, FRN,
4.34%, 10/24/06 | | | 8,898 | | |
| | 9,698 | | | Links Finance LLC, FRN,
4.37%, 10/15/07 | | | 9,698 | | |
| | 8,898 | | | Sigma Finance, Inc., FRN,
4.37%, 10/24/07 | | | 8,898 | | |
| | 8,500 | | | Ulster Bank Ltd., 4.33%, 01/31/06 | | | 8,500 | | |
| | 10,000 | | | Wachovia Bank N.A., FRN,
4.30%, 10/02/06 | | | 10,000 | | |
| | | | 108,256 | | |
PRINCIPAL
AMOUNT | | SECURITY DESCRIPTION | | VALUE | |
| | | Repurchase Agreements — 5.8% | |
| $ | 12,685 | | | Bank of America Securities LLC,
4.26%, dated 12/30/05,
due 01/03/06, repurchase price
$12,690, collateralized by U.S.
Government Agency Mortgages. | | $ | 12,685 | | |
| | 35,000 | | | UBS Securities LLC, 4.26% dated 12/30/05,
due 01/03/06, repurchase price
$35,012, collateralized by U.S.
Government Agency Mortgages. | | | 35,000 | | |
| | | | 47,685 | | |
| | | Total Investments of Cash Collateral
for Securities Loaned
(Cost $197,606) | | |
197,606
| | |
| | | Total Investments — 124.0%
(Cost $937,329) | | $ | 1,011,723 | | |
| | | Liabilities in Excess of Other
Assets — (24.0)% | | | (195,818 | ) | |
| | | NET ASSETS — 100.0% | | $ | 815,905 | | |
Percentages indicated are based on net assets.
Futures Contracts
(Amounts in thousands, except for number of contracts)
NUMBER OF
CONTRACTS | | DESCRIPTION | | EXPIRATION DATE | | NOTIONAL
VALUE AT
12/31/05 (USD) | | UNREALIZED
(DEPRECIATION)
(USD) | |
| | 62 | | | Russell 2000 Index | | March, 2006 | | $ | 20,027 | | | $ | (378 | ) | |
SEE NOTES TO FINANCIAL STATEMENTS.
JPMORGAN U.S. EQUITY MID/SMALL CAP FUNDS66
JPMorgan Small Cap Equity Fund
SCHEDULE OF PORTFOLIO INVESTMENTS AS OF DECEMBER 31, 2005
(Amounts in thousands)
| SHARES | | SECURITY DESCRIPTION | | VALUE | |
| Long-Term Investments — 96.6% | | | |
| | | Common Stocks — 96.6% | |
| | | Aerospace & Defense — 1.9% | |
| | 66 | | | Alliant Techsystems, Inc. (a) | | $ | 5,024 | | |
| | 117 | | | Esterline Technologies Corp. (a) (c) | | | 4,363 | | |
| | | | 9,387 | | |
| | | Automobiles — 0.6% | |
| | 85 | | | Winnebago Industries, Inc. (c) | | | 2,815 | | |
| | | Biotechnology — 0.9% | |
| | 66 | | | ICOS Corp. (a) (c) | | | 1,832 | | |
| | 127 | | | Viropharma, Inc. (a) | | | 2,348 | | |
| | | | 4,180 | | |
| | | Chemicals — 5.7% | |
| | 230 | | | Airgas, Inc. | | | 7,564 | | |
| | 176 | | | Albemarle Corp. (c) | | | 6,730 | | |
| | 120 | | | Georgia Gulf Corp. (c) | | | 3,653 | | |
| | 211 | | | Scotts Miracle-Gro Co. (The), Class A | | | 9,546 | | |
| | | | 27,493 | | |
| | | Commercial Banks — 8.0% | |
| | 89 | | | Alabama National Bancorp (c) | | | 5,731 | | |
| | 51 | | | Bank of the Ozarks, Inc. (c) | | | 1,893 | | |
| | 57 | | | Boston Private Financial Holdings, Inc. (c) | | | 1,731 | | |
| | 98 | | | East-West Bancorp, Inc. (c) | | | 3,583 | | |
| | 56 | | | First Community Bancorp, Inc. (c) | | | 3,028 | | |
| | 120 | | | Hancock Holding Co. (c) | | | 4,534 | | |
| | 35 | | | MB Financial, Inc. (c) | | | 1,225 | | |
| | 151 | | | SY Bancorp, Inc. (c) | | | 3,771 | | |
| | 285 | | | United Bancshares, Inc. (c) | | | 10,036 | | |
| | 13 | | | Western Alliance Bancorp (a) | | | 400 | | |
| | 51 | | | Wintrust Financial Corp. (c) | | | 2,789 | | |
| | | | 38,721 | | |
| | | Commercial Services & Supplies — 3.9% | |
| | 468 | | | Hudson Highland Group, Inc. (a) (c) | | | 8,124 | | |
| | 83 | | | Morningstar, Inc (a) | | | 2,858 | | |
| | 220 | | | Waste Connections, Inc. (a) (c) | | | 7,565 | | |
| | | | 18,547 | | |
| | | Communications Equipment — 1.3% | |
| | 137 | | | Avocent Corp. (a) | | | 3,736 | | |
| | 126 | | | Inter-Tel, Inc. (c) | | | 2,472 | | |
| | | | 6,208 | | |
| SHARES | | SECURITY DESCRIPTION | | VALUE | |
| | | Computers & Peripherals — 1.2% | |
| | 121 | | | Intergraph Corp. (a) (c) | | $ | 6,047 | | |
| | | Containers & Packaging — 2.2% | |
| | 64 | | | Aptar Group, Inc. | | | 3,351 | | |
| | 195 | | | Silgan Holdings, Inc. | | | 7,029 | | |
| | | | 10,380 | | |
| | | Distributors — 1.1% | |
| | 241 | | | Reddy Ice Holdings, Inc. (c) | | | 5,250 | | |
| | | Diversified Financial Services — 0.5% | |
| | 63 | | | IntercontinentalExchange, Inc. (a) | | | 2,305 | | |
| | | Diversified Telecommunication
Services — 1.3% | |
| | 190 | | | Commonwealth Telephone
Enterprises, Inc. | | | 6,403 | | |
| | | Electric Utilities — 0.8% | |
| | 69 | | | ITC Holdings Corp. (c) | | | 1,944 | | |
| | 130 | | | Pike Electric Corp. | | | 2,112 | | |
| | | | 4,056 | | |
| | | Electrical Equipment — 1.4% | |
| | 334 | | | General Cable Corp. (a) (c) | | | 6,584 | | |
| | | Electronic Equipment & Instruments — 1.8% | |
| | 135 | | | Anixter International, Inc. (c) | | | 5,281 | | |
| | 65 | | | Scansource, Inc. (a) (c) | | | 3,576 | | |
| | | | 8,857 | | |
| | | Energy Equipment & Services — 2.3% | |
| | 98 | | | FMC Technologies, Inc. (a) (c) | | | 4,184 | | |
| | 166 | | | Universal Compression Holdings,
Inc. (a) (c) | | | 6,822 | | |
| | | | 11,006 | | |
| | | Gas Utilities — 1.0% | |
| | 88 | | | Atmos Energy Corp. (c) | | | 2,305 | | |
| | 58 | | | New Jersey Resources Corp. (c) | | | 2,429 | | |
| | | | 4,734 | | |
SEE NOTES TO FINANCIAL STATEMENTS.
JPMORGAN U.S. EQUITY MID/SMALL CAP FUNDS67
JPMorgan Small Cap Equity Fund
SCHEDULE OF PORTFOLIO INVESTMENTS AS OF DECEMBER 31, 2005
(Amounts in thousands)
(CONTINUED)
| SHARES | | SECURITY DESCRIPTION | | VALUE | |
| Long-Term Investments — continued | | | |
| | | Health Care Equipment & Supplies — 3.3% | |
| | 93 | | | Advanced Medical Optics, Inc. (a) | | $ | 3,904 | | |
| | 49 | | | Idexx Laboratories, Inc. (a) | | | 3,491 | | |
| | 66 | | | Respironics, Inc. (a) | | | 2,447 | | |
| | 151 | | | Sybron Dental Specialties, Inc. (a) (c) | | | 6,015 | | |
| | | | 15,857 | | |
| | | Health Care Providers & Services — 5.8% | |
| | 558 | | | Alderwoods Group, Inc. (a) | | | 8,855 | | |
| | 144 | | | Kindred Healthcare, Inc. (a) (c) | | | 3,717 | | |
| | 129 | | | LifePoint Hospitals, Inc. (a) | | | 4,849 | | |
| | 388 | | | PSS World Medical, Inc. (a) (c) | | | 5,751 | | |
| | 135 | | | Sunrise Senior Living, Inc. (a) (c) | | | 4,537 | | |
| | | | 27,709 | | |
| | | Hotels, Restaurants & Leisure — 4.7% | |
| | 333 | | | Applebees International, Inc. | | | 7,525 | | |
| | 80 | | | Lone Star Steakhouse & Saloon, Inc. (c) | | | 1,899 | | |
| | 212 | | | Orient-Express Hotels Ltd. (Bermuda) | | | 6,673 | | |
| | 107 | | | Papa John's International, Inc. (a) (c) | | | 6,364 | | |
| | | | 22,461 | | |
| | | Household Durables — 4.2% | |
| | 290 | | | Jarden Corp. (a) (c) | | | 8,734 | | |
| | 670 | | | Williams Scotsman International,
Inc. (a) (c) | | | 11,598 | | |
| | | | 20,332 | | |
| | | Insurance — 4.3% | |
| | 131 | | | American Physicians Capital, Inc. (a) (c) | | | 5,976 | | |
| | 202 | | | ProAssurance Corp. (a) (c) | | | 9,825 | | |
| | 100 | | | RLI Corp. (c) | | | 4,982 | | |
| | | | 20,783 | | |
| | | Internet Software & Services — 0.9% | |
| | 339 | | | Digitas, Inc. (a) | | | 4,245 | | |
| | | IT Services — 1.4% | |
| | 116 | | | CACI International, Inc., Class A (a) (c) | | | 6,656 | | |
| | | Leisure Equipment & Products — 0.4% | |
| | 37 | | | Polaris Industries, Inc. (c) | | | 1,842 | | |
| SHARES | | SECURITY DESCRIPTION | | VALUE | |
| | | Machinery — 5.4% | |
| | 175 | | | Kaydon Corp. (c) | | $ | 5,637 | | |
| | 63 | | | Lincoln Electric Holdings, Inc. (c) | | | 2,511 | | |
| | 142 | | | Manitowoc Co., Inc. (c) | | | 7,146 | | |
| | 147 | | | Oshkosh Truck Corp. | | | 6,533 | | |
| | 95 | | | Toro Co. (c) | | | 4,136 | | |
| | | | 25,963 | | |
| | | Marine — 0.7% | |
| | 278 | | | Horizon Lines Inc., Class A (c) | | | 3,370 | | |
| | | Media — 3.1% | |
| | 164 | | | Entercom Communications Corp. (a) | | | 4,851 | | |
| | 129 | | | Lee Enterprises, Inc. | | | 4,761 | | |
| | 88 | | | R.H. Donnelley Corp. (a) | | | 5,441 | | |
| | | | 15,053 | | |
| | | Metals & Mining — 2.5% | |
| | 187 | | | Commercial Metals Co. | | | 7,016 | | |
| | 198 | | | Compass Minerals International, Inc. (c) | | | 4,862 | | |
| | | | 11,878 | | |
| | | Multi-Utilities — 0.7% | |
| | 117 | | | NorthWestern Corp. (c) | | | 3,620 | | |
| | | Oil, Gas & Consumable Fuels — 3.3% | |
| | 177 | | | Southwestern Energy Co. (a) | | | 6,347 | | |
| | 256 | | | St. Mary Land & Exploration Co. (c) | | | 9,423 | | |
| | | | 15,770 | | |
| | | Real Estate — 5.9% | |
| | 55 | | | Alexandria Real Estate Equities,
Inc. REIT | | | 4,435 | | |
| | 84 | | | EastGroup Properties, Inc. REIT (c) | | | 3,780 | | |
| | 76 | | | First Potomac Realty Trust REIT (m) | | | 2,027 | | |
| | 119 | | | Jones Lang LaSalle, Inc. (c) | | | 6,007 | | |
| | 321 | | | Lexington Corporate Properties
Trust REIT | | | 6,844 | | |
| | 111 | | | Mid-America Apartment Communities,
Inc. REIT (c) | | | 5,398 | | |
| | | | 28,491 | | |
SEE NOTES TO FINANCIAL STATEMENTS.
JPMORGAN U.S. EQUITY MID/SMALL CAP FUNDS68
ANNUAL REPORT DECEMBER 31
2005
SCHEDULE OF PORTFOLIO INVESTMENTS AS OF DECEMBER 31, 2005
(Amounts in thousands)
(CONTINUED)
| SHARES | | SECURITY DESCRIPTION | | VALUE | |
| Long-Term Investments — continued | | | |
| | | Road & Rail — 2.3% | |
| | 92 | | | Arkansas Best Corp. (c) | | $ | 4,023 | | |
| | 169 | | | Landstar System, Inc. | | | 7,050 | | |
| | | | 11,073 | | |
| | | Semiconductors & Semiconductor
Equipment — 1.9% | |
| | 41 | | | Cymer, Inc. (a) | | | 1,467 | | |
| | 97 | | | Standard Microsystems Corp. (a) (c) | | | 2,783 | | |
| | 107 | | | Varian Semiconductor Equipment
Associates, Inc. (a) | | | 4,718 | | |
| | | | 8,968 | | |
| | | Software — 1.1% | |
| | 110 | | | Micros Systems, Inc. (a) (c) | | | 5,310 | | |
| | | Specialty Retail — 3.3% | |
| | 107 | | | Finish Line, Inc., Class A (c) | | | 1,862 | | |
| | 94 | | | Genesco, Inc. (a) | | | 3,633 | | |
| | 175 | | | Men's Wearhouse, Inc. (a) | | | 5,161 | | |
| | 243 | | | New York & Co., Inc. (a) (c) | | | 5,149 | | |
| | | | 15,805 | | |
| | | Textiles, Apparel & Luxury Goods — 1.2% | |
| | 53 | | | Columbia Sportswear Co. (a) (c) | | | 2,506 | | |
| | 96 | | | Timberland Co., Class A (a) | | | 3,125 | | |
| | | | 5,631 | | |
| | | Trading Companies & Distributors — 4.3% | |
| | 172 | | | Hughes Supply, Inc. | | | 6,166 | | |
| | 189 | | | Nuco2, Inc. (a) (c) | | | 5,278 | | |
| | 153 | | | Watsco, Inc. (c) | | | 9,127 | | |
| | | | 20,571 | | |
| | | | | Total Common Stocks
(Cost $365,942) | | | 464,361
| | |
| Short-Term Investment — 5.2% | | | |
| | | Investment Company — 5.2% | |
| | 24,904 | | | JPMorgan Prime Money Market
Fund (b) (m)
(Cost $24,904) | | |
24,904
| | |
PRINCIPAL
AMOUNT | | SECURITY DESCRIPTION | | VALUE | |
| Investments of Cash Collateral for Securities Loaned — 20.3% | | | |
| | | Certificates of Deposit — 2.8% | |
| $ | 4,600 | | | Credit Suisse First Boston LLC, FRN,
4.27%, 10/17/06 | | $ | 4,600 | | |
| | 4,750 | | | Royal Bank of Canada, FRN,
4.30%, 11/13/06 | | | 4,750 | | |
| | 4,500 | | | Wells Fargo Bank San Francisco,
4.30%, 01/27/06 | | | 4,500 | | |
| | | | 13,850 | | |
| | | Commercial Paper — 2.0% | |
| | 4,963 | | | HSBC Finance Corp., 4.35%, 02/01/06 | | | 4,963 | | |
| | 4,500 | | | Morgan Stanley & Co., Inc., FRN,
4.33%, 04/17/06 | | | 4,500 | | |
| | | | 9,463 | | |
| | | Corporate Notes — 8.9% | |
| | 5,000 | | | Alliance and Leister plc, FRN,
4.33%, 01/30/07 | | | 5,000 | | |
| | 5,000 | | | Bank of America N.A., FRN,
4.31%, 11/07/06 | | | 5,000 | | |
| | 4,700 | | | CDC Financial Products, Inc., FRN,
4.35%, 01/30/06 | | | 4,700 | | |
| | 4,700 | | | Citigroup Global Markets, Inc., FRN,
4.32%, 01/06/06 | | | 4,700 | | |
| | 4,000 | | | K2(USA) LLC, FRN, 4.35%, 02/15/06 | | | 4,001 | | |
| | 5,000 | | | Landsbanki Islands HF, FRN,
4.45%, 01/30/07 | | | 5,000 | | |
| | 4,499 | | | Liberty Lighthouse U.S. Capital, FRN,
4.34%, 10/24/06 | | | 4,499 | | |
| | 401 | | | Links Finance LLC, FRN,
4.29%, 10/06/06 | | | 401 | | |
| | 4,699 | | | Links Finance LLC, FRN,
4.37%, 10/15/07 | | | 4,699 | | |
| | 4,499 | | | Sigma Finance, Inc., FRN,
4.37%, 10/24/07 | | | 4,499 | | |
| | | | 42,499 | | |
SEE NOTES TO FINANCIAL STATEMENTS.
JPMORGAN U.S. EQUITY MID/SMALL CAP FUNDS69
JPMorgan Small Cap Equity Fund
SCHEDULE OF PORTFOLIO INVESTMENTS AS OF DECEMBER 31, 2005
(Amounts in thousands)
(CONTINUED)
PRINCIPAL
AMOUNT | | SECURITY DESCRIPTION | | VALUE | |
| Investments of Cash Collateral for Securities Loaned — continued | |
| | | Repurchase Agreements — 6.6% | |
| $ | 16,760 | | | Bank of America Securities LLC,
4.26%, dated 12/30/05, due 01/03/06,
repurchase price $16,768,
collateralized by U.S. Government
Agency Mortgages. | | $ | 16,760 | | |
| | 15,000 | | | UBS Securities LLC, 4.26%,
dated 12/30/05, due 01/03/06,
repurchase price $15,007,
collateralized by U.S. Government
Agency Mortgages. | | | 15,000 | | |
| | | | 31,760 | | |
| | | Total Investments of Cash Collateral
for Securities Loaned
(Cost $97,572) | | |
97,572
| | |
| | | Total Investments — 122.1%
(Cost $488,418) | | | $586,837
| | |
| | | Liabilities in Excess of Other
Assets — (22.1)% | | | (106,295 | ) | |
| | | NET ASSETS — 100.0% | | $ | 480,542 | | |
Percentages indicated are based on net assets.
SEE NOTES TO FINANCIAL STATEMENTS.
JPMORGAN U.S. EQUITY MID/SMALL CAP FUNDS70
JPMorgan U.S. Small Company Fund
SCHEDULE OF PORTFOLIO INVESTMENTS AS OF DECEMBER 31, 2005
(Amounts in thousands)
| SHARES | | SECURITY DESCRIPTION | | VALUE | |
| Long-Term Investments — 103.6% | | | |
| | | Common Stocks — 103.6% | |
| | | Aerospace & Defense — 2.4% | |
| | 4 | | | AAR Corp. (a) | | $ | 89 | | |
| | 5 | | | Armor Holdings, Inc. (a) (c) | | | 209 | | |
| | 15 | | | Aviall, Inc. (c) | | | 432 | | |
| | 10 | | | BE Aerospace, Inc. (a) | | | 220 | | |
| | 2 | | | Ceradyne, Inc. (a) | | | 83 | | |
| | 2 | | | Curtiss-Wright Corp. (c) | | | 131 | | |
| | 16 | | | Esterline Technologies Corp. (a) | | | 584 | | |
| | 6 | | | Heico Corp. (c) | | | 163 | | |
| | 4 | | | Hexcel Corp. (a) (c) | | | 69 | | |
| | 9 | | | Kaman Corp., Class A | | | 169 | | |
| | 44 | | | Moog, Inc., Class A (a) | | | 1,234 | | |
| | 5 | | | Orbital Sciences Corp. (a) (c) | | | 63 | | |
| | 2 | | | Triumph Group, Inc. (a) (c) | | | 89 | | |
| | 2 | | | United Industrial Corp. (c) | | | 87 | | |
| | | | 3,622 | | |
| | | Air Freight & Logistics — 0.1% | |
| | 5 | | | Hub Group, Inc., Class A (a) | | | 187 | | |
| | | Airlines — 1.6% | |
| | 15 | | | Alaska Air Group, Inc. (a) (c) | | | 536 | | |
| | 35 | | | Continental Airlines, Inc., Class B (a) | | | 743 | | |
| | 34 | | | ExpressJet Holdings, Inc. (a) (c) | | | 274 | | |
| | 19 | | | Mesa Air Group, Inc. (a) (c) | | | 197 | | |
| | 18 | | | Pinnacle Airlines Corp. (a) (c) | | | 117 | | |
| | 17 | | | Skywest, Inc. | | | 451 | | |
| | | | 2,318 | | |
| | | Auto Components — 0.5% | |
| | 5 | | | American Axle & Manufacturing
Holdings, Inc. (c) | | | 97 | | |
| | 10 | | | ArvinMeritor, Inc. (c) | | | 143 | | |
| | 3 | | | Sauer-Danfoss, Inc. | | | 58 | | |
| | 23 | | | Tenneco Automotive, Inc. (a) | | | 459 | | |
| | | | 757 | | |
| | | Automobiles — 0.5% | |
| | 11 | | | Fleetwood Enterprises, Inc. (a) (c) | | | 141 | | |
| | 14 | | | Thor Industries, Inc. (c) | | | 565 | | |
| | 2 | | | Winnebago Industries, Inc. (c) | | | 80 | | |
| | | | 786 | | |
| SHARES | | SECURITY DESCRIPTION | | VALUE | |
| | | Biotechnology — 3.5% | |
| | 6 | | | Abgenix, Inc. (a) | | $ | 127 | | |
| | 17 | | | Alexion Pharmaceuticals, Inc. (a) (c) | | | 346 | | |
| | 12 | | | Alkermes, Inc. (a) (c) | | | 224 | | |
| | 9 | | | Amylin Pharmaceuticals, Inc. (a) | | | 359 | | |
| | 7 | | | Applera Corp. - Celera Genomics
Group (a) | | | 72 | | |
| | 8 | | | Cell Genesys, Inc. (a) | | | 46 | | |
| | 16 | | | Cubist Pharmaceuticals, Inc. (a) (c) | | | 341 | | |
| | 4 | | | CV Therapeutics, Inc. (a) (c) | | | 102 | | |
| | 4 | | | Diversa Corp. (a) (c) | | | 21 | | |
| | 21 | | | Encysive Pharmaceuticals, Inc. (a) | | | 166 | | |
| | 3 | | | Exelixis, Inc. (a) (c) | | | 27 | | |
| | 15 | | | Genelabs Technologies | | | 28 | | |
| | 9 | | | GTx, Inc. (a) (c) | | | 64 | | |
| | 5 | | | ICOS Corp. (a) (c) | | | 127 | | |
| | 14 | | | Incyte Corp. (a) (c) | | | 74 | | |
| | 13 | | | InterMune, Inc. (a) (c) | | | 215 | | |
| | 13 | | | Lifecell Corp. (a) (c) | | | 239 | | |
| | 6 | | | Martek Biosciences Corp. (a) (c) | | | 148 | | |
| | 15 | | | Medarex, Inc. (a) (c) | | | 209 | | |
| | 14 | | | Myogen, Inc. (a) | | | 407 | | |
| | 13 | | | Myriad Genetics, Inc. (a) (c) | | | 279 | | |
| | 12 | | | Nektar Therapeutics (a) | | | 196 | | |
| | 8 | | | Panacos Pharmaceuticals, Inc. (a) | | | 54 | | |
| | 12 | | | Renovis, Inc. (a) (c) | | | 181 | | |
| | 10 | | | Seattle Genetics, Inc. (a) (c) | | | 49 | | |
| | 9 | | | Telik, Inc. (a) (c) | | | 152 | | |
| | 6 | | | United Therapeutics Corp. (a) (c) | | | 387 | | |
| | 13 | | | Vertex Pharmaceuticals, Inc. (a) | | | 354 | | |
| | 9 | | | Viropharma, Inc. (a) | | | 165 | | |
| | | | 5,159 | | |
| | | Building Products — 2.0% | |
| | 6 | | | ElkCorp (c) | | | 198 | | |
| | 4 | | | Griffon Corp. (a) (c) | | | 86 | | |
| | 20 | | | Jacuzzi Brands, Inc. (a) (c) | | | 168 | | |
| | 28 | | | Lennox International, Inc. | | | 784 | | |
| | 9 | | | NCI Building Systems, Inc. (a) (c) | | | 399 | | |
| | 24 | | | Universal Forest Products, Inc. | | | 1,314 | | |
| | | | 2,949 | | |
SEE NOTES TO FINANCIAL STATEMENTS.
JPMORGAN U.S. EQUITY MID/SMALL CAP FUNDS71
JPMorgan U.S. Small Company Fund
SCHEDULE OF PORTFOLIO INVESTMENTS AS OF DECEMBER 31, 2005
(Amounts in thousands)
(CONTINUED)
| SHARES | | SECURITY DESCRIPTION | | VALUE | |
| Long-Term Investments — continued | | | |
| | | Capital Markets — 0.4% | |
| | 22 | | | Knight Capital Group, Inc. Class A (a) | | $ | 215 | | |
| | 4 | | | National Financial Partners Corp. | | | 215 | | |
| | 7 | | | Waddell & Reed Financial, Inc. | | | 141 | | |
| | | | 571 | | |
| | | Chemicals — 1.4% | |
| | 15 | | | FMC Corp. (a) | | | 808 | | |
| | 5 | | | Georgia Gulf Corp. | | | 152 | | |
| | 2 | | | H.B. Fuller Co. | | | 61 | | |
| | 5 | | | Headwaters, Inc. (a) (c) | | | 170 | | |
| | 16 | | | Hercules, Inc. (a) | | | 185 | | |
| | 3 | | | Kronos Worlwide, Inc. | | | 73 | | |
| | 5 | | | NewMarket Corp. (a) | | | 127 | | |
| | 26 | | | PolyOne Corp. (a) (c) | | | 168 | | |
| | 8 | | | Terra Industries, Inc. (a) | | | 43 | | |
| | 20 | | | W.R. Grace & Co. (a) (c) | | | 192 | | |
| | 11 | | | Wellman, Inc. (c) | | | 75 | | |
| | | | 2,054 | | |
| | | Commercial Banks — 6.6% | |
| | 6 | | | Amcore Financial, Inc. (c) | | | 186 | | |
| | 1 | | | AmericanWest Bancorp (a) | | | 26 | | |
| | 3 | | | Ameris Bancorp (c) | | | 65 | | |
| | 2 | | | Associated Banc-Corp. | | | 55 | | |
| | 1 | | | BancFirst Corp. | | | 87 | | |
| | 15 | | | Bank of the Ozarks, Inc. (c) | | | 561 | | |
| | 2 | | | Capital Corp. of the West (c) | | | 79 | | |
| | 1 | | | Capital Crossing Bank (a) (c) | | | 17 | | |
| | 5 | | | Capitol Bancorp Ltd. | | | 172 | | |
| | 3 | | | Cardinal Financial Corp. (c) | | | 35 | | |
| | 3 | | | Center Financial Corp. (c) | | | 75 | | |
| | 7 | | | Central Pacific Financial Corp. (c) | | | 262 | | |
| | 3 | | | Chemical Financial Corp. (c) | | | 100 | | |
| | 4 | | | City Holding Co. | | | 158 | | |
| | 4 | | | Columbia Banking System, Inc. | | | 108 | | |
| | 15 | | | Community Bank System, Inc. (c) | | | 341 | | |
| | 4 | | | Community Trust Bancorp, Inc. | | | 108 | | |
| | 1 | | | Enterprise Financial Services Corp. (c) | | | 16 | | |
| | 18 | | | EuroBancshares, Inc. (a) | | | 249 | | |
| | 22 | | | First Bancorp (c) | | | 269 | | |
| | — | (h) | | First Regional Bancorp (a) | | | 27 | | |
| | 5 | | | First Republic Bank | | | 176 | | |
| SHARES | | SECURITY DESCRIPTION | | VALUE | |
| | | Commercial Banks — Continued | |
| | 14 | | | First State Bancorp, Inc. (c) | | $ | 346 | | |
| | 1 | | | FNB Corp. | | | 18 | | |
| | 4 | | | Glacier Bancorp, Inc. (c) | | | 119 | | |
| | 12 | | | Gold Banc Corp., Inc. | | | 219 | | |
| | 8 | | | Greater Bay Bancorp (c) | | | 200 | | |
| | 11 | | | Hanmi Financial Corp. | | | 188 | | |
| | 15 | | | IBERIABANK Corp. (c) | | | 786 | | |
| | 10 | | | Independent Bank Corp. | | | 284 | | |
| | 18 | | | Irwin Financial Corp. (c) | | | 390 | | |
| | 2 | | | Macatawa Bank Corp. (c) | | | 59 | | |
| | 3 | | | MB Financial, Inc. | | | 117 | | |
| | 4 | | | Mercantile Bank Corp. | | | 171 | | |
| | 4 | | | Nara Bancorp, Inc. (c) | | | 76 | | |
| | 7 | | | Oriental Financial Group (c) | | | 89 | | |
| | 7 | | | Pacific Capital Bancorp (c) | | | 231 | | |
| | 3 | | | Peoples Bancorp, Inc. (c) | | | 71 | | |
| | 1 | | | Premierwest Bancorp (c) | | | 15 | | |
| | 17 | | | PrivateBancorp, Inc. | | | 590 | | |
| | 15 | | | Republic Bancorp, Inc. (c) | | | 183 | | |
| | 1 | | | Republic Bancorp, Inc., Class A (c) | | | 23 | | |
| | 1 | | | Santander Bancorp (c) | | | 35 | | |
| | 1 | | | Sierra Bancorp (c) | | | 16 | | |
| | 2 | | | Simmons First National Corp., Class A | | | 66 | | |
| | 2 | | | Southwest Bancorp, Inc. | | | 38 | | |
| | 3 | | | Sterling Bancorp | | | 62 | | |
| | 22 | | | Sterling Bancshares, Inc. (c) | | | 332 | | |
| | 22 | | | Summit Bancshares, Inc. (c) | | | 396 | | |
| | 2 | | | Sun Bancorp, Inc. (a) (c) | | | 43 | | |
| | 1 | | | Taylor Capital Group, Inc. | | | 57 | | |
| | 3 | | | TD Banknorth, Inc. | | | 76 | | |
| | 3 | | | TriCo Bancshares | | | 58 | | |
| | 4 | | | Umpqua Holdings Corp. | | | 108 | | |
| | 12 | | | West Coast Bancorp | | | 311 | | |
| | 12 | | | Westamerica Bancorporation (c) | | | 610 | | |
| | 1 | | | Western Sierra Bancorp (a) | | | 47 | | |
| | 6 | | | Wilshire Bancorp, Inc. | | | 96 | | |
| | 3 | | | Wintrust Financial Corp. (c) | | | 181 | | |
| | | | 9,879 | | |
| | | Commercial Services & Supplies — 3.0% | |
| | 22 | | | Angelica Corp. | | | 361 | | |
| | 3 | | | Banta Corp. | | | 144 | | |
SEE NOTES TO FINANCIAL STATEMENTS.
JPMORGAN U.S. EQUITY MID/SMALL CAP FUNDS72
ANNUAL REPORT DECEMBER 31
2005
SCHEDULE OF PORTFOLIO INVESTMENTS AS OF DECEMBER 31, 2005
(Amounts in thousands)
(CONTINUED)
| SHARES | | SECURITY DESCRIPTION | | VALUE | |
| Long-Term Investments — continued | | | |
| | | Commercial Services & Supplies — Continued | |
| | 1 | | | Clean Harbors, Inc. (a) | | $ | 32 | | |
| | 4 | | | Coinstar, Inc. (a) | | | 84 | | |
| | 10 | | | Corinthian Colleges, Inc. (a) (c) | | | 119 | | |
| | 1 | | | CRA International, Inc. (a) | | | 67 | | |
| | 5 | | | DiamondCluster International, Inc. (a) | | | 38 | | |
| | 7 | | | Duratek, Inc. (a) | | | 100 | | |
| | 4 | | | Escala Group, Inc. (c) | | | 77 | | |
| | 6 | | | Geo Group, Inc. (The) (a) | | | 138 | | |
| | 2 | | | Gevity HR, Inc. (c) | | | 44 | | |
| | 8 | | | Heidrick & Struggles International, Inc. (a) | | | 240 | | |
| | 6 | | | Hudson Highland Group, Inc. (a) (c) | | | 109 | | |
| | 56 | | | IKON Office Solutions, Inc. | | | 580 | | |
| | 5 | | | Interpool, Inc. | | | 98 | | |
| | 7 | | | John H. Harland Co. | | | 263 | | |
| | 4 | | | Kforce, Inc. (a) | | | 49 | | |
| | 4 | | | Korn/Ferry International (a) (c) | | | 65 | | |
| | 14 | | | Labor Ready, Inc. (a) (c) | | | 292 | | |
| | 11 | | | Navigant Consulting, Inc. (a) | | | 237 | | |
| | 4 | | | Pre-Paid Legal Services, Inc. (c) | | | 145 | | |
| | 5 | | | SOURCECORP, Inc. (a) | | | 130 | | |
| | 9 | | | Spherion Corp. (a) | | | 88 | | |
| | 21 | | | TeleTech Holdings, Inc. (a) (c) | | | 257 | | |
| | 4 | | | Tetra Tech, Inc. (a) (c) | | | 61 | | |
| | 9 | | | United Rentals, Inc. (a) (c) | | | 211 | | |
| | 5 | | | United Stationers, Inc. (a) | | | 243 | | |
| | 1 | | | Vertrue, Inc. (a) | | | 49 | | |
| | 3 | | | Waste Connections, Inc. (a) | | | 107 | | |
| | | | 4,428 | | |
| | | Communications Equipment — 2.8% | |
| | 28 | | | 3Com Corp. (a) | | | 99 | | |
| | 7 | | | Ariba, Inc. (a) (c) | | | 49 | | |
| | 21 | | | Arris Group, Inc. (a) | | | 196 | | |
| | 3 | | | Audiovox Corp. (a) | | | 44 | | |
| | 9 | | | Avocent Corp. (a) | | | 250 | | |
| | 4 | | | Bel Fuse, Inc., Class B (c) | | | 114 | | |
| | 6 | | | Black Box Corp. | | | 284 | | |
| | 6 | | | C-COR, Inc. (a) (c) | | | 30 | | |
| | 51 | | | CIENA Corp.(a) | | | 150 | | |
| | 11 | | | CommScope, Inc. (a) (c) | | | 229 | | |
| | 3 | | | Comtech Telecommunications Corp. (a) | | | 90 | | |
| | 4 | | | Ditech Communications Corp. (a) | | | 33 | | |
| SHARES | | SECURITY DESCRIPTION | | VALUE | |
| | | Communications Equipment — Continued | |
| | 4 | | | Echelon Corp. (a) (c) | | $ | 34 | | |
| | 14 | | | Extreme Networks, Inc. (a) | | | 66 | | |
| | 5 | | | Finisar Corp. (a) (c) | | | 10 | | |
| | 12 | | | Foundry Networks, Inc. (a) (c) | | | 167 | | |
| | 12 | | | Glenayre Technologies, Inc. (a) (c) | | | 39 | | |
| | 8 | | | Harmonic, Inc. (a) (c) | | | 41 | | |
| | 21 | | | Inter-Tel, Inc. (c) | | | 417 | | |
| | 2 | | | Interdigital Communications Corp. (a) | | | 33 | | |
| | 16 | | | MRV Communications, Inc. (a) (c) | | | 32 | | |
| | 6 | | | Netgear, Inc. (a) (c) | | | 123 | | |
| | 17 | | | Plantronics, Inc. (c) | | | 492 | | |
| | 3 | | | Polycom, Inc. (a) | | | 46 | | |
| | 22 | | | Powerwave Technologies, Inc. (a) (c) | | | 273 | | |
| | 5 | | | Redback Networks, Inc. (a) | | | 72 | | |
| | 8 | | | SafeNet, Inc. (a) (c) | | | 271 | | |
| | 6 | | | Sonus Networks, Inc. (a) | | | 23 | | |
| | 22 | | | Symmetricom, Inc. (a) (c) | | | 184 | | |
| | 10 | | | Tekelec (a) (c) | | | 138 | | |
| | 10 | | | Terayon Communication Systems, Inc. (a) | | | 23 | | |
| | 13 | | | Utstarcom, Inc. (a) (c) | | | 106 | | |
| | 14 | | | Westell Technologies, Inc., Class A (a) | | | 63 | | |
| | | | 4,221 | | |
| | | Computers & Peripherals — 1.8% | |
| | 15 | | | Adaptec, Inc. (a) (c) | | | 90 | | |
| | 7 | | | Advanced Digital Information Corp. (a) | | | 66 | | |
| | 43 | | | Brocade Communications Systems, Inc. (a) | | | 174 | | |
| | 4 | | | Dot Hill Systems Corp. (a) | | | 30 | | |
| | 3 | | | Electronics for Imaging, Inc. (a) (c) | | | 74 | | |
| | 16 | | | Gateway, Inc. (a) (c) | | | 40 | | |
| | 11 | | | Hutchinson Technology, Inc. (a) (c) | | | 321 | | |
| | 4 | | | Hypercom Corp. (a) | | | 28 | | |
| | 10 | | | Imation Corp. | | | 461 | | |
| | 7 | | | Intergraph Corp. (a) | | | 349 | | |
| | 11 | | | Komag, Inc. (a) (c) | | | 391 | | |
| | 35 | | | Maxtor Corp. (a) (c) | | | 242 | | |
| | 4 | | | McData Corp., Class A (a) (c) | | | 16 | | |
| | 4 | | | Palm, Inc. (a) (c) | | | 111 | | |
| | 22 | | | Quantum Corp. (a) (c) | | | 66 | | |
| | 2 | | | Stratasys, Inc. (a) (c) | | | 45 | | |
| | 5 | | | Synaptics, Inc. (a) | | | 111 | | |
| | 3 | | | UNOVA, Inc. (a) (c) | | | 115 | | |
| | | | 2,730 | | |
SEE NOTES TO FINANCIAL STATEMENTS.
JPMORGAN U.S. EQUITY MID/SMALL CAP FUNDS73
JPMorgan U.S. Small Company Fund
SCHEDULE OF PORTFOLIO INVESTMENTS AS OF DECEMBER 31, 2005
(Amounts in thousands)
(CONTINUED)
| SHARES | | SECURITY DESCRIPTION | | VALUE | |
| Long-Term Investments — continued | | | |
| | | Construction & Engineering — 0.4% | |
| | 4 | | | Mas Tec, Inc. (a) (c) | | $ | 38 | | |
| | 7 | | | Quanta Services, Inc. (a) (c) | | | 96 | | |
| | 4 | | | URS Corp. (a) | | | 143 | | |
| | 5 | | | Washington Group International, Inc. (c) | | | 286 | | |
| | | | 563 | | |
| | | Construction Materials — 0.4% | |
| | 3 | | | Ameron International Corp. | | | 150 | | |
| | 4 | | | Eagle Materials, Inc. (c) | | | 502 | | |
| | | | 652 | | |
| | | Consumer Finance — 1.4% | |
| | 3 | | | ACE Cash Express, Inc. (a) (c) | | | 72 | | |
| | 5 | | | Advanta Corp., Class B (c) | | | 162 | | |
| | 4 | | | Asta Funding, Inc. (c) | | | 107 | | |
| | 37 | | | Cash America International, Inc. (c) | | | 863 | | |
| | 10 | | | CompuCredit Corp. (a) (c) | | | 381 | | |
| | 3 | | | First Cash Financial Services, Inc. (a) (c) | | | 79 | | |
| | 2 | | | United PanAm Financial Corp. (a) | | | 62 | | |
| | 11 | | | World Acceptance Corp. (a) (c) | | | 299 | | |
| | | | 2,025 | | |
| | | Containers & Packaging — 0.4% | |
| | 4 | | | Greif, Inc., Class A | | | 278 | | |
| | 10 | | | Silgan Holdings, Inc. | | | 349 | | |
| | | | 627 | | |
| | | Distributors — 0.2% | |
| | 7 | | | WESCO International, Inc. (a) | | | 308 | | |
| | | Diversified Financial Services — 0.7% | |
| | 2 | | | Encore Capital Group, Inc. (a) (c) | | | 31 | | |
| | 3 | | | eSpeed, Inc. (a) (c) | | | 22 | | |
| | 16 | | | GATX Corp. | | | 563 | | |
| | 10 | | | Nasdaq Stock Market, Inc. (a) | | | 355 | | |
| | | | 971 | | |
| | | Diversified Telecommunication Services — 1.3% | |
| | 8 | | | Broadwing Corp. (a) (c) | | | 48 | | |
| | 90 | | | Cincinnati Bell, Inc. (a) | | | 315 | | |
| | 12 | | | CT Communications, Inc. | | | 146 | | |
| | 5 | | | Golden Telecom, Inc. (Russia) | | | 138 | | |
| SHARES | | SECURITY DESCRIPTION | | VALUE | |
| | | Diversified Telecommunication
Services — Continued | |
| | 73 | | | Level 3 Communications, Inc. (a) (c) | | $ | 209 | | |
| | 87 | | | Premiere Global Services, Inc. (a) (c) | | | 705 | | |
| | 6 | | | Talk America Holdings, Inc. (a) | | | 49 | | |
| | 27 | | | Time Warner Telecom, Inc., Class A (a) (c) | | | 262 | | |
| | | | 1,872 | | |
| | | Electric Utilities — 0.9% | |
| | 4 | | | Black Hills Corp. | | | 152 | | |
| | 22 | | | El Paso Electric Co. (a) | | | 461 | | |
| | 4 | | | Idacorp, Inc. (c) | | | 103 | | |
| | 1 | | | MGE Energy, Inc. (c) | | | 41 | | |
| | 1 | | | UIL Holdings Corp. (c) | | | 60 | | |
| | 15 | | | Unisource Energy Corp. | | | 455 | | |
| | | | 1,272 | | |
| | | Electrical Equipment — 0.3% | |
| | 2 | | | Encore Wire Corp. (a) | | | 43 | | |
| | 9 | | | Evergreen Solar, Inc. (a) (c) | | | 98 | | |
| | 12 | | | General Cable Corp. (a) | | | 231 | | |
| | 4 | | | Power-One, Inc. (a) (c) | | | 22 | | |
| | 4 | | | Valence Technology, Inc. (a) (c) | | | 6 | | |
| | | | 400 | | |
| | | Electronic Equipment & Instruments — 2.3% | |
| | 11 | | | Aeroflex, Inc. (a) (c) | | | 123 | | |
| | 16 | | | Agilysis, Inc. | | | 299 | | |
| | 16 | | | Anixter International, Inc. | | | 642 | | |
| | 11 | | | Bell Microproducts, Inc. (a) (c) | | | 87 | | |
| | 10 | | | Benchmark Electronics, Inc. (a) (c) | | | 346 | | |
| | 7 | | | Brightpoint, Inc. (a) | | | 200 | | |
| | 5 | | | Checkpoint Systems, Inc. (a) | | | 131 | | |
| | 11 | | | CTS Corp. (c) | | | 125 | | |
| | 3 | | | Electro Scientific Industries, Inc. (a) | | | 63 | | |
| | 2 | | | Faro Technologies, Inc. (a) (c) | | | 34 | | |
| | 16 | | | Global Imaging Systems, Inc (a) (c) | | | 547 | | |
| | 7 | | | Itron, Inc. (a) | | | 280 | | |
| | 4 | | | Lexar Media, Inc. (a) (c) | | | 33 | | |
| | 3 | | | MTS Systems Corp. | | | 97 | | |
| | 5 | | | Radisys Corp. (a) (c) | | | 85 | | |
| | 2 | | | Rofin-Sinar Technologies, Inc. (a) | | | 91 | | |
| | 10 | | | Sypris Solutions, Inc. | | | 104 | | |
| | 17 | | | TTM Technologies, Inc. (a) (c) | | | 155 | | |
| | | | 3,442 | | |
SEE NOTES TO FINANCIAL STATEMENTS.
JPMORGAN U.S. EQUITY MID/SMALL CAP FUNDS74
ANNUAL REPORT DECEMBER 31
2005
SCHEDULE OF PORTFOLIO INVESTMENTS AS OF DECEMBER 31, 2005
(Amounts in thousands)
(CONTINUED)
| SHARES | | SECURITY DESCRIPTION | | VALUE | |
| Long-Term Investments — continued | | | |
| | | Energy Equipment & Services — 3.0% | |
| | 39 | | | Grey Wolf, Inc. (a) | | $ | 300 | | |
| | 3 | | | Gulf Island Fabrication, Inc. | | | 80 | | |
| | 10 | | | Hanover Compressor Co. (a) (c) | | | 146 | | |
| | 4 | | | Hydril (a) | | | 244 | | |
| | 27 | | | Key Energy Services, Inc. (a) (c) | | | 365 | | |
| | 9 | | | Lone Star Technologies, Inc. (a) | | | 455 | | |
| | 2 | | | Lufkin Industries, Inc. (c) | | | 95 | | |
| | 5 | | | NS Group, Inc. (a) | | | 188 | | |
| | 13 | | | Oceaneering International, Inc. (a) (c) | | | 647 | | |
| | 6 | | | Offshore Logistics, Inc. (a) (c) | | | 166 | | |
| | 5 | | | Oil States International, Inc. (a) (c) | | | 168 | | |
| | 25 | | | Parker Drilling Co. (a) | | | 265 | | |
| | 28 | | | Todco, Class A (a) | | | 1,066 | | |
| | 9 | | | Veritas DGC, Inc. (a) | | | 312 | | |
| | | | 4,497 | | |
| | | Food & Staples Retailing — 0.6% | |
| | 6 | | | Great Atlantic & Pacific Tea Co., Inc. (a) (c) | | | 184 | | |
| | 3 | | | Nash Finch Co. (c) | | | 76 | | |
| | 12 | | | Pantry, Inc. (The) (a) | | | 569 | | |
| | 6 | | | Pathmark Stores, Inc. (a) | | | 58 | | |
| | | | 887 | | |
| | | Food Products — 1.0% | |
| | 19 | | | Chiquita Brands International, Inc. (c) | | | 386 | | |
| | 15 | | | Corn Products International, Inc. | | | 349 | | |
| | 4 | | | Flowers Foods, Inc. | | | 109 | | |
| | 3 | | | J & J Snack Foods Corp. | | | 184 | | |
| | 14 | | | Sanderson Farms, Inc. (c) | | | 439 | | |
| | | | 1,467 | | |
| | | Gas Utilities — 1.1% | |
| | 8 | | | New Jersey Resources Corp. (c) | | | 331 | | |
| | 8 | | | Nicor, Inc. (c) | | | 318 | | |
| | 6 | | | Northwest Natural Gas Co. (c) | | | 202 | | |
| | 7 | | | South Jersey Industries, Inc. | | | 195 | | |
| | 13 | | | Southwest Gas Corp. | | | 338 | | |
| | 9 | | | WGL Holdings, Inc. | | | 271 | | |
| | | | 1,655 | | |
| SHARES | | SECURITY DESCRIPTION | | VALUE | |
| | | Health Care Equipment & Supplies — 2.9% | |
| | 9 | | | Align Technology, Inc. (a) (c) | | $ | 57 | | |
| | 1 | | | Analogic Corp. | | | 33 | | |
| | 6 | | | Animas Corp. (a) | | | 147 | | |
| | 4 | | | Arrow International, Inc. | | | 113 | | |
| | 7 | | | Arthrocare Corp. (a) (c) | | | 312 | | |
| | 1 | | | Bio-Rad Laboratories, Inc., Class A (a) | | | 85 | | |
| | 4 | | | Biosite, Inc. (a) (c) | | | 231 | | |
| | 11 | | | Conmed Corp. (a) | | | 267 | | |
| | 6 | | | Diagnostic Products Corp. (c) | | | 277 | | |
| | 35 | | | Encore Medical Corp. (a) (c) | | | 173 | | |
| | 3 | | | EPIX Pharmaceuticals, Inc. (a) (c) | | | 13 | | |
| | 3 | | | Immucor, Inc. (a) | | | 73 | | |
| | 6 | | | Integra LifeSciences Holdings Corp. (a) (c) | | | 199 | | |
| | 1 | | | Intuitive Surgical, Inc. (a) (c) | | | 141 | | |
| | 3 | | | Inverness Medical Innovations, Inc. (a) (c) | | | 78 | | |
| | 4 | | | Kyphon, Inc. (a) (c) | | | 160 | | |
| | 7 | | | Mentor Corp. (c) | | | 341 | | |
| | 11 | | | Neurometrix, Inc. (a) (c) | | | 306 | | |
| | 3 | | | Palomar Medical Technologies, Inc. (a) (c) | | | 109 | | |
| | 8 | | | PolyMedica Corp. (c) | | | 271 | | |
| | 22 | | | Steris Corp. (c) | | | 550 | | |
| | 10 | | | SurModics, Inc. (a) (c) | | | 381 | | |
| | | | 4,317 | | |
| | | Health Care Providers & Services — 4.2% | |
| | 8 | | | Alderwoods Group, Inc. (a) | | | 125 | | |
| | 28 | | | Alliance Imaging, Inc. (a) (c) | | | 166 | | |
| | 4 | | | America Service Group, Inc. (a) | | | 60 | | |
| | 15 | | | Andrx Corp. (a) (c) | | | 247 | | |
| | 10 | | | Apria Healthcare Group, Inc. (a) | | | 244 | | |
| | 14 | | | Centene Corp. (a) | | | 378 | | |
| | 11 | | | Computer Programs & Systems, Inc. (c) | | | 475 | | |
| | 2 | | | Dendrite International, Inc. (a) | | | 29 | | |
| | 5 | | | Genesis HealthCare Corp. (a) (c) | | | 168 | | |
| | 13 | | | Kindred Healthcare, Inc. (a) (c) | | | 335 | | |
| | 8 | | | LCA Vision, Inc. (c) | | | 375 | | |
| | 16 | | | Owens & Minor, Inc. | | | 427 | | |
| | 10 | | | Pediatrix Medical Group, Inc. (a) | | | 897 | | |
| | 20 | | | Per-Se Technologies, Inc. (a) (c) | | | 460 | | |
| | 25 | | | PSS World Medical, Inc. (a) | | | 372 | | |
| | 9 | | | Res-Care, Inc. (a) | | | 155 | | |
| | 7 | | | Symbion, Inc. (a) (c) | | | 163 | | |
SEE NOTES TO FINANCIAL STATEMENTS.
JPMORGAN U.S. EQUITY MID/SMALL CAP FUNDS75
JPMorgan U.S. Small Company Fund
SCHEDULE OF PORTFOLIO INVESTMENTS AS OF DECEMBER 31, 2005
(Amounts in thousands)
(CONTINUED)
| SHARES | | SECURITY DESCRIPTION | | VALUE | |
| Long-Term Investments — continued | | | |
| | | Health Care Providers & Services — Continued | |
| | 14 | | | Trizetto Group (a) | | $ | 245 | | |
| | 17 | | | United Surgical Partners International,
Inc. (a) (c) | | | 558 | | |
| | 13 | | | Ventiv Health, Inc. (a) | | | 316 | | |
| | | | 6,195 | | |
| | | Hotels, Restaurants & Leisure — 1.7% | |
| | 15 | | | Ameristar Casinos, Inc. (c) | | | 338 | | |
| | 19 | | | CKE Restaurants, Inc. | | | 250 | | |
| | 11 | | | Domino's Pizza, Inc. | | | 257 | | |
| | 6 | | | Jack in the Box, Inc. (a) | | | 213 | | |
| | 26 | | | Landry's Restaurants, Inc. (c) | | | 692 | | |
| | 9 | | | Multimedia Games, Inc. (a) (c) | | | 86 | | |
| | 4 | | | O'Charley's, Inc. (a) | | | 57 | | |
| | 5 | | | Rare Hospitality International, Inc. (a) | | | 140 | | |
| | 19 | | | Ruby Tuesday, Inc. (c) | | | 479 | | |
| | 5 | | | Ryan's Restaurant Group, Inc. (a) (c) | | | 57 | | |
| | | | 2,569 | | |
| | | Household Durables — 1.2% | |
| | — | (h) | | CSS Industries, Inc. (c) | | | 6 | | |
| | 7 | | | Jarden Corp. (a) | | | 220 | | |
| | 10 | | | Levitt Corp., Class A (c) | | | 228 | | |
| | 6 | | | Stanley Furniture Co., Inc. | | | 148 | | |
| | 21 | | | Technical Olympic USA, Inc. | | | 453 | | |
| | 21 | | | Tupperware Corp. | | | 475 | | |
| | 12 | | | WCI Communities, Inc. (a) (c) | | | 314 | | |
| | | | 1,844 | | |
| | | Industrial Conglomerates — 0.4% | |
| | 12 | | | Walter Industries, Inc. (c) | | | 590 | | |
| | | Insurance — 3.0% | |
| | 3 | | | American Physicians Capital, Inc. (a) | | | 147 | | |
| | 7 | | | Argonaut Group, Inc. (a) | | | 232 | | |
| | 26 | | | Delphi Financial Group, Inc. (c) | | | 1,192 | | |
| | 7 | | | Direct General Corp. (c) | | | 114 | | |
| | 6 | | | LandAmerica Financial Group, Inc. (c) | | | 362 | | |
| | 4 | | | Midland Co. (The) (c) | | | 137 | | |
| | 1 | | | Navigators Group, Inc. (a) | | | 26 | | |
| | 43 | | | PMA Capital Corp., Class A (a) | | | 392 | | |
| | 3 | | | Safety Insurance Group, Inc. | | | 133 | | |
| SHARES | | SECURITY DESCRIPTION | | VALUE | |
| | | Insurance — Continued | |
| | 5 | | | Selective Insurance Group (c) | | $ | 281 | | |
| | 6 | | | Stewart Information Services Corp. (c) | | | 297 | | |
| | 3 | | | United Fire & Casualty Co. (c) | | | 121 | | |
| | 22 | | | Zenith National Insurance Corp. | | | 1,017 | | |
| | | | 4,451 | | |
| | | Internet & Catalog Retail — 0.3% | |
| | 4 | | | GSI Commerce, Inc. (a) | | | 60 | | |
| | 9 | | | Insight Enterprises, Inc. (a) (c) | | | 169 | | |
| | 7 | | | Netflix, Inc. (a) (c) | | | 176 | | |
| | 3 | | | Nutri/System (a) (c) | | | 90 | | |
| | | | 495 | | |
| | | Internet Software & Services — 2.5% | |
| | — | (h) | | aQuantive, Inc. (a) | | | 10 | | |
| | 11 | | | AsiaInfo Holdings, Inc. (a) (c) | | | 44 | | |
| | 4 | | | Blue Coat Systems, Inc. (a) (c) | | | 174 | | |
| | 2 | | | Click Commerce, Inc. (a) (c) | | | 38 | | |
| | 65 | | | CMGI, Inc. (a) (c) | | | 98 | | |
| | 23 | | | CNET Networks, Inc. (a) | | | 342 | | |
| | 5 | | | Digital Insight Corp. (a) | | | 147 | | |
| | 5 | | | Digital River, Inc. (a) (c) | | | 152 | | |
| | 21 | | | Digitas, Inc. (a) | | | 264 | | |
| | 39 | | | EarthLink, Inc. (a) | | | 434 | | |
| | 4 | | | Equinix, Inc. (a) (c) | | | 143 | | |
| | 10 | | | Infospace, Inc. (a) (c) | | | 253 | | |
| | 10 | | | Internet Security Systems (a) | | | 203 | | |
| | — | (h) | | Interwoven, Inc. (a) | | | 3 | | |
| | 7 | | | Ipass, Inc. (a) (c) | | | 47 | | |
| | 6 | | | j2 Global Communications, Inc. (a) | | | 244 | | |
| | 7 | | | Openwave Systems, Inc. (a) (c) | | | 129 | | |
| | 8 | | | RealNetworks, Inc. (a) | | | 61 | | |
| | 12 | | | SupportSoft, Inc. (a) | | | 51 | | |
| | 15 | | | United Online, Inc. (c) | | | 209 | | |
| | 12 | | | ValueClick, Inc. (a) (c) | | | 223 | | |
| | 9 | | | WebEx Communications, Inc. (a) (c) | | | 186 | | |
| | 3 | | | webMethods, Inc. (a) | | | 25 | | |
| | 3 | | | Websense, Inc. (a) (c) | | | 223 | | |
| | | | 3,703 | | |
| | | Investment Companies — 0.2% | |
| | 24 | | | Technology Investment Capital Corp. | | | 366 | | |
SEE NOTES TO FINANCIAL STATEMENTS.
JPMORGAN U.S. EQUITY MID/SMALL CAP FUNDS76
ANNUAL REPORT DECEMBER 31
2005
SCHEDULE OF PORTFOLIO INVESTMENTS AS OF DECEMBER 31, 2005
(Amounts in thousands)
(CONTINUED)
| SHARES | | SECURITY DESCRIPTION | | VALUE | |
| Long-Term Investments — continued | | | |
| | | IT Services — 1.8% | |
| | 21 | | | Acxiom Corp. | | $ | 474 | | |
| | 86 | | | BearingPoint, Inc. (a) | | | 677 | | |
| | 23 | | | Ciber, Inc. (a) (c) | | | 149 | | |
| | 5 | | | Covansys Corp. (a) (c) | | | 67 | | |
| | 7 | | | CSG Systems International, Inc. (a) | | | 161 | | |
| | 8 | | | Euronet Worldwide, Inc. (a) (c) | | | 214 | | |
| | 8 | | | Gartner, Inc., Class A (a) (c) | | | 101 | | |
| | 5 | | | Lionbridge Technologies (a) (c) | | | 38 | | |
| | 10 | | | Mantech International Corp., Class A (a) | | | 267 | | |
| | 16 | | | Perot Systems Corp., Class A (a) | | | 231 | | |
| | 5 | | | Startek, Inc. (c) | | | 95 | | |
| | 15 | | | Sykes Enterprises, Inc. (a) | | | 199 | | |
| | 5 | | | Tyler Technologies, Inc. (a) (c) | | | 47 | | |
| | | | 2,720 | | |
| | | Leisure Equipment & Products — 0.7% | |
| | 10 | | | JAKKS Pacific, Inc. (a) (c) | | | 209 | | |
| | 9 | | | K2, Inc. (a) (c) | | | 88 | | |
| | 6 | | | MarineMax, Inc. (a) (c) | | | 186 | | |
| | 11 | | | RC2 Corp. (a) | | | 394 | | |
| | 5 | | | Steinway Musical Instruments, Inc. (a) | | | 128 | | |
| | | | 1,005 | | |
| | | Machinery — 4.0% | |
| | 13 | | | AGCO Corp. (a) (c) | | | 209 | | |
| | 9 | | | Astec Industries, Inc. (a) | | | 305 | | |
| | 11 | | | Barnes Group, Inc. | | | 370 | | |
| | 10 | | | Briggs & Stratton Corp. (c) | | | 384 | | |
| | 6 | | | Cascade Corp. (c) | | | 267 | | |
| | 14 | | | Crane Co. | | | 490 | | |
| | 3 | | | ESCO Technologies, Inc. (a) | | | 151 | | |
| | 10 | | | Flowserve Corp. (a) | | | 376 | | |
| | 6 | | | Greenbrier Cos., Inc. (c) | | | 162 | | |
| | 3 | | | Intevac, Inc. | | | 33 | | |
| | 11 | | | JLG Industries, Inc. | | | 489 | | |
| | 11 | | | Lincoln Electric Holdings, Inc. | | | 440 | | |
| | 10 | | | Manitowoc Co., Inc. | | | 492 | | |
| | 2 | | | Middleby Corp. (a) (c) | | | 138 | | |
| | 5 | | | NACCO Industries, Inc., Class A | | | 539 | | |
| | 8 | | | Reliance Steel & Aluminum Co. | | | 492 | | |
| | 2 | | | Sun Hydraulics, Inc. (c) | | | 31 | | |
| | 2 | | | Tecumseh Products Co., Class A (c) | | | 53 | | |
| SHARES | | SECURITY DESCRIPTION | | VALUE | |
| | | Machinery — Continued | |
| | 5 | | | Valmont Industries, Inc. (c) | | $ | 151 | | |
| | 8 | | | Wabash National Corp. (c) | | | 145 | | |
| | 6 | | | Watts Water Technologies, Inc., Class A | | | 188 | | |
| | | | 5,905 | | |
| | | Marine — 0.1% | |
| | 3 | | | Kirby Corp. (a) | | | 162 | | |
| | | Media — 2.0% | |
| | 3 | | | Advo, Inc. | | | 93 | | |
| | 6 | | | Arbitron, Inc. (c) | | | 217 | | |
| | 5 | | | Catalina Marketing Corp. (c) | | | 124 | | |
| | 107 | | | Charter Communications, Inc.,
Class A (a) (c) | | | 130 | | |
| | 6 | | | Gray Television, Inc. | | | 60 | | |
| | 28 | | | Lodgenet Entertainment Corp. (a) | | | 383 | | |
| | 6 | | | Media General, Inc., Class A | | | 279 | | |
| | 38 | | | Mediacom Communications Corp.,
Class A (a) (c) | | | 210 | | |
| | 11 | | | Playboy Enterprises, Inc., Class B (a) (c) | | | 147 | | |
| | 10 | | | ProQuest Co. (a) (c) | | | 265 | | |
| | 36 | | | Radio One, Inc., Class D (a) (c) | | | 375 | | |
| | 4 | | | Saga Communications, Inc., Class A (a) | | | 38 | | |
| | 8 | | | Scholastic Corp. (a) (c) | | | 234 | | |
| | 10 | | | Sinclair Broadcast Group, Inc., Class A | | | 95 | | |
| | 6 | | | Valassis Communications, Inc. (a) | | | 163 | | |
| | 13 | | | World Wrestling Entertainment, Inc. | | | 186 | | |
| | | | 2,999 | | |
| | | Metals & Mining — 2.2% | |
| | 4 | | | Chaparral Stell Co. (a) | | | 109 | | |
| | 3 | | | Cleveland-Cliffs, Inc. | | | 292 | | |
| | 31 | | | Commercial Metals Co. | | | 1,169 | | |
| | 3 | | | Metal Management, Inc. | | | 65 | | |
| | 5 | | | NN, Inc. | | | 55 | | |
| | 4 | | | Oregon Steel Mills, Inc. (a) (c) | | | 127 | | |
| | 17 | | | Quanex Corp. | | | 825 | | |
| | 12 | | | Ryerson Tull, Inc. (c) | | | 285 | | |
| | 11 | | | Steel Dynamics, Inc. (c) | | | 401 | | |
| | | | 3,328 | | |
SEE NOTES TO FINANCIAL STATEMENTS.
JPMORGAN U.S. EQUITY MID/SMALL CAP FUNDS77
JPMorgan U.S. Small Company Fund
SCHEDULE OF PORTFOLIO INVESTMENTS AS OF DECEMBER 31, 2005
(Amounts in thousands)
(CONTINUED)
| SHARES | | SECURITY DESCRIPTION | | VALUE | |
| Long-Term Investments — continued | | | |
| | | Multi-Utilities — 0.6% | |
| | 9 | | | Avista Corp. (c) | | $ | 165 | | |
| | 8 | | | NorthWestern Corp. | | | 242 | | |
| | 34 | | | Sierra Pacific Resources (a) | | | 446 | | |
| | | | 853 | | |
| | | Oil, Gas & Consumable Fuels — 3.3% | |
| | 6 | | | ATP Oil & Gas Corp. (a) (c) | | | 215 | | |
| | 4 | | | Callon Petroleum Co. (a) | | | 62 | | |
| | 8 | | | Cimarex Energy Co. (a) | | | 346 | | |
| | 3 | | | Clayton Williams Energy, Inc. (a) | | | 134 | | |
| | 4 | | | Comstock Resources, Inc. (a) | | | 125 | | |
| | 7 | | | Energy Partners Ltd. (a) | | | 159 | | |
| | 7 | | | Frontier Oil Corp. | | | 274 | | |
| | 4 | | | Giant Industries, Inc. (a) (c) | | | 187 | | |
| | 5 | | | Gulfmark Offshore, Inc. (a) | | | 142 | | |
| | 4 | | | Holly Corp. | | | 224 | | |
| | 28 | | | Houston Exploration Co. (a) | | | 1,478 | | |
| | 7 | | | KCS Energy, Inc. (a) (c) | | | 160 | | |
| | 3 | | | Penn Virginia Corp. | | | 178 | | |
| | 3 | | | Remington Oil & Gas Corp. (a) | | | 113 | | |
| | 11 | | | St. Mary Land & Exploration Co. | | | 386 | | |
| | 6 | | | Stone Energy Corp. (a) | | | 290 | | |
| | 6 | | | Swift Energy Co. (a) (c) | | | 266 | | |
| | 3 | | | World Fuel Services Corp. (c) | | | 98 | | |
| | | | 4,837 | | |
| | | Personal Products — 0.2% | |
| | 2 | | | Parlux Fragrances, Inc. (a) (c) | | | 49 | | |
| | 13 | | | Playtex Products, Inc. (a) | | | 182 | | |
| | | | 231 | | |
| | | Pharmaceuticals — 1.7% | |
| | 35 | | | Adolor Corp. (a) (c) | | | 508 | | |
| | 7 | | | Alpharma, Inc., Class A | | | 188 | | |
| | 19 | | | AtheroGenics, Inc. (a) (c) | | | 383 | | |
| | 116 | | | AVANIR Pharmaceuticals, Class A (a) | | | 398 | | |
| | 4 | | | Bentley Pharmaceuticals, Inc. (a) | | | 57 | | |
| | 46 | | | Cypress Bioscience, Inc. (a) (c) | | | 268 | | |
| | 12 | | | Durect, Corp. (a) | | | 60 | | |
| | 8 | | | Medicis Pharmaceutical Corp., Class A (c) | | | 266 | | |
| | 2 | | | Par Pharmaceutical Cos, Inc. (a) (c) | | | 60 | | |
| | 3 | | | Salix Pharmaceuticals Ltd. (a) | | | 44 | | |
| | 12 | | | Theravance, Inc. (a) | | | 259 | | |
| | | | 2,491 | | |
| SHARES | | SECURITY DESCRIPTION | | VALUE | |
| | | Real Estate — 7.9% | |
| | 19 | | | American Home Mortgage Investment
Corp. REIT (c) | | $ | 634 | | |
| | 20 | | | Anthracite Capital, Inc., REIT (c) | | | 210 | | |
| | 15 | | | Ashford Hospitality Trust, Inc. REIT | | | 162 | | |
| | 6 | | | Bluegreen Corp. (a) | | | 87 | | |
| | 4 | | | Boykin Lodging Co. REIT (a) | | | 44 | | |
| | 4 | | | Brandywine Realty Trust REIT | | | 109 | | |
| | 9 | | | Entertainment Properties Trust REIT | | | 346 | | |
| | 18 | | | Equity Inns, Inc. REIT | | | 245 | | |
| | 13 | | | FelCor Lodging Trust, Inc. REIT | | | 219 | | |
| | 6 | | | First Potomac Realty Trust REIT (m) | | | 152 | | |
| | 9 | | | Glimcher Realty Trust REIT (c) | | | 221 | | |
| | 7 | | | Impac Mortgage Holdings, Inc. REIT (c) | | | 69 | | |
| | 39 | | | Innkeepers USA Trust REIT | | | 627 | | |
| | 7 | | | Jones Lang LaSalle, Inc. | | | 337 | | |
| | 22 | | | Kilroy Realty Corp. REIT (c) | | | 1,380 | | |
| | 4 | | | LaSalle Hotel Properties REIT (c) | | | 162 | | |
| | 29 | | | Lexington Corporate Properties Trust REIT | | | 621 | | |
| | 24 | | | LTC Properties, Inc. REIT (c) | | | 494 | | |
| | 43 | | | Meristar Hospitality Corp. REIT (a) | | | 399 | | |
| | 17 | | | MFA Mortgage Investments, Inc. REIT | | | 99 | | |
| | 26 | | | Mid-America Apartment Communities,
Inc. REIT | | | 1,271 | | |
| | 3 | | | National Health Investors, Inc. REIT | | | 80 | | |
| | 7 | | | Novastar Financial, Inc. REIT (c) | | | 183 | | |
| | 18 | | | Pennsylvania Real Estate Investment
Trust REIT (c) | | | 657 | | |
| | 21 | | | Post Properties, Inc. REIT | | | 827 | | |
| | 25 | | | RAIT Investment Trust REIT | | | 645 | | |
| | 12 | | | Saul Centers, Inc. REIT | | | 426 | | |
| | 29 | | | Sunstone Hotel Investors, Inc. REIT | | | 781 | | |
| | 6 | | | Taubman Centers, Inc. REIT | | | 222 | | |
| | | | 11,709 | | |
| | | Road & Rail — 1.9% | |
| | 3 | | | Amerco, Inc. (a) (c) | | | 245 | | |
| | 4 | | | Arkansas Best Corp. (c) | | | 188 | | |
| | 12 | | | Dollar Thrifty Automotive Group,
Inc. (a) (c) | | | 422 | | |
| | 1 | | | Frozen Food Express Industries (a) | | | 15 | | |
| | 15 | | | Genesee & Wyoming, Inc., Class A (a) | | | 575 | | |
| | 2 | | | Marten Transport Ltd. (a) (c) | | | 30 | | |
SEE NOTES TO FINANCIAL STATEMENTS.
JPMORGAN U.S. EQUITY MID/SMALL CAP FUNDS78
ANNUAL REPORT DECEMBER 31
2005
SCHEDULE OF PORTFOLIO INVESTMENTS AS OF DECEMBER 31, 2005
(Amounts in thousands)
(CONTINUED)
| SHARES | | SECURITY DESCRIPTION | | VALUE | |
| Long-Term Investments — continued | | | |
| | | Road & Rail — Continued | |
| | 5 | | | Old Dominion Freight Line (a) | | $ | 140 | | |
| | 16 | | | RailAmerica, Inc. (a) | | | 172 | | |
| | 19 | | | SCS Transportation, Inc. (a) | | | 412 | | |
| | 12 | | | Sirva, Inc. (a) | | | 96 | | |
| | 11 | | | U.S. Xpress Enterprises, Inc., Class A (a) | | | 183 | | |
| | 2 | | | USA Truck, Inc. (a) | | | 61 | | |
| | 16 | | | Werner Enterprises, Inc. (c) | | | 307 | | |
| | | | 2,846 | | |
| | | Semiconductors & Semiconductor
Equipment — 5.1% | |
| | 4 | | | Actel Corp. (a) | | | 55 | | |
| | 6 | | | ADE Corp. (a) (c) | | | 144 | | |
| | 13 | | | Advanced Energy Industries, Inc. (a) (c) | | | 150 | | |
| | 19 | | | AMIS Holdings, Inc. (a) | | | 203 | | |
| | 30 | | | Amkor Technology, Inc. (a) (c) | | | 168 | | |
| | 21 | | | Applied Micro Circuits Corp. (a) | | | 53 | | |
| | 14 | | | Asyst Technologies, Inc. (a) | | | 79 | | |
| | 58 | | | Atmel Corp. (a) (c) | | | 180 | | |
| | 4 | | | ATMI, Inc. (a) (c) | | | 98 | | |
| | 8 | | | August Technology Corp. (a) | | | 89 | | |
| | 13 | | | Axcelis Technologies, Inc. (a) | | | 61 | | |
| | 4 | | | Brooks Automation, Inc. (a) (c) | | | 46 | | |
| | 7 | | | Cabot Microelectronics Corp. (a) | | | 211 | | |
| | 21 | | | Cirrus Logic, Inc. (a) (c) | | | 140 | | |
| | 8 | | | Cohu, Inc. | | | 174 | | |
| | 68 | | | Conexant Systems, Inc. (a) | | | 154 | | |
| | 10 | | | Credence Systems Corp. (a) (c) | | | 71 | | |
| | 8 | | | Cymer, Inc. (a) | | | 288 | | |
| | 16 | | | Cypress Semiconductor Corp. (a) (c) | | | 231 | | |
| | 6 | | | Diodes, Inc. (a) (c) | | | 194 | | |
| | 4 | | | DSP Group, Inc. (a) | | | 103 | | |
| | 14 | | | Entegris, Inc. (a) | | | 134 | | |
| | 4 | | | Exar Corp. (a) | | | 48 | | |
| | 7 | | | Fairchild Semiconductor International,
Inc. (a) | | | 122 | | |
| | 3 | | | Genesis Microchip, Inc. (a) (c) | | | 60 | | |
| | 9 | | | Integrated Device Technology, Inc. (a) | | | 115 | | |
| | 5 | | | Integrated Silicon Solutions, Inc. (a) (c) | | | 32 | | |
| | 12 | | | IXYS Corp. (a) | | | 137 | | |
| | 4 | | | Kopin Corp. (a) (c) | | | 22 | | |
| | 14 | | | Kulicke & Soffa Industries, Inc. (a) (c) | | | 124 | | |
| SHARES | | SECURITY DESCRIPTION | | VALUE | |
| | | Semiconductors & Semiconductor
Equipment — Continued | |
| | 9 | | | Lattice Semiconductor Corp. (a) (c) | | $ | 40 | | |
| | 11 | | | LTX Corp. (a) | | | 49 | | |
| | 12 | | | Mattson Technology, Inc. (a) | | | 119 | | |
| | 17 | | | Micrel, Inc. (a) | | | 193 | | |
| | 12 | | | Microsemi Corp. (a) (c) | | | 328 | | |
| | 15 | | | MIPS Technologies, Inc. (a) | | | 85 | | |
| | 4 | | | MKS Instruments, Inc. (a) | | | 64 | | |
| | 13 | | | Omnivision Technologies, Inc. (a) (c) | | | 259 | | |
| | 61 | | | ON Semiconductor Corp. (a) | | | 335 | | |
| | 13 | | | Photronics, Inc. (a) (c) | | | 200 | | |
| | 7 | | | Pixelworks, Inc. (a) (c) | | | 35 | | |
| | 19 | | | PMC-Sierra, Inc. (a) | | | 145 | | |
| | 4 | | | Power Integrations, Inc. (a) | | | 83 | | |
| | 11 | | | Rambus, Inc. (a) | | | 176 | | |
| | 35 | | | RF Micro Devices, Inc. (a) (c) | | | 187 | | |
| | 2 | | | Semitool, Inc. (a) (c) | | | 22 | | |
| | 9 | | | Semtech Corp. (a) (c) | | | 161 | | |
| | 8 | | | Sigmatel, Inc. (a) (c) | | | 107 | | |
| | 17 | | | Silicon Image, Inc. (a) | | | 154 | | |
| | 7 | | | Silicon Laboratories, Inc. (a) | | | 271 | | |
| | 12 | | | Silicon Storage Technology, Inc. (a) (c) | | | 61 | | |
| | 24 | | | Skyworks Solutions, Inc. (a) | | | 122 | | |
| | 4 | | | Standard Microsystems Corp. (a) (c) | | | 100 | | |
| | 3 | | | Supertex, Inc. (a) | | | 124 | | |
| | 6 | | | Tessera Technologies, Inc. (a) | | | 142 | | |
| | 2 | | | Ultratech, Inc. (a) (c) | | | 31 | | |
| | 4 | | | Varian Semiconductor Equipment
Associates, Inc. (a) | | | 180 | | |
| | 33 | | | Vitesse Semiconductor Corp. (a) (c) | | | 63 | | |
| | 5 | | | Zoran Corp. (a) | | | 76 | | |
| | | | 7,598 | | |
| | | Software — 2.7% | |
| | 2 | | | Ansoft Corp. (a) | | | 51 | | |
| | 4 | | | Ansys, Inc. (a) (c) | | | 171 | | |
| | 10 | | | Aspen Technology, Inc. (a) (c) | | | 75 | | |
| | 7 | | | Borland Software Corp. (a) | | | 45 | | |
| | 6 | | | Epicor Software Corp. (a) | | | 83 | | |
| | 5 | | | EPIQ Systems, Inc. (a) (c) | | | 85 | | |
| | 5 | | | Factset Research Systems, Inc. (c) | | | 185 | | |
| | 3 | | | Filenet Corp. (a) | | | 88 | | |
SEE NOTES TO FINANCIAL STATEMENTS.
JPMORGAN U.S. EQUITY MID/SMALL CAP FUNDS79
JPMorgan U.S. Small Company Fund
SCHEDULE OF PORTFOLIO INVESTMENTS AS OF DECEMBER 31, 2005
(Amounts in thousands)
(CONTINUED)
| SHARES | | SECURITY DESCRIPTION | | VALUE | |
| Long-Term Investments — continued | | | |
| | | Software — Continued | |
| | 8 | | | Informatica Corp. (a) | | $ | 96 | | |
| | 2 | | | Intervideo, Inc. (a) | | | 18 | | |
| | 2 | | | InterVoice, Inc. (a) (c) | | | 18 | | |
| | 6 | | | JDA Software Group, Inc. (a) | | | 100 | | |
| | 3 | | | Kronos, Inc. (a) | | | 113 | | |
| | 3 | | | Macrovision Corp. (a) | | | 52 | | |
| | 7 | | | Magma Design Automation, Inc. (a) | | | 60 | | |
| | 5 | | | Manhattan Associates, Inc. (a) | | | 107 | | |
| | 6 | | | Mapinfo Corp. (a) | | | 76 | | |
| | 10 | | | Mentor Graphics Corp. (a) | | | 107 | | |
| | 4 | | | MicroStrategy, Inc. (a) (c) | | | 315 | | |
| | 4 | | | MRO Software, Inc. (a) | | | 49 | | |
| | 52 | | | Parametric Technology Corp. (a) | | | 316 | | |
| | 1 | | | Pegasystems, Inc. (a) | | | 10 | | |
| | 13 | | | Phoenix Technologies Ltd. (a) (c) | | | 81 | | |
| | 17 | | | Progress Software Corp. (a) | | | 490 | | |
| | 2 | | | Quality Systems, Inc. (a) (c) | | | 138 | | |
| | 4 | | | Quest Software, Inc. (a) | | | 56 | | |
| | 26 | | | Secure Computing Corp. (a) | | | 316 | | |
| | 1 | | | SPSS, Inc. (a) | | | 43 | | |
| | 4 | | | Talx Corp. (c) | | | 162 | | |
| | 7 | | | TIBCO Software, Inc. (a) | | | 55 | | |
| | 2 | | | TradeStation Group, Inc. (a) | | | 25 | | |
| | 9 | | | Transaction Systems Architechs, Inc. (a) | | | 259 | | |
| | 10 | | | Wind River Systems, Inc. (a) (c) | | | 152 | | |
| | | | 3,997 | | |
| | | Specialty Retail — 5.5% | |
| | 63 | | | Aaron Rents, Inc. (c) | | | 1,321 | | |
| | 18 | | | Asbury Automotive Group, Inc. (a) | | | 296 | | |
| | 4 | | | Big 5 Sporting Goods Corp. | | | 83 | | |
| | 4 | | | Build-A-Bear Workshop, Inc. (a) (c) | | | 115 | | |
| | 3 | | | Building Material Holding Corp. (c) | | | 205 | | |
| | 2 | | | Burlington Coat Factory Warehouse Corp. | | | 96 | | |
| | 77 | | | Charming Shoppes, Inc. (a) (c) | | | 1,018 | | |
| | 8 | | | Children's Place, Inc. (a) (c) | | | 375 | | |
| | 14 | | | Dress Barn, Inc. (a) (c) | | | 552 | | |
| | 2 | | | GameStop Corp. (c) | | | 58 | | |
| | 9 | | | Genesco, Inc. (a) (c) | | | 330 | | |
| | 26 | | | Guess?, Inc. (a) | | | 908 | | |
| | 7 | | | HOT Topic, Inc. (a) (c) | | | 93 | | |
| | 10 | | | Lithia Motors, Inc., Class A (c) | | | 300 | | |
| SHARES | | SECURITY DESCRIPTION | | VALUE | |
| | | Specialty Retail — Continued | |
| | 10 | | | Movie Gallery, Inc. (c) | | $ | 58 | | |
| | 20 | | | Pacific Sunwear of California, Inc. (a) (c) | | | 486 | | |
| | 10 | | | Petco Animal Supplies, Inc. (a) (c) | | | 226 | | |
| | 9 | | | Select Comfort Corp. (a) (c) | | | 249 | | |
| | 4 | | | Sonic Automotive, Inc. | | | 85 | | |
| | 3 | | | Sports Authority, Inc. (The) (a) (c) | | | 93 | | |
| | 9 | | | Stage Stores, Inc. (c) | | | 265 | | |
| | 19 | | | Stein Mart, Inc. | | | 343 | | |
| | 17 | | | Too, Inc. (a) | | | 488 | | |
| | 4 | | | United Auto Group, Inc. (c) | | | 168 | | |
| | | | 8,211 | | |
| | | Textiles, Apparel & Luxury Goods — 1.1% | |
| | 4 | | | Brown Shoe Co., Inc. (c) | | | 148 | | |
| | 2 | | | Deckers Outdoor Corp. (a) (c) | | | 61 | | |
| | 3 | | | DHB Industries, Inc. (a) | | | 15 | | |
| | 14 | | | K-Swiss, Inc., Class A | | | 441 | | |
| | 9 | | | Kenneth Cole Productions, Inc., Class A (c) | | | 217 | | |
| | 8 | | | Movado Group, Inc. | | | 150 | | |
| | 2 | | | Oxford Industries, Inc. (c) | | | 98 | | |
| | 4 | | | Russell Corp. | | | 50 | | |
| | 13 | | | Skechers U.S.A., Inc., Class A (a) | | | 199 | | |
| | 7 | | | Unifirst Corp. | | | 221 | | |
| | | | 1,600 | | |
| | | Thrifts & Mortgage Finance — 3.3% | |
| | 9 | | | Accredited Home Lenders
Holding Co. (a) (c) | | | 436 | | |
| | 30 | | | BankAtlantic Bancorp, Inc., Class A | | | 426 | | |
| | 4 | | | Commercial Capital Bancorp, Inc. (c) | | | 63 | | |
| | 17 | | | Corus Bankshares, Inc. (c) | | | 940 | | |
| | 4 | | | Dime Community Bancshares | | | 55 | | |
| | 1 | | | Federal Agricultural Mortgage Corp.,
Class C (c) | | | 33 | | |
| | 15 | | | First Niagara Financial Group, Inc. | | | 224 | | |
| | 3 | | | First Place Financial Corp. | | | 60 | | |
| | 4 | | | FirstFed Financial Corp. (a) (c) | | | 207 | | |
| | 9 | | | Flagstar Bancorp, Inc. (c) | | | 130 | | |
| | 13 | | | Fremont General Corp. | | | 311 | | |
| | 5 | | | Gibraltar Industries, Inc. | | | 122 | | |
| | 3 | | | ITLA Capital Corp. (a) (c) | | | 151 | | |
| | 17 | | | Partners Trust Financial Group, Inc. | | | 205 | | |
SEE NOTES TO FINANCIAL STATEMENTS.
JPMORGAN U.S. EQUITY MID/SMALL CAP FUNDS80
ANNUAL REPORT DECEMBER 31
2005
SCHEDULE OF PORTFOLIO INVESTMENTS AS OF DECEMBER 31, 2005
(Amounts in thousands)
(CONTINUED)
| SHARES | | SECURITY DESCRIPTION | | VALUE | |
| Long-Term Investments — continued | | | |
| | | Thrifts & Mortgage Finance — Continued | |
| | 16 | | | Provident New York Bancorp (c) | | $ | 181 | | |
| | 27 | | | R&G Financial Corp., Class B (c) | | | 359 | | |
| | 11 | | | Sterling Financial Corp. | | | 282 | | |
| | 50 | | | W Holding Co., Inc. | | | 409 | | |
| | 5 | | | WSFS Financial Corp. | | | 325 | | |
| | | | 4,919 | | |
| | | Tobacco — 0.4% | |
| | 34 | | | Alliance One International, Inc. (c) | | | 132 | | |
| | 12 | | | Universal Corp. (c) | | | 520 | | |
| | | | 652 | | |
| | | Trading Companies & Distributors — 1.6% | |
| | 53 | | | Applied Industrial Technologies, Inc. | | | 1,773 | | |
| | 16 | | | Hughes Supply, Inc. | | | 584 | | |
| | 3 | | | Nuco2, Inc. (a) (c) | | | 95 | | |
| | | | 2,452 | | |
| | | Wireless Telecommunication Services — 0.5% | |
| | 15 | | | Centennial Communications Corp. (a) | | | 234 | | |
| | 70 | | | Dobson Communications Corp. (a) | | | 524 | | |
| | 5 | | | InPhonic, Inc. (a) (c) | | | 40 | | |
| | | | 798 | | |
| | | | | Total Common Stocks
(Cost $129,066) | | | 154,142
| | |
| Short-Term Investment — 1.3% | | | |
| | | Investment Company — 1.1% | |
| | 1,656 | | | JPMorgan Prime Money Market
Fund (b) (m) | | | 1,656 | | |
PRINCIPAL
AMOUNT | |
| | | U.S. Treasury Obligation — 0.2% | |
| $ | 265 | | | U.S. Treasury Note, 2.88%, 11/30/06 (k) | | | 261 | | |
| | | | | Total Short-Term Investments
(Cost $1,918) | | | 1,917
| | |
PRINCIPAL
AMOUNT | | SECURITY DESCRIPTION | | VALUE | |
| Investments of Cash Collateral for Securities Loaned — 26.1% | | | |
| | | Certificates of Deposit — 2.2% | |
| $ | 1,800 | | | Royal Bank of Canada, FRN,
4.30%, 11/13/06 | | $ | 1,800 | | |
| | 1,500 | | | Wells Fargo Bank San Francisco,
4.30%, 1/27/06 | | | 1,500 | | |
| | | | 3,300 | | |
| | | Corporate Notes — 6.5% | |
| | 1,000 | | | Alliance and Leister plc, FRN,
4.33, 01/30/07 | | | 1,000 | | |
| | 1,800 | | | American Express Credit Corp., FRN,
4.36%, 06/12/07 | | | 1,800 | | |
| | 1,000 | | | Bank of America, FRN, 4.31%, 11/07/06 | | | 1,000 | | |
| | 1,802 | | | General Electric Capital Corp., FRN,
4.30%, 05/12/06 | | | 1,802 | | |
| | 1,000 | | | K2(USA) LLC, 4.35%, 02/15/06 | | | 1,000 | | |
| | 1,000 | | | Liberty Lighthouse U.S. Capital, FRN,
4.34%, 10/24/06 | | | 1,000 | | |
| | 1,003 | | | Links Finance LLC, FRN, 4.29%, 10/06/06 | | | 1,003 | | |
| | 1,000 | | | Sigma Finance Inc., FRN, 4.37%, 10/24/07 | | | 1,000 | | |
| | | | 9,605 | | |
| | | Repurchase Agreements — 17.4% | |
| | 4,372 | | | Bank of America Securities LLC, 4.26%,
dated 12/30/05, due 01/03/06,
repurchase price $4,374, collateralized
by U.S. Government Agency Mortgages. | | | 4,372 | | |
| | 7,500 | | | Lehman Brothers Inc., FRN, 4.26%,
dated 12/30/05, due 01/03/06,
repurchase price $7,503, collateralized
by U.S. Government Agency Mortgages. | | | 7,500 | | |
| | 7,500 | | | Morgan Stanley & Co., Inc., 4.27%,
dated 12/30/05, due 01/03/06,
repurchase price $7,503, collateralized
by U.S. Government Agency Mortgages. | | | 7,500 | | |
SEE NOTES TO FINANCIAL STATEMENTS.
JPMORGAN U.S. EQUITY MID/SMALL CAP FUNDS81
JPMorgan U.S. Small Company Fund
SCHEDULE OF PORTFOLIO INVESTMENTS AS OF DECEMBER 31, 2005
(Amounts in thousands)
(CONTINUED)
PRINCIPAL
AMOUNT | | SECURITY DESCRIPTION | | VALUE | |
| Short-Term Investments — continued | |
| $ | 6,500 | | | UBS Securities LLC, 4.26%,
dated 12/30/05, due 01/03/06,
repurchase price $6,503, collateralized
by U.S. Government Agency Mortgages. | | $ | 6,500 | | |
| | | | 25,872 | | |
| | | Total Investments of Cash Collateral
for Securities Loaned
(Cost $38,777) | | |
38,777
| | |
| | | Total Investments — 131.0%
(Cost $169,761) | | | $194,836
| | |
| | | Liabilities in Excess of Other
Assets — (31.0)% | | | (46,143 | ) | |
| | | NET ASSETS — 100.0% | | $ | 148,693 | | |
Percentages indicated are based on net assets.
Futures Contracts
(Amounts in thousands, except for number of contracts)
NUMBER OF
CONTRACTS | | DESCRIPTION | | EXPIRATION DATE | | NOTIONAL
VALUE AT
12/31/05 (USD) | | UNREALIZED
(DEPRECIATION)
(USD) | |
| | 12 | | | Russell 2000 Index | | March, 2006 | | $ | 4,070 | | | $ | (56 | ) | |
SEE NOTES TO FINANCIAL STATEMENTS.
JPMORGAN U.S. EQUITY MID/SMALL CAP FUNDS82
JPMorgan Value Advantage Fund
SCHEDULE OF PORTFOLIO INVESTMENTS AS OF DECEMBER 31, 2005
(Amounts in thousands)
| SHARES | | SECURITY DESCRIPTION | | VALUE | |
| Long-Term Investments — 94.9% | | | |
| | | Common Stocks — 94.9% | |
| | | Building Products — 2.9% | |
| | 125 | | | Griffon Corp. (a) | | $ | 2,976 | | |
| | | Capital Markets — 0.9% | |
| | 43 | | | E*Trade Financial Corp. (a) | | | 897 | | |
| | | Chemicals — 2.2% | |
| | 60 | | | Albemarle Corp. | | | 2,301 | | |
| | | Commercial Banks — 6.1% | |
| | 9 | | | M&T Bank Corp. | | | 982 | | |
| | 70 | | | North Fork Bancorp, Inc. | | | 1,915 | | |
| | 10 | | | SunTrust Banks, Inc. | | | 728 | | |
| | 60 | | | U.S. Bancorp | | | 1,793 | | |
| | 15 | | | Wells Fargo & Co. | | | 942 | | |
| | | | 6,360 | | |
| | | Commercial Services & Supplies — 1.6% | |
| | 50 | | | CCE Spinco, Inc. (a) | | | 655 | | |
| | 25 | | | Pitney Bowes, Inc. | | | 1,056 | | |
| | | | 1,711 | | |
| | | Construction & Engineering — 0.5% | |
| | 10 | | | Hanson plc (United Kingdom) | | | 549 | | |
| | | Construction Materials — 1.7% | |
| | 30 | | | Cemex S.A. de C.V. (Mexico) ADR | | | 1,780 | | |
| | | Consumer Finance — 1.0% | |
| | 40 | | | MBNA Corp. | | | 1,086 | | |
| | | Diversified Telecommunication Services — 6.6% | |
| | 10 | | | Alltel Corp. | | | 631 | | |
| | 25 | | | CenturyTel, Inc. | | | 829 | | |
| | 100 | | | Commonwealth Telephone
Enterprises, Inc. | | | 3,377 | | |
| | 160 | | | Consolidated Communications
Holdings, Inc. | | | 2,078 | | |
| | | | 6,915 | | |
| | | Food & Staples Retailing — 1.7% | |
| | 30 | | | CVS Corp. | | | 793 | | |
| | 100 | | | Pathmark Stores, Inc. (a) | | | 999 | | |
| | | | 1,792 | | |
| SHARES | | SECURITY DESCRIPTION | | VALUE | |
| | | Gas Utilities — 1.2% | |
| | 60 | | | UGI Corp. | | $ | 1,236 | | |
| | | Health Care Providers & Services — 0.8% | |
| | 15 | | | Coventry Health Care, Inc. (a) | | | 854 | | |
| | | Hotels, Restaurants & Leisure — 4.3% | |
| | 60 | | | AFC Enterprises, Inc.(a) | | | 907 | | |
| | 50 | | | Hilton Hotels Corp. | | | 1,206 | | |
| | 15 | | | McDonald's Corp. | | | 506 | | |
| | 45 | | | Outback Steakhouse, Inc. | | | 1,872 | | |
| | | | 4,491 | | |
| | | Household Durables — 1.6% | |
| | 60 | | | WCI Communities, Inc. (a) | | | 1,611 | | |
| | | Industrial Conglomerates — 3.6% | |
| | 25 | | | Carlisle Cos., Inc. | | | 1,729 | | |
| | 40 | | | Walter Industries, Inc. | | | 1,989 | | |
| | | | 3,718 | | |
| | | Insurance — 10.2% | |
| | 55 | | | Assurant, Inc. | | | 2,392 | | |
| | — | (h) | | Berkshire Hathaway, Inc., Class A (a) | | | 1,950 | | |
| | 20 | | | Genworth Financial, Inc., Class A | | | 692 | | |
| | 45 | | | IPC Holdings Ltd. (Bermuda) | | | 1,232 | | |
| | 15 | | | Loews Corp. | | | 1,423 | | |
| | 60 | | | ProAssurance Corp. (a) | | | 2,918 | | |
| | | | 10,607 | | |
| | | Marine — 1.4% | |
| | 75 | | | Seaspan Corp. (China) | | | 1,481 | | |
| | | Media — 8.7% | |
| | 120 | | | Citadel Broadcasting Corp. | | | 1,613 | | |
| | 80 | | | Clear Channel Communications, Inc. | | | 2,516 | | |
| | 35 | | | Gannett Co., Inc. | | | 2,120 | | |
| | 70 | | | Liberty Media Corp., Class A (a) | | | 551 | | |
| | 3 | | | Washington Post Co. (The), Class B | | | 2,295 | | |
| | | | 9,095 | | |
SEE NOTES TO FINANCIAL STATEMENTS.
JPMORGAN U.S. EQUITY MID/SMALL CAP FUNDS83
JPMorgan Value Advantage Fund
SCHEDULE OF PORTFOLIO INVESTMENTS AS OF DECEMBER 31, 2005
(Amounts in thousands)
(CONTINUED)
| SHARES | | SECURITY DESCRIPTION | | VALUE | |
| Long-Term Investments — continued | | | |
| | | Multiline Retail — 2.2% | |
| | 20 | | | Sears Holdings Corp. (a) | | $ | 2,311 | | |
| | | Oil, Gas & Consumable Fuels — 9.0% | |
| | 80 | | | Devon Energy Corp. | | | 5,003 | | |
| | 25 | | | Kinder Morgan, Inc. | | | 2,299 | | |
| | 20 | | | Teekay Shipping Corp. (Bahamas) | | | 798 | | |
| | 55 | | | Williams Cos., Inc. | | | 1,274 | | |
| | | | 9,374 | | |
| | | Paper & Forest Products — 1.1% | |
| | 20 | | | MeadWestvaco Corp. | | | 561 | | |
| | 20 | | | Neenah Paper, Inc. | | | 560 | | |
| | | | 1,121 | | |
| | | Real Estate — 9.2% | |
| | 75 | | | Agree Realty Corp. REIT | | | 2,167 | | |
| | 20 | | | First Industrial Realty Trust, Inc. REIT | | | 770 | | |
| | 50 | | | National Health Investors, Inc. REIT | | | 1,298 | | |
| | 25 | | | Sun Communities, Inc. REIT | | | 785 | | |
| | 120 | | | W.P. Carey & Co. LLC | | | 3,043 | | |
| | 50 | | | Washington Real Estate Investment
Trust REIT | | | 1,518 | | |
| | | | 9,581 | | |
| | | Software — 1.0% | |
| | 40 | | | Microsoft Corp. | | | 1,046 | | |
| | | Specialty Retail — 6.4% | |
| | 35 | | | AutoZone, Inc. (a) | | | 3,211 | | |
| | 15 | | | Best Buy Co., Inc. | | | 652 | | |
| | 63 | | | Limited Brands, Inc. | | | 1,408 | | |
| | 60 | | | TJX Cos., Inc. | | | 1,394 | | |
| | | | 6,665 | | |
| SHARES | | SECURITY DESCRIPTION | | VALUE | |
| | | Textiles, Apparel & Luxury Goods — 5.1% | |
| | 35 | | | Columbia Sportswear Co. (a) | | $ | 1,671 | | |
| | 66 | | | V.F. Corp. | | | 3,652 | | |
| | | | 5,323 | | |
| | | Thrifts & Mortgage Finance — 2.9% | |
| | 15 | | | Freddie Mac | | | 980 | | |
| | 31 | | | Golden West Financial Corp. | | | 2,046 | | |
| | | | 3,026 | | |
| | | Wireless Telecommunication Services — 1.0% | |
| | 20 | | | U.S. Cellular Corp. (a) | | | 988 | | |
| | | | | Total Common Stocks
(Cost $96,567) | | | 98,895
| | |
| Short-Term Investment — 4.0% | | | |
| | | Investment Company — 4.0% | |
| | 4,141
| | | JPMorgan Prime Money
Market Fund (b) (m)
(Cost $4,141) | | |
4,141
| | |
| | | | | Total Investments — 98.9%
(Cost $100,708) | | | $103,036
| | |
| | | | | Other Assets in Excess of
Liabilities — 1.1% | | | 1,129 | | |
| | | | | NET ASSETS — 100.0% | | $ | 104,165 | | |
Percentages indicated are based on net assets.
Abbreviations:
(a) — Non-income producing security.
(b) — Investment in affiliate. Money market fund registered under the Investment Company Act of 1940, as amended, and advised by J.P. Morgan Investment Management Inc.
(c) — Security, or a portion of the security, has been delivered to a counterparty as part of a security lending transaction.
(h) — Amount rounds to less than one thousand.
(k) — Security is fully or partially segregated with the broker as collateral for futures or with brokers as initial margin for futures contracts.
(m) — All or a portion of this security is segregated for current or potential holdings of futures, swaps, options, TBA, when-issued securities, delayed delivery securities, and reverse repurchase agreements.
ADR — American Depositary Receipt
FRN — Floating Rate Note. The rate shown is the rate in effect as of December 31, 2005.
REIT — Real Estate Investment Trust
USD — United States Dollar
SEE NOTES TO FINANCIAL STATEMENTS.
JPMORGAN U.S. EQUITY MID/SMALL CAP FUNDS84
JPMorgan Funds
STATEMENT OF ASSETS
AND LIABILITIES AS OF DECEMBER 31, 2005
(Amounts in thousands, except per share amounts)
| | | Capital
Growth
Fund | | Dynamic
Small Cap
Fund | | Growth
Advantage
Fund* | | Micro Cap
Fund | | Mid Cap
Equity
Fund | |
| ASSETS: | |
| Investments in non-affiliates, at value | | $ | 848,415 | | | $ | 219,964 | | | $ | 64,975 | | | $ | 5,068 | | | $ | 282,239 | | |
| Investments in affiliates, at value | | | 7,923 | | | | 5,290 | | | | 409 | | | | 99 | | | | 4,875 | | |
| Total investment securities, at value | | | 856,338 | | | | 225,254 | | | | 65,384 | | | | 5,167 | | | | 287,114 | | |
| Cash | | | 21 | | | | — | | | | 3 | | | | — | | | | 11 | | |
| Receivables: | |
| Investment securities sold | | | 2,092 | | | | 16 | | | | 7 | | | | 5 | | | | 364 | | |
| Fund shares sold | | | 6,707 | | | | 1,531 | | | | 370 | | | | — | | | | 767 | | |
| Interest and dividends | | | 217 | | | | 36 | | | | 24 | | | | 1 | | | | 293 | | |
| Due from advisor | | | — | | | | — | | | | — | | | | 17 | | | | — | | |
| Total Assets | | | 865,375 | | | | 226,837 | | | | 65,788 | | | | 5,190 | | | | 288,549 | | |
| LIABILITIES: | |
| Payables: | |
| Investment securities purchased | | | 419 | | | | — | | | | 54 | | | | — | (a) | | | 1,414 | | |
Collateral for securities lending
program | | | 77,753 | | | | 42,643 | | | | 9,062 | | | | — | | | | 18,220 | | |
| Fund shares redeemed | | | 893 | | | | 1,623 | | | | 513 | | | | — | | | | 81 | | |
| Accrued liabilities: | |
| Investment advisory fees | | | 267 | | | | 8 | | | | 10 | | | | — | | | | 151 | | |
| Administration fees | | | 68 | | | | 13 | | | | 3 | | | | — | | | | 21 | | |
| Shareholder servicing fees | | | 167 | | | | 28 | | | | 3 | | | | — | | | | 21 | | |
| Distribution fees | | | 132 | | | | 71 | | | | 13 | | | | 1 | | | | — | | |
| Custodian and accounting fees | | | 11 | | | | 3 | | | | — | | | | 5 | | | | 4 | | |
Trustees' fees - deferred
compensation plan | | | 42 | | | | 6 | | | | 1 | | | | — | (a) | | | 5 | | |
| Other | | | 143 | | | | 98 | | | | 33 | | | | 26 | | | | 50 | | |
| Total Liabilities | | | 79,895 | | | | 44,493 | | | | 9,692 | | | | 32 | | | | 19,967 | | |
| NET ASSETS: | | $ | 785,480 | | | $ | 182,344 | | | $ | 56,096 | | | $ | 5,158 | | | $ | 268,582 | | |
(a) Amount rounds to less than $1,000.
* Prior to August 17, 2005, the Fund was named Mid Cap Growth Fund
SEE NOTES TO FINANCIAL STATEMENTS.
JPMORGAN U.S. EQUITY MID/SMALL CAP FUNDS85
JPMorgan Funds
STATEMENT OF ASSETS
AND LIABILITIES (CONTINUED) AS OF DECEMBER 31, 2005
(Amounts in thousands, except per share amounts)
| | | Capital
Growth
Fund | | Dynamic
Small Cap
Fund | | Growth
Advantage
Fund* | | Micro Cap
Fund | | Mid Cap
Equity
Fund | |
| NET ASSETS: | |
| Paid in capital | | $ | 650,575 | | | $ | 160,522 | | | $ | 292,658 | | | $ | 4,999 | | | $ | 214,860 | | |
Accumulated undistributed
(distributions in excess of)
net investment income | | | (42 | ) | | | (6 | ) | | | (1 | ) | | | — | | | | 5 | �� | |
Accumulated net realized
gains (losses) from investments
and futures | | | 12,657 | | | | (937 | ) | | | (245,138 | ) | | | 33 | | | | 3,655 | | |
Net unrealized appreciation
(depreciation) from investments
and futures | | | 122,290 | | | | 22,765 | | | | 8,577 | | | | 126 | | | | 50,062 | | |
| Total Net Assets | | $ | 785,480 | | | $ | 182,344 | | | $ | 56,096 | | | $ | 5,158 | | | $ | 268,582 | | |
| Net Assets: | |
| Class A | | $ | 458,716 | | | $ | 75,940 | | | $ | 54,737 | | | $ | 516 | | | $ | — | | |
| Class B | | $ | 34,126 | | | $ | 41,440 | | | $ | 1,359 | | | $ | — | | | $ | — | | |
| Class C | | $ | 17,120 | | | $ | 43,211 | | | $ | — | | | $ | 515 | | | $ | — | | |
| Select Class | | $ | 275,518 | | | $ | 21,753 | | | $ | — | | | $ | 4,127 | | | $ | 268,582 | | |
| Total | | $ | 785,480 | | | $ | 182,344 | | | $ | 56,096 | | | $ | 5,158 | | | $ | 268,582 | | |
Outstanding units of beneficial interest
(shares) ($0.0001/$0.001(c) par value;
unlimited number of shares authorized): | |
| Class A | | | 11,722 | | | | 4,191 | | | | 8,623 | | | | 33 | | | | — | | |
| Class B | | | 951 | | | | 2,442 | | | | 223 | | | | — | | | | — | | |
| Class C | | | 485 | | | | 2,550 | | | | — | | | | 33 | | | | — | | |
| Select Class | | | 6,662 | | | | 1,166 | | | | — | | | | 267 | | | | 8,171 | | |
| Total | | | 19,820 | | | | 10,349 | | | | 8,846 | | | | 333 | | | | 8,171 | | |
| NET ASSET VALUE: | |
| Class A - Redemption price per share | | $ | 39.13 | | | $ | 18.12 | | | $ | 6.35 | | | $ | 15.47 | | | $ | — | | |
| Class B - Offering price per share (b) | | $ | 35.89 | | | $ | 16.97 | | | $ | 6.08 | | | $ | — | | | $ | — | | |
| Class C - Offering price per share (b) | | $ | 35.32 | | | $ | 16.95 | | | $ | — | | | $ | 15.46 | | | $ | — | | |
Select Class - Offering and redemption
price per share | | $ | 41.36 | | | $ | 18.65 | | | $ | — | | | $ | 15.48 | | | $ | 32.87 | | |
| Class A maximum sales charge | | | 5.25 | % | | | 5.25 | % | | | 5.25 | % | | | 5.25 | % | | | — | | |
Class A Maximum Public Offering
Price Per Share (net asset value per
share/100% - maximum sales charge) | | $ | 41.30 | | | $ | 19.12 | | | $ | 6.70 | | | $ | 16.33 | | | $ | — | | |
| Cost of investments | | $ | 734,048 | | | $ | 202,489 | | | $ | 56,807 | | | $ | 5,041 | | | $ | 237,052 | | |
| Market value of securities on loan | | $ | 75,732 | | | $ | 41,718 | | | $ | 8,800 | | | $ | — | | | $ | 17,762 | | |
* Prior to August 17, 2005, the Fund was named Mid Cap Growth Fund
(a) Amount rounds to less than $1,000.
(b) Redemption price for Class B and Class C Shares varies based upon length of time the shares are held.
(c) For Growth Advantage Fund par value is $0.001.
SEE NOTES TO FINANCIAL STATEMENTS.
JPMORGAN U.S. EQUITY MID/SMALL CAP FUNDS86
ANNUAL REPORT DECEMBER 31
2005
STATEMENT OF ASSETS
AND LIABILITIES (CONTINUED) AS OF DECEMBER 31, 2005
(Amounts in thousands, except per share amounts)
| | | Mid Cap
Value
Fund | | Small Cap
Core
Fund** | | Small Cap
Equity
Fund | | U.S. Small
Company
Fund | | Value
Advantage
Fund | |
| ASSETS: | |
| Investments in non-affiliates, at value | | $ | 7,175,313 | | | $ | 992,312 | | | $ | 561,933 | | | $ | 167,308 | | | $ | 98,895 | | |
| Investments in affiliates, at value | | | 434,249 | | | | 19,411 | | | | 24,904 | | | | 1,656 | | | | 4,141 | | |
| Repurchase agreements, at value | | | — | | | | — | | | | — | | | | 25,872 | | | | — | | |
| Total investment securities, at value | | | 7,609,562 | | | | 1,011,723 | | | | 586,837 | | | | 194,836 | | | | 103,036 | | |
| Cash | | | 442 | | | | 40 | | | | 35 | | | | 283 | | | | 273 | | |
| Receivables: | |
| Investment securities sold | | | 509 | | | | 889 | | | | — | | | | 2,493 | | | | — | | |
| Fund shares sold | | | 14,616 | | | | 795 | | | | 2,545 | | | | 445 | | | | 1,654 | | |
| Interest and dividends | | | 13,191 | | | | 882 | | | | 559 | | | | 171 | | | | 218 | | |
| Prepaid expenses and other assets | | | — | | | | — | | | | — | | | | — | | | | 1 | | |
| Total Assets | | | 7,638,320 | | | | 1,014,329 | | | | 589,976 | | | | 198,228 | | | | 105,182 | | |
| LIABILITIES: | |
| Payables: | |
| Investment securities purchased | | | 166,258 | | | | — | | | | 10,425 | | | | — | | | | 803 | | |
Collateral for securities lending
program | | | 417,693 | | | | 197,606 | | | | 97,572 | | | | 38,777 | | | | — | | |
| Fund shares redeemed | | | 31,316 | | | | 160 | | | | 891 | | | | 10,558 | | | | 82 | | |
Variation margin on futures
contracts | | | — | | | | 48 | | | | — | | | | 14 | | | | — | | |
| Accrued liabilities: | |
| Investment advisory fees | | | 2,534 | | | | 460 | | | | 266 | | | | 66 | | | | 45 | | |
| Administration fees | | | 572 | | | | 58 | | | | 15 | | | | 13 | | | | 6 | | |
| Shareholder servicing fees | | | 1,094 | | | | 22 | | | | 50 | | | | 18 | | | | 21 | | |
| Distribution fees | | | 1,284 | | | | — | | | | 62 | | | | — | | | | 44 | | |
| Custodian and accounting fees | | | 47 | | | | 24 | | | | 8 | | | | 33 | | | | 16 | | |
Trustees' fees - deferred
compensation plan | | | 2 | | | | 16 | | | | 25 | | | | 1 | | | | — | (a) | |
| Other | | | 717 | | | | 30 | | | | 120 | | | | 55 | | | | — | | |
| Total Liabilities | | | 621,517 | | | | 198,424 | | | | 109,434 | | | | 49,535 | | | | 1,017 | | |
| NET ASSETS: | | $ | 7,016,803 | | | $ | 815,905 | | | $ | 480,542 | | | $ | 148,693 | | | $ | 104,165 | | |
(a) Amount rounds to less than $1,000.
** Prior to February 19, 2005, the Fund was named Trust Small Cap Equity.
SEE NOTES TO FINANCIAL STATEMENTS.
JPMORGAN U.S. EQUITY MID/SMALL CAP FUNDS87
JPMorgan Funds
STATEMENT OF ASSETS
AND LIABILITIES (CONTINUED) AS OF DECEMBER 31, 2005
(Amounts in thousands, except per share amounts)
| | | Mid Cap
Value
Fund | | Small Cap
Core
Fund** | | Small Cap
Equity
Fund | | U.S. Small
Company
Fund | | Value
Advantage
Fund | |
| NET ASSETS: | |
| Paid in capital | | $ | 6,244,958 | | | $ | 743,912 | | | $ | 378,979 | | | $ | 122,763 | | | $ | 102,272 | | |
Accumulated undistributed
(distributions in excess of)
net investment income | | | (2 | ) | | | (17 | ) | | | (15 | ) | | | 236 | | | | 23 | | |
Accumulated net realized
gains (losses) from
investments and futures | | | 34,891 | | | | (2,006 | ) | | | 3,159 | | | | 675 | | | | (458 | ) | |
Net unrealized appreciation
(depreciation) from
investments and futures | | | 736,956 | | | | 74,016 | | | | 98,419 | | | | 25,019 | | | | 2,328 | | |
| Total Net Assets | | $ | 7,016,803 | | | $ | 815,905 | | | $ | 480,542 | | | $ | 148,693 | | | $ | 104,165 | | |
| Net Assets: | |
| Class A | | $ | 2,822,767 | | | $ | — | | | $ | 209,321 | | | $ | — | | | $ | 45,163 | | |
| Class B | | $ | 233,396 | | | $ | — | | | $ | 17,106 | | | $ | — | | | $ | — | | |
| Class C | | $ | 822,366 | | | $ | — | | | $ | 10,678 | | | $ | — | | | $ | 55,875 | | |
| Select Class | | $ | 1,222,881 | | | $ | 815,905 | | | $ | 243,437 | | | $ | 102,003 | | | $ | 3,107 | | |
| Institutional Class | | $ | 1,915,393 | | | $ | — | | | $ | — | | | $ | 46,690 | | | $ | 20 | | |
| Total | | $ | 7,016,803 | | | $ | 815,905 | | | $ | 480,542 | | | $ | 148,693 | | | $ | 104,165 | | |
Outstanding units of beneficial
interest (shares) ($0.0001/$0.001(c)
par value; unlimited number of
shares authorized): | |
| Class A | | | 121,229 | | | | — | | | | 7,958 | | | | — | | | | 2,844 | | |
| Class B | | | 10,212 | | | | — | | | | 730 | | | | — | | | | — | | |
| Class C | | | 35,909 | | | | — | | | | 456 | | | | — | | | | 3,525 | | |
| Select Class | | | 52,164 | | | | 18,547 | | | | 8,642 | | | | 7,886 | | | | 195 | | |
| Institutional Class | | | 81,228 | | | | — | | | | — | | | | 3,611 | | | | 1 | | |
| Total | | | 300,742 | | | | 18,547 | | | | 17,786 | | | | 11,497 | | | | 6,565 | | |
** Prior to February 19, 2005, the Fund was named Trust Small Cap Equity.
(c) For Mid Cap Value Fund par value is $0.001.
SEE NOTES TO FINANCIAL STATEMENTS.
JPMORGAN U.S. EQUITY MID/SMALL CAP FUNDS88
ANNUAL REPORT DECEMBER 31
2005
STATEMENT OF ASSETS
AND LIABILITIES (CONTINUED) AS OF DECEMBER 31, 2005
(Amounts in thousands, except per share amounts)
| | | Mid Cap
Value
Fund | | Small Cap
Core
Fund** | | Small Cap
Equity
Fund | | U.S. Small
Company
Fund | | Value
Advantage
Fund | |
| NET ASSET VALUE: | |
| Class A - Redemption price per share | | $ | 23.28 | | | $ | — | | | $ | 26.30 | | | $ | — | | | $ | 15.88 | | |
| Class B - Offering price per share (a) | | $ | 22.86 | | | $ | — | | | $ | 23.44 | | | $ | — | | | $ | — | | |
| Class C - Offering price per share (a) | | $ | 22.90 | | | $ | — | | | $ | 23.43 | | | $ | — | | | $ | 15.85 | | |
Select Class - Offering and redemption
price per share | | $ | 23.44 | | | $ | 43.99 | | | $ | 28.17 | | | $ | 12.94 | | | $ | 15.91 | | |
Institutional Class - Offering and
redemption price per share | | $ | 23.58 | | | $ | — | | | $ | — | | | $ | 12.93 | | | $ | 15.83 | | |
| Class A maximum sales charge | | | 5.25 | % | | | — | | | | 5.25 | % | | | — | | | | 5.25 | % | |
Class A Maximum Public Offering
Price Per Share (net asset value per
share/100% - maximum sales charge) | | $ | 24.57 | | | $ | — | | | $ | 27.76 | | | $ | — | | | $ | 16.76 | | |
| Cost of investments | | $ | 6,872,606 | | | $ | 937,329 | | | $ | 488,418 | | | $ | 169,761 | | | $ | 100,708 | | |
| Market value of securities on loan | | $ | 407,858 | | | $ | 191,941 | | | $ | 94,938 | | | $ | 37,571 | | | $ | — | | |
(a) Redemption price for Class B and Class C Shares varies based upon length of time the shares are held.
** Prior to February 19, 2005, the Fund was named Trust Small Cap Equity.
SEE NOTES TO FINANCIAL STATEMENTS.
JPMORGAN U.S. EQUITY MID/SMALL CAP FUNDS89
JPMorgan Funds
STATEMENT OF
OPERATIONS FOR THE PERIOD ENDED DECEMBER 31, 2005
(Amounts in thousands)
| | | Capital
Growth
Fund | | Dynamic
Small Cap
Fund | | Growth
Advantage
Fund(c) | | Micro Cap
Fund(d) | | Mid Cap
Equity
Fund | |
| INVESTMENT INCOME: | |
| Dividend income | | $ | 3,549 | | | $ | 352 | | | $ | 260 | | | $ | 1 | | | $ | 2,758 | | |
| Dividend income from affiliates (a) | | | 451 | | | | 124 | | | | 20 | | | | 1 | | | | 215 | | |
| Income from securities lending (net) | | | 91 | | | | 121 | | | | 8 | | | | — | | | | 15 | | |
| Foreign taxes withheld | | | (6 | ) | | | (2 | ) | | | (1 | ) | | | — | | | | (5 | ) | |
| Total investment income | | | 4,085 | | | | 595 | | | | 287 | | | | 2 | | | | 2,983 | | |
| EXPENSES: | |
| Investment advisory fees | | | 2,864 | | | | 1,143 | | | | 344 | | | | 11 | | | | 1,633 | | |
| Administration fees | | | 798 | | | | 197 | | | | 59 | | | | 1 | | | | 280 | | |
| Distribution fees: | |
| Class A | | | 1,098 | | | | 176 | | | | 126 | | | | — | (b) | | | — | | |
| Class B | | | 298 | | | | 388 | | | | 20 | | | | — | | | | — | | |
| Class C | | | 84 | | | | 279 | | | | — | | | | 1 | | | | — | | |
| Shareholder servicing fees: | |
| Class A | | | 1,098 | | | | 177 | | | | 126 | | | | — | (b) | | | — | | |
| Class B | | | 99 | | | | 129 | | | | 6 | | | | — | | | | — | | |
| Class C | | | 28 | | | | 93 | | | | — | | | | — | (b) | | | — | | |
| Select Class | | | 565 | | | | 41 | | | | — | | | | 2 | | | | 628 | | |
| Custodian and accounting fees | | | 64 | | | | 45 | | | | 41 | | | | 5 | | | | 50 | | |
| Interest expense | | | — | | | | 1 | | | | 1 | | | | — | | | | 6 | | |
| Professional fees | | | 52 | | | | 44 | | | | 43 | | | | 22 | | | | 40 | | |
| Trustees' fees | | | 13 | | | | 3 | | | | 1 | | | | — | (b) | | | 3 | | |
| Printing and mailing costs | | | 108 | | | | 72 | | | | 46 | | | | 1 | | | | 25 | | |
| Registration and filing fees | | | 58 | | | | 52 | | | | 18 | | | | 1 | | | | 17 | | |
| Transfer agent fees | | | 754 | | | | 493 | | | | 86 | | | | 2 | | | | 17 | | |
| Other | | | 26 | | | | 1 | | | | 25 | | | | 1 | | | | 14 | | |
| Total expenses | | | 8,007 | | | | 3,334 | | | | 942 | | | | 47 | | | | 2,713 | | |
| Less amounts waived | | | — | | | | (264 | ) | | | (208 | ) | | | (14 | ) | | | (444 | ) | |
| Less earnings credits | | | (2 | ) | | | (2 | ) | | | — | (b) | | | — | | | | (2 | ) | |
| Less expense reimbursements | | | (1 | ) | | | — | | | | — | | | | (20 | ) | | | — | | |
| Net expenses | | | 8,004 | | | | 3,068 | | | | 734 | | | | 13 | | | | 2,267 | | |
| Net Investment Income (Loss) | | | (3,919 | ) | | | (2,473 | ) | | | (447 | ) | | | (11 | ) | | | 716 | | |
(b) Amount rounds to less than $1,000.
(c) Prior to August 17, 2005, the Fund was named Mid Cap Growth Fund
(d) Commencement of operations was October 31, 2005.
SEE NOTES TO FINANCIAL STATEMENTS.
JPMORGAN U.S. EQUITY MID/SMALL CAP FUNDS90
ANNUAL REPORT DECEMBER 31
2005
STATEMENT OF
OPERATIONS (CONTINUED) FOR THE PERIOD ENDED DECEMBER 31, 2005
(Amounts in thousands)
| | | Capital
Growth
Fund | | Dynamic
Small Cap
Fund | | Growth
Advantage
Fund(b) | | Micro Cap
Fund(c) | | Mid Cap
Equity
Fund | |
REALIZED/UNREALIZED
GAINS (LOSSES): | |
Net realized gain (loss) on
transactions from: | |
| Investments | | $ | 55,475 | | | $ | 16,807 | | | $ | 8,398 | | | $ | 43 | | | $ | 25,609 | | |
Change in net unrealized
appreciation (depreciation) of: | |
| Investments | | | 19,484 | | | | (6,041 | ) | | | (2,867 | ) | | | 126 | | | | (2,188 | ) | |
| Net realized/unrealized gains (losses) | | | 74,959 | | | | 10,766 | | | | 5,531 | | | | 169 | | | | 23,421 | | |
Change in net assets resulting
from operations | | $ | 71,040 | | | $ | 8,293 | | | $ | 5,084 | | | $ | 158 | | | $ | 24,137 | | |
(a) Includes reimbursements of
investment advisory,
administration and shareholder
servicing fees | | | $23 | | | | $7 | | | | $1 | | | | $— | | | | $12 | | |
(b) Prior to August 17, 2005, the Fund was named Mid Cap Growth Fund
(c) Commencement of operations was October 31, 2005.
SEE NOTES TO FINANCIAL STATEMENTS.
JPMORGAN U.S. EQUITY MID/SMALL CAP FUNDS91
JPMorgan Funds
STATEMENT OF
OPERATIONS (CONTINUED) FOR THE PERIOD ENDED DECEMBER 31, 2005
(Amounts in thousands)
| | | Mid Cap
Value
Fund | | Small Cap
Core
Fund(c) | | Small Cap
Equity
Fund | | U.S. Small
Company
Fund | | Value
Advantage
Fund(d) | |
| INVESTMENT INCOME: | |
| Dividend income | | $ | 97,448 | | | $ | 8,461 | | | $ | 3,618 | | | $ | 2,010 | | | $ | 782 | | |
| Dividend income from affiliates (a) | | | 7,596 | | | | 689 | | | | 532 | | | | 106 | | | | 110 | | |
| Interest income | | | — | | | | 60 | | | | — | | | | 9 | | | | — | | |
| Income from securities lending (net) | | | 394 | | | | 685 | | | | 74 | | | | 20 | | | | — | | |
| Foreign taxes withheld | | | (161 | ) | | | (12 | ) | | | — | | | | (3 | ) | | | — | | |
| Total investment income | | | 105,277 | | | | 9,883 | | | | 4,224 | | | | 2,142 | | | | 892 | | |
| EXPENSES: | |
| Investment advisory fees | | | 38,675 | | | | 5,386 | | | | 2,610 | | | | 1,073 | | | | 259 | | |
| Administration fees | | | 6,479 | | | | 929 | | | | 446 | | | | 202 | | | | 42 | | |
| Distribution fees: | |
| Class A | | | 5,680 | | | | — | | | | 403 | | | | — | | | | 41 | | |
| Class B | | | 1,645 | | | | — | | | | 109 | | | | — | | | | — | | |
| Class C | | | 5,575 | | | | — | | | | 27 | | | | — | | | | 164 | | |
| Shareholder servicing fees: | |
| Class A | | | 5,680 | | | | — | | | | 403 | | | | — | | | | 41 | | |
| Class B | | | 548 | | | | — | | | | 37 | | | | — | | | | — | | |
| Class C | | | 1,858 | | | | — | | | | 9 | | | | — | | | | 54 | | |
| Select Class | | | 2,533 | | | | 2,072 | | | | 555 | | | | 292 | | | | 4 | | |
| Institutional Class | | | 1,659 | | | | — | | | | — | | | | 62 | | | | — | (b) | |
| Custodian and accounting fees | | | 319 | | | | 144 | | | | 29 | | | | 138 | | | | 51 | | |
| Interest expense | | | — | | | | — | | | | 1 | | | | 2 | | | | — | | |
| Professional fees | | | 161 | | | | 56 | | | | 54 | | | | 53 | | | | 59 | | |
| Trustees' fees | | | 61 | | | | 12 | | | | 9 | | | | 2 | | | | 1 | | |
| Printing and mailing costs | | | 884 | | | | 39 | | | | 71 | | | | 24 | | | | 26 | | |
| Registration and filing fees | | | 878 | | | | 113 | | | | 53 | | | | 33 | | | | 80 | | |
| Transfer agent fees | | | 4,509 | | | | 10 | | | | 284 | | | | 42 | | | | 23 | | |
| Other | | | 360 | | | | 30 | | | | 37 | | | | 10 | | | | 7 | | |
| Total expenses | | | 77,504 | | | | 8,791 | | | | 5,137 | | | | 1,933 | | | | 852 | | |
| Less amounts waived | | | (9,500 | ) | | | (2,157 | ) | | | (729 | ) | | | (235 | ) | | | (140 | ) | |
| Less earnings credits | | | (16 | ) | | | (4 | ) | | | (1 | ) | | | — | | | | (14 | ) | |
| Less expense reimbursements | | | (18 | ) | | | — | | | | — | | | | — | | | | (97 | ) | |
| Net expenses | | | 67,970 | | | | 6,630 | | | | 4,407 | | | | 1,698 | | | | 601 | | |
| Net Investment Income (Loss) | | | 37,307 | | | | 3,253 | | | | (183 | ) | | | 444 | | | | 291 | | |
(b) Amount rounds to less than $1,000.
(c) Prior to February 19, 2005, the Fund was named Trust Small Cap Equity.
(d) Commencement of operations was March 1, 2005.
SEE NOTES TO FINANCIAL STATEMENTS.
JPMORGAN U.S. EQUITY MID/SMALL CAP FUNDS92
ANNUAL REPORT DECEMBER 31
2005
STATEMENT OF
OPERATIONS (CONTINUED) FOR THE PERIOD ENDED DECEMBER 31, 2005
(Amounts in thousands)
| | | Mid Cap
Value
Fund | | Small Cap
Core
Fund(b) | | Small Cap
Equity
Fund | | U.S. Small
Company
Fund | | Value
Advantage
Fund(c) | |
REALIZED/UNREALIZED
GAINS (LOSSES): | |
Net realized gain (loss) on
transactions from: | |
| Investments | | $ | 196,320 | | | $ | 11,584 | | | $ | 41,601 | | | $ | 14,189 | | | $ | 663 | | |
| Futures | | | — | | | | 241 | | | | — | | | | 75 | | | | — | | |
Change in net unrealized
appreciation (depreciation) of: | |
| Investments | | | 287,118 | | | | 13,706 | | | | 7,373 | | | | (8,794 | ) | | | 2,328 | | |
| Futures | | | — | | | | (1,024 | ) | | | — | | | | (179 | ) | | | — | | |
| Net realized/unrealized gains (losses) | | | 483,438 | | | | 24,507 | | | | 48,974 | | | | 5,291 | | | | 2,991 | | |
Change in net assets resulting
from operations | | $ | 520,745 | | | $ | 27,760 | | | $ | 48,791 | | | $ | 5,735 | | | $ | 3,282 | | |
(a) Includes reimbursements of
investment advisory,
administration and shareholder
servicing fees | | | $420 | | | | $38 | | | | $29 | | | | $6 | | | | $5 | | |
(b) Prior to February 19, 2005, the Fund was named Trust Small Cap Equity.
(c) Commencement of operations was March 1, 2005.
SEE NOTES TO FINANCIAL STATEMENTS.
JPMORGAN U.S. EQUITY MID/SMALL CAP FUNDS93
JPMorgan Funds
STATEMENT OF CHANGES
IN NET ASSETS FOR THE PERIODS INDICATED
(Amounts in thousands)
| | | Capital Growth | | Dynamic Small Cap | |
| | | Year Ended
12/31/2005 | | Year Ended
12/31/2004 | | Year Ended
12/31/2005 | | Year Ended
12/31/2004 | |
CHANGE IN NET ASSETS FROM
OPERATIONS: | |
| Net investment income (loss) | | $ | (3,919 | ) | | $ | (3,194 | ) | | $ | (2,473 | ) | | $ | (2,722 | ) | |
Net realized gain (loss) on
investments and futures | | | 55,475 | | | | 84,582 | | | | 16,807 | | | | 37,317 | | |
Change in net unrealized
appreciation (depreciation) of
investments and futures | | | 19,484 | | | | (5,839 | ) | | | (6,041 | ) | | | (18,399 | ) | |
Change in net assets resulting
from operations | | | 71,040 | | | | 75,549 | | | | 8,293 | | | | 16,196 | | |
| DISTRIBUTIONS TO SHAREHOLDERS: | |
| Class A Shares | |
| From net investment income | | | — | | | | — | | | | — | | | | — | | |
| From net realized gains | | | (34,577 | ) | | | (53,171 | ) | | | (5,187 | ) | | | — | | |
| Class B Shares | |
| From net investment income | | | — | | | | — | | | | — | | | | — | | |
| From net realized gains | | | (2,960 | ) | | | (6,588 | ) | | | (3,103 | ) | | | — | | |
| Class C Shares | |
| From net investment income | | | — | | | | — | | | | — | | | | — | | |
| From net realized gains | | | (1,296 | ) | | | (947 | ) | | | (3,097 | ) | | | — | | |
| Select Class Shares | |
| From net investment income | | | — | | | | — | | | | — | | | | — | | |
| From net realized gains | | | (18,489 | ) | | | (1,142 | ) | | | (1,484 | ) | | | — | | |
| Total distributions to shareholders | | | (57,322 | ) | | | (61,848 | ) | | | (12,871 | ) | | | — | | |
| CAPITAL TRANSACTIONS: | |
Change in net assets from
capital transactions | | | 229,735 | | | | 47,795 | | | | (4,922 | ) | | | (15,717 | ) | |
| NET ASSETS: | |
| Change in net assets | | | 243,453 | | | | 61,496 | | | | (9,500 | ) | | | 479 | | |
| Beginning of period | | | 542,027 | | | | 480,531 | | | | 191,844 | | | | 191,365 | | |
| End of period | | $ | 785,480 | | | $ | 542,027 | | | $ | 182,344 | | | $ | 191,844 | | |
Accumulated undistributed
(distributions in excess of) net
investment income | | $ | (42 | ) | | $ | (43 | ) | | $ | (6 | ) | | $ | (7 | ) | |
SEE NOTES TO FINANCIAL STATEMENTS.
JPMORGAN U.S. EQUITY MID/SMALL CAP FUNDS94
ANNUAL REPORT DECEMBER 31
2005
STATEMENT OF CHANGES
IN NET ASSETS (CONTINUED) FOR THE PERIODS INDICATED
(Amounts in thousands)
| | | Growth Advantage Fund(a) | | Micro Cap Fund | |
| | | Year Ended
12/31/2005 | | Year Ended
12/31/2004 | | Period Ended
12/31/2005(b) | |
CHANGE IN NET ASSETS FROM
OPERATIONS: | |
| Net investment income (loss) | | $ | (447 | ) | | $ | (374 | ) | | $ | (11 | ) | |
Net realized gain (loss) on
investments and futures | | | 8,398 | | | | 10,011 | | | | 43 | | |
Change in net unrealized
appreciation (depreciation) of
investments and futures | | | (2,867 | ) | | | (582 | ) | | | 126 | | |
Change in net assets resulting
from operations | | | 5,084 | | | | 9,055 | | | | 158 | | |
| CAPITAL TRANSACTIONS: | |
Change in net assets from
capital transactions | | | (6,370 | ) | | | (12,240 | ) | | | 5,000 | | |
| NET ASSETS: | |
| Change in net assets | | | (1,286 | ) | | | (3,185 | ) | | | 5,158 | | |
| Beginning of period | | | 57,382 | | | | 60,567 | | | | — | | |
| End of period | | $ | 56,096 | | | $ | 57,382 | | | $ | 5,158 | | |
Accumulated undistributed
(distributions in excess of) net
investment income | | $ | (1 | ) | | $ | (1 | ) | | $ | — | (c) | |
(a) Prior to August 17, 2005, the Fund was named Mid Cap Growth Fund.
(b) Commencement of operations was October 31, 2005.
(c) Amount rounds to less than one thousand.
SEE NOTES TO FINANCIAL STATEMENTS.
JPMORGAN U.S. EQUITY MID/SMALL CAP FUNDS95
JPMorgan Funds
STATEMENT OF CHANGES
IN NET ASSETS (CONTINUED) FOR THE PERIODS INDICATED
(Amounts in thousands)
| | | Mid Cap Equity Fund | | Mid Cap Value Fund | |
| | | Year Ended
12/31/2005 | | Year Ended
12/31/2004 | | Year Ended
12/31/2005 | | Year Ended
12/31/2004 | |
CHANGE IN NET ASSETS FROM
OPERATIONS: | |
| Net investment income (loss) | | $ | 716 | | | $ | 643 | | | $ | 37,307 | | | $ | 8,301 | | |
Net realized gain (loss) on
investments and futures | | | 25,609 | | | | 28,575 | | | | 196,320 | | | | 68,273 | | |
Change in net unrealized
appreciation (depreciation) of
investments and futures | | | (2,188 | ) | | | 8,854 | | | | 287,118 | | | | 344,403 | | |
Change in net assets resulting
from operations | | | 24,137 | | | | 38,072 | | | | 520,745 | | | | 420,977 | | |
| DISTRIBUTIONS TO SHAREHOLDERS: | |
| Class A Shares | |
| From net investment income | | | — | | | | — | | | | (14,169 | ) | | | (2,344 | ) | |
| From net realized gains | | | — | | | | — | | | | (72,188 | ) | | | (16,897 | ) | |
| Class B Shares | |
| From net investment income | | | — | | | | — | | | | — | | | | — | | |
| From net realized gains | | | — | | | | — | | | | (6,168 | ) | | | (2,288 | ) | |
| Class C Shares | |
| From net investment income | | | — | | | | — | | | | (12 | ) | | | — | | |
| From net realized gains | | | — | | | | — | | | | (21,631 | ) | | | (6,079 | ) | |
| Select Class Shares | |
| From net investment income | | | (705 | ) | | | (627 | ) | | | (8,387 | ) | | | (1,398 | ) | |
| From net realized gains | | | (27,072 | ) | | | (23,640 | ) | | | (31,358 | ) | | | (5,785 | ) | |
| Institutional Class Shares | |
| From net investment income | | | — | | | | — | | | | (17,025 | ) | | | (4,851 | ) | |
| From net realized gains | | | — | | | | — | | | | (48,603 | ) | | | (15,152 | ) | |
| Total distributions to shareholders | | | (27,777 | ) | | | (24,267 | ) | | | (219,541 | ) | | | (54,794 | ) | |
| CAPITAL TRANSACTIONS: | |
Change in net assets from
capital transactions | | | 45,115 | | | | 19,236 | | | | 3,026,845 | | | | 2,466,242 | | |
| NET ASSETS: | |
| Change in net assets | | | 41,475 | | | | 33,041 | | | | 3,328,049 | | | | 2,832,425 | | |
| Beginning of period | | | 227,107 | | | | 194,066 | | | | 3,688,754 | | | | 856,329 | | |
| End of period | | $ | 268,582 | | | $ | 227,107 | | | $ | 7,016,803 | | | $ | 3,688,754 | | |
Accumulated undistributed
(distributions in excess of) net
investment income | | $ | 5 | | | $ | (6 | ) | | $ | (2 | ) | | $ | (10 | ) | |
SEE NOTES TO FINANCIAL STATEMENTS.
JPMORGAN U.S. EQUITY MID/SMALL CAP FUNDS96
ANNUAL REPORT DECEMBER 31
2005
STATEMENT OF CHANGES
IN NET ASSETS (CONTINUED) FOR THE PERIODS INDICATED
(Amounts in thousands)
| | | Small Cap Core Fund(a) | | Small Cap Equity Fund | |
| | | Year Ended
12/31/2005 | | Year Ended
12/31/2004 | | Year Ended
12/31/2005 | | Year Ended
12/31/2004 | |
CHANGE IN NET ASSETS FROM
OPERATIONS: | |
| Net investment income (loss) | | $ | 3,253 | | | $ | 920 | | | $ | (183 | ) | | $ | (1,977 | ) | |
Net realized gain (loss) on
investments and futures | | | 11,825 | | | | 100,058 | | | | 41,601 | | | | 276,109 | | |
Change in net unrealized
appreciation (depreciation) of
investments and futures | | | 12,682 | | | | (27,707 | ) | | | 7,373 | | | | (93,478 | ) | |
Change in net assets resulting
from operations | | | 27,760 | | | | 73,271 | | | | 48,791 | | | | 180,654 | | |
| DISTRIBUTIONS TO SHAREHOLDERS: | |
| Class A Shares | |
| From net investment income | | | — | | | | — | | | | — | | | | — | | |
| From net realized gains | | | — | | | | — | | | | (23,198 | ) | | | (16,153 | ) | |
| Class B Shares | |
| From net investment income | | | — | | | | — | | | | — | | | | — | | |
| From net realized gains | | | — | | | | — | | | | (2,173 | ) | | | (2,612 | ) | |
| Class C Shares | |
| From net investment income | | | — | | | | — | | | | — | | | | — | | |
| From net realized gains | | | — | | | | — | | | | (1,082 | ) | | | — | | |
| Select Class Shares | |
| From net investment income | | | (3,562 | ) | | | (605 | ) | | | — | | | | — | | |
| From net realized gains | | | (18,037 | ) | | | (87,711 | ) | | | (26,717 | ) | | | (93,537 | ) | |
| Total distributions to shareholders | | | (21,599 | ) | | | (88,316 | ) | | | (53,170 | ) | | | (112,302 | ) | |
| CAPITAL TRANSACTIONS: | |
Change in net assets from
capital transactions | | | (93,994 | ) | | | 532,830 | | | | 128,051 | | | | (457,947 | ) | |
| NET ASSETS: | |
| Change in net assets | | | (87,833 | ) | | | 517,785 | | | | 123,672 | | | | (389,595 | ) | |
| Beginning of period | | | 903,738 | | | | 385,953 | | | | 356,870 | | | | 746,465 | | |
| End of period | | $ | 815,905 | | | $ | 903,738 | | | $ | 480,542 | | | $ | 356,870 | | |
Accumulated undistributed
(distributions in excess of) net
investment income | | $ | (17 | ) | | $ | 249 | | | $ | (15 | ) | | $ | (8 | ) | |
(a) Prior to February 19, 2005, the Fund was named Trust Small Cap Equity.
SEE NOTES TO FINANCIAL STATEMENTS.
JPMORGAN U.S. EQUITY MID/SMALL CAP FUNDS97
JPMorgan Funds
STATEMENT OF CHANGES
IN NET ASSETS (CONTINUED) FOR THE PERIODS INDICATED
(Amounts in thousands)
| | | U.S. Small Company Fund | | Value
Advantage
Fund | |
| | | Year Ended
12/31/2005 | | Year Ended
12/31/2004 | | Period Ended
12/31/2005(a) | |
CHANGE IN NET ASSETS FROM
OPERATIONS: | |
| Net investment income (loss) | | $ | 444 | | | $ | (249 | ) | | $ | 291 | | |
Net realized gain (loss) on
investments and futures | | | 14,264 | | | | 89,186 | | | | 663 | | |
Change in net unrealized
appreciation (depreciation) of
investments and futures | | | (8,973 | ) | | | (62,529 | ) | | | 2,328 | | |
Change in net assets resulting
from operations | | | 5,735 | | | | 26,408 | | | | 3,282 | | |
| DISTRIBUTIONS TO SHAREHOLDERS: | |
| Class A Shares | |
| From net investment income | | | — | | | | — | | | | (169 | ) | |
| From net realized gains | | | — | | | | — | | | | (477 | ) | |
| Class C Shares | |
| From net investment income | | | — | | | | — | | | | (93 | ) | |
| From net realized gains | | | — | | | | — | | | | (609 | ) | |
| Select Class Shares | |
| From net investment income | | | (57 | ) | | | — | | | | (14 | ) | |
| From net realized gains | | | (11,711 | ) | | | (15,506 | ) | | | (35 | ) | |
| Institutional Class Shares | |
| From net investment income | | | (105 | ) | | | — | | | | — | (b) | |
| From net realized gains | | | (4,879 | ) | | | (12,738 | ) | | | — | (b) | |
| Total distributions to shareholders | | | (16,752 | ) | | | (28,244 | ) | | | (1,397 | ) | |
| CAPITAL TRANSACTIONS: | |
Change in net assets from
capital transactions | | | (51,097 | ) | | | (126,815 | ) | | | 102,280 | | |
| NET ASSETS: | |
| Change in net assets | | | (62,114 | ) | | | (128,651 | ) | | | 104,165 | | |
| Beginning of period | | | 210,807 | | | | 339,458 | | | | — | | |
| End of period | | $ | 148,693 | | | $ | 210,807 | | | $ | 104,165 | | |
Accumulated undistributed
(distributions in excess of) net
investment income | | $ | 236 | | | $ | 3 | | | $ | 23 | | |
(a) Commencement of operations was March 1, 2005.
(b) Amount rounds to less than one thousand.
SEE NOTES TO FINANCIAL STATEMENTS.
JPMORGAN U.S. EQUITY MID/SMALL CAP FUNDS98
ANNUAL REPORT DECEMBER 31
2005
STATEMENT OF CHANGES
IN NET ASSETS (CONTINUED) FOR THE PERIODS INDICATED
(Amounts in thousands)
| | | Capital Growth | | Dynamic Small Cap | |
| | | Year Ended
12/31/2005 | | Year Ended
12/31/2004 | | Year Ended
12/31/2005 | | Year Ended
12/31/2004 | |
| CAPITAL TRANSACTIONS: | |
| Class A Shares | |
| Proceeds from shares issued | | $ | 67,593 | | | $ | 40,060 | | | $ | 24,711 | | | $ | 27,956 | | |
| Dividends reinvested | | | 32,128 | | | | 49,434 | | | | 4,256 | | | | — | | |
| Cost of shares redeemed | | | (89,342 | ) | | | (73,060 | ) | | | (36,245 | ) | | | (38,856 | ) | |
Change in net assets from Class A
capital transactions | | $ | 10,379 | | | $ | 16,434 | | | $ | (7,278 | ) | | $ | (10,900 | ) | |
| Class B Shares | |
| Proceeds from shares issued | | $ | 5,581 | | | $ | 3,364 | | | $ | 11,910 | | | $ | 11,257 | | |
| Dividends reinvested | | | 2,560 | | | | 5,878 | | | | 1,792 | | | | — | | |
| Cost of shares redeemed | | | (25,134 | ) | | | (20,517 | ) | | | (33,000 | ) | | | (16,973 | ) | |
Change in net assets from Class B
capital transactions | | $ | (16,993 | ) | | $ | (11,275 | ) | | $ | (19,298 | ) | | $ | (5,716 | ) | |
| Class C Shares | |
| Proceeds from shares issued | | $ | 10,804 | | | $ | 3,881 | | | $ | 22,694 | | | $ | 19,086 | | |
| Dividends reinvested | | | 754 | | | | 426 | | | | 310 | | | | — | | |
| Cost of shares redeemed | | | (1,654 | ) | | | (1,053 | ) | | | (13,026 | ) | | | (10,644 | ) | |
Change in net assets from Class C
capital transactions | | $ | 9,904 | | | $ | 3,254 | | | $ | 9,978 | | | $ | 8,442 | | |
| Select Class Shares | |
| Proceeds from shares issued | | $ | 233,983 | | | $ | 39,557 | | | $ | 18,995 | | | $ | 7,516 | | |
| Dividends reinvested | | | 17,941 | | | | 1,140 | | | | 458 | | | | — | | |
| Cost of shares redeemed | | | (25,479 | ) | | | (1,315 | ) | | | (7,777 | ) | | | (15,059 | ) | |
Change in net assets from Select Class
capital transactions | | $ | 226,445 | | | $ | 39,382 | | | $ | 11,676 | | | $ | (7,543 | ) | |
SEE NOTES TO FINANCIAL STATEMENTS.
JPMORGAN U.S. EQUITY MID/SMALL CAP FUNDS99
JPMorgan Funds
STATEMENT OF CHANGES
IN NET ASSETS (CONTINUED) FOR THE PERIODS INDICATED
(Amounts in thousands)
| | | Growth Advantage(a) | | Micro Cap | |
| | | Year Ended
12/31/2005 | | Year Ended
12/31/2004 | | Period Ended
12/31/2005(b) | |
| CAPITAL TRANSACTIONS: | |
| Class A Shares | |
| Proceeds from shares issued | | $ | 9,235 | | | $ | 2,220 | | | $ | 500 | | |
| Dividends reinvested | | | — | | | | — | | | | — | | |
| Cost of shares redeemed | | | (13,879 | ) | | | (13,954 | ) | | | — | | |
Change in net assets from Class A
capital transactions | | $ | (4,644 | ) | | $ | (11,734 | ) | | $ | 500 | | |
| Class B Shares | |
| Proceeds from shares issued | | $ | 448 | | | $ | 194 | | | $ | — | | |
| Dividends reinvested | | | — | | | | — | | | | — | | |
| Cost of shares redeemed | | | (2,174 | ) | | | (700 | ) | | | — | | |
Change in net assets from Class B
capital transactions | | $ | (1,726 | ) | | $ | (506 | ) | | $ | — | | |
| Class C Shares | |
| Proceeds from shares issued | | $ | — | | | $ | — | | | $ | 500 | | |
| Dividends reinvested | | | — | | | | — | | | | — | | |
| Cost of shares redeemed | | | — | | | | — | | | | — | | |
Change in net assets from Class C
capital transactions | | $ | — | | | $ | — | | | $ | 500 | | |
| Select Class Shares | |
| Proceeds from shares issued | | $ | — | | | $ | — | | | $ | 4,000 | | |
| Dividends reinvested | | | — | | | | — | | | | — | | |
| Cost of shares redeemed | | | — | | | | — | | | | — | | |
Change in net assets from Select Class
capital transactions | | $ | — | | | $ | — | | | $ | 4,000 | | |
(a) Prior to August 17, 2005, the Fund was named Mid Cap Growth Fund.
(b) Commencement of operations was October 31, 2005.
SEE NOTES TO FINANCIAL STATEMENTS.
JPMORGAN U.S. EQUITY MID/SMALL CAP FUNDS100
ANNUAL REPORT DECEMBER 31
2005
STATEMENT OF CHANGES
IN NET ASSETS (CONTINUED) FOR THE PERIODS INDICATED
(Amounts in thousands)
| | | Mid Cap Equity | | Mid Cap Value | |
| | | Year Ended
12/31/2005 | | Year Ended
12/31/2004 | | Year Ended
12/31/2005 | | Year Ended
12/31/2004 | |
| CAPITAL TRANSACTIONS: | |
| Class A Shares | |
| Proceeds from shares issued | | $ | — | | | $ | — | | | $ | 1,806,575 | | | $ | 1,033,844 | | |
| Dividends reinvested | | | — | | | | — | | | | 75,171 | | | | 16,217 | | |
| Cost of shares redeemed | | | — | | | | — | | | | (504,110 | ) | | | (122,265 | ) | |
Change in net assets from Class A
capital transactions | | $ | — | | | $ | — | | | $ | 1,377,636 | | | $ | 927,796 | | |
| Class B Shares | |
| Proceeds from shares issued | | $ | — | | | $ | — | | | $ | 68,631 | | | $ | 93,272 | | |
| Dividends reinvested | | | — | | | | — | | | | 4,936 | | | | 1,863 | | |
| Cost of shares redeemed | | | — | | | | — | | | | (25,007 | ) | | | (9,647 | ) | |
Change in net assets from Class B
capital transactions | | $ | — | | | $ | — | | | $ | 48,560 | | | $ | 85,488 | | |
| Class C Shares | |
| Proceeds from shares issued | | $ | — | | | $ | — | | | $ | 344,689 | | | $ | 348,253 | | |
| Dividends reinvested | | | — | | | | — | | | | 14,623 | | | | 4,102 | | |
| Cost of shares redeemed | | | — | | | | — | | | | (59,221 | ) | | | (16,865 | ) | |
Change in net assets from Class C
capital transactions | | $ | — | | | $ | — | | | $ | 300,091 | | | $ | 335,490 | | |
| Select Class Shares | |
| Proceeds from shares issued | | $ | 111,814 | | | $ | 57,714 | | | $ | 868,591 | | | $ | 405,562 | | |
| Dividends reinvested | | | 13,373 | | | | 17,555 | | | | 22,433 | | | | 4,698 | | |
| Cost of shares redeemed | | | (80,072 | ) | | | (56,033 | ) | | | (211,875 | ) | | | (43,384 | ) | |
Change in net assets from Select Class
capital transactions | | $ | 45,115 | | | $ | 19,236 | | | $ | 679,149 | | | $ | 366,876 | | |
| Institutional Class Shares | |
| Proceeds from shares issued | | $ | — | | | $ | — | | | $ | 988,690 | | | $ | 848,157 | | |
| Dividends reinvested | | | — | | | | — | | | | 49,428 | | | | 14,335 | | |
| Cost of shares redeemed | | | — | | | | — | | | | (416,709 | ) | | | (111,900 | ) | |
Change in net assets from Institutional
Class capital transactions | | $ | — | | | $ | — | | | $ | 621,409 | | | $ | 750,592 | | |
SEE NOTES TO FINANCIAL STATEMENTS.
JPMORGAN U.S. EQUITY MID/SMALL CAP FUNDS101
JPMorgan Funds
STATEMENT OF CHANGES
IN NET ASSETS (CONTINUED) FOR THE PERIODS INDICATED
(Amounts in thousands)
| | | Small Cap Core(a) | | Small Cap Equity | |
| | | Year Ended
12/31/2005 | | Year Ended
12/31/2004 | | Year Ended
12/31/2005 | | Year Ended
12/31/2004 | |
| CAPITAL TRANSACTIONS: | |
| Class A Shares | |
| Proceeds from shares issued | | $ | — | | | $ | — | | | $ | 118,256 | | | $ | 52,477 | | |
| Dividends reinvested | | | — | | | | — | | | | 21,186 | | | | 14,234 | | |
| Cost of shares redeemed | | | — | | | | — | | | | (55,772 | ) | | | (33,952 | ) | |
Change in net assets from Class A
capital transactions | | $ | — | | | $ | — | | | $ | 83,670 | | | $ | 32,759 | | |
| Class B Shares | |
| Proceeds from shares issued | | $ | — | | | $ | — | | | $ | 7,244 | | | $ | 2,578 | | |
| Dividends reinvested | | | — | | | | — | | | | 1,784 | | | | 2,411 | | |
| Cost of shares redeemed | | | — | | | | — | | | | (8,133 | ) | | | (11,902 | ) | |
Change in net assets from Class B
capital transactions | | $ | — | | | $ | — | | | $ | 895 | | | $ | (6,913 | ) | |
| Class C Shares(b) | |
| Proceeds from shares issued | | $ | — | | | $ | — | | | $ | 11,282 | | | $ | — | | |
| Dividends reinvested | | | — | | | | — | | | | 812 | | | | — | | |
| Cost of shares redeemed | | | — | | | | — | | | | (851 | ) | | | — | | |
Change in net assets from Class C
capital transactions | | $ | — | | | $ | — | | | $ | 11,243 | | | $ | — | | |
| Select Class Shares | |
| Proceeds from shares issued | | $ | 75,594 | | | $ | 640,372 | | | $ | 106,805 | | | $ | 141,242 | | |
| Dividends reinvested | | | 18,140 | | | | 76,052 | | | | 21,272 | | | | 88,631 | | |
| Cost of shares redeemed | | | (187,728 | ) | | | (183,594 | ) | | | (95,834 | ) | | | (195,648 | ) | |
| Redemption in-kind | | | — | | | | — | | | | — | | | | (518,018 | ) | |
Change in net assets from Select Class
capital transactions | | $ | (93,994 | ) | | $ | 532,830 | | | $ | 32,243 | | | $ | (483,793 | ) | |
| Institutional Class Shares | |
| Proceeds from shares issued | | $ | — | | | $ | — | | | $ | — | | | $ | — | | |
| Dividends reinvested | | | — | | | | — | | | | — | | | | — | | |
| Cost of shares redeemed | | | — | | | | — | | | | — | | | | — | | |
Change in net assets from Institutional
Class capital transactions | | $ | — | | | $ | — | | | $ | — | | | $ | — | | |
(a) Prior to February 19, 2005, the Fund was named Trust Small Cap Equity.
(b) Commencement of operations for Class C Shares, February 19, 2005.
SEE NOTES TO FINANCIAL STATEMENTS.
JPMORGAN U.S. EQUITY MID/SMALL CAP FUNDS102
ANNUAL REPORT DECEMBER 31
2005
STATEMENT OF CHANGES
IN NET ASSETS (CONTINUED) FOR THE PERIODS INDICATED
(Amounts in thousands)
| | | U.S. Small Company | | Value Advantage | |
| | | Year Ended
12/31/2005 | | Year Ended
12/31/2004 | | Period Ended
12/31/2005(a) | |
| CAPITAL TRANSACTIONS: | |
| Class A Shares | |
| Proceeds from shares issued | | $ | — | | | $ | — | | | $ | 46,450 | | |
| Dividends reinvested | | | — | | | | — | | | | 490 | | |
| Cost of shares redeemed | | | — | | | | — | | | | (2,464 | ) | |
Change in net assets from Class A
capital transactions | | $ | — | | | $ | — | | | $ | 44,476 | | |
| Class B Shares | |
| Proceeds from shares issued | | $ | — | | | $ | — | | | $ | — | | |
| Dividends reinvested | | | — | | | | — | | | | — | | |
| Cost of shares redeemed | | | — | | | | — | | | | — | | |
Change in net assets from Class B
capital transactions | | $ | — | | | $ | — | | | $ | — | | |
| Class C Shares(a) | |
| Proceeds from shares issued | | $ | — | | | $ | — | | | $ | 56,580 | | |
| Dividends reinvested | | | — | | | | — | | | | 487 | | |
| Cost of shares redeemed | | | — | | | | — | | | | (2,231 | ) | |
Change in net assets from Class C
capital transactions | | $ | — | | | $ | — | | | $ | 54,836 | | |
| Select Class Shares | |
| Proceeds from shares issued | | $ | 39,707 | | | $ | 21,554 | | | $ | 3,524 | | |
| Dividends reinvested | | | 9,746 | | | | 13,051 | | | | 45 | | |
| Cost of shares redeemed | | | (61,397 | ) | | | (97,302 | ) | | | (584 | ) | |
Change in net assets from Select Class
capital transactions | | $ | (11,944 | ) | | $ | (62,697 | ) | | $ | 2,985 | | |
| Institutional Class Shares | |
| Proceeds from shares issued | | $ | 15,205 | | | $ | 21,366 | | | $ | 520 | | |
| Dividends reinvested | | | 2,776 | | | | 6,203 | | | | 1 | | |
| Cost of shares redeemed | | | (57,134 | ) | | | (91,687 | ) | | | (538 | ) | |
Change in net assets from Institutional
Class capital transactions | | $ | (39,153 | ) | | $ | (64,118 | ) | | $ | (17 | ) | |
(a) Commencement of operations was March 1, 2005.
SEE NOTES TO FINANCIAL STATEMENTS.
JPMORGAN U.S. EQUITY MID/SMALL CAP FUNDS103
JPMorgan Funds
STATEMENT OF CHANGES
IN NET ASSETS (CONTINUED) FOR THE PERIODS INDICATED
(Amounts in thousands)
| | | Capital Growth | | Dynamic Small Cap | |
| | | Year Ended
12/31/2005 | | Year Ended
12/31/2004 | | Year Ended
12/31/2005 | | Year Ended
12/31/2004 | |
| SHARE TRANSACTIONS: | |
| Class A Shares | |
| Issued | | | 1,741 | | | | 1,024 | | | | 1,339 | | | | 1,634 | | |
| Reinvested | | | 816 | | | | 1,303 | | | | 233 | | | | — | | |
| Redeemed | | | (2,292 | ) | | | (1,870 | ) | | | (2,025 | ) | | | (2,293 | ) | |
| Change in Class A Shares | | | 265 | | | | 457 | | | | (453 | ) | | | (659 | ) | |
| Class B Shares | |
| Issued | | | 154 | | | | 91 | | | | 695 | | | | 693 | | |
| Reinvested | | | 71 | | | | 167 | | | | 105 | | | | — | | |
| Redeemed | | | (701 | ) | | | (558 | ) | | | (1,905 | ) | | | (1,057 | ) | |
| Change in Class B Shares | | | (476 | ) | | | (300 | ) | | | (1,105 | ) | | | (364 | ) | |
| Class C Shares | |
| Issued | | | 302 | | | | 107 | | | | 1,329 | | | | 1,186 | | |
| Reinvested | | | 21 | | | | 12 | | | | 18 | | | | — | | |
| Redeemed | | | (46 | ) | | | (29 | ) | | | (764 | ) | | | (673 | ) | |
| Change in Class C Shares | | | 277 | | | | 90 | | | | 583 | | | | 513 | | |
| Select Class Shares | |
| Issued | | | 5,804 | | | | 969 | | | | 1,033 | | | | 427 | | |
| Reinvested | | | 432 | | | | 29 | | | | 24 | | | | — | | |
| Redeemed | | | (627 | ) | | | (33 | ) | | | (412 | ) | | | (859 | ) | |
| Change in Select Class Shares | | | 5,609 | | | | 965 | | | | 645 | | | | (432 | ) | |
SEE NOTES TO FINANCIAL STATEMENTS.
JPMORGAN U.S. EQUITY MID/SMALL CAP FUNDS104
ANNUAL REPORT DECEMBER 31
2005
STATEMENT OF CHANGES
IN NET ASSETS (CONTINUED) FOR THE PERIODS INDICATED
(Amounts in thousands)
| | | Growth Advantage(a) | | Micro Cap | |
| | | Year Ended
12/31/2005 | | Year Ended
12/31/2004 | | Period Ended
12/31/2005(b) | |
| SHARE TRANSACTIONS: | |
| Class A Shares | |
| Issued | | | 1,479 | | | | 433 | | | | 33 | | |
| Reinvested | | | — | | | | — | | | | — | | |
| Redeemed | | | (2,348 | ) | | | (2,687 | ) | | | — | | |
| Change in Class A Shares | | | (869 | ) | | | (2,254 | ) | | | 33 | | |
| Class B Shares | |
| Issued | | | 80 | | | | 39 | | | | — | | |
| Reinvested | | | — | | | | — | | | | — | | |
| Redeemed | | | (374 | ) | | | (140 | ) | | | — | | |
| Change in Class B Shares | | | (294 | ) | | | (101 | ) | | | — | | |
| Class C Shares | |
| Issued | | | — | | | | — | | | | 33 | | |
| Reinvested | | | — | | | | — | | | | — | | |
| Redeemed | | | — | | | | — | | | | — | | |
| Change in Class C Shares | | | — | | | | — | | | | 33 | | |
| Select Class Shares | |
| Issued | | | — | | | | — | | | | 267 | | |
| Reinvested | | | — | | | | — | | | | — | | |
| Redeemed | | | — | | | | — | | | | — | | |
| Change in Select Class Shares | | | — | | | | — | | | | 267 | | |
(a) Prior to August 17, 2005, the Fund was named Mid Cap Growth Fund.
(b) Commencement of operations was October 31, 2005.
SEE NOTES TO FINANCIAL STATEMENTS.
JPMORGAN U.S. EQUITY MID/SMALL CAP FUNDS105
JPMorgan Funds
STATEMENT OF CHANGES
IN NET ASSETS (CONTINUED) FOR THE PERIODS INDICATED
(Amounts in thousands)
| | | Mid Cap Equity | | Mid Cap Value | |
| | | Year Ended
12/31/2005 | | Year Ended
12/31/2004 | | Year Ended
12/31/2005 | | Year Ended
12/31/2004 | |
| SHARE TRANSACTIONS: | |
| Class A Shares | |
| Issued | | | — | | | | — | | | | 79,449 | | | | 51,027 | | |
| Reinvested | | | — | | | | — | | | | 3,191 | | | | 746 | | |
| Redeemed | | | — | | | | — | | | | (21,858 | ) | | | (6,071 | ) | |
| Change in Class A Shares | | | — | | | | — | | | | 60,782 | | | | 45,702 | | |
| Class B Shares | |
| Issued | | | — | | | | — | | | | 3,118 | | | | 4,666 | | |
| Reinvested | | | — | | | | — | | | | 214 | | | | 87 | | |
| Redeemed | | | — | | | | — | | | | (1,112 | ) | | | (488 | ) | |
| Change in Class B Shares | | | — | | | | — | | | | 2,220 | | | | 4,265 | | |
| Class C Shares | |
| Issued | | | — | | | | — | | | | 15,649 | | | | 17,330 | | |
| Reinvested | | | — | | | | — | | | | 632 | | | | 192 | | |
| Redeemed | | | — | | | | — | | | | (2,624 | ) | | | (851 | ) | |
| Change in Class C Shares | | | — | | | | — | | | | 13,657 | | | | 16,671 | | |
| Select Class Shares | |
| Issued | | | 3,314 | | | | 1,752 | | | | 38,506 | | | | 19,743 | | |
| Reinvested | | | 399 | | | | 536 | | | | 944 | | | | 215 | | |
| Redeemed | | | (2,361 | ) | | | (1,693 | ) | | | (9,156 | ) | | | (2,172 | ) | |
| Change in Select Class Shares | | | 1,352 | | | | 595 | | | | 30,294 | | | | 17,786 | | |
| Institutional Class Shares | |
| Issued | | | — | | | | — | | | | 42,976 | | | | 41,530 | | |
| Reinvested | | | — | | | | — | | | | 2,069 | | | | 652 | | |
| Redeemed | | | — | | | | — | | | | (18,290 | ) | | | (5,510 | ) | |
| Change in Institutional Class Shares | | | — | | | | — | | | | 26,755 | | | | 36,672 | | |
SEE NOTES TO FINANCIAL STATEMENTS.
JPMORGAN U.S. EQUITY MID/SMALL CAP FUNDS106
ANNUAL REPORT DECEMBER 31
2005
STATEMENT OF CHANGES
IN NET ASSETS (CONTINUED) FOR THE PERIODS INDICATED
(Amounts in thousands)
| | | Small Cap Core(a) | | Small Cap Equity | |
| | | Year Ended
12/31/2005 | | Year Ended
12/31/2004 | | Year Ended
12/31/2005 | | Year Ended
12/31/2004 | |
| SHARE TRANSACTIONS: | |
| Class A Shares | |
| Issued | | | — | | | | — | | | | 4,355 | | | | 1,991 | | |
| Reinvested | | | — | | | | — | | | | 784 | | | | 548 | | |
| Redeemed | | | — | | | | — | | | | (2,049 | ) | | | (1,334 | ) | |
| Change in Class A Shares | | | — | | | | — | | | | 3,090 | | | | 1,205 | | |
| Class B Shares | |
| Issued | | | — | | | | — | | | | 294 | | | | 108 | | |
| Reinvested | | | — | | | | — | | | | 74 | | | | 102 | | |
| Redeemed | | | — | | | | — | | | | (338 | ) | | | (500 | ) | |
| Change in Class B Shares | | | — | | | | — | | | | 30 | | | | (290 | ) | |
| Class C Shares(b) | |
| Issued | | | — | | | | — | | | | 454 | | | | — | | |
| Reinvested | | | — | | | | — | | | | 34 | | | | — | | |
| Redeemed | | | — | | | | — | | | | (32 | ) | | | — | | |
| Change in Class C Shares | | | — | | | | — | | | | 456 | | | | — | | |
| Select Class Shares | |
| Issued | | | 1,766 | | | | 14,251 | | | | 3,737 | | | | 5,240 | | |
| Reinvested | | | 407 | | | | 1,769 | | | | 737 | | | | 3,235 | | |
| Redeemed | | | (4,422 | ) | | | (3,918 | ) | | | (3,391 | ) | | | (7,291 | ) | |
| Redemption in-kind | | | — | | | | — | | | | — | | | | (18,885 | ) | |
| Change in Select Class Shares | | | (2,249 | ) | | | 12,102 | | | | 1,083 | | | | (17,701 | ) | |
| Institutional Class Shares | |
| Issued | | | — | | | | — | | | | — | | | | — | | |
| Reinvested | | | — | | | | — | | | | — | | | | — | | |
| Redeemed | | | — | | | | — | | | | — | | | | — | | |
| Change in Institutional Class Shares | | | — | | | | — | | | | — | | | | — | | |
(a) Prior to February 19, 2005, the Fund was named Trust Small Cap Equity.
(b) Commencement of Class C Shares, February 19, 2005.
SEE NOTES TO FINANCIAL STATEMENTS.
JPMORGAN U.S. EQUITY MID/SMALL CAP FUNDS107
JPMorgan Funds
STATEMENT OF CHANGES
IN NET ASSETS (CONTINUED) FOR THE PERIODS INDICATED
(Amounts in thousands)
| U.S. Small Company | | Value Advantage | |
| | | Year Ended
12/31/2005 | | Year Ended
12/31/2004 | | Period Ended
12/31/2005(a) | |
| SHARE TRANSACTIONS: | |
| Class A Shares | |
| Issued | | | — | | | | — | | | | 2,969 | | |
| Reinvested | | | — | | | | — | | | | 31 | | |
| Redeemed | | | — | | | | — | | | | (156 | ) | |
| Change in Class A Shares | | | — | | | | — | | | | 2,844 | | |
| Class B Shares | |
| Issued | | | — | | | | — | | | | — | | |
| Reinvested | | | — | | | | — | | | | — | | |
| Redeemed | | | — | | | | — | | | | — | | |
| Change in Class B Shares | | | — | | | | — | | | | — | | |
| Class C Shares(a) | |
| Issued | | | — | | | | — | | | | 3,635 | | |
| Reinvested | | | — | | | | — | | | | 31 | | |
| Redeemed | | | — | | | | — | | | | (141 | ) | |
| Change in Class C Shares | | | — | | | | — | | | | 3,525 | | |
| Select Class Shares | |
| Issued | | | 3,118 | | | | 1,535 | | | | 229 | | |
| Reinvested | | | 736 | | | | 962 | | | | 2 | | |
| Redeemed | | | (4,604 | ) | | | (7,032 | ) | | | (36 | ) | |
| Change in Select Class Shares | | | (750 | ) | | | (4,535 | ) | | | 195 | | |
| Institutional Class Shares | |
| Issued | | | 1,169 | | | | 1,563 | | | | 34 | | |
| Reinvested | | | 209 | | | | 458 | | | | — | (b) | |
| Redeemed | | | (4,435 | ) | | | (6,617 | ) | | | (33 | ) | |
| Change in Institutional Class Shares | | | (3,057 | ) | | | (4,596 | ) | | | 1 | | |
(a) Commencement of operations was March 1, 2005.
(b) Amount rounds to less than one thousand.
SEE NOTES TO FINANCIAL STATEMENTS.
JPMORGAN U.S. EQUITY MID/SMALL CAP FUNDS108
THIS PAGE IS INTENTIONALLY LEFT BLANK
JPMORGAN U.S. EQUITY MID/SMALL CAP FUNDS109
JPMorgan Funds
FINANCIAL HIGHLIGHTS
Class A
| | | Per share operating performance: | |
| | | | | Investment operations: | | Distributions: | | | | | |
| | | Net asset
value,
beginning
of period | | Net
investment
income
(loss) | | Net realized
and unrealized
gains
(losses) on
investments | | Total from
investment
operations | | Net
investment
income | | Net
realized
gains | | Total
distributions | | Net asset
value, end
of period | | Total
return
(excludes
sales charge) (h)(i) | |
| CAPITAL GROWTH FUND(a) | |
| Year Ended December 31, 2005 | | $ | 38.51 | | | | (0.23 | )(d) | | | 3.95 | | | | 3.72 | | | | — | | | | (3.10 | ) | | | (3.10 | ) | | $ | 39.13 | | | | 9.77 | % | |
| Year Ended December 31, 2004 | | $ | 37.47 | | | | (0.24 | )(d) | | | 6.49 | | | | 6.25 | | | | — | | | | (5.21 | ) | | | (5.21 | ) | | $ | 38.51 | | | | 16.90 | % | |
| Year Ended December 31, 2003 | | $ | 28.60 | | | | (0.34 | )(d) | | | 10.61 | | | | 10.27 | | | | — | | | | (1.40 | ) | | | (1.40 | ) | | $ | 37.47 | | | | 36.10 | % | |
| Year Ended December 31, 2002 | | $ | 40.10 | | | | (0.38 | )(d) | | | (10.86 | ) | | | (11.24 | ) | | | — | | | | (0.26 | ) | | | (0.26 | ) | | $ | 28.60 | | | | (28.04 | )% | |
November 1, 2001 Through
December 31, 2001(c) | | $ | 35.37 | | | | (0.03 | ) | | | 4.76 | | | | 4.73 | | | | — | | | | — | | | | — | | | $ | 40.10 | | | | 13.37 | % | |
| Year Ended October 31, 2001 | | $ | 47.91 | | | | (0.19 | )(d) | | | (6.87 | ) | | | (7.06 | ) | | | — | | | | (5.48 | ) | | | (5.48 | ) | | $ | 35.37 | | | | (15.86 | )% | |
| DYNAMIC SMALL CAP FUND | |
| Year Ended December 31, 2005 | | $ | 18.46 | | | | (0.21 | )(d) | | | 1.20 | | | | 0.99 | | | | — | | | | (1.33 | ) | | | (1.33 | ) | | $ | 18.12 | | | | 5.29 | % | |
| Year Ended December 31, 2004 | | $ | 16.81 | | | | (0.19 | )(d) | | | 1.84 | | | | 1.65 | | | | — | | | | — | | | | — | | | $ | 18.46 | | | | 9.82 | % | |
| Year Ended December 31, 2003 | | $ | 12.14 | | | | (0.16 | )(d) | | | 4.83 | | | | 4.67 | | | | — | | | | — | | | | — | | | $ | 16.81 | | | | 38.47 | % | |
| Year Ended December 31, 2002 | | $ | 15.72 | | | | (0.18 | ) | | | (3.40 | ) | | | (3.58 | ) | | | — | | | | — | | | | — | | | $ | 12.14 | | | | (22.77 | )% | |
November 1, 2001 Through
December 31, 2001(c) | | $ | 14.21 | | | | (0.03 | ) | | | 1.54 | | | | 1.51 | | | | — | | | | — | | | | — | | | $ | 15.72 | | | | 10.63 | % | |
| Year Ended October 31, 2001 | | $ | 24.54 | | | | (0.24 | ) | | | (6.71 | ) | | | (6.95 | ) | | | — | | | | (3.38 | ) | | | (3.38 | ) | | $ | 14.21 | | | | (30.60 | )% | |
| GROWTH ADVANTAGE FUND(e) | |
| Year Ended December 31, 2005 | | $ | 5.74 | | | | (0.05 | )(d) | | | 0.66 | | | | 0.61 | | | | — | | | | — | | | | — | | | $ | 6.35 | | | | 10.63 | % | |
| Year Ended December 31, 2004 | | $ | 4.91 | | | | (0.03 | )(d) | | | 0.86 | | | | 0.83 | | | | — | | | | — | | | | — | | | $ | 5.74 | | | | 16.90 | % | |
| Year Ended December 31, 2003 | | $ | 3.57 | | | | (0.04 | )(d) | | | 1.38 | | | | 1.34 | | | | — | | | | — | | | | — | | | $ | 4.91 | | | | 37.53 | % | |
| Year Ended December 31, 2002 | | $ | 5.06 | | | | (0.05 | )(d) | | | (1.44 | ) | | | (1.49 | ) | | | — | | | | — | | | | — | | | $ | 3.57 | | | | (29.45 | )% | |
October 1, 2001 Through
December 31, 2001(f) | | $ | 4.27 | | | | (0.01 | ) | | | 0.80 | | | | 0.79 | | | | — | | | | — | | | | — | | | $ | 5.06 | | | | 18.50 | % | |
| Year Ended September 30, 2001 | | $ | 12.51 | | | | (0.02 | )(d) | | | (8.06 | ) | | | (8.08 | ) | | | — | | | | (0.16 | ) | | | (0.16 | ) | | $ | 4.27 | | | | (65.10 | )% | |
| MICRO CAP FUND | |
October 31, 2005(b) Through
December 31, 2005 | | $ | 15.00 | | | | (0.04 | ) | | | 0.51 | | | | 0.47 | | | | — | | | | — | | | | — | | | $ | 15.47 | | | | 3.13 | % | |
(a) Prior to September 10, 2001, Capital Growth Fund invested all of its investable assets in the Capital Growth Portfolio. The portfolio turnover rate disclosed prior to September 10, 2001, is the turnover rate of Capital Growth Portfolio.
(b) Commencement of operations.
(c) The Fund changed its fiscal year end from 10/31 to 12/31.
(d) Calculated based upon average shares outstanding.
(e) Prior to August 17, 2005, the Fund was named Mid Cap Growth Fund.
(f) The Fund changed its fiscal year end from 9/30 to 12/31.
(g) Annualized for periods less than one year.
(h) Not annualized for periods less than one year.
(i) Includes adjustments in accordance with accounting principles generally accepted in the United States of America and as such, the net asset value for financial reporting purposes and the returns based upon those net asset values may differ from the net asset value and returns for shareholder transactions.
SEE NOTES TO FINANCIAL STATEMENTS.
JPMORGAN U.S. EQUITY MID/SMALL CAP FUNDS110
ANNUAL REPORT DECEMBER 31
2005
FINANCIAL HIGHLIGHTS
| | | Ratios/Supplemental data: | |
| | | | | Ratios to average net assets: (g) | | | |
| | | Net assets,
end of
period
(thousands) | | Net
expenses | | Net
investment
income
(loss) | | Expenses
without waivers
reimbursements
and earnings credits | | Portfolio
turnover
rate (h) | |
| CAPITAL GROWTH FUND(a) | |
| Year Ended December 31, 2005 | | $ | 458,716 | | | | 1.17 | % | | | (0.60 | )% | | | 1.17 | % | | | 119 | % | |
| Year Ended December 31, 2004 | | $ | 441,000 | | | | 1.35 | % | | | (0.61 | )% | | | 1.37 | % | | | 122 | % | |
| Year Ended December 31, 2003 | | $ | 412,000 | | | | 1.35 | % | | | (1.05 | )% | | | 1.46 | % | | | 68 | % | |
| Year Ended December 31, 2002 | | $ | 330,000 | | | | 1.35 | % | | | (1.13 | )% | | | 1.38 | % | | | 93 | % | |
November 1, 2001 Through
December 31, 2001(c) | | $ | 495,000 | | | | 1.35 | % | | | (0.40 | )% | | | 1.35 | % | | | 2 | % | |
| Year Ended October 31, 2001 | | $ | 426,000 | | | | 1.35 | % | | | (0.47 | )% | | | 1.37 | % | | | 43 | % | |
| DYNAMIC SMALL CAP FUND | |
| Year Ended December 31, 2005 | | $ | 75,940 | | | | 1.50 | % | | | (1.16 | )% | | | 1.67 | % | | | 143 | % | |
| Year Ended December 31, 2004 | | $ | 86,000 | | | | 1.50 | % | | | (1.14 | )% | | | 1.73 | % | | | 112 | % | |
| Year Ended December 31, 2003 | | $ | 89,000 | | | | 1.50 | % | | | (1.19 | )% | | | 1.86 | % | | | 55 | % | |
| Year Ended December 31, 2002 | | $ | 82,000 | | | | 1.50 | % | | | (1.20 | )% | | | 1.82 | % | | | 52 | % | |
November 1, 2001 Through
December 31, 2001(c) | | $ | 125,000 | | | | 1.50 | % | | | (1.21 | )% | | | 1.63 | % | | | 8 | % | |
| Year Ended October 31, 2001 | | $ | 120,000 | | | | 1.50 | % | | | (1.13 | )% | | | 1.64 | % | | | 57 | % | |
| GROWTH ADVANTAGE FUND(e) | |
| Year Ended December 31, 2005 | | $ | 54,737 | | | | 1.35 | % | | | (0.81 | )% | | | 1.75 | % | | | 140 | % | |
| Year Ended December 31, 2004 | | $ | 54,000 | | | | 1.35 | % | | | (0.61 | )% | | | 1.79 | % | | | 118 | % | |
| Year Ended December 31, 2003 | | $ | 58,000 | | | | 1.35 | % | | | (1.05 | )% | | | 1.77 | % | | | 69 | % | |
| Year Ended December 31, 2002 | | $ | 53,000 | | | | 1.35 | % | | | (1.15 | )% | | | 1.62 | % | | | 39 | % | |
October 1, 2001 Through
December 31, 2001(f) | | $ | 101,000 | | | | 1.35 | % | | | (0.84 | )% | | | 1.35 | % | | | 135 | % | |
| Year Ended September 30, 2001 | | $ | 94,000 | | | | 1.30 | % | | | (0.54 | )% | | | 1.30 | % | | | 159 | % | |
| MICRO CAP FUND | |
October 31, 2005(b) Through
December 31, 2005 | | $ | 516 | | | | 1.70 | % | | | (1.43 | )% | | | 5.58 | % | | | 8 | % | |
SEE NOTES TO FINANCIAL STATEMENTS.
JPMORGAN U.S. EQUITY MID/SMALL CAP FUNDS111
JPMorgan Funds
FINANCIAL HIGHLIGHTS
(CONTINUED)
Class A (continued)
| | | Per share operating performance: | |
| | | | | Investment operations: | | Distributions: | | | | | |
| | | Net asset
value,
beginning
of period | | Net
investment
income
(loss) | | Net realized
and unrealized
gains
(losses) on
investments | | Total from
investment
operations | | Net
investment
income | | Net
realized
gains | | Total
distributions | | Net asset
value, end
of period | | Total
return
(excludes
sales charge) (f)(h) | |
| MID CAP VALUE FUND | |
| Year Ended December 31, 2005 | | $ | 22.05 | | | | 0.12 | (d) | | | 1.84 | | | | 1.96 | | | | (0.12 | ) | | | (0.61 | ) | | | (0.73 | ) | | $ | 23.28 | | | | 8.87 | % | |
| Year Ended December 31, 2004 | | $ | 18.62 | | | | 0.07 | (d) | | | 3.71 | | | | 3.78 | | | | (0.04 | ) | | | (0.31 | ) | | | (0.35 | ) | | $ | 22.05 | | | | 20.32 | % | |
| Year Ended December 31, 2003 | | $ | 14.44 | | | | 0.09 | (d) | | | 4.25 | | | | 4.34 | | | | (0.05 | ) | | | (0.11 | ) | | | (0.16 | ) | | $ | 18.62 | | | | 30.07 | % | |
| Year Ended December 31, 2002 | | $ | 14.10 | | | | 0.07 | (d) | | | 0.31 | | | | 0.38 | | | | (0.03 | ) | | | (0.01 | ) | | | (0.04 | ) | | $ | 14.44 | | | | 2.68 | % | |
October 1, 2001 Through
December 31, 2001(a) | | $ | 13.43 | | | | 0.02 | (d) | | | 1.48 | | | | 1.50 | | | | (0.08 | ) | | | (0.75 | ) | | | (0.83 | ) | | $ | 14.10 | | | | 11.20 | % | |
April 30, 2001(c) Through
September 30, 2001 | | $ | 14.24 | | | | 0.04 | (d) | | | (0.85 | ) | | | (0.81 | ) | | | — | | | | — | | | | — | | | $ | 13.43 | | | | (5.69 | )% | |
| SMALL CAP EQUITY FUND | |
| Year Ended December 31, 2005 | | $ | 26.44 | | | | (0.08 | )(d) | | | 3.36 | | | | 3.28 | | | | — | | | | (3.42 | ) | | | (3.42 | ) | | $ | 26.30 | | | | 12.39 | % | |
| Year Ended December 31, 2004 | | $ | 24.11 | | | | (0.17 | )(d) | | | 6.33 | | | | 6.16 | | | | — | | | | (3.83 | ) | | | (3.83 | ) | | $ | 26.44 | | | | 26.13 | % | |
| Year Ended December 31, 2003 | | $ | 17.68 | | | | (0.15 | )(d) | | | 6.58 | | | | 6.43 | | | | — | | | | — | | | | — | | | $ | 24.11 | | | | 36.37 | % | |
| Year Ended December 31, 2002 | | $ | 21.53 | | | | (0.15 | )(d) | | | (3.57 | ) | | | (3.72 | ) | | | — | | | | (0.13 | ) | | | (0.13 | ) | | $ | 17.68 | | | | (17.30 | )% | |
November 1, 2001 Through
December 31, 2001(b) | | $ | 19.64 | | | | (0.03 | )(d) | | | 1.92 | | | | 1.89 | | | | — | | | | — | | | | — | | | $ | 21.53 | | | | 9.62 | % | |
| Year Ended October 31, 2001 | | $ | 27.89 | | | | (0.10 | ) | | | (4.26 | ) | | | (4.36 | ) | | | — | | | | (3.89 | ) | | | (3.89 | ) | | $ | 19.64 | | | | (16.62 | )% | |
| VALUE ADVANTAGE FUND | |
March 1, 2005(c) Through
December 31, 2005 | | $ | 15.00 | | | | 0.13 | (d) | | | 0.99 | | | | 1.12 | | | | (0.06 | ) | | | (0.18 | ) | | | (0.24 | ) | | $ | 15.88 | | | | 7.46 | % | |
(a) The Fund changed its fiscal year end from 9/30 to 12/31.
(b) The Fund changed its fiscal year end from 10/31 to 12/31.
(c) Commencement of offering of class of shares.
(d) Calculated based upon average shares outstanding.
(e) Annualized for periods less than one year.
(f) Not annualized for periods less than one year.
(g) Due to the size of net assets and fixed expenses, ratios may appear disproportionate.
(h) Includes adjustments in accordance with accounting principles generally accepted in the United States of America and as such, the net asset value for financial reporting purposes and the returns based upon those net asset values may differ from the net asset value and returns for shareholder transactions.
SEE NOTES TO FINANCIAL STATEMENTS.
JPMORGAN U.S. EQUITY MID/SMALL CAP FUNDS112
ANNUAL REPORT DECEMBER 31
2005
FINANCIAL HIGHLIGHTS
| | | Ratios/Supplemental data: | |
| | | | | Ratios to average net assets: (e) | | | |
| | | Net assets,
end of
period
(thousands) | | Net
expenses | | Net
investment
income
(loss) | | Expenses
without waivers
reimbursements
and earnings credits | | Portfolio
turnover
rate (f) | |
| MID CAP VALUE FUND | |
| Year Ended December 31, 2005 | | $ | 2,822,767 | | | | 1.25 | % | | | 0.54 | % | | | 1.39 | % | | | 45 | % | |
| Year Ended December 31, 2004 | | $ | 1,333,000 | | | | 1.25 | % | | | 0.34 | % | | | 1.60 | % | | | 41 | % | |
| Year Ended December 31, 2003 | | $ | 275,000 | | | | 1.25 | % | | | 0.51 | % | | | 1.65 | % | | | 32 | % | |
| Year Ended December 31, 2002 | | $ | 26,000 | | | | 1.25 | % | | | 0.50 | % | | | 1.70 | % | | | 51 | % | |
October 1, 2001 Through
December 31, 2001(a) | | $ | 5,000 | | | | 1.25 | % | | | 0.47 | % | | | 3.72 | %(g) | | | 15 | % | |
April 30, 2001(c) Through
September 30, 2001 | | $ | 2,000 | | | | 1.30 | % | | | 0.71 | % | | | 15.30 | %(g) | | | 98 | % | |
| SMALL CAP EQUITY FUND | |
| Year Ended December 31, 2005 | | $ | 209,321 | | | | 1.35 | % | | | (0.28 | )% | | | 1.41 | % | | | 70 | % | |
| Year Ended December 31, 2004 | | $ | 129,000 | | | | 1.38 | % | | | (0.66 | )% | | | 1.62 | % | | | 44 | % | |
| Year Ended December 31, 2003 | | $ | 88,000 | | | | 1.38 | % | | | (0.75 | )% | | | 1.65 | % | | | 38 | % | |
| Year Ended December 31, 2002 | | $ | 77,000 | | | | 1.38 | % | | | (0.74 | )% | | | 1.40 | % | | | 51 | % | |
November 1, 2001 Through
December 31, 2001(b) | | $ | 71,000 | | | | 1.38 | % | | | (0.81 | )% | | | 1.38 | % | | | 6 | % | |
| Year Ended October 31, 2001 | | $ | 67,000 | | | | 1.39 | % | | | (0.80 | )% | | | 1.40 | % | | | 47 | % | |
| VALUE ADVANTAGE FUND | |
March 1, 2005(c) Through
December 31, 2005 | | $ | 45,163 | | | | 1.25 | % | | | 1.02 | % | | | 1.82 | % | | | 90 | % | |
SEE NOTES TO FINANCIAL STATEMENTS.
JPMORGAN U.S. EQUITY MID/SMALL CAP FUNDS113
JPMorgan Funds
FINANCIAL HIGHLIGHTS
(CONTINUED)
Class B
| | | Per share operating performance: | |
| | | | | Investment operations: | | Distributions: | | | | | |
| | | Net asset
value,
beginning
of period | | Net
investment
income
(loss) | | Net realized
and unrealized
gains
(losses) on
investments | | Total from
investment
operations | | Net
investment
income | | Net
realized
gains | | Total
distributions | | Net asset
value, end
of period | | Total
return
(excludes
sales charge) (g)(h) | |
| CAPITAL GROWTH FUND(a) | |
| Year Ended December 31, 2005 | | $ | 35.73 | | | | (0.40 | )(c) | | | 3.66 | | | | 3.26 | | | | — | | | | (3.10 | ) | | | (3.10 | ) | | $ | 35.89 | | | | 9.23 | % | |
| Year Ended December 31, 2004 | | $ | 35.27 | | | | (0.40 | )(c) | | | 6.07 | | | | 5.67 | | | | — | | | | (5.21 | ) | | | (5.21 | ) | | $ | 35.73 | | | | 16.31 | % | |
| Year Ended December 31, 2003 | | $ | 27.13 | | | | (0.48 | )(c) | | | 10.02 | | | | 9.54 | | | | — | | | | (1.40 | ) | | | (1.40 | ) | | $ | 35.27 | | | | 35.37 | % | |
| Year Ended December 31, 2002 | | $ | 38.24 | | | | (0.65 | )(c) | | | (10.20 | ) | | | (10.85 | ) | | | — | | | | (0.26 | ) | | | (0.26 | ) | | $ | 27.13 | | | | (28.39 | )% | |
November 1, 2001 Through
December 31, 2001(b) | | $ | 33.75 | | | | (0.06 | ) | | | 4.55 | | | | 4.49 | | | | — | | | | — | | | | — | | | $ | 38.24 | | | | 13.30 | % | |
| Year Ended October 31, 2001 | | $ | 46.20 | | | | (0.38 | )(c) | | | (6.59 | ) | | | (6.97 | ) | | | — | | | | (5.48 | ) | | | (5.48 | ) | | $ | 33.75 | | | | (16.30 | )% | |
| DYNAMIC SMALL CAP FUND | |
| Year Ended December 31, 2005 | | $ | 17.47 | | | | (0.29 | )(c) | | | 1.12 | | | | 0.83 | | | | — | | | | (1.33 | ) | | | (1.33 | ) | | $ | 16.97 | | | | 4.66 | % | |
| Year Ended December 31, 2004 | | $ | 16.01 | | | | (0.28 | )(c) | | | 1.74 | | | | 1.46 | | | | — | | | | — | | | | — | | | $ | 17.47 | | | | 9.12 | % | |
| Year Ended December 31, 2003 | | $ | 11.63 | | | | (0.24 | )(c) | | | 4.62 | | | | 4.38 | | | | — | | | | — | | | | — | | | $ | 16.01 | | | | 37.66 | % | |
| Year Ended December 31, 2002 | | $ | 15.16 | | | | (0.27 | ) | | | (3.26 | ) | | | (3.53 | ) | | | — | | | | — | | | | — | | | $ | 11.63 | | | | (23.28 | )% | |
November 1, 2001 Through
December 31, 2001(b) | | $ | 13.72 | | | | (0.04 | ) | | | 1.48 | | | | 1.44 | | | | — | | | | — | | | | — | | | $ | 15.16 | | | | 10.50 | % | |
| Year Ended October 31, 2001 | | $ | 23.96 | | | | (0.23 | ) | | | (6.63 | ) | | | (6.86 | ) | | | — | | | | (3.38 | ) | | | (3.38 | ) | | $ | 13.72 | | | | (31.02 | )% | |
| GROWTH ADVANTAGE FUND(d) | |
| Year Ended December 31, 2005 | | $ | 5.54 | | | | (0.09 | ) | | | 0.63 | | | | 0.54 | | | | — | | | | — | | | | — | | | $ | 6.08 | | | | 9.75 | % | |
| Year Ended December 31, 2004 | | $ | 4.77 | | | | (0.07 | )(c) | | | 0.84 | | | | 0.77 | | | | — | | | | — | | | | — | | | $ | 5.54 | | | | 16.14 | % | |
| Year Ended December 31, 2003 | | $ | 3.49 | | | | (0.07 | )(c) | | | 1.35 | | | | 1.28 | | | | — | | | | — | | | | — | | | $ | 4.77 | | | | 36.68 | % | |
| Year Ended December 31, 2002 | | $ | 4.99 | | | | (0.08 | )(c) | | | (1.42 | ) | | | (1.50 | ) | | | — | | | | — | | | | — | | | $ | 3.49 | | | | (30.06 | )% | |
October 1, 2001 Through
December 31, 2001(e) | | $ | 4.22 | | | | (0.02 | ) | | | 0.79 | | | | 0.77 | | | | — | | | | — | | | | — | | | $ | 4.99 | | | | 18.25 | % | |
| Year Ended September 30, 2001 | | $ | 12.43 | | | | (0.07 | )(c) | | | (7.98 | ) | | | (8.05 | ) | | | — | | | | (0.16 | ) | | | (0.16 | ) | | $ | 4.22 | | | | (65.30 | )% | |
(a) Prior to September 10, 2001, Capital Growth Fund invested all of its investable assets in the Capital Growth Portfolio. The portfolio turnover rate disclosed prior to September 10, 2001, is the turnover rate of Capital Growth Portfolio.
(b) The Fund changed its fiscal year end from 10/31 to 12/31.
(c) Calculated based upon average shares outstanding.
(d) Prior to August 17, 2005, the Fund was named Mid Cap Growth Fund.
(e) The Fund changed its fiscal year end from 9/30 to 12/31.
(f) Annualized for periods less than one year.
(g) Not annualized for periods less than one year.
(h) Includes adjustments in accordance with accounting principles generally accepted in the United States of America and as such, the net asset value for financial reporting purposes and the returns based upon those net asset values may differ from the net asset value and returns for shareholder transactions.
SEE NOTES TO FINANCIAL STATEMENTS.
JPMORGAN U.S. EQUITY MID/SMALL CAP FUNDS114
ANNUAL REPORT DECEMBER 31
2005
FINANCIAL HIGHLIGHTS
| | | Ratios/Supplemental data: | |
| | | | | Ratios to average net assets: (f) | | | |
| | | Net assets,
end of
period
(thousands) | | Net
expenses | | Net
investment
income
(loss) | | Expenses
without waivers
reimbursements
and earnings credits | | Portfolio
turnover
rate (g) | |
| CAPITAL GROWTH FUND(a) | |
| Year Ended December 31, 2005 | | $ | 34,126 | | | | 1.67 | % | | | (1.11 | )% | | | 1.67 | % | | | 119 | % | |
| Year Ended December 31, 2004 | | $ | 51,000 | | | | 1.85 | % | | | (1.10 | )% | | | 1.88 | % | | | 122 | % | |
| Year Ended December 31, 2003 | | $ | 61,000 | | | | 1.85 | % | | | (1.55 | )% | | | 1.96 | % | | | 68 | % | |
| Year Ended December 31, 2002 | | $ | 59,000 | | | | 1.85 | % | | | (1.64 | )% | | | 1.89 | % | | | 93 | % | |
November 1, 2001 Through
December 31, 2001(b) | | $ | 170,000 | | | | 1.85 | % | | | (0.93 | )% | | | 1.85 | % | | | 2 | % | |
| Year Ended October 31, 2001 | | $ | 164,000 | | | | 1.85 | % | | | (0.97 | )% | | | 1.87 | % | | | 43 | % | |
| DYNAMIC SMALL CAP FUND | |
| Year Ended December 31, 2005 | | $ | 41,440 | | | | 2.06 | % | | | (1.72 | )% | | | 2.15 | % | | | 143 | % | |
| Year Ended December 31, 2004 | | $ | 62,000 | | | | 2.12 | % | | | (1.76 | )% | | | 2.23 | % | | | 112 | % | |
| Year Ended December 31, 2003 | | $ | 63,000 | | | | 2.12 | % | | | (1.81 | )% | | | 2.35 | % | | | 55 | % | |
| Year Ended December 31, 2002 | | $ | 48,000 | | | | 2.12 | % | | | (1.82 | )% | | | 2.32 | % | | | 52 | % | |
November 1, 2001 Through
December 31, 2001(b) | | $ | 72,000 | | | | 2.12 | % | | | (1.83 | )% | | | 2.12 | % | | | 8 | % | |
| Year Ended October 31, 2001 | | $ | 67,000 | | | | 2.13 | % | | | (1.75 | )% | | | 2.14 | % | | | 57 | % | |
| GROWTH ADVANTAGE FUND(d) | |
| Year Ended December 31, 2005 | | $ | 1,359 | | | | 2.05 | % | | | (1.51 | )% | | | 2.24 | % | | | 140 | % | |
| Year Ended December 31, 2004 | | $ | 3,000 | | | | 2.05 | % | | | (1.31 | )% | | | 2.29 | % | | | 118 | % | |
| Year Ended December 31, 2003 | | $ | 3,000 | | | | 2.05 | % | | | (1.75 | )% | | | 2.33 | % | | | 69 | % | |
| Year Ended December 31, 2002 | | $ | 3,000 | | | | 2.05 | % | | | (1.85 | )% | | | 2.32 | % | | | 39 | % | |
October 1, 2001 Through
December 31, 2001(e) | | $ | 5,000 | | | | 2.05 | % | | | (1.53 | )% | | | 2.05 | % | | | 135 | % | |
| Year Ended September 30, 2001 | | $ | 6,000 | | | | 2.00 | % | | | (1.22 | )% | | | 2.00 | % | | | 159 | % | |
SEE NOTES TO FINANCIAL STATEMENTS.
JPMORGAN U.S. EQUITY MID/SMALL CAP FUNDS115
JPMorgan Funds
FINANCIAL HIGHLIGHTS
(CONTINUED)
Class B (continued)
| | | Per share operating performance: | |
| | | | | Investment operations: | | Distributions: | | | | | |
| | | Net asset
value,
beginning
of period | | Net
investment
income
(loss) | | Net realized
and unrealized
gains
(losses) on
investments | | Total from
investment
operations | | Net
investment
income | | Net
realized
gains | | Total
distributions | | Net asset
value, end
of period | | Total
return
(excludes
sales charge) (g)(i) | |
| MID CAP VALUE FUND | |
| Year Ended December 31, 2005 | | $ | 21.66 | | | | (— | )(d)(e) | | | 1.81 | | | | 1.81 | | | | — | | | | (0.61 | ) | | | (0.61 | ) | | $ | 22.86 | | | | 8.36 | % | |
| Year Ended December 31, 2004 | | $ | 18.37 | | | | (0.06 | )(d) | | | 3.66 | | | | 3.60 | | | | — | | | | (0.31 | ) | | | (0.31 | ) | | $ | 21.66 | | | | 19.60 | % | |
| Year Ended December 31, 2003 | | $ | 14.32 | | | | (0.03 | )(d) | | | 4.19 | | | | 4.16 | | | | — | | | | (0.11 | ) | | | (0.11 | ) | | $ | 18.37 | | | | 29.06 | % | |
| Year Ended December 31, 2002 | | $ | 14.06 | | | | (0.04 | )(d) | | | 0.31 | | | | 0.27 | | | | — | | | | (0.01 | ) | | | (0.01 | ) | | $ | 14.32 | | | | 1.94 | % | |
October 1, 2001 Through
December 31, 2001(a) | | $ | 13.40 | | | | (0.01 | )(d) | | | 1.47 | | | | 1.46 | | | | (0.05 | ) | | | (0.75 | ) | | | (0.80 | ) | | $ | 14.06 | | | | 10.94 | % | |
April 30, 2001(c) Through
September 30, 2001 | | $ | 14.24 | | | | — | (d) | | | (0.84 | ) | | | (0.84 | ) | | | — | | | | — | | | | — | | | $ | 13.40 | | | | (5.90 | )% | |
| SMALL CAP EQUITY FUND | |
| Year Ended December 31, 2005 | | $ | 24.01 | | | | (0.20 | )(d) | | | 3.05 | | | | 2.85 | | | | — | | | | (3.42 | ) | | | (3.42 | ) | | $ | 23.44 | | | | 11.85 | % | |
| Year Ended December 31, 2004 | | $ | 22.34 | | | | (0.34 | )(d) | | | 5.84 | | | | 5.50 | | | | — | | | | (3.83 | ) | | | (3.83 | ) | | $ | 24.01 | | | | 25.22 | % | |
| Year Ended December 31, 2003 | | $ | 16.50 | | | | (0.27 | )(d) | | | 6.11 | | | | 5.84 | | | | — | | | | — | | | | — | | | $ | 22.34 | | | | 35.39 | % | |
| Year Ended December 31, 2002 | | $ | 20.26 | | | | (0.29 | )(d) | | | (3.34 | ) | | | (3.63 | ) | | | — | | | | (0.13 | ) | | | (0.13 | ) | | $ | 16.50 | | | | (17.94 | )% | |
November 1, 2001 Through
December 31, 2001(b) | | $ | 18.50 | | | | (0.05 | )(d) | | | 1.81 | | | | 1.76 | | | | — | | | | — | | | | — | | | $ | 20.26 | | | | 9.51 | % | |
| Year Ended October 31, 2001 | | $ | 26.73 | | | | (0.09 | ) | | | (4.25 | ) | | | (4.34 | ) | | | — | | | | (3.89 | ) | | | (3.89 | ) | | $ | 18.50 | | | | (17.37 | )% | |
(a) The Fund changed its fiscal year end from 9/30 to 12/31.
(b) The Fund changed its fiscal year end from 10/31 to 12/31.
(c) Commencement of offering of class of shares.
(d) Calculated based upon average shares outstanding.
(e) Amount rounds to less than $0.01.
(f) Annualized for periods less than one year.
(g) Not annualized for periods less than one year.
(h) Due to the size of net assets and fixed expenses, ratios may appear disproportionate.
(i) Includes adjustments in accordance with accounting principles generally accepted in the United States of America and as such, the net asset value for financial reporting purposes and the returns based upon those net asset values may differ from the net asset value and returns for shareholder transactions.
SEE NOTES TO FINANCIAL STATEMENTS.
JPMORGAN U.S. EQUITY MID/SMALL CAP FUNDS116
ANNUAL REPORT DECEMBER 31
2005
FINANCIAL HIGHLIGHTS
| | | Ratios/Supplemental data: | |
| | | | | Ratios to average net assets: (f) | | | |
| | | Net assets,
end of
period
(thousands) | | Net
expenses | | Net
investment
income
(loss) | | Expenses
without waivers
reimbursements
and earnings credits | | Portfolio
turnover
rate (g) | |
| MID CAP VALUE FUND | |
| Year Ended December 31, 2005 | | $ | 233,396 | | | | 1.77 | % | | | (0.01 | )% | | | 1.89 | % | | | 45 | % | |
| Year Ended December 31, 2004 | | $ | 173,000 | | | | 1.90 | % | | | (0.32 | )% | | | 2.10 | % | | | 41 | % | |
| Year Ended December 31, 2003 | | $ | 68,000 | | | | 1.95 | % | | | (0.21 | )% | | | 2.19 | % | | | 32 | % | |
| Year Ended December 31, 2002 | | $ | 14,000 | | | | 2.00 | % | | | (0.27 | )% | | | 2.49 | % | | | 51 | % | |
October 1, 2001 Through
December 31, 2001(a) | | $ | 3,000 | | | | 1.99 | % | | | (0.27 | )% | | | 4.47 | %(h) | | | 15 | % | |
April 30, 2001(c) Through
September 30, 2001 | | $ | 1,000 | | | | 2.03 | % | | | 0.01 | % | | | 16.00 | %(h) | | | 98 | % | |
| SMALL CAP EQUITY FUND | |
| Year Ended December 31, 2005 | | $ | 17,106 | | | | 1.87 | % | | | (0.83 | )% | | | 1.91 | % | | | 70 | % | |
| Year Ended December 31, 2004 | | $ | 17,000 | | | | 2.12 | % | | | (1.43 | )% | | | 2.12 | % | | | 44 | % | |
| Year Ended December 31, 2003 | | $ | 22,000 | | | | 2.12 | % | | | (1.49 | )% | | | 2.21 | % | | | 38 | % | |
| Year Ended December 31, 2002 | | $ | 23,000 | | | | 2.12 | % | | | (1.50 | )% | | | 2.16 | % | | | 51 | % | |
November 1, 2001 Through
December 31, 2001(b) | | $ | 42,000 | | | | 2.12 | % | | | (1.55 | )% | | | 2.12 | % | | | 6 | % | |
| Year Ended October 31, 2001 | | $ | 39,000 | | | | 2.13 | % | | | (1.54 | )% | | | 2.14 | % | | | 47 | % | |
SEE NOTES TO FINANCIAL STATEMENTS.
JPMORGAN U.S. EQUITY MID/SMALL CAP FUNDS117
JPMorgan Funds
FINANCIAL HIGHLIGHTS
(CONTINUED)
Class C
| | | Per share operating performance: | |
| | | | | Investment operations: | | Distributions: | | | | | |
| | | Net asset
value,
beginning
of period | | Net
investment
income
(loss) | | Net realized
and unrealized
gains
(losses) on
investments | | Total from
investment
operations | | Net
investment
income | | Net
realized
gains | | Total
distributions | | Net asset
value, end
of period | | Total
return
(excludes
sales charge) (f)(g) | |
| CAPITAL GROWTH FUND(a) | |
| Year Ended December 31, 2005 | | $ | 35.20 | | | | (0.38 | )(d) | | | 3.60 | | | | 3.22 | | | | — | | | | (3.10 | ) | | | (3.10 | ) | | $ | 35.32 | | | | 9.26 | % | |
| Year Ended December 31, 2004 | | $ | 34.81 | | | | (0.40 | )(d) | | | 6.00 | | | | 5.60 | | | | — | | | | (5.21 | ) | | | (5.21 | ) | | $ | 35.20 | | | | 16.32 | % | |
| Year Ended December 31, 2003 | | $ | 26.83 | | | | (0.47 | )(d) | | | 9.85 | | | | 9.38 | | | | — | | | | (1.40 | ) | | | (1.40 | ) | | $ | 34.81 | | | | 35.17 | % | |
| Year Ended December 31, 2002 | | $ | 37.82 | | | | (0.53 | )(d) | | | (10.20 | ) | | | (10.73 | ) | | | — | | | | (0.26 | ) | | | (0.26 | ) | | $ | 26.83 | | | | (28.39 | )% | |
November 1, 2001 Through
December 31, 2001(b) | | $ | 33.38 | | | | (0.05 | ) | | | 4.49 | | | | 4.44 | | | | — | | | | — | | | | — | | | $ | 37.82 | | | | 13.30 | % | |
| Year Ended October 31, 2001 | | $ | 45.76 | | | | (0.37 | )(d) | | | (6.53 | ) | | | (6.90 | ) | | | — | | | | (5.48 | ) | | | (5.48 | ) | | $ | 33.38 | | | | (16.30 | )% | |
| DYNAMIC SMALL CAP FUND | |
| Year Ended December 31, 2005 | | $ | 17.44 | | | | (0.30 | )(d) | | | 1.14 | | | | 0.84 | | | | — | | | | (1.33 | ) | | | (1.33 | ) | | $ | 16.95 | | | | 4.73 | % | |
| Year Ended December 31, 2004 | | $ | 15.98 | | | | (0.28 | )(d) | | | 1.74 | | | | 1.46 | | | | — | | | | — | | | | — | | | $ | 17.44 | | | | 9.14 | % | |
| Year Ended December 31, 2003 | | $ | 11.61 | | | | (0.25 | )(d) | | | 4.62 | | | | 4.37 | | | | — | | | | — | | | | — | | | $ | 15.98 | | | | 37.64 | % | |
| Year Ended December 31, 2002 | | $ | 15.13 | | | | (0.21 | ) | | | (3.31 | ) | | | (3.52 | ) | | | — | | | | — | | | | — | | | $ | 11.61 | | | | (23.26 | )% | |
November 1, 2001 Through
December 31, 2001(b) | | $ | 13.70 | | | | (0.04 | ) | | | 1.47 | | | | 1.43 | | | | — | | | | — | | | | — | | | $ | 15.13 | | | | 10.44 | % | |
| Year Ended October 31, 2001 | | $ | 23.93 | | | | (0.23 | ) | | | (6.62 | ) | | | (6.85 | ) | | | — | | | | (3.38 | ) | | | (3.38 | ) | | $ | 13.70 | | | | (31.02 | )% | |
| MICRO CAP FUND | |
October 31, 2005(c) Through
December 31, 2005 | | $ | 15.00 | | | | (0.05 | ) | | | 0.51 | | | | 0.46 | | | | — | | | | — | | | | — | | | $ | 15.46 | | | | 3.07 | % | |
(a) Prior to September 10, 2001, Capital Growth Fund invested all of its investable assets in the Capital Growth Portfolio. The portfolio turnover rate disclosed prior to September 10, 2001, is the turnover rate of Capital Growth Portfolio.
(b) The Fund changed its fiscal year end from 10/31 to 12/31.
(c) Commencement of offering of class of shares.
(d) Calculated based upon average shares outstanding.
(e) Annualized for periods less than one year.
(f) Not annualized for periods less than one year.
(g) Includes adjustments in accordance with accounting principles generally accepted in the United States of America and as such, the net asset value for financial reporting purposes and the returns based upon those net asset values may differ from the net asset value and returns for shareholder transactions.
SEE NOTES TO FINANCIAL STATEMENTS.
JPMORGAN U.S. EQUITY MID/SMALL CAP FUNDS118
ANNUAL REPORT DECEMBER 31
2005
FINANCIAL HIGHLIGHTS
| | | Ratios/Supplemental data: | |
| | | | | Ratios to average net assets: (e) | | | |
| | | Net assets,
end of
period
(thousands) | | Net
expenses | | Net
investment
income
(loss) | | Expenses
without waivers
reimbursements
and earnings credits | | Portfolio
turnover
rate (f) | |
| CAPITAL GROWTH FUND(a) | |
| Year Ended December 31, 2005 | | $ | 17,120 | | | | 1.65 | % | | | (1.07 | )% | | | 1.66 | % | | | 119 | % | |
| Year Ended December 31, 2004 | | $ | 7,000 | | | | 1.85 | % | | | (1.09 | )% | | | 1.87 | % | | | 122 | % | |
| Year Ended December 31, 2003 | | $ | 4,000 | | | | 1.85 | % | | | (1.55 | )% | | | 1.96 | % | | | 68 | % | |
| Year Ended December 31, 2002 | | $ | 3,000 | | | | 1.85 | % | | | (1.63 | )% | | | 1.88 | % | | | 93 | % | |
November 1, 2001 Through
December 31, 2001(b) | | $ | 5,000 | | | | 1.85 | % | | | (0.91 | )% | | | 1.85 | % | | | 2 | % | |
| Year Ended October 31, 2001 | | $ | 4,000 | | | | 1.85 | % | | | (0.97 | )% | | | 1.87 | % | | | 43 | % | |
| DYNAMIC SMALL CAP FUND | |
| Year Ended December 31, 2005 | | $ | 43,211 | | | | 2.06 | % | | | (1.72 | )% | | | 2.18 | % | | | 143 | % | |
| Year Ended December 31, 2004 | | $ | 34,000 | | �� | | 2.12 | % | | | (1.76 | )% | | | 2.23 | % | | | 112 | % | |
| Year Ended December 31, 2003 | | $ | 23,000 | | | | 2.12 | % | | | (1.82 | )% | | | 2.35 | % | | | 55 | % | |
| Year Ended December 31, 2002 | | $ | 10,000 | | | | 2.12 | % | | | (1.82 | )% | | | 2.32 | % | | | 52 | % | |
November 1, 2001 Through
December 31, 2001(b) | | $ | 11,000 | | | | 2.12 | % | | | (1.83 | )% | | | 2.12 | % | | | 8 | % | |
| Year Ended October 31, 2001 | | $ | 10,000 | | | | 2.13 | % | | | (1.76 | )% | | | 2.14 | % | | | 57 | % | |
| MICRO CAP FUND | |
October 31, 2005(c) Through
December 31, 2005 | | $ | 515 | | | | 2.20 | % | | | (1.93 | )% | | | 6.08 | % | | | 8 | % | |
SEE NOTES TO FINANCIAL STATEMENTS.
JPMORGAN U.S. EQUITY MID/SMALL CAP FUNDS119
JPMorgan Funds
FINANCIAL HIGHLIGHTS
(CONTINUED)
Class C (continued)
| | | Per share operating performance: | |
| | | | | Investment operations: | | Distributions: | | | | | |
| | | Net asset
value,
beginning
of period | | Net
investment
income
(loss) | | Net realized
and unrealized
gains
(losses) on
investments | | Total from
investment
operations | | Net
investment
income | | Net
realized
gains | | Total
distributions | | Net asset
value, end
of period | | Total
return
(excludes
sales charge) (f)(h) | |
| MID CAP VALUE FUND | |
| Year Ended December 31, 2005 | | $ | 21.70 | | | | — | (c)(d) | | | 1.81 | | | | 1.81 | | | | — | (d) | | | (0.61 | ) | | | (0.61 | ) | | $ | 22.90 | | | | 8.34 | % | |
| Year Ended December 31, 2004 | | $ | 18.41 | | | | (0.06 | )(c) | | | 3.66 | | | | 3.60 | | | | — | | | | (0.31 | ) | | | (0.31 | ) | | $ | 21.70 | | | | 19.56 | % | |
| Year Ended December 31, 2003 | | $ | 14.35 | | | | (0.03 | )(c) | | | 4.20 | | | | 4.17 | | | | — | (d) | | | (0.11 | ) | | | (0.11 | ) | | $ | 18.41 | | | | 29.09 | % | |
| Year Ended December 31, 2002 | | $ | 14.09 | | | | (0.04 | )(c) | | | 0.31 | | | | 0.27 | | | | — | | | | (0.01 | ) | | | (0.01 | ) | | $ | 14.35 | | | | 1.94 | % | |
October 1, 2001 Through
December 31, 2001(a) | | $ | 13.41 | | | | (0.01 | )(c) | | | 1.48 | | | | 1.47 | | | | (0.04 | ) | | | (0.75 | ) | | | (0.79 | ) | | $ | 14.09 | | | | 11.05 | % | |
April 30, 2001(b) Through
September 30, 2001 | | $ | 14.24 | | | | — | (c) | | | (0.83 | ) | | | (0.83 | ) | | | — | | | | — | | | | — | | | $ | 13.41 | | | | (5.83 | )% | |
| SMALL CAP EQUITY FUND | |
February 19, 2005(b) Through
December 31, 2005. | | $ | 24.08 | | | | (0.14 | )(c) | | | 2.91 | | | | 2.77 | | | | — | | | | (3.42 | ) | | | (3.42 | ) | | $ | 23.43 | | | | 11.48 | % | |
| VALUE ADVANTAGE FUND | | | | | | | |
March 1, 2005(b) Through
December 31, 2005 | | $ | 15.00 | | | | 0.06 | (c) | | | 1.00 | | | | 1.06 | | | | (0.03 | ) | | | (0.18 | ) | | | (0.21 | ) | | $ | 15.85 | | | | 7.03 | % | |
(a) The Fund changed its fiscal year end from 9/30 to 12/31.
(b) Commencement of offering of class of shares.
(c) Calculated based upon average shares outstanding.
(d) Amount rounds to less than $0.01.
(e) Annualized for periods less than one year.
(f) Not annualized for periods less than one year.
(g) Due to the size of net assets and fixed expenses, ratios may appear disproportionate.
(h) Includes adjustments in accordance with accounting principles generally accepted in the United States of America and as such, the net asset value for financial reporting purposes and the returns based upon those net asset values may differ from the net asset value and returns for shareholder transactions.
SEE NOTES TO FINANCIAL STATEMENTS.
JPMORGAN U.S. EQUITY MID/SMALL CAP FUNDS120
ANNUAL REPORT DECEMBER 31
ANNUAL REPORT DECEMBER 31
2005
FINANCIAL HIGHLIGHTS
| | | Ratios/Supplemental data: | |
| | | | | Ratios to average net assets: (e) | | | |
| | | Net assets,
end of
period
(thousands) | | Net
expenses | | Net
investment
income
(loss) | | Expenses
without waivers
reimbursements
and earnings credits | | Portfolio
turnover
rate (f) | |
| MID CAP VALUE FUND | |
| Year Ended December 31, 2005 | | $ | 822,366 | | | | 1.76 | % | | | 0.01 | % | | | 1.89 | % | | | 45 | % | |
| Year Ended December 31, 2004 | | $ | 483,000 | | | | 1.90 | % | | | (0.31 | )% | | | 2.10 | % | | | 41 | % | |
| Year Ended December 31, 2003 | | $ | 103,000 | | | | 1.95 | % | | | (0.19 | )% | | | 2.19 | % | | | 32 | % | |
| Year Ended December 31, 2002 | | $ | 9,000 | | | | 2.00 | % | | | (0.28 | )% | | | 2.51 | % | | | 51 | % | |
October 1, 2001 Through
December 31, 2001(a) | | $ | 3,000 | | | | 1.99 | % | | | (0.30 | )% | | | 4.48 | %(g) | | | 15 | % | |
April 30, 2001(b) Through
September 30, 2001 | | $ | 2,000 | | | | 2.04 | % | | | 0.03 | % | | | 15.95 | %(g) | | | 98 | % | |
| SMALL CAP EQUITY FUND | |
February 19, 2005(b) Through
December 31, 2005. | | $ | 10,678 | | | | 1.85 | % | | | (0.49 | )% | | | 1.91 | % | | | 70 | % | |
| VALUE ADVANTAGE FUND | |
March 1, 2005(b) Through
December 31, 2005 | | $ | 55,875 | | | | 1.75 | % | | | 0.47 | % | | | 2.39 | % | | | 90 | % | |
SEE NOTES TO FINANCIAL STATEMENTS.
JPMORGAN U.S. EQUITY MID/SMALL CAP FUNDS121
JPMorgan Funds
FINANCIAL HIGHLIGHTS
(CONTINUED)
Select Class
| | | Per share operating performance: | |
| | | | | Investment operations: | | Distributions: | | | | | |
| | | Net asset
value,
beginning
of period | | Net
investment
income
(loss) | | Net realized
and unrealized
gains
(losses) on
investments | | Total from
investment
operations | | Net
investment
income | | Net
realized
gains | | Total
distributions | | Net asset
value, end
of period | | Total
return
(excludes
sales charge) (g)(i) | |
| CAPITAL GROWTH FUND(a) | |
| Year Ended December 31, 2005 | | $ | 40.42 | | | | (0.13 | )(d) | | | 4.17 | | | | 4.04 | | | | — | | | | (3.10 | ) | | | (3.10 | ) | | $ | 41.36 | | | | 10.10 | % | |
| Year Ended December 31, 2004 | | $ | 38.95 | | | | (0.09 | )(d) | | | 6.77 | | | | 6.68 | | | | — | | | | (5.21 | ) | | | (5.21 | ) | | $ | 40.42 | | | | 17.37 | % | |
| Year Ended December 31, 2003 | | $ | 29.57 | | | | (0.21 | )(d) | | | 10.99 | | | | 10.78 | | | | — | | | | (1.40 | ) | | | (1.40 | ) | | $ | 38.95 | | | | 36.64 | % | |
| Year Ended December 31, 2002 | | $ | 41.26 | | | | (0.24 | )(d) | | | (11.19 | ) | | | (11.43 | ) | | | — | | | | (0.26 | ) | | | (0.26 | ) | | $ | 29.57 | | | | (27.71 | )% | |
November 1, 2001 Through
December 31, 2001(b) | | $ | 36.37 | | | | 0.01 | | | | 4.88 | | | | 4.89 | | | | — | | | | — | | | | — | | | $ | 41.26 | | | | 13.45 | % | |
| Year Ended October 31, 2001 | | $ | 48.76 | | | | — | (c) | | | (6.91 | ) | | | (6.91 | ) | | | — | | | | (5.48 | ) | | | (5.48 | ) | | $ | 36.37 | | | | (15.20 | )% | |
| DYNAMIC SMALL CAP FUND | |
| Year Ended December 31, 2005 | | $ | 18.89 | | | | (0.14 | )(d) | | | 1.23 | | | | 1.09 | | | | — | | | | (1.33 | ) | | | (1.33 | ) | | $ | 18.65 | | | | 5.70 | % | |
| Year Ended December 31, 2004 | | $ | 17.13 | | | | (0.13 | )(d) | | | 1.89 | | | | 1.76 | | | | — | | | | — | | | | — | | | $ | 18.89 | | | | 10.27 | % | |
| Year Ended December 31, 2003 | | $ | 12.32 | | | | (0.11 | )(d) | | | 4.92 | | | | 4.81 | | | | — | | | | — | | | | — | | | $ | 17.13 | | | | 39.04 | % | |
| Year Ended December 31, 2002 | | $ | 15.89 | | | | (0.08 | ) | | | (3.49 | ) | | | (3.57 | ) | | | — | | | | — | | | | — | | | $ | 12.32 | | | | (22.47 | )% | |
November 1, 2001 Through
December 31, 2001(b) | | $ | 14.37 | | | | (0.02 | ) | | | 1.54 | | | | 1.52 | | | | — | | | | — | | | | — | | | $ | 15.89 | | | | 10.58 | % | |
| Year Ended October 31, 2001 | | $ | 24.65 | | | | (0.21 | ) | | | (6.69 | ) | | | (6.90 | ) | | | — | | | | (3.38 | ) | | | (3.38 | ) | | $ | 14.37 | | | | (30.20 | )% | |
| MICRO CAP FUND | |
October 31, 2005(e) Through
December 31, 2005 | | $ | 15.00 | | | | (0.03 | ) | | | 0.51 | | | | 0.48 | | | | — | | | | — | | | | — | | | $ | 15.48 | | | | 3.20 | % | |
(a) Prior to September 10, 2001, Capital Growth Fund invested all of its investable assets in the Capital Growth Portfolio. The portfolio turnover rate disclosed prior to September 10, 2001, is the turnover rate of Capital Growth Portfolio.
(b) The Fund changed its fiscal year end from 10/31 to 12/31.
(c) Amount less than $0.01.
(d) Calculated based upon average shares outstanding.
(e) Commencement of offering of class of shares.
( f) Annualized for periods less than one year.
(g) Not annualized for periods less than one year.
(h) Due to the size of net assets and fixed expenses, ratios may appear disproportionate.
(i) Includes adjustments in accordance with accounting principles generally accepted in the United States of America and as such, the net asset value for financial reporting purposes and the returns based upon those net asset values may differ from the net asset value and returns for shareholder transactions.
SEE NOTES TO FINANCIAL STATEMENTS.
JPMORGAN U.S. EQUITY MID/SMALL CAP FUNDS122
ANNUAL REPORT DECEMBER 31
2005
FINANCIAL HIGHLIGHTS
| | | Ratios/Supplemental data: | |
| | | | | Ratios to average net assets: (f) | | | |
| | | Net assets,
end of
period
(thousands) | | Net
expenses | | Net
investment
income
(loss) | | Expenses
without waivers
reimbursements
and earnings credits | | Portfolio
turnover
rate (g) | |
| CAPITAL GROWTH FUND(a) | |
| Year Ended December 31, 2005 | | $ | 275,518 | | | | 0.90 | % | | | (0.33 | )% | | | 0.90 | % | | | 119 | % | |
| Year Ended December 31, 2004 | | $ | 43,000 | | | | 0.93 | % | | | (0.21 | )% | | | 1.30 | % | | | 122 | % | |
| Year Ended December 31, 2003 | | $ | 4,000 | | | | 0.93 | % | | | (0.63 | )% | | | 1.54 | % | | | 68 | % | |
| Year Ended December 31, 2002 | | $ | 2,000 | | | | 0.93 | % | | | (0.71 | )% | | | 1.26 | % | | | 93 | % | |
November 1, 2001 Through
December 31, 2001(b) | | $ | 3,000 | | | | 0.93 | % | | | 0.01 | % | | | 2.06 | % | | | 2 | % | |
| Year Ended October 31, 2001 | | $ | 3,000 | | | | 0.93 | % | | | (0.01 | )% | | | 1.18 | % | | | 43 | % | |
| DYNAMIC SMALL CAP FUND | |
| Year Ended December 31, 2005 | | $ | 21,753 | | | | 1.10 | % | | | (0.77 | )% | | | 1.43 | % | | | 143 | % | |
| Year Ended December 31, 2004 | | $ | 10,000 | | | | 1.10 | % | | | (0.74 | )% | | | 1.32 | % | | | 112 | % | |
| Year Ended December 31, 2003 | | $ | 16,000 | | | | 1.10 | % | | | (0.79 | )% | | | 1.28 | % | | | 55 | % | |
| Year Ended December 31, 2002 | | $ | 12,000 | | | | 1.10 | % | | | (0.79 | )% | | | 1.22 | % | | | 52 | % | |
November 1, 2001 Through
December 31, 2001(b) | | $ | 8,000 | | | | 1.10 | % | | | (0.82 | )% | | | 10.33 | %(h) | | | 8 | % | |
| Year Ended October 31, 2001 | | $ | 203 | | | | 1.12 | % | | | (0.76 | )% | | | 12.21 | %(h) | | | 57 | % | |
| MICRO CAP FUND | |
October 31, 2005(e) Through
December 31, 2005 | | $ | 4,127 | | | | 1.45 | % | | | (1.18 | )% | | | 5.33 | % | | | 8 | % | |
SEE NOTES TO FINANCIAL STATEMENTS.
JPMORGAN U.S. EQUITY MID/SMALL CAP FUNDS123
JPMorgan Funds
FINANCIAL HIGHLIGHTS
(CONTINUED)
Select Class (continued)
| | | Per share operating performance: | |
| | | | | Investment operations: | | Distributions: | | | | | |
| | | Net asset
value,
beginning
of period | | Net
investment
income
(loss) | | Net realized
and unrealized
gains
(losses) on
investments | | Total from
investment
operations | | Net
investment
income | | Net
realized
gains | | Total
distributions | | Net asset
value, end
of period | | Total
return
(excludes
sales charge) (f)(h) | |
| MID CAP EQUITY FUND | |
| Year Ended December 31, 2005 | | $ | 33.30 | | | | 0.10 | (c) | | | 3.09 | | | | 3.19 | | | | (0.09 | ) | | | (3.53 | ) | | | (3.62 | ) | | $ | 32.87 | | | | 9.61 | % | |
| Year Ended December 31, 2004 | | $ | 31.18 | | | | 0.14 | | | | 5.85 | | | | 5.99 | | | | (0.14 | ) | | | (3.73 | ) | | | (3.87 | ) | | $ | 33.30 | | | | 19.36 | % | |
| Year Ended December 31, 2003 | | $ | 24.39 | | | | 0.13 | | | | 7.71 | | | | 7.84 | | | | (0.13 | ) | | | (0.92 | ) | | | (1.05 | ) | | $ | 31.18 | | | | 32.29 | % | |
| Year Ended December 31, 2002 | | $ | 29.51 | | | | 0.13 | | | | (4.07 | ) | | | (3.94 | ) | | | (0.13 | ) | | | (1.05 | ) | | | (1.18 | ) | | $ | 24.39 | | | | (13.39 | )% | |
November 1, 2001 Through
December 31, 2001(a) | | $ | 26.17 | | | | 0.02 | | | | 3.43 | | | | 3.45 | | | | (0.02 | ) | | | (0.09 | ) | | | (0.11 | ) | | $ | 29.51 | | | | 13.20 | % | |
| Year Ended October 31, 2001 | | $ | 37.85 | | | | 0.12 | | | | (5.30 | ) | | | (5.18 | ) | | | (0.12 | ) | | | (6.38 | ) | | | (6.50 | ) | | $ | 26.17 | | | | (15.27 | )% | |
| MID CAP VALUE FUND | |
| Year Ended December 31, 2005 | | $ | 22.18 | | | | 0.18 | (c) | | | 1.85 | | | | 2.03 | | | | (0.16 | ) | | | (0.61 | ) | | | (0.77 | ) | | $ | 23.44 | | | | 9.16 | % | |
| Year Ended December 31, 2004 | | $ | 18.70 | | | | 0.12 | (c) | | | 3.74 | | | | 3.86 | | | | (0.07 | ) | | | (0.31 | ) | | | (0.38 | ) | | $ | 22.18 | | | | 20.67 | % | |
| Year Ended December 31, 2003 | | $ | 14.48 | | | | 0.12 | (c) | | | 4.27 | | | | 4.39 | | | | (0.06 | ) | | | (0.11 | ) | | | (0.17 | ) | | $ | 18.70 | | | | 30.34 | % | |
| Year Ended December 31, 2002 | | $ | 14.14 | | | | 0.14 | (c) | | | 0.27 | | | | 0.41 | | | | (0.06 | ) | | | (0.01 | ) | | | (0.07 | ) | | $ | 14.48 | | | | 2.90 | % | |
October 31, 2001(b) Through
December 31, 2001 | | $ | 13.48 | | | | 0.01 | (c) | | | 1.49 | | | | 1.50 | | | | (0.09 | ) | | | (0.75 | ) | | | (0.84 | ) | | $ | 14.14 | | | | 11.18 | % | |
| SMALL CAP CORE FUND(d) | |
| Year Ended December 31, 2005 | | $ | 43.46 | | | | 0.18 | | | | 1.52 | | | | 1.70 | | | | (0.19 | ) | | | (0.98 | ) | | | (1.17 | ) | | $ | 43.99 | | | | 3.90 | % | |
| Year Ended December 31, 2004 | | $ | 44.39 | | | | 0.09 | | | | 9.51 | | | | 9.60 | | | | (0.07 | ) | | | (10.46 | ) | | | (10.53 | ) | | $ | 43.46 | | | | 22.31 | % | |
| Year Ended December 31, 2003 | | $ | 33.35 | | | | 0.02 | | | | 11.70 | | | | 11.72 | | | | (0.01 | ) | | | (0.67 | ) | | | (0.68 | ) | | $ | 44.39 | | | | 35.20 | % | |
| Year Ended December 31, 2002 | | $ | 40.46 | | | | 0.04 | | | | (6.86 | ) | | | (6.82 | ) | | | (0.03 | ) | | | (0.26 | ) | | | (0.29 | ) | | $ | 33.35 | | | | (16.94 | )% | |
November 1, 2001 Through
December 31, 2001(a) | | $ | 36.65 | | | | 0.01 | | | | 3.81 | | | | 3.82 | | | | (0.01 | ) | | | — | | | | (0.01 | ) | | $ | 40.46 | | | | 10.42 | % | |
| Year Ended October 31, 2001 | | $ | 51.12 | | | | 0.10 | | | | (7.61 | ) | | | (7.51 | ) | | | (0.14 | ) | | | (6.82 | ) | | | (6.96 | ) | | $ | 36.65 | | | | (15.47 | )% | |
(a) The Fund changed its fiscal year end from 10/31 to 12/31.
(b) Commencement of offering of class of shares.
(c) Calculated based upon average shares outstanding.
(d) Prior to February 19, 2005, the Fund was named Trust Small Cap Equity.
(e) Annualized for periods less than one year.
(f) Not annualized for periods less than one year.
(g) Due to the size of net assets and fixed expenses, ratios may appear disproportionate.
(h) Includes adjustments in accordance with accounting principles generally accepted in the United States of America and as such, the net asset value for financial reporting purposes and the returns based upon those net asset values may differ from the net asset value and returns for shareholder transactions.
SEE NOTES TO FINANCIAL STATEMENTS.
JPMORGAN U.S. EQUITY MID/SMALL CAP FUNDS124
ANNUAL REPORT DECEMBER 31
2005
FINANCIAL HIGHLIGHTS
| | | Ratios/Supplemental data: | |
| | | | | Ratios to average net assets: (e) | | | |
| | | Net assets,
end of
period
(thousands) | | Net
expenses | | Net
investment
income
(loss) | | Expenses
without waivers
reimbursements
and earnings credits | | Portfolio
turnover
rate (f) | |
| MID CAP EQUITY FUND | |
| Year Ended December 31, 2005 | | $ | 268,582 | | | | 0.90 | % | | | 0.29 | % | | | 1.08 | % | | | 99 | % | |
| Year Ended December 31, 2004 | | $ | 227,000 | | | | 0.90 | % | | | 0.32 | % | | | 1.14 | % | | | 102 | % | |
| Year Ended December 31, 2003 | | $ | 194,000 | | | | 0.90 | % | | | 0.48 | % | | | 1.14 | % | | | 62 | % | |
| Year Ended December 31, 2002 | | $ | 139,000 | | | | 0.77 | % | | | 0.51 | % | | | 1.14 | % | | | 84 | % | |
November 1, 2001 Through
December 31, 2001(a) | | $ | 155,000 | | | | 0.60 | % | | | 0.38 | % | | | 1.15 | % | | | 2 | % | |
| Year Ended October 31, 2001 | | $ | 133,000 | | | | 0.55 | % | | | 0.38 | % | | | 1.15 | % | | | 55 | % | |
| MID CAP VALUE FUND | |
| Year Ended December 31, 2005 | | $ | 1,222,881 | | | | 1.00 | % | | | 0.80 | % | | | 1.13 | % | | | 45 | % | |
| Year Ended December 31, 2004 | | $ | 485,000 | | | | 1.00 | % | | | 0.60 | % | | | 1.20 | % | | | 41 | % | |
| Year Ended December 31, 2003 | | $ | 76,000 | | | | 1.00 | % | | | 0.74 | % | | | 1.24 | % | | | 32 | % | |
| Year Ended December 31, 2002 | | $ | 14,000 | | | | 1.00 | % | | | 0.96 | % | | | 1.71 | % | | | 51 | % | |
October 31, 2001(b) Through
December 31, 2001 | | $ | 11 | | | | 0.99 | % | | | 0.58 | % | | | 3.68 | %(g) | | | 15 | % | |
| SMALL CAP CORE FUND(d) | |
| Year Ended December 31, 2005 | | $ | 815,905 | | | | 0.80 | % | | | 0.39 | % | | | 1.06 | % | | | 37 | % | |
| Year Ended December 31, 2004 | | $ | 904,000 | | | | 0.64 | % | | | 0.25 | % | | | 1.12 | % | | | 170 | % | |
| Year Ended December 31, 2003 | | $ | 386,000 | | | | 0.60 | % | | | 0.04 | % | | | 1.10 | % | | | 48 | % | |
| Year Ended December 31, 2002 | | $ | 259,000 | | | | 0.51 | % | | | 0.10 | % | | | 1.11 | % | | | 52 | % | |
November 1, 2001 Through
December 31, 2001(a) | | $ | 317,000 | | | | 0.40 | % | | | 0.09 | % | | | 1.12 | % | | | 7 | % | |
| Year Ended October 31, 2001 | | $ | 299,000 | | | | 0.34 | % | | | 0.28 | % | | | 1.13 | % | | | 50 | % | |
SEE NOTES TO FINANCIAL STATEMENTS.
JPMORGAN U.S. EQUITY MID/SMALL CAP FUNDS125
JPMorgan Funds
FINANCIAL HIGHLIGHTS
(CONTINUED)
Select Class (continued)
| | | Per share operating performance: | |
| | | | | Investment operations: | | Distributions: | | | | | |
| | | Net asset
value,
beginning
of period | | Net
investment
income
(loss) | | Net realized
and unrealized
gains
(losses) on
investments | | Total from
investment
operations | | Net
investment
income | | Net
realized
gains | | Total
distributions | | Net asset
value, end
of period | | Total
return
(excludes
sales charge) (g)(i) | |
| SMALL CAP EQUITY FUND | |
| Year Ended December 31, 2005 | | $ | 27.96 | | | | 0.05 | (c) | | | 3.58 | | | | 3.63 | | | | — | | | | (3.42 | ) | | | (3.42 | ) | | $ | 28.17 | | | | 12.98 | % | |
| Year Ended December 31, 2004 | | $ | 25.18 | | | | (0.05 | )(c) | | | 6.66 | | | | 6.61 | | | | — | | | | (3.83 | ) | | | (3.83 | ) | | $ | 27.96 | | | | 26.81 | % | |
| Year Ended December 31, 2003 | | $ | 18.37 | | | | (0.04 | )(c) | | | 6.85 | | | | 6.81 | | | | — | | | | — | | | | — | | | $ | 25.18 | | | | 37.07 | % | |
| Year Ended December 31, 2002 | | $ | 22.25 | | | | (0.04 | )(c) | | | (3.71 | ) | | | (3.75 | ) | | | — | | | | (0.13 | ) | | | (0.13 | ) | | $ | 18.37 | | | | (16.87 | )% | |
November 1, 2001 Through
December 31, 2001(b) | | $ | 20.27 | | | | (0.01 | )(c) | | | 1.99 | | | | 1.98 | | | | — | | | | — | | | | — | | | $ | 22.25 | | | | 9.77 | % | |
| Year Ended October 31, 2001 | | $ | 28.52 | | | | (0.10 | ) | | | (4.26 | ) | | | (4.36 | ) | | | — | | | | (3.89 | ) | | | (3.89 | ) | | $ | 20.27 | | | | (16.19 | )% | |
| U.S. SMALL COMPANY FUND(a) | |
| Year Ended December 31, 2005 | | $ | 13.78 | | | | 0.02 | | | | 0.57 | | | | 0.59 | | | | (0.01 | ) | | | (1.42 | ) | | | (1.43 | ) | | $ | 12.94 | | | | 4.18 | % | |
| Year Ended December 31, 2004 | | $ | 13.90 | | | | (0.03 | )(c) | | | 1.91 | | | | 1.88 | | | | — | | | | (2.00 | ) | | | (2.00 | ) | | $ | 13.78 | | | | 13.73 | % | |
| Year Ended December 31, 2003 | | $ | 9.97 | | | | 0.02 | (c) | | | 3.94 | | | | 3.96 | | | | (0.03 | ) | | | — | | | | (0.03 | ) | | $ | 13.90 | | | | 39.72 | % | |
| Year Ended December 31, 2002 | | $ | 12.57 | | | | 0.03 | | | | (2.60 | ) | | | (2.57 | ) | | | (0.03 | ) | | | — | | | | (0.03 | ) | | $ | 9.97 | | | | (20.48 | )% | |
June 1, 2001 Through
December 31, 2001(d) | | $ | 13.43 | | | | 0.04 | (c) | | | (0.79 | ) | | | (0.75 | ) | | | (0.05 | ) | | | (0.06 | ) | | | (0.11 | ) | | $ | 12.57 | | | | (5.56 | )% | |
| Year Ended May 31, 2001 | | $ | 14.45 | | | | 0.05 | | | | 0.04 | | | | 0.09 | | | | (0.03 | ) | | | (1.08 | ) | | | (1.11 | ) | | $ | 13.43 | | | | 0.75 | % | |
| VALUE ADVANTAGE FUND | | | | | | | |
March 1, 2005(e) Through
December 31, 2005 | | $ | 15.00 | | | | 0.15 | (c) | | | 1.01 | | | | 1.16 | | | | (0.07 | ) | | | (0.18 | ) | | | (0.25 | ) | | $ | 15.91 | | | | 7.71 | % | |
(a) Prior to the open of business on September 10, 2001, the class underwent a split of shares in connection with a Fund reorganization. Prior periods have been restated to reflect the split.
(b) The Fund changed its fiscal year end from 10/31 to 12/31.
(c) Calculated based upon average shares outstanding.
(d) The Fund changed its fiscal year end from 5/31 to 12/31.
(e) Commencement of offering of class of shares.
(f) Annualized for periods less than one year.
(g) Not annualized for periods less than one year.
(h) Prior to September 10, 2001, U.S. Small Company Fund invested all of its investable assets in The U.S. Small Company Portfolio. The portfolio turnover rate disclosed prior to September 10, 2001, is the turnover rate of U.S. Small Company Portfolio.
(i) Includes adjustments in accordance with accounting principles generally accepted in the United States of America and as such, the net asset value for financial reporting purposes and the returns based upon those net asset values may differ from the net asset value and returns for shareholder transactions.
SEE NOTES TO FINANCIAL STATEMENTS.
JPMORGAN U.S. EQUITY MID/SMALL CAP FUNDS126
ANNUAL REPORT DECEMBER 31
2005
FINANCIAL HIGHLIGHTS
| | | Ratios/Supplemental data: | |
| | | | | Ratios to average net assets: (f) | | | |
| | | Net assets,
end of
period
(thousands) | | Net
expenses | | Net
investment
income
(loss) | | Expenses
without waivers
reimbursements
and earnings credits | | Portfolio
turnover
rate (g) | |
| SMALL CAP EQUITY FUND | |
| Year Ended December 31, 2005 | | $ | 243,437 | | | | 0.85 | % | | | 0.18 | % | | | 1.14 | % | | | 70 | % | |
| Year Ended December 31, 2004 | | $ | 211,000 | | | | 0.85 | % | | | (0.17 | )% | | | 1.11 | % | | | 44 | % | |
| Year Ended December 31, 2003 | | $ | 636,000 | | | | 0.85 | % | | | (0.22 | )% | | | 1.12 | % | | | 38 | % | |
| Year Ended December 31, 2002 | | $ | 502,000 | | | | 0.85 | % | | | (0.22 | )% | | | 1.09 | % | | | 51 | % | |
November 1, 2001 Through
December 31, 2001(b) | | $ | 532,000 | | | | 0.88 | % | | | (0.31 | )% | | | 1.10 | % | | | 6 | % | |
| Year Ended October 31, 2001 | | $ | 390,000 | | | | 0.88 | % | | | (0.30 | )% | | | 1.12 | % | | | 47 | % | |
| U.S. SMALL COMPANY FUND(a) | |
| Year Ended December 31, 2005 | | $ | 102,003 | | | | 1.01 | % | | | 0.18 | % | | | 1.14 | % | | | 32 | % | |
| Year Ended December 31, 2004 | | $ | 119,000 | | | | 1.01 | % | | | (0.18 | )% | | | 1.15 | % | | | 129 | % | |
| Year Ended December 31, 2003 | | $ | 156,000 | | | | 1.01 | % | | | 0.15 | % | | | 1.11 | % | | | 78 | % | |
| Year Ended December 31, 2002 | | $ | 199,000 | | | | 1.01 | % | | | 0.23 | % | | | 1.10 | % | | | 90 | % | |
June 1, 2001 Through
December 31, 2001(d) | | $ | 286,000 | | | | 1.01 | % | | | 0.39 | % | | | 1.04 | % | | | 48 | %(h) | |
| Year Ended May 31, 2001 | | $ | 296,000 | | | | 1.01 | % | | | 0.35 | % | | | 1.01 | % | | | 110 | %(h) | |
| VALUE ADVANTAGE FUND | |
March 1, 2005(e) Through
December 31, 2005 | | $ | 3,107 | | | | 1.00 | % | | | 1.14 | % | | | 1.87 | % | | | 90 | % | |
SEE NOTES TO FINANCIAL STATEMENTS.
JPMORGAN U.S. EQUITY MID/SMALL CAP FUNDS127
JPMorgan Funds
FINANCIAL HIGHLIGHTS
(CONTINUED)
Institutional Class
| | | Per share operating performance: | |
| | | | | Investment operations: | | Distributions: | | | | | |
| | | Net asset
value,
beginning
of period | | Net
investment
income
(loss) | | Net realized
and unrealized
gains
(losses) on
investments | | Total from
investment
operations | | Net
investment
income | | Net
realized
gains | | Total
distributions | | Net asset
value, end
of period | | Total
return
(excludes
sales charge) (g)(j) | |
| MID CAP VALUE FUND | |
| Year Ended December 31, 2005 | | $ | 22.30 | | | | 0.24 | (d) | | | 1.86 | | | | 2.10 | | | | (0.21 | ) | | | (0.61 | ) | | | (0.82 | ) | | $ | 23.58 | | | | 9.42 | % | |
| Year Ended December 31, 2004 | | $ | 18.77 | | | | 0.17 | (d) | | | 3.77 | | | | 3.94 | | | | (0.10 | ) | | | (0.31 | ) | | | (0.41 | ) | | $ | 22.30 | | | | 20.99 | % | |
| Year Ended December 31, 2003 | | $ | 14.52 | | | | 0.17 | (d) | | | 4.27 | | | | 4.44 | | | | (0.08 | ) | | | (0.11 | ) | | | (0.19 | ) | | $ | 18.77 | | | | 30.62 | % | |
| Year Ended December 31, 2002 | | $ | 14.14 | | | | 0.15 | (d) | | | 0.30 | | | | 0.45 | | | | (0.06 | ) | | | (0.01 | ) | | | (0.07 | ) | | $ | 14.52 | | | | 3.23 | % | |
October 1, 2001 Through
December 31, 2001(a) | | $ | 13.47 | | | | 0.03 | (d) | | | 1.48 | | | | 1.51 | | | | (0.09 | ) | | | (0.75 | ) | | | (0.84 | ) | | $ | 14.14 | | | | 11.30 | % | |
| Year Ended September 30, 2001 | | $ | 13.06 | | | | 0.15 | (d) | | | 1.28 | | | | 1.43 | | | | (0.15 | ) | | | (0.87 | ) | | | (1.02 | ) | | $ | 13.47 | | | | 11.19 | % | |
| U.S. SMALL COMPANY FUND(c) | |
| Year Ended December 31, 2005 | | $ | 13.77 | | | | 0.05 | (d) | | | 0.56 | | | | 0.61 | | | | (0.03 | ) | | | (1.42 | ) | | | (1.45 | ) | | $ | 12.93 | | | | 4.34 | % | |
| Year Ended December 31, 2004 | | $ | 13.88 | | | | — | (d) | | | 1.89 | | | | 1.89 | | | | — | | | | (2.00 | ) | | | (2.00 | ) | | $ | 13.77 | | | | 13.82 | % | |
| Year Ended December 31, 2003 | | $ | 9.95 | | | | 0.04 | (d) | | | 3.94 | | | | 3.98 | | | | (0.05 | ) | | | — | | | | (0.05 | ) | | $ | 13.88 | | | | 40.03 | % | |
| Year Ended December 31, 2002 | | $ | 12.57 | | | | 0.05 | | | | (2.61 | ) | | | (2.56 | ) | | | (0.06 | ) | | | — | | | | (0.06 | ) | | $ | 9.95 | | | | (20.36 | )% | |
June 1, 2001 Through
December 31, 2001(b) | | $ | 13.34 | | | | 0.05 | (d) | | | (0.78 | ) | | | (0.73 | ) | | | (0.04 | ) | | | — | | | | (0.04 | ) | | $ | 12.57 | | | | (5.50 | )% | |
| Year Ended May 31, 2001 | | $ | 15.11 | | | | 0.08 | | | | 0.03 | | | | 0.11 | | | | (0.09 | ) | | | (1.79 | ) | | | (1.88 | ) | | $ | 13.34 | | | | 0.94 | % | |
| VALUE ADVANTAGE FUND | | | | | | | |
March 1, 2005(e) Through
December 31, 2005 | | $ | 15.00 | | | | 0.11 | | | | 0.99 | | | | 1.10 | | | | (0.09 | ) | | | (0.18 | ) | | | (0.27 | ) | | $ | 15.83 | | | | 7.32 | % | |
(a) The Fund changed its fiscal year end from 9/30 to 12/31.
(b) The Fund changed its fiscal year end from 5/31 to 12/31.
(c) Prior to the open of business on September 10, 2001, the class underwent a split of shares in connection with a Fund reorganization. Prior periods have been restated to reflect the split.
(d) Calculated based upon average shares outstanding.
(e) Commencement of offering of class of shares.
(f) Annualized for periods less than one year.
(g) Not annualized for periods less than one year.
(h) Due to the size of net assets and fixed expenses, ratios may appear disproportionate.
(i) Prior to September 10, 2001, U.S. Small Company Fund invested all of its investable assets in The U.S. Small Company Portfolio. The portfolio turnover rate disclosed prior to September 10, 2001, is the turnover rate of U.S. Small Company Portfolio.
(j) Includes adjustments in accordance with accounting principles generally accepted in the United States of America and as such, the net asset value for financial reporting purposes and the returns based upon those net asset values may differ from the net asset value and returns for shareholder transactions.
SEE NOTES TO FINANCIAL STATEMENTS.
JPMORGAN U.S. EQUITY MID/SMALL CAP FUNDS128
ANNUAL REPORT DECEMBER 31
2005
FINANCIAL HIGHLIGHTS
| | | Ratios/Supplemental data: | |
| | | | | Ratios to average net assets: (f) | | | |
| | | Net assets,
end of
period
(thousands) | | Net
expenses | | Net
investment
income
(loss) | | Expenses
without waivers
reimbursements
and earnings credits | | Portfolio
turnover
rate (g) | |
| MID CAP VALUE FUND | |
| Year Ended December 31, 2005 | | $ | 1,915,393 | | | | 0.75 | % | | | 1.02 | % | | | 0.98 | % | | | 45 | % | |
| Year Ended December 31, 2004 | | $ | 1,215,000 | | | | 0.75 | % | | | 0.83 | % | | | 1.05 | % | | | 41 | % | |
| Year Ended December 31, 2003 | | $ | 334,000 | | | | 0.75 | % | | | 1.00 | % | | | 1.07 | % | | | 32 | % | |
| Year Ended December 31, 2002 | | $ | 59,000 | | | | 0.75 | % | | | 1.01 | % | | | 1.22 | % | | | 51 | % | |
October 1, 2001 Through
December 31, 2001(a) | | $ | 4,000 | | | | 0.75 | % | | | 0.94 | % | | | 3.30 | %(h) | | | 15 | % | |
| Year Ended September 30, 2001 | | $ | 4,000 | | | | 0.75 | % | | | 1.07 | % | | | 3.25 | %(h) | | | 98 | % | |
| U.S. SMALL COMPANY FUND(c) | |
| Year Ended December 31, 2005 | | $ | 46,690 | | | | 0.83 | % | | | 0.39 | % | | | 0.98 | % | | | 32 | % | |
| Year Ended December 31, 2004 | | $ | 92,000 | | | | 0.83 | % | | | — | % | | | 0.97 | % | | | 129 | % | |
| Year Ended December 31, 2003 | | $ | 183,000 | | | | 0.83 | % | | | 0.33 | % | | | 0.95 | % | | | 78 | % | |
| Year Ended December 31, 2002 | | $ | 214,000 | | | | 0.83 | % | | | 0.41 | % | | | 0.93 | % | | | 90 | % | |
June 1, 2001 Through
December 31, 2001(b) | | $ | 269,000 | | | | 0.82 | % | | | 0.57 | % | | | 0.86 | % | | | 48 | %(i) | |
| Year Ended May 31, 2001 | | $ | 410,000 | | | | 0.82 | % | | | 0.54 | % | | | 0.82 | % | | | 110 | %(i) | |
| VALUE ADVANTAGE FUND | |
March 1, 2005(e) Through
December 31, 2005 | | $ | 20 | | | | 0.75 | % | | | 0.87 | % | | | 3.01 | % | | | 90 | % | |
SEE NOTES TO FINANCIAL STATEMENTS.
JPMORGAN U.S. EQUITY MID/SMALL CAP FUNDS129
JPMorgan Funds
NOTES TO FINANCIAL
STATEMENTS
1. Organization
JPMorgan Trust I ("JPM I") was formed on November 12, 2004 as a Delaware statutory trust, pursuant to a Declaration of Trust dated November 5, 2004 and is registered under the Investment Company Act of 1940, as amended (the "1940 Act") as an open-end management investment company. Except as noted below, the Funds are series of JPM I.
JPMorgan Growth Advantage Fund is a series of J.P. Morgan Mutual Fund Investment Trust ("JPMMFIT"), an open-end management investment company which was organized as a Massachusetts business trust on September 23, 1997.
JPMorgan Mid Cap Value Fund is a series of J.P. Morgan Fleming Mutual Fund Group, Inc. ("JPMFMFG"), an open-end management investment company which was organized as a Maryland corporation on August 19, 1997.
The following are the funds of JPM I, JPMMFIT and JPMFMFG (the "Trusts") (collectively, the "Funds") covered by this report:
| FUND | | CLASSES OFFERED | |
| Capital Growth Fund | | Class A, Class B, Class C and Select Class | |
|
| Dynamic Small Cap Fund | | Class A, Class B, Class C, and Select Class | |
|
| Growth Advantage Fund | | Class A and Class B | |
|
| Micro Cap Fund | | Class A, Class C, Select Class | |
|
| Mid Cap Equity Fund | | Select Class | |
|
| Mid Cap Value Fund | | Class A, Class B, Class C, Select Class and Institutional Class | |
|
| Small Cap Core Fund | | Select Class | |
|
| Small Cap Equity Fund | | Class A, Class B, Class C and Select Class | |
|
| U.S. Small Company Fund | | Select Class and Institutional Class | |
|
| Value Advantage Fund | | Class A, Class C, Select Class and Institutional Class | |
|
Until August 17, 2005, the Growth Advantage Fund was formerly named Mid Cap Growth Fund.
Until February 19, 2005, the Small Cap Core Fund was formerly named Trust Small Cap Equity Fund.
The Micro Cap Fund commenced operations on October 31, 2005.
The Value Advantage Fund commenced operations on March 1, 2005.
Prior to February 19, 2005, U.S. Small Company Fund was a separate series of J.P. Morgan Institutional Funds, Capital Growth Fund, Dynamic Small Cap Fund and Small Cap Equity Fund were separate series of J.P. Morgan Mutual Fund Group and Mid Cap Equity Fund and Small Cap Core Fund were a separate series of J.P. Morgan Mutual Fund Select Group. On August 19, 2004, the Board of Trustees of the then existing Trusts approved Agreements and Plans of Reorganization regarding the reorganization of each series of their respective Trust into a corresponding series of J.P. Morgan Mutual Fund Series ("JPMMFS").
At a special meeting of shareholders of the Funds held on January 20, 2005, and adjourned and reconvened on February 3, 2005, shareholders of each of the Funds, except for Growth Advantage Fund and Mid Cap Value Fund, approved an Agreement and Plan of Reorganization with respect to each Fund. Effective after the close of business on February 18, 2005 pursuant to each Agreement and Plan of Reorganization, the Funds were each reorganized, by means of a tax-free reorganization, as a separate series of JPMMFS. Each corresponding series of JPMMFS had no assets, liabilities or operations prior to the reorganization. The event had no impact on the net assets or results of operations of the Funds.
Additionally, the shareholders of JPMMFS approved an Agreement and Plan of Reorganization and Redomiciliation
JPMORGAN U.S. EQUITY MID/SMALL CAP FUNDS130
ANNUAL REPORT DECEMBER 31
2005
NOTES TO FINANCIAL
STATEMENTS
(CONTINUED)
providing for the reorganization and redomiciliation of each series of JPMMFS as a corresponding series of JPM I, including those series of JPMMFS such as the Funds which became a series of JPMMFS as of February 18, 2005. Therefore, effective after the close of business on February 18, 2005, pursuant to each Agreement and Plan of Reorganization and Redomiciliation, each Fund, except for Growth Advantage Fund and Mid Cap Value Fund, was reorganized and redomiciled, by means of a tax-free reorganization, as a separate series of JPM I. Each corresponding series of JPM I had no assets, liabilities or operations prior to the reorganization. The event had no impact on the net assets or results of operations of the Funds.
As of the close of business on February 28, 2005, the Small Cap Core Fund and the U.S. Small Company Fund are publicly offered on a limited basis. Additionally, as of the close of business on March 31, 2005, the Mid Cap Value Fund is publicly offered on a limited basis. As of the close of business on August 15, 2005, the Mid Cap Equity Fund is publicly offered on a limited basis.
Class A shares generally provide for a front-end sales charge while Class B and Class C shares provide for a contingent deferred sales charge. Class B shares automatically convert to Class A shares after eight years. No sales charges are assessed with respect to the Select Class and Institutional Class. All classes of shares have equal rights as to earnings, assets and voting privileges except that each class may bear different distribution and shareholder servicing fees (and during the current fiscal year have different transfer agent fees) and each class has exclusive voting rights with respect to its distribution plan and shareholder servicing agreements. Class A shares for which front-end sales charges have been waived may be subject to redemption charges as described in the Funds' prospectus.
2. Significant Accounting Policies
The following is a summary of significant accounting policies followed by the Funds in preparation of their financial statements. The policies are in accordance with accounting principles generally accepted in the United States of America. The preparation of financial statements requires management to make estimates and assumptions that affect the reported amounts of assets and liabilities at the date of the financial statements and the reported amounts of income and expenses for the period. Actual results could differ from those estimates.
A. Valuation of Investments — Listed securities are valued at the last sale price on the exchange on which they are primarily traded. The value of National Market Systems equity securities quoted by the Nasdaq Stock Market shall generally be the Nasdaq Official Closing Price. Unlisted securities are valued at the last sale price provided by an independent pricing agent or principal market maker. Listed securities for which the latest sales prices are not available are valued at the mean of the latest bid and ask price as of the closing of the primary exchange where such securities are normally traded. Convertible debt securities, debt securities issued by the U.S. Treasury or a U.S. Government Agency (other than short-term investments maturing in less than 61 days), and municipal securities held by the Funds are valued each day based on readily a vailable market quotations received from third party broker-dealers of comparable securities or independent or affiliated pricing services approved by the Board of Trustees. Such pricing services and broker-dealers will generally provide bid-side quotations. Generally, short-term investments maturing in less than 61 days are valued at amortized cost, which approximates market value. Futures, options and other derivatives are valued on the basis of available market quotations. Investments in other open-end investment companies are valued at such investment company's current day closing net asset value per share.
Securities or other assets for which market quotations are not readily available or for which market quotations do not represent the value at the time of pricing (including certain illiquid securities) are fair valued in accordance with procedures established by and under the supervision and responsibility of the Trustees.
JPMORGAN U.S. EQUITY MID/SMALL CAP FUNDS131
JPMorgan Funds
NOTES TO FINANCIAL
STATEMENTS
(CONTINUED)
Trading in securities on most foreign exchanges and over-the-counter markets is normally completed before the close of the domestic market and may also take place on days when the domestic market is closed. In accordance with procedures adopted by the Trustees, the Funds apply fair value pricing on a daily basis for all non-U.S. and non-Canadian equity securities held in their portfolios by utilizing the quotations of an independent pricing service, unless a Fund's advisor determines that use of another valuation methodology is appropriate. The pricing service uses statistical analyses and quantitative models to adjust local market prices using factors such as subsequent movement and changes in the prices of indices, securities and exchange rates in other markets, in determining the fair value as of the time a Fund calculates its net asset value.
B. Repurchase Agreements — The Funds may enter into repurchase agreement transactions with institutions that meet the advisor's credit guidelines. Each repurchase agreement is valued at amortized cost. The Funds require that the collateral received in a repurchase agreement transaction be transferred to a custodian in a manner sufficient to enable the Funds to obtain collateral in the event of a counterparty default. If the counterparty defaults and the fair value of the collateral declines, realization of the collateral by the Funds may be delayed or limited.
C. Futures Contracts — The Funds may enter into futures contracts for the delayed delivery of securities at a fixed price at some future date or for the change in the value of a specified financial index over a predetermined time period.
Upon entering into a futures contract, the Funds are required to pledge to the broker an amount of cash, U.S. government securities, or other assets, equal to a certain percentage of the contract amount. This is known as the initial margin deposit. Subsequent payments, known as variation margin, are made or received by the Funds each day, depending on the daily fluctuations in fair value of the position. Variation margin is recorded as unrealized appreciation or depreciation until the contract is closed out, at which time the Funds realize a gain or loss.
Use of long futures contracts subjects the Funds to risk of loss in excess of the amounts shown on the Statement of Assets and Liabilities, up to the notional value of the futures contracts. Use of short futures contracts subjects the Funds to unlimited risk of loss. The Funds may enter into futures contracts only on exchanges or boards of trade. The exchange or board of trade acts as the counterparty to each futures transaction; therefore, the Funds' credit risk is limited to failure of the exchange or board of trade.
As of December 31, 2005, the Small Cap Core Fund and U.S. Small Company Fund had outstanding futures contracts as listed on their Schedules of Portfolio Investments.
D. Securities Lending — To generate additional income, each Fund may lend up to 331/3% of its assets pursuant to agreements ("borrower agreements") requiring that the loan be continuously secured by cash or securities issued by the U.S. government or its agencies or its instrumentalities (collectively, "U.S. government securities"). JPMorgan Chase Bank, N.A. ("JPMCB"), an affiliate of the Funds, serves as lending agent to the Funds pursuant to a Securities Lending Agreement approved by the Board of Trustees (the "Securities Lending Agreement"). The Securities Lending Agreement was effective with respect to the Funds on October 15, 2002 and an amended and restated agreement was approv ed by the Board at a meeting held on August 11, 2005.
Under the Securities Lending Agreement, JPMCB acting as agent for the Funds, loans securities to approved borrowers pursuant to approved borrower agreements in exchange for collateral equal to at least 100% of the market value of the loaned securities plus accrued interest. During the term of the loan, the Funds receive payments from borrowers equivalent to the dividends and interest that would have been earned on securities lent while simultaneously seeking to earn income on the investment of cash collateral in accordance with investment guidelines contained in the Securities Lending Agreement. For loans secured by cash, the Funds retain the interest on cash collateral investments but are
JPMORGAN U.S. EQUITY MID/SMALL CAP FUNDS132
ANNUAL REPORT DECEMBER 31
2005
NOTES TO FINANCIAL
STATEMENTS
(CONTINUED)
required to pay the borrower a rebate for the use of the cash collateral. For loans secured by U.S. government securities, the borrower pays a borrower fee to the lending agent on behalf of the Funds. The net income earned on the securities lending (after payment of rebates and the fees) is included in the Statement of Operations as Income from securities lending (net). Information on the investment of cash collateral is shown in the Schedule of Portfolio Investments.
Under the Securities Lending Agreement, JPMCB is entitled to a fee equal to (i) 0.06%, calculated on an annualized basis and accrued daily, based upon the value of Collateral received from Borrowers for each Loan of U.S. Securities outstanding during a given month under this Lending Agreement; and (ii) 0.1142%, calculated on an annualized basis and accrued daily, based upon the value of Collateral received from Borrowers for each Loan of non-U.S. Securities outstanding during a given month under this Lending Agreement. For the period from the effective date of the Agreement through December 31, 2005, JPMCB voluntarily reduced its fees to: (i) 0.05% for each loan of U.S. Securities and (ii) 0.10% for each loan of the non-U.S. Securities, respectively.
As of December 31, 2005, the following Funds had securities with the following market values on loan, received the following collateral and for the period then ended, these Funds paid the following amounts to related party affiliates (amounts in thousands):
| | | Lending
Agent
Fees Paid | | Market
Value of
Collateral | | Market Value
of Loaned
Securities | |
| Capital Growth Fund | | $ | 27 | | | $ | 77,753 | | | $ | 75,732 | | |
| Dynamic Small Cap Fund | | | 20 | | | | 42,643 | | | | 41,718 | | |
| Growth Advantage Fund | | | 3 | | | | 9,062 | | | | 8,800 | | |
| Mid Cap Equity Fund | | | 8 | | | | 18,220 | | | | 17,762 | | |
| Mid Cap Value Fund | | | 161 | | | | 417,693 | | | | 407,858 | | |
| Small Cap Core Fund | | | 87 | | | | 197,606 | | | | 191,941 | | |
| Small Cap Equity Fund | | | 28 | | | | 97,572 | | | | 94,938 | | |
| U.S. Small Company Fund | | | 4 | | | | 38,777 | | | | 37,571 | | |
Risks of delay in recovery of securities or even loss of rights in the securities may occur should the borrower of the securities fail financially. Risks may also arise to the extent that the value of the securities loaned increases above the value of the collateral received. JPMCB will indemnify the Funds for any losses resulting from a borrower's failure to return a loaned security when due. Such indemnification does not extend to losses associated with declines in the value of cash collateral investments. Loans are subject to termination by the Funds or the borrower at any time, and are, therefore, not considered to be illiquid investments.
E. Security Transactions and Investment Income — Investment transactions are accounted for on the trade date (the date the order to buy or sell is executed). Securities gains and losses are calculated on a specifically identified cost basis. Interest income is determined on the basis of coupon interest accrued using the effective interest method adjusted for amortization of premiums and accretion of discounts. Dividend income less foreign taxes withheld (if any) is recorded on the ex-dividend date or when the Funds first learn of the dividend.
The Funds record distributions received in excess of income from underlying investments as a reduction of cost of investments and/or realized gain. Such amounts are
JPMORGAN U.S. EQUITY MID/SMALL CAP FUNDS133
JPMorgan Funds
NOTES TO FINANCIAL
STATEMENTS
(CONTINUED)
based on estimates if actual amounts are not available and actual amounts of income, realized gain and return of capital may differ from the estimated amounts. The Funds adjust the estimated amounts of components of distributions (and consequently their net investment income) as necessary once the issuers provide information about the actual composition of the distributions.
F. Allocation of Income and Expenses — In calculating the net asset value per share of each class, investment income, realized and unrealized gains and losses and expenses other than class specific expenses are allocated daily to each class of shares based upon the proportion of net assets of each class at the beginning of each day. Expenses directly attributable to a Fund are charged directly to that Fund while the expenses attributable to more than one Fund of the Trusts are allocated among the respective Funds. Each class of shares bears its pro-rata portion of expenses attributable to its Fund, except that each class separately bears expenses related specifically to that class, such as distribution and shareholder servicing fees.
G. Federal Income Taxes — Each Fund is treated as a separate taxable entity for Federal income tax purposes. Each Fund's policy is to comply with the provisions of the Internal Revenue Code of 1986, as amended ("Code"), applicable to regulated investment companies and to distribute to shareholders all of its distributable net investment income and net realized gain on investments. Accordingly, no provision for Federal income tax is necessary.
H. Foreign Taxes — The Funds may be subject to foreign taxes on income, gains on investments or currency repatriation, a portion of which may be recoverable. The Funds will accrue such taxes and recoveries as applicable, based upon their current interpretation of tax rules and regulations that exist in the markets in which they invest.
I. Dividends and Distributions to Shareholders — Dividends from net investment income are declared and generally paid annually. Dividends are declared separately for each class. No class has preferential dividend rights; differences in per share rates are due to differences in separate class expenses. Net realized capital gains, if any, are distributed at least annually. The amount of dividends and distributions from net investment income and net realized capital gains is determined in accordance with Federal income tax regulations, which may differ from accounting principles generally accepted in the United States of America. To the extent these "book/tax" differences are permanent in nature (i.e., that they result from other than timing of recognition — "temporary differences"), such amounts are reclassified within the capital accounts bas ed on their Federal tax-basis treatment. The following amounts were reclassified within the capital accounts (amounts in thousands):
| | | Paid-in-capital | | Accumulated
undistributed/
(overdistributed)
net investment income | | Accumulated
net realized
gain (loss)
on investments | |
| FUND | |
| Capital Growth Fund | | $ | 1 | | | $ | 3,920 | | | $ | (3,921 | ) | |
| Dynamic Small Cap Fund | | | (1,557 | ) | | | 2,474 | | | | (917 | ) | |
| Growth Advantage Fund | | | (446 | ) | | | 447 | | | | (1 | ) | |
| Micro Cap Fund | | | (1 | ) | | | 11 | | | | (10 | ) | |
| Mid Cap Equity Fund | | | 1 | | | | — | (b) | | | (1 | ) | |
| Mid Cap Value Fund | | | 287 | | | | 2,294 | | | | (2,581 | ) | |
| Small Cap Core Fund | | | (78 | ) | | | 43 | | | | 35 | | |
| Small Cap Equity Fund | | | 2 | | | | 176 | | | | (178 | ) | |
| U.S. Small Company Fund | | | (9 | ) | | | (49 | ) | | | 58 | | |
| Value Advantage Fund | | | (8 | ) | | | 8 | | | | — | | |
(b) Amount rounds to less than one thousand.
JPMORGAN U.S. EQUITY MID/SMALL CAP FUNDS134
ANNUAL REPORT DECEMBER 31
2005
NOTES TO FINANCIAL
STATEMENTS
(CONTINUED)
The reclassifications for the Funds relate primarily to tax returns of capital, net operating losses, organization costs, distributions reclasses and REIT adjustments.
3. Fees and Other Transactions with Affiliates
A. Investment Advisory Fee — Pursuant to the Investment Advisory Agreement, J.P. Morgan Investment Management, Inc. (the "Advisor") acts as the investment advisor to the Funds. The Advisor is a wholly-owned subsidiary of J.P. Morgan Asset Management Holdings, Inc., which is a wholly-owned subsidiary of JPMorgan Chase & Co. ("JPMorgan"). The Advisor supervises the investments of each respective Fund and for such services is paid a fee. The fee is accrued daily and paid monthly based on each Fund's respective average daily net assets. The annual fee rate for each Fund is as follows:
| Capital Growth Fund | | | 0.40 | % | |
| Dynamic Small Cap Fund | | | 0.65 | | |
| Growth Advantage Fund | | | 0.65 | | |
| Micro Cap Fund | | | 1.25 | | |
| Mid Cap Equity Fund | | | 0.65 | | |
| Mid Cap Value Fund* | | | 0.65 | | |
| Small Cap Core Fund | | | 0.65 | | |
| Small Cap Equity Fund | | | 0.65 | | |
| U.S. Small Company Fund | | | 0.60 | | |
| Value Advantage Fund | | | 0.65 | | |
* Prior to February 19, 2005, the investment advisory fee rate was 0.70%.
The Advisor waived Investment Advisory Fees and/or reimbursed expenses as outlined in Note 3.F.
The Funds may invest in one or more money market funds advised by the Advisor or its affiliates. Advisory, administrative and shareholder servicing fees are waived and/or reimbursed from the Funds in an amount sufficient to offset any doubling up of these fees related to each Fund's investment in an affiliated money market fund to the extent required by law.
B. Administration Fee — Effective February 19, 2005, pursuant to an Administration Agreement, JPMorgan Funds Management, Inc. (the "Administrator"), an indirect, wholly-owned subsidiary of JPMorgan, began providing certain administration services to the Funds. In consideration of these services, the Administrator receives a fee computed daily and paid monthly at the annual rate of 0.15% of the first $25 billion of the average daily net assets of all funds in the JPMorgan Fund Complex (excluding the money market funds; Investor Balanced Fund, Investor Conservative Growth Fund, Investor Growth Fund and Investor Growth & Income Fund) and 0.075% of the average daily net assets in excess of $25 billion of all such funds.
Prior to February 19, 2005, JPMorgan Chase Bank, N.A. ("JPMCB") served as the Funds' Administrator subject to the same fee agreements.
JPMCB and the Administrator waived Administration fees and/or reimbursed expenses as outlined in Note 3.F.
Effective July 1, 2005, J.P. Morgan Investor Services, Co. ("JPMIS") began serving as the Funds' Sub-administrator. For its services as Sub-administrator, JPMIS receives a portion of the fees payable to the Administrator. Prior to July 1, 2005, BISYS Fund Services, L.P. ("BISYS") served as the Funds' Sub-administrator. For its services as
JPMORGAN U.S. EQUITY MID/SMALL CAP FUNDS135
JPMorgan Funds
NOTES TO FINANCIAL
STATEMENTS
(CONTINUED)
Sub-administrator, BISYS received a portion of the fees paid to the Administrator.
C. Distribution Fees — Effective February 19, 2005, pursuant to a Distribution Agreement, JPMorgan Distribution Services, Inc. ("the Distributor"), a wholly-owned subsidiary of JPMorgan, began serving as the Trusts' exclusive underwriter and promotes and arranges for the sale of each Fund's shares.
Prior to February 19, 2005, J.P. Morgan Fund Distributors, Inc. ("JPMFD"), a wholly-owned subsidiary of The BISYS Group, Inc., served as the Funds' exclusive underwriter.
The Trustees have adopted a Distribution Plan (the "Distribution Plan") for Class A, Class B and Class C Shares of the Funds in accordance with Rule 12b-1 under the 1940 Act.
The Distribution Plan provides that each Fund shall pay distribution fees, including payments to the Distributor, at annual rates of the average daily net assets as shown in the table below:
| | | Class A | | Class B | | Class C | |
| Capital Growth Fund | | | 0.25 | % | | | 0.75 | % | | | 0.75 | % | |
| Dynamic Small Cap Fund | | | 0.25 | | | | 0.75 | | | | 0.75 | | |
| Growth Advantage Fund | | | 0.25 | | | | 0.75 | | | | n/a | | |
| Micro Cap Fund | | | 0.25 | | | | n/a | | | | 0.75 | | |
| Mid Cap Value Fund | | | 0.25 | | | | 0.75 | | | | 0.75 | | |
| Small Cap Equity Fund | | | 0.25 | | | | 0.75 | | | | 0.75 | | |
| Value Advantage Fund | | | 0.25 | | | | n/a | | | | 0.75 | | |
In addition, the Distributor is entitled to receive the front-end sales charges from purchases of Class A shares and the contingent deferred sales charges ("CDSC") from redemptions of Class B and Class C shares and certain Class A shares for which front-end sales charges have been waived. For the period February 19, 2005 to December 31, 2005, the Distributor received the following amounts (in thousands):
| | | 12b-1 | | Front-End
Sales Charges | | CDSC | |
| Capital Growth Fund | | $ | 1,348 | | | $ | 486 | | | $ | 40 | | |
| Dynamic Small Cap Fund | | | 697 | | | | 123 | | | | 39 | | |
| Growth Advantage Fund | | | 120 | | | | 31 | | | | 1 | | |
| Micro Cap Fund | | | 1 | | | | — | | | | — | | |
| Mid Cap Value Fund | | | 10,896 | | | | 11,823 | | | | 594 | | |
| Small Cap Equity Fund | | | 441 | | | | 1,032 | | | | 28 | | |
| Value Advantage Fund | | | 160 | | | | 1,272 | | | | 3 | | |
JPMFD and the Distributor waived Distribution Fees as outlined in Note 3.F.
JPMORGAN U.S. EQUITY MID/SMALL CAP FUNDS136
ANNUAL REPORT DECEMBER 31
2005
NOTES TO FINANCIAL
STATEMENTS
(CONTINUED)
D. Shareholder Servicing Fees — Effective February 19, 2005, the Trusts, on behalf of the Funds, have entered into a Shareholder Servicing Agreement with the Distributor under which the Distributor provides certain support services to the shareholders. For performing these services, the Distributor receives a fee that is computed daily and paid monthly equal to a percentage of the average daily net assets as shown in the table below:
| | | Class A | | Class B | | Class C | | Select Class | | Institutional Class | |
| Capital Growth Fund | | | 0.25 | | | | 0.25 | | | | 0.25 | | | | 0.25 | | | | n/a | | |
| Dynamic Small Cap Fund | | | 0.25 | | | | 0.25 | | | | 0.25 | | | | 0.25 | | | | n/a | | |
| Growth Advantage Fund | | | 0.25 | | | | 0.25 | | | | n/a | | | | n/a | | | | n/a | | |
| Micro Cap Fund | | | 0.25 | | | | n/a | | | | 0.25 | | | | 0.25 | | | | n/a | | |
| Mid Cap Equity Fund | | | n/a | | | | n/a | | | | n/a | | | | 0.25 | | | | n/a | | |
| Mid Cap Value Fund | | | 0.25 | | | | 0.25 | | | | 0.25 | | | | 0.25 | | | | 0.10 | | |
| Small Cap Core Fund | | | n/a | | | | n/a | | | | n/a | | | | 0.25 | | | | n/a | | |
| Small Cap Equity Fund | | | 0.25 | | | | 0.25 | | | | 0.25 | | | | 0.25 | | | | n/a | | |
| U.S. Small Company Fund | | | n/a | | | | n/a | | | | n/a | | | | 0.25 | | | | 0.10 | | |
| Value Advantage Fund | | | 0.25 | | | | n/a | | | | 0.25 | | | | 0.25 | | | | 0.10 | | |
The Distributor has entered into shareholder services contracts with affiliated and unaffiliated financial intermediaries who provide shareholder services and administrative services to their clients or customers who invest in the Funds under which the Distributor will pay all or a portion of fees earned to such financial intermediaries for performing such services.
Prior to February 19, 2005, JPMCB served as the Funds' Shareholder Servicing Agent. JPMCB was subject to the fee rates disclosed in the previous table.
JPMCB and the Distributor waived shareholder servicing fees as outlined in Note 3.F.
E. Custodian and Accounting Fees — JPMCB provides portfolio custody and fund accounting services for the Funds. The amounts paid directly to JPMCB by the Funds for custody and fund accounting services are included in custodian and accounting fees in the Statement of Operations. The custodian fees may be reduced by credits earned by each Fund, based on uninvested cash balances held by the custodian. Such earnings credits are presented separately in the Statement of Operations.
Interest expense paid to the custodian related to cash overdrafts is presented as interest expense in the Statement of Operations.
JPMORGAN U.S. EQUITY MID/SMALL CAP FUNDS137
JPMorgan Funds
NOTES TO FINANCIAL
STATEMENTS
(CONTINUED)
F. Waivers and Reimbursements — The Advisor, Administrator and Distributor have contractually agreed to waive fees or reimburse the Funds to the extent that total operating expenses (excluding dividend expenses on short sales, interest, taxes, extraordinary expenses and expenses related to the Board of Trustees' deferred compensation plan) exceed the percentages of the Funds' respective average daily net assets as shown in the table below:
| | | Class A | | Class B | | Class C | | Select Class | | Institutional Class | |
| Capital Growth Fund | | | 1.35 | % | | | 1.85 | % | | | 1.85 | % | | | 0.93 | % | | | n/a | | |
| Dynamic Small Cap Fund | | | 1.50 | | | | 2.12 | | | | 2.12 | | | | 1.10 | | | | n/a | | |
| Growth Advantage Fund | | | 1.35 | | | | 2.05 | | | | n/a | | | | n/a | | | | n/a | | |
| Micro Cap Fund | | | 1.70 | | | | n/a | | | | 2.20 | | | | 1.45 | | | | n/a | | |
| Mid Cap Equity Fund | | | n/a | | | | n/a | | | | n/a | | | | 1.00 | | | | n/a | | |
| Mid Cap Value Fund | | | 1.25 | | | | 2.00 | | | | 2.00 | | | | 1.00 | | | | 0.75 | % | |
| Small Cap Core Fund | | | n/a | | | | n/a | | | | n/a | | | | 1.00 | | | | n/a | | |
| Small Cap Equity Fund | | | 1.38 | | | | 2.12 | | | | 2.12 | | | | 0.85 | | | | n/a | | |
| U.S. Small Company Fund | | | n/a | | | | n/a | | | | n/a | | | | 1.01 | | | | 0.83 | | |
| Value Advantage Fund | | | 1.25 | | | | n/a | | | | 1.75 | | | | 1.00 | | | | 0.75 | | |
The contractual expense limitation agreements were in effect for the year ended December 31, 2005. The expense limitation percentages in the table above are due to expire April 30, 2006.
For the year ended December 31, 2005, the Funds' service providers waived fees and contractually reimbursed expenses for each of the Funds as follows (amounts in thousands). None of these parties expects the Funds to repay any such waived fees and reimbursed expenses in future years.
| | | Contractual Waivers | | | |
| | | Investment
Advisory | | Administration | | Shareholder
Servicing | | Distribution | | Total | | Contractual
Reimbursements | |
| Capital Growth Fund | | $ | — | | | $ | — | | | $ | — | | | $ | — | | | $ | — | | | $ | 1 | | |
| Dynamic Small Cap Fund | | | 162 | | | | 19 | | | | 76 | | | | — | | | | 257 | | | | — | | |
| Growth Advantage Fund | | | 79 | | | | 28 | | | | 101 | | | | — | | | | 208 | | | | — | | |
| Micro Cap Fund | | | 11 | | | | 1 | | | | 2 | | | | — | | | | 14 | | | | 20 | | |
| Mid Cap Equity Fund | | | — | | | | 3 | | | | 193 | | | | — | | | | 196 | | | | — | | |
| Mid Cap Value Fund | | | 5,781 | | | | 575 | | | | 2,003 | | | | — | | | | 8,359 | | | | 18 | | |
| Small Cap Core Fund | | | — | | | | 1 | | | | 500 | | | | — | | | | 501 | | | | — | | |
| Small Cap Equity Fund | | | — | | | | 108 | | | | 578 | | | | — | | | | 686 | | | | — | | |
| U.S. Small Company Fund | | | 48 | | | | 64 | | | | 123 | | | | — | | | | 235 | | | | — | | |
| Value Advantage Fund | | | 123 | | | | 17 | | | | — | | | | — | | | | 140 | | | | 97 | | |
JPMORGAN U.S. EQUITY MID/SMALL CAP FUNDS138
ANNUAL REPORT DECEMBER 31
2005
NOTES TO FINANCIAL
STATEMENTS
(CONTINUED)
| | | Voluntary Waivers | |
| | | Investment
Advisory | | Administration | | Shareholder
Servicing | | Distribution | | Total | |
| Dynamic Small Cap Fund | | $ | 1 | | | $ | 6 | | | $ | — | | | $ | — | | | $ | 7 | | |
| Mid Cap Equity Fund | | | — | | | | 52 | | | | 196 | | | | — | | | | 248 | | |
| Mid Cap Value Fund | | | 1,022 | | | | 119 | | | | — | | | | — | | | | 1,141 | | |
| Small Cap Core Fund | | | — | | | | 184 | | | | 1,472 | | | | — | | | | 1,656 | | |
| Small Cap Equity Fund | | | — | | | | 43 | | | | — | | | | — | | | | 43 | | |
(h) Amount rounds to less than one thousand.
G. Other — Certain officers of the Trusts are affiliated with the Advisor, the Administrator and the Distributor. Such officers receive no compensation from the Funds for serving in their respective roles.
During the period, certain Funds may have purchased securities from an underwriting syndicate in which the principal underwriter or members of the syndicate are affiliated with the Advisor.
The Funds may use related party broker/dealers. For the year ended December 31, 2005, the Funds did not incur any brokerage commissions with broker/dealers affiliated with the Advisor.
The SEC has granted an exemptive order permitting the Funds to engage in principal transactions with J.P. Morgan Securities, Inc., an affiliated broker, involving taxable money market instruments subject to certain conditions.
4. Investment Transactions
During the year ended December 31, 2005 purchases and sales of investments (excluding short-term investments) were as follows (amounts in thousands):
| | | Purchases
(excluding U.S.
Government) | | Sales
(excluding U.S.
Government) | |
| FUND | |
| Capital Growth Fund | | $ | 1,023,343 | | | $ | 823,303 | | |
| Dynamic Small Cap Fund | | | 249,266 | | | | 276,666 | | |
| Growth Advantage Fund | | | 74,110 | | | | 80,393 | | |
| Micro Cap Fund | | | 5,338 | | | | 440 | | |
| Mid Cap Equity Fund | | | 260,864 | | | | 241,776 | | |
| Mid Cap Value Fund | | | 5,228,173 | | | | 2,520,304 | | |
| Small Cap Core Fund | | | 299,790 | | | | 363,694 | | |
| Small Cap Equity Fund | | | 339,344 | | | | 267,310 | | |
| U.S. Small Company Fund | | | 56,661 | | | | 115,739 | | |
| Value Advantage Fund | | | 135,574 | | | | 39,621 | | |
JPMORGAN U.S. EQUITY MID/SMALL CAP FUNDS139
JPMorgan Funds
NOTES TO FINANCIAL
STATEMENTS
(CONTINUED)
5. Federal Income Tax Matters
For Federal income tax purposes, the cost and unrealized appreciation (depreciation) in value of the investment securities at December 31, 2005 were as follows (amounts in thousands):
| | | Aggregate
cost | | Gross
unrealized
appreciation | | Gross
unrealized
depreciation | | Net unrealized
appreciation
(depreciation) | |
| Capital Growth Fund | | $ | 735,216 | | | | 139,623 | | | | (18,501 | ) | | $ | 121,122 | | |
| Dynamic Small Cap Fund | | | 203,151 | | | | 25,571 | | | | (3,468 | ) | | | 22,103 | | |
| Growth Advantage Fund | | | 56,900 | | | | 9,545 | | | | (1,061 | ) | | | 8,484 | | |
| Micro Cap Fund | | | 5,041 | | | | 281 | | | | (155 | ) | | | 126 | | |
| Mid Cap Equity Fund | | | 238,307 | | | | 53,351 | | | | (4,544 | ) | | | 48,807 | | |
| Mid Cap Value Fund | | | 6,890,047 | | | | 850,402 | | | | (130,887 | ) | | | 719,515 | | |
| Small Cap Core Fund | | | 938,350 | | | | 124,082 | | | | (50,709 | ) | | | 73,373 | | |
| Small Cap Equity Fund | | | 488,550 | | | | 103,424 | | | | (5,137 | ) | | | 98,287 | | |
| U.S. Small Company Fund | | | 170,111 | | | | 33,178 | | | | (8,453 | ) | | | 24,725 | | |
| Value Advantage Fund | | | 101,248 | | | | 3,805 | | | | (2,017 | ) | | | 1,788 | | |
For all of the Funds, the difference between book and tax basis appreciation/(depreciation) on investments is primarily attributed to wash sale loss deferrals.
The tax character of distributions paid during the fiscal year ended December 31, 2005 was as follows (amounts in thousands):
| | | Distributions paid from: | |
| | | Ordinary
Income | | Net
Long-Term
Capital Gains | | Tax Return
of Capital | | Total
Distributions
Paid | |
| Capital Growth Fund | | $ | 5,585 | | | $ | 51,737 | | | | — | | | $ | 57,322 | | |
| Dynamic Small Cap Fund | | | — | | | | 12,871 | | | | — | | | | 12,871 | | |
| Mid Cap Equity Fund | | | 7,528 | | | | 20,249 | | | | — | | | | 27,777 | | |
| Mid Cap Value Fund | | | 136,842 | | | | 82,699 | | | | — | | | | 219,541 | | |
| Small Cap Core Fund | | | 14,476 | | | | 7,123 | | | | — | | | | 21,599 | | |
| Small Cap Equity Fund | | | 5,878 | | | | 47,292 | | | | — | | | | 53,170 | | |
| U.S. Small Company Fund | | | 4,252 | | | | 12,500 | | | | — | | | | 16,752 | | |
| Value Advantage Fund | | | 1,391 | | | | 6 | | | | — | | | | 1,397 | | |
JPMORGAN U.S. EQUITY MID/SMALL CAP FUNDS140
ANNUAL REPORT DECEMBER 31
2005
NOTES TO FINANCIAL
STATEMENTS
(CONTINUED)
The tax character of distributions paid during the fiscal year ended December 31, 2004 was as follows (amounts in thousands):
| | | Distributions paid from: | | | |
| | | Ordinary
income | | Net
long-term
capital gains | | Tax return
of capital | | Total
distributions
paid | |
| Capital Growth Fund | | $ | — | | | $ | 61,848 | | | $ | — | | | $ | 61,848 | | |
| Mid Cap Equity Fund | | | 6,536 | | | | 17,731 | | | | — | | | | 24,267 | | |
| Mid Cap Value Fund | | | 44,728 | | | | 10,066 | | | | — | | | | 54,794 | | |
| Small Cap Core Fund | | | 12,478 | | | | 75,838 | | | | — | | | | 88,316 | | |
| Small Cap Equity Fund | | | 5,490 | | | | 106,812 | | | | — | | | | 112,302 | | |
| U.S. Small Company Fund | | | — | | | | 28,244 | | | | — | | | | 28,244 | | |
At December 31, 2005, the components of net assets (excluding paid in capital) on a tax basis were as follows (amounts in thousands):
| | | Current
distributable
ordinary income | | Current distributable
long-term capital gain
or (tax basis capital
loss carryover) | |
Unrealized
appreciation
(depreciation) | |
| Capital Growth Fund | | $ | 5,265 | | | $ | 9,122 | | | $ | 121,122 | | |
| Dynamic Small Cap Fund | | | — | | | | 389 | | | | 22,103 | | |
| Growth Advantage Fund | | | — | | | | (245,044 | ) | | | 8,484 | | |
| Micro Cap Fund | | | 33 | | | | — | | | | 126 | | |
| Mid Cap Equity Fund | | | 1,716 | | | | 3,206 | | | | 48,807 | | |
| Mid Cap Value Fund | | | 19,629 | | | | 32,703 | | | | 719,515 | | |
| Small Cap Core Fund | | | — | | | | — | | | | 73,373 | | |
| Small Cap Equity Fund | | | 1,640 | | | | 1,661 | | | | 98,287 | | |
| U.S. Small Company Fund | | | 241 | | | | 966 | | | | 24,725 | | |
| Value Advantage Fund | | | 95 | | | | 9 | | | | 1,788 | | |
For the Funds, the cumulative timing differences primarily consist of wash sale loss deferrals, deferred compensation, post October losses, investments in 1256 contracts and REIT adjustments.
JPMORGAN U.S. EQUITY MID/SMALL CAP FUNDS141
JPMorgan Funds
NOTES TO FINANCIAL
STATEMENTS
(CONTINUED)
As of December 31, 2005, the following Funds had net capital loss carryforwards, which are available to offset future realized gains (amounts in thousands):
| | | 2006 | | 2007 | | 2008 | | 2009 | | 2010 | | 2011 | | 2012 | | 2013 | | Total | |
| Capital Growth Fund* | | | — | | | | — | | | | — | | | | — | | | | 563 | | | | — | | | | — | | | | — | | | | 563 | | |
| Growth Advantage Fund | | | — | | | | — | | | | — | | | | 214,153 | | | | 28,364 | | | | 2,527 | | | | — | | | | — | | | | 245,044 | | |
* Limited under IRC section 381-384.
During the year ended December 31, 2005, Growth Advantage Fund, Dynamic Small Cap Fund and Capital Growth Fund utilized capital loss carryforwards of $8,373, $3,776 and $113 respectively (in thousands)
Net capital losses incurred after October 31 and within the taxable year are deemed to arise on the first business day of the Funds' next taxable year. For the year ended December 31, 2005, the Dynamic Small Cap Fund and Small Cap Core Fund deferred to January 1, 2006 post October capital losses of $664 and $1,364 (amounts in thousands).
6. Borrowings
Effective February 19, 2005, the Funds began relying upon an exemptive order ("Order") permitting the establishment and operation of an Interfund Lending Facility ("Facility"). The Facility allows the Funds to directly lend and borrow money to or from any other fund relying upon the Order at rates beneficial to both the borrowing and lending funds. Advances under the Facility are taken primarily for temporary or emergency purposes, including the meeting of redemption requests that otherwise might require the untimely disposition of securities, and are subject to each Fund's borrowing restrictions. The Interfund Loan Rate is determined, as specified in the Order, by averaging the current repurchase agreement rate and the current bank loan rate. The Order was granted to JPMorgan Trust II (formerly One Group Mutual Funds) and may be relied upon by the Funds because they are investment companies in the same "group of investment comp anies" (as defined in Section 12(d)(1)(G) of the Investment Company Act of 1940).
In addition, effective February 18, 2005, the Trusts and JPMCB have entered into a financing arrangement. Under this arrangement, JPMCB provides an unsecured, uncommitted credit facility in the aggregate amount of $100 million to certain of the JPMorgan Funds including the Funds. Advances under the arrangement are taken primarily for temporary or emergency purposes, including the meeting of redemption requests that otherwise might require the untimely disposition of securities, and are subject to each Fund's borrowing restrictions. Interest on borrowings is payable at a rate determined by JPMCB at the time of borrowing. This agreement has been extended until November 21, 2006.
Prior to February 18, 2005, the Funds were allowed to borrow money for temporary or emergency purposes, pursuant to a Line of Credit dated April 17, 2003. This agreement enabled the Funds to participate with other JPMorgan Funds in a line of credit with JPMCB, as administrative agent, and a syndicate of banks, which permitted borrowings up to $250 million, collectively. Interest was charged to each Fund based on its borrowings at an annual rate equal to the sum of the Federal Funds Rate plus 0.50%. The Funds also paid a commitment fee of 0.09% per annum on the average daily amount of the available commitment, which was allocated on a pro-rata basis to the Funds. This agreement was terminated as of February 18, 2005.
JPMORGAN U.S. EQUITY MID/SMALL CAP FUNDS142
ANNUAL REPORT DECEMBER 31
2005
NOTES TO FINANCIAL
STATEMENTS
(CONTINUED)
The outstanding borrowings from another fund or from the unsecured uncommitted credit facility and average borrowings for the period ended December 31, 2005, were as follows (in thousands):
| | | Outstanding
balance at
December 31, 2005 | | Average
borrowings | | Number
of days
used | | Interest
paid | |
| Small Cap Equity Fund | | $ | — | | | $ | 1,273 | | | | 1 | | | (c) | |
| U.S. Small Company Fund | | | — | | | | 697 | | | | 1 | | | (c) | |
* Amount is less than one thousand.
7. Concentrations and Indemnifications
In the normal course of business the Funds enter into contracts that contain a variety of representations which provide general indemnifications. Each Fund's maximum exposure under these arrangements is unknown, as this would involve future claims that may be made against each Fund that have not yet occurred. However, based on experience, the Funds expect the risk of loss to be remote.
From time to time, the Funds' investment adviser or an affiliate may exercise discretion on behalf of certain of its clients with respect to the purchase or sale of a significant portion of the Funds' outstanding shares. Investment activities on behalf of these shareholders could impact the Funds.
8. Subsequent Event*
On February 6, 2006, the JPMorgan Chase Bank Emerging Growth Trust and JPMorgan Chase Bank Special Equities Fund common trust funds, managed by JPMorgan Chase Bank, N.A., transferred securities in-kind to the JPMorgan Small Cap Core Fund in a tax-free exchange. The JPMorgan Chase Bank Emerging Growth Trust purchased 2,102 Select Class Shares of JPMorgan Small Cap Core Fund and the JPMorgan Small Cap Core Fund received portfolio securities with a market value of $100,174 in exchange for these shares. The JPMorgan Chase Bank Special Equities Fund purchased 4,895 Select Class Shares of JPMorgan Small Cap Core Fund and the JPMorgan Small Cap Core Fund received portfolio securities with a market value of $233,243 in exchange for these shares. The cost basis of the portfolio securities transferred to the JPMorgan Small Cap Core Fund is equal to the cost of the securities of the JPMorgan Chase Bank Emerging Growth Trust and JPMorgan Ch ase Bank Special Equities Fund, respectively, at the time of the in-kind transfer.
* Amounts in thousands
JPMORGAN U.S. EQUITY MID/SMALL CAP FUNDS143
JPMorgan Funds
REPORT OF INDEPENDENT REGISTERED PUBLIC ACCOUNTING FIRM
To the Trustees and Shareholders of
J.P. Morgan Mutual Fund Investment Trust, J.P. Morgan Fleming Mutual Fund Group, Inc. and JPMorgan Trust I:
In our opinion, the accompanying statements of assets and liabilities, including the schedule of portfolio investments, and the related statements of operations and of changes in net assets and the financial highlights present fairly, in all material respects, the financial position of JPMorgan Growth Advantage Fund (a portfolio of J.P. Morgan Mutual Fund Investment Trust), JPMorgan Mid Cap Value Fund (a portfolio of J.P. Morgan Fleming Mutual Fund Group, Inc.), JPMorgan Capital Growth Fund, JPMorgan Dynamic Small Cap Fund, JPMorgan Micro Cap Fund, JPMorgan Mid Cap Equity Fund, JPMorgan Small Cap Core Fund, JPMorgan Small Cap Equity Fund, JPMorgan U.S. Small Company Fund and JPMorgan Value Advantage Fund (each a portfolio of JPMorgan Trust I) (hereafter collectively referred to as the "Funds") at December 31, 2005, the results of each of their operations for the period then ended, the changes in each of their net assets and the financial highlights for each of the periods presented, in conformity with accounting principles generally accepted in the United States of America. These financial statements and financial highlights (hereafter referred to as "financial statements") are the responsibility of the Funds' management; our responsibility is to express an opinion on these financial statements based on our audits. We conducted our audits of these financial statements in accordance with the standards of the Public Company Accounting Oversight Board (United States). Those standards require that we plan and perform the audit to obtain reasonable assurance about whether the financial statements are free of material misstatement. An audit includes examining, on a test basis, evidence supporting the amounts and disclosures in the financial statements, assessing the accounting principles used and significant estimates made by management, and evaluating the overall financial statement presentation. We believe that our audits, which includ ed confirmation of securities at December 31, 2005 by correspondence with the custodian and brokers, provide a reasonable basis for our opinion.
PricewaterhouseCoopers LLP
New York, New York
February 21, 2006
JPMORGAN U.S. EQUITY MID/SMALL CAP FUNDS144
JPMorgan Funds
TRUSTEES
(Unaudited)
Name (Year of Birth);
Positions With
the Funds | | Principal Occupations
During Past 5 Years | | Number of
Funds in Fund
Complex Overseen
by Trustee(1) | | Other Directorships Held
Outside Fund Complex | |
| Independent Trustees | |
|
| William J. Armstrong (1941); Trustee of Trust since 2005; Trustee of heritage JPMorgan Funds since 1987. | | Retired; Vice President & Treasurer of Ingersoll-Rand Company (manufacturer of industrial equipment) (1972-2000). | | | 118 | | | None. | |
|
| Roland R. Eppley, Jr. (1932); Trustee of Trust since 2005; Trustee of heritage JPMorgan Funds since 1989. | | Retired; President & Chief Executive Officer, Eastern Sales Bankcard (1971-1988). | | | 118 | | | None. | |
|
John F. Finn
(1947); Trustee of Trust since 2005; Trustee of heritage One Group Mutual Funds since 1998. | | President and Chief Executive Officer of Gardner, Inc. (wholesale distributor to outdoor power equipment industry) (1979-present). | | | 117 | * | | Director, Cardinal Health, Inc (CAH) (1994-present); Director, The Crane Group (2003-present); Chairman, The Columbus Association for the Performing Arts (CAPA) (2003-present). | |
|
| Dr. Matthew Goldstein (1941); Trustee of Trust since 2005; Trustee of heritage JPMorgan Funds since 2003. | | Chancellor of the City University of New York (1999-present); President, Adelphi University (New York) (1998-1999). | | | 118 | | | Director, Albert Einstein School of Medicine (1998-present); Director of New Plan Excel Realty Trust, Inc. (real estate investment trust) (2000-present); Director of Lincoln Center Institute for the Arts in Education (1999-present). | |
|
Robert J. Higgins
(1945); Trustee of Trust since 2005; Trustee of heritage JPMorgan Funds since 2002. | | Retired; Director of Administration of the State of Rhode Island (2003-2004); President – Consumer Banking and Investment Services, Fleet Boston Financial (1971-2001). | | | 118 | | | None. | |
|
Peter C. Marshall
(1942); Trustee of Trust since 2005; Trustee of heritage One Group Mutual Funds since 1994. | | Self-employed business consultant (2002-present); Senior Vice President, W.D. Hoard, Inc. (corporate parent of DCI Marketing, Inc.) (2000-2002); President, DCI Marketing, Inc. (1992-2000). | | | 117 | * | | None. | |
|
Marilyn McCoy
(1948); Trustee of Trust since 2005; Trustee of heritage One Group Mutual Funds since 1999. | | Vice President of Administration and Planning, Northwestern University (1985-present). | | | 117 | * | | Trustee, Mather LifeWays (1994-present); Trustee, Carleton College (2003-present). | |
|
| William G. Morton, Jr. (1937); Trustee of Trust since 2005; Trustee of heritage JPMorgan Funds since 2003. | | Retired; Chairman Emeritus (2001-2002), and Chairman and Chief Executive Officer, Boston Stock Exchange (1985-2001). | | | 118 | | | Director of Radio Shack Corporation (electronics) (1987-present); Director of The National Football Foundation and College Hall of Fame (1994-present); Trustee of the Stratton Mountain School (2001-present). | |
|
JPMORGAN U.S. EQUITY MID/SMALL CAP FUNDS145
JPMorgan Funds
TRUSTEES (CONTINUED)
(Unaudited)
Name (Year of Birth);
Positions With
the Funds | | Principal Occupations
During Past 5 Years | | Number of
Funds in Fund
Complex Overseen
by Trustee(1) | | Other Directorships Held
Outside Fund Complex | |
| Independent Trustees (continued) | |
|
| Robert A. Oden, Jr. (1946); Trustee of Trust since 2005; Trustee of heritage One Group Mutual Funds since 1997. | | President, Carleton College (2002-present); President, Kenyon College (1995-2002). | | | 117 | * | | Director, American University in Cairo. | |
|
Fergus Reid, III
(1932); Trustee of Trust (Chairman) since 2005; Trustee (Chairman) of heritage JPMorgan Funds since 1987. | | Chairman of Lumelite Corporation (plastics manufacturing) (2003-present); Chairman and Chief Executive Officer of Lumelite Corporation (1985-2002). | | | 118 | | | Trustee of Morgan Stanley Funds (198 portfolios) (1995-present). | |
|
| Frederick W. Ruebeck (1939); Trustee of Trust since 2005; Trustee of heritage One Group Mutual Funds since 1994. | | Advisor, Jerome P. Green & Associates, LLC (broker-dealer) (2002-present); Chief Investment Officer, Wabash College (2004-present); self-employed consultant (2000-present); Director of Investments, Eli Lilly and Company (1988-1999). | | | 117 | * | | Director, AMS Group (2001-present); Trustee, Wabash College (1988-present); Chairman, Indianapolis Symphony Orchestra Foundation (1994-present). | |
|
| James J. Schonbachler (1943); Trustee of Trust since 2005; Trustee of heritage JPMorgan Funds since 2001. | | Retired; Managing Director of Bankers Trust Company (financial services) (1968-1998). | | | 118 | | | None. | |
|
| Interested Trustee | |
|
| Leonard M. Spalding, Jr.** (1935); Trustee of Trust since 2005; Trustee of heritage JPMorgan Funds since 1998. | | Retired; Chief Executive Officer of Chase Mutual Funds (investment company) (1989-1998); President & Chief Executive Officer of Vista Capital Management (investment management) (1990-1998); Chief Investment Executive of Chase Manhattan Private Bank (investment management) (1990-1998). | | | 118 | | | Director, Glenview Trust Company, LLC (2001-present); Trustee, St. Catherine College (1998-present); Trustee, Bellarmine University (2000-present); Director, Springfield-Washington County Economic Development Authority (1997-present); Trustee, Marion and Washington County, Kentucky Airport Board (1998-present); Trustee, Catholic Education Foundation (2005-present). | |
|
(1) A Fund Complex means two or more registered investment companies that hold themselves out to investors as related companies for purposes of investment and investor services or have a common investment adviser or have an investment adviser that is an affiliated person of the investment adviser of any of the other registered investment companies. The JPMorgan Funds Complex which the Board of Trustees oversees currently includes nine registered investment companies (118 funds).
* This Trustee does not oversee the UM Investment Trust II which is the registered investment company for the Undiscovered Managers Spinnaker Fund, and therefore oversees eight registered investment companies (117 funds).
** Mr. Spalding is deemed to be an "interested person" due to his ownership of JPMorgan Chase stock.
The contact address for each of the Trustees is 522 Fifth Avenue, New York, NY 10036.
JPMORGAN U.S. EQUITY MID/SMALL CAP FUNDS146
ANNUAL REPORT DECEMBER 31
2005
OFFICERS
(Unaudited)
Name (Year of Birth),
Positions Held with
the Funds | | Principal Occupations During Past 5 Years | |
| George C.W. Gatch (1962), President (2005) | | Managing Director of JPMorgan Investment Management Inc.; Director and President, JPMorgan Distribution Services, Inc. and JPMorgan Funds Management, Inc. since 2005. Mr. Gatch is CEO and President of JPMorgan Funds. Mr. Gatch has been an employee since 1986 and has held positions such as President and CEO of DKB Morgan, a Japanese mutual fund company which was a joint venture between J.P. Morgan and Dai-Ichi Kangyo Bank, as well as positions in business management, marketing and sales. | |
|
Robert L. Young
(1963), Senior Vice President (2005)* | | Director and Vice President of JPMorgan Distribution Services, Inc. and JPMorgan Funds Management, Inc.; Chief Operating Officer, JPMorgan Funds since 2005, and One Group Mutual Funds from 2001 until 2005. Mr. Young was Vice President and Treasurer, JPMorgan Funds Management, Inc. (formerly One Group Administrative Services) and Vice President and Treasurer, JPMorgan Distribution Services, Inc. (formerly One Group Dealer Services, Inc.) from 1999 to 2005. | |
|
| Patricia A. Maleski (1960), Vice President and Chief Administrative Officer (2005) | | Vice President, JPMorgan Funds Management, Inc.; previously, Treasurer, JPMorgan Funds and Head of Funds Administration and Board Liaison. Ms. Maleski was Vice President of Finance for the Pierpont Group, Inc., an independent company owned by the Board of Directors/Trustees of the JPMorgan Funds, prior to joining J.P. Morgan Chase & Co. in 2001. | |
|
| Stephanie J. Dorsey (1969), Treasurer (2005)* | | Vice President, JPMorgan Funds Management, Inc.; Director of Mutual Fund Administration, JPMorgan Funds Management, Inc. (formerly One Group Administrative Services), from 2004 to 2005; Ms. Dorsey worked for JP Morgan Chase & Co., (formerly Bank One Corporation) from 2003 to 2004; prior to joining Bank One Corporation, she was a Senior Manager specializing in Financial Services audits at PricewaterhouseCoopers LLP from 1992 through 2002. | |
|
| Stephen M. Ungerman (1953), Senior Vice President and Chief Compliance Officer (2005) | | Senior Vice President, JPMorgan Chase & Co.; Mr. Ungerman was head of Fund Administration – Pooled Vehicles from 2000 to 2004. Mr. Ungerman held a number of positions in Prudential Financial's asset management business prior to 2000. | |
|
Paul L. Gulinello
(1950), AML Compliance Officer (2005) | | Vice President and Anti Money Laundering Compliance Officer for JPMorgan Asset Management Americas, additionally responsible for personal trading and compliance testing since 2004; Treasury Services Operating Risk Management and Compliance Executive supporting all JPMorgan Treasury Services business units from July 2000 to 2004. | |
|
| Stephen M. Benham (1959), Secretary (2005) | | Vice President and Assistant General Counsel, JPMorgan Chase & Co. since 2004; Vice President (Legal Advisory) of Merrill Lynch Investment Managers, L.P. from 2000 to 2004; attorney associated with Kirkpatrick & Lockhart LLP from 1997 to 2000. | |
|
Elizabeth A. Davin
(1964), Assistant Secretary (2005)* | | Vice President and Assistant General Counsel, JPMorgan Chase & Co. since 2005; Senior Counsel, JPMorgan Chase & Co. (formerly Bank One Corporation) from 2004-2005; Assistant General Counsel and Associate General Counsel and Vice President, Gartmore Global Investments, Inc. from 1999 to 2004. | |
|
Jessica K. Ditullio
(1962), Assistant Secretary (2005)* | | Vice President and Assistant General Counsel, JPMorgan Chase & Co. since 2005; Ms. Ditullio has served as an attorney with various titles for JP Morgan Chase & Co. (formerly Bank One Corporation) since 1990. | |
|
Nancy E. Fields
(1949), Assistant Secretary (2005)* | | Vice President, JPMorgan Funds Management, Inc. and JPMorgan Distribution Services, Inc.; From 1999 to 2005, Director, Mutual Fund Administration, JPMorgan Funds Management, Inc. (formerly One Group Administrative Services, Inc.) and Senior Project Manager, Mutual Funds, JPMorgan Distribution Services, Inc. (formerly One Group Dealer Services, Inc). | |
|
Ellen W. O'Brien
(1957), Assistant Secretary (2005)** | | Assistant Vice President, JPMorgan Investor Services, Co., responsible for Blue Sky registration; Ms. O'Brien has served in this capacity since joining the firm in 1991. | |
|
Suzanne E. Cioffi
(1967), Assistant Treasurer (2005) | | Vice President, JPMorgan Funds Management, Inc., responsible for mutual fund financial reporting; Ms. Cioffi has overseen various fund accounting, custody and administration conversion projects during the past five years. | |
|
JPMORGAN U.S. EQUITY MID/SMALL CAP FUNDS147
JPMorgan Funds
OFFICERS (CONTINUED)
(Unaudited)
Name (Year of Birth),
Positions Held with
the Funds | | Principal Occupations During Past 5 Years | |
| Christopher D. Walsh (1965), Assistant Treasurer (2005) | | Vice President, JPMorgan Funds Management, Inc.; Mr. Walsh has managed all aspects of institutional and retail mutual fund administration and vendor relationships within the mutual funds, commingled/ERISA funds, 3(c)(7) funds, hedge funds and LLC products. Mr. Walsh was a director of Mutual Fund Administration at Prudential Investments from 1996 to 2000. | |
|
Arthur A. Jensen
(1966), Assistant Treasurer (2005)* | | Vice President, JPMorgan Funds Management, Inc. since April 2005; formerly, Vice President of Financial Services of BISYS Fund Services, Inc. from 2001 until 2005; Mr. Jensen was Section Manager at Northern Trust Company and Accounting Supervisor at Allstate Insurance Company prior to 2001. | |
|
The contact address for each of the officers, unless otherwise noted, is 522 Fifth Avenue, New York, NY 10036.
* The contact address for the officer is 1111 Polaris Parkway, Columbus, OH 43271.
** The contact address for the officer is 73 Tremont Street, Floor 1, Boston MA 02108.
JPMORGAN U.S. EQUITY MID/SMALL CAP FUNDS148
ANNUAL REPORT DECEMBER 31
2005
SCHEDULE OF SHAREHOLDER EXPENSES
Hypothetical $1,000 Investment at Beginning of Period
December 31, 2005
(Unaudited)
As a shareholder of the Funds, you incur two types of costs: (1) transaction costs, including sales charges (loads) on purchase payments and redemption fees and (2) ongoing costs, including investment advisory, administration fees, distribution fees and other Fund expenses. The examples below are intended to help you understand your ongoing costs (in dollars) of investing in the Funds and to compare these costs with the ongoing costs of investing in other mutual funds. The examples assume that you had a $1,000 investment in the Class at the beginning of the reporting period, July 1, 2005, and continued to hold your shares at the end of the reporting period, December 31, 2005.
Actual Expenses
For each Class of each Fund in the table below, the first line provides information about actual account values and actual expenses. You may use the information in this line, together with the amount you invested, to estimate the expenses that you paid over the period. Simply divide your account value by $1,000 (for example, an $8,600 account value divided by $1,000 = 8.6), then multiply the result by the number in the first line of each Class under the heading entitled "Expenses Paid During Period" to estimate the expenses you paid on your account during this period.
Hypothetical Example for Comparison Purposes
The second line of each Class in the table below provides information about hypothetical account values and hypothetical expenses based on the Class' actual expense ratio and an assumed rate of return of 5% per year before expenses, which is not the Class' actual return. The hypothetical account values and expenses may not be used to estimate the actual ending account balance or expenses you paid for the period. You may use this information to compare the ongoing costs of investing in the Class of the Fund and other funds. To do so, compare this 5% hypothetical example with the 5% hypothetical examples that appear in the shareholder reports of the other funds. Please note that the expenses shown in the table are meant to highlight your ongoing costs only and do not reflect any transaction costs, such as sales charges (loads) or redemption fees. Therefore, the second line for each Class in the table is useful in comparing ongoing costs only, and will not help you determine the relative total costs of owning different funds. In addition, if these transaction costs were included, your costs would have been higher. The examples also assume all dividends and distributions have been reinvested.
JPMORGAN U.S. EQUITY MID/SMALL CAP FUNDS149
JPMorgan Funds
SCHEDULE OF SHAREHOLDER EXPENSES
Hypothetical $1,000 Investment at Beginning of Period
December 31, 2005
(Unaudited)
| | | Beginning
Account Value,
July 1, 2005 | | Ending
Account Value,
December 31, 2005 | | Expenses Paid
During Period | | Annualized
Expense Ratio | |
| CAPITAL GROWTH FUND | |
| Class A | |
| Actual | | $ | 1,000.00 | | | $ | 1,072.60 | | | $ | 5.96 | | | | 1.14 | % | |
| Hypothetical | | $ | 1,000.00 | | | $ | 1,019.46 | | | $ | 5.80 | | | | 1.14 | % | |
| Class B | |
| Actual | | $ | 1,000.00 | | | $ | 1,069.90 | | | $ | 8.56 | | | | 1.64 | % | |
| Hypothetical | | $ | 1,000.00 | | | $ | 1,016.94 | | | $ | 8.34 | | | | 1.64 | % | |
| Class C | |
| Actual | | $ | 1,000.00 | | | $ | 1,069.80 | | | $ | 8.56 | | | | 1.64 | % | |
| Hypothetical | | $ | 1,000.00 | | | $ | 1,016.94 | | | $ | 8.34 | | | | 1.64 | % | |
| Select Class | |
| Actual | | $ | 1,000.00 | | | $ | 1,073.90 | | | $ | 4.65 | | | | 0.89 | % | |
| Hypothetical | | $ | 1,000.00 | | | $ | 1,020.72 | | | $ | 4.53 | | | | 0.89 | % | |
| DYNAMIC SMALL CAP FUND | |
| Class A | |
| Actual | | $ | 1,000.00 | | | $ | 1,071.40 | | | $ | 7.83 | | | | 1.50 | % | |
| Hypothetical | | $ | 1,000.00 | | | $ | 1,017.64 | | | $ | 7.63 | | | | 1.50 | % | |
| Class B | |
| Actual | | $ | 1,000.00 | | | $ | 1,068.00 | | | $ | 10.79 | | | | 2.07 | % | |
| Hypothetical | | $ | 1,000.00 | | | $ | 1,014.77 | | | $ | 10.51 | | | | 2.07 | % | |
| Class C | |
| Actual | | $ | 1,000.00 | | | $ | 1,068.20 | | | $ | 10.79 | | | | 2.07 | % | |
| Hypothetical | | $ | 1,000.00 | | | $ | 1,014.77 | | | $ | 10.51 | | | | 2.07 | % | |
| Select Class | |
| Actual | | $ | 1,000.00 | | | $ | 1,073.40 | | | $ | 5.75 | | | | 1.10 | % | |
| Hypothetical | | $ | 1,000.00 | | | $ | 1,019.66 | | | $ | 5.60 | | | | 1.10 | % | |
| GROWTH ADVANTAGE FUND | |
| Class A | |
| Actual | | $ | 1,000.00 | | | $ | 1,081.80 | | | $ | 7.08 | | | | 1.35 | % | |
| Hypothetical | | $ | 1,000.00 | | | $ | 1,018.40 | | | $ | 6.87 | | | | 1.35 | % | |
| Class B | |
| Actual | | $ | 1,000.00 | | | $ | 1,076.10 | | | $ | 10.73 | | | | 2.05 | % | |
| Hypothetical | | $ | 1,000.00 | | | $ | 1,014.87 | | | $ | 10.41 | | | | 2.05 | % | |
JPMORGAN U.S. EQUITY MID/SMALL CAP FUNDS150
ANNUAL REPORT DECEMBER 31
2005
SCHEDULE OF SHAREHOLDER EXPENSES (CONTINUED)
Hypothetical $1,000 Investment at Beginning of Period
December 31, 2005
(Unaudited)
| | | Beginning
Account Value | | Ending
Account Value,
December 31, 2005 | | Expenses Paid
During Period | | Annualized
Expense Ratio | |
| MICRO CAP FUND | |
| Class A | |
| Actual* | | $ | 1,000.00 | | | $ | 1,031.30 | | | $ | 2.89 | | | | 1.70 | % | |
| Hypothetical** | | $ | 1,000.00 | | | $ | 1,016.64 | | | $ | 8.64 | | | | 1.70 | % | |
| Class C | |
| Actual* | | $ | 1,000.00 | | | $ | 1,030.70 | | | $ | 3.73 | | | | 2.20 | % | |
| Hypothetical** | | $ | 1,000.00 | | | $ | 1,014.12 | | | $ | 11.17 | | | | 2.20 | % | |
| Select Class | |
| Actual* | | $ | 1,000.00 | | | $ | 1,032.00 | | | $ | 2.46 | | | | 1.45 | % | |
| Hypothetical** | | $ | 1,000.00 | | | $ | 1,017.90 | | | $ | 7.37 | | | | 1.45 | % | |
| MID CAP EQUITY FUND | |
| Select Class | |
| Actual | | $ | 1,000.00 | | | $ | 1,056.10 | | | $ | 4.66 | | | | 0.90 | % | |
| Hypothetical | | $ | 1,000.00 | | | $ | 1,020.67 | | | $ | 4.58 | | | | 0.90 | % | |
| MID CAP VALUE FUND | |
| Class A | |
| Actual | | $ | 1,000.00 | | | $ | 1,037.40 | | | $ | 6.42 | | | | 1.25 | % | |
| Hypothetical | | $ | 1,000.00 | | | $ | 1,018.90 | | | $ | 6.36 | | | | 1.25 | % | |
| Class B | |
| Actual | | $ | 1,000.00 | | | $ | 1,034.80 | | | $ | 8.98 | | | | 1.75 | % | |
| Hypothetical | | $ | 1,000.00 | | | $ | 1,016.38 | | | $ | 8.89 | | | | 1.75 | % | |
| Class C | |
| Actual | | $ | 1,000.00 | | | $ | 1,035.20 | | | $ | 8.98 | | | | 1.75 | % | |
| Hypothetical | | $ | 1,000.00 | | | $ | 1,016.38 | | | $ | 8.89 | | | | 1.75 | % | |
| Select Class | |
| Actual | | $ | 1,000.00 | | | $ | 1,038.70 | | | $ | 5.14 | | | | 1.00 | % | |
| Hypothetical | | $ | 1,000.00 | | | $ | 1,020.16 | | | $ | 5.09 | | | | 1.00 | % | |
| Institutional Class | |
| Actual | | $ | 1,000.00 | | | $ | 1,040.10 | | | $ | 3.86 | | | | 0.75 | % | |
| Hypothetical | | $ | 1,000.00 | | | $ | 1,021,42 | | | $ | 3.82 | | | | 0.75 | % | |
| SMALL CAP CORE FUND | |
| Select Class | |
| Actual | | $ | 1,000.00 | | | $ | 1,042.90 | | | $ | 4.18 | | | | 0.80 | % | |
| Hypothetic | | $ | 1,000.00 | | | $ | 1,021.17 | | | $ | 4.08 | | | | 0.80 | % | |
* Beginning account value as of October 31, 2005 (commencement of offering of Classes A, C, and Select Shares) and expenses paid during the period from October 31, 2005 through December 31, 2005.
** Beginning account value as of July 1, 2005 and expenses paid during the period from July 1, 2005 through December 31, 2005.
JPMORGAN U.S. EQUITY MID/SMALL CAP FUNDS151
JPMorgan Funds
SCHEDULE OF SHAREHOLDER EXPENSES (CONTINUED)
Hypothetical $1,000 Investment at Beginning of Period
December 31, 2005
(Unaudited)
| | | Beginning
Account Value | | Ending
Account Value,
December 31, 2005 | | Expenses Paid
During Period | | Annualized
Expense Ratio | |
| SMALL CAP EQUITY FUND | |
| Class A | |
| Actual | | $ | 1,000.00 | | | $ | 1,090.10 | | | $ | 7.11 | | | | 1.35 | % | |
| Hypothetical | | $ | 1,000.00 | | | $ | 1,018.40 | | | $ | 6.87 | | | | 1.35 | % | |
| Class B | |
| Actual | | $ | 1,000.00 | | | $ | 1,087.70 | | | $ | 9.73 | | | | 1.85 | % | |
| Hypothetical | | $ | 1,000.00 | | | $ | 1,015.88 | | | $ | 9.40 | | | | 1.85 | % | |
| Class C | |
| Actual | | $ | 1,000.00 | | | $ | 1,087.70 | | | $ | 9.73 | | | | 1.85 | % | |
| Hypothetical | | $ | 1,000.00 | | | $ | 1,015.88 | | | $ | 9.40 | | | | 1.85 | % | |
| Select Class | |
| Actual | | $ | 1,000.00 | | | $ | 1,093.10 | | | $ | 4.48 | | | | 0.85 | % | |
| Hypothetical | | $ | 1,000.00 | | | $ | 1,020.92 | | | $ | 4.33 | | | | 0.85 | % | |
| U.S.SMALL COMPANY FUND | |
| Select Class | |
| Actual | | $ | 1,000.00 | | | $ | 1,045.60 | | | $ | 5.21 | | | | 1.01 | % | |
| Hypothetical | | $ | 1,000.00 | | | $ | 1,020.11 | | | $ | 5.14 | | | | 1.01 | % | |
| Institutional Class | |
| Actual | | $ | 1,000.00 | | | $ | 1,045.70 | | | $ | 4.28 | | | | 0.83 | % | |
| Hypothetical | | $ | 1,000.00 | | | $ | 1,021.02 | | | $ | 4.23 | | | | 0.83 | % | |
| VALUE ADVANTAGE FUND | |
| Class A | |
| Actual | | $ | 1,000.00 | | | $ | 1,041.90 | | | $ | 6.43 | | | | 1.25 | % | |
| Hypothetical | | $ | 1,000.00 | | | $ | 1,018.90 | | | $ | 6.36 | | | | 1.25 | % | |
| Class C | |
| Actual | | $ | 1,000.00 | | | $ | 1,039.80 | | | $ | 9.00 | | | | 1.75 | % | |
| Hypothetical | | $ | 1,000.00 | | | $ | 1,016.38 | | | $ | 8.89 | | | | 1.75 | % | |
| Select Class | |
| Actual | | $ | 1,000.00 | | | $ | 1,043.70 | | | $ | 5.15 | | | | 1.00 | % | |
| Hypothetical | | $ | 1,000.00 | | | $ | 1,020.16 | | | $ | 5.09 | | | | 1.00 | % | |
| Institutional Class | |
| Actual | | $ | 1,000.00 | | | $ | 1,038.60 | | | $ | 3.85 | | | | 0.75 | % | |
| Hypothetical | | $ | 1,000.00 | | | $ | 1,021.42 | | | $ | 3.82 | | | | 0.75 | % | |
JPMORGAN U.S. EQUITY MID/SMALL CAP FUNDS152
ANNUAL REPORT DECEMBER 31
2005
BOARD APPROVAL OF RENEWAL OF INVESTMENT ADVISORY AGREEMENTS
(Unaudited)
All Funds except Micro Cap Fund
The Board of Trustees meetings held in person in July and August 2005, considered the continuation of each of the investment advisory agreements for the Funds whose annual report is contained herein (each an "Advisory Agreement"). At the July meeting, the Board's investment sub-committees (money market, equity and fixed income) met to review and consider performance and expense information for each Fund. Each investment sub-committee reported to the full Board, which then considered the investment sub-committee's preliminary findings. At and following the July meeting, the Trustees requested additional information from the Funds' management. At the August meeting, the Trustees continued their review and consideration, including the review of management's response to the Trustees' July request. The Trustees, including a majority of the Trustees, who are not "interested persons" (as defined in the '40 Act) of any party to the Advi sory Agreement or any of their affiliates, approved the Advisory Agreement on August 10, 2005.
The Trustees, as part of their review of the investment advisory arrangements for the Funds, receive from the Adviser and review on a regular basis over the course of the year, information regarding the performance of the Funds. This information includes the Funds' performance against the Funds' peers and benchmarks and analyses by the Adviser of the Funds' performance. In addition, with respect to all Funds, except the money market Funds, the Trustees have engaged an independent consultant to similarly review the performance of each of the Funds, at each of the Trustees' regular meetings. The Adviser also periodically provides comparative information regarding the Funds' expense ratios and those of the peer groups. In addition, in preparation for the July and August meetings, the Trustees requested and evaluated extensive materials from the Adviser, including performance and expense information compiled by Lipper Inc. ("Lipper" ), an independent provider of investment company data. Prior to voting, the Trustees reviewed the proposed approval of the Advisory Agreement with representatives of the Adviser and with counsels to the Trust and received a memorandum from independent counsel to the Trustees discussing the legal standards for their consideration of the proposed approval. The Trustees also discussed the proposed approval in private sessions with independent counsel at which no representatives of the Adviser were present. Set forth below is a summary of the material factors evaluated by the Trustees in determining to approve the Advisory Agreement.
In their deliberations, each Trustee attributed different weights to the various factors, and no factor alone was considered determinative. The Trustees determined that the overall arrangement between each Fund and the Adviser, as provided in the Advisory Agreement was fair and reasonable and that the continuance of the investment advisory contract was in the best interests of each Fund and its shareholders.
The matters discussed below were considered and discussed by the Trustees in reaching their conclusions:
Nature, Extent and Quality of Services Provided by the Adviser
The Trustees received and considered information regarding the nature, extent and quality of the services provided to each Fund under the Advisory Agreement. The Trustees took into account information furnished throughout the year at Trustee Meetings, as well as the materials furnished specifically in connection with this
JPMORGAN U.S. EQUITY MID/SMALL CAP FUNDS153
JPMorgan Funds
BOARD APPROVAL OF RENEWAL OF INVESTMENT ADVISORY AGREEMENTS (CONTINUED)
(Unaudited)
annual review process. The Trustees considered the background and experience of the Adviser's senior management and expertise of, and the amount of attention given to each Fund by, investment personnel of the Adviser. In addition, the Trustees reviewed the qualifications, backgrounds and responsibilities of the portfolio management team primarily responsible for the day-to-day management of each Fund and the infrastructure supporting the team. The quality of the administrative services provided by JPMorgan Funds Management, Inc. ("JPMF") an affiliate of the Adviser was also considered. The Board of Trustees also considered its knowledge of the nature and quality of the services provided by the Adviser to the Funds gained from their experience as Trustees of the Funds. In addition, they considered the overall reputation and capabilities of the Adviser and its affiliates, the commitment of the Adviser to provide high quality servi ce to the Funds, the benefits to the Fund of the integration of the infrastructure supporting the heritage One Group and JPMorgan Funds, their overall confidence in the Adviser's integrity and the Adviser's responsiveness to concerns raised by them, including the Adviser's willingness to consider and implement organizational and operational changes designed to improve investment results and the services provided to each Fund.
Based on these considerations and other factors, the Trustees concluded that they were satisfied with the nature, extent and quality of the investment advisory services provided to each Fund by the Adviser.
Costs of Services Provided and Profitability to the Adviser
At the request of the Trustees, the Adviser provided information regarding the profitability to the Adviser and its affiliates in providing services to each of the Funds. The Trustees reviewed and discussed this data. The Trustees recognized that this data is not audited and represents the Adviser's determination of its and its affiliates revenues from the contractual services provided to the Funds, less expenses of providing such services. Expenses include direct and indirect costs and are calculated using an allocation methodology developed by the Adviser. The Trustees also recognized that it is difficult to make comparisons of profitability from fund investment advisory contracts because comparative information is not generally publicly available and is affected by numerous factors, including the structure of the particular adviser, the types of funds it manages, its business mix, numerous assumptions regarding allocations an d the fact that publicly-traded fund managers' operating profits and net income are net of distribution and marketing expenses. Based on their review, the Trustees concluded that the profitability to the Adviser of each of the Investment Advisory Agreements was not unreasonable in light of the services and benefits provided to each Fund.
Fall-Out Benefits
The Trustees reviewed information regarding potential "fall-out" or ancillary benefits received by the Adviser and its affiliates as a result of their relationship with the Funds. The Board considered that the Adviser discontinued third-party soft dollar arrangements with respect to securities transactions it executes for the Funds.
The Trustees also considered that JPMF and JPMorgan Distribution Services, Inc. ("JPMDS") affiliates of the Adviser are expected to earn fees from the Funds for providing administrative and shareholder services. These fees were shown separately in the profitability analysis presented to the Trustees. The Trustees also considered the payments of Rule 12b-1 fees to JPMDS, which also
JPMORGAN U.S. EQUITY MID/SMALL CAP FUNDS154
ANNUAL REPORT DECEMBER 31
2005
BOARD APPROVAL OF RENEWAL OF INVESTMENT ADVISORY AGREEMENTS (CONTINUED)
(Unaudited)
acts as the Funds' distributor and that these fees are generally paid to financial intermediaries that sell the Funds, including financial intermediaries that are affiliates of the Adviser. The Trustees also considered the fees paid to JPMorgan Chase Bank, NA for custody and fund accounting and other related services.
Economies of Scale
The Trustees noted that the proposed investment advisory fee schedule for each Fund does not contain breakpoints. The Trustees considered whether it would be appropriate to add advisory fee breakpoints and the Trustees concluded that the current fee structure was reasonable in light of the fee waivers and expense limitations that the Adviser has in place that serve to limit the overall net expense ratio at competitive levels. The Trustees also recognized that the fee schedule for the administrative services provided by JPMF does include a fee breakpoint, which is tied to the overall level of money market assets or non-money market fund assets, as applicable, advised by the Adviser, and that the Fund would benefit from that breakpoint. The Trustees concluded that shareholders benefited from the lower expense ratios which resulted from these factors.
Independent Written Evaluation of the Fund's Chief Compliance Officer
The Trustees noted that, upon their direction, the Chief Compliance Officer for the Capital Growth Fund, Dynamic Small Cap Fund, Growth Advantage Fund, Mid Cap Equity Fund, Mid Cap Value, Small Cap Core Fund, Small Cap Equity Fund, U.S. Small Company Fund and Value Advantage Fund had prepared an independent written evaluation in order to assist the Trustees in determining the reasonableness of the proposed management fees of these Funds. The Trustees indicated that the written evaluation had been relied upon in this regard in determining whether to continue the Advisory Agreement. The Trustees considered the evaluation as noted in the Investment Performance section of this report.
Fees Relative to Adviser's Other Clients
The Trustees received and considered information about the nature, extent and quality of services and fee rates offered to other clients of the Adviser for comparable services. The Trustees also considered the complexity of investment management for the Funds relative to the Adviser's other clients and the differences in the nature, extent and quality of the services provided to the different clients. The Trustees noted that the fee rates charged to the Funds in comparison to those charged to the Adviser's other clients were reasonable.
Investment Performance
The Trustees received and considered relative performance and expense information for each Fund in a report prepared by Lipper. The Trustees considered the total return performance information, which included each Fund's ranking within a performance universe made up of funds with the same Lipper investment classification and objective (the "Universe Group") by total return for one-year, three-year, and five-year periods. The Trustees also considered the Fund's performance in comparison to the performance results of a group (the "Peer Group") of funds. The Trustees reviewed a description of Lipper's methodology for selecting mutual funds in each Fund's Peer Group and Universe Group. As part of this review, the Trustees also reviewed each Fund's performance against its benchmark and considered the performance information provided for each Fund at regular Board meetings. The attention that was given to the Lipper reports and the ac tions taken as
JPMORGAN U.S. EQUITY MID/SMALL CAP FUNDS155
JPMorgan Funds
BOARD APPROVAL OF RENEWAL OF INVESTMENT ADVISORY AGREEMENTS (CONTINUED)
(Unaudited)
a result of the review of each Fund's investment performance is summarized below:
The Trustees noted that the performance of the one, three and five year periods of the Capital Growth Fund was better than that of its Universe Group median.
The Trustees noted that the performance of the Dynamic Small Cap Fund was within a reasonable range of the Universe Group median.
The Trustees noted that the performance of the Growth Advantage Fund was better than that of its Universe Group median for the one year and three year periods.
The Trustees noted that the performance of the Mid Cap Equity Fund for the one, three and five year periods was better than that of its Universe Group median.
The Trustees noted that the performance of the Mid Cap Value Fund was better than that of its Universe Group median for the one year and three year periods.
The Trustees noted that although the three and five year performance of the Small Cap Core Fund lagged that of its Universe Group, the Fund's one-year performance demonstrated improvement as the Fund had outperformed the median of its Universe Group. The Trustees found such performance satisfactory in view of the recent improvement, however, the Trustees accepted the Chief Compliance Officer's recommendation that, while considering the Fund's portfolio management team change within the past year, the Board's Equity Investment Sub-Committee would review the Fund's performance at each quarterly board meeting until improved performance is demonstrated over a period of time.
The Trustees noted that the performance of the Small Cap Equity Fund was better than that of its Universe Group median for the one year and three year periods.
The Trustees recognized that the one, three and five year performance of the U.S. Small Company Fund lagged that of its Universe Group. The Trustees and the Chief Compliance Officer noted the Adviser's process to periodically review the Fund and address the Fund's performance results. The Trustees directed the Adviser to report to them at each quarterly board meeting about the results of such reviews and steps taken to improve performance and actual performance results.
The Trustees noted that valuation of performance information for contractual continuance purposes would not yet be sufficiently reliable for the Value Advantage Fund because the Fund commenced operations on February 28, 2005.
Advisory Fees and Expense Ratios
The Trustees considered the contractual advisory fee rate paid by the Fund to the Adviser by comparing that rate to the information prepared by Lipper concerning management fee rates paid by other funds in the same Lipper category as the Fund. The Trustees recognized that Lipper reported the Fund's management fee rate as the combined contractual advisory fee rate and the administration fee. The Trustees also considered the fee waiver and/or expense reimbursement arrangements currently in place for the Fund and considered the net advisory fee rate after taking waivers and reimbursements into account. The Trustees recognized that it is difficult to make comparisons of advisory fees because there are variations in the services that are
JPMORGAN U.S. EQUITY MID/SMALL CAP FUNDS156
ANNUAL REPORT DECEMBER 31
2005
BOARD APPROVAL OF RENEWAL OF INVESTMENT ADVISORY AGREEMENTS (CONTINUED)
(Unaudited)
included in the fees paid by other funds. The attention that was given to the Lipper reports and the actions taken as a result of the review of the Fund's advisory fees and expense ratios is summarized below:
The Trustees noted that the Capital Growth Fund's contractual advisory fee was in the first quintile of the Fund's Peer Group and the net advisory fee was in the first quintile of the Fund's Universe Group and concluded that the advisory fee was reasonable.
The Trustees noted that the Dynamic Small Cap Fund's contractual advisory fee was in the first quintile of the Fund's Peer Group and the net advisory fee was in the second quintile of the Fund's Universe Group and concluded that the advisory fee was reasonable.
The Trustees noted that the Growth Advantage Fund's contractual advisory fee was in the second quintile of the Fund's Peer Group and the net advisory fee was in the second quintile of the Fund's Universe Group and concluded that the advisory fee was reasonable.
The Trustees noted that the Mid Cap Equity Fund's contractual advisory fee was in the first quintile of the Fund's Peer Group and the net advisory fee was in the second quintile of the Fund's Universe Group and concluded that the advisory fee was reasonable.
The Trustees noted that although the Mid Cap Value Fund's contractual advisory fee was higher than the median of its Peer Group, the fee was considered reasonable recognizing that the net advisory fee was lower than the median of its Universe Group.
The Trustees noted that the Small Cap Core Fund's contractual advisory fee was in the first quintile of the Fund's Peer Group and the net advisory fee was in the first quintile of the Fund's Universe Group and concluded that the advisory fee was reasonable.
The Trustees noted that the Small Cap Equity Fund's contractual advisory fee was within a reasonable range of the median of its Peer Group and the fee was considered reasonable recognizing that the net advisory fee was lower than the median of its Universe Group.
The Trustees noted that the U.S. Small Company Fund's contractual advisory fee was in the first quintile of the Fund's Peer Group and the net advisory fee was in the first quintile of the Fund's Universe Group and concluded that the advisory fee was reasonable.
The Trustees noted that the Value Advantage Fund's contractual advisory fee was in the second quintile of the Fund's Peer Group and the net advisory fee was in the first quintile of the Fund's Universe Group and concluded that the advisory fee was reasonable.
Micro Cap Fund
The creation of the Micro Cap Fund was considered at the August 2005 board meeting. At the meeting, which was held in person, the Board of Trustees approved the investment advisory agreement for the Fund. In connection with such approval, the portfolio manager provided information concerning the proposed investment strategies to be used by the Fund and the Adviser's experience in using such strategies for other advisory clients. The Trustees also received and evaluated written materials from the Adviser, including expense information compiled by Lipper. Prior to voting, the Trustees reviewed the proposed approval of the advisory agreement with representatives of the Adviser and with counsels to the Trust. The Trustees also discussed the proposed approval in the Trust's Equity Sub-Committee meeting.
The Board evaluated multiple factors in determining whether to approve the investment advisory agreement.
JPMORGAN U.S. EQUITY MID/SMALL CAP FUNDS157
JPMorgan Funds
BOARD APPROVAL OF RENEWAL OF INVESTMENT ADVISORY AGREEMENTS (CONTINUED)
(Unaudited)
In reaching their decision, the Board of Trustees did not identify any single factor as being of paramount importance. Based on their evaluation of the information reviewed and after due consideration, the Board of Trustees concluded that the advisory agreement for the Micro Cap Fund was fair and reasonable and that approval of the agreement would be in the best interest of the Fund and its shareholders. The matters discussed below were considered and discussed by the Trustees in reaching their conclusions:
The Board of Trustees considered the nature and quality of services to be provided by the Adviser to the Micro Cap Fund including portfolio management resources and the experience of the Adviser in connection with the investment strategies used by the Fund. With regard to the nature and quality of the investment advisory services involved, the Board concluded that the services would be of high quality with respect to the Micro Cap Fund given strong staffing resources, infrastructure, and investment processes.
The Board also considered the Adviser's performance with respect to similar investments. The Board noted that, although the Adviser did not have a track record with respect to managing investment companies using the same strategies to be employed by the Micro Cap Fund, the Adviser had extensive experience in managing micro capitalization assets.
The Board of Trustees compared the terms of the Fund's advisory arrangements and similar arrangements by other investment companies, particularly with regard to levels of advisory fees relative to its peer group. In conducting its review, the Board analyzed the materials based on projections and the proposed expense limitation with respect to the Fund.
The Board of Trustees also examined the benefits to the Adviser and its affiliates of their relationship with each Fund. Specifically, the Board of Trustees analyzed the benefits that accrue to the Adviser and its affiliates as a result of the fact that affiliates of the Adviser act as custodian, administrator and shareholder servicing agent for the Fund, and receive fees from the Fund for acting in such capacities.
Finally, the Board considered economies of scale in reviewing the agreement. The Board concluded that the overall contractual environment for the Fund would reflect economies of scale, since breakpoints were included in the administration agreement. It was also noted that the growth of assets in the complex would tend to lower the per-share cost of various fixed expenses and, therefore, would result in certain economies of scale. The board concluded that, given these and other facts, including the anticipated size of the new fund, investment advisory breakpoints were not necessary or appropriate at this time.
JPMORGAN U.S. EQUITY MID/SMALL CAP FUNDS158
ANNUAL REPORT DECEMBER 31
2005
TAX LETTER (UNAUDITED)
Certain tax information for the JPMorgan Funds is required to be provided to shareholders based upon the Funds' income and distributions for the taxable year ended December 31, 2005. The information necessary to complete your income tax returns for the calendar year ending December 31, 2005 will be received under separate cover.
The following represents the percentage of ordinary income distributions eligible for the 70% dividend received deduction for corporate shareholders for the fiscal year ended December 31, 2005:
| | | Dividend
Received
Deduction | |
| Capital Growth | | | 16.70 | % | |
| Mid Cap Equity | | | 33.10 | % | |
| Mid Cap Value | | | 61.03 | % | |
| Small Cap Core | | | 46.24 | % | |
| Small Cap Equity | | | 44.95 | % | |
| U.S. Small Company | | | 26.01 | % | |
| Value Advantage | | | 41.09 | % | |
Each Fund hereby designates the following amount as long-term capital gain distributions for the purpose of the dividend paid deduction on its respective tax return for the fiscal year ended December 31, 2005 (amounts in thousands):
| | | Long-Term
Capital Gain
Distribution | |
| Capital Growth | | $ | 51,737 | | |
| Dynamic Small Cap | | $ | 12,871 | | |
| Mid Cap Equity | | $ | 20,249 | | |
| Mid Cap Value | | $ | 82,699 | | |
| Small Cap Core | | $ | 7,123 | | |
| Small Cap Equity | | $ | 47,292 | | |
| U.S. Small Company | | $ | 12,500 | | |
| Value Advantage | | $ | 6 | | |
JPMORGAN U.S. EQUITY MID/SMALL CAP FUNDS159
JPMorgan Funds
TAX LETTER (UNAUDITED)
For the fiscal year ended December 31, 2005, certain dividends paid by the Funds may be subject to a maximum tax rate of 15% as provided for by the Jobs and Growth Tax Relief Reconciliation Act of 2003. The following represents the amount of ordinary income distributions received by the Fund treated as qualified dividends (amounts in thousands):
| | | Qualified
Dividend
Income | |
| Mid Cap Equity | | $ | 2,548 | | |
| Mid Cap Value | | $ | 90,024 | | |
| Small Cap Core | | $ | 4,200 | | |
| Small Cap Equity | | $ | 2,914 | | |
| U.S. Small Company | | $ | 1,172 | | |
| Value Advantage | | $ | 640 | | |
For the fiscal year ended December 31, 2005, The Funds designate the following amounts of short-term capital gain distributions paid during the Fund's fiscal year that are from qualified and short-term capital gain (amounts in thousands):
| | | Short-term
Gain | |
| Mid Cap Equity | | $ | 4,602 | | |
| Mid Cap Value | | $ | 85,723 | | |
| Small Cap Core | | $ | 6,588 | | |
| Small Cap Equity | | $ | 5,434 | | |
| U.S. Small Company | | $ | 4,089 | | |
| Value Advantage | | $ | 1,115 | | |
JPMORGAN U.S. EQUITY MID/SMALL CAP FUNDS160
JPMorgan Funds are distributed by JPMorgan Distribution Services, Inc., which is an affiliate of JPMorgan Chase & Co. Affiliates of JPMorgan Chase & Co. receive fees for providing various services to the funds.
This report is submitted for the general information of the shareholders of the Funds. It is not authorized for distribution to prospective investors in the Funds unless preceded or accompanied by a prospectus.
Contact JPMorgan Funds Service Center at 1-800-480-4111 for a fund prospectus. You can also visit us at www.jpmorganfunds.com. Investors should carefully consider the investment objectives and risk as well as charges and expenses of the mutual fund before investing. The prospectus contains this and other information about the mutual fund. Read the prospectus carefully before investing.
Each Fund files a complete schedule of its portfolio holdings for the first and third quarters of its fiscal year with the SEC on Form N-Q. Each Fund's Forms N-Q are available on the SEC's website at http://www.sec.gov and may be reviewed and copied at the SEC's Public Reference Room in Washington, DC. Information on the operation of the SEC's Public Reference Room may be obtained by calling 1-800-SEC-0330.
A description of each Fund's policies and procedures with respect to the disclosure of each Fund's portfolio holdings is available in the Statement of Additional Information.
A copy of proxy policies and procedures are available without charge upon request by calling 1-800-480-4111 and on the SEC's website at www.sec.gov. The Trustees have delegated the authority to vote proxies for securities owned by the Fund to the Advisor. A copy of the Fund's voting record for the most recent 12-month period ended June 30 is available on the SEC's website at www.sec.gov or at the Fund's website at www.jpmorganfunds.com no later than August 31 of each year. The Fund's proxy voting record will include, among other things, a brief description of the matter voted on for each portfolio security, and will state how each vote was cast, for example, for or against the proposal.
PRSRT STD
U.S. POSTAGE
PAID
PERMIT 2891
KANSAS CITY, MO
JPMorgan Funds Fulfillment Center
6112 W. 73rd Street
Bedford Park, IL 60638
© J.P. Morgan Chase & Co., 2006 All rights reserved. February 2006. AN-SMC-1205
ITEM 2. CODE OF ETHICS.
Disclose whether, as of the end of the period covered by the report, the registrant has adopted a code of ethics that applies to the registrant’s principal executive officer, principal financial officer, principal accounting officer or controller, or persons performing similar functions, regardless of whether these individuals are employed by the registrant or a third party. If the registrant has not adopted such a code of ethics, explain why it has not done so.
The registrant must briefly describe the nature of any amendment, during the period covered by the report, to a provision of its code of ethics that applies to the registrant’s principal executive officer, principal financial officer, principal accounting officer or controller, or persons performing similar functions, regardless of whether these individuals are employed by the registrant or a third party, and that relates to any element of the code of ethics definition enumerated in paragraph (b) of this Item. The registrant must file a copy of any such amendment as an exhibit pursuant to Item 12(a)(1), unless the registrant has elected to satisfy paragraph (f) of this Item by positing its code of ethics on its website pursuant to paragraph (f)(2) of this Item, or by undertaking to provide its code of ethics to any person without charge, upon request, pursuant to paragraph (f)(3) of this Item.
If the registrant has, during the period covered by the report, granted a waiver, including an implicit waiver, from a provision of the code of ethics that applies to the registrant’s principal executive officer, principal financial officer, principal accounting officer or controller, or persons performing similar functions, regardless of whether these individuals are employed by the registrant or third party, that relates to one or more items set forth in paragraph (b) of this Item, the registrant must briefly describe the nature of the waiver, the name of the person to whom the waiver was granted, and the date of the waiver.
The Registrant has adopted a code of ethics that applies to the Registrant’s principal executive officer, principal financial officer, principal accounting officer or controller, or persons performing similar functions. The code of ethics in effect as of December 31, 2005 is included as Exhibit 12(a)(1).
ITEM 3. AUDIT COMMITTEE FINANCIAL EXPERT.
(a) (1) Disclose that the registrant’s board of directors has determined that the registrant either:
(i) Has at least one audit committee financial expert serving on its audit committee; or
(ii) Does not have an audit committee financial expert serving on its audit committee.
The Registrant’s Board of Trustees has determined that the Registrant has at least one audit committee financial expert serving on its audit committee. The Securities and Exchange Commission has stated that the designation or identification of a person as an audit committee financial expert pursuant to this Item 3 of Form N-CSR does not impose on such person any duties, obligations or liabilities that are greater than the duties, obligations and liabilities imposed on such person as a member of the Audit Committee and the Board of Trustees in the absence of such designation or identification.
(2) If the registrant provides the disclosure required by paragraph (a)(1)(i) of this Item, it must disclose the name of the audit committee financial expert and whether that person is “independent.” In order to be considered “independent” for purposes of this Item, a member of an audit committee may not, other than in his or her capacity as a member of the audit committee, the board of directors, or any other board committee:
(i) Accept directly or indirectly any consulting, advisory, or other compensatory fee from the issuer; or
(ii) Be an “interested person” of the investment company as defined in Section 2(a)(19) of the Act (15 U.S.C. 80a-2(a)(19)).
The audit committee financial expert is William Armstrong. He is a “non-interested” trustee and is also “independent” as defined by the Securities and Exchange Commission for purposes of audit committee financial expert determinations.
(3) If the registrant provides the disclosure required by paragraph (a)(1)(ii) of this Item, it must explain why it does not have an audit committee financial expert.
Not applicable.
ITEM 4. PRINCIPAL ACCOUNTANT FEES AND SERVICES.
(a) Disclose, under the caption Audit Fees, the aggregate fees billed for each of the last two fiscal years for professional
services rendered by the principal accountant for the audit of the registrant’s annual financial statements or services that are normally provided by the accountant in connection with statutory and regulatory filings or engagements for those fiscal years.
AUDIT FEES
2004 – $73,200 | |
2005 - $41,852 | |
(b) Disclose, under the caption Audit-Related Fees, the aggregate fees billed in each of the last two fiscal years for assurance and related services by the principal accountant that are reasonably related to the performance of the audit of the registrant’s financial statements and are not reported under paragraph (a) of this Item. Registrants shall describe the nature of the services comprising the fees disclosed under this category.
AUDIT-RELATED FEES (On a calendar year basis)
2004 – $9,397,000 | |
2005 - $10,110,000 | |
The audit-related fees consist of aggregate fees billed for assurance and related services by the independent public registered accounting firm to the Registrant’s investment adviser (not including any sub-adviser whose role is primarily portfolio management and is subcontracted with or overseen by another investment adviser), and any entity controlling, controlled by or under common control with the investment adviser that provides ongoing services to the Registrant (“Service Affiliates”), that were reasonably related to the performance of the annual audit of the Registrant’s financial statements.
(c) Disclose, under the caption Tax Fees, the aggregate fees billed in each of the last two fiscal years for professional services rendered by the principal accountant for tax compliance, tax advice, and tax planning. Registrants shall describe the nature of the services comprising the fees disclosed under this category.
TAX FEES
2004 – $14,600 | |
2005 - $14,100 | |
The tax fees consist of fees billed in connection with preparing the federal regulated investment company income tax returns for the Registrant for the tax years ended December 31, 2004 and 2005.
For the last fiscal year, no tax fees were required to be approved pursuant to paragraph (c)(7)(ii) of Rule 2-01 of Regulation S-X.
(d) Disclose, under the caption All Other Fees, the aggregate fees billed in each of the last two fiscal years for products and services provided by the principal accountant, other than the services reported in paragraphs (a) through (c) of this Item. Registrants shall describe the nature of the services comprising the fees disclosed under this category.
ALL OTHER FEES
2004 – Not applicable | |
2005 – Not applicable | |
(e) (1) Disclose the audit committee’s pre-approval policies and procedures described in paragraph (c)(7) of Rule 2-01 of Regulation S-X.
Pursuant to the Registrant’s Audit Committee Charter and written policies and procedures for the pre-approval of audit and non-audit services (the “Pre-approval Policy”), the Audit Committee pre-approves all audit and non-audit services performed by the Registrant’s independent public registered accounting firm for the Registrant. In addition, the Audit Committee will pre-approve the auditor’s engagement for non-audit services with the Registrant’s investment adviser (not including a sub-adviser whose role is primarily portfolio management and is sub-contracted or overseen by another investment adviser) and any Service Affiliate in accordance with paragraph (c)(7)(ii) of Rule 2-01 of Regulation S-X, if the engagement relates directly to the operations and financial reporting of the Registrant. Proposed services may be pre-approved either 1) without consideration of specific case-by-case services or 2) require the specific pre-approval of the
Audit Committee. Therefore, initially the Pre-approval Policy listed a number of audit and non-audit services that have been approved by the Audit Committee, or which were not subject to pre-approval under the transition provisions of Sarbanes-Oxley Act of 2002 (the “Pre-approval List”). The Audit Committee will annually review and pre-approve the services included on the Pre-approval List that may be provided by the independent public registered accounting firm without obtaining additional specific pre-approval of individual services from the Audit Committee. The Audit Committee will add to, or subtract from, the list of general pre-approved services from time to time, based on subsequent determinations. All other audit and non-audit services not on the Pre-approval List must be specifically pre-approved by the Audit Committee.
One or more members of the Audit Committee may be appointed as the Committee’s delegate for the purposes of considering whether to approve such services. Any pre-approvals granted by the delegate will be reported, for informational purposes only, to the Audit Committee at its next scheduled meeting. The Audit Committee’s responsibilities to pre-approve services performed by the independent public registered accounting firm are not delegated to management.
(2) Disclose the percentage of services described in each of paragraphs (b) through (d) of this Item that were approved by the audit committee pursuant to paragraph (c)(7)(i)(C) of Rule 2-01 of Regulation S-X.
2004 – Not applicable | |
2005 – 75% | |
(f) If greater than 50 percent, disclose the percentage of hours expended on the principal accountant’s engagement to audit the registrant’s financial statements for the most recent fiscal year that were attributed to work performed by persons other than the principal accountant’s full-time, permanent employees.
None.
(g) Disclose the aggregate non-audit fees billed by the registrant’s accountant for services rendered to the registrant, and rendered to the registrant’s investment adviser (not including any sub-adviser whose role is primarily portfolio management and is subcontracted with or overseen by another investment adviser), and any entity controlling, controlled by, or under common control with the adviser that provides ongoing services to the registrant for each of the last two fiscal years of the registrant.
The aggregate non-audit fees billed by the independent public registered accounting firm for services rendered to the Registrant, and rendered to Service Affiliates, for the last two calendar year ends were $25.3 million in 2004 and $19.1 million in 2005.
(h) Disclose whether the registrant’s audit committee of the board of directors has considered whether the provision of non-audit services that were rendered to the registrant’s investment adviser (not including any subadviser whose role is primarily portfolio management and is subcontracted with or overseen by another investment adviser), and any entity controlling, controlled by, or under common control with the investment adviser that provides ongoing services to the registrant that were not pre-approved pursuant to paragraph (c)(7)(ii) of Rule 2-01 of Regulation S-X is compatible with maintaining the principal accountant’s independence.
The Registrant’s Audit Committee has considered whether the provision of the non-audit services that were rendered to Service Affiliates that were not pre-approved (not requiring pre-approval) is compatible with maintaining the independent public registered accounting firm’s independence. All services provided by the independent public registered accounting firm to the Registrant or to Service Affiliates that were required to be pre-approved were pre-approved as required.
ITEM 5. AUDIT COMMITTEE OF LISTED REGISTRANTS.
(a) If the registrant is a listed issuer as defined in Rule 10A-3 under the Exchange Act (17CFR 240.10A-3), state whether or not the registrant has a separately-designated standing audit committee established in accordance with Section 3(a)(58)(A) of the Exchange Act (15 U.S.C. 78c(a)(58)(A)). If the registrant has such a committee, however designated, identify each committee member. If the entire board of directors is acting as the registrant’s audit committee as specified in Section 3(a)(58)(B) of the Exchange Act (15 U.S.C. 78c(a)(58)(B)), so state.
(b) If applicable, provide the disclosure required by Rule 10A-3(d) under the Exchange Act (17CFR 240.10A-3(d)) regarding an exemption from the listing standards for all audit committees.
Not applicable.
ITEM 6. SCHEDULE OF INVESTMENTS
File Schedule I – Investments in securities of unaffiliated issuers as of the close of the reporting period as set forth in Section 210.12-12 of Regulation S-X, unless the schedule is included as part of the report to shareholders filed under Item 1 of this Form.
Included in Item 1.
ITEM 7. DISCLOSURE OF PROXY VOTING POLICIES AND PROCEDURES FOR CLOSED-END MANAGEMENT INVESTMENT COMPANIES.
A closed-end management investment company that is filing an annual report on this Form N-CSR must, unless it invests exclusively in non-voting securities, describe the policies and procedures that it uses to determine how to vote proxies relating to portfolio securities, including the procedures that the company uses when a vote presents a conflict between the interests of its shareholders, on the one hand, and those of the company’s investment adviser; principal underwriter; or any affiliated person (as defined in Section 2(a)(3) of the Investment Company Act of 1940 (15 U.S.C. 80a-2(a)(3)) and the rules thereunder) of the company, its investment adviser, or its principal underwriter, on the other. Include any policies and procedures of the company’s investment adviser, or any other third party, that the company uses, or that are used on the company’s behalf, to determine how to vote proxies relating to portfolio securities.
Not applicable.
ITEM 8. PORTFOLIO MANAGERS OF CLOSED-END MANAGEMENT INVESTMENT COMPANIES.
Not applicable.
ITEM 9. PURCHASE OF EQUITY SECURITIES BY CLOSED-END MANAGEMENT INVESTMENT COMPANY AND AFFILIATED PURCHASERS.
(a) If the registrant is a closed-end management investment company, provide the information specified in paragraph (b) of this Item with respect to any purchase made by or on behalf of the registrant or any “affiliated purchaser,” as defined in Rule 10b-18(a)(3) under the Exchange Act (17 CFR 240.10b-18(a)(3)), of shares or other units of any class of the registrant’s equity securities that is registered by the registrant pursuant to Section 12 of the Exchange Act (15 U.S.C. 781).
Not applicable.
ITEM 10. SUBMISSION OF MATTERS TO A VOTE OF SECURITY HOLDERS.
Describe any material changes to the procedures by which shareholders may recommend nominees to the registrant’s board of directors, where those changes were implemented after the registrant last provided disclosure in response to the requirements of Item 7(d)(2)(ii)(G) of Schedule 14A (17 CFR 240.14a-101), or this Item.
Not applicable.
ITEM 11. CONTROLS AND PROCEDURES.
(a) Disclose the conclusions of the registrant’s principal executive and principal financial officers, or persons performing similar functions, regarding the effectiveness of the registrant’s disclosure controls and procedures (as defined in Rule 30a-3(c) under the Act (17 CFR 270.30a-3(c))) as of a date within 90 days of the filing date of the report that includes the disclosure required by this paragraph, based on the evaluation of these controls and procedures required by Rule 30a-3(b) under the Act (17 CFR 270.30a-3(b)) and Rules 13a-15(b) or 15d-15(b) under the Exchange Act (17 CFR 240.13a-15(b) or 240.15d-15(b)).
The Registrant’s principal executive and principal financial officers have concluded, based on their evaluation of the Registrant’s disclosure controls and procedures as of a date within 90 days of the filing date of this report, that the Registrant’s disclosure controls and procedures are reasonably designed to ensure that information required to be disclosed by the Registrant on Form N-CSR is recorded, processed, summarized and reported within the required time periods and that information required to be disclosed by the Registrant in the reports that it files or submits on Form N-CSR is accumulated and communicated to the Registrant’s management, including its principal executive and principal financial officers, as appropriate to allow timely decisions regarding required disclosure.
(b) Disclose any change in the registrant’s internal control over financial reporting (as defined in Rule 30a-3(d) under the Act (17 CFR 270.30a-3(d)) that occurred during the registrant’s second fiscal quarter of the period covered by this report that has materially affected, or is reasonably likely to materially affect, the registrant’s internal control over financial reporting.
There were no changes in the Registrant’s internal control over financial reporting that occurred during the Registrant’s fourth fiscal quarter of the period covered by this report that have materially affected, or are reasonably likely to materially affect, the Registrant’s internal control over financial reporting.
ITEM 12. EXHIBITS.
(a) File the exhibits listed below as part of this Form. Letter or number the exhibits in the sequence indicated.
(a)(1) Any code of ethics, or amendment thereto, that is the subject of the disclosure required by Item 2, to the extent that the registrant intends to satisfy the Item 2 requirements through filing of an exhibit.
The Code of Ethics that is the subject of the disclosure required by Item 2 is attached hereto.
(a)(2) A separate certification for each principal executive officer and principal financial officer of the registrant as required by Rule 30a-2 under the Act (17 CFR 270.30a-2).
Certifications pursuant to Rule 30a-2(a) under the Investment Company Act of 1940 are attached hereto.
(a)(3) Any written solicitation to purchase securities under Rule 23c-1 under the Act (17 CFR 270.23c-1) sent or given during the period covered by the report by or on behalf of the registrant to 10 or more persons.
Not applicable.
(b) A separate or combined certification for each principal executive officer and principal officer of the registrant as required by Rule 30a-2(b) under the Act of 1940.
Certifications pursuant to Rule 30a-2(b) under the Investment Company Act of 1940 are attached hereto.
SIGNATURES
Pursuant to the requirements of the Securities Exchange Act of 1934 and the Investment Company Act of 1940, the registrant has duly caused this report to be signed on its behalf by the undersigned, thereunto duly authorized.
J.P. Morgan Fleming Mutual Fund Group, Inc.
By: | /s/ George C.W. Gatch | |
| George C.W. Gatch |
| President and Principal Executive Officer |
| March 8, 2006 |
| | | |
Pursuant to the requirements of the Securities Exchange Act of 1934 and the Investment Company Act of 1940, this report has been signed below by the following persons on behalf of the registrant and in the capacities and on the dates indicated.
By: | /s/ George C.W. Gatch | |
| George C.W. Gatch |
| President and Principal Executive Officer |
| March 8, 2006 |
By: | /s/ Stephanie J. Dorsey | |
| Stephanie J. Dorsey |
| Treasurer and Principal Financial Officer |
| March 8, 2006 |