Past performance is no guarantee for future performance. The general market views expressed in this report are opinions based on current market conditions and are subject to change without notice. These views are not intended to predict the future performance of the Fund or the securities markets. References to specific securities and their issuers are for illustrative purposes only and are not intended to be, and should not be interpreted as, recommendations to purchase or sell such securities. Such views are not meant as investment advice and may not be relied on as an indication of trading intent on behalf of any Fund.
Prospective investors should refer to the Fund’s prospectus for a discussion of the Fund’s investment objective, strategies and risks. Call JPMorgan Funds Service Center at 1-800-480-4111 for a prospectus containing more complete information about the Fund including management fees and other expenses. Please read it carefully before investing.
PRESIDENT’S LETTER
JULY 6, 2007 (Unaudited)
Dear Shareholder:
We are pleased to present this annual report for the JPMorgan Mid/Multi Cap Funds for the 12 months ended June 30, 2007. Inside, you’ll find information detailing the performance of the Funds, along with reports from the portfolio managers.
| |
“Residential construction activity has declined significantly within the last year, and we continue to look for weakness in housing-related employment and consumer spending.”
|
The 12-month period began with the financial markets absorbing the 17th consecutive interest-rate increase from the Federal Reserve (Fed). That 25-basis-point (bp) hike, initiated on June 29, 2006, lifted the fed funds target to 5.25%, where it remained for the next 12 months.
After the Fed’s decision to halt its rate-tightening campaign in August 2006, the financial markets initially speculated that the Fed’s next move would be an easing. A sharp slowdown in the housing market combined with declines in manufacturing activity had triggered the Fed’s pause, and investors anticipated that the resulting slowdown in gross domestic product (GDP) growth would prompt a rate cut.
This sentiment slowly unraveled throughout the rest of the year, though, as the Fed remained on hold. The economy had its ups and downs, but generally held up better than most observers expected, which reduced the chances for a change in monetary policy. What’s more, inflation pressures continued to irritate the Fed and diminish the prospects for a rate cut.
Stocks roll over roadblocks
Nevertheless, no challenge seemed too great for the U.S. stock market — not the increase in oil prices throughout the latter half of 2006; not the sharp, but short-lived, China-market-inspired correction of late February; not the anemic third-quarter 2006 or first-quarter 2007 GDP growth rate of 2.0% and 0.7%, respectively; not the growing fallout from housing-market weakness; not the increasing default rate tied to the sub-prime mortgage market; and not the Fed’s persistent inflation warnings.
Despite these obstacles, the U.S. stock market posted strong returns for the 12-month period. For example, among the capitalization universes, the Russell Midcap Index was the top performer, returning 20.83% for the period. Large-cap stocks followed, with a return of 20.43%, as measured by the Russell 1000 Index, while the small-cap Russell 2000 Index returned 16.43%. In terms of style, there was only a modest difference in the performance of value stocks versus growth stocks. Overall, value stocks maintained a slight performance edge in the large- and mid-cap universes, while growth stocks prevailed in the small-cap universe.
Outside the U.S., stock performance was even stronger. Robust global growth, combined with the relative decline in the U.S. dollar, helped propel international stocks to extraordinary gains. Developed markets, as measured by the MSCI EAFE Index, returned 32.11% for the period, while the MSCI Emerging Markets Index posted a 12-month total return of 50.29%. U.S. stocks, as measured by the S&P 500 Index, posted a return of 20.59% for the one-year period.
Investors generally pointed to abundant liquidity and robust merger-and-acquisition activity, including private equity deals, as drivers of stock market gains. In addition, optimism regarding continued, albeit slow, economic growth, a healthy global economy, higher-than-expected corporate earnings growth, and modest core inflation data provided support.
Volatility resurfaces
A bout of volatility late in the fiscal year reminded investors of the challenges lingering in the market. Rising bond yields and anxiety regarding credit quality helped push stock market returns into negative territory during June.
In early June, the re-rating of U.S. growth prospects caused Treasury yields to move sharply higher. Furthermore, the Fed retained its tightening bias but left the fed funds target unchanged. The market changed its expectations for future Fed policy. Whereas market participants previously had expected the Fed to cut rates during the second half of 2007, it ended the period convinced that the Fed would remain on hold for the rest of the year.
Economy continues to grow, but at a sub-par pace
Overall, economic growth should remain at a below-trend pace of approximately 2.1% for 2007 as a whole. Residential construction activity has declined significantly over the last year, and we continue to look for weakness in housing-related employment and consumer spending. Although this may lead to some periods of unease ahead, we would view such spillovers as positive from a long-term perspective, because they would provide a conclusive arrest of the inflation threat and could lead to a decisive shift in the Fed’s monetary policy bias.
On behalf of everyone at JPMorgan Asset Management, thank you for your confidence and the continued trust you have placed in us. We look forward to serving your investment needs for many years to come. Should you have any questions, please feel free to contact the JPMorgan Funds Service Center at 1-800-480-4111.
George C.W. Gatch
President
JPMorgan Funds
JUNE 30, 2007 JPMORGAN MID CAP/MULTI-CAP FUNDS 1
JPMorgan Capital Growth Fund
FUND COMMENTARY
AS OF JUNE 30, 2007 (Unaudited)
FUND FACTS
| Fund Inception | | | | September 23, 1987 |
| Fiscal Year-End | | | | June 30 |
Net Assets as of 6/30/2007
| | | | | | |
| (In Thousands) | | | | $968,592 |
| Primary Benchmark | | | | Russell Midcap Growth Index |
Q: | | HOW DID THE FUND PERFORM? |
A: | | The JPMorgan Capital Growth Fund, which seeks capital growth over the long term, returned 19.01%* (Class A Shares, no sales charge) over the 12 months ended June 30, 2007, compared to the 19.73% return for the Russell Midcap Growth Index over the same period.** |
Q: | | WHY DID THE FUND PERFORM THIS WAY? |
A: | | The Fund underperformed its benchmark for the period due primarily to stock selection in the information technology and healthcare sectors as well as an underweight in the materials sector. At the individual stock level, Panera Bread Co., a chain of casual bakery cafes, was among the detractors from performance. The company cut its same-store sales growth target for the second quarter. In addition, the company reported that its margins were under pressure due to a shift away from products made in its fresh dough facilities along with higher gasoline and other input costs. Corporate Executive Board Co., which provides research, decision support tools and executive education, also hurt returns. The company was forced to lower its guidance for full-year 2007 earnings due to weaker-than-expected revenue growth. The revised outlook reflects a weaker-than-expected sales increase and slow start to the current sales year. Consol Energy Inc., a multi-fuel energy provider, also negatively impacted performance. The company’s shares declined after it reported that first-quarter profits fell due to reduced coal sales in a flat pricing environment. Additionally, the company trimmed its 2007 production guidance. |
On the positive side, stock selection in the industrials, consumer discretionary and telecommunication service sectors aided returns. At the individual stock level, General Cable Corp., which designs, manufactures and markets copper, aluminum and fiber-optic wire and cable products, was among the contributors to performance. The company’s shares advanced as worldwide demand for electrical infrastructure contributed to double-digit revenue and earnings growth. These positive results were driven by increased demand, particularly for overhead transmission cables in the U.S. and Europe. GameStop Corp., which retails video games and PC entertainment software, also helped returns. The company reported fiscal first-quarter earnings that more than doubled due to sales of new gaming systems like Nintendo Wii and games like “Guitar Hero II.” Amphenol Corp., an electronic and fiber-optic connector manufacturer, also supported performance. The company reported that first-quarter profits increased on double-digit growth, which beat expectations.
Q: | | HOW WAS THE FUND MANAGED? |
A: | | We employ a bottom-up approach to stock selection, constructing portfolios based on company fundamentals, quantitative screening and proprietary fundamental analysis. We look for dominant franchises with predictable business models deemed capable of achieving sustained growth. Potential investments are subjected to rigorous financial analysis and a disciplined approach to valuation. We seek to maintain sector diversification in the Fund by avoiding large allocations that are contingent on macroeconomic or sector trends. |
TOP TEN EQUITY HOLDINGS OF THE PORTFOLIO***
| 1. | | General Cable Corp. | | | 2.5 | % |
| 2. | | VeriFone Holdings, Inc. | | | 2.0 | |
| 3. | | Roper Industries, Inc. | | | 1.9 | |
| 4. | | Amphenol Corp., Class A | | | 1.8 | |
| 5. | | Gentex Corp. | | | 1.5 | |
| 6. | | Time Warner Telecom, Inc., Class A | | | 1.5 | |
| 7. | | Corrections Corp. of America | | | 1.4 | |
| 8. | | GameStop Corp., Class A | | | 1.4 | |
| 9. | | Celgene Corp. | | | 1.4 | |
| 10. | | DreamWorks Animation SKG, Inc., Class A | | | 1.4 | |
PORTFOLIO COMPOSITION***
| Information Technology | | | | | 23.3 | % |
| Consumer Discretionary | | | | | 20.3 | |
| Health Care | | | | | 16.1 | |
| Industrials | | | | | 12.5 | |
| Financials | | | | | 8.8 | |
| Energy | | | | | 8.5 | |
| Telecommunication Services | | | | | 4.9 | |
| Materials | | | | | 2.7 | |
| Consumer Staples | | | | | 1.4 | |
| Utilities | | | | | 0.9 | |
| Short-Term Investment | | | | | 0.6 | |
| * | | The return shown is based on net asset value calculated for shareholder transactions and may differ from the return shown in the financial highlights which reflect adjustments made to the net asset value in accordance with accounting principles generally accepted in the United States of America. |
| ** | | The advisor seeks to achieve the Fund’s objective. There can be no guarantee it will be achieved. |
| *** | | Percentages indicated are based upon total investments (excluding Investments of Cash Collateral for Securities on Loan) as of June 30, 2007. The Fund’s composition is subject to change. |
2 JPMORGAN MID CAP/MULTI-CAP FUNDS JUNE 30, 2007
AVERAGE ANNUAL TOTAL RETURNS AS OF JUNE 30, 2007
| | | | INCEPTION DATE
OF CLASS
| | 1 YEAR
| | 5 YEAR
| | 10 YEAR
|
|---|
CLASS A SHARES | | | | | 9/23/87 | | | | | | | | | | | | | |
| Without Sales Charge | | | | | | | | | 19.01 | % | | | 13.45 | % | | | 8.56 | % |
| With Sales Charge* | | | | | | | | | 12.77 | | | | 12.23 | | | | 7.98 | |
CLASS B SHARES | | | | | 11/4/93 | | | | | | | | | | | | | |
| Without CDSC | | | | | | | | | 18.41 | | | | 12.88 | | | | 8.13 | |
| With CDSC** | | | | | | | | | 13.41 | | | | 12.63 | | | | 8.13 | |
CLASS C SHARES | | | | | 1/2/98 | | | | | | | | | | | | | |
| Without CDSC | | | | | | | | | 18.44 | | | | 12.86 | | | | 7.93 | |
| With CDSC*** | | | | | | | | | 17.44 | | | | 12.86 | | | | 7.93 | |
SELECT CLASS SHARES | | | | | 1/25/96 | | | | 19.30 | | | | 13.84 | | | | 9.01 | |
| * | | Sales Charge for Class A Shares is 5.25%. |
| ** | | Assume 5% CDSC (contingent deferred sales charge) for the one year period, 2% CDSC for the five year period and 0% CDSC thereafter. |
| *** | | Assumes a 1% CDSC for the one year period and 0% CDSC thereafter. |
TEN YEAR PERFORMANCE (6/30/97 TO 6/30/07)
Source: Lipper, Inc. The performance quoted is past performance and is not a guarantee of future results. Mutual funds are subject to certain market risks. Investment returns and principal value of an investment will fluctuate so that an investor’s shares, when redeemed, may be worth more or less than their original cost. Current performance may be higher or lower than the performance data shown. For up-to-date month-end performance information please call 1-800-480-4111.
The Fund commenced operations on September 23, 1987.
Returns for the Class C Shares prior to their inception date are based on the performance of Class B Shares, whose expenses are substantially similar to those of Class C Shares.
The graph illustrates comparative performance for $10,000 invested in Class A Shares of the JPMorgan Capital Growth Fund, Russell Midcap Growth Index, and Lipper Mid-Cap Growth Funds Index from June 30, 1997 to June 30, 2007. The performance of the Fund assumes reinvestment of all dividends and capital gains, if any, and includes a sales charge. The performance of the Russell Midcap Growth Index does not reflect the deduction of expenses or a sales charge associated with a mutual fund and has been adjusted to reflect reinvestment of all dividends and capital gains of the securities included in the benchmark. The performance of the Lipper Mid-Cap Growth Funds Index includes expenses associated with a mutual fund, such as investment management fees. These expenses are not identical to the expenses charged by the Fund. The Russell Midcap Growth Index is an unmanaged index, which measures the performance of those Russell Midcap companies with higher price-to-book ratios and higher financial growth values. The Lipper Mid-Cap Growth Funds Index is an index based on total returns of certain mutual funds within the Fund’s designated category as determined by Lipper, Inc. Investors cannot invest directly in an index.
Class A shares have a $1,000 minimum initial investment and carry a 5.25% sales charge.
Performance may reflect the waiver of the Fund’s fees and reimbursement of expenses for certain periods since the inception date. Without these waivers and reimbursements performance would have been lower. Also, performance shown in this section does not reflect the deduction of taxes that a shareholder would pay on Fund distributions or redemption of Fund shares.
The returns shown are based on net asset values calculated for shareholder transactions and may differ from the return shown in the financial highlights which reflect adjustments made to the net asset values in accordance with accounting principles generally accepted in the United States of America.
JUNE 30, 2007 JPMORGAN MID CAP/MULTI-CAP FUNDS 3
JPMorgan Diversified Mid Cap Growth Fund
FUND COMMENTARY
AS OF JUNE 30, 2007 (Unaudited)
FUND FACTS
| Fund Inception | | | | March 2, 1989 |
| Fiscal Year End | | | | June 30 |
Net Assets as of 6/30/2007
|
| (In Thousands) | | | | $1,385,625 |
| Primary Benchmark | | | | Russell Midcap Growth Index |
Q: | | HOW DID THE FUND PERFORM? |
A: | | The JPMorgan Diversified Mid Cap Growth Fund, which seeks growth of capital and, secondarily, current income by investing primarily in equity securities, returned 18.95%* (Select Class Shares) over the 12 months ended June 30, 2007, compared to the 19.73% return for the Russell Midcap Growth Index over the same period.** |
Q: | | WHY DID THE FUND PERFORM THIS WAY? |
A: | | The Fund underperformed its benchmark for the period due primarily to stock selection in the information technology and healthcare sectors as well as an underweight in the materials sector. At the individual stock level, Panera Bread Co., a chain of casual bakery cafes, was among the detractors from performance. The company cut its same-store sales growth target for the second quarter. In addition, the company reported that its margins were under pressure due to a shift away from products made in its fresh dough facilities along with higher gasoline and other input costs. Corporate Executive Board Co., which provides research, decision support tools and executive education, also hurt returns. The company was forced to lower its guidance for full-year 2007 earnings due to weaker-than-expected revenue growth. The revised outlook reflects a weaker-than-expected sales increase and slow start to the current sales year. Consol Energy Inc., a multi-fuel energy provider, also negatively impacted performance. The company’s shares declined after it reported that first-quarter profits fell due to reduced coal sales in a flat pricing environment. Additionally, the company trimmed its 2007 production guidance. |
On the positive side, stock selection in the industrials, consumer discretionary and telecommunication service sectors aided returns. At the individual stock level, General Cable Corp., which designs, manufactures and markets copper, aluminum and fiber-optic wire and cable products, was among the contributors to performance. The company’s shares advanced as worldwide demand for electrical infrastructure contributed to double-digit revenue and earnings growth. These positive results were driven by increased demand, particularly for overhead transmission cables in the U.S. and Europe. GameStop Corp., which retails video games and PC entertainment software, also helped returns. The company reported fiscal first-quarter earnings that more than doubled due to sales of new gaming systems like Nintendo Wii and games like “Guitar Hero II.” Amphenol Corp., an electronic and fiber-optic connector manufacturer, also supported performance. The company reported that first-quarter profits increased on double-digit growth, which beat expectations.
Q: | | HOW WAS THE FUND MANAGED? |
A: | | We employ a bottom-up approach to stock selection, constructing portfolios based on company fundamentals, quantitative screening and proprietary fundamental analysis. We look for dominant franchises with predictable business models deemed capable of achieving sustained growth. Potential investments are subjected to rigorous financial analysis and a disciplined approach to valuation. We seek to maintain sector diversification in the Fund by avoiding large allocations that are contingent on macroeconomic or sector trends. |
TOP TEN EQUITY HOLDINGS OF THE PORTFOLIO***
| 1. | | General Cable Corp. | | | 2.4 | % |
| 2. | | VeriFone Holdings, Inc. | | | 1.9 | |
| 3. | | Roper Industries, Inc. | | | 1.9 | |
| 4. | | Amphenol Corp., Class A | | | 1.7 | |
| 5. | | Gentex Corp. | | | 1.5 | |
| 6. | | Time Warner Telecom, Inc., Class A | | | 1.4 | |
| 7. | | Corrections Corp. of America | | | 1.4 | |
| 8. | | GameStop Corp., Class A | | | 1.4 | |
| 9. | | Celgene Corp. | | | 1.4 | |
| 10. | | DreamWorks Animation SKG, Inc., Class A | | | 1.4 | |
PORTFOLIO COMPOSITION***
| Information Technology | | | | | 22.9 | % |
| Consumer Discretionary | | | | | 20.0 | |
| Health Care | | | | | 15.8 | |
| Industrials | | | | | 12.3 | |
| Financials | | | | | 8.7 | |
| Energy | | | | | 8.3 | |
| Telecommunication Services | | | | | 4.7 | |
| Materials | | | | | 2.6 | |
| Consumer Staples | | | | | 1.4 | |
| Utilities | | | | | 0.9 | |
| Short-Term Investment | | | | | 2.4 | |
| * | | The return shown is based on net asset value calculated for shareholder transactions and may differ from the return shown in the financial highlights which reflect adjustments made to the net asset value in accordance with accounting principles generally accepted in the United States of America. |
| ** | | The advisor seeks to achieve the Fund’s objective. There can be no guarantee it will be achieved. |
| *** | | Percentages indicated are based upon total investments (excluding Investments of Cash Collateral for Securities on Loan) as of June 30, 2007. The Fund’s composition is subject to change. |
4 JPMORGAN MID CAP/MULTI-CAP FUNDS JUNE 30, 2007
AVERAGE ANNUAL TOTAL RETURNS AS OF JUNE 30, 2007
| | | | INCEPTION DATE
OF CLASS
| | 1 YEAR
| | 5 YEAR
| | 10 YEAR
|
|---|
CLASS A SHARES | | | | | 2/18/92 | | | | | | | | | | | | | |
| Without Sales Charge | | | | | | | | | 18.65 | % | | | 11.85 | % | | | 11.29 | % |
| With Sales Charge* | | | | | | | | | 12.41 | | | | 10.66 | | | | 10.69 | |
CLASS B SHARES | | | | | 1/14/94 | | | | | | | | | | | | | |
| Without CDSC | | | | | | | | | 17.98 | | | | 11.10 | | | | 10.62 | |
| With CDSC** | | | | | | | | | 12.98 | | | | 10.83 | | | | 10.62 | |
CLASS C SHARES | | | | | 11/4/97 | | | | | | | | | | | | | |
| Without CDSC | | | | | | | | | 17.95 | | | | 11.09 | | | | 10.58 | |
| With CDSC*** | | | | | | | | | 16.95 | | | | 11.09 | | | | 10.58 | |
SELECT CLASS SHARES | | | | | 3/2/89 | | | | 18.95 | | | | 12.14 | | | | 11.58 | |
ULTRA SHARES | | | | | 2/22/05 | | | | 19.13 | | | | 12.21 | | | | 11.61 | |
| * | | Sales Charge for Class A Shares is 5.25%. |
| ** | | Assumes 5% CDSC (contingent deferred sales charge) for the one year period, 2% CDSC for the five year period and 0% CDSC thereafter. |
| *** | | Assumes a 1% CDSC for the one year period and 0% CDSC thereafter. |
TEN YEAR PERFORMANCE (6/30/97 TO 6/30/07)
Source: Lipper, Inc. The performance quoted is past performance and is not a guarantee of future results. Mutual funds are subject to certain market risks. Investment returns and principal value of an investment will fluctuate so that an investor’s shares, when redeemed, may be worth more or less than their original cost. Current performance may be higher or lower than the performance data shown. For up-to-date month-end performance information please call 1-800-480-4111.
The Fund commenced operations on March 2, 1989. Returns for the Class C Shares and Ultra Shares prior to their inception date are based on the performance of Select Class Shares. Historical Class C Shares performance has been adjusted to reflect the differences in expenses and sales charges between classes prior to the class inception. The actual returns of Ultra Shares would have been different than those shown because Ultra Shares have different expenses than Select Class Shares.
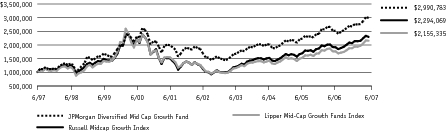
The graph illustrates comparative performance for $1,000,000 invested in Select Class Shares of the JPMorgan Diversified Mid Cap Growth Fund, Russell Midcap Growth Index and the Lipper Mid-Cap Growth Funds Index from June 30, 1997 to June 30, 2007. The performance of the Fund assumes reinvestment of all dividends and capital gains, if any, and does not include a sales charge. The performance of the Russell Midcap Growth Index does not reflect the deduction of expenses or a sales charge associated with a mutual fund and has been adjusted to reflect reinvestment of all dividends and capital gains of the securities included in the benchmark. The performance of the Lipper Mid-Cap Growth Funds Index includes expenses associated with a mutual fund, such as investment management fees. These expenses are not identical to the expenses charged by the Fund. The Russell Midcap Growth Index is an unmanaged index, which measures the performance of those Russell Midcap companies with higher price-to-book ratios and higher forecasted growth values. The Lipper Mid-Cap Growth Funds Index is an index based on total returns of certain mutual funds within the Fund’s designated category as determined by Lipper Inc. Investors cannot invest directly in an index.
Select Class Shares have a $1,000,000 minimum initial investment and carry no sales charge.
Performance may reflect the waiver of the Fund’s fees and reimbursement of expenses for certain periods since the inception date. Without these waivers and reimbursements performance would have been lower. Also, performance shown in this section does not reflect the deduction of taxes that a shareholder would pay on Fund distributions or redemption of Fund shares.
The returns shown are based on net asset values calculated for shareholder transactions and may differ from the return shown in the financial highlights which reflect adjustments made to the net asset values in accordance with accounting principles generally accepted in the United States of America.
JUNE 30, 2007 JPMORGAN MID CAP/MULTI-CAP FUNDS 5
JPMorgan Diversified Mid Cap Value Fund
FUND COMMENTARY
AS OF JUNE 30, 2007 (Unaudited)
FUND FACTS
| Fund Inception | | | | March 2, 1989 |
| Fiscal Year End | | | | June 30 |
Net Assets as of 6/30/2007
|
| (In Thousands) | | | | $739,380 |
| Primary Benchmark | | | | Russell Midcap Value Index |
Q: | | HOW DID THE FUND PERFORM? |
A: | | The JPMorgan Diversified Mid Cap Value Fund, which seeks capital appreciation with the secondary goal of achieving current income by investing primarily in equity securities, returned 19.97%* (Select Class Shares) over the 12 months ended June 30, 2007, compared to the 22.09% return for the Russell Midcap Value Index over the same period.** |
Q: | | WHY DID THE FUND PERFORM THIS WAY? |
A: | | The Fund underperformed its benchmark for the period due primarily to stock selection in the healthcare, utility, and industrials sectors. At the individual stock level, McClatchy Co., the third-largest newspaper company in the U.S., was among the detractors from performance. The company experienced a difficult start to 2007 as advertising revenues declined sharply on the back of disappointing real estate ads. Omnicare Inc., a geriatric pharmaceutical services company, also hurt returns. The company’s shares came under pressure as several events, including legal disputes with regulators and an ongoing lawsuit against UnitedHealthcare, lowered investor sentiment toward the stock. |
On the positive side, stock selection in the consumer discretionary, financial and materials sectors helped returns. At the individual stock level, Tiffany and Co., a global fine jeweler, was among the top contributors to performance. The company’s shares advanced following the announcement that Nelson Peltz’s Trian Fund Management bought a 5.45% stake in the company. Trian seeks to help Tiffany improve its margins and earnings-per-share growth as well as address various operational and strategic issues. SUPERVALU Inc., a grocery retailer and distributor, also helped returns. The company reported solid financial results that surpassed analysts’ estimates, driven primarily by its acquisition of Albertson Inc.’s retail properties in 2006.
Q: | | HOW WAS THE FUND MANAGED? |
A: | | We employ a bottom-up approach to stock selection, constructing portfolios based on company fundamentals, quantitative screening and proprietary fundamental analysis. We look for undervalued companies that have the potential to grow intrinsic value per share. The research process is designed to find companies with predictable and durable business models deemed capable of achieving sustainable growth. Potential investments are subjected to rigorous financial analysis and a disciplined approach to valuation. |
TOP TEN EQUITY HOLDINGS OF THE PORTFOLIO***
| 1. | | Brown-Forman Corp., Class B | | | 1.7 | % |
| 2. | | SUPERVALU, Inc. | | | 1.4 | |
| 3. | | Assurant, Inc. | | | 1.3 | |
| 4. | | American Electric Power Co., Inc. | | | 1.2 | |
| 5. | | Clear Channel Communications, Inc. | | | 1.2 | |
| 6. | | Coventry Health Care, Inc. | | | 1.1 | |
| 7. | | FirstEnergy Corp. | | | 1.1 | |
| 8. | | Tiffany & Co. | | | 1.1 | |
| 9. | | Fortune Brands, Inc. | | | 1.1 | |
| 10. | | Ball Corp. | | | 1.1 | |
PORTFOLIO COMPOSITION***
| Financials | | | | | 25.0 | % |
| Consumer Discretionary | | | | | 19.9 | |
| Utilities | | | | | 12.7 | |
| Industrials | | | | | 8.9 | |
| Consumer Staples | | | | | 8.2 | |
| Materials | | | | | 6.2 | |
| Energy | | | | | 5.3 | |
| Health Care | | | | | 4.9 | |
| Information Technology | | | | | 4.0 | |
| Telecommunication Services | | | | | 3.3 | |
| Short-Term Investment | | | | | 1.6 | |
| * | | The return shown is based on net asset value calculated for shareholder transactions and may differ from the return shown in the financial highlights which reflect adjustments made to the net asset value in accordance with accounting principles generally accepted in the United States of America. |
| ** | | The advisor seeks to achieve the Fund’s objective. There can be no guarantee it will be achieved. |
| *** | | Percentages indicated are based upon total investments (excluding Investments of Cash Collateral for Securities on Loan) as of June 30, 2007. The Fund’s composition is subject to change. |
6 JPMORGAN MID CAP/MULTI-CAP FUNDS JUNE 30, 2007
AVERAGE ANNUAL TOTAL RETURNS AS OF JUNE 30, 2007
| | | | INCEPTION DATE
OF CLASS
| | 1 YEAR
| | 5 YEAR
| | 10 YEAR
|
|---|
CLASS A SHARES | | | | | 2/18/92 | | | | | | | | | | | | | |
| Without Sales Charge | | | | | | | | | 19.66 | % | | | 12.49 | % | | | 12.12 | % |
| With Sales Charge* | | | | | | | | | 13.39 | | | | 11.29 | | | | 11.52 | |
CLASS B SHARES | | | | | 1/14/94 | | | | | | | | | | | | | |
| Without CDSC | | | | | | | | | 18.97 | | | | 11.74 | | | | 11.44 | |
| With CDSC** | | | | | | | | | 13.97 | | | | 11.48 | | | | 11.44 | |
CLASS C SHARES | | | | | 3/22/99 | | | | | | | | | | | | | |
| Without CDSC | | | | | | | | | 18.97 | | | | 11.74 | | | | 11.35 | |
| With CDSC*** | | | | | | | | | 17.97 | | | | 11.74 | | | | 11.35 | |
SELECT CLASS SHARES | | | | | 3/2/89 | | | | 19.97 | | | | 12.77 | | | | 12.39 | |
ULTRA SHARES | | | | | 2/22/05 | | | | 20.13 | | | | 12.86 | | | | 12.43 | |
| * | | Sales Charge for Class A Shares is 5.25%. |
| ** | | Assumes 5% CDSC (contingent deferred sales charge) for the one year period, 2% CDSC for the five year period and 0% CDSC thereafter. |
| *** | | Assumes a 1% CDSC for the one year period and 0% CDSC thereafter. |
TEN YEAR PERFORMANCE (6/30/97 TO 6/30/07)
Source: Lipper, Inc. The performance quoted is past performance and is not a guarantee of future results. Mutual funds are subject to certain market risks. Investment returns and principal value of an investment will fluctuate so that an investor’s shares, when redeemed, may be worth more or less than their original cost. Current performance may be higher or lower than the performance data shown. For up-to-date month-end performance information please call 1-800-480-4111.
The Fund commenced operations on March 2, 1989. Returns for the Class C Shares and Ultra Shares prior to their inception date are based on the performance of Select Class Shares. Historical Class C Shares performance has been adjusted to reflect the differences in expenses and sales charges between classes prior to the class inception. The actual returns of Ultra Shares would have been different than those shown because Ultra Shares have different expenses than Select Class Shares.
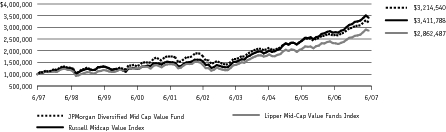
The graph illustrates comparative performance for $1,000,000 invested in Select Class Shares of the JPMorgan Diversified Mid Cap Value Fund, Russell Midcap Value Index and the Lipper Mid-Cap Value Funds Index from June 30, 1997 to June 30, 2007. The performance of the Fund assumes reinvestment of all dividends and capital gains, if any, and does not include a sales charge. The performance of the Russell Midcap Value Index does not reflect the deduction of expenses or a sales charge associated with a mutual fund and has been adjusted to reflect reinvestment of all dividends and capital gains of the securities included in the benchmark. The performance of the Lipper Mid-Cap Value Funds Index includes expenses associated with a mutual fund, such as investment management fees. These expenses are not identical to the expenses charged by the Fund. The Russell Midcap Value Index is an unmanaged index, which measures the performance of those Russell Midcap companies with lower price-to-book ratios and lower forecasted growth values. The Lipper Mid-Cap Value Funds Index is an index based on total returns of certain mutual funds within the Fund’s designated category as determined by Lipper, Inc. Investors cannot invest directly in an index.
Select Class Shares have a $1,000,000 minimum initial investment and carry no sales charge.
Performance may reflect the waiver of the Fund’s fees and reimbursement of expenses for certain periods since the inception date. Without these waivers and reimbursements performance would have been lower. Also, performance shown in this section does not reflect the deduction of taxes that a shareholder would pay on Fund distributions or redemption of Fund shares.
The returns shown are based on net asset values calculated for shareholder transactions and may differ from the return shown in the financial highlights which reflect adjustments made to the net asset values in accordance with accounting principles generally accepted in the United States of America.
JUNE 30, 2007 JPMORGAN MID CAP/MULTI-CAP FUNDS 7
JPMorgan Growth Advantage Fund
FUND COMMENTARY
AS OF JUNE 30, 2007 (Unaudited)
FUND FACTS
| Fund Inception | | | | October 29, 1999 |
| Fiscal Year End | | | | June 30 |
Net Assets as of 6/30/2007
| | | | | | |
| (In Thousands) | | | | $62,519 |
| Primary Benchmark | | | | Russell 3000 Growth Index |
Q: | | HOW DID THE FUND PERFORM? |
A: | | The JPMorgan Growth Advantage Fund, which seeks to provide long-term capital growth, returned 23.53%* (Class A Shares, no sales charge) over the 12 months ended June 30, 2007, compared to the 18.84% return for the Russell 3000 Growth Index over the same period.** |
Q: | | WHY DID THE FUND PERFORM THIS WAY? |
A: | | The Fund outperformed its benchmark for the period due primarily to stock selection in the industrials, consumer discretionary and telecommunication service sectors. At the individual stock level, General Cable Corp., which designs, manufactures and markets copper, aluminum and fiber-optic wire and cable products, was among the contributors to performance. The company’s shares advanced as worldwide demand for electrical infrastructure contributed to double-digit revenue and earnings growth. These positive results were driven by increased demand, particularly for overhead transmission cables in the U.S. and Europe. Apple Inc., which produces hardware, software and Internet tools, also helped returns. The company’s shares advanced as hype surrounding the release of its much-anticipated iPhone continued to drive up the stock’s price. Additionally, the company benefited from upbeat sales. GameStop Corp., which retails video games and PC entertainment software, also supported performance. The company reported fiscal first-quarter earnings that more than doubled due to sales of new gaming systems like Nintendo Wii and games like “Guitar Hero II.” |
On the negative side, stock selection in the information technology and financial sectors as well as an underweight in the materials sector detracted from performance. At the individual stock level, Adams Respiratory Therapeutics Inc., a specialty pharmaceutical company, was among the detractors from performance. The company announced that lower-than-expected trade orders during its fiscal third quarter and a lack of severity in reported levels of upper respiratory ailments would impact sales for its major products for the remainder of the fiscal year. Isilon Systems Inc., which produces clustered storage systems for storing and managing digital content, also hurt returns. The company’s shares declined after it reported a narrower first-quarter loss that missed expectations. Rackable Systems Inc., a leading provider of server and storage products for large, scale-out data center deployments, also negatively impacted performance. The company reported a first-quarter loss due to lower revenue and increased expenses. Intense competition from rivals for the company’s largest customers forced it to cut prices, resulting in a first-quarter warning and subsequent loss.
Q: | | HOW WAS THE FUND MANAGED? |
A: | | We employ a bottom-up approach to stock selection, constructing portfolios based on company fundamentals, quantitative screening and proprietary fundamental analysis. We look for dominant franchises with predictable business models deemed capable of achieving sustained growth. Potential investments are subjected to rigorous financial analysis and a disciplined approach to valuation. We seek to maintain sector diversification in the Fund by avoiding large allocations that are contingent on macroeconomic or sector trends. |
TOP TEN EQUITY HOLDINGS OF THE PORTFOLIO***
| 1. | | General Cable Corp. | | | 2.4 | % |
| 2. | | Cisco Systems, Inc. | | | 2.4 | |
| 3. | | Microsoft Corp. | | | 2.2 | |
| 4. | | Google, Inc., Class A | | | 2.0 | |
| 5. | | VeriFone Holdings, Inc. | | | 2.0 | |
| 6. | | Roper Industries, Inc. | | | 1.8 | |
| 7. | | Research In Motion Ltd. (Canada) | | | 1.7 | |
| 8. | | Amphenol Corp., Class A | | | 1.7 | |
| 9. | | Merck & Co., Inc. | | | 1.6 | |
| 10. | | Schering-Plough Corp. | | | 1.6 | |
PORTFOLIO COMPOSITION***
| Information Technology | | | | | 31.4 | % |
| Health Care | | | | | 18.8 | |
| Consumer Discretionary | | | | | 15.7 | |
| Industrials | | | | | 12.0 | |
| Financials | | | | | 7.6 | |
| Energy | | | | | 5.7 | |
| Telecommunication Services | | | | | 4.2 | |
| Consumer Staples | | | | | 2.6 | |
| Materials | | | | | 1.1 | |
| Utilities | | | | | 0.8 | |
| Short-Term Investment | | | | | 0.1 | |
| * | | The return shown is based on net asset value calculated for shareholder transactions and may differ from the return shown in the financial highlights which reflect adjustments made to the net asset value in accordance with accounting principles generally accepted in the United States of America. |
| ** | | The advisor seeks to achieve the Fund’s objective. There can be no guarantee it will be achieved. |
| *** | | Percentages indicated are based upon total investments (excluding Investments of Cash Collateral for Securities on Loan) as of June 30, 2007. The Fund’s composition is subject to change. |
8 JPMORGAN MID CAP/MULTI-CAP FUNDS JUNE 30, 2007
AVERAGE ANNUAL TOTAL RETURNS AS OF JUNE 30, 2007
| | | | INCEPTION DATE
OF CLASS
| | 1 YEAR
| | 5 YEAR
| | SINCE INCEPTION
|
|---|
CLASS A SHARES | | | | | 10/29/99 | | | | | | | | | | | | | |
| Without Sales Charge | | | | | | | | | 23.53 | % | | | 14.79 | % | | | (2.28 | )% |
| With Sales Charge* | | | | | | | | | 17.00 | | | | 13.54 | | | | (2.96 | ) |
CLASS B SHARES | | | | | 10/29/99 | | | | | | | | | | | | | |
| Without CDSC | | | | | | | | | 22.75 | | | | 13.97 | | | | (2.96 | ) |
| With CDSC** | | | | | | | | | 17.75 | | | | 13.74 | | | | (2.96 | ) |
CLASS C SHARES | | | | | 5/1/06 | | | | | | | | | | | | | |
| Without CDSC | | | | | | | | | 22.56 | | | | 13.97 | | | | (2.96 | ) |
| With CDSC*** | | | | | | | | | 21.56 | | | | 13.97 | | | | (2.96 | ) |
SELECT CLASS SHARES | | | | | 5/1/06 | | | | 23.80 | | | | 14.87 | | | | (2.24 | ) |
| * | | Sales Charge for Class A Shares is 5.25%. |
| ** | | Assumes 5% CDSC (contingent deferred sales charge) for the one year period, 2% CDSC for the five year period and 0% CDSC thereafter. |
| *** | | Assumes a 1% CDSC for the one year period and 0% CDSC thereafter. |
LIFE OF FUND PERFORMANCE (10/29/99 TO 6/30/07)
Source: Lipper, Inc. The performance quoted is past performance and is not a guarantee of future results. Mutual funds are subject to certain market risks. Investment returns and principal value of an investment will fluctuate so that an investor’s shares, when redeemed, may be worth more or less than their original cost. Current performance may be higher or lower than the performance data shown. For up-to-date month-end performance information please call 1-800-480-4111.
The JPMorgan Growth Advantage Fund commenced operations on 10/29/99.
As of 8/17/05, the Fund changed its name, investment objective, certain investment policies and benchmark. Prior to that time, the Fund operated as JPMorgan Mid Cap Growth Fund. Although past performance is not necessarily an indication of how the Fund will perform in the future, in view of these changes, the Fund’s performance record prior to 8/17/05 might be less pertinent for investors considering whether to purchase shares of the Fund. The performance for the Class A and Class B Shares before 3/23/01 is based on the performance of the Class A and Class B Shares of the Fund’s predecessor, H&Q IPO & Emerging Company Fund, a series of Hambrecht & Quist Fund Trust, which transferred all of its assets and liabilities to the Fund pursuant to a reorganization on that date. The predecessor’s investment program was identical to that of the Fund prior to 12/3/01. The predecessor’s Class A and Class B expenses were substantially similar to those of Class A and Class B of the Fund. Returns for the Class C Shares prior to their inception date are based on the performance of Class B Shares, whose expenses are substantially similar to those of Class C Shares. Returns for the Select Class Shares prior to their inception date are based on the performance of Class A Shares. During this period, the actual returns of Select Class Shares would have been different because Select Class Shares have different expenses than Class A Shares.
The graph illustrates comparative performance for $10,000 invested in Class A Shares of the JPMorgan Growth Advantage Fund, Russell 3000 Growth Index and Lipper Multi-Cap Growth Funds Index from October 29, 1999 to June 30, 2007. The performance of the Fund assumes reinvestment of all dividends and capital gains, if any, and includes a sales charge. The performance of the indices reflects an initial investment at the end of the month following the Fund’s inception. The performance of the Russell 3000 Growth Index does not reflect the deduction of expenses or a sales charge associated with a mutual fund and has been adjusted to reflect reinvestment of all dividends and capital gains of the securities included in the benchmark. The performance of the Lipper Multi-Cap Growth Funds Index includes expenses associated with a mutual fund, such as investment management fees. These expenses are not identical to the expenses charged by the Fund. The Russell 3000 Growth Index is an unmanaged index, which measures the performance of those Russell 3000 Index companies (largest 3000 U.S. companies) with higher price-to-book ratios and higher forecasted growth values. The Lipper Multi-Cap Growth Funds Index is an index based on total returns of certain mutual funds within the Fund’s designated category as determined by Lipper, Inc. Investors cannot invest directly in an index.
Class A Shares have a $1,000 minimum initial investment and carry a 5.25% sales charge.
Performance may reflect the waiver of the Fund’s fees and reimbursement of expenses for certain periods since the inception date. Without these waivers and reimbursements performance would have been lower. Also, performance shown in this section does not reflect the deduction of taxes that a shareholder would pay on Fund distributions or redemption of Fund shares.
The returns shown are based on net asset values calculated for shareholder transactions and may differ from the return shown in the financial highlights which reflect adjustments made to the net asset values in accordance with accounting principles generally accepted in the United States of America.
JUNE 30, 2007 JPMORGAN MID CAP/MULTI-CAP FUNDS 9
JPMorgan Mid Cap Equity Fund
FUND COMMENTARY
AS OF JUNE 30, 2007 (Unaudited)
FUND FACTS
| Fund Inception | | | | January 1, 1997 |
| Fiscal Year End | | | | June 30 |
Net Assets as of 6/30/2007
| | | | | | |
| (In Thousands) | | | | $284,546 |
| Primary Benchmark | | | | Russell Midcap Index |
Q: | | HOW DID THE FUND PERFORM? |
A: | | The JPMorgan Mid Cap Equity Fund, which seeks long-term capital growth, returned 18.97%* (Select Class Shares) over the 12 months ended June 30, 2007, compared to the 20.83% return for the Russell Midcap Index over the same period.** |
Q: | | WHY DID THE FUND PERFORM THIS WAY? |
A: | | The Fund underperformed its benchmark for the period due primarily to stock selection in the healthcare, utility and information technology sectors. At the individual stock level, Omnicare Inc., a geriatric pharmaceutical services company, was among the detractors from performance. The company’s shares came under pressure as several events, including legal disputes with regulators and an ongoing lawsuit against UnitedHealthcare, lowered investor sentiment toward the stock. Panera Bread Co., a chain of casual bakery cafes, also hurt returns. The company cut its same-store sales growth target for the second quarter. In addition, the company reported that its margins were under pressure due to a shift away from products made in its fresh dough facilities along with higher gasoline and other input costs. |
On the positive side, stock selection in the consumer discretionary, telecommunication service and energy sectors helped returns. At the individual stock level, General Cable Corp., which designs, manufactures and markets copper, aluminum and fiber-optic wire and cable products, was among the contributors to performance. The company’s shares advanced as worldwide demand for electrical infrastructure contributed to double-digit revenue and earnings growth. These positive results were driven by increased demand, particularly for overhead transmission cables in the U.S. and Europe. Tiffany and Co., a global fine jeweler, also helped returns. The company’s shares advanced following the announcement that Nelson Peltz’s Trian Fund Management bought a 5.45% stake in the company. Trian seeks to help Tiffany improve its margins and earnings-per-share growth as well as address various operational and strategic issues.
Q: | | HOW WAS THE FUND MANAGED? |
A: | | We employ a bottom-up approach to stock selection, constructing portfolios based on company fundamentals, quantitative screening and proprietary fundamental analysis. We look for dominant franchises with predictable business models deemed capable of achieving sustained growth and undervalued companies with the potential to grow their intrinsic value per share. Potential investments are subjected to rigorous financial analysis and a disciplined approach to valuation. |
TOP TEN EQUITY HOLDINGS OF THE PORTFOLIO***
| 1. | | Amphenol Corp., Class A | | | 1.3 | % |
| 2. | | General Cable Corp. | | | 1.2 | |
| 3. | | Assurant, Inc. | | | 1.2 | |
| 4. | | NCR Corp. | | | 1.2 | |
| 5. | | Everest Re Group Ltd. (Bermuda) | | | 1.1 | |
| 6. | | Coventry Health Care, Inc. | | | 1.1 | |
| 7. | | Questar Corp. | | | 1.1 | |
| 8. | | Tiffany & Co. | | | 1.0 | |
| 9. | | VeriFone Holdings, Inc. | | | 1.0 | |
| 10. | | Northern Trust Corp. | | | 1.0 | |
PORTFOLIO COMPOSITION***
| Consumer Discretionary | | | | | 20.3 | % |
| Financials | | | | | 17.7 | |
| Information Technology | | | | | 13.0 | |
| Industrials | | | | | 10.7 | |
| Health Care | | | | | 10.5 | |
| Energy | | | | | 6.8 | |
| Utilities | | | | | 6.3 | |
| Telecommunication Services | | | | | 4.5 | |
| Consumer Staples | | | | | 4.4 | |
| Materials | | | | | 3.9 | |
| Short-Term Investment | | | | | 1.9 | |
| * | | The return shown is based on net asset value calculated for shareholder transactions and may differ from the return shown in the financial highlights which reflect adjustments made to the net asset value in accordance with accounting principles generally accepted in the United States of America. |
| ** | | The advisor seeks to achieve the Fund’s objective. There can be no guarantee it will be achieved. |
| *** | | Percentages indicated are based upon total investments (excluding Investments of Cash Collateral for Securities on Loan) as of June 30, 2007. The Fund’s composition is subject to change. |
10 JPMORGAN MID CAP/MULTI-CAP FUNDS JUNE 30, 2007
AVERAGE ANNUAL TOTAL RETURNS AS OF JUNE 30, 2007
| | | | INCEPTION DATE
OF CLASS
| | 1 YEAR
| | 5 YEAR
| | 10 YEAR
|
|---|
SELECT CLASS SHARES | | | | | 1/1/97 | | | | 18.97 | % | | | 14.83 | % | | | 12.48 | % |
TEN YEAR FUND PERFORMANCE (6/30/97 TO 6/30/07)
Source: Lipper, Inc. The performance quoted is past performance and is not a guarantee of future results. Mutual funds are subject to certain market risks. Investment returns and principal value of an investment will fluctuate so that an investor’s shares, when redeemed, may be worth more or less than their original cost. Current performance may be higher or lower than the performance data shown. For up-to-date month-end performance information please call 1-800-480-4111.
The Fund commenced operations on 1/1/97.
The graph illustrates comparative performance for $1,000,000 invested in the JPMorgan Mid Cap Equity Fund, Russell Midcap Index, and Lipper Mid-Cap Core Funds Index from June 30, 1997 to June 30, 2007. The performance of the Fund assumes reinvestment of all dividends and capital gains, if any. The performance of the Russell Midcap Index does not reflect the deduction of expenses or a sales charge associated with a mutual fund and has been adjusted to reflect reinvestment of all dividends and capital gains of the securities included in the benchmark. The performance of the Lipper Mid-Cap Core Funds Index includes expenses associated with a mutual fund, such as investment management fees. These expenses are not identical to the expenses charged by the Fund. The Russell Midcap Index is an unmanaged index, which measures the performance of the smallest 800 companies of the Russell 1000 Index. The Lipper Mid-Cap Core Funds Index is an index based on total returns of certain mutual funds within the Fund’s designated category as determined by Lipper, Inc. Investors cannot invest directly in an Index.
Select Class Shares have a $1,000,000 minimum initial investment and carry no sales charge.
Performance may reflect the waiver of the Fund’s fees and reimbursement of expenses for certain periods since the inception date. Without these waivers and reimbursements performance would have been lower. Also, performance shown in this section does not reflect the deduction of taxes that a shareholder would pay on Fund distributions or redemption of Fund shares.
The return shown is based on net asset value calculated for shareholder transactions and may differ from the return shown in the financial highlights which reflect adjustments made to the net asset value in accordance with accounting principles generally accepted in the United States of America.
JUNE 30, 2007 JPMORGAN MID CAP/MULTI-CAP FUNDS 11
JPMorgan Mid Cap Value Fund
FUND COMMENTARY
AS OF JUNE 30, 2007 (Unaudited)
FUND FACTS
| Fund Inception | | | | November 13, 1997 |
| Fiscal Year End | | | | June 30 |
Net Assets as of 6/30/2007
| | | | | | |
| (In Thousands) | | | | $8,628,707 |
| Primary Benchmark | | | | Russell Midcap Value Index |
Q: | | HOW DID THE FUND PERFORM? |
A: | | The JPMorgan Mid Cap Value Fund, which seeks growth from capital appreciation, returned 18.82%* (Institutional Class Shares) over the 12 months ended June 30, 2007, compared to the 22.09% return for the Russell Midcap Value Index over the same period.** |
Q: | | WHY DID THE FUND PERFORM THIS WAY? |
A: | | The Fund underperformed its benchmark for the period due primarily to stock selection in the healthcare, industrials and utilities sectors. At the individual stock level, Omnicare Inc., a geriatric pharmaceutical services company, was among the detractors from performance. The company’s shares came under pressure as several events, including legal disputes with regulators and an ongoing lawsuit against UnitedHealthcare, lowered investor sentiment toward the stock. Furthermore, the company released quarterly results below expectations, as higher costs associated with Medicare Part D and the temporary closure of a repackaging facility reduced profits. McClatchy Co., the third-largest newspaper company in the U.S., also hurt performance. The company experienced a difficult start to 2007 as advertising revenues declined sharply on the back of disappointing real estate ads. |
On the positive side, stock selection in the consumer discretionary and energy sectors as well as an overweight in the telecommunication sector helped performance. At the individual stock level, Vulcan Materials Co., a leader in the production of construction aggregates and other construction materials, was among the contributors to performance. The company’s shares rose when its plan to acquire Florida Rock Industries Inc. for about $4.6 billion was received favorably by investors. The company’s acquisition expanded its presence in Florida and other high-growth markets in the Southeast and Mid-Atlantic states while providing significant future earnings prospects and cost synergies. AutoZone Inc., an auto parts retailer, also helped returns. The company announced better-than-expected earnings due to cost containment efforts and an aggressive share repurchasing program. The company’s ongoing initiatives, which focus on improving the customer’s shopping experience, have led to measurable increases in customer service metrics, which benefited its shares.
Q: | | HOW WAS THE FUND MANAGED? |
A: | | We employ a bottom-up approach to stock selection, constructing portfolios based on company fundamentals, quantitative screening and proprietary fundamental analysis. We look for undervalued companies that have the potential to grow intrinsic value per share. The research process is designed to find companies with predictable and durable business models deemed capable of achieving sustainable growth. Potential investments are subjected to rigorous financial analysis and a disciplined approach to valuation. |
TOP TEN EQUITY HOLDINGS OF THE PORTFOLIO***
| 1. | | Assurant, Inc. | | | 2.4 | % |
| 2. | | Coventry Health Care, Inc. | | | 2.3 | |
| 3. | | Synovus Financial Corp. | | | 1.9 | |
| 4. | | Williams Cos., Inc. | | | 1.8 | |
| 5. | | V.F. Corp. | | | 1.8 | |
| 6. | | Brown-Forman Corp., Class B | | | 1.8 | |
| 7. | | M&T Bank Corp. | | | 1.7 | |
| 8. | | Fortune Brands, Inc. | | | 1.7 | |
| 9. | | American Electric Power Co., Inc. | | | 1.7 | |
| 10. | | Genuine Parts Co. | | | 1.6 | |
PORTFOLIO COMPOSITION***
| Financials | | | | | 26.5 | % |
| Consumer Discretionary | | | | | 20.4 | |
| Utilities | | | | | 11.7 | |
| Industrials | | | | | 9.0 | |
| Consumer Staples | | | | | 7.5 | |
| Materials | | | | | 5.1 | |
| Energy | | | | | 5.0 | |
| Health Care | | | | | 4.9 | |
| Telecommunication Services | | | | | 4.2 | |
| Information Technology | | | | | 2.9 | |
| Short-Term Investment | | | | | 2.8 | |
| * | | The return shown is based on net asset value calculated for shareholder transactions and may differ from the return shown in the financial highlights which reflect adjustments made to the net asset value in accordance with accounting principles generally accepted in the United States of America. |
| ** | | The advisor seeks to achieve the Fund’s objective. There can be no guarantee it will be achieved. |
| *** | | Percentages indicated are based upon total investments (excluding Investments of Cash Collateral for Securities on Loan) as of June 30, 2007. The Fund’s composition is subject to change. |
12 JPMORGAN MID CAP/MULTI-CAP FUNDS JUNE 30, 2007
AVERAGE ANNUAL TOTAL RETURNS AS OF JUNE 30, 2007
| | | | INCEPTION DATE
OF CLASS
| | 1 YEAR
| | 5 YEAR
| | SINCE INCEPTION
|
|---|
CLASS A SHARES | | | | | 4/30/01 | | | | | | | | | | | | | |
| Without Sales Charge | | | | | | | | | 18.21 | % | | | 16.04 | % | | | 17.32 | % |
| With Sales Charge* | | | | | | | | | 12.00 | | | | 14.79 | | | | 16.67 | |
CLASS B SHARES | | | | | 4/30/01 | | | | | | | | | | | | | |
| Without CDSC | | | | | | | | | 17.65 | | | | 15.36 | | | | 16.86 | |
| With CDSC** | | | | | | | | | 12.65 | | | | 15.13 | | | | 16.86 | |
CLASS C SHARES | | | | | 4/30/01 | | | | | | | | | | | | | |
| Without CDSC | | | | | | | | | 17.64 | | | | 15.36 | | | | 16.88 | |
| With CDSC*** | | | | | | | | | 16.64 | | | | 15.36 | | | | 16.88 | |
SELECT CLASS SHARES | | | | | 10/31/01 | | | | 18.54 | | | | 16.34 | | | | 17.53 | |
INSTITUTIONAL CLASS SHARES | | | | | 11/13/97 | | | | 18.82 | | | | 16.62 | | | | 17.70 | |
| * | | Sales Charge for Class A Shares is 5.25%. |
| ** | | Assume 5% CDSC (contingent deferred sales charge) for the one year period, 2% CDSC for the five year period and 0% CDSC thereafter. |
| *** | | Assumes a 1% CDSC for the one year period and 0% CDSC thereafter. |
LIFE OF FUND PERFORMANCE (11/13/97 TO 6/30/07)
Source: Lipper, Inc. The performance quoted is past performance and is not a guarantee of future results. Mutual funds are subject to certain market risks. Investment returns and principal value of an investment will fluctuate so that an investor’s shares, when redeemed, may be worth more or less than their original cost. Current performance may be higher or lower than the performance data shown. For up-to-date month-end performance information please call 1-800-480-4111.
The Fund commenced operations on 11/13/97.
Returns for the Class A, Class B, Class C and Select Shares prior to their inception date are based on the performance of Institutional Class Shares. During these periods, the actual returns of Class A, Class B, Class C and Select Shares would have been lower than shown because Class A, Class B, Class C and Select Shares have higher expenses than Institutional Class Shares.
The graph illustrates comparative performance for $3,000,000 invested in Institutional Class Shares of the JPMorgan Mid Cap Value Fund, Russell Midcap Value Index, and Lipper Mid-Cap Value Funds Index from November 13, 1997 to June 30, 2007. The performance of the Fund assumes reinvestment of all dividends and capital gains, if any, and does not include a sales charge. The performance of the indices reflects an initial investment at the end of the month following the Fund’s inception. The performance of the Russell Midcap Value Index does not reflect the deduction of expenses or a sales charge associated with a mutual fund and has been adjusted to reflect reinvestment of all dividends and capital gains of the securities included in the benchmark. The performance of the Lipper Mid-Cap Value Funds Index includes expenses associated with a mutual fund, such as investment management fees. These expenses are not identical to the expenses charged by the Fund. The Russell Midcap Value Index is an unmanaged index that measures the performance of those Russell Midcap companies included in the Russell Midcap Index that have lower price-to-book ratios and lower forecasted growth rates. The Lipper Mid-Cap Value Funds Index is an index based on total returns of certain mutual funds within the Fund’s designated category as determined by Lipper, Inc. Investors cannot invest directly in an index.
Institutional Class Shares have a $3,000,000 minimum initial investment and carry no sales charge.
Performance may reflect the waiver of the Fund’s fees and reimbursement of expenses for certain periods since the inception date. Without these waivers and reimbursements performance would have been lower. Also, performance shown in this section does not reflect the deduction of taxes that a shareholder would pay on Fund distributions or redemption of Fund shares.
The returns shown are based on net asset values calculated for shareholder transactions and may differ from the return shown in the financial highlights which reflect adjustments made to the net asset values in accordance with accounting principles generally accepted in the United States of America.
JUNE 30, 2007 JPMORGAN MID CAP/MULTI-CAP FUNDS 13
JPMorgan Multi-Cap Market Neutral Fund
FUND COMMENTARY
AS OF JUNE 30, 2007 (Unaudited)
FUND FACTS
| Fund Inception | | | | May 23, 2003 |
| Fiscal Year End | | | | June 30 |
Net Assets as of 6/30/2007
| | | | | | |
| (In Thousands) | | | | $2,268,724 |
| Primary Benchmark | | | | Merrill Lynch 3-Month
US Treasury Bill Index* |
Q: | | HOW DID THE FUND PERFORM? |
A: | | The JPMorgan Multi-Cap Market Neutral Fund, which seeks long-term capital preservation and growth by using strategies designed to produce returns which have no correlation with general domestic market performance, returned 5.59%** (Select Class Shares) over the 12 months ended June 30, 2007, compared to the 5.21% return for the Merrill Lynch 3-Month U.S. Treasury Bill Index over the same period.*** |
Q: | | WHY DID THE FUND PERFORM THIS WAY? |
A: | | The Fund outperformed its benchmark due to its overall stock selection process, driven by valuation and fundamentals. In particular, both fundamentals and valuation worked on the long side of the Fund. However, although valuation worked on the short side, fundamentals did not. Stocks are assigned to one of five super-sectors: consumer, financial, industrials, technology and healthcare. Four of these super-sectors generated positive returns during the period, as industrials worked the best and financials the least. The Fund continued to employ a sector-neutral approach, selecting the best stocks and industries within each of 20 sectors. The Fund’s top three industry overweights were property and casualty insurance, managed care and semiconductor production equipment, while its top three industry underweights were brokers, core semiconductors and food products. |
Q: | | HOW WAS THE FUND MANAGED? |
A: | | We rank stocks within a universe of approximately 1,300 large-cap, mid-cap and high-end small-cap stocks. We owned more than 400 positions in the Fund during the period. The Fund is extremely well diversified and sector-neutral. No individual stock has a material impact on the Fund. In essence, we go long on inexpensive stocks with improving fundamentals and short on expensive stocks with deteriorating fundamentals. |
TOP TEN EQUITY LONG HOLDINGS OF THE PORTFOLIO****
| 1. | | ArvinMeritor, Inc. | | | 0.5 | % |
| 2. | | Tidewater, Inc. | | | 0.5 | |
| 3. | | Amkor Technology, Inc. | | | 0.5 | |
| 4. | | Accenture Ltd., Class A | | | 0.5 | |
| 5. | | Global Industries Ltd. | | | 0.5 | |
| 6. | | Energizer Holdings, Inc. | | | 0.4 | |
| 7. | | Dollar Tree Stores, Inc. | | | 0.4 | |
| 8. | | Arris Group, Inc. | | | 0.4 | |
| 9. | | Freeport-McMoRan Copper & Gold, Inc., Class B | | | 0.4 | |
| 10. | | priceline.com, Inc. | | | 0.4 | |
TOP TEN EQUITY SHORT HOLDINGS OF THE PORTFOLIO****
| 1. | | Flowserve Corp. | | | 0.5 | % |
| 2. | | Shaw Group, Inc. (The) | | | 0.5 | |
| 3. | | Rite Aid Corp. | | | 0.5 | |
| 4. | | Cypress Semiconductor Corp. | | | 0.4 | |
| 5. | | Cheniere Energy, Inc. | | | 0.4 | |
| 6. | | Fluor Corp. | | | 0.4 | |
| 7. | | Alcon, Inc. (Switzerland) | | | 0.4 | |
| 8. | | WMS Industries, Inc. | | | 0.4 | |
| 9. | | DST Systems, Inc. | | | 0.4 | |
| 10. | | Quicksilver Resources, Inc. | | | 0.4 | |
PORTFOLIO COMPOSITION LONG POSITIONS****
| Consumer Discretionary | | | | | 20.0 | % |
| Information Technology | | | | | 15.7 | |
| Industrials | | | | | 14.2 | |
| Financials | | | | | 12.3 | |
| Health Care | | | | | 9.8 | |
| Energy | | | | | 7.2 | |
| Materials | | | | | 6.3 | |
| Utilities | | | | | 4.9 | |
| Consumer Staples | | | | | 3.3 | |
| Telecommunication Services | | | | | 1.3 | |
| Short-Term Investment | | | | | 5.0 | |
PORTFOLIO COMPOSITION SHORT POSITIONS****
| Information Technology | | | | | 18.9 | % |
| Consumer Discretionary | | | | | 17.1 | |
| Industrials | | | | | 13.6 | |
| Financials | | | | | 11.5 | |
| Health Care | | | | | 11.2 | |
| Energy | | | | | 10.1 | |
| Consumer Staples | | | | | 5.9 | |
| Materials | | | | | 5.1 | |
| Utilities | | | | | 4.5 | |
| Telecommunication Services | | | | | 2.1 | |
| * | | Effective November 1, 2006, the Advisor changed the Fund’s benchmark to this index because it believes the new benchmark is more closely correlated with total return and is the industry standard. |
| ** | | The return shown is based on net asset value calculated for shareholder transactions and may differ from the return shown in the financial highlights which reflect adjustments made to the net asset value in accordance with accounting principles generally accepted in the United States of America. |
| *** | | The advisor seeks to achieve the Fund’s objective. There can be no guarantee it will be achieved. |
| **** | | Percentages indicated are based upon total investments as of June 30, 2007. The Fund’s composition is subject to change. |
14 JPMORGAN MID CAP/MULTI-CAP FUNDS JUNE 30, 2007
AVERAGE ANNUAL TOTAL RETURNS AS OF JUNE 30, 2007
| | | | INCEPTION DATE
OF CLASS
| | 1 YEAR
| | 3 YEAR
| | SINCE INCEPTION
|
|---|
CLASS A SHARES | | | | | 5/23/03 | | | | | | | | | | | | | |
| Without Sales Charge | | | | | | | | | 5.27 | % | | | 4.88 | % | | | 5.11 | % |
| With Sales Charge* | | | | | | | | | (0.27 | ) | | | 3.00 | | | | 3.75 | |
CLASS B SHARES | | | | | 5/23/03 | | | | | | | | | | | | | |
| Without CDSC | | | | | | | | | 4.56 | | | | 4.10 | | | | 4.35 | |
| With CDSC** | | | | | | | | | (0.44 | ) | | | 3.17 | | | | 3.92 | |
CLASS C SHARES | | | | | 5/23/03 | | | | | | | | | | | | | |
| Without CDSC | | | | | | | | | 4.56 | | | | 4.10 | | | | 4.35 | |
| With CDSC*** | | | | | | | | | 3.56 | | | | 4.10 | | | | 4.35 | |
SELECT CLASS SHARES | | | | | 5/23/03 | | | | 5.59 | | | | 5.15 | | | | 5.38 | |
| * | | Sales Charge for Class A Shares is 5.25%. |
| ** | | Assume 5% CDSC (contingent deferred sales charge) for the one year period, 2% CDSC for the five year period and 0% CDSC thereafter. |
| *** | | Assumes a 1% CDSC for the one year period and 0% CDSC thereafter. |
LIFE OF FUND PERFORMANCE (5/23/03 TO 6/30/07)
Source: Lipper, Inc. The performance quoted is past performance and is not a guarantee of future results. Mutual funds are subject to certain market risks. Investment returns and principal value of an investment will fluctuate so that an investor’s shares, when redeemed, may be worth more or less than their original cost. Current performance may be higher or lower than the performance data shown. For up-to-date month-end performance information please call 1-800-480-4111.
The Fund commenced operations on May 23, 2003.
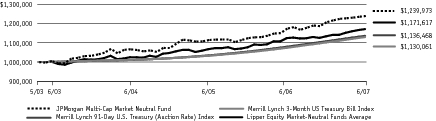
The graph illustrates comparative performance for $1,000,000 invested in Select Class Shares of the JPMorgan Multi-Cap Market Neutral Fund, the Merrill Lynch 3-Month US Treasury Bill Index, the Merrill Lynch 91-Day U.S. Treasury (Auction Rate) Index and the Lipper Equity Market-Neutral Funds Average from May 23, 2003 to June 30, 2007. The performance of the Fund assumes reinvestment of all dividends and capital gains, if any, and does not include a sales charge. The performance of the indices reflects an initial investment at the end of the month following the Fund’s inception. The performance of the Merrill Lynch 3-Month US Treasury Bill Index and Merrill Lynch 91-Day U.S. Treasury (Auction Rate) Index does not reflect the deduction of expenses or a sales charge associated with a mutual fund and has been adjusted to reflect reinvestment of all dividends and capital gains of the securities included in the benchmark. The performance of the Lipper Equity Market-Neutral Funds Average includes expenses associated with a mutual fund, such as investment management fees. These expenses are not identical to the expenses charged by the Fund. The Merrill Lynch 3-Month US Treasury Bill Index is an unmanaged index which represents the performance of 3-month U.S. Treasury bills and it is based on a single issue held for a month, sold and then rolled into a new issue the next month. The Merrill Lynch 91-Day Treasury (Auction Rate) Index is an unmanaged index, which reflects the total return of a hypothetical Treasury bill with a discount rate equal to the average rate established at each of the auctions during a given month. The Advisor changed the Fund’s benchmark to this index because it believes the new benchmark is more closely correlated with total return and is the industry standard. The Lipper Equity Market-Neutral Funds Average is an index based on total returns of certain mutual funds within the Fund’s designated category as determined by Lipper, Inc. Investors cannot invest directly in an index.
Select Class Shares have a $1,000,000 minimum initial investment and carry no sales charge.
Performance may reflect the waiver of the Fund’s fees and reimbursement of expenses for certain periods since the inception date. Without these waivers and reimbursements performance would have been lower. Also, performance shown in this section does not reflect the deduction of taxes that a shareholder would pay on Fund distributions or redemption of Fund shares.
The returns shown are based on net asset values calculated for shareholder transactions and may differ from the return shown in the financial highlights which reflect adjustments made to the net assets value in accordance with accounting principles generally accepted in the United States of America.
JUNE 30, 2007 JPMORGAN MID CAP/MULTI-CAP FUNDS 15
JPMorgan Value Advantage Fund
FUND COMMENTARY
AS OF JUNE 30, 2007 (Unaudited)
FUND FACTS
| Fund Inception | | | | February 28, 2005 |
| Fiscal Year End | | | | June 30 |
Net Assets as of 6/30/2007
| | | | | | |
| (In Thousands) | | | | $510,539 |
| Primary Benchmark | | | | Russell 3000 Value Index |
Q: | | HOW DID THE FUND PERFORM? |
A: | | The JPMorgan Value Advantage Fund, which seeks to provide long-term total return from a combination of income and capital gains, returned 21.58%* (Class A Shares, no sales charge) over the 12 months ended June 30, 2007, compared to the 21.33% for the Russell 3000 Value Index over the same period.** |
Q: | | WHY DID THE FUND PERFORM THIS WAY? |
A: | | The Fund outperformed its benchmark for the period due primarily to stock selection in the materials and financial sectors. At the individual stock level, Devon Energy Corp. was among the contributors to performance. The company continued to benefit from higher energy prices, aggressive deepwater exploration initiatives and its acquisition of privately held Chief Holdings LLC, a natural gas producer. Teekay Shipping Corp., a provider of crude oil and petroleum product transportation services, also helped results. The company began transitioning its business from depending on volatile short-term spot rates to more long-term fixed-rate contracts. Rinker Group LTD, a cement producer, also supported performance. The company’s shares rose sharply after Cemex S.A.B. de C.V. announced intentions to acquire it. Cemex was aggressive in its offer, as it was extended numerous times and eventually increased over 20% above the original offer price. In addition, the company produced solid financial results due primarily to cost-cutting initiatives and price increases that were implemented the prior fiscal year. |
On the negative side, stock selection in the industrials sector as well as an underweight in the utility sector detracted from performance. Walter Industries Inc., a diversified industrial company, was among the detractors from performance. Lower coal production resulting from geographical concerns at one of the company’s mining facilities led to revenues and earnings that fell below expectations. Griffon Corp., a diversified manufacturer, also hurt returns. The stock came under pressure, as the company noted a significant decline in garage door sales and installations due to the slowdown in new home construction and home resale markets. McClatchy Co., the third-largest newspaper company in the U.S., also negatively impacted performance. The company experienced a difficult start to 2007 as advertising revenues declined sharply on the back of disappointing real estate ads.
Q: | | HOW WAS THE FUND MANAGED? |
A: | | We employ a bottom-up approach to stock selection, constructing portfolios based on company fundamentals, quantitative screening and proprietary fundamental analysis. We look for undervalued companies that have the potential to grow intrinsic value per share. The research process is designed to find companies with predictable and durable business models deemed capable of achieving sustainable growth. Potential investments are subjected to rigorous financial analysis and a disciplined approach to valuation. |
TOP TEN EQUITY HOLDINGS OF THE PORTFOLIO***
| 1. | | Devon Energy Corp. | | | 3.3 | % |
| 2. | | Washington Post Co. (The), Class B | | | 3.0 | |
| 3. | | W.P. Carey & Co. LLC | | | 2.7 | |
| 4. | | Clear Channel Communications, Inc. | | | 2.7 | |
| 5. | | Berkshire Hathaway, Inc., Class A | | | 2.4 | |
| 6. | | Agree Realty Corp. | | | 2.1 | |
| 7. | | Assurant, Inc. | | | 2.1 | |
| 8. | | M&T Bank Corp. | | | 2.1 | |
| 9. | | Charles Schwab Corp. (The) | | | 2.0 | |
| 10. | | Synovus Financial Corp. | | | 2.0 | |
PORTFOLIO COMPOSITION***
| Financials | | | | | 37.2 | % |
| Consumer Discretionary | | | | | 18.9 | |
| Energy | | | | | 8.9 | |
| Industrials | | | | | 5.7 | |
| Consumer Staples | | | | | 4.8 | |
| Health Care | | | | | 3.7 | |
| Telecommunication Services | | | | | 3.0 | |
| Materials | | | | | 2.9 | |
| Information Technology | | | | | 1.7 | |
| Investment Company | | | | | 1.3 | |
| Short-Term Investment | | | | | 11.9 | |
| * | | The return shown is based on net asset value calculated for shareholder transactions and may differ from the return shown in the financial highlights which reflect adjustments made to the net asset value in accordance with accounting principles generally accepted in the United States of America. |
| ** | | The advisor seeks to achieve the Fund’s objective. There can be no guarantee it will be achieved. |
| *** | | Percentages indicated are based upon total investments as of June 30, 2007. The Fund’s composition is subject to change. |
16 JPMORGAN MID CAP/MULTI-CAP FUNDS JUNE 30, 2007
AVERAGE ANNUAL TOTAL RETURNS AS OF JUNE 30, 2007
| | | | INCEPTION DATE
OF CLASS
| | 1 YEAR
| | SINCE INCEPTION
| |
|---|
CLASS A SHARES | | | | | 2/28/05 | | | | | | | | | | | | | |
| Without Sales Charge | | | | | | | | | 21.58 | % | | | 15.95 | % | | | | |
| With Sales Charge* | | | | | | | | | 15.21 | | | | 13.31 | | | | | |
CLASS C SHARES | | | | | 2/28/05 | | | | | | | | | | | | | |
| Without CDSC | | | | | | | | | 21.00 | | | | 15.38 | | | | | |
| With CDSC** | | | | | | | | | 20.00 | | | | 15.38 | | | | | |
SELECT CLASS SHARES | | | | | 2/28/05 | | | | 21.89 | | | | 16.24 | | | | | |
INSTITUTIONAL CLASS SHARES | | | | | 2/28/05 | | | | 22.16 | | | | 16.25 | | | | | |
| * | | Sales Charge for Class A Shares is 5.25%. |
| ** | | Assumes a 1% CDSC for the one year period and 0% CDSC thereafter. |
LIFE OF FUND PERFORMANCE (2/28/05 TO 6/30/07)
Source: Lipper, Inc. The performance quoted is past performance and is not a guarantee of future results. Mutual funds are subject to certain market risks. Investment returns and principal value of an investment will fluctuate so that an investor’s shares, when redeemed, may be worth more or less than their original cost. Current performance may be higher or lower than the performance data shown. For up-to-date month-end performance information please call 1-800-480-4111.
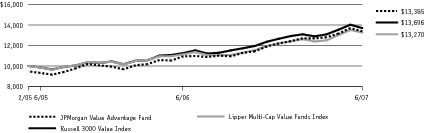
The Fund commenced operations on 2/28/05.
The graph illustrates comparative performance for $10,000 invested in Class A Shares of the JPMorgan Value Advantage Fund, Russell 3000 Value Index and Lipper Multi-Cap Value Funds Index from February 28, 2005 to June 30, 2007. The performance of the Fund assumes reinvestment of all dividends and capital gains, if any, and includes a sales charge. The performance of the indices reflects an initial investment at the inception of the Fund. The performance of the Russell 3000 Value Index does not reflect the deduction of expenses or a sales charge associated with a mutual fund and has been adjusted to reflect reinvestment of all dividends and capital gains of the securities included in the benchmark. The performance of the Lipper Multi-Cap Value Funds Index includes expenses associated with a mutual fund, such as investment management fees. These expenses are not identical to the expenses charged by the Fund. The Russell 3000 Value Index is an unmanaged index which measures the performance of those Russell 3000 Index companies (largest 3000 U.S. companies) with lower price-to-book ratios and lower forecasted growth values. The Lipper Multi-Cap Value Funds Index is an index based on total returns of certain mutual funds within the Fund’s designated category as determined by Lipper, Inc. Investors cannot invest directly in an index.
Class A Shares have a $1,000 minimum initial investment and carry a 5.25% sales charge.
Performance may reflect the waiver of the Fund’s fees and reimbursement of expenses for certain periods since the inception date. Without these waivers and reimbursements performance would have been lower. Also, performance shown in this section does not reflect the deduction of taxes that a shareholder would pay on Fund distributions or redemption of Fund shares.
The returns shown are based on net asset values calculated for shareholder transactions and may differ from the return shown in the financial highlights which reflect adjustments made to the net asset values in accordance with accounting principles generally accepted in the United States of America.
JUNE 30, 2007 JPMORGAN MID CAP/MULTI-CAP FUNDS 17
JPMorgan Capital Growth Fund
SCHEDULE OF PORTFOLIO INVESTMENTS
AS OF JUNE 30, 2007
(Amounts in thousands)
SHARES
|
|
|
| SECURITY DESCRIPTION
|
| VALUE($)
|
|---|
Long-Term Investments �� 99.8% |
| | | | | Common Stocks — 99.8% |
| | | | | Aerospace & Defense — 2.3% |
| 103 | | | | Precision Castparts Corp. | | | 12,439 | |
| 143 | | | | Rockwell Collins, Inc. | | | 10,070 | |
| | | | | | | | 22,509 | |
| | | | | Auto Components — 2.8% |
| 146 | | | | BorgWarner, Inc. | | | 12,545 | |
| 746 | | | | Gentex Corp. (c) | | | 14,679 | |
| | | | | | | | 27,224 | |
| | | | | Biotechnology — 2.2% |
| 238 | | | | Celgene Corp. (a) | | | 13,662 | |
| 88 | | | | Cephalon, Inc. (a) | | | 7,106 | |
| | | | | | | | 20,768 | |
| | | | | Capital Markets — 5.4% |
| 79 | | | | Affiliated Managers Group, Inc. (a) (c) | | | 10,224 | |
| 400 | | | | E*Trade Financial Corp. (a) | | | 8,832 | |
| 190 | | | | Investment Technology Group, Inc. (a) | | | 8,237 | |
| 137 | | | | Lazard Ltd., Class A (Bermuda) | | | 6,151 | |
| 146 | | | | Northern Trust Corp. | | | 9,373 | |
| 189 | | | | T. Rowe Price Group, Inc. | | | 9,781 | |
| | | | | | | | 52,598 | |
| | | | | Chemicals — 1.9% |
| 180 | | | | Ecolab, Inc. | | | 7,669 | |
| 379 | | | | Nalco Holding Co. | | | 10,395 | |
| | | | | | | | 18,064 | |
| | | | | Commercial Services & Supplies — 3.4% |
| 223 | | | | Corrections Corp. of America (a) | | | 14,070 | |
| 228 | | | | Stericycle, Inc. (a) (c) | | | 10,146 | |
| 300 | | | | Waste Connections, Inc. (a) (c) | | | 9,063 | |
| | | | | | | | 33,279 | |
| | | | | Communications Equipment — 3.0% |
| 91 | | | | F5 Networks, Inc. (a) | | | 7,294 | |
| 182 | | | | Harris Corp. | | | 9,923 | |
| 347 | | | | Polycom, Inc. (a) | | | 11,669 | > |
| | | | | | | | 28,886 | |
| | | | | Computers & Peripherals — 3.0% |
| 237 | | | | NCR Corp. (a) | | | 12,431 | |
| 302 | | | | Network Appliance, Inc. (a) | | | 8,824 | |
| 167 | | | | SanDisk Corp. (a) | | | 8,154 | |
| | | | | | | | 29,409 | |
| | | | | Construction & Engineering — 1.0% |
| 324 | | | | Quanta Services, Inc. (a) (c) | | | 9,922 | |
| | | | | Diversified Consumer Services — 1.9% |
| 70 | | | | ITT Educational Services, Inc. (a) | | | 8,240 | |
| 193 | | | | Weight Watchers International, Inc. | | | 9,787 | |
| | | | | | | | 18,027 | |
| | | | | Diversified Financial Services — 1.3% |
| 130 | | | | CIT Group, Inc. | | | 7,100 | |
| 35 | | | | IntercontinentalExchange, Inc. (a) | | | 5,101 | |
| | | | | | | | 12,201 | |
| | | | | Diversified Telecommunication Services — 1.5% |
| 707 | | | | Time Warner Telecom, Inc., Class A (a) (c) | | | 14,201 | |
| | | | | Electrical Equipment — 5.3% |
| 319 | | | | General Cable Corp. (a) (c) | | | 24,164 | |
| 113 | | | | Genlyte Group, Inc. (a) | | | 8,859 | |
| 325 | | | | Roper Industries, Inc. (c) | | | 18,581 | |
| | | | | | | | 51,604 | |
| | | | | Electronic Equipment & Instruments — 1.8% |
| 484 | | | | Amphenol Corp., Class A | | | 17,247 | |
| | | | | Energy Equipment & Services — 4.3% |
| 169 | | | | Cameron International Corp. (a) | | | 12,071 | |
| 106 | | | | Noble Corp. | | | 10,357 | |
| 212 | | | | Oceaneering International, Inc. (a) (c) | | | 11,133 | |
| 132 | | | | W-H Energy Services, Inc. (a) | | | 8,172 | |
| | | | | | | | 41,733 | |
| | | | | Food Products — 0.7% |
| 122 | | | | Wm. Wrigley, Jr., Co. | | | 6,753 | |
| | | | | Gas Utilities — 0.9% |
| 161 | | | | Questar Corp. | | | 8,530 | |
| | | | | Health Care Equipment & Supplies — 3.9% |
| 207 | | | | Cytyc Corp. (a) | | | 8,924 | |
| 156 | | | | Hologic, Inc. (a) (c) | | | 8,606 | |
| 105 | | | | IDEXX Laboratories, Inc. (a) | | | 9,955 | |
| 243 | | | | Mentor Corp. (c) | | | 9,902 | |
| | | | | | | | 37,387 | |
| | | | | Health Care Providers & Services — 3.7% |
| 209 | | | | DaVita, Inc. (a) | | | 11,261 | |
| 335 | | | | Lincare Holdings, Inc. (a) | | | 13,366 | |
| 309 | | | | VCA Antech, Inc. (a) | | | 11,631 | |
| | | | | | | | 36,258 | |
SEE NOTES TO FINANCIAL STATEMENTS.
18 JPMORGAN MID CAP/MULTI-CAP FUNDS JUNE 30, 2007
SHARES
|
|
|
| SECURITY DESCRIPTION
|
| VALUE($)
|
|---|
Long-Term Investments — Continued |
| | | | | Health Care Technology — 1.1% |
| 187 | | | | Cerner Corp. (a) (c) | | | 10,378 | |
| | | | | Hotels, Restaurants & Leisure — 3.5% |
| 401 | | | | Burger King Holdings, Inc. | | | 10,557 | |
| 142 | | | | International Game Technology | | | 5,637 | |
| 102 | | | | Panera Bread Co., Class A (a) (c) | | | 4,694 | |
| 170 | | | | Scientific Games Corp., Class A (a) (c) | | | 5,935 | |
| 239 | | | | Tim Hortons, Inc. (Canada) | | | 7,343 | |
| | | | | | | | 34,166 | |
| | | | | Household Durables — 1.2% |
| 162 | | | | Garmin Ltd. (Cayman Islands) (c) | | | 11,954 | |
| | | | | Industrial Conglomerates — 0.5% |
| 50 | | | | McDermott International, Inc. (a) | | | 4,139 | |
| | | | | Insurance — 2.2% |
| 75 | | | | Everest Re Group Ltd. (Bermuda) | | | 8,148 | |
| 41 | | | | National Financial Partners Corp. | | | 1,917 | |
| 362 | | | | Security Capital Assurance Ltd. (Bermuda) | | | 11,163 | |
| | | | | | | | 21,228 | |
| | | | | Internet & Catalog Retail — 1.1% |
| 157 | | | | priceline.com, Inc. (a) (c) | | | 10,820 | |
| | | | | Internet Software & Services — 0.4% |
| 90 | | | | Digital River, Inc. (a) | | | 4,082 | |
| | | | | IT Services — 2.6% |
| 78 | | | | Cognizant Technology Solutions Corp.,
Class A (a) | | | 5,842 | |
| 541 | | | | VeriFone Holdings, Inc. (a) (c) | | | 19,077 | |
| | | | | | | | 24,919 | |
| | | | | Life Sciences Tools & Services — 1.7% |
| 167 | | | | Covance, Inc. (a) | | | 11,436 | |
| 122 | | | | Illumina, Inc. (a) (c) | | | 4,968 | |
| | | | | | | | 16,404 | |
| | | | | Media — 1.4% |
| 472 | | | | DreamWorks Animation SKG, Inc., Class A (a) | | | 13,612 | |
| | | | | Metals & Mining — 0.8% |
| 146 | | | | Century Aluminum Co. (a) | | | 7,992 | |
| | | | | Multiline Retail — 2.4% |
| 225 | | | | Dollar Tree Stores, Inc. (a) | | | 9,795 | |
| 632 | | | | Saks, Inc. | | | 13,495 | |
| | | | | | | | 23,290 | |
| | | | | Office Electronics — 1.0% |
| 239 | | | | Zebra Technologies Corp. (a) (c) | | | 9,239 | |
| | | | | Oil, Gas & Consumable Fuels — 4.2% |
| 261 | | | | Cabot Oil & Gas Corp. | | | 9,611 | |
| 316 | | | | Forest Oil Corp. (a) (c) | | | 13,333 | |
| 185 | | | | Quicksilver Resources, Inc. (a) (c) | | | 8,234 | |
| 221 | | | | Southwestern Energy Co. (a) | | | 9,825 | |
| | | | | | | | 41,003 | |
| | | | | Personal Products — 0.7% |
| 197 | | | | Bare Escentuals, Inc. (a) (c) | | | 6,724 | |
| | | | | Pharmaceuticals — 3.7% |
| 224 | | | | Adams Respiratory Therapeutics,
Inc. (a) (c) (m) | | | 8,835 | |
| 156 | | | | Allergan, Inc. | | | 8,992 | |
| 293 | | | | Elan Corp. plc ADR (Ireland) (a) | | | 6,421 | |
| 153 | | | | Shire plc ADR (United Kingdom) | | | 11,357 | |
| | | | | | | | 35,605 | |
| | | | | Semiconductors & Semiconductor Equipment — 6.6% |
| 558 | | | | Altera Corp. | | | 12,355 | |
| 231 | | | | Broadcom Corp., Class A (a) | | | 6,744 | |
| 121 | | | | Formfactor, Inc. (a) | | | 4,646 | |
| 222 | | | | KLA-Tencor Corp. | | | 12,171 | |
| 247 | | | | Microchip Technology, Inc. | | | 9,142 | |
| 311 | | | | NVIDIA Corp. (a) | | | 12,827 | |
| 158 | | | | Tessera Technologies, Inc. (a) | | | 6,415 | |
| | | | | | | | 64,300 | |
| | | | | Software — 5.0% |
| 229 | | | | Adobe Systems, Inc. (a) | | | 9,175 | |
| 256 | | | | Amdocs Ltd. (United Kingdom) (a) | | | 10,202 | |
| 357 | | | | ANSYS, Inc. (a) (c) | | | 9,471 | |
| 273 | | | | Autodesk, Inc. (a) | | | 12,862 | |
| 292 | | | | Sybase, Inc. (a) | | | 6,983 | |
| | | | | | | | 48,693 | |
| | | | | Specialty Retail — 5.3% |
| 184 | | | | Barnes & Noble, Inc. | | | 7,086 | |
| 357 | | | | GameStop Corp., Class A (a) | | | 13,974 | |
| 280 | | | | Office Depot, Inc. (a) | | | 8,469 | |
| 205 | | | | PetSmart, Inc. | | | 6,659 | |
| 149 | | | | Tiffany & Co. | | | 7,895 | |
| 308 | | | | Urban Outfitters, Inc. (a) | | | 7,392 | |
| | | | | | | | 51,475 | |
| | | | | Textiles, Apparel & Luxury Goods — 0.7% |
| 158 | | | | Under Armour, Inc., Class A (a) (c) | | | 7,213 | |
SEE NOTES TO FINANCIAL STATEMENTS.
JUNE 30, 2007 JPMORGAN MID CAP/MULTI-CAP FUNDS 19
JPMorgan Capital Growth Fund
SCHEDULE OF PORTFOLIO INVESTMENTS
AS OF JUNE 30, 2007 (continued)
(Amounts in thousands)
SHARES
|
|
|
| SECURITY DESCRIPTION
|
| VALUE($)
|
|---|
Long-Term Investments — Continued |
| | | | | Wireless Telecommunication Services — 3.4% |
| 232 | | | | American Tower Corp., Class A (a) | | | 9,744 | |
| 144 | | | | NII Holdings, Inc. (a) | | | 11,635 | |
| 271 | | | | Rogers Communications, Inc., Class B (Canada) | | | 11,493 | |
| | | | | | | | 32,872 | |
| | | | | Total Long-Term Investments
(Cost $782,402) | | | 966,708 | |
Short-Term Investment — 0.6% |
| | | | | Investment Company — 0.6% |
| 5,911 | | | | JPMorgan Prime Money Market Fund, Institutional Class (b) (m)
(Cost $5,911) | | | 5,911 | |
PRINCIPAL
AMOUNT($)
|
|
|
|
|
|
|
|---|
Investments of Cash Collateral for Securities on Loan — 14.7% |
| | | | | Certificate of Deposit — 0.5% |
| 5,000 | | | | Barclays, New York, FRN, 5.34%, 09/28/07 | | | 5,000 | |
| | | | | Corporate Notes — 8.3% |
| 5,850 | | | | Alliance and Leicester plc, FRN,
5.33%, 07/29/08 | | | 5,850 | |
| 2,000 | | | | Allstate Life Global Funding, FRN,
5.32%, 07/29/08 | | | 2,000 | |
| 4,000 | | | | Allstate Life Global Funding II, FRN,
5.32%, 07/29/08 | | | 4,000 | |
| 6,000 | | | | Banque Federative du Credit Mutuel, FRN, 5.32%, 07/29/08 | | | 6,000 | |
| 6,996 | | | | Beta Finance Inc., FRN, 5.39%, 02/20/09 | | | 6,996 | |
| 6,700 | | | | Caixa Catal, FRN, 5.39%, 07/28/08 | | | 6,700 | |
| 6,100 | | | | Citigroup Global Markets Inc., FRN,
5.45%, 07/06/07 | | | 6,100 | |
| 5,999 | | | | Comerica, FRN, 5.31%, 11/13/07 | | | 5,999 | |
| 6,500 | | | | Dorada Finance Inc., FRN, 5.37%, 01/14/08 | | | 6,500 | |
| 3,400 | | | | Links Finance LLC, FRN, 5.37%, 10/15/07 | | | 3,400 | |
| 6,000 | | | | Macquarie Bank Ltd., FRN, 5.35%, 07/29/08 | | | 6,000 | |
| 4,750 | | | | Metropolitan Life Global Funding, FRN,
5.31%, 07/29/08 | | | 4,750 | |
| 7,999 | | | | National City Bank Cleveland, FRN,
5.33%, 10/04/07 | | | 7,999 | |
| 3,500 | | | | Sigma Finance Inc., FRN, 5.37%, 10/24/07 | | | 3,500 | |
| 5,000 | | | | Wachovia Bank N.A., FRN, 5.36%, 02/23/09 | | | 5,000 | |
| | | | | | | | 80,794 | |
| | | | | Repurchase Agreements — 4.3% |
| 11,662 | | | | Banc of America Securities LLC, 5.39%, dated 06/29/07, due 07/02/07, repurchase price $11,667, collateralized by U.S. Government Agency Mortgages | | | 11,662 | |
| 15,000 | | | | Bear Stearns Cos., Inc., 5.38%, dated
06/29/07, due 07/02/07, repurchase price $15,007, collateralized by U.S. Government Agency Mortgages | | | 15,000 | |
| 15,000 | | | | Credit Suisse First Boston LLC, 5.39%, dated 06/29/07, due 07/02/07, repurchase price $15,007, collateralized by U.S. Government Agency Mortgages | | | 15,000 | |
| | | | | | | | 41,662 | |
| | | | | Time Deposits — 1.6% |
| 5,000 | | | | American Express Centurion,
5.32%, 07/31/07 | | | 5,000 | |
| 5,000 | | | | HSBC Toronto, 5.35%, 08/23/07 | | | 5,000 | |
| 5,000 | | | | Sun Trust Bank, Atlanta, FRN,
5.33%, 07/30/07 | | | 5,000 | |
| | | | | | | | 15,000 | |
| | | | | Total Investments of Cash Collateral
for Securities on Loan
(Cost $142,456) | | | 142,456 | |
| | | | | Total Investments — 115.1%
(Cost $930,769) | | | 1,115,075 | |
| | | | | Liabilities in Excess of
Other Assets — (15.1)% | | | (146,483 | ) |
| | | | | NET ASSETS — 100.0% | | $ | 968,592 | |
Percentages indicated are based on net assets.
SEE NOTES TO FINANCIAL STATEMENTS.
20 JPMORGAN MID CAP/MULTI-CAP FUNDS JUNE 30, 2007
JPMorgan Diversified Mid Cap Growth Fund
SCHEDULE OF PORTFOLIO INVESTMENTS
AS OF JUNE 30, 2007
(Amounts in thousands)
SHARES
|
|
|
| SECURITY DESCRIPTION
|
| VALUE($)
|
|---|
Long-Term Investments — 98.5% |
| | | | | Common Stocks — 98.5% |
| | | | | Aerospace & Defense — 2.3% |
| 145 | | | | Precision Castparts Corp. | | | 17,561 | |
| 201 | | | | Rockwell Collins, Inc. | | | 14,209 | |
| | | | | | | | 31,770 | |
| | | | | Auto Components — 2.8% |
| 206 | | | | BorgWarner, Inc. | | | 17,707 | |
| 1,053 | | | | Gentex Corp. (c) | | | 20,724 | |
| | | | | | | | 38,431 | |
| | | | | Biotechnology — 2.1% |
| 336 | | | | Celgene Corp. (a) | | | 19,286 | |
| 125 | | | | Cephalon, Inc. (a) | | | 10,024 | |
| | | | | | | | 29,310 | |
| | | | | Capital Markets — 5.4% |
| 112 | | | | Affiliated Managers Group, Inc. (a) (c) | | | 14,440 | |
| 565 | | | | E*Trade Financial Corp. (a) | | | 12,470 | |
| 268 | | | | Investment Technology Group, Inc. (a) | | | 11,623 | |
| 193 | | | | Lazard Ltd., Class A (Bermuda) | | | 8,681 | |
| 206 | | | | Northern Trust Corp. | | | 13,234 | |
| 266 | | | | T. Rowe Price Group, Inc. | | | 13,808 | |
| | | | | | | | 74,256 | |
| | | | | Chemicals — 1.8% |
| 253 | | | | Ecolab, Inc. | | | 10,816 | |
| 535 | | | | Nalco Holding Co. | | | 14,675 | |
| | | | | | | | 25,491 | |
| | | | | Commercial Services & Supplies — 3.4% |
| 315 | | | | Corrections Corp. of America (a) | | | 19,864 | |
| 322 | | | | Stericycle, Inc. (a) | | | 14,325 | |
| 423 | | | | Waste Connections, Inc. (a) | | | 12,793 | |
| | | | | | | | 46,982 | |
| | | | | Communications Equipment — 2.9% |
| 128 | | | | F5 Networks, Inc. (a) | | | 10,293 | |
| 257 | | | | Harris Corp. | | | 14,014 | |
| 490 | | | | Polycom, Inc. (a) | | | 16,477 | |
| | | | | | | | 40,784 | |
| | | | | Computers & Peripherals — 2.9% |
| 321 | | | | NCR Corp. (a) | | | 16,878 | |
| 427 | | | | Network Appliance, Inc. (a) | | | 12,461 | |
| 235 | | | | SanDisk Corp. (a) | | | 11,506 | |
| | | | | | | | 40,845 | |
| | | | | Construction & Engineering — 1.0% |
| 457 | | | | Quanta Services, Inc. (a) (c) | | | 14,004 | |
| | | | | Diversified Consumer Services — 1.8% |
| 99 | | | | ITT Educational Services, Inc. (a) | | | 11,644 | |
| 272 | | | | Weight Watchers International, Inc. (c) | | | 13,818 | |
| | | | | | | | 25,462 | |
| | | | | Diversified Financial Services — 1.2% |
| 183 | | | | CIT Group, Inc. | | | 10,023 | |
| 49 | | | | IntercontinentalExchange, Inc. (a) | | | 7,200 | |
| | | | | | | | 17,223 | |
| | | | | Diversified Telecommunication Services — 1.4% |
| 997 | | | | Time Warner Telecom, Inc., Class A (a) | | | 20,048 | |
| | | | | Electrical Equipment — 5.3% |
| 450 | | | | General Cable Corp. (a) | | | 34,118 | |
| 159 | | | | Genlyte Group, Inc. (a) | | | 12,511 | |
| 459 | | | | Roper Industries, Inc. | | | 26,232 | |
| | | | | | | | 72,861 | |
| | | | | Electronic Equipment & Instruments — 1.8% |
| 683 | | | | Amphenol Corp., Class A | | | 24,345 | |
| | | | | Energy Equipment & Services — 4.3% |
| 239 | | | | Cameron International Corp. (a) | | | 17,046 | |
| 150 | | | | Noble Corp. | | | 14,628 | |
| 299 | | | | Oceaneering International, Inc. (a) (c) | | | 15,723 | |
| 189 | | | | W-H Energy Services, Inc. (a) | | | 11,676 | |
| | | | | | | | 59,073 | |
| | | | | Food Products — 0.7% |
| 173 | | | | Wm. Wrigley, Jr., Co. | | | 9,541 | |
| | | | | Gas Utilities — 0.9% |
| 228 | | | | Questar Corp. | | | 12,044 | |
| | | | | Health Care Equipment & Supplies — 3.8% |
| 292 | | | | Cytyc Corp. (a) | | | 12,597 | |
| 220 | | | | Hologic, Inc. (a) (c) | | | 12,146 | |
| 148 | | | | IDEXX Laboratories, Inc. (a) | | | 14,043 | |
| 344 | | | | Mentor Corp. (c) | | | 13,976 | |
| | | | | | | | 52,762 | |
| | | | | Health Care Providers & Services — 3.7% |
| 295 | | | | DaVita, Inc. (a) | | | 15,897 | |
| 474 | | | | Lincare Holdings, Inc. (a) | | | 18,869 | |
| 436 | | | | VCA Antech, Inc. (a) (c) | | | 16,418 | |
| | | | | | | | 51,184 | |
| | | | | Health Care Technology — 1.1% |
| 264 | | | | Cerner Corp. (a) (c) | | | 14,650 | |
SEE NOTES TO FINANCIAL STATEMENTS.
JUNE 30, 2007 JPMORGAN MID CAP/MULTI-CAP FUNDS 21
JPMorgan Diversified Mid Cap Growth Fund
SCHEDULE OF PORTFOLIO INVESTMENTS
AS OF JUNE 30, 2007 (continued)
(Amounts in thousands)
SHARES
|
|
|
| SECURITY DESCRIPTION
|
| VALUE($)
|
|---|
Long-Term Investments — Continued |
| | | | | Hotels, Restaurants & Leisure — 3.5% |
| 566 | | | | Burger King Holdings, Inc. | | | 14,903 | |
| 200 | | | | International Game Technology | | | 7,956 | |
| 144 | | | | Panera Bread Co., Class A (a) (c) | | | 6,623 | |
| 240 | | | | Scientific Games Corp., Class A (a) (c) | | | 8,378 | |
| 337 | | | | Tim Hortons, Inc. (Canada) | | | 10,363 | |
| | | | | | | | 48,223 | |
| | | | | Household Durables — 1.2% |
| 228 | | | | Garmin Ltd. (Cayman Islands) (c) | | | 16,873 | |
| | | | | Industrial Conglomerates — 0.4% |
| 70 | | | | McDermott International, Inc. (a) | | | 5,843 | |
| | | | | Insurance — 2.2% |
| 106 | | | | Everest Re Group Ltd. (Bermuda) | | | 11,516 | |
| 58 | | | | National Financial Partners Corp. | | | 2,704 | |
| 511 | | | | Security Capital Assurance Ltd. (Bermuda) (c) | | | 15,759 | |
| | | | | | | | 29,979 | |
| | | | | Internet & Catalog Retail — 1.1% |
| 222 | | | | priceline.com, Inc. (a) (c) | | | 15,274 | |
| | | | | Internet Software & Services — 0.4% |
| 127 | | | | Digital River, Inc. (a) (c) | | | 5,765 | |
| | | | | IT Services — 2.5% |
| 110 | | | | Cognizant Technology Solutions Corp.,
Class A (a) | | | 8,245 | |
| 764 | | | | VeriFone Holdings, Inc. (a) (c) | | | 26,934 | |
| | | | | | | | 35,179 | |
| | | | | Life Sciences Tools & Services — 1.7% |
| 235 | | | | Covance, Inc. (a) (c) | | | 16,139 | |
| 173 | | | | Illumina, Inc. (a) (c) | | | 7,014 | |
| | | | | | | | 23,153 | |
| | | | | Media — 1.4% |
| 666 | | | | DreamWorks Animation SKG, Inc., Class A (a) | | | 19,216 | |
| | | | | Metals & Mining — 0.8% |
| 207 | | | | Century Aluminum Co. (a) (c) | | | 11,292 | |
| | | | | Multiline Retail — 2.4% |
| 318 | | | | Dollar Tree Stores, Inc. (a) | | | 13,827 | |
| 898 | | | | Saks, Inc. | | | 19,162 | |
| | | | | | | | 32,989 | |
| | | | | Office Electronics — 0.9% |
| 337 | | | | Zebra Technologies Corp., Class A (a) (c) | | | 13,040 | |
| | | | | Oil, Gas & Consumable Fuels — 4.2% |
| 368 | | | | Cabot Oil & Gas Corp. | | | 13,564 | |
| 445 | | | | Forest Oil Corp. (a) (c) | | | 18,823 | |
| 261 | | | | Quicksilver Resources, Inc. (a) (c) | | | 11,622 | |
| 312 | | | | Southwestern Energy Co. (a) | | | 13,873 | |
| | | | | | | | 57,882 | |
| | | | | Personal Products — 0.7% |
| 278 | | | | Bare Escentuals, Inc. (a) (c) | | | 9,494 | |
| | | | | Pharmaceuticals — 3.6% |
| 317 | | | | Adams Respiratory Therapeutics, Inc. (a) (c) | | | 12,479 | |
| 220 | | | | Allergan, Inc. | | | 12,698 | |
| 412 | | | | Elan Corp. plc ADR (Ireland) (a) (c) | | | 9,037 | |
| 215 | | | | Shire plc ADR (United Kingdom) | | | 15,968 | |
| | | | | | | | 50,182 | |
| | | | | Semiconductors & Semiconductor Equipment — 6.6% |
| 788 | | | | Altera Corp. | | | 17,443 | |
| 326 | | | | Broadcom Corp., Class A (a) | | | 9,522 | |
| 172 | | | | Formfactor, Inc. (a) (c) | | | 6,584 | |
| 313 | | | | KLA-Tencor Corp. | | | 17,183 | |
| 349 | | | | Microchip Technology, Inc. | | | 12,908 | |
| 438 | | | | NVIDIA Corp. (a) | | | 18,110 | |
| 223 | | | | Tessera Technologies, Inc. (a) (c) | | | 9,059 | |
| | | | | | | | 90,809 | |
| | | | | Software — 5.0% |
| 323 | | | | Adobe Systems, Inc. (a) | | | 12,950 | |
| 362 | | | | Amdocs Ltd. (United Kingdom) (a) | | | 14,401 | |
| 504 | | | | ANSYS, Inc. (a) (c) | | | 13,367 | |
| 386 | | | | Autodesk, Inc. (a) | | | 18,154 | |
| 413 | | | | Sybase, Inc. (a) | | | 9,855 | |
| | | | | | | | 68,727 | |
| | | | | Specialty Retail — 5.2% |
| 260 | | | | Barnes & Noble, Inc. | | | 10,002 | |
| 505 | | | | GameStop Corp., Class A (a) | | | 19,730 | |
| 395 | | | | Office Depot, Inc. (a) | | | 11,956 | |
| 290 | | | | PetSmart, Inc. | | | 9,401 | |
| 210 | | | | Tiffany & Co. | | | 11,143 | |
| 434 | | | | Urban Outfitters, Inc. (a) | | | 10,436 | |
| | | | | | | | 72,668 | |
| | | | | Textiles, Apparel & Luxury Goods — 0.7% |
| 223 | | | | Under Armour, Inc., Class A (a) (c) | | | 10,184 | |
SEE NOTES TO FINANCIAL STATEMENTS.
22 JPMORGAN MID CAP/MULTI-CAP FUNDS JUNE 30, 2007
SHARES
|
|
|
| SECURITY DESCRIPTION
|
| VALUE($)
|
|---|
Long-Term Investments — Continued |
| | | | | Wireless Telecommunication Services — 3.4% |
| 328 | | | | American Tower Corp., Class A (a) | | | 13,755 | |
| 203 | | | | NII Holdings, Inc. (a) | | | 16,426 | |
| 382 | | | | Rogers Communications, Inc., Class B (Canada) | | | 16,227 | |
| | | | | | | | 46,408 | |
| | | �� | | Total Long-Term Investments
(Cost $1,119,706) | | | 1,364,246 | |
Short-Term Investment — 2.4% |
| | | | | Investment Company — 2.4% |
| 33,758 | | | | JPMorgan Liquid Assets Money Market Fund, Institutional Class (b) (m)
(Cost $33,758) | | | 33,758 | |
PRINCIPAL
AMOUNT($)
|
|
|
|
|
|
|
|---|
Investments of Cash Collateral for Securities on Loan — 14.6% |
| | | | | Certificates of Deposit — 1.4% |
| 10,000 | | | | Barclays, New York, 5.34%, 09/28/07 | | | 10,000 | |
| 4,499 | | | | Calyon, New York, FRN, 5.40%, 03/15/10 | | | 4,499 | |
| 5,000 | | | | Natexis Banques Populaires, New York, FRN, 5.37%, 01/28/08 | | | 5,000 | |
| | | | | | | | 19,499 | |
| | | | | Corporate Notes — 8.1% |
| 7,500 | | | | Allstate Life Global Funding II, FRN, 5.32%, 07/29/08 | | | 7,500 | |
| 5,000 | | | | Banque Federative du Credit Mutuel, FRN, 5.32%, 07/29/08 | | | 5,000 | |
| 5,000 | | | | BBVA Senior Finance S.A., FRN, 5.41%, 03/12/10 | | | 5,000 | |
| 9,700 | | | | Caixa Catal, FRN, 5.39%, 07/28/08 | | | 9,700 | |
| 1,000 | | | | CC USA, Inc., FRN, 5.37%, 01/25/08 | | | 1,000 | |
| 4,000 | | | | CDC Financial Products, Inc., FRN, 5.43%, 07/27/07 | | | 4,000 | |
| 1,750 | | | | CDC Financial Products, Inc., FRN, 5.43%, 08/29/07 | | | 1,750 | |
| 10,500 | | | | Citigroup Global Markets, Inc., FRN, 5.45%, 07/06/07 | | | 10,500 | |
| 6,000 | | | | General Electric Capital Corp., FRN, 5.40%, 03/12/10 | | | 6,000 | |
| 10,000 | | | | Goldman Sachs Group, Inc., FRN, 5.54%, 12/28/07 | | | 10,000 | |
| 6,999 | | | | Liberty Lighthouse U.S. Capital, FRN, 5.34%, 02/04/08 | | | 6,999 | |
| 5,000 | | | | Macquarie Bank Ltd., FRN, 5.35%, 07/29/08 | | | 5,000 | |
| 7,000 | | | | Monumental Global Funding, FRN, 5.41%, 06/28/10 | | | 7,000 | |
| 1,000 | | | | Monumental Global Funding II, FRN,
5.40%, 03/26/10 | | | 1,000 | |
| 4,500 | | | | Morgan Stanley & Co., Inc., FRN,
5.56%, 07/29/08 | | | 4,500 | |
| 5,000 | | | | National City Bank, Cleveland, FRN,
5.33%, 10/04/07 | | | 4,999 | |
| 4,000 | | | | National City Bank, Cleveland, FRN,
5.35%, 09/18/07 | | | 4,000 | |
| 5,000 | | | | National Rural Utilities Coop., FRN,
5.30%, 07/29/08 | | | 5,000 | |
| 6,001 | | | | Nationwide Building Society, FRN,
5.31%, 07/29/08 | | | 6,001 | |
| 5,000 | | | | Pricoa Global Funding I, FRN,
5.31%, 07/29/08 | | | 5,000 | |
| 2,000 | | | | Pricoa Global Funding I, FRN,
5.41%, 12/15/09 | | | 2,000 | |
| | | | | | | | 111,949 | |
| | | | | Repurchase Agreements — 3.5% |
| 14,458 | | | | Banc of America Securities LLC, 5.39%, dated 06/29/07, due 07/02/07, repurchase price $14,464, collateralized by U.S. Agency Mortgages. | | | 14,458 | |
| 35,000 | | | | Credit Suisse First Boston LLC, 5.39%, dated 06/29/07, due 07/02/07, repurchase price $35,016, collateralized by U.S. Agency Mortgages. | | | 35,000 | |
| | | | | | | | 49,458 | |
| | | | | Time Deposits — 1.6% |
| 10,000 | | | | American Express Centurion,
5.32%, 07/31/07 | | | 10,000 | |
| 7,000 | | | | Sun Trust Bank Atlanta, FRN,
5.33%, 07/30/07 | | | 7,000 | |
| 5,000 | | | | Ulster Bank Ireland Ltd., FRN,
5.34%, 10/18/07 | | | 5,000 | |
| | | | | | | | 22,000 | |
| | | | | Total Investments of Cash Collateral
for Securities on Loan
(Cost $202,906) | | | 202,906 | |
| | | | | Total Investments — 115.5%
(Cost $1,356,370) | | | 1,600,910 | |
| | | | | Liabilities in Excess of
Other Assets — (15.5)% | | | (215,285 | ) |
| | | | | NET ASSETS — 100.0% | | $ | 1,385,625 | |
Percentages indicated are based on net assets.
SEE NOTES TO FINANCIAL STATEMENTS.
JUNE 30, 2007 JPMORGAN MID CAP/MULTI-CAP FUNDS 23
JPMorgan Diversified Mid Cap Value Fund
SCHEDULE OF PORTFOLIO INVESTMENTS
AS OF JUNE 30, 2007
(Amounts in thousands)
SHARES
|
|
|
| SECURITY DESCRIPTION
|
| VALUE($)
|
|---|
Long-Term Investments — 99.2% |
| | | | | Common Stocks — 99.2% |
| | | | | Aerospace & Defense — 2.4% |
| 78 | | | | Alliant Techsystems, Inc. (a) (c) | | | 7,692 | |
| 51 | | | | Armor Holdings, Inc. (a) | | | 4,413 | |
| 159 | | | | Spirit Aerosystems Holdings, Inc., Class A (a) | | | 5,736 | |
| | | | | | | | 17,841 | |
| | | | | Beverages — 2.6% |
| 172 | | | | Brown-Forman Corp., Class B (c) | | | 12,575 | |
| 277 | | | | Constellation Brands, Inc., Class A (a) | | | 6,728 | |
| | | | | | | | 19,303 | |
| | | | | Building Products — 0.9% |
| 36 | | | | American Standard Cos., Inc. | | | 2,119 | |
| 137 | | | | Owens Corning, Inc. (a) | | | 4,607 | |
| | | | | | | | 6,726 | |
| | | | | Capital Markets — 3.2% |
| 41 | | | | Bear Stearns Cos., Inc. (The) | | | 5,740 | |
| 209 | | | | E*Trade Financial Corp. (a) | | | 4,613 | |
| 62 | | | | Legg Mason, Inc. | | | 6,070 | |
| 68 | | | | Northern Trust Corp. | | | 4,394 | |
| 58 | | | | T. Rowe Price Group, Inc. | | | 3,029 | |
| | | | | | | | 23,846 | |
| | | | | Chemicals — 2.8% |
| 104 | | | | Albemarle Corp. | | | 4,014 | |
| 76 | | | | Lubrizol Corp. | | | 4,886 | |
| 71 | | | | PPG Industries, Inc. | | | 5,366 | |
| 146 | | | | Sigma-Aldrich Corp. | | | 6,217 | |
| | | | | | | | 20,483 | |
| | | | | Commercial Banks — 5.1% |
| 63 | | | | City National Corp. | | | 4,794 | |
| 101 | | | | Cullen/Frost Bankers, Inc. | | | 5,411 | |
| 87 | | | | East-West Bancorp, Inc. | | | 3,382 | |
| 68 | | | | M&T Bank Corp. | | | 7,216 | |
| 205 | | | | Synovus Financial Corp. | | | 6,300 | |
| 163 | | | | United Community Banks, Inc. (c) | | | 4,229 | |
| 83 | | | | Zions Bancorporation | | | 6,407 | |
| | | | | | | | 37,739 | |
| | | | | Commercial Services & Supplies — 0.7% |
| 178 | | | | Republic Services, Inc. | | | 5,451 | |
| | | | | Computers & Peripherals — 0.9% |
| 131 | | | | NCR Corp. (a) | | | 6,898 | |
| | | | | Construction Materials — 0.9% |
| 49 | | | | Florida Rock Industries, Inc. | | | 3,291 | |
| 31 | | | | Vulcan Materials Co. | | | 3,539 | |
| | | | | | | | 6,830 | |
| | | | | Containers & Packaging — 1.5% |
| 156 | | | | Ball Corp. | | | 8,284 | |
| 51 | | | | Temple-Inland, Inc. | | | 3,132 | |
| | | | | | | | 11,416 | |
| | | | | Distributors — 0.7% |
| 107 | | | | Genuine Parts Co. | | | 5,317 | |
| | | | | Diversified Telecommunication Services — 2.9% |
| 141 | | | | CenturyTel, Inc. | | | 6,926 | |
| 730 | | | | Qwest Communications International, Inc. (a) | | | 7,085 | |
| 488 | | | | Windstream Corp. | | | 7,204 | |
| | | | | | | | 21,215 | |
| | | | | Electric Utilities — 5.1% |
| 205 | | | | American Electric Power Co., Inc. | | | 9,236 | |
| 131 | | | | Edison International | | | 7,371 | |
| 130 | | | | FirstEnergy Corp. | | | 8,434 | |
| 154 | | | | PPL Corp. | | | 7,215 | |
| 235 | | | | Westar Energy, Inc. (c) | | | 5,696 | |
| | | | | | | | 37,952 | |
| | | | | Electrical Equipment — 0.8% |
| 148 | | | | Ametek, Inc. | | | 5,867 | |
| | | | | Electronic Equipment & Instruments — 1.5% |
| 98 | | | | Amphenol Corp., Class A | | | 3,497 | |
| 194 | | | | Arrow Electronics, Inc. (a) | | | 7,467 | |
| | | | | | | | 10,964 | |
| | | | | Energy Equipment & Services — 0.5% |
| 63 | | | | Unit Corp. (a) | | | 3,944 | |
| | | | | Food & Staples Retailing — 2.5% |
| 58 | | | | BJ’s Wholesale Club, Inc. (a) | | | 2,093 | |
| 140 | | | | Ruddick Corp. (c) | | | 4,229 | |
| 66 | | | | Safeway, Inc. | | | 2,242 | |
| 218 | | | | SUPERVALU, Inc. | | | 10,107 | |
| | | | | | | | 18,671 | |
| | | | | Food Products — 1.6% |
| 96 | | | | Dean Foods Co. | | | 3,050 | |
| 174 | | | | Del Monte Foods Co. | | | 2,111 | |
| 119 | | | | Wm. Wrigley, Jr., Co. | | | 6,607 | |
| | | | | | | | 11,768 | |
SEE NOTES TO FINANCIAL STATEMENTS.
24 JPMORGAN MID CAP/MULTI-CAP FUNDS JUNE 30, 2007
SHARES
|
|
|
| SECURITY DESCRIPTION
|
| VALUE($)
|
|---|
Long-Term Investments — Continued |
| | | | | Gas Utilities — 3.1% |
| 96 | | | | Energen Corp. | | | 5,263 | |
| 132 | | | | ONEOK, Inc. | | | 6,629 | |
| 100 | | | | Questar Corp. | | | 5,274 | |
| 205 | | | | UGI Corp. | | | 5,579 | |
| | | | | | | | 22,745 | |
| | | | | Health Care Equipment & Supplies — 0.4% |
| 41 | | | | Beckman Coulter, Inc. | | | 2,671 | |
| | | | | Health Care Providers & Services — 3.2% |
| 96 | | | | Community Health Systems, Inc. (a) | | | 3,883 | |
| 147 | | | | Coventry Health Care, Inc. (a) | | | 8,489 | |
| 58 | | | | DaVita, Inc. (a) | | | 3,120 | |
| 69 | | | | Henry Schein, Inc. (a) | | | 3,703 | |
| 56 | | | | Lincare Holdings, Inc. (a) | | | 2,224 | |
| 54 | | | | Omnicare, Inc. (c) | | | 1,954 | |
| | | | | | | | 23,373 | |
| | | | | Hotels, Restaurants & Leisure — 3.8% |
| 189 | | | | Applebee’s International, Inc. | | | 4,559 | |
| 251 | | | | Burger King Holdings, Inc. | | | 6,622 | |
| 158 | | | | Hilton Hotels Corp. | | | 5,275 | |
| 76 | | | | International Game Technology | | | 3,005 | |
| 106 | | | | Marriott International, Inc., Class A | | | 4,601 | |
| 69 | | | | Vail Resorts, Inc. (a) (c) | | | 4,188 | |
| | | | | | | | 28,250 | |
| | | | | Household Durables — 2.0% |
| 101 | | | | Fortune Brands, Inc. | | | 8,352 | |
| 157 | | | | Jarden Corp. (a) | | | 6,738 | |
| | | | | | | | 15,090 | |
| | | | | Household Products — 1.0% |
| 114 | | | | Clorox Co. | | | 7,082 | |
| | | | | Industrial Conglomerates — 0.8% |
| 121 | | | | Carlisle Cos., Inc. | | | 5,642 | |
| | | | | Insurance — 8.5% |
| 162 | | | | Assurant, Inc. | | | 9,566 | |
| 119 | | | | Cincinnati Financial Corp. | | | 5,169 | |
| 51 | | | | Everest Re Group Ltd. (Bermuda) | | | 5,519 | |
| 167 | | | | Fidelity National Title Group, Inc., Class A | | | 3,958 | |
| 119 | | | | IPC Holdings Ltd. (Bermuda) | | | 3,846 | |
| 150 | | | | Loews Corp. | | | 7,632 | |
| 360 | | | | Old Republic International Corp. | | | 7,657 | |
| 226 | | | | OneBeacon Insurance Group Ltd. | | | 5,735 | |
| 58 | | | | Principal Financial Group, Inc. | | | 3,392 | |
| 54 | | | | ProAssurance Corp. (a) (c) | | | 2,984 | |
| 71 | | | | Protective Life Corp. | | | 3,399 | |
| 119 | | | | W.R. Berkley Corp. | | | 3,885 | |
| | | | | | | | 62,742 | |
| | | | | Internet & Catalog Retail — 0.6% |
| 211 | | | | Liberty Media Holding Corp. - Interactive, Class A (a) | | | 4,709 | |
| | | | | IT Services — 1.1% |
| 82 | | | | Fidelity National Information Services, Inc. | | | 4,460 | |
| 174 | | | | Western Union Co. (The) | | | 3,622 | |
| | | | | | | | 8,082 | |
| | | | | Machinery — 2.9% |
| 83 | | | | Crane Co. | | | 3,768 | |
| 140 | | | | Dover Corp. | | | 7,143 | |
| 62 | | | | Harsco Corp. | | | 3,235 | |
| 116 | | | | Oshkosh Truck Corp. | | | 7,311 | |
| | | | | | | | 21,457 | |
| | | | | Media — 3.9% |
| 147 | | | | Cablevision Systems Corp., Class A (a) | | | 5,302 | |
| 234 | | | | Clear Channel Communications, Inc. | | | 8,848 | |
| 119 | | | | Clear Channel Outdoor Holdings, Inc.,
Class A (a) | | | 3,365 | |
| 123 | | | | Grupo Televisa S.A. ADR (Mexico) | | | 3,402 | |
| 68 | | | | McClatchy Co., Class A (c) | | | 1,730 | |
| 102 | | | | Regal Entertainment Group, Class A | | | 2,232 | |
| 5 | | | | Washington Post Co. (The), Class B | | | 3,997 | |
| | | | | | | | 28,876 | |
| | | | | Metals & Mining — 0.4% |
| 35 | | | | Alcan, Inc. (Canada) | | | 2,823 | |
| | | | | Multi-Utilities — 4.6% |
| 131 | | | | CMS Energy Corp. | | | 2,246 | |
| 157 | | | | MDU Resources Group, Inc. (c) | | | 4,411 | |
| 224 | | | | NiSource, Inc. | | | 4,633 | |
| 140 | | | | NSTAR (c) | | | 4,556 | |
| 161 | | | | PG&E Corp. | | | 7,293 | |
| 156 | | | | SCANA Corp. | | | 5,966 | |
| 224 | | | | Xcel Energy, Inc. | | | 4,585 | |
| | | | | | | | 33,690 | |
| | | | | Oil, Gas & Consumable Fuels — 4.8% |
| 95 | | | | Devon Energy Corp. | | | 7,401 | |
| 115 | | | | Helix Energy Solutions Group, Inc. (a) (c) | | | 4,578 | |
| 78 | | | | Murphy Oil Corp. | | | 4,613 | |
| 76 | | | | Newfield Exploration Co. (a) | | | 3,466 | |
| 122 | | | | Penn Virginia Corp. | | | 4,896 | |
SEE NOTES TO FINANCIAL STATEMENTS.
JUNE 30, 2007 JPMORGAN MID CAP/MULTI-CAP FUNDS 25
JPMorgan Diversified Mid Cap Value Fund
SCHEDULE OF PORTFOLIO INVESTMENTS
AS OF JUNE 30, 2007 (continued)
(Amounts in thousands)
SHARES
|
|
|
| SECURITY DESCRIPTION
|
| VALUE($)
|
|---|
Long-Term Investments — Continued |
| | | | | Oil, Gas & Consumable Fuels — Continued |
| 60 | | | | Teekay Shipping Corp. (Bahamas) | | | 3,498 | |
| 224 | | | | Williams Cos., Inc. | | | 7,086 | |
| | | | | | | | 35,538 | |
| | | | | Paper & Forest Products — 0.7% |
| 434 | | | | Domtar Corp. (Canada) (a) | | | 4,845 | |
| | | | | Personal Products — 0.6% |
| 96 | | | | Estee Lauder Cos., Inc., (The), Class A | | | 4,383 | |
| | | | | Pharmaceuticals — 1.4% |
| 234 | | | | Biovail Corp. (Canada) (c) | | | 5,936 | |
| 260 | | | | Warner Chilcott Ltd., Class A (Bermuda) (a) | | | 4,698 | |
| | | | | | | | 10,634 | |
| | | | | Real Estate Investment Trusts (REITs) — 5.2% |
| 103 | | | | Cousins Properties, Inc. (c) | | | 2,985 | |
| 140 | | | | Host Hotels & Resorts, Inc. | | | 3,226 | |
| 157 | | | | iStar Financial, Inc. | | | 6,969 | �� |
| 66 | | | | Kimco Realty Corp. | | | 2,494 | |
| 72 | | | | Plum Creek Timber Co., Inc. | | | 2,999 | |
| 98 | | | | PS Business Parks, Inc., Class A (c) | | | 6,204 | |
| 39 | | | | Public Storage, Inc. | | | 3,026 | |
| 148 | | | | Rayonier, Inc. | | | 6,683 | |
| 35 | | | | Vornado Realty Trust | | | 3,880 | |
| | | | | | | | 38,466 | |
| | | | | Real Estate Management & Development — 1.4% |
| 301 | | | | Brookfield Properties Corp. | | | 7,314 | |
| 51 | | | | Forest City Enterprises, Inc., Class A (c) | | | 3,154 | |
| | | | | | | | 10,468 | |
| | | | | Road & Rail — 0.4% |
| 60 | | | | Norfolk Southern Corp. | | | 3,149 | |
| | | | | Software — 0.5% |
| 183 | | | | Symantec Corp. (a) | | | 3,701 | |
| | | | | Specialty Retail — 7.3% |
| 94 | | | | Abercrombie & Fitch Co., | | | 6,867 | |
| 98 | | | | AutoNation, Inc. (a) | | | 2,190 | |
| 51 | | | | AutoZone, Inc. (a) | | | 6,954 | |
| 216 | | | | Bed Bath & Beyond, Inc. (a) | | | 7,785 | |
| 216 | | | | Limited Brands, Inc. | | | 5,929 | |
| 51 | | | | Sherwin-Williams Co. (The) | | | 3,395 | |
| 306 | | | | Staples, Inc. | | | 7,257 | |
| 158 | | | | Tiffany & Co. | | | 8,389 | |
| 181 | | | | TJX Cos., Inc. | | | 4,978 | |
| | | | | | | | 53,744 | |
| | | | | Textiles, Apparel & Luxury Goods — 1.7% |
| 80 | | | | Columbia Sportswear Co. (c) | | | 5,460 | |
| 77 | | | | V.F. Corp. | | | 7,065 | |
| | | | | | | | 12,525 | |
| | | | | Thrifts & Mortgage Finance — 1.8% |
| 79 | | | | FirstFed Financial Corp. (a) (c) | | | 4,464 | |
| 241 | | | | Hudson City Bancorp, Inc. | | | 2,944 | |
| 32 | | | | MGIC Investment Corp. | | | 1,831 | |
| 225 | | | | People’s United Financial, Inc. | | | 3,982 | |
| | | | | | | | 13,221 | |
| | | | | Wireless Telecommunication Services — 0.5% |
| 60 | | | | Telephone & Data Systems, Inc. | | | 3,447 | |
| | | | | Total Long-Term Investments
(Cost $562,668) | | | 733,584 | |
Short-Term Investment — 1.6% |
| | | | | Investment Company — 1.6% |
| 12,129 | | | | JPMorgan Liquid Assets Money Market Fund, Institutional Class (b) (m)
(Cost $12,129) | | | 12,129 | |
PRINCIPAL
AMOUNT($)
|
|
|
|
|
|
|
|---|
Investments of Cash Collateral for Securities on Loan — 6.8% |
| | | | | Certificates of Deposit — 1.2% |
| 2,499 | | | | Calyon, New York, FRN, 5.40%, 03/15/10 | | | 2,499 | |
| 6,000 | | | | Canadian Imperial Bank, New York, FRN, 5.37%, 02/14/08 | | | 6,000 | |
| | | | | | | | 8,499 | |
| | | | | Corporate Notes — 5.4% |
| 1,500 | | | | Allstate Life Global Funding II, FRN, 5.32%, 07/29/08 | | | 1,500 | |
| 2,000 | | | | Banque Federative du Credit Mutuel, FRN, 5.32%, 07/29/08 | | | 2,000 | |
| 4,000 | | | | BBVA Senior Finance S.A., FRN, 5.41%, 03/12/10 | | | 4,000 | |
| 4,000 | | | | Caixa Catal, FRN, 5.39%, 07/28/08 | | | 4,000 | |
| 4,000 | | | | CDC Financial Products Inc., FRN, 5.43%, 08/29/07 | | | 4,000 | |
| 4,000 | | | | General Electric Capital Corp., FRN, 5.40%, 03/12/10 | | | 4,000 | |
| 1,000 | | | | Macquarie Bank Ltd., FRN, 5.34%, 07/29/08 | | | 1,000 | |
| 2,000 | | | | Macquarie Bank Ltd., FRN, 5.35%, 07/29/08 | | | 2,000 | |
| 2,000 | | | | Metropolitan Life Global Funding, FRN, 5.31%, 07/29/08 | | | 2,000 | |
| 3,000 | | | | Monumental Global Funding, FRN, 5.41%, 06/28/10 | | | 3,000 | |
SEE NOTES TO FINANCIAL STATEMENTS.
26 JPMORGAN MID CAP/MULTI-CAP FUNDS JUNE 30, 2007
PRINCIPAL
AMOUNT($)
|
|
|
| SECURITY DESCRIPTION
|
| VALUE($)
|
|---|
Investments of Cash Collateral for Securities on Loan — Continued |
| | | | | Corporate Notes — Continued | | | | |
| 3,000 | | | | Morgan Stanley & Co, Inc., FRN, 5.56%, 07/29/08 | | | 3,000 | |
| 3,000 | | | | Pricoa Global Funding I, FRN, 5.41%, 12/15/09 | | | 3,000 | |
| 500 | | | | Sigma Finance Inc., FRN, 5.37%, 01/17/08 | | | 500 | |
| 3,000 | | | | Unicredito Italiano Bank plc, FRN, 5.34%, 07/29/08 | | | 3,000 | |
| 3,000 | | | | Wachovia Bank N.A., FRN, 5.36%, 02/23/09 | | | 3,000 | |
| | | | | | | | 40,000 | |
| | | | | Repurchase Agreement — 0.2% |
| 1,659 | | | | Banc of America Securities LLC, 5.39%, dated
06/29/07, due 07/02/07, repurchase price
$1,660, collateralized by U.S. Agency Mortgages. | | | 1,659 | |
| | | | | Total Investments of Cash Collateral
for Securities on Loan
(Cost $50,158) | | | 50,158 | |
| | | | | Total Investments — 107.6%
(Cost $624,955) | | | 795,871 | |
| | | | | Liabilities in Excess of
Other Assets — (7.6)% | | | (56,491 | ) |
| | | | | NET ASSETS — 100.0% | | $ | 739,380 | |
Percentages indicated are based on net assets.
SEE NOTES TO FINANCIAL STATEMENTS.
JUNE 30, 2007 JPMORGAN MID CAP/MULTI-CAP FUNDS 27
JPMorgan Growth Advantage Fund
SCHEDULE OF PORTFOLIO INVESTMENTS
AS OF JUNE 30, 2007
(Amounts in thousands)
SHARES
|
|
|
| SECURITY DESCRIPTION
|
| VALUE($)
|
|---|
Long-Term Investments — 99.3% |
| | | | | Common Stocks — 99.3% |
| | | | | Aerospace & Defense — 2.8% |
| 6 | | | | Boeing Co. | | | 538 | |
| 6 | | | | General Dynamics Corp. | | | 454 | |
| 6 | | | | Precision Castparts Corp. | | | 759 | |
| | | | | | | | 1,751 | |
| | | | | Auto Components — 1.5% |
| 47 | | | | Gentex Corp. | | | 922 | |
| | | | | Biotechnology — 2.7% |
| 15 | | | | Celgene Corp. (a) | | | 848 | |
| 5 | | | | Cephalon, Inc. (a) | | | 434 | |
| 11 | | | | Gilead Sciences, Inc. (a) | | | 415 | |
| | | | | | | | 1,697 | |
| | | | | Capital Markets — 4.1% |
| 5 | | | | Affiliated Managers Group, Inc. (a) (c) | | | 637 | |
| 9 | | | | Morgan Stanley† | | | 755 | |
| 7 | | | | State Street Corp. | | | 506 | |
| 12 | | | | T. Rowe Price Group, Inc. | | | 644 | |
| | | | | | | | 2,542 | |
| | | | | Chemicals — 1.1% |
| 10 | | | | Monsanto Co. | | | 669 | |
| | | | | Commercial Services & Supplies — 3.0% |
| 11 | | | | Corrections Corp. of America (a) | | | 688 | |
| 14 | | | | Stericycle, Inc. (a) | | | 600 | |
| 19 | | | | Waste Connections, Inc. (a) | | | 567 | |
| | | | | | | | 1,855 | |
| | | | | Communications Equipment — 7.0% |
| 54 | | | | Cisco Systems, Inc. (a) | | | 1,496 | |
| 25 | | | | Corning, Inc. (a) | | | 639 | |
| 6 | | | | F5 Networks, Inc. (a) | | | 467 | |
| 22 | | | | Polycom, Inc. (a) | | | 729 | |
| 5 | | | | Research In Motion Ltd. (Canada) (a) | | | 1,080 | |
| | | | | | | | 4,411 | |
| | | | | Computers & Peripherals — 4.0% |
| 8 | | | | Apple, Inc. (a) | | | 921 | |
| 21 | | | | Hewlett-Packard Co. | | | 915 | |
| 12 | | | | NCR Corp. (a) | | | 646 | |
| | | | | | | | 2,482 | |
| | | | | Construction & Engineering — 1.0% |
| 20 | | | | Quanta Services, Inc. (a) (c) | | | 616 | |
| | | | | Diversified Consumer Services — 1.2% |
| 30 | | | | INVESTools, Inc. (a) (c) | | | 299 | |
| 4 | | | | ITT Educational Services, Inc. (a) | | | 481 | |
| | | | | | | | 780 | |
| | | | | Diversified Financial Services — 1.5% |
| 1 | | | | Chicago Mercantile Exchange Holdings, Inc., Class A | | | 588 | |
| 2 | | | | IntercontinentalExchange, Inc. (a) | | | 325 | |
| | | | | | | | 913 | |
| | | | | Diversified Telecommunication Services — 3.1% |
| 18 | | | | AT&T, Inc. | | | 747 | |
| 15 | | | | Cbeyond Communications, Inc. (a) (c) | | | 593 | |
| 14 | | | | Verizon Communications, Inc. | | | 585 | |
| | | | | | | | 1,925 | |
| | | | | Electrical Equipment — 4.2% |
| 20 | | | | General Cable Corp. (a) | | | 1,511 | |
| 19 | | | | Roper Industries, Inc. | | | 1,102 | |
| | | | | | | | 2,613 | |
| | | | | Electronic Equipment & Instruments — 1.7% |
| 30 | | | | Amphenol Corp., Class A | | | 1,073 | |
| | | | | Energy Equipment & Services — 1.9% |
| 8 | | | | Cameron International Corp. (a) | | | 572 | |
| 7 | | | | Schlumberger Ltd. | | | 628 | |
| | | | | | | | 1,200 | |
| | | | | Food & Staples Retailing — 1.2% |
| 21 | | | | CVS/Caremark Corp. | | | 760 | |
| | | | | Food Products — 0.7% |
| 8 | | | | Wm. Wrigley, Jr., Co. | | | 431 | |
| | | | | Gas Utilities — 0.8% |
| 10 | | | | Questar Corp. | | | 502 | |
| | | | | Health Care Equipment & Supplies — 4.4% |
| 15 | | | | ArthroCare Corp. (a) | | | 637 | |
| 10 | | | | Baxter International, Inc. | | | 586 | |
| 11 | | | | Cytyc Corp. (a) | | | 470 | |
| 8 | | | | Hologic, Inc. (a) | | | 464 | |
| 6 | | | | IDEXX Laboratories, Inc. (a) | | | 606 | |
| | | | | | | | 2,763 | |
| | | | | Health Care Providers & Services — 2.4% |
| 19 | | | | Lincare Holdings, Inc. (a) | | | 769 | |
| 19 | | | | VCA Antech, Inc. (a) | | | 716 | |
| | | | | | | | 1,485 | |
SEE NOTES TO FINANCIAL STATEMENTS.
28 JPMORGAN MID CAP/MULTI-CAP FUNDS JUNE 30, 2007
SHARES
|
|
|
| SECURITY DESCRIPTION
|
| VALUE($)
|
|---|
Long-Term Investments — Continued |
| | | | | Health Care Technology — 0.9% |
| 10 | | | | Cerner Corp. (a) | | | 544 | |
| | | | | Hotels, Restaurants & Leisure — 1.1% |
| 25 | | | | Burger King Holdings, Inc. | | | 669 | |
| | | | | Household Durables — 1.2% |
| 10 | | | | Garmin Ltd. (Cayman Islands) (c) | | | 769 | |
| | | | | Insurance — 2.0% |
| 5 | | | | Everest Re Group Ltd. (Bermuda) | | | 511 | |
| 25 | | | | Security Capital Assurance Ltd. (Bermuda) | | | 765 | |
| | | | | | | | 1,276 | |
| | | | | Internet & Catalog Retail — 1.8% |
| 6 | | | | Amazon.com, Inc. (a) | | | 438 | |
| 10 | | | | priceline.com, Inc. (a) (c) | | | 674 | |
| | | | | | | | 1,112 | |
| | | | | Internet Software & Services — 2.8% |
| 10 | | | | Bankrate, Inc. (a) (c) | | | 470 | |
| 2 | | | | Google, Inc., Class A (a) | | | 1,256 | |
| | | | | | | | 1,726 | |
| | | | | IT Services — 1.9% |
| 34 | | | | VeriFone Holdings, Inc. (a) | | | 1,213 | |
| | | | | Life Sciences Tools & Services — 1.9% |
| 10 | | | | Covance, Inc. (a) | | | 658 | |
| 35 | | | | Enzo Biochem, Inc. (a) (c) | | | 516 | |
| | | | | | | | 1,174 | |
| | | | | Machinery — 1.0% |
| 5 | | | | Deere & Co. | | | 604 | |
| | | | | Media — 2.6% |
| 30 | | | | DreamWorks Animation SKG, Inc., Class A (a) | | | 854 | |
| 35 | | | | News Corp., Class B (c) | | | 798 | |
| | | | | | | | 1,652 | |
| | | | | Multiline Retail — 2.4% |
| 14 | | | | Dollar Tree Stores, Inc. (a) | | | 618 | |
| 43 | | | | Saks, Inc. | | | 910 | |
| | | | | | | | 1,528 | |
| | | | | Office Electronics — 0.9% |
| 15 | | | | Zebra Technologies Corp., Class A (a) (c) | | | 570 | |
| | | | | Oil, Gas & Consumable Fuels — 3.7% |
| 16 | | | | Forest Oil Corp. (a) (c) | | | 676 | |
| 11 | | | | Quicksilver Resources, Inc. (a) (c) | | | 468 | |
| 14 | | | | Southwestern Energy Co. (a) | | | 605 | |
| 10 | | | | XTO Energy, Inc. | | | 595 | |
| | | | | | | | 2,344 | |
| | | | | Personal Products — 0.6% |
| 12 | | | | Bare Escentuals, Inc. (a) (c) | | | 410 | |
| | | | | Pharmaceuticals — 6.5% |
| 10 | | | | Allergan, Inc. | | | 565 | |
| 20 | | | | Merck & Co., Inc. | | | 981 | |
| 32 | | | | Schering-Plough Corp. | | | 968 | |
| 10 | | | | Shire plc ADR (United Kingdom) | | | 764 | |
| 13 | | | | Wyeth | | | 768 | |
| | | | | | | | 4,046 | |
| | | | | Semiconductors & Semiconductor Equipment — 6.1% |
| 26 | | | | Altera Corp. | | | 582 | |
| 12 | | | | Hittite Microwave Corp. (a) (c) | | | 521 | |
| 24 | | | | Intel Corp. | | | 580 | |
| 14 | | | | KLA-Tencor Corp. | | | 780 | |
| 15 | | | | Microchip Technology, Inc. | | | 552 | |
| 20 | | | | NVIDIA Corp. (a) | | | 814 | |
| | | | | | | | 3,829 | |
| | | | | Software — 6.7% |
| 14 | | | | Adobe Systems, Inc. (a) | | | 570 | |
| 22 | | | | ANSYS, Inc. (a) (c) | | | 591 | |
| 17 | | | | Autodesk, Inc. (a) | | | 805 | |
| 47 | | | | Microsoft Corp. | | | 1,379 | |
| 28 | | | | Nuance Communications, Inc. (a) (c) | | | 462 | |
| 17 | | | | Sybase, Inc. (a) | | | 401 | |
| | | | | | | | 4,208 | |
| | | | | Specialty Retail — 3.0% |
| 23 | | | | GameStop Corp., Class A (a) | | | 880 | |
| 10 | | | | Tiffany & Co. | | | 504 | |
| 19 | | | | Urban Outfitters, Inc. (a) | | | 466 | |
| | | | | | | | 1,850 | |
| | | | | Textiles, Apparel & Luxury Goods — 0.8% |
| 10 | | | | Under Armour, Inc., Class A (a) (c) | | | 475 | |
| | | | | Wireless Telecommunication Services — 1.1% |
| 11 | | | | America Movil S.A. de C.V., ADR,
Series L (Mexico) | | | 681 | |
| | | | | Total Long-Term Investments
(Cost $48,769) | | | 62,070 | |
Short-Term Investment — 0.1% |
| | | | | Investment Company — 0.1% |
| 40 | | | | JPMorgan Prime Money Market Fund, Institutional Class (b) (m)
(Cost $40) | | | 40 | |
SEE NOTES TO FINANCIAL STATEMENTS.
JUNE 30, 2007 JPMORGAN MID CAP/MULTI-CAP FUNDS 29
JPMorgan Growth Advantage Fund
SCHEDULE OF PORTFOLIO INVESTMENTS
AS OF JUNE 30, 2007 (continued)
(Amounts in thousands)
PRINCIPAL
AMOUNT($)
|
|
|
| SECURITY DESCRIPTION
|
| VALUE($)
|
|---|
Investments of Cash Collateral for Securities on Loan — 10.5% |
| | | | | Certificate of Deposit — 0.6% |
| 400 | | | | Deutsche Bank, FRN, 5.47%, 01/22/08 | | | 400 | |
| | | | | Corporate Notes — 2.4% |
| 300 | | | | Alliance and Leicester plc, FRN, 5.33%, 07/29/08 | | | 300 | |
| 250 | | | | Banque Federative du Credit Mutuel, FRN, 5.32%, 07/29/08 | | | 250 | |
| 300 | | | | CDC Financial Products, Inc., FRN, 5.43%, 07/27/07 | | | 300 | |
| 300 | | | | Citigroup Global Markets Inc., FRN, 5.45%, 07/06/07 | | | 300 | |
| 350 | | | | Sigma Finance Inc., FRN, 5.37%, 10/24/07 | | | 350 | |
| | | | | | | | 1,500 | |
| | | | | Repurchase Agreements — 7.5% |
| 1,200 | | | | ABN Amro Bank N.V., New York, 5.34%, dated 06/29/07, due 07/02/07, repurchase price $1,201, collateralized by U.S. Government Agency Mortgages | | | 1,200 | |
| 1,085 | | | | Banc of America Securities LLC, 5.39%, dated 06/29/07, due 07/02/07, repurchase price $1,085, collateralized by U.S. Government Agency Mortgages | | | 1,085 | |
| 1,300 | | | | Bear Stearns Cos., Inc., 5.38%, dated
06/29/07, due 07/02/07, repurchase price $1,301, collateralized by U.S. Government Agency Mortgages | | | 1,300 | |
| 1,100 | | | | Credit Suisse First Boston LLC, 5.39%, dated 06/29/07, due 07/02/07, repurchase price $1,100, collateralized by U.S. Government Agency Mortgages | | | 1,100 | |
| | | | | | | | 4,685 | |
| | | | | Total Investments of Cash Collateral
for Securities on Loan
(Cost $6,585) | | | 6,585 | |
| | | | | Total Investments — 109.9%
(Cost $55,394) | | | 68,695 | |
| | | | | Liabilities in Excess of
Other Assets — (9.9)% | | | (6,176 | ) |
| | | | | NET ASSETS — 100.0% | | $ | 62,519 | |
Percentages indicated are based on net assets.
Short Position
SHARES
|
|
|
| SECURITY DESCRIPTION
|
| Value
|
|---|
| 3 | | | | Discover Financial Services (a)†
(Proceeds received $60) | | $ | 57 | |
SEE NOTES TO FINANCIAL STATEMENTS.
30 JPMORGAN MID CAP/MULTI-CAP FUNDS JUNE 30, 2007
JPMorgan Mid Cap Equity Fund
SCHEDULE OF PORTFOLIO INVESTMENTS
AS OF JUNE 30, 2007
(Amounts in thousands)
SHARES
|
|
|
| SECURITY DESCRIPTION
|
| VALUE($)
|
|---|
Long-Term Investments — 98.2% |
| | | | | Common Stocks — 98.2% |
| | | | | Aerospace & Defense — 1.6% |
| 13 | | | | Alliant Techsystems, Inc. (a) | | | 1,249 | |
| 15 | | | | Precision Castparts Corp. | | | 1,808 | |
| 21 | | | | Rockwell Collins, Inc. | | | 1,466 | |
| | | | | | | | 4,523 | |
| | | | | Auto Components — 1.4% |
| 21 | | | | BorgWarner, Inc. | | | 1,824 | |
| 109 | | | | Gentex Corp. | | | 2,138 | |
| | | | | | | | 3,962 | |
| | | | | Beverages — 1.3% |
| 34 | | | | Brown-Forman Corp., Class B | | | 2,519 | |
| 51 | | | | Constellation Brands, Inc., Class A (a) | | | 1,227 | |
| | | | | | | | 3,746 | |
| | | | | Biotechnology — 1.1% |
| 35 | | | | Celgene Corp. (a) | | | 1,989 | |
| 13 | | | | Cephalon, Inc. (a) | | | 1,037 | |
| | | | | | | | 3,026 | |
| | | | | Building Products — 0.3% |
| 21 | | | | Owens Corning, Inc. (a) | | | 703 | |
| | | | | Capital Markets — 4.3% |
| 15 | | | | Affiliated Managers Group, Inc. (a) (c) | | | 1,983 | |
| 103 | | | | E*Trade Financial Corp. (a) | | | 2,273 | |
| 28 | | | | Investment Technology Group, Inc. (a) | | | 1,196 | |
| 20 | | | | Lazard Ltd., Class A (Bermuda) | | | 898 | |
| 7 | | | | Legg Mason, Inc. | | | 698 | |
| 43 | | | | Northern Trust Corp. | | | 2,769 | |
| 44 | | | | T. Rowe Price Group, Inc. | | | 2,304 | |
| | | | | | | | 12,121 | |
| | | | | Chemicals — 2.5% |
| 33 | | | | Albemarle Corp. | | | 1,277 | |
| 26 | | | | Ecolab, Inc. | | | 1,119 | |
| 55 | | | | Nalco Holding Co. | | | 1,513 | |
| 19 | | | | PPG Industries, Inc. | | | 1,438 | |
| 41 | | | | Sigma-Aldrich Corp. | | | 1,762 | |
| | | | | | | | 7,109 | |
| | | | | Commercial Banks — 3.4% |
| 10 | | | | Compass Bancshares, Inc. | | | 669 | |
| 24 | | | | Cullen/Frost Bankers, Inc. | | | 1,299 | |
| 23 | | | | M&T Bank Corp. | | | 2,470 | |
| 86 | | | | Synovus Financial Corp. | | | 2,640 | |
| 31 | | | | Wilmington Trust Corp. | | | 1,266 | |
| 17 | | | | Zions Bancorporation | | | 1,323 | |
| | | | | | | | 9,667 | |
| | | | | Commercial Services & Supplies — 2.3% |
| 33 | | | | Corrections Corp. of America (a) | | | 2,064 | |
| 56 | | | | Republic Services, Inc. | | | 1,703 | |
| 33 | | | | Stericycle, Inc. (a) | | | 1,476 | |
| 44 | | | | Waste Connections, Inc. (a) | | | 1,323 | |
| | | | | | | | 6,566 | |
| | | | | Communications Equipment — 1.5% |
| 13 | | | | F5 Networks, Inc. (a) | | | 1,064 | |
| 26 | | | | Harris Corp. | | | 1,440 | |
| 51 | | | | Polycom, Inc. (a) | | | 1,700 | |
| | | | | | | | 4,204 | |
| | | | | Computers & Peripherals — 2.0% |
| 63 | | | | NCR Corp. (a) | | | 3,297 | |
| 44 | | | | Network Appliance, Inc. (a) | | | 1,286 | |
| 24 | | | | SanDisk Corp. (a) | | | 1,185 | |
| | | | | | | | 5,768 | |
| | | | | Construction & Engineering — 0.5% |
| 47 | | | | Quanta Services, Inc. (a) | | | 1,445 | |
| | | | | Construction Materials — 0.3% |
| 7 | | | | Vulcan Materials Co. | | | 813 | |
| | | | | Containers & Packaging — 0.7% |
| 38 | | | | Ball Corp. | | | 2,015 | |
| | | | | Distributors — 0.8% |
| 47 | | | | Genuine Parts Co. | | | 2,341 | |
| | | | | Diversified Consumer Services — 0.9% |
| 10 | | | | ITT Educational Services, Inc. (a) | | | 1,197 | |
| 28 | | | | Weight Watchers International, Inc. | | | 1,426 | |
| | | | | | | | 2,623 | |
| | | | | Diversified Financial Services — 0.6% |
| 19 | | | | CIT Group, Inc. | | | 1,036 | |
| 5 | | | | IntercontinentalExchange, Inc. (a) | | | 725 | |
| | | | | | | | 1,761 | |
| | | | | Diversified Telecommunication Services — 2.2% |
| 35 | | | | CenturyTel, Inc. | | | 1,732 | |
| 54 | | | | Citizens Communications Co. | | | 817 | |
| 103 | | | | Time Warner Telecom, Inc., Class A (a) | | | 2,070 | |
| 113 | | | | Windstream Corp. | | | 1,669 | |
| | | | | | | | 6,288 | |
SEE NOTES TO FINANCIAL STATEMENTS.
JUNE 30, 2007 JPMORGAN MID CAP/MULTI-CAP FUNDS 31
JPMorgan Mid Cap Equity Fund
SCHEDULE OF PORTFOLIO INVESTMENTS
AS OF JUNE 30, 2007 (continued)
(Amounts in thousands)
SHARES
|
|
|
| SECURITY DESCRIPTION
|
| VALUE($)
|
|---|
Long-Term Investments — Continued |
| | | | | Electric Utilities — 2.5% |
| 52 | | | | American Electric Power Co., Inc. | | | 2,356 | |
| 35 | | | | FirstEnergy Corp. | | | 2,246 | |
| 28 | | | | PPL Corp. | | | 1,301 | |
| 46 | | | | Westar Energy, Inc. | | | 1,124 | |
| | | | | | | | 7,027 | |
| | | | | Electrical Equipment — 3.2% |
| 43 | | | | Ametek, Inc. | | | 1,706 | |
| 47 | | | | General Cable Corp. (a) | | | 3,522 | |
| 16 | | | | Genlyte Group, Inc. (a) | | | 1,288 | |
| 47 | | | | Roper Industries, Inc. | | | 2,707 | |
| | | | | | | | 9,223 | |
| | | | | Electronic Equipment & Instruments — 1.8% |
| 100 | | | | Amphenol Corp., Class A | | | 3,576 | |
| 40 | | | | Arrow Electronics, Inc. (a) | | | 1,529 | |
| | | | | | | | 5,105 | |
| | | | | Energy Equipment & Services — 2.1% |
| 25 | | | | Cameron International Corp. (a) | | | 1,758 | |
| 15 | | | | Noble Corp. | | | 1,502 | |
| 31 | | | | Oceaneering International, Inc. (a) (c) | | | 1,627 | |
| 19 | | | | W-H Energy Services, Inc. (a) | | | 1,201 | |
| | | | | | | | 6,088 | |
| | | | | Food & Staples Retailing — 0.8% |
| 48 | | | | SUPERVALU, Inc. | | | 2,200 | |
| | | | | Food Products — 1.2% |
| 17 | | | | Dean Foods Co. | | | 542 | |
| 59 | | | | Del Monte Foods Co. | | | 719 | |
| 40 | | | | Wm. Wrigley, Jr., Co. | | | 2,234 | |
| | | | | | | | 3,495 | |
| | | | | Gas Utilities — 2.2% |
| 32 | | | | Energen Corp. | | | 1,731 | |
| 9 | | | | ONEOK, Inc. | | | 459 | |
| 60 | | | | Questar Corp. | | | 3,160 | |
| 37 | | | | UGI Corp. | | | 1,017 | |
| | | | | | | | 6,367 | |
| | | | | Health Care Equipment & Supplies — 1.9% |
| 30 | | | | Cytyc Corp. (a) | | | 1,297 | |
| 23 | | | | Hologic, Inc. (a) (c) | | | 1,250 | |
| 16 | | | | IDEXX Laboratories, Inc. (a) | | | 1,467 | |
| 35 | | | | Mentor Corp. (c) | | | 1,440 | |
| | | | | | | | 5,454 | |
| | | | | Health Care Providers & Services — 3.8% |
| 38 | | | | Community Health Systems, Inc. (a) | | | 1,541 | |
| 56 | | | | Coventry Health Care, Inc. (a) | | | 3,214 | |
| 31 | | | | DaVita, Inc. (a) | | | 1,645 | |
| 8 | | | | Henry Schein, Inc. (a) | | | 448 | |
| 59 | | | | Lincare Holdings, Inc. (a) | | | 2,363 | |
| 45 | | | | VCA Antech, Inc. (a) | | | 1,692 | |
| | | | | | | | 10,903 | |
| | | | | Health Care Technology — 0.5% |
| 27 | | | | Cerner Corp. (a) | | | 1,509 | |
| | | | | Hotels, Restaurants & Leisure — 2.9% |
| 36 | | | | Applebee’s International, Inc. | | | 875 | |
| 94 | | | | Burger King Holdings, Inc. | | | 2,471 | |
| 43 | | | | Hilton Hotels Corp. | | | 1,446 | |
| 21 | | | | International Game Technology | | | 822 | |
| 15 | | | | Panera Bread Co., Class A (a) (c) | | | 681 | |
| 25 | | | | Scientific Games Corp. (a) (c) | | | 863 | |
| 35 | | | | Tim Hortons, Inc. (Canada) | | | 1,067 | > |
| | | | | | | | 8,225 | |
| | | | | Household Durables — 1.8% |
| 30 | | | | Fortune Brands, Inc. | | | 2,438 | |
| 24 | | | | Garmin Ltd. (Cayman Islands) (c) | | | 1,746 | |
| 24 | | | | Jarden Corp. (a) | | | 1,019 | |
| | | | | | | | 5,203 | |
| | | | | Household Products — 0.6% |
| 25 | | | | Clorox Co. | | | 1,571 | |
| | | | | Industrial Conglomerates — 1.0% |
| 33 | | | | Carlisle Cos., Inc. | | | 1,544 | |
| 7 | | | | McDermott International, Inc. (a) | | | 598 | |
| 22 | | | | Walter Industries, Inc. | | | 634 | |
| | | | | | | | 2,776 | |
| | | | | Insurance — 5.7% |
| 58 | | | | Assurant, Inc. | | | 3,394 | |
| 45 | | | | Cincinnati Financial Corp. | | | 1,960 | |
| 30 | | | | Everest Re Group Ltd. (Bermuda) | | | 3,270 | |
| 6 | | | | National Financial Partners Corp. | | | 278 | |
| 99 | | | | Old Republic International Corp. | | | 2,114 | |
| 43 | | | | OneBeacon Insurance Group Ltd. | | | 1,084 | |
| 22 | | | | Principal Financial Group, Inc. | | | 1,288 | |
| 53 | | | | Security Capital Assurance Ltd. (Bermuda) (c) | | | 1,627 | |
| 38 | | | | W.R. Berkley Corp. | | | 1,246 | |
| | | | | | | | 16,261 | |
SEE NOTES TO FINANCIAL STATEMENTS.
32 JPMORGAN MID CAP/MULTI-CAP FUNDS JUNE 30, 2007
SHARES
|
|
|
| SECURITY DESCRIPTION
|
| VALUE($)
|
|---|
Long-Term Investments — Continued |
| | | | | Internet & Catalog Retail — 0.8% |
| 33 | | | | Liberty Media Holding Corp. - Interactive, Class A (a) | | | 742 | |
| 23 | | | | priceline.com, Inc. (a) (c) | | | 1,574 | |
| | | | | | | | 2,316 | |
| | | | | Internet Software & Services — 0.2% |
| 13 | | | | Digital River, Inc. (a) | | | 593 | |
| | | | | IT Services — 1.3% |
| 11 | | | | Cognizant Technology Solutions Corp.,
Class A (a) | | | 841 | |
| 79 | | | | VeriFone Holdings, Inc. (a) | | | 2,781 | > |
| | | | | | | | 3,622 | |
| | | | | Life Sciences Tools & Services — 0.9% |
| 25 | | | | Covance, Inc. (a) | | | 1,687 | |
| 18 | | | | Illumina, Inc. (a) (c) | | | 726 | |
| | | | | | | | 2,413 | |
| | | | | Machinery — 1.6% |
| 15 | | | | Crane Co. | | | 677 | |
| 44 | | | | Dover Corp. | | | 2,230 | |
| 24 | | | | Oshkosh Truck Corp. | | | 1,485 | |
| | | | | | | | 4,392 | |
| | | | | Media — 3.0% |
| 50 | | | | Cablevision Systems Corp., Class A (a) | | | 1,791 | |
| 48 | | | | Clear Channel Communications, Inc. | | | 1,812 | |
| 23 | | | | Clear Channel Outdoor Holdings, Inc.,
Class A (a) | | | 640 | |
| 69 | | | | DreamWorks Animation SKG, Inc., Class A (a) | | | 1,984 | |
| 19 | | | | McClatchy Co., Class A | | | 481 | |
| 2 | | | | Washington Post Co. (The), Class B | | | 1,754 | |
| | | | | | | | 8,462 | |
| | | | | Metals & Mining — 0.4% |
| 21 | | | | Century Aluminum Co. (a) (c) | | | 1,169 | |
| | | | | Multi-Utilities — 1.6% |
| 32 | | | | CMS Energy Corp. | | | 552 | |
| 49 | | | | PG&E Corp. | | | 2,224 | |
| 14 | | | | SCANA Corp. | | | 540 | |
| 56 | | | | Xcel Energy, Inc. | | | 1,155 | |
| | | | | | | | 4,471 | |
| | | | | Multiline Retail — 1.2% |
| 33 | | | | Dollar Tree Stores, Inc. (a) | | | 1,429 | |
| 92 | | | | Saks, Inc. | | | 1,966 | |
| | | | | | | | 3,395 | |
| | | | | Office Electronics — 0.5% |
| 35 | | | | Zebra Technologies Corp., Class A (a) (c) | | | 1,348 | |
| | | | | Oil, Gas & Consumable Fuels — 4.6% |
| 38 | | | | Cabot Oil & Gas Corp. | | | 1,402 | |
| 28 | | | | Devon Energy Corp. | | | 2,200 | |
| 47 | | | | Forest Oil Corp. (a) (c) | | | 1,965 | |
| 29 | | | | Helix Energy Solutions Group, Inc. (a) | | | 1,169 | |
| 27 | | | | Quicksilver Resources, Inc. (a) (c) | | | 1,199 | |
| 32 | | | | Southwestern Energy Co. (a) | | | 1,433 | |
| 20 | | | | Teekay Shipping Corp. (Bahamas) | | | 1,170 | |
| 83 | | | | Williams Cos., Inc. | | | 2,618 | |
| | | | | | | | 13,156 | |
| | | | | Personal Products — 0.6% |
| 29 | | | | Bare Escentuals, Inc. (a) | | | 978 | |
| 14 | | | | Estee Lauder Cos., Inc., (The), Class A | | | 619 | |
| | | | | | | | 1,597 | |
| | | | | Pharmaceuticals — 2.3% |
| 33 | | | | Adams Respiratory Therapeutics, Inc. (a) (c) | | | 1,296 | |
| 23 | | | | Allergan, Inc. | | | 1,303 | |
| 43 | | | | Elan Corp. plc ADR (Ireland) (a) | | | 936 | |
| 22 | | | | Shire plc ADR (United Kingdom) | | | 1,653 | |
| 78 | | | | Warner Chilcott Ltd. (Bermuda) (a) | | | 1,409 | |
| | | | | | | | 6,597 | |
| | | | | Real Estate Investment Trusts (REITs) — 2.3% |
| 28 | | | | iStar Financial, Inc. | | | 1,232 | |
| 17 | | | | Plum Creek Timber Co., Inc. | | | 700 | |
| 17 | | | | Public Storage, Inc. | | | 1,268 | |
| 49 | | | | Rayonier, Inc. | | | 2,200 | |
| 11 | | | | Vornado Realty Trust | | | 1,186 | |
| | | | | | | | 6,586 | |
| | | | | Real Estate Management & Development — 0.8% |
| 66 | | | | Brookfield Properties Co. | | | 1,613 | |
| 13 | | | | Forest City Enterprises, Inc., Class A | | | 787 | |
| | | | | | | | 2,400 | |
| | | | | Road & Rail — 0.3% |
| 18 | | | | Norfolk Southern Corp. | | | 962 | |
| | | | | Semiconductors & Semiconductor Equipment — 3.3% |
| 81 | | | | Altera Corp. | | | 1,799 | |
| 34 | | | | Broadcom Corp., Class A (a) | | | 982 | |
| 18 | | | | Formfactor, Inc. (a) | | | 678 | |
| 32 | | | | KLA-Tencor Corp. | | | 1,775 | |
| 36 | | | | Microchip Technology, Inc. | | | 1,330 | |
| 45 | | | | NVIDIA Corp. (a) | | | 1,871 | |
| 23 | | | | Tessera Technologies, Inc. (a) | | | 937 | |
| | | | | | | | 9,372 | |
SEE NOTES TO FINANCIAL STATEMENTS.
JUNE 30, 2007 JPMORGAN MID CAP/MULTI-CAP FUNDS 33
JPMorgan Mid Cap Equity Fund
SCHEDULE OF PORTFOLIO INVESTMENTS
AS OF JUNE 30, 2007 (continued)
(Amounts in thousands)
SHARES
|
|
|
| SECURITY DESCRIPTION
|
| VALUE($)
|
|---|
Long-Term Investments — Continued |
| | | | | Software — 2.5% |
| 33 | | | | Adobe Systems, Inc. (a) | | | 1,337 | |
| 37 | | | | Amdocs Ltd. (United Kingdom) (a) | | | 1,485 | |
| 52 | | | | ANSYS, Inc. (a) (c) | | | 1,378 | |
| 40 | | | | Autodesk, Inc. (a) | | | 1,874 | |
| 43 | | | | Sybase, Inc. (a) | | | 1,018 | |
| | | | | | | | 7,092 | |
| | | | | Specialty Retail — 5.8% |
| 62 | | | | AutoNation, Inc. (a) | | | 1,394 | |
| 13 | | | | AutoZone, Inc. (a) | | | 1,817 | |
| 27 | | | | Barnes & Noble, Inc. | | | 1,043 | |
| 52 | | | | GameStop Corp., Class A (a) | | | 2,037 | |
| 46 | | | | Limited Brands, Inc. | | | 1,263 | |
| 41 | | | | Office Depot, Inc. (a) | | | 1,233 | |
| 30 | | | | PetSmart, Inc. | | | 970 | |
| 45 | | | | Staples, Inc. | | | 1,063 | |
| 55 | | | | Tiffany & Co. | | | 2,934 | |
| 58 | | | | TJX Cos., Inc. | | | 1,589 | |
| 45 | | | | Urban Outfitters, Inc. (a) | | | 1,077 | |
| | | | | | | | 16,420 | |
| | | | | Textiles, Apparel & Luxury Goods — 1.7% |
| 19 | | | | Columbia Sportswear Co. | | | 1,298 | |
| 23 | | | | Under Armour, Inc., Class A (a) (c) | | | 1,050 | |
| 28 | | | | V.F. Corp. | | | 2,592 | |
| | | | | | | | 4,940 | |
| | | | | Thrifts & Mortgage Finance — 0.5% |
| 10 | | | | MGIC Investment Corp. | | | 546 | |
| 52 | | | | People’s United Financial, Inc. | | | 927 | |
| | | | | | | | 1,473 | |
| | | | | Wireless Telecommunication Services — 2.3% |
| 34 | | | | American Tower Corp., Class A (a) | | | 1,424 | |
| 21 | | | | NII Holdings, Inc. (a) | | | 1,696 | |
| 39 | | | | Rogers Communications, Inc., Class B (Canada) | | | 1,674 | |
| 31 | | | | Telephone & Data Systems, Inc. | | | 1,784 | |
| | | | | | | | 6,578 | |
| | | | | Total Long-Term Investments
(Cost $214,495) | | | 279,442 | |
Short-Term Investment — 1.9% |
| | | | | Investment Company — 1.9% |
| 5,483 | | | | JPMorgan Prime Money Market Fund, Institutional Class (b) (m)
(Cost $5,483) | | | 5,483 | |
PRINCIPAL
AMOUNT($)
|
|
|
| SECURITY DESCRIPTION
|
| VALUE($)
|
|---|
Investments of Cash Collateral for Securities on Loan — 4.9% |
| | | | | Corporate Notes — 1.5% |
| 1,000 | | | | Alliance and Leicester plc, FRN, 5.33%, 07/29/08 | | | 1,000 | |
| 500 | | | | Banque Federative du Credit Mutuel, FRN, 5.32%, 07/29/08 | | | 500 | |
| 750 | | | | CDC Financial Products, Inc., FRN, 5.43%, 07/27/07 | | | 750 | |
| 1,000 | | | | Morgan Stanley & Co., Inc., FRN, 5.56%, 07/29/08 | | | 1,000 | |
| 900 | | | | Sigma Finance Inc., FRN, 5.37%, 10/24/07 | | | 900 | |
| | | | | | | | 4,150 | |
| | | | | Repurchase Agreements — 3.4% |
| 3,000 | | | | ABN Amro Bank N.V., New York, 5.34%, dated 06/29/07, due 07/02/07, repurchase price $3,001, collateralized by U.S. Government Agency Mortgages. | | | 3,000 | |
| 811 | | | | Banc of America Securities LLC, 5.39%, dated 06/29/07, due 07/02/07, repurchase price $811, collateralized by U.S. Government Agency Mortgages. | | | 811 | |
| 3,000 | | | | Bear Stearns Cos., Inc., 5.38%, dated 06/29/07, due 07/02/07, repurchase price $3,001, collateralized by U.S. Government Agency Mortgages. | | | 3,000 | |
| 3,000 | | | | Credit Suisse First Boston LLC, 5.39%, dated 06/29/07, due 07/02/07, repurchase price $3,001, collateralized by U.S. Government Agency Mortgages. | | | 3,000 | |
| | | | | | | | 9,811 | |
| | | | | Total Investments of Cash Collateral
for Securities on Loan
(Cost $13,961) | | | 13,961 | |
| | | | | Total Investments — 105.0%
(Cost $233,939) | | | 298,886 | |
| | | | | Liabilities in Excess of
Other Assets — (5.0)% | | | (14,340 | ) |
| | | | | NET ASSETS — 100.0% | | $ | 284,546 | |
Percentages indicated are based on net assets.
SEE NOTES TO FINANCIAL STATEMENTS.
34 JPMORGAN MID CAP/MULTI-CAP FUNDS JUNE 30, 2007
JPMorgan Mid Cap Value Fund
SCHEDULE OF PORTFOLIO INVESTMENTS
AS OF JUNE 30, 2007
(Amounts in thousands)
SHARES
|
|
|
| SECURITY DESCRIPTION
|
| VALUE($)
|
|---|
Long-Term Investments — 97.0% |
| | | | | Common Stocks — 97.0% |
| | | | | Aerospace & Defense — 0.9% |
| 763 | | | | Alliant Techsystems, Inc. (a) (c) | | | 75,661 | |
| | | | | Beverages — 2.6% |
| 2,082 | | | | Brown-Forman Corp., Class B (c) | | | 152,126 | |
| 3,060 | | | | Constellation Brands, Inc., Class A (a) (c) | | | 74,290 | |
| | | | | | | | 226,416 | |
| | | | | Building Products — 0.5% |
| 1,261 | | | | Owens Corning, Inc. (a) (c) | | | 42,421 | |
| | | | | Capital Markets — 3.1% |
| 229 | | | | Affiliated Managers Group, Inc. (a) (c) | | | 29,512 | |
| 2,697 | | | | E*Trade Financial Corp. (a) | | | 59,574 | |
| 428 | | | | Legg Mason, Inc. | | | 42,057 | |
| 1,315 | | | | Northern Trust Corp. | | | 84,450 | |
| 1,021 | | | | T. Rowe Price Group, Inc. | | | 52,980 | |
| | | | | | | | 268,573 | |
| | | | | Chemicals — 3.1% |
| 2,003 | | | | Albemarle Corp. | | | 77,193 | |
| 1,143 | | | | PPG Industries, Inc. | | | 87,001 | |
| 2,497 | | | | Sigma-Aldrich Corp. | | | 106,564 | |
| | | | | | | | 270,758 | |
| | | | | Commercial Banks — 6.8% |
| 589 | | | | Compass Bancshares, Inc. | | | 40,643 | |
| 1,473 | | | | Cullen/Frost Bankers, Inc. (c) | | | 78,745 | |
| 1,398 | | | | M&T Bank Corp. | | | 149,478 | |
| 5,198 | | | | Synovus Financial Corp. (c) | | | 159,573 | |
| 1,846 | | | | Wilmington Trust Corp. | | | 76,624 | |
| 1,044 | | | | Zions Bancorporation | | | 80,263 | |
| | | | | | | | 585,326 | |
| | | | | Commercial Services & Supplies — 1.2% |
| 3,364 | | | | Republic Services, Inc. | | | 103,087 | |
| | | | | Computers & Peripherals — 1.0% |
| 1,712 | | | | NCR Corp. (a) | | | 89,970 | |
| | | | | Construction Materials — 0.6% |
| 424 | | | | Vulcan Materials Co. (c) | | | 48,542 | |
| | | | | Containers & Packaging — 1.4% |
| 2,295 | | | | Ball Corp. | | | 122,015 | |
| | | | | Distributors — 1.6% |
| 2,857 | | | | Genuine Parts Co. | | | 141,682 | |
| | | | | Diversified Telecommunication Services — 3.0% |
| 2,137 | | | | CenturyTel, Inc. | | | 104,835 | |
| 3,230 | | | | Citizens Communications Co. | | | 49,317 | |
| 6,846 | | | | Windstream Corp. | | | 101,051 | |
| | | | | | | | 255,203 | |
| | | | | Electric Utilities — 4.9% |
| 3,161 | | | | American Electric Power Co., Inc. | | | 142,349 | |
| 2,098 | | | | FirstEnergy Corp. | | | 135,804 | |
| 1,682 | | | | PPL Corp. | | | 78,719 | |
| 2,803 | | | | Westar Energy, Inc. (c) | | | 68,054 | |
| | | | | | | | 424,926 | |
| | | | | Electrical Equipment — 1.2% |
| 2,600 | | | | Ametek, Inc. (c) | | | 103,172 | |
| | | | | Electronic Equipment & Instruments — 1.8% |
| 1,800 | | | | Amphenol Corp., Class A | | | 64,166 | |
| 2,345 | | | | Arrow Electronics, Inc. (a) (c) | | | 90,103 | |
| | | | | | | | 154,269 | |
| | | | | Food & Staples Retailing — 1.6% |
| 2,873 | | | | SUPERVALU, Inc. | | | 133,064 | |
| | | | | Food Products — 1.8% |
| 1,031 | | | | Dean Foods Co. | | | 32,865 | |
| 3,575 | | | | Del Monte Foods Co. | | | 43,477 | |
| 1,364 | | | | Wm. Wrigley, Jr., Co. | | | 75,437 | |
| | | | | | | | 151,779 | |
| | | | | Gas Utilities — 3.6% |
| 1,905 | | | | Energen Corp. | | | 104,661 | |
| 553 | | | | ONEOK, Inc. | | | 27,872 | |
| 2,204 | | | | Questar Corp. | | | 116,502 | |
| 2,258 | | | | UGI Corp. | | | 61,595 | |
| | | | | | | | 310,630 | |
| | | | | Health Care Providers & Services — 4.0% |
| 2,303 | | | | Community Health Systems, Inc. (a) | | | 93,152 | |
| 3,375 | | | | Coventry Health Care, Inc. (a) | | | 194,543 | |
| 509 | | | | Henry Schein, Inc. (a) (c) | | | 27,184 | |
| 638 | | | | Lincare Holdings, Inc. (a) | | | 25,404 | |
| | | | | | | | 340,283 | |
| | | | | Hotels, Restaurants & Leisure — 2.3% |
| 2,201 | | | | Applebee’s International, Inc. | | | 53,051 | |
| 2,136 | | | | Burger King Holdings, Inc. | | | 56,273 | |
| 2,613 | | | | Hilton Hotels Corp. | | | 87,462 | |
| | | | | | | | 196,786 | |
SEE NOTES TO FINANCIAL STATEMENTS.
JUNE 30, 2007 JPMORGAN MID CAP/MULTI-CAP FUNDS 35
JPMorgan Mid Cap Value Fund
SCHEDULE OF PORTFOLIO INVESTMENTS
AS OF JUNE 30, 2007 (continued)
(Amounts in thousands)
SHARES
|
|
|
| SECURITY DESCRIPTION
|
| VALUE($)
|
|---|
Long-Term Investments — Continued |
| | | | | Household Durables — 2.4% |
| 1,793 | | | | Fortune Brands, Inc. | | | 147,690 | |
| 1,398 | | | | Jarden Corp. (a) (c) | | | 60,145 | |
| | | | | | | | 207,835 | |
| | | | | Household Products — 1.1% |
| 1,526 | | | | Clorox Co. | | | 94,752 | |
| | | | | Industrial Conglomerates — 1.5% |
| 2,008 | | | | Carlisle Cos., Inc. | | | 93,369 | |
| 1,328 | | | | Walter Industries, Inc. (c) | | | 38,464 | |
| | | | | | | | 131,833 | |
| | | | | Insurance — 9.2% |
| 3,481 | | | | Assurant, Inc. (c) | | | 205,118 | |
| 2,731 | | | | Cincinnati Financial Corp. | | | 118,524 | |
| 1,164 | | | | Everest Re Group Ltd. (Bermuda) | | | 126,403 | |
| 6,021 | | | | Old Republic International Corp. | | | 128,012 | |
| 2,585 | | | | OneBeacon Insurance Group Ltd. | | | 65,483 | |
| 1,308 | | | | Principal Financial Group, Inc. | | | 76,220 | |
| 2,316 | | | | W.R. Berkley Corp. | | | 75,353 | |
| | | | | | | | 795,113 | |
| | | | | Internet & Catalog Retail — 0.5% |
| 2,006 | | | | Liberty Media Holding Corp. — Interactive, Class A (a) | | | 44,785 | |
| | | | | Machinery — 3.1% |
| 896 | | | | Crane Co. | | | 40,737 | |
| 2,632 | | | | Dover Corp. | | | 134,617 | |
| 1,426 | | | | Oshkosh Truck Corp. (c) | | | 89,730 | |
| | | | | | | | 265,084 | |
| | | | | Media — 4.5% |
| 2,992 | | | | Cablevision Systems Corp., Class A (a) | | | 108,270 | |
| 2,897 | | | | Clear Channel Communications, Inc. | | | 109,572 | |
| 1,363 | | | | Clear Channel Outdoor Holdings, Inc.,
Class A (a) (c) | | | 38,640 | |
| 1,148 | | | | McClatchy Co., Class A (c) | | | 29,053 | |
| 137 | | | | Washington Post Co. (The), Class B | | | 106,076 | |
| | | | | | | | 391,611 | |
| | | | | Multi-Utilities — 3.1% |
| 1,942 | | | | CMS Energy Corp. | | | 33,401 | |
| 2,968 | | | | PG&E Corp. | | | 134,464 | |
| 852 | | | | SCANA Corp. | | | 32,635 | |
| 3,411 | | | | Xcel Energy, Inc. (c) | | | 69,831 | |
| | | | | | | | 270,331 | |
| | | | | Oil, Gas & Consumable Fuels — 5.0% |
| 1,703 | | | | Devon Energy Corp. | | | 133,289 | |
| 1,771 | | | | Helix Energy Solutions Group, Inc. (a) | | | 70,661 | |
| 1,220 | | | | Teekay Shipping Corp. (Bahamas) (c) | | | 70,667 | |
| 5,001 | | | | Williams Cos., Inc. | | | 158,141 | |
| | | | | | | | 432,758 | |
| | | | | Personal Products — 0.4% |
| 823 | | | | Estee Lauder Cos., Inc., (The), Class A | | | 37,464 | |
| | | | | Pharmaceuticals — 1.0% |
| 4,706 | | | | Warner Chilcott Ltd., Class A (Bermuda) (a) (c) | | | 85,133 | |
| | | | | Real Estate Investment Trusts (REITs) — 4.6% |
| 1,681 | | | | iStar Financial, Inc. | | | 74,533 | |
| 1,016 | | | | Plum Creek Timber Co., Inc. (c) | | | 42,327 | |
| 999 | | | | Public Storage, Inc. | | | 76,720 | |
| 2,943 | | | | Rayonier, Inc. | | | 132,867 | |
| 651 | | | | Vornado Realty Trust | | | 71,495 | |
| | | | | | | | 397,942 | |
| | | | | Real Estate Management & Development — 1.7% |
| 4,008 | | | | Brookfield Properties Co. | | | 97,431 | |
| 772 | | | | Forest City Enterprises, Inc., Class A (c) | | | 47,456 | |
| | | | | | | | 144,887 | |
| | | | | Road & Rail — 0.7% |
| 1,105 | | | | Norfolk Southern Corp. | | | 58,100 | |
| | | | | Specialty Retail — 6.2% |
| 3,761 | | | | AutoNation, Inc. (a) | | | 84,387 | |
| 801 | | | | AutoZone, Inc. (a) | | | 109,378 | |
| 2,780 | | | | Limited Brands, Inc. | | | 76,305 | |
| 2,711 | | | | Staples, Inc. | | | 64,332 | |
| 2,037 | | | | Tiffany & Co. | | | 108,089 | |
| 3,494 | | | | TJX Cos., Inc. | | | 96,074 | |
| | | | | | | | 538,565 | |
| | | | | Textiles, Apparel & Luxury Goods — 2.7% |
| 1,147 | | | | Columbia Sportswear Co. (c) | | | 78,742 | |
| 1,710 | | | | V.F. Corp. | | | 156,611 | |
| | | | | | | | 235,353 | |
| | | | | Thrifts & Mortgage Finance — 1.0% |
| 578 | | | | MGIC Investment Corp. (c) | | | 32,865 | |
| 3,162 | | | | People’s United Financial, Inc. | | | 56,069 | |
| | | | | | | | 88,934 | |
SEE NOTES TO FINANCIAL STATEMENTS.
36 JPMORGAN MID CAP/MULTI-CAP FUNDS JUNE 30, 2007
SHARES
|
|
|
| SECURITY DESCRIPTION
|
| VALUE($)
|
|---|
Long-Term Investments — Continued |
| | | | | Wireless Telecommunication Services — 1.3% |
| 1,873 | | | | Telephone & Data Systems, Inc. | | | 107,808 | |
| | | | | Total Long-Term Investments
(Cost $6,654,443) | | | 8,372,851 | |
Short-Term Investment — 2.8% |
| | | | | Investment Company — 2.8% |
| 243,352 | | | | JPMorgan Prime Money Market Fund, Institutional Class (b) (m)
(Cost $243,352) | | | 243,352 | |
PRINCIPAL
AMOUNT($)
|
|
|
|
|
|
|
|---|
Investments of Cash Collateral for Securities on Loan — 2.5% |
| | | | | Certificate of Deposit — 0.1% |
| 7,499 | | | | Natexis Banques Populaires, New York, FRN, 5.39%, 01/09/08 | | | 7,499 | |
| | | | | Corporate Notes — 2.2% |
| 2,000 | | | | Alliance and Leicester plc, FRN, 5.33%, 07/29/08 | | | 2,000 | |
| 13,000 | | | | Allstate Life Global Funding II, FRN, 5.32%, 07/29/08 | | | 13,000 | |
| 15,000 | | | | Anglo Irish Bank Corp plc, FRN, 5.36%, 07/29/08 | | | 15,000 | |
| 16,050 | | | | Banque Federative du Credit Mutuel, FRN, 5.32%, 07/29/08 | | | 16,050 | |
| 10,000 | | | | BCP Finance Bank Ltd., FRN, 5.37%, 07/29/08 | | | 10,000 | |
| 2,498 | | | | Beta Finance, Inc., FRN, 5.39%, 02/20/09 | | | 2,499 | |
| 10,000 | | | | Caixa Catal, FRN, 5.39%, 07/28/08 | | | 10,000 | |
| 1,000 | | | | Citigroup Global Markets Inc., FRN, 5.45%, 07/06/07 | | | 1,000 | |
| 11,999 | | | | Comerica, FRN, 5.31%, 11/13/07 | | | 11,999 | |
| 13,500 | | | | Dorada Finance Inc., FRN, 5.37%, 01/14/08 | | | 13,500 | |
| 5,000 | | | | First Tennessee Bank, FRN, 5.33%, 07/29/08 | | | 5,000 | |
| 10,998 | | | | Liberty Lighthouse U.S. Capital, FRN, 5.34%, 02/04/08 | | | 10,998 | |
| 9,000 | | | | Metropolitan Life Global Funding, FRN, 5.31%, 07/29/08 | | | 9,000 | |
| 15,500 | | | | Morgan Stanley & Co., Inc., FRN, 5.56%, 07/29/08 | | | 15,500 | |
| 22,998 | | | | National City Bank of Cleveland, FRN, 5.33%, 10/04/07 | | | 22,998 | |
| 15,000 | | | | National Rural Utilities Coop., FRN, 5.30%, 07/29/08 | | | 15,000 | |
| 5,000 | | | | Pricoa Global Funding I, FRN,
5.31%, 07/29/08 | | | 5,000 | |
| 1,000 | | | | Sigma Finance Inc., FRN, 5.37%, 10/24/07 | | | 1,000 | |
| 10,000 | | | | Wachovia Bank N.A., FRN, 5.36%, 02/23/09 | | | 10,000 | |
| | | | | | | | 189,544 | |
| | | | | Repurchase Agreement — 0.2% |
| 17,873 | | | | Banc of America Securities LLC, 5.39%, dated 06/29/07, due 07/02/07, repurchase price $17,881, collateralized by U.S. Government Agency Mortgages. | | | 17,873 | |
| | | | | Total Investment of Cash Collateral
for Securities on Loan
(Cost $214,916) | | | 214,916 | |
| | | | | Total Investments — 102.3%
(Cost $7,112,711) | | | 8,831,119 | |
| | | | | Liabilities in Excess of
Other Assets — (2.3)% | | | (202,412 | ) |
| | | | | NET ASSETS — 100.0% | | $ | 8,628,707 | |
Percentages indicated are based on net assets.
SEE NOTES TO FINANCIAL STATEMENTS.
JUNE 30, 2007 JPMORGAN MID CAP/MULTI-CAP FUNDS 37
JPMorgan Multi-Cap Market Neutral Fund
SCHEDULE OF PORTFOLIO INVESTMENTS
AS OF JUNE 30, 2007
(Amounts in thousands)
SHARES
|
|
|
| SECURITY DESCRIPTION
|
| VALUE($)
|
|---|
Long Positions — 96.4% (j) |
| | | | | Common Stocks — 91.6% |
| | | | | Aerospace & Defense — 2.6% |
| 64 | | | | BE Aerospace, Inc. (a) | | | 2,653 | |
| 60 | | | | Boeing Co. | | | 5,743 | |
| 124 | | | | Ceradyne, Inc. (a) | | | 9,145 | |
| 36 | | | | DRS Technologies, Inc. | | | 2,070 | |
| 81 | | | | Honeywell International, Inc. | | | 4,540 | |
| 74 | | | | L-3 Communications Holdings, Inc. | | | 7,239 | |
| 83 | | | | Lockheed Martin Corp. | | | 7,787 | |
| 61 | | | | Northrop Grumman Corp. | | | 4,737 | |
| 28 | | | | Precision Castparts Corp. | | | 3,405 | |
| 140 | | | | Raytheon Co. | | | 7,563 | |
| 94 | | | | Spirit Aerosystems Holdings, Inc. (a) | | | 3,386 | �� |
| 4 | | | | United Technologies Corp. | | | 278 | |
| | | | | | | | 58,546 | |
| | | | | Air Freight & Logistics — 0.1% |
| 95 | | | | Hub Group, Inc., Class A (a) | | | 3,326 | |
| | | | | Airlines — 0.8% |
| 160 | | | | AMR Corp. (a) | | | 4,217 | |
| 144 | | | | Continental Airlines, Inc., Class B (a) | | | 4,872 | |
| 150 | | | | SkyWest, Inc. | | | 3,583 | |
| 172 | | | | U.S. Airways Group, Inc. (a) | | | 5,193 | |
| 33 | | | | UAL Corp. (a) | | | 1,350 | |
| | | | | | | | 19,215 | |
| | | | | Auto Components — 0.4% |
| 461 | | | | ArvinMeritor, Inc. | | | 10,239 | |
| | | | | Automobiles — 0.7% |
| 222 | | | | General Motors Corp. | | | 8,387 | |
| 167 | | | | Thor Industries, Inc. | | | 7,554 | |
| | | | | | | | 15,941 | |
| | | | | Beverages — 0.7% |
| 178 | | | | Coca-Cola Enterprises, Inc. | | | 4,276 | |
| 35 | | | | Molson Coors Brewing Co., Class B | | | 3,225 | |
| 210 | | | | Pepsi Bottling Group, Inc. | | | 7,065 | |
| 93 | | | | PepsiAmericas, Inc. | | | 2,287 | |
| | | | | | | | 16,853 | |
| | | | | Biotechnology — 0.9% |
| 116 | | | | Cephalon, Inc. (a) | | | 9,298 | |
| 61 | | | | Cubist Pharmaceuticals, Inc. (a) | | | 1,206 | |
| 277 | | | | Dendreon Corp. (a) | | | 1,961 | |
| 56 | | | | Genzyme Corp. (a) | | | 3,600 | |
| 330 | | | | Millennium Pharmaceuticals, Inc. (a) | | | 3,488 | |
| | | | | | | | 19,553 | |
| | | | | Building Products — 0.7% |
| 69 | | | | American Standard Cos., Inc. | | | 4,045 | |
| 87 | | | | Lennox International, Inc. | | | 2,985 | |
| 246 | | | | Masco Corp. | | | 6,995 | |
| 33 | | | | NCI Building Systems, Inc. (a) | | | 1,620 | |
| | | | | | | | 15,645 | |
| | | | | Capital Markets — 1.2% |
| 1 | | | | Apollo Investment Corp. | | | 26 | |
| 39 | | | | Bear Stearns Cos., Inc. (The) | | | 5,468 | |
| 30 | | | | Goldman Sachs Group, Inc. (The) | | | 6,598 | |
| 81 | | | | Lehman Brothers Holdings, Inc. | | | 6,014 | |
| 21 | | | | Merrill Lynch & Co., Inc. | | | 1,727 | |
| 78 | | | | Morgan Stanley | | | 6,558 | |
| | | | | | | | 26,391 | |
| | | | | Chemicals — 3.2% |
| 180 | | | | Albemarle Corp. | | | 6,927 | |
| 63 | | | | Ashland, Inc. | | | 4,001 | |
| 37 | | | | Cabot Corp. | | | 1,786 | |
| 182 | | | | Celanese Corp., Class A | | | 7,041 | |
| 92 | | | | CF Industries Holdings, Inc. | | | 5,486 | |
| 8 | | | | FMC Corp. | | | 759 | |
| 216 | | | | H.B. Fuller Co. | | | 6,463 | |
| 78 | | | | Huntsman Corp. | | | 1,895 | |
| 135 | | | | Lubrizol Corp. | | | 8,729 | |
| 236 | | | | Lyondell Chemical Co. | | | 8,747 | |
| 24 | | | | Minerals Technologies, Inc. | | | 1,639 | |
| 271 | | | | Olin Corp. | | | 5,688 | |
| 125 | | | | OM Group, Inc. (a) | | | 6,607 | |
| 49 | | | | RPM International, Inc. | | | 1,141 | |
| 224 | | | | Terra Industries, Inc. (a) | | | 5,702 | |
| | | | | | | | 72,611 | |
| | | | | Commercial Banks — 1.6% |
| 109 | | | | BB&T Corp. | | | 4,435 | |
| 97 | | | | Comerica, Inc. | | | 5,739 | |
| 74 | | | | East-West Bancorp, Inc. | | | 2,883 | |
| 200 | | | | Huntington Bancshares, Inc. | | | 4,546 | |
| 82 | | | | Keycorp | | | 2,805 | |
| 56 | | | | PNC Financial Services Group, Inc. | | | 3,983 | |
| 107 | | | | U.S. Bancorp | | | 3,536 | |
| 85 | | | | Wachovia Corp. | | | 4,368 | |
| 108 | | | | Wells Fargo & Co. | | | 3,790 | |
| | | | | | | | 36,085 | |
SEE NOTES TO FINANCIAL STATEMENTS.
38 JPMORGAN MID CAP/MULTI-CAP FUNDS JUNE 30, 2007
SHARES
|
|
|
| SECURITY DESCRIPTION
|
| VALUE($)
|
|---|
Long Positions — Continued |
| | | | | Commercial Services & Supplies — 1.7% |
| 91 | | | | Administaff, Inc. | | | 3,041 | |
| 114 | | | | ChoicePoint, Inc. (a) | | | 4,838 | |
| 110 | | | | Deluxe Corp. | | | 4,457 | |
| 67 | | | | IKON Office Solutions, Inc. | | | 1,053 | |
| 255 | | | | Labor Ready, Inc. (a) | | | 5,884 | |
| 75 | | | | Manpower, Inc. | | | 6,903 | |
| 34 | | | | R.R. Donnelley & Sons Co. | | | 1,496 | |
| 158 | | | | Steelcase, Inc. | | | 2,923 | |
| 58 | | | | United Stationers, Inc. (a) | | | 3,851 | |
| 106 | | | | Watson Wyatt Worldwide, Inc., Class A | | | 5,330 | |
| | | | | | | | 39,776 | |
| | | | | Communications Equipment — 1.6% |
| 1,313 | | | | 3Com Corp. (a) | | | 5,424 | |
| 109 | | | | ADC Telecommunications, Inc. (a) | | | 1,995 | |
| 221 | | | | Andrew Corp. (a) | | | 3,196 | |
| 552 | | | | Arris Group, Inc. (a) | | | 9,705 | |
| 112 | | | | Cisco Systems, Inc. (a) | | | 3,118 | |
| 18 | | | | CommScope, Inc. (a) | | | 1,041 | |
| 202 | | | | InterDigital Communications Corp. (a) | | | 6,507 | |
| 99 | | | | Tekelec (a) | | | 1,429 | |
| 507 | | | | UTStarcom, Inc. (a) | | | 2,844 | |
| | | | | | | | 35,259 | |
| | | | | Computers & Peripherals — 2.2% |
| 16 | | | | Apple, Inc. (a) | | | 1,938 | |
| 782 | | | | Brocade Communications Systems, Inc.(a) | | | 6,119 | |
| 275 | | | | Emulex Corp. (a) | | | 6,012 | |
| 153 | | | | Hewlett-Packard Co. | | | 6,830 | |
| 41 | | | | International Business Machines Corp. | | | 4,337 | |
| 236 | | | | Komag, Inc. (a) | | | 7,532 | |
| 122 | | | | Lexmark International, Inc., Class A (a) | | | 6,006 | |
| 438 | | | | Sun Microsystems, Inc. (a) | | | 2,307 | |
| 408 | | | | Western Digital Corp.(a) | | | 7,904 | |
| | | | | | | | 48,985 | |
| | | | | Construction & Engineering — 0.4% |
| 120 | | | | EMCOR Group, Inc. (a) | | | 8,748 | |
| | | | | Consumer Finance — 0.8% |
| 60 | | | | American Express Co. | | | 3,695 | |
| 246 | | | | AmeriCredit Corp. (a) | | | 6,519 | |
| 189 | | | | First Marblehead Corp. (The) | | | 7,304 | |
| | | | | | | | 17,518 | |
| | | | | Containers & Packaging — 0.7% |
| 29 | | | | Ball Corp. | | | 1,549 | |
| 14 | | | | Packaging Corp. of America | | | 366 | |
| 126 | | | | Rock-Tenn Co., Class A | | | 3,994 | |
| 121 | | | | Sonoco Products Co. | | | 5,183 | |
| 72 | | | | Temple-Inland, Inc. | | | 4,433 | |
| | | | | | | | 15,525 | |
| | | | | Diversified Consumer Services — 0.5% |
| 110 | | | | Jackson Hewitt Tax Service, Inc. | | | 3,083 | |
| 212 | | | | Service Corp. International | | | 2,706 | |
| 115 | | | | Sotheby’s | | | 5,300 | |
| | | | | | | | 11,089 | |
| | | | | Diversified Financial Services — 1.0% |
| 128 | | | | Bank of America Corp. | | | 6,254 | |
| 140 | | | | CIT Group, Inc. | | | 7,687 | |
| 136 | | | | Citigroup, Inc. | | | 6,998 | |
| 32 | | | | Moody’s Corp. | | | 1,966 | |
| | | | | | | | 22,905 | |
| | | | | Diversified Telecommunication Services — 0.8% |
| 79 | | | | CenturyTel, Inc. | | | 3,856 | |
| 669 | | | | Cincinnati Bell, Inc. (a) | | | 3,868 | |
| 126 | | | | Embarq Corp. | | | 7,994 | |
| 50 | | | | Golden Telecom, Inc. (Russia) | | | 2,763 | |
| | | | | | | | 18,481 | |
| | | | | Electric Utilities — 1.1% |
| 4 | | | | American Electric Power Co., Inc. | | | 180 | |
| 327 | | | | Duke Energy Corp. | | | 5,984 | |
| 142 | | | | Edison International | | | 7,961 | |
| 16 | | | | FirstEnergy Corp. | | | 1,025 | |
| 139 | | | | Pinnacle West Capital Corp. | | | 5,541 | |
| 88 | | | | Progress Energy, Inc. | | | 3,994 | |
| | | | | | | | 24,685 | |
| | | | | Electrical Equipment — 1.2% |
| 103 | | | | A.O. Smith Corp. | | | 4,090 | |
| 130 | | | | Acuity Brands, Inc. | | | 7,865 | |
| 108 | | | | Belden, Inc. | | | 5,959 | |
| 6 | | | | Cooper Industries Ltd., Class A | | | 332 | |
| 114 | | | | Regal-Beloit Corp. | | | 5,293 | |
| 30 | | | | Rockwell Automation, Inc. | | | 2,079 | |
| 47 | | | | Thomas & Betts Corp. (a) | | | 2,721 | |
| | | | | | | | 28,339 | |
SEE NOTES TO FINANCIAL STATEMENTS.
JUNE 30, 2007 JPMORGAN MID CAP/MULTI-CAP FUNDS 39
JPMorgan Multi-Cap Market Neutral Fund
SCHEDULE OF PORTFOLIO INVESTMENTS
AS OF JUNE 30, 2007 (continued)
(Amounts in thousands)
SHARES
|
|
|
| SECURITY DESCRIPTION
|
| VALUE($)
|
|---|
Long Positions — Continued |
| | | | | Electronic Equipment & Instruments — 1.2% |
| 26 | | | | Amphenol Corp., Class A | | | 911 | |
| 152 | | | | Avnet, Inc. (a) | | | 6,027 | |
| 168 | | | | AVX Corp. | | | 2,812 | |
| 279 | | | | Ingram Micro, Inc. Class A (a) | | | 6,063 | |
| 63 | | | | Plexus Corp. (a) | | | 1,458 | |
| 80 | | | | Technitrol, Inc. | | | 2,291 | |
| 453 | | | | Vishay Intertechnology, Inc. (a) | | | 7,165 | |
| | | | | | | | 26,727 | |
| | | | | Energy Equipment & Services — 4.0% |
| 45 | | | | Diamond Offshore Drilling, Inc. | | | 4,550 | |
| 150 | | | | ENSCO International, Inc. | | | 9,145 | |
| 368 | | | | Global Industries Ltd. (a) | | | 9,858 | |
| 939 | | | | Grey Wolf, Inc. (a) | | | 7,736 | |
| 135 | | | | Nabors Industries Ltd. (Bermuda) (a) | | | 4,521 | |
| 70 | | | | National Oilwell Varco, Inc. (a) | | | 7,315 | |
| 18 | | | | Noble Corp. | | | 1,712 | |
| 202 | | | | Oil States International, Inc. (a) | | | 8,347 | |
| 271 | | | | Patterson-UTI Energy, Inc. | | | 7,111 | |
| 6 | | | | SEACOR Holdings, Inc. (a) | | | 557 | |
| 193 | | | | Superior Energy Services, Inc. (a) | | | 7,710 | |
| 141 | | | | Tidewater, Inc. | | | 10,003 | |
| 40 | | | | Transocean, Inc.(a) | | | 4,199 | |
| 136 | | | | Unit Corp. (a) | | | 8,574 | |
| | | | | | | | 91,338 | |
| | | | | Food & Staples Retailing — 0.3% |
| 215 | | | | Kroger Co. (The) | | | 6,048 | |
| 44 | | | | Safeway, Inc. | | | 1,507 | |
| | | | | | | | 7,555 | |
| | | | | Food Products — 0.7% |
| 188 | | | | Dean Foods Co. | | | 6,006 | |
| 284 | | | | Del Monte Foods Co. | | | 3,458 | |
| 25 | | | | JM Smucker Co. (The) | | | 1,613 | |
| 11 | | | | Ralcorp Holdings, Inc. (a) | | | 565 | |
| 264 | | | | Sara Lee Corp. | | | 4,597 | |
| | | | | | | | 16,239 | |
| | | | | Gas Utilities — 1.2% |
| 116 | | | | Atmos Energy Corp. | | | 3,493 | |
| 101 | | | | Energen Corp. | | | 5,570 | |
| 74 | | | | New Jersey Resources Corp. | | | 3,793 | |
| 164 | | | | ONEOK, Inc. | | | 8,248 | |
| 7 | | | | Southwest Gas Corp. | | | 233 | |
| 176 | | | | UGI Corp. | | | 4,792 | |
| 67 | | | | WGL Holdings, Inc. | | | 2,179 | |
| | | | | | | | 28,308 | |
| | | | | Health Care Equipment & Supplies — 1.1% |
| 130 | | | | Baxter International, Inc. | | | 7,329 | |
| 96 | | | | Beckman Coulter, Inc. | | | 6,180 | |
| 4 | | | | Edwards Lifesciences Corp. (a) | | | 195 | |
| 23 | | | | Haemonetics Corp. (a) | | | 1,236 | |
| 94 | | | | Immucor, Inc. (a) | | | 2,618 | |
| 114 | | | | Kinetic Concepts, Inc. (a) | | | 5,942 | |
| 41 | | | | Mentor Corp. | | | 1,687 | |
| | | | | | | | 25,187 | |
| | | | | Health Care Providers & Services — 3.4% |
| 178 | | | | Aetna, Inc. | | | 8,797 | |
| 213 | | | | AMERIGROUP Corp. (a) | | | 5,081 | |
| 133 | | | | AmerisourceBergen Corp. | | | 6,564 | |
| 188 | | | | Apria Healthcare Group, Inc. (a) | | | 5,416 | |
| 131 | | | | Cigna Corp. | | | 6,861 | |
| 111 | | | | Coventry Health Care, Inc. (a) | | | 6,423 | |
| 139 | | | | HealthSpring, Inc. (a) | | | 2,649 | |
| 123 | | | | Humana, Inc. (a) | | | 7,495 | |
| 32 | | | | Kindred Healthcare, Inc. (a) | | | 988 | |
| 99 | | | | LifePoint Hospitals, Inc. (a) | | | 3,816 | |
| 76 | | | | McKesson Corp. | | | 4,516 | |
| 68 | | | | Medco Health Solutions, Inc. (a) | | | 5,307 | |
| 68 | | | | UnitedHealth Group, Inc. | | | 3,498 | |
| 80 | | | | WellCare Health Plans, Inc. (a) | | | 7,258 | |
| 46 | | | | WellPoint, Inc. (a) | | | 3,666 | |
| | | | | | | | 78,335 | |
| | | | | Hotels, Restaurants & Leisure — 2.4% |
| 68 | | | | Ameristar Casinos, Inc. | | | 2,352 | |
| 78 | | | | Carnival Corp. | | | 3,820 | |
| 143 | | | | CBRL Group, Inc. | | | 6,066 | |
| 29 | | | | CEC Entertainment, Inc. (a) | | | 1,037 | |
| 190 | | | | Darden Restaurants, Inc. | | | 8,347 | |
| 150 | | | | Domino’s Pizza, Inc. | | | 2,735 | |
| 85 | | | | Jack in the Box, Inc. (a) | | | 6,049 | |
| 95 | | | | McDonald’s Corp. | | | 4,838 | |
| 253 | | | | Ruby Tuesday, Inc. | | | 6,665 | |
| 95 | | | | Vail Resorts, Inc. (a) | | | 5,757 | |
| 50 | | | | Wendy’s International, Inc. | | | 1,838 | |
| 117 | | | | Wyndham Worldwide Corp. (a) | | | 4,251 | |
| | | | | | | | 53,755 | |
SEE NOTES TO FINANCIAL STATEMENTS.
40 JPMORGAN MID CAP/MULTI-CAP FUNDS JUNE 30, 2007
SHARES
|
|
|
| SECURITY DESCRIPTION
|
| VALUE($)
|
|---|
Long Positions — Continued |
| | | | | Household Durables — 2.8% |
| 234 | | | | American Greetings Corp., Class A | | | 6,634 | |
| 69 | | | | Black & Decker Corp. | | | 6,081 | |
| 143 | | | | Jarden Corp. (a) | | | 6,168 | |
| 130 | | | | KB Home | | | 5,102 | |
| 94 | | | | Leggett & Platt, Inc. | | | 2,069 | |
| 166 | | | | Meritage Homes Corp. (a) | | | 4,427 | |
| 86 | | | | Mohawk Industries, Inc. (a) | | | 8,687 | |
| 7 | | | | NVR, Inc. (a) | | | 5,008 | |
| 34 | | | | Ryland Group, Inc. | | | 1,280 | |
| 303 | | | | Tempur-Pedic International, Inc. | | | 7,859 | |
| 152 | | | | Tupperware Brands Corp. | | | 4,360 | |
| 62 | | | | Whirlpool Corp. | | | 6,926 | |
| | | | | | | | 64,601 | |
| | | | | Household Products — 0.4% |
| 98 | | | | Energizer Holdings, Inc. (a) | | | 9,802 | |
| | | | | Independent Power Producers & Energy Traders — 0.3% |
| 83 | | | | AES Corp. (The) (a) | | | 1,826 | |
| 144 | | | | NRG Energy, Inc. (a) | | | 6,005 | |
| | | | | | | | 7,831 | |
| | | | | Industrial Conglomerates — 0.7% |
| 93 | | | | Teleflex, Inc. | | | 7,615 | |
| 273 | | | | Walter Industries, Inc. | | | 7,897 | |
| | | | | | | | 15,512 | |
| | | | | Insurance — 5.2% |
| 112 | | | | ACE Ltd. (Bermuda) | | | 6,974 | |
| 99 | | | | Allstate Corp. (The) | | | 6,090 | |
| 202 | | | | American Financial Group, Inc. | | | 6,888 | |
| 49 | | | | American International Group, Inc. | | | 3,435 | |
| 104 | | | | Assurant, Inc. | | | 6,140 | |
| 90 | | | | Chubb Corp. (The) | | | 4,899 | |
| 95 | | | | CNA Financial Corp. | | | 4,521 | |
| 89 | | | | Commerce Group, Inc. | | | 3,079 | |
| 56 | | | | Everest Re Group Ltd. (Bermuda) | | | 6,127 | |
| 22 | | | | First American Corp. | | | 1,072 | |
| 25 | | | | Hanover Insurance Group, Inc. (The) | | | 1,206 | |
| 62 | | | | Hartford Financial Services Group, Inc. | | | 6,137 | |
| 81 | | | | HCC Insurance Holdings, Inc. | | | 2,692 | |
| 92 | | | | Loews Corp. | | | 4,701 | |
| 102 | | | | MetLife, Inc. | | | 6,579 | |
| 62 | | | | Nationwide Financial Services, Inc. | | | 3,940 | |
| 55 | | | | Odyssey Re Holdings Corp. | | | 2,360 | |
| 82 | | | | Philadelphia Consolidated Holding Co. (a) | | | 3,421 | |
| 148 | | | | Phoenix Cos., Inc. (The) | | | 2,218 | |
| 87 | | | | Protective Life Corp. | | | 4,151 | |
| 35 | | | | RLI Corp. | | | 1,948 | |
| 119 | | | | Safeco Corp. | | | 7,428 | |
| 126 | | | | Travelers Cos., Inc. (The) | | | 6,715 | |
| 182 | | | | W.R. Berkley Corp. | | | 5,917 | |
| 75 | | | | XL Capital Ltd., Class A (Bermuda) | | | 6,348 | |
| 81 | | | | Zenith National Insurance Corp. | | | 3,807 | |
| | | | | | | | 118,793 | |
| | | | | Internet & Catalog Retail — 1.6% |
| 100 | | | | Amazon.com, Inc. (a) | | | 6,866 | |
| 161 | | | | Expedia, Inc. (a) | | | 4,727 | |
| 159 | | | | IAC/InterActiveCorp (a) | | | 5,514 | |
| 134 | | | | NutriSystem (a) | | | 9,362 | |
| 138 | | | | priceline.com, Inc. (a) | | | 9,512 | |
| | | | | | | | 35,981 | |
| | | | | Internet Software & Services — 0.3% |
| 203 | | | | ValueClick, Inc. (a) | | | 5,967 | |
| | | | | IT Services — 1.7% |
| 230 | | | | Accenture Ltd., Class A | | | 9,879 | |
| 57 | | | | Automatic Data Processing, Inc. | | | 2,746 | |
| 108 | | | | Computer Sciences Corp. (a) | | | 6,383 | |
| 302 | | | | Convergys Corp. (a) | | | 7,330 | |
| 183 | | | | CSG Systems International, Inc. (a) | | | 4,839 | |
| 214 | | | | Electronic Data Systems Corp. | | | 5,935 | |
| 139 | | | | Unisys Corp. (a) | | | 1,270 | |
| | | | | | | | 38,382 | |
| | | | | Leisure Equipment & Products — 0.7% |
| 140 | | | | Hasbro, Inc. | | | 4,384 | |
| 220 | | | | Mattel, Inc. | | | 5,577 | |
| 90 | | | | Polaris Industries, Inc. | | | 4,879 | |
| | | | | | | | 14,840 | |
| | | | | Life Sciences Tools & Services — 0.7% |
| 70 | | | | Invitrogen Corp. (a) | | | 5,130 | |
| 78 | | | | Varian, Inc. (a) | | | 4,296 | |
| 104 | | | | Waters Corp. (a) | | | 6,187 | |
| | | | | | | | 15,613 | |
| | | | | Machinery — 4.0% |
| 106 | | | | AGCO Corp. (a) | | | 4,610 | |
| 85 | | | | Caterpillar, Inc. | | | 6,641 | |
| 78 | | | | Cummins, Inc. | | | 7,916 | |
| 65 | | | | Eaton Corp. | | | 6,077 | |
| 176 | | | | Gardner Denver, Inc. (a) | | | 7,475 | |
SEE NOTES TO FINANCIAL STATEMENTS.
JUNE 30, 2007 JPMORGAN MID CAP/MULTI-CAP FUNDS 41
JPMorgan Multi-Cap Market Neutral Fund
SCHEDULE OF PORTFOLIO INVESTMENTS
AS OF JUNE 30, 2007 (continued)
(Amounts in thousands)
SHARES
|
|
|
| SECURITY DESCRIPTION
|
| VALUE($)
|
|---|
Long Positions — Continued |
| | | | | Machinery — Continued |
| 119 | | | | ITT Corp. | | | 8,144 | |
| 65 | | | | Manitowoc Co., Inc. (The) | | | 5,237 | |
| 47 | | | | PACCAR, Inc. | | | 4,072 | |
| 70 | | | | Parker-Hannifin Corp. | | | 6,844 | |
| 92 | | | | SPX Corp. | | | 8,069 | |
| 76 | | | | Terex Corp. (a) | | | 6,156 | |
| 154 | | | | Timken Co. | | | 5,577 | |
| 75 | | | | Toro Co. | | | 4,403 | |
| 116 | | | | Trinity Industries, Inc. | | | 5,059 | |
| 116 | | | | Westinghouse Air Brake Technologies Corp. | | | 4,220 | |
| | | | | | | | 90,500 | |
| | | | | Marine — 0.2% |
| 166 | | | | American Commercial Lines, Inc. (a) | | | 4,329 | |
| | | | | Media — 2.2% |
| 195 | | | | Belo Corp., Class A | | | 4,014 | |
| 189 | | | | DIRECTV Group, Inc. (The) (a) | | | 4,373 | |
| 133 | | | | DreamWorks Animation SKG, Inc., Class A (a) | | | 3,831 | |
| 136 | | | | EchoStar Communications Corp., Class A (a) | | | 5,913 | |
| 66 | | | | Gannett Co., Inc. | | | 3,638 | |
| 163 | | | | Liberty Global, Inc., Class A (a) | | | 6,702 | |
| 56 | | | | Meredith Corp. | | | 3,462 | |
| 126 | | | | Omnicom Group, Inc. | | | 6,662 | |
| 126 | | | | Regal Entertainment Group, Class A | | | 2,762 | |
| 73 | | | | Scholastic Corp. (a) | | | 2,641 | |
| 115 | | | | Viacom, Inc., Class B (a) | | | 4,804 | |
| 11 | | | | Warner Music Group Corp. | | | 164 | |
| | | | | | | | 48,966 | |
| | | | | Metals & Mining — 2.2% |
| 130 | | | | AK Steel Holding Corp. (a) | | | 4,866 | |
| 24 | | | | Alcoa, Inc. | | | 991 | |
| 97 | | | | Century Aluminum Co. (a) | | | 5,302 | |
| 91 | | | | Chaparral Steel Co. | | | 6,537 | |
| 15 | | | | Cleveland-Cliffs, Inc. | | | 1,175 | |
| 117 | | | | Freeport-McMoRan Copper & Gold, Inc., Class B | | | 9,662 | |
| 13 | | | | Metal Management, Inc. | | | 584 | |
| 99 | | | | Southern Copper Corp. | | | 9,364 | |
| 133 | | | | Steel Dynamics, Inc. | | | 5,554 | |
| 56 | | | | United States Steel Corp. | | | 6,055 | |
| | | | | | | | 50,090 | |
| | | | | Multi-Utilities — 2.0% |
| 485 | | | | CenterPoint Energy, Inc. | | | 8,443 | |
| 378 | | | | CMS Energy Corp. | | | 6,501 | |
| 171 | | | | Energy East Corp. | | | 4,455 | |
| 159 | | | | MDU Resources Group, Inc.(c) | | | 4,445 | |
| 233 | | | | NiSource, Inc. | | | 4,830 | |
| 118 | | | | NSTAR | | | 3,826 | |
| 84 | | | | PG&E Corp. | | | 3,795 | |
| 229 | | | | Puget Energy, Inc. | | | 5,530 | |
| 222 | | | | TECO Energy, Inc.(c) | | | 3,819 | |
| | | | | | | | 45,644 | |
| | | | | Multiline Retail — 1.6% |
| 117 | | | | Big Lots, Inc. (a) | | | 3,443 | |
| 225 | | | | Dollar Tree Stores, Inc. (a) | | | 9,792 | |
| 127 | | | | Family Dollar Stores, Inc. | | | 4,343 | |
| 102 | | | | J.C. Penney Co., Inc. | | | 7,347 | |
| 83 | | | | Kohl’s Corp. (a) | | | 5,871 | |
| 151 | | | | Macy’s, Inc. | | | 5,991 | |
| | | | | | | | 36,787 | |
| | | | | Office Electronics — 0.3% |
| 317 | | | | Xerox Corp.(a) | | | 5,865 | |
| | | | | Oil, Gas & Consumable Fuels — 2.9% |
| 96 | | | | Anadarko Petroleum Corp. | | | 4,995 | |
| 87 | | | | ATP Oil & Gas Corp. (a) | | | 4,231 | |
| 23 | | | | Chesapeake Energy Corp. | | | 798 | |
| 17 | | | | Chevron Corp. | | | 1,396 | |
| 116 | | | | ConocoPhillips | | | 9,073 | |
| 201 | | | | Mariner Energy, Inc. (a) | | | 4,878 | |
| 78 | | | | Massey Energy Co. | | | 2,073 | |
| 96 | | | | Noble Energy, Inc. | | | 5,959 | |
| 72 | | | | Occidental Petroleum Corp. | | | 4,179 | |
| 99 | | | | Overseas Shipholding Group, Inc. | | | 8,084 | |
| 134 | | | | Swift Energy Co. (a) | | | 5,724 | |
| 122 | | | | Tesoro Corp. | | | 6,964 | |
| 110 | | | | USEC, Inc. (a) | | | 2,416 | |
| 29 | | | | Valero Energy Corp. | | | 2,115 | |
| 57 | | | | XTO Energy, Inc. | | | 3,432 | |
| | | | | | | | 66,317 | |
| | | | | Personal Products — 0.3% |
| 22 | | | | Alberto-Culver Co. | | | 531 | |
| 133 | | | | NBTY, Inc. (a) | | | 5,743 | |
| | | | | | | | 6,274 | |
| | | | | Pharmaceuticals — 3.4% |
| 326 | | | | Biovail Corp. (Canada) | | | 8,299 | |
| 91 | | | | Eli Lilly & Co. | | | 5,068 | |
| 142 | | | | Endo Pharmaceuticals Holdings, Inc. (a) | | | 4,870 | |
| 126 | | | | Forest Laboratories, Inc. (a) | | | 5,753 | |
SEE NOTES TO FINANCIAL STATEMENTS.
42 JPMORGAN MID CAP/MULTI-CAP FUNDS JUNE 30, 2007
SHARES
|
|
|
| SECURITY DESCRIPTION
|
| VALUE($)
|
|---|
Long Positions — Continued |
| | | | | Pharmaceuticals — Continued |
| 96 | | | | Johnson & Johnson | | | 5,940 | |
| 406 | | | | King Pharmaceuticals, Inc. (a) | | | 8,309 | |
| 171 | | | | Medicines Co. (The) (a) | | | 3,018 | |
| 131 | | | | MGI Pharma, Inc. (a) | | | 2,937 | |
| 300 | | | | Mylan Laboratories, Inc. | | | 5,464 | |
| 235 | | | | Pfizer, Inc. | | | 6,010 | |
| 237 | | | | Schering-Plough Corp. | | | 7,217 | |
| 303 | | | | Valeant Pharmaceuticals International | | | 5,053 | |
| 224 | | | | Watson Pharmaceuticals, Inc. (a) | | | 7,283 | |
| 31 | | | | Wyeth | | | 1,770 | |
| | | | | | | | 76,991 | |
| | | | | Real Estate Investment Trusts (REITs) — 0.6% |
| 25 | | | | Camden Property Trust | | | 1,681 | |
| 208 | | | | CapitalSource, Inc. | | | 5,113 | |
| 28 | | | | Crescent Real Estate Equities Co. | | | 623 | |
| 15 | | | | Essex Property Trust, Inc. | | | 1,768 | |
| 26 | | | | General Growth Properties, Inc. | | | 1,354 | |
| 32 | | | | Liberty Property Trust | | | 1,403 | |
| 11 | | | | ProLogis | | | 631 | |
| | | | | | | | 12,573 | |
| | | | | Road & Rail — 0.8% |
| 76 | | | | Con-way, Inc. | | | 3,795 | |
| 31 | | | | Landstar System, Inc. | | | 1,492 | |
| 61 | | | | Union Pacific Corp. | | | 6,999 | |
| 169 | | | | YRC Worldwide, Inc. (a) | | | 6,212 | |
| | | | | | | | 18,498 | |
| | | | | Semiconductors & Semiconductor Equipment — 4.4% |
| 631 | | | | Amkor Technology, Inc. (a) | | | 9,939 | |
| 215 | | | | Applied Materials, Inc. | | | 4,281 | |
| 85 | | | | Brooks Automation, Inc. (a) | | | 1,546 | |
| 96 | | | | Cymer, Inc. (a) | | | 3,864 | |
| 39 | | | | FEI Co. (a) | | | 1,255 | |
| 279 | | | | Integrated Device Technology, Inc. (a) | | | 4,268 | |
| 174 | | | | International Rectifier Corp. (a) | | | 6,493 | |
| 76 | | | | KLA-Tencor Corp. | | | 4,156 | |
| 150 | | | | Lam Research Corp. (a) | | | 7,706 | |
| 429 | | | | LSI Logic Corp. (a) | | | 3,222 | |
| 109 | | | | MEMC Electronic Materials, Inc. (a) | | | 6,677 | |
| 117 | | | | MKS Instruments, Inc. (a) | | | 3,231 | |
| 209 | | | | Novellus Systems, Inc. (a) | | | 5,941 | |
| 571 | | | | ON Semiconductor Corp. (a) | | | 6,123 | |
| 951 | | | | RF Micro Devices, Inc. (a) | | | 5,935 | |
| 353 | | | | Silicon Image, Inc. (a) | | | 3,025 | |
| 114 | | | | Silicon Laboratories, Inc. (a) | | | 3,936 | |
| 498 | | | | Teradyne, Inc. (a) | | | 8,753 | |
| 53 | | | | Xilinx, Inc. | | | 1,423 | |
| 350 | | | | Zoran Corp. (a) | | | 7,014 | |
| | | | | | | | 98,788 | |
| | | | | Software — 3.7% |
| 83 | | | | BMC Software, Inc. (a) | | | 2,523 | |
| 395 | | | | Cadence Design Systems, Inc. (a) | | | 8,672 | |
| 107 | | | | Cognos, Inc. (Canada) (a) | | | 4,242 | |
| 712 | | | | Compuware Corp. (a) | | | 8,441 | |
| 122 | | | | Informatica Corp. (a) | | | 1,800 | |
| 229 | | | | McAfee, Inc. (a) | | | 8,049 | |
| 363 | | | | Mentor Graphics Corp. (a) | | | 4,787 | |
| 126 | | | | Microsoft Corp. | | | 3,716 | |
| 264 | | | | Novell, Inc. (a) | | | 2,058 | |
| 264 | | | | Nuance Communications, Inc. (a) | | | 4,413 | |
| 183 | | | | Oracle Corp. (a) | | | 3,602 | |
| 61 | | | | Parametric Technology Corp. (a) | | | 1,324 | |
| 64 | | | | Salesforce.com, Inc. (a) | | | 2,739 | |
| 268 | | | | Sybase, Inc. (a) | | | 6,396 | |
| 377 | | | | Symantec Corp. (a) | | | 7,614 | |
| 310 | | | | Synopsys, Inc. (a) | | | 8,204 | |
| 144 | | | | THQ, Inc. (a) | | | 4,385 | |
| | | | | | | | 82,965 | |
| | | | | Specialty Retail — 5.0% |
| 156 | | | | Aeropostale, Inc. (a) | | | 6,503 | |
| 220 | | | | American Eagle Outfitters, Inc. | | | 5,652 | |
| 17 | | | | AnnTaylor Stores Corp. (a) | | | 590 | |
| 343 | | | | AutoNation, Inc. (a) | | | 7,704 | |
| 57 | | | | AutoZone, Inc.(a) | | | 7,844 | |
| 106 | | | | Bed Bath & Beyond, Inc. (a) | | | 3,831 | |
| 123 | | | | Best Buy Co., Inc. | | | 5,759 | |
| 127 | | | | Brown Shoe Co., Inc. | | | 3,093 | |
| 346 | | | | Charming Shoppes, Inc. (a) | | | 3,747 | |
| 324 | | | | Dress Barn, Inc. (a) | | | 6,654 | |
| 152 | | | | Group 1 Automotive, Inc. | | | 6,120 | |
| 164 | | | | Gymboree Corp. (a) | | | 6,463 | |
| 175 | | | | Men’s Wearhouse, Inc. | | | 8,940 | |
| 126 | | | | OfficeMax, Inc. | | | 4,947 | |
| 191 | | | | Payless ShoeSource, Inc. (a) | | | 6,035 | |
| 223 | | | | RadioShack Corp. | | | 7,374 | |
| 193 | | | | Rent-A-Center, Inc. (a) | | | 5,073 | |
| 97 | | | | Sherwin-Williams Co. (The) | | | 6,480 | |
SEE NOTES TO FINANCIAL STATEMENTS.
JUNE 30, 2007 JPMORGAN MID CAP/MULTI-CAP FUNDS 43
JPMorgan Multi-Cap Market Neutral Fund
SCHEDULE OF PORTFOLIO INVESTMENTS
AS OF JUNE 30, 2007 (continued)
(Amounts in thousands)
SHARES
|
|
|
| SECURITY DESCRIPTION
|
| VALUE($)
|
|---|
Long Positions — Continued |
| | | | | Specialty Retail — Continued |
| 199 | | | | TJX Cos., Inc. | | | 5,473 | |
| 239 | | | | United Auto Group, Inc.(a) | | | 5,089 | |
| | | | | | | | 113,371 | |
| | | | | Textiles, Apparel & Luxury Goods — 1.4% |
| 208 | | | | Carter’s, Inc. (a) | | | 5,392 | |
| 73 | | | | Columbia Sportswear Co. | | | 5,014 | |
| 52 | | | | Crocs, Inc. (a) | | | 2,239 | |
| 120 | | | | Fossil, Inc. (a) | | | 3,532 | |
| 208 | | | | Jones Apparel Group, Inc. | | | 5,880 | |
| 41 | | | | Phillips-Van Heusen Corp. | | | 2,501 | |
| 29 | | | | V.F. Corp. | | | 2,612 | |
| 124 | | | | Warnaco Group, Inc. (The) (a) | | | 4,859 | |
| | | | | | | | 32,029 | |
| | | | | Thrifts & Mortgage Finance — 1.5% |
| 155 | | | | Corus Bankshares, Inc. | | | 2,677 | |
| 125 | | | | Countrywide Financial Corp. | | | 4,526 | |
| 104 | | | | Federal National Mortgage Association | | | 6,787 | |
| 129 | | | | FirstFed Financial Corp. (a) | | | 7,305 | |
| 111 | | | | IndyMac Bancorp, Inc. | | | 3,241 | |
| 85 | | | | PMI Group, Inc. (The) | | | 3,787 | |
| 137 | | | | Washington Mutual, Inc. | | | 5,835 | |
| | | | | | | | 34,158 | |
| | | | | Tobacco — 0.7% |
| 55 | | | | Altria Group, Inc. | | | 3,868 | |
| 93 | | | | Loews Corp. - Carolina Group | | | 7,210 | |
| 62 | | | | Reynolds American, Inc. | | | 4,042 | |
| | | | | | | | 15,120 | |
| | | | | Trading Companies & Distributors — 0.4% |
| 104 | | | | Applied Industrial Technologies, Inc. | | | 3,082 | |
| 144 | | | | United Rentals, Inc. (a) | | | 4,673 | |
| 5 | | | | WESCO International, Inc. (a) | | | 309 | |
| | | | | | | | 8,064 | |
| | | | | Wireless Telecommunication Services — 0.4% |
| 431 | | | | Dobson Communications Corp. (a) | | | 4,789 | |
| 80 | | | | Telephone & Data Systems, Inc. | | | 5,023 | |
| | | | | | | | 9,812 | |
| | | | | Total Common Stocks
(Cost $1,728,004) | | | 2,077,622 | |
Short-Term Investment — 4.8% |
| | | | | Investment Company — 4.8% |
| 109,489 | | | | JPMorgan Liquid Assets Money Market
Fund, Institutional Class (b) (m)
(Cost $109,489) | | | 109,489 | |
| | | | | Total Investments — 96.4%
(Cost $1,837,493) | | | 2,187,111 | |
| | | | | Other Assets in Excess
of Liabilities — 3.6% | | | 81,613 | |
| | | | | NET ASSETS — 100.0% | | $ | 2,268,724 | |
Short Positions — 90.9% |
| | | | | Common Stocks — 90.9% |
| | | | | Aerospace & Defense — 1.0% |
| 115 | | | | Goodrich Corp. | | | 6,820 | |
| 382 | | | | Hexcel Corp. (a) | | | 8,058 | |
| 99 | | | | Rockwell Collins, Inc. | | | 7,007 | |
| | | | | | | | 21,885 | |
| | | | | Air Freight & Logistics — 0.5% |
| 145 | | | | Expeditors International of Washington, Inc. | | | 5,999 | |
| 77 | | | | United Parcel Service, Inc., Class B | | | 5,605 | |
| | | | | | | | 11,604 | |
| | | | | Airlines — 0.7% |
| 607 | | | | Airtran Holdings, Inc. (a) | | | 6,627 | |
| 312 | | | | JetBlue Airways Corp. (a) | | | 3,666 | |
| 433 | | | | Southwest Airlines Co. | | | 6,450 | |
| | | | | | | | 16,743 | |
| | | | | Auto Components — 0.2% |
| 133 | | | | Tenneco, Inc. (a) | | | 4,653 | |
| | | | | Beverages — 1.0% |
| 75 | | | | Anheuser-Busch Cos., Inc. | | | 3,913 | |
| 80 | | | | Brown-Forman Corp., Class B | | | 5,854 | |
| 286 | | | | Constellation Brands, Inc., Class A (a) | | | 6,951 | |
| 157 | | | | Hansen Natural Corp. (a) | | | 6,758 | |
| | | | | | | | 23,476 | |
| | | | | Biotechnology — 1.1% |
| 70 | | | | Alexion Pharmaceuticals, Inc. (a) | | | 3,134 | |
| 70 | | | | Amylin Pharmaceuticals, Inc. (a) | | | 2,886 | |
| 109 | | | | Celgene Corp. (a) | | | 6,225 | |
| 16 | | | | Myriad Genetics, Inc. (a) | | | 591 | |
| 70 | | | | Onyx Pharmaceuticals, Inc. (a) | | | 1,887 | |
| 94 | | | | PDL BioPharma, Inc. (a) | | | 2,179 | |
| 93 | | | | United Therapeutics Corp. (a) | | | 5,948 | |
| 48 | | | | Vertex Pharmaceuticals, Inc. (a) | | | 1,371 | |
| | | | | | | | 24,221 | |
SEE NOTES TO FINANCIAL STATEMENTS.
44 JPMORGAN MID CAP/MULTI-CAP FUNDS JUNE 30, 2007
SHARES
|
|
|
| SECURITY DESCRIPTION
|
| VALUE($)
|
|---|
Short Positions — Continued |
| | | | | Building Products — 0.1% |
| 27 | | | | Simpson Manufacturing Co., Inc. | | | 908 | |
| 43 | | | | USG Corp. (a) | | | 2,114 | |
| | | | | | | | 3,022 | |
| | | | | Capital Markets — 2.8% |
| 147 | | | | American Capital Strategies Ltd. | | | 6,260 | |
| 147 | | | | Charles Schwab Corp. (The) | | | 3,023 | |
| 131 | | | | Eaton Vance Corp. | | | 5,770 | |
| 145 | | | | Federated Investors, Inc., Class B | | | 5,574 | |
| 20 | | | | GFI Group, Inc. (a) | | | 1,436 | |
| 75 | | | | Greenhill & Co., Inc. | | | 5,150 | |
| 96 | | | | Investment Technology Group, Inc. (a) | | | 4,180 | |
| 167 | | | | Janus Capital Group, Inc. | | | 4,650 | |
| 42 | | | | Jefferies Group, Inc. | | | 1,143 | |
| 71 | | | | Legg Mason, Inc. | | | 7,034 | |
| 6 | | | | Northern Trust Corp. | | | 414 | |
| 83 | | | | Nuveen Investments, Inc., Class A | | | 5,140 | |
| 92 | | | | optionsXpress Holdings, Inc. | | | 2,352 | |
| 9 | | | | Piper Jaffray Cos. (a) | | | 523 | |
| 367 | | | | TD Ameritrade Holding Corp. (a) | | | 7,341 | |
| 175 | | | | Waddell & Reed Financial, Inc. | | | 4,558 | |
| | | | | | | | 64,548 | |
| | | | | Chemicals — 1.9% |
| 63 | | | | Air Products & Chemicals, Inc. | | | 5,075 | |
| 36 | | | | Airgas, Inc. | | | 1,744 | |
| 57 | | | | Cytec Industries, Inc. | | | 3,621 | |
| 91 | | | | E.I. du Pont de Nemours & Co. | | | 4,645 | |
| 166 | | | | Ecolab, Inc. | | | 7,069 | |
| 190 | | | | Mosiac Co. (The) (a) | | | 7,399 | |
| 21 | | | | PPG Industries, Inc. | | | 1,598 | |
| 68 | | | | Praxair, Inc. | | | 4,885 | |
| 92 | | | | Scotts Miracle-Gro Co. (The), Class A | | | 3,965 | |
| 127 | | | | Westlake Chemical Corp. | | | 3,569 | |
| | | | | | | | 43,570 | |
| | | | | Commercial Banks — 2.0% |
| 205 | | | | Commerce Bancorp, Inc. | | | 7,591 | |
| 32 | | | | Cullen/Frost Bankers, Inc. | | | 1,729 | |
| 173 | | | | Fifth Third Bancorp | | | 6,899 | |
| 155 | | | | First Horizon National Corp. | | | 6,050 | |
| 48 | | | | M&T Bank Corp. | | | 5,118 | |
| 156 | | | | National City Corp. | | | 5,182 | |
| 239 | | | | Popular, Inc. | | | 3,843 | |
| 129 | | | | UCBH Holdings, Inc. | | | 2,360 | |
| 113 | | | | Valley National Bancorp | | | 2,536 | |
| 81 | | | | Webster Financial Corp. | | | 3,459 | |
| 22 | | | | Wilmington Trust Corp. | | | 911 | |
| | | | | | | | 45,678 | |
| | | | | Commercial Services & Supplies — 1.6% |
| 106 | | | | Brady Corp., Class A | | | 3,940 | |
| 85 | | | | Cintas Corp. | | | 3,335 | |
| 24 | | | | Corporate Executive Board Co. | | | 1,574 | |
| 19 | | | | Corrections Corp. of America (a) | | | 1,205 | |
| 297 | | | | Covanta Holding Corp. (a) | | | 7,322 | |
| 75 | | | | FTI Consulting, Inc. (a) | | | 2,852 | |
| 28 | | | | HNI Corp. | | | 1,145 | |
| 40 | | | | IHS, Inc., Class A (a) | | | 1,862 | |
| 78 | | | | Mine Safety Appliances Co. | | | 3,399 | |
| 131 | | | | Pitney Bowes, Inc. | | | 6,122 | |
| 68 | | | | Stericycle, Inc. (a) | | | 3,039 | |
| 42 | | | | TeleTech Holdings, Inc. (a) | | | 1,377 | |
| | | | | | | | 37,172 | |
| | | | | Communications Equipment — 2.2% |
| 188 | | | | Avocent Corp. (a) | | | 5,450 | |
| 236 | | | | Ciena Corp. (a) | | | 8,523 | |
| 47 | | | | Corning, Inc. (a) | | | 1,212 | |
| 1,907 | | | | Finisar Corp. (a) | | | 7,210 | |
| 236 | | | | JDS Uniphase Corp. (a) | | | 3,172 | |
| 216 | | | | Nortel Networks Corp. (Canada) (a) | | | 5,201 | |
| 1,037 | | | | Powerwave Technologies, Inc. (a) | | | 6,946 | |
| 121 | | | | QUALCOMM, Inc. | | | 5,245 | |
| 4 | | | | Research In Motion Ltd. (Canada) (a) | | | 820 | |
| 751 | | | | Sonus Networks, Inc. (a) | | | 6,395 | |
| | | | | | | | 50,174 | |
| | | | | Computers & Peripherals — 1.3% |
| 26 | | | | Diebold, Inc. | | | 1,358 | |
| 98 | | | | Imation Corp. | | | 3,611 | |
| 246 | | | | Intermec, Inc. (a) | | | 6,227 | |
| 322 | | | | QLogic Corp. (a) | | | 5,355 | |
| 128 | | | | SanDisk Corp. (a) | | | 6,274 | |
| 256 | | | | Seagate Technology (Cayman Islands) | | | 5,581 | |
| | | | | | | | 28,406 | |
| | | | | Construction & Engineering — 1.4% |
| 81 | | | | Fluor Corp. | | | 9,051 | |
| 94 | | | | Granite Construction, Inc. | | | 6,025 | |
| 234 | | | | KBR, Inc. (a) | | | 6,132 | |
| 204 | | | | Shaw Group, Inc. (The) (a) | | | 9,453 | |
| | | | | | | | 30,661 | |
SEE NOTES TO FINANCIAL STATEMENTS.
JUNE 30, 2007 JPMORGAN MID CAP/MULTI-CAP FUNDS 45
JPMorgan Multi-Cap Market Neutral Fund
SCHEDULE OF PORTFOLIO INVESTMENTS
AS OF JUNE 30, 2007 (continued)
(Amounts in thousands)
SHARES
|
|
|
| SECURITY DESCRIPTION
|
| VALUE($)
|
|---|
Short Positions — Continued |
| | | | | Construction Materials — 0.6% |
| 77 | | | | Texas Industries, Inc. | | | 6,075 | |
| 60 | | | | Vulcan Materials Co. | | | 6,927 | |
| | | | | | | | 13,002 | |
| | | | | Consumer Finance — 0.2% |
| 57 | | | | Capital One Financial Corp. | | | 4,464 | |
| | | | | Containers & Packaging — 1.0% |
| 34 | | | | AptarGroup, Inc. | | | 1,192 | |
| 155 | | | | Bemis Co., Inc. | | | 5,137 | |
| 96 | | | | Crown Holdings, Inc. (a) | | | 2,398 | |
| 104 | | | | Owens-Illinois, Inc. (a) | | | 3,656 | |
| 73 | | | | Sealed Air Corp. | | | 2,253 | |
| 14 | | | | Silgan Holdings, Inc. | | | 773 | |
| 628 | | | | Smurfit-Stone Container Corp. (a) | | | 8,363 | |
| | | | | | | | 23,772 | |
| | | | | Distributors — 0.3% |
| 71 | | | | Genuine Parts Co. | | | 3,527 | |
| 120 | | | | LKQ Corp. (a) | | | 2,955 | |
| | | | | | | | 6,482 | |
| | | | | Diversified Consumer Services — 1.0% |
| 81 | | | | Apollo Group, Inc., Class A (a) | | | 4,735 | |
| 179 | | | | Career Education Corp. (a) | | | 6,057 | |
| 285 | | | | Corinthian Colleges, Inc. (a) | | | 4,641 | |
| 48 | | | | Strayer Education, Inc. | | | 6,259 | |
| | | | | | | | 21,692 | |
| | | | | Diversified Financial Services — 1.0% |
| 12 | | | | Chicago Mercantile Exchange Holdings, Inc., Class A | | | 6,351 | |
| 244 | | | | Nasdaq Stock Market, Inc. (The) (a) | | | 7,252 | |
| 35 | | | | Nymex Holdings Inc. | | | 4,335 | |
| 63 | | | | NYSE Euronext | | | 4,622 | |
| | | | | | | | 22,560 | |
| | | | | Diversified Telecommunication Services — 0.8% |
| 925 | | | | Level 3 Communications, Inc. (a) | | | 5,409 | |
| 246 | | | | NeuStar, Inc., Class A (a) | | | 7,132 | |
| 254 | | | | Time Warner Telecom, Inc., Class A (a) | | | 5,105 | |
| | | | | | | | 17,646 | |
| | | | | Electric Utilities — 2.0% |
| 159 | | | | Allegheny Energy, Inc. (a) | | | 8,218 | |
| 127 | | | | Cleco Corp. | | | 3,113 | |
| 168 | | | | DPL, Inc. | | | 4,770 | |
| 49 | | | | Entergy Corp. | | | 5,301 | |
| 52 | | | | Exelon Corp. | | | 3,747 | |
| 56 | | | | FPL Group, Inc. | | | 3,196 | |
| 66 | | | | Great Plains Energy, Inc. | | | 1,919 | |
| 104 | | | | IDACORP, Inc. | | | 3,340 | |
| 110 | | | | Northeast Utilities | | | 3,131 | |
| 16 | | | | PPL Corp. | | | 729 | |
| 29 | | | | Reliant Energy, Inc. (a) | | | 782 | |
| 437 | | | | Sierra Pacific Resources (a) | | | 7,673 | |
| | | | | | | | 45,919 | |
| | | | | Electrical Equipment — 1.2% |
| 88 | | | | Baldor Electric Co. | | | 4,313 | |
| 199 | | | | Energy Conversion Devices, Inc. (a) | | | 6,125 | |
| 41 | | | | First Solar, Inc. (a) | | | 3,700 | |
| 93 | | | | Hubbell, Inc., Class B | | | 5,063 | |
| 126 | | | | Roper Industries, Inc. | | | 7,195 | |
| | | | | | | | 26,396 | |
| | | | | Electronic Equipment & Instruments — 1.4% |
| 129 | | | | Benchmark Electronics, Inc. (a) | | | 2,924 | |
| 160 | | | | Daktronics, Inc. | | | 3,440 | |
| 61 | | | | Itron, Inc. (a) | | | 4,719 | |
| 168 | | | | Jabil Circuit, Inc. | | | 3,704 | |
| 144 | | | | L-1 Identity Solutions Inc. (a) | | | 2,935 | |
| 152 | | | | Molex, Inc. | | | 4,565 | |
| 1,036 | | | | Sanmina-SCI Corp. (a) | | | 3,242 | |
| 190 | | | | Tektronix, Inc. | | | 6,413 | |
| | | | | | | | 31,942 | |
| | | | | Energy Equipment & Services — 2.7% |
| 86 | | | | Baker Hughes, Inc. | | | 7,216 | |
| 42 | | | | BJ Services Co. | | | 1,185 | |
| 174 | | | | CARBO Ceramics, Inc. | | | 7,636 | |
| 124 | | | | Dresser-Rand Group, Inc. (a) | | | 4,900 | |
| 119 | | | | Helmerich & Payne, Inc. | | | 4,232 | |
| 81 | | | | Oceaneering International, Inc. (a) | | | 4,252 | |
| 184 | | | | Pride International, Inc. (a) | | | 6,892 | |
| 307 | | | | RPC, Inc. | | | 5,234 | |
| 119 | | | | Smith International, Inc. | | | 6,971 | |
| 162 | | | | Tetra Technologies, Inc. (a) | | | 4,562 | |
| 94 | | | | Universal Compression Holdings, Inc. (a) | | | 6,797 | |
| 34 | | | | Weatherford International Ltd. (a) | | | 1,899 | |
| | | | | | | | 61,776 | |
| | | | | Food & Staples Retailing — 2.0% |
| 209 | | | | CVS/Caremark Corp. | | | 7,631 | |
| 210 | | | | Great Atlantic & Pacific Tea Co., Inc. (a) | | | 7,029 | |
| 47 | | | | Pantry, Inc. (The) (a) | | | 2,156 | |
SEE NOTES TO FINANCIAL STATEMENTS.
46 JPMORGAN MID CAP/MULTI-CAP FUNDS JUNE 30, 2007
SHARES
|
|
|
| SECURITY DESCRIPTION
|
| VALUE($)
|
|---|
Short Positions — Continued |
| | | | | Food & Staples Retailing — Continued |
| 1,465 | | | | Rite Aid Corp. (a) | | | 9,348 | |
| 81 | | | | Ruddick Corp. | | | 2,427 | |
| 108 | | | | SUPERVALU, Inc. | | | 4,988 | |
| 196 | | | | United Natural Foods, Inc. (a) | | | 5,201 | |
| 48 | | | | Walgreen Co. | | | 2,073 | |
| 114 | | | | Whole Foods Market, Inc. | | | 4,371 | |
| | | | | | | | 45,224 | |
| | | | | Food Products — 1.6% |
| 136 | | | | Archer-Daniels-Midland Co. | | | 4,504 | |
| 110 | | | | Flowers Foods, Inc. | | | 3,676 | |
| 135 | | | | Hershey Co. (The) | | | 6,837 | |
| 29 | | | | Hormel Foods Corp. | | | 1,084 | |
| 22 | | | | Kraft Foods, Inc. | | | 788 | |
| 18 | | | | McCormick & Co., Inc. | | | 683 | |
| 223 | | | | Pilgrim’s Pride Corp. | | | 8,497 | |
| 62 | | | | Smithfield Foods, Inc. (a) | | | 1,910 | |
| 152 | | | | Wm. Wrigley, Jr., Co. | | | 8,400 | |
| | | | | | | | 36,379 | |
| | | | | Gas Utilities — 0.5% |
| 128 | | | | Equitable Resources, Inc. | | | 6,343 | |
| 52 | | | | Northwest Natural Gas Co. | | | 2,380 | |
| 38 | | | | Piedmont Natural Gas Co. | | | 931 | |
| 23 | | | | Questar Corp. | | | 1,191 | |
| | | | | | | | 10,845 | |
| | | | | Health Care Equipment & Supplies — 3.5% |
| 96 | | | | Advanced Medical Optics, Inc. (a) | | | 3,332 | |
| 67 | | | | Alcon, Inc. (Switzerland) | | | 8,990 | |
| 187 | | | | Align Technology, Inc. (a) | | | 4,526 | |
| 301 | | | | American Medical Systems Holdings, Inc. (a) | | | 5,423 | |
| 106 | | | | ArthroCare Corp. (a) | | | 4,652 | |
| 404 | | | | Boston Scientific Corp. (a) | | | 6,193 | |
| 135 | | | | Cooper Cos., Inc. (The) | | | 7,202 | |
| 39 | | | | Gen-Probe, Inc. (a) | | | 2,346 | |
| 91 | | | | Hillenbrand Industries, Inc. | | | 5,885 | |
| 104 | | | | Hospira, Inc. (a) | | | 4,054 | |
| 99 | | | | Inverness Medical Innovations, Inc. (a) | | | 5,062 | |
| 154 | | | | ResMed, Inc. (a) | | | 6,348 | |
| 133 | | | | Respironics, Inc. (a) | | | 5,660 | |
| 143 | | | | St. Jude Medical, Inc. (a) | | | 5,946 | |
| 72 | | | | Varian Medical Systems, Inc. (a) | | | 3,042 | |
| | | | | | | | 78,661 | |
| | | | | Health Care Providers & Services — 2.5% |
| 102 | | | | Brookdale Senior Living, Inc. | | | 4,631 | |
| 130 | | | | Health Management Associates, Inc., Class A | | | 1,475 | |
| 126 | | | | Healthways, Inc. (a) | | | 5,990 | |
| 183 | | | | Omnicare, Inc. | | | 6,610 | |
| 146 | | | | Owens & Minor, Inc. | | | 5,086 | |
| 150 | | | | Patterson Cos., Inc. (a) | | | 5,582 | |
| 94 | | | | Pediatrix Medical Group, Inc. (a) | | | 5,173 | |
| 161 | | | | PSS World Medical, Inc. (a) | | | 2,934 | |
| 106 | | | | Psychiatric Solutions, Inc. (a) | | | 3,850 | |
| 50 | | | | Quest Diagnostics, Inc. | | | 2,600 | |
| 1,026 | | | | Tenet Healthcare Corp. (a) | | | 6,681 | |
| 49 | | | | Universal Health Services, Inc., Class B | | | 2,992 | |
| 105 | | | | VCA Antech, Inc. (a) | | | 3,962 | |
| | | | | | | | 57,566 | |
| | | | | Health Care Technology — 0.5% |
| 193 | | | | Allscripts Healthcare Solutions, Inc. (a) | | | 4,909 | |
| 10 | | | | Cerner Corp. (a) | | | 580 | |
| 222 | | | | Eclipsys Corp. (a) | | | 4,402 | |
| 97 | | | | HLTH Corp. (a) | | | 1,359 | |
| | | | | | | | 11,250 | |
| | | | | Hotels, Restaurants & Leisure — 3.6% |
| 100 | | | | Bally Technologies, Inc. (a) | | | 2,645 | |
| 119 | | | | Boyd Gaming Corp. | | | 5,843 | |
| 150 | | | | Burger King Holdings, Inc. | | | 3,952 | |
| 274 | | | | Cheesecake Factory, Inc. (The) (a) | | | 6,727 | |
| 178 | | | | CKE Restaurants, Inc. | | | 3,567 | |
| 112 | | | | Gaylord Entertainment Co. (a) | | | 6,010 | |
| 35 | | | | Hilton Hotels Corp. | | | 1,181 | |
| 103 | | | | International Game Technology | | | 4,072 | |
| 81 | | | | Las Vegas Sands Corp. (a) | | | 6,215 | |
| 123 | | | | Life Time Fitness, Inc. (a) | | | 6,563 | |
| 124 | | | | Panera Bread Co., Class A (a) | | | 5,709 | |
| 237 | | | | Scientific Games Corp., Class A (a) | | | 8,285 | |
| 223 | | | | Starbucks Corp. (a) | | | 5,864 | |
| 181 | | | | Tim Hortons, Inc. (Canada) | | | 5,581 | |
| 307 | | | | WMS Industries, Inc. (a) | | | 8,869 | |
| 42 | | | | Yum! Brands, Inc. | | | 1,374 | |
| | | | | | | | 82,457 | |
| | | | | Household Durables — 1.8% |
| 142 | | | | Beazer Homes USA, Inc. | | | 3,507 | |
| 127 | | | | Centex Corp. | | | 5,073 | |
| 212 | | | | D.R. Horton, Inc. | | | 4,217 | |
| 15 | | | | Fortune Brands, Inc. | | | 1,236 | |
SEE NOTES TO FINANCIAL STATEMENTS.
JUNE 30, 2007 JPMORGAN MID CAP/MULTI-CAP FUNDS 47
JPMorgan Multi-Cap Market Neutral Fund
SCHEDULE OF PORTFOLIO INVESTMENTS
AS OF JUNE 30, 2007 (continued)
(Amounts in thousands)
SHARES
|
|
|
| SECURITY DESCRIPTION
|
| VALUE($)
|
|---|
Short Positions — Continued |
| | | | | Household Durables — Continued |
| 199 | | | | Hovnanian Enterprises, Inc., Class A (a) | | | 3,288 | |
| 73 | | | | Lennar Corp., Class A | | | 2,661 | |
| 152 | | | | MDC Holdings, Inc. | | | 7,330 | |
| 245 | | | | Pulte Homes, Inc. | | | 5,506 | |
| 281 | | | | Standard-Pacific Corp. | | | 4,921 | |
| 103 | | | | Toll Brothers, Inc. (a) | | | 2,574 | |
| | | | | | | | 40,313 | |
| | | | | Household Products — 0.6% |
| 98 | | | | Church & Dwight Co., Inc. | | | 4,733 | |
| 100 | | | | Colgate-Palmolive Co. | | | 6,470 | |
| 53 | | | | Procter & Gamble Co. | | | 3,216 | |
| | | | | | | | 14,419 | |
| | | | | Independent Power Producers & Energy Traders — 0.1% |
| 125 | | | | Dynegy, Inc., Class A (a) | | | 1,183 | |
| 19 | | | | Ormat Technologies, Inc. | | | 731 | |
| | | | | | | | 1,914 | |
| | | | | Industrial Conglomerates — 0.3% |
| 21 | | | | Carlisle Cos., Inc. | | | 961 | |
| 167 | | | | General Electric Co. | | | 6,401 | |
| | | | | | | | 7,362 | |
| | | | | Insurance — 2.6% |
| 131 | | | | Aflac, Inc. | | | 6,727 | |
| 5 | | | | AON Corp. | | | 205 | |
| 116 | | | | Brown & Brown, Inc. | | | 2,911 | |
| 9 | | | | Cincinnati Financial Corp. | | | 399 | |
| 178 | | | | Conseco, Inc. (a) | | | 3,713 | |
| 246 | | | | Gallagher (Arthur J.) & Co. | | | 6,869 | |
| 86 | | | | Hilb, Rogal & Hobbs Co. | | | 3,693 | |
| 75 | | | | LandAmerica Financial Group, Inc. | | | 7,192 | |
| 255 | | | | Marsh & McLennan Cos., Inc. | | | 7,878 | |
| 81 | | | | Mercury General Corp. | | | 4,490 | |
| 145 | | | | National Financial Partners Corp. | | | 6,698 | |
| 221 | | | | Old Republic International Corp. | | | 4,701 | |
| 89 | | | | Progressive Corp. (The) | | | 2,127 | |
| 7 | | | | Stancorp Financial Group, Inc. | | | 361 | |
| | | | | | | | 57,964 | |
| | | | | Internet Software & Services — 1.8% |
| 67 | | | | Akamai Technologies, Inc. (a) | | | 3,262 | |
| 669 | | | | CNET Networks, Inc. (a) | | | 5,480 | |
| 155 | | | | eBay, Inc. (a) | | | 4,974 | |
| 50 | | | | Equinix, Inc. (a) | | | 4,544 | |
| 9 | | | | Google, Inc., Class A (a) | | | 4,468 | |
| 118 | | | | SAVVIS, Inc. (a) | | | 5,837 | |
| 206 | | | | VeriSign, Inc. (a) | | | 6,525 | |
| 252 | | | | Yahoo!, Inc. (a) | | | 6,833 | |
| | | | | | | | 41,923 | |
| | | | | IT Services — 3.3% |
| 700 | | | | BearingPoint, Inc. (a) | | | 5,116 | |
| 112 | | | | DST Systems, Inc. (a) | | | 8,856 | |
| 106 | | | | eFunds Corp. (a) | | | 3,749 | |
| 58 | | | | Euronet Worldwide, Inc. (a) | | | 1,683 | |
| 26 | | | | Fidelity National Information Services, Inc. | | | 1,396 | |
| 246 | | | | Gartner, Inc. (a) | | | 6,055 | |
| 118 | | | | Hewitt Associates, Inc., Class A (a) | | | 3,780 | |
| 212 | | | | Iron Mountain, Inc. (a) | | | 5,546 | |
| 44 | | | | MasterCard, Inc., Class A | | | 7,240 | |
| 155 | | | | Paychex, Inc. | | | 6,074 | |
| 184 | | | | Perot Systems Corp., Class A (a) | | | 3,128 | |
| 260 | | | | SAIC Inc. (a) | | | 4,698 | |
| 219 | | | | VeriFone Holdings, Inc. (a) | | | 7,725 | |
| 295 | | | | Western Union Co. (The) | | | 6,143 | |
| 93 | | | | Wright Express Corp. (a) | | | 3,187 | |
| | | | | | | | 74,376 | |
| | | | | Leisure Equipment & Products — 0.6% |
| 203 | | | | Callaway Golf Co. | | | 3,622 | |
| 116 | | | | Eastman Kodak Co. | | | 3,217 | |
| 67 | | | | Oakley, Inc. | | | 1,892 | |
| 135 | | | | Pool Corp. | | | 5,262 | |
| | | | | | | | 13,993 | |
| | | | | Life Sciences Tools & Services — 2.4% |
| 263 | | | | Affymetrix, Inc. (a) | | | 6,536 | |
| 42 | | | | Charles River Laboratories International,
Inc. (a) | | | 2,150 | |
| 56 | | | | Covance, Inc. (a) | | | 3,858 | |
| 130 | | | | Illumina, Inc. (a) | | | 5,260 | |
| 105 | | | | Millipore Corp. (a) | | | 7,887 | |
| 475 | | | | Nektar Therapeutics (a) | | | 4,510 | |
| 217 | | | | Pharmaceutical Product Development, Inc. | | | 8,299 | |
| 68 | | | | Techne Corp. (a) | | | 3,881 | |
| 124 | | | | Thermo Fisher Scientific, Inc. (a) | | | 6,415 | |
| 65 | | | | Ventana Medical Systems, Inc. (a) | | | 4,994 | |
| | | | | | | | 53,790 | |
| | | | | Machinery — 3.6% |
| 255 | | | | Briggs & Stratton Corp. | | | 8,048 | |
| 121 | | | | Bucyrus International, Inc. | | | 8,555 | |
| 101 | | | | Clarcor, Inc. | | | 3,795 | |
SEE NOTES TO FINANCIAL STATEMENTS.
48 JPMORGAN MID CAP/MULTI-CAP FUNDS JUNE 30, 2007
SHARES
|
|
|
| SECURITY DESCRIPTION
|
| VALUE($)
|
|---|
Short Positions — Continued |
| | | | | Machinery — Continued |
| 29 | | | | Danaher Corp. | | | 2,177 | |
| 141 | | | | Donaldson Co., Inc. | | | 5,019 | |
| 125 | | | | ESCO Technologies, Inc. (a) | | | 4,535 | |
| 138 | | | | Flowserve Corp. | | | 9,863 | |
| 159 | | | | Graco, Inc. | | | 6,415 | |
| 128 | | | | Joy Global, Inc. | | | 7,495 | |
| 73 | | | | Kennametal, Inc. | | | 5,985 | |
| 57 | | | | Nordson Corp. | | | 2,836 | |
| 92 | | | | Oshkosh Truck Corp. | | | 5,791 | |
| 146 | | | | Pentair, Inc. | | | 5,618 | |
| 60 | | | | Valmont Industries, Inc. | | | 4,374 | |
| | | | | | | | 80,506 | |
| | | | | Marine — 0.4% |
| 102 | | | | Alexander & Baldwin, Inc. | | | 5,407 | |
| 109 | | | | Kirby Corp. (a) | | | 4,196 | |
| | | | | | | | 9,603 | |
| | | | | Media — 2.0% |
| 107 | | | | Arbitron, Inc. | | �� | 5,520 | |
| 3 | | | | Citadel Broadcasting Corp. | | | 19 | |
| 334 | | | | Discovery Holding Co., Class A (a) | | | 7,677 | |
| 20 | | | | E.W. Scripps Co., Class A | | | 907 | |
| 1 | | | | Getty Images, Inc. (a) | | | 59 | |
| 95 | | | | Harte-Hanks, Inc. | | | 2,448 | |
| 225 | | | | Interpublic Group of Cos., Inc. (a) | | | 2,563 | |
| 114 | | | | Lamar Advertising Co., Class A | | | 7,173 | |
| 54 | | | | Liberty Media Holding Corp. - Capital,
Class A (a) | | | 6,338 | |
| 96 | | | | Live Nation, Inc. (a) | | | 2,145 | |
| 44 | | | | McClatchy Co., Class A | | | 1,119 | |
| 116 | | | | Walt Disney Co. (The) | | | 3,969 | |
| 7 | | | | Washington Post Co. (The), Class B | | | 5,256 | |
| | | | | | | | 45,193 | |
| | | | | Metals & Mining — 0.6% |
| 27 | | | | Allegheny Technologies, Inc. | | | 2,792 | |
| 156 | | | | Newmont Mining Corp. | | | 6,102 | |
| 117 | | | | Titanium Metals Corp. (a) | | | 3,734 | |
| 57 | | | | Worthington Industries, Inc. | | | 1,239 | |
| | | | | | | | 13,867 | |
| | | | | Multi-Utilities — 1.2% |
| 124 | | | | Ameren Corp. | | | 6,055 | |
| 36 | | | | Black Hills Corp. | | | 1,441 | |
| 106 | | | | Consolidated Edison, Inc. | | | 4,790 | |
| 68 | | | | Dominion Resources, Inc. | | | 5,893 | |
| 88 | | | | Public Service Enterprise Group, Inc. | | | 7,766 | |
| 54 | | | | Wisconsin Energy Corp. | | | 2,386 | |
| | | | | | | | 28,331 | |
| | | | | Multiline Retail — 0.5% |
| 173 | | | | Dillards, Inc., Class A | | | 6,203 | |
| 249 | | | | Saks, Inc. | | | 5,306 | |
| | | | | | | | 11,509 | |
| | | | | Office Electronics — 0.2% |
| 121 | | | | Zebra Technologies Corp., Class A (a) | | | 4,695 | |
| | | | | Oil, Gas & Consumable Fuels — 6.4% |
| 40 | | | | Alon USA Energy, Inc. | | | 1,768 | |
| 222 | | | | Alpha Natural Resources, Inc. (a) | | | 4,611 | |
| 201 | | | | Arch Coal, Inc. | | | 7,006 | |
| 126 | | | | Berry Petroleum Co., Class A | | | 4,764 | |
| 155 | | | | Bill Barrett Corp. (a) | | | 5,710 | |
| 236 | | | | Cheniere Energy, Inc. (a) | | | 9,149 | |
| 160 | | | | Cimarex Energy Co. | | | 6,317 | |
| 73 | | | | CNX Gas Corp. (a) | | | 2,226 | |
| 163 | | | | Consol Energy, Inc. | | | 7,514 | |
| 109 | | | | Delta Petroleum Corp. (a) | | | 2,188 | |
| 371 | | | | El Paso Corp. | | | 6,399 | |
| 189 | | | | Encore Acquisition Co. (a) | | | 5,246 | |
| 178 | | | | EXCO Resources, Inc. (a) | | | 3,113 | |
| 141 | | | | Forest Oil Corp. (a) | | | 5,969 | |
| 174 | | | | Foundation Co. al Holdings, Inc. | | | 7,055 | |
| 188 | | | | Helix Energy Solutions Group, Inc. (a) | | | 7,493 | |
| 94 | | | | Hess Corp. | | | 5,538 | |
| 143 | | | | Murphy Oil Corp. | | | 8,491 | |
| 152 | | | | Peabody Energy Corp. | | | 7,343 | |
| 520 | | | | PetroHawk Energy Corp. (a) | | | 8,242 | |
| 103 | | | | Pogo Producing Co. | | | 5,229 | |
| 197 | | | | Quicksilver Resources, Inc. (a) | | | 8,802 | |
| 192 | | | | Southwestern Energy Co. (a) | | | 8,549 | |
| 158 | | | | W&T Offshore, Inc. | | | 4,436 | |
| 86 | | | | Williams Cos., Inc. | | | 2,710 | |
| | | | | | | | 145,868 | |
| | | | | Paper & Forest Products — 0.5% |
| 310 | | | | Louisiana-Pacific Corp. | | | 5,864 | |
| 128 | | | | MeadWestvaco Corp. | | | 4,528 | |
| 1 | | | | Weyerhaeuser Co. | | | 55 | |
| | | | | | | | 10,447 | |
| | | | | Personal Products — 0.1% |
| 94 | | | | Bare Escentuals, Inc. (a) | | | 3,196 | |
SEE NOTES TO FINANCIAL STATEMENTS.
JUNE 30, 2007 JPMORGAN MID CAP/MULTI-CAP FUNDS 49
JPMorgan Multi-Cap Market Neutral Fund
SCHEDULE OF PORTFOLIO INVESTMENTS
AS OF JUNE 30, 2007 (continued)
(Amounts in thousands)
SHARES
|
|
|
| SECURITY DESCRIPTION
|
| VALUE($)
|
|---|
Short Positions — Continued |
| | | | | Pharmaceuticals — 0.2% |
| 84 | | | | Adams Respiratory Therapeutics, Inc. (a) | | | 3,325 | |
| 61 | | | | Medicis Pharmaceutical Corp., Class A | | | 1,857 | |
| | | | | | | | 5,182 | |
| | | | | Real Estate Investment Trusts (REITs) — 0.5% |
| 36 | | | | Cousins Properties, Inc. | | | 1,049 | |
| 31 | | | | First Industrial Realty Trust, Inc. | | | 1,186 | |
| 46 | | | | Maguire Properties, Inc. | | | 1,579 | |
| 27 | | | | Post Properties, Inc. | | | 1,395 | |
| 120 | | | | Potlatch Corp. | | | 5,169 | |
| 33 | | | | Tanger Factory Outlet Centers | | | 1,218 | |
| | | | | | | | 11,596 | |
| | | | | Road & Rail — 1.0% |
| 27 | | | | Arkansas Best Corp. | | | 1,046 | |
| 174 | | | | Avis Budget Group, Inc. (a) | | | 4,960 | |
| 57 | | | | Hertz Global Holdings, Inc. (a) | | | 1,506 | |
| 102 | | | | Kansas City Southern Industries, Inc. (a) | | | 3,817 | |
| 299 | | | | Knight Transportation, Inc. | | | 5,793 | |
| 227 | | | | Werner Enterprises, Inc. | | | 4,568 | |
| | | | | | | | 21,690 | |
| | | | | Semiconductors & Semiconductor Equipment — 4.1% |
| 425 | | | | Advanced Micro Devices, Inc. (a) | | | 6,081 | |
| 16 | | | | Atheros Communications, Inc. (a) | | | 485 | |
| 1,041 | | | | Atmel Corp. (a) | | | 5,785 | |
| 179 | | | | ATMI, Inc. (a) | | | 5,362 | |
| 132 | | | | Cree, Inc. (a) | | | 3,402 | |
| 396 | | | | Cypress Semiconductor Corp. (a) | | | 9,225 | |
| 36 | | | | Hittite Microwave Corp. (a) | | | 1,535 | |
| 204 | | | | Linear Technology Corp. | | | 7,394 | |
| 363 | | | | Marvell Technology Group Ltd. (Bermuda) (a) | | | 6,605 | |
| 172 | | | | Maxim Integrated Products, Inc. | | | 5,748 | |
| 214 | | | | Microchip Technology, Inc. | | | 7,936 | |
| 473 | | | | Micron Technology, Inc. (a) | | | 5,932 | |
| 317 | | | | Microsemi Corp. (a) | | | 7,601 | |
| 36 | | | | National Semiconductor Corp. | | | 1,004 | |
| 955 | | | | PMC-Sierra, Inc. (a) | | | 7,384 | |
| 298 | | | | Rambus, Inc. (a) | | | 5,352 | |
| 473 | | | | Spansion, Inc., Class A (a) | | | 5,255 | |
| | | | | | | | 92,086 | |
| | | | | Software — 2.9% |
| 329 | | | | Activision, Inc. (a) | | | 6,133 | |
| 201 | | | | Adobe Systems, Inc. (a) | | | 8,064 | |
| 88 | | | | ANSYS, Inc. (a) | | | 2,329 | |
| 61 | | | | Autodesk, Inc. (a) | | | 2,888 | |
| 180 | | | | Citrix Systems, Inc. (a) | | | 6,045 | |
| 142 | | | | Electronic Arts, Inc. (a) | | | 6,703 | |
| 69 | | | | Factset Research Systems, Inc. | | | 4,684 | |
| 628 | | | | Lawson Software, Inc. (a) | | | 6,212 | |
| 178 | | | | NAVTEQ Corp. (a) | | | 7,537 | |
| 71 | | | | Net 1 UEPS Technologies Inc. (South Africa) (a) | | | 1,713 | |
| 265 | | | | Red Hat, Inc. (a) | | | 5,915 | |
| 105 | | | | Take-Two Interactive Software, Inc. (a) | | | 2,104 | |
| 137 | | | | Transaction Systems Architects, Inc. (a) | | | 4,623 | |
| | | | | | | | 64,950 | |
| | | | | Specialty Retail — 4.7% |
| 155 | | | | Aaron Rents, Inc. | | | 4,541 | |
| 48 | | | | Barnes & Noble, Inc. | | | 1,847 | |
| 309 | | | | Borders Group, Inc. | | | 5,887 | |
| 261 | | | | CarMax, Inc. (a) | | | 6,660 | |
| 243 | | | | Chico’s FAS, Inc. (a) | | | 5,903 | |
| 104 | | | | Children’s Place Retail Stores, Inc. (The) (a) | | | 5,393 | |
| 384 | | | | Circuit City Stores, Inc. | | | 5,797 | |
| 64 | | | | Coldwater Creek, Inc. (a) | | | 1,483 | |
| 32 | | | | Guess?, Inc. | | | 1,547 | |
| 94 | | | | Guitar Center, Inc. (a) | | | 5,597 | |
| 54 | | | | J Crew Group, Inc. (a) | | | 2,928 | |
| 236 | | | | Limited Brands, Inc. | | | 6,476 | |
| 175 | | | | O’Reilly Automotive, Inc. (a) | | | 6,406 | |
| 319 | | | | Pacific Sunwear of California, Inc. (a) | | | 7,019 | |
| 275 | | | | Sally Beauty Holdings, Inc. (a) | | | 2,475 | |
| 247 | | | | Talbots, Inc. | | | 6,189 | |
| 134 | | | | Tiffany & Co. | | | 7,095 | |
| 138 | | | | Tractor Supply Co. (a) | | | 7,186 | |
| 242 | | | | Urban Outfitters, Inc. (a) | | | 5,804 | |
| 136 | | | | Williams-Sonoma, Inc. | | | 4,290 | |
| 219 | | | | Zale Corp. (a) | | | 5,212 | |
| | | | | | | | 105,735 | |
| | | | | Textiles, Apparel & Luxury Goods — 0.9% |
| 110 | | | | Hanesbrands, Inc. (a) | | | 2,982 | |
| 110 | | | | Liz Claiborne, Inc. | | | 4,101 | |
| 471 | | | | Quiksilver, Inc. (a) | | | 6,661 | |
| 137 | | | | Under Armour, Inc., Class A (a) | | | 6,243 | |
| | | | | | | | 19,987 | |
| | | | | Thrifts & Mortgage Finance — 1.3% |
| 112 | | | | Astoria Financial Corp. | | | 2,809 | |
| 94 | | | | Freddie Mac | | | 5,723 | |
| 508 | | | | Hudson City Bancorp, Inc. | | | 6,206 | |
SEE NOTES TO FINANCIAL STATEMENTS.
50 JPMORGAN MID CAP/MULTI-CAP FUNDS JUNE 30, 2007
SHARES
|
|
|
| SECURITY DESCRIPTION
|
| VALUE($)
|
|---|
Short Positions — Continued |
| | | | | Thrifts & Mortgage Finance — Continued |
| 80 | | | | MGIC Investment Corp. | | | 4,556 | |
| 102 | | | | New York Community Bancorp, Inc. | | | 1,734 | |
| 253 | | | | NewAlliance Bancshares, Inc. | | | 3,727 | |
| 280 | | | | People’s United Financial, Inc. | | | 4,960 | |
| | | | | | | | 29,715 | |
| | | | | Trading Companies & Distributors — 0.6% |
| 191 | | | | Fastenal Co. | | | 8,011 | |
| 123 | | | | Watsco, Inc. | | | 6,681 | |
| | | | | | | | 14,692 | |
| | | | | Water Utilities — 0.3% |
| 286 | | | | Aqua America, Inc. | | | 6,432 | |
| | | | | Wireless Telecommunication Services — 1.2% |
| 205 | | | | American Tower Corp., Class A (a) | | | 8,631 | |
| 173 | | | | Crown Castle International Corp. (a) | | | 6,270 | |
| 225 | | | | SBA Communications Corp., Class A (a) | | | 7,562 | |
| 174 | | | | Sprint Nextel Corp. | | | 3,603 | |
| | | | | | | | 26,066 | |
| | | | Total Short Positions — 90.9%
(Proceeds $1,903,916) | | $ | 2,061,246 | |
SEE NOTES TO FINANCIAL STATEMENTS.
JUNE 30, 2007 JPMORGAN MID CAP/MULTI-CAP FUNDS 51
JPMorgan Value Advantage Fund
SCHEDULE OF PORTFOLIO INVESTMENTS
AS OF JUNE 30, 2007
(Amounts in thousands)
SHARES
|
|
|
| SECURITY DESCRIPTION
|
| VALUE($)
|
|---|
Long-Term Investments — 88.8% |
| | | | | Common Stocks — 87.5% |
| | | | | Beverages — 2.1% |
| 120 | | | | Anheuser-Busch Cos., Inc. | | | 6,259 | |
| 55 | | | | Diageo plc ADR (United Kingdom) | | | 4,582 | |
| | | | | | | | 10,841 | |
| | | | | Building Products — 0.7% |
| 160 | | | | Griffon Corp. (a) | | | 3,485 | |
| | | | | Capital Markets — 4.8% |
| 500 | | | | Charles Schwab Corp. (The) | | | 10,260 | |
| 450 | | | | W.P. Carey & Co. LLC | | | 14,152 | |
| | | | | | | | 24,412 | |
| | | | | Chemicals — 0.4% |
| 50 | | | | Sigma-Aldrich Corp. | | | 2,134 | |
| | | | | Commercial Banks — 8.0% |
| 100 | | | | M&T Bank Corp. | | | 10,690 | |
| 50 | | | | SunTrust Banks, Inc. | | | 4,287 | |
| 330 | | | | Synovus Financial Corp. | | | 10,131 | |
| 170 | | | | United Community Banks, Inc. | | | 4,402 | |
| 100 | | | | Wachovia Corp. | | | 5,128 | |
| 60 | | | | Wells Fargo & Co. | | | 2,110 | |
| 100 | | | | Wilmington Trust Corp. | | | 4,151 | |
| | | | | | | | 40,899 | |
| | | | | Commercial Services & Supplies — 0.7% |
| 75 | | | | Pitney Bowes, Inc. | | | 3,507 | |
| | | | | Communications Equipment — 0.4% |
| 50 | | | | QUALCOMM, Inc. | | | 2,169 | |
| | | | | Construction Materials — 1.6% |
| 220 | | | | Cemex S.A. de C.V. ADR (Mexico) (a) | | | 8,128 | |
| | | | | Consumer Finance — 0.8% |
| 70 | | | | American Express Co. | | | 4,283 | |
| | | | | Distributors — 0.8% |
| 80 | | | | Genuine Parts Co. | | | 3,968 | |
| | | | | Diversified Financial Services — 0.9% |
| 30 | | | | Bank of America Corp. | | | 1,467 | |
| 60 | | | | Onex Corp. (Canada) | | | 2,073 | |
| 50 | | | | Resource America, Inc., Class A | | | 1,030 | |
| | | | | | | | 4,570 | |
| | | | | Diversified Telecommunication Services — 3.0% |
| 401 | | | | Citizens Communications Co. | | | 6,118 | |
| 350 | | | | Qwest Communications International, Inc. (a) | | | 3,395 | |
| 399 | | | | Windstream Corp. | | | 5,892 | |
| | | | | | | | 15,405 | |
| | | | | Electrical Equipment — 1.1% |
| 115 | | | | Baldor Electric Co. | | | 5,667 | |
| | | | | Energy Equipment & Services — 1.6% |
| 60 | | | | SEACOR Holdings, Inc. (a) | | | 5,602 | |
| 35 | | | | Universal Compression Holdings, Inc. (a) | | | 2,536 | |
| | | | | | | | 8,138 | |
| | | | | Food & Staples Retailing — 1.1% |
| 50 | | | | Costco Wholesale Corp. | | | 2,926 | |
| 35 | | | | CVS/Caremark Corp. | | | 1,276 | |
| 100 | | | | Pathmark Stores, Inc. (a) | | | 1,296 | |
| | | | | | | | 5,498 | |
| | | | | Food Products — 1.3% |
| 183 | | | | B&G Foods, Inc., Class A | | | 2,416 | |
| 75 | | | | Wm. Wrigley, Jr., Co. | | | 4,148 | |
| | | | | | | | 6,564 | |
| | | | | Health Care Providers & Services — 2.9% |
| 150 | | | | Coventry Health Care, Inc. (a) | | | 8,647 | |
| 120 | | | | National Healthcare Corp. | | | 6,192 | |
| | | | | | | | 14,839 | |
| | | | | Hotels, Restaurants & Leisure — 1.9% |
| 85 | | | | AFC Enterprises, Inc. (a) | | | 1,470 | |
| 135 | | | | Cedar Fair LP | | | 3,810 | |
| 70 | | | | McDonald’s Corp. | | | 3,553 | |
| 50 | | | | Steak n Shake Co. (The) (a) | | | 834 | |
| | | | | | | | 9,667 | |
| | | | | Household Durables — 1.0% |
| 60 | | | | Fortune Brands, Inc. | | | 4,942 | |
| | | | | Industrial Conglomerates — 1.2% |
| 135 | | | | Carlisle Cos., Inc. | | | 6,279 | |
| | | | | Insurance — 11.5% |
| 183 | | | | Assurant, Inc. | | | 10,788 | |
| — | (h) | | | Berkshire Hathaway, Inc., Class A (a) | | | 12,590 | |
| 40 | | | | Everest Re Group Ltd. (Bermuda) | | | 4,346 | |
| 160 | | | | IPC Holdings Ltd. (Bermuda) | | | 5,166 | |
| 120 | | | | Loews Corp. | | | 6,118 | |
| 230 | | | | Old Republic International Corp. | | | 4,890 | |
| 229 | | | | OneBeacon Insurance Group Ltd. | | | 5,803 | |
| 165 | | | | ProAssurance Corp. (a) | | | 9,185 | |
| | | | | | | | 58,886 | |
| | | | | IT Services — 0.7% |
| 175 | | | | Western Union Co. (The) | | | 3,645 | |
SEE NOTES TO FINANCIAL STATEMENTS.
52 JPMORGAN MID CAP/MULTI-CAP FUNDS JUNE 30, 2007
SHARES
|
|
|
| SECURITY DESCRIPTION
|
| VALUE($)
|
|---|
Long-Term Investments — Continued |
| | | | | Machinery — 1.1% |
| 50 | | | | Crane Co. | | | 2,272 | |
| 50 | | | | Oshkosh Truck Corp. | | | 3,146 | |
| | | | | | | | 5,418 | |
| | | | | Media — 8.4% |
| 150 | | | | Cablevision Systems Corp., Class A (a) | | | 5,428 | |
| 363 | | | | Clear Channel Communications, Inc. | | | 13,717 | |
| 150 | | | | Entercom Communications Corp., Class A | | | 3,734 | |
| 175 | | | | Lin TV Corp., Class A (a) | | | 3,292 | |
| 40 | | | | McClatchy Co., Class A | | | 1,012 | |
| 20 | | | | Washington Post Co. (The), Class B | | | 15,522 | |
| | | | | | | | 42,705 | |
| | | | | Metals & Mining — 0.9% |
| 15 | | | | Rio Tinto plc ADR (United Kingdom) | | | 4,592 | |
| | | | | Oil, Gas & Consumable Fuels — 7.4% |
| 215 | | | | Devon Energy Corp. | | | 16,832 | |
| 123 | | | | Kinder Morgan Management LLC (a) | | | 6,392 | |
| 30 | | | | NuStar GP Holdings LLC | | | 1,148 | |
| 100 | | | | Teekay Shipping Corp. (Bahamas) | | | 5,791 | |
| 240 | | | | Williams Cos., Inc. | | | 7,589 | |
| | | | | | | | 37,752 | |
| | | | | Pharmaceuticals — 0.8% |
| 85 | | | | Merck & Co., Inc. | | | 4,233 | |
| | | | | Real Estate Investment Trusts (REITs) — 7.5% |
| 352 | | | | Agree Realty Corp. | | | 11,006 | |
| 50 | | | | Crystal River Capital, Inc. (m) | | | 1,214 | |
| 50 | | | | iStar Financial, Inc. | | | 2,217 | |
| 150 | | | | National Health Investors, Inc. | | | 4,758 | |
| 50 | | | | Plum Creek Timber Co., Inc. | | | 2,083 | |
| 75 | | | | PS Business Parks, Inc. | | | 4,753 | |
| 70 | | | | Public Storage, Inc. | | | 5,377 | |
| 150 | | | | Rayonier, Inc. | | | 6,771 | |
| | | | | | | | 38,179 | |
| | | | | Real Estate Management & Development — 1.2% |
| 75 | | | | Brookfield Asset Management, Inc., Class A (Canada) | | | 2,993 | |
| 136 | | | | Brookfield Properties Co. | | | 3,311 | |
| | | | | | | | 6,304 | |
| | | | | Software — 0.6% |
| 100 | | | | Microsoft Corp. | | | 2,947 | |
| | | | | Specialty Retail — 6.1% |
| 225 | | | | AutoNation, Inc. (a) | | | 5,060 | |
| 30 | | | | AutoZone, Inc. (a) | | | 4,099 | |
| 124 | | | | Bed Bath & Beyond, Inc. (a) | | | 4,466 | |
| 185 | | | | Home Depot, Inc. | | | 7,280 | |
| 260 | | | | Staples, Inc. | | | 6,167 | |
| 150 | | | | TJX Cos., Inc. | | | 4,125 | |
| | | | | | | | 31,197 | |
| | | | | Textiles, Apparel & Luxury Goods — 0.9% |
| 50 | | | | V.F. Corp. | | | 4,579 | |
| | | | | Thrifts & Mortgage Finance — 2.8% |
| 60 | | | | FirstFed Financial Corp. (a) | | | 3,404 | |
| 60 | | | | Freddie Mac | | | 3,642 | |
| 400 | | | | People’s United Financial, Inc. | | | 7,092 | |
| | | | | | | | 14,138 | |
| | | | | Tobacco — 0.3% |
| 25 | | | | Altria Group, Inc. | | | 1,754 | |
| | | | | Trading Companies & Distributors — 1.0% |
| 100 | | | | GATX Corp. | | | 4,925 | |
| | | | | Total Common Stocks
(Cost $407,817) | | | 446,649 | |
| | | | | Investment Company — 1.3% |
| 264 | | | | Cohen & Steers Select Utility Fund, Inc.
(Cost $6,341) | | | 6,928 | |
| | | | | Total Long-Term Investments
(Cost $414,158) | | | 453,577 | |
Short-Term Investment — 12.0% |
| | | | | Investment Company — 12.0% |
| 61,189 | | | | JPMorgan Prime Money Market Fund, Institutional Class (b) (m)
(Cost $61,189) | | | 61,189 | |
| | | | | Total Investments — 100.8%
(Cost $475,347) | | | 514,766 | |
| | | | | Liabilities in Excess of
Other Assets — (0.8)% | | | (4,227 | ) |
| | | | | NET ASSETS — 100.0% | | $ | 510,539 | |
Percentages indicated are based on net assets.
SEE NOTES TO FINANCIAL STATEMENTS.
JUNE 30, 2007 JPMORGAN MID CAP/MULTI-CAP FUNDS 53
JPMorgan Mid Cap/Multi Cap Funds
SCHEDULE OF PORTFOLIO INVESTMENTS
AS OF JUNE 30, 2007
ABBREVIATIONS:
| (a) | — | Non-income producing security. |
| (b) | — | Investment in affiliate. Money market fund registered under the Investment Company Act of 1940, as amended, and advised by JPMorgan Investment Management Inc., or JPMorgan Investment Advisors Inc. |
| (c) | — | Security, or a portion of the security, has been delivered to a counterparty as part of a security lending transaction. |
| (h) | — | Amount rounds to less than one thousand. |
| (j) | — | All or a portion of these securities are segregated for short sales. |
| (m) | — | All or a portion of this security is segregated for current or potential holdings of futures, swaps, options, TBA, when-issued securities, delayed delivery securities, and reverse repurchase agreements. |
| ADR | — | American Depositary Receipt |
| FRN | — | Floating Rate Note. The rate shown is the rate in effect as of June 30, 2007. |
| † | — | Short position is the result of the sale of a when issued security to be received from a pending corporate action of the long position. |
SEE NOTES TO FINANCIAL STATEMENTS.
54 JPMORGAN MID CAP/MULTI-CAP FUNDS JUNE 30, 2007
THIS PAGE IS INTENTIONALLY LEFT BLANK
JUNE 30, 2007 JPMORGAN MID CAP/MULTI-CAP FUNDS 55
STATEMENTS OF ASSETS AND LIABILITIES
FOR THE YEAR ENDED JUNE 30, 2007
(Amounts in thousands, except per share amounts)
|
|
|
| Capital
Growth
Fund
|
| Diversified
Mid Cap
Growth Fund
|
| Diversified
Mid Cap
Value Fund
|
| Growth
Advantage
Fund
|
|---|
ASSETS: | | | | | | | | | | | | | | | | | | |
| Investments in non-affiliates, at value | | | | $ | 1,109,164 | | | $ | 1,567,152 | | | $ | 783,742 | | | $ | 68,655 | |
| Investments in affiliates, at value | | | | | 5,911 | | | | 33,758 | | | | 12,129 | | | | 40 | |
| Total investment securities, at value | | | | | 1,115,075 | | | | 1,600,910 | | | | 795,871 | | | | 68,695 | |
| Cash | | | | | — | | | | — | | | | 30 | | | | — | |
| Receivables: | | | | | | | | | | | | | | | | | | |
| Investment securities sold | | | | | 18,166 | | | | 24,852 | | | | 922 | | | | 983 | |
| Fund shares sold | | | | | 2,682 | | | | 871 | | | | 402 | | | | 93 | |
| Interest and dividends | | | | | 255 | | | | 397 | | | | 985 | | | | 24 | |
| Prepaid expenses and other assets | | | | | — | (b) | | | 1 | | | | 1 | | | | — | |
| Total Assets | | | | | 1,136,178 | | | | 1,627,031 | | | | 798,211 | | | | 69,795 | |
| |
LIABILITIES: | | | | | | | | | | | | | | | | | | |
| Payables: | | | | | | | | | | | | | | | | | | |
| Due to custodian | | | | | — | | | | 3,734 | | | | — | | | | — | |
| Dividends | | | | | — | | | | — | | | | 2,038 | | | | — | |
| Investment securities purchased | | | | | 21,133 | | | | 30,283 | | | | 3,673 | | | | 470 | |
| Securities sold short | | | | | — | | | | — | | | | — | | | | 57 | |
| Collateral for securities lending program | | | | | 142,456 | | | | 202,906 | | | | 50,158 | | | | 6,585 | |
| Fund shares redeemed | | | | | 2,868 | | | | 2,665 | | | | 2,017 | | | | 18 | |
| Accrued liabilities: | | | | | | | | | | | | | | | | | | |
| Investment advisory fees | | | | | 320 | | | | 715 | | | | 407 | | | | 31 | |
| Administration fees | | | | | 93 | | | | 113 | | | | 64 | | | | 4 | |
| Shareholder servicing fees | | | | | 200 | | | | 145 | | | | 100 | | | | 9 | |
| Distribution fees | | | | | 137 | | | | 201 | | | | 97 | | | | 12 | |
| Custodian and accounting fees | | | | | 15 | | | | 30 | | | | 27 | | | | 4 | |
| Trustees’ and Chief Compliance Officer’s fees | | | | | 34 | | | | 2 | | | | 1 | | | | 1 | |
| Other | | | | | 330 | | | | 612 | | | | 249 | | | | 85 | |
| Total Liabilities | | | | | 167,586 | | | | 241,406 | | | | 58,831 | | | | 7,276 | |
| Net Assets: | | | | $ | 968,592 | | | $ | 1,385,625 | | | $ | 739,380 | | | $ | 62,519 | |
(a) Redemption price for Class B and Class C Shares varies based on the length of time the shares were held.
(b) Amount rounds to less than $1,000.
SEE NOTES TO FINANCIAL STATEMENTS.
56 JPMORGAN MID CAP/MULTI-CAP FUNDS JUNE 30, 2007
|
|
|
| Capital
Growth
Fund
|
| Diversified
Mid Cap
Growth Fund
|
| Diversified
Mid Cap
Value
Fund
|
| Growth
Advantage
Fund
|
|---|
NET ASSETS: | | | | | | | | | | | | | | | | | | |
| Paid in capital | | | | $ | 713,372 | | | $ | 987,327 | | | $ | 452,565 | | | $ | 281,745 | |
Accumulated undistributed (distributions in excess of)
net investment income | | | | | (45 | ) | | | (23 | ) | | | (1,590 | ) | | | (2 | ) |
| Accumulated net realized gains (losses) | | | | | 70,959 | | | | 153,781 | | | | 117,489 | | | | (232,528 | ) |
| Net unrealized appreciation (depreciation) | | | | | 184,306 | | | | 244,540 | | | | 170,916 | | | | 13,304 | |
| Total Net Assets | | | | $ | 968,592 | | | $ | 1,385,625 | | | $ | 739,380 | | | $ | 62,519 | |
| |
| Net Assets: | | | | | | | | | | | | | | | | | | |
| Class A | | | | $ | 526,157 | | | $ | 480,084 | | | $ | 212,613 | | | $ | 49,782 | |
| Class B | | | | | 20,189 | | | | 123,779 | | | | 53,843 | | | | 1,501 | |
| Class C | | | | | 25,672 | | | | 38,805 | | | | 29,590 | | | | 251 | |
| Select Class | | | | | 396,574 | | | | 740,208 | | | | 440,662 | | | | 10,985 | |
| Ultra | | | | | — | | | | 2,749 | | | | 2,672 | | | | — | |
| Total | | | | $ | 968,592 | | | $ | 1,385,625 | | | $ | 739,380 | | | $ | 62,519 | |
Outstanding units of beneficial interest (shares)
($0.0001 par value; unlimited number of shares authorized): | | | | | | | | | | | | | | | | | | |
| Class A | | | | | 11,768 | | | | 19,284 | | | | 13,414 | | | | 6,087 | |
| Class B | | | | | 500 | | | | 5,929 | | | | 3,587 | | | | 194 | |
| Class C | | | | | 647 | | | | 1,672 | | | | 1,971 | | | | 32 | |
| Select Class | | | | | 8,324 | | | | 28,358 | | | | 27,951 | | | | 1,339 | |
| Ultra | | | | | — | | | | 105 | | | | 169 | | | | — | |
| |
| Net Asset Value | | | | | | | | | | | | | | | | | | |
| Class A — Redemption price per share | | | | $ | 44.71 | | | $ | 24.89 | | | $ | 15.85 | | | $ | 8.18 | |
| Class B — Offering price per share (a) | | | | | 40.38 | | | | 20.88 | | | | 15.01 | | | | 7.76 | |
| Class C — Offering price per share (a) | | | | | 39.68 | | | | 23.21 | | | | 15.01 | | | | 7.76 | |
| Select Class — Offering and redemption price per share | | | | | 47.64 | | | | 26.10 | | | | 15.77 | | | | 8.20 | |
| Ultra — Offering and redemption price per share | | | | | — | | | | 26.19 | | | | 15.77 | | | | — | |
| Class A maximum sales charge | | | | | 5.25 | % | | | 5.25 | % | | | 5.25 | % | | | 5.25 | % |
Class A maximum public offering price per share
(net asset value per share/100% – maximum sales charge) | | | | $ | 47.19 | | | $ | 26.27 | | | $ | 16.73 | | | $ | 8.63 | |
| |
| Cost of investments | | | | $ | 930,769 | | | $ | 1,356,370 | | | $ | 624,955 | | | $ | 55,394 | |
| Market value of securities on loan | | | | | 140,663 | | | | 199,568 | | | | 49,100 | | | �� | 6,546 | |
| Proceeds received from securities sold short | | | | | — | | | | — | | | | — | | | | 60 | |
SEE NOTES TO FINANCIAL STATEMENTS.
JUNE 30, 2007 JPMORGAN MID CAP/MULTI-CAP FUNDS 57
STATEMENTS OF ASSETS AND LIABILITIES
FOR THE YEAR ENDED JUNE 30, 2007 (continued)
(Amounts in thousands, except per share amounts)
|
|
|
| Mid Cap
Equity
Fund
|
| Mid Cap
Value
Fund
|
| Multi-Cap
Market
Neutral
Fund
|
| Value
Advantage
Fund
|
|---|
ASSETS: | | | | | | | | | | | | | | | | | | |
| Investments in non-affiliates, at value | | | | $ | 293,403 | | | $ | 8,587,767 | | | $ | 2,077,622 | | | $ | 453,577 | |
| Investments in affiliates, at value | | | | | 5,483 | | | | 243,352 | | | | 109,489 | | | | 61,189 | |
| Total investment securities, at value | | | | | 298,886 | | | | 8,831,119 | | | | 2,187,111 | | | | 514,766 | |
| Cash | | | | | 7 | | | | 435 | | | | — | | | | 38 | |
| Deposit with broker for securities sold short | | | | | — | | | | — | | | | 2,143,630 | | | | — | |
| Receivables: | | | | | | | | | | | | | | | | | | |
| Investment securities sold | | | | | 3,938 | | | | 77,386 | | | | 96,155 | | | | — | |
| Fund shares sold | | | | | 294 | | | | 26,292 | | | | 5,150 | | | | 3,458 | |
| Interest and dividends | | | | | 265 | | | | 13,713 | | | | 10,332 | | | | 1,181 | |
| Prepaid expenses and other assets | | | | | — | | | | — | | | | 1 | | | | — | |
| Total Assets | | | | | 303,390 | | | | 8,948,945 | | | | 4,442,379 | | | | 519,443 | |
| |
LIABILITIES: | | | | | | | | | | | | | | | | | | |
| Payables: | | | | | | | | | | | | | | | | | | |
| Due to custodian | | | | | — | | | | — | | | | 652 | | | | — | |
| Dividends for securities sold short | | | | | — | | | | — | | | | 1,039 | | | | — | |
| Investment securities purchased | | | | | 4,459 | | | | 84,056 | | | | 97,813 | | | | 8,078 | |
| Securities sold short | | | | | — | | | | — | | | | 2,061,246 | | | | — | |
| Collateral for securities lending program | | | | | 13,961 | | | | 214,916 | | | | — | | | | — | |
| Fund shares redeemed | | | | | 166 | | | | 13,472 | | | | 10,097 | | | | 168 | |
| Accrued liabilities: | | | | | | | | | | | | | | | | | | |
| Investment advisory fees | | | | | 153 | | | | 4,099 | | | | 2,011 | | | | 209 | |
| Administration fees | | | | | 18 | | | | 614 | | | | 172 | | | | 28 | |
| Shareholder servicing fees | | | | | 17 | | | | 1,259 | | | | 44 | | | | 99 | |
| Distribution fees | | | | | — | | | | 1,454 | | | | 174 | | | | 193 | |
| Custodian and accounting fees | | | | | 6 | | | | 73 | | | | 45 | | | | 8 | |
| Trustees’ and Chief Compliance Officer’s fees | | | | | 5 | | | | 4 | | | | 7 | | | | — | (b) |
| Other | | | | | 59 | | | | 291 | | | | 355 | | | | 121 | |
| Total Liabilities | | | | | 18,844 | | | | 320,238 | | | | 2,173,655 | | | | 8,904 | |
| Net Assets: | | | | $ | 284,546 | | | $ | 8,628,707 | | | $ | 2,268,724 | | | $ | 510,539 | |
(a) Redemption price for Class B and Class C Shares varies based on the length of time the shares were held.
(b) Amount rounds to less than $1,000.
SEE NOTES TO FINANCIAL STATEMENTS.
58 JPMORGAN MID CAP/MULTI-CAP FUNDS JUNE 30, 2007
|
|
|
| Mid Cap
Equity
Fund
|
| Mid Cap
Value
Fund
|
| Multi-Cap
Market
Neutral
Fund
|
| Value
Advantage
Fund
|
|---|
NET ASSETS: | | | | | | | | | | | | | | | | | | |
| Paid in capital | | | | $ | 190,690 | | | $ | 6,499,705 | | | $ | 2,129,637 | | | $ | 445,118 | |
Accumulated undistributed (distributions in excess of)
net investment income | | | | | 40 | | | | 21,673 | | | | 36,056 | | | | 1,773 | |
| Accumulated net realized gains (losses) | | | | | 28,869 | | | | 388,921 | | | | (89,257 | ) | | | 24,229 | |
| Net unrealized appreciation (depreciation) | | | | | 64,947 | | | | 1,718,408 | | | | 192,288 | | | | 39,419 | |
| Total Net Assets | | | | $ | 284,546 | | | $ | 8,628,707 | | | $ | 2,268,724 | | | $ | 510,539 | |
| |
| Net Assets: | | | | | | | | | | | | | | | | | | |
| Class A | | | | $ | — | | | $ | 3,822,632 | | | $ | 204,059 | | | $ | 201,151 | |
| Class B | | | | | — | | | | 237,745 | | | | 24,974 | | | | — | |
| Class C | | | | | — | | | | 818,261 | | | | 187,546 | | | | 247,794 | |
| Select Class | | | | | 284,546 | | | | 1,183,839 | | | | 1,852,145 | | | | 36,884 | |
| Institutional Class | | | | | — | | | | 2,566,230 | | | | — | | | | 24,710 | |
| Total | | | | $ | 284,546 | | | $ | 8,628,707 | | | $ | 2,268,724 | | | $ | 510,539 | |
| |
Outstanding units of beneficial interest (shares)
($0.0001 par value; unlimited number of shares authorized): | | | | | | | | | | | | | | | | | | |
| Class A | | | | | — | | | | 137,949 | | | | 18,152 | | | | 9,834 | |
| Class B | | | | | — | | | | 8,771 | | | | 2,257 | | | | — | |
| Class C | | | | | — | | | | 30,119 | | | | 16,947 | | | | 12,199 | |
| Select Class | | | | | 7,502 | | | | 42,334 | | | | 163,822 | | | | 1,797 | |
| Institutional Class | | | | | — | | | | 91,089 | | | | — | | | | 1,207 | |
| |
| Net Asset Value | | | | | | | | | | | | | | | | | | |
| Class A — Redemption price per share | | | | $ | — | | | $ | 27.71 | | | $ | 11.24 | | | $ | 20.45 | |
| Class B — Offering price per share (a) | | | | | — | | | | 27.11 | | | | 11.07 | | | | — | |
| Class C — Offering price per share (a) | | | | | — | | | | 27.17 | | | | 11.07 | | | | 20.31 | |
| Select Class — Offering and redemption price per share | | | | | 37.93 | | | | 27.96 | | | | 11.31 | | | | 20.52 | |
| Institutional Class — Offering and redemption price per share | | | | | — | | | | 28.17 | | | | — | | | | 20.47 | |
| Class A maximum sales charge | | | | | — | | | | 5.25 | % | | | 5.25 | % | | | 5.25 | % |
Class A maximum public offering price per share
(net asset value per share/100% – maximum sales charge) | | | | $ | — | | | $ | 29.25 | | | $ | 11.86 | | | $ | 21.58 | |
| |
| Cost of investments | | | | $ | 233,939 | | | $ | 7,112,711 | | | $ | 1,837,493 | | | $ | 475,347 | |
| Market value of securities on loan | | | | | 13,807 | | | | 210,342 | | | | — | | | | — | |
| Proceeds received from securities sold short | | | | | — | | | | — | | | | 1,903,916 | | | | — | |
SEE NOTES TO FINANCIAL STATEMENTS.
JUNE 30, 2007 JPMORGAN MID CAP/MULTI-CAP FUNDS 59
STATEMENTS OF OPERATIONS
FOR THE YEAR ENDED JUNE 30, 2007
(Amounts in thousands)
|
|
|
| Capital
Growth
Fund
|
| Diversified
Mid Cap
Growth Fund
|
| Diversified
Mid Cap
Value Fund
|
| Growth
Advantage
Fund
|
|---|
INVESTMENT INCOME | | | | | | | | | | | | | | | | | | |
| Dividend income | | | | $ | 3,366 | | | $ | 5,093 | | | $ | 15,501 | | | $ | 391 | |
| Dividend income from affiliates (a) | | | | | 808 | | | | 704 | | | | 839 | | | | 27 | |
| Income from securities lending (net) | | | | | 682 | | | | 1,028 | | | | 340 | | | | 43 | |
| Foreign taxes withheld | | | | | (8 | ) | | | (11 | ) | | | (38 | ) | | | — | (b) |
| Total investment income | | | | | 4,848 | | | | 6,814 | | | | 16,642 | | | | 461 | |
| |
EXPENSES | | | | | | | | | | | | | | | | | | |
| Investment advisory fees | | | | | 3,539 | | | | 8,655 | | | | 5,533 | | | | 470 | |
| Administration fees | | | | | 889 | | | | 1,338 | | | | 856 | | | | 73 | |
| Distribution fees | | | | | | | | | | | | | | | | | | |
| Class A | | | | | 1,215 | | | | 1,120 | | | | 567 | | | | 144 | |
| Class B | | | | | 177 | | | | 1,034 | | | | 432 | | | | 10 | |
| Class C | | | | | 167 | | | | 300 | | | | 233 | | | | — | (b) |
| Shareholder servicing fees | | | | | | | | | | | | | | | | | | |
| Class A | | | | | 1,215 | | | | 1,120 | | | | 567 | | | | 144 | |
| Class B | | | | | 59 | | | | 345 | | | | 144 | | | | 3 | |
| Class C | | | | | 56 | | | | 100 | | | | 77 | | | | — | (b) |
| Select Class | | | | | 882 | | | | 1,739 | | | | 1,329 | | | | 33 | |
| Custodian and accounting fees | | | | | 68 | | | | 108 | | | | 86 | | | | 47 | |
| Interest expense | | | | | — | (b) | | | 19 | | | | 2 | | | | 7 | |
| Professional fees | | | | | 62 | | | | 44 | | | | 43 | | | | 45 | |
| Trustees’ and Chief Compliance Officer’s fees | | | | | 9 | | | | 21 | | | | 13 | | | | 1 | |
| Printing and mailing costs | | | | | 283 | | | | 229 | | | | 99 | | | | 48 | |
| Registration and filing fees | | | | | 81 | | | | 68 | | | | 59 | | | | 50 | |
| Transfer agent fees | | | | | 685 | | | | 967 | | | | 328 | | | | 83 | |
| Other | | | | | 12 | | | | 39 | | | | 33 | | | | 24 | |
| Total expenses | | | | | 9,399 | | | | 17,246 | | | | 10,401 | | | | 1,182 | |
| Less amounts waived | | | | | — | | | | (1,384 | ) | | | (787 | ) | | | (223 | ) |
| Less earnings credits | | | | | (3 | ) | | | (3 | ) | | | (6 | ) | | | — | (b) |
| Less reimbursement for legal matters | | | | | — | | | | (1 | ) | | | (1 | ) | | | — | |
| Net expenses | | | | | 9,396 | | | | 15,858 | | | | 9,607 | | | | 959 | |
| Net investment income (loss) | | | | | (4,548 | ) | | | (9,044 | ) | | | 7,035 | | | | (498 | ) |
| |
REALIZED/UNREALIZED GAINS (LOSSES) | | | | | | | | | | | | | | | | | | |
Net realized gain (loss) on transactions
from investments | | | | | 101,852 | | | | 225,078 | | | | 156,003 | | | | 10,762 | |
Change in net unrealized appreciation (depreciation)
of investments | | | | | | | | | | | | | | | | | | |
| Investments | | | | | 59,558 | | | | 10,761 | | | | (6,646 | ) | | | 4,911 | |
| Securities sold short | | | | | — | | | | — | | | | — | | | | 3 | |
| Change in net unrealized appreciation (depreciation) | | | | | 59,558 | | | | 10,761 | | | | (6,646 | ) | | | 4,914 | |
| Net realized/unrealized gains (losses) | | | | | 161,410 | | | | 235,839 | | | | 149,357 | | | | 15,676 | |
| Change in net assets resulting from operations | | | | $ | 156,862 | | | $ | 226,795 | | | $ | 156,392 | | | $ | 15,178 | |
| (a) | | Includes reimbursements of investment advisory, administration and shareholder servicing fees. Please see Fees and Other Transactions with Affiliates in the Notes to Financial Statements. |
| (b) | | Amount rounds to less than $1,000. |
SEE NOTES TO FINANCIAL STATEMENTS.
60 JPMORGAN MID CAP/MULTI-CAP FUNDS JUNE 30, 2007
|
|
|
| Mid Cap
Equity
Fund
|
| Mid Cap
Value
Fund
|
| Multi-Cap
Market
Neutral
Fund
|
| Value
Advantage
Fund
|
|---|
INVESTMENT INCOME | | | | | | | | | | | | | | | | | | |
| Dividend income | | | | $ | 3,207 | | | $ | 141,566 | | | $ | 21,090 | | | $ | 6,285 | |
| Dividend income from affiliates (a) | | | | | 360 | | | | 14,426 | | | | 5,340 | | | | 2,381 | |
| Interest income | | | | | — | | | | — | | | | 99,347 | (b) | | | — | |
| Income from securities lending (net) | | | | | 104 | | | | 1,112 | | | | — | | | | — | |
| Foreign taxes withheld | | | | | (7 | ) | | | (231 | ) | | | (78 | ) | | | (10 | ) |
| Total investment income | | | | | 3,664 | | | | 156,873 | | | | 125,699 | | | | 8,656 | |
| |
EXPENSES | | | | | | | | | | | | | | | | | | |
| Investment advisory fees | | | | | 1,908 | | | | 52,145 | | | | 26,173 | | | | 2,147 | |
| Administration fees | | | | | 295 | | | | 8,060 | | | | 2,104 | | | | 331 | |
| Distribution fees | | | | | | | | | | | | | | | | | | |
| Class A | | | | | — | | | | 8,603 | | | | 504 | | | | 330 | |
| Class B | | | | | — | | | | 1,769 | | | | 197 | | | | — | |
| Class C | | | | | — | | | | 6,025 | | | | 1,432 | | | | 1,209 | |
| Shareholder servicing fees | | | | | | | | | | | | | | | | | | |
| Class A | | | | | — | | | | 8,603 | | | | 504 | | | | 330 | |
| Class B | | | | | — | | | | 590 | | | | 66 | | | | — | |
| Class C | | | | | — | | | | 2,008 | | | | 477 | | | | 403 | |
| Select Class | | | | | 734 | | | | 3,127 | | | | 4,188 | | | | 64 | |
| Institutional Class | | | | | — | | | | 2,291 | | | | — | | | | 11 | |
| Custodian and accounting fees | | | | | 48 | | | | 483 | | | | 160 | | | | 37 | |
| Interest expense | | | | | 5 | | | | — | | | | — | | | | 1 | |
| Professional fees | | | | | 39 | | | | 134 | | | | 45 | | | | 48 | |
| Trustees’ and Chief Compliance Officer’s fees | | | | | 4 | | | | 100 | | | | 32 | | | | 4 | |
| Printing and mailing costs | | | | | 47 | | | | 1,783 | | | | 246 | | | | 36 | |
| Registration and filing fees | | | | | 18 | | | | 12 | | | | 55 | | | | 107 | |
| Transfer agent fees | | | | | 86 | | | | 5,009 | | | | 674 | | | | 294 | |
| Dividend expense on securities sold short | | | | | — | | | | — | | | | 24,973 | | | | — | |
| Other | | | | | 8 | | | | 183 | | | | 61 | | | | 9 | |
| Total expenses | | | | | 3,192 | | | | 100,925 | | | | 61,891 | | | | 5,361 | |
| Less amounts waived | | | | | (542 | ) | | | (9,944 | ) | | | (8,054 | ) | | | (529 | ) |
| Less earnings credits | | | | | (3 | ) | | | (89 | ) | | | (13 | ) | | | (19 | ) |
| Less reimbursement for legal matters | | | | | — | | | | — | | | | (1 | ) | | | — | |
| Net expenses | | | | | 2,647 | | | | 90,892 | | | | 53,823 | | | | 4,813 | |
| Net investment income (loss) | | | | | 1,017 | | | | 65,981 | | | | 71,876 | | | | 3,843 | |
| |
REALIZED/UNREALIZED GAINS (LOSSES) | | | | | | | | | | | | | | | | | | |
| Net realized gain (loss) on transactions from: | | | | | | | | | | | | | | | | | | |
| Investments | | | | | 37,615 | | | | 488,854 | | | | 184,961 | | | | 24,756 | |
| Securities sold short | | | | | — | | | | — | | | | (249,986 | ) | | | — | |
| Net realized gain (loss) | | | | | 37,615 | | | | 488,854 | | | | (65,025 | ) | | | 24,756 | |
| Change in net unrealized appreciation (depreciation) of: | | | | | | | | | | | | | | | | | | |
| Investments | | | | | 12,225 | | | | 789,575 | | | | 222,400 | | | | 31,286 | |
| Securities sold short | | | | | — | | | | — | | | | (116,547 | ) | | | — | |
| Change in net unrealized appreciation (depreciation) | | | | | 12,225 | | | | 789,575 | | | | 105,853 | | | | 31,286 | |
| Net realized/unrealized gains (losses) | | | | | 49,840 | | | | 1,278,429 | | | | 40,828 | | | | 56,042 | |
| Change in net assets resulting from operations | | | | $ | 50,857 | | | $ | 1,344,410 | | | $ | 112,704 | | | $ | 59,885 | |
| (a) | | Includes reimbursements of investment advisory, administration and shareholder servicing fees. Please see Fees and Other Transactions with Affiliates in the Notes to Financial Statements. |
| (b) | | Interest income earned on segregated cash for short positions. |
SEE NOTES TO FINANCIAL STATEMENTS.
JUNE 30, 2007 JPMORGAN MID CAP/MULTI-CAP FUNDS 61
STATEMENTS OF CHANGES IN NET ASSETS
FOR THE PERIODS INDICATED
(Amounts in thousands)
| | | | Capital Growth Fund (a)
| | Diversified Mid Cap Growth Fund
| |
|---|
|
|
|
| Year
Ended
6/30/2007
|
| Period
Ended
6/30/2006
|
| Year
Ended
12/31/2005
|
| Year
Ended
6/30/2007
|
| Year
Ended
6/30/2006
|
|---|
CHANGE IN NET ASSETS FROM RESULTING OPERATIONS: | | | | | | | | | | | | | | | | | | | | | | |
| Net investment income (loss) | | | | $ | (4,548 | ) | | $ | 77 | | | $ | (3,919 | ) | | $ | (9,044 | ) | | $ | (6,171 | ) |
| Net realized gain (loss) | | | | | 101,852 | | | | 27,670 | | | | 55,475 | | | | 225,078 | | | | 251,056 | |
| Change in net unrealized appreciation (depreciation) | | | | | 59,558 | | | | 2,458 | | | | 19,484 | | | | 10,761 | | | | (49,784 | ) |
| Change in net assets resulting from operations | | | | | 156,862 | | | | 30,205 | | | | 71,040 | | | | 226,795 | | | | 195,101 | |
| | | | | | | | | | | | | | | | | | | | | | | |
DISTRIBUTIONS TO SHAREHOLDERS: | | | | | | | | | | | | | | | | | | | | | | |
Class A | | | | | | | | | | | | | | | | | | | | | | |
| From net realized gains | | | | | (37,430 | ) | | | — | | | | (34,577 | ) | | | (70,626 | ) | | | (34,627 | ) |
Class B | | | | | | | | | | | | | | | | | | | | | | |
| From net realized gains | | | | | (2,088 | ) | | | — | | | | (2,960 | ) | | | (25,785 | ) | | | (16,185 | ) |
Class C | | | | | | | | | | | | | | | | | | | | | | |
| From net realized gains | | | | | (1,859 | ) | | | — | | | | (1,296 | ) | | | (6,792 | ) | | | (3,861 | ) |
Select Class | | | | | | | | | | | | | | | | | | | | | | |
| From net investment income | | | | | (74 | ) | | | — | | | | — | | | | — | | | | — | |
| From net realized gains | | | | | (25,344 | ) | | | — | | | | (18,489 | ) | | | (107,952 | ) | | | (74,921 | ) |
Ultra | | | | | | | | | | | | | | | | | | | | | | |
| From net realized gains | | | | | — | | | | — | | | | — | | | | (1,418 | ) | | | (1,349 | ) |
| Total distributions to shareholders | | | | | (66,795 | ) | | | — | | | | (57,322 | ) | | | (212,573 | ) | | | (130,943 | ) |
| | | | | | | | | | | | | | | | | | | | | | | |
CAPITAL TRANSACTIONS: | | | | | | | | | | | | | | | | | | | | | | |
| Change in net assets from capital transactions | | | | | 37,496 | | | | 25,344 | | | | 229,735 | | | | (62,785 | ) | | | (360,585 | ) |
| | | | | | | | | | | | | | | | | | | | | | | |
NET ASSETS: | | | | | | | | | | | | | | | | | | | | | | |
| Change in net assets | | | | | 127,563 | | | | 55,549 | | | | 243,453 | | | | (48,563 | ) | | | (296,427 | ) |
| Beginning of period | | | | | 841,029 | | | | 785,480 | | | | 542,027 | | | | 1,434,188 | | | | 1,730,615 | |
| End of period | | | | $ | 968,592 | | | $ | 841,029 | | | $ | 785,480 | | | $ | 1,385,625 | | | $ | 1,434,188 | |
| Accumulated undistributed (distributions in excess of) net investment income | | | | $ | (45 | ) | | $ | 22 | | | $ | (42 | ) | | $ | (23 | ) | | $ | (27 | ) |
| (a) | | The Fund changed its fiscal year end from December 31 to June 30. |
SEE NOTES TO FINANCIAL STATEMENTS.
62 JPMORGAN MID CAP/MULTI-CAP FUNDS JUNE 30, 2007
| | | | Diversified Mid Cap Value Fund
| | Growth Advantage Fund (a)(b)
| |
|---|
|
|
|
| Year
Ended
6/30/2007
|
| Year
Ended
6/30/2006
|
| Year
Ended
6/30/2007
|
| Period
Ended
6/30/2006
|
| Year
Ended
12/31/2005
|
|---|
CHANGE IN NET ASSETS FROM RESULTING OPERATIONS: | | | | | | | | | | | | | | | | | | | | | | |
| Net investment income (loss) | | | | $ | 7,035 | | | $ | 9,605 | | | $ | (498 | ) | | $ | (128 | ) | | $ | (447 | ) |
| Net realized gain (loss) | | | | | 156,003 | | | | 195,181 | | | | 10,762 | | | | 1,848 | | | | 8,398 | |
| Change in net unrealized appreciation (depreciation) | | | | | (6,646 | ) | | | (95,936 | ) | | | 4,914 | | | | (187 | ) | | | (2,867 | ) |
| Change in net assets resulting from operations | | | | | 156,392 | | | | 108,850 | | | | 15,178 | | | | 1,533 | | | | 5,084 | |
| | | | | | | | | | | | | | | | | | | | | | | |
DISTRIBUTIONS TO SHAREHOLDERS: | | | | | | | | | | | | | | | | | | | | | | |
Class A | | | | | | | | | | | | | | | | | | | | | | |
| From net investment income | | | | | (1,948 | ) | | | (1,911 | ) | | | — | | | | — | | | | — | |
| From net realized gains | | | | | (37,633 | ) | | | (62,387 | ) | | | — | | | | — | | | | — | |
Class B | | | | | | | | | | | | | | | | | | | | | | |
| From net investment income | | | | | (228 | ) | | | (222 | ) | | | — | | | | — | | | | — | |
| From net realized gains | | | | | (9,974 | ) | | | (16,589 | ) | | | — | | | | — | | | | — | |
Class C | | | | | | | | | | | | | | | | | | | | | | |
| From net investment income | | | | | (124 | ) | | | (119 | ) | | | — | | | | — | | | | — | |
| From net realized gains | | | | | (5,288 | ) | | | (8,894 | ) | | | — | | | | — | | | | — | |
Select Class | | | | | | | | | | | | | | | | | | | | | | |
| From net investment income | | | | | (5,575 | ) | | | (7,557 | ) | | | — | | | | — | | | | — | |
| From net investment income | | | | | (92,296 | ) | | | (210,755 | ) | | | — | | | | — | | | | — | |
Ultra | | | | | | | | | | | | | | | | | | | | | | |
| From net investment income | | | | | (38 | ) | | | (127 | ) | | | — | | | | — | | | | — | |
| From net realized gains | | | | | (483 | ) | | | (3,088 | ) | | | — | | | | — | | | | — | |
| Total distributions to shareholders | | | | | (153,587 | ) | | | (311,649 | ) | | | — | | | | — | | | | — | |
| | | | | | | | | | | | | | | | | | | | | | | |
CAPITAL TRANSACTIONS: | | | | | | | | | | | | | | | | | | | | | | |
| Change in net assets from capital transactions | | | | | (192,190 | ) | | | (178,002 | ) | | | (25,455 | ) | | | 15,167 | | | | (6,370 | ) |
| | | | | | | | | | | | | | | | | | | | | | | |
NET ASSETS: | | | | | | | | | | | | | | | | | | | | | | |
| Change in net assets | | | | | (189,385 | ) | | | (380,801 | ) | | | (10,277 | ) | | | 16,700 | | | | (1,286 | ) |
| Beginning of period | | | | | 928,765 | | | | 1,309,566 | | | | 72,796 | | | | 56,096 | | | | 57,382 | |
| End of period | | | | $ | 739,380 | | | $ | 928,765 | | | $ | 62,519 | | | $ | 72,796 | | | $ | 56,096 | |
| Accumulated undistributed (distributions in excess of) net investment income | | | | $ | (1,590 | ) | | $ | (1,580 | ) | | $ | (2 | ) | | $ | (2 | ) | | $ | (1 | ) |
| (a) | | The Fund changed its fiscal year end from December 31 to June 30. |
| (b) | | Prior to August 17, 2005, the Fund was named Mid Cap Growth Fund. |
SEE NOTES TO FINANCIAL STATEMENTS.
JUNE 30, 2007 JPMORGAN MID CAP/MULTI-CAP FUNDS 63
STATEMENTS OF CHANGES IN NET ASSETS
FOR THE PERIODS INDICATED (continued)
(Amounts in thousands)
| | | | Mid Cap Equity Fund (a)
| | Mid Cap Value Fund (a)
| |
|---|
|
|
|
| Year
Ended
6/30/2007
|
| Period
Ended
6/30/2006
|
| Year
Ended
12/31/2005
|
| Year
Ended
6/30/2007
|
| Period
Ended
6/30/2006
|
| Year
Ended
12/31/2005
|
|---|
CHANGE IN NET ASSETS RESULTING FROM OPERATIONS: | | | | | | | | | | | | | | | | | | | | | | | | | | |
| Net investment income (loss) | | | | $ | 1,017 | | | $ | 1,246 | | | $ | 716 | | | $ | 65,981 | | | $ | 45,431 | | | $ | 37,307 | |
| Net realized gain (loss) | | | | | 37,615 | | | | 10,389 | | | | 25,609 | | | | 488,854 | | | | 200,042 | | | | 196,320 | |
| Change in net unrealized appreciation (depreciation) | | | | | 12,225 | | | | 2,660 | | | | (2,188 | ) | | | 789,575 | | | | 191,877 | | | | 287,118 | |
| Change in net assets resulting from operations | | | | | 50,857 | | | | 14,295 | | | | 24,137 | | | | 1,344,410 | | | | 437,350 | | | | 520,745 | |
| | | | | | | | | | | | | | | | | | | | | | | | | | | |
DISTRIBUTIONS TO SHAREHOLDERS: | | | | | | | | | | | | | | | | | | | | | | | | | | |
Class A | | | | | | | | | | | | | | | | | | | | | | | | | | |
| From net investment income | | | | | — | | | | — | | | | — | | | | (33,796 | ) | | | — | | | | (14,169 | ) |
| From net realized gains | | | | | — | | | | — | | | | — | | | | (145,970 | ) | | | — | | | | (72,188 | ) |
Class B | | | | | | | | | | | | | | | | | | | | | | | | | | |
| From net investment income | | | | | — | | | | — | | | | — | | | | (1,118 | ) | | | — | | | | — | |
| From net realized gains | | | | | — | | | | — | | | | — | | | | (10,457 | ) | | | — | | | | (6,168 | ) |
Class C | | | | | | | | | | | | | | | | | | | | | | | | | | |
| From net investment income | | | | | — | | | | — | | | | — | | | | (3,695 | ) | | | — | | | | (12 | ) |
| From net realized gains | | | | | — | | | | — | | | | — | | | | (35,418 | ) | | | — | | | | (21,631 | ) |
Select Class | | | | | | | | | | | | | | | | | | | | | | | | | | |
| From net investment income | | | | | (827 | ) | | | (1,227 | ) | | | (705 | ) | | | (14,785 | ) | | | — | | | | (8,387 | ) |
| From net realized gains | | | | | (23,004 | ) | | | — | | | | (27,072 | ) | | | (55,110 | ) | | | — | | | | (31,358 | ) |
Institutional Class | | | | | | | | | | | | | | | | | | | | | | | | | | |
| From net investment income | | | | | — | | | | — | | | | — | | | | (31,824 | ) | | | — | | | | (17,025 | ) |
| From net realized gains | | | | | — | | | | — | | | | — | | | | (95,197 | ) | | | — | | | | (48,603 | ) |
| Total distributions to shareholders | | | | | (23,831 | ) | | | (1,227 | ) | | | (27,777 | ) | | | (427,370 | ) | | | — | | | | (219,541 | ) |
| | | | | | | | | | | | | | | | | | | | | | | | | | | |
CAPITAL TRANSACTIONS: | | | | | | | | | | | | | | | | | | | | | | | | | | |
| Change in net assets from capital transactions | | | | | (40,584 | ) | | | 16,454 | | | | 45,115 | | | | 424,154 | | | | (166,640 | ) | | | 3,026,845 | |
| | | | | | | | | | | | | | | | | | | | | | | | | | | |
NET ASSETS: | | | | | | | | | | | | | | | | | | | | | | | | | | |
| Change in net assets | | | | | (13,558 | ) | | | 29,522 | | | | 41,475 | | | | 1,341,194 | | | | 270,710 | | | | 3,328,049 | |
| Beginning of period | | | | | 298,104 | | | | 268,582 | | | | 227,107 | | | | 7,287,513 | | | | 7,016,803 | | | | 3,688,754 | |
| End of period | | | | $ | 284,546 | | | $ | 298,104 | | | $ | 268,582 | | | $ | 8,628,707 | | | $ | 7,287,513 | | | $ | 7,016,803 | |
| Accumulated undistributed (distributions in excess of) net investment income | | | | $ | 40 | | | $ | 23 | | | $ | 5 | | | $ | 21,673 | | | $ | 45,563 | | | $ | (2 | ) |
| (a) | | The Fund changed its fiscal year end from December 31 to June 30. |
SEE NOTES TO FINANCIAL STATEMENTS.
64 JPMORGAN MID CAP/MULTI-CAP FUNDS JUNE 30, 2007
| | | | Multi-Cap Market Neutral Fund
| | Value Advantage Fund (a)(b)
| |
|---|
|
|
|
| Year
Ended
6/30/2007
|
| Year
Ended
6/30/2006
|
| Year
Ended
6/30/2007
|
| Period
Ended
6/30/2006
|
| Period
Ended
12/31/2005
|
|---|
CHANGE IN NET ASSETS RESULTING FROM OPERATIONS: | | | | | | | | | | | | | | | | | | | | | | |
| Net investment income (loss) | | | | $ | 71,876 | | | $ | 41,094 | | | $ | 3,843 | | | $ | 615 | | | $ | 291 | |
| Net realized gain (loss) | | | | | (65,025 | ) | | | (471 | ) | | | 24,756 | | | | 3,239 | | | | 663 | |
| Change in net unrealized appreciation (depreciation) | | | | | 105,853 | | | | 47,312 | | | | 31,286 | | | | 5,805 | | | | 2,328 | |
| Change in net assets resulting from operations | | | | | 112,704 | | | | 87,935 | | | | 59,885 | | | | 9,659 | | | | 3,282 | |
| | | | | | | | | | | | | | | | | | | | | | | |
DISTRIBUTIONS TO SHAREHOLDERS: | | | | | | | | | | | | | | | | | | | | | | |
Class A | | | | | | | | | | | | | | | | | | | | | | |
| From net investment income | | | | | (5,486 | ) | | | (3,219 | ) | | | (748 | ) | | | — | | | | (169 | ) |
| From net realized gains | | | | | — | | | | (6,217 | ) | | | (1,731 | ) | | | — | | | | (477 | ) |
Class B | | | | | | | | | | | | | | | | | | | | | | |
| From net investment income | | | | | (515 | ) | | | (263 | ) | | | — | | | | — | | | | — | |
| From net realized gains | | | | | — | | | | (953 | ) | | | — | | | | — | | | | — | |
Class C | | | | | | | | | | | | | | | | | | | | | | |
| From net investment income | | | | | (3,745 | ) | | | (2,001 | ) | | | (533 | ) | | | — | | | | (93 | ) |
| From net realized gains | | | | | — | | | | (7,230 | ) | | | (2,199 | ) | | | — | | | | (609 | ) |
Select Class | | | | | | | | | | | | | | | | | | | | | | |
| From net investment income | | | | | (51,420 | ) | | | (21,032 | ) | | | (221 | ) | | | — | | | | (14 | ) |
| From net realized gains | | | | | — | | | | (33,786 | ) | | | (389 | ) | | | — | | | | (35 | ) |
Institutional Class | | | | | | | | | | | | | | | | | | | | | | |
| From net investment income | | | | | — | | | | — | | | | (76 | ) | | | — | | | | — | (c) |
| From net realized gains | | | | | — | | | | — | | | | (116 | ) | | | — | | | | — | (c) |
| Total distributions to shareholders | | | | | (61,166 | ) | | | (74,701 | ) | | | (6,013 | ) | | | — | | | | (1,397 | ) |
| | | | | | | | | | | | | | | | | | | | | | | |
CAPITAL TRANSACTIONS: | | | | | | | | | | | | | | | | | | | | | | |
| Change in net assets from capital transactions | | | | | 340,365 | | | | 399,079 | | | | 289,151 | | | | 53,692 | | | | 102,280 | |
| | | | | | | | | | | | | | | | | | | | | | | |
NET ASSETS: | | | | | | | | | | | | | | | | | | | | | | |
| Change in net assets | | | | | 391,903 | | | | 412,313 | | | | 343,023 | | | | 63,351 | | | | 104,165 | |
| Beginning of period | | | | | 1,876,821 | | | | 1,464,508 | | | | 167,516 | | | | 104,165 | | | | — | |
| End of period | | | | $ | 2,268,724 | | | $ | 1,876,821 | | | $ | 510,539 | | | $ | 167,516 | | | $ | 104,165 | |
| Accumulated undistributed (distributions in excess of) net investment income | | | | $ | 36,056 | | | $ | 24,258 | | | $ | 1,773 | | | $ | 430 | | | $ | 23 | |
| (a) | | The Fund changed its fiscal year end from December 31 to June 30. |
| (b) | | Commencement of operations was February 28, 2005. |
| (c) | | Amount rounds to less than $1,000. |
SEE NOTES TO FINANCIAL STATEMENTS.
JUNE 30, 2007 JPMORGAN MID CAP/MULTI-CAP FUNDS 65
STATEMENTS OF CHANGES IN NET ASSETS
FOR THE PERIODS INDICATED (continued)
(Amounts in thousands)
| | | | Capital Growth Fund (a)
| | Diversified Mid Cap Growth Fund
| |
|---|
|
|
|
| Year
Ended
6/30/2007
|
| Period
Ended
6/30/2006
|
| Year
Ended
12/31/2005
|
| Year
Ended
6/30/2007
|
| Year
Ended
6/30/2006
|
|---|
CAPITAL TRANSACTIONS | | | | | | | | | | | | | | | | | | | | | | |
Class A | | | | | | | | | | | | | | | | | | | | | | |
| Proceeds from shares issued | | | | $ | 66,012 | | | $ | 34,766 | | | $ | 67,593 | | | $ | 91,587 | | | $ | 134,263 | |
| Dividends reinvested | | | | | 34,864 | | | | — | | | | 32,128 | | | | 63,206 | | | | 30,576 | |
| Cost of shares redeemed | | | | | (93,518 | ) | | | (40,887 | ) | | | (89,342 | ) | | | (132,338 | ) | | | (165,572 | ) |
| Change in net assets from Class A capital transactions | | | | $ | 7,358 | | | $ | (6,121 | ) | | $ | 10,379 | | | $ | 22,455 | | | $ | (733 | ) |
Class B | | | | | | | | | | | | | | | | | | | | | | |
| Proceeds from shares issued | | | | $ | 2,399 | | | $ | 2,415 | | | $ | 5,581 | | | $ | 4,435 | | | $ | 7,622 | |
| Dividends reinvested | | | | | 1,754 | | | | — | | | | 2,560 | | | | 24,710 | | | | 15,509 | |
| Cost of shares redeemed | | | | | (13,705 | ) | | | (10,024 | ) | | | (25,134 | ) | | | (57,020 | ) | | | (68,714 | ) |
| Change in net assets from Class B capital transactions | | | | $ | (9,552 | ) | | $ | (7,609 | ) | | $ | (16,993 | ) | | $ | (27,875 | ) | | $ | (45,583 | ) |
Class C | | | | | | | | | | | | | | | | | | | | | | |
| Proceeds from shares issued | | | | $ | 5,975 | | | $ | 4,660 | | | $ | 10,804 | | | $ | 3,330 | | | $ | 5,446 | |
| Dividends reinvested | | | | | 1,230 | | | | — | | | | 754 | | | | 5,265 | | | | 3,001 | |
| Cost of shares redeemed | | | | | (4,331 | ) | | | (1,548 | ) | | | (1,654 | ) | | | (11,972 | ) | | | (13,973 | ) |
| Change in net assets from Class C capital transactions | | | | $ | 2,874 | | | $ | 3,112 | | | $ | 9,904 | | | $ | (3,377 | ) | | $ | (5,526 | ) |
Select Class | | | | | | | | | | | | | | | | | | | | | | |
| Proceeds from shares issued | | | | $ | 81,512 | | | $ | 57,099 | | | $ | 233,983 | | | $ | 202,985 | | | $ | 140,967 | |
| Dividends reinvested | | | | | 24,390 | | | | — | | | | 17,941 | | | | 16,561 | | | | 11,637 | |
| Cost of shares redeemed | | | | | (69,086 | ) | | | (21,137 | ) | | | (25,479 | ) | | | (260,625 | ) | | | (464,395 | ) |
| Change in net assets from Select Class capital transactions | | | | $ | 36,816 | | | $ | 35,962 | | | $ | 226,445 | | | $ | (41,079 | ) | | $ | (311,791 | ) |
Ultra | | | | | | | | | | | | | | | | | | | | | | |
| Proceeds from shares issued | | | | $ | — | | | $ | — | | | $ | — | | | $ | 1,213 | | | $ | 5,648 | |
| Cost of shares redeemed | | | | | — | | | | — | | | | — | | | | (14,122 | ) | | | (2,600 | ) |
| Change in net assets from Ultra capital transactions | | | | $ | — | | | $ | — | | | $ | — | | | $ | (12,909 | ) | | $ | 3,048 | |
| (a) | | The Fund changed its fiscal year end from December 31 to June 30. |
SEE NOTES TO FINANCIAL STATEMENTS.
66 JPMORGAN MID CAP/MULTI-CAP FUNDS JUNE 30, 2007
| | | | Capital Growth Fund (a)
| | Diversified Mid Cap Growth Fund
| |
|---|
|
|
|
| Year
Ended
6/30/2007
|
| Period
Ended
6/30/2006
|
| Year
Ended
12/31/2005
|
| Year
Ended
6/30/2007
|
| Year
Ended
6/30/2006
|
|---|
SHARE TRANSACTIONS: | | | | | | | | | | | | | | | | | | | | | | |
Class A | | | | | | | | | | | | | | | | | | | | | | |
| Issued | | | | | 1,589 | | | | 830 | | | | 1,741 | | | | 3,821 | | | | 5,354 | |
| Reinvested | | | | | 862 | | | | — | | | | 816 | | | | 2,784 | | | | 1,266 | |
| Redeemed | | | | | (2,251 | ) | | | (984 | ) | | | (2,292 | ) | | | (5,492 | ) | | | (6,634 | ) |
| Change in Class A Shares | | | | | 200 | | | | (154 | ) | | | 265 | | | | 1,113 | | | | (14 | ) |
Class B | | | | | | | | | | | | | | | | | | | | | | |
| Issued | | | | | 64 | | | | 63 | | | | 154 | | | | 218 | | | | 348 | |
| Reinvested | | | | | 48 | | | | — | | | | 71 | | | | 1,294 | | | | 737 | |
| Redeemed | | | | | (365 | ) | | | (261 | ) | | | (701 | ) | | | (2,776 | ) | | | (3,130 | ) |
| Change in Class B Shares | | | | | (253 | ) | | | (198 | ) | | | (476 | ) | | | (1,264 | ) | | | (2,045 | ) |
Class C | | | | | | | | | | | | | | | | | | | | | | |
| Issued | | | | | 163 | | | | 125 | | | | 302 | | | | 150 | | | | 230 | |
| Reinvested | | | | | 34 | | | | — | | | | 21 | | | | 248 | | | | 130 | |
| Redeemed | | | | | (118 | ) | | | (42 | ) | | | (46 | ) | | | (527 | ) | | | (587 | ) |
| Change in Class C Shares | | | | | 79 | | | | 83 | | | | 277 | | | | (129 | ) | | | (227 | ) |
Select Class | | | | | | | | | | | | | | | | | | | | | | |
| Issued | | | | | 1,850 | | | | 1,291 | | | | 5,804 | | | | 8,196 | | | | 5,510 | |
| Reinvested | | | | | 567 | | | | — | | | | 432 | | | | 697 | | | | 465 | |
| Redeemed | | | | | (1,563 | ) | | | (483 | ) | | | (627 | ) | | | (10,352 | ) | | | (18,136 | ) |
| Change in Select Class Shares | | | | | 854 | | | | 808 | | | | 5,609 | | | | (1,459 | ) | | | (12,161 | ) |
Ultra | | | | | | | | | | | | | | | | | | | | | | |
| Issued | | | | | — | | | | — | | | | — | | | | 50 | | | | 224 | |
| Redeemed | | | | | — | | | | — | | | | — | | | | (538 | ) | | | (101 | ) |
| Change in Ultra Shares | | | | | — | | | | — | | | | — | | | | (488 | ) | | | 123 | |
| (a) | | The Fund changed its fiscal year end from December 31 to June 30. |
SEE NOTES TO FINANCIAL STATEMENTS.
JUNE 30, 2007 JPMORGAN MID CAP/MULTI-CAP FUNDS 67
STATEMENTS OF CHANGES IN NET ASSETS
FOR THE PERIODS INDICATED (continued)
(Amounts in thousands)
| | | | Diversified Mid Cap Value Fund
| | Growth Advantage Fund (a)(b)
| |
|---|
|
|
|
| Year
Ended
6/30/2007
|
| Year
Ended
6/30/2006
|
| Year
Ended
6/30/2007
|
| Period
Ended
6/30/2006
|
| Year
Ended
12/31/2005
|
|---|
CAPITAL TRANSACTIONS: | | | | | | | | | | | | | | | | | | | | | | |
Class A | | | | | | | | | | | | | | | | | | | | | | |
| Proceeds from shares issued | | | | $ | 30,190 | | | $ | 79,245 | | | $ | 3,407 | | | $ | 21,924 | | | $ | 9,235 | |
| Dividends reinvested | | | | | 36,920 | | | | 59,398 | | | | — | | | | — | | | | — | |
| Cost of shares redeemed | | | | | (81,934 | ) | | | (110,791 | ) | | | (37,514 | ) | | | (6,594 | ) | | | (13,879 | ) |
| Change in net assets from Class A capital transactions | | | | $ | (14,824 | ) | | $ | 27,852 | | | $ | (34,107 | ) | | $ | 15,330 | | | $ | (4,644 | ) |
Class B | | | | | | | | | | | | | | | | | | | | | | |
| Proceeds from shares issued | | | | $ | 1,373 | | | $ | 5,496 | | | $ | 396 | | | $ | 210 | | | $ | 448 | |
| Dividends reinvested | | | | | 9,628 | | | | 15,789 | | | | — | | | | — | | | | — | |
| Cost of shares redeemed | | | | | (16,655 | ) | | | (19,081 | ) | | | (396 | ) | | | (403 | ) | | | (2,174 | ) |
| Change in net assets from Class B capital transactions | | | | $ | (5,654 | ) | | $ | 2,204 | | | $ | — | | | $ | (193 | ) | | $ | (1,726 | ) |
Class C | | | | | | | | | | | | | | | | | | | | | | |
| Proceeds from shares issued | | | | $ | 1,573 | | | $ | 24,884 | | | $ | 260 | | | $ | 15 | (d) | | $ | — | |
| Dividends reinvested | | | | | 4,220 | | | | 7,097 | | | | — | | | | — | | | | — | |
| Cost of shares redeemed | | | | | (8,959 | ) | | | (22,769 | ) | | | (40 | ) | | | — | | | | — | |
| Change in net assets from Class C capital transactions | | | | $ | (3,166 | ) | | $ | 9,212 | | | $ | 220 | | | $ | 15 | | | $ | — | |
Select Class | | | | | | | | | | | | | | | | | | | | | | |
| Proceeds from shares issued | | | | $ | 74,337 | | | $ | 212,740 | | | $ | 24,360 | | | $ | 15 | (e) | | $ | — | |
| Dividends reinvested | | | | | 5,663 | | | | 25,159 | | | | — | | | | — | | | | — | |
| Cost of shares redeemed | | | | | (243,125 | ) | | | (452,569 | ) | | | (15,928 | ) | | | — | | | | — | |
| Change in net assets from Select Class capital transactions | | | | $ | (163,125 | ) | | $ | (214,670 | ) | | $ | 8,432 | | | $ | 15 | | | $ | — | |
Ultra | | | | | | | | | | | | | | | | | | | | | | |
| Proceeds from shares issued | | | | $ | — | (c) | | $ | — | (c) | | $ | — | | | $ | — | | | $ | — | |
| Cost of shares redeemed | | | | | (5,421 | ) | | | (2,600 | ) | | | — | | | | — | | | | — | |
| Change in net assets from Ultra capital transactions | | | | $ | (5,421 | ) | | $ | (2,600 | ) | | $ | — | | | $ | — | | | $ | — | |
| (a) | | The Fund changed its fiscal year end from December 31 to June 30. |
| (b) | | Prior to August 17, 2005, the Fund was named Mid Cap Growth Fund. |
| (c) | | Amount rounds to less than $1,000. |
| (d) | | Commencement of offering of Class C Shares on May 1, 2006. |
| (e) | | Commencement of offering of Select Class Shares on May 1, 2006. |
SEE NOTES TO FINANCIAL STATEMENTS.
68 JPMORGAN MID CAP/MULTI-CAP FUNDS JUNE 30, 2007
| | | | Diversified Mid Cap Value Fund
| | Growth Advantage Fund (a)(b)
| |
|---|
|
|
|
| Year
Ended
6/30/2007
|
| Year
Ended
6/30/2006
|
| Year
Ended
6/30/2007
|
| Period
Ended
6/30/2006
|
| Year
Ended
12/31/2005
|
|---|
SHARE TRANSACTIONS: | | | | | | | | | | | | | | | | | | | | | | |
Class A | | | | | | | | | | | | | | | | | | | | | | |
| Issued | | | | | 1,904 | | | | 4,316 | | | | 465 | | | | 3,121 | | | | 1,479 | |
| Reinvested | | | | | 2,472 | | | | 3,854 | | | | — | | | | — | | | | — | |
| Redeemed | | | | | (5,140 | ) | | | (6,472 | ) | | | (5,160 | ) | | | (962 | ) | | | (2,348 | ) |
| Change in Class A Shares | | | | | (764 | ) | | | 1,698 | | | | (4,695 | ) | | | 2,159 | | | | (869 | ) |
Class B | | | | | | | | | | | | | | | | | | | | | | |
| Issued | | | | | 92 | | | | 312 | | | | 56 | | | | 33 | | | | 80 | |
| Reinvested | | | | | 682 | | | | 1,072 | | | | — | | | | — | | | | — | |
| Redeemed | | | | | (1,102 | ) | | | (1,166 | ) | | | (56 | ) | | | (62 | ) | | | (374 | ) |
| Change in Class B Shares | | | | | (328 | ) | | | 218 | | | | — | | | | (29 | ) | | | (294 | ) |
Class C | | | | | | | | | | | | | | | | | | | | | | |
| Issued | | | | | 108 | | | | 1,338 | | | | 35 | | | | 2 | (d) | | | — | |
| Reinvested | | | | | 299 | | | | 482 | | | | — | | | | — | | | | — | |
| Redeemed | | | | | (587 | ) | | | (1,275 | ) | | | (5 | ) | | | — | | | | — | |
| Change in Class C Shares | | | | | (180 | ) | | | 545 | | | | 30 | | | | 2 | | | | — | |
Select Class | | | | | | | | | | | | | | | | | | | | | | |
| Issued | | | | | 4,969 | | | | 13,366 | | | | 3,344 | | | | 2 | (e) | | | — | |
| Reinvested | | | | | 381 | | | | 1,639 | | | | — | | | | — | | | | — | |
| Redeemed | | | | | (15,427 | ) | | | (27,301 | ) | | | (2,007 | ) | | | — | | | | — | |
| Change in Select Class Shares | | | | | (10,077 | ) | | | (12,296 | ) | | | 1,337 | | | | 2 | | | | — | |
Ultra | | | | | | | | | | | | | | | | | | | | | | |
| Issued | | | | | — | (c) | | | — | (c) | | | — | | | | — | | | | — | |
| Redeemed | | | | | (322 | ) | | | (164 | ) | | | — | | | | — | | | | — | |
| Change in Ultra Shares | | | | | (322 | ) | | | (164 | ) | | | — | | | | — | | | | — | |
| (a) | | The Fund changed its fiscal year end from December 31 to June 30. |
| (b) | | Prior to August 17, 2005, the Fund was named Mid Cap Growth Fund. |
| (c) | | Amount rounds to less than one thousand. |
| (d) | | Commencement of offering of Class C Shares on May 1, 2006. |
| (e) | | Commencement of offering of Select Class Shares on May 1, 2006. |
SEE NOTES TO FINANCIAL STATEMENTS.
JUNE 30, 2007 JPMORGAN MID CAP/MULTI-CAP FUNDS 69
STATEMENTS OF CHANGES IN NET ASSETS
FOR THE PERIODS INDICATED (continued)
(Amounts in thousands)
| | | | Mid Cap Equity Fund (a)
| | Mid Cap Value Fund (a)
| |
|---|
|
|
|
| Year
Ended
6/30/2007
|
| Period
Ended
6/30/2006
|
| Year
Ended
12/31/2005
|
| Year
Ended
6/30/2007
|
| Period
Ended
6/30/2006
|
| Year
Ended
12/31/2005
|
|---|
CAPITAL TRANSACTIONS: | | | | | | | | | | | | | | | | | | | | | | | | | | |
Class A | | | | | | | | | | | | | | | | | | | | | | | | | | |
| Proceeds from shares issued | | | | $ | — | | | $ | — | | | $ | — | | | $ | 1,034,419 | | | $ | 487,264 | | | $ | 1,806,575 | |
| Dividends reinvested | | | | | — | | | | — | | | | — | | | | 161,657 | | | | — | | | | 75,171 | |
| Cost of shares redeemed | | | | | — | | | | — | | | | — | | | | (765,918 | ) | | | (483,692 | ) | | | (504,110 | ) |
| Change in net assets from Class A capital transactions | | | | $ | — | | | $ | — | | | $ | — | | | $ | 430,158 | | | $ | 3,572 | | | $ | 1,377,636 | |
Class B | | | | | | | | | | | | | | | | | | | | | | | | | | |
| Proceeds from shares issued | | | | $ | — | | | $ | — | | | $ | — | | | $ | 9,136 | | | $ | 4,697 | | | $ | 68,631 | |
| Dividends reinvested | | | | | — | | | | — | | | | — | | | | 9,616 | | | | — | | | | 4,936 | |
| Cost of shares redeemed | | | | | — | | | | — | | | | — | | | | (37,761 | ) | | | (21,720 | ) | | | (25,007 | ) |
| Change in net assets from Class B capital transactions | | | | $ | — | | | $ | — | | | $ | — | | | $ | (19,009 | ) | | $ | (17,023 | ) | | $ | 48,560 | |
Class C | | | | | | | | | | | | | | | | | | | | | | | | | | |
| Proceeds from shares issued | | | | $ | — | | | $ | — | | | $ | — | | | $ | 42,240 | | | $ | 22,162 | | | $ | 344,689 | |
| Dividends reinvested | | | | | — | | | | — | | | | — | | | | 27,199 | | | | — | | | | 14,623 | |
| Cost of shares redeemed | | | | | — | | | | — | | | | — | | | | (132,764 | ) | | | (101,678 | ) | | | (59,221 | ) |
| Change in net assets from Class C capital transactions | | | | $ | — | | | $ | — | | | $ | — | | | $ | (63,325 | ) | | $ | (79,516 | ) | | $ | 300,091 | |
Select Class | | | | | | | | | | | | | | | | | | | | | | | | | | |
| Proceeds from shares issued | | | | $ | 34,107 | | | $ | 58,534 | | | $ | 111,814 | | | $ | 181,275 | | | $ | 109,574 | | | $ | 868,591 | |
| Dividends reinvested | | | | | 6,210 | | | | 238 | | | | 13,373 | | | | 31,011 | | | | — | | | | 22,433 | |
| Cost of shares redeemed | | | | | (80,901 | ) | | | (42,318 | ) | | | (80,072 | ) | | | (429,576 | ) | | | (153,707 | ) | | | (211,875 | ) |
| Change in net assets from Select Class capital transactions | | | | $ | (40,584 | ) | | $ | 16,454 | | | $ | 45,115 | | | $ | (217,290 | ) | | $ | (44,133 | ) | | $ | 679,149 | |
Institutional Class | | | | | | | | | | | | | | | | | | | | | | | | | | |
| Proceeds from shares issued | | | | $ | — | | | $ | — | | | $ | — | | | $ | 688,235 | | | $ | 236,657 | | | $ | 988,690 | |
| Dividends reinvested | | | | | — | | | | — | | | | — | | | | 100,503 | | | | — | | | | 49,428 | |
| Cost of shares redeemed | | | | | — | | | | — | | | | — | | | | (495,118 | ) | | | (266,197 | ) | | | (416,709 | ) |
| Change in net assets from Institutional Class capital transactions | | | | $ | — | | | $ | — | | | $ | — | | | $ | 293,620 | | | $ | (29,540 | ) | | $ | 621,409 | |
| |
| (a) | | The Fund changed its fiscal year end from December 31 to June 30. |
SEE NOTES TO FINANCIAL STATEMENTS.
70 JPMORGAN MID CAP/MULTI-CAP FUNDS JUNE 30, 2007
| | | | Mid Cap Equity Fund (a)
| | Mid Cap Value Fund (a)
| |
|---|
|
|
|
| Year
Ended
6/30/2007
|
| Period
Ended
6/30/2006
|
| Year
Ended
12/31/2005
|
| Year
Ended
6/30/2007
|
| Period
Ended
6/30/2006
|
| Year
Ended
12/31/2005
|
|---|
SHARE TRANSACTIONS: | | | | | | | | | | | | | | | | | | | | | | | | | | |
Class A | | | | | | | | | | | | | | | | | | | | | | | | | | |
| Issued | | | | | — | | | | — | | | | — | | | | 39,369 | | | | 20,046 | | | | 79,449 | |
| Reinvested | | | | | — | | | | — | | | | — | | | | 6,236 | | | | — | | | | 3,191 | |
| Redeemed | | | | | — | | | | — | | | | — | | | | (29,046 | ) | | | (19,885 | ) | | | (21,858 | ) |
| Change in Class A Shares | | | | | — | | | | — | | | | — | | | | 16,559 | | | | 161 | | | | 60,782 | |
Class B | | | | | | | | | | | | | | | | | | | | | | | | | | |
| Issued | | | | | — | | | | — | | | | — | | | | 358 | | | | 197 | | | | 3,118 | |
| Reinvested | | | | | — | | | | — | | | | — | | | | 380 | | | | — | | | | 214 | |
| Redeemed | | | | | — | | | | — | | | | — | | | | (1,467 | ) | | | (909 | ) | | | (1,112 | ) |
| Change in Class B Shares | | | | | — | | | | — | | | | — | | | | (729 | ) | | | (712 | ) | | | 2,220 | |
Class C | | | | | | | | | | | | | | | | | | | | | | | | | | |
| Issued | | | | | — | | | | — | | | | — | | | | 1,648 | | | | 928 | | | | 15,649 | |
| Reinvested | | | | | — | | | | — | | | | — | | | | 1,072 | | | | — | | | | 632 | |
| Redeemed | | | | | — | | | | — | | | | — | | | | (5,195 | ) | | | (4,243 | ) | | | (2,624 | ) |
| Change in Class C Shares | | | | | — | | | | — | | | | — | | | | (2,475 | ) | | | (3,315 | ) | | | 13,657 | |
Select Class | | | | | | | | | | | | | | | | | | | | | | | | | | |
| Issued | | | | | 959 | | | | 1,697 | | | | 3,314 | | | | 6,808 | | | | 4,490 | | | | 38,506 | |
| Reinvested | | | | | 178 | | | | 7 | | | | 399 | | | | 1,186 | | | | — | | | | 944 | |
| Redeemed | | | | | (2,273 | ) | | | (1,237 | ) | | | (2,361 | ) | | | (16,049 | ) | | | (6,265 | ) | | | (9,156 | ) |
| Change in Select Class Shares | | | | | (1,136 | ) | | | 467 | | | | 1,352 | | | | (8,055 | ) | | | (1,775 | ) | | | 30,294 | |
Institutional Class | | | | | | | | | | | | | | | | | | | | | | | | | | |
| Issued | | | | | — | | | | — | | | | — | | | | 25,631 | | | | 9,612 | | | | 42,976 | |
| Reinvested | | | | | — | | | | — | | | | — | | | | 3,814 | | | | — | | | | 2,069 | |
| Redeemed | | | | | — | | | | — | | | | — | | | | (18,403 | ) | | | (10,793 | ) | | | (18,290 | ) |
| Change in Institutional Class Shares | | | | | — | | | | — | | | | — | | | | 11,042 | | | | (1,181 | ) | | | 26,755 | |
| |
| (a) | | The Fund changed its fiscal year end from December 31 to June 30. |
SEE NOTES TO FINANCIAL STATEMENTS.
JUNE 30, 2007 JPMORGAN MID CAP/MULTI-CAP FUNDS 71
STATEMENTS OF CHANGES IN NET ASSETS
FOR THE PERIODS INDICATED (continued)
(Amounts in thousands)
| | | | Multi-Cap Market Neutral Fund
| | Value Advantage Fund (a)(b)
| |
|---|
|
|
|
| Year
Ended
6/30/2007
|
| Year
Ended
6/30/2006
|
| Year
Ended
6/30/2007
|
| Period
Ended
6/30/2006
|
| Period
Ended
12/31/2005
|
|---|
CAPITAL TRANSACTIONS: | | | | | | | | | | | | | | | | | | | | | | |
Class A | | | | | | | | | | | | | | | | | | | | | | |
| Proceeds from shares issued | | | | $ | 106,779 | | | $ | 95,185 | | | $ | 127,656 | | | $ | 35,749 | | | $ | 46,450 | |
| Dividends reinvested | | | | | 2,524 | | | | 4,054 | | | | 1,939 | | | | — | | | | 490 | |
| Cost of shares redeemed | | | | | (100,921 | ) | | | (106,033 | ) | | | (27,429 | ) | | | (7,672 | ) | | | (2,464 | ) |
| Redemption fees | | | | | — | | | | 1 | | | | — | | | | — | | | | — | |
| Change in net assets from Class A capital transactions | | | | $ | 8,382 | | | $ | (6,793 | ) | | $ | 102,166 | | | $ | 28,077 | | | $ | 44,476 | |
Class B | | | | | | | | | | | | | | | | | | | | | | |
| Proceeds from shares issued | | | | $ | 2,218 | | | $ | 4,114 | | | $ | — | | | $ | — | | | $ | — | |
| Dividends reinvested | | | | | 251 | | | | 606 | | | | — | | | | — | | | | — | |
| Cost of shares redeemed | | | | | (6,264 | ) | | | (8,878 | ) | | | — | | | | — | | | | — | |
| Redemption fees | | | | | — | | | | — | (c) | | | — | | | | — | | | | — | |
| Change in net assets from Class B capital transactions | | | | $ | (3,795 | ) | | $ | (4,158 | ) | | $ | — | | | $ | — | | | $ | — | |
Class C | | | | | | | | | | | | | | | | | | | | | | |
| Proceeds from shares issued | | | | $ | 41,272 | | | $ | 58,107 | | | $ | 152,709 | | | $ | 27,806 | | | $ | 56,580 | |
| Dividends reinvested | | | | | 1,678 | | | | 4,164 | | | | 2,028 | | | | — | | | | 487 | |
| Cost of shares redeemed | | | | | (60,511 | ) | | | (104,690 | ) | | | (16,771 | ) | | | (4,821 | ) | | | (2,231 | ) |
| Redemption fees | | | | | — | | | | 1 | | | | — | | | | — | | | | — | |
| Change in net assets from Class C capital transactions | | | | $ | (17,561 | ) | | $ | (42,418 | ) | | $ | 137,966 | | | $ | 22,985 | | | $ | 54,836 | |
Select Class | | | | | | | | | | | | | | | | | | | | | | |
| Proceeds from shares issued | | | | $ | 662,742 | | | $ | 623,651 | | | $ | 31,389 | | | $ | 2,886 | | | $ | 3,524 | |
| Dividends reinvested | | | | | 2,685 | | | | 13,573 | | | | 236 | | | | — | | | | 45 | |
| Cost of shares redeemed | | | | | (312,088 | ) | | | (184,779 | ) | | | (4,807 | ) | | | (998 | ) | | | (584 | ) |
| Redemption fees | | | | | — | | | | 3 | | | | — | | | | — | | | | — | |
| Change in net assets from Select Class capital transactions | | | | $ | 353,339 | | | $ | 452,448 | | | $ | 26,818 | | | $ | 1,888 | | | $ | 2,985 | |
Institutional Class | | | | | | | | | | | | | | | | | | | | | | |
| Proceeds from shares issued | | | | $ | — | | | $ | — | | | $ | 23,082 | | | $ | 757 | | | $ | 520 | |
| Dividends reinvested | | | | | — | | | | — | | | | 179 | | | | — | | | | 1 | |
| Cost of shares redeemed | | | | | — | | | | — | | | | (1,060 | ) | | | (15 | ) | | | (538 | ) |
| Change in net assets from Institutional Class capital transactions | | | | $ | — | | | $ | — | | | $ | 22,201 | | | $ | 742 | | | $ | (17 | ) |
| (a) | | The Fund changed its fiscal year end from December 31 to June 30. |
| (b) | | Commencement of operations was February 28, 2005. |
| (c) | | Amount rounds to less than $1,000. |
SEE NOTES TO FINANCIAL STATEMENTS.
72 JPMORGAN MID CAP/MULTI-CAP FUNDS JUNE 30, 2007
| | | | Multi-Cap Market Neutral Fund
| | Value Advantage Fund (a)(b)
| |
|---|
|
|
|
| Year
Ended
6/30/2007
|
| Year
Ended
6/30/2006
|
| Year
Ended
6/30/2007
|
| Period
Ended
6/30/2006
|
| Period
Ended
12/31/2005
|
|---|
SHARE TRANSACTIONS: | | | | | | | | | | | | | | | | | | | | | | |
Class A | | | | | | | | | | | | | | | | | | | | | | |
| Issued | | | | | 9,631 | | | | 8,786 | | | | 6,704 | | | | 2,139 | | | | 2,969 | |
| Reinvested | | | | | 230 | | | | 382 | | | | 102 | | | | — | | | | 31 | |
| Redeemed | | | | | (9,099 | ) | | | (9,872 | ) | | | (1,496 | ) | | | (459 | ) | | | (156 | ) |
| Change in Class A Shares | | | | | 762 | | | | (704 | ) | | | 5,310 | | | | 1,680 | | | | 2,844 | |
Class B | | | | | | | | | | | | | | | | | | | | | | |
| Issued | | | | | 203 | | | | 386 | | | | — | | | | — | | | | — | |
| Reinvested | | | | | 23 | | | | 58 | | | | — | | | | — | | | | — | |
| Redeemed | | | | | (574 | ) | | | (838 | ) | | | — | | | | — | | | | — | |
| Change in Class B Shares | | | | | (348 | ) | | | (394 | ) | | | — | | | | — | | | | — | |
Class C | | | | | | | | | | | | | | | | | | | | | | |
| Issued | | | | | 3,779 | | | | 5,454 | | | | 8,078 | | | | 1,663 | | | | 3,635 | |
| Reinvested | | | | | 155 | | | | 399 | | | | 107 | | | | — | | | | 31 | |
| Redeemed | | | | | (5,545 | ) | | | (9,891 | ) | | | (886 | ) | | | (288 | ) | | | (141 | ) |
| Change in Class C Shares | | | | | (1,611 | ) | | | (4,038 | ) | | | 7,299 | | | | 1,375 | | | | 3,525 | |
Select Class | | | | | | | | | | | | | | | | | | | | | | |
| Issued | | | | | 59,506 | | | | 57,687 | | | | 1,725 | | | | 171 | | | | 229 | |
| Reinvested | | | | | 244 | | | | 1,267 | | | | 12 | | | | — | | | | 2 | |
| Redeemed | | | | | (27,997 | ) | | | (17,086 | ) | | | (246 | ) | | | (60 | ) | | | (36 | ) |
| Change in Select Class Shares | | | | | 31,753 | | | | 41,868 | | | | 1,491 | | | | 111 | | | | 195 | |
Institutional Class | | | | | | | | | | | | | | | | | | | | | | |
| Issued | | | | | — | | | | — | | | | 1,207 | | | | 45 | | | | 34 | |
| Reinvested | | | | | — | | | | — | | | | 9 | | | | | | | | — | (c) |
| Redeemed | | | | | — | | | | — | | | | (54 | ) | | | (1 | ) | | | (33 | ) |
| Change in Institutional Class Shares | | | | | — | | | | — | | | | 1,162 | | | | 44 | | | | 1 | |
| (a) | | The Fund changed its fiscal year end from December 31 to June 30. |
| (b) | | Commencement of operations was February 28, 2005. |
| (c) | | Amount rounds to less than $1,000. |
SEE NOTES TO FINANCIAL STATEMENTS.
JUNE 30, 2007 JPMORGAN MID CAP/MULTI-CAP FUNDS 73
FINANCIAL HIGHLIGHTS
FOR THE PERIODS INDICATED
Class A
| | | |
|
|
|
|
|
| Per share operating performance
|
|
|---|
| | | | | | Investment operations
| | Distributions
| |
|---|
|
|
|
| Net asset
value,
beginning
of period
|
| Net
investment
income
(loss)
|
| Net realized
and unrealized
gains
(losses) on
investments
|
| Total from
investment
operations
|
| Net
investment
income
|
| Net
realized
gains
|
| Total
distributions
|
|---|
Capital Growth Fund | | | | | | | | | | | | | | | | | | | | | | | | | | | | | | |
| Year Ended June 30, 2007 | | | | $ | 40.68 | | | $ | (0.24 | )(f) | | $ | 7.57 | | | $ | 7.33 | | | $ | — | | | $ | (3.30 | ) | | $ | (3.30 | ) |
| Period Ended June 30, 2006 (d) | | | | | 39.13 | | | | (0.01 | )(f) | | | 1.56 | | | | 1.55 | | | | — | | | | — | | | | — | |
| Year Ended December 31, 2005 | | | | | 38.51 | | | | (0.23 | )(f) | | | 3.95 | | | | 3.72 | | | | — | | | | (3.10 | ) | | | (3.10 | ) |
| Year Ended December 31, 2004 | | | | | 37.47 | | | | (0.24 | )(f) | | | 6.49 | | | | 6.25 | | | | — | | | | (5.21 | ) | | | (5.21 | ) |
| Year Ended December 31, 2003 | | | | | 28.60 | | | | (0.34 | )(f) | | | 10.61 | | | | 10.27 | | | | — | | | | (1.40 | ) | | | (1.40 | ) |
| Year Ended December 31, 2002 | | | | | 40.10 | | | | (0.38 | )(f) | | | (10.86 | ) | | | (11.24 | ) | | | — | | | | (0.26 | ) | | | (0.26 | ) |
| | | | | | | | | | | | | | | | | | | | | | | | | | | | | | | |
Diversified Mid Cap Growth Fund | | | | | | | | | | | | | | | | | | | | | | | | | | | | | | |
| Year Ended June 30, 2007 | | | | | 24.85 | | | | (0.18 | )(f) | | | 4.41 | | | | 4.23 | | | | — | | | | (4.19 | ) | | | (4.19 | ) |
| Year Ended June 30, 2006 | | | | | 23.99 | | | | (0.10 | ) | | | 2.97 | | | | 2.87 | | | | — | | | | (2.01 | ) | | | (2.01 | ) |
| Year Ended June 30, 2005 | | | | | 21.84 | | | | (0.20 | ) | | | 2.35 | | | | 2.15 | | | | — | | | | — | | | | — | |
| Year Ended June 30, 2004 | | | | | 18.15 | | | | (0.14 | ) | | | 3.83 | | | | 3.69 | | | | — | | | | — | | | | — | |
| Year Ended June 30, 2003 | | | | | 18.24 | | | | (0.09 | ) | | | — | | | | (0.09 | ) | | | — | | | | — | | | | — | |
| | | | | | | | | | | | | | | | | | | | | | | | | | | | | | | |
Diversified Mid Cap Value Fund | | | | | | | | | | | | | | | | | | | | | | | | | | | | | | |
| Year Ended June 30, 2007 | | | | | 15.92 | | | | 0.12 | (f) | | | 2.80 | | | | 2.92 | | | | (0.14 | ) | | | (2.85 | ) | | | (2.99 | ) |
| Year Ended June 30, 2006 | | | | | 19.15 | | | | 0.12 | | | | 1.49 | | | | 1.61 | | | | (0.13 | ) | | | (4.71 | ) | | | (4.84 | ) |
| Year Ended June 30, 2005 | | | | | 17.41 | | | | 0.14 | | | | 2.29 | | | | 2.43 | | | | (0.14 | ) | | | (0.55 | ) | | | (0.69 | ) |
| Year Ended June 30, 2004 | | | | | 13.54 | | | | 0.06 | | | | 3.87 | | | | 3.93 | | | | (0.06 | ) | | | — | | | | (0.06 | ) |
| Year Ended June 30, 2003 | | | | | 15.39 | | | | 0.05 | | | | (1.14 | ) | | | (1.09 | ) | | | (0.05 | ) | | | (0.71 | ) | | | (0.76 | ) |
| | | | | | | | | | | | | | | | | | | | | | | | | | | | | | | |
Growth Advantage Fund (e) | | | | | | | | | | | | | | | | | | | | | | | | | | | | | | |
| Year Ended June 30, 2007 | | | | | 6.63 | | | | (0.05 | )(f) | | | 1.60 | | | | 1.55 | | | | — | | | | — | | | | — | |
| Period Ended June 30, 2006 (d) | | | | | 6.35 | | | | (0.01 | )(f) | | | 0.29 | | | | 0.28 | | | | — | | | | — | | | | — | |
| Year Ended December 31, 2005 | | | | | 5.74 | | | | (0.05 | )(f) | | | 0.66 | | | | 0.61 | | | | — | | | | — | | | | — | |
| Year Ended December 31, 2004 | | | | | 4.91 | | | | (0.03 | )(f) | | | 0.86 | | | | 0.83 | | | | — | | | | — | | | | — | |
| Year Ended December 31, 2003 | | | | | 3.57 | | | | (0.04 | )(f) | | | 1.38 | | | | 1.34 | | | | — | | | | — | | | | — | |
| Year Ended December 31, 2002 | | | | | 5.06 | | | | (0.05 | )(f) | | | (1.44 | ) | | | (1.49 | ) | | | — | | | | — | | | | — | |
| (a) | | Annualized for periods less than one year. |
| (b) | | Not annualized for periods less than one year. |
| (c) | | Includes adjustments in accordance with accounting principles generally accepted in the United States of America and as such, the net asset value for financial reporting purposes and the returns based upon those net asset values may differ from the net asset value and returns for shareholder transactions. |
| (d) | | The Fund changed its fiscal year end from December 31 to June 30. |
| (e) | | Prior to August 17, 2005, the Fund was named Mid Cap Growth Fund. |
| (f) | | Calculated based upon average shares outstanding. |
| (g) | | Includes interest expense for custody overdraft of 0.01%. |
SEE NOTES TO FINANCIAL STATEMENTS.
74 JPMORGAN MID CAP/MULTI-CAP FUNDS JUNE 30, 2007
| |
| Ratios/Supplemental data
|
|
|---|
| | | | | | | | Ratios to average net assets (a)
| |
|---|
Net asset
value, end
of period
|
|
|
| Total
return
(excludes sales
charge) (b)(c)
|
| Net assets
end of
period
(000’s)
|
| Net
expenses
|
| Net
investment
income
(loss)
|
| Expenses
without waivers,
reimbursements
and earnings credits
|
| Portfolio
turnover
rate (b)
|
|---|
| | | | | | | | | | | | | | | | | | | | | | | | | | | |
| $ 44.71 | | | | | 19.01 | % | | $ | 526,157 | | | | 1.14 | % | | | (0.59 | )% | | | 1.14% | | | | 121 | % |
| 40.68 | | | | | 3.96 | | | | 470,613 | | | | 1.14 | | | | (0.03 | ) | | | 1.17 | | | | 63 | |
| 39.13 | | | | | 9.77 | | | | 458,716 | | | | 1.17 | | | | (0.60 | ) | | | 1.17 | | | | 119 | |
| 38.51 | | | | | 16.90 | | | | 441,000 | | | | 1.35 | | | | (0.61 | ) | | | 1.37 | | | | 122 | |
| 37.47 | | | | | 36.10 | | | | 412,000 | | | | 1.35 | | | | (1.05 | ) | | | 1.46 | | | | 68 | |
| 28.60 | | | | | (28.04 | ) | | | 330,000 | | | | 1.35 | | | | (1.13 | ) | | | 1.38 | | | | 93 | |
| | | | | | | | | | | | | | | | | | | | | | | | | | | |
| | | | | | | | | | | | | | | | | | | | | | | | | | | |
| 24.89 | | | | | 18.65 | | | | 480,084 | | | | 1.24 | | | | (0.73 | ) | | | 1.36 | | | | 119 | |
| 24.85 | | | | | 12.20 | | | | 451,565 | | | | 1.24 | | | | (0.42 | ) | | | 1.41 | | | | 112 | |
| 23.99 | | | | | 9.84 | | | | 436,185 | | | | 1.24 | | | | (0.76 | ) | | | 1.37 | | | | 119 | |
| 21.84 | | | | | 20.33 | | | | 544,217 | | | | 1.22 | | | | (0.69 | ) | | | 1.33 | | | | 48 | |
| 18.15 | | | | | (0.49 | ) | | | 409,354 | | | | 1.24 | | | | (0.65 | ) | | | 1.41 | | | | 71 | |
| | | | | | | | | | | | | | | | | | | | | | | | | | | |
| | | | | | | | | | | | | | | | | | | | | | | | | | | |
| 15.85 | | | | | 19.66 | | | | 212,613 | | | | 1.22 | | | | 0.73 | | | | 1.33 | | | | 47 | |
| 15.92 | | | | | 9.45 | | | | 225,776 | | | | 1.24 | | | | 0.70 | | | | 1.36 | | | | 52 | |
| 19.15 | | | | | 14.17 | | | | 238,939 | | | | 1.22 | | | | 0.78 | | | | 1.33 | | | | 67 | |
| 17.41 | | | | | 29.06 | | | | 231,511 | | | | 1.19 | | | | 0.40 | | | | 1.31 | | | | 24 | |
| 13.54 | | | | | (6.68 | ) | | | 175,561 | | | | 1.24 | | | | 0.39 | | | | 1.35 | | | | 99 | |
| | | | | | | | | | | | | | | | | | | | | | | | | | | |
| | | | | | | | | | | | | | | | | | | | | | | | | | | |
| 8.18 | | | | | 23.38 | | | | 49,782 | | | | 1.36 | (g) | | | (0.71 | ) | | | 1.66 | | | | 159 | |
| 6.63 | | | | | 4.41 | | | | 71,538 | | | | 1.35 | | | | (0.37 | ) | | | 1.90 | | | | 81 | |
| 6.35 | | | | | 10.63 | | | | 54,737 | | | | 1.35 | | | | (0.81 | ) | | | 1.75 | | | | 140 | |
| 5.74 | | | | | 16.90 | | | | 54,000 | | | | 1.35 | | | | (0.61 | ) | | | 1.79 | | | | 118 | |
| 4.91 | | | | | 37.53 | | | | 58,000 | | | | 1.35 | | | | (1.05 | ) | | | 1.77 | | | | 69 | |
| 3.57 | | | | | (29.45 | ) | | | 53,000 | | | | 1.35 | | | | (1.15 | ) | | | 1.62 | | | | 39 | |
SEE NOTES TO FINANCIAL STATEMENTS.
JUNE 30, 2007 JPMORGAN MID CAP/MULTI-CAP FUNDS 75
FINANCIAL HIGHLIGHTS
FOR THE PERIODS INDICATED (continued)
Class A (continued)
| | | |
|
|
|
|
|
| Per share operating performance
|
|
|
|
|
|
|---|
| | | | | | Investment operations
| | Distributions
| |
|---|
|
|
|
| Net asset
value,
beginning
of period
|
| Net
investment
income
(loss)
|
| Net realized
and unrealized
gains
(losses) on
investments
|
| Total from
investment
operations
|
| Net
investment
income
|
| Net
realized
gains
|
| Total
distributions
|
| Redemption
fees
|
|---|
Mid Cap Value Fund | | | | | | | | | | | | | | | | | | | | | | | | | | | | | | | | | | |
| Year Ended June 30, 2007 | | | | $ | 24.73 | | | $ | 0.17 | | | $ | 4.21 | | | $ | 4.38 | | | $ | (0.25 | ) | | $ | (1.15 | ) | | $ | (1.40 | ) | | $ | — | |
| Period Ended June 30, 2006 (d) | | | | | 23.28 | | | | 0.14 | | | | 1.31 | | | | 1.45 | | | | — | | | | — | | | | — | | | | — | |
| Year Ended December 31, 2005 | | | | | 22.05 | | | | 0.12 | (f) | | | 1.84 | | | | 1.96 | | | | (0.12 | ) | | | (0.61 | ) | | | (0.73 | ) | | | — | |
| Year Ended December 31, 2004 | | | | | 18.62 | | | | 0.07 | (f) | | | 3.71 | | | | 3.78 | | | | (0.04 | ) | | | (0.31 | ) | | | (0.35 | ) | | | — | |
| Year Ended December 31, 2003 | | | | | 14.44 | | | | 0.09 | (f) | | | 4.25 | | | | 4.34 | | | | (0.05 | ) | | | (0.11 | ) | | | (0.16 | ) | | | — | |
| Year Ended December 31, 2002 | | | | | 14.10 | | | | 0.07 | (f) | | | 0.31 | | | | 0.38 | | | | (0.03 | ) | | | (0.01 | ) | | | (0.04 | ) | | | — | |
| | | | | | | | | | | | | | | | | | | | | | | | | | | | | | | | | | | |
Multi-Cap Market Neutral Fund | | | | | | | | | | | | | | | | | | | | | | | | | | | | | | | | | | |
| Year Ended June 30, 2007 | | | | | 10.98 | | | | 0.37 | | | | 0.20 | | | | 0.57 | | | | (0.31 | ) | | | — | | | | (0.31 | ) | | | — | |
| Year Ended June 30, 2006 | | | | | 10.93 | | | | 0.26 | | | | 0.28 | | | | 0.54 | | | | (0.17 | ) | | | (0.32 | ) | | | (0.49 | ) | | | — | (g) |
| Year Ended June 30, 2005 | | | | | 10.61 | | | | 0.04 | | | | 0.40 | | | | 0.44 | | | | — | | | | (0.12 | ) | | | (0.12 | ) | | | — | |
| Year Ended June 30, 2004 | | | | | 10.05 | | | | (0.05 | ) | | | 0.64 | | | | 0.59 | | | | — | | | | (0.03 | ) | | | (0.03 | ) | | | — | |
| May 23, 2003 (e) through June 30, 2003 | | | | | 10.00 | | | | — | (g) | | | 0.05 | | | | 0.05 | | | | — | | | | — | | | | — | | | | — | |
| | | | | | | | | | | | | | | | | | | | | | | | | | | | | | | | | | | |
Value Advantage Fund | | | | | | | | | | | | | | | | | | | | | | | | | | | | | | | | | | |
| Year Ended June 30, 2007 | | | | | 17.17 | | | | 0.26 | (f) | | | 3.42 | | | | 3.68 | | | | (0.12 | ) | | | (0.28 | ) | | | (0.40 | ) | | | — | |
| Period Ended June 30, 2006 (d) | | | | | 15.88 | | | | 0.10 | (f) | | | 1.19 | | | | 1.29 | | | | — | | | | — | | | | — | | | | — | |
| February 28, 2005 (e) through December 31, 2005 | | | | | 15.00 | | | | 0.13 | (f) | | | 0.99 | | | | 1.12 | | | | (0.06 | ) | | | (0.18 | ) | | | (0.24 | ) | | | — | |
| (a) | | Annualized for periods less than one year. |
| (b) | | Not annualized for periods less than one year. |
| (c) | | Includes adjustments in accordance with accounting principles generally accepted in the United States of America and as such, the net asset value for financial reporting purposes and the returns based upon those net asset values may differ from the net asset value and returns for shareholder transactions. |
| (d) | | The Fund changed its fiscal year end from December 31 to June 30. |
| (e) | | Commencement of offering of class of shares. |
| (f) | | Calculated based upon average shares outstanding. |
| (g) | | Amount rounds to less than $0.01. |
SEE NOTES TO FINANCIAL STATEMENTS.
76 JPMORGAN MID CAP/MULTI-CAP FUNDS JUNE 30, 2007
| |
| Ratios/Supplemental data
|
|
|---|
| | | | | | | | Ratios to average net assets (a)
| |
|---|
Net asset
value, end
of period
|
|
|
| Total
return
(excludes sales
charge) (b)(c)
|
| Net assets
end of
period
(000’s)
|
| Net
expenses
(including
dividend
expenses for
securities
sold short)
|
| Net
expenses
(excluding
dividend
expenses for
securities
sold short)
|
| Net
investment
income
(loss)
|
| Expenses
without waivers,
reimbursements
and earnings credits
(including dividend
expenses for
securities sold short)
|
| Expenses
without waivers,
reimbursements
and earnings credits
(excluding dividend
expenses for
securities sold short)
|
| Portfolio
turnover
rate (b)
|
|---|
| $ 27.71 | | | | | 18.21 | % | | $ | 3,822,632 | | | | 1.25 | % | | | 1.25 | % | | | 0.71 | % | | | 1.35 | % | | | 1.35 | % | | | 45 | % |
| 24.73 | | | | | 6.23 | | | | 3,001,515 | | | | 1.25 | | | | 1.25 | | | | 1.15 | | | | 1.39 | | | | 1.39 | | | | 20 | |
| 23.28 | | | | | 8.87 | | | | 2,822,767 | | | | 1.25 | | | | 1.25 | | | | 0.54 | | | | 1.39 | | | | 1.39 | | | | 45 | |
| 22.05 | | | | | 20.32 | | | | 1,333,000 | | | | 1.25 | | | | 1.25 | | | | 0.34 | | | | 1.60 | | | | 1.60 | | | | 41 | |
| 18.62 | | | | | 30.07 | | | | 275,000 | | | | 1.25 | | | | 1.25 | | | | 0.51 | | | | 1.65 | | | | 1.65 | | | | 32 | |
| 14.44 | | | | | 2.68 | | | | 26,000 | | | | 1.25 | | | | 1.25 | | | | 0.50 | | | | 1.70 | | | | 1.70 | | | | 51 | |
| | | | | | | | | | | | | | | | | | | | | | | | | | | | | | | | | | | |
| | | | | | | | | | | | | | | | | | | | | | | | | | | | | | | | | | | |
| 11.24 | | | | | 5.27 | | | | 204,059 | | | | 2.69 | | | | 1.50 | | | | 3.32 | | | | 3.10 | | | | 1.91 | | | | 96 | |
| 10.98 | | | | | 5.14 | | | | 190,855 | | | | 2.60 | | | | 1.50 | | | | 2.38 | | | | 3.02 | | | | 1.92 | | | | 121 | |
| 10.93 | | | | | 4.23 | | | | 197,816 | | | | 2.39 | | | | 1.50 | | | | 0.58 | | | | 2.75 | | | | 1.86 | | | | 198 | |
| 10.61 | | | | | 5.83 | | | | 114,731 | | | | 2.38 | | | | 1.50 | | | | (0.88 | ) | | | 2.73 | | | | 1.85 | | | | 257 | |
| 10.05 | | | | | 0.50 | | | | 25,478 | | | | 2.48 | | | | 1.50 | | | | (0.42 | ) | | | 3.05 | | | | 2.07 | | | | — | |
| | | | | | | | | | | | | | | | | | | | | | | | | | | | | | | | | | | |
| | | | | | | | | | | | | | | | | | | | | | | | | | | | | | | | | | | |
| 20.45 | | | | | 21.58 | | | | 201,151 | | | | 1.25 | | | | 1.25 | | | | 1.36 | | | | 1.41 | | | | 1.41 | | | | 77 | |
| 17.17 | | | | | 8.12 | | | | 77,691 | | | | 1.25 | | | | 1.25 | | | | 1.16 | | | | 1.67 | | | | 1.67 | | | | 55 | |
| 15.88 | | | | | 7.46 | | | | 45,163 | | | | 1.25 | | | | 1.25 | | | | 1.02 | | | | 1.82 | | | | 1.82 | | | | 90 | |
SEE NOTES TO FINANCIAL STATEMENTS.
JUNE 30, 2007 JPMORGAN MID CAP/MULTI-CAP FUNDS 77
FINANCIAL HIGHLIGHTS
FOR THE PERIODS INDICATED (continued)
Class B
| | | |
|
|
|
|
|
|
|
| Per share operating performance
|
|
|---|
| | | | | | Investment operations
| | Distributions
| |
|---|
|
|
|
| Net asset
value,
beginning
of period
|
| Net
investment
income
(loss)
|
| Net realized
and unrealized
gains
(losses) on
investments
|
| Total from
investment
operations
|
| Net
investment
income
|
| Net
realized
gains
|
| Total
distributions
|
|---|
Capital Growth Fund | | | | | | | | | | | | | | | | | | | | | | | | | | | | | | |
| Year Ended June 30, 2007 | | | | $ | 37.22 | | | $ | (0.41 | )(f) | | $ | 6.87 | | | $ | 6.46 | | | $ | — | | | $ | (3.30 | ) | | $ | (3.30 | ) |
| Period Ended June 30, 2006 (d) | | | | | 35.89 | | | | (0.09 | )(f) | | | 1.42 | | | | 1.33 | | | | — | | | | — | | | | — | |
| Year Ended December 31, 2005 | | | | | 35.73 | | | | (0.40 | )(f) | | | 3.66 | | | | 3.26 | | | | — | | | | (3.10 | ) | | | (3.10 | ) |
| Year Ended December 31, 2004 | | | | | 35.27 | | | | (0.40 | )(f) | | | 6.07 | | | | 5.67 | | | | — | | | | (5.21 | ) | | | (5.21 | ) |
| Year Ended December 31, 2003 | | | | | 27.13 | | | | (0.48 | )(f) | | | 10.02 | | | | 9.54 | | | | — | | | | (1.40 | ) | | | (1.40 | ) |
| Year Ended December 31, 2002 | | | | | 38.24 | | | | (0.65 | )(f) | | | (10.20 | ) | | | (10.85 | ) | | | — | | | | (0.26 | ) | | | (0.26 | ) |
| | | | | | | | | | | | | | | | | | | | | | | | | | | | | | | |
Diversified Mid Cap Growth Fund | | | | | | | | | | | | | | | | | | | | | | | | | | | | | | |
| Year Ended June 30, 2007 | | | | | 21.59 | | | | (0.28 | )(f) | | | 3.76 | | | | 3.48 | | | | — | | | | (4.19 | ) | | | (4.19 | ) |
| Year Ended June 30, 2006 | | | | | 21.21 | | | | (0.70 | ) | | | 3.09 | | | | 2.39 | | | | — | | | | (2.01 | ) | | | (2.01 | ) |
| Year Ended June 30, 2005 | | | | | 19.44 | | | | (0.67 | ) | | | 2.44 | | | | 1.77 | | | | — | | | | — | | | | — | |
| Year Ended June 30, 2004 | | | | | 16.29 | | | | (0.28 | ) | | | 3.43 | | | | 3.15 | | | | — | | | | — | | | | — | |
| Year Ended June 30, 2003 | | | | | 16.48 | | | | (0.22 | ) | | | 0.03 | | | | (0.19 | ) | | | — | | | | — | | | | — | |
| | | | | | | | | | | | | | | | | | | | | | | | | | | | | | | |
Diversified Mid Cap Value Fund | | | | | | | | | | | | | | | | | | | | | | | | | | | | | | |
| Year Ended June 30, 2007 | | | | | 15.24 | | | | 0.02 | (f) | | | 2.66 | | | | 2.68 | | | | (0.06 | ) | | | (2.85 | ) | | | (2.91 | ) |
| Year Ended June 30, 2006 | | | | | 18.54 | | | | 0.03 | | | | 1.43 | | | | 1.46 | | | | (0.05 | ) | | | (4.71 | ) | | | (4.76 | ) |
| Year Ended June 30, 2005 | | | | | 16.92 | | | | (0.01 | ) | | | 2.24 | | | | 2.23 | | | | (0.06 | ) | | | (0.55 | ) | | | (0.61 | ) |
| Year Ended June 30, 2004 | | | | | 13.21 | | | | (0.06 | ) | | | 3.77 | | | | 3.71 | | | | — | | | | — | | | | — | |
| Year Ended June 30, 2003 | | | | | 15.09 | | | | (0.05 | ) | | | (1.12 | ) | | | (1.17 | ) | | | — | | | | (0.71 | ) | | | (0.71 | ) |
| | | | | | | | | | | | | | | | | | | | | | | | | | | | | | | |
Growth Advantage Fund (e) | | | | | | | | | | | | | | | | | | | | | | | | | | | | | | |
| Year Ended June 30, 2007 | | | | | 6.33 | | | | (0.10 | )(f) | | | 1.53 | | | | 1.43 | | | | — | | | | — | | | | — | |
| Period Ended June 30, 2006 (d) | | | | | 6.08 | | | | (0.03 | )(f) | | | 0.28 | | | | 0.25 | | | | — | | | | — | | | | — | |
| Year Ended December 31, 2005 | | | | | 5.54 | | | | (0.09 | ) | | | 0.63 | | | | 0.54 | | | | — | | | | — | | | | — | |
| Year Ended December 31, 2004 | | | | | 4.77 | | | | (0.07 | )(f) | | | 0.84 | | | | 0.77 | | | | — | | | | — | | | | — | |
| Year Ended December 31, 2003 | | | | | 3.49 | | | | (0.07 | )(f) | | | 1.35 | | | | 1.28 | | | | — | | | | — | | | | — | |
| Year Ended December 31, 2002 | | | | | 4.99 | | | | (0.08 | )(f) | | | (1.42 | ) | | | (1.50 | ) | | | — | | | | — | | | | — | |
| (a) | | Annualized for periods less than one year. |
| (b) | | Not annualized for periods less than one year. |
| (c) | | Includes adjustments in accordance with accounting principles generally accepted in the United States of America and as such, the net asset value for financial reporting purposes and the returns based upon those net asset values may differ from the net asset value and returns for shareholder transactions. |
| (d) | | The Fund changed its fiscal year end from December 31 to June 30. |
| (e) | | Prior to August 17, 2005, the Fund was named Mid Cap Growth Fund. |
| (f) | | Calculated based upon average shares outstanding. |
| (g) | | Includes interest expense for custody overdraft of 0.01%. |
SEE NOTES TO FINANCIAL STATEMENTS.
78 JPMORGAN MID CAP/MULTI-CAP FUNDS JUNE 30, 2007
| |
| Ratios/Supplemental data
|
|
|---|
| | | | | | | | Ratios to average net assets (a)
| |
|---|
Net asset
value, end
of period
|
|
|
| Total
return
(excludes sales
charge) (b)(c)
|
| Net assets
end of
period
(000’s)
|
| Net
expenses
|
| Net
investment
income
(loss)
|
| Expenses without
waivers, reimbursements
and earnings credits
|
| Portfolio
turnover
rate (b)
|
|---|
| $40.38 | | | | | 18.41 | % | | $ | 20,189 | | | | 1.64 | % | | | (1.09 | )% | | | 1.64% | | | | 121 | % |
| 37.22 | | | | | 3.71 | | | | 28,031 | | | | 1.64 | | | | (0.50 | ) | | | 1.66 | | | | 63 | |
| 35.89 | | | | | 9.23 | | | | 34,126 | | | | 1.67 | | | | (1.11 | ) | | | 1.67 | | | | 119 | |
| 35.73 | | | | | 16.31 | | | | 51,000 | | | | 1.85 | | | | (1.10 | ) | | | 1.88 | | | | 122 | |
| 35.27 | | | | | 35.37 | | | | 61,000 | | | | 1.85 | | | | (1.55 | ) | | | 1.96 | | | | 68 | |
| 27.13 | | | | | (28.39 | ) | | | 59,000 | | | | 1.85 | | | | (1.64 | ) | | | 1.89 | | | | 93 | |
| | | | | | | | | | | | | | | | | | | | | | | | | | | |
| | | | | | | | | | | | | | | | | | | | | | | | | | | |
| 20.88 | | | | | 17.93 | | | | 123,779 | | | | 1.86 | | | | (1.35 | ) | | | 1.86 | | | | 119 | |
| 21.59 | | | | | 11.51 | | | | 155,268 | | | | 1.89 | | | | (1.07 | ) | | | 1.91 | | | | 112 | |
| 21.21 | | | | | 9.10 | | | | 195,917 | | | | 1.96 | | | | (1.48 | ) | | | 1.98 | | | | 119 | |
| 19.44 | | | | | 19.34 | | | | 238,738 | | | | 1.97 | | | | (1.44 | ) | | | 1.98 | | | | 48 | |
| 16.29 | | | | | (1.15 | ) | | | 226,174 | | | | 1.99 | | | | (1.40 | ) | | | 2.06 | | | | 71 | |
| | | | | | | | | | | | | | | | | | | | | | | | | | | |
| | | | | | | | | | | | | | | | | | | | | | | | | | | |
| 15.01 | | | | | 18.89 | | | | 53,843 | | | | 1.83 | | | | 0.13 | | | | 1.83 | | | | 47 | |
| 15.24 | | | | | 8.89 | | | | 59,652 | | | | 1.84 | | | | 0.09 | | | | 1.86 | | | | 52 | |
| 18.54 | | | | | 13.40 | | | | 68,550 | | | | 1.90 | | | | (0.03 | ) | | | 1.93 | | | | 67 | |
| 16.92 | | | | | 28.08 | | | | 69,874 | | | | 1.94 | | | | (0.35 | ) | | | 1.96 | | | | 24 | |
| 13.21 | | | | | (7.45 | ) | | | 57,501 | | | | 1.99 | | | | (0.36 | ) | | | 2.00 | | | | 99 | |
| | | | | | | | | | | | | | | | | | | | | | | | | | | |
| | | | | | | | | | | | | | | | | | | | | | | | | | | |
| 7.76 | | | | | 22.59 | | | | 1,501 | | | | 2.06 | (g) | | | (1.43 | ) | | | 2.17 | | | | 159 | |
| 6.33 | | | | | 4.11 | | | | 1,230 | | | | 2.05 | | | | (1.02 | ) | | | 2.40 | | | | 81 | |
| 6.08 | | | | | 9.75 | | | | 1,359 | | | | 2.05 | | | | (1.51 | ) | | | 2.24 | | | | 140 | |
| 5.54 | | | | | 16.14 | | | | 3,000 | | | | 2.05 | | | | (1.31 | ) | | | 2.29 | | | | 118 | |
| 4.77 | | | | | 36.68 | | | | 3,000 | | | | 2.05 | | | | (1.75 | ) | | | 2.33 | | | | 69 | |
| 3.49 | | | | | (30.06 | ) | | | 3,000 | | | | 2.05 | | | | (1.85 | ) | | | 2.32 | | | | 39 | |
SEE NOTES TO FINANCIAL STATEMENTS.
JUNE 30, 2007 JPMORGAN MID CAP/MULTI-CAP FUNDS 79
FINANCIAL HIGHLIGHTS
FOR THE PERIODS INDICATED (continued)
Class B (continued)
| | | |
|
|
|
|
|
| Per share operating performance
|
|
|
|
|
|
|---|
| | | | | | Investment operations
| | Distributions
| |
|---|
|
|
|
| Net asset
value,
beginning
of period
|
| Net
investment
income
(loss)
|
| Net realized
and unrealized
gains
(losses) on
investments
|
| Total from
investment
operations
|
| Net
investment
income
|
| Net
realized
gains
|
| Total
distributions
|
| Redemption
fees
|
|---|
Mid Cap Value Fund | | | | | | | | | | | | | | | | | | | | | | | | | | | | | | | | | | |
| Year Ended June 30, 2007 | | | | $ | 24.21 | | | $ | 0.05 | | | $ | 4.12 | | | $ | 4.17 | | | $ | (0.12 | ) | | $ | (1.15 | ) | | $ | (1.27 | ) | | $ | — | |
| Period Ended June 30, 2006 (d) | | | | | 22.86 | | | | 0.08 | | | | 1.27 | | | | 1.35 | | | | — | | | | — | | | | — | | | | — | |
| Year Ended December 31, 2005 | | | | | 21.66 | | | | — | (f)(g) | | | 1.81 | | | | 1.81 | | | | — | | | | (0.61 | ) | | | (0.61 | ) | | | — | |
| Year Ended December 31, 2004 | | | | | 18.37 | | | | (0.06 | )(f) | | | 3.66 | | | | 3.60 | | | | — | | | | (0.31 | ) | | | (0.31 | ) | | | — | |
| Year Ended December 31, 2003 | | | | | 14.32 | | | | (0.03 | )(f) | | | 4.19 | | | | 4.16 | | | | — | | | | (0.11 | ) | | | (0.11 | ) | | | — | |
| Year Ended December 31, 2002 | | | | | 14.06 | | | | (0.04 | )(f) | | | 0.31 | | | | 0.27 | | | | — | | | | (0.01 | ) | | | (0.01 | ) | | | — | |
| | | | | | | | | | | | | | | | | | | | | | | | | | | | | | | | | | | |
Multi-Cap Market Neutral Fund | | | | | | | | | | | | | | | | | | | | | | | | | | | | | | | | | | |
| Year Ended June 30, 2007 | | | | | 10.80 | | | | 0.29 | | | | 0.20 | | | | 0.49 | | | | (0.22 | ) | | | — | | | | (0.22 | ) | | | — | |
| Year Ended June 30, 2006 | | | | | 10.76 | | | | 0.17 | | | | 0.28 | | | | 0.45 | | | | (0.09 | ) | | | (0.32 | ) | | | (0.41 | ) | | | — | (g) |
| Year Ended June 30, 2005 | | | | | 10.53 | | | | (0.02 | ) | | | 0.37 | | | | 0.35 | | | | — | | | | (0.12 | ) | | | (0.12 | ) | | | — | |
| Year Ended June 30, 2004 | | | | | 10.04 | | | | (0.12 | ) | | | 0.64 | | | | 0.52 | | | | — | | | | (0.03 | ) | | | (0.03 | ) | | | — | |
| May 23, 2003 (e) to June 30, 2003 | | | | | 10.00 | | | | (0.01 | ) | | | 0.05 | | | | 0.04 | | | | — | | | | — | | | | — | | | | — | |
| (a) | | Annualized for periods less than one year. |
| (b) | | Not annualized for periods less than one year. |
| (c) | | Includes adjustments in accordance with accounting principles generally accepted in the United States of America and as such, the net asset value for financial reporting purposes and the returns based upon those net asset values may differ from the net asset value and returns for shareholder transactions. |
| (d) | | The Fund changed its fiscal year end from December 31 to June 30. |
| (e) | | Commencement of offering of class of shares. |
| (f) | | Calculated based upon average shares outstanding. |
| (g) | | Amount rounds to less than $0.01. |
SEE NOTES TO FINANCIAL STATEMENTS.
80 JPMORGAN MID CAP/MULTI-CAP FUNDS JUNE 30, 2007
| |
| Ratios/Supplemental data
|
|
|---|
| | | | | | | | Ratios to average net assets (a)
| |
|---|
Net asset
value, end
of period
|
|
|
| Total
return
(excludes sales
charge) (b)(c)
|
| Net assets
end of
period
(000’s)
|
| Net
expenses
(including
dividend
expenses for
securities
sold short)
|
| Net
expenses
(excluding
dividend
expenses for
securities
sold short)
|
| Net
investment
income
(loss)
|
| Expenses
without waivers,
reimbursements
and earnings credits
(including dividend
expenses for
securities sold short)
|
| Expenses
without waivers,
reimbursements
and earnings credits
(excluding dividend
expenses for
securities sold short)
|
| Portfolio
turnover
rate (b)
|
|---|
| $ 27.11 | | | | | 17.65% | | | $ | 237,745 | | | | 1.75 | % | | | 1.75 | % | | | 0.20 | % | | | 1.85% | | | | 1.85% | | | | 45 | % |
| 24.21 | | | | | 5.91 | | | | 229,998 | | | | 1.75 | | | | 1.75 | | | | 0.64 | | | | 1.89 | | | | 1.89 | | | | 20 | |
| 22.86 | | | | | 8.36 | | | | 233,396 | | | | 1.77 | | | | 1.77 | | | | (0.01 | ) | | | 1.89 | | | | 1.89 | | | | 45 | |
| 21.66 | | | | | 19.60 | | | | 173,000 | | | | 1.90 | | | | 1.90 | | | | (0.32 | ) | | | 2.10 | | | | 2.10 | | | | 41 | |
| 18.37 | | | | | 29.06 | | | | 68,000 | | | | 1.95 | | | | 1.95 | | | | (0.21 | ) | | | 2.19 | | | | 2.19 | | | | 32 | |
| 14.32 | | | | | 1.94 | | | | 14,000 | | | | 2.00 | | | | 2.00 | | | | (0.27 | ) | | | 2.49 | | | | 2.49 | | | | 51 | |
| | | | | | | | | | | | | | | | | | | | | | | | | | | | | | | | | | | |
| | | | | | | | | | | | | | | | | | | | | | | | | | | | | | | | | | | |
| 11.07 | | | | | 4.56 | | | | 24,974 | | | | 3.44 | | | | 2.25 | | | | 2.60 | | | | 3.60 | | | | 2.41 | | | | 96 | |
| 10.80 | | | | | 4.33 | | | | 28,129 | | | | 3.35 | | | | 2.25 | | | | 1.63 | | | | 3.52 | | | | 2.42 | | | | 121 | |
| 10.76 | | | | | 3.40 | | | | 32,280 | | | | 3.17 | | | | 2.28 | | | | (0.28 | ) | | | 3.36 | | | | 2.47 | | | | 198 | |
| 10.53 | | | | | 5.14 | | | | 29,222 | | | | 3.13 | | | | 2.25 | | | | (1.65 | ) | | | 3.43 | | | | 2.55 | | | | 257 | |
| 10.04 | | | | | 0.40 | | | | 12,389 | | | | 3.23 | | | | 2.25 | | | | (1.15 | ) | | | 3.68 | | | | 2.70 | | | | — | |
SEE NOTES TO FINANCIAL STATEMENTS.
JUNE 30, 2007 JPMORGAN MID CAP/MULTI-CAP FUNDS 81
FINANCIAL HIGHLIGHTS
FOR THE PERIODS INDICATED (continued)
Class C
| | | |
|
|
|
|
|
|
|
| Per share operating performance
|
|
|---|
| | | | | | Investment operations
| | Distributions
| |
|---|
|
|
|
| Net asset
value,
beginning
of period
|
| Net
investment
income
(loss)
|
| Net realized
and unrealized
gains
(losses) on
investments
|
| Total from
investment
operations
|
| Net
investment
income
|
| Net
realized
gains
|
| Total
distributions
|
|---|
Capital Growth Fund | | | | | | | | | | | | | | | | | | | | | | | | | | | | | | |
| Year Ended June 30, 2007 | | | | $ | 36.63 | | | $ | (0.40 | )(f) | | $ | 6.75 | | | $ | 6.35 | | | $ | — | | | $ | (3.30 | ) | | $ | (3.30 | ) |
| Period Ended June 30, 2006 (d) | | | | | 35.32 | | | | (0.10 | )(f) | | | 1.41 | | | | 1.31 | | | | — | | | | — | | | | — | |
| Year Ended December 31, 2005 | | | | | 35.20 | | | | (0.38 | )(f) | | | 3.60 | | | | 3.22 | | | | — | | | | (3.10 | ) | | | (3.10 | ) |
| Year Ended December 31, 2004 | | | | | 34.81 | | | | (0.40 | )(f) | | | 6.00 | | | | 5.60 | | | | — | | | | (5.21 | ) | | | (5.21 | ) |
| Year Ended December 31, 2003 | | | | | 26.83 | | | | (0.47 | )(f) | | | 9.85 | | | | 9.38 | | | | — | | | | (1.40 | ) | | | (1.40 | ) |
| Year Ended December 31, 2002 | | | | | 37.82 | | | | (0.53 | )(f) | | | (10.20 | ) | | | (10.73 | ) | | | — | | | | (0.26 | ) | | | (0.26 | ) |
| | | | | | | | | | | | | | | | | | | | | | | | | | | | | | | |
Diversified Mid Cap Growth Fund | | | | | | | | | | | | | | | | | | | | | | | | | | | | | | |
| Year Ended June 30, 2007 | | | | | 23.57 | | | | (0.31 | )(f) | | | 4.14 | | | | 3.83 | | | | — | | | | (4.19 | ) | | | (4.19 | ) |
| Year Ended June 30, 2006 | | | | | 22.98 | | | | (0.43 | ) | | | 3.03 | | | | 2.60 | | | | — | | | | (2.01 | ) | | | (2.01 | ) |
| Year Ended June 30, 2005 | | | | | 21.07 | | | | (0.77 | ) | | | 2.68 | | | | 1.91 | | | | — | | | | — | | | | — | |
| Year Ended June 30, 2004 | | | | | 17.65 | | | | (0.31 | ) | | | 3.73 | | | | 3.42 | | | | — | | | | — | | | | — | |
| Year Ended June 30, 2003 | | | | | 17.86 | | | | (0.22 | ) | | | 0.01 | | | | (0.21 | ) | | | — | | | | — | | | | — | |
| | | | | | | | | | | | | | | | | | | | | | | | | | | | | | | |
Diversified Mid Cap Value Fund | | | | | | | | | | | | | | | | | | | | | | | | | | | | | | |
| Year Ended June 30, 2007 | | | | | 15.24 | | | | 0.02 | (f) | | | 2.66 | | | | 2.68 | | | | (0.06 | ) | | | (2.85 | ) | | | (2.91 | ) |
| Year Ended June 30, 2006 | | | | | 18.54 | | | | 0.06 | | | | 1.40 | | | | 1.46 | | | | (0.05 | ) | | | (4.71 | ) | | | (4.76 | ) |
| Year Ended June 30, 2005 | | | | | 16.92 | | | | 0.04 | | | | 2.20 | | | | 2.24 | | | | (0.07 | ) | | | (0.55 | ) | | | (0.62 | ) |
| Year Ended June 30, 2004 | | | | | 13.21 | | | | (0.06 | ) | | | 3.77 | | | | 3.71 | | | | — | | | | — | | | | — | |
| Year Ended June 30, 2003 | | | | | 15.09 | | | | (0.03 | ) | | | (1.14 | ) | | | (1.17 | ) | | | — | | | | (0.71 | ) | | | (0.71 | ) |
| | | | | | | | | | | | | | | | | | | | | | | | | | | | | | | |
Growth Advantage Fund | | | | | | | | | | | | | | | | | | | | | | | | | | | | | | |
| Year Ended June 30, 2007 | | | | | 6.34 | | | | (0.11 | )(f) | | | 1.53 | | | | 1.42 | | | | — | | | | — | | | | — | |
| May 1, 2006 (e) through June 30, 2006 (d) | | | | | 6.80 | | | | (0.04 | )(f) | | | (0.42 | ) | | | (0.46 | ) | | | — | | | | — | | | | — | |
| (a) | | Annualized for periods less than one year. |
| (b) | | Not annualized for periods less than one year. |
| (c) | | Includes adjustments in accordance with accounting principles generally accepted in the United States of America and as such, the net asset value for financial reporting purposes and the returns based upon those net asset values may differ from the net asset value and returns for shareholder transactions. |
| (d) | | The Fund changed its fiscal year end from December 31 to June 30. |
| (e) | | Commencement of offering of class of shares. |
| (f) | | Calculated based upon average shares outstanding. |
| (g) | | Includes interest expense for custody overdraft of 0.02%. |
SEE NOTES TO FINANCIAL STATEMENTS.
82 JPMORGAN MID CAP/MULTI-CAP FUNDS JUNE 30, 2007
| |
| Ratios/Supplemental data
|
|
|---|
| | | | | | | | Ratios to average net assets (a)
| |
|---|
Net asset
value, end
of period
|
|
|
| Total
return
(excludes sales
charge) (b)(c)
|
| Net assets
end of
period
(000’s)
|
| Net
expenses
|
| Net
investment
income
(loss)
|
| Expenses
without waivers,
reimbursements
and earnings credits
|
| Portfolio
turnover
rate (b)
|
|---|
| $ 39.68 | | | | | 18.41% | | | $ | 25,672 | | | | 1.64 | % | | | (1.09 | )% | | | 1.64% | | | | 121 | % |
| 36.63 | | | | | 3.71 | | | | 20,817 | | | | 1.64 | | | | (0.56 | ) | | | 1.67 | | | | 63 | |
| 35.32 | | | | | 9.26 | | | | 17,120 | | | | 1.65 | | | | (1.07 | ) | | | 1.66 | | | | 119 | |
| 35.20 | | | | | 16.32 | | | | 7,000 | | | | 1.85 | | | | (1.09 | ) | | | 1.87 | | | | 122 | |
| 34.81 | | | | | 35.17 | | | | 4,000 | | | | 1.85 | | | | (1.55 | ) | | | 1.96 | | | | 68 | |
| 26.83 | | | | | (28.39) | | | | 3,000 | | | | 1.85 | | | | (1.63 | ) | | | 1.88 | | | | 93 | |
| | | | | | | | | | | | | | | | | | | | | | | | | | | |
| | | | | | | | | | | | | | | | | | | | | | | | | | | |
| 23.21 | | | | | 17.90 | | | | 38,805 | | | | 1.86 | | | | (1.35 | ) | | | 1.86 | | | | 119 | |
| 23.57 | | | | | 11.53 | | | | 42,448 | | | | 1.89 | | | | (1.07 | ) | | | 1.91 | | | | 112 | |
| 22.98 | | | | | 9.06 | | | | 46,607 | | | | 1.96 | | | | (1.48 | ) | | | 1.98 | | | | 119 | |
| 21.07 | | | | | 19.38 | | | | 67,274 | | | | 1.97 | | | | (1.44 | ) | | | 1.98 | | | | 48 | |
| 17.65 | | | | | (1.18) | | | | 58,321 | | | | 1.99 | | | | (1.40 | ) | | | 2.06 | | | | 71 | |
| | | | | | | | | | | | | | | | | | | | | | | | | | | |
| | | | | | | | | | | | | | | | | | | | | | | | | | | |
| 15.01 | | | | | 18.89 | | | | 29,590 | | | | 1.83 | | | | 0.13 | | | | 1.83 | | | | 47 | |
| 15.24 | | | | | 8.89 | | | | 32,775 | | | | 1.84 | | | | 0.11 | | | | 1.86 | | | | 52 | |
| 18.54 | | | | | 13.43 | | | | 29,777 | | | | 1.90 | | | | 0.11 | | | | 1.93 | | | | 67 | |
| 16.92 | | | | | 28.08 | | | | 23,155 | | | | 1.94 | | | | (0.35 | ) | | | 1.96 | | | | 24 | |
| 13.21 | | | | | (7.38) | | | | 17,722 | | | | 1.99 | | | | (0.35 | ) | | | 2.00 | | | | 99 | |
| | | | | | | | | | | | | | | | | | | | | | | | | | | |
| | | | | | | | | | | | | | | | | | | | | | | | | | | |
| 7.76 | | | | | 22.40 | | | | 251 | | | | 2.07 | (g) | | | (1.49 | ) | | | 2.18 | | | | 159 | |
| 6.34 | | | | | (6.76) | | | | 14 | | | | 2.05 | | | | (1.32 | ) | | | 2.37 | | | | 81 | |
SEE NOTES TO FINANCIAL STATEMENTS.
JUNE 30, 2007 JPMORGAN MID CAP/MULTI-CAP FUNDS 83
FINANCIAL HIGHLIGHTS
FOR THE PERIODS INDICATED (continued)
Class C (continued)
| | | |
|
|
|
|
|
| Per share operating performance
|
|
|
|
|
|
|---|
| | | | | | Investment operations
| | Distributions
| |
|---|
|
|
|
| Net asset
value,
beginning
of period
|
| Net
investment
income
(loss)
|
| Net realized
and unrealized
gains
(losses) on
investments
|
| Total from
investment
operations
|
| Net
investment
income
|
| Net
realized
gains
|
| Total
distributions
|
| Redemption
fees
|
|---|
Mid Cap Value Fund | | | | | | | | | | | | | | | | | | | | | | | | | | | | | | | | | | |
| Year Ended June 30, 2007 | | | | $ | 24.26 | | | $ | 0.05 | | | $ | 4.13 | | | $ | 4.18 | | | $ | (0.12 | ) | | $ | (1.15 | ) | | $ | (1.27 | ) | | $ | — | |
| Period Ended June 30, 2006 (d) | | | | | 22.90 | | | | 0.08 | | | | 1.28 | | | | 1.36 | | | | — | | | | — | | | | — | | | | — | |
| Year Ended December 31, 2005 | | | | | 21.70 | | | | — | (f)(g) | | | 1.81 | | | | 1.81 | | | | — | (g) | | | (0.61 | ) | | | (0.61 | ) | | | — | |
| Year Ended December 31, 2004 | | | | | 18.41 | | | | (0.06 | )(f) | | | 3.66 | | | | 3.60 | | | | — | | | | (0.31 | ) | | | (0.31 | ) | | | — | |
| Year Ended December 31, 2003 | | | | | 14.35 | | | | (0.03 | )(f) | | | 4.20 | | | | 4.17 | | | | — | (g) | | | (0.11 | ) | | | (0.11 | ) | | | — | |
| Year Ended December 31, 2002 | | | | | 14.09 | | | | (0.04 | )(f) | | | 0.31 | | | | 0.27 | | | | — | | | | (0.01 | ) | | | (0.01 | ) | | | — | |
| | | | | | | | | | | | | | | | | | | | | | | | | | | | | | | | | | | |
Multi-Cap Market Neutral Fund | | | | | | | | | | | | | | | | | | | | | | | | | | | | | | | | | | |
| Year Ended June 30, 2007 | | | | | 10.80 | | | | 0.29 | | | | 0.20 | | | | 0.49 | | | | (0.22 | ) | | | — | | | | (0.22 | ) | | | — | |
| Year Ended June 30, 2006 | | | | | 10.77 | | | | 0.17 | | | | 0.27 | | | | 0.44 | | | | (0.09 | ) | | | (0.32 | ) | | | (0.41 | ) | | | — | (g) |
| Year Ended June 30, 2005 | | | | | 10.53 | | | | (0.01 | ) | | | 0.37 | | | | 0.36 | | | | — | | | | (0.12 | ) | | | (0.12 | ) | | | — | |
| Year Ended June 30, 2004 | | | | | 10.04 | | | | (0.10 | ) | | | 0.62 | | | | 0.52 | | | | — | | | | (0.03 | ) | | | (0.03 | ) | | | — | |
| May 23, 2003 (e) through June 30, 2003 | | | | | 10.00 | | | | (0.01 | ) | | | 0.05 | | | | 0.04 | | | | — | | | | — | | | | — | | | | — | |
| | | | | | | | | | | | | | | | | | | | | | | | | | | | | | | | | | | |
Value Advantage Fund | | | | | | | | | | | | | | | | | | | | | | | | | | | | | | | | | | |
| Year Ended June 30, 2007 | | | | | 17.10 | | | | 0.17 | (f) | | | 3.38 | | | | 3.55 | | | | (0.06 | ) | | | (0.28 | ) | | | (0.34 | ) | | | — | |
| Period Ended June 30, 2006 (d) | | | | | 15.85 | | | | 0.05 | (f) | | | 1.20 | | | | 1.25 | | | | — | | | | — | | | | — | | | | — | |
| February 28, 2005 (e) through December 31, 2005 | | | | | 15.00 | | | | 0.06 | (f) | | | 1.00 | | | | 1.06 | | | | (0.03 | ) | | | (0.18 | ) | | | (0.21 | ) | | | — | |
| (a) | | Annualized for periods less than one year. |
| (b) | | Not annualized for periods less than one year. |
| (c) | | Includes adjustments in accordance with accounting principles generally accepted in the United States of America and as such, the net asset value for financial reporting purposes and the returns based upon those net asset values may differ from the net asset value and returns for shareholder transactions. |
| (d) | | The Fund changed its fiscal year end from December 31 to June 30. |
| (e) | | Commencement of offering of class of shares. |
| (f) | | Calculated based upon average shares outstanding. |
| (g) | | Amount rounds to less than $0.01. |
SEE NOTES TO FINANCIAL STATEMENTS.
84 JPMORGAN MID CAP/MULTI-CAP FUNDS JUNE 30, 2007
| |
| Ratios/Supplemental data
|
|
|---|
| | | | | | | | Ratios to average net assets (a)
| |
|---|
Net asset
value, end
of period
|
|
|
| Total
return
(excludes sales
charge) (b)(c)
|
| Net assets
end of
period
(000’s)
|
| Net
expenses
(including
dividend
expenses for
securities
sold short)
|
| Net
expenses
(excluding
dividend
expenses for
securities
sold short)
|
| Net
investment
income
(loss)
|
| Expenses
without waivers,
reimbursements
and earnings credits
(including dividend
expenses for
securities sold short)
|
| Expenses
without waivers,
reimbursements
and earnings credits
(excluding dividend
expenses for
securities sold short)
|
| Portfolio
turnover
rate (b)
|
|---|
| $ 27.17 | | | | | 17.64% | | | $ | 818,261 | | | | 1.75 | % | | | 1.75 | % | | | 0.20 | % | | | 1.85% | | | | 1.85% | | | | 45 | % |
| 24.26 | | | | | 5.94 | | | | 790,689 | | | | 1.75 | | | | 1.75 | | | | 0.64 | | | | 1.89 | | | | 1.89 | | | | 20 | |
| 22.90 | | | | | 8.34 | | | | 822,366 | | | | 1.76 | | | | 1.76 | | | | 0.01 | | | | 1.89 | | | | 1.89 | | | | 45 | |
| 21.70 | | | | | 19.56 | | | | 483,000 | | | | 1.90 | | | | 1.90 | | | | (0.31 | ) | | | 2.10 | | | | 2.10 | | | | 41 | |
| 18.41 | | | | | 29.09 | | | | 103,000 | | | | 1.95 | | | | 1.95 | | | | (0.19 | ) | | | 2.19 | | | | 2.19 | | | | 32 | |
| 14.35 | | | | | 1.94 | | | | 9,000 | | | | 2.00 | | | | 2.00 | | | | (0.28 | ) | | | 2.51 | | | | 2.51 | | | | 51 | |
| | | | | | | | | | | | | | | | | | | | | | | | | | | | | | | | | | | |
| | | | | | | | | | | | | | | | | | | | | | | | | | | | | | | | | | | |
| 11.07 | | | | | 4.56 | | | | 187,546 | | | | 3.44 | | | | 2.25 | | | | 2.60 | | | | 3.60 | | | | 2.41 | | | | 96 | |
| 10.80 | | | | | 4.25 | | | | 200,403 | | | | 3.35 | | | | 2.25 | | | | 1.61 | | | | 3.52 | | | | 2.42 | | | | 121 | |
| 10.77 | | | | | 3.50 | | | | 243,243 | | | | 3.15 | | | | 2.26 | | | | (0.24 | ) | | | 3.35 | | | | 2.46 | | | | 198 | |
| 10.53 | | | | | 5.14 | | | | 186,136 | | | | 3.13 | | | | 2.25 | | | | (1.64 | ) | | | 3.40 | | | | 2.55 | | | | 257 | |
| 10.04 | | | | | 0.40 | | | | 54,094 | | | | 3.23 | | | | 2.25 | | | | (1.16 | ) | | | 3.68 | | | | 2.70 | | | | — | |
| | | | | | | | | | | | | | | | | | | | | | | | | | | | | | | | | | | |
| | | | | | | | | | | | | | | | | | | | | | | | | | | | | | | | | | | |
| 20.31 | | | | | 20.93 | | | | 247,794 | | | | 1.75 | | | | 1.75 | | | | 0.87 | | | | 1.91 | | | | 1.91 | | | | 77 | |
| 17.10 | | | | | 7.89 | | | | 83,777 | | | | 1.75 | | | | 1.75 | | | | 0.64 | | | | 2.17 | | | | 2.17 | | | | 55 | |
| 15.85 | | | | | 7.03 | | | | 55,875 | | | | 1.75 | | | | 1.75 | | | | 0.47 | | | | 2.39 | | | | 2.39 | | | | 90 | |
SEE NOTES TO FINANCIAL STATEMENTS.
JUNE 30, 2007 JPMORGAN MID CAP/MULTI-CAP FUNDS 85
FINANCIAL HIGHLIGHTS
FOR THE PERIODS INDICATED (continued)
Select Class
| | | |
|
|
|
|
|
|
|
| Per share operating performance
|
|
|---|
| | | | | | Investment operations
| | Distributions
| |
|---|
|
|
|
| Net asset
value,
beginning
of period
|
| Net
investment
income
(loss)
|
| Net realized
and unrealized
gains
(losses) on
investments
|
| Total from
investment
operations
|
| Net
investment
income
|
| Net
realized
gains
|
| Total
distributions
|
|---|
Capital Growth Fund | | | | | | | | | | | | | | | | | | | | | | | | | | | | | | |
| Year Ended June 30, 2007 | | | | $ | 43.05 | | | $ | (0.15 | )(f) | | $ | 8.05 | | | $ | 7.90 | | | $ | (0.01 | ) | | $ | (3.30 | ) | | $ | (3.31 | ) |
| Period Ended June 30, 2006 (d) | | | | | 41.36 | | | | 0.04 | (f) | | | 1.65 | | | | 1.69 | | | | — | | | | — | | | | ��� | |
| Year Ended December 31, 2005 | | | | | 40.42 | | | | (0.13 | )(f) | | | 4.17 | | | | 4.04 | | | | — | | | | (3.10 | ) | | | (3.10 | ) |
| Year Ended December 31, 2004 | | | | | 38.95 | | | | (0.09 | )(f) | | | 6.77 | | | | 6.68 | | | | — | | | | (5.21 | ) | | | (5.21 | ) |
| Year Ended December 31, 2003 | | | | | 29.57 | | | | (0.21 | )(f) | | | 10.99 | | | | 10.78 | | | | — | | | | (1.40 | ) | | | (1.40 | ) |
| Year Ended December 31, 2002 | | | | | 41.26 | | | | (0.24 | )(f) | | | (11.19 | ) | | | (11.43 | ) | | | — | | | | (0.26 | ) | | | (0.26 | ) |
| | | | | | | | | | | | | | | | | | | | | | | | | | | | | | | |
Diversified Mid Cap Growth Fund | | | | | | | | | | | | | | | | | | | | | | | | | | | | | | |
| Year Ended June 30, 2007 | | | | | 25.81 | | | | (0.12 | )(f) | | | 4.60 | | | | 4.48 | | | | — | | | | (4.19 | ) | | | (4.19 | ) |
| Year Ended June 30, 2006 | | | | | 24.78 | | | | 0.10 | | | | 2.94 | | | | 3.04 | | | | — | | | | (2.01 | ) | | | (2.01 | ) |
| Year Ended June 30, 2005 | | | | | 22.50 | | | | (0.01 | ) | | | 2.29 | | | | 2.28 | | | | — | | | | — | | | | — | |
| Year Ended June 30, 2004 | | | | | 18.66 | | | | (0.10 | ) | | | 3.94 | | | | 3.84 | | | | — | | | | — | | | | — | |
| Year Ended June 30, 2003 | | | | | 18.70 | | | | (0.06 | ) | | | 0.02 | | | | (0.04 | ) | | | — | | | | — | | | | — | |
| | | | | | | | | | | | | | | | | | | | | | | | | | | | | | | |
Diversified Mid Cap Value Fund | | | | | | | | | | | | | | | | | | | | | | | | | | | | | | |
| Year Ended June 30, 2007 | | | | | 15.85 | | | | 0.16 | (f) | | | 2.78 | | | | 2.94 | | | | (0.17 | ) | | | (2.85 | ) | | | (3.02 | ) |
| Year Ended June 30, 2006 | | | | | 19.07 | | | | 0.17 | | | | 1.49 | | | | 1.66 | | | | (0.17 | ) | | | (4.71 | ) | | | (4.88 | ) |
| Year Ended June 30, 2005 | | | | | 17.34 | | | | 0.21 | | | | 2.25 | | | | 2.46 | | | | (0.18 | ) | | | (0.55 | ) | | | (0.73 | ) |
| Year Ended June 30, 2004 | | | | | 13.48 | | | | 0.10 | | | | 3.86 | | | | 3.96 | | | | (0.10 | ) | | | — | | | | (0.10 | ) |
| Year Ended June 30, 2003 | | | | | 15.33 | | | | 0.08 | | | | (1.14 | ) | | | (1.06 | ) | | | (0.08 | ) | | | (0.71 | ) | | | (0.79 | ) |
| | | | | | | | | | | | | | | | | | | | | | | | | | | | | | | |
Growth Advantage Fund | | | | | | | | | | | | | | | | | | | | | | | | | | | | | | |
| Year Ended June 30, 2007 | | | | | 6.64 | | | | (0.04 | )(f) | | | 1.60 | | | | 1.56 | | | | — | | | | — | | | | — | |
| May 1, 2006 (e) through June 30, 2006 (d) | | | | | 7.11 | | | | (0.01 | )(f) | | | (0.46 | ) | | | (0.47 | ) | | | — | | | | — | | | | — | |
| (a) | | Annualized for periods less than one year. |
| (b) | | Not annualized for periods less than one year. |
| (c) | | Includes adjustments in accordance with accounting principles generally accepted in the United States of America and as such, the net asset value for financial reporting purposes and the returns based upon those net asset values may differ from the net asset value and returns for shareholder transactions. |
| (d) | | The Fund changed its fiscal year end from December 31 to June 30. |
| (e) | | Commencement of offering of class of shares. |
| (f) | | Calculated based upon average shares outstanding. |
| (g) | | Includes interest expense for custody overdraft of 0.01%. |
SEE NOTES TO FINANCIAL STATEMENTS.
86 JPMORGAN MID CAP/MULTI-CAP FUNDS JUNE 30, 2007
| |
| Ratios/Supplemental data
|
|
|---|
| | | | | | | | Ratios to average net assets (a)
| |
|---|
Net asset
value, end
of period
|
|
|
| Total
return (b)(c)
|
| Net assets
end of
period
(000’s)
|
| Net
expenses
|
| Net
investment
income
(loss)
|
| Expenses
without waivers,
reimbursements
and earnings credits
|
| Portfolio
turnover
rate (b)
|
|---|
| $ 47.64 | | | | | 19.30 | % | | $ | 396,574 | | | | 0.89 | % | | | (0.34 | )% | | | 0.89% | | | | 121 | % |
| 43.05 | | | | | 4.09 | | | | 321,568 | | | | 0.89 | | | | 0.19 | | | | 0.92 | | | | 63 | |
| 41.36 | | | | | 10.10 | | | | 275,518 | | | | 0.90 | | | | (0.33 | ) | | | 0.90 | | | | 119 | |
| 40.42 | | | | | 17.37 | | | | 43,000 | | | | 0.93 | | | | (0.21 | ) | | | 1.30 | | | | 122 | |
| 38.95 | | | | | 36.64 | | | | 4,000 | | | | 0.93 | | | | (0.63 | ) | | | 1.54 | | | | 68 | |
| 29.57 | | | | | (27.71 | ) | | | 2,000 | | | | 0.93 | | | | (0.71 | ) | | | 1.26 | | | | 93 | |
| | | | | | | | | | | | | | | | | | | | | | | | | | | |
| | | | | | | | | | | | | | | | | | | | | | | | | | | |
| 26.10 | | | | | 18.95 | | | | 740,208 | | | | 0.99 | | | | (0.48 | ) | | | 1.11 | | | | 119 | |
| 25.81 | | | | | 12.51 | | | | 769,574 | | | | 0.99 | | | | (0.19 | ) | | | 1.16 | | | | 112 | |
| 24.78 | | | | | 10.13 | | | | 1,040,265 | | | | 0.99 | | | | (0.50 | ) | | | 1.05 | | | | 119 | |
| 22.50 | | | | | 20.58 | | | | 1,764,404 | | | | 0.97 | | | | (0.44 | ) | | | 0.98 | | | | 48 | |
| 18.66 | | | | | (0.21 | ) | | | 1,493,114 | | | | 0.99 | | | | (0.40 | ) | | | 1.06 | | | | 71 | |
| | | | | | | | | | | | | | | | | | | | | | | | | | | |
| | | | | | | | | | | | | | | | | | | | | | | | | | | |
| 15.77 | | | | | 19.97 | | | | 440,662 | | | | 0.97 | | | | 0.98 | | | | 1.08 | | | | 47 | |
| 15.85 | | | | | 9.79 | | | | 602,775 | | | | 0.99 | | | | 0.92 | | | | 1.11 | | | | 52 | |
| 19.07 | | | | | 14.46 | | | | 959,801 | | | | 0.96 | | | | 0.87 | | | | 1.01 | | | | 67 | |
| 17.34 | | | | | 29.43 | | | | 1,541,179 | | | | 0.94 | | | | 0.65 | | | | 0.96 | | | | 24 | |
| 13.48 | | | | | (6.48 | ) | | | 1,269,438 | | | | 0.99 | | | | 0.65 | | | | 1.00 | | | | 99 | |
| | | | | | | | | | | | | | | | | | | | | | | | | | | |
| | | | | | | | | | | | | | | | | | | | | | | | | | | |
| 8.20 | | | | | 23.49 | | | | 10,985 | | | | 1.11 | (g) | | | (0.50 | ) | | | 1.45 | | | | 159 | |
| 6.64 | | | | | (6.61 | ) | | | 14 | | | | 1.10 | | | | (0.37 | ) | | | 1.61 | | | | 81 | |
SEE NOTES TO FINANCIAL STATEMENTS.
JUNE 30, 2007 JPMORGAN MID CAP/MULTI-CAP FUNDS 87
FINANCIAL HIGHLIGHTS
FOR THE PERIODS INDICATED (continued)
Select Class (continued)
| | | |
|
|
|
|
|
| Per share operating performance
|
|
|
|
|
|
|---|
| | | | | | Investment operations
| | Distributions
| |
|---|
|
|
|
| Net asset
value,
beginning
of period
|
| Net
investment
income
(loss)
|
| Net realized
and unrealized
gains
(losses) on
investments
|
| Total from
investment
operations
|
| Net
investment
income
|
| Net
realized
gains
|
| Total
distributions
|
| Redemption
fees
|
|---|
Mid Cap Equity Fund | | | | | | | | | | | | | | | | | | | | | | | | | | | | | | | | | | |
| Year Ended June 30, 2007 | | | | $ | 34.51 | | | $ | 0.12 | | | $ | 6.13 | | | $ | 6.25 | | | $ | (0.10 | ) | | $ | (2.73 | ) | | $ | (2.83 | ) | | $ | — | |
| Period Ended June 30, 2006 (d) | | | | | 32.87 | | | | 0.14 | (f) | | | 1.64 | | | | 1.78 | | | | (0.14 | ) | | | — | | | | (0.14 | ) | | | — | |
| Year Ended December 31, 2005 | | | | | 33.30 | | | | 0.10 | (f) | | | 3.09 | | | | 3.19 | | | | (0.09 | ) | | | (3.53 | ) | | | (3.62 | ) | | | — | |
| Year Ended December 31, 2004 | | | | | 31.18 | | | | 0.14 | | | | 5.85 | | | | 5.99 | | | | (0.14 | ) | | | (3.73 | ) | | | (3.87 | ) | | | — | |
| Year Ended December 31, 2003 | | | | | 24.39 | | | | 0.13 | | | | 7.71 | | | | 7.84 | | | | (0.13 | ) | | | (0.92 | ) | | | (1.05 | ) | | | — | |
| Year Ended December 31, 2002 | | | | | 29.51 | | | | 0.13 | | | | (4.07 | ) | | | (3.94 | ) | | | (0.13 | ) | | | (1.05 | ) | | | (1.18 | ) | | | — | |
| | | | | | | | | | | | | | | | | | | | | | | | | | | | | | | | | | | |
Mid Cap Value Fund | | | | | | | | | | | | | | | | | | | | | | | | | | | | | | | | | | |
| Year Ended June 30, 2007 | | | | | 24.93 | | | | 0.27 | | | | 4.22 | | | | 4.49 | | | | (0.31 | ) | | | (1.15 | ) | | | (1.46 | ) | | | — | |
| Period Ended June 30, 2006 (d) | | | | | 23.44 | | | | 0.17 | | | | 1.32 | | | | 1.49 | | | | — | | | | — | | | | — | | | | — | |
| Year Ended December 31, 2005 | | | | | 22.18 | | | | 0.18 | (f) | | | 1.85 | | | | 2.03 | | | | (0.16 | ) | | | (0.61 | ) | | | (0.77 | ) | | | — | |
| Year Ended December 31, 2004 | | | | | 18.70 | | | | 0.12 | (f) | | | 3.74 | | | | 3.86 | | | | (0.07 | ) | | | (0.31 | ) | | | (0.38 | ) | | | — | |
| Year Ended December 31, 2003 | | | | | 14.48 | | | | 0.12 | (f) | | | 4.27 | | | | 4.39 | | | | (0.06 | ) | | | (0.11 | ) | | | (0.17 | ) | | | — | |
| Year Ended December 31, 2002 | | | | | 14.14 | | | | 0.14 | (f) | | | 0.27 | | | | 0.41 | | | | (0.06 | ) | | | (0.01 | ) | | | (0.07 | ) | | | — | |
| | | | | | | | | | | | | | | | | | | | | | | | | | | | | | | | | | | |
Multi-Cap Market Neutral Fund | | | | | | | | | | | | | | | | | | | | | | | | | | | | | | | | | | |
| Year Ended June 30, 2007 | | | | | 11.04 | | | | 0.36 | | | | 0.25 | | | | 0.61 | | | | (0.34 | ) | | | — | | | | (0.34 | ) | | | — | |
| Year Ended June 30, 2006 | | | | | 10.99 | | | | 0.24 | | | | 0.32 | | | | 0.56 | | | | (0.19 | ) | | | (0.32 | ) | | | (0.51 | ) | | | — | (g) |
| Year Ended June 30, 2005 | | | | | 10.64 | | | | 0.07 | | | | 0.40 | | | | 0.47 | | | | — | | | | (0.12 | ) | | | (0.12 | ) | | | — | |
| Year Ended June 30, 2004 | | | | | 10.05 | | | | (0.04 | ) | | | 0.66 | | | | 0.62 | | | | — | | | | (0.03 | ) | | | (0.03 | ) | | | — | |
| May 23, 2003 (e) through June 30, 2003 | | | | | 10.00 | | | | — | (g) | | | 0.05 | | | | 0.05 | | | | — | | | | — | | | | — | | | | — | |
| | | | | | | | | | | | | | | | | | | | | | | | | | | | | | | | | | | |
Value Advantage Fund | | | | | | | | | | | | | | | | | | | | | | | | | | | | | | | | | | |
| Year Ended June 30, 2007 | | | | | 17.22 | | | | 0.31 | (f) | | | 3.43 | | | | 3.74 | | | | (0.16 | ) | | | (0.28 | ) | | | (0.44 | ) | | | — | |
| Period Ended June 30, 2006 (d) | | | | | 15.91 | | | | 0.12 | (f) | | | 1.19 | | | | 1.31 | | | | — | | | | — | | | | — | | | | — | |
| February 28, 2005 (e) through December 31, 2005 | | | | | 15.00 | | | | 0.15 | (f) | | | 1.01 | | | | 1.16 | | | | (0.07 | ) | | | (0.18 | ) | | | (0.25 | ) | | | — | |
| (a) | | Annualized for periods less than one year. |
| (b) | | Not annualized for periods less than one year. |
| (c) | | Includes adjustments in accordance with accounting principles generally accepted in the United States of America and as such, the net asset value for financial reporting purposes and the returns based upon those net asset values may differ from the net asset value and returns for shareholder transactions. |
| (d) | | The Fund changed its fiscal year end from December 31 to June 30. |
| (e) | | Commencement of offering of class of shares. |
| (f) | | Calculated based upon average shares outstanding. |
| (g) | | Amount rounds to less than $0.01. |
SEE NOTES TO FINANCIAL STATEMENTS.
88 JPMORGAN MID CAP/MULTI-CAP FUNDS JUNE 30, 2007
| |
| Ratios/Supplemental data
|
|
|---|
| | | | | | | | Ratios to average net assets (a)
| |
|---|
Net asset
value, end
of period
|
|
|
| Total
return (b)(c)
|
| Net assets
end of
period
(000’s)
|
| Net
expenses
(including
dividend
expenses for
securities
sold short)
|
| Net
expenses
(excluding
dividend
expenses for
securities
sold short)
|
| Net
investment
income
(loss)
|
| Expenses
without waivers,
reimbursements
and earnings credits
(including dividend
expenses for
securities sold short)
|
| Expenses
without waivers,
reimbursements
and earnings credits
(excluding dividend
expenses for
securities sold short)
|
| Portfolio
turnover
rate (b)
|
|---|
| $ 37.93 | | | | | 18.97 | % | | $ | 284,546 | | | | 0.90 | % | | | 0.90 | % | | | 0.35 | % | | | 1.09% | | | | 1.09% | | | | 82 | % |
| 34.51 | | | | | 5.42 | | | | 298,104 | | | | 0.90 | | | | 0.90 | | | | 0.85 | | | | 1.08 | | | | 1.08 | | | | 41 | |
| 32.87 | | | | | 9.61 | | | | 268,582 | | | | 0.90 | | | | 0.90 | | | | 0.29 | | | | 1.08 | | | | 1.08 | | | | 99 | |
| 33.30 | | | | | 19.36 | | | | 227,000 | | | | 0.90 | | | | 0.90 | | | | 0.32 | | | | 1.14 | | | | 1.14 | | | | 102 | |
| 31.18 | | | | | 32.29 | | | | 194,000 | | | | 0.90 | | | | 0.90 | | | | 0.48 | | | | 1.14 | | | | 1.14 | | | | 62 | |
| 24.39 | | | | | (13.39 | ) | | | 139,000 | | | | 0.77 | | | | 0.77 | | | | 0.51 | | | | 1.14 | | | | 1.14 | | | | 84 | |
| | | | | | | | | | | | | | | | | | | | | | | | | | | | | | | | | | | |
| | | | | | | | | | | | | | | | | | | | | | | | | | | | | | | | | | | |
| 27.96 | | | | | 18.49 | | | | 1,183,839 | | | | 1.00 | | | | 1.00 | | | | 0.95 | | | | 1.10 | | | | 1.10 | | | | 45 | |
| 24.93 | | | | | 6.36 | | | | 1,255,960 | | | | 1.00 | | | | 1.00 | | | | 1.40 | | | | 1.14 | | | | 1.14 | | | | 20 | |
| 23.44 | | | | | 9.16 | | | | 1,222,881 | | | | 1.00 | | | | 1.00 | | | | 0.80 | | | | 1.13 | | | | 1.13 | | | | 45 | |
| 22.18 | | | | | 20.67 | | | | 485,000 | | | | 1.00 | | | | 1.00 | | | | 0.60 | | | | 1.20 | | | | 1.20 | | | | 41 | |
| 18.70 | | | | | 30.34 | | �� | | 76,000 | | | | 1.00 | | | | 1.00 | | | | 0.74 | | | | 1.24 | | | | 1.24 | | | | 32 | |
| 14.48 | | | | | 2.90 | | | | 14,000 | | | | 1.00 | | | | 1.00 | | | | 0.96 | | | | 1.71 | | | | 1.71 | | | | 51 | |
| | | | | | | | | | | | | | | | | | | | | | | | | | | | | | | | | | | |
| | | | | | | | | | | | | | | | | | | | | | | | | | | | | | | | | | | |
| 11.31 | | | | | 5.59 | | | | 1,852,145 | | | | 2.44 | | | | 1.25 | | | | 3.55 | | | | 2.85 | | | | 1.66 | | | | 96 | |
| 11.04 | | | | | 5.36 | | | | 1,457,434 | | | | 2.35 | | | | 1.25 | | | | 2.71 | | | | 2.77 | | | | 1.67 | | | | 121 | |
| 10.99 | | | | | 4.50 | | | | 991,169 | | | | 2.14 | | | | 1.25 | | | | 0.78 | | | | 2.44 | | | | 1.55 | | | | 198 | |
| 10.64 | | | | | 6.13 | | | | 629,820 | | | | 2.13 | | | | 1.25 | | | | (0.63 | ) | | | 2.42 | | | | 1.54 | | | | 257 | |
| 10.05 | | | | | 0.50 | | | | 196,513 | | | | 2.23 | | | | 1.25 | | | | (0.16 | ) | | | 2.71 | | | | 1.73 | | | | — | |
| | | | | | | | | | | | | | | | | | | | | | | | | | | | | | | | | | | |
| | | | | | | | | | | | | | | | | | | | | | | | | | | | | | | | | | | |
| 20.52 | | | | | 21.89 | | | | 36,884 | | | | 1.00 | | | | 1.00 | | | | 1.62 | | | | 1.16 | | | | 1.16 | | | | 77 | |
| 17.22 | | | | | 8.23 | | | | 5,275 | | | | 1.00 | | | | 1.00 | | | | 1.42 | | | | 1.42 | | | | 1.42 | | | | 55 | |
| 15.91 | | | | | 7.71 | | | | 3,107 | | | | 1.00 | | | | 1.00 | | | | 1.14 | | | | 1.87 | | | | 1.87 | | | | 90 | |
SEE NOTES TO FINANCIAL STATEMENTS.
JUNE 30, 2007 JPMORGAN MID CAP/MULTI-CAP FUNDS 89
FINANCIAL HIGHLIGHTS
FOR THE PERIODS INDICATED (continued)
Institutional Class
| | | |
|
|
|
|
|
|
|
| Per share operating performance
|
|
|---|
| | | | | | Investment operations
| | Distributions
| |
|---|
|
|
|
| Net asset
value,
beginning
of period
|
| Net
investment
income
(loss)
|
| Net realized
and unrealized
gains
(losses) on
investments
|
| Total from
investment
operations
|
| Net
investment
income
|
| Net
realized
gains
|
| Total
distributions
|
|---|
Mid Cap Value Fund | | | | | | | | | | | | | | | | | | | | | | | | | | | | | | |
| Year Ended June 30, 2007 | | | | $ | 25.10 | | | $ | 0.30 | | | $ | 4.29 | | | $ | 4.59 | | | $ | (0.37 | ) | | $ | (1.15 | ) | | $ | (1.52 | ) |
| Period Ended June 30, 2006 (d) | | | | | 23.58 | | | | 0.20 | | | | 1.32 | | | | 1.52 | | | | — | | | | — | | | | — | |
| Year Ended December 31, 2005 | | | | | 22.30 | | | | 0.24 | (f) | | | 1.86 | | | | 2.10 | | | | (0.21 | ) | | | (0.61 | ) | | | (0.82 | ) |
| Year Ended December 31, 2004 | | | | | 18.77 | | | | 0.17 | (f) | | | 3.77 | | | | 3.94 | | | | (0.10 | ) | | | (0.31 | ) | | | (0.41 | ) |
| Year Ended December 31, 2003 | | | | | 14.52 | | | | 0.17 | (f) | | | 4.27 | | | | 4.44 | | | | (0.08 | ) | | | (0.11 | ) | | | (0.19 | ) |
| Year Ended December 31, 2002 | | | | | 14.14 | | | | 0.15 | (f) | | | 0.30 | | | | 0.45 | | | | (0.06 | ) | | | (0.01 | ) | | | (0.07 | ) |
| | | | | | | | | | | | | | | | | | | | | | | | | | | | | | | |
Value Advantage Fund | | | | | | | | | | | | | | | | | | | | | | | | | | | | | | |
| Year Ended June 30, 2007 | | | | | 17.16 | | | | 0.39 | (f) | | | 3.38 | | | | 3.77 | | | | (0.18 | ) | | | (0.28 | ) | | | (0.46 | ) |
| Period Ended June 30, 2006 (d) | | | | | 15.83 | | | | 0.25 | (f) | | | 1.08 | | | | 1.33 | | | | — | | | | — | | | | — | |
| February 28, 2005 (e) through December 31, 2005 | | | | | 15.00 | | | | 0.11 | | | | 0.99 | | | | 1.10 | | | | (0.09 | ) | | | (0.18 | ) | | | (0.27 | ) |
| (a) | | Annualized for periods less than one year. |
| (b) | | Not annualized for periods less than one year. |
| (c) | | Includes adjustments in accordance with accounting principles generally accepted in the United States of America and as such, the net asset value for financial reporting purposes and the returns based upon those net asset values may differ from the net asset value and returns for shareholder transactions. |
| (d) | | The Fund changed its fiscal year end from December 31 to June 30. |
| (e) | | Commencement of offering of class of shares. |
| (f) | | Calculated based upon average shares outstanding. |
SEE NOTES TO FINANCIAL STATEMENTS.
90 JPMORGAN MID CAP/MULTI-CAP FUNDS JUNE 30, 2007
| |
| Ratios/Supplemental data
|
|
|---|
| | | | | | | | Ratios to average net assets (a)
| |
|---|
Net asset
value, end
of period
|
|
|
| Total
return (b)(c)
|
| Net assets
end of
period
(000’s)
|
| Net
expenses
|
| Net
investment
income
(loss)
|
| Expenses
without waivers,
reimbursements
and earnings credits
|
| Portfolio
turnover
rate (b)
|
|---|
| $ 28.17 | | | | | 18.82 | % | | $ | 2,566,230 | | | | 0.75 | % | | | 1.21 | % | | | 0.95% | | | | 45 | % |
| 25.10 | | | | | 6.45 | | | | 2,009,351 | | | | 0.75 | | | | 1.65 | | | | 0.99 | | | | 20 | |
| 23.58 | | | | | 9.42 | | | | 1,915,393 | | | | 0.75 | | | | 1.02 | | | | 0.98 | | | | 45 | |
| 22.30 | | | | | 20.99 | | | | 1,215,000 | | | | 0.75 | | | | 0.83 | | | | 1.05 | | | | 41 | |
| 18.77 | | | | | 30.62 | | | | 334,000 | | | | 0.75 | | | | 1.00 | | | | 1.07 | | | | 32 | |
| 14.52 | | | | | 3.23 | | | | 59,000 | | | | 0.75 | | | | 1.01 | | | | 1.22 | | | | 51 | |
| | | | | | | | | | | | | | | | | | | | | | | | | | | |
| | | | | | | | | | | | | | | | | | | | | | | | | | | |
| 20.47 | | | | | 22.16 | | | | 24,710 | | | | 0.75 | | | | 1.97 | | | | 1.00 | | | | 77 | |
| 17.16 | | | | | 8.40 | | | | 773 | | | | 0.75 | | | | 3.03 | | | | 1.25 | | | | 55 | |
| 15.83 | | | | | 7.32 | | | | 20 | | | | 0.75 | | | | 0.87 | | | | 3.01 | | | | 90 | |
SEE NOTES TO FINANCIAL STATEMENTS.
JUNE 30, 2007 JPMORGAN MID CAP/MULTI-CAP FUNDS 91
FINANCIAL HIGHLIGHTS
FOR THE PERIODS INDICATED (continued)
Ultra Class
| | | |
|
|
|
|
|
|
|
| Per share operating performance
|
|
|---|
| | | | | | Investment operations
| | Distributions
| |
|---|
|
|
|
| Net asset
value,
beginning
of period
|
| Net
investment
income
(loss)
|
| Net realized
and unrealized
gains
(losses) on
investments
|
| Total from
investment
operations
|
| Net
investment
income
|
| Net
realized
gains
|
| Total
distributions
|
|---|
Diversified Mid Cap Growth Fund | | | | | | | | | | | | | | | | | | | | | | | | | | | | | | |
| Year Ended June 30, 2007 | | | | $ | 25.85 | | | $ | (0.09 | )(e) | | $ | 4.62 | | | $ | 4.53 | | | $ | — | | | $ | (4.19 | ) | | $ | (4.19 | ) |
| Year Ended June 30, 2006 | | | | | 24.79 | | | | (0.07 | ) | | | 3.14 | | | | 3.07 | | | | — | | | | (2.01 | ) | | | (2.01 | ) |
| February 22, 2005 (d) through June 30, 2005 | | | | | 23.72 | | | | (0.04 | ) | | | 1.11 | | | | 1.07 | | | | — | | | | — | | | | — | |
| | | | | | | | | | | | | | | | | | | | | | | | | | | | | | | |
Diversified Mid Cap Value Fund | | | | | | | | | | | | | | | | | | | | | | | | | | | | | | |
| Year Ended June 30, 2007 | | | | | 15.85 | | | | 0.17 | (e) | | | 2.80 | | | | 2.97 | | | | (0.20 | ) | | | (2.85 | ) | | | (3.05 | ) |
| Year Ended June 30, 2006 | | | | | 19.08 | | | | 0.18 | | | | 1.49 | | | | 1.67 | | | | (0.19 | ) | | | (4.71 | ) | | | (4.90 | ) |
| February 22, 2005 (d) through June 30, 2005 | | | | | 18.06 | | | | 0.11 | | | | 1.02 | | | | 1.13 | | | | (0.11 | ) | | | — | | | | (0.11 | ) |
| (a) | | Annualized for periods less than one year. |
| (b) | | Not annualized for periods less than one year. |
| (c) | | Includes adjustments in accordance with accounting principles generally accepted in the United States of America and as such, the net asset value for financial reporting purposes and the returns based upon those net asset values may differ from the net asset value and returns for shareholder transactions. |
| (d) | | Commencement of offering of class of shares. |
| (e) | | Calculated based upon average shares outstanding. |
SEE NOTES TO FINANCIAL STATEMENTS.
92 JPMORGAN MID CAP/MULTI-CAP FUNDS JUNE 30, 2007
| |
| Ratios/Supplemental data
|
|
|---|
| | | | | | | | Ratios to average net assets (a)
| |
|---|
Net asset
value, end
of period
|
|
|
| Total
return (b)(c)
|
| Net assets
end of
period
(000’s)
|
| Net
expenses
|
| Net
investment
income
(loss)
|
| Expenses
without waivers,
reimbursements
and earnings credits
|
| Portfolio
turnover
rate (b)
|
|---|
| $ 26.19 | | | | | 19.13 | % | | $ | 2,749 | | | | 0.86 | % | | | (0.34 | )% | | | 0.86% | | | | 119 | % |
| 25.85 | | | | | 12.63 | | | | 15,333 | | | | 0.88 | | | | (0.06 | ) | | | 0.91 | | | | 112 | |
| 24.79 | | | | | 4.51 | | | | 11,641 | | | | 0.88 | | | | (0.44 | ) | | | 0.90 | | | | 119 | |
| | | | | | | | | | | | | | | | | | | | | | | | | | | |
| | | | | | | | | | | | | | | | | | | | | | | | | | | |
| 15.77 | | | | | 20.13 | | | | 2,672 | | | | 0.83 | | | | 1.05 | | | | 0.83 | | | | 47 | |
| 15.85 | | | | | 9.89 | | | | 7,787 | | | | 0.84 | | | | 1.09 | | | | 0.86 | | | | 52 | |
| 19.08 | | | | | 6.25 | | | | 12,499 | | | | 0.81 | | | | 1.67 | | | | 0.87 | | | | 67 | |
SEE NOTES TO FINANCIAL STATEMENTS.
JUNE 30, 2007 JPMORGAN MID CAP/MULTI-CAP FUNDS 93
NOTES TO FINANCIAL STATEMENTS
AS OF JUNE 30, 2007
1. Organization
JPMorgan Trust I (“JPM I”) and JPMorgan Trust II (“JPM II”) were formed on November 12, 2004, as Delaware statutory trusts, pursuant to Declarations of Trusts dated November 5, 2004 and are registered under the Investment Company Act of 1940, as amended (the “1940 Act”), as open-end management investment companies.
J.P. Morgan Mutual Fund Investment Trust (“JPMMFIT”), an open-end management investment company, was organized as a Massachusetts business trust on September 23, 1997.
J.P. Morgan Fleming Mutual Fund Group, Inc. (“JPMFMFG”), an open-end management investment company, was organized as a Maryland corporation on August 19, 1997.
The funds covered by this report are series of JPM I, JPM II, JPMMFIT and JPMFMFG (collectively, the “Trusts”) as noted below.
The following are 8 separate funds of the Trusts (collectively, the “Funds”) covered by this report:
|
| Classes Offered
| Trust
|
|
|---|
| Capital Growth Fund | | Class A, Class B, Class C and Select Class | JPMI | |
| Diversified Mid Cap Growth Fund | | Class A, Class B, Class C, Select Class and Ultra | JPM II | |
| Diversified Mid Cap Value Fund | | Class A, Class B, Class C, Select Class and Ultra | JPM II | |
| Growth Advantage Fund | | Class A, Class B, Class C and Select Class | JPMMFIT | |
| Mid Cap Equity Fund | | Select Class | JPM I | |
| Mid Cap Value Fund | | Class A, Class B, Class C, Select Class and Institutional Class | JPMFMFG | |
| Multi-Cap Market Neutral Fund | | Class A, Class B, Class C and Select Class | JPM II | |
| Value Advantage Fund | | Class A, Class C, Select Class and Institutional Class | JPM I | |
All share classes of the Diversified Mid Cap Value Fund and Mid Cap Value Fund are publicly offered only on a limited basis. Investors are not eligible to purchase shares of these funds unless they meet certain requirements as described in their prospectus.
Class A Shares generally provide for a front-end sales charge while Class B and Class C Shares provide for a contingent deferred sales charge. Class B Shares automatically convert to Class A Shares after eight years. No sales charges are assessed with respect to the Select Class, Institutional Class and Ultra Shares. All classes of shares have equal rights as to earnings, assets and voting privileges except that each class may bear different distribution and shareholder servicing fees and each class has exclusive voting rights with respect to its distribution plan and shareholder servicing agreements. Certain Class A Shares, for which front-end sales charges have been waived, may be subject to contingent deferred sales charges as described in the Funds’ prospectus.
2. Significant Accounting Policies
The following is a summary of significant accounting policies followed by the Trusts in preparation of their financial statements. The policies are in accordance with accounting principles generally accepted in the United States of America. The preparation of financial statements requires management to make estimates and assumptions that affect the reported amounts of assets and liabilities at the date of the financial statements and the reported amounts of income and expenses for the period. Actual results could differ from those estimates.
A. Valuation of Investments — Equity securities listed on a North American, Central American, South American or Caribbean securities exchange shall generally be valued at the last sale price on the exchange on which the security is principally traded that is reported before the time when the net assets of the Funds are valued. The value of securities listed on the NASDAQ Stock Market, Inc. shall generally be the NASDAQ Official Closing Price. Fixed income securities (other than short-term investments maturing in less than 61 days) are valued each day based on readily available market quotations received from third party broker-dealers of comparable securities or independent or affiliated pricing services approved by the Board of Trustees. Such pricing services and broker-dealers will generally provide bid-side quotations. Generally, short-term investments (other than certain high yield securities) maturities in less than 61 days are valued at amortized cost, which approximates market value. Futures, options and other derivatives are valued on the basis of available market quotations. Investments in other open-end investment companies are valued at such investment company’s current day closing net asset value per share.
Securities or other assets for which market quotations are not readily available or for which market quotations do not represent the value at the time of pricing (including certain illiquid securities) are fair valued in accordance with procedures established by and under the supervision and responsibility of the Board of Trustees. It is possible that the estimated values may differ significantly from the values that would have been used had a ready market for the investments existed, and such differences could have been material. Trading in securities on most foreign exchanges and over-the-counter markets is normally completed before the close of the domestic market and may also take place on days when the domestic market is closed. In accordance with procedures adopted by the Board of Trustees, the Funds apply fair value pricing on equity securities on a daily basis except for North American, Central American, South American and Caribbean equity securities held in their portfolios by utilizing the quotations of an independent pricing service, unless a Fund’s advisor determines that use of another valuation methodology is appropriate. The pricing service uses statistical analyses and quantitative models to adjust local market prices using factors such as subsequent
94 JPMORGAN MID CAP/MULTI-CAP FUNDS JUNE 30, 2007
movement and changes in the prices of indices, securities and exchange rates in other markets, in determining fair value as of the time a Fund calculates its net asset value.
B. Restricted and Illiquid Securities — The Funds may invest in securities that are subject to legal or contractual restrictions on resale or are illiquid. Restricted securities generally may be resold in transactions exempt from registration. An illiquid security is a security which cannot be disposed of promptly (within seven days) and in the usual course of business at approximately its fair value and includes repurchase agreements maturing in excess of seven days, time deposits with a withdrawal penalty, non-negotiable instruments and instruments for which no market exists. Disposal of these securities may involve time-consuming negotiations and expense, and prompt sale at the current valuation may be difficult.
C. Repurchase Agreements — The Funds may enter into repurchase agreement transactions with institutions that meet the advisor’s credit guidelines. Each repurchase agreement is valued at amortized cost. The Funds require that the collateral received in a repurchase agreement transaction be transferred to a custodian in a manner sufficient to enable the Funds to obtain collateral in the event of a counterparty default. If the counterparty defaults and the fair value of the collateral declines, realization of the collateral by the Funds may be delayed or limited.
D. Futures Contracts — The Funds may enter into futures contracts for the delayed delivery of securities at a fixed price at some future date or for the change in the value of a specified financial index over a predetermined time period. Upon entering into a futures contract, the Funds are required to pledge to the broker an amount of cash, U.S. government securities, or other assets, equal to a certain percentage of the contract amount. This is known as the initial margin deposit. Subsequent payments, known as variation margin, are made or received by the Funds each day, depending on the daily fluctuations in fair value of the position. Variation margin is recorded as unrealized appreciation or depreciation until the contract is closed out, at which time the Funds realize a gain or loss.
Use of long futures contracts subjects the Funds to risk of loss in excess of the amounts shown on the Statement of Assets and Liabilities, up to the notional value of the futures contracts. Use of short futures contracts subjects the Funds to unlimited risk of loss. The Funds may enter into futures contracts only on exchanges or boards of trade. The exchange or board of trade acts as the counterparty to each futures transaction; therefore, the Funds’ credit risk is limited to failure of the exchange or board of trade.
As of June 30, 2007, the Funds do not have any outstanding future contracts.
E. Short Sales — The Multi-Cap Market Neutral Fund may engage in short sales (selling securities it does not own in anticipation of a decline in the market value of the security) as part of its normal investment activities. These short sales are collateralized by cash deposits and securities. The collateral required is determined daily by reference to the market value of the short positions. The Fund is subject to risk of loss if the applicable counterparty were to fail to perform its obligations under the contractual terms. Dividend expense on securities sold short is treated as an expense on the Statement of Operations. Liabilities for securities sold short are reported at market value in the financial statements. Short sale transactions result in off-balance sheet risk because the ultimate obligation may exceed the related amount shown in the accompanying Statement of Assets and Liabilities. The Fund will incur a loss if the price of the security increases between the date of the short sale and the date on which the Fund replaces the borrowed security. The Fund will realize a gain if the price of the security declines between those dates.
F. Securities Lending — To generate additional income, each Fund, except for Multi-Cap Market Neutral Fund and Value Advantage Fund, may lend up to 33-1/3% of its assets pursuant to agreements (“borrower agreements”) requiring that the loan be continuously secured by cash or securities issued by the U.S. government or its agencies or its instrumentalities (“U.S. government securities”). JPMorgan Chase Bank, N.A. (“JPMCB”), an affiliate of the Funds, serves as lending agent pursuant to a Securities Lending Agreement approved by the Board of Trustees (the “Securities Lending Agreement”).
Under the Securities Lending Agreement, JPMCB, acting as agent for the Funds, loans securities to approved borrowers pursuant to approved borrower agreements in exchange for collateral equal to at least 100% of the market value of the loaned securities plus accrued interest. During the term of the loan, the Funds receive payments from borrowers equivalent to the dividends and interest that would have been earned on securities lent while simultaneously seeking to earn income on the investment of cash collateral in accordance with investment guidelines contained in the Securities Lending Agreement. For loans secured by cash, the Funds retain the interest on cash collateral investments but are required to pay the borrower a portion of such interest for the use of the cash collateral. For loans secured by U.S. government securities, the borrower pays a borrower fee to the lending agent on behalf of the Funds. The net income earned on the securities lending (after payment of rebates and the lending agent’s fee) is included in the Statement of Operations as Income from securities lending (net). Information on the investment of cash collateral is shown in the Schedule of Portfolio Investments.
Under the Securities Lending Agreement, JPMCB is entitled to a fee equal to (i) 0.06% calculated on an annualized basis and accrued daily, based upon the value of collateral received from borrowers for each loan of U.S. securities outstanding during a given month; and (ii) 0.1142% calculated on an annualized basis and accrued daily, based upon the value of collateral received from borrowers for each loan of non-U.S. securities outstanding during a given month. For the year ended June 30, 2007, JPMCB voluntarily reduced its fees to: (i) 0.05% for each loan of U.S. securities and (ii) 0.10% for each loan of the non-U.S. securities, respectively.
Risks of delay in recovery of securities or even loss of rights in the securities may occur should the borrower of the securities fail financially. Risks may also arise to the extent that the value of the securities loaned increases above the value of the collateral received. JPMCB will
JUNE 30, 2007 JPMORGAN MID CAP/MULTI-CAP FUNDS 95
NOTES TO FINANCIAL STATEMENTS
AS OF JUNE 30, 2007 (continued)
indemnify the Funds from losses resulting from a borrower’s failure to return a loaned security when due. Such indemnification does not extend to losses associated with declines in the value of cash collateral investments. Loans are subject to termination by the Funds or the borrower at any time, and are, therefore, not considered to be illiquid investments.
As of June 30, 2007, the following Funds had securities with the following market values on loan, received the following collateral and for the year then ended, these Funds paid the following amounts to related party affiliates (amounts in thousands):
|
|
|
| Lending Agent
Fees Paid
|
| Market Value
of Collateral
|
| Market Value of
Loaned Securities
|
|---|
| Capital Growth Fund | | | | $ | 61 | | | $ | 142,456 | | | $ | 140,663 | |
| Diversified Mid Cap Growth Fund | | | | | 89 | | | | 202,906 | | | | 199,568 | |
| Diversified Mid Cap Value Fund | | | | | 37 | | | | 50,158 | | | | 49,100 | |
| Growth Advantage Fund | | | | | 5 | | | | 6,585 | | | | 6,546 | |
| Mid Cap Equity Fund | | | �� | | 10 | | | | 13,961 | | | | 13,807 | |
| Mid Cap Value Fund | | | | | 198 | | | | 214,916 | | | | 210,342 | |
G. Security Transactions and Investment Income — Investment transactions are accounted for on the trade date (the date the order to buy or sell is executed). Securities gains and losses are calculated on a specifically identified cost basis. Interest income is determined on the basis of coupon interest accrued using the effective interest method adjusted for amortization of premiums and accretion of discounts. Dividend income and expense on securities sold short less foreign taxes withheld, if any, is recorded on the ex-dividend date or when the Funds first learn of the dividend.
The Funds record distributions received in excess of income from underlying investments as a reduction of cost of investments and/or realized gain. Such amounts are based on estimates if actual amounts are not available and actual amounts of income, realized gain and return of capital may differ from the estimated amounts. The Funds adjust the estimated amounts of components of distributions (and consequently their net investment income) as necessary once the issuers provide information about the actual composition of the distributions
H. Allocation of Income and Expenses — In calculating the net asset value per share of each class, investment income, realized and unrealized gains and losses and expenses other than class specific expenses are allocated daily to each class of shares based upon the proportion of net assets of each class at the beginning of each day. Expenses directly attributable to a fund are charged directly to that fund while the expenses attributable to more than one fund of the Trusts are allocated among the respective funds. Each class of shares bears its pro-rata portion of expenses attributable to its Fund, except that each class separately bears expenses related specifically to that class, such as distribution and shareholder servicing fees.
I. Federal Income Taxes — Each Fund is treated as a separate taxable entity for Federal income tax purposes. Each Fund’s policy is to comply with the provisions of the Internal Revenue Code of 1986, as amended (the “Code”), applicable to regulated investment companies and to distribute to shareholders all of its distributable net investment income and net realized gain on investments. Accordingly, no provision for Federal income tax is necessary.
J. Foreign Taxes — The Funds may be subject to foreign taxes on income, gains on investments or currency repatriation, a portion of which may be recoverable. The Funds will accrue such taxes and recoveries as applicable, based upon their current interpretation of tax rules and regulations that exist in the markets in which they invest.
K. Dividends and Distributions to Shareholders — Dividends from net investment income are generally declared and paid annually, except for the Diversified Mid Cap Growth, Diversified Mid Cap Value and Mid Cap Equity Funds, which are declared and paid quarterly. Dividends are declared separately for each class. No class has preferential dividend rights; differences in per share rates are due to differences in separate class expenses. Net realized capital gains, if any, are distributed at least annually. The amount of dividends and distributions from net investment income and net realized capital gains is determined in accordance with Federal income tax regulations, which may differ from accounting principles generally accepted in the United States of America. To the extent these “book/tax” differences are permanent in nature (i.e., that they result from other than timing of recognition — “temporary differences”), such amounts are reclassified within the capital accounts based on their Federal tax-basis treatment.
96 JPMORGAN MID CAP/MULTI-CAP FUNDS JUNE 30, 2007
The following amounts were reclassified within the capital accounts (amounts in thousands):
|
|
|
| Paid-in-capital
|
| Accumulated
Undistributed/
(Overdistributed)
Net Investment
Income
|
| Accumulated
Net Realized
Gain (Loss)
on Investments
|
|---|
| Capital Growth Fund | | | | $ | (56 | ) | | $ | 4,555 | | | $ | (4,499 | ) |
| Diversified Mid Cap Growth Fund | | | | | 34,836 | | | | 9,048 | | | | (43,884 | ) |
| Diversified Mid Cap Value Fund | | | | | (39 | ) | | | 868 | | | | (829 | ) |
| Growth Advantage Fund | | | | | (498 | ) | | | 498 | | | | — | (a) |
| Mid Cap Equity Fund | | | | | (45 | ) | | | (173 | ) | | | 218 | |
| Mid Cap Value Fund | | | | | (2,106 | ) | | | (4,653 | ) | | | 6,759 | |
| Multi-Cap Market Neutral Fund | | | | | (17 | ) | | | 1,088 | | | | (1,071 | ) |
| Value Advantage Fund | | | | | (11 | ) | | | (922 | ) | | | 933 | |
| (a) | | Amount rounds to less than $1,000 |
The reclassifications for the Funds relate primarily to the differences in character for tax purposes of distributions received from investments in real estate investment trusts, tax net operating losses, investments in partnerships (for Value Advantage Fund and Diversified Mid Cap Value Fund), non-taxable special dividends, write off of capital loss carryovers acquired from merger (for Capital Growth Fund), dividend expense for securities sold short (for Multi-Cap Market Neutral Fund) and equalization (for Diversified Mid Cap Growth Fund).
L. New Accounting Pronouncements — In July 2006, the Financial Accounting Standards Board (the “FASB”) issued Interpretation No. 48, “Accounting for Uncertainty in Income Taxes — an Interpretation of FASB Statement No. 109” (the “Interpretation”). The Interpretation establishes for all entities, including pass-through entities such as the Funds, a minimum threshold for financial statement recognition of the benefit of positions taken in filing tax returns (including whether an entity is taxable in a particular jurisdiction), and requires certain expanded tax disclosures. The Interpretation is effective for fiscal years beginning after December 15, 2006, and is to be applied to all open tax years as of the date of effectiveness. Management continues to evaluate the application of the Interpretation to the Funds, and is not in a position at this time to estimate the significance of its impact, if any, on the Funds’ financial statements.
In addition, in September 2006, Statement of Financial Accounting Standards No. 157, “Fair Value Measurements” (SFAS 157), was issued and is effective for fiscal years beginning after November 15, 2007. SFAS 157 defines fair value, establishes a framework for measuring fair value and expands disclosures about fair value measurements. Management continues to evaluate the impact the adoption of SFAS 157 will have on the Funds’ financial statement disclosures.
3. Fees and Other Transactions with Affiliates
A. Investment Advisory Fee — Pursuant to separate Amended and Restated Investment Advisory Agreements, J.P. Morgan Investment Management Inc. (“JPMIM”) acts as the investment advisor to the Capital Growth Fund, Growth Advantage Fund, Mid Cap Equity Fund, Mid Cap Value Fund and Value Advantage Fund and JPMorgan Investment Advisors Inc. (“JPMIA”, and together with JPMIM, each an “Advisor”) acts as the investment advisor to the Diversified Mid Cap Growth Fund, Diversified Mid Cap Value Fund and Multi-Cap Market Neutral Fund. JPMIM is a wholly-owned subsidiary of JPMorgan Asset Management Holdings Inc., which is a wholly-owned subsidiary of JPMorgan Chase & Co. (“JPMorgan”). JPMIA is an indirect, wholly-owned subsidiary of JPMorgan. The Advisors supervise the investments of each respective Fund and for such services are paid a fee. The fee is accrued daily and paid monthly based on each Fund’s respective average daily net assets. The annual fee rate for each Fund is as follows:
| | | | | | | |
| Capital Growth Fund | | | | | 0.40 | % |
| Diversified Mid Cap Growth Fund | | | | | 0.65 | |
| Diversified Mid Cap Value Fund | | | | | 0.65 | |
| Growth Advantage Fund | | | | | 0.65 | |
| Mid Cap Equity Fund | | | | | 0.65 | |
| Mid Cap Value Fund | | | | | 0.65 | |
| Multi-Cap Market Neutral Fund | | | | | 1.25 | |
| Value Advantage Fund | | | | | 0.65 | |
The Advisors waived and/or reimbursed Investment Advisory fees as outlined in Note 3.F.
The Funds may invest in one or more money market funds advised by the Advisor or their affiliates. Advisory, administration and shareholder servicing fees are waived and/or reimbursed from the Funds in an amount sufficient to offset any doubling up of these fees related to each Fund’s investment in an affiliated money market fund to the extent required by law or as undertaken by the Advisor or their affiliates.
JUNE 30, 2007 JPMORGAN MID CAP/MULTI-CAP FUNDS 97
NOTES TO FINANCIAL STATEMENTS
AS OF JUNE 30, 2007 (continued)
The amounts of these waivers/reimbursements resulting from investments in the money market funds for the year ended June 30, 2007 were as follows (in thousands):
| | | | | | | |
| Capital Growth Fund | | | | $ | 29 | |
| Diversified Mid Cap Growth Fund | | | | | 23 | |
| Diversified Mid Cap Value Fund | | | | | 28 | |
| Growth Advantage Fund | | | | | 1 | |
| Mid Cap Equity Fund | | | | | 13 | |
| Mid Cap Value Fund | | | | | 511 | |
| Multi-Cap Market Neutral Fund | | | | | 177 | |
| Value Advantage Fund | | | | | 84 | |
B. Administration Fee — Pursuant to an Administration Agreement, JPMorgan Funds Management, Inc. (the “Administrator”), an indirect, wholly-owned subsidiary of JPMorgan, provides certain administration services to the Funds. In consideration of these services, the Administrator receives a fee computed daily and paid monthly at the annual rate of 0.15% of the first $25 billion of the average daily net assets of all funds in the JPMorgan Fund Complex (excluding funds of funds and money market funds) and 0.075% of the average daily net assets in excess of $25 billion of all such funds.
The Administrator waived Administration fees as outlined in Note 3.F.
J.P. Morgan Investor Services, Co. (“JPMIS”), an indirect, wholly-owned subsidiary of JPMorgan, serves as the Funds’ Sub-administrator (the “Sub-administrator”). For its services as Sub-administrator, JPMIS receives a portion of the fees payable to the Administrator.
C. Distribution Fees — Pursuant to a Distribution Agreement, JPMorgan Distribution Services, Inc. (“the Distributor”), a wholly-owned subsidiary of JPMorgan, serves as the Trusts’ exclusive underwriter and promotes and arranges for the sale of each Fund’s shares.
The Board of Trustees has adopted a Distribution Plan (the “Distribution Plan”) for Class A, Class B and Class C Shares of the Funds in accordance with Rule 12b-1 under the 1940 Act. The Distribution Plan provides that each Fund shall pay distribution fees, including payments to the Distributor, at annual rates of the average daily net assets as shown in the table below:
|
|
|
| Class A
|
| Class B
|
| Class C
|
|---|
| Capital Growth Fund | | | | | 0.25 | % | | | 0.75 | % | | | 0.75 | % |
| Diversified Mid Cap Growth Fund | | | | | 0.25 | | | | 0.75 | | | | 0.75 | |
| Diversified Mid Cap Value Fund | | | | | 0.25 | | | | 0.75 | | | | 0.75 | |
| Growth Advantage Fund | | | | | 0.25 | | | | 0.75 | | | | 0.75 | |
| Mid Cap Value Fund | | | | | 0.25 | | | | 0.75 | | | | 0.75 | |
| Multi-Cap Market Neutral Fund | | | | | 0.25 | | | | 0.75 | | | | 0.75 | |
| Value Advantage Fund | | | | | 0.25 | | | | n/a | | | | 0.75 | |
In addition, the Distributor is entitled to receive the front-end sales charges from purchases of Class A Shares and the contingent deferred sales charges (“CDSC”) from redemptions of Class B and Class C Shares and certain Class A Shares for which front-end sales charges have been waived. For the year ended June 30, 2007, the Distributor retained the following amounts (in thousands):
|
|
|
| Front-end
Sales Charge
|
| CDSC
|
|---|
| Capital Growth Fund | | | | $ | 22 | | | $ | 22 | |
| Diversified Mid Cap Growth Fund | | | | | 18 | | | | 129 | |
| Diversified Mid Cap Value Fund | | | | | 7 | | | | 72 | |
| Growth Advantage Fund | | | | | 4 | | | | 11 | |
| Mid Cap Value Fund | | | | | 51 | | | | 300 | |
| Multi-Cap Market Neutral Fund | | | | | 27 | | | | 86 | |
| Value Advantage Fund | | | | | 166 | | | | 17 | |
| (a) | | Amount rounds to less than $1,000 |
98 JPMORGAN MID CAP/MULTI-CAP FUNDS JUNE 30, 2007
D. Shareholder Servicing Fees — The Trusts, on behalf of the Funds, have entered into Shareholder Servicing Agreements with the Distributor under which the Distributor provides certain support services to the shareholders. The Ultra Shares do not participate in the Shareholder Servicing Agreement. For performing these services, the Distributor receives a fee that is computed daily and paid monthly equal to a percentage of the average daily net assets as shown in the table below:
|
|
|
| Class A
|
| Class B
|
| Class C
|
| Select Class
|
| Institutional Class
|
|---|
| Capital Growth Fund | | | | | 0.25 | % | | | 0.25 | % | | | 0.25 | % | | | 0.25 | % | | | n/a | |
| Diversified Mid Cap Growth Fund | | | | | 0.25 | | | | 0.25 | | | | 0.25 | | | | 0.25 | | | | n/a | |
| Diversified Mid Cap Value Fund | | | | | 0.25 | | | | 0.25 | | | | 0.25 | | | | 0.25 | | | | n/a | |
| Growth Advantage Fund | | | | | 0.25 | | | | 0.25 | | | | 0.25 | | | | 0.25 | | | | n/a | |
| Mid Cap Equity Fund | | | | | n/a | | | | n/a | | | | n/a | | | | 0.25 | | | | n/a | |
| Mid Cap Value Fund | | | | | 0.25 | | | | 0.25 | | | | 0.25 | | | | 0.25 | | | | 0.10 | % |
| Multi-Cap Market Neutral Fund | | | | | 0.25 | | | | 0.25 | | | | 0.25 | | | | 0.25 | | | | n/a | |
| Value Advantage Fund | | | | | 0.25 | | | | n/a | | | | 0.25 | | | | 0.25 | | | | 0.10 | |
The Distributor has entered into shareholder services contracts with affiliated and unaffiliated financial intermediaries who provide shareholder services and other related services to their clients or customers who invest in the Funds under which the Distributor will pay all or a portion of such fees earned to financial intermediaries for performing such services.
The Distributor waived Shareholder Servicing fees as outlined in Note 3.F.
E. Custodian and Accounting Fees — JPMCB provides portfolio custody and accounting services for the Funds. The amounts paid directly to JPMCB by the Funds for custody and accounting services are included in Custodian and accounting fees in the Statement of Operations. The custodian fees may be reduced by credits earned by each Fund, based on uninvested cash balances held by the custodian. Such earnings credits are presented separately in the Statement of Operations.
Interest expense, if any, paid to the custodian related to cash overdrafts is included in Interest expense in the Statement of Operations.
F. Waivers and Reimbursements — The Advisor, Administrator and Distributor have contractually agreed to waive fees and/or reimburse the Funds to the extent that total annual operating expenses (excluding acquired fund fees and expenses, dividend expense on short sales, interest, taxes, extraordinary expenses and expenses related to the Board of Trustees’ deferred compensation plan) exceed the percentages of the Funds’ respective average daily net assets as shown in the table below:
|
|
|
| Class A
|
| Class B
|
| Class C
|
| Select Class
|
| Institutional Class
|
| Ultra
|
|---|
| Capital Growth Fund | | | | | 1.35 | % | | | 1.85 | % | | | 1.85 | % | | | 0.93 | % | | | n/a | | | | n/a | |
| Diversified Mid Cap Growth Fund | | | | | 1.24 | | | | 1.99 | | | | 1.99 | | | | 0.99 | | | | n/a | | | | 0.89 | % |
| Diversified Mid Cap Value Fund | | | | | 1.24 | | | | 1.99 | | | | 1.99 | | | | 0.99 | | | | n/a | | | | 0.84 | |
| Growth Advantage Fund | | | | | 1.35 | | | | 2.05 | | | | 2.05 | | | | 1.10 | | | | n/a | | | | n/a | |
| Mid Cap Equity Fund | | | | | n/a | | | | n/a | | | | n/a | | | | 1.00 | | | | n/a | | | | n/a | |
| Mid Cap Value Fund | | | | | 1.25 | | | | 2.00 | | | | 2.00 | | | | 1.00 | | | | 0.75 | % | | | n/a | |
| Multi-Cap Market Neutral Fund | | | | | 1.75 | | | | 2.50 | | | | 2.50 | | | | 1.50 | | | | n/a | | | | n/a | |
| Value Advantage Fund | | | | | 1.25 | | | | n/a | | | | 1.75 | | | | 1.00 | | | | 0.75 | | | | n/a | |
The contractual expense limitation agreements were in effect for the year ended June 30, 2007. The expense limitation percentages in the table above are in place until at least October 31, 2007.
For the year ended June 30, 2007, the Funds’ service providers waived fees and/or reimbursed expenses for each of the Funds as follows (amounts in thousands). None of these parties expects the Funds to repay any such waived fees and reimbursed expenses in future years.
| | | | Contractual Waivers
| |
|---|
|
|
|
| Investment
Advisory
|
| Administration
|
| Shareholder
Servicing
|
| Total
|
|---|
| Diversified Mid Cap Growth Fund | | | | $ | — | | | $ | — | | | $ | 1,384 | | | $ | 1,384 | |
| Diversified Mid Cap Value Fund | | | | | — | | | | 10 | | | | 652 | | | | 662 | |
| Growth Advantage Fund | | | | | 66 | | | | 15 | | | | 142 | | | | 223 | |
| Mid Cap Equity Fund | | | | | — | | | | — | | | | 249 | | | | 249 | |
| Mid Cap Value Fund | | | | | 5,280 | | | | 1,382 | | | | 2,291 | | | | 8,953 | |
| Multi-Cap Market Neutral Fund | | | | | 1 | | | | — | | | | 3,015 | | | | 3,016 | |
| Value Advantage Fund | | | | | 460 | | | | 58 | | | | 11 | | | | 529 | |
JUNE 30, 2007 JPMORGAN MID CAP/MULTI-CAP FUNDS 99
NOTES TO FINANCIAL STATEMENTS
AS OF JUNE 30, 2007 (continued)
| | | | Voluntary Waivers
| |
|---|
|
|
|
| Investment
Advisory
|
| Administration
|
| Shareholder
Servicing
|
| Total
|
|---|
| Diversified Mid Cap Value Fund | | | | $ | — | | | $ | 1 | | | $ | 124 | | | $ | 125 | |
| Mid Cap Equity Fund | | | | | — | | | | 33 | | | | 260 | | | | 293 | |
| Mid Cap Value Fund | | | | | 786 | | | | 205 | | | | — | | | | 991 | |
| Multi-Cap Market Neutral Fund | | | | | 3,087 | | | | 274 | | | | 1,677 | | | | 5,038 | |
G. Other — Certain officers of the Trust are affiliated with the Advisor, the Administrator, the Sub-Administrator and the Distributor. Such officers, with the exception of the Chief Compliance Officer, receive no compensation from the Funds for serving in their respective roles.
The Board of Trustees appointed a Chief Compliance Officer to the Funds in accordance with federal securities regulations. Each Fund, along with other affiliated funds, makes reimbursement payments, on a pro-rata basis, to the Administrator for a portion of the fees associated with the Office of the Chief Compliance Officer. Such fees are included in Trustees’ and Chief Compliance Officer’s fees in the Statement of Operations.
The Trust adopted a Trustee Deferred Compensation Plan (the “Plan”) which allows the independent Trustees to defer the receipt of all or a portion of compensation related to performance of their duties as a Trustee. The deferred fees are invested in various JPMorgan Funds until distribution in accordance with the Plan.
During the period, certain Funds may have purchased securities from an underwriting syndicate in which the principal underwriter or members of the syndicate are affiliated with the Advisor.
The Funds may use related party broker/dealers. For the year ended June 30, 2007 the Funds did not incur any brokerage commissions with broker/dealers affiliated with the Advisor.
The SEC has granted an exemptive order permitting the Funds to engage in principal transactions with J.P. Morgan Securities, Inc., an affiliated broker, involving taxable money market instruments subject to certain conditions.
4. Investment Transactions
During the year ended June 30, 2007, purchases and sales of investments (excluding short-term investments) were as follows (amounts in thousands):
|
|
|
| Purchases
(excluding U.S.
Government)
|
| Sales
(excluding U.S.
Government)
|
| Securities
Sold Short
|
| Covers on
Securities
Sold Short
|
|---|
| Capital Growth Fund | | | | $ | 1,056,476 | | | $ | 1,074,954 | | | $ | — | | | $ | — | |
| Diversified Mid Cap Growth Fund | | | | | 1,578,946 | | | | 1,882,174 | | | | — | | | | — | |
| Diversified Mid Cap Value Fund | | | | | 396,582 | | | | 725,208 | | | | — | | | | — | |
| Growth Advantage Fund | | | | | 114,256 | | | | 140,415 | | | | — | | | | — | |
| Mid Cap Equity Fund | | | | | 234,278 | | | | 297,873 | | | | — | | | | — | |
| Mid Cap Value Fund | | | | | 3,496,326 | | | | 3,598,944 | | | | — | | | | — | |
| Multi-Cap Market Neutral Fund | | | | | 1,849,590 | | | | 1,843,991 | | | | 2,159,023 | | | | 2,088,589 | |
| Value Advantage Fund | | | | | 460,546 | | | | 221,053 | | | | — | | | | — | |
During the year ended June 30, 2007, there were no purchases or sales of U.S. Government securities.
100 JPMORGAN MID CAP/MULTI-CAP FUNDS JUNE 30, 2007
5. Federal Income Tax Matters
For Federal income tax purposes, the cost and unrealized appreciation (depreciation) in value of the investment securities at June 30, 2007 were as follows (amounts in thousands):
|
|
|
| Aggregate
Cost
|
| Gross
Unrealized
Appreciation
|
| Gross
Unrealized
Depreciation
|
| Net Unrealized
Appreciation
(Depreciation)
|
|---|
| Capital Growth Fund | | | | $ | 932,495 | | | $ | 192,480 | | | $ | 9,900 | | | $ | 182,580 | |
| Diversified Mid Cap Growth Fund | | | | | 1,359,468 | | | | 254,794 | | | | 13,352 | | | | 241,442 | |
| Diversified Mid Cap Value Fund | | | | | 627,525 | | | | 174,497 | | | | 6,151 | | | | 168,346 | |
| Growth Advantage Fund | | | | | 55,548 | | | | 13,419 | | | | 272 | | | | 13,147 | |
| Mid Cap Equity Fund | | | | | 234,796 | | | | 66,431 | | | | 2,341 | | | | 64,090 | |
| Mid Cap Value Fund | | | | | 7,117,120 | | | | 1,775,980 | | | | 61,981 | | | | 1,713,999 | |
| Multi-Cap Market Neutral Fund | | | | | 1,839,164 | | | | 389,462 | | | | 41,515 | | | | 347,947 | |
| Value Advantage Fund | | | | | 475,185 | | | | 45,295 | | | | 5,714 | | | | 39,581 | |
For all of the Funds, the difference between book and tax basis appreciation (depreciation) on investments is primarily attributed to wash sale loss deferrals, return of capital from investments in real estate investment trusts, investments in partnerships and non-taxable special dividends.
The tax character of distributions paid during the fiscal year ended June 30, 2007 was as follows (amounts in thousands):
| | | | Total Distributions Paid From:
| |
|---|
|
|
|
| Ordinary
Income
|
| Net
Long-term
Capital gains
|
| Total
Distributions
Paid
|
|---|
| Capital Growth Fund | | | | $ | 10,997 | | | $ | 55,798 | | | $ | 66,795 | |
| Diversified Mid Cap Growth Fund | | | | | 30,732 | | | | 181,841 | | | | 212,573 | |
| Diversified Mid Cap Value Fund | | | | | 19,413 | | | | 134,174 | | | | 153,587 | |
| Mid Cap Equity Fund | | | | | 5,748 | | | | 18,083 | | | | 23,831 | |
| Mid Cap Value Fund | | | | | 212,636 | | | | 214,734 | | | | 427,370 | |
| Multi-Cap Market Neutral Fund | | | | | 61,166 | | | | — | | | | 61,166 | |
| Value Advantage Fund | | | | | 5,857 | | | | 156 | | | | 6,013 | |
The tax character of distributions paid during the period ended June 30, 2006 was as follows (amounts in thousands):
| | | | Total Distributions Paid From:
| |
|---|
|
|
|
| Ordinary
Income
|
| Net
Long-term
Capital gains
|
| Total
Distributions
Paid
|
|---|
| Diversified Mid Cap Growth Fund | | | | $ | — | | | $ | 130,943 | | | $ | 130,943 | |
| Diversified Mid Cap Value Fund | | | | | 39,572 | | | | 272,077 | | | | 311,649 | |
| Mid Cap Equity Fund | | | | | 1,227 | | | | — | | | | 1,227 | |
| Multi-Cap Market Neutral Fund | | | | | 26,515 | | | | 48,186 | | | | 74,701 | |
The tax character of distributions paid during the fiscal year ended December 31, 2005 was as follows (amounts in thousands):
| | | | Total Distributions Paid From:
| |
|---|
|
|
|
| Ordinary
Income
|
| Net
Long-term
Capital gains
|
| Total
Distributions
Paid
|
|---|
| Capital Growth Fund | | | | $ | 5,585 | | | $ | 51,737 | | | $ | 57,322 | |
| Mid Cap Equity Fund | | | | | 7,528 | | | | 20,249 | | | | 27,777 | |
| Mid Cap Value Fund | | | | | 136,842 | | | | 82,699 | | | | 219,541 | |
| Value Advantage Fund | | | | | 1,391 | | | | 6 | | | | 1,397 | |
JUNE 30, 2007 JPMORGAN MID CAP/MULTI-CAP FUNDS 101
NOTES TO FINANCIAL STATEMENTS
AS OF JUNE 30, 2007 (continued)
At June 30, 2007, the components of net assets (excluding paid in capital) on a tax basis were as follows (amounts in thousands):
|
|
|
| Current
Distributable
Ordinary
Income
|
| Current
Distributable
Long-term
Capital Gain or
(Tax Basis
Loss Carryover)
|
| Unrealized
Appreciation
(Depreciation)
|
|---|
| Capital Growth Fund | | | | $ | 24,216 | | | $ | 48,807 | | | $ | 182,580 | |
| Diversified Mid Cap Growth Fund | | | | | 34,338 | | | | 122,540 | | | | 241,442 | |
| Diversified Mid Cap Value Fund | | | | | 13,095 | | | | 107,430 | | | | 168,346 | |
| Growth Advantage Fund | | | | | — | | | | (232,374 | ) | | | 13,150 | |
| Mid Cap Equity Fund | | | | | 6,188 | | | | 23,588 | | | | 64,090 | |
| Mid Cap Value Fund | | | | | 47,254 | | | | 367,854 | | | | 1,713,999 | |
| Multi-Cap Market Neutral Fund | | | | | 36,079 | | | | (43,987 | ) | | | 171,955 | |
| Value Advantage Fund | | | | | 19,929 | | | | 5,913 | | | | 39,581 | |
For the Funds, the cumulative timing differences primarily consist of wash sale loss deferrals, deferred compensation, distributions payable, return of capital from investments in real estate investment trusts, non-taxable special dividends, investments in partnerships, short sales wash sales less deferrals, post October loss deferrals and unsettled short sale loss deferrals (for Multi-Cap Market Neutral Fund).
As of June 30, 2007, the following Funds had net capital loss carryforwards, which are available to offset future realized gains (amounts in thousands):
|
|
|
| 2009
|
| 2010
|
| 2011
|
| 2015
|
| Total
|
|---|
| Capital Growth Fund | | | | $ | — | | | $ | 338 | * | | $ | — | | | $ | — | | | $ | 338 | |
| Growth Advantage Fund | | | | | 201,483 | | | | 28,364 | | | | 2,527 | | | | — | | | | 232,374 | |
| Multi-Cap Market Neutral Fund | | | | | — | | | | — | | | | — | | | | 43,987 | | | | 43,987 | |
| * | | Subject to limitation under Code sections 381–384. |
During the year ended June 30, 2007, the Funds utilized capital loss carryforwards as follows (amounts in thousands):
| | | | | | | |
| Capital Growth Fund | | | | $ | 113 | |
| Growth Advantage Fund | | | | | 10,523 | |
Net capital losses incurred after October 31 and within the taxable year are deemed to arise on the first business day of the Funds’ next taxable year. For the year ended June 30, 2007, the Funds deferred to July 1, 2007 post October capital losses of (amounts in thousands):
|
|
|
| Capital Losses
|
|
|---|
| Multi-Cap Market Neutral Fund | | | | $ | 24,935 | | |
6. Borrowings
The Funds rely upon an exemptive order (“Order”) permitting the establishment and operation of an Interfund Lending Facility (“Facility”). The Facility allows the Funds to directly lend and borrow money to or from any other fund relying upon the Order at rates beneficial to both the borrowing and lending funds. Advances under the Facility are taken primarily for temporary or emergency purposes, including the meeting of redemption requests that otherwise might require the untimely disposition of securities, and are subject to each Fund’s borrowing restrictions. The Interfund Loan Rate is determined, as specified in the Order, by averaging the current repurchase agreement rate and the current bank loan rate. The Order was granted to JPM II and may be relied upon by the Funds because they are investment companies in the same “group of investment companies” (as defined in Section 12(d)(1)(G) of the 1940 Act).
In addition, the Trusts and JPMCB have entered into a financing arrangement. Under this arrangement, JPMCB provides an unsecured, uncommitted credit facility in the aggregate amount of $100 million to certain of the JPMorgan Funds including the Funds. Advances under the arrangement are taken primarily for temporary or emergency purposes, including the meeting of redemption requests that otherwise might require the untimely disposition of securities, and are subject to each Fund’s borrowing restrictions. Interest on borrowings is payable at a rate determined by JPMCB at the time of borrowing. This agreement has been extended until November 20, 2007.
102 JPMORGAN MID CAP/MULTI-CAP FUNDS JUNE 30, 2007
The Funds do not have outstanding borrowings from another fund or from the unsecured, uncommitted credit facility as of year ended June 30, 2007. Average borrowings from the Facility for the year ended June 30, 2007, were as follows (amounts in thousands):
|
|
|
| Average
Borrowings
|
| Number of
Days Used
|
| Interest
Paid
|
|---|
| Capital Growth Fund | | | | $ | 641 | | | | 2 | | | $ | — | (a) |
| Diversified Mid Cap Growth Fund | | | | | 2,221 | | | | 27 | | | | 9 | |
| Diversified Mid Cap Value Fund | | | | | 3,175 | | | | 4 | | | | 2 | |
| Growth Advantage Fund | | | | | 1,515 | | | | 21 | | | | 5 | |
| Mid Cap Equity Fund | | | | | 1,789 | | | | 19 | | | | 5 | |
| (a) | | Amounts rounds to less than $1,000. |
Interest expense paid, if any, as a result of borrowings from another fund or from the unsecured, uncommitted credit facility is included in Interest Expense in the Statement of Operations.
7. Concentrations and Indemnifications
In the normal course of business, the Funds enter into contracts that contain a variety of representations which provide general indemnifications. Each Fund’s maximum exposure under these arrangements is unknown, as this would involve future claims that may be made against each Fund that have not yet occurred. However, based on experience, the Funds expect the risk of loss to be remote.
From time to time, the Funds’ investment advisor or an affiliate may exercise discretion on behalf of certain of its clients with respect to the purchase or sale of a significant portion of the Funds’ outstanding shares. Investment activities on behalf of these shareholders could impact the Funds.
8. Legal Matters
Prior to becoming an affiliate of JPMorgan Chase, on June 29, 2004, Banc One Investment Advisors Corporation (BOIA), now known as JPMorgan Investment Advisors Inc., entered into agreements with the Securities and Exchange Commission (the SEC) and the New York Attorney General (NYAG) in resolution of investigations conducted by the SEC and the NYAG into market timing of certain funds advised by BOIA which were series of One Group Mutual Funds, possible late trading of certain funds and related matters. In its settlement with the SEC, BOIA consented to the entry of an order by the SEC (the SEC Order) instituting and settling administrative and cease-and-desist proceedings against it. Under the terms of the SEC Order and the NYAG settlement agreement, BOIA agreed to pay disgorgement of $10 million and a civil money penalty of $40 million for a total payment of $50 million, which is being distributed to certain current and former shareholders of certain funds. Pursuant to the settlement agreement with the NYAG, BOIA reduced its management fee for certain funds which were series of One Group Mutual Funds (now known as JPM II) in the aggregate amount of approximately $8 million annually over a five-year period commencing September, 2004.
In addition to the matters involving the SEC and NYAG, various lawsuits were filed by private plaintiffs in connection with these circumstances in various state and federal courts. These actions were transferred to the United States District Court for the District of Maryland for coordinated or consolidated pretrial proceedings by the orders of the Judicial Panel on Multidistrict Litigation, a federal judicial body that assists in the administration of such actions. The plaintiffs filed consolidated amended complaints, naming as defendants, among others, BOIA, Bank One Corporation and JPMorgan Chase (the former and current corporate parent of BOIA), the Distributor, One Group Services Company (the former distributor of One Group Mutual Funds), certain officers of One Group Mutual Funds and BOIA, and certain current and former Trustees of One Group Mutual Funds. These complaints alleged, among other things, that various defendants (i) violated various antifraud and other provisions of federal securities laws, (ii) breached their fiduciary duties, (iii) unjustly enriched themselves, (iv) breached Fund-related contracts, and (v) conspired to commit unlawful acts.
As of June 14, 2006, all claims against One Group Mutual Funds and current and former Trustees were dismissed by the United States District Court in Maryland. Certain claims against BOIA and its affiliates have also been dismissed, and a settlement in principle has been reached for the purpose of resolving all remaining claims in the litigation in Maryland. The settlement is subject to court approval.
In addition, on August 30, 2005, the commissioner of the West Virginia Securities Division entered a Summary Cease and Desist Order and Notice of Right to Hearing with respect to JPMorgan Investment Advisors Inc. and JPMorgan Chase & Co. In June 2007, the matter, which generally related to the same facts that were the subject of the SEC Order and NYAG settlement discussed above, was settled, and the West Virginia Order will be vacated.
JPM II and its Funds will be reimbursed for all costs associated with these matters to ensure that JPM II and its Funds incur no expense as it relates to the matters described above. A portion of these reimbursements may be from related parties.
As noted above, the settlement agreement with the NYAG requires BOIA to establish reduced “net management fee rates” for certain funds (“Reduced Rate Funds”). “Net Management Fee Rates” means the percentage fee rates specified in contracts between BOIA and its affiliates
JUNE 30, 2007 JPMORGAN MID CAP/MULTI-CAP FUNDS 103
NOTES TO FINANCIAL STATEMENTS
AS OF JUNE 30, 2007 (continued)
and the Reduced Rate Funds, less waivers and reimbursements by BOIA and its affiliates, in effect as of June 30, 2004. The settlement agreement requires that the reduced Net Management Fee Rates must result in a reduction of $8 million annually based upon assets under management as of June 30, 2004, for a total reduction over five years of $40 million from that which would have been paid by the Reduced Rate Funds on the Net Management Fee Rates as of June 30, 2004. To the extent that BOIA and its affiliates have agreed as part of the settlement with the NYAG to waive or reimburse expenses of a Fund in connection with the settlement with the NYAG, those reduced Net Management Fee Rates are referred to as “Reduced Rates.” The Reduced Rates will remain in place at least through June 30, 2009. To the extent that a Reduced Rate Fund merges into another Fund, the Reduced Rate is required to carry forward and apply with respect to the acquiring Fund.
104 JPMORGAN MID CAP/MULTI-CAP FUNDS JUNE 30, 2007
REPORT OF INDEPENDENT REGISTERED PUBLIC ACCOUNTING FIRM
To the Trustees and Shareholders of
J.P. Morgan Mutual Fund Investment Trust, J.P. Morgan Fleming Mutual Fund Group, Inc.,
JPMorgan Trust I and JPMorgan Trust II:
In our opinion, the accompanying statements of assets and liabilities, including the schedules of portfolio investments, and the related statements of operations and of changes in net assets and the financial highlights present fairly, in all material respects, the financial position of each of the Funds indicated in Note 1 of the financial statements (hereafter collectively referred to as the “Funds”) at June 30, 2007, the results of each of their operations for the year then ended, and the changes in each of their net assets and the financial highlights for each of the periods presented, in conformity with accounting principles generally accepted in the United States of America. These financial statements and financial highlights (hereafter referred to as “financial statements”) are the responsibility of the Funds’ management; our responsibility is to express an opinion on these financial statements based on our audits. We conducted our audits of these financial statements in accordance with the standards of the Public Company Accounting Oversight Board (United States). Those standards require that we plan and perform the audit to obtain reasonable assurance about whether the financial statements are free of material misstatement. An audit includes examining, on a test basis, evidence supporting the amounts and disclosures in the financial statements, assessing the accounting principles used and significant estimates made by management, and evaluating the overall financial statement presentation. We believe that our audits, which included confirmation of securities at June 30, 2007 by correspondence with the custodian and brokers, provide a reasonable basis for our opinion.
PricewaterhouseCoopers LLP
New York, New York
August 23, 2007
JUNE 30, 2007 JPMORGAN MID CAP/MULTI-CAP FUNDS 105
TRUSTEES
(Unaudited)
The Funds’ Statement of Additional Information includes additional information about the Funds’ Trustees and is available, without charge, upon request by calling 1-800-480-4111 or on the JPMorgan Funds’ website at www.jpmorganfunds.com.
Name (Year of Birth);
Positions With
the Funds
|
|
|
| Principal Occupations
During Past 5 Years
|
| Number of
Portfolios in Fund
Complex Overseen
by Trustee (1)
|
| Other Directorships Held
Outside Fund Complex
|
|---|
Independent Trustees |
William J. Armstrong
(1941); Trustee of Trust since 2005; Trustee of heritage JPMorgan Funds since 1987. | | | | Retired; CFO and Consultant, EduNeering, Inc. (internet business education supplier) (2000–2001); Vice President and Treasurer, Ingersoll–Rand Company (manufacturer of industrial equipment) (1972–2000). | | 140 | | None. |
| | | | | | | | | |
Roland R. Eppley, Jr.
(1932); Trustee of Trust since 2005; Trustee of heritage JPMorgan Funds since 1989. | | | | Retired; President and Chief Executive Officer, Eastern States Bankcard (1971–1988). | | 140 | | None. |
| | | | | | | | | |
| John F. Finn (1947); Trustee of Trust since 2005; Trustee of heritage One Group Mutual Funds since 1998. | | | | President and Chief Executive Officer, Gardner, Inc. (wholesale distributor to outdoor power equipment industry) (1979–present). | | 140 | | Director, Cardinal Health, Inc. (CAH) (1994–present); Chairman, The Columbus Association of the Performing Arts (CAPA) (2003–present). |
| | | | | | | | | |
Dr. Matthew Goldstein
(1941); Trustee of Trust since 2005; Trustee of heritage JPMorgan Funds since 2003. | | | | Chancellor, City University of New York (1999–present); President, Adelphi University (New York) (1998–1999). | | 140 | | Director, Albert Einstein School of Medicine (1998–present); Director, New Plan Excel Realty Trust, Inc. (real estate investment trust) (2000–present); Director, Lincoln Center Institute for the Arts in Education (1999–present). |
| | | | | | | | | |
Robert J. Higgins
(1945); Trustee of Trust since 2005; Trustee of heritage JPMorgan Funds since 2002. | | | | Retired; Director of Administration of the State of Rhode Island (2003–2004); President — Consumer Banking and Investment Services, Fleet Boston Financial (1971–2001). | | 140 | | None. |
| | | | | | | | | |
Peter C. Marshall
(1942); Trustee of Trust since 2005; Trustee of heritage One Group Mutual Funds since 1994. | | | | Self-employed business consultant (2001–present); Senior Vice President, W.D. Hoard, Inc. (corporate parent of DCI Marketing, Inc.) (2000–2002); President, DCI Marketing, Inc. (1992–2000). | | 140 | | None. |
| | | | | | | | | |
| Marilyn McCoy (1948); Trustee of Trust since 2005; Trustee of heritage One Group Mutual Funds since 1999. | | | | Vice President of Administration and Planning, Northwestern University (1985–present). | | 140 | | Trustee, Carleton College (2003–present). |
| | | | | | | | | |
| William G. Morton, Jr. (1937); Trustee of Trust since 2005; Trustee of heritage JPMorgan Funds since 2003. | | | | Retired; Chairman Emeritus (2001–2002), and Chairman and Chief Executive Officer, Boston Stock Exchange (1985–2001). | | 140 | | Director, Radio Shack Corporation (electronics) (1987–present); Director, The National Football Foundation and College Hall of Fame (1994–present); Trustee, Stratton Mountain School (2001–present). |
106 JPMORGAN MID CAP/MULTI-CAP FUNDS JUNE 30, 2007
Name (Year of Birth);
Positions With
the Funds
|
|
|
| Principal Occupations
During Past 5 Years
|
| Number of
Portfolios in Fund
Complex Overseen
by Trustee (1)
|
| Other Directorships Held
Outside Fund Complex
|
|---|
Independent Trustees |
| Robert A. Oden, Jr. (1946); Trustee of Trust since 2005; Trustee of heritage One Group Mutual Funds since 1997. | | | | President, Carleton College (2002–present); President, Kenyon College (1995–2002). | | 140 | | Director, American University in Cairo. |
| | | | | | | | | |
| Fergus Reid, III (1932); Trustee of Trust (Chairman) since 2005; Trustee (Chairman) of heritage JPMorgan Funds since 1987. | | | | Chairman, Lumelite Corporation (plastics manufacturing) (2003–present); Chairman and Chief Executive Officer, Lumelite Corporation (1985–2002). | | 140 | | Trustee, Morgan Stanley Funds (196 portfolios) (1995–present). |
| | | | | | | | | |
Frederick W. Ruebeck
(1939); Trustee of Trust since 2005; Trustee of heritage One Group Mutual Funds since 1994. | | | | Advisor, Jerome P. Green & Associates, LLC (broker-dealer) (2000–present); Chief Investment Officer, Wabash College (2004–present); self-employed consultant (2000–present); Director of Investments, Eli Lilly and Company (1988–1999). | | 140 | | Trustee, Wabash College (1988–present); Chairman, Indianapolis Symphony Orchestra Foundation (1994–present). |
| | | | | | | | | |
| James J. Schonbachler (1943); Trustee of Trust since 2005; Trustee of heritage JPMorgan Funds since 2001. | | | | Retired; Managing Director of Bankers Trust Company (financial services) (1968–1998). | | 140 | | None. |
Interested Trustee |
| Leonard M. Spalding, Jr.* (1935); Trustee of Trust since 2005; Trustee of heritage JPMorgan Funds since 1998. | | | | Retired; Chief Executive Officer, Chase Mutual Funds (investment company) (1989–1998); President and Chief Executive Officer, Vista Capital Management (investment management) (1990–1998); Chief Investment Executive, Chase Manhattan Private Bank (investment management) (1990–1998). | | 140 | | Director, Glenview Trust Company, LLC (2001–present); Trustee, St. Catherine College (1998–present); Trustee, Bellarmine University (2000–present); Director, Springfield-Washington County Economic Development Authority (1997–present); Trustee, Marion and Washington County, Kentucky Airport Board (1998–present); Trustee, Catholic Education Foundation (2005–present). |
| (1) | | A Fund Complex means two or more registered investment companies that hold themselves out to investors as related companies for purposes of investment and investor services or have a common investment adviser or have an investment adviser that is an affiliated person of the investment adviser of any of the other registered investment companies. The JPMorgan Funds Complex for which the Board of Trustees serves currently includes eight registered investment companies (140 funds). |
| * | | Mr. Spalding is deemed to be an “interested person” due to his ownership of JPMorgan Chase stock. |
The contact address for each of the Trustees is 245 Park Avenue, New York, NY 10167.
JUNE 30, 2007 JPMORGAN MID CAP/MULTI-CAP FUNDS 107
OFFICERS
(Unaudited)
Name (Year of Birth),
Positions Held with
the Trust (Since)
|
|
|
| Principal Occupations During Past 5 Years
|
|---|
George C.W. Gatch (1962),
President (2005) | | | | Managing Director, J.P. Morgan Investment Management Inc.; Director and President, JPMorgan Distribution Services, Inc. and JPMorgan Funds Management, Inc. since 2005. Mr. Gatch is CEO and President of the JPMorgan Funds. Mr. Gatch has been an employee of JPMorgan since 1986 and has held positions such as President and CEO of DKB Morgan, a Japanese mutual fund company, which was a joint venture between J.P. Morgan and Dai-Ichi Kangyo Bank, as well as positions in business management, marketing, and sales. |
| | | | | |
Robert L. Young (1963),
Senior Vice President (2005)* | | | | Director and Vice President, JPMorgan Distribution Services, Inc. and JPMorgan Funds Management, Inc.; Chief Operating Officer, JPMorgan Funds since 2005, and One Group Mutual Funds from 2001 until 2005. Mr. Young was Vice President and Treasurer, JPMorgan Funds Management, Inc. (formerly One Group Administrative Services), and Vice President and Treasurer, JPMorgan Distribution Services, Inc. (formerly One Group Dealer Services, Inc.) from 1999 to 2005. |
| | | | | |
Patricia A. Maleski (1960),
Vice President and Chief
Administrative Officer (2005) | | | | Managing Director, JPMorgan Funds Management, Inc.; Head of Funds Administration and Board Liaison, previously, Treasurer, JPMorgan Funds. Ms. Maleski has been with JPMorgan Chase & Co. since 2001. |
| | | | | |
Stephen M. Benham (1959),
Secretary (2005) | | | | Vice President and Assistant General Counsel, JPMorgan Chase & Co. since 2004; Vice President (Legal Advisory) of Merrill Lynch Investment Managers, L.P. from 2000 to 2004. |
| | | | | |
Stephanie J. Dorsey (1969),
Treasurer (2005)* | | | | Vice President, JPMorgan Funds Management, Inc.; Director of Mutual Fund Administration, JPMorgan Funds Management, Inc. (formerly One Group Administrative Services), from 2004 to 2005; Ms. Dorsey worked for JPMorgan Chase & Co. (formerly Bank One Corporation) from 2003 to 2004; prior to joining Bank One Corporation, she was a Senior Manager specializing in Financial Services audits at PricewaterhouseCoopers LLP from 1992 through 2002. |
| | | | | |
Stephen M. Ungerman (1953),
Chief Compliance Officer (2005) | | | | Vice President, JPMorgan Chase & Co.; Mr. Ungerman was head of Fund Administration — Pooled Vehicles from 2000 to 2004. Mr. Ungerman has been with JPMorgan Chase & Co. since 2000. |
| | | | | |
Paul L. Gulinello (1950),
AML Compliance Officer (2005) | | | | Vice President and Anti Money Laundering Compliance Officer for JPMorgan Asset Management Americas, additionally responsible for personal trading and compliance testing since 2004; Treasury Services Operating Risk Management and Compliance Executive supporting all JPMorgan Treasury Services business units from July 2000 to 2004. |
| | | | | |
Elizabeth A. Davin (1964),
Assistant Secretary (2005)* | | | | Vice President and Assistant General Counsel, JPMorgan Chase & Co. since 2005; Senior Counsel, JPMorgan Chase & Co. (formerly Bank One Corporation) from 2004 to 2005; Assistant General Counsel and Associate General Counsel and Vice President, Gartmore Global Investments, Inc. from 1999 to 2004. |
| | | | | |
Jessica K. Ditullio (1962),
Assistant Secretary (2005)* | | | | Vice President and Assistant General Counsel, JPMorgan Chase & Co. since 2005; Ms. Ditullio has served as an attorney with various titles for JPMorgan Chase & Co. (formerly Bank One Corporation) since 1990. |
| | | | | |
Nancy E. Fields (1949),
Assistant Secretary (2005)* | | | | Vice President, JPMorgan Funds Management, Inc. and JPMorgan Distribution Services, Inc.; from 1999 to 2005, Director, Mutual Fund Administration, JPMorgan Funds Management, Inc. (formerly One Group Administrative Services) and Senior Project Manager, Mutual Funds, JPMorgan Distribution Services, Inc. (formerly One Group Dealer Services, Inc.). |
| | | | | |
Ellen W. O’Brien (1957),
Assistant Secretary (2005)** | | | | Assistant Vice President, JPMorgan Investor Services, Co., responsible for Blue Sky registration. Ms. O’Brien has served in this capacity since joining the firm in 1991. |
| | | | | |
Jeffrey D. House (1972),
Assistant Treasurer (2006)* | | | | Vice President, JPMorgan Funds Management, Inc. since July 2006; formerly, Senior Manager of Financial Services of BISYS Fund Services, Inc. from December 1995 until July 2006. |
| | | | | |
Arthur A. Jensen (1966),
Assistant Treasurer (2005)* | | | | Vice President, JPMorgan Funds Management, Inc. since April 2005; formerly, Vice President of Financial Services of BISYS Fund Services, Inc. from 2001 until 2005. |
| | | | | |
Laura S. Melman (1966),
Assistant Treasurer (2006) | | | | Vice President, JPMorgan Funds Management, Inc. since August, 2006, responsible for Taxation; Vice President of Structured Products at The Bank of New York Co., Inc. from 2001 until 2006. |
| | | | | |
Francesco Tango (1971)
Assistant Treasurer (2007) | | | | Vice President, JPMorgan Funds Management, Inc. since January 2003: Associate, JPMorgan Funds Management, Inc. since 1999. |
The contact address for each of the officers, unless otherwise noted, is 245 Park Avenue, New York, NY 10167.
| * | | The contact address for the officer is 1111 Polaris Parkway, Columbus, OH 43271. |
| ** | | The contact address for the officer is 73 Tremont Street, Floor 1, Boston, MA 02108. |
108 JPMORGAN MID CAP/MULTI-CAP FUNDS JUNE 30, 2007
SCHEDULE OF SHAREHOLDER EXPENSES
(Unaudited)
Hypothetical $1,000 Investment at Beginning of Period
June 30, 2007
As a shareholder of the Funds, you incur two types of costs: (1) transaction costs, including sales charges (loads) on purchase payments and redemption fees and (2) ongoing costs, including investment advisory, administration fees, distribution fees and other Fund expenses. The examples below are intended to help you understand your ongoing costs (in dollars) of investing in the Funds and to compare these costs with the ongoing costs of investing in other mutual funds. The examples assume that you had a $1,000 investment in the Class at the beginning of the reporting period, January 1, 2007, and continued to hold your shares at the end of the reporting period, June 30, 2007.
Actual Expenses
For each Class of each Fund in the table below, the first line provides information about actual account values and actual expenses. You may use the information in this line, together with the amount you invested, to estimate the expenses that you paid over the period. Simply divide your account value by $1,000 (for example, an $8,600 account value divided by $1,000 = 8.6), then multiply the result by the number in the first line of each Class under the heading entitled “Expenses Paid During Period” to estimate the expenses you paid on your account during this period.
Hypothetical Example for Comparison Purposes
The second line of each Class in the table below provides information about hypothetical account values and hypothetical expenses based on the Class’ actual expense ratio and an assumed rate of return of 5% per year before expenses, which is not the Class’ actual return. The hypothetical account values and expenses may not be used to estimate the actual ending account balance or expenses you paid for the period. You may use this information to compare the ongoing costs of investing in the Class of the Fund and other funds. To do so, compare this 5% hypothetical example with the 5% hypothetical examples that appear in the shareholder reports of the other funds. Please note that the expenses shown in the table are meant to highlight your ongoing costs only and do not reflect any transaction costs, such as sales charges (loads) or redemption fees. Therefore, the second line for each Class in the table is useful in comparing ongoing costs only, and will not help you determine the relative total costs of owning different funds. In addition, if these transaction costs were included, your costs would have been higher. The examples also assume all dividends and distributions have been reinvested.
|
|
|
| Beginning
Account Value,
January 1, 2007
|
| Ending
Account Value,
June 30, 2007
|
| Expenses Paid During
January 1, 2007 to
June 30, 2007*
|
| Annualized
Expense Ratio
|
|---|
Capital Growth Fund | | | | | | | | | | | | | | | | | | |
Class A | | | | | | | | | | | | | | | | | | |
| Actual | | | | $ | 1,000.00 | | | $ | 1,116.40 | | | $ | 5.93 | | | | 1.13 | % |
| Hypothetical | | | | | 1,000.00 | | | | 1,019.19 | | | | 5.66 | | | | 1.13 | |
Class B | | | | | | | | | | | | | | | | | | |
| Actual | | | | | 1,000.00 | | | | 1,113.90 | | | | 8.54 | �� | | | 1.63 | |
| Hypothetical | | | | | 1,000.00 | | | | 1,016.71 | | | | 8.15 | | | | 1.63 | |
Class C | | | | | | | | | | | | | | | | | | |
| Actual | | | | | 1,000.00 | | | | 1,113.70 | | | | 8.54 | | | | 1.63 | |
| Hypothetical | | | | | 1,000.00 | | | | 1,016.71 | | | | 8.15 | | | | 1.63 | |
Select Class | | | | | | | | | | | | | | | | | | |
| Actual | | | | | 1,000.00 | | | | 1,117.80 | | | | 4.62 | | | | 0.88 | |
| Hypothetical | | | | | 1,000.00 | | | | 1,020.43 | | | | 4.41 | | | | 0.88 | |
JUNE 30, 2007 JPMORGAN MID CAP/MULTI-CAP FUNDS 109
SCHEDULE OF SHAREHOLDER EXPENSES
(Unaudited) (continued)
Hypothetical $1,000 Investment at Beginning of Period
June 30, 2007
|
|
|
| Beginning
Account Value,
January 1, 2007
|
| Ending
Account Value,
June 30, 2007
|
| Expenses Paid During
January 1, 2007 to
June 30, 2007*
|
| Annualized
Expense Ratio
|
|---|
Diversified Mid Cap Growth Fund | | | | | | | | | | | | | | | | | | |
Class A | | | | | | | | | | | | | | | | | | |
| Actual | | | | $ | 1,000.00 | | | $ | 1,115.60 | | | | $ 6.50 | | | | 1.24 | % |
| Hypothetical | | | | | 1,000.00 | | | | 1,018.65 | | | | 6.21 | | | | 1.24 | |
Class B | | | | | | | | | | | | | | | | | | |
| Actual | | | | | 1,000.00 | | | | 1,112.40 | | | | 9.79 | | | | 1.87 | |
| Hypothetical | | | | | 1,000.00 | | | | 1,015.52 | | | | 9.35 | | | | 1.87 | |
Class C | | | | | | | | | | | | | | | | | | |
| Actual | | | | | 1,000.00 | | | | 1,112.10 | | | | 9.79 | | | | 1.87 | |
| Hypothetical | | | | | 1,000.00 | | | | 1,015.52 | | | | 9.35 | | | | 1.87 | |
Select Class | | | | | | | | | | | | | | | | | | |
| Actual | | | | | 1,000.00 | | | | 1,116.80 | | | | 5.20 | | | | 0.99 | |
| Hypothetical | | | | | 1,000.00 | | | | 1,019.89 | | | | 4.96 | | | | 0.99 | |
Ultra | | | | | | | | | | | | | | | | | | |
| Actual | | | | | 1,000.00 | | | | 1,117.80 | | | | 4.57 | | | | 0.87 | |
| Hypothetical | | | | | 1,000.00 | | | | 1,020.48 | | | | 4.36 | | | | 0.87 | |
| |
Diversified Mid Cap Value Fund | | | | | | | | | | | | | | | | | | |
Class A | | | | | | | | | | | | | | | | | | |
| Actual | | | | | 1,000.00 | | | | 1,078.10 | | | | 6.29 | | | | 1.22 | |
| Hypothetical | | | | | 1,000.00 | | | | 1,018.74 | | | | 6.11 | | | | 1.22 | |
Class B | | | | | | | | | | | | | | | | | | |
| Actual | | | | | 1,000.00 | | | | 1,075.20 | | | | 9.36 | | | | 1.82 | |
| Hypothetical | | | | | 1,000.00 | | | | 1,015.77 | | | | 9.10 | | | | 1.82 | |
Class C | | | | | | | | | | | | | | | | | | |
| Actual | | | | | 1,000.00 | | | | 1,075.20 | | | | 9.36 | | | | 1.82 | |
| Hypothetical | | | | | 1,000.00 | | | | 1,015.77 | | | | 9.10 | | | | 1.82 | |
Select Class | | | | | | | | | | | | | | | | | | |
| Actual | | | | | 1,000.00 | | | | 1,079.80 | | | | 5.00 | | | | 0.97 | |
| Hypothetical | | | | | 1,000.00 | | | | 1,019.98 | | | | 4.86 | | | | 0.97 | |
Ultra | | | | | | | | | | | | | | | | | | |
| Actual | | | | | 1,000.00 | | | | 1,079.90 | | | | 4.23 | | | | 0.82 | |
| Hypothetical | | | | | 1,000.00 | | | | 1,020.73 | | | | 4.11 | | | | 0.82 | |
| |
Growth Advantage Fund | | | | | | | | | | | | | | | | | | |
Class A | | | | | | | | | | | | | | | | | | |
| Actual | | | | | 1,000.00 | | | | 1,126.70 | | | | 7.17 | | | | 1.36 | |
| Hypothetical | | | | | 1,000.00 | | | | 1,018.05 | | | | 6.80 | | | | 1.36 | |
Class B | | | | | | | | | | | | | | | | | | |
| Actual | | | | | 1,000.00 | | | | 1,123.00 | | | | 10.90 | | | | 2.07 | |
| Hypothetical | | | | | 1,000.00 | | | | 1,014.53 | | | | 10.34 | | | | 2.07 | |
Class C | | | | | | | | | | | | | | | | | | |
| Actual | | | | | 1,000.00 | | | | 1,123.50 | | | | 10.90 | | | | 2.07 | |
| Hypothetical | | | | | 1,000.00 | | | | 1,014.53 | | | | 10.34 | | | | 2.07 | |
Select Class | | | | | | | | | | | | | | | | | | |
| Actual | | | | | 1,000.00 | | | | 1,127.90 | | | | 5.86 | | | | 1.11 | |
| Hypothetical | | | | | 1,000.00 | | | | 1,019.29 | | | | 5.56 | | | | 1.11 | |
110 JPMORGAN MID CAP/MULTI-CAP FUNDS JUNE 30, 2007
|
|
|
| Beginning
Account Value,
January 1, 2007
|
| Ending
Account Value,
June 30, 2007
|
| Expenses Paid During
January 1, 2007 to
June 30, 2007*
|
| Annualized
Expense Ratio
|
|---|
Mid Cap Equity Fund | | | | | | | | | | | | | | | | | | |
Select Class | | | | | | | | | | | | | | | | | | |
| Actual | | | | $ | 1,000.00 | | | $ | 1,097.80 | | | | $ 4.68 | | | | 0.90 | % |
| Hypothetical | | | | | 1,000.00 | | | | 1,020.33 | | | | 4.51 | | | | 0.90 | |
| |
Mid Cap Value Fund | | | | | | | | | | | | | | | | | | |
Class A | | | | | | | | | | | | | | | | | | |
| Actual | | | | | 1,000.00 | | | | 1,075.70 | | | | 6.43 | | | | 1.25 | |
| Hypothetical | | | | | 1,000.00 | | | | 1,018.60 | | | | 6.26 | | | | 1.25 | |
Class B | | | | | | | | | | | | | | | | | | |
| Actual | | | | | 1,000.00 | | | | 1,073.20 | | | | 9.00 | | | | 1.75 | |
| Hypothetical | | | | | 1,000.00 | | | | 1,016.12 | | | | 8.75 | | | | 1.75 | |
Class C | | | | | | | | | | | | | | | | | | |
| Actual | | | | | 1,000.00 | | | | 1,073.10 | | | | 9.00 | | | | 1.75 | |
| Hypothetical | | | | | 1,000.00 | | | | 1,016.12 | | | | 8.75 | | | | 1.75 | |
Select Class | | | | | | | | | | | | | | | | | | |
| Actual | | | | | 1,000.00 | | | | 1,076.60 | | | | 5.15 | | | | 1.00 | |
| Hypothetical | | | | | 1,000.00 | | | | 1,019.84 | | | | 5.01 | | | | 1.00 | |
Institutional Class | | | | | | | | | | | | | | | | | | |
| Actual | | | | | 1,000.00 | | | | 1,078.10 | | | | 3.86 | | | | 0.75 | |
| Hypothetical | | | | | 1,000.00 | | | | 1,021.08 | | | | 3.76 | | | | 0.75 | |
| |
Multi-Cap Market Neutral Fund | | | | | | | | | | | | | | | | | | |
Class A | | | | | | | | | | | | | | | | | | |
| Actual | | | | | 1,000.00 | | | | 1,025.50 | | | | 14.01 | | | | 2.79 | |
| Hypothetical | | | | | 1,000.00 | | | | 1,010.96 | | | | 13.91 | | | | 2.79 | |
Class B | | | | | | | | | | | | | | | | | | |
| Actual | | | | | 1,000.00 | | | | 1,022.20 | | | | 17.85 | | | | 3.56 | |
| Hypothetical | | | | | 1,000.00 | | | | 1,007.14 | | | | 17.72 | | | | 3.56 | |
Class C | | | | | | | | | | | | | | | | | | |
| Actual | | | | | 1,000.00 | | | | 1,022.20 | | | | 17.80 | | | | 3.55 | |
| Hypothetical | | | | | 1,000.00 | | | | 1,007.19 | | | | 17.67 | | | | 3.55 | |
Select Class | | | | | | | | | | | | | | | | | | |
| Actual | | | | | 1,000.00 | | | | 1,027.20 | | | | 12.77 | | | | 2.54 | |
| Hypothetical | | | | | 1,000.00 | | | | 1,012.20 | | | | 12.67 | | | | 2.54 | |
| |
Value Advantage Fund | | | | | | | | | | | | | | | | | | |
Class A | | | | | | | | | | | | | | | | | | |
| Actual | | | | | 1,000.00 | | | | 1,077.40 | | | | 6.44 | | | | 1.25 | |
| Hypothetical | | | | | 1,000.00 | | | | 1,018.60 | | | | 6.26 | | | | 1.25 | |
Class C | | | | | | | | | | | | | | | | | | |
| Actual | | | | | 1,000.00 | | | | 1,074.60 | | | | 9.00 | | | | 1.75 | |
| Hypothetical | | | | | 1,000.00 | | | | 1,016.12 | | | | 8.75 | | | | 1.75 | |
Select Class | | | | | | | | | | | | | | | | | | |
| Actual | | | | | 1,000.00 | | | | 1,078.90 | | | | 5.15 | | | | 1.00 | |
| Hypothetical | | | | | 1,000.00 | | | | 1,019.84 | | | | 5.01 | | | | 1.00 | |
Institutional Class | | | | | | | | | | | | | | | | | | |
| Actual | | | | | 1,000.00 | | | | 1,080.20 | | | | 3.87 | | | | 0.75 | |
| Hypothetical | | | | | 1,000.00 | | | | 1,021.08 | | | | 3.76 | | | | 0.75 | |
| * | | Expenses are equal to the Funds’ annualized expense ratio, multiplied by the average account value over the period, multiplied by 181/365 to reflect the one-half year period). |
JUNE 30, 2007 JPMORGAN MID CAP/MULTI-CAP FUNDS 111
TAX LETTER
(Unaudited)
Certain tax information for the Funds is required to be provided to shareholders based upon the Funds’ income and distributions for the taxable year ended June 30, 2007. The information and distributions reported in this letter may differ from the information and taxable distributions reported to the shareholders for the calendar year ending December 31, 2007. The information necessary to complete your income tax returns for the calendar year ending December 31, 2007 will be received under separate cover.
Dividend Received Deductions (DRD)
The following represents the percentage of ordinary income distributions eligible for the 70% dividend received deduction for corporate rate shareholders for the fiscal year ended June 30, 2007:
|
|
|
| Dividend
Received
Deduction
|
|---|
| Capital Growth Fund | | | | | 62.67 | % |
| Diversified Mid Cap Growth Fund | | | | | 37.44 | |
| Diversified Mid Cap Value Fund | | | | | 49.65 | |
| Mid Cap Equity Fund | | | | | 52.72 | |
| Mid Cap Value Fund | | | | | 68.92 | |
| Multi-Cap Market Neutral Fund | | | | | 36.29 | |
| Value Advantage Fund | | | | | 22.35 | |
Qualified Dividend Income (QDI)
For the fiscal year ended June 30, 2007, certain dividends paid by the Funds may be subject to a maximum tax rate of 15%. The following represents the amount of ordinary income distributions treated as qualified dividends (amounts in thousands):
|
|
|
| Qualified
Dividend
Income
|
|---|
| Capital Growth Fund | | | | $ | 3,459 | |
| Diversified Mid Cap Growth Fund | | | | | 7,825 | |
| Diversified Mid Cap Value Fund | | | | | 19,413 | |
| Mid Cap Equity Fund | | | | | 5,749 | |
| Mid Cap Value Fund | | | | | 116,673 | |
| Multi-Cap Market Neutral Fund | | | | | 17,239 | |
| Value Advantage Fund | | | | | 2,548 | |
Short Term Capital Gain Designation
For the fiscal year ended June 30, 2007, the Funds designate the following amounts of ordinary distributions paid during the Funds’ fiscal year that are from qualified short-term capital gain (amounts in thousands):
|
|
|
| Qualified
Short-Term
Gain
|
|---|
| Capital Growth Fund | | | | $ | 10,923 | |
| Diversified Mid Cap Growth Fund | | | | | 30,732 | |
| Diversified Mid Cap Value Fund | | | | | 11,499 | |
| Mid Cap Equity Fund | | | | | 4,921 | |
| Mid Cap Value Fund | | | | | 127,417 | |
| Value Advantage Fund | | | | | 4,278 | |
Long Term Capital Gain Designation — 15%
The Funds hereby designate the following amounts as long-term capital gain distributions for the purpose of the dividend paid deduction on its respective tax returns for the fiscal year ended June 30, 2007 (amounts in thousands):
|
|
|
| Long-Term
Capital Gain
Distribution
|
|---|
| Capital Growth Fund | | | | $ | 55,798 | |
| Diversified Mid Cap Growth Fund | | | | | 195,726 | |
| Diversified Mid Cap Value Fund | | | | | 134,174 | |
| Mid Cap Equity Fund | | | | | 18,083 | |
| Mid Cap Value Fund | | | | | 214,734 | |
| Value Advantage Fund | | | | | 156 | |
112 JPMORGAN MID CAP/MULTI-CAP FUNDS JUNE 30, 2007
THIS PAGE IS INTENTIONALLY LEFT BLANK
THIS PAGE IS INTENTIONALLY LEFT BLANK
THIS PAGE IS INTENTIONALLY LEFT BLANK
THIS PAGE IS INTENTIONALLY LEFT BLANK
JPMorgan Funds are distributed by JPMorgan Distribution Services, Inc., which is an affiliate of JPMorgan Chase & Co. Affiliates of JPMorgan Chase & Co. receive fees for providing various services to the funds.
This report is submitted for the general information of the shareholders of the Funds. It is not authorized for distribution to prospective investors in the Funds unless preceded or accompanied by a prospectus.
Contact JPMorgan Funds Distribution Services at 1-800-480-4111 for a fund prospectus. You can also visit us at www.jpmorganfunds.com. Investors should carefully consider the investment objectives and risk as well as charges and expenses of the mutual fund before investing. The prospectus contains this and other information about the mutual fund. Read the prospectus carefully before investing.
Each Fund files a complete schedule of its fund holdings for the first and third quarters of its fiscal year with the SEC on Form N-Q. The Funds’ Forms N-Q are available on the SEC’s website at http://www.sec.gov and may be reviewed and copied at the SEC’s Public Reference Room in Washington, DC. Information on the operation of the SEC’s Public Reference Room may be obtained by calling 1-800-SEC-0330. Shareholders may request the Form N-Q without charge by calling 1-800-480-4111 or by visiting the JPMorgan Funds’ website at www.jpmorganfunds.com.
A description of each Fund’s policies and procedures with respect to the disclosure of each Fund’s holdings is available in the Statement of Additional Information.
A copy of proxy policies and procedures are available without charge upon request by calling 1-800-480-4111 and a description of such policies and procedures is on the SEC’s website at www.sec.gov. The Trustees have delegated the authority to vote proxies for securities owned by the Funds to the Advisor. A copy of the Funds’ voting record for the most recent 12-month period ended June 30 is available on the SEC’s website at www.sec.gov or at the Funds’ website at www.jpmorganfunds.com no later than August 31 of each year. The Funds’ proxy voting record will include, among other things, a brief description of the matter voted on for each fund security, and will state how each vote was cast, for example, for or against the proposal.

© JPMorgan Chase & Co., 2007 All rights reserved. June 2007. | | AN-MC-607 |
ITEM 2. CODE OF ETHICS.
Disclose whether, as of the end of the period covered by the report, the registrant has adopted a code of ethics that applies to the registrant’s principal executive officer, principal financial officer, principal accounting officer or controller, or persons performing similar functions, regardless of whether these individuals are employed by the registrant or a third party. If the registrant has not adopted such a code of ethics, explain why it has not done so.
The registrant must briefly describe the nature of any amendment, during the period covered by the report, to a provision of its code of ethics that applies to the registrant’s principal executive officer, principal financial officer, principal accounting officer or controller, or persons performing similar functions, regardless of whether these individuals are employed by the registrant or a third party, and that relates to any element of the code of ethics definition enumerated in paragraph (b) of this Item. The registrant must file a copy of any such amendment as an exhibit pursuant to Item 12(a)(1), unless the registrant has elected to satisfy paragraph (f) of this Item by positing its code of ethics on its website pursuant to paragraph (f)(2) of this Item, or by undertaking to provide its code of ethics to any person without charge, upon request, pursuant to paragraph (f)(3) of this Item.
If the registrant has, during the period covered by the report, granted a waiver, including an implicit waiver, from a provision of the code of ethics that applies to the registrant’s principal executive officer, principal financial officer, principal accounting officer or controller, or persons performing similar functions, regardless of whether these individuals are employed by the registrant or third party, that relates to one or more items set forth in paragraph (b) of this Item, the registrant must briefly describe the nature of the waiver, the name of the person to whom the waiver was granted, and the date of the waiver.
The Registrant has adopted a code of ethics that applies to the Registrant’s principal executive officer and principal financial officer. There were no amendments to the code of ethics or waivers granted with respect to the code of ethics in the period covered by the report.
ITEM 3. AUDIT COMMITTEE FINANCIAL EXPERT.
(a) (1) Disclose that the registrant’s board of directors has determined that the registrant either:
| (i) Has at least one audit committee financial expert serving on its audit committee; or |
(ii) Does not have an audit committee financial expert serving on its audit committee.
The Registrant’s Board of Trustees has determined that the Registrant has at least one audit committee financial expert serving on its audit committee. The Securities and Exchange Commission has stated that the designation or identification of a person as an audit committee financial expert pursuant to this Item 3 of Form N-CSR does not impose on such person any duties, obligations or liabilities that are greater than the duties, obligations and liabilities imposed on such person as a member of the Audit Committee and the Board of Trustees in the absence of such designation or identification.
(2) If the registrant provides the disclosure required by paragraph (a)(1)(i) of this Item, it must disclose the name of the audit committee financial expert and whether that person is “independent.” In order to be considered “independent” for purposes of this Item, a member of an audit committee may not, other than in his or her capacity as a member of the audit committee, the board of directors, or any other board committee:
(i) Accept directly or indirectly any consulting, advisory, or other compensatory fee from the issuer; or
(ii) Be an “interested person” of the investment company as defined in Section 2(a)(19) of the Act (15 U.S.C. 80a-2(a)(19)).
The audit committee financial expert is William Armstrong. He is not an “interested person” of the Registrant and is also “independent” as defined by the U.S. Securities and Exchange Commission for purposes of audit committee financial expert determinations.
(3) If the registrant provides the disclosure required by paragraph (a)(1)(ii) of this Item, it must explain why it does not have an audit committee financial expert.
Not applicable.
ITEM 4. PRINCIPAL ACCOUNTANT FEES AND SERVICES.
(a) Disclose, under the caption Audit Fees, the aggregate fees billed for each of the last two fiscal years for professional
services rendered by the principal accountant for the audit of the registrant’s annual financial statements or services that are normally provided by the accountant in connection with statutory and regulatory filings or engagements for those fiscal years.
AUDIT FEES
2006 – $34,895 *
* The Fund’s fiscal year end changed to June 30 effective June 2006. The fees are for the six months ending June 30, 2006, the new fiscal year end of the Fund.
(b) Disclose, under the caption Audit-Related Fees, the aggregate fees billed in each of the last two fiscal years for assurance and related services by the principal accountant that are reasonably related to the performance of the audit of the registrant’s financial statements and are not reported under paragraph (a) of this Item. Registrants shall describe the nature of the services comprising the fees disclosed under this category.
| AUDIT-RELATED FEES (On a calendar year basis) |
2005 – $10,110,000
The audit-related fees consist of aggregate fees billed for assurance and related services by the independent registered public accounting firm to the Registrant’s investment adviser (not including any sub-adviser whose role is primarily portfolio management and is subcontracted with or overseen by another investment adviser), and any entity controlling, controlled by or under common control with the investment adviser that provides ongoing services to the Registrant (“Service Affiliates”), that were reasonably related to the performance of the annual audit of the Registrant’s financial statements.
(c) Disclose, under the caption Tax Fees, the aggregate fees billed in each of the last two fiscal years for professional services rendered by the principal accountant for tax compliance, tax advice, and tax planning. Registrants shall describe the nature of the services comprising the fees disclosed under this category.
2006 – $7,500 *
* The Fund’s fiscal year end changed to June 30 effective June 2006. The fees are for the six months ending June 30, 2006, the new fiscal year end of the Fund.
The tax fees consist of fees billed in connection with preparing the federal regulated investment company income tax returns for the Registrant for the tax years ended December 31, 2006 and 2005.
For the last fiscal year, no tax fees were required to be approved pursuant to paragraph (c)(7)(ii) of Rule 2-01 of Regulation S-X.
(d) Disclose, under the caption All Other Fees, the aggregate fees billed in each of the last two fiscal years for products and services provided by the principal accountant, other than the services reported in paragraphs (a) through (c) of this Item. Registrants shall describe the nature of the services comprising the fees disclosed under this category.
2006 – Not applicable
(e) (1) Disclose the audit committee’s pre-approval policies and procedures described in paragraph (c)(7) of Rule 2-01 of Regulation S-X.
Pursuant to the Registrant’s Audit Committee Charter and written policies and procedures for the pre-approval of audit and non-audit services (the “Pre-approval Policy”), the Audit Committee pre-approves all audit and non-audit services
performed by the Registrant’s independent public registered accounting firm for the Registrant. In addition, the Audit Committee pre-approves the auditor’s engagement for non-audit services with the Registrant’s investment adviser (not including a sub-adviser whose role is primarily portfolio management and is sub-contracted or overseen by another investment adviser) and any Service Affiliate in accordance with paragraph (c)(7)(ii) of Rule 2-01 of Regulation S-X, if the engagement relates directly to the operations and financial reporting of the Registrant. Proposed services may be pre-approved either 1) without consideration of specific case-by-case services or 2) require the specific pre-approval of the Audit Committee. Therefore, the Pre-approval Policy lists a number of audit and non-audit services that have been approved by the Audit Committee, or which were not subject to pre-approval under the transition provisions of Sarbanes-Oxley Act of 2002 (the “Pre-approval List”). The Audit Committee annually reviews and pre-approves the services included on the Pre-approval List that may be provided by the independent public registered accounting firm without obtaining additional specific pre-approval of individual services from the Audit Committee. The Audit Committee adds to, or subtracts from, the list of general pre-approved services from time to time, based on subsequent determinations. All other audit and non-audit services not on the Pre-approval List must be specifically pre-approved by the Audit Committee.
One or more members of the Audit Committee may be appointed as the Committee’s delegate for the purposes of considering whether to approve such services. Any pre-approvals granted by the delegate will be reported, for informational purposes only, to the Audit Committee at its next scheduled meeting. The Audit Committee’s responsibilities to pre-approve services performed by the independent public registered accounting firm are not delegated to management.
(2) Disclose the percentage of services described in each of paragraphs (b) through (d) of this Item that were approved by the audit committee pursuant to paragraph (c)(7)(i)(C) of Rule 2-01 of Regulation S-X.
2007 – 100%
2006 – 100%
(f) If greater than 50 percent, disclose the percentage of hours expended on the principal accountant’s engagement to audit the registrant’s financial statements for the most recent fiscal year that were attributed to work performed by persons other than the principal accountant’s full-time, permanent employees.
None.
(g) Disclose the aggregate non-audit fees billed by the registrant’s accountant for services rendered to the registrant, and rendered to the registrant’s investment adviser (not including any sub-adviser whose role is primarily portfolio management and is subcontracted with or overseen by another investment adviser), and any entity controlling, controlled by, or under common control with the adviser that provides ongoing services to the registrant for each of the last two fiscal years of the registrant.
The aggregate non-audit fees billed by the independent registered public accounting firm for services rendered to the Registrant, and rendered to Service Affiliates, for the last two calendar year ends were $21.6 million in 2006 and $19.1 million in 2005.
(h) Disclose whether the registrant’s audit committee of the board of directors has considered whether the provision of non-audit services that were rendered to the registrant’s investment adviser (not including any subadviser whose role is primarily portfolio management and is subcontracted with or overseen by another investment adviser), and any entity controlling, controlled by, or under common control with the investment adviser that provides ongoing services to the registrant that were not pre-approved pursuant to paragraph (c)(7)(ii) of Rule 2-01 of Regulation S-X is compatible with maintaining the principal accountant’s independence.
The Registrant’s Audit Committee has considered whether the provision of the non-audit services that were rendered to Service Affiliates that were not pre-approved (not requiring pre-approval) is compatible with maintaining the independent public registered accounting firm’s independence. All services provided by the independent public registered accounting firm to the Registrant or to Service Affiliates that were required to be pre-approved were pre-approved as required.
ITEM 5. AUDIT COMMITTEE OF LISTED REGISTRANTS.
(a) If the registrant is a listed issuer as defined in Rule 10A-3 under the Exchange Act (17CFR 240.10A-3), state whether or not the registrant has a separately-designated standing audit committee established in accordance with Section 3(a)(58)(A) of the Exchange Act (15 U.S.C. 78c(a)(58)(A)). If the registrant has such a committee, however designated, identify each committee member. If the entire board of directors is acting as the registrant’s audit committee as specified in Section 3(a)(58)(B) of the Exchange Act (15 U.S.C. 78c(a)(58)(B)), so state.
(b) If applicable, provide the disclosure required by Rule 10A-3(d) under the Exchange Act (17CFR 240.10A-3(d)) regarding an exemption from the listing standards for all audit committees.
Not applicable.
ITEM 6. SCHEDULE OF INVESTMENTS
File Schedule I – Investments in securities of unaffiliated issuers as of the close of the reporting period as set forth in Section 210.12-12 of Regulation S-X, unless the schedule is included as part of the report to shareholders filed under Item 1 of this Form.
Included in Item 1.
ITEM 7. DISCLOSURE OF PROXY VOTING POLICIES AND PROCEDURES FOR CLOSED-END MANAGEMENT INVESTMENT COMPANIES.
A closed-end management investment company that is filing an annual report on this Form N-CSR must, unless it invests exclusively in non-voting securities, describe the policies and procedures that it uses to determine how to vote proxies relating to portfolio securities, including the procedures that the company uses when a vote presents a conflict between the interests of its shareholders, on the one hand, and those of the company’s investment adviser; principal underwriter; or any affiliated person (as defined in Section 2(a)(3) of the Investment Company Act of 1940 (15 U.S.C. 80a-2(a)(3)) and the rules thereunder) of the company, its investment adviser, or its principal underwriter, on the other. Include any policies and procedures of the company’s investment adviser, or any other third party, that the company uses, or that are used on the company’s behalf, to determine how to vote proxies relating to portfolio securities.
Not applicable.
ITEM 8. PORTFOLIO MANAGERS OF CLOSED-END MANAGEMENT INVESTMENT COMPANIES.
Not applicable.
ITEM 9. PURCHASE OF EQUITY SECURITIES BY CLOSED-END MANAGEMENT INVESTMENT COMPANY AND AFFILIATED PURCHASERS.
(a) If the registrant is a closed-end management investment company, provide the information specified in paragraph (b) of this Item with respect to any purchase made by or on behalf of the registrant or any “affiliated purchaser,” as defined in Rule 10b-18(a)(3) under the Exchange Act (17 CFR 240.10b-18(a)(3)), of shares or other units of any class of the registrant’s equity securities that is registered by the registrant pursuant to Section 12 of the Exchange Act (15 U.S.C. 781).
Not applicable.
ITEM 10. SUBMISSION OF MATTERS TO A VOTE OF SECURITY HOLDERS.
Describe any material changes to the procedures by which shareholders may recommend nominees to the registrant’s board of directors, where those changes were implemented after the registrant last provided disclosure in response to the requirements of Item 7(d)(2)(ii)(G) of Schedule 14A (17 CFR 240.14a-101), or this Item.
No material changes to report.
ITEM 11. CONTROLS AND PROCEDURES.
(a) Disclose the conclusions of the registrant’s principal executive and principal financial officers, or persons performing similar functions, regarding the effectiveness of the registrant’s disclosure controls and procedures (as defined in Rule 30a-3(c) under the
Act (17 CFR 270.30a-3(c))) as of a date within 90 days of the filing date of the report that includes the disclosure required by this paragraph, based on the evaluation of these controls and procedures required by Rule 30a-3(b) under the Act (17 CFR 270.30a-3(b)) and Rules 13a-15(b) or 15d-15(b) under the Exchange Act (17 CFR 240.13a-15(b) or 240.15d-15(b)).
The Registrant’s principal executive and principal financial officers have concluded, based on their evaluation of the Registrant’s disclosure controls and procedures as of a date within 90 days of the filing date of this report, that the Registrant’s disclosure controls and procedures are reasonably designed to ensure that information required to be disclosed by the Registrant on Form N-CSR is recorded, processed, summarized and reported within the required time periods and that information required to be disclosed by the Registrant in the reports that it files or submits on Form N-CSR is accumulated and communicated to the Registrant’s management, including its principal executive and principal financial officers, as appropriate to allow timely decisions regarding required disclosure.
(b) Disclose any change in the registrant’s internal control over financial reporting (as defined in Rule 30a-3(d) under the Act (17 CFR 270.30a-3(d)) that occurred during the registrant’s second fiscal quarter of the period covered by this report that has materially affected, or is reasonably likely to materially affect, the registrant’s internal control over financial reporting.
There were no changes in the Registrant’s internal control over financial reporting that occurred during the last fiscal quarter covered by this report that have materially affected, or are reasonably likely to materially affect, the Registrant’s internal control over financial reporting.
ITEM 12. EXHIBITS.
(a) File the exhibits listed below as part of this Form. Letter or number the exhibits in the sequence indicated.
(a)(1) Any code of ethics, or amendment thereto, that is the subject of the disclosure required by Item 2, to the extent that the registrant intends to satisfy the Item 2 requirements through filing of an exhibit.
Code of Ethics applicable to its Principal Executive and Principal Financial Officers pursuant to Section 406 of the Sarbanes-Oxley Act of 2002 attached hereto.
(a)(2) A separate certification for each principal executive officer and principal financial officer of the registrant as required by Rule 30a-2(a) under the Act (17 CFR 270.30a-2).
Certifications pursuant to Rule 30a-2(a) under the Investment Company Act of 1940 are attached hereto.
(a)(3) Any written solicitation to purchase securities under Rule 23c-1 under the Act (17 CFR 270.23c-1) sent or given during the period covered by the report by or on behalf of the registrant to 10 or more persons.
Not applicable.
(b) A separate or combined certification for each principal executive officer and principal officer of the registrant as required by Rule 30a-2(b) under the Act of 1940.
Certifications pursuant to Rule 30a-2(b) under the Investment Company Act of 1940 are attached hereto.
SIGNATURES
Pursuant to the requirements of the Securities Exchange Act of 1934 and the Investment Company Act of 1940, the registrant has duly caused this report to be signed on its behalf by the undersigned, thereunto duly authorized.
J.P. Morgan Fleming Mutual Fund Group, Inc.
By: | /s/_____________________________ |
George C.W. Gatch
President and Principal Executive Officer
September 7, 2007
Pursuant to the requirements of the Securities Exchange Act of 1934 and the Investment Company Act of 1940, this report has been signed below by the following persons on behalf of the registrant and in the capacities and on the dates indicated.
By: | /s/___________________________ |
George C.W. Gatch
President and Principal Executive Officer
September 7, 2007
By: | /s/____________________________ |
Stephanie J. Dorsey
Treasurer and Principal Financial Officer
September 7, 2007