UNITED STATES
SECURITIES AND EXCHANGE COMMISSION
Washington, D.C. 20549
FORM N-CSR
CERTIFIED SHAREHOLDER REPORT OF REGISTERED
MANAGEMENT INVESTMENT COMPANIES
Investment Company Act file number: 811-08189
J.P. Morgan Fleming Mutual Fund Group, Inc.
(Exact name of registrant as specified in charter)
270 Park Avenue
New York, NY 10017
(Address of principal executive offices) (Zip code)
Frank J. Nasta
270 Park Avenue
New York, NY 10017
(Name and Address of Agent for Service)
Registrant’s telephone number, including area code: (800) 480-4111
Date of fiscal year end: June 30
Date of reporting period: July 1, 2010 through June 30, 2011
Form N-CSR is to be used by management investment companies to file reports with the Commission not later than 10 days after the transmission to stockholders of any report that is required to be transmitted to stockholders under Rule 30e-1 under the Investment Company Act of 1940 (17 CFR 270.30e-1). The Commission may use the information provided on Form N-CSR in its regulatory, disclosure review, inspection, and policymaking roles.
A registrant is required to disclose the information specified by Form N-CSR, and the Commission will make this information public. A registrant is not required to respond to the collection of information contained in Form N-CSR unless the Form displays a currently valid Office of Management and Budget (“OMB”) control number. Please direct comments concerning the accuracy of the information collection burden estimate and any suggestions for reducing the burden to Secretary, Securities and Exchange Commission, 450 Fifth Street, NW, Washington, DC 20549-0609. The OMB has reviewed this collection of information under the clearance requirements of 44 U.S.C. Section 3507.
ITEM 1. REPORTS TO STOCKHOLDERS.
The following is a copy of the report transmitted to shareholders pursuant to Rule 30e-1 under the Investment Company Act of 1940 (17 CFR 270.30e-1).
Annual Report
J.P. Morgan Mid Cap/Multi-Cap Funds
June 30, 2011
JPMorgan Growth Advantage Fund
JPMorgan Mid Cap Core Fund
JPMorgan Mid Cap Equity Fund
JPMorgan Mid Cap Growth Fund
JPMorgan Mid Cap Value Fund
JPMorgan Multi-Cap Market Neutral Fund
JPMorgan Value Advantage Fund

CONTENTS
Investments in a Fund are not bank deposits or obligations of, or guaranteed or endorsed by, any bank and are not insured or guaranteed by the FDIC, the Federal Reserve Board or any other government agency. You could lose money if you sell when the Fund’s share price is lower than when you invested.
Past performance is no guarantee for future performance. The general market views expressed in this report are opinions based on conditions through the end of the reporting period and are subject to change without notice based on market and other conditions. These views are not intended to predict the future performance of a Fund or the securities markets. References to specific securities and their issuers are for illustrative purposes only and are not intended to be, and should not be interpreted as, recommendations to purchase or sell such securities. Such views are not meant as investment advice and may not be relied on as an indication of trading intent on behalf of any Fund.
Prospective investors should refer to the Funds’ prospectus for a discussion of the Funds’ investment objective, strategies and risks. Call J.P. Morgan Funds Service Center at 1-800-480-4111 for a prospectus containing more complete information about a Fund including management fees and other expenses. Please read it carefully before investing.
CEO’S LETTER
August 8, 2011 (Unaudited)
Dear Shareholder:
Last summer, investors’ optimism about the markets was tempered by a wave of both discouraging U.S. economic data and sovereign debt issues in Europe, which led to a market correction.
| | |
 | | “Earlier this year, we reminded investors about the likelihood of setbacks on the road out of the economic doldrums. Meanwhile, the tragic earthquake in Japan and political unrest in the Middle East are examples of how sensitive the markets and economy can be to geopolitical shocks and other global crises.” |
As we enter the second half of 2011, concerns about softening U.S. economic data persist. While we are encouraged that corporate earnings and profits have continued to grow consistently, spending levels in many areas of the economy remain critically low, which has resulted in tight inventories and pent-up consumer demand. Meanwhile, investors still lack confidence in the ability of the European governments to combat the region’s debt crisis. Concerns about the credit downgrade of U.S.-issued debt exacerbated this negative sentiment among investors and helped trigger the recent downturn, as August 8, 2011 saw each of the three major U.S. stock indices experience their worst one-day performance since December 1, 2008. The current slowdown in growth should not be viewed as a surprise. Earlier this year, we reminded investors about the likelihood of setbacks on the road out of the economic doldrums. Meanwhile, the tragic earthquake in Japan and political unrest in the Middle East are examples of how sensitive the markets and economy can be to geopolitical shocks and other global crises.
Monetary stimulus and corporate profits move stocks higher
Despite periods of volatility, monetary and fiscal stimulus and strong corporate profits lifted stocks higher over the past year. As of the end of the 12-month reporting period ended June 30, 2011, the S&P 500 Index was at a level of 1,321, an increase of 30.7% from 12 months earlier.
Small cap growth stocks led all style categories for the 12-month reporting period, with the Russell 2000 Growth Index returning 43.5%. For the same period, the Russell Midcap Growth Index returned 43.3%, compared to 35.0% for the Russell 1000 Growth Index. In the value category, the Russell Midcap Value Index returned 34.3%, outperforming both the Russell 2000 Value Index, which returned 31.4%, and the Russell 1000 Value index, which returned 28.9%.
Most U.S. Treasury yields rise amid softer economic data
In the U.S. bond markets, yields were generally volatile, but longer-term Treasury yields generally rose, while shorter-term yields declined as economic expectations weakened. The yield on the 10-year U.S. Treasury bond rose from 3.0% to 3.2% as of the end of the 12-month reporting period ended June 30, 2011, while yields on the 30-year U.S. Treasury bond increased from 3.9% to 4.4%. Yields on the 2-year U.S. Treasury bond dropped from 0.6% to 0.5% as of the end of the same period.
Is the economic soft patch temporary?
As we enter the second half of 2011, the markets have clearly entered a period of uncertainty. Stocks have been volatile in response to weaker economic growth, as well as concerns over the European sovereign debt crisis, the credit downgrade of U.S.-issued debt, policy tightening in China, and the conclusion of the second round of quantitative easing (QE2) in the U.S. Given these events, it’s not surprising that investors remain largely risk averse, and less than confident about prospects for future growth.
Despite the slowdown and uncertain political environment, however, we do believe that some aspects of our markets and economy — including strong corporate balance sheets and valuations — present potential opportunities for investors. As always, we advise investors to be mindful of continued volatility and other unexpected risks by maintaining a diversified and balanced approach to investing.
On behalf of everyone at J.P. Morgan Asset Management, thank you for your continued support. We look forward to managing your investment needs for years to come. Should you have any questions, please visit www.jpmorganfunds.com or contact the J.P. Morgan Funds Service Center at 1-800-480-4111.
Sincerely yours,

George C.W. Gatch
CEO, Investment Management Americas
J.P. Morgan Asset Management
| | | | | | | | |
| | | |
| JUNE 30, 2011 | | J.P. MORGAN MID CAP/MULTI-CAP FUNDS | | | | | 1 | |
J.P. Morgan Mid Cap/Multi-Cap Funds
MARKET OVERVIEW
TWELVE MONTHS ENDED JUNE 30, 2011 (Unaudited)
Stocks in most of the world’s capital markets rallied during the twelve months ended June 30, 2011. In the United States, investor sentiment was supported by strong corporate earnings, returning merger and acquisition activity and accommodative policies from the U.S. Federal Reserve. Investors were also encouraged by the U.S. government’s two-year extension of the Bush era tax cuts, emergency unemployment benefits and a payroll tax cut. Concerns about economic contagion from Europe’s debt crisis, political unrest in the Middle East and the tragic earthquake and subsequent tsunami in Japan lowered investor confidence toward the end of the reporting period but stocks still finished with gains.
U.S. stocks, as measured by the Russell 3000 Index, returned 32.37% for the twelve months ended June 30, 2011. The Russell Midcap Index, which is comprised of U.S. mid-cap stocks, returned 38.47% for the twelve months ended June 30, 2011, while the Russell Midcap Growth Index and the Russell Midcap Value Index returned 43.25% and 34.28%, respectively.
| | | | | | |
| | | |
| 2 | | | | J.P. MORGAN MID CAP/MULTI-CAP FUNDS | | JUNE 30, 2011 |
JPMorgan Growth Advantage Fund
FUND COMMENTARY
TWELVE MONTHS ENDED JUNE 30, 2011 (Unaudited)
| | | | |
| REPORTING PERIOD RETURN: | |
| Fund (Class A Shares, without a sales charge)* | | | 37.28% | |
| Russell 3000 Growth Index | | | 35.68% | |
| |
| Net Assets as of 6/30/2011 (In Thousands) | | $ | 1,216,156 | |
INVESTMENT OBJECTIVE**
The JPMorgan Growth Advantage Fund (the “Fund”) seeks to provide long-term capital growth.
WHAT WERE THE MAIN DRIVERS OF THE FUND’S PERFORMANCE?
The Fund (Class A Shares, without a sales charge) outperformed the Russell 3000 Growth Index (the “Benchmark”) for the twelve months ended June 30, 2011. The Fund’s stock selection in the consumer discretionary and health care sectors contributed to relative performance, while the Fund’s stock selection in the energy and materials and processing sectors detracted from relative performance.
The Fund’s individual contributors to relative performance included Amazon.com, Inc., UnitedHealth Group, Inc. and Valeant Pharmaceuticals International Inc. Amazon.com, Inc., an online retailer, reported better-than-expected profit, as the company continued to grow its revenue and gain market share despite the challenging environment for retail spending. Shares of UnitedHealth Group, Inc., an accident and health insurance company, increased after the company reported better-than-expected first-quarter profit, fueled by enrollment growth across its health plans. Shares of Valeant Pharmaceuticals International Inc. rose after the specialty pharmaceutical company completed its merger with Biovail Corp. and reported a positive outlook for 2011, suggesting that the integration of the two companies was proceeding faster than investors had initially anticipated.
Individual detractors from the Fund’s relative performance included the Fund’s underweight positions in Exxon Mobil Corp., Caterpillar, Inc. and International Business Machines Corp. (“IBM”) as these stocks were strong performers in the Benchmark during the reporting period. Shares of integrated energy company Exxon Mobil Corp. advanced due to rising oil prices and increased production of natural gas during the reporting period. Shares of construction and agricultural machinery provider Caterpillar, Inc. advanced on the company’s strong earnings, boosted by recovering demand for its products. Shares of IBM advanced following the company’s better-than-expected first-quarter revenue, driven by strong software sales.
HOW WAS THE FUND POSITIONED?
The Fund’s portfolio managers utilized a bottom-up approach to stock selection, rigorously researching individual companies
across market capitalizations in an effort to construct portfolios of stocks that have strong fundamentals. The Fund’s portfolio managers preferred to invest in high quality companies with durable franchises that, in their view, possessed the ability to generate strong future earnings growth.
As a result of this bottom-up stock selection process, the Fund’s largest overweight versus the Benchmark was in the financial services sector, while the Fund’s largest underweight versus the Benchmark was in the consumer staples sector.
| | | | | | | | |
| TOP TEN EQUITY HOLDINGS OF THE PORTFOLIO*** | |
| | 1. | | | Apple, Inc. | | | 5.8 | % |
| | 2. | | | QUALCOMM, Inc. | | | 2.3 | |
| | 3. | | | Amazon.com, Inc. | | | 2.2 | |
| | 4. | | | Oracle Corp. | | | 2.1 | |
| | 5. | | | Coach, Inc. | | | 2.0 | |
| | 6. | | | MasterCard, Inc. | | | 1.8 | |
| | 7. | | | UnitedHealth Group, Inc. | | | 1.8 | |
| | 8. | | | Valeant Pharmaceuticals International, Inc. | | | 1.8 | |
| | 9. | | | American Express Co. | | | 1.8 | |
| | 10. | | | Schlumberger Ltd. | | | 1.7 | |
| | | | |
PORTFOLIO COMPOSITION BY SECTOR*** | |
| Information Technology | | | 32.2 | % |
| Consumer Discretionary | | | 19.7 | |
| Health Care | | | 14.7 | |
| Industrials | | | 12.8 | |
| Energy | | | 9.1 | |
| Financials | | | 7.8 | |
| Materials | | | 3.2 | |
| Short-Term Investments | | | 0.5 | |
| * | | The return shown is based on net asset value calculated for shareholder transactions and may differ from the return shown in the financial highlights, which reflects adjustments made to the net asset value in accordance with accounting principles generally accepted in the United States of America. |
| ** | | The advisor seeks to achieve the Fund’s objective. There can be no guarantee it will be achieved. |
| *** | | Percentages indicated are based upon total investments (excluding Investments of Cash Collateral for Securities on Loan) as of June 30, 2011. The Fund’s composition is subject to change. |
| | | | | | | | |
| | | |
| JUNE 30, 2011 | | J.P. MORGAN MID CAP/MULTI-CAP FUNDS | | | | | 3 | |
JPMorgan Growth Advantage Fund
FUND COMMENTARY
TWELVE MONTHS ENDED JUNE 30, 2011 (Unaudited) (continued)
| | | | | | | | | | | | | | | | |
AVERAGE ANNUAL TOTAL RETURNS AS OF JUNE 30, 2011 | |
| | | | |
| | | INCEPTION DATE
OF CLASS | | | 1 YEAR | | | 5 YEAR | | | 10 YEAR | |
CLASS A SHARES | | | 10/29/99 | | | | | | | | | | | | | |
Without Sales Charge | | | | | | | 37.28 | % | | | 6.96 | % | | | 4.94 | % |
With Sales Charge* | | | | | | | 30.15 | | | | 5.80 | | | | 4.37 | |
CLASS B SHARES | | | 10/29/99 | | | | | | | | | | | | | |
Without CDSC | | | | | | | 36.67 | | | | 6.35 | | | | 4.37 | |
With CDSC** | | | | | | | 31.67 | | | | 6.03 | | | | 4.37 | |
CLASS C SHARES | | | 5/1/06 | | | | | | | | | | | | | |
Without CDSC | | | | | | | 36.45 | | | | 6.31 | | | | 4.27 | |
With CDSC*** | | | | | | | 35.45 | | | | 6.31 | | | | 4.27 | |
CLASS R5 SHARES | | | 1/8/09 | | | | 37.81 | | | | 7.29 | | | | 5.12 | |
SELECT CLASS SHARES | | | 5/1/06 | | | | 37.48 | | | | 7.18 | | | | 5.06 | |
| * | | Sales Charge for Class A Shares is 5.25%. |
| ** | | Assumes 5% CDSC (contingent deferred sales charge) for the one year period, 2% CDSC for the five year period and 0% CDSC thereafter. |
| *** | | Assumes a 1% CDSC for the one year period and 0% CDSC thereafter. |
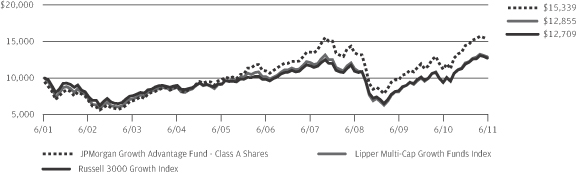
TEN YEAR PERFORMANCE (6/30/01 TO 6/30/11)
Source: Lipper, Inc. The performance quoted is past performance and is not a guarantee of future results. Mutual funds are subject to certain market risks. Investment returns and principal value of an investment will fluctuate so that an investor’s shares, when redeemed, may be worth more or less than their original cost. Current performance may be higher or lower than the performance data shown. For up-to-date month-end performance information please call 1-800-480-4111.
As of August 17, 2005, the Fund changed its name, investment objective, certain investment policies and benchmark. Prior to that time, the Fund operated as JPMorgan Mid Cap Growth Fund. Although past performance is not necessarily an indication of how the Fund will perform in the future, in view of these changes, the Fund’s performance record prior to August 17, 2005 might be less pertinent for investors considering whether to purchase shares of the Fund. Returns for the Class C Shares prior to their inception date are based on the performance of Class B Shares, whose expenses are substantially similar to those of Class C Shares. Returns for the Select Class Shares prior to their inception date are based on the performance of Class A Shares. During this period, the actual returns of Select Class Shares would have been different because Select Class Shares have different expenses than Class A Shares. Returns for Class R5 Shares prior to its inception date are based on the performance of Select Class Shares from May 1, 2006 to June 30, 2009 and Class A Shares prior to May 1, 2006. The actual returns of Class R5 Shares would have been different than those shown because Class R5 Shares have different expenses than Select Class and Class A Shares.
The graph illustrates comparative performance for $10,000 invested in Class A Shares of the JPMorgan Growth Advantage Fund, the Russell 3000 Growth Index and the Lipper Multi-Cap Growth Funds Index from June 30, 2001 to June 30, 2011. The performance of the Fund assumes reinvestment of all dividends and capital gains, if any, and includes a sales charge. The performance of the Russell 3000 Growth Index does not reflect the deduction of expenses or a sales charge associated with a mutual fund and has been adjusted to reflect reinvestment of all dividends and capital gains of the securities included in the benchmark. The performance of the Lipper Multi-Cap Growth Funds Index includes expenses associated with a mutual fund, such as investment management fees. These expenses are not identical to the expenses charged by the Fund. The Russell 3000 Growth Index is an unmanaged index which measures the performance of those Russell 3000 Index companies (largest 3000 U.S. companies) with higher price-to-book ratios and higher forecasted growth values. The Lipper Multi-Cap Growth Funds Index is an index based on total returns of certain mutual funds within the Fund’s designated category as determined by Lipper, Inc. Investors cannot invest directly in an index.
Class A Shares have a $1,000 minimum initial investment and carry a 5.25% sales charge.
Performance may reflect the waiver of the Fund’s fees and reimbursement of expenses for certain periods since the inception date. Without these waivers and reimbursements performance would have been lower. Also, performance shown in this section does not reflect the deduction of taxes that a shareholder would pay on Fund distributions or redemption of Fund shares.
| | | | | | |
| | | |
| 4 | | | | J.P. MORGAN MID CAP/MULTI-CAP FUNDS | | JUNE 30, 2011 |
Because Class B Shares automatically convert to Class A Shares after 8 years, the 10 year annual average total return shown above for Class B reflects Class A performance for the period after conversion.
The returns shown are based on net asset values calculated for shareholder transactions and may differ from the return shown in the financial highlights, which reflect adjustments made to the net asset values in accordance with accounting principles generally accepted in the United States of America.
| | | | | | | | |
| | | |
| JUNE 30, 2011 | | J.P. MORGAN MID CAP/MULTI-CAP FUNDS | | | | | 5 | |
JPMorgan Mid Cap Core Fund
FUND COMMENTARY
FOR THE PERIOD NOVEMBER 30, 2010 (FUND INCEPTION DATE) THROUGH JUNE 30, 2011
(Unaudited)
| | | | |
| REPORTING PERIOD RETURN: | |
| Fund (Select Class Shares)* | | | 14.84% | |
| Russell Midcap Index | | | 15.56% | |
| |
| Net Assets as of 6/30/2011 (In Thousands) | | $ | 91,782 | |
INVESTMENT OBJECTIVE**
The JPMorgan Mid Cap Core Fund (the “Fund”) seeks long-term capital appreciation.
WHAT WERE THE MAIN DRIVERS OF THE FUND’S PERFORMANCE?
The Fund (Select Class Shares) underperformed the Russell Midcap Index for the period November 30, 2010 through June 30, 2011. The Fund’s stock selection in the consumer discretionary sector detracted from relative performance, while the Fund’s stock selection in the producer durables sector contributed to relative performance.
Individual detractors from relative performance included Greenhill & Co., Inc and Marvell Technology Group Ltd. Shares of financial advisory firm Greenhill & Co., Inc. declined as the company’s increased compensation costs associated with its expansion plans and lower financial advisor fees resulted in profits below what investors had anticipated. Marvell Technology Group Ltd. provides parts for products manufactured by Research In Motion. The stock declined after Research In Motion reported disappointing sales, prompting investors’ concerns about slowing demand for Marvell Technology Group Ltd.’s products.
Individual contributors to relative performance included the Fund’s positions in UnitedHealth Group, Inc. and KAR Auction Services, Inc. Shares of UnitedHealth Group, Inc., an accident and health insurance company, increased after the company reported better-than-expected first-quarter profits, fueled by enrollment growth across its health plans. Shares of KAR Auction Services, Inc., a provider of vehicle auction services in North America, increased after the company announced strong first-quarter profits.
HOW WAS THE FUND POSITIONED?
The Fund’s portfolio managers employed a bottom-up approach to stock selection, constructing a portfolio based on company fundamentals, quantitative screening and proprietary
fundamental analysis. The Fund’s portfolio managers invested in companies that, in their view, had leading competitive advantages, predictable and durable business models, sustainable free cash flow generation and management teams committed to increasing intrinsic value.
| | | | | | | | |
| TOP TEN EQUITY HOLDINGS OF THE PORTFOLIO*** | |
| | 1. | | | Devon Energy Corp. | | | 2.8 | % |
| | 2. | | | Jarden Corp. | | | 2.8 | |
| | 3. | | | Silgan Holdings, Inc. | | | 2.7 | |
| | 4. | | | Iberiabank Corp. | | | 2.2 | |
| | 5. | | | Walgreen Co. | | | 2.2 | |
| | 6. | | | Calamos Asset Management, Inc., Class A | | | 2.0 | |
| | 7. | | | ProAssurance Corp. | | | 2.0 | |
| | 8. | | | Chubb Corp. | | | 2.0 | |
| | 9. | | | Joy Global, Inc. | | | 1.9 | |
| | 10. | | | Coventry Health Care, Inc. | | | 1.8 | |
| | | | |
PORTFOLIO COMPOSITION BY SECTOR*** | |
| Financials | | | 19.4 | % |
| Consumer Discretionary | | | 18.1 | |
| Industrials | | | 14.9 | |
| Health Care | | | 10.0 | |
| Information Technology | | | 8.8 | |
| Materials | | | 8.7 | |
| Energy | | | 8.3 | |
| Utilities | | | 6.1 | |
| Consumer Staples | | | 1.8 | |
| Short-Term Investment | | | 3.9 | |
| * | | The return shown is based on net asset value calculated for shareholder transactions any may differ from the return shown in the financial highlights, which reflects adjustments made to the net asset value in accordance with accounting principles generally accepted in the United States of America. |
| ** | | The advisor seeks to achieve the Fund’s objective. There can be no guarantee it will be achieved. |
| *** | | Percentages indicated are based upon total investments as of June 30, 2011. The Fund’s composition is subject to change. |
| | | | | | |
| | | |
| 6 | | | | J.P. MORGAN MID CAP/MULTI-CAP FUNDS | | JUNE 30, 2011 |
| | | | | | | | |
TOTAL RETURNS AS OF JUNE 30, 2011 | |
| | |
| | | INCEPTION DATE
OF CLASS | | | SINCE
INCEPTION | |
CLASS A SHARES | | | 11/30/10 | | | | | |
Without Sales Charge | | | | | | | 14.70 | % |
With Sales Charge* | | | | | | | 8.69 | |
CLASS C SHARES | | | 11/30/10 | | | | | |
Without CDSC | | | | | | | 14.33 | |
With CDSC** | | | | | | | 13.33 | |
CLASS R2 SHARES | | | 11/30/10 | | | | 14.53 | |
CLASS R5 SHARES | | | 11/30/10 | | | | 15.00 | |
CLASS R6 SHARES | | | 1/31/11 | | | | 15.00 | |
SELECT CLASS SHARES | | | 11/30/10 | | | | 14.84 | |
| * | | Sales Charge for Class A Shares is 5.25%. |
| ** | | Assumes a 1% CDSC (contingent deferred sales charge) for the one year period and 0% CDSC thereafter. |
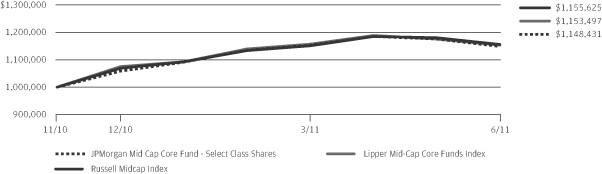
LIFE OF FUND PERFORMANCE (11/30/2010-6/30/2011)
Source: Lipper, Inc. The performance quoted is past performance and is not a guarantee of future results. Mutual funds are subject to certain market risks. Investment returns and principal value of an investment will fluctuate so that an investor’s shares, when redeemed, may be worth or less than their original cost. Current performance may be higher or lower than the performance data shown. For up-to-data, month-end performance information please call 1-800-480-4111.
The fund commenced operations on November 30, 2010.
Returns for Class R6 Shares prior to its inception date were based on the performance of Class R5 Shares. The actual returns of Class R6 Shares would have been different than those shown because Class R6 Shares have different expenses than Class R5 Shares.
The graph illustrates comparative performance for $1,000,000 invested in Select Class Shares of the JPMorgan Mid Cap Core Fund, the Russell Midcap Index and the Lipper Mid-Cap Core Funds Index from November 30, 2010 to June 30, 2011. The performance of the Fund assumes reinvestment of all dividends and capital gains, if any. The performance of the Russell Midcap Index does not reflect the deduction of expenses or a sales charge associated with a mutual fund and has been adjusted to reflect reinvestment of all dividends and capital gains of the securities included in the benchmark. The performance of
the Lipper Mid-Cap Core Funds Index includes expenses associated with a mutual fund, such as investment management fees. These expenses are not identical to the expenses charged by the Fund. The Russell Midcap Index is an unmanaged index which measures the performance of the 800 smallest companies in the Russell 1000 Index. The Lipper Mid-Cap Core Funds Index is an index based on total returns of certain mutual funds within the Fund’s designated category as determined by Lipper, Inc. Investors cannot invest directly in an Index.
Select Class Shares have a $1,000,000 minimum initial investment and carry no sales charge.
Performance may reflect the waiver of the Fund’s fees and reimbursement of expenses for certain periods since the inception date. Without these waivers and reimbursements performance would have been lower. Also, performance shown in this section does not reflect the deduction of taxes that a shareholder would pay on Fund distributions or redemption of Fund shares.
The returns shown are based on net asset values calculated for shareholder transactions and differ from the returns shown in the financial highlights, which reflect adjustments made to the net asset values in accordance with accounting principles generally accepted in the United States of America.
| | | | | | | | |
| | | |
| JUNE 30, 2011 | | J.P. MORGAN MID CAP/MULTI-CAP FUNDS | | | | | 7 | |
JPMorgan Mid Cap Equity Fund
FUND COMMENTARY
TWELVE MONTHS ENDED JUNE 30, 2011 (Unaudited)
| | | | |
| REPORTING PERIOD RETURN: | |
| Fund (Select Class Shares)* | | | 37.15% | |
| Russell Midcap Index | | | 38.47% | |
| |
| Net Assets as of 6/30/2011 (In Thousands) | | $ | 572,219 | |
INVESTMENT OBJECTIVE**
The JPMorgan Mid Cap Equity Fund (the “Fund”) seeks long-term capital growth.
WHAT WERE THE MAIN DRIVERS OF THE FUND’S PERFORMANCE?
The Fund (Select Class Shares) underperformed the Russell Midcap Index (the “Benchmark”) for the twelve months ended June 30, 2011. The Fund’s stock selection in the consumer discretionary and financials sectors detracted from relative performance, while the Fund’s stock selection in the information technology and health care sectors contributed to relative performance.
Individual detractors from relative performance included the Fund’s underweight positions in priceline.com, Inc., Discover Financial Services and Altera Corp., three stocks that performed strongly in the Benchmark. Shares of priceline.com, Inc., an online travel company, rose on investor optimism that increasing on-line commerce would continue to benefit the company. Shares of consumer financial services company Discover Financial Services gained due to consistent improvements in credit card delinquencies. Shares of chipmaker Altera Corp. benefited from increased capital spending on global wireless infrastructure.
Individual contributors to relative performance included the Fund’s positions in Valeant Pharmaceuticals International Inc., Coventry Health Care, Inc. and Williams Cos. Shares of Valeant Pharmaceuticals International Inc. rose after the specialty pharmaceutical company completed its merger with Biovail Corp. and reported a positive outlook for 2011, suggesting that the integration of the two companies was proceeding faster than investors had initially anticipated. Shares of Coventry Health Care, Inc. increased as investor concerns about healthcare reform eased. In addition, the company continued to experience lower medical costs and increased member enrollment. Shares of Williams Cos., an integrated energy company, rose as investors reacted positively to the announcement that it would separate into two distinct publicly traded companies.
HOW WAS THE FUND POSITIONED?
The Fund’s portfolio managers employed a bottom-up approach to stock selection, constructing a portfolio based on
company fundamentals, quantitative screening and proprietary fundamental analysis. The Fund’s portfolio managers sought to identify dominant franchises with predictable business models deemed capable of achieving sustained growth, as well as undervalued companies with the potential to grow their intrinsic value per share.
| | | | | | | | |
| TOP TEN EQUITY HOLDINGS OF THE PORTFOLIO*** | |
| | 1. | | | TE Connectivity Ltd., (Switzerland) | | | 1.6 | % |
| | 2. | | | Lincare Holdings, Inc. | | | 1.3 | |
| | 3. | | | Humana, Inc. | | | 1.3 | |
| | 4. | | | Sherwin-Williams Co. (The) | | | 1.3 | |
| | 5. | | | Carlisle Cos., Inc. | | | 1.2 | |
| | 6. | | | Coach, Inc. | | | 1.2 | |
| | 7. | | | Coventry Health Care, Inc. | | | 1.1 | |
| | 8. | | | Concho Resources, Inc. | | | 1.1 | |
| | 9. | | | Marriott International, Inc., Class A | | | 1.1 | |
| | 10. | | | T. Rowe Price Group, Inc. | | | 1.1 | |
| | | | |
PORTFOLIO COMPOSITION BY SECTOR*** | |
| Consumer Discretionary | | | 19.3 | % |
| Financials | | | 15.7 | |
| Information Technology | | | 15.3 | |
| Industrials | | | 13.0 | |
| Health Care | | | 11.2 | |
| Energy | | | 8.1 | |
| Materials | | | 5.4 | |
| Utilities | | | 5.0 | |
| Consumer Staples | | | 3.0 | |
| Telecommunication Services | | | 0.8 | |
| Short-Term Investment | | | 3.2 | |
| * | | The return shown is based on net asset value calculated for shareholder transactions and may differ from the return shown in the financial highlights, which reflects adjustments made to the net asset value in accordance with accounting principles generally accepted in the United States of America. |
| ** | | The advisor seeks to achieve the Fund’s objective. There can be no guarantee it will be achieved. |
| *** | | Percentages indicated are based upon total investments (excluding Investments of Cash Collateral for Securities on Loan) as of June 30, 2011. The Fund’s composition is subject to change. |
| | | | | | |
| | | |
| 8 | | | | J.P. MORGAN MID CAP/MULTI-CAP FUNDS | | JUNE 30, 2011 |
| | | | | | | | | | | | | | | | |
AVERAGE ANNUAL TOTAL RETURNS AS OF JUNE 30, 2011 | |
| | | | |
| | | INCEPTION DATE
OF CLASS | | | 1 YEAR | | | 5 YEAR | | | 10 YEAR | |
CLASS A SHARES | | | 11/2/09 | | | | | | | | | | | | | |
Without Sales Charge | | | | | | | 36.66 | % | | | 5.46 | % | | | 7.39 | % |
With Sales Charge* | | | | | | | 29.49 | | | | 4.33 | | | | 6.81 | |
CLASS C SHARES | | | 11/2/09 | | | | | | | | | | | | | |
Without CDSC | | | | | | | 36.04 | | | | 5.29 | | | | 7.31 | |
With CDSC** | | | | | | | 35.04 | | | | 5.29 | | | | 7.31 | |
SELECT CLASS SHARES | | | 1/1/97 | | | | 37.15 | | | | 5.58 | | | | 7.45 | |
| * | | Sales Charge for Class A Shares is 5.25%. |
| ** | | Assumes a 1% CDSC (contingent deferred sales charge) for the one year period and 0% CDSC thereafter. |
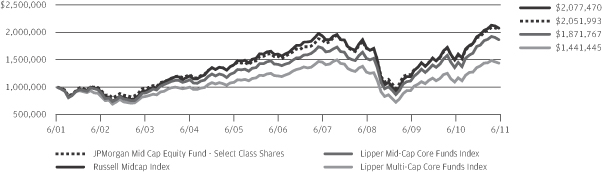
TEN YEAR PERFORMANCE (6/30/01 TO 6/30/11)
Source: Lipper, Inc. The performance quoted is past performance and is not a guarantee of future results. Mutual funds are subject to certain market risks. Investment returns and principal value of an investment will fluctuate so that an investor’s shares, when redeemed, may be worth more or less than their original cost. Current performance may be higher or lower than the performance data shown. For up-to-date month-end performance information please call 1-800-480-4111.
Returns for Class A and Class C Shares prior to their inception date were based on the performance of Select Class Shares. The actual returns of Class A and Class C Shares would have been lower than those shown because Class A and Class C Shares have higher expenses than Select Class Shares.
The graph illustrates comparative performance for $1,000,000 invested in the Select Class Shares of JPMorgan Mid Cap Equity Fund, the Russell Midcap Index, the Lipper Mid-Cap Core Funds Index and the Lipper Multi-Cap Core Funds Index from June 30, 2001 to June 30, 2011. The performance of the Fund assumes reinvestment of all dividends and capital gains, if any. The performance of the Russell Midcap Index does not reflect the deduction of expenses or a sales charge associated with a mutual fund and has been adjusted to reflect reinvestment of all dividends and capital gains of the securities included in the benchmark. The performance of the Lipper Mid-Cap Core Funds Index and the
Lipper Multi-Cap Core Funds Index include expenses associated with a mutual fund, such as investment management fees. These expenses are not identical to the expenses charged by the Fund. The Russell Midcap Index is an unmanaged index which measures the performance of the 800 smallest companies in the Russell 1000 Index. The Lipper Mid-Cap Core Funds Index and the Lipper Multi-Cap Core Funds Index are indexes based on total returns of certain mutual funds as determined by Lipper, Inc. Investors cannot invest directly in an Index.
Select Class Shares have a $1,000,000 minimum initial investment and carry no sales charge.
Performance may reflect the waiver of the Fund’s fees and reimbursement of expenses for certain periods since the inception date. Without these waivers and reimbursements performance would have been lower. Also, performance shown in this section does not reflect the deduction of taxes that a shareholder would pay on Fund distributions or redemption of Fund shares.
The return shown is based on net asset value calculated for shareholder transactions and may differ from the return shown in the financial highlights, which reflect adjustments made to the net asset value in accordance with accounting principles generally accepted in the United States of America.
| | | | | | | | |
| | | |
| JUNE 30, 2011 | | J.P. MORGAN MID CAP/MULTI-CAP FUNDS | | | | | 9 | |
JPMorgan Mid Cap Growth Fund
FUND COMMENTARY
TWELVE MONTHS ENDED JUNE 30, 2011 (Unaudited)
| | | | |
| REPORTING PERIOD RETURN: | | | |
| Fund (Select Class Shares)* | | | 43.01% | |
| Russell Midcap Growth Index | | | 43.25% | |
| |
| Net Assets as of 6/30/2011 (In Thousands) | | $ | 1,775,753 | |
INVESTMENT OBJECTIVE**
The JPMorgan Mid Cap Growth Fund (the “Fund”) seeks growth of capital and secondarily, current income by investing primarily in equity securities.
WHAT WERE THE MAIN DRIVERS OF THE FUND’S PERFORMANCE?
The Fund (Select Class Shares) underperformed the Russell Midcap Growth Index (the “Benchmark”) for the twelve months ended June 30, 2011. The Fund’s stock selection in the consumer discretionary and materials and processing sectors detracted from relative performance, while the Fund’s stock selection in the producer durables and health care sectors contributed to relative performance
Individual detractors from the Fund’s relative performance included the Fund’s underweight positions in priceline.com, Inc., Altera Corp. and Wynn Resorts Ltd., three stocks that performed strongly in the Benchmark. Shares of online travel company priceline.com, Inc. increased due to the company’s better-than-expected earnings, driven by strong growth in its global hotel business. Shares of chipmaker Altera Corp. benefited from the company’s higher-than-expected second-quarter sales. Casino and gaming company Wynn Resorts Ltd. benefited from investor optimism about growth from the company’s position in the Macau gaming industry.
Individual contributors to relative performance included the Fund’s positions in Valeant Pharmaceuticals International Inc., Coventry Health Care, Inc. and Cummins Inc. Shares of Valeant Pharmaceuticals International Inc. rose after the specialty pharmaceutical company completed its merger with Biovail Corp. and reported a positive outlook for 2011, suggesting that the integration of the two companies was proceeding faster than investors had initially anticipated. Shares of accident and health insurance company Coventry Health Care, Inc. increased after the company reported better-than-expected first-quarter earnings. Cummins Inc., a provider of components for truck engines, reported strong earnings driven mainly by robust demand for new trucks in emerging markets. Meanwhile, demand in North America continued to recover from very depressed levels as trucking companies replaced their aging truck fleets.
HOW WAS THE FUND POSITIONED?
The Fund’s portfolio managers utilized a bottom-up approach to stock selection, rigorously researching individual companies
in an effort to construct a portfolio of stocks that have strong fundamentals. The Fund’s portfolio managers preferred to invest in high quality companies with durable franchises that, in their view, possessed the ability to generate strong future earnings growth.
As a result of this bottom-up stock selection process, the Fund’s largest overweights versus the Benchmark were in the technology and financial services sectors and the Fund’s largest underweights versus the Benchmark were in the consumer staples and materials and processing sectors.
| | | | | | | | |
| TOP TEN EQUITY HOLDINGS OF THE PORTFOLIO*** | |
| | 1. | | | Coach, Inc. | | | 2.3 | % |
| | 2. | | | Concho Resources, Inc. | | | 2.2 | |
| | 3. | | | Agilent Technologies, Inc. | | | 1.9 | |
| | 4. | | | W.W. Grainger, Inc. | | | 1.9 | |
| | 5. | | | Valeant Pharmaceuticals International, Inc., (Canada) | | | 1.8 | |
| | 6. | | | Cameron International Corp. | | | 1.7 | |
| | 7. | | | TE Connectivity Ltd., (Switzerland) | | | 1.6 | |
| | 8. | | | Humana, Inc. | | | 1.6 | |
| | 9. | | | Cummins, Inc. | | | 1.5 | |
| | 10. | | | Coventry Health Care, Inc. | | | 1.5 | |
| | | | |
PORTFOLIO COMPOSITION BY SECTOR*** | |
| Information Technology | | | 24.6 | % |
| Consumer Discretionary | | | 19.3 | |
| Industrials | | | 17.0 | |
| Health Care | | | 16.2 | |
| Financials | | | 8.7 | |
| Energy | | | 8.4 | |
| Materials | | | 3.6 | |
| Short-Term Investment | | | 2.2 | |
| * | | The return shown is based on net asset value calculated for shareholder transactions and may differ from the return shown in the financial highlights, which reflects adjustments made to the net asset value in accordance with accounting principles generally accepted in the United States of America. |
| ** | | The advisor seeks to achieve the Fund’s objective. There can be no guarantee it will be achieved. |
| *** | | Percentages indicated are based upon total investments (excluding Investments of Cash Collateral for Securities on Loan) as of June 30, 2011. The Fund’s composition is subject to change. |
| | | | | | |
| | | |
| 10 | | | | J.P. MORGAN MID CAP/MULTI-CAP FUNDS | | JUNE 30, 2011 |
| | | | | | | | | | | | | | | | |
AVERAGE ANNUAL TOTAL RETURNS AS OF JUNE 30, 2011 | |
| | | | |
| | | INCEPTION DATE
OF CLASS | | | 1 YEAR | | | 5 YEAR | | | 10 YEAR | |
CLASS A SHARES | | | 2/18/92 | | | | | | | | | | | | | |
Without Sales Charge | | | | | | | 42.59 | % | | | 6.19 | % | | | 5.36 | % |
With Sales Charge* | | | | | | | 35.07 | | | | 5.05 | | | | 4.79 | |
CLASS B SHARES | | | 1/14/94 | | | | | | | | | | | | | |
Without CDSC | | | | | | | 41.89 | | | | 5.58 | | | | 4.79 | |
With CDSC** | | | | | | | 36.89 | | | | 5.26 | | | | 4.79 | |
CLASS C SHARES | | | 11/4/97 | | | | | | | | | | | | | |
Without CDSC | | | | | | | 41.85 | | | | 5.57 | | | | 4.67 | |
With CDSC*** | | | | | | | 40.85 | | | | 5.57 | | | | 4.67 | |
CLASS R2 SHARES | | | 6/19/09 | | | | 42.37 | | | | 6.02 | | | | 5.18 | |
SELECT CLASS SHARES | | | 3/2/89 | | | | 43.01 | | | | 6.49 | | | | 5.64 | |
| * | | Sales Charge for Class A Shares is 5.25%. |
| ** | | Assumes 5% CDSC (contingent deferred sales charge) for the one year period, 2% CDSC for the five year period and 0% CDSC thereafter. |
| *** | | Assumes a 1% CDSC for the one year period and 0% CDSC thereafter. |
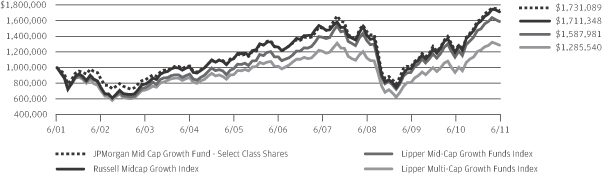
TEN YEAR PERFORMANCE (6/30/01 TO 6/30/11)
Source: Lipper, Inc. The performance quoted is past performance and is not a guarantee of future results. Mutual funds are subject to certain market risks. Investment returns and principal value of an investment will fluctuate so that an investor’s shares, when redeemed, may be worth more or less than their original cost. Current performance may be higher or lower than the performance data shown. For up-to-date month-end performance information please call 1-800-480-4111.
Returns for the Class R2 Shares prior to its inception date are based on the performance of Select Class Shares. Prior performance for Class R2 Shares has been adjusted to reflect the differences in expenses and sales charges between classes.
The graph illustrates comparative performance for $1,000,000 invested in Select Class Shares of the JPMorgan Mid Cap Growth Fund, the Russell Midcap Growth Index, the Lipper Multi-Cap Growth Funds Index and Lipper Mid-Cap Growth Funds Index from June 30, 2001 to June 30, 2011. The performance of the Fund assumes reinvestment of all dividends and capital gains, if any, and does not include a sales charge. The performance of the Russell Midcap Growth Index does not reflect the deduction of expenses or a sales charge associated with a mutual fund and has been adjusted to reflect reinvestment of all dividends and capital gains of the securities included in the benchmark. The performance of the Lipper Multi-Cap Growth Funds Index and Lipper Mid-Cap Growth Funds Index include expenses associated with a mutual fund, such as
investment management fees. These expenses are not identical to the expenses charged by the Fund. The Russell Midcap Growth Index is an unmanaged index which measures the performance of those Russell Midcap companies with higher price-to-book ratios and higher forecasted growth values. The Lipper Multi-Cap Growth Funds Index and Lipper Mid-Cap Growth Funds Index are indexes based on total returns of certain mutual funds as determined by Lipper, Inc. Investors cannot invest directly in an index.
Select Class Shares have a $1,000,000 minimum initial investment and carry no sales charge.
Performance may reflect the waiver of the Fund’s fees and reimbursement of expenses for certain periods since the inception date. Without these waivers and reimbursements performance would have been lower. Also, performance shown in this section does not reflect the deduction of taxes that a shareholder would pay on Fund distributions or redemption of Fund shares.
Because Class B Shares automatically convert to Class A Shares after 8 years, the 10 year average annual total return shown above for Class B reflects Class A performance for the period after conversion.
The returns shown are based on net asset values calculated for shareholder transactions and may differ from the return shown in the financial highlights, which reflect adjustments made to the net asset values in accordance with accounting principles generally accepted in the United States of America.
| | | | | | | | |
| | | |
| JUNE 30, 2011 | | J.P. MORGAN MID CAP/MULTI-CAP FUNDS | | | | | 11 | |
JPMorgan Mid Cap Value Fund
FUND COMMENTARY
TWELVE MONTHS ENDED JUNE 30, 2011 (Unaudited)
| | | | |
| REPORTING PERIOD RETURN: | | | |
| Fund (Institutional Class Shares)* | | | 32.66% | |
| Russell Midcap Value Index | | | 34.28% | |
| |
| Net Assets as of 6/30/2011 (In Thousands) | | $ | 6,775,834 | |
INVESTMENT OBJECTIVE**
The JPMorgan Mid Cap Value Fund (the “Fund”) seeks growth from capital appreciation.
WHAT WERE THE MAIN DRIVERS OF THE FUND’S PERFORMANCE?
The Fund (Institutional Class Shares) underperformed the Russell Midcap Value Index (the “Benchmark”) for the twelve months ended June 30, 2011. The Fund’s relative underperformance versus the Benchmark was primarily driven by negative stock selection in the health care and financials sectors. The Fund’s stock selection in the information technology sector as well as stock selection and an underweight in the utilities sector contributed to relative performance.
Individual detractors from the Fund’s relative performance included the Fund’s underweight positions in Cigna Corp., Discover Financial Services and Spectra Energy Corp., three stocks that performed strongly in the Benchmark. Insurance company Cigna raised its expectations for 2011 earnings, which helped the stock. Shares of consumer financial services company Discover Financial Services advanced due to consistent improvements in credit card delinquencies. Shares of natural gas company, Spectra Energy Corp. increased as investors began to recognize that a lower percentage of company profits are being derived from commodity sensitive activities while pipelines were making larger contributions to cash flow.
Individual contributors to relative performance included Williams Cos., Tiffany & Co. and Albemarle Corp. Shares of Williams Cos., an integrated energy company, rose as investors reacted positively to the announcement that it would separate into two distinct publicly traded companies. Shares of jewelry retailer Tiffany & Co. gained after the company reported strong fiscal first-quarter earnings and raised its outlook for full-year earnings, as its strong market position more than offset the impact from rising raw materials costs. Shares of Albemarle Corp., a specialty chemical company, advanced on strong earnings gains throughout the reporting period, driven by the continued growth in electronics, which led to increased demand for brominated flame retardants.
HOW WAS THE FUND POSITIONED?
The Fund’s portfolio managers utilized a bottom-up approach to stock selection and sought to identify durable franchises possessing the ability to generate sustainable levels of free
cash flow. The Fund’s portfolio managers believed that these types of companies should perform relatively well in what they view as a slow but sustainable economic recovery in the United States. The Fund’s largest overweight continued to be in the consumer discretionary sector. The Fund’s portfolio managers sought to own retailers with strong brands and business models that produce recurring revenue, believing that these factors, coupled with lower levels of capital spending, should contribute to their sustainable generation of free cash flow.
| | | | | | | | |
| TOP TEN EQUITY HOLDINGS OF THE PORTFOLIO*** | |
| | 1. | | | Republic Services, Inc. | | | 2.1 | % |
| | 2. | | | Energen Corp. | | | 1.9 | |
| | 3. | | | Loews Corp. | | | 1.9 | |
| | 4. | | | Fortune Brands, Inc. | | | 1.7 | |
| | 5. | | | Oneok, Inc. | | | 1.7 | |
| | 6. | | | CMS Energy Corp. | | | 1.6 | |
| | 7. | | | Bed Bath & Beyond, Inc. | | | 1.6 | |
| | 8. | | | Ball Corp. | | | 1.6 | |
| | 9. | | | TE Connectivity Ltd., (Switzerland) | | | 1.6 | |
| | 10. | | | Devon Energy Corp. | | | 1.5 | |
| | | | |
PORTFOLIO COMPOSITION BY SECTOR*** | |
| Financials | | | 23.4 | % |
| Consumer Discretionary | | | 19.6 | |
| Utilities | | | 10.1 | |
| Industrials | | | 9.0 | |
| Energy | | | 7.8 | |
| Materials | | | 7.3 | |
| Health Care | | | 6.2 | |
| Consumer Staples | | | 6.1 | |
| Information Technology | | | 5.9 | |
| Telecommunication Services | | | 1.9 | |
| Short-Term Investment | | | 2.7 | |
| * | | The return shown is based on net asset value calculated for shareholder transactions and may differ from the return shown in the financial highlights, which reflects adjustments made to the net asset value in accordance with accounting principles generally accepted in the United States of America. |
| ** | | The advisor seeks to achieve the Fund’s objective. There can be no guarantee it will be achieved. |
| *** | | Percentages indicated are based upon total investments (excluding Investments of Cash Collateral for Securities on Loan) as of June 30, 2011. The Fund’s composition is subject to change. |
| | | | | | |
| | | |
| 12 | | | | J.P. MORGAN MID CAP/MULTI-CAP FUNDS | | JUNE 30, 2011 |
| | | | | | | | | | | | | | | | |
AVERAGE ANNUAL TOTAL RETURNS AS OF JUNE 30, 2011 | |
| | | | |
| | | INCEPTION DATE
OF CLASS | | | 1 YEAR | | | 5 YEAR | | | 10 YEAR | |
CLASS A SHARES | | | 4/30/01 | | | | | | | | | | | | | |
Without Sales Charge | | | | | | | 31.96 | % | | | 4.47 | % | | | 8.86 | % |
With Sales Charge* | | | | | | | 25.02 | | | | 3.35 | | | | 8.27 | |
CLASS B SHARES | | | 4/30/01 | | | | | | | | | | | | | |
Without CDSC | | | | | | | 31.33 | | | | 3.95 | | | | 8.35 | |
With CDSC** | | | | | | | 26.33 | | | | 3.60 | | | | 8.35 | |
CLASS C SHARES | | | 4/30/01 | | | | | | | | | | | | | |
Without CDSC | | | | | | | 31.29 | | | | 3.95 | | | | 8.26 | |
With CDSC*** | | | | | | | 30.29 | | | | 3.95 | | | | 8.26 | |
CLASS R2 SHARES | | | 11/3/08 | | | | 31.66 | | | | 4.33 | | | | 8.79 | |
INSTITUTIONAL CLASS SHARES | | | 11/13/97 | | | | 32.66 | | | | 5.00 | | | | 9.40 | |
SELECT CLASS SHARES | | | 10/31/01 | | | | 32.29 | | | | 4.74 | | | | 9.14 | |
| * | | Sales Charge for Class A Shares is 5.25%. |
| ** | | Assumes 5% CDSC (contingent deferred sales charge) for the one year period, 2% CDSC for the five year period and 0% CDSC thereafter. |
| *** | | Assumes a 1% CDSC for the one year period and 0% CDSC thereafter. |
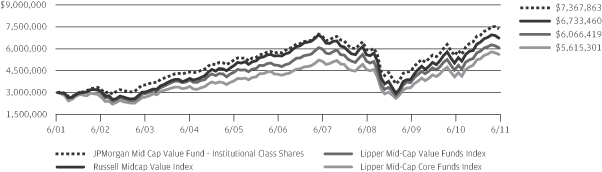
TEN YEAR PERFORMANCE (6/30/01 TO 6/30/11)
Source: Lipper, Inc. The performance quoted is past performance and is not a guarantee of future results. Mutual funds are subject to certain market risks. Investment returns and principal value of an investment will fluctuate so that an investor’s shares, when redeemed, may be worth more or less than their original cost. Current performance may be higher or lower than the performance data shown. For up-to-date month-end performance information please call 1-800-480-4111.
Returns for Class R2 Shares prior to its inception date are based on the performance of Class A Shares. The actual returns of Class R2 Shares would have been lower than those shown because Class R2 Shares have higher expenses than Class A Shares.
The graph illustrates comparative performance for $3,000,000 invested in Institutional Class Shares of the JPMorgan Mid Cap Value Fund, the Russell Mid-cap Value Index, the Lipper Mid-Cap Core Funds Index and the Lipper Mid-Cap Value Funds Index from June 30, 2001 to June 30, 2011. The performance of the Fund assumes reinvestment of all dividends and capital gains, if any, and does not include a sales charge. The performance of the Russell Midcap Value Index does not reflect the deduction of expenses or a sales charge associated with a mutual fund and has been adjusted to reflect
reinvestment of all dividends and capital gains of the securities included in the benchmark. The performance of the Lipper Mid-Cap Core Funds Index and the Lipper Mid-Cap Value Funds Index include expenses associated with a mutual fund, such as investment management fees. These expenses are not identical to the expenses charged by the Fund. The Russell Midcap Value Index is an unmanaged index which measures the performance of those Russell Midcap companies with lower price-to-book ratios and lower forecasted growth values. The Lipper Mid-Cap Core Funds Index and the Lipper Mid-Cap Value Funds Index are indexes based on total returns of certain groups of mutual funds as determined by Lipper, Inc. The Fund’s Lipper Index changed to the Lipper Mid-Cap Core Funds Index because Lipper recategorized the Fund. Investors cannot invest directly in an index.
Institutional Class Shares have a $3,000,000 minimum initial investment and carry no sales charge.
Performance may reflect the waiver of the Fund’s fees and reimbursement of expenses for certain periods since the inception date. Without these waivers and reimbursements performance would have been lower. Also, performance shown in this section does not reflect the deduction of taxes that a shareholder would pay on Fund distributions or redemption of Fund shares.
| | | | | | | | |
| | | |
| JUNE 30, 2011 | | J.P. MORGAN MID CAP/MULTI-CAP FUNDS | | | | | 13 | |
JPMorgan Mid Cap Value Fund
FUND COMMENTARY
TWELVE MONTHS ENDED JUNE 30, 2011 (Unaudited) (continued)
Because Class B Shares automatically convert to Class A Shares after 8 years, the 10 year average annual total return shown above for Class B reflects Class A performance for the period after conversion.
The returns shown are based on net asset values calculated for shareholder transactions and may differ from the return shown in the financial highlights, which reflect adjustments made to the net asset values in accordance with accounting principles generally accepted in the United States of America.
| | | | | | |
| | | |
| 14 | | | | J.P. MORGAN MID CAP/MULTI-CAP FUNDS | | JUNE 30, 2011 |
JPMorgan Multi-Cap Market Neutral Fund
FUND COMMENTARY
TWELVE MONTHS ENDED JUNE 30, 2011 (Unaudited)
| | | | |
| REPORTING PERIOD RETURN: | | | |
| Fund (Select Class Shares)* | | | 1.23% | |
| BofA Merrill Lynch 3-Month U.S. Treasury Bill Index | | | 0.16% | |
| |
| Net Assets as of 6/30/2011 (In Thousands) | | | $546,447 | |
INVESTMENT OBJECTIVE**
The JPMorgan Multi-Cap Market Neutral Fund (the “Fund”) seeks long-term capital preservation and growth by using strategies designed to produce returns which have no correlation with general domestic market performance.
WHAT WERE THE MAIN DRIVERS OF THE FUND’S PERFORMANCE?
The Fund (Select Class Shares) outperformed the BofA Merrill Lynch 3-Month U.S. Treasury Bill Index for the twelve months ended June 30, 2011.
The Fund’s portfolio managers employed a quantitative bottom-up approach to their stock selection process, focusing on both valuation and fundamentals. The Fund’s valuation stock selection model seeks to determine how a stock is priced relative to its intrinsic value by considering valuation factors such as a company’s cash flow and price-to-book values. The Fund’s fundamentals stock selection model attempts to identify how healthy a company’s short-term operating trends are judged to be, using metrics such as stock price momentum and earnings momentum.
During the reporting period, the environment was positive for the Fund’s stock selection process as investors began to refocus on stock specific information and trade less based on macroeconomic data. As a result, the Fund experienced positive returns in each of the following five supersectors: consumer, financial, industrial, technology and health care sectors. Stock selection in the technology, consumer and health care sectors contributed the most to the Fund’s return.
HOW WAS THE FUND POSITIONED?
The Fund’s portfolio managers ranked stocks within a universe of approximately 1,300 large-cap, mid-cap and high-end small-cap stocks. The Fund owned more than 350 long and short positions during the reporting period and was sector-neutral. The Fund’s portfolio managers sought to go long on inexpensive stocks with improving fundamentals and short on expensive stocks with deteriorating fundamentals. They continued to use strategies designed to produce returns that have no correlation with general domestic market performance.
| | | | | | | | |
| | | |
| JUNE 30, 2011 | | J.P. MORGAN MID CAP/MULTI-CAP FUNDS | | | | | 15 | |
JPMorgan Multi-Cap Market Neutral Fund
FUND COMMENTARY
TWELVE MONTHS ENDED JUNE 30, 2011 (Unaudited) (continued)
| | | | | | | | |
| TOP TEN EQUITY LONG HOLDINGS OF THE PORTFOLIO*** | |
| | 1. | | | GT Solar International, Inc. | | | 0.5 | % |
| | 2. | | | TRW Automotive Holdings Corp. | | | 0.4 | |
| | 3. | | | Lorillard, Inc. | | | 0.4 | |
| | 4. | | | IAC/InterActiveCorp. | | | 0.4 | |
| | 5. | | | Forest Laboratories, Inc. | | | 0.4 | |
| | 6. | | | Alliance Data Systems Corp. | | | 0.4 | |
| | 7. | | | AMERIGROUP Corp. | | | 0.4 | |
| | 8. | | | Complete Production Services, Inc. | | | 0.4 | |
| | 9. | | | RPC, Inc. | | | 0.4 | |
| | 10. | | | Healthspring, Inc. | | | 0.4 | |
| | | | | | | | |
| TOP TEN EQUITY SHORT HOLDINGS OF THE PORTFOLIO**** | |
| | 1. | | | Robbins & Myers, Inc. | | | 0.5 | % |
| | 2. | | | Green Mountain Coffee Roasters, Inc. | | | 0.5 | |
| | 3. | | | Pharmasset, Inc. | | | 0.5 | |
| | 4. | | | Under Armour, Inc., Class A | | | 0.5 | |
| | 5. | | | CarMax, Inc. | | | 0.5 | |
| | 6. | | | Spectra Energy Corp. | | | 0.5 | |
| | 7. | | | Eastman Kodak Co. | | | 0.5 | |
| | 8. | | | Carpenter Technology Corp. | | | 0.5 | |
| | 9. | | | Office Depot, Inc. | | | 0.5 | |
| | 10. | | | Mead Johnson Nutrition Co. | | | 0.4 | |
| | | | |
PORTFOLIO COMPOSITION BY SECTOR LONG POSITIONS*** | |
| Consumer Discretionary | | | 17.9 | % |
| Information Technology | | | 17.5 | |
| Industrials | | | 12.2 | |
| Financials | | | 11.0 | |
| Health Care | | | 9.6 | |
| Energy | | | 7.4 | |
| Materials | | | 6.3 | |
| Utilities | | | 5.9 | |
| Consumer Staples | | | 4.9 | |
| Telecommunication Services | | | 0.9 | |
| Short-Term Investment | | | 6.4 | |
| | | | |
PORTFOLIO COMPOSITION BY SECTOR SHORT POSITIONS**** | |
| Information Technology | | | 16.5 | % |
| Industrials | | | 14.4 | |
| Consumer Discretionary | | | 13.4 | |
| Financials | | | 12.8 | |
| Health Care | | | 11.2 | |
| Energy | | | 10.8 | |
| Materials | | | 8.2 | |
| Utilities | | | 6.0 | |
| Consumer Staples | | | 5.0 | |
| Telecommunication Services | | | 1.7 | |
| * | | The return shown is based on net asset value calculated for shareholder transactions and may differ from the return shown in the financial highlights, which reflects adjustments made to the net asset value in accordance with accounting principles generally accepted in the United States of America. |
| ** | | The advisor seeks to achieve the Fund’s objective. There can be no guarantee it will be achieved. |
| *** | | Percentages indicated are based upon total long investments as of June 30, 2011. The Fund’s composition is subject to change. |
| **** | | Percentages indicated are based upon total short investments as of June 30, 2011. The Fund’s composition is subject to change. |
| | | | | | |
| | | |
| 16 | | | | J.P. MORGAN MID CAP/MULTI-CAP FUNDS | | JUNE 30, 2011 |
| | | | | | | | | | | | | | | | |
AVERAGE ANNUAL TOTAL RETURNS AS OF JUNE 30, 2011 | |
| | | INCEPTION DATE
OF CLASS | | | 1 YEAR | | | 5 YEAR | | | SINCE
INCEPTION | |
| | | | | | | | | | | | | | | | |
CLASS A SHARES | | | 5/23/03 | | | | | | | | | | | | | |
Without Sales Charge | | | | | | | 1.03 | % | | | (0.63 | )% | | | 1.51 | % |
With Sales Charge* | | | | | | | (4.29 | ) | | | (1.69 | ) | | | 0.85 | |
CLASS B SHARES | | | 5/23/03 | | | | | | | | | | | | | |
Without CDSC | | | | | | | 0.32 | | | | (1.36 | ) | | | 0.77 | |
With CDSC** | | | | | | | (4.68 | ) | | | (1.79 | ) | | | 0.77 | |
CLASS C SHARES | | | 5/23/03 | | | | | | | | | | | | | |
Without CDSC | | | | | | | 0.21 | | | | (1.37 | ) | | | 0.76 | |
With CDSC*** | | | | | | | (0.79 | ) | | | (1.37 | ) | | | 0.76 | |
SELECT CLASS SHARES | | | 5/23/03 | | | | 1.23 | | | | (0.39 | ) | | | 1.76 | |
| * | | Sales Charge for Class A Shares is 5.25%. |
| ** | | Assumes 5% CDSC (contingent deferred sales charge) for the one year period, 2% CDSC for the five year period and 0% CDSC thereafter. |
| *** | | Assumes a 1% CDSC for the one year period and 0% CDSC thereafter. |
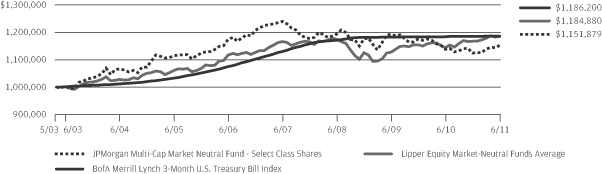
LIFE OF FUND PERFORMANCE (5/23/03 TO 6/30/11)
Source: Lipper, Inc. The performance quoted is past performance and is not a guarantee of future results. Mutual funds are subject to certain market risks. Investment returns and principal value of an investment will fluctuate so that an investor’s shares, when redeemed, may be worth more or less than their original cost. Current performance may be higher or lower than the performance data shown. For up-to-date month-end performance information please call 1-800-480-4111.
The Fund commenced operations on May 23, 2003.
The graph illustrates comparative performance for $1,000,000 invested in Select Class Shares of the JPMorgan Multi-Cap Market Neutral Fund, the BofA Merrill Lynch 3-Month U.S. Treasury Bill Index and the Lipper Equity Market-Neutral Funds Average from May 23, 2003 to June 30, 2011. The performance of the Fund assumes reinvestment of all dividends and capital gains, if any, and does not include a sales charge. The performance of the indices reflects an initial investment at the end of the month following the Fund’s inception. The performance of the BofA Merrill Lynch 3-Month U.S. Treasury Bill Index does not reflect the deduction of expenses or a sales charge associated with a mutual fund and has been adjusted to reflect reinvestment of all dividends and capital gains of the securities included in the benchmark. The performance of the Lipper Equity Market-Neutral Funds Average includes expenses associated with a mutual fund, such as investment management fees. These expenses are not identical to the expenses charged by the Fund. The BofA Merrill Lynch
3-Month U.S. Treasury Bill Index is comprised of a single issue purchased at the beginning of the month and held for a full month. Each month the index is rebalanced and the issue selected is the outstanding Treasury Bill that matures closest to, but not beyond 3 months from the rebalancing date. The Lipper Equity Market-Neutral Funds Average is an index based on total returns of certain mutual funds within the Fund’s designated category as determined by Lipper, Inc. Investors cannot invest directly in an index.
Select Class Shares have a $1,000,000 minimum initial investment and carry no sales charge.
Performance may reflect the waiver of the Fund’s fees and reimbursement of expenses for certain periods since the inception date. Without these waivers and reimbursements performance would have been lower. Also, performance shown in this section does not reflect the deduction of taxes that a shareholder would pay on Fund distributions or redemption of Fund shares.
Because the Class B Shares automatically convert to Class A Shares after eight years, the since inception average annual total return shown above for Class B reflects Class A performance for the period after conversion.
The returns shown are based on net asset values calculated for shareholder transactions and may differ from the return shown in the financial highlights, which reflect adjustments made to the net assets value in accordance with accounting principles generally accepted in the United States of America.
| | | | | | | | |
| | | |
| JUNE 30, 2011 | | J.P. MORGAN MID CAP/MULTI-CAP FUNDS | | | | | 17 | |
JPMorgan Value Advantage Fund
FUND COMMENTARY
TWELVE MONTHS ENDED JUNE 30, 2011 (Unaudited)
| | | | |
| REPORTING PERIOD RETURN: | | | |
| Fund (Institutional Class Shares)* | | | 27.06% | |
| Russell 3000 Value Index | | | 29.13% | |
| |
| Net Assets as of 6/30/2011 (In Thousands) | | $ | 918,841 | |
INVESTMENT OBJECTIVE**
The JPMorgan Value Advantage Fund (the “Fund”) seeks to provide long-term total return from a combination of income and capital gains.
WHAT WERE THE MAIN DRIVERS OF THE FUND’S PERFORMANCE?
The Fund (Institutional Class Shares) underperformed the Russell 3000 Value Index (the “Benchmark”) for the twelve months ended June 30, 2011. The Fund’s relative underperformance versus the Benchmark was driven primarily by the Fund’s stock selection in the energy and health care sectors. The Fund’s stock selection in the consumer discretionary sector also detracted from the Fund’s relative performance. The Fund’s stock selection in the financials and utilities sector contributed to relative performance. The Fund’s stock selection and underweight in the consumer staples sector also contributed to the Fund’s relative performance.
Individual detractors from the Fund’s relative performance included the Fund’s underweight positions in Chevron Corp., General Electric Co. and Verizon Communications Inc., three stocks that performed strongly in the Benchmark. Integrated energy company Chevron Corp. benefited from higher oil and gas prices as well as the corresponding increase in production volumes. Shares of General Electric Co. advanced as the company became increasingly optimistic about the economic recovery. Shares of Verizon Communications Inc. benefited from increased investor optimism about the company becoming a provider of the iPhone and its potential positive impact to future earnings.
Individual contributors to relative performance included Oneok, Inc., Loews Corp. and Albemarle Corp. Shares of diversified natural gas company Oneok, Inc. benefited from the company’s interest in Oneok Partners, a master limited partnership that reported strong first-quarter results. Shares of diversified holding company Loews Corp. increased after the company announced better-than-expected earnings and the reinstatement of its quarterly dividend. Shares of Albemarle Corp., a specialty chemical company, advanced on strong earnings gains throughout the reporting period, driven by the continued growth in electronics, which led to increased demand for brominated flame retardants.
HOW WAS THE FUND POSITIONED?
The Fund’s portfolio managers utilized a bottom-up approach to stock selection and sought to identify durable franchises possessing the ability to generate significant levels of free cash flow. The Fund’s largest overweight was in the consumer discretionary sector. The Fund’s portfolio managers sought retailers with strong brands and recurring revenue business models. They believed that these factors coupled with lower levels of capital spending should contribute to the generation of free cash flow for the retailers.
| | | | | | | | |
| TOP TEN EQUITY HOLDINGS OF THE PORTFOLIO*** | |
| | 1. | | | Wells Fargo & Co. | | | 3.7 | % |
| | 2. | | | Loews Corp. | | | 3.2 | |
| | 3. | | | Devon Energy Corp. | | | 2.8 | |
| | 4. | | | AT&T, Inc. | | | 2.6 | |
| | 5. | | | Exxon Mobil Corp. | | | 2.5 | |
| | 6. | | | Johnson & Johnson | | | 2.2 | |
| | 7. | | | Oneok, Inc. | | | 1.9 | |
| | 8. | | | Teekay Corp. (Canada) | | | 1.8 | |
| | 9. | | | Procter & Gamble Co. (The) | | | 1.7 | |
| | 10. | | | Pfizer, Inc. | | | 1.6 | |
| | | | |
PORTFOLIO COMPOSITION BY SECTOR*** | |
| Financials | | | 30.5 | % |
| Consumer Discretionary | | | 14.9 | |
| Energy | | | 11.2 | |
| Health Care | | | 10.5 | |
| Utilities | | | 7.4 | |
| Consumer Staples | | | 6.2 | |
| Telecommunication Services | | | 4.8 | |
| Industrials | | | 3.9 | |
| Materials | | | 3.5 | |
| Information Technology | | | 2.6 | |
| Investment Company | | | 1.0 | |
| Short-Term Investment | | | 3.5 | |
| * | | The return shown is based on net asset value calculated for share- holder transactions and may differ from the return shown in the financial highlights, which reflects adjustments made to the net asset value in accordance with accounting principles generally accepted in the United States of America. |
| ** | | The advisor seeks to achieve the Fund’s objective. There can be no guarantee it will be achieved. |
| *** | | Percentages indicated are based upon total investments as of June 30, 2011. The Fund’s composition is subject to change. |
| | | | | | |
| | | |
| 18 | | | | J.P. MORGAN MID CAP/MULTI-CAP FUNDS | | JUNE 30, 2011 |
| | | | | | | | | | | | | | | | |
AVERAGE ANNUAL TOTAL RETURNS AS OF JUNE 30, 2011 | |
| | | INCEPTION DATE
OF CLASS | | | 1 YEAR | | | 5 YEAR | | | SINCE
INCEPTION | |
CLASS A SHARES | | | 2/28/05 | | | | | | | | | | | | | |
Without Sales Charge | | | | | | | 26.45 | % | | | 4.89 | % | | | 6.33 | % |
With Sales Charge* | | | | | | | 19.84 | | | | 3.76 | | | | 5.43 | |
CLASS C SHARES | | | 2/28/05 | | | | | | | | | | | | | |
Without CDSC | | | | | | | 25.82 | | | | 4.37 | | | | 5.80 | |
With CDSC** | | | | | | | 24.82 | | | | 4.37 | | | | 5.80 | |
INSTITUTIONAL CLASS SHARES | | | 2/28/05 | | | | 27.06 | | | | 5.42 | | | | 6.78 | |
SELECT CLASS SHARES | | | 2/28/05 | | | | 26.75 | | | | 5.16 | | | | 6.60 | |
| * | | Sales Charge for Class A Shares is 5.25%. |
| ** | | Assumes a 1% CDSC (contingent deferred sales charge) for the one year period and 0% CDSC thereafter. |
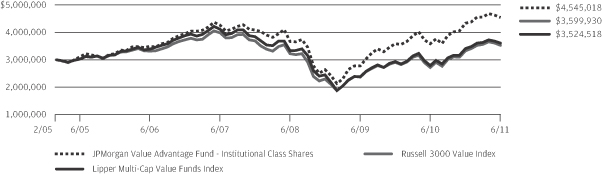
LIFE OF FUND PERFORMANCE (2/28/05 TO 6/30/11)
Source: Lipper, Inc. The performance quoted is past performance and is not a guarantee of future results. Mutual funds are subject to certain market risks. Investment returns and principal value of an investment will fluctuate so that an investor’s shares, when redeemed, may be worth more or less than their original cost. Current performance may be higher or lower than the performance data shown. For up-to-date month-end performance information please call 1-800-480-4111.
The Fund commenced operations on February 28, 2005.
The graph illustrates comparative performance for $3,000,000 invested in Institutional Class Shares of the JPMorgan Value Advantage Fund, the Russell 3000 Value Index and the Lipper Multi-Cap Value Funds Index from February 28, 2005 to June 30, 2011. The performance of the Fund assumes reinvestment of all dividends and capital gains, if any, and does not include a sales charge. The performance of the Russell 3000 Value Index does not reflect the deduction of expenses or a sales charge associated with a mutual fund and has been adjusted to reflect reinvestment of all dividends and capital gains of the securities included in the benchmark. The performance of the Lipper Multi-Cap Value Funds Index includes expenses associated with a mutual fund, such as
investment management fees. These expenses are not identical to the expenses charged by the Fund. The Russell 3000 Value Index is an unmanaged index which measures the performance of those Russell 3000 companies (largest 3000 U.S. companies) with lower price-to-book ratios and lower forecasted growth values. The Lipper Multi-Cap Value Funds Index is an index based on total returns of certain mutual funds within the Fund’s designated category as determined by Lipper, Inc. Investors cannot invest directly in an index.
Institutional Class Shares have a $3,000,000 minimum initial investment and carry no sales charge.
Performance may reflect the waiver of the Fund’s fees and reimbursement of expenses for certain periods since the inception date. Without these waivers and reimbursements performance would have been lower. Also, performance shown in this section does not reflect the deduction of taxes that a shareholder would pay on Fund distributions or redemption of Fund shares.
The returns shown are based on net asset values calculated for shareholder transactions and may differ from the return shown in the financial highlights, which reflect adjustments made to the net asset values in accordance with accounting principles generally accepted in the United States of America.
| | | | | | | | |
| | | |
| JUNE 30, 2011 | | J.P. MORGAN MID CAP/MULTI-CAP FUNDS | | | | | 19 | |
JPMorgan Growth Advantage Fund
SCHEDULE OF PORTFOLIO INVESTMENTS
AS OF JUNE 30, 2011
(Amounts in thousands)
| | | | | | | | |
| SHARES | | | SECURITY DESCRIPTION | | VALUE($) | |
| | | | | | | | |
| Common Stocks — 99.6% | | | | |
| | | | Consumer Discretionary — 19.7% | | | | |
| | | | Auto Components — 2.2% | |
| | 162 | | | BorgWarner, Inc. (a) | | | 13,056 | |
| | 334 | | | Johnson Controls, Inc. | | | 13,931 | |
| | | | | | | | |
| | | | | | | 26,987 | |
| | | | | | | | |
| | | | Automobiles — 1.6% | |
| | 327 | | | Harley-Davidson, Inc. | | | 13,381 | |
| | 186 | | | Tesla Motors, Inc. (a) (c) | | | 5,421 | |
| | | | | | | | |
| | | | | | | 18,802 | |
| | | | | | | | |
| | | | Diversified Consumer Services — 1.5% | |
| | 236 | | | American Public Education, Inc. (a) | | | 10,500 | |
| | 168 | | | Sotheby’s | | | 7,312 | |
| | | | | | | | |
| | | | | | | 17,812 | |
| | | | | | | | |
| | | | Hotels, Restaurants & Leisure — 3.0% | |
| | 169 | | | BJ’s Restaurants, Inc. (a) | | | 8,854 | |
| | 230 | | | Cheesecake Factory, Inc. (The) (a) | | | 7,227 | |
| | 302 | | | Gaylord Entertainment Co. (a) | | | 9,060 | |
| | 327 | | | Marriott International, Inc., Class A | | | 11,609 | |
| | | | | | | | |
| | | | | | | 36,750 | |
| | | | | | | | |
| | | | Internet & Catalog Retail — 3.5% | |
| | 131 | | | Amazon.com, Inc. (a) | | | 26,727 | |
| | 170 | | | HomeAway, Inc. (a) | | | 6,587 | |
| | 37 | | | NetFlix, Inc. (a) | | | 9,772 | |
| | | | | | | | |
| | | | | | | 43,086 | |
| | | | | | | | |
| | | | Media — 4.5% | |
| | 319 | | | DIRECTV, Class A (a) | | | 16,196 | |
| | 290 | | | Scripps Networks Interactive, Inc., Class A | | | 14,190 | |
| | 4,467 | | | Sirius XM Radio, Inc. (a) | | | 9,783 | |
| | 361 | | | Walt Disney Co. (The) | | | 14,078 | |
| | | | | | | | |
| | | | | | | 54,247 | |
| | | | | | | | |
| | | | Textiles, Apparel & Luxury Goods— 3.4% | |
| | 374 | | | Coach, Inc. | | | 23,903 | |
| | 102 | | | Deckers Outdoor Corp. (a) | | | 8,982 | |
| | 224 | | | Vera Bradley, Inc. (a) | | | 8,549 | |
| | | | | | | | |
| | | | | | | 41,434 | |
| | | | | | | | |
| | | | Total Consumer Discretionary | | | 239,118 | |
| | | | | | | | |
| | | | Energy — 9.1% | |
| | | | Energy Equipment & Services — 4.2% | |
| | 345 | | | Cameron International Corp. (a) | | | 17,364 | |
| | 171 | | | National Oilwell Varco, Inc. | | | 13,382 | |
| | 234 | | | Schlumberger Ltd. | | | 20,191 | |
| | | | | | | | |
| | | | | | | 50,937 | |
| | | | | | | | |
| | | | | | | | |
| SHARES | | | SECURITY DESCRIPTION | | VALUE($) | |
| | | | | | | | |
| | | | | | | | |
| | | | Oil, Gas & Consumable Fuels — 4.9% | |
| | 90 | | | Apache Corp. | | | 11,056 | |
| | 211 | | | Concho Resources, Inc. (a) | | | 19,362 | |
| | 294 | | | Forest Oil Corp. (a) | | | 7,856 | |
| | 151 | | | Newfield Exploration Co. (a) | | | 10,264 | |
| | 271 | | | Southwestern Energy Co. (a) | | | 11,633 | |
| | | | | | | | |
| | | | | | | 60,171 | |
| | | | | | | | |
| | | | Total Energy | | | 111,108 | |
| | | | | | | | |
| | | | Financials — 7.8% | |
| | | | Capital Markets — 2.4% | |
| | 281 | | | Lazard Ltd., (Bermuda), Class A | | | 10,440 | |
| | 467 | | | Och-Ziff Capital Management Group LLC, Class A | | | 6,473 | |
| | 201 | | | T. Rowe Price Group, Inc. | | | 12,152 | |
| | | | | | | | |
| | | | | | | 29,065 | |
| | | | | | | | |
| | | | Commercial Banks — 1.9% | |
| | 465 | | | U.S. Bancorp | | | 11,855 | |
| | 417 | | | Wells Fargo & Co. | | | 11,698 | |
| | | | | | | | |
| | | | | | | 23,553 | |
| | | | | | | | |
| | | | Consumer Finance — 1.8% | |
| | 417 | | | American Express Co. | | | 21,554 | |
| | | | | | | | |
| | | | Diversified Financial Services — 0.8% | |
| | 34 | | | CME Group, Inc. | | | 9,856 | |
| | | | | | | | |
| | | | Insurance — 0.9% | |
| | 172 | | | ACE Ltd., (Switzerland) | | | 11,288 | |
| | | | | | | | |
| | | | Total Financials | | | 95,316 | |
| | | | | | | | |
| | | | Health Care — 14.8% | |
| | | | Biotechnology — 3.3% | |
| | 170 | | | Alexion Pharmaceuticals, Inc. (a) | | | 7,995 | |
| | 175 | | | Biogen Idec, Inc. (a) | | | 18,711 | |
| | 212 | | | Celgene Corp. (a) | | | 12,806 | |
| | | | | | | | |
| | | | | | | 39,512 | |
| | | | | | | | |
| | | | Health Care Equipment & Supplies — 1.7% | |
| | 217 | | | Sirona Dental Systems, Inc. (a) | | | 11,496 | |
| | 269 | | | Thoratec Corp. (a) | | | 8,842 | |
| | | | | | | | |
| | | | | | | 20,338 | |
| | | | | | | | |
| | | | Health Care Providers & Services — 5.0% | |
| | 130 | | | DaVita, Inc. (a) | | | 11,216 | |
| | 293 | | | Emeritus Corp. (a) (c) | | | 6,230 | |
| | 188 | | | Healthspring, Inc. (a) | | | 8,683 | |
| | 450 | | | Lincare Holdings, Inc. | | | 13,176 | |
| | 423 | | | UnitedHealth Group, Inc. | | | 21,803 | |
| | | | | | | | |
| | | | | | | 61,108 | |
| | | | | | | | |
SEE NOTES TO FINANCIAL STATEMENTS.
| | | | | | |
| | | |
| 20 | | | | J.P. MORGAN MID CAP/MULTI-CAP FUNDS | | JUNE 30, 2011 |
| | | | | | | | |
| SHARES | | | SECURITY DESCRIPTION | | VALUE($) | |
| | | | | | | | |
| Common Stocks — Continued | | | | |
| | | | Life Sciences Tools & Services — 1.5% | |
| | 356 | | | Agilent Technologies, Inc. (a) | | | 18,200 | |
| | | | | | | | |
| | | | Pharmaceuticals — 3.3% | |
| | 355 | | | Aegerion Pharmaceuticals, Inc. (a) | | | 5,598 | |
| | 155 | | | Allergan, Inc. | | | 12,879 | |
| | 420 | | | Valeant Pharmaceuticals International, Inc., (Canada) (c) | | | 21,802 | |
| | | | | | | | |
| | | | | | | 40,279 | |
| | | | | | | | |
| | | | Total Health Care | | | 179,437 | |
| | | | | | | | |
| | | | Industrials — 12.8% | |
| | | | Aerospace & Defense — 2.1% | |
| | 130 | | | Goodrich Corp. | | | 12,415 | |
| | 184 | | | HEICO Corp. (c) | | | 10,078 | |
| | 42 | | | TransDigm Group, Inc. (a) | | | 3,821 | |
| | | | | | | | |
| | | | | | | 26,314 | |
| | | | | | | | |
| | | | Electrical Equipment — 0.7% | |
| | 237 | | | EnerSys (a) | | | 8,164 | |
| | | | | | | | |
| | | | Industrial Conglomerates — 1.0% | |
| | 243 | | | Carlisle Cos., Inc. | | | 11,963 | |
| | | | | | | | |
| | | | Machinery — 3.5% | |
| | 171 | | | Cummins, Inc. | | | 17,697 | |
| | 171 | | | Deere & Co. | | | 14,082 | |
| | 172 | | | Wabtec Corp. | | | 11,304 | |
| | | | | | | | |
| | | | | | | 43,083 | |
| | | | | | | | |
| | | | Professional Services — 0.7% | |
| | 104 | | | IHS, Inc., Class A (a) | | | 8,651 | |
| | | | | | | | |
| | | | Road & Rail — 2.5% | |
| | 477 | | | Avis Budget Group, Inc. (a) | | | 8,155 | |
| | 210 | | | J.B. Hunt Transport Services, Inc. | | | 9,880 | |
| | 327 | | | Old Dominion Freight Line, Inc. (a) | | | 12,182 | |
| | | | | | | | |
| | | | | | | 30,217 | |
| | | | | | | | |
| | | | Trading Companies & Distributors — 2.3% | |
| | 334 | | | Air Lease Corp. (a) | | | 8,115 | |
| | 127 | | | W.W. Grainger, Inc. (c) | | | 19,529 | |
| | | | | | | | |
| | | | | | | 27,644 | |
| | | | | | | | |
| | | | Total Industrials | | | 156,036 | |
| | | | | | | | |
| | | | Information Technology — 32.2% | |
| | | | Communications Equipment — 4.4% | |
| | 462 | | | JDS Uniphase Corp. (a) | | | 7,697 | |
| | 346 | | | Juniper Networks, Inc. (a) | | | 10,887 | |
| | 495 | | | QUALCOMM, Inc. | | | 28,094 | |
| | | | | | | | |
| SHARES | | | SECURITY DESCRIPTION | | VALUE($) | |
| | | | | | | | |
| | | | | | | | |
| | | | Communications Equipment — Continued | |
| | 165 | | | Riverbed Technology, Inc. (a) | | | 6,544 | |
| | | | | | | | |
| | | | | | | 53,222 | |
| | | | | | | | |
| | | | Computers & Peripherals — 7.6% | |
| | 209 | | | Apple, Inc. (a) | | | 70,004 | |
| | 431 | | | EMC Corp. (a) | | | 11,874 | |
| | 190 | | | NetApp, Inc. (a) | | | 10,012 | |
| | | | | | | | |
| | | | | | | 91,890 | |
| | | | | | | | |
| | | | Electronic Equipment, Instruments & Components — 2.1% | |
| | 157 | | | Amphenol Corp., Class A | | | 8,471 | |
| | 464 | | | TE Connectivity Ltd., (Switzerland) | | | 17,057 | |
| | | | | | | | |
| | | | | | | 25,528 | |
| | | | | | | | |
| | | | Internet Software & Services — 1.4% | |
| | 24 | | | Google, Inc., Class A (a) | | | 12,305 | |
| | 55 | | | LinkedIn Corp., Class A (a) (c) | | | 4,964 | |
| | | | | | | | |
| | | | | | | 17,269 | |
| | | | | | | | |
| | | | IT Services — 3.9% | |
| | 402 | | | CGI Group, Inc., (Canada), Class A (a) | | | 9,909 | |
| | 208 | | | Cognizant Technology Solutions Corp., Class A (a) | | | 15,284 | |
| | 74 | | | MasterCard, Inc., Class A | | | 22,209 | |
| | | | | | | | |
| | | | | | | 47,402 | |
| | | | | | | | |
| | | | Office Electronics — 0.8% | |
| | 231 | | | Zebra Technologies Corp., Class A (a) | | | 9,754 | |
| | | | | | | | |
| | | | Semiconductors & Semiconductor Equipment — 3.7% | |
| | 260 | | | Avago Technologies Ltd., (Singapore) | | | 9,873 | |
| | 579 | | | Freescale Semiconductor Holdings I Ltd. (a) | | | 10,653 | |
| | 223 | | | Lam Research Corp. (a) | | | 9,883 | |
| | 412 | | | Xilinx, Inc. | | | 15,018 | |
| | | | | | | | |
| | | | | | | 45,427 | |
| | | | | | | | |
| | | | Software — 8.3% | |
| | 398 | | | Adobe Systems, Inc. (a) (m) | | | 12,511 | |
| | 225 | | | Autodesk, Inc. (a) | | | 8,685 | |
| | 141 | | | Concur Technologies, Inc. (a) | | | 7,040 | |
| | 242 | | | MICROS Systems, Inc. (a) | | | 12,040 | |
| | 394 | | | Nuance Communications, Inc. (a) | | | 8,468 | |
| | 778 | | | Oracle Corp. | | | 25,594 | |
| | 195 | | | RealPage, Inc. (a) | | | 5,170 | |
| | 89 | | | Salesforce.com, Inc. (a) | | | 13,319 | |
| | 220 | | | Taleo Corp., Class A (a) | | | 8,139 | |
| | | | | | | | |
| | | | | | | 100,966 | |
| | | | | | | | |
| | | | Total Information Technology | | | 391,458 | |
| | | | | | | | |
SEE NOTES TO FINANCIAL STATEMENTS.
| | | | | | | | |
| | | |
| JUNE 30, 2011 | | J.P. MORGAN MID CAP/MULTI-CAP FUNDS | | | | | 21 | |
JPMorgan Growth Advantage Fund
SCHEDULE OF PORTFOLIO INVESTMENTS
AS OF JUNE 30, 2011 (continued)
(Amounts in thousands)
| | | | | | | | |
| SHARES | | | SECURITY DESCRIPTION | | VALUE($) | |
| | | | | | | | |
| Common Stocks — Continued | | | | |
| | | | Materials — 3.2% | |
| | | | Chemicals — 2.4% | |
| | 168 | | | FMC Corp. | | | 14,434 | |
| | 174 | | | Sherwin-Williams Co. (The) | | | 14,593 | |
| | | | | | | | |
| | | | | | | 29,027 | |
| | | | | | | | |
| | | | Metals & Mining — 0.8% | |
| | 174 | | | Freeport-McMoRan Copper & Gold, Inc. | | | 9,210 | |
| | | | | | | | |
| | | | Total Materials | | | 38,237 | |
| | | | | | | | |
| | | | Total Common Stocks
(Cost $967,250) | | | 1,210,710 | |
| | | | | | | | |
| | | | | | | | |
| SHARES | | | SECURITY DESCRIPTION | | VALUE($) | |
| | | | | | | | |
| Short-Term Investment — 0.5% | | | | |
| | | | Investment Company — 0.5% | |
| | 5,903 | | | JPMorgan Prime Money Market Fund, Institutional Class Shares,
0.050% (b) (l) (m)
(Cost $5,903) | | | 5,903 | |
| | | | | | | | |
| Investments of Cash Collateral for Securities on Loan — 3.2% | | | | |
| | | | Investment Company — 3.2% | |
| | 39,434 | | | JPMorgan Prime Money Market Fund,
Capital Shares, 0.080% (b) (l)
(Cost $39,434) | | | 39,434 | |
| | | | | | | | |
| | | | Total Investments — 103.3%
(Cost $1,012,587) | | | 1,256,047 | |
| | | | Liabilities in Excess of
Other Assets — (3.3)% | | | (39,891 | ) |
| | | | | | | | |
| | | | NET ASSETS — 100.0% | | $ | 1,216,156 | |
| | | | | | | | |
Percentages indicated are based on net assets.
SEE NOTES TO FINANCIAL STATEMENTS.
| | | | | | |
| | | |
| 22 | | | | J.P. MORGAN MID CAP/MULTI-CAP FUNDS | | JUNE 30, 2011 |
JPMorgan Mid Cap Core Fund
SCHEDULE OF PORTFOLIO INVESTMENTS
AS OF JUNE 30, 2011
(Amounts in thousands)
| | | | | | | | |
| SHARES | | | SECURITY DESCRIPTION | | VALUE($) | |
| | | | | | | | |
| Common Stocks — 96.1% | | | | |
| | | | Consumer Discretionary — 18.0% | |
| | | | Automobiles — 2.0% | | | | |
| | 44 | | | Harley-Davidson, Inc. | | | 1,808 | |
| | | | | | �� | | |
| | | | Distributors — 1.1% | | | | |
| | 19 | | | Genuine Parts Co. | | | 1,022 | |
| | | | | | | | |
| | | | Hotels, Restaurants & Leisure — 4.2% | |
| | 33 | | | Brinker International, Inc. (m) | | | 808 | |
| | 33 | | | Papa John’s International, Inc. (a) | | | 1,108 | |
| | 47 | | | Penn National Gaming, Inc. (a) | | | 1,897 | |
| | | | | | | | |
| | | | | | | 3,813 | |
| | | | | | | | |
| | | | Household Durables — 4.8% | | | | |
| | 71 | | | Jarden Corp. | | | 2,440 | |
| | 50 | | | Newell Rubbermaid, Inc. | | | 781 | |
| | 63 | | | Toll Brothers, Inc. (a) | | | 1,298 | |
| | | | | | | | |
| | | | | | | 4,519 | |
| | | | | | | | |
| | | | Multiline Retail — 1.9% | | | | |
| | 37 | | | Nordstrom, Inc. | | | 1,733 | |
| | | | | | | | |
| | | | Specialty Retail — 4.0% | | | | |
| | 80 | | | American Eagle Outfitters, Inc. (m) | | | 1,018 | |
| | 88 | | | Chico’s FAS, Inc. | | | 1,344 | |
| | 36 | | | Williams-Sonoma, Inc. | | | 1,308 | |
| | | | | | | | |
| | | | | | | 3,670 | |
| | | | | | | | |
| | | | Total Consumer Discretionary | | | 16,565 | |
| | | | | | | | |
| | | | Consumer Staples — 1.8% | |
| | | | Food & Staples Retailing — 1.8% | |
| | 40 | | | Walgreen Co. | | | 1,679 | |
| | | | | | | | |
| | | | Energy — 8.3% | | | | |
| | | | Energy Equipment & Services — 3.7% | |
| | 46 | | | Exterran Holdings, Inc. (a) | | | 914 | |
| | 47 | | | Patterson-UTI Energy, Inc. | | | 1,489 | |
| | 18 | | | Tidewater, Inc. | | | 978 | |
| | | | | | | | |
| | | | | | | 3,381 | |
| | | | | | | | |
| | | | Oil, Gas & Consumable Fuels — 4.6% | |
| | 19 | | | Cimarex Energy Co. | | | 1,676 | |
| | 33 | | | Devon Energy Corp. | | | 2,585 | |
| | | | | | | | |
| | | | | | | 4,261 | |
| | | | | | | | |
| | | | Total Energy | | | 7,642 | |
| | | | | | | | |
| | | | Financials — 19.5% | |
| | | | Capital Markets — 7.3% | |
| | 125 | | | Calamos Asset Management, Inc., Class A | | | 1,818 | |
| | 21 | | | Greenhill & Co., Inc. | | | 1,123 | |
| | 54 | | | HFF, Inc., Class A (a) | | | 813 | |
| | | | | | | | |
| SHARES | | | SECURITY DESCRIPTION | | VALUE($) | |
| | | | | | | | |
| | | | | | | | |
| | | | Capital Markets — Continued | |
| | 103 | | | Janus Capital Group, Inc. | | | 977 | |
| | 96 | | | TD AMERITRADE Holding Corp. | | | 1,880 | |
| | | | | | | | |
| | | | | | | 6,611 | |
| | | | | | | | |
| | | | Commercial Banks — 4.1% | |
| | 27 | | | First Republic Bank (a) | | | 874 | |
| | 23 | | | Iberiabank Corp. | | | 1,339 | |
| | 133 | | | Umpqua Holdings Corp. | | | 1,535 | |
| | | | | | | | |
| | | | | | | 3,748 | |
| | | | | | | | |
| | | | Insurance — 4.1% | | | | |
| | 27 | | | Chubb Corp. | | | 1,712 | |
| | 29 | | | ProAssurance Corp. (a) | | | 2,054 | |
| | | | | | | | |
| | | | | | | 3,766 | |
| | | | | | | | |
| | | | Real Estate Investment Trusts (REITs) — 4.0% | |
| | 23 | | | Mid-America Apartment Communities, Inc. | | | 1,520 | |
| | 48 | | | National Retail Properties, Inc. | | | 1,180 | |
| | 56 | | | RLJ Lodging Trust | | | 969 | |
| | | | | | | | |
| | | | | | | 3,669 | |
| | | | | | | | |
| | | | Total Financials | | | 17,794 | |
| | | | | | | | |
| | | | Health Care — 10.0% | | | | |
| | | | Health Care Equipment & Supplies — 1.3% | |
| | 15 | | | IDEXX Laboratories, Inc. (a) | | | 1,198 | |
| | | | | | | | |
| | | | Health Care Providers & Services — 8.7% | |
| | 55 | | | Coventry Health Care, Inc. (a) | | | 2,000 | |
| | 18 | | | Laboratory Corp. of America Holdings (a) | | | 1,707 | |
| | 35 | | | Patterson Cos., Inc. | | | 1,151 | |
| | 40 | | | UnitedHealth Group, Inc. | | | 2,084 | |
| | 49 | | | VCA Antech, Inc. (a) | | | 1,044 | |
| | | | | | | | |
| | | | | | | 7,986 | |
| | | | | | | | |
| | | | Total Health Care | | | 9,184 | |
| | | | | | | | |
| | | | Industrials — 14.9% | | | | |
| | | | Aerospace & Defense — 3.0% | |
| | 13 | | | Goodrich Corp. | | | 1,199 | |
| | 17 | | | TransDigm Group, Inc. (a) | | | 1,566 | |
| | | | | | | | |
| | | | | | | 2,765 | |
| | | | | | | | |
| | | | Commercial Services & Supplies — 2.9% | |
| | 73 | | | KAR Auction Services, Inc. (a) | | | 1,375 | |
| | 42 | | | Waste Connections, Inc. | | | 1,327 | |
| | | | | | | | |
| | | | | | | 2,702 | |
| | | | | | | | |
| | | | Electrical Equipment — 1.2% | |
| | 16 | | | Regal-Beloit Corp. | | | 1,091 | |
| | | | | | | | |
SEE NOTES TO FINANCIAL STATEMENTS.
| | | | | | | | |
| | | |
| JUNE 30, 2011 | | J.P. MORGAN MID CAP/MULTI-CAP FUNDS | | | | | 23 | |
JPMorgan Mid Cap Core Fund
SCHEDULE OF PORTFOLIO INVESTMENTS
AS OF JUNE 30, 2011 (continued)
(Amounts in thousands)
| | | | | | | | |
| SHARES | | | SECURITY DESCRIPTION | | VALUE($) | |
| | | | | | | | |
| Common Stocks — Continued | | | | |
| | | | Machinery — 6.5% | |
| | 25 | | | Dover Corp. | | | 1,671 | |
| | 27 | | | Eaton Corp. | | | 1,381 | |
| | 18 | | | Joy Global, Inc. | | | 1,694 | |
| | 20 | | | Toro Co. (The) | | | 1,210 | |
| | | | | | | | |
| | | | | | | 5,956 | |
| | | | | | | | |
| | | | Road & Rail — 1.3% | |
| | 15 | | | Norfolk Southern Corp. | | | 1,149 | |
| | | | | | | | |
| | | | Total Industrials | | | 13,663 | |
| | | | | | | | |
| | | | Information Technology — 8.8% | |
| | | | Computers & Peripherals — 1.0% | |
| | 18 | | | NetApp, Inc. (a) | | | 958 | |
| | | | | | | | |
| | | | Electronic Equipment, Instruments & Components — 1.6% | |
| | 22 | | | Anixter International, Inc. (m) | | | 1,453 | |
| | | | | | | | |
| | | | Semiconductors & Semiconductor Equipment — 3.3% | |
| | 79 | | | Intersil Corp., Class A | | | 1,016 | |
| | 35 | | | Linear Technology Corp. | | | 1,161 | |
| | 56 | | | Marvell Technology Group Ltd., (Bermuda) (a) | | | 830 | |
| | | | | | | | |
| | | | | | | 3,007 | |
| | | | | | | | |
| | | | Software — 2.9% | |
| | 27 | | | MICROS Systems, Inc. (a) | | | 1,351 | |
| | 23 | | | Solera Holdings, Inc. | | | 1,343 | |
| | | | | | | | |
| | | | | | | 2,694 | |
| | | | | | | | |
| | | | Total Information Technology | | | 8,112 | |
| | | | | | | | |
| | | | Materials — 8.7% | |
| | | | Chemicals — 2.8% | |
| | 19 | | | Airgas, Inc. (m) | | | 1,345 | |
| | 24 | | | Scotts Miracle-Gro Co. (The), Class A | | | 1,221 | |
| | | | | | | | |
| | | | | | | 2,566 | |
| | | | | | | | |
| | | | Containers & Packaging — 4.4% | |
| | 43 | | | Crown Holdings, Inc. (a) | | | 1,679 | |
| | 58 | | | Silgan Holdings, Inc. | | | 2,372 | |
| | | | | | | | |
| | | | | | | 4,051 | |
| | | | | | | | |
| | | | | | | | |
| SHARES | | | SECURITY DESCRIPTION | | VALUE($) | |
| | | | | | | | |
| | | | | | | | |
| | | | Metals & Mining — 1.5% | |
| | 27 | | | Reliance Steel & Aluminum Co. | | | 1,332 | |
| | | | | | | | |
| | | | Total Materials | | | 7,949 | |
| | | | | | | | |
| | | | Utilities — 6.1% | |
| | | | Electric Utilities — 1.2% | |
| | 27 | | | Southern Co. | | | 1,090 | |
| | | | | | | | |
| | | | Gas Utilities — 1.0% | |
| | 21 | | | Northwest Natural Gas Co. | | | 948 | |
| | | | | | | | |
| | | | Multi-Utilities — 3.9% | |
| | 59 | | | CMS Energy Corp. | | | 1,170 | |
| | 34 | | | NorthWestern Corp. | | | 1,125 | |
| | 40 | | | Wisconsin Energy Corp. | | | 1,263 | |
| | | | | | | | |
| | | | | | | 3,558 | |
| | | | | | | | |
| | | | Total Utilities | | | 5,596 | |
| | | | | | | | |
| | | | Total Common Stocks
(Cost $87,786) | | | 88,184 | |
| | | | | | | | |
| Short-Term Investment — 3.9% | | | | |
| | | | Investment Company — 3.9% | |
| | 3,576 | | | JPMorgan Prime Money Market Fund, Institutional Class Shares,
0.050% (b) (l) (m)
(Cost $3,576) | | | 3,576 | |
| | | | | | | | |
| | | | Total Investments — 100.0%
(Cost $91,362) | | | 91,760 | |
| | | | Other Assets in Excess of
Liabilities — 0.0% (g) | | | 22 | |
| | | | | | | | |
| | | | NET ASSETS — 100.0% | | $ | 91,782 | |
| | | | | | | | |
Percentages indicated are based on net assets.
SEE NOTES TO FINANCIAL STATEMENTS.
| | | | | | |
| | | |
| 24 | | | | J.P. MORGAN MID CAP/MULTI-CAP FUNDS | | JUNE 30, 2011 |
JPMorgan Mid Cap Equity Fund
SCHEDULE OF PORTFOLIO INVESTMENTS
AS OF JUNE 30, 2011
(Amounts in thousands)
| | | | | | | | |
| SHARES | | | SECURITY DESCRIPTION | | VALUE($) | |
| | | | | | | | |
| | | | | | | | |
| Common Stocks — 96.5% | | | | |
| | | | Consumer Discretionary — 19.2% | |
| | | | Auto Components — 0.7% | |
| | 49 | | | BorgWarner, Inc. (a) | | | 3,943 | |
| | | | | | | | |
| | | | Automobiles — 0.9% | |
| | 96 | | | Harley-Davidson, Inc. | | | 3,929 | |
| | 44 | | | Tesla Motors, Inc. (a) (c) | | | 1,267 | |
| | | | | | | | |
| | | | | | | 5,196 | |
| | | | | | | | |
| | | | Distributors — 0.5% | |
| | 52 | | | Genuine Parts Co. | | | 2,806 | |
| | | | | | | | |
| | | | Diversified Consumer Services — 0.6% | |
| | 30 | | | DeVry, Inc. | | | 1,792 | |
| | 40 | | | Sotheby’s | | | 1,753 | |
| | | | | | | | |
| | | | | | | 3,545 | |
| | | | | | | | |
| | | | Hotels, Restaurants & Leisure — 3.7% | |
| | 57 | | | Cheesecake Factory, Inc. (The) (a) | | | 1,798 | |
| | 60 | | | Darden Restaurants, Inc. | | | 2,969 | |
| | 45 | | | Gaylord Entertainment Co. (a) | | | 1,362 | |
| | 124 | | | International Game Technology | | | 2,181 | |
| | 172 | | | Marriott International, Inc., Class A | | | 6,090 | |
| | 126 | | | Royal Caribbean Cruises Ltd. (a) | | | 4,734 | |
| | 35 | | | Yum! Brands, Inc. | | | 1,911 | |
| | | | | | | | |
| | | | | | | 21,045 | |
| | | | | | | | |
| | | | Household Durables — 1.8% | |
| | 76 | | | Fortune Brands, Inc. | | | 4,853 | |
| | 57 | | | Harman International Industries, Inc. | | | 2,593 | |
| | 52 | | | Jarden Corp. | | | 1,784 | |
| | 16 | | | Mohawk Industries, Inc. (a) | | | 948 | |
| | | | | | | | |
| | | | | | | 10,178 | |
| | | | | | | | |
| | | | Internet & Catalog Retail — 0.9% | |
| | 76 | | | Expedia, Inc. | | | 2,195 | |
| | 12 | | | NetFlix, Inc. (a) | | | 3,073 | |
| | | | | | | | |
| | | | | | | 5,268 | |
| | | | | | | | |
| | | | Media — 3.9% | | | | |
| | 88 | | | Cablevision Systems Corp., Class A | | | 3,197 | |
| | 111 | | | CBS Corp., Class B | | | 3,168 | |
| | 91 | | | Clear Channel Outdoor Holdings, Inc., Class A (a) | | | 1,158 | |
| | 69 | | | DISH Network Corp., Class A (a) | | | 2,101 | |
| | 120 | | | Gannett Co., Inc. | | | 1,713 | |
| | 76 | | | Lamar Advertising Co., Class A (a) | | | 2,072 | |
| | 28 | | | Omnicom Group, Inc. | | | 1,368 | |
| | 83 | | | Scripps Networks Interactive, Inc., Class A | | | 4,032 | |
| | 1,360 | | | Sirius XM Radio, Inc. (a) | | | 2,979 | |
| | | | | | | | |
| SHARES | | | SECURITY DESCRIPTION | | VALUE($) | |
| | | | | | | | |
| | | | | | | | |
| | | | Media — Continued | | | | |
| | 2 | | | Washington Post Co. (The), Class B | | | 693 | |
| | | | | | | | |
| | | | | | | 22,481 | |
| | | | | | | | |
| | | | Multiline Retail — 0.4% | | | | |
| | 41 | | | Kohl’s Corp. | | | 2,065 | |
| | | | | | | | |
| | | | Specialty Retail — 3.2% | | | | |
| | 9 | | | AutoZone, Inc. (a) | | | 2,712 | |
| | 79 | | | Bed Bath & Beyond, Inc. (a) | | | 4,588 | |
| | 67 | | | Dick’s Sporting Goods, Inc. (a) | | | 2,584 | |
| | 158 | | | Gap, Inc. (The) | | | 2,856 | |
| | 29 | | | Tiffany & Co. | | | 2,293 | |
| | 67 | | | TJX Cos., Inc. | | | 3,504 | |
| | | | | | | | |
| | | | | | | 18,537 | |
| | | | | | | | |
| | | | Textiles, Apparel & Luxury Goods — 2.6% | | | | |
| | 105 | | | Coach, Inc. | | | 6,738 | |
| | 24 | | | Deckers Outdoor Corp. (a) | | | 2,106 | |
| | 21 | | | Fossil, Inc. (a) | | | 2,460 | |
| | 15 | | | Lululemon Athletica, Inc., (Canada) (a) | | | 1,633 | |
| | 30 | | | Phillips-Van Heusen Corp. | | | 1,958 | |
| | | | | | | | |
| | | | | | | 14,895 | |
| | | | | | | | |
| | | | Total Consumer Discretionary | | | 109,959 | |
| | | | | | | | |
| | | | Consumer Staples — 2.9% | | | | |
| | | | Beverages — 0.6% | | | | |
| | 24 | | | Brown-Forman Corp., Class B | | | 1,791 | |
| | 41 | | | Dr. Pepper Snapple Group, Inc. | | | 1,732 | |
| | | | | | | | |
| | | | | | | 3,523 | |
| | | | | | | | |
| | | | Food & Staples Retailing — 0.5% | | | | |
| | 120 | | | Safeway, Inc. | | | 2,814 | |
| | | | | | | | |
| | | | Food Products — 1.4% | | | | |
| | 23 | | | Hershey Co. (The) | | | 1,308 | |
| | 49 | | | JM Smucker Co. (The) | | | 3,738 | |
| | 38 | | | Ralcorp Holdings, Inc. (a) | | | 3,281 | |
| | | | | | | | |
| | | | | | | 8,327 | |
| | | | | | | | |
| | | | Household Products — 0.4% | | | | |
| | 30 | | | Energizer Holdings, Inc. (a) | | | 2,164 | |
| | | | | | | | |
| | | | Total Consumer Staples | | | 16,828 | |
| | | | | | | | |
| | | | Energy — 8.1% | | | | |
| | | | Energy Equipment & Services — 1.3% | | | | |
| | 97 | | | Cameron International Corp. (a) | | | 4,890 | |
| | 15 | | | CARBO Ceramics, Inc. (c) | | | 2,363 | |
| | | | | | | | |
| | | | | | | 7,253 | |
| | | | | | | | |
SEE NOTES TO FINANCIAL STATEMENTS.
| | | | | | | | |
| | | |
| JUNE 30, 2011 | | J.P. MORGAN MID CAP/MULTI-CAP FUNDS | | | | | 25 | |
JPMorgan Mid Cap Equity Fund
SCHEDULE OF PORTFOLIO INVESTMENTS
AS OF JUNE 30, 2011 (continued)
(Amounts in thousands)
| | | | | | | | |
| SHARES | | | SECURITY DESCRIPTION | | VALUE($) | |
| | | | | | | | |
| Common Stocks — Continued | | | | |
| | | | Oil, Gas & Consumable Fuels — 6.8% | | | | |
| | 69 | | | Concho Resources, Inc. (a) | | | 6,310 | |
| | 47 | | | CVR Energy, Inc. (a) | | | 1,145 | |
| | 53 | | | Devon Energy Corp. | | | 4,201 | |
| | 97 | | | Energen Corp. | | | 5,452 | |
| | 38 | | | EQT Corp. | | | 2,017 | |
| | 73 | | | Forest Oil Corp. (a) | | | 1,962 | |
| | 17 | | | Kinder Morgan Management LLC (a) | | | 1,104 | |
| | 84 | | | Newfield Exploration Co. (a) | | | 5,693 | |
| | 49 | | | Peabody Energy Corp. | | | 2,857 | |
| | 51 | | | Range Resources Corp. | | | 2,853 | |
| | 50 | | | Teekay Corp., (Canada) | | | 1,532 | |
| | 129 | | | Williams Cos., Inc. (The) | | | 3,899 | |
| | | | | | | | |
| | | | | | | 39,025 | |
| | | | | | | | |
| | | | Total Energy | | | 46,278 | |
| | | | | | | | |
| | | | Financials — 15.7% | |
| | | | Capital Markets — 3.5% | |
| | 63 | | | Ameriprise Financial, Inc. | | | 3,657 | |
| | 106 | | | Invesco Ltd. | | | 2,483 | |
| | 74 | | | Lazard Ltd., (Bermuda), Class A | | | 2,731 | |
| | 28 | | | Northern Trust Corp. | | | 1,273 | |
| | 91 | | | Och-Ziff Capital Management Group LLC, Class A | | | 1,258 | |
| | 100 | | | T. Rowe Price Group, Inc. | | | 6,061 | |
| | 117 | | | TD AMERITRADE Holding Corp. | | | 2,279 | |
| | | | | | | | |
| | | | | | | 19,742 | |
| | | | | | | | |
| | | | Commercial Banks — 3.6% | |
| | 27 | | | BancorpSouth, Inc. | | | 333 | |
| | 41 | | | BB&T Corp. | | | 1,098 | |
| | 46 | | | BOK Financial Corp. (c) | | | 2,497 | |
| | 41 | | | City National Corp. | | | 2,246 | |
| | 56 | | | Comerica, Inc. | | | 1,950 | |
| | 32 | | | Cullen/Frost Bankers, Inc. | | | 1,796 | |
| | 205 | | | Fifth Third Bancorp | | | 2,611 | |
| | 123 | | | Huntington Bancshares, Inc. | | | 804 | |
| | 42 | | | M&T Bank Corp. | | | 3,676 | |
| | 82 | | | SunTrust Banks, Inc. | | | 2,123 | |
| | 65 | | | Zions Bancorp | | | 1,563 | |
| | | | | | | | |
| | | | | | | 20,697 | |
| | | | | | | | |
| | | | Diversified Financial Services — 0.7% | |
| | 99 | | | Moody’s Corp. | | | 3,812 | |
| | | | | | | | |
| | | | Insurance — 5.2% | |
| | 104 | | | AON Corp. | | | 5,334 | |
| | 42 | | | Arch Capital Group Ltd., (Bermuda) (a) | | | 1,334 | |
| | 49 | | | Cincinnati Financial Corp. | | | 1,434 | |
| | | | | | | | |
| SHARES | | | SECURITY DESCRIPTION | | VALUE($) | |
| | | | | | | | |
| | | | | | | | |
| | | | Insurance — Continued | |
| | 125 | | | Loews Corp. | | | 5,265 | |
| | 200 | | | Old Republic International Corp. | | | 2,345 | |
| | 78 | | | OneBeacon Insurance Group Ltd., Class A | | | 1,050 | |
| | 56 | | | Principal Financial Group, Inc. | | | 1,694 | |
| | 19 | | | Torchmark Corp. | | | 1,225 | |
| | 80 | | | Transatlantic Holdings, Inc. | | | 3,940 | |
| | 113 | | | W.R. Berkley Corp. | | | 3,663 | |
| | 122 | | | XL Group plc, (Ireland) | | | 2,686 | |
| | | | | | | | |
| | | | | | | 29,970 | |
| | | | | | | | |
| | | | Real Estate Investment Trusts (REITs) — 1.8% | |
| | 45 | | | Camden Property Trust | | | 2,863 | |
| | 51 | | | HCP, Inc. | | | 1,856 | |
| | 30 | | | Kimco Realty Corp. | | | 550 | |
| | 55 | | | Regency Centers Corp. | | | 2,423 | |
| | 27 | | | Vornado Realty Trust | | | 2,531 | |
| | | | | | | | |
| | | | | | | 10,223 | |
| | | | | | | | |
| | | | Real Estate Management & Development — 0.3% | |
| | 103 | | | Brookfield Office Properties, Inc. | | | 1,993 | |
| | | | | | | | |
| | | | Thrifts & Mortgage Finance — 0.6% | |
| | 75 | | | Capitol Federal Financial, Inc. | | | 876 | |
| | 176 | | | People’s United Financial, Inc. | | | 2,359 | |
| | | | | | | | |
| | | | | | | 3,235 | |
| | | | | | | | |
| | | | Total Financials | | | 89,672 | |
| | | | | | | | |
| | | | Health Care — 11.1% | |
| | | | Biotechnology — 0.7% | |
| | 62 | | | Alexion Pharmaceuticals, Inc. (a) | | | 2,906 | |
| | 35 | | | Dendreon Corp. (a) | | | 1,369 | |
| | | | | | | | |
| | | | | | | 4,275 | |
| | | | | | | | |
| | | | Health Care Equipment & Supplies — 1.6% | |
| | 35 | | | Becton, Dickinson & Co. | | | 3,042 | |
| | 57 | | | Sirona Dental Systems, Inc. (a) | | | 3,032 | |
| | 93 | | | Thoratec Corp. (a) | | | 3,042 | |
| | | | | | | | |
| | | | | | | 9,116 | |
| | | | | | | | |
| | | | Health Care Providers & Services — 5.9% | |
| | 60 | | | AmerisourceBergen Corp. | | | 2,463 | |
| | 121 | | | Brookdale Senior Living, Inc. (a) | | | 2,942 | |
| | 180 | | | Coventry Health Care, Inc. (a) | | | 6,548 | |
| | 47 | | | DaVita, Inc. (a) | | | 4,053 | |
| | 47 | | | HCA Holdings, Inc. (a) | | | 1,548 | |
| | 91 | | | Humana, Inc. | | | 7,366 | |
| | 261 | | | Lincare Holdings, Inc. | | | 7,637 | |
SEE NOTES TO FINANCIAL STATEMENTS.
| | | | | | |
| | | |
| 26 | | | | J.P. MORGAN MID CAP/MULTI-CAP FUNDS | | JUNE 30, 2011 |
| | | | | | | | |
| SHARES | | | SECURITY DESCRIPTION | | VALUE($) | |
| | | | | | | | |
| Common Stocks — Continued | | | | |
| | | | Health Care Providers & Services — Continued | |
| | 51 | | | VCA Antech, Inc. (a) | | | 1,083 | |
| | | | | | | | |
| | | | | | | 33,640 | |
| | | | | | | | |
| | | | Health Care Technology — 0.4% | |
| | 40 | | | Cerner Corp. (a) (c) | | | 2,459 | |
| | | | | | | | |
| | | | Life Sciences Tools & Services — 1.6% | |
| | 107 | | | Agilent Technologies, Inc. (a) | | | 5,469 | |
| | 62 | | | Bruker Corp. (a) | | | 1,259 | |
| | 31 | | | Illumina, Inc. (a) | | | 2,321 | |
| | | | | | | | |
| | | | | | | 9,049 | |
| | | | | | | | |
| | | | Pharmaceuticals — 0.9% | |
| | 100 | | | Valeant Pharmaceuticals International, Inc., (Canada) (c) | | | 5,201 | |
| | | | | | | | |
| | | | Total Health Care | | | 63,740 | |
| | | | | | | | |
| | | | Industrials — 13.0% | |
| | | | Aerospace & Defense — 1.6% | |
| | 33 | | | Alliant Techsystems, Inc. | | | 2,318 | |
| | 40 | | | Goodrich Corp. | | | 3,801 | |
| | 22 | | | L-3 Communications Holdings, Inc. | | | 1,941 | |
| | 10 | | | TransDigm Group, Inc. (a) | | | 876 | |
| | | | | | | | |
| | | | | | | 8,936 | |
| | | | | | | | |
| | | | Airlines — 0.4% | |
| | 249 | | | Delta Air Lines, Inc. (a) | | | 2,279 | |
| | | | | | | | |
| | | | Commercial Services & Supplies — 1.6% | |
| | 194 | | | Republic Services, Inc. | | | 5,982 | |
| | 36 | | | Stericycle, Inc. (a) | | | 3,249 | |
| | | | | | | | |
| | | | | | | 9,231 | |
| | | | | | | | |
| | | | Electrical Equipment — 2.7% | |
| | 67 | | | AMETEK, Inc. | | | 3,004 | |
| | 45 | | | Cooper Industries plc | | | 2,667 | |
| | 52 | | | Hubbell, Inc., Class B | | | 3,397 | |
| | 40 | | | Regal-Beloit Corp. | | | 2,664 | |
| | 42 | | | Roper Industries, Inc. | | | 3,510 | |
| | | | | | | | |
| | | | | | | 15,242 | |
| | | | | | | | |
| | | | Industrial Conglomerates — 1.2% | |
| | 141 | | | Carlisle Cos., Inc. | | | 6,945 | |
| | | | | | | | |
| | | | Machinery — 2.9% | |
| | 50 | | | AGCO Corp. (a) | | | 2,448 | |
| | 42 | | | Cummins, Inc. | | | 4,338 | |
| | 33 | | | Parker Hannifin Corp. | | | 2,926 | |
| | 52 | | | Snap-On, Inc. | | | 3,243 | |
| | | | | | | | |
| SHARES | | | SECURITY DESCRIPTION | | VALUE($) | |
| | | | | | | | |
| | | | | | | | |
| | | | Machinery — Continued | |
| | 53 | | | Wabtec Corp. | | | 3,494 | |
| | | | | | | | |
| | | | | | | 16,449 | |
| | | | | | | | |
| | | | Professional Services — 0.5% | |
| | 33 | | | IHS, Inc., Class A (a) | | | 2,786 | |
| | | | | | | | |
| | | | Road & Rail — 0.8% | |
| | 116 | | | Avis Budget Group, Inc. (a) | | | 1,975 | |
| | 62 | | | J.B. Hunt Transport Services, Inc. | | | 2,901 | |
| | | | | | | | |
| | | | | | | 4,876 | |
| | | | | | | | |
| | | | Trading Companies & Distributors — 1.3% | |
| | 80 | | | Air Lease Corp. (a) (c) | | | 1,948 | |
| | 35 | | | W.W. Grainger, Inc. (c) | | | 5,393 | |
| | | | | | | | |
| | | | | | | 7,341 | |
| | | | | | | | |
| | | | Total Industrials | | | 74,085 | |
| | | | | | | | |
| | | | Information Technology — 15.2% | |
| | | | Communications Equipment — 2.0% | |
| | 66 | | | Aruba Networks, Inc. (a) | | | 1,953 | |
| | 24 | | | F5 Networks, Inc. (a) | | | 2,602 | |
| | 133 | | | JDS Uniphase Corp. (a) | | | 2,221 | |
| | 48 | | | Polycom, Inc. (a) | | | 3,073 | |
| | 40 | | | Riverbed Technology, Inc. (a) | | | 1,580 | |
| | | | | | | | |
| | | | | | | 11,429 | |
| | | | | | | | |
| | | | Computers & Peripherals — 0.5% | |
| | 54 | | | NetApp, Inc. (a) | | | 2,866 | |
| | | | | | | | |
| | | | Electronic Equipment, Instruments & Components — 2.9% | |
| | 97 | | | Amphenol Corp., Class A | | | 5,223 | |
| | 53 | | | Arrow Electronics, Inc. (a) | | | 2,183 | |
| | 244 | | | TE Connectivity Ltd., (Switzerland) | | | 8,973 | |
| | | | | | | | |
| | | | | | | 16,379 | |
| | | | | | | | |
| | | | Internet Software & Services — 0.7% | |
| | 28 | | | Equinix, Inc. (a) | | | 2,788 | |
| | 13 | | | LinkedIn Corp., Class A (a) (c) | | | 1,144 | |
| | | | | | | | |
| | | | | | | 3,932 | |
| | | | | | | | |
| | | | IT Services — 2.2% | |
| | 40 | | | Alliance Data Systems Corp. (a) (c) | | | 3,735 | |
| | 114 | | | CGI Group, Inc., (Canada), Class A (a) | | | 2,815 | |
| | 49 | | | FleetCor Technologies, Inc. (a) | | | 1,444 | |
| | 94 | | | Jack Henry & Associates, Inc. | | | 2,821 | |
| | 46 | | | VeriFone Systems, Inc. (a) | | | 2,022 | |
| | | | | | | | |
| | | | | | | 12,837 | |
| | | | | | | | |
| | | | Office Electronics — 0.4% | |
| | 59 | | | Zebra Technologies Corp., Class A (a) | | | 2,471 | |
| | | | | | | | |
SEE NOTES TO FINANCIAL STATEMENTS.
| | | | | | | | |
| | | |
| JUNE 30, 2011 | | J.P. MORGAN MID CAP/MULTI-CAP FUNDS | | | | | 27 | |
JPMorgan Mid Cap Equity Fund
SCHEDULE OF PORTFOLIO INVESTMENTS
AS OF JUNE 30, 2011 (continued)
(Amounts in thousands)
| | | | | | | | |
| SHARES | | | SECURITY DESCRIPTION | | VALUE($) | |
| | | | | | | | |
| Common Stocks — Continued | | | | |
| | | | Semiconductors & Semiconductor Equipment — 2.4% | |
| | 52 | | | Analog Devices, Inc. | | | 2,047 | |
| | 70 | | | Avago Technologies Ltd., (Singapore) | | | 2,671 | |
| | 132 | | | Freescale Semiconductor Holdings I Ltd. (a) | | | 2,424 | |
| | 78 | | | Microchip Technology, Inc. (c) | | | 2,961 | |
| | 99 | | | Xilinx, Inc. | | | 3,607 | |
| | | | | | | | |
| | | | | | | 13,710 | |
| | | | | | | | |
| | | | Software — 4.1% | |
| | 83 | | | Adobe Systems, Inc. (a) | | | 2,601 | |
| | 68 | | | Autodesk, Inc. (a) | | | 2,625 | |
| | 41 | | | Citrix Systems, Inc. (a) | | | 3,264 | |
| | 34 | | | Concur Technologies, Inc. (a) | | | 1,713 | |
| | 58 | | | MICROS Systems, Inc. (a) | | | 2,883 | |
| | 102 | | | Nuance Communications, Inc. (a) | | | 2,186 | |
| | 58 | | | Red Hat, Inc. (a) | | | 2,671 | |
| | 19 | | | Salesforce.com, Inc. (a) | | | 2,875 | |
| | 101 | | | Synopsys, Inc. (a) | | | 2,607 | |
| | | | | | | | |
| | | | | | | 23,425 | |
| | | | | | | | |
| | | | Total Information Technology | | | 87,049 | |
| | | | | | | | |
| | | | Materials — 5.4% | |
| | | | Chemicals — 3.3% | |
| | 34 | | | Airgas, Inc. | | | 2,374 | |
| | 42 | | | Albemarle Corp. | | | 2,881 | |
| | 40 | | | FMC Corp. | | | 3,441 | |
| | 87 | | | Sherwin-Williams Co. (The) | | | 7,280 | |
| | 43 | | | Sigma-Aldrich Corp. | | | 3,185 | |
| | | | | | | | |
| | | | | | | 19,161 | |
| | | | | | | | |
| | | | Containers & Packaging — 2.1% | |
| | 115 | | | Ball Corp. | | | 4,415 | |
| | 43 | | | Greif, Inc., Class A | | | 2,809 | |
| | 35 | | | Rock-Tenn Co., Class A | | | 2,322 | |
| | 56 | | | Silgan Holdings, Inc. | | | 2,293 | |
| | | | | | | | |
| | | | | | | 11,839 | |
| | | | | | | | |
| | | | Total Materials | | | 31,000 | |
| | | | | | | | |
| | | | Telecommunication Services — 0.9% | |
| | | | Diversified Telecommunication Services — 0.6% | |
| | 78 | | | CenturyLink, Inc. | | | 3,153 | |
| | | | | | | | |
| | | | | | | | |
| SHARES | | | SECURITY DESCRIPTION | | VALUE($) | |
| | | | | | | | |
| | | | | | | | |
| | | | Wireless Telecommunication Services — 0.3% | |
| | 65 | | | Telephone & Data Systems, Inc. | | | 1,748 | |
| | | | | | | | |
| | | | Total Telecommunication Services | | | 4,901 | |
| | | | | | | | |
| | | | Utilities — 5.0% | |
| | | | Electric Utilities — 1.1% | |
| | 41 | | | Northeast Utilities | | | 1,439 | |
| | 99 | | | NV Energy, Inc. | | | 1,524 | |
| | 130 | | | Westar Energy, Inc. | | | 3,485 | |
| | | | | | | | |
| | | | | | | 6,448 | |
| | | | | | | | |
| | | | Gas Utilities — 0.9% | |
| | 65 | | | Oneok, Inc. | | | 4,840 | |
| | | | | | | | |
| | | | Multi-Utilities — 3.0% | |
| | 235 | | | CMS Energy Corp. | | | 4,629 | |
| | 63 | | | NSTAR | | | 2,897 | |
| | 45 | | | Sempra Energy | | | 2,369 | |
| | 112 | | | Wisconsin Energy Corp. | | | 3,505 | |
| | 161 | | | Xcel Energy, Inc. | | | 3,912 | |
| | | | | | | | |
| | | | | | | 17,312 | |
| | | | | | | | |
| | | | Total Utilities | | | 28,600 | |
| | | | | | | | |
| | | | Total Common Stocks
(Cost $424,602) | | | 552,112 | |
| | | | | | | | |
| Short-Term Investment — 3.2% | | | | |
| | | | Investment Company — 3.2% | |
| | 18,277 | | | JPMorgan Prime Money Market Fund, Institutional Class Shares,
0.050% (b) (l) (m)
(Cost $18,277) | | | 18,277 | |
| | | | | | | | |
| Investment of Cash Collateral for Securities on Loan — 3.1% | | | | |
| | | | Investment Company — 3.1% | |
| | 17,693 | | | JPMorgan Prime Money Market Fund,
Capital Shares, 0.080% (b) (l)
(Cost $17,693) | | | 17,693 | |
| | | | | | | | |
| | | | Total Investments — 102.8%
(Cost $460,572) | | | 588,082 | |
| | | | Liabilities in Excess of
Other Assets — (2.8)% | | | (15,863 | ) |
| | | | | | | | |
| | | | NET ASSETS — 100.0% | | $ | 572,219 | |
| | | | | | | | |
Percentages indicated are based on net assets.
SEE NOTES TO FINANCIAL STATEMENTS.
| | | | | | |
| | | |
| 28 | | | | J.P. MORGAN MID CAP/MULTI-CAP FUNDS | | JUNE 30, 2011 |
JPMorgan Mid Cap Growth Fund
SCHEDULE OF PORTFOLIO INVESTMENTS
AS OF JUNE 30, 2011
(Amounts in thousands)
| | | | | | | | |
| SHARES | | | SECURITY DESCRIPTION | | VALUE($) | |
| | | | | | | | |
| Common Stocks — 93.3% | |
| | | | Consumer Discretionary — 18.4% | |
| | | | Auto Components — 1.3% | |
| | 290 | | | BorgWarner, Inc. (a) | | | 23,397 | |
| | | | | | | | |
| | | | Automobiles — 1.7% | |
| | 569 | | | Harley-Davidson, Inc. | | | 23,320 | |
| | 256 | | | Tesla Motors, Inc. (a) (c) | | | 7,460 | |
| | | | | | | | |
| | | | | | | 30,780 | |
| | | | | | | | |
| | | | Diversified Consumer Services — 1.2% | |
| | 180 | | | DeVry, Inc. | | | 10,638 | |
| | 238 | | | Sotheby’s | | | 10,366 | |
| | | | | | | | |
| | | | | | | 21,004 | |
| | | | | | | | |
| | | | Hotels, Restaurants & Leisure — 4.1% | |
| | 340 | | | Cheesecake Factory, Inc. (The) (a) | | | 10,650 | |
| | 268 | | | Gaylord Entertainment Co. (a) | | | 8,049 | |
| | 735 | | | International Game Technology | | | 12,928 | |
| | 678 | | | Marriott International, Inc., Class A | | | 24,077 | |
| | 445 | | | Royal Caribbean Cruises Ltd. (a) | | | 16,746 | |
| | | | | | | | |
| | | | | | | 72,450 | |
| | | | | | | | |
| | | | Household Durables — 0.9% | |
| | 338 | | | Harman International Industries, Inc. | | | 15,398 | |
| | | | | | | | |
| | | | Internet & Catalog Retail — 1.0% | |
| | 70 | | | NetFlix, Inc. (a) | | | 18,283 | |
| | | | | | | | |
| | | | Media — 3.0% | |
| | 449 | | | Lamar Advertising Co., Class A (a) | | | 12,286 | |
| | 490 | | | Scripps Networks Interactive, Inc., Class A | | | 23,956 | |
| | 8,075 | | | Sirius XM Radio, Inc. (a) | | | 17,684 | |
| | | | | | | | |
| | | | | | | 53,926 | �� |
| | | | | | | | |
| | | | Specialty Retail — 0.9% | |
| | 396 | | | Dick’s Sporting Goods, Inc. (a) | | | 15,215 | |
| | | | | | | | |
| | | | Textiles, Apparel & Luxury Goods — 4.3% | |
| | 618 | | | Coach, Inc. | | | 39,521 | |
| | 142 | | | Deckers Outdoor Corp. (a) | | | 12,516 | |
| | 122 | | | Fossil, Inc. (a) | | | 14,385 | |
| | 87 | | | Lululemon Athletica, Inc., (Canada) (a) (c) | | | 9,751 | |
| | | | | | | | |
| | | | | | | 76,173 | |
| | | | | | | | |
| | | | Total Consumer Discretionary | | | 326,626 | |
| | | | | | | | |
| | | | Energy — 8.0% | |
| | | | Energy Equipment & Services — 2.4% | |
| | 578 | | | Cameron International Corp. (a) | | | 29,071 | |
| | 86 | | | CARBO Ceramics, Inc. | | | 14,046 | |
| | | | | | | | |
| | | | | | | 43,117 | |
| | | | | | | | |
| | | | | | | | |
| SHARES | | | SECURITY DESCRIPTION | | VALUE($) | |
| | | | | | | | |
| | | | | | | | |
| | | | Oil, Gas & Consumable Fuels — 5.6% | |
| | 405 | | | Concho Resources, Inc. (a) | | | 37,190 | |
| | 436 | | | Forest Oil Corp. (a) | | | 11,634 | |
| | 258 | | | Newfield Exploration Co. (a) | | | 17,556 | |
| | 283 | | | Peabody Energy Corp. | | | 16,695 | |
| | 300 | | | Range Resources Corp. | | | 16,661 | |
| | | | | | | | |
| | | | | | | 99,736 | |
| | | | | | | | |
| | | | Total Energy | | | 142,853 | |
| | | | | | | | |
| | | | Financials — 8.2% | |
| | | | Capital Markets — 3.5% | |
| | 463 | | | Lazard Ltd., (Bermuda), Class A | | | 17,188 | |
| | 743 | | | Och-Ziff Capital Management Group LLC, Class A | | | 10,312 | |
| | 349 | | | T. Rowe Price Group, Inc. | | | 21,056 | |
| | 693 | | | TD AMERITRADE Holding Corp. | | | 13,519 | |
| | | | | | | | |
| | | | | | | 62,075 | |
| | | | | | | | |
| | | | Commercial Banks — 1.5% | |
| | 271 | | | BOK Financial Corp. | | | 14,815 | |
| | 335 | | | Comerica, Inc. | | | 11,564 | |
| | | | | | | | |
| | | | | | | 26,379 | |
| | | | | | | | |
| | | | Diversified Financial Services — 1.3% | |
| | 590 | | | Moody’s Corp. | | | 22,642 | |
| | | | | | | | |
| | | | Insurance — 1.0% | |
| | 338 | | | AON Corp. | | | 17,319 | |
| | | | | | | | |
| | | | Real Estate Investment Trusts (REITs) — 0.9% | |
| | 267 | | | Camden Property Trust | | | 16,980 | |
| | | | | | | | |
| | | | Total Financials | | | 145,395 | |
| | | | | | | | |
| | | | Health Care — 15.5% | |
| | | | Biotechnology — 1.4% | |
| | 367 | | | Alexion Pharmaceuticals, Inc. (a) | | | 17,265 | |
| | 205 | | | Dendreon Corp. (a) | | | 8,085 | |
| | | | | | | | |
| | | | | | | 25,350 | |
| | | | | | | | |
| | | | Health Care Equipment & Supplies — 2.0% | |
| | 339 | | | Sirona Dental Systems, Inc. (a) | | | 17,996 | |
| | 551 | | | Thoratec Corp. (a) | | | 18,067 | |
| | | | | | | | |
| | | | | | | 36,063 | |
| | | | | | | | |
| | | | Health Care Providers & Services — 6.5% | |
| | 720 | | | Brookdale Senior Living, Inc. (a) | | | 17,470 | |
| | 697 | | | Coventry Health Care, Inc. (a) | | | 25,419 | |
| | 278 | | | DaVita, Inc. (a) | | | 24,056 | |
| | 328 | | | Humana, Inc. | | | 26,411 | |
| | 723 | | | Lincare Holdings, Inc. | | | 21,171 | |
| | | | | | | | |
| | | | | | | 114,527 | |
| | | | | | | | |
SEE NOTES TO FINANCIAL STATEMENTS.
| | | | | | | | |
| | | |
| JUNE 30, 2011 | | J.P. MORGAN MID CAP/MULTI-CAP FUNDS | | | | | 29 | |
JPMorgan Mid Cap Growth Fund
SCHEDULE OF PORTFOLIO INVESTMENTS
AS OF JUNE 30, 2011 (continued)
(Amounts in thousands, except number of contracts)
| | | | | | | | |
| SHARES | | | SECURITY DESCRIPTION | | VALUE($) | |
| | | | | | | | |
| Common Stocks — Continued | | | | |
| | | | Health Care Technology — 0.8% | |
| | 239 | | | Cerner Corp. (a) | | | 14,623 | |
| | | | | | | | |
| | | | Life Sciences Tools & Services — 3.0% | |
| | 625 | | | Agilent Technologies, Inc. (a) | | | 31,954 | |
| | 386 | | | Bruker Corp. (a) | | | 7,855 | |
| | 183 | | | Illumina, Inc. (a) | | | 13,745 | |
| | | | | | | | |
| | | | | | | 53,554 | |
| | | | | | | | |
| | | | Pharmaceuticals — 1.8% | |
| | 595 | | | Valeant Pharmaceuticals International, Inc., (Canada) (c) | | | 30,931 | |
| | | | | | | | |
| | | | Total Health Care | | | 275,048 | |
| | | | | | | | |
| | | | Industrials — 16.2% | |
| | | | Aerospace & Defense — 1.6% | |
| | 237 | | | Goodrich Corp. | | | 22,586 | |
| | 61 | | | TransDigm Group, Inc. (a) | | | 5,599 | |
| | | | | | | | |
| | | | | | | 28,185 | |
| | | | | | | | |
| | | | Airlines — 0.8% | |
| | 1,473 | | | Delta Air Lines, Inc. (a) | | | 13,511 | |
| | | | | | | | |
| | | | Commercial Services & Supplies — 1.1% | |
| | 217 | | | Stericycle, Inc. (a) | | | 19,310 | |
| | | | | | | | |
| | | | Electrical Equipment — 2.0% | |
| | 310 | | | Hubbell, Inc., Class B | | | 20,160 | |
| | 180 | | | Roper Industries, Inc. | | | 14,981 | |
| | | | | | | | |
| | | | | | | 35,141 | |
| | | | | | | | |
| | | | Industrial Conglomerates — 1.4% | |
| | 514 | | | Carlisle Cos., Inc. | | | 25,324 | |
| | | | | | | | |
| | | | Machinery — 4.4% | |
| | 294 | | | AGCO Corp. (a) | | | 14,512 | |
| | 247 | | | Cummins, Inc. | | | 25,578 | |
| | 194 | | | Parker Hannifin Corp. | | | 17,383 | |
| | 314 | | | Wabtec Corp. | | | 20,644 | |
| | | | | | | | |
| | | | | | | 78,117 | |
| | | | | | | | |
| | | | Professional Services — 0.9% | |
| | 198 | | | IHS, Inc., Class A (a) | | | 16,517 | |
| | | | | | | | |
| | | | Road & Rail — 1.6% | |
| | 685 | | | Avis Budget Group, Inc. (a) | | | 11,710 | |
| | 366 | | | J.B. Hunt Transport Services, Inc. | | | 17,216 | |
| | | | | | | | |
| | | | | | | 28,926 | |
| | | | | | | | |
| | | | Trading Companies & Distributors — 2.4% | |
| | 476 | | | Air Lease Corp. (a) (c) | | | 11,555 | |
| | | | | | | | |
| SHARES | | | SECURITY DESCRIPTION | | VALUE($) | |
| | | | | | | | |
| | | | | | | | |
| | | | Trading Companies & Distributors — Continued | |
| | 205 | | | W.W. Grainger, Inc. | | | 31,544 | |
| | | | | | | | |
| | | | | | | 43,099 | |
| | | | | | | | |
| | | | Total Industrials | | | 288,130 | |
| | | | | | | | |
| | | | Information Technology — 23.5% | |
| | | | Communications Equipment — 3.8% | |
| | 387 | | | Aruba Networks, Inc. (a) | | | 11,442 | |
| | 140 | | | F5 Networks, Inc. (a) | | | 15,413 | |
| | 791 | | | JDS Uniphase Corp. (a) | | | 13,175 | |
| | 284 | | | Polycom, Inc. (a) | | | 18,235 | |
| | 236 | | | Riverbed Technology, Inc. (a) | | | 9,347 | |
| | | | | | | | |
| | | | | | | 67,612 | |
| | | | | | | | |
| | | | Computers & Peripherals — 1.0% | |
| | 319 | | | NetApp, Inc. (a) | | | 16,810 | |
| | | | | | | | |
| | | | Electronic Equipment, Instruments & Components — 2.4% | |
| | 299 | | | Amphenol Corp., Class A | | | 16,141 | |
| | 739 | | | TE Connectivity Ltd., (Switzerland) | | | 27,162 | |
| | | | | | | | |
| | | | | | | 43,303 | |
| | | | | | | | |
| | | | Internet Software & Services — 1.3% | |
| | 164 | | | Equinix, Inc. (a) | | | 16,568 | |
| | 77 | | | LinkedIn Corp., Class A (a) (c) | | | 6,946 | |
| | | | | | | | |
| | | | | | | 23,514 | |
| | | | | | | | |
| | | | IT Services — 3.4% | |
| | 236 | | | Alliance Data Systems Corp. (a) (c) | | | 22,182 | |
| | 678 | | | CGI Group, Inc., (Canada), Class A (a) | | | 16,701 | |
| | 288 | | | FleetCor Technologies, Inc. (a) | | | 8,539 | |
| | 270 | | | VeriFone Systems, Inc. (a) | | | 11,983 | |
| | | | | | | | |
| | | | | | | 59,405 | |
| | | | | | | | |
| | | | Office Electronics — 0.8% | |
| | 348 | | | Zebra Technologies Corp., Class A (a) | | | 14,663 | |
| | | | | | | | |
| | | | Semiconductors & Semiconductor Equipment — 3.9% | |
| | 416 | | | Avago Technologies Ltd., (Singapore) | | | 15,797 | |
| | 784 | | | Freescale Semiconductor Holdings I Ltd. (a) (c) | | | 14,408 | |
| | 464 | | | Microchip Technology, Inc. (c) | | | 17,583 | |
| | 588 | | | Xilinx, Inc. | | | 21,426 | |
| | | | | | | | |
| | | | | | | 69,214 | |
| | | | | | | | |
| | | | Software — 6.9% | |
| | 483 | | | Adobe Systems, Inc. (a) | | | 15,187 | |
| | 397 | | | Autodesk, Inc. (a) | | | 15,332 | |
| | 242 | | | Citrix Systems, Inc. (a) | | | 19,352 | |
| | 202 | | | Concur Technologies, Inc. (a) | | | 10,134 | |
| | 345 | | | MICROS Systems, Inc. (a) | | | 17,125 | |
SEE NOTES TO FINANCIAL STATEMENTS.
| | | | | | |
| | | |
| 30 | | | | J.P. MORGAN MID CAP/MULTI-CAP FUNDS | | JUNE 30, 2011 |
| | | | | | | | |
| SHARES | | | SECURITY DESCRIPTION | | VALUE($) | |
| | | | | | | | |
| Common Stocks — Continued | | | | |
| | | | Software — Continued | |
| | 604 | | | Nuance Communications, Inc. (a) | | | 12,957 | |
| | 345 | | | Red Hat, Inc. (a) | | | 15,850 | |
| | 114 | | | Salesforce.com, Inc. (a) | | | 16,909 | |
| | | | | | | | |
| | | | | | | 122,846 | |
| | | | | | | | |
| | | | Total Information Technology | | | 417,367 | |
| | | | | | | | |
| | | | Materials — 3.5% | |
| | | | Chemicals — 2.5% | |
| | 238 | | | FMC Corp. | | | 20,456 | |
| | 287 | | | Sherwin-Williams Co. (The) | | | 24,062 | |
| | | | | | | | |
| | | | | | | 44,518 | |
| | | | | | | | |
| | | | Containers & Packaging — 1.0% | |
| | 256 | | | Greif, Inc., Class A | | | 16,674 | |
| | | | | | | | |
| | | | Total Materials | | | 61,192 | |
| | | | | | | | |
| | | | | | | | |
| SHARES | | | SECURITY DESCRIPTION | | VALUE($) | |
| | | | Total Common Stocks
(Cost $1,228,055) | | | 1,656,611 | |
| | | | | | | | |
| | | | | | | | |
| Short-Term Investment — 2.0% | |
| | | | Investment Company — 2.0% | |
| | 36,757 | | | JPMorgan Liquid Assets Money Market Fund, Institutional Class Shares,
0.050% (b) (l) (m)
(Cost $36,757) | | | 36,757 | |
| | | | | | | | |
| Investment of Cash Collateral for Securities on Loan — 4.0% | |
| | | | Investment Company — 4.0% | |
| | 70,726 | | | JPMorgan Prime Money Market Fund,
Capital Shares, 0.080% (b) (l)
(Cost $70,726) | | | 70,726 | |
| | | | Total Investments — 99.3%
(Cost $1,335,538) | | | 1,764,094 | |
| | | | | | | | |
| | | | Other Assets in Excess of
Liabilities — 0.7% | | | 11,659 | |
| | | | | | | | |
| | | | NET ASSETS — 100.0% | | $ | 1,775,753 | |
| | | | | | | | |
Percentages indicated are based on net assets.
| | | | | | | | | | | | | | | | |
| Futures Contracts | |
NUMBER OF
CONTRACTS | | | DESCRIPTION | | EXPIRATION
DATE | | | NOTIONAL
VALUE AT
06/30/11 | | | UNREALIZED
APPRECIATION
(DEPRECIATION) | |
| | | | Long Futures Outstanding | | | | | | | | | | | | |
| | 536 | | | S&P Mid Cap 400 | | | 09/16/11 | | | $ | 52,340 | | | $ | 173 | |
| | | | | | | | | | | | | | | | |
SEE NOTES TO FINANCIAL STATEMENTS.
| | | | | | | | |
| | | |
| JUNE 30, 2011 | | J.P. MORGAN MID CAP/MULTI-CAP FUNDS | | | | | 31 | |
JPMorgan Mid Cap Value Fund
SCHEDULE OF PORTFOLIO INVESTMENTS
AS OF JUNE 30, 2011
(Amounts in thousands)
| | | | | | | | |
| SHARES | | | SECURITY DESCRIPTION | | VALUE($) | |
| | | | | | | | |
| Common Stocks — 97.1% | |
| | | | Consumer Discretionary — 19.6% | |
| | | | Distributors — 1.0% | |
| | 1,243 | | | Genuine Parts Co. | | | 67,640 | |
| | | | | | | | |
| | | | Hotels, Restaurants & Leisure — 3.1% | |
| | 1,436 | | | Darden Restaurants, Inc. | | | 71,453 | |
| | 1,340 | | | Marriott International, Inc., Class A | | | 47,550 | |
| | 1,205 | | | Royal Caribbean Cruises Ltd. (a) | | | 45,373 | |
| | 832 | | | Yum! Brands, Inc. | | | 45,952 | |
| | | | | | | | |
| | | | | | | 210,328 | |
| | | | | | | | |
| | | | Household Durables — 2.7% | |
| | 1,827 | | | Fortune Brands, Inc. | | | 116,476 | |
| | 1,245 | | | Jarden Corp. | | | 42,963 | |
| | 381 | | | Mohawk Industries, Inc. (a) | | | 22,846 | |
| | | | | | | | |
| | | | | | | 182,285 | |
| | | | | | | | |
| | | | Internet & Catalog Retail — 0.8% | |
| | 1,824 | | | Expedia, Inc. | | | 52,891 | |
| | | | | | | | |
| | | | Media — 4.9% | |
| | 2,123 | | | Cablevision Systems Corp., Class A | | | 76,858 | |
| | 2,676 | | | CBS Corp., Class B | | | 76,227 | |
| | 2,170 | | | Clear Channel Outdoor Holdings, Inc., Class A (a) | | | 27,562 | |
| | 1,637 | | | DISH Network Corp., Class A (a) | | | 50,203 | |
| | 3,624 | | | Gannett Co., Inc. | | | 51,897 | |
| | 684 | | | Omnicom Group, Inc. | | | 32,947 | |
| | 39 | | | Washington Post Co. (The), Class B (c) | | | 16,264 | |
| | | | | | | | |
| | | | | | | 331,958 | |
| | | | | | | | |
| | | | Multiline Retail — 0.7% | |
| | 995 | | | Kohl’s Corp. | | | 49,747 | |
| | | | | | | | |
| | | | Specialty Retail — 5.7% | |
| | 221 | | | AutoZone, Inc. (a) | | | 65,097 | |
| | 1,887 | | | Bed Bath & Beyond, Inc. (a) | | | 110,136 | |
| | 3,798 | | | Gap, Inc. (The) | | | 68,746 | |
| | 709 | | | Tiffany & Co. | | | 55,646 | |
| | 1,608 | | | TJX Cos., Inc. | | | 84,476 | |
| | | | | | | | |
| | | | | | | 384,101 | |
| | | | | | | | |
| | | | Textiles, Apparel & Luxury Goods — 0.7% | |
| | 716 | | | Phillips-Van Heusen Corp. | | | 46,850 | |
| | | | | | | | |
| | | | Total Consumer Discretionary | | | 1,325,800 | |
| | | | | | | | |
| | | | Consumer Staples — 6.0% | |
| | | | Beverages — 1.2% | |
| | 578 | | | Brown-Forman Corp., Class B | | | 43,170 | |
| | 987 | | | Dr. Pepper Snapple Group, Inc. | | | 41,381 | |
| | | | | | | | |
| | | | | | | 84,551 | |
| | | | | | | | |
| | | | | | | | |
| SHARES | | | SECURITY DESCRIPTION | | VALUE($) | |
| | | | | | | | |
| | | | | | | | |
| | | | Food & Staples Retailing — 1.0% | |
| | 2,935 | | | Safeway, Inc. | | | 68,600 | |
| | | | | | | | |
| | | | Food Products — 3.0% | |
| | 553 | | | Hershey Co. (The) | | | 31,464 | |
| | 1,172 | | | JM Smucker Co. (The) | | | 89,603 | |
| | 909 | | | Ralcorp Holdings, Inc. (a) | | | 78,726 | |
| | | | | | | | |
| | | | | | | 199,793 | |
| | | | | | | | |
| | | | Household Products — 0.8% | |
| | 721 | | | Energizer Holdings, Inc. (a) | | | 52,155 | |
| | | | | | | | |
| | | | Total Consumer Staples | | | 405,099 | |
| | | | | | | | |
| | | | Energy — 7.8% | |
| | | | Oil, Gas & Consumable Fuels — 7.8% | |
| | 1,119 | | | CVR Energy, Inc. (a) | | | 27,551 | |
| | 1,279 | | | Devon Energy Corp. | | | 100,761 | |
| | 2,318 | | | Energen Corp. | | | 130,950 | |
| | 924 | | | EQT Corp. | | | 48,521 | |
| | 403 | | | Kinder Morgan Management LLC (a) | | | 26,460 | |
| | 967 | | | Newfield Exploration Co. (a) | | | 65,784 | |
| | 1,193 | | | Teekay Corp., (Canada) | | | 36,825 | |
| | 3,092 | | | Williams Cos., Inc. (The) | | | 93,527 | |
| | | | | | | | |
| | | | Total Energy | | | 530,379 | |
| | | | | | | | |
| | | | Financials — 23.3% | |
| | | | Capital Markets — 3.5% | |
| | 1,527 | | | Ameriprise Financial, Inc. | | | 88,095 | |
| | 2,555 | | | Invesco Ltd. | | | 59,790 | |
| | 659 | | | Northern Trust Corp. | | | 30,306 | |
| | 1,005 | | | T. Rowe Price Group, Inc. | | | 60,622 | |
| | | | | | | | |
| | | | | | | 238,813 | |
| | | | | | | | |
| | | | Commercial Banks — 5.8% | |
| | 618 | | | BancorpSouth, Inc. (c) | | | 7,666 | |
| | 972 | | | BB&T Corp. | | | 26,094 | |
| | 996 | | | City National Corp. | | | 54,038 | |
| | 761 | | | Cullen/Frost Bankers, Inc. | | | 43,274 | |
| | 4,933 | | | Fifth Third Bancorp | | | 62,892 | |
| | 2,897 | | | Huntington Bancshares, Inc. | | | 19,002 | |
| | 1,001 | | | M&T Bank Corp. | | | 88,051 | |
| | 1,981 | | | SunTrust Banks, Inc. | | | 51,119 | |
| | 1,551 | | | Zions Bancorp | | | 37,247 | |
| | | | | | | | |
| | | | | | | 389,383 | |
| | | | | | | | |
| | | | Insurance — 9.6% | |
| | 1,127 | | | AON Corp. | | | 57,795 | |
| | 1,006 | | | Arch Capital Group Ltd., (Bermuda) (a) | | | 32,121 | |
| | 1,184 | | | Cincinnati Financial Corp. (c) | | | 34,551 | |
| | 3,002 | | | Loews Corp. | | | 126,367 | |
SEE NOTES TO FINANCIAL STATEMENTS.
| | | | | | |
| | | |
| 32 | | | | J.P. MORGAN MID CAP/MULTI-CAP FUNDS | | JUNE 30, 2011 |
| | | | | | | | |
| SHARES | | | SECURITY DESCRIPTION | | VALUE($) | |
| | | | | | | | |
| Common Stocks — Continued | |
| | | | Insurance — Continued | | | | |
| | 4,776 | | | Old Republic International Corp. | | | 56,113 | |
| | 2,143 | | | OneBeacon Insurance Group Ltd., Class A | | | 28,699 | |
| | 1,330 | | | Principal Financial Group, Inc. | | | 40,455 | |
| | 460 | | | Torchmark Corp. | | | 29,485 | |
| | 1,928 | | | Transatlantic Holdings, Inc. | | | 94,491 | |
| | 2,720 | | | W.R. Berkley Corp. | | | 88,227 | |
| | 2,926 | | | XL Group plc, (Ireland) | | | 64,310 | |
| | | | | | | | |
| | | | | | | 652,614 | |
| | | | | | | | |
| | | | Real Estate Investment Trusts (REITs) — 2.6% | |
| | 1,208 | | | HCP, Inc. | | | 44,314 | |
| | 710 | | | Kimco Realty Corp. | | | 13,237 | |
| | 1,320 | | | Regency Centers Corp. | | | 58,027 | |
| | 649 | | | Vornado Realty Trust | | | 60,506 | |
| | | | | | | | |
| | | | | | | 176,084 | |
| | | | | | | | |
| | | | Real Estate Management & Development — 0.7% | |
| | 2,470 | | | Brookfield Office Properties, Inc. | | | 47,618 | |
| | | | | | | | |
| | | | Thrifts & Mortgage Finance — 1.1% | |
| | 1,766 | | | Capitol Federal Financial, Inc. | | | 20,762 | |
| | 4,199 | | | People’s United Financial, Inc. | | | 56,440 | |
| | | | | | | | |
| | | | | | | 77,202 | |
| | | | | | | | |
| | | | Total Financials | | | 1,581,714 | |
| | | | | | | | |
| | | | Health Care — 6.2% | |
| | | | Health Care Equipment & Supplies — 1.1% | |
| | 847 | | | Becton, Dickinson & Co. | | | 72,952 | |
| | | | | | | | |
| | | | Health Care Providers & Services — 5.1% | |
| | 1,424 | | | AmerisourceBergen Corp. | | | 58,937 | |
| | 1,489 | | | Coventry Health Care, Inc. (a) | | | 54,286 | |
| | 1,120 | | | HCA Holdings, Inc. (a) | | | 36,973 | |
| | 869 | | | Humana, Inc. | | | 69,989 | |
| | 3,339 | | | Lincare Holdings, Inc. | | | 97,731 | |
| | 1,215 | | | VCA Antech, Inc. (a) | | | 25,764 | |
| | | | | | | | |
| | | | | | | 343,680 | |
| | | | | | | | |
| | | | Total Health Care | | | 416,632 | |
| | | | | | | | |
| | | | Industrials — 9.0% | |
| | | | Aerospace & Defense — 1.5% | |
| | 777 | | | Alliant Techsystems, Inc. | | | 55,419 | |
| | 531 | | | L-3 Communications Holdings, Inc. | | | 46,455 | |
| | | | | | | | |
| | | | | | | 101,874 | |
| | | | | | | | |
| | | | Commercial Services & Supplies — 2.1% | |
| | 4,657 | | | Republic Services, Inc. | | | 143,682 | |
| | | | | | | | |
| | | | Electrical Equipment — 3.3% | |
| | 1,609 | | | AMETEK, Inc. | | | 72,241 | |
| | | | | | | | |
| SHARES | | | SECURITY DESCRIPTION | | VALUE($) | |
| | | | | | | | |
| | | | | | | | |
| | | | Electrical Equipment — Continued | | | | |
| | 1,074 | | | Cooper Industries plc | | | 64,084 | |
| | 962 | | | Regal-Beloit Corp. | | | 64,250 | |
| | 284 | | | Roper Industries, Inc. | | | 23,651 | |
| | | | | | | | |
| | | | | | | 224,226 | |
| | | | | | | | |
| | | | Industrial Conglomerates — 1.0% | |
| | 1,304 | | | Carlisle Cos., Inc. | | | 64,188 | |
| | | | | | | | |
| | | | Machinery — 1.1% | |
| | 1,243 | | | Snap-On, Inc. | | | 77,682 | |
| | | | | | | | |
| | | | Total Industrials | | | 611,652 | |
| | | | | | | | |
| | | | Information Technology — 5.9% | |
| | | | Electronic Equipment, Instruments & Components — 3.3% | |
| | 1,110 | | | Amphenol Corp., Class A | | | 59,945 | |
| | 1,282 | | | Arrow Electronics, Inc. (a) | | | 53,210 | |
| | 2,875 | | | TE Connectivity Ltd., (Switzerland) | | | 105,689 | |
| | | | | | | | |
| | | | | | | 218,844 | |
| | | | | | | | |
| | | | IT Services — 1.0% | |
| | 2,252 | | | Jack Henry & Associates, Inc. | | | 67,576 | |
| | | | | | | | |
| | | | Semiconductors & Semiconductor Equipment — 0.7% | |
| | 1,259 | | | Analog Devices, Inc. | | | 49,276 | |
| | | | | | | | |
| | | | Software — 0.9% | |
| | 2,427 | | | Synopsys, Inc. (a) | | | 62,406 | |
| | | | | | | | |
| | | | Total Information Technology | | | 398,102 | |
| | | | | | | | |
| | | | Materials — 7.3% | |
| | | | Chemicals — 4.1% | |
| | 811 | | | Airgas, Inc. | | | 56,828 | |
| | 998 | | | Albemarle Corp. | | | 69,083 | |
| | 917 | | | Sherwin-Williams Co. (The) | | | 76,889 | |
| | 1,039 | | | Sigma-Aldrich Corp. | | | 76,271 | |
| | | | | | | | |
| | | | | | | 279,071 | |
| | | | | | | | |
| | | | Containers & Packaging — 3.2% | |
| | 2,754 | | | Ball Corp. | | | 105,936 | |
| | 838 | | | Rock-Tenn Co., Class A | | | 55,567 | |
| | 1,348 | | | Silgan Holdings, Inc. | | | 55,219 | |
| | | | | | | | |
| | | | | | | 216,722 | |
| | | | | | | | |
| | | | Total Materials | | | 495,793 | |
| | | | | | | | |
| | | | Telecommunication Services — 1.9% | |
| | | | Diversified Telecommunication Services — 1.1% | |
| | 1,869 | | | CenturyLink, Inc. | | | 75,551 | |
| | | | | | | | |
| | | | Wireless Telecommunication Services — 0.8% | |
| | 1,996 | | | Telephone & Data Systems, Inc. | | | 53,746 | |
| | | | | | | | |
| | | | Total Telecommunication Services | | | 129,297 | |
| | | | | | | | |
SEE NOTES TO FINANCIAL STATEMENTS.
| | | | | | | | |
| | | |
| JUNE 30, 2011 | | J.P. MORGAN MID CAP/MULTI-CAP FUNDS | | | | | 33 | |
JPMorgan Mid Cap Value Fund
SCHEDULE OF PORTFOLIO INVESTMENTS
AS OF JUNE 30, 2011 (continued)
(Amounts in thousands)
| | | | | | | | |
| SHARES | | | SECURITY DESCRIPTION | | VALUE($) | |
| | | | | | | | |
| Common Stocks — Continued | |
| | | | Utilities — 10.1% | |
| | | | Electric Utilities — 2.3% | |
| | 976 | | | Northeast Utilities | | | 34,312 | |
| | 2,388 | | | NV Energy, Inc. | | | 36,663 | |
| | 3,104 | | | Westar Energy, Inc. | | | 83,531 | |
| | | | | | | | |
| | | | | | | 154,506 | |
| | | | | | | | |
| | | | Gas Utilities — 1.7% | |
| | 1,568 | | | Oneok, Inc. | | | 116,068 | |
| | | | | | | | |
| | | | Multi-Utilities — 6.1% | |
| | 5,643 | | | CMS Energy Corp. | | | 111,101 | |
| | 1,508 | | | NSTAR | | | 69,338 | |
| | 1,077 | | | Sempra Energy | | | 56,945 | |
| | 2,680 | | | Wisconsin Energy Corp. | | | 84,018 | |
| | 3,862 | | | Xcel Energy, Inc. | | | 93,839 | |
| | | | | | | | |
| | | | | | | 415,241 | |
| | | | | | | | |
| | | | Total Utilities | | | 685,815 | |
| | | | | | | | |
| | | | Total Common Stocks
(Cost $5,013,019) | | | 6,580,283 | |
| | | | | | | | |
| | | | | | | | |
| SHARES | | | SECURITY DESCRIPTION | | VALUE($) | |
| | | | | | | | |
| Short-Term Investment — 2.7% | |
| | | | Investment Company — 2.7% | |
| | 183,564 | | | JPMorgan Prime Money Market Fund, Institutional Class Shares,
0.050% (b) (l) (m)
(Cost $183,564) | | | 183,564 | |
| | | | | | | | |
| Investment of Cash Collateral for Securities on Loan — 0.6% | |
| | | | Investment Company — 0.6% | |
| | 36,367 | | | JPMorgan Prime Money Market Fund,
Capital Shares, 0.080% (b) (l)
(Cost $36,367) | | | 36,367 | |
| | | | | | | | |
| | | | Total Investments — 100.4%
(Cost $5,232,950) | | | 6,800,214 | |
| | | | Liabilities in Excess of
Other Assets — (0.4)% | | | (24,380 | ) |
| | | | | | | | |
| | | | NET ASSETS — 100.0% | | $ | 6,775,834 | |
| | | | | | | | |
Percentages indicated are based on net assets.
SEE NOTES TO FINANCIAL STATEMENTS.
| | | | | | |
| | | |
| 34 | | | | J.P. MORGAN MID CAP/MULTI-CAP FUNDS | | JUNE 30, 2011 |
JPMorgan Multi-Cap Market Neutral Fund
SCHEDULE OF PORTFOLIO INVESTMENTS
AS OF JUNE 30, 2011
(Amounts in thousands)
| | | | | | | | |
| SHARES | | | SECURITY DESCRIPTION | | VALUE($) | |
| | | | | | | | |
| Long Positions — 104.0% (j) | |
| | | | Common Stocks — 97.4% | |
| | | | Consumer Discretionary — 18.7% | |
| | | | Auto Components — 1.9% | |
| | 27 | | | Autoliv, Inc., (Sweden) | | | 2,144 | |
| | 14 | | | BorgWarner, Inc. (a) | | | 1,139 | |
| | 80 | | | Cooper Tire & Rubber Co. | | | 1,592 | |
| | 78 | | | Goodyear Tire & Rubber Co. (The) (a) | | | 1,305 | |
| | 38 | | | Tenneco, Inc. (a) | | | 1,680 | |
| | 43 | | | TRW Automotive Holdings Corp. (a) | | | 2,545 | |
| | | | | | | | |
| | | | | | | 10,405 | |
| | | | | | | | |
| | | | Automobiles — 0.6% | |
| | 128 | | | Ford Motor Co. (a) | | | 1,765 | |
| | 38 | | | Harley-Davidson, Inc. | | | 1,577 | |
| | | | | | | | |
| | | | | | | 3,342 | |
| | | | | | | | |
| | | | Diversified Consumer Services — 2.2% | |
| | 52 | | | Apollo Group, Inc., Class A (a) | | | 2,263 | |
| | 69 | | | Career Education Corp. (a) | | | 1,463 | |
| | 43 | | | Coinstar, Inc. (a) | | | 2,352 | |
| | 25 | | | ITT Educational Services, Inc. (a) | | | 1,979 | |
| | 32 | | | Regis Corp. | | | 491 | |
| | 100 | | | Service Corp. International | | | 1,167 | |
| | 7 | | | Strayer Education, Inc. | | | 836 | |
| | 17 | | | Weight Watchers International, Inc. | | | 1,295 | |
| | | | | | | | |
| | | | | | | 11,846 | |
| | | | | | | | |
| | | | Hotels, Restaurants & Leisure — 2.4% | |
| | 96 | | | Brinker International, Inc. | | | 2,342 | |
| | 33 | | | Cracker Barrel Old Country Store, Inc. | | | 1,619 | |
| | 30 | | | Las Vegas Sands Corp. (a) | | | 1,247 | |
| | 24 | | | MGM Resorts International (a) | | | 314 | |
| | 44 | | | Penn National Gaming, Inc. (a) | | | 1,774 | |
| | 26 | | | PF Chang’s China Bistro, Inc. | | | 1,026 | |
| | 32 | | | Vail Resorts, Inc. | | | 1,492 | |
| | 37 | | | Wyndham Worldwide Corp. | | | 1,254 | |
| | 15 | | | Wynn Resorts Ltd. | | | 2,115 | |
| | | | | | | | |
| | | | | | | 13,183 | |
| | | | | | | | |
| | | | Household Durables — 1.5% | |
| | 61 | | | Garmin Ltd., (Switzerland) | | | 2,007 | |
| | 7 | | | Harman International Industries, Inc. | | | 305 | |
| | 46 | | | Jarden Corp. | | | 1,571 | |
| | 31 | | | Tempur-Pedic International, Inc. (a) | | | 2,088 | |
| | 26 | | | Whirlpool Corp. | | | 2,144 | |
| | | | | | | | |
| | | | | | | 8,115 | |
| | | | | | | | |
| | | | | | | | |
| SHARES | | | SECURITY DESCRIPTION | | VALUE($) | |
| | | | | | | | |
| | | | | | | | |
| | | | Internet & Catalog Retail — 0.9% | |
| | 2 | | | Amazon.com, Inc. (a) | | | 343 | |
| | 75 | | | Expedia, Inc. | | | 2,176 | |
| | 3 | | | NetFlix, Inc. (a) | | | 747 | |
| | 27 | | | Shutterfly, Inc. (a) | | | 1,572 | |
| | | | | | | | |
| | | | | | | 4,838 | |
| | | | | | | | |
| | | | Leisure Equipment & Products — 0.6% | |
| | 54 | | | Brunswick Corp. | | | 1,092 | |
| | 4 | | | Mattel, Inc. | | | 106 | |
| | 17 | | | Polaris Industries, Inc. | | | 1,930 | |
| | | | | | | | |
| | | | | | | 3,128 | |
| | | | | | | | |
| | | | Media — 2.3% | |
| | 57 | | | CBS Corp., Class B | | | 1,630 | |
| | 60 | | | DISH Network Corp., Class A (a) | | | 1,833 | |
| | 58 | | | Gannett Co., Inc. | | | 837 | |
| | 24 | | | John Wiley & Sons, Inc., Class A | | | 1,253 | |
| | 40 | | | Liberty Global, Inc., Class A (a) | | | 1,820 | |
| | 24 | | | Liberty Media Corp. - Starz, Class A (a) | | | 1,780 | |
| | 8 | | | McGraw-Hill Cos., Inc. (The) | | | 344 | |
| | 19 | | | Time Warner Cable, Inc. | | | 1,497 | |
| | 49 | | | Virgin Media, Inc. | | | 1,463 | |
| | | | | | | | |
| | | | | | | 12,457 | |
| | | | | | | | |
| | | | Multiline Retail — 0.6% | |
| | 21 | | | Dollar Tree, Inc. (a) | | | 1,384 | |
| | 72 | | | Macy’s, Inc. | | | 2,096 | |
| | | | | | | | |
| | | | | | | 3,480 | |
| | | | | | | | |
| | | | Specialty Retail — 4.0% | |
| | 20 | | | Abercrombie & Fitch Co., Class A | | | 1,364 | |
| | 20 | | | Aeropostale, Inc. (a) | | | 356 | |
| | 82 | | | American Eagle Outfitters, Inc. | | | 1,042 | |
| | 35 | | | ANN, Inc. (a) | | | 915 | |
| | 55 | | | Ascena Retail Group, Inc. (a) | | | 1,863 | |
| | 6 | | | AutoZone, Inc. (a) | | | 1,894 | |
| | 14 | | | Bed Bath & Beyond, Inc. (a) | | | 833 | |
| | 36 | | | Buckle, Inc. (The) | | | 1,535 | |
| | 61 | | | Foot Locker, Inc. | | | 1,457 | |
| | 72 | | | GameStop Corp., Class A (a) | | | 1,913 | |
| | 54 | | | Limited Brands, Inc. | | | 2,079 | |
| | 31 | | | Men’s Wearhouse, Inc. (The) | | | 1,044 | |
| | 40 | | | Penske Automotive Group, Inc. | | | 916 | |
| | 171 | | | Pier 1 Imports, Inc. (a) | | | 1,973 | |
| | 83 | | | RadioShack Corp. | | | 1,100 | |
| | 40 | | | Sally Beauty Holdings, Inc. (a) | | | 683 | |
| | 29 | | | Williams-Sonoma, Inc. | | | 1,052 | |
| | | | | | | | |
| | | | | | | 22,019 | |
| | | | | | | | |
SEE NOTES TO FINANCIAL STATEMENTS.
| | | | | | | | |
| | | |
| JUNE 30, 2011 | | J.P. MORGAN MID CAP/MULTI-CAP FUNDS | | | | | 35 | |
JPMorgan Multi-Cap Market Neutral Fund
SCHEDULE OF PORTFOLIO INVESTMENTS
AS OF JUNE 30, 2011 (continued)
(Amounts in thousands)
| | | | | | | | |
| SHARES | | | SECURITY DESCRIPTION | | VALUE($) | |
| | | | | | | | |
| Long Positions — Continued | |
| | | | Textiles, Apparel & Luxury Goods — 1.7% | |
| | 48 | | | CROCS, Inc. (a) | | | 1,243 | |
| | 15 | | | Deckers Outdoor Corp. (a) | | | 1,332 | |
| | 20 | | | Fossil, Inc. (a) | | | 2,325 | |
| | 84 | | | Iconix Brand Group, Inc. (a) | | | 2,022 | |
| | 13 | | | V.F. Corp. | | | 1,397 | |
| | 14 | | | Warnaco Group, Inc. (The) (a) | | | 743 | |
| | | | | | | | |
| | | | | | | 9,062 | |
| | | | | | | | |
| | | | Total Consumer Discretionary | | | 101,875 | |
| | | | | | | | |
| | | | Consumer Staples — 5.1% | |
| | | | Beverages — 1.1% | |
| | 55 | | | Coca-Cola Enterprises, Inc. | | | 1,592 | |
| | 85 | | | Constellation Brands, Inc., Class A (a) | | | 1,773 | |
| | 50 | | | Dr. Pepper Snapple Group, Inc. | | | 2,097 | |
| | 2 | | | PepsiCo, Inc. | | | 164 | |
| | | | | | | | |
| | | | | | | 5,626 | |
| | | | | | | | |
| | | | Food & Staples Retailing — 0.7% | |
| | 17 | | | Casey’s General Stores, Inc. | | | 732 | |
| | 33 | | | Kroger Co. (The) | | | 817 | |
| | 65 | | | Safeway, Inc. | | | 1,520 | |
| | 94 | | | SUPERVALU, Inc. | | | 885 | |
| | | | | | | | |
| | | | | | | 3,954 | |
| | | | | | | | |
| | | | Food Products — 1.8% | |
| | 29 | | | ConAgra Foods, Inc. | | | 750 | |
| | 27 | | | Corn Products International, Inc. | | | 1,485 | |
| | 103 | | | Dean Foods Co. (a) | | | 1,260 | |
| | 35 | | | Fresh Del Monte Produce, Inc. | | | 936 | |
| | 38 | | | Hormel Foods Corp. | | | 1,125 | |
| | 91 | | | Smithfield Foods, Inc. (a) | | | 1,979 | |
| | 120 | | | Tyson Foods, Inc., Class A | | | 2,337 | |
| | | | | | | | |
| | | | | | | 9,872 | |
| | | | | | | | |
| | | | Personal Products — 0.6% | |
| | 36 | | | Herbalife Ltd., (Cayman Islands) | | | 2,095 | |
| | 32 | | | Nu Skin Enterprises, Inc., Class A | | | 1,195 | |
| | | | | | | | |
| | | | | | | 3,290 | |
| | | | | | | | |
| | | | Tobacco — 0.9% | |
| | 23 | | | Lorillard, Inc. | | | 2,543 | |
| | 18 | | | Philip Morris International, Inc. | | | 1,191 | |
| | 8 | | | Reynolds American, Inc. | | | 292 | |
| | 28 | | | Universal Corp. | | | 1,051 | |
| | | | | | | | |
| | | | | | | 5,077 | |
| | | | | | | | |
| | | | Total Consumer Staples | | | 27,819 | |
| | | | | | | | |
| | | | | | | | |
| SHARES | | | SECURITY DESCRIPTION | | VALUE($) | |
| | | | | | | | |
| | | | | | | | |
| | | | Energy — 7.7% | |
| | | | Energy Equipment & Services — 3.0% | |
| | 71 | | | Complete Production Services, Inc. (a) | | | 2,374 | |
| | 29 | | | Diamond Offshore Drilling, Inc. | | | 2,039 | |
| | 130 | | | Helix Energy Solutions Group, Inc. (a) | | | 2,148 | |
| | 37 | | | Key Energy Services, Inc. (a) | | | 666 | |
| | 102 | | | McDermott International, Inc. (a) | | | 2,019 | |
| | 17 | | | Nabors Industries Ltd., (Bermuda) (a) | | | 426 | |
| | 55 | | | Patterson-UTI Energy, Inc. | | | 1,745 | |
| | 96 | | | RPC, Inc. | | | 2,361 | |
| | 25 | | | Superior Energy Services, Inc. (a) | | | 925 | |
| | 18 | | | Transocean Ltd., (Switzerland) | | | 1,151 | |
| | 6 | | | Unit Corp. (a) | | | 373 | |
| | | | | | | | |
| | | | | | | 16,227 | |
| | | | | | | | |
| | | | Oil, Gas & Consumable Fuels — 4.7% | |
| | 25 | | | Alpha Natural Resources, Inc. (a) | | | 1,121 | |
| | 40 | | | Arch Coal, Inc. | | | 1,071 | |
| | 20 | | | Chevron Corp. | | | 2,099 | |
| | 24 | | | Concho Resources, Inc. (a) | | | 2,207 | |
| | 98 | | | Denbury Resources, Inc. (a) | | | 1,954 | |
| | 4 | | | Devon Energy Corp. | | | 303 | |
| | 61 | | | Gulfport Energy Corp. (a) | | | 1,798 | |
| | 8 | | | Marathon Oil Corp. | | | 417 | |
| | 28 | | | Newfield Exploration Co. (a) | | | 1,896 | |
| | 14 | | | Occidental Petroleum Corp. | | | 1,451 | |
| | 26 | | | Peabody Energy Corp. | | | 1,506 | |
| | 20 | | | Rosetta Resources, Inc. (a) | | | 1,041 | |
| | 69 | | | Stone Energy Corp. (a) | | | 2,109 | |
| | 55 | | | Swift Energy Co. (a) | | | 2,042 | |
| | 70 | | | Valero Energy Corp. | | | 1,796 | |
| | 75 | | | W&T Offshore, Inc. | | | 1,953 | |
| | 40 | | | Williams Cos., Inc. (The) | | | 1,199 | |
| | | | | | | | |
| | | | | | | 25,963 | |
| | | | | | | | |
| | | | Total Energy | | | 42,190 | |
| | | | | | | | |
| | | | Financials — 11.4% | |
| | | | Capital Markets — 1.6% | |
| | 5 | | | Affiliated Managers Group, Inc. (a) | | | 464 | |
| | 31 | | | Ameriprise Financial, Inc. | | | 1,811 | |
| | 113 | | | Ares Capital Corp. | | | 1,810 | |
| | 56 | | | Bank of New York Mellon Corp. (The) | | | 1,426 | |
| | 122 | | | Knight Capital Group, Inc., Class A (a) | | | 1,347 | |
| | 34 | | | State Street Corp. | | | 1,551 | |
| | | | | | | | |
| | | | | | | 8,409 | |
| | | | | | | | |
| | | | Commercial Banks — 1.7% | |
| | 13 | | | Bank of Hawaii Corp. | | | 624 | |
| | 36 | | | FirstMerit Corp. | | | 602 | |
SEE NOTES TO FINANCIAL STATEMENTS.
| | | | | | |
| | | |
| 36 | | | | J.P. MORGAN MID CAP/MULTI-CAP FUNDS | | JUNE 30, 2011 |
| | | | | | | | |
| SHARES | | | SECURITY DESCRIPTION | | VALUE($) | |
| | | | | | | | |
| Long Positions — Continued | |
| | | | Commercial Banks — Continued | |
| | 126 | | | KeyCorp | | | 1,053 | |
| | 25 | | | PNC Financial Services Group, Inc. | | | 1,508 | |
| | 8 | | | Popular, Inc. (a) | | | 21 | |
| | 7 | | | Prosperity Bancshares, Inc. | | | 301 | |
| | 27 | | | Signature Bank (a) | | | 1,539 | |
| | 37 | | | TCF Financial Corp. | | | 515 | |
| | 62 | | | U.S. Bancorp | | | 1,572 | |
| | 61 | | | Wells Fargo & Co. | | | 1,722 | |
| | | | | | | | |
| | | | | | | 9,457 | |
| | | | | | | | |
| | | | Consumer Finance — 1.3% | |
| | 29 | | | Capital One Financial Corp. | | | 1,506 | |
| | 66 | | | Discover Financial Services | | | 1,765 | |
| | 45 | | | Ezcorp, Inc., Class A (a) | | | 1,584 | |
| | 134 | | | SLM Corp. | | | 2,253 | |
| | | | | | | | |
| | | | | | | 7,108 | |
| | | | | | | | |
| | | | Diversified Financial Services — 0.8% | |
| | 80 | | | Bank of America Corp. | | | 880 | |
| | 48 | | | Citigroup, Inc. | | | 2,015 | |
| | 53 | | | NASDAQ OMX Group, Inc. (The) (a) | | | 1,352 | |
| | | | | | | | |
| | | | | | | 4,247 | |
| | | | | | | | |
| | | | Insurance — 5.3% | |
| | 31 | | | ACE Ltd., (Switzerland) | | | 2,027 | |
| | 37 | | | Aflac, Inc. | | | 1,722 | |
| | 34 | | | Allied World Assurance Co. Holdings Ltd., (Switzerland) | | | 1,948 | |
| | 45 | | | American Financial Group, Inc. | | | 1,617 | |
| | 56 | | | Assurant, Inc. | | | 2,049 | |
| | 126 | | | Assured Guaranty Ltd., (Bermuda) | | | 2,048 | |
| | 6 | | | Chubb Corp. | | | 379 | |
| | 28 | | | CNA Financial Corp. | | | 814 | |
| | 185 | | | CNO Financial Group, Inc. (a) | | | 1,463 | |
| | 51 | | | Delphi Financial Group, Inc., Class A | | | 1,497 | |
| | 21 | | | Everest Re Group Ltd., (Bermuda) | | | 1,729 | |
| | 72 | | | Hartford Financial Services Group, Inc. | | | 1,886 | |
| | 62 | | | Lincoln National Corp. | | | 1,760 | |
| | 149 | | | MBIA, Inc. (a) | | | 1,296 | |
| | 19 | | | MetLife, Inc. | | | 820 | |
| | 49 | | | Montpelier Re Holdings Ltd., (Bermuda) | | | 890 | |
| | 8 | | | Principal Financial Group, Inc. | | | 250 | |
| | 61 | | | Protective Life Corp. | | | 1,404 | |
| | 23 | | | Prudential Financial, Inc. | | | 1,434 | |
| | 24 | | | Reinsurance Group of America, Inc. | | | 1,445 | |
| | 8 | | | RenaissanceRe Holdings Ltd., (Bermuda) | | | 568 | |
| | | | | | | | |
| | | | | | | 29,046 | |
| | | | | | | | |
| | | | | | | | |
| SHARES | | | SECURITY DESCRIPTION | | VALUE($) | |
| | | | | | | | |
| | | | | | | | |
| | | | Real Estate Investment Trusts (REITs) — 0.7% | |
| | 4 | | | AvalonBay Communities, Inc. | | | 532 | |
| | 7 | | | Camden Property Trust | | | 468 | |
| | 26 | | | CBL & Associates Properties, Inc. | | | 473 | |
| | 34 | | | Douglas Emmett, Inc. (m) | | | 681 | |
| | 11 | | | Mid-America Apartment Communities, Inc. | | | 732 | |
| | 3 | | | Simon Property Group, Inc. | | | 324 | |
| | 6 | | | UDR, Inc. | | | 158 | |
| | 7 | | | Vornado Realty Trust | | | 668 | |
| | | | | | | | |
| | | | | | | 4,036 | |
| | | | | | | | |
| | | | Total Financials | | | 62,303 | |
| | | | | | | | |
| | | | Health Care — 10.0% | |
| | | | Biotechnology — 1.2% | |
| | 66 | | | Amylin Pharmaceuticals, Inc. (a) | | | 876 | |
| | 18 | | | Biogen Idec, Inc. (a) | | | 1,881 | |
| | 11 | | | Human Genome Sciences, Inc. (a) | | | 265 | |
| | 58 | | | Incyte Corp., Ltd. (a) | | | 1,096 | |
| | 16 | | | Onyx Pharmaceuticals, Inc. (a) | | | 573 | |
| | 32 | | | United Therapeutics Corp. (a) | | | 1,767 | |
| | | | | | | | |
| | | | | | | 6,458 | |
| | | | | | | | |
| | | | Health Care Equipment & Supplies — 0.6% | |
| | 19 | | | CareFusion Corp. (a) | | | 508 | |
| | 20 | | | Cooper Cos., Inc. (The) | | | 1,565 | |
| | 53 | | | Hologic, Inc. (a) | | | 1,064 | |
| | | | | | | | |
| | | | | | | 3,137 | |
| | | | | | | | |
| | | | Health Care Providers & Services — 3.5% | |
| | 35 | | | AMERIGROUP Corp. (a) | | | 2,437 | |
| | 8 | | | AmerisourceBergen Corp. | | | 317 | |
| | 7 | | | Cardinal Health, Inc. | | | 318 | |
| | 46 | | | CIGNA Corp. | | | 2,349 | |
| | 45 | | | Community Health Systems, Inc. (a) | | | 1,165 | |
| | 42 | | | Coventry Health Care, Inc. (a) | | | 1,542 | |
| | 38 | | | Health Net, Inc. (a) | | | 1,207 | |
| | 51 | | | Healthspring, Inc. (a) | | | 2,357 | |
| | 25 | | | Humana, Inc. | | | 2,053 | |
| | 13 | | | LifePoint Hospitals, Inc. (a) | | | 503 | |
| | 56 | | | Molina Healthcare, Inc. (a) | | | 1,518 | |
| | 28 | | | UnitedHealth Group, Inc. | | | 1,427 | |
| | 30 | | | WellCare Health Plans, Inc. (a) | | | 1,554 | |
| | 6 | | | WellPoint, Inc. | | | 479 | |
| | | | | | | | |
| | | | | | | 19,226 | |
| | | | | | | | |
| | | | Health Care Technology — 0.3% | |
| | 31 | | | SXC Health Solutions Corp. (a) | | | 1,824 | |
| | | | | | | | |
| | | | Life Sciences Tools & Services — 0.3% | |
| | 24 | | | Bruker Corp. (a) | | | 487 | |
SEE NOTES TO FINANCIAL STATEMENTS.
| | | | | | | | |
| | | |
| JUNE 30, 2011 | | J.P. MORGAN MID CAP/MULTI-CAP FUNDS | | | | | 37 | |
JPMorgan Multi-Cap Market Neutral Fund
SCHEDULE OF PORTFOLIO INVESTMENTS
AS OF JUNE 30, 2011 (continued)
(Amounts in thousands)
| | | | | | | | |
| SHARES | | | SECURITY DESCRIPTION | | VALUE($) | |
| | | | | | | | |
| Long Positions — Continued | |
| | | | Life Sciences Tools & Services — Continued | |
| | 14 | | | Illumina, Inc. (a) | | | 1,026 | |
| | | | | | | | |
| | | | | | | 1,513 | |
| | | | | | | | |
| | | | Pharmaceuticals — 4.1% | |
| | 38 | | | Abbott Laboratories | | | 2,012 | |
| | 60 | | | Bristol-Myers Squibb Co. | | | 1,734 | |
| | 56 | | | Eli Lilly & Co. | | | 2,107 | |
| | 46 | | | Endo Pharmaceuticals Holdings, Inc. (a) | | | 1,836 | |
| | 63 | | | Forest Laboratories, Inc. (a) | | | 2,459 | |
| | 11 | | | Impax Laboratories, Inc. (a) | | | 246 | |
| | 27 | | | Jazz Pharmaceuticals, Inc. (a) | | | 884 | |
| | 41 | | | Medicis Pharmaceutical Corp., Class A | | | 1,563 | |
| | 42 | | | Merck & Co., Inc. | | | 1,497 | |
| | 92 | | | Pfizer, Inc. | | | 1,888 | |
| | 49 | | | Salix Pharmaceuticals Ltd. (a) | | | 1,949 | |
| | 73 | | | ViroPharma, Inc. (a) | | | 1,346 | |
| | 75 | | | Warner Chilcott plc, (Ireland), Class A | | | 1,808 | |
| | 14 | | | Watson Pharmaceuticals, Inc. (a) | | | 979 | |
| | | | | | | | |
| | | | | | | 22,308 | |
| | | | | | | | |
| | | | Total Health Care | | | 54,466 | |
| | | | | | | | |
| | | | Industrials — 12.7% | |
| | | | Aerospace & Defense — 2.3% | |
| | 9 | | | Alliant Techsystems, Inc. | | | 618 | |
| | 5 | | | Esterline Technologies Corp. (a) | | | 356 | |
| | 24 | | | General Dynamics Corp. | | | 1,808 | |
| | 24 | | | L-3 Communications Holdings, Inc. | | | 2,125 | |
| | 24 | | | Lockheed Martin Corp. | | | 1,908 | |
| | 32 | | | Northrop Grumman Corp. | | | 2,253 | |
| | 31 | | | Raytheon Co. | | | 1,540 | |
| | 79 | | | Textron, Inc. | | | 1,873 | |
| | 3 | | | Triumph Group, Inc. | | | 252 | |
| | | | | | | | |
| | | | | | | 12,733 | |
| | | | | | | | |
| | | | Air Freight & Logistics — 0.5% | |
| | 36 | | | Atlas Air Worldwide Holdings, Inc. (a) | | | 2,166 | |
| | 4 | | | United Parcel Service, Inc., Class B | | | 316 | |
| | | | | | | | |
| | | | | | | 2,482 | |
| | | | | | | | |
| | | | Airlines — 0.4% | |
| | 6 | | | Alaska Air Group, Inc. (a) | | | 422 | |
| | 57 | | | Southwest Airlines Co. | | | 652 | |
| | 123 | | | U.S. Airways Group, Inc. (a) | | | 1,099 | |
| | | | | | | | |
| | | | | | | 2,173 | |
| | | | | | | | |
| | | | Commercial Services & Supplies — 0.4% | |
| | 20 | | | Brink’s Co. (The) | | | 586 | |
| | 42 | | | Deluxe Corp. | | | 1,031 | |
| | | | | | | | |
| SHARES | | | SECURITY DESCRIPTION | | VALUE($) | |
| | | | | | | | |
| | | | | | | | |
| | | | Commercial Services & Supplies — Continued | |
| | 27 | | | R.R. Donnelley & Sons Co. | | | 529 | |
| | | | | | | | |
| | | | | | | 2,146 | |
| | | | | | | | |
| | | | Construction & Engineering — 1.3% | |
| | 11 | | | EMCOR Group, Inc. (a) | | | 324 | |
| | 17 | | | Fluor Corp. | | | 1,110 | |
| | 52 | | | KBR, Inc. | | | 1,948 | |
| | 89 | | | MasTec, Inc. (a) | | | 1,754 | |
| | 45 | | | URS Corp. (a) | | | 2,012 | |
| | | | | | | | |
| | | | | | | 7,148 | |
| | | | | | | | |
| | | | Electrical Equipment — 1.2% | |
| | 16 | | | AMETEK, Inc. | | | 710 | |
| | 15 | | | Belden, Inc. | | | 521 | |
| | 29 | | | General Cable Corp. (a) | | | 1,243 | |
| | 31 | | | Polypore International, Inc. (a) | | | 2,110 | |
| | 35 | | | Thomas & Betts Corp. (a) | | | 1,888 | |
| | | | | | | | |
| | | | | | | 6,472 | |
| | | | | | | | |
| | | | Industrial Conglomerates — 0.4% | |
| | 118 | | | General Electric Co. | | | 2,220 | |
| | | | | | | | |
| | | | Machinery — 3.9% | |
| | 42 | | | Actuant Corp., Class A | | | 1,130 | |
| | 22 | | | AGCO Corp. (a) | | | 1,092 | |
| | 19 | | | Caterpillar, Inc. | | | 2,056 | |
| | 31 | | | CNH Global N.V., (Netherlands) (a) | | | 1,214 | |
| | 14 | | | Cummins, Inc. | | | 1,462 | |
| | 20 | | | Dover Corp. | | | 1,358 | |
| | 21 | | | Joy Global, Inc. | | | 2,003 | |
| | 27 | | | Kennametal, Inc. | | | 1,120 | |
| | 79 | | | Meritor, Inc. (a) | | | 1,271 | |
| | 11 | | | Middleby Corp. (a) | | | 1,036 | |
| | 34 | | | Navistar International Corp. (a) | | | 1,930 | |
| | 24 | | | Parker Hannifin Corp. | | | 2,168 | |
| | 29 | | | Stanley Black & Decker, Inc. | | | 2,064 | |
| | 24 | | | Timken Co. | | | 1,207 | |
| | 2 | | | Toro Co. (The) | | | 92 | |
| | | | | | | | |
| | | | | | | 21,203 | |
| | | | | | | | |
| | | | Marine — 0.4% | |
| | 24 | | | Alexander & Baldwin, Inc. | | | 1,160 | |
| | 19 | | | Kirby Corp. (a) | | | 1,083 | |
| | | | | | | | |
| | | | | | | 2,243 | |
| | | | | | | | |
| | | | Road & Rail — 1.2% | |
| | 39 | | | Con-way, Inc. | | | 1,522 | |
| | 56 | | | CSX Corp. | | | 1,465 | |
| | 17 | | | Hertz Global Holdings, Inc. (a) | | | 263 | |
SEE NOTES TO FINANCIAL STATEMENTS.
| | | | | | |
| | | |
| 38 | | | | J.P. MORGAN MID CAP/MULTI-CAP FUNDS | | JUNE 30, 2011 |
| | | | | | | | |
| SHARES | | | SECURITY DESCRIPTION | | VALUE($) | |
| | | | | | | | |
| Long Positions — Continued | |
| | | | Road & Rail — Continued | |
| | 21 | | | Norfolk Southern Corp. | | | 1,541 | |
| | 39 | | | Old Dominion Freight Line, Inc. (a) | | | 1,467 | |
| | 5 | | | Union Pacific Corp. | | | 566 | |
| | | | | | | | |
| | | | | | | 6,824 | |
| | | | | | | | |
| | | | Trading Companies & Distributors — 0.7% | |
| | 94 | | | RSC Holdings, Inc. (a) | | | 1,118 | |
| | 36 | | | TAL International Group, Inc. | | | 1,232 | |
| | 62 | | | United Rentals, Inc. (a) | | | 1,563 | |
| | | | | | | | |
| | | | | | | 3,913 | |
| | | | | | | | |
| | | | Total Industrials | | | 69,557 | |
| | | | | | | | |
| | | | Information Technology — 18.3% | |
| | | | Communications Equipment — 2.0% | |
| | 86 | | | Arris Group, Inc. (a) | | | 994 | |
| | 70 | | | Cisco Systems, Inc. | | | 1,095 | |
| | 33 | | | Harris Corp. | | | 1,488 | |
| | 42 | | | Motorola Solutions, Inc. (a) | | | 1,925 | |
| | 56 | | | Plantronics, Inc. | | | 2,035 | |
| | 52 | | | Research In Motion Ltd., (Canada) (a) | | | 1,489 | |
| | 44 | | | Riverbed Technology, Inc. (a) | | | 1,733 | |
| | | | | | | | |
| | | | | | | 10,759 | |
| | | | | | | | |
| | | | Computers & Peripherals — 0.9% | |
| | 5 | | | Apple, Inc. (a) | | | 1,798 | |
| | 133 | | | Dell, Inc. (a) | | | 2,212 | |
| | 36 | | | Diebold, Inc. | | | 1,114 | |
| | | | | | | | |
| | | | | | | 5,124 | |
| | | | | | | | |
| | | | Electronic Equipment, Instruments & Components — 2.4% | |
| | 36 | | | Arrow Electronics, Inc. (a) | | | 1,512 | |
| | 29 | | | Avnet, Inc. (a) | | | 934 | |
| | 15 | | | Coherent, Inc. (a) | | | 842 | |
| | 106 | | | Corning, Inc. | | | 1,918 | |
| | 24 | | | IPG Photonics Corp. (a) | | | 1,766 | |
| | 14 | | | Itron, Inc. (a) | | | 658 | |
| | 229 | | | Power-One, Inc. (a) | | | 1,853 | |
| | 14 | | | Rofin-Sinar Technologies, Inc. (a) | | | 493 | |
| | 17 | | | SYNNEX Corp. (a) | | | 532 | |
| | 26 | | | Universal Display Corp. (a) | | | 915 | |
| | 102 | | | Vishay Intertechnology, Inc. (a) | | | 1,533 | |
| | | | | | | | |
| | | | | | | 12,956 | |
| | | | | | | | |
| | | | Internet Software & Services — 2.1% | |
| | 35 | | | Ancestry.com, Inc. (a) | | | 1,467 | |
| | 65 | | | eBay, Inc. (a) | | | 2,102 | |
| | 66 | | | IAC/InterActiveCorp. (a) | | | 2,523 | |
| | 15 | | | Sohu.com, Inc., (China) (a) | | | 1,069 | |
| | | | | | | | |
| SHARES | | | SECURITY DESCRIPTION | | VALUE($) | |
| | | | | | | | |
| | | | | | | | |
| | | | Internet Software & Services — Continued | |
| | 12 | | | Travelzoo, Inc. (a) | | | 774 | |
| | 88 | | | ValueClick, Inc. (a) | | | 1,462 | |
| | 60 | | | VeriSign, Inc. | | | 2,022 | |
| | | | | | | | |
| | | | | | | 11,419 | |
| | | | | | | | |
| | | | IT Services — 3.5% | |
| | 6 | | | Accenture plc, (Ireland), Class A | | | 353 | |
| | 26 | | | Alliance Data Systems Corp. (a) | | | 2,439 | |
| | 52 | | | Amdocs Ltd., (United Kingdom) (a) | | | 1,588 | |
| | 64 | | | Broadridge Financial Solutions, Inc. | | | 1,545 | |
| | 33 | | | CACI International, Inc., Class A (a) | | | 2,082 | |
| | 67 | | | Convergys Corp. (a) | | | 912 | |
| | 30 | | | DST Systems, Inc. | | | 1,576 | |
| | 46 | | | Fidelity National Information Services, Inc. | | | 1,427 | |
| | 15 | | | Global Payments, Inc. | | | 784 | |
| | 125 | | | SAIC, Inc. (a) | | | 2,095 | |
| | 45 | | | Unisys Corp. (a) | | | 1,159 | |
| | 39 | | | VeriFone Systems, Inc. (a) | | | 1,716 | |
| | 72 | | | Western Union Co. (The) | | | 1,451 | |
| | | | | | | | |
| | | | | | | 19,127 | |
| | | | | | | | |
| | | | Office Electronics — 0.4% | |
| | 199 | | | Xerox Corp. | | | 2,072 | |
| | | | | | | | |
| | | | Semiconductors & Semiconductor Equipment — 4.4% | |
| | 242 | | | Amkor Technology, Inc. (a) | | | 1,493 | |
| | 113 | | | Applied Materials, Inc. | | | 1,465 | |
| | 39 | | | Fairchild Semiconductor International, Inc. (a) | | | 659 | |
| | 168 | | | GT Solar International, Inc. (a) | | | 2,729 | |
| | 39 | | | Intel Corp. | | | 870 | |
| | 54 | | | KLA-Tencor Corp. | | | 2,190 | |
| | 40 | | | Lam Research Corp. (a) | | | 1,779 | |
| | 78 | | | Marvell Technology Group Ltd., (Bermuda) (a) | | | 1,148 | |
| | 70 | | | MEMC Electronic Materials, Inc. (a) | | | 601 | |
| | 156 | | | Micron Technology, Inc. (a) | | | 1,168 | |
| | 34 | | | MKS Instruments, Inc. | | | 893 | |
| | 13 | | | National Semiconductor Corp. | | | 308 | |
| | 63 | | | Novellus Systems, Inc. (a) | | | 2,269 | |
| | 59 | | | OmniVision Technologies, Inc. (a) | | | 2,057 | |
| | 100 | | | Teradyne, Inc. (a) | | | 1,487 | |
| | 41 | | | Tessera Technologies, Inc. (a) | | | 704 | |
| | 47 | | | Veeco Instruments, Inc. (a) | | | 2,294 | |
| | | | | | | | |
| | | | | | | 24,114 | |
| | | | | | | | |
| | | | Software — 2.6% | |
| | 177 | | | Activision Blizzard, Inc. | | | 2,062 | |
| | 25 | | | BMC Software, Inc. (a) | | | 1,360 | |
| | 88 | | | CA, Inc. | | | 2,003 | |
SEE NOTES TO FINANCIAL STATEMENTS.
| | | | | | | | |
| | | |
| JUNE 30, 2011 | | J.P. MORGAN MID CAP/MULTI-CAP FUNDS | | | | | 39 | |
JPMorgan Multi-Cap Market Neutral Fund
SCHEDULE OF PORTFOLIO INVESTMENTS
AS OF JUNE 30, 2011 (continued)
(Amounts in thousands)
| | | | | | | | |
| SHARES | | | SECURITY DESCRIPTION | | VALUE($) | |
| | | | | | | | |
| Long Positions — Continued | |
| | | | Software — Continued | |
| | 196 | | | Cadence Design Systems, Inc. (a) | | | 2,069 | |
| | 47 | | | Fair Isaac Corp. | | | 1,414 | |
| | 84 | | | Microsoft Corp. | | | 2,176 | |
| | 67 | | | Oracle Corp. | | | 2,194 | |
| | 42 | | | Symantec Corp. (a) | | | 819 | |
| | | | | | | | |
| | | | | | | 14,097 | |
| | | | | | | | |
| | | | Total Information Technology | | | 99,668 | |
| | | | | | | | |
| | | | Materials — 6.5% | |
| | | | Chemicals — 2.9% | |
| | 30 | | | Cabot Corp. | | | 1,205 | |
| | 30 | | | Celanese Corp., Class A | | | 1,607 | |
| | 12 | | | CF Industries Holdings, Inc. | | | 1,715 | |
| | 28 | | | Cytec Industries, Inc. | | | 1,612 | |
| | 12 | | | Eastman Chemical Co. | | | 1,233 | |
| | 94 | | | Ferro Corp. (a) | | | 1,264 | |
| | 23 | | | Kraton Performance Polymers, Inc. (a) | | | 909 | |
| | 32 | | | OM Group, Inc. (a) | | | 1,316 | |
| | 36 | | | Rockwood Holdings, Inc. (a) | | | 1,967 | |
| | 86 | | | Solutia, Inc. (a) | | | 1,964 | |
| | 18 | | | Westlake Chemical Corp. | | | 928 | |
| | | | | | | | |
| | | | | | | 15,720 | |
| | | | | | | | |
| | | | Containers & Packaging — 1.1% | |
| | 38 | | | Ball Corp. | | | 1,446 | |
| | 40 | | | Crown Holdings, Inc. (a) | | | 1,535 | |
| | 30 | | | Rock-Tenn Co., Class A | | | 1,964 | |
| | 54 | | | Sealed Air Corp. | | | 1,274 | |
| | | | | | | | |
| | | | | | | 6,219 | |
| | | | | | | | |
| | | | Metals & Mining — 2.1% | |
| | 47 | | | Alcoa, Inc. | | | 744 | |
| | 107 | | | Century Aluminum Co. (a) | | | 1,672 | |
| | 23 | | | Cliffs Natural Resources, Inc. | | | 2,168 | |
| | 44 | | | Freeport-McMoRan Copper & Gold, Inc. | | | 2,310 | |
| | 5 | | | Schnitzer Steel Industries, Inc., Class A | | | 304 | |
| | 93 | | | Steel Dynamics, Inc. | | | 1,513 | |
| | 17 | | | Walter Energy, Inc. | | | 1,920 | |
| | 43 | | | Worthington Industries, Inc. | | | 991 | |
| | | | | | | | |
| | | | | | | 11,622 | |
| | | | | | | | |
| | | | Paper & Forest Products — 0.4% | |
| | 23 | | | Domtar Corp., (Canada) | | | 2,144 | |
| | | | | | | | |
| | | | Total Materials | | | 35,705 | |
| | | | | | | | |
| | | | Telecommunication Services — 0.9% | |
| | | | Diversified Telecommunication Services — 0.4% | |
| | 360 | | | Level 3 Communications, Inc. (a) | | | 878 | |
| | | | | | | | |
| SHARES | | | SECURITY DESCRIPTION | | VALUE($) | |
| | | | | | | | |
| | | | | | | | |
| | | | Diversified Telecommunication Services — Continued | |
| | 36 | | | Verizon Communications, Inc. | | | 1,339 | |
| | | | | | | | |
| | | | | | | 2,217 | |
| | | | | | | | |
| | | | Wireless Telecommunication Services — 0.5% | |
| | 82 | | | MetroPCS Communications, Inc. (a) | | | 1,407 | |
| | 260 | | | Sprint Nextel Corp. (a) | | | 1,403 | |
| | | | | | | | |
| | | | | | | 2,810 | |
| | | | | | | | |
| | | | Total Telecommunication Services | | | 5,027 | |
| | | | | | | | |
| | | | Utilities — 6.1% | |
| | | | Electric Utilities — 2.7% | |
| | 50 | | | American Electric Power Co., Inc. | | | 1,874 | |
| | 80 | | | Duke Energy Corp. | | | 1,516 | |
| | 24 | | | Edison International | | | 919 | |
| | 24 | | | El Paso Electric Co. | | | 767 | |
| | 26 | | | Entergy Corp. | | | 1,764 | |
| | 22 | | | Exelon Corp. | | | 948 | |
| | 105 | | | Pepco Holdings, Inc. | | | 2,068 | |
| | 81 | | | PNM Resources, Inc. | | | 1,357 | |
| | 85 | | | Portland General Electric Co. | | | 2,146 | |
| | 35 | | | Unisource Energy Corp. | | | 1,320 | |
| | | | | | | | |
| | | | | | | 14,679 | |
| | | | | | | | |
| | | | Gas Utilities — 1.2% | |
| | 39 | | | Atmos Energy Corp. | | | 1,282 | |
| | 117 | | | Questar Corp. | | | 2,067 | |
| | 19 | | | South Jersey Industries, Inc. | | | 1,012 | |
| | 20 | | | Southwest Gas Corp. | | | 776 | |
| | 51 | | | UGI Corp. | | | 1,619 | |
| | | | | | | | |
| | | | | | | 6,756 | |
| | | | | | | | |
| | | | Independent Power Producers & Energy Traders — 0.6% | |
| | 133 | | | AES Corp. (The) (a) | | | 1,690 | |
| | 63 | | | NRG Energy, Inc. (a) | | | 1,542 | |
| | | | | | | | |
| | | | | | | 3,232 | |
| | | | | | | | |
| | | | Multi-Utilities — 1.5% | |
| | 70 | | | Ameren Corp. | | | 2,031 | |
| | 106 | | | CMS Energy Corp. | | | 2,084 | |
| | 87 | | | MDU Resources Group, Inc. | | | 1,963 | |
| | 22 | | | NorthWestern Corp. | | | 719 | |
| | 28 | | | Sempra Energy | | | 1,506 | |
| | | | | | | | |
| | | | | | | 8,303 | |
| | | | | | | | |
| | | | Water Utilities — 0.1% | |
| | 15 | | | American Water Works Co., Inc. | | | 431 | |
| | | | | | | | |
| | | | Total Utilities | | | 33,401 | |
| | | | | | | | |
| | | | Total Common Stocks
(Cost $443,125) | | | 532,011 | |
| | | | | | | | |
SEE NOTES TO FINANCIAL STATEMENTS.
| | | | | | |
| | | |
| 40 | | | | J.P. MORGAN MID CAP/MULTI-CAP FUNDS | | JUNE 30, 2011 |
| | | | | | | | |
| SHARES | | | SECURITY DESCRIPTION | | VALUE($) | |
| | | | | | | | |
| Long Positions — Continued | |
| | | | Short-Term Investment — 6.6% | |
| | | | Investment Company — 6.6% | |
| | 36,094 | | | JPMorgan Liquid Assets Money Market Fund, Institutional Class Shares, 0.050% (b) (l) (Cost $36,094) | | | 36,094 | |
| | | | | | | | |
| | | | Total Investments — 104.0%
(Cost $479,219) | | | 568,105 | |
| | | | Liabilities in Excess of
Other Assets — (4.0)% | | | (21,658 | ) |
| | | | | | | | |
| | | | NET ASSETS — 100.0% | | $ | 546,447 | |
| | | | | | | | |
| Short Positions — 97.5% | |
| | | | Common Stocks — 97.5% | |
| | | | Consumer Discretionary — 13.1% | |
| | | | Auto Components — 0.3% | |
| | 11 | | | Gentex Corp. | | | 336 | |
| | 32 | | | Johnson Controls, Inc. | | | 1,327 | |
| | | | | | | | |
| | | | | | | 1,663 | |
| | | | | | | | |
| | | | Automobiles — 0.1% | |
| | 27 | | | Thor Industries, Inc. | | | 775 | |
| | | | | | | | |
| | | | Diversified Consumer Services — 0.1% | |
| | 41 | | | H&R Block, Inc. | | | 661 | |
| | | | | | | | |
| | | | Hotels, Restaurants & Leisure — 2.7% | |
| | 24 | | | Bally Technologies, Inc. (a) | | | 981 | |
| | 36 | | | BJ’s Restaurants, Inc. (a) | | | 1,887 | |
| | 20 | | | Carnival Corp. | | | 746 | |
| | 6 | | | Chipotle Mexican Grill, Inc. (a) | | | 1,939 | |
| | 71 | | | Gaylord Entertainment Co. (a) | | | 2,131 | |
| | 38 | | | Hyatt Hotels Corp., Class A (a) | | | 1,571 | |
| | 7 | | | Starbucks Corp. | | | 265 | |
| | 34 | | | Starwood Hotels & Resorts Worldwide, Inc. | | | 1,925 | |
| | 333 | | | Wendy’s/Arby’s Group, Inc., Class A | | | 1,687 | |
| | 35 | | | WMS Industries, Inc. (a) | | | 1,079 | |
| | 6 | | | Yum! Brands, Inc. | | | 329 | |
| | | | | | | | |
| | | | | | | 14,540 | |
| | | | | | | | |
| | | | Household Durables — 1.3% | |
| | 96 | | | Lennar Corp., Class A | | | 1,742 | |
| | 72 | | | MDC Holdings, Inc. | | | 1,772 | |
| | 266 | | | Pulte Group, Inc. (a) | | | 2,040 | |
| | 79 | | | Toll Brothers, Inc. (a) | | | 1,629 | |
| | | | | | | | |
| | | | | | | 7,183 | |
| | | | | | | | |
| | | | Internet & Catalog Retail — 0.1% | |
| | 14 | | | HSN, Inc. (a) | | | 477 | |
| | | | | | | | |
| | | | Leisure Equipment & Products — 0.5% | |
| | 692 | | | Eastman Kodak Co. (a) | | | 2,478 | |
| | | | | | | | |
| | | | | | | | |
| SHARES | | | SECURITY DESCRIPTION | | VALUE($) | |
| | | | | | | | |
| | | | | | | | |
| | | | Media — 2.7% | |
| | 42 | | | Discovery Communications, Inc., Class A (a) | | | 1,735 | |
| | 82 | | | DreamWorks Animation SKG, Inc., Class A (a) | | | 1,656 | |
| | 57 | | | Lamar Advertising Co., Class A (a) | | | 1,547 | |
| | 168 | | | Live Nation Entertainment, Inc. (a) | | | 1,924 | |
| | 261 | | | New York Times Co. (The), Class A (a) | | | 2,279 | |
| | 89 | | | Regal Entertainment Group, Class A | | | 1,095 | |
| | 30 | | | Scripps Networks Interactive, Inc., Class A | | | 1,487 | |
| | 56 | | | Thomson Reuters Corp. | | | 2,095 | |
| | 22 | | | Walt Disney Co. (The) | | | 865 | |
| | | | | | | | |
| | | | | | | 14,683 | |
| | | | | | | | |
| | | | Multiline Retail — 0.3% | |
| | 37 | | | J.C. Penney Co., Inc. | | | 1,292 | |
| | 12 | | | Kohl’s Corp. | | | 591 | |
| | | | | | | | |
| | | | | | | 1,883 | |
| | | | | | | | |
| | | | Specialty Retail — 2.5% | |
| | 81 | | | Cabela’s, Inc. (a) | | | 2,203 | |
| | 76 | | | CarMax, Inc. (a) | | | 2,514 | |
| | 115 | | | Collective Brands, Inc. (a) | | | 1,693 | |
| | 7 | | | Home Depot, Inc. | | | 253 | |
| | 579 | | | Office Depot, Inc. (a) | | | 2,443 | |
| | 13 | | | OfficeMax, Inc. (a) | | | 105 | |
| | 136 | | | Staples, Inc. | | | 2,141 | |
| | 4 | | | Tiffany & Co. | | | 338 | |
| | 6 | | | Tractor Supply Co. | | | 387 | |
| | 58 | | | Urban Outfitters, Inc. (a) | | | 1,632 | |
| | | | | | | | |
| | | | | | | 13,709 | |
| | | | | | | | |
| | | | Textiles, Apparel & Luxury Goods — 2.5% | |
| | 60 | | | Carter’s, Inc. (a) | | | 1,845 | |
| | 26 | | | Columbia Sportswear Co. | | | 1,644 | |
| | 75 | | | Hanesbrands, Inc. (a) | | | 2,134 | |
| | 146 | | | Jones Group, Inc. (The) | | | 1,585 | |
| | 13 | | | NIKE, Inc., Class B | | | 1,189 | |
| | 27 | | | Steven Madden Ltd. (a) | | | 995 | |
| | 33 | | | Under Armour, Inc., Class A (a) | | | 2,518 | |
| | 35 | | | Wolverine World Wide, Inc. | | | 1,459 | |
| | | | | | | | |
| | | | | | | 13,369 | |
| | | | | | | | |
| | | | Total Consumer Discretionary | | | 71,421 | |
| | | | | | | | |
| | | | Consumer Staples — 4.8% | |
| | | | Beverages — 0.2% | |
| | 5 | | | Brown-Forman Corp., Class B | | | 337 | |
| | 10 | | | Coca-Cola Co. (The) | | | 666 | |
| | | | | | | | |
| | | | | | | 1,003 | |
| | | | | | | | |
SEE NOTES TO FINANCIAL STATEMENTS.
| | | | | | | | |
| | | |
| JUNE 30, 2011 | | J.P. MORGAN MID CAP/MULTI-CAP FUNDS | | | | | 41 | |
JPMorgan Multi-Cap Market Neutral Fund
SCHEDULE OF PORTFOLIO INVESTMENTS
AS OF JUNE 30, 2011 (continued)
(Amounts in thousands)
| | | | | | | | |
| SHARES | | | SECURITY DESCRIPTION | | VALUE($) | |
| | | | | | | | |
| Short Positions — Continued | |
| | | | Food & Staples Retailing — 0.8% | |
| | 36 | | | BJ’s Wholesale Club, Inc. (a) | | | 1,803 | |
| | 40 | | | United Natural Foods, Inc. (a) | | | 1,717 | |
| | 12 | | | Whole Foods Market, Inc. | | | 731 | |
| | | | | | | | |
| | | | | | | 4,251 | |
| | | | | | | | |
| | | | Food Products — 3.2% | |
| | 23 | | | Bunge Ltd. | | | 1,556 | |
| | 29 | | | Campbell Soup Co. | | | 997 | |
| | 25 | | | Darling International, Inc. (a) | | | 440 | |
| | 14 | | | Diamond Foods, Inc. | | | 1,061 | |
| | 75 | | | Flowers Foods, Inc. | | | 1,652 | |
| | 30 | | | Green Mountain Coffee Roasters, Inc. (a) | | | 2,659 | |
| | 32 | | | Kellogg Co. | | | 1,774 | |
| | 65 | | | Kraft Foods, Inc., Class A | | | 2,287 | |
| | 31 | | | McCormick & Co., Inc. (Non-Voting) | | | 1,532 | |
| | 35 | | | Mead Johnson Nutrition Co. | | | 2,334 | |
| | 10 | | | Sanderson Farms, Inc. | | | 473 | |
| | 15 | | | TreeHouse Foods, Inc. (a) | | | 798 | |
| | | | | | | | |
| | | | | | | 17,563 | |
| | | | | | | | |
| | | | Household Products — 0.3% | |
| | 47 | | | Church & Dwight Co., Inc. | | | 1,901 | |
| | | | | | | | |
| | | | Personal Products — 0.3% | |
| | 16 | | | Estee Lauder Cos., Inc. (The), Class A | | | 1,701 | |
| | | | | | | | |
| | | | Total Consumer Staples | | | 26,419 | |
| | | | | | | | |
| | | | Energy — 10.6% | |
| | | | Energy Equipment & Services — 2.5% | |
| | 17 | | | Cameron International Corp. (a) | | | 848 | |
| | 11 | | | Dresser-Rand Group, Inc. (a) | | | 588 | |
| | 23 | | | Dril-Quip, Inc. (a) | | | 1,551 | |
| | 84 | | | Exterran Holdings, Inc. (a) | | | 1,661 | |
| | 28 | | | FMC Technologies, Inc. (a) | | | 1,257 | |
| | 35 | | | Global Industries Ltd. (a) | | | 192 | |
| | 11 | | | Lufkin Industries, Inc. | | | 931 | |
| | 52 | | | Noble Corp., (Switzerland) | | | 2,056 | |
| | 23 | | | Rowan Cos., Inc. (a) | | | 907 | |
| | 16 | | | Schlumberger Ltd. | | | 1,351 | |
| | 39 | | | Tidewater, Inc. | | | 2,105 | |
| | | | | | | | |
| | | | | | | 13,447 | |
| | | | | | | | |
| | | | Oil, Gas & Consumable Fuels — 8.1% | |
| | 75 | | | Brigham Exploration Co. (a) | | | 2,253 | |
| | 10 | | | Cabot Oil & Gas Corp. | | | 630 | |
| | 9 | | | Carrizo Oil & Gas, Inc. (a) | | | 374 | |
| | 23 | | | Chesapeake Energy Corp. | | | 688 | |
| | | | | | | | |
| SHARES | | | SECURITY DESCRIPTION | | VALUE($) | |
| | | | | | | | |
| | | | | | | | |
| | | | Oil, Gas & Consumable Fuels — Continued | |
| | 17 | | | Cimarex Energy Co. | | | 1,525 | |
| | 87 | | | Cobalt International Energy, Inc. (a) | | | 1,186 | |
| | 75 | | | Comstock Resources, Inc. (a) | | | 2,151 | |
| | 38 | | | Consol Energy, Inc. | | | 1,831 | |
| | 105 | | | El Paso Corp. | | | 2,125 | |
| | 12 | | | EOG Resources, Inc. | | | 1,279 | |
| | 44 | | | EQT Corp. | | | 2,302 | |
| | 105 | | | Frontline Ltd., (Bermuda) | | | 1,551 | |
| | 17 | | | Hess Corp. | | | 1,248 | |
| | 332 | | | Kodiak Oil & Gas Corp. (a) | | | 1,918 | |
| | 124 | | | McMoRan Exploration Co. (a) | | | 2,295 | |
| | 59 | | | Nordic American Tanker Shipping Ltd., (Bermuda) | | | 1,340 | |
| | 48 | | | Northern Oil & Gas, Inc. (a) | | | 1,070 | |
| | 54 | | | Overseas Shipholding Group, Inc. | | | 1,443 | |
| | 65 | | | Patriot Coal Corp. (a) | | | 1,450 | |
| | 46 | | | Petroleum Development Corp. (a) | | | 1,372 | |
| | 26 | | | QEP Resources, Inc. | | | 1,092 | |
| | 88 | | | Quicksilver Resources, Inc. (a) | | | 1,299 | |
| | 6 | | | Range Resources Corp. | | | 329 | |
| | 197 | | | SandRidge Energy, Inc. (a) | | | 2,104 | |
| | 40 | | | Southwestern Energy Co. (a) | | | 1,722 | |
| | 91 | | | Spectra Energy Corp. | | | 2,492 | |
| | 39 | | | Sunoco, Inc. | | | 1,631 | |
| | 44 | | | Teekay Corp., (Canada) | | | 1,347 | |
| | 62 | | | World Fuel Services Corp. | | | 2,211 | |
| | | | | | | | |
| | | | | | | 44,258 | |
| | | | | | | | |
| | | | Total Energy | | | 57,705 | |
| | | | | | | | |
| | | | Financials — 12.5% | |
| | | | Capital Markets — 2.5% | |
| | 100 | | | Charles Schwab Corp. (The) | | | 1,646 | |
| | 149 | | | E*Trade Financial Corp. (a) | | | 2,050 | |
| | 26 | | | Greenhill & Co., Inc. | | | 1,405 | |
| | 66 | | | Legg Mason, Inc. | | | 2,176 | |
| | 269 | | | MF Global Holdings Ltd. (a) | | | 2,085 | |
| | 21 | | | Morgan Stanley | | | 484 | |
| | 75 | | | SEI Investments Co. | | | 1,685 | |
| | 14 | | | T. Rowe Price Group, Inc. | | | 852 | |
| | 50 | | | TD AMERITRADE Holding Corp. | | | 977 | |
| | | | | | | | |
| | | | | | | 13,360 | |
| | | | | | | | |
| | | | Commercial Banks — 4.5% | |
| | 69 | | | Associated Banc-Corp. | | | 958 | |
| | 130 | | | BancorpSouth, Inc. | | | 1,612 | |
| | 348 | | | CapitalSource, Inc. | | | 2,246 | |
| | 44 | | | CIT Group, Inc. (a) | | | 1,927 | |
SEE NOTES TO FINANCIAL STATEMENTS.
| | | | | | |
| | | |
| 42 | | | | J.P. MORGAN MID CAP/MULTI-CAP FUNDS | | JUNE 30, 2011 |
| | | | | | | | |
| SHARES | | | SECURITY DESCRIPTION | | VALUE($) | |
| | | | | | | | |
| Short Positions — Continued | |
| | | | Commercial Banks — Continued | |
| | 46 | | | Comerica, Inc. | | | 1,586 | |
| | 97 | | | Fifth Third Bancorp | | | 1,239 | |
| | 186 | | | First Horizon National Corp. | | | 1,773 | |
| | 43 | | | Hancock Holding Co. | | | 1,334 | |
| | 30 | | | Iberiabank Corp. | | | 1,729 | |
| | 262 | | | Regions Financial Corp. | | | 1,623 | |
| | 81 | | | SunTrust Banks, Inc. | | | 2,080 | |
| | 958 | | | Synovus Financial Corp. | | | 1,994 | |
| | 145 | | | Umpqua Holdings Corp. | | | 1,673 | |
| | 21 | | | Wintrust Financial Corp. | | | 662 | |
| | 88 | | | Zions Bancorp | | | 2,123 | |
| | | | | | | | |
| | | | | | | 24,559 | |
| | | | | | | | |
| | | | Diversified Financial Services — 0.8% | |
| | 6 | | | CME Group, Inc. | | | 1,692 | |
| | 11 | | | IntercontinentalExchange, Inc. (a) | | | 1,423 | |
| | 38 | | | MSCI, Inc., Class A (a) | | | 1,449 | |
| | | | | | | | |
| | | | | | | 4,564 | |
| | | | | | | | |
| | | | Insurance — 2.6% | |
| | 54 | | | Allstate Corp. (The) | | | 1,652 | |
| | 6 | | | AON Corp. | | | 298 | |
| | 71 | | | Cincinnati Financial Corp. | | | 2,086 | |
| | 33 | | | First American Financial Corp. | | | 519 | |
| | 198 | | | Genworth Financial, Inc., Class A (a) | | | 2,032 | |
| | 40 | | | Hanover Insurance Group, Inc. (The) | | | 1,502 | |
| | 3 | | | Markel Corp. (a) | | | 1,361 | |
| | 32 | | | Marsh & McLennan Cos., Inc. | | | 1,007 | |
| | 40 | | | Mercury General Corp. | | | 1,578 | |
| | 176 | | | Old Republic International Corp. | | | 2,067 | |
| | | | | | | | |
| | | | | | | 14,102 | |
| | | | | | | | |
| | | | Real Estate Investment Trusts (REITs) — 0.9% | |
| | 24 | | | Apartment Investment & Management Co., Class A | | | 604 | |
| | 14 | | | BRE Properties, Inc. | | | 697 | |
| | 24 | | | Corporate Office Properties Trust | | | 741 | |
| | 8 | | | Federal Realty Investment Trust | | | 658 | |
| | 14 | | | Kilroy Realty Corp. | | | 572 | |
| | 80 | | | Weyerhaeuser Co. | | | 1,739 | |
| | | | | | | | |
| | | | | | | 5,011 | |
| | | | | | | | |
| | | | Thrifts & Mortgage Finance — 1.2% | |
| | 121 | | | Capitol Federal Financial, Inc. | | | 1,421 | |
| | 178 | | | Hudson City Bancorp, Inc. | | | 1,460 | |
| | 130 | | | MGIC Investment Corp. (a) | | | 775 | |
| | 80 | | | Northwest Bancshares, Inc. | | | 1,005 | |
| | | | | | | | |
| SHARES | | | SECURITY DESCRIPTION | | VALUE($) | |
| | | | | | | | |
| | | | | | | | |
| | | | Thrifts & Mortgage Finance — Continued | |
| | 138 | | | People’s United Financial, Inc. | | | 1,850 | |
| | | | | | | | |
| | | | | | | 6,511 | |
| | | | | | | | |
| | | | Total Financials | | | 68,107 | |
| | | | | | | | |
| | | | Health Care — 11.0% | |
| | | | Biotechnology — 1.2% | |
| | 45 | | | Alkermes, Inc. (a) | | | 829 | |
| | 22 | | | Celgene Corp. (a) | | | 1,320 | |
| | 25 | | | Cepheid, Inc. (a) | | | 853 | |
| | 42 | | | Myriad Genetics, Inc. (a) | | | 963 | |
| | 23 | | | Pharmasset, Inc. (a) | | | 2,596 | |
| | | | | | | | |
| | | | | | | 6,561 | |
| | | | | | | | |
| | | | Health Care Equipment & Supplies — 3.7% | |
| | 148 | | | Boston Scientific Corp. (a) | | | 1,022 | |
| | 43 | | | DENTSPLY International, Inc. | | | 1,651 | |
| | 6 | | | Edwards Lifesciences Corp. (a) | | | 547 | |
| | 4 | | | Gen-Probe, Inc. (a) | | | 309 | |
| | 13 | | | Haemonetics Corp. (a) | | | 835 | |
| | 21 | | | HeartWare International, Inc. (a) | | | 1,569 | |
| | 21 | | | IDEXX Laboratories, Inc. (a) | | | 1,606 | |
| | 3 | | | Intuitive Surgical, Inc. (a) | | | 1,090 | |
| | 39 | | | Masimo Corp. | | | 1,152 | |
| | 39 | | | Medtronic, Inc. | | | 1,512 | |
| | 62 | | | NuVasive, Inc. (a) | | | 2,047 | |
| | 68 | | | NxStage Medical, Inc. (a) | | | 1,424 | |
| | 31 | | | ResMed, Inc. (a) | | | 961 | |
| | 41 | | | Thoratec Corp. (a) | | | 1,333 | |
| | 52 | | | Volcano Corp. (a) | | | 1,669 | |
| | 36 | | | West Pharmaceutical Services, Inc. | | | 1,561 | |
| | | | | | | | |
| | | | | | | 20,288 | |
| | | | | | | | |
| | | | Health Care Providers & Services — 2.8% | |
| | 87 | | | Brookdale Senior Living, Inc. (a) | | | 2,116 | |
| | 13 | | | Chemed Corp. | | | 878 | |
| | 81 | | | Healthsouth Corp. (a) | | | 2,120 | |
| | 29 | | | Henry Schein, Inc. (a) | | | 2,061 | |
| | 3 | | | HMS Holdings Corp. (a) | | | 246 | |
| | 16 | | | Mednax, Inc. (a) | | | 1,190 | |
| | 36 | | | Owens & Minor, Inc. | | | 1,239 | |
| | 30 | | | Patterson Cos., Inc. | | | 974 | |
| | 35 | | | PSS World Medical, Inc. (a) | | | 991 | |
| | 37 | | | Universal Health Services, Inc., Class B | | | 1,902 | |
| | 73 | | | VCA Antech, Inc. (a) | | | 1,554 | |
| | | | | | | | |
| | | | | | | 15,271 | |
| | | | | | | | |
| | | | Health Care Technology — 0.6% | |
| | 28 | | | Cerner Corp. (a) | | | 1,709 | |
SEE NOTES TO FINANCIAL STATEMENTS.
| | | | | | | | |
| | | |
| JUNE 30, 2011 | | J.P. MORGAN MID CAP/MULTI-CAP FUNDS | | | | | 43 | |
JPMorgan Multi-Cap Market Neutral Fund
SCHEDULE OF PORTFOLIO INVESTMENTS
AS OF JUNE 30, 2011 (continued)
(Amounts in thousands)
| | | | | | | | |
| SHARES | | | SECURITY DESCRIPTION | | VALUE($) | |
| | | | | | | | |
| Short Positions — Continued | |
| | | | Health Care Technology — Continued | |
| | 14 | | | Quality Systems, Inc. | | | 1,229 | |
| | | | | | | | |
| | | | | | | 2,938 | |
| | | | | | | | |
| | | | Life Sciences Tools & Services — 1.3% | |
| | 25 | | | Agilent Technologies, Inc. (a) | | | 1,269 | |
| | 5 | | | Mettler-Toledo International, Inc. (a) | | | 784 | |
| | 76 | | | Parexel International Corp. (a) | | | 1,785 | |
| | 55 | | | Pharmaceutical Product Development, Inc. | | | 1,480 | |
| | 27 | | | Thermo Fisher Scientific, Inc. (a) | | | 1,741 | |
| | | | | | | | |
| | | | | | | 7,059 | |
| | | | | | | | |
| | | | Pharmaceuticals — 1.4% | |
| | 76 | | | Auxilium Pharmaceuticals, Inc. (a) | | | 1,493 | |
| | 34 | | | Hospira, Inc. (a) | | | 1,922 | |
| | 70 | | | Mylan, Inc. (a) | | | 1,722 | |
| | 169 | | | Nektar Therapeutics (a) | | | 1,232 | |
| | 16 | | | Perrigo Co. | | | 1,373 | |
| | | | | | | | |
| | | | | | | 7,742 | |
| | | | | | | | |
| | | | Total Health Care | | | 59,859 | |
| | | | | | | | |
| | | | Industrials — 14.0% | |
| | | | Aerospace & Defense — 1.4% | |
| | 21 | | | Boeing Co. (The) | | | 1,560 | |
| | 66 | | | DigitalGlobe, Inc. (a) | | | 1,671 | |
| | 10 | | | Goodrich Corp. | | | 984 | |
| | 16 | | | Hexcel Corp. (a) | | | 353 | |
| | 14 | | | Rockwell Collins, Inc. | | | 869 | |
| | 100 | | | Spirit Aerosystems Holdings, Inc., Class A (a) | | | 2,192 | |
| | | | | | | | |
| | | | | | | 7,629 | |
| | | | | | | | |
| | | | Air Freight & Logistics — 0.8% | |
| | 23 | | | C.H. Robinson Worldwide, Inc. | | | 1,846 | |
| | 30 | | | Hub Group, Inc., Class A (a) | | | 1,131 | |
| | 67 | | | UTi Worldwide, Inc., (United Kingdom) | | | 1,320 | |
| | | | | | | | |
| | | | | | | 4,297 | |
| | | | | | | | |
| | | | Airlines — 0.2% | |
| | 218 | | | AMR Corp. (a) | | | 1,175 | |
| | | | | | | | |
| | | | Building Products — 1.3% | |
| | 30 | | | Lennox International, Inc. | | | 1,292 | |
| | 118 | | | Masco Corp. | | | 1,414 | |
| | 58 | | | Owens Corning (a) | | | 2,181 | |
| | 159 | | | USG Corp. (a) | | | 2,286 | |
| | | | | | | | |
| | | | | | | 7,173 | |
| | | | | | | | |
| | | | Commercial Services & Supplies — 1.4% | |
| | 52 | | | Cintas Corp. | | | 1,701 | |
| | 16 | | | Clean Harbors, Inc. (a) | | | 1,681 | |
| | 67 | | | GEO Group, Inc. (The) (a) | | | 1,546 | |
| | 10 | | | HNI Corp. | | | 262 | |
| | | | | | | | |
| SHARES | | | SECURITY DESCRIPTION | | VALUE($) | |
| | | | | | | | |
| | | | | | | | |
| | | | Commercial Services & Supplies — Continued | |
| | 23 | | | Republic Services, Inc. | | | 699 | |
| | 49 | | | Waste Connections, Inc. | | | 1,564 | |
| | | | | | | | |
| | | | | | | 7,453 | |
| | | | | | | | |
| | | | Construction & Engineering — 1.2% | |
| | 12 | | | Foster Wheeler AG, (Switzerland) (a) | | | 363 | |
| | 52 | | | Jacobs Engineering Group, Inc. (a) | | | 2,230 | |
| | 111 | | | Quanta Services, Inc. (a) | | | 2,241 | |
| | 62 | | | Shaw Group, Inc. (The) (a) | | | 1,874 | |
| | | | | | | | |
| | | | | | | 6,708 | |
| | | | | | | | |
| | | | Electrical Equipment — 1.6% | |
| | 32 | | | Acuity Brands, Inc. | | | 1,773 | |
| | 21 | | | American Superconductor Corp. (a) | | | 192 | |
| | 73 | | | Babcock & Wilcox Co. (The) (a) | | | 2,026 | |
| | 5 | | | Cooper Industries plc | | | 312 | |
| | 3 | | | Emerson Electric Co. | | | 149 | |
| | 79 | | | GrafTech International Ltd. (a) | | | 1,595 | |
| | 16 | | | Regal-Beloit Corp. | | | 1,077 | |
| | 50 | | | Woodward, Inc. | | | 1,730 | |
| | | | | | | | |
| | | | | | | 8,854 | |
| | | | | | | | |
| | | | Industrial Conglomerates — 0.4% | |
| | 9 | | | 3M Co. | | | 849 | |
| | 31 | | | Carlisle Cos., Inc. | | | 1,537 | |
| | | | | | | | |
| | | | | | | 2,386 | |
| | | | | | | | |
| | | | Machinery — 3.5% | |
| | 34 | | | Chart Industries, Inc. (a) | | | 1,822 | |
| | 13 | | | Danaher Corp. | | | 673 | |
| | 19 | | | Flowserve Corp. | | | 2,082 | |
| | 67 | | | Harsco Corp. | | | 2,182 | |
| | 30 | | | Kaydon Corp. | | | 1,132 | |
| | 65 | | | Oshkosh Corp. (a) | | | 1,895 | |
| | 51 | | | Robbins & Myers, Inc. | | | 2,694 | |
| | 16 | | | SPX Corp. | | | 1,314 | |
| | 81 | | | Terex Corp. (a) | | | 2,291 | |
| | 67 | | | Trinity Industries, Inc. | | | 2,329 | |
| | 3 | | | Valmont Industries, Inc. | | | 317 | |
| | 5 | | | Wabtec Corp. | | | 321 | |
| | | | | | | | |
| | | | | | | 19,052 | |
| | | | | | | | |
| | | | Professional Services — 1.3% | |
| | 20 | | | Dun & Bradstreet Corp. | | | 1,547 | |
| | 23 | | | FTI Consulting, Inc. (a) | | | 883 | |
| | 20 | | | IHS, Inc., Class A (a) | | | 1,629 | |
| | 5 | | | Manpower, Inc. | | | 276 | |
| | 60 | | | Robert Half International, Inc. | | | 1,619 | |
| | 33 | | | Verisk Analytics, Inc., Class A (a) | | | 1,125 | |
| | | | | | | | |
| | | | | | | 7,079 | |
| | | | | | | | |
SEE NOTES TO FINANCIAL STATEMENTS.
| | | | | | |
| | | |
| 44 | | | | J.P. MORGAN MID CAP/MULTI-CAP FUNDS | | JUNE 30, 2011 |
| | | | | | | | |
| SHARES | | | SECURITY DESCRIPTION | | VALUE($) | |
| | | | | | | | |
| Short Positions — Continued | |
| | | | Road & Rail — 0.2% | |
| | 20 | | | Avis Budget Group, Inc. (a) | | | 334 | |
| | 52 | | | Knight Transportation, Inc. | | | 878 | |
| | | | | | | | |
| | | | | | | 1,212 | |
| | | | | | | | |
| | | | Trading Companies & Distributors — 0.7% | |
| | 60 | | | Fastenal Co. | | | 2,150 | |
| | 22 | | | MSC Industrial Direct Co., Class A | | | 1,477 | |
| | | | | | | | |
| | | | | | | 3,627 | |
| | | | | | | | |
| | | | Total Industrials | | | 76,645 | |
| | | | | | | | |
| | | | Information Technology — 16.1% | |
| | | | Communications Equipment — 1.2% | |
| | 28 | | | Acme Packet, Inc. (a) | | | 1,938 | |
| | 76 | | | Ciena Corp. (a) | | | 1,395 | |
| | 42 | | | Motorola Mobility Holdings, Inc. (a) | | | 919 | |
| | 133 | | | Tellabs, Inc. | | | 612 | |
| | 40 | | | ViaSat, Inc. (a) | | | 1,731 | |
| | | | | | | | |
| | | | | | | 6,595 | |
| | | | | | | | |
| | | | Computers & Peripherals — 1.4% | |
| | 37 | | | EMC Corp. (a) | | | 1,013 | |
| | 59 | | | Hewlett-Packard Co. | | | 2,142 | |
| | 36 | | | SanDisk Corp. (a) | | | 1,503 | |
| | 91 | | | Seagate Technology plc, (Ireland) | | | 1,469 | |
| | 32 | | | Western Digital Corp. (a) | | | 1,176 | |
| | | | | | | | |
| | | | | | | 7,303 | |
| | | | | | | | |
| | | | Electronic Equipment, Instruments & Components — 3.1% | |
| | 32 | | | Amphenol Corp., Class A | | | 1,711 | |
| | 47 | | | Cognex Corp. | | | 1,659 | |
| | 44 | | | Dolby Laboratories, Inc., Class A (a) | | | 1,885 | |
| | 61 | | | FLIR Systems, Inc. | | | 2,054 | |
| | 119 | | | Ingram Micro, Inc., Class A (a) | | | 2,157 | |
| | 68 | | | Molex, Inc. | | | 1,751 | |
| | 17 | | | National Instruments Corp. | | | 518 | |
| | 46 | | | Plexus Corp. (a) | | | 1,614 | |
| | 52 | | | Trimble Navigation Ltd. (a) | | | 2,045 | |
| | 108 | | | TTM Technologies, Inc. (a) | | | 1,728 | |
| | | | | | | | |
| | | | | | | 17,122 | |
| | | | | | | | |
| | | | Internet Software & Services — 1.8% | |
| | 62 | | | Akamai Technologies, Inc. (a) | | | 1,948 | |
| | 31 | | | Digital River, Inc. (a) | | | 1,007 | |
| | 22 | | | Equinix, Inc. (a) | | | 2,235 | |
| | 1 | | | Google, Inc., Class A (a) | | | 258 | |
| | 40 | | | LogMeIn, Inc. (a) | | | 1,525 | |
| | 63 | | | Monster Worldwide, Inc. (a) | | | 916 | |
| | 5 | | | VistaPrint N.V., (Netherlands) (a) | | | 242 | |
| | | | | | | | |
| SHARES | | | SECURITY DESCRIPTION | | VALUE($) | |
| | | | | | | | |
| | | | | | | | |
| | | | Internet Software & Services — Continued | |
| | 125 | | | Yahoo!, Inc. (a) | | | 1,874 | |
| | | | | | | | |
| | | | | | | 10,005 | |
| | | | | | | | |
| | | | IT Services — 2.1% | |
| | 17 | | | Automatic Data Processing, Inc. | | | 897 | |
| | 90 | | | CoreLogic, Inc. (a) | | | 1,497 | |
| | 2 | | | International Business Machines Corp. | | | 328 | |
| | 51 | | | Jack Henry & Associates, Inc. | | | 1,533 | |
| | 42 | | | NeuStar, Inc., Class A (a) | | | 1,108 | |
| | 42 | | | Paychex, Inc. | | | 1,296 | |
| | 28 | | | Sapient Corp. (a) | | | 424 | |
| | 12 | | | Syntel, Inc. | | | 694 | |
| | 34 | | | Teradata Corp. (a) | | | 2,066 | |
| | 32 | | | Wright Express Corp. (a) | | | 1,663 | |
| | | | | | | | |
| | | | | | | 11,506 | |
| | | | | | | | |
| | | | Semiconductors & Semiconductor Equipment — 3.0% | |
| | 269 | | | Advanced Micro Devices, Inc. (a) | | | 1,883 | |
| | 63 | | | Atmel Corp. (a) | | | 889 | |
| | 9 | | | Broadcom Corp., Class A (a) | | | 313 | |
| | 35 | | | Cavium, Inc. (a) | | | 1,505 | |
| | 41 | | | Cirrus Logic, Inc. (a) | | | 652 | |
| | 54 | | | Cree, Inc. (a) | | | 1,810 | |
| | 96 | | | Cypress Semiconductor Corp. (a) | | | 2,028 | |
| | 10 | | | Diodes, Inc. (a) | | | 252 | |
| | 21 | | | Hittite Microwave Corp. (a) | | | 1,277 | |
| | 2 | | | PMC-Sierra, Inc. (a) | | | 15 | |
| | 37 | | | Power Integrations, Inc. | | | 1,428 | |
| | 26 | | | Silicon Laboratories, Inc. (a) | | | 1,054 | |
| | 29 | | | Skyworks Solutions, Inc. (a) | | | 673 | |
| | 143 | | | TriQuint Semiconductor, Inc. (a) | | | 1,456 | |
| | 27 | | | Xilinx, Inc. | | | 986 | |
| | | | | | | | |
| | | | | | | 16,221 | |
| | | | | | | | |
| | | | Software — 3.5% | |
| | 34 | | | ANSYS, Inc. (a) | | | 1,869 | |
| | 95 | | | AsiaInfo-Linkage, Inc., (China) (a) | | | 1,572 | |
| | 13 | | | CommVault Systems, Inc. (a) | | | 595 | |
| | 33 | | | Electronic Arts, Inc. (a) | | | 784 | |
| | 14 | | | Fortinet, Inc. (a) | | | 374 | |
| | 7 | | | JDA Software Group, Inc. (a) | | | 226 | |
| | 48 | | | NetSuite, Inc. (a) | | | 1,885 | |
| | 66 | | | Parametric Technology Corp. (a) | | | 1,520 | |
| | 34 | | | Pegasystems, Inc. | | | 1,567 | |
| | 33 | | | Red Hat, Inc. (a) | | | 1,529 | |
| | 6 | | | Rovi Corp. (a) | | | 340 | |
| | 5 | | | Salesforce.com, Inc. (a) | | | 758 | |
SEE NOTES TO FINANCIAL STATEMENTS.
| | | | | | | | |
| | | |
| JUNE 30, 2011 | | J.P. MORGAN MID CAP/MULTI-CAP FUNDS | | | | | 45 | |
JPMorgan Multi-Cap Market Neutral Fund
SCHEDULE OF PORTFOLIO INVESTMENTS
AS OF JUNE 30, 2011 (continued)
(Amounts in thousands)
| | | | | | | | |
| SHARES | | | SECURITY DESCRIPTION | | VALUE($) | |
| | | | | | | | |
| Short Positions — Continued | |
| | | | Software — Continued | |
| | 87 | | | SolarWinds, Inc. (a) | | | 2,268 | |
| | 6 | | | Solera Holdings, Inc. | | | 330 | |
| | 20 | | | Synchronoss Technologies, Inc. (a) | | | 634 | |
| | 45 | | | Taleo Corp., Class A (a) | | | 1,658 | |
| | 12 | | | Ultimate Software Group, Inc. (a) | | | 647 | |
| | 5 | | | VMware, Inc., Class A (a) | | | 477 | |
| | | | | | | | |
| | | | | | | 19,033 | |
| | | | | | | | |
| | | | Total Information Technology | | | 87,785 | |
| | | | | | | | |
| | | | Materials — 8.0% | |
| | | | Chemicals — 3.8% | |
| | 11 | | | Air Products & Chemicals, Inc. | | | 1,011 | |
| | 28 | | | Airgas, Inc. | | | 1,927 | |
| | 24 | | | Albemarle Corp. | | | 1,657 | |
| | 22 | | | Ashland, Inc. | | | 1,417 | |
| | 12 | | | Dow Chemical Co. (The) | | | 426 | |
| | 35 | | | Ecolab, Inc. | | | 1,962 | |
| | 20 | | | FMC Corp. | | | 1,759 | |
| | 35 | | | H.B. Fuller Co. | | | 846 | |
| | 58 | | | Huntsman Corp. | | | 1,100 | |
| | 30 | | | International Flavors & Fragrances, Inc. | | | 1,902 | |
| | 50 | | | Intrepid Potash, Inc. (a) | | | 1,626 | |
| | 4 | | | Monsanto Co. | | | 317 | |
| | 20 | | | Mosaic Co. (The) | | | 1,349 | |
| | 17 | | | Praxair, Inc. | | | 1,887 | |
| | 35 | | | RPM International, Inc. | | | 817 | |
| | 10 | | | Sigma-Aldrich Corp. | | | 734 | |
| | | | | | | | |
| | | | | | | 20,737 | |
| | | | | | | | |
| | | | Construction Materials — 1.2% | |
| | 58 | | | Eagle Materials, Inc. | | | 1,621 | |
| | 17 | | | Martin Marietta Materials, Inc. | | | 1,355 | |
| | 41 | | | Texas Industries, Inc. | | | 1,714 | |
| | 55 | | | Vulcan Materials Co. | | | 2,132 | |
| | | | | | | | |
| | | | | | | 6,822 | |
| | | | | | | | |
| | | | Containers & Packaging — 0.8% | |
| | 23 | | | Aptargroup, Inc. | | | 1,200 | |
| | 22 | | | Owens-Illinois, Inc. (a) | | | 562 | |
| | 51 | | | Packaging Corp. of America | | | 1,432 | |
| | 34 | | | Silgan Holdings, Inc. | | | 1,393 | |
| | | | | | | | |
| | | | | | | 4,587 | |
| | | | | | | | |
| | | | Metals & Mining — 2.2% | |
| | 140 | | | AK Steel Holding Corp. | | | 2,202 | |
| | 60 | | | Allied Nevada Gold Corp. (a) | | | 2,137 | |
| | 42 | | | Carpenter Technology Corp. | | | 2,448 | |
| | | | | | | | |
| SHARES | | | SECURITY DESCRIPTION | | VALUE($) | |
| | | | | | | | |
| | | | | | | | |
| | | | Metals & Mining — Continued | |
| | 11 | | | Compass Minerals International, Inc. | | | 923 | |
| | 24 | | | Royal Gold, Inc. | | | 1,417 | |
| | 65 | | | Titanium Metals Corp. | | | 1,199 | |
| | 33 | | | United States Steel Corp. | | | 1,508 | |
| | | | | | | | |
| | | | | | | 11,834 | |
| | | | | | | | |
| | | | Total Materials | | | 43,980 | |
| | | | | | | | |
| | | | Telecommunication Services — 1.6% | |
| | | | Diversified Telecommunication Services — 1.0% | |
| | 12 | | | AboveNet, Inc. | | | 879 | |
| | 14 | | | CenturyLink, Inc. | | | 583 | |
| | 257 | | | Frontier Communications Corp. | | | 2,075 | |
| | 90 | | | tw telecom, inc. (a) | | | 1,839 | |
| | | | | | | | |
| | | | | | | 5,376 | |
| | | | | | | | |
| | | | Wireless Telecommunication Services — 0.6% | |
| | 41 | | | American Tower Corp., Class A (a) | | | 2,170 | |
| | 32 | | | NII Holdings, Inc. (a) | | | 1,343 | |
| | | | | | | | |
| | | | | | | 3,513 | |
| | | | | | | | |
| | | | Total Telecommunication Services | | | 8,889 | |
| | | | | | | | |
| | | | Utilities — 5.8% | |
| | | | Electric Utilities — 2.4% | |
| | 50 | | | Cleco Corp. | | | 1,757 | |
| | 36 | | | FirstEnergy Corp. | | | 1,597 | |
| | 16 | | | Great Plains Energy, Inc. | | | 336 | |
| | 17 | | | Hawaiian Electric Industries, Inc. | | | 419 | |
| | 10 | | | IDACORP, Inc. | | | 378 | |
| | 37 | | | NextEra Energy, Inc. | | | 2,129 | |
| | 44 | | | Northeast Utilities | | | 1,554 | |
| | 75 | | | PPL Corp. | | | 2,074 | |
| | 29 | | | Southern Co. | | | 1,182 | |
| | 45 | | | UIL Holdings Corp. | | | 1,442 | |
| | 12 | | | Westar Energy, Inc. | | | 320 | |
| | | | | | | | |
| | | | | | | 13,188 | |
| | | | | | | | |
| | | | Gas Utilities — 0.9% | |
| | 26 | | | National Fuel Gas Co. | | | 1,872 | |
| | 15 | | | New Jersey Resources Corp. | | | 678 | |
| | 9 | | | Nicor, Inc. | | | 496 | |
| | 27 | | | Northwest Natural Gas Co. | | | 1,207 | |
| | 26 | | | Piedmont Natural Gas Co., Inc. | | | 779 | |
| | | | | | | | |
| | | | | | | 5,032 | |
| | | | | | | | |
| | | | Independent Power Producers & Energy Traders — 0.8% | |
| | 137 | | | Calpine Corp. (a) | | | 2,206 | |
| | 540 | | | GenOn Energy, Inc. (a) | | | 2,086 | |
| | | | | | | | |
| | | | | | | 4,292 | |
| | | | | | | | |
SEE NOTES TO FINANCIAL STATEMENTS.
| | | | | | |
| | | |
| 46 | | | | J.P. MORGAN MID CAP/MULTI-CAP FUNDS | | JUNE 30, 2011 |
| | | | | | | | |
| SHARES | | | SECURITY DESCRIPTION | | VALUE($) | |
| | | | | | | | |
| Short Positions — Continued | |
| | | | Multi-Utilities — 1.5% | |
| | 52 | | | Black Hills Corp. | | | 1,560 | |
| | 73 | | | CenterPoint Energy, Inc. | | | 1,416 | |
| | 7 | | | Consolidated Edison, Inc. | | | 374 | |
| | 7 | | | DTE Energy Co. | | | 334 | |
| | 42 | | | OGE Energy Corp. | | | 2,119 | |
| | 71 | | | TECO Energy, Inc. | | | 1,341 | |
| | 31 | | | Vectren Corp. | | | 856 | |
| | 13 | | | Xcel Energy, Inc. | | | 313 | |
| | | | | | | | |
| | | | | | | 8,313 | |
| | | | | | | | |
| | | | | | | | |
| SHARES | | | SECURITY DESCRIPTION | | VALUE($) | |
| | | | | | | | |
| | | | | | | | |
| | | | Water Utilities — 0.2% | |
| | 48 | | | Aqua America, Inc. | | | 1,061 | |
| | | | | | | | |
| | | | Total Utilities | | | 31,886 | |
| | | | | | | | |
| | | | Total Short Positions
(Proceeds $521,840) | | | 532,696 | |
| | | | | | | | |
Percentages indicated are based on net assets.
SEE NOTES TO FINANCIAL STATEMENTS.
| | | | | | | | |
| | | |
| JUNE 30, 2011 | | J.P. MORGAN MID CAP/MULTI-CAP FUNDS | | | | | 47 | |
JPMorgan Value Advantage Fund
SCHEDULE OF PORTFOLIO INVESTMENTS
AS OF JUNE 30, 2011
(Amounts in thousands)
| | | | | | | | |
| SHARES | | | SECURITY DESCRIPTION | | VALUE($) | |
| | | | | | | | |
| Common Stocks — 96.1% | |
| | | | Consumer Discretionary — 15.0% | |
| | | | Distributors — 1.0% | |
| | 167 | | | Genuine Parts Co. | | | 9,090 | |
| | | | | | | | |
| | | | Hotels, Restaurants & Leisure — 0.9% | |
| | 66 | | | McDonald’s Corp. | | | 5,599 | |
| | 212 | | | Monarch Casino & Resort, Inc. (a) | | | 2,208 | |
| | | | | | | | |
| | | | | | | 7,807 | |
| | | | | | | | |
| | | | Household Durables — 1.3% | |
| | 194 | | | Fortune Brands, Inc. | | | 12,397 | |
| | | | | | | | |
| | | | Internet & Catalog Retail — 0.8% | |
| | 266 | | | Expedia, Inc. | | | 7,706 | |
| | | | | | | | |
| | | | Media — 3.7% | |
| | 247 | | | AH Belo Corp., Class A | | | 1,839 | |
| | 382 | | | Belo Corp., Class A (a) | | | 2,878 | |
| | 119 | | | Cablevision Systems Corp., Class A | | | 4,298 | |
| | 220 | | | Clear Channel Outdoor Holdings, Inc., Class A (a) | | | 2,790 | |
| | 340 | | | Entercom Communications Corp., Class A (a) | | | 2,950 | |
| | 406 | | | Gannett Co., Inc. | | | 5,811 | |
| | 551 | | | LIN TV Corp., Class A (a) | | | 2,684 | |
| | 61 | | | Time Warner Cable, Inc. | | | 4,729 | |
| | 81 | | | Time Warner, Inc. | | | 2,931 | |
| | 7 | | | Washington Post Co. (The), Class B | | | 2,933 | |
| | | | | | | | |
| | | | | | | 33,843 | |
| | | | | | | | |
| | | | Multiline Retail — 2.1% | |
| | 140 | | | Kohl’s Corp. | | | 7,016 | |
| | 171 | | | Sears Holdings Corp. (a) | | | 12,181 | |
| | | | | | | | |
| | | | | | | 19,197 | |
| | | | | | | | |
| | | | Specialty Retail — 5.2% | |
| | 33 | | | AutoZone, Inc. (a) | | | 9,848 | |
| | 227 | | | Bed Bath & Beyond, Inc. (a) | | | 13,238 | |
| | 510 | | | Gap, Inc. (The) | | | 9,231 | |
| | 222 | | | Home Depot, Inc. | | | 8,052 | |
| | 144 | | | TJX Cos., Inc. | | | 7,564 | |
| | | | | | | | |
| | | | | | | 47,933 | |
| | | | | | | | |
| | | | Total Consumer Discretionary | | | 137,973 | |
| | | | | | | | |
| | | | Consumer Staples — 6.2% | |
| | | | Beverages — 0.8% | |
| | 96 | | | Diageo plc, (United Kingdom), ADR | | | 7,818 | |
| | | | | | | | |
| | | | Food & Staples Retailing — 2.2% | |
| | 314 | | | Walgreen Co. | | | 13,333 | |
| | 132 | | | Wal-Mart Stores, Inc. | | | 6,993 | |
| | | | | | | | |
| | | | | | | 20,326 | |
| | | | | | | | |
| | | | | | | | |
| SHARES | | | SECURITY DESCRIPTION | | VALUE($) | |
| | | | | | | | |
| | | | | | | | |
| | | | Food Products — 1.4% | |
| | 167 | | | JM Smucker Co. (The) | | | 12,750 | |
| | | | | | | | |
| | | | Household Products — 1.8% | |
| | 254 | | | Procter & Gamble Co. (The) | | | 16,115 | |
| | | | | | | | |
| | | | Total Consumer Staples | | | 57,009 | |
| | | | | | | | |
| | | | Energy — 11.3% | |
| | | | Oil, Gas & Consumable Fuels — 11.3% | |
| | 333 | | | Devon Energy Corp. | | | 26,252 | |
| | 314 | | | El Paso Corp. | | | 6,333 | |
| | 229 | | | Energen Corp. | | | 12,910 | |
| | 126 | | | Energy Transfer Equity LP | | | 5,674 | |
| | 283 | | | Exxon Mobil Corp. | | | 23,006 | |
| | 257 | | | NuStar GP Holdings LLC | | | 9,237 | |
| | 532 | | | Teekay Corp., (Canada) | | | 16,431 | |
| | 135 | | | Williams Cos., Inc. (The) | | | 4,075 | |
| | | | | | | | |
| | | | Total Energy | | | 103,918 | |
| | | | | | | | |
| | | | Financials — 30.7% | |
| | | | Capital Markets — 3.5% | |
| | 171 | | | Ameriprise Financial, Inc. | | | 9,834 | |
| | 343 | | | Charles Schwab Corp. (The) | | | 5,636 | |
| | 39 | | | Goldman Sachs Group, Inc. (The) | | | 5,204 | |
| | 285 | | | Invesco Ltd. | | | 6,669 | |
| | 123 | | | W.P. Carey & Co. LLC | | | 4,974 | |
| | | | | | | | |
| | | | | | | 32,317 | |
| | | | | | | | |
| | | | Commercial Banks — 6.6% | |
| | 104 | | | M&T Bank Corp. | | | 9,103 | |
| | 238 | | | SunTrust Banks, Inc. | | | 6,143 | |
| | 438 | | | U.S. Bancorp | | | 11,171 | |
| | 1,232 | | | Wells Fargo & Co. | | | 34,570 | |
| | | | | | | | |
| | | | | | | 60,987 | |
| | | | | | | | |
| | | | Consumer Finance — 1.1% | |
| | 195 | | | Capital One Financial Corp. | | | 10,071 | |
| | | | | | | | |
| | | | Diversified Financial Services — 1.3% | |
| | 293 | | | Citigroup, Inc. | | | 12,215 | |
| | | | | | | | |
| | | | Insurance — 12.0% | |
| | 105 | | | American International Group, Inc. (a) | | | 3,067 | |
| | 119 | | | AON Corp. | | | 6,125 | |
| | — | (h) | | Berkshire Hathaway, Inc., Class A (a) | | | 7,663 | |
| | 61 | | | Cincinnati Financial Corp. | | | 1,792 | |
| | 280 | | | Fortegra Financial Corp. (a) | | | 2,192 | |
| | 450 | | | Genworth Financial, Inc., Class A (a) | | | 4,625 | |
| | 696 | | | Loews Corp. | | | 29,282 | |
| | 185 | | | MetLife, Inc. | | | 8,103 | |
SEE NOTES TO FINANCIAL STATEMENTS.
| | | | | | |
| | | |
| 48 | | | | J.P. MORGAN MID CAP/MULTI-CAP FUNDS | | JUNE 30, 2011 |
| | | | | | | | |
| SHARES | | | SECURITY DESCRIPTION | | VALUE($) | |
| | | | | | | | |
| Common Stocks — Continued | |
| | | | Insurance — Continued | |
| | 283 | | | Old Republic International Corp. | | | 3,325 | |
| | 166 | | | OneBeacon Insurance Group Ltd., Class A | | | 2,225 | |
| | 114 | | | ProAssurance Corp. (a) | | | 8,001 | |
| | 154 | | | Prudential Financial, Inc. | | | 9,761 | |
| | 249 | | | Transatlantic Holdings, Inc. | | | 12,194 | |
| | 354 | | | W.R. Berkley Corp. | | | 11,490 | |
| | | | | | | | |
| | | | | | | 109,845 | |
| | | | | | | | |
| | | | Real Estate Investment Trusts (REITs) — 4.3% | |
| | 208 | | | Agree Realty Corp. | | | 4,640 | |
| | 439 | | | Annaly Capital Management, Inc. | | | 7,923 | |
| | 544 | | | Cousins Properties, Inc. | | | 4,645 | |
| | 545 | | | CreXus Investment Corp. | | | 6,058 | |
| | 412 | | | Excel Trust, Inc. | | | 4,544 | |
| | 164 | | | Getty Realty Corp. | | | 4,128 | |
| | 79 | | | National Health Investors, Inc. | | | 3,489 | |
| | 81 | | | Regency Centers Corp. | | | 3,562 | |
| | | | | | | | |
| | | | | | | 38,989 | |
| | | | | | | | |
| | | | Real Estate Management & Development — 1.0% | |
| | 287 | | | Brookfield Asset Management, Inc., (Canada), Class A | | | 9,503 | |
| | | | | | | | |
| | | | Thrifts & Mortgage Finance — 0.9% | |
| | 138 | | | Capitol Federal Financial, Inc. | | | 1,626 | |
| | 476 | | | People’s United Financial, Inc. | | | 6,403 | |
| | | | | | | | |
| | | | | | | 8,029 | |
| | | | | | | | |
| | | | Total Financials | | | 281,956 | |
| | | | | | | | |
| | | | Health Care — 10.6% | |
| | | | Health Care Equipment & Supplies — 0.5% | |
| | 53 | | | Becton, Dickinson & Co. | | | 4,567 | |
| | | | | | | | |
| | | | Health Care Providers & Services — 3.7% | |
| | 242 | | | AmerisourceBergen Corp. | | | 10,031 | |
| | 60 | | | Humana, Inc. | | | 4,792 | |
| | 291 | | | Lincare Holdings, Inc. | | | 8,528 | |
| | 211 | | | National Healthcare Corp. | | | 10,460 | |
| | | | | | | | |
| | | | | | | 33,811 | |
| | | | | | | | |
| | | | Pharmaceuticals — 6.4% | |
| | 324 | | | Bristol-Myers Squibb Co. | | | 9,389 | |
| | 312 | | | Johnson & Johnson | | | 20,721 | |
| | 394 | | | Merck & Co., Inc. | | | 13,897 | |
| | 711 | | | Pfizer, Inc. | | | 14,651 | |
| | | | | | | | |
| | | | | | | 58,658 | |
| | | | | | | | |
| | | | Total Health Care | | | 97,036 | |
| | | | | | | | |
| | | | | | | | |
| SHARES | | | SECURITY DESCRIPTION | | VALUE($) | |
| | | | | | | | |
| | | | | | | | |
| | | | Industrials — 3.9% | |
| | | | Commercial Services & Supplies — 0.6% | |
| | 170 | | | Republic Services, Inc. | | | 5,248 | |
| | | | | | | | |
| | | | Industrial Conglomerates — 1.2% | |
| | 226 | | | Carlisle Cos., Inc. | | | 11,101 | |
| | | | | | | | |
| | | | Machinery — 1.2% | |
| | 200 | | | Illinois Tool Works, Inc. | | | 11,304 | |
| | | | | | | | |
| | | | Professional Services — 0.5% | |
| | 143 | | | Equifax, Inc. | | | 4,968 | |
| | | | | | | | |
| | | | Trading Companies & Distributors — 0.4% | |
| | 90 | | | GATX Corp. | | | 3,322 | |
| | | | | | | | |
| | | | Total Industrials | | | 35,943 | |
| | | | | | | | |
| | | | Information Technology — 2.7% | |
| | | | Communications Equipment — 0.5% | |
| | 79 | | | QUALCOMM, Inc. | | | 4,492 | |
| | | | | | | | |
| | | | Electronic Equipment, Instruments & Components — 1.0% | |
| | 245 | | | TE Connectivity Ltd., (Switzerland) | | | 9,010 | |
| | | | | | | | |
| | | | Software — 1.2% | |
| | 417 | | | Microsoft Corp. | | | 10,850 | |
| | | | | | | | |
| | | | Total Information Technology | | | 24,352 | |
| | | | | | | | |
| | | | Materials — 3.5% | |
| | | | Chemicals — 1.7% | |
| | 137 | | | Albemarle Corp. | | | 9,460 | |
| | 77 | | | Sherwin-Williams Co. (The) | | | 6,449 | |
| | | | | | | | |
| | | | | | | 15,909 | |
| | | | | | | | |
| | | | Construction Materials — 0.3% | |
| | 33 | | | Martin Marietta Materials, Inc. | | | 2,599 | |
| | | | | | | | |
| | | | Containers & Packaging — 0.9% | |
| | 129 | | | Rock-Tenn Co., Class A | | | 8,525 | |
| | | | | | | | |
| | | | Paper & Forest Products — 0.6% | |
| | 159 | | | MeadWestvaco Corp. | | | 5,283 | |
| | | | | | | | |
| | | | Total Materials | | | 32,316 | |
| | | | | | | | |
| | | | Telecommunication Services — 4.8% | |
| | | | Diversified Telecommunication Services — 3.7% | |
| | 773 | | | AT&T, Inc. | | | 24,267 | |
| | 232 | | | CenturyLink, Inc. | | | 9,384 | |
| | | | | | | | |
| | | | | | | 33,651 | |
| | | | | | | | |
| | | | Wireless Telecommunication Services — 1.1% | |
| | 183 | | | Telephone & Data Systems, Inc. | | | 4,916 | |
| | 213 | | | Vodafone Group plc, (United Kingdom), ADR | | | 5,702 | |
| | | | | | | | |
| | | | | | | 10,618 | |
| | | | | | | | |
| | | | Total Telecommunication Services | | | 44,269 | |
| | | | | | | | |
SEE NOTES TO FINANCIAL STATEMENTS.
| | | | | | | | |
| | | |
| JUNE 30, 2011 | | J.P. MORGAN MID CAP/MULTI-CAP FUNDS | | | | | 49 | |
JPMorgan Value Advantage Fund
SCHEDULE OF PORTFOLIO INVESTMENTS
AS OF JUNE 30, 2011 (continued)
(Amounts in thousands)
| | | | | | | | |
| SHARES | | | SECURITY DESCRIPTION | | VALUE($) | |
| | | | | | | | |
| Common Stocks — Continued | |
| | | | Utilities — 7.4% | |
| | | | Electric Utilities — 3.8% | |
| | 159 | | | NextEra Energy, Inc. | | | 9,125 | |
| | 158 | | | Northeast Utilities | | | 5,557 | |
| | 156 | | | Progress Energy, Inc. | | | 7,504 | |
| | 317 | | | Southern Co. | | | 12,800 | |
| | | | | | | | |
| | | | | | | 34,986 | |
| | | | | | | | |
| | | | Gas Utilities — 1.9% | |
| | 237 | | | Oneok, Inc. | | | 17,503 | |
| | | | | | | | |
| | | | Multi-Utilities — 1.7% | |
| | 160 | | | PG&E Corp. | | | 6,717 | |
| | 171 | | | Sempra Energy | | | 9,037 | |
| | | | | | | | |
| | | | | | | 15,754 | |
| | | | | | | | |
| | | | Total Utilities | | | 68,243 | |
| | | | | | | | |
| | | | Total Common Stocks
(Cost $741,286) | | | 883,015 | |
| | | | | | | | |
| | | | | | | | |
| SHARES | | | SECURITY DESCRIPTION | | VALUE($) | |
| | | | | | | | |
| Investment Company — 1.0% | |
| | 503 | | | Cohen & Steers Infrastructure Fund, Inc.
(Cost $7,825) | | | 8,946 | |
| | | | | | | | |
| Short-Term Investment — 3.5% | |
| | | | Investment Company — 3.5% | | | | |
| | 32,245 | | | JPMorgan Prime Money Market Fund, Institutional Class Shares,
0.050% (b) (l) (m)
(Cost $32,245) | | | 32,245 | |
| | | | | | | | |
| | | | Total Investments — 100.6%
(Cost $781,356) | | | 924,206 | |
| | | | Liabilities in Excess of
Other Assets — (0.6)% | | | (5,365 | ) |
| | | | | | | | |
| | | | NET ASSETS — 100.0% | | $ | 918,841 | |
| | | | | | | | |
Percentages indicated are based on net assets.
SEE NOTES TO FINANCIAL STATEMENTS.
| | | | | | |
| | | |
| 50 | | | | J.P. MORGAN MID CAP/MULTI-CAP FUNDS | | JUNE 30, 2011 |
NOTES TO SCHEDULE OF PORTFOLIO INVESTMENTS
AS OF JUNE 30, 2011
| | |
| ADR | | — American Depositary Receipt |
| |
| (a) | | — Non-income producing security. |
| (b) | | — Investment in affiliate. Money market fund registered under the Investment Company Act of 1940, as amended, and advised by J.P. Morgan Investment Management Inc. |
| (c) | | — Security, or a portion of the security, has been delivered to a counterparty as part of a security lending transaction. |
| (g) | | — Amount rounds to less than 0.1%. |
| (h) | | — Amount rounds to less than one thousand (shares or dollars). |
| | |
| (j) | | — All or a portion of these securities are segregated for short sales. |
| (l) | | — The rate shown is the current yield as of June 30, 2011. |
| (m) | | — All or a portion of this security is reserved and/or pledged with the custodian for current or potential holdings of futures, swaps, options, TBAs, when-issued securities, delayed delivery securities, reverse repurchase agreements, and forward foreign currency contracts. |
SEE NOTES TO FINANCIAL STATEMENTS.
| | | | | | | | |
| | | |
| JUNE 30, 2011 | | J.P. MORGAN MID CAP/MULTI-CAP FUNDS | | | | | 51 | |
STATEMENTS OF ASSETS AND LIABILITIES
AS OF JUNE 30, 2011
(Amounts in thousands, except per share amounts)
| | | | | | | | | | | | | | | | |
| | | Growth
Advantage Fund | | | Mid Cap
Core Fund | | | Mid Cap
Equity Fund | | | Mid Cap
Growth Fund | |
ASSETS: | | | | | | | | | | | | | | | | |
Investments in non-affiliates, at value | | $ | 1,210,710 | | | $ | 88,184 | | | $ | 552,112 | | | $ | 1,656,611 | |
Investments in affiliates, at value | | | 45,337 | | | | 3,576 | | | | 35,970 | | | | 107,483 | |
| | | | | | | | | | | | | | | | |
Total investment securities, at value | | | 1,256,047 | | | | 91,760 | | | | 588,082 | | | | 1,764,094 | |
Cash | | | 2 | | | | — | | | | — | | | | — | |
Deposits at broker for futures contracts | | | — | | | | — | | | | — | | | | 1,620 | |
Receivables: | | | | | | | | | | | | | | | | |
Investment securities sold | | | 10,609 | | | | — | | | | 1,855 | | | | 85,852 | |
Fund shares sold | | | 1,413 | | | | 6,625 | | | | 1,936 | | | | 2,429 | |
Interest and dividends | | | 525 | | | | 46 | | | | 466 | | | | 858 | |
Securities lending income | | | 39 | | | | — | | | | 12 | | | | 78 | |
Variation margin on futures contracts | | | — | | | | — | | | | — | | | | 173 | |
Due from Advisor | | | — | | | | 20 | | | | — | | | | — | |
Due from Administrator | | | — | | | | — | (a) | | | — | | | | — | |
| | | | | | | | | | | | | | | | |
Total Assets | | | 1,268,635 | | | | 98,451 | | | | 592,351 | | | | 1,855,104 | |
| | | | | | | | | | | | | | | | |
| | | | |
LIABILITIES: | | | | | | | | | | | | | | | | |
Payables: | | | | | | | | | | | | | | | | |
Due to custodian | | | — | | | | — | | | | — | | | | 35 | |
Dividends | | | — | | | | — | | | | 386 | | | | — | |
Investment securities purchased | | | 4,595 | | | | 6,520 | | | | 1,204 | | | | 2,010 | |
Collateral for securities lending program | | | 39,434 | | | | — | | | | 17,693 | | | | 70,726 | |
Fund shares redeemed | | | 7,294 | | | | 21 | | | | 391 | | | | 4,424 | |
Accrued liabilities: | | | | | | | | | | | | | | | | |
Investment advisory fees | | | 619 | | | | — | | | | 174 | | | | 911 | |
Administration fees | | | 83 | | | | — | | | | 1 | | | | 115 | |
Shareholder servicing fees | | | 199 | | | | 16 | | | | — | (a) | | | 246 | |
Distribution fees | | | 50 | | | | — | (a) | | | 1 | | | | 167 | |
Custodian and accounting fees | | | 31 | | | | 24 | | | | 19 | | | | 28 | |
Trustees’ and Chief Compliance Officer’s fees | | | 1 | | | | — | (a) | | | 2 | | | | 6 | |
Other | | | 173 | | | | 88 | | | | 261 | | | | 683 | |
| | | | | | | | | | | | | | | | |
Total Liabilities | | | 52,479 | | | | 6,669 | | | | 20,132 | | | | 79,351 | |
| | | | | | | | | | | | | | | | |
Net Assets | | $ | 1,216,156 | | | $ | 91,782 | | | $ | 572,219 | | | $ | 1,775,753 | |
| | | | | | | | | | | | | | | | |
SEE NOTES TO FINANCIAL STATEMENTS.
| | | | | | |
| | | |
| 52 | | | | J.P. MORGAN MID CAP/MULTI-CAP FUNDS | | JUNE 30, 2011 |
| | | | | | | | | | | | | | | | |
| | | Growth
Advantage Fund | | | Mid Cap
Core Fund | | | Mid Cap
Equity Fund | | | Mid Cap
Growth Fund | |
NET ASSETS: | | | | | | | | | | | | | | | | |
Paid in capital | | $ | 1,027,123 | | | $ | 91,262 | | | $ | 466,429 | | | $ | 1,325,089 | |
Accumulated undistributed (distributions in excess of) net investment income | | | (37 | ) | | | 44 | | | | (220 | ) | | | (122 | ) |
Accumulated net realized gains (losses) | | | (54,390 | ) | | | 78 | | | | (21,500 | ) | | | 22,057 | |
Net unrealized appreciation (depreciation) | | | 243,460 | | | | 398 | | | | 127,510 | | | | 428,729 | |
| | | | | | | | | | | | | | | | |
Total Net Assets | | $ | 1,216,156 | | | $ | 91,782 | | | $ | 572,219 | | | $ | 1,775,753 | |
| | | | | | | | | | | | | | | | |
| | | | |
Net Assets: | | | | | | | | | | | | | | | | |
Class A | | $ | 176,492 | | | $ | 276 | | | $ | 2,918 | | | $ | 696,334 | |
Class B | | | 3,157 | | | | — | | | | — | | | | 18,648 | |
Class C | | | 20,676 | | | | 99 | | | | 447 | | | | 29,187 | |
Class R2 | | | — | | | | 57 | | | | — | | | | 121 | |
Class R5 | | | 179,677 | | | | 57 | | | | — | | | | — | |
Class R6 | | | — | | | | 53 | | | | — | | | | — | |
Select Class | | | 836,154 | | | | 91,240 | | | | 568,854 | | | | 1,031,463 | |
| | | | | | | | | | | | | | | | |
Total | | $ | 1,216,156 | | | $ | 91,782 | | | $ | 572,219 | | | $ | 1,775,753 | |
| | | | | | | | | | | | | | | | |
| | | | |
Outstanding units of beneficial interest (shares) | | | | | | | | | | | | | | | | |
($0.0001 par value; unlimited number of shares authorized): | | | | | | | | | | | | | | | | |
Class A | | | 19,026 | | | | 16 | | | | 93 | | | | 29,882 | |
Class B | | | 367 | | | | — | | | | — | | | | 1,020 | |
Class C | | | 2,400 | | | | 6 | | | | 14 | | | | 1,398 | |
Class R2 | | | — | | | | 3 | | | | — | | | | 5 | |
Class R5 | | | 19,031 | | | | 3 | | | | — | | | | — | |
Class R6 | | | — | | | | 3 | | | | — | | | | — | |
Select Class | | | 89,009 | | | | 5,300 | | | | 18,140 | | | | 41,304 | |
| | | | |
Net Asset Value: | | | | | | | | | | | | | | | | |
Class A — Redemption price per share | | $ | 9.28 | | | $ | 17.19 | | | $ | 31.29 | | | $ | 23.30 | |
Class B — Offering price per share (b) | | | 8.61 | | | | — | | | | — | | | | 18.29 | |
Class C — Offering price per share (b) | | | 8.61 | | | | 17.15 | | | | 31.16 | | | | 20.88 | |
Class R2 — Offering and redemption price per share | | | — | | | | 17.17 | | | | — | | | | 24.73 | |
Class R5 — Offering and redemption price per share | | | 9.44 | | | | 17.23 | | | | — | | | | — | |
Class R6 — Offering and redemption price per share | | | — | | | | 17.24 | | | | — | | | | — | |
Select Class — Offering and redemption price per share | | | 9.39 | | | | 17.22 | | | | 31.36 | | | | 24.97 | |
Class A maximum sales charge | | | 5.25 | % | | | 5.25 | % | | | 5.25 | % | | | 5.25 | % |
Class A maximum public offering price per share
[net asset value per share/(100% — maximum sales charge)] | | $ | 9.79 | | | $ | 18.14 | | | $ | 33.02 | | | $ | 24.59 | |
| | | | | | | | | | | | | | | | |
| | | | |
Cost of investments in non-affiliates | | $ | 967,250 | | | $ | 87,786 | | | $ | 424,602 | | | $ | 1,228,055 | |
Cost of investments in affiliates | | | 45,337 | | | | 3,576 | | | | 35,970 | | | | 107,483 | |
Value of securities on loan | | | 38,658 | | | | — | | | | 17,421 | | | | 70,219 | |
| (a) | Amount rounds to less than $1,000. |
| (b) | Redemption price for Class B and Class C Shares varies based upon length of time the shares are held. |
SEE NOTES TO FINANCIAL STATEMENTS.
| | | | | | | | |
| | | |
| JUNE 30, 2011 | | J.P. MORGAN MID CAP/MULTI-CAP FUNDS | | | | | 53 | |
STATEMENTS OF ASSETS AND LIABILITIES
AS OF JUNE 30, 2011 (continued)
(Amounts in thousands, except per share amounts)
| | | | | | | | | | | | |
| | | Mid Cap Value Fund | | | Multi-Cap
Market
Neutral Fund | | | Value
Advantage
Fund | |
ASSETS: | | | | | | | | | | | | |
Investments in non-affiliates, at value | | $ | 6,580,283 | | | $ | 532,011 | | | $ | 891,961 | |
Investments in affiliates, at value | | | 219,931 | | | | 36,094 | | | | 32,245 | |
| | | | | | | | | | | | |
Total investment securities, at value | | | 6,800,214 | | | | 568,105 | | | | 924,206 | |
Cash | | | 1 | | | | — | | | | — | |
Deposits at broker for securities sold short | | | — | | | | 569,315 | | | | — | |
Receivables: | | | | | | | | | | | | |
Investment securities sold | | | 26,539 | | | | 43,165 | | | | — | |
Fund shares sold | | | 18,101 | | | | 8,215 | | | | 1,946 | |
Interest and dividends | | | 7,985 | | | | 419 | | | | 1,783 | |
Securities lending income | | | 22 | | | | — | | | | — | |
| | | | | | | | | | | | |
Total Assets | | | 6,852,862 | | | | 1,189,219 | | | | 927,935 | |
| | | | | | | | | | | | |
| | | |
LIABILITIES: | | | | | | | | | | | | |
Payables: | | | | | | | | | | | | |
Due to custodian | | | — | | | | 3,975 | | | | — | |
Securities sold short, at value | | | — | | | | 532,696 | | | | — | |
Dividends for securities sold short | | | — | | | | 429 | | | | — | |
Investment securities purchased | | | 21,524 | | | | 43,430 | | | | — | |
Interest expense for securities sold short | | | — | | | | 88 | | | | — | |
Collateral for securities lending program | | | 36,367 | | | | — | | | | — | |
Fund shares redeemed | | | 12,852 | | | | 61,382 | | | | 8,410 | |
Accrued liabilities: | | | | | | | | | | | | |
Investment advisory fees | | | 2,853 | | | | 515 | | | | 363 | |
Administration fees | | | 28 | | | | 34 | | | | — | (a) |
Shareholder servicing fees | | | 777 | | | | 5 | | | | 128 | |
Distribution fees | | | 691 | | | | 35 | | | | 128 | |
Custodian and accounting fees | | | 130 | | | | 15 | | | | 19 | |
Trustees’ and Chief Compliance Officer’s fees | | | 3 | | | | 5 | | | | 3 | |
Other | | | 1,803 | | | | 163 | | | | 43 | |
| | | | | | | | | | | | |
Total Liabilities | | | 77,028 | | | | 642,772 | | | | 9,094 | |
| | | | | | | | | | | | |
Net Assets | | $ | 6,775,834 | | | $ | 546,447 | | | $ | 918,841 | |
| | | | | | | | | | | | |
SEE NOTES TO FINANCIAL STATEMENTS.
| | | | | | |
| | | |
| 54 | | | | J.P. MORGAN MID CAP/MULTI-CAP FUNDS | | JUNE 30, 2011 |
| | | | | | | | | | | | |
| | | Mid Cap Value Fund | | | Multi-Cap
Market
Neutral Fund | | | Value
Advantage
Fund | |
NET ASSETS: | | | | | | | | | | | | |
Paid in capital | | $ | 5,539,610 | | | $ | 587,781 | | | $ | 832,160 | |
Accumulated undistributed (distributions in excess of) net investment income | | | 60,033 | | | | (37 | ) | | | 5,361 | |
Accumulated net realized gains (losses) | | | (391,073 | ) | | | (119,327 | ) | | | (61,530 | ) |
Net unrealized appreciation (depreciation) | | | 1,567,264 | | | | 78,030 | | | | 142,850 | |
| | | | | | | | | | | | |
Total Net Assets | | $ | 6,775,834 | | | $ | 546,447 | | | $ | 918,841 | |
| | | | | | | | | | | | |
| | | |
Net Assets: | | | | | | | | | | | | |
Class A | | $ | 1,979,270 | | | $ | 29,216 | | | $ | 232,103 | |
Class B | | | 90,427 | | | | 3,484 | | | | — | |
Class C | | | 373,415 | | | | 22,094 | | | | 131,743 | |
Class R2 | | | 6,500 | | | | — | | | | — | |
Institutional Class | | | 2,812,296 | | | | — | | | | 284,433 | |
Select Class | | | 1,513,926 | | | | 491,653 | | | | 270,562 | |
| | | | | | | | | | | | |
Total | | $ | 6,775,834 | | | $ | 546,447 | | | $ | 918,841 | |
| | | | | | | | | | | | |
| | | |
Outstanding units of beneficial interest (shares) | | | | | | | | | | | | |
($0.0001 par value; unlimited number of shares authorized): | | | | | | | | | | | | |
Class A | | | 79,947 | | | | 2,979 | | | | 12,171 | |
Class B | | | 3,752 | | | | 368 | | | | — | |
Class C | | | 15,476 | | | | 2,331 | | | | 6,929 | |
Class R2 | | | 268 | | | | — | | | | — | |
Institutional Class | | | 111,653 | | | | — | | | | 14,882 | |
Select Class | | | 60,625 | | | | 49,605 | | | | 14,154 | |
| | | |
Net Asset Value: | | | | | | | | | | | | |
Class A — Redemption price per share | | $ | 24.76 | | | $ | 9.81 | | | $ | 19.07 | |
Class B — Offering price per share (b) | | | 24.10 | | | | 9.47 | | | | — | |
Class C — Offering price per share (b) | | | 24.13 | | | | 9.48 | | | | 19.01 | |
Class R2 — Offering and redemption price per share | | | 24.27 | | | | — | | | | — | |
Institutional Class — Offering and redemption price per share | | | 25.19 | | | | — | | | | 19.11 | |
Select Class — Offering and redemption price per share | | | 24.97 | | | | 9.91 | | | | 19.12 | |
Class A maximum sales charge | | | 5.25 | % | | | 5.25 | % | | | 5.25 | % |
Class A maximum public offering price per share
[net asset value per share/(100% — maximum sales charge)] | | $ | 26.13 | | | $ | 10.35 | | | $ | 20.13 | |
| | | | | | | | | | | | |
| | | |
Cost of investments in non-affiliates | | $ | 5,013,019 | | | $ | 443,125 | | | $ | 749,111 | |
Cost of investments in affiliates | | | 219,931 | | | | 36,094 | | | | 32,245 | |
Value of securities on loan | | | 35,750 | | | | — | | | | — | |
Proceeds from securities sold short | | | — | | | | 521,840 | | | | — | |
| (a) | Amount rounds to less than $1,000. |
| (b) | Redemption price for Class B and Class C Shares varies based upon length of time the shares are held. |
SEE NOTES TO FINANCIAL STATEMENTS.
| | | | | | | | |
| | | |
| JUNE 30, 2011 | | J.P. MORGAN MID CAP/MULTI-CAP FUNDS | | | | | 55 | |
STATEMENTS OF OPERATIONS
FOR THE PERIOD ENDED JUNE 30, 2011
(Amounts in thousands)
| | | | | | | | | | | | | | | | |
| | | Growth
Advantage
Fund | | | Mid Cap
Core Fund (b) | | | Mid Cap
Equity Fund | | | Mid Cap
Growth Fund | |
INVESTMENT INCOME: | | | | | | | | | | | | | | | | |
Dividend income from non-affiliates | | $ | 7,161 | | | $ | 152 | | | $ | 6,125 | | | $ | 12,214 | |
Interest income from non-affiliates | | | — | (a) | | | — | (a) | | | — | | | | — | |
Dividend income from affiliates | | | 21 | | | | 1 | | | | 16 | | | | 34 | |
Income from securities lending (net) | | | 250 | | | | — | | | | 86 | | | | 400 | |
Other income | | | 9 | | | | — | | | | 5 | | | | 95 | |
| | | | | | | | | | | | | | | | |
Total investment income | | | 7,441 | | | | 153 | | | | 6,232 | | | | 12,743 | |
| | | | | | | | | | | | | | | | |
| | | | |
EXPENSES: | | | | | | | | | | | | | | | | |
Investment advisory fees | | | 6,085 | | | | 71 | | | | 2,905 | | | | 10,402 | |
Administration fees | | | 841 | | | | 10 | | | | 401 | | | | 1,439 | |
Distribution fees: | | | | | | | | | | | | | | | | |
Class A | | | 367 | | | | — | (a) | | | 6 | | | | 1,624 | |
Class B | | | 24 | | | | — | | | | — | | | | 157 | |
Class C | | | 133 | | | | — | (a) | | | 2 | | | | 203 | |
Class R2 | | | — | | | | — | (a) | | | — | | | | — | (a) |
Shareholder servicing fees: | | | | | | | | | | | | | | | | |
Class A | | | 367 | | | | — | (a) | | | 6 | | | | 1,624 | |
Class B | | | 8 | | | | — | | | | — | | | | 52 | |
Class C | | | 44 | | | | — | (a) | | | 1 | | | | 68 | |
Class R2 | | | — | | | | — | (a) | | | — | | | | — | (a) |
Class R5 | | | 64 | | | | — | (a) | | | — | | | | — | |
Select Class | | | 1,599 | | | | 27 | | | | 1,111 | | | | 2,257 | |
Custodian and accounting fees | | | 65 | | | | 28 | | | | 33 | | | | 69 | |
Interest expense to affiliates | | | 1 | | | | — | | | | — | (a) | | | — | |
Professional fees | | | 52 | | | | 97 | | | | 47 | | | | 47 | |
Trustees’ and Chief Compliance Officer’s fees | | | 11 | | | | — | (a) | | | 5 | | | | 27 | |
Printing and mailing costs | | | 60 | | | | 35 | | | | 76 | | | | 139 | |
Registration and filing fees | | | 88 | | | | 107 | | | | 92 | | | | 167 | |
Transfer agent fees | | | 316 | | | | 11 | | | | 986 | | | | 1,381 | |
Other | | | 100 | | | | 7 | | | | 15 | | | | 30 | |
| | | | | | | | | | | | | | | | |
Total expenses | | | 10,225 | | | | 393 | | | | 5,686 | | | | 19,686 | |
| | | | | | | | | | | | | | | | |
Less amounts waived | | | (133 | ) | | | (81 | ) | | | (1,683 | ) | | | (2,430 | ) |
Less earnings credits | | | — | (a) | | | — | (a) | | | — | (a) | | | — | (a) |
Less expense reimbursements | | | — | | | | (203 | ) | | | — | | | | — | |
| | | | | | | | | | | | | | | | |
Net expenses | | | 10,092 | | | | 109 | | | | 4,003 | | | | 17,256 | |
| | | | | | | | | | | | | | | | |
Net investment income (loss) | | | (2,651 | ) | | | 44 | | | | 2,229 | | | | (4,513 | ) |
| | | | | | | | | | | | | | | | |
| | | | |
REALIZED/UNREALIZED GAINS (LOSSES): | | | | | | | | | | | | | | | | |
Net realized gain (loss) on transactions from: | | | | | | | | | | | | | | | | |
Investments in non-affiliates | | | 80,245 | | | | 74 | | | | 27,793 | | | | 267,778 | |
Futures | | | — | | | | 4 | | | | — | | | | — | |
| | | | | | | | | | | | | | | | |
Net realized gain (loss) | | | 80,245 | | | | 78 | | | | 27,793 | | | | 267,778 | |
| | | | | | | | | | | | | | | | |
Change in net unrealized appreciation (depreciation) of: | | | | | | | | | | | | | | | | |
Investments in non-affiliates | | | 181,810 | | | | 398 | | | | 96,239 | | | | 276,061 | |
Futures | | | — | | | | — | | | | — | | | | 173 | |
| | | | | | | | | | | | | | | | |
Change in net unrealized appreciation (depreciation) | | | 181,810 | | | | 398 | | | | 96,239 | | | | 276,234 | |
| | | | | | | | | | | | | | | | |
Net realized/unrealized gains (losses) | | | 262,055 | | | | 476 | | | | 124,032 | | | | 544,012 | |
| | | | | | | | | | | | | | | | |
Change in net assets resulting from operations | | $ | 259,404 | | | $ | 520 | | | $ | 126,261 | | | $ | 539,499 | |
| | | | | | | | | | | | | | | | |
| (a) | Amount rounds to less than $1,000. |
| (b) | Commencement of operations was November 30, 2010. |
SEE NOTES TO FINANCIAL STATEMENTS.
| | | | | | |
| | | |
| 56 | | | | J.P. MORGAN MID CAP/MULTI-CAP FUNDS | | JUNE 30, 2011 |
| | | | | | | | | | | | |
| | | Mid Cap
Value Fund | | | Multi-Cap
Market
Neutral Fund | | | Value
Advantage
Fund | |
INVESTMENT INCOME: | | | | | | | | | | | | |
Dividend income from non-affiliates | | $ | 124,279 | | | $ | 7,259 | | | $ | 18,731 | |
Interest income from non-affiliates | | | — | | | | 12 | | | | — | |
Dividend income from affiliates | | | 183 | | | | 55 | | | | 33 | |
Income from securities lending (net) | | | 372 | | | | — | | | | — | |
Other income | | | 34 | | | | — | | | | — | |
| | | | | | | | | | | | |
Total investment income | | | 124,868 | | | | 7,326 | | | | 18,764 | |
| | | | | | | | | | | | |
| | | |
EXPENSES: | | | | | | | | | | | | |
Investment advisory fees | | | 39,810 | | | | 7,184 | | | | 4,828 | |
Administration fees | | | 5,508 | | | | 518 | | | | 667 | |
Distribution fees: | | | | | | | | | | | | |
Class A | | | 4,842 | | | | 227 | | | | 510 | |
Class B | | | 741 | | | | 43 | | | | — | |
Class C | | | 2,636 | | | | 227 | | | | 937 | |
Class R2 | | | 20 | | | | — | | | | — | |
Shareholder servicing fees: | | | | | | | | | | | | |
Class A | | | 4,842 | | | | 227 | | | | 510 | |
Class B | | | 247 | | | | 14 | | | | — | |
Class C | | | 879 | | | | 76 | | | | 312 | |
Class R2 | | | 10 | | | | — | | | | — | |
Institutional Class | | | 2,414 | | | | — | | | | 235 | |
Select Class | | | 3,298 | | | | 1,120 | | | | 446 | |
Custodian and accounting fees | | | 286 | | | | 48 | | | | 45 | |
Professional fees | | | 123 | | | | 56 | | | | 52 | |
Trustees’ and Chief Compliance Officer’s fees | | | 66 | | | | 3 | | | | 8 | |
Printing and mailing costs | | | 847 | | | | 72 | | | | 45 | |
Registration and filing fees | | | 250 | | | | 61 | | | | 121 | |
Transfer agent fees | | | 7,710 | | | | 397 | | | | 458 | |
Other | | | 195 | | | | 14 | | | | 19 | |
Dividend expense on securities sold short | | | — | | | | 7,789 | | | | — | |
Interest expense to non-affiliates on securities sold short | | | — | | | | 449 | | | | — | |
| | | | | | | | | | | | |
Total expenses | | | 74,724 | | | | 18,525 | | | | 9,193 | |
| | | | | | | | | | | | |
Less amounts waived | | | (11,938 | ) | | | (2,585 | ) | | | (968 | ) |
Less earnings credits | | | — | (a) | | | — | (a) | | | — | (a) |
| | | | | | | | | | | | |
Net expenses | | | 62,786 | | | | 15,940 | | | | 8,225 | |
| | | | | | | | | | | | |
Net investment income (loss) | | | 62,082 | | | | (8,614 | ) | | | 10,539 | |
| | | | | | | | | | | | |
| | | |
REALIZED/UNREALIZED GAINS (LOSSES): | | | | | | | | | | | | |
Net realized gain (loss) on transactions from: | | | | | | | | | | | | |
Investments in non-affiliates | | | 261,763 | | | | 113,791 | | | | 43,953 | |
Securities sold short | | | — | | | | (101,730 | ) | | | — | |
Payment by affiliate (See Note 3) | | | 31 | | | | — | | | | — | |
| | | | | | | | | | | | |
Net realized gain (loss) | | | 261,794 | | | | 12,061 | | | | 43,953 | |
| | | | | | | | | | | | |
Change in net unrealized appreciation (depreciation) of: | | | | | | | | | | | | |
Investments in non-affiliates | | | 1,311,629 | | | | 72,852 | | | | 101,318 | |
Securities sold short | | | — | | | | (69,423 | ) | | | — | |
| | | | | | | | | | | | |
Change in net unrealized appreciation (depreciation) | | | 1,311,629 | | | | 3,429 | | | | 101,318 | |
| | | | | | | | | | | | |
Net realized/unrealized gains (losses) | | | 1,573,423 | | | | 15,490 | | | | 145,271 | |
| | | | | | | | | | | | |
Change in net assets resulting from operations | | $ | 1,635,505 | | | $ | 6,876 | | | $ | 155,810 | |
| | | | | | | | | | | | |
SEE NOTES TO FINANCIAL STATEMENTS.
| | | | | | | | |
| | | |
| JUNE 30, 2011 | | J.P. MORGAN MID CAP/MULTI-CAP FUNDS | | | | | 57 | |
STATEMENTS OF CHANGES IN NET ASSETS
FOR THE PERIODS INDICATED
(Amounts in thousands)
| | | | | | | | | | | | |
| | | Growth Advantage Fund | | | Mid Cap Core Fund | |
| | | Year Ended
6/30/2011 | | | Year Ended
6/30/2010 | | | Period Ended
6/30/2011 (a) | |
CHANGE IN NET ASSETS RESULTING FROM OPERATIONS: | | | | | | | | | | | | |
Net investment income (loss) | | $ | (2,651 | ) | | $ | (1,459 | ) | | $ | 44 | |
Net realized gain (loss) | | | 80,245 | | | | 52,894 | | | | 78 | |
Change in net unrealized appreciation (depreciation) | | | 181,810 | | | | 38,819 | | | | 398 | |
| | | | | | | | | | | | |
Change in net assets resulting from operations | | | 259,404 | | | | 90,254 | | | | 520 | |
| | | | | | | | | | | | |
| | | |
DISTRIBUTIONS TO SHAREHOLDERS: | | | | | | | | | | | | |
Class A | | | | | | | | | | | | |
From net investment income | | | — | | | | — | | | | — | (b) |
Class R5 | | | | | | | | | | | | |
From net investment income | | | — | | | | — | | | | — | (b) |
Select Class | | | | | | | | | | | | |
From net investment income | | | — | | | | — | | | | (1 | ) |
| | | | | | | | | | | | |
Total distributions to shareholders | | | — | | | | — | | | | (1 | ) |
| | | | | | | | | | | | |
| | | |
CAPITAL TRANSACTIONS: | | | | | | | | | | | | |
Change in net assets from capital transactions | | | 157,627 | | | | 136,769 | | | | 91,263 | |
| | | | | | | | | | | | |
| | | |
NET ASSETS: | | | | | | | | | | | | |
Change in net assets | | | 417,031 | | | | 227,023 | | | | 91,782 | |
Beginning of period | | | 799,125 | | | | 572,102 | | | | — | |
| | | | | | | | | | | | |
End of period | | $ | 1,216,156 | | | $ | 799,125 | | | $ | 91,782 | |
| | | | | | | | | | | | |
Accumulated undistributed (distributions in excess of) net investment income | | $ | (37 | ) | | $ | (13 | ) | | $ | 44 | |
| | | | | | | | | | | | |
| (a) | Commencement of operations was November 30, 2010. |
| (b) | Amount rounds to less than $1,000. |
SEE NOTES TO FINANCIAL STATEMENTS.
| | | | | | |
| | | |
| 58 | | | | J.P. MORGAN MID CAP/MULTI-CAP FUNDS | | JUNE 30, 2011 |
| | | | | | | | | | | | | | | | |
| | | Mid Cap Equity Fund | | | Mid Cap Growth Fund | |
| | | Year Ended
6/30/2011 | | | Year Ended
6/30/2010 | | | Year Ended
6/30/2011 | | | Year Ended
6/30/2010 | |
CHANGE IN NET ASSETS RESULTING FROM OPERATIONS: | | | | | | | | | | | | | | | | |
Net investment income (loss) | | $ | 2,229 | | | $ | 1,933 | | | $ | (4,513 | ) | | $ | (5,412 | ) |
Net realized gain (loss) | | | 27,793 | | | | 9,383 | | | | 267,778 | | | | 107,222 | |
Change in net unrealized appreciation (depreciation) | | | 96,239 | | | | 26,548 | | | | 276,234 | | | | 131,041 | |
| | | | | | | | | | | | | | | | |
Change in net assets resulting from operations | | | 126,261 | | | | 37,864 | | | | 539,499 | | | | 232,851 | |
| | | | | | | | | | | | | | | | |
| | | | |
DISTRIBUTIONS TO SHAREHOLDERS: | | | | | | | | | | | | | | | | |
Class A | | | | | | | | | | | | | | | | |
From net investment income | | | (5 | ) | | | (1 | ) | | | — | | | | — | |
Class C | | | | | | | | | | | | | | | | |
From net investment income | | | — | (a) | | | — | (a) | | | — | | | | — | |
Select Class | | | | | | | | | | | | | | | | |
From net investment income | | | (1,984 | ) | | | (1,929 | ) | | | — | | | | — | |
| | | | | | | | | | | | | | | | |
Total distributions to shareholders | | | (1,989 | ) | | | (1,930 | ) | | | — | | | | — | |
| | | | | | | | | | | | | | | | |
| | | | |
CAPITAL TRANSACTIONS: | | | | | | | | | | | | | | | | |
Change in net assets from capital transactions | | | (16,990 | ) | | | 233,218 | | | | (53,988 | ) | | | (149,860 | ) |
| | | | | | | | | | | | | | | | |
| | | | |
NET ASSETS: | | | | | | | | | | | | | | | | |
Change in net assets | | | 107,282 | | | | 269,152 | | | | 485,511 | | | | 82,991 | |
Beginning of period | | | 464,937 | | | | 195,785 | | | | 1,290,242 | | | | 1,207,251 | |
| | | | | | | | | | | | | | | | |
End of period | | $ | 572,219 | | | $ | 464,937 | | | $ | 1,775,753 | | | $ | 1,290,242 | |
| | | | | | | | | | | | | | | | |
Accumulated undistributed (distributions in excess of) net investment income | | $ | (220 | ) | | $ | (190 | ) | | $ | (122 | ) | | $ | (82 | ) |
| | | | | | | | | | | | | | | | |
| (a) | Amount rounds to less than $1,000. |
SEE NOTES TO FINANCIAL STATEMENTS.
| | | | | | | | |
| | | |
| JUNE 30, 2011 | | J.P. MORGAN MID CAP/MULTI-CAP FUNDS | | | | | 59 | |
STATEMENTS OF CHANGES IN NET ASSETS
FOR THE PERIODS INDICATED (continued)
(Amounts in thousands)
| | | | | | | | | | | | | | | | |
| | | Mid Cap Value Fund | | | Multi-Cap Market Neutral Fund | |
| | | Year Ended
6/30/2011 | | | Year Ended
6/30/2010 | | | Year Ended
6/30/2011 | | | Year Ended
6/30/2010 | |
CHANGE IN NET ASSETS RESULTING FROM OPERATIONS: | | | | | | | | | | | | | | | | |
Net investment income (loss) | | $ | 62,082 | | | $ | 62,503 | | | $ | (8,614 | ) | | $ | (9,582 | ) |
Net realized gain (loss) | | | 261,794 | | | | 23,325 | | | | 12,061 | | | | 43,479 | |
Change in net unrealized appreciation (depreciation) | | | 1,311,629 | | | | 936,527 | | | | 3,429 | | | | (63,292 | ) |
| | | | | | | | | | | | | | | | |
Change in net assets resulting from operations | | | 1,635,505 | | | | 1,022,355 | | | | 6,876 | | | | (29,395 | ) |
| | | | | | | | | | | | | | | | |
| | | | |
DISTRIBUTIONS TO SHAREHOLDERS: | | | | | | | | | | | | | | | | |
Class A | | | | | | | | | | | | | | | | |
From net investment income | | | (15,422 | ) | | | — | | | | — | | | | — | |
Class B | | | | | | | | | | | | | | | | |
From net investment income | | | (167 | ) | | | — | | | | — | | | | — | |
Class C | | | | | | | | | | | | | | | | |
From net investment income | | | (1,171 | ) | | | — | | | | — | | | | — | |
Class R2 | | | | | | | | | | | | | | | | |
From net investment income | | | (36 | ) | | | — | | | | — | | | | — | |
Institutional Class | | | | | | | | | | | | | | | | |
From net investment income | | | (29,944 | ) | | | (1,669 | ) | | | — | | | | — | |
Select Class | | | | | | | | | | | | | | | | |
From net investment income | | | (13,423 | ) | | | (279 | ) | | | — | | | | — | |
| | | | | | | | | | | | | | | | |
Total distributions to shareholders | | | (60,163 | ) | | | (1,948 | ) | | | — | | | | — | |
| | | | | | | | | | | | | | | | |
| | | | |
CAPITAL TRANSACTIONS: | | | | | | | | | | | | | | | | |
Change in net assets from capital transactions | | | 111,762 | | | | (131,054 | ) | | | (35,976 | ) | | | (65,653 | ) |
| | | | | | | | | | | | | | | | |
| | | | |
NET ASSETS: | | | | | | | | | | | | | | | | |
Change in net assets | | | 1,687,104 | | | | 889,353 | | | | (29,100 | ) | | | (95,048 | ) |
Beginning of period | | | 5,088,730 | | | | 4,199,377 | | | | 575,547 | | | | 670,595 | |
| | | | | | | | | | | | | | | | |
End of period | | $ | 6,775,834 | | | $ | 5,088,730 | | | $ | 546,447 | | | $ | 575,547 | |
| | | | | | | | | | | | | | | | |
Accumulated undistributed (distributions in excess of) net investment income | | $ | 60,033 | | | $ | 59,967 | | | $ | (37 | ) | | $ | (37 | ) |
| | | | | | | | | | | | | | | | |
SEE NOTES TO FINANCIAL STATEMENTS.
| | | | | | |
| | | |
| 60 | | | | J.P. MORGAN MID CAP/MULTI-CAP FUNDS | | JUNE 30, 2011 |
| | | | | | | | |
| | | Value Advantage Fund | |
| | | Year Ended
6/30/2011 | | | Year Ended
6/30/2010 | |
CHANGE IN NET ASSETS RESULTING FROM OPERATIONS: | | | | | | | | |
Net investment income (loss) | | $ | 10,539 | | | $ | 6,916 | |
Net realized gain (loss) | | | 43,953 | | | | (10,567 | ) |
Change in net unrealized appreciation (depreciation) | | | 101,318 | | | | 96,114 | |
| | | | | | | | |
Change in net assets resulting from operations | | | 155,810 | | | | 92,463 | |
| | | | | | | | |
| | |
DISTRIBUTIONS TO SHAREHOLDERS: | | | | | | | | |
Class A | | | | | | | | |
From net investment income | | | (1,878 | ) | | | (1,905 | ) |
Class C | | | | | | | | |
From net investment income | | | (513 | ) | | | (889 | ) |
Institutional Class | | | | | | | | |
From net investment income | | | (3,215 | ) | | | (1,840 | ) |
Select Class | | | | | | | | |
From net investment income | | | (2,578 | ) | | | (995 | ) |
| | | | | | | | |
Total distributions to shareholders | | | (8,184 | ) | | | (5,629 | ) |
| | | | | | | | |
| | |
CAPITAL TRANSACTIONS: | | | | | | | | |
Change in net assets from capital transactions | | | 285,229 | | | | 66,865 | |
| | | | | | | | |
| | |
NET ASSETS: | | | | | | | | |
Change in net assets | | | 432,855 | | | | 153,699 | |
Beginning of period | | | 485,986 | | | | 332,287 | |
| | | | | | | | |
End of period | | $ | 918,841 | | | $ | 485,986 | |
| | | | | | | | |
Accumulated undistributed (distributions in excess of) net investment income | | $ | 5,361 | | | $ | 2,634 | |
| | | | | | | | |
SEE NOTES TO FINANCIAL STATEMENTS.
| | | | | | | | |
| | | |
| JUNE 30, 2011 | | J.P. MORGAN MID CAP/MULTI-CAP FUNDS | | | | | 61 | |
STATEMENTS OF CHANGES IN NET ASSETS
FOR THE PERIODS INDICATED (continued)
(Amounts in thousands)
| | | | | | | | | | | | |
| | | Growth Advantage Fund | | | Mid Cap Core Fund | |
| | | Year Ended
6/30/2011 | | | Year Ended
6/30/2010 | | | Period Ended
6/30/2011 (a) | |
CAPITAL TRANSACTIONS: | | | | | | | | | | | | |
Class A | | | | | | | | | | | | |
Proceeds from shares issued | | $ | 92,600 | | | $ | 55,364 | | | $ | 296 | |
Dividends and distributions reinvested | | | — | | | | — | | | | — | (b) |
Cost of shares redeemed | | | (59,032 | ) | | | (36,207 | ) | | | (33 | ) |
| | | | | | | | | | | | |
Change in net assets from Class A capital transactions | | $ | 33,568 | | | $ | 19,157 | | | $ | 263 | |
| | | | | | | | | | | | |
Class B | | | | | | | | | | | | |
Proceeds from shares issued | | | 267 | | | | 520 | | | | — | |
Cost of shares redeemed | | | (1,177 | ) | | | (1,277 | ) | | | — | |
| | | | | | | | | | | | |
Change in net assets from Class B capital transactions | | $ | (910 | ) | | $ | (757 | ) | | $ | — | |
| | | | | | | | | | | | |
Class C | | | | | | | | | | | | |
Proceeds from shares issued | | | 11,077 | | | | 5,617 | | | | 100 | |
Cost of shares redeemed | | | (7,860 | ) | | | (3,392 | ) | | | (9 | ) |
| | | | | | | | | | | | |
Change in net assets from Class C capital transactions | | $ | 3,217 | | | $ | 2,225 | | | $ | 91 | |
| | | | | | | | | | | | |
Class R2 | | | | | | | | | | | | |
Proceeds from shares issued | | | — | | | | — | | | | 50 | |
Cost of shares redeemed | | | — | | | | — | | | | — | (b) |
| | | | | | | | | | | | |
Change in net assets from Class R2 capital transactions | | $ | — | | | $ | — | | | $ | 50 | |
| | | | | | | | | | | | |
Class R5 | | | | | | | | | | | | |
Proceeds from shares issued | | | 67,907 | | | | 27,290 | | | | 50 | |
Dividends and distributions reinvested | | | — | | | | — | | | | — | (b) |
Cost of shares redeemed | | | (762 | ) | | | (3,562 | ) | | | — | |
| | | | | | | | | | | | |
Change in net assets from Class R5 capital transactions | | $ | 67,145 | | | $ | 23,728 | | | $ | 50 | |
| | | | | | | | | | | | |
Class R6 (c) | | | | | | | | | | | | |
Proceeds from shares issued | | | — | | | | — | | | | 50 | |
Cost of shares redeemed | | | — | | | | — | | | | — | (b) |
| | | | | | | | | | | | |
Change in net assets from Class R6 capital transactions | | $ | — | | | $ | — | | | $ | 50 | |
| | | | | | | | | | | | |
Select Class | | | | | | | | | | | | |
Proceeds from shares issued | | | 418,656 | | | | 324,548 | | | | 94,382 | |
Dividends and distributions reinvested | | | — | | | | — | | | | 1 | |
Cost of shares redeemed | | | (364,049 | ) | | | (232,132 | ) | | | (3,624 | ) |
| | | | | | | | | | | | |
Change in net assets from Select Class capital transactions | | $ | 54,607 | | | $ | 92,416 | | | $ | 90,759 | |
| | | | | | | | | | | | |
Total change in net assets from capital transactions | | $ | 157,627 | | | $ | 136,769 | | | $ | 91,263 | |
| | | | | | | | | | | | |
SEE NOTES TO FINANCIAL STATEMENTS.
| | | | | | |
| | | |
| 62 | | | | J.P. MORGAN MID CAP/MULTI-CAP FUNDS | | JUNE 30, 2011 |
| | | | | | | | | | | | |
| | | Growth Advantage Fund | | | Mid Cap Core Fund | |
| | | Year Ended
6/30/2011 | | | Year Ended
6/30/2010 | | | Period Ended
6/30/2011 (a) | |
SHARE TRANSACTIONS: | | | | | | | | | | | | |
Class A | | | | | | | | | | | | |
Issued | | | 10,834 | | | | 7,959 | | | | 18 | |
Reinvested | | | — | | | | — | | | | — | (b) |
Redeemed | | | (6,865 | ) | | | (5,122 | ) | | | (2 | ) |
| | | | | | | | | | | | |
Change in Class A Shares | | | 3,969 | | | | 2,837 | | | | 16 | |
| | | | | | | | | | | | |
Class B | | | | | | | | | | | | |
Issued | | | 32 | | | | 83 | | | | — | |
Redeemed | | | (152 | ) | | | (196 | ) | | | — | |
| | | | | | | | | | | | |
Change in Class B Shares | | | (120 | ) | | | (113 | ) | | | — | |
| | | | | | | | | | | | |
Class C | | | | | | | | | | | | |
Issued | | | 1,351 | | | | 868 | | | | 6 | |
Redeemed | | | (981 | ) | | | (524 | ) | | | — | (b) |
| | | | | | | | | | | | |
Change in Class C Shares | | | 370 | | | | 344 | | | | 6 | |
| | | | | | | | | | | | |
Class R2 | | | | | | | | | | | | |
Issued | | | — | | | | — | | | | 3 | |
Redeemed | | | — | | | | — | | | | — | (b) |
| | | | | | | | | | | | |
Change in Class R2 Shares | | | — | | | | — | | | | 3 | |
| | | | | | | | | | | | |
Class R5 | | | | | | | | | | | | |
Issued | | | 7,917 | | | | 3,874 | | | | 3 | |
Reinvested | | | — | | | | — | | | | — | (b) |
Redeemed | | | (85 | ) | | | (480 | ) | | | — | |
| | | | | | | | | | | | |
Change in Class R5 Shares | | | 7,832 | | | | 3,394 | | | | 3 | |
| | | | | | | | | | | | |
Class R6 (c) | | | | | | | | | | | | |
Issued | | | — | | | | — | | | | 3 | |
Redeemed | | | — | | | | — | | | | — | (b) |
| | | | | | | | | | | | |
Change in Class R6 Shares | | | — | | | | — | | | | 3 | |
| | | | | | | | | | | | |
Select Class | | | | | | | | | | | | |
Issued | | | 46,982 | | | | 46,815 | | | | 5,510 | |
Reinvested | | | — | | | | — | | | | — | (b) |
Redeemed | | | (46,450 | ) | | | (32,808 | ) | | | (210 | ) |
| | | | | | | | | | | | |
Change in Select Class Shares | | | 532 | | | | 14,007 | | | | 5,300 | |
| | | | | | | | | | | | |
| (a) | Commencement of operations was November 30, 2010. |
| (b) | Amount rounds to less than 1,000 (shares or dollars). |
| (c) | Commencement of offering of class of shares effective January 31, 2011 for Mid Cap Core Fund. |
SEE NOTES TO FINANCIAL STATEMENTS.
| | | | | | | | |
| | | |
| JUNE 30, 2011 | | J.P. MORGAN MID CAP/MULTI-CAP FUNDS | | | | | 63 | |
STATEMENTS OF CHANGES IN NET ASSETS
FOR THE PERIODS INDICATED (continued)
(Amounts in thousands)
| | | | | | | | | | | | | | | | |
| | | Mid Cap Equity Fund | | | Mid Cap Growth Fund | |
| | | Year Ended
6/30/2011 | | | Year Ended
6/30/2010 | | | Year Ended
6/30/2011 | | | Year Ended
6/30/2010 | |
CAPITAL TRANSACTIONS: | | | | | | | | | | | | | | | | |
Class A | | | | | | | | | | | | | | | | |
Proceeds from shares issued | | $ | 2,423 | | | $ | 1,597 | | | $ | 75,693 | | | $ | 103,096 | |
Dividends and distributions reinvested | | | 5 | | | | 1 | | | | — | | | | — | |
Cost of shares redeemed | | | (1,487 | ) | | | (95 | ) | | | (160,643 | ) | | | (167,798 | ) |
| | | | | | | | | | | | | | | | |
Change in net assets from Class A capital transactions | | $ | 941 | | | $ | 1,503 | | | $ | (84,950 | ) | | $ | (64,702 | ) |
| | | | | | | | | | | | | | | | |
Class B | | | | | | | | | | | | | | | | |
Proceeds from shares issued | | $ | — | | | $ | — | | | $ | 693 | | | $ | 1,165 | |
Cost of shares redeemed | | | — | | | | — | | | | (10,361 | ) | | | (16,165 | ) |
| | | | | | | | | | | | | | | | |
Change in net assets from Class B capital transactions | | $ | — | | | $ | — | | | $ | (9,668 | ) | | $ | (15,000 | ) |
| | | | | | | | | | | | | | | | |
Class C | | | | | | | | | | | | | | | | |
Proceeds from shares issued | | $ | 443 | | | $ | 66 | | | $ | 3,672 | | | $ | 2,193 | |
Dividends and distributions reinvested | | | — | (a) | | | — | (a) | | | — | | | | — | |
Cost of shares redeemed | | | (113 | ) | | | (3 | ) | | | (6,894 | ) | | | (9,337 | ) |
| | | | | | | | | | | | | | | | |
Change in net assets from Class C capital transactions | | $ | 330 | | | $ | 63 | | | $ | (3,222 | ) | | $ | (7,144 | ) |
| | | | | | | | | | | | | | | | |
Class R2 | | | | | | | | | | | | | | | | |
Proceeds from shares issued | | $ | — | | | $ | — | | | $ | 31 | | | $ | — | (a) |
Cost of shares redeemed | | | — | | | | — | | | | — | (a) | | | (32 | ) |
| | | | | | | | | | | | | | | | |
Change in net assets from Class R2 capital transactions | | $ | — | | | $ | — | | | $ | 31 | | | $ | (32 | ) |
| | | | | | | | | | | | | | | | |
Select Class | | | | | | | | | | | | | | | | |
Proceeds from shares issued | | $ | 269,128 | | | $ | 316,115 | | | $ | 247,747 | | | $ | 155,494 | |
Dividends and distributions reinvested | | | 447 | | | | 305 | | | | — | | | | — | |
Cost of shares redeemed | | | (287,836 | ) | | | (84,768 | ) | | | (203,926 | ) | | | (218,476 | ) |
| | | | | | | | | | | | | | | | |
Change in net assets from Select Class capital transactions | | $ | (18,261 | ) | | $ | 231,652 | | | $ | 43,821 | | | $ | (62,982 | ) |
| | | | | | | | | | | | | | | | |
Total change in net assets from capital transactions | | $ | (16,990 | ) | | $ | 233,218 | | | $ | (53,988 | ) | | $ | (149,860 | ) |
| | | | | | | | | | | | | | | | |
SEE NOTES TO FINANCIAL STATEMENTS.
| | | | | | |
| | | |
| 64 | | | | J.P. MORGAN MID CAP/MULTI-CAP FUNDS | | JUNE 30, 2011 |
| | | | | | | | | | | | | | | | |
| | | Mid Cap Equity Fund | | | Mid Cap Growth Fund | |
| | | Year Ended
6/30/2011 | | | Year Ended
6/30/2010 | | | Year Ended
6/30/2011 | | | Year Ended
6/30/2010 | |
SHARE TRANSACTIONS: | | | | | | | | | | | | | | | | |
Class A | | | | | | | | | | | | | | | | |
Issued | | | 84 | | | | 65 | | | | 3,594 | | | | 6,323 | |
Reinvested | | | — | (a) | | | — | (a) | | | — | | | | — | |
Redeemed | | | (52 | ) | | | (4 | ) | | | (7,968 | ) | | | (10,091 | ) |
| | | | | | | | | | | | | | | | |
Change in Class A Shares | | | 32 | | | | 61 | | | | (4,374 | ) | | | (3,768 | ) |
| | | | | | | | | | | | | | | | |
Class B | | | | | | | | | | | | | | | | |
Issued | | | — | | | | — | | | | 41 | | | | 93 | |
Reinvested | | | — | | | | — | | | | — | | | | — | |
Redeemed | | | — | | | | — | | | | (641 | ) | | | (1,235 | ) |
| | | | | | | | | | | | | | | | |
Change in Class B Shares | | | — | | | | — | | | | (600 | ) | | | (1,142 | ) |
| | | | | | | | | | | | | | | | |
Class C | | | | | | | | | | | | | | | | |
Issued | | | 15 | | | | 3 | | | | 189 | | | | 146 | |
Reinvested | | | — | (a) | | | — | (a) | | | — | | | | — | |
Redeemed | | | (4 | ) | | | — | (a) | | | (379 | ) | | | (627 | ) |
| | | | | | | | | | | | | | | | |
Change in Class C Shares | | | 11 | | | | 3 | | | | (190 | ) | | | (481 | ) |
| | | | | | | | | | | | | | | | |
Class R2 | | | | | | | | | | | | | | | | |
Issued | | | — | | | | — | | | | 1 | | | | — | (a) |
Redeemed | | | — | | | | — | | | | — | (a) | | | (2 | ) |
| | | | | | | | | | | | | | | | |
Change in Class R2 Shares | | | — | | | | — | | | | 1 | | | | (2 | ) |
| | | | | | | | | | | | | | | | |
Select Class | | | | | | | | | | | | | | | | |
Issued | | | 9,351 | | | | 13,451 | | | | 11,401 | | | | 8,781 | |
Reinvested | | | 15 | | | | 13 | | | | — | | | | — | |
Redeemed | | | (11,406 | ) | | | (3,604 | ) | | | (9,364 | ) | | | (12,859 | ) |
| | | | | | | | | | | | | | | | |
Change in Select Class Shares | | | (2,040 | ) | | | 9,860 | | | | 2,037 | | | | (4,078 | ) |
| | | | | | | | | | | | | | | | |
| (a) | Amount rounds to less than 1,000 (shares or dollars). |
SEE NOTES TO FINANCIAL STATEMENTS.
| | | | | | | | |
| | | |
| JUNE 30, 2011 | | J.P. MORGAN MID CAP/MULTI-CAP FUNDS | | | | | 65 | |
STATEMENTS OF CHANGES IN NET ASSETS
FOR THE PERIODS INDICATED (continued)
(Amounts in thousands)
| | | | | | | | | | | | | | | | |
| | | Mid Cap Value Fund | | | Multi-Cap Market Neutral Fund | |
| | | Year Ended
6/30/2011 | | | Year Ended
6/30/2010 | | | Year Ended
6/30/2011 | | | Year Ended
6/30/2010 | |
CAPITAL TRANSACTIONS: | | | | | | | | | | | | | | | | |
Class A | | | | | | | | | | | | | | | | |
Proceeds from shares issued | | $ | 373,327 | | | $ | 286,766 | | | $ | 34,632 | | | $ | 64,504 | |
Dividends and distributions reinvested | | | 14,615 | | | | — | | | | — | | | | — | |
Cost of shares redeemed | | | (621,660 | ) | | | (562,984 | ) | | | (100,820 | ) | | | (33,398 | ) |
| | | | | | | | | | | | | | | | |
Change in net assets from Class A capital transactions | | $ | (233,718 | ) | | $ | (276,218 | ) | | $ | (66,188 | ) | | $ | 31,106 | |
| | | | | | | | | | | | | | | | |
Class B | | | | | | | | | | | | | | | | |
Proceeds from shares issued | | $ | 626 | | | $ | 1,155 | | | $ | 22 | | | $ | 84 | |
Dividends and distributions reinvested | | | 148 | | | | — | | | | — | | | | — | |
Cost of shares redeemed | | | (34,335 | ) | | | (37,583 | ) | | | (4,375 | ) | | | (4,436 | ) |
| | | | | | | | | | | | | | | | |
Change in net assets from Class B capital transactions | | $ | (33,561 | ) | | $ | (36,428 | ) | | $ | (4,353 | ) | | $ | (4,352 | ) |
| | | | | | | | | | | | | | | | |
Class C | | | | | | | | | | | | | | | | |
Proceeds from shares issued | | $ | 37,081 | | | $ | 24,188 | | | $ | 1,079 | | | $ | 4,139 | |
Dividends and distributions reinvested | | | 873 | | | | — | | | | — | | | | — | |
Cost of shares redeemed | | | (65,800 | ) | | | (83,767 | ) | | | (18,536 | ) | | | (23,169 | ) |
| | | | | | | | | | | | | | | | |
Change in net assets from Class C capital transactions | | $ | (27,846 | ) | | $ | (59,579 | ) | | $ | (17,457 | ) | | $ | (19,030 | ) |
| | | | | | | | | | | | | | | | |
Class R2 | | | | | | | | | | | | | | | | |
Proceeds from shares issued | | $ | 5,542 | | | $ | 2,331 | | | $ | — | | | $ | — | |
Dividends and distributions reinvested | | | 28 | | | | — | | | | — | | | | — | |
Cost of shares redeemed | | | (1,307 | ) | | | (1,209 | ) | | | — | | | | — | |
| | | | | | | | | | | | | | | | |
Change in net assets from Class R2 capital transactions | | $ | 4,263 | | | $ | 1,122 | | | $ | — | | | $ | — | |
| | | | | | | | | | | | | | | | |
Institutional Class | | | | | | | | | | | | | | | | |
Proceeds from shares issued | | $ | 789,825 | | | $ | 527,453 | | | $ | — | | | $ | — | |
Dividends and distributions reinvested | | | 22,919 | | | | 1,318 | | | | — | | | | — | |
Cost of shares redeemed | | | (526,461 | ) | | | (435,724 | ) | | | — | | | | — | |
Redemptions in-kind (See Note 9) | | | — | | | | 47,173 | | | | — | | | | — | |
| | | | | | | | | | | | | | | | |
Change in net assets from Institutional Class capital transactions | | $ | 286,283 | | | $ | 140,220 | | | $ | — | | | $ | — | |
| | | | | | | | | | | | | | | | |
Select Class | | | | | | | | | | | | | | | | |
Proceeds from shares issued | | $ | 449,654 | | | $ | 468,382 | | | $ | 155,618 | | | $ | 153,988 | |
Dividends and distributions reinvested | | | 9,285 | | | | 167 | | | | — | | | | — | |
Cost of shares redeemed | | | (342,598 | ) | | | (368,720 | ) | | | (103,596 | ) | | | (227,365 | ) |
| | | | | | | | | | | | | | | | |
Change in net assets from Select Class capital transactions | | $ | 116,341 | | | $ | 99,829 | | | $ | 52,022 | | | $ | (73,377 | ) |
| | | | | | | | | | | | | | | | |
Total change in net assets from capital transactions | | $ | 111,762 | | | $ | (131,054 | ) | | $ | (35,976 | ) | | $ | (65,653 | ) |
| | | | | | | | | | | | | | | | |
SEE NOTES TO FINANCIAL STATEMENTS.
| | | | | | |
| | | |
| 66 | | | | J.P. MORGAN MID CAP/MULTI-CAP FUNDS | | JUNE 30, 2011 |
| | | | | | | | | | | | | | | | |
| | | Mid Cap Value Fund | | | Multi-Cap Market Neutral Fund | |
| | | Year Ended
6/30/2011 | | | Year Ended
6/30/2010 | | | Year Ended
6/30/2011 | | | Year Ended
6/30/2010 | |
SHARE TRANSACTIONS: | | | | | | | | | | | | | | | | |
Class A | | | | | | | | | | | | | | | | |
Issued | | | 16,395 | | | | 15,310 | | | | 3,576 | | | | 6,429 | |
Reinvested | | | 636 | | | | — | | | | — | | | | — | |
Redeemed | | | (27,300 | ) | | | (30,094 | ) | | | (10,335 | ) | | | (3,339 | ) |
| | | | | | | | | | | | | | | | |
Change in Class A Shares | | | (10,269 | ) | | | (14,784 | ) | | | (6,759 | ) | | | 3,090 | |
| | | | | | | | | | | | | | | | |
Class B | | | | | | | | | | | | | | | | |
Issued | | | 29 | | | | 66 | | | | 2 | | | | 8 | |
Reinvested | | | 7 | | | | — | | | | — | | | | — | |
Redeemed | | | (1,559 | ) | | | (2,050 | ) | | | (465 | ) | | | (453 | ) |
| | | | | | | | | | | | | | | | |
Change in Class B Shares | | | (1,523 | ) | | | (1,984 | ) | | | (463 | ) | | | (445 | ) |
| | | | | | | | | | | | | | | | |
Class C | | | | | | | | | | | | | | | | |
Issued | | | 1,660 | | | | 1,313 | | | | 115 | | | | 423 | |
Reinvested | | | 39 | | | | — | (a) | | | — | | | | — | |
Redeemed | | | (3,011 | ) | | | (4,607 | ) | | | (1,973 | ) | | | (2,368 | ) |
| | | | | | | | | | | | | | | | |
Change in Class C Shares | | | (1,312 | ) | | | (3,294 | ) | | | (1,858 | ) | | | (1,945 | ) |
| | | | | | | | | | | | | | | | |
Class R2 | | | | | | | | | | | | | | | | |
Issued | | | 245 | | | | 121 | | | | — | | | | — | |
Reinvested | | | 1 | | | | — | | | | — | | | | — | |
Redeemed | | | (55 | ) | | | (64 | ) | | | — | | | | — | |
| | | | | | | | | | | | | | | | |
Change in Class R2 Shares | | | 191 | | | | 57 | | | | — | | | | — | |
| | | | | | | | | | | | | | | | |
Institutional Class | | | | | | | | | | | | | | | | |
Issued | | | 34,031 | | | | 27,515 | | | | — | | | | — | |
Reinvested | | | 983 | | | | 69 | | | | — | | | | — | |
Redeemed | | | (22,926 | ) | | | (22,644 | ) | | | — | | | | — | |
Redemptions in-kind (See Note 9) | | | — | | | | 2,355 | | | | — | | | | — | |
| | | | | | | | | | | | | | | | |
Change in Institutional Class Shares | | | 12,088 | | | | 7,295 | | | | — | | | | — | |
| | | | | | | | | | | | | | | | |
Select Class | | | | | | | | | | | | | | | | |
Issued | | | 19,629 | | | | 25,058 | | | | 15,949 | | | | 15,269 | |
Reinvested | | | 401 | | | | 9 | | | | — | | | | — | |
Redeemed | | | (15,059 | ) | | | (19,421 | ) | | | (10,636 | ) | | | (22,446 | ) |
| | | | | | | | | | | | | | | | |
Change in Select Class Shares | | | 4,971 | | | | 5,646 | | | | 5,313 | | | | (7,177 | ) |
| | | | | | | | | | | | | | | | |
| (a) | Amount rounds to less than 1,000. |
SEE NOTES TO FINANCIAL STATEMENTS.
| | | | | | | | |
| | | |
| JUNE 30, 2011 | | J.P. MORGAN MID CAP/MULTI-CAP FUNDS | | | | | 67 | |
STATEMENTS OF CHANGES IN NET ASSETS
FOR THE PERIODS INDICATED (continued)
(Amounts in thousands)
| | | | | | | | |
| | | Value Advantage Fund | |
| | | Year Ended
6/30/2011 | | | Year Ended
6/30/2010 | |
CAPITAL TRANSACTIONS: | | | | | | | | |
Class A | | | | | | | | |
Proceeds from shares issued | | $ | 119,805 | | | $ | 72,764 | |
Dividends and distributions reinvested | | | 1,727 | | | | 1,731 | |
Cost of shares redeemed | | | (81,151 | ) | | | (67,947 | ) |
| | | | | | | | |
Change in net assets from Class A capital transactions | | $ | 40,381 | | | $ | 6,548 | |
| | | | | | | | |
Class C | | | | | | | | |
Proceeds from shares issued | | $ | 22,682 | | | $ | 17,785 | |
Dividends and distributions reinvested | | | 413 | | | | 717 | |
Cost of shares redeemed | | | (26,534 | ) | | | (33,293 | ) |
| | | | | | | | |
Change in net assets from Class C capital transactions | | $ | (3,439 | ) | | $ | (14,791 | ) |
| | | | | | | | |
Institutional Class | | | | | | | | |
Proceeds from shares issued | | $ | 138,756 | | | $ | 76,158 | |
Dividends and distributions reinvested | | | 2,906 | | | | 1,753 | |
Cost of shares redeemed | | | (20,173 | ) | | | (9,427 | ) |
Redemptions in-kind (See Note 9) | | | (41,498 | ) | | | — | |
| | | | | | | | |
Change in net assets from Institutional Class capital transactions | | $ | 79,991 | | | $ | 68,484 | |
| | | | | | | | |
Select Class | | | | | | | | |
Proceeds from shares issued | | $ | 196,760 | | | $ | 28,225 | |
Dividends and distributions reinvested | | | 1,855 | | | | 411 | |
Cost of shares redeemed | | | (30,319 | ) | | | (22,012 | ) |
| | | | | | | | |
Change in net assets from Select Class capital transactions | | $ | 168,296 | | | $ | 6,624 | |
| | | | | | | | |
Total change in net assets from capital transactions | | $ | 285,229 | | | $ | 66,865 | |
| | | | | | | | |
SHARE TRANSACTIONS: | | | | | | | | |
Class A | | | | | | | | |
Issued | | | 6,732 | | | | 4,748 | |
Reinvested | | | 96 | | | | 114 | |
Redeemed | | | (4,517 | ) | | | (4,392 | ) |
| | | | | | | | |
Change in Class A Shares | | | 2,311 | | | | 470 | |
| | | | | | | | |
Class C | | | | | | | | |
Issued | | | 1,279 | | | | 1,153 | |
Reinvested | | | 23 | | | | 47 | |
Redeemed | | | (1,501 | ) | | | (2,236 | ) |
| | | | | | | | |
Change in Class C Shares | | | (199 | ) | | | (1,036 | ) |
| | | | | | | | |
Institutional Class | | | | | | | | |
Issued | | | 7,736 | | | | 4,877 | |
Reinvested | | | 162 | | | | 115 | |
Redeemed | | | (1,098 | ) | | | (619 | ) |
Redemptions in-kind (See Note 9) | | | (2,189 | ) | | | — | |
| | | | | | | | |
Change in Institutional Class Shares | | | 4,611 | | | | 4,373 | |
| | | | | | | | |
Select Class | | | | | | | | |
Issued | | | 11,074 | | | | 1,827 | |
Reinvested | | | 103 | | | | 27 | |
Redeemed | | | (1,687 | ) | | | (1,427 | ) |
| | | | | | | | |
Change in Select Class Shares | | | 9,490 | | | | 427 | |
| | | | | | | | |
SEE NOTES TO FINANCIAL STATEMENTS.
| | | | | | |
| | | |
| 68 | | | | J.P. MORGAN MID CAP/MULTI-CAP FUNDS | | JUNE 30, 2011 |
THIS PAGE IS INTENTIONALLY LEFT BLANK
| | | | | | | | |
| | | |
| JUNE 30, 2011 | | J.P. MORGAN MID CAP/MULTI-CAP FUNDS | | | | | 69 | |
FINANCIAL HIGHLIGHTS
FOR THE PERIODS INDICATED
| | | | | | | | | | | | | | | | |
| | | | | | Per share operating performance | |
| | | | | | Investment operations | |
| | | Net asset
value,
beginning
of period | | | Net
investment
income
(loss) | | | Net realized
and unrealized gains (losses) on
investments | | | Total from
investment
operations | |
Growth Advantage Fund | | | | | | | | | | | | | | | | |
Class A | | | | | | | | | | | | | | | | |
Year Ended June 30, 2011 | | $ | 6.76 | | | $ | (0.04 | )(e) | | $ | 2.56 | | | $ | 2.52 | |
Year Ended June 30, 2010 | | | 5.88 | | | | (0.03 | )(e) | | | 0.91 | | | | 0.88 | |
Year Ended June 30, 2009 | | | 8.14 | | | | (0.03 | )(e) | | | (2.23 | ) | | | (2.26 | ) |
Year Ended June 30, 2008 | | | 8.18 | | | | (0.05 | )(e) | | | 0.01 | | | | (0.04 | ) |
Year Ended June 30, 2007 | | | 6.63 | | | | (0.05 | )(e) | | | 1.60 | | | | 1.55 | |
| | | | |
Class B | | | | | | | | | | | | | | | | |
Year Ended June 30, 2011 | | | 6.31 | | | | (0.07 | )(e) | | | 2.37 | | | | 2.30 | |
Year Ended June 30, 2010 | | | 5.51 | | | | (0.06 | )(e) | | | 0.86 | | | | 0.80 | |
Year Ended June 30, 2009 | | | 7.67 | | | | (0.06 | )(e) | | | (2.10 | ) | | | (2.16 | ) |
Year Ended June 30, 2008 | | | 7.76 | | | | (0.09 | )(e) | | | — | (g) | | | (0.09 | ) |
Year Ended June 30, 2007 | | | 6.33 | | | | (0.10 | )(e) | | | 1.53 | | | | 1.43 | |
| | | | |
Class C | | | | | | | | | | | | | | | | |
Year Ended June 30, 2011 | | | 6.31 | | | | (0.08 | )(e) | | | 2.38 | | | | 2.30 | |
Year Ended June 30, 2010 | | | 5.52 | | | | (0.06 | )(e) | | | 0.85 | | | | 0.79 | |
Year Ended June 30, 2009 | | | 7.68 | | | | (0.06 | )(e) | | | (2.10 | ) | | | (2.16 | ) |
Year Ended June 30, 2008 | | | 7.76 | | | | (0.09 | )(e) | | | 0.01 | | | | (0.08 | ) |
Year Ended June 30, 2007 | | | 6.34 | | | | (0.11 | )(e) | | | 1.53 | | | | 1.42 | |
| | | | |
Class R5 | | | | | | | | | | | | | | | | |
Year Ended June 30, 2011 | | | 6.86 | | | | — | (e)(g) | | | 2.58 | | | | 2.58 | |
Year Ended June 30, 2010 | | | 5.93 | | | | — | (e)(g) | | | 0.93 | | | | 0.93 | |
January 8, 2009 (h) through June 30, 2009 | | | 5.37 | | | | — | (e)(g) | | | 0.56 | | | | 0.56 | |
| | | | |
Select Class | | | | | | | | | | | | | | | | |
Year Ended June 30, 2011 | | | 6.83 | | | | (0.02 | )(e) | | | 2.58 | | | | 2.56 | |
Year Ended June 30, 2010 | | | 5.93 | | | | (0.01 | )(e) | | | 0.91 | | | | 0.90 | |
Year Ended June 30, 2009 | | | 8.18 | | | | (0.01 | )(e) | | | (2.24 | ) | | | (2.25 | ) |
Year Ended June 30, 2008 | | | 8.20 | | | | (0.03 | )(e) | | | 0.01 | | | | (0.02 | ) |
Year Ended June 30, 2007 | | | 6.64 | | | | (0.04 | )(e) | | | 1.60 | | | | 1.56 | |
| (a) | Annualized for periods less than one year. |
| (b) | Not annualized for periods less than one year. |
| (c) | Includes adjustments in accordance with accounting principles generally accepted in the United States of America and as such, the net asset value for financial reporting purposes and the returns based upon those net asset values may differ from the net asset value and returns for shareholder transactions. |
| (d) | Includes earnings credits and interest expense, each of which is less than 0.01%, if applicable or unless otherwise noted. |
| (e) | Calculated based upon average shares outstanding. |
| (f) | Includes interest expense of 0.01%. |
| (g) | Amount rounds to less than $0.01. |
| (h) | Commencement of offering of class of shares. |
SEE NOTES TO FINANCIAL STATEMENTS.
| | | | | | |
| | | |
| 70 | | | | J.P. MORGAN MID CAP/MULTI-CAP FUNDS | | JUNE 30, 2011 |
| | | | | | | | | | | | | | | | | | | | | | | | | | |
| | | Ratios/Supplemental data | |
| | | | | | | Ratios to average net assets (a) | | | | |
Net asset
value,
end of
period | | | Total return
(excludes
sales charge) (b)(c) | | |
Net assets,
end of
period
(000’s) | | | Net
expenses (d) | | | Net
investment income
(loss) | | | Expenses
without waivers,
reimbursements and
earnings credits | | | Portfolio
turnover
rate (b) | |
| | | | | | | | | | | | | | | | | | | | | | | | | | |
| | | | | | | | | | | | | | | | | | | | | | | | | | |
| $ | 9.28 | | | | 37.28 | % | | $ | 176,492 | | | | 1.25 | % | | | (0.45 | )% | | | 1.31 | % | | | 96 | % |
| | 6.76 | | | | 14.97 | | | | 101,814 | | | | 1.31 | | | | (0.41 | ) | | | 1.31 | | | | 102 | |
| | 5.88 | | | | (27.76 | ) | | | 71,841 | | | | 1.35 | | | | (0.48 | ) | | | 1.42 | | | | 119 | |
| | 8.14 | | | | (0.49 | ) | | | 70,546 | | | | 1.34 | | | | (0.58 | ) | | | 1.47 | | | | 118 | |
| | 8.18 | | | | 23.38 | | | | 49,782 | | | | 1.36 | (f) | | | (0.71 | ) | | | 1.66 | | | | 159 | |
| | | | | | |
| | | | | | | | | | | | | | | | | | | | | | | | | | |
| | 8.61 | | | | 36.45 | | | | 3,157 | | | | 1.75 | | | | (0.94 | ) | | | 1.81 | | | | 96 | |
| | 6.31 | | | | 14.52 | | | | 3,070 | | | | 1.81 | | | | (0.91 | ) | | | 1.81 | | | | 102 | |
| | 5.51 | | | | (28.16 | ) | | | 3,304 | | | | 1.87 | | | | (1.02 | ) | | | 1.92 | | | | 119 | |
| | 7.67 | | | | (1.16 | ) | | | 4,340 | | | | 1.91 | | | | (1.16 | ) | | | 1.94 | | | | 118 | |
| | 7.76 | | | | 22.59 | | | | 1,501 | | | | 2.06 | (f) | | | (1.43 | ) | | | 2.17 | | | | 159 | |
| | | | | | |
| | | | | | | | | | | | | | | | | | | | | | | | | | |
| | 8.61 | | | | 36.45 | | | | 20,676 | | | | 1.75 | | | | (0.95 | ) | | | 1.81 | | | | 96 | |
| | 6.31 | | | | 14.31 | | | | 12,811 | | | | 1.81 | | | | (0.91 | ) | | | 1.81 | | | | 102 | |
| | 5.52 | | | | (28.13 | ) | | | 9,300 | | | | 1.87 | | | | (1.02 | ) | | | 1.91 | | | | 119 | |
| | 7.68 | | | | (1.03 | ) | | | 14,499 | | | | 1.88 | | | | (1.16 | ) | | | 1.89 | | | | 118 | |
| | 7.76 | | | | 22.40 | | | | 251 | | | | 2.07 | (f) | | | (1.49 | ) | | | 2.18 | | | | 159 | |
| | | | | | |
| | | | | | | | | | | | | | | | | | | | | | | | | | |
| | 9.44 | | | | 37.61 | | | | 179,677 | | | | 0.86 | | | | (0.05 | ) | | | 0.86 | | | | 96 | |
| | 6.86 | | | | 15.68 | | | | 76,767 | | | | 0.86 | | | | 0.05 | | | | 0.86 | | | | 102 | |
| | 5.93 | | | | 10.43 | | | | 46,312 | | | | 0.90 | | | | (0.08 | ) | | | 1.06 | | | | 119 | |
| | | | | | |
| | | | | | | | | | | | | | | | | | | | | | | | | | |
| | 9.39 | | | | 37.48 | | | | 836,154 | | | | 1.06 | | | | (0.27 | ) | | | 1.06 | | | | 96 | |
| | 6.83 | | | | 15.18 | | | | 604,663 | | | | 1.06 | | | | (0.16 | ) | | | 1.06 | | | | 102 | |
| | 5.93 | | | | (27.51 | ) | | | 441,345 | | | | 1.10 | | | | (0.24 | ) | | | 1.17 | | | | 119 | |
| | 8.18 | | | | (0.24 | ) | | | 399,777 | | | | 1.09 | | | | (0.41 | ) | | | 1.12 | | | | 118 | |
| | 8.20 | | | | 23.49 | | | | 10,985 | | | | 1.11 | (f) | | | (0.50 | ) | | | 1.45 | | | | 159 | |
SEE NOTES TO FINANCIAL STATEMENTS.
| | | | | | | | |
| | | |
| JUNE 30, 2011 | | J.P. MORGAN MID CAP/MULTI-CAP FUNDS | | | | | 71 | |
FINANCIAL HIGHLIGHTS
FOR THE PERIODS INDICATED (continued)
| | | | | | | | | | | | | | | | | | | | |
| | | | | | Per share operating performance | |
| | | | | | Investment operations | | | Distributions | |
| | | Net asset
value,
beginning
of period | | | Net
investment
income
(loss) | | | Net realized
and unrealized
gains
(losses) on
investments | | | Total from
investment
operations | | | Net
investment
income | |
Mid Cap Core Fund | | | | | | | | | | | | | | | | | | | | |
Class A | | | | | | | | | | | | | | | | | | | | |
November 30, 2010 (e) through June 30, 2011 | | $ | 15.00 | | | $ | 0.01 | (f) | | $ | 2.18 | | | $ | 2.19 | | | $ | — | (g) |
| | | | | |
Class C | | | | | | | | | | | | | | | | | | | | |
November 30, 2010 (e) through June 30, 2011 | | | 15.00 | | | | (0.04 | )(f) | | | 2.19 | | | | 2.15 | | | | — | |
| | | | | |
Class R2 | | | | | | | | | | | | | | | | | | | | |
November 30, 2010 (e) through June 30, 2011 | | | 15.00 | | | | (0.02 | )(f) | | | 2.19 | | | | 2.17 | | | | — | |
| | | | | |
Class R5 | | | | | | | | | | | | | | | | | | | | |
November 30, 2010 (e) through June 30, 2011 | | | 15.00 | | | | 0.05 | (f) | | | 2.19 | | | | 2.24 | | | | (0.01 | ) |
| | | | | |
Class R6 | | | | | | | | | | | | | | | | | | | | |
January 31, 2011 (i) through June 30, 2011 | | | 16.36 | | | | 0.05 | (f) | | | 0.83 | | | | 0.88 | | | | — | |
| | | | | |
Select Class | | | | | | | | | | | | | | | | | | | | |
November 30, 2010 (e) through June 30, 2011 | | | 15.00 | | | | 0.04 | (f) | | | 2.19 | | | | 2.23 | | | | (0.01 | ) |
| (a) | Annualized for periods less than one year. |
| (b) | Not annualized for periods less than one year. |
| (c) | Includes adjustments in accordance with accounting principles generally accepted in the United States of America and as such, the net asset value for financial reporting purposes and the returns based upon those net asset values may differ from the net asset value and returns for shareholder transactions. |
| (d) | Includes earnings credits and interest expense, each of which is less than 0.01%, if applicable or unless otherwise noted. |
| (e) | Commencement of operations. |
| (f) | Calculated based upon average shares outstanding |
| (g) | Amount rounds to less than $0.01. |
| (h) | Ratios are disproportionate between classes due to the size of net assets and fixed expenses. |
| (i) | Commencement of offering of class of shares. |
| (j) | Certain non-recurring expenses incurred by the Fund were not annualized for the period ended June 30, 2011. |
SEE NOTES TO FINANCIAL STATEMENTS.
| | | | | | |
| | | |
| 72 | | | | J.P. MORGAN MID CAP/MULTI-CAP FUNDS | | JUNE 30, 2011 |
| | | | | | | | | | | | | | | | | | | | | | | | | | |
| | | Ratios/Supplemental data | |
| | | | | | | | | | Ratios to average net assets (a) | | | | |
Net asset
value,
end of
period | | | Total return
(excludes
sales charge) (b)(c) | | |
Net assets,
end of
period
(000’s) | | | Net
expenses (d) | | | Net
investment
income
(loss) | | | Expenses
without waivers,
reimbursements and
earnings credits | | | Portfolio
turnover
rate (b) | |
| | | | | | | | | | | | | | | | | | | | | | | | | | |
| | | | | | | | | | | | | | | | | | | | | | | | | | |
| $ | 17.19 | | | | 14.70 | % | | $ | 276 | | | | 1.24 | %(j) | | | 0.11 | %(j) | | | 5.79 | %(h)(j) | | | 13 | % |
| | | | | | |
| | | | | | | | | | | | | | | | | | | | | | | | | | |
| | 17.15 | | | | 14.33 | | | | 99 | | | | 1.75 | (j) | | | (0.39 | )(j) | | | 6.49 | (h)(j) | | | 13 | |
| | | | | | |
| | | | | | | | | | | | | | | | | | | | | | | | | | |
| | 17.17 | | | | 14.53 | | | | 57 | | | | 1.49 | (j) | | | (0.17 | )(j) | | | 6.84 | (h)(j) | | | 13 | |
| | | | | | |
| | | | | | | | | | | | | | | | | | | | | | | | | | |
| | 17.23 | | | | 15.00 | | | | 57 | | | | 0.80 | (j) | | | 0.52 | (j) | | | 6.17 | (h)(j) | | | 13 | |
| | | | | | |
| | | | | | | | | | | | | | | | | | | | | | | | | | |
| | 17.24 | | | | 5.38 | | | | 53 | | | | 0.75 | (j) | | | 0.68 | (j) | | | 5.52 | (h)(j) | | | 13 | |
| | | | | | |
| | | | | | | | | | | | | | | | | | | | | | | | | | |
| | 17.22 | | | | 14.84 | | | | 91,240 | | | | 1.00 | (j) | | | 0.41 | (j) | | | 3.41 | (h)(j) | | | 13 | |
SEE NOTES TO FINANCIAL STATEMENTS.
| | | | | | | | |
| | | |
| JUNE 30, 2011 | | J.P. MORGAN MID CAP/MULTI-CAP FUNDS | | | | | 73 | |
FINANCIAL HIGHLIGHTS
FOR THE PERIODS INDICATED (continued)
| | | | | | | | | | | | | | | | | | | | | | | | | | | | |
| | | | | | Per share operating performance | |
| | | | | | Investment operations | | | Distributions | |
| | | Net asset
value,
beginning
of period | | | Net
investment
income
(loss) | | | Net realized
and unrealized
gains
(losses) on
investments | | | Total from
investment
operations | | | Net
investment
income | | | Net
realized
gain | | | Total
distributions | |
Mid Cap Equity Fund | | | | | | | | | | | | | | | | | | | | | | | | | | | | |
Class A | | | | | | | | | | | | | | | | | | | | | | | | | | | | |
Year Ended June 30, 2011 | | $ | 22.95 | | | $ | 0.04 | (e) | | $ | 8.36 | | | $ | 8.40 | | | $ | (0.06 | ) | | $ | — | | | $ | (0.06 | ) |
November 2, 2009 (f) through June 30, 2010 | | | 21.55 | | | | 0.05 | | | | 1.41 | | | | 1.46 | | | | (0.06 | ) | | | — | | | | (0.06 | ) |
| | | | | | | |
Class C | | | | | | | | | | | | | | | | | | | | | | | | | | | | |
Year Ended June 30, 2011 | | | 22.93 | | | | (0.12 | )(e) | | | 8.37 | | | | 8.25 | | | | (0.02 | ) | | | — | | | | (0.02 | ) |
November 2, 2009 (f) through June 30, 2010 | | | 21.55 | | | | (0.03 | ) | | | 1.41 | | | | 1.38 | | | | — | (g) | | | — | | | | — | (g) |
| | | | | | | |
Select Class | | | | | | | | | | | | | | | | | | | | | | | | | | | | |
Year Ended June 30, 2011 | | | 22.97 | | | | 0.14 | (e) | | | 8.37 | | | | 8.51 | | | | (0.12 | ) | | | — | | | | (0.12 | ) |
Year Ended June 30, 2010 | | | 18.97 | | | | 0.12 | | | | 4.00 | | | | 4.12 | | | | (0.12 | ) | | | — | | | | (0.12 | ) |
Year Ended June 30, 2009 | | | 28.63 | | | | 0.18 | | | | (8.37 | ) | | | (8.19 | ) | | | (0.17 | ) | | | (1.30 | ) | | | (1.47 | ) |
Year Ended June 30, 2008 | | | 37.93 | | | | 0.11 | | | | (2.80 | ) | | | (2.69 | ) | | | (0.11 | ) | | | (6.50 | ) | | | (6.61 | ) |
Year Ended June 30, 2007 | | | 34.51 | | | | 0.12 | | | | 6.13 | | | | 6.25 | | | | (0.10 | ) | | | (2.73 | ) | | | (2.83 | ) |
| (a) | Annualized for periods less than one year. |
| (b) | Not annualized for periods less than one year. |
| (c) | Includes adjustments in accordance with accounting principles generally accepted in the United States of America and as such, the net asset value for financial reporting purposes and the returns based upon those net asset values may differ from the net asset value and returns for shareholder transactions. |
| (d) | Includes earnings credits and interest expense, each of which is less than 0.01%, if applicable or unless otherwise noted. |
| (e) | Calculated based upon average shares outstanding. |
| (f) | Commencement of offering of class of shares. |
| (g) | Amount rounds to less than $0.01. |
SEE NOTES TO FINANCIAL STATEMENTS.
| | | | | | |
| | | |
| 74 | | | | J.P. MORGAN MID CAP/MULTI-CAP FUNDS | | JUNE 30, 2011 |
| | | | | | | | | | | | | | | | | | | | | | | | | | |
| | | Ratios/Supplemental data | |
| | | | | | | | | | Ratios to average net assets (a) | | | | |
Net asset
value,
end of
period | | | Total return
(excludes
sales charge) (b)(c) | | | Net assets,
end of
period
(000’s) | | | Net
expenses (d) | | | Net
investment income
(loss) | | | Expenses
without waivers,
reimbursements and
earnings credits | | | Portfolio
turnover
rate (b) | |
| | | | | | | | | | | | | | | | | | | | | | | | | | |
| | | | | | | | | | | | | | | | | | | | | | | | | | |
| $ | 31.29 | | | | 36.60 | % | | $ | 2,918 | | | | 1.24 | % | | | 0.14 | % | | | 1.53 | % | | | 88 | % |
| | 22.95 | | | | 6.77 | | | | 1,394 | | | | 1.24 | | | | 0.30 | | | | 1.44 | | | | 56 | |
| | | | | | |
| | | | | | | | | | | | | | | | | | | | | | | | | | |
| | 31.16 | | | | 35.98 | | | | 447 | | | | 1.74 | | | | (0.40 | ) | | | 2.06 | | | | 88 | |
| | 22.93 | | | | 6.40 | | | | 65 | | | | 1.74 | | | | (0.23 | ) | | | 1.92 | | | | 56 | |
| | | | | | |
| | | | | | | | | | | | | | | | | | | | | | | | | | |
| | 31.36 | | | | 37.09 | | | | 568,854 | | | | 0.89 | | | | 0.50 | | | | 1.27 | | | | 88 | |
| | 22.97 | | | | 21.72 | | | | 463,478 | | | | 0.89 | | | | 0.55 | | | | 1.17 | | | | 56 | |
| | 18.97 | | | | (28.02 | ) | | | 195,785 | | | | 0.90 | | | | 0.94 | | | | 1.20 | | | | 107 | |
| | 28.63 | | | | (8.19 | ) | | | 189,589 | | | | 0.91 | | | | 0.32 | | | | 1.12 | | | | 79 | |
| | 37.93 | | | | 18.97 | | | | 284,546 | | | | 0.90 | | | | 0.35 | | | | 1.09 | | | | 82 | |
SEE NOTES TO FINANCIAL STATEMENTS.
| | | | | | | | |
| | | |
| JUNE 30, 2011 | | J.P. MORGAN MID CAP/MULTI-CAP FUNDS | | | | | 75 | |
FINANCIAL HIGHLIGHTS
FOR THE PERIODS INDICATED (continued)
| | | | | | | | | | | | | | | | | | | | |
| | | | | | Per share operating performance | |
| | | | | | Investment operations | | | Distributions | |
| | | Net asset value, beginning of period | | | Net investment income (loss) | | | Net realized and unrealized gains (losses) on investments | | | Total from investment operations | | | Net realized gain | |
Mid Cap Growth Fund | | | | | | | | | | | | | | | | | | | | |
Class A | | | | | | | | | | | | | | | | | | | | |
Year Ended June 30, 2011 | | $ | 16.35 | | | $ | (0.09 | )(e) | | $ | 7.04 | | | $ | 6.95 | | | $ | — | |
Year Ended June 30, 2010 | | | 13.68 | | | | (0.09 | )(e) | | | 2.76 | | | | 2.67 | | | | — | |
Year Ended June 30, 2009 | | | 20.46 | | | | (0.07 | )(e) | | | (6.33 | )(f) | | | (6.40 | ) | | | (0.38 | ) |
Year Ended June 30, 2008 | | | 24.89 | | | | (0.17 | )(e) | | | (0.45 | ) | | | (0.62 | ) | | | (3.81 | ) |
Year Ended June 30, 2007 | | | 24.85 | | | | (0.18 | )(e) | | | 4.41 | | | | 4.23 | | | | (4.19 | ) |
| | | | | |
Class B | | | | | | | | | | | | | | | | | | | | |
Year Ended June 30, 2011 | | | 12.90 | | | | (0.16 | )(e) | | | 5.55 | | | | 5.39 | | | | — | |
Year Ended June 30, 2010 | | | 10.85 | | | | (0.14 | )(e) | | | 2.19 | | | | 2.05 | | | | — | |
Year Ended June 30, 2009 | | | 16.45 | | | | (0.13 | )(e) | | | (5.09 | )(f) | | | (5.22 | ) | | | (0.38 | ) |
Year Ended June 30, 2008 | | | 20.88 | | | | (0.26 | )(e) | | | (0.36 | ) | | | (0.62 | ) | | | (3.81 | ) |
Year Ended June 30, 2007 | | | 21.59 | | | | (0.28 | )(e) | | | 3.76 | | | | 3.48 | | | | (4.19 | ) |
| | | | | |
Class C | | | | | | | | | | | | | | | | | | | | |
Year Ended June 30, 2011 | | | 14.73 | | | | (0.18 | )(e) | | | 6.33 | | | | 6.15 | | | | — | |
Year Ended June 30, 2010 | | | 12.39 | | | | (0.16 | )(e) | | | 2.50 | | | | 2.34 | | | | — | |
Year Ended June 30, 2009 | | | 18.70 | | | | (0.15 | )(e) | | | (5.78 | )(f) | | | (5.93 | ) | | | (0.38 | ) |
Year Ended June 30, 2008 | | | 23.21 | | | | (0.29 | )(e) | | | (0.41 | ) | | | (0.70 | ) | | | (3.81 | ) |
Year Ended June 30, 2007 | | | 23.57 | | | | (0.31 | )(e) | | | 4.14 | | | | 3.83 | | | | (4.19 | ) |
| | | | | |
Class R2 | | | | | | | | | | | | | | | | | | | | |
Year Ended June 30, 2011 | | | 17.38 | | | | (0.13 | )(e) | | | 7.48 | | | | 7.35 | | | | — | |
Year Ended June 30, 2010 | | | 14.56 | | | | (0.12 | )(e) | | | 2.94 | | | | 2.82 | | | | — | |
June 19, 2009 (h) through June 30, 2009 | | | 14.56 | | | | — | (e)(i) | | | — | (i) | | | — | (i) | | | — | |
| | | | | |
Select Class | | | | | | | | | | | | | | | | | | | | |
Year Ended June 30, 2011 | | | 17.47 | | | | (0.03 | )(e) | | | 7.53 | | | | 7.50 | | | | — | |
Year Ended June 30, 2010 | | | 14.57 | | | | (0.04 | )(e) | | | 2.94 | | | | 2.90 | | | | — | |
Year Ended June 30, 2009 | | | 21.68 | | | | (0.03 | )(e) | | | (6.70 | )(f) | | | (6.73 | ) | | | (0.38 | ) |
Year Ended June 30, 2008 | | | 26.10 | | | | (0.12 | )(e) | | | (0.49 | ) | | | (0.61 | ) | | | (3.81 | ) |
Year Ended June 30, 2007 | | | 25.81 | | | | (0.12 | )(e) | | | 4.60 | | | | 4.48 | | | | (4.19 | ) |
| (a) | Annualized for periods less than one year. |
| (b) | Not annualized for periods less than one year. |
| (c) | Includes adjustments in accordance with accounting principles generally accepted in the United States of America and as such, the net asset value for financial reporting purposes and the returns based upon those net asset values may differ from the net asset value and returns for shareholder transactions. |
| (d) | Includes earnings credits and interest expense, each of which is less than 0.01%, if applicable or unless otherwise noted. |
| (e) | Calculated based upon average shares outstanding. |
| (f) | An affiliate of JPMorgan Chase & Co. reimbursed the Fund for losses incurred from an operational error. The impact was less than $0.01 to the net realized and unrealized gains (losses) per share and less than 0.01% to total return. |
| (g) | Includes a gain incurred resulting from a payment by affiliate. The effect was less than 0.01% on total return. |
| (h) | Commencement of offering of class of shares. |
| (i) | Amount rounds to less than $0.01. |
SEE NOTES TO FINANCIAL STATEMENTS.
| | | | | | |
| | | |
| 76 | | | | J.P. MORGAN MID CAP/MULTI-CAP FUNDS | | JUNE 30, 2011 |
| | | | | | | | | | | | | | | | | | | | | | | | | | |
| | | Ratios/Supplemental data | |
| | | | | | | | | | Ratios to average net assets (a) | | | | |
Net asset value, end of period | | | Total return (excludes sales charge) (b)(c) | | |
Net assets, end of period (000’s) | | | Net expenses (d) | | | Net investment income (loss) | | | Expenses without waivers, reimbursements and earnings credits | | | Portfolio turnover rate (b) | |
| | | | | | | | | | | | | | | | | | | | | | | | | | |
| | | | | | | | | | | | | | | | | | | | | | | | | | |
| $ | 23.30 | | | | 42.51 | % | | $ | 696,334 | | | | 1.24 | % | | | (0.44 | )% | | | 1.36 | % | | | 79 | % |
| | 16.35 | | | | 19.52 | | | | 560,054 | | | | 1.24 | | | | (0.53 | ) | | | 1.42 | | | | 82 | |
| | 13.68 | | | | (30.97 | )(f) | | | 520,201 | | | | 1.24 | | | | (0.48 | ) | | | 1.56 | | | | 96 | |
| | 20.46 | | | | (3.22 | )(g) | | | 384,225 | | | | 1.24 | | | | (0.75 | ) | | | 1.39 | | | | 95 | |
| | 24.89 | | | | 18.65 | | | | 480,084 | | | | 1.24 | | | | (0.73 | ) | | | 1.36 | | | | 119 | |
| | | | | | |
| | | | | | | | | | | | | | | | | | | | | | | | | | |
| | 18.29 | | | | 41.78 | | | | 18,648 | | | | 1.77 | | | | (0.97 | ) | | | 1.86 | | | | 79 | |
| | 12.90 | | | | 18.89 | | | | 20,893 | | | | 1.77 | | | | (1.07 | ) | | | 1.92 | | | | 82 | |
| | 10.85 | | | | (31.35 | )(f) | | | 29,963 | | | | 1.88 | | | | (1.14 | ) | | | 2.03 | | | | 96 | |
| | 16.45 | | | | (3.90 | )(g) | | | 69,186 | | | | 1.88 | | | | (1.38 | ) | | | 1.89 | | | | 95 | |
| | 20.88 | | | | 17.93 | | | | 123,779 | | | | 1.86 | | | | (1.35 | ) | | | 1.86 | | | | 119 | |
| | | | | | |
| | | | | | | | | | | | | | | | | | | | | | | | | | |
| | 20.88 | | | | 41.75 | | | | 29,187 | | | | 1.77 | | | | (0.97 | ) | | | 1.86 | | | | 79 | |
| | 14.73 | | | | 18.89 | | | | 23,389 | | | | 1.77 | | | | (1.06 | ) | | | 1.92 | | | | 82 | |
| | 12.39 | | | | (31.38 | )(f) | | | 25,624 | | | | 1.88 | | | | (1.13 | ) | | | 2.04 | | | | 96 | |
| | 18.70 | | | | (3.85 | )(g) | | | 27,785 | | | | 1.88 | | | | (1.38 | ) | | | 1.89 | | | | 95 | |
| | 23.21 | | | | 17.90 | | | | 38,805 | | | | 1.86 | | | | (1.35 | ) | | | 1.86 | | | | 119 | |
| | | | | | |
| | | | | | | | | | | | | | | | | | | | | | | | | | |
| | 24.73 | | | | 42.29 | | | | 121 | | | | 1.40 | | | | (0.59 | ) | | | 1.60 | | | | 79 | |
| | 17.38 | | | | 19.37 | | | | 63 | | | | 1.40 | | | | (0.69 | ) | | | 1.67 | | | | 82 | |
| | 14.56 | | | | 0.00 | | | | 83 | | | | 1.22 | | | | (0.31 | ) | | | 1.94 | | | | 96 | |
| | | | | | |
| | | | | | | | | | | | | | | | | | | | | | | | | | |
| | 24.97 | | | | 42.93 | | | | 1,031,463 | | | | 0.93 | | | | (0.13 | ) | | | 1.10 | | | | 79 | |
| | 17.47 | | | | 19.90 | | | | 685,843 | | | | 0.93 | | | | (0.22 | ) | | | 1.17 | | | | 82 | |
| | 14.57 | | | | (30.74 | )(f) | | | 631,380 | | | | 0.98 | | | | (0.23 | ) | | | 1.30 | | | | 96 | |
| | 21.68 | | | | (3.02 | )(g) | | | 539,292 | | | | 0.99 | | | | (0.49 | ) | | | 1.13 | | | | 95 | |
| | 26.10 | | | | 18.95 | | | | 740,208 | | | | 0.99 | | | | (0.48 | ) | | | 1.11 | | | | 119 | |
SEE NOTES TO FINANCIAL STATEMENTS.
| | | | | | | | |
| | | |
| JUNE 30, 2011 | | J.P. MORGAN MID CAP/MULTI-CAP FUNDS | | | | | 77 | |
FINANCIAL HIGHLIGHTS
FOR THE PERIODS INDICATED (continued)
| | | | | | | | | | | | | | | | | | | | | | | | | | | | |
| | | | | | Per share operating performance | |
| | | | | | Investment operations | | | Distributions | |
| | | Net asset value, beginning of period | | | Net investment income (loss) | | | Net realized and unrealized gains (losses) on investments | | | Total from investment operations | | | Net investment income | | | Net realized gain | | | Total distributions | |
Mid Cap Value Fund | | | | | | | | | | | | | | | | | | | | | | | | | | | | |
Class A | | | | | | | | | | | | | | | | | | | | | | | | | | | | |
Year Ended June 30, 2011 | | $ | 18.91 | | | $ | 0.18 | (e) | | $ | 5.85 | (h) | | $ | 6.03 | | | $ | (0.18 | ) | | $ | — | | | $ | (0.18 | ) |
Year Ended June 30, 2010 | | | 15.24 | | | | 0.19 | (e) | | | 3.48 | | | | 3.67 | | | | — | | | | — | | | | — | |
Year Ended June 30, 2009 | | | 21.91 | | | | 0.28 | (e) | | | (5.92 | ) | | | (5.64 | ) | | | (0.34 | ) | | | (0.69 | ) | | | (1.03 | ) |
Year Ended June 30, 2008 | | | 27.71 | | | | 0.16 | | | | (3.78 | ) | | | (3.62 | ) | | | (0.12 | ) | | | (2.06 | ) | | | (2.18 | ) |
Year Ended June 30, 2007 | | | 24.73 | | | | 0.17 | | | | 4.21 | | | | 4.38 | | | | (0.25 | ) | | | (1.15 | ) | | | (1.40 | ) |
| | | | | | | |
Class B | | | | | | | | | | | | | | | | | | | | | | | | | | | | |
Year Ended June 30, 2011 | | | 18.38 | | | | 0.07 | (e) | | | 5.69 | (h) | | | 5.76 | | | | (0.04 | ) | | | — | | | | (0.04 | ) |
Year Ended June 30, 2010 | | | 14.89 | | | | 0.10 | (e) | | | 3.39 | | | | 3.49 | | | | — | | | | — | | | | — | |
Year Ended June 30, 2009 | | | 21.39 | | | | 0.20 | (e) | | | (5.79 | ) | | | (5.59 | ) | | | (0.22 | ) | | | (0.69 | ) | | | (0.91 | ) |
Year Ended June 30, 2008 | | | 27.11 | | | | 0.03 | | | | (3.69 | ) | | | (3.66 | ) | | | — | | | | (2.06 | ) | | | (2.06 | ) |
Year Ended June 30, 2007 | | | 24.21 | | | | 0.05 | | | | 4.12 | | | | 4.17 | | | | (0.12 | ) | | | (1.15 | ) | | | (1.27 | ) |
| | | | | | | |
Class C | | | | | | | | | | | | | | | | | | | | | | | | | | | | |
Year Ended June 30, 2011 | | | 18.44 | | | | 0.07 | (e) | | | 5.69 | (h) | | | 5.76 | | | | (0.07 | ) | | | — | | | | (0.07 | ) |
Year Ended June 30, 2010 | | | 14.94 | | | | 0.10 | (e) | | | 3.40 | | | | 3.50 | | | | — | | | | — | | | | — | |
Year Ended June 30, 2009 | | | 21.45 | | | | 0.20 | (e) | | | (5.80 | ) | | | (5.60 | ) | | | (0.22 | ) | | | (0.69 | ) | | | (0.91 | ) |
Year Ended June 30, 2008 | | | 27.17 | | | | 0.04 | | | | (3.70 | ) | | | (3.66 | ) | | | — | | | | (2.06 | ) | | | (2.06 | ) |
Year Ended June 30, 2007 | | | 24.26 | | | | 0.05 | | | | 4.13 | | | | 4.18 | | | | (0.12 | ) | | | (1.15 | ) | | | (1.27 | ) |
| | | | | | | |
Class R2 | | | | | | | | | | | | | | | | | | | | | | | | | | | | |
Year Ended June 30, 2011 | | | 18.63 | | | | 0.12 | (e) | | | 5.76 | (h) | | | 5.88 | | | | (0.24 | ) | | | — | | | | (0.24 | ) |
Year Ended June 30, 2010 | | | 15.06 | | | | 0.15 | (e) | | | 3.42 | | | | 3.57 | | | | — | | | | — | | | | — | |
November 3, 2008 (g) through June 30, 2009 | | | 16.34 | | | | 0.20 | (e) | | | (0.30 | ) | | | (0.10 | ) | | | (0.49 | ) | | | (0.69 | ) | | | (1.18 | ) |
| | | | | | | |
Institutional Class | | | | | | | | | | | | | | | | | | | | | | | | | | | | |
Year Ended June 30, 2011 | | | 19.22 | | | | 0.30 | (e) | | | 5.95 | (h) | | | 6.25 | | | | (0.28 | ) | | | — | | | | (0.28 | ) |
Year Ended June 30, 2010 | | | 15.43 | | | | 0.29 | (e) | | | 3.52 | | | | 3.81 | | | | (0.02 | ) | | | — | | | | (0.02 | ) |
Year Ended June 30, 2009 | | | 22.31 | | | | 0.38 | (e) | | | (6.06 | ) | | | (5.68 | ) | | | (0.51 | ) | | | (0.69 | ) | | | (1.20 | ) |
Year Ended June 30, 2008 | | | 28.17 | | | | 0.31 | | | | (3.85 | ) | | | (3.54 | ) | | | (0.26 | ) | | | (2.06 | ) | | | (2.32 | ) |
Year Ended June 30, 2007 | | | 25.10 | | | | 0.30 | | | | 4.29 | | | | 4.59 | | | | (0.37 | ) | | | (1.15 | ) | | | (1.52 | ) |
| | | | | | | |
Select Class | | | | | | | | | | | | | | | | | | | | | | | | | | | | |
Year Ended June 30, 2011 | | | 19.07 | | | | 0.24 | (e) | | | 5.90 | (h) | | | 6.14 | | | | (0.24 | ) | | | — | | | | (0.24 | ) |
Year Ended June 30, 2010 | | | 15.34 | | | | 0.24 | (e) | | | 3.49 | | | | 3.73 | | | | — | (f) | | | — | | | | — | (f) |
Year Ended June 30, 2009 | | | 22.14 | | | | 0.34 | (e) | | | (6.01 | ) | | | (5.67 | ) | | | (0.44 | ) | | | (0.69 | ) | | | (1.13 | ) |
Year Ended June 30, 2008 | | | 27.96 | | | | 0.27 | | | | (3.85 | ) | | | (3.58 | ) | | | (0.18 | ) | | | (2.06 | ) | | | (2.24 | ) |
Year Ended June 30, 2007 | | | 24.93 | | | | 0.27 | | | | 4.22 | | | | 4.49 | | | | (0.31 | ) | | | (1.15 | ) | | | (1.46 | ) |
| (a) | Annualized for periods less than one year. |
| (b) | Not annualized for periods less than one year. |
| (c) | Includes adjustments in accordance with accounting principles generally accepted in the United States of America and as such, the net asset value for financial reporting purposes and the returns based upon those net asset values may differ from the net asset value and returns for shareholder transactions. |
| (d) | Includes earnings credits and interest expense, each of which is less than 0.01%, if applicable or unless otherwise noted. |
| (e) | Calculated based upon average shares outstanding. |
| (f) | Amount rounds to less than $0.01. |
| (g) | Commencement of offering of class of shares. |
| (h) | An affiliate of JPMorgan Chase & Co. reimbursed the Fund for losses incurred from an operational error. The impact was less than $0.01 to the net realized and unrealized gains (losses) per share and less than 0.01% to total return. |
SEE NOTES TO FINANCIAL STATEMENTS.
| | | | | | |
| | | |
| 78 | | | | J.P. MORGAN MID CAP/MULTI-CAP FUNDS | | JUNE 30, 2011 |
| | | | | | | | | | | | | | | | | | | | | | | | | | |
| | | Ratios/Supplemental data | |
| | | | | | | | | | Ratios to average net assets (a) | | | | |
Net asset value, end of period | | | Total return (excludes sales charge) (b)(c) | | |
Net assets, end of period (000’s) | | | Net
expenses (d) | | | Net
investment income (loss) | | | Expenses without waivers, reimbursements and earnings credits | | | Portfolio turnover rate (b) | |
| | | | | | | | | | | | | | | | | | | | | | | | | | |
| | | | | | | | | | | | | | | | | | | | | | | | | | |
| $ | 24.76 | | | | 31.96 | %(h) | | $ | 1,979,270 | | | | 1.23 | % | | | 0.81 | % | | | 1.39 | % | | | 41 | % |
| | 18.91 | | | | 24.08 | | | | 1,705,572 | | | | 1.23 | | | | 1.04 | | | | 1.40 | | | | 34 | |
| | 15.24 | | | | (25.49 | ) | | | 1,600,044 | | | | 1.25 | | | | 1.71 | | | | 1.42 | | | | 47 | |
| | 21.91 | | | | (13.70 | ) | | | 2,661,377 | | | | 1.25 | | | | 0.66 | | | | 1.42 | | | | 31 | |
| | 27.71 | | | | 18.21 | | | | 3,822,632 | | | | 1.25 | | | | 0.71 | | | | 1.35 | | | | 45 | |
| | | | | | |
| | | | | | | | | | | | | | | | | | | | | | | | | | |
| | 24.10 | | | | 31.33 | (h) | | | 90,427 | | | | 1.74 | | | | 0.30 | | | | 1.89 | | | | 41 | |
| | 18.38 | | | | 23.44 | | | | 96,966 | | | | 1.74 | | | | 0.53 | | | | 1.90 | | | | 34 | |
| | 14.89 | | | | (25.89 | ) | | | 108,114 | | | | 1.75 | | | | 1.21 | | | | 1.92 | | | | 47 | |
| | 21.39 | | | | (14.14 | ) | | | 163,091 | | | | 1.75 | | | | 0.15 | | | | 1.92 | | | | 31 | |
| | 27.11 | | | | 17.65 | | | | 237,745 | | | | 1.75 | | | | 0.20 | | | | 1.85 | | | | 45 | |
| | | | | | |
| | | | | | | | | | | | | | | | | | | | | | | | | | |
| | 24.13 | | | | 31.29 | (h) | | | 373,415 | | | | 1.74 | | | | 0.30 | | | | 1.89 | | | | 41 | |
| | 18.44 | | | | 23.43 | | | | 309,513 | | | | 1.74 | | | | 0.53 | | | | 1.90 | | | | 34 | |
| | 14.94 | | | | (25.88 | ) | | | 299,956 | | | | 1.75 | | | | 1.20 | | | | 1.92 | | | | 47 | |
| | 21.45 | | | | (14.11 | ) | | | 523,722 | | | | 1.75 | | | | 0.14 | | | | 1.92 | | | | 31 | |
| | 27.17 | | | | 17.64 | | | | 818,261 | | | | 1.75 | | | | 0.20 | | | | 1.85 | | | | 45 | |
| | | | | | |
| | | | | | | | | | | | | | | | | | | | | | | | | | |
| | 24.27 | | | | 31.66 | (h) | | | 6,500 | | | | 1.49 | | | | 0.50 | | | | 1.65 | | | | 41 | |
| | 18.63 | | | | 23.71 | | | | 1,441 | | | | 1.49 | | | | 0.77 | | | | 1.65 | | | | 34 | |
| | 15.06 | | | | (0.24 | ) | | | 294 | | | | 1.50 | | | | 2.12 | | | | 1.69 | | | | 47 | |
| | | | | | |
| | | | | | | | | | | | | | | | | | | | | | | | | | |
| | 25.19 | | | | 32.66 | (h) | | | 2,812,296 | | | | 0.74 | | | | 1.29 | | | | 0.99 | | | | 41 | |
| | 19.22 | | | | 24.68 | | | | 1,913,930 | | | | 0.74 | | | | 1.52 | | | | 1.00 | | | | 34 | |
| | 15.43 | | | | (25.15 | ) | | | 1,424,004 | | | | 0.75 | | | | 2.26 | | | | 1.02 | | | | 47 | |
| | 22.31 | | | | (13.25 | ) | | | 1,777,057 | | | | 0.75 | | | | 1.16 | | | | 1.02 | | | | 31 | |
| | 28.17 | | | | 18.82 | | | | 2,566,230 | | | | 0.75 | | | | 1.21 | | | | 0.95 | | | | 45 | |
| | | | | | |
| | | | | | | | | | | | | | | | | | | | | | | | | | |
| | 24.97 | | | | 32.29 | (h) | | | 1,513,926 | | | | 0.98 | | | | 1.05 | | | | 1.14 | | | | 41 | |
| | 19.07 | | | | 24.35 | | | | 1,061,308 | | | | 0.98 | | | | 1.29 | | | | 1.15 | | | | 34 | |
| | 15.34 | | | | (25.31 | ) | | | 766,965 | | | | 1.00 | | | | 2.05 | | | | 1.18 | | | | 47 | |
| | 22.14 | | | | (13.46 | ) | | | 721,777 | | | | 1.00 | | | | 0.90 | | | | 1.16 | | | | 31 | |
| | 27.96 | | | | 18.49 | | | | 1,183,839 | | | | 1.00 | | | | 0.95 | | | | 1.10 | | | | 45 | |
SEE NOTES TO FINANCIAL STATEMENTS.
| | | | | | | | |
| | | |
| JUNE 30, 2011 | | J.P. MORGAN MID CAP/MULTI-CAP FUNDS | | | | | 79 | |
FINANCIAL HIGHLIGHTS
FOR THE PERIODS INDICATED (continued)
| | | | | | | | | | | | | | | | | | | | | | | | | | | | |
| | | | | | Per share operating performance | |
| | | | | | Investment operations | | | Distributions | |
| | | Net asset value, beginning of period | | | Net investment income (loss) | | | Net realized and unrealized gains (losses) on investments | | | Total from investment operations | | | Net investment income | | | Return of capital | | | Total
distributions | |
Multi-Cap Market Neutral Fund | | | | | | | | | | | | | | | | | | | | | | | | | | | | |
Class A | | | | | | | | | | | | | | | | | | | | | | | | | | | | |
Year Ended June 30, 2011 | | $ | 9.71 | | | $ | (0.16 | )(d) | | $ | 0.26 | | | $ | 0.10 | | | $ | — | | | $ | — | | | $ | — | |
Year Ended June 30, 2010 | | | 10.21 | | | | (0.17 | )(d) | | | (0.33 | ) | | | (0.50 | ) | | | — | | | | — | | | | — | |
Year Ended June 30, 2009 | | | 10.23 | | | | (0.08 | )(d) | | | 0.06 | | | | (0.02 | ) | | | — | | | | — | | | | — | |
Year Ended June 30, 2008 | | | 11.24 | | | | 0.28 | (d) | | | (0.74 | ) | | | (0.46 | ) | | | (0.54 | ) | | | (0.01 | ) | | | (0.55 | ) |
Year Ended June 30, 2007 | | | 10.98 | | | | 0.37 | | | | 0.20 | | | | 0.57 | | | | (0.31 | ) | | | — | | | | (0.31 | ) |
| | | | | | | |
Class B | | | | | | | | | | | | | | | | | | | | | | | | | | | | |
Year Ended June 30, 2011 | | | 9.44 | | | | (0.23 | )(d) | | | 0.26 | | | | 0.03 | | | | — | | | | — | | | | — | |
Year Ended June 30, 2010 | | | 10.01 | | | | (0.23 | )(d) | | | (0.34 | ) | | | (0.57 | ) | | | — | | | | — | | | | — | |
Year Ended June 30, 2009 | | | 10.10 | | | | (0.15 | )(d) | | | 0.06 | | | | (0.09 | ) | | | — | | | | — | | | | — | |
Year Ended June 30, 2008 | | | 11.07 | | | | 0.17 | (d) | | | (0.70 | ) | | | (0.53 | ) | | | (0.43 | ) | | | (0.01 | ) | | | (0.44 | ) |
Year Ended June 30, 2007 | | | 10.80 | | | | 0.29 | | | | 0.20 | | | | 0.49 | | | | (0.22 | ) | | | — | | | | (0.22 | ) |
| | | | | | | |
Class C | | | | | | | | | | | | | | | | | | | | | | | | | | | | |
Year Ended June 30, 2011 | | | 9.46 | | | | (0.23 | )(d) | | | 0.25 | | | | 0.02 | | | | — | | | | — | | | | — | |
Year Ended June 30, 2010 | | | 10.02 | | | | (0.23 | )(d) | | | (0.33 | ) | | | (0.56 | ) | | | — | | | | — | | | | — | |
Year Ended June 30, 2009 | | | 10.12 | | | | (0.15 | )(d) | | | 0.05 | | | | (0.10 | ) | | | — | | | | — | | | | — | |
Year Ended June 30, 2008 | | | 11.07 | | | | 0.19 | (d) | | | (0.71 | ) | | | (0.52 | ) | | | (0.42 | ) | | | (0.01 | ) | | | (0.43 | ) |
Year Ended June 30, 2007 | | | 10.80 | | | | 0.29 | | | | 0.20 | | | | 0.49 | | | | (0.22 | ) | | | — | | | | (0.22 | ) |
| | | | | | | |
Select Class | | | | | | | | | | | | | | | | | | | | | | | | | | | | |
Year Ended June 30, 2011 | | | 9.79 | | | | (0.14 | )(d) | | | 0.26 | | | | 0.12 | | | | — | | | | — | | | | — | |
Year Ended June 30, 2010 | | | 10.27 | | | | (0.14 | )(d) | | | (0.34 | ) | | | (0.48 | ) | | | — | | | | — | | | | — | |
Year Ended June 30, 2009 | | | 10.27 | | | | (0.05 | )(d) | | | 0.05 | | | | — | (e) | | | — | | | | — | | | | — | |
Year Ended June 30, 2008 | | | 11.31 | | | | 0.30 | (d) | | | (0.73 | ) | | | (0.43 | ) | | | (0.60 | ) | | | (0.01 | ) | | | (0.61 | ) |
Year Ended June 30, 2007 | | | 11.04 | | | | 0.36 | | | | 0.25 | | | | 0.61 | | | | (0.34 | ) | | | — | | | | (0.34 | ) |
| (a) | Includes adjustments in accordance with accounting principles generally accepted in the United States of America and as such, the net asset value for financial reporting purposes and the returns based upon those net asset values may differ from the net asset value and returns for shareholder transactions. |
| (b) | Includes earnings credits and interest expense, each of which is less than 0.01%, if applicable or unless otherwise noted. |
| (c) | Commencing on June 30, 2009, the Fund presented portfolio turnover in two ways, one including short sales and the other excluding short sales. For periods prior to June 30, 2009, the Fund's portfolio turnover calculation excluded short sales. |
| (d) | Calculated based upon average shares outstanding. |
| (e) | Amount rounds to less than $0.01. |
SEE NOTES TO FINANCIAL STATEMENTS.
| | | | | | |
| | | |
| 80 | | | | J.P. MORGAN MID CAP/MULTI-CAP FUNDS | | JUNE 30, 2011 |
| | | | | | | | | | | | | | | | | | | | | | | | | | | | | | | | | | | | | | |
| | | Ratios/Supplemental data | |
| | | | | | | | | | Ratios to average net assets | | | | | | | |
Net asset value, end of period | | | Total return (excludes sales charge) (a) | | | Net assets, end of period (000’s) | | | Net expenses (including dividend and interest expense for securities sold short) (b) | | | Net expenses (excluding dividend and interest expense for securities sold short) (b) | | | Net investment income (loss) | | | Expenses without waivers, reimbursements and earnings credits (including dividend and interest expense for securities sold short) | | | Expenses without waivers, reimbursements and earnings credits (excluding dividend and interest expense for securities sold short) | | | Portfolio
turnover rate
(excluding short sales) (c) | | | Portfolio turnover rate (including
short sales) (c) | |
| | | | | | | | | | | | | | | | | | | | | | | | | | | | | | | | | | | | | | |
| | | | | | | | | | | | | | | | | | | | | | | | | | | | | | | | | | | | | | |
| $ | 9.81 | | | | 1.03 | % | | $ | 29,216 | | | | 2.92 | % | | | 1.49 | % | | | (1.65 | )% | | | 3.38 | % | | | 1.95 | % | | | 145 | % | | | 339 | % |
| | 9.71 | | | | (4.90 | ) | | | 94,549 | | | | 2.94 | | | | 1.49 | | | | (1.65 | ) | | | 3.39 | | | | 1.94 | | | | 146 | | | | 348 | |
| | 10.21 | | | | (0.20 | ) | | | 67,884 | | | | 2.84 | | | | 1.50 | | | | (0.79 | ) | | | 3.29 | | | | 1.95 | | | | 175 | | | | 350 | |
| | 10.23 | | | | (4.00 | ) | | | 77,838 | | | | 2.52 | | | | 1.51 | | | | 2.62 | | | | 2.94 | | | | 1.93 | | | | 116 | | | | — | |
| | 11.24 | | | | 5.27 | | | | 204,059 | | | | 2.69 | | | | 1.50 | | | | 3.32 | | | | 3.10 | | | | 1.91 | | | | 96 | | | | — | |
| | | | | | | | | |
| | | | | | | | | | | | | | | | | | | | | | | | | | | | | | | | | | | | | | |
| | 9.47 | | | | 0.32 | | | | 3,484 | | | | 3.67 | | | | 2.24 | | | | (2.47 | ) | | | 3.88 | | | | 2.45 | | | | 145 | | | | 339 | |
| | 9.44 | | | | (5.69 | ) | | | 7,849 | | | | 3.69 | | | | 2.24 | | | | (2.39 | ) | | | 3.89 | | | | 2.44 | | | | 146 | | | | 348 | |
| | 10.01 | | | | (0.89 | ) | | | 12,766 | | | | 3.59 | | | | 2.25 | | | | (1.55 | ) | | | 3.79 | | | | 2.45 | | | | 175 | | | | 350 | |
| | 10.10 | | | | (4.77 | ) | | | 16,402 | | | | 3.28 | | | | 2.26 | | | | 1.66 | | | | 3.45 | | | | 2.43 | | | | 116 | | | | — | |
| | 11.07 | | | | 4.56 | | | | 24,974 | | | | 3.44 | | | | 2.25 | | | | 2.60 | | | | 3.60 | | | | 2.41 | | | | 96 | | | | — | |
| | | | | | | | | |
| | | | | | | | | | | | | | | | | | | | | | | | | | | | | | | | | | | | | | |
| | 9.48 | | | | 0.21 | | | | 22,094 | | | | 3.67 | | | | 2.24 | | | | (2.46 | ) | | | 3.88 | | | | 2.45 | | | | 145 | | | | 339 | |
| | 9.46 | | | | (5.59 | ) | | | 39,610 | | | | 3.70 | | | | 2.24 | | | | (2.39 | ) | | | 3.89 | | | | 2.44 | | | | 146 | | | | 348 | |
| | 10.02 | | | | (0.99 | ) | | | 61,467 | | | | 3.59 | | | | 2.25 | | | | (1.54 | ) | | | 3.79 | | | | 2.45 | | | | 175 | | | | 350 | |
| | 10.12 | | | | (4.71 | ) | | | 90,603 | | | | 3.28 | | | | 2.26 | | | | 1.79 | | | | 3.45 | | | | 2.43 | | | | 116 | | | | — | |
| | 11.07 | | | | 4.56 | | | | 187,546 | | | | 3.44 | | | | 2.25 | | | | 2.60 | | | | 3.60 | | | | 2.41 | | | | 96 | | | | — | |
| | | | | | | | | |
| | | | | | | | | | | | | | | | | | | | | | | | | | | | | | | | | | | | | | |
| | 9.91 | | | | 1.23 | | | | 491,653 | | | | 2.67 | | | | 1.24 | | | | (1.39 | ) | | | 3.13 | | | | 1.70 | | | | 145 | | | | 339 | |
| | 9.79 | | | | (4.67 | ) | | | 433,539 | | | | 2.70 | | | | 1.24 | | | | (1.39 | ) | | | 3.15 | | | | 1.69 | | | | 146 | | | | 348 | |
| | 10.27 | | | | 0.00 | | | | 528,478 | | | | 2.59 | | | | 1.25 | | | | (0.45 | ) | | | 3.04 | | | | 1.70 | | | | 175 | | | | 350 | |
| | 10.27 | | | | (3.73 | ) | | | 933,631 | | | | 2.27 | | | | 1.25 | | | | 2.79 | | | | 2.69 | | | | 1.67 | | | | 116 | | | | — | |
| | 11.31 | | | | 5.59 | | | | 1,852,145 | | | | 2.44 | | | | 1.25 | | | | 3.55 | | | | 2.85 | | | | 1.66 | | | | 96 | | | | — | |
SEE NOTES TO FINANCIAL STATEMENTS.
| | | | | | | | |
| | | |
| JUNE 30, 2011 | | J.P. MORGAN MID CAP/MULTI-CAP FUNDS | | | | | 81 | |
FINANCIAL HIGHLIGHTS
FOR THE PERIODS INDICATED (continued)
| | | | | | | | | | | | | | | | | | | | | | | | | | | | |
| | | | | | Per share operating performance | |
| | | | | | Investment operations | | | Distributions | |
| | | Net asset value, beginning of period | | | Net investment income (loss) | | | Net realized and unrealized gains (losses) on investments | | | Total from investment operations | | | Net investment income | | | Net realized gain | | | Total distributions | |
Value Advantage Fund | | | | | | | | | | | | | | | | | | | | | | | | | | | | |
Class A | | | | | | | | | | | | | | | | | | | | | | | | | | | | |
Year Ended June 30, 2011 | | $ | 15.22 | | | $ | 0.23 | (c) | | $ | 3.79 | | | $ | 4.02 | | | $ | (0.17 | ) | | $ | — | | | $ | (0.17 | ) |
Year Ended June 30, 2010 | | | 12.01 | | | | 0.23 | (c) | | | 3.17 | | | | 3.40 | | | | (0.19 | ) | | | — | | | | (0.19 | ) |
Year Ended June 30, 2009 | | | 16.38 | | | | 0.30 | (c) | | | (4.40 | ) | | | (4.10 | ) | | | (0.20 | ) | | | (0.07 | ) | | | (0.27 | ) |
Year Ended June 30, 2008 | | | 20.45 | | | | 0.35 | | | | (3.19 | ) | | | (2.84 | ) | | | (0.24 | ) | | | (0.99 | ) | | | (1.23 | ) |
Year Ended June 30, 2007 | | | 17.17 | | | | 0.26 | (c) | | | 3.42 | | | | 3.68 | | | | (0.12 | ) | | | (0.28 | ) | | | (0.40 | ) |
| | | | | | | |
Class C | | | | | | | | | | | | | | | | | | | | | | | | | | | | |
Year Ended June 30, 2011 | | | 15.17 | | | | 0.14 | (c) | | | 3.77 | | | | 3.91 | | | | (0.07 | ) | | | — | | | | (0.07 | ) |
Year Ended June 30, 2010 | | | 11.97 | | | | 0.15 | (c) | | | 3.17 | | | | 3.32 | | | | (0.12 | ) | | | — | | | | (0.12 | ) |
Year Ended June 30, 2009 | | | 16.25 | | | | 0.23 | (c) | | | (4.34 | ) | | | (4.11 | ) | | | (0.10 | ) | | | (0.07 | ) | | | (0.17 | ) |
Year Ended June 30, 2008 | | | 20.31 | | | | 0.26 | | | | (3.18 | ) | | | (2.92 | ) | | | (0.15 | ) | | | (0.99 | ) | | | (1.14 | ) |
Year Ended June 30, 2007 | | | 17.10 | | | | 0.17 | (c) | | | 3.38 | | | | 3.55 | | | | (0.06 | ) | | | (0.28 | ) | | | (0.34 | ) |
| | | | | | | |
Institutional Class | | | | | | | | | | | | | | | | | | | | | | | | | | | | |
Year Ended June 30, 2011 | | | 15.24 | | | | 0.32 | (c) | | | 3.79 | | | | 4.11 | | | | (0.24 | ) | | | — | | | | (0.24 | ) |
Year Ended June 30, 2010 | | | 12.01 | | | | 0.31 | (c) | | | 3.18 | | | | 3.49 | | | | (0.26 | ) | | | — | | | | (0.26 | ) |
Year Ended June 30, 2009 | | | 16.40 | | | | 0.37 | (c) | | | (4.42 | ) | | | (4.05 | ) | | | (0.27 | ) | | | (0.07 | ) | | | (0.34 | ) |
Year Ended June 30, 2008 | | | 20.47 | | | | 0.44 | | | | (3.19 | ) | | | (2.75 | ) | | | (0.33 | ) | | | (0.99 | ) | | | (1.32 | ) |
Year Ended June 30, 2007 | | | 17.16 | | | | 0.39 | (c) | | | 3.38 | | | | 3.77 | | | | (0.18 | ) | | | (0.28 | ) | | | (0.46 | ) |
| | | | | | | |
Select Class | | | | | | | | | | | | | | | | | | | | | | | | | | | | |
Year Ended June 30, 2011 | | | 15.27 | | | | 0.28 | (c) | | | 3.79 | | | | 4.07 | | | | (0.22 | ) | | | — | | | | (0.22 | ) |
Year Ended June 30, 2010 | | | 12.04 | | | | 0.27 | (c) | | | 3.19 | | | | 3.46 | | | | (0.23 | ) | | | — | | | | (0.23 | ) |
Year Ended June 30, 2009 | | | 16.44 | | | | 0.34 | (c) | | | (4.42 | ) | | | (4.08 | ) | | | (0.25 | ) | | | (0.07 | ) | | | (0.32 | ) |
Year Ended June 30, 2008 | | | 20.52 | | | | 0.37 | | | | (3.17 | ) | | | (2.80 | ) | | | (0.29 | ) | | | (0.99 | ) | | | (1.28 | ) |
Year Ended June 30, 2007 | | | 17.22 | | | | 0.31 | (c) | | | 3.43 | | | | 3.74 | | | | (0.16 | ) | | | (0.28 | ) | | | (0.44 | ) |
| (a) | Includes adjustments in accordance with accounting principles generally accepted in the United States of America and as such, the net asset value for financial reporting purposes and the returns based upon those net asset values may differ from the net asset value and returns for shareholder transactions. |
| (b) | Includes earnings credits and interest expense, each of which is less than 0.01%, if applicable or unless otherwise noted. |
| (c) | Calculated based upon average shares outstanding. |
SEE NOTES TO FINANCIAL STATEMENTS.
| | | | | | |
| | | |
| 82 | | | | J.P. MORGAN MID CAP/MULTI-CAP FUNDS | | JUNE 30, 2011 |
| | | | | | | | | | | | | | | | | | | | | | | | | | |
| | | Ratios/Supplemental data | |
| | | | | | | | | | Ratios to average net assets | | | | |
Net asset value, end of period | | | Total return (excludes sales charge) (a) | | | Net assets, end of period (000’s) | | | Net expenses (b) | | | Net investment income (loss) | | | Expenses without waivers, reimbursements and earnings credits | | | Portfolio turnover rate | |
| | | | | | | | | | | | | | | | | | | | | | | | | | |
| | | | | | | | | | | | | | | | | | | | | | | | | | |
| $ | 19.07 | | | | 26.45 | % | | $ | 232,103 | | | | 1.24 | % | | | 1.28 | % | | | 1.34 | % | | | 33 | % |
| | 15.22 | | | | 28.35 | | | | 150,081 | | | | 1.24 | | | | 1.52 | | | | 1.38 | | | | 45 | |
| | 12.01 | | | | (24.82 | ) | | | 112,739 | | | | 1.25 | | | | 2.45 | | | | 1.50 | | | | 70 | |
| | 16.38 | | | | (14.42 | ) | | | 152,696 | | | | 1.25 | | | | 1.87 | | | | 1.43 | | | | 103 | |
| | 20.45 | | | | 21.58 | | | | 201,151 | | | | 1.25 | | | | 1.36 | | | | 1.41 | | | | 77 | |
| | | | | | |
| | | | | | | | | | | | | | | | | | | | | | | | | | |
| | 19.01 | | | | 25.82 | | | | 131,743 | | | | 1.74 | | | | 0.78 | | | | 1.84 | | | | 33 | |
| | 15.17 | | | | 27.72 | | | | 108,165 | | | | 1.74 | | | | 1.01 | | | | 1.88 | | | | 45 | |
| | 11.97 | | | | (25.19 | ) | | | 97,723 | | | | 1.75 | | | | 1.86 | | | | 1.99 | | | | 70 | |
| | 16.25 | | | | (14.86 | ) | | | 182,093 | | | | 1.75 | | | | 1.36 | | | | 1.93 | | | | 103 | |
| | 20.31 | | | | 20.93 | | | | 247,794 | | | | 1.75 | | | | 0.87 | | | | 1.91 | | | | 77 | |
| | | | | | |
| | | | | | | | | | | | | | | | | | | | | | | | | | |
| | 19.11 | | | | 27.06 | | | | 284,433 | | | | 0.74 | | | | 1.79 | | | | 0.94 | | | | 33 | |
| | 15.24 | | | | 29.03 | | | | 156,531 | | | | 0.74 | | | | 2.04 | | | | 0.98 | | | | 45 | |
| | 12.01 | | | | (24.41 | ) | | | 70,825 | | | | 0.75 | | | | 3.11 | | | | 1.15 | | | | 70 | |
| | 16.40 | | | | (13.97 | ) | | | 19,872 | | | | 0.75 | | | | 2.37 | | | | 1.03 | | | | 103 | |
| | 20.47 | | | | 22.16 | | | | 24,710 | | | | 0.75 | | | | 1.97 | | | | 1.00 | | | | 77 | |
| | | | | | |
| | | | | | | | | | | | | | | | | | | | | | | | | | |
| | 19.12 | | | | 26.75 | | | | 270,562 | | | | 0.99 | | | | 1.53 | | | | 1.09 | | | | 33 | |
| | 15.27 | | | | 28.70 | | | | 71,209 | | | | 0.99 | | | | 1.77 | | | | 1.13 | | | | 45 | |
| | 12.04 | | | | (24.62 | ) | | | 51,000 | | | | 1.00 | | | | 2.75 | | | | 1.25 | | | | 70 | |
| | 16.44 | | | | (14.19 | ) | | | 49,262 | | | | 1.00 | | | | 2.18 | | | | 1.18 | | | | 103 | |
| | 20.52 | | | | 21.89 | | | | 36,884 | | | | 1.00 | | | | 1.62 | | | | 1.16 | | | | 77 | |
SEE NOTES TO FINANCIAL STATEMENTS.
| | | | | | | | |
| | | |
| JUNE 30, 2011 | | J.P. MORGAN MID CAP/MULTI-CAP FUNDS | | | | | 83 | |
NOTES TO FINANCIAL STATEMENTS
AS OF JUNE 30, 2011
1. Organization
JPMorgan Trust I (“JPM I”) and JPMorgan Trust II (“JPM II”) were formed on November 12, 2004, as Delaware statutory trusts, pursuant to Declarations of Trusts dated November 5, 2004 and are registered under the Investment Company Act of 1940, as amended (the “1940 Act”), as open-end management investment companies.
J.P. Morgan Mutual Fund Investment Trust (“JPMMFIT”), an open-end management investment company, was organized as a Massachusetts business trust on September 23, 1997.
J.P. Morgan Fleming Mutual Fund Group, Inc. (“JPMFMFG”), an open-end management investment company, was organized as a Maryland corporation on August 19, 1997.
The following are 7 separate funds of the Trusts (collectively, the “Funds”) covered by this report:
| | | | | | |
| | | Classes Offered | | Trust | | Diversified/Non-Diversified |
| Growth Advantage Fund | | Class A, Class B, Class C, Class R5 and Select Class | | JPMMFIT | | Diversified |
| Mid Cap Core Fund | | Class A, Class C, Class R2, Class R5, Class R6 and Select Class | | JPM I | | Diversified |
| Mid Cap Equity Fund | | Class A, Class C, and Select Class | | JPM I | | Diversified |
| Mid Cap Growth Fund | | Class A, Class B, Class C, Class R2, and Select Class | | JPM II | | Diversified |
| Mid Cap Value Fund | | Class A, Class B, Class C, Class R2, Institutional Class and Select Class | | JPMFMFG | | Diversified |
| Multi-Cap Market Neutral Fund | | Class A, Class B, Class C, and Select Class | | JPM II | | Diversified |
| Value Advantage Fund | | Class A, Class C, Institutional Class and Select Class | | JPM I | | Diversified |
Class A and Class C Shares commenced operations on November 2, 2009 for the Mid Cap Equity Fund.
The Mid Cap Core Fund commenced operations on November 30, 2010.
Class R6 Shares commenced operations on January 31, 2011 for the Mid Cap Core Fund.
Effective November 1, 2009, Class B Shares of the Growth Advantage Fund, Mid Cap Growth Fund, Mid Cap Value Fund and Multi-Cap Market Neutral Fund may not be purchased or acquired by new or existing shareholders, except through exchanges from Class B of another J.P. Morgan Fund and dividend reinvestments. Shareholders who have invested in Class B Shares prior to November 1, 2009 may continue to hold their Class B shares until they automatically convert to Class A Shares.
Class A Shares generally provide for a front-end sales charge while Class B and Class C Shares provide for a contingent deferred sales charge (“CDSC”). Class B Shares automatically convert to Class A Shares after eight years. No sales charges are assessed with respect to the Class R2, Class R5, Class R6, Select Class and Institutional Class Shares. All classes of shares have equal rights as to earnings, assets and voting privileges except that each class may bear different distribution and shareholder servicing fees and each class has exclusive voting rights with respect to its distribution plan and shareholder servicing agreements. Certain Class A Shares, for which front-end sales charges have been waived, may be subject to a CDSC as described in the Funds’ prospectus.
2. Significant Accounting Policies
The following is a summary of significant accounting policies followed by the Trusts in the preparation of their financial statements. The policies are in accordance with accounting principles generally accepted in the United States of America. The preparation of financial statements requires management to make estimates and assumptions that affect the reported amounts of assets and liabilities at the date of the financial statements and the reported amounts of income and expenses for the period. Actual results could differ from those estimates.
A. Valuation of Investments — Equity securities listed on a North American, Central American, South American or Caribbean securities exchange shall generally be valued at the last sale price on the exchange on which the security is principally traded that is reported before the time when the net assets of the Funds are valued. The value of securities listed on The NASDAQ Stock Market LLC shall generally be the NASDAQ Official Closing Price. Fixed income securities (other than certain short-term investments maturing in less than 61 days) are valued each day based on readily available market quotations received from independent or affiliated pricing services approved by the Board of Trustees or third party broker-dealers. Such pricing services and broker-dealers will generally provide bid-side quotations. Generally, short-term investments of sufficient credit quality maturing in less than 61 days are valued at amortized cost, which approximates market value. Certain investments of the Funds may, depending upon market conditions, trade in relatively thin markets and/or in markets that experience significant volatility. As a result of these conditions, the prices used by the Funds to value securities may differ from the value that would be realized if these securities were sold, and the differences could be material. Futures and options shall generally be valued on the basis of available market quotations. Swaps and other derivatives are valued daily, primarily using independent or affiliated pricing services approved by the Board of Trustees. If valuations are not available from such services or values received are deemed not representative of market value, values will be obtained from a third party broker-dealer or counterparty. Investments in other open-end investment companies are valued at such investment company’s current day closing net asset value per share.
Securities or other assets for which market quotations are not readily available or for which market quotations do not represent the value at the time of pricing (including certain illiquid securities) are fair valued in accordance with procedures established by and under the supervision and responsibility of the Board of Trustees. Under these procedures, the Funds primarily employ a market-based approach which may use related or comparable assets or liabilities, recent transactions, market multiples, book values, and other relevant information for the investment to determine
| | | | | | |
| | | |
| 84 | | | | J.P. MORGAN MID CAP/MULTI-CAP FUNDS | | JUNE 30, 2011 |
the fair value of the investment. The Funds may also use an income-based valuation approach in which the anticipated future cash flows of the investment are discounted to calculate fair value. Discounts may also be applied due to the nature or duration of any restrictions on the disposition of the investments. It is possible that the estimated values may differ significantly from the values that would have been used had a ready market for the investments existed, and such differences could be material. Trading in securities on most foreign exchanges and over-the-counter markets is normally completed before the close of the domestic market and may also take place on days when the domestic market is closed. In accordance with procedures adopted by the Board of Trustees, the Funds apply fair value pricing on equity securities on a daily basis except for North American, Central American, South American and Caribbean equity securities held in their portfolios by utilizing the quotations of an independent pricing service, unless a Fund’s advisor determines that use of another valuation methodology is appropriate. The pricing service uses statistical analyses and quantitative models to adjust local market prices using factors such as subsequent movement and changes in the prices of indices, securities and exchange rates in other markets, in determining fair value as of the time a Fund calculates its net asset values.
Valuations reflected in this report are as of the report date. As a result, changes in valuation due to market events and/or issuer related events after the report date and prior to issuance of the report are not reflected herein.
The various inputs that are used in determining the fair value of the Funds’ investments are summarized into the three broad levels listed below:
| Ÿ | | Level 1 — quoted prices in active markets for identical securities |
| Ÿ | | Level 2 — other significant observable inputs (including quoted prices for similar securities, interest rates, prepayment speeds, credit risk, etc.) |
| Ÿ | | Level 3 — significant unobservable inputs (including the Funds’ own assumptions in determining the fair value of investments) |
A financial instrument’s level within the fair value hierarchy is based on the lowest level of any input both individually and in aggregate that is significant to the fair value measurement. The inputs or methodology used for valuing securities are not necessarily an indication of the risk associated with investing in those securities.
The following tables represent each valuation input by sector as presented on the Schedules of Portfolio Investments (“SOIs”) (amounts in thousands):
Growth Advantage Fund
| | | | | | | | | | | | | | | | |
| | | Level 1 Quoted prices | | | Level 2 Other significant observable inputs | | | Level 3 Significant
unobservable inputs | | | Total | |
Total Investments in Securities # | | $ | 1,256,047 | | | $ | — | | | $ | — | | | $ | 1,256,047 | |
| | | | | | | | | | | | | | | | |
Mid Cap Core Fund
| | | | | | | | | | | | | | | | |
| | | Level 1 Quoted prices | | | Level 2 Other significant observable inputs | | | Level 3 Significant
unobservable inputs | | | Total | |
Total Investments in Securities # | | $ | 91,760 | | | $ | — | | | $ | — | | | $ | 91,760 | |
| | | | | | | | | | | | | | | | |
Mid Cap Equity Fund
| | | | | | | | | | | | | | | | |
| | | Level 1 Quoted prices | | | Level 2 Other significant observable inputs | | | Level 3 Significant
unobservable inputs | | | Total | |
Total Investments in Securities # | | $ | 588,082 | | | $ | — | | | $ | — | | | $ | 588,082 | |
| | | | | | | | | | | | | | | | |
Mid Cap Growth Fund
| | | | | | | | | | | | | | | | |
| | | Level 1 Quoted prices | | | Level 2 Other significant observable inputs | | | Level 3 Significant
unobservable inputs | | | Total | |
Total Investments in Securities # | | $ | 1,764,094 | | | $ | — | | | $ | — | | | $ | 1,764,094 | |
| | | | | | | | | | | | | | | | |
Appreciation in Other Financial Instruments | | | | | | | | | | | | | | | | |
Futures Contracts | | $ | 173 | | | $ | — | | | $ | — | | | $ | 173 | |
| | | | | | | | | | | | | | | | |
Mid Cap Value Fund
| | | | | | | | | | | | | | | | |
| | | Level 1 Quoted prices | | | Level 2 Other significant observable inputs | | | Level 3 Significant
unobservable inputs | | | Total | |
Total Investments in Securities # | | $ | 6,800,214 | | | $ | — | | | $ | — | | | $ | 6,800,214 | |
| | | | | | | | | | | | | | | | |
| | | | | | | | |
| | | |
| JUNE 30, 2011 | | J.P. MORGAN MID CAP/MULTI-CAP FUNDS | | | | | 85 | |
NOTES TO FINANCIAL STATEMENTS
AS OF JUNE 30, 2011 (continued)
Multi-Cap Market Neutral Fund
| | | | | | | | | | | | | | | | |
| | | Level 1 Quoted prices | | | Level 2 Other significant observable inputs | | | Level 3 Significant
unobservable inputs | | | Total | |
Total Investments in Securities # | | $ | 568,105 | | | $ | — | | | $ | — | | | $ | 568,105 | |
| | | | | | | | | | | | | | | | |
Liabilities in Securities Sold Short # | | $ | (532,696 | ) | | $ | — | | | $ | — | | | $ | (532,696 | ) |
| | | | | | | | | | | | | | | | |
Value Advantage Fund
| | | | | | | | | | | | | | | | |
| | | Level 1 Quoted prices | | | Level 2 Other significant observable inputs | | | Level 3 Significant
unobservable inputs | | | Total | |
Total Investments in Securities ## | | $ | 910,686 | | | $ | 13,520 | | | $ | — | | | $ | 924,206 | |
| | | | | | | | | | | | | | | | |
| # | All portfolio holdings designated as Level 1 are disclosed individually in the SOI. Please refer to the SOI for industry specifics of the portfolio holdings. |
| ## | Portfolio holdings designated as Level 1 and Level 2 are disclosed individually in the SOIs. Level 2 consists of ADRs, the reported values of which are an evaluated price. Please refer to the SOI for industry specifics of the portfolio holdings. |
There were no transfers between Levels 1 and 2 during the period ended June 30, 2011.
B. Short Sales — The Multi-Cap Market Neutral Fund engages in short sales as part of its normal investment activities. In a short sale, the Fund sells securities it does not own. In order to deliver securities to the purchaser, the Fund borrows securities from a broker. To close out a short position, the Fund must purchase the same securities at the current market price and deliver them to the broker.
The Fund is required to pledge cash or securities to the broker as collateral for the securities sold short. Collateral requirements are calculated daily based on the current market value of the short positions. Cash collateral deposited with the broker is recorded as an asset on the Statements of Assets and Liabilities. Securities segregated as collateral are denoted in the SOI. The Fund may receive or pay the net of the following amounts: (i) a portion of the income from the investment of cash collateral (ii) the broker’s fee on the borrowed securities (calculated daily based upon the market value of each borrowed security and a variable rate that is dependent on availability of the security) and (iii) a financing charge for the difference in the market value of the short position and cash collateral deposited with the broker. The net income or fee amount is included as interest income or interest expense on securities sold short, respectively, in the Statements of Operations.
The Fund is obligated to pay the broker dividends declared on short positions when a position is open on record date. Dividends on short positions are recorded on the Statements of Operations as dividend expense on ex-dividend date.
Liabilities for securities sold short are reported at market value on the Statements of Assets and Liabilities and the change in market value is recorded as unrealized gain or loss on the Statements of Operations. Short sale transactions may result in unlimited losses as the short position loses value and the securities’ price increases. There is no upward limit on the price a borrowed security could attain. The Fund is also subject to risk of loss if the broker were to fail to perform its obligations under the contractual terms.
The Fund will record a realized loss if the price of the security increases between the date of the short sale and the date on which the Fund replaces the borrowed security. The Fund will record a realized gain if the price of the security declines between those dates.
As of June 30, 2011, the Fund had outstanding short sales as listed on its SOI.
C. Futures Contracts — The Mid Cap Core Fund and Mid Cap Growth Fund use index futures contracts to gain or reduce exposure to the stock market, maintain liquidity and minimize transaction costs. The Funds buy futures contracts to immediately invest incoming cash in the market or sell futures in response to cash outflows, thereby simulating an invested position in the underlying index while maintaining a cash balance for liquidity. The use of futures contracts exposes the Funds to equity price risk.
Futures contracts provide for the delayed delivery of the underlying instrument at a fixed price or for a cash amount based on the change in the value of the underlying instrument at a specific date in the future. Upon entering into a futures contract, the Funds are required to deposit with the broker, cash or securities in an amount equal to a certain percentage of the contract amount which is referred to as the initial margin deposit. Subsequent payments, referred to as variation margin, are made or received by the Funds periodically and are based on changes in the market value of open futures contracts. Changes in the market value of open futures contracts are recorded as unrealized appreciation or depreciation in the Statements of Operations. Realized gains or losses, representing the difference between the value of the contract at the time it was opened and the value at the time it was closed, are reported in the Statements of Operations at the closing or expiration of futures contracts. Securities deposited as initial margin are designated in the SOIs and cash deposited is recorded on the Statements of Assets and Liabilities. A receivable from and/or a payable to brokers for the daily variation margin is also recorded on the Statements of Assets and Liabilities.
The Funds may be subject to the risk that the change in the value of the futures contract may not correlate perfectly with the underlying instrument. Use of long futures contracts subjects the Funds to risk of loss in excess of the amounts shown on the Statements of Assets and Liabilities, up to the
| | | | | | |
| | | |
| 86 | | | | J.P. MORGAN MID CAP/MULTI-CAP FUNDS | | JUNE 30, 2011 |
notional amount of the futures contracts. Use of short futures contracts subjects the Funds to unlimited risk of loss. The Funds may enter into futures contracts only on exchanges or boards of trade. The exchange or board of trade acts as the counterparty to each futures transaction; therefore, the Funds’ credit risk is limited to failure of the exchange or board of trade. Under some circumstances, futures exchanges may establish daily limits on the amount that the price of a futures contract can vary from the previous day’s settlement price, which could effectively prevent liquidation of unfavorable positions.
The table below discloses the volume of the Funds’ futures activities during the period ended June 30, 2011:
| | | | | | | | |
| | | Mid Cap Core Fund | | | Mid Cap Growth Fund | |
Futures Contracts: | | | | | | | | |
Average Notional Balance Long | | $ | 1,247 | (a) | | $ | 52,340 | (b) |
Ending Notional Balance Long | | $ | — | | | $ | 52,340 | |
| (a) | For the period March 1, 2011 through March 31, 2011 |
| (b) | For the period June 1, 2011 through June 30, 2011. |
D. Securities Lending — Each Fund (except Mid Cap Core Fund, Multi-Cap Market Neutral Fund and Value Advantage Fund) may lend securities to brokers approved by J.P. Morgan Investment Management Inc. (“JPMIM” or the “Advisor”) in order to generate additional income. Goldman Sachs Bank USA (“GS Bank”) serves as lending agent for the Growth Advantage Fund, Mid Cap Equity Fund, Mid Cap Growth Fund and Mid Cap Value Fund pursuant to a Securities Lending Agreement (the “GS Bank Securities Lending Agreement”). Prior to March 1, 2011, JPMorgan Chase Bank, N.A. (“JPMCB”), an affiliate of the Funds, served as lending agent for Mid Cap Growth Fund and Mid Cap Value Fund pursuant to a Securities Lending Agreement (the “JPMCB Securities Lending Agreement”). Securities loaned are collateralized by cash, which is invested in Capital Shares of the JPMorgan Prime Money Market Fund. Upon termination of a loan, the Funds are required to return to the borrower the posted cash collateral. Loans are subject to termination by the Funds or the borrower at any time.
Securities lending income is comprised of income earned on cash collateral investments (“Collateral Investments”), net of a rebate received from or paid to borrowers for use of cash collateral and lending agent fees. This amount is recorded as Income from securities lending (net) on the Statements of Operations. The Funds also receive payments from the borrower during the period of the loan, equivalent to dividends and interest earned on the securities loaned, which are recorded as Dividend or Interest income, respectively, on the Statements of Operations.
For the period ended June 30, 2011, the Funds earned the following amounts from the investment of cash collateral, prior to rebates or fees, from an investment in an affiliated fund as described below (amounts in thousands).
| | | | |
Growth Advantage Fund | | $ | 131 | |
Mid Cap Equity Fund | | | 54 | |
Mid Cap Growth Fund | | | 61 | |
Mid Cap Value Fund | | | 96 | |
Under the GS Bank Securities Lending Agreement, at the inception of a loan, securities are exchanged for cash collateral equal to at least 102% of the value of loaned U.S. securities plus accrued interest. The GS Bank Securities Lending Agreement requires that the loaned securities be marked to market on a daily basis and additional cash collateral is requested from borrowers when the cash received from borrowers becomes less than 102% of the value of loaned securities. Under the JPMCB Securities Lending Agreement, at the inception of a loan, securities were exchanged for cash collateral equal to at least 102% of the value of loaned U.S. dollar-denominated securities, plus accrued interest, and 105% of the value of loaned non-dollar-denominated securities, plus accrued interest. The JPMCB Securities Lending Agreement required that the loaned securities be marked to market on a daily basis and additional cash collateral was requested from borrowers when the cash received from borrowers became less than 102% and 105% of the value of loaned U.S. dollar denominated and non-dollar denominated securities, respectively, subject to certain de minimis guidelines.
The value of the cash collateral received is recorded as a liability on the Statements of Assets and Liabilities and details of Collateral Investments are disclosed in the SOIs. At June 30, 2011, the value of outstanding securities on loan and the value of Collateral Investments were as follows (amounts in thousands):
| | | | | | | | | | | | |
| | | Value of
Securities
on Loan | | | Cash Collateral
Posted by
Borrower | | | Total Value
of Collateral
Investments | |
Growth Advantage Fund | | $ | 38,658 | | | $ | 39,434 | | | $ | 39,434 | |
Mid Cap Equity Fund | | | 17,421 | | | | 17,693 | * | | | 17,693 | |
Mid Cap Growth Fund | | | 70,219 | | | | 70,726 | * | | | 70,726 | |
Mid Cap Value Fund | | | 35,750 | | | | 36,367 | * | | | 36,367 | |
| * | Subsequent to June 30, 2011, additional collateral was received from borrowers. |
| | | | | | | | |
| | | |
| JUNE 30, 2011 | | J.P. MORGAN MID CAP/MULTI-CAP FUNDS | | | | | 87 | |
NOTES TO FINANCIAL STATEMENTS
AS OF JUNE 30, 2011 (continued)
The Funds bear the risk of loss associated with the Collateral Investments and are not entitled to additional collateral from the borrower to cover any such losses. To the extent that the value of the Collateral Investments decline below the amount owed to a borrower, a Fund may incur losses that exceed the amount it earned on lending the security. Upon termination of a loan, a Fund may use leverage (borrow money) to repay the borrower for cash collateral posted, if the Advisor does not believe that it is prudent to sell the Collateral Investments to fund the payment of this liability.
Securities lending also involves counterparty risks, including the risk that the loaned securities may not be returned in a timely manner or at all. Subject to certain conditions, GS Bank and JPMCB each have agreed to indemnify the Funds, under their respective agreements, from losses resulting from a borrower’s failure to return a loaned security, as applicable.
JPMIM waived fees associated with the Funds’ investment in JPMorgan Prime Money Market Fund as follows (amounts in thousands).
| | | | |
Growth Advantage Fund | | $ | 74 | |
Mid Cap Equity Fund | | | 31 | |
Mid Cap Growth Fund | | | 36 | |
Mid Cap Value Fund | | | 59 | |
These amounts offset the administration fees and shareholder servicing fees incurred by JPMorgan Prime Money Market Fund related to the Funds’ investment in such fund. A portion of the waiver is voluntary.
Under the JPMCB Securities Lending Agreement, JPMCB was entitled to a fee paid monthly in arrears equal to: (i) 0.03% of the average dollar value of the loans of U.S. dollar-denominated securities outstanding during a given month; and (ii) 0.09% of the average dollar value of loans of non-dollar-denominated securities outstanding during a given month.
The Funds incurred lending agent fees to JPMCB as follows for the period ended June 30, 2011 (amounts in thousands):
| | | | |
| | | Lending
Agent Fees
Incurred | |
Mid Cap Growth Fund | | $ | 9 | |
Mid Cap Value Fund | | | 13 | |
E. Offering and Organization Costs — Offering costs (Registration and filing fees) paid in connection with the offering of shares of the Mid Cap Core Fund are amortized up to 12 months from the date the Fund commenced operations. Costs paid in connection with the organization of the Fund were recorded as an expense at the time they commenced operations and are included as part of Professional fees on the Statements of Operations.
F. Security Transactions and Investment Income — Investment transactions are accounted for on the trade date (the date the order to buy or sell is executed). Securities gains and losses are calculated on a specifically identified cost basis. Interest income is determined on the basis of coupon interest accrued using the effective interest method adjusted for amortization of premiums and accretion of discounts. Dividend income and expense on securities sold short less foreign taxes withheld, if any, are recorded on the ex-dividend date or when a Fund first learns of the dividend.
The Funds record distributions received in excess of income from underlying investments as a reduction of cost of investments and/or realized gain. Such amounts are based on estimates if actual amounts are not available and actual amounts of income, realized gain and return of capital may differ from the estimated amounts. The Funds adjust the estimated amounts of components of distributions (and consequently their net investment income) as necessary once the issuers provide information about the actual composition of the distributions.
G. Allocation of Income and Expenses — In calculating the net asset value per share of each class, investment income, realized and unrealized gains and losses and expenses other than class specific expenses are allocated daily to each class of shares based upon the proportion of net assets of each class at the beginning of each day. Expenses directly attributable to a fund are charged directly to that fund while the expenses attributable to more than one fund of the Trusts are allocated among the respective funds. Each class of shares bears its pro-rata portion of expenses attributable to its Fund, except that each class separately bears expenses related specifically to that class, such as distribution and shareholder servicing fees.
H. Federal Income Taxes — Each Fund is treated as a separate taxable entity for Federal income tax purposes. Each Fund’s policy is to comply with the provisions of the Internal Revenue Code of 1986, as amended (the “Code”), applicable to regulated investment companies and to distribute to shareholders all of its distributable net investment income and net realized gain on investments. Accordingly, no provision for Federal income tax is necessary. The Funds are not aware of any tax positions for which it is reasonably possible that the total amounts of unrecognized tax benefits or losses will significantly change in the next twelve months. However, the Funds’ conclusions may be subject to future review based on changes in, or the interpretation of, the accounting standards or tax laws and regulations. Each of the Funds’ Federal tax returns for the prior three fiscal years remains subject to examination by the Internal Revenue Service.
I. Dividends and Distributions to Shareholders — Dividends from net investment income are generally declared and paid annually, except for the Mid Cap Equity, Mid Cap Growth and Multi-Cap Market Neutral Funds, which are declared and paid quarterly. Dividends are declared separately for each class. No class has preferential dividend rights; differences in per share rates are due to differences in separate class expenses. Net realized
| | | | | | |
| | | |
| 88 | | | | J.P. MORGAN MID CAP/MULTI-CAP FUNDS | | JUNE 30, 2011 |
capital gains, if any, are distributed by each Fund at least annually. The amount of dividends and distributions from net investment income and net realized capital gains is determined in accordance with Federal income tax regulations, which may differ from accounting principles generally accepted in the United States of America. To the extent these “book/tax” differences are permanent in nature (i.e., that they result from other than timing of recognition — “temporary differences”), such amounts are reclassified within the capital accounts based on their Federal tax-basis treatment.
The following amounts were reclassified within the capital accounts (amounts in thousands):
| | | | | | | | | | | | |
| | | Paid-in-Capital | | | Accumulated Undistributed/ (Overdistributed) Net Investment Income | | | Accumulated Net Realized Gain (Loss) on
Investments | |
Growth Advantage Fund | | $ | (3,266 | ) | | $ | 2,627 | | | $ | 639 | |
Mid Cap Core Fund | | | (1 | ) | | | 1 | | | | — | |
Mid Cap Equity Fund | | | — | | | | (270 | ) | | | 270 | |
Mid Cap Growth Fund | | | (6,191 | ) | | | 4,473 | | | | 1,718 | |
Mid Cap Value Fund | | | — | | | | (1,853 | ) | | | 1,853 | |
Multi-Cap Market Neutral Fund | | | (8,597 | ) | | | 8,614 | | | | (17 | ) |
Value Advantage Fund | | | 14,316 | | | | 372 | | | | (14,688 | ) |
The reclassifications for the Funds relate primarily to investments in partnerships (Growth Advantage Fund, Mid Cap Equity Fund, Mid Cap Growth Fund and Value Advantage Fund), net operating loss (Growth Advantage Fund, Mid Cap Growth Fund and Multi-Cap Market Neutral Fund), non-taxable special dividends (Mid Cap Equity Fund and Mid Cap Value Fund), redemptions in-kind (Value Advantage Fund) and nondeductible 12b-1 fees in the initial years of operations (Mid Cap Core Fund).
3. Fees and Other Transactions with Affiliates
A. Investment Advisory Fee — Pursuant to the Investment Advisory Agreement, JPMIM acts as the investment advisor to the Funds. JPMIM is a wholly-owned subsidiary of JPMorgan Asset Management Holdings Inc., which is a wholly-owned subsidiary of JPMorgan Chase & Co. (“JPMorgan”). JPMIM supervises the investments of each respective Fund and for such services is paid a fee. The fee is accrued daily and paid monthly based on each Fund’s respective average daily net assets. The annual fee rate for each Fund is as follows:
| | | | |
Growth Advantage Fund | | | 0.65 | % |
Mid Cap Core Fund | | | 0.65 | |
Mid Cap Equity Fund | | | 0.65 | |
Mid Cap Growth Fund | | | 0.65 | |
Mid Cap Value Fund | | | 0.65 | |
Multi-Cap Market Neutral Fund | | | 1.25 | |
Value Advantage Fund | | | 0.65 | |
The Advisor waived Investment Advisory fees and/or reimbursed expenses as outlined in Note 3.F.
B. Administration Fee — Pursuant to an Administration Agreement, JPMorgan Funds Management, Inc. (the “Administrator”), an indirect, wholly-owned subsidiary of JPMorgan, provides certain administration services to the Funds. In consideration of these services, the Administrator receives a fee computed daily and paid monthly at the annual rate of 0.15% of the first $25 billion of the average daily net assets of all funds in the J.P. Morgan Funds Complex (excluding certain funds of funds and money market funds) and 0.075% of the average daily net assets in excess of $25 billion of all such funds. For the period ended June 30, 2011, the annual effective rate was 0.09% of each Fund’s average daily net assets.
The Administrator waived Administration fees as outlined in Note 3.F.
J.P. Morgan Investor Services, Co. (“JPMIS”), an indirect, wholly-owned subsidiary of JPMorgan, serves as the Funds’ Sub-administrator (the “Sub-administrator”). For its services as Sub-administrator, JPMIS receives a portion of the fees payable to the Administrator.
C. Distribution Fees — Pursuant to a Distribution Agreement, JPMorgan Distribution Services, Inc. (“the Distributor”), a wholly-owned subsidiary of JPMorgan, serves as the Trusts’ exclusive underwriter and promotes and arranges for the sale of each Fund’s shares.
| | | | | | | | |
| | | |
| JUNE 30, 2011 | | J.P. MORGAN MID CAP/MULTI-CAP FUNDS | | | | | 89 | |
NOTES TO FINANCIAL STATEMENTS
AS OF JUNE 30, 2011 (continued)
The Board of Trustees has adopted a Distribution Plan (the “Distribution Plan”) for Class A, Class B, Class C and Class R2 Shares of the Funds in accordance with Rule 12b-1 under the 1940 Act. The Distribution Plan provides that each Fund shall pay distribution fees, including payments to the Distributor, at annual rates of the average daily net assets as shown in the table below:
| | | | | | | | | | | | | | | | |
| | | Class A | | | Class B | | | Class C | | | Class R2 | |
Growth Advantage Fund | | | 0.25 | % | | | 0.75 | % | | | 0.75 | % | | | n/a | |
Mid Cap Core Fund | | | 0.25 | | | | n/a | | | | 0.75 | | | | 0.50 | % |
Mid Cap Equity Fund | | | 0.25 | | | | n/a | | | | 0.75 | | | | n/a | |
Mid Cap Growth Fund | | | 0.25 | | | | 0.75 | | | | 0.75 | | | | 0.50 | |
Mid Cap Value Fund | | | 0.25 | | | | 0.75 | | | | 0.75 | | | | 0.50 | |
Multi-Cap Market Neutral Fund | | | 0.25 | | | | 0.75 | | | | 0.75 | | | | n/a | |
Value Advantage Fund | | | 0.25 | | | | n/a | | | | 0.75 | | | | n/a | |
In addition, the Distributor is entitled to receive the front-end sales charges from purchases of Class A Shares and the CDSC from redemptions of Class B and Class C Shares and certain Class A Shares for which front-end sales charges have been waived. For the period ended June 30, 2011, the Distributor retained the following amounts (in thousands):
| | | | | | | | |
| | | Front-End Sales Charge | | | CDSC | |
Growth Advantage Fund | | $ | 27 | | | $ | 11 | |
Mid Cap Core Fund | | | — | (a) | | | — | (a) |
Mid Cap Equity Fund | | | 3 | | | | — | (a) |
Mid Cap Growth Fund | | | 19 | | | | 17 | |
Mid Cap Value Fund | | | 89 | | | | 46 | |
Multi-Cap Market Neutral Fund | | | 3 | | | | 6 | |
Value Advantage Fund | | | 32 | | | | 5 | |
| (a) | Amount rounds to less than $1,000. |
D. Shareholder Servicing Fees — The Trusts, on behalf of the Funds, have entered into Shareholder Servicing Agreements with the Distributor under which the Distributor provides certain support services to the shareholders. The Class R6 Shares do not participate in the Shareholder Servicing Agreement. For performing these services, the Distributor receives a fee that is computed daily and paid monthly equal to a percentage of the average daily net assets as shown in the table below:
| | | | | | | | | | | | | | | | | | | | | | | | | | | | |
| | | Class A | | | Class B | | | Class C | | | Class R2 | | | Class R5 | | | Institutional Class | | | Select Class | |
Growth Advantage Fund | | | 0.25 | % | | | 0.25 | % | | | 0.25 | % | | | n/a | | | | 0.05 | % | | | n/a | | | | 0.25 | % |
Mid Cap Core Fund | | | 0.25 | | | | n/a | | | | 0.25 | | | | 0.25 | % | | | 0.05 | | | | n/a | | | | 0.25 | |
Mid Cap Equity Fund | | | 0.25 | | | | n/a | | | | 0.25 | | | | n/a | | | | n/a | | | | n/a | | | | 0.25 | |
Mid Cap Growth Fund | | | 0.25 | | | | 0.25 | | | | 0.25 | | | | 0.25 | | | | n/a | | | | n/a | | | | 0.25 | |
Mid Cap Value Fund | | | 0.25 | | | | 0.25 | | | | 0.25 | | | | 0.25 | | | | n/a | | | | 0.10 | % | | | 0.25 | |
Multi-Cap Market Neutral Fund | | | 0.25 | | | | 0.25 | | | | 0.25 | | | | n/a | | | | n/a | | | | n/a | | | | 0.25 | |
Value Advantage Fund | | | 0.25 | | | | n/a | | | | 0.25 | | | | n/a | | | | n/a | | | | 0.10 | | | | 0.25 | |
The Distributor has entered into shareholder services contracts with affiliated and unaffiliated financial intermediaries who provide shareholder services and other related services to their clients or customers who invest in the Funds under which the Distributor will pay all or a portion of such fees earned to financial intermediaries for performing such services.
The Distributor waived Shareholder Servicing fees as outlined in Note 3.F.
E. Custodian and Accounting Fees — JPMCB provides portfolio custody and accounting services for the Funds. The amounts paid directly to JPMCB by the Funds for custody and accounting services are included in Custodian and accounting fees in the Statements of Operations. The custodian fees may be reduced by credits earned by each Fund, based on uninvested cash balances held by the custodian. Such earnings credits are presented separately in the Statements of Operations.
Interest expense, if any, paid to the custodian related to cash overdrafts is included in Interest expense to affiliates in the Statements of Operations.
| | | | | | |
| | | |
| 90 | | | | J.P. MORGAN MID CAP/MULTI-CAP FUNDS | | JUNE 30, 2011 |
F. Waivers and Reimbursements — The Advisor, Administrator and Distributor have contractually agreed to waive fees and/or reimburse the Funds to the extent that total annual operating expenses (excluding acquired fund fees and expenses, dividend and interest expense related to short sales, interest, taxes, extraordinary expenses and expenses related to the Board of Trustees’ deferred compensation plan) exceed the percentages of the Funds’ respective average daily net assets as shown in the table below:
| | | | | | | | | | | | | | | | | | | | | | | | | | | | | | | | |
| | | Class A | | | Class B | | | Class C | | | Class R2 | | | Class R5 | | | Class R6 | | | Institutional Class | | | Select Class | |
Growth Advantage Fund | | | 1.25 | % | | | 1.75 | % | | | 1.75 | % | | | n/a | | | | 0.90 | % | | | n/a | | | | n/a | | | | 1.10 | % |
Mid Cap Core Fund | | | 1.25 | | | | n/a | | | | 1.75 | | | | 1.50 | % | | | 0.80 | | | | 0.75 | % | | | n/a | | | | 1.00 | |
Mid Cap Equity Fund | | | 1.25 | | | | n/a | | | | 1.75 | | | | n/a | | | | n/a | | | | n/a | | | | n/a | | | | 0.90 | |
Mid Cap Growth Fund | | | 1.24 | | | | 1.77 | | | | 1.77 | | | | 1.40 | | | | n/a | | | | n/a | | | | n/a | | | | 0.93 | |
Mid Cap Value Fund | | | 1.24 | | | | 1.75 | | | | 1.75 | | | | 1.50 | | | | n/a | | | | n/a | | | | 0.75 | % | | | 0.99 | |
Multi-Cap Market Neutral Fund | | | 1.75 | | | | 2.50 | | | | 2.50 | | | | n/a | | | | n/a | | | | n/a | | | | n/a | | | | 1.50 | |
Value Advantage Fund | | | 1.25 | | | | n/a | | | | 1.75 | | | | n/a | | | | n/a | | | | n/a | | | | 0.75 | | | | 1.00 | |
The contractual expense limitation agreements were in effect for the period ended June 30, 2011. The contractual expense limitation percentages in the table above are in place until at least October 31, 2011 for all Funds except Mid Cap Core Fund. For Mid Cap Core Fund, the contractual expense limitation percentages in the table above are in place until at least November 30, 2011 for Class A, Class C, Class R2, Class R5 and Select Class Shares and are in place until at least January 31, 2012 for Class R6 Shares. In addition, the Funds’ service providers have voluntarily waived fees during the period ended June 30, 2011. However, the Funds’ service providers are under no obligation to do so and may discontinue such voluntary waivers at any time.
Prior to September 1, 2010, the contractual expense limitations for Class A, Class B and Class C Shares of the Growth Advantage Fund were 1.35%, 2.05% and 2.05% respectively.
Prior to November 1, 2010, the contractual expense limitation for Select Class Shares of the Mid Cap Equity Fund was 1.00%.
For the period ended June 30, 2011, the Funds’ service providers waived fees and/or reimbursed expenses for each of the Funds as follows (amounts in thousands). None of these parties expects the Funds to repay any such waived fees and reimbursed expenses in future years.
| | | | | | | | | | | | | | | | | | | | |
| | | Contractual Waivers | | | Reimbursements | |
| | | Investment
Advisory | | | Administration | | | Shareholder
Servicing | | | Total | | |
Growth Advantage Fund | | $ | — | | | $ | — | | | $ | 93 | | | $ | 93 | | | $ | — | |
Mid Cap Core Fund | | | 71 | | | | 10 | | | | — | | | | 81 | | | | 203 | |
Mid Cap Equity Fund | | | 279 | | | | 274 | | | | 1,101 | | | | 1,654 | | | | — | |
Mid Cap Growth Fund | | | — | | | | 520 | | | | 1,867 | | | | 2,387 | | | | — | |
Mid Cap Value Fund | | | 3,862 | | | | 5,000 | | | | 2,740 | | | | 11,602 | | | | — | |
Multi-Cap Market Neutral Fund | | | 1 | | | | — | | | | 1,095 | | | | 1,096 | | | | — | |
Value Advantage Fund | | | 128 | | | | 544 | | | | 235 | | | | 907 | | | | — | |
| | | | | | | | | | | | | | | | |
| | | Voluntary Waivers | |
| | | Investment
Advisory | | | Administration | | | Shareholder
Servicing | | | Total | |
Multi-Cap Market Neutral Fund | | $ | 968 | | | $ | 200 | | | $ | 251 | | | $ | 1,419 | |
Additionally, the Funds may invest in one or more money market funds advised by the Advisor or its affiliates. The Advisors, Administrator and the Distributor as shareholder servicing agent waive an amount sufficient to offset the respective fees each charges to the affiliated money market fund on the Funds’ investment in such affiliated money market fund. A portion of the waiver is voluntary.
The amounts of waivers resulting from investments in the money market funds for the period ended June 30, 2011 were as follows (excluding the waiver disclosed in Note 2.C. regarding cash collateral for securities lending invested in the JPMorgan Prime Money Market Fund) (amounts in thousands):
| | | | |
Growth Advantage Fund | | $ | 40 | |
Mid Cap Equity Fund | | | 29 | |
Mid Cap Growth Fund | | | 43 | |
Mid Cap Value Fund | | | 336 | |
Multi-Cap Market Neutral Fund | | | 70 | |
Value Advantage Fund | | | 61 | |
G. Other — Certain officers of the Trusts are affiliated with the Advisor, the Administrator and the Distributor. Such officers, with the exception of the Chief Compliance Officer, receive no compensation from the Funds for serving in their respective roles.
| | | | | | | | |
| | | |
| JUNE 30, 2011 | | J.P. MORGAN MID CAP/MULTI-CAP FUNDS | | | | | 91 | |
NOTES TO FINANCIAL STATEMENTS
AS OF JUNE 30, 2011 (continued)
The Board of Trustees appointed a Chief Compliance Officer to the Funds in accordance with federal securities regulations. Each Fund, along with other affiliated funds, makes reimbursement payments, on a pro-rata basis, to the Administrator for a portion of the fees associated with the Office of the Chief Compliance Officer. Such fees are included in Trustees’ and Chief Compliance Officer’s fees in the Statements of Operations.
The Trusts adopted a Trustee Deferred Compensation Plan (the “Plan”) which allows the Independent Trustees to defer the receipt of all or a portion of compensation related to performance of their duties as a Trustee. The deferred fees are invested in various J.P. Morgan Funds until distribution in accordance with the Plan.
During the period ended June 30, 2011, certain Funds may have purchased securities from an underwriting syndicate in which the principal underwriter or members of the syndicate are affiliated with Advisors.
The Funds may use related party broker/dealers. For the period ended June 30, 2011, the Funds did not incur any brokerage commissions with brokers/dealers affiliated with the Advisors.
The Securities and Exchange Commission (“SEC”) has granted an exemptive order permitting the Funds to engage in principal transactions with J.P. Morgan Securities, Inc., an affiliated broker, involving taxable money market instruments subject to certain conditions.
An Affiliate of JPMCB made a payment to the Mid Cap Value Fund in the amount of approximately $31,000 relating to an operational error.
4. Investment Transactions
During the period ended June 30, 2011, purchases and sales of investments (excluding short-term investments) were as follows (amounts in thousands):
| | | | | | | | | | | | | | | | |
| | | Purchases
(excluding U.S.
Government) | | | Sales
(excluding U.S.
Government) | | | Securities
Sold Short | | | Covers on
Securities
Sold Short | |
Growth Advantage Fund | | $ | 1,035,282 | | | $ | 885,525 | | | $ | — | | | $ | — | |
Mid Cap Core Fund | | | 90,770 | | | | 3,057 | | | | — | | | | — | |
Mid Cap Equity Fund | | | 390,634 | | | | 402,036 | | | | — | | | | — | |
Mid Cap Growth Fund | | | 1,235,596 | | | | 1,388,274 | | | | — | | | | — | |
Mid Cap Value Fund | | | 2,424,872 | | | | 2,417,753 | | | | — | | | | — | |
Multi-Cap Market Neutral Fund | | | 773,209 | | | | 911,442 | | | | 904,957 | | | | 1,032,160 | |
Value Advantage Fund | | | 513,617 | | | | 236,675 | | | | — | | | | — | |
During the period ended June 30, 2011, there were no purchases or sales of U.S. Government securities.
5. Federal Income Tax Matters
For Federal income tax purposes, the cost and unrealized appreciation (depreciation) in value of the investment securities at June 30, 2011, were as follows (amounts in thousands):
| | | | | | | | | | | | | | | | |
| | | Aggregate
Cost | | | Gross
Unrealized
Appreciation | | | Gross
Unrealized
Depreciation | | | Net Unrealized
Appreciation
(Depreciation) | |
Growth Advantage Fund | | $ | 1,019,140 | | | $ | 249,507 | | | $ | 12,600 | | | $ | 236,907 | |
Mid Cap Core Fund | | | 91,378 | | | | 1,779 | | | | 1,397 | | | | 382 | |
Mid Cap Equity Fund | | | 473,761 | | | | 117,054 | | | | 2,733 | | | | 114,321 | |
Mid Cap Growth Fund | | | 1,357,642 | | | | 418,560 | | | | 12,108 | | | | 406,452 | |
Mid Cap Value Fund | | | 5,291,485 | | | | 1,601,287 | | | | 92,558 | | | | 1,508,729 | |
Multi-Cap Market Neutral Fund | | | 484,742 | | | | 91,532 | | | | 8,169 | | | | 83,363 | |
Value Advantage Fund | | | 790,045 | | | | 140,800 | | | | 6,639 | | | | 134,161 | |
For all of the Funds, the difference between the book and tax basis appreciation (depreciation) on investments is primarily attributed to wash sale loss deferrals and partnership basis outstanding (Value Advantage Fund).
The tax character of distributions paid during the fiscal period ended June 30, 2011 was as follows (amounts in thousands):
| | | | | | | | | | | | |
| | | Total Distributions Paid From: | | | Total
Distributions Paid | |
| | | Ordinary
Income | | | Net
Long Term
Capital Gains | | |
Mid Cap Core Fund | | $ | 1 | | | $ | — | | | $ | 1 | |
Mid Cap Equity Fund | | | 1,989 | | | | — | | | | 1,989 | |
Mid Cap Value Fund | | | 60,163 | | | | — | | | | 60,163 | |
Value Advantage Fund | | | 8,184 | | | | — | | | | 8,184 | |
| | | | | | |
| | | |
| 92 | | | | J.P. MORGAN MID CAP/MULTI-CAP FUNDS | | JUNE 30, 2011 |
The tax character of distributions paid during the fiscal year ended June 30, 2010 was as follows (amounts in thousands):
| | | | | | | | | | | | |
| | | Total Distributions Paid From: | | | Total
Distributions Paid | |
| | | Ordinary
Income | | | Net
Long Term
Capital Gains | | |
Mid Cap Equity Fund | | $ | 1,930 | | | $ | — | | | $ | 1,930 | |
Mid Cap Value Fund | | | 1,948 | | | | — | | | | 1,948 | |
Value Advantage Fund | | | 5,629 | | | | — | | | | 5,629 | |
At June 30, 2011, the components of net assets (excluding paid in capital) on a tax basis were as follows (amounts in thousands):
| | | | | | | | | | | | |
| | | Current
Distributable
Ordinary
Income | | | Current
Distributable Long-Term Capital Gain or (Tax Basis Capital
Loss Carryover) | | | Unrealized
Appreciation
(Depreciation) | |
Growth Advantage Fund | | $ | — | | | $ | (47,838 | ) | | $ | 236,907 | |
Mid Cap Core Fund | | | 135 | | | | 2 | | | | 382 | |
Mid Cap Equity Fund | | | 183 | | | | (8,310 | ) | | | 114,321 | |
Mid Cap Growth Fund | | | — | | | | 134,277 | | | | 406,452 | |
Mid Cap Value Fund | | | 60,235 | | | | (332,540 | ) | | | 1,508,729 | |
Multi-Cap Market Neutral Fund | | | — | | | | (98,936 | ) | | | 57,638 | |
Value Advantage Fund | | | 6,285 | | | | (53,759 | ) | | | 134,161 | |
For the Funds, the cumulative timing differences primarily consist of trustee deferred compensation (Growth Advantage Fund, Mid Cap Core Fund, Mid Cap Growth Fund, Mid Cap Value Fund and Multi-Cap Market Neutral Fund), post-October loss deferrals (Growth Advantage Fund and Mid Cap Growth Fund), distributions payable (Mid Cap Equity Fund), partnership basis outstanding (Value Advantage), loss deferrals on unsettled short sales (Multi-Cap Market Neutral), limitations on capital loss carry forwards acquired in a merger (Mid Cap Growth Fund) and wash sale loss deferrals.
As of June 30, 2011, the Funds had net capital loss carryforwards, expiring during the year indicated, which are available to offset future realized gains (amounts in thousands):
| | | | | | | | | | | | | | | | | | | | |
| | | 2015 | | | 2016 | | | 2017 | | | 2018 | | | Total | |
Growth Advantage Fund | | $ | — | | | $ | — | | | $ | — | | | $ | 47,838 | | | $ | 47,838 | |
Mid Cap Equity Fund | | | — | | | | — | | | | — | | | | 8,310 | | | | 8,310 | |
Mid Cap Value Fund | | | — | | | | 1,151 | | | | 14,176 | | | | 317,213 | | | | 332,540 | * |
Multi-Cap Market Neutral Fund | | | 1,901 | | | | 97,035 | | | | — | | | | — | | | | 98,936 | |
Value Advantage Fund | | | — | | | | — | | | | — | | | | 53,759 | | | | 53,759 | |
During the period ended June 30, 2011, the Funds utilized capital loss carryforwards as follows (amounts in thousands):
| | | | |
Growth Advantage Fund | | $ | 77,942 | |
Mid Cap Equity Fund | | | 24,453 | |
Mid Cap Growth Fund | | | 119,160 | |
Mid Cap Value Fund | | | 251,037 | |
Multi-Cap Market Neutral Fund | | | 462 | |
Value Advantage Fund | | | 24,523 | |
During the period ended June 30, 2011, the following Funds had capital loss carryforwards disallowed (amounts in thousands):
| | | | |
Mid Cap Growth Fund | | $ | 89,945 | * |
Net Capital losses and currency losses incurred after October 31 and within the taxable year are deemed to arise on the first business day of the Funds’ next taxable year. For the period ended June 30, 2011, the Funds deferred to July 1, 2011 post October capital losses of:
| | | | | | | | |
| | | Capital Losses | | | Currency Losses | |
Growth Advantage Fund | | $ | — | | | $ | 25 | |
Mid Cap Equity Fund | | | — | | | | 5 | |
Mid Cap Growth Fund | | | — | | | | 40 | |
| * | Amounts include capital loss carry forwards from business combinations, which may be limited in future years under Internal Revenue Code Sections 381-384. |
| | | | | | | | |
| | | |
| JUNE 30, 2011 | | J.P. MORGAN MID CAP/MULTI-CAP FUNDS | | | | | 93 | |
NOTES TO FINANCIAL STATEMENTS
AS OF JUNE 30, 2011 (continued)
Under the recently enacted Regulated Investment Company Modernization Act of 2010 (“the Act”), net capital losses recognized by the Funds after June 30, 2011, may get carried forward indefinitely, and retain their character as short-term and/or long term losses. Prior to this Act, pre-enactment net capital losses incurred by the Funds were carried forward for eight years and treated as short-term losses. The Act requires that post-enactment net capital losses are used before pre-enactment net capital losses.
6. Borrowings
The Funds rely upon an exemptive order (“Order”) permitting the establishment and operation of an Interfund Lending Facility (“Facility”). The Facility allows the Funds to directly lend and borrow money to or from any other fund relying upon the Order at rates beneficial to both the borrowing and lending funds. Advances under the Facility are taken primarily for temporary or emergency purposes, including the meeting of redemption requests that otherwise might require the untimely disposition of securities, and are subject to each Fund’s borrowing restrictions. The Interfund Loan Rate is determined, as specified in the Order, by averaging the current repurchase agreement rate and the current bank loan rate. The Order was granted to JPM II and may be relied upon by the Funds because they are investment companies in the same “group of investment companies” (as defined in Section 12(d)(1)(G) of the 1940 Act).
In addition, the Trusts and JPMCB have entered into a financing arrangement. Under this arrangement, JPMCB provides an unsecured, uncommitted credit facility in the aggregate amount of $100 million to certain of the J.P. Morgan Funds, including the Funds. Advances under the arrangement are taken primarily for temporary or emergency purposes, including the meeting of redemption requests that otherwise might require the untimely disposition of securities, and are subject to each Fund’s borrowing restrictions. Interest on borrowings is payable at a rate determined by JPMCB at the time of borrowing. This agreement has been extended until November 15, 2011.
The Funds had no borrowings outstanding from another fund or from the unsecured, uncommitted credit facility at June 30, 2011. Average borrowings from the Facility for the period ended June 30, 2011, were as follows (amounts in thousands):
| | | | | | | | | | | | |
| | | Average Borrowings | | | Number of Days Used | | | Interest
Paid | |
Growth Advantage Fund | | $ | 13,659 | | | | 3 | | | $ | — | (a) |
| (a) | Amount rounds to less than $1,000. |
Interest expense paid, if any, as a result of borrowings from another fund or from the unsecured, uncommitted credit facility is included in Interest expense to affiliates in the Statements of Operations.
7. Risks, Concentrations and Indemnifications
In the normal course of business, the Funds enter into contracts that contain a variety of representations which provide general indemnifications. Each Fund’s maximum exposure under these arrangements is unknown, as this would involve future claims that may be made against each Fund that have not yet occurred. However, based on experience, the Funds expect the risk of loss to be remote.
One or more affiliates of the Advisor have investment discretion with respect to their clients’ holdings in the Funds, which collectively represent a significant portion of the Funds’ assets for Growth Advantage Fund, Mid Cap Core Fund and Mid Cap Equity Fund. Additionally, the Advisor owns a significant portion of the outstanding shares of Mid Cap Core Fund.
In addition, the JPMorgan Investor Funds, JPMorgan Access Funds and JPMorgan SmartRetirement Funds, which are affiliated funds of funds, own, in the aggregate more than 10% of the net assets of the Funds as follows:
| | | | | | | | | | | | |
| | | J.P. Morgan
Investor Funds | | | J.P. Morgan
Access Funds | | | JPMorgan
SmartRetirement
Funds | |
Growth Advantage Fund | | | N/A | | | | N/A | | | | 14.1 | % |
Mid Cap Core Fund | | | N/A | | | | 25.2 | % | | | N/A | |
Multi-Cap Market Neutral Fund | | | 75.7 | % | | | N/A | | | | N/A | |
Value Advantage Fund | | | N/A | | | | N/A | | | | 18.2 | |
Significant shareholder transactions, if any, may impact the Funds’ performance.
As of June 30, 2011, the Multi-Cap Market Neutral Fund pledged substantially all of its assets for securities sold short to Credit Suisse Group, who also held 100% of the Multi-Cap Market Neutral Fund’s cash proceeds for securities sold short.
8. Legal Matters
Prior to becoming an affiliate of JPMorgan, on June 29, 2004, Banc One Investment Advisors Corporation (“BOIA”) subsequently known as JPMorgan Investment Advisors Inc. (“JPMIA”), entered into agreements with the SEC (the “SEC Order”) and the New York Attorney General (“NYAG settlement”) in resolution of investigations into market timing of certain One Group mutual funds advised by BOIA. JPMIA was investment advisor to certain of the Funds until January 1, 2010. Effective January 1, 2010, JPMIA transferred its investment advisory business to JPMIM and JPMIM became investment advisor to such Funds. Under the terms of the SEC Order and the NYAG settlement, BOIA agreed to pay disgorgement of $10 million and a civil money penalty of $40 million for a total payment of $50 million, which has been distributed to certain current and former shareholders of certain
| | | | | | |
| | | |
| 94 | | | | J.P. MORGAN MID CAP/MULTI-CAP FUNDS | | JUNE 30, 2011 |
funds. Pursuant to the NYAG settlement, BOIA reduced its management fee for certain funds in the aggregate amount of approximately $8 million annually (based on assets under management as of June 30, 2004) over a five year period from September 27, 2004 through September 27, 2009.
In addition to the matters involving the SEC and NYAG, various lawsuits were filed by private plaintiffs in connection with these circumstances in various state and federal courts. These actions were transferred to the United States District Court for the District of Maryland. The plaintiffs filed consolidated amended complaints, naming as defendants, BOIA, Bank One Corporation and JPMorgan, One Group Services Company (the former distributor of One Group Mutual Funds), certain officers of One Group Mutual Funds and BOIA, and certain current and former Trustees.
As of June 14, 2006, all claims against One Group Mutual Funds and current and former trustees were dismissed by the United States District Court in Maryland. Certain claims against BOIA and its affiliates were also dismissed. On October 25, 2010, the court approved a settlement resolving all remaining claims in the litigation in Maryland.
The Funds will be reimbursed for all costs associated with these matters to ensure that they incur no expense as it relates to the matters described above. A portion of these reimbursements may be from related parties.
As noted above, the NYAG settlement required BOIA to establish reduced “net management fee rates” for certain Funds (“Reduced Rate Funds”). “Net Management Fee Rates” means the percentage fee rates specified in contracts between BOIA and its affiliates and the Reduced Rate Funds, less waivers and reimbursements by BOIA and its affiliates, in effect as of June 30, 2004. The settlement agreement required that the reduced Net Management Fee Rates must result in a reduction of $8 million annually based upon assets under management as of June 30, 2004, for a total reduction over five years of $40 million from that which would have been paid by the Reduced Rate Funds on the Net Management Fee Rates as of June 30, 2004. To the extent that BOIA and its affiliates have agreed as part of the settlement with the NYAG to waive or reimburse expenses of a Fund in connection with the settlement with the NYAG, those reduced Net Management Fee Rates were referred to as “Reduced Rates.” The Reduced Rates were implemented on September 27, 2004 and remained in place through September 27, 2009. Thus, the Reduced Rates are no longer in effect.
9. Transfers-In-Kind
Pursuant to procedures approved by the Board of Trustees, on May 24, 2010, certain shareholders of the Mid Cap Value Fund redeemed Institutional Class Shares and the Fund paid the redemption proceeds primarily by means of a redemption in-kind of the Fund’s portfolio securities.
| | | | | | | | | | | | |
| | | Value
(000’s) | | | Realized
Gains/(Losses)
(000’s) | | | Type | |
Institutional Class | | $ | 47,173 | | | $ | (7,817 | ) | | | Redemption-In-Kind | |
Pursuant to procedures approved by the Board of Trustees, on March 29, 2011, an affiliate of the Value Advantage Fund redeemed Institutional Class Shares and the Fund paid the redemption proceeds primarily by means of a redemption in-kind of the Fund’s portfolio securities.
| | | | | | | | | | | | |
| | | Value
(000’s) | | | Realized
Gains/(Losses)
(000’s) | | | Type | |
Institutional Class | | $ | 41,498 | | | $ | 14,315 | | | | Redemption-In-Kind | |
| | | | | | | | |
| | | |
| JUNE 30, 2011 | | J.P. MORGAN MID CAP/MULTI-CAP FUNDS | | | | | 95 | |
REPORT OF INDEPENDENT REGISTERED PUBLIC ACCOUNTING FIRM
To the Trustees of J.P. Morgan Mutual Fund Investment Trust, J.P. Morgan Fleming Mutual Fund Group, Inc., JPMorgan Trust I and JPMorgan Trust II and the Shareholders of JPMorgan Growth Advantage Fund, JPMorgan Mid Cap Core Fund, JPMorgan Mid Cap Equity Fund, JPMorgan Mid Cap Growth Fund, JPMorgan Mid Cap Value Fund, JPMorgan Multi-Cap Market Neutral Fund and JPMorgan Value Advantage Fund:
In our opinion, the accompanying statements of assets and liabilities, including the schedules of portfolio investments, and the related statements of operations and of changes in net assets and the financial highlights present fairly, in all material respects, the financial position of JPMorgan Mid Cap Equity Fund, JPMorgan Value Advantage Fund (each a separate fund of JPMorgan Trust I), JPMorgan Mid Cap Growth Fund, JPMorgan Multi-Cap Market Neutral Fund (each a separate fund of JPMorgan Trust II), JPMorgan Growth Advantage Fund (a separate fund of J.P. Morgan Mutual Fund Investment Trust) and JPMorgan Mid Cap Value Fund (a separate fund of J.P. Morgan Fleming Mutual Fund Group, Inc.) at June 30, 2011, the results of each of their operations for the year then ended, the changes in each of their net assets for each of the two years in the period then ended and the financial highlights for each of the periods presented, and the financial position of JPMorgan Mid Cap Core Fund (a separate fund of JPMorgan Trust I)(hereafter collectively referred to as the “Funds”) at June 30, 2011, the results of its operations, the changes in its net assets and the financial highlights for the period November 30, 2010 (commencement of operations) through June 30, 2011, in conformity with accounting principles generally accepted in the United States of America. These financial statements and financial highlights (hereafter referred to as “financial statements”) are the responsibility of the Funds’ management. Our responsibility is to express an opinion on these financial statements based on our audits. We conducted our audits of these financial statements in accordance with the standards of the Public Company Accounting Oversight Board (United States). Those standards require that we plan and perform the audit to obtain reasonable assurance about whether the financial statements are free of material misstatement. An audit includes examining, on a test basis, evidence supporting the amounts and disclosures in the financial statements, assessing the accounting principles used and significant estimates made by management, and evaluating the overall financial statement presentation. We believe that our audits, which included confirmation of securities at June 30, 2011 by correspondence with the custodian and brokers, provide a reasonable basis for our opinion.
PricewaterhouseCoopers LLP
New York, New York
August 26, 2011
| | | | | | |
| | | |
| 96 | | | | J.P. MORGAN MID CAP/MULTI-CAP FUNDS | | JUNE 30, 2011 |
TRUSTEES
(Unaudited)
The Funds’ Statement of Additional Information includes additional information about the Funds’ Trustees and is available, without charge, upon request by calling 1-800-480-4111 or on the J.P. Morgan Funds’ website at www.jpmorganfunds.com.
| | | | | | |
Name (Year of Birth); Positions With the Funds (1) | | Principal Occupations During Past 5 Years | | Number of
Portfolios in Fund
Complex Overseen
by Trustee (2) | | Other Directorships Held Outside Fund Complex During Past 5 Years |
Independent Trustees | | |
| | | |
| William J. Armstrong (1941); Trustee of Trusts since 2005; Trustee of heritage J.P. Morgan Funds since 1987. | | Retired; CFO and Consultant, EduNeering, Inc. (internet business education supplier)
(2000-2001); Vice President and Treasurer, Ingersoll-Rand Company (manufacturer of industrial equipment) (1972-2000). | | 149 | | None. |
| | | |
| John F. Finn (1947); Trustee of Trusts since 2005; Trustee of heritage One Group Mutual Funds since 1998. | | Chairman (1985-present), President and Chief Executive Officer, Gardner, Inc. (supply chain management company serving industrial and consumer markets) (1974-present). | | 149 | | Director, Cardinal Health, Inc. (CAH) (1994-present); Director, Greif, Inc. (GEF) (industrial package products and services) (2007-present). |
| | | |
| Dr. Matthew Goldstein (1941); Trustee of Trusts since 2005; Trustee of heritage J.P. Morgan Funds since 2003. | | Chancellor, City University of New York
(1999-present); President, Adelphi University (New York) (1998-1999). | | 149 | | Director, New Plan Excel (NXL)
(1999-2005); Director, National Financial Partners (NFP) (2003-2005); Director, Bronx-Lebanon Hospital Center; Director, United Way of New York City (2002-present). |
| | | |
| Robert J. Higgins (1945); Trustee of Trusts since 2005; Trustee of heritage J.P. Morgan Funds since 2002. | | Retired; Director of Administration of the State of Rhode Island (2003-2004); President — Consumer Banking and Investment Services, Fleet Boston Financial (1971-2001). | | 149 | | None. |
| | | |
| Peter C. Marshall (1942); Trustee of Trusts since 2005; Trustee of heritage One Group Mutual Funds since 1985. | | Self-employed business consultant
(2002-present). | | 149 | | Director, Center for Communication, Hearing, and Deafness (1990-present). |
| | | |
| Marilyn McCoy* (1948); Trustee of Trusts since 2005; Trustee of heritage One Group Mutual Funds since 1999. | | Vice President of Administration and Planning, Northwestern University (1985-present). | | 149 | | Trustee, Carleton College
(2003-present). |
| | | |
| William G. Morton, Jr. (1937); Trustee of Trusts since 2005; Trustee of heritage J.P. Morgan Funds since 2003. | | Retired; Chairman Emeritus (2001-2002), and Chairman and Chief Executive Officer, Boston Stock Exchange (1985-2001). | | 149 | | Director, Radio Shack Corp.
(1987-2008); Trustee, Stratton Mountain School (2001-present). |
| | | |
| Robert A. Oden, Jr. (1946); Trustee of Trusts since 2005; Trustee of heritage One Group Mutual Funds since 1997. | | Retired; President, Carleton College
(2002-2010); President, Kenyon College
(1995-2002). | | 149 | | Trustee, American University in Cairo (1999-present); Trustee, Carleton College (2002-2010). |
| | | |
| Fergus Reid, III (1932); Trustee of Trusts (Chairman) since 2005; Trustee (Chairman) of heritage J.P. Morgan Funds since 1987. | | Chairman, Joe Pietryka, Inc. (formerly Lumelite Corporation) (plastics manufacturing)
(2003-present); Chairman and Chief Executive Officer, Lumelite Corporation (1985-2002). | | 149 | | Trustee, Morgan Stanley Funds
(105 portfolios) (1992-present). |
| | | | | | | | |
| | | |
| JUNE 30, 2011 | | J.P. MORGAN MID CAP/MULTI-CAP FUNDS | | | | | 97 | |
TRUSTEES
(Unaudited) (continued)
| | | | | | |
Name (Year of Birth); Positions With the Funds (1) | | Principal Occupations During Past 5 Years | | Number of
Portfolios in Fund Complex Overseen by Trustee (2) | | Other Directorships Held Outside Fund Complex During Past 5 Years |
Independent Trustees (continued) | | |
| | | |
| Frederick W. Ruebeck (1939); Trustee of Trusts since 2005; Trustee of heritage One Group Mutual Funds since 1994. | | Consultant (2000-present); Advisor, JP Greene & Associates, LLC (broker-dealer)
(2000-2009); Chief Investment Officer, Wabash College (2004-present); Director of Investments, Eli Lilly and Company (pharmaceuticals) (1988-1999). | | 149 | | Trustee, Wabash College
(1988-present); Chairman, Indianapolis Symphony Orchestra Foundation (1994-present). |
| | | |
James J. Schonbachler (1943); Trustee of Trusts since 2005; Trustee of heritage J.P. Morgan Funds
since 2001. | | Retired; Managing Director of Bankers Trust Company (financial services) (1968-1998). | | 149 | | None. |
Interested Trustees | | | | | | |
| | | |
| Frankie D. Hughes** (1952), Trustee of Trusts since 2008. | | Principal and Chief Investment Officer, Hughes Capital Management, Inc. (fixed income asset management) (1993-present). | | 149 | | Trustee, The Victory Portfolios
(2000-2008). |
| | | |
Leonard M. Spalding, Jr.*** (1935); Trustee of Trusts since 2005; Trustee of heritage J.P. Morgan Funds
since 1998. | | Retired; Chief Executive Officer, Chase Mutual Funds (investment company) (1989-1998); President and Chief Executive Officer, Vista Capital Management (investment management) (1990-1998); Chief Investment Executive, Chase Manhattan Private Bank (investment management) (1990-1998). | | 149 | | Director, Glenview Trust Company, LLC (2001-present); Trustee, St. Catharine College (1998-present); Trustee, Bellarmine University (2000-present); Director, Springfield-Washington County Economic Development Authority (1997-present); Trustee, Catholic Education Foundation
(2005-present). |
| (1) | Each Trustee serves for an indefinite term, subject to the Trusts’ current retirement policy, which is age 75 for all Trustees, except that the Board has determined Messrs. Reid and Spalding should continue to serve until December 31, 2012. |
| (2) | A Fund Complex means two or more registered investment companies that hold themselves out to investors as related companies for purposes of investment and investor services or have a common investment advisor or have an investment advisor that is an affiliated person of the investment advisor of any of the other registered investment companies. The J.P. Morgan Funds Complex for which the Board of Trustees serves currently includes eleven registered investment companies (149 funds). |
| * | Ms. McCoy has served as Vice President of Administration and Planning for Northwestern University since 1985. William M. Daley was the Head of Corporate Responsibility for JPMorgan Chase & Co. prior to January 2011 and served as a member of the Board of Trustees of Northwestern University from 2005 through 2010. JPMIM, the Funds’ investment advisor, is a wholly-owned subsidiary of JPMorgan Chase & Co. Three other members of the Board of Trustees of Northwestern University are executive officers of registered investment advisors (not affiliated with JPMorgan) that are under common control with subadvisors to certain J.P. Morgan Funds. |
| ** | Ms. Hughes is treated as an “interested person” based on the portfolio holdings of clients of Hughes Capital Management, Inc. |
| *** | Mr. Spalding is treated as an “interested person” due to his ownership of JPMorgan Chase stock. |
The contact address for each of the Trustees is 270 Park Avenue, New York, NY 10017.
| | | | | | |
| | | |
| 98 | | | | J.P. MORGAN MID CAP/MULTI-CAP FUNDS | | JUNE 30, 2011 |
OFFICERS
(Unaudited)
| | |
Name (Year of Birth), Positions Held with the Trusts (Since) | | Principal Occupations During Past 5 Years |
| |
Patricia A. Maleski (1960),
President and Principal Executive Officer (2010) | | Managing Director, J.P. Morgan Investment Management Inc. and Chief Administrative Officer, J.P. Morgan Funds and Institutional Pooled Vehicles since 2010; previously, Treasurer and Principal Financial Officer of the Trusts from 2008 to 2010; previously, Head of Funds Administration and Board Liaison, J.P. Morgan Funds prior to 2010. Ms. Maleski has been with JPMorgan Chase & Co. since 2001. |
| |
Joy C. Dowd (1972),
Treasurer and Principal Financial Officer (2010) | | Assistant Treasurer of the Trusts from 2009 to 2010; Executive Director, JPMorgan Funds Management, Inc. from February 2011; Vice President, JPMorgan Funds Management, Inc. from December 2008 to February 2011; prior to joining JPMorgan Chase, Ms. Dowd worked in MetLife’s investments audit group from 2005 through 2008, and Vice President of Credit Suisse, in the audit area from 1999 through 2005. |
| |
Frank J. Nasta (1964),
Secretary (2008) | | Managing Director and Associate General Counsel, JPMorgan Chase since 2008; Previously, Director, Managing Director, General Counsel and Corporate Secretary, J. & W. Seligman & Co. Incorporated; Secretary of each of the investment companies of the Seligman Group of Funds and Seligman Data Corp.; Director and Corporate Secretary, Seligman Advisors, Inc. and Seligman Services, Inc. |
| |
Stephen M. Ungerman (1953),
Chief Compliance Officer (2005) | | Managing Director, JPMorgan Chase & Co.; Mr. Ungerman was head of Fund Administration — Pooled Vehicles from 2000 to 2004. Mr. Ungerman has been with JPMorgan Chase & Co. since 2000. |
| |
Paul L. Gulinello (1950),
AML Compliance Officer (2005) | | Vice President and Anti Money Laundering Compliance Officer for JPMorgan Asset Management Americas, additionally responsible for privacy, personal trading and Code of Ethics compliance since 2004. Mr. Gulinello has been with JPMorgan Chase & Co. since 1972. |
| |
Elizabeth A. Davin (1964), Assistant Secretary (2005)* | | Vice President and Assistant General Counsel, JPMorgan Chase since 2005; Senior Counsel, JPMorgan Chase (formerly Bank One Corporation) from 2004 to 2005; Assistant General Counsel and Associate General Counsel and Vice President, Gartmore Global Investments, Inc. from 1999 to 2004. |
| |
Jessica K. Ditullio (1962),
Assistant Secretary (2005)* | | Executive Director and Assistant General Counsel, JPMorgan Chase since February 2011; Ms. Ditullio has served as an attorney with various titles for JPMorgan Chase (formerly Bank One Corporation) since 1990. |
| |
John T. Fitzgerald (1975),
Assistant Secretary (2008) | | Executive Director and Assistant General Counsel, JPMorgan chase since February 2011; formerly, Vice President and Assistant General Counsel, JPMorgan Chase from 2005 until February 2011; Associate, Willkie Farr & Gallagher LLP (law firm) from 2002 to 2005. |
| |
Carmine Lekstutis (1980)
Assistant Secretary (2011) | | Vice President and Assistant General Counsel, JPMorgan Chase since 2011; Associate, Skadden, Arps, Slate, Meagher & Flom LLP (law firm) from 2006 to 2011. |
| |
Gregory S. Samuels (1980)
Assistant Secretary (2010) | | Vice President and Assistant General Counsel, JPMorgan Chase since 2010; Associate, Ropes & Gray (law firm) from 2008 to 2010; Associate, Clifford Chance LLP (law firm) from 2005 to 2008. |
| |
Brian L. Duncan (1965),
Assistant Treasurer (2008)* | | Vice President, JPMorgan Funds Management, Inc. since June 2007; prior to joining JPMorgan Chase, Mr. Duncan worked for Penn Treaty American Corporation as Vice President and Controller from 2004 through 2007 and Assistant Vice President of Financial Reporting from 2003-2004. |
| |
Jeffrey D. House (1972),
Assistant Treasurer (2006)* | | Vice President, JPMorgan Funds Management, Inc. since July 2006; formerly, Senior Manager of Financial Services of BISYS Fund Services, Inc. from December 1995 until July 2006. |
| |
Laura S. Melman (1966),
Assistant Treasurer (2006) | | Executive Director, JPMorgan Funds Management, Inc. since February 2011, responsible for Taxation; Vice President, JPMorgan Funds Management, Inc. from August, 2006 to February 2011, responsible for Taxation; Vice President of Structured Products at The Bank of New York Co., Inc. from 2001 until 2006. |
The contact address for each of the officers, unless otherwise noted, is 270 Park Avenue, New York, NY 10017.
| * | The contact address for the officer is 1111 Polaris Parkway, Columbus, OH 43240. |
| | | | | | | | |
| | | |
| JUNE 30, 2011 | | J.P. MORGAN MID CAP/MULTI-CAP FUNDS | | | | | 99 | |
SCHEDULE OF SHAREHOLDER EXPENSES
(Unaudited)
Hypothetical $1,000
As a shareholder of the Funds, you incur two types of costs: (1) transaction costs, including sales charges (loads) on purchase payments and redemption fees and (2) ongoing costs, including investment advisory, administration fees, distribution fees and other Fund expenses. The examples below are intended to help you understand your ongoing costs (in dollars) of investing in the Funds and to compare these costs with the ongoing costs of investing in other mutual funds. The examples assume that you had a $1,000 investment in the Class at the beginning of the reporting period, January 1, 2011, and continued to hold your shares at the end of the reporting period, June 30, 2011.
Actual Expenses
For each Class of each Fund in the table below, the first line provides information about actual account values and actual expenses. You may use the information in this line, together with the amount you invested, to estimate the expenses that you paid over the period. Simply divide your account value by $1,000 (for example, an $8,600 account value divided by $1,000 = 8.6), then multiply the result by the number in the first line of each Class under the heading entitled “Expenses Paid During” to estimate the expenses you paid on your account during this period.
Hypothetical Example for Comparison Purposes
The second line of each Class in the table below provides information about hypothetical account values and hypothetical expenses based on the Class’ actual expense ratio and an assumed rate of return of 5% per year before expenses, which is not the Class’ actual return. The hypothetical account values and expenses may not be used to estimate the actual ending account balance or expenses you paid for the period. You may use this information to compare the ongoing costs of investing in the Class of the Fund and other funds. To do so, compare this 5% hypothetical example with the 5% hypothetical examples that appear in the shareholder reports of the other funds. Please note that the expenses shown in the table are meant to highlight your ongoing costs only and do not reflect any transaction costs, such as sales charges (loads) or redemption fees. Therefore, the second line for each Class in the table is useful in comparing ongoing costs only, and will not help you determine the relative total costs of owning different funds. In addition, if these transaction costs were included, your costs would have been higher. The examples also assume all dividends and distributions have been reinvested.
| | | | | | | | | | | | | | | | |
| | | Beginning
Account Value,
January 1, 2011 | | | Ending
Account Value,
June 30, 2011 | | | Expenses
Paid During
January 1, 2011
to June 30, 2011 | | | Annualized
Expense
Ratio | |
Growth Advantage Fund | | | | | | | | | | | | | | | | |
Class A | | | | | | | | | | | | | | | | |
Actual* | | $ | 1,000.00 | | | $ | 1,064.20 | | | $ | 6.40 | | | | 1.25 | % |
Hypothetical* | | | 1,000.00 | | | | 1,018.60 | | | | 6.26 | | | | 1.25 | |
Class B | | | | | | | | | | | | | | | | |
Actual* | | | 1,000.00 | | | | 1,061.70 | | | | 8.95 | | | | 1.75 | |
Hypothetical* | | | 1,000.00 | | | | 1,016.12 | | | | 8.75 | | | | 1.75 | |
Class C | | | | | | | | | | | | | | | | |
Actual* | | | 1,000.00 | | | | 1,061.70 | | | | 8.95 | | | | 1.75 | |
Hypothetical* | | | 1,000.00 | | | | 1,016.12 | | | | 8.75 | | | | 1.75 | |
Class R5 | | | | | | | | | | | | | | | | |
Actual* | | | 1,000.00 | | | | 1,066.70 | | | | 4.41 | | | | 0.86 | |
Hypothetical* | | | 1,000.00 | | | | 1,020.53 | | | | 4.31 | | | | 0.86 | |
Select Class | | | | | | | | | | | | | | | | |
Actual* | | | 1,000.00 | | | | 1,064.60 | | | | 5.43 | | | | 1.06 | |
Hypothetical* | | | 1,000.00 | | | | 1,019.54 | | | | 5.31 | | | | 1.06 | |
| | | | |
Mid Cap Core Fund | | | | | | | | | | | | | | | | |
Class A | | | | | | | | | | | | | | | | |
Actual* | | | 1,000.00 | | | | 1,082.50 | | | | 6.45 | | | | 1.25 | |
Hypothetical* | | | 1,000.00 | | | | 1,018.60 | | | | 6.26 | | | | 1.25 | |
Class C | | | | | | | | | | | | | | | | |
Actual* | | | 1,000.00 | | | | 1,080.00 | | | | 9.03 | | | | 1.75 | |
Hypothetical* | | | 1,000.00 | | | | 1,016.12 | | | | 8.75 | | | | 1.75 | |
Class R2 | | | | | | | | | | | | | | | | |
Actual* | | | 1,000.00 | | | | 1,081.20 | | | | 7.74 | | | | 1.50 | |
Hypothetical* | | | 1,000.00 | | | | 1,017.36 | | | | 7.50 | | | | 1.50 | |
| | | | | | |
| | | |
| 100 | | | | J.P. MORGAN MID CAP/MULTI-CAP FUNDS | | JUNE 30, 2011 |
| | | | | | | | | | | | | | | | |
| | | Beginning
Account Value,
January 1, 2011 | | | Ending
Account Value,
June 30, 2011 | | | Expenses
Paid During
January 1, 2011
to June 30, 2011 | | | Annualized
Expense
Ratio | |
Mid Cap Core Fund (continued) | | | | | | | | | | | | | | | | |
Class R5 | | | | | | | | | | | | | | | | |
Actual* | | $ | 1,000.00 | | | $ | 1,085.00 | | | $ | 4.14 | | | | 0.80 | % |
Hypothetical* | | | 1,000.00 | | | | 1,020.83 | | | | 4.01 | | | | 0.80 | |
Class R6 | | | | | | | | | | | | | | | | |
Actual** | | | 1,000.00 | | | | 1,053.80 | | | | 3.17 | | | | 0.75 | |
Hypothetical* | | | 1,000.00 | | | | 1,021.08 | | | | 3.76 | | | | 0.75 | |
Select Class | | | | | | | | | | | | | | | | |
Actual* | | | 1,000.00 | | | | 1,084.40 | | | | 5.17 | | | | 1.00 | |
Hypothetical* | | | 1,000.00 | | | | 1,019.84 | | | | 5.01 | | | | 1.00 | |
| | | | |
Mid Cap Equity Fund | | | | | | | | | | | | | | | | |
Class A | | | | | | | | | | | | | | | | |
Actual* | | | 1,000.00 | | | | 1,075.20 | | | | 6.43 | | | | 1.25 | |
Hypothetical* | | | 1,000.00 | | | | 1,018.60 | | | | 6.26 | | | | 1.25 | |
Class C | | | | | | | | | | | | | | | | |
Actual* | | | 1,000.00 | | | | 1,072.90 | | | | 8.94 | | | | 1.74 | |
Hypothetical* | | | 1,000.00 | | | | 1,016.17 | | | | 8.70 | | | | 1.74 | |
Select Class | | | | | | | | | | | | | | | | |
Actual* | | | 1,000.00 | | | | 1,077.40 | | | | 4.64 | | | | 0.90 | |
Hypothetical* | | | 1,000.00 | | | | 1,020.33 | | | | 4.51 | | | | 0.90 | |
| | | | |
Mid Cap Growth Fund | | | | | | | | | | | | | | | | |
Class A | | | | | | | | | | | | | | | | |
Actual* | | | 1,000.00 | | | | 1,084.20 | | | | 6.41 | | | | 1.24 | |
Hypothetical* | | | 1,000.00 | | | | 1,018.65 | | | | 6.21 | | | | 1.24 | |
Class B | | | | | | | | | | | | | | | | |
Actual* | | | 1,000.00 | | | | 1,081.60 | | | | 9.14 | | | | 1.77 | |
Hypothetical* | | | 1,000.00 | | | | 1,016.02 | | | | 8.85 | | | | 1.77 | |
Class C | | | | | | | | | | | | | | | | |
Actual* | | | 1,000.00 | | | | 1,081.30 | | | | 9.13 | | | | 1.77 | |
Hypothetical* | | | 1,000.00 | | | | 1,016.02 | | | | 8.85 | | | | 1.77 | |
Class R2 | | | | | | | | | | | | | | | | |
Actual* | | | 1,000.00 | | | | 1,083.20 | | | | 7.23 | | | | 1.40 | |
Hypothetical* | | | 1,000.00 | | | | 1,017.85 | | | | 7.00 | | | | 1.40 | |
Select Class | | | | | | | | | | | | | | | | |
Actual* | | | 1,000.00 | | | | 1,086.10 | | | | 4.81 | | | | 0.93 | |
Hypothetical* | | | 1,000.00 | | | | 1,020.18 | | | | 4.66 | | | | 0.93 | |
| | | | |
Mid Cap Value Fund | | | | | | | | | | | | | | | | |
Class A | | | | | | | | | | | | | | | | |
Actual* | | | 1,000.00 | | | | 1,070.50 | | | | 6.31 | | | | 1.23 | |
Hypothetical* | | | 1,000.00 | | | | 1,018.70 | | | | 6.16 | | | | 1.23 | |
Class B | | | | | | | | | | | | | | | | |
Actual* | | | 1,000.00 | | | | 1,067.80 | | | | 8.92 | | | | 1.74 | |
Hypothetical* | | | 1,000.00 | | | | 1,016.17 | | | | 8.70 | | | | 1.74 | |
Class C | | | | | | | | | | | | | | | | |
Actual* | | | 1,000.00 | | | | 1,067.70 | | | | 8.92 | | | | 1.74 | |
Hypothetical* | | | 1,000.00 | | | | 1,016.17 | | | | 8.70 | | | | 1.74 | |
Class R2 | | | | | | | | | | | | | | | | |
Actual* | | | 1,000.00 | | | | 1,069.20 | | | | 7.64 | | | | 1.49 | |
Hypothetical* | | | 1,000.00 | | | | 1,017.41 | | | | 7.45 | | | | 1.49 | |
Institutional Class | | | | | | | | | | | | | | | | |
Actual* | | | 1,000.00 | | | | 1,072.80 | | | | 3.80 | | | | 0.74 | |
Hypothetical* | | | 1,000.00 | | | | 1,021.12 | | | | 3.71 | | | | 0.74 | |
| | | | | | | | |
| | | |
| JUNE 30, 2011 | | J.P. MORGAN MID CAP/MULTI-CAP FUNDS | | | | | 101 | |
SCHEDULE OF SHAREHOLDER EXPENSES
(Unaudited) (continued)
Hypothetical $1,000
| | | | | | | | | | | | | | | | |
| | | Beginning
Account Value,
January 1, 2011 | | | Ending
Account Value,
June 30, 2011 | | | Expenses
Paid During
January 1, 2011
to June 30, 2011 | | | Annualized
Expense
Ratio | |
Mid Cap Value Fund (continued) | | | | | | | | | | | | | | | | |
Select Class | | | | | | | | | | | | | | | | |
Actual* | | $ | 1,000.00 | | | $ | 1,071.70 | | | $ | 5.03 | | | | 0.98 | % |
Hypothetical* | | | 1,000.00 | | | | 1,019.93 | | | | 4.91 | | | | 0.98 | |
| | | | |
Multi-Cap Market Neutral Fund | | | | | | | | | | | | | | | | |
Class A | | | | | | | | | | | | | | | | |
Actual* | | | 1,000.00 | | | | 1,024.00 | | | | 12.80 | | | | 2.55 | |
Hypothetical* | | | 1,000.00 | | | | 1,012.15 | | | | 12.72 | | | | 2.55 | |
Class B | | | | | | | | | | | | | | | | |
Actual* | | | 1,000.00 | | | | 1,020.50 | | | | 15.63 | | | | 3.12 | |
Hypothetical* | | | 1,000.00 | | | | 1,009.32 | | | | 15.54 | | | | 3.12 | |
Class C | | | | | | | | | | | | | | | | |
Actual* | | | 1,000.00 | | | | 1,019.40 | | | | 15.82 | | | | 3.16 | |
Hypothetical* | | | 1,000.00 | | | | 1,009.12 | | | | 15.74 | | | | 3.16 | |
Select Class | | | | | | | | | | | | | | | | |
Actual* | | | 1,000.00 | | | | 1,024.80 | | | | 11.75 | | | | 2.34 | |
Hypothetical* | | | 1,000.00 | | | | 1,013.19 | | | | 11.68 | | | | 2.34 | |
| | | | |
Value Advantage Fund | | | | | | | | | | | | | | | | |
Class A | | | | | | | | | | | | | | | | |
Actual* | | | 1,000.00 | | | | 1,048.40 | | | | 6.30 | | | | 1.24 | |
Hypothetical* | | | 1,000.00 | | | | 1,018.65 | | | | 6.21 | | | | 1.24 | |
Class C | | | | | | | | | | | | | | | | |
Actual* | | | 1,000.00 | | | | 1,045.70 | | | | 8.83 | | | | 1.74 | |
Hypothetical* | | | 1,000.00 | | | | 1,016.17 | | | | 8.70 | | | | 1.74 | |
Institutional Class | | | | | | | | | | | | | | | | |
Actual* | | | 1,000.00 | | | | 1,051.20 | | | | 3.76 | | | | 0.74 | |
Hypothetical* | | | 1,000.00 | | | | 1,021.12 | | | | 3.71 | | | | 0.74 | |
Select Class | | | | | | | | | | | | | | | | |
Actual* | | | 1,000.00 | | | | 1,050.00 | | | | 5.03 | | | | 0.99 | |
Hypothetical* | | | 1,000.00 | | | | 1,019.89 | | | | 4.96 | | | | 0.99 | |
| * | Expenses are equal to the Funds’ annualized expense ratio, multiplied by the average account value over the period, multiplied by 181/365 to reflect the one-half year period). |
| ** | Expenses are equal to the Fund’s annualized expense ratio, multiplied by the average account value over the period, multiplied by 151/365 to reflect the actual period). Commencement of offering class of shares was January 31, 2011. |
| | | | | | |
| | | |
| 102 | | | | J.P. MORGAN MID CAP/MULTI-CAP FUNDS | | JUNE 30, 2011 |
TAX LETTER
(Unaudited)
Certain tax information for the J.P. Morgan Funds is required to be provided to shareholders based upon the Funds’ income and distributions for the taxable year ended June 30, 2011. The information and distributions reported in this letter may differ from the information and taxable distributions reported to the shareholders for the calendar year ending December 31, 2011. The information necessary to complete your income tax returns for the calendar year ending December 31, 2011 will be received under separate cover.
Dividends Received Deductions (DRD)
The following represents the percentage of ordinary income distributions eligible for the 70% dividends received deduction for corporate rate shareholders for the fiscal year ended June 30, 2011:
| | | | |
| | | Dividends Received Deduction | |
Mid Cap Core Fund | | | 100.00 | % |
Mid Cap Equity Fund | | | 100.00 | |
Mid Cap Value Fund | | | 100.00 | |
Value Advantage Fund | | | 100.00 | |
Qualified Dividend Income (QDI)
For the fiscal year ended June 30, 2011, certain dividends paid by the Funds may be subject to a maximum tax rate of 15%. The following represents the amount of ordinary income distributions treated as qualified dividends (amounts in thousands):
| | | | |
| | | Qualified
Dividend
Income | |
Mid Cap Core Fund | | $ | 1 | |
Mid Cap Equity Fund | | | 1,989 | |
Mid Cap Value Fund | | | 60,163 | |
Value Advantage Fund | | | 8,184 | |
| | | | | | | | |
| | | |
| JUNE 30, 2011 | | J.P. MORGAN MID CAP/MULTI-CAP FUNDS | | | | | 103 | |

Rev. January 2011
| | |
| FACTS | | WHAT DOES J.P. MORGAN FUNDS DO WITH YOUR PERSONAL INFORMATION? |
| | |
| Why? | | Financial companies choose how they share your personal information. Federal law gives consumers the right to limit some but not all sharing. Federal law also requires us to tell you how we collect, share, and protect your personal information. Please read this notice carefully to understand what we do. |
| | |
| What? | | The types of personal information we collect and share depend on the product or service you have with us. This information can include: ¡ Social Security number and account balances ¡ transaction history and account transactions ¡ checking account information and wire transfer instructions When you are no longer our customer, we continue to share your information as described in this notice. |
| | |
| How? | | All financial companies need to share customers’ personal information to run their everyday business. In the section below, we list the reasons financial companies can share their customers’ personal information; the reasons J.P. Morgan Funds chooses to share; and whether you can limit this sharing. |
| | | | |
| Reasons we can share your personal information | | Does J.P. Morgan
Funds share? | | Can you limit this
sharing? |
For our everyday business purposes — such as to process your transactions, maintain your account(s), respond to court orders and legal investigations, or report to credit bureaus | | Yes | | No |
For marketing purposes — to offer our products and services to you | | Yes | | No |
| For joint marketing with other financial companies | | No | | We don’t share |
For our affiliates’ everyday business purposes — information about your transactions and experiences | | No | | We don’t share |
For our affiliates’ everyday business purposes — information about your creditworthiness | | No | | We don’t share |
| For nonaffiliates to market to you | | No | | We don’t share |
| | |
| | |
| Questions? | | Call 1-800-480-4111 or go to www.jpmorganfunds.com |

| | |
| Who we are |
| Who is providing this notice? | | J.P. Morgan Funds |
| | |
| What we do |
| How does J.P. Morgan Funds protect my personal information? | | To protect your personal information from unauthorized access and use, we use security measures that comply with federal law. These measures include computer safeguards and secured files and buildings. We authorize our employees to access your information only when they need it to do their work and we require companies that work for us to protect your information. |
How does J.P. Morgan Funds collect my personal information? | | We collect your personal information, for example, when you: ¡ open an account or provide contact information ¡ give us your account information or pay us by check ¡ make a wire transfer We also collect your personal information from others, such as credit bureaus, affiliates and other companies. |
| Why can’t I limit all sharing? | | Federal law gives you the right to limit only ¡ sharing for affiliates’ everyday business purposes – information about your creditworthiness ¡ affiliates from using your information to market to you ¡ sharing for nonaffiliates to market to you State laws and individual companies may give you additional rights to limit sharing. |
| | |
| Definitions |
| Affiliates | | Companies related by common ownership or control. They can be financial and nonfinancial companies. ¡ J.P. Morgan Funds does not share with our affiliates. |
| Nonaffiliates | | Companies not related by common ownership or control. They can be financial and nonfinancial companies. ¡ J.P. Morgan Funds does not share with nonaffiliates so they can market to you. |
| Joint Marketing | | A formal agreement between nonaffiliated financial companies that together market financial products or services to you. ¡ J.P. Morgan Funds doesn’t jointly market. |
| | |
| Who we are |
| Who is providing this notice? | | J.P. Morgan Funds |
| | |
| What we do |
| How does J.P. Morgan Funds protect my personal information? | | To protect your personal information from unauthorized access and use, we use security measures that comply with federal law. These measures include computer safeguards and secured files and buildings. We authorize our employees to access your information only when they need it to do their work and we require companies that work for us to protect your information. |
How does J.P. Morgan Funds collect my personal information? | | We collect your personal information, for example, when you: ¡ open an account or provide contact information ¡ give us your account information or pay us by check ¡ make a wire transfer We also collect your personal information from others, such as credit bureaus, affiliates and other companies. |
| Why can’t I limit all sharing? | | Federal law gives you the right to limit only ¡ sharing for affiliates’ everyday business purposes – information about your creditworthiness ¡ affiliates from using your information to market to you ¡ sharing for nonaffiliates to market to you State laws and individual companies may give you additional rights to limit sharing. |
| | |
| Definitions |
| Affiliates | | Companies related by common ownership or control. They can be financial and nonfinancial companies. ¡ J.P. Morgan Funds does not share with our affiliates. |
| Nonaffiliates | | Companies not related by common ownership or control. They can be financial and nonfinancial companies. ¡ J.P. Morgan Funds does not share with nonaffiliates so they can market to you. |
| Joint Marketing | | A formal agreement between nonaffiliated financial companies that together market financial products or services to you. ¡ J.P. Morgan Funds doesn’t jointly market. |
J.P. Morgan Funds are distributed by JPMorgan Distribution Services, Inc., which is an affiliate of JPMorgan Chase & Co. Affiliates of JPMorgan Chase & Co. receive fees for providing various services to the funds.
Contact JPMorgan Distribution Services, Inc. at 1-800-480-4111 for a fund prospectus. You can also visit us at www.jpmorganfunds.com. Investors should carefully consider the investment objectives and risk as well as charges and expenses of the mutual fund before investing. The prospectus contains this and other information about the mutual fund. Read the prospectus carefully before investing.
Investors may obtain information about the Securities Investor Protection Corporation (SIPC), including the SIPC brochure by visiting www.sipc.org or by calling SIPC at 202-371-8300.
Each Fund files a complete schedule of its fund holdings for the first and third quarters of its fiscal year with the SEC on Form N-Q. The Funds’ Forms N-Q are available on the SEC’s website at http://www.sec.gov and may be reviewed and copied at the SEC’s Public Reference Room in Washington, DC. Information on the operation of the SEC’s Public Reference Room may be obtained by calling 1-800-SEC-0330. Shareholders may request the Form N-Q without charge by calling 1-800-480-4111 or by visiting the J.P. Morgan Funds’ website at www.jpmorganfunds.com.
A description of each Fund’s policies and procedures with respect to the disclosure of each Fund’s holdings is available in the prospectus and Statement of Additional Information.
A copy of proxy policies and procedures is available without charge upon request by calling 1-800-480-4111 and a description of such policies and procedures is on the SEC’s website at www.sec.gov. The Trustees have delegated the authority to vote proxies for securities owned by the Funds to the Advisor. A copy of the Funds’ voting record for the most recent 12-month period ended June 30 is available on the SEC’s website at www.sec.gov or at the Funds’ website at www.jpmorganfunds.com no later than August 31 of each year. The Funds’ proxy voting record will include, among other things, a brief description of the matter voted on for each fund security, and will state how each vote was cast, for example, for or against the proposal.


J.P. Morgan Asset Management is the marketing name for the asset management business of JPMorgan Chase & Co. Those businesses include, but are not limited to, J.P. Morgan Investment Management Inc., Security Capital Research & Management Incorporated and J.P. Morgan Alternative Asset Management, Inc.
| | | | |
| | © JPMorgan Chase & Co., 2011. All rights reserved. June 2011. | | AN-MC-611 |
ITEM 2. CODE OF ETHICS.
Disclose whether, as of the end of the period covered by the report, the registrant has adopted a code of ethics that applies to the registrant’s principal executive officer, principal financial officer, principal accounting officer or controller, or persons performing similar functions, regardless of whether these individuals are employed by the registrant or a third party. If the registrant has not adopted such a code of ethics, explain why it has not done so.
The registrant must briefly describe the nature of any amendment, during the period covered by the report, to a provision of its code of ethics that applies to the registrant’s principal executive officer, principal financial officer, principal accounting officer or controller, or persons performing similar functions, regardless of whether these individuals are employed by the registrant or a third party, and that relates to any element of the code of ethics definition enumerated in paragraph (b) of this Item. The registrant must file a copy of any such amendment as an exhibit pursuant to Item 12(a)(1), unless the registrant has elected to satisfy paragraph (f) of this Item by positing its code of ethics on its website pursuant to paragraph (f)(2) of this Item, or by undertaking to provide its code of ethics to any person without charge, upon request, pursuant to paragraph (f)(3) of this Item.
If the registrant has, during the period covered by the report, granted a waiver, including an implicit waiver, from a provision of the code of ethics that applies to the registrant’s principal executive officer, principal financial officer, principal accounting officer or controller, or persons performing similar functions, regardless of whether these individuals are employed by the registrant or third party, that relates to one or more items set forth in paragraph (b) of this Item, the registrant must briefly describe the nature of the waiver, the name of the person to whom the waiver was granted, and the date of the waiver.
The Registrant has adopted a code of ethics that applies to the Registrant’s principal executive officer and principal financial officer. There were no amendments to the code of ethics or waivers granted with respect to the code of ethics in the period covered by the report.
ITEM 3. AUDIT COMMITTEE FINANCIAL EXPERT.
(a) (1) Disclose that the registrant’s board of directors has determined that the registrant either:
(i) Has at least one audit committee financial expert serving on its audit committee; or
(ii) Does not have an audit committee financial expert serving on its audit committee.
The Registrant’s Board of Trustees has determined that the Registrant has at least one audit committee financial expert serving on its audit committee. The Securities and Exchange Commission has stated that the designation or identification of a person as an audit committee financial expert pursuant to this Item 3 of Form N-CSR does not impose on such person any duties, obligations or liabilities that are greater than the duties, obligations and liabilities imposed on such person as a member of the Audit Committee and the Board of Trustees in the absence of such designation or identification.
(2) If the registrant provides the disclosure required by paragraph (a)(1)(i) of this Item, it must disclose the name of the audit committee financial expert and whether that person is “independent.” In order to be considered “independent” for purposes of this Item, a member of an audit committee may not, other than in his or her capacity as a member of the audit committee, the board of directors, or any other board committee:
(i) Accept directly or indirectly any consulting, advisory, or other compensatory fee from the issuer; or
(ii) Be an “interested person” of the investment company as defined in Section 2(a)(19) of the Act (15 U.S.C. 80a-2(a)(19)).
The audit committee financial expert is William Armstrong. He is not an “interested person” of the Registrant and is also “independent” as defined by the U.S. Securities and Exchange Commission for purposes of audit committee financial expert determinations.
(3) If the registrant provides the disclosure required by paragraph (a)(1)(ii) of this Item, it must explain why it does not have an audit committee financial expert.
Not applicable.
ITEM 4. PRINCIPAL ACCOUNTANT FEES AND SERVICES.
(a) Disclose, under the caption Audit Fees, the aggregate fees billed for each of the last two fiscal years for professional services rendered by the principal accountant for the audit of the registrant’s annual financial statements or services that are normally provided by the accountant in connection with statutory and regulatory filings or engagements for those fiscal years.
AUDIT FEES
2011 – $30,800
2010 – $30,500
(b) Disclose, under the caption Audit-Related Fees, the aggregate fees billed in each of the last two fiscal years for assurance and related services by the principal accountant that are reasonably related to the performance of the audit of the registrant’s financial statements and are not reported under paragraph (a) of this Item. Registrants shall describe the nature of the services comprising the fees disclosed under this category.
AUDIT-RELATED FEES
2011 – $11,800
2010 – $11,800
The audit-related fees consist of aggregate fees billed for assurance and related services by the independent registered public accounting firm to the Registrant that were reasonably related to the performance of the annual audit of the Registrant’s financial statements.
(c) Disclose, under the caption Tax Fees, the aggregate fees billed in each of the last two fiscal years for professional services rendered by the principal accountant for tax compliance, tax advice, and tax planning. Registrants shall describe the nature of the services comprising the fees disclosed under this category.
TAX FEES
2011 – $8,100
2010 – $8,100
The tax fees consist of fees billed in connection with preparing the federal regulated investment company income tax returns for the Registrant for the tax years ended June 30, 2011 and 2010, respectively.
For the last fiscal year, no tax fees were required to be approved pursuant to paragraph (c)(7)(ii) of Rule 2-01 of Regulation S-X.
(d) Disclose, under the caption All Other Fees, the aggregate fees billed in each of the last two fiscal years for products and services provided by the principal accountant, other than the services reported in paragraphs (a) through (c) of this Item. Registrants shall describe the nature of the services comprising the fees disclosed under this category.
ALL OTHER FEES
2011 – Not applicable
2010 – Not applicable
(e)(1) Disclose the audit committee’s pre-approval policies and procedures described in paragraph (c)(7) of Rule 2-01 of Regulation S-X.
Pursuant to the Registrant’s Audit Committee Charter and written policies and procedures for the pre-approval of audit and non-audit services (the “Pre-approval Policy”), the Audit Committee pre-approves all audit and non-audit services performed by the Registrant’s independent public registered accounting firm for the Registrant. In addition, the Audit Committee pre-approves the auditor’s engagement for non-audit services with the Registrant’s investment adviser (not including a sub-adviser whose role is primarily portfolio management and is sub-contracted or overseen by another investment adviser) and any Service Affiliate in accordance with paragraph (c)(7)(ii) of Rule 2-01 of Regulation S-X, if the engagement relates directly to the operations and financial reporting of the Registrant. Proposed services may be pre-approved either 1) without consideration of specific case-by-case services or 2) require the specific pre-approval of the Audit Committee. Therefore, initially the Pre-approval Policy listed a number of audit and non-audit services that have been approved by the Audit Committee, or which were not subject to pre-approval under the transition provisions of Sarbanes-Oxley Act of 2002 (the “Pre-approval List”). The Audit Committee annually reviews and pre-approves the
services included on the Pre-approval List that may be provided by the independent public registered accounting firm without obtaining additional specific pre-approval of individual services from the Audit Committee. The Audit Committee adds to, or subtracts from, the list of general pre-approved services from time to time, based on subsequent determinations. All other audit and non-audit services not on the Pre-approval List must be specifically pre-approved by the Audit Committee.
One or more members of the Audit Committee may be appointed as the Committee’s delegate for the purposes of considering whether to approve such services. Any pre-approvals granted by the delegate will be reported, for informational purposes only, to the Audit Committee at its next scheduled meeting. The Audit Committee’s responsibilities to pre-approve services performed by the independent public registered accounting firm are not delegated to management.
(2) Disclose the percentage of services described in each of paragraphs (b) through (d) of this Item that were approved by the audit committee pursuant to paragraph (c)(7)(i)(C) of Rule 2-01 of Regulation S-X.
2011 – 0.0%
2010 – 0.0%
(f) If greater than 50 percent, disclose the percentage of hours expended on the principal accountant’s engagement to audit the registrant’s financial statements for the most recent fiscal year that were attributed to work performed by persons other than the principal accountant’s full-time, permanent employees.
None.
(g) Disclose the aggregate non-audit fees billed by the registrant’s accountant for services rendered to the registrant, and rendered to the registrant’s investment adviser (not including any sub-adviser whose role is primarily portfolio management and is subcontracted with or overseen by another investment adviser), and any entity controlling, controlled by, or under common control with the adviser that provides ongoing services to the registrant for each of the last two fiscal years of the registrant.
The aggregate non-audit fees billed by the independent registered public accounting firm for services rendered to the Registrant for the last two calendar year ends were:
2010 - $31.8 million
2009 - $25.8 million
These amounts also include the aggregate non audit fees billed by the Independent Registered Public Accounting firm for services rendered to J.P. Morgan Chase & Co. (“JPMC”) and certain related entities.
(h) Disclose whether the registrant’s audit committee of the board of directors has considered whether the provision of non-audit services that were rendered to the registrant’s investment adviser (not including any subadviser whose role is primarily portfolio management and is subcontracted with or overseen by another investment adviser), and any entity controlling, controlled by, or under common control with the investment adviser that provides ongoing services to the registrant that were not pre-approved pursuant to paragraph (c)(7)(ii) of Rule 2-01 of Regulation S-X is compatible with maintaining the principal accountant’s independence.
The Registrant’s Audit Committee has considered whether the provision of the non-audit services that were rendered to Service Affiliates that were not pre-approved (not requiring pre-approval) is compatible with maintaining the independent public registered accounting firm’s independence. All services provided by the independent public registered accounting firm to the Registrant or to Service Affiliates that were required to be pre-approved were pre-approved as required.
ITEM 5. AUDIT COMMITTEE OF LISTED REGISTRANTS.
(a) If the registrant is a listed issuer as defined in Rule 10A-3 under the Exchange Act (17CFR 240.10A-3), state whether or not the registrant has a separately-designated standing audit committee established in accordance with Section 3(a)(58)(A) of the Exchange Act (15 U.S.C. 78c(a)(58)(A)). If the registrant has such a committee, however designated, identify each committee member. If the entire board of directors is acting as the registrant’s audit committee as specified in Section 3(a)(58)(B) of the Exchange Act (15 U.S.C. 78c(a)(58)(B)), so state.
(b) If applicable, provide the disclosure required by Rule 10A-3(d) under the Exchange Act (17CFR 240.10A-3(d)) regarding an exemption from the listing standards for all audit committees.
Not applicable.
ITEM 6. SCHEDULE OF INVESTMENTS.
File Schedule I – Investments in securities of unaffiliated issuers as of the close of the reporting period as set forth in Section 210.12-12 of Regulation S-X, unless the schedule is included as part of the report to shareholders filed under Item 1 of this Form.
Included in Item 1.
ITEM 7. DISCLOSURE OF PROXY VOTING POLICIES AND PROCEDURES FOR CLOSED-END MANAGEMENT INVESTMENT COMPANIES.
A closed-end management investment company that is filing an annual report on this Form N-CSR must, unless it invests exclusively in non-voting securities, describe the policies and procedures that it uses to determine how to vote proxies relating to portfolio securities, including the procedures that the company uses when a vote presents a conflict between the interests of its shareholders, on the one hand, and those of the company’s investment adviser; principal underwriter; or any affiliated person (as defined in Section 2(a)(3) of the Investment Company Act of 1940 (15 U.S.C. 80a-2(a)(3)) and the rules thereunder) of the company, its investment adviser, or its principal underwriter, on the other. Include any policies and procedures of the company’s investment adviser, or any other third party, that the company uses, or that are used on the company’s behalf, to determine how to vote proxies relating to portfolio securities.
Not applicable.
ITEM 8. PORTFOLIO MANAGERS OF CLOSED-END MANAGEMENT INVESTMENT COMPANIES.
Not applicable.
ITEM 9. PURCHASE OF EQUITY SECURITIES BY CLOSED-END MANAGEMENT INVESTMENT COMPANY AND AFFILIATED PURCHASERS.
(a) If the registrant is a closed-end management investment company, provide the information specified in paragraph (b) of this Item with respect to any purchase made by or on behalf of the registrant or any “affiliated purchaser,” as defined in Rule 10b-18(a)(3) under the Exchange Act (17 CFR 240.10b-18(a)(3)), of shares or other units of any class of the registrant’s equity securities that is registered by the registrant pursuant to Section 12 of the Exchange Act (15 U.S.C. 781).
Not applicable.
ITEM 10. SUBMISSION OF MATTERS TO A VOTE OF SECURITY HOLDERS.
Describe any material changes to the procedures by which shareholders may recommend nominees to the registrant’s board of directors, where those changes were implemented after the registrant last provided disclosure in response to the requirements of Item 7(d)(2)(ii)(G) of Schedule 14A (17 CFR 240.14a-101), or this Item.
No material changes to report.
ITEM 11. CONTROLS AND PROCEDURES.
(a) Disclose the conclusions of the registrant’s principal executive and principal financial officers, or persons performing similar functions, regarding the effectiveness of the registrant’s disclosure controls and procedures (as defined in Rule 30a-3(c) under the Act (17 CFR 270.30a-3(c))) as of a date within 90 days of the filing date of the report that includes the disclosure required by this paragraph, based on the evaluation of these controls and procedures required by Rule 30a-3(b) under the Act (17 CFR 270.30a-3(b)) and Rules 13a-15(b) or 15d-15(b) under the Exchange Act (17 CFR 240.13a-15(b) or 240.15d-15(b)).
The Registrant’s principal executive and principal financial officers have concluded, based on their evaluation of the Registrant’s disclosure controls and procedures as of a date within 90 days of the filing date of this report, that the Registrant’s disclosure controls and procedures are reasonably designed to ensure that information required to be
disclosed by the Registrant on Form N-CSR is recorded, processed, summarized and reported within the required time periods and that information required to be disclosed by the Registrant in the reports that it files or submits on Form N-CSR is accumulated and communicated to the Registrant’s management, including its principal executive and principal financial officers, as appropriate to allow timely decisions regarding required disclosure.
(b) Disclose any change in the registrant’s internal control over financial reporting (as defined in Rule 30a-3(d) under the Act (17 CFR 270.30a-3(d)) that occurred during the registrant’s second fiscal quarter of the period covered by this report that has materially affected, or is reasonably likely to materially affect, the registrant’s internal control over financial reporting.
There were no changes in the Registrant’s internal control over financial reporting that occurred during the last fiscal quarter covered by this report that have materially affected, or are reasonably likely to materially affect, the Registrant’s internal control over financial reporting.
ITEM 12. EXHIBITS.
(a) File the exhibits listed below as part of this Form. Letter or number the exhibits in the sequence indicated.
(a)(1) Any code of ethics, or amendment thereto, that is the subject of the disclosure required by Item 2, to the extent that the registrant intends to satisfy the Item 2 requirements through filing of an exhibit.
Code of Ethics applicable to its Principal Executive and Principal Financial Officers pursuant to Section 406 of the Sarbanes-Oxley Act of 2002 attached hereto.
(a)(2) A separate certification for each principal executive officer and principal financial officer of the registrant as required by Rule 30a-2(a) under the Act (17 CFR 270.30a-2).
Certifications pursuant to Rule 30a-2(a) under the Investment Company Act of 1940 are attached hereto.
(a)(3) Any written solicitation to purchase securities under Rule 23c-1 under the Act (17 CFR 270.23c-1) sent or given during the period covered by the report by or on behalf of the registrant to 10 or more persons.
Not applicable.
(b) A separate or combined certification for each principal executive officer and principal officer of the registrant as required by Rule 30a-2(b) under the Act of 1940.
Certifications pursuant to Rule 30a-2(b) under the Investment Company Act of 1940 are attached hereto.
SIGNATURES
Pursuant to the requirements of the Securities Exchange Act of 1934 and the Investment Company Act of 1940, the registrant has duly caused this report to be signed on its behalf by the undersigned, thereunto duly authorized.
J.P. Morgan Fleming Mutual Fund Group, Inc.
| | |
| By: | | /s/ Patricia A. Maleski |
| | Patricia A. Maleski President and Principal Executive Officer September 2, 2011 |
Pursuant to the requirements of the Securities Exchange Act of 1934 and the Investment Company Act of 1940, this report has been signed below by the following persons on behalf of the registrant and in the capacities and on the dates indicated.
| | |
| By: | | /s/ Patricia A. Maleski |
| | Patricia A. Maleski President and Principal Executive Officer September 2, 2011 |
| |
By: | | /s/ Joy C. Dowd |
| | Joy C. Dowd Treasurer and Principal Financial Officer September 2, 2011 |