Item 1: Report to Shareholders
 |
| Diversified Small-Cap Growth Fund | June 30, 2006 |
The views and opinions in this report were current as of June 30, 2006. They are not guarantees of performance or investment results and should not be taken as investment advice. Investment decisions reflect a variety of factors, and the managers reserve the right to change their views about individual stocks, sectors, and the markets at any time. As a result, the views expressed should not be relied upon as a forecast of the fund’s future investment intent. The report is certified under the Sarbanes-Oxley Act of 2002, which requires mutual funds and other public companies to affirm that, to the best of their knowledge, the information in their financial reports is fairly and accurately stated in all material respects.
REPORTS ON THE WEB
Sign up for our E-mail Program, and you can begin to receive updated fund reports and prospectuses online rather than through the mail. Log in to your account at troweprice.com for more information.
Fellow Shareholders
Small-cap growth stocks generally rose in the first half of 2006, but a sharp stock market decline from mid-May to mid-June erased a large portion of their earlier gains. Investor sentiment—which had been favorable amid hopes that the Federal Reserve would soon stop increasing short-term interest rates—deteriorated rapidly in mid-May due to concerns that rising inflation would force the central bank to raise rates more than investors had expected, which, in turn, could crimp economic and corporate profit growth. In response, investors became risk averse and shunned traditional growth stocks and other aggressive investments.
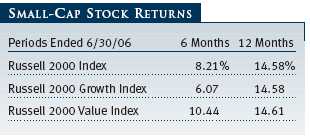
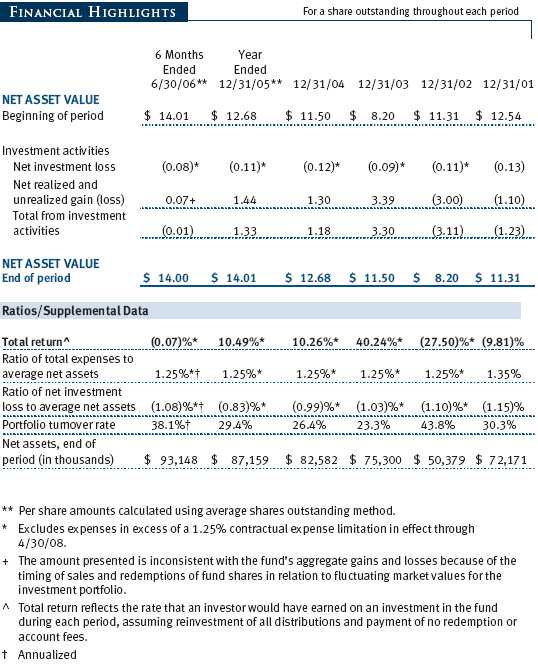
Your fund returned -0.07% in the first half of our fiscal year and 8.53% for the 12-month period ended June 30, 2006. As shown in the Performance Comparison table, the fund significantly trailed its benchmarks in both periods. The fund’s disappointing relative performance primarily reflects weak stock selection, particularly among health care and information technology companies, in the last six months. Also, our broad diversification and conservative investment approach, which limited our gains as stocks rose strongly through the end of April, failed to provide much of a cushion as investors indiscriminately discarded growth stocks—both high and low quality—in May and June.

MARKET ENVIRONMENT
The economy accelerated at the beginning of 2006, expanding at a robust annualized rate of 5.6% in the first quarter versus a sluggish 1.7% in the final quarter of 2005 following last year’s hurricane assault on the Gulf Coast. In the second quarter, however, growth has shown signs of moderating. Consumer spending has been decelerating amid rising interest rates and stubbornly high oil and gas prices. Also, gradually rising mortgage rates have helped cool the housing market without a significant economic disruption, and job growth has softened. On the other hand, business investment has been strong, manufacturing activity seems healthy, and the unemployment rate dipped to a cyclical low of 4.6% in May and June.
Although inflation has been mostly contained, Federal Reserve officials have expressed concerns that the strong economy and heightened commodity prices could push inflation higher. In recent weeks, Fed officials have increasingly noted that certain measures of inflation are at or above the upper end of their comfort zones. In response, the central bank—now led by Ben Bernanke following Alan Greenspan’s retirement at the end of January—raised the federal funds target rate in the last six months from 4.25% to 5.25%, a level the short-term benchmark has not seen in five years. The central bank has now lifted the target rate 17 times since mid-2004.
Small-cap shares surpassed their larger peers in the first half, though they surrendered a significant part of their performance advantage during the May-June sell-off. The small-cap Russell 2000 Index returned 8.21% versus 2.70% for the S&P 500 Index. As measured by various Russell indexes, value stocks did better than growth across all market capitalizations.
In the small-cap growth universe, most sectors produced positive returns in the first half of the year, despite the recent stock market pullback. Industrials and business services companies did very well, buoyed by the strong economy. Energy and materials stocks also produced excellent returns, as prices of oil and other commodities reached their highest levels in a generation, though these sectors have relatively low representation in our opportunity set. Most other segments generated moderate gains, but the information technology and health care sectors declined slightly.
PORTFOLIO REVIEW
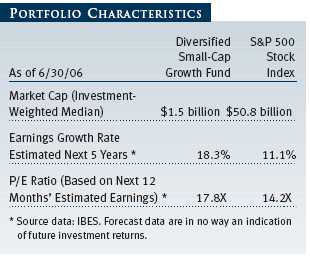
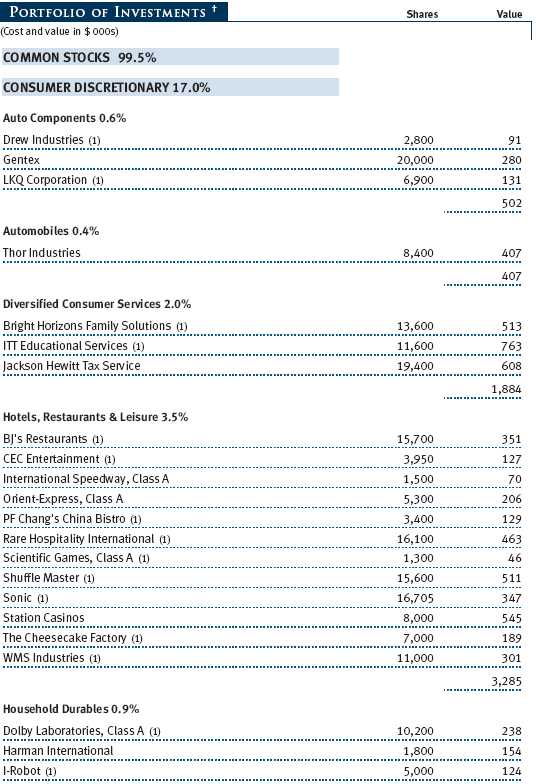
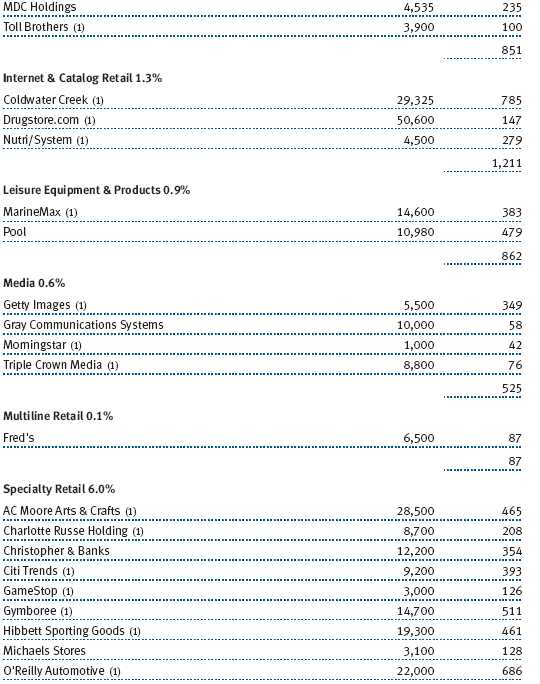
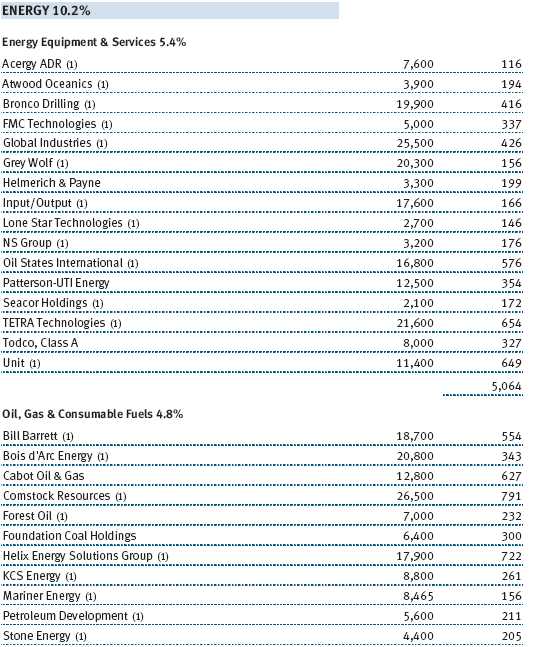
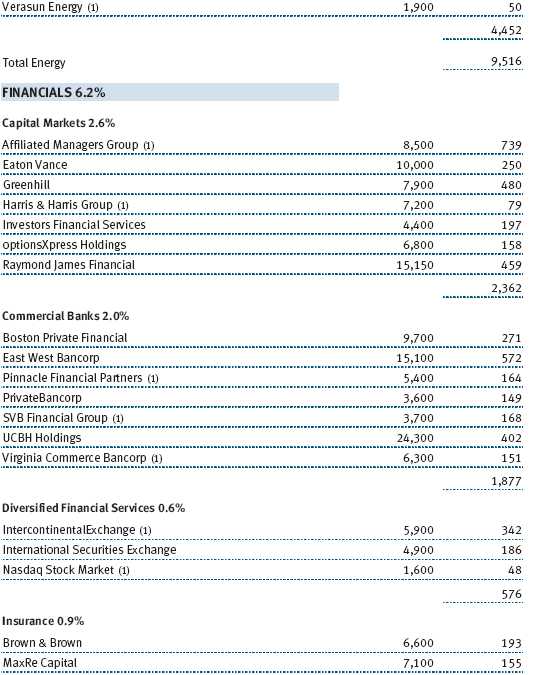
The Diversified Small-Cap Growth Fund provides a means for investors to gain exposure to the broad small-cap growth universe. It invests in a wide array of small-cap companies whose earnings are likely to grow at an above-average rate over time. As of June 30, the fund owned approximately 300 companies, and very few holdings represented more than 1.0% of fund assets. This level of diversification helps us manage the risks of investing in small-cap growth companies. We use rigorous proprietary research and analysis to find and monitor portfolio holdings, and we use quantitative tools to structure the portfolio so that its sector allocations and other characteristics are similar to those of various small-cap growth benchmarks. This is not an index fund; occasionally, we will overweight or underweight some sectors based on their prospects or valuations.
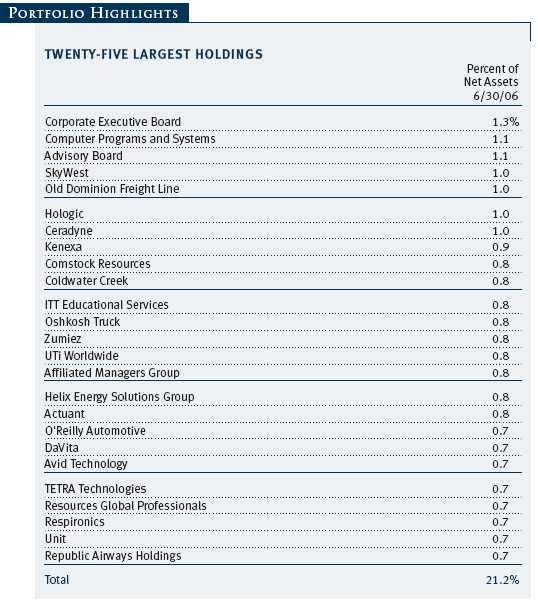
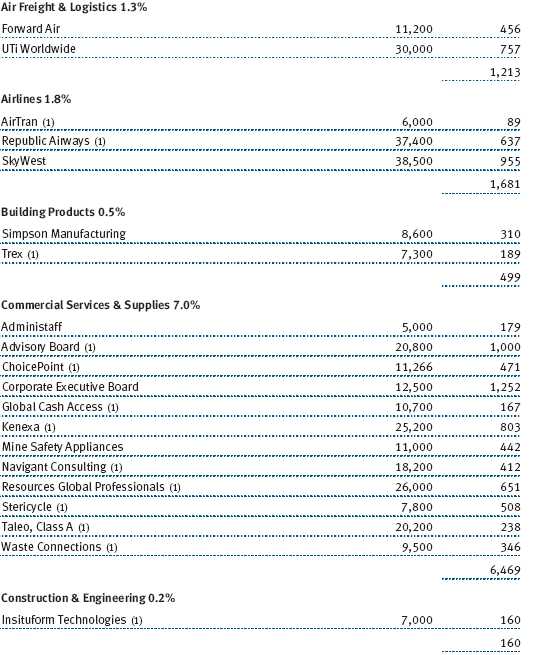
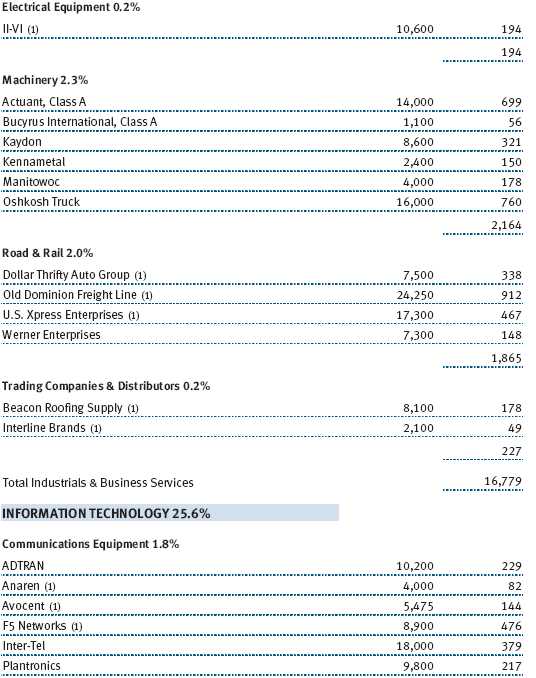
The industrials and business services sector (18.0% of fund assets as of June 30) contributed the most to the fund’s absolute performance in our reporting period. Despite high fuel costs, road and rail stocks did best, particularly trucking company Old Dominion Freight Line, which surged nearly 40% amid increased shipping volume and higher prices. Commercial services and supply companies also did well, led by Kenexa, which offers products and services to help companies recruit and retain employees, and longtime holding Corporate Executive Board, which is our largest holding (1.3% of assets). On the downside, our relatively large position in air freight and logistics company UTi Worldwide (0.8% of assets), which is not in our Russell benchmark, struggled amid declining profit margins and high fuel costs, thus hurting our relative performance. (Please refer to the fund’s portfolio of investments for a complete listing of the fund’s holdings and the amount each represents in the portfolio.)
Our consumer discretionary holdings (17.0% of assets) generally produced gains in the last six months. Education-related companies (in the diversified consumer services industry) performed well, as did specialty retailers Zumiez (which sells sports apparel) and Gymboree and Internet and catalog retailers Coldwater Creek and Sportsman’s Guide, an online seller of sporting goods that we eliminated after the company received a takeover offer. However, other industries were lackluster. Media stocks continued to disappoint, and we eliminated several radio broadcasters as it became clear that the industry—given heightened competition from Internet media and satellite radio—is facing significant long-term challenges.
The energy sector also contributed to the fund’s performance in absolute terms, though gains were shaved significantly by the sharp mid-May to mid-June sell-off. Unfortunately, weak stock selection in the sector, which was one of the strongest in the Russell benchmark, limited our gains during the first half of the year. Specifically, owning stocks that fell substantially and are not part of the benchmark, such as Patterson-UTI Energy and Bill Barrett, hurt our relative performance. Not owning companies that rose strongly was also disadvantageous. We increased the sector’s representation in the fund from roughly 6% to 10% in the last six months—which is now a meaningful overweight versus the benchmark’s 7% allocation—because we believe that heightened energy prices and demand will continue for some time, which bodes well for the sector.
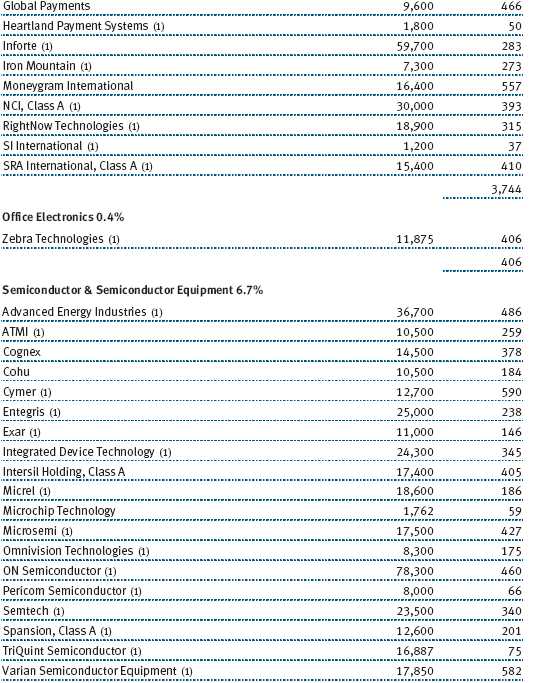
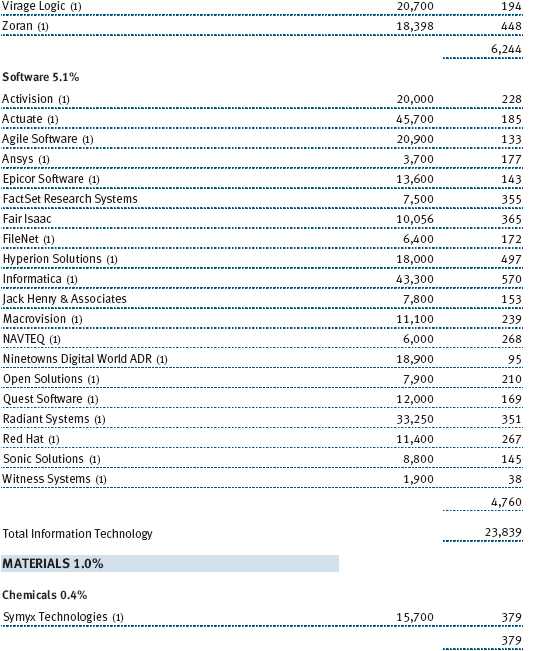
Information technology stocks (25.6% of assets) generally detracted from our absolute performance, though electronic equipment and instrument companies bucked the negative trend, led by TTM Technologies, which makes printed circuit boards, and Color Kinetics, a maker of LED lighting systems. Makers of computers and peripherals did worst, led by Avid Technology, which tumbled nearly 40%. This maker of hardware and software products used in digital media production reported weaker-than-expected earnings amid slackening sales. In the communications equipment segment, our holdings did not perform as well as other companies that we did not own, although Packeteer did well. Similarly, semiconductor companies Zoran and Cymer performed favorably, but our lack of exposure to others that also did well hurt our relative results. In addition, software companies Hyperion Solutions and Fair Isaac, which are not part of the Russell benchmark, were notable detractors.
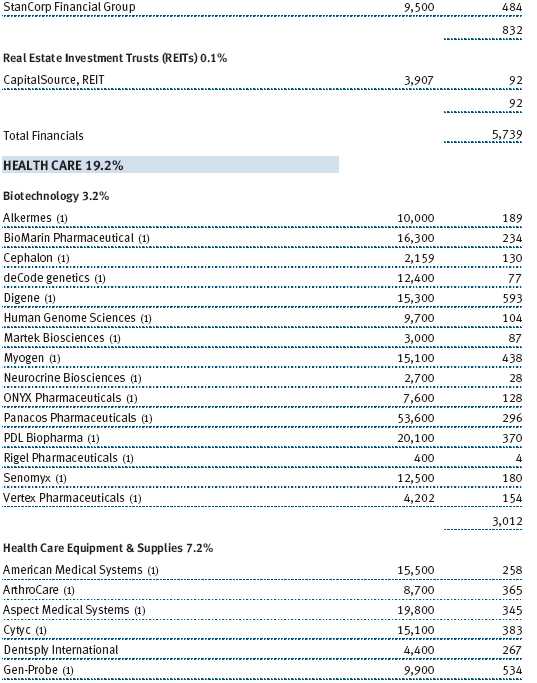
The health care sector (19.2% of assets) detracted the most from fund performance in absolute terms and, due to poor stock selection, substantially hurt our relative performance. Most underlying industries declined, led by health care providers and service companies, particularly Matria Healthcare and Omnicare. Biotechnology shares also fell, though Digene performed well. Equipment and supply companies contributed substantially to our underperformance, with Aspect Medical Systems and Thoratec among our weakest holdings in the entire portfolio.
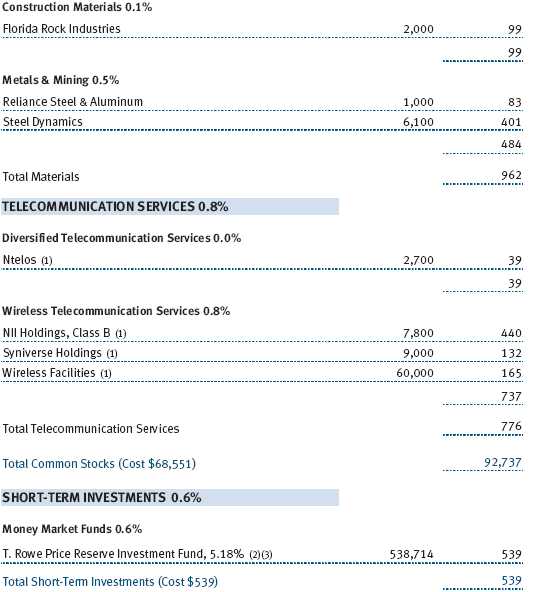
Two sectors with very low representation in our fund—consumer staples (1.5% of assets) and materials (1.1% of assets)—each had a major contributor to our performance that we would like to highlight. In the former, organic and specialty foods company SunOpta surged more than 75%. The Toronto-based company benefited from growing demand for ethanol, a cleaner burning gasoline substitute that can be made from corn and other natural feedstocks. In the latter, Steel Dynamics advanced more than 80%, thanks to favorable earnings, strong demand, and global industry consolidation.
OUTLOOK
Small-cap shares, which lagged large-caps in the second quarter, remain ahead of large-caps for the year-to-date period and have significantly outperformed for seven years. This is now one of the longest small-cap outperformance cycles in modern market history. Considering that the average length of such cycles is five years, it is increasingly likely that large-cap shares will soon take the lead, particularly if aversion to investment risks lingers for some time. We are disappointed with the poor performance of small-cap growth stocks in recent months, but we still believe that, as economic growth moderates, investors will show greater interest in stocks of companies that can produce strong and steady earnings growth over the long term.
Respectfully submitted,

Paul W. Wojcik
Chairman of the fund’s Investment Advisory Committee
July 17, 2006
The committee chairman has day-to-day responsibility for managing the portfolio and works with committee members in developing and executing the fund’s investment program.
RISKS OF INVESTING
As with all stock mutual funds, the fund’s share price can fall because of weakness in the stock market, a particular industry, or specific holdings. Stock markets can decline for many reasons, including adverse political or economic developments, changes in investor psychology, or heavy institutional selling. The prospects for an industry or company may deteriorate because of a variety of factors, including disappointing earnings or changes in the competitive environment. In addition, the investment manager’s assessment of companies held in a fund may prove incorrect, resulting in losses or poor performance even in rising markets.
Growth stocks can be volatile for several reasons. Since these companies usually invest a high portion of earnings in their businesses, they may lack the dividends of value stocks that can cushion stock prices in a falling market. Also, earnings disappointments often lead to sharply falling prices because investors buy growth stocks in anticipation of superior earnings growth.
Investing in small companies involves greater risk than is customarily associated with larger companies. Stocks of smaller companies are subject to more abrupt or erratic price movements than larger-company stocks. Small companies often have limited product lines, markets, or financial resources, and their managements may lack depth and experience. Such companies seldom pay significant dividends that could cushion returns in a falling market.
GLOSSARY
Fed funds target rate: An overnight lending rate set by the Federal Reserve and used by banks to meet reserve requirements. Banks also use the fed funds rate as a benchmark for their prime lending rates.
Inflation: A sustained increase in prices throughout the economy.
Lipper indexes: Consist of a small number (10 to 30) of the largest mutual funds in a particular category as tracked by Lipper Inc.
Price/earnings (P/E) ratio: A ratio that shows the “multiple” of earnings at which a stock is selling. It is calculated by dividing a stock’s current price by its current earnings per share. For example, if a stock’s price is $60 per share and the issuing company earns $2 per share, the P/E ratio is $60/$2, or 30.
Russell 2000 Growth Index: Measures the performance of those Russell 2000 companies with higher price-to-book ratios and higher forecasted growth values.
Russell 2000 Index: Tracks the stocks of 2,000 small U.S. companies.
Russell 2000 Value Index: Measures the performance of those Russell 2000 companies with lower price-to-book ratios and lower forecasted growth values.
S&P 500 Stock Index: Tracks the stocks of 500 primarily large U.S. companies.

| GROWTH OF $10,000 |
This chart shows the value of a hypothetical $10,000 investment in the fund over the past 10 fiscal year periods or since inception (for funds lacking 10-year records). The result is compared with benchmarks, which may include a broad-based market index and a peer group average or index. Market indexes do not include expenses, which are deducted from fund returns as well as mutual fund averages and indexes.
| AVERAGE ANNUAL COMPOUND TOTAL RETURN |
This table shows how the fund would have performed each year if its actual (or cumulative) returns for the periods shown had been earned at a constant rate.

| FUND EXPENSE EXAMPLE |
As a mutual fund shareholder, you may incur two types of costs: (1) transaction costs, such as redemption fees or sales loads, and (2) ongoing costs, including management fees, distribution and service (12b-1) fees, and other fund expenses. The following example is intended to help you understand your ongoing costs (in dollars) of investing in the fund and to compare these costs with the ongoing costs of investing in other mutual funds. The example is based on an investment of $1,000 invested at the beginning of the most recent six-month period and held for the entire period.
Actual Expenses
The first line of the following table (“Actual”) provides information about actual account values and actual expenses. You may use the information in this line, together with your account balance, to estimate the expenses that you paid over the period. Simply divide your account value by $1,000 (for example, an $8,600 account value divided by $1,000 = 8.6), then multiply the result by the number in the first line under the heading “Expenses Paid During Period” to estimate the expenses you paid on your account during this period.
Hypothetical Example for Comparison Purposes
The information on the second line of the table (“Hypothetical”) is based on hypothetical account values and expenses derived from the fund’s actual expense ratio and an assumed 5% per year rate of return before expenses (not the fund’s actual return). You may compare the ongoing costs of investing in the fund with other funds by contrasting this 5% hypothetical example and the 5% hypothetical examples that appear in the shareholder reports of the other funds. The hypothetical account values and expenses may not be used to estimate the actual ending account balance or expenses you paid for the period.
Note: T. Rowe Price charges an annual small-account maintenance fee of $10, generally for accounts with less than $2,000 ($500 for UGMA/UTMA). The fee is waived for any investor whose T. Rowe Price mutual fund accounts total $25,000 or more, accounts employing automatic investing, and IRAs and other retirement plan accounts that utilize a prototype plan sponsored by T. Rowe Price (although a separate custodial or administrative fee may apply to such accounts). This fee is not included in the accompanying table. If you are subject to the fee, keep it in mind when you are estimating the ongoing expenses of investing in the fund and when comparing the expenses of this fund with other funds.
You should also be aware that the expenses shown in the table highlight only your ongoing costs and do not reflect any transaction costs, such as redemption fees or sales loads. Therefore, the second line of the table is useful in comparing ongoing costs only and will not help you determine the relative total costs of owning different funds. To the extent a fund charges transaction costs, however, the total cost of owning that fund is higher.

Unaudited
The accompanying notes are an integral part of these financial statements.
Unaudited


The accompanying notes are an integral part of these financial statements.
Unaudited
The accompanying notes are an integral part of these financial statements.
Unaudited
The accompanying notes are an integral part of these financial statements.
Unaudited
The accompanying notes are an integral part of these financial statements.
Unaudited
| NOTES TO FINANCIAL STATEMENTS |
NOTE 1 - SIGNIFICANT ACCOUNTING POLICIES
T. Rowe Price Diversified Small-Cap Growth Fund, Inc. (the fund), is registered under the Investment Company Act of 1940 (the 1940 Act) as a diversified, open-end management investment company. The fund commenced operations on June 30, 1997. The fund seeks long-term growth of capital by investing primarily in common stocks of small growth companies.
The accompanying financial statements were prepared in accordance with accounting principles generally accepted in the United States of America, which require the use of estimates made by fund management. Fund management believes that estimates and security valuations are appropriate; however, actual results may differ from those estimates, and the security valuations reflected in the financial statements may differ from the value the fund ultimately realizes upon sale of the securities.
Valuation The fund values its investments and computes its net asset value per share at the close of the New York Stock Exchange (NYSE), normally 4 p.m. ET, each day that the NYSE is open for business. Equity securities listed or regularly traded on a securities exchange or in the over-the-counter (OTC) market are valued at the last quoted sale price or, for certain markets, the official closing price at the time the valuations are made, except for OTC Bulletin Board securities, which are valued at the mean of the latest bid and asked prices. A security that is listed or traded on more than one exchange is valued at the quotation on the exchange determined to be the primary market for such security. Listed securities not traded on a particular day are valued at the mean of the latest bid and asked prices for domestic securities and the last quoted sale price for international securities.
Investments in mutual funds are valued at the mutual fund’s closing net asset value per share on the day of valuation.
Other investments, including restricted securities, and those for which the above valuation procedures are inappropriate or are deemed not to reflect fair value are stated at fair value as determined in good faith by the T. Rowe Price Valuation Committee, established by the fund’s Board of Directors.
Rebates and Credits Subject to best execution, the fund may direct certain security trades to brokers who have agreed to rebate a portion of the related brokerage commission to the fund in cash. Commission rebates are reflected as realized gain on securities in the accompanying financial statements and totaled $4,000 for the six months ended June 30, 2006. Additionally, the fund earns credits on temporarily uninvested cash balances at the custodian that reduce the fund’s custody charges. Custody expense in the accompanying financial statements is presented before reduction for credits.
Redemption Fees A 1% fee is assessed on redemptions of fund shares held less than 90 days/3 months to deter short-term trading and to protect the interests of long-term shareholders. Redemption fees are withheld from proceeds that shareholders receive from the sale or exchange of fund shares. The fees are paid to the fund, and are recorded as an increase to paid-in capital. The fees may cause the redemption price per share to differ from the net asset value per share.
Investment Transactions, Investment Income, and Distributions Income and expenses are recorded on the accrual basis. Dividends received from mutual fund investments are reflected as dividend income; capital gain distributions are reflected as realized gain/loss. Dividend income and capital gain distributions are recorded on the ex-dividend date. Investment transactions are accounted for on the trade date. Realized gains and losses are reported on the identified cost basis. Distributions to shareholders are recorded on the ex-dividend date. Income distributions are declared and paid on an annual basis. Capital gain distributions, if any, are declared and paid by the fund, typically on an annual basis.
NOTE 2 - INVESTMENT TRANSACTIONS
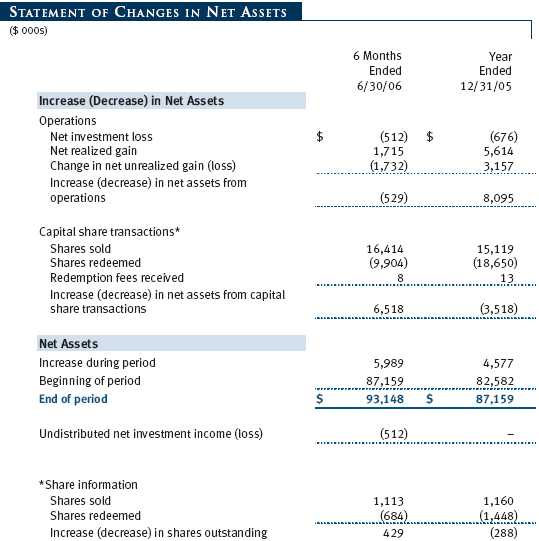
Purchases and sales of portfolio securities, other than short-term securities, aggregated $25,528,000 and $17,936,000, respectively, for the six months ended June 30, 2006.
NOTE 3 - FEDERAL INCOME TAXES
No provision for federal income taxes is required since the fund intends to continue to qualify as a regulated investment company under Subchapter M of the Internal Revenue Code and distribute to shareholders all of its taxable income and gains. Federal income tax regulations differ from generally accepted accounting principles; therefore, distributions determined in accordance with tax regulations may differ in amount or character from net investment income and realized gains for financial reporting purposes. Financial reporting records are adjusted for permanent book/tax differences to reflect tax character. Financial records are not adjusted for temporary differences. The amount and character of tax-basis distributions and composition of net assets are finalized at fiscal year-end; accordingly, tax-basis balances have not been determined as of June 30, 2006.
The fund intends to retain realized gains to the extent of available capital loss carryforwards. As of December 31, 2005, the fund had $8,899,000 of unused capital loss carryforwards, of which $6,520,000 expire in 2010 and $2,379,000 expire in 2011.
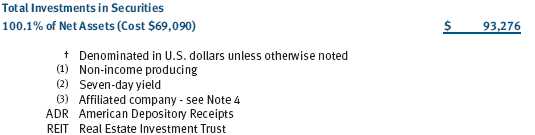
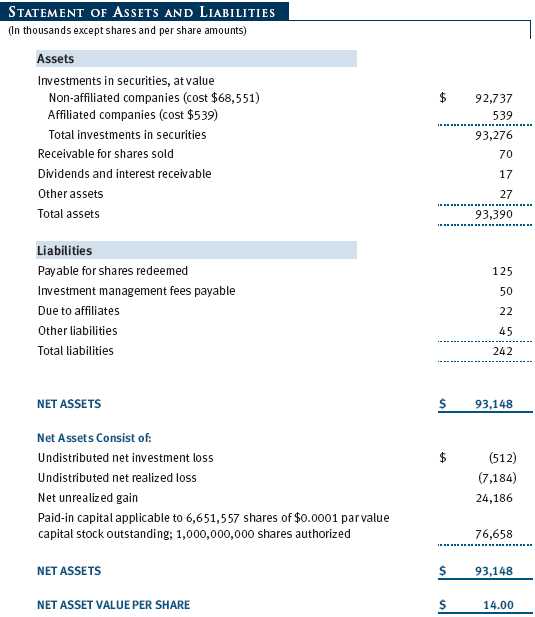
At June 30, 2006, the cost of investments for federal income tax purposes was $69,090,000. Net unrealized gain aggregated $24,186,000 at period-end, of which $27,766,000 related to appreciated investments and $3,580,000 related to depreciated investments.
NOTE 4 - RELATED PARTY TRANSACTIONS
The fund is managed by T. Rowe Price Associates, Inc. (the manager or Price Associates), a wholly owned subsidiary of T. Rowe Price Group, Inc. The investment management agreement between the fund and the manager provides for an annual investment management fee, which is computed daily and paid monthly. The fee consists of an individual fund fee, equal to 0.35% of the fund’s average daily net assets, and a group fee. The group fee rate is calculated based on the combined net assets of certain mutual funds sponsored by Price Associates (the group) applied to a graduated fee schedule, with rates ranging from 0.48% for the first $1 billion of assets to 0.29% for assets in excess of $160 billion. The fund’s group fee is determined by applying the group fee rate to the fund’s average daily net assets. At June 30, 2006, the effective annual group fee rate was 0.31%.
The fund is also subject to a contractual expense limitation through April 30, 2008. During the limitation period, the manager is required to waive its management fee and reimburse the fund for any expenses, excluding interest, taxes, brokerage commissions, and extraordinary expenses, that would otherwise cause the fund’s ratio of total expenses to average net assets (expense ratio) to exceed its expense limitation of 1.25%. The fund is required to repay the manager for expenses previously reimbursed and management fees waived to the extent the fund’s net assets have grown or expenses have declined sufficiently to allow repayment without causing the fund’s expense ratio to exceed its expense limitation. However, no repayment will be made more than three years after the date of any reimbursement or waiver or later than April 30, 2010. Pursuant to this agreement, management fees in the amount of $26,000 were repaid during the six months ended June 30, 2006. Including these a mounts, management fees waived in the amount of $31,000 remain subject to repayment by the fund at June 30, 2006.
In addition, the fund has entered into service agreements with Price Associates and two wholly owned subsidiaries of Price Associates (collectively, Price). Price Associates computes the daily share price and provides certain other administrative services to the fund. T. Rowe Price Services, Inc., provides shareholder and administrative services in its capacity as the fund’s transfer and dividend disbursing agent. T. Rowe Price Retirement Plan Services, Inc., provides subaccounting and recordkeeping services for certain retirement accounts invested in the fund. For the six months ended June 30, 2006, expenses incurred pursuant to these service agreements were $33,000 for Price Associates, $108,000 for T. Rowe Price Services, Inc., and $1,000 for T. Rowe Price Retirement Plan Services, Inc. The total amount payable at period-end pursuant to these service agreements is reflected as Due to Affiliates in the accompanying financial statements.
The fund may invest in the T. Rowe Price Reserve Investment Fund and the T. Rowe Price Government Reserve Investment Fund (collectively, the T. Rowe Price Reserve Funds), open-end management investment companies managed by Price Associates and affiliates of the fund. The T. Rowe Price Reserve Funds are offered as cash management options to mutual funds, trusts, and other accounts managed by Price Associates and/or its affiliates, and are not available for direct purchase by members of the public. The T. Rowe Price Reserve Funds pay no investment management fees. During the six months ended June 30, 2006, dividend income from the T. Rowe Price Reserve Funds totaled $49,000, and the value of shares of the T. Rowe Price Reserve Funds held at June 30, 2006, and December 31 2005, was $539,000 and $1,137,000, respectively.
As of June 30, 2006, T. Rowe Price Group, Inc. and/or its wholly owned subsidiaries owned 107,206 shares of the fund, representing 2% of the fund’s net assets.
| INFORMATION ON PROXY VOTING POLICIES, PROCEDURES, AND RECORDS |
A description of the policies and procedures used by T. Rowe Price funds and portfolios to determine how to vote proxies relating to portfolio securities is available in each fund’s Statement of Additional Information, which you may request by calling 1-800-225-5132 or by accessing the SEC’s Web site, www.sec.gov. The description of our proxy voting policies and procedures is also available on our Web site, www.troweprice.com. To access it, click on the words “Company Info” at the top of our homepage for individual investors. Then, in the window that appears, click on the “Proxy Voting Policy” navigation button in the top left corner.
Each fund’s most recent annual proxy voting record is available on our Web site and through the SEC’s Web site. To access it through our Web site, follow the directions above, then click on the words “Proxy Voting Record” at the bottom of the Proxy Voting Policy page.
| HOW TO OBTAIN QUARTERLY PORTFOLIO HOLDINGS |
HOW TO OBTAIN QUARTERLY PORTFOLIO HOLDINGS
The fund files a complete schedule of portfolio holdings with the Securities and Exchange Commission for the first and third quarters of each fiscal year on Form N-Q. The fund’s Form N-Q is available electronically on the SEC’s Web site (www.sec.gov); hard copies may be reviewed and copied at the SEC’s Public Reference Room, 450 Fifth St. N.W., Washington, DC 20549. For more information on the Public Reference Room, call 1-800-SEC-0330.
| APPROVAL OF INVESTMENT MANAGEMENT AGREEMENT |
On March 8, 2006, the fund’s Board of Directors unanimously approved the investment advisory contract (Contract) between the fund and its investment manager, T. Rowe Price Associates, Inc. (Manager). The Board considered a variety of factors in connection with its review of the Contract, also taking into account information provided by the Manager during the course of the year, as discussed below:
Services Provided by the Manager
The Board considered the nature, quality, and extent of the services provided to the fund by the Manager. These services included, but were not limited to, management of the fund’s portfolio and a variety of activities related to portfolio management. The Board also reviewed the background and experience of the Manager’s senior management team and investment personnel involved in the management of the fund. The Board concluded that it was satisfied with the nature, quality, and extent of the services provided by the Manager.
Investment Performance of the Fund
The Board reviewed the fund’s average annual total return over the one-, three-, and five-year and since-inception periods as well as the fund’s year-by-year returns and compared these returns with previously agreed upon comparable performance measures and market data, including those supplied by Lipper and Morningstar, which are independent providers of mutual fund data. On the basis of this evaluation and the Board’s ongoing review of investment results, the Board concluded that the fund’s performance was satisfactory.
Costs, Benefits, Profits, and Economies of Scale
The Board reviewed detailed information regarding the revenues received by the Manager under the Contract and other benefits that the Manager (and its affiliates) may have realized from its relationship with the fund, including research received under “soft dollar” agreements. The Board noted that the use of soft dollars as a means of paying for third-party, non-broker research had been eliminated. The Board also received information on the estimated costs incurred and profits realized by the Manager and its affiliates from advising T. Rowe Price mutual funds, as well as estimates of the gross profits realized from managing the fund in particular. The Board concluded that the Manager’s profits were reasonable in light of the services provided to the fund. The Board also considered whether the fund or other funds benefit under the fee levels set forth in the Contract from any economies of scale realized by the Manager. Under the Contract, the fund pays a fee to the Manager composed of two components—a group fee rate based on the aggregate assets of certain T. Rowe Price mutual funds (including the fund) that declines at certain asset levels and an individual fund fee rate that is assessed on the assets of the fund. The Board concluded that the advisory fee structure for the fund continued to provide for a reasonable sharing of benefits from any economies of scale with the fund’s investors.
Fees
The Board reviewed the fund’s management fee rate, operating expenses, and total expense ratio and compared them with fees and expenses of other comparable funds based on information and data supplied by Lipper. The information provided to the Board indicated that the fund’s management fee rate and expense ratio were generally below the median for comparable funds. The Board also reviewed the fee schedules for comparable privately managed accounts of the Manager and its affiliates. Management informed the Board that the Manager’s responsibilities for privately managed accounts are more limited than its responsibilities for the fund and other T. Rowe Price mutual funds that it or its affiliates advise. On the basis of the information provided, the Board concluded that the fees paid by the fund under the Contract were reasonable.
Approval of the Contract
As noted, the Board approved the continuation of the Contract. No single factor was considered in isolation or to be determinative to the decision. Rather, the Board concluded, in light of a weighting and balancing of all factors considered, that it was in the best interests of the fund to approve the continuation of the Contract, including the fees to be charged for services thereunder.
Item 2. Code of Ethics.
A code of ethics, as defined in Item 2 of Form N-CSR, applicable to its principal executive officer, principal financial officer, principal accounting officer or controller, or persons performing similar functions is filed as an exhibit to the registrant’s annual Form N-CSR. No substantive amendments were approved or waivers were granted to this code of ethics during the registrant’s most recent fiscal half-year.
Item 3. Audit Committee Financial Expert.
Disclosure required in registrant’s annual Form N-CSR.
Item 4. Principal Accountant Fees and Services.
Disclosure required in registrant’s annual Form N-CSR.
Item 5. Audit Committee of Listed Registrants.
Not applicable.
Item 6. Schedule of Investments.
Not applicable. The complete schedule of investments is included in Item 1 of this Form N-CSR.
Item 7. Disclosure of Proxy Voting Policies and Procedures for Closed-End Management Investment Companies.
Not applicable.
Item 8. Portfolio Managers of Closed-End Management Investment Companies.
Not applicable.
Item 9. Purchases of Equity Securities by Closed-End Management Investment Company and Affiliated Purchasers.
Not applicable.
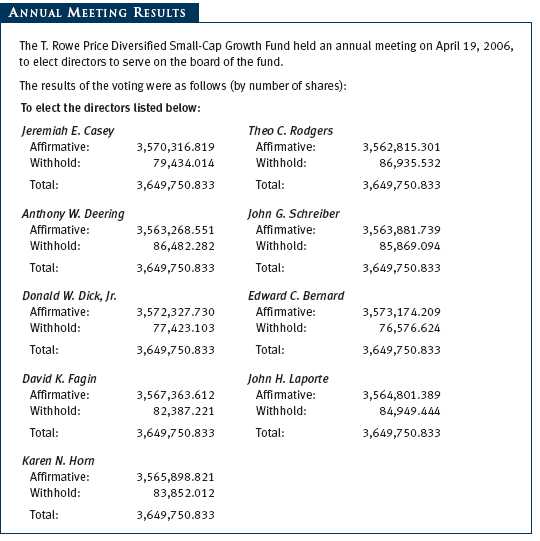
Item 10. Submission of Matters to a Vote of Security Holders.
Not applicable.
Item 11. Controls and Procedures.
(a) The registrant’s principal executive officer and principal financial officer have evaluated the registrant’s disclosure controls and procedures within 90 days of this filing and have concluded that the registrant’s disclosure controls and procedures were effective, as of that date, in ensuring that information required to be disclosed by the registrant in this Form N-CSR was recorded, processed, summarized, and reported timely.
(b) The registrant’s principal executive officer and principal financial officer are aware of no change in the registrant’s internal control over financial reporting that occurred during the registrant’s second fiscal quarter covered by this report that has materially affected, or is reasonably likely to materially affect, the registrant’s internal control over financial reporting.
Item 12. Exhibits.(a)(1) The registrant’s code of ethics pursuant to Item 2 of Form N-CSR is filed with the registrant’s annual Form N-CSR.
(2) Separate certifications by the registrant's principal executive officer and principal financial officer, pursuant to Section 302 of the Sarbanes-Oxley Act of 2002 and required by Rule 30a-2(a) under the Investment Company Act of 1940, are attached.
(3) Written solicitation to repurchase securities issued by closed-end companies: not applicable.
(b) A certification by the registrant's principal executive officer and principal financial officer, pursuant to Section 906 of the Sarbanes-Oxley Act of 2002 and required by Rule 30a-2(b) under the Investment Company Act of 1940, is attached.
SIGNATURES | |
| Pursuant to the requirements of the Securities Exchange Act of 1934 and the Investment | |
| Company Act of 1940, the registrant has duly caused this report to be signed on its behalf by the | |
| undersigned, thereunto duly authorized. | |
| T. Rowe Price Diversified Small-Cap Growth Fund, Inc. | |
| By | /s/ Edward C. Bernard |
| Edward C. Bernard | |
| Principal Executive Officer | |
| Date | August 18, 2006 |
| Pursuant to the requirements of the Securities Exchange Act of 1934 and the Investment | |
| Company Act of 1940, this report has been signed below by the following persons on behalf of | |
| the registrant and in the capacities and on the dates indicated. | |
| By | /s/ Edward C. Bernard |
| Edward C. Bernard | |
| Principal Executive Officer | |
| Date | August 18, 2006 |
| By | /s/ Joseph A. Carrier |
| Joseph A. Carrier | |
| Principal Financial Officer | |
| Date | August 18, 2006 |