| UNITED STATES |
| SECURITIES AND EXCHANGE COMMISSION |
| Washington, D.C. 20549 |
FORM N-CSR |
CERTIFIED SHAREHOLDER REPORT OF REGISTERED |
MANAGEMENT INVESTMENT COMPANIES |
| Investment Company Act File Number: 811-08203 |
| T. Rowe Price Diversified Small-Cap Growth Fund, Inc. |
| (Exact name of registrant as specified in charter) |
| 100 East Pratt Street, Baltimore, MD 21202 |
| (Address of principal executive offices) |
| David Oestreicher |
| 100 East Pratt Street, Baltimore, MD 21202 |
| (Name and address of agent for service) |
| Registrant’s telephone number, including area code: (410) 345-2000 |
| Date of fiscal year end: December 31 |
| Date of reporting period: June 30, 2008 |
Item 1: Report to Shareholders
 |
| Diversified Small-Cap Growth Fund | June 30, 2008 |
The views and opinions in this report were current as of June 30, 2008. They are not guarantees of performance or investment results and should not be taken as investment advice. Investment decisions reflect a variety of factors, and the managers reserve the right to change their views about individual stocks, sectors, and the markets at any time. As a result, the views expressed should not be relied upon as a forecast of the fund’s future investment intent. The report is certified under the Sarbanes-Oxley Act, which requires mutual funds and other public companies to affirm that, to the best of their knowledge, the information in their financial reports is fairly and accurately stated in all material respects.
REPORTS ON THE WEB
Sign up for our E-mail Program, and you can begin to receive updated fund reports and prospectuses online rather than through the mail. Log in to your account at troweprice.com for more information.
Manager’s Letter
Fellow Shareholders
U.S. stocks declined as the economy struggled in the first half of 2008, but small-cap and growth stocks held up better than their large-cap and value-oriented peers. Surging food and energy costs, tighter lending conditions, massive mortgage-related losses in the financials sector, and the continuing downturn in the housing market were some of the factors that weighed on investor sentiment and led to weaker consumer spending and corporate profit growth in some sectors. Stock market volatility reached extraordinary levels, which underscores the value of our diversified approach to the small-cap growth sector.
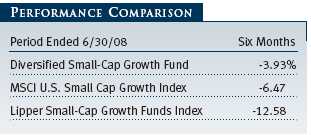
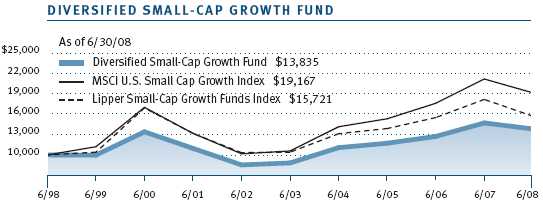
Your fund returned -3.93% in the last six months but it held up much better than its unmanaged MSCI benchmark and the Lipper peer group index, as shown in the Performance Comparison table. Fund performance relative to the MSCI index was helped by relatively good stock selection in the information technology, materials, and consumer discretionary sectors. In contrast, our industrials and business services holdings eroded our relative performance advantage. Sector allocations had very little impact on our relative results, as our allocations are very similar to those of the benchmark.
HIGHLIGHTS
• U.S. stocks declined as the economy struggled in the first half of 2008, but small-cap and growth stocks held up better than their large-cap and value-oriented peers.
• The fund declined moderately in the last six months but held up much better than its unmanaged MSCI benchmark and the Lipper peer group index, thanks to good stock selection in several sectors.
• Stock selection is based on a quantitative model, but we also consider fundamental research. In general, sector allocations are fairly consistent with those of the MSCI benchmark.
• Corporate earnings are likely to continue deteriorating, but stock valuations are favorable compared with historical norms. In this environment, we are looking for attractive stocks of companies that have been unduly punished or are growing earnings at a healthy rate.
MARKET ENVIRONMENT
Economic growth slowed significantly this year, with the gross domestic product expanding at an annualized rate of only 1.0% in the first quarter of 2008 and expectations for roughly 1.5% growth in the second quarter. The housing market continued to deteriorate, and aggregate employment fell during the first half of the year. In addition, output in manufacturing and services sectors showed little or no growth, and inflation eroded consumers’ purchasing power.
As subprime mortgage losses mounted and financial institutions cut back on lending to preserve capital and avoid additional losses, the Federal Reserve took several extraordinary actions to boost market liquidity—such as helping J.P. Morgan Chase acquire Bear Stearns and creating new credit facilities to allow investment banks and broker-dealers to borrow directly from the Fed. The central bank also aggressively reduced the fed funds target rate—an interbank lending rate that banks also use as a benchmark for their prime consumer lending rates—from 4.25% at the end of 2007 to 2.00% by the end of April. Although the economy remains weak, the Fed refrained from cutting rates at the end of June due to rising inflation.
Small-cap shares held up better than their large-cap peers: The small-cap Russell 2000 Index returned -9.37% versus -11.91% for the large-cap S&P 500 Index. As measured by various Russell indexes, growth stocks outperformed value across all market capitalizations.
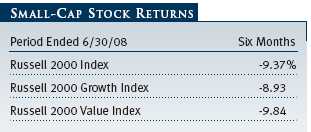
Most major sectors in the small-cap growth universe, as measured by the MSCI U.S. Small Cap Growth Index, declined in the last six months, but energy stocks surged as oil prices climbed to $140 per barrel. Industrials and business services, consumer staples, and materials stocks posted relatively mild declines. Financials and consumer discretionary shares were among the worst performers.
PORTFOLIO REVIEW
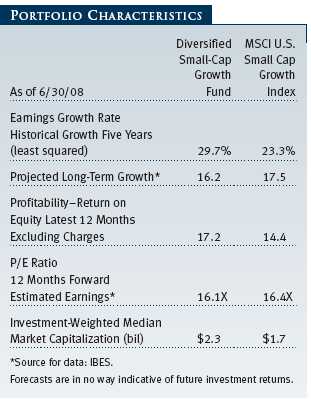
Before we discuss the portfolio’s six-month performance in detail, we would like to welcome new shareholders to the fund and thank our longer-term investors for their confidence in our investment management capabilities. For the benefit of all investors, we would like to highlight the characteristics of the companies in which we invest and describe our investment process so that shareholders can better understand our approach to investing in the small-cap growth universe:
• We favor companies that have a high return on capital and use cash flows wisely in a manner that benefits shareholders. We prefer companies that generate substantial free cash flow.
• We seek companies with good earnings quality and sustainable growth characteristics.
• We look for companies with attractive valuations relative to other firms in the same industry and relative to the small-cap growth universe as a whole. We like companies with reasonable valuations relative to their earnings and sales growth rates.
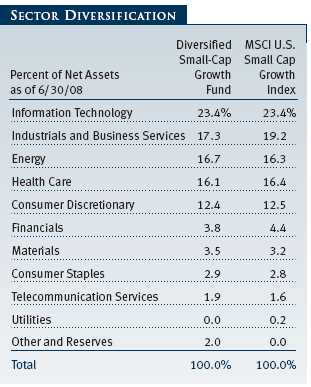
While our stock selection is based on a quantitative model, we do take into consideration the fundamental research done by T. Rowe Price’s equity analysts. In constructing the portfolio, we do not usually make big sector bets, but we will occasionally overweight or underweight certain sectors based on our analysis. In general, sector allocations will be fairly consistent with those of the MSCI benchmark, as shown in the table on page 5.
Our strategy is to try to outperform our benchmark by owning a large number of good stocks instead of making large investments in a small number of stocks. The portfolio usually holds approximately 300 to 320 names, with very few positions representing more than 1% of the fund’s net assets. This level of diversification should help manage the risk of investing in small-cap growth stocks. Cash reserves are a drag on performance over the long run, so we keep our cash position low. Trading is another cost that reduces returns, so we trade electronically and in low-cost venues when possible.
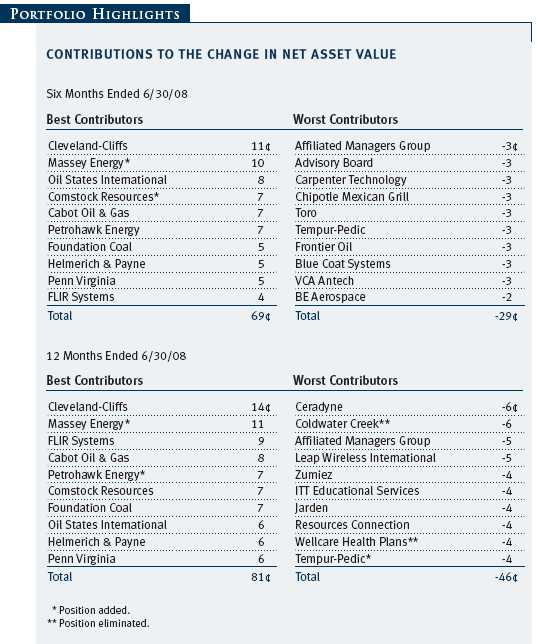
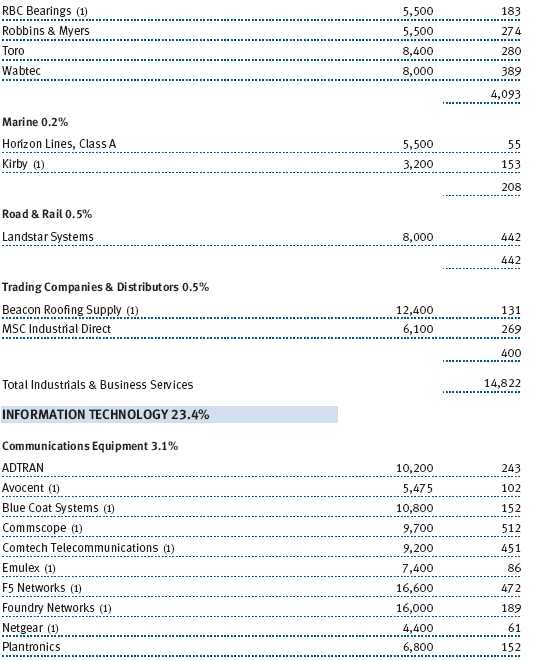
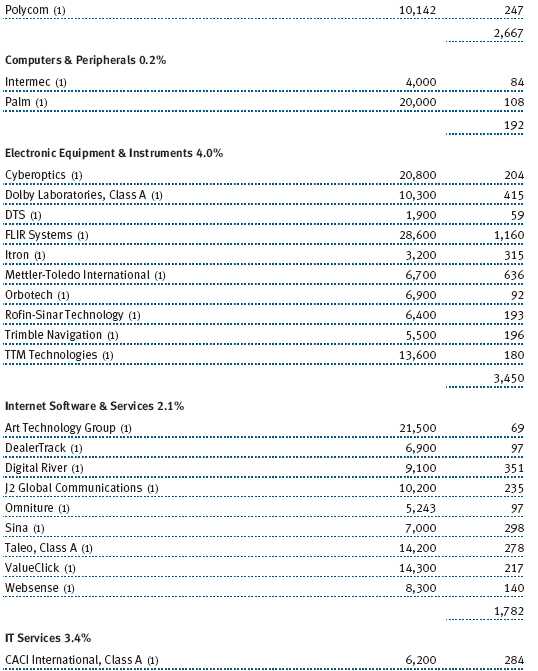
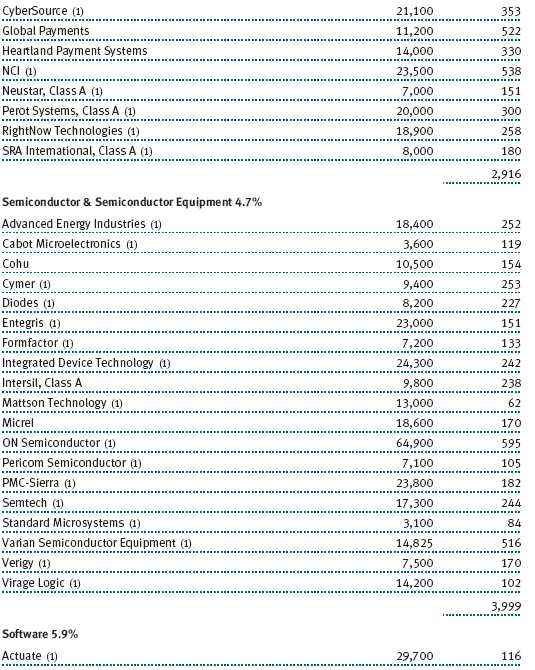
Stocks in the information technology (IT) sector, our largest sector weighting at the end of June, declined significantly in the first half of the year, but good stock selection in the sector contributed to the fund’s outperformance. For example, IT services company NCI, which designs and installs network systems for government agencies, performed well due to favorable first-quarter earnings and increased business, including a $94 million task order from the U.S. Army. Avoiding semiconductor companies that fared worse than our holdings was also helpful. In addition, our position in FLIR Systems, which makes infrared imaging cameras for commercial and military use, greatly added value. The company—our largest holding as of June 30, 2008—was recently awarded a large contract to develop a sensor system for the U.S. Army Space and Missile Defense Command. (Please refer to the fund’s portfolio of investments for a complete listing of holdings and the amount each represents in the portfolio.)
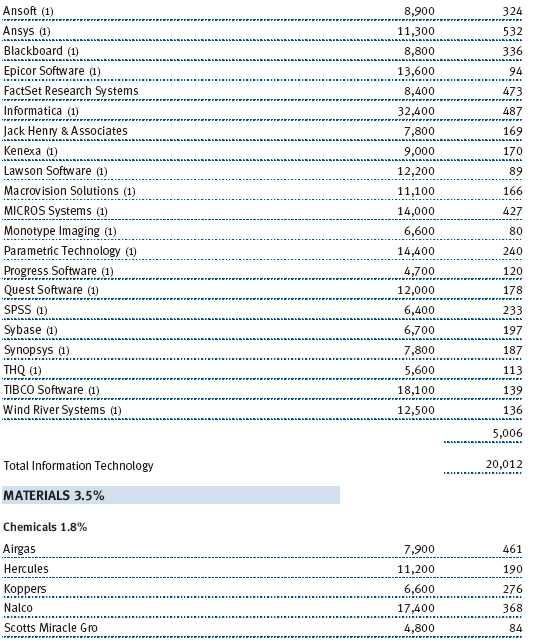
The materials sector, one of the smallest in the benchmark, declined in the last six months, though losses were mitigated somewhat by rising commodity prices. Good stock selection contributed to the fund’s relative performance advantage. Our best performer in the entire portfolio was mining company Cleveland-Cliffs, a producer of iron ore pellets and a major supplier of metallurgical coal to the steel industry. Shares soared due to global demand for its products, which resulted in significant price increases for iron ore and coal. Chemical company Airgas also did well; the company distributes specialty gases to a variety of industries, including food products, utilities, mining, and transportation.
Consumer discretionary stocks slumped in the last six months, as rising energy and food prices crimped spending on nonessentials. Hotels, restaurants, and gaming companies were among the hardest hit, led by Chipotle Mexican Grill. Specialty retailers also struggled, but good stock selection worked to our advantage. Children’s apparel retailer Gymboree bucked the negative trend among retailers, reporting a significant increase in same-store sales in the first quarter. Our diversified providers of consumer services outperformed other industries. One of our best performers in this segment was child-care center operator Bright Horizons Family Solutions, which surged as Bain Capital offered a significant premium to buy the company and take it private.
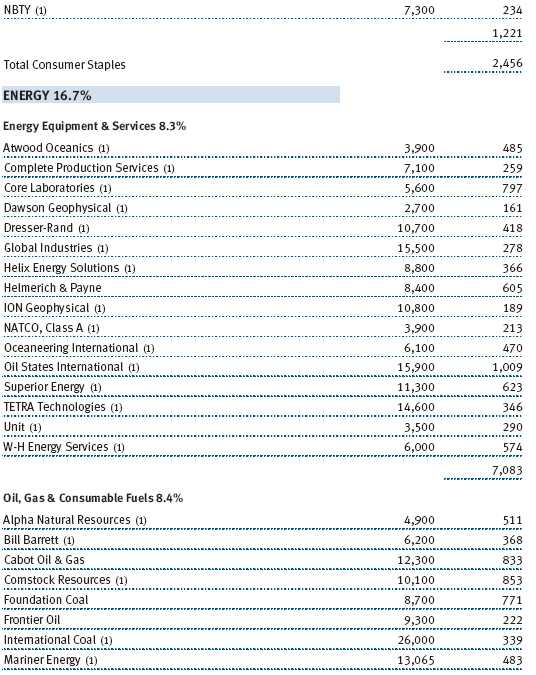
Energy stocks produced excellent returns in the last six months, as global demand for energy commodities remained solid. Our stock selection was favorable, and most of our holdings—oil and gas businesses, coal producers, and energy equipment companies—were among the portfolio’s best performers. In fact, our second-largest performance contributor in absolute terms was coal company Massey Energy, which we added to the fund and which returned well over 100% in the last six months.
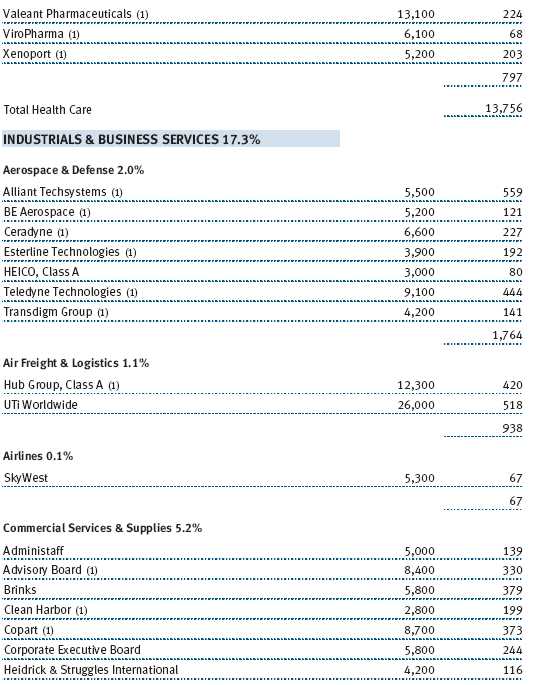
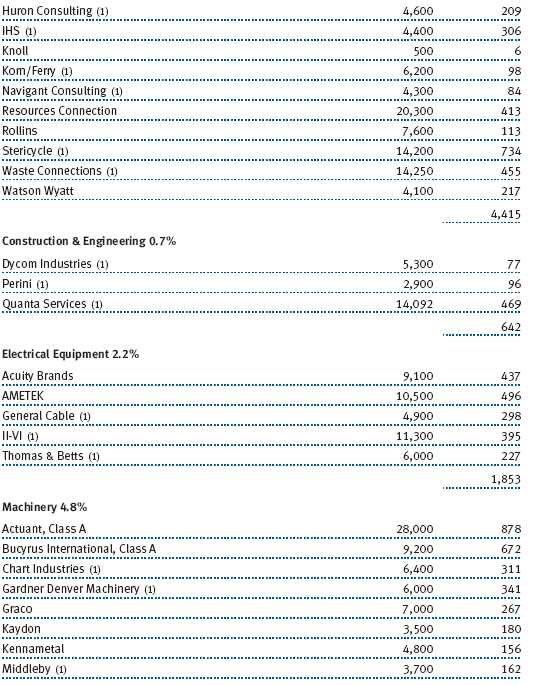
The industrials and business services sector declined as the economy weakened in the first half of the year, and weak stock selection in the sector reduced our performance advantage versus the MSCI benchmark. Our commercial services and supply companies performed worst, led by Advisory Board. The company, which provides best-practices research and decision-support systems to health care businesses, sagged after tempering its earnings outlook and making an acquisition that was not well-received by the market. Aerospace and defense stocks also lost altitude, led by BE Aerospace and Ceradyne, a maker of ceramic products for the military. In addition, several of our machinery stocks fell sharply, which weighed on our results.
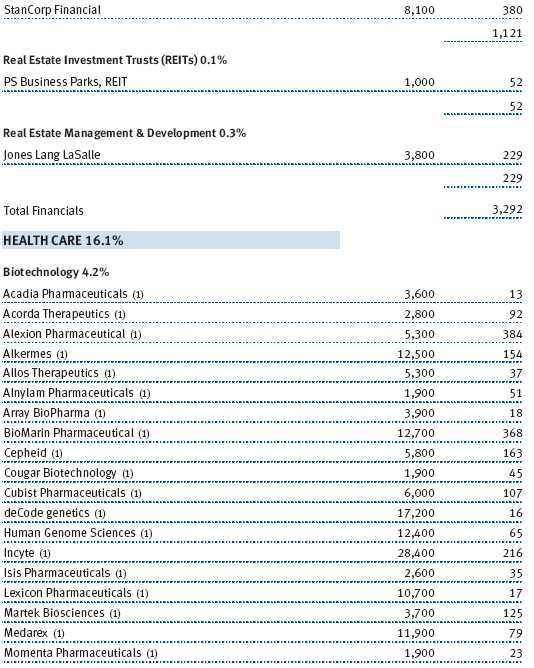
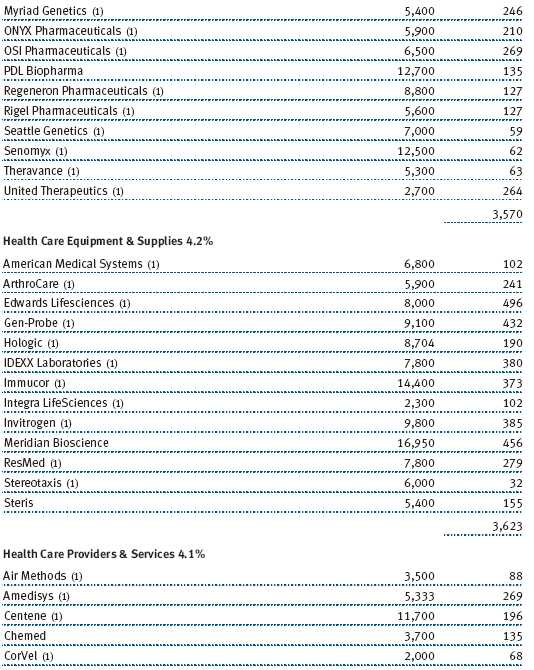
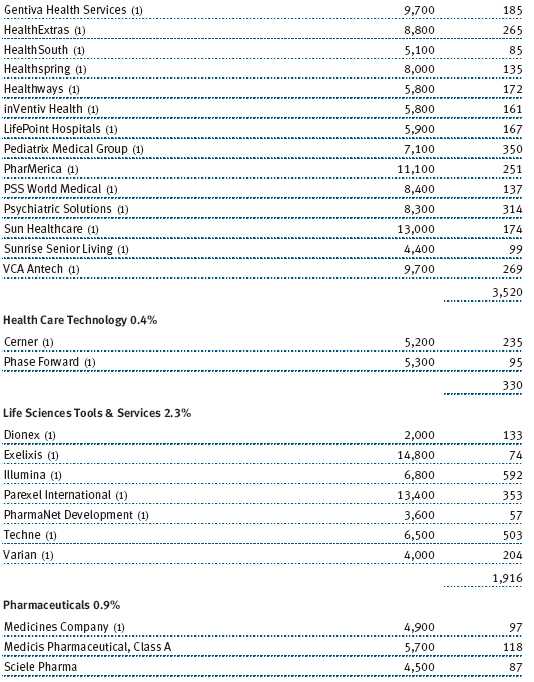
Health care stocks detracted the most from fund performance in absolute terms in the last six months. Providers and service companies stumbled as medical costs increased and the economy weakened. Biotechnology and health care equipment companies also fared poorly. Our life sciences companies outperformed other health care industries, helped by strong gains from Illumina, whose products and services facilitate genetic analysis.
Virtually all of our holdings in the financials sector, which represented only about 4% of fund assets as of June 30, declined in the last six months. Sentiment toward the sector was poor across all market capitalizations, as various large-cap commercial banks, brokerages, and insurance companies reported steep losses, wrote down the values of mortgage assets, slashed dividends, or were forced to raise capital to replenish their balance sheets. Our capital markets businesses did worst, led by shares of asset management company Affiliated Managers Group. Our insurers and commercial banks held up somewhat better.
OUTLOOK
Economic conditions appear to be weakening, with mortgage losses and credit concerns continuing to affect the financials sector. The uptick in inflation stemming from rising food and oil prices has had a negative effect on the markets and could limit the Federal Reserve’s ability to further stimulate the economy. Investor sentiment is negative, and market conditions remain challenging.
Corporate earnings are likely to continue deteriorating in the second half of the year, but stock valuations are favorable compared with historical norms. Given the potential for continued market volatility, we believe fund investors will be served well by the portfolio’s broad diversification across the small-cap growth sector. In the current environment, we are looking for attractive stocks of companies that have been unduly punished or are growing earnings at a healthy rate. Historically, small-cap growth companies have been attractive investments once the economy recovers.
Thank you for your confidence in our investment management abilities.
Respectfully submitted,

Sudhir Nanda
Chairman of the fund’s Investment Advisory Committee
July 21, 2008
The committee chairman has day-to-day responsibility for managing the portfolio and works with committee members in developing and executing the fund’s investment program.
RISKS OF INVESTING
As with all stock mutual funds, the fund’s share price can fall because of weakness in the stock market, a particular industry, or specific holdings. Stock markets can decline for many reasons, including adverse political or economic developments, changes in investor psychology, or heavy institutional selling. The prospects for an industry or company may deteriorate because of a variety of factors, including disappointing earnings or changes in the competitive environment. In addition, the investment manager’s assessment of companies held in a fund may prove incorrect, resulting in losses or poor performance even in rising markets.
Growth stocks can be volatile for several reasons. Since these companies usually invest a high portion of earnings in their businesses, they may lack the dividends of value stocks that can cushion stock prices in a falling market. Also, earnings disappointments often lead to sharply falling prices because investors buy growth stocks in anticipation of superior earnings growth.
Investing in small companies involves greater risk than is customarily associated with larger companies. Stocks of smaller companies are subject to more abrupt or erratic price movements than larger-company stocks. Small companies often have limited product lines, markets, or financial resources, and their managements may lack depth and experience. Such companies seldom pay significant dividends that could cushion returns in a falling market.
GLOSSARY
Fed funds target rate: An overnight lending rate set by the Federal Reserve and used by banks to meet reserve requirements. Banks also use the fed funds rate as a benchmark for their prime lending rates.
Inflation: A sustained increase in prices throughout the economy.
Lipper indexes: Consist of a small number (10 to 30) of the largest mutual funds in a particular category as tracked by Lipper Inc.
MSCI U.S. Small Cap Growth Index: Tracks the performance of domestic small-cap growth stocks as defined by MSCI.
Price/earnings (P/E) ratio: A ratio that shows the “multiple” of earnings at which a stock is selling. It is calculated by dividing a stock’s current price by its current earnings per share. For example, if a stock’s price is $60 per share and the issuing company earns $2 per share, the P/E ratio is $60/$2, or 30.
Russell 2000 Growth Index: Measures the performance of those Russell 2000 companies with higher price-to-book ratios and higher forecasted growth values.
Russell 2000 Index: Tracks the stocks of 2,000 small U.S. companies.
Russell 2000 Value Index: Measures the performance of those Russell 2000 companies with lower price-to-book ratios and lower forecasted growth values.
S&P 500 Stock Index: Tracks the stocks of 500 primarily large U.S. companies.
Performance and Expenses
| GROWTH OF $10,000 |
This chart shows the value of a hypothetical $10,000 investment in the fund over the past 10 fiscal year periods or since inception (for funds lacking 10-year records). The result is compared with benchmarks, which may include a broad-based market index and a peer group average or index. Market indexes do not include expenses, which are deducted from fund returns as well as mutual fund averages and indexes.
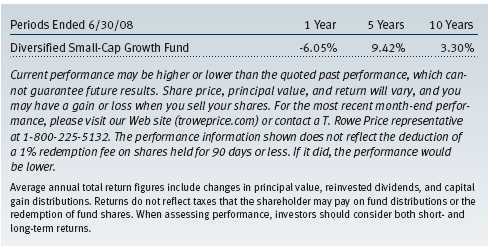
| AVERAGE ANNUAL COMPOUND TOTAL RETURN |
This table shows how the fund would have performed each year if its actual (or cumulative) returns for the periods shown had been earned at a constant rate.

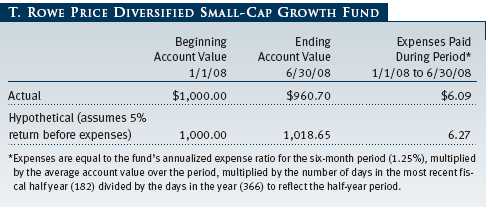
| FUND EXPENSE EXAMPLE |
As a mutual fund shareholder, you may incur two types of costs: (1) transaction costs, such as redemption fees or sales loads, and (2) ongoing costs, including management fees, distribution and service (12b-1) fees, and other fund expenses. The following example is intended to help you understand your ongoing costs (in dollars) of investing in the fund and to compare these costs with the ongoing costs of investing in other mutual funds. The example is based on an investment of $1,000 invested at the beginning of the most recent six-month period and held for the entire period.
Actual Expenses
The first line of the following table (“Actual”) provides information about actual account values and expenses based on the fund’s actual returns. You may use the information in this line, together with your account balance, to estimate the expenses that you paid over the period. Simply divide your account value by $1,000 (for example, an $8,600 account value divided by $1,000 = 8.6), then multiply the result by the number in the first line under the heading “Expenses Paid During Period” to estimate the expenses you paid on your account during this period.
Hypothetical Example for Comparison Purposes
The information on the second line of the table (“Hypothetical”) is based on hypothetical account values and expenses derived from the fund’s actual expense ratio and an assumed 5% per year rate of return before expenses (not the fund’s actual return). You may compare the ongoing costs of investing in the fund with other funds by contrasting this 5% hypothetical example and the 5% hypothetical examples that appear in the shareholder reports of the other funds. The hypothetical account values and expenses may not be used to estimate the actual ending account balance or expenses you paid for the period.
Note: T. Rowe Price charges an annual small-account maintenance fee of $10, generally for accounts with less than $2,000 ($500 for UGMA/UTMA). The fee is waived for any investor whose T. Rowe Price mutual fund accounts total $25,000 or more, accounts employing automatic investing, and IRAs and other retirement plan accounts that utilize a prototype plan sponsored by T. Rowe Price (although a separate custodial or administrative fee may apply to such accounts). This fee is not included in the accompanying table. If you are subject to the fee, keep it in mind when you are estimating the ongoing expenses of investing in the fund and when comparing the expenses of this fund with other funds.
You should also be aware that the expenses shown in the table highlight only your ongoing costs and do not reflect any transaction costs, such as redemption fees or sales loads. Therefore, the second line of the table is useful in comparing ongoing costs only and will not help you determine the relative total costs of owning different funds. To the extent a fund charges transaction costs, however, the total cost of owning that fund is higher.
Unaudited

The accompanying notes are an integral part of these financial statements.
Unaudited


The accompanying notes are an integral part of these financial statements.
Unaudited

The accompanying notes are an integral part of these financial statements.
Unaudited
The accompanying notes are an integral part of these financial statements.
Unaudited
The accompanying notes are an integral part of these financial statements.
Unaudited
| NOTES TO FINANCIAL STATEMENTS |
T. Rowe Price Diversified Small-Cap Growth Fund, Inc. (the fund), is registered under the Investment Company Act of 1940 (the 1940 Act) as a diversified, open-end management investment company. The fund commenced operations on June 30, 1997. The fund seeks long-term growth of capital by investing primarily in common stocks of small growth companies.
NOTE 1 - SIGNIFICANT ACCOUNTING POLICIES
Basis of Preparation The accompanying financial statements were prepared in accordance with accounting principles generally accepted in the United States of America, which require the use of estimates made by fund management. Fund management believes that estimates and security valuations are appropriate; however, actual results may differ from those estimates, and the security valuations reflected in the financial statements may differ from the value the fund ultimately realizes upon sale of the securities.
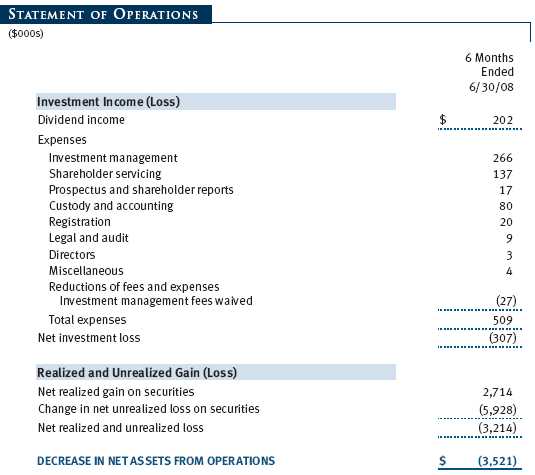
Investment Transactions, Investment Income, and Distributions Income and expenses are recorded on the accrual basis. Dividends received from mutual fund investments are reflected as dividend income; capital gain distributions are reflected as realized gain/loss. Dividend income and capital gain distributions are recorded on the ex-dividend date. Income tax-related interest and penalties, if incurred, would be recorded as income tax expense. Investment transactions are accounted for on the trade date. Realized gains and losses are reported on the identified cost basis. Distributions to shareholders are recorded on the ex-dividend date. Income distributions are declared and paid on an annual basis. Capital gain distributions, if any, are declared and paid by the fund, typically on an annual basis.
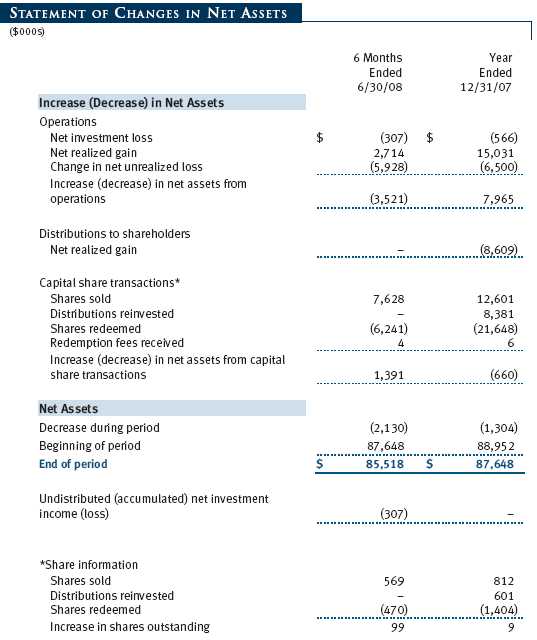
Redemption Fees A 1% fee is assessed on redemptions of fund shares held for 90 days or less to deter short-term trading and to protect the interests of long-term shareholders. Redemption fees are withheld from proceeds that shareholders receive from the sale or exchange of fund shares. The fees are paid to the fund, and are recorded as an increase to paid-in capital. The fees may cause the redemption price per share to differ from the net asset value per share.
Rebates and Credits Subject to best execution, the fund may direct certain security trades to brokers who have agreed to rebate a portion of the related brokerage commission to the fund in cash. Commission rebates are reflected as realized gain on securities in the accompanying financial statements. Additionally, the fund earns credits on temporarily uninvested cash balances at the custodian that reduce the fund’s custody charges. Custody expense in the accompanying financial statements is presented before reduction for credits.
New Accounting Pronouncement On January 1, 2008, the fund adopted Statement of Financial Accounting Standards No. 157 (FAS 157), Fair Value Measurements. FAS 157 defines fair value, establishes the framework for measuring fair value, and expands the disclosures of fair value measurements in the financial statements. Adoption of FAS 157 did not have a material impact on the fund’s net assets or results of operations.
In March 2008, the Financial Accounting Standards Board issued Statement of Financial Accounting Standards No. 161, Disclosures about Derivative Instruments and Hedging Activities (“FAS 161”), which is effective for fiscal years and interim periods beginning after November 15, 2008. FAS 161 requires enhanced disclosures about derivative and hedging activities, including how such activities are accounted for and their effect on financial position, performance and cash flows. Management is currently evaluating the impact the adoption of FAS 161 will have on the fund’s financial statements and related disclosures.
NOTE 2 - VALUATION
The fund’s investments are reported at fair value as defined under FAS 157. The fund values its investments and computes its net asset value per share at the close of the New York Stock Exchange (NYSE), normally 4 p.m. ET, each day that the NYSE is open for business.
Valuation Methods Equity securities listed or regularly traded on a securities exchange or in the over-the-counter (OTC) market are valued at the last quoted sale price or, for certain markets, the official closing price at the time the valuations are made, except for OTC Bulletin Board securities, which are valued at the mean of the latest bid and asked prices. A security that is listed or traded on more than one exchange is valued at the quotation on the exchange determined to be the primary market for such security. Listed securities not traded on a particular day are valued at the mean of the latest bid and asked prices for domestic securities and the last quoted sale price for international securities.
Investments in mutual funds are valued at the mutual fund’s closing net asset value per share on the day of valuation.
Other investments, including restricted securities, and those for which the above valuation procedures are inappropriate or are deemed not to reflect fair value are stated at fair value as determined in good faith by the T. Rowe Price Valuation Committee, established by the fund’s Board of Directors.
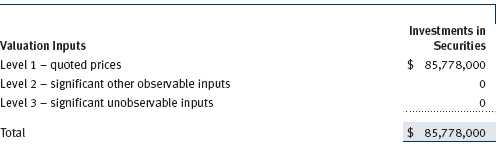
Valuation Inputs Various inputs are used to determine the value of the fund’s investments. These inputs are summarized in the three broad levels listed below:
Level 1 – quoted prices in active markets for identical securities
Level 2 – observable inputs other than Level 1 quoted prices (including, but not limited to, quoted prices for similar securities, interest rates, prepayment speeds, credit risk)
Level 3 – unobservable inputs
Observable inputs are those based on market data obtained from sources independent of the fund, and unobservable inputs reflect the fund’s own assumptions based on the best information available. The input levels are not necessarily an indication of the risk or liquidity associated with investments at that level. The following table summarizes the fund’s investments, based on the inputs used to determine their values on June 30, 2008:
NOTE 3 - INVESTMENT TRANSACTIONS
Purchases and sales of portfolio securities, other than short-term securities, aggregated $12,863,000 and $12,990,000, respectively, for the six months ended June 30, 2008.
NOTE 4 - FEDERAL INCOME TAXES
No provision for federal income taxes is required since the fund intends to continue to qualify as a regulated investment company under Subchapter M of the Internal Revenue Code and distribute to shareholders all of its taxable income and gains. Distributions are determined in accordance with Federal income tax regulations, which differ from generally accepted accounting principles, and, therefore, may differ in amount or character from net investment income and realized gains for financial reporting purposes. Financial reporting records are adjusted for permanent book/tax differences to reflect tax character but are not adjusted for temporary differences. The amount and character of tax-basis distributions and composition of net assets are finalized at fiscal year-end; accordingly, tax-basis balances have not been determined as of June 30, 2008.
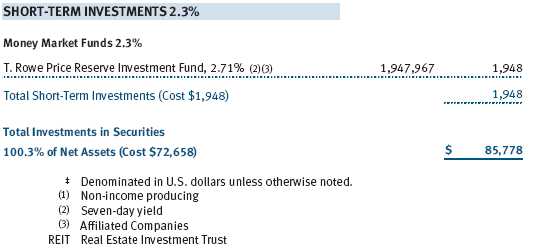
At June 30, 2008, the cost of investments for federal income tax purposes was $72,658,000. Net unrealized gain aggregated $13,120,000 at period-end, of which $21,861,000 related to appreciated investments and $8,741,000 related to depreciated investments.
NOTE 5 - RELATED PARTY TRANSACTIONS
The fund is managed by T. Rowe Price Associates, Inc. (the manager or Price Associates), a wholly owned subsidiary of T. Rowe Price Group, Inc. The investment management agreement between the fund and the manager provides for an annual investment management fee, which is computed daily and paid monthly. The fee consists of an individual fund fee, equal to 0.35% of the fund’s average daily net assets, and a group fee. The group fee rate is calculated based on the combined net assets of certain mutual funds sponsored by Price Associates (the group) applied to a graduated fee schedule, with rates ranging from 0.48% for the first $1 billion of assets to 0.285% for assets in excess of $220 billion. The fund’s group fee is determined by applying the group fee rate to the fund’s average daily net assets. At June 30, 2008, the effective annual group fee rate was 0.30%.
The fund is also subject to a contractual expense limitation through April 30, 2010. During the limitation period, the manager is required to waive its management fee and reimburse the fund for any expenses, excluding interest, taxes, brokerage commissions, and extraordinary expenses, that would otherwise cause the fund’s ratio of annualized total expenses to average net assets (expense ratio) to exceed its expense limitation of 1.25%. The fund is required to repay the manager for expenses previously reimbursed and management fees waived to the extent the fund’s net assets have grown or expenses have declined sufficiently to allow repayment without causing the fund’s expense ratio to exceed its expense limitation. However, no repayment will be made more than three years after the date of any reimbursement or waiver or later than April 30, 2012. Pursuant to this agreement, management fees in the amount of $27,000 were waived during the six months ended June 30, 2008. Including these amounts, management fees waived in the amount of $28,000 remain subject to repayment at June 30, 2008.
In addition, the fund has entered into service agreements with Price Associates and two wholly owned subsidiaries of Price Associates (collectively, Price). Price Associates computes the daily share price and provides certain other administrative services to the fund. T. Rowe Price Services, Inc., provides shareholder and administrative services in its capacity as the fund’s transfer and dividend disbursing agent. T. Rowe Price Retirement Plan Services, Inc., provides subaccounting and recordkeeping services for certain retirement accounts invested in the fund. For the six months ended June 30, 2008, expenses incurred pursuant to these service agreements were $53,000 for Price Associates, $108,000 for T. Rowe Price Services, Inc., and $1,000 for T. Rowe Price Retirement Plan Services, Inc. The total amount payable at period-end pursuant to these service agreements is reflected as Due to Affiliates in the accompanying financial statements.
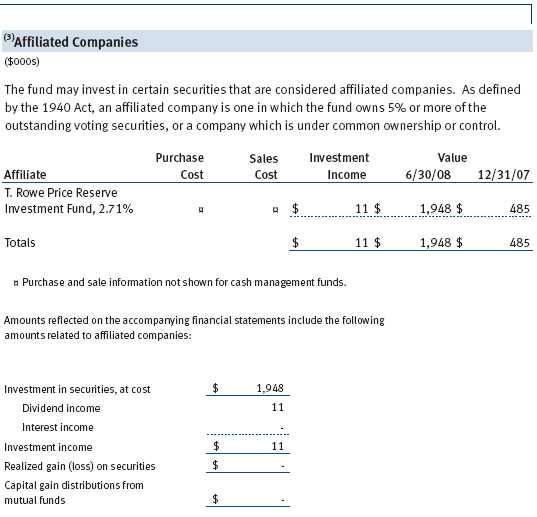
The fund may invest in the T. Rowe Price Reserve Investment Fund and the T. Rowe Price Government Reserve Investment Fund (collectively, the T. Rowe Price Reserve Investment Funds), open-end management investment companies managed by Price Associates and considered affiliates of the fund. The T. Rowe Price Reserve Investment Funds are offered as cash management options to mutual funds, trusts, and other accounts managed by Price Associates and/or its affiliates and are not available for direct purchase by members of the public. The T. Rowe Price Reserve Investment Funds pay no investment management fees.
| INFORMATION ON PROXY VOTING POLICIES, PROCEDURES, AND RECORDS |
A description of the policies and procedures used by T. Rowe Price funds and portfolios to determine how to vote proxies relating to portfolio securities is available in each fund’s Statement of Additional Information, which you may request by calling 1-800-225-5132 or by accessing the SEC’s Web site, www.sec.gov. The description of our proxy voting policies and procedures is also available on our Web site, www.troweprice.com. To access it, click on the words “Company Info” at the top of our homepage for individual investors. Then, in the window that appears, click on the “Proxy Voting Policy” navigation button in the top left corner.
Each fund’s most recent annual proxy voting record is available on our Web site and through the SEC’s Web site. To access it through our Web site, follow the directions above, then click on the words “Proxy Voting Record” at the bottom of the Proxy Voting Policy page.
| HOW TO OBTAIN QUARTERLY PORTFOLIO HOLDINGS |
The fund files a complete schedule of portfolio holdings with the Securities and Exchange Commission for the first and third quarters of each fiscal year on Form N-Q. The fund’s Form N-Q is available electronically on the SEC’s Web site (www.sec.gov); hard copies may be reviewed and copied at the SEC’s Public Reference Room, 450 Fifth St. N.W., Washington, DC 20549. For more information on the Public Reference Room, call 1-800-SEC-0330.
| APPROVAL OF INVESTMENT MANAGEMENT AGREEMENT |
On March 4, 2008, the fund’s Board of Directors (Board) unanimously approved the investment advisory contract (Contract) between the fund and its investment manager, T. Rowe Price Associates, Inc. (Manager). The Board considered a variety of factors in connection with its review of the Contract, also taking into account information provided by the Manager during the course of the year, as discussed below:
Services Provided by the Manager
The Board considered the nature, quality, and extent of the services provided to the fund by the Manager. These services included, but were not limited to, management of the fund’s portfolio and a variety of related activities, as well as financial and administrative services, reporting, and communications. The Board also reviewed the background and experience of the Manager’s senior management team and investment personnel involved in the management of the fund. The Board concluded that it was satisfied with the nature, quality, and extent of the services provided by the Manager.
Investment Performance of the Fund
The Board reviewed the fund’s average annual total returns over the 1-, 3-, 5-, and 10-year periods as well as the fund’s year-by-year returns and compared these returns with previously agreed upon comparable performance measures and market data, including those supplied by Lipper and Morningstar, which are independent providers of mutual fund data. On the basis of this evaluation and the Board’s ongoing review of investment results, the Board concluded that the fund’s performance was satisfactory.
Costs, Benefits, Profits, and Economies of Scale
The Board reviewed detailed information regarding the revenues received by the Manager under the Contract and other benefits that the Manager (and its affiliates) may have realized from its relationship with the fund, including research received under “soft dollar” agreements. The Board noted that soft dollars were not used to pay for third-party, non-broker research. The Board also received information on the estimated costs incurred and profits realized by the Manager and its affiliates from advising T. Rowe Price mutual funds. The Board concluded that the Manager’s profits from advising T. Rowe Price mutual funds were reasonable in light of the services provided to the fund. The Board also considered whether the fund or other funds benefit under the fee levels set forth in the Contract from any economies of scale realized by the Manager. Under the Contract, the fund pays a fee to the Manager composed of two components—a group fee rate based on the aggregate assets of certain T. Rowe Price mutual funds (including the fund) that declines at certain asset levels and an individual fund fee rate that is assessed on the assets of the fund. The Board concluded that the advisory fee structure for the fund continued to provide for a reasonable sharing of benefits from any economies of scale with the fund’s investors.
Fees
The Board reviewed the fund’s management fee rate, operating expenses, and total expense ratio and compared them with fees and expenses of other comparable funds based on information and data supplied by Lipper. The information provided to the Board indicated that the fund’s management fee rate and expense ratio were above the median for certain groups of comparable funds but below the median for other groups of comparable funds. The Board also reviewed the fee schedules for comparable privately managed accounts of the Manager and its affiliates. Management informed the Board that the Manager’s responsibilities for privately managed accounts are more limited than its responsibilities for the fund and other T. Rowe Price mutual funds that it or its affiliates advise. On the basis of the information provided, the Board concluded that the fees paid by the fund under the Contract were reasonable.
Approval of the Contract
As noted, the Board approved the continuation of the Contract. No single factor was considered in isolation or to be determinative to the decision. Rather, the Board concluded, in light of a weighting and balancing of all factors considered, that it was in the best interests of the fund to approve the continuation of the Contract, including the fees to be charged for services thereunder.
Item 2. Code of Ethics.
A code of ethics, as defined in Item 2 of Form N-CSR, applicable to its principal executive officer, principal financial officer, principal accounting officer or controller, or persons performing similar functions is filed as an exhibit to the registrant’s annual Form N-CSR. No substantive amendments were approved or waivers were granted to this code of ethics during the registrant’s most recent fiscal half-year.
Item 3. Audit Committee Financial Expert.
Disclosure required in registrant’s annual Form N-CSR.
Item 4. Principal Accountant Fees and Services.
Disclosure required in registrant’s annual Form N-CSR.
Item 5. Audit Committee of Listed Registrants.
Not applicable.
Item 6. Investments.
(a) Not applicable. The complete schedule of investments is included in Item 1 of this Form N-CSR.
(b) Not applicable.
Item 7. Disclosure of Proxy Voting Policies and Procedures for Closed-End Management Investment Companies.
Not applicable.
Item 8. Portfolio Managers of Closed-End Management Investment Companies.
Not applicable.
Item 9. Purchases of Equity Securities by Closed-End Management Investment Company and Affiliated Purchasers.
Not applicable.
Item 10. Submission of Matters to a Vote of Security Holders.
Not applicable.
Item 11. Controls and Procedures.
(a) The registrant’s principal executive officer and principal financial officer have evaluated the registrant’s disclosure controls and procedures within 90 days of this filing and have concluded that the registrant’s disclosure controls and procedures were effective, as of that date, in ensuring that information required to be disclosed by the registrant in this Form N-CSR was recorded, processed, summarized, and reported timely.
(b) The registrant’s principal executive officer and principal financial officer are aware of no change in the registrant’s internal control over financial reporting that occurred during the registrant’s second fiscal quarter covered by this report that has materially affected, or is reasonably likely to materially affect, the registrant’s internal control over financial reporting.
Item 12. Exhibits.
(a)(1) The registrant’s code of ethics pursuant to Item 2 of Form N-CSR is filed with the registrant’s annual Form N-CSR.
(2) Separate certifications by the registrant's principal executive officer and principal financial officer, pursuant to Section 302 of the Sarbanes-Oxley Act of 2002 and required by Rule 30a-2(a) under the Investment Company Act of 1940, are attached.
(3) Written solicitation to repurchase securities issued by closed-end companies: not applicable.
(b) A certification by the registrant's principal executive officer and principal financial officer, pursuant to Section 906 of the Sarbanes-Oxley Act of 2002 and required by Rule 30a-2(b) under the Investment Company Act of 1940, is attached.
SIGNATURES | |
| Pursuant to the requirements of the Securities Exchange Act of 1934 and the Investment | |
| Company Act of 1940, the registrant has duly caused this report to be signed on its behalf by the | |
| undersigned, thereunto duly authorized. | |
| T. Rowe Price Diversified Small-Cap Growth Fund, Inc. | |
| By | /s/ Edward C. Bernard |
| Edward C. Bernard | |
| Principal Executive Officer | |
| Date | August 20, 2008 |
| Pursuant to the requirements of the Securities Exchange Act of 1934 and the Investment | |
| Company Act of 1940, this report has been signed below by the following persons on behalf of | |
| the registrant and in the capacities and on the dates indicated. | |
| By | /s/ Edward C. Bernard |
| Edward C. Bernard | |
| Principal Executive Officer | |
| Date | August 20, 2008 |
| By | /s/ Gregory K. Hinkle |
| Gregory K. Hinkle | |
| Principal Financial Officer | |
| Date | August 20, 2008 |