UNITED STATES
SECURITIES AND EXCHANGE COMMISSION
Washington, D.C. 20549
FORM N-CSR
CERTIFIED SHAREHOLDER REPORT OF REGISTERED
MANAGEMENT INVESTMENT COMPANIES
Investment Company Act File Number: 811-08203
T. Rowe Price Integrated Equity Funds, Inc.
(Exact name of registrant as specified in charter)
100 East Pratt Street, Baltimore, MD 21202
(Address of principal executive offices)
David Oestreicher
100 East Pratt Street, Baltimore, MD 21202
(Name and address of agent for service)
Registrant’s telephone number, including area code: (410) 345-2000
Date of fiscal year end: December 31
Date of reporting period: December 31, 2024
Item 1. Reports to Shareholders
(a) Report pursuant to Rule 30e-1
Annual Shareholder Report
December 31, 2024
Integrated Global Equity Fund
This annual shareholder report contains important information about Integrated Global Equity Fund (the "fund") for the period of January 1, 2024 to December 31, 2024. You can find the fund’s prospectus, financial information on Form N‑CSR (which includes required tax information for dividends), holdings, proxy voting information, and other information atwww.troweprice.com/prospectus. You can also request this information without charge by contacting T. Rowe Price at 1‑800‑638‑5660 or info@troweprice.com or contacting your intermediary. This report describes changes to the fund that occurred during the reporting period.
What were the fund costs for the last year? (based on a hypothetical $10,000 investment)
| | Costs of a $10,000 investment | Costs paid as a percentage of a $10,000 investment |
|---|
| Integrated Global Equity Fund - Investor Class | $81 | 0.74% |
|---|
What drove fund performance during the past 12 months?
Global stocks produced strong gains in 2024, helped by easing inflation pressures in many economies and looser monetary policies from various central banks around the world. Benefiting from the strength in the U.S. dollar, U.S. stocks generally outperformed non-U.S. equity markets.
Relative to the MSCI All Country World Index Net, stock selection in the utilities sector—such as Vistra, an integrated retail electricity and power generation company that serves close to half of the states in the U.S.—contributed the most to relative performance. Stock choices among consumer staples and materials companies contributed to a lesser degree.
On the other hand, our stock selection in the communication services sector and an average underweight allocation to this strong-performing sector—such as underweighting Facebook’s parent company Meta Platforms—detracted from relative results. An average underweight in the information technology sector and stock choices among financials companies also detracted.
The fund seeks long-term capital growth by investing primarily in common stocks in the U.S. and in non-U.S. countries, including emerging markets. Our disciplined, long-term-oriented investment approach represents an integration of quantitative and fundamental insights and analysis. Notable changes in positioning during the year were focused on maintaining a broadly diversified global portfolio of stocks in which we have high conviction while staying fully invested and generally keeping the fund’s sector and country allocations in line with those of the MSCI index.
How has the fund performed?
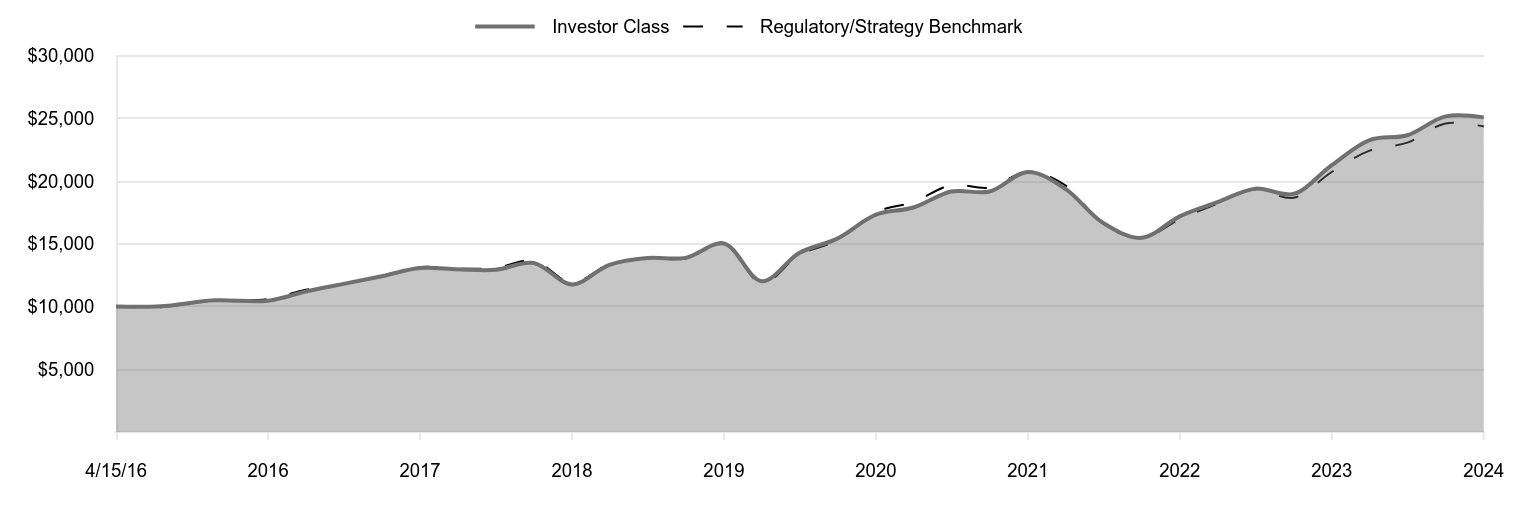
Cumulative Returns of a Hypothetical $10,000 Investment as of December 31, 2024
| Investor Class | Regulatory/Strategy Benchmark |
|---|
| 4/15/16 | 10,000 | 10,000 |
|---|
| 6/30/16 | 10,020 | 9,955 |
|---|
| 9/30/16 | 10,500 | 10,482 |
|---|
| 12/31/16 | 10,470 | 10,607 |
|---|
| 3/31/17 | 11,200 | 11,340 |
|---|
| 6/30/17 | 11,809 | 11,824 |
|---|
| 9/30/17 | 12,418 | 12,437 |
|---|
| 12/31/17 | 13,077 | 13,150 |
|---|
| 3/31/18 | 12,974 | 13,023 |
|---|
| 6/30/18 | 12,933 | 13,093 |
|---|
| 9/30/18 | 13,478 | 13,653 |
|---|
| 12/31/18 | 11,770 | 11,912 |
|---|
| 3/31/19 | 13,329 | 13,362 |
|---|
| 6/30/19 | 13,873 | 13,845 |
|---|
| 9/30/19 | 13,884 | 13,841 |
|---|
| 12/31/19 | 15,026 | 15,080 |
|---|
| 3/31/20 | 12,023 | 11,858 |
|---|
| 6/30/20 | 14,284 | 14,137 |
|---|
| 9/30/20 | 15,440 | 15,286 |
|---|
| 12/31/20 | 17,332 | 17,531 |
|---|
| 3/31/21 | 17,900 | 18,333 |
|---|
| 6/30/21 | 19,175 | 19,688 |
|---|
| 9/30/21 | 19,175 | 19,480 |
|---|
| 12/31/21 | 20,738 | 20,781 |
|---|
| 3/31/22 | 19,389 | 19,667 |
|---|
| 6/30/22 | 16,668 | 16,587 |
|---|
| 9/30/22 | 15,481 | 15,456 |
|---|
| 12/31/22 | 17,197 | 16,965 |
|---|
| 3/31/23 | 18,319 | 18,204 |
|---|
| 6/30/23 | 19,402 | 19,329 |
|---|
| 9/30/23 | 18,985 | 18,671 |
|---|
| 12/31/23 | 21,270 | 20,731 |
|---|
| 3/31/24 | 23,272 | 22,431 |
|---|
| 6/30/24 | 23,662 | 23,074 |
|---|
| 9/30/24 | 25,166 | 24,600 |
|---|
| 12/31/24 | 25,085 | 24,357 |
|---|
202501-4140694, 202502-4108710
Average Annual Total Returns
| | 1 Year | 5 Years | Since Inception 4/15/16 |
|---|
| Integrated Global Equity Fund (Investor Class) | 17.94% | 10.79% | 11.13% |
|---|
| MSCI All Country World Index Net (Regulatory/Strategy Benchmark) | 17.49 | 10.06 | 10.76 |
|---|
The preceding line graph shows the value of a hypothetical $10,000 investment in the fund over the past 10 fiscal year periods or since inception (for funds lacking 10-year records). The fund’s performance information included in the line graph and table above is compared with a regulatory required index that represents an overall securities market (Regulatory Benchmark). In addition, the line graph and table may also include one or more indexes that more closely aligns to the fund's investment strategy (Strategy Benchmark(s)). Due to new SEC Rules on shareholder reporting the fund adopted a new broad-based securities market index, referred to as the Regulatory Benchmark. Market index returns do not include expenses, which are deducted from fund returns. The fund's total return figures reflect the reinvestment of dividends and capital gains, if any.Neither the fund’s returns nor the index returns reflect the deduction of taxes that a shareholder would pay on fund distributions or redemptions of fund shares.The fund’s past performance is not a good predictor of the fund’s future performance.Updated performance information can be found at www.troweprice.com.
What are some fund statistics?
- Total Net Assets (000s)$61,407
- Number of Portfolio Holdings287
- Investment Advisory Fees Paid (000s)$(102)
- Portfolio Turnover Rate48.5%
What did the fund invest in?
Sector Allocation (as a % of Net Assets)
| Information Technology | 25.4% |
| Financials | 16.5 |
| Consumer Discretionary | 11.3 |
| Industrials & Business Services | 11.0 |
| Health Care | 9.0 |
| Communication Services | 8.0 |
| Consumer Staples | 6.6 |
| Energy | 3.5 |
| Utilities | 3.3 |
| Other | 5.4 |
Top Ten Holdings (as a % of Net Assets)
| Apple | 4.7% |
| Microsoft | 4.2 |
| NVIDIA | 3.8 |
| Amazon.com | 2.3 |
| Alphabet | 2.2 |
| Meta Platforms | 1.5 |
| Taiwan Semiconductor Manufacturing | 1.3 |
| Tesla | 1.1 |
| Visa | 0.9 |
| Mastercard | 0.9 |
How has the fund changed?
This is a summary of certain material changes to Integrated Global Equity Fund. The fund invests in at least five countries, including the U.S., and the fund will typically invest at least 25% of its net assets in securities of foreign issuers. The fund’s March 1, 2025 prospectus contains more information.
If you invest directly with T. Rowe Price, you can elect to receive future shareholder reports or other important documents through electronic delivery by enrolling at www.troweprice.com/paperless. If you invest through a financial intermediary such as an investment advisor, a bank, retirement plan sponsor or a brokerage firm, please contact that organization and ask if it can provide electronic delivery.
MSCI does not accept any liability for any errors or omissions in the indexes or data, and hereby expressly disclaim all warranties of originality, accuracy, completeness, timeliness, merchantability and fitness for a particular purpose. No party may rely on any indexes or data contained in this communication. Visit www.troweprice.com/en/us/market-data-disclosures for additional legal notices & disclaimers.
Integrated Global Equity Fund
Investor Class (TQGEX)
T. Rowe Price Investment Services, Inc.
100 East Pratt Street
Baltimore, MD 21202
Annual Shareholder Report
December 31, 2024
Integrated Global Equity Fund
This annual shareholder report contains important information about Integrated Global Equity Fund (the "fund") for the period of January 1, 2024 to December 31, 2024. You can find the fund’s prospectus, financial information on Form N‑CSR (which includes required tax information for dividends), holdings, proxy voting information, and other information atwww.troweprice.com/prospectus. You can also request this information without charge by contacting T. Rowe Price at 1‑800‑638‑5660 or info@troweprice.com or contacting your intermediary. This report describes changes to the fund that occurred during the reporting period.
What were the fund costs for the last year? (based on a hypothetical $10,000 investment)
| | Costs of a $10,000 investment | Costs paid as a percentage of a $10,000 investment |
|---|
| Integrated Global Equity Fund - I Class | $63 | 0.58% |
|---|
What drove fund performance during the past 12 months?
Global stocks produced strong gains in 2024, helped by easing inflation pressures in many economies and looser monetary policies from various central banks around the world. Benefiting from the strength in the U.S. dollar, U.S. stocks generally outperformed non-U.S. equity markets.
Relative to the MSCI All Country World Index Net, stock selection in the utilities sector—such as Vistra, an integrated retail electricity and power generation company that serves close to half of the states in the U.S.—contributed the most to relative performance. Stock choices among consumer staples and materials companies contributed to a lesser degree.
On the other hand, our stock selection in the communication services sector and an average underweight allocation to this strong-performing sector—such as underweighting Facebook’s parent company Meta Platforms—detracted from relative results. An average underweight in the information technology sector and stock choices among financials companies also detracted.
The fund seeks long-term capital growth by investing primarily in common stocks in the U.S. and in non-U.S. countries, including emerging markets. Our disciplined, long-term-oriented investment approach represents an integration of quantitative and fundamental insights and analysis. Notable changes in positioning during the year were focused on maintaining a broadly diversified global portfolio of stocks in which we have high conviction while staying fully invested and generally keeping the fund’s sector and country allocations in line with those of the MSCI index.
How has the fund performed?
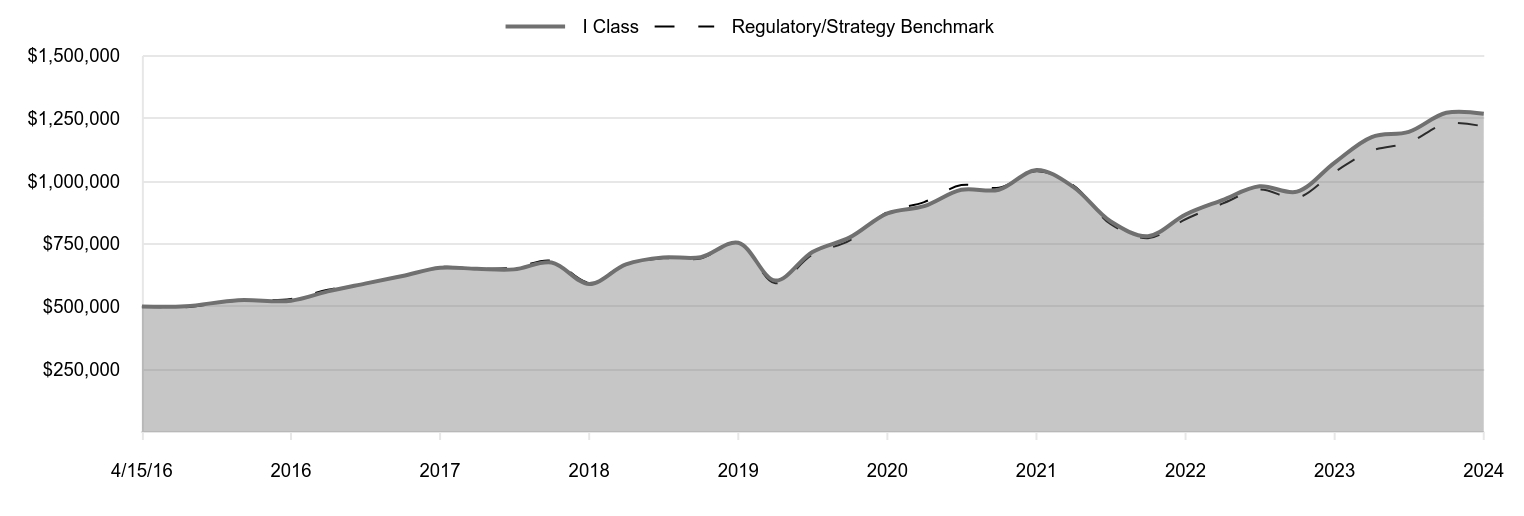
Cumulative Returns of a Hypothetical $500,000 Investment as of December 31, 2024
| I Class | Regulatory/Strategy Benchmark |
|---|
| 4/15/16 | 500,000 | 500,000 |
|---|
| 6/30/16 | 501,000 | 497,727 |
|---|
| 9/30/16 | 525,500 | 524,116 |
|---|
| 12/31/16 | 523,477 | 530,350 |
|---|
| 3/31/17 | 560,542 | 566,988 |
|---|
| 6/30/17 | 591,514 | 591,216 |
|---|
| 9/30/17 | 621,978 | 621,854 |
|---|
| 12/31/17 | 654,996 | 657,486 |
|---|
| 3/31/18 | 650,358 | 651,164 |
|---|
| 6/30/18 | 648,296 | 654,639 |
|---|
| 9/30/18 | 675,609 | 682,637 |
|---|
| 12/31/18 | 589,993 | 595,588 |
|---|
| 3/31/19 | 668,273 | 668,101 |
|---|
| 6/30/19 | 696,118 | 692,232 |
|---|
| 9/30/19 | 696,643 | 692,053 |
|---|
| 12/31/19 | 754,547 | 753,999 |
|---|
| 3/31/20 | 603,744 | 592,905 |
|---|
| 6/30/20 | 717,779 | 706,855 |
|---|
| 9/30/20 | 775,862 | 764,325 |
|---|
| 12/31/20 | 871,392 | 876,560 |
|---|
| 3/31/21 | 900,438 | 916,631 |
|---|
| 6/30/21 | 965,523 | 984,400 |
|---|
| 9/30/21 | 965,523 | 974,022 |
|---|
| 12/31/21 | 1,044,609 | 1,039,051 |
|---|
| 3/31/22 | 977,320 | 983,350 |
|---|
| 6/30/22 | 840,028 | 829,352 |
|---|
| 9/30/22 | 780,879 | 772,793 |
|---|
| 12/31/22 | 867,258 | 848,240 |
|---|
| 3/31/23 | 924,592 | 910,211 |
|---|
| 6/30/23 | 979,290 | 966,437 |
|---|
| 9/30/23 | 958,201 | 933,553 |
|---|
| 12/31/23 | 1,074,055 | 1,036,565 |
|---|
| 3/31/24 | 1,175,958 | 1,121,525 |
|---|
| 6/30/24 | 1,196,338 | 1,153,705 |
|---|
| 9/30/24 | 1,272,426 | 1,230,009 |
|---|
| 12/31/24 | 1,268,552 | 1,217,846 |
|---|
202501-4140694, 202502-4108710
Average Annual Total Returns
| | 1 Year | 5 Years | Since Inception 4/15/16 |
|---|
| Integrated Global Equity Fund (I Class) | 18.11% | 10.95% | 11.28% |
|---|
| MSCI All Country World Index Net (Regulatory/Strategy Benchmark) | 17.49 | 10.06 | 10.76 |
|---|
The preceding line graph shows the value of a hypothetical $500,000 investment in the fund over the past 10 fiscal year periods or since inception (for funds lacking 10-year records). The fund’s performance information included in the line graph and table above is compared with a regulatory required index that represents an overall securities market (Regulatory Benchmark). In addition, the line graph and table may also include one or more indexes that more closely aligns to the fund's investment strategy (Strategy Benchmark(s)). Due to new SEC Rules on shareholder reporting the fund adopted a new broad-based securities market index, referred to as the Regulatory Benchmark. Market index returns do not include expenses, which are deducted from fund returns. The fund's total return figures reflect the reinvestment of dividends and capital gains, if any.Neither the fund’s returns nor the index returns reflect the deduction of taxes that a shareholder would pay on fund distributions or redemptions of fund shares.The fund’s past performance is not a good predictor of the fund’s future performance.Updated performance information can be found at www.troweprice.com.
What are some fund statistics?
- Total Net Assets (000s)$61,407
- Number of Portfolio Holdings287
- Investment Advisory Fees Paid (000s)$(102)
- Portfolio Turnover Rate48.5%
What did the fund invest in?
Sector Allocation (as a % of Net Assets)
| Information Technology | 25.4% |
| Financials | 16.5 |
| Consumer Discretionary | 11.3 |
| Industrials & Business Services | 11.0 |
| Health Care | 9.0 |
| Communication Services | 8.0 |
| Consumer Staples | 6.6 |
| Energy | 3.5 |
| Utilities | 3.3 |
| Other | 5.4 |
Top Ten Holdings (as a % of Net Assets)
| Apple | 4.7% |
| Microsoft | 4.2 |
| NVIDIA | 3.8 |
| Amazon.com | 2.3 |
| Alphabet | 2.2 |
| Meta Platforms | 1.5 |
| Taiwan Semiconductor Manufacturing | 1.3 |
| Tesla | 1.1 |
| Visa | 0.9 |
| Mastercard | 0.9 |
How has the fund changed?
This is a summary of certain material changes to Integrated Global Equity Fund. The fund invests in at least five countries, including the U.S., and the fund will typically invest at least 25% of its net assets in securities of foreign issuers. The fund’s March 1, 2025 prospectus contains more information.
If you invest directly with T. Rowe Price, you can elect to receive future shareholder reports or other important documents through electronic delivery by enrolling at www.troweprice.com/paperless. If you invest through a financial intermediary such as an investment advisor, a bank, retirement plan sponsor or a brokerage firm, please contact that organization and ask if it can provide electronic delivery.
MSCI does not accept any liability for any errors or omissions in the indexes or data, and hereby expressly disclaim all warranties of originality, accuracy, completeness, timeliness, merchantability and fitness for a particular purpose. No party may rely on any indexes or data contained in this communication. Visit www.troweprice.com/en/us/market-data-disclosures for additional legal notices & disclaimers.
Integrated Global Equity Fund
I Class (TQGIX)
T. Rowe Price Investment Services, Inc.
100 East Pratt Street
Baltimore, MD 21202
Item 1. (b) Notice pursuant to Rule 30e-3.
Not applicable.
Item 2. Code of Ethics.
The registrant has adopted a code of ethics, as defined in Item 2 of Form N-CSR, applicable to its principal executive officer, principal financial officer, principal accounting officer or controller, or persons performing similar functions. A copy of this code of ethics is filed as an exhibit to this Form N-CSR. No substantive amendments were approved or waivers were granted to this code of ethics during the period covered by this report.
Item 3. Audit Committee Financial Expert.
The registrant’s Board of Directors has determined that Mr. Paul F. McBride qualifies as an audit committee financial expert, as defined in Item 3 of Form N-CSR. Mr. McBride is considered independent for purposes of Item 3 of Form N-CSR.
Item 4. Principal Accountant Fees and Services.
(a) – (d) Aggregate fees billed for the last two fiscal years for professional services rendered to, or on behalf of, the registrant by the registrant’s principal accountant were as follows:
| | | | | | | | | | |
| | | 2024 | | | 2023 | | | |
| | | | | | | |
Audit Fees | | | $26,450 | | | | $25,925 | |
Audit-Related Fees | | | - | | | | - | |
Tax Fees | | | - | | | | - | |
All Other Fees | | | - | | | | - | | | |
Audit fees include amounts related to the audit of the registrant’s annual financial statements and services normally provided by the accountant in connection with statutory and regulatory filings. Audit-related fees include amounts reasonably related to the performance of the audit of the registrant’s financial statements and specifically include the issuance of a report on internal controls and, if applicable, agreed-upon procedures related to fund acquisitions. Tax fees include amounts related to services for tax compliance, tax planning, and tax advice. The nature of these services specifically includes the review of distribution calculations and the preparation of Federal, state, and excise tax returns. All other fees include the registrant’s pro-rata share of amounts for agreed-upon procedures in conjunction with service contract approvals by the registrant’s Board of Directors/Trustees.
(e)(1) The registrant’s audit committee has adopted a policy whereby audit and non-audit services performed by the registrant’s principal accountant for the registrant, its investment adviser, and any entity controlling, controlled by, or under common control with the investment adviser that provides ongoing services to the registrant require pre-approval in advance at regularly scheduled audit committee meetings. If such a service is required between regularly scheduled audit committee meetings, pre-approval may be authorized by one audit committee member with ratification at the next scheduled audit committee meeting. Waiver of pre-approval for audit or non-audit services requiring fees of a de minimis amount is not permitted.
(2) No services included in (b) – (d) above were approved pursuant to paragraph (c)(7)(i)(C) of Rule 2-01 of Regulation S-X.
(f) Less than 50 percent of the hours expended on the principal accountant’s engagement to audit the registrant’s financial statements for the most recent fiscal year were attributed to work performed by persons other than the principal accountant’s full-time, permanent employees.
(g) The aggregate fees billed for the most recent fiscal year and the preceding fiscal year by the registrant’s principal accountant for non-audit services rendered to the registrant, its investment adviser, and any entity controlling, controlled by, or under common control with the investment adviser that provides ongoing services to the registrant were $1,262,000 and $1,524,000, respectively.
(h) All non-audit services rendered in (g) above were pre-approved by the registrant’s audit committee. Accordingly, these services were considered by the registrant’s audit committee in maintaining the principal accountant’s independence.
(i) Not applicable.
(j) Not applicable.
Item 5. Audit Committee of Listed Registrants.
Not applicable.
Item 6. Investments.
(a) Not applicable. The complete schedule of investments is included in Item 7 of this Form N-CSR.
(b) Not applicable.
Item 7. Financial Statements and Financial Highlights for Open-End Management Investment Companies.
(a – b) Report pursuant to Regulation S-X.
Financial
Highlights
Portfolio
of
Investments
Financial
Statements
and
Notes
Additional
Fund
Information
Financial
Statements
and
Other
Information
For
more
insights
from
T.
Rowe
Price
investment
professionals,
go
to
troweprice.com
.
T.
ROWE
PRICE
TQGEX
Integrated
Global
Equity
Fund
TQGIX
Integrated
Global
Equity
Fund–
.
I Class
T.
ROWE
PRICE
Integrated
Global
Equity
Fund
For
a
share
outstanding
throughout
each
period
The
accompanying
notes
are
an
integral
part
of
these
financial
statements.
Investor
Class
..
Year
..
..
Ended
.
12/31/24
12/31/23
12/31/22
12/31/21
12/31/20
NET
ASSET
VALUE
Beginning
of
period
$
15.83
$
13.18
$
19.21
$
16.18
$
14.16
Investment
activities
Net
investment
income
(1)(2)
0.22
0.21
0.31
0.12
0.14
Net
realized
and
unrealized
gain/loss
2.63
2.90
(3.59)
3.06
2.03
Total
from
investment
activities
2.85
3.11
(3.28)
3.18
2.17
Distributions
Net
investment
income
(0.22)
(0.22)
(0.34)
(0.12)
(0.14)
Net
realized
gain
(0.54)
(0.24)
(2.41)
(0.03)
(0.01)
Total
distributions
(0.76)
(0.46)
(2.75)
(0.15)
(0.15)
NET
ASSET
VALUE
End
of
period
$
17.92
$
15.83
$
13.18
$
19.21
$
16.18
Ratios/Supplemental
Data
Total
return
(2)(3)
17.94%
23.68%
(17.08)%
19.65%
15.34%
Ratios
to
average
net
assets:
(2)
Gross
expenses
before
waivers/payments
by
Price
Associates
1.51%
1.90%
2.18%
1.77%
2.05%
Net
expenses
after
waivers/
payments
by
Price
Associates
0.74%
0.75%
0.73%
0.76%
0.74%
Net
investment
income
1.22%
1.47%
1.83%
0.67%
1.04%
Portfolio
turnover
rate
48.5%
44.7%
102.9%
25.6%
32.5%
Net
assets,
end
of
period
(in
thousands)
$26,984
$16,554
$12,547
$30,478
$22,638
0%
0%
0%
0%
0%
(1)
Per
share
amounts
calculated
using
average
shares
outstanding
method.
(2)
Includes
the
impact
of
expense-related
arrangements
with
Price
Associates.
(3)
Total
return
reflects
the
rate
that
an
investor
would
have
earned
on
an
investment
in
the
fund
during
each
period,
assuming
reinvestment
of
all
distributions,
and
payment
of
no
redemption
or
account
fees,
if
applicable.
T.
ROWE
PRICE
Integrated
Global
Equity
Fund
For
a
share
outstanding
throughout
each
period
The
accompanying
notes
are
an
integral
part
of
these
financial
statements.
I
Class
..
Year
..
..
Ended
.
12/31/24
12/31/23
12/31/22
12/31/21
12/31/20
NET
ASSET
VALUE
Beginning
of
period
$
15.81
$
13.16
$
19.25
$
16.20
$
14.16
Investment
activities
Net
investment
income
(1)(2)
0.24
0.24
0.37
0.15
0.16
Net
realized
and
unrealized
gain/loss
2.64
2.89
(3.64)
3.07
2.03
Total
from
investment
activities
2.88
3.13
(3.27)
3.22
2.19
Distributions
Net
investment
income
(0.26)
(0.24)
(0.41)
(0.14)
(0.14)
Net
realized
gain
(0.54)
(0.24)
(2.41)
(0.03)
(0.01)
Total
distributions
(0.80)
(0.48)
(2.82)
(0.17)
(0.15)
NET
ASSET
VALUE
End
of
period
$
17.89
$
15.81
$
13.16
$
19.25
$
16.20
Ratios/Supplemental
Data
Total
return
(2)(3)
18.11%
23.84%
(16.98)%
19.88%
15.49%
Ratios
to
average
net
assets:
(2)
Gross
expenses
before
waivers/payments
by
Price
Associates
1.31%
1.70%
2.21%
1.72%
1.97%
Net
expenses
after
waivers/payments
by
Price
Associates
0.58%
0.59%
0.58%
0.60%
0.60%
Net
investment
income
1.37%
1.64%
2.30%
0.84%
1.16%
Portfolio
turnover
rate
48.5%
44.7%
102.9%
25.6%
32.5%
Net
assets,
end
of
period
(in
thousands)
$34,423
$17,078
$11,558
$1,268
$791
0%
0%
0%
0%
0%
(1)
Per
share
amounts
calculated
using
average
shares
outstanding
method.
(2)
Includes
the
impact
of
expense-related
arrangements
with
Price
Associates.
(3)
Total
return
reflects
the
rate
that
an
investor
would
have
earned
on
an
investment
in
the
fund
during
each
period,
assuming
reinvestment
of
all
distributions,
and
payment
of
no
redemption
or
account
fees,
if
applicable.
T.
ROWE
PRICE
Integrated
Global
Equity
Fund
December
31,
2024
Shares
$
Value
(
Cost
and
value
in
$000s)
‡
ARGENTINA 0.6%
Common
Stocks 0.6%
MercadoLibre
(USD) (1)
104
177
Tenaris
(EUR)
10,155
192
Total
Argentina
(Cost
$390)
369
AUSTRALIA 1.5%
Common
Stocks 1.5%
ANZ
Group
Holdings
10,118
178
Aristocrat
Leisure
3,974
168
Brambles
9,828
117
Coles
Group
7,943
93
Computershare
7,722
162
Northern
Star
Resources
6,182
59
Qantas
Airways (1)
12,187
67
Scentre
Group
38,709
82
Total
Australia
(Cost
$852)
926
AUSTRIA 0.5%
Common
Stocks 0.5%
Erste
Group
Bank
3,359
208
voestalpine
5,997
114
Total
Austria
(Cost
$315)
322
BELGIUM 0.4%
Common
Stocks 0.4%
Groupe
Bruxelles
Lambert
2,214
151
Warehouses
De
Pauw
5,289
104
Total
Belgium
(Cost
$318)
255
BRAZIL 0.6%
Common
Stocks 0.5%
Petroleo
Brasileiro
15,165
98
Suzano
6,210
63
TOTVS
10,259
44
Vale
12,080
107
312
T.
ROWE
PRICE
Integrated
Global
Equity
Fund
Shares
$
Value
(Cost
and
value
in
$000s)
Preferred
Stocks 0.1%
Itau
Unibanco
Holding
16,666
82
82
Total
Brazil
(Cost
$474)
394
CANADA 3.5%
Common
Stocks 3.5%
Canadian
National
Railway
2,203
224
Cenovus
Energy
(USD)
9,445
143
Constellation
Software
94
291
Constellation
Software,
Warrants,
3/31/40 (1)(2)
76
—
Descartes
Systems
Group (1)
1,474
167
Fairfax
Financial
Holdings
127
177
George
Weston
765
119
Granite
Real
Estate
Investment
Trust
1,501
73
Kinaxis (1)(3)
1,747
210
Kinross
Gold
12,479
116
Loblaw
1,125
148
Parkland (3)
4,877
110
Suncor
Energy
4,453
159
TFI
International
1,486
201
Total
Canada
(Cost
$1,766)
2,138
CHILE 0.1%
Common
Stocks 0.1%
Banco
de
Chile
491,538
56
Total
Chile
(Cost
$51)
56
CHINA 2.7%
Common
Stocks 2.2%
Alibaba
Group
Holding,
ADR
(USD)
2,347
199
Aluminum
Corp.
of
China,
Class
H
(HKD)
70,000
40
China
Coal
Energy,
Class
H
(HKD)
51,000
61
China
Merchants
Bank,
Class
H
(HKD)
21,500
110
COSCO
SHIPPING
Holdings,
Class
H
(HKD)
36,500
60
PDD
Holdings,
ADR
(USD) (1)
1,261
122
Tencent
Holdings
(HKD)
6,500
347
Tingyi
Cayman
Islands
Holding
(HKD)
72,000
93
Xiaomi,
Class
B
(HKD) (1)
47,600
209
T.
ROWE
PRICE
Integrated
Global
Equity
Fund
Shares
$
Value
(Cost
and
value
in
$000s)
ZTO
Express
Cayman
(HKD)
4,350
85
1,326
Common
Stocks
-
China
A
Shares 0.5%
CNOOC
Energy
Technology
&
Services,
A
Shares
(CNH)
179,700
105
CRRC,
A
Shares
(CNH)
78,400
90
Eastroc
Beverage
Group,
A
Shares
(CNH)
3,320
113
308
Total
China
(Cost
$1,510)
1,634
COLOMBIA 0.1%
Common
Stocks 0.1%
Bancolombia,
ADR
(USD)
1,998
63
Total
Colombia
(Cost
$64)
63
DENMARK 1.0%
Common
Stocks 1.0%
Carlsberg,
Class
B
2,031
195
Genmab (1)
720
151
Novo
Nordisk,
Class
B
3,397
293
Total
Denmark
(Cost
$640)
639
FRANCE 2.1%
Common
Stocks 2.1%
AXA
4,849
173
Cie
Generale
des
Etablissements
Michelin
2,979
98
Dassault
Aviation
678
138
Edenred
2,046
67
Engie
8,352
132
Eurofins
Scientific
1,611
82
Euronext
1,575
177
TotalEnergies
3,116
174
Verallia
4,295
108
Vinci
1,061
109
Total
France
(Cost
$1,340)
1,258
T.
ROWE
PRICE
Integrated
Global
Equity
Fund
Shares
$
Value
(Cost
and
value
in
$000s)
GERMANY 2.7%
Common
Stocks 2.7%
adidas
610
150
Allianz
819
252
Deutsche
Post
3,905
138
Deutsche
Telekom
7,411
222
Muenchener
Rueckversicherungs-Gesellschaft
375
189
Puma
3,282
151
SAP
556
137
Scout24
2,073
183
Zalando (1)
6,422
215
Total
Germany
(Cost
$1,514)
1,637
HONG
KONG 0.1%
Common
Stocks 0.1%
HKT
Trust
&
HKT
66,000
82
Total
Hong
Kong
(Cost
$83)
82
HUNGARY 0.2%
Common
Stocks 0.2%
OTP
Bank
1,909
104
Total
Hungary
(Cost
$82)
104
INDIA 0.9%
Common
Stocks 0.9%
Infosys
5,912
129
Page
Industries
113
63
Petronet
LNG
25,921
104
Power
Grid
Corp.
of
India
24,128
87
Shriram
Finance
3,286
111
Vedanta
8,096
42
Total
India
(Cost
$461)
536
INDONESIA 0.1%
Common
Stocks 0.1%
Bank
Mandiri
Persero
221,900
78
Total
Indonesia
(Cost
$86)
78
T.
ROWE
PRICE
Integrated
Global
Equity
Fund
Shares
$
Value
(Cost
and
value
in
$000s)
IRELAND 0.6%
Common
Stocks 0.6%
Kingspan
Group
1,403
102
TE
Connectivity
(USD)
1,732
248
Total
Ireland
(Cost
$384)
350
ITALY 1.2%
Common
Stocks 1.2%
DiaSorin
973
100
Enel
20,071
143
FinecoBank
Banca
Fineco
7,629
133
Intesa
Sanpaolo
40,730
164
UniCredit
4,707
189
Total
Italy
(Cost
$589)
729
JAPAN 6.2%
Common
Stocks 6.2%
AGC
3,300
96
Asahi
Group
Holdings
9,800
103
Asics
9,200
179
Daiwa
Securities
Group
14,800
98
Food
&
Life
7,200
151
Inpex
6,400
80
JFE
Holdings
6,000
68
KDDI
5,800
185
MatsukiyoCocokara
11,000
160
Mitsubishi
Estate
11,800
164
Mitsubishi
UFJ
Financial
Group
19,800
231
Nippon
Steel
6,500
131
Nomura
Real
Estate
Holdings
6,100
150
Olympus
9,200
137
Panasonic
Holdings
17,500
179
Recruit
Holdings
3,400
236
Renesas
Electronics
13,700
173
Seven
&
i
Holdings
12,600
198
SoftBank
Group
2,900
166
Sony
Group
11,700
247
Subaru
8,300
147
Sumitomo
4,600
100
T.
ROWE
PRICE
Integrated
Global
Equity
Fund
Shares
$
Value
(Cost
and
value
in
$000s)
Suntory
Beverage
&
Food (3)
2,100
67
Taiheiyo
Cement
6,100
138
Takeda
Pharmaceutical
5,300
140
TIS
4,100
97
Total
Japan
(Cost
$3,797)
3,821
MEXICO 0.4%
Common
Stocks 0.4%
Coca-Cola
Femsa
10,287
80
Gruma,
Class
B
4,558
71
Grupo
Aeroportuario
del
Sureste,
Class
B
3,122
80
Total
Mexico
(Cost
$272)
231
NETHERLANDS 1.4%
Common
Stocks 1.4%
Adyen (1)
125
186
ASML
Holding
(USD)
146
101
Koninklijke
Ahold
Delhaize
3,842
126
Koninklijke
KPN
42,311
154
Koninklijke
Philips (1)
6,603
167
NN
Group
3,330
145
Total
Netherlands
(Cost
$871)
879
NORWAY 0.2%
Common
Stocks 0.2%
Kongsberg
Gruppen
1,063
120
Total
Norway
(Cost
$110)
120
PERU 0.1%
Common
Stocks 0.1%
Credicorp
(USD)
492
90
Total
Peru
(Cost
$81)
90
PHILIPPINES 0.2%
Common
Stocks 0.2%
BDO
Unibank
44,022
109
Total
Philippines
(Cost
$95)
109
T.
ROWE
PRICE
Integrated
Global
Equity
Fund
Shares
$
Value
(Cost
and
value
in
$000s)
PORTUGAL 0.2%
Common
Stocks 0.2%
Jeronimo
Martins
7,931
151
Total
Portugal
(Cost
$166)
151
QATAR 0.1%
Common
Stocks 0.1%
Qatar
National
Bank
14,868
71
Total
Qatar
(Cost
$62)
71
SAUDI
ARABIA 0.3%
Common
Stocks 0.3%
Nahdi
Medical
2,403
75
Saudi
National
Bank
12,766
113
Total
Saudi
Arabia
(Cost
$222)
188
SINGAPORE 0.5%
Common
Stocks 0.5%
DBS
Group
Holdings
5,990
192
United
Overseas
Bank
5,100
135
Total
Singapore
(Cost
$246)
327
SOUTH
AFRICA 0.2%
Common
Stocks 0.2%
Absa
Group
9,071
91
Woolworths
Holdings
15,611
51
Total
South
Africa
(Cost
$144)
142
SOUTH
KOREA 1.0%
Common
Stocks 1.0%
DB
Insurance
1,007
70
HD
Korea
Shipbuilding
&
Offshore
Engineering (1)
666
102
Hyundai
Mobis
636
101
KB
Financial
Group
1,566
88
KT
2,614
78
Samsung
Electronics
2,238
80
T.
ROWE
PRICE
Integrated
Global
Equity
Fund
Shares
$
Value
(Cost
and
value
in
$000s)
Samsung
Fire
&
Marine
Insurance
357
87
Total
South
Korea
(Cost
$648)
606
SPAIN 0.2%
Common
Stocks 0.2%
Iberdrola (3)
10,277
142
Total
Spain
(Cost
$153)
142
SWEDEN 0.6%
Common
Stocks 0.6%
Essity,
Class
B
6,106
163
Telefonaktiebolaget
LM
Ericsson,
Class
B
25,031
203
Total
Sweden
(Cost
$338)
366
SWITZERLAND 0.6%
Common
Stocks 0.6%
Logitech
International
1,204
99
SIG
Group
7,175
142
Sonova
Holding
369
121
Total
Switzerland
(Cost
$381)
362
TAIWAN 2.2%
Common
Stocks 2.2%
Accton
Technology
9,000
211
Chailease
Holding
2,353
8
Delta
Electronics
10,000
131
MediaTek
5,000
215
Taiwan
Semiconductor
Manufacturing
24,000
780
Total
Taiwan
(Cost
$839)
1,345
THAILAND 0.1%
Common
Stocks 0.1%
Bangkok
Dusit
Medical
Services,
Class
F
124,000
89
Total
Thailand
(Cost
$94)
89
T.
ROWE
PRICE
Integrated
Global
Equity
Fund
Shares
$
Value
(Cost
and
value
in
$000s)
UNITED
ARAB
EMIRATES 0.2%
Common
Stocks 0.2%
Abu
Dhabi
National
Oil
for
Distribution
108,088
104
Total
United
Arab
Emirates
(Cost
$103)
104
UNITED
KINGDOM 2.7%
Common
Stocks 2.7%
3i
Group
2,987
133
Auto
Trader
Group
14,986
148
Barclays
58,144
194
BT
Group
71,087
128
Bunzl
4,226
174
Compass
Group
6,387
213
Imperial
Brands
5,591
179
Informa
10,088
101
Rolls-Royce
Holdings (1)
28,783
204
Unilever
2,714
154
Total
United
Kingdom
(Cost
$1,249)
1,628
UNITED
STATES 62.8%
Common
Stocks 62.8%
3M
1,842
238
AbbVie
622
111
Accenture,
Class
A
702
247
Agilent
Technologies
1,606
216
Alphabet,
Class
A
7,144
1,352
Amazon.com (1)
6,322
1,387
Ameren
1,345
120
Ameriprise
Financial
298
159
Apple
11,473
2,873
Applied
Materials
1,481
241
AppLovin,
Class
A (1)(3)
1,214
393
Autodesk (1)(3)
966
286
AutoZone (1)
78
250
Bank
of
America
9,953
437
Bank
of
New
York
Mellon
4,347
334
Bath
&
Body
Works
5,524
214
Becton
Dickinson
&
Company
1,171
266
Berkshire
Hathaway,
Class
B (1)
230
104
T.
ROWE
PRICE
Integrated
Global
Equity
Fund
Shares
$
Value
(Cost
and
value
in
$000s)
Booking
Holdings
67
333
Booz
Allen
Hamilton
Holding
1,725
222
Broadcom
2,335
541
Broadridge
Financial
Solutions
1,003
227
Cardinal
Health
2,188
259
Cencora
677
152
Charles
Schwab
4,038
299
Charter
Communications,
Class
A (1)
666
228
Chubb
964
266
Cigna
Group
773
213
Citigroup
4,961
349
Coca-Cola
2,156
134
Colgate-Palmolive
2,508
228
Constellation
Energy
1,068
239
Corebridge
Financial
7,301
219
Corning (3)
3,831
182
Corpay (1)
793
268
Corteva
3,496
199
CSX
8,172
264
Cummins
736
257
Dover
1,157
217
Eli
Lilly
455
351
Entergy
2,912
221
Equity
Residential,
REIT
869
62
Evergy
3,473
214
Exelon
5,745
216
Exxon
Mobil
1,440
155
Fair
Isaac (1)
96
191
FedEx (3)
955
269
Fidelity
National
Information
Services
1,760
142
Fortinet (1)
3,628
343
Fortive (3)
2,859
214
Gaming
&
Leisure
Properties,
REIT
2,699
130
Gen
Digital
4,582
125
General
Electric
1,498
250
Global
Payments
2,109
236
GoDaddy,
Class
A (1)
1,586
313
Hartford
Financial
Services
Group
2,455
269
HCA
Healthcare
592
178
Hilton
Worldwide
Holdings
733
181
Hologic (1)
2,648
191
Home
Depot
1,069
416
International
Paper (3)
3,187
172
T.
ROWE
PRICE
Integrated
Global
Equity
Fund
Shares
$
Value
(Cost
and
value
in
$000s)
Jabil (3)
914
132
JPMorgan
Chase
960
230
Keurig
Dr
Pepper
5,613
180
KeyCorp
12,596
216
Kimberly-Clark
2,018
264
Kinder
Morgan
10,639
292
L3Harris
Technologies
1,193
251
Las
Vegas
Sands
3,146
162
Leidos
Holdings
1,334
192
Lowe's
1,211
299
Marsh
&
McLennan
1,241
264
Mastercard,
Class
A
1,030
542
McKesson
370
211
Medtronic
3,493
279
Merck
750
75
Meta
Platforms,
Class
A
1,577
923
MetLife
3,071
251
Mettler-Toledo
International (1)
190
233
Microsoft
6,095
2,569
Molina
Healthcare (1)
766
223
Mosaic
5,661
139
Netflix (1)
536
478
Northrop
Grumman
534
251
NVIDIA
17,497
2,350
NXP
Semiconductors
838
174
O'Reilly
Automotive (1)
153
181
Parker-Hannifin
424
270
PG&E
10,224
206
Philip
Morris
International
2,801
337
Procter
&
Gamble
2,230
374
PTC (1)
921
169
Public
Storage,
REIT
268
80
QUALCOMM (3)
2,164
332
Reliance
525
141
ResMed
762
174
RPM
International
1,156
142
Salesforce
999
334
Schlumberger
5,179
199
SS&C
Technologies
Holdings
2,769
210
Stanley
Black
&
Decker
2,469
198
State
Street
2,056
202
Stryker
550
198
Synchrony
Financial
2,983
194
T.
ROWE
PRICE
Integrated
Global
Equity
Fund
Shares
$
Value
(Cost
and
value
in
$000s)
T-Mobile
U.S.
669
148
Tesla (1)
1,603
647
Textron
2,552
195
Thermo
Fisher
Scientific
668
348
United
Parcel
Service,
Class
B (3)
2,002
252
UnitedHealth
Group
355
180
Valero
Energy (3)
2,058
252
Ventas,
REIT
784
46
Verisk
Analytics
655
180
Viatris
18,445
230
VICI
Properties,
REIT
4,002
117
Visa,
Class
A
1,787
565
Vistra
1,196
165
Walmart
1,650
149
Xcel
Energy
2,488
168
Zebra
Technologies,
Class
A (1)
565
218
Zimmer
Biomet
Holdings
1,964
207
Total
United
States
(Cost
$28,630)
38,551
VIETNAM 0.2%
Common
Stocks 0.2%
Saigon
Beer
Alcohol
Beverage
24,000
52
Vietnam
Dairy
Products
20,300
51
Total
Vietnam
(Cost
$111)
103
SHORT-TERM
INVESTMENTS 0.4%
Money
Market
Funds 0.4%
T.
Rowe
Price
Government
Reserve
Fund,
4.53% (4)(5)
235,412
235
Total
Short-Term
Investments
(Cost
$235)
235
T.
ROWE
PRICE
Integrated
Global
Equity
Fund
Shares
$
Value
(Cost
and
value
in
$000s)
SECURITIES
LENDING
COLLATERAL 4.2%
INVESTMENTS
IN
A
POOLED
ACCOUNT
THROUGH
SECURITIES
LENDING
PROGRAM
WITH
JPMORGAN
CHASE
BANK 4.2%
Money
Market
Funds 4.2%
T.
Rowe
Price
Government
Reserve
Fund,
4.53% (4)(5)
2,570,909
2,571
Total
Investments
in
a
Pooled
Account
through
Securities
Lending
Program
with
JPMorgan
Chase
Bank
2,571
Total
Securities
Lending
Collateral
(Cost
$2,571)
2,571
Total
Investments
in
Securities
103.9%
of
Net
Assets
(Cost
$52,337)
$
63,801
‡
Country
classifications
are
generally
based
on
MSCI
categories
or
another
unaffiliated
third
party
data
provider;
Shares
are
denominated
in
the
currency
of
the
country
presented
unless
otherwise
noted.
(1)
Non-income
producing
(2)
See
Note
2.
Level
3
in
fair
value
hierarchy.
(3)
See
Note
3.
All
or
a
portion
of
this
security
is
on
loan
at
December
31,
2024.
(4)
Seven-day
yield
(5)
Affiliated
Companies
ADR
American
Depositary
Receipts
CNH
Offshore
China
Renminbi
EUR
Euro
HKD
Hong
Kong
Dollar
REIT
A
domestic
Real
Estate
Investment
Trust
whose
distributions
pass-through
with
original
tax
character
to
the
shareholder
USD
U.S.
Dollar
T.
ROWE
PRICE
Integrated
Global
Equity
Fund
The
accompanying
notes
are
an
integral
part
of
these
financial
statements.
AFFILIATED
COMPANIES
($000s)
The
fund
may
invest
in
certain
securities
that
are
considered
affiliated
companies.
As
defined
by
the
1940
Act,
an
affiliated
company
is
one
in
which
the
fund
owns
5%
or
more
of
the
outstanding
voting
securities,
or
a
company
that
is
under
common
ownership
or
control.
The
following
securities
were
considered
affiliated
companies
for
all
or
some
portion
of
the
year
ended
December
31,
2024.
Net
realized
gain
(loss),
investment
income,
change
in
net
unrealized
gain/loss,
and
purchase
and
sales
cost
reflect
all
activity
for
the
period
then
ended.
Affiliate
Net
Realized
Gain
(Loss)
Change
in
Net
Unrealized
Gain/Loss
Investment
Income
T.
Rowe
Price
Government
Reserve
Fund,
4.53%
$
—
$
—
$
16++
Totals
$
—#
$
—
$
16+
Supplementary
Investment
Schedule
Affiliate
Value
12/31/23
Purchase
Cost
Sales
Cost
Value
12/31/24
T.
Rowe
Price
Government
Reserve
Fund,
4.53%
$
1,345
¤
¤
$
2,806
Total
$
2,806^
#
Capital
gain
distributions
from
underlying
Price
funds
represented
$0
of
the
net
realized
gain
(loss).
++
Excludes
earnings
on
securities
lending
collateral,
which
are
subject
to
rebates
and
fees
as
described
in
Note
3.
+
Investment
income
comprised
$16
of
dividend
income
and
$0
of
interest
income.
¤
Purchase
and
sale
information
not
shown
for
cash
management
funds.
^
The
cost
basis
of
investments
in
affiliated
companies
was
$2,806.
T.
ROWE
PRICE
Integrated
Global
Equity
Fund
December
31,
2024
Statement
of
Assets
and
Liabilities
($000s,
except
shares
and
per
share
amounts)
Assets
Investments
in
securities,
at
value
(cost
$52,337)
$
63,801
Receivable
for
shares
sold
561
Receivable
for
investment
securities
sold
534
Dividends
receivable
48
Cash
44
Foreign
currency
(cost
$39)
38
Due
from
affiliates
13
Other
assets
47
Total
assets
65,086
Liabilities
Obligation
to
return
securities
lending
collateral
2,571
Payable
for
investment
securities
purchased
991
Payable
for
shares
redeemed
38
Investment
management
fees
payable
27
Other
liabilities
52
Total
liabilities
3,679
Commitments
and
Contingent
Liabilities
(note
6
)
NET
ASSETS
$
61,407
T.
ROWE
PRICE
Integrated
Global
Equity
Fund
December
31,
2024
Statement
of
Assets
and
Liabilities
($000s,
except
shares
and
per
share
amounts)
The
accompanying
notes
are
an
integral
part
of
these
financial
statements.
Net
Assets
Consist
of:
Total
distributable
earnings
(loss)
$
11,387
Paid-in
capital
applicable
to
3,429,574
shares
of
$0.0001
par
value
capital
stock
outstanding;
1,000,000,000
shares
authorized
50,020
NET
ASSETS
$
61,407
NET
ASSET
VALUE
PER
SHARE
Investor
Class
(Net
assets:
$26,984;
Shares
outstanding:
1,505,834)
$
17.92
I
Class
(Net
assets:
$34,423;
Shares
outstanding:
1,923,740)
$
17.89
T.
ROWE
PRICE
Integrated
Global
Equity
Fund
Year
Ended
12/31/24
Investment
Income
(Loss)
Income
Dividend
(net
of
foreign
taxes
of
$67)
$
949
Securities
lending
4
Total
income
953
Expenses
Investment
management
259
Shareholder
servicing
Investor
Class
$
47
I
Class
8
55
Prospectus
and
shareholder
reports
Investor
Class
7
I
Class
5
12
Custody
and
accounting
210
Legal
and
audit
74
Registration
57
Miscellaneous
13
Waived
/
paid
by
Price
Associates
(361)
Total
expenses
319
Net
investment
income
634
T.
ROWE
PRICE
Integrated
Global
Equity
Fund
The
accompanying
notes
are
an
integral
part
of
these
financial
statements.
Year
Ended
12/31/24
Realized
and
Unrealized
Gain
/
Loss
–
Net
realized
gain
(loss)
Securities
(net
of
foreign
taxes
of
$10)
3,587
Foreign
currency
transactions
(41)
Net
realized
gain
3,546
Change
in
net
unrealized
gain
/
loss
Securities
(net
of
increase
in
deferred
foreign
taxes
of
$14)
3,148
Other
assets
and
liabilities
denominated
in
foreign
currencies
(2)
Change
in
net
unrealized
gain
/
loss
3,146
Net
realized
and
unrealized
gain
/
loss
6,692
INCREASE
IN
NET
ASSETS
FROM
OPERATIONS
$
7,326
T.
ROWE
PRICE
Integrated
Global
Equity
Fund
Statement
of
Changes
in
Net
Assets
Year
.
.
.
.
.
.
.
.
.
.
.
.
.
.
Ended
.
.
.
.
.
.
.
.
.
.
.
.
.
.
12/31/24
12/31/23
Increase
(Decrease)
in
Net
Assets
Operations
Net
investment
income
$
634
$
438
Net
realized
gain
3,546
999
Change
in
net
unrealized
gain
/
loss
3,146
4,597
Increase
in
net
assets
from
operations
7,326
6,034
Distributions
to
shareholders
Net
earnings
Investor
Class
(1,048)
(464)
I
Class
(1,453)
(497)
Decrease
in
net
assets
from
distributions
(2,501)
(961)
Capital
share
transactions
*
Shares
sold
Investor
Class
18,512
3,559
I
Class
19,396
9,197
Distributions
reinvested
Investor
Class
763
286
I
Class
1,415
469
Shares
redeemed
Investor
Class
(11,197)
(2,352)
Advisor
Class
–
(359)
I
Class
(5,939)
(6,673)
Increase
in
net
assets
from
capital
share
transactions
22,950
4,127
T.
ROWE
PRICE
Integrated
Global
Equity
Fund
Statement
of
Changes
in
Net
Assets
The
accompanying
notes
are
an
integral
part
of
these
financial
statements.
Year
.
.
.
.
.
.
.
.
.
.
.
.
.
.
Ended
.
.
.
.
.
.
.
.
.
.
.
.
.
.
12/31/24
12/31/23
Net
Assets
Increase
during
period
27,775
9,200
Beginning
of
period
33,632
24,432
End
of
period
$
61,407
$
33,632
*Share
information
(000s)
Shares
sold
Investor
Class
1,040
239
I
Class
1,103
646
Distributions
reinvested
Investor
Class
42
18
I
Class
77
30
Shares
redeemed
Investor
Class
(622)
(163)
Advisor
Class
–
(25)
I
Class
(336)
(474)
Increase
in
shares
outstanding
1,304
271
T.
ROWE
PRICE
Integrated
Global
Equity
Fund
NOTES
TO
FINANCIAL
STATEMENTS
T.
Rowe
Price
Integrated
Equity
Funds,
Inc.
(the
corporation)
is
registered
under
the
Investment
Company
Act
of
1940
(the
1940
Act).
The
Integrated
Global
Equity
Fund
(the
fund)
is
a
diversified,
open-end
management
investment
company
established
by
the
corporation.
The
fund
seeks
long-term
growth
of
capital.
The
fund
has
two classes
of
shares:
the
Integrated
Global
Equity
Fund
(Investor
Class) and
the
Integrated
Global
Equity
Fund–I
Class
(I
Class). I
Class
shares
require
a
$500,000
initial
investment
minimum,
although
the
minimum
generally
is
waived
or
reduced
for
financial
intermediaries,
eligible
retirement
plans,
and
certain
other
accounts.
Each
class
has
exclusive
voting
rights
on
matters
related
solely
to
that
class;
separate
voting
rights
on
matters
that
relate
to
all
classes;
and,
in
all
other
respects,
the
same
rights
and
obligations
as
the
other
class.
NOTE
1
-
SIGNIFICANT
ACCOUNTING
POLICIES
Basis
of
Preparation
The fund
is
an
investment
company
and
follows
accounting
and
reporting
guidance
in
the
Financial
Accounting
Standards
Board
(FASB)
Accounting
Standards
Codification
Topic
946
(ASC
946).
The
accompanying
financial
statements
were
prepared
in
accordance
with
accounting
principles
generally
accepted
in
the
United
States
of
America
(GAAP),
including,
but
not
limited
to,
ASC
946.
GAAP
requires
the
use
of
estimates
made
by
management.
Management
believes
that
estimates
and
valuations
are
appropriate;
however,
actual
results
may
differ
from
those
estimates,
and
the
valuations
reflected
in
the
accompanying
financial
statements
may
differ
from
the
value
ultimately
realized
upon
sale
or
maturity.
Investment
Transactions,
Investment
Income,
and
Distributions
Investment
transactions
are
accounted
for
on
the
trade
date
basis.
Income
and
expenses
are
recorded
on
the
accrual
basis.
Realized
gains
and
losses
are
reported
on
the
identified
cost
basis. Income
tax-related
interest
and
penalties,
if
incurred,
are
recorded
as
income
tax
expense. Dividends
received
from other
investment
companies are
reflected
as
dividend income;
capital
gain
distributions
are
reflected
as
realized
gain/loss. Dividend
income and
capital
gain
distributions
are
recorded
on
the
ex-dividend
date. Distributions
from
REITs
are
initially
recorded
as
dividend
income
and,
to
the
extent
such
represent
a
return
of
capital
or
capital
gain
for
tax
purposes,
are
reclassified
when
such
information
becomes
available. Non-cash
dividends,
if
any,
are
recorded
at
the
fair
market
value
of
the
asset
received. Proceeds
from
litigation
payments,
if
any,
T.
ROWE
PRICE
Integrated
Global
Equity
Fund
are
included
in
either
net
realized
gain
(loss)
or
change
in
net
unrealized
gain/loss
from
securities. Distributions
to
shareholders
are
recorded
on
the
ex-dividend
date. Income
distributions,
if
any,
are
declared
and
paid
by
each
class annually. A
capital
gain
distribution,
if
any, may
also
be
declared
and
paid
by
the
fund
annually.
Currency
Translation
Assets,
including
investments,
and
liabilities
denominated
in
foreign
currencies
are
translated
into
U.S.
dollar
values
each
day
at
the
prevailing
exchange
rate,
using
the
mean
of
the
bid
and
asked
prices
of
such
currencies
against
U.S.
dollars
as
provided
by
an
outside
pricing
service.
Purchases
and
sales
of
securities,
income,
and
expenses
are
translated
into
U.S.
dollars
at
the
prevailing
exchange
rate
on
the
respective
date
of
such
transaction.
The
effect
of
changes
in
foreign
currency
exchange
rates
on
realized
and
unrealized
security
gains
and
losses
is
not
bifurcated
from
the
portion
attributable
to
changes
in
market
prices.
Class
Accounting
Shareholder
servicing,
prospectus,
and
shareholder
report
expenses
incurred
by
each
class
are
charged
directly
to
the
class
to
which
they
relate.
Expenses
common
to
all
classes,
investment
income,
and
realized
and
unrealized
gains
and
losses
are
allocated
to
the
classes
based
upon
the
relative
daily
net
assets
of
each
class.
In-Kind
Redemptions
In
accordance
with
guidelines
described
in
the
fund’s
prospectus,
and
when
considered
to
be
in
the
best
interest
of
all
shareholders,
the
fund
may
distribute
portfolio
securities
rather
than
cash
as
payment
for
a
redemption
of
fund
shares
(in-kind
redemption).
Gains
and
losses
realized
on
in-kind
redemptions
are
not
recognized
for
tax
purposes
and
are
reclassified
from
undistributed
realized
gain
(loss)
to
paid-in
capital.
During
the
year ended
December
31,
2024,
the
fund
realized
$1,520,000 of
net
gain
on
$3,594,000
of
in-kind
redemptions.
Capital
Transactions
Each
investor’s
interest
in
the
net
assets
of the
fund
is
represented
by
fund
shares. The
fund’s
net
asset
value
(NAV)
per
share
is
computed
at
the
close
of
the
New
York
Stock
Exchange
(NYSE),
normally
4
p.m.
Eastern
time,
each
day
the
NYSE
is
open
for
business.
However,
the
NAV
per
share
may
be
calculated
at
a
time
other
than
the
normal
close
of
the
NYSE
if
trading
on
the
NYSE
is
restricted,
if
the
NYSE
closes
earlier,
or
as
may
be
permitted
by
the
SEC.
Purchases
and
redemptions
of
fund
shares
are
transacted
at
the
next-computed
NAV
per
share,
after
receipt
of
the
transaction
order
by
T.
Rowe
Price
Associates,
Inc.,
or
its
agents.
T.
ROWE
PRICE
Integrated
Global
Equity
Fund
New
Accounting
Guidance
In December
2023,
the
FASB
issued
Accounting
Standards
Update
(ASU),
ASU
2023-09,
Income
Taxes
(Topic
740)
–
Improvements
to
Income
Taxes
Disclosures,
which
enhances
the
transparency
of
income
tax
disclosures.
The
ASU
requires
public
entities,
on
an
annual
basis,
to
provide
disclosure
of
specific
categories
in
the
rate
reconciliation,
as
well
as
disclosure
of
income
taxes
paid
disaggregated
by
jurisdiction.
The
amendments
under
this
ASU
are
required
to
be
applied
prospectively
and
are
effective
for
fiscal
years
beginning
after
December
15,
2024.
Management
expects
that
adoption
of
the
guidance
will
not
have
a
material
impact
on
the
fund’s
financial
statements.
Indemnification
In
the
normal
course
of
business, the
fund
may
provide
indemnification
in
connection
with
its
officers
and
directors,
service
providers,
and/or
private
company
investments. The
fund’s
maximum
exposure
under
these
arrangements
is
unknown;
however,
the
risk
of
material
loss
is
currently
considered
to
be
remote.
NOTE
2
-
VALUATION
Fair
Value
The
fund’s
financial
instruments
are
valued
at
the
close
of
the
NYSE
and
are
reported
at
fair
value,
which
GAAP
defines
as
the
price
that
would
be
received
to
sell
an
asset
or
paid
to
transfer
a
liability
in
an
orderly
transaction
between
market
participants
at
the
measurement
date. The fund’s
Board
of
Directors
(the
Board)
has
designated
T.
Rowe
Price
Associates,
Inc.
as
the
fund’s
valuation
designee
(Valuation
Designee).
Subject
to
oversight
by
the
Board,
the
Valuation
Designee
performs
the
following
functions
in
performing
fair
value
determinations:
assesses
and
manages
valuation
risks;
establishes
and
applies
fair
value
methodologies;
tests
fair
value
methodologies;
and
evaluates
pricing
vendors
and
pricing
agents.
The
duties
and
responsibilities
of
the
Valuation
Designee
are
performed
by
its
Valuation
Committee. The
Valuation
Designee provides
periodic
reporting
to
the
Board
on
valuation
matters.
Various
valuation
techniques
and
inputs
are
used
to
determine
the
fair
value
of
financial
instruments.
GAAP
establishes
the
following
fair
value
hierarchy
that
categorizes
the
inputs
used
to
measure
fair
value:
Level
1
–
quoted
prices
(unadjusted)
in
active
markets
for
identical
financial
instruments
that
the
fund
can
access
at
the
reporting
date
T.
ROWE
PRICE
Integrated
Global
Equity
Fund
Level
2
–
inputs
other
than
Level
1
quoted
prices
that
are
observable,
either
directly
or
indirectly
(including,
but
not
limited
to,
quoted
prices
for
similar
financial
instruments
in
active
markets,
quoted
prices
for
identical
or
similar
financial
instruments
in
inactive
markets,
interest
rates
and
yield
curves,
implied
volatilities,
and
credit
spreads)
Level
3
–
unobservable
inputs
(including
the Valuation
Designee’s assumptions
in
determining
fair
value)
Observable
inputs
are
developed
using
market
data,
such
as
publicly
available
information
about
actual
events
or
transactions,
and
reflect
the
assumptions
that
market
participants
would
use
to
price
the
financial
instrument.
Unobservable
inputs
are
those
for
which
market
data
are
not
available
and
are
developed
using
the
best
information
available
about
the
assumptions
that
market
participants
would
use
to
price
the
financial
instrument.
GAAP
requires
valuation
techniques
to
maximize
the
use
of
relevant
observable
inputs
and
minimize
the
use
of
unobservable
inputs.
When
multiple
inputs
are
used
to
derive
fair
value,
the
financial
instrument
is
assigned
to
the
level
within
the
fair
value
hierarchy
based
on
the
lowest-level
input
that
is
significant
to
the
fair
value
of
the
financial
instrument.
Input
levels
are
not
necessarily
an
indication
of
the
risk
or
liquidity
associated
with
financial
instruments
at
that
level
but
rather
the
degree
of
judgment
used
in
determining
those
values.
Valuation
Techniques
Equity
securities,
including
exchange-traded
funds, listed
or
regularly
traded
on
a
securities
exchange
or
in
the
over-the-
counter
(OTC)
market
are
valued
at
the
last
quoted
sale
price
or,
for
certain
markets,
the
official
closing
price
at
the
time
the
valuations
are
made.
OTC
Bulletin
Board
securities
are
valued
at
the
mean
of
the
closing
bid
and
asked
prices.
A
security
that
is
listed
or
traded
on
more
than
one
exchange
is
valued
at
the
quotation
on
the
exchange
determined
to
be
the
primary
market
for
such
security.
Listed
securities
not
traded
on
a
particular
day
are
valued
at
the
mean
of
the
closing
bid
and
asked
prices
for
domestic
securities
and
the
last
quoted
sale
or
closing
price
for
international
securities.
The
last
quoted
prices
of
non-U.S.
equity
securities
may
be
adjusted
to
reflect
the
fair
value
of
such
securities
at
the
close
of
the
NYSE,
if
the Valuation
Designee
determines
that
developments
between
the
close
of
a
foreign
market
and
the
close
of
the
NYSE
will
affect
the
value
of
some
or
all
of
the
fund’s portfolio
securities.
Each
business
day,
the
Valuation
Designee uses
information
from
outside
pricing
services
to
evaluate
the
quoted
prices
of
portfolio
securities
and,
if
appropriate,
decide whether
it
is
necessary
to
adjust
quoted
prices
to
reflect
fair
value
by
reviewing
a
variety
of
factors,
including
T.
ROWE
PRICE
Integrated
Global
Equity
Fund
developments
in
foreign
markets,
the
performance
of
U.S.
securities
markets,
and
the
performance
of
instruments
trading
in
U.S.
markets
that
represent
foreign
securities
and
baskets
of
foreign
securities. The Valuation
Designee
uses
outside
pricing
services
to
provide
it
with
quoted
prices
and
information
to
evaluate
or
adjust
those
prices.
The Valuation
Designee
cannot
predict
how
often
it
will
use
quoted
prices
and
how
often
it
will
determine
it
necessary
to
adjust
those
prices
to
reflect
fair
value.
Investments
in
mutual
funds
are
valued
at
the
mutual
fund’s
closing
NAV
per
share
on
the
day
of
valuation.
Assets
and
liabilities
other
than
financial
instruments,
including
short-term
receivables
and
payables,
are
carried
at
cost,
or
estimated
realizable
value,
if
less,
which
approximates
fair
value.
Investments
for
which
market
quotations are
not
readily
available
or
deemed
unreliable
are
valued
at
fair
value
as
determined
in
good
faith
by
the
Valuation
Designee.
The
Valuation
Designee
has
adopted
methodologies
for
determining
the
fair
value
of
investments
for
which
market
quotations
are
not
readily
available
or
deemed
unreliable,
including
the
use
of
other
pricing
sources.
Factors
used
in
determining
fair
value
vary
by
type
of
investment
and
may
include
market
or
investment
specific
considerations.
The
Valuation
Designee typically
will
afford
greatest
weight
to
actual
prices
in
arm’s
length
transactions,
to
the
extent
they
represent
orderly
transactions
between
market
participants,
transaction
information
can
be
reliably
obtained,
and
prices
are
deemed
representative
of
fair
value.
However,
the
Valuation
Designee may
also
consider
other
valuation
methods
such
as
market-based
valuation
multiples;
a
discount
or
premium
from
market
value
of
a
similar,
freely
traded
security
of
the
same
issuer;
discounted
cash
flows;
yield
to
maturity;
or
some
combination.
Fair
value
determinations
are
reviewed
on
a
regular
basis.
Because
any
fair
value
determination
involves
a
significant
amount
of
judgment,
there
is
a
degree
of
subjectivity
inherent
in
such
pricing
decisions. Fair
value
prices
determined
by
the
Valuation
Designee could
differ
from
those
of
other
market
participants,
and
it
is
possible
that
the
fair
value
determined
for
a
security
may
be
materially
different
from
the
value
that
could
be
realized
upon
the
sale
of
that
security.
T.
ROWE
PRICE
Integrated
Global
Equity
Fund
Valuation
Inputs
The
following
table
summarizes
the
fund’s
financial
instruments,
based
on
the
inputs
used
to
determine
their
fair
values
on
December
31,
2024
(for
further
detail
by
category,
please
refer
to
the
accompanying
Portfolio
of
Investments):
NOTE
3
-
OTHER
INVESTMENT
TRANSACTIONS
Consistent
with
its
investment
objective, the
fund
engages
in
the
following
practices
to
manage
exposure
to
certain
risks
and/or
to
enhance
performance.
The
investment
objective,
policies,
program,
and
risk
factors
of the
fund
are
described
more
fully
in the
fund’s prospectus
and
Statement
of
Additional
Information.
Emerging
and
Frontier
Markets
The fund
invests,
either
directly
or
through
investments
in
other
T.
Rowe
Price
funds,
in
securities
of
companies
located
in,
issued
by
governments
of,
or
denominated
in
or
linked
to
the
currencies
of
emerging
and
frontier
market
countries.
Emerging
markets,
and
to
a
greater
extent
frontier
markets, tend
to
have
economic
structures
that
are
less
diverse
and
mature,
less
developed
legal
and
regulatory
regimes,
and
political
systems
that
are
less
stable,
than
those
of
developed
countries.
These
markets
may
be
subject
to
greater
political,
economic,
and
social
uncertainty
and
differing
accounting
standards
and
regulatory
environments
that
may
potentially
impact
the
fund’s
ability
to
buy
or
sell
certain
securities
or
repatriate
proceeds
to
U.S.
dollars.
Emerging
markets
securities
exchanges
are
more
likely
to
experience
delays
with
the
clearing
and
settling
of
trades,
as
well
as
the
custody
of
holdings
by
local
banks,
agents,
and
depositories.
Such
securities
are
often
subject
($000s)
Level
1
Level
2
Level
3
Total
Value
Assets
Common
Stocks
$
39,694
$
21,219
$
—
$
60,913
Preferred
Stocks
—
82
—
82
Short-Term
Investments
235
—
—
235
Securities
Lending
Collateral
2,571
—
—
2,571
Total
$
42,500
$
21,301
$
—
$
63,801
T.
ROWE
PRICE
Integrated
Global
Equity
Fund
to
greater
price
volatility,
less
liquidity,
and
higher
rates
of
inflation
than
U.S.
securities.
Investing
in
frontier
markets
is
typically
significantly
riskier
than
investing
in
other
countries,
including
emerging
markets.
Securities
Lending
The fund
may
lend
its
securities
to
approved
borrowers
to
earn
additional
income.
Its
securities
lending
activities
are
administered
by
a
lending
agent
in
accordance
with
a
securities
lending
agreement.
Security
loans
generally
do
not
have
stated
maturity
dates,
and
the
fund
may
recall
a
security
at
any
time.
The
fund
receives
collateral
in
the
form
of
cash
or
U.S.
government
securities.
Collateral
is
maintained
over
the
life
of
the
loan
in
an
amount
not
less
than
the
value
of
loaned
securities;
any
additional
collateral
required
due
to
changes
in
security
values
is
delivered
to
the
fund
the
next
business
day.
Cash
collateral
is
invested
in
accordance
with
investment
guidelines
approved
by
fund
management.
Additionally,
the
lending
agent
indemnifies
the
fund
against
losses
resulting
from
borrower
default.
Although
risk
is
mitigated
by
the
collateral
and
indemnification,
the
fund
could
experience
a
delay
in
recovering
its
securities
and
a
possible
loss
of
income
or
value
if
the
borrower
fails
to
return
the
securities,
collateral
investments
decline
in
value,
and
the
lending
agent
fails
to
perform.
Securities
lending
revenue
consists
of
earnings
on
invested
collateral
and
borrowing
fees,
net
of
any
rebates
to
the
borrower,
compensation
to
the
lending
agent,
and
other
administrative
costs.
In
accordance
with
GAAP,
investments
made
with
cash
collateral
are
reflected
in
the
accompanying
financial
statements,
but
collateral
received
in
the
form
of
securities
is
not.
At
December
31,
2024,
the
value
of
loaned
securities
was
$2,497,000;
the
value
of
cash
collateral
and
related
investments
was
$2,571,000.
Other
Purchases
and
sales
of
portfolio
securities
other
than
in-kind
transactions,
if
any,
and short-term securities
aggregated $47,812,000 and
$23,286,000,
respectively,
for
the
year ended
December
31,
2024.
NOTE
4
-
FEDERAL
INCOME
TAXES
Generally,
no
provision
for
federal
income
taxes
is
required
since
the
fund
intends
to continue
to
qualify
as
a
regulated
investment
company
under
Subchapter
M
of
the
Internal
Revenue
Code
and
distribute
to
shareholders
all
of
its taxable
income
and
gains.
Distributions
determined
in
accordance
with
federal
income
tax
regulations
may
differ
in
amount
or
character
from
net
investment
income
and
realized
gains
for
financial
reporting
purposes.
T.
ROWE
PRICE
Integrated
Global
Equity
Fund
The
fund
files
U.S.
federal,
state,
and
local
tax
returns
as
required.
The
fund’s
tax
returns
are
subject
to
examination
by
the
relevant
tax
authorities
until
expiration
of
the
applicable
statute
of
limitations,
which
is
generally
three
years
after
the
filing
of
the
tax
return
but
which
can
be
extended
to
six
years
in
certain
circumstances.
Tax
returns
for
open
years
have
incorporated
no
uncertain
tax
positions
that
require
a
provision
for
income
taxes.
Capital
accounts
within
the
financial
reporting
records
are
adjusted
for
permanent
book/tax
differences
to
reflect
tax
character
but
are
not
adjusted
for
temporary
differences.
The
permanent
book/tax
adjustments,
if
any,
have
no
impact
on
results
of
operations
or
net
assets.
The
permanent
book/tax
adjustments
relate
primarily
to
redemptions
in
kind,
deemed
distributions
on
shareholder
redemptions,
the
character
of
net
currency
gains
or
losses
and
the
character
of
income
on
passive
foreign
investment
companies.
The
tax
character
of
distributions
paid
for
the
periods
presented
was
as
follows:
At
December
31,
2024,
the
tax-basis
cost
of
investments
(including
derivatives,
if
any)
and
gross
unrealized
appreciation
and
depreciation
were as
follows:
($000s)
December
31,
2024
December
31,
2023
Ordinary
income
(including
short-term
capital
gains,
if
any)
$
1,017
$
467
Long-term
capital
gain
1,484
494
Total
distributions
$
2,501
$
961
($000s)
Cost
of
investments
$
52,523
Unrealized
appreciation
$
13,545
Unrealized
depreciation
(2,282)
Net
unrealized
appreciation
(depreciation)
$
11,263
T.
ROWE
PRICE
Integrated
Global
Equity
Fund
At
December
31,
2024,
the
tax-basis
components
of
accumulated
net
earnings
(loss)
were
as
follows:
Temporary
differences
between
book-basis
and
tax-basis
components
of
total
distributable
earnings
(loss)
arise
when
certain
items
of
income,
gain,
or
loss
are
recognized
in
different
periods
for
financial
statement
purposes
versus
for
tax
purposes;
these
differences
will
reverse
in
a
subsequent
reporting
period.
The
temporary
differences
relate
primarily
to
the
deferral
of
losses
from
wash
sales
and
the
realization
of
gains/losses
on
passive
foreign
investment
companies.
NOTE
5
-
FOREIGN TAXES
The
fund
is
subject
to
foreign
income
taxes
imposed
by
certain
countries
in
which
it
invests.
Additionally,
capital
gains
realized
upon
disposition
of
securities
issued
in
or
by
certain
foreign
countries
are
subject
to
capital
gains
tax
imposed
by
those
countries.
All
taxes
are
computed
in
accordance
with
the
applicable
foreign
tax
law,
and,
to
the
extent
permitted,
capital
losses
are
used
to
offset
capital
gains.
Taxes
attributable
to
income
are
accrued
by
the
fund
as
a
reduction
of
income.
Current
and
deferred
tax
expense
attributable
to
capital
gains
is
reflected
as
a
component
of
realized
or
change
in
unrealized
gain/
loss
on
securities
in
the
accompanying
financial
statements.
To
the
extent
that
the
fund
has
country
specific
capital
loss
carryforwards,
such
carryforwards
are
applied
against
net
unrealized
gains
when
determining
the
deferred
tax
liability.
Any
deferred
tax
liability
incurred
by
the
fund
is
included
in
either
Other
liabilities
or
Deferred
tax
liability
on
the
accompanying
Statement
of
Assets
and
Liabilities.
($000s)
Undistributed
ordinary
income
$
5
Undistributed
long-term
capital
gain
119
Net
unrealized
appreciation
(depreciation)
11,263
Total
distributable
earnings
(loss)
$
11,387
T.
ROWE
PRICE
Integrated
Global
Equity
Fund
NOTE
6
-
RELATED
PARTY
TRANSACTIONS
The
fund
is
managed
by
T.
Rowe
Price
Associates,
Inc.
(Price
Associates),
a
wholly
owned
subsidiary
of
T.
Rowe
Price
Group,
Inc.
(Price
Group).
The
investment
management
agreement
between
the
fund
and
Price
Associates
provides
for
an
annual
investment
management
fee,
which
is
computed
daily
and
paid
monthly. The
fee
consists
of
an
individual
fund
fee,
equal
to
0.25%
of
the
fund’s
average
daily
net
assets,
and
a
group
fee.
The
group
fee
rate
is
calculated
based
on
the
combined
net
assets
of
certain
mutual
funds
sponsored
by
Price
Associates
(the
group)
applied
to
a
graduated
fee
schedule,
with
rates
ranging
from
0.48%
for
the
first
$1
billion
of
assets
to
0.260%
for
assets
in
excess
of
$845
billion.
The
fund’s
group
fee
is
determined
by
applying
the
group
fee
rate
to
the
fund’s
average
daily
net
assets. At
December
31,
2024,
the
effective
annual
group
fee
rate
was
0.28%.
The Investor
Class is
subject
to
a
contractual
expense
limitation
through
the
expense
limitation
date
indicated
in
the
table
below.
This
agreement
will
continue
through
the
expense
limitation
date
indicated
in
the
table
below,
and
may
be
renewed,
revised,
or
revoked
only
with
approval
of
the
fund’s
Board.
During
the
limitation
period,
Price
Associates
is required
to
waive
or
pay
any
expenses
(excluding
interest;
expenses
related
to
borrowings,
taxes,
and
brokerage;
non-recurring,
extraordinary
expenses;
and
acquired
fund
fees
and
expenses)
that
would
otherwise
cause
the class’s ratio
of
annualized
total
expenses
to
average
net
assets
(net
expense
ratio)
to
exceed
its
expense
limitation.
The
class
is
required
to
repay
Price
Associates
for
expenses
previously
waived/paid
to
the
extent
the
class’s net
assets
grow
or
expenses
decline
sufficiently
to
allow
repayment
without
causing
the class’s net
expense
ratio
(after
the
repayment
is
taken
into
account)
to
exceed
the
lesser
of:
(1)
the
expense
limitation
in
place
at
the
time
such
amounts
were
waived;
or
(2)
the class’s
current
expense
limitation.
However,
no
repayment
will
be
made
more
than
three
years
after
the
date
of
a
payment
or
waiver.
The
I
Class
is
also
subject
to
an
operating
expense
limitation
(I
Class
Limit)
pursuant
to
which
Price
Associates
is
contractually
required
to
pay
all
operating
expenses
of
the
I
Class,
excluding
management
fees;
interest;
expenses
related
to
borrowings,
taxes,
and
brokerage; non-recurring,
extraordinary expenses; and
acquired
fund
fees
and
expenses, to
the
extent
such
operating
expenses,
on
an
annualized
basis,
exceed
the
I
Class
Limit. This
agreement
will
continue
through
the
expense
limitation
date
indicated
in
the
table
below,
and
may
be
renewed,
revised,
or
revoked
only
with
approval
of
the
fund’s
Board.
The
I
Class
is
required
to
repay
Price
Associates
for
expenses
previously
paid
to
T.
ROWE
PRICE
Integrated
Global
Equity
Fund
the
extent
the
class’s
net
assets
grow
or
expenses
decline
sufficiently
to
allow
repayment
without
causing
the
class’s
operating
expenses
(after
the
repayment
is
taken
into
account)
to
exceed
the
lesser
of:
(1)
the
I
Class
Limit
in
place
at
the
time
such
amounts
were
paid;
or
(2)
the
current
I
Class
Limit.
However,
no
repayment
will
be
made
more
than
three
years
after
the
date
of
a
payment
or
waiver.
Pursuant
to
these
agreements,
expenses
were waived/paid
by
and/or
repaid
to
Price
Associates
during
the year
ended December
31,
2024 as
indicated
in
the
table
below.
Including
these
amounts,
expenses
previously
waived/paid
by
Price
Associates
in
the
amount
of $983,000 remain
subject
to
repayment
by
the
fund
at
December
31,
2024. Any
repayment
of
expenses
previously
waived/paid
by
Price
Associates
during
the
period
would
be
included
in
the
net
investment
income
and
expense
ratios
presented
on
the
accompanying
Financial
Highlights.
In
addition,
the
fund
has
entered
into
service
agreements
with
Price
Associates
and
a
wholly
owned
subsidiary
of
Price
Associates,
each
an
affiliate
of
the
fund
(collectively,
Price).
Price
Associates
provides
certain
accounting
and
administrative
services
to
the
fund.
T.
Rowe
Price
Services,
Inc.
provides
shareholder
and
administrative
services
in
its
capacity
as
the
fund’s
transfer
and
dividend-disbursing
agent.
For
the
year
ended
December
31,
2024,
expenses
incurred
pursuant
to
these
service
agreements
were
$117,000
for
Price
Associates
and
$40,000
for
T.
Rowe
Price
Services,
Inc.
All
amounts
due
to
and
due
from
Price,
exclusive
of
investment
management
fees
payable,
are
presented
net
on
the
accompanying
Statement
of
Assets
and
Liabilities.
T.
Rowe
Price
Investment
Services,
Inc.
(Investment
Services)
serves
as
distributor
to
the
fund.
Pursuant
to
an
underwriting
agreement,
no
compensation
for
any
distribution
services
provided
is
paid
to
Investment
Services
by
the
fund
(except
for
12b-1
fees
under
a
Board-approved
Rule
12b-1
plan).
Investor
Class
I
Class
Expense
limitation/I
Class
Limit
0.74%
0.05%
Expense
limitation
date
04/30/26
04/30/26
(Waived)/repaid
during
the
period
($000s)
$(172)
$(189)
T.
ROWE
PRICE
Integrated
Global
Equity
Fund
The fund
may
invest
its
cash
reserves
in
certain
open-end
management
investment
companies
managed
by
Price
Associates
and
considered
affiliates
of
the
fund:
the
T.
Rowe
Price
Government
Reserve
Fund
or
the
T.
Rowe
Price
Treasury
Reserve
Fund,
organized
as
money
market
funds
(together,
the
Price
Reserve
Funds).
The
Price
Reserve
Funds
are
offered
as
short-term
investment
options
to
mutual
funds,
trusts,
and
other
accounts
managed
by
Price
Associates
or
its
affiliates
and
are
not
available
for
direct
purchase
by
members
of
the
public.
Cash
collateral
from
securities
lending,
if
any,
is
invested
in
the
T.
Rowe
Price
Government
Reserve Fund. The
Price
Reserve
Funds
pay
no
investment
management
fees.
As
of
December
31,
2024,
T.
Rowe
Price
Group,
Inc.,
or
its
wholly
owned
subsidiaries,
owned
359,800
shares
of
the
Investor
Class,
representing
24%
of
the
Investor
Class's
net
assets.
The fund may
participate
in
securities
purchase
and
sale
transactions
with
other
funds
or
accounts
advised
by
Price
Associates
(cross
trades),
in
accordance
with
procedures
adopted
by the
fund’s
Board
and
Securities
and
Exchange
Commission
rules,
which
require,
among
other
things,
that
such
purchase
and
sale
cross
trades
be
effected
at
the
independent
current
market
price
of
the
security.
During
the
year
ended
December
31,
2024,
the
fund
had
no
purchases
or
sales
cross
trades
with
other
funds
or
accounts
advised
by
Price
Associates.
NOTE
7
-
SEGMENT
REPORTING
Operating
segments
are
defined
as
components
of
a
company
that
engage
in
business
activities
and
for
which
discrete
financial
information
is
available
and
regularly
reviewed
by
the
chief
operating
decision
maker
(CODM)
in
deciding
how
to
allocate
resources
and
assess
performance.
The
Management
Committee
of
Price
Associates
acts
as
the
fund’s
CODM.
The
fund
makes
investments
in
accordance
with
its
investment
objective
as
outlined
in
the
Prospectus
and
is
considered
one
reportable
segment
because
the
CODM
allocates
resources
and
assesses
the
operating
results
of
the
fund
on
the
whole.
The
fund’s
revenue
is
derived
from
investments
in
portfolio
of
securities.
The
CODM
allocates
resources
and
assesses
performance
based
on
the
operating
results
of
the
fund,
which
is
consistent
with
the
results
presented
in
the
statement
of
operations,
statement
of
changes
in
net
assets
and
financial
highlights.
The
CODM
compares
the
fund’s
performance
to
its
benchmark
index
T.
ROWE
PRICE
Integrated
Global
Equity
Fund
and
evaluates
the
positioning
of
the
fund
in
relation
to
its
investment
objective.
The
measure
of
segment
assets
is
net
assets
of
the
fund
which
is
disclosed
in
the
statement
of
assets
and
liabilities.
The
accounting
policies
of
the
segment
are
the
same
as
those
described
in
the
summary
of
significant
accounting
policies.
The
financial
statements
include
all
details
of
the
segment
assets,
segment
revenue
and
expenses;
and
reflect
the
financial
results
of
the
segment.
NOTE
8
-
OTHER
MATTERS
Unpredictable environmental,
political,
social
and
economic
events,
including
but
not
limited
to,
environmental
or
natural
disasters,
war
and
conflict
(including
Russia’s
military
invasion
of
Ukraine
and
the
conflict
in
Israel,
Gaza
and
surrounding
areas),
terrorism,
geopolitical
developments
(including
trading
and
tariff
arrangements,
sanctions
and
cybersecurity
attacks),
and
public
health
epidemics
(including
the
global
outbreak
of
COVID-19)
and
similar
public
health
threats,
may
significantly
affect
the
economy
and
the
markets
and
issuers
in
which
a
fund
invests.
The
extent
and
duration
of
such
events
and
resulting
market
disruptions
cannot
be
predicted.
These
and
other
similar
events
may
cause
instability
across
global
markets,
including
reduced
liquidity
and
disruptions
in
trading
markets,
while
some
events
may
affect
certain
geographic
regions,
countries,
sectors,
and
industries
more
significantly
than
others,
and
exacerbate
other
pre-existing
political,
social,
and
economic
risks.
The
fund’s
performance
could
be
negatively
impacted
if
the
value
of
a
portfolio
holding
were
harmed
by
these
or
such
events.
Management
actively
monitors
the
risks
and
financial
impacts
arising
from
such
events.
T.
ROWE
PRICE
Integrated
Global
Equity
Fund
REPORT
OF
INDEPENDENT
REGISTERED
PUBLIC
ACCOUNTING
FIRM
To
the
Board
of
Directors
of
T.
Rowe
Price
Integrated
Equity
Funds,
Inc.
and
Shareholders
of
T.
Rowe
Price
Integrated
Global
Equity
Fund
Opinion
on
the
Financial
Statements
We
have
audited
the
accompanying
statement
of
assets
and
liabilities,
including
the
portfolio
of
investments,
of
T.
Rowe
Price
Integrated
Global
Equity
Fund
(one
of
the
funds
constituting
T.
Rowe
Price
Integrated
Equity
Funds,
Inc.,
referred
to
hereafter
as
the
"Fund")
as
of
December
31,
2024,
the
related
statement
of
operations
for
the
year
ended
December
31,
2024,
the
statement
of
changes
in
net
assets
for
each
of
the
two
years
in
the
period
ended
December
31,
2024,
including
the
related
notes,
and
the
financial
highlights
for
each
of
the
five
years
in
the
period
ended
December
31,
2024
(collectively
referred
to
as
the
“financial
statements”).
In
our
opinion,
the
financial
statements
present
fairly,
in
all
material
respects,
the
financial
position
of
the
Fund
as
of
December
31,
2024,
the
results
of
its
operations
for
the
year
then
ended,
the
changes
in
its
net
assets
for
each
of
the
two
years
in
the
period
ended
December
31,
2024
and
the
financial
highlights
for
each
of
the
five
years
in
the
period
ended
December
31,
2024
in
conformity
with
accounting
principles
generally
accepted
in
the
United
States
of
America.
Basis
for
Opinion
These
financial
statements
are
the
responsibility
of
the
Fund’s
management.
Our
responsibility
is
to
express
an
opinion
on
the
Fund’s
financial
statements
based
on
our
audits.
We
are
a
public
accounting
firm
registered
with
the
Public
Company
Accounting
Oversight
Board
(United
States)
(PCAOB)
and
are
required
to
be
independent
with
respect
to
the
Fund
in
accordance
with
the
U.S.
federal
securities
laws
and
the
applicable
rules
and
regulations
of
the
Securities
and
Exchange
Commission
and
the
PCAOB.
We
conducted
our
audits
of
these
financial
statements
in
accordance
with
the
standards
of
the
PCAOB.
Those
standards
require
that
we
plan
and
perform
the
audit
to
obtain
reasonable
assurance
about
whether
the
financial
statements
are
free
of
material
misstatement,
whether
due
to
error
or
fraud.
T.
ROWE
PRICE
Integrated
Global
Equity
Fund
Our
audits
included
performing
procedures
to
assess
the
risks
of
material
misstatement
of
the
financial
statements,
whether
due
to
error
or
fraud,
and
performing
procedures
that
respond
to
those
risks.
Such
procedures
included
examining,
on
a
test
basis,
evidence
regarding
the
amounts
and
disclosures
in
the
financial
statements.
Our
audits
also
included
evaluating
the
accounting
principles
used
and
significant
estimates
made
by
management,
as
well
as
evaluating
the
overall
presentation
of
the
financial
statements.
Our
procedures
included
confirmation
of
securities
owned
as
of
December
31,
2024
by
correspondence
with
the
custodians,
transfer
agent
and
brokers;
when
replies
were
not
received
from
brokers,
we
performed
other
auditing
procedures.
We
believe
that
our
audits
provide
a
reasonable
basis
for
our
opinion.
/s/
PricewaterhouseCoopers
LLP
Baltimore,
Maryland
February
18,
2025
We
have
served
as
the
auditor
of
one
or
more
investment
companies
in
the
T.
Rowe
Price
group
of
investment
companies
since
1973.
REPORT
OF
INDEPENDENT
REGISTERED
PUBLIC
ACCOUNTING
FIRM
(continued)
T.
ROWE
PRICE
Integrated
Global
Equity
Fund
TAX
INFORMATION
(UNAUDITED)
FOR
THE
TAX
YEAR
ENDED 12/31/24
We
are
providing
this
information
as
required
by
the
Internal
Revenue
Code.
The
amounts
shown
may
differ
from
those
elsewhere
in
this
report
because
of
differences
between
tax
and
financial
reporting
requirements.
The
fund’s
distributions
to
shareholders
included:
$1,836,000
from
long-term
capital
gains,
subject
to
a
long-term
capital
gains
tax
rate
of
not
greater
than
20%
For
nonresident
alien
shareholders,
100%
of
short-term
capital
gain
dividends
distributed
by
the
fund
for
the
fiscal
year
are
qualified
short-term
capital
gains.
For
taxable
non-corporate
shareholders,
$788,000
of
the
fund's
income
represents
qualified
dividend
income
subject
to
a
long-term
capital
gains
tax
rate
of
not
greater
than
20%.
For
corporate
shareholders,
$336,000
of
the
fund's
income
qualifies
for
the
dividends-received
deduction.
For
individuals
and
certain
trusts
and
estates
which
are
entitled
to
claim
a
deduction
of
up
to
20%
of
their
combined
qualified
real
estate
investment
trust
(REIT)
dividends,
$10,000
of
the
fund's
income
qualifies
as
qualified
real
estate
investment
trust
(REIT)
dividends.
100
East
Pratt
Street
Baltimore,
MD
21202
T.
Rowe
Price
Investment
Services,
Inc.
Call
1-800-225-5132
to
request
a
prospectus
or
summary
prospectus;
each
includes
investment
objectives,
risks,
fees,
expenses,
and
other
information
that
you
should
read
and
consider
carefully
before
investing.
F203-050
2/25
Item 8. Changes in and Disagreements with Accountants for Open-End Management Investment Companies.
Not applicable.
Item 9. Proxy Disclosures for Open-End Management Investment Companies.
Not applicable.
Item 10. Remuneration Paid to Directors, Officers, and Others of Open-End Management Investment Companies.
Remuneration paid to Directors is included in Item 7 of this Form N-CSR.
Item 11. Statement Regarding Basis for Approval of Investment Advisory Contract.
If applicable, see Item 7.
Item 12. Disclosure of Proxy Voting Policies and Procedures for Closed-End Management Investment Companies.
Not applicable.
Item 13. Portfolio Managers of Closed-End Management Investment Companies.
Not applicable.
Item 14. Purchases of Equity Securities by Closed-End Management Investment Company and Affiliated Purchasers.
Not applicable.
Item 15. Submission of Matters to a Vote of Security Holders.
There has been no change to the procedures by which shareholders may recommend nominees to the registrant’s board of directors.
Item 16. Controls and Procedures.
(a) The registrant’s principal executive officer and principal financial officer have evaluated the registrant’s disclosure controls and procedures within 90 days of this filing and have concluded that the registrant’s disclosure controls and procedures were effective, as of that date, in ensuring that information required to be disclosed by the registrant in this Form N-CSR was recorded, processed, summarized, and reported timely.
(b) The registrant’s principal executive officer and principal financial officer are aware of no change in the registrant’s internal control over financial reporting that occurred during the period covered by this report that has materially affected, or is reasonably likely to materially affect, the registrant’s internal control over financial reporting.
Item 17. Disclosure of Securities Lending Activities for Closed-End Management Investment Companies.
Not applicable.
Item 18. Recovery of Erroneously Awarded Compensation.
Not applicable.
Item 19. Exhibits.
SIGNATURES
Pursuant to the requirements of the Securities Exchange Act of 1934 and the Investment Company Act of 1940, the registrant has duly caused this report to be signed on its behalf by the undersigned, thereunto duly authorized.
| | | | |
| T. Rowe Price Integrated Equity Funds, Inc. |
| | |
| By | | /s/ David Oestreicher | | |
| | David Oestreicher | | |
| | Principal Executive Officer | | |
| | |
| Date | | February 18, 2025 | | |
Pursuant to the requirements of the Securities Exchange Act of 1934 and the Investment Company Act of 1940, this report has been signed below by the following persons on behalf of the registrant and in the capacities and on the dates indicated.
| | | | |
| By | | /s/ David Oestreicher | | |
| | David Oestreicher | | |
| | Principal Executive Officer | | |
| | |
| Date | | February 18, 2025 | | |
| | | | |
| By | | /s/ Alan S. Dupski | | |
| | Alan S. Dupski | | |
| | Principal Financial Officer | | |
| | |
| Date | | February 18, 2025 | | |