Item 1: Report to Shareholders
 |
| Tax-Efficient Growth Fund | February 28, 2005 |
The views and opinions in this report were current as of February 28, 2005. They are not guarantees of performance or investment results and should not be taken as investment advice. Investment decisions reflect a variety of factors, and the managers reserve the right to change their views about individual stocks, sectors, and the markets at any time. As a result, the views expressed should not be relied upon as a forecast of the fund’s future investment intent. The report is certified under the Sarbanes-Oxley Act of 2002, which requires mutual funds and other public companies to affirm that, to the best of their knowledge, the information in their financial reports is fairly and accurately stated in all material respects.
REPORTS ON THE WEB
Sign up for our E-mail Program, and you can begin to receive updated fund reports and prospectuses online rather than through the mail. Log in to your account at troweprice.com for more information.
Fellow ShareholdersGrowth stocks produced gains but generally lagged value stocks in the 6- and 12-month periods ended February 28, 2005. Municipal bonds outperformed taxable bonds in both periods as long-term interest rates declined from their highs last spring despite several increases in the federal funds target rate since mid-2004. Although the growth-oriented Tax-Efficient Funds lagged their benchmarks in both periods, they maintained good long-term after-tax performance records, thanks to a high degree of tax efficiency associated with their low-turnover investment approaches.
MARKET ENVIRONMENT
Twelve months ago, at the beginning of our fiscal year, the economy was growing vigorously, and the Federal Reserve prepared to begin unwinding at a “measured” pace the accommodative monetary policy that had prevailed for almost three years. From June 30, 2004, through the end of February 2005—and despite a brief period of uncertainty about the economic outlook related to geopolitical concerns, rising oil prices, and a tight presidential race—the central bank gradually lifted the federal funds target rate from 1.00% to 2.50%, a three-year high.
As shown in the graph, municipal money market yields rose over the last year. Long-term rates, on the other hand, declined after peaking in the spring of 2004—the opposite of what one would expect when the Fed is raising short-term rates. The result was that longer-term municipal securities outperformed short- and intermediate-term bonds in the last six months and for our entire fiscal year.
| Municipal Bond and Note Yields |

U.S. stocks produced good returns in the last six months. A large portion of the gains occurred in the last two months of 2004, as investors welcomed a late-year decline in oil prices and an uncontested presidential election result. In addition, corporate earnings and economic growth remained solid, and short-term interest rates remained fairly low, even though they have been lifted at a gradual pace by the Federal Reserve since mid-2004.
Small- and mid-cap stocks outperformed their larger counterparts throughout our funds’ fiscal year. The Russell 2000 Index returned 16.40% and 9.53% in the 6- and 12-month periods ended February 28, 2005, respectively, versus 9.99% and 6.98% for the S&P 500 Index. Growth stocks lagged value across all market capitalizations over the last year, as shown in the table below, continuing a trend that has persisted for about five years. In the last six months, growth stocks surpassed value among small-caps and performed in line with value among mid-caps. In both the 6- and 12-month periods, large-cap growth stocks lagged their value counterparts, primarily because of strong gains from energy and materials companies amid rising commodity prices. Based on the magnitude and duration of value-stock and small-cap outperformance, larger growth stocks may be poised to have better relative returns in the years ahead.
| PERFORMANCE OF GROWTH STOCKS VS. VALUE |
| Periods Ended 2/28/05 | 6 Months | 12 Months | 5 Years* |
| Large-Cap | |||
| Russell 1000 Growth Index | 7.67% | 1.13% | -9.71% |
| Russell 1000 Value Index | 13.75 | 13.74 | 7.94 |
| Mid-Cap | |||
| Russell Midcap Growth Index | 17.94 | 9.71 | -7.01 |
| Russell Midcap Value Index | 18.03 | 18.89 | 16.12 |
| Small-Cap | |||
| Russell 2000 Growth Index | 17.56 | 5.30 | -7.95 |
| Russell 2000 Value Index | 15.38 | 13.64 | 16.01 |
| * Five-year returns are annualized. |
Historical experience shows that our steady investment style, which focuses on high-quality growth companies, tends to underperform early in business recovery cycles, when deep cyclical stocks and lower-quality companies outperform. However, we do not expect our underperformance to persist. Our investment style is more likely to outperform as the recovery matures, economic conditions become more challenging (e.g., interest rates rise and corporate earnings growth rates decelerate), stock market returns moderate, and investors become more mindful of risk, particularly during periods of market stress.
INVESTMENT PHILOSOPHY
Before discussing our investment strategy and each fund’s performance, we would like to summarize the principles that guide our management of T. Rowe Price’s Tax-Efficient Funds.
• The Tax-Efficient Funds invest in stocks of growth companies that have strong prospects and are market leaders within their niches. Tax-Efficient Balanced and Tax-Efficient Growth invest primarily in large-cap growth stocks (the former also purchases municipal bonds), and Tax-Efficient Multi-Cap Growth invests in small- and mid-cap growth companies.
• Our objective is to produce the best after-tax returns. To minimize capital gain distributions, we plan to own our companies for a long time, so we focus on those with strong, sustainable market positions and high returns on capital.
• We keep our cash position low and stay almost fully invested, since we believe successful market timing is nearly impossible.
• We make new purchases opportunistically but do not trade opportunistically or rotate from sector to sector in an effort to capture short-term outperformance.
• We purchase stocks that meet our criteria even though it may be evident that time and patience will be required before the investment pays off. It is important to note, therefore, that performance over short periods will often deviate, both positively and negatively, from that of competing funds focused on pretax returns.
• We prefer to let our winners run and try not to realize gains unless a company’s long-term outlook has deteriorated materially. In addition, we will sell investments that have declined (i.e., “harvest” losses) to build up tax losses that can be used to offset future gains.
CHARACTERISTICS OF THE FUNDSAs illustrated by the portfolio characteristics tables that appear in the performance discussion of each fund, both the Tax-Efficient Balanced Fund’s equity portfolio and the Tax-Efficient Growth Fund are more growth oriented than the S&P 500. For example, our large-cap equity portfolios have higher price/earnings (P/E) ratios and anticipated long-term growth rates than the S&P 500, as well as lower dividend yields. The tables also show that each large-cap portfolio’s return on equity (ROE) exceeds that of the S&P 500. A high and sustainable ROE is one of the most important characteristics we consider when researching potential investments and reviewing our current holdings. Our intention is to maintain portfolios of companies with strong profitability that should perform relatively well during favorable and unfavorable periods for both the economy and the stock market.
The Tax-Efficient Multi-Cap Growth Fund, as shown in the table on page 12, has characteristics that are similar to those of the Russell Midcap Growth Index, such as its projected earnings growth rate, dividend yield, P/E ratio, and ROE. In addition to our tax-efficient strategy, what distinguishes this fund from most small- and mid-cap portfolios is that we do not automatically sell successful investments when their market capitalizations become too large for that particular style. (Most tax-blind small- and mid-cap funds must do that to adhere to their stated investment strategies.) As many of the fund’s holdings grow, hopefully, into bigger companies over time, we will seek to maintain our mid-cap orientation by directing new purchases to mid- and small-cap companies. For example, we purchased eBay and Yahoo! when they were mid-cap companies, and we continue to own them, although their mark et capitalizations are too large for us to buy them now. At the end of February, the fund was well diversified across nearly 280 companies (compared with about 110 for the Tax-Efficient Growth Fund). This broad diversification reflects the fact that smaller companies are earlier in their life cycles than larger ones, and therefore a higher failure rate is expected. We will eliminate those that falter and reinvest the proceeds into companies with stronger prospects. (Please refer to each fund’s portfolio of investments for a complete listing of the fund’s holdings and the amount each represents in the portfolio.)
| TAX-EFFICIENT ATTRIBUTES |
| Tax-Efficiency Ratio | Tax-Loss | |||
| Since Inception* | Carryforward | 12-Month | ||
| (After-Tax Return Divided | (Percentage of | Portfolio | ||
| As of 2/28/05 | by Pretax Return) | Net Assets) | Turnover Rate | |
| Tax-Efficient Balanced | 98.0% | 6.9% | 18.0% | |
| (inception date: 6/30/97) | ||||
| Tax-Efficient Growth | 99.9 | 28.0 | 14.9 | |
| (inception date: 7/30/99) | ||||
| Tax-Efficient Multi-Cap Growth | 100.0 | 21.8 | 7.8 | |
| (inception date: 12/29/00) | ||||
| * The ratio assumes that you did not sell your shares at the end of our reporting period. | ||||
The table above shows each fund’s tax-efficiency ratio, which is calculated by dividing each fund’s after-tax return by its pretax return for the period from its inception through February 28, 2005. The Tax-Efficient Multi-Cap Growth Fund’s 100% tax-efficiency ratio indicates that the fund has made no taxable dividend or capital gain distributions since its inception. Tax-Efficient Balanced and Tax-Efficient Growth have made small distributions of taxable dividends since their inception, but no capital gain distributions, and their tax-efficiency ratios remain very close to 100%. Given each fund’s high degree of tax efficiency, the performance of each fund versus its benchmarks and tax-blind portfolios looks better on an after-tax basis than on a pretax basis.
The table also shows the value of each fund’s tax capital loss carry forward (as a percentage of net assets) accumulated through February 28, 2005. These tax losses can be used in the future to offset capital gains that each fund may realize so they are not passed on to shareholders. In addition, the table shows each fund’s turnover in percentage terms for the 12-month period ended February 28, 2005. These numbers are dramatically different than most who invest in mid-cap and large growth companies. The low percentages are evidence of our intention to keep our holdings for long periods.
INVESTMENT STRATEGYIn the last six months, we purchased additional shares of financial companies State Street and Northern Trust for the Tax-Efficient Balanced and Tax-Efficient Growth Funds. In Tax-Efficient Growth and Tax-Efficient Multi-Cap Growth, we added to positions in Mellon Financial and Charles Schwab. We believe that trust banks—which have a more-stable, fee-based revenue model and are more differentiated than spread-lending focused banks—and asset managers offer the best risk/reward trade-off among growth stocks.
We also looked for opportunities to add to our consumer discretionary holdings. For Tax-Efficient Balanced and Tax-Efficient Growth, we purchased additional shares of International Game Technology and Family Dollar Stores and established a position in cruise-line operator Carnival. For all three tax-efficient funds, we bought additional shares of retailer Tiffany, online merchant Amazon.com (which was a new holding for Tax-Efficient Multi-Cap Growth), and Station Casinos (which was a new position in the Tax-Efficient Balanced and Tax-Efficient Growth Funds).
The information technology sector—which has dramatically underperformed for several years—continued to provide opportunities for us to purchase shares of companies with strong long-term growth prospects at reasonable valuations. For Tax-Efficient Balanced and Tax-Efficient Growth, we increased our exposure to Dell, Nokia, Automatic Data Processing, and Analog Devices. For Tax-Efficient Growth and Tax-Efficient Multi-Cap Growth, we added to our existing positions in Altera, and for all three tax-efficient funds, we purchased additional shares of Microchip Technology and Xilinx. We prefer reasonably valued stocks of differentiated semiconductor companies with quality business models. Although semiconductors were among the worst-performing industries in 2004, we believe the industry will shortly resolve its inventory issues and do well this year.
TAX-EFFICIENT BALANCED FUND
Your fund returned 3.97% in the last six months and 0.64% for the 12-month period ended February 28, 2005. The fund lagged its Lipper benchmark in both periods, as shown in the table on page 7, primarily because the growth-oriented stock portion of the fund performed worse than equity portfolios of other balanced funds. The fund also lagged the hypothetical Combined Index Portfolio in both periods because its stock portfolio lagged the S&P 500 Index, which is a blend of growth and value stocks.
| PERFORMANCE COMPARISON |
| Periods Ended 2/28/05 | 6 Months | 12 Months |
| Tax-Efficient Balanced Fund | 3.97% | 0.64%* |
| Lipper Balanced Funds Index | 8.09 | 6.05 |
| Combined Index Portfolio ** | 6.03 | 4.97 |
| * The Tax-Efficient Balanced Fund charges a 1% redemption | ||
| fee on shares held less than one year. The performance | ||
| information shown does not reflect the deduction of the | ||
| redemption fee. If it did, the performance would be lower. | ||
| ** An unmanaged portfolio of 48% stocks (S&P 500 Stock | ||
| Index) and 52% bonds (Lehman Brothers Municipal Bond | ||
| Index). | ||
Equity Portfolio
In the last six months, our lack of exposure to the robust energy sector significantly limited the equity portfolio’s potential gains, particularly relative to the S&P 500. Stock selection within the financial sector hindered our performance relative to other growth investors, yet we remain overweighted in financials as we view the sector’s risk/reward profile very favorably. In addition, our overweighting of Cisco Systems in the information technology sector and Amazon.com and eBay in the consumer discretionary sector were disadvantageous relative to the S&P 500. On the plus side, our positions in United Health Group and Wellpoint (especially before its merger with Anthem) greatly added value.
| EQUITY PORTFOLIO CHARACTERISTICS |
| Tax-Efficient | S&P 500 | ||
| As of 2/28/05 | Balanced Fund | Stock Index | |
| Earnings Growth Rate | |||
| Historical Growth 5 Years | |||
| (least squared) | 10.6% | 10.9% | |
| Projected Long-Term Growth 1 | 13.9 | 11.2 | |
| Profitability – Return on Equity | |||
| Latest 12 Months | |||
| Excluding Charges | 20.9 | 19.3 | |
| Average Company Yield 2 | 1.1 | 1.8 | |
| P/E Ratio | |||
| 12 Months Forward | |||
| Estimated Earnings 1 | 17.6 X | 16.0 X | |
| Investment-Weighted Median | |||
| Market Capitalization (bil) | $51.3 | $53.8 | |
| 1 Source data: IBES. 2 Source data: Bloomberg | |||
| Forecasts are in no way indicative of future investment returns. | |||
In the 12-month period ended February 28, 2005, avoiding the energy sector detracted substantially from our results. Although prices of oil and other commodities have spiked and the corresponding companies have produced spectacular shorter-term returns, they are not the consistent-growth companies with a sustainable competitive advantage that we seek. Overweighting media names Clear Channel Communications and Univision Communications in the consumer discretionary sector, State Street in the financials sector, and semiconductor companies Xilinx, Analog Devices, and Maxim Integrated Products in the information technology sector also worked against us. On the plus side, our overweighting of Wellpoint in the health care sector helped our results. Overweighting Johnson & Johnson also helped the equity portfolio’s performance versus other large-cap growth portfolios.
Municipal Bond Portfolio
Nationally, new municipal supply in 2004 was down about 6% from the previous year’s record. While still high from a historical perspective, the increased participation of property and casualty insurance companies and other nontraditional buyers of municipal securities easily absorbed supply, which reduced downward pressure on municipal bond prices. Many states have recovered nicely from the 2001 recession as higher-than-anticipated revenues, spending cuts, and fee increases have improved many states’ finances and reduced the need to borrow.
Local governments and school districts are participating in the states’ recovery in that they are receiving more in assistance and transfers. The rise in housing prices over the last three years also benefited local governments since it resulted in increased property tax receipts, which are localities’ primary revenue source. Broadly speaking, the outlook for public finance is brighter, though escalating pension and benefit costs may hinder further improvement.
| Security Diversification |

In the last six months, we concentrated our new municipal investments primarily in longer-term securities. We felt the municipal yield curve was too steep by historical standards and would likely flatten. We also wanted to benefit from the yield advantage offered by longer-term issues. Overall, the municipal bond portfolio’s duration and average maturity were little changed in the last six months as we kept a portion of assets in short-and intermediate-term securities to offset the higher risk of the longer-term holdings. For the period, our municipal bonds with longer maturities outperformed those with shorter maturities.
We kept a high weighting in California issues, which continued to contribute to the municipal portfolio’s relative performance. We believe the long-term prospects for California will improve in tandem with the growing economy.
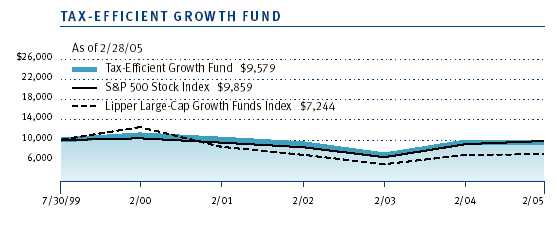
TAX-EFFICIENT GROWTH FUND
Your fund returned 6.56% and -0.53% in the 6- and 12-month periods ended February 28, 2005. As shown in the table, the fund lagged its growth-oriented Lipper benchmark and the S&P 500 Index, which is a blend of growth and value stocks, in both periods.
| PERFORMANCE COMPARISON |
| Periods Ended 2/28/05 | 6 Months | 12 Months |
| Tax-Efficient Growth Fund | 6.56% | -0.53%* |
| Lipper Large-Cap Growth | ||
| Funds Index | 9.40 | 2.03 |
| S&P 500 Stock Index | 9.99 | 6.98 |
| * The Tax-Efficient Growth Fund charges a 1% redemption fee | ||
| on shares held less than one year. The performance informa- | ||
| tion shown does not reflect the deduction of the redemption | ||
| fee. If it did, the performance would be lower. | ||
Since we invest for longer-term holding periods, it is best to evaluate our performance over longer spans. In fact, the fund’s longer-term relative performance record remains very favorable. Lipper placed the fund in the top 8% of the large-cap growth universe for the five-year period ended December 31, 2004. Lipper also placed the fund in the top 18% of that universe for the period from its inception (7/30/99) through the end of December 2004. (Based on total return, Lipper ranked the Tax-Efficient Growth Fund 523 out of 652, 111 out of 538, 31 out of 418, and 64 out of 367 funds for the one-year, three-year, five-year, and since-inception periods ended December 31, 2004, respectively. Results will vary for other time periods, and past performance cannot guarantee future results.)
| PORTFOLIO CHARACTERISTICS |
| Tax-Efficient | S&P 500 | |
| As of 2/28/05 | Growth Fund | Stock Index |
| Earnings Growth Rate | ||
| Historical Growth 5 Years | ||
| (least squared) | 9.6% | 10.9% |
| Projected Long-Term Growth | 13.9 | 11.2 |
| Profitability – Return on Equity | ||
| Latest 12 Months | ||
| Excluding Charges | 20.1 | 19.3 |
| Average Company Yield 2 | 1.1 | 1.8 |
| P/E Ratio | ||
| 12 Months Forward | ||
| Estimated Earnings 1 | 17.8 X | 16.0 X |
| Investment-Weighted Median | ||
| Market Capitalization (bil) | $44.4 | $53.8 |
| 1 Source data: IBES. 2 Source data: Bloomberg | ||
| Forecasts are in no way indicative of future investment returns. | ||
In the last six months, our lack of exposure to the red-hot energy sector significantly limited the portfolio’s potential gains, particularly relative to the S&P 500, which has greater energy sector representation than many large-cap growth portfolios. Overweighting financial stocks and media names Clear Channel Communications and Univision Communications in the consumer discretionary sector also hurt our relative results. On the plus side, our positions in United Health Group and Wellpoint greatly added value.
| Sector Diversification |
In the 12-month period ended February 28, 2005, avoiding the energy sector detracted substantially from our results. Overweighting media names Clear Channel Communications, Univision Communications, and Viacom in the consumer discretionary sector and State Street in the financials sector hurt our results versus both benchmarks, whereas overweighting semiconductor companies Xilinx, Analog Devices, and Maxim Integrated Products in the information technology sector also detracted from our performance relative to the Lipper benchmark. On the plus side, our overweighting of Wellpoint in the health care sector helped our results.
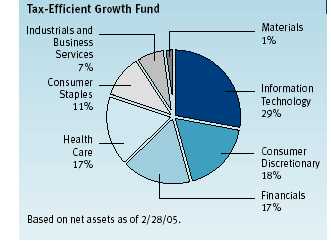
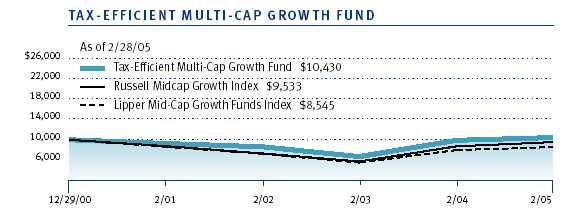
At the end of February, consumer discretionary, financials, and health care stocks collectively represented about one-half of the fund’s assets. Our largest single-sector allocation was information technology, which represented nearly one-third of the portfolio, while exposure to consumer staples and industrials and business services companies was relatively low. We owned no energy or utility companies at the end of February and had very little exposure to the materials and telecommunications sectors. Companies with good growth prospects and high, sustainable returns on equity are seldom found in these areas.TAX-EFFICIENT MULTI-CAP GROWTH FUND
Your fund produced returns of 12.88% and 5.57% in the 6- and 12-month periods ended February 28, 2005. The fund lagged both of its benchmarks in both periods, as shown in the table.
| PERFORMANCE COMPARISON |
| Periods Ended 2/28/05 | 6 Months | 12 Months |
| Tax-Efficient Multi-Cap | ||
| Growth Fund | 12.88% | 5.57%* |
| Lipper Mid-Cap Growth | ||
| Funds Index | 16.30 | 7.53 |
| Russell Midcap Growth Index | 17.94 | 9.71 |
| * The Tax-Efficient Multi-Cap Growth Fund charges a 1% | ||
| redemption fee on shares held less than one year. The perfor- | ||
| mance information shown does not reflect the deduction of | ||
| the redemption fee. If it did, the performance would be lower. | ||
Although the fund’s relative performance over the last year was disappointing, we are pleased with the fund’s longer-term results relative to competing funds since its inception on December 29, 2000. Lipper placed the fund in the top 18% of the mid-cap growth funds universe for the period from its inception through December 31, 2004. Lipper also placed the fund in the top 25% of that universe for the three-year period ending December 31, 2004. (Based on total return, Lipper ranked the Tax-Efficient Multi-Cap Growth Fund 209 out of 529, 106 out of 425, and 66 out of 370 funds for the one-year, three-year, and since-inception periods ended December 31, 2004, respectively. Results will vary for other time periods, and past performance cannot guarantee future results.)
In the last six months, the fund lagged its benchmarks due to weak stock selection in the information technology sector, such as overweighting security software maker Symantec. In addition, underweighting Marvell Technology limited our gains versus the Lipper benchmark. Underweighting the energy sector also hurt our performance versus Lipper, while overweighting Northern Trust and owning State Street in the financials sector detracted from our results relative to the Russell benchmark. Our position in media and marketing company Meredith in the consumer discretionary sector generally hurt our performance. On the plus side, overweighting WellPoint and WellChoice in the health care sector helped our results versus both benchmarks.
| PORTFOLIO CHARACTERISTICS |
| Russell | ||
| Tax-Efficient | Midcap | |
| Multi-Cap | Growth | |
| As of 2/28/05 | Growth Fund | Index |
| Earnings Growth Rate | ||
| Historical Growth 5 Years | ||
| (least squared) | 14.3% | 13.2% |
| Projected Long-Term Growth 1 | 15.6 | 15.1 |
| Profitability – Return on Equity | ||
| Latest 12 Months | ||
| Excluding Charges | 18.5 | 18.8 |
| Average Company Yield 2 | 0.5 | 0.6 |
| P/E Ratio | ||
| 12 Months Forward | ||
| Estimated Earnings 1 | 19.3 X | 18.7 X |
| Investment-Weighted Median | ||
| Market Capitalization (bil) | $7.1 | $5.7 |
| 1 Source data: IBES. 2 Source data: Bloomberg | ||
| Forecasts are in no way indicative of future investment returns. | ||
For the 12-month period ended February 28, 2005, the fund lagged its benchmarks because we underweighted the energy sector and because of weak stock selection in the consumer discretionary sector, such as overweighting International Game Technology. Overweighting retailer Tiffany also hurt results versus the Lipper benchmark, while our positions in State Street and Northern Trust hurt our performance relative to the Russell benchmark. On the plus side, favorable stock selection in the technology sector, such as Yahoo! and Kronos, helped our results. Overweighting tech company VeriSign and health care stocks WellPoint and WellChoice also helped our performance versus Lipper.
| Sector Diversification |
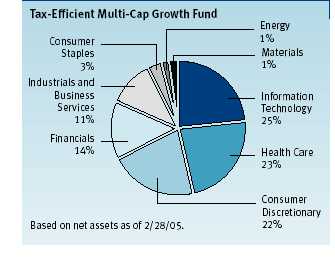
At the end of February, we had nearly equal allocations to the information technology, health care, and consumer discretionary sectors, our largest sector commitments. Exposure to financials and industrials and business services companies was materially lower. We owned no utility or telecommunications services companies at the end of February and had very little exposure to the consumer staples, energy, and materials sectors. Smaller companies with good growth prospects and high, sustainable returns on equity are seldom found in these areas.
OUTLOOK
While higher energy prices may dampen consumer spending, strong fundamentals support our outlook for sustained economic expansion. Because the Fed remains committed to removing monetary policy accommodation, interest rates along the yield curve are likely to rise, suggesting a more challenging bond market environment in the period ahead.
Although it may be time for renewed caution regarding fixed-income investments, we believe several factors are likely to temper a broad increase in interest rates. First, the current cyclical increase in inflation may be modest compared with previous inflationary periods, as forces that encourage price increases—such as dollar weakness and a tighter labor market—may be offset to some degree by forces that tend to restrain inflation, including productivity gains and intense global price competition. Second, reduced supply in a higher interest rate environment should lead to less refinancing issuance, less borrowing, and generally better fiscal conditions. Third, the greater transparency of the Federal Open Market Committee process, as evidenced by the earlier publication of Fed meeting minutes, may lessen the prospect for a surprise rate hike by the central bank and should help mitigate any overreaction to new economic data. Finally, given that the municipal yield curve remains som ewhat steep, we believe that bonds with longer maturities still offer value to investors.
The stock market environment has been challenging for our funds’ growth-oriented investment strategies, most recently because of the leadership by commodity-producing companies in the materials and energy sectors. We believe that our investment style should produce better relative performance when companies with consistent earnings growth are rewarded. Such companies are still the best investment vehicles for long-term taxable investors, in our opinion, and we believe that the market is beginning to focus more on them.
Our fully invested approach focuses on strong businesses and management with a long-term orientation. We will work to keep each portfolio’s tax efficiency high by using a buy-and-hold approach to invest in companies with strong long-term prospects and reasonable valuations and by realizing losses from holdings with deteriorating fundamentals to offset taxable capital gains.Thank you for your continued confidence in T. Rowe Price.
Respectfully submitted,
Donald J. Peters
Cochairman of the Investment Advisory Committee,
Tax-Efficient Balanced Fund
Chairman of the Investment Advisory Committee,
Tax-Efficient Growth and Tax-Efficient Multi-Cap Growth Funds

Hugh D. McGuirk
Cochairman of the Investment Advisory Committee,
Tax-Efficient Balanced Fund
March 18, 2005
The committee chairmen have day-to-day responsibility for managing the portfolios and work with committee members in developing and executing the funds’ investment programs.
RISKS OF STOCK INVESTINGThe stock market as a whole can decline for many reasons, including adverse political or economic developments here or abroad, changes in investor psychology, or heavy institutional selling. The prospects for an industry or company may deteriorate because of a variety of factors, including disappointing earnings or changes in the competitive environment. In addition, our assessment of companies held in the funds may prove incorrect, resulting in losses or poor performance even in a rising market.
Growth stocks can be volatile for several reasons. Since growth companies usually reinvest a high proportion of their earnings in their own businesses, they may lack the dividends often associated with value stocks that could cushion their decline in a falling market. Also, since investors buy growth stocks because of their expected superior earnings growth, earnings disappointments often result in sharp price declines.
The stocks of mid-cap companies entail greater risk and are usually more volatile than the shares of large companies. Investing in small companies also involves greater risk than is customarily associated with larger companies. Stocks of small companies are subject to more abrupt or erratic price movements than larger-company stocks. Small companies often have limited product lines, markets, or financial resources, and their managements may lack depth and experience. Such companies seldom pay significant dividends that could cushion returns in a falling market.
RISKS OF BOND INVESTING (TAX-EFFICIENT BALANCED FUND)
Like all bonds, municipal bonds have two main sources of risk: interest rate and credit risk. Interest rate risk is the decline in bond prices that usually accompanies a rise in interest rates. Longer-maturity bonds typically suffer greater declines than those with shorter maturities. Credit risk is the chance that any fund holding could have its credit rating downgraded, or that a bond issuer will default (fail to make timely payments of interest or principal), potentially reducing the fund’s income level and share price. To the extent that we invest in junk bonds, credit risk will be higher since their issuers are more vulnerable to financial setbacks and recession than more creditworthy companies.
Municipal bonds are also subject to the possibility that tax reform or lower overall taxes may reduce their value, or that individual issuers will be unable to meet their obligations due to problems in that state or locality.
GLOSSARYAverage company yield: Investment-weighted average yield of the underlying company yields. Individual company yields are calculated by dividing the estimated annual dividends per share by the current price.
Earnings growth rate: Measures the annualized percent change in earnings per share for a given time period.
Fed funds target rate: An overnight lending rate set by the Federal Reserve and used by banks to meet reserve requirements. Banks also use the fed funds rate as a benchmark for their prime lending rates.
Historical growth 5 years (least squared): Least squares growth calculation attempts to find the “normal” growth rate given a stream of historical growth rates. It searches for the growth rate that best fits the line produced by a stream of growth numbers.
Investment-weighted median market capitalization: The investment weighted mid-point market capitalization (shares outstanding multiplied by current price) representing a typical security in a portfolio. An investment-weighted median represents the breakpoint where 50% of the values are above and 50% of the values are below based on portfolio weight.
Lehman Brothers Municipal Bond Index: An unmanaged index that tracks municipal debt instruments.
Lipper indices: Consist of a small number (10 to 30) of the largest mutual funds in a particular category as tracked by Lipper Inc.
Price/earnings (P/E) ratio: A ratio shows the “multiple” of earnings at which a stock is selling. It is calculated by dividing a stock’s current price by its current earnings per share. For example, if a stock’s price is $60 per share and the issuing company earns $2 per share, the P/E ratio is $60/$2, or 30.
Projected long-term growth (IBES): Long-term projected earnings per share growth rate based on IBES estimates.
Return on equity (ROE): Calculated by dividing a company’s net income by shareholders’ equity (i.e., the company’s book value), ROE measures how much a company earns on each dollar that common stock investors have put into that company. ROE indicates how effectively and efficiently a company and its management are using stockholder investments. Excluding charges refers to the earnings figure used in the calculation. It represents earnings before extraordinary items and discontinued operations.
Russell 1000 Index: Measures the performance of the 1,000 largest companies in the Russell 3000 Index.
Russell 1000 Growth Index: Measures the performance of those Russell 1000 Index companies with higher price-to-book ratios and higher forecasted growth values.
Russell 1000 Value Index: Measures the performance of those Russell 1000 companies with lower price-to-book ratios and lower forecasted growth values.Russell 2000 Index: Measures the performance of the 2,000 smallest companies in the Russell 3000 Index.
Russell 2000 Growth Index: Measures the performance of those Russell 2000 companies with higher price-to-book ratios and higher forecasted growth values.
Russell 2000 Value Index: Measures the performance of those Russell 2000 companies with lower price-to-book ratios and lower forecasted growth values.
Russell Midcap Index: Measures the performance of the 800 smallest companies in the Russell 1000 Index.
Russell Midcap Growth Index: Measures the performance of those Russell Midcap companies with higher price-to-book ratios and higher forecasted growth values. The stocks are also members of the Russell 1000 Growth Index.
Russell Midcap Value Index: Measures the performance of those Russell Midcap companies with lower price-to-book ratios and lower forecasted growth values. The stocks are also members of the Russell 1000 Value Index.
S&P 500 Stock Index: Tracks the stocks of 500 primarily large U.S. companies.
Yield curve: A graphic depiction of the relationship between yields and maturity dates for a set of similar securities, such as Treasuries or municipal securities. Yield curves typically slope upward, indicating that longer maturities offer higher yields. When the yield curve is flat, there is little or no difference between the yields offered by shorter- and longer-term securities.
| PORTFOLIO HIGHLIGHTS |
| SECTOR DIVERSIFICATION | ||
| Tax-Efficient Balanced Fund | ||
| Percent of | Percent of | |
| Net Assets | Net Assets | |
| Stocks | 8/31/04 | 2/28/05 |
| Information Technology | 12% | 14% |
| Consumer Discretionary | 8 | 9 |
| Financials | 9 | 8 |
| Health Care | 9 | 8 |
| Consumer Staples | 6 | 6 |
| Industrials and Business Services | 3 | 3 |
| Total | 47% | 48% |
| Historical weightings reflect current industry/sector classifications. | ||
| Bonds and Reserves | ||
| General Obligations – Local | 8% | 7% |
| General Obligations – State | 6 | 7 |
| Water and Sewer Revenue | 7 | 6 |
| Dedicated Tax Revenue | 5 | 6 |
| Prerefunded | 5 | 6 |
| Hospital Revenue | 5 | 5 |
| Housing Finance Revenue | 3 | 3 |
| Air and Sea Transportation | 2 | 3 |
| Education Revenue | 2 | 2 |
| Life Care/Nursing Home Revenue | 2 | 2 |
| All Other | 7 | 5 |
| Reserves | 1 | 0 |
| Total | 53% | 52% |
| PORTFOLIO HIGHLIGHTS |
| LARGEST HOLDINGS | ||||
| Tax-Efficient Balanced Fund | ||||
| Percent of | Percent of | |||
| Net Assets | Net Assets | |||
| Stocks | 2/28/05 | Bonds | 2/28/05 | |
| GE | 1.7% | District of Columbia | 4.1% | |
| WellPoint | 1.4 | Massachusetts Water Pollution | 2.8 | |
| Dell | 1.4 | Georgia | 2.8 | |
| UnitedHealth Group | 1.4 | NY City Trans Fin Auth | 2.6 | |
| Microsoft | 1.4 | West Virginia | 2.6 | |
| Citigroup | 1.2 | Port of Seattle | 2.5 | |
| Wal-Mart | 1.2 | Michigan Hosp. Fin. Auth. | 2.4 | |
| Cisco Systems | 1.2 | Dallas County Utility & | ||
| Johnson & Johnson | 1.2 | Reclamation Dist. | 2.3 | |
| Medtronic | 1.1 | Houston, TX. Water & Sewer | 1.9 | |
| Total | 13.2% | South Carolina Trans. Infra. Bk. Rev. | 1.3 | |
| Total | 25.3% | |||
| PORTFOLIO HIGHLIGHTS |
| TWENTY-FIVE LARGEST HOLDINGS | |
| Percent of | |
| Net Assets | |
| Tax-Efficient Growth Fund | 2/28/05 |
| GE | 3.2% |
| WellPoint | 3.1 |
| Dell | 2.8 |
| Microsoft | 2.7 |
| UnitedHealth Group | 2.6 |
| Citigroup | 2.5 |
| Medtronic | 2.3 |
| Wal-Mart | 2.2 |
| State Street | 2.1 |
| Intel | 2.1 |
| Cisco Systems | 2.1 |
| Johnson & Johnson | 2.0 |
| eBay | 2.0 |
| Northern Trust | 1.9 |
| Pfizer | 1.9 |
| Home Depot | 1.8 |
| American International Group | 1.7 |
| Linear Technology | 1.7 |
| Maxim Integrated Products | 1.7 |
| Altera | 1.5 |
| Amazon.com | 1.5 |
| Xilinx | 1.5 |
| Franklin Resources | 1.4 |
| Analog Devices | 1.4 |
| Procter & Gamble | 1.4 |
| Total | 51.1% |
| Note: Table excludes investments in the T. Rowe Price Reserve Investment Fund. | |
| PORTFOLIO HIGHLIGHTS |
| TWENTY-FIVE LARGEST HOLDINGS | |
| Percent of | |
| Net Assets | |
| Tax-Efficient Multi-Cap Growth Fund | 2/28/05 |
| WellPoint | 2.0% |
| Apollo Group | 1.3 |
| Franklin Resources | 1.0 |
| Moody’s | 1.0 |
| WellChoice | 1.0 |
| Adobe Systems | 1.0 |
| eBay | 0.9 |
| Yahoo! | 0.9 |
| Electronic Arts | 0.9 |
| Zimmer Holdings | 0.9 |
| Symantec | 0.9 |
| Gilead Sciences | 0.9 |
| Marriott | 0.9 |
| Stryker | 0.9 |
| Patterson Companies | 0.8 |
| Northern Trust | 0.8 |
| Willis Group Holdings | 0.8 |
| Station Casinos | 0.8 |
| Microchip Technology | 0.7 |
| Altera | 0.7 |
| Xilinx | 0.7 |
| Biomet | 0.7 |
| State Street | 0.7 |
| International Game Technology | 0.7 |
| Renal Care Group | 0.7 |
| Total | 22.6% |
| Note: Table excludes investments in the T. Rowe Price Reserve Investment Fund. | |
| PORTFOLIO HIGHLIGHTS |
| CONTRIBUTIONS TO THE CHANGE IN NET ASSET VALUE | ||||
| Tax-Efficient Growth Fund | ||||
| 6 Months Ended 2/28/05 | ||||
| Best Contributors | Worst Contributors | |||
| WellPoint* | 12¢ | Pfizer | -5¢ | |
| UnitedHealth Group | 7 | Marsh & McLennan | 3 | |
| Dell | 3 | Fannie Mae | 2 | |
| Franklin Resources | 3 | Microsoft | 2 | |
| Omnicom | 3 | American International Group | 2 | |
| GE | 3 | Merck | 2 | |
| McGraw-Hill | 3 | Cisco Systems | 2 | |
| Johnson & Johnson | 2 | Univision Communications | 1 | |
| Intel | 2 | Amazon.com | 1 | |
| Texas Instruments | 2 | Eli Lilly | 1 | |
| Total | 40¢ | Total | -21¢ | |
| 12 Months Ended 2/28/05 | ||||
| Best Contributors | Worst Contributors | |||
| WellPoint* | 12¢ | Pfizer | -8¢ | |
| UnitedHealth Group | 8 | Cisco Systems | 5 | |
| eBay | 4 | Intel | 4 | |
| Dell | 4 | Clear Channel Communications | 4 | |
| Johnson & Johnson | 3 | State Street | 4 | |
| GE | 3 | Marsh & McLennan | 4 | |
| Franklin Resources | 3 | Xilinx | 4 | |
| Yahoo! | 2 | Wal-Mart | 3 | |
| McGraw-Hill | 2 | Northern Trust | 3 | |
| Medtronic | 2 | American International Group | 3 | |
| Total | 43¢ | Total | -42¢ | |
| * Merger | ||||
| PORTFOLIO HIGHLIGHTS |
| CONTRIBUTIONS TO THE CHANGE IN NET ASSET VALUE | ||||
| Tax-Efficient Multi-Cap Growth Fund | ||||
| 6 Months Ended 2/28/05 | ||||
| Best Contributors | Worst Contributors | |||
| WellPoint* | 8¢ | Biogen Idec | -2¢ | |
| VeriSign | 4 | Univision Communications | 1 | |
| WellChoice | 3 | Symantec | 1 | |
| Starbucks | 3 | Apollo Group | 1 | |
| Adobe Systems | 3 | JDS Uniphase | 1 | |
| Cognizant Technology Solutions | 3 | Lexmark International | 1 | |
| Franklin Resources | 3 | Techne | 1 | |
| Marriott | 2 | Iron Mountain | 1 | |
| Patterson Companies | 2 | Biomet | 1 | |
| Electronic Arts | 2 | Meredith | 1 | |
| Total | 33¢ | Total | -11¢ | |
| 12 Months Ended 2/28/05 | ||||
| Best Contributors | Worst Contributors | |||
| WellPoint* | 7¢ | Forest Laboratories | -3¢ | |
| Adobe Systems | 4 | Omnicare | 3 | |
| Starbucks | 4 | Xilinx | 2 | |
| VeriSign | 4 | International Game Technology | 2 | |
| Yahoo! | 3 | IAC/InterActiveCorp | 2 | |
| WellChoice | 3 | Univision Communications | 2 | |
| Station Casinos | 3 | Analog Devices | 2 | |
| Cognizant Technology Solutions | 3 | Career Education | 2 | |
| Kronos | 3 | JDS Uniphase | 2 | |
| Patterson Companies | 3 | Tiffany | 2 | |
| Total | 37¢ | Total | -22¢ | |
| * Merger | ||||
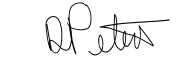
| GROWTH OF $10,000 |
This chart shows the value of a hypothetical $10,000 investment in the fund over the past 10 fiscal year periods or since inception (for funds lacking 10-year records). The result is compared with benchmarks, which may include a broad-based market index and a peer group average or index. Market indexes do not include expenses, which are deducted from fund returns as well as mutual fund averages and indexes.
| AVERAGE ANNUAL COMPOUND TOTAL RETURN |
This table shows how the fund and its benchmarks would have performed each year if their actual (or cumulative) returns for the periods shown were earned at a constant rate.
| Since | |||
| Inception | |||
| Periods Ended 2/28/05 | 1 Year | 5 Years | 6/30/97 |
| Tax-Efficient Balanced Fund | 0.64% | 2.10% | 6.42% |
| Lipper Balanced Funds Index | 6.05 | 3.55 | 6.06 |
| Combined Index Portfolio* | 4.97 | 3.59 | 6.30 |
| The Tax-Efficient Balanced Fund charges a 1% redemption fee on shares held less than one year. The | |||
| performance information shown does not reflect the deduction of the redemption fee. If it did, the | |||
| performance would be lower. | |||
| * An unmanaged portfolio of 48% stocks (S&P 500 Stock Index) and 52% bonds (Lehman Brothers | |||
| Municipal Bond Index). | |||
| Returns do not reflect taxes that the shareholder may pay on fund distributions or the redemption of | |||
| fund shares. Past performance cannot guarantee future results. | |||
| GROWTH OF $10,000 |
This chart shows the value of a hypothetical $10,000 investment in the fund over the past 10 fiscal year periods or since inception (for funds lacking 10-year records). The result is compared with benchmarks, which may include a broad-based market index and a peer group average or index. Market indexes do not include expenses, which are deducted from fund returns as well as mutual fund averages and indexes.
| AVERAGE ANNUAL COMPOUND TOTAL RETURN |
This table shows how the fund and its benchmarks would have performed each year if their actual (or cumulative) returns for the periods shown were earned at a constant rate.
| Since | |||
| Inception | |||
| Periods Ended 2/28/05 | 1 Year | 5 Years | 7/30/99 |
| Tax-Efficient Growth Fund | -0.53% | -2.78% | -0.77% |
| Lipper Large-Cap Growth Funds Index | 2.03 | -10.42 | -5.61* |
| S&P 500 Stock Index | 6.98 | -0.98 | -0.25 |
| *As of 7/31/99 | |||
| The Tax-Efficient Growth Fund charges a 1% redemption fee on shares held less than one year. The | |||
| performance information shown does not reflect the deduction of the redemption fee. If it did, the | |||
| performance would be lower. | |||
| Returns do not reflect taxes that the shareholder may pay on fund distributions or the redemption of | |||
| fund shares. Past performance cannot guarantee future results. | |||
| GROWTH OF $10,000 |
This chart shows the value of a hypothetical $10,000 investment in the fund over the past 10 fiscal year periods or since inception (for funds lacking 10-year records). The result is compared with benchmarks, which may include a broad-based market index and a peer group average or index. Market indexes do not include expenses, which are deducted from fund returns as well as mutual fund averages and indexes.
| AVERAGE ANNUAL COMPOUND TOTAL RETURN |
This table shows how the fund and its benchmarks would have performed each year if their actual (or cumulative) returns for the periods shown were earned at a constant rate.
| Since | ||
| Inception | ||
| Periods Ended 2/28/05 | 1 Year | 12/29/00 |
| Tax-Efficient Multi-Cap Growth Fund | 5.57% | 1.02% |
| Lipper Mid-Cap Growth Funds Index | 7.53 | -3.70 |
| Russell Midcap Growth Index | 9.71 | -1.14 |
| The Tax-Efficient Multi-Cap Growth Fund charges a 1% redemption fee on shares held less than one | ||
| year. The performance information shown does not reflect the deduction of the redemption fee. If it did, | ||
| the performance would be lower. | ||
| Returns do not reflect taxes that the shareholder may pay on fund distributions or the redemption of | ||
| fund shares. Past performance cannot guarantee future results. | ||
| FUND EXPENSE EXAMPLE |
As a mutual fund shareholder, you may incur two types of costs: (1) transaction costs such as redemption fees or sales loads and (2) ongoing costs, including management fees, distribution and service (12b-1) fees, and other fund expenses. The following example is intended to help you understand your ongoing costs (in dollars) of investing in the fund and to compare these costs with the ongoing costs of investing in other mutual funds. The example is based on an investment of $1,000 invested at the beginning of the most recent six-month period and held for the entire period.
Actual Expenses
The first line of the following table (“Actual”) provides information about actual account values and actual expenses. You may use the information in this line, together with your account balance, to estimate the expenses that you paid over the period. Simply divide your account value by $1,000 (for example, an $8,600 account value divided by $1,000 = 8.6), then multiply the result by the number in the first line under the heading “Expenses Paid During Period” to estimate the expenses you paid on your account during this period.
Hypothetical Example for Comparison Purposes
The information on the second line of the table (“Hypothetical”) is based on hypothetical account values and expenses derived from the fund’s actual expense ratio and an assumed 5% per year rate of return before expenses (not the fund’s actual return). You may compare the ongoing costs of investing in the fund with other funds by contrasting this 5% hypothetical example and the 5% hypothetical examples that appear in the shareholder reports of the other funds. The hypothetical account values and expenses may not be used to estimate the actual ending account balance or expenses you paid for the period.
Note: T. Rowe Price charges an annual small-account maintenance fee of $10, generally for accounts with less than $2,000 ($500 for UGMA/UTMA). The fee is waived for any investor whose T. Rowe Price mutual fund accounts total $25,000 or more, accounts employing automatic investing, and IRAs and other retirement plan accounts that utilize a prototype plan sponsored by T. Rowe Price (although a separate custodial or administrative fee may apply to such accounts). This fee is not included in the accompanying table. If you are subject to the fee, keep it in mind when you are estimating the ongoing expenses of investing in the fund and when comparing the expenses of this fund with other funds.
You should also be aware that the expenses shown in the table highlight only your ongoing costs and do not reflect any transaction costs, such as redemption fees or sales loads. Therefore, the second line of the table is useful in comparing ongoing costs only and will not help you determine the relative total costs of owning different funds. To the extent a fund charges transaction costs, however, the total cost of owning that fund is higher.
| T. ROWE PRICE TAX-EFFICIENT BALANCED FUND |
| Beginning | Ending | Expenses Paid | |
| Account Value | Account Value | During Period* | |
| 9/1/04 | 2/28/05 | 9/1/04 to 2/28/05 | |
| Actual | $1,000.00 | $1,039.70 | $5.21 |
| Hypothetical (assumes 5% | |||
| return before expenses) | 1,000.00 | 1,019.69 | 5.16 |
| * Expenses are equal to the fund’s annualized expense ratio for the six-month period (1.03%), multi- | |||
| plied by the average account value over the period, multiplied by the number of days in the most | |||
| recent fiscal half year (181) divided by the days in the year (365) to reflect the half-year period. | |||
| T. ROWE PRICE TAX-EFFICIENT GROWTH FUND |
| Beginning | Ending | Expenses Paid | |
| Account Value | Account Value | During Period* | |
| 9/1/04 | 2/28/05 | 9/1/04 to 2/28/05 | |
| Actual | $1,000.00 | $1,065.60 | $5.33 |
| Hypothetical (assumes 5% | |||
| return before expenses) | 1,000.00 | 1,019.64 | 5.21 |
| * Expenses are equal to the fund’s annualized expense ratio for the six-month period (1.04%), multi- | |||
| plied by the average account value over the period, multiplied by the number of days in the most | |||
| recent fiscal half year (181) divided by the days in the year (365) to reflect the half-year period. | |||
| T. ROWE PRICE TAX-EFFICIENT MULTI-CAP GROWTH FUND |
| Beginning | Ending | Expenses Paid | |
| Account Value | Account Value | During Period* | |
| 9/1/04 | 2/28/05 | 9/1/04 to 2/28/05 | |
| Actual | $1,000.00 | $1,128.80 | $6.60 |
| Hypothetical (assumes 5% | |||
| return before expenses) | 1,000.00 | 1,018.60 | 6.26 |
| * Expenses are equal to the fund’s annualized expense ratio for the six-month period (1.25%), multi- | |||
| plied by the average account value over the period, multiplied by the number of days in the most | |||
| recent fiscal half year (181) divided by the days in the year (365) to reflect the half-year period. | |||
| QUARTER-END RETURNS |
| Since | Inception | |||
| Periods Ended 12/31/04 | 1 Year | 5 Years | Inception | Date |
| Tax-Efficient Balanced Fund | 3.80% | 2.49% | 6.77% | 6/30/97 |
| After Taxes on Distributions | 3.72 | 2.40 | 6.66 | |
| After Taxes on Distributions | ||||
| and Sale of Fund Shares | 3.15 | 2.34 | 6.10 | |
| Lipper Balanced Funds Index | 8.99 | 2.95 | 6.18 | |
| Combined Index Portfolio * | 7.59 | 2.94 | 6.43 | |
| Tax-Efficient Growth Fund | 3.18 | -2.59 | -0.18 | 7/30/99 |
| After Taxes on Distributions | 3.10 | -2.61 | -0.20 | |
| After Taxes on Distributions | ||||
| and Sale of Fund Shares | 2.17 | -2.18 | -0.16 | |
| Lipper Large-Cap Growth Funds Index | 7.45 | -9.72 | -5.28** | |
| S&P 500 Stock Index | 10.88 | -2.30 | -0.19 | |
| Tax-Efficient Multi-Cap Growth Fund | 12.90 | – | 1.94 | 12/29/00 |
| After Taxes on Distributions | 12.90 | – | 1.94 | |
| After Taxes on Distributions | ||||
| and Sale of Fund Shares | 8.39 | – | 1.66 | |
| Lipper Mid-Cap Growth Funds Index | 14.03 | – | -3.37*** | |
| Russell Midcap Growth Index | 15.48 | – | -1.14 | |
| * An unmanaged portfolio of 48% stocks (S&P 500 Stock Index) and 52% bonds (Lehman Brothers | ||||
| Municipal Bond Index). | ||||
| ** As of 7/31/99 | ||||
| *** As of 12/30/00 | ||||
| Current performance may be higher or lower than the quoted past performance, which can- | ||||
| not guarantee future results. Share price, principal value, and return will vary, and you may | ||||
| have a gain or loss when you sell your shares. For the most recent month-end performance | ||||
| information, please visit our Web site (troweprice.com) or contact a T. Rowe Price represen- | ||||
| tative at 1-800-225-5132. Each fund charges a 1% redemption fee on shares held for less | ||||
| than one year. The performance information shown does not reflect the deduction of the | ||||
| redemption fee. If it did, the performance would be lower. | ||||
| This table provides returns through the most recent calendar quarter-end rather than through the end | ||||
| of the fund’s fiscal period. It shows how the funds and their benchmarks would have performed each | ||||
| year if their actual (or cumulative) returns for the periods shown had been earned at a constant rate. | ||||
| Average annual total returns include changes in principal value, reinvested dividends, and capital gain | ||||
| distributions. | ||||
The returns presented in this table reflect the return before taxes, the return after taxes on dividends and capital gain distributions, and the return after taxes on dividends, capital gain distributions, and gains (or losses) from the redemption of shares held for 1-, 5-, and 10-year or since-inception periods as applicable. After-tax returns reflect the highest federal income tax rates but exclude state and local taxes. The after-tax returns reflect the rates applicable to ordinary and qualified dividends and capital gains effective in 2003 but exclude state and local taxes. During periods when a fund incurs a loss, the post-liquidation after-tax return may exceed the fund’s other returns because the loss generates a tax benefit that is factored into the result.
Market indexes do not include expenses, which are deducted from fund returns, or taxes. An investor’s actual after-tax return will likely differ from those shown and depend on his or her tax situation. The funds’ past returns (before and after taxes) do not necessarily indicate future performance. When assessing performance, investors should consider both short- and long-term returns.
| FINANCIAL HIGHLIGHTS | For a share outstanding throughout each period | |||||||||
| Year | ||||||||||
| Ended | ||||||||||
| 2/28/05** | 2/29/04 | 2/28/03 | 2/28/02 | 2/28/01 | ||||||
| NET ASSET VALUE | ||||||||||
| Beginning of period | $ | 9.62 | $ | 7.08 | $ | 9.28 | $ | 10.18 | $ | 11.03 |
| Investment activities | ||||||||||
| Net investment income (loss) | 0.05 | 0.01 | – | (0.01) | (0.03) | |||||
| Net realized and | ||||||||||
| unrealized gain (loss) | (0.10) | 2.54 | (2.20) | (0.89) | (0.82) | |||||
| Total from | ||||||||||
| investment activities | (0.05) | 2.55 | (2.20) | (0.90) | (0.85) | |||||
| Distributions | ||||||||||
| Net investment income | (0.05) | (0.01) | – | – | – | |||||
| NET ASSET VALUE | ||||||||||
| End of period | $ | 9.52 | $ | 9.62 | $ | 7.08 | $ | 9.28 | $ | 10.18 |
| Ratios/Supplemental Data | ||||||||||
| Total return^ | (0.53)% | 36.02% | (23.71)% | (8.84)% | (7.71)% | |||||
| Ratio of total expenses to | ||||||||||
| average net assets | 1.01% | 1.02% | 1.08% | 1.04% | 1.04% | |||||
| Ratio of net investment | ||||||||||
| income (loss) to average | ||||||||||
| net assets | 0.54% | 0.07% | 0.02% | (0.10)% | (0.26)% | |||||
| Portfolio turnover rate | 14.9% | 13.4% | 17.6% | 8.5% | 12.0% | |||||
| Net assets, end of period | ||||||||||
| (in thousands) | $ | 74,016 | $ | 80,092 | $ | 56,955 | $ | 75,688 | $83,608 | |
| ^ Total return reflects the rate that an investor would have earned on an investment in the fund during each period, |
| assuming reinvestment of all distributions and payment of no redemption or account fees. |
| ** Per share amounts calculated using average shares outstanding method. |
| The accompanying notes are an integral part of these financial statements. |
| PORTFOLIO OF INVESTMENTS (1) | Shares | Value |
| (Cost and value in $ 000s) | ||
| COMMON STOCKS 99.6% | ||
| CONSUMER DISCRETIONARY 17.8% | ||
| Automobiles 0.8% | ||
| Harley-Davidson | 9,500 | 588 |
| 588 | ||
| Hotels, Restaurants & Leisure 2.2% | ||
| Carnival | 4,500 | 245 |
| International Game Technology | 11,500 | 350 |
| Marriott, Class A | 7,000 | 449 |
| Starbucks * | 4,200 | 217 |
| Station Casinos | 6,000 | 366 |
| 1,627 | ||
| Internet & Catalog Retail 3.5% | ||
| Amazon.com * | 32,300 | 1,136 |
| eBay * | 34,000 | 1,457 |
| 2,593 | ||
| Media 6.4% | ||
| Clear Channel Communications | 15,652 | 521 |
| Disney | 18,500 | 517 |
| McGraw-Hill | 10,000 | 919 |
| Omnicom | 9,800 | 892 |
| Time Warner * | 29,450 | 507 |
| Univision Communications, Class A * | 14,600 | 385 |
| Viacom, Class B | 14,550 | 508 |
| WPP Group ADR | 8,500 | 489 |
| 4,738 | ||
| Multiline Retail 1.2% | ||
| Dollar General | 22,100 | 469 |
| Family Dollar Stores | 12,500 | 412 |
| 881 | ||
| Specialty Retail 3.2% | ||
| Bed Bath & Beyond * | 7,000 | 263 |
| Home Depot | 34,000 | 1,361 |
| Tiffany | 15,700 | 473 |
| Williams-Sonoma * | 8,000 | 277 |
| 2,374 | ||
| Textiles, Apparel, & Luxury Goods 0.5% | ||
| Nike, Class B | 4,200 | 365 |
| 365 | ||
| Total Consumer Discretionary | 13,166 | |
| CONSUMER STAPLES 11.5% | ||
| Beverages 2.6% | ||
| Anheuser-Busch | 5,100 | 242 |
| Coca-Cola | 17,000 | 728 |
| PepsiCo | 18,000 | 969 |
| 1,939 | ||
| Food & Staples Retailing 5.1% | ||
| CVS | 8,500 | 424 |
| Sysco | 29,200 | 1,005 |
| Wal-Mart | 31,600 | 1,631 |
| Walgreen | 16,800 | 719 |
| 3,779 | ||
| Food Products 0.6% | ||
| General Mills | 4,800 | 251 |
| Wrigley | 3,200 | 213 |
| 464 | ||
| Household Products 2.2% | ||
| Colgate-Palmolive | 6,700 | 355 |
| Kimberly-Clark | 3,600 | 237 |
| Procter & Gamble | 19,000 | 1,009 |
| 1,601 | ||
| Personal Products 1.0% | ||
| Avon | 8,100 | 346 |
| Gillette | 7,500 | 377 |
| 723 | ||
| Total Consumer Staples | 8,506 | |
| FINANCIALS 16.7% | ||
| Capital Markets 7.6% | ||
| Bank of New York | 25,900 | 784 |
| Charles Schwab | 32,180 | 338 |
| Franklin Resources | 15,000 | 1,053 |
| Mellon Financial | 15,000 | 430 |
| Northern Trust | 33,900 | 1,432 |
| State Street | 35,900 | 1,574 |
| 5,611 | ||
| Commercial Banks 1.1% | ||
| Wells Fargo | 14,000 | 831 |
| 831 | ||
| Consumer Finance 1.1% | ||
| American Express | 11,100 | 601 |
| SLM Corporation | 4,700 | 230 |
| 831 | ||
| Diversified Financial Services 3.4% | ||
| Citigroup | 38,700 | 1,847 |
| Moody's | 7,700 | 646 |
| 2,493 | ||
| Insurance 2.4% | ||
| Ambac | 3,000 | 233 |
| American International Group | 19,000 | 1,269 |
| Marsh & McLennan | 9,000 | 294 |
| 1,796 | ||
| Thrifts & Mortgage Finance 1.1% | ||
| Fannie Mae | 8,500 | 497 |
| Freddie Mac | 4,500 | 279 |
| 776 | ||
| Total Financials | 12,338 | |
| HEALTH CARE 16.7% | ||
| Biotechnology 0.8% | ||
| Amgen * | 9,500 | 585 |
| 585 | ||
| Health Care Equipment & Supplies 3.5% | ||
| Baxter International | 7,200 | 257 |
| Guidant | 4,800 | 352 |
| Medtronic | 32,700 | 1,704 |
| Stryker | 6,000 | 298 |
| 2,611 | ||
| Health Care Providers & Services 5.7% | ||
| UnitedHealth Group | 21,000 | 1,914 |
| WellPoint * | 18,800 | 2,295 |
| 4,209 | ||
| Pharmaceuticals 6.7% | ||
| Abbott Laboratories | 11,600 | 533 |
| AstraZeneca ADR | 5,200 | 207 |
| Eli Lilly | 8,100 | 454 |
| GlaxoSmithKline ADR | 5,400 | 260 |
| Johnson & Johnson | 23,000 | 1,509 |
| Merck | 7,200 | 228 |
| Pfizer | 53,447 | 1,405 |
| Wyeth | 9,300 | 380 |
| 4,976 | ||
| Total Health Care | 12,381 | |
| INDUSTRIALS & BUSINESS SERVICES 6.9% | ||
| Aerospace & Defense 0.3% | ||
| Boeing | 4,300 | 236 |
| 236 | ||
| Air Freight & Logistics 0.3% | ||
| Expeditors International of Washington | 4,100 | 228 |
| 228 | ||
| Commercial Services & Supplies 1.9% | ||
| Apollo Group, Class A * | 5,250 | 387 |
| ChoicePoint * | 6,500 | 262 |
| Cintas § | 8,250 | 361 |
| Robert Half International | 13,900 | 405 |
| 1,415 | ||
| Industrial Conglomerates 4.1% | ||
| 3M | 7,100 | 596 |
| GE | 67,800 | 2,387 |
| 2,983 | ||
| Machinery 0.3% | ||
| Illinois Tool Works | 2,500 | 224 |
| 224 | ||
| Total Industrials & Business Services | 5,086 | |
| INFORMATION TECHNOLOGY 29.1% | ||
| Communications Equipment 2.4% | ||
| Cisco Systems * | 87,500 | 1,525 |
| Nokia ADR | 16,000 | 258 |
| 1,783 | ||
| Computers & Peripherals 3.4% | ||
| Dell * | 51,500 | 2,065 |
| EMC * | 34,000 | 430 |
| 2,495 | ||
| Electronic Equipment & Instruments 0.3% | ||
| Molex, Class A | 9,625 | 221 |
| 221 | ||
| Internet Software & Services 1.9% | ||
| IAC/InterActiveCorp * | 9,500 | 214 |
| Monster Worldwide * | 12,500 | 360 |
| Yahoo! * | 26,000 | 839 |
| 1,413 | ||
| IT Services 2.8% | ||
| Automatic Data Processing | 16,200 | 696 |
| Certegy | 10,000 | 356 |
| First Data | 9,200 | 377 |
| Paychex | 20,750 | 663 |
| 2,092 | ||
| Semiconductor & Semiconductor Equipment 12.3% | ||
| Altera * | 55,000 | 1,141 |
| Analog Devices | 28,500 | 1,047 |
| Applied Materials * | 13,700 | 240 |
| Broadcom, Class A * | 7,500 | 242 |
| Intel | 65,100 | 1,561 |
| Linear Technology | 31,600 | 1,234 |
| Maxim Integrated Products | 28,500 | 1,226 |
| Microchip Technology | 25,000 | 686 |
| Texas Instruments | 23,600 | 625 |
| Xilinx | 37,300 | 1,126 |
| 9,128 | ||
| Software 6.0% | ||
| Adobe Systems | 4,000 | 247 |
| Computer Associates | 10,112 | 274 |
| Electronic Arts * | 4,500 | 290 |
| Intuit * | 5,600 | 240 |
| Microsoft | 78,000 | 1,964 |
| Oracle * | 53,700 | 693 |
| SAP ADR | 18,000 | 730 |
| 4,438 | ||
| Total Information Technology | 21,570 | |
| MATERIALS 0.6% | ||
| Chemicals 0.6% | ||
| Ecolab | 7,000 | 222 |
| Valspar | 5,000 | 231 |
| Total Materials | 453 | |
| TELECOMMUNICATION SERVICES 0.3% | ||
| Wireless Telecommunication Services 0.3% | ||
| Vodafone ADR | 8,900 | 234 |
| Total Telecommunication Services | 234 | |
| Total Common Stocks (Cost $60,596) | 73,734 | |
| SHORT-TERM INVESTMENTS 0.0% | ||
| Money Market Fund 0.0% | ||
| T. Rowe Price Reserve Investment Fund, 2.55% #† | 1,000 | 1 |
| Total Short-Term Investments (Cost $1) | 1 | |
| SECURITIES LENDING COLLATERAL 0.5% | |||
| Money Market Trust 0.5% | |||
| State Street Bank and Trust Company of New Hampshire N.A. | |||
| Securities Lending Quality Trust units, 2.519% # | 369,188 | 369 | |
| Total Securities Lending Collateral (Cost $369) | 369 | ||
| Total Investments in Securities | |||
| 100.1% of Net Assets (Cost $60,966) | $ | 74,104 | |
| (1) | Denominated in U.S. dollars unless other- |
| wise noted | |
| # | Seven-day yield |
| * | Non-income producing |
| § | All or a portion of this security is on loan at |
| February 28, 2005 – See Note 2 | |
| † | Affiliated company – See Note 4 |
| ADR | American Depository Receipts |
| The accompanying notes are an integral part of these financial statements. | |
| STATEMENT OF ASSETS AND LIABILITIES |
| (In thousands except shares and per share amounts) | ||
| Assets | ||
| Investments in securities, at value | ||
| Affiliated companies (cost $1) | $ | 1 |
| Non-affiliated companies (cost $60,965) | 74,103 | |
| Total investments in securities | 74,104 | |
| Dividends receivable | 90 | |
| Receivable for investment securities sold | 644 | |
| Receivable for shares sold | 22 | |
| Other assets | 14 | |
| Total assets | 74,874 | |
| Liabilities | ||
| Investment management fees payable | 35 | |
| Payable for shares redeemed | 87 | |
| Obligation to return securities lending collateral | 369 | |
| Due to affiliates | 14 | |
| Other liabilities | 353 | |
| Total liabilities | 858 | |
| NET ASSETS | $ | 74,016 |
| Net Assets Consist of: | ||
| Undistributed net investment income (loss) | $ | 13 |
| Undistributed net realized gain (loss) | (21,291) | |
| Net unrealized gain (loss) | 13,138 | |
| Paid-in-capital applicable to 7,776,506 shares of | ||
| $0.0001 par value capital stock outstanding; | ||
| 1,000,000,000 shares of the Corporation authorized | 82,156 | |
| NET ASSETS | $ | 74,016 |
| �� NET ASSET VALUE PER SHARE | $ | 9.52 |
| The accompanying notes are an integral part of these financial statements. | ||
| STATEMENT OF OPERATIONS |
| ($ 000s) | ||
| Year | ||
| Ended | ||
| 2/28/05 | ||
| Investment Income (Loss) | ||
| Income | ||
| Dividend | $ | 1,179 |
| Securities lending | 1 | |
| Total income | 1,180 | |
| Expenses | ||
| Investment management | 469 | |
| Shareholder servicing | 117 | |
| Custody and accounting | 100 | |
| Registration | 29 | |
| Prospectus and shareholder reports | 27 | |
| Legal and audit | 12 | |
| Directors | 5 | |
| Miscellaneous | 9 | |
| Total expenses | 768 | |
| Net investment income (loss) | 412 | |
| Realized and Unrealized Gain (Loss) | ||
| Net realized gain (loss) on securities | (554) | |
| Change in net unrealized gain (loss) on securities | (414) | |
| Net realized and unrealized gain (loss) | (968) | |
| INCREASE (DECREASE) IN NET | ||
| ASSETS FROM OPERATIONS | $ | (556) |
| The accompanying notes are an integral part of these financial statements. | ||
| STATEMENT OF CHANGES IN NET ASSETS |
| ($ 000s) | ||||
| Year | ||||
| Ended | ||||
| 2/28/05 | 2/29/04 | |||
| Increase (Decrease) in Net Assets | ||||
| Operations | ||||
| Net investment income (loss) | $ | 412 | $ | 51 |
| Net realized gain (loss) | (554) | (2,774) | ||
| Change in net unrealized gain (loss) | (414) | 23,600 | ||
| Increase (decrease) in net assets from operations | (556) | 20,877 | ||
| Distributions to shareholders | ||||
| Net investment income | (399) | (83) | ||
| Capital share transactions * | ||||
| Shares sold | 8,490 | 11,666 | ||
| Distributions reinvested | 360 | 74 | ||
| Shares redeemed | (13,991) | (9,411) | ||
| Redemption fees received | 20 | 14 | ||
| Increase (decrease) in net assets from capital | ||||
| share transactions | (5,121) | 2,343 | ||
| Net Assets | ||||
| Increase (decrease) during period | (6,076) | 23,137 | ||
| Beginning of period | 80,092 | 56,955 | ||
| End of period | $ | 74,016 | $ | 80,092 |
| (Including undistributed net investment income of | ||||
| $13 at 2/28/05 and $0 at 2/29/04) | ||||
| *Share information | ||||
| Shares sold | 902 | 1,360 | ||
| Distributions reinvested | 37 | 8 | ||
| Shares redeemed | (1,487) | (1,087) | ||
| Increase (decrease) in shares outstanding | (548) | 281 | ||
| The accompanying notes are an integral part of these financial statements. | ||||
| NOTES TO FINANCIAL STATEMENTS |
NOTE 1 - SIGNIFICANT ACCOUNTING POLICIES
T. Rowe Price Tax-Efficient Funds, Inc. (the corporation) is registered under the Investment Company Act of 1940 (the 1940 Act). The Tax-Efficient Growth Fund (the fund), a diversified, open-end management investment company, is one portfolio established by the corporation. The fund commenced operations on July 30, 1999. The fund seeks attractive long-term capital appreciation on an after-tax basis.
The accompanying financial statements were prepared in accordance with accounting principles generally accepted in the United States of America, which require the use of estimates made by fund management.
Valuation The fund values its investments and computes its net asset value per share at the close of the New York Stock Exchange (NYSE), normally 4 p.m. ET, each day that the NYSE is open for business. Equity securities listed or regularly traded on a securities exchange or in the over-the-counter market are valued at the last quoted sale price or, for certain markets, the official closing price at the time the valuations are made, except for OTC Bulletin Board securities, which are valued at the mean of the latest bid and asked prices. A security that is listed or traded on more than one exchange is valued at the quotation on the exchange determined to be the primary market for such security. Listed securities not traded on a particular day are valued at the mean of the latest bid and asked prices for domestic securities and the last quoted sale price for international securities.
Investments in mutual funds are valued at the mutual fund’s closing net asset value per share on the day of valuation.
Other investments, including restricted securities, and those for which the above valuation procedures are inappropriate or are deemed not to reflect fair value are stated at fair value as determined in good faith by the T. Rowe Price Valuation Committee, established by the fund’s Board of Directors.
Rebates and Credits Subject to best execution, the fund may direct certain security trades to brokers who have agreed to rebate a portion of the related brokerage commission to the fund in cash. Commission rebates are included in realized gain on securities in the accompanying financial statements. Additionally, the fund earns credits on temporarily uninvested cash balances at the custodian that reduce the fund’s custody charges. Custody expense in the accompanying financial statements is presented before reduction for credits.
Redemption Fees A 1% fee is assessed on redemptions of fund shares held less than one year to deter short-term trading and protect the interests of long-term shareholders. Redemption fees are withheld from proceeds that shareholders receive from the sale or exchange of fund shares. The fees are paid to the fund, and are recorded as an increase to paid-in capital. The fees may cause the redemption price per share to differ from the net asset value per share.Investment Transactions, Investment Income, and Distributions Income and expenses are recorded on the accrual basis. Dividends received from mutual fund investments are reflected as dividend income; capital gain distributions are reflected as realized gain/loss. Dividend income and capital gain distributions are recorded on the ex-dividend date. Investment transactions are accounted for on the trade date. Realized gains and losses are reported on the identified cost basis. Distributions to shareholders are recorded on the ex-dividend date. Income distributions are declared and paid on an annual basis. Capital gain distributions, if any, are declared and paid by the fund, typically on an annual basis. During the year ended February 28, 2005, the fund received a one-time special dividend on a security held in its portfolio (Microsoft Corp.). The dividend, which totaled $339,000, represents 28.8% of dividend income reflected in the accompanying financial statements a nd is not expected to recur.
Other In the normal course of business, the fund enters into contracts that provide general indemnifications. The fund’s maximum exposure under these arrangements is dependent on claims that may be made against the fund in the future and, therefore, cannot be estimated; however, based on experience, the risk of material loss from such claims is considered remote.
NOTE 2 - INVESTMENT TRANSACTIONS
Consistent with its investment objective, the fund engages in the following practices to manage exposure to certain risks or enhance performance. The investment objective, policies, program, and risk factors of the fund are described more fully in the fund’s prospectus and Statement of Additional Information.
Securities Lending The fund lends its securities to approved brokers to earn additional income. It receives as collateral cash and U.S. government securities valued at 102% to 105% of the value of the securities on loan. Cash collateral is invested in a money market pooled trust managed by the fund’s lending agent in accordance with investment guidelines approved by fund management. Collateral is maintained over the life of the loan in an amount not less than the value of loaned securities, as determined at the close of fund business each day; any additional collateral required due to changes in security values is delivered to the fund the next business day. Although risk is mitigated by the collateral, the fund could experience a delay in recovering its securities and a possible loss of income or value if the borrower fails to return the securities. Securities lending revenue recognized by the fund consists of earnings on invested collateral and borrowing fees , net of any rebates to the borrower and compensation to the lending agent. At February 28, 2005, the value of loaned securities was $361,000; aggregate collateral consisted of $369,000 in the money market pooled trust.Other Purchases and sales of portfolio securities, other than short-term securities, aggregated $11,339,000 and $16,734,000, respectively, for the year ended February 28, 2005.
NOTE 3 - FEDERAL INCOME TAXES
No provision for federal income taxes is required since the fund intends to continue to qualify as a regulated investment company under Subchapter M of the Internal Revenue Code and distribute to shareholders all of its taxable income and gains. Federal income tax regulations differ from generally accepted accounting principles; therefore, distributions determined in accordance with tax regulations may differ significantly in amount or character from net investment income and realized gains for financial reporting purposes. Financial reporting records are adjusted for permanent book/tax differences to reflect tax character. Financial records are not adjusted for temporary differences.
Distributions during the year ended February 28, 2005 totaled $399,000 and were characterized as ordinary income for tax purposes. At February 28, 2005, the tax-basis components of net assets were as follows:
| Unrealized appreciation | $ | 17,107,000 |
| Unrealized depreciation | (4,521,000) | |
| Net unrealized appreciation (depreciation) | 12,586,000 | |
| Undistributed ordinary income | 13,000 | |
| Capital loss carryforwards | (20,739,000) | |
| Paid-in capital | 82,156,000 | |
| Net assets | $ | 74,016,000 |
Pursuant to federal income tax regulations applicable to investment companies, the fund has elected to treat net capital losses realized between November 1 and February 28 of each year as occurring on the first day of the following tax year. Consequently, $552,000 of realized losses reflected in the accompanying financial statements will not be recognized for tax purposes until 2006. The fund intends to retain realized gains to the extent of available capital loss carryforwards for federal income tax purposes. As of February 28, 2005, the fund had $1,717,000 of capital loss carryforwards that expire in fiscal 2008, $4,793,000 that expire in fiscal 2009, and $14,229,000 that expire thereafter through fiscal 2013.
At February 28, 2005, the cost of investments for federal income tax purposes was $61,518,000.
NOTE 4 - RELATED PARTY TRANSACTIONS
The fund is managed by T. Rowe Price Associates, Inc. (the manager or Price Associates), a wholly owned subsidiary of T. Rowe Price Group, Inc. The investment management agreement between the fund and the manager provides for an annual investment management fee, which is computed daily and paid monthly. The fee consists of an individual fund fee, equal to 0.30% of the fund’s average daily net assets, and the fund’s pro-rata share of a group fee. The group fee is calculated based on the combined net assets of certain mutual funds sponsored by Price Associates (the group) applied to a graduated fee schedule, with rates ranging from 0.48% for the first $1 billion of assets to 0.295% for assets in excess of $120 billion. The fund’s portion of the group fee is determined by the ratio of its average daily net assets to those of the group. At February 28, 2005, the effective annual group fee rate was 0.31% .
In addition, the fund has entered into service agreements with Price Associates and a wholly owned subsidiary of Price Associates (collectively, Price). Price Associates computes the daily share price and maintains the financial records of the fund. T. Rowe Price Services, Inc., provides shareholder and administrative services in its capacity as the fund’s transfer and dividend disbursing agent. For the year ended February 28, 2005, expenses incurred pursuant to these service agreements were $64,000 for Price Associates and $90,000 for T. Rowe Price Services. The total amount payable at period end pursuant to these service agreements is reflected as due to affiliates in the accompanying financial statements.
The fund may invest in the T. Rowe Price Reserve Investment Fund and the T. Rowe Price Government Reserve Investment Fund (collectively, the Reserve Funds), open-end management investment companies managed by Price Associates and affiliates of the fund. The Reserve Funds are offered as cash management options to mutual funds, trusts, and other accounts managed by Price Associates and/or its affiliates, and are not available for direct purchase by members of the public. The Reserve Funds pay no investment management fees. During the year ended February 28, 2005, dividend income from the Reserve Funds totaled $1,000, and the value of shares of the Reserve Funds held at February 28, 2005 and February 29, 2004 was $1,000 and $1,000, respectively.
As of February 28, 2005, T. Rowe Price Group, Inc. and/or its wholly owned subsidiaries owned 90,890 shares of the fund, representing 1.2% of the fund’s net assets.
| REPORT OF INDEPENDENT REGISTERED PUBLIC ACCOUNTING FIRM |
To the Board of Directors of T. Rowe Price Tax-Efficient Funds, Inc. and Shareholders of T. Rowe Price Tax-Efficient Growth Fund
In our opinion, the accompanying statement of assets and liabilities, including the portfolio of investments, and the related statements of operations and of changes in net assets and the financial highlights present fairly, in all material respects, the financial position of T. Rowe Price Tax-Efficient Growth Fund (one of the portfolios comprising T. Rowe Price Tax-Efficient Funds, Inc., hereafter referred to as the “Fund”) at February 28, 2005, the results of its operations for the year then ended, the changes in its net assets for each of the two years in the period then ended and the financial highlights for each of the five years in the period then ended, in conformity with accounting principles generally accepted in the United States of America. These financial statements and financial highlights (hereafter referred to as “financial statements”) are the responsibility of the Fund’s management; our responsibility is to express an opinion on these financial sta tements based on our audits. We conducted our audits of these financial statements in accordance with the auditing standards of the Public Company Accounting Oversight Board (United States). Those standards require that we plan and perform the audit to obtain reasonable assurance about whether the financial statements are free of material misstatement. An audit includes examining, on a test basis, evidence supporting the amounts and disclosures in the financial statements, assessing the accounting principles used and significant estimates made by management, and evaluating the overall financial statement presentation. We believe that our audits, which included confirmation of securities at February 28, 2005 by correspondence with the custodian, provide a reasonable basis for our opinion.
PricewaterhouseCoopers LLP
Baltimore, Maryland
April 11, 2005
| TAX INFORMATION (UNAUDITED) FOR THE TAX YEAR ENDED 2/28/05 |
We are providing this information as required by the Internal Revenue Code. The amounts shown may differ from those elsewhere in this report because of differences between tax and financial reporting requirements.
• For taxable non-corporate shareholders, $412,000 of the fund’s income represents qualified dividend income subject to the 15% rate category.
• For corporate shareholders, $412,000 of the fund’s income qualifies for the dividends-received deduction.
| INFORMATION ON PROXY VOTING POLICIES, PROCEDURES, AND RECORDS |
A description of the policies and procedures used by T. Rowe Price funds and portfolios to determine how to vote proxies relating to portfolio securities is available in each fund’s Statement of Additional Information, which you may request by calling 1-800-225-5132 or by accessing the SEC’s Web site, www.sec.gov. The description of our proxy voting policies and procedures is also available on our Web site, www.troweprice.com. To access it, click on the words “Company Info” at the top of our homepage for individual investors. Then, in the window that appears, click on the “Proxy Voting Policy” navigation button in the top left corner.
Each fund’s most recent annual proxy voting record is available on our Web site and through the SEC’s Web site. To access it through our Web site, follow the directions above, then click on the words “Proxy Voting Record” at the bottom of the Proxy Voting Policy page.
| HOW TO OBTAIN QUARTERLY PORTFOLIO HOLDINGS |
The fund files a complete schedule of portfolio holdings with the Securities and Exchange Commission for the first and third quarters of each fiscal year on Form N-Q. The fund’s Form N-Q is available electronically on the SEC’s Web site (www.sec.gov); hard copies may be reviewed and copied at the SEC’s Public Reference Room, 450 Fifth St. N.W., Washington, DC 20549. For more information on the Public Reference Room, call 1-800-SEC-0330.
| ABOUT THE FUND’S DIRECTORS AND OFFICERS |
Your fund is governed by a Board of Directors that meets regularly to review investments, performance, expenses, and other business matters, and is responsible for protecting the interests of shareholders. The majority of the fund’s directors are independent of T. Rowe Price Associates, Inc. (T. Rowe Price); “inside” directors are officers of T. Rowe Price. The Board of Directors elects the fund’s officers, who are listed in the final table. The business address of each director and officer is 100 East Pratt Street, Baltimore, MD 21202. The Statement of Additional Information includes additional information about the fund directors and is available without charge by calling a T. Rowe Price representative at 1-800-225-5132.
| Independent Directors | |
| Name | |
| (Year of Birth) | Principal Occupation(s) During Past 5 Years and |
| Year Elected* | Directorships of Other Public Companies |
| Anthony W. Deering | Chairman, Exeter Capital, LLC, a private investment firm (2004 to |
| (1945) | present); Director, Chairman of the Board, and Chief Executive Officer, |
| 2001 | The Rouse Company, real estate developers (1997 to 2004); Director, |
| Mercantile Bank (4/03 to present) | |
| Donald W. Dick, Jr. | Principal, EuroCapital Advisors, LLC, an acquisition and management |
| (1943) | advisory firm; Chairman, President, and Chief Executive Officer, The |
| 1997 | Haven Group, a custom manufacturer of modular homes (1/04 to |
| present) | |
| David K. Fagin | Chairman and President, Nye Corporation (6/88 to present); Director, |
| (1938) | Canyon Resources Corporation, Golden Star Resources Ltd. (5/00 to |
| 1997 | present), and Pacific Rim Mining Corporation (2/02 to present) |
| Karen N. Horn | Managing Director and President, Global Private Client Services, |
| (1943) | Marsh Inc. (1999 to 2003); Managing Director and Head of |
| 2003 | International Private Banking, Bankers Trust (1996 to 1999); |
| Director, Eli Lilly and Company and Georgia Pacific (5/04 to present) | |
| F. Pierce Linaweaver | President, F. Pierce Linaweaver & Associates, Inc., consulting |
| (1934) | environmental and civil engineers |
| 2001 | |
| John G. Schreiber | Owner/President, Centaur Capital Partners, Inc., a real estate |
| (1946) | investment company; Partner, Blackstone Real Estate Advisors, L.P.; |
| 2001 | Director, AMLI Residential Properties Trust and The Rouse Company, |
| real estate developers | |
| * Each independent director oversees 112 T. Rowe Price portfolios and serves until retirement, resignation, or | |
| election of a successor. | |
| Inside Directors | |
| Name | |
| (Year of Birth) | |
| Year Elected* | |
| [Number of T. Rowe Price | Principal Occupation(s) During Past 5 Years and |
| Portfolios Overseen] | Directorships of Other Public Companies |
| James A.C. Kennedy, CFA | Director and Vice President, T. Rowe Price and T. Rowe Price Group, |
| (1953) | Inc.; Director, T. Rowe Price Global Investment Services Limited and |
| 1997 | T. Rowe Price International, Inc. |
| [43] | |
| James S. Riepe | Director and Vice President, T. Rowe Price; Vice Chairman of the |
| (1943) | Board, Director, and Vice President, T. Rowe Price Group, Inc.; |
| 1997 | Chairman of the Board and Director, T. Rowe Price Global Asset |
| [112] | Management Limited, T. Rowe Price Global Investment Services |
| Limited, T. Rowe Price Investment Services, Inc., T. Rowe Price | |
| Retirement Plan Services, Inc., and T. Rowe Price Services, Inc.; | |
| Chairman of the Board, Director, President, and Trust Officer, | |
| T. Rowe Price Trust Company; Director, T. Rowe Price International, | |
| Inc.; Chairman of the Board, Tax-Efficient Funds | |
| * Each inside director serves until retirement, resignation, or election of a successor. | |
| Officers | |
| Name (Year of Birth) | |
| Title and Fund(s) Served | Principal Occupation(s) |
| Stephen V. Booth, CPA (1961) | Vice President, T. Rowe Price, T. Rowe Price |
| Vice President, Tax-Efficient Funds | Group, Inc., and T. Rowe Price Trust Company |
| Joseph A. Carrier, CPA (1960) | Vice President, T. Rowe Price, T. Rowe Price |
| Treasurer, Tax-Efficient Funds | Group, Inc., T. Rowe Price Investment Services, |
| Inc., and T. Rowe Price Trust Company | |
| Donald J. Easley, CFA (1971) | Vice President, T. Rowe Price and T. Rowe Price |
| Vice President, Tax-Efficient Funds | Group, Inc. |
| Roger L. Fiery III, CPA (1959) | Vice President, T. Rowe Price, T. Rowe Price |
| Vice President, Tax-Efficient Funds | Group, Inc., T. Rowe Price International, Inc., |
| and T. Rowe Price Trust Company | |
| John R. Gilner (1961) | Chief Compliance Officer and Vice President, |
| Chief Compliance Officer, Tax-Efficient Funds | T. Rowe Price; Vice President, T. Rowe Price |
| Group, Inc., and T. Rowe Price Investment | |
| Services, Inc. | |
| Gregory S. Golczewski (1966) | Vice President, T. Rowe Price and T. Rowe Price |
| Vice President, Tax-Efficient Funds | Trust Company |
| Henry H. Hopkins (1942) | Director and Vice President, T. Rowe Price |
| Vice President, Tax-Efficient Funds | Investment Services, Inc., T. Rowe Price |
| Services, Inc., and T. Rowe Price Trust | |
| Company; Vice President, T. Rowe Price, | |
| T. Rowe Price Group, Inc., T. Rowe Price | |
| International, Inc., and T. Rowe Price | |
| Retirement Plan Services, Inc. | |
| Patricia B. Lippert (1953) | Assistant Vice President, T. Rowe Price and |
| Secretary, Tax-Efficient Funds | T. Rowe Price Investment Services, Inc. |
| Hugh D. McGuirk, CFA (1960) | Vice President, T. Rowe Price and T. Rowe Price |
| Executive Vice President, Tax-Efficient Funds | Group, Inc. |
| Mary J. Miller, CFA (1955) | Director and Vice President, T. Rowe Price; Vice |
| Vice President, Tax-Efficient Funds | President, T. Rowe Price Group, Inc. |
| Donald J. Peters (1959) | Vice President, T. Rowe Price and T. Rowe Price |
| President, Tax-Efficient Funds | Group, Inc. |
| William J. Stromberg, CFA (1960) | Vice President, T. Rowe Price, T. Rowe Price |
| Vice President, Tax-Efficient Funds | Group, Inc., and T. Rowe Price Trust Company |
| Julie L. Waples (1970) | Vice President, T. Rowe Price |
| Vice President, Tax-Efficient Funds | |
| Mark R. Weigman, CFA, CIC (1962) | Vice President, T. Rowe Price, T. Rowe Price |
| Vice President, Tax-Efficient Funds | Group, Inc., and T. Rowe Price Trust Company |
| Unless otherwise noted, officers have been employees of T. Rowe Price or T. Rowe Price International for at least | |
| five years. | |
Item 2. Code of Ethics.
The registrant has adopted a code of ethics, as defined in Item 2 of Form N-CSR, applicable to its principal executive officer, principal financial officer, principal accounting officer or controller, or persons performing similar functions. A copy of this code of ethics is filed as an exhibit to this Form N-CSR. No substantive amendments were approved or waivers were granted to this code of ethics during the period covered by this report.
Item 3. Audit Committee Financial Expert.
The registrant’s Board of Directors/Trustees has determined that Mr. David K. Fagin qualifies as an audit committee financial expert, as defined in Item 3 of Form N-CSR. Mr. Fagin is considered independent for purposes of Item 3 of Form N-CSR.
Item 4. Principal Accountant Fees and Services.
(a) – (d) Aggregate fees billed to the registrant for the last two fiscal years for professional services rendered by the registrant’s principal accountant were as follows:
| 2005 | 2004 | |
| Audit Fees | $6,552 | $7,674 |
| Audit-Related Fees | 743 | 679 |
| Tax Fees | 1,907 | 2,139 |
| All Other Fees | - | 124 |
Audit fees include amounts related to the audit of the registrant’s annual financial statements and services normally provided by the accountant in connection with statutory and regulatory filings. Audit-related fees include amounts reasonably related to the performance of the audit of the registrant’s financial statements, specifically the issuance of a report on internal controls. Tax fees include amounts related to tax compliance, tax planning, and tax advice. Other fees include the registrant’s pro-rata share of amounts for agreed-upon procedures in conjunction with service contract approvals by the registrant’s Board of Directors/Trustees.
(e)(1) The registrant’s audit committee has adopted a policy whereby audit and non-audit services performed by the registrant’s principal accountant for the registrant, its investment adviser, and any entity controlling, controlled by, or under common control with the investment adviser that provides ongoing services to the registrant require pre-approval in advance at regularly scheduled audit committee meetings. If such a service is required between regularly scheduled audit committee meetings, pre-approval may be authorized by one audit committee member with ratification at the next scheduled audit committee meeting. Waiver of pre-approval for audit or non-audit services requiring fees of a de minimis amount is not permitted.
(2) No services included in (b) – (d) above were approved pursuant to paragraph (c)(7)(i)(C) of Rule 2-01 of Regulation S-X.
(f) Less than 50 percent of the hours expended on the principal accountant’s engagement to audit the registrant’s financial statements for the most recent fiscal year were attributed to work performed by persons other than the principal accountant’s full-time, permanent employees.
(g) The aggregate fees billed for the most recent fiscal year and the preceding fiscal year by the registrant’s principal accountant for non-audit services rendered to the registrant, its investment adviser, and any entity controlling, controlled by, or under common control with the investment adviser that provides ongoing services to the registrant were $903,000 and $821,000, respectively, and were less than the aggregate fees billed for those same periods by the registrant’s principal accountant for audit services rendered to the T. Rowe Price Funds.
(h) All non-audit services rendered in (g) above were pre-approved by the registrant’s audit committee. Accordingly, these services were considered by the registrant’s audit committee in maintaining the principal accountant’s independence.Item 5. Audit Committee of Listed Registrants.
Not applicable.
Item 6. Schedule of Investments.
Not applicable. The complete schedule of investments is included in Item 1 of this Form N-CSR.
Item 7. Disclosure of Proxy Voting Policies and Procedures for Closed-End Management Investment Companies.
Not applicable.
Item 8. Portfolio Managers of Closed-End Management Investment Companies.
Not applicable.
Item 9. Purchases of Equity Securities by Closed-End Management Investment Company and Affiliated Purchasers.
Not applicable.
Item 10. Submission of Matters to a Vote of Security Holders.
Not applicable.
Item 11. Controls and Procedures.
(a) The registrant’s principal executive officer and principal financial officer have evaluated the registrant’s disclosure controls and procedures within 90 days of this filing and have concluded that the registrant’s disclosure controls and procedures were effective, as of that date, in ensuring that information required to be disclosed by the registrant in this Form N-CSR was recorded, processed, summarized, and reported timely.
(b) The registrant’s principal executive officer and principal financial officer are aware of no change in the registrant’s internal control over financial reporting that occurred during the registrant’s second fiscal quarter covered by this report that has materially affected, or is reasonably likely to materially affect, the registrant’s internal control over financial reporting.
Item 12. Exhibits.
(a)(1) The registrant’s code of ethics pursuant to Item 2 of Form N-CSR is attached.
(2) Separate certifications by the registrant's principal executive officer and principal financial officer, pursuant to Section 302 of the Sarbanes-Oxley Act of 2002 and required by Rule 30a-2(a) under the Investment Company Act of 1940, are attached.
(3) Written solicitation to repurchase securities issued by closed-end companies: not applicable.
(b) A certification by the registrant's principal executive officer and principal financial officer, pursuant to Section 906 of the Sarbanes-Oxley Act of 2002 and required by Rule 30a-2(b) under the Investment Company Act of 1940, is attached.SIGNATURES
Pursuant to the requirements of the Securities Exchange Act of 1934 and the Investment Company Act of 1940, the registrant has duly caused this report to be signed on its behalf by the undersigned, thereunto duly authorized.
T. Rowe Price Tax-Efficient Funds, Inc.
| By | /s/ James S. Riepe |
| James S. Riepe | |
| Principal Executive Officer |
| Date | April 15, 2005 |
| Pursuant to the requirements of the Securities Exchange Act of 1934 and the Investment | |
| Company Act of 1940, this report has been signed below by the following persons on behalf of | |
| the registrant and in the capacities and on the dates indicated. | |
| By | /s/ James S. Riepe |
| James S. Riepe | |
| Principal Executive Officer |
Date April 15, 2005
| By | /s/ Joseph A. Carrier |
| Joseph A. Carrier | |
| Principal Financial Officer |
Date April 15, 2005