Item 1: Report to Shareholders
 |
| Tax-Efficient Balanced Fund | February 28, 2006 |
The views and opinions in this report were current as of February 28, 2006. They are not guarantees of performance or investment results and should not be taken as investment advice. Investment decisions reflect a variety of factors, and the managers reserve the right to change their views about individual stocks, sectors, and the markets at any time. As a result, the views expressed should not be relied upon as a forecast of the fund’s future investment intent. The report is certified under the Sarbanes-Oxley Act of 2002, which requires mutual funds and other public companies to affirm that, to the best of their knowledge, the information in their financial reports is fairly and accurately stated in all material respects.
REPORTS ON THE WEB
Sign up for our E-mail Program, and you can begin to receive updated fund reports and prospectuses online rather than through the mail. Log in to your account at troweprice.com for more information.
Fellow Shareholders
U.S. stocks rose in the 6- and 12-month periods ended February 28, 2006, with small- and mid-cap shares besting their large-cap peers in our fiscal year and growth stocks showing improving performance relative to value in the second half. Tax-free municipal bonds produced modest positive returns but surpassed their taxable counterparts in both periods, led by longer-term and lower-quality issues. The growth-oriented Tax-Efficient Funds lagged their benchmarks in these short-term periods, which is not surprising given the current economic environment and the general willingness of investors to seek higher returns from riskier, lower-quality investments.
Our portfolios emphasize high-quality growth companies that we believe will outperform lower-quality and more cyclical businesses over the course of a full economic cycle. We use intensive research and a steady, disciplined investment approach to identify good long-term growth opportunities that we can own for an extended period in order to keep portfolio turnover low and taxable capital gains minimal. In the early stages of a cycle, stocks of economically sensitive and lower-quality companies usually do best because the economy and corporate earnings are growing rapidly, interest rates are low, and investors are willing to embrace riskier investments for higher returns. Given our emphasis on quality and growth and our unwillingness to time the markets or chase short-term performance, we are likely to trail equity portfolios that emphasize cyclical and lower-quality investments when these investments are leading the market.
Later in the economic cycle, as the expansion matures, as interest rates rise, and as economic and corporate earnings growth rates slow to a more moderate pace, investors usually become more mindful of risk and begin to favor what we believe are the best long-term investments: quality companies with a high return on invested capital and the ability to grow their earnings without the need for a strong cyclical tailwind. We cannot predict when this transition will begin or how long today’s market leaders will remain dominant, but we do believe in mean reversion—the idea that certain equity sectors that outperform for some time will eventually experience a period of subpar performance, resulting in longer-term returns that are consistent with historical averages. What we do know is that quality growth stocks have underperformed for an extended period and are attractively valued. In short, when fear replaces greed in the equity markets, our investment style should do better.
Buying market-leading companies with a sustainable competitive advantage and holding them through time as long as they maintain these characteristics seems like an easy strategy. However, it requires strong discipline from both portfolio managers and investors to maintain this time-tested approach. This is difficult, and behavioral finance literature provides many examples of mistakes.
MARKET ENVIRONMENT
Despite some weakness in the fourth quarter of 2005, the U.S. economy was generally healthy over the last 12 months. Job growth was steady, unemployment slipped below 5%, and the red-hot housing market began to cool. Inflation increased, partially because of rising energy costs, though recent declines in oil, natural gas, and gasoline prices from their post-Hurricane Katrina peaks have helped ease fears of a significant acceleration of inflation throughout the economy.
Nevertheless, central bank officials acknowledged that rising employment and capacity utilization trends and a renewed increase in energy costs have the potential to push inflation higher. In response, the Federal Reserve—now led by Ben Bernanke following Alan Greenspan’s retirement at the end of January—raised the federal funds target rate from 3.50% to 4.50% in four quarter-point increments during the second half of our fiscal year.
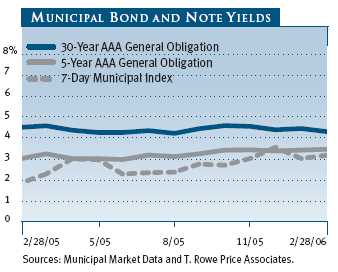
As shown in the graph, municipal money market yields increased in the last six months. Intermediate-and longer-term rates rose to a lesser extent, resulting in a flatter municipal yield curve and causing longer-term municipal securities to outperform other maturities. The taxable bond market experienced similar trends, but municipal bonds outperformed their taxable counterparts on a pretax and after-tax basis. In the 6- and 12-month periods ending February 28, 2006, the Lehman Brothers Municipal Bond Index returned 0.99% and 3.87%, respectively, versus -0.11% and 2.74% for the taxable Lehman Brothers U.S. Aggregate Index.
In recent months, there have been growing signs that the end of the Fed’s tightening program may be in sight. For example, according to the minutes and the post-meeting statement for the Fed’s mid-December monetary policy meeting, central bank officials no longer consider monetary policy to be “accommodative,” and they believe that the number of additional interest rate increases “probably would not be large.” In addition, the Treasury yield curve was inverted for most of the last two months, as two-year yields rose above 10-year yields. Such inversions—which are rare because long-term rates are usually higher than short-term rates to compensate investors for the greater risk associated with long-term securities—sometimes precede a period of slower economic growth. The municipal yield curve maintained a positive slope but continued to flatten, with only a one-percentage-point difference between municipal money market yields and 30-year municipal bond yields at the end of our reporting period.
Despite rising interest rates and elevated energy costs, stocks advanced throughout our fiscal year. Small-cap shares decisively surpassed their large-cap peers: the small-cap Russell 2000 Index returned 10.24% and 16.59% for the 6- and 12-month periods ended February 28, 2006, respectively, versus 6.20% and 9.85% for the large-cap Russell 1000 Index. Small-caps have outperformed large-caps for about seven years, and the performance disparity is extraordinary. For the seven-year period ended February 28, 2006, the Russell 2000’s average annual return was 10.70% versus 2.74% for the Russell 1000—a difference of about eight percentage points per year. Mid-cap stocks have fared even better: the Russell Midcap Index had an average annual return of 11.10% over the same period. The outperformance of small- and mid-cap stocks is unlikely to continue indefinitely, certainly not with this magnitude. This is a good time to be a contrarian.
Another longer-term trend is the dominance of value stocks over growth. For example, in the same seven-year period ended February 28, the Russell 1000 Value Index’s average annual return was 6.58% compared with -2.04% for the Russell 1000 Growth Index. The disparity was even larger among small-caps: the Russell 2000 Value Index’s average annual return was 15.34% compared with 5.22% for the Russell 2000 Growth Index—a difference of more than 10 percentage points per year. This performance gap also cannot continue forever.
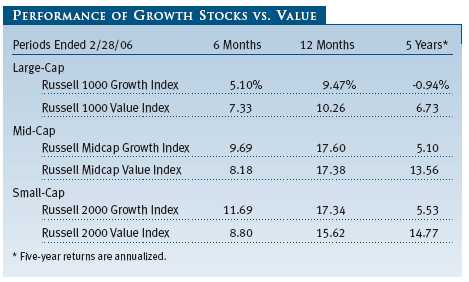
As the table above shows, value stocks trumped growth among larger companies in our 6- and 12-month reporting periods, although growth surpassed value among small- and mid-cap names, thanks to improved growth stock performance starting in mid-2005. We do not know if this heralds the beginning of a long-expected period of growth stock outperformance, but we do believe that value stocks, having enjoyed an extended reign, are unlikely to remain market leaders as the expansion matures over the next few years.
There are two other trends that have recently proved challenging for our growth-focused investment style. The first is the extraordinary outperformance of the energy sector, which is largely in response to a spike in the price of oil. The funds underweight the sector relative to their benchmarks because few energy companies can truly grow their earnings at a sustainable pace in the absence of rising oil prices. Our investments in this sector involve companies with a sustainable competitive advantage. We do not forecast oil, natural gas, or other commodity prices because accurately predicting such prices is virtually impossible. In just the last two years, actively traded U.S. stocks in the energy sector have gained 88%, far in excess of returns produced by stocks in traditional growth sectors, such as information technology (2%), consumer discretionary (12%), and health care (14%). Our strategy is to focus on longer-term fundamentals and avoid forecasting factors that are extremely difficult to get consistently right, such as short-term market moves and a continuation of energy’s dominance over other sectors.
Another phenomenon that has hindered our results is that momentum investing has been rewarding to investors with short time horizons. Despite having extreme valuations, some companies that have exhibited strong fundamentals in the short run have continued to appreciate as investors jump on the bandwagon of what has recently done well in the market. (Google and Apple Computer are two examples.) We are not willing to chase the performance of overvalued stocks because we believe that they represent an unfavorable risk/reward trade-off. Our preference is for high-quality companies with good business models, more reasonable valuations, and other favorable long-term attributes, such as a demonstrated ability to consistently increase their revenues, earnings, and cash flow. For more information about our investment philosophy, please see the following section.
INVESTMENT PHILOSOPHY
Before we discuss our investment strategy and each fund’s performance, we would like to welcome all new shareholders to the T. Rowe Price Tax-Efficient Funds, offer our thanks to long-term investors who have remained in the funds during an extended period in which growth stocks have lagged their value counterparts, and summarize the principles that guide our management of the funds.
• The Tax-Efficient Funds invest in stocks of growth companies that have strong prospects and are market leaders within their niches. Tax-Efficient Balanced and Tax-Efficient Growth invest primarily in large-cap growth stocks (the former also purchases municipal bonds) and Tax-Efficient Multi-Cap Growth focuses on small- and mid-cap growth companies.
• Our objective is to produce the best after-tax returns. To minimize capital gain distributions, we plan to own our companies for a long time, so we focus on those with strong, sustainable market positions and high returns on capital.
• We keep our cash position low and stay almost fully invested because we believe successful market timing is virtually impossible.
• Although we may make new purchases opportunistically, we will not trade opportunistically or rotate from one sector to another in an attempt to capture short-term outperformance.• We purchase stocks that meet our criteria even though it may be evident that time and patience will be required before an investment pays off. It is important to note, therefore, that performance over short periods will often deviate, both positively and negatively, from that of competing funds focused on pretax returns.
• We prefer to let our winners run, and we try not to realize gains unless a company’s long-term outlook has deteriorated materially. In addition, we will sell investments that have declined and accumulate tax losses that can be used to offset future gains that would otherwise be taxable.
CHARACTERISTICS OF THE FUNDS
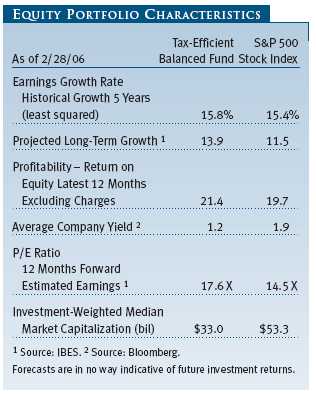
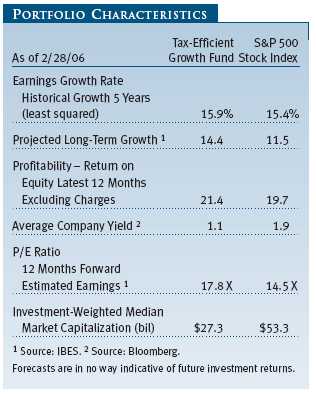
As you can see in the portfolio characteristics tables on pages 10 and 13, both the Tax-Efficient Balanced Fund’s equity portfolio and the Tax-Efficient Growth Fund are more growth oriented than the S&P 500. For example, our large-cap equity portfolios have higher price/earnings (P/E) ratios and anticipated long-term growth rates than the S&P 500, as well as lower dividend yields. The tables also show that each large-cap portfolio’s return on equity (ROE), at 21.4%, materially exceeds the S&P 500’s 19.7% ROE. A high and sustainable ROE is one of the most important characteristics we consider when researching potential investments and reviewing our current holdings. Our intention is to maintain portfolios of companies with strong profitability that should perform relatively well during favorable and unfavorable periods for both the economy and the stock market.
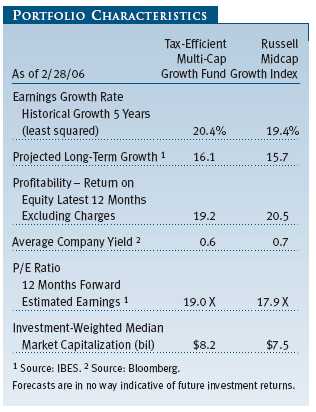
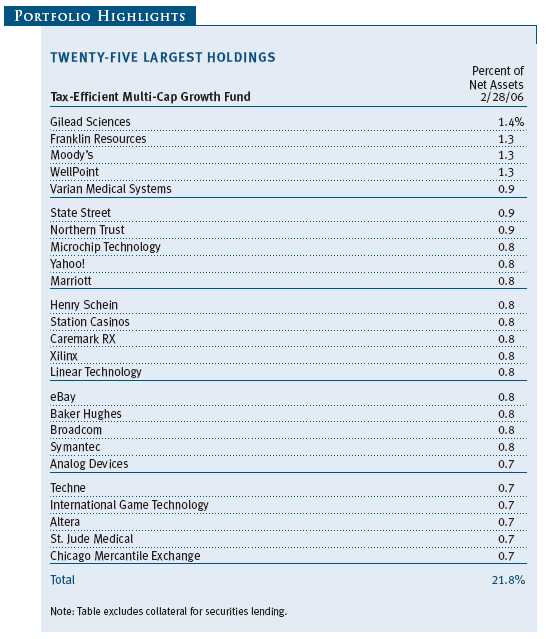
The Tax-Efficient Multi-Cap Growth Fund, as shown in the table on page 15, has characteristics that are similar to those of the Russell Midcap Growth Index, such as its projected and historical earnings growth rate, dividend yield, and investment-weighted median market capitalization. The fund’s 19.0 P/E ratio is a bit higher than the benchmark’s 17.9 P/E; its 19.2% ROE, while lower than the index’s 20.5% ROE, is still very high. Typically, we have a higher ROE than the Russell benchmark, but the Russell index currently has greater exposure to cyclical companies that are enjoying near-peak profitability. Unlike most small- and mid-cap portfolios, however, this fund is managed to be tax-efficient, and we will not automatically sell successful investments when their market capitalizations become too large. For example, the fund initially purchased eBay several years ago, and it has been a very successful investment for us. Although we stopped buying it when it became a large-cap stock, we intend to own it until it is no longer a good investment. (Please refer to each fund’s portfolio of investments for a complete listing of holdings and the amount each represents in each portfolio.)
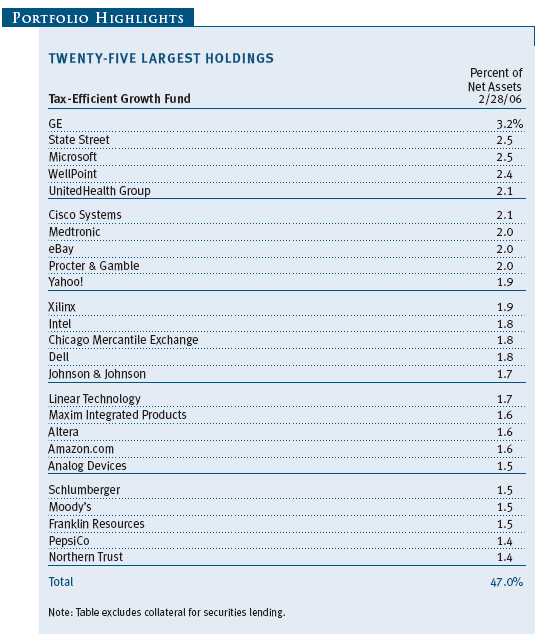
As many of the fund’s holdings grow, hopefully, into bigger companies over time, we will seek to maintain our mid-cap orientation by directing new purchases to mid- and small-cap companies. At the end of February, the fund was well diversified across approximately 270 companies (compared with about 120 for the Tax-Efficient Growth Fund). This broad diversification reflects the fact that smaller companies are earlier in their life cycles than larger ones, and therefore a higher failure rate should be expected. We will eliminate those that falter and reinvest the proceeds into companies that appear to have better long-term prospects.
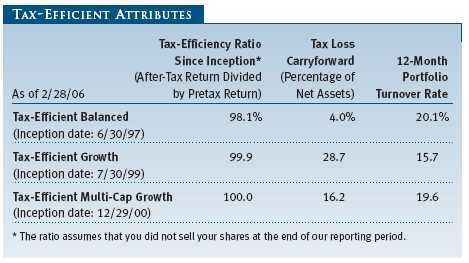
The table above shows each fund’s tax-efficiency ratio, which is calculated by dividing each fund’s after-tax return by its pretax return for the period from its inception through February 28, 2006. The Tax-Efficient Multi-Cap Growth Fund’s 100% tax-efficiency ratio indicates that the fund has made no taxable dividend or capital gain distributions since its inception. Tax-Efficient Balanced and Tax-Efficient Growth have made small distributions of taxable dividends since their inceptions, but no capital gain distributions, and their tax-efficiency ratios remain very close to 100%. Given each fund’s high degree of tax efficiency, the performance of each fund versus its benchmarks and tax-blind portfolios looks better on an after-tax basis than on a pretax basis.
The table also shows the value of each fund’s tax loss carryforward (as a percentage of net assets) accumulated through February 28, 2006. These realized tax losses can be used in the future to offset capital gains that each fund may realize so they are not passed on to shareholders. In addition, the table shows each fund’s turnover in percentage terms for the last 12 months. These turnover rates are substantially lower than those of other funds investing in growth companies. The low percentages are evidence of our buy-and-hold strategy and our focus on longer-term fundamentals.
As we mentioned in our semiannual report six months ago, our longer-term investment style has revealed an interesting performance pattern. Our equity portfolios tend to do better (relative to Russell growth indexes) in challenging markets than in strong markets. This is consistent with our quality bias and with portfolios that are less cyclically sensitive. In a strong economy and stock market, lower-quality companies seem to do better than higher-quality businesses, and investors feel there is less need for a high-quality portfolio. Of course, the strong economy won’t last indefinitely.
INVESTMENT STRATEGY
We continued to find and take advantage of attractive long-term growth opportunities in multiple sectors in the last six months. For example, from the industrials and business services sector, we purchased avionics company Rockwell Collins for Tax-Efficient Balanced and Tax-Efficient Growth and added to existing positions in 3M and Boeing. For the Tax-Efficient Multi-Cap Growth Fund, we bought shares of SkyWest, a rapidly growing and highly profitable regional airline that has not been grounded by negative trends throughout the industry.
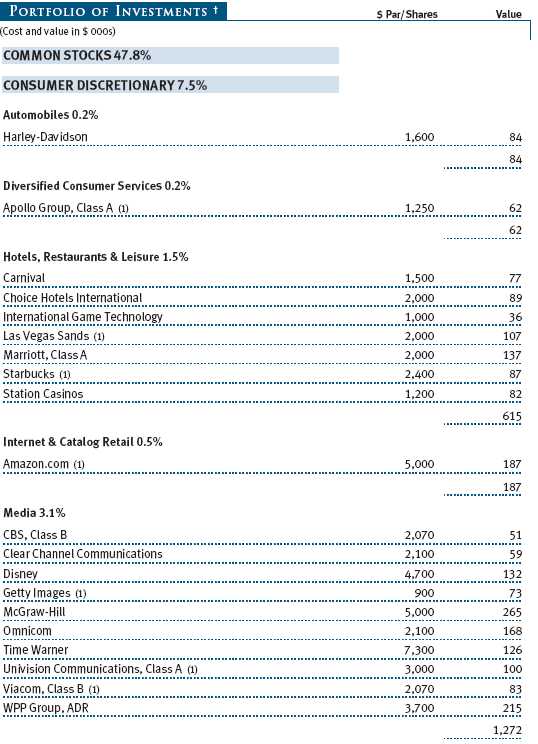
From the consumer discretionary sector, we purchased shares of numerous companies that have favorable long-term growth prospects. For Tax-Efficient Balanced, for example, we added Las Vegas Sands and Choice Hotels International. For Tax-Efficient Growth, we also established a position in Las Vegas Sands and increased exposure to Harley-Davidson, Marriott, and marketing service companies WPP Group and Getty Images. For Tax-Efficient Multi-Cap Growth, we purchased Clear Channel Outdoor and added to an existing position in another outdoor advertising company, Lamar Advertising. Some gaming additions were Las Vegas Sands and Shuffle Master.
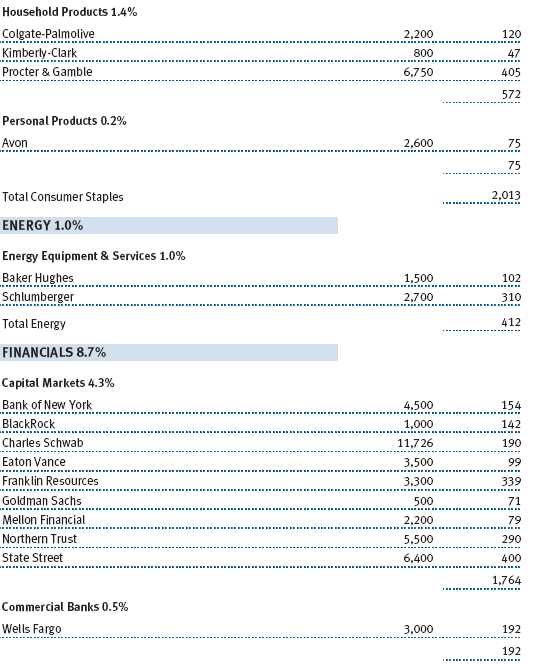
We also selectively purchased companies in the energy sector, though each fund continued to underweight the sector. For Tax-Efficient Balanced and Tax-Efficient Growth, we established positions in Schlumberger and Baker Hughes; for Tax-Efficient Multi-Cap Growth, we purchased Weatherford International, Grant Prideco, and Cooper Cameron. We believe these energy service companies offer good earnings growth and are good long-term investments. They are differentiated businesses whose longer-term prospects are not solely a function of the price of energy commodities.
TAX-EFFICIENT BALANCED FUND
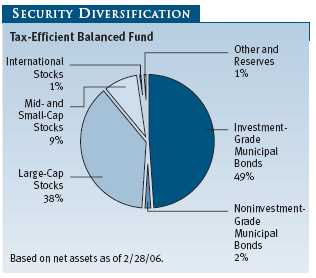
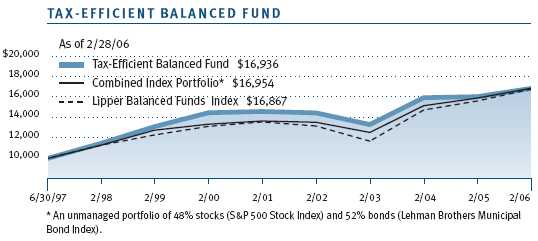
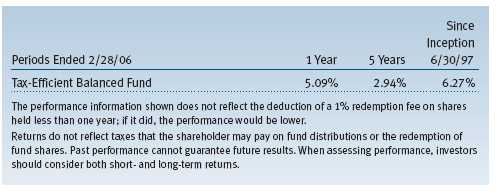
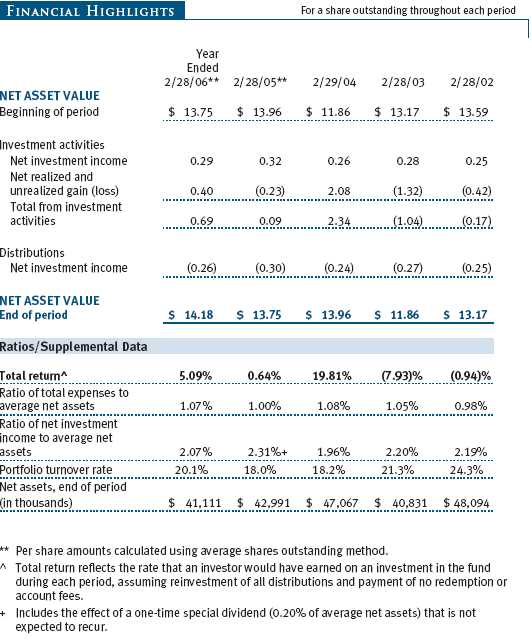
Your fund returned 2.58% and 5.09% in the 6- and 12-month periods ended February 28, 2006. The fund trailed a hypothetical portfolio of large-cap stocks and municipal bonds in both periods, as shown in the performance comparison table, because the growth-oriented equity portfolio did not perform as well as the S&P 500, which is a blend of growth and value stocks. However, the municipal bond portfolio’s good performance relative to the Lehman Brothers Municipal Bond Index in both periods reduced our underperformance. The fund lagged the Lipper Balanced Funds Index in both time frames because typical balanced funds have a greater commitment to equities (60%, versus our 48%), which outperformed bonds.
Equity Portfolio
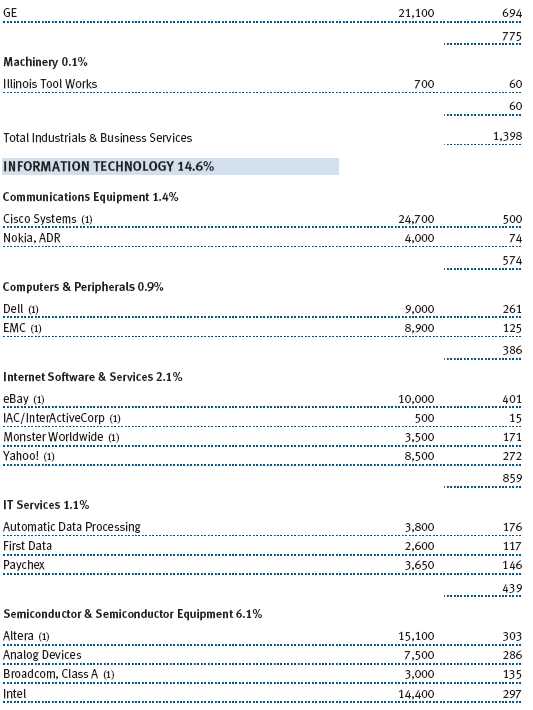
In the second half of our fiscal year, the equity portion of the fund (which we structure and manage like the Tax-Efficient Growth Fund) lagged the S&P 500 Index because large-cap value stocks did better than large-cap growth and because sectors we emphasized, such as information technology, did not perform as well as sectors we underweighted, including materials. The equity portfolio also underperformed other large-cap growth portfolios (as measured by the Lipper Large-Cap Growth Funds Index) because some of the sectors we overweighted, including information technology and consumer discretionary, did not perform as well as others that we underweighted, such as industrials and business services.
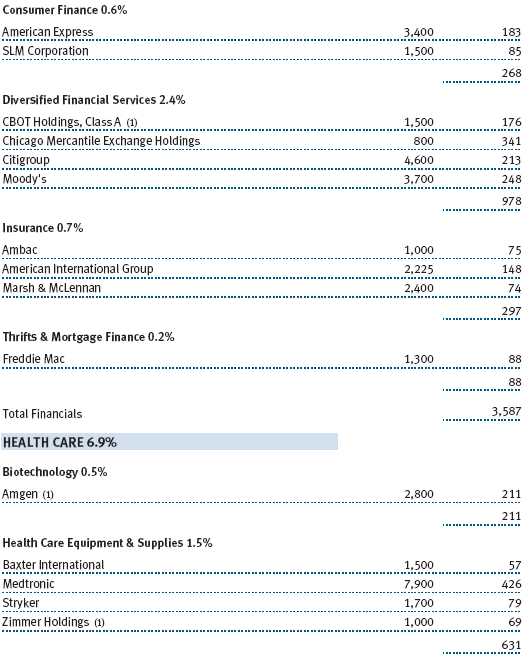
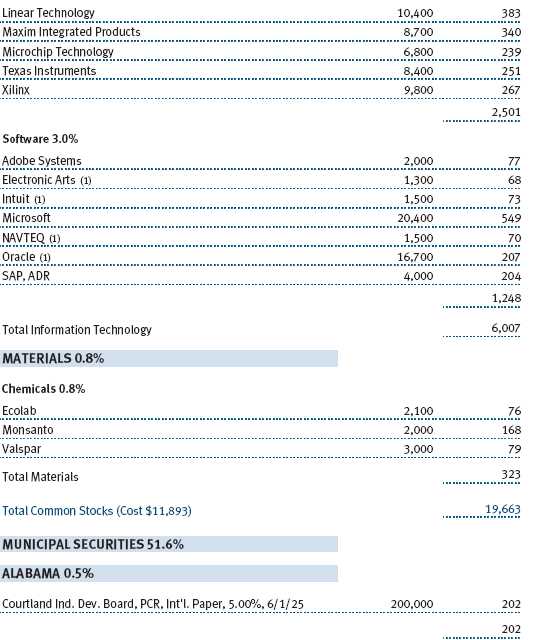
Stock selection in the information technology and health care sectors also detracted to some extent from our performance relative to both equity benchmarks. For example, our semiconductor holdings Intel, Altera, and Maxim Integrated Products, despite having high-quality business models, reasonable valuations, and excellent long-term prospects, had poor short-term performance. Similarly, the medical device companies that we favored in the health care sector did not fare as well as those in the S&P 500. On the other hand, overweighting financials—which we believe offer a good risk/reward trade-off—and strong performance of BlackRock, State Street, Franklin Resources, and futures exchange CBOT Holdings greatly helped our relative results. Also, good stock selection in the lackluster consumer discretionary sector, especially Choice Hotels, Las Vegas Sands, Univision Communications, and publisher McGraw-Hill, was advantageous.
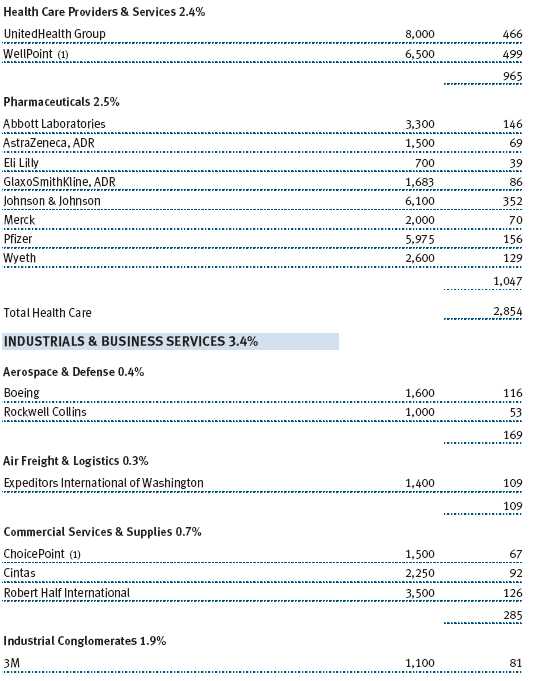
For the one-year period, the equity portion of the fund lagged the average large-cap growth portfolio and the S&P 500 because of unfavorable stock selection, particularly in the health care and information technology sectors. In health care, not owning several biotechnology companies that appreciated briskly limited our gains, though managed care company WellPoint helped our results. In technology, sluggish semiconductor stocks and our lack of exposure to communication equipment companies that did well also worked against us.
In addition, very low exposure to the energy sector, which soared with oil prices over the last year, limited our gains relative to the S&P 500. In contrast, our holdings in the financials sector did well, and good stock selection in the materials sector, such as owning Monsanto and avoiding chemical manufacturers that fell sharply, was beneficial.Bond Portfolio
New municipal borrowing in 2005 totaled a record of more than $400 billion. Nearly half of new issuance was refunding debt, as issuers refinanced older, high-coupon debt to lower their overall interest costs. Despite heavy issuance, demand for tax-free securities remained strong, thanks greatly to institutional investors, hedge funds, and various nontraditional buyers of municipals. Credit quality in the municipal market remains good, as state governments are flush with cash due to better-than-expected tax collections stemming from a strong economy. Given higher interest rates, reduced refunding activity, and stronger state tax revenues, municipal issuance in 2006 seems likely to be less robust. The portfolio benefited from the heavy refinancing activity in 2005: several of our holdings were refunded and appreciated nicely.
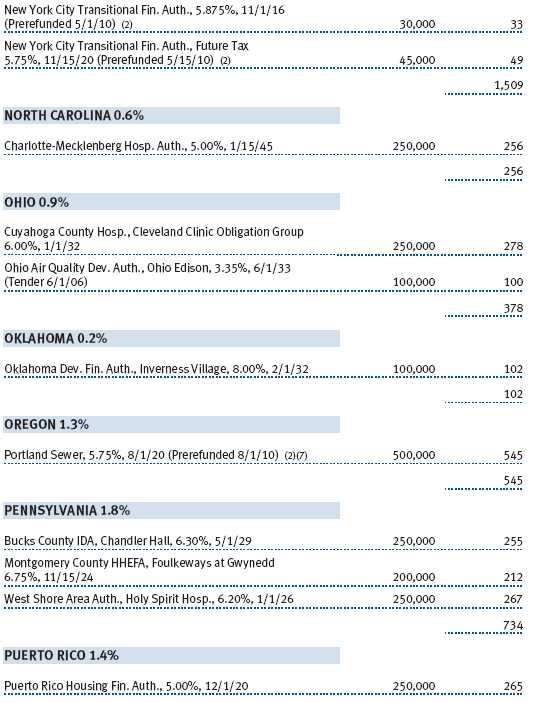
Lower-quality municipal securities outperformed investment-grade issues in the last six months, as yield-hungry investors sought more speculative investments. In fact, many of our best performers over the last year have been rated below investment grade, including the improving life care facility at Inverness Village (issued by the Oklahoma Development Finance Authority) and bonds backed by International Paper (issued by Courtland Alabama IDB). As yield spreads tightened, we used our research-driven process to selectively and modestly add to our below investment-grade holdings since our last report to you.
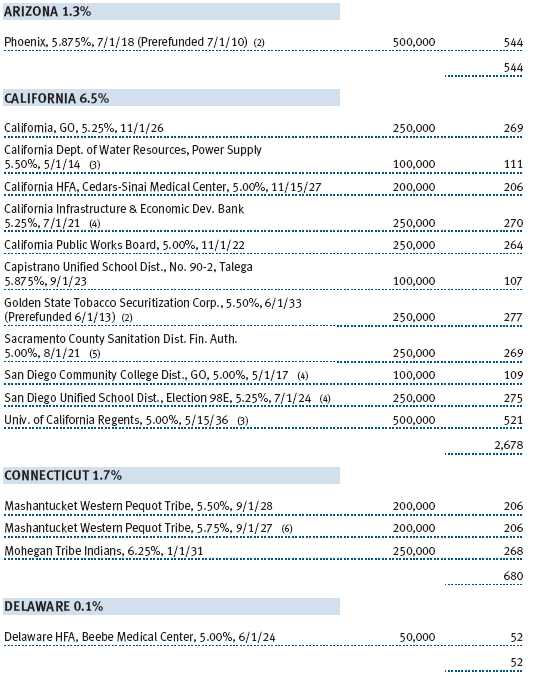
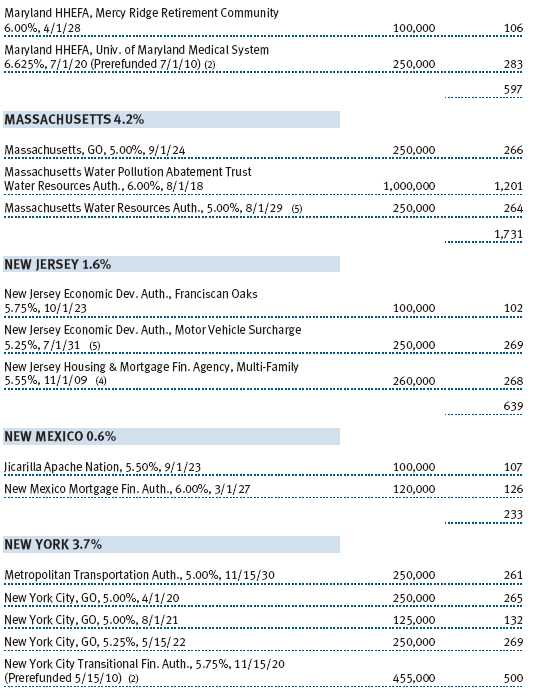
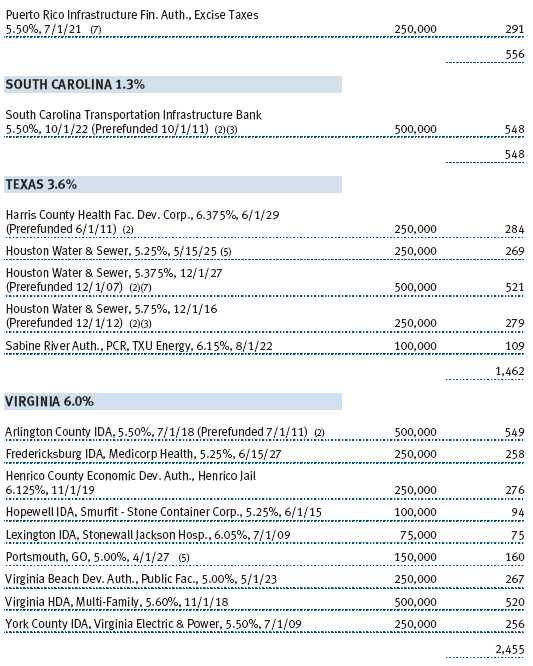
The bond portfolio’s overall credit quality remained fairly high, though we purchased lower-quality, investment-grade bonds when opportunities presented themselves to capture their yield advantage over insured and higher-quality issues. These higher-yielding credits also did very well as quality spreads tightened. The fund continued to benefit from exposure to revenue bonds backed by life care facilities and hospitals, sectors that typically offer good opportunities to pick up incremental yield. In fact, in the second half of our fiscal year, health care holdings were some of our best performers, as some positions were refunded, including Arlington, Virginia; Baltimore, Maryland; and Harris County, Texas. In addition, we continued to emphasize securities issued in California and New York, which still offer attractive investment opportunities, though these positions did not distinguish themselves over the most recent six-month period. Over longer periods, most positions in these states have done well as the overall national economy has improved.
During the last six months, we reinvested interest and principal payments from our holdings in bonds maturing in 20 years or more, but we structured the portfolio like a barbell by emphasizing short- and long-term securities at the expense of intermediate-term issues. This portfolio structure worked in our favor, as the municipal yield curve continued to flatten, intermediate-term bonds lagged, and longer-term bonds provided excellent relative returns. As the municipal yield curve continues to flatten, we expect to moderate our barbell structure modestly, though we will likely continue to emphasize longer maturity bonds in an effort to lock in good yields over a long time horizon. We expect to keep trading activity low to protect this fund’s long record of high tax efficiency.
TAX-EFFICIENT GROWTH FUND
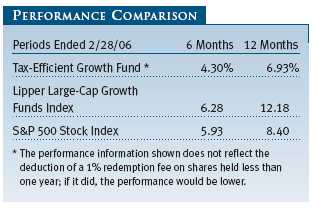
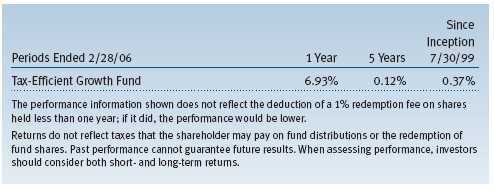
Your fund returned 4.30% and 6.93% in the 6- and 12-month periods ended February 28, 2006. As shown in the performance comparison table, the fund underperformed its benchmarks in both periods.
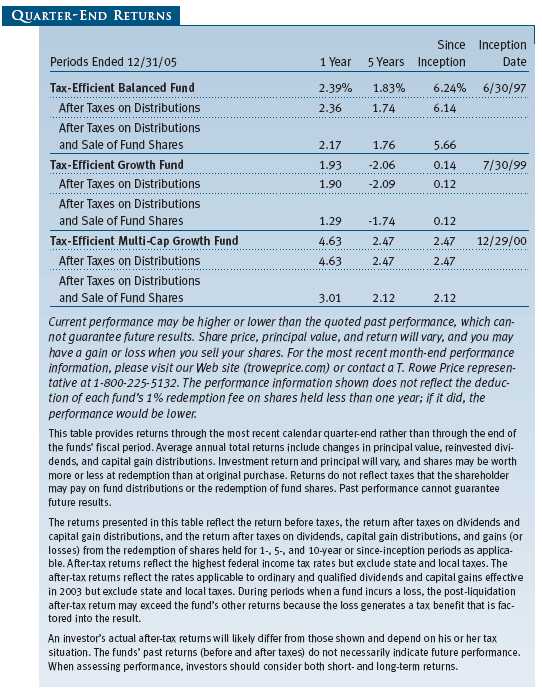
Although we underperformed our benchmarks in the short run, we believe it is best to evaluate our relative results over longer periods because we have a buy-and-hold approach and a long-term investment horizon. For example, Lipper placed the fund in the top 28% of the large-cap growth universe for the five-year period ended December 31, 2005—a very challenging period for large-cap growth investors. Lipper also placed the fund in the top 26% of that universe for the period from its inception (July 30, 1999) through the end of last year. (Based on total return, Lipper ranked the Tax-Efficient Growth Fund 599 out of 687, 130 out of 475, and 93 out of 357 funds for the one-year, five-year, and since-inception periods ended December 31, 2005, respectively. Results will vary for other time periods, and past performance cannot guarantee future results.)
What was true for the equity portion of the Tax-Efficient Balanced Fund was generally true for the Tax-Efficient Growth Fund, as both equity portfolios are structured and managed in a similar fashion. In the last six months, the fund lagged its benchmarks because some of the sectors we favored trailed sectors that we underweighted. Our investments in the information technology and health care sectors, particularly semiconductors and medical device companies, also detracted from our results, but favorable stock selection in the financials and consumer discretionary sectors offset some of this disadvantage.
For the 12-month period, the fund’s relative performance was hindered by our lack of exposure to biotechnology and communications equipment shares in the health care and information technology sectors, respectively, that performed very well. Low exposure to the robust energy sector also hurt our results versus the S&P 500, but good stock selection among financials and materials stocks was helpful.
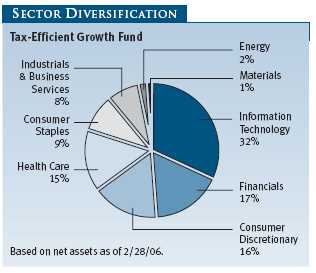
At the end of February, we overweighted the information technology, financials, consumer discretionary, and consumer staples sectors relative to other large-cap growth investors. We believe these sectors offer some of the best growth companies with strong franchises at attractive valuations. In contrast, we underweighted the industrials and business services and energy sectors because they offer fewer candidates that meet our criteria. Relative to the S&P 500 Index, we emphasized technology, consumer discretionary, and health care shares but have less exposure to financials, industrials and business services, energy, and materials. We owned no utility or telecommunications companies at the end of our reporting period because companies with good growth prospects and high, sustainable returns on equity are not usually found in these areas.
TAX-EFFICIENT MULTI-CAP GROWTH FUND
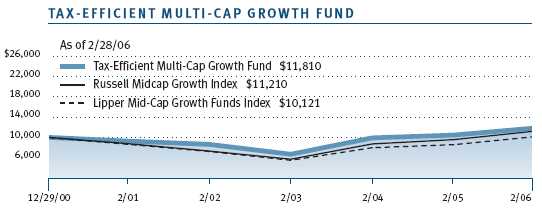
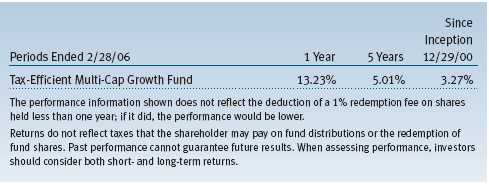
Your fund produced strong returns of 8.85% and 13.23% in the 6- and 12-month periods ended February 28, 2006. As shown in the performance comparison table, however, the fund trailed its benchmarks in both periods.
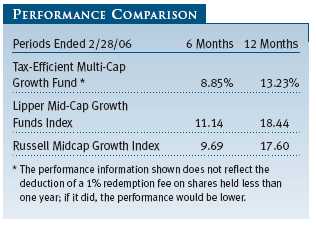
Although we underperformed our benchmarks in the short run, we believe it is best to evaluate our relative results over a longer period because we have a long-term investment horizon. Lipper placed the fund in the top 24% of the mid-cap growth funds universe for the five-year period from its inception on December 31, 2000, through the end of 2005—a challenging period for growth investors. (Based on total return, Lipper ranked the Tax-Efficient Multi-Cap Growth Fund 464 out of 553 and 81 out of 348 funds for the one-year and five-year/since-inception periods ended December 31, 2005, respectively. Results will vary for other time periods, and past performance cannot guarantee future results.)
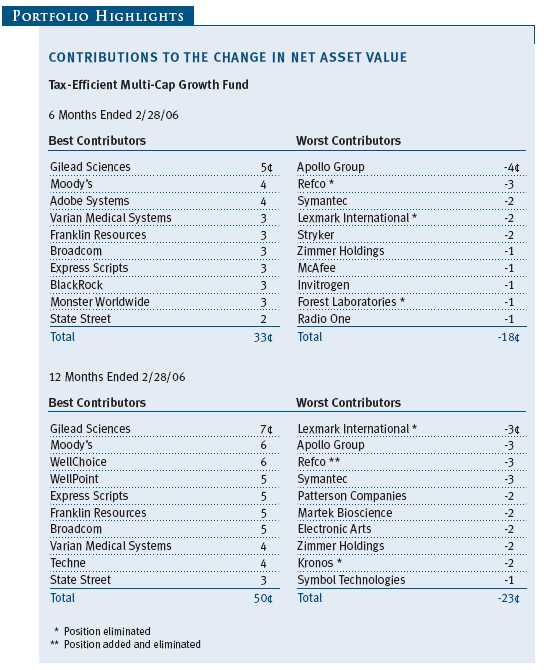
In the second half of our fiscal year, the fund’s performance relative to its benchmarks was hindered by some of our sector allocations, such as underweighting the industrials and business services sector, which performed very well, and overweighting health care stocks, which produced more modest gains. Overweighting financials, which generally performed well, offset some of this disadvantage. In addition, our stock selection generally detracted from our results versus both benchmarks. For example, poor short-term performance of our information technology holdings, specifically Yahoo! and software companies Symantec and Electronic Arts, limited our gains. Not owning less differentiated semiconductor stocks that rose rapidly but have less-than-optimal long-term prospects was also disadvantageous versus the Russell index. Similarly, stock selection in the robust industrials and business services sector also hurt our relative results, particularly avoiding makers of mining and construction equipment that performed very well. Many industrial companies have rallied with the vigorous economy in the last few years; however, relatively few of these economically sensitive companies are likely to feature consistently strong earnings growth once economic growth moderates.
On the plus side, stock selection in the consumer discretionary sector—owning Choice Hotels International, Las Vegas Sands, and Starbucks and avoiding satellite radio companies—was quite beneficial. Also, our holdings in the financials sector, including BlackRock, Franklin Resources, Janus Capital Group, Lazard, and CBOT Holdings, helped our performance relative to the Russell benchmark, while underweighting the energy sector—which retreated as oil prices declined from post-Katrina highs—helped our results versus the Lipper index.

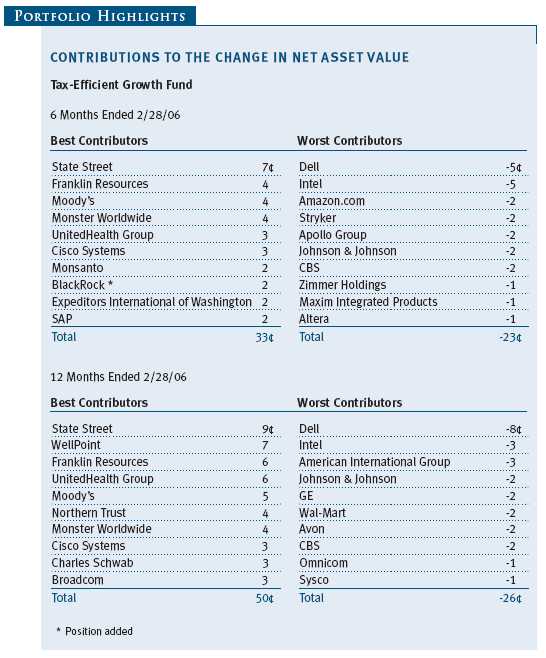
For the 12-month period, our relative performance was hindered by stock selection in the information technology sector. The tech names mentioned on page 15 and our lack of exposure to momentum stocks that did very well were the primary culprits. Underweighting the robust energy sector was also detrimental. On the other hand, our stock selection in the health care sector, particularly Varian Medical Systems and biotechnology stocks Gilead Sciences, Techne, and Vertex Pharmaceuticals, was advantageous. Underweighting the materials sector also helped our results relative to the Lipper index, while our overweighting in the financials sector and good performance of various holdings, such as Charles Schwab and State Street, helped results versus the Russell benchmark.
At the end of February, we overweighted the consumer discretionary, health care, and financials sectors relative to other mid-cap growth investors. We believe these sectors offer some of the best mid-cap growth opportunities for long-term investors. We underweighted the industrials and business services, energy, and materials sectors because they offer fewer candidates that meet our criteria. We owned no utilities and very few telecommunication services companies at the end of our reporting period because mid-cap companies with good growth prospects and high, sustainable returns on equity are not typically found in these areas.
OUTLOOKDespite the approaching end of the Federal Reserve’s tightening cycle, the taxable and municipal bond markets do not appear poised to rally off a year of moderate returns in 2005. In fact, given the strong U.S. economy and the current level of interest rates, bond yields may climb modestly. In general, we believe 2006 will be a transition year as interest rates settle into some higher ranges and as yield spreads widen for those taking more risk. The good news for municipal investors will be higher tax-free income, especially from shorter-term bonds. Inflation will be a key driver of interest rates as we wait to see whether the rise in energy prices feeds through into core inflation, which has remained notably constrained to date.
We see good value in municipal bonds, which offer yields only slightly below taxable Treasury bond yields even after providing good relative returns this past year. This makes them an especially appealing option for those in higher tax brackets. We will continue to use our proprietary research to uncover the best credit opportunities and selectively invest in attractive income-producing investments that we believe will perform well, even if credit spreads should widen from current levels.
In general, the environment for equities looks favorable. The U.S. economy is growing at a steady clip, the Federal Reserve is nearly finished raising short-term interest rates, corporate profit growth remains healthy, and corporate balance sheets are flush with cash. Of course, there are a few hints of speculative investment activity we should not overlook. For example, some investors seem to be reaching for returns without respecting the risks or downside potential of an investment, while companies with favorable characteristics, such as a sustainable competitive advantage and a demonstrated ability to increase revenues, earnings, and cash flow, seem to be undervalued. The performance of energy stocks in recent years is somewhat reminiscent of technology stock performance in the late 1990s, which we all know ended painfully. In addition, private equity buyout activity is brisk, but such investors will eventually want to see some returns on their investments. It is notable that, within the taxable fixed-income market, yield spreads are compressed for riskier investments, such as high-yield bonds.
Our outlook for growth stocks has not changed in the last six months, as our time horizon is much longer. We believe higher-quality companies are poised to have stronger relative returns if profit growth slows as the business cycle matures and if investors place a premium on companies that can grow their earnings steadily in more challenging economic conditions. Investors usually need to pay a significant premium to own companies with strong franchises and sustainable competitive advantages. Today, these companies are priced very attractively relative to the average company. We remain committed to finding and buying attractively valued growth opportunities for our portfolios, as well as maintaining a high degree of tax efficiency and having strong after-tax returns by keeping our winners and by eliminating holdings whose long-term prospects are dimming.
Respectfully submitted,

Donald J. Peters
Cochairman of the Investment Advisory Committee,
Tax-Efficient Balanced Fund
Chairman of the Investment Advisory Committees,
Tax-Efficient Growth and Tax-Efficient Multi-Cap Growth Funds

Hugh D. McGuirk
Cochairman of the Investment Advisory Committee,
Tax-Efficient Balanced Fund
March 20, 2006
The committee chairmen have day-to-day responsibility for managing the portfolios and work with committee members in developing and executing the funds’ investment programs.
RISKS OF STOCK INVESTING
The stock market as a whole can decline for many reasons, including adverse political or economic developments here or abroad, changes in investor psychology, or heavy institutional selling. The prospects for an industry or company may deteriorate because of a variety of factors, including disappointing earnings or changes in the competitive environment. In addition, our assessment of companies held in the funds may prove incorrect, resulting in losses or poor performance even in a rising market.
Growth stocks can be volatile for several reasons. Since growth companies usually reinvest a high proportion of their earnings in their own businesses, they may lack the dividends often associated with value stocks that could cushion their decline in a falling market. Also, since investors buy growth stocks because of their expected superior earnings growth, earnings disappointments often result in sharp price declines.
The stocks of mid-cap companies entail greater risk and are usually more volatile than the shares of large companies. Investing in small companies also involves greater risk than is customarily associated with larger companies. Stocks of small companies are subject to more abrupt or erratic price movements than larger company stocks. Small companies often have limited product lines, markets, or financial resources, and their managements may lack depth and experience. Such companies seldom pay significant dividends that could cushion returns in a falling market.
Technology stocks are particularly volatile and subject to greater price swings, up and down, than the broad market. It is possible that companies whose products and services first appear promising may not succeed over the long term; they may succumb to intense competition or could quickly become obsolete in a rapidly developing marketplace. Earnings projections for developing companies that are not met can result in sharp price declines. This is true even in a generally rising stock market environment.
RISKS OF BOND INVESTING (TAX-EFFICIENT BALANCED FUND)
Like all bonds, municipal bonds have two main sources of risk: interest rate and credit risk. Interest rate risk is the decline in bond prices that usually accompanies a rise in interest rates. Longer-maturity bonds typically suffer greater declines than those with shorter-term maturities. Credit risk is the chance that any fund holding could have its credit rating downgraded, or that a bond issuer will default (fail to make timely payments of interest or principal), potentially reducing the fund’s income level and share price. To the extent that we invest in junk bonds, credit risk will be higher since their issuers are more vulnerable to financial setbacks and recession than more creditworthy companies.
Municipal bonds are also subject to the possibility that tax reform or lower overall taxes may reduce their value or that individual issuers will be unable to meet their obligations due to problems in that state or locality.
GLOSSARYAverage company yield: Investment-weighted average yield of the underlying company yields. Individual company yields are calculated by dividing the estimated annual dividends per share by the current price.
Earnings growth rate: Measures the annualized percent change in earnings per share for a given time period.
Fed funds target rate: An overnight lending rate set by the Federal Reserve and used by banks to meet reserve requirements. Banks also use the fed funds rate as a benchmark for their prime lending rates.
Historical growth five years (least squared): Least squared growth calculation attempts to find the “normal” growth rate given a stream of historical growth rates. It searches for the growth rate that best fits the line produced by a stream of growth numbers.
Investment-weighted median market capitalization: The investment-weighted mid-point market capitalization (shares outstanding x current price) representing a typical security in a portfolio. An investment-weighted median represents the breakpoint where 50% of the values are above and 50% of the values are below based on portfolio weight.
Lehman Brothers Municipal Bond Index: An unmanaged index that tracks municipal debt instruments.
Lehman Brothers U.S. Aggregate Index: An unmanaged index that tracks domestic investment-grade bonds, including corporate, government, and mortgage-backed securities.
Lipper indices: Consist of a small number (10 to 30) of the largest mutual funds in a particular category as tracked by Lipper Inc.
Price/earnings (P/E) ratio: A ratio that shows the multiple of earnings at which a stock is selling. It is calculated by dividing a stock’s current price by its current earnings per share. For example, if a stock’s price is $60 per share and the issuing company earns $2 per share, the P/E ratio is $60/$2, or 30.
Projected long-term growth (IBES): Long-term projected earnings per share growth rate based on IBES estimates.
Return on equity (ROE): Calculated by dividing a company’s net income by shareholders’ equity (i.e., the company’s book value), ROE measures how much a company earns on each dollar that common stock investors have put into that company. ROE indicates how effectively and efficiently a company and its management are using stockholder investments. Excluding charges refers to the earnings figure used in the calculation. It represents earnings before extraordinary items and discontinued operations.
Russell 1000 Index: Measures the performance of the 1,000 largest companies in the Russell 3000 Index.
Russell 1000 Growth Index: Measures the performance of those Russell 1000 Index companies with higher price-to-book ratios and higher forecasted growth values.Russell 1000 Value Index: Measures the performance of those Russell 1000 companies with lower price-to-book ratios and lower forecasted growth values.
Russell 2000 Index: Measures the performance of the 2,000 smallest companies in the Russell 3000 Index.
Russell 2000 Growth Index: Measures the performance of those Russell 2000 companies with higher price-to-book ratios and higher forecasted growth values.
Russell 2000 Value Index: Measures the performance of those Russell 2000 companies with lower price-to-book ratios and lower forecasted growth values.
Russell Midcap Index: Measures the performance of the 800 smallest companies in the Russell 1000 Index.
Russell Midcap Growth Index: Measures the performance of those Russell Midcap companies with higher price-to-book ratios and higher forecasted growth values. The stocks are also members of the Russell 1000 Growth Index.
Russell Midcap Value Index: Measures the performance of those Russell Midcap companies with lower price-to-book ratios and lower forecasted growth values. The stocks are also members of the Russell 1000 Value Index.
S&P 500 Stock Index: Tracks the stocks of 500 primarily large U.S. companies.
Yield curve: A graphic depiction of the relationship between yields and maturity dates for a set of similar securities, such as Treasuries or municipal securities. Yield curves typically slope upward, indicating that longer maturities offer higher yields. When the yield curve is flat, there is little or no difference between the yields offered by shorter- and longer-term securities.

| GROWTH OF $10,000 |
This chart shows the value of a hypothetical $10,000 investment in the fund over the past 10 fiscal year periods or since inception (for funds lacking 10-year records). The result is compared with benchmarks, which may include a broad-based market index and a peer group average or index. Market indexes do not include expenses, which are deducted from fund returns as well as mutual fund averages and indexes.
| AVERAGE ANNUAL COMPOUND TOTAL RETURN |
This table shows how the fund would have performed each year if its actual (or cumulative) returns for the periods shown had been earned at a constant rate.
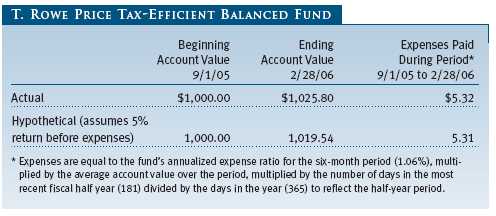
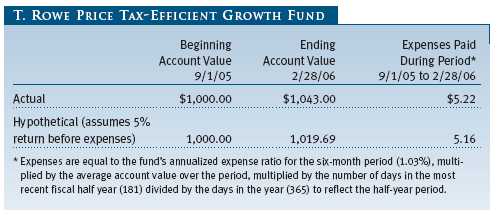
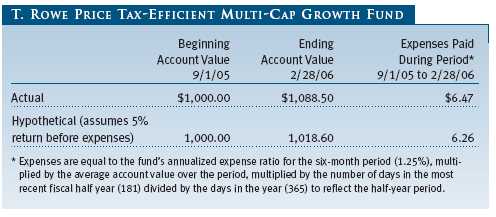
| FUND EXPENSE EXAMPLE |
As a mutual fund shareholder, you may incur two types of costs: (1) transaction costs, such as redemption fees or sales loads, and (2) ongoing costs, including management fees, distribution and service (12b-1) fees, and other fund expenses. The following example is intended to help you understand your ongoing costs (in dollars) of investing in the fund and to compare these costs with the ongoing costs of investing in other mutual funds. The example is based on an investment of $1,000 invested at the beginning of the most recent six-month period and held for the entire period.
Actual Expenses
The first line of the following table (“Actual”) provides information about actual account values and actual expenses. You may use the information in this line, together with your account balance, to estimate the expenses that you paid over the period. Simply divide your account value by $1,000 (for example, an $8,600 account value divided by $1,000 = 8.6), then multiply the result by the number in the first line under the heading “Expenses Paid During Period” to estimate the expenses you paid on your account during this period.
Hypothetical Example for Comparison Purposes
The information on the second line of the table (“Hypothetical”) is based on hypothetical account values and expenses derived from the fund’s actual expense ratio and an assumed 5% per year rate of return before expenses (not the fund’s actual return). You may compare the ongoing costs of investing in the fund with other funds by contrasting this 5% hypothetical example and the 5% hypothetical examples that appear in the shareholder reports of the other funds. The hypothetical account values and expenses may not be used to estimate the actual ending account balance or expenses you paid for the period.
Note: T. Rowe Price charges an annual small-account maintenance fee of $10, generally for accounts with less than $2,000 ($500 for UGMA/UTMA). The fee is waived for any investor whose T. Rowe Price mutual fund accounts total $25,000 or more, accounts employing automatic investing, and IRAs and other retirement plan accounts that utilize a prototype plan sponsored by T. Rowe Price (although a separate custodial or administrative fee may apply to such accounts). This fee is not included in the accompanying table. If you are subject to the fee, keep it in mind when you are estimating the ongoing expenses of investing in the fund and when comparing the expenses of this fund with other funds.
You should also be aware that the expenses shown in the table highlight only your ongoing costs and do not reflect any transaction costs, such as redemption fees or sales loads. Therefore, the second line of the table is useful in comparing ongoing costs only and will not help you determine the relative total costs of owning different funds. To the extent a fund charges transaction costs, however, the total cost of owning that fund is higher.
The accompanying notes are an integral part of these financial statements.
The accompanying notes are an integral part of these financial statements.
The accompanying notes are an integral part of these financial statements.
The accompanying notes are an integral part of these financial statements.
The accompanying notes are an integral part of these financial statements.
| NOTES TO FINANCIAL STATEMENTS |
NOTE 1 - SIGNIFICANT ACCOUNTING POLICIES
T. Rowe Price Tax-Efficient Funds, Inc. (the corporation), is registered under the Investment Company Act of 1940 (the 1940 Act). The Tax-Efficient Balanced Fund (the fund), a diversified, open-end management investment company, is one portfolio established by the corporation. The fund commenced operations on June 30, 1997. The fund seeks to provide attractive long-term total returns on an after-tax basis with a balanced portfolio of stocks and municipal bonds.
The accompanying financial statements were prepared in accordance with accounting principles generally accepted in the United States of America, which require the use of estimates made by fund management. Fund management believes that estimates and security valuations are appropriate; however, actual results may differ from those estimates, and the security valuations reflected in the financial statements may differ from the value the fund ultimately realizes upon sale of the securities.
Valuation The fund values its investments and computes its net asset value per share at the close of the New York Stock Exchange (NYSE), normally 4 p.m. ET, each day that the NYSE is open for business. Debt securities are generally traded in the over-the-counter market. Securities are valued at prices furnished by dealers who make markets in such securities or by an independent pricing service, which considers yield or price of bonds of comparable quality, coupon, maturity, and type, as well as prices quoted by dealers who make markets in such securities.
Equity securities listed or regularly traded on a securities exchange or in the over-the-counter market are valued at the last quoted sale price or, for certain markets, the official closing price at the time the valuations are made, except for OTC Bulletin Board securities, which are valued at the mean of the latest bid and asked prices. A security that is listed or traded on more than one exchange is valued at the quotation on the exchange determined to be the primary market for such security. Listed securities not traded on a particular day are valued at the mean of the latest bid and asked prices for domestic securities and the last quoted sale price for international securities.
Other investments, including restricted securities, and those for which the above valuation procedures are inappropriate or are deemed not to reflect fair value are stated at fair value as determined in good faith by the T. Rowe Price Valuation Committee, established by the fund’s Board of Directors.
Credits The fund earns credits on temporarily uninvested cash balances at the custodian that reduce the fund’s custody charges. Custody expense in the accompanying financial statements is presented before reduction for credits, which are reflected as expenses paid indirectly.
Redemption Fees A 1% fee is assessed on redemptions of fund shares held less than one year to deter short-term trading and protect the interests of long-term shareholders. Redemption fees are withheld from proceeds that shareholders receive from the sale or exchange of fund shares. The fees are paid to the fund, and are recorded as an increase to paid-in capital. The fees may cause the redemption price per share to differ from the net asset value per share.
Investment Transactions, Investment Income, and Distributions Income and expenses are recorded on the accrual basis. Premiums and discounts on debt securities are amortized for financial reporting purposes. Dividend income is recorded on the ex-dividend date. Investment transactions are accounted for on the trade date. Realized gains and losses are reported on the identified cost basis. Distributions to shareholders are recorded on the ex-dividend date. Income distributions are declared on a daily basis and paid monthly. Capital gain distributions, if any, are declared and paid by the fund, typically on an annual basis.
NOTE 2 - INVESTMENT TRANSACTIONS
Consistent with its investment objective, the fund engages in the following practices to manage exposure to certain risks or enhance performance. The investment objective, policies, program, and risk factors of the fund are described more fully in the fund’s prospectus and Statement of Additional Information.
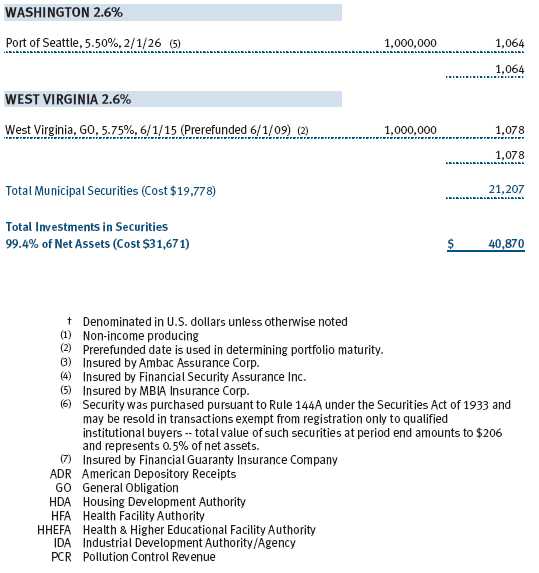
Restricted Securities The fund may invest in securities that are subject to legal or contractual restrictions on resale. Although certain of these securities may be readily sold, for example, under Rule 144A, others may be illiquid, their sale may involve substantial delays and additional costs, and prompt sale at an acceptable price may be difficult.
Other Purchases and sales of portfolio securities, other than short-term securities, aggregated $8,315,000 and $11,745,000, respectively, for the year ended February 28, 2006.
NOTE 3 - FEDERAL INCOME TAXES
No provision for federal income taxes is required since the fund intends to continue to qualify as a regulated investment company under Subchapter M of the Internal Revenue Code and distribute to shareholders all of its income and gains. Federal income tax regulations differ from generally accepted accounting principles; therefore, distributions determined in accordance with tax regulations may differ significantly in amount or character from net investment income and realized gains for financial reporting purposes. Financial reporting records are adjusted for permanent book/tax differences to reflect tax character. Financial records are not adjusted for temporary differences.
Distributions during the year ended February 28, 2006, were characterized as follows for tax purposes:
![]()
At February 28, 2006, the tax-basis components of net assets were as follows:
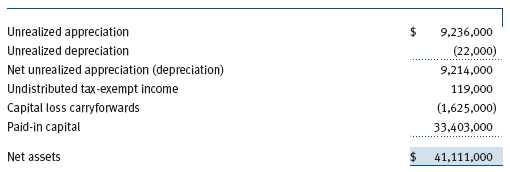
The fund intends to retain realized gains to the extent of available capital loss carryforwards for federal income tax purposes. During the fiscal year ended February 28, 2006, the fund utilized $1,324,000 of capital loss carryforwards. As of February 28, 2006, the fund had $63,000 of capital loss carryforwards that expire in fiscal 2010, $814,000 that expire in fiscal 2011, and $748,000 that expire in fiscal 2012.
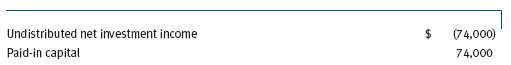
For the year ended February 28, 2006, the fund recorded the following permanent reclassifications to reflect tax character. Reclassifications to paid-in capital relate primarily to a tax practice that treats a portion of the proceeds from each redemption of capital shares as a distribution of taxable net investment income and/or realized capital gain. Results of operations and net assets were not affected by these reclassifications.
At February 28, 2006, the cost of investments for federal income tax purposes was $31,656,000.
NOTE 4 - RELATED PARTY TRANSACTIONS
The fund is managed by T. Rowe Price Associates, Inc. (the manager or Price Associates), a wholly owned subsidiary of T. Rowe Price Group, Inc. The investment management agreement between the fund and the manager provides for an annual investment management fee, which is computed daily and paid monthly. The fee consists of an individual fund fee, equal to 0.20% of the fund’s average daily net assets, and a group fee. The group fee rate is calculated based on the combined net assets of certain mutual funds sponsored by Price Associates (the group) applied to a graduated fee schedule, with rates ranging from 0.48% for the first $1 billion of assets to 0.29% for assets in excess of $160 billion. Prior to May 1, 2005, the maximum group fee rate in the graduated fee schedule had been 0.295% for assets in excess of $120 billion. The fund’s group fee is determined by applying the group fee rate to the fund’s average daily net assets. At February 28, 2006, the effective annual gr oup fee rate was 0.31%.
In addition, the fund has entered into service agreements with Price Associates and a wholly owned subsidiary of Price Associates (collectively, Price). Price Associates computes the daily share price and provides certain other administrative services to the fund. T. Rowe Price Services, Inc., provides shareholder and administrative services in its capacity as the fund’s transfer and dividend disbursing agent. For the year ended February 28, 2006, expenses incurred pursuant to these service agreements were $68,000 for Price Associates and $25,000 for T. Rowe Price Services. The total amount payable at period end pursuant to these service agreements is reflected as Due to Affiliates in the accompanying financial statements.
As of February 28, 2006, T. Rowe Price Group, Inc., and/or its wholly owned subsidiaries owned 78,683 shares of the fund, representing 3% of the fund’s net assets.
| REPORT OF INDEPENDENT REGISTERED PUBLIC ACCOUNTING FIRM |
To the Board of Directors of T. Rowe Price Tax-Efficient Funds, Inc. and Shareholders of T. Rowe Price Tax-Efficient Balanced Fund
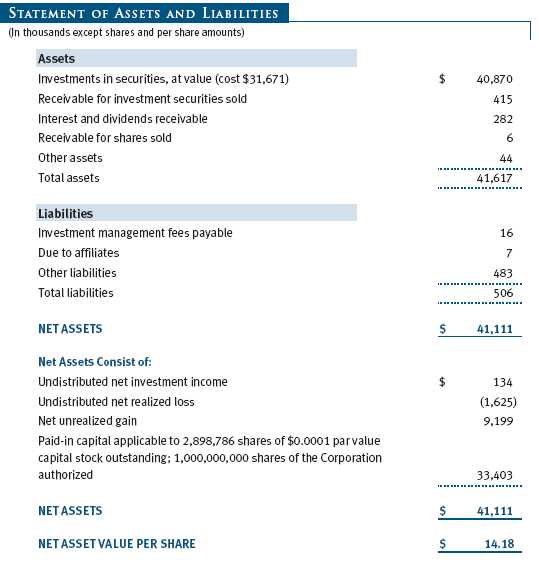
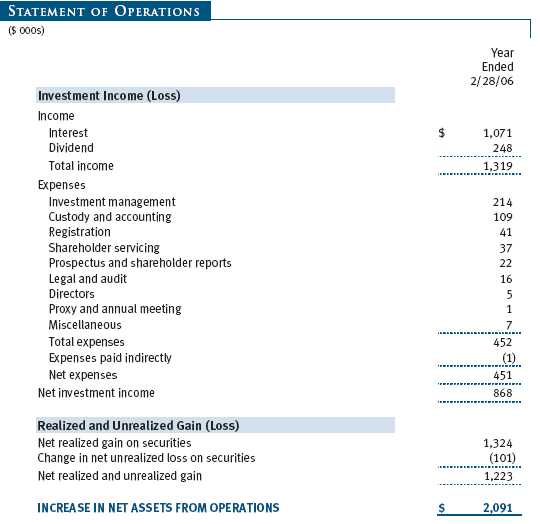
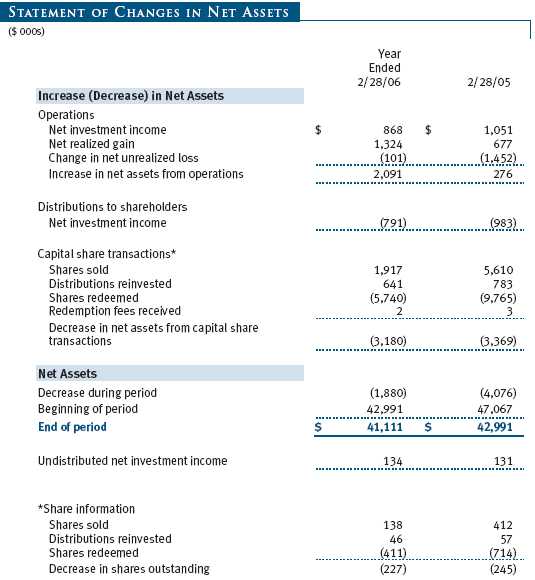
In our opinion, the accompanying statement of assets and liabilities, including the portfolio of investments, and the related statements of operations and of changes in net assets and the financial highlights present fairly, in all material respects, the financial position of T. Rowe Price Tax-Efficient Balanced Fund (one of the portfolios comprising T. Rowe Price Tax-Efficient Funds, Inc., hereafter referred to as the “Fund”) at February 28, 2006, the results of its operations for the year then ended, the changes in its net assets for each of the two years in the period then ended and the financial highlights for each of the five years in the period then ended, in conformity with accounting principles generally accepted in the United States of America. These financial statements and financial highlights (hereafter referred to as “financial statements”) are the responsibility of the Fund’s management; our responsibility is to express an opinion on these financial statements based on our audits. We conducted our audits of these financial statements in accordance with the standards of the Public Company Accounting Oversight Board (United States). Those standards require that we plan and perform the audit to obtain reasonable assurance about whether the financial statements are free of material misstatement. An audit includes examining, on a test basis, evidence supporting the amounts and disclosures in the financial statements, assessing the accounting principles used and significant estimates made by management, and evaluating the overall financial statement presentation. We believe that our audits, which included confirmation of securities at February 28, 2006 by correspondence with the custodian, provide a reasonable basis for our opinion.
PricewaterhouseCoopers LLP
Baltimore, Maryland
April 10, 2006
| TAX INFORMATION (UNAUDITED) FOR THE TAX YEAR ENDED 2/28/06 |
We are providing this information as required by the Internal Revenue Code. The amounts shown may differ from those elsewhere in this report because of differences between tax and financial reporting requirements.
The fund’s distributions to shareholders included $701,000 which qualified as exempt-interest dividends.
For taxable non-corporate shareholders, $163,000 of the fund’s income represents qualified dividend income subject to the 15% rate category.
For corporate shareholders, $163,000 of the fund’s income qualifies for the dividends-received deduction.
| INFORMATION ON PROXY VOTING POLICIES, PROCEDURES, AND RECORDS |
A description of the policies and procedures used by T. Rowe Price funds and portfolios to determine how to vote proxies relating to portfolio securities is available in each fund’s Statement of Additional Information, which you may request by calling 1-800-225-5132 or by accessing the SEC’s Web site, www.sec.gov. The description of our proxy voting policies and procedures is also available on our Web site, www.troweprice.com. To access it, click on the words “Company Info” at the top of our homepage for individual investors. Then, in the window that appears, click on the “Proxy Voting Policy” navigation button in the top left corner.
Each fund’s most recent annual proxy voting record is available on our Web site and through the SEC’s Web site. To access it through our Web site, follow the directions above, then click on the words “Proxy Voting Record” at the bottom of the Proxy Voting Policy page.
| HOW TO OBTAIN QUARTERLY PORTFOLIO HOLDINGS |
The fund files a complete schedule of portfolio holdings with the Securities and Exchange Commission for the first and third quarters of each fiscal year on Form N-Q. The fund’s Form N-Q is available electronically on the SEC’s Web site (www.sec.gov); hard copies may be reviewed and copied at the SEC’s Public Reference Room, 450 Fifth St. N.W., Washington, DC 20549. For more information on the Public Reference Room, call 1-800-SEC-0330.
| ABOUT THE FUND’S DIRECTORS AND OFFICERS |
Your fund is governed by a Board of Directors that meets regularly to review performance, investment programs, compliance matters, advisory fees and expenses, service providers, and other business matters, and is responsible for protecting the interests of shareholders. At least 75% of the fund’s directors are independent of T. Rowe Price Associates, Inc. (T. Rowe Price); “inside” directors are officers of T. Rowe Price. The Board of Directors elects the fund’s officers, who are listed in the final table. The business address of each director and officer is 100 East Pratt Street, Baltimore, MD 21202. The Statement of Additional Information includes additional information about the fund directors and is available without charge by calling a T. Rowe Price representative at 1-800-225-5132.
| Independent Directors | |
| Name | |
| (Year of Birth) | |
| Year Elected* | |
| [Number of T. Rowe Price | Principal Occupation(s) During Past 5 Years and |
| Portfolios Overseen] | Directorships of Other Public Companies |
| Jeremiah E. Casey | Director, Allfirst Financial, Inc. (previously First Maryland Bankcorp) |
| (1940) | (1983 to 2002); Director, National Life Insurance (2001 to 2005); |
| 2005 | Director, The Rouse Company, real estate developers (1990 to 2004) |
| [59] | |
| Anthony W. Deering | Chairman, Exeter Capital, LLC, a private investment firm (2004 to |
| (1945) | present); Director, Vornado Real Estate Investment Trust (3/04 to |
| 2001 | present); Director, Mercantile Bankshares (4/03 to present); Member, |
| [113] | Advisory Board, Deutsche Bank North America (2004 to present); |
| Director, Chairman of the Board, and Chief Executive Officer, The | |
| Rouse Company, real estate developers (1997 to 2004) | |
| Donald W. Dick, Jr. | Principal, EuroCapital Advisors, LLC, an acquisition and management |
| (1943) | advisory firm; Chairman, President, and Chief Executive Officer, |
| 1997 | The Haven Group, a custom manufacturer of modular homes |
| [113] | (1/04 to present) |
| David K. Fagin | Chairman and President, Nye Corporation (6/88 to present); Director, |
| (1938) | Canyon Resources Corp. and Golden Star Resources Ltd. (5/92 to |
| 1997 | present), and Pacific Rim Mining Corp. (2/02 to present) |
| [113] | |
| Karen N. Horn | Managing Director and President, Global Private Client Services, |
| (1943) | Marsh Inc. (1999 to 2003); Managing Director and Head of |
| 2003 | International Private Banking, Bankers Trust (1996 to 1999); Director, |
| [113] | Georgia Pacific, Eli Lilly and Company, and Simon Property Group |
| Theo C. Rodgers | President, A&R Development Corporation |
| (1941) | |
| 2005 | |
| [97] | |
| John G. Schreiber | Owner/President, Centaur Capital Partners, Inc., a real estate invest- |
| (1946) | ment company; Partner, Blackstone Real Estate Advisors, L.P.; |
| 2001 | Director, AMLI Residential Properties Trust |
| [113] | |
* Each independent director serves until retirement, resignation, or election of a successor.
| Inside Directors | |
| Name | |
| (Year of Birth) | |
| Year Elected* | |
| [Number of T. Rowe Price | Principal Occupation(s) During Past 5 Years and |
| Portfolios Overseen] | Directorships of Other Public Companies |
| James A.C. Kennedy, CFA | Director and Vice President, T. Rowe Price and T. Rowe Price Group, |
| (1953) | Inc.; Director, T. Rowe Price Global Asset Management Limited, |
| 1997 | T. Rowe Price Global Investment Services Limited, and T. Rowe Price |
| [45] | International, Inc. |
| James S. Riepe | Chairman of the Board and Director, T. Rowe Price Investment |
| (1943) | Services, Inc.; Director, T. Rowe Price Group, Inc.; Chairman of the |
| 1997 | Board, all funds |
| [113] | |
* Each inside director serves until retirement, resignation, or election of a successor.
| Officers | |
| Name (Year of Birth) | |
| Title and Fund(s) Served | Principal Occupation(s) |
| Joseph A. Carrier, CPA (1960) | Vice President, T. Rowe Price, T. Rowe Price |
| Treasurer, Tax-Efficient Funds | Group, Inc., T. Rowe Price Investment Services, |
| Inc., and T. Rowe Price Trust Company | |
| Donald J. Easley, CFA (1971) | Vice President, T. Rowe Price and T. Rowe Price |
| Vice President, Tax-Efficient Funds | Group, Inc. |
| Roger L. Fiery III, CPA (1959) | Vice President, T. Rowe Price, T. Rowe Price |
| Vice President, Tax-Efficient Funds | Group, Inc., T. Rowe Price International, Inc., |
| and T. Rowe Price Trust Company | |
| John R. Gilner (1961) | Chief Compliance Officer and Vice President, |
| Chief Compliance Officer, Tax-Efficient Funds | T. Rowe Price; Vice President, T. Rowe Price Group, |
| Inc., and T. Rowe Price Investment Services, Inc. | |
| Gregory S. Golczewski (1966) | Vice President, T. Rowe Price and T. Rowe Price |
| Vice President, Tax-Efficient Funds | Trust Company |
| Jill L. Hauser (1958) | Vice President, T. Rowe Price and T. Rowe Price |
| Vice President, Tax-Efficient Funds | Group, Inc. |
| Henry H. Hopkins (1942) | Director and Vice President, T. Rowe Price |
| Vice President, Tax-Efficient Funds | Investment Services, Inc., T. Rowe Price |
| Services, Inc., and T. Rowe Price Trust Company; | |
| Vice President, T. Rowe Price, T. Rowe Price | |
| Group, Inc., T. Rowe Price International, Inc., | |
| and T. Rowe Price Retirement Plan Services, Inc. | |
| Patricia B. Lippert (1953) | Assistant Vice President, T. Rowe Price and |
| Secretary, Tax-Efficient Funds | T. Rowe Price Investment Services, Inc. |
| Hugh D. McGuirk, CFA (1960) | Vice President, T. Rowe Price and T. Rowe Price |
| Executive Vice President, Tax-Efficient Funds | Group, Inc. |
| Mary J. Miller, CFA (1955) | Director and Vice President, T. Rowe Price; Vice |
| Vice President, Tax-Efficient Funds | President, T. Rowe Price Group, Inc. |
| Donald J. Peters (1959) | Vice President, T. Rowe Price and T. Rowe Price |
| President, Tax-Efficient Funds | Group, Inc. |
| William J. Stromberg, CFA (1960) | Vice President, T. Rowe Price, T. Rowe Price |
| Vice President, Tax-Efficient Funds | Group, Inc., and T. Rowe Price Trust Company |
| Julie L. Waples (1970) | Vice President, T. Rowe Price |
| Vice President, Tax-Efficient Funds | |
| Mark R. Weigman, CFA, CIC (1962) | Vice President, T. Rowe Price, T. Rowe Price |
| Vice President, Tax-Efficient Funds | Group, Inc., and T. Rowe Price Trust Company |
Unless otherwise noted, officers have been employees of T. Rowe Price or T. Rowe Price International for at least five years.
Item 2. Code of Ethics.
The registrant has adopted a code of ethics, as defined in Item 2 of Form N-CSR, applicable to its principal executive officer, principal financial officer, principal accounting officer or controller, or persons performing similar functions. A copy of this code of ethics is filed as an exhibit to this Form N-CSR. No substantive amendments were approved or waivers were granted to this code of ethics during the period covered by this report.
Item 3. Audit Committee Financial Expert.
The registrant’s Board of Directors/Trustees has determined that Mr. Donald W. Dick Jr. qualifies as an audit committee financial expert, as defined in Item 3 of Form N-CSR. Mr. Dick is considered independent for purposes of Item 3 of Form N-CSR.
Item 4. Principal Accountant Fees and Services.
(a) – (d) Aggregate fees billed to the registrant for the last two fiscal years for professional services rendered by the registrant’s principal accountant were as follows:
| 2006 | 2005 | |
| Audit Fees | $7,356 | $6,343 |
| Audit-Related Fees | 599 | 721 |
| Tax Fees | 2,093 | 1,847 |
| All Other Fees | 418 | - |
Audit fees include amounts related to the audit of the registrant’s annual financial statements and services normally provided by the accountant in connection with statutory and regulatory filings. Audit-related fees include amounts reasonably related to the performance of the audit of the registrant’s financial statements and specifically include the issuance of a report on internal controls. Tax fees include amounts related to services for tax compliance, tax planning, and tax advice. The nature of these services specifically includes the review of distribution calculations and the preparation of Federal, state, and excise tax returns. All other fees include the registrant’s pro-rata share of amounts for agreed-upon procedures in conjunction with service contract approvals by the registrant’s Board of Directors/Trustees.
(e)(1) The registrant’s audit committee has adopted a policy whereby audit and non-audit services performed by the registrant’s principal accountant for the registrant, its investment adviser, and any entity controlling, controlled by, or under common control with the investment adviser that provides ongoing services to the registrant require pre-approval in advance at regularly scheduled audit committee meetings. If such a service is required between regularly scheduled audit committee meetings, pre-approval may be authorized by one audit committee member with ratification at the next scheduled audit committee meeting. Waiver of pre-approval for audit or non-audit services requiring fees of a de minimis amount is not permitted.
(2) No services included in (b) – (d) above were approved pursuant to paragraph (c)(7)(i)(C) of Rule 2-01 of Regulation S-X.
(f) Less than 50 percent of the hours expended on the principal accountant’s engagement to audit the registrant’s financial statements for the most recent fiscal year were attributed to work performed by persons other than the principal accountant’s full-time, permanent employees.
(g) The aggregate fees billed for the most recent fiscal year and the preceding fiscal year by the registrant’s principal accountant for non-audit services rendered to the registrant, its investment adviser, and any entity controlling, controlled by, or under common control with the investment adviser that provides ongoing services to the registrant were $1,008,000 and $903,000, respectively, and were less than the aggregate fees billed for those same periods by the registrant’s principal accountant for audit services rendered to the T. Rowe Price Funds.
(h) All non-audit services rendered in (g) above were pre-approved by the registrant’s audit committee. Accordingly, these services were considered by the registrant’s audit committee in maintaining the principal accountant’s independence.Item 5. Audit Committee of Listed Registrants.
Not applicable.
Item 6. Schedule of Investments.
Not applicable. The complete schedule of investments is included in Item 1 of this Form N-CSR.
Item 7. Disclosure of Proxy Voting Policies and Procedures for Closed-End Management Investment Companies.
Not applicable.
Item 8. Portfolio Managers of Closed-End Management Investment Companies.
Not applicable.
Item 9. Purchases of Equity Securities by Closed-End Management Investment Company and Affiliated Purchasers.
Not applicable.
Item 10. Submission of Matters to a Vote of Security Holders.
Not applicable.
Item 11. Controls and Procedures.
(a) The registrant’s principal executive officer and principal financial officer have evaluated the registrant’s disclosure controls and procedures within 90 days of this filing and have concluded that the registrant’s disclosure controls and procedures were effective, as of that date, in ensuring that information required to be disclosed by the registrant in this Form N-CSR was recorded, processed, summarized, and reported timely.
(b) The registrant’s principal executive officer and principal financial officer are aware of no change in the registrant’s internal control over financial reporting that occurred during the registrant’s second fiscal quarter covered by this report that has materially affected, or is reasonably likely to materially affect, the registrant’s internal control over financial reporting.
Item 12. Exhibits.
(a)(1) The registrant’s code of ethics pursuant to Item 2 of Form N-CSR is attached.
(2) Separate certifications by the registrant's principal executive officer and principal financial officer, pursuant to Section 302 of the Sarbanes-Oxley Act of 2002 and required by Rule 30a-2(a) under the Investment Company Act of 1940, are attached.
(3) Written solicitation to repurchase securities issued by closed-end companies: not applicable.
(b) A certification by the registrant's principal executive officer and principal financial officer, pursuant to Section 906 of the Sarbanes-Oxley Act of 2002 and required by Rule 30a-2(b) under the Investment Company Act of 1940, is attached.
SIGNATURES | |
| Pursuant to the requirements of the Securities Exchange Act of 1934 and the Investment | |
| Company Act of 1940, the registrant has duly caused this report to be signed on its behalf by the | |
| undersigned, thereunto duly authorized. | |
| T. Rowe Price Tax-Efficient Funds, Inc. | |
| By | /s/ James S. Riepe |
| James S. Riepe | |
| Principal Executive Officer | |
| Date | April 13, 2006 |
| Pursuant to the requirements of the Securities Exchange Act of 1934 and the Investment | |
| Company Act of 1940, this report has been signed below by the following persons on behalf of | |
| the registrant and in the capacities and on the dates indicated. | |
| By | /s/ James S. Riepe |
| James S. Riepe | |
| Principal Executive Officer | |
| Date | April 13, 2006 |
| By | /s/ Joseph A. Carrier |
| Joseph A. Carrier | |
| Principal Financial Officer | |
| Date | April 13, 2006 |