Item 1: Report to Shareholders
 |
| Tax-Efficient Growth Fund | February 28, 2007 |
The views and opinions in this report were current as of February 28, 2007. They are not guarantees of performance or investment results and should not be taken as investment advice. Investment decisions reflect a variety of factors, and the managers reserve the right to change their views about individual stocks, sectors, and the markets at any time. As a result, the views expressed should not be relied upon as a forecast of the fund’s future investment intent. The report is certified under the Sarbanes-Oxley Act, which requires mutual funds and other public companies to affirm that, to the best of their knowledge, the information in their financial reports is fairly and accurately stated in all material respects.
REPORTS ON THE WEB
Sign up for our E-mail Program, and you can begin to receive updated fund reports and prospectuses online rather than through the mail. Log in to your account at troweprice.com for more information.
Fellow ShareholdersU.S. stocks produced solid returns in the one-year period ended February 28, 2007, thanks to strong performance in the second half of our fiscal year. In the last six months, mid- and small-cap shares surpassed their large-cap peers, while value and growth stocks in each market-cap segment fared about the same. Tax-free municipal bonds advanced but lagged taxable bonds as longer-term Treasury yields declined in response to slower economic growth and the Fed’s maintenance of a 5.25% fed funds target rate. The Tax-Efficient Funds generally trailed their benchmarks over the last year, but their relative results improved notably in the last six months as growth stocks—which are at the heart of our equity strategies—demonstrated better relative performance.
HIGHLIGHTS
• U.S. stocks produced solid returns over the last year due to strong performance in the last six months. Tax-free bonds also advanced as the economy decelerated.
• The Tax-Efficient Funds generally trailed their benchmarks over the last year, but relative results improved as growth stocks demonstrated better relative performance in the last six months.
• Our investment philosophy remains constant, and our growth strategies are not predicated on timing a relative performance cycle. We think investing in high-quality businesses at attractive valuations never goes out of style.
• As the economic expansion matures, we believe long-term investors are more likely to focus on what we favor: stocks of high-quality companies with solid fundamentals and the ability to grow their earnings at a strong or steady pace.
• We remain committed to maintaining each portfolio’s high degree of tax efficiency by keeping our winners indefinitely, eliminating stocks of companies with faltering fundamentals, reinvesting in businesses with better long-term prospects, and using tax losses to offset taxable capital gains.
MARKET ENVIRONMENT
Economic growth moderated significantly over the course of 2006, thanks in part to a significantly cooler housing market, softer manufacturing activity, and elevated energy costs. The economy (as measured by gross domestic product, or GDP) grew at an annualized rate of 2.2% in the fourth quarter of 2006 compared with a very robust 5.6% in the first quarter of last year.
The overall rate of inflation eased somewhat as oil and gas prices declined from their peaks last summer, but “core” inflation, which excludes food and energy prices, has remained above the comfort zone of Federal Reserve officials. Nevertheless, the central bank has kept the fed funds target rate at 5.25% since the end of June 2006 in anticipation that inflation will ease as growth continues at a more moderate pace than in the last few years. However, Fed officials remain vigilant and have left open the possibility of additional rate increases if inflation pressures do not wane.
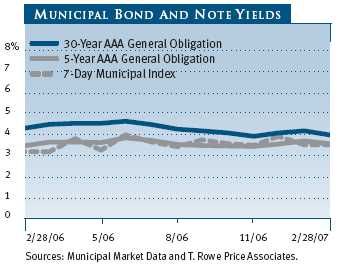
As shown in the graph, municipal money market yields were fairly flat in the second half of our fiscal year, reflecting the Fed’s steady stance on the fed funds target rate. Short- and intermediate-term rates edged higher, but long-term rates declined, resulting in the outperformance of long-term securities and a continued flattening of the municipal yield curve. At the end of February, yields of the highest-quality municipal securities maturing in 10 years or less were practically the same, and the difference between money market yields and 30-year bond yields decreased to approximately 40 basis points (0.40%) —an extraordinary and historically narrow gap.
In the taxable bond market, the Treasury yield curve remained inverted, as short-term rates were fairly steady while intermediate- and long-term interest rates—already lower than short-term rates—declined in the last six months. The resulting price appreciation helped taxable securities outperform their tax-free counterparts—a reversal of the performance pattern of recent years. In the 6- and 12-month periods ended February 28, 2007, the Lehman Brothers U.S. Aggregate Index returned 3.66% and 5.54%, respectively, versus 2.89% and 4.96% for the Lehman Brothers Municipal Bond Index.
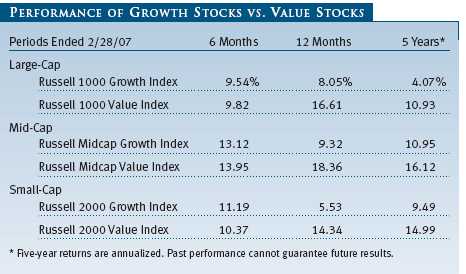
U.S. stocks advanced strongly in the last six months, recovering soundly from a sharp sell-off in May and June thanks to favorable corporate earnings growth, feverish merger and buyout activity, and moderating economic growth and inflation that enabled the Federal Reserve to refrain from raising short-term interest rates. Small-cap shares surpassed their larger peers: The Russell 2000 Index returned 10.76% versus 8.93% for the S&P 500 Index.As shown in the table below, value stocks maintained a strong performance advantage over growth in the one- and five-year periods ended February 28. However, growth stocks were neck and neck with value across all market capitalizations in the last six months. This improved relative performance is to be expected during periods of slowing economic growth, when investors begin seeking higher-quality companies that are capable of delivering strong or steady earnings growth without a robust cyclical tailwind.
Stock market activity for the last few years has been driven in part by speculation. Consider the following: lower-quality companies have outperformed better businesses; stocks that tend to be relatively stable have lagged more volatile equities; investors have been willing to embrace disproportionate risks in pursuit of higher returns; and merger and acquisition activity has reached a fevered pitch. Although some of our holdings have appreciated as a result of buyouts or takeover speculation, the other factors have been somewhat disadvantageous to our strategies, given our quality bias. As the economic expansion matures and investors become more mindful of investment risks—which we witnessed as stocks dropped at the end of our reporting period—we believe they will increasingly favor what we favor: high-quality companies with solid fundamentals and strong business models that can maintain strong earnings growth rates without a cyclical tailwind. We anticipate that the relative performance of quality growth stocks will continue to improve if volatility persists. Moreover, the under-appreciation of the best companies will evaporate as investors become less speculative and more risk neutral.
INVESTMENT PHILOSOPHY
Our investment philosophy remains constant, despite investors’ aggressive risk-seeking behavior that has been driving equities for some time. We expect the marginal investor to continue to make all the traditional errors, such as raising cash levels after a significant market decline and “chasing performance”—buying asset classes that have already produced outstanding relative returns in the recent past. Our steady investment approach is not predicated on timing a relative performance cycle. We think investing in high-quality businesses at attractive valuations never goes out of style, but relative performance will be bumpy. Nevertheless, we believe that the performance of the Tax-Efficient Funds through a full capital market cycle will be very competitive on a pretax basis and superior on an after-tax basis.
Before we discuss our investment strategy and each fund’s performance, we would like to summarize the principles that guide our management of the funds.
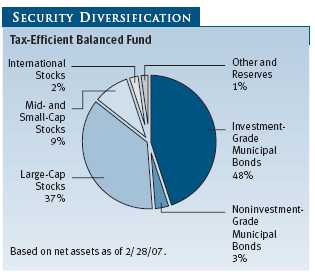
• The Tax-Efficient Funds invest in stocks of growth companies that have strong prospects and are market leaders within their niches. Tax-Efficient Balanced and Tax-Efficient Growth invest primarily in large-cap growth stocks (the former also purchases municipal bonds), and Tax-Efficient Multi-Cap Growth emphasizes small- and mid-cap growth companies. Consequently, we have less cyclical and commodity exposure than other funds.
• Our objective is to produce the best after-tax returns. To minimize capital gain distributions, we plan to own our companies for a long time, so we focus on those with strong, sustainable market positions and high returns on capital.
• We keep our cash position low and stay almost fully invested because we believe successful market timing is virtually impossible.
• Although we may make new purchases opportunistically, we will not trade opportunistically or rotate from one sector to another in an attempt to capture short-term outperformance.• We purchase stocks that meet our criteria even though it may be evident that time and patience will be required before an investment pays off. As a result, each fund’s short-term performance will frequently deviate, both positively and negatively, from that of competing funds focused on pretax returns.
• We prefer to let our winners run, and we try not to realize capital gains unless a company’s long-term outlook has deteriorated materially. In addition, we will sell investments that have declined and accumulate tax losses that can be used to offset future gains that would otherwise be taxable.
CHARACTERISTICS OF THE FUNDS
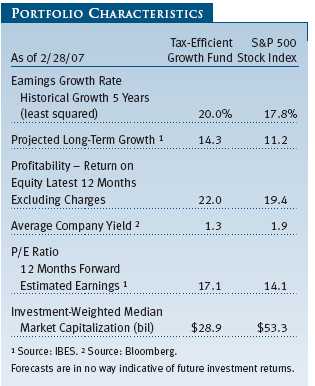
We structure and manage the Tax-Efficient Balanced Fund’s equity portfolio and the Tax-Efficient Growth Fund so that they are more growth oriented than the S&P 500 Index. As you can see in the Portfolio Characteristics tables on page 9 and on page 12, our large-cap equity portfolios have higher price/earnings (P/E) ratios and projected long-term growth rates than the S&P 500, as well as lower dividend yields. The tables also show that each large-cap portfolio’s return on equity (ROE) materially exceeds the S&P 500’s 19.4% ROE. A high and sustainable ROE is one of the most important characteristics we consider when researching potential investments and reviewing our current holdings. Our intention is to maintain portfolios of quality companies with strong profitability that should mostly keep up with the broad market when stocks are rising and hold up better than the market during more difficult periods for equities.
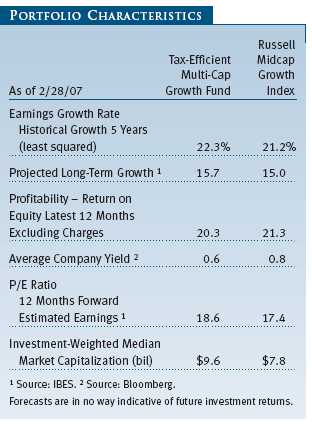
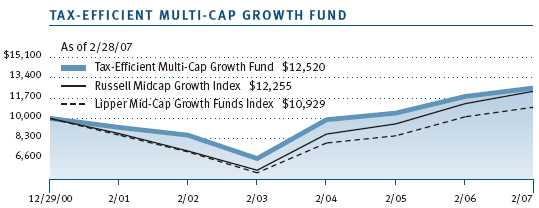
The Tax-Efficient Multi-Cap Growth Fund, as shown in the table on page 15, has characteristics that are comparable to those of the Russell Midcap Growth Index, such as its projected and historical earnings growth rate and dividend yield. The fund’s 18.6 P/E ratio is a bit higher than the benchmark’s 17.4 P/E; its 20.3% ROE, while lower than the index’s 21.3% ROE, is still very high. (The Russell index’s higher ROE reflects its greater exposure to cyclical companies with near-peak profitability, which is unlikely to last as the economic expansion matures.) The fund’s investment-weighted median market capitalization is about $9.6 billion, which is modestly bigger than the benchmark’s $7.8 billion market cap as of February 28. Unlike most small- and mid-cap portfolios, however, this fund is managed to be tax-efficient, and we do not sell successful investments when their market capitalizations become too large. As many of the fund’s holdings grow, hopefully, into bigger companies over time, we will maintain our mid-cap orientation by directing new purchases to mid- and small-cap companies. At the end of our fiscal year, the fund was well diversified across approximately 280 companies (compared with about 130 for the Tax-Efficient Growth Fund). This broad diversification reflects the fact that smaller companies are earlier in their life cycles than larger ones, and therefore a higher failure rate should be expected. We will eliminate those that falter and reinvest the proceeds into companies that appear to have better long-term prospects.
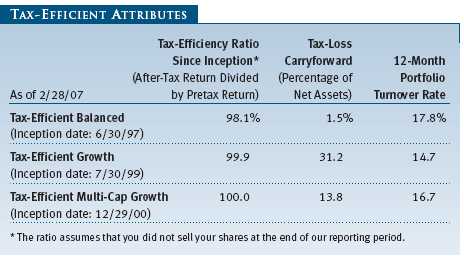
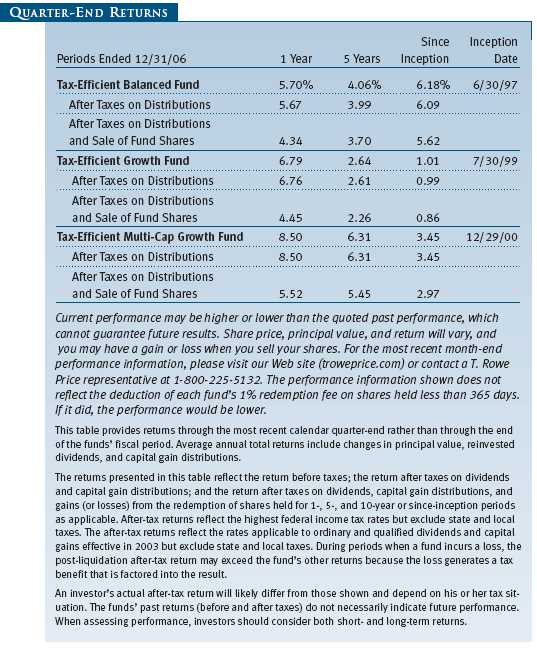
The Tax-Efficient Attributes table shows each fund’s tax-efficiency ratio, which is calculated by dividing each fund’s after-tax return by its pretax return for the period from its inception through February 28, 2007. The Tax-Efficient Multi-Cap Growth Fund’s 100% tax-efficiency ratio indicates that the fund has made no taxable dividend or capital gain distributions since its inception. Tax-Efficient Balanced and Tax-Efficient Growth have made small distributions of taxable dividends since their inception, but no capital gain distributions, and their tax-efficiency ratios remain very close to 100%. Given each fund’s high degree of tax efficiency, the performance of each fund versus its benchmarks and tax-blind portfolios looks better on an after-tax basis than on a pretax basis.
The table also shows the value of each fund’s tax capital loss carryforward (as a percentage of net assets) accumulated through the end of our fiscal year. We can use these losses in the future to offset capital gains that each fund may realize so they are not passed on to shareholders. In addition, the table shows each fund’s turnover in percentage terms for the last 12 months. These turnover rates are substantially lower than those of other funds investing in growth companies and are evidence of our buy-and-hold strategy and our focus on longer-term fundamentals. In fact, these turnover rates suggest that each fund’s average holding period for a given security is more than five years. For frame of reference, in the one-year period ended February 28, the typical large-cap growth portfolio had a 100% turnover rate, while the average mid-cap growth portfolio’s turnover rate was 110%. (Source: Morningstar Principia.)PORTFOLIO ACTIONS
The health care sector has been one of the worst-performing sectors over the last five years. Accordingly, we continue to find many attractively valued growth companies with terrific longer-term prospects in that sector. One example is pharmacy benefits manager Medco Health Solutions. We purchased additional shares for the Growth and Multi-Cap Growth Funds and established a position in Tax-Efficient Balanced in the last six months. Another example is biotechnology firm Celgene. We increased our exposure in Tax-Efficient Multi-Cap Growth and established new positions in the Balanced and Growth portfolios. In addition, we added European drug giant Novartis to our large-cap growth portfolios and purchased additional shares of Merck and biotech company Gilead Sciences. For the Multi-Cap Growth Fund, new health care holdings included Hologic, which makes medical imaging systems, and managed care companies CIGNA and Health Net. (Please refer to each fund’s portfolio of investments for a complete listing of holdings and the amount each represents in the portfolio.)
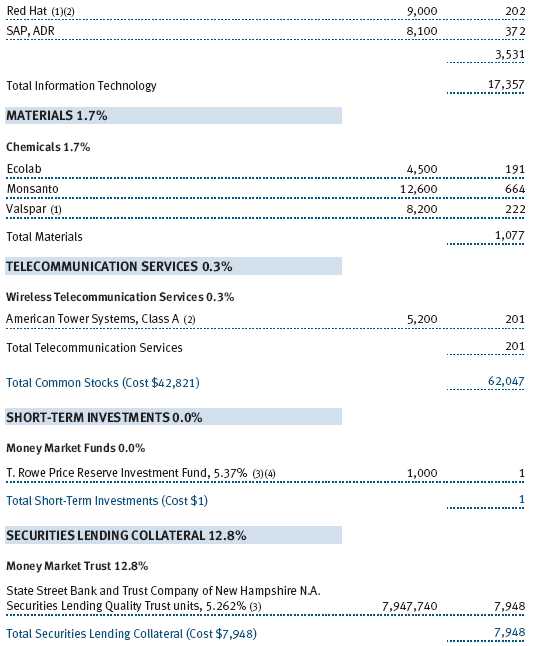
The information technology sector, which also has lagged many sectors in recent years, featured a variety of companies with excellent long-term growth potential as well as reasonable valuations. One new holding for all three portfolios was software company Autodesk. Also, we added Linux software company Red Hat to the large-cap portfolios and purchased additional shares for Tax-Efficient Multi-Cap Growth. In addition, we bought more shares of payroll processing company Paychex for Tax-Efficient Growth and Tax-Efficient Multi-Cap Growth. For the former, we also increased exposure to technology bellwethers Intel and Microsoft; for the latter, we purchased more shares of sound system maker Dolby Laboratories and electronics design company Jabil Circuit.
Stocks in the financials sector continued to represent good long-term investments, and we selectively purchased shares of several companies for our portfolios. Capital markets companies have excellent long-term prospects and a good risk/return tradeoff, so we added Swiss asset manager UBS to the Tax-Efficient Balanced Fund and purchased additional shares for Tax-Efficient Growth. We also bought additional shares of Blackrock for Tax-Efficient Growth and Lazard for Tax-Efficient Multi-Cap Growth. Several companies that own various futures exchanges also have excellent long-term prospects and business models, so we added IntercontinentalExchange and Nymex Holdings, the parent company of the New York Mercantile Exchange, to all three portfolios.
TAX-EFFICIENT BALANCED FUND
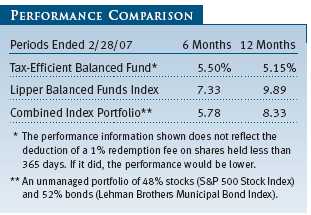
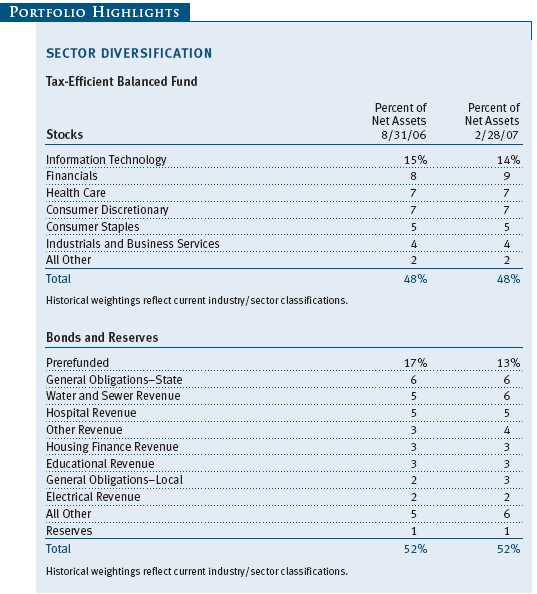
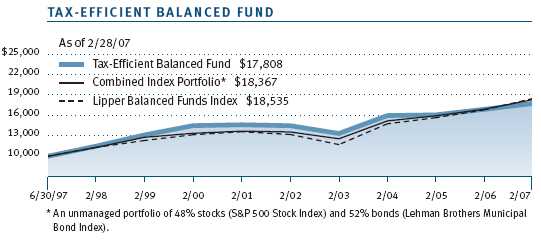
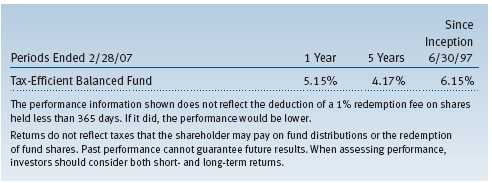
Your fund returned 5.50% in the second half of our fiscal year and 5.15% in the 12-month period ended February 28, 2007. The fund lagged the Lipper Balanced Funds Index in both periods, as shown in the table, primarily because it is more conservative than other balanced funds with greater exposure to equities. The fund also trailed a hypothetical portfolio that is 48% S&P 500 Index and 52% municipal bonds in both periods, but our performance disadvantage in the last six months was narrow. Since the end of August, our quality growth-oriented equity portfolio mostly kept pace with the S&P 500, which is a blend of growth and value stocks, and our municipal bond portfolio fared about the same as the Lehman Brothers Municipal Bond Index.
Equity Portfolio
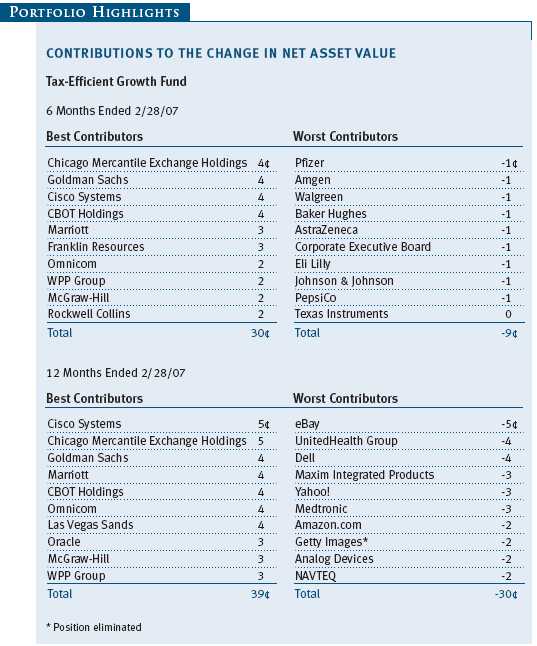
In the second half of our fiscal year, the performance of the fund’s equity portfolio (which we structure and manage like the Tax-Efficient Growth Fund) was good relative to other large-cap growth portfolios. It was helped by our underweighting of the energy sector, which cooled as oil prices fell from last summer’s peak. Our exposure to energy stocks does not represent a “play” on commodity prices. We seek differentiated service companies or exploration companies with good production growth because we believe they are better long-term investments than companies that are highly leveraged to the price of oil. Stock selection among financials also helped our results, especially Chicago Mercantile Exchange Holdings. Capital markets companies, such as Eaton Vance, also worked in our favor. Such companies were lifted by favorable market conditions in the last six months.
On the other hand, stock selection among consumer discretionary companies detracted somewhat from our results. Casino stocks performed well, helped by excellent industry fundamentals, brisk expansion of gaming in the Chinese city of Macau, and leveraged buyout activity. However, not owning MGM Mirage limited our gains. In addition, poor performance of for-profit education provider Apollo Group and Choice Hotels International worked against us. Stock selection among information technology companies was also disadvantageous. Not owning momentum stocks such as Apple Computer, which is in the midst of a product cycle, and Google limited our performance. In addition, shares of PC maker Dell languished as the company struggled with some earnings weakness and an SEC accounting investigation. The performance of the fund’s equity portfolio was mostly consistent with that of the S&P 500. It was helped by strength in our financials stocks, by underweighting the energy sector, and by overweighting consumer discretionary names. These advantages were eroded, however, by our lack of exposure to the utilities and telecommunication services sectors, which have very few businesses that meet our growth criteria.
For the one-year period ended February 28, 2007, the fund’s equity portfolio outperformed the typical large-cap growth portfolio, as measured by the Lipper Large-Cap Growth Funds Index, thanks to favorable stock selection in several sectors, including financials (Chicago Mercantile Exchange Holdings), health care (Abbott Labs, Merck, and Johnson & Johnson), and consumer staples (Avon and Colgate-Palmolive). On the downside, chemical companies Ecolab and Valspar lagged other materials companies with more robust short-term returns. Although we do not own many materials companies, our approach to the sector is to focus on differentiated businesses—specifically, companies that improve upon an underlying commodity and are less susceptible to commodity price swings. Like many other growth stock managers, the equity portfolio underperformed the S&P 500 Index over the last year. Relative to the S&P 500, the fund’s equity portfolio lagged because of relatively weak stock selection in the information technology, health care, and consumer discretionary sectors. Overweighting technology, which lagged over the last year, also detracted from our results, but our holdings in the financials sector performed well.
Municipal Bond Portfolio
New municipal issuance in 2006 totaled more than $383 billion, slightly less than the record $408 billion in the previous year, according to The Bond Buyer, but the second-highest annual issuance ever. Fourth-quarter supply was much stronger than expected, as municipalities took advantage of falling long-term interest rates in the second half of last year, and issuance remained strong in the first two months of the new year. Nevertheless, demand for tax-free securities from traditional investors (such as mutual funds and individual investors) and from nontraditional investors (including hedge funds and foreign buyers) has been supportive, credit conditions have remained favorable, and the fiscal health of municipalities is still very encouraging. The credit cycle could be approaching a near-term peak, however, if the economy cools significantly.
Long-term municipals outperformed shorter-term issues in the last six months, as they have throughout our fiscal year, and our emphasis on long-term securities was a major reason for the bond portfolio’s favorable performance in the last six months. Our exposure to lower-rated municipal bonds was also beneficial. High-yield securities maintained their performance advantage as investors seeking higher returns continued to embrace risk, despite the diminishing yield advantage provided by high-yield over investment-grade securities. However, the magnitude of their outperformance has been dwindling as lower-quality bond valuations reach more expensive levels.
Activity in the bond portfolio was fairly quiet in the last six months, which is not unusual given the fund’s tax-efficient mandate, but we did shift some assets from securities maturing in three years to municipals with 10-year maturities. We believe longer-term tax-free bonds could continue to outperform shorter maturities if the economy continues to decelerate and if inflation pressures do not force the Fed to raise short-term rates again. In addition, as the difference, or the “spread,” between high- and low-quality municipal bond yields narrowed, we selectively purchased some lower-quality issues whose valuations justified the additional credit risk. Most of our transactions involved investment-grade bonds, however. We are increasingly favoring high-quality securities over high-yield issues because of current valuations and the potential for increased risk aversion.
TAX-EFFICIENT GROWTH FUND
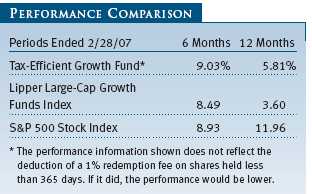
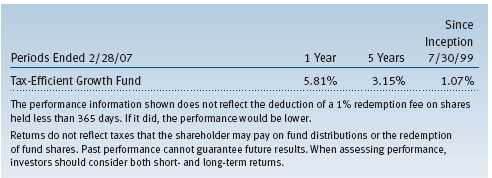
Your fund returned 9.03% in the second half of our fiscal year and 5.81% for the 12-month period ended February 28, 2007. As shown in the Performance Comparison table, the fund fared better than the Lipper Large-Cap Growth Funds Index and the S&P 500 Index, which is a blend of growth and value stocks, in the last six months. The fund also surpassed the Lipper benchmark in the one-year period but lagged the S&P 500, as value stocks had a strong performance advantage over growth during that period.
We believe it is best to evaluate our relative results over longer periods because of our steady buy-and-hold approach and long-term investment horizon. For the period from the fund’s inception on July 30, 1999, through February 28, 2007, Lipper placed the fund in the top 23% of its large-cap growth funds universe. (Based on cumulative total return, Lipper ranked the Tax-Efficient Growth Fund 214 out of 729, 271 out of 514, and 80 out of 350 funds for the one-year, five-year, and since-inception periods ended February 28, 2007, respectively. Past performance cannot guarantee future results.)What was true for the equity portion of the Tax-Efficient Balanced Fund was generally true for the Tax-Efficient Growth Fund, as both equity portfolios are structured and managed in a similar fashion. In the last six months, fund performance relative to other large-cap growth portfolios (as measured by the Lipper Large-Cap Growth Funds Index) was helped by our underweighting of the energy sector, which lagged as oil prices fell from last summer’s peak. Stock selection among financials also helped our results, especially Chicago Mercantile Exchange Holdings.
On the other hand, poor performance of Choice Hotels International in the consumer discretionary sector and not owning MGM Mirage and Wynn Resorts, which produced strong short-term returns, limited our gains. Lackluster performance of Valspar in an otherwise robust materials sector also worked against us. Our approach to the sector is to focus on differentiated businesses—specifically, companies that improve upon an underlying commodity and are less susceptible to commodity price swings.
Relative to the S&P 500, fund performance was helped by owning futures exchanges, overweighting the consumer discretionary sector, and good performance of Marriott and Tiffany. In contrast, overweighting health care, which lagged, and weak stock selection among pharmaceutical companies eroded our performance advantage. Stock selection and our underweighting of materials companies also detracted from our results.
For the one-year period ended February 28, 2007, the fund outperformed other large-cap growth portfolios because of favorable stock selection in the financials sector and in the lagging health care sector, especially pharmaceutical companies Merck, Johnson & Johnson, Abbott Labs, and AstraZeneca. Overweighting consumer staples and good performance of Sysco, CVS, Colgate-Palmolive, and Avon also worked in our favor.
On the other hand, poor performance of our holdings in the information technology sector, which we overweighted and which lagged over the last year, was disadvantageous. Sluggishness in shares of Dell and avoiding momentum stocks Apple Computer and Google limited our potential gains. Relative to the S&P 500, overweighting the long-lagging technology sector also hurt our results, and our bias toward quality Internet companies eBay and Yahoo! and semiconductor companies Maxim Integrated Products and Linear Technology was not rewarded. The health care sector also trailed other areas, and overweighting the sector plus poor performance of Medtronic, UnitedHealth Group, and biotechnology giant Amgen greatly detracted from our results. Low exposure to large-cap telecommunication services companies, which performed well over the last year but which do not typically meet our growth criteria, also limited our gains. On the plus side, strong stock selection among financials helped our relative results.
At the end of February, we were overweighted in the information technology, financials, and consumer staples sectors relative to other large-cap growth investors. We continue to believe that these sectors offer some of the best growth companies with strong franchises and attractive valuations.
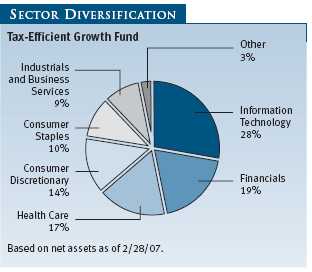
Relative to the S&P 500 Index, we emphasized traditional growth sectors—technology, consumer discretionary, and health care—but underweighted the financials, industrials and business services, energy, and materials sectors. We owned no utilities and only one telecommunication services security (wireless tower company American Tower Systems) at the end of our reporting period because companies with good growth prospects and high, sustainable returns on equity are not usually found in these areas.
TAX-EFFICIENT MULTI-CAP GROWTH FUND
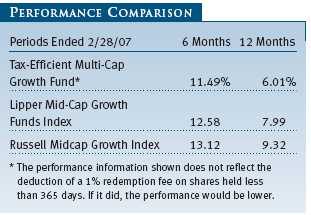
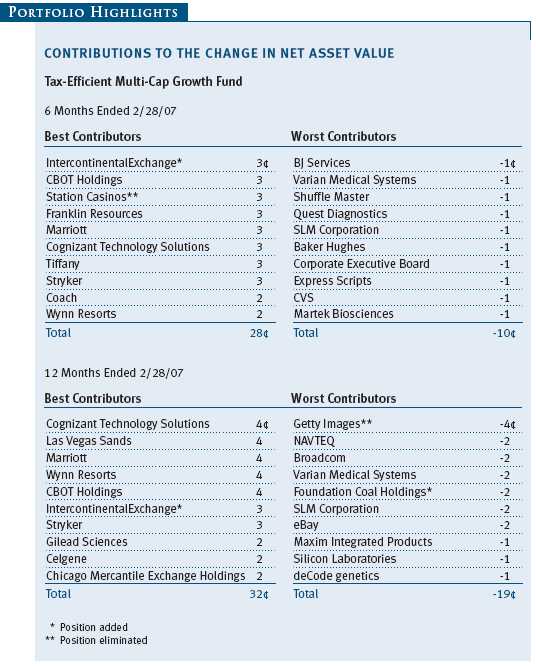
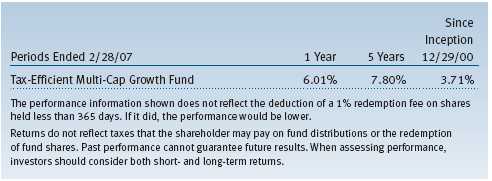
Your fund produced a strong return of 11.49% in the second half of our fiscal year and a milder 6.01% for the 12-month period ended February 28, 2007. As shown in the Performance Comparison table, the fund lagged its benchmarks in both periods. Our bias toward higher-quality companies limited our gains in the last six months because lower-quality businesses fared better in an increasingly speculative environment, but the margin of underperformance narrowed as growth stocks demonstrated improving performance.
We believe it is best to evaluate our relative results over longer periods because of our steady buy-and-hold approach and long-term investment horizon. For the period from the fund’s inception on December 29, 2000, through February 28, 2007, which was a very challenging period for growth investors relative to other investment styles, Lipper placed the fund in the top 30% of its mid-cap growth funds universe. (Based on cumulative total return, Lipper ranked the Tax-Efficient Multi-Cap Growth Fund 287 out of 624, 213 out of 394, and 100 out of 333 funds for the one-year, five-year, and since-inception periods ended February 28, 2007, respectively. Past performance cannot guarantee future results.)
In the second half of our fiscal year, the fund lagged its benchmarks due to poor performance of our holdings in an otherwise robust materials sector, namely chemical companies Valspar and Symyx Technologies. Our approach to the sector is to focus on differentiated businesses—specifically, companies that improve upon an underlying commodity and are less susceptible to commodity price swings and operating margin pressures—and we do not attempt to forecast the direction of commodity prices. Relatively weak performance of our industrials and business services holdings, such as Corporate Executive Board, which provides services to corporate executives to help them manage their businesses, and logistics company Landstar Systems also worked against us. We are underweighting this cyclical sector because many stock valuations are expensive following several years of robust performance, and we believe there are better long-term investment opportunities elsewhere.
On the plus side, good stock selection in the information technology sector aided our results. Owning Xilinx and avoiding semiconductor companies with poor share price performance was advantageous, as was owning Chinese Internet company Baidu.com and not holding poor-performing computer and peripheral companies. We tend to avoid such companies because they have a high risk of commoditization. Underweighting the energy sector as oil prices fell also helped our results. We believe differentiated service companies and exploration companies with good production growth are better long-term investments than companies that are highly leveraged to the price of oil.
For the 12-month period ended February 28, fund performance relative to our benchmarks was hurt by underweighting the energy and materials sectors and by below-average performance of our holdings in those sectors. Underweighting the telecommunications sector relative to competing portfolios and overweighting the health care sector also worked against us. On the other hand, good stock selection among information technology stocks, especially software companies, was advantageous.
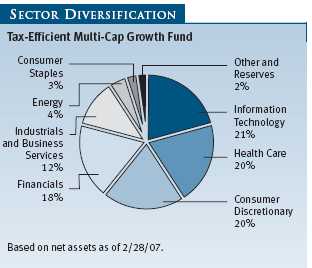
At the end of February, we were substantially overweighted in the health care and financials sectors relative to competing portfolios and to the Russell Midcap Growth Index. We still believe these sectors offer some of the best mid-cap growth opportunities for long-term investors. We also overweighted technology versus the Russell index but materially underweighted the energy sector relative to both benchmarks. We own very few utilities, materials, and telecommunication services businesses because mid-cap companies with good growth prospects and high, sustainable returns on equity are not usually found in these areas.
OUTLOOK
The economy appears to be in the middle of a “soft landing”—a period of below-average growth during an economic expansion that reduces inflation pressures but does not result in a recession. Some recent economic data have been weaker than expected, and the cooling of the housing market, despite some tentative signs of stabilizing, as well as concerns about subprime mortgage lending may continue to have ripple effects throughout the economy and the bond market.
Despite the recent turmoil in the capital markets, macroeconomic fundamentals currently appear to be favorable. Corporate profit growth is slowing but remains sturdy, energy costs have fallen substantially from their peaks, and interest rates, though not as low as they were a few years ago, remain supportive. These factors should bode well for equities in the near term, though our investment horizon is much longer.
Over the last several years, value stocks have dominated growth, higher-yielding stocks have generated extraordinary relative returns, international indexes have trounced domestic benchmarks, and higher-quality companies have lagged materially. We forecast mean reversion regarding these performance patterns. The timing is impossible to forecast, but investors should always incorporate the level of risk assumed when assessing the prospect of anticipated returns.The speculative activity we discussed earlier will eventually end. History suggests that the longer it lasts, the more abrupt the transition back to more rational investment behavior and returns that are more consistent with long-term averages. Our strategies are steady and should provide much better capital preservation during tougher market environments than more aggressive and speculative alternatives.
Our outlook has not changed in the last six months. As the economic expansion matures and long-term investors become more mindful of risks, we believe they are more likely to focus increasingly on the types of investments that we favor: stocks of high-quality companies with solid fundamentals, including the ability to grow their earnings at a strong or steady pace, even in tougher economic conditions. We will maintain our long-term focus when seeking and analyzing current and prospective investments for the funds, and we remain committed to maintaining each portfolio’s high degree of tax efficiency with a strategy that we believe will serve taxable investors well over the long run: keep our winners indefinitely, eliminate stocks of companies with faltering fundamentals, reinvest sale proceeds in businesses with better long-term prospects, and use the tax losses that we accumulate to offset taxable capital gains.
One factor that should remain supportive of municipal bonds at current levels is the municipal yield curve’s positive slope (that is, the longest maturities still have higher yields than shorter maturities). Another is that demand for municipals is likely to remain steady, even though issuance in 2007 could be robust as municipalities continue to tap the credit markets to meet ongoing capital needs, including funding for post-employment benefits. As always, we will continue to rely upon our proprietary research to uncover the best credit opportunities and selectively invest in attractive income-producing investments that can be held for long periods.
Thank you for your continuing confidence in our investment management abilities.Respectfully submitted,
Donald J. Peters
Cochairman of the Investment Advisory Committee,
Tax-Efficient Balanced Fund
Chairman of the Investment Advisory Committee,
Tax-Efficient Growth and Tax-Efficient Multi-Cap Growth Funds

Hugh D. McGuirk
Cochairman of the Investment Advisory Committee,
Tax-Efficient Balanced Fund
March 19, 2007
The committee chairmen have day-to-day responsibility for managing the portfolios and work with committee members in developing and executing the funds’ investment programs.
RISKS OF STOCK INVESTINGThe stock market as a whole can decline for many reasons, including adverse political or economic developments here or abroad, changes in investor psychology, or heavy institutional selling. The prospects for an industry or company may deteriorate because of a variety of factors, including disappointing earnings or changes in the competitive environment. In addition, our assessment of companies held in the funds may prove incorrect, resulting in losses or poor performance even in a rising market.
Growth stocks can be volatile for several reasons. Since growth companies usually reinvest a high proportion of their earnings in their own businesses, they may lack the dividends often associated with value stocks that could cushion their decline in a falling market. Also, since investors buy growth stocks because of their expected superior earnings growth, earnings disappointments often result in sharp price declines.
The stocks of mid-cap companies entail greater risk and are usually more volatile than the shares of large companies. Investing in small companies also involves greater risk than is customarily associated with larger companies. Stocks of small companies are subject to more abrupt or erratic price movements than larger company stocks. Small companies often have limited product lines, markets, or financial resources, and their managements may lack depth and experience. Such companies seldom pay significant dividends that could cushion returns in a falling market.
Technology stocks are particularly volatile and subject to greater price swings, up and down, than the broad market. It is possible that companies whose products and services first appear promising may not succeed over the long term; they may succumb to intense competition or could quickly become obsolete in a rapidly developing marketplace. Earnings projections for developing companies that are not met can result in sharp price declines. This is true even in a generally rising stock market environment.
RISKS OF BOND INVESTING (TAX-EFFICIENT BALANCED FUND)
Like all bonds, municipal bonds have two main sources of risk: interest rate and credit risk. Interest rate risk is the decline in bond prices that usually accompanies a rise in interest rates. Longer-maturity bonds typically suffer greater declines than those with shorter-term maturities. Credit risk is the chance that any fund holding could have its credit rating downgraded, or that a bond issuer will default (fail to make timely payments of interest or principal), potentially reducing the fund’s income level and share price. To the extent that we invest in junk bonds, credit risk will be higher since their issuers are more vulnerable to financial setbacks and recession than more creditworthy companies.
Municipal bonds are also subject to the possibility that tax reform or lower overall taxes may reduce their value or that individual issuers will be unable to meet their obligations due to problems in that state or locality.
GLOSSARYAverage company yield: Investment-weighted average yield of the underlying company yields. Individual company yields are calculated by dividing the estimated annual dividends per share by the current price.
Combined index portfolio: An unmanaged portfolio of 48% stocks (S&P 500 Stock Index) and 52% bonds (Lehman Brothers Municipal Bond Index).
Earnings growth rate: Measures the annualized percent change in earnings per share for a given time period.
Fed funds target rate: An overnight lending rate set by the Federal Reserve and used by banks to meet reserve requirements. Banks also use the fed funds rate as a benchmark for their prime lending rates.
Historical growth five years (least squared): Least squared growth calculation attempts to find the “normal” growth rate given a stream of historical growth rates. It searches for the growth rate that best fits the line produced by a stream of growth numbers.
Investment-weighted median market capitalization: The investment-weighted midpoint market capitalization (shares outstanding x current price) representing a typical security in a portfolio. An investment-weighted median represents the breakpoint where 50% of the values are above and 50% of the values are below based on portfolio weight.
Lehman Brothers Municipal Bond Index: An unmanaged index that tracks municipal debt instruments.
Lehman Brothers U.S. Aggregate Index: An unmanaged index that tracks domestic investment-grade bonds, including corporate, government, and mortgage-backed securities.
Lipper indices: Consist of a small number (10 to 30) of the largest mutual funds in a particular category as tracked by Lipper Inc.
Price/earnings (P/E) ratio: A ratio shows the “multiple” of earnings at which a stock is selling. It is calculated by dividing a stock’s current price by its current earnings per share. For example, if a stock’s price is $60 per share and the issuing company earns $2 per share, the P/E ratio is $60/$2, or 30.
Projected long-term growth (IBES): Long-term projected earnings per share growth rate based on IBES estimates.
Return on equity (ROE): Calculated by dividing a company’s net income by shareholders’ equity (i.e., the company’s book value), ROE measures how much a company earns on each dollar that common stock investors have put into that company. ROE indicates how effectively and efficiently a company and its management are using stockholder investments. Excluding charges refers to the earnings figure used in the calculation. It represents earnings before extraordinary items and discontinued operations.
Russell 1000 Index: Measures the performance of the 1,000 largest companies in the Russell 3000 Index.Russell 1000 Growth Index: Measures the performance of those Russell 1000 Index companies with higher price-to-book ratios and higher forecasted growth values.
Russell 1000 Value Index: Measures the performance of those Russell 1000 companies with lower price-to-book ratios and lower forecasted growth values.
Russell 2000 Index: Measures the performance of the 2,000 smallest companies in the Russell 3000 Index.
Russell 2000 Growth Index: Measures the performance of those Russell 2000 companies with higher price-to-book ratios and higher forecasted growth values.
Russell 2000 Value Index: Measures the performance of those Russell 2000 companies with lower price-to-book ratios and lower forecasted growth values.
Russell Midcap Index: Measures the performance of the 800 smallest companies in the Russell 1000 Index.
Russell Midcap Growth Index: Measures the performance of those Russell Midcap companies with higher price-to-book ratios and higher forecasted growth values. The stocks are also members of the Russell 1000 Growth Index.
Russell Midcap Value Index: Measures the performance of those Russell Midcap companies with lower price-to-book ratios and lower forecasted growth values. The stocks are also members of the Russell 1000 Value Index.
S&P 500 Stock Index: Tracks the stocks of 500 primarily large U.S. companies.
Yield curve: A graphic depiction of the relationship between yields and maturity dates for a set of similar securities, such as Treasuries or municipal securities. Yield curves typically slope upward, indicating that longer maturities offer higher yields. When the yield curve is flat, there is little or no difference between the yields offered by shorter-and longer-term securities.
| GROWTH OF $10,000 |
This chart shows the value of a hypothetical $10,000 investment in the fund over the past 10 fiscal year periods or since inception (for funds lacking 10-year records). The result is compared with benchmarks, which may include a broad-based market index and a peer group average or index. Market indexes do not include expenses, which are deducted from fund returns as well as mutual fund averages and indexes.
| AVERAGE ANNUAL COMPOUND TOTAL RETURN |
This table shows how the fund would have performed each year if its actual (or cumulative) returns for the periods shown had been earned at a constant rate.
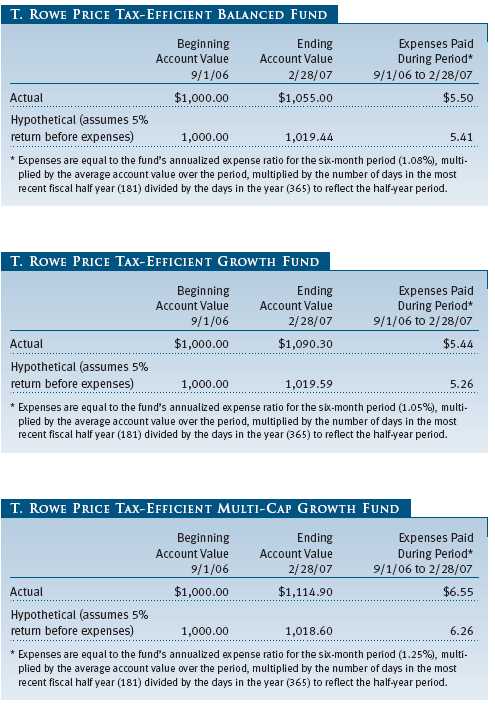
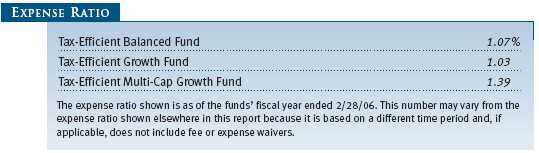
| FUND EXPENSE EXAMPLE |
As a mutual fund shareholder, you may incur two types of costs: (1) transaction costs, such as redemption fees or sales loads, and (2) ongoing costs, including management fees, distribution and service (12b-1) fees, and other fund expenses. The following example is intended to help you understand your ongoing costs (in dollars) of investing in the fund and to compare these costs with the ongoing costs of investing in other mutual funds. The example is based on an investment of $1,000 invested at the beginning of the most recent six-month period and held for the entire period.
Actual Expenses
The first line of the following table (“Actual”) provides information about actual account values and expenses based on the fund’s actual returns. You may use the information in this line, together with your account balance, to estimate the expenses that you paid over the period. Simply divide your account value by $1,000 (for example, an $8,600 account value divided by $1,000 = 8.6), then multiply the result by the number in the first line under the heading “Expenses Paid During Period” to estimate the expenses you paid on your account during this period.
Hypothetical Example for Comparison Purposes
The information on the second line of the table (“Hypothetical”) is based on hypothetical account values and expenses derived from the fund’s actual expense ratio and an assumed 5% per year rate of return before expenses (not the fund’s actual return). You may compare the ongoing costs of investing in the fund with other funds by contrasting this 5% hypothetical example and the 5% hypothetical examples that appear in the shareholder reports of the other funds. The hypothetical account values and expenses may not be used to estimate the actual ending account balance or expenses you paid for the period.
Note: T. Rowe Price charges an annual small-account maintenance fee of $10, generally for accounts with less than $2,000 ($500 for UGMA/UTMA). The fee is waived for any investor whose T. Rowe Price mutual fund accounts total $25,000 or more, accounts employing automatic investing, and IRAs and other retirement plan accounts that utilize a prototype plan sponsored by T. Rowe Price (although a separate custodial or administrative fee may apply to such accounts). This fee is not included in the accompanying table. If you are subject to the fee, keep it in mind when you are estimating the ongoing expenses of investing in the fund and when comparing the expenses of this fund with other funds.
You should also be aware that the expenses shown in the table highlight only your ongoing costs and do not reflect any transaction costs, such as redemption fees or sales loads. Therefore, the second line of the table is useful in comparing ongoing costs only and will not help you determine the relative total costs of owning different funds. To the extent a fund charges transaction costs, however, the total cost of owning that fund is higher.

The accompanying notes are an integral part of these financial statements.

The accompanying notes are an integral part of these financial statements.
The accompanying notes are an integral part of these financial statements.
The accompanying notes are an integral part of these financial statements.
The accompanying notes are an integral part of these financial statements.
| NOTES TO FINANCIAL STATEMENTS |
NOTE 1 - SIGNIFICANT ACCOUNTING POLICIES
T. Rowe Price Tax-Efficient Funds, Inc. (the corporation), is registered under the Investment Company Act of 1940 (the 1940 Act). The Tax Efficient Growth Fund (the fund), a diversified, open-end management investment company, is one portfolio established by the corporation. The fund commenced operations on July 30, 1999. The fund seeks to provide long-term capital growth on an after-tax basis.
The accompanying financial statements were prepared in accordance with accounting principles generally accepted in the United States of America, which require the use of estimates made by fund management. Fund management believes that estimates and security valuations are appropriate; however, actual results may differ from those estimates, and the security valuations reflected in the financial statements may differ from the value the fund ultimately realizes upon sale of the securities.
Valuation The fund values its investments and computes its net asset value per share at the close of the New York Stock Exchange (NYSE), normally 4 p.m. ET, each day that the NYSE is open for business. Equity securities listed or regularly traded on a securities exchange or in the over-the-counter (OTC) market are valued at the last quoted sale price or, for certain markets, the official closing price at the time the valuations are made, except for OTC Bulletin Board securities, which are valued at the mean of the latest bid and asked prices. A security that is listed or traded on more than one exchange is valued at the quotation on the exchange determined to be the primary market for such security. Listed securities not traded on a particular day are valued at the mean of the latest bid and asked prices for domestic securities and the last quoted sale price for international securities.
Investments in mutual funds are valued at the mutual fund’s closing net asset value per share on the day of valuation.
Other investments, including restricted securities, and those for which the above valuation procedures are inappropriate or are deemed not to reflect fair value are stated at fair value as determined in good faith by the T. Rowe Price Valuation Committee, established by the fund’s Board of Directors.
Credits The fund earns credits on temporarily uninvested cash balances at the custodian that reduce the fund’s custody charges. Custody expense in the accompanying financial statements is presented before reduction for credits.
Redemption Fees A 1% fee is assessed on redemptions of fund shares held less than 365 days to deter short-term trading and to protect the interests of long-term shareholders. Redemption fees are withheld from proceeds that shareholders receive from the sale or exchange of fund shares. The fees are paid to the fund, and are recorded as an increase to paid-in capital. The fees may cause the redemption price per share to differ from the net asset value per share.
Investment Transactions, Investment Income, and Distributions Income and expenses are recorded on the accrual basis. Dividends received from mutual fund investments are reflected as dividend income; capital gain distributions are reflected as realized gain/loss. Dividend income is recorded on the ex-dividend date. Investment transactions are accounted for on the trade date. Realized gains and losses are reported on the identified cost basis. Distributions to shareholders are recorded on the ex-dividend date. Income distributions are declared and paid on an annual basis. Capital gain distributions, if any, are declared and paid by the fund, typically on an annual basis.
New Accounting Pronouncements In June 2006, the Financial Accounting Standards Board (“FASB”) issued FASB Interpretation No. 48 (“FIN 48”), Accounting for Uncertainty in Income Taxes, a clarification of FASB Statement No. 109, Accounting for Income Taxes. FIN 48 establishes financial reporting rules regarding recognition and measurement of tax positions taken or expected to be taken on a tax return. Management is evaluating the anticipated impact, if any, that FIN 48 will have on the fund upon adoption, which, pursuant to a delay granted by the U.S. Securities and Exchange Commission, is expected to be on the last business day of the fund’s semi-annual period, August 31, 2007.
In September 2006, the FASB released the Statement of Financial Accounting Standard No. 157 (“FAS 157”), Fair Value Measurements. FAS 157 clarifies the definition of fair value and establishes the framework for measuring fair value, as well as proper disclosure of this methodology in the financial statements. It will be effective for the fund’s fiscal year beginning March 1, 2008. Management is evaluating the effects of FAS 157; however, it is not expected to have a material impact on the fund’s net assets or results of operations.
NOTE 2 - INVESTMENT TRANSACTIONS
Consistent with its investment objective, the fund engages in the following practices to manage exposure to certain risks or to enhance performance. The investment objective, policies, program, and risk factors of the fund are described more fully in the fund’s prospectus and Statement of Additional Information.
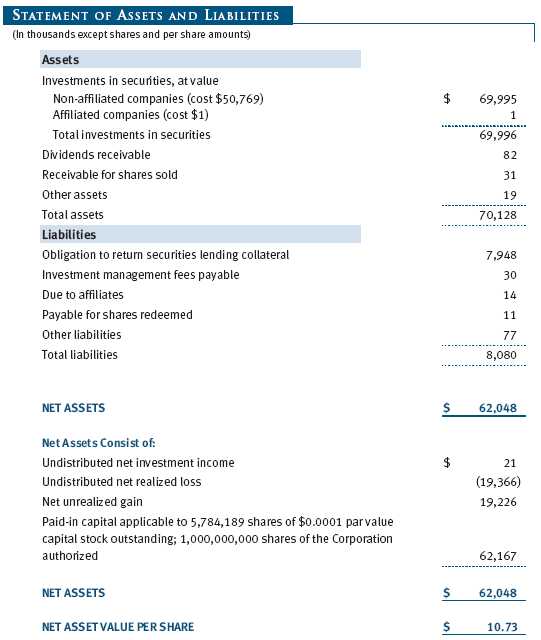
Securities Lending The fund lends its securities to approved brokers to earn additional income. It receives as collateral cash and U.S. government securities valued at 102% to 105% of the value of the securities on loan. Cash collateral is invested in a money market pooled trust managed by the fund’s lending agent in accordance with investment guidelines approved by fund management. Collateral is maintained over the life of the loan in an amount not less than the value of loaned securities, as determined at the close of fund business each day; any additional collateral required due to changes in security values is delivered to the fund the next business day. Although risk is mitigated by the collateral, the fund could experience a delay in recovering its securities and a possible loss of income or value if the borrower fails to return the securities. Securities lending revenue recognized by the fund consists of earnings on invested collateral and borrowing fees, net of any rebates to the borrower and compensation to the lending agent. At February 28, 2007, the value of loaned securities was $7,816,000; aggregate collateral consisted of $7,948,000 in the money market pooled trust.
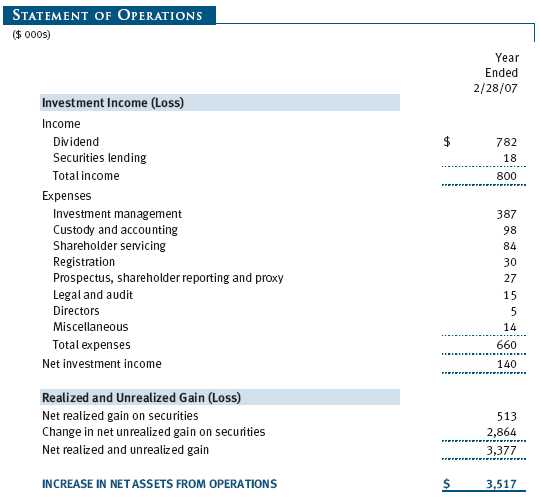
Other Purchases and sales of portfolio securities, other than short-term securities, aggregated $9,378,000 and $20,165,000, respectively, for the year ended February 28, 2007.
NOTE 3 - FEDERAL INCOME TAXES
No provision for federal income taxes is required since the fund intends to continue to qualify as a regulated investment company under Subchapter M of the Internal Revenue Code and distribute to shareholders all of its taxable income and gains. Federal income tax regulations differ from generally accepted accounting principles; therefore, distributions determined in accordance with tax regulations may differ significantly in amount or character from net investment income and realized gains for financial reporting purposes. Financial reporting records are adjusted for permanent book/tax differences to reflect tax character. Financial records are not adjusted for temporary differences.
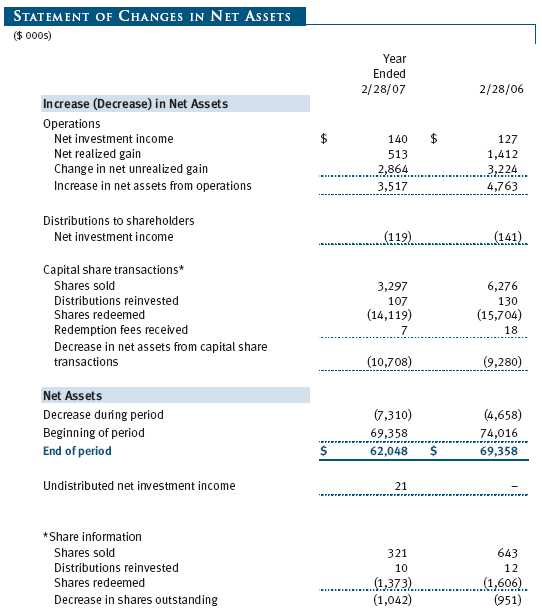
Distributions during the year ended February 28, 2007, totaled $119,000 and were characterized as ordinary income for tax purposes. At February 28, 2007, the tax-basis components of net assets were as follows:
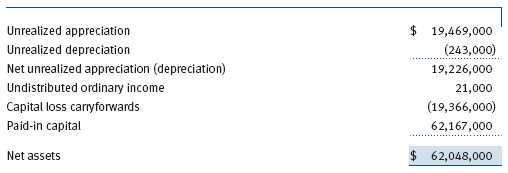
The fund intends to retain realized gains to the extent of available capital loss carryforwards. During the fiscal year ended February 28, 2007, the fund utilized $513,000 of capital loss carryfowards. As of February 28, 2007, the fund had $344,000 of capital loss carryfowards that expire in fiscal 2008, $4,794,000 that expire in fiscal 2009, $6,702,000 that expire in fiscal 2010, $3,838,000 that expire in fiscal 2011, $3,683,000 that expire in fiscal 2012, and $5,000 that expire in fiscal 2013.
At February 28, 2007, the cost of investments for federal income tax purposes was $50,770,000.
NOTE 4 - RELATED PARTY TRANSACTIONS
The fund is managed by T. Rowe Price Associates, Inc. (the manager or Price Associates), a wholly owned subsidiary of T. Rowe Price Group, Inc. The investment management agreement between the fund and the manager provides for an annual investment management fee, which is computed daily and paid monthly. The fee consists of an individual fund fee, equal to 0.30% of the fund’s average daily net assets, and a group fee. The group fee rate is calculated based on the combined net assets of certain mutual funds sponsored by Price Associates (the group) applied to a graduated fee schedule, with rates ranging from 0.48% for the first $1 billion of assets to 0.29% for assets in excess of $160 billion. The fund’s group fee is determined by applying the group fee rate to the fund’s average daily net assets. At February 28, 2007, the effective annual group fee rate was 0.31%.
In addition, the fund has entered into service agreements with Price Associates and two wholly owned subsidiaries of Price Associates (collectively, Price). Price Associates computes the daily share price and provides certain other administrative services to the fund. T. Rowe Price Services, Inc., provides shareholder and administrative services in its capacity as the fund’s transfer and dividend disbursing agent. T. Rowe Price Retirement Plan Services, Inc., provides subaccounting and recordkeeping services for certain retirement accounts invested in the fund. For the year ended February 28, 2007, expenses incurred pursuant to these service agreements were $72,000 for Price Associates, $68,000 for T. Rowe Price Services, Inc., and $0 for T. Rowe Price Retirement Plan Services, Inc. The total amount payable at period-end pursuant to these service agreements is reflected as Due to Affiliates in the accompanying financial statements.
The fund may invest in the T. Rowe Price Reserve Investment Fund and the T. Rowe Price Government Reserve Investment Fund (collectively, the T. Rowe Price Reserve Funds), open-end management investment companies managed by Price Associates and affiliates of the fund. The T. Rowe Price Reserve Funds are offered as cash management options to mutual funds, trusts, and other accounts managed by Price Associates and/or its affiliates, and are not available for direct purchase by members of the public. The T. Rowe Price Reserve Funds pay no investment management fees. During the year ended February 28, 2007, dividend income from the T. Rowe Price Reserve Funds totaled $2,000, and the value of shares of the T. Rowe Price Reserve Funds held at February 28, 2007, and February 28, 2006, was $1,000 and $1,000, respectively.
| REPORT OF INDEPENDENT REGISTERED PUBLIC ACCOUNTING FIRM |
To the Board of Directors of T. Rowe Price Tax-Efficient Funds, Inc. and Shareholders of T. Rowe Price Tax-Efficient Growth Fund
In our opinion, the accompanying statement of assets and liabilities, including the portfolio of investments, and the related statements of operations and of changes in net assets and the financial highlights present fairly, in all material respects, the financial position of T. Rowe Price Tax-Efficient Growth Fund (one of the portfolios comprising T. Rowe Price Tax-Efficient Funds, Inc., hereafter referred to as the “Fund”) at February 28, 2007, the results of its operations for the year then ended, the changes in its net assets for each of the two years in the period then ended and the financial highlights for each of the five years in the period then ended, in conformity with accounting principles generally accepted in the United States of America. These financial statements and financial highlights (hereafter referred to as “financial statements”) are the responsibility of the Fund’s management; our responsibility is to express an opinion on these financial sta tements based on our audits. We conducted our audits of these financial statements in accordance with the standards of the Public Company Accounting Oversight Board (United States). Those standards require that we plan and perform the audit to obtain reasonable assurance about whether the financial statements are free of material misstatement. An audit includes examining, on a test basis, evidence supporting the amounts and disclosures in the financial statements, assessing the accounting principles used and significant estimates made by management, and evaluating the overall financial statement presentation. We believe that our audits, which included confirmation of securities at February 28, 2007 by correspondence with the custodian and by agreement to the underlying ownership records for T. Rowe Price Reserve Investment Fund, provide a reasonable basis for our opinion.
PricewaterhouseCoopers LLP
Baltimore, Maryland
April 11, 2007
| TAX INFORMATION (UNAUDITED) FOR THE TAX YEAR ENDED 2/28/07 |
We are providing this information as required by the Internal Revenue Code. The amounts shown may differ from those elsewhere in this report because of differences between tax and financial reporting requirements.
For taxable non-corporate shareholders, $140,000 of the fund’s income represents qualified dividend income subject to the 15% rate category.
For corporate shareholders, $140,000 of the fund’s income qualifies for the dividends-received deduction.
| INFORMATION ON PROXY VOTING POLICIES, PROCEDURES, AND RECORDS |
A description of the policies and procedures used by T. Rowe Price funds and portfolios to determine how to vote proxies relating to portfolio securities is available in each fund’s Statement of Additional Information, which you may request by calling 1-800-225-5132 or by accessing the SEC’s Web site, www.sec.gov. The description of our proxy voting policies and procedures is also available on our Web site, www.troweprice.com. To access it, click on the words “Company Info” at the top of our homepage for individual investors. Then, in the window that appears, click on the “Proxy Voting Policy” navigation button in the top left corner.
Each fund’s most recent annual proxy voting record is available on our Web site and through the SEC’s Web site. To access it through our Web site, follow the directions above, then click on the words “Proxy Voting Record” at the bottom of the Proxy Voting Policy page.
| HOW TO OBTAIN QUARTERLY PORTFOLIO HOLDINGS |
The fund files a complete schedule of portfolio holdings with the Securities and Exchange Commission for the first and third quarters of each fiscal year on Form N-Q. The fund’s Form N-Q is available electronically on the SEC’s Web site (www.sec.gov); hard copies may be reviewed and copied at the SEC’s Public Reference Room, 450 Fifth St. N.W., Washington, DC 20549. For more information on the Public Reference Room, call 1-800-SEC-0330.
| ABOUT THE FUND’S DIRECTORS AND OFFICERS |
Your fund is governed by a Board of Directors that meets regularly to review a wide variety of matters affecting the fund, including performance, investment programs, compliance matters, advisory fees and expenses, service providers, and other business affairs. The Board of Directors elects the fund’s officers, who are listed in the final table. At least 75% of Board members are independent of T. Rowe Price Associates, Inc. (T. Rowe Price), and T. Rowe Price International, Inc. (T. Rowe Price International); “inside” or “interested” directors are employees or officers of T. Rowe Price. The business address of each director and officer is 100 East Pratt Street, Baltimore, Maryland 21202. The Statement of Additional Information includes additional information about the fund directors and is available without charge by calling a T. Rowe Price representative at 1-800-225-5132.
| Independent Directors | |
| Name | |
| (Year of Birth) | Principal Occupation(s) During Past 5 Years |
| Year Elected* | and Directorships of Other Public Companies |
| Jeremiah E. Casey | Director, Allfirst Financial Inc. (previously First Maryland Bankcorp) |
| (1940) | (1983 to 2002); Director, National Life Insurance (2001 to 2005); |
| 2005 | Director, The Rouse Company, real estate developers (1990 to 2004) |
| Anthony W. Deering | Chairman, Exeter Capital, LLC, a private investment firm (2004 to |
| (1945) | present); Director, Vornado Real Estate Investment Trust (3/04 to |
| 2001 | present); Director, Mercantile Bankshares (4/03 to present); Member, |
| Advisory Board, Deutsche Bank North America (2004 to present); | |
| Director, Chairman of the Board, and Chief Executive Officer, The | |
| Rouse Company, real estate developers (1997 to 2004) | |
| Donald W. Dick, Jr. | Principal, EuroCapital Advisors, LLC, an acquisition and management |
| (1943) | advisory firm; Chairman, The Haven Group, a custom manufacturer of |
| 1997 | modular homes (1/04 to present) |
| David K. Fagin | Chairman and President, Nye Corporation (6/88 to present); Director, |
| (1938) | Canyon Resources Corp. (5/00 to present); Director, Golden Star |
| 1997 | Resources Ltd. (5/92 to present); Director, Pacific Rim Mining Corp. |
| (2/02 to present) | |
| Karen N. Horn | Director, Federal National Mortgage Association (9/06 to present); |
| (1943) | Managing Director and President, Global Private Client Services, Marsh |
| 2003 | Inc. (1999 to 2003); Managing Director and Head of International |
| Private Banking, Bankers Trust (1996 to 1999); Director, Georgia Pacific | |
| (5/04 to 12/05), Eli Lilly and Company, and Simon Property Group | |
| Theo C. Rodgers | President, A&R Development Corporation (1977 to present) |
| (1941) | |
| 2005 | |
| John G. Schreiber | Owner/President, Centaur Capital Partners, Inc., a real estate invest- |
| (1946) | ment company; Partner, Blackstone Real Estate Advisors, L.P. |
| 2001 | |
| * Each independent director oversees 118 T. Rowe Price portfolios and serves until retirement, resignation, or |
| election of a successor. |
| Inside Directors | |
| Name | |
| (Year of Birth) | |
| Year Elected* | |
| [Number of T. Rowe Price | Principal Occupation(s) During Past 5 Years |
| Portfolios Overseen] | and Directorships of Other Public Companies |
| Edward C. Bernard | Director and Vice President, T. Rowe Price and T. Rowe Price Group, |
| (1956) | Inc.; Chairman of the Board, Director, and President, T. Rowe Price |
| 2006 | Investment Services, Inc.; Chairman of the Board and Director, |
| [118] | T. Rowe Price Retirement Plan Services, Inc., T. Rowe Price Services, |
| Inc., and T. Rowe Price Savings Bank; Director, T. Rowe Price Global | |
| Asset Management Limited, T. Rowe Price Global Investment Services | |
| Limited, and T. Rowe Price International, Inc.; Chief Executive Officer, | |
| Chairman of the Board, Director, and President, T. Rowe Price Trust | |
| Company; Chairman of the Board, all funds | |
| Brian Rogers, CFA, CIC | Chief Investment Officer, Director, and Vice President, T. Rowe Price |
| (1955) | and T. Rowe Price Group, Inc.; Vice President, T. Rowe Price Trust |
| 2006 | Company |
| [65] | |
| * Each inside director serves until retirement, resignation, or election of a successor. | |
| Officers | |
| Name (Year of Birth) | |
| Title and Fund(s) Served | Principal Occupation(s) |
| Joseph A. Carrier, CPA (1960) | Vice President, T. Rowe Price, T. Rowe Price |
| Treasurer, Tax-Efficient Funds | Group, Inc., T. Rowe Price Investment Services, |
| Inc., and T. Rowe Price Trust Company | |
| Donald J. Easley, CFA (1971) | Vice President, T. Rowe Price and T. Rowe Price |
| Vice President, Tax-Efficient Funds | Group, Inc. |
| Roger L. Fiery III, CPA (1959) | Vice President, T. Rowe Price, T. Rowe Price |
| Vice President, Tax-Efficient Funds | Group, Inc., T. Rowe Price International, Inc., |
| and T. Rowe Price Trust Company | |
| John R. Gilner (1961) | Chief Compliance Officer and Vice President, |
| Chief Compliance Officer, Tax-Efficient Funds | T. Rowe Price; Vice President, T. Rowe Price |
| Group, Inc., and T. Rowe Price Investment | |
| Services, Inc. | |
| Gregory S. Golczewski (1966) | Vice President, T. Rowe Price and T. Rowe Price |
| Vice President, Tax-Efficient Funds | Trust Company |
| Henry H. Hopkins (1942) | Director and Vice President, T. Rowe Price |
| Vice President, Tax-Efficient Funds | Investment Services, Inc., T. Rowe Price Services, |
| Inc., and T. Rowe Price Trust Company; Vice | |
| President, T. Rowe Price, T. Rowe Price Group, | |
| Inc., T. Rowe Price International, Inc., and | |
| T. Rowe Price Retirement Plan Services, Inc. | |
| Philip J. Kligman, CFA (1974) | Assistant Vice President, T. Rowe Price |
| Assistant Vice President, Tax-Efficient Funds | |
| Patricia B. Lippert (1953) | Assistant Vice President, T. Rowe Price and |
| Secretary, Tax-Efficient Funds | T. Rowe Price Investment Services, Inc. |
| Hugh D. McGuirk, CFA (1960) | Vice President, T. Rowe Price and T. Rowe Price |
| Executive Vice President, Tax-Efficient Funds | Group, Inc. |
| Mary J. Miller, CFA (1955) | Director, T. Rowe Price Trust Company; Director |
| Vice President, Tax-Efficient Funds | and Vice President, T. Rowe Price; Vice |
| President, T. Rowe Price Group, Inc. | |
| Donald J. Peters (1959) | Vice President, T. Rowe Price and T. Rowe Price |
| President, Tax-Efficient Funds | Group, Inc. |
| William J. Stromberg, CFA (1960) | Vice President, T. Rowe Price, T. Rowe Price |
| Vice President, Tax-Efficient Funds | Group, Inc., and T. Rowe Price Trust Company |
| Julie L. Waples (1970) | Vice President, T. Rowe Price |
| Vice President, Tax-Efficient Funds | |
| Mark R. Weigman, CFA, CIC (1962) | Vice President, T. Rowe Price, T. Rowe Price |
| Vice President, Tax-Efficient Funds | Group, Inc., and T. Rowe Price Trust Company |
| Unless otherwise noted, officers have been employees of T. Rowe Price or T. Rowe Price International for at least | |
| five years. | |
Item 2. Code of Ethics.
The registrant has adopted a code of ethics, as defined in Item 2 of Form N-CSR, applicable to its principal executive officer, principal financial officer, principal accounting officer or controller, or persons performing similar functions. A copy of this code of ethics is filed as an exhibit to this Form N-CSR. No substantive amendments were approved or waivers were granted to this code of ethics during the period covered by this report.
Item 3. Audit Committee Financial Expert.
The registrant’s Board of Directors/Trustees has determined that Mr. Donald W. Dick Jr. qualifies as an audit committee financial expert, as defined in Item 3 of Form N-CSR. Mr. Dick is considered independent for purposes of Item 3 of Form N-CSR.
Item 4. Principal Accountant Fees and Services.
(a) – (d) Aggregate fees billed to the registrant for the last two fiscal years for professional services rendered by the registrant’s principal accountant were as follows:
Audit fees include amounts related to the audit of the registrant’s annual financial statements and services normally provided by the accountant in connection with statutory and regulatory filings. Audit-related fees include amounts reasonably related to the performance of the audit of the registrant’s financial statements and specifically include the issuance of a report on internal controls and, if applicable, agreed-upon procedures related to fund acquisitions. Tax fees include amounts related to services for tax compliance, tax planning, and tax advice. The nature of these services specifically includes the review of distribution calculations and the preparation of Federal, state, and excise tax returns. Reclassification from tax fees to audit fees of fiscal 2006 amounts related to the auditing of tax disclosures within the registrant’s annual financial statements has been made in order to conform to fiscal 2007 presentation. All other fees include the registrant’s pro-rata share of amounts for agreed-upon procedures in conjunction with service contract approvals by the registrant’s Board of Directors/Trustees.
(e)(1) The registrant’s audit committee has adopted a policy whereby audit and non-audit services performed by the registrant’s principal accountant for the registrant, its investment adviser, and any entity controlling, controlled by, or under common control with the investment adviser that provides ongoing services to the registrant require pre-approval in advance at regularly scheduled audit committee meetings. If such a service is required between regularly scheduled audit committee meetings, pre-approval may be authorized by one audit committee member with ratification at the next scheduled audit committee meeting. Waiver of pre-approval for audit or non-audit services requiring fees of a de minimis amount is not permitted.
(2) No services included in (b) – (d) above were approved pursuant to paragraph (c)(7)(i)(C) of Rule 2-01 of Regulation S-X.
(f) Less than 50 percent of the hours expended on the principal accountant’s engagement to audit the registrant’s financial statements for the most recent fiscal year were attributed to work performed by persons other than the principal accountant’s full-time, permanent employees.
(g) The aggregate fees billed for the most recent fiscal year and the preceding fiscal year by the registrant’s principal accountant for non-audit services rendered to the registrant, its investment adviser, and any entity controlling, controlled by, or under common control with the investment adviser that provides ongoing services to the registrant were $1,263,000 and $883,000, respectively, and were less than the aggregate fees billed for those same periods by the registrant’s principal accountant for audit services rendered to the T. Rowe Price Funds. Preceding fiscal year amount reflects the reclassification of tax fees described in (a) – (d) above.
(h) All non-audit services rendered in (g) above were pre-approved by the registrant’s audit committee. Accordingly, these services were considered by the registrant’s audit committee in maintaining the principal accountant’s independence.Item 5. Audit Committee of Listed Registrants.
Not applicable.
Item 6. Schedule of Investments.
Not applicable. The complete schedule of investments is included in Item 1 of this Form N-CSR.
Item 7. Disclosure of Proxy Voting Policies and Procedures for Closed-End Management Investment Companies.
Not applicable.
Item 8. Portfolio Managers of Closed-End Management Investment Companies.
Not applicable.
Item 9. Purchases of Equity Securities by Closed-End Management Investment Company and Affiliated Purchasers.
Not applicable.
Item 10. Submission of Matters to a Vote of Security Holders.
Not applicable.
Item 11. Controls and Procedures.
(a) The registrant’s principal executive officer and principal financial officer have evaluated the registrant’s disclosure controls and procedures within 90 days of this filing and have concluded that the registrant’s disclosure controls and procedures were effective, as of that date, in ensuring that information required to be disclosed by the registrant in this Form N-CSR was recorded, processed, summarized, and reported timely.
(b) The registrant’s principal executive officer and principal financial officer are aware of no change in the registrant’s internal control over financial reporting that occurred during the registrant’s second fiscal quarter covered by this report that has materially affected, or is reasonably likely to materially affect, the registrant’s internal control over financial reporting.
Item 12. Exhibits.
(a)(1) The registrant’s code of ethics pursuant to Item 2 of Form N-CSR is attached.
(2) Separate certifications by the registrant's principal executive officer and principal financial officer, pursuant to Section 302 of the Sarbanes-Oxley Act of 2002 and required by Rule 30a-2(a) under the Investment Company Act of 1940, are attached.
(3) Written solicitation to repurchase securities issued by closed-end companies: not applicable.
(b) A certification by the registrant's principal executive officer and principal financial officer, pursuant to Section 906 of the Sarbanes-Oxley Act of 2002 and required by Rule 30a-2(b) under the Investment Company Act of 1940, is attached.
SIGNATURES | |
| Pursuant to the requirements of the Securities Exchange Act of 1934 and the Investment | |
| Company Act of 1940, the registrant has duly caused this report to be signed on its behalf by the | |
| undersigned, thereunto duly authorized. | |
| T. Rowe Price Tax-Efficient Funds, Inc. | |
| By | /s/ Edward C. Bernard |
| Edward C. Bernard | |
| Principal Executive Officer | |
| Date | April 16, 2007 |
| Pursuant to the requirements of the Securities Exchange Act of 1934 and the Investment | |
| Company Act of 1940, this report has been signed below by the following persons on behalf of | |
| the registrant and in the capacities and on the dates indicated. | |
| By | /s/ Edward C. Bernard |
| Edward C. Bernard | |
| Principal Executive Officer | |
| Date | April 16, 2007 |
| By | /s/ Joseph A. Carrier |
| Joseph A. Carrier | |
| Principal Financial Officer | |
| Date | April 16, 2007 |