UNITED STATES
SECURITIES AND EXCHANGE COMMISSION
Washington, D.C. 20549
FORM N-CSR
CERTIFIED SHAREHOLDER REPORT OF REGISTERED
MANAGEMENT INVESTMENT COMPANIES
Investment Company Act File Number: 811-08207
| T. Rowe Price Tax-Efficient Funds, Inc. |
| (Exact name of registrant as specified in charter) |
| 100 East Pratt Street, Baltimore, MD 21202 |
| (Address of principal executive offices) |
| David Oestreicher |
| 100 East Pratt Street, Baltimore, MD 21202 |
| (Name and address of agent for service) |
Registrant’s telephone number, including area code: (410) 345-2000
Date of fiscal year end: February 28
Date of reporting period: February 28, 2014
Item 1. Report to Shareholders
 |
| Tax-Efficient Equity Fund | February 28, 2014 |
The views and opinions in this report were current as of February 28, 2014. They are not guarantees of performance or investment results and should not be taken as investment advice. Investment decisions reflect a variety of factors, and the managers reserve the right to change their views about individual stocks, sectors, and the markets at any time. As a result, the views expressed should not be relied upon as a forecast of the fund’s future investment intent. The report is certified under the Sarbanes-Oxley Act, which requires mutual funds and other public companies to affirm that, to the best of their knowledge, the information in their financial reports is fairly and accurately stated in all material respects.
REPORTS ON THE WEB
Sign up for our E-mail Program, and you can begin to receive updated fund reports and prospectuses online rather than through the mail. Log in to your account at troweprice.com for more information.
Manager’s Letter
Fellow Shareholders
U.S. stocks generated strong gains for the 6- and 12-month periods ended February 28, 2014, amid improved corporate earnings, low inflation, and continued accommodative monetary policies. Fixed income securities lagged significantly amid sharply rising longer-term interest rates as investors anticipated that the Federal Reserve would begin to curtail its extraordinary stimulus efforts. When the central bank announced in mid-December that it would start to reduce its asset purchases in January 2014, equity investors were assuaged by the Fed’s pledge to keep short-term interest rates low as long as inflation remains contained. Given the remarkably low rate environment and the lessening of the Fed’s ongoing manipulation of the fixed income markets, we continue to find that equities have more attractive prospects.
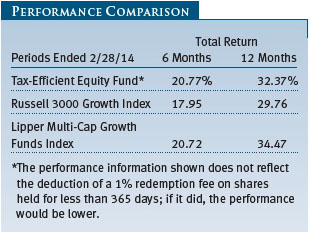
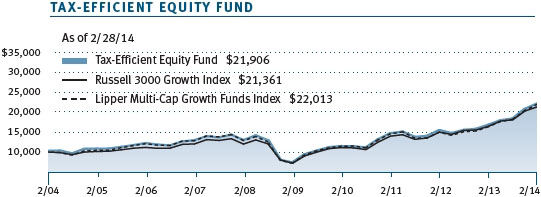
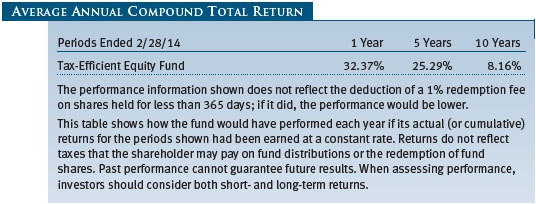
As shown in the Performance Comparison table, the Tax-Efficient Equity Fund gained 20.77% and 32.37% for the 6- and 12-month periods ended February 28, 2014, respectively. The fund outpaced the Russell 3000 Growth Index for both periods and performed in line with the Lipper Multi-Cap Growth Funds Index over the last six months. The fund modestly lagged the Lipper index for the one-year period. The health care, financials, and consumer discretionary sectors generated the fund’s largest absolute gains for the 12-month period, followed by information technology and industrials and business services. Energy, telecommunication services (a small position), materials, and consumer staples shares produced more modest gains. Both stock selection and sector weightings helped performance versus the Russell benchmark over the last 12 months.
MARKET ENVIRONMENT
Despite higher federal tax rates and modest spending cuts at the beginning of 2013, the U.S. economy grew at a moderate pace over the last 12 months. Gross domestic product expanded at a 4.1% annualized rate in the third quarter of 2013—the highest rate in approximately two years—and at a more modest 2.4% in the fourth quarter, in part due to weaker-than-expected consumer spending. Nevertheless, steady job growth helped reduce the national unemployment rate to 6.7% in February. We expect the U.S. economic recovery to strengthen in 2014, as last year’s fiscal policy headwinds subside and wage growth improves.
To support the recovery, the Federal Reserve purchased $45 billion in Treasuries and $40 billion in agency mortgage-backed securities every month in 2013 to suppress longer-term rates. In both January and February 2014, the Fed reduced the size of its monthly purchases by $10 billion in accordance with previously announced policy directions. We expect the Fed to announce similar reductions after future monetary policy meetings, with asset purchases likely to end by the end of 2014. While Fed tapering may result in higher long-term interest rates, short-term rate increases seem unlikely to occur until sometime in late 2015 or 2016.
U.S. stocks generated exceptionally strong performance over the 12-month reporting period, as investors remained optimistic about the economy despite moderating corporate fundamentals and uncertainty about the direction of fiscal and monetary policies. As our reporting period began, labor market gains and the Federal Reserve’s accommodative monetary policy helped to offset concerns that federal tax increases and automatic spending cuts might derail the U.S. economic recovery. Equities fell in May after the Fed indicated that it might begin slowing its monthly asset purchases, but they rallied in September after the central bank unexpectedly delayed tapering its quantitative easing program. Equities weakened again in October as political bickering over fiscal policy gave rise to concerns about a government shutdown, but stocks climbed after the shutdown and debt ceiling showdown ended with a temporary solution that put fiscal policy concerns on hold until early 2014. As the year ended, investors welcomed the Fed’s mid-December announcement that it would reduce its asset purchases by $10 billion in January 2014, as it removed an element of uncertainty from markets. Equities declined in January amid turmoil in emerging markets but rebounded in our reporting period’s closing month as investors appeared to attribute some weak economic data to recent bouts of unusually severe winter weather.
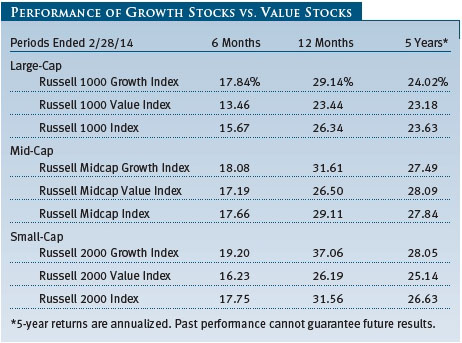
Small-cap stocks posted the biggest 12-month gains, followed by mid-caps and large-caps. As measured by various Russell indexes, growth stocks outperformed value stocks across all market capitalizations, particularly among small-caps. All sectors in the large-cap S&P 500 Index generated double-digit gains for the year. Financials and materials performed in line with the broader market, while energy, consumer staples, utilities, and telecommunication services stocks trailed with more modest gains.
PORTFOLIO CHARACTERISTICS
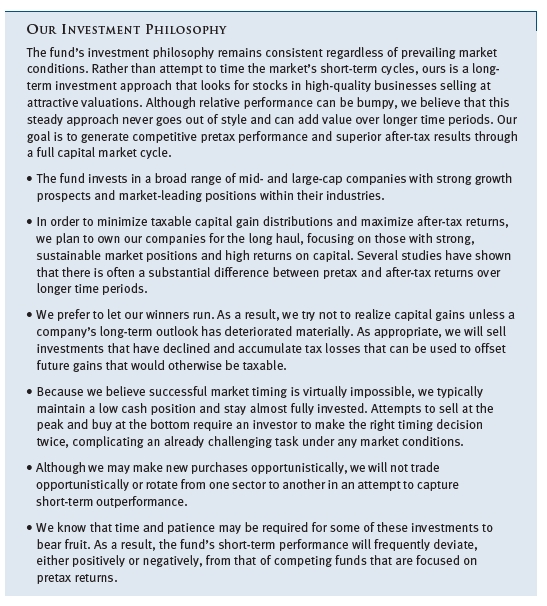
The Tax-Efficient Equity Fund seeks to buy and hold attractively valued, high-quality growth companies with good business models, strong management, and favorable long-term prospects. Our goal is to build a portfolio that provides strong after-tax returns.
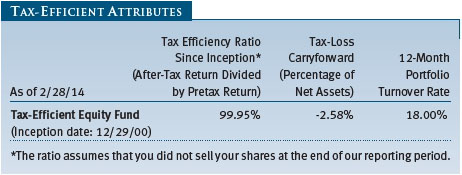
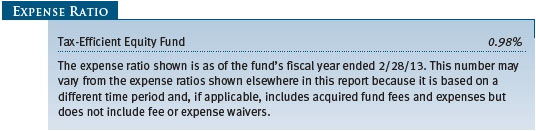
- Tax Efficiency Ratio: The fund’s tax efficiency ratio is calculated by dividing the fund’s after-tax return by its pretax return. Our 99.95% tax efficiency ratio reflects that the fund has made only minimal capital gain distributions since its inception on December 29, 2000.
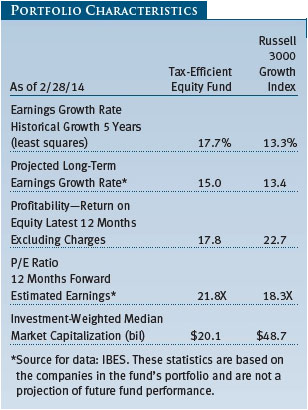
- Earnings Growth: The earnings of the companies in our portfolio are expected to grow faster than companies in the Russell 3000 Growth Index. The fund’s projected long-term earnings growth rate of 15.0% exceeds the 13.4% index rate, while our historical earnings growth rate over the last five years was 17.7% versus 13.3% for the index.
- Return on Equity: The fund’s 12-month return on equity (ROE) at the end of our reporting period was 17.8%. A high, sustainable ROE indicates that a company is using its investment dollars to generate earnings growth. It is one of the most important characteristics we consider when researching potential investments and reviewing current holdings.
- Market Capitalization: The fund’s investment-weighted median market capitalization was $20.1 billion versus $48.7 billion for the index, reflecting the fund’s greater exposure to mid-cap companies and its broad diversification. The fund held shares in approximately 332 companies at the end of our reporting period. Although diversification cannot guarantee a profit or protect against loss in a declining market, it may help to lower a portfolio’s volatility versus a more concentrated strategy.
PERFORMANCE REVIEW
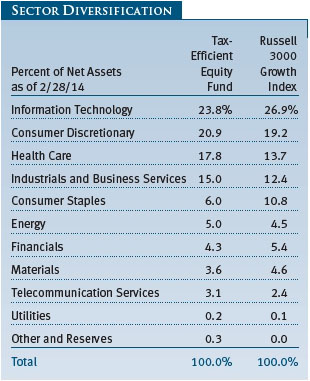
At the end of our reporting period, the fund’s largest absolute sector allocations were information technology, consumer discretionary, health care, and industrials and business services. We had relatively small allocations to materials, telecommunication services, and utilities stocks—sectors that traditionally do not have many of the growth-oriented companies that are the focus of our investment approach. Health care, industrials and business services, and consumer discretionary were our largest overweight allocations relative to the benchmark Russell 3000 Growth Index. Consumer staples, information technology, and materials were our largest relative underweights.
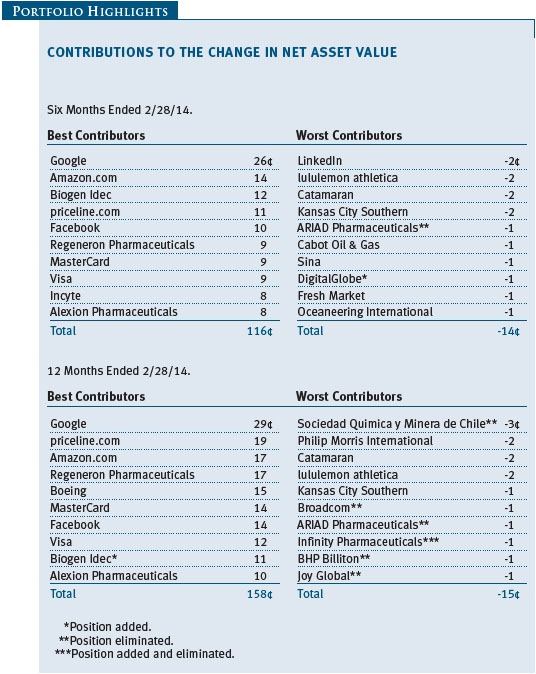
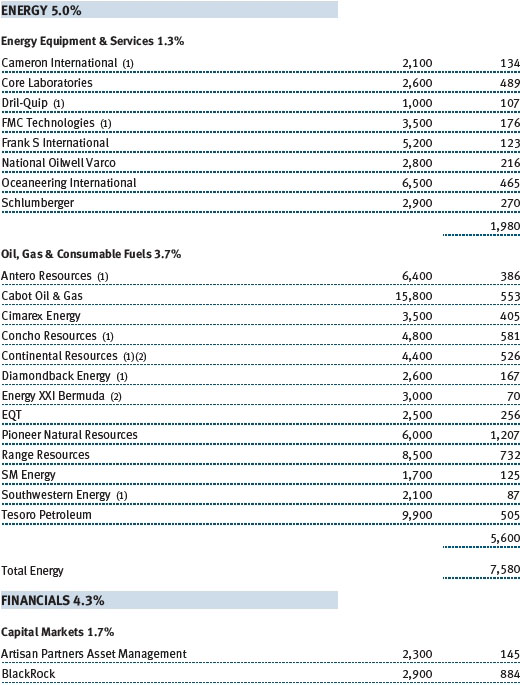
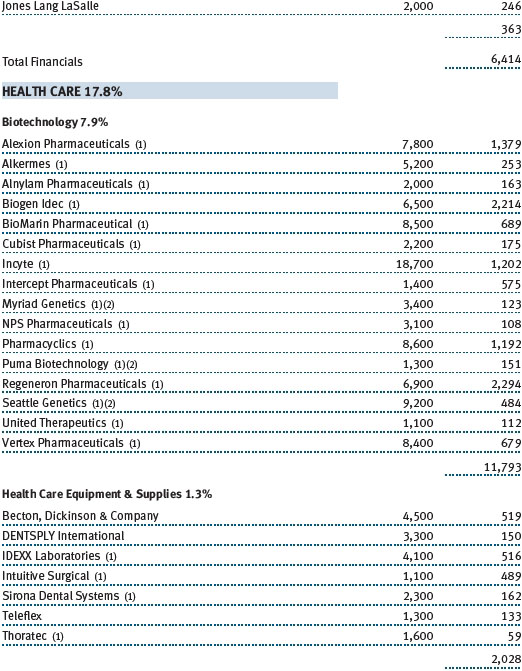
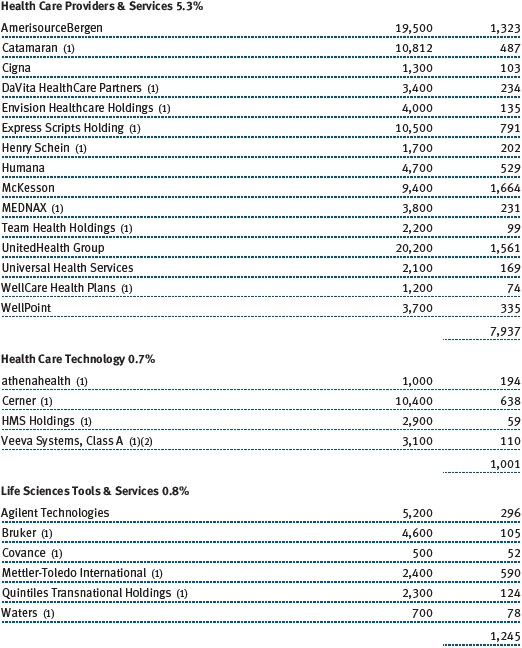
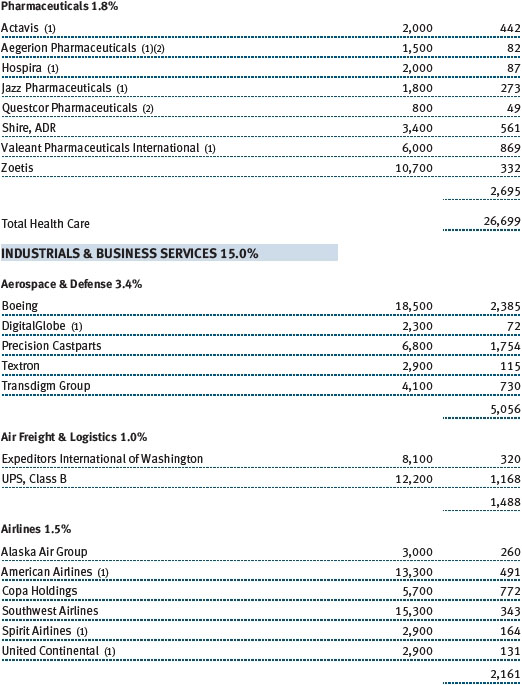
Our health care stocks posted exceptionally strong gains over the past 12 months. Stock selection and an overweight position helped results versus the Russell 3000 Growth Index. Health care remains a challenging sector in which to invest, given that innovation is difficult, expensive, and increasingly unaffordable. Still, the sector features some good long-term investment opportunities. For several years, we have focused on the promising growth potential of biotech companies rather than large-cap pharmaceutical firms. Our approach reaped benefits over the past year as several biotech stocks were among the fund’s biggest gainers. Regeneron Pharmaceuticals benefited from the ongoing success of Eylea, the company’s macular degeneration drug. Incyte was another top performer on the strength of Jakafi, a drug approved in the U.S. and Europe for the treatment of myelofibrosis, a fatal disease of the bone marrow, and which is being developed for treatment of several other cancer indications. It’s important to note that Regeneron and Incyte have been in the portfolio for a number of years, having been identified by our research analysts as possessing breakthrough potential in areas of then-unmet medical needs. Biogen Idec and Alexion Pharmaceuticals also posted strong results in the biotech area. Health care service providers posted strong performance for the year as well and were led by drug distributors McKesson and AmerisourceBergen. (Please refer to the fund’s portfolio of investments for a complete list of holdings and the amount each represents in the portfolio.)
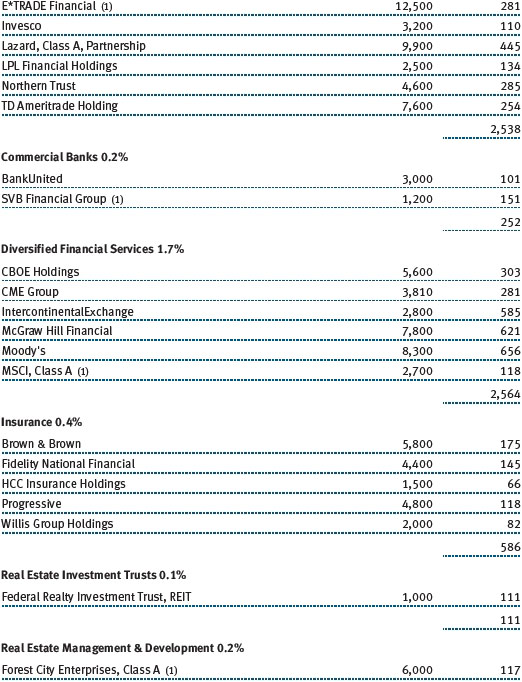
The financials sector also generated strong absolute gains for the fund’s fiscal year. Stock selection helped our allocation outperform the benchmark sector by a wide margin, due in part to broadly favorable capital markets and interest rate trends. The sector accounts for approximately 4% of our overall portfolio, with a focus on diversified financial services companies, capital markets firms, and insurance companies. Credit rating agency Moody’s and McGraw-Hill Financial, owner of Standard & Poor’s, were solid contributors as the economic recovery contributed to strong bond issuance and renewed strength in capital markets, which also benefited asset manager BlackRock. Securities exchange operators IntercontinentalExchange and CBOE Holdings also posted good results. Increased trading activity and strong equity market performance boosted shares of E*TRADE Financial. Insurance stocks generated more modest gains, led by Arch Capital and Fidelity National Financial.
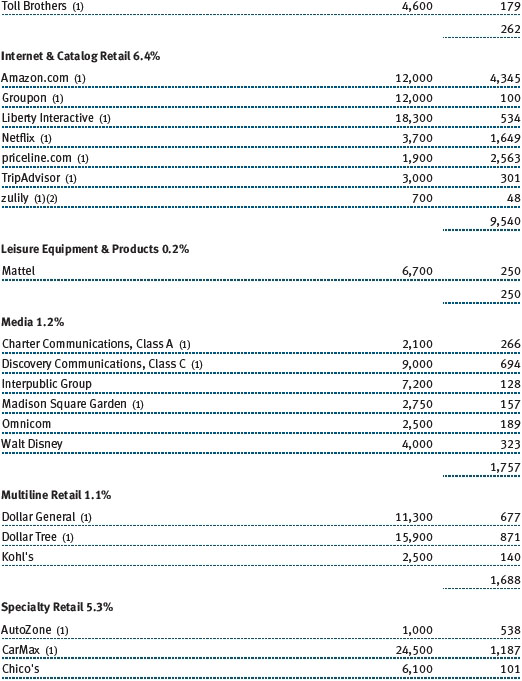
Consumer discretionary—an eclectic assortment of retailers, restaurants, and media companies, among others—was another of our better-performing sectors for the 12-month period. Stock selection and a modest overweight proved beneficial to results versus the benchmark. Although the ongoing U.S. economic recovery has been modest, it provided a tailwind for many companies in the sector and benefited a number of retailers, media companies, hotels, and restaurant operators with good business models, excellent cash flow, and other favorable attributes. Internet companies priceline. com, Amazon.com, and Netflix were among the fund’s top overall contributors. Specialty retailers O’Reilly Automotive, Home Depot, and Tiffany benefited from robust earnings and continue to enjoy good growth prospects. On the other hand, cruise-ship operator Carnival weighed on results after suffering several high-profile mishaps at sea. We eliminated Carnival during the reporting period, although we maintain modest exposure to the cruise industry via our position in Royal Caribbean Cruises.
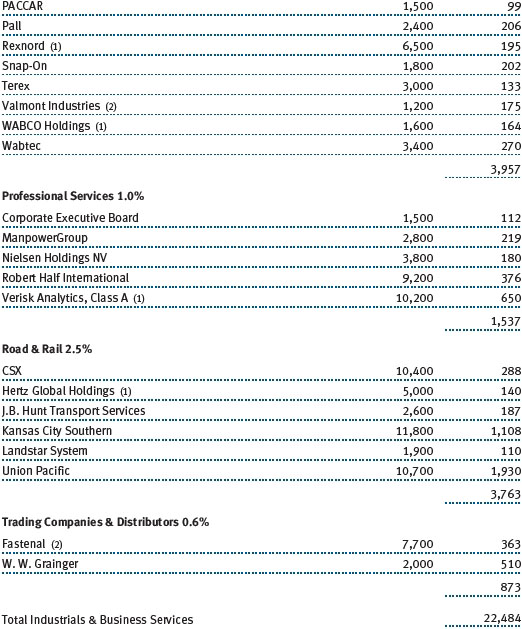
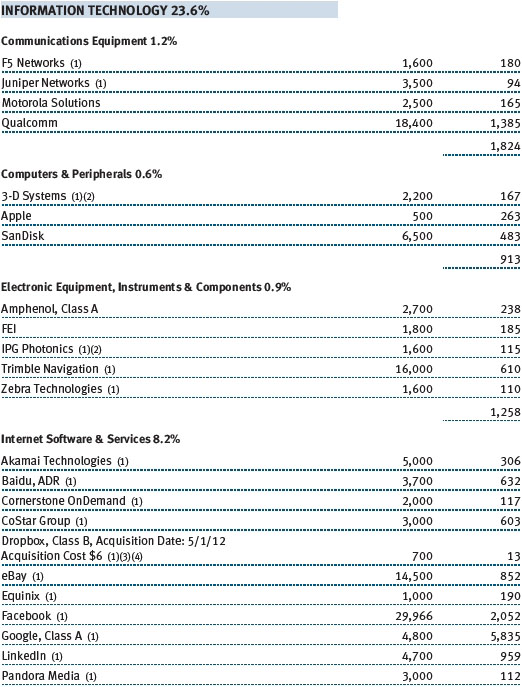
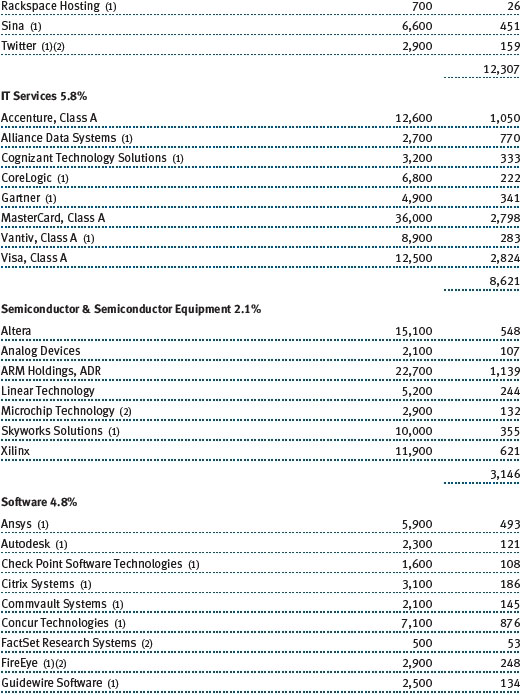
Our information technology stocks recorded good absolute gains, and stock selection boosted our relative performance. An underweight allocation had little net impact on results versus the benchmark, although information technology remains our largest sector allocation due to the high number of companies with attractive long-term growth potential. We are broadly diversified in the sector, but we favor companies with strong business models in industries with high barriers to entry and a lower risk of commoditization. Search engine Google was the fund’s top overall contributor for the year and our largest holding. We are impressed with the company’s continued efforts in social, local, mobile, video and display, and also with its Chrome search engine and software products, and we continue to view Google’s stock valuation as compelling. IT services companies MasterCard, Visa, and Alliance Data Systems benefited from an improved consumer spending environment and a systemic move toward online payments and processing. Electronic equipment and components stocks, including Trimble Navigation, connector company Amphenol, and specialty printer manufacturer Zebra Technologies, were less robust.
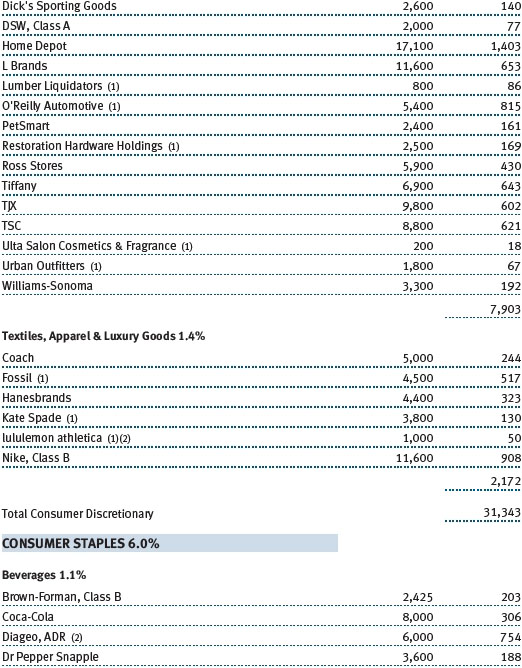
Our consumer staples stocks posted double-digit gains but trailed the broader market by a wide margin. Stock selection weighed modestly on results versus the benchmark, but this was largely offset by the benefits from a substantial underweight position as the sector generally underperformed. Our positions are focused on specialty food retailers, drug retailers, and food and beverage companies with strong brands that we have owned for several years. CVS Caremark and Hershey Foods were among our top performers in this relatively lackluster sector. Food companies J.M. Smucker and spice maker McCormick posted uninspiring results for the year. However, we believe these companies are well positioned for future growth due to good management and strong brand recognition.
OUTLOOK
Stocks performed very well over the past 12 months and over the last five years, despite a weaker-than-average economic recovery. Although equity valuations are higher than they have been in several years, they remain reasonable by historical standards. If sluggish economic growth persists, it would be highly unlikely for the equity market to achieve 30% gains again in 2014, and we believe investors should expect modest equity returns in the near term.
While there are pockets of speculation and excessive valuations, the core of the market appears reasonably valued. The most attractive companies, in our opinion, are the ones we favor: companies with solid earnings growth and reasonable valuations. In fact, they have become somewhat easier to identify because they have significantly lagged the short-term performance of companies with the fastest anticipated growth.
Our basic outlook has not changed since our last report six months ago. We believe the current environment continues to provide patient investors who are willing to take prudent risks with a great opportunity to invest in equities for long-term capital growth. Consider the positives: The U.S. economy and corporate earnings are growing; the Federal Reserve is likely to keep short-term interest rates very low for several years even as it tapers its asset purchases; and corporations have substantial cash reserves on their strong balance sheets and have generally been responsible stewards of capital. In addition, bond returns are likely to be negative as interest rates return to normalized levels in the years ahead, while stocks, which are generally under-represented in the portfolios of many individual investors, have much more potential for long-term capital appreciation.
As always, thank you for your confidence in T. Rowe Price.
Respectfully submitted,
Donald J. Peters
Portfolio manager and chairman of the fund’s Investment
Advisory Committee
March 18, 2014
The committee chairman has day-to-day responsibility for managing the portfolio and works with committee members in developing and executing the fund’s investment programs.
RISKS OF STOCK INVESTING
The stock market as a whole can decline for many reasons, including adverse political or economic developments here or abroad, changes in investor psychology, or heavy institutional selling. The prospects for an industry or company may deteriorate because of a variety of factors, including disappointing earnings or changes in the competitive environment. In addition, our assessment of companies held in the funds may prove incorrect, resulting in losses or poor performance even in a rising market.
Growth stocks can be volatile for several reasons. Since growth companies usually reinvest a high proportion of their earnings in their own businesses, they may lack the dividends often associated with value stocks that could cushion their decline in a falling market. Also, since investors buy growth stocks because of their expected superior earnings growth, earnings disappointments often result in sharp price declines.
The stocks of mid-cap companies entail greater risk and are usually more volatile than the shares of large companies. Investing in small companies also involves greater risk than is customarily associated with larger companies. Stocks of small companies are subject to more abrupt or erratic price movements than larger-company stocks. Small companies often have limited product lines, markets, or financial resources, and their managements may lack depth and experience. Such companies seldom pay significant dividends that could cushion returns in a falling market.
Technology stocks are particularly volatile and subject to greater price swings than the broad market. It is possible that companies whose products and services first appear promising may not succeed over the long term; they may succumb to intense competition or could quickly become obsolete in a rapidly developing marketplace. Earnings projections for developing companies that are not met can result in sharp price declines. This is true even in a generally rising stock market environment.
GLOSSARY
Earnings growth rate: Measures the annualized percent change in earnings per share for a given time period.
Gross domestic product (GDP): The total market value of all goods and services produced in a country in a given year.
Historical growth five years (least squares): Least squares growth calculation attempts to find the “normal” growth rate given a stream of historical growth rates. It searches for the growth rate that best fits the line produced by a stream of growth numbers.
Investment-weighted median market capitalization: The investment-weighted midpoint market capitalization (shares outstanding multiplied by current price) representing a typical security in a portfolio. An investment-weighted median represents the breakpoint where 50% of the values are above and 50% of the values are below based on portfolio weight.
Lipper indexes: Fund benchmarks that consist of a small number (10 to 30) of the largest mutual funds in a particular category as tracked by Lipper Inc.
Market capitalization: The total value of a company’s publicly traded shares.
Price-to-book ratio: A valuation measure that compares a stock’s market price with its book value; i.e., the company’s net worth divided by the number of outstanding shares.
Price-to-earnings (P/E) ratio – 12 months forward: A valuation measure calculated by dividing the price of a stock by the analysts’ forecast of the next 12 months’ expected earnings. The ratio is a measure of how much investors are willing to pay for the company’s future earnings. The higher the P/E, the more investors are paying for a company’s earnings growth in the next 12 months.
Projected earnings growth rate (IBES): A company’s expected earnings per share growth rate for a given time period based on the forecast from the Institutional Brokers’ Estimate System, which is commonly referred to as IBES.
Return on equity (ROE) – current fiscal year: A valuation measure calculated by dividing the company’s current fiscal year net income by shareholders’ equity (i.e., the company’s book value). ROE measures how much a company earns on each dollar that common stock investors have put into the company. It indicates how effectively and efficiently a company and its management are using stockholder investments.
Russell 1000 Growth Index: An index that tracks the performance of large-cap stocks with higher price-to-book ratios and higher forecast growth values.
Russell 1000 Index: An index that tracks the performance of the 1,000 largest companies in the Russell 3000 Index.
Russell 1000 Value Index: An index that tracks the performance of large-cap stocks with lower price-to-book ratios and lower forecast growth values.
Russell 2000 Growth Index: An index that tracks the performance of small-cap stocks with higher price-to-book ratios and higher forecast growth values.
Russell 2000 Index: An unmanaged index that tracks the stocks of 2,000 small U.S. companies.
Russell 2000 Value Index: An index that tracks the performance of small-cap stocks with lower price-to-book ratios and lower forecast growth values.
Russell 3000 Growth Index: An index that measures the performance of those Russell 3000 companies with higher price-to-book ratios and higher forecast growth values.
Russell 3000 Index: An index that tracks the performance of the 3,000 largest U.S. companies, representing approximately 98% of the investable U.S. equity market.
Russell Midcap Growth Index: An index that tracks the performance of mid-cap stocks with higher price-to-book ratios and higher forecast growth values.
Russell Midcap Index: An unmanaged index that tracks the performance of the 800 smallest companies in the Russell 1000 Index.
Russell Midcap Value Index: An index that tracks the performance of mid-cap stocks with lower price-to-book ratios and lower forecast growth values.
Note: Russell Investment Group is the source and owner of the trademarks, service marks, and copyrights related to the Russell indexes. Russell® is a trademark of Russell Investment Group.
Performance and Expenses
| Growth of $10,000 |
This chart shows the value of a hypothetical $10,000 investment in the fund over the past 10 fiscal year periods or since inception (for funds lacking 10-year records). The result is compared with benchmarks, which may include a broad-based market index and a peer group average or index. Market indexes do not include expenses, which are deducted from fund returns as well as mutual fund averages and indexes.
| Fund Expense Example |
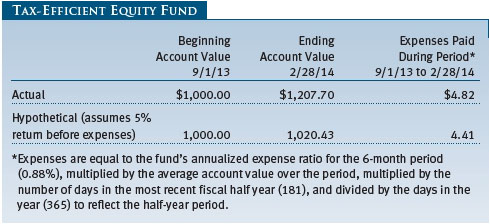
As a mutual fund shareholder, you may incur two types of costs: (1) transaction costs, such as redemption fees or sales loads, and (2) ongoing costs, including management fees, distribution and service (12b-1) fees, and other fund expenses. The following example is intended to help you understand your ongoing costs (in dollars) of investing in the fund and to compare these costs with the ongoing costs of investing in other mutual funds. The example is based on an investment of $1,000 invested at the beginning of the most recent six-month period and held for the entire period.
Actual Expenses
The first line of the following table (Actual) provides information about actual account values and expenses based on the fund’s actual returns. You may use the information on this line, together with your account balance, to estimate the expenses that you paid over the period. Simply divide your account value by $1,000 (for example, an $8,600 account value divided by $1,000 = 8.6), then multiply the result by the number on the first line under the heading “Expenses Paid During Period” to estimate the expenses you paid on your account during this period.
Hypothetical Example for Comparison Purposes
The information on the second line of the table (Hypothetical) is based on hypothetical account values and expenses derived from the fund’s actual expense ratio and an assumed 5% per year rate of return before expenses (not the fund’s actual return). You may compare the ongoing costs of investing in the fund with other funds by contrasting this 5% hypothetical example and the 5% hypothetical examples that appear in the shareholder reports of the other funds. The hypothetical account values and expenses may not be used to estimate the actual ending account balance or expenses you paid for the period.
Note: T. Rowe Price charges an annual account service fee of $20, generally for accounts with less than $10,000. The fee is waived for any investor whose T. Rowe Price mutual fund accounts total $50,000 or more; accounts electing to receive electronic delivery of account statements, transaction confirmations, prospectuses, and shareholder reports; or accounts of an investor who is a T. Rowe Price Preferred Services, Personal Services, or Enhanced Personal Services client (enrollment in these programs generally requires T. Rowe Price assets of at least $100,000). This fee is not included in the accompanying table. If you are subject to the fee, keep it in mind when you are estimating the ongoing expenses of investing in the fund and when comparing the expenses of this fund with other funds.
You should also be aware that the expenses shown in the table highlight only your ongoing costs and do not reflect any transaction costs, such as redemption fees or sales loads. Therefore, the second line of the table is useful in comparing ongoing costs only and will not help you determine the relative total costs of owning different funds. To the extent a fund charges transaction costs, however, the total cost of owning that fund is higher.
The accompanying notes are an integral part of these financial statements.

The accompanying notes are an integral part of these financial statements.
The accompanying notes are an integral part of these financial statements.
The accompanying notes are an integral part of these financial statements.
The accompanying notes are an integral part of these financial statements.
| Notes to Financial Statements |
T. Rowe Price Tax-Efficient Funds, Inc. (the corporation), is registered under the Investment Company Act of 1940 (the 1940 Act). The Tax-Efficient Equity Fund (the fund) is a diversified, open-end management investment company established by the corporation. The fund commenced operations on December 29, 2000. The fund seeks to maximize after-tax growth of capital through investments primarily in common stocks.
NOTE 1 - SIGNIFICANT ACCOUNTING POLICIES
Basis of Preparation The fund is an investment company and follows accounting and reporting guidance in the Financial Accounting Standards Board Accounting Standards Codification Topic 946 (ASC 946). The accompanying financial statements were prepared in accordance with accounting principles generally accepted in the United States of America (GAAP), including but not limited to ASC 946. GAAP requires the use of estimates made by management. Management believes that estimates and valuations are appropriate; however, actual results may differ from those estimates, and the valuations reflected in the accompanying financial statements may differ from the value ultimately realized upon sale or maturity.
Investment Transactions, Investment Income, and Distributions Income and expenses are recorded on the accrual basis. Dividends received from mutual fund investments are reflected as dividend income; capital gain distributions are reflected as realized gain/loss. Earnings on investments recognized as partnerships for federal income tax purposes reflect the tax character of such earnings. Dividend income and capital gain distributions are recorded on the ex-dividend date. Income tax-related interest and penalties, if incurred, would be recorded as income tax expense. Investment transactions are accounted for on the trade date. Realized gains and losses are reported on the identified cost basis. Distributions to shareholders are recorded on the ex-dividend date. Income distributions are declared and paid annually. Capital gain distributions, if any, are generally declared and paid by the fund annually.
Rebates and Credits Subject to best execution, the fund may direct certain security trades to brokers who have agreed to rebate a portion of the related brokerage commission to the fund in cash. Commission rebates are reflected as realized gain on securities in the accompanying financial statements.
Additionally, the fund earns credits on temporarily uninvested cash balances held at the custodian, which reduce the fund’s custody charges. Custody expense in the accompanying financial statements is presented before reduction for credits.
Redemption Fees A 1% fee is assessed on redemptions of fund shares held for less than 365 days to deter short-term trading and to protect the interests of long-term shareholders. Redemption fees are withheld from proceeds that shareholders receive from the sale or exchange of fund shares. The fees are paid to the fund and are recorded as an increase to paid-in capital. The fees may cause the redemption price per share to differ from the net asset value per share.
NOTE 2 - VALUATION
The fund’s financial instruments are valued, and its net asset value (NAV) per share is computed at the close of the New York Stock Exchange (NYSE), normally 4 p.m. ET, each day the NYSE is open for business.
Fair Value The fund’s financial instruments are reported at fair value, which GAAP defines as the price that would be received to sell an asset or paid to transfer a liability in an orderly transaction between market participants at the measurement date. The T. Rowe Price Valuation Committee (the Valuation Committee) has been established by the fund’s Board of Directors (the Board) to ensure that financial instruments are appropriately priced at fair value in accordance with GAAP and the 1940 Act. Subject to oversight by the Board, the Valuation Committee develops and oversees pricing-related policies and procedures and approves all fair value determinations. Specifically, the Valuation Committee establishes procedures to value securities; determines pricing techniques, sources, and persons eligible to effect fair value pricing actions; oversees the selection, services, and performance of pricing vendors; oversees valuation-related business continuity practices; and provides guidance on internal controls and valuation-related matters. The Valuation Committee reports to the fund’s Board; is chaired by the fund’s treasurer; and has representation from legal, portfolio management and trading, operations, and risk management.
Various valuation techniques and inputs are used to determine the fair value of financial instruments. GAAP establishes the following fair value hierarchy that categorizes the inputs used to measure fair value:
Level 1 – quoted prices (unadjusted) in active markets for identical financial instruments that the fund can access at the reporting date
Level 2 – inputs other than Level 1 quoted prices that are observable, either directly or indirectly (including, but not limited to, quoted prices for similar financial instruments in active markets, quoted prices for identical or similar financial instruments in inactive markets, interest rates and yield curves, implied volatilities, and credit spreads)
Level 3 – unobservable inputs
Observable inputs are developed using market data, such as publicly available information about actual events or transactions, and reflect the assumptions that market participants would use to price the financial instrument. Unobservable inputs are those for which market data are not available and are developed using the best information available about the assumptions that market participants would use to price the financial instrument. GAAP requires valuation techniques to maximize the use of relevant observable inputs and minimize the use of unobservable inputs. When multiple inputs are used to derive fair value, the financial instrument is assigned to the level within the fair value hierarchy based on the lowest-level input that is significant to the fair value of the financial instrument. Input levels are not necessarily an indication of the risk or liquidity associated with financial instruments at that level but rather the degree of judgment used in determining those values.
Valuation Techniques Equity securities listed or regularly traded on a securities exchange or in the over-the-counter (OTC) market are valued at the last quoted sale price or, for certain markets, the official closing price at the time the valuations are made. OTC Bulletin Board securities are valued at the mean of the closing bid and asked prices. A security that is listed or traded on more than one exchange is valued at the quotation on the exchange determined to be the primary market for such security. Listed securities not traded on a particular day are valued at the mean of the closing bid and asked prices. Actively traded domestic equity securities generally are categorized in Level 1 of the fair value hierarchy. OTC Bulletin Board securities, certain preferred securities, and equity securities traded in inactive markets generally are categorized in Level 2 of the fair value hierarchy.
Investments in mutual funds are valued at the mutual fund’s closing NAV per share on the day of valuation and are categorized in Level 1 of the fair value hierarchy. Assets and liabilities other than financial instruments, including short-term receivables and payables, are carried at cost, or estimated realizable value, if less, which approximates fair value.
Thinly traded financial instruments and those for which the above valuation procedures are inappropriate or are deemed not to reflect fair value are stated at fair value as determined in good faith by the Valuation Committee. The objective of any fair value pricing determination is to arrive at a price that could reasonably be expected from a current sale. Financial instruments fair valued by the Valuation Committee are primarily private placements, restricted securities, warrants, rights, and other securities that are not publicly traded.
Subject to oversight by the Board, the Valuation Committee regularly makes good faith judgments to establish and adjust the fair valuations of certain securities as events occur and circumstances warrant. For instance, in determining the fair value of an equity investment with limited market activity, such as a private placement or a thinly traded public company stock, the Valuation Committee considers a variety of factors, which may include, but are not limited to, the issuer’s business prospects, its financial standing and performance, recent investment transactions in the issuer, new rounds of financing, negotiated transactions of significant size between other investors in the company, relevant market valuations of peer companies, strategic events affecting the company, market liquidity for the issuer, and general economic conditions and events. In consultation with the investment and pricing teams, the Valuation Committee will determine an appropriate valuation technique based on available information, which may include both observable and unobservable inputs. The Valuation Committee typically will afford greatest weight to actual prices in arm’s length transactions, to the extent they represent orderly transactions between market participants; transaction information can be reliably obtained; and prices are deemed representative of fair value. However, the Valuation Committee may also consider other valuation methods such as market-based valuation multiples; a discount or premium from market value of a similar, freely traded security of the same issuer; or some combination. Fair value determinations are reviewed on a regular basis and updated as information becomes available, including actual purchase and sale transactions of the issue. Because any fair value determination involves a significant amount of judgment, there is a degree of subjectivity inherent in such pricing decisions, and fair value prices determined by the Valuation Committee could differ from those of other market participants. Depending on the relative significance of unobservable inputs, including the valuation technique(s) used, fair valued securities may be categorized in Level 2 or 3 of the fair value hierarchy.
Valuation Inputs The following table summarizes the fund’s financial instruments, based on the inputs used to determine their fair values on February 28, 2014:
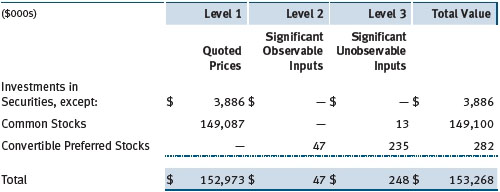
There were no material transfers between Levels 1 and 2 during the year.
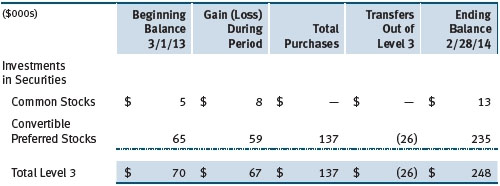
Following is a reconciliation of the fund’s Level 3 holdings for the year ended February 28, 2014. Gain (loss) reflects both realized and change in unrealized gain/loss on Level 3 holdings during the period, if any, and is included on the accompanying Statement of Operations. The change in unrealized gain/loss on Level 3 instruments held at February 28, 2014, totaled $67,000 for the year ended February 28, 2014. Transfers into and out of Level 3 are reflected at the value of the financial instrument at the beginning of the period. During the year, transfers out of Level 3 were because observable market data became available for the security.
NOTE 3 - OTHER INVESTMENT TRANSACTIONS
Consistent with its investment objective, the fund engages in the following practices to manage exposure to certain risks and/or to enhance performance. The investment objective, policies, program, and risk factors of the fund are described more fully in the fund’s prospectus and Statement of Additional Information.
Restricted Securities The fund may invest in securities that are subject to legal or contractual restrictions on resale. Prompt sale of such securities at an acceptable price may be difficult and may involve substantial delays and additional costs.
Securities Lending The fund may lend its securities to approved brokers to earn additional income. Its securities lending activities are administered by a lending agent in accordance with a securities lending agreement. It receives collateral in the form of cash or U.S. government securities, valued at 102% to 105% of the value of the securities on loan. Collateral is maintained over the life of the loan in an amount not less than the value of loaned securities; any additional collateral required due to changes in security values is delivered to the fund the next business day. Cash collateral is invested by the lending agent(s) in accordance with investment guidelines approved by fund management. Additionally, the lending agent indemnifies the fund against losses resulting from borrower default. Although risk is mitigated by the collateral and indemnification, the fund could experience a delay in recovering its securities and a possible loss of income or value if the borrower fails to return the securities, collateral investments decline in value and the lending agent fails to perform. Securities lending revenue consists of earnings on invested collateral and borrowing fees, net of any rebates to the borrower, compensation to the lending agent, and other administrative costs. In accordance with GAAP, investments made with cash collateral are reflected in the accompanying financial statements, but collateral received in the form of securities is not. At February 28, 2014, the value of loaned securities was $3,212,000; the value of cash collateral and related investments was $3,334,000.
Other Purchases and sales of portfolio securities other than short-term securities aggregated $29,860,000 and $22,464,000, respectively, for the year ended February 28, 2014.
NOTE 4 - FEDERAL INCOME TAXES
No provision for federal income taxes is required since the fund intends to continue to qualify as a regulated investment company under Subchapter M of the Internal Revenue Code and distribute to shareholders all of its taxable income and gains. Distributions determined in accordance with federal income tax regulations may differ in amount or character from net investment income and realized gains for financial reporting purposes. Financial reporting records are adjusted for permanent book/tax differences to reflect tax character but are not adjusted for temporary differences.
The fund files U.S. federal, state, and local tax returns as required. The fund’s tax returns are subject to examination by the relevant tax authorities until expiration of the applicable statute of limitations, which is generally three years after the filing of the tax return but which can be extended to six years in certain circumstances. Tax returns for open years have incorporated no uncertain tax positions that require a provision for income taxes.
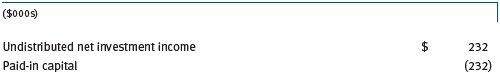
Reclassifications to paid-in capital relate primarily to distributions required for excise tax purposes. For the year ended February 28, 2014, the following reclassifications were recorded to reflect tax character (there was no impact on results of operations or net assets):
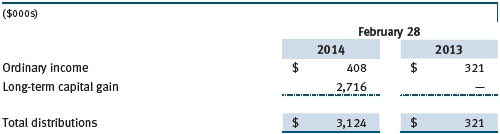
Distributions during the years ended February 28, 2014 and February 28, 2013, were characterized for tax purposes as follows:
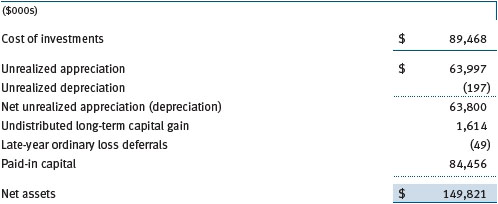
At February 28, 2014, the tax-basis cost of investments and components of net assets were as follows:
The fund intends to retain realized gains to the extent of available capital loss carryforwards. Net realized capital losses may be carried forward indefinitely to offset future realized capital gains. During the year ended February 28, 2014, the fund utilized $33,000 of capital loss carryforwards. In accordance with federal tax laws applicable to investment companies, all or a portion of net losses resulting from (a) specified gains and losses realized between November 1 and the fund’s fiscal year-end plus (b) ordinary income or loss realized between January 1 and the fund’s fiscal year-end are not recognized for tax purposes until the subsequent year (late-year ordinary loss deferrals); however, such losses are recognized for financial reporting purposes in the year realized.
NOTE 5 - RELATED PARTY TRANSACTIONS
The fund is managed by T. Rowe Price Associates, Inc. (Price Associates), a wholly owned subsidiary of T. Rowe Price Group, Inc. (Price Group). The investment management agreement between the fund and Price Associates provides for an annual investment management fee, which is computed daily and paid monthly. The fee consists of an individual fund fee, equal to 0.35% of the fund’s average daily net assets, and a group fee. The group fee rate is calculated based on the combined net assets of certain mutual funds sponsored by Price Associates (the group) applied to a graduated fee schedule, with rates ranging from 0.48% for the first $1 billion of assets to 0.275% for assets in excess of $400 billion. The fund’s group fee is determined by applying the group fee rate to the fund’s average daily net assets. At February 28, 2014, the effective annual group fee rate was 0.29%.
In addition, the fund has entered into service agreements with Price Associates and two wholly owned subsidiaries of Price Associates (collectively, Price). Price Associates computes the daily share price and provides certain other administrative services to the fund. T. Rowe Price Services, Inc., provides shareholder and administrative services in its capacity as the fund’s transfer and dividend-disbursing agent. T. Rowe Price Retirement Plan Services, Inc., provides subaccounting and recordkeeping services for certain retirement accounts invested in the fund. For the year ended February 28, 2014, expenses incurred pursuant to these service agreements were $91,000 for Price Associates; $59,000 for T. Rowe Price Services, Inc.; and less than $1,000 for T. Rowe Price Retirement Plan Services, Inc. The total amount payable at period-end pursuant to these service agreements is reflected as Due to Affiliates in the accompanying financial statements.
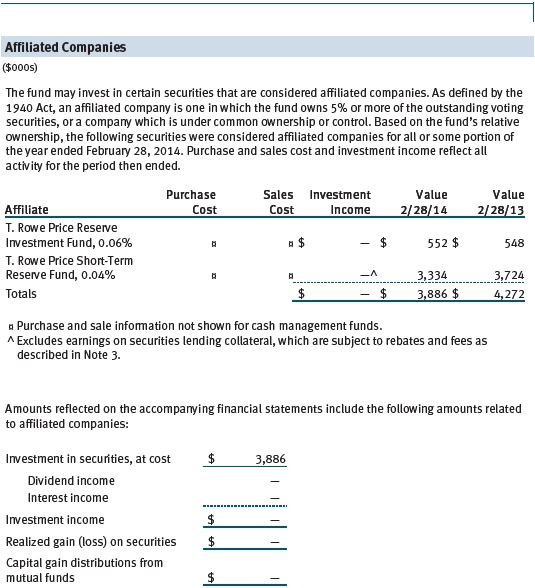
The fund may invest in the T. Rowe Price Reserve Investment Fund, the T. Rowe Price Government Reserve Investment Fund, or the T. Rowe Price Short-Term Reserve Fund (collectively, the Price Reserve Investment Funds), open-end management investment companies managed by Price Associates and considered affiliates of the fund. The Price Reserve Investment Funds are offered as short-term investment options to mutual funds, trusts, and other accounts managed by Price Associates or its affiliates and are not available for direct purchase by members of the public. The Price Reserve Investment Funds pay no investment management fees.
| Report of Independent Registered Public Accounting Firm |
To the Board of Directors of T. Rowe Price Tax-Efficient Funds, Inc. and
Shareholders of T. Rowe Price Tax-Efficient Equity Fund
In our opinion, the accompanying statement of assets and liabilities, including the portfolio of investments, and the related statements of operations and of changes in net assets and the financial highlights present fairly, in all material respects, the financial position of T. Rowe Price Tax-Efficient Equity Fund (comprising T. Rowe Price Tax-Efficient Funds, Inc., hereafter referred to as the “Fund”) at February 28, 2014, and the results of its operations, the changes in its net assets and the financial highlights for each of the periods indicated therein, in conformity with accounting principles generally accepted in the United States of America. These financial statements and financial highlights (hereafter referred to as “financial statements”) are the responsibility of the Fund’s management; our responsibility is to express an opinion on these financial statements based on our audits. We conducted our audits of these financial statements in accordance with the standards of the Public Company Accounting Oversight Board (United States). Those standards require that we plan and perform the audit to obtain reasonable assurance about whether the financial statements are free of material misstatement. An audit includes examining, on a test basis, evidence supporting the amounts and disclosures in the financial statements, assessing the accounting principles used and significant estimates made by management, and evaluating the overall financial statement presentation. We believe that our audits, which included confirmation of securities at February 28, 2014 by correspondence with the custodian and brokers, and confirmation of the underlying funds by correspondence with the transfer agent, provide a reasonable basis for our opinion.
PricewaterhouseCoopers LLP
Baltimore, Maryland
April 16, 2014
| Tax Information (Unaudited) for the Tax Year Ended 2/28/14 |
We are providing this information as required by the Internal Revenue Code. The amounts shown may differ from those elsewhere in this report because of differences between tax and financial reporting requirements.
The fund’s distributions to shareholders included $2,716,000 from long-term capital gains, subject to the 15% rate gains category.
For taxable non-corporate shareholders, $408,000 of the fund’s income represents qualified dividend income subject to the 15% rate category.
For corporate shareholders, $408,000 of the fund’s income qualifies for the dividends-received deduction
| Information on Proxy Voting Policies, Procedures, and Records |
A description of the policies and procedures used by T. Rowe Price funds and portfolios to determine how to vote proxies relating to portfolio securities is available in each fund’s Statement of Additional Information. You may request this document by calling 1-800-225-5132 or by accessing the SEC’s website, sec.gov.
The description of our proxy voting policies and procedures is also available on our website, troweprice.com. To access it, click on the words “Social Responsibility” at the top of our corporate homepage. Next, click on the words “Conducting Business Responsibly” on the left side of the page that appears. Finally, click on the words “Proxy Voting Policies” on the left side of the page that appears.
Each fund’s most recent annual proxy voting record is available on our website and through the SEC’s website. To access it through our website, follow the above directions to reach the “Conducting Business Responsibly” page. Click on the words “Proxy Voting Records” on the left side of that page, and then click on the “View Proxy Voting Records” link at the bottom of the page that appears.
| How to Obtain Quarterly Portfolio Holdings |
The fund files a complete schedule of portfolio holdings with the Securities and Exchange Commission for the first and third quarters of each fiscal year on Form N-Q. The fund’s Form N-Q is available electronically on the SEC’s website (sec.gov); hard copies may be reviewed and copied at the SEC’s Public Reference Room, 100 F St. N.E., Washington, DC 20549. For more information on the Public Reference Room, call 1-800-SEC-0330.
| About the Fund’s Directors and Officers |
Your fund is overseen by a Board of Directors (Board) that meets regularly to review a wide variety of matters affecting or potentially affecting the fund, including performance, investment programs, compliance matters, advisory fees and expenses, service providers, and business and regulatory affairs. The Board elects the fund’s officers, who are listed in the final table. At least 75% of the Board’s members are independent of T. Rowe Price Associates, Inc. (T. Rowe Price), and its affiliates; “inside” or “interested” directors are employees or officers of T. Rowe Price. The business address of each director and officer is 100 East Pratt Street, Baltimore, Maryland 21202. The Statement of Additional Information includes additional information about the fund directors and is available without charge by calling a T. Rowe Price representative at 1-800-638-5660.
Independent Directors
| Name | ||
| (Year of Birth) | ||
| Year Elected* | ||
| [Number of T. Rowe Price | Principal Occupation(s) and Directorships of Public Companies and | |
| Portfolios Overseen] | Other Investment Companies During the Past Five Years | |
| William R. Brody | President and Trustee, Salk Institute for Biological Studies (2009 | |
| (1944) | to present); Director, Novartis, Inc. (2009 to present); Director, IBM | |
| 2009 | (2007 to present); Director, BioMed Realty Trust (2013 to present) | |
| [157] | ||
| Anthony W. Deering | Chairman, Exeter Capital, LLC, a private investment firm (2004 to | |
| (1945) | present); Director, Brixmor Real Estate Investment Trust (2012 to | |
| 2001 | present); Director and Member of the Advisory Board, Deutsche | |
| [157] | Bank North America (2004 to present); Director, Under Armour | |
| (2008 to present); Director, Vornado Real Estate Investment Trust | ||
| (2004 to 2012) | ||
| Donald W. Dick, Jr. | Principal, EuroCapital Partners, LLC, an acquisition and management | |
| (1943) | advisory firm (1995 to present) | |
| 1997 | ||
| [157] | ||
| Bruce W. Duncan | President, Chief Executive Officer, and Director, First Industrial Realty | |
| (1951) | Trust, owner and operator of industrial properties (2009 to present); | |
| 2013 | Chairman of the Board (2005 to present), Interim Chief Executive | |
| [157] | Officer (2007), and Director (1999 to present), Starwood Hotels & | |
| Resorts, a hotel and leisure company | ||
| Robert J. Gerrard, Jr. | Advisory Board Member, Pipeline Crisis/Winning Strategies (1997 | |
| (1952) | to present); Chairman of Compensation Committee and Director, | |
| 2012 | Syniverse Holdings, Inc. (2008 to 2011) | |
| [157] | ||
| Karen N. Horn | Limited Partner and Senior Managing Director, Brock Capital | |
| (1943) | Group, an advisory and investment banking firm (2004 to present); | |
| 2003 | Director, Eli Lilly and Company (1987 to present); Director, Simon | |
| [157] | Property Group (2004 to present); Director, Norfolk Southern (2008 | |
| to present) | ||
| Paul F. McBride | Former Company Officer and Senior Vice President, Human | |
| (1956) | Resources and Corporate Initiatives (2004 to 2010) | |
| 2013 | ||
| [157] | ||
| Cecilia E. Rouse, Ph.D. | Dean, Woodrow Wilson School (2012 to present); Professor and | |
| (1963) | Researcher, Princeton University (1992 to present); Director, MDRC, | |
| 2012 | a nonprofit education and social policy research organization | |
| [157] | (2011 to present); Member, National Academy of Education (2010 | |
| to present); Research Associate, National Bureau of Economic | ||
| Research’s Labor Studies Program (2011 to present); Member, | ||
| President’s Council of Economic Advisors (2009 to 2011); Chair | ||
| of Committee on the Status of Minority Groups in the Economic | ||
| Profession, American Economic Association (2012 to present) | ||
| John G. Schreiber | Owner/President, Centaur Capital Partners, Inc., a real estate | |
| (1946) | investment company (1991 to present); Cofounder and Partner, | |
| 2001 | Blackstone Real Estate Advisors, L.P. (1992 to present); Director, | |
| [157] | General Growth Properties, Inc. (2010 to present); Director, BXMT | |
| (formerly Capital Trust, Inc.), a real estate investment company | ||
| (2012 to present); Director and Chairman of the Board, Brixmor | ||
| Property Group, Inc. (2013 to present); Director, Hilton Worldwide | ||
| (2013 to present) | ||
| Mark R. Tercek | President and Chief Executive Officer, The Nature Conservancy (2008 | |
| (1957) | to present); Managing Director, The Goldman Sachs Group, Inc. | |
| 2009 | (1984 to 2008) | |
| [157] | ||
| *Each independent director serves until retirement, resignation, or election of a successor. | ||
| Inside Directors | ||
| Name | ||
| (Year of Birth) | ||
| Year Elected* | ||
| [Number of T. Rowe Price | Principal Occupation(s) and Directorships of Public Companies and | |
| Portfolios Overseen] | Other Investment Companies During the Past Five Years | |
| Edward C. Bernard | Director and Vice President, T. Rowe Price; Vice Chairman of the | |
| (1956) | Board, Director, and Vice President, T. Rowe Price Group, Inc.; | |
| 2006 | Chairman of the Board, Director, and President, T. Rowe Price | |
| [157] | Investment Services, Inc.; Chairman of the Board and Director, | |
| T. Rowe Price Retirement Plan Services, Inc., and T. Rowe Price | ||
| Services, Inc.; Chairman of the Board, Chief Executive Officer, | ||
| and Director, T. Rowe Price International; Chairman of the Board, | ||
| Chief Executive Officer, Director, and President, T. Rowe Price Trust | ||
| Company; Chairman of the Board, all funds | ||
| Brian C. Rogers, CFA, CIC | Chief Investment Officer, Director, and Vice President, T. Rowe Price; | |
| (1955) | Chairman of the Board, Chief Investment Officer, Director, and Vice | |
| 2006 | President, T. Rowe Price Group, Inc.; Vice President, T. Rowe Price | |
| [105] | Trust Company | |
| *Each inside director serves until retirement, resignation, or election of a successor. | ||
| Officers | ||
| Name (Year of Birth) | ||
| Position Held With Tax-Efficient Equity Fund | Principal Occupation(s) | |
| Kennard W. Allen (1977) | Vice President, T. Rowe Price and T. Rowe Price | |
| Vice President | Group, Inc. | |
| Preston G. Athey, CFA, CIC (1949) | Vice President, T. Rowe Price, T. Rowe Price | |
| Vice President | Group, Inc., and T. Rowe Price Trust Company | |
| Ziad Bakri, M.D., CFA (1980) | Vice President, T. Rowe Price and T. Rowe Price | |
| Vice President | Group, Inc.; formerly Vice President, Cowen and | |
| Company (to 2011) | ||
| Andrew S. Davis (1978) | Vice President, T. Rowe Price and T. Rowe | |
| Vice President | Price Group, Inc.; Intern, Franklin Templeton | |
| Investments (to 2009) | ||
| Donald J. Easley, CFA (1971) | Vice President, T. Rowe Price and T. Rowe Price | |
| Vice President | Group, Inc. | |
| Roger L. Fiery III, CPA (1959) | Vice President, Price Hong Kong, Price | |
| Vice President | Singapore, T. Rowe Price, T. Rowe Price Group, | |
| Inc., T. Rowe Price International, and T. Rowe | ||
| Price Trust Company | ||
| John R. Gilner (1961) | Chief Compliance Officer and Vice President, | |
| Chief Compliance Officer | T. Rowe Price; Vice President, T. Rowe Price | |
| Group, Inc., and T. Rowe Price Investment | ||
| Services, Inc. | ||
| Gregory S. Golczewski (1966) | Vice President, T. Rowe Price and T. Rowe Price | |
| Vice President | Trust Company | |
| Gregory K. Hinkle, CPA (1958) | Vice President, T. Rowe Price, T. Rowe Price | |
| Treasurer | Group, Inc., and T. Rowe Price Trust Company | |
| Patricia B. Lippert (1953) | Assistant Vice President, T. Rowe Price and | |
| Secretary | T. Rowe Price Investment Services, Inc. | |
| David Oestreicher (1967) | Director, Vice President, and Secretary, T. Rowe | |
| Vice President | Price Investment Services, Inc., T. Rowe | |
| Price Retirement Plan Services, Inc., T. Rowe | ||
| Price Services, Inc., and T. Rowe Price Trust | ||
| Company; Chief Legal Officer, Vice President, | ||
| and Secretary, T. Rowe Price Group, Inc.; Vice | ||
| President and Secretary, T. Rowe Price and | ||
| T. Rowe Price International; Vice President, | ||
| Price Hong Kong and Price Singapore | ||
| Timothy E. Parker, CFA (1974) | Vice President, T. Rowe Price and T. Rowe Price | |
| Vice President | Group, Inc. | |
| Donald J. Peters (1959) | Vice President, T. Rowe Price and T. Rowe Price | |
| President | Group, Inc. | |
| Robert T. Quinn, Jr., (1972) | Vice President, T. Rowe Price and T. Rowe Price | |
| Vice President | Group, Inc. | |
| Deborah D. Seidel (1962) | Vice President, T. Rowe Price, T. Rowe Price | |
| Vice President | Group, Inc., T. Rowe Price Investment Services, | |
| Inc., and T. Rowe Price Services, Inc. | ||
| William J. Stromberg, CFA (1960) | Director and Vice President, T. Rowe Price; Vice | |
| Vice President | President, Price Hong Kong, Price Singapore, | |
| T. Rowe Price Group, Inc., T. Rowe Price | ||
| International , and T. Rowe Price Trust Company | ||
| Taymour R. Tamaddon, CFA (1976) | Vice President, T. Rowe Price and T. Rowe Price | |
| Vice President | Group, Inc. | |
| Julie L. Waples (1970) | Vice President, T. Rowe Price | |
| Vice President | ||
| Mark R. Weigman, CFA, CIC (1962) | Vice President, T. Rowe Price, T. Rowe Price | |
| Vice President | Group, Inc., and T. Rowe Price Trust Company | |
| Unless otherwise noted, officers have been employees of T. Rowe Price or T. Rowe Price International for at least 5 years. | ||
Item 2. Code of Ethics.
The registrant has adopted a code of ethics, as defined in Item 2 of Form N-CSR, applicable to its principal executive officer, principal financial officer, principal accounting officer or controller, or persons performing similar functions. A copy of this code of ethics is filed as an exhibit to this Form N-CSR. No substantive amendments were approved or waivers were granted to this code of ethics during the period covered by this report.
Item 3. Audit Committee Financial Expert.
The registrant’s Board of Directors/Trustees has determined that Mr. Anthony W. Deering qualifies as an audit committee financial expert, as defined in Item 3 of Form N-CSR. Mr. Deering is considered independent for purposes of Item 3 of Form N-CSR.
Item 4. Principal Accountant Fees and Services.
(a) – (d) Aggregate fees billed for the last two fiscal years for professional services rendered to, or on behalf of, the registrant by the registrant’s principal accountant were as follows:
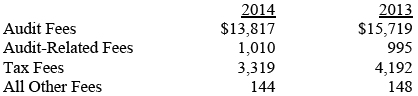
Audit fees include amounts related to the audit of the registrant’s annual financial statements and services normally provided by the accountant in connection with statutory and regulatory filings. Audit-related fees include amounts reasonably related to the performance of the audit of the registrant’s financial statements and specifically include the issuance of a report on internal controls and, if applicable, agreed-upon procedures related to fund acquisitions. Tax fees include amounts related to services for tax compliance, tax planning, and tax advice. The nature of these services specifically includes the review of distribution calculations and the preparation of Federal, state, and excise tax returns. All other fees include the registrant’s pro-rata share of amounts for agreed-upon procedures in conjunction with service contract approvals by the registrant’s Board of Directors/Trustees.
(e)(1) The registrant’s audit committee has adopted a policy whereby audit and non-audit services performed by the registrant’s principal accountant for the registrant, its investment adviser, and any entity controlling, controlled by, or under common control with the investment adviser that provides ongoing services to the registrant require pre-approval in advance at regularly scheduled audit committee meetings. If such a service is required between regularly scheduled audit committee meetings, pre-approval may be authorized by one audit committee member with ratification at the next scheduled audit committee meeting. Waiver of pre-approval for audit or non-audit services requiring fees of a de minimis amount is not permitted.
(2) No services included in (b) – (d) above were approved pursuant to paragraph (c)(7)(i)(C) of Rule 2-01 of Regulation S-X.
(f) Less than 50 percent of the hours expended on the principal accountant’s engagement to audit the registrant’s financial statements for the most recent fiscal year were attributed to work performed by persons other than the principal accountant’s full-time, permanent employees.
(g) The aggregate fees billed for the most recent fiscal year and the preceding fiscal year by the registrant’s principal accountant for non-audit services rendered to the registrant, its investment adviser, and any entity controlling, controlled by, or under common control with the investment adviser that provides ongoing services to the registrant were $1,862,000 and $1,651,000, respectively.
(h) All non-audit services rendered in (g) above were pre-approved by the registrant’s audit committee. Accordingly, these services were considered by the registrant’s audit committee in maintaining the principal accountant’s independence.
Item 5. Audit Committee of Listed Registrants.
Not applicable.
Item 6. Investments.
(a) Not applicable. The complete schedule of investments is included in Item 1 of this Form N-CSR.
(b) Not applicable.
Item 7. Disclosure of Proxy Voting Policies and Procedures for Closed-End Management Investment Companies.
Not applicable.
Item 8. Portfolio Managers of Closed-End Management Investment Companies.
Not applicable.
Item 9. Purchases of Equity Securities by Closed-End Management Investment Company and Affiliated Purchasers.
Not applicable.
Item 10. Submission of Matters to a Vote of Security Holders.
Not applicable.
Item 11. Controls and Procedures.
(a) The registrant’s principal executive officer and principal financial officer have evaluated the registrant’s disclosure controls and procedures within 90 days of this filing and have concluded that the registrant’s disclosure controls and procedures were effective, as of that date, in ensuring that information required to be disclosed by the registrant in this Form N-CSR was recorded, processed, summarized, and reported timely.
(b) The registrant’s principal executive officer and principal financial officer are aware of no change in the registrant’s internal control over financial reporting that occurred during the registrant’s second fiscal quarter covered by this report that has materially affected, or is reasonably likely to materially affect, the registrant’s internal control over financial reporting.
Item 12. Exhibits.
(a)(1) The registrant’s code of ethics pursuant to Item 2 of Form N-CSR is attached.
(2) Separate certifications by the registrant's principal executive officer and principal financial officer, pursuant to Section 302 of the Sarbanes-Oxley Act of 2002 and required by Rule 30a-2(a) under the Investment Company Act of 1940, are attached.
(3) Written solicitation to repurchase securities issued by closed-end companies: not applicable.
(b) A certification by the registrant's principal executive officer and principal financial officer, pursuant to Section 906 of the Sarbanes-Oxley Act of 2002 and required by Rule 30a-2(b) under the Investment Company Act of 1940, is attached.
SIGNATURES
Pursuant to the requirements of the Securities Exchange Act of 1934 and the Investment Company Act of 1940, the registrant has duly caused this report to be signed on its behalf by the undersigned, thereunto duly authorized.
T. Rowe Price Tax-Efficient Funds, Inc.
| By | /s/ Edward C. Bernard | |
| Edward C. Bernard | ||
| Principal Executive Officer | ||
| Date April 16, 2014 | ||
Pursuant to the requirements of the Securities Exchange Act of 1934 and the Investment Company Act of 1940, this report has been signed below by the following persons on behalf of the registrant and in the capacities and on the dates indicated.
| By | /s/ Edward C. Bernard | |
| Edward C. Bernard | ||
| Principal Executive Officer | ||
| Date April 16, 2014 | ||
| By | /s/ Gregory K. Hinkle | |
| Gregory K. Hinkle | ||
| Principal Financial Officer | ||
| Date April 16, 2014 | ||