UNITED STATES
SECURITIES AND EXCHANGE COMMISSION
Washington, D.C. 20549
FORM N-CSR
CERTIFIED SHAREHOLDER REPORT OF REGISTERED
MANAGEMENT INVESTMENT COMPANIES
Investment Company Act File Number: 811-08207
| T. Rowe Price Tax-Efficient Funds, Inc. |
| (Exact name of registrant as specified in charter) |
| 100 East Pratt Street, Baltimore, MD 21202 |
| (Address of principal executive offices) |
| David Oestreicher |
| 100 East Pratt Street, Baltimore, MD 21202 |
| (Name and address of agent for service) |
Registrant’s telephone number, including area code: (410) 345-2000
Date of fiscal year end: February 29
Date of reporting period: February 29, 2012
Item 1. Report to Shareholders
 |
| Tax-Efficient Equity Fund | February 29, 2012 |
The views and opinions in this report were current as of February 29, 2012. They are not guarantees of performance or investment results and should not be taken as investment advice. Investment decisions reflect a variety of factors, and the managers reserve the right to change their views about individual stocks, sectors, and the markets at any time. As a result, the views expressed should not be relied upon as a forecast of the fund’s future investment intent. The report is certified under the Sarbanes-Oxley Act, which requires mutual funds and other public companies to affirm that, to the best of their knowledge, the information in their financial reports is fairly and accurately stated in all material respects.
REPORTS ON THE WEB
Sign up for our E-mail Program, and you can begin to receive updated fund reports and prospectuses online rather than through the mail. Log in to your account at troweprice.com for more information.
Manager’s Letter
Fellow Shareholders
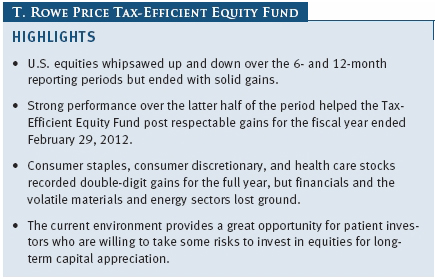
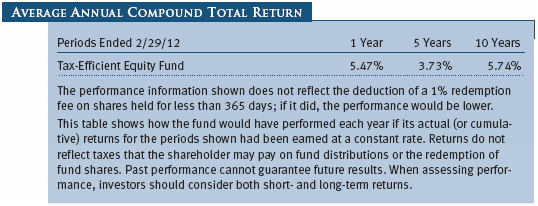
U.S. equities went on a roller coaster ride over the 12 months ended February 29, 2012, but ended the period with solid gains. A resilient U.S. economic recovery coupled with healthy corporate earnings and improved balance sheets were able to overcome headwinds from the European debt crisis, turmoil in the Middle East, and slowing growth in China and other key emerging markets. The Tax-Efficient Equity Fund posted double-digit gains over the latter half of our reporting period, lifting full-year returns into solidly positive territory. The fund lagged the Russell 3000 Growth Index but outpaced its Lipper peer group index for both periods.
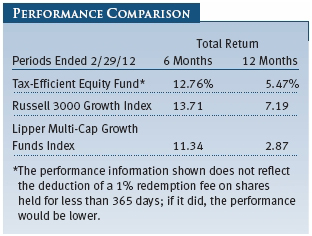
As shown in the Performance Comparison table, the Tax-Efficient Equity Fund gained 12.76% and 5.47% for the 6- and 12-month periods ended February 29, 2012, respectively. The fund’s information technology, industrials and business services, and financial stocks were our strongest absolute performers for the latter half of the year, while energy shares generated modest gains. Our materials stocks posted a slim loss. Consumer staples, consumer discretionary, and health care recorded double-digit gains for the full year, but financials and the volatile materials and energy sectors each lost ground. Stock selection weighed on returns versus the Russell index over both time periods, due largely to the underperformance of our information technology holdings. However, this was partially offset by positive sector weightings over the latter half of the fiscal year, with an underweight to the defensive consumer staples sector providing a substantial boost.
MARKET ENVIRONMENT
The U.S. economy proved far more resilient than many experts had expected and continued to recover over the past 12 months despite a series of significant headwinds. Challenges included political brinksmanship over extending the U.S. debt ceiling and a subsequent rating downgrade of U.S. debt, the ongoing debt crisis and economic malaise in Europe, political and social unrest in the oil-rich Middle East and North Africa, and slowing economic growth in China and other key emerging markets. Stock markets found support in a steady stream of solid corporate earnings and healthy balance sheets. Volatility was high, however, as risk appetite seemed to wax and wane with each news cycle.
The past 12 months are a classic example of why we remain fully invested and do not attempt to time the market or forecast market direction. Many investors remain hesitant to invest in equities for long-term growth, preferring instead the perceived safety of low-yielding U.S. government securities. Long-term Treasuries were, in fact, one of the best-performing assets during 2011 as the Citigroup 30-year Treasury Index soared in excess of 33%.
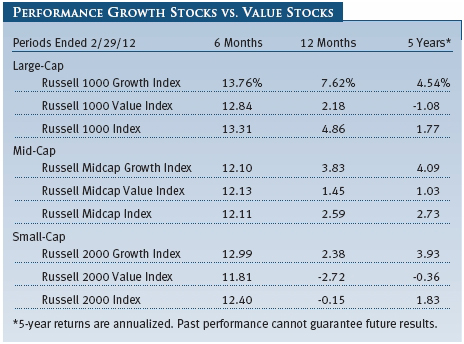
As measured by various Russell indexes, large- and mid-cap shares generated modest 12-month gains, but small-caps posted a slight loss. Growth stocks outperformed value for the full year, but returns were roughly equal over the closing six months—a period marked by positive performance across all market caps and styles. The defensive consumer staples, utilities, and health care sectors posted the strongest returns in a volatile 12-month period. Consumer discretionary, information technology, and telecommunication services also posted solid gains, but financials and the economically sensitive materials and energy sectors lost ground.
PORTFOLIO CHARACTERISTICS
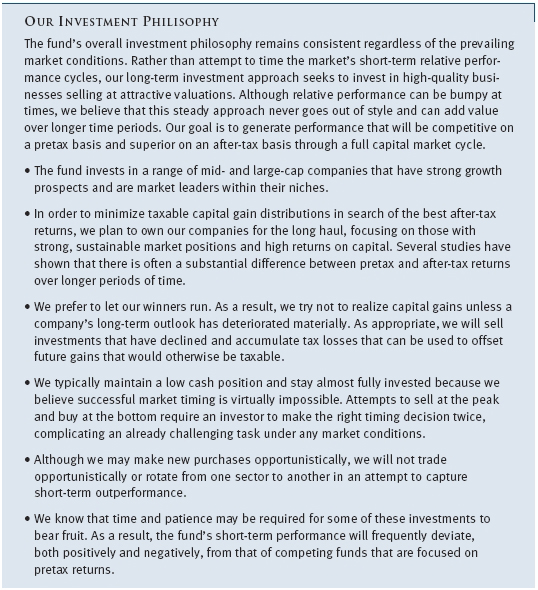
The Tax-Efficient Equity Fund seeks to buy and hold attractively valued, high-quality growth companies with good business models, strong management, and favorable long-term prospects. Our goal is to build a portfolio that keeps pace with the broader market when stocks are rising and outperforms during more challenging periods. Through a full market cycle, we seek to generate competitive pretax performance and outperform on an after-tax basis.
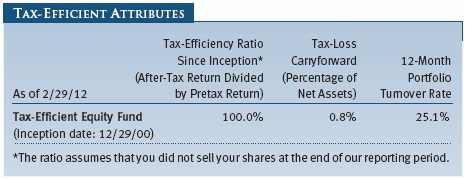
- Tax Efficiency: The fund’s tax-efficiency ratio is calculated by dividing the fund’s after-tax return by its pretax return. Our high tax-efficiency ratio reflects that the fund has made no capital gain distributions since its inception on December 29, 2000. Given the fund’s relatively low turnover and high tax efficiency, its performance versus its benchmarks and tax-blind portfolios looks better on an after-tax basis than on a pretax basis. Considering the near certainty of higher tax rates in the future, we believe strategies that recognize significant short- and long-term gains will be increasingly disadvantageous for taxable investors.
- Tax Loss Carryforward: The fund’s tax capital loss carryforward (as a percentage of net assets) accumulated through the end of our fiscal year allows us to use losses in the future to offset capital gains that the fund may realize so they are not passed to shareholders.
- Return on Equity: The fund’s 12-month return on equity (ROE) at the end of our reporting period was 20.6%. A high, sustainable ROE indicates that a company is wisely using its investment dollars to generate earnings growth and is one of the most important characteristics we consider when researching potential investments and reviewing current holdings.
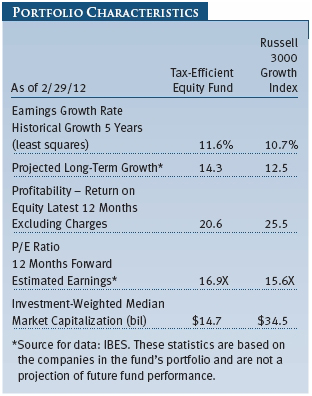
- Earnings Growth: The earnings of the companies in our portfolio are expected to grow faster than that of the Russell 3000 Growth Index. The fund’s projected long-term earnings growth rate of 14.3% exceeds the 12.5% index rate, while our historical earnings growth rate over the last five years was 11.6% versus 10.7% for the index.
- Market Capitalization: The fund’s investment-weighted median market capitalization is $14.7 billion versus $34.5 billion for the index, reflecting the fund’s greater exposure to mid-cap companies and its broad diversification. At the end of our reporting period, the fund held shares in approximately 342 companies. (Diversification cannot assure a profit or protect against loss in a declining market.)
PERFORMANCE REVIEW
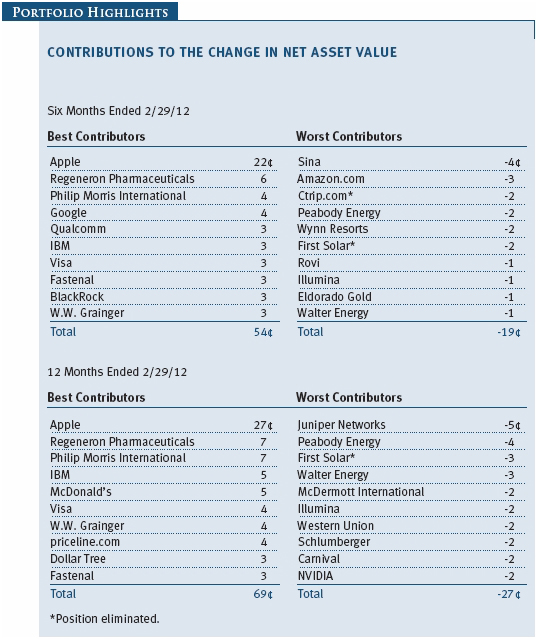
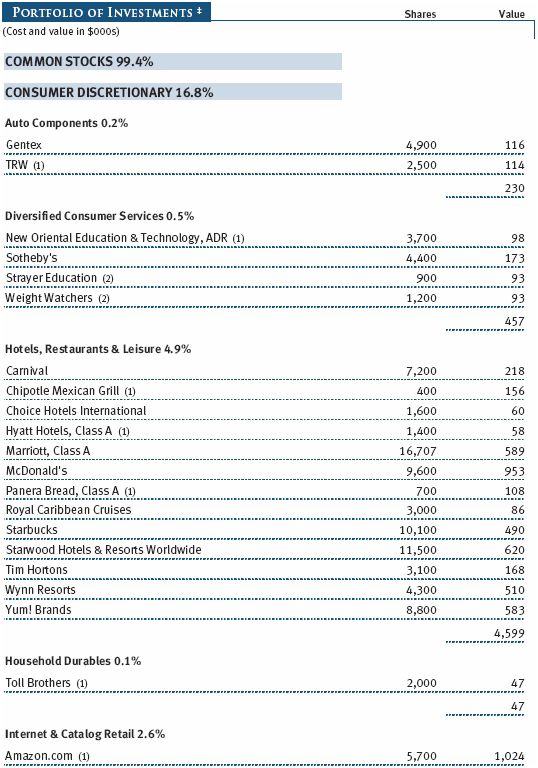
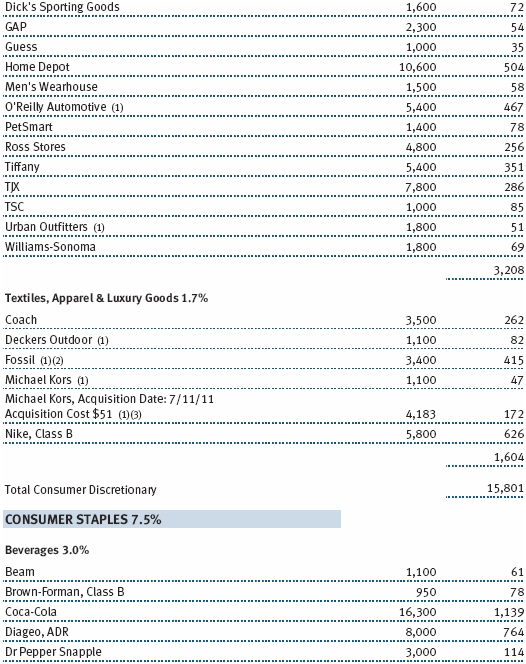
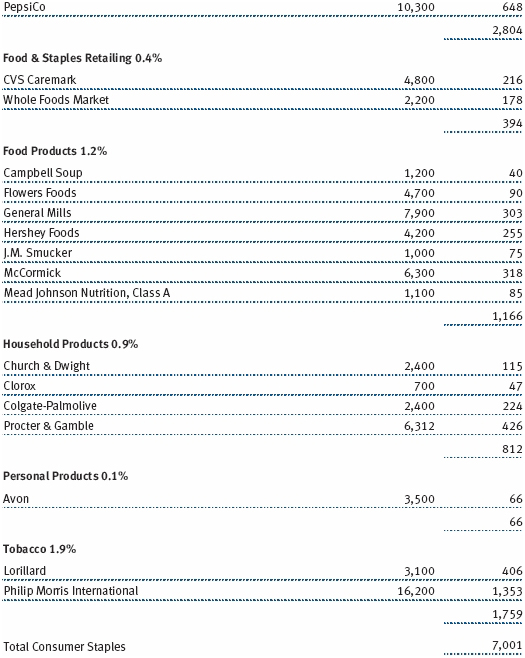
Consumer staples was the fund’s best-performing sector in absolute terms over the past 12 months. In our last shareholder letter, we acknowledged that the fund’s underweight allocation to this traditionally defensive sector detracted from relative returns as investors sought safety amid heightened market volatility. We also indicated that we were maintaining our underweight as we did not believe market and economic fundamentals warranted extreme risk aversion. In fact, our belief was justified over the closing six months of the period as risk appetite rebounded and consumer staples shares generally underperformed the broader market. Shares of tobacco giant Philip Morris International climbed as investors were attracted by its diversified non-U.S. revenue stream and good pricing power. Shares of spirits maker Diageo rose nicely due to strong organic sales growth in its core European market, as well as in the U.S. and emerging markets, particularly Latin America. Global beverage giant Coca-Cola was another good performer as the company continued to grow in key emerging markets and gained market share from rivals in established markets. Shares of Walgreen and Avon weighed on returns. Walgreen declined after the company announced the termination of its relationship with the Express Scripts network, while cosmetics company Avon experienced weakness in its North American operations and disappointing results in important growth markets like Brazil. (Please refer to the portfolio of investments for a complete list of holdings and the amount each represents in the portfolio.)
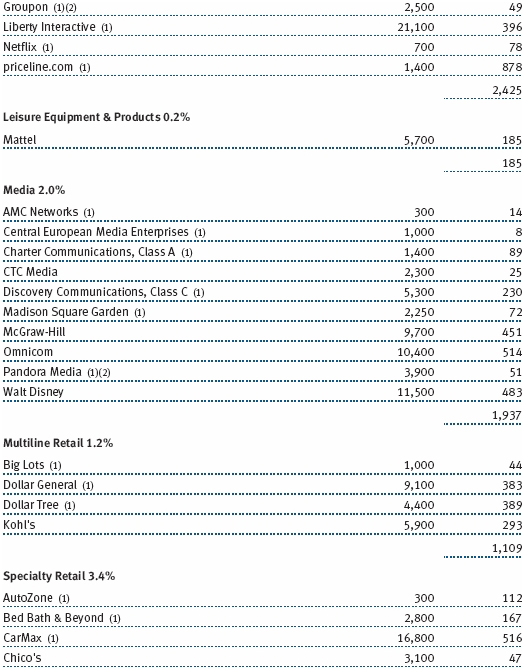
Our consumer discretionary holdings posted double-digit gains, while stock selection and an overweight allocation versus the index boosted relative performance. The sector includes a broad assortment of businesses, including retailers, media companies, homebuilders, hotels, and restaurants, that frequently feature good business models, excellent cash flow, and other favorable attributes. McDonald’s was a standout performer on the heels of strong same-store sales at home and overseas. The company’s consistent stock performance and impressive fundamental underpinnings continue to set it apart from many other major consumer companies. Internet and catalog retailers rebounded as the U.S. economic recovery proved remarkably resilient, benefiting Amazon.com and travel site priceline.com. Value-oriented retailers Dollar Tree and Dollar General were also among our better performers, as were specialty retailers such as O’Reilly Automotive and Home Depot. Cruise ship operator Carnival suffered from rising fuel prices, economic weakness in European end markets, and a subsidiary’s highly publicized grounding in the Mediterranean Sea. Hotel stocks such as Starwood Hotels & Resorts Worldwide and Hyatt Hotels also struggled as higher fuel prices curtailed leisure and business travel. Chipotle Mexican Grill did well, as its efficient operations continued to generate high returns, allowing the company to open new locations and fund development of new products. McGraw-Hill, a global information services provider and publisher, benefited from strong cash flows and shareholder activism aimed at splitting the company into separate segments.
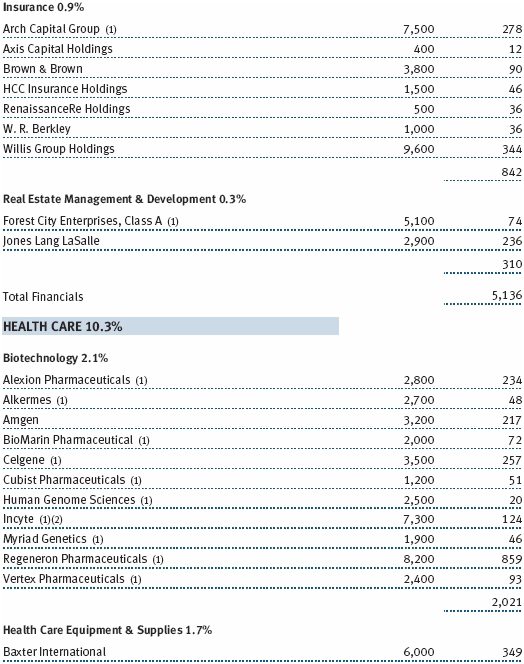
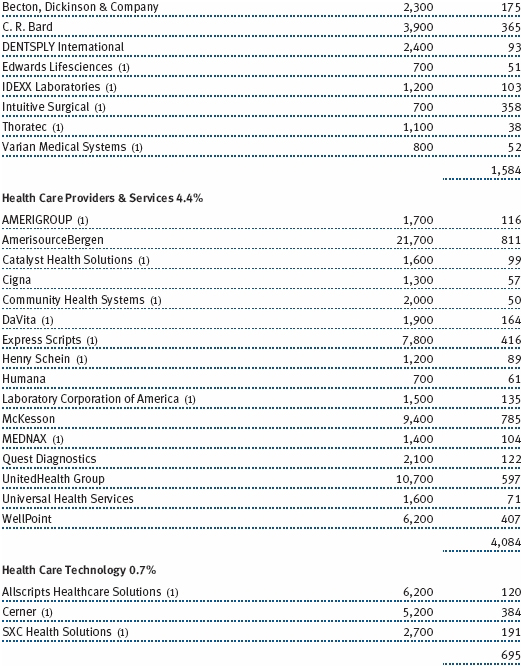
Our health care stocks generated good gains, and stock selection aided relative performance. Health care remains a challenging sector in which to invest, given that innovation is difficult, expensive, and increasingly unaffordable. Still, the sector features some good long-term investment opportunities. Shares of Regeneron Pharmaceuticals were particularly strong after FDA approval of Eylea, the company’s advanced biologic drug targeted for the treatment of age-related macular degeneration, a retinal disease that could lead to blindness if left untreated. Regeneron also maintains a lucrative research and development collaboration with Sanofi-Aventis, which offsets the large majority of pipeline R&D expenses. Alexion Pharmaceuticals was another good contributor, driven by growing sales of its rare blood disorder drug Soliris. Our positions in health care equipment and supplies generated mixed results. Intuitive Surgical fared reasonably well, but Stryker and Becton, Dickinson & Company were among our weaker performers. Biotech companies Human Genome Sciences and Dendreon weighed on results due to disappointing sales of new drugs.
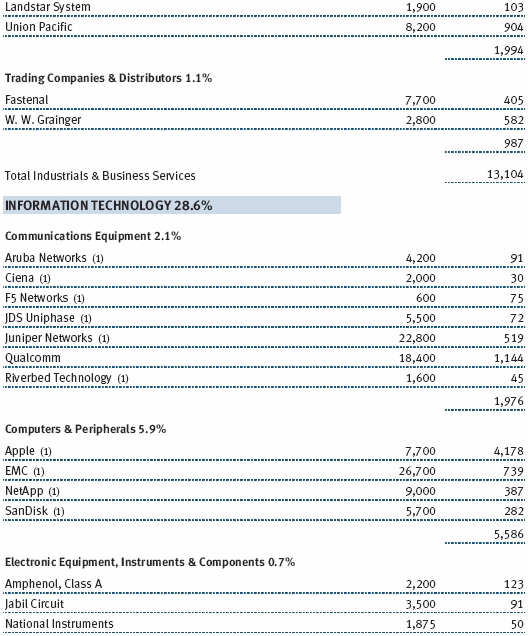
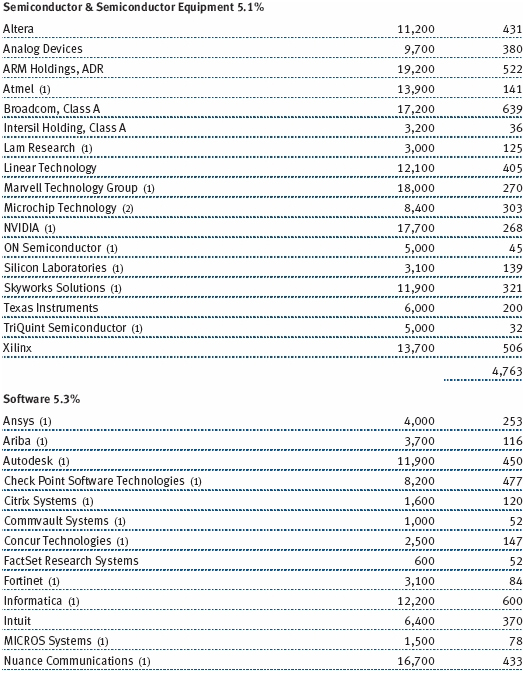
The information technology sector registered good gains for the year due to exceptional performance in the latter half of the period, but stock selection detracted from relative performance. Information technology has a number of businesses with attractive long-term growth potential, and it continues to be our largest sector allocation. Apple was the fund’s strongest contributor and remained our largest single position. Although the tragic passing of founder Steve Jobs represents a significant loss, the company continues to execute its strategy well. Sales of the iPad tablet device were better than expected, and the iPad joins the iPod, iPhone, and other devices in a long list of consumer hits for Apple that should help drive strong growth for some time. Visa was also a significant contributor. Shares rallied sharply as the U.S. economy continued to grow and labor markets improved, both of which bode well for consumer spending. Semiconductor stocks fared poorly overall for the year, led by NVIDIA, Marvell Technology Group, and Altera. However, National Semiconductor and Varian Semiconductor Equipment managed respectable gains and offset some of the damage as they were acquired at substantial premiums. Chinese Internet portal Sina was a top performer in the first half of the year, but shares tumbled sharply in the second half amid onerous government requirements to register and verify microbloggers. We still believe in the company’s long-term prospects, and its valuation remains reasonable compared with U.S. social media companies.
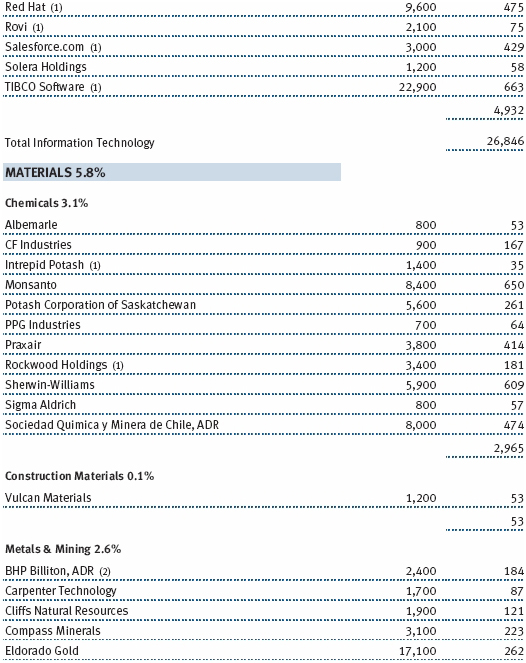
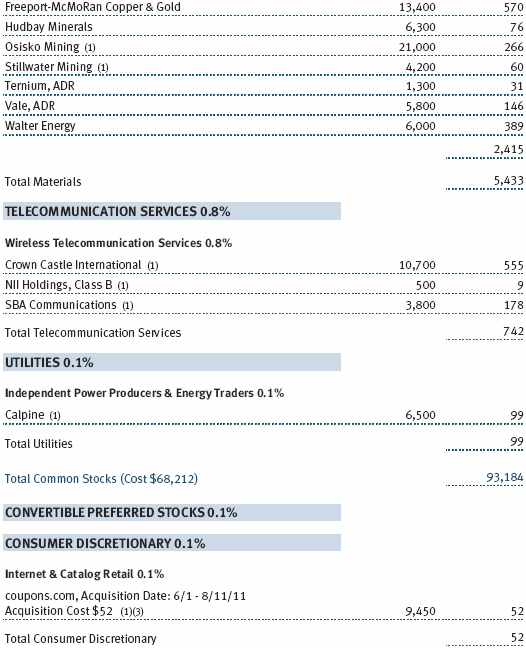
Materials, which accounts for approximately 6% of our portfolio, was the fund’s weakest sector for the fiscal year amid investor concerns about slowing global economic growth. Stock selection and a slight overweight allocation also detracted from performance relative to the index. We do not attempt to forecast commodity price fluctuations in this extremely volatile sector, nor do we seek to profit from such movements. Rather, our approach is to seek differentiated or low-cost basic materials companies that are well positioned for long-term growth. The sector also serves as a hedge against inflation. Metals and mining stocks were particularly weak, and copper producer Freeport-McMoRan Copper & Gold fell more than most. Our chemical companies helped to offset some of the poor performance from metals and mining. Praxair and Monsanto produced solid gains, as did defensive companies such as paint maker Sherwin-Williams.
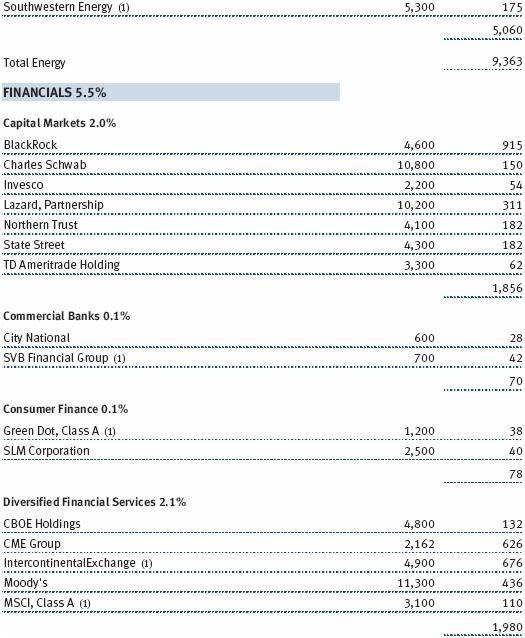
Our financials shares also weighed on performance as weak loan demand, low interest rates, and burdensome capital requirements contributed to a tough earnings growth environment in the first half of the fiscal year. Stock selection and a modest overweight versus the Russell index detracted from relative performance, but financials remains one of our smaller sector allocations. Capital markets firms such as Lazard and Charles Schwab were particularly weak amid the heightened market volatility. Commercial banks also lost ground, with First Horizon National and TCF Financial among the fund’s poorest performers. Leading global rating agency Moody’s was a rare bright spot in the sector. Moody’s is a high-quality business with growth prospects tied to long-term growth and development in global financial markets. The more time that passes, the less likely it is that legal and regulatory risks are going to materially alter the company’s business model. Insurance holdings Arch Capital Group and W.R. Berkley were solid performers. We continue to favor insurance underwriters and insurance brokers because we expect an improving pricing environment in the years ahead.
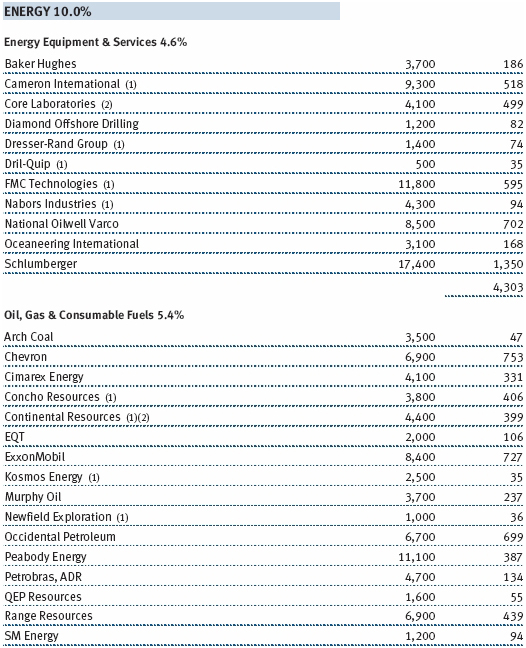
Our energy stocks declined as strong performance over the latter half of the period was unable to overcome pronounced weakness over the first six months of our fiscal year. As with the materials sector, we do not attempt to forecast energy prices, nor do we invest in energy stocks in an attempt to play short-term price movements. Rather, we look to invest in differentiated service companies and those that are skilled at finding underlying resources. Coal stocks Peabody Energy and Arch Coal were among our largest detractors over the 12-month period as low natural gas prices led many utilities to choose gas over coal during a mild winter. In the face of a relatively subdued outlook for natural gas prices, we continue to stick to our philosophy of buying low-cost producers whose assets are improving with technology and time. Range Resources, a leading producer in the Marcellus shale, is such a company and was one of our stronger performers for the year. FMC Technologies, a world leader in subsea well control equipment, was another good performer. FMC provides key enabling technology for offshore production and has benefited from spending growth in this area as onshore access in OPEC nations remains challenging.
OUTLOOK
Despite the volatility of the past year, the current environment provides a great opportunity for patient investors who are willing to take reasonable risks to invest in equities for long-term capital appreciation. The U.S. economy and corporate earnings are growing, and the Federal Reserve’s monetary policies are highly accommodative. Corporations have substantial cash reserves on their balance sheets and are increasing dividends to shareholders. In some cases, stock dividend yields are higher than yields offered by investment-grade bonds; stocks also provide greater long-term return potential. Profit margins have been buoyed by widespread caution in hiring and capital expenditures. Equity valuations are attractive relative to historical norms, and the market is far from speculative, as skittish investors remain on the sidelines.
The current environment appears favorable for our investment management approach, which is characterized by a disciplined focus on world-class companies with market-leading positions. We are dedicated to fundamental research and maintain a long-term investment horizon. In addition, we are sensitive to valuations and seek companies with good risk/reward characteristics. We believe these hallmarks of our investment approach will continue to serve shareholders well in the years ahead.
As always, thank you for your confidence in T. Rowe Price.
Respectfully submitted,

Donald J. Peters
Chairman of the fund’s Investment Advisory Committee
March 14, 2012
The committee chairman has day-to-day responsibility for managing the portfolio and works with committee members in developing and executing the fund’s investment programs.
RISKS OF STOCK INVESTING
The stock market as a whole can decline for many reasons, including adverse political or economic developments here or abroad, changes in investor psychology, or heavy institutional selling. The prospects for an industry or company may deteriorate because of a variety of factors, including disappointing earnings or changes in the competitive environment. In addition, our assessment of companies held in the funds may prove incorrect, resulting in losses or poor performance even in a rising market.
Growth stocks can be volatile for several reasons. Since growth companies usually reinvest a high proportion of their earnings in their own businesses, they may lack the dividends often associated with value stocks that could cushion their decline in a falling market. Also, since investors buy growth stocks because of their expected superior earnings growth, earnings disappointments often result in sharp price declines.
The stocks of mid-cap companies entail greater risk and are usually more volatile than the shares of large companies. Investing in small companies also involves greater risk than is customarily associated with larger companies. Stocks of small companies are subject to more abrupt or erratic price movements than larger-company stocks. Small companies often have limited product lines, markets, or financial resources, and their managements may lack depth and experience. Such companies seldom pay significant dividends that could cushion returns in a falling market.
Technology stocks are particularly volatile and subject to greater price swings, up and down, than the broad market. It is possible that companies whose products and services first appear promising may not succeed over the long term; they may succumb to intense competition or could quickly become obsolete in a rapidly developing marketplace. Earnings projections for developing companies that are not met can result in sharp price declines. This is true even in a generally rising stock market environment.
GLOSSARY
Earnings growth rate: Measures the annualized percent change in earnings per share for a given time period.
Historical growth five years (least squares): Least squares growth calculation attempts to find the “normal” growth rate given a stream of historical growth rates. It searches for the growth rate that best fits the line produced by a stream of growth numbers.
Investment-weighted median market capitalization: The investment weighted mid-point market capitalization (shares outstanding multiplied by current price) representing a typical security in a portfolio. An investment-weighted median represents the breakpoint where 50% of the values are above and 50% of the values are below based on portfolio weight.
Lipper indexes: Fund benchmarks that consist of a small number (10 to 30) of the largest mutual funds in a particular category as tracked by Lipper Inc.
Market capitalization: The total value of a company’s publicly traded shares.
Price-to-book ratio: A valuation measure that compares a stock’s market price with its book value; i.e., the company’s net worth divided by the number of outstanding shares.
Price-to-earnings (P/E) ratio – 12 months forward: A valuation measure calculated by dividing the price of a stock by the analysts’ forecast of the next 12 months expected earnings. The ratio is a measure of how much investors are willing to pay for the company’s future earnings. The higher the P/E, the more investors are paying for a company’s earnings growth in the next 12 months.
Projected earnings growth rate (IBES): A company’s expected earnings per share growth rate for a given time period based on the forecast from the Institutional Brokers’ Estimate System, which is commonly referred to as IBES.
Return on equity (ROE) – current fiscal year: A valuation measure calculated by dividing the company’s current fiscal year net income by shareholders’ equity (i.e., the company’s book value). ROE measures how much a company earns on each dollar that common stock investors have put into the company. It indicates how effectively and efficiently a company and its management are using stockholder investments.
Russell 1000 Index: An index that tracks the performance of the 1,000 largest companies in the Russell 3000 Index.
Russell 1000 Growth Index: An index that tracks the performance of large-cap stocks with higher price-to-book ratios and higher forecasted growth values.
Russell 1000 Value Index: An index that tracks the performance of large-cap stocks with lower price-to-book ratios and lower forecasted growth values.
Russell 2000 Index: An unmanaged index that tracks the stocks of 2,000 small U.S. companies.
Russell 2000 Growth Index: An index that tracks the performance of small-cap stocks with higher price-to-book ratios and higher forecasted growth values.
Russell 2000 Value Index: An index that tracks the performance of small-cap stocks with lower price-to-book ratios and lower forecasted growth values.
Russell 3000 Index: An index that tracks the performance of the 3,000 largest U.S. companies, representing approximately 98% of the investable U.S. equity market.
Russell 3000 Growth Index: An index that measures the performance of those Russell 3000 companies with higher price-to-book ratios and higher forecasted growth values.
Russell Midcap Index: An unmanaged index that tracks the performance of the 800 smallest companies in the Russell 1000 Index.
Russell Midcap Growth Index: An index that tracks the performance of mid-cap stocks with higher price-to-book ratios and higher forecasted growth values.
Russell Midcap Value Index: An index that tracks the performance of mid-cap stocks with lower price-to-book ratios and lower forecasted growth values.
Performance and Expenses
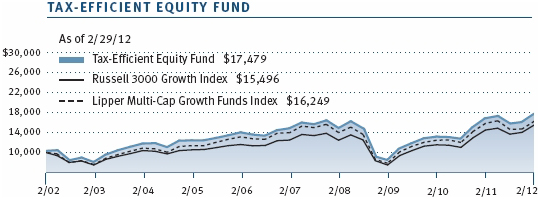
| Growth of $10,000 |
This chart shows the value of a hypothetical $10,000 investment in the fund over the past 10 fiscal year periods or since inception (for funds lacking 10-year records). The result is compared with benchmarks, which may include a broad-based market index and a peer group average or index. Market indexes do not include expenses, which are deducted from fund returns as well as mutual fund averages and indexes.
| Fund Expense Example |
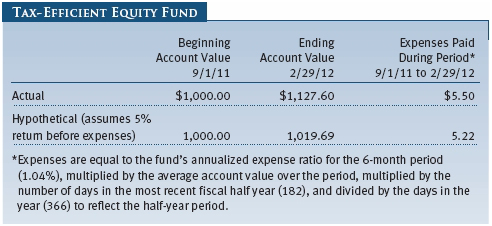
As a mutual fund shareholder, you may incur two types of costs: (1) transaction costs, such as redemption fees or sales loads, and (2) ongoing costs, including management fees, distribution and service (12b-1) fees, and other fund expenses. The following example is intended to help you understand your ongoing costs (in dollars) of investing in the fund and to compare these costs with the ongoing costs of investing in other mutual funds. The example is based on an investment of $1,000 invested at the beginning of the most recent six-month period and held for the entire period.
Actual Expenses
The first line of the following table (“Actual”) provides information about actual account values and expenses based on the fund’s actual returns. You may use the information on this line, together with your account balance, to estimate the expenses that you paid over the period. Simply divide your account value by $1,000 (for example, an $8,600 account value divided by $1,000 = 8.6), then multiply the result by the number on the first line under the heading “Expenses Paid During Period” to estimate the expenses you paid on your account during this period.
Hypothetical Example for Comparison Purposes
The information on the second line of the table (“Hypothetical”) is based on hypothetical account values and expenses derived from the fund’s actual expense ratio and an assumed 5% per year rate of return before expenses (not the fund’s actual return). You may compare the ongoing costs of investing in the fund with other funds by contrasting this 5% hypothetical example and the 5% hypothetical examples that appear in the shareholder reports of the other funds. The hypothetical account values and expenses may not be used to estimate the actual ending account balance or expenses you paid for the period.
Note: T. Rowe Price charges an annual account service fee of $20, generally for accounts with less than $10,000. The fee is waived for any investor whose T. Rowe Price mutual fund accounts total $50,000 or more; accounts electing to receive electronic delivery of account statements, transaction confirmations, prospectuses, and shareholder reports; or accounts of an investor who is a T. Rowe Price Preferred Services, Personal Services, or Enhanced Personal Services client (enrollment in these programs generally requires T. Rowe Price assets of at least $100,000). This fee is not included in the accompanying table. If you are subject to the fee, keep it in mind when you are estimating the ongoing expenses of investing in the fund and when comparing the expenses of this fund with other funds.
You should also be aware that the expenses shown in the table highlight only your ongoing costs and do not reflect any transaction costs, such as redemption fees or sales loads. Therefore, the second line of the table is useful in comparing ongoing costs only and will not help you determine the relative total costs of owning different funds. To the extent a fund charges transaction costs, however, the total cost of owning that fund is higher.
The accompanying notes are an integral part of these financial statements.


The accompanying notes are an integral part of these financial statements.
The accompanying notes are an integral part of these financial statements.
The accompanying notes are an integral part of these financial statements.
The accompanying notes are an integral part of these financial statements.
| Notes to Financial Statements |
T. Rowe Price Tax-Efficient Funds, Inc. (the corporation), is registered under the Investment Company Act of 1940 (the 1940 Act). The Tax-Efficient Equity Fund (the fund), a diversified, open-end management investment company, is one portfolio established by the corporation. The fund commenced operations on December 29, 2000. The fund seeks to maximize after-tax growth of capital through investments primarily in common stocks.
NOTE 1 - SIGNIFICANT ACCOUNTING POLICIES
Basis of Preparation The accompanying financial statements were prepared in accordance with accounting principles generally accepted in the United States of America (GAAP), which require the use of estimates made by management. Management believes that estimates and valuations are appropriate; however, actual results may differ from those estimates, and the valuations reflected in the accompanying financial statements may differ from the value ultimately realized upon sale or maturity.
Investment Transactions, Investment Income, and Distributions Income and expenses are recorded on the accrual basis. Dividends received from mutual fund investments are reflected as dividend income; capital gain distributions are reflected as realized gain/loss. Dividend income and capital gain distributions are recorded on the ex-dividend date. Income tax-related interest and penalties, if incurred, would be recorded as income tax expense. Investment transactions are accounted for on the trade date. Realized gains and losses are reported on the identified cost basis. Distributions to shareholders are recorded on the ex-dividend date. Income distributions are declared and paid annually. Capital gain distributions, if any, are generally declared and paid by the fund annually.
Rebates and Credits Subject to best execution, the fund may direct certain security trades to brokers who have agreed to rebate a portion of the related brokerage commission to the fund in cash. Commission rebates are reflected as realized gain on securities in the accompanying financial statements. Additionally, the fund earns credits on temporarily uninvested cash balances held at the custodian, which reduce the fund’s custody charges. Custody expense in the accompanying financial statements is presented before reduction for credits.
Redemption Fees A 1% fee is assessed on redemptions of fund shares held for less than 365 days to deter short-term trading and to protect the interests of long-term shareholders. Redemption fees are withheld from proceeds that shareholders receive from the sale or exchange of fund shares. The fees are paid to the fund and are recorded as an increase to paid-in capital. The fees may cause the redemption price per share to differ from the net asset value per share.
New Accounting Pronouncements In December 2011, the Financial Accounting Standards Board issued amended guidance to enhance disclosure for offsetting assets and liabilities. The guidance is effective for fiscal years and interim periods beginning on or after January 1, 2013; adoption will have no effect on the fund’s net assets or results of operations.
NOTE 2 - VALUATION
The fund’s financial instruments are reported at fair value as defined by GAAP. The fund determines the values of its assets and liabilities and computes its net asset value per share at the close of the New York Stock Exchange (NYSE), normally 4 p.m. ET, each day that the NYSE is open for business.
Valuation Methods Equity securities listed or regularly traded on a securities exchange or in the over-the-counter (OTC) market are valued at the last quoted sale price or, for certain markets, the official closing price at the time the valuations are made, except for OTC Bulletin Board securities, which are valued at the mean of the latest bid and asked prices. A security that is listed or traded on more than one exchange is valued at the quotation on the exchange determined to be the primary market for such security. Listed securities not traded on a particular day are valued at the mean of the latest bid and asked prices for domestic securities and the last quoted sale price for international securities.
Investments in mutual funds are valued at the mutual fund’s closing net asset value per share on the day of valuation.
Other investments, including restricted securities and private placements, and those financial instruments for which the above valuation procedures are inappropriate or are deemed not to reflect fair value, are stated at fair value as determined in good faith by the T. Rowe Price Valuation Committee, established by the fund’s Board of Directors (the Board). Subject to oversight by the Board, the Valuation Committee develops pricing-related policies and procedures and approves all fair-value determinations. The Valuation Committee regularly makes good faith judgments, using a wide variety of sources and information, to establish and adjust valuations of certain securities as events occur and circumstances warrant. For instance, in determining the fair value of private-equity instruments, the Valuation Committee considers a variety of factors, including the company’s business prospects, its financial performance, strategic events impacting the company, relevant valuations of similar companies, new rounds of financing, and any negotiated transactions of significant size between other investors in the company. Because any fair-value determination involves a significant amount of judgment, there is a degree of subjectivity inherent in such pricing decisions.
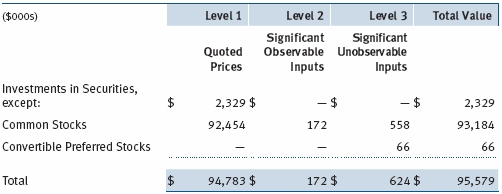
Valuation Inputs Various inputs are used to determine the value of the fund’s financial instruments. These inputs are summarized in the three broad levels listed below:
Level 1 – quoted prices in active markets for identical financial instruments
Level 2 – observable inputs other than Level 1 quoted prices (including, but not limited to, quoted prices for similar financial instruments, interest rates, prepayment speeds, and credit risk)
Level 3 – unobservable inputs
Observable inputs are those based on market data obtained from sources independent of the fund, and unobservable inputs reflect the fund’s own assumptions based on the best information available. The input levels are not necessarily an indication of the risk or liquidity associated with financial instruments at that level. The following table summarizes the fund’s financial instruments, based on the inputs used to determine their values on February 29, 2012:
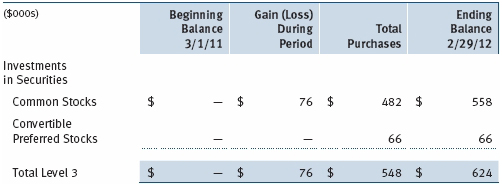
Following is a reconciliation of the fund’s Level 3 holdings for the year ended February 29, 2012. Gain (loss) reflects both realized and change in unrealized gain (loss) on Level 3 holdings during the period, if any, and is included on the accompanying Statement of Operations. The change in unrealized gain (loss) on Level 3 instruments held at February 29, 2012, totaled $76,000 for the year ended February 29, 2012.
NOTE 3 - OTHER INVESTMENT TRANSACTIONS
Consistent with its investment objective, the fund engages in the following practices to manage exposure to certain risks and/or to enhance performance. The investment objective, policies, program, and risk factors of the fund are described more fully in the fund’s prospectus and Statement of Additional Information.
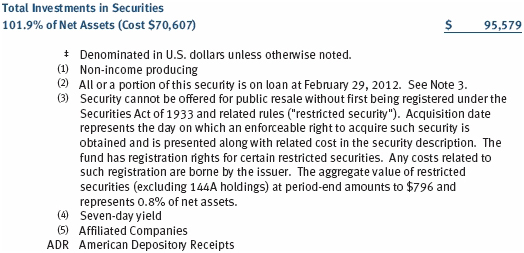
Restricted Securities The fund may invest in securities that are subject to legal or contractual restrictions on resale. Prompt sale of such securities at an acceptable price may be difficult and may involve substantial delays and additional costs.
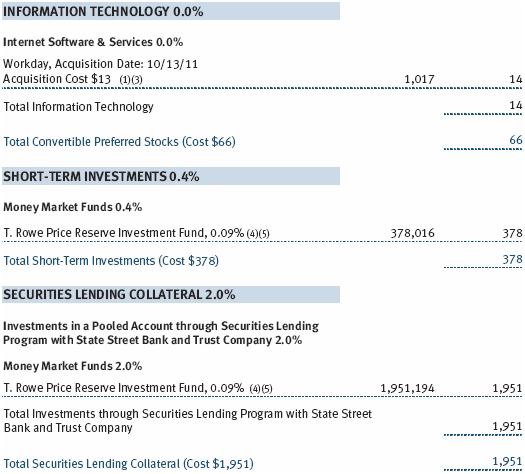
Securities Lending The fund lends its securities to approved brokers to earn additional income. It receives as collateral cash and U.S. government securities valued at 102% to 105% of the value of the securities on loan. Collateral is maintained over the life of the loan in an amount not less than the value of loaned securities as determined at the close of fund business each day; any additional collateral required due to changes in security values is delivered to the fund the next business day. Cash collateral is invested by the fund’s lending agent(s) in accordance with investment guidelines approved by management. Although risk is mitigated by the collateral, the fund could experience a delay in recovering its securities and a possible loss of income or value if the borrower fails to return the securities or if collateral investments decline in value. Securities lending revenue recognized by the fund consists of earnings on invested collateral and borrowing fees, net of any rebates to the borrower and compensation to the lending agent. In accordance with GAAP, investments made with cash collateral are reflected in the accompanying financial statements, but collateral received in the form of securities are not. On February 29, 2012, the value of cash collateral investments was $1,951,000, and the value of loaned securities was $1,884,000.
Other Purchases and sales of portfolio securities other than short-term securities aggregated $21,909,000 and $22,550,000, respectively, for the year ended February 29, 2012.
NOTE 4 - FEDERAL INCOME TAXES
No provision for federal income taxes is required since the fund intends to continue to qualify as a regulated investment company under Subchapter M of the Internal Revenue Code and distribute to shareholders all of its taxable income and gains. Distributions determined in accordance with federal income tax regulations may differ in amount or character from net investment income and realized gains for financial reporting purposes. Financial reporting records are adjusted for permanent book/tax differences to reflect tax character but are not adjusted for temporary differences.
The fund files U.S. federal, state, and local tax returns as required. The fund’s tax returns are subject to examination by the relevant tax authorities until expiration of the applicable statute of limitations, which is generally three years after the filing of the tax return but which can be extended to six years in certain circumstances. Tax returns for open years have incorporated no uncertain tax positions that require a provision for income taxes.
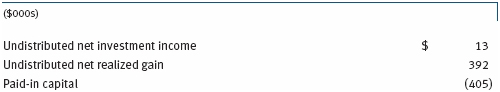
Reclassifications to paid-in capital relate primarily to expiring capital loss carryforwards. For the year ended February 29, 2012, the following reclassifications were recorded to reflect tax character (there was no impact on results of operations or net assets):
Distributions during the years ended February 29, 2012 and February 28, 2011, totaled $157,000 and $132,000, respectively, and were characterized as ordinary income for tax purposes. At February 29, 2012, the tax-basis cost of investments and components of net assets were as follows:
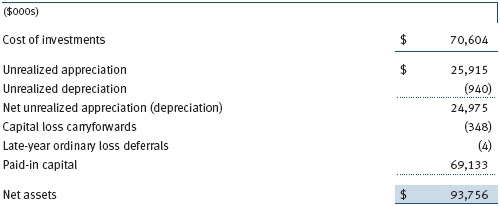
As a result of the Regulated Investment Company Modernization Act of 2010, net capital losses realized on or after March 1, 2011 (effective date) may be carried forward indefinitely to offset future realized capital gains; however, post-effective losses must be used before pre-effective capital loss carryforwards with expiration dates. Accordingly, it is possible that all or a portion of the fund’s pre-effective capital loss carryforwards could expire unused. All or a portion of the fund’s capital loss carryforwards may be from losses realized between November 1 and the fund’s fiscal year-end, which are deferred for tax purposes until the subsequent year but recognized for financial reporting purposes in the year realized. The fund intends to retain realized gains to the extent of available capital loss carryforwards. During the year ended February 29, 2012, the fund utilized $658,000 of capital loss carryforwards. The fund’s available capital loss carryforwards as of February 29, 2012, expire as follows: $52,000 in fiscal 2017; $296,000 have no expiration. In accordance with federal tax laws applicable to investment companies, specified net losses realized between November 1 and the fund’s fiscal year-end as well as operating losses realized between January 1 and the fund’s fiscal year-end, are not recognized for tax purposes until the subsequent year (late-year ordinary loss deferrals); however, such losses are recognized for financial reporting purposes in the year realized.
NOTE 5 - RELATED PARTY TRANSACTIONS
The fund is managed by T. Rowe Price Associates, Inc. (Price Associates), a wholly owned subsidiary of T. Rowe Price Group, Inc. (Price Group). The investment management agreement between the fund and Price Associates provides for an annual investment management fee, which is computed daily and paid monthly. The fee consists of an individual fund fee, equal to 0.35% of the fund’s average daily net assets, and a group fee. The group fee rate is calculated based on the combined net assets of certain mutual funds sponsored by Price Associates (the group) applied to a graduated fee schedule, with rates ranging from 0.48% for the first $1 billion of assets to 0.28% for assets in excess of $300 billion. The fund’s group fee is determined by applying the group fee rate to the fund’s average daily net assets. At February 29, 2012, the effective annual group fee rate was 0.30%.
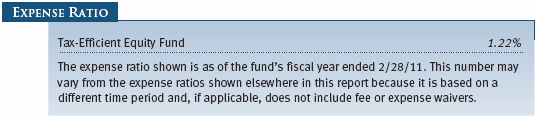
The fund is also subject to a contractual expense limitation through June 30, 2012. During the limitation period, Price Associates is required to waive its management fee and reimburse the fund for any expenses, excluding interest, taxes, brokerage commissions, and extraordinary expenses, that would otherwise cause the fund’s ratio of annualized total expenses to average net assets (expense ratio) to exceed its expense limitation of 1.25%. The fund is required to repay Price Associates for expenses previously reimbursed and management fees waived to the extent the fund’s net assets have grown or expenses have declined sufficiently to allow repayment without causing the fund’s expense ratio to exceed its expense limitation. However, no repayment will be made more than three years after the date of any reimbursement or waiver or later than June 30, 2014. At February 29, 2012, there were no amounts subject to repayment by the fund. For the year ended February 29, 2012, the fund operated below its expense limitation.
In addition, the fund has entered into service agreements with Price Associates and two wholly owned subsidiaries of Price Associates (collectively, Price). Price Associates computes the daily share price and provides certain other administrative services to the fund. T. Rowe Price Services, Inc., provides shareholder and administrative services in its capacity as the fund’s transfer and dividend disbursing agent. T. Rowe Price Retirement Plan Services, Inc., provides subaccounting and recordkeeping services for certain retirement accounts invested in the fund. For the year ended February 29, 2012, expenses incurred pursuant to these service agreements were $95,000 for Price Associates; $63,000 for T. Rowe Price Services, Inc.; and less than $1,000 for T. Rowe Price Retirement Plan Services, Inc. The total amount payable at period-end pursuant to these service agreements is reflected as Due to Affiliates in the accompanying financial statements.
The fund may invest in the T. Rowe Price Reserve Investment Fund and the T. Rowe Price Government Reserve Investment Fund (collectively, the T. Rowe Price Reserve Investment Funds), open-end management investment companies managed by Price Associates and considered affiliates of the fund. The T. Rowe Price Reserve Investment Funds are offered as cash management options to mutual funds, trusts, and other accounts managed by Price Associates and/or its affiliates and are not available for direct purchase by members of the public. The T. Rowe Price Reserve Investment Funds pay no investment management fees.
| Report of Independent Registered Public Accounting Firm |
To the Board of Directors of T. Rowe Price Tax-Efficient Funds, Inc. and
Shareholders of T. Rowe Price Tax-Efficient Equity Fund
In our opinion, the accompanying statement of assets and liabilities, including the portfolio of investments, and the related statements of operations and of changes in net assets and the financial highlights present fairly, in all material respects, the financial position of T. Rowe Price Tax-Efficient Equity Fund (comprising T. Rowe Price Tax-Efficient Funds, Inc., hereafter referred to as the “Fund”) at February 29, 2012, and the results of its operations, the changes in its net assets and the financial highlights for each of the periods indicated therein, in conformity with accounting principles generally accepted in the United States of America. These financial statements and financial highlights (hereafter referred to as “financial statements”) are the responsibility of the Fund’s management; our responsibility is to express an opinion on these financial statements based on our audits. We conducted our audits of these financial statements in accordance with the standards of the Public Company Accounting Oversight Board (United States). Those standards require that we plan and perform the audit to obtain reasonable assurance about whether the financial statements are free of material misstatement. An audit includes examining, on a test basis, evidence supporting the amounts and disclosures in the financial statements, assessing the accounting principles used and significant estimates made by management, and evaluating the overall financial statement presentation. We believe that our audits, which included confirmation of securities at February 29, 2012 by correspondence with the custodian and brokers, and confirmation of the underlying funds by correspondence with the transfer agent, provide a reasonable basis for our opinion.
PricewaterhouseCoopers LLP
Baltimore, Maryland
April 13, 2012
| Tax Information (Unaudited) for the Tax Year Ended 2/29/12 |
We are providing this information as required by the Internal Revenue Code. The amounts shown may differ from those elsewhere in this report because of differences between tax and financial reporting requirements.
The fund’s distributions to shareholders included $2,000 from short-term capital gains.
For taxable non-corporate shareholders, $146,000 of the fund’s income represents qualified dividend income subject to the 15% rate category.
For corporate shareholders, $146,000 of the fund’s income qualifies for the dividends-received deduction.
| Information on Proxy Voting Policies, Procedures, and Records |
A description of the policies and procedures used by T. Rowe Price funds and portfolios to determine how to vote proxies relating to portfolio securities is available in each fund’s Statement of Additional Information, which you may request by calling 1-800-225-5132 or by accessing the SEC’s website, sec.gov. The description of our proxy voting policies and procedures is also available on our website, troweprice.com. To access it, click on the words “Our Company” at the top of our corporate homepage. Then, when the next page appears, click on the words “Proxy Voting Policies” on the left side of the page.
Each fund’s most recent annual proxy voting record is available on our website and through the SEC’s website. To access it through our website, follow the directions above, then click on the words “Proxy Voting Records” on the right side of the Proxy Voting Policies page.
| How to Obtain Quarterly Portfolio Holdings |
The fund files a complete schedule of portfolio holdings with the Securities and Exchange Commission for the first and third quarters of each fiscal year on Form N-Q. The fund’s Form N-Q is available electronically on the SEC’s website (sec.gov); hard copies may be reviewed and copied at the SEC’s Public Reference Room, 450 Fifth St. N.W., Washington, DC 20549. For more information on the Public Reference Room, call 1-800-SEC-0330.
| About the Fund’s Directors and Officers |
Your fund is overseen by a Board of Directors (Board) that meets regularly to review a wide variety of matters affecting the fund, including performance, investment programs, compliance matters, advisory fees and expenses, service providers, and other business affairs. The Board elects the fund’s officers, who are listed in the final table. At least 75% of the Board’s members are independent of T. Rowe Price Associates, Inc. (T. Rowe Price), and its affiliates; “inside” or “interested” directors are employees or officers of T. Rowe Price. The business address of each director and officer is 100 East Pratt Street, Baltimore, Maryland 21202. The Statement of Additional Information includes additional information about the fund directors and is available without charge by calling a T. Rowe Price representative at 1-800-638-5660.
| Independent Directors | ||
| Name | ||
| (Year of Birth) | Principal Occupation(s) and Directorships of Public Companies and | |
| Year Elected* | Other Investment Companies During the Past Five Years | |
| William R. Brody | President and Trustee, Salk Institute for Biological Studies (2009 | |
| (1944) | to present); Director, Novartis, Inc. (2009 to present); Director, IBM | |
| 2009 | (2007 to present); President and Trustee, Johns Hopkins University | |
| (1996 to 2009); Chairman of Executive Committee and Trustee, | ||
| Johns Hopkins Health System (1996 to 2009) | ||
| Jeremiah E. Casey | Retired | |
| (1940) | ||
| 2005 | ||
| Anthony W. Deering | Chairman, Exeter Capital, LLC, a private investment firm (2004 | |
| (1945) | to present); Director, Under Armour (2008 to present); Director, | |
| 2001) | Vornado Real Estate Investment Trust (2004 to present); Director, | |
| Mercantile Bankshares (2002 to 2007); Director and Member of the | ||
| Advisory Board, Deutsche Bank North America (2004 to present) | ||
| Donald W. Dick, Jr. | Principal, EuroCapital Partners, LLC, an acquisition and management | |
| (1943) | advisory firm (1995 to present) | |
| 1997 | ||
| Karen N. Horn | Senior Managing Director, Brock Capital Group, an advisory and | |
| (1943) | investment banking firm (2004 to present); Director, Eli Lilly and | |
| 2003 | Company (1987 to present); Director, Simon Property Group (2004 | |
| to present); Director, Norfolk Southern (2008 to present); Director, | ||
| Fannie Mae (2006 to 2008) | ||
| Theo C. Rodgers | President, A&R Development Corporation (1977 to present) | |
| (1941) | ||
| 2005 | ||
| John G. Schreiber | Owner/President, Centaur Capital Partners, Inc., a real estate | |
| (1946) | investment company (1991 to present); Cofounder and Partner, | |
| 2001 | Blackstone Real Estate Advisors, L.P. (1992 to present); Director, | |
| General Growth Properties, Inc. (2010 to present) | ||
| Mark R. Tercek | President and Chief Executive Officer, The Nature Conservancy (2008 | |
| (1957) | to present); Managing Director, The Goldman Sachs Group, Inc. | |
| 2009 | (1984 to 2008) | |
| *Each independent director oversees 136 T. Rowe Price portfolios and serves until retirement, resignation, or election of a successor. | ||
| Inside Directors | ||
| Name | ||
| (Year of Birth) | ||
| Year Elected* | ||
| [Number of T. Rowe Price | Principal Occupation(s) and Directorships of Public Companies and | |
| Portfolios Overseen] | Other Investment Companies During the Past Five Years | |
| Edward C. Bernard | Director and Vice President, T. Rowe Price; Vice Chairman of the | |
| (1956) | Board, Director, and Vice President, T. Rowe Price Group, Inc.; | |
| 2006 | Chairman of the Board, Director, and President, T. Rowe Price | |
| [136] | Investment Services, Inc.; Chairman of the Board and Director, | |
| T. Rowe Price Retirement Plan Services, Inc., T. Rowe Price Savings | ||
| Bank, and T. Rowe Price Services, Inc.; Chairman of the Board, Chief | ||
| Executive Officer, and Director, T. Rowe Price International; Chief | ||
| Executive Officer, Chairman of the Board, Director, and President, | ||
| T. Rowe Price Trust Company; Chairman of the Board, all funds | ||
| Brian C. Rogers, CFA, CIC | Chief Investment Officer, Director, and Vice President, T. Rowe Price; | |
| (1955) | Chairman of the Board, Chief Investment Officer, Director, and Vice | |
| 2006 | President, T. Rowe Price Group, Inc.; Vice President, T. Rowe Price | |
| [74] | Trust Company | |
| *Each inside director serves until retirement, resignation, or election of a successor. | ||
| Officers | ||
| Name (Year of Birth) | ||
| Position Held With Tax-Efficient Equity Fund | Principal Occupation(s) | |
| Kennard W. Allen (1977) | Vice President, T. Rowe Price and T. Rowe Price | |
| Vice President | Group, Inc. | |
| Preston G. Athey, CFA, CIC (1949) | Vice President, T. Rowe Price, T. Rowe Price | |
| Vice President | Group, Inc., T. Rowe Price International, and | |
| T. Rowe Price Trust Company | ||
| Andrew S. Davis (1978) | Employee, T. Rowe Price; Intern, Franklin | |
| Vice President | Templeton Investments (to 2009); Manager, | |
| Deloitte Financial Advisory Services (to 2008) | ||
| Donald J. Easley, CFA (1971) | Vice President, T. Rowe Price and T. Rowe Price | |
| Vice President | Group, Inc. | |
| Roger L. Fiery III, CPA (1959) | Vice President, Price Hong Kong, Price | |
| Vice President | Singapore, T. Rowe Price, T. Rowe Price Group, | |
| Inc., T. Rowe Price International, and T. Rowe | ||
| Price Trust Company | ||
| John R. Gilner (1961) | Chief Compliance Officer and Vice President, | |
| Chief Compliance Officer | T. Rowe Price; Vice President, T. Rowe Price | |
| Group, Inc., and T. Rowe Price Investment | ||
| Services, Inc. | ||
| Gregory S. Golczewski (1966) | Vice President, T. Rowe Price and T. Rowe Price | |
| Vice President | Trust Company | |
| Gregory K. Hinkle, CPA (1958) | Vice President, T. Rowe Price, T. Rowe Price | |
| Treasurer | Group, Inc., and T. Rowe Price Trust Company; | |
| formerly Partner, PricewaterhouseCoopers LLP | ||
| (to 2007) | ||
| Patricia B. Lippert (1953) | Assistant Vice President, T. Rowe Price and | |
| Secretary | T. Rowe Price Investment Services, Inc. | |
| David Oestreicher (1967) | Director and Vice President, T. Rowe Price | |
| Vice President | Investment Services, Inc., T. Rowe Price | |
| Retirement Plan Services, Inc., T. Rowe Price | ||
| Services, Inc., and T. Rowe Price Trust | ||
| Company; Vice President, Price Hong Kong, | ||
| Price Singapore, T. Rowe Price, T. Rowe Price | ||
| Group, Inc., and T. Rowe Price International | ||
| Timothy E. Parker, CFA (1974) | Vice President, T. Rowe Price and T. Rowe Price | |
| Vice President | Group, Inc. | |
| Donald J. Peters (1959) | Vice President, T. Rowe Price and T. Rowe Price | |
| President | Group, Inc. | |
| Robert T. Quinn, Jr., (1972) | Vice President, T. Rowe Price and T. Rowe Price | |
| Vice President | Group, Inc. | |
| Deborah D. Seidel (1962) | Vice President, T. Rowe Price, T. Rowe Price | |
| Vice President | Group, Inc., and T. Rowe Price Investment | |
| Services, Inc.; Assistant Treasurer and Vice | ||
| President, T. Rowe Price Services, Inc.; | ||
| Assistant Treasurer, T. Rowe Price Retirement | ||
| Plan Services, Inc. | ||
| William J. Stromberg, CFA (1960) | Director and Vice President, T. Rowe Price; Vice | |
| Vice President | President, Price Hong Kong, Price Singapore, | |
| T. Rowe Price Group, Inc., T. Rowe Price | ||
| International, and T. Rowe Price Trust Company | ||
| Taymour R. Tamaddon, CFA (1976) | Vice President, T. Rowe Price and T. Rowe Price | |
| Vice President | Group, Inc. | |
| Julie L. Waples (1970) | Vice President, T. Rowe Price | |
| Vice President | ||
| Mark R. Weigman, CFA, CIC (1962) | Vice President, T. Rowe Price, T. Rowe Price | |
| Vice President | Group, Inc., and T. Rowe Price Trust Company | |
| Unless otherwise noted, officers have been employees of T. Rowe Price or T. Rowe Price International for at least 5 years. | ||
Item 2. Code of Ethics.
The registrant has adopted a code of ethics, as defined in Item 2 of Form N-CSR, applicable to its principal executive officer, principal financial officer, principal accounting officer or controller, or persons performing similar functions. A copy of this code of ethics is filed as an exhibit to this Form N-CSR. No substantive amendments were approved or waivers were granted to this code of ethics during the period covered by this report.
Item 3. Audit Committee Financial Expert.
The registrant’s Board of Directors/Trustees has determined that Mr. Anthony W. Deering qualifies as an audit committee financial expert, as defined in Item 3 of Form N-CSR. Mr. Deering is considered independent for purposes of Item 3 of Form N-CSR.
Item 4. Principal Accountant Fees and Services.
(a) – (d) Aggregate fees billed to the registrant for the last two fiscal years for professional services rendered by the registrant’s principal accountant were as follows:
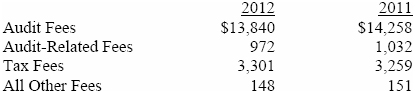
Audit fees include amounts related to the audit of the registrant’s annual financial statements and services normally provided by the accountant in connection with statutory and regulatory filings. Audit-related fees include amounts reasonably related to the performance of the audit of the registrant’s financial statements and specifically include the issuance of a report on internal controls and, if applicable, agreed-upon procedures related to fund acquisitions. Tax fees include amounts related to services for tax compliance, tax planning, and tax advice. The nature of these services specifically includes the review of distribution calculations and the preparation of Federal, state, and excise tax returns. All other fees include the registrant’s pro-rata share of amounts for agreed-upon procedures in conjunction with service contract approvals by the registrant’s Board of Directors/Trustees.
(e)(1) The registrant’s audit committee has adopted a policy whereby audit and non-audit services performed by the registrant’s principal accountant for the registrant, its investment adviser, and any entity controlling, controlled by, or under common control with the investment adviser that provides ongoing services to the registrant require pre-approval in advance at regularly scheduled audit committee meetings. If such a service is required between regularly scheduled audit committee meetings, pre-approval may be authorized by one audit committee member with ratification at the next scheduled audit committee meeting. Waiver of pre-approval for audit or non-audit services requiring fees of a de minimis amount is not permitted.
(2) No services included in (b) – (d) above were approved pursuant to paragraph (c)(7)(i)(C) of Rule 2-01 of Regulation S-X.
(f) Less than 50 percent of the hours expended on the principal accountant’s engagement to audit the registrant’s financial statements for the most recent fiscal year were attributed to work performed by persons other than the principal accountant’s full-time, permanent employees.
(g) The aggregate fees billed for the most recent fiscal year and the preceding fiscal year by the registrant’s principal accountant for non-audit services rendered to the registrant, its investment adviser, and any entity controlling, controlled by, or under common control with the investment adviser that provides ongoing services to the registrant were $1,704,000 and $1,583,000, respectively.
(h) All non-audit services rendered in (g) above were pre-approved by the registrant’s audit committee. Accordingly, these services were considered by the registrant’s audit committee in maintaining the principal accountant’s independence.
Item 5. Audit Committee of Listed Registrants.
Not applicable.
Item 6. Investments.
(a) Not applicable. The complete schedule of investments is included in Item 1 of this Form N-CSR.
(b) Not applicable.
Item 7. Disclosure of Proxy Voting Policies and Procedures for Closed-End Management Investment Companies.
Not applicable.
Item 8. Portfolio Managers of Closed-End Management Investment Companies.
Not applicable.
Item 9. Purchases of Equity Securities by Closed-End Management Investment Company and Affiliated Purchasers.
Not applicable.
Item 10. Submission of Matters to a Vote of Security Holders.
Not applicable.
Item 11. Controls and Procedures.
(a) The registrant’s principal executive officer and principal financial officer have evaluated the registrant’s disclosure controls and procedures within 90 days of this filing and have concluded that the registrant’s disclosure controls and procedures were effective, as of that date, in ensuring that information required to be disclosed by the registrant in this Form N-CSR was recorded, processed, summarized, and reported timely.
(b) The registrant’s principal executive officer and principal financial officer are aware of no change in the registrant’s internal control over financial reporting that occurred during the registrant’s second fiscal quarter covered by this report that has materially affected, or is reasonably likely to materially affect, the registrant’s internal control over financial reporting.
Item 12. Exhibits.
(a)(1) The registrant’s code of ethics pursuant to Item 2 of Form N-CSR is attached.
(2) Separate certifications by the registrant's principal executive officer and principal financial officer, pursuant to Section 302 of the Sarbanes-Oxley Act of 2002 and required by Rule 30a-2(a) under the Investment Company Act of 1940, are attached.
(3) Written solicitation to repurchase securities issued by closed-end companies: not applicable.
(b) A certification by the registrant's principal executive officer and principal financial officer, pursuant to Section 906 of the Sarbanes-Oxley Act of 2002 and required by Rule 30a-2(b) under the Investment Company Act of 1940, is attached.
SIGNATURES
Pursuant to the requirements of the Securities Exchange Act of 1934 and the Investment Company Act of 1940, the registrant has duly caused this report to be signed on its behalf by the undersigned, thereunto duly authorized.
T. Rowe Price Tax-Efficient Funds, Inc.
| By | /s/ Edward C. Bernard | |
| Edward C. Bernard | ||
| Principal Executive Officer | ||
| Date April 13, 2012 | ||
Pursuant to the requirements of the Securities Exchange Act of 1934 and the Investment Company Act of 1940, this report has been signed below by the following persons on behalf of the registrant and in the capacities and on the dates indicated.
| By | /s/ Edward C. Bernard | |
| Edward C. Bernard | ||
| Principal Executive Officer | ||
| Date April 13, 2012 | ||
| By | /s/ Gregory K. Hinkle | |
| Gregory K. Hinkle | ||
| Principal Financial Officer | ||
| Date April 13, 2012 | ||