| UNITED STATES |
| SECURITIES AND EXCHANGE COMMISSION |
| Washington, D.C. 20549 |
FORM N-CSR |
CERTIFIED SHAREHOLDER REPORT OF REGISTERED |
MANAGEMENT INVESTMENT COMPANIES |
| Investment Company Act File Number: 811-08207 |
| T. Rowe Price Tax-Efficient Funds, Inc. |
| (Exact name of registrant as specified in charter) |
| 100 East Pratt Street, Baltimore, MD 21202 |
| (Address of principal executive offices) |
| David Oestreicher |
| 100 East Pratt Street, Baltimore, MD 21202 |
| (Name and address of agent for service) |
| Registrant’s telephone number, including area code: (410) 345-2000 |
| Date of fiscal year end: February 28 |
| Date of reporting period: February 28, 2011 |
Item 1: Report to Shareholders
 |
| Tax-Efficient Equity Fund | February 28, 2011 |
The views and opinions in this report were current as of February 28, 2011. They are not guarantees of performance or investment results and should not be taken as investment advice. Investment decisions reflect a variety of factors, and the managers reserve the right to change their views about individual stocks, sectors, and the markets at any time. As a result, the views expressed should not be relied upon as a forecast of the fund’s future investment intent. The report is certified under the Sarbanes-Oxley Act, which requires mutual funds and other public companies to affirm that, to the best of their knowledge, the information in their financial reports is fairly and accurately stated in all material respects.
REPORTS ON THE WEB
Sign up for our E-mail Program, and you can begin to receive updated fund reports and prospectuses online rather than through the mail. Log in to your account at troweprice.com for more information.
Manager’s Letter
Fellow Shareholders
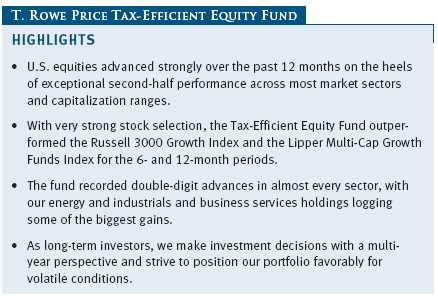
U.S. equities soared over the past 12 months amid solid earnings, healthy balance sheets, and extraordinarily low interest rates. Investors became less risk averse and returned to stocks toward the end of 2010, lured by signs of a sustainable economic recovery and the poor relative performance of many fixed income alternatives. In this environment, the Tax-Efficient Equity Fund generated robust returns for the 12-month period, with particularly strong performance over the closing six months.
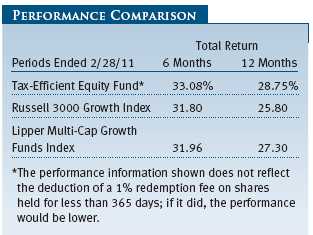
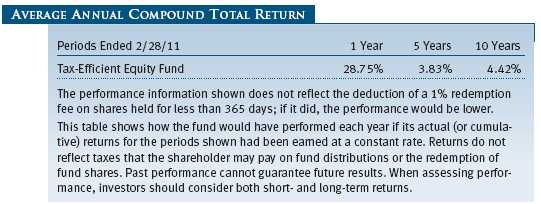
As shown in the accompanying table, your fund surged 33.08% for the six-month period ended February 28, 2011, outpacing the Russell 3000 Growth Index and the Lipper Multi-Cap Growth Funds Index of similarly managed funds. The fund’s strong performance over the latter half of the reporting period lifted annual returns into positive territory as the fund gained 28.75% for the 12-month period versus 25.80% for the Russell index and 27.30% for its Lipper peer group index.
MARKET ENVIRONMENT
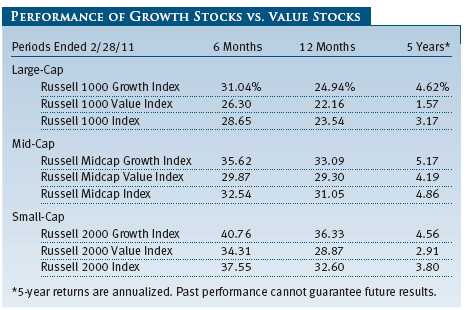
All sectors in the large-cap stock universe generated positive returns over the past year. Growth stocks outpaced value shares across all market capitalizations over the six-month and 12-month periods covered by this letter, as well as the five-year period. Energy stocks posted exceptional results as the global economic recovery became more entrenched. Oil prices, in particular, surged in early 2011 as political turmoil in the Middle East gave rise to heightened supply concerns and demand remained strong. Materials stocks also outperformed as the global economic recovery supported strong demand and higher prices for commodities. Consumer discretionary shares benefited from gradually improving consumer sentiment.
The lack of attractive alternatives in the fixed income universe provided further impetus for investors to reembrace stocks. Money market funds, for example, generated negative real returns, while longer-duration fixed income assets are vulnerable to interest rate increases. It is notable that the Citigroup 30-Year Treasury Index and Barclays Capital U.S. Aggregate Index returned 4.04% and 4.93%, respectively, for the 12-month period versus 22.57% for the S&P 500 Index.
PORTFOLIO CHARACTERISTICS
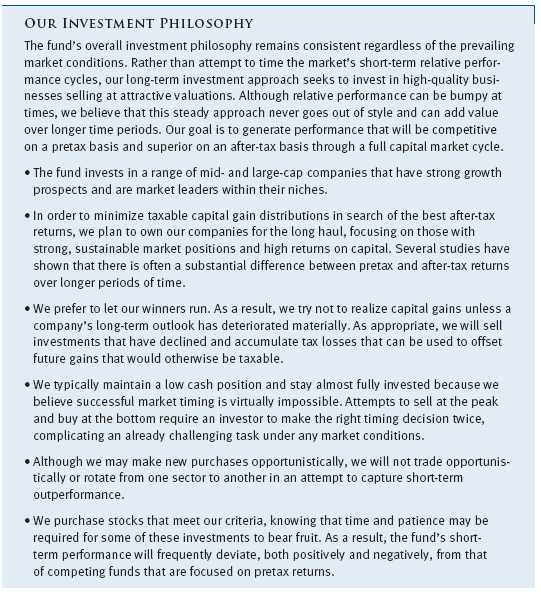
The Tax-Efficient Equity Fund seeks to buy and hold attractively valued, high-quality growth companies with good business models, strong management, and favorable long-term prospects. Our goal is to build a portfolio that keeps pace with the broader market when stocks are rising and outperforms during more challenging periods. Through a full market cycle, we seek to generate competitive pretax performance and outperform on an after-tax basis.
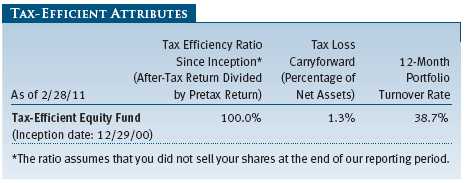
• Tax Efficiency: The fund’s tax efficiency ratio is calculated by dividing the fund’s after-tax return by its pretax return. Our tax efficiency ratio indicates that the fund has made no capital gain distributions since its inception on December 29, 2000. On December 10, 2010, your Board of Directors declared a year-end dividend distribution of $0.021 per share, which was paid on December 14, 2010. (Shareholders of record on December 10, 2010, should have received a check or statement reflecting this distribution, as well as Form 1099-DIV summarizing this information for tax purposes.) Given the fund’s high tax efficiency, its performance versus its benchmarks and tax-blind portfolios looks better on an after-tax basis than on a pretax basis. Considering the near certainty of higher tax rates in the future, we believe strategies that recognize significant short- and long-term gains will be increasingly disadvantageous for taxable investors.
• Tax Loss Carryforward: The fund’s tax capital loss carryforward (as a percentage of net assets) accumulated through the end of our fiscal year allows us to use losses in the future to offset capital gains that the fund may realize so they are not passed to shareholders.
• Return on Equity: The fund’s 12-month return on equity (ROE) at the end of our reporting period was 20.8% versus 22.0% for the Russell 3000 Growth Index. A high, sustainable ROE indicates how well a company uses investment dollars to generate earnings growth and is one of the most important characteristics we consider when researching potential investments and reviewing current holdings.
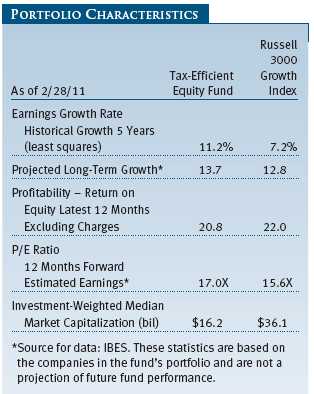
• Earnings Growth: The earnings of the companies in our portfolio are expected to grow faster than that of the Russell 3000 Growth Index. Our projected long-term earnings growth rate of 13.7% exceeds the 12.8% index rate, while our historical earnings growth rate over the last five years was 11.2% versus 7.2% for the index.
• Market Capitalization: The fund’s investment-weighted median market capitalization is lower than that of the index, reflecting the fund’s broad diversification and greater exposure to mid-cap companies. At the end of our reporting period, the fund held shares in approximately 305 companies. (Diversification cannot guarantee a profit or protect against loss in a declining market.)
PERFORMANCE REVIEW
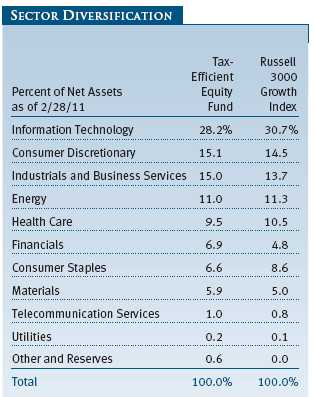
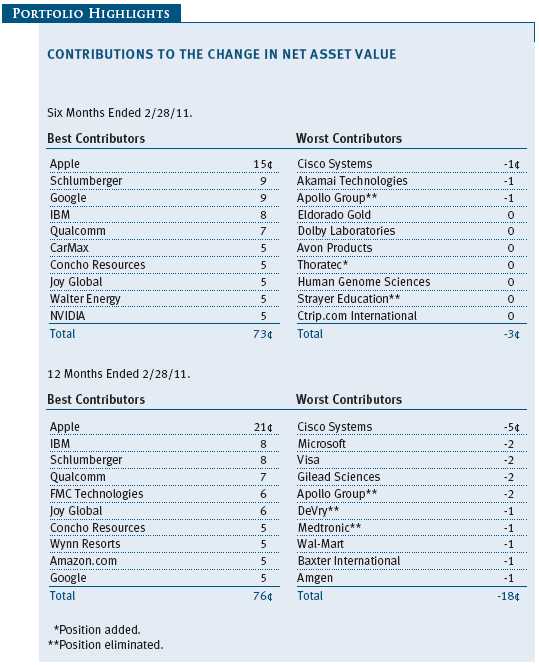
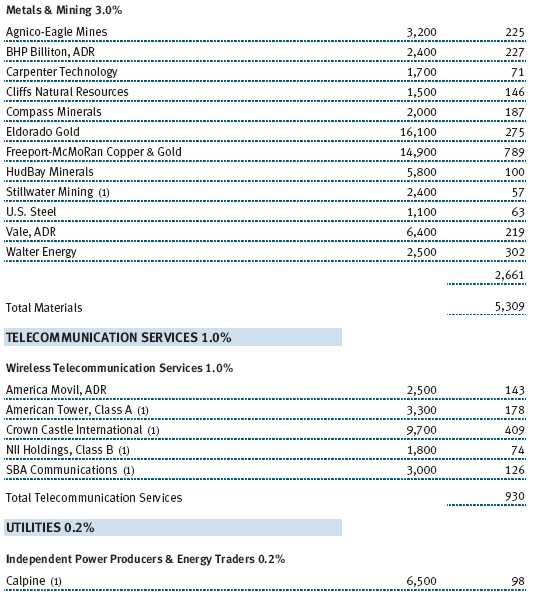
Very strong security selection enhanced fund returns relative to the benchmark Russell 3000 Growth Index over the 6- and 12-month periods. Our health care, information technology (IT), and financials stocks recorded the biggest relative gains for the six-month period, while our IT, industrials and business services, and health care shares were strongest for the full 12 months. In terms of the fund’s absolute performance, most sectors recorded strong double-digit advances over both periods, with our energy and industrials and business services holdings posting the biggest gains. A small position in the utilities sector lagged, but still managed single-digit increases over both periods.
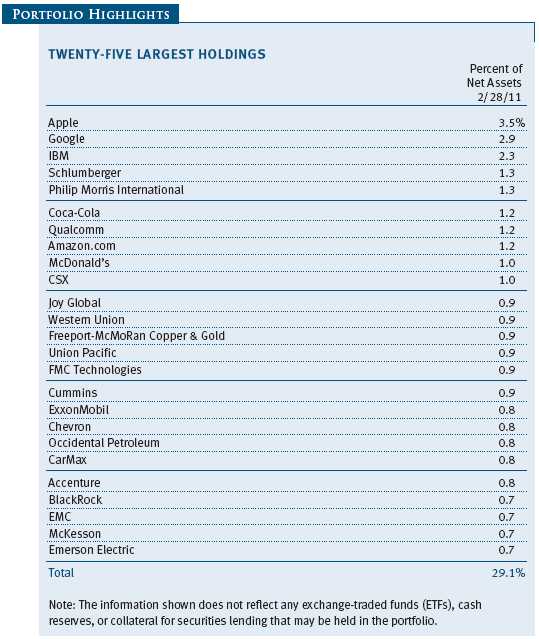
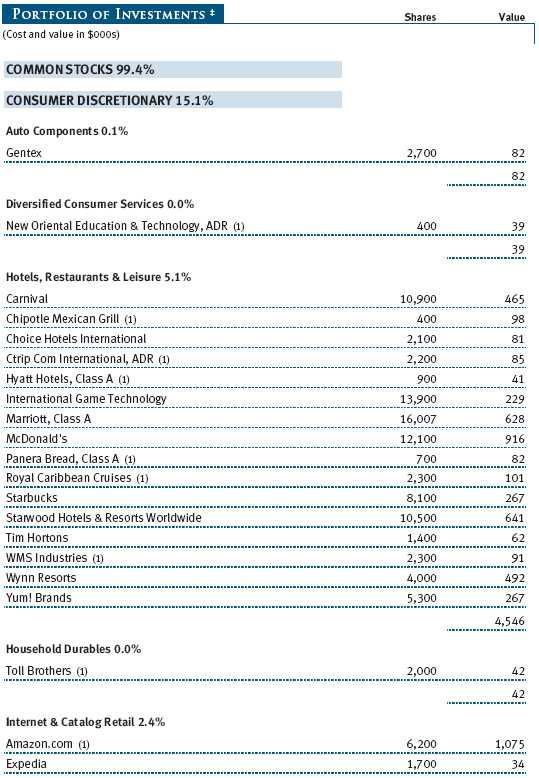
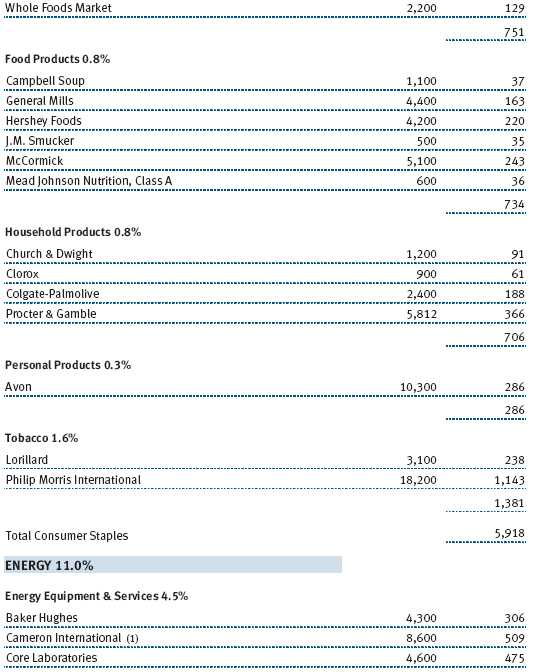
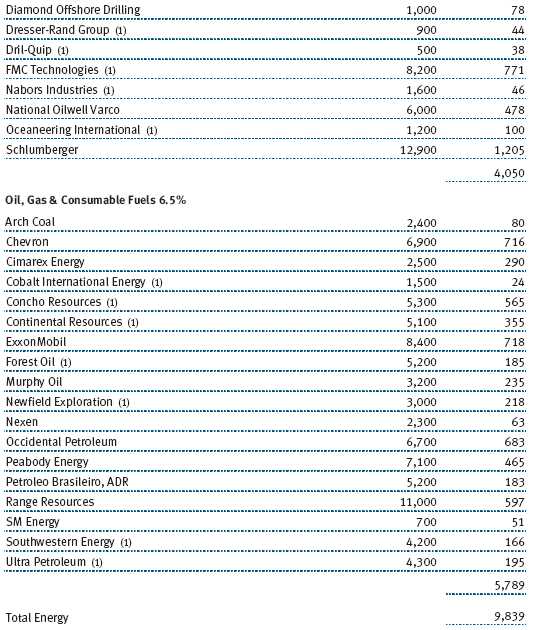
Our energy stocks soared in the second half of the reporting period as the global economy improved and resource-hungry emerging economies accounted for an increasingly larger share of demand. In addition, oil prices rose sharply in early 2011 amid political and social upheavals in the Middle East and North Africa. Although rising energy prices have certainly boosted recent returns, we do not attempt to predict price trends in this extremely volatile market. Rather, we look for high-quality service companies operating in attractive markets, as well as exploration companies showing good organic growth. Two of the largest contributors to absolute performance in our 6- and 12-month reporting periods were Concho Resources, an oil exploration and production company, and Peabody Energy. Peabody is a coal producer with attractive assets in the Powder River Basin and Australia. The fund’s oil services stocks recovered nicely in the second half of the year, with subsea oil and gas equipment manufacturers FMC Technologies and Oceaneering International among our best performers. (Please refer to the portfolio of investments for a complete list of holdings and the amount each represents in the portfolio.)
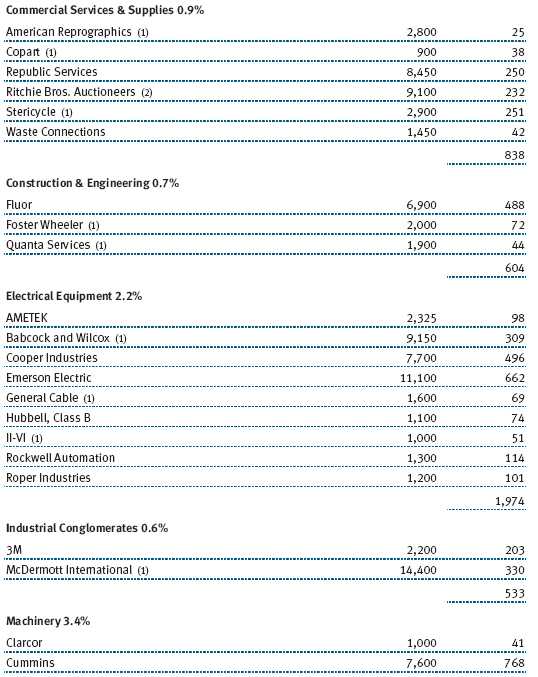
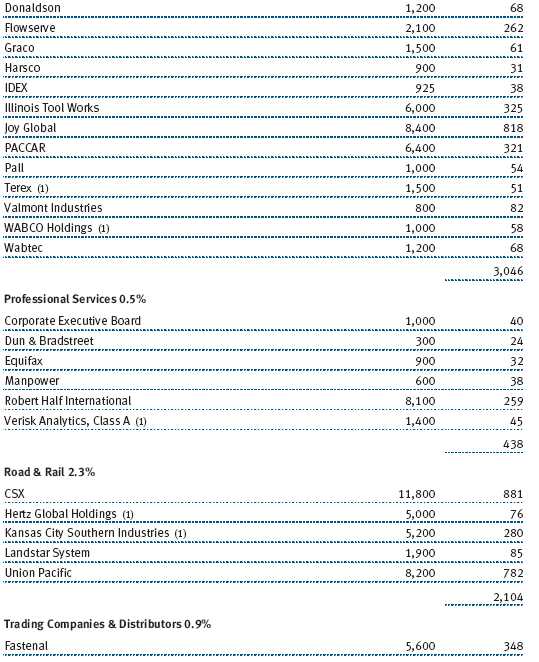
Our industrials and business services shares also posted solid gains. Many companies in this space cut costs aggressively during the downturn and are now reporting impressive gains in margins and earnings. Our machinery stocks paced the sector’s advance over both the 6- and 12-month periods. Engine maker Cummins and mining equipment manufacturer Joy Global benefited substantially from the improving global economy. Elsewhere in the sector, engineering and construction firm Fluor was a standout performer. The company posted solid results, possesses a growing backlog, and is positioned for growth over the next several years due to rising global capital expenditures, particularly in the company’s key oil, gas, and mining segments. The performance of our aerospace and defense companies was generally lackluster, with high-tech defense systems manufacturer Elbit Systems among our weaker performers.
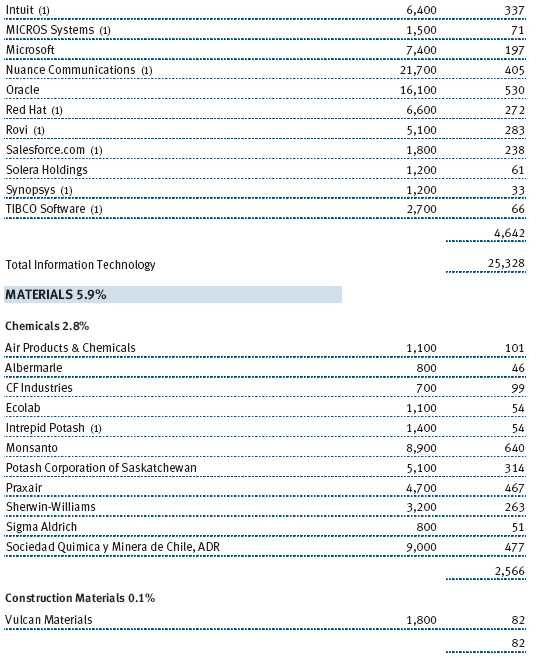
The fund’s materials stocks performed well amid strong global commodity demand. Among the fund’s biggest absolute contributors was Walter Energy, a metallurgical coal miner. Voracious demand from booming Asian economies such as China and India should continue to support prices for metallurgical coal, which is a critical component in steel production. Sociedad Quimica y Minera de Chile (SQM), a producer of specialty plant nutrients and lithium, benefited from growing food demand around the world. Specialty chemical manufacturer Sigma-Aldrich was one of our weaker performers in the sector.
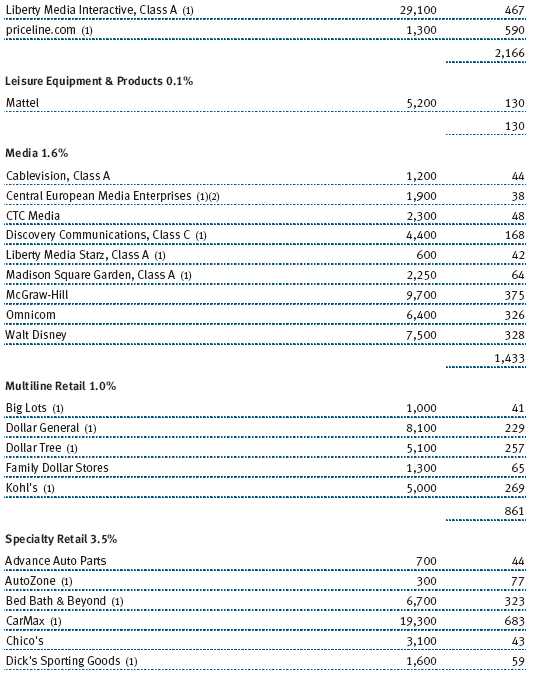
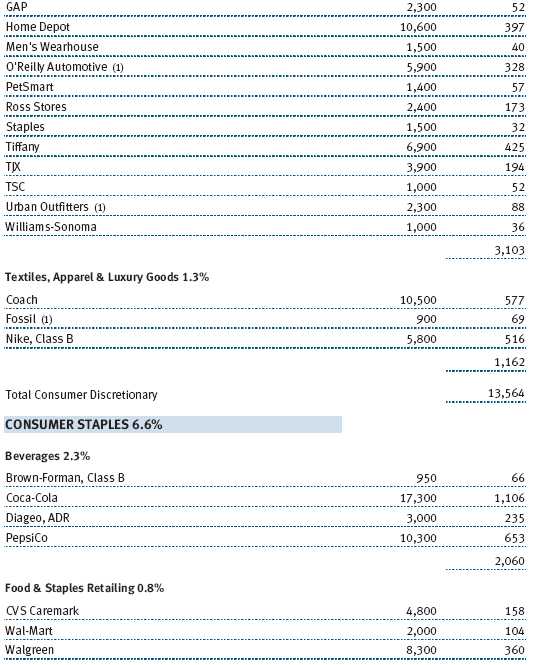
Holdings in the specialty retail industry led the way among our consumer discretionary stocks. Auto retailer CarMax received a boost from pent-up demand for used cars as consumers returned to dealerships. Iconic jewelry retailer Tiffany and discounter Ross Stores also did well, though Men’s Wearhouse was disappointing. A solid rebound in business and leisure travel spending boosted shares of hotel and resort operators, including Wynn Resorts, Marriott, and Starwood Hotels & Resorts. We continue to find investment opportunities in this sector, and we are looking for companies with good business models and excellent cash flow.
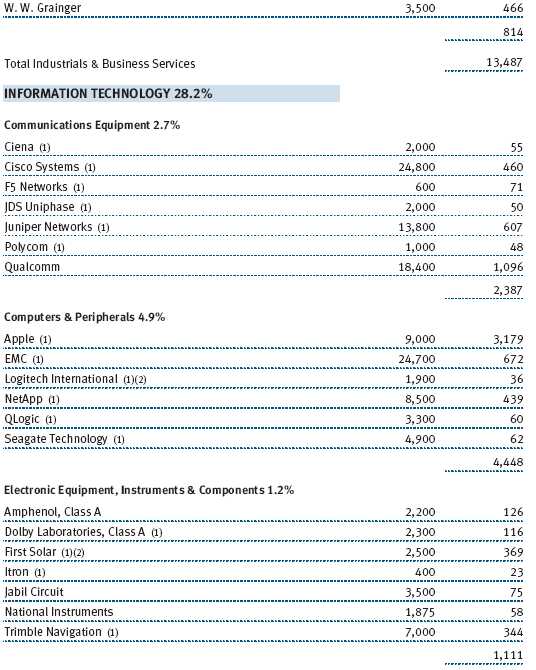
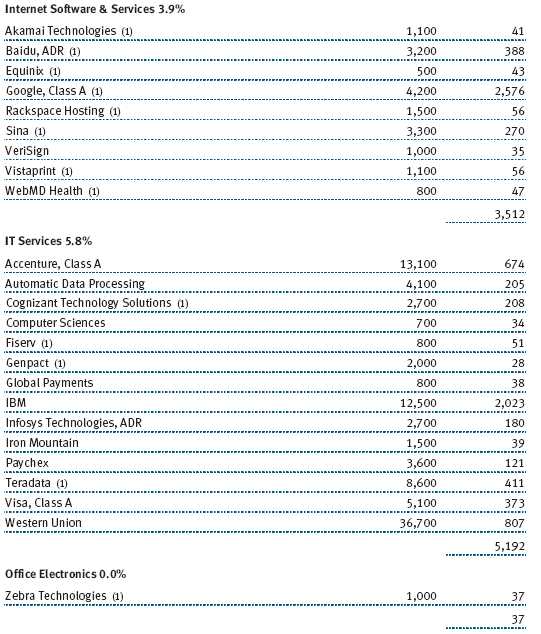
The information technology sector continues to be our largest sector allocation. Interestingly, it contained some of the fund’s best contributors as well as some of its worst. Apple was among the fund’s top overall performers. Sales of the iPad tablet device were better than expected. The iPad joins the iPod, iPhone, and other devices in a long list of consumer hits for Apple that should help drive strong growth for some time. Google weighed on returns in the first half of the reporting period but rallied nicely in the latter half. We believe that the Android operating system—used in a number of top-selling smartphones and devices—will boost search and advertising revenues, where the company already maintains a dominant industry position.
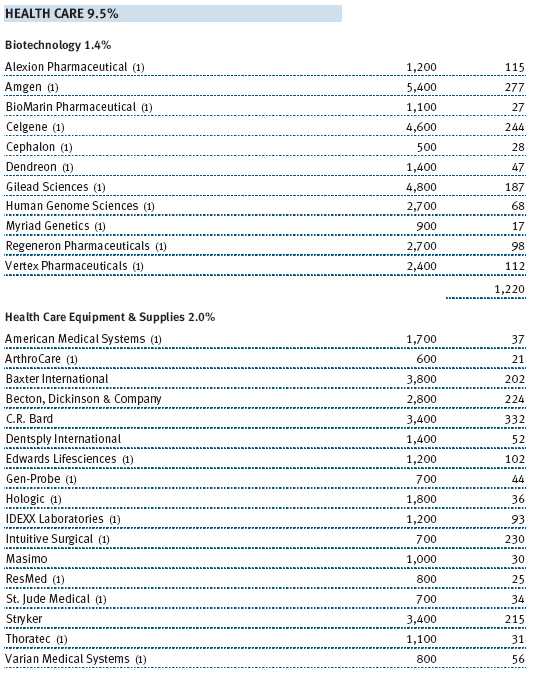
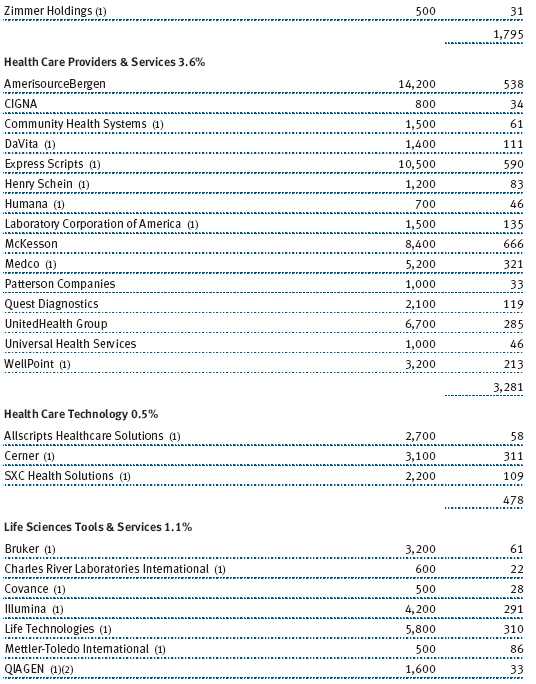
The health care sector trailed most other sectors for the 12-month period amid regulatory overhang resulting from the passage of Obamacare legislation in early 2010. Nevertheless, good stock selection contributed to strong relative and absolute returns for the latter half of our reporting period. Equipment and supplies was the strongest industry in our health care portfolio over the past six and 12 months, led by companies such as Edwards Lifesciences, C.R. Bard, and Varian Medical Systems. Gilead Sciences was one of our largest detractors for the full year due to ongoing concerns over the new regulations and apprehension about patent expirations that will occur later in the decade. However, we remain impressed and confident in Gilead’s management team and its history of good execution in all aspects of its business. Our health care investments continue to focus on services and volume-related companies reflective of demographic factors and desires for increased access to health care services.
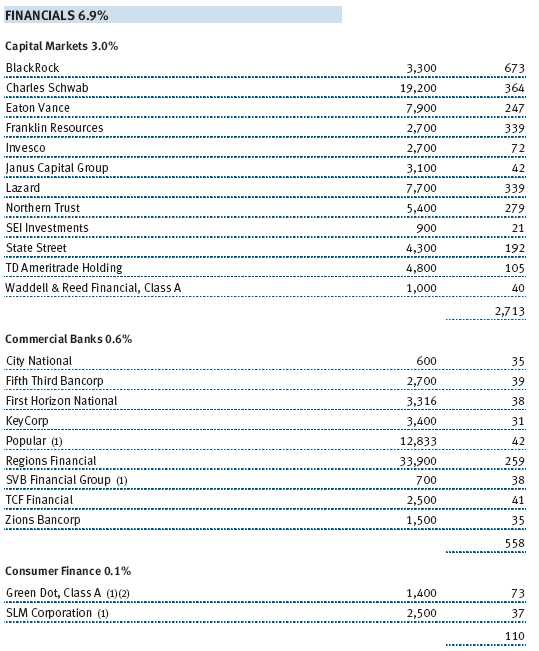
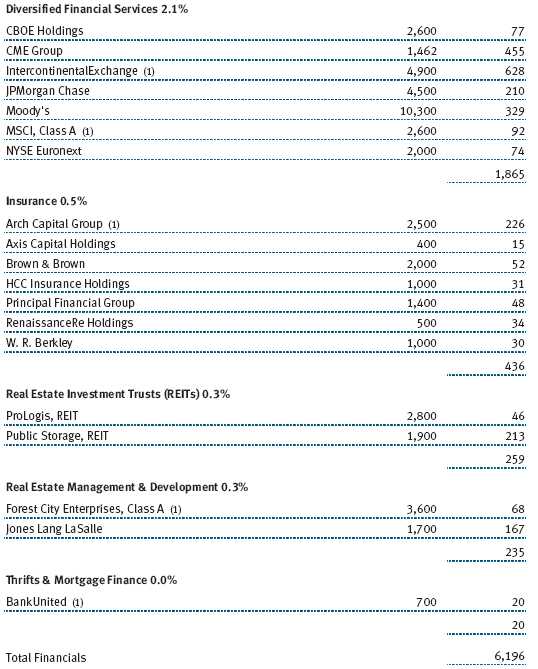
The fund’s financials stocks generated good returns over the second half of the period but underperformed the broader market for the full year as legislative and regulatory concerns weighed on the sector. Diversified financial services firms were the strongest performers over the closing six months, including ratings and information services provider Moody’s. Capital markets firms TD Ameritrade and Lazard also performed relatively well. We took advantage of favorable valuations to establish a position in prepaid card provider Green Dot. Although this holding weighed on returns during our reporting period, we like the company’s leading industry position. Green Dot technology enables consumers to bypass traditional banks by reloading cash onto their prepaid cards for use in a network of 50,000 retail partners. We are optimistic that management will be able to execute its business strategies effectively. We continue to favor capital markets companies, especially asset managers and trust banks, because they have good long-term prospects and a favorable risk/reward trade-off.
OUTLOOK
The economy is gaining strength, and we expect it to continue growing reasonably in 2011. Corporations are financially healthy, and investors’ extreme risk aversion is waning, as indicated by higher Treasury yields and the outperformance of equities relative to bonds. With the Federal Reserve’s aggressive efforts to stimulate the economy, we remain concerned that the central bank is playing with fire and could cause a significant uptick in inflation in the years ahead. There may be other unintended consequences stemming from the Fed’s actions. These are rarely beneficial in the long term. Most would agree that we have had enough bubbles for a generation.
Fixed income investors may be developing a better appreciation of the risks they are assuming as rates eventually rise. However, many will be surprised by the losses generated when long-duration bonds encounter higher inflation and interest rates. Skittish investors who fled equities to money market instruments may benefit from increasing their stock allocations. Within this context, a risk-managed equity strategy is attractive.
While we are pleased with the strong performance of the market, the fund, and its individual holdings over the past year, we know that short-term performance trends will not always be so favorable.
As long-term investors, we make investment decisions with a multiyear time frame and are prepared for periods of volatility while waiting for our investments to bear fruit. We believe the environment remains favorable for our investment management approach.
As always, thank you for your confidence in T. Rowe Price.
Respectfully submitted,
Donald J. Peters
Chairman of the Investment Advisory Committee
March 17, 2011
The committee chairman has day-to-day responsibility for managing the portfolio and works with committee members in developing and executing the fund’s investment programs.
RISKS OF STOCK INVESTING
The stock market as a whole can decline for many reasons, including adverse political or economic developments here or abroad, changes in investor psychology, or heavy institutional selling. The prospects for an industry or company may deteriorate because of a variety of factors, including disappointing earnings or changes in the competitive environment. In addition, our assessment of companies held in the funds may prove incorrect, resulting in losses or poor performance even in a rising market.
Growth stocks can be volatile for several reasons. Since growth companies usually reinvest a high proportion of their earnings in their own businesses, they may lack the dividends often associated with value stocks that could cushion their decline in a falling market. Also, since investors buy growth stocks because of their expected superior earnings growth, earnings disappointments often result in sharp price declines.
The stocks of mid-cap companies entail greater risk and are usually more volatile than the shares of large companies. Investing in small companies also involves greater risk than is customarily associated with larger companies. Stocks of small companies are subject to more abrupt or erratic price movements than larger-company stocks. Small companies often have limited product lines, markets, or financial resources, and their managements may lack depth and experience. Such companies seldom pay significant dividends that could cushion returns in a falling market.
Technology stocks are particularly volatile and subject to greater price swings, up and down, than the broad market. It is possible that companies whose products and services first appear promising may not succeed over the long term; they may succumb to intense competition or could quickly become obsolete in a rapidly developing marketplace. Earnings projections for developing companies that are not met can result in sharp price declines. This is true even in a generally rising stock market environment.
GLOSSARY
Barclays Capital U.S. Aggregate Index: An unmanaged index that tracks domestic investment-grade bonds, including corporate, government, and mortgage-backed securities.
Citigroup 30-Year Treasury Bond Index: An unmanaged index that tracks 30-year U.S. government debt instruments.
Earnings growth rate: Measures the annualized percent change in earnings per share for a given time period.
Historical growth five years (least squares): Least squares growth calculation attempts to find the “normal” growth rate given a stream of historical growth rates. It searches for the growth rate that best fits the line produced by a stream of growth numbers.
Investment-weighted median market capitalization: The investment-weighted midpoint market capitalization (shares outstanding x current price) representing a typical security in a portfolio. An investment-weighted median represents the breakpoint where 50% of the values are above and 50% of the values are below based on portfolio weight.
Lipper indexes: Consist of a small number (10 to 30) of the largest mutual funds in a particular category as tracked by Lipper Inc.
Market capitalization: The total value of a company’s publicly traded shares.
Price-to-earnings (P/E) ratio – 12 months forward: A valuation measure calculated by dividing the price of a stock by the analysts’ forecast of the next 12 months’ expected earnings. The ratio is a measure of how much investors are willing to pay for the company’s future earnings. The higher the P/E, the more investors are paying for a company’s earnings growth in the next 12 months.
Projected earnings growth rate (IBES): A company’s expected earnings per share growth rate for a given time period based on the forecast from the Institutional Broker’s Estimate System, which is commonly referred to as IBES.
Return on equity (ROE): Calculated by dividing a company’s net income by shareholders’ equity (i.e., the company’s book value), ROE measures how much a company earns on each dollar that common stock investors have put into that company. ROE indicates how effectively and efficiently a company and its management are using stockholder investments. Excluding charges refers to the earnings figure used in the calculation. It represents earnings before extraordinary items and discontinued operations.
Russell 1000 Index: An index that tracks the performance of the 1,000 largest companies in the Russell 3000 Index.
Russell 1000 Growth Index: An index that tracks the performance of large-cap stocks with higher price-to-book ratios and higher forecasted growth values.
Russell 1000 Value Index: An index that tracks the performance of large-cap stocks with lower price-to-book ratios and lower forecasted growth values.
Russell 2000 Index: An index that tracks the performance of 2,000 small-cap U.S. companies.
Russell 2000 Growth Index: An index that tracks the performance of small-cap stocks with higher price-to-book ratios and higher forecasted growth values.
Russell 2000 Value Index: An index that tracks the performance of small-cap stocks with lower price-to-book ratios and lower forecasted growth values.
Russell 3000 Index: An index that tracks the performance of the 3,000 largest U.S. companies, representing approximately 98% of the investable U.S. equity market.
Russell 3000 Growth Index: The Russell 3000 Growth Index measures the performance of those Russell 3000 companies with higher price-to-book ratios and higher forecasted growth values.
Russell Midcap Index: An unmanaged index that tracks the performance of the 800 smallest companies in the Russell 1000 Index.
Russell Midcap Growth Index: An index that tracks the performance of mid-cap stocks with higher price-to-book ratios and higher forecasted growth values.
Russell Midcap Value Index: An index that tracks the performance of mid-cap stocks with lower price-to-book ratios and lower forecasted growth values.
S&P 500 Index: An unmanaged index that tracks the stocks of 500 primarily large-cap U.S. companies.
Performance and Expenses
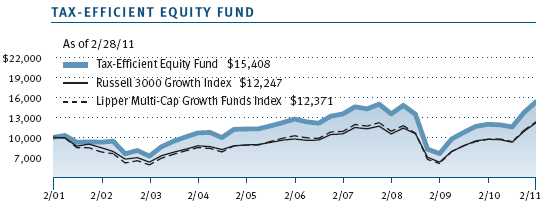
| GROWTH OF $10,000 |
This chart shows the value of a hypothetical $10,000 investment in the fund over the past 10 fiscal year periods or since inception (for funds lacking 10-year records). The result is compared with benchmarks, which may include a broad-based market index and a peer group average or index. Market indexes do not include expenses, which are deducted from fund returns as well as mutual fund averages and indexes.
| FUND EXPENSE EXAMPLE |
As a mutual fund shareholder, you may incur two types of costs: (1) transaction costs, such as redemption fees or sales loads, and (2) ongoing costs, including management fees, distribution and service (12b-1) fees, and other fund expenses. The following example is intended to help you understand your ongoing costs (in dollars) of investing in the fund and to compare these costs with the ongoing costs of investing in other mutual funds. The example is based on an investment of $1,000 invested at the beginning of the most recent six-month period and held for the entire period.
Actual Expenses
The first line of the following table (“Actual”) provides information about actual account values and expenses based on the fund’s actual returns. You may use the information in this line, together with your account balance, to estimate the expenses that you paid over the period. Simply divide your account value by $1,000 (for example, an $8,600 account value divided by $1,000 = 8.6), then multiply the result by the number in the first line under the heading “Expenses Paid During Period” to estimate the expenses you paid on your account during this period.
Hypothetical Example for Comparison Purposes
The information on the second line of the table (“Hypothetical”) is based on hypothetical account values and expenses derived from the fund’s actual expense ratio and an assumed 5% per year rate of return before expenses (not the fund’s actual return). You may compare the ongoing costs of investing in the fund with other funds by contrasting this 5% hypothetical example and the 5% hypothetical examples that appear in the shareholder reports of the other funds. The hypothetical account values and expenses may not be used to estimate the actual ending account balance or expenses you paid for the period.
Note: T. Rowe Price charges an annual small-account maintenance fee of $10, generally for accounts with less than $2,000 ($500 for UGMA/UTMA). The fee is waived for any investor whose T. Rowe Price mutual fund accounts total $25,000 or more, accounts employing automatic investing, and IRAs and other retirement plan accounts that utilize a prototype plan sponsored by T. Rowe Price (although a separate custodial or administrative fee may apply to such accounts). This fee is not included in the accompanying table. If you are subject to the fee, keep it in mind when you are estimating the ongoing expenses of investing in the fund and when comparing the expenses of this fund with other funds.
You should also be aware that the expenses shown in the table highlight only your ongoing costs and do not reflect any transaction costs, such as redemption fees or sales loads. Therefore, the second line of the table is useful in comparing ongoing costs only and will not help you determine the relative total costs of owning different funds. To the extent a fund charges transaction costs, however, the total cost of owning that fund is higher.

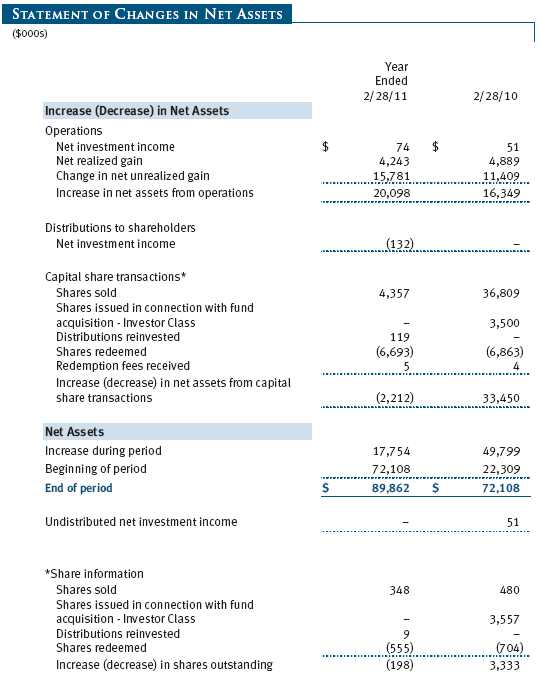
The accompanying notes are an integral part of these financial statements.
The accompanying notes are an integral part of these financial statements.
The accompanying notes are an integral part of these financial statements.
The accompanying notes are an integral part of these financial statements.
The accompanying notes are an integral part of these financial statements.
| NOTES TO FINANCIAL STATEMENTS |
T. Rowe Price Tax-Efficient Funds, Inc. (the corporation), is registered under the Investment Company Act of 1940 (the 1940 Act). The Tax-Efficient Equity Fund (the fund), a diversified, open-end management investment company, is one portfolio established by the corporation. The fund commenced operations on December 29, 2000. The fund seeks to maximize after-tax growth of capital through investments primarily in common stocks.
NOTE 1 - SIGNIFICANT ACCOUNTING POLICIES
Basis of Preparation The accompanying financial statements were prepared in accordance with accounting principles generally accepted in the United States of America (GAAP), which require the use of estimates made by management. Management believes that estimates and valuations are appropriate; however, actual results may differ from those estimates, and the valuations reflected in the accompanying financial statements may differ from the value ultimately realized upon sale or maturity.
Investment Transactions, Investment Income, and Distributions Income and expenses are recorded on the accrual basis. Dividends received from mutual fund investments are reflected as dividend income; capital gain distributions are reflected as realized gain/loss. Dividend income and capital gain distributions are recorded on the ex-dividend date. Income tax-related interest and penalties, if incurred, would be recorded as income tax expense. Investment transactions are accounted for on the trade date. Realized gains and losses are reported on the identified cost basis. Distributions to shareholders are recorded on the ex-dividend date. Income distributions are declared and paid annually. Capital gain distributions, if any, are generally declared and paid by the fund annually.
Rebates and Credits Subject to best execution, the fund may direct certain security trades to brokers who have agreed to rebate a portion of the related brokerage commission to the fund in cash. Commission rebates are reflected as realized gain on securities in the accompanying financial statements. Additionally, the fund earns credits on temporarily uninvested cash balances held at the custodian, which reduce the fund’s custody charges. Custody expense in the accompanying financial statements is presented before reduction for credits.
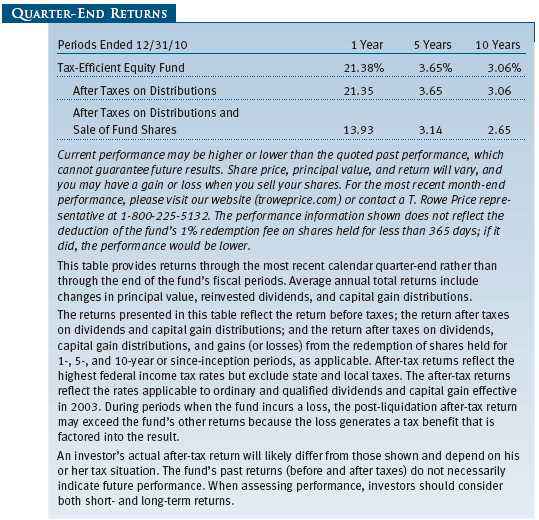
Redemption Fees A 1% fee is assessed on redemptions of fund shares held for less than 365 days to deter short-term trading and to protect the interests of long-term shareholders. Redemption fees are withheld from proceeds that shareholders receive from the sale or exchange of fund shares. The fees are paid to the fund and are recorded as an increase to paid-in capital. The fees may cause the redemption price per share to differ from the net asset value per share.
NOTE 2 - VALUATION
The fund’s financial instruments are reported at fair value as defined by GAAP. The fund determines the values of its assets and liabilities and computes its net asset value per share at the close of the New York Stock Exchange (NYSE), normally 4 p.m. ET, each day that the NYSE is open for business.
Valuation Methods Equity securities listed or regularly traded on a securities exchange or in the over-the-counter (OTC) market are valued at the last quoted sale price or, for certain markets, the official closing price at the time the valuations are made, except for OTC Bulletin Board securities, which are valued at the mean of the latest bid and asked prices. A security that is listed or traded on more than one exchange is valued at the quotation on the exchange determined to be the primary market for such security. Listed securities not traded on a particular day are valued at the mean of the latest bid and asked prices for domestic securities and the last quoted sale price for international securities.
Investments in mutual funds are valued at the mutual fund’s closing net asset value per share on the day of valuation.
Other investments, including restricted securities, and those financial instruments for which the above valuation procedures are inappropriate or are deemed not to reflect fair value are stated at fair value as determined in good faith by the T. Rowe Price Valuation Committee, established by the fund’s Board of Directors.
Valuation Inputs Various inputs are used to determine the value of the fund’s financial instruments. These inputs are summarized in the three broad levels listed below:
Level 1 – quoted prices in active markets for identical financial instruments
Level 2 – observable inputs other than Level 1 quoted prices (including, but not limited to, quoted prices for similar financial instruments, interest rates, prepayment speeds, and credit risk)
Level 3 – unobservable inputs
Observable inputs are those based on market data obtained from sources independent of the fund, and unobservable inputs reflect the fund’s own assumptions based on the best information available. The input levels are not necessarily an indication of the risk or liquidity associated with financial instruments at that level. On February 28, 2011, all of the fund’s financial instruments were classified as Level 1, based on the inputs used to determine their values.
NOTE 3 - OTHER INVESTMENT TRANSACTIONS
Consistent with its investment objective, the fund engages in the following practices to manage exposure to certain risks and/or to enhance performance. The investment objective, policies, program, and risk factors of the fund are described more fully in the fund’s prospectus and Statement of Additional Information.
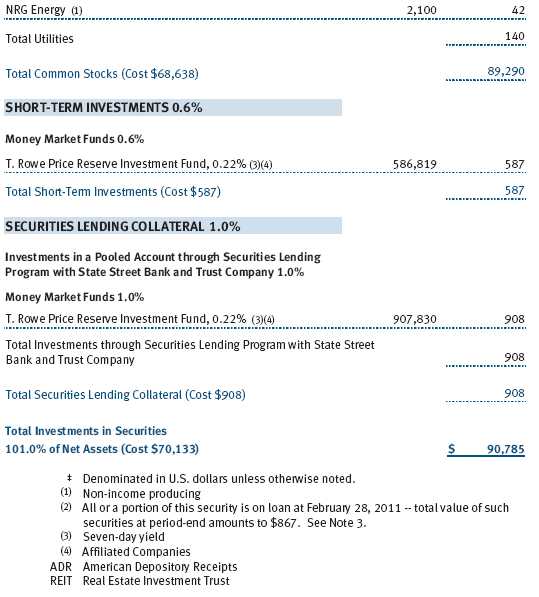
Securities Lending The fund lends its securities to approved brokers to earn additional income. It receives as collateral cash and U.S. government securities valued at 102% to 105% of the value of the securities on loan. Cash collateral is invested by the fund’s lending agent(s) in accordance with investment guidelines approved by management. Although risk is mitigated by the collateral, the fund could experience a delay in recovering its securities and a possible loss of income or value if the borrower fails to return the securities or if collateral investments decline in value. Securities lending revenue recognized by the fund consists of earnings on invested collateral and borrowing fees, net of any rebates to the borrower and compensation to the lending agent. In accordance with GAAP, investments made with cash collateral are reflected in the accompanying financial statements, but collateral received in the form of securities are not. On February 28, 2011, the value of loaned securities was $867,000 and cash collateral investments totaled $908,000.
Other Purchases and sales of portfolio securities other than short-term securities aggregated $29,337,000 and $31,953,000, respectively, for the year ended February 28, 2011.
NOTE 4 - FEDERAL INCOME TAXES
No provision for federal income taxes is required since the fund intends to continue to qualify as a regulated investment company under Subchapter M of the Internal Revenue Code and distribute to shareholders all of its taxable income and gains. Distributions determined in accordance with federal income tax regulations may differ in amount or character from net investment income and realized gains for financial reporting purposes. Financial reporting records are adjusted for permanent book/tax differences to reflect tax character but are not adjusted for temporary differences.
The fund files U.S. federal, state, and local tax returns as required. The fund’s tax returns are subject to examination by the relevant tax authorities until expiration of the applicable statute of limitations, which is generally three years after the filing of the tax return but which can be extended to six years in certain circumstances. Tax returns for open years have incorporated no uncertain tax positions that require a provision for income taxes.
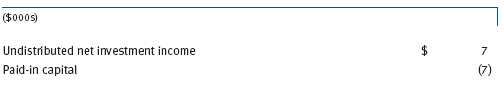
Reclassifications to paid-in capital relate primarily to an overdistribution of taxable income not deemed a return of capital for tax purposes. For the year ended February 28, 2011, the following reclassifications were recorded to reflect tax character; there was no impact on results of operations or net assets:
Distributions during the years ended February 28, 2011 and February 28, 2010, totaled $132,000 and $0, respectively, and were characterized as ordinary income for tax purposes. At February 28, 2011, the tax-basis cost of investments and components of net assets were as follows:
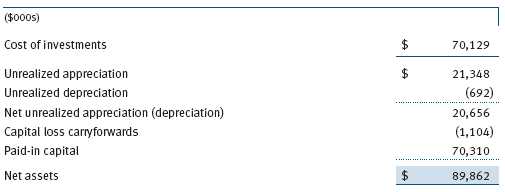
The fund intends to retain realized gains to the extent of available capital loss carryforwards. During the year ended February 28, 2011, the fund utilized $4,267,000 of capital loss carryforwards. The fund’s unused capital loss carryforwards as of February 28, 2011, expire: $1,052,000 in fiscal 2012 and $52,000 in fiscal 2017.
NOTE 5 - ACQUISITION
On August 31, 2009, the fund acquired substantially all of the assets of the T. Rowe Price Tax-Efficient Growth Fund (the acquired fund), pursuant to the Agreement and Plan of Reorganization dated June 23, 2009, and approved by shareholders of the acquired fund on August 21, 2009. The acquired fund’s assets had declined over the last five years, which caused its expenses to increase to a relatively high level. The reorganization provided acquired fund shareholders the opportunity to become shareholders of a larger, more diversified fund with an expense ratio limitation, while maintaining a tax-efficient approach to investing. The acquisition was accomplished by a tax-free exchange of 3,556,681 shares of the fund (with a value of $35,780,000) for all 4,504,112 shares of the acquired fund outstanding on August 28, 2009 with the same value. The net assets of the acquired fund at that date included $3,500,000 of unrealized depreciation and $7,526,000 of net realized losses carried forward for tax purposes to offset distributable gains realized by the fund in the future. Assets of the acquired fund, including securities of $35,716,000, cash of $13,000, and receivables and other assets of $52,000, were combined with those of the fund, resulting in aggregate net assets of $66,451,000 immediately after the acquisition.
Proforma results of operations of the combined entity for the entire year ended February 28, 2010, as though the acquisition had occurred as of the beginning of the year (rather than on the actual acquisition date), are as follows:
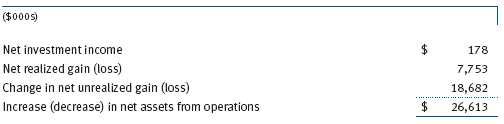
Because the combined investment portfolios have been managed as a single portfolio since the acquisition was completed, it is not practicable to separate the amounts of revenue and earnings of the acquired fund that have been included in the fund’s accompanying Statement of Operations since August 31, 2009.
NOTE 6 - RELATED PARTY TRANSACTIONS
The fund is managed by T. Rowe Price Associates, Inc. (Price Associates), a wholly owned subsidiary of T. Rowe Price Group, Inc. (Price Group). The investment management agreement between the fund and Price Associates provides for an annual investment management fee, which is computed daily and paid monthly. The fee consists of an individual fund fee, equal to 0.35% of the fund’s average daily net assets, and a group fee. The group fee rate is calculated based on the combined net assets of certain mutual funds sponsored by Price Associates (the group) applied to a graduated fee schedule, with rates ranging from 0.48% for the first $1 billion of assets to 0.285% for assets in excess of $220 billion. The fund’s group fee is determined by applying the group fee rate to the fund’s average daily net assets. At February 28, 2011, the effective annual group fee rate was 0.30%.
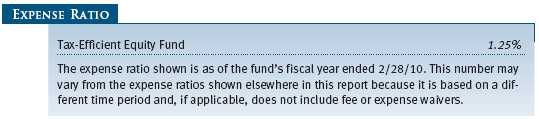
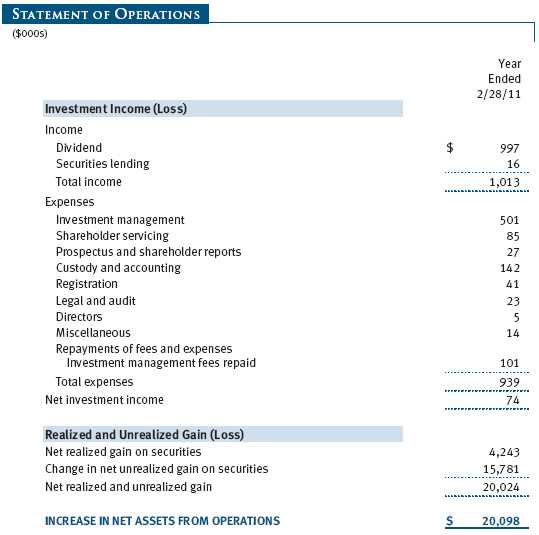
The fund is also subject to a contractual expense limitation through June 30, 2012. During the limitation period, Price Associates is required to waive its management fee and reimburse the fund for any expenses, excluding interest, taxes, brokerage commissions, and extraordinary expenses that would otherwise cause the fund’s ratio of annualized total expenses to average net assets (expense ratio) to exceed its expense limitation of 1.25%. The fund is required to repay Price Associates for expenses previously reimbursed and management fees waived to the extent the fund’s net assets have grown or expenses have declined sufficiently to allow repayment without causing the fund’s expense ratio to exceed its expense limitation. However, no repayment will be made more than three years after the date of any reimbursement or waiver or later than June 30, 2014. Pursuant to this agreement, management fees in the amount of $101,000 were repaid to Price Associates during the year ended February 28, 2011. At February 28, 2011, there were no amounts subject to repayment by the fund. For the period ended February 28, 2011, the fund operated below its expense limitation.
In addition, the fund has entered into service agreements with Price Associates and two wholly owned subsidiaries of Price Associates (collectively, Price). Price Associates computes the daily share price and provides certain other administrative services to the fund. T. Rowe Price Services, Inc., provides shareholder and administrative services in its capacity as the fund’s transfer and dividend disbursing agent. T. Rowe Price Retirement Plan Services, Inc., provides subaccounting and recordkeeping services for certain retirement accounts invested in the fund. For the year ended February 28, 2011, expenses incurred pursuant to these service agreements were $88,000 for Price Associates; $65,000 for T. Rowe Price Services, Inc.; and less than $1,000 for T. Rowe Price Retirement Plan Services, Inc. The total amount payable at period-end pursuant to these service agreements is reflected as Due to Affiliates in the accompanying financial statements.
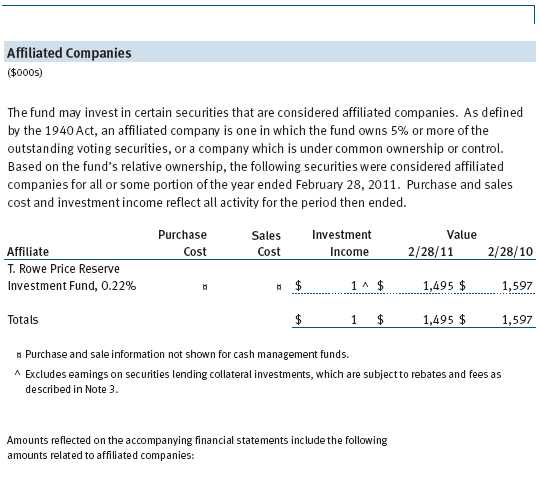
The fund may invest in the T. Rowe Price Reserve Investment Fund and the T. Rowe Price Government Reserve Investment Fund (collectively, the T. Rowe Price Reserve Investment Funds), open-end management investment companies managed by Price Associates and considered affiliates of the fund. The T. Rowe Price Reserve Investment Funds are offered as cash management options to mutual funds, trusts, and other accounts managed by Price Associates and/or its affiliates and are not available for direct purchase by members of the public. The T. Rowe Price Reserve Investment Funds pay no investment management fees.
| REPORT OF INDEPENDENT REGISTERED PUBLIC ACCOUNTING FIRM |
To the Board of Directors of T. Rowe Price Tax-Efficient Funds, Inc. and
Shareholders of T. Rowe Price Tax-Efficient Equity Fund
In our opinion, the accompanying statement of assets and liabilities, including the portfolio of investments, and the related statements of operations and of changes in net assets and the financial highlights present fairly, in all material respects, the financial position of T. Rowe Price Tax-Efficient Equity Fund (comprising T. Rowe Price Tax-Efficient Funds, Inc., hereafter referred to as the “Fund”) at February 28, 2011, the results of its operations for the year then ended, the changes in its net assets for each of the two years in the period then ended and the financial highlights for each of the five years in the period then ended, in conformity with accounting principles generally accepted in the United States of America. These financial statements and financial highlights (hereafter referred to as “financial statements”) are the responsibility of the Fund’s management; our responsibility is to express an opinion on these financial statements based on our audits. We conducted our audits of these financial statements in accordance with the standards of the Public Company Accounting Oversight Board (United States). Those standards require that we plan and perform the audit to obtain reasonable assurance about whether the financial statements are free of material misstatement. An audit includes examining, on a test basis, evidence supporting the amounts and disclosures in the financial statements, assessing the accounting principles used and significant estimates made by management, and evaluating the overall financial statement presentation. We believe that our audits, which included confirmation of securities at February 28, 2011 by correspondence with the custodian and brokers, and confirmation of the underlying funds by correspondence with the transfer agent, provide a reasonable basis for our opinion.
PricewaterhouseCoopers LLP
Baltimore, Maryland
April 15, 2011
| TAX INFORMATION (UNAUDITED) FOR THE TAX YEAR ENDED 2/28/11 |
We are providing this information as required by the Internal Revenue Code. The amounts shown may differ from those elsewhere in this report because of differences between tax and financial reporting requirements.
For taxable non-corporate shareholders, $76,000 of the fund’s income represents qualified dividend income subject to the 15% rate category.
For corporate shareholders, $76,000 of the fund’s income qualifies for the dividends-received deduction.
| INFORMATION ON PROXY VOTING POLICIES, PROCEDURES, AND RECORDS |
A description of the policies and procedures used by T. Rowe Price funds and portfolios to determine how to vote proxies relating to portfolio securities is available in each fund’s Statement of Additional Information, which you may request by calling 1-800-225-5132 or by accessing the SEC’s website, sec.gov. The description of our proxy voting policies and procedures is also available on our website, troweprice.com. To access it, click on the words “Our Company” at the top of our corporate homepage. Then, when the next page appears, click on the words “Proxy Voting Policies” on the left side of the page.
Each fund’s most recent annual proxy voting record is available on our website and through the SEC’s website. To access it through our website, follow the directions above, then click on the words “Proxy Voting Records” on the right side of the Proxy Voting Policies page.
| HOW TO OBTAIN QUARTERLY PORTFOLIO HOLDINGS |
The fund files a complete schedule of portfolio holdings with the Securities and Exchange Commission for the first and third quarters of each fiscal year on Form N-Q. The fund’s Form N-Q is available electronically on the SEC’s website (sec.gov); hard copies may be reviewed and copied at the SEC’s Public Reference Room, 450 Fifth St. N.W., Washington, DC 20549. For more information on the Public Reference Room, call 1-800-SEC-0330.
| ABOUT THE FUND’S DIRECTORS AND OFFICERS |
Your fund is overseen by a Board of Directors (Board) that meets regularly to review a wide variety of matters affecting the fund, including performance, investment programs, compliance matters, advisory fees and expenses, service providers, and other business affairs. The Board elects the fund’s officers, who are listed in the final table. At least 75% of the Board’s members are independent of T. Rowe Price Associates, Inc. (T. Rowe Price), and T. Rowe Price International Ltd (T. Rowe Price International); “inside” or “interested” directors are employees or officers of T. Rowe Price. The business address of each director and officer is 100 East Pratt Street, Baltimore, Maryland 21202. The Statement of Additional Information includes additional information about the fund directors and is available without charge by calling a T. Rowe Price representative at 1-800-225-5132.
| Independent Directors | |
| Name | |
| (Year of Birth) | Principal Occupation(s) and Directorships of Public Companies and |
| Year Elected* | Other Investment Companies During the Past Five Years |
| William R. Brody | President and Trustee, Salk Institute for Biological Studies (2009 |
| (1944) | to present); Director, Novartis, Inc. (2009 to present); Director, IBM |
| 2009 | (2007 to present); President and Trustee, Johns Hopkins University |
| (1996 to 2009); Chairman of Executive Committee and Trustee, | |
| Johns Hopkins Health System (1996 to 2009) | |
| Jeremiah E. Casey | Retired |
| (1940) | |
| 2005 | |
| Anthony W. Deering | Chairman, Exeter Capital, LLC, a private investment firm (2004 |
| (1945) | to present); Director, Under Armour (2008 to present); Director, |
| 2001 | Vornado Real Estate Investment Trust (2004 to present); Director, |
| Mercantile Bankshares (2002 to 2007); Member, Advisory Board, | |
| Deutsche Bank North America (2004 to present) | |
| Donald W. Dick, Jr. | Principal, EuroCapital Partners, LLC, an acquisition and management |
| (1943) | advisory firm (1995 to present) |
| 1997 | |
| Karen N. Horn | Senior Managing Director, Brock Capital Group, an advisory and |
| (1943) | investment banking firm (2004 to present); Director, Eli Lilly and |
| 2003 | Company (1987 to present); Director, Simon Property Group (2004 |
| to present); Director, Norfolk Southern (2008 to present); Director, | |
| Fannie Mae (2006 to 2008) | |
| Theo C. Rodgers | President, A&R Development Corporation (1977 to present) |
| (1941) | |
| 2005 | |
| John G. Schreiber | Owner/President, Centaur Capital Partners, Inc., a real estate |
| (1946) | investment company (1991 to present); Cofounder and Partner, |
| 2001 | Blackstone Real Estate Advisors, L.P. (1992 to present); Director, |
| General Growth Properties, Inc. (2010 to present) | |
| Mark R. Tercek | President and Chief Executive Officer, The Nature Conservancy |
| (1957) | (2008 to present); Managing Director, The Goldman Sachs Group, |
| 2009 | Inc. (1984 to 2008) |
| *Each independent trustee oversees 128 T. Rowe Price portfolios and serves until retirement, | |
| resignation, or election of a successor. | |
| Inside Directors | |
| Name | |
| (Year of Birth) | |
| Year Elected* | |
| [Number of T. Rowe Price | Principal Occupation(s) and Directorships of Public Companies |
| Portfolios Overseen] | and Other Investment Companies During the Past Five Years |
| Edward C. Bernard | Director and Vice President, T. Rowe Price; Vice Chairman of the |
| (1956) | Board, Director, and Vice President, T. Rowe Price Group, Inc.; |
| 2006 | Chairman of the Board, Director, and President, T. Rowe Price |
| [128] | Investment Services, Inc.; Chairman of the Board and Director, |
| T. Rowe Price Retirement Plan Services, Inc., T. Rowe Price Savings | |
| Bank, and T. Rowe Price Services, Inc.; Director and Chief Executive | |
| Officer, T. Rowe Price International; Chief Executive Officer, | |
| Chairman of the Board, Director, and President, T. Rowe Price | |
| Trust Company; Chairman of the Board, all funds | |
| Brian C. Rogers, CFA, CIC | Chief Investment Officer, Director, and Vice President, T. Rowe Price; |
| (1955) | Chairman of the Board, Chief Investment Officer, Director, and Vice |
| 2006 | President, T. Rowe Price Group, Inc.; Vice President, T. Rowe Price |
| [73] | Trust Company |
| *Each inside director serves until retirement, resignation, or election of a successor. | |
| Officers | |
| Name (Year of Birth) | |
| Position Held With Tax-Efficient Equity Fund | Principal Occupation(s) |
| Kennard W. Allen (1977) | Vice President, T. Rowe Price and T. Rowe Price |
| Vice President | Group, Inc. |
| Preston G. Athey, CFA, CIC (1949) | Vice President, T. Rowe Price, T. Rowe Price |
| Vice President | Group, Inc., T. Rowe Price Trust Company, and |
| T. Rowe Price International | |
| Donald J. Easley, CFA (1971) | Vice President, T. Rowe Price and T. Rowe Price |
| Vice President | Group, Inc. |
| Roger L. Fiery III, CPA (1959) | Vice President, Price Hong Kong, Price |
| Vice President | Singapore, T. Rowe Price, T. Rowe Price Group, |
| Inc., T. Rowe Price International, and T. Rowe | |
| Price Trust Company | |
| John R. Gilner (1961) | Chief Compliance Officer and Vice President, |
| Chief Compliance Officer | T. Rowe Price; Vice President, T. Rowe Price |
| Group, Inc., and T. Rowe Price Investment | |
| Services, Inc. | |
| Gregory S. Golczewski (1966) | Vice President, T. Rowe Price and T. Rowe Price |
| Vice President | Trust Company |
| Gregory K. Hinkle, CPA (1958) | Vice President, T. Rowe Price, T. Rowe Price |
| Treasurer | Group, Inc., and T. Rowe Price Trust Company; |
| formerly Partner, PricewaterhouseCoopers LLP | |
| (to 2007) | |
| Patricia B. Lippert (1953) | Assistant Vice President, T. Rowe Price and |
| Secretary | T. Rowe Price Investment Services, Inc. |
| Sudhir Nanda, Ph.D., CFA (1959) | Vice President, T. Rowe Price and T. Rowe Price |
| Vice President | Group, Inc. |
| David Oestreicher (1967) | Director and Vice President, T. Rowe Price |
| Vice President | Investment Services, Inc., T. Rowe Price Trust |
| Company, and T. Rowe Price Services, Inc.; | |
| Vice President, Price Hong Kong, Price | |
| Singapore, T. Rowe Price, T. Rowe Price Group, | |
| Inc., T. Rowe Price International, and T. Rowe | |
| Price Retirement Plan Services, Inc. | |
| Timothy E. Parker, CFA (1974) | Vice President, T. Rowe Price and T. Rowe Price |
| Vice President | Group, Inc. |
| Donald J. Peters (1959) | Vice President, T. Rowe Price and T. Rowe Price |
| President | Group, Inc. |
| Deborah D. Seidel (1962) | Vice President, T. Rowe Price, T. Rowe Price |
| Vice President | Group, Inc., and T. Rowe Price Investment |
| Services, Inc.; Vice President and Assistant | |
| Treasurer, T. Rowe Price Services, Inc., and | |
| T. Rowe Price Retirement Plan Services, Inc. | |
| William J. Stromberg, CFA (1960) | Director and Vice President, T. Rowe Price; Vice |
| Vice President | President, Price Hong Kong, Price Singapore, |
| T. Rowe Price Group, Inc., T. Rowe Price | |
| International, and T. Rowe Price Trust Company | |
| Julie L. Waples (1970) | Vice President, T. Rowe Price |
| Vice President | |
| Mark R. Weigman, CFA, CIC (1962) | Vice President, T. Rowe Price, T. Rowe Price |
| Vice President | Group, Inc., and T. Rowe Price Trust Company |
| Unless otherwise noted, officers have been employees of T. Rowe Price or T. Rowe Price | |
| International for at least 5 years. | |
Item 2. Code of Ethics.
The registrant has adopted a code of ethics, as defined in Item 2 of Form N-CSR, applicable to its principal executive officer, principal financial officer, principal accounting officer or controller, or persons performing similar functions. A copy of this code of ethics is filed as an exhibit to this Form N-CSR. No substantive amendments were approved or waivers were granted to this code of ethics during the period covered by this report.
Item 3. Audit Committee Financial Expert.
The registrant’s Board of Directors/Trustees has determined that Mr. Anthony W. Deering qualifies as an audit committee financial expert, as defined in Item 3 of Form N-CSR. Mr. Deering is considered independent for purposes of Item 3 of Form N-CSR.
Item 4. Principal Accountant Fees and Services.
(a) – (d) Aggregate fees billed to the registrant for the last two fiscal years for professional services rendered by the registrant’s principal accountant were as follows:
Audit fees include amounts related to the audit of the registrant’s annual financial statements and services normally provided by the accountant in connection with statutory and regulatory filings. Audit-related fees include amounts reasonably related to the performance of the audit of the registrant’s financial statements and specifically include the issuance of a report on internal controls and, if applicable, agreed-upon procedures related to fund acquisitions. Tax fees include amounts related to services for tax compliance, tax planning, and tax advice. The nature of these services specifically includes the review of distribution calculations and the preparation of Federal, state, and excise tax returns. All other fees include the registrant’s pro-rata share of amounts for agreed-upon procedures in conjunction with service contract approvals by the registrant’s Board of Directors/Trustees.
(e)(1) The registrant’s audit committee has adopted a policy whereby audit and non-audit services performed by the registrant’s principal accountant for the registrant, its investment adviser, and any entity controlling, controlled by, or under common control with the investment adviser that provides ongoing services to the registrant require pre-approval in advance at regularly scheduled audit committee meetings. If such a service is required between regularly scheduled audit committee meetings, pre-approval may be authorized by one audit committee member with ratification at the next scheduled audit committee meeting. Waiver of pre-approval for audit or non-audit services requiring fees of a de minimis amount is not permitted.
(2) No services included in (b) – (d) above were approved pursuant to paragraph (c)(7)(i)(C) of Rule 2-01 of Regulation S-X.
(f) Less than 50 percent of the hours expended on the principal accountant’s engagement to audit the registrant’s financial statements for the most recent fiscal year were attributed to work performed by persons other than the principal accountant’s full-time, permanent employees.
(g) The aggregate fees billed for the most recent fiscal year and the preceding fiscal year by the registrant’s principal accountant for non-audit services rendered to the registrant, its investment adviser, and any entity controlling, controlled by, or under common control with the investment adviser that provides ongoing services to the registrant were $1,345,000 and $1,879,000, respectively.
(h) All non-audit services rendered in (g) above were pre-approved by the registrant’s audit committee. Accordingly, these services were considered by the registrant’s audit committee in maintaining the principal accountant’s independence.
Item 5. Audit Committee of Listed Registrants.
Not applicable.
Item 6. Investments.
(a) Not applicable. The complete schedule of investments is included in Item 1 of this Form N-CSR.
(b) Not applicable.
Item 7. Disclosure of Proxy Voting Policies and Procedures for Closed-End Management Investment Companies.
Not applicable.
Item 8. Portfolio Managers of Closed-End Management Investment Companies.
Not applicable.
Item 9. Purchases of Equity Securities by Closed-End Management Investment Company and Affiliated Purchasers.
Not applicable.
Item 10. Submission of Matters to a Vote of Security Holders.
Not applicable.
Item 11. Controls and Procedures.
(a) The registrant’s principal executive officer and principal financial officer have evaluated the registrant’s disclosure controls and procedures within 90 days of this filing and have concluded that the registrant’s disclosure controls and procedures were effective, as of that date, in ensuring that information required to be disclosed by the registrant in this Form N-CSR was recorded, processed, summarized, and reported timely.
(b) The registrant’s principal executive officer and principal financial officer are aware of no change in the registrant’s internal control over financial reporting that occurred during the registrant’s second fiscal quarter covered by this report that has materially affected, or is reasonably likely to materially affect, the registrant’s internal control over financial reporting.
Item 12. Exhibits.
(a)(1) The registrant’s code of ethics pursuant to Item 2 of Form N-CSR is attached.
(2) Separate certifications by the registrant's principal executive officer and principal financial officer, pursuant to Section 302 of the Sarbanes-Oxley Act of 2002 and required by Rule 30a-2(a) under the Investment Company Act of 1940, are attached.
(3) Written solicitation to repurchase securities issued by closed-end companies: not applicable.
(b) A certification by the registrant's principal executive officer and principal financial officer, pursuant to Section 906 of the Sarbanes-Oxley Act of 2002 and required by Rule 30a-2(b) under the Investment Company Act of 1940, is attached.
SIGNATURES | |
| Pursuant to the requirements of the Securities Exchange Act of 1934 and the Investment | |
| Company Act of 1940, the registrant has duly caused this report to be signed on its behalf by the | |
| undersigned, thereunto duly authorized. | |
| T. Rowe Price Tax-Efficient Funds, Inc. | |
| By | /s/ Edward C. Bernard |
| Edward C. Bernard | |
| Principal Executive Officer | |
| Date | April 15, 2011 |
| Pursuant to the requirements of the Securities Exchange Act of 1934 and the Investment | |
| Company Act of 1940, this report has been signed below by the following persons on behalf of | |
| the registrant and in the capacities and on the dates indicated. | |
| By | /s/ Edward C. Bernard |
| Edward C. Bernard | |
| Principal Executive Officer | |
| Date | April 15, 2011 |
| By | /s/ Gregory K. Hinkle |
| Gregory K. Hinkle | |
| Principal Financial Officer | |
| Date | April 15, 2011 |