| UNITED STATES |
| SECURITIES AND EXCHANGE COMMISSION |
| Washington, D.C. 20549 |
FORM N-CSR |
CERTIFIED SHAREHOLDER REPORT OF REGISTERED |
MANAGEMENT INVESTMENT COMPANIES |
| Investment Company Act File Number: 811-08207 |
| T. Rowe Price Tax-Efficient Funds, Inc. |
| (Exact name of registrant as specified in charter) |
| 100 East Pratt Street, Baltimore, MD 21202 |
| (Address of principal executive offices) |
| David Oestreicher |
| 100 East Pratt Street, Baltimore, MD 21202 |
| (Name and address of agent for service) |
| Registrant’s telephone number, including area code: (410) 345-2000 |
| Date of fiscal year end: February 28 |
| Date of reporting period: February 28, 2010 |
Item 1: Report to Shareholders
 |
| Tax-Efficient Equity Fund | February 28, 2010 |
The views and opinions in this report were current as of February 28, 2010. They are not guarantees of performance or investment results and should not be taken as investment advice. Investment decisions reflect a variety of factors, and the managers reserve the right to change their views about individual stocks, sectors, and the markets at any time. As a result, the views expressed should not be relied upon as a forecast of the fund’s future investment intent. The report is certified under the Sarbanes-Oxley Act, which requires mutual funds and other public companies to affirm that, to the best of their knowledge, the information in their financial reports is fairly and accurately stated in all material respects.
REPORTS ON THE WEB
Sign up for our E-mail Program, and you can begin to receive updated fund reports and prospectuses online rather than through the mail. Log in to your account at troweprice.com for more information.
Manager’s Letter
Fellow Shareholders
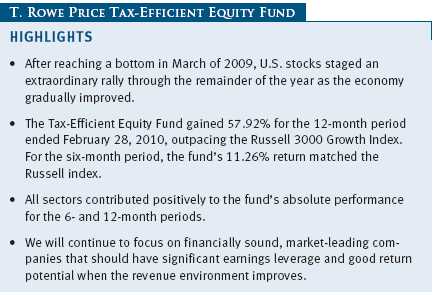
After reaching a bottom in early 2009, the global economy gradually improved as the year progressed and U.S. stocks staged an extraordinary rally from their March lows through much of 2009. We expect economic growth to continue but remain concerned that an extended period of extraordinary monetary and fiscal stimulus may have significant implications for future inflation. Accordingly, we are overweighting the materials and energy sectors as we believe they will not only benefit from global growth, but also provide a good hedge against inflation. We also believe our investments in companies with strong brands and differentiated products could provide similar benefits.
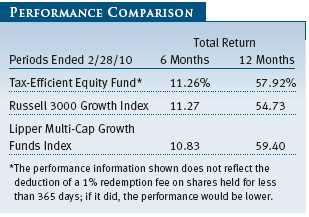
As seen in the accompanying table, the Tax-Efficient Equity Fund gained 57.92% for the 12-month period ended February 28, 2010, outpacing the Russell 3000 Growth Index but trailing the Lipper Multi-Cap Growth Funds Index of similarly managed mutual funds. For the six-month period, the fund’s 11.26% return was in line with the return of the Russell index and outpaced its Lipper peer group index.
We would like to welcome our new shareholders and thank our long-term shareholders for their continued support. As always, the Tax-Efficient Equity Fund seeks to buy and hold attractively valued, high-quality growth companies with good business models, strong management, and favorable long-term prospects. We strive to maintain a portfolio that generally keeps pace with the broad market when stocks are rising and outperforms during more difficult periods. As a result, the fund’s performance during the 2009 market rally is especially gratifying. And through a full market cycle, our goal is to generate competitive pretax performance and outperform on an after-tax basis.
TAX-EFFICIENCY RATIO
The Tax-Efficient Attributes table shows the fund’s tax-efficiency ratio, which is calculated by dividing the fund’s after-tax return by its pre-tax return. The Tax-Efficient Equity Fund’s 100% tax-efficiency ratio indicates that the fund has made no taxable dividend or capital gain distributions since inception. Thus, its pretax returns equal its after-tax returns. Given the fund’s high tax efficiency, its performance versus its benchmarks and tax-blind portfolios looks better on an after-tax basis than on a pretax basis. Considering the near certainty of higher tax rates in the future, we believe strategies that recognize significant short- and long-term gains will be increasingly disadvantageous for taxable investors.
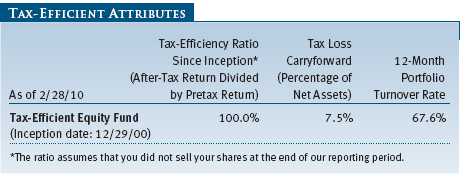
TAX LOSS CARRYFORWARD
The table also shows the value of the fund’s capital tax loss carryforward (as a percentage of net assets) accumulated through the end of our fiscal year. We will use these losses in the future to offset capital gains that the fund may realize so they are not passed on to shareholders. One characteristic of mutual funds is that the loss carryforwards expire after eight years. During the past year, we had losses that were expiring and, as a result, we recognized some gains and then repurchased the positions to establish a higher cost basis. Thus, our portfolio turnover was higher than usual.
OUR INVESTMENT PHILOSOPHY
The fund’s overall investment philosophy remains consistent regardless of the prevailing market conditions. Rather than attempt to time the market’s short-term relative performance cycles, our long-term investment approach seeks to invest in high-quality businesses selling at attractive valuations. Although relative performance can be bumpy at times, we believe that this steady approach never goes out of style and can add value over longer time periods. Our goal is to generate performance that will be competitive on a pretax basis and superior on an after-tax basis through a full capital market cycle.
• The fund invests in a range of mid- and large-cap companies that have strong growth prospects and are market leaders within their niches.
• In order to minimize taxable capital gain distributions in search of the best after-tax returns, we plan to own our companies for the long haul, focusing on those with strong, sustainable market positions and high returns on capital. Several studies have shown that there is often a substantial difference between pretax and after-tax returns over longer periods of time.
• We prefer to let our winners run. As a result, we try not to realize capital gains unless a company’s long-term outlook has deteriorated materially. As appropriate, we will sell investments that have declined and accumulate tax losses that can be used to offset future gains that would otherwise be taxable.
• We typically maintain a low cash position and stay almost fully invested because we believe successful market timing is virtually impossible. Attempts to sell at the peak and buy at the bottom require an investor to make the right timing decision twice, complicating an already challenging task under any market conditions.
• Although we may make new purchases opportunistically, we will not trade opportunistically or rotate from one sector to another in an attempt to capture short-term outperformance.
• We purchase stocks that meet our criteria, knowing that time and patience may be required for some of these investments to bear fruit. As a result, the fund’s short-term performance will frequently deviate, both positively and negatively, from that of competing funds that are focused on pretax returns.
FUND CHARACTERISTICS
The portfolio characteristics of the Tax-Efficient Equity Fund are roughly comparable to those of the Russell 3000 Growth Index. For example, the fund’s return on equity (ROE) of 21.2% is similar to that of the index. A high, sustainable ROE shows how well a company uses investment dollars to generate earnings growth and is one of the most important characteristics we consider when researching potential investments and reviewing current holdings. Although the portfolio is structured such that it is generally consistent with growth indices, it tends to be more conservative given our goal of minimizing the capital erosion that can result from market downturns. That said, the fund’s 12.0% historical five-year earnings growth rate modestly exceeds that of the index, as does the fund’s projected long-term earnings growth.
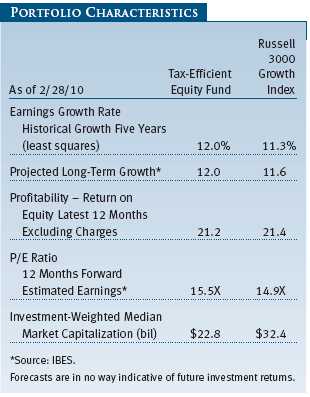
The Portfolio Characteristics table also shows that the investment-weighted median market capitalization of the fund is lower than that of the index, reflecting the fund’s greater exposure to mid-cap companies. The fund was well diversified at the end of our reporting period, holding shares in approximately 369 companies. (Diversification cannot assure a profit or protect against loss in a declining market.) We will eliminate holdings in companies that falter and reinvest the proceeds into companies that we believe possess more attractive long-term prospects.
MARKET ENVIRONMENT
The longest and deepest U.S. recession since the Great Depression has thankfully passed. The economy, which shrank at an annualized rate of more than 5% in the fourth quarter of 2008 and in the first quarter of 2009, started expanding again in the third quarter. Gross domestic product grew at a brisk 5.9% annualized rate in the last three months of 2009. Other encouraging signs include a decrease in the national unemployment rate, evidence of stabilization in several residential real estate markets, and the significant rebound in equities over the last 12 months. We expect economic growth to continue into a self-sustaining recovery with improvements in job growth, the housing market, business fixed investment, and consumer spending.
U.S. stocks produced strong gains over the past 12 months as the intense risk aversion that had dominated markets during the downturn of 2008 and early 2009 gave way to renewed risk appetite as investors clearly favored more speculative stocks for much of the period. Some tepid economic news in the first two months of 2010 tempered the rally, and U.S. stocks traded in a fairly tight range from the middle of January. Mid-cap shares were the strongest performers over both the 6- and 12-month periods, as measured by various Russell indexes, followed by small-cap and large-cap stocks, in that order. Value shares outpaced growth stocks for the full year, but growth outperformed value over the last six months and narrowed the gap.
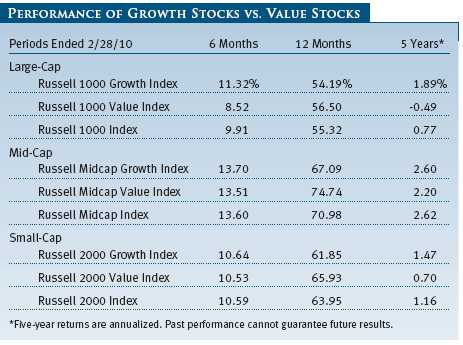
The stock market rally has helped to lift equity returns back into positive territory for the five-year period. As with the 6- and 12-month periods, mid-caps outperformed other market-cap ranges. Growth stocks modestly outperformed value over the period, closing a long-term performance gap after several years of outperformance in value shares.
PERFORMANCE REVIEW
All sectors contributed positively to the fund’s strong performance for the 6- and 12-month periods. Information technology was the largest contributor over both periods as the pace of the economic downturn slowed and eventually returned to growth. Health care and consumer staples were also among our best-performing sectors. With the market favoring growth, telecommunication services and utilities stocks—typically viewed as safe-haven sectors—posted more modest returns for the period, although our small positions still recorded gains.
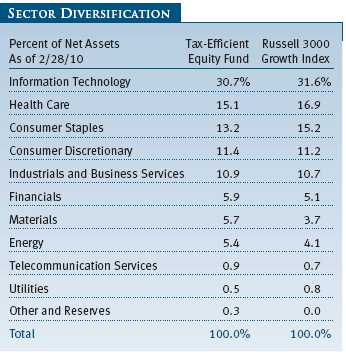
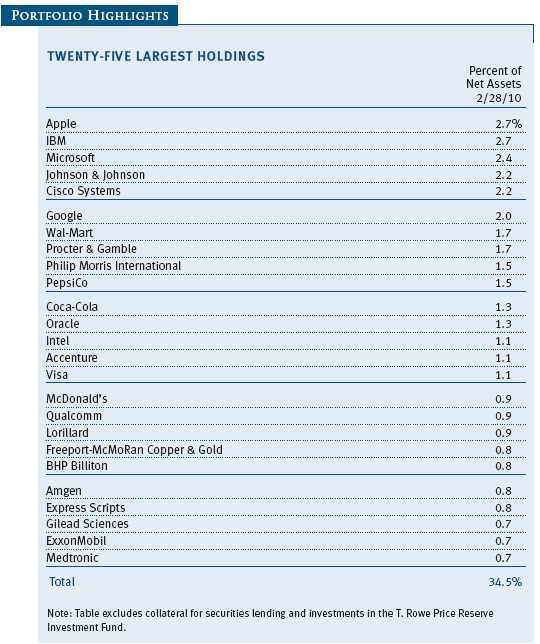
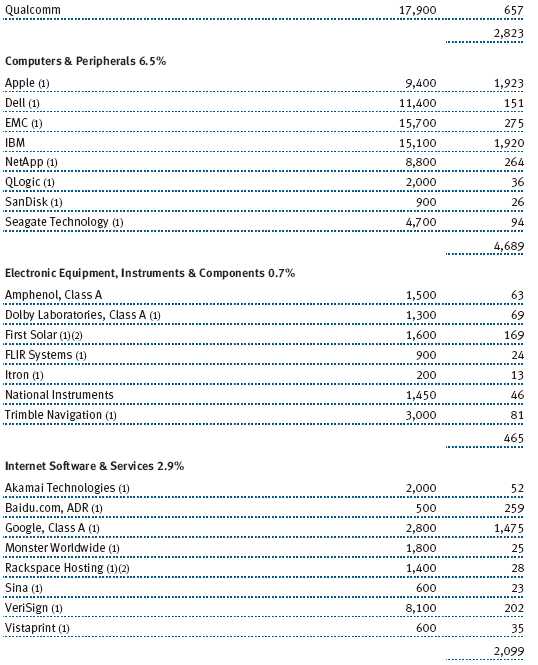
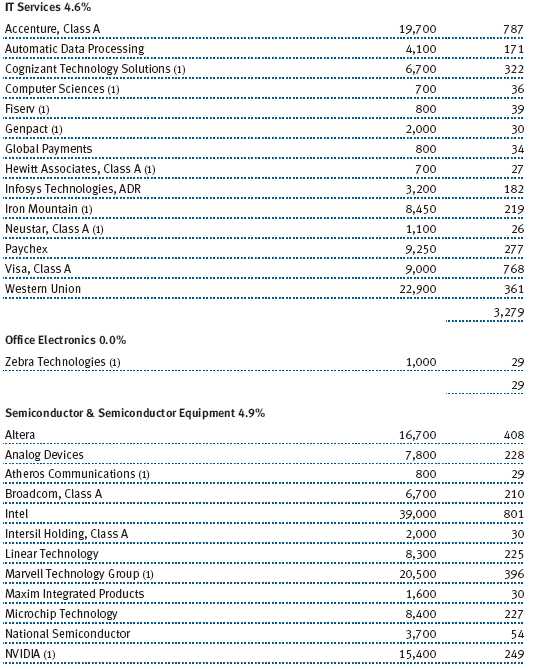
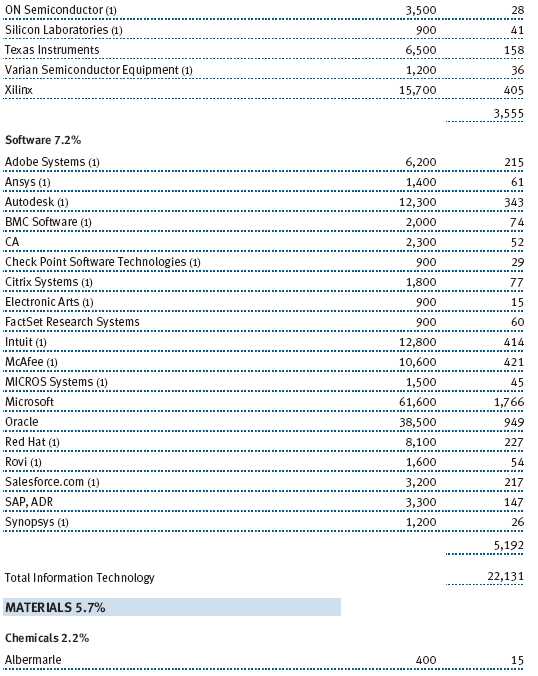
The information technology sector was the fund’s largest sector exposure. Our holdings in the software industry performed particularly well, followed by computers and peripherals and semiconductors. Apple continues to post impressive gains and was the fund’s best contributor for both the 6- and 12-month periods. The company generated solid profits during the year due to strong sales of the iPhone and Mac computers. Software giant Microsoft was also among the fund’s top contributors. Microsoft remains dominant in desktop software and is entering a major product cycle with Windows 7 (and Office 2010) that should drive solid earnings growth. Google was another strong performer as the company benefited from improvement in the global advertising market and reported excellent growth in revenue and profits. Elsewhere in the sector, fund holdings IBM, Cisco Systems, and Intel also recorded good gains. (Please refer to the portfolio of investments for a complete listing of holdings and the amount each represents in the portfolio.)
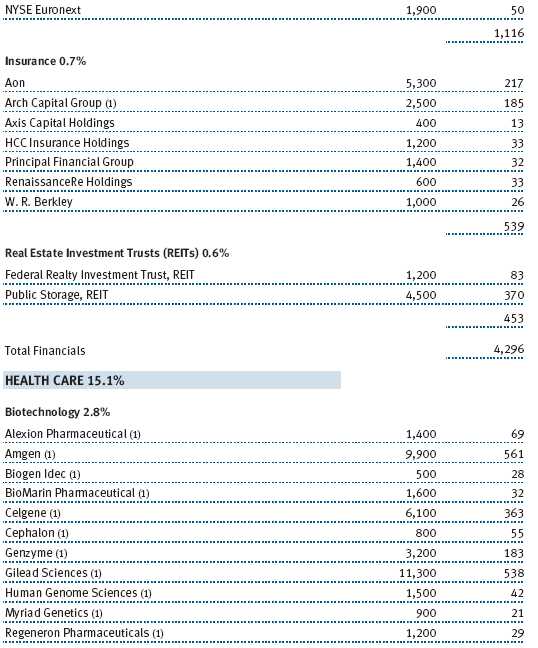
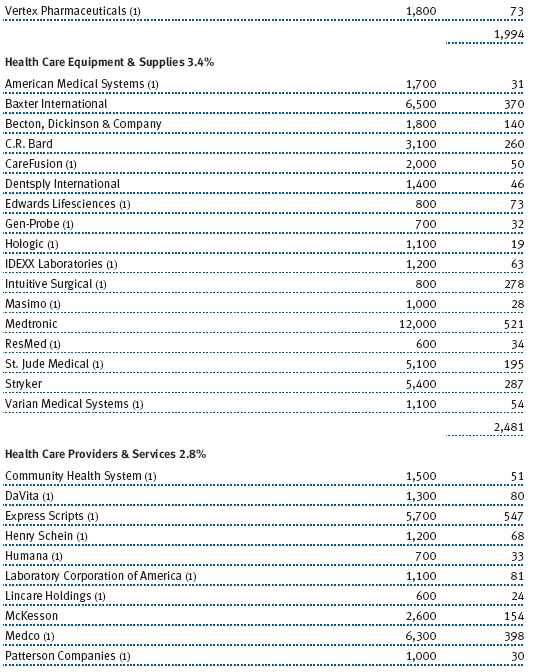
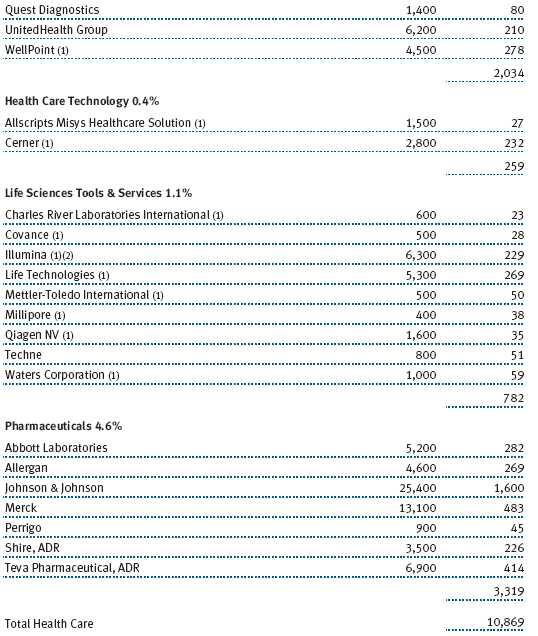
The fund is broadly diversified across the health care sector, which represents our second-largest sector allocation. Pharmaceuticals, health care equipment, and health care providers were the fund’s best-performing industries in the sector. Among pharmaceuticals, Johnson & Johnson (J&J) performed well but lagged other companies in the portfolio. J&J is one of the largest health care companies in the world, participating in industries with steady demand, solid growth, and strong brand presence. Over the longer term, the company is attractive due to its improving fundamentals and business mix; the breadth of its product pipeline opportunities; and the potential for sustainable, predictable cash flow. Express Scripts, a pharmacy benefits manager, continued to benefit from generic drug substitution and the increased mail order drug purchases. We expect a larger number of patent expirations over the next several years for many brand-name drugs, which should have positive implications for the company’s profitability. In the biotechnology industry, we attempt to stay well diversified to reduce risk.
In the consumer staples sector, we are focused on companies that provide excellent long-term growth potential and attractive valuations. Our stake in the world’s biggest retailer Wal-Mart fell over the first half of the reporting period as investors were concerned with weak consumer spending and a dismal retail environment. However, shares rebounded nicely over the second half of the year as the economic recovery took hold and investors anticipated increased consumer spending. Wal-Mart remains the dominant player in its segment and, with its “Project Impact,” plans to significantly upgrade its stores to put even more pressure on its competition. Procter & Gamble (P&G) also struggled early in the period as revenues, earnings, and profitability weakened in response to slower consumer spending. But the stock rallied in anticipation of stronger consumer spending, and we believe P&G is positioned well for the long term despite these near-term challenges.
Among our consumer discretionary stocks, Amazon.com soared early in the period as the company delivered impressive results in a difficult consumer environment. Amazon experienced revenue growth across each business line and geographical area and continues to take market share from both online and offline retailers. Specialty retailer TJX was also a top contributor for the year. The parent company of TJ Maxx and Marshalls is a good example of the type of company we favor in the consumer sector, providing a good product at a good value and preserving its relevance even in tough economic times.
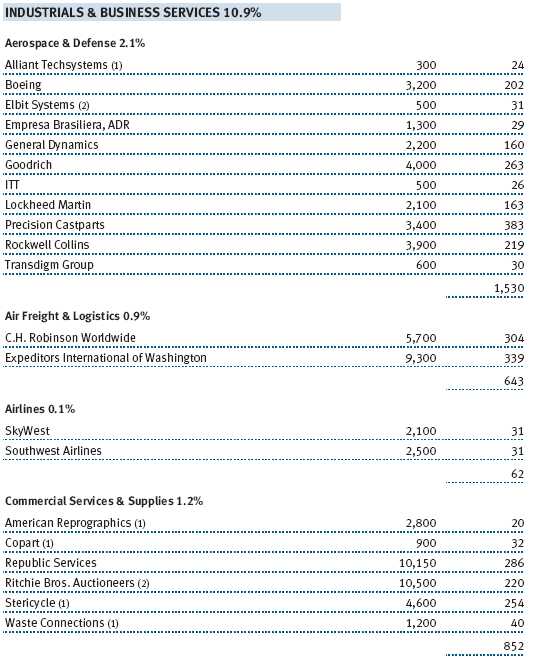
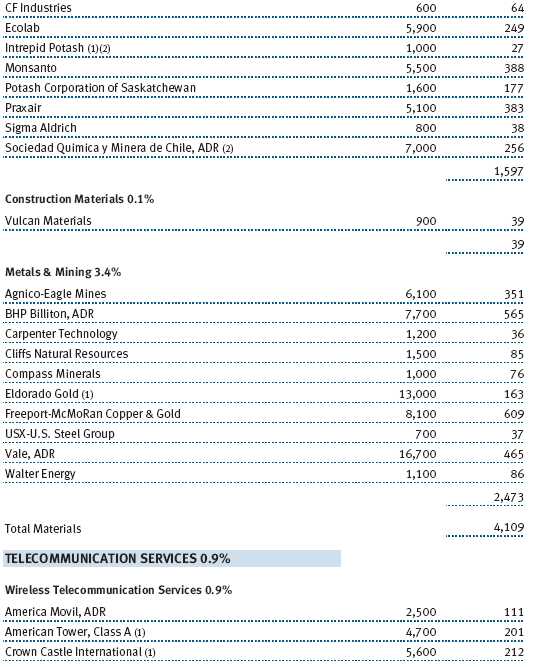
Although the industrials and business services sector was hit hard by the global economic downturn early in our reporting period, several fund positions in market-leading companies benefited from signs of a gradual economic recovery. Joy Global, which is one of the world’s best mining equipment manufacturers, performed well and will benefit from an improving global economy. Precision Castparts is a manufacturer of complex metal components and products, providing high-quality castings, forgings, and fasteners primarily for aerospace and industrial gas turbine applications. Management performed well during the economic downturn even as the stock price fell, taking steps to conserve cash and making strategic acquisitions when conditions were ripe. We believe the company will do well as global industrial production picks up steam. Union Pacific was also another strong contributor in anticipation of a better operating environment and heightened economic activity.
OUTLOOK
The companies in our portfolio did a solid job of negotiating the economic downturn by aggressively trimming costs to offset declining revenues and protect profitability. Many companies will have significant earnings leverage when the revenue environment improves. We believe shares in the financially sound companies that our investment approach seeks will continue to produce strong returns during the expansion.
Our long-term investment approach emphasizes and rewards patience. We retain our belief in the good long-term growth potential for the global economy and the dynamic companies that form its bedrock. Our reliance on in-house research and a disciplined investment strategy are designed to identify, buy, and hold attractively valued, high-quality growth companies. With good business models, talented managements, and favorable long-term prospects, these investments should continue to help the fund generate attractive after-tax returns for our shareholders.
As always, we thank you for investing with T. Rowe Price.
Respectfully submitted,
Donald J. Peters
Chairman of the Investment Advisory Committee
March 19, 2010
The committee chairman has day-to-day responsibility for managing the portfolio and works with committee members in developing and executing the fund’s investment programs.
RISKS OF STOCK INVESTING
The stock market as a whole can decline for many reasons, including adverse political or economic developments here or abroad, changes in investor psychology, or heavy institutional selling. The prospects for an industry or company may deteriorate because of a variety of factors, including disappointing earnings or changes in the competitive environment. In addition, our assessment of companies held in the fund may prove incorrect, resulting in losses or poor performance even in a rising market.
Growth stocks can be volatile for several reasons. Since growth companies usually reinvest a high proportion of their earnings in their own businesses, they may lack the dividends often associated with value stocks that could cushion their decline in a falling market. Also, since investors buy growth stocks because of their expected superior earnings growth, earnings disappointments often result in sharp price declines.
The stocks of mid-cap companies entail greater risk and are usually more volatile than the shares of large companies. Investing in small companies also involves greater risk than is customarily associated with larger companies. Stocks of small companies are subject to more abrupt or erratic price movements than larger-company stocks. Small companies often have limited product lines, markets, or financial resources, and their managements may lack depth and experience. Such companies seldom pay significant dividends that could cushion returns in a falling market.
Technology stocks are particularly volatile and subject to greater price swings, up and down, than the broad market. It is possible that companies whose products and services first appear promising may not succeed over the long term; they may succumb to intense competition or could quickly become obsolete in a rapidly developing marketplace. Earnings projections for developing companies that are not met can result in sharp price declines. This is true even in a generally rising stock market environment.
GLOSSARY
Earnings growth rate: Measures the annualized percent change in earnings per share for a given time period.
Historical growth five years (least squares): Least squares growth calculation attempts to find the “normal” growth rate given a stream of historical growth rates. It searches for the growth rate that best fits the line produced by a stream of growth numbers.
Investment-weighted median market capitalization: The investment-weighted midpoint market capitalization (shares outstanding x current price) representing a typical security in a portfolio. An investment-weighted median represents the breakpoint where 50% of the values are above and 50% of the values are below based on portfolio weight.
Lipper indexes: Consist of a small number (10 to 30) of the largest mutual funds in a particular category as tracked by Lipper Inc.
Price/earnings (P/E) ratio: A ratio that shows the “multiple” of earnings at which a stock is selling. It is calculated by dividing a stock’s current price by its current earnings per share. For example, if a stock’s price is $60 per share and the issuing company earns $2 per share, the P/E ratio is $60/$2, or 30.
Projected long-term growth (IBES): Long-term projected earnings per share growth rate based on IBES estimates.
Return on equity (ROE): Calculated by dividing a company’s net income by shareholders’ equity (i.e., the company’s book value), ROE measures how much a company earns on each dollar that common stock investors have put into that company. ROE indicates how effectively and efficiently a company and its management are using stockholder investments. “Excluding charges” refers to the earnings figure used in the calculation. It represents earnings before extraordinary items and discontinued operations.
Russell 3000 Index: An index that tracks the performance of the 3,000 largest U.S. companies, representing approximately 98% of the investable U.S. equity market.
Russell 3000 Growth Index: The Russell 3000 Growth Index measures the performance of those Russell 3000 companies with higher price-to-book ratios and higher forecasted growth values.

Performance and Expenses
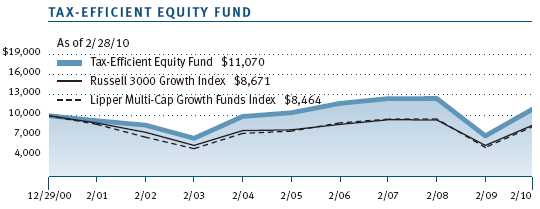
| GROWTH OF $10,000 |
This chart shows the value of a hypothetical $10,000 investment in the fund over the past 10 fiscal year periods or since inception (for funds lacking 10-year records). The result is compared with benchmarks, which may include a broad-based market index and a peer group average or index. Market indexes do not include expenses, which are deducted from fund returns as well as mutual fund averages and indexes.
| AVERAGE ANNUAL COMPOUND TOTAL RETURN |
This table shows how the fund would have performed each year if its actual (or cumulative) returns for the periods shown had been earned at a constant rate.
| FUND EXPENSE EXAMPLE |
As a mutual fund shareholder, you may incur two types of costs: (1) transaction costs, such as redemption fees or sales loads, and (2) ongoing costs, including management fees, distribution and service (12b-1) fees, and other fund expenses. The following example is intended to help you understand your ongoing costs (in dollars) of investing in the fund and to compare these costs with the ongoing costs of investing in other mutual funds. The example is based on an investment of $1,000 invested at the beginning of the most recent six-month period and held for the entire period.
Actual Expenses
The first line of the following table (“Actual”) provides information about actual account values and expenses based on the fund’s actual returns. You may use the information in this line, together with your account balance, to estimate the expenses that you paid over the period. Simply divide your account value by $1,000 (for example, an $8,600 account value divided by $1,000 = 8.6), then multiply the result by the number in the first line under the heading “Expenses Paid During Period” to estimate the expenses you paid on your account during this period.
Hypothetical Example for Comparison Purposes
The information on the second line of the table (“Hypothetical”) is based on hypothetical account values and expenses derived from the fund’s actual expense ratio and an assumed 5% per year rate of return before expenses (not the fund’s actual return). You may compare the ongoing costs of investing in the fund with other funds by contrasting this 5% hypothetical example and the 5% hypothetical examples that appear in the shareholder reports of the other funds. The hypothetical account values and expenses may not be used to estimate the actual ending account balance or expenses you paid for the period.
Note: T. Rowe Price charges an annual small-account maintenance fee of $10, generally for accounts with less than $2,000 ($500 for UGMA/UTMA). The fee is waived for any investor whose T. Rowe Price mutual fund accounts total $25,000 or more, accounts employing automatic investing, and IRAs and other retirement plan accounts that utilize a prototype plan sponsored by T. Rowe Price (although a separate custodial or administrative fee may apply to such accounts). This fee is not included in the accompanying table. If you are subject to the fee, keep it in mind when you are estimating the ongoing expenses of investing in the fund and when comparing the expenses of this fund with other funds.
You should also be aware that the expenses shown in the table highlight only your ongoing costs and do not reflect any transaction costs, such as redemption fees or sales loads. Therefore, the second line of the table is useful in comparing ongoing costs only and will not help you determine the relative total costs of owning different funds. To the extent a fund charges transaction costs, however, the total cost of owning that fund is higher.

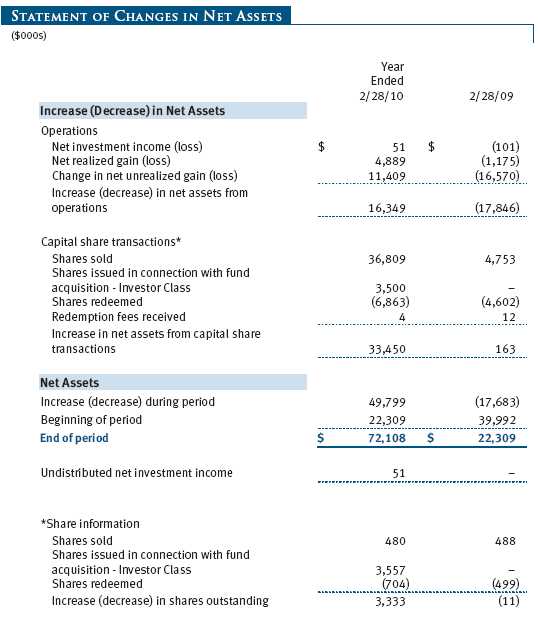
The accompanying notes are an integral part of these financial statements.

The accompanying notes are an integral part of these financial statements.
The accompanying notes are an integral part of these financial statements.
The accompanying notes are an integral part of these financial statements.
The accompanying notes are an integral part of these financial statements.
| NOTES TO FINANCIAL STATEMENTS |
T. Rowe Price Tax-Efficient Funds, Inc. (the corporation), is registered under the Investment Company Act of 1940 (the 1940 Act). The Tax-Efficient Equity Fund (the fund), a diversified, open-end management investment company, is one portfolio established by the corporation. The fund commenced operations on December 29, 2000. The fund seeks to maximize after-tax growth of capital through investments primarily in common stocks.
NOTE 1 - SIGNIFICANT ACCOUNTING POLICIES
Basis of Preparation The accompanying financial statements were prepared in accordance with accounting principles generally accepted in the United States of America (GAAP), which require the use of estimates made by fund management. Fund management believes that estimates and security valuations are appropriate; however, actual results may differ from those estimates, and the security valuations reflected in the accompanying financial statements may differ from the value ultimately realized upon sale of the securities.
Investment Transactions, Investment Income, and Distributions Income and expenses are recorded on the accrual basis. Dividends received from mutual fund investments are reflected as dividend income; capital gain distributions are reflected as realized gain/loss. Dividend income and capital gain distributions are recorded on the ex-dividend date. Income tax-related interest and penalties, if incurred, would be recorded as income tax expense. Investment transactions are accounted for on the trade date. Realized gains and losses are reported on the identified cost basis. Distributions to shareholders are recorded on the ex-dividend date. Income distributions are declared and paid annually. Capital gain distributions, if any, are generally declared and paid by the fund, annually.
Credits The fund earns credits on temporarily uninvested cash balances held at the custodian, which reduce the fund’s custody charges. Custody expense in the accompanying financial statements is presented before reduction for credits.
Redemption Fees A 1% fee is assessed on redemptions of fund shares held for less than 365 days to deter short-term trading and to protect the interests of long-term shareholders. Redemption fees are withheld from proceeds that shareholders receive from the sale or exchange of fund shares. The fees are paid to the fund and are recorded as an increase to paid-in capital. The fees may cause the redemption price per share to differ from the net asset value per share.
New Accounting Pronouncements On March 1, 2009, the fund adopted new accounting guidance that requires enhanced disclosures about derivative and hedging activities, including how such activities are accounted for and their effect on financial position, performance, and cash flows. Adoption of this guidance had no impact on the fund’s net assets or results of operations.
In January 2010, new accounting guidance was issued that will require enhanced disclosures about fair value measurements in the financial statements; it is effective for fiscal years and interim periods beginning after December 15, 2009. Management expects that adoption of this guidance will have no impact on the fund’s net assets or results of operations.
NOTE 2 - VALUATION
The fund’s investments are reported at fair value as defined under GAAP. The fund determines the values of its assets and liabilities and computes its net asset value per share at the close of the New York Stock Exchange (NYSE), normally 4 p.m. ET, each day that the NYSE is open for business.
Valuation Methods Equity securities listed or regularly traded on a securities exchange or in the over-the-counter (OTC) market are valued at the last quoted sale price or, for certain markets, the official closing price at the time the valuations are made, except for OTC Bulletin Board securities, which are valued at the mean of the latest bid and asked prices. A security that is listed or traded on more than one exchange is valued at the quotation on the exchange determined to be the primary market for such security. Listed securities not traded on a particular day are valued at the mean of the latest bid and asked prices for domestic securities and the last quoted sale price for international securities.
Investments in mutual funds are valued at the mutual fund’s closing net asset value per share on the day of valuation.
Other investments, including restricted securities, and those financial instruments for which the above valuation procedures are inappropriate or are deemed not to reflect fair value are stated at fair value as determined in good faith by the T. Rowe Price Valuation Committee, established by the fund’s Board of Directors.
Valuation Inputs Various inputs are used to determine the value of the fund’s financial instruments. These inputs are summarized in the three broad levels listed below:
Level 1 – quoted prices in active markets for identical securities
Level 2 – observable inputs other than Level 1 quoted prices (including, but not limited to, quoted prices for similar securities, interest rates, prepayment speeds, and credit risk)
Level 3 – unobservable inputs
Observable inputs are those based on market data obtained from sources independent of the fund, and unobservable inputs reflect the fund’s own assumptions based on the best information available. The input levels are not necessarily an indication of the risk or liquidity associated with financial instruments at that level. On February 28, 2010, all of the fund’s investments were classified as Level 1, based on the inputs used to determine their values.
NOTE 3 - OTHER INVESTMENT TRANSACTIONS
Consistent with its investment objective, the fund engages in the following practices to manage exposure to certain risks and/or to enhance performance. The investment objective, policies, program, and risk factors of the fund are described more fully in the fund’s prospectus and Statement of Additional Information.
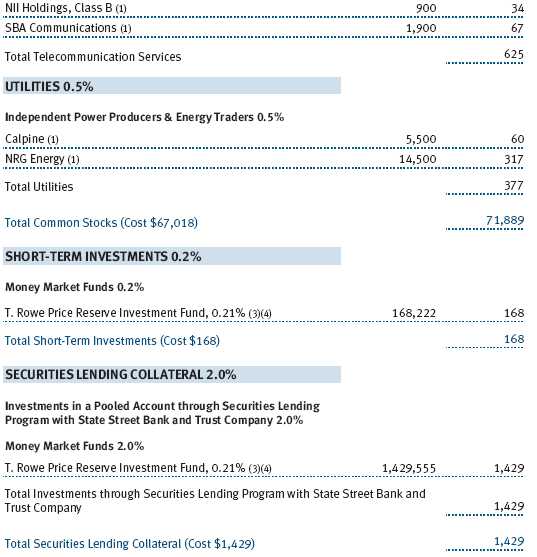
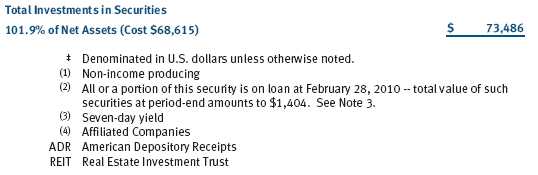
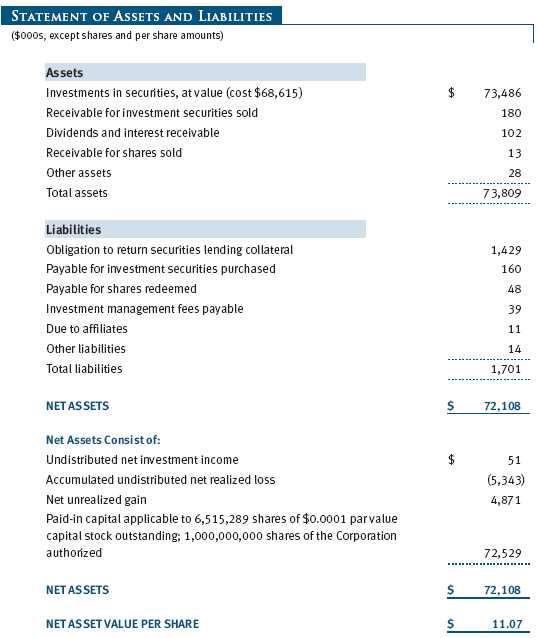
Securities Lending The fund lends its securities to approved brokers to earn additional income. It receives as collateral cash and U.S. government securities valued at 102% to 105% of the value of the securities on loan. Cash collateral is invested by the fund’s lending agent(s) in accordance with investment guidelines approved by fund management. Although risk is mitigated by the collateral, the fund could experience a delay in recovering its securities and a possible loss of income or value if the borrower fails to return the securities or if collateral investments decline in value. Securities lending revenue recognized by the fund consists of earnings on invested collateral and borrowing fees, net of any rebates to the borrower and compensation to the lending agent. On February 28, 2010, the value of loaned securities was $1,404,000.
Other Purchases and sales of portfolio securities other than short-term securities aggregated $33,818,000 and $35,939,000, respectively, for the year ended February 28, 2010.
NOTE 4 - FEDERAL INCOME TAXES
No provision for federal income taxes is required since the fund intends to continue to qualify as a regulated investment company under Subchapter M of the Internal Revenue Code and distribute to shareholders all of its taxable income and gains. Distributions determined in accordance with federal income tax regulations may differ in amount or character from net investment income and realized gains for financial reporting purposes. Financial reporting records are adjusted for permanent book/tax differences to reflect tax character but are not adjusted for temporary differences.
The fund files U.S. federal, state, and local tax returns as required. The fund’s tax returns are subject to examination by the relevant tax authorities until expiration of the applicable statute of limitations, which is generally three years after filing of the tax return but could be longer in certain circumstances.
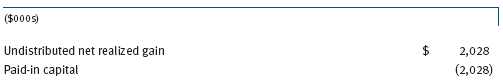
Reclassifications to paid-in capital relate primarily to expiring capital loss carryforwards. For the year ended February 28, 2010, the following reclassifications were recorded to reflect tax character; there was no impact on results of operations or net assets:
There were no distributions in the years ended February 28, 2010 and February 28, 2009. At February 28, 2010, the tax-basis cost of investments and components of net assets were as follows:
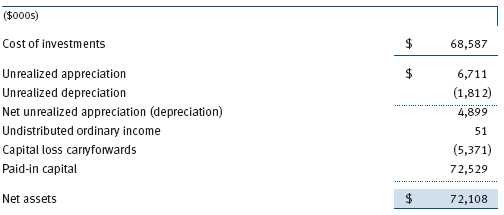
The fund intends to retain realized gains to the extent of available capital loss carryforwards. During the year ended February 28, 2010, the fund utilized $3,620,000 of capital loss carryforwards. The fund’s unused capital loss carryforwards as of February 28, 2010, expire: $4,207,000 in fiscal 2011, $1,112,000 in fiscal 2012, and $52,000 in fiscal 2017. Further, $262,000 of the fund’s unused capital loss carryforwards acquired through tax-free reorganizations may be subject to certain limitations on amount and/or timing of use.
NOTE 5 - ACQUISITION
On August 31, 2009, the fund acquired substantially all of the assets of the T. Rowe Price Tax-Efficient Growth Fund (the acquired fund), pursuant to the Agreement and Plan of Reorganization dated June 23, 2009, and approved by shareholders of the acquired fund on August 21, 2009. The acquired fund’s assets had declined over the last five years, which caused its expenses to increase to a relatively high level. The reorganization provided acquired fund shareholders the opportunity to become shareholders of a larger, more diversified fund with an expense ratio limitation, while maintaining a tax-efficient approach to investing. The acquisition was accomplished by a tax-free exchange of 3,556,681 shares of the fund (with a value of $35,780,000) for all 4,504,112 shares of the acquired fund outstanding on August 28, 2009 with the same value. The net assets of the acquired fund at that date included $3,500,000 of unrealized depreciation and $7,526,000 of net realized losses carried forward for tax purposes to offset distributable gains realized by the fund in the future. Assets of the acquired fund, including securities of $35,716,000, cash of $13,000, and receivables and other assets of $52,000, were combined with those of the fund, resulting in aggregate net assets of $66,451,000 immediately after the acquisition.
Proforma results of operations of the combined entity for the entire year ended February 28, 2010, as though the acquisition had occurred as of the beginning of the year (rather than on the actual acquisition date), are as follows:
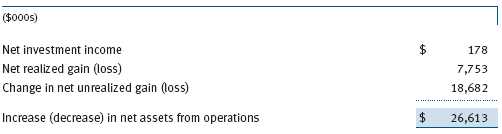
Because the combined investment portfolios have been managed as a single portfolio since the acquisition was completed, it is not practicable to separate the amounts of revenue and earnings of the acquired fund that have been included in the fund’s accompanying Statement of Operations since August 31, 2009.
NOTE 6 - RELATED PARTY TRANSACTIONS
The fund is managed by T. Rowe Price Associates, Inc. (the manager or Price Associates), a wholly owned subsidiary of T. Rowe Price Group, Inc. The investment management agreement between the fund and the manager provides for an annual investment management fee, which is computed daily and paid monthly. The fee consists of an individual fund fee, equal to 0.35% of the fund’s average daily net assets, and a group fee. The group fee rate is calculated based on the combined net assets of certain mutual funds sponsored by Price Associates (the group) applied to a graduated fee schedule, with rates ranging from 0.48% for the first $1 billion of assets to 0.285% for assets in excess of $220 billion. The fund’s group fee is determined by applying the group fee rate to the fund’s average daily net assets. At February 28, 2010, the effective annual group fee rate was 0.30%.
The fund is also subject to a contractual expense limitation through June 30, 2010. During the limitation period, the manager is required to waive its management fee and reimburse the fund for any expenses, excluding interest, taxes, brokerage commissions, and extraordinary expenses, that would otherwise cause the fund’s ratio of annualized total expenses to average net assets (expense ratio) to exceed its expense limitation of 1.25%. The fund is required to repay the manager for expenses previously reimbursed and management fees waived to the extent the fund’s net assets have grown or expenses have declined sufficiently to allow repayment without causing the fund’s expense ratio to exceed its expense limitation. However, no repayment will be made more than three years after the date of any reimbursement or waiver or later than June 30, 2012. Pursuant to this agreement, expenses in the amount of $1,000 were reimbursed by the manager during the year ended February 28, 2010. Including these amounts, management fees waived and expenses previously reimbursed by the manager in the amount of $101,000 remain subject to repayment at February 28, 2010.
In addition, the fund has entered into service agreements with Price Associates and two wholly owned subsidiaries of Price Associates (collectively, Price). Price Associates computes the daily share price and provides certain other administrative services to the fund. T. Rowe Price Services, Inc., provides shareholder and administrative services in its capacity as the fund’s transfer and dividend disbursing agent. T. Rowe Price Retirement Plan Services, Inc., provides subaccounting and recordkeeping services for certain retirement accounts invested in the fund. For the year ended February 28, 2010, expenses incurred pursuant to these service agreements were $69,000 for Price Associates; $47,000 for T. Rowe Price Services, Inc.; and less than $1,000 for T. Rowe Price Retirement Plan Services, Inc. The total amount payable at period-end pursuant to these service agreements is reflected as Due to Affiliates in the accompanying financial statements.
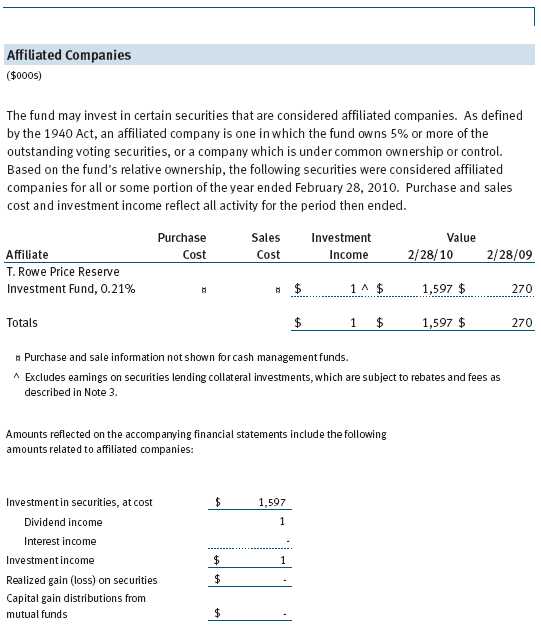
The fund may invest in the T. Rowe Price Reserve Investment Fund and the T. Rowe Price Government Reserve Investment Fund (collectively, the T. Rowe Price Reserve Investment Funds), open-end management investment companies managed by Price Associates and considered affiliates of the fund. The T. Rowe Price Reserve Investment Funds are offered as cash management options to mutual funds, trusts, and other accounts managed by Price Associates and/or its affiliates and are not available for direct purchase by members of the public. The T. Rowe Price Reserve Investment Funds pay no investment management fees.
| REPORT OF INDEPENDENT REGISTERED PUBLIC ACCOUNTING FIRM |
To the Board of Directors and Shareholders of T. Rowe Price Tax-Efficient Equity Fund
In our opinion, the accompanying statement of assets and liabilities, including the schedule of investments, and the related statements of operations and of changes in net assets and the financial highlights present fairly, in all material respects, the financial position of T. Rowe Price Tax-Efficient Equity Fund, Inc. (the “Fund”) at February 28, 2010, the results of its operations for the year then ended, the changes in its net assets for each of the two years in the period then ended and the financial highlights for each of the five years in the period then ended, in conformity with accounting principles generally accepted in the United States of America. These financial statements and financial highlights (hereafter referred to as “financial statements”) are the responsibility of the Fund’s management; our responsibility is to express an opinion on these financial statements based on our audits. We conducted our audits of these financial statements in accordance with the standards of the Public Company Accounting Oversight Board (United States). Those standards require that we plan and perform the audit to obtain reasonable assurance about whether the financial statements are free of material misstatement. An audit includes examining, on a test basis, evidence supporting the amounts and disclosures in the financial statements, assessing the accounting principles used and significant estimates made by management, and evaluating the overall financial statement presentation. We believe that our audits, which included confirmation of securities at February 28, 2010 by correspondence with the custodian and confirmation of the underlying funds by correspondence with the transfer agent, provide a reasonable basis for our opinion.
PricewaterhouseCoopers LLP
Baltimore, Maryland
April 13, 2010
| TAX INFORMATION (UNAUDITED) FOR THE TAX YEAR ENDED 2/28/10 |
We are providing this information as required by the Internal Revenue Code. The amounts shown may differ from those elsewhere in this report because of differences between tax and financial reporting requirements.
For taxable non-corporate shareholders, $51,000 of the fund’s income represents qualified dividend income subject to the 15% rate category.
For corporate shareholders, $51,000 of the fund’s income qualifies for the dividends-received deduction.
| INFORMATION ON PROXY VOTING POLICIES, PROCEDURES, AND RECORDS |
A description of the policies and procedures used by T. Rowe Price funds and portfolios to determine how to vote proxies relating to portfolio securities is available in each fund’s Statement of Additional Information, which you may request by calling 1-800-225-5132 or by accessing the SEC’s Web site, www.sec.gov. The description of our proxy voting policies and procedures is also available on our Web site, www.troweprice.com. To access it, click on the words “Our Company” at the top of our corporate homepage. Then, when the next page appears, click on the words “Proxy Voting Policies” on the left side of the page.
Each fund’s most recent annual proxy voting record is available on our Web site and through the SEC’s Web site. To access it through our Web site, follow the directions above, then click on the words “Proxy Voting Records” on the right side of the Proxy Voting Policies page.
| HOW TO OBTAIN QUARTERLY PORTFOLIO HOLDINGS |
The fund files a complete schedule of portfolio holdings with the Securities and Exchange Commission for the first and third quarters of each fiscal year on Form N-Q. The fund’s Form N-Q is available electronically on the SEC’s Web site (www.sec.gov); hard copies may be reviewed and copied at the SEC’s Public Reference Room, 450 Fifth St. N.W., Washington, DC 20549. For more information on the Public Reference Room, call 1-800-SEC-0330.
| ABOUT THE FUND’S DIRECTORS AND OFFICERS |
Your fund is governed by a Board of Directors (Board) that meets regularly to review a wide variety of matters affecting the fund, including performance, investment programs, compliance matters, advisory fees and expenses, service providers, and other business affairs. The Board elects the fund’s officers, who are listed in the final table. At least 75% of Board members are independent of T. Rowe Price Associates, Inc. (T. Rowe Price), and T. Rowe Price International, Inc. (T. Rowe Price International); “inside” or “interested” directors are employees or officers of T. Rowe Price. The business address of each director and officer is 100 East Pratt Street, Baltimore, Maryland 21202. The Statement of Additional Information includes additional information about the directors and is available without charge by calling a T. Rowe Price representative at 1-800-225-5132.
| Independent Directors | |
| Name | |
| (Year of Birth) | Principal Occupation(s) During Past Five Years and Directorships of |
| Year Elected* | Other Public Companies |
| William R. Brody | President and Trustee, Salk Institute for Biological Studies (2009 |
| (1944) | to present); Director, Novartis, Inc. (2009 to present); Director, IBM |
| 2009 | (2007 to present); President and Trustee, Johns Hopkins University |
| (1996 to 2009); Chairman of Executive Committee and Trustee, | |
| Johns Hopkins Health System (1996 to 2009) | |
| Jeremiah E. Casey | Director, National Life Insurance (2001 to 2005); Director, The Rouse |
| (1940) | Company, real estate developers (1990 to 2004) |
| 2005 | |
| Anthony W. Deering | Chairman, Exeter Capital, LLC, a private investment firm (2004 |
| (1945) | to present); Director, Under Armour (2008 to present); Director, |
| 2001 | Vornado Real Estate Investment Trust (2004 to present); Director, |
| Mercantile Bankshares (2002 to 2007); Member, Advisory Board, | |
| Deutsche Bank North America (2004 to present); Director, Chairman | |
| of the Board, and Chief Executive Officer, The Rouse Company, real | |
| estate developers (1997 to 2004) | |
| Donald W. Dick, Jr. | Principal, EuroCapital Advisors, LLC, an acquisition and manage- |
| (1943) | ment advisory firm (1995 to present) |
| 1997 | |
| Karen N. Horn | Director, Eli Lilly and Company (1987 to present); Director, Simon |
| (1943) | Property Group (2004 to present); Director, Norfolk Southern (2008 |
| 2003 | to present); Director, Georgia Pacific (2004 to 2005) |
| Theo C. Rodgers | President, A&R Development Corporation (1977 to present) |
| (1941) | |
| 2005 | |
| John G. Schreiber | Owner/President, Centaur Capital Partners, Inc., a real estate invest- |
| (1946) | ment company (1991 to present); Partner, Blackstone Real Estate |
| 2001 | Advisors, L.P. (1992 to present) |
| Mark R. Tercek | President and Chief Executive Officer, The Nature Conservancy (2008 |
| (1957) | to present); Managing Director, The Goldman Sachs Group, Inc. |
| 2009 | (1984 to 2008) |
| *Each independent director oversees 125 T. Rowe Price portfolios and serves until retirement, resignation, | |
| or election of a successor. | |
| Inside Directors | |
| Name | |
| (Year of Birth) | |
| Year Elected* | |
| [Number of T. Rowe Price | Principal Occupation(s) During Past Five Years and Directorships of |
| Portfolios Overseen] | Other Public Companies |
| Edward C. Bernard | Director and Vice President, T. Rowe Price; Vice Chairman of the |
| (1956) | Board, Director, and Vice President, T. Rowe Price Group, Inc.; |
| 2006 | Chairman of the Board, Director, and President, T. Rowe |
| [125] | Price Investment Services, Inc.; Chairman of the Board and Director, |
| T. Rowe Price Global Asset Management Limited, T. Rowe Price | |
| Global Investment Services Limited, T. Rowe Price Retirement | |
| Plan Services, Inc., T. Rowe Price Savings Bank, and T. Rowe Price | |
| Services, Inc.; Director, T. Rowe Price International, Inc.; Chief | |
| Executive Officer, Chairman of the Board, Director, and President, | |
| T. Rowe Price Trust Company; Chairman of the Board, all funds | |
| Brian C. Rogers, CFA, CIC | Chief Investment Officer, Director, and Vice President, T. Rowe Price; |
| (1955) | Chairman of the Board, Chief Investment Officer, Director, and Vice |
| 2006 | President, T. Rowe Price Group, Inc.; Vice President, T. Rowe Price |
| [70] | Trust Company |
| *Each inside director serves until retirement, resignation, or election of a successor. | |
| Officers | |
| Name (Year of Birth) | |
| Position Held With Tax-Efficient Funds | Principal Occupation(s) |
| Donald J. Easley, CFA (1971) | Vice President, T. Rowe Price and T. Rowe Price |
| Vice President | Group, Inc. |
| Charles E. Emrich (1961) | Vice President, T. Rowe Price |
| Vice President | |
| Roger L. Fiery III, CPA (1959) | Vice President, T. Rowe Price, T. Rowe Price |
| Vice President | Group, Inc., T. Rowe Price International, Inc., |
| and T. Rowe Price Trust Company | |
| John R. Gilner (1961) | Chief Compliance Officer and Vice President, |
| Chief Compliance Officer | T. Rowe Price; Vice President, T. Rowe Price |
| Group, Inc., and T. Rowe Price Investment | |
| Services, Inc. | |
| Gregory S. Golczewski (1966) | Vice President, T. Rowe Price and T. Rowe Price |
| Vice President | Trust Company |
| Gregory K. Hinkle, CPA (1958) | Vice President, T. Rowe Price, T. Rowe Price |
| Treasurer | Group, Inc., and T. Rowe Price Trust Company; |
| formerly Partner, PricewaterhouseCoopers LLP | |
| (to 2007) | |
| Patricia B. Lippert (1953) | Assistant Vice President, T. Rowe Price and |
| Secretary | T. Rowe Price Investment Services, Inc. |
| Hugh D. McGuirk, CFA (1960) | Vice President, T. Rowe Price and T. Rowe Price |
| Executive Vice President | Group, Inc. |
| David Oestreicher (1967) | Director and Vice President, T. Rowe Price |
| Vice President | Investment Services, Inc., T. Rowe Price Trust |
| Company, and T. Rowe Price Services, Inc.; Vice | |
| President, T. Rowe Price, T. Rowe Price Global | |
| Asset Management Limited, T. Rowe Price | |
| Global Investment Services Limited, T. Rowe | |
| Price Group, Inc., T. Rowe Price International, | |
| Inc., and T. Rowe Price Retirement Plan | |
| Services, Inc. | |
| Donald J. Peters (1959) | Vice President, T. Rowe Price and T. Rowe Price |
| President | Group, Inc. |
| Deborah D. Seidel (1962) | Vice President, T. Rowe Price, T. Rowe Price |
| Vice President | Investment Services, Inc., and T. Rowe Price |
| Services, Inc. | |
| William J. Stromberg, CFA (1960) | Director and Vice President, T. Rowe Price; Vice |
| Vice President | President, T. Rowe Price Global Investment |
| Services Limited, T. Rowe Price Group, Inc., | |
| T. Rowe Price International, Inc., and T. Rowe | |
| Price Trust Company | |
| Julie L. Waples (1970) | Vice President, T. Rowe Price |
| Vice President | |
| Mark R. Weigman, CFA, CIC (1962) | Vice President, T. Rowe Price, T. Rowe Price |
| Vice President | Group, Inc., and T. Rowe Price Trust Company |
| Unless otherwise noted, officers have been employees of T. Rowe Price or T. Rowe Price International | |
| for at least five years. | |
Item 2. Code of Ethics.
The registrant has adopted a code of ethics, as defined in Item 2 of Form N-CSR, applicable to its principal executive officer, principal financial officer, principal accounting officer or controller, or persons performing similar functions. A copy of this code of ethics is filed as an exhibit to this Form N-CSR. No substantive amendments were approved or waivers were granted to this code of ethics during the period covered by this report.
Item 3. Audit Committee Financial Expert.
The registrant’s Board of Directors/Trustees has determined that Mr. Anthony W. Deering qualifies as an audit committee financial expert, as defined in Item 3 of Form N-CSR. Mr. Deering is considered independent for purposes of Item 3 of Form N-CSR.
Item 4. Principal Accountant Fees and Services.
(a) – (d) Aggregate fees billed to the registrant for the last two fiscal years for professional services rendered by the registrant’s principal accountant were as follows:
Audit fees include amounts related to the audit of the registrant’s annual financial statements and services normally provided by the accountant in connection with statutory and regulatory filings. Audit-related fees include amounts reasonably related to the performance of the audit of the registrant’s financial statements and specifically include the issuance of a report on internal controls and, if applicable, agreed-upon procedures related to fund acquisitions. Tax fees include amounts related to services for tax compliance, tax planning, and tax advice. The nature of these services specifically includes the review of distribution calculations and the preparation of Federal, state, and excise tax returns. All other fees include the registrant’s pro-rata share of amounts for agreed-upon procedures in conjunction with service contract approvals by the registrant’s Board of Directors/Trustees.
(e)(1) The registrant’s audit committee has adopted a policy whereby audit and non-audit services performed by the registrant’s principal accountant for the registrant, its investment adviser, and any entity controlling, controlled by, or under common control with the investment adviser that provides ongoing services to the registrant require pre-approval in advance at regularly scheduled audit committee meetings. If such a service is required between regularly scheduled audit committee meetings, pre-approval may be authorized by one audit committee member with ratification at the next scheduled audit committee meeting. Waiver of pre-approval for audit or non-audit services requiring fees of a de minimis amount is not permitted.
(2) No services included in (b) – (d) above were approved pursuant to paragraph (c)(7)(i)(C) of Rule 2-01 of Regulation S-X.
(f) Less than 50 percent of the hours expended on the principal accountant’s engagement to audit the registrant’s financial statements for the most recent fiscal year were attributed to work performed by persons other than the principal accountant’s full-time, permanent employees.
(g) The aggregate fees billed for the most recent fiscal year and the preceding fiscal year by the registrant’s principal accountant for non-audit services rendered to the registrant, its investment adviser, and any entity controlling, controlled by, or under common control with the investment adviser that provides ongoing services to the registrant were $1,879,000 and $1,922,000, respectively.
(h) All non-audit services rendered in (g) above were pre-approved by the registrant’s audit committee. Accordingly, these services were considered by the registrant’s audit committee in maintaining the principal accountant’s independence.
Item 5. Audit Committee of Listed Registrants.
Not applicable.
Item 6. Investments.
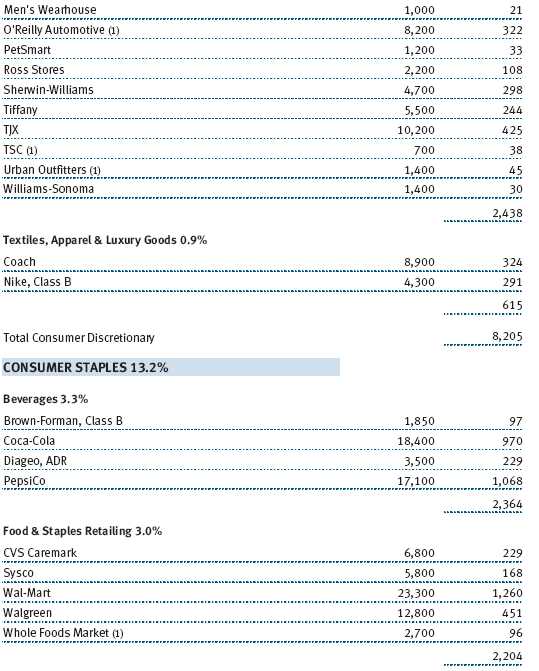
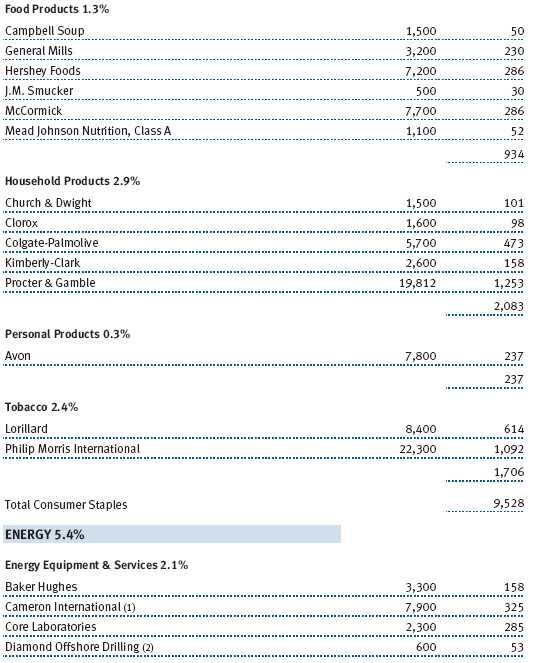
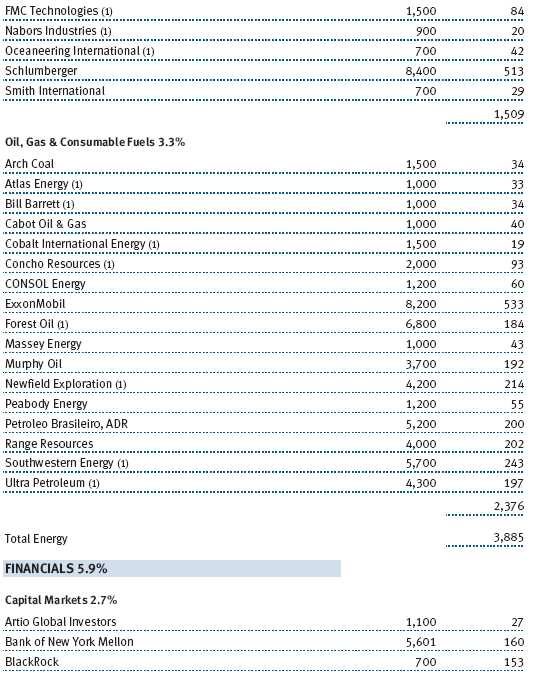
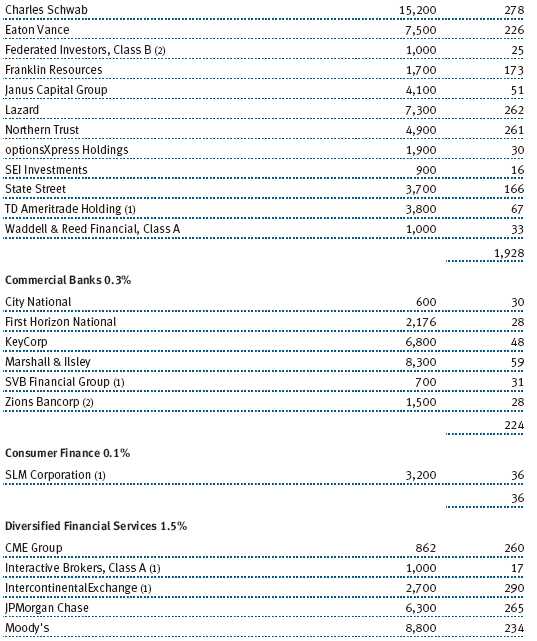
(a) Not applicable. The complete schedule of investments is included in Item 1 of this Form N-CSR.
(b) Not applicable.
Item 7. Disclosure of Proxy Voting Policies and Procedures for Closed-End Management Investment Companies.
Not applicable.
Item 8. Portfolio Managers of Closed-End Management Investment Companies.
Not applicable.
Item 9. Purchases of Equity Securities by Closed-End Management Investment Company and Affiliated Purchasers.
Not applicable.
Item 10. Submission of Matters to a Vote of Security Holders.
Not applicable.
Item 11. Controls and Procedures.
(a) The registrant’s principal executive officer and principal financial officer have evaluated the registrant’s disclosure controls and procedures within 90 days of this filing and have concluded that the registrant’s disclosure controls and procedures were effective, as of that date, in ensuring that information required to be disclosed by the registrant in this Form N-CSR was recorded, processed, summarized, and reported timely.
(b) The registrant’s principal executive officer and principal financial officer are aware of no change in the registrant’s internal control over financial reporting that occurred during the registrant’s second fiscal quarter covered by this report that has materially affected, or is reasonably likely to materially affect, the registrant’s internal control over financial reporting.
Item 12. Exhibits.
(a)(1) The registrant’s code of ethics pursuant to Item 2 of Form N-CSR is attached.
(2) Separate certifications by the registrant's principal executive officer and principal financial officer, pursuant to Section 302 of the Sarbanes-Oxley Act of 2002 and required by Rule 30a-2(a) under the Investment Company Act of 1940, are attached.
(3) Written solicitation to repurchase securities issued by closed-end companies: not applicable.
(b) A certification by the registrant's principal executive officer and principal financial officer, pursuant to Section 906 of the Sarbanes-Oxley Act of 2002 and required by Rule 30a-2(b) under the Investment Company Act of 1940, is attached.
SIGNATURES | |
| Pursuant to the requirements of the Securities Exchange Act of 1934 and the Investment | |
| Company Act of 1940, the registrant has duly caused this report to be signed on its behalf by the | |
| undersigned, thereunto duly authorized. | |
| T. Rowe Price Tax-Efficient Funds, Inc. | |
| By | /s/ Edward C. Bernard |
| Edward C. Bernard | |
| Principal Executive Officer | |
| Date | April 16, 2010 |
| Pursuant to the requirements of the Securities Exchange Act of 1934 and the Investment | |
| Company Act of 1940, this report has been signed below by the following persons on behalf of | |
| the registrant and in the capacities and on the dates indicated. | |
| By | /s/ Edward C. Bernard |
| Edward C. Bernard | |
| Principal Executive Officer | |
| Date | April 16, 2010 |
| By | /s/ Gregory K. Hinkle |
| Gregory K. Hinkle | |
| Principal Financial Officer | |
| Date | April 16, 2010 |