| UNITED STATES |
| SECURITIES AND EXCHANGE COMMISSION |
| Washington, D.C. 20549 |
FORM N-CSR |
CERTIFIED SHAREHOLDER REPORT OF REGISTERED |
MANAGEMENT INVESTMENT COMPANIES |
| Investment Company Act File Number: 811-08207 |
| T. Rowe Price Tax-Efficient Funds, Inc. |
| (Exact name of registrant as specified in charter) |
| 100 East Pratt Street, Baltimore, MD 21202 |
| (Address of principal executive offices) |
| David Oestreicher |
| 100 East Pratt Street, Baltimore, MD 21202 |
| (Name and address of agent for service) |
| Registrant’s telephone number, including area code: (410) 345-2000 |
| Date of fiscal year end: February 28 |
| Date of reporting period: February 28, 2009 |
Item 1: Report to Shareholders
 |
| Tax-Efficient Balanced Fund | February 28, 2009 |
The views and opinions in this report were current as of February 28, 2009. They are not guarantees of performance or investment results and should not be taken as investment advice. Investment decisions reflect a variety of factors, and the managers reserve the right to change their views about individual stocks, sectors, and the markets at any time. As a result, the views expressed should not be relied upon as a forecast of the fund’s future investment intent. The report is certified under the Sarbanes-Oxley Act, which requires mutual funds and other public companies to affirm that, to the best of their knowledge, the information in their financial reports is fairly and accurately stated in all material respects.
REPORTS ON THE WEB
Sign up for our E-mail Program, and you can begin to receive updated fund reports and prospectuses online rather than through the mail. Log in to your account at troweprice.com for more information.
Manager’s Letter
Fellow Shareholders
Reflecting the extraordinary global economic slowdown, equities of all styles and capitalization ranges fell sharply over the 12 months ended February 28, 2009. As it required several years for many of the systemic financial excesses to reach unsustainable levels, there are no quick or painless solutions to the current conundrum. In fact, some of the actions taken by government policymakers and corporate managements to remedy the situation may serve to prolong the pain or make matters worse.
In this environment, virtually every equity category was punished severely. Large-caps outperformed small- and mid-cap stocks, and growth shares outperformed value across all capitalization ranges. Investment-grade municipal bonds produced good returns in the one-year period ended February 28. In the last six months, short- and intermediate-term securities produced moderate gains, but long-term issues generally declined. Although losses over the 12-month period were substantial, the Tax-Efficient Balanced Fund significantly outperformed its Lipper peer group index, while the Tax-Efficient Growth and Tax-Efficient Multi-Cap Growth Funds performed in line with their Lipper indices.
The speed and severity of the economic and market downturns over the past several months have surprised us. As fellow shareholders, we understand that the losses have been extremely painful. Frankly, it has been striking to watch investor sentiment go from extremely aggressive to extremely risk averse over the last 18 months. To be more specific, many investors eagerly participated in an intense, momentum-driven market in which valuations and risk did not seem to matter. Many of these same investors also competed to lend-for next to nothing-to heavily indebted government entities with growing obligations and widening revenue shortfalls.
HIGHLIGHTS
• Although losses over the 12-month period were substantial, the Tax-Efficient Balanced Fund significantly outperformed its Lipper peer group index, while the Tax-Efficient Growth and Tax-Efficient Multi-Cap Growth Funds performed in line with their Lipper indices.
• Reflecting the extraordinary global economic slowdown, equities of all styles and capitalization ranges fell sharply over the past year.
• Given the continuing credit market stress, short- and intermediate-term and AAA rated municipal securities had greater appeal than long-term and lower-quality issues.
• When fear and pessimism recede from the marketplace, investors will once again be willing to accept risks in pursuit of potentially higher return asset classes. Given our equity portfolios’ bias toward quality companies, we believe the funds will be well positioned for that change in sentiment.
The phenomenon of “rolling bubbles” over the last 15 years has led many to view the capital markets as the world’s biggest casino. While the speculative excesses have contributed significantly to the current downturn, we believe this behavior may prove advantageous to those long-term investors who remain disciplined and sober during times of stress. Nevertheless, adherence to a sound investment strategy is not easy. The experience of the last six months has been so traumatic that instead of the traditional flight to high-quality and conservative companies that frequently occurs during challenging periods, it appears that many investors have abandoned the equity asset class altogether—a decision that could be extremely detrimental, depending on one’s longer-term financial needs or liabilities. Moreover, inflation is expected to reappear as a major concern once the economy stabilizes, and equities have historically proven to be the most effective asset class to mitigate long-term inflationary pressures.
In our opinion, the current conditions offer a favorable risk/reward trade-off for long-term investors. In periods when fear rules the marketplace and many investors find it difficult to act rationally, we believe that the patient, disciplined execution of a sound investment strategy will lead to long-term investment success.
MARKET ENVIRONMENT
The U.S. economy is in the midst of a painful and prolonged recession that officially began in December 2007. Consumer spending, stock prices, and home values have declined; national unemployment has crept over 8%; and shaky financial institutions have raised capital and curtailed spending in order to survive. The Federal Reserve and Treasury Department have attempted to lessen the damage to the economy and the financial markets by taking some extraordinary actions. These have included slashing short-term interest rates to all-time lows, creating extraordinary credit facilities, and committing hundreds of billions of taxpayer dollars to several major financial institutions to prevent collapse. Although their short-term effectiveness has yet to be fully determined, these measures will ultimately give rise to significant inflationary pressures once the economy stabilizes and improves.
Over the past year, U.S. stocks have plunged in what has been one of the most challenging periods since the Great Depression. The latter half of our reporting period, in particular, was marked by extreme volatility, heightened risk aversion, and intense pressures on financial companies stemming from severe mortgage losses and excessive speculation.
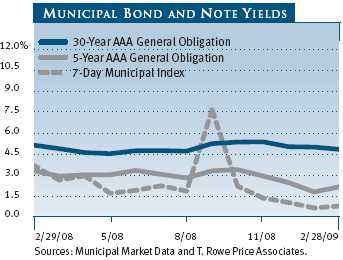
In the last six months, U.S. Treasury yields fell sharply across all maturities as the Federal Reserve reduced the fed funds target rate to an all-time low range of 0.00% to 0.25% by the end of 2008. Short- and intermediate-term municipal bond yields also declined significantly. Long-term municipal bond yields remained relatively high, however, as deleveraging and forced selling contributed to a material supply/demand imbalance that has impacted the long end of the municipal yield curve.
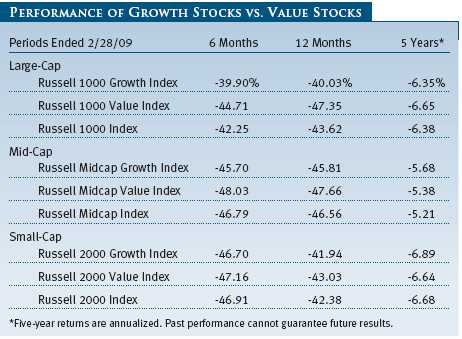
Amid the carnage, large-cap equities fared better than their mid- and small-cap counterparts, but still posted substantial declines. The large-cap Russell 1000 Index fell 43.62% over the 12 months ended February 28, 2009, with growth shares significantly outperforming value. The Russell Midcap Index returned -46.56% overall, with a -45.81% return in the Russell Midcap Growth Index outpacing the -47.66% return in the Russell Midcap Value Index. Among small-caps, the Russell 2000 Index posted a 12-month return of -42.38%. Growth shares outperformed value stocks in the small-cap universe also.
For the five-year period, equities have performed markedly better. The Russell 1000 Index had a -6.38% annualized return, with growth stocks maintaining a slight performance edge over value stocks. Mid-caps outperformed large-caps overall as the Russell Midcap Index posted a -5.21% annualized return. Value stocks outperformed growth over the period, but the difference is much smaller than it was in previous five-year periods as growth stock relative performance has improved. In the small-cap universe, the Russell 2000 declined 6.68% (on an annualized basis) over the past five years, with value outperforming growth over the period. Growth stocks appear to be closing the long-term performance gap, and the process of mean reversion appears to be continuing after value’s strong multiyear outperformance run.
Despite the poor recent performance of equities, we believe the current risk-averse environment is one in which our growth-oriented strategies can potentially outperform similar mandates. Although the Tax-Efficient Funds’ losses were painful, we believe our bias toward high-quality companies—those with solid business models, strong managements, and favorable long-term prospects—helped us avoid even larger losses.
INVESTMENT PHILOSOPHY
We would like to welcome our new shareholders and thank our long-term investors for their continued support. Before we discuss the specific management and performance of each fund, please allow us to summarize a few of the basic principles that guide our approach to managing the Tax-Efficient Funds.
The funds’ overall investment philosophy remains consistent regardless of market conditions. Rather than attempting to time the market’s short-term relative performance cycles, our long-term investment approach seeks to invest in high-quality businesses selling at attractive valuations. Although relative performance can be bumpy at times, we believe that this steady approach never goes out of style and can add value over longer time periods. Through a full capital market cycle, our goal is to generate performance that will be very competitive on a pretax basis and superior on an after-tax basis.
• The funds invest in stocks of companies that have strong growth prospects and are market leaders within their niches. While the Tax-Efficient Growth Fund and the Tax-Efficient Balanced Fund invest primarily in large-cap growth stocks (the latter also purchases municipal bonds), the Tax-Efficient Multi-Cap Growth Fund emphasizes small- and mid-cap growth companies.
• Our objective is to produce the best after-tax returns. To minimize taxable capital gain distributions, we plan on owning our companies for the long haul, focusing on those with strong, sustainable market positions and high returns on capital. Several studies have shown that there can be a substantial difference between pretax and after-tax returns over longer periods of time.
• We typically maintain a low cash position and stay almost fully invested because we believe successful market timing is virtually impossible. Attempts to sell at the peak and buy at the bottom require an investor to make the right timing decision twice—a difficult task in any environment, but particularly so in today’s volatile marketplace.
• Although we may make new purchases opportunistically, we will not trade opportunistically or rotate from one sector to another in an attempt to capture short-term outperformance.
• We purchase stocks that meet our criteria, knowing that time and patience may be required for some of these investments to bear fruit. As a result, each fund’s short-term performance will frequently deviate, both positively and negatively, from that of competing funds focused on pretax returns.
• We prefer to let our winners run. As a result, we try not to realize capital gains unless a company’s long-term outlook has deteriorated materially. As appropriate, we will sell investments that have declined and accumulate tax losses that can be used to offset future gains that would otherwise be taxable.
FUND CHARACTERISTICS
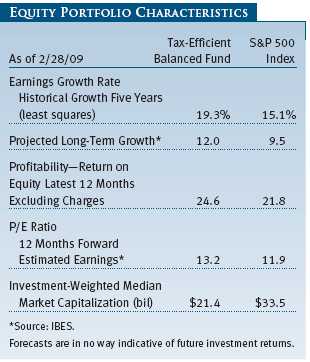
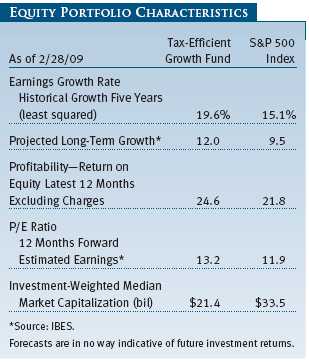
We structure and manage the Tax-Efficient Balanced Fund’s equity portfolio and the Tax-Efficient Growth Fund so that they are more growth oriented than the S&P 500 Index. As you can see in the portfolio characteristics tables on pages 10 and 13, our large-cap equity portfolios have higher forward price/earnings (P/E) ratios and projected long-term growth rates than the S&P 500. The tables also show that each large-cap portfolio’s return on equity (ROE) exceeded the S&P 500’s 21.8% ROE as of February 28, 2009. A high, sustainable return on equity tends to show how well a company uses investment dollars to generate earnings growth. It is one of the most important characteristics we consider when researching potential investments and reviewing our current holdings. Our intention is to maintain portfolios of quality companies with strong profitability that generally keep pace with the broad market when stocks are rising and fare better than the market during more difficult periods. Although the portfolios are structured such that they are generally consistent with growth indexes, they tend to be more conservative given our goal of minimizing capital erosion that can result from taxes, losses, and trading costs.
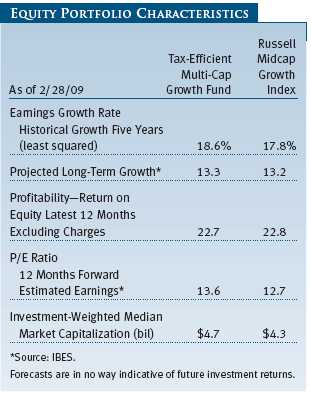
As shown in the portfolio characteristics table on page 15, the Tax-Efficient Multi-Cap Growth Fund has comparable characteristics to those of the Russell Midcap Growth Index. For example, the fund’s projected and historical earnings growth rate and ROE are roughly similar to those of the index. The fund’s 13.6 forward P/E ratio exceeded the benchmark’s 12.7 P/E as of February 28, 2009, while its $4.7 billion investment-weighted median market capitalization was modestly higher than that of the benchmark at the end of our reporting period.
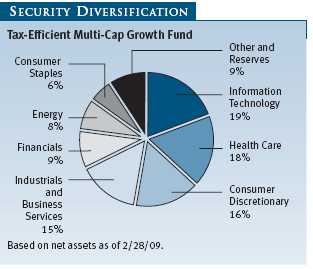
Unlike most small- and mid-cap portfolios, however, the multi-cap growth fund is managed to be tax-efficient. A distinctive feature of the fund is that we typically do not sell successful investments solely because their market capitalizations exceed the upper boundary of the mid-cap universe. As many of the fund’s holdings grow and increase their market capitalization over time, we will maintain our mid-cap orientation by directing new purchases to companies in smaller capitalization ranges. Broad diversification is also a hallmark of this fund, reflecting the fact that smaller companies are earlier in their life cycles than larger ones, and therefore a higher failure rate may be expected. At the end of our reporting period, the fund was well diversified across approximately 260 companies. We will eliminate holdings in companies that falter and reinvest the proceeds into companies that we believe possess more attractive long-term prospects.
Tax-Efficiency Ratio
Clearly, 2008 will be a memorable year. Not only did markets crash, but many investors were hit with sizable capital gain distributions. Effective asset location is an extremely important consideration—one that many investors may not be able to manage appropriately. Although a full explanation is beyond the scope of this letter, it can be summarized in a simple rule: Investors, particularly those in the highest tax brackets, should hold taxable fixed-income and equity assets that are not tax-efficient in tax-deferred vehicles such as 401(k) plans and IRAs.
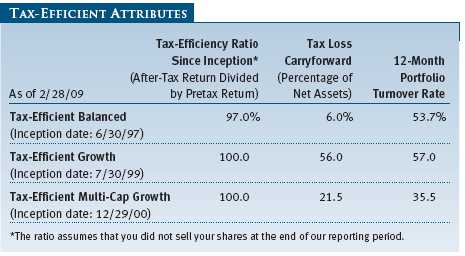
The Tax-Efficient Attributes table shows each fund’s tax-efficiency ratio, which is calculated by dividing the fund’s after-tax return by its pretax return for the period from its inception through February 28, 2009. The 100% tax-efficiency ratio of the Tax-Efficient Multi-Cap Growth Fund indicates that this fund has made no taxable dividend or capital gain distributions since inception. The Tax-Efficient Balanced and Tax-Efficient Growth Funds have made small distributions of taxable dividends since inception, but no capital gain distributions, and their tax-efficiency ratios remain very high. Given each fund’s high tax efficiency, the performance of each fund versus its benchmarks and tax-blind portfolios looks better on an after-tax basis than on a pretax basis.
Tax Loss Carryforward
The table also shows the value of each fund’s tax capital loss carryforward (as a percentage of net assets) accumulated through the end of our fiscal year. We can use these losses in the future to offset capital gains that each fund may realize so they are not passed on to shareholders.
Portfolio Turnover
The turnover rates shown in the table on page 7 are illustrative of our focus on longer-term fundamentals. Our trading levels are substantially below comparable funds that focus on pretax returns. For example, the Tax-Efficient Multi-Cap Growth Fund had a portfolio turnover rate of 21.3% for the fiscal year ending February 29, 2008, versus 127.9% for other funds in its Morningstar category with fiscal years ending in 2008 (as measured by Morningstar Direct). Portfolio turnover in the Tax-Efficient Balanced and Tax-Efficient Growth Funds exceeds 50% for our reporting period, which is significantly higher than normal. Given current market conditions, most selling activity in our funds consists of recognizing losses. Therefore, it is not unusual for turnover to increase during periods of large negative returns.
PORTFOLIO ACTIONS
Companies in the industrials and business services sector have been hit particularly hard by the global economic downturn. Continuing a theme from the first half of the reporting period, we took advantage of share price weakness among these firms to establish positions in some high-quality companies operating in segments that should benefit from an eventual economic recovery. In both the Tax-Efficient Balanced Fund and the Tax-Efficient Growth Fund, we initiated positions in rail transportation providers CSX and Union Pacific, as well as in aerospace and defense companies Lockheed Martin and Goodrich. In the Tax-Efficient Multi-Cap Growth Fund, we added to an existing position in payroll services provider Paychex and established positions in industrial equipment maker Flowserve and Copart, which provides salvage services to insurance companies. (Please refer to each fund’s portfolio of investments for a complete listing of holdings and the amount each represents in the portfolio.)
In keeping with our overall approach, we tend to favor companies with excellent long-term business models, strong cash flow, and superior management teams. In the consumer discretionary sector, the Tax-Efficient Balanced and Tax-Efficient Growth portfolios established a position in the discount apparel retailer TJX, which includes T.J. Maxx and Marshall’s stores among its brands. In addition, we purchased shares of iconic fast-food chain McDonald’s and a leading education and training services provider, DeVry. In the Tax-Efficient Multi-Cap Growth Fund, we established positions in Advance Auto Parts, an automobile parts retailer catering to the do-it-yourself mechanic, and paint manufacturer and retailer Sherwin-Williams.
In the health care sector, we continued our approach of broad diversification in the biotech industry. In the Tax-Efficient Balanced and Tax-Efficient Growth portfolios, we purchased shares of Genzyme and Genentech, two of the leading innovators in the biotechnology field. We also initiated positions in pharmacy benefit management service provider Express Scripts. In the Tax-Efficient Multi-Cap Growth Fund, we established a position in Humana, which provides health and benefit plans for governments, private employers, and individuals.
Although shares in energy firms have fallen sharply since mid-2008, we are maintaining our exposure to this sector due to the potential for increased inflationary pressures resulting from the massive government fiscal and monetary stimulus programs to address the current economic challenges. To the Tax-Efficient Balanced and Tax-Efficient Growth portfolios, we added ExxonMobil, oil and gas exploration and production company Murphy Oil, and natural gas firm Forest Oil. In the Tax-Efficient Multi-Cap Growth Fund, we initiated a position in Peabody Energy, a leading coal company. As many of our longer-term investors are aware, we prefer to invest in differentiated energy companies rather than those that are more dependent on commodity prices.
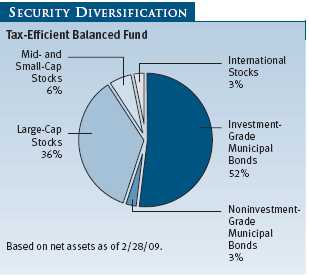
TAX-EFFICIENT BALANCED FUND
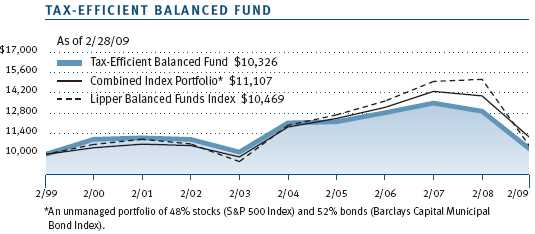
The Tax-Efficient Balanced Fund posted significant losses in the second half of our fiscal year but substantially outperformed its Lipper peer group index, as well as a combined market-based index composed of 48% S&P 500 Index and 52% Barclays Capital Municipal Bond Index. For the 12 months ended February 28, 2009, the fund modestly outperformed the combined index portfolio and significantly outpaced the Lipper index. Losses of this magnitude are painful, but it is nevertheless important to understand why the fund did better than its benchmarks. The fund outperformed the Lipper benchmark over the past 12 months in part because our municipal bond holdings fared better than most taxable bonds, which usually represent the fixed-income component of a typical balanced portfolio. The fund outpaced the combined index portfolio because our equity portfolio held up better than the S&P 500 in this brutal market environment. As our longer-term shareholders know, the fund has tended to outperform during challenging capital market environments as investors become less speculative.
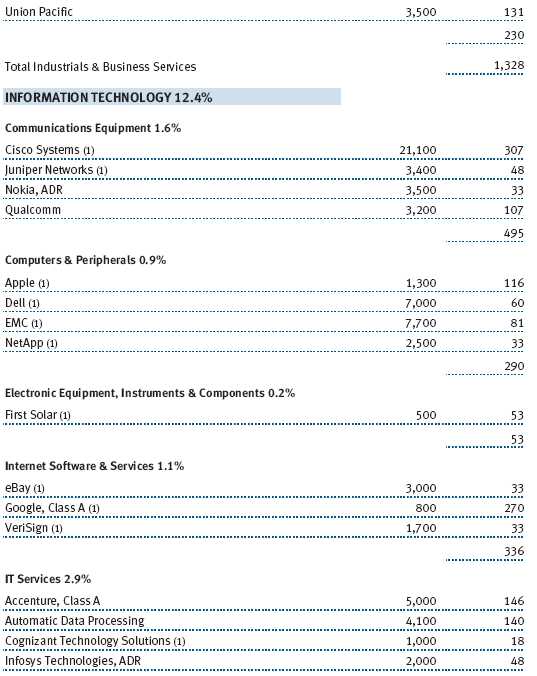
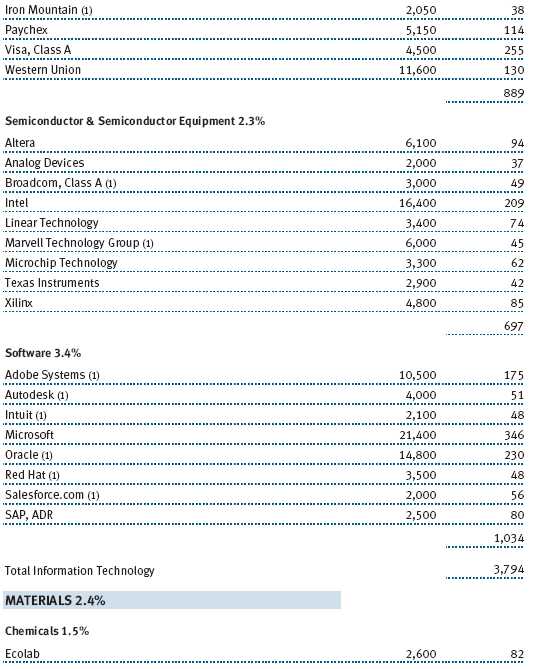
We structure and manage the fund’s equity portfolio in a manner consistent with the Tax-Efficient Growth Fund. In the last 12 months, the performance of the fund’s equity portfolio relative to the broad S&P 500 Index was helped by stock selection in the struggling financial sector. Since the fund’s inception, we have had very little exposure to traditional banks. This reflects our long-term negative view of these riskier commoditized businesses—a view that has been validated dramatically over the past year as many traditional banks face failure or need substantial help to recapitalize. Our emphasis on strong, differentiated companies, such as Northern Trust, was beneficial. The fund’s significant allocation to the information technology sector also aided returns. We favor the software, information technology services, and semiconductor industries. Logic chip-maker Altera was a strong positive contributor within the sector.
Weak stock selection in the energy sector, including energy equipment and services company Smith International, was among the largest detractors from the fund’s relative performance. Stock selection among our consumer discretionary holdings also detracted from results relative to the S&P 500 Index. Our investments in the hotels, restaurants, and leisure industry were especially weak as the dim economic environment weighed on consumer spending.
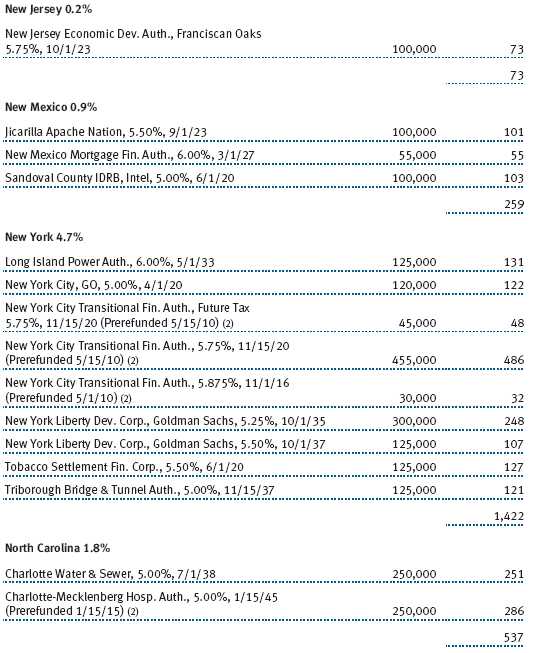
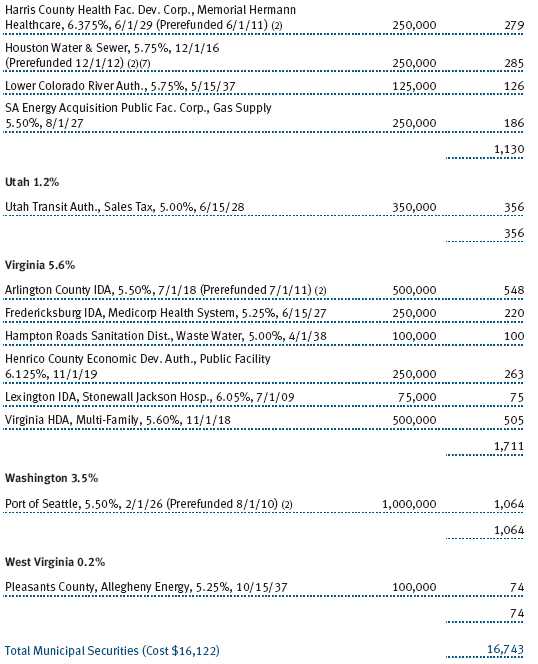
Municipal Bond Portfolio
New municipal supply in 2008 totaled about $390 billion, according to The Bond Buyer. Much of this supply came during the first three quarters of the year, before credit markets overall seized up immediately following the collapse of Lehman Brothers in mid-September. With the national economy likely to be in a recession until at least midyear and with a significant fiscal stimulus package that will provide some direct capital spending to the states, we anticipate aggregate new borrowing in 2009 could be lower than in 2008.
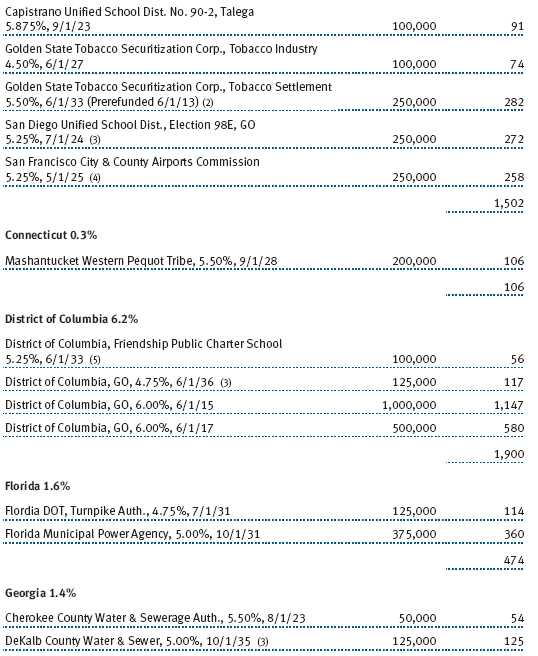
Demand from retail investors for municipal securities has picked up markedly in recent months. However, interest from retail alone was unable to support the market in the face of a substantial unwinding of leveraged trades involving municipal bonds, selling related to margin calls, and a diminished list of broker-dealers willing to provide liquidity for tax-free bonds. Given the continuing credit market stress, short- and intermediate-term and AAA rated municipal securities had greater appeal than long-term and lower-quality issues.
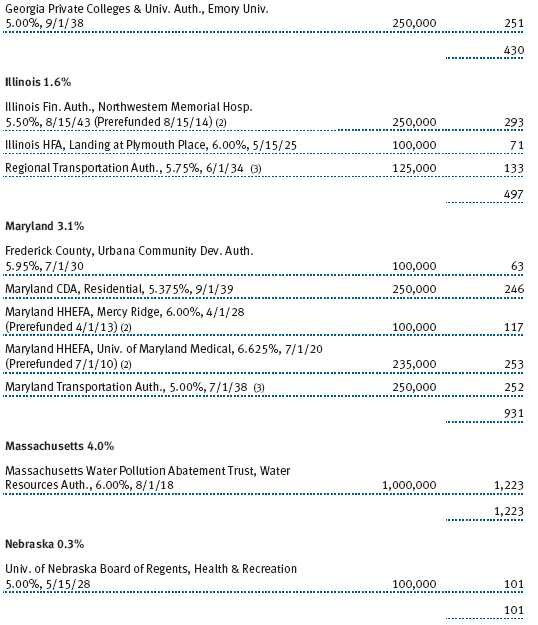
Sector performance during our fiscal year was mixed. In the last six months, prerefunded and escrowed-to-maturity bonds were the only segments that produced gains. Education, transportation, and housing revenue bonds were flat. In the one-year period, most high-quality sectors advanced moderately, led by prerefunded and escrowed-to-maturity bonds. Higher-yielding bonds in the industrial revenue/pollution control revenue, tobacco, and life-care sectors were hammered in both periods as investors shunned lower-quality credits.
We maintained a conservative interest rate stance for much of the period, particularly as volatility increased. Weighted average maturity and duration were shortened measurably versus the Barclays Capital Municipal Bond Index. We realized losses as interest rates rose, with the majority of sales occurring in the lower-rated sectors as we upgraded the overall credit quality of the portfolio. We increased our allocation to intermediate-term bonds, which lessened the blow from rising long-term rates. Our strongest returns were among our higher-quality, intermediate-term bonds, and relative returns were enhanced by a higher-than-average concentration in these securities. Trading activity was high as rising interest rates enabled us to realize losses and reinvest at higher yields.
Although some states are struggling more than others because of significant exposure to the housing and financial market downturns, we believe municipal market weakness primarily reflects general risk aversion rather than fundamental credit concerns. Tax-free securities are still an attractive alternative to taxable bonds, particularly for investors in the highest tax brackets.
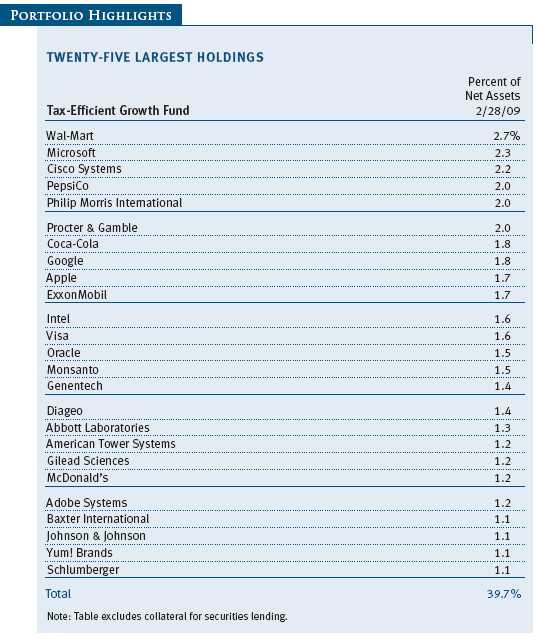
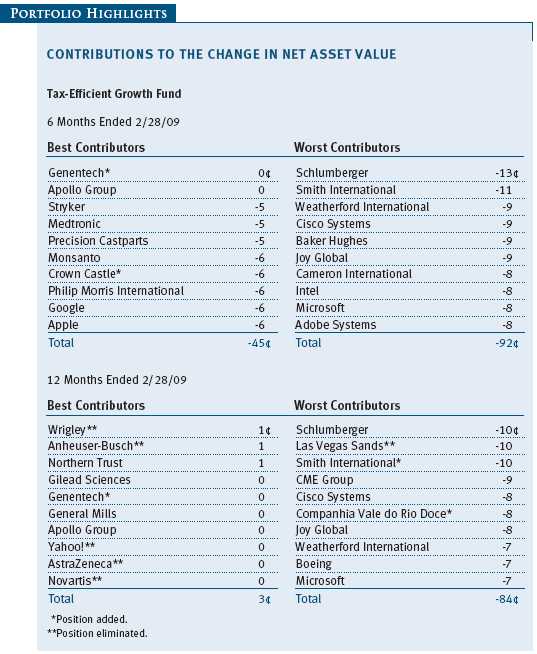
TAX-EFFICIENT GROWTH FUND
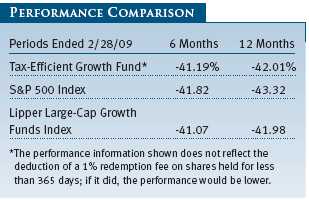
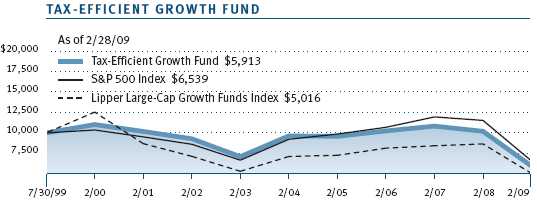
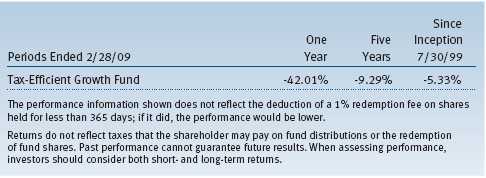
The Tax-Efficient Growth Fund declined sharply in the second half of our fiscal year, accounting for nearly all of the -42.01% return for the 12-month period. These results were roughly comparable to the S&P 500 Index and the Lipper Large-Cap Growth Funds Index over both time periods.
Weak stock selection in the energy sector hurt performance. Large exposure to energy equipment and services companies, including Smith International and Weatherford International, further hampered results. In the consumer discretionary space, weak stock selection also detracted from results. The share price of Marriott—a long-term fund holding—fell during the period as the dim economic environment weighed on consumer spending. However, this position is illustrative of our overall investment approach. Despite the short-term share price fluctuations, we still believe that Marriott is a solid long-term investment. It is a well-managed company with a strong industry position, sustainable competitive advantages, and an attractive business model that should weather the current downturn and participate in an eventual market recovery.
Led by our holdings in the capital markets industry, a significant underweight and strong stock selection in the financials sector were the best contributors to performance versus the benchmark S&P 500 Index over the past 12 months. Our leading capital market holdings included Northern Trust, Charles Schwab, and investment manager Blackrock.
We avoided many of the financial companies facing significant challenges, further enhancing performance. In fact, we have made very few investments among traditional banks since the fund’s inception. An overweight position in the information technology sector also aided relative returns, led by heavy concentrations in software, information technology services, and semiconductor companies. Leading performers during the period were Visa and Automatic Data Processing.
For the year, we were overweight in the consumer staples, materials, and industrials and business services sectors relative to other large-cap growth portfolios. We believe that these sectors offer excellent growth companies with strong prospects and attractive valuations. We were underweight versus the Lipper index in financials, consumer discretionary, health care, and utilities—a sector in which we have no holdings. Relative to the S&P 500 Index, we were significantly overweight in information technology, with smaller overweight positions in the materials, consumer staples, and health care sectors. We were significantly underweight in energy and financials versus the S&P 500. We owned very few telecommunication services companies because strong growth prospects and attractive returns on equity are not generally found in this sector.

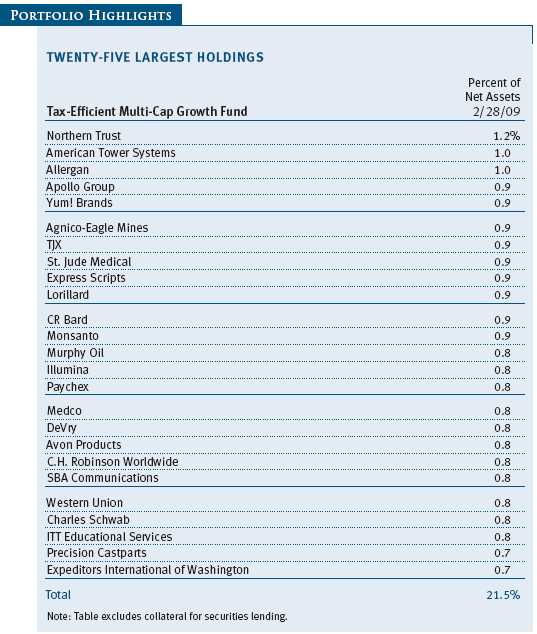
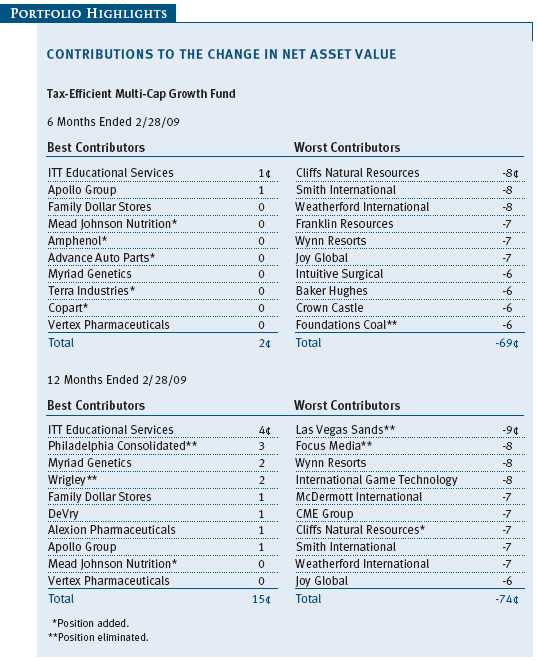
TAX-EFFICIENT MULTI-CAP GROWTH FUND
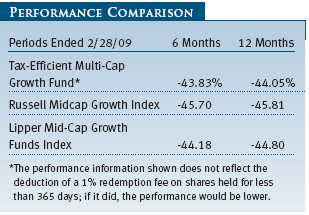
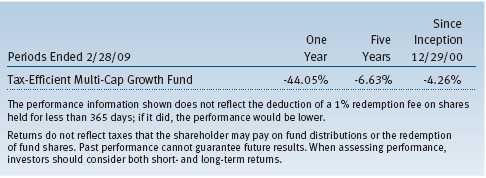
The Tax-Efficient Multi-Cap Growth Fund registered a steep loss in the second half of our fiscal year but outperformed the benchmark Russell Midcap Growth Index while performing in line with the Lipper Mid-Cap Growth Funds Index. For the 12 months ended February 28, 2009, the fund declined 44.05%, with most of the loss coming during the last six months. The fund outperformed the Russell index and was in line with the Lipper index.
Stock selection in the energy sector detracted from overall returns, particularly in our oil and gas holdings. An overweight position in the energy equipment and services industry, especially Weatherford International, also detracted from returns. Stock selection in the consumer discretionary sector hindered performance. The share price of Marriott—a long-term fund holding—fell during the period as the dim economic environment weighed on consumer spending. However, this position is illustrative of our overall investment approach. Despite the short-term share price fluctuations, we still believe that Marriott is a solid long-term investment. It is a well-managed company with a strong industry position, sustainable competitive advantages, and an attractive business model that should weather the current downturn and participate in an eventual market recovery.
Stock selection in industrials and business services was the primary contributor to fund performance relative to the benchmark Russell index over the past 12 months, led by our holdings in the commercial services and supplies and the machinery industries. Within the commercial services and supplies industry, medical waste management firm Stericycle was among the strongest contributors. An overweight position in the health care sector also helped performance, with the biotechnology industry especially beneficial to performance within the sector. Strong relative performers in this industry were holdings in biotechnology firms Gilead Sciences and Myriad Genetics. Our goal is to stay well diversified in the biotech industry to reduce our exposure to potential risks.
During the year, the fund had modest overweight positions in the health care, telecommunication services, materials, and consumer staples sectors relative to other mid-cap growth portfolios. We were slightly underweight in the consumer discretionary and information technology sectors. Versus the Russell Midcap Growth Index, the fund had substantial overweight positions in the health care and consumer staples sectors, with a smaller overweight in telecommunication services. Our largest underweights versus the Russell index were in the consumer discretionary and industrials and business services sectors. We continued to have no positions in the utilities sector as companies with strong growth prospects and attractive returns on equity are rarely found in this sector.
OUTLOOK
The painful unwinding of years of speculation and financial excess is likely to continue for several years. As this process unfolds, investors will probably remain risk averse. Nevertheless, attempting to accurately forecast the direction of the economy and capital markets is a losing proposition. Fortunately, our long-term investment approach emphasizes—and, we believe, rewards—patience. When fear and pessimism recede from the marketplace, investors will once again be willing to accept risks in pursuit of potentially higher-reward asset classes. Given our equity portfolios’ bias toward quality companies, we believe the funds will be well positioned for that change in sentiment.
The national recession will reduce the tax revenues collected by state and local municipalities, contributing to worries about a general decline in the overall credit quality of the municipal market. In addition, the credit environment for the municipal market is likely to remain challenging for some time. Municipal bond defaults, which historically have been rare, are likely to increase moderately over the next year. Nevertheless, many municipal issuers are making the difficult but necessary fiscal decisions—higher taxes, lower spending, or a combination of the two—as they adjust to the economic downturn. We believe the municipal market offers good long-term value, especially considering that tax rates are likely to rise in the next few years. We also believe that our emphasis on rigorous, fundamental research positions us well for the current market environment and an eventual recovery.
As our longer-term investors know, we do not attempt to time the markets. We retain our belief in the long-term viability of the economy and the dynamic growth companies that form the bedrock of that economy. We remain committed to finding, buying, and holding attractively valued, high-quality growth companies with good business models, strong managements, and favorable long-term prospects, and we will continue to seek strong long-term after-tax returns while attempting to maintain a high degree of tax efficiency.
As always, we thank you for investing with T. Rowe Price, particularly during this extraordinarily challenging period.
Respectfully submitted,

Donald J. Peters
Cochairman of the Investment Advisory Committee,
Tax-Efficient Balanced Fund
Chairman of the Investment Advisory Committee,
Tax-Efficient Growth and Tax-Efficient Multi-Cap Growth Funds

Hugh D. McGuirk
Cochairman of the Investment Advisory Committee,
Tax-Efficient Balanced Fund
March 13, 2009
The committee chairmen have day-to-day responsibility for managing the portfolios and work with committee members in developing and executing the funds’ investment programs.
RISKS OF STOCK INVESTING
The stock market as a whole can decline for many reasons, including adverse political or economic developments here or abroad, changes in investor psychology, or heavy institutional selling. The prospects for an industry or company may deteriorate because of a variety of factors, including disappointing earnings or changes in the competitive environment. In addition, our assessment of companies held in the funds may prove incorrect, resulting in losses or poor performance even in a rising market.
Growth stocks can be volatile for several reasons. Since growth companies usually reinvest a high proportion of their earnings in their own businesses, they may lack the dividends often associated with value stocks that could cushion their decline in a falling market. Also, since investors buy growth stocks because of their expected superior earnings growth, earnings disappointments often result in sharp price declines.
The stocks of mid-cap companies entail greater risk and are usually more volatile than the shares of large companies. Investing in small companies also involves greater risk than is customarily associated with larger companies. Stocks of small companies are subject to more abrupt or erratic price movements than larger company stocks. Small companies often have limited product lines, markets, or financial resources, and their managements may lack depth and experience. Such companies seldom pay significant dividends that could cushion returns in a falling market.
Technology stocks are particularly volatile and subject to greater price swings, up and down, than the broad market. It is possible that companies whose products and services first appear promising may not succeed over the long term; they may succumb to intense competition or could quickly become obsolete in a rapidly developing marketplace. Earnings projections for developing companies that are not met can result in sharp price declines. This is true even in a generally rising stock market environment.
RISKS OF BOND INVESTING (TAX-EFFICIENT BALANCED FUND)
Like all bonds, municipal bonds have two main sources of risk: interest rate and credit risk. Interest rate risk is the decline in bond prices that usually accompanies a rise in interest rates. Longer-maturity bonds typically suffer greater declines than those with shorter-term maturities. Credit risk is the chance that any fund holding could have its credit rating downgraded or that a bond issuer will default (fail to make timely payments of interest or principal), potentially reducing the fund’s income level and share price. To the extent that we invest in junk bonds, credit risk will be higher since their issuers are more vulnerable to financial setbacks and recession than more creditworthy companies.
Municipal bonds are also subject to the possibility that tax reform or lower overall taxes may reduce their value or that individual issuers will be unable to meet their obligations due to problems in that state or locality.
GLOSSARY
Barclays Capital Municipal Bond Index: An unmanaged index that tracks municipal debt instruments.
Barclays Capital U.S. Aggregate Index: An unmanaged index that tracks domestic investment-grade bonds, including corporate, government, and mortgage-backed securities.
Earnings growth rate: Measures the annualized percent change in earnings per share for a given time period.
Escrowed-to-maturity bond: A bond that has the funds necessary for repayment at maturity, or a call date, set aside in a separate or “escrow” account.
Fed funds target rate: An overnight lending rate set by the Federal Reserve and used by banks to meet reserve requirements. Banks also use the fed funds rate as a benchmark for their prime lending rates.
Historical growth five years (least squares): Least squares growth calculation attempts to find the “normal” growth rate given a stream of historical growth rates. It searches for the growth rate that best fits the line produced by a stream of growth numbers.
Investment-weighted median market capitalization: The investment-weighted midpoint market capitalization (shares outstanding x current price) representing a typical security in a portfolio. An investment-weighted median represents the breakpoint where 50% of the values are above and 50% of the values are below based on portfolio weight.
Lipper indices: Consist of a small number (10 to 30) of the largest mutual funds in a particular category as tracked by Lipper Inc.
Prerefunded bond: A bond that originally may have been issued as a general obligation or revenue bond but that is now secured by an escrow fund consisting entirely of direct U.S. government obligations that are sufficient for paying the bondholders.
Price/earnings (P/E) ratio: A ratio that shows the “multiple” of earnings at which a stock is selling. It is calculated by dividing a stock’s current price by its current earnings per share. For example, if a stock’s price is $60 per share and the issuing company earns $2 per share, the P/E ratio is $60/$2, or 30.
Projected long-term growth (IBES): Long-term projected earnings-per-share growth rate based on IBES estimates.
Return on equity (ROE): Calculated by dividing a company’s net income by shareholders’ equity (i.e., the company’s book value), ROE measures how much a company earns on each dollar that common stock investors have put into that company. ROE indicates how effectively and efficiently a company and its management are using stockholder investments. Excluding charges refers to the earnings figure used in the calculation. It represents earnings before extraordinary items and discontinued operations.
Russell 1000 Index: Measures the performance of the 1,000 largest companies in the Russell 3000 Index.
Russell 1000 Growth Index: Measures the performance of those Russell 1000 Index companies with higher price-to-book ratios and higher forecasted growth values.
Russell 1000 Value Index: Measures the performance of those Russell 1000 companies with lower price-to-book ratios and lower forecasted growth values.
Russell 2000 Index: Measures the performance of the 2,000 smallest companies in the Russell 3000 Index.
Russell 2000 Growth Index: Measures the performance of those Russell 2000 companies with higher price-to-book ratios and higher forecasted growth values.
Russell 2000 Value Index: Measures the performance of those Russell 2000 companies with lower price-to-book ratios and lower forecasted growth values.
Russell Midcap Index: Measures the performance of the 800 smallest companies in the Russell 1000 Index.
Russell Midcap Growth Index: Measures the performance of those Russell Midcap companies with higher price-to-book ratios and higher forecasted growth values. The stocks are also members of the Russell 1000 Growth Index.
Russell Midcap Value Index: Measures the performance of those Russell Midcap companies with lower price-to-book ratios and lower forecasted growth values. The stocks are also members of the Russell 1000 Value Index.
S&P 500 Stock Index: Tracks the stocks of 500 primarily large U.S. companies.
Performance and Expenses
| GROWTH OF $10,000 |
This chart shows the value of a hypothetical $10,000 investment in the fund over the past 10 fiscal year periods or since inception (for funds lacking 10-year records). The result is compared with benchmarks, which may include a broad-based market index and a peer group average or index. Market indexes do not include expenses, which are deducted from fund returns as well as mutual fund averages and indexes.
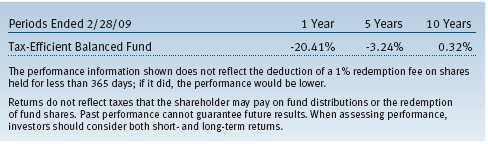
| AVERAGE ANNUAL COMPOUND TOTAL RETURN |
This table shows how the fund would have performed each year if its actual (or cumulative) returns for the periods shown had been earned at a constant rate.
| GROWTH OF $10,000 |
This chart shows the value of a hypothetical $10,000 investment in the fund over the past 10 fiscal year periods or since inception (for funds lacking 10-year records). The result is compared with benchmarks, which may include a broad-based market index and a peer group average or index. Market indexes do not include expenses, which are deducted from fund returns as well as mutual fund averages and indexes.
| AVERAGE ANNUAL COMPOUND TOTAL RETURN |
This table shows how the fund would have performed each year if its actual (or cumulative) returns for the periods shown had been earned at a constant rate.
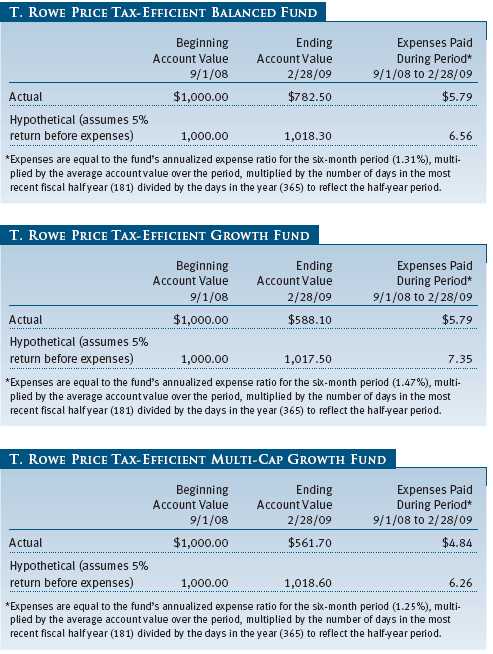
| FUND EXPENSE EXAMPLE |
As a mutual fund shareholder, you may incur two types of costs: (1) transaction costs, such as redemption fees or sales loads, and (2) ongoing costs, including management fees, distribution and service (12b-1) fees, and other fund expenses. The following example is intended to help you understand your ongoing costs (in dollars) of investing in the fund and to compare these costs with the ongoing costs of investing in other mutual funds. The example is based on an investment of $1,000 invested at the beginning of the most recent six-month period and held for the entire period.
Actual Expenses
The first line of the following table (“Actual”) provides information about actual account values and expenses based on the fund’s actual returns. You may use the information in this line, together with your account balance, to estimate the expenses that you paid over the period. Simply divide your account value by $1,000 (for example, an $8,600 account value divided by $1,000 = 8.6), then multiply the result by the number in the first line under the heading “Expenses Paid During Period” to estimate the expenses you paid on your account during this period.
Hypothetical Example for Comparison Purposes
The information on the second line of the table (“Hypothetical”) is based on hypothetical account values and expenses derived from the fund’s actual expense ratio and an assumed 5% per year rate of return before expenses (not the fund’s actual return). You may compare the ongoing costs of investing in the fund with other funds by contrasting this 5% hypothetical example and the 5% hypothetical examples that appear in the shareholder reports of the other funds. The hypothetical account values and expenses may not be used to estimate the actual ending account balance or expenses you paid for the period.
Note: T. Rowe Price charges an annual small-account maintenance fee of $10, generally for accounts with less than $2,000 ($500 for UGMA/UTMA). The fee is waived for any investor whose T. Rowe Price mutual fund accounts total $25,000 or more, accounts employing automatic investing, and IRAs and other retirement plan accounts that utilize a prototype plan sponsored by T. Rowe Price (although a separate custodial or administrative fee may apply to such accounts). This fee is not included in the accompanying table. If you are subject to the fee, keep it in mind when you are estimating the ongoing expenses of investing in the fund and when comparing the expenses of this fund with other funds.
You should also be aware that the expenses shown in the table highlight only your ongoing costs and do not reflect any transaction costs, such as redemption fees or sales loads. Therefore, the second line of the table is useful in comparing ongoing costs only and will not help you determine the relative total costs of owning different funds. To the extent a fund charges transaction costs, however, the total cost of owning that fund is higher.

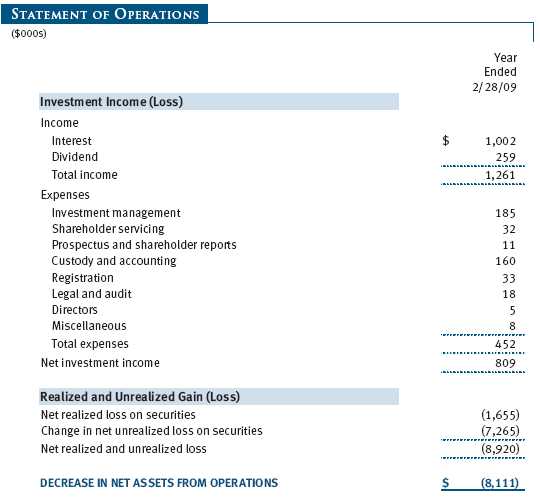
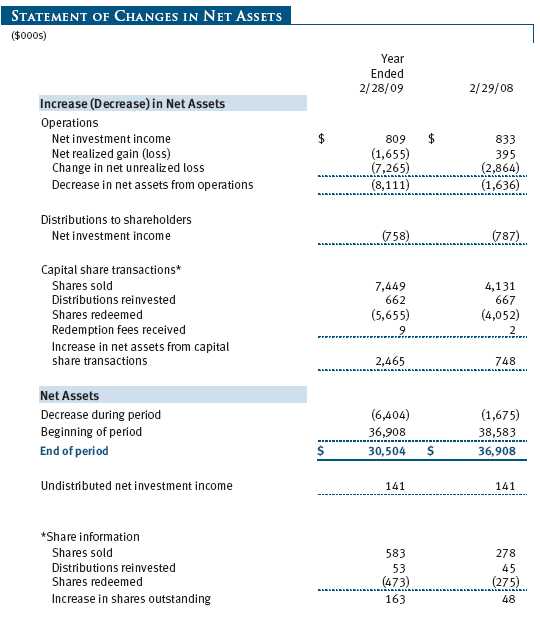
The accompanying notes are an integral part of these financial statements.


The accompanying notes are an integral part of these financial statements.
The accompanying notes are an integral part of these financial statements.
The accompanying notes are an integral part of these financial statements.
The accompanying notes are an integral part of these financial statements.
| NOTES TO FINANCIAL STATEMENTS |
T. Rowe Price Tax-Efficient Funds, Inc. (the corporation), is registered under the Investment Company Act of 1940 (the 1940 Act). The Tax-Efficient Balanced Fund (the fund), a diversified, open-end management investment company, is one portfolio established by the corporation. The fund commenced operations on June 30, 1997. The fund seeks to provide attractive long-term total returns on an after-tax basis with a balanced portfolio of stocks and municipal bonds.
NOTE 1 - SIGNIFICANT ACCOUNTING POLICIES
Basis of Preparation The accompanying financial statements were prepared in accordance with accounting principles generally accepted in the United States of America, which require the use of estimates made by fund management. Fund management believes that estimates and security valuations are appropriate; however, actual results may differ from those estimates, and the security valuations reflected in the financial statements may differ from the value the fund ultimately realizes upon sale of the securities.
Investment Transactions, Investment Income, and Distributions Income and expenses are recorded on the accrual basis. Premiums and discounts on debt securities are amortized for financial reporting purposes. Dividend income and capital gain distributions are recorded on the ex-dividend date. Income tax-related interest and penalties, if incurred, would be recorded as income tax expense. Investment transactions are accounted for on the trade date. Realized gains and losses are reported on the identified cost basis. Distributions to shareholders are recorded on the ex-dividend date. Income distributions from municipal sources are declared daily and paid quarterly; income distributions from taxable sources are declared and paid on an annual basis. Capital gain distributions, if any, are declared and paid by the fund, typically on an annual basis.
Credits The fund earns credits on temporarily uninvested cash balances at the custodian that reduce the fund’s custody charges. Custody expense in the accompanying financial statements is presented before reduction for credits.
Redemption Fees A 1% fee is assessed on redemptions of fund shares held for less than 365 days to deter short-term trading and to protect the interests of long-term shareholders. Redemption fees are withheld from proceeds that shareholders receive from the sale or exchange of fund shares. The fees are paid to the fund, and are recorded as an increase to paid-in capital. The fees may cause the redemption price per share to differ from the net asset value per share.
New Accounting Pronouncements On March 1, 2008, the fund adopted Statement of Financial Accounting Standards No. 157 (FAS 157), Fair Value Measurements. FAS 157 defines fair value, establishes the framework for measuring fair value, and expands the disclosures of fair value measurements in the financial statements. Adoption of FAS 157 did not have a material impact on the fund’s net assets or results of operations.
In March 2008, the Financial Accounting Standards Board issued Statement of Financial Accounting Standards No. 161 (FAS 161), Disclosures about Derivative Instruments and Hedging Activities, which is effective for fiscal years and interim periods beginning after November 15, 2008. FAS 161 requires enhanced disclosures about derivative and hedging activities, including how such activities are accounted for and their effect on financial position, performance and cash flows. Management is currently evaluating the impact the adoption of FAS 161 will have on the fund’s financial statements and related disclosures; however, it is expected to have no material impact on the fund’s net assets or results of operations.
NOTE 2 - VALUATION
The fund’s investments are reported at fair value as defined under FAS 157. The fund values its investments and computes its net asset value per share at the close of the New York Stock Exchange (NYSE), normally 4 p.m. ET, each day that the NYSE is open for business.
Valuation Methods Equity securities listed or regularly traded on a securities exchange or in the over-the-counter (OTC) market are valued at the last quoted sale price or, for certain markets, the official closing price at the time the valuations are made, except for OTC Bulletin Board securities, which are valued at the mean of the latest bid and asked prices. A security that is listed or traded on more than one exchange is valued at the quotation on the exchange determined to be the primary market for such security. Listed securities not traded on a particular day are valued at the mean of the latest bid and asked prices for domestic securities and the last quoted sale price for international securities.
Debt securities are generally traded in the OTC market. Securities with remaining maturities of one year or more at the time of acquisition are valued at prices furnished by dealers who make markets in such securities or by an independent pricing service, which considers the yield or price of bonds of comparable quality, coupon, maturity, and type, as well as prices quoted by dealers who make markets in such securities. Securities with remaining maturities of less than one year at the time of acquisition generally use amortized cost in local currency to approximate fair value. However, if amortized cost is deemed not to reflect fair value or the fund holds a significant amount of such securities with remaining maturities of more than 60 days, the securities are valued at prices furnished by dealers who make markets in such securities or by an independent pricing service.
Other investments, including restricted securities, and those for which the above valuation procedures are inappropriate or are deemed not to reflect fair value are stated at fair value as determined in good faith by the T. Rowe Price Valuation Committee, established by the fund’s Board of Directors.
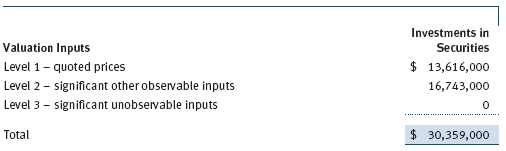
Valuation Inputs Various inputs are used to determine the value of the fund’s investments. These inputs are summarized in the three broad levels listed below:
Level 1 – quoted prices in active markets for identical securities
Level 2 – observable inputs other than Level 1 quoted prices (including, but not limited to, quoted prices for similar securities, interest rates, prepayment speeds, credit risk)
Level 3 – unobservable inputs
Observable inputs are those based on market data obtained from sources independent of the fund, and unobservable inputs reflect the fund’s own assumptions based on the best information available. The input levels are not necessarily an indication of the risk or liquidity associated with investments at that level. The following table summarizes the fund’s investments, based on the inputs used to determine their values on February 28, 2009:
NOTE 3 - INVESTMENT TRANSACTIONS
Consistent with its investment objective, the fund engages in the following practices to manage exposure to certain risks or to enhance performance. The investment objective, policies, program, and risk factors of the fund are described more fully in the fund’s prospectus and Statement of Additional Information.
Purchases and sales of portfolio securities, other than short-term securities, aggregated $22,194,000 and $19,285,000, respectively, for the year ended February 28, 2009.
NOTE 4 - FEDERAL INCOME TAXES
No provision for federal income taxes is required since the fund intends to continue to qualify as a regulated investment company under Subchapter M of the Internal Revenue Code and distribute to shareholders all of its income and gains. Distributions are determined in accordance with Federal income tax regulations, which differ from generally accepted accounting principles, and, therefore, may differ significantly in amount or character from net investment income and realized gains for financial reporting purposes. Financial reporting records are adjusted for permanent book/tax differences to reflect tax character but are not adjusted for temporary differences.
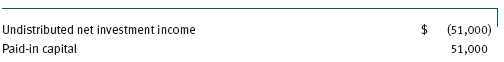
Reclassifications to paid-in capital relate primarily to a tax practice that treats a portion of the proceeds from each redemption of capital shares as a distribution of taxable net investment income and/or realized capital gain. For the year ended February 28, 2009, the following reclassifications, which had no impact on results of operations or net assets, were recorded to reflect tax character:
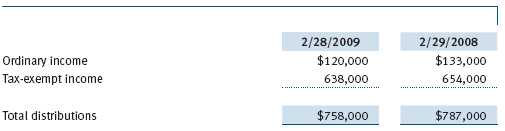
Distributions during the years ended February 28, 2009, and February 29, 2008, were characterized for tax purposes as follows:
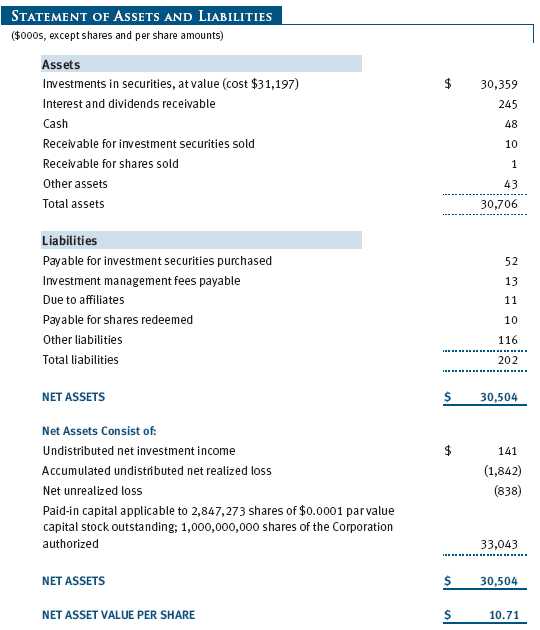
At February 28, 2009, the tax-basis cost of investments and components of net assets were as follows:
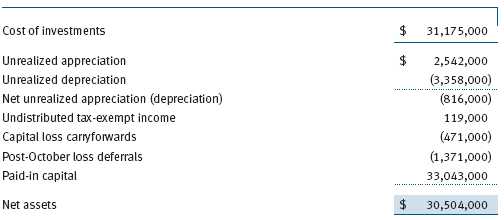
The fund intends to retain realized gains to the extent of available capital loss carryforwards. As of February 28, 2009, unused capital loss carryforwards expire as follows: $154,000 in fiscal 2012 and $317,000 in fiscal 2017.
Pursuant to federal income tax regulations applicable to investment companies, recognition of capital losses on certain transactions is deferred until the subsequent tax year. Consequently, realized losses reflected in the accompanying financial statements include net capital losses realized between November 1 and the fund’s fiscal year-end that have not been recognized for tax purposes (Post-October loss deferrals).
NOTE 5 - RELATED PARTY TRANSACTIONS
The fund is managed by T. Rowe Price Associates, Inc. (the manager or Price Associates), a wholly owned subsidiary of T. Rowe Price Group, Inc. The investment management agreement between the fund and the manager provides for an annual investment management fee, which is computed daily and paid monthly. The fee consists of an individual fund fee, equal to 0.20% of the fund’s average daily net assets, and a group fee. The group fee rate is calculated based on the combined net assets of certain mutual funds sponsored by Price Associates (the group) applied to a graduated fee schedule, with rates ranging from 0.48% for the first $1 billion of assets to 0.285% for assets in excess of $220 billion. The fund’s group fee is determined by applying the group fee rate to the fund’s average daily net assets. At February 28, 2009, the effective annual group fee rate was 0.31%.
In addition, the fund has entered into service agreements with Price Associates and two wholly owned subsidiaries of Price Associates (collectively, Price). Price Associates computes the daily share price and provides certain other administrative services to the fund. T. Rowe Price Services, Inc., provides shareholder and administrative services in its capacity as the fund’s transfer and dividend disbursing agent. T. Rowe Price Retirement Plan Services, Inc., provides subaccounting and recordkeeping services for certain retirement accounts invested in the fund. For the year ended February 28, 2009, expenses incurred pursuant to these service agreements were $107,000 for Price Associates, $24,000 for T. Rowe Price Services, Inc., and $0 for T. Rowe Price Retirement Plan Services, Inc. The total amount payable at period-end pursuant to these service agreements is reflected as Due to Affiliates in the accompanying financial statements.
| REPORT OF INDEPENDENT REGISTERED PUBLIC ACCOUNTING FIRM |
To the Board of Directors of T. Rowe Price Tax-Efficient Funds, Inc. and
Shareholders of T. Rowe Price Tax-Efficient Balanced Fund
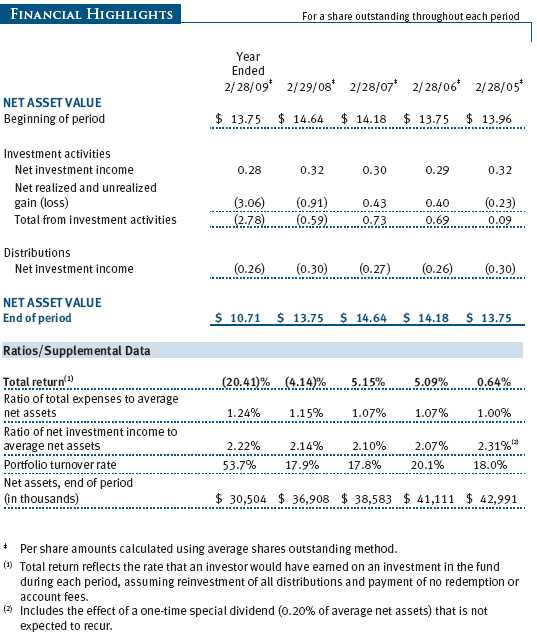
In our opinion, the accompanying statement of assets and liabilities, including the schedule of investments, and the related statements of operations and of changes in net assets and the financial highlights present fairly, in all material respects, the financial position of T. Rowe Price Tax-Efficient Balanced Fund (one of the portfolios comprising T. Rowe Price Tax-Efficient Funds, Inc., hereafter referred to as the “Fund”) at February 28, 2009, the results of its operations for the year then ended, the changes in its net assets for each of the two years in the period then ended and the financial highlights for each of the five years in the period then ended, in conformity with accounting principles generally accepted in the United States of America. These financial statements and financial highlights (hereafter referred to as “financial statements”) are the responsibility of the Fund’s management; our responsibility is to express an opinion on these financial statements based on our audits. We conducted our audits of these financial statements in accordance with the standards of the Public Company Accounting Oversight Board (United States). Those standards require that we plan and perform the audit to obtain reasonable assurance about whether the financial statements are free of material misstatement. An audit includes examining, on a test basis, evidence supporting the amounts and disclosures in the financial statements, assessing the accounting principles used and significant estimates made by management, and evaluating the overall financial statement presentation. We believe that our audits, which included confirmation of securities at February 28, 2009 by correspondence with the custodian, provide a reasonable basis for our opinion.
PricewaterhouseCoopers LLP
Baltimore, Maryland
April 10, 2009
| TAX INFORMATION (UNAUDITED) FOR THE TAX YEAR ENDED 2/28/09 |
We are providing this information as required by the Internal Revenue Code. The amounts shown may differ from those elsewhere in this report because of differences between tax and financial reporting requirements.
The fund’s distributions to shareholders included $651,000 which qualified as exempt-interest dividends.
For taxable non-corporate shareholders, $166,000 of the fund’s income represents qualified dividend income subject to the 15% rate category.
For corporate shareholders, $166,000 of the fund’s income qualifies for the dividends-received deduction.
| INFORMATION ON PROXY VOTING POLICIES, PROCEDURES, AND RECORDS |
A description of the policies and procedures used by T. Rowe Price funds and portfolios to determine how to vote proxies relating to portfolio securities is available in each fund’s Statement of Additional Information, which you may request by calling 1-800-225-5132 or by accessing the SEC’s Web site, www.sec.gov. The description of our proxy voting policies and procedures is also available on our Web site, www.troweprice.com. To access it, click on the words “Our Company” at the top of our corporate homepage. Then, when the next page appears, click on the words “Proxy Voting Policies” on the left side of the page.
Each fund’s most recent annual proxy voting record is available on our Web site and through the SEC’s Web site. To access it through our Web site, follow the directions above, then click on the words “Proxy Voting Records” on the right side of the Proxy Voting Policies page.
| HOW TO OBTAIN QUARTERLY PORTFOLIO HOLDINGS |
The fund files a complete schedule of portfolio holdings with the Securities and Exchange Commission for the first and third quarters of each fiscal year on Form N-Q. The fund’s Form N-Q is available electronically on the SEC’s Web site (www.sec.gov); hard copies may be reviewed and copied at the SEC’s Public Reference Room, 450 Fifth St. N.W., Washington, DC 20549. For more information on the Public Reference Room, call 1-800-SEC-0330.
| ABOUT THE FUND’S DIRECTORS AND OFFICERS |
Your fund is governed by a Board of Directors (Board) that meets regularly to review a wide variety of matters affecting the fund, including performance, investment programs, compliance matters, advisory fees and expenses, service providers, and other business affairs. The Board elects the fund’s officers, who are listed in the final table. At least 75% of Board members are independent of T. Rowe Price Associates, Inc. (T. Rowe Price), and T. Rowe Price International, Inc. (T. Rowe Price International); “inside” or “interested” directors are employees or officers of T. Rowe Price. The business address of each director and officer is 100 East Pratt Street, Baltimore, Maryland 21202. The Statement of Additional Information includes additional information about the directors and is available without charge by calling a T. Rowe Price representative at 1-800-225-5132.
| Independent Directors | |
| Name | |
| (Year of Birth) | Principal Occupation(s) During Past Five Years and Directorships of |
| Year Elected* | Other Public Companies |
| Jeremiah E. Casey | Director, National Life Insurance (2001 to 2005); Director, The Rouse |
| (1940) | Company, real estate developers (1990 to 2004) |
| 2005 | |
| Anthony W. Deering | Chairman, Exeter Capital, LLC, a private investment firm (2004 |
| (1945) | to present); Director, Under Armour (2008 to present); Director, |
| 2001 | Vornado Real Estate Investment Trust (2004 to present); Director, |
| Mercantile Bankshares (2002 to 2007); Member, Advisory Board, | |
| Deutsche Bank North America (2004 to present); Director, Chairman | |
| of the Board, and Chief Executive Officer, The Rouse Company, real | |
| estate developers (1997 to 2004) | |
| Donald W. Dick, Jr. | Principal, EuroCapital Advisors, LLC, an acquisition and manage- |
| (1943) | ment advisory firm (1995 to present) |
| 1997 | |
| Karen N. Horn | Director, Eli Lilly and Company (1987 to present); Director, Simon |
| (1943) | Property Group (2004 to present); Director, Norfolk Southern (2008 |
| 2003 | to present); Director, Georgia Pacific (2004 to 2005) |
| Theo C. Rodgers | President, A&R Development Corporation (1977 to present) |
| (1941) | |
| 2005 | |
| John G. Schreiber | Owner/President, Centaur Capital Partners, Inc., a real estate invest- |
| (1946) | ment company (1991 to present); Partner, Blackstone Real Estate |
| 2001 | Advisors, L.P. (1992 to present) |
| *Each independent director oversees 126 T. Rowe Price portfolios and serves until retirement, resignation, or | |
| election of a successor. | |
| Inside Directors | |
| Name | |
| (Year of Birth) | |
| Year Elected* | |
| [Number of T. Rowe Price | Principal Occupation(s) During Past Five Years and Directorships of |
| Portfolios Overseen] | Other Public Companies |
| Edward C. Bernard | Director and Vice President, T. Rowe Price; Vice Chairman of the Board, |
| (1956) | Director, and Vice President, T. Rowe Price Group, Inc.; Chairman of |
| 2006 | the Board, Director, and President, T. Rowe Price Investment Services, |
| [126] | Inc.; Chairman of the Board and Director, T. Rowe Price Global |
| Investment Services Limited, T. Rowe Price Retirement Plan Services, | |
| Inc., T. Rowe Price Savings Bank, and T. Rowe Price Services, Inc.; | |
| Director, T. Rowe Price International, Inc.; Chief Executive Officer, | |
| Chairman of the Board, Director, and President, T. Rowe Price Trust | |
| Company; Chairman of the Board, all funds | |
| Brian C. Rogers, CFA, CIC | Chief Investment Officer, Director, and Vice President, T. Rowe Price; |
| (1955) | Chairman of the Board, Chief Investment Officer, Director, and Vice |
| 2006 | President, T. Rowe Price Group, Inc.; Vice President, T. Rowe Price |
| [71] | Trust Company |
| *Each inside director serves until retirement, resignation, or election of a successor. | |
| Officers | |
| Name (Year of Birth) | |
| Position Held With Tax-Efficient Funds | Principal Occupation(s) |
| Donald J. Easley, CFA (1971) | Vice President, T. Rowe Price and T. Rowe Price |
| Vice President | Group, Inc. |
| Charles E. Emrich (1961) | Vice President, T. Rowe Price; formerly First Vice |
| Vice President | President/Credit Analyst, Legg Mason Wood |
| Walker, Inc. (to 2005) | |
| Roger L. Fiery III, CPA (1959) | Vice President, T. Rowe Price, T. Rowe Price |
| Vice President | Group, Inc., T. Rowe Price International, Inc., |
| and T. Rowe Price Trust Company | |
| John R. Gilner (1961) | Chief Compliance Officer and Vice President, |
| Chief Compliance Officer | T. Rowe Price; Vice President, T. Rowe Price |
| Group, Inc., and T. Rowe Price Investment | |
| Services, Inc. | |
| Gregory S. Golczewski (1966) | Vice President, T. Rowe Price and T. Rowe Price |
| Vice President | Trust Company |
| Gregory K. Hinkle, CPA (1958) | Vice President, T. Rowe Price, T. Rowe Price |
| Treasurer | Group, Inc., T. Rowe Price Investment Services, |
| Inc., and T. Rowe Price Trust Company; formerly | |
| Partner, PricewaterhouseCoopers LLP (to 2007) | |
| Patricia B. Lippert (1953) | Assistant Vice President, T. Rowe Price and |
| Secretary | T. Rowe Price Investment Services, Inc. |
| Hugh D. McGuirk, CFA (1960) | Vice President, T. Rowe Price and T. Rowe Price |
| Executive Vice President | Group, Inc. |
| Mary J. Miller, CFA (1955) | Director, T. Rowe Price Trust Company; Director |
| Vice President | and Vice President, T. Rowe Price; Vice |
| President, T. Rowe Price Group, Inc. | |
| David Oestreicher (1967) | Director and Vice President, T. Rowe Price |
| Vice President | Investment Services, Inc., T. Rowe Price Trust |
| Company, and T. Rowe Price Services, Inc.; Vice | |
| President, T. Rowe Price, T. Rowe Price Global | |
| Investment Services Limited, T. Rowe Price | |
| Group, Inc., T. Rowe Price International, Inc., | |
| and T. Rowe Price Retirement Plan Services, Inc. | |
| Donald J. Peters (1959) | Vice President, T. Rowe Price and T. Rowe Price |
| President | Group, Inc. |
| Deborah D. Seidel (1962) | Vice President, T. Rowe Price Investment |
| Vice President | Services, Inc. |
| William J. Stromberg, CFA (1960) | Vice President, T. Rowe Price, T. Rowe Price |
| Vice President | Group, Inc., and T. Rowe Price Trust Company |
| Julie L. Waples (1970) | Vice President, T. Rowe Price |
| Vice President | |
| Mark R. Weigman, CFA, CIC (1962) | Vice President, T. Rowe Price, T. Rowe Price |
| Vice President | Group, Inc., and T. Rowe Price Trust Company |
| Unless otherwise noted, officers have been employees of T. Rowe Price or T. Rowe Price International | |
| for at least five years. | |
Item 2. Code of Ethics.
The registrant has adopted a code of ethics, as defined in Item 2 of Form N-CSR, applicable to its principal executive officer, principal financial officer, principal accounting officer or controller, or persons performing similar functions. A copy of this code of ethics is filed as an exhibit to this Form N-CSR. No substantive amendments were approved or waivers were granted to this code of ethics during the period covered by this report.
Item 3. Audit Committee Financial Expert.
The registrant’s Board of Directors/Trustees has determined that Ms. Karen N. Horn qualifies as an audit committee financial expert, as defined in Item 3 of Form N-CSR. Ms. Horn is considered independent for purposes of Item 3 of Form N-CSR.
Item 4. Principal Accountant Fees and Services.
(a) – (d) Aggregate fees billed to the registrant for the last two fiscal years for professional services rendered by the registrant’s principal accountant were as follows:
Audit fees include amounts related to the audit of the registrant’s annual financial statements and services normally provided by the accountant in connection with statutory and regulatory filings. Audit-related fees include amounts reasonably related to the performance of the audit of the registrant’s financial statements and specifically include the issuance of a report on internal controls and, if applicable, agreed-upon procedures related to fund acquisitions. Tax fees include amounts related to services for tax compliance, tax planning, and tax advice. The nature of these services specifically includes the review of distribution calculations and the preparation of Federal, state, and excise tax returns. All other fees include the registrant’s pro-rata share of amounts for agreed-upon procedures in conjunction with service contract approvals by the registrant’s Board of Directors/Trustees.
(e)(1) The registrant’s audit committee has adopted a policy whereby audit and non-audit services performed by the registrant’s principal accountant for the registrant, its investment adviser, and any entity controlling, controlled by, or under common control with the investment adviser that provides ongoing services to the registrant require pre-approval in advance at regularly scheduled audit committee meetings. If such a service is required between regularly scheduled audit committee meetings, pre-approval may be authorized by one audit committee member with ratification at the next scheduled audit committee meeting. Waiver of pre-approval for audit or non-audit services requiring fees of a de minimis amount is not permitted.
(2) No services included in (b) – (d) above were approved pursuant to paragraph (c)(7)(i)(C) of Rule 2-01 of Regulation S-X.
(f) Less than 50 percent of the hours expended on the principal accountant’s engagement to audit the registrant’s financial statements for the most recent fiscal year were attributed to work performed by persons other than the principal accountant’s full-time, permanent employees.
(g) The aggregate fees billed for the most recent fiscal year and the preceding fiscal year by the registrant’s principal accountant for non-audit services rendered to the registrant, its investment adviser, and any entity controlling, controlled by, or under common control with the investment adviser that provides ongoing services to the registrant were $1,922,000 and $1,486,000, respectively.
(h) All non-audit services rendered in (g) above were pre-approved by the registrant’s audit committee. Accordingly, these services were considered by the registrant’s audit committee in maintaining the principal accountant’s independence.
Item 5. Audit Committee of Listed Registrants.
Not applicable.
Item 6. Investments.
(a) Not applicable. The complete schedule of investments is included in Item 1 of this Form N-CSR.
(b) Not applicable.
Item 7. Disclosure of Proxy Voting Policies and Procedures for Closed-End Management Investment Companies.
Not applicable.
Item 8. Portfolio Managers of Closed-End Management Investment Companies.
Not applicable.
Item 9. Purchases of Equity Securities by Closed-End Management Investment Company and Affiliated Purchasers.
Not applicable.
Item 10. Submission of Matters to a Vote of Security Holders.
Not applicable.
Item 11. Controls and Procedures.
(a) The registrant’s principal executive officer and principal financial officer have evaluated the registrant’s disclosure controls and procedures within 90 days of this filing and have concluded that the registrant’s disclosure controls and procedures were effective, as of that date, in ensuring that information required to be disclosed by the registrant in this Form N-CSR was recorded, processed, summarized, and reported timely.
(b) The registrant’s principal executive officer and principal financial officer are aware of no change in the registrant’s internal control over financial reporting that occurred during the registrant’s second fiscal quarter covered by this report that has materially affected, or is reasonably likely to materially affect, the registrant’s internal control over financial reporting.
Item 12. Exhibits.
(a)(1) The registrant’s code of ethics pursuant to Item 2 of Form N-CSR is attached.
(2) Separate certifications by the registrant's principal executive officer and principal financial officer, pursuant to Section 302 of the Sarbanes-Oxley Act of 2002 and required by Rule 30a-2(a) under the Investment Company Act of 1940, are attached.
(3) Written solicitation to repurchase securities issued by closed-end companies: not applicable.
(b) A certification by the registrant's principal executive officer and principal financial officer, pursuant to Section 906 of the Sarbanes-Oxley Act of 2002 and required by Rule 30a-2(b) under the Investment Company Act of 1940, is attached.
SIGNATURES | |
| Pursuant to the requirements of the Securities Exchange Act of 1934 and the Investment | |
| Company Act of 1940, the registrant has duly caused this report to be signed on its behalf by the | |
| undersigned, thereunto duly authorized. | |
| T. Rowe Price Tax-Efficient Funds, Inc. | |
| By | /s/ Edward C. Bernard |
| Edward C. Bernard | |
| Principal Executive Officer | |
| Date | April 17, 2009 |
| Pursuant to the requirements of the Securities Exchange Act of 1934 and the Investment | |
| Company Act of 1940, this report has been signed below by the following persons on behalf of | |
| the registrant and in the capacities and on the dates indicated. | |
| By | /s/ Edward C. Bernard |
| Edward C. Bernard | |
| Principal Executive Officer | |
| Date | April 17, 2009 |
| By | /s/ Gregory K. Hinkle |
| Gregory K. Hinkle | |
| Principal Financial Officer | |
| Date | April 17, 2009 |