FORM 6-K
SECURITIES AND EXCHANGE COMMISSION
Washington, D.C. 20549
Report of Foreign Private Issuer
Pursuant to Rule 13a-16 or 15d-16 of
the Securities Exchange Act of 1934
For the month of April, 2017
Brazilian Distribution Company
(Translation of Registrant’s Name Into English)
Av. Brigadeiro Luiz Antonio,
3142 São Paulo, SP 01402-901
Brazil
(Address of Principal Executive Offices)
(Indicate by check mark whether the registrant files or will file annual reports under cover of Form 20-F or Form 40-F)
Form 20-F X Form 40-F
(Indicate by check mark if the registrant is submitting the Form 6-K in paper as permitted by Regulation S-T Rule
101 (b) (1)):
Yes ___ No X
(Indicate by check mark if the registrant is submitting the Form 6-K in paper as permitted by Regulation S-T Rule
101 (b) (7)):
Yes ___ No X
(Indicate by check mark whether the registrant by furnishing the information contained in this Form is also thereby furnishing the information to the Commission pursuant to Rule 12g3-2(b) under the Securities Exchange Act of 1934.)
Yes ___ No X

São Paulo, Brazil, April 27, 2017 - GPA [BM&FBovespa: PCAR4 (PN); NYSE: CBD] announces its results for the first quarter of 2017. The comments refer to the consolidated results of the Group or of its business units. All comparisons are with the same period in 2016, except where stated otherwise.
| 1Q17 Results In the quarterly financial statements of GPA on March 31, 2017, due to the ongoing divestment of the interest held by GPA in Via Varejo S.A. as announced in the material fact notice of November 23, 2016, the operations of Via Varejo are treated as discontinued operations, with a retrospective adjustment to net sales and other profit or loss lines as from January 1, 2015, as determined by IFRS 5/CPC 31, and approved by CVM Resolution 598/09 - Sale of non-current assets and discontinued operations. Accordingly, the following comments do not include the performance of Via Varejo, which is shown on page 13. Food segment net sales reach R$10.5 billion, driven by consistent growth at Assaí and recovery at Extra Hiper Multivarejo oSequential volume recovery and improved customer traffic trend translated into market share gains in the period -Notable growth in same-store sales at Extra Hiper of 5.4%, with recovery in market share. This performance reflects the successful commercial strategies without additional pressure on gross margin Assaí oRevenue reached R$4.4 billion, increasing 28.9% in the year, due to: -Strong performance of same-store sales, of 12.9%, and double-digit growth in customer traffic, though impacted by lower food inflation Adjusted EBITDA margin grew 60 bps, and net income(*) grew 97% in the quarter: Multivarejo oMaintenance of price competitiveness initiatives, with higher accuracy and assertiveness on promotional investments. oDecrease of 1.3% in selling, general and administrative expenses as a result of efficiency and productivity projects oIncrease of 60 bps in adjusted EBITDA margin, which reached 5.3%. Adjusted EBITDA grew 9.2% to R$345 million, despite the negative impact of the calendar effect. oNet income(*) growth of 72.2% in the quarter Assaí oGross margin grew 80 bps to 14.4%, due to maturation of stores, optimization of commercial dynamics and higher share of individual customers in sales oOperating expenses fell 10 bps as a percentage of sales, despite the strong store expansion in the last 12 months oAdjusted EBITDA margin reached 4.0%, increasing 80 bps, mainly due to store maturation oNet Income(*) reached R$68 million in 1Q17, up 103.3%, accompanied by margin expansion of 60 bps Financial result stood at 1.7% of net sales, reducing 10 bps from 1Q16 Net debt(**) improved R$286 million and net debt(**) / EBITDA ratio remained stable at 1.5 times (*) Adjusted net income attributable to controlling shareholders – continued operations (**) Includes credit card receivables not discounted of R$404 million in 1Q17 and R$37 million in 1Q16. |
| Food Business | Multivarejo(1) | Assaí | |||||||||
| (R$ million)(2) | 1Q17 | 1Q16 | Δ | 1Q17 | 1Q16 | Δ | 1Q17 | 1Q16 | Δ | ||
| Gross Revenue | 11,430 | 10,721 | 6.6% | 7,030 | 7,307 | -3.8% | 4,400 | 3,414 | 28.9% | ||
| Net Revenue | 10,552 | 9,888 | 6.7% | 6,513 | 6,740 | -3.4% | 4,039 | 3,148 | 28.3% | ||
| Gross Profit | 2,361 | 2,191 | 7.8% | 1,780 | 1,762 | 1.0% | 581 | 429 | 35.5% | ||
| Gross Margin | 22.4% | 22.2% | 20 bps | 27.3% | 26.1% | 120 bps | 14.4% | 13.6% | 80 bps | ||
| Selling, General and Adm. Expenses | (1,884) | (1,812) | 4.0% | (1,464) | (1,482) | -1.3% | (421) | (330) | 27.6% | ||
| % of Net Revenue | 17.9% | 18.3% | -40 bps | 22.5% | 22.0% | 50 bps | 10.4% | 10.5% | -10 bps | ||
| EBITDA(3) | 540 | 371 | 45.4% | 365 | 272 | 34.5% | 175 | 100 | 75.0% | ||
| EBITDA Margin | 5.1% | 3.8% | 130 bps | 5.6% | 4.0% | 160 bps | 4.3% | 3.2% | 110 bps | ||
| Adjusted EBITDA(3)(4) | 506 | 416 | 21.7% | 345 | 315 | 9.2% | 162 | 101 | 61.0% | ||
| Adjusted EBITDA Margin | 4.8% | 4.2% | 60 bps | 5.3% | 4.7% | 60 bps | 4.0% | 3.2% | 80 bps | ||
| Net Financial Revenue (Expenses) | (182) | (179) | 1.8% | (164) | (160) | 2.4% | (18) | (18) | -3.7% | ||
| % of Net Revenue | 1.7% | 1.8% | -10 bps | 2.5% | 2.4% | 10 bps | 0.4% | 0.6% | -20 bps | ||
| Net Income (Loss) - Controlling Shareholders - continuing operations | 107 | 9 | 1116.9% | 31 | (24) | n.a. | 76 | 33 | 132.0% | ||
| Net Margin | 1.0% | 0.1% | 90 bps | 0.5% | -0.4% | 90 bps | 1.9% | 1.0% | 90 bps | ||
| Adjusted Net Income (Loss) - Controlling Shareholders - continuing operations(5) | 83 | 42 | 96.8% | 15 | 9 | 72.2% | 68 | 33 | 103.3% | ||
| Adjusted Net Margin | 0.8% | 0.4% | 40 bps | 0.2% | 0.1% | 10 bps | 1.7% | 1.1% | 60 bps | ||
(1) Includes the results of Malls and Corporate. (2) Totals and percentages may not add up due to rounding. All margins were calculated as a percentage of net sales; (3) Earnings before interest, tax, depreciation and amortization; (4) Adjusted by the total of “Other Operating Income and Expenses”, thus eliminating nonrecurring income and expenses; (5) Net Income adjusted for the total of “Other Operating Income and Expenses”, thus eliminating nonrecurring income and expenses, as well as the respective effects of associated income tax.
1
Sales Performance
| Net Total Store Sales | |||||
| 1Q17 x | |||||
| 1Q16 | Δ Net 'Same-Store' Sales | ||||
| (R$ million) | 1Q17 | Δ(1) | 1Q17(1) | ||
| Food Business | 10,552 | 9.5% | Food Business(3) | 5.6% | |
| Multivarejo(2) | 6,513 | 0.4% | Multivarejo(2) | 2.0% | |
| Assaí | 4,039 | 28.8% | Assaí(3) | 12.9% | |
(1) Adjusted for calendar effects related to: February (1 day less) and March (Easter effect). The adjustment was 280 bps for GPA Food, and approximately 380 bps in Multivarejo and 50 bps in Assaí.
(2) Extra and Pão de Açúcar: Supermarket stores, hypermarket, proximity, gas stations, drugstores and food e-commerce, in addition to revenue from leasing of commercial centers.
(3) Includes sales of two stores already converted from Extra Hiper to Assaí, which contributed by 190 bps to Assaí and 60 bps to Food.
Multivarejo:
Net sales totaled R$6.5 billion in 1Q17, with same-store sales growing 2.0%(1), resulting in market share gains in the first two months of the year.
Other effects had a negative impact on sales performance in the period:
i) optimization of the store portfolio, resulting in the closure of 60 stores in the last 12 months and 20 in the quarter, of which 5 hypermarkets are in process to be converted into Assaí; and
ii) lower food inflation in the period (around 5.2% in 1Q17 vs. 13.1% in the same period last year).
The highlights at each banner were:
o Extra:
Extra Hipercontinued to register improvement in same-store sales performance, with market share recovery and increases in volume and customer traffic as a result of the successful strategies adopted for this format. The highlights were:
– Same-store sales presented a performance above 4Q16, with growth of 5.4%(1). This performance is even more significant considering that inflation in the food category was 520 bps lower in relation to 4Q16.
– The non-food category continued to register positive growth, driven by store-in-store mobile initiatives (already implemented in 60 stores) and the Technology Festival campaign, as well as FGTS (severance guarantee fund for workers) withdrawals in March;
– Market share gains in volume at Extra Hiper in the last 12 measurements. Current market share is already higher than the historical levels of 2015, and the banner outperforms market growth in the initial months of 2017.
Extra Superregisteredsame-store sales performance of 1.0%(1), despite being impacted by the decline in inflation in the food category. The highlight was the strong recovery in volume, growing 1.9% in the quarter, besides improved customer traffic compared to 1Q16 and 4Q16.
o Pão de Açúcar:
Same-store sales performance was significantly affected by lower inflation in the period. The banner continued to retain its market share in January and February within its segment of operation.
o Proximity:
Sales performance impacted by the closure of 41 stores in the last 12 months. Same-store sales growth was affected by a strong comparison basis due to store conversions from Minimercado Extra to Minuto Pão de Açúcar in 1Q16.
2
Assaí:
o Net sales reached R$4.0 billion in 1Q17, with strong growth of 28.8%(1). Expansion in the last 12 months (12 stores including two Extra Hiper conversions) contributed approximately R$600 million to net sales in the period;
o Assaí already accounts for 38.3% of net sales in 1Q17, an increase of 640 bps from the same period last year;
o Same-stores sales increased 12.9%(1)(3), driven by the continued double-digit growth in customer traffic, but strongly impacted by inflation in the food category, which was 790 bps lower;
o The first two Extra Hiper stores converted into Assaí continue to deliver strong performance in 1Q17, registering an increase of over 2.5 times in sales;
o The Company has already started working on the conversion of five more stores, which should be delivered over the course of 2Q17 and in early 3Q17. A minimum of 15 conversions are expected by the year-end;
o As in 2016, Assaí continues to gain market share due to the maturation of new stores and the strong pace of expansion in recent years.
Expansion:
o In 1Q17, the Company focused on continuing the store portfolio optimization plan:
i) 5 Extra Hiper stores were closed and are in process to be converted to Assaí;
ii) 16 stores were closed: 10 Minimercado Extra, 1 Pão de Açúcar, 1 Assaí, 1 fuel station and 3 drugstores;
o Opening of 1 Pão de Açúcar and 2 gas stations in the quarter, as well as 48 new adhesions to the Aliados project, which already has 150 partners.
o 8 stores are under construction; 7 Assaí (including 5 Extra Hiper conversions), 2 new stores and 1 Minuto Pão de Açúcar. These stores should be delivered in 2Q17 or early 3Q17.
Via Varejo - Discontinued Operations
| Via Varejo - "same store sales" | 1Q17 | 1Q16 | R$ million | 1Q17 | 1Q17 X 1Q16 | |
| Offline | 2.5% | (11.8%) | Offline | 4,891 | 4.2% | |
| Online (GMV change) | 2.0% | (10.5%) | Online | 1,102 | (4.0%) | |
Total | 5,993 | 2.6% |
Net revenue in 1Q17 was R$6 billion, up 2.6% from 1Q16, showing a significant recovery in performance compared to the previous year (-11.8%) and the previous quarter (-1.0%). This sales level reflects greater balance between growth and profitability. The end of the quarter was marked by a significant recovery in the sales pace at both the online and offline channels. Sales growth returned to above double-digit levels, similar to during the pre-crisis period.
Brick-and-Mortar Stores
o In 1Q17, same-store sales growth recovered by 2.5%. Net sales grew 4.2% in 1Q17 compared to 1Q16. On a pro forma basis, adding R$110 million of revenue from credits related to the Lei do Bem tax incentive law in 1Q16, growth would be 1.8%.
o This performance was the result of the following factors: (1) successful commercial strategy adopted during the Consumer Week; (2) kiosks to provide customers with guidance on withdrawing the balance available in their inactive FGTS (workers’ severance pay) accounts; (3) activation of multichannel sales; and (4) favorable commercial conditions resulting from close relations with suppliers.
3
o Mobile Telephones remained the top performing category, with double-digit growth and a greater share of the sales mix. TV sales also increased their share of the total sales mix, possibly reflecting the switch from analog to digital signals in the São Paulo metropolitan region.
Online Business
o Important recovery in GMV, which reached R$1,576, up 2.0%, compared to -10.5% in 1Q16. Marketplace accounted for 20% of total GMV in 1Q17, an increase of 500 bps compared to 1Q16. Today, there are approximately 4,000 sellers who offer around 2 million items that complement the portfolio of products offered by Via Varejo.
o Net sales fell 4.0% in 1Q17 compared to 1Q16. On a pro forma basis, adding R$32 million of revenue from credits related to the Lei do Bem in 1Q16, the decline would be 6.7%.
o Additionally, the click & collect segment expanded its presence to 974 Via Varejo stores, reflecting the successful integration of the Online and Offline stores. Sales volume increased 66%, while eligible products increased from 18% of sales to around 30%.
4
Consolidated Operating Performance
| (R$ million) | 1Q17 | 1Q16 | Δ |
| Gross Revenue | 11,430 | 10,721 | 6.6% |
| Net Revenue | 10,552 | 9,888 | 6.7% |
| Gross Profit | 2,361 | 2,191 | 7.8% |
| Gross Margin | 22.4% | 22.2% | 20 bps |
| Selling Expenses | (1,657) | (1,602) | 3.5% |
| General and Administrative Expenses | (227) | (210) | 8.1% |
| Selling, General and Adm. Expenses | (1,884) | (1,812) | 4.0% |
| % of Net Revenue | 17.9% | 18.3% | -40 bps |
| Equity Income(1) | (8) | 23 | n.a. |
| Other Operating Revenue (Expenses) | 34 | (45) | n.a. |
| Depreciation (Logistic) | 12 | 14 | -9.1% |
| EBITDA | 515 | 371 | 38.7% |
| EBITDA Margin | 4.9% | 3.8% | 110 bps |
| Adjusted EBITDA(2) | 481 | 416 | 15.7% |
| Adjusted EBITDA Margin | 4.6% | 4.2% | 40 bps |
(1) Equity Income reflects the Company’s share in FIC and Cdiscount. Note that equity income from Cdiscount is reflected in the Consolidated results and not in the Retail and Cash-and-Carry segments.
(2) EBITDA adjusted for “Other Operating Income and Expenses”, thus eliminating nonrecurring income and expenses.
In thequarterlyfinancial statements of GPA on March 31, 2017, due to the ongoing divestment of the interest held by GPA in Via Varejo S.A. as announced in the material fact notice of November 23, 2016, the operations of Via Varejo are treated as discontinued operations, with a retrospective adjustment to net sales and other profit or loss lines as from January 1, 2015, as determined by IFRS 5/CPC 31, and approved by CVM Resolution 598/09 – Sale of non-current assets and discontinued operations. Accordingly, the following comments do not include the performance of Via Varejo.
The quarter was marked by important operational improvements at Multivarejo and Assaí, which led to higher profitability. This performance mainly reflects a lower shrinkage level and the discipline and control over operating expenses as a result of the initiatives adopted last year.
Adjusted EBITDA grew 15.7% to R$481 million. Margin grew 40 bps to 4.6%. The key factors behind this performance were:
§ Gross Profit totaled R$2,361 million, with margin of 22.4%. DespiteAssaí’s higher share of the sales mix (increase of 640 bps from the previous year), margin growth posted byMultivarejo and Assaí contributed to a higher level compared to 1Q16 gross margin (22.2%).
§ Selling, general and administrative expensesof R$1,884 million, corresponding to 17.9% of net sales, down 40 bps compared to 1Q16, mainly due to the significant reduction in expenses at Multivarejo as a result of efficiency and productivity projects, notably the reduction in electricity consumption and the optimization of staff, with no impact on service levels.
Other Operating Income and Expenses totaled R$34 million in the quarter, mainly due to: (i) the gain from asset divestment; (ii) the write-off of stores undergoing conversion; and (iii) the reversal of provisions related to PIS/COFINS on ICMS due to favorable decision of the STF (Brazilian Supreme Court).
5
| Multivarejo(1) | |||
| (R$ million) | 1Q17 | 1Q16 | Δ |
| Gross Revenue | 7,030 | 7,307 | -3.8% |
| Net Revenue | 6,513 | 6,740 | -3.4% |
| Gross Profit | 1,780 | 1,762 | 1.0% |
| Gross Margin | 27.3% | 26.1% | 120 bps |
| Selling Expenses | (1,286) | (1,312) | -2.0% |
| General and Administrative Expenses | (177) | (170) | 4.5% |
| Selling, General and Adm. Expenses | (1,464) | (1,482) | -1.3% |
| % of Net Revenue | 22.5% | 22.0% | 50 bps |
| Equity Income | 17 | 23 | -25.4% |
| Other Operating Revenue (Expenses) | 21 | (44) | n.a. |
| Depreciation (Logistic) | 11 | 13 | -11.3% |
| EBITDA | 365 | 272 | 34.5% |
| EBITDA Margin | 5.6% | 4.0% | 160 bps |
| Adjusted EBITDA(2) | 345 | 315 | 9.2% |
| Adjusted EBITDA Margin | 5.3% | 4.7% | 60 bps |
(1) Includes the results of Malls and Corporate
(2) EBITDA adjusted for “Other Operating Income and Expenses”, thus eliminating nonrecurring income and expenses
In 1Q17, Multivarejo posted sequential volume recovery and improved customer traffic compared to 1Q16, which translated into market share gains in the period.
Performance in the quarter was mainly affected by the calendar effect (1 day less in February and Easter effect in March).Despite this negative impact, adjusted EBITDA totaled R$345 million, increasing 9.2% from 1Q16. Adjusted EBITDA margin expanded by 60 bps as a result of higher gross profit and cost-cutting initiatives. The main variations impacting this performance were:
§ Gross Profitof R$1,780 million, with gross margin of 27.3%. This margin level is similar to previous quarters, reflecting the new commercial strategies implemented since late 1Q16. The higher margin compared to the previous year was due to:
–Betterlevel ofshrinkage;
–Maintenance of price competitiveness initiatives, but with higher accuracy and successful investments in promotions;
–Weaker comparison base due to Easter, which this year fell in 2Q.
§ Selling, general and administrative expenses reached R$1,464 million, down 1.3%due to the efficiency and productivity projects, the highlights being:
–Electricity: reduction in consumption through efficiency projects;
–Personnel: optimization of personnel, with the reduction of approximately 7,000 jobs as a result of increased productivity of operational teams at the stores and DCs, such as new restocking practices;
–Service level: increase in customer satisfaction levels through a balance between cost optimization and improved service level, with the highlights being higher investments in store personnel training, new tools to manage customer lines and increase in multifunctional employees to improve efficiency and customer service, among others.
Other Operating Income and Expenses totaled R$21 million, mainly due to the following: (i) gain from asset divestment; (ii) write-off of stores undergoing conversion; and (iii) reversal of provision related to PIS/COFINS on ICMS due to favorable decision of the STF (Brazilian Supreme Court).
6
| Assaí | |||
| (R$ million) | 1Q17 | 1Q16 | Δ |
| Gross Revenue | 4,400 | 3,414 | 28.9% |
| Net Revenue | 4,039 | 3,148 | 28.3% |
| Gross Profit | 581 | 429 | 35.5% |
| Gross Margin | 14.4% | 13.6% | 80 bps |
| Selling Expenses | (371) | (289) | 28.2% |
| General and Administrative Expenses | (50) | (40) | 23.2% |
| Selling, General and Adm. Expenses | (421) | (330) | 27.6% |
| % of Net Revenue | 10.4% | 10.5% | -10 bps |
| Other Operating Revenue (Expenses) | 13 | (1) | n.a. |
| Depreciation (Logistic) | 1 | 1 | 18.2% |
| EBITDA | 175 | 100 | 75.0% |
| EBITDA Margin | 4.3% | 3.2% | 110 bps |
| Adjusted EBITDA(1) | 162 | 101 | 61.0% |
| Adjusted EBITDA Margin | 4.0% | 3.2% | 80 bps |
(1) EBITDA adjusted for “Other Operating Income and Expenses”, thus eliminating nonrecurring income and expenses
Assaí continues to register strong sales performance, growing 28.3% in the quarter (28.8% adjusted for calendar effects), even when compared to a strong basis of 36.2% in 1Q16. The banner continues a strong organic expansion process and consistent growth in same-store sales, which stood at 12.9% adjusted for calendar effects and conversions.
Same-store growth was strongly impacted by lower food inflation in the period (from 13.1% in 1Q16 to 5.2% in 1Q17), though maintaining the double-digit growth in customer traffic. During 1Q17, Assaí continued to gain market share, with growth of 300 bps from the previous year.
Assaí closed 1Q17 with 106 stores across 16 states. Assaí already accounts for 38.3% of net sales, an increase of 640 bps from 1Q16.
It is worth to mention the success of the first two conversions, which registered an increase of more than 2.5 times in sales and of around 50% growth in customer traffic. Five more stores are in the process of being converted, with the goal being at least 15 conversions by the end of the year.
Gross margin in the quarter reached 14.4%, growing 80 bps from 1Q16. This performance was mainly driven by faster maturation of stores opened in 2016 compared to stores opened in late 2015. This growth was also driven by improvements in the commercial dynamics and an increased share of individual customers in total sales.
Operating expenses as a percentage of net sales reached 10.4%, a dilution of 10 bps in comparison with last year despite the strong expansion in the last 12 months.
Adjusted EBITDA grew 61.0%, which was double the sales growth in the period. Adjusted EBITDA margin reached 4.0%, increasing 80 bps due to operating leverage.
7
Financial Result – Consolidated
| (R$ million) | 1Q17 | 1Q16 | Δ |
| Financial Revenue | 58 | 64 | -9.8% |
| Financial Expenses | (240) | (243) | -1.2% |
| Cost of Debt | (174) | (151) | 15.1% |
| Cost of Sale of Receivables of Credit Card | (40) | (30) | 32.0% |
| Restatement of Contingent Liabilities and Other financial expenses | (26) | (62) | -57.5% |
| Net Financial Revenue (Expenses) | (182) | (179) | 1.8% |
| % of Net Revenue | 1.7% | 1.8% | -10 bps |
In the financial statements of GPA of December 31, 2016, consequent to the ongoing divestment of the interest held by GPA in Via Varejo S.A. as announced in the material fact notice of November 23, 2016,the operations of Via Varejo are treated as discontinued operations. Accordingly, net sales and other income/expense lines were adjusted retrospectively from January 1, 2015, as defined in IFRS 5 / CPC31, approved by CVM Resolution 598/09 - Sale of non-current assets and discontinued operations. Consequently, the following comments do not include the performance of Via Varejo.
In 1Q17, net financial result of the Company reached R$ 182 million, remaining stable compared to the same period last year. Financial result as a ratio of net sales stood at 1.7%, improving 10 bps from 1Q16.
This ratio of 1.7% represents the trend expected until the end of the year due to the declining curve of the Selic interest rate.
Cost of debt increased 15.1%, mainly due to the non-recurring impact of mark-to-market adjustments last year. Excluding this impact, cost of debt decreased 7%, in line with the decline in the interest rate during the period (as measured by average CDI).
Cost of receivables remained stable at 0.3% of revenue.
Restatements of contingencies and other financial expenses decreased 58%, or R$36 million, mainly due to the effect of the decline in the balance of contingencies, which led to lower monetary restatements, and the improvement in costs of guarantees, benefiting from the process of replacing bails by surety bonds.
8
Net Income
Consolidated | Food Business | ||||||
| (R$ million) | 1Q17 | 1Q16 | Δ | 1Q17 | 1Q16 | Δ% | |
| EBITDA | 515 | 371 | 38.7% | 540 | 371 | 45.4% | |
| Depreciation (Logistic) | (12) | (14) | -9.1% | (12) | (14) | -9.1% | |
| Depreciation and Amortization | (190) | (170) | 11.5% | (190) | (170) | 11.5% | |
| Net Financial Revenue (Expenses) | (182) | (179) | 1.8% | (182) | (179) | 1.8% | |
| Income (Loss) before Income Tax | 131 | 9 | 1433.1% | 156 | 9 | 1726.4% | |
| Income Tax | (49) | 0 | n.a. | (49) | 0 | n.a. | |
| Net Income (Loss) Company - continuing operations | 81 | 9 | 826.2% | 106 | 9 | 1110.7% | |
| Net income from discontinued operations | 134 | (165) | n.a. | (25) | (10) | 142.3% | |
| Net Income (Loss) Consolidated Company | 215 | (157) | n.a. | 81 | (2) | n.a. | |
| Net Income (Loss) - Controlling Shareholders - continuing operations | 82 | 9 | 832.5% | 107 | 9 | 1116.9% | |
| Net Income (Loss) - Controlling Shareholders - descontinuing operations | 43 | (57) | n.a. | (25) | (10) | 142.3% | |
| Net Income (Loss) - Controlling Shareholders - Consolidated | 125 | (49) | n.a. | 82 | (2) | n.a. | |
| Other Operating Revenue (Expenses) | 34 | (45) | n.a. | 34 | (45) | n.a. | |
| Income Tax from Other Operating Revenues (Expenses) and Income Tax from Nonrecurring | (9) | 11 | n.a. | (9) | 11 | n.a. | |
| Adjusted Net Income (Loss) - Controlling Shareholders - continuing operations(1) | 58 | 42 | 37.5% | 83 | 42 | 96.8% | |
| Adjusted Net Margin - Controlling Shareholders | 0.5% | 0.4% | 10 bps | 0.8% | 0.4% | 40 bps | |
| (1) Net Income adjusted for “Other Operating Income and Expenses”, thus eliminating nonrecurring income and expenses, excluding the effects of Income and social contribution taxes. | |||||||
(1) Net Income adjusted for “Other Operating Income and Expenses”, thus eliminating nonrecurring income and expenses, excluding the effects of Income and social contribution taxes.
In the financial statements of GPA on December 31, 2016, due to the ongoing divestment of the interest held by GPA in Via Varejo S.A. as announced in the material fact notice of November 23, 2016,the operations of Via Varejo are treated as discontinued operations. Hence, net sales and other profit or loss lines were adjusted retroactively as from January 1, 2015, as determined by IFRS 5/CPC 31, and approved by CVM Resolution 598/09 - Sale of non-current assets and discontinued operations.
Adjusted net income of controlling shareholders from continuing operations totaled R$58million in the quarter, with the Food segment growing by a notable96.8% to reach R$83million, driven by greater profitability at bothMultivarejo(+72.2%) andAssaí (+103.3%).
Net income attributable to controlling shareholders, considering continuing and discontinued operations, totaled R$125 million, reflecting a significant improvement in the operating result across all businesses.
9
| Debt – Consolidated | |||
| (R$ million) | |||
03.31.2017 Food | 03.31.2016 Food | 03.31.2016 Consolidated including Via | |
| Business | Business | Varejo | |
Short Term Debt | (2,231) | (2,874) | (3,712) |
| Loans and Financing | (1,379) | (2,351) | (3,190) |
| Debentures and Promissory Notes | (852) | (522) | (522) |
Long Term Debt | (2,569) | (2,548) | (2,949) |
| Loans and Financing | (663) | (1,650) | (2,052) |
| Debentures | (1,906) | (898) | (898) |
| Total Gross Debt | (4,800) | (5,421) | (6,661) |
| Cash and Financial investments | 1,683 | 2,386 | 4,448 |
| Net Debt | (3,117) | (3,035) | (2,213) |
| EBITDA(1) | 1,764 | 2,150 | 2,148 |
| Net Debt / EBITDA(1) | -1.8x | -1.4x | -1.03x |
| Payment Book (CDCI) | - | - | (2,464) |
| On balance Credit Card Receivables not discounted | 404 | 37 | 2,880 |
| Net Debt with Payment Book and Credit Card Receivables not discounted | (2,712) | (2,998) | (1,797) |
| Net Debt with Payment Book and Credit Card Receivables not discounted / EBITDA(1) | -1.5x | -1.4x | -0.84x |
In the financial statements of GPA of December 31, 2016, consequent to the ongoing divestment of the interest held by GPA in Via Varejo S.A. as announced in the material fact notice of November 23, 2016, the operations of Via Varejo are treated as discontinued operations. Accordingly, net sales and other income/expense lines were adjusted retrospectively from January 1, 2015, as defined in IFRS 5 / CPC31, approved by CVM Resolution 598/09 - Sale of non-current assets and discontinued operations. Consequently, the following comments do not include the performance of Via Varejo.
However, this technical standard does not require restatement of the balance sheet in such situations. For better comparison between the periods, a column presenting comparable results for March 2016 was added to the above table on debt.
(1) EBITDA in the last 12 months.
Net debt, including unsold receivables, totaled R$2,712 million in the quarter, improving by R$286 million from the same period in 2016.
In 1Q17, the Company reached a ratio of net debt to EBITDA of 1.5 times, virtually stable compared to the same period last year.
Gross debt decreased R$621 million from 1Q16 to reach R$4.8 billion in the period.
Successful issuance of a second CRA in the amount of R$1.08 billion, at 96.0% of the CDI rate and with a three-year term.
Cash position was R$1.7 billion and the balance of receivables not discounted was R$404 million, for total available resources of R$2.1 billion.
The Company also has approximately R$1.3 billion in pre-approved/confirmed credit lines.
10
| Simplified cash flow – Consolidated (including Via Varejo) | ||
| (R$ million) | 1Q17 | 1Q16 |
| Cash Balance at Beginning of Period | 9,142 | 11,015 |
| Cash Flow from Operating Activities | (5,106) | (7,975) |
| EBITDA | 793 | 458 |
| Cost of Sale of Receivables | (174) | (169) |
| Working Capital | (5,449) | (7,808) |
| Assets and Liabilities Variation | (276) | (456) |
| Cash Flow from Investment Activities | (354) | (263) |
| Net Investment | (354) | (354) |
| Acquisition / Sale of Interest and Others | - | 91 |
| Change on net cash after investments | (5,460) | (8,238) |
| Cash Flow from Financing Activities | (1,473) | 1,667 |
| Dividends Payments and Others | - | (1) |
| Net Payments | (1,473) | 1,668 |
| Change on Net Cash | (6,933) | (6,571) |
| Exchange Rate | - | 4 |
| Cash Balance at End of Period | 2,209 | 4,448 |
| (-) Cash includes "Assets held for sale and op. Discontinued" | 526 | - |
| Cash as balance sheet (excluding Via Varejo) | 1,683 | 4,448 |
In the financial statements of GPA of December 31, 2016, consequent to the ongoing divestment of the interest held by GPA in Via Varejo S.A. as announced in the material fact notice of November 23, 2016, the operations of Via Varejo are treated as discontinued operations. Accordingly, net sales and other income/expense lines were adjusted retrospectively from January 1, 2015, as defined in IFRS 5 / CPC31, approved by CVM Resolution 598/09 - Sale of non-current assets and discontinued operations.Held-for-sale assets and the corresponding liabilities were reclassified only on the reporting date, i.e. December 31, 2016, and therefore all of the above changes in balance sheet accounts include Via Varejo, although the closing cash position has been reconciled to reflect only continuing operations.
Cash position including discontinued operations came to R$2.2 billion in 1Q17, an R$2.2 billion change from last year. The main changes were:
§ Lower initial cash in the period of R$1.9 billion, partially explained by the deconsolidation of Cdiscount;
§ Higher debt amortization volume compared to funding in the period;
§ Partially offset by the improvement in working capital in the Non-Food Segment, due to better ratio of suppliers to inventories resulting from the recovery in operational activity.
11
Capital Expenditure (Capex)
| Food Business | |||
| (R$ million) | 1Q17 | 1Q16 | Δ |
| New stores and land acquisition | 28 | 103 | -73.2% |
| Store renovations and conversions | 74 | 134 | -44.7% |
| Infrastructure and Others | 43 | 142 | -69.9% |
| Non-cash Effect | |||
| Financing Assets | 124 | (60) | n.a. |
| Total | 268 | 319 | -15.8% |
Investments in property and equipment totaled R$268 million in the quarter. Three stores were opened in the quarter: 1 Pão de Açúcar and 2 Extra stations.
At the end of the quarter, another 8 stores were under construction:
o 7 Assaí: 5 conversions from Extra Hiper and 2 new stores
o 1 Minuto Pão de Açúcar
These stores should be delivered in 2Q17 or early 3Q17.
The decrease in Capex compared to the previous year was mainly due to the following factors:
(i) in 1Q17, there was a stronger focus on store conversions, while in 1Q16 the Company invested in land to open Assaí stores;
(ii) a different store expansion calendar. For the year, total Capex will be similar to 2016.
The Company continues to focus on formats with higher return. It will also continue to perform conversions between banners, especially Extra Hiper into Assaí, and implement the store modernization plan, mainly Pão de Açúcar and Extra.
12
Via Varejo - Discontinued Operations
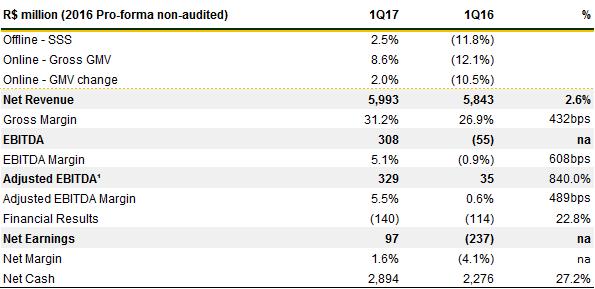
Net revenue in 1Q17 reached R$6 billion, up 2.6% from 1Q16, a significant recovery in performance compared to the previous year (-11.8%) and the previous quarter (-1.0%). This sales volume reflects greater balance between growth and profitability.The end of the quarter was marked by a significant recovery in the pace of sales at both Online and Brick-and-Mortar channels.Sales growth returned to above double-digit levels in March, similar to during the pre-crisis period, mainly due to(i) withdrawals from inactive FGTS accounts and (ii) an integrated commercial strategy for both businesses.
Gross margin ended 1Q17 at 31.2%, up 432 bps.Considering the effects ofLei do Bem in 1Q16, consolidated gross margin would be 259 bps higher.This improvement is the result of the successful multichannel commercial strategy and the higher share of financial services and products in brick-and-mortar stores.The commercial strategy was focused on balancing sales growth in both businesses with improved profitability.The Online Business saw a significant improvement of approximately 1,000 bps in gross margin, thanks to the successful implementation of the multichannel commercial strategy to establish the correct positioning of prices and assortment.
Adjusted EBITDA margin was 5.5% in 1Q17, higher than adjusted EBITDA of 0.6% in 1Q16.Considering the effects ofLei do Bem in 1Q17, consolidated gross margin was 248 bps higher than in 2016.The successful multichannel commercial strategy, with significant improvement in consolidated gross margin, combined with the optimization of SG&A expenses, contributed to the improvement in adjusted EBITDA margin.It is worth highlighting the profitability achieved by the Online business, which was slightly positive and recovered earlier than expected.
Net Income stood at R$97 million, as against a loss of R$237 million in 1Q16.This result reflects the efforts to implement a multichannel commercial strategy to achieve operating efficiency, and the start of capture of synergies between Brick-and-Mortar and Online operations.
13
Appendix II – Definitions used in this document
Company’s Business Units:The Company’s business is divided into two segments – Retail and Cash & Carry – grouped as follows:

Food segment:Represents the combined results of Multivarejo and Assaí, excluding equity income (loss) from Cdiscount, which is not included in the operating segments reported by the Company.
Growth and changes:The growth and changes presented in this document refer to variations from the same period last year, except where stated otherwise.
EBITDA:EBITDA is calculated in accordance with Instruction 527 issued by the Securities and Exchange Commission of Brazil (CVM) on October 4, 2012.
Adjusted EBITDA:Measure of profitability calculated by excluding Other Operating Income and Expenses from EBITDA. Management uses this measure in its analyses as it believes it eliminates nonrecurring expenses and revenues and other nonrecurring items that could compromise the comparability and analysis of results.
Adjusted net income:Measure of profitability calculated as Net Income from continuing operations excluding Other Operating Income and Expenses and excluding the effects of Income and Social Contribution Taxes. Also excluded are the effects of nonrecurring direct income tax. Management uses this metric in its analyses given its belief that it eliminates any nonrecurring expenses and revenues and other nonrecurring items that could compromise the comparability and analysis of results.
14
| BALANCE SHEET | |||||||
| ASSETS | |||||||
| Consolidated | Food Businesses | ||||||
| (R$ million) | 03.31.2017 | 12.31.2016 | 03.31.2016 | 03.31.2017 | 12.31.2016 | 03.31.2016 | |
| Current Assets | 27,970 | 31,651 | 21,076 | 8,305 | 11,354 | 8,010 | |
| Cash and Marketable Securities | 1,683 | 5,112 | 4,448 | 1,683 | 5,112 | 2,386 | |
| Accounts Receivable | 682 | 543 | 5,321 | 687 | 549 | 171 | |
| Credit Cards | 404 | 241 | 2,851 | 404 | 241 | 37 | |
| Payment book | - | - | 1,815 | - | - | - | |
| Sales Vouchers and Others | 167 | 209 | 804 | 171 | 215 | 136 | |
| Allowance for Doubtful Accounts | (3) | (2) | (360) | (3) | (2) | (2) | |
| Resulting from Commercial Agreements | 114 | 95 | 211 | 114 | 95 | 76 | |
| Inventories | 4,578 | 4,641 | 9,161 | 4,578 | 4,641 | 4,487 | |
| Recoverable Taxes | 617 | 674 | 1,228 | 617 | 674 | 429 | |
| Noncurrent Assets for Sale | 19,848 | 20,303 | 13 | 179 | - | 8 | |
| Expenses in Advance and Other Accounts Receivables | 562 | 378 | 905 | 561 | 378 | 452 | |
| Noncurrent Assets | 13,422 | 13,566 | 22,407 | 16,256 | 13,575 | 15,928 | |
| Long-Term Assets | 2,197 | 2,137 | 4,982 | 2,215 | 2,141 | 1,906 | |
| Accounts Receivables | - | - | 123 | - | - | - | |
| Credit Cards | - | - | 29 | - | - | - | |
| Payment Book | - | - | 106 | - | - | - | |
| Allowance for Doubtful Accounts | - | - | (12) | - | - | - | |
| Recoverable Taxes | 653 | 632 | 2,419 | 653 | 632 | 550 | |
| Deferred Income Tax and Social Contribution | 181 | 170 | 364 | 181 | 170 | 44 | |
| Amounts Receivable from Related Parties | 28 | 17 | 312 | 47 | 21 | 63 | |
| Judicial Deposits | 680 | 661 | 1,067 | 680 | 661 | 583 | |
| Expenses in Advance and Others | 655 | 657 | 697 | 655 | 657 | 666 | |
| Investments | 356 | 339 | 439 | 355 | 339 | 282 | |
| Property and Equipment | 8,972 | 9,182 | 10,419 | 9,067 | 9,182 | 8,911 | |
| Intangible Assets | 1,897 | 1,908 | 6,567 | 4,618 | 1,913 | 4,829 | |
| TOTAL ASSETS | 41,392 | 45,217 | 43,483 | 24,561 | 24,929 | 23,939 | |
| LIABILITIES | |||||||
| Consolidated | Food Businesses | ||||||
| 03.31.2017 | 12.31.2016 | 03.31.2016 | 03.31.2017 | 12.31.2016 | 03.31.2016 | ||
| Current Liabilities | 23,912 | 27,582 | 22,691 | 9,147 | 12,191 | 8,946 | |
| Suppliers | 5,241 | 7,232 | 10,849 | 5,243 | 7,235 | 4,312 | |
| Suppliers ('Forfait') | - | - | 350 | - | - | - | |
| Loans and Financing | 1,379 | 2,389 | 3,190 | 1,379 | 2,389 | 2,351 | |
| Payment Book (CDCI) | - | - | 2,293 | - | - | - | |
| Debentures | 852 | 568 | 522 | 852 | 568 | 522 | |
| Payroll and Related Charges | 609 | 614 | 1,001 | 609 | 614 | 543 | |
| Taxes and Social Contribution Payable | 203 | 254 | 932 | 203 | 254 | 180 | |
| Dividends Proposed | - | - | 2 | - | - | 0 | |
| Financing for Purchase of Fixed Assets | 49 | 116 | 70 | 49 | 116 | 48 | |
| Rents | 76 | 110 | 133 | 76 | 110 | 90 | |
| Acquisition of minority interest | 8 | 7 | 80 | 8 | 7 | 80 | |
| Debt with Related Parties | 145 | 147 | 1,446 | 334 | 379 | 173 | |
| Advertisement | 35 | 43 | 83 | 35 | 43 | 62 | |
| Provision for Restructuring | 3 | 4 | 10 | 3 | 4 | 6 | |
| Advanced Revenue | 103 | 224 | 426 | 103 | 224 | 132 | |
| Non-current Assets Held for Sale | 14,961 | 15,632 | - | - | - | - | |
| Others | 248 | 242 | 1,304 | 253 | 248 | 449 | |
| Long-Term Liabilities | 4,659 | 5,038 | 7,517 | 5,584 | 5,038 | 5,097 | |
| Loans and Financing | 663 | 1,008 | 2,052 | 663 | 1,008 | 1,650 | |
| Payment Book (CDCI) | - | - | 171 | - | - | - | |
| Debentures | 1,906 | 1,904 | 898 | 1,906 | 1,904 | 898 | |
| Financing for Purchase of Assets | - | 4 | 4 | - | 4 | 4 | |
| Acquisition of minority interest | - | - | 27 | - | - | - | |
| Deferred Income Tax and Social Contribution | 331 | 317 | 1,148 | 1,165 | 317 | 1,119 | |
| Tax Installments | 528 | 540 | 563 | 528 | 540 | 563 | |
| Provision for Contingencies | 1,116 | 1,177 | 1,437 | 1,207 | 1,177 | 802 | |
| Advanced Revenue | 22 | 24 | 1,171 | 22 | 24 | 30 | |
| Others | 93 | 64 | 47 | 93 | 64 | 31 | |
| Shareholders' Equity | 12,821 | 12,597 | 13,276 | 9,830 | 7,700 | 9,895 | |
| Capital | 6,815 | 6,811 | 6,806 | 5,519 | 5,584 | 5,135 | |
| Capital Reserves | 336 | 331 | 308 | 336 | 331 | 308 | |
| Profit Reserves | 2,843 | 2,718 | 3,282 | 2,843 | 1,785 | 3,381 | |
| Adjustment of Equity Valuation | - | - | (71) | - | - | (68) | |
| Minority Interest | 2,827 | 2,737 | 2,951 | 1,133 | - | 1,140 | |
| TOTAL LIABILITIES | 41,392 | 45,217 | 43,483 | 24,561 | 24,929 | 23,939 | |
15
INCOME STATEMENT | |||||||||||||||
| Consolidated | Food Businesses | Multivarejo(1) | Assaí | ||||||||||||
| R$ - Million | 1Q17 | 1Q16 | Δ | 1Q17 | 1Q16 | Δ | 1Q17 | 1Q16 | Δ | 1Q17 | 1Q16 | Δ | |||
| Gross Revenue | 11,430 | 10,721 | 6.6% | 11,430 | 10,721 | 6.6% | 7,030 | 7,307 | -3.8% | 4,400 | 3,414 | 28.9% | |||
| Net Revenue | 10,552 | 9,888 | 6.7% | 10,552 | 9,888 | 6.7% | 6,513 | 6,740 | -3.4% | 4,039 | 3,148 | 28.3% | |||
| Cost of Goods Sold | (8,179) | (7,683) | 6.5% | (8,179) | (7,683) | 6.5% | (4,722) | (4,965) | -4.9% | (3,456) | (2,718) | 27.2% | |||
| Depreciation (Logistic) | (12) | (14) | -9.1% | (12) | (14) | -9.1% | (11) | (13) | -11.3% | (1) | (1) | 18.2% | |||
| Gross Profit | 2,361 | 2,191 | 7.8% | 2,361 | 2,191 | 7.8% | 1,780 | 1,762 | 1.0% | 581 | 429 | 35.5% | |||
| Selling Expenses | (1,657) | (1,602) | 3.5% | (1,657) | (1,602) | 3.5% | (1,286) | (1,312) | -2.0% | (371) | (289) | 28.2% | |||
| General and Administrative Expenses | (227) | (210) | 8.1% | (227) | (210) | 8.1% | (177) | (170) | 4.5% | (50) | (40) | 23.2% | |||
| Selling, General and Adm. Expenses | (1,884) | (1,812) | 4.0% | (1,884) | (1,812) | 4.0% | (1,464) | (1,482) | -1.3% | (421) | (330) | 27.6% | |||
| Equity Income(2) | (8) | 23 | n.a. | 17 | 23 | -25.4% | 17 | 23 | -25.4% | - | - | n.a. | |||
| Other Operating Revenue (Expenses) | 34 | (45) | n.a. | 34 | (45) | n.a. | 21 | (44) | n.a. | 13 | (1) | n.a. | |||
| Depreciation and Amortization | (190) | (170) | 11.5% | (190) | (170) | 11.5% | (149) | (140) | 6.7% | (41) | (30) | 33.3% | |||
| Earnings before interest and Taxes - EBIT | 313 | 187 | 66.9% | 338 | 187 | 80.2% | 205 | 119 | 72.1% | 133 | 68 | 94.5% | |||
| Financial Revenue | 58 | 64 | -9.8% | 58 | 64 | -9.8% | 50 | 54 | -7.3% | 7 | 10 | -23.6% | |||
| Financial Expenses | (240) | (243) | -1.2% | (240) | (243) | -1.2% | (215) | (215) | 0.0% | (25) | (28) | -10.5% | |||
| Net Financial Result | (182) | (179) | 1.8% | (182) | (179) | 1.8% | (164) | (160) | 2.4% | (18) | (18) | -3.7% | |||
| Income (Loss) Before Income Tax | 131 | 9 | 1433.1% | 156 | 9 | 1726.4% | 41 | (41) | n.a. | 115 | 50 | 130.9% | |||
| Income Tax | (49) | 0 | n.a. | (49) | 0 | n.a. | (10) | 17 | n.a. | (39) | (17) | 128.9% | |||
| Net Income (Loss) Company - continuing operations | 81 | 9 | 826.2% | 106 | 9 | 1110.7% | 30 | (24) | n.a. | 76 | 33 | 132.0% | |||
| Net Result from discontinued operations | 134 | (165) | n.a. | (25) | (10) | 142.3% | (25) | (10) | 142.3% | - | - | n.a. | |||
| Net Income (Loss) - Consolidated Company | 215 | (157) | n.a. | 81 | (2) | n.a. | 5 | (35) | n.a. | 76 | 33 | 132.0% | |||
| Net Income (Loss) - Controlling Shareholders - continuing operations(3) | 82 | 9 | 832.5% | 107 | 9 | 1116.9% | 31 | (24) | n.a. | 76 | 33 | 132.0% | |||
| Net Income (Loss) - Controlling Shareholders - discontinued operations(3) | 43 | (57) | n.a. | (25) | (10) | 142.3% | (25) | (10) | 142.3% | - | - | n.a. | |||
| Net Income (Loss) - Consolidated Controlling Shareholders | 125 | (49) | n.a. | 82 | (2) | n.a. | 5 | (35) | n.a. | 76 | 33 | 132.0% | |||
| Minority Interest - Noncontrolling - continuing operations | (1) | - | n.a. | (1) | - | n.a. | (1) | - | n.a. | - | - | n.a. | |||
| Minority Interest - Noncontrolling - discontinued operations | 90 | (108) | n.a. | - | - | n.a. | - | - | n.a. | - | - | n.a. | |||
| Minority Interest - Noncontrolling - Consolidated | 89 | (108) | n.a. | (1) | - | n.a. | (1) | - | n.a. | - | - | n.a. | |||
| Earnings before Interest, Taxes, Depreciation, Amortization - EBITDA | 515 | 371 | 38.7% | 540 | 371 | 45.4% | 365 | 272 | 34.5% | 175 | 100 | 75.0% | |||
| Adjusted EBITDA(4) | 481 | 416 | 15.7% | 506 | 416 | 21.7% | 345 | 315 | 9.2% | 162 | 101 | 61.0% | |||
| Consolidated | Food Businesses | Multivarejo(1) | Assaí | ||||||||
| % of Net Revenue | |||||||||||
| 1Q17 | 1Q16 | 1Q17 | 1Q16 | 1Q17 | 1Q16 | 1Q17 | 1Q16 | ||||
| Gross Profit | 22.4% | 22.2% | 22.4% | 22.2% | 27.3% | 26.1% | 14.4% | 13.6% | |||
| Selling Expenses | 15.7% | 16.2% | 15.7% | 16.2% | 19.7% | 19.5% | 9.2% | 9.2% | |||
| General and Administrative Expenses | 2.2% | 2.1% | 2.2% | 2.1% | 2.7% | 2.5% | 1.2% | 1.3% | |||
| Selling, General and Adm. Expenses | 17.9% | 18.3% | 17.9% | 18.3% | 22.5% | 22.0% | 10.4% | 10.5% | |||
| Equity Income(2) | -0.1% | 0.2% | 0.2% | 0.2% | 0.3% | 0.3% | 0.0% | 0.0% | |||
| Other Operating Revenue (Expenses) | -0.3% | 0.5% | -0.3% | 0.5% | -0.3% | 0.7% | -0.3% | 0.0% | |||
| Depreciation and Amortization | 1.8% | 1.7% | 1.8% | 1.7% | 2.3% | 2.1% | 1.0% | 1.0% | |||
| EBIT | 3.0% | 1.9% | 3.2% | 1.9% | 3.1% | 1.8% | 3.3% | 2.2% | |||
| Net Financial Revenue (Expenses) | 1.7% | 1.8% | 1.7% | 1.8% | 2.5% | 2.4% | 0.4% | 0.6% | |||
| Income (Loss) Before Income Tax | 1.2% | 0.1% | 1.5% | 0.1% | 0.6% | -0.6% | 2.8% | 1.6% | |||
| Income Tax | -0.5% | 0.0% | -0.5% | 0.0% | -0.2% | 0.3% | -1.0% | -0.5% | |||
| Net Income (Loss) - Company | 0.8% | 0.1% | 1.0% | 0.1% | 0.5% | -0.4% | 1.9% | 1.0% | |||
| Net Income (Loss) - Controlling Shareholders - continuing operations(3) | 0.8% | 0.1% | 1.0% | 0.1% | 0.5% | -0.4% | 1.9% | 1.0% | |||
| Minority Interest - Noncontrolling - continuing operations | 0.0% | 0.0% | 0.0% | 0.0% | 0.0% | 0.0% | 0.0% | 0.0% | |||
| EBITDA | 4.9% | 3.8% | 5.1% | 3.8% | 5.6% | 4.0% | 4.3% | 3.2% | |||
| Adjusted EBITDA(4) | 4.6% | 4.2% | 4.8% | 4.2% | 5.3% | 4.7% | 4.0% | 3.2% | |||
| (1) Includes the result of M alls and Corporation | |||||||||||
| (2) Cdiscount's equity income is considered in the Consolidated and not in the Retail and Cash and Carry segments. | |||||||||||
| (3) Net Income after noncontrolling shareholders | |||||||||||
| (4) Adjusted EBITDA by excluding the Other Operating Revenue (Expenses), thereby eliminating nonrecurring income, expenses and other nonrecurring items. | |||||||||||
16
| STATEMENT OF CASH FLOW | ||
| (R$ million) | Consolidated | |
| 03.31.2017 | 03.31.2016 | |
| Net Income (Loss) for the period | 214 | (157) |
| Adjustment for reconciliation of net income | ||
| Deferred income tax | (30) | (7) |
| Loss (gain) on disposal of fixed and intangible assets | (11) | 46 |
| Depreciation and amortization | 202 | 280 |
| Interests and exchange variation | 223 | 272 |
| Adjustment to present value | - | 3 |
| Equity Income | 1 | (32) |
| Provision for contingencies | 111 | 69 |
| Share-Based Compensation | 6 | 8 |
| Allowance for doubtful accounts | 159 | 109 |
| Provision for obsolescence/breakage | (20) | 5 |
| Gains resulting from sale of subisidiaries | - | (94) |
| Deferred revenue | (82) | (55) |
| 773 | 447 | |
| Asset (Increase) decreases | ||
| Accounts receivable | (2,557) | (2,276) |
| Inventories | (481) | (260) |
| Taxes recoverable | (66) | (76) |
| Other Assets | (130) | (194) |
| Related parties | 14 | 33 |
| Restricted deposits for legal proceeding | (33) | (55) |
| (3,253) | (2,828) | |
| Liability (Increase) decrease | ||
| Suppliers | (2,411) | (4,567) |
| Suppliers ('Forfait') | - | (705) |
| Payroll and charges | (10) | (22) |
| Taxes and Social contributions payable | (58) | 77 |
| Other Accounts Payable | (25) | (316) |
| Contingencies | (116) | (71) |
| Deferred revenue | (3) | 10 |
| Taxes and Social contributions paid | (3) | - |
| (2,626) | (5,594) | |
| Net cash generated from (used) in operating activities | (5,106) | (7,975) |
| Acquisition of property and equipment | (266) | (284) |
| Increase Intangible assets | (91) | (83) |
| Sales of property and equipment | 3 | 13 |
| Cash provided on sale of subisidiary | - | 91 |
| Net cash flow investment activities | (354) | (263) |
| Cash flow from financing activities | ||
| Increase of capital | 4 | - |
| Funding and refinancing | 2,222 | 2,409 |
| Payments of loans and financing | (3,699) | (1,592) |
| Dividend Payment | - | (1) |
| Intercompany loans | - | 851 |
| Net cash generated from (used) in financing activities | (1,473) | 1,667 |
| Monetary variation over cash and cash equivalents | - | 4 |
| Increase (decrease) in cash and cash equivalents | (6,933) | (6,567) |
| Cash and cash equivalents at the beginning of the year | 9,142 | 11,015 |
| Cash and cash equivalents at the end of the year | 2,209 | 4,448 |
| Change in cash and cash equivalents | (6,933) | (6,567) |
17
| BREAKDOWN OF GROSS SALES BY BUSINESS | |||||
| (R$ million) | 1Q17 | % | 1Q16 | % | Δ |
| Pão de Açúcar | 1,718 | 15.0% | 1,804 | 16.8% | -4.8% |
| Extra(1) | 4,416 | 38.6% | 4,580 | 42.7% | -3.6% |
| Convenience Stores(2) | 296 | 2.6% | 304 | 2.8% | -2.4% |
| Assaí | 4,400 | 38.5% | 3,414 | 31.8% | 28.9% |
| Other Businesses(3) | 600 | 5.2% | 620 | 5.8% | -3.2% |
| Food Business | 11,430 | 100.0% | 10,721 | 100.0% | 6.6% |
| (1) Includes Extra Supermercado and Extra Hiper. Same-store gross sales of 4.1%in 1Q17. | |||||
| (2) Includes M inimercado Extra and M inuto Pão de Açúcar sales. | |||||
| (3) Includes Gas Station, Drugstores, Delivery sales and revenues from the leasing of commercial galleries. | |||||
| BREAKDOWN OF NET SALES BY BUSINESS | |||||
| (R$ million) | 1Q17 | % | 1Q16 | % | Δ |
| Pão de Açúcar | 1,585 | 15.0% | 1,660 | 16.8% | -4.5% |
| Extra(1) | 4,065 | 38.5% | 4,191 | 42.4% | -3.0% |
| Convenience Stores(2) | 277 | 2.6% | 283 | 2.9% | -2.2% |
| Assaí | 4,039 | 38.3% | 3,148 | 31.8% | 28.3% |
| Other Businesses(3) | 586 | 5.6% | 606 | 6.1% | -3.3% |
| Food Business | 10,552 | 100.0% | 9,888 | 100.0% | 6.7% |
| (1) Includes Extra Supermercado and Extra Hiper. Same-store gross sales of 3.5%in 1Q17. | |||||
| (2) Includes M inimercado Extra and M inuto Pão de Açúcar sales. | |||||
| (3) Includes Gas Station, Drugstores, Delivery sales and revenues from the leasing of commercial galleries. | |||||
| SALES BREAKDOWN (% of Net Sales) | ||
| Food Business | ||
| 1Q17 | 1Q16 | |
| Cash | 51.5% | 52.4% |
| Credit Card | 38.2% | 37.8% |
| Food Voucher | 10.3% | 9.8% |
18
| STORE OPENINGS/CLOSINGS BY BANNER | |||||||||
| 12/31/2016 | Opened | Closed | Converted | 03/31/2017 | |||||
| Pão de Açúcar | 185 | 1 | (1) | - | 185 | ||||
| Extra Hiper | 134 | - | (5) | - | 129 | ||||
| Extra Supermercado | 194 | - | - | - | 194 | ||||
| Minimercado Extra | 207 | - | (10) | - | 197 | ||||
| Minuto Pão de Açucar | 77 | - | - | - | 77 | ||||
| Assaí | 107 | - | (1) | - | 106 | ||||
| Other Business | 231 | 2 | (4) | - | 229 | ||||
| Gas Station | 76 | 2 | (1) | - | 77 | ||||
| Drugstores | 155 | - | (3) | - | 152 | ||||
| Food Business | 1,135 | 3 | (21) | - | 1,117 | ||||
| Sales Area ('000 m2) | |||||||||
| Food Business | 1,814 | 1,789 | |||||||
| # of employees ('000)(1) | 91 | 89 | |||||||
| (1)Excludes employees of discontinued operations. | |||||||||
(1) Excludes employees of discontinued operations.
19
1Q17 Results Conference Call and Webcast Conference call in Portuguese (original language) Conference call in English (simultaneous translation) Webcast: http://www.gpari.com.br Replay http://www.gpari.com.br |
Investor Relations Contacts
GPA Tel.: 55 (11) 3886-0421 Fax: 55 (11) 3884-2677 gpa.ri@gpabr.com www.gpari.com.br |
Via Varejo Tel.: 55 (11) 4225-8668 Fax: 55 (11) 4225-9596 ri@viavarejo.com.br www.viavarejo.com.br/ri |
Cnova Tel.: 33 (1) 5370-5590 investor@cnova.com www.cnova.com/investor-relations | |
Any and all non-accounting information or derived from non-accounting figures has not been reviewed by independent auditors. To calculate EBITDA, we use earnings before interest, taxes, depreciation and amortization. GPA adopts the IPCA consumer price index as its benchmark inflation index, which is also used by the Brazilian Supermarkets Association (ABRAS), since it more accurately reflects the mix of products and brands sold by the Company. IPCA inflation in the 12 months ended March 2017 was 4.57%. | About GPA:GPA is Brazil’s largest retailer, with a distribution network comprising over 2,000 points of sale as well as electronic channels. Established in 1948 in São Paulo, it has its head office in the city and operations in 20 Brazilian states and the Federal District. With a strategy of focusing its decisions on customers and better serving them based on their consumer profile in the wide variety of shopping experiences it offers, GPA adopts a multi-business and multi-channel platform with brick-and-mortar stores and e-commerce operations divided into three business units: Multivarejo, which operates the supermarket, hypermarket and Minimercado store formats, as well as fuel stations and drugstores under the Pão de Açúcar and Extra banners; Assaí, which operates in the cash-and-carry wholesale segment; GPA Malls, which is responsible for managing the Group's real estate assets, expansion projects and new store openings;and Via Varejo’s discontinued operations, with its bricks and mortar electronics and home appliances stores under the Casas Bahia and Pontofrio banners, and the e-commerce segment. | ||
Disclaimer:Statements contained in this release relating to the business outlook of the Company, projections of operating/financial results, the growth potential of the Company and the market and macroeconomic estimates are mere forecasts and were based on the expectations of Management in relation to the Company’s future. These expectations are highly dependent on changes in the market, Brazil’s general economic performance, the industry and international markets, and are thus subject to change. | |||
20
SIGNATURES
Pursuant to the requirement of the Securities Exchange Act of 1934, the registrant has duly caused this report to be signed on its behalf by the undersigned, thereunto duly authorized.
| COMPANHIA BRASILEIRA DE DISTRIBUIÇÃO | ||
| Date: April 28, 2017 | By: /s/ Ronaldo Iabrudi Name: Ronaldo Iabrudi Title: Chief Executive Officer | |
| By: /s/ Daniela Sabbag Name: Daniela Sabbag Title: Investor Relations Officer | ||
FORWARD-LOOKING STATEMENTS
This press release may contain forward-looking statements. These statements are statements that are not historical facts, and are based on management's current view and estimates offuture economic circumstances, industry conditions, company performance and financial results. The words "anticipates", "believes", "estimates", "expects", "plans" and similar expressions, as they relate to the company, are intended to identify forward-looking statements. Statements regarding the declaration or payment of dividends, the implementation of principal operating and financing strategies and capital expenditure plans, the direction of future operations and the factors or trends affecting financial condition, liquidity or results of operations are examples of forward-looking statements. Such statements reflect the current views of management and are subject to a number of risks and uncertainties. There is no guarantee that the expected events, trends or results will actually occur. The statements are based on many assumptions and factors, including general economic and market conditions, industry conditions, and operating factors. Any changes in such assumptions or factors could cause actual results to differ materially from current expectations.