FORM 6-K
SECURITIES AND EXCHANGE COMMISSION
Washington, D.C. 20549
Report of Foreign Private Issuer
Pursuant to Rule 13a-16 or 15d-16 of
the Securities Exchange Act of 1934
For the month ofMay, 2019
Brazilian Distribution Company
(Translation of Registrant’s Name Into English)
Av. Brigadeiro Luiz Antonio,
3142 São Paulo, SP 01402-901
Brazil
(Address of Principal Executive Offices)
(Indicate by check mark whether the registrant files or will file annual reports under cover of Form 20-F or Form 40-F)
Form 20-F X Form 40-F
(Indicate by check mark if the registrant is submitting the Form 6-K in paper as permitted by Regulation S-T Rule
101 (b) (1)):
Yes ___ No X
(Indicate by check mark if the registrant is submitting the Form 6-K in paper as permitted by Regulation S-T Rule
101 (b) (7)):
Yes ___ No X
(Indicate by check mark whether the registrant by furnishing the information contained in this Form is also thereby furnishing the information to the Commission pursuant to Rule 12g3-2(b) under the Securities Exchange Act of 1934.)
Yes ___ No X

São Paulo, May 8, 2019 - GPA [B3: PCAR4; NYSE: CBD] announces its results for the first quarter of 2019. Due to the ongoing divestment of the interest held by GPA in Via Varejo S.A., the operations of Via Varejo are treated as discontinued operations. The following comments are related to the results of continuing operations. All comparisons are with the same period in 2018, except where stated otherwise. All comments regarding adjusted EBITDA and gross margin exclude the non-recurring effects from the periods. Comments related to net income refer to net income attributable to controlling shareholders of continuing operations. In addition, starting from 2019, results include the effects of IFRS 16/CPC 06 (R2) – Leases, which eliminates the distinction between operating and financial leases and requires the recognition of a financial asset and liability related to future leases discounted at present value for virtually all lease agreements of our stores. Comments in this page refer to numbers before the application of IFRS 16.
1Q19 RESULTS
GPA Food
The following comments refer to numbers before the application of IFRS 16.
▪ Gross sales revenue reached R$13.8 billion in 1Q19, maintaining a strong growth pace of 12.4%;
▪ Significant growth of 15.2% in adjusted EBITDA despite the unfavorable Easter calendar, totaling R$680 million and margin reaching 5.4%, +20 basis points (bps);
▪ Net income up 41.7% in the quarter, totaling R$216 million, with net margin improving to 1.7% (+40 bps), mainly reflecting the operational growth at Assaí and Multivarejo;
▪ Solid financial structure achieved through maintenance of low level of leverage, which reached -1.12x EBITDA;
▪ Significant growth of food e-commerce, underlining the leadership position in the sector and expanding the share of sales under the Pão de Açúcar banner to over 4%;
▪ Consistent advances in Digital Transformation, with the following highlights:
(i) Launch of the James Delivery (last miler) operations in São Paulo and expansion to 10 more cities until the end of 2019;
(ii) Rollout of strategic partnership with Cheftime to 28 stores and an estimate to reach more than 100 store in 2Q19;
(iii) My Discount app reached over 70% growth in downloads - more than 8.3 million - with strong growth in the penetration of loyalty programs.
(iv) Partnership agreement with Get Ninjas and other initiatives to optimize clients’ time at stores: Pre-Scanning, Shop & Go, Self Check-out and Scan & Go.
Consolidated | Food Business | |||||||
(R$ million) | 1Q19 | 1Q18 | Δ | 1Q19 | 1Q18 | Δ | ||
Gross Revenue | 13,827 | 12,300 | 12.4% | 13,827 | 12,300 | 12.4% | ||
Net Revenue | 12,709 | 11,343 | 12.0% | 12,709 | 11,343 | 12.0% | ||
Gross Profit | 2,788 | 2,547 | 9.5% | 2,788 | 2,547 | 9.5% | ||
Gross Margin | 21.9% | 22.5% | -60 bps | 21.9% | 22.5% | -60 bps | ||
Selling, General and Adm. Expenses | (2,215) | (2,057) | 7.7% | (2,176) | (2,012) | 8.1% | ||
% of Net Revenue | 17.4% | 18.1% | -70 bps | 17.1% | 17.7% | -60 bps | ||
EBITDA(1) | 586 | 503 | 16.4% | 624 | 548 | 14.0% | ||
EBITDA Margin | 4.6% | 4.4% | 20 bps | 4.9% | 4.8% | 10 bps | ||
Adjusted EBITDA(1)(2) | 642 | 546 | 17.5% | 680 | 591 | 15.2% | ||
Adjusted EBITDA Margin | 5.1% | 4.8% | 30 bps | 5.4% | 5.2% | 20 bps | ||
Net Financial Revenue (Expenses) | (142) | (132) | 8.2% | (142) | (132) | 8.2% | ||
% of Net Revenue | 1.1% | 1.2% | -10 bps | 1.1% | 1.2% | -10 bps | ||
Net Income - Controlling Shareholders - continuing operations | 178 | 108 | 64.2% | 216 | 153 | 41.7% | ||
Net Margin- continuing operations | 1.4% | 1.0% | 40 bps | 1.7% | 1.3% | 40 bps | ||
Net Income (Loss) -continuing and discontinued operations | 152 | 150 | 1.3% | 193 | 142 | 36.1% | ||
Net margin-continuing and discontinued operations | 1.2% | 1.3% | -10 bps | 1.5% | 1.3% | 20 bps | ||
(1) Earnings before interest, tax, depreciation and amortization. (2) Adjusted by Other Operating Income and Expenses.
1
IFRS 16
As of January 1st, 2019, GPA’s results include the effects of IFRS 16/CPC 06 (R2) – Leases, which eliminates the distinction between operating and financial leases and requires the recognition of a financial asset and liability related to future leases, discounted at present value, for virtually all lease agreements of our stores.
The Company opted for the full retrospective adoption, as if the pronouncement had always been adopted since the start of the contracts in order to show the comparable effects for each past period. As such, operational lease expenses are replaced by depreciation expenses related to the right of use and interest expenses related to the lease liability.
To sum up, the main items affected and the respectiveannual amounts for 2018 are listed below:
Income Statement:
▪ EBITDA: positive effect of R$ 0,9 billion
▪ Amortization: negative impact of R$ 0,4 billion
▪ Financial Result:negative effect of R$ 0,5 billion
▪ Net income: negative impact of R$ 50 million
For a better understanding of the 1Q19 results, below is a summary of the adjustments to reconcile the effects of IFRS 16 for GPA Consolidated and GPA Food:
Consolidated | 1Q19 | 1Q18 | Δ | ||||||||
|
|
|
|
|
|
|
|
| |||
(R$ million) | Pre- | Change | Post- | Pre- | Change | Post- | Pre- | Post- | |||
Gross Revenue | 13,827 | 0 | 13,828 | 12,300 | 0 | 12,300 | 12.4% | 12.4% | |||
Net Revenue | 12,709 | 0 | 12,709 | 11,343 | 0 | 11,343 | 12.0% | 12.0% | |||
Gross Profit | 2,788 | 8 | 2,796 | 2,547 | 13 | 2,560 | 9.5% | 9.2% | |||
Gross Margin | 21.9% | 10 bps | 22.0% | 22.5% | 10 bps | 22.6% | -60 bps | -60 bps | |||
Selling, General and Adm. Expenses | (2,215) | 205 | (2,010) | �� | (2,057) | 181 | (1,876) | 7.7% | 7.1% | ||
% of Net Revenue | 17.4% | -160 bps | 15.8% | 18.1% | -160 bps | 16.5% | -70 bps | -70 bps | |||
Adjusted EBITDA(1)(2) | 642 | 233 | 875 | 546 | 211 | 757 | 17.5% | 15.5% | |||
Adjusted EBITDA Margin | 5.1% | 180 bps | 6.9% | 4.8% | 190 bps | 6.7% | 30 bps | 20 bps | |||
Net Financial Revenue (Expenses) | (142) | (147) | (289) | (132) | (142) | (274) | 8.2% | 5.7% | |||
% of Net Revenue | 1.1% | 120 bps | 2.3% | 1.2% | 120 bps | 2.4% | -10 bps | -10 bps | |||
Net Income - Controlling Shareholders - continuing operations | 178 | (28) | 149 | 108 | (31) | 77 | 64.2% | 94.5% | |||
Net Margin- continuing operations | 1.4% | -20 bps | 1.2% | 1.0% | -30 bps | 0.7% | 40 bps | 50 bps | |||
Net Income (Loss) -continuing and discontinued operations | 152 | 3 | 155 | 150 | 0 | 150 | 1.3% | 3.4% | |||
Net margin-continuing and discontinued operations | 1.2% | 0 bps | 1.2% | 1.3% | 0 bps | 1.3% | -10 bps | -10 bps | |||
|
|
|
|
|
|
| |||||
Food Business | 1Q19 | 1Q18 | Δ | ||||||||
|
|
|
|
|
|
|
|
| |||
(R$ million) | Pre- | Change | Post- | Pre- | Change | Post- | Pre- | Post- | |||
Net Revenue | 12,709 | 0 | 12,709 | 11,343 | 0 | 11,343 | 12.0% | 12.0% | |||
Gross Profit | 2,788 | 8 | 2,796 | 2,547 | 13 | 2,560 | 9.5% | 9.2% | |||
Gross Margin | 21.9% | 10 bps | 22.0% | 22.5% | 10 bps | 22.6% | -60 bps | -60 bps | |||
Selling, General and Adm. Expenses | (2,176) | 206 | (1,970) | (2,012) | 184 | (1,828) | 8.1% | 7.7% | |||
% of Net Revenue | 17.1% | -160 bps | 15.5% | 17.7% | -160 bps | 16.1% | -60 bps | -60 bps | |||
Adjusted EBITDA(1)(2) | 680 | 234 | 915 | 591 | 214 | 804 | 15.2% | 13.7% | |||
Adjusted EBITDA Margin | 5.4% | 180 bps | 7.2% | 5.2% | 190 bps | 7.1% | 20 bps | 10 bps | |||
Net Financial Revenue (Expenses) | (142) | (147) | (289) | (132) | (142) | (274) | 8.2% | 5.7% | |||
% of Net Revenue | 1.1% | 120 bps | 2.3% | 1.2% | 120 bps | 2.4% | -10 bps | -10 bps | |||
Net Income - Controlling Shareholders - continuing operations | 216 | (27) | 189 | 153 | (29) | 124 | 41.7% | 52.8% | |||
Net Margin- continuing operations | 1.7% | -20 bps | 1.5% | 1.3% | -20 bps | 1.1% | 40 bps | 40 bps | |||
Net Income (Loss) -continuing and discontinued operations | 193 | (27) | 166 | 142 | (29) | 113 | 36.1% | 46.9% | |||
Net margin-continuing and discontinued operations | 1.5% | -20 bps | 1.3% | 1.3% | -30 bps | 1.0% | 20 bps | 30 bps | |||
(1) Earnings before interest, tax, depreciation and amortization. (2) Adjusted by Other Operating Income and Expenses.
2
“For another quarter, we have made important advances in all formats of the food business, as a result of our assertive multi-channel, multi-format and multi-region strategy. Assaí presented an exceptional sales performance and profitability while Multivarejo continued with consistent results. We maintained the initiatives of portfolio adjustments with retrofits and conversions of stores, progressed sequentially in private label brands and advanced in the projects of digital transformation in the Group, with the expansion of the performance of James delivery and other initiatives in store.”
Peter Estermann, Chief Executive Officer of GPA
OPERATING PERFORMANCE BY BUSINESS
Assaí
1Q19 | 1Q18 | Δ | |||||||||
|
|
|
|
|
|
|
|
| |||
(R$ million) | Pre- | Change | Post- | Pre- | Change | Post- | Pre- | Post- | |||
Gross Revenue | 6,907 | 0 | 6,907 | 5,499 | 0 | 5,499 | 25.6% | 25.6% | |||
Net Revenue | 6,327 | 0 | 6,327 | 5,058 | 0 | 5,058 | 25.1% | 25.1% | |||
Gross Profit | 969 | 2 | 970 | 777 | 2 | 779 | 24.6% | 24.6% | |||
Gross Margin | 15.3% | 0 bps | 15.3% | 15.4% | 0 bps | 15.4% | -10 bps | -10 bps | |||
Selling, General and Adm. Expenses | (643) | 45 | (598) | (538) | 37 | (501) | 19.6% | 19.5% | |||
% of Net Revenue | 10.2% | -70 bps | 9.5% | 10.6% | -70 bps | 9.9% | -40 bps | -40 bps | |||
EBITDA(1) | 328 | 50 | 378 | 242 | 44 | 286 | 35.7% | 32.3% | |||
EBITDA Margin | 5.2% | 80 bps | 6.0% | 4.8% | 80 bps | 5.6% | 40 bps | 40 bps | |||
Adjusted EBITDA(1)(3) | 329 | 50 | 378 | 244 | 44 | 288 | 34.7% | 31.4% | |||
Adjusted EBITDA Margin | 5.2% | 80 bps | 6.0% | 4.8% | 90 bps | 5.7% | 40 bps | 30 bps | |||
Net Financial Revenue (Expenses) | (13) | (34) | (47) | (10) | (30) | (40) | 27.4% | 17.9% | |||
% of Net Revenue | 0.2% | 60 bps | 0.8% | 0.2% | 60 bps | 0.8% | 0 bps | 0 bps | |||
Net Income - Controlling Shareholders - continuing operations | 165 | (6) | 158 | 115 | (6) | 109 | 42.6% | 44.6% | |||
Net Margin- continuing operations | 2.6% | -10 bps | 2.5% | 2.3% | -10 bps | 2.2% | 30 bps | 30 bps | |||
(1) Earnings before interest, tax, depreciation and amortization. (2) Adjusted by Other Operating Income and Expenses.
Gross sales revenuetotaled R$6.9 billion, speeding up the growth pace to 25.6%, reflecting the accelerated maturation of stores opened in 2018 and the strong same-store growth of 10.7%. Market share increased 230 bps and customer traffic registered a significant 14.8% growth. The quarterly highlights also include:
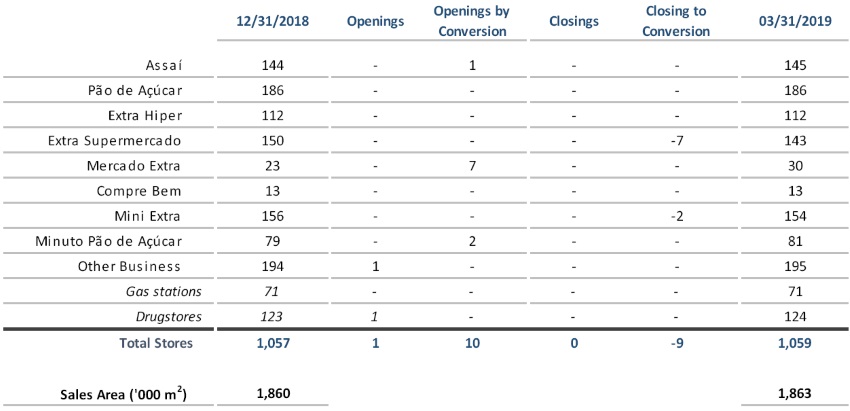
▪ Conversion of hypermarket to Assaí: one more store converted (Sezefredo), totaling 145 Assaí stores. Around 20 stores will be opened in the year;
▪ More than 100,000 Passaí cards issued in the quarter.Presently, Assaí has more than 720,000 cards, with total penetration of more than 5% of sales.
Gross profitgrew 24.6%, with gross margin of 15.3%, remaining at the same level as in 1Q18 despite the acceleration in sales growth, reflecting an appropriate level of commercial competitiveness. Implementation of IFRS 16 did not affect gross margin in the quarter.
Selling, general and administrative expensesamounted to R$598 million, corresponding to 9.5% of sales. The significant 40 bps dilution mainly stems from the strong sales growth combined with the rigorous control of expenses, despite the pre-operational expenses incurred at the stores under construction as part of the expansion plan. The adoption of IFRS 16 had no influence over the dilution of expenses in the quarter.
3
Adjusted EBITDA rose 31.4%, with EBITDA margin of 6.0% (+30 bps). Implementation of IFRS 16 affected EBITDA margin expansion by -10 bps. The evolution of profitability is in line with the guidance for the year.
Net income totaledR$158 million, significant growth of 44.6%, with margin of 2.5% (+30 bps). Implementation of IFRS 16 did not affect net margin expansion in the quarter.
Multivarejo
1Q19 | 1Q18 | Δ | |||||||||
|
|
|
|
|
|
|
|
| |||
(R$ million) | Pre- | Change | Post- | Pre- | Change | Post- | Pre- | Post- | |||
Gross Revenue | 6,921 | 0 | 6,921 | 6,801 | 0 | 6,801 | 1.8% | 1.8% | |||
Net Revenue | 6,382 | 0 | 6,382 | 6,285 | 0 | 6,285 | 1.5% | 1.5% | |||
Gross Profit | 1,819 | 7 | 1,826 | 1,770 | 11 | 1,781 | 2.8% | 2.5% | |||
Gross Margin | 28.5% | 10 bps | 28.6% | 28.2% | 10 bps | 28.3% | 30 bps | 30 bps | |||
Selling, General and Adm. Expenses | (1,532) | 161 | (1,371) | (1,474) | 146 | (1,328) | 3.9% | 3.3% | |||
% of Net Revenue | 24.0% | -250 bps | 21.5% | 23.5% | -240 bps | 21.1% | 50 bps | 40 bps | |||
EBITDA(1) | 297 | 189 | 486 | 306 | 171 | 477 | -3.1% | 1.9% | |||
EBITDA Margin | 4.6% | 300 bps | 7.6% | 4.9% | 270 bps | 7.6% | -30 bps | 0 bps | |||
Adjusted EBITDA(1)(2) | 352 | 184 | 536 | 347 | 170 | 516 | 1.5% | 3.9% | |||
Adjusted EBITDA Margin | 5.5% | 290 bps | 8.4% | 5.5% | 270 bps | 8.2% | 0 bps | 20 bps | |||
Net Financial Revenue (Expenses) | (129) | (113) | (242) | (121) | (112) | (233) | 6.6% | 3.6% | |||
% of Net Revenue | 2.0% | 180 bps | 3.8% | 1.9% | 180 bps | 3.7% | 10 bps | 10 bps | |||
Net Income - Controlling Shareholders - continuing operations | 52 | (21) | 31 | 37 | (23) | 14 | 38.9% | 115.3% | |||
Net Margin- continuing operations | 0.8% | -30 bps | 0.5% | 0.6% | -40 bps | 0.2% | 20 bps | 30 bps | |||
(1) Earnings before interest, tax, depreciation and amortization. (2) Adjusted by Other Operating Income and Expenses.
Gross sales revenuetotaled R$6.9 billion in the period, up 1.8% from 1Q18, despite the unfavorable calendar caused by Easter falling in the second quarter. Same-store growth has remained at aroundmid-single digits since 1Q18, reaching4.8% in 1Q19.The period highlights were:
▪ Market share gains in all banners;
▪ Strong growth in food e-commerce sales, consolidating the leadership of the segment;
▪ Continuation of initiatives related to the optimization of store portfolio:renovation and conversion of stores, which boosted performance atPão de Açúcar and Extra Supermarkets;
▪ Penetration of Private-Label Brands rose to approximately 12% of sales;
▪ Consistent progress in digital transformation initiatives
Gross profittotaled R$1.8 billion, with gross margin of 28.6%.Gross margin was higher than in the previous year due to the Easter effect and reflects the level of competitiveness the Company believes is adequate for each Multivarejo banner.Implementation of IFRS 16did not affectgross margin in the quarter.
Selling, general and administrative expenses totaled R$1.4 billion, up 3.3%, mainly driven by the increase, significantly below inflation, of personnel and store operation expenses. Selling, general and administrative expenses corresponded to 21.5% of sales, an increase of 40 bps from 1Q18.Implementation of IFRS 16 affected the dilution of expenses in the quarter by -10 bps.
4
Adjusted EBITDAcame to R$536 million, with margin of 8.4%. Implementation of IFRS improved adjusted EBITDA margin by +20 bps. Without the application of IFRS 16, adjusted EBITDA remained at the 1Q18 level (+5.5%) despite the absence of seasonal effect (Easter) in the quarter, demonstrating consistent performance and control over operating expenses.
Net incomegrew 115.3% to R$31 million, with margin of 0.5% (+30 bps). Implementation of IFRS 16 contributed +10 bps to net margin expansion in the quarter.
Digital Transformation and e-commerce:
Focus on offering customers increasingly customized solutions through innovation and the omnichannel strategy in order to ensure a better shopping experience.
● Maintenance of leadership in food e-commerce operation:
○ Pão de Açúcar Adega, the multichannel digital platform with nationwide coverage launched in 4Q18, enabled us to double online sales in the wine category in the quarter;
○ The Click&Collect and Express operations posted a strong 32% growth in the quarter, already being offered at 76 stores under the Pão de Açúcar and Extra banners.
● James Delivery: launch of the operations in São Paulo in April and expansion to 10 more cities until the end of 2019;
● My Discount:More than 8.3 million downloads, up 70%, with strong increase in penetration in loyalty programs;
● Cheftime:Rollout of the partnership in 28 more stores, in addition to e-commerce sales. Estimate to reach more than 100 stores in 2Q19;
● Partnership with Get Ninjas and other initiatives to optimize customers’ time at stores:Launch of pilot operations of Pre-scanning, Shop & Go, Self Check-out, as well as the possibility of paying for purchases through the app (Scan & Go);
OTHER INCOME AND EXPENSES
In the quarter, Other Income and Expenses amounted to an expense of R$51 million, mainly related to restructuring expenses and asset write-offs, chiefly stemming from the review of the store portfolio, in addition to expenses related to tax contingencies in connection with previous periods (2001 to 2008).
5
FINANCIAL RESULT
Consolidated | |||
(R$ million) | 1Q19 | 1Q18 | Δ |
Financial Revenue | 36 | 40 | -10.0% |
Financial Expenses | (178) | (172) | 3.5% |
Cost of Debt | (96) | (98) | -2.0% |
Cost of Receivables Discount | (29) | (35) | -17.1% |
Contingencies adjustments and Other financial expenses | (53) | (39) | 35.9% |
Net Financial Revenue (Expenses) - Pre IFRS 16 | (142) | (132) | 7.6% |
% of Net Revenue | 1.1% | 1.2% | -10 bps |
| |||
Interest on lease liabilities | (147) | (142) | 3.5% |
Net Financial Revenue (Expenses) - Post IFRS 16 | (289) | (274) | 5.5% |
% of Net Revenue | 2.3% | 2.4% | -10 bps |
The Company’s financial result amounted to R$289 million, or 2.3% of net sales. Without the application of IFRS 16, financial result amounted to R$142 million, 1.1% of net sales, down 10 bps from 1Q18.
The main variations were:
▪ Reduction in thecost of debt:in line with the decline in the CDI interest rate, from 6.7% in 1Q18 to 6.4% in 1Q19;
▪ Lower expenses withsales of receivables:reflecting the lower interest rate and shorter term of the receivables portfolio, influenced by the higher share of Assaí;
▪ Restatement of contingencies and other expenses: remained virtually stable as a percentage of net sales revenue compared to 1Q18;
Due to the adoption of IFRS 16, the financial result now includesInterest on lease liabilities. In the quarter, a sum of R$147 million was recognized under this item, which corresponds to 1.2% of revenue (vs. 1.3% in 1Q18).
6
Net Income – Food
Q1 2019 | Q1 2018 |
| Δ | |||||||
(R$ million) | Pre- | Change | Post- | Pre- | Change | Post- |
| Pre- | Post- | |
EBITDA | 624 | 239 | 864 | 548 | 215 | 763 |
| 14.0% | 13.3% | |
Depreciation (Logistic) | (12) | (25) | (37) | (12) | (18) | (31) |
| -1.9% | 19.8% | |
Depreciation and Amortization | (224) | (105) | (329) | (210) | (94) | (303) |
| 6.7% | 8.5% | |
Net Financial Revenue (Expenses) | (142) | (147) | (289) | (132) | (142) | (274) |
| 8.2% | 5.7% | |
Income (Loss) before Income Tax | 246 | (38) | 208 | 194 | (39) | 154 |
| 26.9% | 34.8% | |
Income Tax | (29) | 10 | (19) | (41) | 11 | (30) |
| -29.9% | -38.7% | |
Net Income (Loss) Company - continuing operations | 217 | (28) | 189 | 153 | (29) | 124 |
| 42.2% | 52.8% | |
Net income from discontinued operations | (23) | 0 | (23) | (11) | 0 | (11) |
| 116.1% | 116.1% | |
Net Income (Loss) Consolidated Company | 194 | (28) | �� 166 | 142 | (29) | 113 |
| 36.6% | 46.9% | |
Net Income (Loss) - Controlling Shareholders - continuing operations | 216 | (27) | 189 | 153 | (29) | 124 |
| 41.7% | 52.8% | |
Net Income (Loss) - Controlling Shareholders - descontinuing operations | (23) | 0 | (23) | (11) | 0 | (11) |
| 116.1% | 116.1% | |
Net Income (Loss) - Controlling Shareholders - Consolidated | 193 | (27) | 166 | 142 | (29) | 113 |
| 36.1% | 46.9% | |
In the Food segment, net income attributable to the controlling shareholders from continuing operations was R$189 million, 52.8% higher than in 1Q18, with margin of 1.5%. At Assaí, net income grew 44.6% to R$158 million, with margin of 2.5%. At Multivarejo, net income grew 115.3% to R$31 million, with net margin of 0.5%.
Earnings per Share
Consolidated net income attributable to the controlling shareholders, considering continuing and discontinued operations, came to R$152 million, with margin of 1.2%.
In 1Q19, earnings per share stood at R$0.54778 for common shares and at R$0.59771 for preferred shares.
7
Net Debt
The Company does not consider the adjustments resulting from IFRS 16 on debt and EBITDA in order to calculate the indicators in the following table.
(R$ million) | 03.31.2019 | 03.31.2018 |
Short Term Debt | (2,288) | (1,339) |
Loans and Financing | (1,221) | (834) |
Debentures and Promissory Notes | (1,067) | (506) |
Long Term Debt | (4,151) | (3,950) |
Loans and Financing | (261) | (614) |
Debentures | (3,890) | (3,336) |
Total Gross Debt | (6,439) | (5,289) |
Cash and Financial investments | 2,359 | 1,701 |
Net Debt | (4,079) | (3,588) |
EBITDA(1) | 3,150 | 2,329 |
Net Debt / EBITDA(1) | -1.30x | -1.54x |
On balance Credit Card Receivables not discounted | 546 | 636 |
Net Debt incl. Credit Card Receivables not discounted | (3,533) | (2,952) |
Net Debt incl. Credit Card Receivables not discounted / EBITDA(1) | -1.12x | -1.27x |
(1) EBITDA before IFRS 16, in the last 12 months.
Net debt adjusted for the balance of unsold receivables stood at R$3.5 billion. The Company’s financial leverage remains low and is constantly improving, with net debt/EBITDA ratio of -1.12.
Cash balance stood at R$2.4 billion and the balance of unsold receivables stood at R$546 million, for total available funds of R$2.9 billion. The Company also has R$1.8 billion in pre-approved/confirmed credit lines.
Investments
| Food Business | ||
(R$ million) | 1Q19 | 1Q18 | Δ |
New stores, land acquisition and conversions | 164 | 87 | 87.6% |
Store renovations and Maintenance | 102 | 78 | 29.7% |
Infrastructure and Others | 94 | 68 | 37.5% |
Non-cash Effect |
|
|
|
Financing Assets | 103 | 96 | 7.6% |
Total | 463 | 330 | 40.2% |
Investments in the Food segment totaled R$463 million in the quarter, up 40.2% from 1Q18.
We opened one Assaí store through conversion (another 10 are under construction) and one drugstore. Moreover, 2 conversions of Mini Extra to Minuto Pão de Açúcar and 7 conversions of Extra Super to Mercado Extra stores were concluded (totaling 43 Extra Super stores converted, of which 30 became Mercado Extra and 13 Compre Bem stores).
8
CONSOLIDATED FINANCIAL STATEMENTS
1. Balance Sheet
BALANCE SHEET | |||||||
ASSETS | |||||||
Consolidated | Food Businesses | ||||||
(R$ million) | 03.31.2019 | 12.31.2018 | 03.31.2018 | 03.31.2019 | 12.31.2018 | 03.31.2018 | |
Current Assets | 36,919 | 40,862 | 34,587 |
| 10,210 | 11,879 | 8,491 |
Cash and Marketable Securities | 2,359 | 4,369 | 1,701 |
| 2,358 | 4,369 | 1,701 |
Accounts Receivable | 765 | 384 | 857 |
| 770 | 390 | 862 |
Credit Cards | 487 | 92 | 594 |
| 487 | 90 | 599 |
Sales Vouchers and Trade Account Receivable | 217 | 196 | 206 |
| 222 | 240 | 206 |
Allowance for Doubtful Accounts | (5) | (5) | (4) |
| (5) | (4) | (4) |
Resulting from Commercial Agreements | 66 | 101 | 61 |
| 66 | 64 | 61 |
Inventories | 5,732 | 5,909 | 4,758 |
| 5,732 | 5,909 | 4,758 |
Recoverable Taxes | 648 | 679 | 573 |
| 648 | 679 | 573 |
Noncurrent Assets for Sale | 26,743 | 29,020 | 26,129 |
| 31 | 31 | 22 |
Prepaid Expenses and Other Accounts Receivables | 672 | 500 | 569 |
| 671 | 501 | 575 |
Noncurrent Assets | 20,753 | 20,424 | 18,516 |
| 20,773 | 20,440 | 18,547 |
Long-Term Assets | 4,468 | 4,235 | 3,791 |
| 4,489 | 4,251 | 3,817 |
Accounts Receivables | 60 | 4 | 42 |
| 60 | 4 | 42 |
Credit Cards | 60 | 4 | 42 |
| 60 | 4 | 42 |
Recoverable Taxes | 2,876 | 2,745 | 1,785 |
| 2,876 | 2,745 | 1,785 |
Deferred Income Tax and Social Contribution | 518 | 488 | 414 |
| 518 | 488 | 414 |
Amounts Receivable from Related Parties | 39 | 34 | 52 |
| 61 | 50 | 78 |
Judicial Deposits | 785 | 776 | 788 |
| 785 | 776 | 788 |
Prepaid Expenses and Others | 191 | 188 | 711 |
| 190 | 188 | 711 |
Investments | 236 | 223 | 188 |
| 236 | 223 | 188 |
Property and Equipment | 13,181 | 13,120 | 12,618 |
| 13,180 | 13,120 | 12,618 |
Intangible Assets | 2,868 | 2,846 | 1,919 |
| 2,868 | 2,846 | 1,924 |
TOTAL ASSETS | 57,672 | 61,284 | 53,103 |
| 30,982 | 32,318 | 27,039 |
LIABILITIES | |||||||
Consolidated | Food Businesses | ||||||
03.31.2019 | 12.31.2018 | 03.31.2018 | 03.31.2019 | 12.31.2018 | 03.31.2018 | ||
Current Liabilities | 32,724 | 37,547 | 29,988 |
| 11,348 | 13,791 | 9,082 |
Suppliers | 6,481 | 9,246 | 5,510 |
| 6,486 | 9,258 | 5,515 |
Loans and Financing | 1,275 | 916 | 834 |
| 1,275 | 916 | 834 |
Debentures | 1,067 | 1,068 | 506 |
| 1,067 | 1,068 | 506 |
Lease Liability | 481 | 465 | 425 |
| 481 | 465 | 425 |
Payroll and Related Charges | 694 | 686 | 664 |
| 694 | 686 | 664 |
Taxes and Social Contribution Payable | 363 | 370 | 272 |
| 363 | 370 | 272 |
Dividends Proposed | 164 | 57 | 78 |
| 164 | 57 | 78 |
Financing for Purchase of Fixed Assets | 47 | 149 | 24 |
| 47 | 149 | 24 |
Rents | 8 | 8 | 11 |
| 8 | 8 | 11 |
Debt with Related Parties | 159 | 146 | 160 |
| 278 | 251 | 376 |
Advertisement | 31 | 59 | 39 |
| 31 | 59 | 39 |
Provision for Restructuring | 7 | 10 | 3 |
| 7 | 10 | 3 |
Advanced Revenue | 213 | 250 | 125 |
| 213 | 250 | 125 |
Non-current Assets Held for Sale | 21,500 | 23,875 | 21,131 |
| - | - | - |
Others | 234 | 241 | 205 |
| 234 | 244 | 211 |
Long-Term Liabilities | 11,268 | 10,493 | 10,686 |
| 11,267 | 10,493 | 10,686 |
Loans and Financing | 307 | 313 | 642 |
| 307 | 313 | 642 |
Debentures | 3,890 | 3,078 | 3,336 |
| 3,890 | 3,078 | 3,336 |
Lease Liability | 4,386 | 4,458 | 4,260 |
| 4,386 | 4,458 | 4,260 |
Deferred Income Tax and Social Contribution | 561 | 581 | 424 |
| 561 | 581 | 424 |
Tax Installments | 447 | 471 | 540 |
| 447 | 471 | 540 |
Provision for Contingencies | 1,276 | 1,235 | 1,155 |
| 1,276 | 1,235 | 1,155 |
Advanced Revenue | 18 | 13 | 19 |
| 18 | 13 | 19 |
Provision for loss on investment in Associates | 330 | 293 | 261 |
| 330 | 293 | 261 |
Others | 54 | 49 | 49 |
| 53 | 49 | 49 |
Shareholders' Equity | 13,680 | 13,246 | 12,429 |
| 8,367 | 8,035 | 7,270 |
Capital | 6,825 | 6,825 | 6,822 |
| 5,692 | 5,514 | 5,450 |
Capital Reserves | 426 | 414 | 379 |
| 427 | 414 | 379 |
Profit Reserves | 3,217 | 3,146 | 2,394 |
| 2,322 | 2,173 | 1,501 |
Other Comprehensive Results | (73) | (66) | (60) |
| (73) | (66) | (60) |
Minority Interest | 3,285 | 2,927 | 2,893 |
| - | - | - |
TOTAL LIABILITIES | 57,672 | 61,284 | 53,103 |
| 30,982 | 32,318 | 27,039 |
9
2.1 Income Statement for 1Q19 – Before IFRS 16
Consolidated | Food Business | Multivarejo | Assaí | ||||||||||||
R$ - Million | 1Q19 | 1Q18 | Δ | 1Q19 | 1Q18 | Δ | 1Q19 | 1Q18 | Δ | 1Q19 | 1Q18 | Δ | |||
Gross Revenue | 13,827 | 12,300 | 12.4% |
| 13,827 | 12,300 | 12.4% |
| 6,921 | 6,801 | 1.8% |
| 6,907 | 5,499 | 25.6% |
Net Revenue | 12,709 | 11,343 | 12.0% | 12,709 | 11,343 | 12.0% | 6,382 | 6,285 | 1.5% | 6,327 | 5,058 | 25.1% | |||
Cost of Goods Sold | (9,909) | (8,784) | 12.8% | (9,908) | (8,784) | 12.8% | (4,553) | (4,505) | 1.1% | (5,356) | (4,279) | 25.2% | |||
Depreciation (Logistic) | (12) | (12) | -1.9% | (12) | (12) | -1.9% | (10) | (10) | -6.3% | (3) | (2) | 19.4% | |||
Gross Profit | 2,788 | 2,547 | 9.5% | 2,788 | 2,547 | 9.5% | 1,819 | 1,770 | 2.8% | 969 | 777 | 24.6% | |||
Selling Expenses | (1,871) | (1,739) | 7.6% | (1,869) | (1,739) | 7.5% | (1,308) | (1,266) | 3.3% | (561) | (473) | 18.7% | |||
General and Administrative Expenses | (272) | (241) | 12.5% | (272) | (241) | 12.5% | (190) | (179) | 6.3% | (81) | (63) | 30.1% | |||
Selling, General and Adm. Expenses | (2,215) | (2,057) | 7.7% | (2,176) | (2,012) | 8.1% | (1,532) | (1,474) | 3.9% | (643) | (538) | 19.6% | |||
Equity Income(2) | (16) | (33) | -51.9% | 21 | 11 | 84.7% | 21 | 11 | 84.7% | 0 | 0 | n.d. | |||
Other Operating Revenue (Expenses) | (56) | (43) | 30.8% | (56) | (43) | 30.8% | (55) | (41) | 36.8% | (1) | (2) | -70.1% | |||
Depreciation and Amortization | (224) | (210) | 6.7% | (224) | (210) | 6.7% | (156) | (155) | 0.8% | (67) | (55) | 23.3% | |||
Earnings before interest and Taxes - EBIT | 350 | 281 | 24.5% | 388 | 325 | 19.3% | 131 | 141 | -7.2% | 258 | 185 | 39.6% | |||
Financial Revenue | 36 | 40 | -11.3% | 36 | 40 | -11.4% | 24 | 32 | -24.1% | 11 | 8 | 38.0% | |||
Financial Expenses | (178) | (172) | 3.6% | (178) | (172) | 3.6% | (154) | (153) | 0.2% | (25) | (19) | 32.1% | |||
Net Financial Result | (142) | (132) | 8.2% | (142) | (132) | 8.2% | (129) | (121) | 6.6% | (13) | (10) | 27.4% | |||
Income (Loss) Before Income Tax | 207 | 149 | 38.8% | 246 | 194 | 26.9% | 1 | 19 | -93.5% | 245 | 174 | 40.3% | |||
Income Tax | (29) | (41) | -29.9% | (29) | (41) | -29.9% | 51 | 18 | 187.9% | (80) | (59) | 35.9% | |||
Net Income (Loss) Company - continuing operations | 178 | 108 | 64.9% | 217 | 153 | 42.2% | 52 | 37 | 40.9% | 165 | 115 | 42.6% | |||
Net Result from discontinued operations | (15) | 117 | n.d. | (23) | (11) | 116.1% | (23) | (11) | 116.1% | 0 | 0 | n.d. | |||
Net Income (Loss) - Consolidated Company | 164 | 226 | -27.4% | 194 | 142 | 36.6% | 30 | 27 | 10.9% | 165 | 115 | 42.6% | |||
Net Income (Loss) - Controlling Shareholders - continuing operations(3) | 178 | 108 | 64.2% | 216 | 153 | 41.7% | 52 | 37 | 38.9% | 165 | 115 | 42.6% | |||
Net Income (Loss) - Controlling Shareholders - discontinued operations(3) | (26) | 42 | n.d. | (23) | (11) | 116.1% | (23) | (11) | 116.1% | 0 | 0 | n.d. | |||
Net Income (Loss) - Consolidated Controlling Shareholders(3) | 152 | 150 | 1.3% | 193 | 142 | 36.1% | 30 | 27 | 10.9% | 165 | 115 | 42.6% | |||
Minority Interest - Non-controlling - continuing operations | 0 | 0 | n.d. | 0 | 0 | n.d. | 0 | 0 | n.d. | 0 | 0 | n.d. | |||
Minority Interest - Non-controlling - discontinued operations | 11 | 76 | -85.3% | 0 | 0 | n.d. | 0 | 0 | n.d. | 0 | 0 | n.d. | |||
Minority Interest - Non-controlling - Consolidated | 11 | 76 | -85.3% | 0 | 0 | n.d. | 0 | 0 | n.d. | 0 | 0 | n.d. | |||
Earnings before Interest, Taxes, Depreciation, Amortization - EBITDA | 586 | 503 | 16.4% | 624 | 548 | 14.0% | 297 | 306 | -3.1% | 328 | 242 | 35.7% | |||
Adjusted EBITDA(4) | 642 | 546 | 17.5% | 680 | 591 | 15.2% | 352 | 347 | 1.5% | 329 | 244 | 34.7% | |||
Consolidated | Food Business | Multivarejo(1) | Assaí | ||||||||
% of Net Revenue | 1Q19 | 1Q18 | 1Q19 | 1Q18 | 1Q19 | 1Q18 | 1Q19 | 1Q18 | |||
Gross Profit | 21.9% | 22.5% |
| 21.9% | 22.5% |
| 28.5% | 28.2% |
| 15.3% | 15.4% |
Selling Expenses | 14.7% | 15.3% |
| 14.7% | 15.3% |
| 20.5% | 20.1% |
| 8.9% | 9.3% |
General and Administrative Expenses | 2.1% | 2.1% |
| 2.1% | 2.1% |
| 3.0% | 2.8% |
| 1.3% | 1.2% |
Selling, General and Adm. Expenses | 17.4% | 18.1% |
| 17.1% | 17.7% |
| 24.0% | 23.5% |
| 10.2% | 10.6% |
Equity Income(2) | 0.1% | 0.3% |
| 0.2% | 0.1% |
| 0.3% | 0.2% |
| 0.0% | 0.0% |
Other Operating Revenue (Expenses) | 0.4% | 0.4% |
| 0.4% | 0.4% |
| 0.9% | 0.6% |
| 0.0% | 0.0% |
Depreciation and Amortization | 1.8% | 1.8% |
| 1.8% | 1.8% |
| 2.5% | 2.5% |
| 1.1% | 1.1% |
EBIT | 2.8% | 2.5% |
| 3.1% | 2.9% |
| 2.0% | 2.2% |
| 4.1% | 3.7% |
Net Financial Revenue (Expenses) | 1.1% | 1.2% |
| 1.1% | 1.2% |
| 2.0% | 1.9% |
| 0.2% | 0.2% |
Income Before Income Tax | 1.6% | 1.3% |
| 1.9% | 1.7% |
| 0.0% | 0.3% |
| 3.9% | 3.4% |
Income Tax | 0.2% | 0.4% |
| 0.2% | 0.4% |
| 0.8% | 0.3% |
| 1.3% | 1.2% |
Net Income (Loss) Company - continuing operations | 1.4% | 1.0% |
| 1.7% | 1.3% |
| 0.8% | 0.6% |
| 2.6% | 2.3% |
Net Income (Loss) - Consolidated Company | 1.3% | 2.0% |
| 1.5% | 1.3% |
| 0.5% | 0.4% |
| 2.6% | 2.3% |
Net Income (Loss) - Controlling Shareholders - continuing operations(3) | 1.4% | 1.0% |
| 1.7% | 1.3% |
| 0.8% | 0.6% |
| 2.6% | 2.3% |
Net Income (Loss) - Consolidated Controlling Shareholders(3) | 1.2% | 1.3% |
| 1.5% | 1.3% |
| 0.5% | 0.4% |
| 2.6% | 2.3% |
Minority Interest - Non-controlling - continuing operations | 0.0% | 0.0% |
| 0.0% | 0.0% |
| 0.0% | 0.0% |
| 0.0% | 0.0% |
Minority Interest - Non-controlling - Consolidated | 0.1% | 0.7% |
| 0.0% | 0.0% |
| 0.0% | 0.0% |
| 0.0% | 0.0% |
EBITDA | 4.6% | 4.4% |
| 4.9% | 4.8% |
| 4.6% | 4.9% |
| 5.2% | 4.8% |
Adjusted EBITDA(4) | 5.1% | 4.8% |
| 5.4% | 5.2% |
| 5.5% | 5.5% |
| 5.2% | 4.8% |
(1) Multivarejo includes the results of Malls and Corporate.(2) Equity income from Cdiscount is included in the Consolidated results and not in the Retail and Cash-and-Carry segments.(3) Net income after non-controlling interest.(4) Adjusted by Other Operating Income and Expenses.
10
2.1 Income Statement for 1Q19 – After IFRS 16
Consolidated | Food Business | Multivarejo | Assaí | ||||||||||||
R$ - Million | 1Q19 | 1Q18 | Δ | 1Q19 | 1Q18 | Δ | 1Q19 | 1Q18 | Δ | 1Q19 | 1Q18 | Δ | |||
Gross Revenue | 13,828 | 12,300 | 12.4% | 13,827 | 12,300 | 12.4% | 6,921 | 6,801 | 1.8% | 6,907 | 5,499 | 25.6% | |||
Net Revenue | 12,709 | 11,343 | 12.0% | 12,709 | 11,343 | 12.0% | 6,382 | 6,285 | 1.5% | 6,327 | 5,058 | 25.1% | |||
Cost of Goods Sold | (9,876) | (8,752) | 12.8% | (9,875) | (8,752) | 12.8% | (4,524) | (4,481) | 1.0% | (5,351) | (4,272) | 25.3% | |||
Depreciation (Logistic) | (37) | (31) | 19.8% | (37) | (31) | 19.8% | (32) | (24) | 32.8% | (5) | (7) | -24.1% | |||
Gross Profit | 2,796 | 2,560 | 9.2% | 2,796 | 2,560 | 9.2% | 1,826 | 1,781 | 2.5% | 970 | 779 | 24.6% | |||
Selling Expenses | (1,672) | (1,559) | 7.3% | (1,670) | (1,559) | 7.2% | (1,153) | (1,122) | 2.8% | (517) | (436) | 18.5% | |||
General and Administrative Expenses | (269) | (239) | 12.5% | (269) | (239) | 12.5% | (189) | (178) | 6.3% | (80) | (62) | 30.1% | |||
Selling, General and Adm. Expenses | (2,010) | (1,876) | 7.1% | (1,970) | (1,828) | 7.7% | (1,371) | (1,328) | 3.3% | (598) | (501) | 19.5% | |||
Equity Income(2) | (17) | (36) | -51.4% | 21 | 11 | 84.7% | 21 | 11 | 84.7% | 0 | 0 | n.d. | |||
Other Operating Revenue (Expenses) | (51) | (42) | 22.2% | (51) | (42) | 22.2% | (50) | (39) | 27.8% | (1) | (2) | -70.1% | |||
Depreciation and Amortization | (329) | (303) | 8.5% | (329) | (303) | 8.5% | (239) | (231) | 3.8% | (90) | (73) | 23.2% | |||
Earnings before interest and Taxes - EBIT | 457 | 381 | 20.1% | 497 | 428 | 16.2% | 215 | 223 | -3.4% | 283 | 206 | 37.4% | |||
Financial Revenue | 36 | 40 | -11.1% | 36 | 40 | -11.1% | 24 | 32 | -23.7% | 11 | 8 | 38.0% | |||
Financial Expenses | (325) | (314) | 3.6% | (325) | (314) | 3.6% | (266) | (266) | 0.3% | (59) | (49) | 21.3% | |||
Net Financial Result | (289) | (274) | 5.7% | (289) | (274) | 5.7% | (242) | (233) | 3.6% | (47) | (40) | 17.9% | |||
Income (Loss) Before Income Tax | 168 | 107 | 56.7% | 208 | 154 | 34.8% | (27) | (11) | 146.9% | 235 | 165 | 42.2% | |||
Income Tax | (19) | (30) | -38.7% | (19) | (30) | -38.7% | 58 | 25 | 128.9% | (77) | (56) | 37.5% | |||
Net Income (Loss) Company - continuing operations | 149 | 77 | 94.5% | 189 | 124 | 52.8% | 31 | 14 | 115.3% | 158 | 109 | 44.6% | |||
Net Result from discontinued operations | 70 | 190 | -63.3% | (23) | (11) | 116.1% | (23) | (11) | 116.1% | 0 | 0 | n.d. | |||
Net Income (Loss) - Consolidated Company | 219 | 266 | -17.9% | 166 | 113 | 46.9% | 8 | 4 | 113.1% | 158 | 109 | 44.6% | |||
Net Income (Loss) - Controlling Shareholders - continuing operations(3) | 149 | 77 | 94.5% | 189 | 124 | 52.8% | 31 | 14 | 115.3% | 158 | 109 | 44.6% | |||
Net Income (Loss) - Controlling Shareholders - discontinued operations(3) | 6 | 73 | -92.4% | (23) | (11) | 116.1% | (23) | (11) | 116.1% | 0 | 0 | n.d. | |||
Net Income (Loss) - Consolidated Controlling Shareholders(3) | 155 | 150 | 3.4% | 166 | 113 | 46.9% | 8 | 4 | 113.2% | 158 | 109 | 44.6% | |||
Minority Interest - Non-controlling - continuing operations | 0 | 0 | n.d. | 0 | 0 | n.d. | 0 | 0 | n.d. | 0 | 0 | n.d. | |||
Minority Interest - Non-controlling - discontinued operations | 64 | 117 | -45.1% | 0 | 0 | n.d. | 0 | 0 | n.d. | 0 | 0 | n.d. | |||
Minority Interest - Non-controlling - Consolidated | 64 | 117 | -45.2% | 0 | 0 | n.d. | 0 | 0 | n.d. | 0 | 0 | n.d. | |||
Earnings before Interest, Taxes, Depreciation, Amortization - EBITDA | 824 | 715 | 15.1% | 864 | 763 | 13.3% | 486 | 477 | 1.9% | 378 | 286 | 32.3% | |||
Adjusted EBITDA(4) | 875 | 757 | 15.5% | 915 | 804 | 13.7% | 536 | 516 | 3.9% | 378 | 288 | 31.4% | |||
Consolidated | Food Business | Multivarejo(1) | Assaí | ||||||||
% of Net Revenue | 1Q19 | 1Q18 | 1Q19 | 1Q18 | 1Q19 | 1Q18 | 1Q19 | 1Q18 | |||
Gross Profit | 22.0% | 22.6% |
| 22.0% | 22.6% |
| 28.6% | 28.3% |
| 15.3% | 15.4% |
Selling Expenses | 13.2% | 13.7% |
| 13.1% | 13.7% |
| 18.1% | 17.9% |
| 8.2% | 8.6% |
General and Administrative Expenses | 2.1% | 2.1% |
| 2.1% | 2.1% |
| 3.0% | 2.8% |
| 1.3% | 1.2% |
Selling, General and Adm. Expenses | 15.8% | 16.5% |
| 15.5% | 16.1% |
| 21.5% | 21.1% |
| 9.5% | 9.9% |
Equity Income(2) | 0.1% | 0.3% |
| 0.2% | 0.1% |
| 0.3% | 0.2% |
| 0.0% | 0.0% |
Other Operating Revenue (Expenses) | 0.4% | 0.4% |
| 0.4% | 0.4% |
| 0.8% | 0.6% |
| 0.0% | 0.0% |
Depreciation and Amortization | 2.6% | 2.7% |
| 2.6% | 2.7% |
| 3.8% | 3.7% |
| 1.4% | 1.4% |
EBIT | 3.6% | 3.4% |
| 3.9% | 3.8% |
| 3.4% | 3.5% |
| 4.5% | 4.1% |
Net Financial Revenue (Expenses) | 2.3% | 2.4% |
| 2.3% | 2.4% |
| 3.8% | 3.7% |
| 0.8% | 0.8% |
Income Before Income Tax | 1.3% | 0.9% |
| 1.6% | 1.4% |
| 0.4% | 0.2% |
| 3.7% | 3.3% |
Income Tax | 0.1% | 0.3% |
| 0.1% | 0.3% |
| 0.9% | 0.4% |
| 1.2% | 1.1% |
Net Income (Loss) Company - continuing operations | 1.2% | 0.7% |
| 1.5% | 1.1% |
| 0.5% | 0.2% |
| 2.5% | 2.2% |
Net Income (Loss) - Consolidated Company | 1.7% | 2.3% |
| 1.3% | 1.0% |
| 0.1% | 0.1% |
| 2.5% | 2.2% |
Net Income (Loss) - Controlling Shareholders - continuing operations(3) | 1.2% | 0.7% |
| 1.5% | 1.1% |
| 0.5% | 0.2% |
| 2.5% | 2.2% |
Net Income (Loss) - Consolidated Controlling Shareholders(3) | 1.2% | 1.3% |
| 1.3% | 1.0% |
| 0.1% | 0.1% |
| 2.5% | 2.2% |
Minority Interest - Non-controlling - continuing operations | 0.0% | 0.0% |
| 0.0% | 0.0% |
| 0.0% | 0.0% |
| 0.0% | 0.0% |
Minority Interest - Non-controlling - Consolidated | 0.5% | 1.0% |
| 0.0% | 0.0% |
| 0.0% | 0.0% |
| 0.0% | 0.0% |
EBITDA | 6.5% | 6.3% |
| 6.8% | 6.7% |
| 7.6% | 7.6% |
| 6.0% | 5.6% |
Adjusted EBITDA(4) | 6.9% | 6.7% |
| 7.2% | 7.1% |
| 8.4% | 8.2% |
| 6.0% | 5.7% |
(1) Multivarejo includes the results of Malls and Corporate. (2) Equity income from Cdiscount is included in the Consolidated results and not in the Retail and Cash-and-Carry segments. (3) Net income after non-controlling interest. (4) Adjusted by Other Operating Income and Expenses.
11
3. Cash Flow - Consolidated (including Via Varejo)
STATEMENT OF CASH FLOW | |||
Consolidated | |||
(R$ million) | 03.31.2019 | 03.31.2018 | |
Net Income (Loss) for the period | 219 | 267 | |
Deferred income tax | (1) | 32 | |
Loss (gain) on disposal of fixed and intangible assets | 74 | 17 | |
Depreciation and amortization | 365 | 334 | |
Interests and exchange variation | 445 | 451 | |
Equity Income | 7 | 30 | |
Provision for contingencies | 68 | 202 | |
Provision for disposals and impairment of property and equipment | 1 | - | |
Share-Based Compensation | 15 | 7 | |
Allowance for doubtful accounts | 123 | 177 | |
Provision for obsolescence/breakage | (13) | (19) | |
Deferred revenue | (122) | (103) | |
Eventual expenses | (47) | (3) | |
|
|
| |
Asset (Increase) decreases |
|
| |
Accounts receivable | (725) | (1,131) | |
Inventories | 268 | �� (914) | |
Taxes recoverable | (34) | (141) | |
Dividends received | 12 | - | |
Other Assets | (250) | (416) | |
Related parties | 4 | (15) | |
Restricted deposits for legal proceeding | - | (75) | |
|
|
| |
Liability (Increase) decrease |
|
| |
Suppliers | (4,667) | (3,313) | |
Payroll and charges | (86) | 14 | |
Taxes and Social contributions payable | 19 | (66) | |
Other Accounts Payable | (5) | 74 | |
Contingencies | (189) | (153) | |
Deferred revenue | 3 | 4 | |
Taxes and Social contributions paid | (92) | (133) | |
|
| ||
|
| ||
Net cash generated from (used) in operating activities | (4,608) | (4,873) | |
- | - | ||
Acquisition of property and equipment | (495) | (356) | |
Increase Intangible assets | (120) | (80) | |
Sales of property and equipment | - | 9 | |
Net cash flow investment activities | (615) | (427) | |
- | - | ||
Cash flow from financing activities | - | - | |
Funding and refinancing | 2,734 | 2,633 | |
Payments of loans and financing | (1,776) | (1,864) | |
Acquisition of society | (19) | - | |
Transactions with minorities | 396 | - | |
Intercompany loans | (537) | (515) | |
Net cash generated from (used) in financing activities | 798 | 254 | |
- | - | ||
Increase (decrease) in cash and cash equivalents | (4,425) | (5,046) | |
- | - | ||
Cash and cash equivalents at the beginning of the year | 8,080 | 7,351 | |
Cash and cash equivalents at the end of the year | 3,655 | 2,305 | |
Change in cash and cash equivalents | (4,425) | (5,046) | |
12
3.1. Simplified Cash Flow Statement – Consolidated (including Via Varejo)
Consolidated | |||
(R$ million) | 1Q19 | 1Q18 | |
Cash Balance at Beginning of Exercise | 8,080 | 7,351 | |
|
|
| |
Cash Flow from Operating Activities | (4,608) | (4,873) | |
EBITDA | 1,270 | 1,220 | |
Cost of Sale of Receivables | (174) | (176) | |
Working Capital | (5,124) | (5,358) | |
Assets and Liabilities Variation | (579) | (559) | |
Cash Flow from Investment Activities | (615) | (427) | |
Net Investment | (615) | (427) | |
|
|
| |
Change on net cash after investments | (5,223) | (5,300) | |
|
|
| |
Cash Flow from Financing Activities | 798 | 254 | |
Dividends Payments and Others | - | - | |
Net Payments | 798 | 254 | |
|
|
| |
Change on Net Cash | (4,425) | (5,046) | |
|
|
| |
Cash Balance at End of Exercise | 3,655 | 2,305 | |
|
| ||
Cash includes "Assets held for sale and op. Discontinued" | 1,296 | 604 | |
|
| ||
Cash t as balance sheet (excluding Via Varejo) | 2,359 | 1,701 | |
13
4. Breakdown of Sales by Business
Breakdown of Gross Sales by Business | ||||||
(R$ million) | 1Q19 | % | 1Q18 | % | Δ | |
Multivarejo |
| 6,922 | 50.1% | 6,801 | 55.3% | 1.8% |
Pão de Açúcar |
| 1,778 | 12.9% | 1,753 | 14.3% | 1.4% |
Extra(1) |
| 4,155 | 30.0% | 4,151 | 33.8% | 0.1% |
Convenience Stores(2) |
| 290 | 2.1% | 264 | 2.1% | 9.8% |
Other Businesses(3) |
| 699 | 5.1% | 632 | 5.1% | 10.7% |
Cash & Carry |
| 6,907 | 49.9% | 5,499 | 44.7% | 25.6% |
Assaí |
| 6,907 | 49.9% | 5,499 | 44.7% | 25.6% |
Food Business |
| 13,829 | 100.0% | 12,300 | 100.0% | 12.4% |
Breakdown of Net Sales by Business | ||||||
(R$ million) | 1Q19 | % | 1Q18 | % | Δ | |
Multivarejo |
| 6,382 | 50.2% | 6,285 | 55.4% | 1.5% |
Pão de Açúcar |
| 1,636 | 12.9% | 1,614 | 14.2% | 1.4% |
Extra(1) |
| 3,787 | 29.8% | 3,805 | 33.5% | -0.5% |
Convenience Stores(2) |
| 272 | 2.1% | 246 | 2.2% | 10.5% |
Other Businesses(3) |
| 687 | 5.4% | 621 | 5.5% | 10.6% |
Cash & Carry |
| 6,327 | 49.8% | 5,058 | 44.6% | 25.1% |
Assaí |
| 6,327 | 49.8% | 5,058 | 44.6% | 25.1% |
Food Business |
| 12,709 | 100.0% | 11,343 | 100.0% | 12.0% |
(1) Includes Extra Supermercado and Extra Hiper. | ||||||
(2) Includes Minimercado Extra and Minuto Pão de Açúcar sales. | ||||||
(3) Includes Gas Station, Drugstores, Delivery sales and revenues from the leasing of commercial galleries. | ||||||
5. Breakdown of Sales (% of Net Sales)
SALES BREAKDOWN (% of Net Sales) | ||
Food Business | ||
1Q19 | 1Q18 | |
Cash | 49.1% | 49.9% |
Credit Card | 40.0% | 39.2% |
Food Voucher | 10.9% | 10.9% |
14
6. Store Portfolio Changes by Banner
1Q19 Results Conference Call and Webcast
Thursday, May 9, 2019
10:30 a.m. (Brasília) | 9:30 a.m. (New York) | 2:30 p.m. (London)
Conference call in Portuguese (original language)
+55 (11) 3181-8565
Conference call in English (simultaneous translation)
+1 (412) 717-9224 or +1 (844) 763-8274
Webcast:http://www.gpari.com.br
Replay
+55 11 3193-1012
Access code for audio in Portuguese: 1932275#
Access code for audio in English: 1779586#
http://www.gpari.com.br
Investor Relations Contacts
GPA Telephone: 55 (11) 3886-0421 gpa.ri@gpabr.com www.gpari.com.br
|
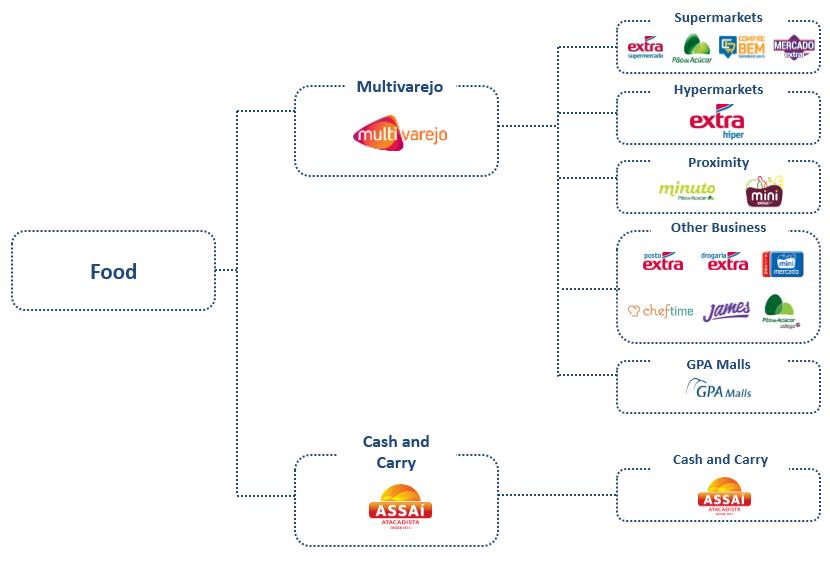
About GPA:GPA is Brazil’s largest retailer, with a distribution network comprising over 2,000 points of sale as well as electronic channels. Established in 1948 in São Paulo, it has its head office in the city and operations in 18 Brazilian states and the Federal District. With a strategy of focusing its decisions on customers and better serving them based on their consumer profile in the wide variety of shopping experiences it offers, GPA adopts a multi-business and multi-channel platform consisting of brick-and-mortar stores and e-commerce operations, divided into three business units: Multivarejo, which operates the supermarket, hypermarket and Minimercado store formats, as well as fuel stations and drugstores under the Pão de Açúcar and Extra banners; Assaí, which operates in the cash-and-carry wholesale segment; GPA Malls, which is responsible for managing the Group's real estate assets, expansion projects and new store openings;and Via Varejo’s discontinued operations, with its bricks and mortar electronics and home appliances stores under the Casas Bahia and Ponto Frio banners, and the e-commerce segment.
Disclaimer:Statements contained in this release related to the business outlook of the Company, projections of operating/financial results, growth prospects of the Company and market and macroeconomic estimates are merely forecasts and are based on the beliefs, plans and expectations of Management in relation to the Company’s future. These expectations are highly dependent on changes in the market, the general economic performance of Brazil, industry and international markets, and hence are subject to change.
15
Glossary
Food Segment:Represents the combined results of Multivarejo and Assaí, excluding equity income (loss) from Cdiscount, which is not included in the operating segments reported by the Company.
Discontinued Operations:Due to the ongoing divestment of the interest held by GPA in Via Varejo S.A., the operations of Via Varejo are treated as discontinued operations. Accordingly, net sales and other profit or loss accounts were adjusted retrospectively, as required under IFRS 5/CPC 31, approved by CVM Resolution 598/09 – Non-current assets held for sale and discontinued operations.
EBITDA:EBITDA is calculated in accordance with Instruction 527 issued by the Securities and Exchange Commission of Brazil (CVM) on October 4, 2012.
Adjusted EBITDA:Measure of profitability calculated by excluding Other Operating Income and Expenses from EBITDA. Management uses this measure in its analyses as it believes it eliminates nonrecurring expenses and revenues and other nonrecurring items that could compromise the comparability and analysis of results.
Earnings per share:Diluted earnings per share are calculated as follows:
● Numerator: profit in the year adjusted by dilutive effects of stock options granted by subsidiaries.
● Denominator: number of shares of each category adjusted to include potential shares corresponding to dilutive instruments (stock options), less the number of shares that could be repurchased in the market, if applicable.
Equity instruments that must or can be settled with the shares of the Company and its subsidiaries are only included in the calculation when the settlement has a dilutive impact on earnings per share.
Compre Bem:Project involving the conversion of stores in order to enter a market niche currently occupied by regional supermarkets. The store model is better adapted to the needs of consumers in the regions where the stores are located. Theservice and assortment of the perishables category will be reinforced, while other categories will have a leaner assortment. Compre Bem is managed independently from the Extra Super banner, with the focus on streamlining operating costs, especially logistics and IT.
16
Mercado Extra:Project aims to renovate Extra Super by reinforcing the quality of perishables and customer service, with the focus on the B and C income groups. There will be no change in the operating model of the stores, which will continue to be managed under the Extra banner.
James Delivery (last miler):Multiservice platform for ordering and delivering in minutes of diverse products selected by our customers, including restaurants and integration with our supermarkets and drugstores.
Cheftime:pioneering startup in the Foodtech segment, offering online subscription services and sales of gastronomic kits.
Same-store growth:Same-store growth, as mentioned in this document, is adjusted by the calendar effect in each period.
Growth and Changes:The growth and changes presented in this document refer to variations from the same period last year, except where stated otherwise.
17
SIGNATURES
Pursuant to the requirement of the Securities Exchange Act of 1934, the registrant has duly caused this report to be signed on its behalf by the undersigned, thereunto duly authorized.
| COMPANHIA BRASILEIRA DE DISTRIBUIÇÃO | ||
| Date: May 8, 2019 | By: /s/ Peter Estermann Name: Peter Estermann Title: Chief Executive Officer | |
| By: /s/ Daniela Sabbag Name: Daniela Sabbag Title: Investor Relations Officer | ||
FORWARD-LOOKING STATEMENTS
This press release may contain forward-looking statements. These statements are statements that are not historical facts, and are based on management's current view and estimates offuture economic circumstances, industry conditions, company performance and financial results. The words "anticipates", "believes", "estimates", "expects", "plans" and similar expressions, as they relate to the company, are intended to identify forward-looking statements. Statements regarding the declaration or payment of dividends, the implementation of principal operating and financing strategies and capital expenditure plans, the direction of future operations and the factors or trends affecting financial condition, liquidity or results of operations are examples of forward-looking statements. Such statements reflect the current views of management and are subject to a number of risks and uncertainties. There is no guarantee that the expected events, trends or results will actually occur. The statements are based on many assumptions and factors, including general economic and market conditions, industry conditions, and operating factors. Any changes in such assumptions or factors could cause actual results to differ materially from current expectations.