FORM 6-K
SECURITIES AND EXCHANGE COMMISSION
Washington, D.C. 20549
Report of Foreign Private Issuer
Pursuant to Rule 13a-16 or 15d-16 of
the Securities Exchange Act of 1934
For the month of May, 2019
Brazilian Distribution Company
(Translation of Registrant’s Name Into English)
Av. Brigadeiro Luiz Antonio,
3142 São Paulo, SP 01402-901
Brazil
(Address of Principal Executive Offices)
(Indicate by check mark whether the registrant files or will file annual reports under cover of Form 20-F or Form 40-F)
Form 20-F X Form 40-F
(Indicate by check mark if the registrant is submitting the Form 6-K in paper as permitted by Regulation S-T Rule
101 (b) (1)):
Yes ___ No X
(Indicate by check mark if the registrant is submitting the Form 6-K in paper as permitted by Regulation S-T Rule
101 (b) (7)):
Yes ___ No X
(Indicate by check mark whether the registrant by furnishing the information contained in this Form is also thereby furnishing the information to the Commission pursuant to Rule 12g3-2(b) under the Securities Exchange Act of 1934.)
Yes ___ No X
(FreeTranslation into English from the Original Previously Issued in Portuguese.)
Companhia Brasileira Individual and Consolidated Ernst &Young auditores Independentes |
A free translation from Portuguese into English of Independent Auditor’s Report on Review of Quarterly Financial Information
Independent auditor’s review report on quarterly information
To the Shareholders, Directors and Officers
Companhia Brasileira de Distribuição
São Paulo – SP – Brazil
Introduction
We have reviewed the accompanying individual and consolidated interim financial information, contained in the Quarterly Information Form (ITR) of Companhia Brasileira de Distribuição for the quarter ended March 31, 2019, comprising the statement of financial position as of March 31, 2019 and the related statements of profit or loss, comprehensive income, changes in equity and cash flows for the three-month period then ended, including other explanatory information.
Management is responsible for the preparation of the individual and consolidated interim financial information in accordance with Accounting Pronouncement CPC 21 (R1) - Interim Financial Reportingand IAS 34 - Interim Financial Reporting, issued by the International Accounting Standards Board (IASB), as well as for the fair presentation of this information in conformity with the rules issued by the Brazilian Securities and Exchange Commission (CVM) applicable to the preparation of the Quarterly Information Form (ITR). Our responsibility is to express a conclusion on this interim financial information based on our review.
Scope of the review
We conducted our review in accordance with Brazilian and International Standards on Review Engagements (NBC TR 2410 and ISRE 2410 - Review of Interim Financial Information Performed by the Independent Auditor of the Entity, respectively). A review of interim financial information consists of making inquiries, primarily of persons responsible for financial and accounting matters, and applying analytical and other review procedures. A review is substantially less in scope than an audit conducted in accordance with auditing standards and consequently does not enable us to obtain assurance that we would become aware of all significant matters that might be identified in an audit. Accordingly, we do not express an audit opinion.
Conclusion on the individual and consolidated interim financial information
Based on our review, nothing has come to our attention that causes us to believe that the accompanying individual and consolidated interim financial information included in the quarterly information referred to above are not prepared, in all material respects, in accordance with CPC 21 (R1) and IAS 34 applicable to the preparation of Quarterly Information Form (ITR), and presented consistently with the rules issued by the Brazilian Securities and Exchange Commission (CVM).
Emphasis of matter
Restatement of corresponding figures
As mentioned in Note 5, due the adoption of the new accounting pronouncement CPC06(R2) and IFRS16 – Leases, the corresponding individual and consolidated figures related to the balance sheet for the year ended December 31, 2018 and the corresponding individual and consolidated interim financial information comprising the statements of profit or loss and cash flows for the three-month period ended March 31, 2018, presented for comparison purposes, were adjusted and restated as required by CPC 23 (Accounting Policies, Changes in Accounting Estimates and Error Correction) and CPC 26(R1) - Presentation of Financial Statements. Our conclusion is not modified in respect of this matter.
Other matters
Statements of value added
We have also reviewed the individual and consolidated statements of value added (SVA) for the three-month period ended March 31, 2019, prepared under Company’s management responsibility, whose presentation in the interim financial information is required by the rules issued by the Brazilian Securities and Exchange Commission (CVM) applicable to preparation of Quarterly Information Form (ITR), and as supplementary information by the International Financial Reporting Standards (IFRS), which does not require SVA presentation. These statements have been subject to the same review procedures previously described and, based on our review, nothing has come to our attention that causes us to believe that they were not prepared, in all material respects, consistently with the overall individual and consolidated interim financial information.
São Paulo,May 07, 2019.
ERNST & YOUNG
Auditores Independentes S.S.
CRC-2SP034519/O-6
Antonio Humberto Barros dos Santos
Accountant CRC-1SP161745/O-3
Company Information | |
Capital Composition | 5 |
Individual Interim Financial Information |
|
Balance Sheet – Assets | 6 |
Balance Sheet – Liabilities | 7 |
Statement of Operations | 8 |
Statement of Comprehensive Income | 9 |
Statement of Cash Flows | 10 |
Statement of Changes in Shareholders’ Equity |
|
1/1/2019 to 3/31/2019 | 11 |
1/1/2018 to 3/31/2018 | 12 |
Statement of Value Added | 13 |
Consolidated Interim Financial Information |
|
Balance Sheet – Assets | 14 |
Balance Sheet – Liabilities | 15 |
Statement of Operations | 16 |
Statement of Comprehensive Income | 17 |
Statement of Cash Flows | 18 |
Statement of Changes in Shareholders’ Equity |
|
1/1/2019 to 3/31/2019 | 19 |
1/1/2018 to 3/31/2018 | 20 |
Statement of Value Added | 21 |
Comments on the Company`s Performance | 22 |
Notes to the Interim Financial Information | 40 |
Number of Shares (thousand) | Current Quarter 3/31/2019 |
|
Share Capital |
|
|
Common | 99,680 |
|
Preferred | 167,174 |
|
Total | 266,854 |
|
Treasury Shares |
|
|
Common | 0 |
|
Preferred | 233 |
|
Total | 233 |
|
5
Individual Interim Financial Information / Balance Sheet - Assets | |||
R$ (in thousands) | |||
Code | Description | Current Quarter | Previous Year |
1 | Total Assets | 26,548,000 | 27,587,000 |
1.01 | Current Assets | 8,320,000 | 9,607,000 |
1.01.01 | Cash and Cash Equivalents | 1,594,000 | 2,935,000 |
1.01.03 | Accounts Receivable | 852,000 | 565,000 |
1.01.03.01 | Trade Receivables | 560,000 | 274,000 |
1.01.03.02 | Other Receivables | 292,000 | 291,000 |
1.01.04 | Inventories | 3,481,000 | 3,606,000 |
1.01.06 | Recoverable Taxes | 331,000 | 316,000 |
1.01.08 | Other Current Assets | 2,062,000 | 2,185,000 |
1.01.08.01 | Assets Held for Sale | 1,811,000 | 2,067,000 |
1.01.08.03 | Other | 251,000 | 118,000 |
1.01.08.03.01 | Financial Instruments - Fair Value Hedge | 7,000 | 0 |
1.01.08.03.02 | Others Assets | 244,000 | 118,000 |
1.02 | Noncurrent Assets | 18,228,000 | 17,980,000 |
1.02.01 | Long-term Assets | 3,410,000 | 3,353,000 |
1.02.01.03 | Accounts Receivable | 189,000 | 132,000 |
1.02.01.03.01 | Trade receivables, net | 60,000 | 4,000 |
1.02.01.03.02 | Other accounts receivable | 129,000 | 128,000 |
1.02.01.06 | Deferred Taxes | 411,000 | 391,000 |
1.02.01.07 | Prepaid Expenses | 15,000 | 17,000 |
1.02.01.08 | Receivables from related parties | 244,000 | 341,000 |
1.02.01.09 | Other Noncurrent Assets | 2,551,000 | 2,472,000 |
1.02.01.09.04 | Recoverable Taxes | 1,881,000 | 1,813,000 |
1.02.01.09.05 | Restricted deposits for legal proceedings | 634,000 | 624,000 |
1.02.01.09.06 | Financial Instruments - Fair Value Hedge | 36,000 | 35,000 |
1.02.02 | Investments | 4,746,000 | 4,431,000 |
1.02.02.01 | Investments in Associates | 4,726,000 | 4,411,000 |
1.02.02.01.02 | Investments in Subsidiaries | 4,726,000 | 4,411,000 |
1.02.02.02 | Investment properties | 20,000 | 20,000 |
1.02.03 | Property and Equipment, Net | 8,228,000 | 8,351,000 |
1.02.03.01 | Property and Equipment in Use | 5,762,000 | 5,843,000 |
1.02.03.02 | Leased Properties | 2,466,000 | 2,508,000 |
1.02.04 | Intangible Assets, net | 1,844,000 | 1,845,000 |
1.02.04.01 | Intangible Assets | 1,844,000 | 1,845,000 |
1.02.04.01.02 | Intangible Assets | 1,185,000 | 1,169,000 |
1.02.04.01.03 | Intangible Right-of-use | 659,000 | 676,000 |
6
Individual Interim Financial Information / Balance Sheet - Liabilities | |||
R$ (in thousands) | |||
Code | Description | Current Quarter | Previous Year |
2 | Total Liabilities | 26,548,000 | 27,587,000 |
2.01 | Current Liabilities | 6,899,000 | 8,777,000 |
2.01.01 | Payroll and Related Taxes | 417,000 | 433,000 |
2.01.02 | Trade payables, net | 3,541,000 | 5,604,000 |
2.01.03 | Taxes and Contributions Payable | 216,000 | 236,000 |
2.01.04 | Borrowings and Financing | 1,459,000 | 1,306,000 |
2.01.05 | Other Liabilities | 1,266,000 | 1,198,000 |
2.01.05.01 | Payables to Related Parties | 344,000 | 316,000 |
2.01.05.02 | Other | 922,000 | 882,000 |
2.01.05.02.01 | Dividends and interest on own capital | 164,000 | 57,000 |
2.01.05.02.08 | Financing Related to Acquisition of Assets | 26,000 | 68,000 |
2.01.05.02.09 | Deferred Revenue | 82,000 | 89,000 |
2.01.05.02.12 | Other Accounts Payable | 235,000 | 264,000 |
2.01.05.02.17 | Lease Liability | 415,000 | 404,000 |
2.02 | Noncurrent Liabilities | 9,254,000 | 8,492,000 |
2.02.01 | Borrowings and Financing | 4,099,000 | 3,290,000 |
2.02.02 | Other Liabilities | 4,114,000 | 4,205,000 |
2.02.02.02 | Other | 4,114,000 | 4,205,000 |
2.02.02.02.03 | Taxes payable in installments | 447,000 | 471,000 |
2.02.02.02.07 | Other Accounts Payable | 41,000 | 38,000 |
2.02.02.02.08 | Provision for Losses on Investments in Associates | 330,000 | 293,000 |
2.02.02.02.09 | Lease Liability | 3,296,000 | 3,403,000 |
2.02.04 | Provisions | 1,027,000 | 987,000 |
2.02.06 | Deferred Revenue | 14,000 | 10,000 |
2.03 | Shareholders’ Equity | 10,395,000 | 10,318,000 |
2.03.01 | Share Capital | 6,825,000 | 6,825,000 |
2.03.02 | Capital Reserves | 426,000 | 413,000 |
2.03.02.04 | Stock Option | 419,000 | 406,000 |
2.03.02.07 | Capital Reserve | 7,000 | 7,000 |
2.03.04 | Earnings Reserve | 3,827,000 | 3,146,000 |
2.03.04.01 | Legal Reserve | 517,000 | 517,000 |
2.03.04.05 | Earnings Retention Reserve | 230,000 | 230,000 |
2.03.04.07 | Tax Incentive Reserve | 58,000 | 58,000 |
2.03.04.10 | Expansion Reserve | 3,216,000 | 2,588,000 |
2.03.04.12 | Transactions with non-controlling interests | -44,000 | -97,000 |
2.03.04.14 | Settlement of Equity Instrument | -150,000 | -150,000 |
2.03.05 | Retained Earnings/ Accumulated Losses | -610,000 | 0 |
2.03.08 | Other comprehensive income | -73,000 | -66,000 |
7
Individual Interim Financial Information / Statement of Operations | |||
R$ (in thousands) | Year to date current period | Year to date previous period | |
Code | Description | 01/01/2019 to 03/31/2019 | 01/01/2018 to 03/31/2018 |
3.01 | Net operating revenue | 6,236,000 | 6,238,000 |
3.02 | Cost of sales | -4,432,000 | -4,466,000 |
3.03 | Gross Profit | 1,804,000 | 1,772,000 |
3.04 | Operating Income/Expenses | -1,440,000 | -1,405,000 |
3.04.01 | Selling Expenses | -1,128,000 | -1,118,000 |
3.04.02 | General and administrative expenses | -185,000 | -176,000 |
3.04.05 | Other Operating Expenses | -285,000 | -269,000 |
3.04.05.01 | Depreciation and Amortization | -235,000 | -230,000 |
3.04.05.03 | Other operating expenses, net | -50,000 | -39,000 |
3.04.06 | Share of Profit of associates | 158,000 | 158,000 |
3.05 | Profit from operations before net financial expenses | 364,000 | 367,000 |
3.06 | Net Financial expenses | -236,000 | -232,000 |
3.07 | Income (loss) before income tax and social contribution | 128,000 | 135,000 |
3.08 | Income tax and social contribution | 50,000 | 26,000 |
3.08.01 | Current | -8,000 | -4,000 |
3.08.02 | Deferred | 58,000 | 30,000 |
3.09 | Net Income (loss) from continued operations | 178,000 | 161,000 |
3.10 | Net Income (loss) from discontinued operations | -23,000 | -11,000 |
3.10.01 | Net Income (loss) from Discontinued Operations | -23,000 | -11,000 |
3.11 | Net Income (loss) for the period | 155,000 | 150,000 |
3.99.01 | Basic Earnings per Share | ||
3.99.01.01 | ON | 0.54710 | 0.53000 |
3.99.01.02 | PN | 0.60181 | 0.58300 |
3.99.02 | Diluted Earnings per Share | ||
3.99.02.01 | ON | 0.54778 | 0.52827 |
3.99.02.02 | PN | 0.59771 | 0.57980 |
8
Individual Interim Financial Information / Statement of Comprehensive Income | |||
R$ (in thousands) | Year to date current period | Year to date previous period | |
Code | Description | 01/01/2019 to 03/31/2019 | 01/01/2018 to 03/31/2018 |
4.01 | Net income for the Period | 155,000 | 150,000 |
4.02 | Other Comprehensive Income | -7,000 | -10,000 |
4.02.02 | Foreign Currency Translation | 1,000 | -7,000 |
4.02.04 | Fair Value of Trade Receivables | -17,000 | -4,000 |
4.02.05 | Income Tax Related to Other Comprehensive Income | 9,000 | 1,000 |
4.03 | Total Comprehensive Income for the Period | 148,000 | 140,000 |
9
Individual Interim Financial Information / Statement of Cash Flows - Indirect Method | |||
1.000,00 | |||
R$ (in thousands) | Year to date current period | Year to date previous period | |
Code | Description | 01/01/2019 to 03/31/2019 | 01/01/2018 to 03/31/2018 |
6.01 | Net Cash Operating Activities | -2,102,000 | -1,890,000 |
6.01.01 | Cash Provided by the Operations | 504,000 | 498,000 |
6.01.01.01 | Net Income for the Period | 155,000 | 150,000 |
6.01.01.02 | Deferred Income Tax and Social Contribution | -58,000 | -30,000 |
6.01.01.03 | Gain (Losses) on Disposal of Property and equipment | 39,000 | 7,000 |
6.01.01.04 | Depreciation/Amortization | 267,000 | 255,000 |
6.01.01.05 | Interest and Inflation Adjustments | 221,000 | 214,000 |
6.01.01.07 | Share of Profit (Loss) of Subsidiaries and Associates | -158,000 | -158,000 |
6.01.01.08 | Provision for Risks | 38,000 | 50,000 |
6.01.01.10 | Share-based Payment | 13,000 | 7,000 |
6.01.01.11 | Allowance for Doubtful Accounts | 1,000 | 0 |
6.01.01.13 | Allowance for obsolescence and damages | -1,000 | -1,000 |
6.01.01.14 | Other Operating Expenses | 14,000 | 10,000 |
6.01.01.15 | Deferred Revenue | -3,000 | -3,000 |
6.01.01.16 | Loss or gain on lease liabilities | -24,000 | -3,000 |
6.01.02 | Changes in Assets and Liabilities | -2,606,000 | -2,388,000 |
6.01.02.01 | Accounts Receivable | -355,000 | -217,000 |
6.01.02.02 | Inventories | 125,000 | 33,000 |
6.01.02.03 | Recoverable Taxes | -93,000 | 39,000 |
6.01.02.04 | Other Assets | -114,000 | -200,000 |
6.01.02.05 | Related Parties | -34,000 | 6,000 |
6.01.02.06 | Restricted Deposits for Legal Proceeding | -11,000 | -17,000 |
6.01.02.07 | Trade Payables | -2,064,000 | -1,979,000 |
6.01.02.08 | Payroll and Related Taxes | -15,000 | 1,000 |
6.01.02.09 | Taxes and Social Contributions Payable | -67,000 | -58,000 |
6.01.02.10 | Payments of provision for risk | -16,000 | -20,000 |
6.01.02.12 | Other Payables | -8,000 | 24,000 |
6.01.02.13 | Income Tax and Social contribution, paid | -4,000 | 0 |
6.01.02.15 | Received Dividends and Interest on own capital | 50,000 | 0 |
6.02 | Net Cash of Investing Activities | -211,000 | -172,000 |
6.02.02 | Acquisition of Property and Equipment (Note 14.2) | -194,000 | -147,000 |
6.02.03 | Increase in Intangible Assets (Note 15.2) | -18,000 | -25,000 |
6.02.04 | Sales of Property and Equipment | 1,000 | 0 |
6.03 | Net Cash of Financing Activities | 972,000 | 458,000 |
6.03.02 | Proceeds from Borrowings and Financing (Note 16.2) | 1,299,000 | 1,213,000 |
6.03.03 | Payments of Borrowings and Financing (Note 16.2) | -440,000 | -509,000 |
6.03.07 | Acquisition of companies | -19,000 | 0 |
6.03.08 | Transactions with Non-controlling Interest | 396,000 | 0 |
6.03.09 | Payment of lease liability | -264,000 | -246,000 |
6.05 | Increase (Decrease) in Cash and Cash Equivalents | -1,341,000 | -1,604,000 |
6.05.01 | Cash and Cash Equivalents at the Beginning of the Period | 2,935,000 | 2,868,000 |
6.05.02 | Cash and Cash Equivalents at the End of the Period | 1,594,000 | 1,264,000 |
10
Individual Interim Financial Information / Statement of Changes in Shareholders' Equity 01/01/2019 to 03/31/2019 | |||||||
R$ (in thousands) |
|
|
|
|
|
| |
Code | Description | Share | Capital Reserves, | Earnings | Retained Earnings /Accumulated Losses | Other comprehensive income | Shareholders' |
5.01 | Opening balance | 6,825,000 | 413,000 | 3,911,000 | 0 | -66,000 | 11,083,000 |
5.02 | Net income for the year | 0 | 0 | 0 | -765,000 | 0 | -765,000 |
5.03 | Adjusted opening balance | 6,825,000 | 413,000 | 3,911,000 | -765,000 | -66,000 | 10,318,000 |
5.04 | Capital Transactions with Shareholders | 0 | 13,000 | -137,000 | 0 | 0 | -124,000 |
5.04.03 | Share based expenses | 0 | 10,000 | 0 | 0 | 0 | 10,000 |
5.04.07 | Interest on own Capital | 0 | 0 | -137,000 | 0 | 0 | -137,000 |
5.04.08 | Share based expenses of Subsidiaries | 0 | 3,000 | 0 | 0 | 0 | 3,000 |
5.05 | Total Comprehensive Income | 0 | 0 | 0 | 155,000 | -7,000 | 148,000 |
5.05.01 | Net Income for the Period | 0 | 0 | 0 | 155,000 | 0 | 155,000 |
5.05.02 | Other Comprehensive Income | 0 | 0 | 0 | 0 | -7,000 | -7,000 |
5.05.02.04 | Foreign currency translation | 0 | 0 | 0 | 0 | 1,000 | 1,000 |
5.05.02.07 | Fair value of trade receivables | 0 | 0 | 0 | 0 | -17,000 | -17,000 |
5.05.02.08 | Income taxes related to other comprehensive income | 0 | 0 | 0 | 0 | 9,000 | 9,000 |
5.06 | Internal Changes of Shareholders’ Equity | 0 | 0 | 53,000 | 0 | 0 | 53,000 |
5.06.05 | Transactions with Non-controlling Interests | 0 | 0 | 53,000 | 0 | 0 | 53,000 |
5.07 | Closing Balance | 6,825,000 | 426,000 | 3,827,000 | -610,000 | -73,000 | 10,395,000 |
11
Individual Interim Financial Information / Statement of Changes in Shareholders' Equity 01/01/2018 to 03/31/2018 | |||||||
R$ (in thousands) |
|
|
|
|
|
| |
Code | Description | Share | Capital Reserves, | Earnings | Retained Earnings /Accumulated Losses | Other comprehensive Income | Shareholders' |
5.01 | Opening balance | 6,822,000 | 355,000 | 3,174,000 | -114,000 | -49,000 | 10,188,000 |
5.02 | Net income for the year | 0 | 0 | 0 | -802,000 | 0 | -802,000 |
5.03 | Adjusted opening balance | 6,822,000 | 355,000 | 3,174,000 | -916,000 | -49,000 | 9,386,000 |
5.04 | Capital Transactions with Shareholders | 0 | 23,000 | -13,000 | 0 | 0 | 10,000 |
5.04.03 | Share based expenses | 0 | 14,000 | 0 | 0 | 0 | 14,000 |
5.04.07 | Interest on own Capital | 0 | 0 | -13,000 | 0 | 0 | -13,000 |
5.04.08 | Share based expenses of Subsidiaries | 0 | 9,000 | 0 | 0 | 0 | 9,000 |
5.05 | Total Comprehensive Income | 0 | 0 | 0 | 150,000 | -10,000 | 140,000 |
5.05.01 | Net Income for the Period | 0 | 0 | 0 | 150,000 | 0 | 150,000 |
5.05.02 | Other Comprehensive Income | 0 | 0 | 0 | 0 | -10,000 | -10,000 |
5.05.02.04 | Foreign currency translation | 0 | 0 | 0 | 0 | -7,000 | -7,000 |
5.05.02.07 | Fair value of trade receivables | 0 | 0 | 0 | 0 | -4,000 | -4,000 |
5.05.02.08 | Income taxes related to other comprehensive income | 0 | 0 | 0 | 0 | 1,000 | 1,000 |
5.07 | Closing Balance | 6,822,000 | 378,000 | 3,161,000 | -766,000 | -59,000 | 9,536,000 |
12
Individual Interim Financial Information / Statement of Value Added | |||
R$ (in thousands) | Year to date current period | Year to date previous period | |
Code | Description | 01/01/2019 to 03/31/2019 | 01/01/2018 to 03/31/2018 |
7.01 | Revenues | 6,780,000 | 6,775,000 |
7.01.01 | Sales of Goods, Products and Services | 6,769,000 | 6,753,000 |
7.01.02 | Other Revenues | 12,000 | 19,000 |
7.01.04 | Allowance for/Reversal of Doubtful Accounts | -1,000 | 3,000 |
7.02 | Products Acquired from Third Parties | -5,326,000 | -5,373,000 |
7.02.01 | Costs of Products, Goods and Services Sold | -4,514,000 | -4,586,000 |
7.02.02 | Materials, Energy, Outsourced Services and Other | -812,000 | -787,000 |
7.03 | Gross Value Added | 1,454,000 | 1,402,000 |
7.04 | Retention | -267,000 | -254,000 |
7.04.01 | Depreciation and Amortization | -267,000 | -254,000 |
7.05 | Net Value Added Produced | 1,187,000 | 1,148,000 |
7.06 | Value Added Received in Transfer | 150,000 | 173,000 |
7.06.01 | Share of Profit of Subsidiaries and Associates | 158,000 | 158,000 |
7.06.02 | Financial Revenue | 15,000 | 26,000 |
7.06.03 | Other | -23,000 | -11,000 |
7.07 | Total Value Added to Distribute | 1,337,000 | 1,321,000 |
7.08 | Distribution of Value Added | 1,337,000 | 1,321,000 |
7.08.01 | Personnel | 725,000 | 735,000 |
7.08.01.01 | Direct Compensation | 478,000 | 466,000 |
7.08.01.02 | Benefits | 137,000 | 149,000 |
7.08.01.03 | Government Severance Indemnity Fund for Employees (FGTS) | 46,000 | 46,000 |
7.08.01.04 | Other | 64,000 | 74,000 |
7.08.02 | Taxes, Fees and Contributions | 190,000 | 167,000 |
7.08.02.01 | Federal | 38,000 | 90,000 |
7.08.02.02 | State | 83,000 | 35,000 |
7.08.02.03 | Municipal | 69,000 | 42,000 |
7.08.03 | Value Distributed to Providers of Capital | 267,000 | 269,000 |
7.08.03.01 | Interest | 266,000 | 268,000 |
7.08.03.02 | Rentals | 1,000 | 1,000 |
7.08.04 | Value Distributed to Shareholders | 155,000 | 150,000 |
7.08.04.01 | Interest on shareholders' equity | 137,000 | 14,000 |
7.08.04.03 | Retained Earnings/ Accumulated Losses for the Period | 18,000 | 136,000 |
13
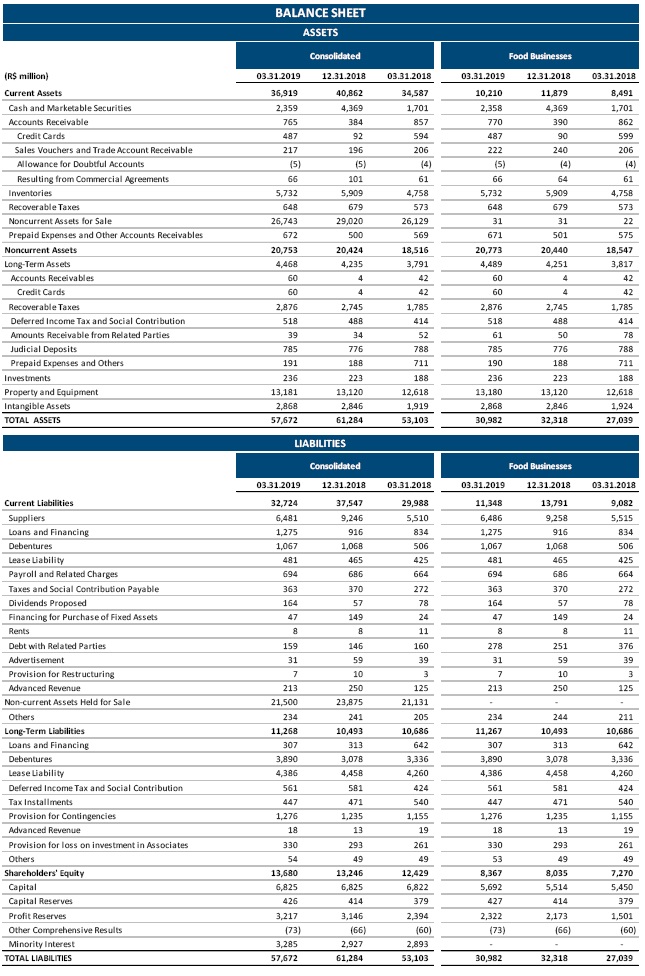
Consolidated Interim Financial Information /Balance Sheet - Assets | |||
R$ (in thousands) | |||
Code | Description | Current Quarter | Previous Year |
1 | Total Assets | 57,672,000 | 61,284,000 |
1.01 | Current Assets | 36,919,000 | 40,859,000 |
1.01.01 | Cash and Cash Equivalents | 2,359,000 | 4,369,000 |
1.01.03 | Accounts Receivable | 1,072,000 | 686,000 |
1.01.03.01 | Trade Receivables | 765,000 | 384,000 |
1.01.03.02 | Other Receivables | 307,000 | 302,000 |
1.01.04 | Inventories | 5,732,000 | 5,909,000 |
1.01.06 | Recoverable Taxes | 648,000 | 679,000 |
1.01.08 | Other Current Assets | 27,108,000 | 29,216,000 |
1.01.08.01 | Assets Held for Sale | 26,742,000 | 29,020,000 |
1.01.08.03 | Other | 366,000 | 196,000 |
1.01.08.03.01 | Financial Instruments - Fair Value Hedge | 54,000 | 43,000 |
1.01.08.03.02 | Other Assets | 312,000 | 153,000 |
1.02 | Noncurrent Assets | 20,753,000 | 20,425,000 |
1.02.01 | Long-term Assets | 4,468,000 | 4,236,000 |
1.02.01.03 | Accounts Receivable | 189,000 | 132,000 |
1.02.01.03.01 | Trade receivables, net | 60,000 | 4,000 |
1.02.01.03.02 | Other accounts receivable | 129,000 | 128,000 |
1.02.01.06 | Deferred Taxes | 518,000 | 488,000 |
1.02.01.07 | Prepaid Expenses | 15,000 | 17,000 |
1.02.01.08 | Receivables from related parties | 39,000 | 34,000 |
1.02.01.09 | Other Noncurrent Assets | 3,707,000 | 3,565,000 |
1.02.01.09.04 | Recoverable Taxes | 2,876,000 | 2,745,000 |
1.02.01.09.05 | Restricted deposits for legal proceedings | 785,000 | 776,000 |
1.02.01.09.06 | Financial Instruments - Fair Value Hedge | 46,000 | 44,000 |
1.02.02 | Investments | 236,000 | 223,000 |
1.02.02.01 | Investments in Associates | 216,000 | 203,000 |
1.02.02.02 | Investment properties | 20,000 | 20,000 |
1.02.03 | Property and Equipment, Net | 13,181,000 | 13,120,000 |
1.02.03.01 | Property and Equipment in Use | 9,695,000 | 9,621,000 |
1.02.03.02 | Leased Properties | 3,486,000 | 3,499,000 |
1.02.04 | Intangible Assets, net | 2,868,000 | 2,846,000 |
1.02.04.01.02 | Intangible Assets | 1,979,000 | 1,937,000 |
1.02.04.01.03 | Intangible Right-of-use | 889,000 | 909,000 |
14
Consolidated Interim Financial Information / Balance Sheet - Liabilities | |||
R$ (in thousands) | |||
Code | Description | Current Quarter | Previous Year |
2 | Total Liabilities | 57,672,000 | 61,284,000 |
2.01 | Current Liabilities | 32,724,000 | 37,548,000 |
2.01.01 | Payroll and Related Taxes | 694,000 | 686,000 |
2.01.02 | Trade payables, net | 6,481,000 | 9,246,000 |
2.01.03 | Taxes and Contributions Payable | 364,000 | 370,000 |
2.01.04 | Borrowings and Financing | 2,342,000 | 1,981,000 |
2.01.05 | Other Liabilities | 1,344,000 | 1,389,000 |
2.01.05.01 | Payables to Related Parties | 159,000 | 145,000 |
2.01.05.02 | Other | 1,185,000 | 1,244,000 |
2.01.05.02.01 | Dividends and interest on own capital | 164,000 | 57,000 |
2.01.05.02.08 | Financing Related to Acquisition of Assets | 47,000 | 149,000 |
2.01.05.02.09 | Deferred Revenue | 213,000 | 250,000 |
2.01.05.02.12 | Other Accounts Payable | 280,000 | 323,000 |
2.01.05.02.17 | Lease liability | 481,000 | 465,000 |
2.01.07 | Liabilities related to assets held for sale | 21,499,000 | 23,876,000 |
2.02 | Noncurrent Liabilities | 11,268,000 | 10,492,000 |
2.02.01 | Borrowings and Financing | 4,197,000 | 3,392,000 |
2.02.02 | Other Liabilities | 5,217,000 | 5,271,000 |
2.02.02.02 | Other | 5,217,000 | 5,271,000 |
2.02.02.02.03 | Taxes payable in installments | 447,000 | 471,000 |
2.02.02.02.07 | Other Accounts Payable | 54,000 | 49,000 |
2.02.02.02.08 | Provision for Losses on Investments in Associates | 330,000 | 293,000 |
2.02.02.02.09 | Lease Liability | 4,386,000 | 4,458,000 |
2.02.03 | Deferred taxes | 561,000 | 581,000 |
2.02.04 | Provisions | 1,275,000 | 1,235,000 |
2.02.06 | Deferred Revenue | 18,000 | 13,000 |
2.03 | Shareholders’ Equity | 13,680,000 | 13,244,000 |
2.03.01 | Share Capital | 6,825,000 | 6,825,000 |
2.03.02 | Capital Reserves | 426,000 | 413,000 |
2.03.02.04 | Stock Option | 419,000 | 406,000 |
2.03.02.07 | Capital Reserve | 7,000 | 7,000 |
2.03.04 | Earnings Reserve | 3,827,000 | 3,146,000 |
2.03.04.01 | Legal Reserve | 517,000 | 517,000 |
2.03.04.05 | Earnings Retention Reserve | 230,000 | 230,000 |
2.03.04.07 | Tax Incentive Reserve | 58,000 | 58,000 |
2.03.04.10 | Expansion Reserve | 3,216,000 | 2,588,000 |
2.03.04.12 | Transactions with non-controlling interests | -44,000 | -97,000 |
2.03.04.14 | Settlement of Equity Instrument | -150,000 | -150,000 |
2.03.05 | Retained Earnings/ Accumulated Losses | -610,000 | 0 |
2.03.08 | Other comprehensive income | -73,000 | -66,000 |
2.03.09 | Non-Controlling interests | 3,285,000 | 2,926,000 |
15
Consolidated Interim Financial Information / Statement of Operations | |||
R$ (in thousands) | Year to date current period | Year to date previous period | |
Code | Description | 01/01/2019 to 03/31/2019 | 01/01/2018 to 03/31/2018 |
3.01 | Net operating revenue | 12,709,000 | 11,343,000 |
3.02 | Cost of sales | -9,913,000 | -8,783,000 |
3.03 | Gross Profit | 2,796,000 | 2,560,000 |
3.04 | Operating Income/Expenses | -2,338,000 | -2,179,000 |
3.04.01 | Selling Expenses | -1,672,000 | -1,558,000 |
3.04.02 | General and administrative expenses | -269,000 | -239,000 |
3.04.05 | Other Operating Expenses | -380,000 | -346,000 |
3.04.05.01 | Depreciation and Amortization | -329,000 | -304,000 |
3.04.05.03 | Other operating expenses, net | -51,000 | -42,000 |
3.04.06 | Share of Profit of associates | -17,000 | -36,000 |
3.05 | Profit from operations before net financial expenses | 458,000 | 381,000 |
3.06 | Net Financial expenses | -289,000 | -274,000 |
3.07 | Income (loss) before income tax and social contribution | 169,000 | 107,000 |
3.08 | Income tax and social contribution | -19,000 | -30,000 |
3.08.01 | Current | -109,000 | -32,000 |
3.08.02 | Deferred | 90,000 | 2,000 |
3.09 | Net Income (loss) from continued operations | 150,000 | 77,000 |
3.10 | Net Income (loss) from discontinued operations | 69,000 | 190,000 |
3.10.01 | Net Income (loss) from Discontinued Operations | 69,000 | 190,000 |
3.11 | Net Income (loss) for the period | 219,000 | 267,000 |
3.11.01 | Attributable to Controlling Shareholders | 155,000 | 150,000 |
3.11.02 | Attributable to Non-controlling Shareholders | 64,000 | 117,000 |
3.99.01 | Basic Earnings per Share | ||
3.99.01.01 | ON | 0.54710 | 0.53000 |
3.99.01.02 | PN | 0.60181 | 0.58300 |
3.99.02 | Diluted Earnings per Share | ||
3.99.02.01 | ON | 0.54778 | 0.52827 |
3.99.02.02 | PN | 0.59771 | 0.57980 |
16
Consolidated Interim Financial Information / Statement of Comprehensive Income | |||
|
|
|
|
Year to date current period | Year to date previous period | ||
R$ (in thousands) | 01/01/2019 to | 01/01/2018 to | |
Code | Description | 03/31/2019 | 03/31/2018 |
4.01 | Net income for the Period | 219,000 | 267,000 |
4.02 | Other Comprehensive Income | -7,000 | -13,000 |
4.02.02 | Foreign Currency Translation | 1,000 | -7,000 |
4.02.04 | Fair Value of Trade Receivables | -27,000 | -9,000 |
4.02.05 | Deferred tax on fair value of estimated losses | 19,000 | 3,000 |
4.03 | Total Comprehensive Income for the Period | 212,000 | 254,000 |
4.03.01 | Attributable to Controlling Shareholders | 148,000 | 140,000 |
4.03.02 | Attributable to Non-Controlling Shareholders | 64,000 | 114,000 |
17
Consolidated Interim Financial Information / Statement of Cash Flows - Indirect Method | |||
R$ (in thousands) | 1000 | ||
Year to date current period | Year to date previous period | ||
Code | Description | 01/01/2019 to 03/31/2019 | 01/01/2018 to 03/31/2018 |
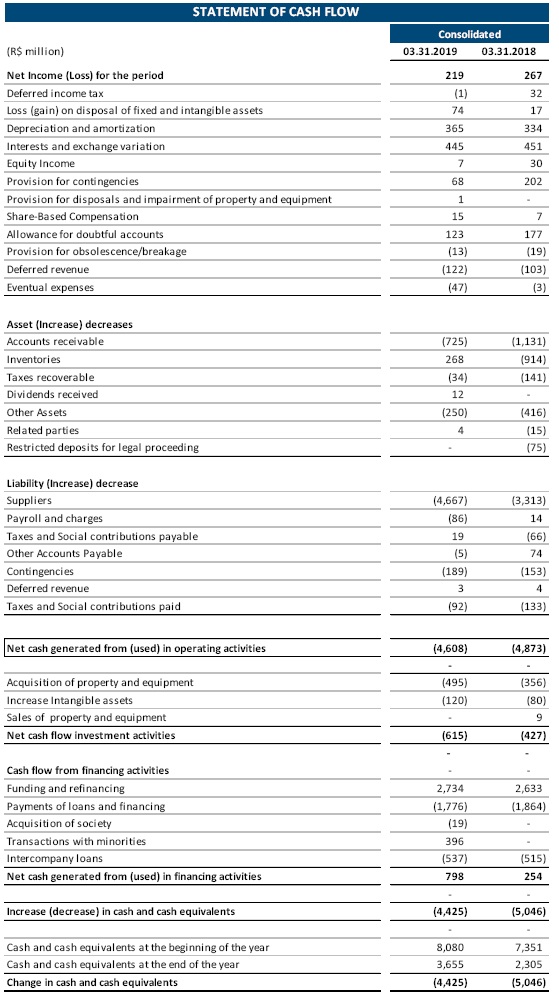
6.01 | Net Cash Operating Activities | -4,608,000 | -4,873,000 |
6.01.01 | Cash Provided by the Operations | 1,134,000 | 1,392,000 |
6.01.01.01 | Net Income for the Period | 219,000 | 267,000 |
6.01.01.02 | Deferred Income Tax and Social Contribution | -1,000 | 32,000 |
6.01.01.03 | Gain (Losses) on Disposal of Property and equipment | 74,000 | 17,000 |
6.01.01.04 | Depreciation/Amortization | 365,000 | 334,000 |
6.01.01.05 | Interest and Inflation Adjustments | 445,000 | 451,000 |
6.01.01.07 | Share of Profit (Loss) of Subsidiaries and Associates | 7,000 | 30,000 |
6.01.01.08 | Provision for Risks | 68,000 | 202,000 |
6.01.01.09 | Provision for Write-off and impairment | 1,000 | 0 |
6.01.01.10 | Share-based Payment | 15,000 | 7,000 |
6.01.01.11 | Allowance for Doubtful Accounts | 123,000 | 177,000 |
6.01.01.13 | Allowance for obsolescence and damages | -13,000 | -19,000 |
6.01.01.15 | Allowance for Doubtful Accounts | -122,000 | -103,000 |
6.01.01.16 | Loss or gain on lease liabilities | -47,000 | -3,000 |
6.01.02 | Changes in Assets and Liabilities | -5,742,000 | -6,265,000 |
6.01.02.01 | Accounts Receivable | -725,000 | -1,131,000 |
6.01.02.02 | Inventories | 268,000 | -914,000 |
6.01.02.03 | Recoverable Taxes | -34,000 | -141,000 |
6.01.02.04 | Other Assets | -250,000 | -416,000 |
6.01.02.05 | Related Parties | 4,000 | -15,000 |
6.01.02.06 | Restricted Deposits for Legal Proceeding | 0 | -75,000 |
6.01.02.07 | Trade Payables | -4,667,000 | -3,313,000 |
6.01.02.08 | Payroll and Related Taxes | -86,000 | 14,000 |
6.01.02.09 | Taxes and Social Contributions Payable | 19,000 | -66,000 |
6.01.02.10 | Payments of provision for risk | -189,000 | -153,000 |
6.01.02.11 | Deferred Revenue | 3,000 | 4,000 |
6.01.02.12 | Other Payables | -5,000 | 74,000 |
6.01.02.13 | Income Tax and Social contribution, paid | -92,000 | -133,000 |
6.01.02.15 | Received Dividends and Interest on own capital | 12,000 | 0 |
6.02 | Net Cash of Investing Activities | -615,000 | -427,000 |
6.02.02 | Acquisition of Property and Equipment (Note 14.2) | -495,000 | -356,000 |
6.02.03 | Increase in Intangible Assets (Note 15.2) | -120,000 | -80,000 |
6.02.04 | Sales of Property and Equipment | 0 | 9,000 |
6.03 | Net Cash of Financing Activities | 798,000 | 254,000 |
6.03.02 | Proceeds from Borrowings and Financing (Note 16.2) | 2,734,000 | 2,633,000 |
6.03.03 | Payments of Borrowings and Financing (Note 16.2) | -1,776,000 | -1,864,000 |
6.03.07 | Acquisition of companies | -19,000 | 0 |
6.03.08 | Transactions with Non-controlling Interest | 396,000 | 0 |
6.03.09 | Payment of lease liability | -537,000 | -515,000 |
6.05 | Increase (Decrease) in Cash and Cash Equivalents | -4,425,000 | -5,046,000 |
6.05.01 | Cash and Cash Equivalents at the Beginning of the Period | 8,080,000 | 7,351,000 |
6.05.02 | Cash and Cash Equivalents at the End of the Period | 3,655,000 | 2,305,000 |
18
Consolidated Interim Financial Information / Statement of Changes in Shareholders' Equity 01/01/2019 to 03/31/2019 | |||||||||
R$ (in thousands) | 1000 | ||||||||
Code | Description | Share | Capital Reserves, | Earnings | Retained Earnings/ Accumulated Losses | Other comprehen-sive Income | Shareholders' | Non-Controlling | Consolidated |
5.01 | Opening balance | 6,825,000 | 413,000 | 3,911,000 | 0 | -66,000 | 11,083,000 | 2,856,000 | 13,939,000 |
5.02 | Net income for the year | 0 | 0 | 0 | -765,000 | 0 | -765,000 | 70,000 | -695,000 |
5.03 | Adjusted opening balance | 6,825,000 | 413,000 | 3,911,000 | -765,000 | -66,000 | 10,318,000 | 2,926,000 | 13,244,000 |
5.04 | Capital Transactions with Shareholders | 0 | 13,000 | -137,000 | 0 | 0 | -124,000 | 2,000 | -122,000 |
5.04.03 | Share based expenses | 0 | 10,000 | 0 | 0 | 0 | 10,000 | 0 | 10,000 |
5.04.07 | Options Granted - subsidiaries | 0 | 0 | -137,000 | 0 | 0 | -137,000 | 0 | -137,000 |
5.04.08 | Share based expenses of Subsidiaries | 0 | 3,000 | 0 | 0 | 0 | 3,000 | 2,000 | 5,000 |
5.05 | Total Comprehensive Income | 0 | 0 | 0 | 155,000 | -7,000 | 148,000 | 64,000 | 212,000 |
5.05.01 | Net Income for the Period | 0 | 0 | 0 | 155,000 | 0 | 155,000 | 64,000 | 219,000 |
5.05.02 | Other Comprehensive Income | 0 | 0 | 0 | 0 | -7,000 | -7,000 | 0 | -7,000 |
5.05.02.04 | Foreign currency translation | 0 | 0 | 0 | 0 | 1,000 | 1,000 | 0 | 1,000 |
5.05.02.07 | Fair value of trade receivables | 0 | 0 | 0 | 0 | -17,000 | -17,000 | -10,000 | -27,000 |
5.05.02.08 | Income taxes related to other comprehensive income | 0 | 0 | 0 | 0 | 9,000 | 9,000 | 10,000 | 19,000 |
5.06 | Internal Changes of Shareholders’ Equity | 0 | 0 | 53,000 | 0 | 0 | 53,000 | 293,000 | 346,000 |
5.06.05 | Transactions with Non-controlling Interests | 0 | 0 | 53,000 | 0 | 0 | 53,000 | 293,000 | 346,000 |
5.07 | Closing Balance | 6,825,000 | 426,000 | 3,827,000 | -610,000 | -73,000 | 10,395,000 | 3,285,000 | 13,680,000 |
Consolidated Interim Financial Information / Statement of Changes in Shareholders' Equity 01/01/2018 to 03/31/2018 | |||||||||
R$ (in thousands) | |||||||||
Code | Description | Share | Capital Reserves, | Earnings | Retained Earnings/ Accumulated Losses | Other comprehen-sive Income | Shareholders' | Non-Controlling | Consolidated |
5.01 | Opening balance | 6,822,000 | 355,000 | 3,174,000 | -114,000 | -49,000 | 10,188,000 | 2,853,000 | 13,041,000 |
5.02 | Net income for the year | 0 | 0 | 0 | -802,000 | 0 | -802,000 | -80,000 | -882,000 |
5.03 | Adjusted opening balance | 6,822,000 | 355,000 | 3,174,000 | -916,000 | -49,000 | 9,386,000 | 2,773,000 | 12,159,000 |
5.04 | Capital Transactions with Shareholders | 0 | 23,000 | -13,000 | 0 | 0 | 10,000 | 6,000 | 16,000 |
5.04.03 | Share based expenses | 0 | 14,000 | 0 | 0 | 0 | 14,000 | 0 | 14,000 |
5.04.07 | Options Granted - subsidiaries | 0 | 0 | -13,000 | 0 | 0 | -13,000 | 0 | -13,000 |
5.04.08 | Share based expenses of Subsidiaries | 0 | 9,000 | 0 | 0 | 0 | 9,000 | 6,000 | 15,000 |
5.05 | Total Comprehensive Income | 0 | 0 | 0 | 150,000 | -10,000 | 140,000 | 114,000 | 254,000 |
5.05.01 | Net Income for the Period | 0 | 0 | 0 | 150,000 | 0 | 150,000 | 117,000 | 267,000 |
5.05.02 | Other Comprehensive Income | 0 | 0 | 0 | 0 | -10,000 | -10,000 | -3,000 | -13,000 |
5.05.02.04 | Foreign currency translation | 0 | 0 | 0 | 0 | -7,000 | -7,000 | 0 | -7,000 |
5.05.02.07 | Fair value of trade receivables | 0 | 0 | 0 | 0 | -4,000 | -4,000 | -5,000 | -9,000 |
5.05.02.08 | Income taxes related to other comprehensive income | 0 | 0 | 0 | 0 | 1,000 | 1,000 | 2,000 | 3,000 |
5.07 | Closing Balance | 6,822,000 | 378,000 | 3,161,000 | -766,000 | -59,000 | 9,536,000 | 2,893,000 | 12,429,000 |
19
Consolidated Interim Financial Information / Statement of Value Added | |||
R$ (in thousands) | 1000 | ||
Year to date current period | Year to date previous period | ||
Code | Description | 1/01/2019 to | 01/01/2018 to 03/31/2018 |
7.01 | Revenues | 13,842,000 | 12,326,000 |
7.01.01 | Sales of Goods, Products and Services | 13,828,000 | 12,300,000 |
7.01.02 | Other Revenues | 15,000 | 23,000 |
7.01.04 | Allowance for/Reversal of Doubtful Accounts | -1,000 | 3,000 |
7.02 | Products Acquired from Third Parties | -11,289,000 | -10,219,000 |
7.02.01 | Costs of Products, Goods and Services Sold | -10,170,000 | -9,194,000 |
7.02.02 | Materials, Energy, Outsourced Services and Other | -1,119,000 | -1,025,000 |
7.03 | Gross Value Added | 2,553,000 | 2,107,000 |
7.04 | Retention | -365,000 | -334,000 |
7.04.01 | Depreciation and Amortization | -365,000 | -334,000 |
7.05 | Net Value Added Produced | 2,188,000 | 1,773,000 |
7.06 | Value Added Received in Transfer | 78,000 | 192,000 |
7.06.01 | Share of Profit of Subsidiaries and Associates | -17,000 | -36,000 |
7.06.02 | Financial Revenue | 26,000 | 38,000 |
7.06.03 | Other | 69,000 | 190,000 |
7.07 | Total Value Added to Distribute | 2,266,000 | 1,965,000 |
7.08 | Distribution of Value Added | 2,266,000 | 1,965,000 |
7.08.01 | Personnel | 1,073,000 | 1,008,000 |
7.08.01.01 | Direct Compensation | 713,000 | 646,000 |
7.08.01.02 | Benefits | 224,000 | 222,000 |
7.08.01.03 | Government Severance Indemnity Fund for Employees (FGTS) | 65,000 | 62,000 |
7.08.01.04 | Other | 71,000 | 78,000 |
7.08.01.04.01 | Profit (cost) sharing | 71,000 | 78,000 |
7.08.02 | Taxes, Fees and Contributions | 632,000 | 352,000 |
7.08.02.01 | Federal | 358,000 | 174,000 |
7.08.02.02 | State | 194,000 | 122,000 |
7.08.02.03 | Municipal | 80,000 | 56,000 |
7.08.03 | Value Distributed to Providers of Capital | 342,000 | 338,000 |
7.08.03.01 | Interest | 332,000 | 326,000 |
7.08.03.02 | Rentals | 10,000 | 12,000 |
7.08.04 | Value Distributed to Shareholders | 219,000 | 267,000 |
7.08.04.01 | Interest on shareholders' equity | 137,000 | 14,000 |
7.08.04.03 | Retained Earnings/ Accumulated Losses for the Period | 18,000 | 136,000 |
7.08.04.04 | Noncontrolling Interest in Retained Earnings | 64,000 | 117,000 |
20

São Paulo, May 8, 2019 - GPA [B3: PCAR4; NYSE: CBD] announces its results for the first quarter of 2019. Due to the ongoing divestment of the interest held by GPA in Via Varejo S.A., the operations of Via Varejo are treated as discontinued operations. The following comments are related to the results of continuing operations. All comparisons are with the same period in 2018, except where stated otherwise. All comments regarding adjusted EBITDA and gross margin exclude the non-recurring effects from the periods. Comments related to net income refer to net income attributable to controlling shareholders of continuing operations. In addition, starting from 2019, results include the effects of IFRS 16/CPC 06 (R2) – Leases, which eliminates the distinction between operating and financial leases and requires the recognition of a financial asset and liability related to future leases discounted at present value for virtually all lease agreements of our stores. Comments in this page refer to numbers before the application of IFRS 16.
1Q19 RESULTS
GPA Food
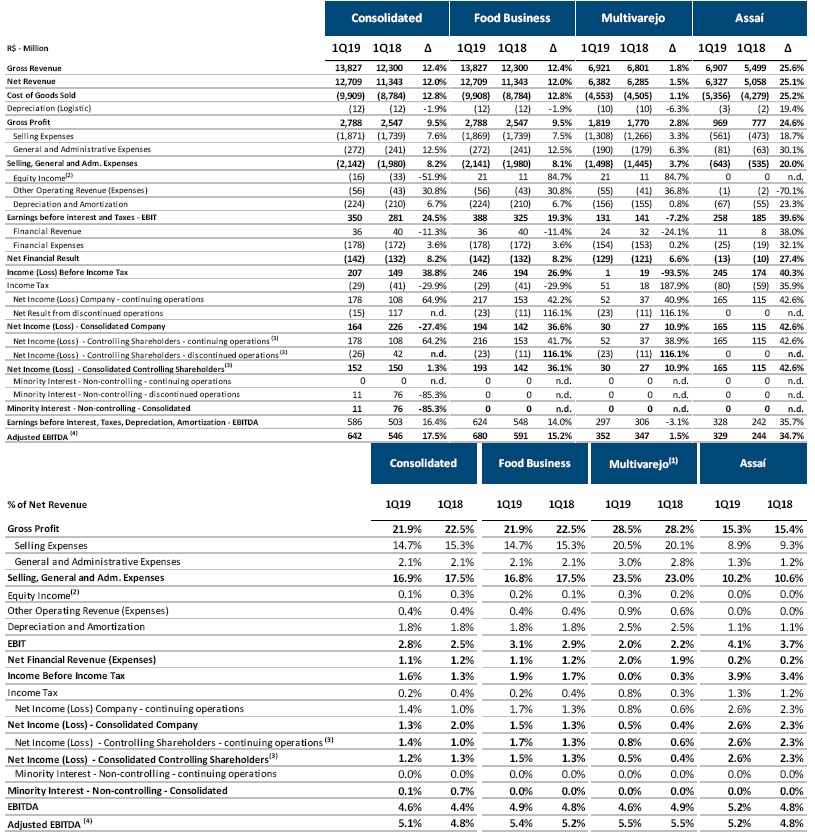
The following comments refer to numbers before the application of IFRS 16.
▪ Gross sales revenue reached R$13.8 billion in 1Q19, maintaining a strong growth pace of 12.4%;
▪ Significant growth of 15.2% in adjusted EBITDA despite the unfavorable Easter calendar, totaling R$680 million and margin reaching 5.4%, +20 basis points (bps);
▪ Net income up 41.7% in the quarter, totaling R$216 million, with net margin improving to 1.7% (+40 bps), mainly reflecting the operational growth at Assaí and Multivarejo;
▪ Solid financial structure achieved through maintenance of low level of leverage, which reached -1.12x EBITDA;
▪ Significant growth of food e-commerce, underlining the leadership position in the sector and expanding the share of sales under the Pão de Açúcar banner to over 4%;
▪ Consistent advances in Digital Transformation, with the following highlights:
(i) Launch of the James Delivery (last miler) operations in São Paulo and expansion to 10 more cities until the end of 2019;
(ii) Rollout of strategic partnership with Cheftime to 28 stores and an estimate to reach more than 100 store in 2Q19;
(iii) My Discount app reached over 70% growth in downloads - more than 8.3 million - with strong growth in the penetration of loyalty programs.
(iv) Partnership agreement with Get Ninjas and other initiatives to optimize clients’ time at stores: Pre-Scanning, Shop & Go, Self Check-out and Scan & Go.
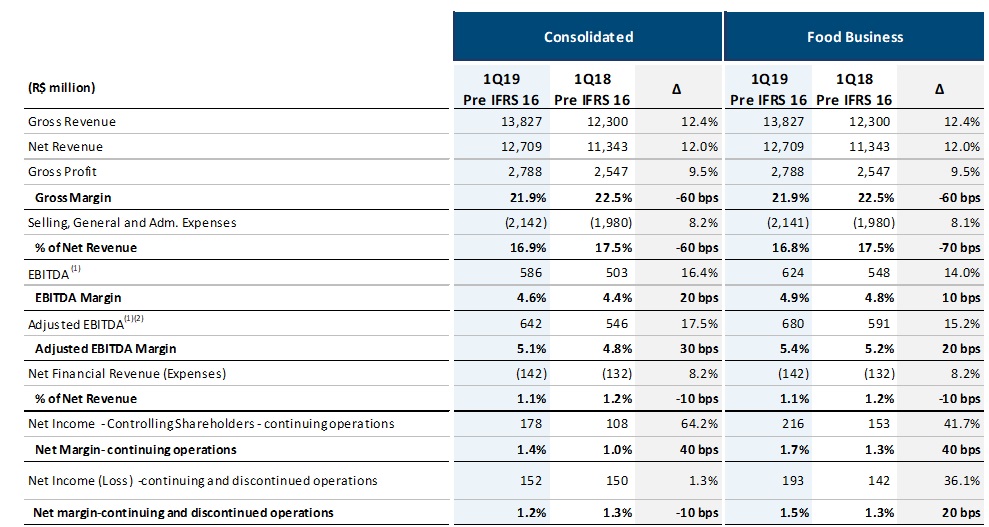
(1) Earnings before interest, tax, depreciation and amortization. (2) Adjusted by Other Operating Income and Expenses.
21
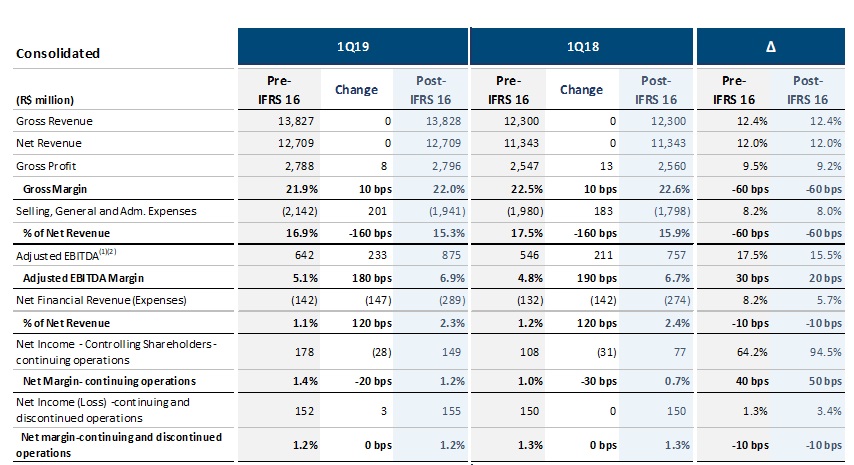
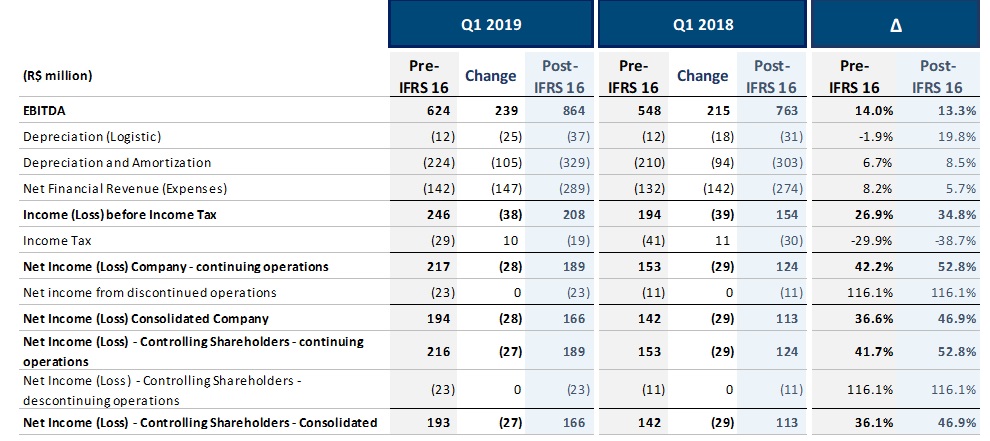
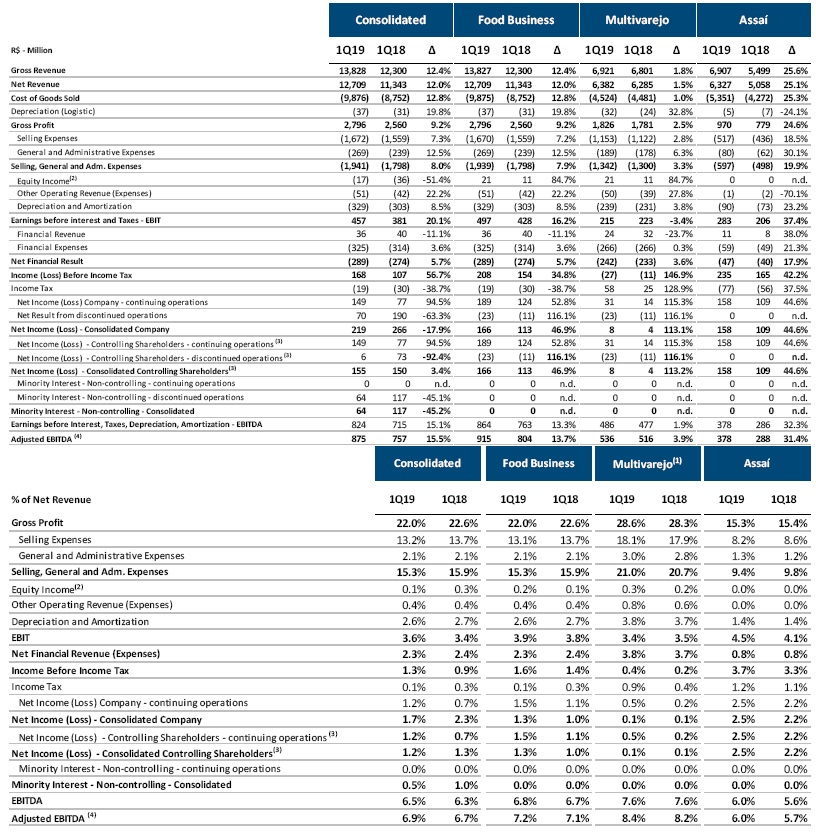
IFRS 16
As of January 1st, 2019, GPA’s results include the effects of IFRS 16/CPC 06 (R2) – Leases, which eliminates the distinction between operating and financial leases and requires the recognition of a financial asset and liability related to future leases, discounted at present value, for virtually all lease agreements of our stores.
The Company opted for the full retrospective adoption, as if the pronouncement had always been adopted since the start of the contracts in order to show the comparable effects for each past period. As such, operational lease expenses are replaced by depreciation expenses related to the right of use and interest expenses related to the lease liability.
To sum up, the main items affected and the respectiveannual amounts for 2018 are listed below:
Income Statement:
▪ EBITDA: positive effect of R$ 0.9 billion
▪ Amortization: negative impact of R$ 0.4 billion
▪ Financial Result:negative effect of R$ 0.5 billion
▪ Net income: negative impact of R$ 50 million
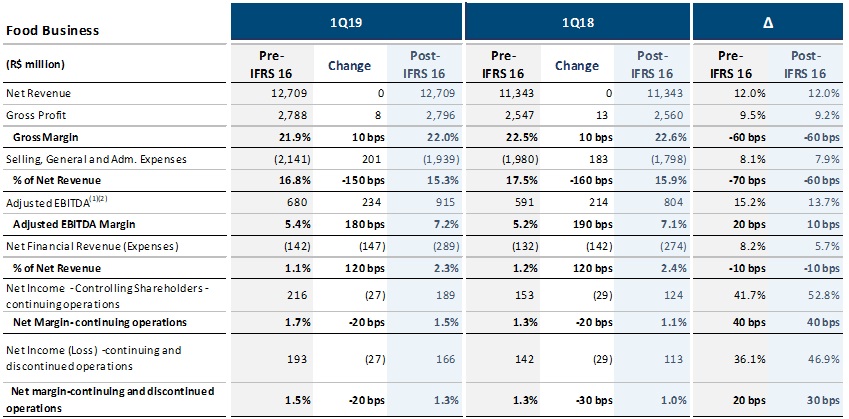
For a better understanding of the 1Q19 results, below is a summary of the adjustments to reconcile the effects of IFRS 16 for GPA Consolidated and GPA Food:
22
(1) Earnings before interest, tax, depreciation and amortization. (2) Adjusted by Other Operating Income and Expenses.
“For another quarter, we have made important advances in all formats of the food business, as a result of our assertive multi-channel, multi-format and multi-region strategy. Assaí presented an exceptional sales performance and profitability while Multivarejo continued with consistent results. We maintained the initiatives of portfolio adjustments with retrofits and conversions of stores, progressed sequentially in private label brands and advanced in the projects of digital transformation in the Group, with the expansion of the performance of James delivery and other initiatives in store.”
Peter Estermann, Chief Executive Officer of GPA
23
OPERATING PERFORMANCE BY BUSINESS
Assaí
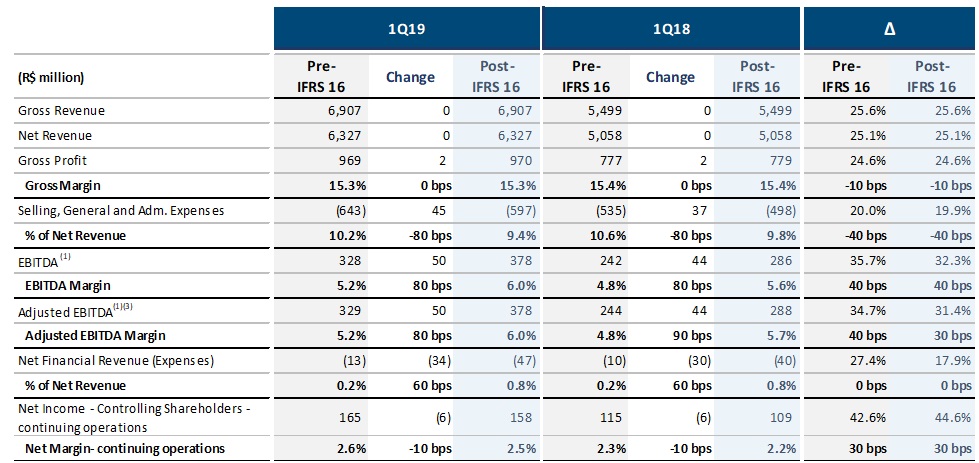
(1) Earnings before interest, tax, depreciation and amortization. (2) Adjusted by Other Operating Income and Expenses.
Gross sales revenuetotaled R$6.9 billion, speeding up the growth pace to 25.6%, reflecting the accelerated maturation of stores opened in 2018 and the strong same-store growth of 10.7%. Market share increased 230 bps and customer traffic registered a significant 14.8% growth. The quarterly highlights also include:
▪ Conversion of hypermarket to Assaí: one more store converted (Sezefredo), totaling 145 Assaí stores.Around 20 stores will be opened in the year;
▪ More than 100,000 Passaí cards issued in the quarter.Presently, Assaí has more than 720,000 cards, with total penetration of more than 5% of sales.
Gross profitgrew 24.6%, with gross margin of 15.3%, remaining at the same level as in 1Q18 despite the acceleration in sales growth, reflecting an appropriate level of commercial competitiveness. Implementation of IFRS 16 did not affect gross margin in the quarter.
Selling, general and administrative expensesamounted to R$597 million, corresponding to 9.4% of sales. The significant 40 bps dilution mainly stems from the strong sales growth combined with the rigorous control of expenses, despite the pre-operational expenses incurred at the stores under construction as part of the expansion plan. The adoption of IFRS 16 had no influence over the dilution of expenses in the quarter.
24
Adjusted EBITDA rose 31.4%, with EBITDA margin of 6.0% (+30 bps). Implementation of IFRS 16 affected EBITDA margin expansion by -10 bps. The evolution of profitability is in line with the guidance for the year.
Net income totaledR$158 million, significant growth of 44.6%, with margin of 2.5% (+30 bps). Implementation of IFRS 16 did not affect net margin expansion in the quarter.
Multivarejo

(1) Earnings before interest, tax, depreciation and amortization. (2) Adjusted by Other Operating Income and Expenses.
Gross sales revenuetotaled R$6.9 billion in the period, up 1.8% from 1Q18, despite the unfavorable calendar caused by Easter falling in the second quarter. Same-store growth has remained at aroundmid-single digits since 1Q18, reaching4.8% in 1Q19.The period highlights were:
▪ Market share gains in all banners;
▪ Strong growth in food e-commerce sales, consolidating the leadership of the segment;
▪ Continuation of initiatives related to the optimization of store portfolio:renovation and conversion of stores, which boosted performance atPão de Açúcar and Extra Supermarkets;
▪ Penetration of Private-Label Brands rose to approximately 12% of sales;
▪ Consistent progress in digital transformation initiatives
Gross profittotaled R$1.8 billion, with gross margin of 28.6%.Gross margin was higher than in the previous year due to the Easter effect and reflects the level of competitiveness the Company believes is adequate for each Multivarejo banner.Implementation of IFRS 16did not affectgross margin in the quarter.
25
Selling, general and administrative expenses totaled R$1.3 billion, up 3.3%, mainly driven by the increase, significantly below inflation, of personnel and store operation expenses. Selling, general and administrative expenses corresponded to 21.0% of sales, an increase of 30 bps from 1Q18.Implementation of IFRS 16 affected the dilution of expenses in the quarter by -20 bps.
Adjusted EBITDAcame to R$536 million, with margin of 8.4%. Implementation of IFRS improved adjusted EBITDA margin by +20 bps. Without the application of IFRS 16, adjusted EBITDA remained at the 1Q18 level (+5.5%) despite the absence of seasonal effect (Easter) in the quarter, demonstrating consistent performance and control over operating expenses.
Net incomegrew 115.3% to R$31 million, with margin of 0.5% (+30 bps). Implementation of IFRS 16 contributed +10 bps to net margin expansion in the quarter.
Digital Transformation and e-commerce:
Focus on offering customers increasingly customized solutions through innovation and the omnichannel strategy in order to ensure a better shopping experience.
● Maintenance of leadership in food e-commerce operation:
○ Pão de Açúcar Adega, the multichannel digital platform with nationwide coverage launched in 4Q18, enabled us to double online sales in the wine category in the quarter;
○ The Click&Collect and Express operations posted a strong 32% growth in the quarter, already being offered at 76 stores under the Pão de Açúcar and Extra banners.
● James Delivery: launch of the operations in São Paulo in April and expansion to 10 more cities until the end of 2019;
● My Discount:More than 8.3 million downloads, up 70%, with strong increase in penetration in loyalty programs;
● Cheftime:Rollout of the partnership in 28 more stores, in addition to e-commerce sales.Estimate to reach more than 100 stores in 2Q19;
● Partnership with Get Ninjas and other initiatives to optimize customers’ time at stores:Launch of pilot operations of Pre-scanning, Shop & Go, Self Check-out, as well as the possibility of paying for purchases through the app (Scan & Go);
OTHER INCOME AND EXPENSES
In the quarter, Other Income and Expenses amounted to an expense of R$51 million, mainly related to restructuring expenses and asset write-offs, chiefly stemming from the review of the store portfolio, in addition to expenses related to tax contingencies in connection with previous periods (2001 to 2008).
26
FINANCIAL RESULT
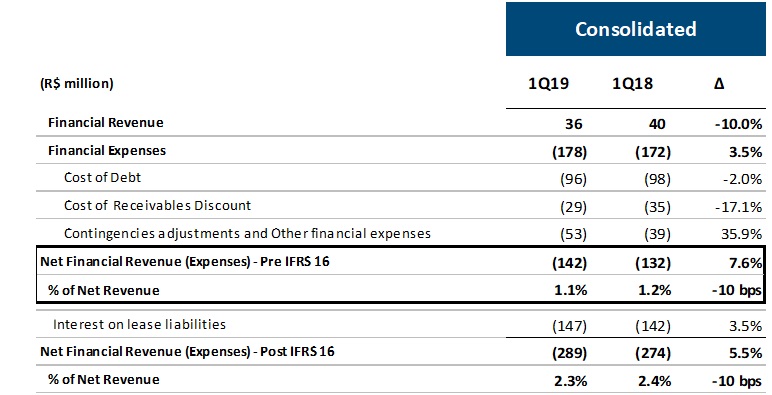
The Company’s financial result amounted to R$289 million, or 2.3% of net sales. Without the application of IFRS 16, financial result amounted to R$142 million, 1.1% of net sales, down 10 bps from 1Q18.
The main variations were:
▪ Reduction in thecost of debt:in line with the decline in the CDI interest rate, from 6.7% in 1Q18 to 6.4% in 1Q19;
▪ Lower expenses withsales of receivables:reflecting the lower interest rate and shorter term of the receivables portfolio, influenced by the higher share of Assaí;
▪ Restatement of contingencies and other expenses: remained virtually stable as a percentage of net sales revenue compared to 1Q18;
Due to the adoption of IFRS 16, the financial result now includesInterest on lease liabilities. In the quarter, a sum of R$147 million was recognized under this item, which corresponds to 1.2% of revenue (vs. 1.3% in 1Q18).
27
Net Income - Food
In the Food segment, net income attributable to the controlling shareholders from continuing operations was R$189 million, 52.8% higher than in 1Q18, with margin of 1.5%. At Assaí, net income grew 44.6% to R$158 million, with margin of 2.5%. At Multivarejo, net income grew 115.3% to R$31 million, with net margin of 0.5%.
Earnings per Share
Consolidated net income attributable to the controlling shareholders, considering continuing and discontinued operations, came to R$152 million, with margin of 1.2%.
In 1Q19, earnings per share stood at R$0.54778 for common shares and at R$0.59771 for preferred shares.
28
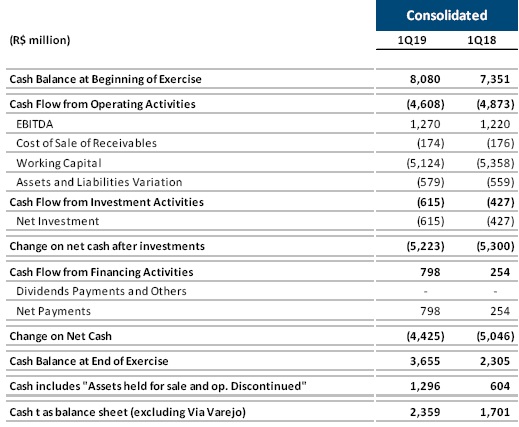
Net Debt
The Company does not consider the adjustments resulting from IFRS 16 on debt and EBITDA in order to calculate the indicators in the following table.
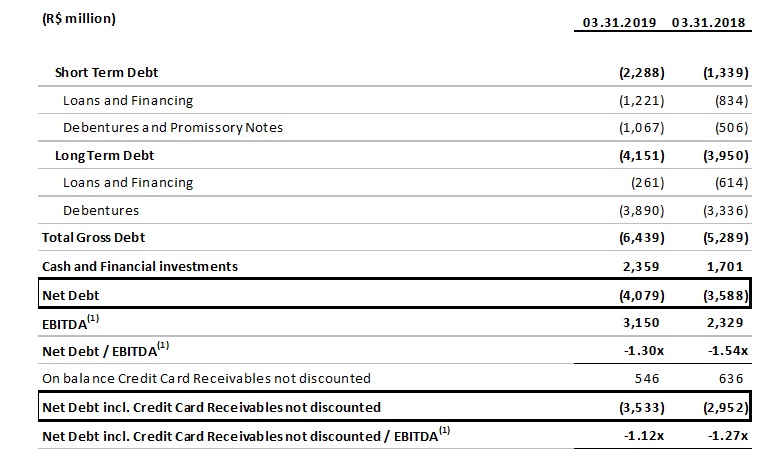
(1) EBITDA before IFRS 16, in the last 12 months.
Net debt adjusted for the balance of unsold receivables stood at R$3.5 billion. The Company’s financial leverage remains low and is constantly improving, with net debt/EBITDA ratio of -1.12.
Cash balance stood at R$2.4 billion and the balance of unsold receivables stood at R$546 million, for total available funds of R$2.9 billion. The Company also has R$1.8 billion in pre-approved/confirmed credit lines.
Investments
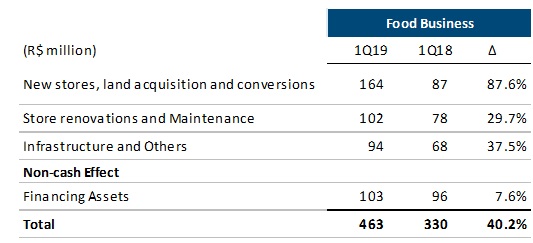
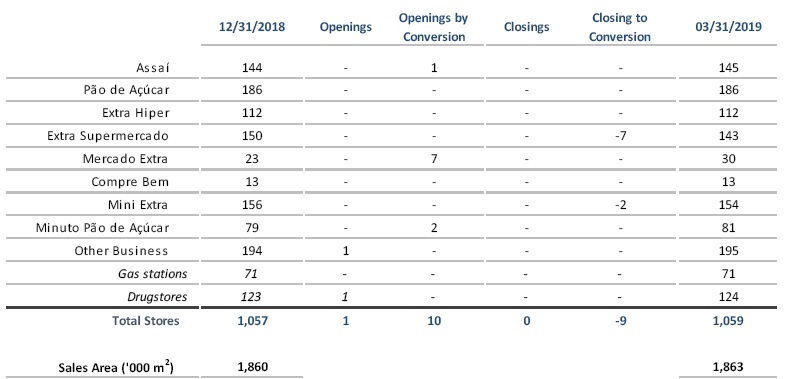
Investments in the Food segment totaled R$463 million in the quarter, up 40.2% from 1Q18.
We opened one Assaí store through conversion (another 10 are under construction) and one drugstore. Moreover, 2 conversions of Mini Extra to Minuto Pão de Açúcar and 7 conversions of Extra Super to Mercado Extra stores were concluded (totaling 43 Extra Super stores converted, of which 30 became Mercado Extra and 13 Compre Bem stores).
29
2.1 Income Statement for 1Q19 – Before IFRS 16
(1) Multivarejo includes the results of Malls and Corporate. (2) Equity income from Cdiscount is included in the Consolidated results and not in the Retail and Cash-and-Carry segments. (3) Net income after non-controlling interest. (4) Adjusted by Other Operating Income and Expenses.
31
2.1 Income Statement for 1Q19 – After IFRS 16
(1) Multivarejo includes the results of Malls and Corporate. (2) Equity income from Cdiscount is included in the Consolidated results and not in the Retail and Cash-and-Carry segments. (3) Net income after non-controlling interest. (4) Adjusted by Other Operating Income and Expenses.
32
4. Breakdown of Sales by Business
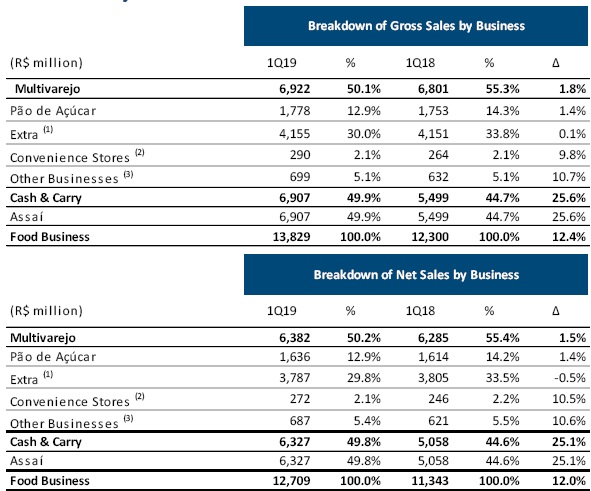
(1)Includes sales by Extra Supermercado, Mercado Extra, Extra Hiper and Compre Bem.(2) Includes sales by Mini Extra and Minuto Pão de Açúcar.
(3)Includes sales by Gas stations, Drugstores, Delivery and rental revenue from commercial centers.
5. Breakdown of Sales (% of Net Sales)
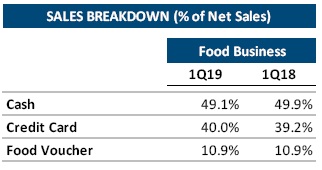
35
6. Store Portfolio Changes by Banner
1Q19 Results Conference Call and Webcast
Thursday, May 9, 2019
10:30 a.m. (Brasília) | 9:30 a.m. (New York) | 2:30 p.m. (London)
Conference call in Portuguese (original language)
+55 (11) 3181-8565
Conference call in English (simultaneous translation)
+1 (412) 717-9224 or +1 (844) 763-8274
Webcast: http://www.gpari.com.br
Replay
+55 11 3193-1012
Access code for audio in Portuguese: 1932275#
Access code for audio in English: 1779586#
http://www.gpari.com.br
Investor Relations Contacts
GPA Telephone: 55 (11) 3886-0421 gpa.ri@gpabr.com www.gpari.com.br
|
Disclaimer:Statements contained in this release related to the business outlook of the Company, projections of operating/financial results, growth prospects of the Company and market and macroeconomic estimates are merely forecasts and are based on the beliefs, plans and expectations of Management in relation to the Company’s future. These expectations are highly dependent on changes in the market, the general economic performance of Brazil, industry and international markets, and hence are subject to change.
36
Glossary
Food Segment:Represents the combined results of Multivarejo and Assaí, excluding equity income (loss) from Cdiscount, which is not included in the operating segments reported by the Company.
Discontinued Operations:Due to the ongoing divestment of the interest held by GPA in Via Varejo S.A., the operations of Via Varejo are treated as discontinued operations. Accordingly, net sales and other profit or loss accounts were adjusted retrospectively, as required under IFRS 5/CPC 31, approved by CVM Resolution 598/09 – Non-current assets held for sale and discontinued operations.
EBITDA:EBITDA is calculated in accordance with Instruction 527 issued by the Securities and Exchange Commission of Brazil (CVM) on October 4, 2012.
Adjusted EBITDA:Measure of profitability calculated by excluding Other Operating Income and Expenses from EBITDA. Management uses this measure in its analyses as it believes it eliminates nonrecurring expenses and revenues and other nonrecurring items that could compromise the comparability and analysis of results.
Earnings per share:Diluted earnings per share are calculated as follows:
● Numerator: profit in the year adjusted by dilutive effects of stock options granted by subsidiaries.
● Denominator: number of shares of each category adjusted to include potential shares corresponding to dilutive instruments (stock options), less the number of shares that could be repurchased in the market, if applicable.
Equity instruments that must or can be settled with the shares of the Company and its subsidiaries are only included in the calculation when the settlement has a dilutive impact on earnings per share.
37
Compre Bem:Project involving the conversion of stores in order to enter a market niche currently occupied by regional supermarkets. The store model is better adapted to the needs of consumers in the regions where the stores are located. The service and assortment of the perishables category will be reinforced, while other categories will have a leaner assortment. Compre Bem is managed independently from the Extra Super banner, with the focus on streamlining operating costs, especially logistics and IT.
Mercado Extra:Project aims to renovate Extra Super by reinforcing the quality of perishables and customer service, with the focus on the B and C income groups. There will be no change in the operating model of the stores, which will continue to be managed under the Extra banner.
James Delivery (last miler):Multiservice platform for ordering and delivering in minutes of diverse products selected by our customers, including restaurants and integration with our supermarkets and drugstores.
Cheftime:pioneering startup in the Foodtech segment, offering online subscription services and sales of gastronomic kits.
Same-store growth:Same-store growth, as mentioned in this document, is adjusted by the calendar effect in each period.
Growth and Changes:The growth and changes presented in this document refer to variations from the same period last year, except where stated otherwise.
41
38
Companhia Brasileira de Distribuição
Notes to the interim financial information
March 31, 2019
(In millions of Brazilian reais, unless otherwise stated)
1. Corporate information
Companhia Brasileira de Distribuição ("Company" or “CBD”), directly or through its subsidiaries (“Group” or “GPA”) is engaged in the retail of food, clothing, home appliances, electronics and other products through its chain of hypermarkets, supermarkets, specialized stores and department stores especially under the trade names "Pão de Açúcar, “Minuto Pão de Açúcar”, "Extra Hiper", “Extra Super”, “Mercado Extra“, “Minimercado Extra”, “Assai”, and the neighborhood shopping mall brand “Conviva”. The activities related to the segments of electronics and e-commerce are presented as discontinued operations (note 32) and represent the stores under the brands “Ponto Frio” and “Casas Bahia", as well as the e-commerce platforms “CasasBahia.com,” “Extra.com”, “Pontofrio.com”, “Barateiro.com”. The Group’s headquarters are located in the city of São Paulo, State of São Paulo, Brazil.
The Company’s shares are listed on the São Paulo Stock Exchange (“B3”) Level 1 of Corporate Governance under the ticker symbol “PCAR4” and on the New York Stock Exchange (ADR level III), under the ticker symbol “CBD”.
The Company is indirectly controlled by Almacenes Éxito S.A., through Wilkes Participações S.A. (“Wilkes”), and its ultimate parent company is Casino Guichard Perrachon (“Casino”), French company listed on Paris Stock Exchange.
2. Basis of preparation
The individual and consolidated interim financial information has been prepared in accordance with IAS 34 - Interim Financial Reporting issued by the International Accounting Standard Board (“IASB”) and CPC 21 (R1) - Interim Financial Reporting and presented consistently with the standards approved and issued by the Brazilian Securities and Exchange Commission (“CVM”) applicable to the preparation of interim financial information – ITR.
The individual and consolidated interim financial information is being presented in millions of Brazilian Reais. The reporting currency of the Company is Real and for subsidiaries located abroad is the local currency of each jurisdiction.
The individual and consolidated interim financial information for the quarter ended March 31, 2019 were approved by the Board of Directors on May 07, 2019.
As a result of the process in progress for the sale of the subsidiary Via Varejo S.A. (note 32 on the financial statements for year ended December 31, 2018, presented in February 20, 2019) and in accordance to the CPC 31 / IFRS 5 – Non current assets held for sale and discontinued operation, the individual and consolidated interim financial information of the statement of the operations and the statement of the added value for the periods ended March 31, 2019 and March 31, 2018 were presented with the effects of the transaction.
The cash flow statements presented include the continuing and discontinued operations in line with technical pronouncement CPC31 / IFRS 5. The summary cash flow of discontinued operations is presented in note 31.1.
The balance sheet, the statement of operations, the statement of value added, the statement of changes in shareholders equity and the statement of cash flow were restated with the adoption of IFRS16 (see note 5).
3. Basis of consolidation
The information on the basis of consolidation did not have significant modification and was presented in the annual financial statements for 2018, in note 3.
39
Companhia Brasileira de Distribuição
Notes to the interim financial information
March 31, 2019
(In millions of Brazilian reais, unless otherwise stated)
4. Significant accounting policies
The significant accounting policies adopted by the Company in the preparation of the individual and consolidated interim financial information are consistent with those adopted and disclosed on Note 4 of the financial statements for the year ended December 31, 2018 and therefore should be read in conjunction and except for the adoption of CPC06 (R2) leases pronouncement, presented in note 5.1. and the policy of recognition and measurement of income tax in the interim period described in Note 19.1.
5. Adoption of new accounting pronouncements, amendments and interpretations issued by IASB and CPC as from January 1, 2019
5.1. CPC 06(R2)/ IFRS 16 - Leases
CPC 06 (R2) / IFRS 16 sets forth the principles for the recognition, measurement, presentation and disclosure of leasing operations and requires tenants to account for all leases in a single model balance sheet similar to accounting for molds of CPC 06 (R1) / IAS 17.
The Company opted for the adoption of the full retrospective approach as a transition method on January 1, 2019, with effect from the beginning of the first practicable period and consequently, the comparative periods are being restated.
In the signing of an agreement, the Company must consider if the contract is a lease, or contains a lease component. The contract is, or contains, a lease if it transfers the rights to control the use of an asset for a period of time in exchange of a consideration.
The Group leases equipment and commercial spaces, including stores and distribution centers, through cancelable and non-cancelable lease agreements. The agreements length vary substantially from 5 to 25 years.
The Group as a lessee
Company evaluates its agreements in order to identify the lease relationships of a right of use, considering the exceptions described in the standard as short-term agreements lower than twelve months and individual assets with amount lower than US$5 thousands.
Lease agreements are then recorded, at its beginning, as a Lease liability (note 21) against a Right of use (note 14 and 15), both by the present value of the minimum lease payments, using the implied interest rate in the agreement, or the incremental borrowing rate of the lessee.
The lease term utilized in the measurement relates to the term that the lessee is reasonably certain that will extend, or that will not extend, the lease relationship.
Subsequently, the payments made are allocated between financial interest and reduction of the liability, applying the interest rate in the balance of the liability. The financial interest is recognized as financial expenses.
The Right of Use of the lease agreements is amortized as expense, as incurred, during the lease term used for the lease estimation of the lease liabilities. The leasehold improvements made in our stores are amortized over their useful life, or the expected time for utilization of the asset limited in the cases where there is evidence of impossibility of extension of the lease term.
The contingent rentals are recognized as expenses as incurred.
40
Companhia Brasileira de Distribuição
Notes to the interim financial information
March 31, 2019
(In millions of Brazilian reais, unless otherwise stated)
5. Adoption of new accounting pronouncements, amendments and interpretations issued by IASB and CPC as from January 1, 2019 - Continued
5.1. Leases - Continued
Group as lessors
Lease agreements in which the Group does not transfer substantially all the risks and rewards of ownership of the asset are classified as operating lease. Rental income arising is accounted for on a straight-line basis over the lease terms and is included in revenue in the statement of profit or loss due to its operating nature. Initial direct costs incurred in negotiating an operating lease are accounted for as part of the carrying amount of the leased asset and amortized over the agreement term on the same basis as rental income.
Contingent rentals are recognized as revenue in the periods in which they are earned.
5.2. Presentation of the retrospective effects of the application of pronouncements
As the decision to adopt the full retrospective approach of CPC 06 (R2) (IFRS16) the comparative periods are being restated as follows:
Balance Sheet
Parent Company | |||
12.31.2018 | |||
As originally presented | IFRS16 effects | Restated | |
| |||
Assets held for sale | 2,014 | 53 | 2,067 |
Total current assets | 9,554 | 53 | 9,607 |
| |||
Deferred income tax and social contribution taxes | 172 | 219 | 391 |
Investments in subsidiaries and associates | 4,536 | (125) | 4,411 |
Property and equipment | 5,864 | 2,487 | 8,351 |
Intangible assets | 1,674 | 171 | 1,845 |
Total non-current assets | 15,228 | 2,752 | 17,980 |
Total Assets | 24,782 | 2,805 | 27,587 |
| |||
Borrowings and financing | 1,336 | (30) | 1,306 |
Lease liability | - | 404 | 404 |
Other current liabilities | 384 | (120) | 264 |
Total current liabilities | 8,523 | 254 | 8,777 |
| |||
Borrowings and financing | 3,403 | (113) | 3,290 |
Lease liability | - | 3,403 | 3,403 |
Provision for losses on investments in associates | 267 | 26 | 293 |
Total non-current liabilities | 5,176 | 3,316 | 8,492 |
|
|
|
|
Total liabilities | 13,699 | 3,570 | 17,269 |
| |||
Total Shareholders' Equity | 11,083 | (765) | 10,318 |
Total liabilities and shareholders' equity | 24,782 | 2,805 | 27,587 |
41
Companhia Brasileira de Distribuição
Notes to the interim financial information
March 31, 2019
(In millions of Brazilian reais, unless otherwise stated)
5. Adoption of new accounting pronouncements, amendments and interpretations issued by IASB and CPC as from January 1, 2019 -Continued
5.2. Presentation of the retrospective effects of the application of pronouncements - Continued
Consolidated | |||
12.31.2018 | |||
As originally presented | IFRS16 effects | Restated | |
| |||
Assets held for sale | 175 | (22) | 153 |
Total current assets | 24,443 | 4,577 | 29,020 |
| 36,304 | 4,555 | 40,859 |
Deferred income tax and social contribution taxes | |||
Investments in subsidiaries and associates | 207 | 281 | 488 |
Property and equipment | 59 | (42) | 17 |
Intangible assets | 9,650 | 3,470 | 13,120 |
Total non-current assets | 2,675 | 171 | 2,846 |
Total Assets | 16,545 | 3,880 | 20,425 |
| 52,849 | 8,435 | 61,284 |
Borrowings and financing | |||
Lease liability | 2,016 | (35) | 1,981 |
Other current liabilities | - | 465 | 465 |
Total current liabilities | 454 | (131) | 323 |
| 19,412 | 4,464 | 23,876 |
Borrowings and financing | 32,785 | 4,763 | 37,548 |
Lease liability | |||
Provision for losses on investments in associates | 3,509 | (117) | 3,392 |
Total non-current liabilities | - | 4,458 | 4,458 |
| 267 | 26 | 293 |
Total liabilities | 6,125 | 4,367 | 10,492 |
|
|
|
|
Total Shareholders' Equity | 38,910 | 9,130 | 48,040 |
Total liabilities and shareholders' equity | |||
Assets held for sale | 13,939 | (695) | 13,244 |
Total current assets | 52,849 | 8,435 | 61,284 |
42
Companhia Brasileira de Distribuição
Notes to the interim financial information
March 31, 2019
(In millions of Brazilian reais, unless otherwise stated)
5. Adoption of new accounting pronouncements, amendments and interpretations issued by IASB and CPC as from January 1, 2019 -Continued
5.2. Presentation of the retrospective effects of the application of pronouncements - Continued
Statement of Operations
Parent Company | |||
03.31.2018 | |||
As originally presented | IFRS16 effects | Restated | |
| |||
| |||
Cost of sales | (4,478) | 12 | (4,466) |
Gross profit | 1,760 | 12 | 1,772 |
Operating income (expenses) |
| ||
Selling expenses | (1,262) | 144 | (1,118) |
General and administrative expenses | (177) | 1 | (176) |
Depreciation and amortization | (155) | (75) | (230) |
Share of profit of associates | 136 | 22 | 158 |
Other operation expenses, net | (40) | 1 | (39) |
Profit from operations before net financial expenses | 262 | 105 | 367 |
Net financial expenses | (119) | (113) | (232) |
Income before income tax and social | 143 | (8) | 135 |
Income tax and social contribution | 18 | 8 | 26 |
Net income from continuing operations | 161 | - | 161 |
Net income (loss) from discontinued operations | (11) | - | (11) |
Net income for the period | 150 | - | 150 |
Attributable: |
| ||
Controlling shareholders – continuing operations | 161 | - | 161 |
Controlling shareholders – discontinued operations | (11) | - | (11) |
Total of controlling shareholders | 150 | - | 150 |
43
Companhia Brasileira de Distribuição
Notes to the interim financial information
March 31, 2019
(In millions of Brazilian reais, unless otherwise stated)
5. Adoption of new accounting pronouncements, amendments and interpretations issued by IASB and CPC as from January 1, 2019 -Continued
5.2. Presentation of the retrospective effects of the application of pronouncements - Continued
| Consolidated | ||
03.31.2018 | |||
As originally presented | IFRS16 effects | Restated | |
|
| ||
Cost of sales | (8,796) | 13 | (8,783) |
Gross profit | 2,547 | 13 | 2,560 |
Operating income (expenses) |
| ||
Selling expenses | (1,739) | 181 | (1,558) |
General and administrative expenses | (241) | 2 | (239) |
Depreciation and amortization | (210) | (94) | (304) |
Share of profit of associates | (33) | (3) | (36) |
Other operation expenses, net | (43) | 1 | (42) |
Profit from operations before net financial expenses | 281 | 100 | 381 |
Net financial expenses | (132) | (142) | (274) |
Income before income tax and social | 149 | (42) | 107 |
Income tax and social contribution | (41) | 11 | (30) |
Net income from continuing operations | 108 | (31) | 77 |
Net income (loss) from discontinued operations | 118 | 72 | 190 |
Net income for the period | 226 | 41 | 267 |
Attributable: | |||
Controlling shareholders – continuing operations | 108 | (31) | 77 |
Controlling shareholders – discontinued operations | 42 | 31 | 73 |
Total of Controlling shareholders | 150 | - | 150 |
Non-controlling shareholders – discontinued operations | 76 | 41 | 117 |
Total of non-controlling shareholders | 76 | 41 | 117 |
44
Companhia Brasileira de Distribuição
Notes to the interim financial information
March 31, 2019
(In millions of Brazilian reais, unless otherwise stated)
5. Adoption of new accounting pronouncements, amendments and interpretations issued by IASB and CPC as from January 1, 2019 -Continued
5.2. Presentation of the retrospective effects of the application of pronouncements - Continued
Statement of Cash Flows
Parent Company | |||
03.31.2018 | |||
As originally presented | IFRS16 effects | Restated | |
| |||
Net income for the period | 150 | - | 150 |
Deferred income tax | (22) | (8) | (30) |
Losses (gain) of disposals of property and equipment | 5 | 2 | 7 |
Depreciation/ Amortization | 166 | 89 | 255 |
Interest and inflation adjustments | 97 | 118 | 215 |
Share of profit (loss) of subsidiaries and associates | (136) | (22) | (158) |
Losses (gain) on lease liability write off | - | (3) | (3) |
Other liabilities | (22) | 45 | 23 |
Payments of borrowings and financing | (534) | 25 | (509) |
Payments of lease liability | - | (246) | (246) |
Consolidated | |||
03.31.2018 | |||
As originally presented | IFRS16 effects | Restated | |
| |||
Net income for the period | 226 | 41 | 267 |
Deferred income tax | 6 | 26 | 32 |
Losses (gain) of disposals of property and equipment | 15 | 2 | 17 |
Depreciation/ Amortization | 223 | 111 | 334 |
Interest and inflation adjustments | 205 | 246 | 451 |
Share of profit (loss) of subsidiaries and associates | 27 | 3 | 30 |
Losses (gain) on lease liability write off | - | (3) | (3) |
Other liabilities | 25 | 49 | 74 |
Payments of borrowings and financing | (1,904) | 40 | (1,864) |
Payments of lease liability | - | (515) | (515) |
5.3 ICPC 22
The interpretation of ICPC22 clarifies how to apply the recognition and measurement requirements of CPC 32 when there is uncertainty about tax treatments on profit. The interpretation was approved on December 21, 2018 and entered into force on January 1, 2019. Management concludes that there are no significant impacts as a result of the adoption of such interpretation.
45
Companhia Brasileira de Distribuição
Notes to the interim financial information
March 31, 2019
(In millions of Brazilian reais, unless otherwise stated)
6. Significant accounting judgments, estimates and assumptions
Judgments, estimates and assumptions
The preparation of the Company’s individual and consolidated interim financial information requires Management to make judgments, estimates and assumptions that affect the reported amounts of revenues, expenses, assets and liabilities, and the disclosure of contingent liabilities at the end of the reporting period; however, uncertainties about these assumptions and estimates may result in outcomes that require adjustments to the carrying amount of the affected asset or liability in future periods.
The significant assumptions and estimates used in the preparation of the individual and consolidated interim financial information for the three-month period ended March 31, 2019 were the same as those adopted in the individual and consolidated financial statements for the year ended December 31, 2018, except for the adoption of CPC 06 – R2 (IFRS 16) described in Note 5.1.
7. Cash and cash equivalents
The detailed information on cash and cash equivalents was presented in the annual financial statements for 2018, in note 7.
| Parent Company | Consolidated | |||||
Rate |
| 03.31.2019 | 12.31.2018 | 03.31.2019 | 12.31.2018 | ||
| |||||||
|
|
|
|
|
|
|
|
Cash and banks - Brazil |
| 171 | 345 | 296 | 406 | ||
Cash and banks - Abroad | (*) |
| 80 | 80 |
| 80 | 80 |
Short-term investments - Brazil | (**) |
| 1,343 | 2,510 |
| 1,983 | 3,883 |
| 1,594 | 2,935 | 2,359 | 4,369 | |||
(*) Refers to amounts deposited in the United States of America in US Dollars.
(**) Short-term investments as March 31, 2019 refer substantially to highly liquid investments accruing interest corresponding to a weighted average rate of 87.92% (85.78% on December 31, 2018) of the Interbank deposit Certificate ("CDI") and redeemable in terms of less than 90 days as of investment date.
8. Trade receivables
The detailed information on trade receivables was presented in the annual financial statements for 2018, in note 8.
Parent Company | Consolidated | ||||
03.31.2019 | 12.31.2018 | 03.31.2019 | 12.31.2018 | ||
Credit card companies | 234 | 19 | 329 | 38 | |
Credit card companies - related parties (note 12.2) | 201 | 37 |
| 218 | 58 |
Sales vouchers | 74 | 68 | 155 | 128 | |
Private label credit card | 45 | 52 | 47 | 53 | |
Receivables from related parties (note 12.2) | 25 | 39 | 15 | 15 | |
Receivables from suppliers | 43 | 64 | 66 | 101 | |
Allowance for doubtful accounts (note 8.1) | (2) | (1) | (5) | (5) | |
620 | 278 | 825 | 388 | ||
|
| ||||
Current | 560 | 274 |
| 765 | 384 |
Noncurrent | 60 | 4 |
| 60 | 4 |
|
|
|
|
|
|
|
|
|
|
|
|
46
Companhia Brasileira de Distribuição
Notes to the interim financial information
March 31, 2019
(In millions of Brazilian reais, unless otherwise stated)
8. Trade receivables- Continued
8.1. Allowance for doubtful accounts
Parent Company | Consolidated | ||||
03.31.2019 | 03.31.2018 | 03.31.2019 | 03.31.2018 | ||
At the beginning of the period | (1) | (3) | (5) | (6) | |
Allowance booked for the period | (1) | - | (123) | (177) | |
Write-off of receivables | - | 2 | 147 | 154 | |
Assets held for sale and discontinuedoperations (note 31) | - | - | (24) | 25 | |
At the end of the period | (2) | (1) | (5) | (4) | |
Below is the aging list of consolidated gross receivables, by maturity period:
Overdue receivables - Consolidated | ||||||
Total | Not overdue | <30 days | 30-60 days | 61-90 days | >90 days | |
03.31.2019 | 830 | 802 | 14 | 2 | 3 | 9 |
12.31.2018 | 393 | 362 | 10 | 5 | 5 | 11 |
9. Other receivables
The detailed information on cash and cash equivalents was presented in the annual financial statements for 2018, in note 9.
Parent Company | Consolidated | ||||
03.31.2019 | 12.31.2018 | 03.31.2019 | 12.31.2018 | ||
|
|
|
| ||
Accounts receivable from insurers | 224 | 213 |
| 229 | 213 |
Receivable from the sale of subsidiaries | 86 | 82 | 86 | 82 | |
Lease receivable | 39 | 40 |
| 42 | 44 |
Receivable from sale of real estate properties | 33 | 40 | 33 | 40 | |
Other | 53 | 58 | 62 | 67 | |
Allowance for doubtful accounts | (14) | (14) |
| (16) | (16) |
421 | 419 | 436 | 430 | ||
|
| ||||
Current | 292 | 291 | 307 | 302 | |
Noncurrent | 129 | 128 | 129 | 128 | |
47
Companhia Brasileira de Distribuição
Notes to the interim financial information
March 31, 2019
(In millions of Brazilian reais, unless otherwise stated)
9. Other receivables- Continued
9.1. Allowance for doubtful accounts
| Parent Company | Consolidated | |||
| 03.31.2019 | 03.31.2018 | 03.31.2019 | 03.31.2018 | |
|
|
|
|
| |
At the beginning of the period | (14) | (10) | (16) | (12) | |
Write-off of receivables | - | 1 | 5 | 13 | |
Assets held for sale and discontinued operations (note 31) | - | - |
| (5) | (12) |
At the end of the period | (14) | (9) |
| (16) | (11) |
10. Inventories
The detailed information on inventories was presented in the annual financial statements for 2018, in note 10.
Parent Company | Consolidated | ||||
03.31.2019 | 12.31.2018 | 03.31.2019 | 12.31.2018 | ||
Stores | 2,248 | 2,206 | 4,162 | 4,162 | |
Distribution centers | 1,263 | 1,431 | 1,614 | 1,807 | |
Real estate inventories | - | - | 2 | 5 | |
Allowance for losses on inventory obsolescence and damages (note 10.1) | (30) | (31) | (46) | (65) | |
3,481 | 3,606 |
| 5,732 | 5,909 | |
10.1.Allowance for losses on inventory obsolescence and damages
Parent Company | Consolidated | ||||
03.31.2019 | 03.31.2018 | 03.31.2019 | 03.31.2018 | ||
At the beginning of the period | (31) | (36) | (65) | (73) | |
Additions | (3) | - | (28) | (25) | |
Write-offs | 4 | 1 | 41 | 44 | |
Assets held for sale and discontinuedoperations (note 31) | - | - | 6 | 4 | |
At the end of the period | (30) | (35) | (46) | (50) | |
48
Companhia Brasileira de Distribuição
Notes to the interim financial information
March 31, 2019
(In millions of Brazilian reais, unless otherwise stated)
11. Recoverable taxes
The detailed information on recoverable taxes was presented in the annual financial statements for 2018, in note 11.
Parent Company | Consolidated | ||||
03.31.2019 | 12.31.2018 | 03.31.2019 | 12.31.2018 | ||
State VAT tax credits – ICMS | 1,371 | 1,326 | 2,396 | 2,335 | |
Provision for non-realization to ICMS (VAT) tax credits | - | - |
| (35) | (28) |
Social Integration Program/Contribution for Social Security Financing-PIS/COFINS | 511 | 461 | 780 | 717 | |
Social Security Contribution - INSS | 301 | 295 |
| 330 | 328 |
Income tax and social contribution prepayments | 19 | 38 |
| 33 | 52 |
Other | 10 | 9 | 20 | 20 | |
Total | 2,212 | 2,129 | 3,524 | 3,424 | |
|
|
|
|
|
|
Current | 331 | 316 |
| 648 | 679 |
Noncurrent | 1,881 | 1,813 | 2,876 | 2,745 | |
|
|
|
|
|
|
11.1.State VAT (ICMS) is expected to be realized as follows (net of provision):
In | Parent Company | Consolidated |
Up to one year | 104 | 244 |
From 1 to 2 years | 145 | 390 |
From 2 to 3 years | 149 | 418 |
From 3 to 4 years | 156 | 415 |
From 4 to 5 years | 150 | 218 |
More than 5 years | 667 | 676 |
| 1,371 | 2,361 |
The Group understands that future realization of ICMS tax credits is probable based on a feasibility study, on the expectation of future growth and the expected offset against tax debts from its operations. The projections on the realization of ICMS balances are revised at least annually by the occasion of the annual strategic planning approved by the Company’s Board of Directors. For the quarter ended March 31, 2019, management has implemented monitoring controls over the progress of the plan annually established, assessing and including new elements that contribute to the recoverability of ICMS tax credits, net of provision of R$35, as shown in the table above:
49
Companhia Brasileira de Distribuição
Notes to the interim financial information
March 31, 2019
(In millions of Brazilian reais, unless otherwise stated)
12. Related parties
12.1.Management and Advisory Committees compensation
The expenses related to management compensation (officers appointed pursuant to the Bylaws including members of the Board of Directors and advisory committees) for the three-months period ended March 31, 2019 and 2018, were as follows:
In thousands of Brazilian reais
Base salary | Variable compensation | Stock option plan | Total | ||||||||
2019 | 2018 | 2019 | 2018 | 2019 | 2018 | 2019 | 2018 | ||||
Board of directors (*) | 4,612 | 1,396 | - | - | - | - | 4,612 | 1,396 | |||
Executive officers | 8,537 | 7,722 |
| 3,344 | 5,192 |
| 4,997 | 3,203 |
| 16,878 | 16,117 |
Fiscal Council | - | 171 |
| - | - |
| - | - |
| - | 171 |
13,149 | 9,289 | 3,344 | 5,192 | 4,997 | 3,203 | 21,490 | 17,684 | ||||
(*) Includes the compensation of the Board of Directors’ advisory committees (Human Resources and Compensation, Audit, Finance, Sustainable Development and Corporate Governance).
50
Companhia Brasileira de Distribuição
Notes to the interim financial information
March 31, 2019
(In millions of Brazilian reais, unless otherwise stated)
12. Related parties– Continued
12.2. Balances and transactions with related parties.
The detailed information on related parties was presented in the annual financial statements for 2018, in note 12.
Parent company | ||||||||||||||
Balances | Transactions | |||||||||||||
Trade receivables | Other assets | Trade payables | Other liabilities | Revenues (expenses) | ||||||||||
2019 | 2018 | 2019 | 2018 | 2019 | 2018 | 2019 | 2018 | 2019 | 2018 | |||||
|
|
|
|
|
|
|
|
|
|
|
|
|
|
|
Controlling shareholders: |
|
|
|
|
| |||||||||
Casino | 10 | 10 | - | - |
| 1 | 2 | 12 | 1 | (15) | (15) | |||
Euris | - | - | - | - | - | - | 1 | - | (1) | (1) | ||||
Helicco | - | - |
| - | - |
| - | - |
| 3 | 3 |
| (3) | - |
Subsidiaries: |
|
|
|
|
| |||||||||
Novasoc Comercial | - | - |
| 47 | 45 |
| - | - |
| 2 | 2 |
| - | - |
Sendas Distribuidora | 10 | 23 | 76 | 94 | 9 | 11 | - | - | 19 | 17 | ||||
SCB Distribuição e Comércio | - | - |
| 4 | 96 |
| - | - |
| - | - |
| - | - |
Via Varejo | 5 | 6 | 19 | 16 | 4 | 11 | 118 | 105 | (18) | (21) | ||||
James Delivery | - | - | 3 | - | - | - | - | - | - | - | ||||
Cnova Brasil | - | - | - | - | - | - | 1 | - | - | 1 | ||||
GPA M&P | - | - | 2 | 3 | - | - | 13 | 13 | - | - | ||||
GPA Logística | - | - | 62 | 59 | 2 | 4 | 52 | 50 | - | - | ||||
Bellamar | - | - |
| 1 | 1 |
| - | - |
| - | - |
| - | - |
Associates |
|
|
|
|
| |||||||||
FIC | 201 | 37 | 29 | 26 | 16 | 21 | - | - | 22 | 41 | ||||
Other related parties |
|
|
|
|
|
|
|
|
|
|
|
|
|
|
Greenyellow do Brasil Energia e Serviços Ltda(“Greenyellow”) (i) | - | - |
| - | - |
| - | - |
| 142 | 142 |
| (11) | 12 |
Others | - | - |
| 1 | 1 |
| - | - |
| - | - |
| - | - |
Total | 226 | 76 |
| 244 | 341 |
| 32 | 49 |
| 344 | 316 |
| (7) | 34 |
|
|
|
|
|
|
|
|
|
|
|
|
|
|
|
|
|
|
|
|
|
|
|
|
|
|
|
|
|
|
(i) Amount refers to acquisition of products and services with purpose the Company’s energy efficience.
51
Companhia Brasileira de Distribuição
Notes to the interim financial information
March 31, 2019
(In millions of Brazilian reais, unless otherwise stated)
12. Related parties– Continued
12.2.Balances and transactions with related parties – Continued
Consolidated | ||||||||||||||
| Balances |
| Transactions | |||||||||||
Trade receivables | Other assets | Trade payables | Other liabilities | Revenues (expenses) | ||||||||||
2019 | 2018 | 2019 | 2018 | 2019 | 2018 | 2019 | 2018 | 2019 | 2018 | |||||
|
|
|
|
|
|
|
|
|
|
|
|
|
|
|
Controlling shareholders |
|
|
|
| ||||||||||
Casino | 15 | 15 |
| - | - |
| 1 | 2 |
| 13 | 1 |
| (15) | (15) |
Euris | - | - |
| - | - |
| - | - |
| 1 | - |
| (1) | (1) |
Helicco | - | - |
| - | - |
| - | - |
| 3 | 3 |
| (3) | - |
Associates |
|
|
|
|
|
|
|
|
| |||||
FIC | 218 | 58 |
| 38 | 33 |
| 28 | 31 |
| - | - |
| 38 | 52 |
Other related parties |
|
|
|
|
|
|
|
|
|
|
|
|
|
|
Greenyellow do Brasil Energia e Serviços Ltda (Greenyellow) | - | - |
| - | - |
| - | - |
| 142 | 141 |
| (11) | (12) |
Others | - | - |
| 1 | 1 |
| - | - |
| - | - |
| - | - |
Total | 233 | 73 |
| 39 | 34 |
| 29 | 33 |
| 159 | 145 |
| 8 | 24 |
52
Companhia Brasileira de Distribuição
Notes to the interim financial information
March 31, 2019
(In millions of Brazilian reais, unless otherwise stated)
13. Investments in subsidiaries and associates
The detailed information on investments was presented in the annual financial statements for 2018, in note 13.
13.1. Breakdown of investments
Parent Company | |||||||
Sendas | Novasoc | Via Varejo | Bellamar | SCB | Others | Total (*) | |
| |||||||
Balances at 12.31.2018 | 4,210 | 1 | - | 207 | 75 | (224) | 4,269 |
Adjustment related to IFRS 16 | (125) | - | - | - | - | (26) | (151) |
Balances at 12.31.2018 - restated | 4,085 | 1 | - | 207 | 75 | (250) | 4,118 |
Share of profit of subsidiaries and associates | 159 | (1) | 34 | 19 | (8) | (45) | 158 |
Dividends and interest on own capital | (50) | - | - | (9) | - | - | (59) |
Stock options | 2 | - | 1 | - | - | - | 3 |
Capital increase | - | - | - | - | 142 | - | 142 |
Capital increase with property and equipment | 67 | - | - | - | - | - | 67 |
Share of other comprehensive income | - | - | - | - | - | 2 | 2 |
Disposal of interest | - | - | (190) | - | - | (101) | (291) |
Assets held for sale and discontinued operations (note 31) | - | - | 155 | - | - | 101 | 256 |
Balances at 03.31.2019 | 4,263 | - | - | 217 | 209 | (293) | 4,396 |
Parent Company | ||||||
| Sendas | Novasoc | Via Varejo | Bellamar | Others | Total (*) |
| ||||||
Balances at 12.31.2017 | 3,119 | 5 | - | 155 | (129) | 3,150 |
Adjustment related to IFRS 16 | (102) | - | - | - | (11) | (113) |
Balances at 12.31.2017 - restated | 3,017 | 5 | - | 155 | (140) | 3,037 |
Share of profit of subsidiaries and associates | 109 | (1) | 89 | 11 | (50) | 158 |
Stock options | 4 | - | 4 | - | 1 | 9 |
Share of other comprehensive income | - | - | (3) | - | (6) | (9) |
Assets held for sale and discontinued operations (note 31) | - | - | (90) | - | - | (90) |
Balances at 03.31.2018 - restated | 3,130 | 4 | - | 166 | (195) | 3,105 |
(*) Includes the effects of on the provision for losses on investments in associates in Luxco of R$330 on March, 31 2019 (R$261 on March 31, 2018).
| Consolidated | |
| 03.31.2019 | 03.31.2018 |
|
| Restated |
Balances in the beginning of the period | (64) | (39) |
Adjustment related to IFRS 16 | (26) | (11) |
Balances in the beginning of the period – restated | (90) | (50) |
Share of profit of associates – Continuing operations | (17) | (36) |
Share of profit of associates – Discontinued operations | 10 | 6 |
Share of other comprehensive income | 2 | (7) |
Dividends and interest on own capital – continuing operations | (9) | - |
Dividends and interest on own capital - discontinued operations | (3) | - |
Assets held for sale and discontinued operations (note 31) | (7) | (6) |
Balances at the end of the period | (114) | (93) |
|
|
|
53
Companhia Brasileira de Distribuição
Notes to the interim financial information
March 31, 2019
(In millions of Brazilian reais, unless otherwise stated)
14. Property and equipment
The detailed information on property and equipment was presented in the annual financial statements for 2018, in note 14.
|
| Parent company | |||||
Balance at 12.31.2018 | Additions | Remeasurement | Depreciation | Write-offs | Transfers | Balance at 03.31.2019 | |
| Restated |
|
|
|
|
|
|
Land | 991 | - | - | - | - | (26) | 965 |
Buildings | 1,179 | 1 | - | (11) | - | (16) | 1,153 |
Leasehold improvements | 2,033 | 2 | - | (48) | - | 54 | 2,041 |
Machinery and equipment | 861 | 12 | - | (41) | (20) | 40 | 852 |
Facilities | 275 | 6 | - | (10) | - | - | 271 |
Furniture and fixtures | 357 | 6 | - | (15) | (1) | 15 | 362 |
Construction in progress | 115 | 123 | - | - | - | (152) | 86 |
Other | 32 | 4 | - | (3) | - | (1) | 32 |
Total | 5,843 | 154 | - | (128) | (21) | (86) | 5,762 |
|
|
|
|
|
|
| |
Lease - right of use: |
|
|
|
|
|
|
|
IT equipment | 4 | - | - | - | - | - | 4 |
Buildings | 2,504 | - | 76 | (99) | (19) | - | 2,462 |
2,508 | - | 76 | (99) | (19) | - | 2,466 | |
Total | 8,351 | 154 | 76 | (227) | (40) | (86) | 8,228 |
|
| Parent company | |||||
Balance at 12.31.2017 | Additions | Remeasurement | Depreciation | Write-offs | Transfers | Balance at 03.31.2018 | |
| Restated |
|
|
|
|
| Restated |
Land | 1,094 | - | - | - | - | 7 | 1,101 |
Buildings | 1,333 | 1 | - | (12) | - | (7) | 1,315 |
Leasehold improvements | 2,142 | 4 | - | (51) | - | 44 | 2,139 |
Machinery and equipment | 904 | 1 | - | (43) | (5) | 33 | 890 |
Facilities | 306 | - | - | (10) | - | 1 | 297 |
Furniture and fixtures | 365 | 1 | - | (15) | - | 19 | 370 |
Construction in progress | 79 | 51 | - | - | - | (91) | 39 |
Other | 41 | 5 | - | (3) | - | (6) | 37 |
Total | 6,264 | 63 | - | (134) | (5) | - | 6,188 |
|
|
|
|
|
| ||
Lease - right of use: |
|
|
|
|
|
| |
IT equipment | 5 | - | - | - | (1) | - | 4 |
Buildings | 2,590 | 1 | 57 | (89) | (1) | - | 2,558 |
2,595 | 1 | 57 | (89) | (2) | - | 2,562 | |
Total | 8,859 | 64 | 57 | (223) | (7) | - | 8,750 |
|
|
|
|
|
|
|
|
54
Companhia Brasileira de Distribuição
Notes to the interim financial information
March 31, 2019
(In millions of Brazilian reais, unless otherwise stated)
14. Property and equipment– Continued
| Parent Company | ||||||
Balance at 03.31.2019 |
| Balance at 12.31.2018 | |||||
Cost | Accumulated depreciation | Net |
| Cost | Accumulated depreciation | Net | |
|
|
|
|
|
| Restated |
|
Land | 965 | - | 965 |
| 991 | - | 991 |
Buildings | 1,879 | (726) | 1,153 |
| 1,898 | (719) | 1,179 |
Leasehold improvements | 3,716 | (1,675) | 2,041 |
| 3,666 | (1,633) | 2,033 |
Machinery and equipment | 2,272 | (1,420) | 852 |
| 2,247 | (1,386) | 861 |
Facilities | 589 | (318) | 271 |
| 583 | (308) | 275 |
Furniture and fixtures | 962 | (600) | 362 |
| 945 | (588) | 357 |
Construction in progress | 86 | - | 86 |
| 115 | - | 115 |
Other | 139 | (107) | 32 |
| 136 | (104) | 32 |
10,608 | (4,846) | 5,762 |
| 10,581 | (4,738) | 5,843 | |
|
|
|
| ||||
Lease - right of use: |
|
|
|
| |||
IT equipment | 4,837 | (2,375) | 2,462 |
| 4,799 | (2,295) | 2,504 |
Buildings | 40 | (36) | 4 |
| 40 | (36) | 4 |
4,877 | (2,411) | 2,466 |
| 4,839 | (2,331) | 2,508 | |
Total | 15,485 | (7,257) | 8,228 |
| 15,420 | (7,069) | 8,351 |
|
| Consolidated | ||||||
Balance at 12.31.2018 | Additions | Remensura-tion | Depreciation | Write-offs | Transfers | Assets held for sale and discontinued operations (*) | Balance at 03.31.2019 | |
| Restated |
|
|
|
|
|
|
|
Land | 1,366 | 21 | - | - | - | (1) | - | 1,386 |
Buildings | 1,773 | 28 | - | (15) | - | 26 | - | 1,812 |
Leasehold improvements | 3,843 | 73 | - | (77) | (10) | 89 | (21) | 3,897 |
Machinery and equipment | 1,308 | 36 | - | (61) | (19) | 58 | (21) | 1,301 |
Facilities | 501 | 13 | - | (14) | (1) | 6 | (3) | 502 |
Furniture and fixtures | 595 | 22 | - | (23) | (1) | 25 | (9) | 609 |
Construction in progress | 176 | 170 | - | - | (1) | (228) | 7 | 124 |
Other | 59 | 9 | - | (6) | - | 5 | (3) | 64 |
Total | 9,621 | 372 | - | (196) | (32) | (20) | (50) | 9,695 |
|
|
|
|
|
|
| ||
Lease - right of use: |
|
|
|
|
|
|
| |
Equipment | 9 | - | - | (1) | - | - | - | 8 |
Buildings | 3,490 | 35 | 149 | (123) | (38) | - | (35) | 3,478 |
3,499 | 35 | 149 | (124) | (38) | - | (35) | 3,486 | |
Total | 13,120 | 407 | 149 | (320) | (70) | (20) | (85) | 13,181 |
55
Companhia Brasileira de Distribuição
Notes to the interim financial information
March 31, 2019
(In millions of Brazilian reais, unless otherwise stated)
14. Property and equipment– Continued
|
| Consolidated | ||||||
Balance at 12.31.2017 | Additi-ons | Remea-surement | Depre-ciation | Write-offs | Transfers | Assets held for sale and discontinued operations (*) | Balance at 03.31.2018 | |
| Restated |
|
|
|
|
|
| Restated |
Land | 1,362 | - | - | - | - | 7 | - | 1,369 |
Buildings | 1,770 | 34 | - | (15) | - | (7) | - | 1,782 |
Leasehold improvements |
3,492 | 57 | - | (73) | (1) | 62 | (4) | 3,533 |
Machinery and equipment | 1,262 | 28 | - | (60) | (7) | 54 | (21) | 1,256 |
Facilities | 487 | 11 | - | (13) | (6) | 8 | (2) | 485 |
Furniture and fixtures | 540 | 18 | - | (21) | - | 26 | (7) | 556 |
Construction in progress | 126 | 106 | - | - | - | (149) | (7) | 76 |
Other | 64 | 9 | - | (6) | (9) | (7) | 9 | 60 |
Total | 9,103 | 263 | - | (188) | (23) | (6) | (32) | 9,117 |
|
|
|
|
|
|
| ||
Lease - right of use: |
|
|
|
|
|
|
| |
Equipment | 15 | - | - | (1) | (1) | - | - | 13 |
Buildings | 3,435 | 80 | 147 | (111) | (2) | - | (61) | 3,488 |
3,450 | 80 | 147 | (112) | (3) | - | (61) | 3,501 | |
Total | 12,553 | 343 | 147 | (300) | (26) | (6) | (93) | 12,618 |
(*) See note 31.
| Consolidated | ||||||
Balance at 03.31.2019 | Balance at 12.31.2018 | ||||||
Cost | Accumulated depreciation | Net | Cost | Accumulated depreciation | Net | ||
|
|
|
|
|
| Restated |
|
Land | 1,386 | - | 1,386 | 1,366 | - | 1,366 | |
Buildings | 2,636 | (824) | 1,812 | 2,585 | (812) | 1,773 | |
Leasehold improvements | 5,991 | (2,094) | 3,897 | 5,868 | (2,025) | 3,843 | |
Machinery and equipment | 3,004 | (1,703) | 1,301 | 2,957 | (1,649) | 1,308 | |
Facilities | 879 | (377) | 502 | 865 | (364) | 501 | |
Furniture and fixtures | 1,322 | (713) | 609 | 1,287 | (692) | 595 | |
Construction in progress | 124 | - | 124 | 176 | - | 176 | |
Other | 216 | (152) | 64 | 206 | (147) | 59 | |
15,558 | (5,863) | 9,695 | 15,310 | (5,689) | 9,621 | ||
|
|
| |||||
Lease - right of use: |
|
|
|
| |||
Equipment | 83 | (75) | 8 | 82 | (73) | 9 | |
Buildings | 6,310 | (2,832) | 3,478 | 6,218 | (2,728) | 3,490 | |
6,393 | (2,907) | 3,486 | 6,300 | (2,801) | 3,499 | ||
Total | 21,951 | (8,770) | 13,181 | 21,610 | (8,490) | 13,120 | |
56
Companhia Brasileira de Distribuição
Notes to the interim financial information
March 31, 2019
(In millions of Brazilian reais, unless otherwise stated)
14. Property and equipment– Continued
14.1. Capitalized borrowing costs
The consolidated capitalized borrowing costs for the three-months period ended March 31, 2019 were R$4 (R$3 for the three-months period ended March 31, 2018). The rate used to determine the borrowing costs eligible for capitalization was 101.87% of the CDI (101.50% of the CDI for the period ended March 31, 2018), corresponding to the effective interest rate on the Company’s borrowings.
14.2. Additions to property and equipment for cash flow presentation purposes:
Parent Company |
| Consolidated | |||
03.31.2019 | 03.31.2018 |
| 03.31.2019 | 03.31.2018 | |
|
| Restated |
|
| Restated |
Additions | 154 | 64 |
| 407 | 343 |
Lease | - | (1) |
| (35) | (80) |
Capitalized borrowing costs | (1) | (1) |
| (7) | (3) |
Property and equipment financing - Additions | (121) | (31) |
| (284) | (170) |
Property and equipment financing - Payments | 162 | 116 |
| 414 | 266 |
Total | 194 | 147 |
| 495 | 356 |
14.3.Other information
On March 31, 2019, the Company and its subsidiaries recorded in the cost of sales the amount of R$32 in the parent company (R$24 on March 31, 2018) and R$37 in consolidated (R$31 on March 31, 2018) related to the depreciation, machinery, buildings and facilities related to the distribution centers.
The Company monitored the plan for impairment test performed on December 31, 2018 and there were no significant discrepancies indicating loss or need to perform a new impairment test on March 31,2019.
15. Intangible assets
The detailed information on intangible assets was presented in the annual financial statements for 2018, in note 15.
| Parent Company | ||||
Balance at 12.31.2018 | Additions | Amortization | Transfers | Balance at 03.31.2019 | |
| Restated |
|
|
|
|
|
|
|
|
|
|
Goodwill - retail | 542 | - | - | - | 542 |
Commercial rights - retail | 64 | - | - | - | 64 |
Software and implementation | 563 | 18 | (22) | 21 | 580 |
Total | 1,169 | 18 | (22) | 21 | 1,186 |
|
|
|
|
|
|
Lease - right of use: |
|
|
|
|
|
Right of use Paes Mendonça (**) | 568 | - | (9) | - | 559 |
Software | 108 | - | (9) | - | 99 |
676 | - | (18) | - | 658 | |
Total | 1,845 | 18 | (40) | 21 | 1,844 |
57
Companhia Brasileira de Distribuição
Notes to the interim financial information
March 31, 2019
(In millions of Brazilian reais, unless otherwise stated)
15. Intangible assets– Continued
|
| Consolidated | |||||
Balance at 12.31.2018 | Addi-tions | Amorti-zation | Write-offs | Transfer | Assets held for sale and discontinued operations (*) | Balance at 03.31.2019 | |
Restated |
|
|
|
|
|
| |
Goodwill - retail | 1,148 | - | - | - | - | - | 1,148 |
Brands | 39 | - | - | - | - | - | 39 |
Commercial rights | 129 | 24 | - | - | - | - | 153 |
Software | 621 | 71 | (24) | (3) | 19 | (44) | 640 |
Total | 1,937 | 95 | (24) | (3) | 19 | (44) | 1,980 |
|
|
|
|
|
| ||
Lease - right of use: |
|
|
|
|
|
|
|
Right of use Paes Mendonça (**) | 799 | - | (11) | - | - | - | 788 |
Software | 110 | - | (10) | (1) | - | 1 | 100 |
| 909 | - | (21) | (1) | - | 1 | 888 |
Total | 2,846 | 95 | (45) | (4) | 19 | (43) | 2,868 |
(*) See note 31.
(**) Related to leases and operations agreements of some stores. The Company has the contractual right to operate these stores for 30 years.
In the Parent Company, the balance of accumulated cost on March 31, 2019 is R$3,414 (R$3,377 on December 31, 2018) and of accumulated amortization R$1,570 (R$1,532 on December 31, 2018). In the Consolidated the balance of accumulated cost on March 31, 2019 is R$4,729 (R$4,663 on December 31, 2018) and of accumulated amortization R$1,861 (R$1,817 on December 31, 2018).
15.1. Impairment testing of goodwill, brands and intangible assets with indefinite useful life
Goodwill and intangible assets were tested for impairment as of December 31, 2018 according to the method described in note 4 - Significant accounting policies, in the financial statements for the year ended December 31, 2018.
The Company monitored the plan used to assess the impairment as of December 31, 2018 and has not observed any significant changes that would indicate the need to perform a new impairment test as of March 31, 2019.
15.2. Additions to intangible assets for cash flow presentation purposes:
Parent Company |
| Consolidated | |||
03.31.2019 | 03.31.2018 |
| 03.31.2019 | 03.31.2018 | |
|
|
|
|
|
|
Additions | 18 | 25 |
| 95 | 80 |
Intangible assets financing - Additions | - | - |
| (22) | - |
Intangible assets financing - Payments | - | - |
| 47 | - |
Total | 18 | 25 |
| 120 | 80 |
58
Companhia Brasileira de Distribuição
Notes to the interim financial information
March 31, 2019
(In millions of Brazilian reais, unless otherwise stated)
16. Borrowings and financing
The detailed information on borrowings and financing was presented in the annual financial statements for 2018, in note 17.
16.1. Debt breakdown
Parent Company |
| Consolidated | ||||
Weighted average rate | 03.31.2019 | 12.31.2018 |
| 03.31.2019 | 12.31.2018 | |
Debentures and promissory note |
|
|
|
|
|
|
Debentures and Certificate of Agribusiness Receivables (note 16.4) | 101.90% of CDI (i) | 4,957 | 4,146 |
| 4,957 | 4,146 |
|
| 4,957 | 4,146 |
| 4,957 | 4,146 |
|
|
|
|
|
|
|
Borrowings and financing |
|
|
|
|
|
|
Local currency |
|
|
|
|
|
|
BNDES | 3.91% per year | 5 | 6 |
| 34 | 37 |
Working capital | 94.83% of CDI | 68 | 238 |
| 68 | 238 |
Working capital | TR (ii) + 9.80% per year | 18 | 17 |
| 109 | 112 |
Swap contracts (note 16.7) | 101.40% of CDI | 11 | (2) |
| 1 | (11) |
Borrowing costs | - | - |
| (2) | (3) | |
102 | 259 |
| 210 | 373 | ||
Foreign currency (note 16.5) |
|
|
| |||
Working capital | USD + 3.33% per year | 190 | 189 |
| 1,046 | 843 |
Working capital | EURO + 0.85% per year | 307 | - |
| 307 | - |
Swap contracts (note 16.7) | 104.58% of CDI | (41) | (33) |
| (81) | (76) |
456 | 156 |
| 1,272 | 767 | ||
Total | 5,515 | 4,561 |
| 6,439 | 5,286 | |
|
|
|
|
|
|
|
Current assets |
| 7 | - |
| 54 | 43 |
Noncurrent assets |
| 36 | 35 |
| 46 | 44 |
Current liabilities |
| 1,459 | 1,306 |
| 2,342 | 1,981 |
Noncurrent liabilities |
| 4,099 | 3,290 |
| 4,197 | 3,392 |
(i) CDI – Certificate of interbank deposit
(ii)TR – Referential rate
59
Companhia Brasileira de Distribuição
Notes to the interim financial information
March 31, 2019
(In millions of Brazilian reais, unless otherwise stated)
16. Borrowings and financing– Continued
16.2. Changes in borrowings
| Parent Company |
| Consolidated |
At December 31, 2018 | 4,704 |
| 5,438 |
Adjustment IFRS 16 | (143) |
| (152) |
Restated beginning balance | 4,561 |
| 5,286 |
Additions - working capital | 1,299 |
| 2,734 |
Accrued interest | 78 |
| 161 |
Accrued swap | 7 |
| 9 |
Mark-to-market | - |
| (1) |
Monetary and exchange rate changes | 8 |
| 11 |
Borrowing costs | 2 |
| 2 |
Interest paid | (70) |
| (148) |
Payments | (369) |
| (1,624) |
Swap paid | (1) |
| (4) |
Liabilities related to assets held for sale and discontinued operations (note 31) | - |
| 13 |
At March 31, 2019 | 5,515 |
| 6,439 |
|
|
|
|
|
|
|
|
| Parent Company |
| Consolidated |
At December 31, 2017 | 4,087 |
| 4,560 |
Adjustment IFRS 16 | (181) |
| (195) |
Restated beginning balance | 3,906 |
| 4,365 |
Additions - working capital | 1,213 |
| 2,633 |
Accrued interest | 67 |
| 157 |
Accrued swap | 2 |
| 4 |
Mark-to-market | - |
| (7) |
Monetary and exchange rate changes | 5 |
| 5 |
Borrowing costs | 3 |
| 3 |
Interest paid | (41) |
| (135) |
Payments | (415) |
| (1,672) |
Swap paid | (53) |
| (57) |
Liabilities related to assets held for sale and discontinued operations (note 31) | - |
| (5) |
At March 31, 2018 - Restated | 4,687 |
| 5,291 |
16.3. Maturity schedule of noncurrent borrowings and financing
Year | Parent Company | Consolidated | |
|
|
|
|
From 1 to 2 years | 2,040 |
| 2,059 |
From 2 to 3 years | 1,515 |
| 1,533 |
From 3 to 4 years | 503 |
| 520 |
From 4 to 5 years | 3 |
| 14 |
After 5 years | 4 |
| 29 |
Subtotal | 4,065 |
| 4,155 |
|
|
| |
Borrowing costs | (2) |
| (4) |
Total | 4,063 |
| 4,151 |
60
Companhia Brasileira de Distribuição
Notes to the interim financial information
March 31, 2019
(In millions of Brazilian reais, unless otherwise stated)
16. Borrowings and financing– Continued
16.4. Debentures, Promissory Note and Certificate of Agribusiness Receivables
Date | Parent Company and Consolidated | ||||||||
Type | Issue Amount | Outstanding debentures (units) | Issue | Maturity | Annual financial charges | Unit price (in reais) | 03.31.2019 | 12.31.2018 | |
13th Issue of Debentures – CBD and CRA | No preference | 1,012 | 1,012,500 | 12/20/16 | 12/20/19 | 97.50% of CDI | 1,016 | 1,029 | 1,014 |
14th Issue of Debentures – CBD and CRA | No preference | 1,080 | 1,080,000 | 04/17/17 | 04/13/20 | 96.00% of CDI | 1,028 | 1,110 | 1,094 |
15th Issue of Debentures – CBD | No preference | 800 | 800,000 | 01/17/18 | 01/15/21 | 104.75% of CDI | 1,013 | 810 | 824 |
16th Issue of Debentures – CBD – 1st serie | No preference | 700 | 700,000 | 09/11/18 | 09/10/21 | 106.00% of CDI | 1,004 | 703 | 714 |
16th Issue of Debentures – CBD – 2nd serie | No preference | 500 | 500,000 | 09/11/18 | 09/12/22 | 107.40% of CDI | 1,004 | 502 | 510 |
4th Issue of Promissory note - CBD | No preference | 800 | 800 | 01/10/19 | 01/09/22 | 105.75% of CDI | 1,014,157 | 811 | - |
Borrowing cost | (8) | (10) | |||||||
Parent Company/Consolidated | 4,957 | 4,146 | |||||||
|
|
|
|
|
|
|
|
|
|
Current liabilities | 1,067 | 1,068 | |||||||
Noncurrent liabilities | 3,890 | 3,078 | |||||||
61
Companhia Brasileira de Distribuição
Notes to the interim financial information
March 31, 2019
(In millions of Brazilian reais, unless otherwise stated)
16. Borrowings and financing– Continued
16.5.Borrowings in foreign currencies
On March 31, 2019 GPA had loans in foreign currencies (dollar and euro) to strengthen its working capital, maintain its cash strategy, lengthening its debt profile and make investments, being the last due date in September, 2020.
16.6.Guarantees
The Company has signed promissory notes for some loan contracts.
16.7.Swap contracts
The Company use swap transactions for 100% of its borrowings denominated in US dollars, euros and fixed interest rates, exchanging these obligations for Real linked to CDI (floating) interest rates. These contracts have the same debt due date and protect the interest and principal and are signed, with the same economic group. The weighted average annual rate of CDI in March 2019 was 6.34% (8.39% in March 31, 2018).
16.8.Financial covenants
In connection with the debentures and promissory notes and for a portion of borrowings denominated in foreign currencies, GPA is required to maintain certain debt financial covenants. These ratios are quarterly calculated based on consolidated financial statements of the Company prepared in accordance with accounting practices adopted in Brazil, as follows: (i) net debt (debt minus cash and cash equivalents and trade accounts receivable) should not exceed the amount of equity and (ii) consolidated net debt/EBITDA ratio should be lower than or equal to 3.25. At March 31, 2019, GPA was in compliance with these covenants.
16.9.Total Return Swap ("TRS")
The Company sold 50,000,000 shares representing a 3.8% stake in Via Varejo through an auction at B3 on December 27, 2018 for the amount of R$ 218. On December 21, 2018 a contract was signed with a bank foreseeing the sale described and defining a Total Return Swap ("TRS") on the same number of shares. The contract was fully settled during the month of February.
On February 20, 2019, the Board of Directors approved a new TRS agreement authorizing the sale of 40,000,000 (forty million) of shares of Via Varejo held by the Company, corresponding to 3.09%, for the amount of R$200. This auction was made at B3 on February 25, 2019. Although the ownership of the shares was transferred to the Bank, the Group bears the risk on changes to the market value of the shares in future sales made by the bank, which, based on IFRS 9, determines that the shares should not be derecognized. As of March 31, 2019, the unpaid balance is R$ 69.
62
Companhia Brasileira de Distribuição
Notes to the interim financial information
March 31, 2019
(In millions of Brazilian reais, unless otherwise stated)
17. Financial instruments
The detailed information on financial instruments was presented in the annual financial statements for 2018, in note 18.
The main financial instruments and their carrying amounts in the interim financial information, by category, are as follows:
Parent Company |
| Consolidated | |||
Carrying amount |
| Carrying amount | |||
03.31.2019 | 12.31.2018 |
| 03.31.2019 | 12.31.2018 | |
|
| Restated |
|
| Restated |
Financial assets: |
|
|
|
|
|
Amortized cost |
|
|
|
|
|
Related parties - assets | 244 | 341 |
| 39 | 34 |
Trade receivables and other receivables | 578 | 627 |
| 641 | 695 |
Fair value through profit or loss |
|
|
|
|
|
Cash and cash equivalents | 1,594 | 2,935 |
| 2,359 | 4,369 |
Financial instruments – Fair value hedge | 43 | 35 |
| 100 | 87 |
Fair value through other comprehensive income |
|
|
|
|
|
Trade receivables with credit card companies and sales vouchers | 463 | 70 |
| 620 | 123 |
Financial liabilities: |
|
|
|
|
|
Other financial liabilities - amortized cost |
|
|
|
|
|
Related parties -liabilities | (344) | (316) |
| (159) | (145) |
Trade payables | (3,541) | (5,604) |
| (6,481) | (9,246) |
Financing for purchase of assets | (26) | (68) |
| (47) | (149) |
Debentures | (4,957) | (4,146) |
| (4,957) | (4,146) |
Borrowings and financing | (85) | (244) |
| (43) | (271) |
Lease liability | (3,711) | (3,807) |
| (4,867) | (4,923) |
Fair value through profit or loss |
|
|
|
|
|
Loans and financing (Hedge accounting) | (503) | (206) |
| (1,519) | (956) |
Financial instruments – Fair Value Hedge | (13) | - |
| (20) | - |
The fair value of other financial liabilities detailed in table above approximates the carrying amount based on the existing terms and conditions. The borrowings and financing measured at amortized cost, the related fair values of which differ from the carrying amounts, are disclosed in note 17.3.
17.1. Considerations on risk factors that may affect the business of the Company and its subsidiaries
(i) Capital risk management
The main objective of the Company’s capital management is to ensure that the Company sustains its credit rating and a well-defined equity ratio, in order to support businesses and maximize shareholder value. The Company manages the capital structure and makes adjustments taking into account changes in the economic conditions.
63
Companhia Brasileira de Distribuição
Notes to the interim financial information
March 31, 2019
(In millions of Brazilian reais, unless otherwise stated)
17. Financial instruments- Continued
17.1. Considerations on risk factors that may affect the business of the Company and its subsidiaries - Continued
There were no changes as to objectives, policies or processes during the quarter ended on March 31, 2019. The capital structure is presented as follows:
Parent Company | Consolidated | ||||
03.31.2019 | 12.31.2018 |
| 03.31.2019 | 12.31.2018 | |
|
| Restated |
|
| Restated |
Cash and cash equivalents | 1,594 | 2,935 |
| 2,359 | 4,369 |
Financial instruments – Fair value hedge | 43 | 35 |
| 100 | 87 |
Borrowings and financing | (5,558) | (4,596) |
| (6,539) | (5,373) |
Other liabilities with related parties (*) | (138) | (138) |
| (138) | (138) |
Net debt | (4,059) | (1,764) |
| (4,218) | (1,055) |
|
|
|
|
|
|
Shareholders’ equity | (10,395) | (10,318) |
| (13,680) | (13,244) |
|
|
|
|
|
|
Net debt to equity ratio | 39% | 17% |
| 31% | 8% |
(*) Represents the trade payable to Greenyellow related purchase of equipment.
(ii) Liquidity risk management
The Company manages liquidity risk through the daily analysis of cash flows, control of maturities of financial assets and liabilities.
The table below summarizes the aging profile of the Company’s financial liabilities as of March 31, 2019.
a) Parent Company
Up to 1 Year | 1 – 5 years | More than 5 years | Total | |
Borrowings and financing | 533 | 215 | 7 | 755 |
Debentures and promissory note | 1,279 | 4,372 | - | 5,651 |
Derivative financial instruments | 10 | (37) | - | (27) |
Lease liability | 839 | 3,245 | 1,512 | 5,596 |
Trade payables | 3,541 | - | - | 3,541 |
Total | 6,202 | 7,795 | 1,519 | 15,516 |
b) Consolidated
| Up to 1 Year | 1 – 5 years | More than 5 years | Total |
Borrowings and financing | 1,446 | 304 | 49 | 1,799 |
Debentures and promissory note | 1,279 | 4,372 | - | 5,651 |
Derivative financial instruments | (35) | (43) | (2) | (80) |
Lease liability | 1,033 | 4,007 | 2,856 | 7,896 |
Trade payables | 6,481 | - | - | 6,481 |
Total | 10,204 | 8,640 | 2,903 | 21,747 |
64
Companhia Brasileira de Distribuição
Notes to the interim financial information
March 31, 2019
(In millions of Brazilian reais, unless otherwise stated)
17. Financial instruments– Continued
17.1. Considerations on risk factors that may affect the business of the Company and its subsidiaries - Continued
(iii) Derivative financial instruments
| Consolidated | |||||
| Notional value |
| Fair value | |||
| 03.31.2019 | 12.31.2018 |
| 03.31.2019 | 12.31.2018 | |
Swap with hedge |
|
|
|
|
| |
Hedge object (debt) | 1,380 | 883 |
| 1,519 | 955 | |
|
|
|
|
|
| |
Long position (buy) |
|
|
|
|
|
|
Prefixed rate | TR+9.80% per year | 127 | 127 |
| 109 | 112 |
US$ + fixed | USD+3.33% per year | 953 | 756 |
| 1,046 | 843 |
EUR + fixed | EUR+0.85%peryear | 300 | - |
| 307 | - |
| 1,380 | 883 |
| 1,462 | 955 | |
Short position (sell) |
|
|
|
|
| |
| 104.34% of CDI | (1,380) | (883) |
| (1,382) | (868) |
|
|
|
|
|
|
|
Hedge position - asset |
| - | - |
| 100 | 87 |
Hedge position - liability |
| - | - |
| (20) | - |
Net hedge position | - | - |
| 80 | 87 | |
Realized and unrealized gains and losses on these contracts during the quarter ended on March 31, 2019 are recorded as financial income (expenses), net and the balance receivable at fair value is R$80 (balance payable of R$87 as of December 31, 2018), recorded in line item “Financial Instruments – Fair Value Hedge” in the assets and “Borrowings and financing” in the liabilities.
The effects of the fair value hedge recorded in the Statement of Operations for the period ended March 31, 2019 were a gain of R$4 (gain of R$42 as of March 31, 2018).
17.2. Sensitivity analysis of financial instruments
According to the Management’s assessment, the most probable scenario is what the market has been estimating through market curves (currency and interest rates) of B3, on the maturity dates of each transaction. Therefore, in the probable scenario (I), there is no impact on the fair value of financial instruments. For scenarios (II) and (III), for the sensitivity analysis effect, according to CVM rules, a deterioration of 25% and 50%, respectively, on risk variables, up to one year of the financial instruments.
For the probable scenario, weighted exchange rate was R$4.11 on the due date, and the weighted interest rate weighted was 6.56% per year.
In case of derivative financial instruments (aiming at hedging the financial debt), changes in scenarios are accompanied by respective hedges, indicating effects are not significant according to the table below:
65
Companhia Brasileira de Distribuição
Notes to the interim financial information
March 31, 2019
(In millions of Brazilian reais, unless otherwise stated)
17. Financial instruments– Continued
17.2. Sensitivity analysis of financial instruments – Continued
The Company disclosed the net exposure of the derivatives financial instruments, corresponding to financial instruments and certain financial instruments in the sensitivity analysis table below, to each of the scenarios mentioned.
|
|
| Market projection | |||||||
Operations |
| Risk (CDI variation) |
| Balance at 03.31.2019 |
| Scenario I | Scenario II | Scenario III | ||
|
|
| ||||||||
Fair value hedge of fixed rate |
| 101.4% of CDI |
| (110) |
| (205) |
| (209) |
| (212) |
Fair value hedge of exchange rate |
| 104.58% of CDI |
| (1,272) |
| (1,378) |
| (1,381) |
| (1,411) |
Debentures |
| 105.81% of CDI |
| (2,826) |
| (3,025) |
| (3,075) |
| (3,125) |
Debentures (1st issue CRA) |
| 97.5% of CDI |
| (1,029) |
| (1,101) |
| (1,119) |
| (1,137) |
Debentures (2nd issue CRA) |
| 96% of CDI |
| (1,110) |
| (1,188) |
| (1,207) |
| (1,227) |
Bank loans |
| 94.83% of CDI |
| (67) |
| (72) |
| (73) |
| (74) |
Total borrowings and financing exposure |
|
| (6,414) |
| (6,969) |
| (7,064) |
| (7,186) | |
|
|
|
|
|
|
|
|
| ||
|
|
|
|
|
|
|
|
|
|
|
Cash and cash equivalents (*) |
| 87.92% of CDI |
| 1,983 |
| 2,111 |
| 2,143 |
| 2,175 |
Net exposure |
|
| (4,431) |
| (4,858) |
| (4,921) |
| (5,011) | |
Net effect - loss |
|
|
|
| (427) |
| (490) |
| (580) | |
(*) Weighted average
17.3. Fair value measurements
The Company discloses the fair value of financial instruments measured at fair value and of financial instruments measured at amortized cost, the fair value of which differ from the carrying amount, in accordance with CPC 46 (“IFRS13”), which refer to the requirements of measurement and disclosure.
The fair values of cash and cash equivalents, trade receivables and trade payables are equivalent to their carrying amounts.
66
Companhia Brasileira de Distribuição
Notes to the interim financial information
March 31, 2019
(In millions of Brazilian reais, unless otherwise stated)
17. Financial instruments– Continued
17.3. Fair value measurements - Continued
The table below presents the fair value hierarchy of financial assets and liabilities measured at fair value and of financial instruments measured at amortized cost, the fair value of which is disclosed in the financial statements:
Carrying amount | Fair value |
| |
| 03.31.2019 | 03.31.2019 | Level |
Financial assets and liabilities |
|
| |
Trade receivables with credit card companies and sales vouchers (FVOCI) | 620 | 620 | 2 |
Cross-currency interest rate swaps | 81 | 81 | 2 |
Interest rate swaps | (1) | (1) | 2 |
Borrowings and financing (FVPL) | (1,519) | (1,519) | 2 |
Borrowings and financing (amortized cost) | (5,000) | (4,992) | 2 |
Total | (5,819) | (5,811) |
|
There were no changes between the fair value measurements levels in the quarter ended on March 31, 2019.
Cross-currency and interest rate swaps and borrowings and financing are classified in level 2 since the fair value of such financial instruments was determined based on readily observable market inputs, such as expected interest rate and current and future foreign exchange rate.
67
Companhia Brasileira de Distribuição
Notes to the interim financial information
March 31, 2019
(In millions of Brazilian reais, unless otherwise stated)
17. Financial instruments– Continued
17.4. Consolidated position of derivative transactions
The consolidated position of outstanding derivative financial instruments are presented in the table below:
Outstanding | Amount payable or receivable |
| Fair value | ||||||
Description | Counterparties | Notional value | Contractual date | Maturity | 03.31.2019 | 12.31.2018 |
| 03.31.2019 | 12.31.2018 |
|
|
|
|
|
|
|
|
| |
Exchange swaps registered with CETIP |
| ||||||||
(US$ x CDI) |
| ||||||||
|
|
|
|
|
|
|
|
| |
Scotiabank | US$ 50 | 09/29/2017 | 09/29/2020 | 38 | 37 |
| 34 | 33 | |
| Banco Tokyo | US$ 100 | 12/12/2017 | 12/12/2019 | 54 | 52 |
| 46 | 42 |
| Bradesco | US$ 70 | 06/18/2018 | 06/13/2019 | 3 | �� 3 |
| - | 1 |
| Scotiabank | US$ 50 | 01/03/2019 | 12/27/2019 | (4) | - |
| (6) | - |
| Itaú BBA | EUR $ 26 | 03/22/2019 | 12/02/2019 | 2 | - |
| 3 | - |
| Itaú BBA | EUR $ 44 | 03/22/2019 | 12/02/2019 | 4 | - |
| 4 | - |
|
|
|
|
| |||||
Interest rate swap registered with CETIP |
|
|
|
|
| ||||
(pre-fixed rate x CDI) |
|
|
|
|
| ||||
Itaú BBA | R$ 21 | 11/11/2014 | 11/5/2026 | 1 | 1 |
| 2 | 2 | |
Itaú BBA | R$ 54 | 1/14/2015 | 1/5/2027 | 2 | 3 |
| 5 | 5 | |
Itaú BBA | R$ 52 | 5/26/2015 | 5/5/2027 | 3 | 2 |
| 5 | 4 | |
| Santander | R$ 13 | 02/21/2019 | 04/18/2019 | (13) | - |
| (13) | - |
90 | 98 |
| 80 | 87 | |||||
71
68
Companhia Brasileira de Distribuição
Notes to the interim financial information
March 31, 2019
(In millions of Brazilian reais, unless otherwise stated)
18. Taxes and contributions payable and taxes payable in installments
The detailed information on taxes and contributions payable and taxes payable in installments was presented in the annual financial statements for 2018, in note 19.
18.1. Taxes and contributions payable and taxes payable in installments
Parent Company | Consolidated | ||||
03.31.2019 | 12.31.2018 | 03.31.2019 | 12.31.2018 | ||
Taxes payable in installments - Law 11,941/09 | 413 | 432 |
| 413 | 432 |
Taxes payable in installments – PERT | 166 | 169 |
| 166 | 169 |
ICMS | 41 | 62 |
| 71 | 88 |
PIS and COFINS | 6 | 4 |
| 8 | 8 |
Provision for income tax and social contribution | 2 | 26 |
| 104 | 115 |
Withholding income tax | 1 | 1 |
| 2 | 2 |
INSS | 1 | 1 |
| 3 | 4 |
Other | 33 | 12 |
| 44 | 23 |
663 | 707 |
| 811 | 841 | |
|
|
|
|
| |
Current | 216 | 236 |
| 364 | 370 |
Noncurrent | 447 | 471 |
| 447 | 471 |
18.2. Maturity schedule of taxes payable in installments in noncurrent liabilities:
Parent Company and Consolidated | |
From 1 to 2 years | 76 |
From 2 to 3 years | 102 |
From 3 to 4 years | 84 |
From 4 to 5 years | 78 |
After 5 years | 107 |
| 447 |
69
Companhia Brasileira de Distribuição
Notes to the interim financial information
March 31, 2019
(In millions of Brazilian reais, unless otherwise stated)
19. Income tax and social contribution
19.1.Income tax and social contribution expense reconciliation
The detailed information on income tax and social contribution was presented in the annual financial statements for 2018, in note 20.
Parent Company | Consolidated | ||||
03.31.2019 | 03.31.2018 | 03.31.2019 | 03.31.2018 | ||
Restated | Restated | ||||
Income before income tax and social contribution | 128 | 135 |
| 169 | 107 |
Expense of income tax and social contribution at the nominal rate of 25% for the Company and 34% for subsidiaries | (32) | (34) |
| (63) | (43) |
Tax penalties | (3) | (2) |
| (3) | (2) |
Share of profit of associates | 40 | 40 |
| (2) | (7) |
Interest on own capital (*) | 48 | 23 |
| 48 | 23 |
Tax benefits | 2 | - |
| 6 | - |
Other permanent differences | (5) | (1) |
| (5) | (1) |
Effective income tax and social contribution | 50 | 26 |
| (19) | (30) |
|
|
|
|
| |
Income tax and social contribution for the period: |
|
|
|
|
|
Current | (8) | (4) |
| (109) | (32) |
Deferred | 58 | 30 |
| 90 | 2 |
Deferred income tax and social contribution expense | 50 | 26 |
| (19) | (30) |
Effective rate | -39.06% | -19.26% |
| 11.24% | 28.04% |
CBD does not pay social contribution based on a final favorable court decision in the past, therefore its nominal rate is 25%.
(*) Effect of income tax on interest on own capital paid.
The Group calculates the period income tax expense using the tax rate that would be applicable to the expected total annual earnings. Such policy is in accordance with IAS 34 / CPC 21 (R1). This rule requests the companies recognize the income tax expense in its interim statements with the same base used in the complete annual financial statement.
70
Companhia Brasileira de Distribuição
Notes to the interim financial information
March 31, 2019
(In millions of Brazilian reais, unless otherwise stated)
19. Income tax and social contribution- Continued
19.2. Breakdown of deferred income tax and social contribution
Parent Company | |||||||
03.31.2019 |
| 12.31.2018 | |||||
Asset | Liability | Net |
| Asset | Liability | Net | |
|
|
|
|
| Restated | ||
Tax losses and negative basis of social contribution | 173 | - | 173 |
| 167 | - | 167 |
Provision for risks | 237 | - | 237 |
| 230 | - | 230 |
Goodwill tax amortization | - | (56) | (56) |
| - | (56) | (56) |
Mark-to-market adjustment | 3 | - | 3 |
| 2 | - | 2 |
Technological innovation – future realization | - | (9) | (9) |
| - | (10) | (10) |
Depreciation of fixed assets as per tax rates | - | (126) | (126) |
| - | (125) | (125) |
Unrealized gains with tax credits | - | (93) | (93) |
| - | (88) | (88) |
Timing difference on adoption of IFRS 16 | 226 | - | 226 |
| 219 | - | 219 |
Other | 66 | (10) | 56 |
| 60 | (8) | 52 |
Deferred income tax and social contribution assets (liabilities) | 705 | (294) | 411 |
| 678 | (287) | 391 |
|
|
|
|
|
|
|
|
Compensation | (294) | 294 | - |
| (287) | 287 | - |
Deferred income tax and social contribution assets (liabilities), net | 411 | - | 411 |
| 391 | - | 391 |
|
|
|
|
|
|
|
|
Consolidated | |||||||
03.31.2019 |
| 12.31.2018 | |||||
Asset | Liability | Net |
| Asset | Liability | Net | |
|
|
|
|
| Restated | ||
Tax losses and negative basis of social contribution | 211 | - | 211 |
| 198 | - | 198 |
Provision for risks | 307 | - | 307 |
| 292 | - | 292 |
Goodwill tax amortization | - | (604) | (604) |
| - | (601) | (601) |
Mark-to-market adjustment | - | (1) | (1) |
| - | (1) | (1) |
Technological innovation – future realization | - | (9) | (9) |
| - | (10) | (10) |
Depreciation of fixed assets as per tax rates | - | (128) | (128) |
| - | (128) | (128) |
Unrealized gains with tax credits | - | (206) | (206) |
| - | (222) | (222) |
Timing difference on adoption of IFRS 16 | 300 | - | 300 |
| 281 | - | 281 |
Other | 103 | (16) | 87 |
| 112 | (14) | 98 |
Deferred income tax and social contribution assets (liabilities) | 921 | (964) | (43) |
| 883 | (976) | (93) |
|
|
|
|
|
|
|
|
Compensation | (403) | 403 | - |
| (395) | 395 | - |
Deferred income tax and social contribution assets (liabilities), net | 518 | (561) | (43) |
| 488 | (581) | (93) |
71
Companhia Brasileira de Distribuição
Notes to the interim financial information
March 31, 2019
(In millions of Brazilian reais, unless otherwise stated)
19. Income tax and social contribution– Continued
19.2. Breakdown ofdeferred income tax and social contribution – Continued
The Company estimates to recover these deferred tax assets as follows:
Parent Company | Consolidated | |
Year | ||
Up to one year | 264 | 347 |
From 1 to 2 years | 235 | 281 |
From 2 to 3 years | 179 | 222 |
From 3 to 4 years | 27 | 71 |
705 | 921 |
19.3. Changes in deferred income tax and social contribution
Parent Company | Consolidated | ||||
03.31.2019 | 03.31.2018 | 03.31.2019 | 03.31.2018 | ||
|
| Restated |
|
| Restated |
At the beginning of the period | 172 | 112 |
| (374) | (269) |
Adjustment related to IFRS 16 | 219 | 216 |
| 281 | 266 |
Restated opening balance | 391 | 328 |
| (93) | (3) |
Expense for the period – continuing operations | 58 | 30 |
| 90 | 2 |
Expense for the period – discontinued operations | - | - |
| (89) | (34) |
Income tax related to OCI - continuing operations | 3 | - |
| 3 | - |
Income tax related to OCI - discontinued operations | - | - |
| 16 | 23 |
Non-controlling interest transaction (see note 23.4) | (42) | - |
| (42) | - |
Assets held for sale and discontinued operations (see note 31) | - | - |
| 73 | 11 |
Other | 1 | - |
| (1) | 1 |
At the end of the period | 411 | 358 |
| (43) | - |
72
Companhia Brasileira de Distribuição
Notes to the interim financial information
March 31, 2019
(In millions of Brazilian reais, unless otherwise stated)
20. Provision for contingencies
The provision for contingencies is estimated by the Company’s management, supported by its legal counsel. The provision was recognized in an amount considered sufficient to cover probable losses.
20.
20.1. Parent Company
PIS/COFINS | Taxes and other | Social security and labor | Civil | Regulatory | Total | |
Balance at December 31, 2018 | 84 | 595 | 231 | 62 | 15 | 987 |
|
|
|
|
|
|
|
Additions | 29 | 33 | 21 | 9 | 4 | 96 |
Payments | - | (1) | (8) | (4) | (3) | (16) |
Reversals | (24) | (6) | (20) | (4) | (4) | (58) |
Monetary adjustment | 1 | 6 | 7 | 3 | 1 | 18 |
|
|
|
|
|
|
|
Balance at March 31, 2019 | 90 | 627 | 231 | 66 | 13 | 1,027 |
| PIS/COFINS | Taxes and other | Social security and labor | Civil | Regulatory | Total |
Balance at December 31, 2017 | 73 | 363 | 274 | 81 | 21 | 812 |
|
|
|
|
|
|
|
Additions | - | 44 | 27 | 13 | 6 | 90 |
Payments | - | - | (12) | (4) | (4) | (20) |
Reversals | - | (7) | (13) | (14) | (6) | (40) |
Monetary adjustment | 1 | 3 | 8 | 3 | 1 | 16 |
|
|
|
|
|
| |
Balance at March 31, 2018 | 74 | 403 | 284 | 79 | 18 | 858 |
20.2. Consolidated
PIS/COFINS | Taxes and other | Social security and labor | Civil | Regulatory | Total | |
Balance at December 31, 2018 | 86 | 742 | 291 | 89 | 27 | 1,235 |
|
|
|
|
|
|
|
Additions | 29 | 34 | 183 | 60 | 5 | 311 |
Payments | - | (1) | (151) | (34) | (3) | (189) |
Reversals | (133) | (10) | (69) | (25) | (6) | (243) |
Monetary adjustment | (4) | 8 | 28 | 7 | 1 | 40 |
Liabilities related to assets held for sale and discontinued operations (see Note 31) | 113 | (1) | 11 | (3) | 1 | 121 |
|
|
|
|
|
|
|
Balance at March 31, 2019 | 91 | 772 | 293 | 94 | 25 | 1,275 |
|
|
|
|
|
| |
| PIS/COFINS | Taxes and other | Social security and labor | Civil | Regulatory | Total |
Balance at December 31, 2017 | 74 | 563 | 331 | 105 | 34 | 1,107 |
|
|
|
|
|
|
|
Additions | 3 | 45 | 209 | 67 | 10 | 334 |
Payments | (1) | - | (123) | (24) | (5) | (153) |
Reversals | - | (11) | (64) | (49) | (8) | (132) |
Monetary adjustment | 2 | 5 | 28 | 10 | 2 | 47 |
Liabilities related to assets held for sale and discontinued operations (see Note 31) | (3) | (2) | (37) | (5) | (1) | (48) |
|
|
|
|
|
|
|
Balance at March 31, 2018 | 75 | 600 | 344 | 104 | 32 | 1,155 |
76
73
Companhia Brasileira de Distribuição
Notes to the interim financial information
March 31, 2019
(In millions of Brazilian reais, unless otherwise stated)
20. Provision for contingencies- Continued
20.3. Tax
As per prevailing legislation, tax claims are subject to monetary indexation, which refers to an adjustment to the provision based on tax to the indexation rates used by each tax jurisdiction. In all cases, both the interest charges and fines, when applicable, were computed and fully provisioned with respect to unpaid amounts.
The main provisioned tax claims are as follows:
20.3.1. PIS and COFINS
Regarding the remainder accrued amount for other discussions related to PIS and COFINS includes challenging of tax offset and other small amounts, as of March 31, 2019 represent R$127, being R$91 of continuing operations and R$36 of discontinued operations (R$234 as of December 31, 2018, being R$86 of continuing operation and R$148 of discontinued operations).
20.3.2. Tax
After entering in the Special program for installment, remained other tax claims, which according to the analysis of external legal counsel, were accrued by the Company. These refer to: (i) challenge on the non-application of the Accident Prevention Factor - FAP; (ii) challenge on the State Finance Department on the ICMS tax rate calculated on electric energy bills; (iii) undue credit; (iv)non-payment of social security contributions on benefits granted to its employees, as a result of an unfavorable decision before the Court; (v) other minor issues. The amount accrued for these matters as of March 31, 2019 is R$364 of continuing operation (R$341 as of December 31, 2018, being R$340 of continuing operation and R$1 of discontinued operations).
ICMS
The Federal Supreme Court ("STF") on October 16, 2014 decided that ICMS taxpayers that trade products included in the “basic food basket” have no right to fully utilize the ICMS credits. The Company, with the assistance of its legal counsel, decided to record a provision for this matter amounting to R$84 as of March 31, 2019 (R$92 as of December 31, 2018) since this claim was considered a “probable” loss. The amounts accrued represent Management’s best estimate of the probable cash disbursement to settle this claim.
Additionally, there are cases assessed by São Paulo State tax authorities related to the refund of ICMS over tax substitution without proper compliance with accessory tax obligations introduced by CAT Administrative Rule 17. Considering recent court decisions the Company accrued R$233 (R$221 in December 31, 2018) representing the best estimation of probable loss evaluated by management based on documentation evidence aspect of the claims.
20.3.3. Supplementary Law 110/2001
The Company claims in court the eligibility to not pay the contributions related to the Government Severance Indemnity Fund for Employees (“FGTS”) costs. The accrued amount as of March 31, 2019 is R$92 being R$91 of continuing operation and R$1 of discontinued operations (R$89 of continuing operation as of December 31, 2018 being R$88 of continuing operation and R$1 of discontinued operations).
74
Companhia Brasileira de Distribuição
Notes to the interim financial information
March 31, 2019
(In millions of Brazilian reais, unless otherwise stated)
20. Provision for contingencies– Continued
20.3. Tax – Continued
20.3.4. Other contingent tax claims - Via Varejo
It was recorded as a result of the business combination with Via Varejo, as required by CPC 15 (R1)/(IFRS 3). As of March 31, 2019, the balance was R$93 (R$92 as of December 31, 2018). These accrued claims refer to administrative proceedings related to the offset of tax debts against credits from the contribution levied on coffee exports.
20.4.Labor
The Company and its subsidiaries are parties to various labor lawsuits mainly due to termination of employees in the ordinary course of business. At March 31, 2019, the Company recorded a provision of R$982, being R$293 for continuing operations and R$689 for discontinued operations (R$991 as of December 31, 2018, being R$291 for continuing operations and R$700 for discontinued operations). Management, with the assistance of its legal counsel, assessed these claims and recorded a provision for losses when reasonably estimable, based on past experiences in relation to the amounts claimed.
20.5.Civil and others
The Company and its subsidiaries are parties to civil lawsuits at several court levels (indemnities and collections, among others) and at different courts. The Company’s management records provisions in amounts considered sufficient to cover unfavorable court decisions, when its legal counsel considers the loss as probable.
Among these lawsuits, we point out the following:
· The Company and its subsidiaries are parties to various lawsuits requesting the renewal of rental agreements and the review of the current rent paid. The Company recognizes a provision for the difference between the amount originally paid and the amounts claimed by the adverse party in the lawsuit, when internal and external legal counsel consider that it is probable that the rent amount will be changed by the Company. As of March 31, 2019, the amount accrued for these lawsuits is R$96, being R$55 for continuing operations and R$41 for discontinued operations (R$94 as of December 31, 2018, being R$49 for continuing operations and R$45 for discontinued operations), for which there are no escrow deposits.
· The Company and its subsidiaries are parties to legal claims related to penalties applied by regulatory agencies, from the Federal, State and Municipal Administrations, among which includes Consumer Protection Agencies (Procon), National Institute of Metrology, Standardization and Industrial Quality (INMETRO) and Municipalities and some lawsuits involving contract terminations with suppliers. Company supported by its legal counsel, assessed these claims, and recorded a provision according to probable cash expending and estimative of loss .On March 31, 2019 the amount of this provision is R$35, being R$25 for continuing operations and R$10 for discontinued operations (R$37 on December 31, 2018, being R$27 for continuing operations and R$10 for discontinued operations).
75
Companhia Brasileira de Distribuição
Notes to the interim financial information
March 31, 2019
(In millions of Brazilian reais, unless otherwise stated)
20. Provision for contingencies – Continued
20.5. Civil and others - Continued
· As of March 31, 2019, the amount accrued related to other civil matters is R$119, being R$ 39 for continuing operation R$80 for discontinued operations (R$113 as of December 31, 2018, being R$ 40 for continuing operation R$73 for discontinued operations).
Total civil lawsuits and others as of March 31, 2019 amount to R$250, being R$119 for continuing operations and R$131 for discontinued operations (R$244 as of December 31, 2018, being R$ 116 for continuing operations and R$128 for discontinued operations).
20.6. Possible contingent liabilities
The Company has other litigations which have been analyzed by the legal counsel and considered as possible loss and, therefore, have not been accrued. The possible litigations updated balance is of R$12,356, being R$10,601 for continuing operations and R$1,755 for discontinued operations as of March 31, 2019 (R$12,292 as of December 31, 2018, being R$10,671 for continuing operations and R$1,621 for discontinued operations), and are mainly related to:
· INSS (Social Security Contribution) – GPA was assessed for non-levy of payroll charges on benefits granted to its employees, among other matters, for which possible loss amounts to R$456, being R$423 for continuing operations and R$33 for discontinued operations as of March 31, 2019 (R$453 as of December 31, 2018, being R$420 for continuing operations and R$33 for discontinued operations). The lawsuits are under administrative and court discussions.
· IRPJ, withholding income tax - IRRF, CSLL, tax on financial transactions - IOF, withholding income tax on net income – GPA has several assessment notices regarding offsetting proceedings, rules on the deductibility of provisions, payment divergences and overpayments; fine for failure to comply with accessory obligations, among other less significant taxes. Among those claims, there are one tax assessment related to the tax deduction of goodwill in the years of 2012 and 2013, originated by the acquisition of Ponto Frio (goodwill Mandala) accrued in the year of 2009. The restated amount of the assessment notice correspond to R$90 of income tax and social contribution (R$89 at December 31, 2018). The lawsuits await administrative and court ruling. The amount involved is R$1,188, being R$1,031 for continuing operations and R$157 for discontinued operations as of March 31, 2019 (R$1,177 as of December 31, 2018, being R$1,021 for continuing operations and R$156 for discontinued operations).
· COFINS, PIS and IPI – the Company has been challenged about offsets of IPI credits acquired from third parties with a final and an-appeal over the decision, fine for failure to comply with accessory obligations, disallowance of COFINS and PIS credits on one-phase products (“produtos monofásicos”), among others less significant taxes. These lawsuits await decision at the administrative and court levels. The amount involved in these assessments is R$2,562, being R$1,999 for continuing operations and R$563 for discontinued operations as March 31, 2019 (R$2,430 as of December 31, 2018, being R$1,985 for continuing operations and R$445 for discontinued operations).
76
Companhia Brasileira de Distribuição
Notes to the interim financial information
March 31, 2019
(In millions of Brazilian reais, unless otherwise stated)
20. Provision for contingencies– Continued
20.6. Other non-accrued contingent liabilities – Continued
· ICMS – GPA received tax assessment notices by the State tax authorities regarding: (i) utilization of electric energy credits; (ii) purchases from suppliers considered not qualified in the State Finance Department registry; (iii) levied on its own operation of merchandise purchase (own ICMS)) – article 271 of ICMS by-law; (iv) resulting from sale of extended warranty, (v) resulting from financed sales; and (vi) among other matters. The total amount of these assessments is R$7,371, being R$6,581 for continuing operations and R$790 for discontinued operations as of March 31, 2019 (R$7,357 as of December 31, 2018, being R$6,582 for continuing operations and R$775 for discontinued operations), which await a final decision at the administrative and court levels.
· Municipal service tax - ISS, Municipal Real Estate Tax (“IPTU”), rates, and others – these refer to assessments on withholdings of third parties, IPTU payment divergences, fines for failure to comply with accessory obligations, ISS – reimbursement of advertising expenses and sundry taxes, in the amount of R$290 being R$149 for continuing operations and R$141 for discontinued operations as March 31, 2019 (R$290 as of December 31, 2018, being R$150 for continuing operations and R$140 for discontinued operations), which await decision at the administrative and court levels.
· Other litigations – these refer to administrative proceedings and lawsuits in which the Company claims the renewal of rental agreements and setting of rents according to market values and actions in the civil court, special civil court, Consumer Protection Agency - PROCON (in many States), Institute of Weights and Measure - IPEM, National Institute of Metrology, Standardization and Industrial Quality - INMETRO and National Health Surveillance Agency - ANVISA, among others, amounting to R$489, being R$418 for continuing operations and R$71 for discontinued operations as March 31, 2019 (R$585 as of December 31, 2018, being R$513 for continuing operations and R$72 discontinued operations).
The Company has litigations related to challenges by tax authorities on the income tax payment, for which, based on management and legal assessment, the Company has the right of indemnization from its former and current shareholders, related to years from 2007 to 2013, under allegation that had improper deduction of goodwill amortizations. These assessments amount R$1,374 on March 31, 2019 (R$1,317 on December 31, 2018).
The Company engages external legal counsel to represent it in the tax assessments, whose fees are contingent upon a percentage to be applied to the amount of success in the final outcome of these lawsuits. This percentage may vary according to qualitative and quantitative factors of each claim, and as of March 31, 2019 the estimated amount, in case of success in all lawsuits, is approximately R$207, being R$183 for continuing operations and R$24 for discontinued operations (R$209 as of December 31, 2018, being R$186 for continuing operations and R$23 for discontinued operations).
77
Companhia Brasileira de Distribuição
Notes to the interim financial information
March 31, 2019
(In millions of Brazilian reais, unless otherwise stated)
20. Provision for contingencies– Continued
20.7. Restricted deposits for legal proceedings
The Company is challenging the payment of certain taxes, contributions and labor-related obligations and has made judicial deposits in the corresponding amounts, as well as escrow deposits related to the provision for legal proceedings.
Parent Company | Consolidated | ||||
03.31.2019 | 12.31.2018 | 03.31.2019 | 12.31.2018 | ||
Tax | 173 | 168 |
| 242 | 237 |
Labor | 423 | 417 |
| 468 | 463 |
Civil and other | 24 | 24 |
| 34 | 34 |
Regulatory | 14 | 15 |
| 41 | 42 |
Total | 634 | 624 |
| 785 | 776 |
20.8. Guarantees
Lawsuits | Property and equipment |
| Letter of Guarantee |
| Total | |||
| 03.31.2019 | 12.31.2018 |
| 03.31.2019 | 12.31.2018 |
| 03.31.2019 | 12.31.2018 |
|
|
|
|
| ||||
Tax | 839 | 838 |
| 9,221 | 9,033 |
| 10,060 | 9,871 |
Labor | 3 | 3 |
| 240 | 190 |
| 243 | 193 |
Civil and other | 9 | 9 |
| 255 | 252 |
| 264 | 261 |
Regulatory | 3 | 3 |
| 185 | 181 |
| 188 | 184 |
Total | 854 | 853 |
| 9,901 | 9,656 |
| 10,755 | 10,509 |
The cost of letter of guarantees is approximately 0.66% per year of the amount of the lawsuits and is recorded as expense.
20.9. Deduction of ICMS from the calculation basis for PIS and COFINS
Since the adoption of the non cumulative regime to calculate PIS and COFINS, the Group has challenged the right to deduct ICMS taxes from the calculation basis for PIS and COFINS. On March 15, 2017, the Supreme Court ruled that ICMS should be excluded from the calculation basis of PIS and COFINS. As a result of this ruling, in 2017, the Group reversed a provision of R$117 based on the court decision and the legal opinion of its external counsel.
Since the decision of the Federal Supreme Court (“FSC”) on March 15, 2017, the procedural steps were within the anticipated by the Group’s legal advisors without any change in management's judgment regarding periods prior to March 15, 2017, although a final decision is expected in relation to the appeal filed by the prosecution. The Group and its external legal counsel believe that the decision related to the definitive application of the sentence will not limit the right on a legal claim as proposed by the Group, nevertheless, the elements of the process still pending of decision do not allow the recognition of the asset related to the credits to be measured since the Group started the claim in 2003. The Group estimates that it will be able to use tax credits for an amount of R$1,400.
As disclosed in Via Varejo’s financial statements as of December 31, 2018, the tax credits for this subsidiary, classified as discontinued operations, were estimated approximately R$1,365, being R$910 of discontinued operations and R$455 of continuing operations, attributed to the Group due to an agreement between shareholders and the Group.
78
Companhia Brasileira de Distribuição
Notes to the interim financial information
March 31, 2019
(In millions of Brazilian reais, unless otherwise stated)
20. Provision for contingencies– Continued
20.10. ArbitrationPenínsula
On September 12, 2017, the Company received a notice from the Brazil-Canada Chamber of Commerce regarding a request for arbitration (“Proceeding”) filed by Banco Ourinvest S.A., a financial institution, in its capacity as fund manager and acting in the exclusively interest of the quotaholders of Fundo de Investimento Imobiliário Península ("Península").
The Proceeding aims to discuss the calculation of the rental fees and other operational matters related to the stores owned by Peninsula, which are under several lease agreements and contracts entered into between the Company and Peninsula during 2005 (the "Agreements"). The Agreements assure to CBD the rent of the stores for a period of twenty (20) years, which may be extended for an additional 20-year term, at CBD’s discretion, and rules the calculation of the rental fees.
The Proceeding refers to certain terms and conditions of the Agreements and does not affect the continuity of the leasing of the stores, which are contractually assured. The amounts on which the Company is exposed can not be determined with reasonable certainty based on the current stage of the arbitral process. Management assessed the arbitration as possible loss, based on the opinion provided by the external legal counsel.
21. Lease liability
21.1. Leasing obligations
Lease liability amounted to R$4,867 as of March 31, 2019 (R$4,923 as of December 31, 2018), as shown in the table below:
Parent Company | Consolidated | ||||
03.31.2019 | 12.31.2018 | 03.31.2019 | 12.31.2018 | ||
|
| Restated |
|
| Restated |
Lease liability –minimum rental payments: |
|
|
|
| |
Up to 1 year | 415 | 404 |
| 481 | 465 |
1 - 5 years | 1,934 | 1,964 |
| 2,220 | 2,245 |
Over 5 years | 1,362 | 1,439 |
| 2,166 | 2,213 |
Present value of lease agreements | 3,711 | 3,807 |
| 4,867 | 4,923 |
Future financing charges | 1,885 | 2,052 |
| 3,029 | 3,208 |
Future value of lease agreements | 5,596 | 5,859 |
| 7,896 | 8,131 |
The interest expense on lease liability is presented in note 27. The incremental interest rate of the Company and its subsidiaries at the date of signing of the agreements was 13.14% in the quarter ended March 31, 2019 (13.54% as of March 31, 2018).
79
Companhia Brasileira de Distribuição
Notes to the interim financial information
March 31, 2019
(In millions of Brazilian reais, unless otherwise stated)
21. Leasing transactions - Continued
21.2. Movement of leasing liability
| Parent Company |
| Consolidated |
At December 31, 2018 | 3,807 |
| 4,923 |
Additions | - |
| 35 |
Remeasurement | 76 |
| 149 |
Accrued interest | 116 |
| 244 |
Payments | (264) |
| (537) |
Anticipated lease contract closure | (24) |
| (47) |
Liabilities related to assets held for sale and discontinued operations (note 31) | - |
| 100 |
At March 31, 2019 | 3,711 |
| 4,867 |
|
|
|
|
Current | 415 |
| 481 |
Noncurrent | 3,296 |
| 4,386 |
|
|
|
|
| Parent Company |
| Consolidated |
At December 31, 2017 | 3,769 |
| 4,735 |
Additions | 1 |
| 80 |
Remeasurement | 58 |
| 145 |
Accrued interest | 122 |
| 254 |
Payments | (246) |
| (515) |
Anticipated lease contract closure | (3) |
| (5) |
Liabilities related to assets held for sale and discontinued operations (note 31) | - |
| 64 |
At March 31, 2018 | 3,701 |
| 4,758 |
|
|
|
|
Current | 362 |
| 433 |
Noncurrent | 3,339 |
| 4,325 |
21.3. Lease expense on variable rents, low value assets and short-term agreements
Parent Company | Consolidated | ||||
03.31.2019 | 03.31.2018 | 03.31.2019 | 03.31.2018 | ||
Expenses (income) for the period: |
| Restated |
|
| Restated |
Variable (0.1% to 4.5% of sales) | 1 | 2 |
| 10 | 5 |
Sublease rentals (*) | (46) | (41) |
| (55) | (50) |
(*) Refers to lease agreements receivable from commercial shopping malls.
80
Companhia Brasileira de Distribuição
Notes to the interim financial information
March 31, 2019
(In millions of Brazilian reais, unless otherwise stated)
22. Deferred revenue
The Company receives amounts from business partners on exclusivity in the intermediation of additional or extended warranty services, and the subsidiary Sendas receives amounts for the rental of back lights for exhibition of products from its suppliers.
The detailed information on deferred revenue was presented in the annual financial statements for 2018, in note 23.
Parent Company | Consolidated | ||||
03.31.2019 | 12.31.2018 | 03.31.2019 | 12.31.2018 | ||
Deferred revenue in relation to sale of real estate property | 16 | 16 |
| 16 | 16 |
Back lights | - | - |
| 102 | 134 |
Additional or extended warranties | 18 | 19 |
| 18 | 19 |
Services rendering agreement - Allpark | 11 | 11 |
| 11 | 11 |
Revenue from credit card companies | 44 | 44 |
| 44 | 44 |
Others | 7 | 9 |
| 40 | 39 |
96 | 99 |
| 231 | 263 | |
Current |
|
|
|
|
|
Noncurrent | 82 | 89 |
| 213 | 250 |
| 14 | 10 |
| 18 | 13 |
23. Shareholders’ equity
The detailed information on shareholders’ equity was presented in the annual financial statements for 2018, in note 24.
23.1. Capital stock
The subscribed and paid-up capital as of March 31, 2019 is represented by 266,854 (266,845 as of December 31, 2018) thousands of registered shares with no par value, of which 99,680 thousands of common shares (99,680 as of December 31, 2018) and 167,174 thousands of preferred shares (166,165 as of December 31, 2018).
The Company is authorized to increase its capital stock up to the limit of 400,000 thousands of shares, regardless of any amendment to the Company’s Bylaws, upon resolution of the Board of Directors, which will establish the terms and conditions.
At the Board of Directors’ Meetings held on February 20, 2019, it was approved a capital increase of R$0,2 (R$3 on December 31, 2018) through the issuance of 8 thousands preferred shares (265 thousands of preferred shares on December 31,2018). On March 31, 2019, the capital stock is R$ 6,825 (R$ 6,825 on December 31, 2018).
81
Companhia Brasileira de Distribuição
Notes to the interim financial information
March 31, 2019
(In millions of Brazilian reais, unless otherwise stated)
23. Shareholders’ equity– Continued
23.2. Stock option plan for preferred shares
|
|
|
|
| 03.31.2019 | |||
|
| Number of options (in thousands) | ||||||
Series granted | Grant date | 1st date of exercise | Expiration date | Exercise price at the grant date |
Granted | Exercised | Cancelled | Total in effect |
Series B3 | 05/30/16 | 05/30/19 | 11/30/19 | 0.01 | 823 | (283) | (74) | 466 |
Series C3 | 05/30/16 | 05/30/19 | 11/30/19 | 37.21 | 823 | (275) | (109) | 439 |
Series B4 | 05/31/17 | 05/31/20 | 11/30/20 | 0.01 | 537 | (160) | (43) | 334 |
Series C4 | 05/31/17 | 05/31/20 | 11/30/20 | 56.78 | 537 | (159) | (44) | 334 |
Series B3 -Tranche2 | 04/27/18 | 05/30/19 | 11/30/19 | 0.01 | 95 | - | - | 95 |
Series C3 -Tranche2 | 04/27/18 | 05/30/19 | 11/30/19 | 56.83 | 95 | - | - | 95 |
Series B5 | 05/31/18 | 05/31/21 | 11/30/21 | 0.01 | 499 | (3) | (6) | 490 |
Series C5 | 05/31/18 | 05/31/21 | 11/30/21 | 62.61 | 499 | (3) | (6) | 490 |
|
|
|
|
| 3,908 | (883) | (282) | 2,743 |
The changes of the quantity of exercised options, the weighted average of the exercise price, and the weighted average of the remaining term are presented at the chart below:
Options | Weighted average of exercise price | Weighted average of remaining contractual term | |
in thousands | R$ | ||
At December 31, 2018 | 2,755 | 26.03 | 1.37 |
|
|
|
|
Cancelled during the period | (2) | 35.24 |
|
Exercised during the period | (10) | 24.07 |
|
Outstanding at the end of the period | 2,743 | 26.04 | 1.13 |
At March 31, 2018 | 2,743 | 26.04 | 1.13 |
The weighted average of the provided options fair value at March,31 2019 were R$45.81 (R$45.24 at the December 31, 2018).
The recorded amounts at the Parent Company and Consolidated’s statement of operations at the March 31, 2019 were R$7 (R$4 at the March 31, 2018).
23.3. Foreign exchange variation of investment abroad
Cumulative effect of exchange gains and losses on the translation of assets, liabilities and profit (loss) of Euros to Brazilian reais, corresponding to the investment in subsidiary Cnova N.V.. The effect in the Parent Company was R$1 (R$24 at the December 31, 2018).
23.4. Non-Controlling shareholder transactions
As described in note 31.1, the Company sold through two transactions of TRS 6.1% of the participation in Via Varejo, from 43.23% on December 31, 2018 to 37.13% on March 31, 2019. The transaction resulted in a gain of R$ 53 after income tax fully recorded in shareholders' equity as it was treated in transactions with non-controlling shareholders, without change in the Company's control. The result is preliminary and subject to stock price variation until the full settlement of the second Total Return Swap (See note 16.9).
82
Companhia Brasileira de Distribuição
Notes to the interim financial information
March 31, 2019
(In millions of Brazilian reais, unless otherwise stated)
23. Shareholders’ equity– Continued
23.4. Non-Controlling shareholder transactions - Continued
Net value received |
| (386) |
Investment cost – 6.1% |
| 291 |
Gain on disposal |
| (95) |
Income tax |
| 42 |
Net gain |
| (53) |
24. Net operating revenue
Parent Company | Consolidated | ||||
03.31.2019 | 03.31.2018 | 03.31.2019 | 03.31.2018 | ||
Gross sales | |||||
Goods | 6,729 | 6,760 |
| 13,790 | 12,307 |
Services rendered | 88 | 88 |
| 99 | 98 |
Sales returns and cancellations | (48) | (95) |
| (61) | (105) |
6,769 | 6,753 |
| 13,828 | 12,300 | |
|
|
|
|
| |
Taxes on sales | (533) | (515) |
| (1,119) | (957) |
|
|
|
|
| |
Net operating revenues | 6,236 | 6,238 |
| 12,709 | 11,343 |
25. Expenses by nature
Parent Company | Consolidated | ||||
03.31.2019 | 03.31.2018 | 03.31.2019 | 03.31.2018 | ||
Restated | Restated | ||||
|
|
|
|
|
|
Cost of inventories | (4,120) | (4,155) |
| (9,515) | (8,412) |
Personnel expenses | (806) | (804) |
| (1,208) | (1,123) |
Outsourced services | (136) | (126) |
| (185) | (161) |
Functional expenses | (278) | (301) |
| (411) | (402) |
Selling expenses | (227) | (218) |
| (315) | (290) |
Other expenses | (178) | (156) |
| (220) | (192) |
(5,745) | (5,760) |
| (11,854) | (10,580) | |
|
|
|
|
| |
Cost of sales | (4,432) | (4,466) |
| (9,913) | (8,783) |
Selling expenses | (1,128) | (1,118) |
| (1,672) | (1,558) |
General and administrative expenses | (185) | (176) |
| (269) | (239) |
(5,745) | (5,760) |
| (11,854) | (10,580) | |
83
Companhia Brasileira de Distribuição
Notes to the interim financial information
March 31, 2019
(In millions of Brazilian reais, unless otherwise stated)
26. Other operating expenses, net
Parent Company | Consolidated | ||||
03.31.2019 | 03.31.2018 | 03.31.2019 | 03.31.2018 | ||
|
| Restated |
|
| Restated |
|
|
|
| ||
Tax installments and other tax risks | (22) | (19) |
| (20) | (21) |
Restructuring expenses | (13) | (16) |
| (13) | (16) |
Losses on disposals of fixed assets | (15) | (4) |
| (18) | (5) |
Total | (50) | (39) |
| (51) | (42) |
27. Financial income (expenses), net
Parent Company | Consolidated | ||||
03.31.2019 | 03.31.2018 | 03.31.2019 | 03.31.2018 | ||
|
| Restated |
|
| Restated |
Finance expenses: |
|
|
|
| |
Cost of debt | (84) | (89) |
| (96) | (98) |
Cost of discounting receivables | (18) | (25) |
| (29) | (35) |
Monetary restatement loss | (30) | (22) |
| (31) | (17) |
Interest on lease liability | (113) | (113) |
| (147) | (142) |
Other finance expenses | (15) | (16) |
| (22) | (22) |
Total financial expenses | (260) | (265) |
| (325) | (314) |
|
|
|
|
| |
Financial income: |
|
|
|
|
|
Income from short term investments | 3 | 4 |
| 4 | 5 |
Monetary restatement gain | 19 | 23 |
| 28 | 30 |
Other financial income | 2 | 6 |
| 4 | 5 |
Total financial income | 24 | 33 |
| 36 | 40 |
|
|
|
|
|
|
Total | (236) | (232) |
| (289) | (274) |
The gains or losses on derivative financial instruments are recorded as cost of debt and disclosed in Note 17.
84
Companhia Brasileira de Distribuição
Notes to the interim financial information
March 31, 2019
(In millions of Brazilian reais, unless otherwise stated)
27. Earnings per share
The information on earnings per share was presented in the annual financial statements for 2018, in note 29.
The table below presents the determination of net income available to holders of common and preferred shares and the weighted average number of common and preferred shares outstanding used to calculate basic and diluted earnings per share in each reporting period:
03.31.2019 | 03.31.2018 | ||||||
Preferred | Common | Total | Preferred | Common | Total | ||
|
|
|
|
| Restated | ||
Basic numerator | |||||||
Net income allocated to common and preferred shares - continuing operations | 96 | 52 | 148 |
| 50 | 27 | 77 |
Net income allocated to common and preferred shares - discontinued operations | 5 | 2 | 7 |
| 47 | 26 | 73 |
Net income allocated to common and preferred shares | 101 | 54 | 155 |
| 97 | 53 | 150 |
|
|
|
|
|
|
| |
Basic denominator (millions of shares) |
|
|
|
|
|
|
|
Weighted average of shares | 167 | 100 | 267 |
| 167 | 100 | 267 |
|
|
|
|
|
|
| |
Basic earnings per millions of shares (R$) - continuing operations | 0,57464 | 0,52240 |
|
| 0,29928 | 0,27207 |
|
Basic earnings per millions of shares (R$) - discontinued operations | 0,02718 | 0,02471 |
|
| 0,28373 | 0,25793 |
|
Basic earnings per millions of shares (R$) - total | 0,60181 | 0,54710 |
|
| 0,58300 | 0,53000 |
|
|
|
|
|
|
|
| |
Diluted numerator |
|
|
|
|
|
|
|
Net income allocated to common and preferred shares - continuing operations | 96 | 52 | 148 |
| 50 | 27 | 77 |
Net income allocated to common and preferred shares - discontinued operations | 5 | 2 | 7 |
| 47 | 26 | 73 |
Net income allocated to common and preferred shares | 101 | 54 | 155 |
| 97 | 53 | 150 |
|
|
|
|
|
|
| |
Diluted denominator |
|
|
|
|
|
|
|
Weighted average of shares (in millions) | 167 | 100 | 267 |
| 167 | 100 | 267 |
Stock options | 1 | - | 1 |
| 1 | - | 1 |
Diluted weighted average of shares (millions) | 168 | 100 | 268 |
| 168 | 100 | 268 |
|
|
|
|
|
|
| |
Diluted earnings per millions of shares (R$) – continuing operations | 0,57071 | 0,52274 |
|
| 0,29763 | 0,27120 |
|
Diluted earnings per millions of shares (R$) – discontinued operations | 0,02699 | 0,02505 |
|
| 0,28217 | 0,25707 |
|
Diluted earnings per millions of shares (R$) – total | 0,59771 | 0,54778 |
|
| 0,57980 | 0,52827 |
|
85
Companhia Brasileira de Distribuição
Notes to the interim financial information
March 31, 2019
(In millions of Brazilian reais, unless otherwise stated)
29. Segment information
The information about segments was presented in the annual financial statements of 2018, in note 30 Management considers the following segments:
· Food retail – includes the banners “Pão de Açúcar”, “Minuto Pão de Açúcar”, “Extra Hiper”, “Extra Supermercado” / “Mercado Extra”, “Minimercado Extra”, “Posto Extra”, “Drogaria Extra” and “GPA Malls & Properties”.
· Cash & Carry – includes the brand “ASSAÍ”.
Home appliances and e-commerce segments are presented as discontinued operations at the March 31, 2019 and 2018 (as per note 31) and kept in this note for the purposes of reconciliation with consolidated interim financial information.
Information on the Company’s segments as of March 31, 2019 is included in the table below:
86
Companhia Brasileira de Distribuição
Notes to the interim financial information
March 31, 2019
(In millions of Brazilian reais, unless otherwise stated)
29. Segment information– Continued
Description | Food Retail (*) | Cash & Carry | Assets held for sale and discontinued operations (**) | Subtotal | Eliminations/ Others(***) | Total | |||||||||||
2019 | 2018 | 2019 | 2018 | 2019 | 2018 | 2019 | 2018 | 2019 | 2018 | 2019 | 2018 | ||||||
|
| Restated |
|
| Restated |
|
| Restated |
|
| Restated |
|
| Restated |
|
| Restated |
|
|
|
|
|
|
|
|
|
|
|
|
|
|
|
|
|
|
Net operating revenues | 6,382 | 6,285 |
| 6,327 | 5,058 |
| - | - |
| 12,709 | 11,343 |
| - | - |
| 12,709 | 11,343 |
Gross profit | 1,826 | 1,781 |
| 970 | 779 |
| - | - |
| 2,796 | 2,560 |
| - | - |
| 2,796 | 2,560 |
Depreciation and amortization | (239) | (231) |
| (90) | (73) |
| - | - |
| (329) | (304) |
| - | - |
| (329) | (304) |
Share of profit of subsidiaries and associates | 21 | 11 |
| - | - |
| - | - |
| 21 | 11 |
| (38) | (47) |
| (17) | (36) |
Operating income | 215 | 223 |
| 283 | 205 |
| - | - |
| 498 | 428 |
| (40) | (47) |
| 458 | 381 |
Net financial expenses | (242) | (234) |
| (47) | (40) |
| - | - |
| (289) | (274) |
| - | - |
| (289) | (274) |
Profit(loss) before income tax and social contribution | (27) | (11) |
| 236 | 165 |
| - | - |
| 209 | 154 |
| (40) | (47) |
| 169 | 107 |
Income tax and social contribution | 58 | 26 |
| (77) | (56) |
| - | - |
| (19) | (30) |
| - | - |
| (19) | (30) |
Net income (loss) for continuing operations | 31 | 15 |
| 159 | 109 |
| - | - |
| 190 | 124 |
| (40) | (47) |
| 150 | 77 |
Net income (loss) for discontinued operations | (23) | (11) |
| - | - |
| 92 | 201 |
| 69 | 190 |
| - | - |
| 69 | 190 |
Profit (loss) of year end | 8 | 4 |
| 159 | 109 |
| 92 | 201 |
| 259 | 314 |
| (40) | (47) |
| 219 | 267 |
|
|
|
|
|
|
|
|
|
|
|
|
|
|
|
|
| |
Current assets | 6,626 | 7,682 |
| 3,583 | 4,196 |
| 26,869 | 29,144 |
| 37,078 | 41,022 |
| (159) | (163) |
| 36,919 | 40,859 |
Noncurrent assets | 14,455 | 14,384 |
| 6,319 | 6,057 |
| - | - |
| 20,774 | 20,441 |
| (21) | (16) |
| 20,753 | 20,425 |
Current liabilities | 6,839 | 8,499 |
| 4,508 | 5,294 |
| 21,557 | 23,934 |
| 32,904 | 37,727 |
| (180) | (179) |
| 32,724 | 37,548 |
Noncurrent liabilities | 9,764 | 8,999 |
| 1,504 | 1,493 |
| - | - |
| 11,268 | 10,492 |
| - | - |
| 11,268 | 10,492 |
Shareholders' equity | 4,478 | 4,568 |
| 3,890 | 3,466 |
| 5,312 | 5,210 |
| 13,680 | 13,244 |
| - | - |
| 13,680 | 13,244 |
(*)Food retail includes GPA Malls & Properties and Comprebem.
(**) See note 31.
(***) The eliminations consist of intercompany balances. In the management’s view, the net earnings eliminations are made inside of own segment, besides, the equity pickup of the Company in Luxco.
87
Companhia Brasileira de Distribuição
Notes to the interim financial information
March 31, 2019
(In millions of Brazilian reais, unless otherwise stated)
29. Segment information– Continued
The Company and its subsidiaries operate primarily as a retailer of food, clothing, home appliances and other products. Total revenues are composed of the following brands:
03.31.2019 | 03.31.2018 | ||
Assaí | 6,327 |
| 5,058 |
Extra | 3,703 |
| 3,805 |
Pão de Açúcar | 1,671 |
| 1,614 |
Proximidade | 272 |
| 265 |
Other business | 736 |
| 601 |
Total net operating revenue | 12,709 |
| 11,343 |
30. Non cash transactions
During the quarter ended at March 31, 2019 and 2018 the Company had the following non-cash transactions:
· Purchase of fixed assets not paid yet as note 14.2;
· Purchase of intangible assets not paid yet as per note 15.2;
· Deferred income tax as per note 19;
· Additions of provisions for contingencies as per note 20;
31. Non current assets held for sale and discontinued operations
The detailed information about assets held for sale and discontinued operations were presented in the annual financial statements of 2018, in note 32.
Composition: |
| 03.31.2019 |
| 12.31.2018 |
| Restated | |||
|
|
|
|
|
Net assets Via Varejo (see note 31.1) | 26,712 |
| 28,990 | |
Property/lands held for sale CBD |
| 30 |
| 30 |
Total | 26,742 |
| 29,020 | |
On September 29, 2018 the Company entered into a contract for the sale of a land for R$115, which was not recognized under IFRS 15 due to the contractual characteristics of long-term payment and transfer of legal title at a future date.
88
Companhia Brasileira de Distribuição
Notes to the interim financial information
March 31, 2019
(In millions of Brazilian reais, unless otherwise stated)
31. Non current assets held for sale and discontinued operations– Continued
31.1. Ongoing transaction to dispose of Via Varejo subsidiary
The Board of Directors held on November 23, 2016 approved a process to dispose of the Company’s interest in Via Varejo’s capital stock, in line with its long-term strategy of focusing on the development of the food activity.
Throughout 2017 and 2018 the Group actively sought to sell such interest to potential strategic investors, however, the sale was not completed until December 31, 2018 due to external factors beyond the Group's control including, among others, certain events occurred in these years that impacted the macroeconomic scenario and political instability that brought market volatility and impacted the perception of potential investors regarding the recovery of the Brazilian economy In December 2018, the Company’s Board of Directors authorized our management to actively pursue selling our remaining equity interest in Via Varejo to a strategic investor or through operations available in capital markets in order to complete the full divesture in Via Varejo by December 2019.
Within this new context, in the same meeting, the Board of Directors authorized the sale of 50,000,000 common shares of Via Varejo, corresponding to 3.86% of its share capital, through a TRS (Total Return Swap) with a leading bank (note 17.10), whereby such shares were sold in daily operations conducted by the bank. On February 20, 2019, the Board of Directors approved a new TRS agreement, authorizing the sale of 40.000.000 (forty millions) ordinary shares of Via Varejo held by the Company, corresponding to 3.09% of the share capital of Via Varejo. This sale was carried out on the B3 on February 25, 2019. The operation does not imply changing of the control or in the administrative structure of Via Varejo. As a result of these transactions, our interest in Via Varejo decreased from 559,521,085 common shares to 469,521,085 common shares, corresponding to 36.27% of Via Varejo’s capital stock. The new TRS agreement entered into in February 2019 were fully settled during the month of April 2019.
Accordingly, among other requirements of IFRS 5, as the sale of the Group's investment in Via Varejo in 2019 is highly probable, the subsidiary's operations are presented as discontinued operations as required in IFRS 5. The disclosure of the net income of Via Varejo is included in a single line in the statement of operations after taxes and the balances of assets and liabilities as held for sale and discontinued operations.
Statement of value added on March 31, 2019 and 2018 also discloses the discontinued operations as a single line, nevertheless, for cash flows there were no effects as per IFRS 5 being disclosed at this note the effect of discontinued operations. Non current assets and liabilities held for sale on March 31, 2019 were R$26,742 (R$29,020 on December 31, 2018) and R$21,499 (R$23,876 on December 31, 2018), respectively. The net effects on discontinued operations were a net income of R$69 in 2019 (R$190 at March 31, 2018).
Via Varejo shares are listed on B3 under ticker symbol “VVAR3, whose consolidated financial statements can be found on the investor relations website (www.ri.viavarejo.com.br).See below the summary of the consolidated statement of operations, balance sheet and cash flow statements of Via Varejo before the eliminations, including effects of the purchase price allocation of Globex and Casa Bahia acquisition.
89
Companhia Brasileira de Distribuição
Notes to the interim financial information
March 31, 2019
(In millions of Brazilian reais, unless otherwise stated)
31. Non current assets held for sale and discontinued operations– Continued
31.1. Ongoing transaction to dispose of Via Varejo subsidiary - Continued
Balance sheet (*):
03.31.2019 |
| 12.31.2018 | |
|
|
| Restated |
Assets |
|
| |
Current |
|
| |
Cash and cash equivalents | 1,296 |
| 3,711 |
Trade receivables, net (i) | 3,913 |
| 3,768 |
Inventories, net | 4,695 |
| 4,773 |
Recoverable taxes | 934 |
| 1,060 |
Other current assets | 181 |
| 100 |
Total current assets | 11,019 |
| 13,412 |
|
|
| |
Noncurrent |
|
|
|
Trade receivables, net | 224 |
| 217 |
Recoverable taxes | 2,570 |
| 2,519 |
Other accounts receivable, net | 990 |
| 984 |
Deferred income tax and social contribution | 298 |
| 386 |
Related parties | 330 |
| 322 |
Investment properties | 114 |
| 108 |
Property and equipment, net | 6,656 |
| 6,571 |
Intangible assets, net | 4,668 |
| 4,625 |
Total noncurrent assets | 15,850 |
| 15,732 |
Total assets | 26,869 |
| 29,144 |
90
Companhia Brasileira de Distribuição
Notes to the interim financial information
March 31, 2019
(In millions of Brazilian reais, unless otherwise stated)
31. Non current assets held for sale and discontinued operations– Continued
31.1. Ongoing transaction to dispose of Via Varejo subsidiary – Continued
Balance sheet (*):
| 03.31.2019 |
| 12.31.2018 | |
|
|
|
| Restated |
Liabilities |
|
|
|
|
Current |
|
|
| |
Trade payable, net |
| 6,608 |
| 8,652 |
Structured payable program |
| 506 |
| 421 |
Borrowings and financing (i) |
| 3,975 |
| 3,357 |
Leasing liability |
| 933 |
| 952 |
Related parties |
| 157 |
| 159 |
Other current liabilities (ii) |
| 2,097 |
| 2,192 |
Total current liabilities |
| 14,276 |
| 15,733 |
|
|
|
|
|
Noncurrent |
|
|
|
|
Borrowings and financing (i) |
| 343 |
| 966 |
Leasing liability |
| 3,593 |
| 3,681 |
Deferred income tax and social contribution |
| 839 |
| 840 |
Other noncurrent liabilities (ii) |
| 2,506 |
| 2,713 |
Total noncurrent liabilities |
| 7,281 |
| 8,200 |
Shareholders’ equity |
| 5,312 |
| 5,211 |
Total liabilities and shareholders’ equity |
| 26,869 |
| 29,144 |
(*) Before intercompany eliminations with GPA in the amount R$157 of assets and R$58 of liabilities. In the total balance held for sale of the balance sheet as of March 31, 2019, R$30 refers to the reclassification of a CBD land available for sale.
(i)Includes financed sales through CDCI, whose value on March 31, 2019 is R$ 2,304 in assets (R$ 2,297 at December 31, 2018) and R$ 3,401 in liabilities (R$ 3,400 on December 31, 2018).
(ii) Includes balance of R$1,923 on March 31, 2019 (R$2,006 on December 31, 2018) of deferred revenue related to the advance received from Zurich Seguros (extended warranty and insurance) and from Bradesco (cards transactions and banking correspondent).
Parent Company’s effects | Note | 03.31.2019 | 12.31.2018 |
|
|
| Restated |
|
|
|
|
Reclassification of investment as asset held for sale | 13.1 | 1,602 | 1,858 |
Reclassification of goodwill as asset held for sale | 15 | 179 | 179 |
Assets held for sale and discontinued operations | 1,781 | 2,037 | |
91
Companhia Brasileira de Distribuição
Notes to the interim financial information
March 31, 2019
(In millions of Brazilian reais, unless otherwise stated)
31.1. Ongoing transaction to dispose of Via Varejo subsidiary – Continued
Statement of operations (*) | 03.31.2019 | 03.31.2018 | |
Restated | |||
|
|
|
|
Net operating revenue | 6,330 |
| 6,684 |
Cost of sales | (4,534) |
| (4,437) |
Gross profit | 1,796 |
| 2,247 |
Operating income (expenses) |
|
|
|
Selling, general and administrative expenses | (1,286) |
| (1,646) |
Share of profit of associates | 10 |
| 6 |
Other operating expenses, net | (75) |
| (15) |
(1,351) |
| (1,655) | |
Profit from operations before net financial result | 445 |
| 592 |
|
|
| |
Financial expenses, net | (260) |
| (255) |
Income (loss) before income tax and social contribution | 185 |
| 337 |
|
|
| |
Income tax and social contribution | (87) |
| (131) |
|
|
| |
Net income (loss) for the period | 98 |
| 206 |
Attributed to: |
|
|
|
Controlling shareholders | 37 |
| 85 |
Non-controlling shareholders | 61 |
| 121 |
(*) Before eliminations of amounts of related parties with GPA.
Description | 03.31.2019 | 03.31.2018 |
Net operating revenue | (8) | (10) |
Cost of sales | (4) | (2) |
Selling costs | 1 | 1 |
General and administrative expenses | (1) | 1 |
Financial result, net | 4 | 2 |
Income tax and social contribution | 2 | 2 |
Total | (6) | (6) |
|
|
|
Additionally a reclassification was made of incurred costs on Parent Company basically related to indemnity costs of contingences from prior periods to acquisition, paid to Via Varejo. According to IFRS 5, these costs were reclassified to discontinued operations in the amount of R$23 as of March 31, 2019 (R$11 as of March 31, 2018).
Cash flow | 03.31.2019 |
| 03.31.2018 | |
Cash flow provided by (used in) operating activities | (1,935) |
| (2,543) | |
Net cash provided by (used in) investing activities | (167) |
| (117) | |
Net cash provided by (used in) financing activities | (313) |
| (295) | |
Cash variation in the period | (2,415) |
| (2,955) | |
92
Companhia Brasileira de Distribuição
Notes to the interim financial information
March 31, 2019
(In millions of Brazilian reais, unless otherwise stated)
31.2. Fair Value Via Varejo
In accordance with IFRS 5 the Via Varejo investment should be recognized considering the lower of the book value of the net assets and the fair value less cost to sell.
The Company determined that the fair value less cost to sell is higher than the carrying amount of the net assets held for sale, considering the recent average stock price of Via Varejo at the date and subsequent to the date of the interim financial statements.
93
Other information deemed as relevant by the Company
Shareholding at 03.31.2019 | ||||||
|
|
|
|
|
|
|
SHAREHOLDING OF CONTROLLING PARTIES OF THE COMPANY’S SHARES | ||||||
COMPANHIA BRASILEIRA DE DISTRIBUIÇÃO (Publicly-held company) | Shareholding at 03/31/2019 | |||||
Shareholder | Common Shares | Preferred Shares | Total | |||
Number | % | Number | % | Number | % | |
Wilkes Participações S/A | 94,019,178 | 94.32% | 0 | 0.00% | 94,019,178 | 35.23% |
Jean-Charles Naouri | 0 | 0.00% | 1 | 0.00% | 1 | 0.00% |
Geant International BV | 0 | 0.00% | 9,423,742 | 5.64% | 9,423,742 | 3.53% |
Segisor | 5,600,050 | 5.62% | 0 | 0.00% | 5,600,050 | 2.10% |
Casino Guichard Perrachon | 1 | 0.00% | 0 | 0.00% | 1 | 0.00% |
Almacenes Éxito S.A. | 1 | 0.00% | 0 | 0.00% | 1 | 0.00% |
King LLC | 0 | 0.00% | 852,000 | 0.51% | 852,000 | 0.32% |
Helicco Participações Ltda. | 0 | 0.00% | 581,600 | 0.35% | 581,600 | 0.22% |
Carmignac Gestion | 0 | 0.00% | 13,374,888 | 8.00% | 13,374,888 | 5.01% |
Brandes Investment Partners, LP | 0 | 0.00% | 6,903,029 | 4.13% | 6,903,029 | 2.59% |
Conselho de Administração | 0 | 0.00% | 501,023 | 0.30% | 501,023 | 0.19% |
Diretoria | 0 | 0.00% | 39,755 | 0.02% | 39,755 | 0.01% |
Em Tesouraria | 0 | 0.00% | 232,586 | 0.14% | 232,586 | 0.09% |
Outros | 60,621 | 0.06% | 133,265,107 | 80.91% | 135,325,728 | 50.71% |
TOTAL | 99,679,851 | 100.00% | 167,173,731 | 100.00% | 266,853,582 | 100.00% |
(*) Foreign Company | ||||||
CORPORATE’S CAPITAL STOCK DISTRIBUTION (COMPANY’S SHAREHOLDER) | ||||||
WILKES PARTICIPAÇÕES S.A | Shareholding | |||||
Shareholder/Quotaholder | Common Shares | Preferred Shares | Total | |||
Number | % | Number | % | Number | % | |
CASINO GUICHARD PERRACHON * | 1 | 0.00% | 0 | 0.00% | 1 | 0.00% |
SEGISOR* | 223,698,566 | 100.00% | 0 | 0.00% | 223,698,566 | 100.00% |
Almacenes Éxito S.A. * | 1 | 0.00% | 0 | 0.00% | 1 | 0.00% |
Treasury Shares | 0 | 0.00% | 0 | 0.00% | 0 | 0.00% |
TOTAL | 223,698,568 | 100.00% | 0 | 0.00% | 223,698,568 | 100.00% |
(*) Foreign Company | ||||||
94
Other information deemed as relevant by the Company
SHAREHOLDING OF CONTROLLING PARTIES OF THE COMPANY’S SHARES | ||||||
SEGISOR |
|
| Shareholding | |||
Quotaholder | Quotas | % | Preferred Shares | % | Number | % |
Onper Investimentos 2015 S.L.* | 887,239,543 | 50.00% | 0 | 0.00% | 887,239,543 | 50.00% |
Casino Guichard Perrachon* | 887,239,543 | 50.00% | 0 | 0.00% | 887,239,543 | 50.00% |
TOTAL | 1,774,479,086 | 100.00% | 0 | 0.00% | 1,774,479,086 | 100.00% |
SHAREHOLDING OF CONTROLLING PARTIES OF THE COMPANY’S SHARES | ||||||
ONPER INVESTIMENTOS 2015 S.L. | Shareholding | |||||
Shareholder | Common Shares | % | Preferred Shares | % | Number | % |
ALMANACENES ÉXITO S.A.* | 3,000 | 100.00% | 0 | 0.00% | 3,000 | 100.00% |
TOTAL | 3,000 | 100.00% | 0 | 0.00% | 3,000 | 100.00% |
SHAREHOLDING OF CONTROLLING PARTIES OF THE COMPANY’S SHARES | ||||||
ALMANACENES ÉXITO S.A. | Shareholding | |||||
Shareholders* | Common | % | Preferred | % | Number | % |
Geant International B.V. | 187,689,792 | 41.93% | 0 | 0.00% | 187,689,792 | 41.93% |
Geant Fonciere B.V. | 47,725,428 | 10.66% | 0 | 0.00% | 47,725,428 | 10.66% |
Fondo de Pensiones Obligatorias Porvenir Moderado | 23,322,916 | 5.21% | 0 | 0.00% | 23,322,916 | 5.21% |
Fondo de Pensiones Obligatorias Proteccion | 25,272,142 | 5.65% | 0 | 0.00% | 25,272,142 | 5.65% |
Other Shareholders | 163,594,038 | 36.55% | 0 | 0.00% | 163,594,038 | 36.55% |
TOTAL | 447,604,316 | 100.00% | 0 | 0.00% | 447,604,316 | 100.00% |
95
Other information deemed as relevant by the Company
CONSOLIDATED SHAREHOLDING OF CONTROLLING PARTIES AND MANAGEMENT AND OUTSTANDING SHARES | Shareholding at 03/31/2019 (In units) Total | |||||
Shareholder | Common Shares | Preferred Shares | ||||
Number | % | Number | % | Number | % | |
Controlling parties | 99,619,230 | 99.94% | 10,857,343 | 6.49% | 110,476,573 | 41.40% |
|
|
|
|
|
|
|
Management |
|
|
|
|
|
|
Board of Directors | - | 0.00% | 501,023 | 0.30% | 501,023 | 0.19% |
Board of Executive Officers | - | 0.00% | 39,755 | 0.02% | 39,755 | 0.01% |
|
|
|
|
|
|
|
Treasury Shares | - | 0.00% | 232,586 | 0.14% | 232,586 | 0.09% |
|
|
|
|
|
|
|
Other Shareholdersas | 60,621 | 0.06% | 155,543,024 | 93.04% | 155,603,645 | 58.31% |
|
|
|
|
|
|
|
Total | 99,679,851 | 100.00% | 167,173,731 | 100.00% | 266,853,582 | 100.00% |
|
|
|
|
|
|
|
Outstanding Shares | 60,621 | 0.06% | 156,083,802 | 93.37% | 156,144,423 | 58.51% |
CONSOLIDATED SHAREHOLDING OF CONTROLLING PARTIES AND MANAGEMENT AND OUTSTANDING | Shareholding at 03/31/2018 (In units) Total | |||||
Shareholder | Common Shares | Preferred Shares | ||||
Number | % | Number | % | Number | % | |
Controlling parties | 99,619,230 | 99.94% | 10,857,343 | 6.51% | 110,476,573 | 41.44% |
|
|
|
|
|
|
|
Management |
|
|
|
|
|
|
Board of Directors | - | 0.00% | 1 | 0.00% | 1 | 0.00% |
Board of Executive Officers | - | 0.00% | 470,379 | 0.28% | 470,379 | 0.18% |
|
|
|
|
|
|
|
Treasury Shares | - | 0.00% | 232,586 | 0.14% | 232,586 | 0.09% |
|
|
|
|
|
|
|
Other Shareholdersas | 60,621 | 0.06% | 155,346,800 | 93.07% | 155,407,421 | 58.30% |
|
|
|
|
|
|
|
Total | 99,679,851 | 100.00% | 166,907,109 | 100.00% | 266,586,960 | 100.00% |
|
|
|
|
|
|
|
Outstanding Shares | 60,621 | 0.06% | 155,817,180 | 93.36% | 155,877,801 | 58.47% |
96
SIGNATURES
Pursuant to the requirement of the Securities Exchange Act of 1934, the registrant has duly caused this report to be signed on its behalf by the undersigned, thereunto duly authorized.
| COMPANHIA BRASILEIRA DE DISTRIBUIÇÃO | ||
| Date: May 10, 2019 | By: /s/ Peter Estermann Name: Peter Estermann Title: Chief Executive Officer | |
| By: /s/ Daniela Sabbag Name: Daniela Sabbag Title: Investor Relations Officer | ||
FORWARD-LOOKING STATEMENTS
This press release may contain forward-looking statements. These statements are statements that are not historical facts, and are based on management's current view and estimates offuture economic circumstances, industry conditions, company performance and financial results. The words "anticipates", "believes", "estimates", "expects", "plans" and similar expressions, as they relate to the company, are intended to identify forward-looking statements. Statements regarding the declaration or payment of dividends, the implementation of principal operating and financing strategies and capital expenditure plans, the direction of future operations and the factors or trends affecting financial condition, liquidity or results of operations are examples of forward-looking statements. Such statements reflect the current views of management and are subject to a number of risks and uncertainties. There is no guarantee that the expected events, trends or results will actually occur. The statements are based on many assumptions and factors, including general economic and market conditions, industry conditions, and operating factors. Any changes in such assumptions or factors could cause actual results to differ materially from current expectations.