UNITED STATES
SECURITIES AND EXCHANGE COMMISSION
Washington, D.C. 20549
Form N-CSR
CERTIFIED SHAREHOLDER REPORT OF
REGISTERED MANAGEMENT INVESTMENT COMPANIES
Investment Company Act file number: 811-08319
Voya Partners, Inc.
(Exact name of registrant as specified in charter)
| 7337 East Doubletree Ranch Road, Suite 100, Scottsdale, AZ | 85258 |
| (Address of principal executive offices) | (Zip code) |
The Corporation Trust Company, 1209 Orange Street, Wilmington, DE 19801
(Name and address of agent for service)
Registrant’s telephone number, including area code: 1-800-262-3862
Date of fiscal year end: December 31
Date of reporting period: December 31, 2021
Item 1. Reports to Stockholders.
The following is a copy of the report transmitted to stockholders pursuant to Rule 30e-1 under the Act (17 CFR 270.30e-1):


Voya Investment Management
Annual Report
December 31, 2021
Classes ADV, I, R6, S and S2
Voya Partners, Inc.
◼ Voya Global Bond Portfolio
◼ Voya International High Dividend Low Volatility Portfolio
◼ VY® American Century Small-Mid Cap Value Portfolio
◼ VY® Baron Growth Portfolio
◼ VY® Columbia Contrarian Core Portfolio
◼ VY® Columbia Small Cap Value II Portfolio
◼ VY® Invesco Comstock Portfolio
◼ VY® Invesco Equity and Income Portfolio
◼ VY® Invesco Global Portfolio (formerly VY® Invesco Oppenheimer Global Portfolio)
◼ VY® JPMorgan Mid Cap Value Portfolio
◼ VY® T. Rowe Price Diversified Mid Cap Growth Portfolio
◼ VY® T. Rowe Price Growth Equity Portfolio
As permitted by regulations adopted by the U.S. Securities and Exchange Commission, paper copies of each portfolio's annual and semi-annual shareholder reports, like this annual report, are not sent by mail, unless you specifically request paper copies of the reports. Instead, the reports will be made available on a website and you will be notified by mail each time a report is posted and provided with a website link to access the report.
If you already elected to receive shareholder reports electronically, you need not take any action. You may elect to receive shareholder reports and other communications from your insurance carrier electronically by contacting them directly.
You may elect to receive all future reports in paper free of charge. If you received this document in the mail, please follow the instructions provided to elect to continue receiving paper copies of your shareholder reports. You can inform us that you wish to continue receiving paper copies by calling 1-866-345-5954. Your election to receive reports in paper will apply to all the funds in which you invest.
This report is submitted for general information to shareholders of the Voya mutual funds. It is not authorized for distribution to prospective shareholders unless accompanied or preceded by a prospectus which includes details regarding the funds' investment objectives, risks, charges, expenses and other information. This information should be read carefully.
INVESTMENT MANAGEMENT
voyainvestments.com

President's Letter | | | 1 | | |
Portfolio Managers' Reports | | | 3 | | |
Shareholder Expense Examples | | | 27 | | |
Report of Independent Registered Public Accounting Firm | | | 30 | | |
Statements of Assets and Liabilities | | | 31 | | |
Statements of Operations | | | 37 | | |
Statements of Changes in Net Assets | | | 40 | | |
Financial Highlights | | | 46 | | |
Notes to Financial Statements | | | 53 | | |
Portfolios of Investments | | | 76 | | |
Tax Information | | | 173 | | |
Director and Officer Information | | | 175 | | |
Shareholder Meeting Information | | | 180 | | |
Advisory and Sub-Advisory Contract Approval Discussion | | | 181 | | |
PROXY VOTING INFORMATION
A description of the policies and procedures that the Portfolios use to determine how to vote proxies related to portfolio securities is available: (1) without charge, upon request, by calling Shareholder Services toll-free at (800) 992-0180; (2) on the Portfolios' website at www.voyainvestments.com; and (3) on the U.S. Securities and Exchange Commission's ("SEC's") website at www.sec.gov. Information regarding how the Portfolios voted proxies related to portfolio securities during the most recent 12-month period ended June 30 is available without charge on the Portfolios' website at www.voyainvestments.com and on the SEC's website at www.sec.gov.
QUARTERLY PORTFOLIO HOLDINGS
The Portfolios file their complete schedule of portfolio holdings with the SEC for the first and third quarters of each fiscal year on Form NPORT-P. The Portfolios' Forms NPORT-P are available on the SEC's website at www.sec.gov. Each Portfolio's complete schedule of portfolio holdings is available at: www.voyainvestments.com and without charge upon request from the Portfolio by calling Shareholder Services toll-free at (800) 992-0180.

A Solid Year Ends for the Financial Markets, Gauging the Policy Shifts to Come
Dear Shareholder,
The 12-month period ended December 31, 2021, marked another strong year for stocks. Forcefully accommodative and persistent monetary and fiscal policy, along with the COVID-19 vaccine rollouts and an impressively adaptable global economy, drove big gains within risk assets. The ascent wasn't particularly smooth, as several new COVID-19 variants thwarted attempts at a full-fledged reopening. Besides the distress induced by a public health crisis, prolongation of the pandemic negatively impacted the supply of labor and costs of core goods. These two factors, combined with others such as economic stimulus and rising commodity prices, drove inflation higher. As economic activity proved resilient, however, investors shrugged off soaring prices and continued to buy stocks.
The U.S. unemployment rate declined to 3.9% in December and job openings continued to exceed job seekers, indicating the labor market is approaching full employment. This dynamic is pressuring wages upward and has contributed to inflation running above the U.S Federal Reserve Board's (the "Fed") 2% target since April. Sharply higher prices have caused the Fed to hasten its plans to withdraw stimulus. We recognize that in 2022, monetary and fiscal policy are likely to become less supportive of the global economy. Yet in our view, we also see potential offsets to tightening financial conditions, including consumer spending and corporate inventory rebuilding, which make us believe there is scope for continued global equity gains.
The pace and path to policy normalization will be a key market factor for the year ahead. A sharp rise in wages from prolonged labor market tightness is possible, but firms, particularly larger ones, have been able to pass through rising input costs to maintain margins. In our view, this is likely to continue and, combined with still above trend GDP growth, will support earnings growth in 2022.
As we've often noted, it's important to have a plan for investing consistently through headwinds and tailwinds. Keep focused on your long-term goals and don't get distracted by short-term fluctuations, however compelling or distracting they may seem. Should your long-term goals change, discuss the situation thoroughly with your investment advisor before making any changes to your investment portfolio.
Regardless of events, at Voya we remain well prepared for and fully committed to serving our clients without disruption. We appreciate your continued confidence in us, and we look forward to working with you in the future.
Sincerely,

Dina Santoro
President
Voya Family of Funds
January 21, 2022
The views expressed in the President's Letter reflect those of the President as of the date of the letter. Any such views are subject to change at any time based upon market or other conditions and the Voya mutual funds disclaim any responsibility to update such views. These views may not be relied on as investment advice and because investment decisions for a Voya mutual fund are based on numerous factors, may not be relied on as an indication of investment intent on behalf of any Voya mutual fund. Reference to specific company securities should not be construed as recommendations or investment advice.
International investing poses special risks including currency fluctuation, economic and political risks not found in investments that are solely domestic.
1
Index | | Description | |
Bloomberg Global Aggregate Index | | Provides a broad-based measure of the global investment-grade fixed-rate debt markets. | |
Bloomberg U.S. Government/Credit Index | | An index made up of the Barclays Government and Credit indices, including securities issued by the U.S. government and its agencies and publicly issued U.S. corporate and foreign debentures and secured notes that meet specified maturity, liquidity and quality requirements. | |
MSCI All Country World IndexSM | | A free-float adjusted market capitalization index that is designed to measure equity performance in the global developed and emerging markets. | |
MSCI Europe, Australasia and Far East® ("MSCI EAFE®") Index | | An index that measures the performance of securities listed on exchanges in Europe, Australasia and the Far East. It includes the reinvestment of dividends net of withholding taxes, but does not reflect fees, brokerage commissions or other expenses of investing. | |
MSCI EAFE® Value Index ("MSCI EAFE® Value") | | The index captures large and mid cap securities exhibiting overall value style characteristics across Developed Markets countries around the world, excluding the U.S. and Canada. | |
Russell 1000® Index | | A comprehensive large-cap index measuring the performance of the largest 1,000 U.S. incorporated companies. | |
Russell 1000® Growth Index | | Measures the performance of the 1,000 largest companies in the Russell 3000® Index with higher price-to-book ratios and higher forecasted growth. | |
Russell 1000® Value Index | | An index that measures the performance of those Russell 1000® securities with lower price-to-book ratios and lower forecasted growth values. | |
Russell 2000® Growth Index | | An index that measures the performance of securities of smaller U.S. companies with greater than average growth orientation. | |
Russell 2000® Value Index | | An index that measures the performance of those Russell 2000® companies with lower price-to-book ratios and lower than forecasted growth values. | |
Russell 2500TM Growth Index | | Measures the performance of the small- to mid-cap growth segment of the U.S. equity universe. It includes those Russell 2500TM Index companies with higher price-to-book ratios and higher forecasted growth values. | |
Russell 2500TM Value Index | | Measures the performance of those Russell 2500 companies with lower price-to-book ratios and lower forecasted growth values. | |
Russell Midcap® Growth Index | | An index that measures the performance of those companies included in the Russell Midcap® Index with relatively higher price-to-book ratios and higher forecasted growth values. | |
Russell Midcap® Value Index | | Measures the performance of those Russell Midcap companies with lower price-to-book ratios and lower forecasted growth values. | |
S&P 500® Index | | An index that measures the performance of securities of approximately 500 large-capitalization companies whose securities are traded on major U.S. stock markets. | |
S&P MidCap 400® Index | | An index that measures the performance of the mid-size company segment of the U.S. market. | |
S&P SmallCap 600® Value Index | | Measures the performance of those S&P SmallCap 600® Index companies with lower price-to-book ratios. | |
2
PORTFOLIO MANAGERS' REPORT
VOYA GLOBAL BOND PORTFOLIO
Voya Global Bond Portfolio (the "Portfolio") seeks to maximize total return through a combination of current income and capital appreciation. The Portfolio is managed by Sean Banai, CFA, and Brian Timberlake, Ph.D., CFA, Portfolio Managers of Voya Investment Management Co. LLC ("Voya IM") — the Sub-Adviser.
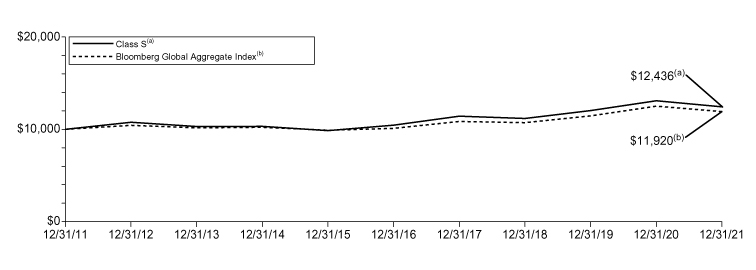
Performance: For the year ended December 31, 2021, the Portfolio's Class S shares provided a total return of -5.03% compared to the Bloomberg Global Aggregate Index, which returned -4.71% for the same period.
Portfolio Specifics: The Portfolio slightly lagged the Bloomberg Global Aggregate Index for the period. Interest rate and currency positioning detracted, while sector allocations added to performance.
Fixed income markets lost ground, as interest rates rose over the course of 2021. Strong momentum in the U.S. recovery, expectations of a faster vaccination program and more fiscal stimulus propelled U.S. Treasury yields higher early in the reporting period, with other developed countries witnessing an increase in rates as well. After peaking in the first quarter of 2021, the remainder of the year witnessed a tug-of-war in yield levels, with elevated inflation concerns pushing rates higher, slowing growth and episodic COVID-19-related concerns sparking recoveries in bond markets. Non-government sectors, including corporate and securitized credit, outperformed global Treasuries. Corporate markets were supported by further improvements in the economy and earnings. In securitized sectors, non-agency residential mortgage-backed securities ("RMBS") were underpinned by the strong housing market and resilient consumers, while commercial mortgage-backed securities ("CMBS") markets responded positively to vaccine news and the prospect of a return to pre-COVID-19 behavior. One exception was agency mortgage-backed securities ("MBS"), a sector that struggled in the wake of higher rates and rate volatility. Meanwhile, the U.S. dollar ("USD") strengthened versus developed and emerging currencies, as it remained the preferred "flight to quality" currency during periods of COVID-19-related volatility.
Sector allocation, in aggregate, contributed to performance. Allocations to corporate credit, spanning investment-grade and high-yield added to performance. The impact from securitized sectors was mixed as allocations to agency RMBS detracted over the period, while investments in more credit sensitive segments, including CMBS, non-agency RMBS and collateralized loan obligations added to performance.
Overall, duration positioning was periodically underweight versus the Bloomberg Global Aggregate Index, and yield curve positioning, particularly in the United States, was a challenge to performance as the curve flattened. Duration allocations to local emerging markets ("EM") also detracted, as many EM central banks pivoted to raising rates to combat early signs of inflation. Emerging currencies also struggled in this environment and allocations weighed on performance. Currency positioning across developed currencies, in aggregate, detracted over the period.
The Portfolio used derivatives, such as used futures, swaps, options and forward contracts, for hedging and overall risk management. The use of derivatives negatively impacted performance for the period.
Current Strategy and Outlook: Looking ahead, we expect pressure for the global ten-year yield to move higher throughout 2022, but the magnitude of those increases will be limited, and we believe the U.S. Treasury market will resist moving significantly above 2%. We think that global inflation, accentuated by energy and commodity prices, will peak in early 2022, but the rate of decline will vary across economies. We believe U.S. inflation will decline only gradually, and likely remain above the U.S. Federal Reserve Board's (the "Fed") target, as wage-driven services inflation and continued rising shelter costs offset a retracement in COVID-19-driven goods inflation.
In this environment, we believe corporate and consumer fundamentals should remain strong and justify valuations remaining at historically "fully-valued" levels, with episodes of volatility creating tactical opportunities and anchoring our preference for credit sensitivity over rate sensitivity in portfolios. As a result, we remain underweight in global Treasuries, while allocating risk across the corporate and securitized credit spectrum. In our opinion, the first Fed rate hike is a limited risk to global credit markets, as credit spreads have historically held steady and even narrowed in the early stages of a Fed hiking cycle. At the same time, we are mindful of the limited upside available, which we believe increases the need for downside protection beyond the traditional duration toolkit.
In our view, the US Dollar ("USD") will remain a barometer for global sentiment regarding COVID-19. We expect the USD to depreciate as COVID-19 variant fears ebb, even in a period when the Fed is raising rates. Further out, as U.S. rates reach an equilibrium and USD strength abates, EM debt securities and currencies could prove attractive. We continue to expect that divergence across EM will also reflect the success (and challenges) in containing inflation and managing COVID-19 across these countries, with dispersion across bond and currency markets.
Geographic Diversification
as of December 31, 2021
(as a percentage of net assets)
United States(1) | | | 89.1 | % | |
China | | | 6.6 | % | |
Spain | | | 1.5 | % | |
Malaysia | | | 1.2 | % | |
Portugal | | | 1.0 | % | |
Italy | | | 0.9 | % | |
United Kingdom | | | 0.9 | % | |
Japan | | | 0.8 | % | |
France | | | 0.7 | % | |
Canada | | | 0.7 | % | |
Countries between 0.0%-0.4%^ | | | 2.3 | % | |
Liabilities in Excess of Other Assets* | | | (5.7 | )% | |
Net Assets | | | 100.0 | % | |
* Includes short-term investments and purchased options.
^ Includes 10 countries, which each represents 0.0%-0.4% of net assets.
(1) Includes 24.9% total investment in Voya Emerging Markets Corporate Debt Fund, Voya Emerging Markets Hard Currency Debt Fund, Voya Emerging Markets Local Currency Debt Fund and Voya High Yield Bond Fund.
Portfolio holdings are subject to change daily.
Top Ten Holdings
as of December 31, 2021
(as a percentage of net assets)
Voya Emerging Markets Hard Currency Debt
Fund — Class P | | | 8.5 | % | |
Voya High Yield Bond Fund — Class P | | | 7.0 | % | |
Voya Emerging Markets Corporate Debt
Fund — Class P | | | 4.9 | % | |
Voya Emerging Markets Local Currency Debt
Fund — Class P | | | 4.5 | % | |
China Government Bond, 3.250%, 11/22/28 | | | 3.0 | % | |
Uniform Mortgage-Backed Securities,
2.000%, 02/15/52 | | | 2.3 | % | |
Ginnie Mae, 3.000%, 01/15/52 | | | 2.1 | % | |
Uniform Mortgage-Backed Securities,
2.500%, 02/15/52 | | | 1.6 | % | |
Fannie Mae REMICS 2021-4 IN, 2.500%, 02/25/51 | | | 1.4 | % | |
China Government Bond, 2.850%, 06/04/27 | | | 1.4 | % | |
Portfolio holdings are subject to change daily.
The views expressed in this commentary are informed opinions. They should not be considered promises or advice. The views expressed reflect those of the portfolio managers, only through the end of the period as stated on the cover. The portfolio managers' views are subject to change at any time based on market and other conditions.
Portfolio holdings and characteristics are subject to change and may not be representative of current holdings and characteristics. Portfolio holdings are subject to change daily. The outlook for this Portfolio may differ from that presented for other Voya mutual funds. This report contains statements that may be "forward-looking" statements. Actual results may differ materially from those projected in the "forward-looking" statements. The Portfolio's performance returns shown reflect applicable fee waivers and/or expense limits in effect during this period. Absent such fee waivers/expense limitations, if any, performance would have been lower. Performance for the different classes of shares will vary based on differences in fees associated with each class. An index has no cash in its portfolio and imposes no sales charges. An investor cannot invest directly in an index.
3
VOYA GLOBAL BOND PORTFOLIO
PORTFOLIO MANAGERS' REPORT
Average Annual Total Returns for the Periods Ended December 31, 2021 | |
| | 1 Year | | 5 Year | | 10 Year | |
Class ADV | | | -5.21 | % | | | 3.29 | % | | | 1.95 | % | |
Class I | | | -4.78 | % | | | 3.82 | % | | | 2.47 | % | |
Class S | | | -5.03 | % | | | 3.54 | % | | | 2.20 | % | |
Blooomberg Global Aggregate Index | | | -4.71 | % | | | 3.36 | % | | | 1.77 | % | |
Based on a $10,000 initial investment, the graph and table above illustrate the total return of Voya Global Bond Portfolio against the index indicated. The index is unmanaged and has no cash in its portfolio and imposes no sales charges. An investor cannot invest directly in an index.
The Portfolio's performance is shown without the imposition of any expenses or charges which are, or may be, imposed under your variable annuity contract or variable life insurance policy. Total returns would have been lower if such expenses or charges were included.
The performance graph and table do not reflect the deduction of taxes that a shareholder will pay on Portfolio distributions or the redemption of Portfolio shares.
The performance shown includes, if applicable, the effect of fee waivers and/or expense reimbursements by the Investment Adviser and/or other service providers, which
have the effect of increasing total return. Had all fees and expenses been considered, the total returns would have been lower.
The performance update illustrates performance for a variable investment option available through a variable annuity contract or a variable life insurance policy. The performance shown indicates past performance and is not a projection or prediction of future results. Actual investment returns and principal value will fluctuate so that shares and/or units, at redemption, may be worth more or less than their original cost. Please log on to www.voyainvestments.com or call (800) 262-3862 to get performance through the most recent month end.
Portfolio holdings are subject to change daily.
4
PORTFOLIO MANAGERS' REPORT
VOYA INTERNATIONAL HIGH DIVIDEND LOW VOLATILITY PORTFOLIO
Voya International High Dividend Low Volatility Portfolio (the "Portfolio") seeks maximum total return. The Portfolio is managed by Vincent Costa, CFA, Kai Yee Wong, Peg DiOrio, CFA, and Steve Wetter, Portfolio Managers of Voya Investment Management Co. LLC ("VIM") — the Sub-Adviser.
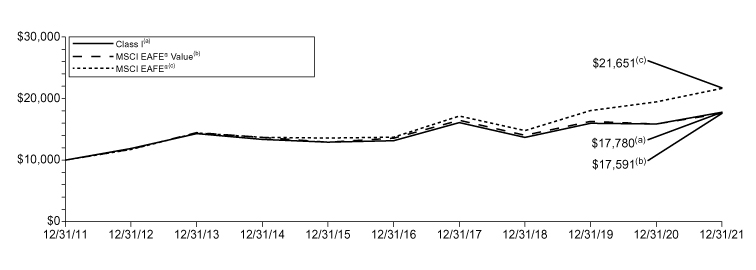
Performance*: For the year ended December 31, 2021, the Portfolio's Class I shares provided a total return of 12.08% compared to the MSCI EAFE® Value Index (the "Index" or "MSCI EAFE® Value") and the MSCI EAFE® Index ("MSCI EAFE®"), which returned 10.89% and 11.26%, respectively, for the same period.
Portfolio Specifics: For the reporting period, the Portfolio outperformed the MSCI EAFE® Value. In terms of the Portfolio's performance, the stock ranking model outperformed along with the Portfolio's higher dividend yield and lower beta (relative to the MSCI EAFE® Value). Conversely, the small market capitalization tilt detracted from performance.
On the regional level, stock selection within Europe and Africa/Middle East was additive. By contrast, stock selection within Japan had the largest negative impact on performance.
On the sector level, the underweight and stock selection within real estate, utilities and health care, had the largest positive impact on performance. Conversely, the largest detractors from performance came from stock selection in the consumer discretionary sector.
At the individual stock level, not owning benchmark stock SoftBank Group Corp, an overweight to Bank Leumi Le-Israel Ltd., and an underweight in Novartis AG, were among the key contributors for the period. The key detractors for the period included owning non-benchmark stocks Nintendo Co., Ltd. and TSURUHA Holdings, Inc., as well as an overweight to Secom Co., Ltd.
Current Strategy and Outlook: This is an actively managed international quantitative equity strategy that seeks to generate higher dividend income and total returns, with lower volatility and better downside capture, than the MSCI EAFE® Value. The investment process seeks to create a universe of sustainable dividend-paying stocks and utilizes fundamentally driven sector-specific alpha models to identify the most attractive stocks within each region-sector. The managers then seek to optimize the Portfolio's potential to achieve its dividend, alpha, and volatility objectives.
Geographic Diversification
as of December 31, 2021
(as a percentage of net assets)
Japan | | | 22.7 | % | |
United Kingdom | | | 17.0 | % | |
Germany | | | 9.3 | % | |
France | | | 8.9 | % | |
Australia | | | 7.6 | % | |
Switzerland | | | 6.7 | % | |
Italy | | | 4.4 | % | |
Hong Kong | | | 3.7 | % | |
Netherlands | | | 3.2 | % | |
Denmark | | | 2.8 | % | |
Countries between 0.2%-2.4%^ | | | 11.3 | % | |
Assets in Excess of Other Liabilities* | | | 2.4 | % | |
Net Assets | | | 100.0 | % | |
* Includes short-term investments and exchange-traded funds.
^ Includes 12 countries, which each represents 0.2%-2.4% of net assets.
Portfolio holdings are subject to change daily.
Top Ten Holdings
as of December 31, 2021
(as a percentage of net assets)
GlaxoSmithKline PLC | | | 1.9 | % | |
Rio Tinto Ltd. | | | 1.7 | % | |
Sanofi | | | 1.5 | % | |
British American Tobacco PLC | | | 1.5 | % | |
Mitsubishi UFJ Financial Group, Inc. | | | 1.3 | % | |
Zurich Insurance Group AG | | | 1.3 | % | |
Deutsche Post AG | | | 1.2 | % | |
National Grid PLC | | | 1.2 | % | |
Novartis AG | | | 1.2 | % | |
| BP PLC | | | 1.1 | % | |
Portfolio holdings are subject to change daily.
* Effective December 31, 2020, the Portfolio's benchmark changed from the MSCI EAFE® Index to the MSCI EAFE® Value Index because the MSCI EAFE® Value is considered by the adviser to be a more appropriate benchmark, reflecting the type of securities in which the Portfolio invests.
The views expressed in this commentary are informed opinions. They should not be considered promises or advice. The views expressed reflect those of the portfolio managers, only through the end of the period as stated on the cover. The portfolio managers' views are subject to change at any time based on market and other conditions.
Portfolio holdings and characteristics are subject to change and may not be representative of current holdings and characteristics. Portfolio holdings are subject to change daily. The outlook for this Portfolio may differ from that presented for other Voya mutual funds. This report contains statements that may be "forward-looking" statements. Actual results may differ materially from those projected in the "forward-looking" statements. The Portfolio's performance returns shown reflect applicable fee waivers and/or expense limits in effect during this period. Absent such fee waivers/expense limitations, if any, performance would have been lower. Performance for the different classes of shares will vary based on differences in fees associated with each class. An index has no cash in its portfolio and imposes no sales charges. An investor cannot invest directly in an index.
5
VOYA INTERNATIONAL HIGH DIVIDEND LOW VOLATILITY PORTFOLIO
PORTFOLIO MANAGERS' REPORT
Average Annual Total Returns for the Periods Ended December 31, 2021 | |
| | 1 Year | | 5 Year | | 10 Year | |
Class ADV | | | 11.50 | % | | | 5.68 | % | | | 5.40 | % | |
Class I | | | 12.08 | % | | | 6.22 | % | | | 5.92 | % | |
Class S | | | 11.79 | % | | | 5.94 | % | | | 5.65 | % | |
Class S2 | | | 11.67 | % | | | 5.80 | % | | | 5.50 | % | |
MSCI EAFE® Value | | | 10.89 | % | | | 5.34 | % | | | 5.81 | % | |
MSCI EAFE® | | | 11.26 | % | | | 9.55 | % | | | 8.03 | % | |
Based on a $10,000 initial investment, the graph and table above illustrate the total return of Voya International High Dividend Low Volatility Portfolio against the indices indicated. An index is unmanaged and has no cash in its portfolio and imposes no sales charges. An investor cannot invest directly in an index.
The Portfolio's performance is shown without the imposition of any expenses or charges which are, or may be, imposed under your variable annuity contract or variable life insurance policy. Total returns would have been lower if such expenses or charges were included.
The performance graph and table do not reflect the deduction of taxes that a shareholder will pay on Portfolio distributions or the redemption of Portfolio shares.
The performance shown includes, if applicable, the effect of fee waivers and/or expense reimbursements by the Investment Adviser and/or other service providers, which have the effect of increasing total return. Had all fees and expenses been considered, the total returns would have been lower.
The performance update illustrates performance for a variable investment option available through a variable annuity contract or a variable life insurance policy. The performance shown indicates past performance and is not a projection or prediction of future results. Actual investment returns and principal value will fluctuate so that shares and/or units, at redemption, may be worth more or less than their original cost. Please log on to www.voyainvestments.com or call (800) 262-3862 to get performance through the most recent month end.
Portfolio holdings are subject to change daily.
Effective December 31, 2020 the Portfolio changed its benchmark from the MSCI EAFE® Index to the MSCI EAFE® Value Index because the MSCI EAFE® Value Index is considered by the adviser to be a more appropriate benchmark, reflecting the type of securities in which the Portfolio invests.
Prior to May 1, 2019, the Portfolio was managed by a different sub-adviser. The Portfolio's performance information for these periods reflects returns achieved by different sub-advisers.
6
VY® AMERICAN CENTURY SMALL-MID CAP VALUE PORTFOLIO
PORTFOLIO MANAGERS' REPORT
VY® American Century Small-Mid Cap Value Portfolio (the "Portfolio") seeks long-term capital growth. Income is a secondary objective. The Portfolio is managed by a team of portfolio managers comprised of Jeff John, CFA, Vice President and Ryan Cope, CFA (responsible for the management of the Small Cap Value portion of the Portfolio) and Kevin Toney, CFA, Co-Chief Investment Officer — Global Value Equity and Senior Vice President, Phillip N. Davidson, CFA, Senior Vice President and Co-Chief Investment Officer — Global Value Equity and Senior Vice President, Michael Liss, CFA, CPA and Vice President, and Brian Woglom, CFA, Vice President (responsible for the Mid Cap Value portion of the Portfolio) (each a "Sleeve"), Portfolio Managers of American Century Investment Management, Inc. — the Sub-Adviser.
Performance: For the year ended December 31, 2021, the Portfolio's Class S shares provided a total return of 27.30% compared to the Russell 2500TM Value Index and the S&P SmallCap 600® Value Index, which returned 27.78% and 30.95%, respectively, for the same period.
Portfolio Specifics: Broad U.S. equity markets delivered strong returns in 2021, buoyed by expanding vaccine availability, federal aid, positive economic news and strong corporate earnings reports. Stocks experienced some volatility throughout the year, however, due to the emergence of the delta and omicron variants of the coronavirus, supply chain constraints, inflation concerns and labor shortages.
Value stocks outperformed. Mid-cap stocks as measured by the Russell family of indices outperformed small cap equities but underperformed large cap equities. Value stocks outperformed growth stocks for the period among mid-cap stocks.
The Portfolio underperformed the Russell 2500 TM Value Index after the deduction of fees and expenses but outperformed before fees and expenses during the reporting period. Although the Russell 2500 TM Value Index is the overall portfolio benchmark, the Small Cap Value and Mid Cap Value sleeves are managed against the Russell 2000® Value and Russell Midcap Value® indices, respectively.
The Mid Cap Value sleeve underperformed its benchmark, the Russell Midcap® Value Index, for the year. Stock selection in materials hindered relative performance. Higher materials costs pressured containers and packaging holdings such as Sonoco Products. A lack of exposure to the metals and mining industry also dampened relative returns. Security selection in financials weighed on relative returns against a backdrop of strong equity markets and continued re-openings. Our preference for higher-quality banks and our investments in insurance dampened performance. Not owning companies in the consumer finance industry also detracted. On a positive note, stock selection in industrials contributed to performance. Select holdings in the machinery and electrical equipment industries benefited performance. Electrical product provider nVent Electric was a top performer.
The Small Cap Value sleeve, however, outperformed its benchmark, the Russell 2000® Value Index. Stock selection in the financials sector aided relative performance. Signature Bank, a top performer, is what we believe to be a higher-quality, New York-based commercial bank that reported improved credit trends and deposit growth. Stock selection in information technology also lifted relative performance, assisted by software investments such as Teradata. Teradata benefited from growth in its public cloud business. Stock selection in materials, and especially in the containers and packaging industry, weighed on relative performance. Pactiv Evergreen, a producer of fresh food and beverage packaging, underperformed. Pactiv faced transitory challenges caused by the pandemic.
The blended Portfolio outperformed its benchmark, the Russell 2500® Value Index before the deduction of fees and expenses but underperformed net of fees and expenses during the reporting period. Information technology holdings drove relative outperformance, aided by an investment in Teradata. The market reacted favorably after this leader in software for database management reported strong quarterly results. In addition, investors were encouraged by better-than-expected data for Teradata's public cloud business, validating the strategic efforts initiated by new senior management to strengthen its position in public cloud. ConcoPhillips was another strong performer. This exploration and production company outperformed due in part to its continued strong execution. During the third quarter, it unveiled what we think is an attractive 10-year financial plan and announced an attractively priced acquisition of assets from a competitor. The stock also benefited from stronger commodity prices. Stock selection in materials detracted from relative performance, as higher input costs pressured several containers and packaging holdings. Among individual holdings, Zimmer Biomet Holdings was a prominent detractor. This medical device company underperformed following strong performances in the second half of 2020, when elective surgeries began to be allowed during the pandemic. With the omicron surge toward the end of 2021, many providers delayed elective surgeries.
Current Strategy and Outlook: The Portfolio seeks to invest in companies where we believe the valuation does not reflect the quality and normal earnings power of the company. Our process is based on individual security selection, but broad themes have emerged.
We do not rely on impending catalysts in our process. Investors wonder if there are impending catalysts that might bring about a long-awaited and a lasting shift toward value stocks. We believe value catalysts are embedded in our security selection. Our process involves buying what we believe to be higher-quality companies trading at a discount to fair value. We believe our fundamental analysis leads us to companies that are undervalued for transitory reasons, and their shares will inherently revert at some point. Relying on catalysts can be precarious, in our opinion. When a catalyst becomes recognizable to the market, in our view the corresponding securities may have already become less attractive on a relative risk/reward basis.
We believe companies in the consumer staples sector generally offer strong defensive characteristics. Furthermore, we believe many of our holdings have taken steps to improve operations and strengthen their balance sheets. We added to some of our positions as select securities became more attractively priced in our view.
We believe the financial sector offers select higher-quality companies that fit our process. We prefer trust banks and other financials that risk minimal capital as part of their business model. Our exposure to banks focuses on those we think are more likely to manage credit successfully through the ups and downs of the business cycle.
The pandemic accelerated paradigm-shifting structural trends. For example, we believe de-denisfication has reshaped the real estate market as millennials migrate from urban cores, boosted by low mortgage interest rates and the acceptance of work-from-home practices. Declining technology costs and growing environmental concerns have created opportunities, in our view, for utilities to transition power generation from coal and natural gas to renewable sources such as solar and wind. In addition, we believe government entities will support renewables by enacting policies intended to combat global warming. In our opinion, these and other significant themes may create investment opportunities while increasing the importance of fundamental analysis and security selection.
Sector Diversification
as of December 31, 2021
(as a percentage of net assets)
Financials | | | 21.7 | % | |
Industrials | | | 15.9 | % | |
Health Care | | | 12.8 | % | |
Consumer Discretionary | | | 9.9 | % | |
Information Technology | | | 8.7 | % | |
Consumer Staples | | | 7.2 | % | |
Real Estate | | | 6.4 | % | |
Utilities | | | 5.6 | % | |
Materials | | | 5.1 | % | |
Energy | | | 3.8 | % | |
Communication Services | | | 1.2 | % | |
Assets in Excess of Other Liabilities* | | | 1.7 | % | |
Net Assets | | | 100.0 | % | |
* Includes short-term investments.
Portfolio holdings are subject to change daily.
Top Ten Holdings
as of December 31, 2021*
(as a percentage of net assets)
Zimmer Biomet Holdings, Inc. | | | 2.2 | % | |
Northern Trust Corp. | | | 1.7 | % | |
Cerner Corp. | | | 1.6 | % | |
Conagra Brands, Inc. | | | 1.4 | % | |
Advance Auto Parts, Inc. | | | 1.4 | % | |
Bank of New York Mellon Corp. | | | 1.4 | % | |
Edison International | | | 1.4 | % | |
Southwest Airlines Co. | | | 1.3 | % | |
Sonoco Products Co. | | | 1.2 | % | |
Emerson Electric Co. | | | 1.2 | % | |
* Excludes short-term investments.
Portfolio holdings are subject to change daily.
The views expressed in this commentary are informed opinions. They should not be considered promises or advice. The views expressed reflect those of the portfolio managers, only through the end of the period as stated on the cover. The portfolio managers' views are subject to change at any time based on market and other conditions.
Portfolio holdings and characteristics are subject to change and may not be representative of current holdings and characteristics. Portfolio holdings are subject to change daily. The outlook for this Portfolio may differ from that presented for other Voya mutual funds. This report contains statements that may be "forward-looking" statements. Actual results may differ materially from those projected in the "forward-looking" statements. The Portfolio's performance returns shown reflect applicable fee waivers and/or expense limits in effect during this period. Absent such fee waivers/expense limitations, if any, performance would have been lower. Performance for the different classes of shares will vary based on differences in fees associated with each class. An index has no cash in its portfolio and imposes no sales charges. An investor cannot invest directly in an index.
7
VY® AMERICAN CENTURY SMALL-MID CAP VALUE PORTFOLIO
PORTFOLIO MANAGERS' REPORT

Average Annual Total Returns for the Periods Ended December 31, 2021 | |
| | 1 Year | | 5 Year | | 10 Year | |
Class ADV | | | 26.94 | % | | | 10.12 | % | | | 12.86 | % | |
Class I | | | 27.57 | % | | | 10.66 | % | | | 13.42 | % | |
Class S | | | 27.30 | % | | | 10.39 | % | | | 13.13 | % | |
Class S2 | | | 27.11 | % | | | 10.22 | % | | | 12.97 | % | |
Russell 2500TM Value Index | | | 27.78 | % | | | 9.88 | % | | | 12.43 | % | |
S&P SmallCap 600® Value Index | | | 30.95 | % | | | 10.25 | % | | | 13.52 | % | |
Based on a $10,000 initial investment, the graph and table above illustrate the total return of VY® American Century Small-Mid Cap Value Portfolio against the indices indicated. An index is unmanaged and has no cash in its portfolio and imposes no sales charges. An investor cannot invest directly in an index.
The Portfolio's performance is shown without the imposition of any expenses or charges which are, or may be, imposed under your variable annuity contract or variable life insurance policy. Total returns would have been lower if such expenses or charges were included.
The performance graph and table do not reflect the deduction of taxes that a shareholder will pay on Portfolio distributions or the redemption of Portfolio shares.
The performance shown includes, if applicable, the effect of fee waivers and/or expense reimbursements by the
Investment Adviser and/or other service providers, which have the effect of increasing total return. Had all fees and expenses been considered, the total returns would have been lower.
The performance update illustrates performance for a variable investment option available through a variable annuity contract or a variable life insurance policy. The performance shown indicates past performance and is not a projection or prediction of future results. Actual investment returns and principal value will fluctuate so that shares and/or units, at redemption, may be worth more or less than their original cost. Please log on to www.voyainvestments.com or call (800) 262-3862 to get performance through the most recent month end.
Portfolio holdings are subject to change daily.
8
PORTFOLIO MANAGERS' REPORT
VY® BARON GROWTH PORTFOLIO
VY® Baron Growth Portfolio (the "Portfolio") seeks capital appreciation. The Portfolio is managed by Ronald Baron, Founder, Chief Executive Officer, Chief Investment Officer, Chairman, and Portfolio Manager and Neal Rosenberg, Portfolio Manager of BAMCO, Inc. — the Sub-Adviser.
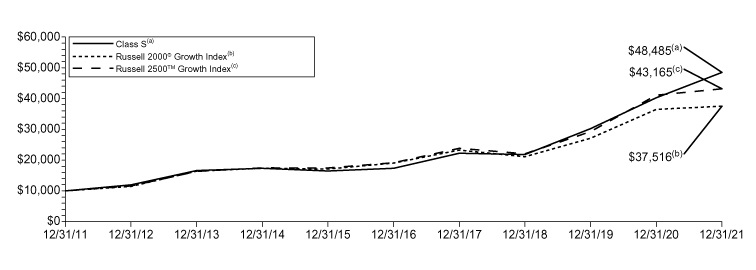
Performance: For the year ended December 31, 2021, the Portfolio's Class S shares provided a total return of 20.43% compared to the Russell 2000® Growth Index and the Russell 2500TM Growth Index, which returned 2.83% and 5.04%, respectively, for the same period.
Portfolio Specifics: The U.S. stock market rose relatively steadily during 2021, buoyed by COVID-19 vaccines, strong corporate earnings, and robust consumer demand. While the distribution of vaccines and lifting of lockdowns kicked off an economic rebound at the start of the year, the subsequent emergence of new variants slowed the recovery. Investors largely shrugged off concerns around labor shortages, supply chain issues, rising inflation, and signs that the U.S. Federal Reserve Board would taper its Quantitative Easing program. Large cap equities significantly outpaced small- and mid-cap stocks, particularly in the second half of the year.
Absolute Performance: Shares of investment decision support tools provider MSCI, Inc. increased on solid earnings and upbeat management reports. MSCI, Inc. enhanced its private markets capabilities with the acquisition of Real Capital Analytics. We believe the company owns strong, "all weather" franchises and we believe remains positioned to benefit from numerous secular tailwinds in the investment community.
Shares of syndicated IT research provider Gartner, Inc. increased on financial results that significantly beat street forecasts. Growth in the research business reaccelerated to double-digit levels, led by the Global Business Services segment, which is benefiting from a multi-year investment cycle. We expect improved revenue growth and renewed focus on cost control to drive margin expansion and enhanced cash generation. In our view, Gartner, Inc.'s stellar balance sheet can support aggressive share repurchases and bolt-on acquisitions, in our view.
Shares of hotel franchisor Choice Hotels International, Inc. rose in 2021 on earnings that surpassed pre-pandemic levels, beating investor expectations. Work-from-anywhere policies implemented during the pandemic, which allowed people to add leisure travel to their business plans, boosted demand, augmenting revenue per available room. Unit growth in Choice Hotels International, Inc.'s higher revenue-generating brands also added to fee-based income. We retain conviction given what we believe to be the company's strong franchising business, consistent profitability, and continued new unit growth.
Shares of regional casino company Penn National Gaming, Inc. declined due to market share losses and increased marketing costs related to online sports betting company Barstool Sportsbook. Penn National Gaming, Inc.'s increased exposure in this highly competitive business with its $2 billion acquisition of sports betting app theScore also pressured shares. We think Penn National Gaming, Inc. will have a solid foothold in the U.S. and Canada with these two purchases. Penn National Gaming, Inc. has a strong balance sheet to fund its digital losses, and we expect it to be profitable by 2023.
Real estate data and marketing platform CoStar Group, Inc. detracted as record-high apartment occupancy caused a slowdown in its multifamily marketing platform. We think this condition is temporary and growth will improve through higher prices and better customer segmentation. We believe CoStar Group, Inc. push into the residential market, while requiring a meaningful short-term investment, should ultimately yield high returns and enhance growth and profitability, in our view.
Shares of corporate childcare provider Bright Horizons Family Solutions, Inc. dropped in 2021 as COVID-19 variants pushed out its re-enrollment ramp and labor shortages pressured capacity and margins. The possibility that more hybrid work-from-home arrangements could result in lower demand for services also hurt share price. We continue to like what we believe to be this high-quality name.
Relative Performance: The Portfolio outperformed the Russell 2000® Growth Index in 2021 due to stock selection, differences in sector/sub-industry weights, and tailwinds from style biases, particularly underexposure to the weak performing residual volatility and beta factors.
Investments in health care, financials, and information technology added the most value. Within health care, lower exposure to lagging biotechnology stocks contributed over 585 basis points. Strength in the sector also came from Bio-Techne Corporation, veterinary diagnostics leader IDEXX Laboratories, Inc., and pharmaceutical packaging manufacturer West Pharmaceutical Services, Inc. Gains in financials were driven by financial exchanges & data providers MSCI, Inc. and FactSet Research Systems, Inc. Independent investment research provider Morningstar, Inc., asset manager The Carlyle Group Inc., and specialty insurer Arch Capital Group Ltd. also performed well in the sector. Performance in IT was bolstered by Gartner, Inc. Positive stock selection in information technology was somewhat offset by lack of exposure to semiconductor stocks.
Underperformance of industrials and consumer discretionary investments weighed the most on relative results. Weakness in industrials came from CoStar Group, Inc., while Penn National Gaming, Inc. and Bright Horizons Family Solutions, Inc. were responsible for the relative shortfall in the consumer discretionary sector.
Current Strategy and Outlook: As long-term investors in what we view as high quality growth stocks, we are always actively looking for companies with what we believe are open-ended growth opportunities, competitive advantages, and what we believe to be excellent management, at attractive valuations. While we are certainly aware of short-term macro events, we do not manage the Portfolio in response to these developments. Rather, we position the Portfolio to seek to benefit from what we believe to be durable growth opportunities over the long term.
Sector Diversification
as of December 31, 2021
(as a percentage of net assets)
Financials | | | 31.4 | % | |
Consumer Discretionary | | | 22.2 | % | |
Health Care | | | 14.6 | % | |
Information Technology | | | 14.6 | % | |
Industrials | | | 7.4 | % | |
Real Estate | | | 6.2 | % | |
Communication Services | | | 3.6 | % | |
Assets in Excess of Other Liabilities | | | 0.0 | % | |
Net Assets | | | 100.0 | % | |
Portfolio holdings are subject to change daily.
Top Ten Holdings
as of December 31, 2021
(as a percentage of net assets)
MSCI, Inc. — Class A | | | 10.2 | % | |
Vail Resorts, Inc. | | | 7.3 | % | |
Choice Hotels International, Inc. | | | 7.0 | % | |
Factset Research Systems, Inc. | | | 5.8 | % | |
Gartner, Inc. | | | 5.6 | % | |
ANSYS, Inc. | | | 4.6 | % | |
Idexx Laboratories, Inc. | | | 4.5 | % | |
CoStar Group, Inc. | | | 4.2 | % | |
Bio-Techne Corp. | | | 3.8 | % | |
Morningstar, Inc. | | | 3.4 | % | |
Portfolio holdings are subject to change daily.
The views expressed in this commentary are informed opinions. They should not be considered promises or advice. The views expressed reflect those of the portfolio managers, only through the end of the period as stated on the cover. The portfolio managers' views are subject to change at any time based on market and other conditions.
Portfolio holdings and characteristics are subject to change and may not be representative of current holdings and characteristics. Portfolio holdings are subject to change daily. The outlook for this Portfolio may differ from that presented for other Voya mutual funds. This report contains statements that may be "forward-looking" statements. Actual results may differ materially from those projected in the "forward-looking" statements. The Portfolio's performance returns shown reflect applicable fee waivers and/or expense limits in effect during this period. Absent such fee waivers/expense limitations, if any, performance would have been lower. Performance for the different classes of shares will vary based on differences in fees associated with each class. An index has no cash in its portfolio and imposes no sales charges. An investor cannot invest directly in an index.
9
VY® BARON GROWTH PORTFOLIO
PORTFOLIO MANAGERS' REPORT
Average Annual Total Returns for the Periods Ended December 31, 2021 | |
| | 1 Year | | 5 Year | | 10 Year | |
Class ADV | | | 20.14 | % | | | 22.53 | % | | | 16.81 | % | |
Class I | | | 20.73 | % | | | 23.14 | % | | | 17.39 | % | |
Class R6(1) | | | 20.74 | % | | | 23.15 | % | | | 17.40 | % | |
Class S | | | 20.43 | % | | | 22.83 | % | | | 17.10 | % | |
Class S2 | | | 20.25 | % | | | 22.64 | % | | | 16.93 | % | |
Russell 2000® Growth Index | | | 2.83 | % | | | 14.53 | % | | | 14.14 | % | |
Russell 2500TM Growth Index | | | 5.04 | % | | | 17.65 | % | | | 15.75 | % | |
Based on a $10,000 initial investment, the graph and table above illustrate the total return of VY® Baron Growth Portfolio against the indices indicated. An index is unmanaged and has no cash in its portfolio and imposes no sales charges. An investor cannot invest directly in an index.
The Portfolio's performance is shown without the imposition of any expenses or charges which are, or may be, imposed under your variable annuity contract or variable life insurance policy. Total returns would have been lower if such expenses or charges were included.
The performance graph and table do not reflect the deduction of taxes that a shareholder will pay on Portfolio distributions or the redemption of Portfolio shares.
The performance shown includes, if applicable, the effect of fee waivers and/or expense reimbursements by the Investment Adviser and/or other service providers, which have the effect of increasing total return. Had all fees and
expenses been considered, the total returns would have been lower.
The performance update illustrates performance for a variable investment option available through a variable annuity contract or a variable life insurance policy. The performance shown indicates past performance and is not a projection or prediction of future results. Actual investment returns and principal value will fluctuate so that shares and/or units, at redemption, may be worth more or less than their original cost. Please log on to www.voyainvestments.com or call (800) 262-3862 to get performance through the most recent month end.
Portfolio holdings are subject to change daily.
(1) Class R6 incepted on May 3, 2016. The Class R6 shares performance shown for the period prior to their inception date is the performance of Class I shares without adjustment for any differences in the expenses between the two classes. If adjusted for such differences, returns would be different.
10
VY® COLUMBIA CONTRARIAN CORE PORTFOLIO
PORTFOLIO MANAGERS' REPORT
VY® Columbia Contrarian Core Portfolio (the "Portfolio") seeks total return consisting of long-term capital appreciation and current income. The Portfolio is managed by Guy W. Pope, CFA, Senior Portfolio Manager and Head of Contrarian Core Strategy with Columbia Management Investment Advisers, LLC — the Sub-Adviser.
Performance: For the year ended December 31, 2021, the Portfolio's Class S shares provided a total return of 23.94% compared to the Russell 1000® Index, which returned 26.45% for the same period.
Portfolio Specifics: The Portfolio's relative underperformance was driven by a combination of stock selection and sector allocation. From an allocation perspective, overweights to the communication services and materials sectors hurt relative performance. An underweight to the strong performing real estate sector also detracted from performance. The industrials sector was the weakest sector for the Portfolio, driven primarily by stock selection, most notably Uber, but also Southwest Airlines and Honeywell. Health care was also an area of detraction. Medical devices company, Medtronic, was the biggest relative detractor. We remain confident in Medtronic's new management team and believe that it will be among top performers in the health care sector once we are through the last COVID-19 surge from the Omicron variant. Other health care holdings that weighed on relative performance included, BioMarin and Vertex, health care equipment company, Dentsply Sirona, Inc. and Johnson & Johnson. Activision Blizzard, Inc. and T-Mobile USA, Inc., both within the communication services sector, were among the Portfolio's largest top detractors during the year. Within the consumer staples sector, Coca-Cola Company (which has been sold from the Portfolio) and Sysco Corporation disappointed. Within consumer discretionary, the Portfolio's large holding in Amazon.com (which had been a huge positive contributor in 2020) weighed on results, as did Dollar Tree (which has been sold from the Portfolio).
The Portfolio's overweight allocations to financials, energy and information technology contributed positively to performance versus the Russell 1000® Index. Underweight allocations to the utilities and consumer staples also added to relative results. The information technology sector was the Portfolio's strongest area of contribution, with performance driven by strong stock selection. Holdings that delivered strong results included software companies Intuit, Microsoft and Palo Alto Networks. Semiconductor equipment companies NVIDIA Corp., Lam Research Corp., and Marvell Technology were also strong contributors to performance. Within energy, all three of the Portfolio's holdings, Canadian Natural Resources Limited, Chevron and EOG Resources, Inc. benefited the Portfolio's performance versus the Russell 1000® Index. Eli Lilly and Company stood out in the sector as a significant positive contributor in health care. Within the financials sector notable contributors included Morgan Stanley, Bank of America Corp. and American Express. In the communications sector, Alphabet was one of the Portfolio's top individual contributors for the year.
Current Strategy and Outlook: In our opinion, the market's focus remains on the re-opening of economic activity, supply-chain improvement and a return to normal life, post-COVID-19. The rapid spread of the virus caused by the Omicron variant in the last month of 2021 has been mitigated thus far by the fact that cases have been much milder. Concerns for financial markets also include inflation and the pace and timing of interest rate hikes by the U.S. Federal Reserve Board. In our view, corporate earnings and capital markets remain strong, and our Contrarian Core team continues to be positive in its overall market outlook, while recognizing that recovery still depends on getting the coronavirus fully under control.
Sector Diversification
as of December 31, 2021
(as a percentage of net assets)
Information Technology | | | 32.3 | % | |
Health Care | | | 13.4 | % | |
Communication Services | | | 11.8 | % | |
Financials | | | 10.0 | % | |
Consumer Discretionary | | | 9.2 | % | |
Industrials | | | 8.3 | % | |
Consumer Staples | | | 4.5 | % | |
Materials | | | 3.1 | % | |
Energy | | | 3.0 | % | |
Utilities | | | 1.7 | % | |
Real Estate | | | 1.2 | % | |
Assets in Excess of Other Liabilities* | | | 1.5 | % | |
Net Assets | | | 100.0 | % | |
* Includes short-term investments.
Portfolio holdings are subject to change daily.
Top Ten Holdings
as of December 31, 2021
(as a percentage of net assets)
Microsoft Corp. | | | 7.1 | % | |
Apple, Inc. | | | 6.4 | % | |
Amazon.com, Inc. | | | 4.4 | % | |
Alphabet, Inc. — Class C | | | 2.8 | % | |
Berkshire Hathaway, Inc. — Class B | | | 2.7 | % | |
Raytheon Technologies Corp. | | | 2.7 | % | |
Alphabet, Inc. — Class A | | | 2.6 | % | |
Johnson & Johnson | | | 2.5 | % | |
Meta Platforms, Inc. | | | 2.3 | % | |
TE Connectivity Ltd. | | | 2.2 | % | |
Portfolio holdings are subject to change daily.
The views expressed in this commentary are informed opinions. They should not be considered promises or advice. The views expressed reflect those of the portfolio managers, only through the end of the period as stated on the cover. The portfolio managers' views are subject to change at any time based on market and other conditions.
Portfolio holdings and characteristics are subject to change and may not be representative of current holdings and characteristics. Portfolio holdings are subject to change daily. The outlook for this Portfolio may differ from that presented for other Voya mutual funds. This report contains statements that may be "forward-looking" statements. Actual results may differ materially from those projected in the "forward-looking" statements. The Portfolio's performance returns shown reflect applicable fee waivers and/or expense limits in effect during this period. Absent such fee waivers/expense limitations, if any, performance would have been lower. Performance for the different classes of shares will vary based on differences in fees associated with each class. An index has no cash in its portfolio and imposes no sales charges. An investor cannot invest directly in an index.
11
VY® COLUMBIA CONTRARIAN CORE PORTFOLIO
PORTFOLIO MANAGERS' REPORT

Average Annual Total Returns for the Periods Ended December 31, 2021 | |
| | 1 Year | | 5 Year | | 10 Year | |
Class ADV | | | 23.62 | % | | | 16.92 | % | | | 15.18 | % | |
Class I | | | 24.23 | % | | | 17.50 | % | | | 15.77 | % | |
Class S | | | 23.94 | % | | | 17.25 | % | | | 15.49 | % | |
Russell 1000® Index | | | 26.45 | % | | | 18.43 | % | | | 16.54 | % | |
Based on a $10,000 initial investment, the graph and table above illustrate the total return of VY® Columbia Contrarian Core Portfolio against the index indicated. The index is unmanaged and has no cash in its portfolio and imposes no sales charges. An investor cannot invest directly in an index.
The Portfolio's performance is shown without the imposition of any expenses or charges which are, or may be, imposed under your variable annuity contract or variable life insurance policy. Total returns would have been lower if such expenses or charges were included.
The performance graph and table do not reflect the deduction of taxes that a shareholder will pay on Portfolio distributions or the redemption of Portfolio shares.
The performance shown includes, if applicable, the effect of fee waivers and/or expense reimbursements by the Investment Adviser and/or other service providers, which have the effect of increasing total return. Had all fees and
expenses been considered, the total returns would have been lower.
The performance update illustrates performance for a variable investment option available through a variable annuity contract or a variable life insurance policy. The performance shown indicates past performance and is not a projection or prediction of future results. Actual investment returns and principal value will fluctuate so that shares and/or units, at redemption, may be worth more or less than their original cost. Please log on to www.voyainvestments.com or call (800) 262-3862 to get performance through the most recent month end.
Portfolio holdings are subject to change daily.
Prior to April 30, 2013, the Portfolio was managed by a different sub-adviser. The Portfolio's performance information for these periods reflects returns achieved by different sub-advisers.
12
PORTFOLIO MANAGERS' REPORT
VY® COLUMBIA SMALL CAP VALUE II PORTFOLIO
VY® Columbia Small Cap Value II Portfolio (the "Portfolio") seeks long-term growth of capital. The Portfolio is managed by Christian K. Stadlinger, Ph.D., CFA, and Jarl Ginsberg, CFA, CAIA, Portfolio Managers, of Columbia Management Investment Advisers, LLC — the Sub-Adviser.
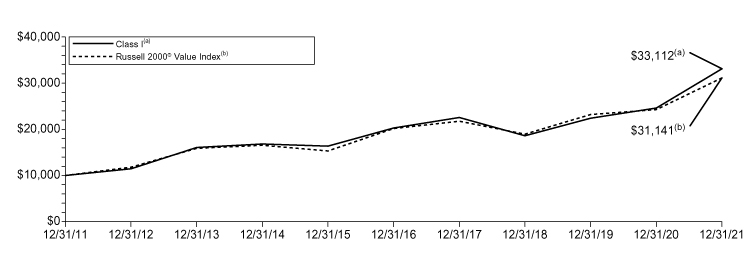
Performance: For the year ended December 31, 2021, the Portfolio's Class I shares provided a total return of 34.52% compared to the Russell 2000® Value Index, which returned 28.27% for the same period.
Portfolio Specifics: For year ended December 31, 2021, Portfolio meaningfully outperformed the Russell 2000® Value Index, which returned 28.27% for the period. Outperformance was driven by strong, broad-based stock selection across a variety of sectors. Selection was especially strong within consumer staples, financials, industrials, and information technology. Selection within consumer discretionary detracted from relative results (though this was largely due to the strategy not owning GameStop). Sector allocation added to relative results, due in large part to an underweight to the underperforming healthcare sector.
Despite continued challenges due to the COVID-19 pandemic as well as supply chain disruptions and rising inflation, equity markets posted remarkably strong returns in 2021. High levels of fiscal and monetary stimulus along with strong consumer spending and corporate earnings propelled markets higher. Our long-standing investment process of searching for value companies that are exhibiting signs of early improvement and upward inflection allowed us to generate significant outperformance in this market environment. We have used this same investment process since the strategy's inception, and it has helped us navigate the Portfolio through all types of past market environments as well.
In terms of individual securities, one of the top contributors to relative performance was our position in United Natural Foods. Shares in the company, which is a leading distributor of health and specialty foods, saw tailwinds from the coronavirus pandemic as consumers looked for healthy foods at home. The company also announced they extended their distribution contract with Whole Foods through 2027.
Current Strategy and Outlook: We continue to be cautiously optimistic on equity markets and believe that the expansionary trajectory of the economy will continue. In our view, consumer spending remains strong and we believe that supply chain issues will alleviate eventually. While inflation may remain higher for longer, we do not see this as being enough to derail further growth, in our opinion. Of course, the COVID-19 pandemic has not gone away and continues to be something we must monitor closely.
As of year-end, the Portfolio is overweight industrials, information technology (specifically semiconductors), materials, and financials. Underweights remain in healthcare, real estate, and communication services.
Sector Diversification
as of December 31, 2021
(as a percentage of net assets)
Financials | | | 29.0 | % | |
Industrials | | | 18.7 | % | |
Information Technology | | | 9.1 | % | |
Consumer Discretionary | | | 7.8 | % | |
Real Estate | | | 7.0 | % | |
Materials | | | 6.6 | % | |
Energy | | | 6.5 | % | |
Health Care | | | 5.6 | % | |
Utilities | | | 4.6 | % | |
Consumer Staples | | | 3.8 | % | |
Communication Services | | | 1.1 | % | |
Assets in Excess of Other Liabilities* | | | 0.2 | % | |
Net Assets | | | 100.0 | % | |
* Includes short-term investments.
Portfolio holdings are subject to change daily.
Top Ten Holdings
as of December 31, 2021
(as a percentage of net assets)
Axos Financial, Inc. | | | 1.6 | % | |
Ovintiv, Inc. | | | 1.6 | % | |
First Industrial Realty Trust, Inc. | | | 1.6 | % | |
SMART Global Holdings, Inc. | | | 1.5 | % | |
ArcBest Corp. | | | 1.5 | % | |
UMB Financial Corp. | | | 1.4 | % | |
Kforce, Inc. | | | 1.4 | % | |
Diodes, Inc. | | | 1.4 | % | |
Focus Financial Partners, Inc. | | | 1.4 | % | |
United Natural Foods, Inc. | | | 1.4 | % | |
Portfolio holdings are subject to change daily.
The views expressed in this commentary are informed opinions. They should not be considered promises or advice. The views expressed reflect those of the portfolio managers, only through the end of the period as stated on the cover. The portfolio managers' views are subject to change at any time based on market and other conditions.
Portfolio holdings and characteristics are subject to change and may not be representative of current holdings and characteristics. Portfolio holdings are subject to change daily. The outlook for this Portfolio may differ from that presented for other Voya mutual funds. This report contains statements that may be "forward-looking" statements. Actual results may differ materially from those projected in the "forward-looking" statements. The Portfolio's performance returns shown reflect applicable fee waivers and/or expense limits in effect during this period. Absent such fee waivers/expense limitations, if any, performance would have been lower. Performance for the different classes of shares will vary based on differences in fees associated with each class. An index has no cash in its portfolio and imposes no sales charges. An investor cannot invest directly in an index.
13
VY® COLUMBIA SMALL CAP VALUE II PORTFOLIO
PORTFOLIO MANAGERS' REPORT
Average Annual Total Returns for the Periods Ended December 31, 2021 | |
| | 1 Year | | 5 Year | | 10 Year | |
Class ADV | | | 33.85 | % | | | 9.74 | % | | | 12.16 | % | |
Class I | | | 34.52 | % | | | 10.30 | % | | | 12.72 | % | |
Class R6(1) | | | 34.57 | % | | | 10.32 | % | | | 12.73 | % | |
Class S | | | 34.22 | % | | | 10.02 | % | | | 12.43 | % | |
Class S2 | | | 33.96 | % | | | 9.86 | % | | | 12.27 | % | |
Russell 2000® Value Index | | | 28.27 | % | | | 9.07 | % | | | 12.03 | % | |
Based on a $10,000 initial investment, the graph and table above illustrate the total return of VY® Columbia Small Cap Value II Portfolio against the index indicated. The index is unmanaged and has no cash in its portfolio and imposes no sales charges. An investor cannot invest directly in an index.
The Portfolio's performance is shown without the imposition of any expenses or charges which are, or may be, imposed under your variable annuity contract or variable life insurance policy. Total returns would have been lower if such expenses or charges were included.
The performance graph and table do not reflect the deduction of taxes that a shareholder will pay on Portfolio distributions or the redemption of Portfolio shares.
The performance shown includes, if applicable, the effect of fee waivers and/or expense reimbursements by the Investment Adviser and/or other service providers, which have the effect of increasing total return. Had all fees and expenses been considered, the total returns would have been lower.
The performance update illustrates performance for a variable investment option available through a variable annuity contract or a variable life insurance policy. The performance shown indicates past performance and is not a projection or prediction of future results. Actual investment returns and principal value will fluctuate so that shares and/or units, at redemption, may be worth more or less than their original cost. Please log on to www.voyainvestments.com or call (800) 262-3862 to get performance through the most recent month end.
Portfolio holdings are subject to change daily.
(1) Class R6 incepted on May 3, 2016. The Class R6 shares performance shown for the period prior to their inception date is the performance of Class I shares without adjustment for any differences in the expenses between the two classes. If adjusted for such differences, returns would be different.
14
PORTFOLIO MANAGERS' REPORT
VY® INVESCO COMSTOCK PORTFOLIO
VY® Invesco Comstock Portfolio (the "Portfolio") seeks capital growth and income. The Portfolio is managed by Kevin Holt, Co-Lead Portfolio Manager, Devin Armstrong, Co-Lead Portfolio Manager, and James Warwick, each a Portfolio Manager* of Invesco Advisers, Inc. — the Sub-Adviser.
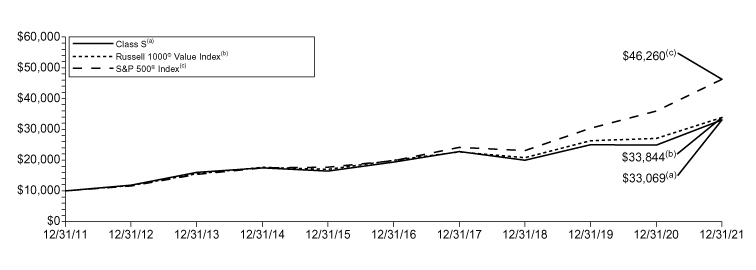
Performance: For the year ended December 31, 2021, the Portfolio's Class S shares provided a total return of 32.96% compared to the Russell 1000® Value Index and the S&P 500® Index, which returned 25.16% and 28.71%, respectively, for the same period.
Portfolio Specifics: For the year ended December 31, 2021, the Portfolio outperformed the Russell 1000® Value Index. On the positive side, stock selection and an overweight in energy boosted relative return. Energy stocks were buoyed by rising oil prices resulting from OPEC production cuts and a gas and oil shortage in Europe and Asia. Devon Energy, Marathon Oil and Canadian Natural Resources were leading contributors to absolute and relative returns. Strong stock selection within industrials also boosted relative return. Johnson Controls International and Textron added to both absolute and relative returns. Textron benefited from a material uptick in business jet orders. Stock selection and an overweight in financials was a large contributor to relative return. American International, Bank of America and Wells Fargo aided both absolute and relative returns. We believe that financial companies are well positioned to benefit as interest rates/yields move higher and loan growth recovers. A material underweight to communication services enhanced relative returns, as the sector was the worst performing sector for the year.
On the negative side, although the average cash allocation averaged less than 3% for the period, cash was a large detractor in a strong equity market. Having a material underweight to real estate also detracted from relative returns, as the sector was the second-best performing sector for the period. Stock selection in consumer discretionary detracted from relative return, with Las Vegas Sands and not owning Ford Motor Company were the largest detractors in the sector. Las Vegas Sands stock underperformed due to COVID-19 restrictions as well as uncertainty surrounding the Macau government's re-tendering of casino/gaming licenses and divestiture of its U.S. casinos.
We used currency forward contracts during the reporting period for the purpose of hedging currency exposure of non-U.S.-based companies held in the Portfolio. The use of currency forward contracts had a slightly positive impact on the Portfolio's performance relative to the Russell 1000® Value Index for the reporting period.
Current Strategy and Outlook: The Portfolio currently has a cyclical bias with overweight exposures in financial and energy companies and is also overweight information technology, consumer staples and industrials stocks. Conversely, the Portfolio is underweight real estate, utilities, communication services, healthcare and consumer discretionary.
Despite recent fears of inflation and the new Omicron variant causing a decrease in consumer demand, we remain cautiously optimistic about the longer-term outlook for U.S. and global economies. Though the creation of new vaccines and recently approved COVID-19 treatments should provide a measure of stability, we believe equity markets may experience continued volatility.
Sector Diversification
as of December 31, 2021
(as a percentage of net assets)
Financials | | | 23.3 | % | |
Health Care | | | 15.5 | % | |
Industrials | | | 12.9 | % | |
Information Technology | | | 12.7 | % | |
Energy | | | 11.4 | % | |
Consumer Staples | | | 8.7 | % | |
Consumer Discretionary | | | 4.5 | % | |
Materials | | | 4.5 | % | |
Utilities | | | 1.7 | % | |
Communication Services | | | 1.3 | % | |
Real Estate | | | 1.0 | % | |
Assets in Excess of Other Liabilities* | | | 2.5 | % | |
Net Assets | | | 100.0 | % | |
* Includes short-term investments.
Portfolio holdings are subject to change daily.
Top Ten Holdings
as of December 31, 2021*
(as a percentage of net assets)
Bank of America Corp. | | | 3.4 | % | |
Philip Morris International, Inc. | | | 3.0 | % | |
Citigroup, Inc. | | | 2.9 | % | |
Anthem, Inc. | | | 2.5 | % | |
Wells Fargo & Co. | | | 2.4 | % | |
American International Group, Inc. | | | 2.3 | % | |
Cisco Systems, Inc. | | | 2.3 | % | |
Cognizant Technology Solutions Corp. | | | 2.2 | % | |
CVS Health Corp. | | | 2.0 | % | |
General Motors Co. | | | 2.0 | % | |
* Excludes short-term investments.
Portfolio holdings are subject to change daily.
* Effective July 8, 2021, Charles DyReyes no longer serves as a portfolio manager for the Portfolio.
The views expressed in this commentary are informed opinions. They should not be considered promises or advice. The views expressed reflect those of the portfolio managers, only through the end of the period as stated on the cover. The portfolio managers' views are subject to change at any time based on market and other conditions.
Portfolio holdings and characteristics are subject to change and may not be representative of current holdings and characteristics. Portfolio holdings are subject to change daily. The outlook for this Portfolio may differ from that presented for other Voya mutual funds. This report contains statements that may be "forward-looking" statements. Actual results may differ materially from those projected in the "forward-looking" statements. The Portfolio's performance returns shown reflect applicable fee waivers and/or expense limits in effect during this period. Absent such fee waivers/expense limitations, if any, performance would have been lower. Performance for the different classes of shares will vary based on differences in fees associated with each class. An index has no cash in its portfolio and imposes no sales charges. An investor cannot invest directly in an index.
15
VY® INVESCO COMSTOCK PORTFOLIO
PORTFOLIO MANAGERS' REPORT
Average Annual Total Returns for the Periods Ended December 31, 2021 | |
| | 1 Year | | 5 Year | | 10 Year | |
Class ADV | | | 32.69 | % | | | 11.03 | % | | | 12.43 | % | |
Class I | | | 33.33 | % | | | 11.59 | % | | | 12.99 | % | |
Class S | | | 32.96 | % | | | 11.31 | % | | | 12.71 | % | |
Russell 1000® Value Index | | | 25.16 | % | | | 11.16 | % | | | 12.97 | % | |
S&P 500® Index | | | 28.71 | % | | | 18.47 | % | | | 16.55 | % | |
Based on a $10,000 initial investment, the graph and table above illustrate the total return of VY® Invesco Comstock Portfolio against the indices indicated. An index is unmanaged and has no cash in its portfolio and imposes no sales charges. An investor cannot invest directly in an index.
The Portfolio's performance is shown without the imposition of any expenses or charges which are, or may be, imposed under your variable annuity contract or variable life insurance policy. Total returns would have been lower if such expenses or charges were included.
The performance graph and table do not reflect the deduction of taxes that a shareholder will pay on Portfolio distributions or the redemption of Portfolio shares.
The performance shown includes, if applicable, the effect of fee waivers and/or expense reimbursements by the
Investment Adviser and/or other service providers, which have the effect of increasing total return. Had all fees and expenses been considered, the total returns would have been lower.
The performance update illustrates performance for a variable investment option available through a variable annuity contract or a variable life insurance policy. The performance shown indicates past performance and is not a projection or prediction of future results. Actual investment returns and principal value will fluctuate so that shares and/or units, at redemption, may be worth more or less than their original cost. Please log on to www.voyainvestments.com or call (800) 262-3862 to get performance through the most recent month end.
Portfolio holdings are subject to change daily.
16
VY® INVESCO EQUITY AND INCOME PORTFOLIO
PORTFOLIO MANAGERS' REPORT
VY® Invesco Equity and Income Portfolio (the "Portfolio") seeks total return consisting of long-term capital appreciation and current income. The Portfolio is managed by Brian Jurkash, Co-lead Portfolio Manager, Matthew Titus, Co-lead Portfolio Manager, Sergio Marcheli and Chuck Burge, Portfolio Managers of Invesco Advisers, Inc. — the Sub-Adviser.
Performance: For the year ended December 31, 2021, the Portfolio's Class S shares provided a total return of 18.31% compared to the Russell 1000® Value Index, Bloomberg U.S. Government/Credit Index and the 60% Russell 1000® Value Index/40% Bloomberg U.S. Government/Credit Index, which returned 25.16%, -1.75% and 13.91%, respectively, for the same period.
Portfolio Specifics: For the year ended December 31, 2021, the Portfolio outperformed the 60% Russell 1000® Value Index/40% Bloomberg U.S. Government/Credit Index.
The equity sleeve underperformed the Russell 1000® Value Index. Within the equity allocation, stock selection in health care and information technology ("IT") detracted from relative returns. In health care, Zimmer Biomet and Medtronic were key detractors from both relative and absolute performance. Device makers suffered as COVID-19 variants began to spread rapidly, causing delays or cancellations to elective procedures.
Within IT, Splunk and Intel posted double-digit declines. Intel provided weaker guidance for the full year, driven by shortages of production components for microchips. Splunk announced an abrupt CEO departure in November that was viewed skeptically by investors, causing a sharp selloff in the stock.
Within the equity portion of the Portfolio, stock selection in industrials was the largest contributor to relative returns, due primarily to Johnson Controls. The company reported better than expected earnings driven in part by strength in its HVAC segment.
Stock selection and an overweight in financials also aided relative performance. Wells Fargo, Bank of America, AIG and Goldman Sachs were significant contributors.
Stock selection and an overweight in energy also contributed to relative returns during the year.
The Portfolio's non-equity sleeve holds investment grade bonds and convertible securities as a source of income and to provide stability amid market volatility. Both asset classes underperformed the Bloomberg U.S. Government/Credit Index during the year and detracted from relative performance.
The Portfolio's cash position, while less than 3.5% on average, also detracted from relative returns amid the strong market environment.
The Portfolio held currency forward contracts during the fiscal year for the purpose of hedging currency exposure of non-U.S.-based companies held in the Portfolio. These derivatives were not for speculative purposes or leverage, and these positions had a small positive impact on the Portfolio's relative performance for the fiscal year.
Current Strategy and Outlook: During the fiscal year, the team eliminated equity positions in materials, energy and financials, and added positions in communication services, consumer discretionary and health care. At the end of the fiscal year, the Portfolio's largest overweight exposures were in IT and consumer discretionary, while the largest underweights were in health care and utilities.
Top Ten Holdings
as of December 31, 2021*
(as a percentage of net assets)
United States Treasury Note, 1.250%, 11/30/26 | | | 3.8 | % | |
Wells Fargo & Co. | | | 2.4 | % | |
General Motors Co. | | | 2.3 | % | |
United States Treasury Note, 1.000%, 12/15/24 | | | 2.1 | % | |
Cognizant Technology Solutions Corp. | | | 2.0 | % | |
United States Treasury Note, 1.500%, 11/30/28 | | | 2.0 | % | |
Bank of America Corp. | | | 1.9 | % | |
CBRE Group, Inc. | | | 1.9 | % | |
CSX Corp. | | | 1.6 | % | |
American International Group, Inc. | | | 1.5 | % | |
* Excludes short-term investments.
Portfolio holdings are subject to change daily.
Sector Diversification
as of December 31, 2021
(as a percentage of net assets)
Financials | | | 21.4 | % | |
Health Care | | | 9.9 | % | |
U.S. Treasury Notes | | | 8.7 | % | |
Industrials | | | 8.6 | % | |
Information Technology | | | 8.5 | % | |
Energy | | | 6.0 | % | |
Communications | | | 5.4 | % | |
Consumer Discretionary | | | 5.2 | % | |
Communication Services | | | 4.5 | % | |
Consumer Staples | | | 3.3 | % | |
Technology | | | 3.3 | % | |
Consumer, Non-cyclical | | | 2.7 | % | |
Utilities | | | 2.2 | % | |
Real Estate | | | 1.9 | % | |
Materials | | | 1.9 | % | |
U.S. Treasury Bonds | | | 1.7 | % | |
Consumer, Cyclical | | | 1.5 | % | |
Basic Materials | | | 0.1 | % | |
Federal National Mortgage Association | | | 0.1 | % | |
Municipal Bonds | | | 0.0 | % | |
Assets in Excess of Other Liabilities* | | | 3.1 | % | |
Net Assets | | | 100.0 | % | |
* Includes short-term investments.
Portfolio holdings are subject to change daily.
The views expressed in this commentary are informed opinions. They should not be considered promises or advice. The views expressed reflect those of the portfolio managers, only through the end of the period as stated on the cover. The portfolio managers' views are subject to change at any time based on market and other conditions.
Portfolio holdings and characteristics are subject to change and may not be representative of current holdings and characteristics. Portfolio holdings are subject to change daily. The outlook for this Portfolio may differ from that presented for other Voya mutual funds. This report contains statements that may be "forward-looking" statements. Actual results may differ materially from those projected in the "forward-looking" statements. The Portfolio's performance returns shown reflect applicable fee waivers and/or expense limits in effect during this period. Absent such fee waivers/expense limitations, if any, performance would have been lower. Performance for the different classes of shares will vary based on differences in fees associated with each class. An index has no cash in its portfolio and imposes no sales charges. An investor cannot invest directly in an index.
17
VY® INVESCO EQUITY AND INCOME PORTFOLIO
PORTFOLIO MANAGERS' REPORT

Average Annual Total Returns for the Periods Ended December 31, 2021 | |
| | 1 Year | | 5 Year | | 10 Year | |
Class ADV | | | 18.03 | % | | | 8.98 | % | | | 10.02 | % | |
Class I | | | 18.60 | % | | | 9.52 | % | | | 10.57 | % | |
Class S | | | 18.31 | % | | | 9.25 | % | | | 10.30 | % | |
Class S2 | | | 18.17 | % | | | 9.11 | % | | | 10.15 | % | |
Russell 1000® Value Index | | | 25.16 | % | | | 11.16 | % | | | 12.97 | % | |
Bloomberg U.S. Government/Credit Index | | | -1.75 | % | | | 3.99 | % | | | 3.13 | % | |
60% Russell 1000® Value Index/40% Bloomberg U.S. Government/Credit Index | | | 13.91 | % | | | 8.62 | % | | | 9.21 | % | |
Based on a $10,000 initial investment, the graph and table above illustrate the total return of VY® Invesco Equity and Income Portfolio against the indices indicated. An index is unmanaged and has no cash in its portfolio and imposes no sales charges. An investor cannot invest directly in an index.
The Portfolio's performance is shown without the imposition of any expenses or charges which are, or may be, imposed under your variable annuity contract or variable life insurance policy. Total returns would have been lower if such expenses or charges were included.
The performance graph and table do not reflect the deduction of taxes that a shareholder will pay on Portfolio distributions or the redemption of Portfolio shares.
The performance shown includes, if applicable, the effect of fee waivers and/or expense reimbursements by the
Investment Adviser and/or other service providers, which have the effect of increasing total return. Had all fees and expenses been considered, the total returns would have been lower.
The performance update illustrates performance for a variable investment option available through a variable annuity contract or a variable life insurance policy. The performance shown indicates past performance and is not a projection or prediction of future results. Actual investment returns and principal value will fluctuate so that shares and/or units, at redemption, may be worth more or less than their original cost. Please log on to www.voyainvestments.com or call (800) 262-3862 to get performance through the most recent month end.
Portfolio holdings are subject to change daily.
18
PORTFOLIO MANAGERS' REPORT
VY® INVESCO GLOBAL PORTFOLIO
VY® Invesco Global Portfolio* (the "Portfolio") seeks capital appreciation. The Portfolio is managed by John Delano, CFA. Vice President and Portfolio Manager of Invesco Advisers, Inc. ("Invesco") — the Sub-Adviser.
Performance: For the year ended December 31, 2021, the Portfolio's Class S shares provided a total return of 15.13% compared to the MSCI All Country World IndexSM (the "Index"), which returned 18.54% for the same period.
Portfolio Specifics: For the reporting period, the Portfolio underperformed the Index. Three sectors were the primary drivers of our relative performance. Those were the information technology, consumer discretionary and healthcare sectors. Our relative deficits in those sectors were sizable enough to exceed the relatively good results we had in the communication service and real estate sectors, among others.
The top individual positions which contributed to our results were Alphabet Inc, which is dominant in many areas of increasing relevance, Intuit Inc the brand owner of both TurboTax and QuickBooks, the small business cornerstones, and S&P Global Inc, a company benefiting from rising debt issuance and the increasing prevalence of passive investing.
2021, as in every year, had its share of things which did not go as planned. JD.com was one such name. The company is fine, in our opinion, China however had its share of woes in 2021 and JD was not immune to it. It fell by 20%. StoneCo Ltd Class A is another company that disappointed. It is a Brazilian digital payments processor that had some execution mistakes and was then hurt by the domestic economic downturn in that country. Farfetch Limited Class A is an e-commerce company that is focused on luxury goods. It's share price declined during the period due to concerns about the Chinese economy and expectations that ended 2020, simply too high.
Current Strategy and Outlook: Our thematic, long-term, investment style leads us towards what we believe are quality businesses with sustainability of both enterprise and advantaged position. We hope to buy these at prices that do not fully reflect their future value, usually because the current understanding of that value by the market is misestimated for a reason that is temporary. Unpopularity is a price we are willing to incur for a while. Also, it has been our experience that competitively advantaged companies in ascendant industries can create economic value that can go on for decades. This is why we believe and behave with a long-term focus.
Geographic Diversification
as of December 31, 2021
(as a percentage of net assets)
United States | | | 58.1 | % | |
Japan | | | 12.0 | % | |
France | | | 8.5 | % | |
India | | | 4.5 | % | |
Netherlands | | | 3.7 | % | |
China | | | 3.6 | % | |
Sweden | | | 3.5 | % | |
Germany | | | 2.5 | % | |
United Kingdom | | | 1.1 | % | |
Switzerland | | | 1.0 | % | |
Countries between 0.2%-0.4%^ | | | 1.0 | % | |
Assets in Excess of Other Liabilities* | | | 0.5 | % | |
Net Assets | | | 100.0 | % | |
* Includes short-term investments.
^ Includes 4 countries, which each represents 0.2%-0.4% of net assets.
Portfolio holdings are subject to change daily.
Top Ten Holdings
as of December 31, 2021
(as a percentage of net assets)
Alphabet, Inc. — Class A | | | 11.3 | % | |
Intuit, Inc. | | | 6.5 | % | |
S&P Global, Inc. | | | 5.3 | % | |
LVMH Moet Hennessy Louis Vuitton SE | | | 5.3 | % | |
Meta Platforms, Inc. | | | 5.1 | % | |
Adobe, Inc. | | | 4.3 | % | |
Analog Devices, Inc. | | | 3.4 | % | |
Nidec Corp. | | | 3.3 | % | |
JD.com, Inc. ADR | | | 3.3 | % | |
Keyence Corp. | | | 3.0 | % | |
Portfolio holdings are subject to change daily.
* Prior to May 1, 2021, the Portfolio was known as "VY® Invesco Oppenheimer Global Portfolio."
The views expressed in this commentary are informed opinions. They should not be considered promises or advice. The views expressed reflect those of the portfolio managers, only through the end of the period as stated on the cover. The portfolio managers' views are subject to change at any time based on market and other conditions.
Portfolio holdings and characteristics are subject to change and may not be representative of current holdings and characteristics. Portfolio holdings are subject to change daily. The outlook for this Portfolio may differ from that presented for other Voya mutual funds. This report contains statements that may be "forward-looking" statements. Actual results may differ materially from those projected in the "forward-looking" statements. The Portfolio's performance returns shown reflect applicable fee waivers and/or expense limits in effect during this period. Absent such fee waivers/expense limitations, if any, performance would have been lower. Performance for the different classes of shares will vary based on differences in fees associated with each class. An index has no cash in its portfolio and imposes no sales charges. An investor cannot invest directly in an index.
19
VY® INVESCO GLOBAL PORTFOLIO
PORTFOLIO MANAGERS' REPORT
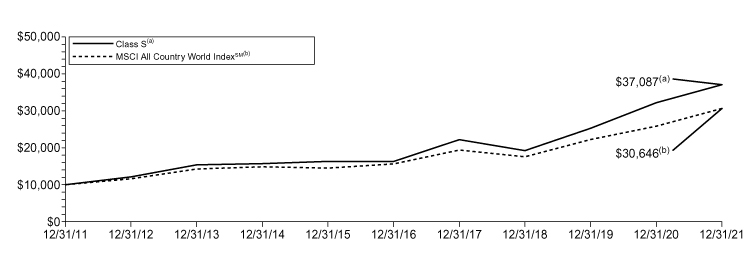
Average Annual Total Returns for the Periods Ended December 31, 2021 | |
| | 1 Year | | 5 Year | | 10 Year | |
Class ADV | | | 14.80 | % | | | 17.56 | % | | | 13.73 | % | |
Class I | | | 15.37 | % | | | 18.15 | % | | | 14.29 | % | |
Class S | | | 15.13 | % | | | 17.86 | % | | | 14.00 | % | |
Class S2 | | | 14.91 | % | | | 17.67 | % | | | 13.83 | % | |
MSCI All Country World IndexSM | | | 18.54 | % | | | 14.40 | % | | | 11.85 | % | |
Based on a $10,000 initial investment, the graph and table above illustrate the total return of VY® Invesco Global Portfolio against the index indicated. The index is unmanaged and has no cash in its portfolio and imposes no sales charges. An investor cannot invest directly in an index.
The Portfolio's performance is shown without the imposition of any expenses or charges which are, or may be, imposed under your variable annuity contract or variable life insurance policy. Total returns would have been lower if such expenses or charges were included.
The performance graph and table do not reflect the deduction of taxes that a shareholder will pay on Portfolio distributions or the redemption of Portfolio shares.
The performance shown includes, if applicable, the effect of fee waivers and/or expense reimbursements by the Investment Adviser and/or other service providers, which have the effect of increasing total return. Had all fees and
expenses been considered, the total returns would have been lower.
The performance update illustrates performance for a variable investment option available through a variable annuity contract or a variable life insurance policy. The performance shown indicates past performance and is not a projection or prediction of future results. Actual investment returns and principal value will fluctuate so that shares and/or units, at redemption, may be worth more or less than their original cost. Please log on to www.voyainvestments.com or call (800) 262-3862 to get performance through the most recent month end.
Portfolio holdings are subject to change daily.
Prior to June 27, 2019, the Portfolio was managed by a different sub-adviser. The Portfolio's performance information for these periods reflects returns achieved by different sub-advisers.
20
VY® JPMORGAN MID CAP VALUE PORTFOLIO
PORTFOLIO MANAGERS' REPORT
VY® JPMorgan Mid Cap Value Portfolio (the "Portfolio") seeks growth from capital appreciation. The Portfolio is managed by Jonathan K.L. Simon and Lawrence Playford, CFA, Managing Directors and Portfolio Managers of J.P. Morgan Investment Management Inc. — the Sub-Adviser.
Performance: For the year ended December 31, 2021, the Portfolio's Class S shares provided a total return of 29.51% compared to the Russell Midcap® Value Index (the "Index" or "Russell Midcap® Value"), which returned 28.34% for the same period.
Portfolio Specifics: Equity markets rallied during the reporting year, despite a bumpy ride highlighted by an increase in COVID-19 cases and macroeconomic concerns. Ultimately investors chose to focus on improving fundamentals over short-term headlines, as robust 3rd quarter earnings and favorable forward looking guidance led the market to continued all-time highs.
2021 was a banner year for markets, with the Russell Midcap® Value returning over 28%. Despite the strong overall return, volatility persisted underneath the hood, as COVID-19 surges, mixed economic data, and supply chain issues remained in the headlines. The Portfolio was able to navigate the pockets of volatility; outperforming its benchmark. In terms of portfolio impact, industrials was our top contributor to performance, with health care as the most challenged sector.
Our stock selection within industrials has been additive, as we have been able to gain exposure to cyclicality through high quality companies that have been able to maintain strong pricing power during a difficult operating environment. One of our top contributors was CSL, a diversified manufacturer that serves a broad range of niche industrial markets with significant exposure to commercial roofing. CSL continued to deliver strong earnings as the year progressed, which demonstrates that construction projects are rebounding, in our view, amidst the economic recovery. Despite the recent outperformance, we still view CSL as attractively valued given their ability to capitalize on the cyclical uptick, which we believe will allow for continued margin and return improvement. Additionally, we appreciate management's history of delivering steady and consistent cash flows, and their focus on returning capital to shareholders.
On the other hand, health care has been a detractor from a stock selection perspective. Particularly, our position in ("ZBH") has lagged this year as hospitals have been forced to postpone elective surgeries in response to increasing COVID-19 cases. While this continues to hamper earnings, we believe that management is navigating this situation well, and will be well-positioned for a rebound once elective surgeries resume at a more normalized pace. Additionally, ZBH's size as the largest manufacturer of orthopedic devices, plus current valuations, provide significant room for multiple expansion, in our opinion. Finally, the company has recently delivered multiple successful product launches, which we believe should increase the magnitude of the future recovery and set up for long-term earnings and margin expansion.
Current Strategy and Outlook: Equity markets delivered a strong market rally in 2021, and Russell Midcap® Value was one of the top performers (+28%) on the heels of positive COVID-19 vaccine rollouts and optimism around an economic recovery. However, the year was mired with negative headlines surrounding inflation, supply chain issues, and surging COVID-19 cases; all of which led to volatility across the marketplace. This has created what we believed to be an attractive environment to find high quality companies that can benefit from the economic recovery at compelling valuations.
Wide intra-sector valuation spreads have led to heightened portfolio activity, with over 15 initiations this year. Financials remains our highest conviction sector given what we view as an attractive economic backdrop, excellent credit fundamentals, and relatively undemanding valuations, yet we've taken profits on strength in 2021. We expect strong spending trends thanks to elevated wealth levels, healthy balance sheets & pent-up demand; short-term supply chain & Omicron variant fears have given us opportunities to add to select retailers (Tapestry) and auto parts repair (LKQ). Investors' narrow focus on high growth has given us the opportunity to invest in companies who we believe are well-run with impressive management teams at what we view as attractive multiples (FleetCor Technologies & NortonLifeLock); but remain underweight the sector due to overall high valuations. We have taken profits in the top performing energy sector. We maintain an approach of investing in companies with well-located assets, strong balance sheets, and a shareholder friendly approach to capital allocation.
Sector Diversification
as of December 31, 2021
(as a percentage of net assets)
Financials | | | 22.3 | % | |
Industrials | | | 14.1 | % | |
Real Estate | | | 12.1 | % | |
Consumer Discretionary | | | 11.3 | % | |
Utilities | | | 8.1 | % | |
Information Technology | | | 7.3 | % | |
Health Care | | | 6.8 | % | |
Materials | | | 4.9 | % | |
Communication Services | | | 4.1 | % | |
Consumer Staples | | | 4.1 | % | |
Energy | | | 4.0 | % | |
Assets in Excess of Other Liabilities* | | | 0.9 | % | |
Net Assets | | | 100.0 | % | |
* Includes short-term investments.
Portfolio holdings are subject to change daily.
Top Ten Holdings
as of December 31, 2021
(as a percentage of net assets)
Ameriprise Financial, Inc. | | | 1.9 | % | |
Autozone, Inc. | | | 1.6 | % | |
Huntington Bancshares, Inc. | | | 1.6 | % | |
Motorola Solutions, Inc. | | | 1.6 | % | |
M&T Bank Corp. | | | 1.6 | % | |
Laboratory Corp. of America Holdings | | | 1.5 | % | |
Loews Corp. | | | 1.5 | % | |
Fortune Brands Home & Security, Inc. | | | 1.5 | % | |
Xcel Energy, Inc. | | | 1.5 | % | |
Fifth Third Bancorp | | | 1.5 | % | |
Portfolio holdings are subject to change daily.
The views expressed in this commentary are informed opinions. They should not be considered promises or advice. The views expressed reflect those of the portfolio managers, only through the end of the period as stated on the cover. The portfolio managers' views are subject to change at any time based on market and other conditions.
Portfolio holdings and characteristics are subject to change and may not be representative of current holdings and characteristics. Portfolio holdings are subject to change daily. The outlook for this Portfolio may differ from that presented for other Voya mutual funds. This report contains statements that may be "forward-looking" statements. Actual results may differ materially from those projected in the "forward-looking" statements. The Portfolio's performance returns shown reflect applicable fee waivers and/or expense limits in effect during this period. Absent such fee waivers/expense limitations, if any, performance would have been lower. Performance for the different classes of shares will vary based on differences in fees associated with each class. An index has no cash in its portfolio and imposes no sales charges. An investor cannot invest directly in an index.
21
VY® JPMORGAN MID CAP VALUE PORTFOLIO
PORTFOLIO MANAGERS' REPORT
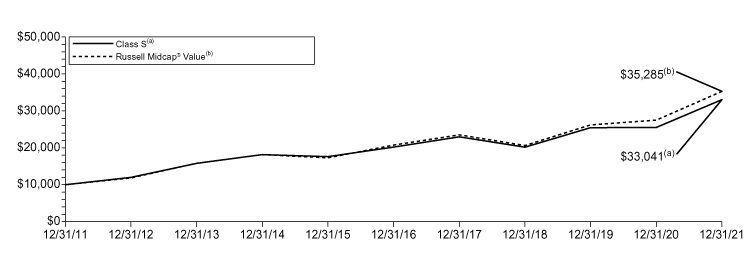
Average Annual Total Returns for the Periods Ended December 31, 2021 | |
| | 1 Year | | 5 Year | | 10 Year | |
Class ADV | | | 29.15 | % | | | 10.07 | % | | | 12.41 | % | |
Class I | | | 29.79 | % | | | 10.63 | % | | | 12.98 | % | |
Class S | | | 29.51 | % | | | 10.36 | % | | | 12.70 | % | |
Class S2 | | | 29.29 | % | | | 10.19 | % | | | 12.53 | % | |
Russell Midcap® Value | | | 28.34 | % | | | 11.22 | % | | | 13.44 | % | |
Based on a $10,000 initial investment, the graph and table above illustrate the total return of VY® JPMorgan Mid Cap Value Portfolio against the index indicated. The index is unmanaged and has no cash in its portfolio and imposes no sales charges. An investor cannot invest directly in an index.
The Portfolio's performance is shown without the imposition of any expenses or charges which are, or may be, imposed under your variable annuity contract or variable life insurance policy. Total returns would have been lower if such expenses or charges were included.
The performance graph and table do not reflect the deduction of taxes that a shareholder will pay on Portfolio distributions or the redemption of Portfolio shares.
The performance shown includes, if applicable, the effect of fee waivers and/or expense reimbursements by the
Investment Adviser and/or other service providers, which have the effect of increasing total return. Had all fees and expenses been considered, the total returns would have been lower.
The performance update illustrates performance for a variable investment option available through a variable annuity contract or a variable life insurance policy. The performance shown indicates past performance and is not a projection or prediction of future results. Actual investment returns and principal value will fluctuate so that shares and/or units, at redemption, may be worth more or less than their original cost. Please log on to www.voyainvestments.com or call (800) 262-3862 to get performance through the most recent month end.
Portfolio holdings are subject to change daily.
22
PORTFOLIO MANAGERS' REPORT
VY® T. ROWE PRICE DIVERSIFIED MID CAP GROWTH PORTFOLIO
VY® T. Rowe Price Diversified Mid Cap Growth Portfolio (the "Portfolio") seeks long-term capital appreciation. The Portfolio is managed by Donald J. Peters, Vice President, Portfolio Manager* of T. Rowe Price Associates, Inc. — the Sub-Adviser.
Performance: For the year ended December 31, 2021, the Portfolio's Class S shares provided a total return of 13.58% compared to the S&P MidCap 400® Index and the Russell Midcap® Growth Index, which returned 24.76% and 12.73%, respectively, for the same period.
Portfolio Specifics: The Portfolio outperformed the Russell Midcap Growth Index, for the reporting period. Broadly speaking, stock selection drove relative outperformance, although sector allocation had a negative impact.
Information technology contributed to relative results, due to stock selection. Fortinet is a network firewall security company with steady growth and what we believe to be a thoughtful capital allocation approach that is both profitable and trading at a reasonable valuation relative to peers, in our view. Shares traded higher over the period driven by product and revenue growth.
Security selection in the consumer discretionary sector aided relative performance. AutoZone is a leading distributor of automotive replacement parts and accessories, selling products to both do-it-yourself and commercial customers. Shares traded higher as the company reported strong sales and earnings results due to the company being able to attract customers through reliable product availability, in our view.
Stock choices in the consumer staples sector also had a positive impact on relative results, driven by BJ's Wholesale Club Holdings.
Conversely, industrials and business services weighed on relative results, due to stock selection and an unfavorable underweight position. Array Technologies is a leading manufacturer of solar trackers in large, utility-scale solar operations. The trackers allow the solar panels to move and track the sun throughout the day, leading to greater energy generation. Shares plunged after the company noted that it was unable to affirm its previous earnings guidance for fiscal year 2021 due to surging steel and freight prices. Considering that industry competition is tough, we decided to exit the stock in favor of what we believe to be better long-term growth opportunities.
The Portfolio's overweight to the communication services sector also hindered relative returns during the period, although the effect was partially offset by security selection.
Current Strategy and Outlook: After back-to-back years of strong performance across most equity and credit sectors, we believe that global markets face more uncertain prospects in 2022. In our view, investors will need to use greater selectivity to identify potential opportunities. We believe that higher inflation, a shift toward monetary tightening, and new coronavirus variants all pose potential challenges for economic growth and earnings — at a time when valuations, in our view, appear elevated across many asset categories. Many believe that as governments and central banks withdraw the massive stimulus applied during the pandemic, economic growth inevitably will slow sharply. But in our opinion, slower growth doesn't necessarily mean low growth. We believe that a number of tailwinds should sustain the recovery in 2022, including strong consumer and corporate balance sheets.
Sector Diversification
as of December 31, 2021
(as a percentage of net assets)
Information Technology | | | 35.3 | % | |
Health Care | | | 18.1 | % | |
Consumer Discretionary | | | 15.7 | % | |
Industrials | | | 12.8 | % | |
Communication Services | | | 5.0 | % | |
Financials | | | 4.3 | % | |
Materials | | | 2.5 | % | |
Consumer Staples | | | 2.4 | % | |
Energy | | | 2.0 | % | |
Real Estate | | | 1.8 | % | |
Assets in Excess of Other Liabilities* | | | 0.1 | % | |
Net Assets | | | 100.0 | % | |
* Includes short-term investments.
Portfolio holdings are subject to change daily.
Top Ten Holdings
as of December 31, 2021*
(as a percentage of net assets)
Fortinet, Inc. | | | 1.4 | % | |
Cadence Design Systems, Inc. | | | 1.3 | % | |
McKesson Corp. | | | 1.3 | % | |
Chipotle Mexican Grill, Inc. | | | 1.3 | % | |
DexCom, Inc. | | | 1.2 | % | |
Palo Alto Networks, Inc. | | | 1.2 | % | |
Lululemon Athletica, Inc. | | | 1.1 | % | |
Trade Desk, Inc./The | | | 1.1 | % | |
Microchip Technology, Inc. | | | 1.1 | % | |
Amphenol Corp. | | | 1.1 | % | |
* Excludes short-term investments.
Portfolio holdings are subject to change daily.
* Effective January 1, 2021, Donald J. Easley, CFA was removed as a portfolio manager of the Portfolio.
The views expressed in this commentary are informed opinions. They should not be considered promises or advice. The views expressed reflect those of the portfolio managers, only through the end of the period as stated on the cover. The portfolio managers' views are subject to change at any time based on market and other conditions.
Portfolio holdings and characteristics are subject to change and may not be representative of current holdings and characteristics. Portfolio holdings are subject to change daily. The outlook for this Portfolio may differ from that presented for other Voya mutual funds. This report contains statements that may be "forward-looking" statements. Actual results may differ materially from those projected in the "forward-looking" statements. The Portfolio's performance returns shown reflect applicable fee waivers and/or expense limits in effect during this period. Absent such fee waivers/expense limitations, if any, performance would have been lower. Performance for the different classes of shares will vary based on differences in fees associated with each class. An index has no cash in its portfolio and imposes no sales charges. An investor cannot invest directly in an index.
23
VY® T. ROWE PRICE DIVERSIFIED MID CAP GROWTH PORTFOLIO
PORTFOLIO MANAGERS' REPORT
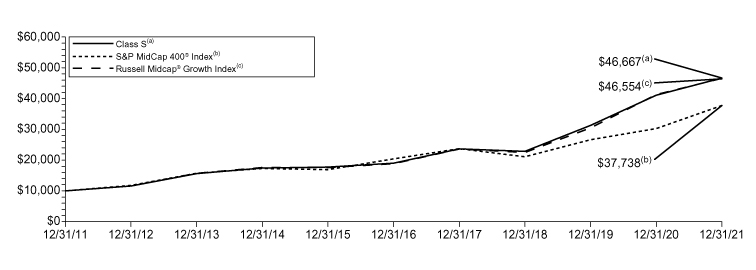
Average Annual Total Returns for the Periods Ended December 31, 2021 | |
| | 1 Year | | 5 Year | | 10 Year | |
Class ADV | | | 13.24 | % | | | 19.38 | % | | | 16.38 | % | |
Class I | | | 13.80 | % | | | 19.98 | % | | | 16.94 | % | |
Class R6(1) | | | 13.80 | % | | | 20.01 | % | | | 16.96 | % | |
Class S | | | 13.58 | % | | | 19.68 | % | | | 16.65 | % | |
Class S2 | | | 13.28 | % | | | 19.50 | % | | | 16.48 | % | |
S&P MidCap 400® Index | | | 24.76 | % | | | 13.09 | % | | | 14.20 | % | |
Russell Midcap® Growth Index | | | 12.73 | % | | | 19.83 | % | | | 16.63 | % | |
Based on a $10,000 initial investment, the graph and table above illustrate the total return of VY® T. Rowe Price Diversified Mid Cap Growth Portfolio against the indices indicated. An index is unmanaged and has no cash in its portfolio and imposes no sales charges. An investor cannot invest directly in an index.
The Portfolio's performance is shown without the imposition of any expenses or charges which are, or may be, imposed under your variable annuity contract or variable life insurance policy. Total returns would have been lower if such expenses or charges were included.
The performance graph and table do not reflect the deduction of taxes that a shareholder will pay on Portfolio distributions or the redemption of Portfolio shares.
The performance shown includes, if applicable, the effect of fee waivers and/or expense reimbursements by the Investment Adviser and/or other service providers, which have the effect of increasing total return. Had all fees and
expenses been considered, the total returns would have been lower.
The performance update illustrates performance for a variable investment option available through a variable annuity contract or a variable life insurance policy. The performance shown indicates past performance and is not a projection or prediction of future results. Actual investment returns and principal value will fluctuate so that shares and/or units, at redemption, may be worth more or less than their original cost. Please log on to www.voyainvestments.com or call (800) 262-3862 to get performance through the most recent month end.
Portfolio holdings are subject to change daily.
(1) Class R6 incepted on May 3, 2016. The Class R6 shares performance shown for the period prior to their inception date is the performance of Class I shares without adjustment for any differences in the expenses between the two classes. If adjusted for such differences, returns would be different.
24
PORTFOLIO MANAGERS' REPORT
VY® T. ROWE PRICE GROWTH EQUITY PORTFOLIO
VY® T. Rowe Price Growth Equity Portfolio (the "Portfolio") seeks long-term growth through investments in stocks. The Portfolio is managed by Joseph B. Fath, Vice President and Portfolio Manager of T. Rowe Price Associates, Inc. — the Sub-Adviser.
Performance: For the year ended December 31, 2021, the Portfolio's Class I shares, provided a total return of 20.15% compared to the S&P 500® Index and the Russell 1000® Growth Index, which returned 28.71% and 27.60%, respectively, for the same period.
Portfolio Specifics: The Portfolio underperformed the S&P 500® Index for the period. Stock selection largely drove the relative underperformance. Information technology was the leading relative detractor, due to security selection. Consumer discretionary also hindered relative results, owing to stock choices. The communication services sector further weighed on returns due to an overweight exposure, although favorable stock picks partially offset losses. Conversely, a lack of exposure to consumer staples and utilities aided relative performance.
The information technology sector detracted the most during the period. Shares of Zoom Video Communications traded lower due to faster-than-expected churn within small and mid-size customers as some employees begin to return to the office.
Consumer staples and utilities were the only two sectors that aided relative performance due to a lack of exposure.
Current Strategy and Outlook: After back-to-back years of strong performance across most equity and credit sectors, in our view global markets face more uncertain prospects in 2022. We believe that investors will need to use greater selectivity to identify potential opportunities. We also believe that higher inflation, a shift toward monetary tightening, and new coronavirus variants all pose potential challenges for economic growth and earnings — at a time when valuations, in our view, appear elevated across many asset categories. Many believe that as governments and central banks withdraw the massive stimulus applied during the pandemic, economic growth inevitably will slow sharply. But in our opinion, slower growth doesn't necessarily mean low growth. We believe that a number of tailwinds should sustain the recovery in 2022, including strong consumer and corporate balance sheets.
Sector Diversification
as of December 31, 2021
(as a percentage of net assets)
Information Technology | | | 38.7 | % | |
Consumer Discretionary | | | 25.3 | % | |
Communication Services | | | 20.7 | % | |
Health Care | | | 7.8 | % | |
Industrials | | | 4.5 | % | |
Financials | | | 1.9 | % | |
Assets in Excess of Other Liabilities* | | | 1.1 | % | |
Net Assets | | | 100.0 | % | |
* Includes short-term investments.
Portfolio holdings are subject to change daily.
Top Ten Holdings
as of December 31, 2021
(as a percentage of net assets)
Microsoft Corp. | | | 10.5 | % | |
Amazon.com, Inc. | | | 9.8 | % | |
Rivian Automotive, Inc. Lockup Shares | | | 5.9 | % | |
Apple, Inc. | | | 5.8 | % | |
Meta Platforms, Inc. | | | 4.8 | % | |
Alphabet, Inc. — Class A | | | 4.2 | % | |
Alphabet, Inc. — Class C | | | 4.2 | % | |
Intuit, Inc. | | | 2.3 | % | |
NetFlix, Inc. | | | 1.9 | % | |
Nvidia Corp. | | | 1.8 | % | |
Portfolio holdings are subject to change daily.
The views expressed in this commentary are informed opinions. They should not be considered promises or advice. The views expressed reflect those of the portfolio managers, only through the end of the period as stated on the cover. The portfolio managers' views are subject to change at any time based on market and other conditions.
Portfolio holdings and characteristics are subject to change and may not be representative of current holdings and characteristics. Portfolio holdings are subject to change daily. The outlook for this Portfolio may differ from that presented for other Voya mutual funds. This report contains statements that may be "forward-looking" statements. Actual results may differ materially from those projected in the "forward-looking" statements. The Portfolio's performance returns shown reflect applicable fee waivers and/or expense limits in effect during this period. Absent such fee waivers/expense limitations, if any, performance would have been lower. Performance for the different classes of shares will vary based on differences in fees associated with each class. An index has no cash in its portfolio and imposes no sales charges. An investor cannot invest directly in an index.
25
VY® T. ROWE PRICE GROWTH EQUITY PORTFOLIO
PORTFOLIO MANAGERS' REPORT
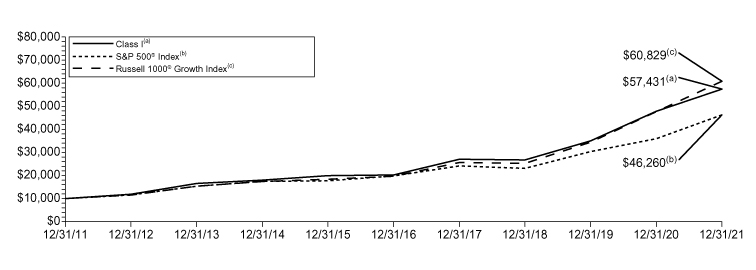
Average Annual Total Returns for the Periods Ended December 31, 2021 | |
| | 1 Year | | 5 Year | | 10 Year | |
Class ADV | | | 19.54 | % | | | 22.59 | % | | | 18.51 | % | |
Class I | | | 20.15 | % | | | 23.21 | % | | | 19.11 | % | |
Class S | | | 19.85 | % | | | 22.89 | % | | | 18.81 | % | |
Class S2 | | | 19.68 | % | | | 22.71 | % | | | 18.63 | % | |
S&P 500® Index | | | 28.71 | % | | | 18.47 | % | | | 16.55 | % | |
Russell 1000® Growth Index | | | 27.60 | % | | | 25.32 | % | | | 19.79 | % | |
Based on a $10,000 initial investment, the graph and table above illustrate the total return of VY® T. Rowe Price Growth Equity Portfolio against the indices indicated. An index is unmanaged and has no cash in its portfolio and imposes no sales charges. An investor cannot invest directly in an index.
The Portfolio's performance is shown without the imposition of any expenses or charges which are, or may be, imposed under your variable annuity contract or variable life insurance policy. Total returns would have been lower if such expenses or charges were included.
The performance graph and table do not reflect the deduction of taxes that a shareholder will pay on Portfolio distributions or the redemption of Portfolio shares.
The performance shown includes, if applicable, the effect of fee waivers and/or expense reimbursements by the
Investment Adviser and/or other service providers, which have the effect of increasing total return. Had all fees and expenses been considered, the total returns would have been lower.
The performance update illustrates performance for a variable investment option available through a variable annuity contract or a variable life insurance policy. The performance shown indicates past performance and is not a projection or prediction of future results. Actual investment returns and principal value will fluctuate so that shares and/or units, at redemption, may be worth more or less than their original cost. Please log on to www.voyainvestments.com or call (800) 262-3862 to get performance through the most recent month end.
Portfolio holdings are subject to change daily.
26
SHAREHOLDER EXPENSE EXAMPLES (UNAUDITED)
As a shareholder of a Portfolio, you incur two types of costs: (1) transaction costs, including redemption fees and exchange fees; and (2) ongoing costs, including management fees, distribution and/or service (12b-1) fees, and other Portfolio expenses. These Examples are intended to help you understand your ongoing costs (in dollars) of investing in a Portfolio and to compare these costs with the ongoing costs of investing in other mutual funds.
The Examples are based on an investment of $1,000 invested at the beginning of the period and held for the entire period from July 1, 2021 to December 31, 2021. The Portfolios' expenses are shown without the imposition of any charges which are, or may be, imposed under your variable annuity contract, variable life insurance policy, qualified pension, or retirement plan. Expenses would have been higher if such charges were included.
Actual Expenses
The left section of the table shown below, "Actual Portfolio Return," provides information about actual account values and actual expenses. You may use the information in this section, together with the amount you invested, to estimate the expenses that you paid over the period. Simply divide your account value by $1,000 (for example, an $8,600 account value divided by $1,000 = 8.6), then multiply the result by the number in the first section under the heading entitled "Expenses Paid During the Period" to estimate the expenses you paid on your account during this period.
Hypothetical Example for Comparison Purposes
The right section of the table shown below, "Hypothetical (5% return before expenses)," provides information about hypothetical account values and hypothetical expenses based on a Portfolio's actual expense ratio and an assumed rate of return of 5% per year before expenses, which is not a Portfolio's actual return. The hypothetical account values and expenses may not be used to estimate the actual ending account balance or expenses you paid for the period. You may use this information to compare the ongoing costs of investing in a Portfolio and other mutual funds. To do so, compare this 5% hypothetical example with the 5% hypothetical examples that appear in the shareholder reports of the other mutual funds.
Please note that the expenses shown in the table are meant to highlight your ongoing costs only and do not reflect any transactional costs, such as redemption fees or exchange fees. Therefore, the hypothetical section of the table is useful in comparing ongoing costs only, and will not help you determine the relative total costs of owning different mutual funds. In addition, if these transactional costs were included, your costs would have been higher.
| | | Actual Portfolio Return | | Hypothetical (5% return before expenses) | |
Voya Global Bond Portfolio | | Beginning
Account
Value
July 1,
2021 | | Ending
Account
Value
December 31,
2021 | | Annualized
Expense
Ratio | | Expenses Paid
During the
Period Ended
December 31,
2021* | | Beginning
Account
Value
July 1,
2021 | | Ending
Account
Value
December 31,
2021 | | Annualized
Expense
Ratio | | Expenses Paid
During the
Period Ended
December 31,
2021* | |
Class ADV | | $ | 1,000.00 | | | $ | 978.20 | | | | 1.17 | % | | $ | 5.83 | | | $ | 1,000.00 | | | $ | 1,019.31 | | | | 1.17 | % | | $ | 5.96 | | |
Class I | | | 1,000.00 | | | | 981.30 | | | | 0.67 | | | | 3.35 | | | | 1,000.00 | | | | 1,021.83 | | | | 0.67 | | | | 3.41 | | |
Class S | | | 1,000.00 | | | | 979.10 | | | | 0.92 | | | | 4.59 | | | | 1,000.00 | | | | 1,020.57 | | | | 0.92 | | | | 4.69 | | |
Voya International High Dividend Low Volatility Portfolio | |
Class ADV | | $ | 1,000.00 | | | $ | 1,022.80 | | | | 1.23 | % | | $ | 6.27 | | | $ | 1,000.00 | | | $ | 1,019.00 | | | | 1.23 | % | | $ | 6.26 | | |
Class I | | | 1,000.00 | | | | 1,026.20 | | | | 0.73 | | | | 3.73 | | | | 1,000.00 | | | | 1,021.53 | | | | 0.73 | | | | 3.72 | | |
Class S | | | 1,000.00 | | | | 1,023.90 | | | | 0.98 | | | | 5.00 | | | | 1,000.00 | | | | 1,020.27 | | | | 0.98 | | | | 4.99 | | |
Class S2 | | | 1,000.00 | | | | 1,023.50 | | | | 1.13 | | | | 5.76 | | | | 1,000.00 | | | | 1,019.51 | | | | 1.13 | | | | 5.75 | | |
VY® American Century Small-Mid Cap Value Portfolio | |
Class ADV | | $ | 1,000.00 | | | $ | 1,054.20 | | | | 1.35 | % | | $ | 6.99 | | | $ | 1,000.00 | | | $ | 1,018.40 | | | | 1.35 | % | | $ | 6.87 | | |
Class I | | | 1,000.00 | | | | 1,056.70 | | | | 0.85 | | | | 4.41 | | | | 1,000.00 | | | | 1,020.92 | | | | 0.85 | | | | 4.33 | | |
Class S | | | 1,000.00 | | | | 1,055.70 | | | | 1.10 | | | | 5.70 | | | | 1,000.00 | | | | 1,019.66 | | | | 1.10 | | | | 5.60 | | |
Class S2 | | | 1,000.00 | | | | 1,054.70 | | | | 1.25 | | | | 6.47 | | | | 1,000.00 | | | | 1,018.90 | | | | 1.25 | | | | 6.36 | | |
27
SHAREHOLDER EXPENSE EXAMPLES (UNAUDITED) (CONTINUED)
| | | Actual Portfolio Return | | Hypothetical (5% return before expenses) | |
VY® Baron Growth Portfolio | | Beginning
Account
Value
July 1,
2021 | | Ending
Account
Value
December 31,
2021 | | Annualized
Expense
Ratio | | Expenses Paid
During the
Period Ended
December 31,
2021* | | Beginning
Account
Value
July 1,
2021 | | Ending
Account
Value
December 31,
2021 | | Annualized
Expense
Ratio | | Expenses Paid
During the
Period Ended
December 31,
2021* | |
Class ADV | | $ | 1,000.00 | | | $ | 1,108.00 | | | | 1.49 | % | | $ | 7.92 | | | $ | 1,000.00 | | | $ | 1,017.69 | | | | 1.49 | % | | $ | 7.58 | | |
Class I | | | 1,000.00 | | | | 1,110.60 | | | | 0.99 | | | | 5.27 | | | | 1,000.00 | | | | 1,020.21 | | | | 0.99 | | | | 5.04 | | |
Class R6 | | | 1,000.00 | | | | 1,110.50 | | | | 0.97 | | | | 5.16 | | | | 1,000.00 | | | | 1,020.32 | | | | 0.97 | | | | 4.94 | | |
Class S | | | 1,000.00 | | | | 1,109.30 | | | | 1.24 | | | | 6.59 | | | | 1,000.00 | | | | 1,018.95 | | | | 1.24 | | | | 6.31 | | |
Class S2 | | | 1,000.00 | | | | 1,108.30 | | | | 1.39 | | | | 7.39 | | | | 1,000.00 | | | | 1,018.20 | | | | 1.39 | | | | 7.07 | | |
VY® Columbia Contrarian Core Portfolio | |
Class ADV | | $ | 1,000.00 | | | $ | 1,069.40 | | | | 1.23 | % | | $ | 6.42 | | | $ | 1,000.00 | | | $ | 1,019.00 | | | | 1.23 | % | | $ | 6.26 | | |
Class I | | | 1,000.00 | | | | 1,071.80 | | | | 0.73 | | | | 3.81 | | | | 1,000.00 | | | | 1,021.53 | | | | 0.73 | | | | 3.72 | | |
Class S | | | 1,000.00 | | | | 1,070.20 | | | | 0.98 | | | | 5.11 | | | | 1,000.00 | | | | 1,020.27 | | | | 0.98 | | | | 4.99 | | |
VY® Columbia Small Cap Value II Portfolio | |
Class ADV | | $ | 1,000.00 | | | $ | 1,055.30 | | | | 1.42 | % | | $ | 7.36 | | | $ | 1,000.00 | | | $ | 1,018.05 | | | | 1.42 | % | | $ | 7.22 | | |
Class I | | | 1,000.00 | | | | 1,057.80 | | | | 0.92 | | | | 4.77 | | | | 1,000.00 | | | | 1,020.57 | | | | 0.92 | | | | 4.69 | | |
Class R6 | | | 1,000.00 | | | | 1,058.00 | | | | 0.86 | | | | 4.46 | | | | 1,000.00 | | | | 1,020.87 | | | | 0.86 | | | | 4.38 | | |
Class S | | | 1,000.00 | | | | 1,056.60 | | | | 1.17 | | | | 6.06 | | | | 1,000.00 | | | | 1,019.31 | | | | 1.17 | | | | 5.96 | | |
Class S2 | | | 1,000.00 | | | | 1,055.60 | | | | 1.32 | | | | 6.84 | | | | 1,000.00 | | | | 1,018.55 | | | | 1.32 | | | | 6.72 | | |
VY® Invesco Comstock Portfolio | |
Class ADV | | $ | 1,000.00 | | | $ | 1,072.90 | | | | 1.20 | % | | $ | 6.27 | | | $ | 1,000.00 | | | $ | 1,019.16 | | | | 1.20 | % | | $ | 6.11 | | |
Class I | | | 1,000.00 | | | | 1,075.20 | | | | 0.70 | | | | 3.66 | | | | 1,000.00 | | | | 1,021.68 | | | | 0.70 | | | | 3.57 | | |
Class S | | | 1,000.00 | | | | 1,074.10 | | | | 0.95 | | | | 4.97 | | | | 1,000.00 | | | | 1,020.42 | | | | 0.95 | | | | 4.84 | | |
VY® Invesco Equity and Income Portfolio | |
Class ADV | | $ | 1,000.00 | | | $ | 1,044.10 | | | | 1.14 | % | | $ | 5.87 | | | $ | 1,000.00 | | | $ | 1,019.46 | | | | 1.14 | % | | $ | 5.80 | | |
Class I | | | 1,000.00 | | | | 1,046.60 | | | | 0.64 | | | | 3.30 | | | | 1,000.00 | | | | 1,021.98 | | | | 0.64 | | | | 3.26 | | |
Class S | | | 1,000.00 | | | | 1,045.30 | | | | 0.89 | | | | 4.59 | | | | 1,000.00 | | | | 1,020.72 | | | | 0.89 | | | | 4.53 | | |
Class S2 | | | 1,000.00 | | | | 1,044.60 | | | | 1.02 | | | | 5.26 | | | | 1,000.00 | | | | 1,020.06 | | | | 1.02 | | | | 5.19 | | |
VY® Invesco Global Portfolio | |
Class ADV | | $ | 1,000.00 | | | $ | 1,031.40 | | | | 1.30 | % | | $ | 6.66 | | | $ | 1,000.00 | | | $ | 1,018.65 | | | | 1.30 | % | | $ | 6.61 | | |
Class I | | | 1,000.00 | | | | 1,033.80 | | | | 0.80 | | | | 4.10 | | | | 1,000.00 | | | | 1,021.17 | | | | 0.80 | | | | 4.08 | | |
Class S | | | 1,000.00 | | | | 1,032.70 | | | | 1.05 | | | | 5.38 | | | | 1,000.00 | | | | 1,019.91 | | | | 1.05 | | | | 5.35 | | |
Class S2 | | | 1,000.00 | | | | 1,031.90 | | | | 1.20 | | | | 6.15 | | | | 1,000.00 | | | | 1,019.16 | | | | 1.20 | | | | 6.11 | | |
VY® JPMorgan Mid Cap Value Portfolio | |
Class ADV | | $ | 1,000.00 | | | $ | 1,063.80 | | | | 1.38 | % | | $ | 7.18 | | | $ | 1,000.00 | | | $ | 1,018.25 | | | | 1.38 | % | | $ | 7.02 | | |
Class I | | | 1,000.00 | | | | 1,066.00 | | | | 0.88 | | | | 4.58 | | | | 1,000.00 | | | | 1,020.77 | | | | 0.88 | | | | 4.48 | | |
Class S | | | 1,000.00 | | | | 1,065.50 | | | | 1.13 | | | | 5.88 | | | | 1,000.00 | | | | 1,019.51 | | | | 1.13 | | | | 5.75 | | |
Class S2 | | | 1,000.00 | | | | 1,064.40 | | | | 1.28 | | | | 6.66 | | | | 1,000.00 | | | | 1,018.75 | | | | 1.28 | | | | 6.51 | | |
28
SHAREHOLDER EXPENSE EXAMPLES (UNAUDITED) (CONTINUED)
| | | Actual Portfolio Return | | Hypothetical (5% return before expenses) | |
VY® T. Rowe Price Diversified
Mid Cap Growth Portfolio | | Beginning
Account
Value
July 1,
2021 | | Ending
Account
Value
December 31,
2021 | | Annualized
Expense
Ratio | | Expenses Paid
During the
Period Ended
December 31,
2021* | | Beginning
Account
Value
July 1,
2021 | | Ending
Account
Value
December 31,
2021 | | Annualized
Expense
Ratio | | Expenses Paid
During the
Period Ended
December 31,
2021* | |
Class ADV | | $ | 1,000.00 | | | $ | 1,037.10 | | | | 1.30 | % | | $ | 6.67 | | | $ | 1,000.00 | | | $ | 1,018.65 | | | | 1.30 | % | | $ | 6.61 | | |
Class I | | | 1,000.00 | | | | 1,039.50 | | | | 0.80 | | | | 4.11 | | | | 1,000.00 | | | | 1,021.17 | | | | 0.80 | | | | 4.08 | | |
Class R6 | | | 1,000.00 | | | | 1,039.60 | | | | 0.76 | | | | 3.91 | | | | 1,000.00 | | | | 1,021.37 | | | | 0.76 | | | | 3.87 | | |
Class S | | | 1,000.00 | | | | 1,038.40 | | | | 1.05 | | | | 5.39 | | | | 1,000.00 | | | | 1,019.91 | | | | 1.05 | | | | 5.35 | | |
Class S2 | | | 1,000.00 | | | | 1,037.50 | | | | 1.20 | | | | 6.16 | | | | 1,000.00 | | | | 1,019.16 | | | | 1.20 | | | | 6.11 | | |
VY® T. Rowe Price Growth Equity Portfolio | |
Class ADV | | $ | 1,000.00 | | | $ | 1,037.00 | | | | 1.23 | % | | $ | 6.32 | | | $ | 1,000.00 | | | $ | 1,019.00 | | | | 1.23 | % | | $ | 6.26 | | |
Class I | | | 1,000.00 | | | | 1,039.60 | | | | 0.73 | | | | 3.75 | | | | 1,000.00 | | | | 1,021.53 | | | | 0.73 | | | | 3.72 | | |
Class S | | | 1,000.00 | | | | 1,038.20 | | | | 0.98 | | | | 5.03 | | | | 1,000.00 | | | | 1,020.27 | | | | 0.98 | | | | 4.99 | | |
Class S2 | | | 1,000.00 | | | | 1,037.50 | | | | 1.13 | | | | 5.80 | | | | 1,000.00 | | | | 1,019.51 | | | | 1.13 | | | | 5.75 | | |
* Expenses are equal to each Portfolio's respective annualized expense ratios multiplied by the average account value over the period, multiplied by 184/365 to reflect the most recent fiscal half-year.
29
REPORT OF INDEPENDENT REGISTERED PUBLIC ACCOUNTING FIRM
To the Shareholders of Voya Global Bond Portfolio, Voya International High Dividend Low Volatility Portfolio, VY® American Century Small-Mid Cap Value Portfolio, VY® Baron Growth Portfolio, VY® Columbia Contrarian Core Portfolio, VY® Columbia Small Cap Value II Portfolio, VY® Invesco Comstock Portfolio, VY® Invesco Equity and Income Portfolio, VY® Invesco Global Portfolio (formerly, VY® Invesco Oppenheimer Global Portfolio), VY® JPMorgan Mid Cap Value Portfolio, VY® T. Rowe Price Diversified Mid Cap Growth Portfolio and VY® T. Rowe Price Growth Equity Portfolio and the Board of Directors of Voya Partners, Inc.
Opinion on the Financial Statements
We have audited the accompanying statements of assets and liabilities of Voya Global Bond Portfolio, Voya International High Dividend Low Volatility Portfolio, VY® American Century Small-Mid Cap Value Portfolio, VY® Baron Growth Portfolio, VY® Columbia Contrarian Core Portfolio, VY® Columbia Small Cap Value II Portfolio, VY® Invesco Comstock Portfolio, VY® Invesco Equity and Income Portfolio, VY® Invesco Global Portfolio (formerly, VY® Invesco Oppenheimer Global Portfolio), VY® JPMorgan Mid Cap Value Portfolio, VY® T. Rowe Price Diversified Mid Cap Growth Portfolio and VY® T. Rowe Price Growth Equity Portfolio (collectively referred to as the "Portfolios") (twelve of the portfolios constituting Voya Partners, Inc. (the "Company")), including the portfolios of investments, as of December 31, 2021, and the related statements of operations for the year then ended, and the statements of changes in net assets and the financial highlights for each of the two years in the period then ended and the related notes (collectively referred to as the "financial statements"). In our opinion, the financial statements present fairly, in all material respects, the financial position of the Portfolios (twelve of the portfolios constituting Voya Partners, Inc.) at December 31, 2021, the results of their operations for the year then ended, and the changes in their net assets and their financial highlights for each of the two years in the period then ended, in conformity with U.S. generally accepted accounting principles.
The financial highlights for each of the periods in the three-year period ended December 31, 2019, were audited by another independent registered public accounting firm whose report, dated February 26, 2020, expressed an unqualified opinion on those financial highlights.
Basis for Opinion
These financial statements are the responsibility of the Company's management. Our responsibility is to express an opinion on the Portfolios' financial statements based on our audits. We are a public accounting firm registered with the Public Company Accounting Oversight Board (United States) ("PCAOB") and are required to be independent with respect to the Company in accordance with the U.S. federal securities laws and the applicable rules and regulations of the Securities and Exchange Commission and the PCAOB.
We conducted our audits in accordance with the standards of the PCAOB. Those standards require that we plan and perform the audits to obtain reasonable assurance about whether the financial statements are free of material misstatement, whether due to error or fraud. The Company is not required to have, nor were we engaged to perform, an audit of the Company's internal control over financial reporting. As part of our audits, we are required to obtain an understanding of internal control over financial reporting, but not for the purpose of expressing an opinion on the effectiveness of the Company's internal control over financial reporting. Accordingly, we express no such opinion.
Our audits included performing procedures to assess the risks of material misstatement of the financial statements, whether due to error or fraud, and performing procedures that respond to those risks. Such procedures included examining, on a test basis, evidence regarding the amounts and disclosures in the financial statements. Our procedures included confirmation of securities owned as of December 31, 2021, by correspondence with the custodian and others or by other appropriate auditing procedures where replies from others were not received. Our audits also included evaluating the accounting principles used and significant estimates made by management, as well as evaluating the overall presentation of the financial statements. We believe that our audits provide a reasonable basis for our opinion.

We have served as the auditor of one or more Voya investment companies since 2019.
Boston, Massachusetts
February 24, 2022
30
STATEMENTS OF ASSETS AND LIABILITIES AS OF DECEMBER 31, 2021
| | | Voya
Global Bond
Portfolio | | Voya
International
High Dividend
Low Volatility
Portfolio | | VY®
American Century
Small-Mid Cap Value
Portfolio | | VY®
Baron
Growth
Portfolio | |
ASSETS: | |
Investments in securities at fair value+* | | $ | 128,381,077 | | | $ | 405,590,975 | | | $ | 392,985,811 | | | $ | 652,694,234 | | |
Investments in affiliates at fair value** | | | 39,603,081 | | | | — | | | | — | | | | — | | |
| Short-term investments at fair value† | | | 1,613,120 | | | | 13,517,409 | | | | 13,522,613 | | | | — | | |
Cash | | | — | | | | 397,181 | | | | — | | | | 596 | | |
Cash collateral for futures contracts | | | 450,000 | | | | — | | | | — | | | | — | | |
Cash pledged for centrally cleared swaps (Note 2) | | | 955,000 | | | | — | | | | — | | | | — | | |
Cash pledged as collateral for OTC derivatives (Note 2) | | | 640,000 | | | | — | | | | — | | | | — | | |
| Foreign currencies at value‡ | | | 152,188 | | | | 302,099 | | | | 103,353 | | | | — | | |
Receivables: | |
Investment securities sold | | | 51,107 | | | | 101,432 | | | | 438,128 | | | | 1,602,240 | | |
Investment securities sold on a delayed-delivery or
when-issued basis | | | 8,605,192 | | | | — | | | | — | | | | — | | |
Fund shares sold | | | 310,322 | | | | 2,862,180 | | | | 32,342 | | | | 51,662 | | |
Dividends | | | — | | | | 813,136 | | | | 659,800 | | | | 423,820 | | |
Interest | | | 920,500 | | | | — | | | | — | | | | 49,583 | | |
Foreign tax reclaims | | | 4,989 | | | | 1,715,372 | | | | 14,379 | | | | — | | |
Variation margin on futures contracts | | | 240,834 | | | | — | | | | — | | | | — | | |
Unrealized appreciation on forward foreign currency
contracts | | | 1,666,480 | | | | — | | | | 30,762 | | | | — | | |
Unrealized appreciation on OTC swap agreements | | | 15,675 | | | | — | | | | — | | | | — | | |
Prepaid expenses | | | 15 | | | | 38 | | | | 31 | | | | 51 | | |
Reimbursement due from Investment Adviser | | | 16,343 | | | | — | | | | 79,946 | | | | 46,190 | | |
Other assets | | | 11,646 | | | | 39,769 | | | | 12,298 | | | | 30,738 | | |
Total assets | | | 183,637,569 | | | | 425,339,591 | | | | 407,879,463 | | | | 654,899,114 | | |
LIABILITIES: | |
Payable for investment securities purchased | | | 47,404 | | | | 101,431 | | | | 213,119 | | | | 111,924 | | |
Payable for investment securities purchased on a
delayed-delivery or when-issued basis | | | 22,173,436 | | | | — | | | | — | | | | — | | |
Payable for fund shares redeemed | | | 259 | | | | 187 | | | | 1,259,617 | | | | 427,255 | | |
Payable upon receipt of securities loaned | | | 132,120 | | | | 13,517,409 | | | | 5,933,484 | | | | — | | |
Unrealized depreciation on forward foreign currency
contracts | | | 1,883,321 | | | | 371 | | | | 237,171 | | | | — | | |
Unrealized depreciation on OTC swap agreements | | | 221,203 | | | | — | | | | — | | | | — | | |
Variation margin payable on centrally cleared swaps | | | 3,393 | | | | — | | | | — | | | | — | | |
Payable for investment management fees | | | 80,634 | | | | 205,133 | | | | 304,563 | | | | 512,885 | | |
Payable for distribution and shareholder service fees | | | 14,371 | | | | 64,890 | | | | 67,725 | | | | 117,083 | | |
Payable to custodian due to bank overdraft | | | 75,070 | | | | — | | | | — | | | | — | | |
Payable for directors fees | | | 838 | | | | 2,108 | | | | 1,953 | | | | 3,100 | | |
Payable to directors under the deferred compensation
plan (Note 6) | | | 11,646 | | | | 39,769 | | | | 12,298 | | | | 30,738 | | |
Payable for borrowings against line of credit | | | — | | | | — | | | | — | | | | 531,000 | | |
Other accrued expenses and liabilities | | | 84,296 | | | | 202,864 | | | | 155,746 | | | | 247,688 | | |
Written options, at fair value^ | | | 29,730 | | | | — | | | | — | | | | — | | |
Total liabilities | | | 24,757,721 | | | | 14,134,162 | | | | 8,185,676 | | | | 1,981,673 | | |
NET ASSETS | | $ | 158,879,848 | | | $ | 411,205,429 | | | $ | 399,693,787 | | | $ | 652,917,441 | | |
NET ASSETS WERE COMPRISED OF: | |
Paid-in capital | | $ | 164,891,375 | | | $ | 357,029,372 | | | $ | 271,372,693 | | | $ | 60,448,228 | | |
Total distributable earnings (loss) | | | (6,011,527 | ) | | | 54,176,057 | | | | 128,321,094 | | | | 592,469,213 | | |
NET ASSETS | | $ | 158,879,848 | | | $ | 411,205,429 | | | $ | 399,693,787 | | | $ | 652,917,441 | | |
| + Including securities loaned at value | | $ | 128,450 | | | $ | 12,863,088 | | | $ | 5,763,078 | | | $ | — | | |
| * Cost of investments in securities | | $ | 125,112,400 | | | $ | 363,272,429 | | | $ | 327,585,076 | | | $ | 112,437,049 | | |
| ** Cost of investments in affiliates | | $ | 41,399,129 | | | $ | — | | | $ | — | | | $ | — | | |
| † Cost of short-term investments | | $ | 1,613,120 | | | $ | 13,517,409 | | | $ | 13,522,613 | | | $ | — | | |
| ‡ Cost of foreign currencies | | $ | 153,720 | | | $ | 299,650 | | | $ | 103,353 | | | $ | — | | |
| ^ Premiums received on written options | | $ | 63,500 | | | $ | — | | | $ | — | | | $ | — | | |
See Accompanying Notes to Financial Statements
31
STATEMENTS OF ASSETS AND LIABILITIES AS OF DECEMBER 31, 2021 (CONTINUED)
| | | Voya
Global Bond
Portfolio | | Voya
International
High Dividend
Low Volatility
Portfolio | | VY®
American Century
Small-Mid Cap Value
Portfolio | | VY®
Baron
Growth
Portfolio | |
Class ADV: | |
Net assets | | $ | 19,155,618 | | | $ | 27,020,903 | | | $ | 110,891,873 | | | $ | 140,345,452 | | |
Shares authorized | | | 100,000,000 | | | | 100,000,000 | | | | 100,000,000 | | | | 100,000,000 | | |
Par value | | $ | 0.001 | | | $ | 0.001 | | | $ | 0.001 | | | $ | 0.001 | | |
Shares outstanding | | | 1,891,638 | | | | 2,621,564 | | | | 7,804,192 | | | | 4,907,985 | | |
Net asset value and redemption price per share | | $ | 10.13 | | | $ | 10.31 | | | $ | 14.21 | | | $ | 28.60 | | |
Class I: | |
Net assets | | $ | 110,162,128 | | | $ | 125,719,011 | | | $ | 186,364,510 | | | $ | 177,253,897 | | |
Shares authorized | | | 100,000,000 | | | | 100,000,000 | | | | 100,000,000 | | | | 100,000,000 | | |
Par value | | $ | 0.001 | | | $ | 0.001 | | | $ | 0.001 | | | $ | 0.001 | | |
Shares outstanding | | | 10,679,381 | | | | 12,045,236 | | | | 12,131,594 | | | | 5,007,053 | | |
Net asset value and redemption price per share | | $ | 10.32 | | | $ | 10.44 | | | $ | 15.36 | | | $ | 35.40 | | |
Class R6: | |
Net assets | | | n/a | | | | n/a | | | | n/a | | | $ | 50,409,775 | | |
Shares authorized | | | n/a | | | | n/a | | | | n/a | | | | 100,000,000 | | |
Par value | | | n/a | | | | n/a | | | | n/a | | | $ | 0.001 | | |
Shares outstanding | | | n/a | | | | n/a | | | | n/a | | | | 1,422,263 | | |
Net asset value and redemption price per share | | | n/a | | | | n/a | | | | n/a | | | $ | 35.44 | | |
Class S: | |
Net assets | | $ | 29,562,102 | | | $ | 258,075,245 | | | $ | 100,022,067 | | | $ | 282,226,940 | | |
Shares authorized | | | 100,000,000 | | | | 100,000,000 | | | | 100,000,000 | | | | 100,000,000 | | |
Par value | | $ | 0.001 | | | $ | 0.001 | | | $ | 0.001 | | | $ | 0.001 | | |
Shares outstanding | | | 2,869,462 | | | | 24,909,982 | | | | 6,628,053 | | | | 8,784,535 | | |
Net asset value and redemption price per share | | $ | 10.30 | | | $ | 10.36 | | | $ | 15.09 | | | $ | 32.13 | | |
Class S2: | |
Net assets | | | n/a | | | $ | 390,270 | | | $ | 2,415,337 | | | $ | 2,681,377 | | |
Shares authorized | | | n/a | | | | 100,000,000 | | | | 100,000,000 | | | | 100,000,000 | | |
Par value | | | n/a | | | $ | 0.001 | | | $ | 0.001 | | | $ | 0.001 | | |
Shares outstanding | | | n/a | | | | 37,290 | | | | 169,894 | | | | 91,726 | | |
Net asset value and redemption price per share | | | n/a | | | $ | 10.47 | | | $ | 14.22 | | | $ | 29.23 | | |
See Accompanying Notes to Financial Statements
32
STATEMENTS OF ASSETS AND LIABILITIES AS OF DECEMBER 31, 2021
| | | VY®
Columbia
Contrarian Core
Portfolio | | VY®
Columbia Small
Cap Value II
Portfolio | | VY®
Invesco
Comstock
Portfolio | | VY®
Invesco
Equity and Income
Portfolio | |
ASSETS: | |
Investments in securities at fair value+* | | $ | 209,383,232 | | | $ | 195,667,445 | | | $ | 287,546,429 | | | $ | 1,270,388,288 | | |
| Short-term investments at fair value† | | | 3,303,059 | | | | 2,254,436 | | | | 10,252,966 | | | | 45,416,715 | | |
| Foreign currencies at value‡ | | | — | | | | — | | | | 881 | | | | 671 | | |
Receivables: | |
Investment securities sold | | | — | | | | — | | | | 26,672 | | | | — | | |
Fund shares sold | | | 98,986 | | | | 29,519 | | | | 252,554 | | | | 64,964 | | |
Dividends | | | 144,380 | | | | 228,685 | | | | 412,079 | | | | 838,941 | | |
Interest | | | — | | | | — | | | | — | | | | 1,942,431 | | |
Foreign tax reclaims | | | 17,012 | | | | — | | | | 28,283 | | | | 254,450 | | |
Unrealized appreciation on forward foreign currency
contracts | | | — | | | | — | | | | 4,727 | | | | 28,364 | | |
Prepaid expenses | | | 15 | | | | 15 | | | | 20 | | | | 113 | | |
Reimbursement due from Investment Adviser | | | 37,187 | | | | — | | | | 18,977 | | | | 59,918 | | |
Other assets | | | 12,305 | | | | 8,249 | | | | 20,760 | | | | 73,047 | | |
Total assets | | | 212,996,176 | | | | 198,188,349 | | | | 298,564,348 | | | | 1,319,067,902 | | |
LIABILITIES: | |
Payable for investment securities purchased | | | — | | | | 46,023 | | | | 2,741,818 | | | | — | | |
Payable for fund shares redeemed | | | 160,759 | | | | 1,658,230 | | | | 433,982 | | | | 1,940,570 | | |
Payable upon receipt of securities loaned | | | — | | | | — | | | | — | | | | 5,295,209 | | |
Unrealized depreciation on forward foreign currency
contracts | | | — | | | | — | | | | 52,328 | | | | 433,668 | | |
Payable for investment management fees | | | 155,206 | | | | 135,836 | | | | 171,175 | | | | 690,852 | | |
Payable for distribution and shareholder service fees | | | 18,021 | | | | 37,643 | | | | 31,213 | | | | 215,423 | | |
Payable for directors fees | | | 969 | | | | 946 | | | | 1,267 | | | | 6,597 | | |
Payable to directors under the deferred compensation
plan (Note 6) | | | 12,305 | | | | 8,249 | | | | 20,760 | | | | 73,047 | | |
Other accrued expenses and liabilities | | | 117,907 | | | | 57,419 | | | | 122,048 | | | | 184,858 | | |
Total liabilities | | | 465,167 | | | | 1,944,346 | | | | 3,574,591 | | | | 8,840,224 | | |
NET ASSETS | | $ | 212,531,009 | | | $ | 196,244,003 | | | $ | 294,989,757 | | | $ | 1,310,227,678 | | |
NET ASSETS WERE COMPRISED OF: | |
Paid-in capital | | $ | 132,545,307 | | | $ | 112,308,317 | | | $ | 225,632,873 | | | $ | 880,982,968 | | |
Total distributable earnings | | | 79,985,702 | | | | 83,935,686 | | | | 69,356,884 | | | | 429,244,710 | | |
NET ASSETS | | $ | 212,531,009 | | | $ | 196,244,003 | | | $ | 294,989,757 | | | $ | 1,310,227,678 | | |
| + Including securities loaned at value | | $ | — | | | $ | — | | | $ | — | | | $ | 54,744,008 | | |
| * Cost of investments in securities | | $ | 157,903,994 | | | $ | 135,954,576 | | | $ | 212,159,327 | | | $ | 1,001,185,348 | | |
| † Cost of short-term investments | | $ | 3,303,059 | | | $ | 2,254,436 | | | $ | 10,252,966 | | | $ | 45,416,715 | | |
| ‡ Cost of foreign currencies | | $ | — | | | $ | — | | | $ | 869 | | | $ | 670 | | |
See Accompanying Notes to Financial Statements
33
STATEMENTS OF ASSETS AND LIABILITIES AS OF DECEMBER 31, 2021 (CONTINUED)
| | | VY®
Columbia
Contrarian Core
Portfolio | | VY®
Columbia Small
Cap Value II
Portfolio | | VY®
Invesco
Comstock
Portfolio | | VY®
Invesco
Equity and Income
Portfolio | |
Class ADV: | |
Net assets | | $ | 31,288,400 | | | $ | 39,427,128 | | | $ | 34,649,233 | | | $ | 49,436,090 | | |
Shares authorized | | | 100,000,000 | | | | 100,000,000 | | | | 100,000,000 | | | | 100,000,000 | | |
Par value | | $ | 0.001 | | | $ | 0.001 | | | $ | 0.001 | | | $ | 0.001 | | |
Shares outstanding | | | 1,481,727 | | | | 1,893,158 | | | | 1,646,316 | | | | 956,082 | | |
Net asset value and redemption price per share | | $ | 21.12 | | | $ | 20.83 | | | $ | 21.05 | | | $ | 51.71 | | |
Class I: | |
Net assets | | $ | 157,467,715 | | | $ | 45,423,534 | | | $ | 178,855,973 | | | $ | 502,444,651 | | |
Shares authorized | | | 100,000,000 | | | | 100,000,000 | | | | 100,000,000 | | | | 100,000,000 | | |
Par value | | $ | 0.001 | | | $ | 0.001 | | | $ | 0.001 | | | $ | 0.001 | | |
Shares outstanding | | | 6,790,106 | | | | 2,092,480 | | | | 8,417,321 | | | | 9,535,087 | | |
Net asset value and redemption price per share | | $ | 23.19 | | | $ | 21.71 | | | $ | 21.25 | | | $ | 52.69 | | |
Class R6: | |
Net assets | | | n/a | | | $ | 12,559,756 | | | | n/a | | | | n/a | | |
Shares authorized | | | n/a | | | | 100,000,000 | | | | n/a | | | | n/a | | |
Par value | | | n/a | | | $ | 0.001 | | | | n/a | | | | n/a | | |
Shares outstanding | | | n/a | | | | 577,644 | | | | n/a | | | | n/a | | |
Net asset value and redemption price per share | | | n/a | | | $ | 21.74 | | | | n/a | | | | n/a | | |
Class S: | |
Net assets | | $ | 23,774,894 | | | $ | 96,977,662 | | | $ | 81,484,551 | | | $ | 437,820,564 | | |
Shares authorized | | | 100,000,000 | | | | 100,000,000 | | | | 100,000,000 | | | | 100,000,000 | | |
Par value | | $ | 0.001 | | | $ | 0.001 | | | $ | 0.001 | | | $ | 0.001 | | |
Shares outstanding | | | 1,061,688 | | | | 4,488,585 | | | | 3,828,708 | | | | 8,372,257 | | |
Net asset value and redemption price per share | | $ | 22.39 | | | $ | 21.61 | | | $ | 21.28 | | | $ | 52.29 | | |
Class S2: | |
Net assets | | | n/a | | | $ | 1,855,923 | | | | n/a | | | $ | 320,526,373 | | |
Shares authorized | | | n/a | | | | 100,000,000 | | | | n/a | | | | 100,000,000 | | |
Par value | | | n/a | | | $ | 0.001 | | | | n/a | | | $ | 0.001 | | |
Shares outstanding | | | n/a | | | | 89,024 | | | | n/a | | | | 6,230,041 | | |
Net asset value and redemption price per share | | | n/a | | | $ | 20.85 | | | | n/a | | | $ | 51.45 | | |
See Accompanying Notes to Financial Statements
34
STATEMENTS OF ASSETS AND LIABILITIES AS OF DECEMBER 31, 2021
| | | VY®
Invesco
Global
Portfolio | | VY®
JPMorgan
Mid Cap Value
Portfolio | | VY®
T. Rowe Price
Diversified Mid Cap
Growth
Portfolio | | VY®
T. Rowe Price
Growth Equity
Portfolio | |
ASSETS: | |
Investments in securities at fair value+* | | $ | 1,712,341,570 | | | $ | 419,433,317 | | | $ | 1,459,054,888 | | | $ | 2,190,372,492 | | |
| Short-term investments at fair value† | | | 14,064,319 | | | | 4,996,940 | | | | 117,033,584 | | | | 71,955,145 | | |
Cash | | | — | | | | — | | | | 519,011 | | | | 1,966,640 | | |
| Foreign currencies at value‡ | | | 8,617 | | | | — | | | | — | | | | — | | |
Receivables: | |
Investment securities sold | | | — | | | | — | | | | 1,875,330 | | | | — | | |
Fund shares sold | | | 796,642 | | | | 32,614 | | | | 286,418 | | | | 238,448 | | |
Dividends | | | 4,502 | | | | 702,040 | | | | 417,962 | | | | 116,477 | | |
Foreign tax reclaims | | | 2,311,012 | | | | — | | | | — | | | | 1,834 | | |
Prepaid expenses | | | 146 | | | | 32 | | | | 128 | | | | 172 | | |
Reimbursement due from Investment Adviser | | | 35,171 | | | | 39,582 | | | | 42,662 | | | | 56,104 | | |
Other assets | | | 68,726 | | | | 20,264 | | | | 40,563 | | | | 66,702 | | |
Total assets | | | 1,729,630,705 | | | | 425,224,789 | | | | 1,579,270,546 | | | | 2,264,774,014 | | |
LIABILITIES: | |
Payable for investment securities purchased | | | — | | | | — | | | | 77 | | | | 643 | | |
Payable for fund shares redeemed | | | 101,369 | | | | 1,716,691 | | | | 121,030 | | | | 1,031,526 | | |
Payable upon receipt of securities loaned | | | 4,425,451 | | | | — | | | | 116,541,462 | | | | 45,268,511 | | |
Payable for investment management fees | | | 1,019,920 | | | | 299,780 | | | | 903,259 | | | | 1,281,239 | | |
Payable for distribution and shareholder service fees | | | 104,093 | | | | 79,161 | | | | 43,175 | | | | 185,660 | | |
Payable for directors fees | | | 8,617 | | | | 2,094 | | | | 7,354 | | | | 10,681 | | |
Payable to directors under the deferred compensation
plan (Note 6) | | | 68,726 | | | | 20,264 | | | | 40,563 | | | | 66,702 | | |
Payable for foreign capital gains tax | | | 2,123,304 | | | | — | | | | — | | | | — | | |
Other accrued expenses and liabilities | | | 588,620 | | | | 108,537 | | | | 341,840 | | | | 700,209 | | |
Total liabilities | | | 8,440,100 | | | | 2,226,527 | | | | 117,998,760 | | | | 48,545,171 | | |
NET ASSETS | | $ | 1,721,190,605 | | | $ | 422,998,262 | | | $ | 1,461,271,786 | | | $ | 2,216,228,843 | | |
NET ASSETS WERE COMPRISED OF: | |
Paid-in capital | | $ | 437,766,119 | | | $ | 229,507,541 | | | $ | 755,307,308 | | | $ | 999,938,238 | | |
Total distributable earnings | | | 1,283,424,486 | | | | 193,490,721 | | | | 705,964,478 | | | | 1,216,290,605 | | |
NET ASSETS | | $ | 1,721,190,605 | | | $ | 422,998,262 | | | $ | 1,461,271,786 | | | $ | 2,216,228,843 | | |
| + Including securities loaned at value | | $ | 4,217,848 | | | $ | — | | | $ | 114,095,065 | | | $ | 44,234,476 | | |
| * Cost of investments in securities | | $ | 604,275,681 | | | $ | 282,704,509 | | | $ | 1,020,429,685 | | | $ | 1,230,804,933 | | |
| † Cost of short-term investments | | $ | 14,064,319 | | | $ | 4,996,940 | | | $ | 117,033,584 | | | $ | 71,955,145 | | |
| ‡ Cost of foreign currencies | | $ | 8,705 | | | $ | — | | | $ | — | | | $ | — | | |
See Accompanying Notes to Financial Statements
35
STATEMENTS OF ASSETS AND LIABILITIES AS OF DECEMBER 31, 2021 (CONTINUED)
| | | VY®
Invesco
Global
Portfolio | | VY®
JPMorgan
Mid Cap Value
Portfolio | | VY®
T. Rowe Price
Diversified Mid Cap
Growth
Portfolio | | VY®
T. Rowe Price
Growth Equity
Portfolio | |
Class ADV: | |
Net assets | | $ | 149,741,431 | | | $ | 93,649,155 | | | $ | 76,148,988 | | | $ | 394,504,072 | | |
Shares authorized | | | 100,000,000 | | | | 100,000,000 | | | | 100,000,000 | | | | 100,000,000 | | |
Par value | | $ | 0.001 | | | $ | 0.001 | | | $ | 0.001 | | | $ | 0.001 | | |
Shares outstanding | | | 6,098,535 | | | | 4,868,019 | | | | 6,126,247 | | | | 3,854,277 | | |
Net asset value and redemption price per share | | $ | 24.55 | | | $ | 19.24 | | | $ | 12.43 | | | $ | 102.35 | | |
Class I: | |
Net assets | | $ | 1,381,311,614 | | | $ | 138,540,472 | | | $ | 1,214,370,556 | | | $ | 1,742,541,779 | | |
Shares authorized | | | 250,000,000 | | | | 100,000,000 | | | | 250,000,000 | | | | 100,000,000 | | |
Par value | | $ | 0.001 | | | $ | 0.001 | | | $ | 0.001 | | | $ | 0.001 | | |
Shares outstanding | | | 52,693,391 | | | | 6,925,337 | | | | 81,930,611 | | | | 14,627,964 | | |
Net asset value and redemption price per share | | $ | 26.21 | | | $ | 20.00 | | | $ | 14.82 | | | $ | 119.12 | | |
Class R6: | |
Net assets | | | n/a | | | | n/a | | | $ | 118,927,419 | | | | n/a | | |
Shares authorized | | | n/a | | | | n/a | | | | 100,000,000 | | | | n/a | | |
Par value | | | n/a | | | | n/a | | | $ | 0.001 | | | | n/a | | |
Shares outstanding | | | n/a | | | | n/a | | | | 8,013,149 | | | | n/a | | |
Net asset value and redemption price per share | | | n/a | | | | n/a | | | $ | 14.84 | | | | n/a | | |
Class S: | |
Net assets | | $ | 185,985,506 | | | $ | 188,813,068 | | | $ | 45,921,899 | | | $ | 72,845,235 | | |
Shares authorized | | | 100,000,000 | | | | 100,000,000 | | | | 100,000,000 | | | | 100,000,000 | | |
Par value | | $ | 0.001 | | | $ | 0.001 | | | $ | 0.001 | | | $ | 0.001 | | |
Shares outstanding | | | 7,489,623 | | | | 9,576,683 | | | | 3,309,356 | | | | 656,759 | | |
Net asset value and redemption price per share | | $ | 24.83 | | | $ | 19.72 | | | $ | 13.88 | | | $ | 110.92 | | |
Class S2: | |
Net assets | | $ | 4,152,054 | | | $ | 1,995,567 | | | $ | 5,902,924 | | | $ | 6,337,757 | | |
Shares authorized | | | 100,000,000 | | | | 100,000,000 | | | | 100,000,000 | | | | 100,000,000 | | |
Par value | | $ | 0.001 | | | $ | 0.001 | | | $ | 0.001 | | | $ | 0.001 | | |
Shares outstanding | | | 174,054 | | | | 104,121 | | | | 469,515 | | | | 60,281 | | |
Net asset value and redemption price per share | | $ | 23.85 | | | $ | 19.17 | | | $ | 12.57 | | | $ | 105.14 | | |
See Accompanying Notes to Financial Statements
36
STATEMENTS OF OPERATIONS FOR THE YEAR ENDED DECEMBER 31, 2021
| | Voya
Global Bond
Portfolio | | Voya
International
High Dividend
Low Volatility
Portfolio | | VY®
American Century
Small-Mid Cap Value
Portfolio | | VY®
Baron
Growth
Portfolio | |
INVESTMENT INCOME: | |
Dividends, net of foreign taxes withheld* | | $ | 5,695 | | | $ | 16,590,544 | | | $ | 7,898,935 | | | $ | 4,140,340 | | |
Dividends from affiliated underlying funds | | | 1,943,792 | | | | — | | | | — | | | | — | | |
Interest, net of foreign taxes withheld* | | | 4,271,720 | | | | — | | | | — | | | | 39,001 | | |
Securities lending income, net | | | 2,427 | | | | 195,216 | | | | 19,606 | | | | — | | |
Total investment income | | | 6,223,634 | | | | 16,785,760 | | | | 7,918,541 | | | | 4,179,341 | | |
EXPENSES: | |
Investment management fees | | | 1,005,938 | | | | 2,529,157 | | | | 4,227,190 | | | | 5,890,368 | | |
Distribution and shareholder service fees: | | | | | | | | | |
Class ADV | | | 99,824 | | | | 136,335 | | | | 545,871 | | | | 657,381 | | |
Class S | | | 75,574 | | | | 668,511 | | | | 239,692 | | | | 670,687 | | |
Class S2 | | | — | | | | 1,489 | | | | 12,934 | | | | 11,133 | | |
Transfer agent fees: | | | | | | | | | |
Class ADV | | | 24,170 | | | | 19,727 | | | | 188,959 | | | | 151,536 | | |
Class I | | | 142,185 | | | | 91,498 | | | | 315,853 | | | | 196,806 | | |
Class R6 | | | — | | | | — | | | | — | | | | 79 | | |
Class S | | | 36,593 | | | | 193,444 | | | | 165,745 | | | | 309,415 | | |
Class S2 | | | — | | | | 269 | | | | 5,713 | | | | 3,227 | | |
Shareholder reporting expense | | | 17,141 | | | | 28,435 | | | | 24,310 | | | | 14,015 | | |
Professional fees | | | 17,783 | | | | 37,390 | | | | 26,898 | | | | 33,213 | | |
Custody and accounting expense | | | 75,710 | | | | 101,714 | | | | 79,952 | | | | 50,274 | | |
Directors fees | | | 6,706 | | | | 16,861 | | | | 15,627 | | | | 24,802 | | |
Shareholder notification costs (Note 4) | | | — | | | | 31,995 | | | | — | | | | — | | |
Miscellaneous expense | | | 13,093 | | | | 34,396 | | | | 11,060 | | | | 22,712 | | |
Interest expense | | | — | | | | 423 | | | | 297 | | | | 4,845 | | |
Total expenses | | | 1,514,717 | | | | 3,891,644 | | | | 5,860,101 | | | | 8,040,493 | | |
Waived and reimbursed fees | | | (216,179 | ) | | | — | | | | (1,712,489 | ) | | | (556,930 | ) | |
Net expenses | | | 1,298,538 | | | | 3,891,644 | | | | 4,147,612 | | | | 7,483,563 | | |
Net investment income (loss) | | | 4,925,096 | | | | 12,894,116 | | | | 3,770,929 | | | | (3,304,222 | ) | |
REALIZED AND UNREALIZED GAIN (LOSS): | |
Net realized gain (loss) on: | |
Investments (net of foreign capital gains taxes
withheld^) | | | (427,681 | ) | | | 32,719,734 | | | | 67,198,863 | | | | 54,558,239 | | |
Capital gain distributions from affiliated
underlying funds | | | 163,877 | | | | — | | | | — | | | | — | | |
Forward foreign currency contracts | | | (4,734,543 | ) | | | (1,629 | ) | | | 1,058,873 | | | | — | | |
Foreign currency related transactions | | | 49,512 | | | | (10,786 | ) | | | (7,526 | ) | | | (2,129 | ) | |
Futures | | | 518,890 | | | | — | | | | — | | | | — | | |
Swaps | | | (1,067,835 | ) | | | — | | | | — | | | | — | | |
Written options | | | 1,414,253 | | | | — | | | | — | | | | — | | |
Net realized gain (loss) | | | (4,083,527 | ) | | | 32,707,319 | | | | 68,250,210 | | | | 54,556,110 | | |
Net change in unrealized appreciation (depreciation) on: | |
Investments | | | (4,640,738 | ) | | | 1,831,461 | | | | 19,163,655 | | | | 64,034,412 | | |
Affiliated underlying funds | | | (2,560,351 | ) | | | — | | | | — | | | | — | | |
Forward foreign currency contracts | | | (955,231 | ) | | | (381 | ) | | | (86,344 | ) | | | — | | |
Foreign currency related transactions | | | (124,382 | ) | | | (86,654 | ) | | | (425 | ) | | | — | | |
Futures | | | (445,844 | ) | | | — | | | | — | | | | — | | |
Swaps | | | (649,771 | ) | | | — | | | | — | | | | — | | |
Written options | | | 3,528 | | | | — | | | | — | | | | — | | |
Net change in unrealized appreciation (depreciation) | | | (9,372,789 | ) | | | 1,744,426 | | | | 19,076,886 | | | | 64,034,412 | | |
Net realized and unrealized gain (loss) | | | (13,456,316 | ) | | | 34,451,745 | | | | 87,327,096 | | | | 118,590,522 | | |
Increase (decrease) in net assets resulting from
operations | | $ | (8,531,220 | ) | | $ | 47,345,861 | | | $ | 91,098,025 | | | $ | 115,286,300 | | |
| * Foreign taxes withheld | | $ | 2,514 | | | $ | 1,581,371 | | | $ | 71,136 | | | $ | 6,804 | | |
| ^ Foreign capital gains taxes withheld | | $ | 41,032 | | | $ | — | | | $ | — | | | $ | — | | |
See Accompanying Notes to Financial Statements
37
STATEMENTS OF OPERATIONS FOR THE YEAR ENDED DECEMBER 31, 2021
| | | VY®
Columbia
Contrarian Core
Portfolio | | VY®
Columbia Small
Cap Value II
Portfolio | | VY®
Invesco
Comstock
Portfolio | | VY®
Invesco
Equity and Income
Portfolio | |
INVESTMENT INCOME: | |
Dividends, net of foreign taxes withheld* | | $ | 2,403,588 | | | $ | 2,460,955 | | | $ | 5,737,664 | | | $ | 17,380,985 | | |
Interest | | | — | | | | — | | | | — | | | | 7,137,395 | | |
Securities lending income, net | | | — | | | | — | | | | 14,277 | | | | 120,489 | | |
Total investment income | | | 2,403,588 | | | | 2,460,955 | | | | 5,751,941 | | | | 24,638,869 | | |
EXPENSES: | |
Investment management fees | | | 1,744,499 | | | | 1,609,229 | | | | 1,774,086 | | | | 8,398,903 | | |
Distribution and shareholder service fees: | | | | | | | | | |
Class ADV | | | 147,575 | | | | 176,745 | | | | 166,051 | | | | 235,346 | | |
Class S | | | 56,255 | | | | 242,936 | | | | 187,731 | | | | 1,124,681 | | |
Class S2 | | | — | | | | 7,234 | | | | — | | | | 1,293,954 | | |
Transfer agent fees: | | | | | | | | | |
Class ADV | | | 14,445 | | | | 30,151 | | | | 19,995 | | | | 22,218 | | |
Class I | | | 69,244 | | | | 38,393 | | | | 87,790 | | | | 235,598 | | |
Class R6 | | | — | | | | 35 | | | | — | | | | — | | |
Class S | | | 11,027 | | | | 83,900 | | | | 45,241 | | | | 212,377 | | |
Class S2 | | | — | | | | 1,572 | | | | — | | | | 152,713 | | |
Shareholder reporting expense | | | 6,202 | | | | 17,534 | | | | 17,880 | | | | 21,806 | | |
Professional fees | | | 14,496 | | | | 12,241 | | | | 15,515 | | | | 64,940 | | |
Custody and accounting expense | | | 28,513 | | | | 25,204 | | | | 31,193 | | | | 95,482 | | |
Directors fees | | | 7,753 | | | | 7,573 | | | | 10,138 | | | | 52,780 | | |
Miscellaneous expense | | | 9,165 | | | | 8,238 | | | | 9,149 | | | | 40,247 | | |
Total expenses | | | 2,109,174 | | | | 2,260,985 | | | | 2,364,769 | | | | 11,951,045 | | |
Waived and reimbursed fees | | | (492,492 | ) | | | (89,884 | ) | | | (233,799 | ) | | | (886,264 | ) | |
Brokerage commission recapture | | | (8,094 | ) | | | (7,858 | ) | | | — | | | | — | | |
Net expenses | | | 1,608,588 | | | | 2,163,243 | | | | 2,130,970 | | | | 11,064,781 | | |
Net investment income | | | 795,000 | | | | 297,712 | | | | 3,620,971 | | | | 13,574,088 | | |
REALIZED AND UNREALIZED GAIN (LOSS): | |
Net realized gain (loss) on: | |
Investments | | | 28,186,665 | | | | 24,469,921 | | | | 19,976,039 | | | | 166,187,323 | | |
Forward foreign currency contracts | | | — | | | | — | | | | 178,219 | | | | 1,064,187 | | |
Foreign currency related transactions | | | — | | | | — | | | | (37,499 | ) | | | 14,543 | | |
Net realized gain | | | 28,186,665 | | | | 24,469,921 | | | | 20,116,759 | | | | 167,266,053 | | |
Net change in unrealized appreciation (depreciation) on: | |
Investments | | | 12,226,799 | | | | 26,184,413 | | | | 42,716,437 | | | | 39,975,993 | | |
Forward foreign currency contracts | | | — | | | | — | | | | 41,646 | | | | 53,542 | | |
Foreign currency related transactions | | | — | | | | — | | | | (1,417 | ) | | | (11,977 | ) | |
Net change in unrealized appreciation (depreciation) | | | 12,226,799 | | | | 26,184,413 | | | | 42,756,666 | | | | 40,017,558 | | |
Net realized and unrealized gain | | | 40,413,464 | | | | 50,654,334 | | | | 62,873,425 | | | | 207,283,611 | | |
Increase in net assets resulting from operations | | $ | 41,208,464 | | | $ | 50,952,046 | | | $ | 66,494,396 | | | $ | 220,857,699 | | |
| * Foreign taxes withheld | | $ | 14,762 | | | $ | 4,446 | | | $ | 64,678 | | | $ | 185,247 | | |
See Accompanying Notes to Financial Statements
38
STATEMENTS OF OPERATIONS FOR THE YEAR ENDED DECEMBER 31, 2021
| | | VY®
Invesco
Global
Portfolio | | VY®
JPMorgan
Mid Cap Value
Portfolio | | VY®
T. Rowe Price
Diversified Mid Cap
Growth
Portfolio | | VY®
T. Rowe Price
Growth Equity
Portfolio | |
INVESTMENT INCOME: | |
Dividends, net of foreign taxes withheld* | | $ | 8,670,531 | | | $ | 6,938,411 | | | $ | 5,627,727 | | | $ | 6,760,181 | | |
Securities lending income, net | | | 53,738 | | | | 1,405 | | | | 135,966 | | | | 156,400 | | |
Total investment income | | | 8,724,269 | | | | 6,939,816 | | | | 5,763,693 | | | | 6,916,581 | | |
EXPENSES: | |
Investment management fees | | | 12,063,851 | | | | 3,560,260 | | | | 10,884,337 | | | | 14,954,326 | | |
Distribution and shareholder service fees: | | | | | | | | | |
Class ADV | | | 717,500 | | | | 455,471 | | | | 358,480 | | | | 1,937,449 | | |
Class S | | | 473,396 | | | | 472,585 | | | | 120,255 | | | | 179,937 | | |
Class S2 | | | 17,198 | | | | 6,033 | | | | 27,258 | | | | 24,527 | | |
Transfer agent fees: | | | | | | | | | |
Class ADV | | | 141,254 | | | | 106,163 | | | | 56,714 | | | | 263,649 | | |
Class I | | | 1,365,785 | | | | 159,912 | | | | 963,857 | | | | 1,136,081 | | |
Class R6 | | | — | | | | — | | | | 165 | | | | — | | |
Class S | | | 186,636 | | | | 220,302 | | | | 38,307 | | | | 48,989 | | |
Class S2 | | | 4,239 | | | | 1,755 | | | | 5,437 | | | | 4,166 | | |
Shareholder reporting expense | | | 31,391 | | | | 14,296 | | | | 38,482 | | | | 82,900 | | |
Professional fees | | | 99,384 | | | | 21,954 | | | | 77,342 | | | | 116,435 | | |
Custody and accounting expense | | | 239,304 | | | | 44,112 | | | | 114,356 | | | | 176,184 | | |
Directors fees | | | 68,936 | | | | 16,754 | | | | 58,834 | | | | 85,453 | | |
Proxy and solicitation costs (Note 1) | | | — | | | | — | | | | — | | | | 105,950 | | |
Miscellaneous expense | | | 72,226 | | | | 13,265 | | | | 46,316 | | | | 71,616 | | |
Interest expense | | | 2,729 | | | | 164 | | | | 402 | | | | — | | |
Total expenses | | | 15,483,829 | | | | 5,093,026 | | | | 12,790,542 | | | | 19,187,662 | | |
Waived and reimbursed fees | | | (432,246 | ) | | | (463,244 | ) | | | (537,587 | ) | | | (1,382,047 | ) | |
Brokerage commission recapture | | | — | | | | (7,752 | ) | | | — | | | | — | | |
Net expenses | | | 15,051,583 | | | | 4,622,030 | | | | 12,252,955 | | | | 17,805,615 | | |
Net investment income (loss) | | | (6,327,314 | ) | | | 2,317,786 | | | | (6,489,262 | ) | | | (10,889,034 | ) | |
REALIZED AND UNREALIZED GAIN (LOSS): | |
Net realized gain (loss) on: | |
Investments (net of foreign capital gains taxes
withheld^) | | | 185,793,782 | | | | 59,265,122 | | | | 274,598,406 | | | | 275,440,602 | | |
Forward foreign currency contracts | | | 37,903 | | | | — | | | | — | | | | (12,134 | ) | |
Foreign currency related transactions | | | (66,841 | ) | | | — | | | | — | | | | (17,039 | ) | |
Net realized gain | | | 185,764,844 | | | | 59,265,122 | | | | 274,598,406 | | | | 275,411,429 | | |
Net change in unrealized appreciation (depreciation) on: | |
Investments (net of foreign capital gains taxes
accrued#) | | | 64,264,489 | | | | 43,813,263 | | | | (78,857,995 | ) | | | 114,830,720 | | |
Forward foreign currency contracts | | | 4,449 | | | | — | | | | — | | | | — | | |
Foreign currency related transactions | | | (156,463 | ) | | | — | | | | — | | | | 65 | | |
Net change in unrealized appreciation (depreciation) | | | 64,112,475 | | | | 43,813,263 | | | | (78,857,995 | ) | | | 114,830,785 | | |
Net realized and unrealized gain | | | 249,877,319 | | | | 103,078,385 | | | | 195,740,411 | | | | 390,242,214 | | |
Increase in net assets resulting from operations | | $ | 243,550,005 | | | $ | 105,396,171 | | | $ | 189,251,149 | | | $ | 379,353,180 | | |
| * Foreign taxes withheld | | $ | 849,446 | | | $ | — | | | $ | 23,633 | | | $ | 90,992 | | |
| ^ Foreign capital gains taxes withheld | | $ | 18 | | | $ | — | | | $ | — | | | $ | — | | |
| # Change in foreign capital gains taxes accrued | | $ | 2,123,304 | | | $ | — | | | $ | — | | | $ | — | | |
See Accompanying Notes to Financial Statements
39
STATEMENTS OF CHANGES IN NET ASSETS
| | | Voya Global Bond Portfolio | | Voya International High Dividend
Low Volatility Portfolio | |
| | | Year
Ended
December 31,
2021 | | Year
Ended
December 31,
2020 | | Year
Ended
December 31,
2021 | | Year
Ended
December 31,
2020 | |
FROM OPERATIONS: | |
Net investment income | | $ | 4,925,096 | | | $ | 5,671,017 | | | $ | 12,894,116 | | | $ | 8,705,812 | | |
Net realized gain (loss) | | | (4,083,527 | ) | | | 4,861,124 | | | | 32,707,319 | | | | (31,060,166 | ) | |
Net change in unrealized appreciation (depreciation) | | | (9,372,789 | ) | | | 6,090,949 | | | | 1,744,426 | | | | 12,103,137 | | |
Increase (decrease) in net assets resulting from operations | | | (8,531,220 | ) | | | 16,623,090 | | | | 47,345,861 | | | | (10,251,217 | ) | |
FROM DISTRIBUTIONS TO SHAREHOLDERS: | |
Total distributions (excluding return of capital): | |
Class ADV | | | (915,517 | ) | | | (499,001 | ) | | | (540,901 | ) | | | (3,998,093 | ) | |
Class I | | | (5,901,123 | ) | | | (4,117,554 | ) | | | (3,068,169 | ) | | | (18,958,530 | ) | |
Class S | | | (1,449,150 | ) | | | (856,131 | ) | | | (5,834,728 | ) | | | (41,156,670 | ) | |
Class S2 | | | — | | | | — | | | | (7,373 | ) | | | (73,179 | ) | |
Return of capital: | |
Class ADV | | | (144,296 | ) | | | — | | | | — | | | | — | | |
Class I | | | (824,076 | ) | | | — | | | | — | | | | — | | |
Class S | | | (214,197 | ) | | | — | | | | — | | | | — | | |
Total distributions | | | (9,448,359 | ) | | | (5,472,686 | ) | | | (9,451,171 | ) | | | (64,186,472 | ) | |
FROM CAPITAL SHARE TRANSACTIONS: | |
Net proceeds from sale of shares | | | 10,210,633 | | | | 17,959,104 | | | | 10,505,727 | | | | 20,855,018 | | |
Reinvestment of distributions | | | 9,448,359 | | | | 5,472,686 | | | | 9,451,171 | | | | 64,186,472 | | |
| | | | 19,658,992 | | | | 23,431,790 | | | | 19,956,898 | | | | 85,041,490 | | |
Cost of shares redeemed | | | (22,323,447 | ) | | | (56,396,854 | ) | | | (64,164,436 | ) | | | (71,367,998 | ) | |
Net increase (decrease) in net assets resulting from capital
share transactions | | | (2,664,455 | ) | | | (32,965,064 | ) | | | (44,207,538 | ) | | | 13,673,492 | | |
Net decrease in net assets | | | (20,644,034 | ) | | | (21,814,660 | ) | | | (6,312,848 | ) | | | (60,764,197 | ) | |
NET ASSETS: | |
Beginning of year or period | | | 179,523,882 | | | | 201,338,542 | | | | 417,518,277 | | | | 478,282,474 | | |
End of year or period | | $ | 158,879,848 | | | $ | 179,523,882 | | | $ | 411,205,429 | | | $ | 417,518,277 | | |
See Accompanying Notes to Financial Statements
40
STATEMENTS OF CHANGES IN NET ASSETS
| | | VY® American Century Small-Mid
Cap Value Portfolio | | VY® Baron Growth Portfolio | |
| | | Year
Ended
December 31,
2021 | | Year
Ended
December 31,
2020 | | Year
Ended
December 31,
2021 | | Year
Ended
December 31,
2020 | |
FROM OPERATIONS: | |
Net investment income (loss) | | $ | 3,770,929 | | | $ | 3,845,487 | | | $ | (3,304,222 | ) | | $ | (2,566,484 | ) | |
Net realized gain (loss) | | | 68,250,210 | | | | (2,741,117 | ) | | | 54,556,110 | | | | 47,657,871 | | |
Net change in unrealized appreciation (depreciation) | | | 19,076,886 | | | | 6,978,194 | | | | 64,034,412 | | | | 104,781,202 | | |
Increase in net assets resulting from operations | | | 91,098,025 | | | | 8,082,564 | | | | 115,286,300 | | | | 149,872,589 | | |
FROM DISTRIBUTIONS TO SHAREHOLDERS: | |
Total distributions (excluding return of capital): | |
Class ADV | | | (741,893 | ) | | | (1,711,366 | ) | | | (11,180,973 | ) | | | — | | |
Class I | | | (1,787,999 | ) | | | (3,371,776 | ) | | | (11,935,097 | ) | | | — | | |
Class R6 | | | — | | | | — | | | | (3,273,603 | ) | | | — | | |
Class S | | | (786,510 | ) | | | (1,584,274 | ) | | | (20,610,306 | ) | | | — | | |
Class S2 | | | (19,149 | ) | | | (59,796 | ) | | | (211,817 | ) | | | — | | |
Total distributions | | | (3,335,551 | ) | | | (6,727,212 | ) | | | (47,211,796 | ) | | | — | | |
FROM CAPITAL SHARE TRANSACTIONS: | |
Net proceeds from sale of shares | | | 31,109,075 | | | | 20,389,448 | | | | 26,834,028 | | | | 43,933,495 | | |
Reinvestment of distributions | | | 3,335,551 | | | | 6,727,212 | | | | 47,211,796 | | | | — | | |
| | | | 34,444,626 | | | | 27,116,660 | | | | 74,045,824 | | | | 43,933,495 | | |
Cost of shares redeemed | | | (69,553,735 | ) | | | (62,309,206 | ) | | | (85,094,711 | ) | | | (114,832,332 | ) | |
Net decrease in net assets resulting from capital
share transactions | | | (35,109,109 | ) | | | (35,192,546 | ) | | | (11,048,887 | ) | | | (70,898,837 | ) | |
Net increase (decrease) in net assets | | | 52,653,365 | | | | (33,837,194 | ) | | | 57,025,617 | | | | 78,973,752 | | |
NET ASSETS: | |
Beginning of year or period | | | 347,040,422 | | | | 380,877,616 | | | | 595,891,824 | | | | 516,918,072 | | |
End of year or period | | $ | 399,693,787 | | | $ | 347,040,422 | | | $ | 652,917,441 | | | $ | 595,891,824 | | |
See Accompanying Notes to Financial Statements
41
STATEMENTS OF CHANGES IN NET ASSETS
| | | VY® Columbia Contrarian
Core Portfolio | | VY® Columbia Small Cap
Value II Portfolio | |
| | | Year
Ended
December 31,
2021 | | Year
Ended
December 31,
2020 | | Year
Ended
December 31,
2021 | | Year
Ended
December 31,
2020 | |
FROM OPERATIONS: | |
Net investment income | | $ | 795,000 | | | $ | 995,168 | | | $ | 297,712 | | | $ | 564,427 | | |
Net realized gain | | | 28,186,665 | | | | 20,183,714 | | | | 24,469,921 | | | | 160,673 | | |
Net change in unrealized appreciation (depreciation) | | | 12,226,799 | | | | 29,571,634 | | | | 26,184,413 | | | | 9,456,557 | | |
Increase in net assets resulting from operations | | | 41,208,464 | | | | 50,750,516 | | | | 50,952,046 | | | | 10,181,657 | | |
FROM DISTRIBUTIONS TO SHAREHOLDERS: | |
Total distributions (excluding return of capital): | |
Class ADV | | | (3,369,226 | ) | | | (743,213 | ) | | | (207,547 | ) | | | (972,185 | ) | |
Class I | | | (15,634,335 | ) | | | (4,445,739 | ) | | | (368,043 | ) | | | (1,435,739 | ) | |
Class R6 | | | — | | | | — | | | | (87,814 | ) | | | (255,902 | ) | |
Class S | | | (2,522,728 | ) | | | (552,006 | ) | | | (587,512 | ) | | | (3,428,166 | ) | |
Class S2 | | | — | | | | — | | | | (9,407 | ) | | | (55,992 | ) | |
Total distributions | | | (21,526,289 | ) | | | (5,740,958 | ) | | | (1,260,323 | ) | | | (6,147,984 | ) | |
FROM CAPITAL SHARE TRANSACTIONS: | |
Net proceeds from sale of shares | | | 31,293,760 | | | | 141,807,257 | | | | 53,308,350 | | | | 12,993,038 | | |
Reinvestment of distributions | | | 21,526,289 | | | | 5,740,958 | | | | 1,260,323 | | | | 6,147,984 | | |
| | | | 52,820,049 | | | | 147,548,215 | | | | 54,568,673 | | | | 19,141,022 | | |
Cost of shares redeemed | | | (35,836,004 | ) | | | (67,475,819 | ) | | | (57,321,932 | ) | | | (33,759,350 | ) | |
Net increase (decrease) in net assets resulting from capital
share transactions | | | 16,984,045 | | | | 80,072,396 | | | | (2,753,259 | ) | | | (14,618,328 | ) | |
Net increase (decrease) in net assets | | | 36,666,220 | | | | 125,081,954 | | | | 46,938,464 | | | | (10,584,655 | ) | |
NET ASSETS: | |
Beginning of year or period | | | 175,864,789 | | | | 50,782,835 | | | | 149,305,539 | | | | 159,890,194 | | |
End of year or period | | $ | 212,531,009 | | | $ | 175,864,789 | | | $ | 196,244,003 | | | $ | 149,305,539 | | |
See Accompanying Notes to Financial Statements
42
STATEMENTS OF CHANGES IN NET ASSETS
| | | VY® Invesco Comstock Portfolio | | VY® Invesco Equity and
Income Portfolio | |
| | | Year
Ended
December 31,
2021 | | Year
Ended
December 31,
2020 | | Year
Ended
December 31,
2021 | | Year
Ended
December 31,
2020 | |
FROM OPERATIONS: | |
Net investment income | | $ | 3,620,971 | | | $ | 4,842,340 | | | $ | 13,574,088 | | | $ | 19,246,602 | | |
Net realized gain (loss) | | | 20,116,759 | | | | (23,108,052 | ) | | | 167,266,053 | | | | 9,602,771 | | |
Net change in unrealized appreciation (depreciation) | | | 42,756,666 | | | | (10,389,112 | ) | | | 40,017,558 | | | | 74,680,078 | | |
Increase (decrease) in net assets resulting from operations | | | 66,494,396 | | | | (28,654,824 | ) | | | 220,857,699 | | | | 103,529,451 | | |
FROM DISTRIBUTIONS TO SHAREHOLDERS: | |
Total distributions (excluding return of capital): | |
Class ADV | | | (403,191 | ) | | | (1,304,497 | ) | | | (1,040,639 | ) | | | (2,330,514 | ) | |
Class I | | | (2,872,788 | ) | | | (6,426,417 | ) | | | (12,825,759 | ) | | | (27,058,975 | ) | |
Class S | | | (1,119,663 | ) | | | (3,064,953 | ) | | | (10,309,711 | ) | | | (24,794,296 | ) | |
Class S2 | | | — | | | | — | | | | (7,171,073 | ) | | | (17,171,131 | ) | |
Total distributions | | | (4,395,642 | ) | | | (10,795,867 | ) | | | (31,347,182 | ) | | | (71,354,916 | ) | |
FROM CAPITAL SHARE TRANSACTIONS: | |
Net proceeds from sale of shares | | | 100,491,712 | | | | 89,543,749 | | | | 20,219,029 | | | | 13,882,671 | | |
Reinvestment of distributions | | | 4,395,642 | | | | 10,795,867 | | | | 31,347,182 | | | | 71,354,916 | | |
| | | | 104,887,354 | | | | 100,339,616 | | | | 51,566,211 | | | | 85,237,587 | | |
Cost of shares redeemed | | | (78,319,236 | ) | | | (162,953,033 | ) | | | (186,570,258 | ) | | | (193,635,444 | ) | |
Net increase (decrease) in net assets resulting from capital
share transactions | | | 26,568,118 | | | | (62,613,417 | ) | | | (135,004,047 | ) | | | (108,397,857 | ) | |
Net increase (decrease) in net assets | | | 88,666,872 | | | | (102,064,108 | ) | | | 54,506,470 | | | | (76,223,322 | ) | |
NET ASSETS: | |
Beginning of year or period | | | 206,322,885 | | | | 308,386,993 | | | | 1,255,721,208 | | | | 1,331,944,530 | | |
End of year or period | | $ | 294,989,757 | | | $ | 206,322,885 | | | $ | 1,310,227,678 | | | $ | 1,255,721,208 | | |
See Accompanying Notes to Financial Statements
43
STATEMENTS OF CHANGES IN NET ASSETS
| | | VY® Invesco Global Portfolio | | VY® JPMorgan Mid Cap
Value Portfolio | |
| | | Year
Ended
December 31,
2021 | | Year
Ended
December 31,
2020 | | Year
Ended
December 31,
2021 | | Year
Ended
December 31,
2020 | |
FROM OPERATIONS: | |
Net investment income (loss) | | $ | (6,327,314 | ) | | $ | (1,449,121 | ) | | $ | 2,317,786 | | | $ | 3,038,963 | | |
Net realized gain | | | 185,764,844 | | | | 84,593,469 | | | | 59,265,122 | | | | 14,330,361 | | |
Net change in unrealized appreciation (depreciation) | | | 64,112,475 | | | | 279,045,095 | | | | 43,813,263 | | | | (24,564,419 | ) | |
Increase (decrease) in net assets resulting from operations | | | 243,550,005 | | | | 362,189,443 | | | | 105,396,171 | | | | (7,195,095 | ) | |
FROM DISTRIBUTIONS TO SHAREHOLDERS: | |
Total distributions (excluding return of capital): | |
Class ADV | | | (6,650,068 | ) | | | (4,996,181 | ) | | | (3,739,188 | ) | | | (6,939,506 | ) | |
Class I | | | (60,106,187 | ) | | | (53,910,828 | ) | | | (5,837,589 | ) | | | (11,193,835 | ) | |
Class S | | | (8,612,323 | ) | | | (7,716,024 | ) | | | (7,866,665 | ) | | | (15,047,063 | ) | |
Class S2 | | | (200,349 | ) | | | (149,769 | ) | | | (53,361 | ) | | | (138,167 | ) | |
Total distributions | | | (75,568,927 | ) | | | (66,772,802 | ) | | | (17,496,803 | ) | | | (33,318,571 | ) | |
FROM CAPITAL SHARE TRANSACTIONS: | |
Net proceeds from sale of shares | | | 32,945,982 | | | | 19,464,266 | | | | 31,952,852 | | | | 16,958,254 | | |
Reinvestment of distributions | | | 75,568,927 | | | | 66,772,802 | | | | 17,496,803 | | | | 33,318,571 | | |
| | | | 108,514,909 | | | | 86,237,068 | | | | 49,449,655 | | | | 50,276,825 | | |
Cost of shares redeemed | | | (213,252,498 | ) | | | (258,026,375 | ) | | | (89,164,000 | ) | | | (77,538,133 | ) | |
Net decrease in net assets resulting from capital share
transactions | | | (104,737,589 | ) | | | (171,789,307 | ) | | | (39,714,345 | ) | | | (27,261,308 | ) | |
Net increase (decrease) in net assets | | | 63,243,489 | | | | 123,627,334 | | | | 48,185,023 | | | | (67,774,974 | ) | |
NET ASSETS: | |
Beginning of year or period | | | 1,657,947,116 | | | | 1,534,319,782 | | | | 374,813,239 | | | | 442,588,213 | | |
End of year or period | | $ | 1,721,190,605 | | | $ | 1,657,947,116 | | | $ | 422,998,262 | | | $ | 374,813,239 | | |
See Accompanying Notes to Financial Statements
44
STATEMENTS OF CHANGES IN NET ASSETS
| | | VY® T. Rowe Price Diversified
Mid Cap Growth Portfolio | | VY® T. Rowe Price Growth
Equity Portfolio | |
| | | Year
Ended
December 31,
2021 | | Year
Ended
December 31,
2020 | | Year
Ended
December 31,
2021 | | Year
Ended
December 31,
2020 | |
FROM OPERATIONS: | |
Net investment (loss) | | $ | (6,489,262 | ) | | $ | (1,252,109 | ) | | $ | (10,889,034 | ) | | $ | (6,118,962 | ) | |
Net realized gain | | | 274,598,406 | | | | 225,120,348 | | | | 275,411,429 | | | | 178,779,501 | | |
Net change in unrealized appreciation (depreciation) | | | (78,857,995 | ) | | | 127,862,938 | | | | 114,830,785 | | | | 378,276,668 | | |
Increase in net assets resulting from operations | | | 189,251,149 | | | | 351,731,177 | | | | 379,353,180 | | | | 550,937,207 | | |
FROM DISTRIBUTIONS TO SHAREHOLDERS: | |
Total distributions (excluding return of capital): | |
Class ADV | | | (12,473,482 | ) | | | (4,946,458 | ) | | | (34,928,755 | ) | | | (13,600,775 | ) | |
Class I | | | (179,469,278 | ) | | | (86,073,841 | ) | | | (134,596,628 | ) | | | (50,553,168 | ) | |
Class R6 | | | (21,456,701 | ) | | | (2,931,489 | ) | | | — | | | | — | | |
Class S | | | (7,427,852 | ) | | | (3,459,838 | ) | | | (5,950,016 | ) | | | (2,861,917 | ) | |
Class S2 | | | (1,217,580 | ) | | | (490,552 | ) | | | (500,457 | ) | | | (415,290 | ) | |
Total distributions | | | (222,044,893 | ) | | | (97,902,178 | ) | | | (175,975,856 | ) | | | (67,431,150 | ) | |
FROM CAPITAL SHARE TRANSACTIONS: | |
Net proceeds from sale of shares | | | 67,311,211 | | | | 203,466,649 | | | | 210,975,263 | | | | 174,272,043 | | |
Reinvestment of distributions | | | 222,044,893 | | | | 97,902,178 | | | | 175,975,856 | | | | 67,431,150 | | |
| | | | 289,356,104 | | | | 301,368,827 | | | | 386,951,119 | | | | 241,703,193 | | |
Cost of shares redeemed | | | (205,325,704 | ) | | | (304,349,380 | ) | | | (323,591,279 | ) | | | (443,066,547 | ) | |
Net increase (decrease) in net assets resulting from
capital share transactions | | | 84,030,400 | | | | (2,980,553 | ) | | | 63,359,840 | | | | (201,363,354 | ) | |
Net increase in net assets | | | 51,236,656 | | | | 250,848,446 | | | | 266,737,164 | | | | 282,142,703 | | |
NET ASSETS: | |
Beginning of year or period | | | 1,410,035,130 | | | | 1,159,186,684 | | | | 1,949,491,679 | | | | 1,667,348,976 | | |
End of year or period | | $ | 1,461,271,786 | | | $ | 1,410,035,130 | | | $ | 2,216,228,843 | | | $ | 1,949,491,679 | | |
See Accompanying Notes to Financial Statements
45
Selected data for a share of beneficial interest outstanding throughout each year or period.
| | | | | Income (loss)
from investment
operations | | | | Less distributions | |
| | | Net asset value, beginning of year or period | | Net investment income (loss) | | Net realized and unrealized gain (loss) | | Total from investment operations | | From net investment income | | From net realized gains | | From return of capital | |
Year or period ended | | ($) | | ($) | | ($) | | ($) | | ($) | | ($) | | ($) | |
Voya Global Bond Portfolio | | | |
Class ADV | | | |
| | 12-31-21 | | | | 11.28 | | | | 0.27 | • | | | (0.85 | ) | | | (0.58 | ) | | | 0.49 | | | | — | | | | 0.08 | | |
| | 12-31-20 | | | | 10.64 | | | | 0.28 | | | | 0.62 | | | | 0.90 | | | | 0.26 | | | | — | | | | — | | |
| | 12-31-19 | | | | 10.33 | | | | 0.27 | • | | | 0.48 | | | | 0.75 | | | | 0.44 | | | | — | | | | — | | |
| | 12-31-18 | | | | 10.94 | | | | 0.29 | • | | | (0.55 | ) | | | (0.26 | ) | | | 0.35 | | | | — | | | | — | | |
| | 12-31-17 | | | | 10.24 | | | | 0.26 | • | | | 0.66 | | | | 0.92 | | | | 0.22 | | | | — | | | | — | | |
Class I | | | |
| | 12-31-21 | | | | 11.49 | | | | 0.33 | • | | | (0.87 | ) | | | (0.54 | ) | | | 0.55 | | | | — | | | | 0.08 | | |
| | 12-31-20 | | | | 10.83 | | | | 0.33 | • | | | 0.64 | | | | 0.97 | | | | 0.31 | | | | — | | | | — | | |
| | 12-31-19 | | | | 10.51 | | | | 0.33 | • | | | 0.49 | | | | 0.82 | | | | 0.50 | | | | — | | | | — | | |
| | 12-31-18 | | | | 11.14 | | | | 0.35 | • | | | (0.57 | ) | | | (0.22 | ) | | | 0.41 | | | | — | | | | — | | |
| | 12-31-17 | | | | 10.42 | | | | 0.32 | • | | | 0.68 | | | | 1.00 | | | | 0.28 | | | | — | | | | — | | |
Class S | | | |
| | 12-31-21 | | | | 11.47 | | | | 0.30 | • | | | (0.87 | ) | | | (0.57 | ) | | | 0.52 | | | | — | | | | 0.08 | | |
| | 12-31-20 | | | | 10.82 | | | | 0.31 | | | | 0.63 | | | | 0.94 | | | | 0.29 | | | | — | | | | — | | |
| | 12-31-19 | | | | 10.50 | | | | 0.31 | • | | | 0.48 | | | | 0.79 | | | | 0.47 | | | | — | | | | — | | |
| | 12-31-18 | | | | 11.12 | | | | 0.32 | • | | | (0.56 | ) | | | (0.24 | ) | | | 0.38 | | | | — | | | | — | | |
| | 12-31-17 | | | | 10.41 | | | | 0.30 | • | | | 0.66 | | | | 0.96 | | | | 0.25 | | | | — | | | | — | | |
Voya International High Dividend Low Volatility Portfolio | | | |
Class ADV | | | |
| | 12-31-21 | | | | 9.43 | | | | 0.28 | • | | | 0.80 | | | | 1.08 | | | | 0.20 | | | | — | | | | — | | |
| | 12-31-20 | | | | 11.36 | | | | 0.19 | | | | (0.49 | ) | | | (0.30 | ) | | | 0.32 | | | | 1.31 | | | | — | | |
| | 12-31-19 | | | | 10.88 | | | | 0.27 | • | | | 1.38 | | | | 1.65 | | | | 0.19 | | | | 0.98 | | | | — | | |
| | 12-31-18 | | | | 13.06 | | | | 0.16 | • | | | (2.13 | ) | | | (1.97 | ) | | | 0.21 | | | | — | | | | — | | |
| | 12-31-17 | | | | 10.90 | | | | 0.19 | | | | 2.16 | | | | 2.35 | | | | 0.19 | | | | — | | | | — | | |
Class I | | | |
| | 12-31-21 | | | | 9.54 | | | | 0.33 | • | | | 0.82 | | | | 1.15 | | | | 0.25 | | | | — | | | | — | | |
| | 12-31-20 | | | | 11.49 | | | | 0.25 | | | | (0.51 | ) | | | (0.26 | ) | | | 0.38 | | | | 1.31 | | | | — | | |
| | 12-31-19 | | | | 11.00 | | | | 0.33 | • | | | 1.40 | | | | 1.73 | | | | 0.26 | | | | 0.98 | | | | — | | |
| | 12-31-18 | | | | 13.21 | | | | 0.23 | • | | | (2.17 | ) | | | (1.94 | ) | | | 0.27 | | | | — | | | | — | | |
| | 12-31-17 | | | | 11.01 | | | | 0.25 | • | | | 2.20 | | | | 2.45 | | | | 0.25 | | | | — | | | | — | | |
Class S | | | |
| | 12-31-21 | | | | 9.47 | | | | 0.30 | • | | | 0.82 | | | | 1.12 | | | | 0.23 | | | | — | | | | — | | |
| | 12-31-20 | | | | 11.41 | | | | 0.22 | | | | (0.50 | ) | | | (0.28 | ) | | | 0.35 | | | | 1.31 | | | | — | | |
| | 12-31-19 | | | | 10.93 | | | | 0.30 | • | | | 1.38 | | | | 1.68 | | | | 0.22 | | | | 0.98 | | | | — | | |
| | 12-31-18 | | | | 13.12 | | | | 0.19 | • | | | (2.15 | ) | | | (1.96 | ) | | | 0.23 | | | | — | | | | — | | |
| | 12-31-17 | | | | 10.94 | | | | 0.22 | • | | | 2.18 | | | | 2.40 | | | | 0.22 | | | | — | | | | — | | |
Class S2 | | | |
| | 12-31-21 | | | | 9.56 | | | | 0.29 | • | | | 0.82 | | | | 1.11 | | | | 0.20 | | | | — | | | | — | | |
| | 12-31-20 | | | | 11.52 | | | | 0.18 | • | | | (0.48 | ) | | | (0.30 | ) | | | 0.35 | | | | 1.31 | | | | — | | |
| | 12-31-19 | | | | 10.99 | | | | 0.27 | • | | | 1.41 | | | | 1.68 | | | | 0.17 | | | | 0.98 | | | | — | | |
| | 12-31-18 | | | | 13.05 | | | | 0.18 | • | | | (2.16 | ) | | | (1.98 | ) | | | 0.08 | | | | — | | | | — | | |
| | 12-31-17 | | | | 10.86 | | | | 0.19 | • | | | 2.18 | | | | 2.37 | | | | 0.18 | | | | — | | | | — | | |
| VY® American Century Small-Mid Cap Value Portfolio | | | |
Class ADV | | | |
| | 12-31-21 | | | | 11.27 | | | | 0.09 | • | | | 2.94 | | | | 3.03 | | | | 0.09 | | | | — | | | | — | | |
| | 12-31-20 | | | | 11.12 | | | | 0.11 | | | | 0.22 | | | | 0.33 | | | | 0.12 | | | | 0.06 | | | | — | | |
| | 12-31-19 | | | | 9.64 | | | | 0.11 | | | | 2.66 | | | | 2.77 | | | | 0.12 | | | | 1.17 | | | | — | | |
| | 12-31-18 | | | | 12.66 | | | | 0.09 | | | | (1.67 | ) | | | (1.58 | ) | | | 0.10 | | | | 1.34 | | | | — | | |
| | 12-31-17 | | | | 12.03 | | | | 0.11 | | | | 1.16 | | | | 1.27 | | | | 0.12 | | | | 0.52 | | | | — | | |
| | | | | Ratios to average net assets | | Supplemental
data | |
| | | Total distributions | | Payment by affiliate | | Net asset value, end of year or period | | Total Return(1) | | Expenses before reductions/additions(2)(3)(4) | | Expenses net of fee waivers and/or recoupments if any(2)(3)(4) | | Expenses net of all reductions/additions(2)(3)(4) | | Net investment income (loss)(2)(3) | | Net assets, end of year or period | | Portfolio turnover rate | |
Year or period ended | | ($) | | ($) | | ($) | | (%) | | (%) | | (%) | | (%) | | (%) | | ($000's) | | (%) | |
Voya Global Bond Portfolio | |
Class ADV | |
| | 12-31-21 | | | | 0.57 | | | | — | | | | 10.13 | | | | (5.21 | ) | | | 1.30 | | | | 1.17 | | | | 1.17 | | | | 2.54 | | | | 19,156 | | | | 144 | | |
| | 12-31-20 | | | | 0.26 | | | | — | | | | 11.28 | | | | 8.58 | | | | 1.28 | | | | 1.17 | | | | 1.17 | | | | 2.50 | | | | 21,097 | | | | 150 | | |
| | 12-31-19 | | | | 0.44 | | | | — | | | | 10.64 | | | | 7.36 | | | | 1.16 | | | | 1.16 | | | | 1.16 | | | | 2.58 | | | | 21,661 | | | | 228 | | |
| | 12-31-18 | | | | 0.35 | | | | — | | | | 10.33 | | | | (2.40 | ) | | | 1.17 | | | | 1.15 | | | | 1.15 | | | | 2.71 | | | | 22,161 | | | | 119 | | |
| | 12-31-17 | | | | 0.22 | | | | — | | | | 10.94 | | | | 9.05 | | | | 1.17 | | | | 1.10 | | | | 1.10 | | | | 2.48 | | | | 24,922 | | | | 127 | | |
Class I | |
| | 12-31-21 | | | | 0.63 | | | | — | | | | 10.32 | | | | (4.78 | ) | | | 0.80 | | | | 0.67 | | | | 0.67 | | | | 3.04 | | | | 110,162 | | | | 144 | | |
| | 12-31-20 | | | | 0.31 | | | | — | | | | 11.49 | | | | 9.20 | | | | 0.78 | | | | 0.67 | | | | 0.67 | | | | 3.00 | | | | 125,244 | | | | 150 | | |
| | 12-31-19 | | | | 0.50 | | | | — | | | | 10.83 | | | | 7.90 | | | | 0.66 | | | | 0.66 | | | | 0.66 | | | | 3.08 | | | | 146,354 | | | | 228 | | |
| | 12-31-18 | | | | 0.41 | | | | — | | | | 10.51 | | | | (2.01 | ) | | | 0.67 | | | | 0.65 | | | | 0.65 | | | | 3.21 | | | | 146,473 | | | | 119 | | |
| | 12-31-17 | | | | 0.28 | | | | — | | | | 11.14 | | | | 9.67 | | | | 0.67 | | | | 0.60 | | | | 0.60 | | | | 2.98 | | | | 161,715 | | | | 127 | | |
Class S | |
| | 12-31-21 | | | | 0.60 | | | | — | | | | 10.30 | | | | (5.03 | ) | | | 1.05 | | | | 0.92 | | | | 0.92 | | | | 2.79 | | | | 29,562 | | | | 144 | | |
| | 12-31-20 | | | | 0.29 | | | | — | | | | 11.47 | | | | 8.85 | | | | 1.03 | | | | 0.92 | | | | 0.92 | | | | 2.75 | | | | 33,183 | | | | 150 | | |
| | 12-31-19 | | | | 0.47 | | | | — | | | | 10.82 | | | | 7.64 | | | | 0.91 | | | | 0.91 | | | | 0.91 | | | | 2.83 | | | | 33,323 | | | | 228 | | |
| | 12-31-18 | | | | 0.38 | | | | — | | | | 10.50 | | | | (2.17 | ) | | | 0.92 | | | | 0.90 | | | | 0.90 | | | | 2.97 | | | | 35,849 | | | | 119 | | |
| | 12-31-17 | | | | 0.25 | | | | — | | | | 11.12 | | | | 9.31 | | | | 0.92 | | | | 0.85 | | | | 0.85 | | | | 2.73 | | | | 41,785 | | | | 127 | | |
Voya International High Dividend Low Volatility Portfolio | |
Class ADV | |
| | 12-31-21 | | | | 0.20 | | | | — | | | | 10.31 | | | | 11.50 | | | | 1.23 | | | | 1.23 | | | | 1.23 | | | | 2.75 | | | | 27,021 | | | | 73 | | |
| | 12-31-20 | | | | 1.63 | | | | — | | | | 9.43 | | | | (1.17 | ) | | | 1.24 | | | | 1.24 | | | | 1.24 | | | | 1.86 | | | | 26,702 | | | | 74 | | |
| | 12-31-19 | | | | 1.17 | | | | — | | | | 11.36 | | | | 16.13 | | | | 1.30 | | | | 1.26 | | | | 1.25 | | | | 2.36 | | | | 29,900 | | | | 143 | | |
| | 12-31-18 | | | | 0.21 | | | | — | | | | 10.88 | | | | (15.32 | ) | | | 1.47 | | | | 1.40 | | | | 1.40 | | | | 1.26 | | | | 30,149 | | | | 16 | | |
| | 12-31-17 | | | | 0.19 | | | | — | | | | 13.06 | | | | 21.66 | (a) | | | 1.46 | | | | 1.40 | | | | 1.40 | | | | 1.50 | | | | 37,898 | | | | 14 | | |
Class I | |
| | 12-31-21 | | | | 0.25 | | | | — | | | | 10.44 | | | | 12.08 | | | | 0.73 | | | | 0.73 | | | | 0.73 | | | | 3.25 | | | | 125,719 | | | | 73 | | |
| | 12-31-20 | | | | 1.69 | | | | — | | | | 9.54 | | | | (0.71 | ) | | | 0.74 | | | | 0.74 | | | | 0.74 | | | | 2.37 | | | | 122,082 | | | | 74 | | |
| | 12-31-19 | | | | 1.24 | | | | — | | | | 11.49 | | | | 16.75 | | | | 0.80 | | | | 0.76 | | | | 0.75 | | | | 2.86 | | | | 139,862 | | | | 143 | | |
| | 12-31-18 | | | | 0.27 | | | | — | | | | 11.00 | | | | (14.95 | ) | | | 0.97 | | | | 0.90 | | | | 0.90 | | | | 1.77 | | | | 135,229 | | | | 16 | | |
| | 12-31-17 | | | | 0.25 | | | | — | | | | 13.21 | | | | 22.35 | (a) | | | 0.96 | | | | 0.90 | | | | 0.90 | | | | 2.00 | | | | 183,905 | | | | 14 | | |
Class S | |
| | 12-31-21 | | | | 0.23 | | | | — | | | | 10.36 | | | | 11.79 | | | | 0.98 | | | | 0.98 | | | | 0.98 | | | | 3.00 | | | | 258,075 | | | | 73 | | |
| | 12-31-20 | | | | 1.66 | | | | — | | | | 9.47 | | | | (0.94 | ) | | | 0.99 | | | | 0.99 | | | | 0.99 | | | | 2.12 | | | | 268,402 | | | | 74 | | |
| | 12-31-19 | | | | 1.20 | | | | — | | | | 11.41 | | | | 16.40 | | | | 1.05 | | | | 1.01 | | | | 1.00 | | | | 2.61 | | | | 308,132 | | | | 143 | | |
| | 12-31-18 | | | | 0.23 | | | | — | | | | 10.93 | | | | (15.15 | ) | | | 1.22 | | | | 1.15 | | | | 1.15 | | | | 1.52 | | | | 309,059 | | | | 16 | | |
| | 12-31-17 | | | | 0.22 | | | | — | | | | 13.12 | | | | 22.00 | (a) | | | 1.21 | | | | 1.15 | | | | 1.15 | | | | 1.76 | | | | 404,801 | | | | 14 | | |
Class S2 | |
| | 12-31-21 | | | | 0.20 | | | | — | | | | 10.47 | | | | 11.67 | | | | 1.13 | | | | 1.13 | | | | 1.13 | | | | 2.85 | | | | 390 | | | | 73 | | |
| | 12-31-20 | | | | 1.66 | | | | — | | | | 9.56 | | | | (1.15 | ) | | | 1.14 | | | | 1.14 | | | | 1.14 | | | | 1.92 | | | | 334 | | | | 74 | | |
| | 12-31-19 | | | | 1.15 | | | | — | | | | 11.52 | | | | 16.28 | | | | 1.20 | | | | 1.16 | | | | 1.15 | | | | 2.39 | | | | 389 | | | | 143 | | |
| | 12-31-18 | | | | 0.08 | | | | — | | | | 10.99 | | | | (15.26 | ) | | | 1.37 | | | | 1.30 | | | | 1.30 | | | | 1.41 | | | | 397 | | | | 16 | | |
| | 12-31-17 | | | | 0.18 | | | | — | | | | 13.05 | | | | 21.90 | (a) | | | 1.36 | | | | 1.30 | | | | 1.30 | | | | 1.57 | | | | 999 | | | | 14 | | |
| VY® American Century Small-Mid Cap Value Portfolio | |
Class ADV | |
| | 12-31-21 | | | | 0.09 | | | | — | | | | 14.21 | | | | 26.94 | | | | 1.80 | | | | 1.35 | | | | 1.35 | | | | 0.67 | | | | 110,892 | | | | 55 | | |
| | 12-31-20 | | | | 0.18 | | | | — | | | | 11.27 | | | | 3.35 | | | | 1.86 | | | | 1.35 | | | | 1.35 | | | | 0.92 | | | | 96,609 | | | | 70 | | |
| | 12-31-19 | | | | 1.29 | | | | — | | | | 11.12 | | | | 30.17 | | | | 1.66 | | | | 1.34 | | | | 1.34 | | | | 0.99 | | | | 108,460 | | | | 52 | | |
| | 12-31-18 | | | | 1.44 | | | | — | | | | 9.64 | | | | (14.49 | ) | | | 1.65 | | | | 1.36 | | | | 1.36 | | | | 0.77 | | | | 91,283 | | | | 76 | | |
| | 12-31-17 | | | | 0.64 | | | | — | | | | 12.66 | | | | 10.90 | | | | 1.65 | | | | 1.36 | | | | 1.36 | | | | 0.95 | | | | 115,235 | | | | 57 | | |
See Accompanying Notes to Financial Statements
46
FINANCIAL HIGHLIGHTS (CONTINUED)
Selected data for a share of beneficial interest outstanding throughout each year or period.
| | | | | Income (loss)
from investment
operations | | | | Less distributions | |
| | | Net asset value, beginning of year or period | | Net investment income (loss) | | Net realized and unrealized gain (loss) | | Total from investment operations | | From net investment income | | From net realized gains | | From return of capital | |
Year or period ended | | ($) | | ($) | | ($) | | ($) | | ($) | | ($) | | ($) | |
| VY® American Century Small-Mid Cap Value Portfolio (continued) | | | |
Class I | | | |
| | 12-31-21 | | | | 12.16 | | | | 0.17 | • | | | 3.17 | | | | 3.34 | | | | 0.14 | | | | — | | | | — | | |
| | 12-31-20 | | | | 11.99 | | | | 0.16 | | | | 0.25 | | | | 0.41 | | | | 0.18 | | | | 0.06 | | | | — | | |
| | 12-31-19 | | | | 10.30 | | | | 0.17 | | | | 2.87 | | | | 3.04 | | | | 0.18 | | | | 1.17 | | | | — | | |
| | 12-31-18 | | | | 13.44 | | | | 0.17 | • | | | (1.81 | ) | | | (1.64 | ) | | | 0.16 | | | | 1.34 | | | | — | | |
| | 12-31-17 | | | | 12.72 | | | | 0.19 | • | | | 1.22 | | | | 1.41 | | | | 0.17 | | | | 0.52 | | | | — | | |
Class S | | | |
| | 12-31-21 | | | | 11.95 | | | | 0.13 | • | | | 3.13 | | | | 3.26 | | | | 0.12 | | | | — | | | | — | | |
| | 12-31-20 | | | | 11.79 | | | | 0.13 | | | | 0.24 | | | | 0.37 | | | | 0.15 | | | | 0.06 | | | | — | | |
| | 12-31-19 | | | | 10.14 | | | | 0.15 | | | | 2.81 | | | | 2.96 | | | | 0.14 | | | | 1.17 | | | | — | | |
| | 12-31-18 | | | | 13.25 | | | | 0.13 | • | | | (1.77 | ) | | | (1.64 | ) | | | 0.13 | | | | 1.34 | | | | — | | |
| | 12-31-17 | | | | 12.56 | | | | 0.16 | | | | 1.19 | | | | 1.35 | | | | 0.14 | | | | 0.52 | | | | — | | |
Class S2 | | | |
| | 12-31-21 | | | | 11.26 | | | | 0.10 | • | | | 2.95 | | | | 3.05 | | | | 0.09 | | | | — | | | | — | | |
| | 12-31-20 | | | | 11.12 | | | | 0.10 | • | | | 0.23 | | | | 0.33 | | | | 0.13 | | | | 0.06 | | | | — | | |
| | 12-31-19 | | | | 9.62 | | | | 0.12 | • | | | 2.67 | | | | 2.79 | | | | 0.12 | | | | 1.17 | | | | — | | |
| | 12-31-18 | | | | 12.64 | | | | 0.10 | • | | | (1.67 | ) | | | (1.57 | ) | | | 0.11 | | | | 1.34 | | | | — | | |
| | 12-31-17 | | | | 12.01 | | | | 0.12 | • | | | 1.15 | | | | 1.27 | | | | 0.12 | | | | 0.52 | | | | — | | |
| VY® Baron Growth Portfolio | | | |
Class ADV | | | |
| | 12-31-21 | | | | 25.98 | | | | (0.22 | )• | | | 5.28 | | | | 5.06 | | | | — | | | | 2.44 | | | | — | | |
| | 12-31-20 | | | | 19.55 | | | | (0.17 | ) | | | 6.60 | | | | 6.43 | | | | — | | | | — | | | | — | | |
| | 12-31-19 | | | | 24.63 | | | | (0.07 | ) | | | 9.03 | | | | 8.96 | | | | — | | | | 13.89 | | | | 0.15 | | |
| | 12-31-18 | | | | 27.88 | | | | (0.09 | ) | | | 0.00 | * | | | (0.09 | ) | | | — | | | | 3.16 | | | | — | | |
| | 12-31-17 | | | | 24.82 | | | | (0.10 | )• | | | 6.72 | | | | 6.62 | | | | 0.16 | | | | 3.40 | | | | — | | |
Class I | | | |
| | 12-31-21 | | | | 31.49 | | | | (0.11 | )• | | | 6.46 | | | | 6.35 | | | | — | | | | 2.44 | | | | — | | |
| | 12-31-20 | | | | 23.58 | | | | (0.08 | ) | | | 7.99 | | | | 7.91 | | | | — | | | | — | | | | — | | |
| | 12-31-19 | | | | 27.41 | | | | 0.01 | | | | 10.20 | | | | 10.21 | | | | — | | | | 13.89 | | | | 0.15 | | |
| | 12-31-18 | | | | 30.58 | | | | 0.05 | | | | (0.06 | ) | | | (0.01 | ) | | | — | | | | 3.16 | | | | — | | |
| | 12-31-17 | | | | 26.92 | | | | 0.03 | • | | | 7.34 | | | | 7.37 | | | | 0.31 | | | | 3.40 | | | | — | | |
Class R6 | | | |
| | 12-31-21 | | | | 31.52 | | | | (0.10 | )• | | | 6.46 | | | | 6.36 | | | | — | | | | 2.44 | | | | — | | |
| | 12-31-20 | | | | 23.60 | | | | (0.07 | ) | | | 7.99 | | | | 7.92 | | | | — | | | | — | | | | — | | |
| | 12-31-19 | | | | 27.43 | | | | 0.04 | | | | 10.17 | | | | 10.21 | | | | — | | | | 13.89 | | | | 0.15 | | |
| | 12-31-18 | | | | 30.59 | | | | 0.06 | | | | (0.06 | ) | | | 0.00 | * | | | — | | | | 3.16 | | | | — | | |
| | 12-31-17 | | | | 26.93 | | | | 0.13 | • | | | 7.24 | | | | 7.37 | | | | 0.31 | | | | 3.40 | | | | — | | |
Class S | | | |
| | 12-31-21 | | | | 28.85 | | | | (0.17 | )• | | | 5.89 | | | | 5.72 | | | | — | | | | 2.44 | | | | — | | |
| | 12-31-20 | | | | 21.65 | | | | (0.13 | ) | | | 7.33 | | | | 7.20 | | | | — | | | | — | | | | — | | |
| | 12-31-19 | | | | 26.10 | | | | (0.03 | )• | | | 9.62 | | | | 9.59 | | | | — | | | | 13.89 | | | | 0.15 | | |
| | 12-31-18 | | | | 29.31 | | | | (0.02 | ) | | | (0.03 | ) | | | (0.05 | ) | | | — | | | | 3.16 | | | | — | | |
| | 12-31-17 | | | | 25.93 | | | | (0.04 | )• | | | 7.05 | | | | 7.01 | | | | 0.23 | | | | 3.40 | | | | — | | |
Class S2 | | | |
| | 12-31-21 | | | | 26.48 | | | | (0.21 | )• | | | 5.40 | | | | 5.19 | | | | — | | | | 2.44 | | | | — | | |
| | 12-31-20 | | | | 19.91 | | | | (0.15 | ) | | | 6.72 | | | | 6.57 | | | | — | | | | — | | | | — | | |
| | 12-31-19 | | | | 24.87 | | | | (0.45 | )• | | | 9.53 | | | | 9.08 | | | | — | | | | 13.89 | | | | 0.15 | | |
| | 12-31-18 | | | | 28.10 | | | | (0.08 | ) | | | 0.01 | | | | (0.07 | ) | | | — | | | | 3.16 | | | | — | | |
| | 12-31-17 | | | | 24.92 | | | | (0.09 | )• | | | 6.78 | | | | 6.69 | | | | 0.11 | | | | 3.40 | | | | — | | |
| | | | | Ratios to average net assets | | Supplemental
data | |
| | | Total distributions | | Payment by affiliate | | Net asset value, end of year or period | | Total Return(1) | | Expenses before reductions/additions(2)(3)(4) | | Expenses net of fee waivers and/or recoupments if any(2)(3)(4) | | Expenses net of all reductions/additions(2)(3)(4) | | Net investment income (loss)(2)(3) | | Net assets, end of year or period | | Portfolio turnover rate | |
Year or period ended | | ($) | | ($) | | ($) | | (%) | | (%) | | (%) | | (%) | | (%) | | ($000's) | | (%) | |
| VY® American Century Small-Mid Cap Value Portfolio (continued) | |
Class I | |
| | 12-31-21 | | | | 0.14 | | | | — | | | | 15.36 | | | | 27.57 | | | | 1.30 | | | | 0.85 | | | | 0.85 | | | | 1.17 | | | | 186,365 | | | | 55 | | |
| | 12-31-20 | | | | 0.24 | | | | — | | | | 12.16 | | | | 3.84 | | | | 1.36 | | | | 0.85 | | | | 0.85 | | | | 1.42 | | | | 161,201 | | | | 70 | | |
| | 12-31-19 | | | | 1.35 | | | | — | | | | 11.99 | | | | 30.96 | | | | 1.16 | | | | 0.84 | | | | 0.84 | | | | 1.49 | | | | 175,917 | | | | 52 | | |
| | 12-31-18 | | | | 1.50 | | | | — | | | | 10.30 | | | | (14.15 | ) | | | 1.15 | | | | 0.86 | | | | 0.86 | | | | 1.30 | | | | 142,379 | | | | 76 | | |
| | 12-31-17 | | | | 0.69 | | | | — | | | | 13.44 | | | | 11.44 | | | | 1.15 | | | | 0.86 | | | | 0.86 | | | | 1.44 | | | | 151,054 | | | | 57 | | |
Class S | |
| | 12-31-21 | | | | 0.12 | | | | — | | | | 15.09 | | | | 27.30 | | | | 1.55 | | | | 1.10 | | | | 1.10 | | | | 0.92 | | | | 100,022 | | | | 55 | | |
| | 12-31-20 | | | | 0.21 | | | | — | | | | 11.95 | | | | 3.52 | | | | 1.61 | | | | 1.10 | | | | 1.10 | | | | 1.17 | | | | 85,902 | | | | 70 | | |
| | 12-31-19 | | | | 1.31 | | | | — | | | | 11.79 | | | | 30.67 | | | | 1.41 | | | | 1.09 | | | | 1.09 | | | | 1.24 | | | | 93,230 | | | | 52 | | |
| | 12-31-18 | | | | 1.47 | | | | — | | | | 10.14 | | | | (14.34 | ) | | | 1.40 | | | | 1.11 | | | | 1.11 | | | | 1.02 | | | | 79,986 | | | | 76 | | |
| | 12-31-17 | | | | 0.66 | | | | — | | | | 13.25 | | | | 11.12 | | | | 1.40 | | | | 1.11 | | | | 1.11 | | | | 1.20 | | | | 106,501 | | | | 57 | | |
Class S2 | |
| | 12-31-21 | | | | 0.09 | | | | — | | | | 14.22 | | | | 27.11 | | | | 1.70 | | | | 1.25 | | | | 1.25 | | | | 0.74 | | | | 2,415 | | | | 55 | | |
| | 12-31-20 | | | | 0.19 | | | | — | | | | 11.26 | | | | 3.40 | | | | 1.76 | | | | 1.25 | | | | 1.25 | | | | 1.02 | | | | 3,328 | | | | 70 | | |
| | 12-31-19 | | | | 1.29 | | | | — | | | | 11.12 | | | | 30.42 | | | | 1.56 | | | | 1.24 | | | | 1.24 | | | | 1.07 | | | | 3,271 | | | | 52 | | |
| | 12-31-18 | | | | 1.45 | | | | — | | | | 9.62 | | | | (14.48 | ) | | | 1.55 | | | | 1.26 | | | | 1.26 | | | | 0.84 | | | | 2,891 | | | | 76 | | |
| | 12-31-17 | | | | 0.64 | | | | — | | | | 12.64 | | | | 10.96 | | | | 1.55 | | | | 1.26 | | | | 1.26 | | | | 1.01 | | | | 4,627 | | | | 57 | | |
| VY® Baron Growth Portfolio | |
Class ADV | |
| | 12-31-21 | | | | 2.44 | | | | — | | | | 28.60 | | | | 20.14 | | | | 1.59 | | | | 1.49 | | | | 1.49 | | | | (0.82 | ) | | | 140,345 | | | | 1 | | |
| | 12-31-20 | | | | — | | | | — | | | | 25.98 | | | | 32.89 | | | | 1.64 | | | | 1.49 | | | | 1.49 | | | | (0.80 | ) | | | 122,298 | | | | 1 | | |
| | 12-31-19 | | | | 14.04 | | | | — | | | | 19.55 | | | | 38.24 | | | | 1.49 | | | | 1.49 | | | | 1.49 | | | | (0.40 | ) | | | 105,271 | | | | 23 | | |
| | 12-31-18 | | | | 3.16 | | | | — | | | | 24.63 | | | | (2.15 | ) | | | 1.49 | | | | 1.49 | | | | 1.49 | | | | (0.32 | ) | | | 82,126 | | | | 4 | | |
| | 12-31-17 | | | | 3.56 | | | | — | | | | 27.88 | | | | 27.86 | | | | 1.49 | | | | 1.49 | | | | 1.49 | | | | (0.38 | ) | | | 88,499 | | | | 3 | | |
Class I | |
| | 12-31-21 | | | | 2.44 | | | | — | | | | 35.40 | | | | 20.73 | | | | 1.09 | | | | 0.99 | | | | 0.99 | | | | (0.32 | ) | | | 177,254 | | | | 1 | | |
| | 12-31-20 | | | | — | | | | — | | | | 31.49 | | | | 33.55 | | | | 1.14 | | | | 0.99 | | | | 0.99 | | | | (0.30 | ) | | | 164,347 | | | | 1 | | |
| | 12-31-19 | | | | 14.04 | | | | — | | | | 23.58 | | | | 38.97 | | | | 0.99 | | | | 0.99 | | | | 0.99 | | | | 0.04 | | | | 147,370 | | | | 23 | | |
| | 12-31-18 | | | | 3.16 | | | | — | | | | 27.41 | | | | (1.68 | ) | | | 0.99 | | | | 0.99 | | | | 0.99 | | | | 0.17 | | | | 118,743 | | | | 4 | | |
| | 12-31-17 | | | | 3.71 | | | | — | | | | 30.58 | | | | 28.52 | | | | 0.99 | | | | 0.99 | | | | 0.99 | | | | 0.11 | | | | 145,389 | | | | 3 | | |
Class R6 | |
| | 12-31-21 | | | | 2.44 | | | | — | | | | 35.44 | | | | 20.74 | | | | 0.97 | | | | 0.97 | | | | 0.97 | | | | (0.30 | ) | | | 50,410 | | | | 1 | | |
| | 12-31-20 | | | | — | | | | — | | | | 31.52 | | | | 33.56 | | | | 0.99 | | | | 0.99 | | | | 0.99 | | | | (0.30 | ) | | | 44,926 | | | | 1 | | |
| | 12-31-19 | | | | 14.04 | | | | — | | | | 23.60 | | | | 38.94 | | | | 0.99 | | | | 0.99 | | | | 0.99 | | | | 0.20 | | | | 33,764 | | | | 23 | | |
| | 12-31-18 | | | | 3.16 | | | | — | | | | 27.43 | | | | (1.64 | ) | | | 0.99 | | | | 0.99 | | | | 0.99 | | | | 0.23 | | | | 15,007 | | | | 4 | | |
| | 12-31-17 | | | | 3.71 | | | | — | | | | 30.59 | | | | 28.51 | | | | 0.99 | | | | 0.99 | | | | 0.99 | | | | 0.43 | | | | 11,442 | | | | 3 | | |
Class S | |
| | 12-31-21 | | | | 2.44 | | | | — | | | | 32.13 | | | | 20.43 | | | | 1.34 | | | | 1.24 | | | | 1.24 | | | | (0.57 | ) | | | 282,227 | | | | 1 | | |
| | 12-31-20 | | | | — | | | | — | | | | 28.85 | | | | 33.26 | | | | 1.39 | | | | 1.24 | | | | 1.24 | | | | (0.55 | ) | | | 261,358 | | | | 1 | | |
| | 12-31-19 | | | | 14.04 | | | | — | | | | 21.65 | | | | 38.52 | | | | 1.24 | | | | 1.24 | | | | 1.24 | | | | (0.10 | ) | | | 228,141 | | | | 23 | | |
| | 12-31-18 | | | | 3.16 | | | | — | | | | 26.10 | | | | (1.89 | ) | | | 1.24 | | | | 1.24 | | | | 1.24 | | | | (0.08 | ) | | | 451,687 | | | | 4 | | |
| | 12-31-17 | | | | 3.63 | | | | — | | | | 29.31 | | | | 28.20 | | | | 1.24 | | | | 1.24 | | | | 1.24 | | | | (0.13 | ) | | | 512,397 | | | | 3 | | |
Class S2 | |
| | 12-31-21 | | | | 2.44 | | | | — | | | | 29.23 | | | | 20.25 | | | | 1.49 | | | | 1.39 | | | | 1.39 | | | | (0.73 | ) | | | 2,681 | | | | 1 | | |
| | 12-31-20 | | | | — | | | | — | | | | 26.48 | | | | 33.00 | | | | 1.54 | | | | 1.39 | | | | 1.39 | | | | (0.69 | ) | | | 2,963 | | | | 1 | | |
| | 12-31-19 | | | | 14.04 | | | | — | | | | 19.91 | | | | 38.37 | | | | 1.39 | | | | 1.39 | | | | 1.39 | | | | (1.58 | ) | | | 2,373 | | | | 23 | | |
| | 12-31-18 | | | | 3.16 | | | | — | | | | 24.87 | | | | (2.05 | ) | | | 1.39 | | | | 1.39 | | | | 1.39 | | | | (0.25 | ) | | | 1,625 | | | | 4 | | |
| | 12-31-17 | | | | 3.51 | | | | — | | | | 28.10 | | | | 28.02 | | | | 1.39 | | | | 1.39 | | | | 1.39 | | | | (0.32 | ) | | | 1,835 | | | | 3 | | |
See Accompanying Notes to Financial Statements
47
FINANCIAL HIGHLIGHTS (CONTINUED)
Selected data for a share of beneficial interest outstanding throughout each year or period.
| | | | | Income (loss)
from investment
operations | | | | Less distributions | |
| | | Net asset value, beginning of year or period | | Net investment income (loss) | | Net realized and unrealized gain (loss) | | Total from investment operations | | From net investment income | | From net realized gains | | From return of capital | |
Year or period ended | | ($) | | ($) | | ($) | | ($) | | ($) | | ($) | | ($) | |
| VY® Columbia Contrarian Core Portfolio | | | |
Class ADV | | | |
| | 12-31-21 | | | | 19.23 | | | | 0.00 | *• | | | 4.42 | | | | 4.42 | | | | 0.05 | | | | 2.48 | | | | — | | |
| | 12-31-20 | | | | 16.38 | | | | 0.06 | | | | 3.33 | | | | 3.39 | | | | — | | | | 0.54 | | | | — | | |
| | 12-31-19 | | | | 18.94 | | | | 0.13 | • | | | 5.51 | | | | 5.64 | | | | 0.29 | | | | 7.91 | | | | — | | |
| | 12-31-18 | | | | 23.40 | | | | 0.14 | • | | | (1.97 | ) | | | (1.83 | ) | | | 0.15 | | | | 2.48 | | | | — | | |
| | 12-31-17 | | | | 20.66 | | | | 0.13 | | | | 4.17 | | | | 4.30 | | | | 0.20 | | | | 1.36 | | | | — | | |
Class I | | | |
| | 12-31-21 | | | | 20.88 | | | | 0.12 | • | | | 4.81 | | | | 4.93 | | | | 0.14 | | | | 2.48 | | | | — | | |
| | 12-31-20 | | | | 17.67 | | | | 0.15 | • | | | 3.61 | | | | 3.76 | | | | 0.01 | | | | 0.54 | | | | — | | |
| | 12-31-19 | | | | 20.01 | | | | 0.25 | • | | | 5.84 | | | | 6.09 | | | | 0.52 | | | | 7.91 | | | | — | | |
| | 12-31-18 | | | | 24.58 | | | | 0.26 | • | | | (2.07 | ) | | | (1.81 | ) | | | 0.28 | | | | 2.48 | | | | — | | |
| | 12-31-17 | | | | 21.61 | | | | 0.25 | • | | | 4.37 | | | | 4.62 | | | | 0.29 | | | | 1.36 | | | | — | | |
Class S | | | |
| | 12-31-21 | | | | 20.24 | | | | 0.06 | • | | | 4.66 | | | | 4.72 | | | | 0.09 | | | | 2.48 | | | | — | | |
| | 12-31-20 | | | | 17.18 | | | | 0.11 | | | | 3.49 | | | | 3.60 | | | | — | | | | 0.54 | | | | — | | |
| | 12-31-19 | | | | 19.56 | | | | 0.20 | • | | | 5.73 | | | | 5.93 | | | | 0.40 | | | | 7.91 | | | | — | | |
| | 12-31-18 | | | | 24.08 | | | | 0.20 | • | | | (2.03 | ) | | | (1.83 | ) | | | 0.21 | | | | 2.48 | | | | — | | |
| | 12-31-17 | | | | 21.21 | | | | 0.19 | • | | | 4.27 | | | | 4.46 | | | | 0.23 | | | | 1.36 | | | | — | | |
| VY® Columbia Small Cap Value II Portfolio | | | |
Class ADV | | | |
| | 12-31-21 | | | | 15.65 | | | | (0.02 | )• | | | 5.30 | | | | 5.28 | | | | 0.03 | | | | 0.07 | | | | — | | |
| | 12-31-20 | | | | 15.06 | | | | 0.03 | | | | 1.17 | | | | 1.20 | | | | 0.05 | | | | 0.56 | | | | — | | |
| | 12-31-19 | | | | 14.42 | | | | 0.05 | | | | 2.67 | | | | 2.72 | | | | 0.01 | | | | 2.07 | | | | — | | |
| | 12-31-18 | | | | 19.57 | | | | 0.00 | * | | | (3.06 | ) | | | (3.06 | ) | | | 0.00 | * | | | 2.09 | | | | — | | |
| | 12-31-17 | | | | 18.50 | | | | 0.00 | *• | | | 1.89 | | | | 1.89 | | | | 0.03 | | | | 0.79 | | | | — | | |
Class I | | | |
| | 12-31-21 | | | | 16.27 | | | | 0.07 | • | | | 5.53 | | | | 5.60 | | | | 0.09 | | | | 0.07 | | | | — | | |
| | 12-31-20 | | | | 15.65 | | | | 0.10 | | | | 1.22 | | | | 1.32 | | | | 0.14 | | | | 0.56 | | | | — | | |
| | 12-31-19 | | | | 14.94 | | | | 0.13 | | | | 2.76 | | | | 2.89 | | | | 0.11 | | | | 2.07 | | | | — | | |
| | 12-31-18 | | | | 20.20 | | | | 0.10 | • | | | (3.16 | ) | | | (3.06 | ) | | | 0.11 | | | | 2.09 | | | | — | | |
| | 12-31-17 | | | | 19.05 | | | | 0.10 | • | | | 1.95 | | | | 2.05 | | | | 0.11 | | | | 0.79 | | | | — | | |
Class R6 | | | |
| | 12-31-21 | | | | 16.29 | | | | 0.10 | • | | | 5.51 | | | | 5.61 | | | | 0.09 | | | | 0.07 | | | | — | | |
| | 12-31-20 | | | | 15.66 | | | | 0.10 | | | | 1.23 | | | | 1.33 | | | | 0.14 | | | | 0.56 | | | | — | | |
| | 12-31-19 | | | | 14.94 | | | | 0.12 | | | | 2.78 | | | | 2.90 | | | | 0.11 | | | | 2.07 | | | | — | | |
| | 12-31-18 | | | | 20.21 | | | | 0.09 | | | | (3.16 | ) | | | (3.07 | ) | | | 0.11 | | | | 2.09 | | | | — | | |
| | 12-31-17 | | | | 19.06 | | | | 0.13 | • | | | 1.92 | | | | 2.05 | | | | 0.11 | | | | 0.79 | | | | — | | |
Class S | | | |
| | 12-31-21 | | | | 16.20 | | | | 0.02 | • | | | 5.51 | | | | 5.53 | | | | 0.05 | | | | 0.07 | | | | — | | |
| | 12-31-20 | | | | 15.58 | | | | 0.07 | | | | 1.20 | | | | 1.27 | | | | 0.09 | | | | 0.56 | | | | — | | |
| | 12-31-19 | | | | 14.86 | | | | 0.09 | | | | 2.76 | | | | 2.85 | | | | 0.06 | | | | 2.07 | | | | — | | |
| | 12-31-18 | | | | 20.10 | | | | 0.05 | | | | (3.15 | ) | | | (3.10 | ) | | | 0.05 | | | | 2.09 | | | | — | | |
| | 12-31-17 | | | | 18.96 | | | | 0.05 | • | | | 1.94 | | | | 1.99 | | | | 0.06 | | | | 0.79 | | | | — | | |
Class S2 | | | |
| | 12-31-21 | | | | 15.65 | | | | (0.00 | )*• | | | 5.30 | | | | 5.30 | | | | 0.03 | | | | 0.07 | | | | — | | |
| | 12-31-20 | | | | 15.02 | | | | 0.05 | | | | 1.18 | | | | 1.23 | | | | 0.04 | | | | 0.56 | | | | — | | |
| | 12-31-19 | | | | 14.40 | | | | 0.05 | • | | | 2.67 | | | | 2.72 | | | | 0.03 | | | | 2.07 | | | | — | | |
| | 12-31-18 | | | | 19.52 | | | | 0.02 | | | | (3.05 | ) | | | (3.03 | ) | | | — | | | | 2.09 | | | | — | | |
| | 12-31-17 | | | | 18.44 | | | | 0.01 | • | | | 1.90 | | | | 1.91 | | | | 0.04 | | | | 0.79 | | | | — | | |
| | | | | Ratios to average net assets | | Supplemental
data | |
| | | Total distributions | | Payment by affiliate | | Net asset value, end of year or period | | Total Return(1) | | Expenses before reductions/additions(2)(3)(4) | | Expenses net of fee waivers and/or recoupments if any(2)(3)(4) | | Expenses net of all reductions/additions(2)(3)(4) | | Net investment income (loss)(2)(3) | | Net assets, end of year or period | | Portfolio turnover rate | |
Year or period ended | | ($) | | ($) | | ($) | | (%) | | (%) | | (%) | | (%) | | (%) | | ($000's) | | (%) | |
| VY® Columbia Contrarian Core Portfolio | |
Class ADV | |
| | 12-31-21 | | | | 2.53 | | | | — | | | | 21.12 | | | | 23.62 | | | | 1.48 | | | | 1.23 | | | | 1.23 | | | | 0.01 | | | | 31,288 | | | | 54 | | |
| | 12-31-20 | | | | 0.54 | | | | — | | | | 19.23 | | | | 21.22 | | | | 1.54 | | | | 1.23 | | | | 1.22 | | | | 0.36 | | | | 26,173 | | | | 91 | | |
| | 12-31-19 | | | | 8.20 | | | | — | | | | 16.38 | | | | 32.41 | | | | 1.46 | | | | 1.23 | | | | 1.23 | | | | 0.64 | | | | 23,961 | | | | 45 | | |
| | 12-31-18 | | | | 2.63 | | | | — | | | | 18.94 | | | | (9.23 | ) | | | 1.44 | | | | 1.22 | | | | 1.21 | | | | 0.61 | | | | 21,088 | | | | 64 | | |
| | 12-31-17 | | | | 1.56 | | | | — | | | | 23.40 | | | | 21.32 | | | | 1.44 | | | | 1.21 | | | | 1.20 | | | | 0.58 | | | | 29,515 | | | | 45 | | |
Class I | |
| | 12-31-21 | | | | 2.62 | | | | — | | | | 23.19 | | | | 24.23 | | | | 0.98 | | | | 0.73 | | | | 0.73 | | | | 0.52 | | | | 157,468 | | | | 54 | | |
| | 12-31-20 | | | | 0.55 | | | | — | | | | 20.88 | | | | 21.79 | | | | 1.04 | | | | 0.73 | | | | 0.72 | | | | 0.80 | | | | 129,553 | | | | 91 | | |
| | 12-31-19 | | | | 8.43 | | | | — | | | | 17.67 | | | | 33.05 | | | | 0.96 | | | | 0.73 | | | | 0.73 | | | | 1.14 | | | | 8,548 | | | | 45 | | |
| | 12-31-18 | | | | 2.76 | | | | — | | | | 20.01 | | | | (8.77 | ) | | | 0.94 | | | | 0.72 | | | | 0.71 | | | | 1.11 | | | | 7,982 | | | | 64 | | |
| | 12-31-17 | | | | 1.65 | | | | — | | | | 24.58 | | | | 21.96 | | | | 0.94 | | | | 0.71 | | | | 0.70 | | | | 1.08 | | | | 10,099 | | | | 45 | | |
Class S | |
| | 12-31-21 | | | | 2.57 | | | | — | | | | 22.39 | | | | 23.94 | | | | 1.23 | | | | 0.98 | | | | 0.98 | | | | 0.26 | | | | 23,775 | | | | 54 | | |
| | 12-31-20 | | | | 0.54 | | | | — | | | | 20.24 | | | | 21.45 | | | | 1.29 | | | | 0.98 | | | | 0.97 | | | | 0.61 | | | | 20,139 | | | | 91 | | |
| | 12-31-19 | | | | 8.31 | | | | — | | | | 17.18 | | | | 33.06 | | | | 1.19 | | | | 0.96 | | | | 0.96 | | | | 0.92 | | | | 18,274 | | | | 45 | | |
| | 12-31-18 | | | | 2.69 | | | | — | | | | 19.56 | | | | (8.99 | ) | | | 1.19 | | | | 0.97 | | | | 0.96 | | | | 0.86 | | | | 222,203 | | | | 64 | | |
| | 12-31-17 | | | | 1.59 | | | | — | | | | 24.08 | | | | 21.58 | | | | 1.19 | | | | 0.96 | | | | 0.95 | | | | 0.83 | | | | 285,025 | | | | 45 | | |
| VY® Columbia Small Cap Value II Portfolio | |
Class ADV | |
| | 12-31-21 | | | | 0.10 | | | | — | | | | 20.83 | | | | 33.85 | | | | 1.47 | | | | 1.42 | | | | 1.42 | | | | (0.10 | ) | | | 39,427 | | | | 56 | | |
| | 12-31-20 | | | | 0.61 | | | | — | | | | 15.65 | | | | 9.28 | | | | 1.51 | | | | 1.42 | | | | 1.41 | | | | 0.18 | | | | 24,162 | | | | 47 | | |
| | 12-31-19 | | | | 2.08 | | | | — | | | | 15.06 | | | | 19.88 | | | | 1.41 | | | | 1.38 | | | | 1.37 | | | | 0.27 | | | | 25,615 | | | | 25 | | |
| | 12-31-18 | | | | 2.09 | | | | — | | | | 14.42 | | | | (17.96 | ) | | | 1.40 | | | | 1.37 | | | | 1.36 | | | | 0.02 | | | | 27,725 | | | | 41 | | |
| | 12-31-17 | | | | 0.82 | | | | — | | | | 19.57 | | | | 10.65 | | | | 1.40 | | | | 1.37 | | | | 1.36 | | | | 0.01 | | | | 37,004 | | | | 44 | | |
Class I | |
| | 12-31-21 | | | | 0.16 | | | | — | | | | 21.71 | | | | 34.52 | | | | 0.97 | | | | 0.92 | | | | 0.92 | | | | 0.37 | | | | 45,424 | | | | 56 | | |
| | 12-31-20 | | | | 0.70 | | | | — | | | | 16.27 | | | | 9.89 | | | | 1.01 | | | | 0.92 | | | | 0.91 | | | | 0.68 | | | | 34,277 | | | | 47 | | |
| | 12-31-19 | | | | 2.18 | | | | — | | | | 15.65 | | | | 20.42 | | | | 0.91 | | | | 0.88 | | | | 0.87 | | | | 0.79 | | | | 36,201 | | | | 25 | | |
| | 12-31-18 | | | | 2.20 | | | | — | | | | 14.94 | | | | (17.53 | ) | | | 0.90 | | | | 0.87 | | | | 0.86 | | | | 0.53 | | | | 33,887 | | | | 41 | | |
| | 12-31-17 | | | | 0.90 | | | | — | | | | 20.20 | | | | 11.21 | | | | 0.90 | | | | 0.87 | | | | 0.86 | | | | 0.50 | | | | 43,897 | | | | 44 | | |
Class R6 | |
| | 12-31-21 | | | | 0.16 | | | | — | | | | 21.74 | | | | 34.57 | | | | 0.89 | | | | 0.86 | | | | 0.86 | | | | 0.49 | | | | 12,560 | | | | 56 | | |
| | 12-31-20 | | | | 0.70 | | | | — | | | | 16.29 | | | | 9.94 | | | | 0.91 | | | | 0.88 | | | | 0.87 | | | | 0.71 | | | | 6,983 | | | | 47 | | |
| | 12-31-19 | | | | 2.18 | | | | — | | | | 15.66 | | | | 20.48 | | | | 0.91 | | | | 0.88 | | | | 0.87 | | | | 0.81 | | | | 6,701 | | | | 25 | | |
| | 12-31-18 | | | | 2.20 | | | | — | | | | 14.94 | | | | (17.57 | ) | | | 0.90 | | | | 0.87 | | | | 0.86 | | | | 0.56 | | | | 5,349 | | | | 41 | | |
| | 12-31-17 | | | | 0.90 | | | | — | | | | 20.21 | | | | 11.20 | | | | 0.90 | | | | 0.87 | | | | 0.86 | | | | 0.69 | | | | 4,389 | | | | 44 | | |
Class S | |
| | 12-31-21 | | | | 0.12 | | | | — | | | | 21.61 | | | | 34.22 | | | | 1.22 | | | | 1.17 | | | | 1.17 | | | | 0.12 | | | | 96,978 | | | | 56 | | |
| | 12-31-20 | | | | 0.65 | | | | — | | | | 16.20 | | | | 9.54 | | | | 1.26 | | | | 1.17 | | | | 1.16 | | | | 0.42 | | | | 82,438 | | | | 47 | | |
| | 12-31-19 | | | | 2.13 | | | | — | | | | 15.58 | | | | 20.21 | | | | 1.16 | | | | 1.13 | | | | 1.12 | | | | 0.53 | | | | 89,702 | | | | 25 | | |
| | 12-31-18 | | | | 2.14 | | | | — | | | | 14.86 | | | | (17.76 | ) | | | 1.15 | | | | 1.12 | | | | 1.11 | | | | 0.26 | | | | 89,274 | | | | 41 | | |
| | 12-31-17 | | | | 0.85 | | | | — | | | | 20.10 | | | | 10.92 | | | | 1.15 | | | | 1.12 | | | | 1.11 | | | | 0.25 | | | | 124,984 | | | | 44 | | |
Class S2 | |
| | 12-31-21 | | | | 0.10 | | | | — | | | | 20.85 | | | | 33.96 | | | | 1.37 | | | | 1.32 | | | | 1.32 | | | | (0.01 | ) | | | 1,856 | | | | 56 | | |
| | 12-31-20 | | | | 0.60 | | | | — | | | | 15.65 | | | | 9.45 | | | | 1.41 | | | | 1.32 | | | | 1.31 | | | | 0.27 | | | | 1,446 | | | | 47 | | |
| | 12-31-19 | | | | 2.10 | | | | — | | | | 15.02 | | | | 19.95 | | | | 1.31 | | | | 1.28 | | | | 1.27 | | | | 0.34 | | | | 1,671 | | | | 25 | | |
| | 12-31-18 | | | | 2.09 | | | | — | | | | 14.40 | | | | (17.87 | ) | | | 1.30 | | | | 1.27 | | | | 1.26 | | | | 0.11 | | | | 2,431 | | | | 41 | | |
| | 12-31-17 | | | | 0.83 | | | | — | | | | 19.52 | | | | 10.77 | | | | 1.30 | | | | 1.27 | | | | 1.26 | | | | 0.06 | | | | 3,431 | | | | 44 | | |
See Accompanying Notes to Financial Statements
48
FINANCIAL HIGHLIGHTS (CONTINUED)
Selected data for a share of beneficial interest outstanding throughout each year or period.
| | | | | Income (loss)
from investment
operations | | | | Less distributions | |
| | | Net asset value, beginning of year or period | | Net investment income (loss) | | Net realized and unrealized gain (loss) | | Total from investment operations | | From net investment income | | From net realized gains | | From return of capital | |
Year or period ended | | ($) | | ($) | | ($) | | ($) | | ($) | | ($) | | ($) | |
| VY® Invesco Comstock Portfolio | | | |
Class ADV | | | |
| | 12-31-21 | | | | 16.05 | | | | 0.21 | • | | | 5.03 | | | | 5.24 | | | | 0.24 | | | | — | | | | — | | |
| | 12-31-20 | | | | 17.01 | | | | 0.25 | | | | (0.46 | ) | | | (0.21 | ) | | | 0.30 | | | | 0.45 | | | | — | | |
| | 12-31-19 | | | | 17.39 | | | | 0.30 | • | | | 3.74 | | | | 4.04 | | | | 0.41 | | | | 4.01 | | | | — | | |
| | 12-31-18 | | | | 20.14 | | | | 0.24 | • | | | (2.77 | ) | | | (2.53 | ) | | | 0.22 | | | | — | | | | — | | |
| | 12-31-17 | | | | 17.33 | | | | 0.19 | | | | 2.80 | | | | 2.99 | | | | 0.18 | | | | — | | | | — | | |
Class I | | | |
| | 12-31-21 | | | | 16.20 | | | | 0.31 | • | | | 5.09 | | | | 5.40 | | | | 0.35 | | | | — | | | | — | | |
| | 12-31-20 | | | | 17.19 | | | | 0.32 | • | | | (0.46 | ) | | | (0.14 | ) | | | 0.40 | | | | 0.45 | | | | — | | |
| | 12-31-19 | | | | 17.52 | | | | 0.40 | • | | | 3.78 | | | | 4.18 | | | | 0.50 | | | | 4.01 | | | | — | | |
| | 12-31-18 | | | | 20.32 | | | | 0.33 | | | | (2.80 | ) | | | (2.47 | ) | | | 0.33 | | | | — | | | | — | | |
| | 12-31-17 | | | | 17.47 | | | | 0.28 | • | | | 2.85 | | | | 3.13 | | | | 0.28 | | | | — | | | | — | | |
Class S | | | |
| | 12-31-21 | | | | 16.23 | | | | 0.26 | • | | | 5.09 | | | | 5.35 | | | | 0.30 | | | | — | | | | — | | |
| | 12-31-20 | | | | 17.18 | | | | 0.31 | | | | (0.48 | ) | | | (0.17 | ) | | | 0.33 | | | | 0.45 | | | | — | | |
| | 12-31-19 | | | | 17.51 | | | | 0.36 | • | | | 3.77 | | | | 4.13 | | | | 0.45 | | | | 4.01 | | | | — | | |
| | 12-31-18 | | | | 20.30 | | | | 0.29 | • | | | (2.81 | ) | | | (2.52 | ) | | | 0.27 | | | | — | | | | — | | |
| | 12-31-17 | | | | 17.45 | | | | 0.23 | • | | | 2.85 | | | | 3.08 | | | | 0.23 | | | | — | | | | — | | |
| VY® Invesco Equity and Income Portfolio | | | |
Class ADV | | | |
| | 12-31-21 | | | | 44.76 | | | | 0.36 | • | | | 7.69 | | | | 8.05 | | | | 0.50 | | | | 0.60 | | | | — | | |
| | 12-31-20 | | | | 43.36 | | | | 0.58 | | | | 3.25 | | | | 3.83 | | | | 0.59 | | | | 1.84 | | | | — | | |
| | 12-31-19 | | | | 38.95 | | | | 0.62 | • | | | 6.82 | | | | 7.44 | | | | 0.68 | | | | 2.35 | | | | — | | |
| | 12-31-18 | | | | 46.81 | | | | 0.64 | • | | | (4.95 | ) | | | (4.31 | ) | | | 0.66 | | | | 2.89 | | | | — | | |
| | 12-31-17 | | | | 44.06 | | | | 0.65 | | | | 3.84 | | | | 4.49 | | | | 0.61 | | | | 1.13 | | | | — | | |
Class I | | | |
| | 12-31-21 | | | | 45.58 | | | | 0.62 | • | | | 7.83 | | | | 8.45 | | | | 0.74 | | | | 0.60 | | | | — | | |
| | 12-31-20 | | | | 44.08 | | | | 0.80 | | | | 3.34 | | | | 4.14 | | | | 0.80 | | | | 1.84 | | | | — | | |
| | 12-31-19 | | | | 39.54 | | | | 0.85 | • | | | 6.94 | | | | 7.79 | | | | 0.90 | | | | 2.35 | | | | — | | |
| | 12-31-18 | | | | 47.51 | | | | 0.88 | • | | | (5.06 | ) | | | (4.18 | ) | | | 0.90 | | | | 2.89 | | | | — | | |
| | 12-31-17 | | | | 44.86 | | | | 0.89 | • | | | 3.93 | | | | 4.82 | | | | 1.04 | | | | 1.13 | | | | — | | |
Class S | | | |
| | 12-31-21 | | | | 45.24 | | | | 0.49 | • | | | 7.77 | | | | 8.26 | | | | 0.61 | | | | 0.60 | | | | — | | |
| | 12-31-20 | | | | 43.79 | | | | 0.70 | | | | 3.28 | | | | 3.98 | | | | 0.69 | | | | 1.84 | | | | — | | |
| | 12-31-19 | | | | 39.30 | | | | 0.74 | • | | | 6.88 | | | | 7.62 | | | | 0.78 | | | | 2.35 | | | | — | | |
| | 12-31-18 | | | | 47.22 | | | | 0.76 | • | | | (5.01 | ) | | | (4.25 | ) | | | 0.78 | | | | 2.89 | | | | — | | |
| | 12-31-17 | | | | 44.48 | | | | 0.77 | • | | | 3.89 | | | | 4.66 | | | | 0.79 | | | | 1.13 | | | | — | | |
Class S2 | | | |
| | 12-31-21 | | | | 44.52 | | | | 0.42 | • | | | 7.64 | | | | 8.06 | | | | 0.53 | | | | 0.60 | | | | — | | |
| | 12-31-20 | | | | 43.13 | | | | 0.63 | | | | 3.23 | | | | 3.86 | | | | 0.63 | | | | 1.84 | | | | — | | |
| | 12-31-19 | | | | 38.75 | | | | 0.67 | • | | | 6.78 | | | | 7.45 | | | | 0.72 | | | | 2.35 | | | | — | | |
| | 12-31-18 | | | | 46.59 | | | | 0.69 | • | | | (4.93 | ) | | | (4.24 | ) | | | 0.71 | | | | 2.89 | | | | — | | |
| | 12-31-17 | | | | 43.85 | | | | 0.70 | • | | | 3.83 | | | | 4.53 | | | | 0.66 | | | | 1.13 | | | | — | | |
| VY® Invesco Global Portfolio | | | |
Class ADV | | | |
| | 12-31-21 | | | | 22.38 | | | | (0.19 | )• | | | 3.51 | | | | 3.32 | | | | — | | | | 1.15 | | | | — | | |
| | 12-31-20 | | | | 18.41 | | | | (0.10 | )• | | | 4.91 | | | | 4.81 | | | | 0.13 | | | | 0.71 | | | | — | | |
| | 12-31-19 | | | | 17.06 | | | | 0.04 | | | | 4.89 | | | | 4.93 | | | | — | | | | 3.58 | | | | — | | |
| | 12-31-18 | | | | 21.42 | | | | 0.04 | | | | (2.66 | ) | | | (2.62 | ) | | | 0.25 | | | | 1.49 | | | | — | | |
| | 12-31-17 | | | | 15.90 | | | | 0.04 | | | | 5.64 | | | | 5.68 | | | | 0.13 | | | | 0.03 | | | | — | | |
| | | | | Ratios to average net assets | | Supplemental
data | |
| | | Total distributions | | Payment by affiliate | | Net asset value, end of year or period | | Total Return(1) | | Expenses before reductions/additions(2)(3)(4) | | Expenses net of fee waivers and/or recoupments if any(2)(3)(4) | | Expenses net of all reductions/additions(2)(3)(4) | | Net investment income (loss)(2)(3) | | Net assets, end of year or period | | Portfolio turnover rate | |
Year or period ended | | ($) | | ($) | | ($) | | (%) | | (%) | | (%) | | (%) | | (%) | | ($000's) | | (%) | |
| VY® Invesco Comstock Portfolio | |
Class ADV | |
| | 12-31-21 | | | | 0.24 | | | | — | | | | 21.05 | | | | 32.69 | | | | 1.29 | | | | 1.20 | | | | 1.20 | | | | 1.06 | | | | 34,649 | | | | 31 | | |
| | 12-31-20 | | | | 0.75 | | | | — | | | | 16.05 | | | | (0.74 | ) | | | 1.33 | | | | 1.27 | | | | 1.27 | | | | 1.71 | | | | 28,434 | | | | 64 | | |
| | 12-31-19 | | | | 4.42 | | | | — | | | | 17.01 | | | | 24.86 | | | | 1.25 | | | | 1.23 | | | | 1.23 | | | | 1.60 | | | | 31,202 | | | | 25 | | |
| | 12-31-18 | | | | 0.22 | | | | — | | | | 17.39 | | | | (12.56 | ) | | | 1.25 | | | | 1.23 | | | | 1.23 | | | | 1.16 | | | | 28,006 | | | | 29 | | |
| | 12-31-17 | | | | 0.18 | | | | — | | | | 20.14 | | | | 17.31 | | | | 1.25 | | | | 1.23 | | | | 1.23 | | | | 1.00 | | | | 36,178 | | | | 14 | | |
Class I | |
| | 12-31-21 | | | | 0.35 | | | | — | | | | 21.25 | | | | 33.33 | | | | 0.79 | | | | 0.70 | | | | 0.70 | | | | 1.58 | | | | 178,856 | | | | 31 | | |
| | 12-31-20 | | | | 0.85 | | | | — | | | | 16.20 | | | | (0.22 | ) | | | 0.83 | | | | 0.77 | | | | 0.77 | | | | 2.25 | | | | 114,569 | | | | 64 | | |
| | 12-31-19 | | | | 4.51 | | | | — | | | | 17.19 | | | | 25.51 | | | | 0.75 | | | | 0.73 | | | | 0.73 | | | | 2.09 | | | | 203,510 | | | | 25 | | |
| | 12-31-18 | | | | 0.33 | | | | — | | | | 17.52 | | | | (12.16 | ) | | | 0.75 | | | | 0.73 | | | | 0.73 | | | | 1.72 | | | | 219,086 | | | | 29 | | |
| | 12-31-17 | | | | 0.28 | | | | — | | | | 20.32 | | | | 17.95 | | | | 0.75 | | | | 0.73 | | | | 0.73 | | | | 1.50 | | | | 188,040 | | | | 14 | | |
Class S | |
| | 12-31-21 | | | | 0.30 | | | | — | | | | 21.28 | | | | 32.96 | | | | 1.04 | | | | 0.95 | | | | 0.95 | | | | 1.31 | | | | 81,485 | | | | 31 | | |
| | 12-31-20 | | | | 0.78 | | | | — | | | | 16.23 | | | | (0.47 | ) | | | 1.08 | | | | 1.02 | | | | 1.02 | | | | 1.97 | | | | 63,320 | | | | 64 | | |
| | 12-31-19 | | | | 4.46 | | | | — | | | | 17.18 | | | | 25.24 | | | | 1.00 | | | | 0.98 | | | | 0.98 | | | | 1.88 | | | | 73,675 | | | | 25 | | |
| | 12-31-18 | | | | 0.27 | | | | — | | | | 17.51 | | | | (12.39 | ) | | | 1.00 | | | | 0.98 | | | | 0.98 | | | | 1.41 | | | | 215,609 | | | | 29 | | |
| | 12-31-17 | | | | 0.23 | | | | — | | | | 20.30 | | | | 17.68 | | | | 1.00 | | | | 0.98 | | | | 0.98 | | | | 1.25 | | | | 274,498 | | | | 14 | | |
| VY® Invesco Equity and Income Portfolio | |
Class ADV | |
| | 12-31-21 | | | | 1.10 | | | | — | | | | 51.71 | | | | 18.03 | | | | 1.21 | | | | 1.14 | | | | 1.14 | | | | 0.73 | | | | 49,436 | | | | 127 | | |
| | 12-31-20 | | | | 2.43 | | | | — | | | | 44.76 | | | | 9.62 | | | | 1.21 | | | | 1.14 | | | | 1.14 | | | | 1.34 | | | | 42,053 | | | | 90 | | |
| | 12-31-19 | | | | 3.03 | | | | — | | | | 43.36 | | | | 19.50 | | | | 1.17 | | | | 1.14 | | | | 1.14 | | | | 1.47 | | | | 44,825 | | | | 143 | | |
| | 12-31-18 | | | | 3.55 | | | | — | | | | 38.95 | | | | (9.90 | ) | | | 1.17 | | | | 1.14 | | | | 1.14 | | | | 1.40 | | | | 43,200 | | | | 161 | | |
| | 12-31-17 | | | | 1.74 | | | | — | | | | 46.81 | | | | 10.32 | | | | 1.17 | | | | 1.14 | | | | 1.14 | | | | 1.43 | | | | 54,583 | | | | 134 | | |
Class I | |
| | 12-31-21 | | | | 1.34 | | | | — | | | | 52.69 | | | | 18.60 | | | | 0.71 | | | | 0.64 | | | | 0.64 | | | | 1.23 | | | | 502,445 | | | | 127 | | |
| | 12-31-20 | | | | 2.64 | | | | — | | | | 45.58 | | | | 10.18 | | | | 0.71 | | | | 0.64 | | | | 0.64 | | | | 1.84 | | | | 467,994 | | | | 90 | | |
| | 12-31-19 | | | | 3.25 | | | | — | | | | 44.08 | | | | 20.10 | | | | 0.67 | | | | 0.64 | | | | 0.64 | | | | 1.97 | | | | 484,839 | | | | 143 | | |
| | 12-31-18 | | | | 3.79 | | | | — | | | | 39.54 | | | | (9.46 | ) | | | 0.67 | | | | 0.64 | | | | 0.64 | | | | 1.90 | | | | 468,289 | | | | 161 | | |
| | 12-31-17 | | | | 2.17 | | | | — | | | | 47.51 | | | | 10.90 | | | | 0.67 | | | | 0.64 | | | | 0.64 | | | | 1.92 | | | | 594,834 | | | | 134 | | |
Class S | |
| | 12-31-21 | | | | 1.21 | | | | — | | | | 52.29 | | | | 18.31 | | | | 0.96 | | | | 0.89 | | | | 0.89 | | | | 0.97 | | | | 437,821 | | | | 127 | | |
| | 12-31-20 | | | | 2.53 | | | | — | | | | 45.24 | | | | 9.88 | | | | 0.96 | | | | 0.89 | | | | 0.89 | | | | 1.59 | | | | 436,888 | | | | 90 | | |
| | 12-31-19 | | | | 3.13 | | | | — | | | | 43.79 | | | | 19.80 | | | | 0.92 | | | | 0.89 | | | | 0.89 | | | | 1.72 | | | | 473,465 | | | | 143 | | |
| | 12-31-18 | | | | 3.67 | | | | — | | | | 39.30 | | | | (9.67 | ) | | | 0.92 | | | | 0.89 | | | | 0.89 | | | | 1.65 | | | | 463,989 | | | | 161 | | |
| | 12-31-17 | | | | 1.92 | | | | — | | | | 47.22 | | | | 10.62 | | | | 0.92 | | | | 0.89 | | | | 0.89 | | | | 1.67 | | | | 606,503 | | | | 134 | | |
Class S2 | |
| | 12-31-21 | | | | 1.13 | | | | — | | | | 51.45 | | | | 18.17 | | | | 1.11 | | | | 1.02 | | | | 1.02 | | | | 0.84 | | | | 320,526 | | | | 127 | | |
| | 12-31-20 | | | | 2.47 | | | | — | | | | 44.52 | | | | 9.76 | | | | 1.11 | | | | 1.02 | | | | 1.02 | | | | 1.46 | | | | 308,786 | | | | 90 | | |
| | 12-31-19 | | | | 3.07 | | | | — | | | | 43.13 | | | | 19.63 | | | | 1.07 | | | | 1.02 | | | | 1.02 | | | | 1.59 | | | | 328,815 | | | | 143 | | |
| | 12-31-18 | | | | 3.60 | | | | — | | | | 38.75 | | | | (9.79 | ) | | | 1.07 | | | | 1.02 | | | | 1.02 | | | | 1.52 | | | | 321,618 | | | | 161 | | |
| | 12-31-17 | | | | 1.79 | | | | — | | | | 46.59 | | | | 10.48 | | | | 1.07 | | | | 1.02 | | | | 1.02 | | | | 1.54 | | | | 420,527 | | | | 134 | | |
| VY® Invesco Global Portfolio | |
Class ADV | |
| | 12-31-21 | | | | 1.15 | | | | — | | | | 24.55 | | | | 14.80 | | | | 1.33 | | | | 1.30 | | | | 1.30 | | | | (0.80 | ) | | | 149,741 | | | | 7 | | |
| | 12-31-20 | | | | 0.84 | | | | — | | | | 22.38 | | | | 27.19 | | | | 1.35 | | | | 1.30 | | | | 1.30 | | | | (0.53 | ) | | | 131,946 | | | | 8 | | |
| | 12-31-19 | | | | 3.58 | | | | — | | | | 18.41 | | | | 31.10 | | | | 1.25 | | | | 1.25 | | | | 1.25 | | | | 0.26 | | | | 123,467 | | | | 8 | | |
| | 12-31-18 | | | | 1.74 | | | | — | | | | 17.06 | | | | (13.62 | ) | | | 1.25 | | | | 1.25 | | | | 1.25 | | | | 0.22 | | | | 101,759 | | | | 17 | | |
| | 12-31-17 | | | | 0.16 | | | | — | | | | 21.42 | | | | 35.82 | | | | 1.25 | | | | 1.25 | | | | 1.25 | | | | 0.17 | | | | 120,344 | | | | 9 | | |
See Accompanying Notes to Financial Statements
49
FINANCIAL HIGHLIGHTS (CONTINUED)
Selected data for a share of beneficial interest outstanding throughout each year or period.
| | | | | Income (loss)
from investment
operations | | | | Less distributions | |
| | | Net asset value, beginning of year or period | | Net investment income (loss) | | Net realized and unrealized gain (loss) | | Total from investment operations | | From net investment income | | From net realized gains | | From return of capital | |
Year or period ended | | ($) | | ($) | | ($) | | ($) | | ($) | | ($) | | ($) | |
| VY® Invesco Global Portfolio (continued) | | | |
Class I | | | |
| | 12-31-21 | | | | 23.71 | | | | (0.08 | )• | | | 3.73 | | | | 3.65 | | | | — | | | | 1.15 | | | | — | | |
| | 12-31-20 | | | | 19.46 | | | | (0.01 | )• | | | 5.20 | | | | 5.19 | | | | 0.23 | | | | 0.71 | | | | — | | |
| | 12-31-19 | | | | 17.86 | | | | 0.15 | | | | 5.13 | | | | 5.28 | | | | 0.10 | | | | 3.58 | | | | — | | |
| | 12-31-18 | | | | 22.33 | | | | 0.16 | • | | | (2.80 | ) | | | (2.64 | ) | | | 0.34 | | | | 1.49 | | | | — | | |
| | 12-31-17 | | | | 16.56 | | | | 0.15 | | | | 5.87 | | | | 6.02 | | | | 0.22 | | | | 0.03 | | | | — | | |
Class S | | | |
| | 12-31-21 | | | | 22.56 | | | | (0.13 | )• | | | 3.55 | | | | 3.42 | | | | — | | | | 1.15 | | | | — | | |
| | 12-31-20 | | | | 18.56 | | | | (0.05 | )• | | | 4.94 | | | | 4.89 | | | | 0.18 | | | | 0.71 | | | | — | | |
| | 12-31-19 | | | | 17.17 | | | | 0.10 | | | | 4.91 | | | | 5.01 | | | | 0.04 | | | | 3.58 | | | | — | | |
| | 12-31-18 | | | | 21.53 | | | | 0.10 | • | | | (2.68 | ) | | | (2.58 | ) | | | 0.29 | | | | 1.49 | | | | — | | |
| | 12-31-17 | | | | 15.98 | | | | 0.08 | | | | 5.67 | | | | 5.75 | | | | 0.17 | | | | 0.03 | | | | — | | |
Class S2 | | | |
| | 12-31-21 | | | | 21.75 | | | | (0.16 | )• | | | 3.41 | | | | 3.25 | | | | — | | | | 1.15 | | | | — | | |
| | 12-31-20 | | | | 17.89 | | | | (0.07 | )• | | | 4.77 | | | | 4.70 | | | | 0.13 | | | | 0.71 | | | | — | | |
| | 12-31-19 | | | | 16.67 | | | | 0.06 | | | | 4.77 | | | | 4.83 | | | | 0.03 | | | | 3.58 | | | | — | | |
| | 12-31-18 | | | | 20.97 | | | | 0.06 | • | | | (2.60 | ) | | | (2.54 | ) | | | 0.27 | | | | 1.49 | | | | — | | |
| | 12-31-17 | | | | 15.58 | | | | 0.05 | | | | 5.53 | | | | 5.58 | | | | 0.16 | | | | 0.03 | | | | — | | |
| VY® JPMorgan Mid Cap Value Portfolio | | | |
Class ADV | | | |
| | 12-31-21 | | | | 15.51 | | | | 0.05 | • | | | 4.43 | | | | 4.48 | | | | 0.05 | | | | 0.70 | | | | — | | |
| | 12-31-20 | | | | 17.15 | | | | 0.09 | | | | (0.33 | ) | | | (0.24 | ) | | | 0.11 | | | | 1.29 | | | | — | | |
| | 12-31-19 | | | | 15.74 | | | | 0.12 | | | | 3.74 | | | | 3.86 | | | | 0.12 | | | | 2.33 | | | | — | | |
| | 12-31-18 | | | | 19.78 | | | | 0.15 | | | | (2.35 | ) | | | (2.20 | ) | | | 0.16 | | | | 1.68 | | | | — | | |
| | 12-31-17 | | | | 19.31 | | | | 0.07 | | | | 2.41 | | | | 2.48 | | | | 0.07 | | | | 1.94 | | | | — | | |
Class I | | | |
| | 12-31-21 | | | | 16.09 | | | | 0.15 | • | | | 4.60 | | | | 4.75 | | | | 0.14 | | | | 0.70 | | | | — | | |
| | 12-31-20 | | | | 17.72 | | | | 0.17 | | | | (0.33 | ) | | | (0.16 | ) | | | 0.18 | | | | 1.29 | | | | — | | |
| | 12-31-19 | | | | 16.18 | | | | 0.22 | | | | 3.86 | | | | 4.08 | | | | 0.21 | | | | 2.33 | | | | — | | |
| | 12-31-18 | | | | 20.30 | | | | 0.25 | • | | | (2.43 | ) | | | (2.18 | ) | | | 0.26 | | | | 1.68 | | | | — | | |
| | 12-31-17 | | | | 19.75 | | | | 0.18 | • | | | 2.48 | | | | 2.66 | | | | 0.17 | | | | 1.94 | | | | — | | |
Class S | | | |
| | 12-31-21 | | | | 15.87 | | | | 0.10 | • | | | 4.54 | | | | 4.64 | | | | 0.09 | | | | 0.70 | | | | — | | |
| | 12-31-20 | | | | 17.51 | | | | 0.13 | | | | (0.33 | ) | | | (0.20 | ) | | | 0.15 | | | | 1.29 | | | | — | | |
| | 12-31-19 | | | | 16.01 | | | | 0.17 | | | | 3.82 | | | | 3.99 | | | | 0.16 | | | | 2.33 | | | | — | | |
| | 12-31-18 | | | | 20.10 | | | | 0.20 | • | | | (2.40 | ) | | | (2.20 | ) | | | 0.21 | | | | 1.68 | | | | — | | |
| | 12-31-17 | | | | 19.58 | | | | 0.12 | • | | | 2.46 | | | | 2.58 | | | | 0.12 | | | | 1.94 | | | | — | | |
Class S2 | | | |
| | 12-31-21 | | | | 15.47 | | | | 0.08 | • | | | 4.41 | | | | 4.49 | | | | 0.09 | | | | 0.70 | | | | — | | |
| | 12-31-20 | | | | 17.10 | | | | 0.11 | | | | (0.33 | ) | | | (0.22 | ) | | | 0.12 | | | | 1.29 | | | | — | | |
| | 12-31-19 | | | | 15.69 | | | | 0.14 | • | | | 3.73 | | | | 3.87 | | | | 0.13 | | | | 2.33 | | | | — | | |
| | 12-31-18 | | | | 19.72 | | | | 0.16 | • | | | (2.33 | ) | | | (2.17 | ) | | | 0.18 | | | | 1.68 | | | | — | | |
| | 12-31-17 | | | | 19.25 | | | | 0.09 | • | | | 2.41 | | | | 2.50 | | | | 0.09 | | | | 1.94 | | | | — | | |
| VY® T. Rowe Price Diversified Mid Cap Growth Portfolio | | | |
Class ADV | | | |
| | 12-31-21 | | | | 13.16 | | | | (0.12 | )• | | | 1.84 | | | | 1.72 | | | | — | | | | 2.45 | | | | — | | |
| | 12-31-20 | | | | 11.00 | | | | (0.05 | ) | | | 3.27 | | | | 3.22 | | | | 0.01 | | | | 1.05 | | | | — | | |
| | 12-31-19 | | | | 9.08 | | | | (0.03 | ) | | | 3.26 | | | | 3.23 | | | | 0.03 | | | | 1.28 | | | | — | | |
| | 12-31-18 | | | | 10.50 | | | | (0.02 | ) | | | (0.24 | ) | | | (0.26 | ) | | | — | | | | 1.16 | | | | — | | |
| | 12-31-17 | | | | 9.19 | | | | (0.03 | ) | | | 2.17 | | | | 2.14 | | | | 0.03 | | | | 0.80 | | | | — | | |
| | | | | Ratios to average net assets | | Supplemental
data | |
| | | Total distributions | | Payment by affiliate | | Net asset value, end of year or period | | Total Return(1) | | Expenses before reductions/additions(2)(3)(4) | | Expenses net of fee waivers and/or recoupments if any(2)(3)(4) | | Expenses net of all reductions/additions(2)(3)(4) | | Net investment income (loss)(2)(3) | | Net assets, end of year or period | | Portfolio turnover rate | |
Year or period ended | | ($) | | ($) | | ($) | | (%) | | (%) | | (%) | | (%) | | (%) | | ($000's) | | (%) | |
| VY® Invesco Global Portfolio (continued) | |
Class I | |
| | 12-31-21 | | | | 1.15 | | | | — | | | | 26.21 | | | | 15.37 | | | | 0.83 | | | | 0.80 | | | | 0.80 | | | | (0.30 | ) | | | 1,381,312 | | | | 7 | | |
| | 12-31-20 | | | | 0.94 | | | | — | | | | 23.71 | | | | 27.78 | | | | 0.85 | | | | 0.80 | | | | 0.80 | | | | (0.03 | ) | | | 1,332,750 | | | | 8 | | |
| | 12-31-19 | | | | 3.68 | | | | — | | | | 19.46 | | | | 31.80 | | | | 0.75 | | | | 0.75 | | | | 0.75 | | | | 0.76 | | | | 1,225,197 | | | | 8 | | |
| | 12-31-18 | | | | 1.83 | | | | — | | | | 17.86 | | | | (13.19 | ) | | | 0.75 | | | | 0.75 | | | | 0.75 | | | | 0.72 | | | | 1,061,448 | | | | 17 | | |
| | 12-31-17 | | | | 0.25 | | | | — | | | | 22.33 | | | | 36.49 | | | | 0.75 | | | | 0.75 | | | | 0.75 | | | | 0.68 | | | | 1,384,452 | | | | 9 | | |
Class S | |
| | 12-31-21 | | | | 1.15 | | | | — | | | | 24.83 | | | | 15.13 | | | | 1.08 | | | | 1.05 | | | | 1.05 | | | | (0.55 | ) | | | 185,986 | | | | 7 | | |
| | 12-31-20 | | | | 0.89 | | | | — | | | | 22.56 | | | | 27.43 | | | | 1.10 | | | | 1.05 | | | | 1.05 | | | | (0.28 | ) | | | 188,985 | | | | 8 | | |
| | 12-31-19 | | | | 3.62 | | | | — | | | | 18.56 | | | | 31.44 | | | | 1.00 | | | | 1.00 | | | | 1.00 | | | | 0.52 | | | | 181,045 | | | | 8 | | |
| | 12-31-18 | | | | 1.78 | | | | — | | | | 17.17 | | | | (13.39 | ) | | | 1.00 | | | | 1.00 | | | | 1.00 | | | | 0.49 | | | | 167,520 | | | | 17 | | |
| | 12-31-17 | | | | 0.20 | | | | — | | | | 21.53 | | | | 36.13 | | | | 1.00 | | | | 1.00 | | | | 1.00 | | | | 0.41 | | | | 238,436 | | | | 9 | | |
Class S2 | |
| | 12-31-21 | | | | 1.15 | | | | — | | | | 23.85 | | | | 14.91 | | | | 1.23 | | | | 1.20 | | | | 1.20 | | | | (0.69 | ) | | | 4,152 | | | | 7 | | |
| | 12-31-20 | | | | 0.84 | | | | — | | | | 21.75 | | | | 27.33 | | | | 1.25 | | | | 1.20 | | | | 1.20 | | | | (0.42 | ) | | | 4,266 | | | | 8 | | |
| | 12-31-19 | | | | 3.61 | | | | — | | | | 17.89 | | | | 31.26 | | | | 1.15 | | | | 1.15 | | | | 1.15 | | | | 0.37 | | | | 4,611 | | | | 8 | | |
| | 12-31-18 | | | | 1.76 | | | | — | | | | 16.67 | | | | (13.56 | ) | | | 1.15 | | | | 1.15 | | | | 1.15 | | | | 0.30 | | | | 3,963 | | | | 17 | | |
| | 12-31-17 | | | | 0.19 | | | | — | | | | 20.97 | | | | 35.92 | | | | 1.15 | | | | 1.15 | | | | 1.15 | | | | 0.27 | | | | 4,030 | | | | 9 | | |
| VY® JPMorgan Mid Cap Value Portfolio | |
Class ADV | |
| | 12-31-21 | | | | 0.75 | | | | — | | | | 19.24 | | | | 29.15 | | | | 1.49 | | | | 1.38 | | | | 1.38 | | | | 0.28 | | | | 93,649 | | | | 22 | | |
| | 12-31-20 | | | | 1.40 | | | | — | | | | 15.51 | | | | 0.08 | | | | 1.51 | | | | 1.38 | | | | 1.38 | | | | 0.58 | | | | 79,036 | | | | 18 | | |
| | 12-31-19 | | | | 2.45 | | | | — | | | | 17.15 | | | | 25.81 | | | | 1.39 | | | | 1.39 | | | | 1.39 | | | | 0.71 | | | | 89,967 | | | | 9 | | |
| | 12-31-18 | | | | 1.84 | | | | — | | | | 15.74 | | | | (12.37 | ) | | | 1.38 | | | | 1.38 | | | | 1.38 | | | | 0.79 | | | | 80,243 | | | | 12 | | |
| | 12-31-17 | | | | 2.01 | | | | — | | | | 19.78 | | | | 13.41 | | | | 1.37 | | | | 1.37 | | | | 1.37 | | | | 0.37 | | | | 99,801 | | | | 10 | | |
Class I | |
| | 12-31-21 | | | | 0.84 | | | | — | | | | 20.00 | | | | 29.79 | | | | 0.99 | | | | 0.88 | | | | 0.88 | | | | 0.77 | | | | 138,540 | | | | 22 | | |
| | 12-31-20 | | | | 1.47 | | | | — | | | | 16.09 | | | | 0.55 | | | | 1.01 | | | | 0.88 | | | | 0.88 | | | | 1.08 | | | | 124,709 | | | | 18 | | |
| | 12-31-19 | | | | 2.54 | | | | — | | | | 17.72 | | | | 26.46 | | | | 0.89 | | | | 0.89 | | | | 0.89 | | | | 1.21 | | | | 150,535 | | | | 9 | | |
| | 12-31-18 | | | | 1.94 | | | | — | | | | 16.18 | | | | (11.96 | ) | | | 0.88 | | | | 0.88 | | | | 0.88 | | | | 1.28 | | | | 144,880 | | | | 12 | | |
| | 12-31-17 | | | | 2.11 | | | | — | | | | 20.30 | | | | 14.04 | | | | 0.87 | | | | 0.87 | | | | 0.87 | | | | 0.87 | | | | 210,989 | | | | 10 | | |
Class S | |
| | 12-31-21 | | | | 0.79 | | | | — | | | | 19.72 | | | | 29.51 | | | | 1.24 | | | | 1.13 | | | | 1.13 | | | | 0.53 | | | | 188,813 | | | | 22 | | |
| | 12-31-20 | | | | 1.44 | | | | — | | | | 15.87 | | | | 0.28 | | | | 1.26 | | | | 1.13 | | | | 1.13 | | | | 0.83 | | | | 169,728 | | | | 18 | | |
| | 12-31-19 | | | | 2.49 | | | | — | | | | 17.51 | | | | 26.21 | | | | 1.14 | | | | 1.14 | | | | 1.14 | | | | 0.96 | | | | 200,304 | | | | 9 | | |
| | 12-31-18 | | | | 1.89 | | | | — | | | | 16.01 | | | | (12.19 | ) | | | 1.13 | | | | 1.13 | | | | 1.13 | | | | 1.03 | | | | 187,165 | | | | 12 | | |
| | 12-31-17 | | | | 2.06 | | | | — | | | | 20.10 | | | | 13.72 | | | | 1.12 | | | | 1.12 | | | | 1.12 | | | | 0.61 | | | | 256,845 | | | | 10 | | |
Class S2 | |
| | 12-31-21 | | | | 0.79 | | | | — | | | | 19.17 | | | | 29.29 | | | | 1.39 | | | | 1.28 | | | | 1.28 | | | | 0.43 | | | | 1,996 | | | | 22 | | |
| | 12-31-20 | | | | 1.41 | | | | — | | | | 15.47 | | | | 0.18 | | | | 1.41 | | | | 1.28 | | | | 1.28 | | | | 0.69 | | | | 1,340 | | | | 18 | | |
| | 12-31-19 | | | | 2.46 | | | | — | | | | 17.10 | | | | 25.96 | | | | 1.29 | | | | 1.29 | | | | 1.29 | | | | 0.81 | | | | 1,782 | | | | 9 | | |
| | 12-31-18 | | | | 1.86 | | | | — | | | | 15.69 | | | | (12.30 | ) | | | 1.28 | | | | 1.28 | | | | 1.28 | | | | 0.86 | | | | 2,116 | | | | 12 | | |
| | 12-31-17 | | | | 2.03 | | | | — | | | | 19.72 | | | | 13.52 | | | | 1.27 | | | | 1.27 | | | | 1.27 | | | | 0.45 | | | | 3,382 | | | | 10 | | |
| VY® T. Rowe Price Diversified Mid Cap Growth Portfolio | |
Class ADV | |
| | 12-31-21 | | | | 2.45 | | | | — | | | | 12.43 | | | | 13.24 | | | | 1.34 | | | | 1.30 | | | | 1.30 | | | | (0.91 | ) | | | 76,149 | | | | 31 | | |
| | 12-31-20 | | | | 1.06 | | | | — | | | | 13.16 | | | | 31.26 | | | | 1.37 | | | | 1.30 | | | | 1.30 | | | | (0.49 | ) | | | 64,622 | | | | 53 | | |
| | 12-31-19 | | | | 1.31 | | | | — | | | | 11.00 | | | | 36.56 | | | | 1.27 | | | | 1.27 | | | | 1.27 | | | | (0.28 | ) | | | 90,526 | | | | 16 | | |
| | 12-31-18 | | | | 1.16 | | | | — | | | | 9.08 | | | | (3.77 | ) | | | 1.27 | | | | 1.27 | | | | 1.27 | | | | (0.14 | ) | | | 61,179 | | | | 19 | | |
| | 12-31-17 | | | | 0.83 | | | | — | | | | 10.50 | | | | 24.12 | | | | 1.27 | | | | 1.27 | | | | 1.27 | | | | (0.32 | ) | | | 62,022 | | | | 28 | | |
See Accompanying Notes to Financial Statements
50
FINANCIAL HIGHLIGHTS (CONTINUED)
Selected data for a share of beneficial interest outstanding throughout each year or period.
| | | | | Income (loss)
from investment
operations | | | | Less distributions | |
| | | Net asset value, beginning of year or period | | Net investment income (loss) | | Net realized and unrealized gain (loss) | | Total from investment operations | | From net investment income | | From net realized gains | | From return of capital | |
Year or period ended | | ($) | | ($) | | ($) | | ($) | | ($) | | ($) | | ($) | |
| VY® T. Rowe Price Diversified Mid Cap Growth Portfolio (continued) | | | |
Class I | | | |
| | 12-31-21 | | | | 15.20 | | | | (0.06 | )• | | | 2.13 | | | | 2.07 | | | | 0.00 | * | | | 2.45 | | | | — | | |
| | 12-31-20 | | | | 12.50 | | | | (0.01 | ) | | | 3.77 | | | | 3.76 | | | | 0.01 | | | | 1.05 | | | | — | | |
| | 12-31-19 | | | | 10.14 | | | | 0.03 | | | | 3.65 | | | | 3.68 | | | | 0.04 | | | | 1.28 | | | | — | | |
| | 12-31-18 | | | | 11.56 | | | | 0.04 | | | | (0.28 | ) | | | (0.24 | ) | | | 0.02 | | | | 1.16 | | | | — | | |
| | 12-31-17 | | | | 10.03 | | | | 0.02 | | | | 2.38 | | | | 2.40 | | | | 0.07 | | | | 0.80 | | | | — | | |
Class R6 | | | |
| | 12-31-21 | | | | 15.22 | | | | (0.06 | )• | | | 2.13 | | | | 2.07 | | | | 0.00 | * | | | 2.45 | | | | — | | |
| | 12-31-20 | | | | 12.51 | | | | (0.01 | ) | | | 3.78 | | | | 3.77 | | | | 0.01 | | | | 1.05 | | | | — | | |
| | 12-31-19 | | | | 10.14 | | | | 0.02 | | | | 3.67 | | | | 3.69 | | | | 0.04 | | | | 1.28 | | | | — | | |
| | 12-31-18 | | | | 11.56 | | | | 0.03 | | | | (0.27 | ) | | | (0.24 | ) | | | 0.02 | | | | 1.16 | | | | — | | |
| | 12-31-17 | | | | 10.03 | | | | 0.02 | • | | | 2.38 | | | | 2.40 | | | | 0.07 | | | | 0.80 | | | | — | | |
Class S | | | |
| | 12-31-21 | | | | 14.40 | | | | (0.10 | )• | | | 2.03 | | | | 1.93 | | | | — | | | | 2.45 | | | | — | | |
| | 12-31-20 | | | | 11.93 | | | | (0.03 | ) | | | 3.56 | | | | 3.53 | | | | 0.01 | | | | 1.05 | | | | — | | |
| | 12-31-19 | | | | 9.74 | | | | (0.00 | )* | | | 3.50 | | | | 3.50 | | | | 0.03 | | | | 1.28 | | | | — | | |
| | 12-31-18 | | | | 11.15 | | | | 0.02 | | | | (0.27 | ) | | | (0.25 | ) | | | — | | | | 1.16 | | | | — | | |
| | 12-31-17 | | | | 9.71 | | | | (0.01 | )• | | | 2.30 | | | | 2.29 | | | | 0.05 | | | | 0.80 | | | | — | | |
Class S2 | | | |
| | 12-31-21 | | | | 13.28 | | | | (0.11 | )• | | | 1.85 | | | | 1.74 | | | | — | | | | 2.45 | | | | — | | |
| | 12-31-20 | | | | 11.08 | | | | (0.05 | ) | | | 3.31 | | | | 3.26 | | | | 0.01 | | | | 1.05 | | | | — | | |
| | 12-31-19 | | | | 9.13 | | | | (0.02 | ) | | | 3.28 | | | | 3.26 | | | | 0.03 | | | | 1.28 | | | | — | | |
| | 12-31-18 | | | | 10.54 | | | | (0.01 | ) | | | (0.24 | ) | | | (0.25 | ) | | | — | | | | 1.16 | | | | — | | |
| | 12-31-17 | | | | 9.22 | | | | (0.02 | ) | | | 2.18 | | | | 2.16 | | | | 0.04 | | | | 0.80 | | | | — | | |
| VY® T. Rowe Price Growth Equity Portfolio | | | |
Class ADV | | | |
| | 12-31-21 | | | | 93.76 | | | | (0.92 | )• | | | 19.06 | | | | 18.14 | | | | — | | | | 9.55 | | | | — | | |
| | 12-31-20 | | | | 71.90 | | | | (0.61 | ) | | | 25.93 | | | | 25.32 | | | | — | | | | 3.46 | | | | — | | |
| | 12-31-19 | | | | 70.96 | | | | (0.31 | ) | | | 20.51 | | | | 20.20 | | | | — | | | | 19.26 | | | | — | | |
| | 12-31-18 | | | | 86.22 | | | | (0.20 | )• | | | 0.81 | | | | 0.61 | | | | — | | | | 15.87 | | | | — | | |
| | 12-31-17 | | | | 72.53 | | | | (0.23 | ) | | | 23.41 | | | | 23.18 | | | | — | | | | 9.49 | | | | — | | |
Class I | | | |
| | 12-31-21 | | | | 107.26 | | | | (0.48 | )• | | | 21.89 | | | | 21.41 | | | | — | | | | 9.55 | | | | — | | |
| | 12-31-20 | | | | 81.43 | | | | (0.24 | ) | | | 29.53 | | | | 29.29 | | | | — | | | | 3.46 | | | | — | | |
| | 12-31-19 | | | | 78.04 | | | | 0.07 | | | | 22.75 | | | | 22.82 | | | | 0.17 | | | | 19.26 | | | | — | | |
| | 12-31-18 | | | | 93.19 | | | | 0.24 | | | | 0.71 | | | | 0.95 | | | | 0.23 | | | | 15.87 | | | | — | | |
| | 12-31-17 | | | | 77.44 | | | | 0.19 | | | | 25.10 | | | | 25.29 | | | | 0.05 | | | | 9.49 | | | | — | | |
Class S | | | |
| | 12-31-21 | | | | 100.68 | | | | (0.72 | )• | | | 20.51 | | | | 19.79 | | | | — | | | | 9.55 | | | | — | | |
| | 12-31-20 | | | | 76.79 | | | | (0.42 | )• | | | 27.77 | | | | 27.35 | | | | — | | | | 3.46 | | | | — | | |
| | 12-31-19 | | | | 74.54 | | | | (0.15 | )• | | | 21.66 | | | | 21.51 | | | | — | | | | 19.26 | | | | — | | |
| | 12-31-18 | | | | 89.69 | | | | 0.00 | * | | | 0.76 | | | | 0.76 | | | | 0.04 | | | | 15.87 | | | | — | | |
| | 12-31-17 | | | | 74.96 | | | | (0.03 | ) | | | 24.25 | | | | 24.22 | | | | — | | | | 9.49 | | | | — | | |
Class S2 | | | |
| | 12-31-21 | | | | 95.99 | | | | (0.85 | )• | | | 19.55 | | | | 18.70 | | | | — | | | | 9.55 | | | | — | | |
| | 12-31-20 | | | | 73.47 | | | | (0.51 | )• | | | 26.49 | | | | 25.98 | | | | — | | | | 3.46 | | | | — | | |
| | 12-31-19 | | | | 72.10 | | | | (0.27 | )• | | | 20.90 | | | | 20.63 | | | | — | | | | 19.26 | | | | — | | |
| | 12-31-18 | | | | 87.30 | | | | (0.12 | )• | | | 0.79 | | | | 0.67 | | | | — | | | | 15.87 | | | | — | | |
| | 12-31-17 | | | | 73.27 | | | | (0.16 | )• | | | 23.68 | | | | 23.52 | | | | — | | | | 9.49 | | | | — | | |
| | | | | Ratios to average net assets | | Supplemental
data | |
| | | Total distributions | | Payment by affiliate | | Net asset value, end of year or period | | Total Return(1) | | Expenses before reductions/additions(2)(3)(4) | | Expenses net of fee waivers and/or recoupments if any(2)(3)(4) | | Expenses net of all reductions/additions(2)(3)(4) | | Net investment income (loss)(2)(3) | | Net assets, end of year or period | | Portfolio turnover rate | |
Year or period ended | | ($) | | ($) | | ($) | | (%) | | (%) | | (%) | | (%) | | (%) | | ($000's) | | (%) | |
| VY® T. Rowe Price Diversified Mid Cap Growth Portfolio (continued) | |
Class I | |
| | 12-31-21 | | | | 2.45 | | | | — | | | | 14.82 | | | | 13.80 | | | | 0.84 | | | | 0.80 | | | | 0.80 | | | | (0.41 | ) | | | 1,214,371 | | | | 31 | | |
| | 12-31-20 | | | | 1.06 | | | | — | | | | 15.20 | | | | 31.84 | | | | 0.87 | | | | 0.80 | | | | 0.80 | | | | (0.07 | ) | | | 1,179,581 | | | | 53 | | |
| | 12-31-19 | | | | 1.32 | | | | — | | | | 12.50 | | | | 37.20 | | | | 0.77 | | | | 0.77 | | | | 0.77 | | | | 0.21 | | | | 985,213 | | | | 16 | | |
| | 12-31-18 | | | | 1.18 | | | | — | | | | 10.14 | | | | (3.23 | ) | | | 0.77 | | | | 0.77 | | | | 0.77 | | | | 0.36 | | | | 763,686 | | | | 19 | | |
| | 12-31-17 | | | | 0.87 | | | | — | | | | 11.56 | | | | 24.81 | | | | 0.77 | | | | 0.77 | | | | 0.77 | | | | 0.18 | | | | 879,678 | | | | 28 | | |
Class R6 | |
| | 12-31-21 | | | | 2.45 | | | | — | | | | 14.84 | | | | 13.80 | | | | 0.76 | | | | 0.76 | | | | 0.76 | | | | (0.37 | ) | | | 118,927 | | | | 31 | | |
| | 12-31-20 | | | | 1.06 | | | | — | | | | 15.22 | | | | 31.90 | | | | 0.77 | | | | 0.77 | | | | 0.77 | | | | (0.13 | ) | | | 109,585 | | | | 53 | | |
| | 12-31-19 | | | | 1.32 | | | | — | | | | 12.51 | | | | 37.31 | | | | 0.77 | | | | 0.77 | | | | 0.77 | | | | 0.24 | | | | 30,761 | | | | 16 | | |
| | 12-31-18 | | | | 1.18 | | | | — | | | | 10.14 | | | | (3.24 | ) | | | 0.77 | | | | 0.77 | | | | 0.77 | | | | 0.38 | | | | 15,642 | | | | 19 | | |
| | 12-31-17 | | | | 0.87 | | | | — | | | | 11.56 | | | | 24.81 | | | | 0.77 | | | | 0.77 | | | | 0.77 | | | | 0.18 | | | | 9,313 | | | | 28 | | |
Class S | |
| | 12-31-21 | | | | 2.45 | | | | — | | | | 13.88 | | | | 13.58 | | | | 1.09 | | | | 1.05 | | | | 1.05 | | | | (0.66 | ) | | | 45,922 | | | | 31 | | |
| | 12-31-20 | | | | 1.06 | | | | — | | | | 14.40 | | | | 31.42 | | | | 1.12 | | | | 1.05 | | | | 1.05 | | | | (0.30 | ) | | | 49,415 | | | | 53 | | |
| | 12-31-19 | | | | 1.31 | | | | — | | | | 11.93 | | | | 36.88 | | | | 1.02 | | | | 1.02 | | | | 1.02 | | | | (0.04 | ) | | | 47,101 | | | | 16 | | |
| | 12-31-18 | | | | 1.16 | | | | — | | | | 9.74 | | | | (3.44 | ) | | | 1.02 | | | | 1.02 | | | | 1.02 | | | | 0.11 | | | | 42,403 | | | | 19 | | |
| | 12-31-17 | | | | 0.85 | | | | — | | | | 11.15 | | | | 24.46 | | | | 1.02 | | | | 1.02 | | | | 1.02 | | | | (0.07 | ) | | | 55,222 | | | | 28 | | |
Class S2 | |
| | 12-31-21 | | | | 2.45 | | | | — | | | | 12.57 | | | | 13.28 | | | | 1.24 | | | | 1.20 | | | | 1.20 | | | | (0.82 | ) | | | 5,903 | | | | 31 | | |
| | 12-31-20 | | | | 1.06 | | | | — | | | | 13.28 | | | | 31.40 | | | | 1.27 | | | | 1.20 | | | | 1.20 | | | | (0.46 | ) | | | 6,833 | | | | 53 | | |
| | 12-31-19 | | | | 1.31 | | | | — | | | | 11.08 | | | | 36.69 | | | | 1.17 | | | | 1.17 | | | | 1.17 | | | | (0.18 | ) | | | 5,586 | | | | 16 | | |
| | 12-31-18 | | | | 1.16 | | | | — | | | | 9.13 | | | | (3.65 | ) | | | 1.17 | | | | 1.17 | | | | 1.17 | | | | (0.03 | ) | | | 4,094 | | | | 19 | | |
| | 12-31-17 | | | | 0.84 | | | | — | | | | 10.54 | | | | 24.28 | | | | 1.17 | | | | 1.17 | | | | 1.17 | | | | (0.21 | ) | | | 4,103 | | | | 28 | | |
| VY® T. Rowe Price Growth Equity Portfolio | |
Class ADV | |
| | 12-31-21 | | | | 9.55 | | | | — | | | | 102.35 | | | | 19.54 | | | | 1.30 | | | | 1.23 | | | | 1.23 | | | | (0.91 | ) | | | 394,504 | | | | 28 | | |
| | 12-31-20 | | | | 3.46 | | | | — | | | | 93.76 | | | | 36.00 | | | | 1.31 | | | | 1.23 | | | | 1.23 | | | | (0.75 | ) | | | 362,950 | | | | 36 | | |
| | 12-31-19 | | | | 19.26 | | | | — | | | | 71.90 | | | | 30.15 | | | | 1.23 | | | | 1.21 | | | | 1.21 | | | | (0.43 | ) | | | 302,258 | | | | 26 | | |
| | 12-31-18 | | | | 15.87 | | | | — | | | | 70.96 | | | | (1.57 | ) | | | 1.23 | | | | 1.21 | | | | 1.21 | | | | (0.24 | ) | | | 239,404 | | | | 47 | | |
| | 12-31-17 | | | | 9.49 | | | | — | | | | 86.22 | | | | 32.91 | | | | 1.24 | | | | 1.23 | | | | 1.23 | | | | (0.29 | ) | | | 248,624 | | | | 51 | | |
Class I | |
| | 12-31-21 | | | | 9.55 | | | | — | | | | 119.12 | | | | 20.15 | | | | 0.80 | | | | 0.73 | | | | 0.73 | | | | (0.41 | ) | | | 1,742,542 | | | | 28 | | |
| | 12-31-20 | | | | 3.46 | | | | — | | | | 107.26 | | | | 36.68 | | | | 0.81 | | | | 0.73 | | | | 0.73 | | | | (0.25 | ) | | | 1,506,472 | | | | 36 | | |
| | 12-31-19 | | | | 19.43 | | | | — | | | | 81.43 | | | | 30.83 | | | | 0.73 | | | | 0.71 | | | | 0.71 | | | | 0.07 | | | | 1,290,657 | | | | 26 | | |
| | 12-31-18 | | | | 16.10 | | | | — | | | | 78.04 | | | | (1.09 | ) | | | 0.73 | | | | 0.71 | | | | 0.71 | | | | 0.27 | | | | 1,092,998 | | | | 47 | | |
| | 12-31-17 | | | | 9.54 | | | | — | | | | 93.19 | | | | 33.58 | | | | 0.74 | | | | 0.73 | | | | 0.73 | | | | 0.21 | | | | 1,101,965 | | | | 51 | | |
Class S | |
| | 12-31-21 | | | | 9.55 | | | | — | | | | 110.92 | | | | 19.85 | | | | 1.05 | | | | 0.98 | | | | 0.98 | | | | (0.66 | ) | | | 72,845 | | | | 28 | | |
| | 12-31-20 | | | | 3.46 | | | | — | | | | 100.68 | | | | 36.36 | | | | 1.06 | | | | 0.98 | | | | 0.98 | | | | (0.50 | ) | | | 74,335 | | | | 36 | | |
| | 12-31-19 | | | | 19.26 | | | | — | | | | 76.79 | | | | 30.47 | | | | 0.98 | | | | 0.96 | | | | 0.96 | | | | (0.18 | ) | | | 65,359 | | | | 26 | | |
| | 12-31-18 | | | | 15.91 | | | | — | | | | 74.54 | | | | (1.33 | ) | | | 0.98 | | | | 0.96 | | | | 0.96 | | | | 0.01 | | | | 329,427 | | | | 47 | | |
| | 12-31-17 | | | | 9.49 | | | | — | | | | 89.69 | | | | 33.25 | | | | 0.99 | | | | 0.98 | | | | 0.98 | | | | (0.04 | ) | | | 379,473 | | | | 51 | | |
Class S2 | |
| | 12-31-21 | | | | 9.55 | | | | — | | | | 105.14 | | | | 19.68 | | | | 1.20 | | | | 1.13 | | | | 1.13 | | | | (0.81 | ) | | | 6,338 | | | | 28 | | |
| | 12-31-20 | | | | 3.46 | | | | — | | | | 95.99 | | | | 36.13 | | | | 1.21 | | | | 1.13 | | | | 1.13 | | | | (0.64 | ) | | | 5,735 | | | | 36 | | |
| | 12-31-19 | | | | 19.26 | | | | — | | | | 73.47 | | | | 30.27 | | | | 1.13 | | | | 1.11 | | | | 1.11 | | | | (0.33 | ) | | | 9,074 | | | | 26 | | |
| | 12-31-18 | | | | 15.87 | | | | — | | | | 72.10 | | | | (1.47 | ) | | | 1.13 | | | | 1.11 | | | | 1.11 | | | | (0.14 | ) | | | 8,564 | | | | 47 | | |
| | 12-31-17 | | | | 9.49 | | | | — | | | | 87.30 | | | | 33.06 | | | | 1.14 | | | | 1.13 | | | | 1.13 | | | | (0.19 | ) | | | 9,014 | | | | 51 | | |
See Accompanying Notes to Financial Statements
51
FINANCIAL HIGHLIGHTS (CONTINUED)
(1) Total return is calculated assuming reinvestment of all dividends, capital gain distributions and return of capital distributions, if any, at net asset value and does not reflect the effect of insurance contract charges. Total return for periods less than one year is not annualized.
(2) Annualized for periods less than one year.
(3) Ratios reflect operating expenses of a Portfolio. Expenses before reductions/additions do not reflect amounts reimbursed or recouped by the Investment Adviser and/or Distributor or reductions from brokerage service arrangements or other expense offset arrangements and do not represent the amount paid by a Portfolio during periods when reimbursements or reductions occur. Expenses net of fee waivers reflect expenses after reimbursement by the Investment Adviser and/or Distributor or recoupment of previously reimbursed fees by the Investment Adviser, but prior to reductions from brokerage service arrangements or other expense offset arrangements. Expenses net of all reductions/additions represent the net expenses paid by a Portfolio. Net investment income (loss) is net of all such additions or reductions.
(4) Ratios do not include fees and expenses charged under the variable annuity contract or variable life insurance policy.
(a) Excluding amounts from foreign withholding tax claims received in the year ended December 31, 2017, total return for Voya International High Dividend Low Volatility Portfolio would have been 21.38%, 21.98%, 21.63%, and 21.53% for Classes ADV, I, S, and S2, respectively.
• Calculated using average number of shares outstanding throughout the year or period.
* Amount is less than $0.005 or 0.005% or more than $(0.005) or (0.005)%.
See Accompanying Notes to Financial Statements
52
NOTES TO FINANCIAL STATEMENTS AS OF DECEMBER 31, 2021
Voya Partners, Inc. (the "Company") is an open-end management investment company registered under the Investment Company Act of 1940, as amended (the "1940 Act"). It was incorporated under the laws of Maryland on May 7, 1997. The Articles of Incorporation permit the Company to offer separate series, each of which has its own investment objective, policies and restrictions. The Company currently consists of thirty-seven active separate investment series. The twelve series (each, a "Portfolio" and collectively, the "Portfolios") included in this report are: Voya Global Bond Portfolio ("Global Bond"), Voya International High Dividend Low Volatility Portfolio ("International High Dividend Low Volatility"), VY® American Century Small-Mid Cap Value Portfolio ("American Century Small-Mid Cap Value"), VY® Baron Growth Portfolio ("Baron Growth"), VY® Columbia Contrarian Core Portfolio ("Columbia Contrarian Core"), VY® Columbia Small Cap Value II Portfolio ("Columbia Small Cap Value II"), VY® Invesco Comstock Portfolio ("Invesco Comstock"), VY® Invesco Equity and Income Portfolio ("Invesco Equity and Income"), VY® Invesco Global Portfolio ("Invesco Global"), VY® JPMorgan Mid Cap Value Portfolio ("JPMorgan Mid Cap Value"), VY® T. Rowe Price Diversified Mid Cap Growth Portfolio ("T. Rowe Price Diversified Mid Cap Growth") and VY® T. Rowe Price Growth Equity Portfolio ("T. Rowe Price Growth Equity"). Each Portfolio is a diversified series of the Company, except T. Rowe Price Growth Equity, which is non-diversified effective October 7, 2021. Prior to October 7, 2021, T. Row Price Growth Equity was a diversified series of the Company(1). Prior to May 1, 2021, VY® Invesco Global was known as VY® Invesco Oppenheimer Global Portfolio. The investment objective of the Portfolios is described in the respective Portfolio's Prospectus.
The classes of shares included in this report are: Adviser ("Class ADV"), Initial ("Class I"), Class R6, Service ("Class S") and Service 2 ("Class S2"); however, each Portfolio may not offer all share classes. Shares of the Portfolios may be offered to separate accounts ("Separate Accounts") of insurance companies as investment options in connection with variable annuity contracts and variable life insurance policies ("Variable Contracts") and to certain of the Portfolios' investment advisers and their affiliates. In the future, shares may also be offered to qualified pension and retirement plans ("Qualified Plans") outside the Separate Account context. With the exception of class specific matters, each class
has equal voting rights as to voting privileges. For class specific proposals, only the applicable class would have voting privileges. The classes differ principally in the applicable distribution and shareholder service fees, as well as differences in the amount of waiver of fees and reimbursement of expenses, if any. Generally, shareholders of each class also bear certain expenses that pertain to that particular class. All shareholders are allocated the common expenses of a portfolio and earn income and realized gains/losses from a portfolio pro rata based on the daily ending net assets of each class, without distinction between share classes. Distributions are determined separately for each class based on income and expenses allocated to each class. Expenses that are specific to a portfolio or a class are charged directly to that portfolio or class. Other operating expenses shared by several portfolios are generally allocated among those portfolios based on average net assets. Realized gain distributions are allocated to each class pro rata based on the shares outstanding of each class on the date of distribution. Differences in per share dividend rates generally result from differences in separate class expenses, including distribution and shareholder service fees, if any, as well as differences in the amount of waiver of fees and reimbursement of expenses between the separate classes, if any.
Voya Investments, LLC ("Voya Investments" or the "Investment Adviser"), an Arizona limited liability company, serves as the Investment Adviser to the Portfolios. Voya Investment Management Co. LLC ("Voya IM"), a Delaware limited liability company, serves as the sub-adviser to Global Bond and International High Dividend Low Volatility. Voya Investments Distributor, LLC ("VID" or the "Distributor"), a Delaware limited liability company, serves as the principal underwriter to the Portfolios.
NOTE 2 — SIGNIFICANT ACCOUNTING POLICIES
The following significant accounting policies are consistently followed by the Portfolios in the preparation of their financial statements. Each Portfolio is considered an investment company under U.S. generally accepted accounting principles ("GAAP") and follows the accounting and reporting guidance applicable to investment companies.
A. Security Valuation. Each Portfolio is open for business every day the New York Stock Exchange ("NYSE") opens for regular trading (each such day, a "Business Day"). The net asset value ("NAV") per share
(1) During the year ended December 31, 2021, T. Rowe Price Growth Equity incurred $105,950 of proxy and solicitation costs associated with the Portfolio's classification change from diversified to non-diversified.
53
NOTES TO FINANCIAL STATEMENTS AS OF DECEMBER 31, 2021 (CONTINUED)
NOTE 2 — SIGNIFICANT ACCOUNTING POLICIES (continued)
for each class of each Portfolio is determined each Business Day as of the close of the regular trading session ("Market Close"), as determined by the Consolidated Tape Association ("CTA"), the central distributor of transaction prices for exchange-traded securities (normally 4:00 p.m. Eastern time unless otherwise designated by the CTA). The data reflected on the consolidated tape provided by the CTA is generated by various market centers, including all securities exchanges, electronic communications networks, and third-market broker-dealers. The NAV per share of each class of each Portfolio is calculated by taking the value of the Portfolio's assets attributable to that class, subtracting the Portfolio's liabilities attributable to that class, and dividing by the number of shares of that class that are outstanding. On days when a Portfolio is closed for business, Portfolio shares will not be priced and a Portfolio does no transact purchase and redemption orders. To the extent a Portfolio's assets are traded in other markets on days when a Portfolio does not price its shares, the value of a Portfolio's assets will likely change and you will not be able to purchase or redeem shares of a Portfolio.
Assets for which market quotations are readily available are valued at market value. A security listed or traded on an exchange is valued at its last sales price or official closing price as of the close of the regular trading session on the exchange where the security is principally traded or, if such price is not available, at the last sale price as of the Market Close for such security provided by the CTA. Bank loans are valued at the average of the averages of the bid and ask prices provided to an independent loan pricing service by brokers. Futures contracts are valued at the final settlement price set by an exchange on which they are principally traded. Listed options are valued at the mean between the last bid and ask prices from the exchange on which they are principally traded. Investments in open-end registered investment companies that do not trade on an exchange are valued at the end of day NAV per share. Investments in registered investment companies that trade on an exchange are valued at the last sales price or official closing price as of the close of the regular trading session on the exchange where the security is principally traded.
When a market quotation is not readily available or is deemed unreliable, each Portfolio will determine a fair value for the relevant asset in accordance with procedures adopted by the Portfolios' Board of Directors
("Board"). Such procedures provide, for example, that: (a) Exchange-traded securities are valued at the mean of the closing bid and ask; (b) Debt obligations are valued using an evaluated price provided by an independent pricing service. Evaluated prices provided by the pricing service may be determined without exclusive reliance on quoted prices, and may reflect factors such as institution-size trading in similar groups of securities, developments related to specific securities, benchmark yield, quality, type of issue, coupon rate, maturity, individual trading characteristics and other market data; (c) Securities traded in the over-the-counter ("OTC") market are valued based on prices provided by independent pricing services or market makers; (d) Options not listed on an exchange are valued by an independent source using an industry accepted model, such as Black-Scholes; (e) Centrally cleared swap agreements are valued using a price provided by an independent pricing service; (f) OTC swap agreements are valued using a price provided by an independent pricing service; (g) Forward foreign currency exchange contracts are valued utilizing current and forward rates obtained from an independent pricing service. Such prices from the third party pricing service are for specific settlement periods and each Portfolio's forward foreign currency exchange contracts are valued at an interpolated rate between the closest preceding and subsequent period reported by the independent pricing service; and (h) Securities for which market prices are not provided by any of the above methods may be valued based upon quotes furnished by brokers.
The prospectuses of the open-end registered investment companies in which each Portfolio may invest explain the circumstances under which they will use fair value pricing and the effects of using fair value pricing.
Foreign securities' (including forward foreign currency exchange contracts) prices are converted into U.S. dollar amounts using the applicable exchange rates as of Market Close. If market quotations are available and believed to be reliable for foreign exchange-traded equity securities, the securities will be valued at the market quotations. Because trading hours for certain foreign securities end before Market Close, closing market quotations may become unreliable. An independent pricing service determines the degree of certainty, based on historical data, that the closing price in the principal market where a foreign security trades is not the current value as of Market Close. Foreign securities' prices meeting the approved degree of certainty that the price is not reflective of current value will be valued by the independent pricing service using pricing models designed to estimate likely changes in the values of those securities between the times in which the trading in those securities is substantially completed and Market
54
NOTES TO FINANCIAL STATEMENTS AS OF DECEMBER 31, 2021 (CONTINUED)
NOTE 2 — SIGNIFICANT ACCOUNTING POLICIES (continued)
Close. Multiple factors may be considered by the independent pricing service in determining the value of such securities and may include information relating to sector indices, American Depositary Receipts and domestic and foreign index futures.
All other assets for which market quotations are not readily available or became unreliable (or if the above fair valuation methods are unavailable or determined to be unreliable) are valued at fair value as determined in good faith by or under the supervision of the Board following procedures approved by the Board. The Board has delegated to the Investment Adviser responsibility for overseeing the implementation of the Portfolios' valuation procedures; a "Pricing Committee" comprised of employees of the Investment Adviser or its affiliates has responsibility for applying the fair valuation methods set forth in the procedures and, if a fair valuation cannot be determined pursuant to the fair valuation methods, determining the fair value of assets held by the Portfolios. Issuer specific events, transaction price, position size, nature and duration of restrictions on disposition of the security, market trends, bid/ask quotes of brokers and other market data may be reviewed in the course of making a good faith determination of a security's fair value. Valuations change in response to many factors including the historical and prospective earnings of the issuer, the value of the issuer's assets, general economic conditions, interest rates, investor perceptions and market liquidity. Because of the inherent uncertainties of fair valuation, the values used to determine each Portfolio's NAV may materially differ from the value received upon actual sale of those investments. Thus, fair valuation may have an unintended dilutive or accretive effect on the value of shareholders' investments in each Portfolio.
Each investment asset or liability of the Portfolios is assigned a level at measurement date based on the significance and source of the inputs to its valuation. Quoted prices in active markets for identical securities are classified as "Level 1," inputs other than quoted prices for an asset or liability that are observable are classified as "Level 2" and significant unobservable inputs, including the sub-advisers' or Pricing Committee's judgment about the assumptions that a market participant would use in pricing an asset or liability are classified as "Level 3." The inputs used for valuing securities are not necessarily an indication of the risks associated with investing in those securities. Short-term securities of sufficient credit quality are generally considered to be Level 2 securities under applicable
accounting rules. A table summarizing the Portfolios' investments under these levels of classification is included within the Summary Portfolio of Investments.
GAAP requires a reconciliation of the beginning to ending balances for reported fair values that presents changes attributable to total realized and unrealized gains or losses, purchases and sales, and transfers in or out of the Level 3 category during the period. A reconciliation of Level 3 investments within the Summary Portfolio of Investments is presented only when a Portfolio has a significant amount of Level 3 investments.
B. Securities Transactions and Revenue Recognition. Securities transactions are accounted for on the trade date. Realized gains and losses are reported on the basis of identified cost of securities sold. Interest income is recorded on an accrual basis. Dividend income is recorded on the ex-dividend date, or for certain foreign securities, when the information becomes available to the Portfolios. Premium amortization and discount accretion are determined by the effective yield method.
C. Foreign Currency Translation. The books and records of the Portfolios are maintained in U.S. dollars. Any foreign currency amounts are translated into U.S. dollars on the following basis:
(1) Market value of investment securities, other assets and liabilities — at the exchange rates prevailing at Market Close.
(2) Purchases and sales of investment securities, income and expenses — at the rates of exchange prevailing on the respective dates of such transactions.
Although the net assets and the market values are presented at the foreign exchange rates at Market Close, the Portfolios do not isolate the portion of the results of operations resulting from changes in foreign exchange rates on investments from the fluctuations arising from changes in market prices of securities held. Such fluctuations are included with the net realized and unrealized gains or losses from investments. For securities, which are subject to foreign withholding tax upon disposition, liabilities are recorded on the Statements of Assets and Liabilities for the estimated tax withholding based on the securities' current market value. Upon disposition, realized gains or losses on such securities are recorded net of foreign withholding tax.
Reported net realized foreign exchange gains or losses arise from sales of foreign currencies, currency gains or losses realized between the trade and settlement dates on securities transactions, the difference between the amounts of dividends, interest, and foreign withholding
55
NOTES TO FINANCIAL STATEMENTS AS OF DECEMBER 31, 2021 (CONTINUED)
NOTE 2 — SIGNIFICANT ACCOUNTING POLICIES (continued)
tax reclaims recorded on each Portfolio's books, and the U.S. dollar equivalent of the amounts actually received or paid. Net unrealized foreign exchange gains and losses arise from changes in the value of assets and liabilities other than investments in securities, resulting from changes in the exchange rate. Foreign security and currency transactions may involve certain considerations and risks not typically associated with investing in U.S. companies and U.S. government securities. These risks include, but are not limited to, revaluation of currencies and future adverse political and economic developments, which could cause securities and their markets to be less liquid and prices more volatile than those of comparable U.S. companies and U.S. government securities. The foregoing risks are even greater with respect to securities of issuers in emerging markets.
D. Distributions to Shareholders. The Portfolios record distributions to their shareholders on the ex-dividend date. Dividends from net investment income, if any, are declared daily and paid monthly and net capital gains distributions, if any, are declared and paid annually by Global Bond. Dividends from net investment income, if any, are declared and paid semi-annually and net capital gains distributions, if any, are declared and paid annually by Invesco Comstock, Invesco Equity and Income, JPMorgan Mid Cap Value, T. Rowe Price Diversified Mid Cap Growth and T. Rowe Price Growth Equity. For all other Portfolios, dividends from net investment income and net capital gain distributions, if any, are declared and paid annually. The Portfolios may make distributions on a more frequent basis to comply with the distribution requirements of subchapter M of the Internal Revenue Code. The characteristics of income and gains to be distributed are determined in accordance with income tax regulations, which may differ from GAAP for investment companies.
E. Federal Income Taxes. It is the policy of each Portfolio to comply with the requirements of subchapter M of the Internal Revenue Code that are applicable to regulated investment companies and to distribute substantially all of its net investment income and any net realized capital gains to its shareholders. Therefore, a federal income tax or excise tax provision is not required. Management has considered the sustainability of the Portfolios' tax positions taken on federal income tax returns for all open tax years in making this determination. No capital gain distributions shall be made until the capital loss carryforwards have been fully utilized.
The Portfolios may utilize equalization accounting for tax purposes, whereby a portion of redemption payments are treated as distributions of income or gain.
F. Use of Estimates. Management of the Portfolios has made certain estimates and assumptions relating to the reporting of assets, liabilities, income, and expenses to prepare these financial statements in conformity with GAAP for investment companies. Actual results could differ from these estimates.
G. Risk Exposures and the Use of Derivative Instruments. The Portfolios' investment strategies permit the Portfolios to enter into various types of derivatives contracts, including, but not limited to, futures contracts, forward foreign currency exchange contracts, credit default swaps, interest rate swaps, total return swaps, and purchased and written options. In doing so, a Portfolio will employ strategies in differing combinations to permit it to increase or decrease the level of risk, or change the level or types of exposure to risk factors. This may allow a Portfolio to pursue its objectives more quickly, and efficiently than if it were to make direct purchases or sales of securities capable of affecting a similar response to market or credit factors.
In pursuit of its investment objectives, a Portfolio may seek to increase or decrease its exposure to the following market or credit risk factors:
Credit Risk. The price of a bond or other debt instrument is likely to fall if the issuer's actual or perceived financial health deteriorates, whether because of broad economic or issuer-specific reasons. In certain cases, the issuer could be late in paying interest or principal, or could fail to pay its financial obligations altogether.
Equity Risk. Stock prices may be volatile or have reduced liquidity in response to real or perceived impacts of factors including, but not limited to, economic conditions, changes in market interest rates, and political events. Stock markets tend to be cyclical, with periods when stock prices generally rise and periods when stock prices generally decline. Any given stock market segment may remain out of favor with investors for a short or long period of time, and stocks as an asset class may underperform bonds or other asset classes during some periods. Additionally, legislative, regulatory or tax policies or developments in these areas may adversely impact the investment techniques available to a manager, add to costs and impair the ability of a Portfolio to achieve its investment objectives.
Foreign Exchange Rate Risk. To the extent that a Portfolio invests directly in foreign (non-U.S.) currencies or in securities denominated in, or that trade in, foreign (non-U.S.) currencies, it is subject to the risk that those
56
NOTES TO FINANCIAL STATEMENTS AS OF DECEMBER 31, 2021 (CONTINUED)
NOTE 2 — SIGNIFICANT ACCOUNTING POLICIES (continued)
foreign (non-U.S.) currencies will decline in value relative to the U.S. dollar or, in the case of hedging positions, that the U.S. dollar will decline in value relative to the currency being hedged by a Portfolio through foreign currency exchange transactions.
Currency rates may fluctuate significantly over short periods of time. Currency rates may be affected by changes in market interest rates, intervention (or the failure to intervene) by U.S. or foreign governments, central banks or supranational entities such as the International Monetary Fund, by the imposition of currency controls, or other political or economic developments in the United States or abroad.
Interest Rate Risk. With bonds and other fixed rate debt instruments, a rise in market interest rates generally causes values to fall; conversely, values generally rise as market interest rates fall. The higher the credit quality of the instrument, and the longer its maturity or duration, the more sensitive it is likely to be to interest rate risk. In the case of inverse securities, the interest rate paid by the securities is a floating rate, which generally will decrease when the market rate of interest to which the inverse security is indexed increases and will increase when the market rate of interest to which the inverse security is indexed decreases. As of the date of this report, the United States experiences a low interest rate environment, which may increase a Portfolio's exposure to risks associated with rising market interest rates. Rising market interest rates could have unpredictable effects on the markets and may expose fixed-income and related markets to heightened volatility. For a fund that invests in fixed-income securities, an increase in market interest rates may lead to increased redemptions and increased portfolio turnover, which could reduce liquidity for certain investments, adversely affect values, and increase costs. If dealer capacity in fixed-income markets is insufficient for market conditions, it may further inhibit liquidity and increase volatility in the fixed-income markets. Further, recent and potential changes in government policy may affect interest rates.
Risks of Investing in Derivatives. A Portfolio's use of derivatives can result in losses due to unanticipated changes in the market or credit risk factors and the overall market. In instances where a Portfolio is using derivatives to decrease, or hedge, exposures to market or credit risk factors for securities held by a Portfolio, there are also risks that those derivatives may not perform as expected resulting in losses for the combined or hedged positions.
Derivative instruments are subject to a number of risks, including the risk of changes in the market price of the underlying securities, credit risk with respect to the counterparty, risk of loss due to changes in market interest rates and liquidity and volatility risk. The amounts required to purchase certain derivatives may be small relative to the magnitude of exposure assumed by a Portfolio. Therefore, the purchase of certain derivatives may have an economic leveraging effect on a Portfolio and exaggerate any increase or decrease in the NAV. Derivatives may not perform as expected, so a Portfolio may not realize the intended benefits. When used for hedging purposes, the change in value of a derivative may not correlate as expected with the currency, security or other risk being hedged. When used as an alternative or substitute for direct cash investments, the return provided by the derivative may not provide the same return as direct cash investment. In addition, given their complexity, derivatives expose a Portfolio to the risk of improper valuation.
Generally, derivatives are sophisticated financial instruments whose performance is derived, at least in part, from the performance of an underlying asset or assets. Derivatives include, among other things, swap agreements, options, forwards and futures. Investments in derivatives are generally negotiated OTC with a single counterparty and as a result are subject to credit risks related to the counterparty's ability or willingness to perform its obligations; any deterioration in the counterparty's creditworthiness could adversely affect the value of the derivative. In addition, derivatives and their underlying securities may experience periods of illiquidity which could cause a Portfolio to hold a security it might otherwise sell, or to sell a security it otherwise might hold at inopportune times or at an unanticipated price. A manager might imperfectly judge the direction of the market. For instance, if a derivative is used as a hedge to offset investment risk in another security, the hedge might not correlate to the market's movements and may have unexpected or undesired results such as a loss or a reduction in gains.
Counterparty Credit Risk and Credit Related Contingent Features. Certain derivative positions are subject to counterparty credit risk, which is the risk that the counterparty will not fulfill its obligation to a Portfolio. Each Portfolio's derivative counterparties are financial institutions who are subject to market conditions that may weaken their financial position. A Portfolio intends to enter into financial transactions with counterparties it believes to be creditworthy at the time of the transaction. To reduce this risk, a Portfolio has entered into master netting arrangements, established within each Portfolio's International Swap and Derivatives Association, Inc.
57
NOTES TO FINANCIAL STATEMENTS AS OF DECEMBER 31, 2021 (CONTINUED)
NOTE 2 — SIGNIFICANT ACCOUNTING POLICIES (continued)
("ISDA") Master Agreements ("Master Agreements"). These Master Agreements are with select counterparties and they govern transactions, including certain OTC derivative and forward foreign currency contracts, entered into by a Portfolio and the counterparty. The Master Agreements maintain provisions for general obligations, representations, agreements, collateral, and events of default or termination. The occurrence of a specified event of termination may give a counterparty the right to terminate all of its contracts and affect settlement of all outstanding transactions under the applicable Master Agreement.
A Portfolio may also enter into collateral agreements with certain counterparties to further mitigate counterparty credit risk on OTC derivative and forward foreign currency contracts. Subject to established minimum levels, collateral is generally determined based on the net aggregate unrealized gain or loss on contracts with a certain counterparty. Collateral pledged to or from a Portfolio is held in a segregated account by a third-party agent and can be in the form of cash or debt securities issued by the U.S. government or related agencies.
As of December 31, 2021, the maximum amount of loss that Global Bond, Invesco Comstock, and Invesco Equity and Income would incur if the counterparties to its derivative transactions failed to perform would be $1,719,925, $4,727 and $28,364, respectively, which represents the gross payments to be received by the Portfolios on open forward foreign currency contracts, purchased options and OTC total return swaps were they to be unwound as of December 31, 2021. There was no cash collateral received by any Portfolios at December 31, 2021.
Each Portfolio has credit related contingent features that if triggered would allow its derivative counterparties to close out and demand payment or additional collateral to cover their exposure from a Portfolio. Credit related contingent features are established between each Portfolio and their derivatives counterparties to reduce the risk that a Portfolio will not fulfill its payment obligations to its counterparties. These triggering features include, but are not limited to, a percentage decrease in a Portfolio's net assets and/or a percentage decrease in a Portfolio's NAV, which could cause a Portfolio to accelerate payment of any net liability owed to the counterparty. The contingent features are established within each Portfolio's Master Agreements.
As of December 31, 2021, Global Bond, International High Dividend Low Volatility, Invesco Comstock, and
Invesco Equity and Income had a liability position of $2,134,254, $371, $52,328, and $433,668, respectively, on open forward foreign currency contracts, OTC written options, OTC volatility swaps and OTC total return swaps with credit related contingent features. If a contingent feature would have been triggered as of December 31, 2021, the Portfolios could have been required to pay this amount in cash to its counterparties. As of December 31, 2021, Global Bond had pledged $640,000 in cash collateral for open OTC derivatives transactions with its respective counterparties. There was no cash collateral pledged by any other Portfolio at December 31, 2021.
As of December 31, 2021, American Century Small-Mid Cap Value had not entered into any Master Agreements.
H. Forward Foreign Currency Contracts. Certain Portfolios may enter into forward foreign currency contracts primarily to hedge against foreign currency exchange rate risks on their non-U.S. dollar denominated investment securities. When entering into a forward currency contract, a Portfolio agrees to receive or deliver a fixed quantity of foreign currency for an agreed-upon price on an agreed future date. These contracts are valued daily and a Portfolio's net equity therein, representing unrealized gain or loss on the contracts as measured by the difference between the forward foreign exchange rates at the dates of entry into the contracts and the forward rates at the reporting date, is included in the Statement of Assets and Liabilities. Realized and unrealized gains and losses are included in the Statement of Operations. These instruments involve market and/or credit risk in excess of the amount recognized in the Statement of Assets and Liabilities. Risks arise from the possible inability of counterparties to meet the terms of their contracts and from movement in currency and securities values and interest rates. Open forward foreign currency contracts are presented following the Summary Portfolio of Investments.
During the year ended December 31, 2021, the following Portfolios had average contract amounts on forward foreign currency contracts purchased and sold as disclosed below:
| | | Purchased | | Sold | |
Global Bond* | | $ | 160,224,043 | | | $ | 93,967,224 | | |
International High Dividend
Low Volatility** | | | — | | | | 193,130 | | |
American Century Small-Mid Cap
Value** | | | 376,804 | | | | 19,051,272 | | |
Invesco Comstock** | | | 551,807 | | | | 6,005,767 | | |
Invesco Equity and Income** | | | 1,864,553 | | | | 38,747,816 | | |
Invesco Global** | | | — | | | | 1,599,586 | | |
T. Rowe Price Growth Equity** | | | — | | | | 268,602 | | |
* For the year ended December 31, 2021, the Portfolio used forward foreign currency contracts primarily to protect any non-U.S. dollar-denominated holdings from adverse currency movements and to
58
NOTES TO FINANCIAL STATEMENTS AS OF DECEMBER 31, 2021 (CONTINUED)
NOTE 2 — SIGNIFICANT ACCOUNTING POLICIES (continued)
gain exposure to currencies for the purposes of risk management or enhanced return. Please refer to the tables within the Portfolio of Investments for open forward foreign currency contracts at December 31, 2021.
** For the year ended December 31, 2021, the Portfolios used forward foreign currency contracts primarily to protect any non-U.S. dollar-denominated holdings from adverse currency movements. Please refer to the tables within each respective Portfolio of Investments for open forward foreign currency contracts at December 31, 2021. Invesco Global and T.Rowe Price Growth Equity did not have any open forward foreign currency contracts at December 31, 2021.
I. Futures Contracts. Certain Portfolios may enter into futures contracts involving foreign currency, interest rates, securities and security indices. A futures contract is a commitment to buy or sell a specific amount of a financial instrument at a negotiated price on a stipulated future date. A Portfolio may buy and sell futures contracts. Futures contracts traded on a commodities or futures exchange will be valued at the final settlement price or official closing price on the principal exchange as reported by such principal exchange at its trading session ending at, or most recently prior to, the time when each Portfolio's assets are valued.
Upon entering into a futures contract, a Portfolio is required to deposit either cash or securities (initial margin) in an amount equal to a certain percentage of the contract value. Subsequent payments (variation margin) are made or received by a Portfolio each day. The variation margin payments are equal to the daily changes in the contract value and are recorded as unrealized gains and losses and, if any, shown as variation margin receivable or payable on futures contracts on the Statement of Assets and Liabilities. Open futures contracts are reported on a table following each Portfolio's Summary Portfolio of Investments. Securities held in collateralized accounts to cover initial margin requirements on open futures contracts are footnoted in the Summary Portfolio of Investments. Cash collateral held by the broker to cover initial margin requirements on open futures contracts are noted in the Statements of Assets and Liabilities. The net change in unrealized appreciation and depreciation is reported in the Statements of Operations. Realized gains (losses) are reported in the Statements of Operations at the closing or expiration of futures contracts.
Futures contracts are exposed to the market risk factor of the underlying financial instrument. During the year ended December 31, 2021, Global Bond had purchased and sold futures contracts on various notes and bonds as part of their respective duration strategy. Additional associated risks of entering into futures contracts include the possibility that there may be an illiquid market where
each Portfolio is unable to liquidate the contract or enter into an offsetting position and, if used for hedging purposes, the risk that the price of the contract will correlate imperfectly with the prices of each Portfolios' securities. With futures, there is minimal counterparty credit risk to the Portfolios since futures are exchange traded and the exchange's clearinghouse, as counterparty to all exchange traded futures, guarantees the futures against default.
During the year ended December 31, 2021, Global Bond had an average notional value of $45,665,132 and $31,663,583 on futures contracts purchased and sold, respectively. Please refer to the table within the Portfolio of Investments for open futures contracts at December 31, 2021.
J. Securities Lending. Each Portfolio may temporarily loan up to 331/3% of its total assets to brokers, dealers or other financial institutions in exchange for a negotiated lender's fee. Securities lending involves two primary risks: "investment risk" and "borrower default risk." When lending securities, the Portfolios will receive cash or U.S. government securities as collateral. Investment risk is the risk that the Portfolios will lose money from the investment of the cash collateral received from the borrower. Borrower default risk is the risk that the Portfolios will lose money due to the failure of a borrower to return a borrowed security. Loans are subject to termination at the option of the borrower or the Portfolios. Securities lending may result in leverage. The use of leverage may exaggerate any increase or decrease in the NAV, causing the Portfolios to be more volatile. The use of leverage may increase expenses and increase the impact of the Portfolios' other risks.
K. Restricted Securities. The Portfolios may invest in restricted securities which include those sold under Rule 144A of the Securities Act of 1933, as amended ("1933 Act") or securities offered pursuant to Section 4(a)(2) of the 1933 Act, and/or are subject to legal or contractual restrictions on resale and may not be publicly sold without registration under the 1933 Act. Restricted securities are fair valued using market quotations when readily available. In the absence of market quotations, the securities are valued based upon their fair value determined in good faith under procedures approved by the Board.
Securities that are not registered for sale to the public under the 1933 Act are referred to as "restricted securities." These securities may be sold in private placement transactions between issuers and their purchasers and may be neither listed on an exchange nor traded in other established markets. Many times these securities are subject to legal or contractual restrictions
59
NOTES TO FINANCIAL STATEMENTS AS OF DECEMBER 31, 2021 (CONTINUED)
NOTE 2 — SIGNIFICANT ACCOUNTING POLICIES (continued)
on resale. As a result of the absence of a public trading market, the prices of these securities may be more volatile, less liquid and more difficult to value than publicly traded securities. The price realized from the sale of these securities could be less than the amount originally paid or less than their fair value if they are resold in privately negotiated transactions. In addition, these securities may not be subject to disclosure and other investment protection requirements that are afforded to publicly traded securities. Certain investments may include investment in smaller, less seasoned issuers, which may involve greater risk.
L. Delayed-Delivery and When-Issued Transactions. Certain Portfolios may purchase or sell securities on a when-issued or forward commitment basis. The price of the underlying securities and date when the securities will be delivered and paid for are fixed at the time the transaction is negotiated. The fair value of such is identified in the Portfolios' Summary Portfolio of Investments. Losses may arise due to changes in the fair value of the securities or from the inability of counterparties to meet the terms of the contract. In connection with such purchases, the Portfolios are required to hold liquid assets as collateral with the Portfolios' custodian sufficient to cover the purchase price.
To mitigate counterparty risk, certain Portfolios have entered into Master Securities Forward Transaction Agreements ("MSFTA") with their respective counterparties that provide for collateral and the right to offset amounts due to or from those counterparties under specified conditions. Subject to minimum transfer amounts, collateral requirements are determined and transfers made based on the net aggregate unrealized gain or loss on all the when-issued or delayed-delivery transactions with a particular counterparty. Cash collateral, if any, is presented on the Statement of Assets and Liabilities as an asset (Cash pledged as collateral for delayed-delivery or when-issued securities) and a liability (Cash received as collateral for delayed-delivery or when-issued securities). At December 31, 2021, there was no cash collateral pledged to or received by any Portfolio.
M. Mortgage Dollar Roll Transactions. Certain Portfolios may engage in dollar roll transactions with respect to mortgage-backed securities issued by Government National Mortgage Association, Federal National Mortgage Association and Federal Home Loan Mortgage Corp. In a dollar roll transaction, a Portfolio sells a mortgage-backed security to a financial institution, such as a bank or broker/dealer, and simultaneously
agrees to repurchase a substantially similar (i.e., same type, coupon, and maturity) security from the institution on a delayed delivery basis at an agreed upon price. The mortgage-backed securities that are repurchased will bear the same interest rate as those sold, but generally will be collateralized by different pools of mortgages with different prepayment histories. The Portfolios account for dollar roll transactions as purchases and sales. For fee based dollar roll transactions, the fee is recorded as income.
N. Options Contracts. Certain Portfolios may purchase put and call options and may write (sell) put options and covered call options on futures, swaps ("swaptions"), securities, commodities or foreign currencies. The Portfolios may engage in option transactions as a hedge against adverse movements in the value of portfolio holdings or to increase market exposure. Option contracts are valued daily and unrealized gains or losses are recorded based upon the last sales price on the principal exchange on which the options are traded. An amount equal to the proceeds of the premium received by the Portfolios upon the writing of a put or call option is included in the Statements of Assets and Liabilities as an asset and equivalent liability which is subsequently marked-to-market until it is exercised or closed, or it expires. Forward premium swaptions include premiums that have extended settlement dates. The delayed settlement of the premiums is factored into the daily valuation of the option contracts. Premiums received from writing options which expire are treated as realized gains. The Portfolios will realize a gain or loss upon the expiration or closing of the option contract. When an option is exercised, the proceeds on sales of the underlying security for a written call option, the purchase cost of the security for a written put option, or the cost of the security for a purchased put or call option is adjusted by the amount of premium received or paid. Realized and unrealized gains or losses on option contracts are reflected in the accompanying financial statements. The risk in writing a covered call option is that the Portfolios give up the opportunity for profit if the market price of the security increases and the option is exercised. The risk in writing a put option is that the Portfolios may incur a loss if the market price of the security decreases and the option is exercised. The risk in buying an option is that the Portfolios pay a premium whether or not the option is exercised. Risks may also arise from an illiquid secondary market or from the inability of counterparties to meet the terms of the contract.
During the year ended December 31, 2021, Global Bond had purchased and written interest rate swaptions with an average notional value of $3,569,373 and $12,684,481, respectively, to gain additional exposure to interest rates
60
NOTES TO FINANCIAL STATEMENTS AS OF DECEMBER 31, 2021 (CONTINUED)
NOTE 2 — SIGNIFICANT ACCOUNTING POLICIES (continued)
and to generate income. Please refer to the tables within the Portfolio of Investments for open written interest swaptions at December 31, 2021. There were no open purchased interest rate swaptions at December 31, 2021.
During the year ended December 31, 2021, Global Bond had purchased and written foreign currency options with an average notional value of $6,904,750 and $4,384,000, respectively, to gain exposure to foreign currencies and to generate income. There were no open purchased and written foreign currency options at December 31, 2021.
During the year ended December 31, 2021, Global Bond had purchased credit default swaptions with an average notional value of $3,120,333 to gain exposure to certain credit markets. There were no open purchased credit default swaptions at December 31, 2021.
During the year ended December 31, 2021, Global Bond had purchased and written options on equity indices with an average notional value of $11,618,793 and $6,310,922, respectively, to gain exposure to certain equity markets and to generate income. Please refer to the tables within the Portfolio of Investments for open purchased and written equity options at December 31, 2021.
O. Swap Agreements. Certain Portfolios may enter into swap agreements. A swap is an agreement between two parties pursuant to which each party agrees to make one or more payments to the other at specified future intervals based on the return of an asset (such as a stock, bond or currency) or non-asset reference (such as an interest rate or index). Swap agreements are privately negotiated in the OTC market and may be executed in a multilateral or other trade facility platform, such as a registered commodities exchange ("centrally cleared swaps").
The swap agreement will specify the "notional" amount of the asset or non-asset reference to which the contract relates. Subsequent changes in fair value, if any, are calculated based upon changes in the performance of the asset or non-asset reference multiplied by the notional value of the contract. A Portfolio may enter into credit default, interest rate, total return and currency swaps to manage its exposure to credit, currency and interest rate risk. All outstanding swap agreements are reported following each Portfolio's Summary Portfolio of Investments.
Swaps are marked to market daily using quotations primarily from third party pricing services, registered commodities exchange(s), counterparties or brokers. The
fair value of an OTC swap contract is recorded on each Portfolio's Statements of Assets and Liabilities. Daily changes in the value of centrally cleared swaps, if any, are recorded as variation margin receivable or payable on the Statement of Assets and Liabilities. During the term of the swap, changes in the value of the swap, if any, are recorded as unrealized gains or losses on the Statements of Operations. Upfront payments paid or received on OTC swaps by a Portfolio when entering into the agreements are reported on the Statements of Assets and Liabilities and as a component of the changes in unrealized gains or losses on the Statements of Operations. These upfront payments represent the amounts paid or received when initially entering into the swap agreement to compensate for differences between the stated terms of the swap agreement and the prevailing market conditions. The upfront payments are included as a component in the realized gains or losses on each Portfolio's Statement of Operations upon termination or maturity of the swap. A Portfolio also records net periodic payments paid or received on the swap contract as a realized gain or loss on the Statements of Operations.
In a centrally cleared swap, immediately following execution of the swap agreement, the swap agreement is novated to a central counterparty (the "CCP") and the Portfolio's counterparty on the swap agreement becomes the CCP. The Portfolios are required to interface with the CCP through a broker. Upon entering into a centrally cleared swap, the Portfolios are required to deposit initial margin with the broker in the form of cash or securities in an amount that varies depending on the size and risk profile of the particular swap. Securities deposited as initial margin are footnoted as pledged on the Portfolio of Investments and cash deposited is recorded on the Statements of Assets and Liabilities as cash pledged for centrally cleared swaps. The daily change in valuation of centrally cleared swaps is recorded as a receivable or payable for variation margin in the Statements of Assets and Liabilities. Payments received from (paid to) the counterparty, including at termination, are recorded as realized gain (loss) on the Statements of Operations.
Entering into swap agreements involves the risk that the maximum potential loss of an investment exceeds the current value of the investment as reported on each Portfolio's Statements of Assets and Liabilities. Other risks involve the possibility that the counterparty to the agreements may default on its obligation to perform, that there will be no liquid market for these investments and that unfavorable changes in the market will have a negative impact on the value of the index or securities underlying the respective swap agreement.
61
NOTES TO FINANCIAL STATEMENTS AS OF DECEMBER 31, 2021 (CONTINUED)
NOTE 2 — SIGNIFICANT ACCOUNTING POLICIES (continued)
Credit Default Swap Contracts. A credit default swap is a bilateral agreement between counterparties in which the buyer of the protection agrees to make a stream of periodic payments to the seller of protection in exchange for the right to receive a specified return in the event of a default or other credit event for a referenced entity, obligation or index. As a seller of protection on credit default swaps, a Portfolio will generally receive from the buyer a fixed payment stream based on the notional amount of the swap contract. This fixed payment stream will continue until the swap contract expires or a defined credit event occurs.
A Portfolio is subject to credit risk in the normal course of pursuing its investment objectives. As a seller of protection in a credit default swap, a Portfolio may execute these contracts to manage its exposure to the market or certain sectors of the market. Certain Portfolios may also enter into credit default swaps to speculate on changes in an issuer's credit quality, to take advantage of perceived spread advantages, or to offset an existing short equivalent (i.e. buying protection on an equivalent reference entity).
Certain Portfolios may sell credit default swaps which expose these Portfolios to the risk of loss from credit risk- related events specified in the contract. Although contract specific, credit events are generally defined as bankruptcy, failure to pay, restructuring, obligation acceleration, obligation default or repudiation/moratorium. If a Portfolio is a seller of protection, and a credit event occurs, as defined under the terms of that particular swap agreement, a Portfolio will generally either (i) pay to the buyer an amount equal to the notional amount of the swap and take delivery of the referenced obligation, other deliverable obligations, or underlying securities comprising a referenced index or (ii) pay a net settlement amount in the form of cash or securities equal to the notional amount of the swap less the recovery value of the referenced obligation or underlying securities comprising a referenced index. If a Portfolio is a buyer of protection and a credit event occurs, as defined under the terms of that particular swap agreement, a Portfolio will either (i) receive from the seller of protection an amount equal to the notional amount of the swap and deliver the referenced obligation, other deliverable obligations or underlying securities comprising the referenced index or (ii) receive a net settlement amount in the form of cash or securities equal to the notional amount of the swap less the recovery value of the referenced obligation or underlying securities comprising the referenced index. Recovery values are assumed by market makers
considering either industry standard recovery rates or entity specific factors and considerations until a credit event occurs. If a credit event has occurred, the recovery value is determined by a facilitated auction whereby a minimum number of allowable broker bids, together with a specified valuation method, are used to calculate the settlement value.
Implied credit spreads, represented in absolute terms, utilized in determining the fair value of credit default swap agreements on corporate issues or sovereign issues are disclosed in each Portfolio's Portfolio of Investments and serve as an indicator of the current status of the payment/performance risk and represent the likelihood or risk of default for the credit derivative. The implied credit spread of a particular referenced entity reflects the cost of buying/selling protection and may include upfront payments required to be made to enter into the agreement. For credit default swaps on asset-backed securities or credit indices, the quoted market prices and resulting fair values serve as the indicator of the current status of the payment/performance risk. Wider credit spreads and increasing fair values, in absolute terms when compared to the notional amount of the swap, represent a deterioration of the referenced entity's credit soundness and a greater likelihood or risk of default or other credit event occurring as defined under the terms of the agreement.
The maximum amount of future payments (undiscounted) that a Portfolio as seller of protection could be required to make under a credit default swap agreement would be an amount equal to the notional amount of the agreement. These potential amounts would be partially offset by any recovery values of the respective referenced obligations, upfront payments received upon entering into the agreements, or net amounts received from the settlement of buy protection credit default swap agreements entered into by a Portfolio for the same referenced entity or entities.
During the year ended December 31, 2021, Global Bond bought credit protection on credit default swap indices ("CDX") with an average notional amount of $1,420,000 to hedge the credit risk associated with various sectors within the credit market. A CDX is a basket of credit instruments or exposures designed to be representative of some part of the credit market as a whole.
During the year ended December 31, 2021, Global Bond sold credit protection on credit default swap indices ("CDX") with an average notional amount of $1,600,000 to gain additional exposure to the various sectors of the credit market. A CDX is a basket of credit instruments or
62
NOTES TO FINANCIAL STATEMENTS AS OF DECEMBER 31, 2021 (CONTINUED)
NOTE 2 — SIGNIFICANT ACCOUNTING POLICIES (continued)
exposures designed to be representative of some part of the credit market as a whole.
There were no open credit default swaps to buy or sell protection at December 31, 2021.
Interest Rate Swap Contracts. An interest rate swap involves the agreement between counterparties to exchange periodic payments based on interest rates. One payment will be based on a floating rate of a specified interest rate while the other will be a fixed rate. Risks involve the future fluctuations of interest rates in which a Portfolio may make payments that are greater than what a Portfolio received from the counterparty. Other risks include credit, liquidity and market risk.
For the year ended December 31, 2021, Global Bond had entered into interest rate swaps in which it pays a floating interest rate and receives a fixed interest rate ("Long interest rate swap") in order to increase exposure to interest rate risk. Average notional amounts on long interest rate swaps was $24,252,400.
For the year ended December 31, 2021, Global Bond had entered into interest rate swaps in which it pays a fixed interest rate and receives a floating interest rate ("Short interest rate swap") in order to decrease exposure to interest rate risk. Average notional amounts on short interest rate swaps was $64,248,282.
Global Bond entered into interest rate swaps to adjust interest rate and yield curve exposures and to substitute for physical fixed-income securities. Please refer to the tables within the Portfolio of Investments for Global Bond for open centrally cleared interest rate swaps at December 31, 2021.
At December 31, 2021, Global Bond had pledged $955,000 in cash collateral for open centrally cleared swaps.
Volatility Swap Contracts. Certain Portfolios may enter into volatility swaps. Volatility swaps are agreements in which the counterparties agree to make payments in connection with changes in the volatility (i.e., the magnitude of change over a specified period of time) of an underlying referenced instrument, such as a currency, rate, index, security or other financial instrument. Volatility swaps permit the parties to attempt to hedge volatility risk and/or take positions on the projected future volatility of an underlying referenced instrument. As a receiver of the realized price volatility, the Portfolio would receive the payoff amount when the realized price volatility of the referenced instrument is greater than the strike and
would owe the payoff amount when the volatility is less than the strike. As a payer of the realized price volatility, the Portfolio would owe the payoff amount when the realized price volatility of the referenced instrument is greater than the strike and would receive the payoff amount when the volatility is less than the strike.
During the year ended December 31, 2021, Global Bond had entered into receiver volatility swaps on foreign currencies with an average notional amount of $3,131,935. Please refer to the Portfolio of Investments for open volatility swaps at December 31, 2021.
Total Return Swap Contracts. Certain Portfolios may enter into total return swaps. Total return swaps are entered into to gain or mitigate exposure to the underlying reference asset. Total return swap agreements involve commitments where single or multiple cash flows are exchanged based on the price of an underlying reference asset and on a fixed or variable interest rate. Total return swap agreements may involve commitments to pay interest in exchange for a market-linked return. One counterparty pays out the total return of a specific underlying reference asset, which may include a single security, a basket of securities, or an index, and in return receives a fixed or variable rate. At the maturity date, a net cash flow is exchanged where the total return is equivalent to the return of the underlying reference asset less a financing rate, if any. As a receiver, a Portfolio would receive payments based on any net positive total return and would owe payments in the event of a net negative total return. As the payer, a Portfolio would owe payments on any net positive total return, and would receive payments in the event of a net negative total return. A Portfolio's use of a total return swap exposes the Portfolio to credit loss in the event of nonperformance by the swap counterparty. Risk may also arise from the unanticipated movements in value of exchange rates, interest rates, securities, or the index.
For the year ended December 31, 2021, Global Bond entered into receiver and payer total return swaps on sovereign bonds with an average notional amount of $19,603,045 and $6,954,707, respectively. Please refer to the Portfolio of Investments for open total return swaps at December 31, 2021.
P. Equity-Linked Notes. Invesco Equity and Income invests in equity-linked notes. Equity-linked notes are hybrid financial instruments that generally combine both debt and equity characteristics into a single note form. Income earned from equity-linked notes is recorded as Interest income in the Statements of Operations and may be based on the performance of an underlying equity security, an equity index, or an option position. The
63
NOTES TO FINANCIAL STATEMENTS AS OF DECEMBER 31, 2021 (CONTINUED)
NOTE 2 — SIGNIFICANT ACCOUNTING POLICIES (continued)
Portfolio records the net change in the fair value of the equity-linked note on the accompanying Statements of Operations as a change in unrealized appreciation or depreciation on investments. The Portfolio records a realized gain or loss on the Statements of Operations upon the sale or maturity of the equity-linked note. The risks of investing in equity-linked notes include unfavorable price movements in the underlying security and the credit risk of the issuing financial institution. There may be no guarantee of a return of principal with equity- linked notes and the appreciation potential may be limited. Equity-linked notes may be more volatile and less liquid than other investments held by the Portfolio. Please refer to the Portfolio of Investments for open equity-linked notes at December 31, 2021.
Q. Structured Notes. Global Bond and Invesco Equity and Income invest in structured notes whose principal payments or interest payments are linked to the performance of underlying foreign currencies, interest rate spreads, stock market indices, prices of individual securities, commodities or other financial instruments or the occurrence of other specific events. The terms and conditions of these notes may be 'structured' by the purchaser (a Portfolio) and the borrower issuing the note. The market value of these notes will increase or decrease based on the performance of the underlying asset or reference. A Portfolio records the net change in the market value of the structured note on the accompanying Statements of Operations as a change in unrealized appreciation or depreciation on investments. A Portfolio records a realized gain or loss on the Statements of Operations upon the sale or maturity of the structured note. Please refer to the Portfolio of Investments for structured notes held by Global Bond and Invesco Equity and Income at December 31, 2021.
R. Indemnifications. In the normal course of business, the Company may enter into contracts that provide certain indemnifications. The Company's maximum exposure under these arrangements is dependent on future claims that may be made against the Portfolios and, therefore, cannot be estimated; however, based on experience, management considers the risk of loss from such claims remote.
NOTE 3 — INVESTMENT TRANSACTIONS
For the year ended December 31, 2021, the cost of purchases and the proceeds from the sales of securities,
excluding U.S. government and short-term securities were as follows:
| | | Purchases | | Sales | |
Global Bond | | $ | 53,279,971 | | | $ | 47,668,595 | | |
International High Dividend
Low Volatility | | | 299,438,874 | | | | 334,291,303 | | |
American Century Small-Mid
Cap Value | | | 208,258,928 | | | | 243,520,473 | | |
Baron Growth | | | 8,981,203 | | | | 70,755,916 | | |
Columbia Contrarian Core | | | 101,646,675 | | | | 106,798,686 | | |
Columbia Small Cap Value II | | | 101,916,723 | | | | 105,200,544 | | |
Invesco Comstock | | | 99,527,071 | | | | 75,339,493 | | |
Invesco Equity and Income | | | 341,490,607 | | | | 571,711,642 | | |
Invesco Global | | | 126,103,055 | | | | 325,030,977 | | |
JPMorgan Mid Cap Value | | | 87,732,781 | | | | 142,991,481 | | |
T. Rowe Price Diversified Mid
Cap Growth | | | 457,963,412 | | | | 604,597,541 | | |
T. Rowe Price Growth Equity | | | 588,919,827 | | | | 734,655,834 | | |
U.S. government securities not included above were as follows:
| | | Purchases | | Sales | |
Global Bond | | $ | 197,400,346 | | | $ | 206,520,026 | | |
Invesco Equity and Income | | | 1,265,316,705 | | | | 1,174,084,957 | | |
NOTE 4 — INVESTMENT MANAGEMENT FEES
The Portfolios have entered into an investment management agreement ("Management Agreement") with the Investment Adviser. The Investment Adviser has overall responsibility for the management of the Portfolios. The Investment Adviser oversees all investment management and portfolio management services for the Portfolios and assists in managing and supervising all aspects of the general day-to-day business activities and operations of the Portfolios, including custodial, transfer agency, dividend disbursing, accounting, auditing, compliance and related services. This Management Agreement compensates the Investment Adviser with a management fee, computed daily and payable monthly, based on the average daily net assets of each Portfolio, at the following annual rates:
Portfolio | | Fee | |
Global Bond(1) | | 0.600% on the first $4 billion; | |
| | | 0.575% on the next $1 billion; | |
| | | 0.550% on the next $1 billion; | |
| | | 0.530% on assets over $6 billion | |
International High Dividend
Low Volatility | | 0.60% on all assets | |
American Century Small-Mid
Cap Value(1) | | 1.10% on the first $250 million; | |
| | | 1.05% on the next $250 million; | |
| | | 1.00% on assets over $500 million | |
Baron Growth | | 0.950% on the first $1 billion; | |
| | | 0.925% on the next $1 billion; | |
| | | 0.900% on assets over $2 billion | |
Columbia Contrarian Core(1) | | 0.90% on the first $500 million; | |
| | | 0.85% on the next $500 million; | |
| | | 0.80% on assets over $1 billion | |
Columbia Small Cap Value II(1) | | 0.85% on all assets | |
Invesco Comstock(2) | | 0.70% on all assets | |
64
NOTES TO FINANCIAL STATEMENTS AS OF DECEMBER 31, 2021 (CONTINUED)
NOTE 4 — INVESTMENT MANAGEMENT FEES (continued)
Portfolio | | Fee | |
Invesco Equity and Income(1) | | 0.65% on the first $750 million; | |
| | | 0.63% on the next $250 million; | |
| | | 0.61% on assets over $1 billion | |
Invesco Global | | 0.70% on the first $3 billion; | |
| | | 0.68% on the next $1 billion; | |
| | | 0.67% on the next $4 billion; | |
| | | 0.66% on assets over $8 billion | |
JPMorgan Mid Cap Value | | 0.85% on the first $500 million; | |
| | | 0.75% on the next $500 million; | |
| | | 0.70% on assets over $1 billion | |
T. Rowe Price Diversified
Mid Cap Growth | | 0.74% on all assets | |
T. Rowe Price Growth Equity(1) | | 0.70% on all assets | |
(1) The Investment Adviser is contractually obligated to waive 0.003%, 0.165%, 0.023%, 0.027%, 0.01% and 0.019% of the management fee for Global Bond, American Century Small-Mid Cap Value, Columbia Contrarian Core, Columbia Small Cap Value II, Invesco Equity and Income, and T. Rowe Price Growth Equity, respectively. Any fees waived or reimbursed are not eligible for recoupment. Termination or modification of this obligation requires approval by the Board.
(2) Prior to January 1, 2021, the Investment Adviser was contractually obligated to waive 0.017% of the management fee for Invesco Comstock. Any fees waived or reimbursed were not eligible for recoupment. Termination of this obligation was approved by the Board.
The Investment Adviser has entered into a sub-advisory agreement with each respective sub-adviser. These sub-advisers provide investment advice for certain Portfolios and are paid by the Investment Adviser based on the average daily net assets of the respective Portfolios. Subject to such policies as the Board or the Investment Adviser may determine, the sub-advisers manage each respective Portfolio's assets in accordance with the Portfolio's investment objectives, policies, and limitations. The sub-advisers of the Portfolios are as follows (*denotes an affiliated sub-adviser):
Portfolio | | Sub-Adviser | |
Global Bond | | Voya Investment Management Co. LLC* | |
International High Dividend Low Volatility | | Voya Investment Management Co. LLC* | |
American Century Small-Mid Cap Value | | American Century Investment Management, Inc. | |
Baron Growth | | BAMCO, Inc. | |
Columbia Contrarian Core & Columbia Small Cap Value II | | Columbia Management Investment Advisers, LLC | |
Invesco Comstock, Invesco Equity and Income & Invesco Global | | Invesco Advisers, Inc. | |
JPMorgan Mid Cap Value | | J.P. Morgan Investment Management Inc. | |
T. Rowe Price Diversified Mid Cap Growth & T. Rowe Price Growth Equity | | T. Rowe Price Associates, Inc. | |
During the year ended December 31, 2021, International High Dividend Low Volatility incurred $31,995 of shareholder notification costs associated with changes to the Portfolio's principal investment strategies.
NOTE 5 — DISTRIBUTION AND SERVICE FEES
Class ADV and Class S2 shares of each respective Portfolio have a plan of distribution (the "Plan"), whereby the Distributor is reimbursed or compensated by the Portfolios for expenses incurred in the distribution of each Portfolio's shares. The Distributor may pay, on behalf of each Portfolio, out of its distribution fee, compensation to certain financial institutions for providing distribution assistance. Under the Plan, a Portfolio makes payments at an annual rate of 0.25% of the Portfolio's average daily net assets attributable to its Class ADV shares and a Portfolio makes payments at an annual rate of 0.15% of the Portfolio's average daily net assets attributable to its Class S2 shares. The Distributor has contractually agreed to waive 0.02% of the distribution fee for Class S2 shares of Invesco Equity and Income. Termination or modification of this obligation requires approval by the Board.
Class ADV, Class S and Class S2 shares are further subject to a shareholder servicing fee payable to shareholder organizations pursuant to the shareholder servicing plan adopted for Class ADV, Class S and Class S2 shares which shall not exceed an annual rate of 0.25% of the average daily net assets of each class, respectively.
NOTE 6 — OTHER TRANSACTIONS WITH AFFILIATES AND RELATED PARTIES
At December 31, 2021, the following direct or indirect, wholly-owned subsidiaries of Voya Financial, Inc. or affiliated investment companies owned more than 5% of the following Portfolios:
Subsidiary/Affiliated
Investment Company | | Portfolio | | Percentage | |
ReliaStar Life Insurance
Company | | Invesco Comstock | | | 5.59 | % | |
| | | Invesco Global | | | 6.83 | | |
| | | T. Rowe Price Diversified
Mid Cap Growth | | | 11.01 | | |
Security Life of Denver
Insurance Company | | Global Bond | | | 8.32 | | |
| | | Columbia Small Cap Value II | | | 5.40 | | |
65
NOTES TO FINANCIAL STATEMENTS AS OF DECEMBER 31, 2021 (CONTINUED)
NOTE 6 — OTHER TRANSACTIONS WITH AFFILIATES AND RELATED PARTIES (continued)
Subsidiary/Affiliated
Investment Company | | Portfolio | | Percentage | |
Voya Institutional Trust
Company | | Global Bond | | | 14.09 | % | |
| | | International High
Dividend Low Volatility | | | 6.43 | | |
| | | American Century
Small-Mid Cap Value | | | 53.30 | | |
| | | Baron Growth | | | 32.56 | | |
| | | Columbia Contrarian Core | | | 15.36 | | |
| | | Columbia Small Cap Value II | | | 23.25 | | |
| | | Invesco Comstock | | | 11.83 | | |
| | | Invesco Global | | | 15.43 | | |
| | | JPMorgan Mid Cap Value | | | 30.94 | | |
| | | T. Rowe Price Diversified
Mid Cap Growth | | | 14.73 | | |
| | | T. Rowe Price Growth Equity | | | 29.11 | | |
Voya Retirement Insurance
and Annuity Company | | Global Bond | | | 70.79 | | |
| | | International High
Dividend Low Volatility | | | 25.01 | | |
| | | American Century
Small-Mid Cap Value | | | 44.28 | | |
| | | Baron Growth | | | 61.26 | | |
| | | Columbia Contrarian Core | | | 13.99 | | |
| | | Columbia Small Cap Value II | | | 29.25 | | |
| | | Invesco Comstock | | | 31.05 | | |
| | | Invesco Equity and Income | | | 37.00 | | |
| | | Invesco Global | | | 66.96 | | |
| | | JPMorgan Mid Cap Value | | | 39.58 | | |
| | | T. Rowe Price Diversified
Mid Cap Growth | | | 63.91 | | |
| | | T. Rowe Price Growth Equity | | | 55.96 | | |
Voya Solution 2035 Portfolio | | Columbia Contrarian Core | | | 19.27 | | |
| | | Invesco Comstock | | | 6.91 | | |
Voya Solution 2045 Portfolio | | Columbia Contrarian Core | | | 18.61 | | |
| | | Invesco Comstock | | | 9.00 | | |
Voya Solution 2055 Portfolio | | Columbia Contrarian Core | | | 6.25 | | |
Voya Solution Moderately
Aggressive Portfolio | | Columbia Contrarian Core | | | 17.63 | | |
| | | Invesco Comstock | | | 9.41 | | |
The Investment Adviser may direct the Portfolios' sub-advisers to use their best efforts (subject to obtaining best execution of each transaction) to allocate a Portfolio's equity security transactions through certain designated broker-dealers. The designated broker-dealer, in turn, will reimburse a portion of the brokerage commissions to pay certain expenses of that Portfolio. Any amounts credited to the Portfolios are reflected as brokerage commission recapture on the accompanying Statements of Operations.
The Portfolios have adopted a deferred compensation plan (the "DC Plan"), which allows eligible independent directors, as described in the DC Plan, to defer the receipt of all or a portion of the directors' fees that they are entitled to receive from the Portfolios. For purposes of determining the amount owed to the director under the DC Plan, the amounts deferred are invested in shares of the funds selected by the director (the "Notional Funds"). When the Portfolios purchase shares of the Notional
Funds, which are all advised by Voya Investments, in amounts equal to the directors' deferred fees, this results in a Portfolio asset equal to the deferred compensation liability. Such assets, if applicable, are included as a component of "Other assets" on the accompanying Statements of Assets and Liabilities. Deferral of directors' fees under the DC Plan will not affect net assets of the Portfolios, and will not materially affect the Portfolios' assets, liabilities or net investment income per share. Amounts will be deferred until distributed in accordance with the DC Plan.
The Portfolios may pay per account fees to affiliates of Voya Investments for recordkeeping services provided on certain assets. For the year ended December 31, 2021, the per account fees for affiliated recordkeeping services paid by each Portfolio were as follows:
Portfolio | | Amount | |
Global Bond | | $ | 202,627 | | |
International High Dividend Low Volatility | | | 303,990 | | |
American Century Small-Mid Cap Value | | | 675,137 | | |
Baron Growth | | | 659,997 | | |
Columbia Contrarian Core | | | 93,706 | | |
Columbia Small Cap Value II | | | 153,390 | | |
Invesco Comstock | | | 151,744 | | |
Invesco Equity and Income | | | 621,235 | | |
Invesco Global | | | 1,695,903 | | |
JPMorgan Mid Cap Value | | | 487,035 | | |
T. Rowe Price Diversified Mid Cap Growth | | | 1,062,598 | | |
T. Rowe Price Growth Equity | | | 1,449,813 | | |
NOTE 7 — EXPENSE LIMITATION AGREEMENTS
The Investment Adviser has entered into a written expense limitation agreement ("Expense Limitation Agreement") with the following Portfolios, whereby the Investment Adviser has agreed to limit expenses, excluding interest, taxes, investment-related costs, leverage expenses, extraordinary expenses, and acquired fund fees and expenses to the levels listed below:
Portfolio | | Class ADV | | Class I | | Class R6 | | Class S | | Class S2 | |
Global Bond | | | 1.17 | % | | | 0.67 | % | | | N/A | | | | 0.92 | % | | | N/A | | |
International High
Dividend Low
Volatility | | | 1.25 | % | | | 0.75 | % | | | N/A | | | | 1.00 | % | | | 1.15 | % | |
American Century
Small-Mid Cap
Value | | | 1.52 | % | | | 1.02 | % | | | N/A | | | | 1.27 | % | | | 1.42 | % | |
Baron Growth | | | 1.49 | % | | | 0.99 | % | | | 0.99 | % | | | 1.24 | % | | | 1.39 | % | |
Columbia Contrarian
Core(1) | | | N/A | | | | N/A | | | | N/A | | | | N/A | | | | N/A | | |
Columbia Small Cap
Value II | | | 1.45 | % | | | 0.95 | % | | | 0.95 | % | | | 1.20 | % | | | 1.35 | % | |
Invesco Comstock(2) | | | N/A | | | | N/A | | | | N/A | | | | N/A | | | | N/A | | |
Invesco Equity and
Income | | | 1.15 | % | | | 0.65 | % | | | N/A | | | | 0.90 | % | | | 1.05 | % | |
Invesco Global | | | 1.30 | % | | | 0.80 | % | | | N/A | | | | 1.05 | % | | | 1.20 | % | |
JPMorgan Mid Cap
Value | | | 1.38 | % | | | 0.88 | % | | | N/A | | | | 1.13 | % | | | 1.28 | % | |
66
NOTES TO FINANCIAL STATEMENTS AS OF DECEMBER 31, 2021 (CONTINUED)
NOTE 7 — EXPENSE LIMITATION AGREEMENTS (continued)
Portfolio | | Class ADV | | Class I | | Class R6 | | Class S | | Class S2 | |
T. Rowe Price
Diversified Mid
Cap Growth | | | 1.30 | % | | | 0.80 | % | | | 0.80 | % | | | 1.05 | % | | | 1.20 | % | |
T. Rowe Price
Growth Equity | | | 1.25 | % | | | 0.75 | % | | | N/A | | | | 1.00 | % | | | 1.15 | % | |
(1) Pursuant to a side letter agreement, through May 1, 2022, the Investment Adviser has agreed to waive all or a portion of the management fee and/or reimburse expenses so that the expense limits are 1.25%, 0.75% and 1.00% for Class ADV, Class I and Class S, respectively. Termination or modification of this obligation requires approval by the Board. Any fees waived pursuant to the side letter agreement shall not be eligible for recoupment.
(2) Effective January 1, 2021, pursuant to a side letter agreement, through May 1, 2022, the Investment Adviser has agreed to waive all or a portion of the management fee and/or reimburse expenses so that the expense limits are 1.20%, 0.70%, 0.70%, 0.95%, and 1.10% for Class ADV, Class I, Class R6, Class S, and Class S2, respectively. Any fees waived pursuant to the side letter agreement shall not be eligible for recoupment. Termination or modification of this obligation requires approval by the Board. Prior to January 1, 2021, pursuant to a side letter agreement, the Investment Adviser had agreed to waive all or a portion of the management fee and/or reimburse expenses so that the expense limits were 1.29%, 0.79%, 0.79%, 1.04% and 1.19% for Class ADV, Class I, Class R6, Class S and Class S2, respectively. Any fees waived pursuant to the side letter agreement were not eligible for recoupment.
Unless otherwise specified above and with the exception of the non-recoupable management fee waivers for certain Portfolios, the Investment Adviser may, at a later date, recoup from a Portfolio for fees waived and/or other expenses reimbursed by the Investment Adviser during the previous 36 months, but only if, after such recoupment, a Portfolio's expense ratio does not exceed the percentage described above. Waived and reimbursed fees net of any recoupment by the Investment Adviser of such waived and reimbursed fees are reflected on the accompanying Statements of Operations. Amounts payable by the Investment Adviser are reflected on the accompanying Statements of Assets and Liabilities.
At December 31, 2021, the amounts of waived and/or reimbursed fees that are subject to possible recoupment by the Investment Adviser and the related expiration dates are as follows:
| | | December 31, | |
| | | 2022 | | 2023 | | 2024 | | Total | |
Global Bond | | $ | — | | | $ | 209,164 | | | $ | 211,149 | | | $ | 420,313 | | |
American Century
Small-Mid Cap
Value | | | 478,862 | | | | 1,094,983 | | | | 1,067,866 | | | | 2,641,711 | | |
Baron Growth | | | — | | | | 2,722 | | | | — | | | | 2,722 | | |
Invesco Equity and
Income | | | 284,321 | | | | 735,475 | | | | 689,609 | | | | 1,709,405 | | |
Invesco Global | | | — | | | | 694,966 | | | | 432,246 | | | | 1,127,212 | | |
JPMorgan Mid Cap
Value | | | — | | | | 448,778 | | | | 463,244 | | | | 912,022 | | |
T. Rowe Price Growth
Equity | | | — | | | | 1,106,658 | | | | 976,182 | | | | 2,082,840 | | |
In addition to the above waived and/or reimbursed fees, the amount of class specific fees waived or reimbursed that are subject to possible recoupment by the Investment Adviser, and the related expiration dates, as of December 31, 2021, are as follows:
| | | December 31, | |
| | | 2022 | | 2023 | | 2024 | | Total | |
Baron Growth | |
Class ADV | | $ | — | | | $ | 149,830 | | | $ | 127,757 | | | $ | 277,587 | | |
Class I | | | — | | | | 210,262 | | | | 165,825 | | | | 376,087 | | |
Class S | | | — | | | | 320,888 | | | | 260,627 | | | | 581,515 | | |
Class S2 | | | — | | | | 3,574 | | | | 2,721 | | | | 6,295 | | |
Columbia Small
Cap Value II | |
Class ADV | | | — | | | | 12,463 | | | | 7,521 | | | | 19,984 | | |
Class I | | | — | | | | 16,873 | | | | 9,718 | | | | 26,591 | | |
Class S | | | — | | | | 42,446 | | | | 21,127 | | | | 63,573 | | |
Class S2 | | | — | | | | 746 | | | | 403 | | | | 1,149 | | |
T. Rowe Price
Diversified Mid Cap
Growth | |
Class ADV | | | — | | | | 41,013 | | | | 28,525 | | | | 69,538 | | |
Class I | | | — | | | | 709,134 | | | | 486,839 | | | | 1,195,973 | | |
Class S | | | — | | | | 29,018 | | | | 19,449 | | | | 48,467 | | |
Class S2 | | | — | | | | 3,796 | | | | 2,774 | | | | 6,570 | | |
The Expense Limitation Agreement is contractual through May 1, 2022 and shall renew automatically for one-year terms. Termination or modification of this obligation requires approval by the Board.
NOTE 8 — LINE OF CREDIT
Effective June 14, 2021, the Portfolios, in addition to certain other funds managed by the Investment Adviser, entered into a 364-day unsecured committed revolving line of credit agreement (the "Credit Agreement") with The Bank of New York Mellon ("BNY") for an aggregate amount of $400,000,000 through June 13, 2022. The proceeds may be used only to finance temporarily: (1) the purchase or sale of investment securities; or (2) the repurchase or redemption of shares of a Portfolio or certain other funds managed by the Investment Adviser. The funds to which the line of credit is available pay a commitment fee equal to 0.15% per annum on the daily unused portion of the committed line amount payable quarterly in arrears. Prior to June 14, 2021, the predecessor line of credit was for an aggregate amount of $400,000,000 and the funds to which the line of credit was available paid a commitment fee equal to 0.15% per annum on the daily unused portion of the committed line amount through June 14, 2021.
Borrowings under the Credit Agreement accrue interest at the federal funds rate plus a specified margin. Repayments generally must be made within 60 days after the date of a revolving credit advance.
67
NOTES TO FINANCIAL STATEMENTS AS OF DECEMBER 31, 2021 (CONTINUED)
NOTE 8 — LINE OF CREDIT (continued)
The below Portfolios utilized the line of credit during the year ended December 31, 2021 as follows:
Portfolio | | Days
Utilized | | Approximate
Average Daily
Balance For
Days Utilized | | Approximate
Weighted
Average
Interest Rate
For Days
Utilized | |
International High
Dividend Low Volatility | | | 7 | | | $ | 1,714,857 | | | | 1.27 | % | |
American Century Small-Mid
Cap Value | | | 7 | | | | 1,156,286 | | | | 1.32 | | |
Baron Growth(1) | | | 63 | | | | 2,129,698 | | | | 1.30 | | |
Invesco Global | | | 18 | | | | 4,264,111 | | | | 1.28 | | |
JPMorgan Mid Cap Value | | | 4 | | | | 1,101,250 | | | | 1.34 | | |
T. Rowe Price Diversified
Mid Cap Growth | | | 12 | | | | 927,083 | | | | 1.30 | | |
(1) As of December 31, 2021, Baron Growth had an outstanding balance of $531,000.
NOTE 9 — CAPITAL SHARES
Transactions in capital shares and dollars were as follows:
| | | Shares sold | | Shares
issued
in merger | | Reinvestment
of
distributions | | Shares
redeemed | | Net increase
(decrease)
in shares
outstanding | | Shares sold | | Proceeds
from shares
issued
in merger | | Reinvestment
of
distributions | | Shares
redeemed | | Net increase
(decrease) | |
Year or period ended | | # | | # | | # | | # | | # | | ($) | | ($) | | ($) | | ($) | | ($) | |
Global Bond | |
Class ADV | |
12/31/2021 | | | 146,488 | | | | — | | | | 101,137 | | | | (225,961 | ) | | | 21,664 | | | | 1,554,242 | | | | — | | | | 1,059,813 | | | | (2,405,586 | ) | | | 208,469 | | |
12/31/2020 | | | 151,522 | | | | — | | | | 46,784 | | | | (363,955 | ) | | | (165,649 | ) | | | 1,614,012 | | | | — | | | | 499,001 | | | | (3,837,787 | ) | | | (1,724,774 | ) | |
Class I | |
12/31/2021 | | | 427,848 | | | | — | | | | 628,708 | | | | (1,280,804 | ) | | | (224,248 | ) | | | 4,747,549 | | | | — | | | | 6,725,199 | | | | (13,948,944 | ) | | | (2,476,196 | ) | |
12/31/2020 | | | 1,071,924 | | | | — | | | | 379,018 | | | | (4,056,693 | ) | | | (2,605,751 | ) | | | 11,625,495 | | | | — | | | | 4,117,554 | | | | (44,941,232 | ) | | | (29,198,183 | ) | |
Class S | |
12/31/2021 | | | 359,591 | | | | — | | | | 155,896 | | | | (538,462 | ) | | | (22,975 | ) | | | 3,908,842 | | | | — | | | | 1,663,347 | | | | (5,968,917 | ) | | | (396,728 | ) | |
12/31/2020 | | | 437,512 | | | | — | | | | 78,922 | | | | (703,803 | ) | | | (187,369 | ) | | | 4,719,597 | | | | — | | | | 856,131 | | | | (7,617,835 | ) | | | (2,042,107 | ) | |
International High Dividend Low Volatility | |
Class ADV | |
12/31/2021 | | | 102,390 | | | | — | | | | 52,566 | | | | (365,602 | ) | | | (210,646 | ) | | | 1,037,243 | | | | — | | | | 540,901 | | | | (3,670,569 | ) | | | (2,092,425 | ) | |
12/31/2020 | | | 231,631 | | | | — | | | | 468,161 | | | | (499,287 | ) | | | 200,505 | | | | 2,179,892 | | | | — | | | | 3,998,093 | | | | (4,695,750 | ) | | | 1,482,235 | | |
Class I | |
12/31/2021 | | | 460,734 | | | | — | | | | 295,016 | | | | (1,508,212 | ) | | | (752,462 | ) | | | 4,759,975 | | | | — | | | | 3,068,169 | | | | (15,417,513 | ) | | | (7,589,369 | ) | |
12/31/2020 | | | 635,652 | | | | — | | | | 2,196,817 | | | | (2,209,074 | ) | | | 623,395 | | | | 5,913,333 | | | | — | | | | 18,958,530 | | | | (20,893,043 | ) | | | 3,978,820 | | |
Class S | |
12/31/2021 | | | 454,811 | | | | — | | | | 564,287 | | | | (4,446,542 | ) | | | (3,427,444 | ) | | | 4,684,050 | | | | — | | | | 5,834,728 | | | | (45,069,304 | ) | | | (34,550,526 | ) | |
12/31/2020 | | | 1,333,822 | | | | — | | | | 4,802,412 | | | | (4,796,011 | ) | | | 1,340,223 | | | | 12,622,870 | | | | — | | | | 41,156,670 | | | | (45,576,239 | ) | | | 8,203,301 | | |
Class S2 | |
12/31/2021 | | | 2,385 | | | | — | | | | 706 | | | | (689 | ) | | | 2,402 | | | | 24,459 | | | | — | | | | 7,373 | | | | (7,050 | ) | | | 24,782 | | |
12/31/2020 | | | 13,983 | | | | — | | | | 8,450 | | | | (21,300 | ) | | | 1,133 | | | | 138,923 | | | | — | | | | 73,179 | | | | (202,966 | ) | | | 9,136 | | |
American Century Small-Mid Cap Value | |
Class ADV | |
12/31/2021 | | | 574,260 | | | | — | | | | 54,874 | | | | (1,398,054 | ) | | | (768,920 | ) | | | 7,645,195 | | | | — | | | | 741,893 | | | | (18,477,186 | ) | | | (10,090,098 | ) | |
12/31/2020 | | | 609,735 | | | | — | | | | 184,018 | | | | (1,972,522 | ) | | | (1,178,769 | ) | | | 5,290,505 | | | | — | | | | 1,711,366 | | | | (19,033,186 | ) | | | (12,031,315 | ) | |
Class I | |
12/31/2021 | | | 1,216,000 | | | | — | | | | 122,634 | | | | (2,463,814 | ) | | | (1,125,180 | ) | | | 17,471,822 | | | | — | | | | 1,787,999 | | | | (35,235,044 | ) | | | (15,975,223 | ) | |
12/31/2020 | | | 1,093,595 | | | | — | | | | 336,841 | | | | (2,845,523 | ) | | | (1,415,087 | ) | | | 10,880,226 | | | | — | | | | 3,371,776 | | | | (29,671,861 | ) | | | (15,419,859 | ) | |
Class S | |
12/31/2021 | | | 371,537 | | | | — | | | | 54,847 | | | | (984,265 | ) | | | (557,881 | ) | | | 5,318,031 | | | | — | | | | 786,510 | | | | (13,429,366 | ) | | | (7,324,825 | ) | |
12/31/2020 | | | 373,825 | | | | — | | | | 160,840 | | | | (1,258,367 | ) | | | (723,702 | ) | | | 3,687,266 | | | | — | | | | 1,584,274 | | | | (12,976,185 | ) | | | (7,704,645 | ) | |
68
NOTES TO FINANCIAL STATEMENTS AS OF DECEMBER 31, 2021 (CONTINUED)
NOTE 9 — CAPITAL SHARES (continued)
| | | Shares sold | | Shares
issued
in merger | | Reinvestment
of
distributions | | Shares
redeemed | | Net increase
(decrease)
in shares
outstanding | | Shares sold | | Proceeds
from shares
issued
in merger | | Reinvestment
of
distributions | | Shares
redeemed | | Net increase
(decrease) | |
Year or period ended | | # | | # | | # | | # | | # | | ($) | | ($) | | ($) | | ($) | | ($) | |
American Century Small-Mid Cap Value (continued) | |
Class S2 | |
12/31/2021 | | | 52,013 | | | | — | | | | 1,416 | | | | (179,069 | ) | | | (125,640 | ) | | | 674,027 | | | | — | | | | 19,149 | | | | (2,412,139 | ) | | | (1,718,963 | ) | |
12/31/2020 | | | 56,480 | | | | — | | | | 6,436 | | | | (61,500 | ) | | | 1,416 | | | | 531,451 | | | | — | | | | 59,796 | | | | (627,974 | ) | | | (36,727 | ) | |
Baron Growth | |
Class ADV | |
12/31/2021 | | | 260,360 | | | | — | | | | 419,077 | | | | (479,266 | ) | | | 200,171 | | | | 7,095,819 | | | | — | | | | 11,180,973 | | | | (13,154,085 | ) | | | 5,122,707 | | |
12/31/2020 | | | 385,123 | | | | — | | | | — | | | | (1,063,153 | ) | | | (678,030 | ) | | | 7,667,594 | | | | — | | | | — | | | | (21,036,151 | ) | | | (13,368,557 | ) | |
Class I | |
12/31/2021 | | | 311,835 | | | | — | | | | 361,998 | | | | (885,710 | ) | | | (211,877 | ) | | | 10,500,975 | | | | — | | | | 11,935,097 | | | | (29,525,384 | ) | | | (7,089,312 | ) | |
12/31/2020 | | | 992,333 | | | | — | | | | — | | | | (2,024,333 | ) | | | (1,032,000 | ) | | | 24,933,092 | | | | — | | | | — | | | | (50,380,515 | ) | | | (25,447,423 | ) | |
Class R6 | |
12/31/2021 | | | 143,926 | | | | — | | | | 99,200 | | | | (246,153 | ) | | | (3,027 | ) | | | 4,799,695 | | | | — | | | | 3,273,603 | | | | (8,201,082 | ) | | | (127,784 | ) | |
12/31/2020 | | | 305,059 | | | | — | | | | — | | | | (310,598 | ) | | | (5,539 | ) | | | 7,457,909 | | | | — | | | | — | | | | (7,433,159 | ) | | | 24,750 | | |
Class S | |
12/31/2021 | | | 132,534 | | | | — | | | | 688,156 | | | | (1,095,774 | ) | | | (275,084 | ) | | | 4,072,010 | | | | — | | | | 20,610,306 | | | | (33,055,860 | ) | | | (8,373,544 | ) | |
12/31/2020 | | | 137,540 | | | | — | | | | — | | | | (1,614,638 | ) | | | (1,477,098 | ) | | | 2,983,204 | | | | — | | | | — | | | | (35,003,201 | ) | | | (32,019,997 | ) | |
Class S2 | |
12/31/2021 | | | 13,002 | | | | — | | | | 7,767 | | | | (40,917 | ) | | | (20,148 | ) | | | 365,529 | | | | — | | | | 211,817 | | | | (1,158,300 | ) | | | (580,954 | ) | |
12/31/2020 | | | 42,355 | | | | — | | | | — | | | | (49,702 | ) | | | (7,347 | ) | | | 891,696 | | | | — | | | | — | | | | (979,306 | ) | | | (87,610 | ) | |
Columbia Contrarian Core | |
Class ADV | |
12/31/2021 | | | 164,911 | | | | — | | | | 167,124 | | | | (211,683 | ) | | | 120,352 | | | | 3,382,325 | | | | — | | | | 3,369,226 | | | | (4,427,216 | ) | | | 2,324,335 | | |
12/31/2020 | | | 157,408 | | | | — | | | | 44,611 | | | | (303,254 | ) | | | (101,235 | ) | | | 2,566,533 | | | | — | | | | 743,213 | | | | (4,812,920 | ) | | | (1,503,174 | ) | |
Class I | |
12/31/2021 | | | 1,138,555 | | | | — | | | | 707,436 | | | | (1,261,034 | ) | | | 584,957 | | | | 26,185,506 | | | | — | | | | 15,634,335 | | | | (28,569,053 | ) | | | 13,250,788 | | |
12/31/2020 | | | 8,464,802 | | | | — | | | | 246,165 | | | | (2,989,447 | ) | | | 5,721,520 | | | | 137,733,870 | | | | — | | | | 4,445,739 | | | | (59,332,213 | ) | | | 82,847,396 | | |
Class S | |
12/31/2021 | | | 78,569 | | | | — | | | | 118,105 | | | | (129,803 | ) | | | 66,871 | | | | 1,725,929 | | | | — | | | | 2,522,728 | | | | (2,839,735 | ) | | | 1,408,922 | | |
12/31/2020 | | | 89,490 | | | | — | | | | 31,489 | | | | (189,843 | ) | | | (68,864 | ) | | | 1,506,854 | | | | — | | | | 552,006 | | | | (3,330,686 | ) | | | (1,271,826 | ) | |
Columbia Small Cap Value II | |
Class ADV | |
12/31/2021 | | | 872,371 | | | | — | | | | 10,889 | | | | (533,975 | ) | | | 349,285 | | | | 16,819,188 | | | | — | | | | 207,547 | | | | (10,353,412 | ) | | | 6,673,323 | | |
12/31/2020 | | | 217,420 | | | | — | | | | 82,110 | | | | (457,014 | ) | | | (157,484 | ) | | | 2,610,253 | | | | — | | | | 972,185 | | | | (5,746,042 | ) | | | (2,163,604 | ) | |
Class I | |
12/31/2021 | | | 797,433 | | | | — | | | | 18,560 | | | | (830,131 | ) | | | (14,138 | ) | | | 15,875,731 | | | | — | | | | 368,043 | | | | (16,734,530 | ) | | | (490,756 | ) | |
12/31/2020 | | | 331,812 | | | | — | | | | 116,917 | | | | (654,816 | ) | | | (206,087 | ) | | | 4,350,521 | | | | — | | | | 1,435,739 | | | | (8,830,432 | ) | | | (3,044,172 | ) | |
Class R6 | |
12/31/2021 | | | 285,247 | | | | — | | | | 4,422 | | | | (140,643 | ) | | | 149,026 | | | | 5,805,072 | | | | — | | | | 87,814 | | | | (2,859,917 | ) | | | 3,032,969 | | |
12/31/2020 | | | 190,128 | | | | — | | | | 20,805 | | | | (210,151 | ) | | | 782 | | | | 2,655,126 | | | | — | | | | 255,902 | | | | (2,766,895 | ) | | | 144,133 | | |
Class S | |
12/31/2021 | | | 682,426 | | | | — | | | | 29,732 | | | | (1,310,880 | ) | | | (598,722 | ) | | | 13,766,939 | | | | — | | | | 587,512 | | | | (26,262,690 | ) | | | (11,908,239 | ) | |
12/31/2020 | | | 273,276 | | | | — | | | | 279,850 | | | | (1,224,385 | ) | | | (671,259 | ) | | | 3,238,618 | | | | — | | | | 3,428,166 | | | | (15,939,137 | ) | | | (9,272,353 | ) | |
Class S2 | |
12/31/2021 | | | 52,418 | | | | — | | | | 493 | | | | (56,307 | ) | | | (3,396 | ) | | | 1,041,420 | | | | — | | | | 9,407 | | | | (1,111,383 | ) | | | (60,556 | ) | |
12/31/2020 | | | 11,681 | | | | — | | | | 4,733 | | | | (35,205 | ) | | | (18,791 | ) | | | 138,520 | | | | — | | | | 55,992 | | | | (476,844 | ) | | | (282,332 | ) | |
Invesco Comstock | |
Class ADV | |
12/31/2021 | | | 145,469 | | | | — | | | | 19,416 | | | | (289,658 | ) | | | (124,773 | ) | | | 2,836,895 | | | | — | | | | 403,191 | | | | (5,615,125 | ) | | | (2,375,039 | ) | |
12/31/2020 | | | 116,617 | | | | — | | | | 90,354 | | | | (269,952 | ) | | | (62,981 | ) | | | 1,500,720 | | | | — | | | | 1,304,497 | | | | (3,764,154 | ) | | | (958,937 | ) | |
Class I | |
12/31/2021 | | | 4,561,351 | | | | — | | | | 136,276 | | | | (3,351,084 | ) | | | 1,346,543 | | | | 90,254,805 | | | | — | | | | 2,872,788 | | | | (63,144,551 | ) | | | 29,983,042 | | |
12/31/2020 | | | 5,954,266 | | | | — | | | | 441,015 | | | | (11,162,406 | ) | | | (4,767,125 | ) | | | 86,529,706 | | | | — | | | | 6,426,417 | | | | (149,060,396 | ) | | | (56,104,273 | ) | |
Class S | |
12/31/2021 | | | 370,756 | | | | — | | | | 53,139 | | | | (496,521 | ) | | | (72,626 | ) | | | 7,400,012 | | | | — | | | | 1,119,663 | | | | (9,559,560 | ) | | | (1,039,885 | ) | |
12/31/2020 | | | 104,843 | | | | — | | | | 209,474 | | | | (701,229 | ) | | | (386,912 | ) | | | 1,513,323 | | | | — | | | | 3,064,953 | | | | (10,128,483 | ) | | | (5,550,207 | ) | |
69
NOTES TO FINANCIAL STATEMENTS AS OF DECEMBER 31, 2021 (CONTINUED)
NOTE 9 — CAPITAL SHARES (continued)
| | | Shares sold | | Shares
issued
in merger | | Reinvestment
of
distributions | | Shares
redeemed | | Net increase
(decrease)
in shares
outstanding | | Shares sold | | Proceeds
from shares
issued
in merger | | Reinvestment
of
distributions | | Shares
redeemed | | Net increase
(decrease) | |
Year or period ended | | # | | # | | # | | # | | # | | ($) | | ($) | | ($) | | ($) | | ($) | |
Invesco Equity and Income | |
Class ADV | |
12/31/2021 | | | 104,226 | | | | — | | | | 20,455 | | | | (108,131 | ) | | | 16,550 | | | | 5,203,568 | | | | — | | | | 1,040,639 | | | | (5,364,684 | ) | | | 879,523 | | |
12/31/2020 | | | 75,973 | | | | — | | | | 58,895 | | | | (229,092 | ) | | | (94,224 | ) | | | 3,056,251 | | | | — | | | | 2,330,514 | | | | (9,024,067 | ) | | | (3,637,302 | ) | |
Class I | |
12/31/2021 | | | 137,798 | | | | — | | | | 246,394 | | | | (1,117,269 | ) | | | (733,077 | ) | | | 6,968,284 | | | | — | | | | 12,825,759 | | | | (56,526,696 | ) | | | (36,732,653 | ) | |
12/31/2020 | | | 117,159 | | | | — | | | | 664,170 | | | | (1,511,062 | ) | | | (729,733 | ) | | | 4,802,008 | | | | — | | | | 27,058,975 | | | | (61,781,862 | ) | | | (29,920,879 | ) | |
Class S | |
12/31/2021 | | | 91,794 | | | | — | | | | 200,039 | | | | (1,577,207 | ) | | | (1,285,374 | ) | | | 4,665,687 | | | | — | | | | 10,309,711 | | | | (79,391,738 | ) | | | (64,416,340 | ) | |
12/31/2020 | | | 90,613 | | | | — | | | | 616,561 | | | | (1,862,782 | ) | | | (1,155,608 | ) | | | 3,561,494 | | | | — | | | | 24,794,296 | | | | (75,496,740 | ) | | | (47,140,950 | ) | |
Class S2 | |
12/31/2021 | | | 69,727 | | | | — | | | | 141,604 | | | | (917,369 | ) | | | (706,038 | ) | | | 3,381,490 | | | | — | | | | 7,171,073 | | | | (45,287,140 | ) | | | (34,734,577 | ) | |
12/31/2020 | | | 64,773 | | | | — | | | | 435,036 | | | | (1,186,931 | ) | | | (687,122 | ) | | | 2,462,918 | | | | — | | | | 17,171,131 | | | | (47,332,775 | ) | | | (27,698,726 | ) | |
Invesco Global | |
Class ADV | |
12/31/2021 | | | 356,278 | | | | — | | | | 269,670 | | | | (424,309 | ) | | | 201,639 | | | | 8,574,570 | | | | — | | | | 6,650,068 | | | | (10,140,640 | ) | | | 5,083,998 | | |
12/31/2020 | | | 199,176 | | | | — | | | | 272,420 | | | | (1,280,327 | ) | | | (808,731 | ) | | | 3,733,927 | | | | — | | | | 4,996,181 | | | | (23,092,469 | ) | | | (14,362,361 | ) | |
Class I | |
12/31/2021 | | | 639,488 | | | | — | | | | 2,288,016 | | | | (6,456,145 | ) | | | (3,528,641 | ) | | | 16,254,795 | | | | — | | | | 60,106,187 | | | | (164,710,892 | ) | | | (88,349,910 | ) | |
12/31/2020 | | | 485,441 | | | | — | | | | 2,780,342 | | | | (10,017,159 | ) | | | (6,751,376 | ) | | | 9,491,825 | | | | — | | | | 53,910,828 | | | | (194,533,543 | ) | | | (131,130,890 | ) | |
Class S | |
12/31/2021 | | | 309,536 | | | | — | | | | 345,738 | | | | (1,541,488 | ) | | | (886,214 | ) | | | 7,551,935 | | | | — | | | | 8,612,323 | | | | (37,125,539 | ) | | | (20,961,281 | ) | |
12/31/2020 | | | 314,509 | | | | — | | | | 417,760 | | | | (2,112,243 | ) | | | (1,379,974 | ) | | | 5,696,566 | | | | — | | | | 7,716,024 | | | | (38,768,097 | ) | | | (25,355,507 | ) | |
Class S2 | |
12/31/2021 | | | 24,294 | | | | — | | | | 8,365 | | | | (54,759 | ) | | | (22,100 | ) | | | 564,682 | | | | — | | | | 200,349 | | | | (1,275,427 | ) | | | (510,396 | ) | |
12/31/2020 | | | 29,719 | | | | — | | | | 8,405 | | | | (99,655 | ) | | | (61,531 | ) | | | 541,948 | | | | — | | | | 149,769 | | | | (1,632,266 | ) | | | (940,549 | ) | |
JPMorgan Mid Cap Value | |
Class ADV | |
12/31/2021 | | | 465,629 | | | | — | | | | 203,042 | | | | (896,948 | ) | | | (228,277 | ) | | | 8,560,886 | | | | — | | | | 3,739,188 | | | | (16,193,716 | ) | | | (3,893,642 | ) | |
12/31/2020 | | | 348,762 | | | | — | | | | 525,236 | | | | (1,023,700 | ) | | | (149,702 | ) | | | 4,557,818 | | | | — | | | | 6,939,506 | | | | (14,379,457 | ) | | | (2,882,133 | ) | |
Class I | |
12/31/2021 | | | 865,455 | | | | — | | | | 302,747 | | | | (1,992,142 | ) | | | (823,940 | ) | | | 16,488,418 | | | | — | | | | 5,837,589 | | | | (37,944,867 | ) | | | (15,618,860 | ) | |
12/31/2020 | | | 579,873 | | | | — | | | | 809,416 | | | | (2,135,388 | ) | | | (746,099 | ) | | | 8,343,245 | | | | — | | | | 11,193,835 | | | | (31,410,219 | ) | | | (11,873,139 | ) | |
Class S | |
12/31/2021 | | | 310,094 | | | | — | | | | 415,449 | | | | (1,842,421 | ) | | | (1,116,878 | ) | | | 5,812,653 | | | | — | | | | 7,866,665 | | | | (34,229,733 | ) | | | (20,550,415 | ) | |
12/31/2020 | | | 283,193 | | | | — | | | | 1,107,872 | | | | (2,140,089 | ) | | | (749,024 | ) | | | 3,937,227 | | | | — | | | | 15,047,063 | | | | (31,257,437 | ) | | | (12,273,147 | ) | |
Class S2 | |
12/31/2021 | | | 59,064 | | | | — | | | | 2,885 | | | | (44,471 | ) | | | 17,478 | | | | 1,090,895 | | | | — | | | | 53,361 | | | | (795,684 | ) | | | 348,572 | | |
12/31/2020 | | | 8,116 | | | | — | | | | 10,496 | | | | (36,180 | ) | | | (17,568 | ) | | | 119,964 | | | | — | | | | 138,167 | | | | (491,020 | ) | | | (232,889 | ) | |
T. Rowe Price Diversified Mid Cap Growth | |
Class ADV | |
12/31/2021 | | | 797,966 | | | | — | | | | 1,013,280 | | | | (595,469 | ) | | | 1,215,777 | | | | 10,583,797 | | | | — | | | | 12,473,482 | | | | (7,822,090 | ) | | | 15,235,189 | | |
12/31/2020 | | | 642,178 | | | | — | | | | 450,087 | | | | (4,408,208 | ) | | | (3,315,943 | ) | | | 7,184,265 | | | | — | | | | 4,946,458 | | | | (41,263,880 | ) | | | (29,133,157 | ) | |
Class I | |
12/31/2021 | | | 526,034 | | | | — | | | | 12,250,463 | | | | (8,435,391 | ) | | | 4,341,106 | | | | 8,136,801 | | | | — | | | | 179,469,278 | | | | (129,593,015 | ) | | | 58,013,064 | | |
12/31/2020 | | | 8,861,288 | | | | — | | | | 6,793,515 | | | | (16,857,282 | ) | | | (1,202,479 | ) | | | 98,888,405 | | | | — | | | | 86,073,841 | | | | (219,582,198 | ) | | | (34,619,952 | ) | |
Class R6 | |
12/31/2021 | | | 2,833,110 | | | | — | | | | 1,463,622 | | | | (3,485,925 | ) | | | 810,807 | | | | 45,529,761 | | | | — | | | | 21,456,701 | | | | (53,314,177 | ) | | | 13,672,285 | | |
12/31/2020 | | | 6,492,519 | | | | — | | | | 231,190 | | | | (1,980,280 | ) | | | 4,743,429 | | | | 90,808,349 | | | | — | | | | 2,931,489 | | | | (28,259,378 | ) | | | 65,480,460 | | |
Class S | |
12/31/2021 | | | 192,838 | | | | — | | | | 540,994 | | | | (854,958 | ) | | | (121,126 | ) | | | 2,793,284 | | | | — | | | | 7,427,852 | | | | (12,508,362 | ) | | | (2,287,226 | ) | |
12/31/2020 | | | 495,351 | | | | — | | | | 287,840 | | | | (1,301,795 | ) | | | (518,604 | ) | | | 5,989,623 | | | | — | | | | 3,459,838 | | | | (14,276,367 | ) | | | (4,826,906 | ) | |
Class S2 | |
12/31/2021 | | | 19,996 | | | | — | | | | 97,876 | | | | (163,084 | ) | | | (45,212 | ) | | | 267,568 | | | | — | | | | 1,217,580 | | | | (2,088,060 | ) | | | (602,912 | ) | |
12/31/2020 | | | 54,706 | | | | — | | | | 44,274 | | | | (88,181 | ) | | | 10,799 | | | | 596,007 | | | | — | | | | 490,552 | | | | (967,557 | ) | | | 119,002 | | |
70
NOTES TO FINANCIAL STATEMENTS AS OF DECEMBER 31, 2021 (CONTINUED)
NOTE 9 — CAPITAL SHARES (continued)
| | | Shares sold | | Shares
issued
in merger | | Reinvestment
of
distributions | | Shares
redeemed | | Net increase
(decrease)
in shares
outstanding | | Shares sold | | Proceeds
from shares
issued
in merger | | Reinvestment
of
distributions | | Shares
redeemed | | Net increase
(decrease) | |
Year or period ended | | # | | # | | # | | # | | # | | ($) | | ($) | | ($) | | ($) | | ($) | |
T. Rowe Price Growth Equity | |
Class ADV | |
12/31/2021 | | | 149,326 | | | | — | | | | 347,792 | | | | (514,043 | ) | | | (16,925 | ) | | | 15,332,817 | | | | — | | | | 34,928,755 | | | | (51,591,722 | ) | | | (1,330,150 | ) | |
12/31/2020 | | | 255,157 | | | | — | | | | 168,681 | | | | (756,738 | ) | | | (332,900 | ) | | | 19,352,797 | | | | — | | | | 13,600,775 | | | | (57,164,784 | ) | | | (24,211,212 | ) | |
Class I | |
12/31/2021 | | | 1,579,947 | | | | — | | | | 1,153,850 | | | | (2,150,279 | ) | | | 583,518 | | | | 187,644,821 | | | | — | | | | 134,596,628 | | | | (249,226,605 | ) | | | 73,014,844 | | |
12/31/2020 | | | 1,715,903 | | | | — | | | | 549,133 | | | | (4,071,203 | ) | | | (1,806,167 | ) | | | 144,464,162 | | | | — | | | | 50,553,168 | | | | (356,716,718 | ) | | | (161,699,388 | ) | |
Class S | |
12/31/2021 | | | 52,349 | | | | — | | | | 54,728 | | | | (188,684 | ) | | | (81,607 | ) | | | 5,717,825 | | | | — | | | | 5,950,016 | | | | (20,069,600 | ) | | | (8,401,759 | ) | |
12/31/2020 | | | 90,994 | | | | — | | | | 33,086 | | | | (236,804 | ) | | | (112,724 | ) | | | 7,559,513 | | | | — | | | | 2,861,917 | | | | (20,218,396 | ) | | | (9,796,966 | ) | |
Class S2 | |
12/31/2021 | | | 21,355 | | | | — | | | | 4,853 | | | | (25,672 | ) | | | 536 | | | | 2,279,800 | | | | — | | | | 500,457 | | | | (2,703,352 | ) | | | 76,905 | | |
12/31/2020 | | | 37,006 | | | | — | | | | 5,032 | | | | (105,797 | ) | | | (63,759 | ) | | | 2,895,571 | | | | — | | | | 415,290 | | | | (8,966,649 | ) | | | (5,655,788 | ) | |
NOTE 10 — SECURITIES LENDING
Under a Master Securities Lending Agreement (the "Agreement") with BNY, the Portfolios can lend their securities to approved brokers, dealers and other financial institutions. Loans are collateralized by cash and U.S. government securities. The collateral is equal to at least 105% of the market value of non-U.S. securities loaned and 102% of the market value of U.S. securities loaned. The market value of the loaned securities is determined at Market Close of the Portfolios at their last sale price or official closing price on the principal exchange or system on which they are traded and any additional collateral is delivered to the Portfolios on the next business day. The cash collateral received is invested in approved investments as defined in the Agreement with BNY. The Portfolios bear the risk of loss with respect to the investment of collateral with the following exception: BNY provides the Portfolios indemnification from loss with respect to the investment of collateral to the extent the cash collateral is invested in overnight repurchase agreements.
Cash collateral received in connection with securities lending is invested in cash equivalents, money market funds, repurchase agreements with maturities of not more than 99 days that are collateralized with U.S. Government securities, or certain short-term investments that have a remaining maturity of 190 days or less ("Permitted Investments"). Short-term investments include: securities, units, shares or other participations in short-term investment funds, pools or trusts; commercial paper, notes, bonds or other debt obligations, certificates of deposit, time deposits and other bank obligations and asset-backed commercial paper backed by diversified receivables and repurchase-backed programs. Permitted Investments are subject to certain guidelines established
by the Adviser regarding liquidity, diversification, credit quality and average credit life/duration requirements. The securities purchased with cash collateral received are reflected in the Portfolio of Investments under Short-Term Investments.
Generally, in the event of counterparty default, the Portfolios have the right to use the collateral to offset losses incurred. The Agreement contains certain guarantees by BNY in the event of counterparty default and/or a borrower's failure to return a loaned security; however, there would be a potential loss to the Portfolios in the event the Portfolios are delayed or prevented from exercising their right to dispose of the collateral. Engaging in securities lending could have a leveraging effect, which may intensify the credit, market and other risks associated with investing in a Portfolio.
The following is a summary of each respective Portfolio's securities lending agreements by counterparty which are subject to offset under the Agreement as of December 31, 2021:
Global Bond
Counterparty | | Securities
Loaned
at Value | | Cash
Collateral
Received(1) | | Net
Amount | |
BNP Paribas Prime
Brokerage Intl Ltd | | $ | 3,587 | | | $ | (3,587 | ) | | $ | — | | |
Goldman Sachs & Co. LLC | | | 2,149 | | | | (2,149 | ) | | | — | | |
MUFG Securities
Americas Inc. | | | 24,287 | | | | (24,287 | ) | | | — | | |
TD Prime Services LLC | | | 98,427 | | | | (98,427 | ) | | | — | | |
Total | | $ | 128,450 | | | $ | (128,450 | ) | | $ | — | | |
(1) Cash collateral with a fair value of $132,120 has been received in connection with the above securities lending transactions. Excess cash collateral received from the individual counterparty is not shown for financial reporting purposes.
71
NOTES TO FINANCIAL STATEMENTS AS OF DECEMBER 31, 2021 (CONTINUED)
NOTE 10 — SECURITIES LENDING (continued)
International High Dividend Low Volatility
Counterparty | | Securities
Loaned
at Value | | Cash
Collateral
Received(1) | | Net
Amount | |
Citigroup Global Markets
Limited | | $ | 5,321,971 | | | $ | (5,321,971 | ) | | $ | — | | |
J.P. Morgan Securities LLC | | | 3,937,856 | | | | (3,937,856 | ) | | | — | | |
Morgan Stanley & Co. LLC | | | 655,930 | | | | (655,930 | ) | | | — | | |
Morgan Stanley & Co.
International PLC | | | 2,947,331 | | | | (2,947,331 | ) | | | — | | |
Total | | $ | 12,863,088 | | | $ | (12,863,088 | ) | | $ | — | | |
(1) Cash collateral with a fair value of $13,517,409 has been received in connection with the above securities lending transactions. Excess cash collateral received from the individual counterparty is not shown for financial reporting purposes.
American Century Small-Mid Cap Value
Counterparty | | Securities
Loaned
at Value | | Cash
Collateral
Received(1) | | Net
Amount | |
Barclays Capital Inc. | | $ | 136,116 | | | $ | (136,116 | ) | | $ | — | | |
BNP Paribas Securities Corp. | | | 27,274 | | | | (27,274 | ) | | | — | | |
Citadel Securities LLC | | | 92,616 | | | | (92,616 | ) | | | — | | |
Citigroup Global Markets Inc. | | | 254,677 | | | | (254,677 | ) | | | — | | |
Citigroup Global Markets
Limited | | | 231,473 | | | | (231,473 | ) | | | — | | |
Goldman Sachs & Co. LLC | | | 7,600 | | | | (7,600 | ) | | | — | | |
J.P. Morgan Securities LLC | | | 256,270 | | | | (256,270 | ) | | | — | | |
Morgan Stanley & Co. LLC | | | 368,282 | | | | (368,282 | ) | | | — | | |
National Bank of Canada
Financial INC | | | 26,150 | | | | (26,150 | ) | | | — | | |
National Financial
Services LLC | | | 27,360 | | | | (27,360 | ) | | | — | | |
Natixis Securities
America LLC | | | 3,053,723 | | | | (3,053,723 | ) | | | — | | |
Nomura International PLC | | | 1,104,506 | | | | (1,104,506 | ) | | | — | | |
UBS Securities LLC. | | | 91,063 | | | | (91,063 | ) | | | — | | |
Wells Fargo Securities LLC | | | 85,968 | | | | (85,968 | ) | | | — | | |
Total | | $ | 5,763,078 | | | $ | (5,763,078 | ) | | $ | — | | |
(1) Cash collateral with a fair value of $5,933,484 has been received in connection with the above securities lending transactions. Excess cash collateral received from the individual counterparty is not shown for financial reporting purposes.
Invesco Equity and Income
Counterparty | | Securities
Loaned
at Value | | Cash
Collateral
Received(1) | | Net
Amount | |
Barclays Capital Inc. | | $ | 2,108,533 | | | $ | (2,108,533 | ) | | $ | — | | |
BNP Paribas Prime
Brokerage Intl Ltd | | | 2,056,353 | | | | (2,056,353 | ) | | | — | | |
Citadel Clearing LLC | | | 61,604 | | | | (61,604 | ) | | | — | | |
Citigroup Global Markets Inc. | | | 312,152 | | | | (312,152 | ) | | | — | | |
Goldman Sachs & Co. LLC | | | 1,266,040 | | | | (1,266,040 | ) | | | — | | |
Industrial And Commercial
Bank Of China | | | 3,784,381 | | | | (3,784,381 | ) | | | — | | |
J.P. Morgan Securities LLC | | | 677,370 | | | | (677,370 | ) | | | — | | |
Morgan Stanley & Co. LLC | | | 2,099 | | | | (2,099 | ) | | | — | | |
National Financial
Services LLC | | | 1,976,392 | | | | (1,976,392 | ) | | | — | | |
Societe Generale | | | 28,839,140 | | | | (28,839,140 | ) | | | — | | |
Invesco Equity and Income (continued)
Counterparty | | Securities
Loaned
at Value | | Cash
Collateral
Received(1) | | Net
Amount | |
TD Prime Services LLC | | $ | 11,748,211 | | | $ | (11,748,211 | ) | | $ | — | | |
Wells Fargo Bank NA | | | 1,911,733 | | | | (1,911,733 | ) | | | — | | |
Total | | $ | 54,744,008 | | | $ | (54,744,008 | ) | | $ | — | | |
(1) Cash collateral with a fair value of $55,954,717 has been received in connection with the above securities lending transactions. Excess cash collateral received from the individual counterparty is not shown for financial reporting purposes.
Invesco Global
Counterparty | | Securities
Loaned
at Value | | Cash
Collateral
Received(1) | | Net
Amount | |
Morgan Stanley & Co. LLC | | $ | 3,886,015 | | | $ | (3,886,015 | ) | | $ | — | | |
State Street Bank and Trust
Company | | | 331,833 | | | | (331,833 | ) | | | — | | |
Total | | $ | 4,217,848 | | | $ | (4,217,848 | ) | | $ | — | | |
(1) Cash collateral with a fair value of $4,425,451 has been received in connection with the above securities lending transactions. Excess cash collateral received from the individual counterparty is not shown for financial reporting purposes.
T. Rowe Price Diversified Mid Cap Growth
Counterparty | | Securities
Loaned
at Value | | Cash
Collateral
Received(1) | | Net
Amount | |
Barclays Capital Inc. | | $ | 211,259 | | | $ | (211,259 | ) | | $ | — | | |
BNP Paribas Prime
Brokerage Intl Ltd | | | 10,161,015 | | | | (10,161,015 | ) | | | — | | |
BNP Paribas Securities Corp. | | | 3,208,551 | | | | (3,208,551 | ) | | | — | | |
BofA Securities Inc | | | 11,851 | | | | (11,851 | ) | | | — | | |
Citadel Clearing LLC | | | 80,508 | | | | (80,508 | ) | | | — | | |
CITADEL SECURITIES LLC | | | 82,039 | | | | (82,039 | ) | | | — | | |
Citigroup Global Markets Inc. | | | 11,601,497 | | | | (11,601,497 | ) | | | — | | |
Cowen Excecution
Services LLC | | | 8,109,170 | | | | (8,109,170 | ) | | | — | | |
Credit Suisse Securities
(USA) LLC | | | 61,555 | | | | (61,555 | ) | | | — | | |
Goldma, Sachs & Co. LLC | | | 418,927 | | | | (418,927 | ) | | | — | | |
HSBC Bank PLC | | | 156,774 | | | | (156,774 | ) | | | — | | |
J.P. Morgan Securities LLC | | | 44,693,970 | | | | (44,693,970 | ) | | | — | | |
Mizuho Securities USA LLC. | | | 453,618 | | | | (453,618 | ) | | | — | | |
Morgan Stanley & Co. LLC | | | 448,955 | | | | (448,955 | ) | | | — | | |
National Bank of Canada
Financial INC | | | 103,466 | | | | (103,466 | ) | | | — | | |
National Financial
Services LLC | | | 6,104,490 | | | | (6,104,490 | ) | | | — | | |
Natixis Securities
America LLC | | | 2,013,718 | | | | (2,013,718 | ) | | | — | | |
Scotia Capital (USA) INC | | | 1,376,264 | | | | (1,376,264 | ) | | | — | | |
State Street Bank and Trust
Company | | | 9,450,273 | | | | (9,450,273 | ) | | | — | | |
TD Prime Services LLC | | | 947,525 | | | | (947,525 | ) | | | — | | |
UBS AG | | | 336 | | | | (336 | ) | | | — | | |
Wells Fargo Bank NA | | | 10,805,428 | | | | (10,805,428 | ) | | | — | | |
Wells Fargo Securities LLC | | | 3,593,876 | | | | (3,593,876 | ) | | | — | | |
Total | | $ | 114,095,065 | | | $ | (114,095,065 | ) | | $ | — | | |
(1) Cash collateral with a fair value of $116,541,462 has been received in connection with the above securities lending transactions. Excess cash collateral received from the individual counterparty is not shown for financial reporting purposes.
72
NOTES TO FINANCIAL STATEMENTS AS OF DECEMBER 31, 2021 (CONTINUED)
NOTE 10 — SECURITIES LENDING (continued)
T. Rowe Price Growth Equity
Counterparty | | Securities
Loaned
at Value | | Cash
Collateral
Received(1) | | Net
Amount | |
Barclays Capital Inc. | | $ | 328,120 | | | $ | (328,120 | ) | | $ | — | | |
BNP Paribas Prime
Brokerage Intl Ltd | | | 2,121 | | | | (2,121 | ) | | | — | | |
BNP Paribas Securities Corp. | | | 7,261,516 | | | | (7,261,516 | ) | | | — | | |
Citigroup Global Markets Inc. | | | 7,271,564 | | | | (7,271,564 | ) | | | — | | |
Cowen Excecution
Services LLC | | | 300,769 | | | | (300,769 | ) | | | — | | |
Credit Suisse Securities
(USA) LLC | | | 1,373,127 | | | | (1,373,127 | ) | | | — | | |
J.P. Morgan Securities LLC | | | 6,940,952 | | | | (6,940,952 | ) | | | — | | |
Jefferies LLC | | | 115,624 | | | | (115,624 | ) | | | — | | |
Morgan Stanley & Co. LLC | | | 122,964 | | | | (122,964 | ) | | | — | | |
National Bank of Canada
Financial INC | | | 18,642,935 | | | | (18,642,935 | ) | | | — | | |
RBC Capital Markets, LLC | | | 30,741 | | | | (30,741 | ) | | | — | | |
Wells Fargo Securities LLC | | | 1,844,043 | | | | (1,844,043 | ) | | | — | | |
Total | | $ | 44,234,476 | | | $ | (44,234,476 | ) | | $ | — | | |
(1) Cash collateral with a fair value of $45,268,511 has been received in connection with the above securities lending transactions. Excess cash collateral received from the individual counterparty is not shown for financial reporting purposes.
NOTE 11 — FEDERAL INCOME TAXES
The amount of distributions from net investment income and net realized capital gains are determined in accordance with federal income tax regulations, which may differ from GAAP for investment companies. These book/tax differences may be either temporary or permanent. Permanent differences are reclassified within the capital accounts based on their federal tax-basis treatment; temporary differences are not reclassified. Key differences include the treatment of foreign currency transactions, futures contracts, capital loss carryforwards, income from passive foreign investment companies (PFICs), paydowns, straddle loss deferrals and wash sale deferrals. Distributions in excess of net investment income and/or net realized capital gains for tax purposes are reported as return of capital.
The following permanent tax differences have been reclassified as of December 31, 2021:
| | | Paid-in
Capital | | Distributable
Earnings | |
Global Bond | | $ | (574,603 | ) | | $ | 574,603 | | |
American Century Small-Mid Cap Value | | | (57 | ) | | | 57 | | |
Baron Growth | | | (3,417,045 | ) | | | 3,417,045 | | |
Invesco Global | | | (4,163,234 | ) | | | 4,163,234 | | |
Dividends paid by the Portfolios from net investment income and distributions of net realized short-term capital gains are, for federal income tax purposes, taxable as ordinary income to shareholders.
The tax composition of dividends and distributions to shareholders was as follows:
| | | Year Ended December 31, 2021 | | Year Ended December 31, 2020 | |
| | | Ordinary
Income | | Long-term
Capital
Gains | | Return of
Capital | | Ordinary
Income | | Long-term
Capital
Gains | |
Global Bond | | $ | 8,265,790 | | | $ | — | | | $ | 1,182,569 | | | $ | 5,472,686 | | | $ | — | | |
International High Dividend Low Volatility | | | 9,451,171 | | | | — | | | | — | | | | 13,890,705 | | | | 50,295,767 | | |
American Century Small-Mid Cap Value | | | 3,335,551 | | | | — | | | | — | | | | 6,727,212 | | | | — | | |
Baron Growth | | | — | | | | 47,211,796 | | | | — | | | | — | | | | — | | |
Columbia Contrarian Core | | | 10,412,507 | | | | 11,113,782 | | | | — | | | | 5,740,958 | | | | — | | |
Columbia Small Cap Value II | | | 554,727 | | | | 705,596 | | | | — | | | | 909,064 | | | | 5,238,920 | | |
Invesco Comstock | | | 4,395,642 | | | | — | | | | — | | | | 6,123,894 | | | | 4,671,973 | | |
Invesco Equity and Income | | | 30,664,167 | | | | 683,015 | | | | — | | | | 23,558,242 | | | | 47,796,674 | | |
Invesco Global | | | — | | | | 75,568,927 | | | | — | | | | 15,525,835 | | | | 51,246,967 | | |
JPMorgan Mid Cap Value | | | 2,779,046 | | | | 14,717,757 | | | | — | | | | 3,665,483 | | | | 29,653,088 | | |
T. Rowe Price Diversified Mid Cap Growth | | | 16,444,346 | | | | 205,600,547 | | | | — | | | | 3,687,499 | | | | 94,214,679 | | |
T. Rowe Price Growth Equity | | | 27,343,625 | | | | 148,632,231 | | | | — | | | | — | | | | 67,431,150 | | |
73
NOTES TO FINANCIAL STATEMENTS AS OF DECEMBER 31, 2021 (CONTINUED)
NOTE 11 — FEDERAL INCOME TAXES (continued)
The tax-basis components of distributable earnings and the capital loss carryforwards which may be used to offset future realized capital gains for federal income tax purposes as of December 31, 2021 were:
| | | Undistributed
Ordinary | | Undistributed
Long-term | | Unrealized
Appreciation/ | | Capital Loss Carryforwards | | | | Total
Distributable
Earnings/ | |
| | | Income | | Capital Gains | | (Depreciation) | | Amount | | Character | | Expiration | | Other | | (Loss) | |
Global Bond | | $ | — | | | $ | — | | | $ | 41,540 | | | $ | (6,042,192 | ) | | Long-term | | | None | | | $ | (10,875 | ) | | $ | (6,011,527 | ) | |
International High Dividend Low Volatility | | | 15,547,949 | | | | — | | | | 39,186,443 | | | | (531,918 | ) | | Short-term | | | None | | | | (26,417 | ) | | | 54,176,057 | | |
American Century Small-Mid Cap Value | | | 27,374,765 | | | | 40,831,873 | | | | 60,121,478 | | | | — | | | | — | | | | — | | | | (7,022 | ) | | | 128,321,094 | | |
Baron Growth | | | — | | | | 54,336,029 | | | | 538,158,723 | | | | — | | | | — | | | | — | | | | (25,539 | ) | | | 592,469,213 | | |
Columbia Contrarian Core | | | 13,182,266 | | | | 15,664,717 | | | | 51,146,057 | | | | — | | | | — | | | | — | | | | (7,338 | ) | | | 79,985,702 | | |
Columbia Small Cap Value II | | | 7,461,659 | | | | 17,028,215 | | | | 59,450,659 | | | | — | | | | — | | | | — | | | | (4,847 | ) | | | 83,935,686 | | |
Invesco Comstock | | | 229,538 | | | | 665,454 | | | | 68,474,945 | | | | — | | | | — | | | | — | | | | (13,053 | ) | | | 69,356,884 | | |
Invesco Equity and Income | | | 23,549,692 | | | | 141,557,974 | | | | 264,182,080 | | | | — | | | | — | | | | — | | | | (45,036 | ) | | | 429,244,710 | | |
Invesco Global | | | — | | | | 182,846,424 | | | | 1,102,744,226 | | | | — | | | | — | | | | — | | | | (2,166,164 | ) | | | 1,283,424,486 | | |
JPMorgan Mid Cap Value | | | 3,823,832 | | | | 54,264,781 | | | | 135,413,687 | | | | — | | | | — | | | | — | | | | (11,579 | ) | | | 193,490,721 | | |
T. Rowe Price Diversified Mid Cap Growth | | | 22,880,683 | | | | 244,804,726 | | | | 438,303,772 | | | | — | | | | — | | | | — | | | | (24,703 | ) | | | 705,964,478 | | |
T. Rowe Price Growth Equity | | | 23,938,000 | | | | 238,639,554 | | | | 953,752,638 | | | | — | | | | — | | | | — | | | | (39,587 | ) | | | 1,216,290,605 | | |
The Portfolios' major tax jurisdictions are U.S. federal and Arizona state.
As of December 31, 2021, no provision for income tax is required in the Portfolios' financial statements as a result of tax positions taken on federal and state income tax returns for open tax years. The Portfolios' federal and state income and federal excise tax returns for tax years for which the applicable statutes of limitations have not expired are subject to examination by the Internal Revenue Service and state department of revenue. Generally, the preceding four tax years remain subject to examination by these jurisdictions.
NOTE 12 — LONDON INTERBANK OFFERED RATE ("LIBOR")
In 2017, the UK Financial Conduct Authority announced its intention to cease compelling banks to provide the quotations needed to sustain LIBOR after 2021. On March 5, 2021, ICE Benchmark Administration, the administrator of LIBOR, stated that non-U.S. dollar LIBOR reference rates and the one-week and two-month LIBOR reference rates will cease to be provided or no longer be representative immediately after December 31, 2021 and the remaining more commonly used LIBOR settings will cease to be provided or no longer be representative immediately after June 30, 2023. In addition, global regulators have announced that, with limited exceptions, no new LIBOR-based contracts should be entered into after 2021. Actions by regulators have resulted in the establishment of alternative reference rates to LIBOR in most major currencies (e.g., the Secured Overnight Financing Rate for U.S. Dollar LIBOR and the Sterling Overnight Interbank Average Rate for Sterling LIBOR).
Discontinuance of LIBOR and adoption/implementation of alternative rates pose a number of risks, including among others whether any substitute rate will experience the market participation and liquidity necessary to provide a workable substitute for LIBOR; the effect on parties' existing contractual arrangements, hedging transactions, and investment strategies generally from a conversion from LIBOR to alternative rates; the effect on a Portfolio's existing investments (including, for example, fixed-income investments; senior loans; CLOs and CDOs; and derivatives transactions), including the possibility that some of those investments may terminate or their terms may be adjusted to the disadvantage of a Portfolio; and the risk of general market disruption during the period of the conversion. It is difficult to predict at this time the likely impact of the transition away from LIBOR on a Portfolio.
NOTE 13 — MARKET DISRUPTION
A Portfolio is subject to the risk that geopolitical events will disrupt securities markets and adversely affect global economies and markets. Due to the increasing interdependence among global economies and markets, conditions in one country, market, or region might adversely impact markets, issuers and/or foreign exchange rates in other countries, including the United States. Wars, terrorism, global health crises and pandemics, and other geopolitical events have led, and in the future may lead, to increased market volatility and may have adverse short- or long-term effects on U.S. and world economies and markets generally. For example, the COVID-19 pandemic has resulted, and may continue to result, in significant market volatility, exchange trading suspensions and closures, declines in global financial markets, higher default rates, and a substantial economic
74
NOTES TO FINANCIAL STATEMENTS AS OF DECEMBER 31, 2021 (CONTINUED)
NOTE 13 — MARKET DISRUPTION (continued)
downturn in economies throughout the world. Natural and environmental disasters and systemic market dislocations are also highly disruptive to economies and markets. Those events as well as other changes in non-U.S. and domestic economic, social, and political conditions also could adversely affect individual issuers or related groups of issuers, securities markets, interest rates, credit ratings, inflation, investor sentiment, and other factors affecting the value of the investments of the portfolio and of the Portfolios. Any of these occurrences could disrupt the operations of a Portfolio and of the Portfolios' service providers.
NOTE 14 — OTHER ACCOUNTING PRONOUNCEMENTS
In March 2020, the Financial Accounting Standards Board issued Accounting Standards Update No. 2020-04 ("ASU 2020-04"), Reference Rate Reform (Topic 848) — Facilitation of the Effects of Reference Rate Reform on Financial Reporting. The amendments in ASU 2020-04 provide optional temporary financial reporting relief from the effect of certain types of contract modifications due to the planned discontinuation of LIBOR and other interbank-offered based reference rates as of the end of 2021. ASU 2020-04 is effective for certain reference rate-related contract modifications that occur during the period March 12, 2020 through December 31, 2022. Management is currently evaluating the impact, if any, of applying ASU 2020-04.
NOTE 15 — SUBSEQUENT EVENTS
Dividends: Subsequent to December 31, 2021, the following Portfolio paid dividends from net investment income of:
| | | Per Share
Amount | | Payable Date | | Record Date | |
Global Bond | |
Class ADV | | $ | 0.0206 | | | February 1, 2022 | | Daily | |
Class I | | $ | 0.0254 | | | February 1, 2022 | | Daily | |
Class S | | $ | 0.0232 | | | February 1, 2022 | | Daily | |
The Portfolios have evaluated events occurring after the Statements of Assets and Liabilities date through the date that the financial statements were issued ("subsequent events") to determine whether any subsequent events necessitated adjustment to or disclosure in the financial statements. Other than the above, no such subsequent events were identified.
75
PORTFOLIO OF INVESTMENTS
VOYA GLOBAL BOND PORTFOLIO AS OF DECEMBER 31, 2021
Principal
Amount† | |
| |
| | Value | | Percentage
of Net
Assets | |
CORPORATE BONDS/NOTES: 22.9% | | | |
| | | | | Australia: 0.2% | |
| | 58,000 | | | | | | | Rio Tinto
Finance
USA Ltd.,
2.750%,
11/02/2051 | | $ | 57,610 | | | | 0.1 | | |
| | 180,000 | | | | (1 | ) | | Santos
Finance Ltd.,
3.649%,
04/29/2031 | | | 183,460 | | | | 0.1 | | |
| | 24,000 | | | | | | | Westpac
Banking
Corp.,
1.953%,
11/20/2028 | | | 23,924 | | | | 0.0 | | |
| | 55,000 | | | | (2 | ) | | Westpac
Banking
Corp.,
3.020%,
11/18/2036 | | | 54,429 | | | | 0.0 | | |
| | | | | | | | | | 319,423 | | | | 0.2 | | |
| | | | | Bermuda: 0.1% | |
| | 150,000 | | | | (1 | ) | | Triton
Container
International
Ltd., 3.150%,
06/15/2031 | | | 151,434 | | | | 0.1 | | |
| | | | | Canada: 0.4% | |
| | 18,000 | | | | | | | Canadian
Pacific
Railway Co.,
2.450%,
12/02/2031 | | | 18,373 | | | | 0.0 | | |
| | 112,000 | | | | | | | Canadian
Pacific
Railway Co.,
3.000%,
12/02/2041 | | | 114,746 | | | | 0.1 | | |
| | 38,000 | | | | | | | Canadian
Pacific
Railway Co.,
3.100%,
12/02/2051 | | | 39,151 | | | | 0.0 | | |
| | 50,000 | | | | | | | Cenovus
Energy, Inc.,
5.400%,
06/15/2047 | | | 62,392 | | | | 0.1 | | |
| | 186,000 | | | | | | | Fortis, Inc./
Canada,
3.055%,
10/04/2026 | | | 193,749 | | | | 0.1 | | |
| | 49,000 | | | | | | | Royal Bank of
Canada,
2.300%,
11/03/2031 | | | 49,283 | | | | 0.0 | | |
Principal
Amount† | |
| |
| | Value | | Percentage
of Net
Assets | |
| | 56,000 | | | | | | | Teck
Resources
Ltd., 5.400%,
02/01/2043 | | $ | 68,433 | | | | 0.1 | | |
| | | | | | | | | | 546,127 | | | | 0.4 | | |
| | | | | France: 0.7% | |
| | 572,000 | | | | (1 | ) | | BNP Paribas
SA, 3.500%,
03/01/2023 | | | 589,440 | | | | 0.4 | | |
| | 265,000 | | | | (1 | ) | | BPCE SA,
2.700%,
10/01/2029 | | | 270,869 | | | | 0.1 | | |
| | 287,000 | | | | (1 | ) | | BPCE SA,
5.150%,
07/21/2024 | | | 311,003 | | | | 0.2 | | |
| | | | | | | | | | 1,171,312 | | | | 0.7 | | |
| | | | | Japan: 0.8% | |
| | 200,000 | | | | | | | Mitsubishi UFJ
Financial
Group, Inc.,
2.193%,
02/25/2025 | | | 204,112 | | | | 0.1 | | |
| | 200,000 | | | | (1 | ) | | Mizuho Bank
Ltd., 3.200%,
03/26/2025 | | | 210,929 | | | | 0.1 | | |
| | 200,000 | | | | | | | Sumitomo
Mitsui
Financial
Group, Inc.,
2.448%,
09/27/2024 | | | 205,823 | | | | 0.1 | | |
| | 639,000 | | | | | | | Sumitomo
Mitsui
Financial
Group, Inc.,
3.784%,
03/09/2026 | | | 689,912 | | | | 0.5 | | |
| | | | | | | | | | 1,310,776 | | | | 0.8 | | |
| | | | | Mexico: 0.0% | |
MXN | 1,007,437 | | | | (3 | ),(4) | | Banco Invex
SA /
Hipotecaria
Credito y
Casa SA de
CV, 6.450%,
03/13/2034 | | | — | | | | — | | |
MXN | 38,114 | | | | (3 | ) | | JP Morgan /
Hipotecaria
su Casita,
6.100%,
09/25/2035 | | | 1,858 | | | | 0.0 | | |
| | | | | | | | | | 1,858 | | | | 0.0 | | |
See Accompanying Notes to Financial Statements
76
PORTFOLIO OF INVESTMENTS
VOYA GLOBAL BOND PORTFOLIO AS OF DECEMBER 31, 2021 (CONTINUED)
Principal
Amount† | |
| |
| | Value | | Percentage
of Net
Assets | |
| | | | | MULTI: 0.0% | |
| | 25,000 | | | | (1 | ) | | NXP BV / NXP
Funding
LLC / NXP
USA, Inc.,
3.250%,
11/30/2051 | | $ | 25,046 | | | | 0.0 | | |
| | | | | Netherlands: 0.4% | |
| | 15,000 | | | | | | | Shell
International
Finance BV,
2.875%,
11/26/2041 | | | 15,042 | | | | 0.0 | | |
| | 490,000 | | | | | | | Shell
International
Finance BV,
3.250%,
05/11/2025 | | | 521,905 | | | | 0.3 | | |
| | 100,000 | | | | | | | Shell
International
Finance BV,
4.000%,
05/10/2046 | | | 116,572 | | | | 0.1 | | |
| | | | | | | | | | 653,519 | | | | 0.4 | | |
| | | | | Norway: 0.0% | |
| | 41,000 | | | | | | | Equinor ASA,
3.125%,
04/06/2030 | | | 44,092 | | | | 0.0 | | |
| | | | | South Africa: 0.1% | |
ZAR | 1,000,000 | | | | | | | Transnet
SOC Ltd.,
10.800%,
11/06/2023 | | | 67,074 | | | | 0.1 | | |
| | | | | Switzerland: 0.4% | |
| | 400,000 | | | | (1 | ) | | Credit Suisse
AG, 6.500%,
08/08/2023 | | | 431,462 | | | | 0.3 | | |
| | 250,000 | | | | | | | UBS AG/
Stamford CT,
7.625%,
08/17/2022 | | | 259,696 | | | | 0.1 | | |
| | | | | | | | | | 691,158 | | | | 0.4 | | |
| | | | | United Kingdom: 0.9% | |
| | 220,000 | | | | (2 | ) | | HSBC Holdings
PLC, 2.251%,
11/22/2027 | | | 220,588 | | | | 0.2 | | |
| | 405,000 | | | | (2 | ) | | HSBC Holdings
PLC, 3.973%,
05/22/2030 | | | 439,730 | | | | 0.3 | | |
| | 200,000 | | | | (1 | ) | | LSEGA
Financing
PLC, 3.200%,
04/06/2041 | | | 209,148 | | | | 0.1 | | |
Principal
Amount† | |
| |
| | Value | | Percentage
of Net
Assets | |
| | 200,000 | | | | (1 | ) | | Reckitt
Benckiser
Treasury
Services
PLC,
3.000%,
06/26/2027 | | $ | 212,376 | | | | 0.1 | | |
| | 150,000 | | | | | | | Royalty
Pharma
PLC,
1.200%,
09/02/2025 | | | 146,971 | | | | 0.1 | | |
| | 150,000 | | | | | | | Royalty
Pharma
PLC,
1.750%,
09/02/2027 | | | 147,473 | | | | 0.1 | | |
| | | | | | | | | | 1,376,286 | | | | 0.9 | | |
| | | | | United States: 18.9% | |
| | 185,000 | | | | | | | AbbVie, Inc.,
3.200%,
11/21/2029 | | | 198,006 | | | | 0.1 | | |
| | 154,000 | | | | | | | AbbVie, Inc.,
3.800%,
03/15/2025 | | | 164,042 | | | | 0.1 | | |
| | 174,000 | | | | | | | AbbVie, Inc.,
4.050%,
11/21/2039 | | | 200,027 | | | | 0.1 | | |
| | 321,000 | | | | | | | AbbVie, Inc.,
4.300%,
05/14/2036 | | | 379,063 | | | | 0.2 | | |
| | 100,000 | | | | | | | Advance Auto
Parts, Inc.,
3.900%,
04/15/2030 | | | 109,225 | | | | 0.1 | | |
| | 153,000 | | | | (1 | ) | | AEP Texas,
Inc., 3.850%,
10/01/2025 | | | 163,451 | | | | 0.1 | | |
| | 175,000 | | | | | | | Altria Group,
Inc., 4.500%,
05/02/2043 | | | 181,758 | | | | 0.1 | | |
| | 92,000 | | | | | | | Altria Group,
Inc., 4.800%,
02/14/2029 | | | 103,859 | | | | 0.1 | | |
| | 171,000 | | | | | | | Amazon.com,
Inc., 2.875%,
05/12/2041 | | | 177,909 | | | | 0.1 | | |
| | 228,000 | | | | | | | American
Airlines
2021-1
Class A Pass
Through
Trust,
2.875%,
01/11/2036 | | | 226,817 | | | | 0.1 | | |
| | 67,000 | | | | | | | American
Electric
Power Co.,
Inc., 3.250%,
03/01/2050 | | | 66,387 | | | | 0.0 | | |
See Accompanying Notes to Financial Statements
77
PORTFOLIO OF INVESTMENTS
VOYA GLOBAL BOND PORTFOLIO AS OF DECEMBER 31, 2021 (CONTINUED)
Principal
Amount† | |
| |
| | Value | | Percentage
of Net
Assets | |
| | | | | United States (continued) | |
| | 45,000 | | | | (2 | ) | | American
Electric
Power Co.,
Inc., 3.875%,
02/15/2062 | | $ | 45,710 | | | | 0.0 | | |
| | 91,000 | | | | | | | American
International
Group, Inc.,
3.400%,
06/30/2030 | | | 98,513 | | | | 0.1 | | |
| | 59,000 | | | | | | | American
International
Group, Inc.,
4.250%,
03/15/2029 | | | 67,481 | | | | 0.0 | | |
| | 174,000 | | | | | | | American
International
Group, Inc.,
4.500%,
07/16/2044 | | | 214,795 | | | | 0.1 | | |
| | 59,000 | | | | | | | American
International
Group, Inc.,
4.750%,
04/01/2048 | | | 75,338 | | | | 0.1 | | |
| | 650,000 | | | | | | | American
Tower Corp.,
2.750%,
01/15/2027 | | | 670,386 | | | | 0.4 | | |
| | 45,000 | | | | (1 | ) | | American
Transmission
Systems,
Inc., 2.650%,
01/15/2032 | | | 45,468 | | | | 0.0 | | |
| | 37,000 | | | | | | | Amgen, Inc.,
2.000%,
01/15/2032 | | | 35,869 | | | | 0.0 | | |
| | 300,000 | | | | | | | Amgen, Inc.,
3.200%,
11/02/2027 | | | 323,549 | | | | 0.2 | | |
| | 22,000 | | | | | | | Analog
Devices, Inc.,
2.800%,
10/01/2041 | | | 22,295 | | | | 0.0 | | |
| | 170,000 | | | | | | | Anheuser-
Busch Cos
LLC /
Anheuser-
Busch InBev
Worldwide,
Inc., 4.900%,
02/01/2046 | | | 215,364 | | | | 0.1 | | |
| | 130,000 | | | | | | | Anheuser-
Busch InBev
Worldwide,
Inc., 4.750%,
01/23/2029 | | | 151,448 | | | | 0.1 | | |
| | 60,000 | | | | | | | Apple, Inc.,
2.650%,
02/08/2051 | | | 59,146 | | | | 0.0 | | |
Principal
Amount† | |
| |
| | Value | | Percentage
of Net
Assets | |
| | 40,000 | | | | | | | Apple, Inc.,
2.700%,
08/05/2051 | | $ | 39,645 | | | | 0.0 | | |
| | 45,000 | | | | | | | Apple, Inc.,
2.850%,
08/05/2061 | | | 45,226 | | | | 0.0 | | |
| | 131,000 | | | | | | | Assurant, Inc.,
2.650%,
01/15/2032 | | | 128,653 | | | | 0.1 | | |
| | 80,000 | | | | | | | AT&T, Inc.,
3.300%,
02/01/2052 | | | 78,569 | | | | 0.1 | | |
| | 123,000 | | | | | | | AT&T, Inc.,
3.650%,
09/15/2059 | | | 124,458 | | | | 0.1 | | |
| | 40,000 | | | | | | | Atmos Energy
Corp.,
2.850%,
02/15/2052 | | | 38,973 | | | | 0.0 | | |
| | 161,000 | | | | (2 | ) | | Bank of
America
Corp.,
1.734%,
07/22/2027 | | | 159,916 | | | | 0.1 | | |
| | 145,000 | | | | (2 | ) | | Bank of
America
Corp.,
1.898%,
07/23/2031 | | | 138,932 | | | | 0.1 | | |
| | 71,000 | | | | (2 | ) | | Bank of
America
Corp.,
2.087%,
06/14/2029 | | | 70,555 | | | | 0.0 | | |
| | 32,000 | | | | (2 | ) | | Bank of
America
Corp.,
2.299%,
07/21/2032 | | | 31,497 | | | | 0.0 | | |
| | 80,000 | | | | (2 | ) | | Bank of
America
Corp.,
2.572%,
10/20/2032 | | | 80,443 | | | | 0.1 | | |
| | 59,000 | | | | (2 | ) | | Bank of
America
Corp.,
2.592%,
04/29/2031 | | | 59,664 | | | | 0.0 | | |
| | 496,000 | | | | (2 | ) | | Bank of
America
Corp.,
2.687%,
04/22/2032 | | | 503,882 | | | | 0.3 | | |
| | 150,000 | | | | (2 | ) | | Bank of
America
Corp.,
3.458%,
03/15/2025 | | | 156,950 | | | | 0.1 | | |
See Accompanying Notes to Financial Statements
78
PORTFOLIO OF INVESTMENTS
VOYA GLOBAL BOND PORTFOLIO AS OF DECEMBER 31, 2021 (CONTINUED)
Principal
Amount† | |
| |
| | Value | | Percentage
of Net
Assets | |
| | | | | United States (continued) | |
| | 233,000 | | | | | | | Bank of
America
Corp.,
4.183%,
11/25/2027 | | $ | 255,106 | | | | 0.2 | | |
| | 258,000 | | | | (2 | ) | | Bank of
America
Corp.,
4.330%,
03/15/2050 | | | 319,964 | | | | 0.2 | | |
| | 137,000 | | | | | | | BAT Capital
Corp.,
2.259%,
03/25/2028 | | | 133,615 | | | | 0.1 | | |
| | 24,000 | | | | (1 | ) | | Baxter
International,
Inc., 1.915%,
02/01/2027 | | | 24,103 | | | | 0.0 | | |
| | 55,000 | | | | (1 | ) | | Baxter
International,
Inc., 2.272%,
12/01/2028 | | | 55,443 | | | | 0.0 | | |
| | 38,000 | | | | (1 | ) | | Baxter
International,
Inc., 2.539%,
02/01/2032 | | | 38,431 | | | | 0.0 | | |
| | 22,000 | | | | (1 | ) | | Baxter
International,
Inc., 3.132%,
12/01/2051 | | | 22,691 | | | | 0.0 | | |
| | 241,000 | | | | | | | Berry Global,
Inc., 1.650%,
01/15/2027 | | | 235,813 | | | | 0.2 | | |
| | 84,000 | | | | (1 | ) | | Blackstone
Holdings
Finance Co.
LLC, 2.850%,
08/05/2051 | | | 81,973 | | | | 0.1 | | |
| | 250,000 | | | | | | | Boeing Co/The,
3.625%,
02/01/2031 | | | 266,904 | | | | 0.2 | | |
| | 74,000 | | | | | | | Boeing Co/The,
5.150%,
05/01/2030 | | | 86,288 | | | | 0.1 | | |
| | 59,000 | | | | | | | Boston
Scientific
Corp.,
4.000%,
03/01/2029 | | | 65,580 | | | | 0.0 | | |
| | 41,000 | | | | | | | BP Capital
Markets
America, Inc.,
3.000%,
02/24/2050 | | | 40,470 | | | | 0.0 | | |
| | 126,000 | | | | | | | Bristol-Myers
Squibb Co.,
3.875%,
08/15/2025 | | | 136,457 | | | | 0.1 | | |
Principal
Amount† | |
| |
| | Value | | Percentage
of Net
Assets | |
| | 73,000 | | | | | | | Bristol-Myers
Squibb Co.,
4.250%,
10/26/2049 | | $ | 90,436 | | | | 0.1 | | |
| | 80,000 | | | | | | | Brookfield
Finance LLC,
3.450%,
04/15/2050 | | | 83,571 | | | | 0.1 | | |
| | 50,000 | | | | (2 | ) | | Capital One
Financial
Corp.,
1.878%,
11/02/2027 | | | 49,774 | | | | 0.0 | | |
| | 55,000 | | | | (2 | ) | | Capital One
Financial
Corp.,
2.618%,
11/02/2032 | | | 54,912 | | | | 0.0 | | |
| | 52,000 | | | | (1 | ) | | Cargill, Inc.,
2.125%,
11/10/2031 | | | 51,314 | | | | 0.0 | | |
| | 150,000 | | | | | | | CBRE
Services,
Inc., 2.500%,
04/01/2031 | | | 151,024 | | | | 0.1 | | |
| | 100,000 | | | | | | | CenterPoint
Energy, Inc.,
4.250%,
11/01/2028 | | | 111,204 | | | | 0.1 | | |
| | 38,000 | | | | | | | Charter
Communications
Operating LLC /
Charter
Communications
Operating
Capital,
2.250%,
01/15/2029 | | | 37,107 | | | | 0.0 | | |
| | 55,000 | | | | | | | Charter
Communications
Operating LLC /
Charter
Communications
Operating
Capital,
3.500%,
03/01/2042 | | | 53,442 | | | | 0.0 | | |
| | 55,000 | | | | | | | Chubb INA
Holdings,
Inc., 1.375%,
09/15/2030 | | | 51,864 | | | | 0.0 | | |
| | 20,000 | | | | | | | Chubb INA
Holdings,
Inc., 2.850%,
12/15/2051 | | | 20,101 | | | | 0.0 | | |
| | 15,000 | | | | | | | Chubb INA
Holdings,
Inc., 3.050%,
12/15/2061 | | | 15,350 | | | | 0.0 | | |
| | 135,000 | | | | | | | Cigna Corp.,
3.200%,
03/15/2040 | | | 140,148 | | | | 0.1 | | |
See Accompanying Notes to Financial Statements
79
PORTFOLIO OF INVESTMENTS
VOYA GLOBAL BOND PORTFOLIO AS OF DECEMBER 31, 2021 (CONTINUED)
Principal
Amount† | |
| |
| | Value | | Percentage
of Net
Assets | |
| | | | | United States (continued) | |
| | 59,000 | | | | | | | Cigna Corp.,
3.400%,
03/15/2050 | | $ | 61,408 | | | | 0.0 | | |
| | 50,000 | | | | | | | Cigna Corp.,
4.800%,
08/15/2038 | | | 61,611 | | | | 0.0 | | |
| | 579,000 | | | | | | | Citigroup, Inc.,
4.000%,
08/05/2024 | | | 617,346 | | | | 0.4 | | |
| | 469,000 | | | | | | | Citigroup, Inc.,
5.500%,
09/13/2025 | | | 530,877 | | | | 0.3 | | |
| | 278,000 | | | | (1 | ) | | Cleveland
Electric
Illuminating
Co/The,
3.500%,
04/01/2028 | | | 296,507 | | | | 0.2 | | |
| | 165,000 | | | | | | | Comcast Corp.,
2.350%,
01/15/2027 | | | 171,005 | | | | 0.1 | | |
| | 310,000 | | | | | | | Comcast Corp.,
4.150%,
10/15/2028 | | | 352,145 | | | | 0.2 | | |
| | 110,000 | | | | | | | Comcast Corp.,
4.250%,
01/15/2033 | | | 128,902 | | | | 0.1 | | |
| | 80,000 | | | | | | | Comcast Corp.,
5.650%,
06/15/2035 | | | 106,123 | | | | 0.1 | | |
| | 65,000 | | | | | | | CSX Corp.,
4.500%,
08/01/2054 | | | 82,264 | | | | 0.1 | | |
| | 198,000 | | | | | | | CVS Health
Corp.,
4.300%,
03/25/2028 | | | 222,374 | | | | 0.1 | | |
| | 40,000 | | | | | | | CVS Health
Corp.,
5.050%,
03/25/2048 | | | 52,390 | | | | 0.0 | | |
| | 313,000 | | | | | | | Dell
International
LLC / EMC
Corp.,
6.020%,
06/15/2026 | | | 362,141 | | | | 0.2 | | |
| | 105,417 | | | | | | | Delta Air Lines
2015-1
Class B Pass
Through
Trust,
4.250%,
01/30/2025 | | | 108,974 | | | | 0.1 | | |
| | 94,000 | | | | (1 | ) | | Delta Air Lines,
Inc. /
SkyMiles IP
Ltd., 4.500%,
10/20/2025 | | | 98,853 | | | | 0.1 | | |
Principal
Amount† | |
| |
| | Value | | Percentage
of Net
Assets | |
| | 135,000 | | | | | | | Discovery
Communications
LLC, 5.300%,
05/15/2049 | | $ | 169,439 | | | | 0.1 | | |
| | 26,000 | | | | | | | Dollar General
Corp.,
3.500%,
04/03/2030 | | | 28,128 | | | | 0.0 | | |
| | 108,000 | | | | (2 | ) | | Dominion
Energy, Inc.,
4.350%,
12/31/2199 | | | 111,780 | | | | 0.1 | | |
| | 120,000 | | | | (2 | ) | | Dominion
Energy, Inc.,
4.650%,
12/31/2199 | | | 125,400 | | | | 0.1 | | |
| | 108,000 | | | | | | | DTE Electric
Co., 4.300%,
07/01/2044 | | | 130,831 | | | | 0.1 | | |
| | 125,000 | | | | | | | Duke Energy
Carolinas
LLC, 3.200%,
08/15/2049 | | | 129,721 | | | | 0.1 | | |
| | 45,000 | | | | | | | Duke Energy
Florida LLC,
2.400%,
12/15/2031 | | | 45,597 | | | | 0.0 | | |
| | 167,000 | | | | | | | Duke Energy
Indiana LLC,
3.250%,
10/01/2049 | | | 173,438 | | | | 0.1 | | |
| | 40,000 | | | | | | | DXC
Technology
Co., 1.800%,
09/15/2026 | | | 39,569 | | | | 0.0 | | |
| | 40,000 | | | | | | | DXC
Technology
Co., 2.375%,
09/15/2028 | | | 39,133 | | | | 0.0 | | |
| | 80,000 | | | | | | | Ecolab, Inc.,
2.750%,
08/18/2055 | | | 78,738 | | | | 0.1 | | |
| | 280,000 | | | | | | | Energy
Transfer
L.P. /
Regency
Energy
Finance
Corp.,
4.500%,
11/01/2023 | | | 293,421 | | | | 0.2 | | |
| | 104,000 | | | | | | | Energy
Transfer L.P.,
4.250%,
04/01/2024 | | | 109,242 | | | | 0.1 | | |
| | 1,026,000 | | | | | | | Energy
Transfer L.P.,
4.900%,
02/01/2024 | | | 1,086,113 | | | | 0.7 | | |
See Accompanying Notes to Financial Statements
80
PORTFOLIO OF INVESTMENTS
VOYA GLOBAL BOND PORTFOLIO AS OF DECEMBER 31, 2021 (CONTINUED)
Principal
Amount† | |
| |
| | Value | | Percentage
of Net
Assets | |
| | | | | United States (continued) | |
| | 100,000 | | | | | | | Energy
Transfer L.P.,
5.400%,
10/01/2047 | | $ | 117,609 | | | | 0.1 | | |
| | 36,000 | | | | | | | Entergy
Louisiana
LLC, 2.900%,
03/15/2051 | | | 35,374 | | | | 0.0 | | |
| | 200,000 | | | | | | | Entergy
Louisiana
LLC, 4.200%,
04/01/2050 | | | 238,587 | | | | 0.2 | | |
| | 48,000 | | | | | | | Equifax, Inc.,
2.350%,
09/15/2031 | | | 47,403 | | | | 0.0 | | |
| | 112,000 | | | | | | | Essential
Utilities, Inc.,
2.704%,
04/15/2030 | | | 113,917 | | | | 0.1 | | |
| | 111,000 | | | | | | | Evergy Kansas
Central, Inc.,
3.250%,
09/01/2049 | | | 115,657 | | | | 0.1 | | |
| | 72,000 | | | | | | | Evergy Kansas
Central, Inc.,
4.125%,
03/01/2042 | | | 83,587 | | | | 0.1 | | |
| | 50,000 | | | | | | | Eversource
Energy,
1.400%,
08/15/2026 | | | 49,057 | | | | 0.0 | | |
| | 55,000 | | | | | | | Extra Space
Storage L.P.,
2.350%,
03/15/2032 | | | 53,528 | | | | 0.0 | | |
| | 100,000 | | | | | | | Exxon Mobil
Corp.,
2.610%,
10/15/2030 | | | 103,754 | | | | 0.1 | | |
| | 57,000 | | | | | | | Exxon Mobil
Corp.,
2.995%,
08/16/2039 | | | 57,786 | | | | 0.0 | | |
| | 58,000 | | | | | | | Exxon Mobil
Corp.,
3.095%,
08/16/2049 | | | 58,897 | | | | 0.0 | | |
| | 75,000 | | | | | | | Exxon Mobil
Corp.,
3.452%,
04/15/2051 | | | 81,428 | | | | 0.1 | | |
| | 77,000 | | | | | | | FedEx Corp.,
4.050%,
02/15/2048 | | | 86,668 | | | | 0.1 | | |
| | 59,000 | | | | | | | FedEx Corp.,
5.250%,
05/15/2050 | | | 79,129 | | | | 0.1 | | |
Principal
Amount† | |
| |
| | Value | | Percentage
of Net
Assets | |
| | 532,000 | | | | | | | FirstEnergy
Corp.,
4.750%,
03/15/2023 | | $ | 553,945 | | | | 0.4 | | |
| | 233,000 | | | | | | | Fiserv, Inc.,
3.200%,
07/01/2026 | | | 246,617 | | | | 0.2 | | |
| | 38,000 | | | | | | | Florida
Power &
Light Co.,
2.875%,
12/04/2051 | | | 38,637 | | | | 0.0 | | |
| | 125,000 | | | | | | | FMC Corp.,
3.200%,
10/01/2026 | | | 132,218 | | | | 0.1 | | |
| | 147,000 | | | | | | | General
Dynamics
Corp.,
3.500%,
04/01/2027 | | | 160,140 | | | | 0.1 | | |
| | 111,000 | | | | | | | General
Electric Co.,
6.750%,
03/15/2032 | | | 151,566 | | | | 0.1 | | |
| | 100,000 | | | | (5 | ) | | General Mills,
Inc., 2.875%,
04/15/2030 | | | 104,480 | | | | 0.1 | | |
| | 224,000 | | | | | | | General
Motors
Financial
Co., Inc.,
4.300%,
07/13/2025 | | | 241,658 | | | | 0.2 | | |
| | 260,000 | | | | | | | HCA, Inc.,
4.125%,
06/15/2029 | | | 286,372 | | | | 0.2 | | |
| | 130,000 | | | | | | | Healthpeak
Properties,
Inc., 3.000%,
01/15/2030 | | | 136,615 | | | | 0.1 | | |
| | 130,000 | | | | | | | Hess Corp.,
5.600%,
02/15/2041 | | | 160,814 | | | | 0.1 | | |
| | 200,000 | | | | | | | Intel Corp.,
3.250%,
11/15/2049 | | | 211,641 | | | | 0.1 | | |
| | 59,000 | | | | | | | Intel Corp.,
4.750%,
03/25/2050 | | | 78,763 | | | | 0.1 | | |
| | 55,000 | | | | | | | Intercontinental
Exchange,
Inc., 3.000%,
06/15/2050 | | | 55,280 | | | | 0.0 | | |
| | 45,000 | | | | (1 | ) | | International
Flavors &
Fragrances,
Inc., 3.268%,
11/15/2040 | | | 45,778 | | | | 0.0 | | |
See Accompanying Notes to Financial Statements
81
PORTFOLIO OF INVESTMENTS
VOYA GLOBAL BOND PORTFOLIO AS OF DECEMBER 31, 2021 (CONTINUED)
Principal
Amount† | |
| |
| | Value | | Percentage
of Net
Assets | |
| | | | | United States (continued) | |
| | 27,000 | | | | | | | Interstate
Power and
Light Co.,
3.100%,
11/30/2051 | | $ | 26,902 | | | | 0.0 | | |
| | 90,000 | | | | | | | Johnson &
Johnson,
3.625%,
03/03/2037 | | | 103,500 | | | | 0.1 | | |
| | 63,000 | | | | (2 | ) | | JPMorgan
Chase & Co.,
1.470%,
09/22/2027 | | | 61,782 | | | | 0.0 | | |
| | 210,000 | | | | (2 | ) | | JPMorgan
Chase & Co.,
1.578%,
04/22/2027 | | | 207,634 | | | | 0.1 | | |
| | 28,000 | | | | (2 | ) | | JPMorgan
Chase & Co.,
1.953%,
02/04/2032 | | | 26,997 | | | | 0.0 | | |
| | 115,000 | | | | (2 | ) | | JPMorgan
Chase & Co.,
2.545%,
11/08/2032 | | | 115,775 | | | | 0.1 | | |
| | 101,000 | | | | (2 | ) | | JPMorgan
Chase & Co.,
2.580%,
04/22/2032 | | | 102,406 | | | | 0.1 | | |
| | 125,000 | | | | | | | JPMorgan
Chase & Co.,
2.950%,
10/01/2026 | | | 132,039 | | | | 0.1 | | |
| | 72,000 | | | | (2 | ) | | JPMorgan
Chase & Co.,
3.157%,
04/22/2042 | | | 75,300 | | | | 0.1 | | |
| | 96,000 | | | | (2 | ) | | JPMorgan
Chase & Co.,
3.964%,
11/15/2048 | | | 112,867 | | | | 0.1 | | |
| | 478,000 | | | | (2 | ) | | JPMorgan
Chase & Co.,
6.000%,
12/31/2199 | | | 498,972 | | | | 0.3 | | |
| | 222,000 | | | | | | | Kinder Morgan
Energy
Partners L.P.,
4.250%,
09/01/2024 | | | 236,823 | | | | 0.2 | | |
| | 40,000 | | | | | | | Kinder Morgan,
Inc., 3.600%,
02/15/2051 | | | 40,319 | | | | 0.0 | | |
| | 48,000 | | | | | | | Life Storage
L.P., 2.400%,
10/15/2031 | | | 47,234 | | | | 0.0 | | |
| | 380,000 | | | | (1 | ) | | Metropolitan
Edison Co.,
4.000%,
04/15/2025 | | | 402,850 | | | | 0.3 | | |
Principal
Amount† | |
| |
| | Value | | Percentage
of Net
Assets | |
| | 45,000 | | | | | | | Mid-America
Apartments
L.P., 2.875%,
09/15/2051 | | $ | 44,458 | | | | 0.0 | | |
| | 170,000 | | | | | | | Mississippi
Power Co.,
4.250%,
03/15/2042 | | | 195,535 | | | | 0.1 | | |
| | 100,000 | | | | | | | Mondelez
International,
Inc., 2.750%,
04/13/2030 | | | 103,164 | | | | 0.1 | | |
| | 338,000 | | | | (2 | ) | | Morgan
Stanley,
1.593%,
05/04/2027 | | | 334,846 | | | | 0.2 | | |
| | 177,000 | | | | (2 | ) | | Morgan
Stanley,
2.239%,
07/21/2032 | | | 173,308 | | | | 0.1 | | |
| | 74,000 | | | | (2 | ) | | Morgan
Stanley,
2.511%,
10/20/2032 | | | 74,008 | | | | 0.1 | | |
| | 200,000 | | | | | | | Morgan
Stanley,
3.125%,
07/27/2026 | | | 212,070 | | | | 0.1 | | |
| | 303,000 | | | | (2 | ) | | Morgan
Stanley,
3.622%,
04/01/2031 | | | 330,516 | | | | 0.2 | | |
| | 618,000 | | | | | | | Morgan
Stanley,
4.100%,
05/22/2023 | | | 643,895 | | | | 0.4 | | |
| | 150,000 | | | | | | | Mosaic
Co/The,
3.250%,
11/15/2022 | | | 152,928 | | | | 0.1 | | |
| | 280,000 | | | | | | | National Rural
Utilities
Cooperative
Finance
Corp.,
3.900%,
11/01/2028 | | | 312,989 | | | | 0.2 | | |
| | 150,000 | | | | (1 | ) | | Nestle
Holdings,
Inc., 1.500%,
09/14/2028 | | | 146,251 | | | | 0.1 | | |
| | 143,000 | | | | | | | Northern
States Power
Co/MN,
3.600%,
09/15/2047 | | | 161,264 | | | | 0.1 | | |
| | 39,000 | | | | | | | ONEOK, Inc.,
3.100%,
03/15/2030 | | | 39,766 | | | | 0.0 | | |
| | 233,000 | | | | | | | Oracle Corp.,
2.800%,
04/01/2027 | | | 240,360 | | | | 0.2 | | |
See Accompanying Notes to Financial Statements
82
PORTFOLIO OF INVESTMENTS
VOYA GLOBAL BOND PORTFOLIO AS OF DECEMBER 31, 2021 (CONTINUED)
Principal
Amount† | |
| |
| | Value | | Percentage
of Net
Assets | |
| | | | | United States (continued) | |
| | 54,000 | | | | | | | Oracle Corp.,
3.950%,
03/25/2051 | | $ | 56,154 | | | | 0.0 | | |
| | 48,000 | | | | | | | O'Reilly
Automotive,
Inc., 3.600%,
09/01/2027 | | | 51,920 | | | | 0.0 | | |
| | 95,000 | | | | | | | O'Reilly
Automotive,
Inc., 4.350%,
06/01/2028 | | | 107,249 | | | | 0.1 | | |
| | 26,000 | | | | | | | Pacific Gas
and Electric
Co., 4.250%,
03/15/2046 | | | 26,020 | | | | 0.0 | | |
| | 21,000 | | | | | | | Pacific Gas
and Electric
Co., 4.300%,
03/15/2045 | | | 21,281 | | | | 0.0 | | |
| | 33,000 | | | | | | | Pacific Gas
and Electric
Co., 4.450%,
04/15/2042 | | | 33,613 | | | | 0.0 | | |
| | 81,000 | | | | (2 | ) | | PartnerRe
Finance B
LLC,
4.500%,
10/01/2050 | | | 85,322 | | | | 0.1 | | |
| | 140,000 | | | | | | | PayPal
Holdings,
Inc., 2.850%,
10/01/2029 | | | 147,483 | | | | 0.1 | | |
| | 168,000 | | | | | | | PECO Energy
Co., 4.150%,
10/01/2044 | | | 200,404 | | | | 0.1 | | |
| | 24,000 | | | | (5 | ) | | PepsiCo, Inc.,
2.625%,
10/21/2041 | | | 24,331 | | | | 0.0 | | |
| | 9,000 | | | | | | | PepsiCo, Inc.,
2.750%,
10/21/2051 | | | 9,248 | | | | 0.0 | | |
| | 26,000 | | | | | | | Phillips 66,
3.300%,
03/15/2052 | | | 26,020 | | | | 0.0 | | |
| | 63,000 | | | | | | | Phillips 66,
3.850%,
04/09/2025 | | | 67,223 | | | | 0.0 | | |
| | 175,000 | | | | | | | Plains All
American
Pipeline
L.P. / PAA
Finance
Corp.,
3.800%,
09/15/2030 | | | 182,950 | | | | 0.1 | | |
Principal
Amount† | |
| |
| | Value | | Percentage
of Net
Assets | |
| | 200,000 | | | | | | | Plains All
American
Pipeline
L.P. / PAA
Finance
Corp.,
4.900%,
02/15/2045 | | $ | 217,544 | | | | 0.1 | | |
| | 100,000 | | | | | | | Public Service
Enterprise
Group, Inc.,
2.450%,
11/15/2031 | | | 98,928 | | | | 0.1 | | |
| | 18,000 | | | | | | | Public Storage,
1.950%,
11/09/2028 | | | 17,952 | | | | 0.0 | | |
| | 18,000 | | | | | | | Public Storage,
2.250%,
11/09/2031 | | | 18,111 | | | | 0.0 | | |
| | 45,000 | | | | | | | Puget Sound
Energy, Inc.,
3.250%,
09/15/2049 | | | 47,673 | | | | 0.0 | | |
| | 160,000 | | | | | | | Raytheon
Technologies
Corp.,
4.500%,
06/01/2042 | | | 198,240 | | | | 0.1 | | |
| | 181,000 | | | | | | | Regeneron
Pharmaceuticals,
Inc., 1.750%,
09/15/2030 | | | 171,372 | | | | 0.1 | | |
| | 15,000 | | | | | | | Rexford
Industrial
Realty L.P.,
2.150%,
09/01/2031 | | | 14,179 | | | | 0.0 | | |
| | 40,000 | | | | | | | Reynolds
American,
Inc., 5.700%,
08/15/2035 | | | 47,510 | | | | 0.0 | | |
| | 35,000 | | | | | | | Reynolds
American,
Inc., 5.850%,
08/15/2045 | | | 42,619 | | | | 0.0 | | |
| | 272,000 | | | | | | | Reynolds
American,
Inc., 6.150%,
09/15/2043 | | | 334,257 | | | | 0.2 | | |
| | 25,000 | | | | | | | Ross Stores,
Inc., 4.700%,
04/15/2027 | | | 28,278 | | | | 0.0 | | |
| | 135,000 | | | | | | | salesforce.com,
Inc., 2.700%,
07/15/2041 | | | 135,089 | | | | 0.1 | | |
| | 55,000 | | | | (1 | ) | | Sealed Air
Corp.,
1.573%,
10/15/2026 | | | 53,359 | | | | 0.0 | | |
See Accompanying Notes to Financial Statements
83
PORTFOLIO OF INVESTMENTS
VOYA GLOBAL BOND PORTFOLIO AS OF DECEMBER 31, 2021 (CONTINUED)
Principal
Amount† | |
| |
| | Value | | Percentage
of Net
Assets | |
| | | | | United States (continued) | |
| | 85,000 | | | | (2 | ) | | Sempra
Energy,
4.125%,
04/01/2052 | | $ | 86,128 | | | | 0.1 | | |
| | 370,000 | | | | | | | Shire
Acquisitions
Investments
Ireland DAC,
3.200%,
09/23/2026 | | | 392,886 | | | | 0.3 | | |
| | 35,000 | | | | | | | Southern
California
Edison Co.,
3.650%,
02/01/2050 | | | 37,129 | | | | 0.0 | | |
| | 272,000 | | | | | | | Time Warner
Cable LLC,
5.875%,
11/15/2040 | | | 340,085 | | | | 0.2 | | |
| | 125,000 | | | | | | | T-Mobile USA,
Inc., 3.000%,
02/15/2041 | | | 122,265 | | | | 0.1 | | |
| | 233,000 | | | | | | | T-Mobile USA,
Inc., 3.750%,
04/15/2027 | | | 252,432 | | | | 0.2 | | |
| | 59,000 | | | | | | | T-Mobile USA,
Inc., 3.875%,
04/15/2030 | | | 64,589 | | | | 0.0 | | |
| | 287,000 | | | | | | | UnitedHealth
Group, Inc.,
2.300%,
05/15/2031 | | | 292,305 | | | | 0.2 | | |
| | 95,000 | | | | | | | UnitedHealth
Group, Inc.,
2.750%,
05/15/2040 | | | 96,642 | | | | 0.1 | | |
| | 48,000 | | | | | | | UnitedHealth
Group, Inc.,
3.050%,
05/15/2041 | | | 50,307 | | | | 0.0 | | |
| | 67,410 | | | | | | | US Airways
2012-1
Class A
Pass
Through
Trust,
5.900%,
04/01/2026 | | | 70,736 | | | | 0.1 | | |
| | 200,000 | | | | | | | Utah
Acquisition
Sub, Inc.,
3.950%,
06/15/2026 | | | 215,858 | | | | 0.1 | | |
| | 45,000 | | | | | | | Valero Energy
Corp.,
3.650%,
12/01/2051 | | | 44,816 | | | | 0.0 | | |
Principal
Amount† | |
| |
| | Value | | Percentage
of Net
Assets | |
| | 147,000 | | | | (1 | ) | | Verizon
Communications,
Inc., 2.355%,
03/15/2032 | | $ | 145,009 | | | | 0.1 | | |
| | 86,000 | | | | | | | Verizon
Communications,
Inc., 3.400%,
03/22/2041 | | | 90,198 | | | | 0.1 | | |
| | 86,000 | | | | | | | Verizon
Communications,
Inc., 3.550%,
03/22/2051 | | | 92,828 | | | | 0.1 | | |
| | 230,000 | | | | | | | Verizon
Communications,
Inc., 4.125%,
03/16/2027 | | | 255,843 | | | | 0.2 | | |
| | 265,000 | | | | | | | Verizon
Communications,
Inc., 4.125%,
08/15/2046 | | | 308,114 | | | | 0.2 | | |
| | 80,000 | | | | | | | Viatris, Inc.,
2.700%,
06/22/2030 | | | 80,360 | | | | 0.1 | | |
| | 80,000 | | | | | | | Visa, Inc.,
2.000%,
08/15/2050 | | | 70,276 | | | | 0.0 | | |
| | 335,000 | | | | | | | VMware, Inc.,
1.400%,
08/15/2026 | | | 329,581 | | | | 0.2 | | |
| | 40,000 | | | | | | | VMware, Inc.,
1.800%,
08/15/2028 | | | 38,957 | | | | 0.0 | | |
| | 240,000 | | | | (2 | ) | | Wells Fargo &
Co., 2.406%,
10/30/2025 | | | 246,151 | | | | 0.2 | | |
| | 327,000 | | | | | | | Wells Fargo &
Co., 3.000%,
10/23/2026 | | | 343,774 | | | | 0.2 | | |
| | | | | | | | | | 29,955,085 | | | | 18.9 | | |
| | | | | | | Total
Corporate
Bonds/Notes
(Cost
$35,263,351) | | | 36,313,190 | | | | 22.9 | | |
COLLATERALIZED MORTGAGE OBLIGATIONS: 14.5% | | | |
| | | | | United States: 14.5% | |
| | 157,468 | | | | (2 | ) | | Adjustable
Rate
Mortgage
Trust 2006-2
1A1, 3.156%,
05/25/2036 | | | 153,357 | | | | 0.1 | | |
| | 60,713 | | | | | | | Alternative
Loan Trust
2006-13T1
A9, 6.000%,
05/25/2036 | | | 40,568 | | | | 0.0 | | |
See Accompanying Notes to Financial Statements
84
PORTFOLIO OF INVESTMENTS
VOYA GLOBAL BOND PORTFOLIO AS OF DECEMBER 31, 2021 (CONTINUED)
Principal
Amount† | |
| |
| | Value | | Percentage
of Net
Assets | |
| | | | | United States (continued) | |
| | 240,272 | | | | | | | Banc of
America
Funding
2005-1 Trust
1A1, 5.500%,
02/25/2035 | | $ | 248,139 | | | | 0.2 | | |
| | 25,501 | | | | | | | CHL Mortgage
Pass-
Through
Trust
2005-17 1A8,
5.500%,
09/25/2035 | | | 25,640 | | | | 0.0 | | |
| | 32,517 | | | | | | | CHL Mortgage
Pass-
Through
Trust
2005-J4 A7,
5.500%,
11/25/2035 | | | 32,009 | | | | 0.0 | | |
| | 197,329 | | | | | | | CHL Mortgage
Pass-
Through
Trust
2007-7 A7,
5.750%,
06/25/2037 | | | 137,064 | | | | 0.1 | | |
| | 39,494 | | | | (2 | ) | | Citigroup
Mortgage
Loan Trust,
Inc. 2005-2
1A3, 2.816%,
05/25/2035 | | | 39,889 | | | | 0.0 | | |
| | 190,878 | | | | | | | CitiMortgage
Alternative
Loan Trust
Series
2006-A3 1A7,
6.000%,
07/25/2036 | | | 189,653 | | | | 0.1 | | |
| | 39,320 | | | | | | | Countrywide
Alternative
Loan Trust
2005-53T2
2A6, 0.602%,
(US0001M +
0.500%),
11/25/2035 | | | 21,233 | | | | 0.0 | | |
| | 154,195 | | | | (1 | ),(2) | | CSMC Trust
2015-3 B1,
3.885%,
03/25/2045 | | | 155,235 | | | | 0.1 | | |
| | 675 | | | | (1 | ) | | Deutsche
ALT-A
Securities,
Inc.
ALT2007-
RS1 A2,
0.592%,
(US0001M +
0.500%),
01/27/2037 | | | 815 | | | | 0.0 | | |
Principal
Amount† | |
| |
| | Value | | Percentage
of Net
Assets | |
| | 414,663 | | | | | | | Fannie Mae
Connecticut
Avenue
Securities
2017-C03
1M2, 3.103%,
(US0001M +
3.000%),
10/25/2029 | | $ | 424,691 | | | | 0.3 | | |
| | 355,825 | | | | | | | Fannie Mae
Connecticut
Avenue
Securities
2017-C07
2M2, 2.602%,
(US0001M +
2.500%),
05/25/2030 | | | 360,446 | | | | 0.2 | | |
| | 63,679 | | | | (1 | ) | | Fannie Mae
Connecticut
Avenue
Securities
2019-R02
1M2, 2.403%,
(US0001M +
2.300%),
08/25/2031 | | | 63,971 | | | | 0.1 | | |
| | 23,829 | | | | (1 | ) | | Fannie Mae
Connecticut
Avenue
Securities
Trust
2019-R01
2M2, 2.553%,
(US0001M +
2.450%),
07/25/2031 | | | 23,950 | | | | 0.0 | | |
| | 29,331 | | | | (6 | ) | | Fannie Mae
Interest Strip
Series 254 2,
7.500%,
01/25/2024 | | | 1,442 | | | | 0.0 | | |
| | 10,777 | | | | (6 | ) | | Fannie Mae
Interest Strip
Series 294 2,
7.000%,
02/25/2028 | | | 1,687 | | | | 0.0 | | |
| | 97,647 | | | | (6 | ) | | Fannie Mae
Interest Strip
Series 319 2,
6.500%,
02/25/2032 | | | 19,189 | | | | 0.0 | | |
| | 33,987 | | | | (6 | ) | | Fannie Mae
Interest Strip
Series 328 2,
6.000%,
12/25/2032 | | | 6,798 | | | | 0.0 | | |
| | 15,525 | | | | (6 | ) | | Fannie Mae
Interest Strip
Series 331 5,
6.000%,
02/25/2033 | | | 3,029 | | | | 0.0 | | |
See Accompanying Notes to Financial Statements
85
PORTFOLIO OF INVESTMENTS
VOYA GLOBAL BOND PORTFOLIO AS OF DECEMBER 31, 2021 (CONTINUED)
Principal
Amount† | |
| |
| | Value | | Percentage
of Net
Assets | |
| | | | | United States (continued) | |
| | 18,071 | | | | (6 | ) | | Fannie Mae
Interest Strip
Series 332 2,
6.000%,
03/25/2033 | | $ | 3,473 | | | | 0.0 | | |
| | 15,135 | | | | (6 | ) | | Fannie Mae
Interest Strip
Series 334 12,
6.000%,
03/25/2033 | | | 3,011 | | | | 0.0 | | |
| | 18,450 | | | | (6 | ) | | Fannie Mae
Interest Strip
Series 338 2,
5.500%,
07/25/2033 | | | 3,177 | | | | 0.0 | | |
| | 7,955 | | | | (6 | ) | | Fannie Mae
Interest Strip
Series 356 10,
5.500%,
06/25/2035 | | | 1,617 | | | | 0.0 | | |
| | 9,026 | | | | (6 | ) | | Fannie Mae
Interest Strip
Series 364 15,
6.000%,
09/25/2035 | | | 1,754 | | | | 0.0 | | |
| | 264,213 | | | | (6 | ) | | Fannie Mae
Interest Strip
Series 418 5,
3.500%,
08/25/2043 | | | 36,346 | | | | 0.0 | | |
| | 384,765 | | | | (2 | ),(6) | | Fannie Mae
Interest Strip
Series 418 80,
3.500%,
08/25/2033 | | | 45,470 | | | | 0.0 | | |
| | 4,598 | | | | | | | Fannie Mae
REMIC Trust
1999-14 MB,
6.500%,
04/25/2029 | | | 5,000 | | | | 0.0 | | |
| | 7,018 | | | | | | | Fannie Mae
REMIC Trust
2001-80 ZB,
6.000%,
01/25/2032 | | | 7,827 | | | | 0.0 | | |
| | 34,482 | | | | (6 | ) | | Fannie Mae
REMIC Trust
2002-12 SB,
7.648%,
(-1.000*
US0001M +
7.750%),
07/25/2031 | | | 7,483 | | | | 0.0 | | |
| | 21,777 | | | | (6 | ) | | Fannie Mae
REMIC Trust
2002-2 SW,
7.648%,
(-1.000*
US0001M +
7.750%),
02/25/2032 | | | 4,917 | | | | 0.0 | | |
Principal
Amount† | |
| |
| | Value | | Percentage
of Net
Assets | |
| | 9,144 | | | | | | | Fannie Mae
REMIC Trust
2002-21 PE,
6.500%,
04/25/2032 | | $ | 10,539 | | | | 0.0 | | |
| | 3,896 | | | | | | | Fannie Mae
REMIC Trust
2002-29 F,
1.102%,
(US0001M +
1.000%),
04/25/2032 | | | 3,985 | | | | 0.0 | | |
| | 11,365 | | | | (6 | ) | | Fannie Mae
REMIC Trust
2002-41 S,
7.848%,
(-1.000*
US0001M +
7.950%),
07/25/2032 | | | 1,933 | | | | 0.0 | | |
| | 1,199 | | | | | | | Fannie Mae
REMIC Trust
2002-64 FJ,
1.102%,
(US0001M +
1.000%),
04/25/2032 | | | 1,227 | | | | 0.0 | | |
| | 2,547 | | | | | | | Fannie Mae
REMIC Trust
2002-68 FH,
0.604%,
(US0001M +
0.500%),
10/18/2032 | | | 2,564 | | | | 0.0 | | |
| | 411,818 | | | | (6 | ) | | Fannie Mae
REMIC Trust
2002-77 JS,
7.896%,
(-1.000*
US0001M +
8.000%),
12/18/2032 | | | 90,379 | | | | 0.1 | | |
| | 10,871 | | | | | | | Fannie Mae
REMIC Trust
2002-84 FB,
1.102%,
(US0001M +
1.000%),
12/25/2032 | | | 11,121 | | | | 0.0 | | |
| | 10,870 | | | | | | | Fannie Mae
REMIC Trust
2003-11 FA,
1.102%,
(US0001M +
1.000%),
09/25/2032 | | | 10,903 | | | | 0.0 | | |
| | 2,390 | | | | | | | Fannie Mae
REMIC Trust
2003-116 FA,
0.502%,
(US0001M +
0.400%),
11/25/2033 | | | 2,403 | | | | 0.0 | | |
See Accompanying Notes to Financial Statements
86
PORTFOLIO OF INVESTMENTS
VOYA GLOBAL BOND PORTFOLIO AS OF DECEMBER 31, 2021 (CONTINUED)
Principal
Amount† | |
| |
| | Value | | Percentage
of Net
Assets | |
| | | | | United States (continued) | |
| | 14,800 | | | | (6 | ) | | Fannie Mae
REMIC Trust
2003-13 IO,
7.000%,
03/25/2033 | | $ | 3,591 | | | | 0.0 | | |
| | 12,525 | | | | (6 | ) | | Fannie Mae
REMIC Trust
2003-26 IK,
7.000%,
04/25/2033 | | | 2,554 | | | | 0.0 | | |
| | 269,867 | | | | (6 | ) | | Fannie Mae
REMIC Trust
2004-56 SE,
7.448%,
(-1.000*
US0001M +
7.550%),
10/25/2033 | | | 54,321 | | | | 0.0 | | |
| | 17,301 | | | | | | | Fannie Mae
REMIC Trust
2005-25 PS,
27.712%,
(-4.400*
US0001M +
28.160%),
04/25/2035 | | | 29,301 | | | | 0.0 | | |
| | 7,031 | | | | (6 | ) | | Fannie Mae
REMIC Trust
2005-40 SB,
6.648%,
(-1.000*
US0001M +
6.750%),
05/25/2035 | | | 927 | | | | 0.0 | | |
| | 10,301 | | | | | | | Fannie Mae
REMIC Trust
2005-71 DB,
4.500%,
08/25/2025 | | | 10,539 | | | | 0.0 | | |
| | 93,152 | | | | | | | Fannie Mae
REMIC Trust
2005-74 DK,
23.593%,
(-4.000*
US0001M +
24.000%),
07/25/2035 | | | 140,888 | | | | 0.1 | | |
| | 219,685 | | | | | | | Fannie Mae
REMIC Trust
2005-87 SB,
23.460%,
(-3.667*
US0001M +
23.833%),
10/25/2035 | | | 329,751 | | | | 0.2 | | |
Principal
Amount† | |
| |
| | Value | | Percentage
of Net
Assets | |
| | 111,759 | | | | | | | Fannie Mae
REMIC Trust
2006-104 ES,
32.941%,
(-5.000*
US0001M +
33.450%),
11/25/2036 | | $ | 214,009 | | | | 0.1 | | |
| | 9,131 | | | | | | | Fannie Mae
REMIC Trust
2006-11 PS,
24.193%,
(-3.667*
US0001M +
24.567%),
03/25/2036 | | | 14,721 | | | | 0.0 | | |
| | 20,591 | | | | | | | Fannie Mae
REMIC Trust
2006-46 SW,
23.826%,
(-3.667*
US0001M +
24.199%),
06/25/2036 | | | 30,761 | | | | 0.0 | | |
| | 4,609,154 | | | | (6 | ) | | Fannie Mae
REMIC Trust
2006-51 SA,
6.468%,
(-1.000*
US0001M +
6.570%),
06/25/2036 | | | 860,056 | | | | 0.6 | | |
| | 43,159 | | | | (6 | ) | | Fannie Mae
REMIC Trust
2006-90 SX,
7.128%,
(-1.000*
US0001M +
7.230%),
09/25/2036 | | | 7,537 | | | | 0.0 | | |
| | 5,078,454 | | | | (6 | ) | | Fannie Mae
REMIC Trust
2007-116 DI,
5.838%,
(-1.000*
US0001M +
5.940%),
01/25/2038 | | | 942,204 | | | | 0.6 | | |
| | 31,138 | | | | (6 | ) | | Fannie Mae
REMIC Trust
2007-88 XI,
6.438%,
(-1.000*
US0001M +
6.540%),
06/25/2037 | | | 7,086 | | | | 0.0 | | |
| | 467,850 | | | | (6 | ) | | Fannie Mae
REMIC Trust
2007-89 SB,
6.448%,
(-1.000*
US0001M +
6.550%),
09/25/2037 | | | 61,466 | | | | 0.1 | | |
See Accompanying Notes to Financial Statements
87
PORTFOLIO OF INVESTMENTS
VOYA GLOBAL BOND PORTFOLIO AS OF DECEMBER 31, 2021 (CONTINUED)
Principal
Amount† | |
| |
| | Value | | Percentage
of Net
Assets | |
| | | | | United States (continued) | |
| | 826,484 | | | | (6 | ) | | Fannie Mae
REMIC Trust
2007-94 SG,
6.348%,
(-1.000*
US0001M +
6.450%),
10/25/2037 | | $ | 165,989 | | | | 0.1 | | |
| | 248,774 | | | | | | | Fannie Mae
REMIC Trust
2010-109 SN,
24.504%,
(-5.000*
US0001M +
25.000%),
10/25/2040 | | | 647,668 | | | | 0.4 | | |
| | 34,081 | | | | | | | Fannie Mae
REMIC Trust
2010-155 PL,
5.000%,
07/25/2040 | | | 37,510 | | | | 0.0 | | |
| | 1,785,125 | | | | (6 | ) | | Fannie Mae
REMIC Trust
2011-55 SK,
6.458%,
(-1.000*
US0001M +
6.560%),
06/25/2041 | | | 389,892 | | | | 0.3 | | |
| | 1,363,626 | | | | (6 | ) | | Fannie Mae
REMIC Trust
2011-86 NS,
5.848%,
(-1.000*
US0001M +
5.950%),
09/25/2041 | | | 225,251 | | | | 0.2 | | |
| | 324,843 | | | | (6 | ) | | Fannie Mae
REMIC Trust
2012-10 US,
6.348%,
(-1.000*
US0001M +
6.450%),
02/25/2042 | | | 55,159 | | | | 0.0 | | |
| | 635,061 | | | | (6 | ) | | Fannie Mae
REMIC Trust
2012-110 JI,
4.000%,
06/25/2042 | | | 89,658 | | | | 0.1 | | |
| | 1,669,355 | | | | (6 | ) | | Fannie Mae
REMIC Trust
2012-133 PS,
6.098%,
(-1.000*
US0001M +
6.200%),
03/25/2042 | | | 130,511 | | | | 0.1 | | |
Principal
Amount† | |
| |
| | Value | | Percentage
of Net
Assets | |
| | 1,330,063 | | | | (6 | ) | | Fannie Mae
REMIC Trust
2012-144 SB,
5.998%,
(-1.000*
US0001M +
6.100%),
01/25/2043 | | $ | 302,754 | | | | 0.2 | | |
| | 814,476 | | | | (6 | ) | | Fannie Mae
REMIC Trust
2012-27 SB,
5.878%,
(-1.000*
US0001M +
5.980%),
11/25/2041 | | | 78,978 | | | | 0.1 | | |
| | 809,978 | | | | (6 | ) | | Fannie Mae
REMIC Trust
2013-64 LI,
3.000%,
06/25/2033 | | | 83,413 | | | | 0.1 | | |
| | 3,592,374 | | | | (6 | ) | | Fannie Mae
REMICS
2012-138 DI,
3.000%,
12/25/2027 | | | 179,998 | | | | 0.1 | | |
| | 11,672,167 | | | | (6 | ) | | Fannie Mae
REMICS
2019-15 SA,
5.898%,
(-1.000*
US0001M +
6.000%),
04/25/2049 | | | 2,125,722 | | | | 1.3 | | |
| | 16,601,784 | | | | (6 | ) | | Fannie Mae
REMICS
2021-4 IN,
2.500%,
02/25/2051 | | | 2,220,598 | | | | 1.4 | | |
| | 4,097,625 | | | | (6 | ) | | Freddie Mac
3502 DL,
5.890%,
(-1.000*
US0001M +
6.000%),
01/15/2039 | | | 833,504 | | | | 0.5 | | |
| | 85,266 | | | | | | | Freddie Mac
REMIC Trust
1360 PZ,
7.500%,
09/15/2022 | | | 86,593 | | | | 0.1 | | |
| | 6,550 | | | | | | | Freddie Mac
REMIC Trust
1674 Z,
6.750%,
02/15/2024 | | | 6,821 | | | | 0.0 | | |
| | 15,061 | | | | | | | Freddie Mac
REMIC Trust
1897 K,
7.000%,
09/15/2026 | | | 16,357 | | | | 0.0 | | |
See Accompanying Notes to Financial Statements
88
PORTFOLIO OF INVESTMENTS
VOYA GLOBAL BOND PORTFOLIO AS OF DECEMBER 31, 2021 (CONTINUED)
Principal
Amount† | |
| |
| | Value | | Percentage
of Net
Assets | |
| | | | | United States (continued) | |
| | 4,425 | | | | (6 | ) | | Freddie Mac
REMIC Trust
2035 PE,
7.000%,
03/15/2028 | | $ | 667 | | | | 0.0 | | |
| | 24,847 | | | | (6 | ) | | Freddie Mac
REMIC Trust
2049 PL,
7.000%,
04/15/2028 | | | 3,755 | | | | 0.0 | | |
| | 11,773 | | | | | | | Freddie Mac
REMIC Trust
2122 F,
0.560%,
(US0001M +
0.450%),
02/15/2029 | | | 11,820 | | | | 0.0 | | |
| | 31,648 | | | | (6 | ) | | Freddie Mac
REMIC Trust
2134 SB,
7.590%,
(-1.000*
US0001M +
7.700%),
03/15/2029 | | | 3,564 | | | | 0.0 | | |
| | 35,433 | | | | (6 | ) | | Freddie Mac
REMIC Trust
2136 SG,
7.540%,
(-1.000*
US0001M +
7.650%),
03/15/2029 | | | 5,499 | | | | 0.0 | | |
| | 45,934 | | | | (6 | ) | | Freddie Mac
REMIC Trust
2177 SB,
8.840%,
(-1.000*
US0001M +
8.950%),
08/15/2029 | | | 7,655 | | | | 0.0 | | |
| | 6,530 | | | | | | | Freddie Mac
REMIC Trust
2344 FP,
1.060%,
(US0001M +
0.950%),
08/15/2031 | | | 6,687 | | | | 0.0 | | |
| | 2,791 | | | | | | | Freddie Mac
REMIC Trust
2412 GF,
1.060%,
(US0001M +
0.950%),
02/15/2032 | | | 2,855 | | | | 0.0 | | |
| | 23,821 | | | | | | | Freddie Mac
REMIC Trust
2415 ZA,
6.500%,
02/15/2032 | | | 27,730 | | | | 0.0 | | |
Principal
Amount† | |
| |
| | Value | | Percentage
of Net
Assets | |
| | 3,509 | | | | | | | Freddie Mac
REMIC Trust
2464 FI,
1.110%,
(US0001M +
1.000%),
02/15/2032 | | $ | 3,588 | | | | 0.0 | | |
| | 3,599 | | | | | | | Freddie Mac
REMIC Trust
2470 LF,
1.110%,
(US0001M +
1.000%),
02/15/2032 | | | 3,681 | | | | 0.0 | | |
| | 5,085 | | | | | | | Freddie Mac
REMIC Trust
2471 FD,
1.110%,
(US0001M +
1.000%),
03/15/2032 | | | 5,199 | | | | 0.0 | | |
| | 4,134 | | | | | | | Freddie Mac
REMIC Trust
2504 FP,
0.610%,
(US0001M +
0.500%),
03/15/2032 | | | 4,162 | | | | 0.0 | | |
| | 13,964 | | | | | | | Freddie Mac
REMIC Trust
2551 LF,
0.610%,
(US0001M +
0.500%),
01/15/2033 | | | 14,168 | | | | 0.0 | | |
| | 12,124 | | | | | | | Freddie Mac
REMIC Trust
2676 KY,
5.000%,
09/15/2023 | | | 12,415 | | | | 0.0 | | |
| | 177,460 | | | | | | | Freddie Mac
REMIC Trust
2750 XG,
5.000%,
02/15/2034 | | | 199,606 | | | | 0.1 | | |
| | 153,423 | | | | | | | Freddie Mac
REMIC Trust
2890 PE,
5.000%,
11/15/2034 | | | 170,817 | | | | 0.1 | | |
| | 34,864 | | | | | | | Freddie Mac
REMIC Trust
3001 HT,
8.000%,
(-6.667*
US0001M +
44.667%),
05/15/2035 | | | 39,415 | | | | 0.0 | | |
See Accompanying Notes to Financial Statements
89
PORTFOLIO OF INVESTMENTS
VOYA GLOBAL BOND PORTFOLIO AS OF DECEMBER 31, 2021 (CONTINUED)
Principal
Amount† | |
| |
| | Value | | Percentage
of Net
Assets | |
| | | | | United States (continued) | |
| | 29,621 | | | | (6 | ) | | Freddie Mac
REMIC Trust
3004 SB,
6.040%,
(-1.000*
US0001M +
6.150%),
07/15/2035 | | $ | 3,692 | | | | 0.0 | | |
| | 7,167 | | | | | | | Freddie Mac
REMIC Trust
3025 SJ,
24.348%,
(-3.667*
US0001M +
24.750%),
08/15/2035 | | | 11,949 | | | | 0.0 | | |
| | 506,061 | | | | (6 | ) | | Freddie Mac
REMIC Trust
3223 S,
5.840%,
(-1.000*
US0001M +
5.950%),
10/15/2036 | | | 77,725 | | | | 0.1 | | |
| | 1,375,219 | | | | (6 | ) | | Freddie Mac
REMIC Trust
3505 SA,
5.890%,
(-1.000*
US0001M +
6.000%),
01/15/2039 | | | 261,375 | | | | 0.2 | | |
| | 1,246,674 | | | | (6 | ) | | Freddie Mac
REMIC Trust
3702 S,
4.340%,
(-1.000*
US0001M +
4.450%),
05/15/2036 | | | 138,089 | | | | 0.1 | | |
| | 665,262 | | | | (6 | ) | | Freddie Mac
REMIC Trust
3925 SD,
5.940%,
(-1.000*
US0001M +
6.050%),
07/15/2040 | | | 36,105 | | | | 0.0 | | |
| | 649,955 | | | | (6 | ) | | Freddie Mac
REMIC Trust
4136 SW,
6.140%,
(-1.000*
US0001M +
6.250%),
11/15/2032 | | | 91,613 | | | | 0.1 | | |
| | 375,615 | | | | (6 | ) | | Freddie Mac
REMIC Trust
4161 CI,
4.000%,
02/15/2043 | | | 57,963 | | | | 0.0 | | |
Principal
Amount† | |
| |
| | Value | | Percentage
of Net
Assets | |
| | 4,879,691 | | | | (6 | ) | | Freddie Mac
REMIC Trust
4194 GI,
4.000%,
04/15/2043 | | $ | 686,083 | | | | 0.4 | | |
| | 7,963,026 | | | | (6 | ) | | Freddie Mac
REMICS
3582 SL,
6.040%,
(-1.000*
US0001M +
6.150%),
10/15/2039 | | | 1,474,192 | | | | 0.9 | | |
| | 543,683 | | | | (6 | ) | | Freddie Mac
Series 4120
IK, 3.000%,
10/15/2032 | | | 51,002 | | | | 0.0 | | |
| | 212,768 | | | | (1 | ) | | Freddie Mac
STACR
2019-HQA3
M2, 1.953%,
(US0001M +
1.850%),
09/25/2049 | | | 213,492 | | | | 0.1 | | |
| | 511,912 | | | | (1 | ) | | Freddie Mac
Stacr Remic
Trust
2020-HQA2
M2, 3.203%,
(US0001M +
3.100%),
03/25/2050 | | | 518,406 | | | | 0.3 | | |
| | 260,254 | | | | (1 | ) | | Freddie Mac
STACR Trust
2019-DNA3
M2, 2.153%,
(US0001M +
2.050%),
07/25/2049 | | | 262,286 | | | | 0.2 | | |
| | 361,960 | | | | (1 | ) | | Freddie Mac
Stacr Trust
2019-HQA1
M2, 2.453%,
(US0001M +
2.350%),
02/25/2049 | | | 365,257 | | | | 0.2 | | |
| | 59,093 | | | | | | | Freddie Mac
Structured
Agency
Credit Risk
Debt Notes
2015-DNA2
M3, 4.003%,
(US0001M +
3.900%),
12/25/2027 | | | 59,407 | | | | 0.0 | | |
See Accompanying Notes to Financial Statements
90
PORTFOLIO OF INVESTMENTS
VOYA GLOBAL BOND PORTFOLIO AS OF DECEMBER 31, 2021 (CONTINUED)
Principal
Amount† | |
| |
| | Value | | Percentage
of Net
Assets | |
| | | | | United States (continued) | |
| | 234,200 | | | | | | | Freddie Mac
Structured
Agency
Credit Risk
Debt Notes
2016-HQA1
M3, 6.453%,
(US0001M +
6.350%),
09/25/2028 | | $ | 245,780 | | | | 0.2 | | |
| | 3,245 | | | | (2 | ) | | Freddie Mac
Whole Loan
Securities
Trust
2016-SC02
M1, 3.661%,
10/25/2046 | | | 3,251 | | | | 0.0 | | |
| | 203,979 | | | | | | | Ginnie Mae
Series
2007-8 SP,
21.712%,
(-3.242*
US0001M +
22.048%),
03/20/2037 | | | 319,548 | | | | 0.2 | | |
| | 937,885 | | | | (6 | ) | | Ginnie Mae
Series
2010-68 MS,
5.746%,
(-1.000*
US0001M +
5.850%),
06/20/2040 | | | 149,753 | | | | 0.1 | | |
| | 705,330 | | | | (6 | ) | | Ginnie Mae
Series
2012-97 SC,
6.593%,
(-1.000*
US0001M +
6.700%),
07/16/2041 | | | 102,649 | | | | 0.1 | | |
| | 8,916,852 | | | | (6 | ) | | Ginnie Mae
Series
2014-133 BS,
5.496%,
(-1.000*
US0001M +
5.600%),
09/20/2044 | | | 1,331,591 | | | | 0.9 | | |
| | 143,086 | | | | | | | GreenPoint
Mortgage
Funding Trust
2006-AR3
4A1, 0.522%,
(US0001M +
0.210%),
04/25/2036 | | | 141,841 | | | | 0.1 | | |
Principal
Amount† | |
| |
| | Value | | Percentage
of Net
Assets | |
| | 24,701 | | | | (1 | ),(2) | | GS Mortgage-
Backed
Securities
Corp. Trust
2019-PJ2 A1,
4.000%,
11/25/2049 | | $ | 24,751 | | | | 0.0 | | |
| | 19,902 | | | | (1 | ),(2) | | GS Mortgage-
Backed
Securities
Corp. Trust
2019-PJ3 A1,
3.500%,
03/25/2050 | | | 20,042 | | | | 0.0 | | |
| | 481,441 | | | | (1 | ),(2) | | GS Mortgage-
Backed
Securities
Corp. Trust
2020-PJ3
B1A, 3.431%,
10/25/2050 | | | 492,370 | | | | 0.3 | | |
| | 10,387 | | | | (2 | ) | | GSR Mortgage
Loan Trust
2005-AR6
1A4, 2.749%,
09/25/2035 | | | 10,534 | | | | 0.0 | | |
| | 401,908 | | | | | | | IndyMac INDX
Mortgage
Loan Trust
2006-AR2
1A1B,
0.522%,
(US0001M +
0.420%),
04/25/2046 | | | 385,661 | | | | 0.3 | | |
| | 524,181 | | | | (2 | ) | | JP Morgan
Mortgage
Trust
2005-A4 B1,
2.445%,
07/25/2035 | | | 524,472 | | | | 0.3 | | |
| | 39,097 | | | | (2 | ) | | JP Morgan
Mortgage
Trust
2007-A1 7A1,
2.511%,
07/25/2035 | | | 39,793 | | | | 0.0 | | |
| | 264,551 | | | | (1 | ),(2) | | JP Morgan
Mortgage
Trust
2017-3 B1,
3.773%,
08/25/2047 | | | 271,576 | | | | 0.2 | | |
| | 293,664 | | | | (1 | ),(2) | | JP Morgan
Mortgage
Trust
2019-8 A5,
3.500%,
03/25/2050 | | | 296,006 | | | | 0.2 | | |
See Accompanying Notes to Financial Statements
91
PORTFOLIO OF INVESTMENTS
VOYA GLOBAL BOND PORTFOLIO AS OF DECEMBER 31, 2021 (CONTINUED)
Principal
Amount† | |
| |
| | Value | | Percentage
of Net
Assets | |
| | | | | United States (continued) | |
| | 62,210 | | | | (1 | ),(2) | | JP Morgan
Mortgage
Trust
2019-INV3
A15, 3.500%,
05/25/2050 | | $ | 63,200 | | | | 0.1 | | |
| | 20,194 | | | | (1 | ),(2) | | JP Morgan
Mortgage
Trust
2019-LTV2
A18, 4.000%,
12/25/2049 | | | 20,287 | | | | 0.0 | | |
| | 34,075 | | | | (1 | ),(2) | | JP Morgan
Mortgage
Trust
2019-LTV3
A15, 3.500%,
03/25/2050 | | | 34,236 | | | | 0.0 | | |
| | 138,105 | | | | | | | Lehman XS
Trust Series
2005-5N
1A2, 0.462%,
(US0001M +
0.360%),
11/25/2035 | | | 134,507 | | | | 0.1 | | |
| | 41,281 | | | | (2 | ) | | MASTR
Adjustable
Rate
Mortgages
Trust 2006-2
1A1, 2.619%,
04/25/2036 | | | 41,304 | | | | 0.0 | | |
| | 181,903 | | | | (1 | ),(2) | | Morgan
Stanley
Residential
Mortgage
Loan Trust
2021-2 A9,
2.500%,
05/25/2051 | | | 180,486 | | | | 0.1 | | |
| | 1,518,793 | | | | (2 | ),(6) | | RALI Series
Trust
2006-QO1
X2, 2.185%,
02/25/2046 | | | 103,001 | | | | 0.1 | | |
| | 11,150 | | | | (1 | ),(2) | | Sequoia
Mortgage
Trust
2018-CH1
A19, 4.000%,
03/25/2048 | | | 11,238 | | | | 0.0 | | |
| | 3,675,595 | | | | (2 | ),(6) | | WaMu
Mortgage
Pass-
Through
Certificates
Series
2005-AR11 X,
1.800%,
08/25/2045 | | | 141,266 | | | | 0.1 | | |
Principal
Amount† | |
| |
| | Value | | Percentage
of Net
Assets | |
| | 25,843 | | | | (2 | ) | | WaMu
Mortgage
Pass-
Through
Certificates
Series
2006-AR12
1A1, 2.956%,
10/25/2036 | | $ | 26,038 | | | | 0.0 | | |
| | 84,653 | | | | (2 | ) | | WaMu
Mortgage
Pass-
Through
Certificates
Series
2006-AR8
1A4, 2.847%,
08/25/2046 | | | 84,648 | | | | 0.1 | | |
| | 185,550 | | | | (2 | ) | | WaMu
Mortgage
Pass-
Through
Certificates
Series
2007-HY2
1A1, 2.991%,
12/25/2036 | | | 186,316 | | | | 0.1 | | |
| | 55,971 | | | | (2 | ) | | WaMu
Mortgage
Pass-
Through
Certificates
Series
2007-HY4
1A1, 2.737%,
04/25/2037 | | | 55,817 | | | | 0.0 | | |
| | 51,340 | | | | | | | Wells Fargo
Alternative
Loan
2007-PA2
2A1, 0.533%,
(US0001M +
0.430%),
06/25/2037 | | | 41,302 | | | | 0.0 | | |
| | 114,700 | | | | (1 | ),(2) | | WinWater
Mortgage
Loan Trust
2015-5 B4,
3.774%,
08/20/2045 | | | 113,778 | | | | 0.1 | | |
| | | | | | | Total
Collateralized
Mortgage
Obligations
(Cost
$21,796,318) | | | 23,018,983 | | | | 14.5 | | |
See Accompanying Notes to Financial Statements
92
PORTFOLIO OF INVESTMENTS
VOYA GLOBAL BOND PORTFOLIO AS OF DECEMBER 31, 2021 (CONTINUED)
Principal
Amount† | |
| |
| | Value | | Percentage
of Net
Assets | |
SOVEREIGN BONDS: 12.6% | | | |
| | | | | Australia: 0.2% | |
AUD | 558,000 | | | | (1 | ) | | Queensland
Treasury
Corp.,
1.750%,
07/20/2034 | | $ | 384,703 | | | | 0.2 | | |
| | | | | Canada: 0.3% | |
CAD | 500,000 | | | | | | | Canadian
Government
Bond,
2.000%,
12/01/2051 | | | 425,713 | | | | 0.3 | | |
| | | | | China: 6.6% | |
CNY | 13,660,000 | | | | | | | China
Government
Bond,
2.850%,
06/04/2027 | | | 2,165,126 | | | | 1.4 | | |
CNY | 6,880,000 | | | | | | | China
Government
Bond,
3.250%,
06/06/2026 | | | 1,108,749 | | | | 0.7 | | |
CNY | 29,640,000 | | | | | | | China
Government
Bond,
3.250%,
11/22/2028 | | | 4,774,370 | | | | 3.0 | | |
CNY | 12,880,000 | | | | | | | China
Government
Bond,
3.290%,
05/23/2029 | | | 2,077,731 | | | | 1.3 | | |
CNY | 1,780,000 | | | | | | | China
Government
Bond,
4.080%,
10/22/2048 | | | 312,298 | | | | 0.2 | | |
| | | | | | | | | | 10,438,274 | | | | 6.6 | | |
| | | | | Germany: 0.3% | |
EUR | 120,000 | | | | | | | Bundesrepublik
Deutschland
Bundesanleihe,
-0.500%,
08/15/2026 | | | 139,803 | | | | 0.1 | | |
EUR | 30,000 | | | | | | | Bundesrepublik
Deutschland
Bundesanleihe,
0.500%,
02/15/2028 | | | 36,090 | | | | 0.0 | | |
EUR | 200,000 | | | | | | | Bundesrepublik
Deutschland
Bundesanleihe,
1.250%,
08/15/2048 | | | 295,114 | | | | 0.2 | | |
Principal
Amount† | |
| |
| | Value | | Percentage
of Net
Assets | |
EUR | 10,000 | | | | | | | Bundesrepublik
Deutschland
Bundesanleihe,
2.000%,
08/15/2023 | | $ | 11,893 | | | | 0.0 | | |
| | | | | | | | | | 482,900 | | | | 0.3 | | |
| | | | | Indonesia: 0.3% | |
IDR | 6,452,000,000 | | | | | Indonesia
Treasury
Bond,
8.375%,
04/15/2039 | | | 511,090 | | | | 0.3 | | |
| | | | | Italy: 0.9% | |
EUR | 438,000 | | | | (1 | ) | | Italy Buoni
Poliennali
Del Tesoro,
3.850%,
09/01/2049 | | | 701,411 | | | | 0.4 | | |
EUR | 438,000 | | | | (1 | ) | | Italy Buoni
Poliennali
Del Tesoro,
5.000%,
08/01/2034 | | | 709,535 | | | | 0.5 | | |
| | | | | | | | | | 1,410,946 | | | | 0.9 | | |
| | | | | Malaysia: 1.2% | |
MYR | 7,864,000 | | | | | | | Malaysia
Government
Bond,
3.828%,
07/05/2034 | | | 1,879,860 | | | | 1.2 | | |
| | | | | Portugal: 1.0% | |
EUR | 1,135,000 | | | | (1 | ) | | Portugal
Obrigacoes
do Tesouro
OT, 2.250%,
04/18/2034 | | | 1,537,967 | | | | 1.0 | | |
| | | | | Spain: 1.5% | |
EUR | 870,000 | | | | (1 | ) | | Spain
Government
Bond,
1.450%,
04/30/2029 | | | 1,078,896 | | | | 0.7 | | |
EUR | 908,000 | | | | (1 | ) | | Spain
Government
Bond,
2.700%,
10/31/2048 | | | 1,358,987 | | | | 0.8 | | |
| | | | | | | | | | 2,437,883 | | | | 1.5 | | |
See Accompanying Notes to Financial Statements
93
PORTFOLIO OF INVESTMENTS
VOYA GLOBAL BOND PORTFOLIO AS OF DECEMBER 31, 2021 (CONTINUED)
Principal
Amount† | |
| |
| | Value | | Percentage
of Net
Assets | |
| | | | | Thailand: 0.3% | |
THB | 17,994,000 | | | | | | | Thailand
Government
Bond,
2.875%,
12/17/2028 | | $ | 580,396 | | | | 0.3 | | |
| | | | | | | Total
Sovereign
Bonds
(Cost
$18,656,773) | | | 20,089,732 | | | | 12.6 | | |
U.S. GOVERNMENT AGENCY OBLIGATIONS: 9.9% | | | |
| | | | | | | Federal Home Loan Mortgage
Corporation: 0.5%(7) | | | | | |
| | 394,313 | | | | | | | 3.500%,
01/01/2048 | | | 420,895 | | | | 0.3 | | |
| | 93,560 | | | | | | | 4.000%,
09/01/2045 | | | 101,548 | | | | 0.1 | | |
| | 57,754 | | | | | | | 4.000%,
09/01/2045 | | | 63,135 | | | | 0.0 | | |
| | 46,183 | | | | | | | 4.000%,
09/01/2045 | | | 50,049 | | | | 0.0 | | |
| | 39,545 | | | | | | | 4.000%,
09/01/2045 | | | 43,072 | | | | 0.0 | | |
| | 65,123 | | | | | | | 4.000%,
05/01/2046 | | | 70,560 | | | | 0.1 | | |
| | 6,104 | | | | | | | 5.000%,
12/01/2034 | | | 6,733 | | | | 0.0 | | |
| | 15,704 | | | | | | | 6.000%,
02/01/2034 | | | 17,838 | | | | 0.0 | | |
| | 38 | | | | | | | 6.500%,
02/01/2022 | | | 39 | | | | 0.0 | | |
| | 366 | | | | | | | 6.500%,
09/01/2022 | | | 370 | | | | 0.0 | | |
| | 1,546 | | | | | | | 6.500%,
08/01/2032 | | | 1,755 | | | | 0.0 | | |
| | 5,509 | | | | | | | 6.500%,
07/01/2034 | | | 6,085 | | | | 0.0 | | |
| | 2,158 | | | | | | | 6.500%,
07/01/2034 | | | 2,382 | | | | 0.0 | | |
| | | | | | | | | | 784,461 | | | | 0.5 | | |
| | | | | | | Federal National Mortgage
Association: 0.0%(7) | | | | | |
| | 50,572 | | | | | | | 2.107%,
(US0012M +
1.777%),
10/01/2036 | | | 53,375 | | | | 0.0 | | |
| | | | | | | Government National Mortgage
Association: 3.5% | | | | | |
| | 2,103,000 | | | | (8 | ) | | 2.500%,
01/15/2052 | | | 2,153,765 | | | | 1.4 | | |
| | 3,205,000 | | | | (8 | ) | | 3.000%,
01/15/2052 | | | 3,316,312 | | | | 2.1 | | |
| | 19,094 | | | | | | | 5.000%,
04/15/2034 | | | 21,909 | | | | 0.0 | | |
Principal
Amount† | |
| |
| | Value | | Percentage
of Net
Assets | |
| | 8,915 | | | | | | | 6.500%,
02/20/2035 | | $ | 10,357 | | | | 0.0 | | |
| | | | | | | | | | 5,502,343 | | | | 3.5 | | |
| | | | | | | Uniform Mortgage-Backed
Securities: 5.9% | | | | | |
| | 3,615,000 | | | | (8 | ) | | 2.000%,
02/15/2052 | | | 3,596,095 | | | | 2.3 | | |
| | 2,475,000 | | | | (8 | ) | | 2.500%,
02/15/2052 | | | 2,519,001 | | | | 1.6 | | |
| | 38,242 | | | | | | | 2.500%,
06/01/2030 | | | 39,730 | | | | 0.0 | | |
| | 28,535 | | | | | | | 2.500%,
06/01/2030 | | | 29,646 | | | | 0.0 | | |
| | 16,998 | | | | | | | 2.500%,
07/01/2030 | | | 17,661 | | | | 0.0 | | |
| | 1,900,000 | | | | (8 | ) | | 3.500%,
02/15/2052 | | | 1,997,504 | | | | 1.3 | | |
| | 43,468 | | | | | | | 4.000%,
05/01/2045 | | | 47,269 | | | | 0.0 | | |
| | 783,521 | | | | | | | 4.000%,
04/01/2049 | | | 845,518 | | | | 0.6 | | |
| | 45,095 | | | | | | | 5.000%,
06/01/2041 | | | 50,957 | | | | 0.0 | | |
| | 5,510 | | | | | | | 5.500%,
09/01/2024 | | | 6,031 | | | | 0.0 | | |
| | 40,161 | | | | | | | 6.000%,
11/01/2034 | | | 45,581 | | | | 0.0 | | |
| | 67,178 | | | | | | | 6.000%,
04/01/2035 | | | 76,339 | | | | 0.1 | | |
| | 28,283 | | | | | | | 6.500%,
12/01/2029 | | | 31,232 | | | | 0.0 | | |
| | 12,497 | | | | | | | 6.500%,
01/01/2034 | | | 13,940 | | | | 0.0 | | |
| | 210 | | | | | | | 7.000%,
04/01/2033 | | | 233 | | | | 0.0 | | |
| | 10,806 | | | | | | | 7.500%,
09/01/2032 | | | 12,410 | | | | 0.0 | | |
| | 22,590 | | | | | | | 7.500%,
01/01/2033 | | | 25,751 | | | | 0.0 | | |
| | | | | | | | | | 9,354,898 | | | | 5.9 | | |
| | | | | | | Total U.S.
Government
Agency
Obligations
(Cost
$15,641,013) | | | 15,695,077 | | | | 9.9 | | |
COMMERCIAL MORTGAGE-BACKED SECURITIES: 10.7% | | | |
| | | | | United States: 10.7% | |
| | 6,717,865 | | | | (2 | ),(6) | | BANK
2017-BNK5
XA, 1.044%,
06/15/2060 | | | 260,876 | | | | 0.2 | | |
| | 900,000 | | | | (1 | ),(2) | | BANK
2017-BNK6
E, 2.645%,
07/15/2060 | | | 529,601 | | | | 0.3 | | |
| | 1,948,000 | | | | (1 | ),(2),(6) | | BANK
2017-BNK6
XE, 1.500%,
07/15/2060 | | | 138,841 | | | | 0.1 | | |
See Accompanying Notes to Financial Statements
94
PORTFOLIO OF INVESTMENTS
VOYA GLOBAL BOND PORTFOLIO AS OF DECEMBER 31, 2021 (CONTINUED)
Principal
Amount† | |
| |
| | Value | | Percentage
of Net
Assets | |
| | | | | United States (continued) | |
| | 968,471 | | | | (2 | ),(6) | | BANK
2019-BNK16
XA, 0.946%,
02/15/2052 | | $ | 53,535 | | | | 0.0 | | |
| | 9,404,694 | | | | (2 | ),(6) | | BANK
2019-BNK21
XA, 0.869%,
10/17/2052 | | | 519,949 | | | | 0.3 | | |
| | 8,020,000 | | | | (1 | ),(2),(6) | | BBCCRE
Trust
2015-GTP
XA, 0.597%,
08/10/2033 | | | 169,328 | | | | 0.1 | | |
| | 210,000 | | | | (1 | ) | | Benchmark
2019-B9 D
Mortgage
Trust,
3.000%,
03/15/2052 | | | 195,172 | | | | 0.1 | | |
| | 1,187,278 | | | | (2 | ),(6) | | Benchmark
2019-B9 XA
Mortgage
Trust,
1.039%,
03/15/2052 | | | 74,098 | | | | 0.0 | | |
| | 180,000 | | | | (1 | ) | | Benchmark
2020-B18
AGNE
Mortgage
Trust,
3.759%,
07/15/2053 | | | 180,492 | | | | 0.1 | | |
| | 2,984,572 | | | | (2 | ),(6) | | Benchmark
2020-B18
XA Mortgage
Trust,
1.792%,
07/15/2053 | | | 308,435 | | | | 0.2 | | |
| | 270,000 | | | | (1 | ),(2) | | BX Trust
2019-OC11
E, 4.076%,
12/09/2041 | | | 268,590 | | | | 0.2 | | |
| | 1,643,635 | | | | (2 | ),(6) | | CD 2016-CD1
Mortgage
Trust XA,
1.389%,
08/10/2049 | | | 84,159 | | | | 0.0 | | |
| | 7,900,000 | | | | (2 | ),(6) | | Citigroup
Commercial
Mortgage
Trust
2016-C2 XB,
0.838%,
08/10/2049 | | | 289,331 | | | | 0.2 | | |
| | 3,054,789 | | | | (2 | ),(6) | | Citigroup
Commercial
Mortgage
Trust
2017-C4 XA,
1.082%,
10/12/2050 | | | 132,595 | | | | 0.1 | | |
Principal
Amount† | |
| |
| | Value | | Percentage
of Net
Assets | |
| | 8,772,398 | | | | (1 | ),(2),(6) | | COMM
2012-LTRT
XA, 0.839%,
10/05/2030 | | $ | 18,409 | | | | 0.0 | | |
| | 110,000 | | | | (1 | ),(2) | | COMM
2013-CR10
E Mortgage
Trust,
4.900%,
08/10/2046 | | | 107,170 | | | | 0.1 | | |
| | 10,497,417 | | | | (2 | ),(6) | | COMM
2014-CR16
XA, 0.950%,
04/10/2047 | | | 193,839 | | | | 0.1 | | |
| | 570,000 | | | | (2 | ) | | COMM
2016-COR1
C, 4.333%,
10/10/2049 | | | 599,542 | | | | 0.4 | | |
| | 4,024,967 | | | | (2 | ),(6) | | COMM
2016-CR28
XA, 0.712%,
02/10/2049 | | | 89,653 | | | | 0.1 | | |
| | 200,000 | | | | (2 | ) | | CSAIL
2015-C2 C
Commercial
Mortgage
Trust,
4.187%,
06/15/2057 | | | 191,614 | | | | 0.1 | | |
| | 500,000 | | | | | | | CSAIL
Commercial
Mortgage
Trust
2021-C20
A3, 2.805%,
03/15/2054 | | | 520,881 | | | | 0.3 | | |
| | 249,564 | | | | (1 | ),(3) | | DBUBS
2011-LC2A F
Mortgage
Trust,
3.749%,
(US0001M +
3.650%),
07/10/2044 | | | 233,155 | | | | 0.2 | | |
| | 290,000 | | | | (1 | ),(2) | | DBJPM 16-C3
Mortgage
Trust,
3.484%,
08/10/2049 | | | 245,454 | | | | 0.1 | | |
| | 270,000 | | | | (1 | ),(2) | | Fontainebleau
Miami Beach
Trust
2019-FBLU F,
3.963%,
12/10/2036 | | | 265,952 | | | | 0.2 | | |
See Accompanying Notes to Financial Statements
95
PORTFOLIO OF INVESTMENTS
VOYA GLOBAL BOND PORTFOLIO AS OF DECEMBER 31, 2021 (CONTINUED)
Principal
Amount† | |
| |
| | Value | | Percentage
of Net
Assets | |
| | | | | United States (continued) | |
| | 7,000,000 | | | | (2 | ),(6) | | Freddie Mac
Multifamily
Structured
Pass
Through
Certificates
K035 X3,
1.788%,
12/25/2041 | | $ | 190,352 | | | | 0.1 | | |
| | 4,083,963 | | | | (2 | ),(6) | | Freddie Mac
Multifamily
Structured
Pass
Through
Certificates
K122 X1,
0.883%,
11/25/2030 | | | 273,117 | | | | 0.2 | | |
| | 2,097,425 | | | | (2 | ),(6) | | Freddie Mac
Multifamily
Structured
Pass
Through
Certificates
K-1517 X1,
1.331%,
07/25/2035 | | | 296,677 | | | | 0.2 | | |
| | 2,109,000 | | | | (6 | ) | | Freddie Mac
Multifamily
Structured
Pass
Through
Certificates
KL06 XFX,
1.364%,
12/25/2029 | | | 182,302 | | | | 0.1 | | |
| | 543,000 | | | | (1 | ),(9) | | FREMF
2016-K60 D
Mortgage
Trust,
0.000%,
12/25/2049 | | | 404,376 | | | | 0.2 | | |
| | 6,950,483 | | | | (1 | ),(6) | | FREMF
Mortgage
Trust
2012-K17
X2A, 0.100%,
12/25/2044 | | | 7 | | | | 0.0 | | |
| | 1,819,100 | | | | (1 | ),(3) | | GAM
2021-WF1 A
LLC, 5.250%,
12/30/2026 | | | 1,819,100 | | | | 1.1 | | |
| | 152,000 | | | | (1 | ) | | GAM RE-
REMIC TR
2021-FFR2
BK44,
2.071%,
10/27/2028 | | | 146,245 | | | | 0.1 | | |
Principal
Amount† | |
| |
| | Value | | Percentage
of Net
Assets | |
| | 171,000 | | | | (1 | ) | | GAM RE-
REMIC TR
2021-FFR2
BK78,
2.435%,
10/27/2028 | | $ | 156,074 | | | | 0.1 | | |
| | 130,000 | | | | (1 | ),(9) | | GAM RE-
REMIC TR
2021-FFR2
C730,
0.000%,
10/27/2028 | | | 116,824 | | | | 0.1 | | |
| | 159,000 | | | | (1 | ),(9) | | GAM RE-
REMIC TR
2021-FFR2
CK44,
0.000%,
10/27/2028 | | | 139,678 | | | | 0.1 | | |
| | 129,000 | | | | (1 | ) | | GAM RE-
REMIC TR
2021-FFR2
CK49,
1.079%,
10/27/2028 | | | 118,998 | | | | 0.1 | | |
| | 109,000 | | | | (1 | ),(9) | | GAM RE-
REMIC TR
2021-FFR2
CK78,
0.000%,
10/27/2028 | | | 78,977 | | | | 0.0 | | |
| | 130,000 | | | | (1 | ),(9) | | GAM RE-
REMIC TR
2021-FFR2
D730,
0.000%,
10/27/2028 | | | 113,344 | | | | 0.1 | | |
| | 129,000 | | | | (1 | ),(9) | | GAM RE-
REMIC TR
2021-FFR2
DK49,
0.000%,
10/27/2028 | | | 110,280 | | | | 0.1 | | |
| | 143,000 | | | | (1 | ),(2) | | Grace Trust
2020-GRCE
E, 2.680%,
12/10/2040 | | | 128,206 | | | | 0.1 | | |
| | 500,000 | | | | (1 | ) | | Great Wolf
Trust 2019-
WOLF E,
2.842%,
(US0001M +
2.732%),
12/15/2036 | | | 486,206 | | | | 0.3 | | |
| | 180,000 | | | | (1 | ) | | GS Mortgage
Securities
Trust 2013-
GC16 G,
3.500%,
11/10/2046 | | | 109,925 | | | | 0.1 | | |
See Accompanying Notes to Financial Statements
96
PORTFOLIO OF INVESTMENTS
VOYA GLOBAL BOND PORTFOLIO AS OF DECEMBER 31, 2021 (CONTINUED)
Principal
Amount† | |
| |
| | Value | | Percentage
of Net
Assets | |
| | | | | United States (continued) | |
| | 3,705,145 | | | | (2 | ),(6) | | GS Mortgage
Securities
Trust 2013-
GC16 XA,
1.009%,
11/10/2046 | | $ | 54,988 | | | | 0.0 | | |
| | 2,270,631 | | | | (2 | ),(6) | | GS Mortgage
Securities
Trust 2017-
GS6 XA,
1.019%,
05/10/2050 | | | 111,604 | | | | 0.1 | | |
| | 410,000 | | | | (1 | ),(2) | | GS Mortgage
Securities
Trust 2019-
GC40 DBD,
3.550%,
07/10/2052 | | | 409,628 | | | | 0.3 | | |
| | 310,000 | | | | (1 | ),(2) | | GS Mortgage
Securities
Trust 2019-
GC40 DBE,
3.550%,
07/10/2052 | | | 304,204 | | | | 0.2 | | |
| | 5,126,786 | | | | (2 | ),(6) | | GS Mortgage
Securities
Trust 2019-
GC42 XA,
0.808%,
09/01/2052 | | | 264,696 | | | | 0.2 | | |
| | 861,229 | | | | (2 | ),(6) | | GS Mortgage
Securities
Trust 2020-
GC47 XA,
1.131%,
05/12/2053 | | | 68,789 | | | | 0.0 | | |
| | 1,740,000 | | | | (1 | ),(2) | | JP Morgan
Chase
Commercial
Mortgage
Securities
Trust 2011-
C5 E,
4.000%,
08/15/2046 | | | 1,434,526 | | | | 0.9 | | |
| | 2,017,529 | | | | (2 | ),(6) | | JP Morgan
Chase
Commercial
Mortgage
Securities
Trust 2012-
CIBX XA,
0.863%,
06/15/2045 | | | 2,410 | | | | 0.0 | | |
| | 269,944 | | | | (1 | ) | | JP Morgan
Chase
Commercial
Mortgage
Securities
Trust 2014-
C20 A4A2,
3.538%,
07/15/2047 | | | 274,692 | | | | 0.2 | | |
Principal
Amount† | |
| |
| | Value | | Percentage
of Net
Assets | |
| | 140,000 | | | | (1 | ),(2) | | LSTAR
Commercial
Mortgage
Trust
2015-3 D,
3.166%,
04/20/2048 | | $ | 139,365 | | | | 0.1 | | |
| | 2,535,230 | | | | (1 | ),(2),(6) | | LSTAR
Commercial
Mortgage
Trust
2017-5 X,
0.857%,
03/10/2050 | | | 59,639 | | | | 0.0 | | |
| | 1,090,000 | | | | (1 | ),(2) | | Morgan
Stanley
Bank of
America
Merrill Lynch
Trust 2012-
C6 E,
4.598%,
11/15/2045 | | | 1,050,844 | | | | 0.7 | | |
| | 18,750,000 | | | | (1 | ),(2),(6) | | Morgan
Stanley
Bank of
America
Merrill Lynch
Trust 2014
C19 XB,
0.433%,
12/15/2047 | | | 242,406 | | | | 0.1 | | |
| | 1,708,271 | | | | (2 | ),(6) | | Morgan
Stanley
Capital I
Trust
2021-L5 XA,
1.300%,
05/15/2054 | | | 158,408 | | | | 0.1 | | |
| | 700,000 | | | | (1 | ) | | SFO
Commercial
Mortgage
Trust
2021-555 C,
1.910%,
(US0001M +
1.800%),
05/15/2038 | | | 701,765 | | | | 0.4 | | |
| | 6,647,496 | | | | (2 | ),(6) | | UBS
Commercial
Mortgage
Trust
2018-C9 XA,
0.874%,
03/15/2051 | | | 302,988 | | | | 0.2 | | |
| | 2,226,080 | | | | (1 | ),(2),(6) | | WFRBS
Commercial
Mortgage
Trust
2012-C8 XA,
1.763%,
08/15/2045 | | | 7,567 | | | | 0.0 | | |
See Accompanying Notes to Financial Statements
97
PORTFOLIO OF INVESTMENTS
VOYA GLOBAL BOND PORTFOLIO AS OF DECEMBER 31, 2021 (CONTINUED)
Principal
Amount† | |
| |
| | Value | | Percentage
of Net
Assets | |
| | | | | United States (continued) | |
| | 550,000 | | | | (1 | ),(2) | | WFRBS
Commercial
Mortgage
Trust
2013-C11 F,
4.239%,
03/15/2045 | | $ | 460,099 | | | | 0.3 | | |
| | 330,000 | | | | (1 | ),(2) | | WFRBS
Commercial
Mortgage
Trust
2013-C14 D,
3.960%,
06/15/2046 | | | 274,094 | | | | 0.2 | | |
| | 8,494,586 | | | | (2 | ),(6) | | WFRBS
Commercial
Mortgage
Trust
2014-C19 XA,
1.005%,
03/15/2047 | | | 134,269 | | | | 0.1 | | |
| | | | | | | | | Total
Commercial
Mortgage-
Backed
Securities
(Cost
$17,293,521) | | | 16,998,340 | | | | 10.7 | | |
ASSET-BACKED SECURITIES: 9.6% | | | |
| | | | | United States: 9.6% | |
| | 700,000 | | | | (1 | ) | | AGL CLO
11 Ltd.
2021-11A AJ,
1.474%,
(US0003M +
1.350%),
04/15/2034 | | | 700,269 | | | | 0.4 | | |
| | 600,000 | | | | (1 | ) | | Allegro
CLO IV Ltd.
2016-1A
CR2,
2.124%,
(US0003M +
2.000%),
01/15/2030 | | | 600,009 | | | | 0.4 | | |
| | 500,000 | | | | (1 | ) | | AMMC CLO
16 Ltd.
2015-16A
CR2,
2.077%,
(US0003M +
1.950%),
04/14/2029 | | | 495,816 | | | | 0.3 | | |
| | 350,000 | | | | (1 | ) | | Ares XXVIIIR
CLO Ltd.
2018-28RA
A2, 1.522%,
(US0003M +
1.400%),
10/17/2030 | | | 350,029 | | | | 0.2 | | |
Principal
Amount† | |
| |
| | Value | | Percentage
of Net
Assets | |
| | 500,000 | | | | (1 | ) | | Barings
Clo Ltd.
2019-4A C,
2.924%,
(US0003M +
2.800%),
01/15/2033 | | $ | 500,106 | | | | 0.3 | | |
| | 412,500 | | | | (1 | ) | | BlueMountain
CLO
2013-2A CR,
2.078%,
(US0003M +
1.950%),
10/22/2030 | | | 408,365 | | | | 0.3 | | |
| | 250,000 | | | | (1 | ) | | BlueMountain
CLO Ltd.
2021-28A C,
2.124%,
(US0003M +
2.000%),
04/15/2034 | | | 248,138 | | | | 0.2 | | |
| | 250,000 | | | | (1 | ) | | BlueMountain
CLO XXXI
Ltd.
2021-31A A2,
1.524%,
(US0003M +
1.400%),
04/19/2034 | | | 250,097 | | | | 0.2 | | |
| | 300,000 | | | | (1 | ) | | BlueMountain
Fuji US
Clo I Ltd.
2017-1A CR,
2.382%,
(US0003M +
2.250%),
07/20/2029 | | | 299,016 | | | | 0.2 | | |
| | 1,000,000 | | | | (1 | ) | | Carlyle Global
Market
Strategies
CLO 2016-1
Ltd. 2016-1A
A1R2,
1.272%,
(US0003M +
1.140%),
04/20/2034 | | | 998,366 | | | | 0.6 | | |
| | 250,000 | | | | (1 | ) | | Carlyle US
Clo 2017-2A
CR Ltd.,
1.534%,
(US0003M +
1.400%),
07/20/2031 | | | 250,002 | | | | 0.2 | | |
| | 250,000 | | | | (1 | ) | | Cedar
Funding VIII
Clo Ltd.
2017-8A A2R,
1.572%,
(US0003M +
1.450%),
10/17/2034 | | | 249,644 | | | | 0.2 | | |
See Accompanying Notes to Financial Statements
98
PORTFOLIO OF INVESTMENTS
VOYA GLOBAL BOND PORTFOLIO AS OF DECEMBER 31, 2021 (CONTINUED)
Principal
Amount† | |
| |
| | Value | | Percentage
of Net
Assets | |
| | | | | United States (continued) | |
| | 400,000 | | | | (1 | ) | | CIFC Funding
2013-IA BR
Ltd., 2.522%,
(US0003M +
2.400%),
07/16/2030 | | $ | 400,296 | | | | 0.2 | | |
| | 500,000 | | | | (1 | ) | | CIFC Funding
2020-2A AR
Ltd., 1.308%,
(US0003M +
1.170%),
10/20/2034 | | | 500,272 | | | | 0.3 | | |
| | 229,387 | | | | (2 | ) | | Citigroup
Mortgage
Loan Trust
2006-WF1
A2E, 4.818%,
03/25/2036 | | | 137,182 | | | | 0.1 | | |
| | 400,000 | | | | (1 | ) | | Clear Creek
CLO
2015-1A CR,
2.082%,
(US0003M +
1.950%),
10/20/2030 | | | 398,941 | | | | 0.2 | | |
| | 650,000 | | | | (1 | ) | | Elevation CLO
2014-2A
A1R Ltd.,
1.354%,
(US0003M +
1.230%),
10/15/2029 | | | 649,786 | | | | 0.4 | | |
| | 500,000 | | | | (1 | ) | | Galaxy XV
CLO Ltd.
2013-15A
CRR,
1.974%,
(US0003M +
1.850%),
10/15/2030 | | | 499,496 | | | | 0.3 | | |
| | 400,000 | | | | (1 | ) | | Galaxy XXI
CLO Ltd.
2015-21A
CR, 1.882%,
(US0003M +
1.750%),
04/20/2031 | | | 394,223 | | | | 0.2 | | |
| | 500,000 | | | | (1 | ) | | Jay Park
CLO Ltd.
2016-1A BR,
2.132%,
(US0003M +
2.000%),
10/20/2027 | | | 499,631 | | | | 0.3 | | |
Principal
Amount† | |
| |
| | Value | | Percentage
of Net
Assets | |
| | 250,000 | | | | (1 | ) | | Madison Park
Funding
XXVII Ltd.
2018-27A B,
1.932%,
(US0003M +
1.800%),
04/20/2030 | | $ | 247,257 | | | | 0.2 | | |
| | 400,000 | | | | (1 | ) | | Madison Park
Funding
XXXI Ltd.
2018-31A C,
2.274%,
(US0003M +
2.150%),
01/23/2031 | | | 400,019 | | | | 0.2 | | |
| | 250,000 | | | | (1 | ) | | Marble Point
CLO XIV Ltd.
2018-2A A1R,
1.412%,
(US0003M +
1.280%),
01/20/2032 | | | 250,111 | | | | 0.2 | | |
| | 200,000 | | | | (1 | ),(2) | | Mill City
Mortgage
Loan Trust
2017-2 M2,
3.250%,
07/25/2059 | | | 206,409 | | | | 0.1 | | |
| | 250,000 | | | | (1 | ) | | Oak Hill Credit
Partners
2021-8A C,
2.022%,
(US0003M +
1.900%),
01/18/2034 | | | 247,272 | | | | 0.2 | | |
| | 500,000 | | | | (1 | ) | | OCP CLO
2014-5 A
BR Ltd.,
1.925%,
(US0003M +
1.800%),
04/26/2031 | | | 495,279 | | | | 0.3 | | |
| | 250,000 | | | | (1 | ) | | Octagon
Investment
Partners 30
Ltd. 2017-1A
BR, 2.082%,
(US0003M +
1.950%),
03/17/2030 | | | 248,822 | | | | 0.2 | | |
| | 550,000 | | | | (1 | ) | | Octagon
Investment
Partners 31
Ltd. 2017-1A
CR, 2.182%,
(US0003M +
2.050%),
07/20/2030 | | | 548,968 | | | | 0.3 | | |
See Accompanying Notes to Financial Statements
99
PORTFOLIO OF INVESTMENTS
VOYA GLOBAL BOND PORTFOLIO AS OF DECEMBER 31, 2021 (CONTINUED)
Principal
Amount† | |
| |
| | Value | | Percentage
of Net
Assets | |
| | | | | United States (continued) | |
| | 350,000 | | | | (1 | ) | | Octagon
Investment
Partners
32 Ltd.
2017-1A
A2R, 1.324%,
(US0003M +
1.200%),
07/15/2029 | | $ | 350,001 | | | | 0.2 | | |
| | 1,200,000 | | | | (1 | ) | | Palmer Square
CLO Ltd.
2021-2A A,
1.274%,
(US0003M +
1.150%),
07/15/2034 | | | 1,200,182 | | | | 0.8 | | |
| | 440,000 | | | | (1 | ) | | Shackleton
2019-15A
CR CLO Ltd.,
2.274%,
(US0003M +
2.150%),
01/15/2032 | | | 437,699 | | | | 0.3 | | |
| | 400,000 | | | | (1 | ) | | Sound Point
Clo XIV Ltd.
2016-3A CR,
2.174%,
(US0003M +
2.050%),
01/23/2029 | | | 398,773 | | | | 0.2 | | |
| | 400,000 | | | | (1 | ) | | Sound Point
Clo XV Ltd.
2017-1A CR,
2.174%,
(US0003M +
2.050%),
01/23/2029 | | | 398,744 | | | | 0.2 | | |
| | 250,000 | | | | (1 | ) | | THL Credit
Wind River
2013-2A CR
CLO Ltd.,
2.122%,
(US0003M +
2.000%),
10/18/2030 | | | 248,225 | | | | 0.2 | | |
| | 800,000 | | | | (1 | ) | | THL Credit
Wind River
2019-1A
AR CLO Ltd.,
1.292%,
(US0003M +
1.160%),
07/20/2034 | | | 799,998 | | | | 0.5 | | |
| | | | | | | | | Total Asset-
Backed
Securities
(Cost
$15,280,354) | | | 15,307,443 | | | | 9.6 | | |
Principal
Amount† | |
| |
| | Value | | Percentage
of Net
Assets | |
U.S. TREASURY OBLIGATIONS: 0.5% | | | |
| | | | | U.S. Treasury Bonds: 0.5% | |
| | 1,000 | | | | | | | 1.250%,
05/15/2050 | | $ | 849 | | | | 0.0 | | |
| | 201,900 | | | | | | | 1.375%,
11/15/2031 | | | 199,408 | | | | 0.1 | | |
| | 1,700 | | | | | | | 1.625%,
11/15/2050 | | | 1,584 | | | | 0.0 | | |
| | 240,000 | | | | | | | 2.000%,
08/15/2051 | | | 244,725 | | | | 0.2 | | |
| | 296,000 | | | | | | | 2.000%,
11/15/2041 | | | 299,469 | | | | 0.2 | | |
| | | | | | | | | | 746,035 | | | | 0.5 | | |
| | | | | U.S. Treasury Notes: 0.0% | |
| | 1,000 | | | | | | | 0.125%,
10/15/2023 | | | 990 | | | | 0.0 | | |
| | 3,600 | | | | (5 | ) | | 0.500%,
11/30/2023 | | | 3,586 | | | | 0.0 | | |
| | 32,000 | | | | | | | 0.750%,
12/31/2023 | | | 32,009 | | | | 0.0 | | |
| | 5,000 | | | | (5 | ) | | 1.250%,
11/30/2026 | | | 4,998 | | | | 0.0 | | |
| | 49,200 | | | | | | | 1.250%,
12/31/2026 | | | 49,154 | | | | 0.0 | | |
| | 1,000 | | | | | | | 1.250%,
09/30/2028 | | | 989 | | | | 0.0 | | |
| | | | | | | | | | 91,726 | | | | 0.0 | | |
| | | | | | | Total U.S.
Treasury
Obligations
(Cost
$847,550) | | | 837,761 | | | | 0.5 | | |
STRUCTURED NOTES: —% | | | |
| | | | | Russia: —% | |
RUB | 3,719,550 | | | | (3 | ) | | Morgan
Stanley & Co.
International
PLC - EM
Whole Loan
SA /Russian
Federation
Total Return
Linked Bonds,
Series 007,
Cl. VR,
5.000%,
08/22/2034 | | | — | | | | — | �� | |
| | | | | | | | | Total
Structured
Notes
(Cost
$133,678) | | | — | | | | — | | |
See Accompanying Notes to Financial Statements
100
PORTFOLIO OF INVESTMENTS
VOYA GLOBAL BOND PORTFOLIO AS OF DECEMBER 31, 2021 (CONTINUED)
Shares | |
| |
| | Value | | Percentage
of Net
Assets | |
COMMON STOCK: 0.1% | | | |
| | | | | United States: 0.1% | |
| | 2,149 | | | | (3 | ),(5),(10) | | American
Media, Inc. | | $ | — | | | | — | | |
| | 18 | | | | (10 | ) | | Ingevity Corp. | | | 1,291 | | | | 0.0 | | |
| | 4,988 | | | | | | | Resolute
Forest
Products, Inc. | | | 76,167 | | | | 0.1 | | |
| | 120 | | | | | | | WestRock Co. | | | 5,323 | | | | 0.0 | | |
| | | | | | | | | Total Common
Stock
(Cost
$131,025) | | | 82,781 | | | | 0.1 | | |
MUTUAL FUNDS: 24.9% | | | |
| | | | | United States: 24.9% | |
| | 786,220 | | | | | | | Voya Emerging
Markets
Corporate
Debt Fund -
Class P | | | 7,767,851 | | | | 4.9 | | |
| | 1,444,986 | | | | | | | Voya Emerging
Markets
Hard
Currency
Debt Fund -
Class P | | | 13,553,973 | | | | 8.5 | | |
| | 1,154,408 | | | | | | | Voya Emerging
Markets
Local
Currency
Debt Fund -
Class P | | | 7,099,609 | | | | 4.5 | | |
| | 1,392,484 | | | | | | | Voya High
Yield Bond
Fund -
Class P | | | 11,181,648 | | | | 7.0 | | |
| | | | | | | Total Mutual
Funds
(Cost
$41,399,129) | | | 39,603,081 | | | | 24.9 | | |
PURCHASED OPTIONS(11): 0.0% | | | |
| | | | | | | | | Total
Purchased
Options
(Cost
$68,817) | | | 37,770 | | | | 0.0 | | |
| | | | | | | | | Total
Long-Term
Investments
(Cost
$166,511,529) | | | 167,984,158 | | | | 105.7 | | |
Principal
Amount† | |
| |
| | Value | | Percentage
of Net
Assets | |
SHORT-TERM INVESTMENTS: 1.0% | |
| | | | | Repurchase Agreements: 0.1% | |
| | 132,120 | | | | (12 | ) | | Barclays
Capital, Inc.,
Repurchase
Agreement
dated
12/31/21,
0.05%,
due 01/03/22
(Repurchase
Amount
$132,121,
collateralized
by various
U.S.
Government
Securities,
0.125%-
1.000%,
Market Value
plus accrued
interest
$134,763,
due 07/15/30-
02/15/46)
(Cost
$132,120) | | $ | 132,120 | | | | 0.1 | | |
Shares | |
| |
| | Value | | Percentage
of Net
Assets | |
| | | | | Mutual Funds: 0.9% | |
| | 1,481,000 | | | | (13 | ) | | BlackRock
Liquidity
Funds,
FedFund,
Institutional
Class,
0.030%
(Cost
$1,481,000) | | $ | 1,481,000 | | | | 0.9 | | |
| | | | | Total
Short-Term
Investments
(Cost
$1,613,120) | | | 1,613,120 | | | | 1.0 | | |
| | | | | Total
Investments
in Securities
(Cost
$168,124,649) | | $ | 169,597,278 | | | | 106.7 | | |
| | | | | Liabilities in
Excess of
Other
Assets | | | (10,717,430 | ) | | | (6.7 | ) | |
| | | | | Net Assets | | $ | 158,879,848 | | | | 100.0 | | |
See Accompanying Notes to Financial Statements
101
PORTFOLIO OF INVESTMENTS
VOYA GLOBAL BOND PORTFOLIO AS OF DECEMBER 31, 2021 (CONTINUED)
† Unless otherwise indicated, principal amount is shown in USD.
(1) Securities with purchases pursuant to Rule 144A or section 4(a)(2), under the Securities Act of 1933 and may not be resold subject to that rule except to qualified institutional buyers.
(2) Variable rate security. Rate shown is the rate in effect as of December 31, 2021.
(3) For fair value measurement disclosure purposes, security is categorized as Level 3, whose value was determined using significant unobservable inputs.
(4) Defaulted security.
(5) Security, or a portion of the security, is on loan.
(6) Interest only securities represent the right to receive the monthly interest payments on an underlying pool of mortgage loans. Principal amount shown represents the notional amount on which current interest is calculated. Payments of principal on the pool reduce the value of the interest only security.
(7) The Federal Housing Finance Agency ("FHFA") placed the Federal Home Loan Mortgage Corporation and Federal National Mortgage Association into conservatorship with FHFA as the conservator. As such, the FHFA oversees the continuing affairs of these companies.
(8) Represents or includes a TBA transaction.
(9) Principal only securities represent the right to receive the monthly principal payments on an underlying pool of mortgage loans. No payments of interest on the pool are passed through the principal only security.
(10) Non-income producing security.
(11) The tables within the Portfolio of Investments detail open purchased options which are non-income producing securities.
(12) All or a portion of the security represents securities purchased with cash collateral received for securities on loan.
(13) Rate shown is the 7-day yield as of December 31, 2021.
Currency Abbreviations:
AUD Australian Dollar
CAD Canadian Dollar
CNY Chinese Yuan
EUR EU Euro
IDR Indonesian Rupiah
MXN Mexican Peso
MYR Malaysian Ringgit
RUB Russian Ruble
THB Thai Baht
ZAR South African Rand
Reference Rate Abbreviations:
US0001M 1-month LIBOR
US0003M 3-month LIBOR
US0012M 12-month LIBOR
Sector Diversification | | Percentage
of Net Assets | |
Affiliated Investment Companies | | | 24.9 | % | |
Collateralized Mortgage Obligations | | | 14.5 | | |
Sovereign Bonds | | | 12.6 | | |
Commercial Mortgage-Backed Securities | | | 10.7 | | |
Other Asset-Backed Securities | | | 9.6 | | |
Financial | | | 8.3 | | |
Uniform Mortgage-Backed Securities | | | 5.9 | | |
Consumer, Non-cyclical | | | 4.1 | | |
U.S. Government Agency Obligations | | | 4.0 | | |
Utilities | | | 2.9 | | |
Energy | | | 2.5 | | |
Communications | | | 1.9 | | |
Technology | | | 1.2 | | |
Industrial | | | 1.0 | | |
Consumer, Cyclical | | | 0.7 | | |
U.S. Treasury Obligations | | | 0.5 | | |
Basic Materials | | | 0.3 | | |
Materials | | | 0.1 | | |
Purchased Options | | | 0.0 | | |
Communication Services | | | 0.0 | | |
Structured Notes | | | 0.0 | | |
Short-Term Investments | | | 1.0 | | |
Liabilities in Excess of Other Assets | | | (6.7 | ) | |
Net Assets | | | 100.0 | % | |
Portfolio holdings are subject to change daily.
Fair Value Measurements^
The following is a summary of the fair valuations according to the inputs used as of December 31, 2021 in valuing the assets and liabilities:
| | | Quoted Prices
in Active Markets
for Identical Investments
(Level 1) | | Significant Other
Observable
Inputs
(Level 2) | | Significant
Unobservable
Inputs
(Level 3) | | Fair Value
at
December 31, 2021 | |
Asset Table | |
Investments, at fair value | |
Common Stock | |
United States | | $ | 82,781 | | | $ | — | | | $ | — | | | $ | 82,781 | | |
Total Common Stock | | | 82,781 | | | | — | | | | — | | | | 82,781 | | |
Mutual Funds | | | 39,603,081 | | | | — | | | | — | | | | 39,603,081 | | |
Purchased Options | | | — | | | | 37,770 | | | | — | | | | 37,770 | | |
Corporate Bonds/Notes | | | — | | | | 36,311,332 | | | | 1,858 | | | | 36,313,190 | | |
Collateralized Mortgage Obligations | | | — | | | | 23,018,983 | | | | — | | | | 23,018,983 | | |
Asset-Backed Securities | | | — | | | | 15,307,443 | | | | — | | | | 15,307,443 | | |
U.S. Government Agency Obligations | | | — | | | | 15,695,077 | | | | — | | | | 15,695,077 | | |
Commercial Mortgage-Backed Securities | | | — | | | | 14,946,085 | | | | 2,052,255 | | | | 16,998,340 | | |
Sovereign Bonds | | | — | | | | 20,089,732 | | | | — | | | | 20,089,732 | | |
U.S. Treasury Obligations | | | — | | | | 837,761 | | | | — | | | | 837,761 | | |
Structured Notes | | | — | | | | — | | | | — | | | | — | | |
Short-Term Investments | | | 1,481,000 | | | | 132,120 | | | | — | | | | 1,613,120 | | |
Total Investments, at fair value | | $ | 41,166,862 | | | $ | 126,376,303 | | | $ | 2,054,113 | | | $ | 169,597,278 | | |
See Accompanying Notes to Financial Statements
102
PORTFOLIO OF INVESTMENTS
VOYA GLOBAL BOND PORTFOLIO AS OF DECEMBER 31, 2021 (CONTINUED)
| | | Quoted Prices
in Active Markets
for Identical Investments
(Level 1) | | Significant Other
Observable
Inputs
(Level 2) | | Significant
Unobservable
Inputs
(Level 3) | | Fair Value
at
December 31, 2021 | |
Other Financial Instruments+ | |
Centrally Cleared Swaps | | $ | — | | | $ | 820,323 | | | $ | — | | | $ | 820,323 | | |
Forward Foreign Currency Contracts | | | — | | | | 1,666,480 | | | | — | | | | 1,666,480 | | |
Futures | | | 96,423 | | | | — | | | | — | | | | 96,423 | | |
OTC Swaps | | | — | | | | 15,675 | | | | — | | | | 15,675 | | |
Total Assets | | $ | 41,263,285 | | | $ | 128,878,781 | | | $ | 2,054,113 | | | $ | 172,196,179 | | |
Liabilities Table | |
Other Financial Instruments+ | |
Centrally Cleared Swaps | | $ | — | | | $ | (1,599,381 | ) | | $ | — | | | $ | (1,599,381 | ) | |
Forward Foreign Currency Contracts | | | — | | | | (1,883,321 | ) | | | — | | | | (1,883,321 | ) | |
Futures | | | (459,465 | ) | | | — | | | | — | | | | (459,465 | ) | |
OTC Swaps | | | — | | | | (207,010 | ) | | | — | | | | (207,010 | ) | |
Volatility Swaps | | | — | | | | (14,193 | ) | | | — | | | | (14,193 | ) | |
Written Options | | | — | | | | (29,730 | ) | | | — | | | | (29,730 | ) | |
Total Liabilities | | $ | (459,465 | ) | | $ | (3,733,635 | ) | | $ | — | | | $ | (4,193,100 | ) | |
^ See Note 2, "Significant Accounting Policies" in the Notes to Financial Statements for additional information.
+ Other Financial Instruments may include open forward foreign currency contracts, futures, centrally cleared swaps, OTC swaps and written options. Forward foreign currency contracts, futures and centrally cleared swaps are fair valued at the unrealized appreciation (depreciation) on the instrument. OTC swaps and written options are valued at the fair value of the instrument.
Transactions with Affiliates
An investment of at least 5% of the voting securities of an issuer, or a company which is under common control results in that issuer becoming an affiliated person as defined by the 1940 Act.
The following table provides transactions during the year ended December 31, 2021, where the following issuers were considered an affiliate:
Issuer | | Beginning
Fair
Value at
12/31/20 | | Purchases
at Cost | | Sales
at Cost | | Change in
Unrealized
Appreciation/
(Depreciation) | | Ending
Fair
Value at
12/31/21 | | Investment
Income | | Realized
Gains/
(Losses) | | Net Capital
Gain
Distributions | |
Voya Emerging Markets
Corporate Debt
Fund - Class P | | $ | 7,704,709 | | | $ | 518,278 | | | $ | — | | | $ | (455,136 | ) | | $ | 7,767,851 | | | $ | 354,563 | | | $ | — | | | $ | 163,877 | | |
Voya Emerging Markets
Hard Currency Debt
Fund - Class P | | | 13,865,056 | | | | 682,345 | | | | — | | | | (993,428 | ) | | | 13,553,973 | | | | 682,486 | | | | — | | | | — | | |
Voya Emerging Markets
Local Currency Debt
Fund - Class P | | | 7,896,804 | | | | 293,221 | | | | — | | | | (1,090,416 | ) | | | 7,099,609 | | | | 293,221 | | | | — | | | | — | | |
Voya High Yield Bond
Fund - Class P | | | 10,589,498 | | | | 613,521 | | | | — | | | | (21,371 | ) | | | 11,181,648 | | | | 613,522 | | | | — | | | | — | | |
| | | $ | 40,056,067 | | | $ | 2,107,365 | | | $ | — | | | $ | (2,560,351 | ) | | $ | 39,603,081 | | | $ | 1,943,792 | | | $ | — | | | $ | 163,877 | | |
The financial statements for the above mutual fund[s] can be found at www.sec.gov.
At December 31, 2021, the following forward foreign currency contracts were outstanding for Voya Global Bond Portfolio:
Currency
Purchased | | Currency Sold | | Counterparty | | Settlement
Date | | Unrealized
Appreciation
(Depreciation) | |
USD | | | | | 1,822,120 | | | MYR | | | | | 7,721,050 | | | Barclays Bank PLC | | 01/21/22 | | $ | (31,771 | ) | |
USD | | | | | 143,235 | | | CLP | | | | | 121,399,057 | | | Barclays Bank PLC | | 02/04/22 | | | 1,373 | | |
USD | | | | | 3,649,781 | | | SEK | | | | | 33,317,526 | | | BNP Paribas | | 01/14/22 | | | (37,627 | ) | |
USD | | | | | 2,953,488 | | | AUD | | | | | 4,150,431 | | | BNP Paribas | | 01/14/22 | | | (66,252 | ) | |
GBP | | | | | 1,220,926 | | | USD | | | | | 1,640,996 | | | BNP Paribas | | 01/14/22 | | | 11,547 | | |
CHF | | | | | 3,999,443 | | | USD | | | | | 4,394,172 | | | BNP Paribas | | 01/14/22 | | | (3,810 | ) | |
CAD | | | | | 629,241 | | | USD | | | | | 491,871 | | | BNP Paribas | | 01/14/22 | | | 5,568 | | |
USD | | | | | 4,476,972 | | | CHF | | | | | 4,116,135 | | | BNP Paribas | | 01/14/22 | | | (41,486 | ) | |
USD | | | | | 4,339,168 | | | JPY | | | | | 492,377,892 | | | BNP Paribas | | 01/14/22 | | | 58,390 | | |
GBP | | | | | 398,591 | | | USD | | | | | 531,291 | | | BNP Paribas | | 01/14/22 | | | 8,208 | | |
USD | | | | | 4,678,367 | | | EUR | | | | | 4,129,808 | | | BNP Paribas | | 01/14/22 | | | (24,395 | ) | |
NZD | | | | | 1,922,225 | | | USD | | | | | 1,305,752 | | | BNP Paribas | | 01/14/22 | | | 10,603 | | |
USD | | | | | 2,937,352 | | | SEK | | | | | 26,522,966 | | | BNP Paribas | | 01/14/22 | | | 1,929 | | |
See Accompanying Notes to Financial Statements
103
PORTFOLIO OF INVESTMENTS
VOYA GLOBAL BOND PORTFOLIO AS OF DECEMBER 31, 2021 (CONTINUED)
Currency
Purchased | | Currency Sold | | Counterparty | | Settlement
Date | | Unrealized
Appreciation
(Depreciation) | |
AUD | | | | | 1,399,806 | | | USD | | | | | 1,001,068 | | | BNP Paribas | | 01/14/22 | | $ | 17,392 | | |
EUR | | | | | 26,727,448 | | | USD | | | | | 30,367,325 | | | BNP Paribas | | 01/14/22 | | | 68,184 | | |
AUD | | | | | 1,994,608 | | | USD | | | | | 1,420,261 | | | BNP Paribas | | 01/14/22 | | | 30,961 | | |
SEK | | | | | 26,914,555 | | | USD | | | | | 2,944,401 | | | BNP Paribas | | 01/14/22 | | | 34,360 | | |
USD | | | | | 940,587 | | | CAD | | | | | 1,194,311 | | | BNP Paribas | | 01/14/22 | | | (3,559 | ) | |
NZD | | | | | 3,189,543 | | | USD | | | | | 2,171,919 | | | BNP Paribas | | 01/14/22 | | | 12,305 | | |
CHF | | | | | 4,084,114 | | | USD | | | | | 4,458,773 | | | BNP Paribas | | 01/14/22 | | | 24,535 | | |
USD | | | | | 1,554,496 | | | AUD | | | | | 2,184,569 | | | BNP Paribas | | 01/14/22 | | | (34,937 | ) | |
USD | | | | | 1,310,812 | | | NOK | | | | | 11,808,909 | | | BNP Paribas | | 01/14/22 | | | (29,867 | ) | |
CAD | | | | | 2,783,361 | | | USD | | | | | 2,166,698 | | | BNP Paribas | | 01/14/22 | | | 33,652 | | |
USD | | | | | 4,469,784 | | | CAD | | | | | 5,652,476 | | | BNP Paribas | | 01/14/22 | | | 1,294 | | |
GBP | | | | | 1,354,730 | | | USD | | | | | 1,793,460 | | | BNP Paribas | | 01/14/22 | | | 40,189 | | |
EUR | | | | | 2,747,309 | | | USD | | | | | 3,122,009 | | | BNP Paribas | | 01/14/22 | | | 6,452 | | |
AUD | | | | | 3,266,757 | | | USD | | | | | 2,346,014 | | | BNP Paribas | | 01/14/22 | | | 30,788 | | |
USD | | | | | 8,000,509 | | | EUR | | | | | 7,078,729 | | | BNP Paribas | | 01/14/22 | | | (60,295 | ) | |
GBP | | | | | 726,591 | | | USD | | | | | 963,067 | | | BNP Paribas | | 01/14/22 | | | 20,385 | | |
EUR | | | | | 2,258,922 | | | USD | | | | | 2,560,850 | | | BNP Paribas | | 01/14/22 | | | 11,467 | | |
GBP | | | | | 8,790,855 | | | USD | | | | | 11,718,693 | | | BNP Paribas | | 01/14/22 | | | 179,868 | | |
KRW | | | | | 2,244,175,069 | | | USD | | | | | 1,885,182 | | | BNP Paribas | | 01/21/22 | | | 1,359 | | |
HKD | | | | | 379,429 | | | USD | | | | | 48,632 | | | BNP Paribas | | 01/21/22 | | | 29 | | |
CNY | | | | | 3,921,496 | | | USD | | | | | 612,533 | | | BNP Paribas | | 01/21/22 | | | 2,719 | | |
USD | | | | | 539,027 | | | NOK | | | | | 4,906,477 | | | Brown Brothers Harriman & Co. | | 01/14/22 | | | (18,010 | ) | |
SEK | | | | | 17,377,136 | | | USD | | | | | 1,919,727 | | | Brown Brothers Harriman & Co. | | 01/14/22 | | | 3,483 | | |
USD | | | | | 319,518 | | | EUR | | | | | 282,584 | | | Brown Brothers Harriman & Co. | | 01/14/22 | | | (2,270 | ) | |
NOK | | | | | 10,487,968 | | | USD | | | | | 1,153,248 | | | Brown Brothers Harriman & Co. | | 01/14/22 | | | 37,463 | | |
JPY | | | | | 1,744,523 | | | USD | | | | | 15,250 | | | Brown Brothers Harriman & Co. | | 01/14/22 | | | (83 | ) | |
USD | | | | | 709,113 | | | SEK | | | | | 6,436,347 | | | Citibank N.A. | | 01/14/22 | | | (3,228 | ) | |
USD | | | | | 3,862,889 | | | CHF | | | | | 3,567,668 | | | Citibank N.A. | | 01/14/22 | | | (53,494 | ) | |
CHF | | | | | 3,546,656 | | | USD | | | | | 3,860,684 | | | Citibank N.A. | | 01/14/22 | | | 32,633 | | |
JPY | | | | | 530,469,958 | | | USD | | | | | 4,675,577 | | | Citibank N.A. | | 01/14/22 | | | (63,624 | ) | |
SEK | | | | | 9,662,206 | | | USD | | | | | 1,070,854 | | | Citibank N.A. | | 01/14/22 | | | (1,492 | ) | |
USD | | | | | 2,217,867 | | | GBP | | | | | 1,662,238 | | | Citibank N.A. | | 01/14/22 | | | (31,999 | ) | |
CAD | | | | | 4,805,052 | | | USD | | | | | 3,747,447 | | | Citibank N.A. | | 01/14/22 | | | 51,123 | | |
USD | | | | | 626,548 | | | SEK | | | | | 5,706,330 | | | Citibank N.A. | | 01/14/22 | | | (4,999 | ) | |
USD | | | | | 2,928,581 | | | NZD | | | | | 4,298,974 | | | Citibank N.A. | | 01/14/22 | | | (15,390 | ) | |
USD | | | | | 787,274 | | | IDR | | | | | 11,336,669,763 | | | Citibank N.A. | | 01/21/22 | | | (8,900 | ) | |
USD | | | | | 221,259 | | | PEN | | | | | 901,961 | | | Citibank N.A. | | 02/04/22 | | | (4,389 | ) | |
DKK | | | | | 3,145,127 | | | USD | | | | | 480,454 | | | Deutsche Bank AG | | 01/14/22 | | | 1,142 | | |
GBP | | | | | 178,467 | | | USD | | | | | 236,399 | | | Deutsche Bank AG | | 01/14/22 | | | 5,160 | | |
EUR | | | | | 624,847 | | | USD | | | | | 706,868 | | | Deutsche Bank AG | | 01/14/22 | | | 4,668 | | |
JPY | | | | | 246,264 | | | USD | | | | | 2,170 | | | Deutsche Bank AG | | 01/14/22 | | | (29 | ) | |
USD | | | | | 649,135 | | | EUR | | | | | 575,245 | | | Deutsche Bank AG | | 01/14/22 | | | (5,917 | ) | |
AUD | | | | | 466,188 | | | USD | | | | | 332,772 | | | Goldman Sachs International | | 01/14/22 | | | 6,414 | | |
USD | | | | | 2,252,826 | | | NOK | | | | | 19,815,185 | | | Goldman Sachs International | | 01/14/22 | | | 3,186 | | |
NOK | | | | | 2,789,949 | | | USD | | | | | 308,919 | | | Goldman Sachs International | | 01/14/22 | | | 7,827 | | |
AUD | | | | | 3,389,529 | | | USD | | | | | 2,453,141 | | | Goldman Sachs International | | 01/14/22 | | | 12,987 | | |
USD | | | | | 217,547 | | | EUR | | | | | 191,863 | | | Goldman Sachs International | | 01/14/22 | | | (934 | ) | |
USD | | | | | 2,941,234 | | | SEK | | | | | 26,817,397 | | | Goldman Sachs International | | 01/14/22 | | | (26,775 | ) | |
USD | | | | | 602,952 | | | NZD | | | | | 884,823 | | | Goldman Sachs International | | 01/14/22 | | | (2,982 | ) | |
USD | | | | | 2,242,547 | | | EUR | | | | | 1,990,709 | | | Goldman Sachs International | | 01/14/22 | | | (24,345 | ) | |
NZD | | | | | 1,956,142 | | | USD | | | | | 1,335,594 | | | Goldman Sachs International | | 01/14/22 | | | (8,904 | ) | |
NOK | | | | | 2,937,184 | | | USD | | | | | 324,037 | | | Goldman Sachs International | | 01/14/22 | | | 9,425 | | |
NOK | | | | | 25,677,388 | | | USD | | | | | 2,851,792 | | | Goldman Sachs International | | 01/14/22 | | | 63,392 | | |
EUR | | | | | 534,520 | | | USD | | | | | 604,811 | | | Goldman Sachs International | | 01/14/22 | | | 3,866 | | |
NOK | | | | | 3,554,864 | | | USD | | | | | 400,347 | | | Goldman Sachs International | | 01/14/22 | | | 3,241 | | |
USD | | | | | 578,240 | | | GBP | | | | | 437,262 | | | Goldman Sachs International | | 01/14/22 | | | (13,601 | ) | |
USD | | | | | 1,974,179 | | | GBP | | | | | 1,487,755 | | | Goldman Sachs International | | 01/14/22 | | | (39,521 | ) | |
CHF | | | | | 1,377,823 | | | USD | | | | | 1,492,335 | | | Goldman Sachs International | | 01/14/22 | | | 20,161 | | |
GBP | | | | | 1,075,161 | | | USD | | | | | 1,431,744 | | | Goldman Sachs International | | 01/14/22 | | | 23,504 | | |
USD | | | | | 115,729 | | | RON | | | | | 509,854 | | | Goldman Sachs International | | 01/21/22 | | | (1,397 | ) | |
USD | | | | | 310,423 | | | RUB | | | | | 23,348,652 | | | Goldman Sachs International | | 01/21/22 | | | (73 | ) | |
USD | | | | | 179,809 | | | COP | | | | | 703,004,542 | | | Goldman Sachs International | | 02/04/22 | | | 7,574 | | |
USD | | | | | 245,056 | | | MXN | | | | | 5,176,878 | | | Goldman Sachs International | | 02/04/22 | | | (6,419 | ) | |
USD | | | | | 225,569 | | | PLN | | | | | 941,843 | | | HSBC Bank USA N.A. | | 01/21/22 | | | (7,912 | ) | |
USD | | | | | 19,136 | | | PHP | | | | | 966,184 | | | HSBC Bank USA N.A. | | 01/21/22 | | | 290 | | |
SGD | | | | | 537,066 | | | USD | | | | | 392,093 | | | HSBC Bank USA N.A. | | 01/21/22 | | | 6,397 | | |
JPY | | | | | 40,612,425 | | | USD | | | | | 357,528 | | | JPMorgan Chase Bank N.A. | | 01/14/22 | | | (4,439 | ) | |
GBP | | | | | 1,190,155 | | | USD | | | | | 1,596,750 | | | JPMorgan Chase Bank N.A. | | 01/14/22 | | | 14,143 | | |
USD | | | | | 4,874 | | | JPY | | | | | 554,691 | | | JPMorgan Chase Bank N.A. | | 01/14/22 | | | 51 | | |
ILS | | | | | 792,296 | | | USD | | | | | 251,169 | | | JPMorgan Chase Bank N.A. | | 01/21/22 | | | 3,692 | | |
See Accompanying Notes to Financial Statements
104
PORTFOLIO OF INVESTMENTS
VOYA GLOBAL BOND PORTFOLIO AS OF DECEMBER 31, 2021 (CONTINUED)
Currency
Purchased | | Currency Sold | | Counterparty | | Settlement
Date | | Unrealized
Appreciation
(Depreciation) | |
USD | | | | | 2,185,748 | | | NZD | | | | | 3,235,963 | | | Morgan Stanley Capital Services LLC | | 01/14/22 | | $ | (30,266 | ) | |
AUD | | | | | 2,574,780 | | | USD | | | | | 1,826,836 | | | Morgan Stanley Capital Services LLC | | 01/14/22 | | | 46,503 | | |
AUD | | | | | 4,567,032 | | | USD | | | | | 3,267,635 | | | Morgan Stanley Capital Services LLC | | 01/14/22 | | | 55,212 | | |
NZD | | | | | 905,768 | | | USD | | | | | 611,790 | | | Morgan Stanley Capital Services LLC | | 01/14/22 | | | 8,487 | | |
USD | | | | | 3,925,436 | | | CHF | | | | | 3,625,044 | | | Morgan Stanley Capital Services LLC | | 01/14/22 | | | (53,931 | ) | |
USD | | | | | 2,262,383 | | | NOK | | | | | 20,456,125 | | | Morgan Stanley Capital Services LLC | | 01/14/22 | | | (60,025 | ) | |
EUR | | | | | 2,470,741 | | | USD | | | | | 2,793,259 | | | Morgan Stanley Capital Services LLC | | 01/14/22 | | | 20,263 | | |
USD | | | | | 2,845,567 | | | EUR | | | | | 2,525,218 | | | Morgan Stanley Capital Services LLC | | 01/14/22 | | | (29,990 | ) | |
USD | | | | | 1,739,068 | | | NOK | | | | | 15,628,203 | | | Morgan Stanley Capital Services LLC | | 01/14/22 | | | (35,220 | ) | |
EUR | | | | | 3,554,082 | | | USD | | | | | 4,017,392 | | | Morgan Stanley Capital Services LLC | | 01/14/22 | | | 29,770 | | |
NOK | | | | | 20,306,348 | | | USD | | | | | 2,268,353 | | | Morgan Stanley Capital Services LLC | | 01/14/22 | | | 37,050 | | |
NZD | | | | | 2,246,914 | | | USD | | | | | 1,525,349 | | | Morgan Stanley Capital Services LLC | | 01/14/22 | | | 13,356 | | |
NOK | | | | | 19,256,450 | | | USD | | | | | 2,139,491 | | | Morgan Stanley Capital Services LLC | | 01/14/22 | | | 46,716 | | |
CAD | | | | | 1,281,550 | | | USD | | | | | 995,247 | | | Morgan Stanley Capital Services LLC | | 01/14/22 | | | 17,865 | | |
USD | | | | | 3,958,451 | | | GBP | | | | | 2,983,156 | | | Morgan Stanley Capital Services LLC | | 01/14/22 | | | (79,298 | ) | |
USD | | | | | 348,542 | | | NOK | | | | | 3,098,664 | | | Morgan Stanley Capital Services LLC | | 01/14/22 | | | (3,253 | ) | |
SEK | | | | | 12,041,583 | | | USD | | | | | 1,333,062 | | | Morgan Stanley Capital Services LLC | | 01/14/22 | | | (362 | ) | |
USD | | | | | 4,624,311 | | | JPY | | | | | 525,566,824 | | | Morgan Stanley Capital Services LLC | | 01/14/22 | | | 54,986 | | |
USD | | | | | 918,502 | | | AUD | | | | | 1,280,592 | | | Morgan Stanley Capital Services LLC | | 01/14/22 | | | (13,222 | ) | |
JPY | | | | | 75,927,139 | | | USD | | | | | 669,205 | | | Morgan Stanley Capital Services LLC | | 01/14/22 | | | (9,088 | ) | |
SEK | | | | | 10,199,674 | | | USD | | | | | 1,126,199 | | | Morgan Stanley Capital Services LLC | | 01/14/22 | | | 2,647 | | |
CAD | | | | | 5,000 | | | USD | | | | | 3,891 | | | Morgan Stanley Capital Services LLC | | 01/14/22 | | | 62 | | |
USD | | | | | 993,755 | | | CHF | | | | | 918,349 | | | Morgan Stanley Capital Services LLC | | 01/14/22 | | | (14,356 | ) | |
USD | | | | | 974,795 | | | CAD | | | | | 1,260,356 | | | Morgan Stanley Capital Services LLC | | 01/14/22 | | | (21,562 | ) | |
AUD | | | | | 2,092,809 | | | USD | | | | | 1,517,381 | | | Morgan Stanley Capital Services LLC | | 01/14/22 | | | 5,290 | | |
GBP | | | | | 2,493,901 | | | USD | | | | | 3,299,455 | | | Morgan Stanley Capital Services LLC | | 01/14/22 | | | 76,078 | | |
USD | | | | | 326,165 | | | SEK | | | | | 2,962,514 | | | Morgan Stanley Capital Services LLC | | 01/14/22 | | | (1,711 | ) | |
USD | | | | | 3,226,304 | | | CAD | | | | | 4,129,202 | | | Morgan Stanley Capital Services LLC | | 01/14/22 | | | (37,982 | ) | |
EUR | | | | | 5,581,881 | | | USD | | | | | 6,296,605 | | | Morgan Stanley Capital Services LLC | | 01/14/22 | | | 59,685 | | |
USD | | | | | 446,292 | | | CAD | | | | | 570,456 | | | Morgan Stanley Capital Services LLC | | 01/14/22 | | | (4,674 | ) | |
USD | | | | | 276,744 | | | NOK | | | | | 2,444,063 | | | Morgan Stanley Capital Services LLC | | 01/14/22 | | | (733 | ) | |
USD | | | | | 1,072,794 | | | JPY | | | | | 121,854,915 | | | Morgan Stanley Capital Services LLC | | 01/14/22 | | | 13,376 | | |
NOK | | | | | 6,063,091 | | | USD | | | | | 666,622 | | | Morgan Stanley Capital Services LLC | | 01/14/22 | | | 21,728 | | |
USD | | | | | 894,501 | | | AUD | | | | | 1,234,420 | | | Morgan Stanley Capital Services LLC | | 01/14/22 | | | (3,629 | ) | |
USD | | | | | 2,838,920 | | | EUR | | | | | 2,513,481 | | | Morgan Stanley Capital Services LLC | | 01/14/22 | | | (23,272 | ) | |
USD | | | | | 465,175 | | | CHF | | | | | 429,997 | | | Morgan Stanley Capital Services LLC | | 01/14/22 | | | (6,852 | ) | |
USD | | | | | 2,933,315 | | | CHF | | | | | 2,691,570 | | | Morgan Stanley Capital Services LLC | | 01/14/22 | | | (21,338 | ) | |
SEK | | | | | 4,309,413 | | | USD | | | | | 477,774 | | | Morgan Stanley Capital Services LLC | | 01/14/22 | | | (831 | ) | |
USD | | | | | 883,501 | | | CAD | | | | | 1,132,022 | | | Morgan Stanley Capital Services LLC | | 01/14/22 | | | (11,403 | ) | |
USD | | | | | 321,748 | | | JPY | | | | | 36,549,590 | | | Morgan Stanley Capital Services LLC | | 01/14/22 | | | 3,982 | | |
NZD | | | | | 610,039 | | | USD | | | | | 416,767 | | | Morgan Stanley Capital Services LLC | | 01/14/22 | | | 993 | | |
CHF | | | | | 287,176 | | | USD | | | | | 313,017 | | | Morgan Stanley Capital Services LLC | | 01/14/22 | | | 2,228 | | |
AUD | | | | | 4,175,993 | | | USD | | | | | 3,027,467 | | | Morgan Stanley Capital Services LLC | | 01/14/22 | | | 10,871 | | |
USD | | | | | 2,231,654 | | | EUR | | | | | 1,967,329 | | | Morgan Stanley Capital Services LLC | | 01/14/22 | | | (8,614 | ) | |
USD | | | | | 211,940 | | | NOK | | | | | 1,869,228 | | | Morgan Stanley Capital Services LLC | | 01/14/22 | | | (275 | ) | |
EUR | | | | | 2,661,619 | | | USD | | | | | 3,018,763 | | | Morgan Stanley Capital Services LLC | | 01/14/22 | | | 12,118 | | |
EUR | | | | | 2,483,293 | | | USD | | | | | 2,814,626 | | | Morgan Stanley Capital Services LLC | | 01/14/22 | | | 13,190 | | |
USD | | | | | 548,978 | | | NOK | | | | | 4,855,546 | | | Morgan Stanley Capital Services LLC | | 01/14/22 | | | (2,278 | ) | |
SEK | | | | | 13,433,209 | | | USD | | | | | 1,486,903 | | | Morgan Stanley Capital Services LLC | | 01/14/22 | | | (185 | ) | |
SEK | | | | | 26,673,200 | | | USD | | | | | 2,938,872 | | | Morgan Stanley Capital Services LLC | | 01/14/22 | | | 13,178 | | |
USD | | | | | 80,675 | | | CZK | | | | | 1,836,117 | | | Morgan Stanley Capital Services LLC | | 01/21/22 | | | (3,226 | ) | |
USD | | | | | 133,562 | | | HUF | | | | | 43,692,117 | | | Morgan Stanley Capital Services LLC | | 01/21/22 | | | (880 | ) | |
USD | | | | | 635,364 | | | ZAR | | | | | 10,344,239 | | | Morgan Stanley Capital Services LLC | | 01/21/22 | | | (12,164 | ) | |
JPY | | | | | 215,871,783 | | | USD | | | | | 1,879,755 | | | Standard Chartered Bank | | 01/14/22 | | | (2,946 | ) | |
USD | | | | | 875,447 | | | GBP | | | | | 660,355 | | | Standard Chartered Bank | | 01/14/22 | | | (18,353 | ) | |
USD | | | | | 16,606 | | | NZD | | | | | 24,247 | | | Standard Chartered Bank | | 01/14/22 | | | 1 | | |
JPY | | | | | 1,814,359,038 | | | USD | | | | | 16,071,985 | | | Standard Chartered Bank | | 01/14/22 | | | (297,785 | ) | |
USD | | | | | 2,146,931 | | | NOK | | | | | 19,382,225 | | | Standard Chartered Bank | | 01/14/22 | | | (53,555 | ) | |
USD | | | | | 2,418,071 | | | SEK | | | | | 21,802,425 | | | Standard Chartered Bank | | 01/14/22 | | | 5,093 | | |
JPY | | | | | 201,079,728 | | | USD | | | | | 1,751,913 | | | Standard Chartered Bank | | 01/14/22 | | | (3,707 | ) | |
SEK | | | | | 2,016,333 | | | USD | | | | | 222,582 | | | Standard Chartered Bank | | 01/14/22 | | | 575 | | |
USD | | | | | 682,289 | | | THB | | | | | 23,053,643 | | | Standard Chartered Bank | | 01/21/22 | | | (7,752 | ) | |
USD | | | | | 68,591 | | | TRY | | | | | 893,433 | | | Standard Chartered Bank | | 01/21/22 | | | 2,073 | | |
USD | | | | | 611,006 | | | BRL | | | | | 3,502,483 | | | Standard Chartered Bank | | 02/04/22 | | | (13,081 | ) | |
JPY | | | | | 483,322,053 | | | USD | | | | | 4,197,463 | | | State Street Bank and Trust Co. | | 01/14/22 | | | 4,583 | | |
USD | | | | | 553,732 | | | GBP | | | | | 417,134 | | | State Street Bank and Trust Co. | | 01/14/22 | | | (10,865 | ) | |
CAD | | | | | 627,396 | | | USD | | | | | 491,692 | | | State Street Bank and Trust Co. | | 01/14/22 | | | 4,288 | | |
USD | | | | | 506,165 | | | CAD | | | | | 643,410 | | | State Street Bank and Trust Co. | | 01/14/22 | | | (2,474 | ) | |
SEK | | | | | 16,964,780 | | | USD | | | | | 1,867,593 | | | State Street Bank and Trust Co. | | 01/14/22 | | | 9,979 | | |
JPY | | | | | 31,157,779 | | | USD | | | | | 275,042 | | | State Street Bank and Trust Co. | | 01/14/22 | | | (4,154 | ) | |
See Accompanying Notes to Financial Statements
105
PORTFOLIO OF INVESTMENTS
VOYA GLOBAL BOND PORTFOLIO AS OF DECEMBER 31, 2021 (CONTINUED)
Currency
Purchased | | Currency Sold | | Counterparty | | Settlement
Date | | Unrealized
Appreciation
(Depreciation) | |
EUR | | | | | 462,864 | | | USD | | | | | 524,525 | | | State Street Bank and Trust Co. | | 01/14/22 | | $ | 2,555 | | |
JPY | | | | | 521,182,396 | | | USD | | | | | 4,586,886 | | | State Street Bank and Trust Co. | | 01/14/22 | | | (55,680 | ) | |
USD | | | | | 262,993 | | | AUD | | | | | 375,549 | | | State Street Bank and Trust Co. | | 01/14/22 | | | (10,246 | ) | |
CAD | | | | | 1,462,610 | | | USD | | | | | 1,141,997 | | | State Street Bank and Trust Co. | | 01/14/22 | | | 14,250 | | |
CAD | | | | | 436,785 | | | USD | | | | | 341,118 | | | State Street Bank and Trust Co. | | 01/14/22 | | | 4,176 | | |
CAD | | | | | 617,610 | | | USD | | | | | 483,023 | | | State Street Bank and Trust Co. | | 01/14/22 | | | 5,220 | | |
USD | | | | | 2,225,566 | | | NZD | | | | | 3,278,829 | | | State Street Bank and Trust Co. | | 01/14/22 | | | (19,802 | ) | |
USD | | | | | 516,840 | | | AUD | | | | | 727,036 | | | State Street Bank and Trust Co. | | 01/14/22 | | | (12,131 | ) | |
USD | | | | | 324,568 | | | JPY | | | | | 36,875,442 | | | State Street Bank and Trust Co. | | 01/14/22 | | | 3,969 | | |
JPY | | | | | 67,127,170 | | | USD | | | | | 590,586 | | | State Street Bank and Trust Co. | | 01/14/22 | | | (6,976 | ) | |
CAD | | | | | 2,756,977 | | | USD | | | | | 2,165,280 | | | State Street Bank and Trust Co. | | 01/14/22 | | | 14,212 | | |
CHF | | | | | 687,122 | | | USD | | | | | 748,444 | | | State Street Bank and Trust Co. | | 01/14/22 | | | 5,839 | | |
USD | | | | | 1,124,741 | | | CAD | | | | | 1,422,656 | | | State Street Bank and Trust Co. | | 01/14/22 | | | 79 | | |
USD | | | | | 834,724 | | | GBP | | | | | 631,778 | | | State Street Bank and Trust Co. | | 01/14/22 | | | (20,398 | ) | |
NZD | | | | | 744,076 | | | USD | | | | | 506,802 | | | State Street Bank and Trust Co. | | 01/14/22 | | | 2,747 | | |
EUR | | | | | 484,158 | | | USD | | | | | 546,549 | | | State Street Bank and Trust Co. | | 01/14/22 | | | 4,779 | | |
USD | | | | | 230,366 | | | CHF | | | | | 210,758 | | | State Street Bank and Trust Co. | | 01/14/22 | | | (992 | ) | |
USD | | | | | 1,878,243 | | | EUR | | | | | 1,657,344 | | | State Street Bank and Trust Co. | | 01/14/22 | | | (9,035 | ) | |
USD | | | | | 2,389,941 | | | AUD | | | | | 3,330,763 | | | State Street Bank and Trust Co. | | 01/14/22 | | | (33,431 | ) | |
CAD | | | | | 2,365,594 | | | USD | | | | | 1,841,693 | | | State Street Bank and Trust Co. | | 01/14/22 | | | 28,396 | | |
USD | | | | | 1,851,423 | | | EUR | | | | | 1,636,599 | | | State Street Bank and Trust Co. | | 01/14/22 | | | (12,231 | ) | |
USD | | | | | 448,196 | | | NZD | | | | | 665,021 | | | State Street Bank and Trust Co. | | 01/14/22 | | | (7,215 | ) | |
CHF | | | | | 3,605,605 | | | USD | | | | | 3,932,771 | | | State Street Bank and Trust Co. | | 01/14/22 | | | 25,257 | | |
USD | | | | | 3,915,347 | | | GBP | | | | | 2,903,482 | | | State Street Bank and Trust Co. | | 01/14/22 | | | (14,562 | ) | |
USD | | | | | 2,261,969 | | | AUD | | | | | 3,132,074 | | | State Street Bank and Trust Co. | | 01/14/22 | | | (16,842 | ) | |
USD | | | | | 2,405,044 | | | JPY | | | | | 276,491,459 | | | State Street Bank and Trust Co. | | 01/14/22 | | | 1,202 | | |
USD | | | | | 540,050 | | | AUD | | | | | 753,682 | | | State Street Bank and Trust Co. | | 01/14/22 | | | (8,309 | ) | |
GBP | | | | | 2,526,869 | | | USD | | | | | 3,408,297 | | | State Street Bank and Trust Co. | | 01/14/22 | | | 11,860 | | |
EUR | | | | | 223,771 | | | USD | | | | | 253,037 | | | State Street Bank and Trust Co. | | 01/14/22 | | | 1,779 | | |
USD | | | | | 1,418,681 | | | AUD | | | | | 1,967,298 | | | State Street Bank and Trust Co. | | 01/14/22 | | | (12,671 | ) | |
CAD | | | | | 451,477 | | | USD | | | | | 352,384 | | | State Street Bank and Trust Co. | | 01/14/22 | | | 4,525 | | |
USD | | | | | 3,676,108 | | | GBP | | | | | 2,737,729 | | | State Street Bank and Trust Co. | | 01/14/22 | | | (29,452 | ) | |
CHF | | | | | 807,963 | | | USD | | | | | 879,837 | | | State Street Bank and Trust Co. | | 01/14/22 | | | 7,099 | | |
USD | | | | | 1,698,439 | | | GBP | | | | | 1,271,774 | | | State Street Bank and Trust Co. | | 01/14/22 | | | (22,927 | ) | |
JPY | | | | | 884,709 | | | USD | | | | | 7,695 | | | State Street Bank and Trust Co. | | 01/14/22 | | | (4 | ) | |
AUD | | | | | 335,633 | | | USD | | | | | 243,266 | | | State Street Bank and Trust Co. | | 01/14/22 | | | 931 | | |
| | | | | | | | | | | | | $ | (216,841 | ) | |
At December 31, 2021, the following futures contracts were outstanding for Voya Global Bond Portfolio:
Description | | Number
of Contracts | | Expiration Date | | Notional
Amount | | Unrealized
Appreciation/
(Depreciation) | |
Long Contracts: | |
Australia 10-Year Bond | | | 10 | | | 03/15/22 | | $ | 1,012,509 | | | $ | (1,708 | ) | |
Australia 3-Year Bond | | | 26 | | | 03/15/22 | | | 2,159,291 | | | | 1,584 | | |
Canada 10-Year Bond | | | 27 | | | 03/22/22 | | | 3,044,183 | | | | 77,045 | | |
Euro-Bobl 5-Year | | | 58 | | | 03/08/22 | | | 8,798,224 | | | | (63,630 | ) | |
Euro-Buxl® 30-year German Government Bond | | | 2 | | | 03/08/22 | | | 470,746 | | | | (17,753 | ) | |
Euro-OAT | | | 45 | | | 03/08/22 | | | 8,358,570 | | | | (148,673 | ) | |
Euro-Schatz | | | 80 | | | 03/08/22 | | | 10,203,677 | | | | (15,071 | ) | |
Japanese Government Bonds 10-Year Mini | | | 22 | | | 03/11/22 | | | 2,899,609 | | | | (7,711 | ) | |
Long Gilt | | | 24 | | | 03/29/22 | | | 4,057,390 | | | | (1,388 | ) | |
Long-Term Euro-BTP | | | 9 | | | 03/08/22 | | | 1,506,336 | | | | (28,354 | ) | |
U.S. Treasury 10-Year Note | | | 7 | | | 03/22/22 | | | 913,281 | | | | 95 | | |
U.S. Treasury Ultra Long Bond | | | 5 | | | 03/22/22 | | | 985,625 | | | | (10,323 | ) | |
| | | | | | | $ | 44,409,441 | | | $ | (215,887 | ) | |
Short Contracts: | |
Euro-Bund | | | (3 | ) | | 03/08/22 | | | (585,313 | ) | | | 9,826 | | |
Japan 10-Year Bond (TSE) | | | (1 | ) | | 03/14/22 | | | (1,317,830 | ) | | | 3,562 | | |
U.S. Treasury 2-Year Note | | | (39 | ) | | 03/31/22 | | | (8,508,703 | ) | | | 4,311 | | |
U.S. Treasury 5-Year Note | | | (36 | ) | | 03/31/22 | | | (4,355,156 | ) | | | (16,100 | ) | |
U.S. Treasury Long Bond | | | (15 | ) | | 03/22/22 | | | (2,406,563 | ) | | | (10,555 | ) | |
U.S. Treasury Ultra 10-Year Note | | | (56 | ) | | 03/22/22 | | | (8,200,500 | ) | | | (138,199 | ) | |
| | | | | | | $ | (25,374,065 | ) | | $ | (147,155 | ) | |
See Accompanying Notes to Financial Statements
106
PORTFOLIO OF INVESTMENTS
VOYA GLOBAL BOND PORTFOLIO AS OF DECEMBER 31, 2021 (CONTINUED)
At December 31, 2021, the following centrally cleared interest rate swaps were outstanding for Voya Global Bond Portfolio:
Pay/Receive
Floating Rate | | Floating Rate Index | | Floating Rate
Index
Payment
Frequency | | Fixed Rate | | Fixed Rate
Payment
Frequency | | Maturity
Date | | Notional
Amount | | Fair
Value | | Unrealized
Appreciation/
(Depreciation) | |
Pay | | 3-month EUR-EURIBOR | | Quarterly | | | 0.264 | % | | Annual | | 12/14/51 | | EUR | 500,000 | | | $ | (36,915 | ) | | $ | (36,915 | ) | |
Pay | | 3-month EUR-EURIBOR | | Quarterly | | | 0.292 | | | Annual | | 12/20/51 | | EUR | 700,000 | | | | (45,364 | ) | | | (45,364 | ) | |
Pay | | 3-month NZD-BBR-FRA | | Quarterly | | | 1.318 | | | Semi-Annual | | 12/31/22 | | NZD | 28,413,000 | | | | (72,926 | ) | | | (72,926 | ) | |
Pay | | 1-month USD-LIBOR | | Monthly | | | 2.726 | | | Monthly | | 12/27/28 | | USD | 1,250,000 | | | | 116,965 | | | | 116,965 | | |
Pay | | 1-month USD-LIBOR | | Monthly | | | 2.466 | | | Monthly | | 01/07/29 | | USD | 584,000 | | | | 44,507 | | | | 44,507 | | |
Pay | | 3-month USD-LIBOR | | Quarterly | | | 1.997 | | | Semi-Annual | | 06/25/29 | | USD | 3,950,000 | | | | 143,019 | | | | 143,019 | | |
Pay | | 3-month USD-LIBOR | | Quarterly | | | 1.466 | | | Semi-Annual | | 12/21/31 | | USD | 161,200 | | | | (1,646 | ) | | | (1,646 | ) | |
Pay | | 3-month USD-LIBOR | | Quarterly | | | 1.540 | | | Semi-Annual | | 12/24/31 | | USD | 108,000 | | | | (357 | ) | | | (357 | ) | |
Pay | | 3-month USD-LIBOR | | Quarterly | | | 1.581 | | | Semi-Annual | | 01/04/32 | | USD | 314,000 | | | | 109 | | | | 109 | | |
Pay | | 1-month USD-LIBOR | | Monthly | | | 2.400 | | | Monthly | | 10/27/32 | | USD | 690,000 | | | | 65,392 | | | | 65,392 | | |
Pay | | 1-month USD-LIBOR | | Monthly | | | 2.488 | | | Monthly | | 10/27/47 | | USD | 800,000 | | | | 152,802 | | | | 152,802 | | |
Receive | | 1-month USD-LIBOR | | Monthly | | | 1.983 | | | Monthly | | 10/27/22 | | USD | 23,590,000 | | | | (309,224 | ) | | | (309,224 | ) | |
Receive | | 1-month USD-LIBOR | | Monthly | | | 2.816 | | | Monthly | | 06/19/23 | | USD | 1,716,000 | | | | (54,124 | ) | | | (54,124 | ) | |
Receive | | 1-month USD-LIBOR | | Monthly | | | 2.514 | | | Monthly | | 01/24/25 | | USD | 1,210,000 | | | | (53,059 | ) | | | (53,059 | ) | |
Receive | | 1-month USD-LIBOR | | Monthly | | | 2.728 | | | Monthly | | 03/01/25 | | USD | 4,110,000 | | | | (212,388 | ) | | | (212,388 | ) | |
Receive | | 1-month USD-LIBOR | | Monthly | | | 0.801 | | | Monthly | | 05/19/26 | | USD | 16,000,000 | | | | 272,633 | | | | 272,623 | | |
Receive | | 1-month USD-LIBOR | | Monthly | | | 2.210 | | | Monthly | | 10/27/26 | | USD | 3,590,000 | | | | (166,147 | ) | | | (166,147 | ) | |
Receive | | 1-month USD-LIBOR | | Monthly | | | 2.681 | | | Monthly | | 02/02/28 | | USD | 1,690,000 | | | | (138,063 | ) | | | (138,063 | ) | |
Receive | | 1-month USD-LIBOR | | Monthly | | | 1.115 | | | Monthly | | 03/01/28 | | USD | 2,000,000 | | | | 22,055 | | | | 21,891 | | |
Receive | | 1-month USD-LIBOR | | Monthly | | | 2.884 | | | Monthly | | 06/19/28 | | USD | 910,000 | | | | (89,405 | ) | | | (89,405 | ) | |
Receive | | 1-month USD-LIBOR | | Monthly | | | 3.099 | | | Monthly | | 10/18/28 | | USD | 780,000 | | | | (90,606 | ) | | | (90,606 | ) | |
Receive | | 1-month USD-LIBOR | | Monthly | | | 1.646 | | | Monthly | | 10/30/29 | | USD | 3,000,000 | | | | (60,751 | ) | | | (60,751 | ) | |
Receive | | 3-month USD-LIBOR | | Quarterly | | | 1.807 | | | Semi-Annual | | 12/18/29 | | USD | 2,250,000 | | | | (50,183 | ) | | | (50,183 | ) | |
Receive | | 3-month USD-LIBOR | | Quarterly | | | 1.497 | | | Semi-Annual | | 12/22/31 | | USD | 200,000 | | | | 1,453 | | | | 1,453 | | |
Receive | | 3-month USD-LIBOR | | Quarterly | | | 1.548 | | | Semi-Annual | | 12/23/31 | | USD | 573,000 | | | | 1,435 | | | | 1,435 | | |
Receive | | 3-month USD-LIBOR | | Quarterly | | | 1.569 | | | Semi-Annual | | 12/29/31 | | USD | 227,401 | | | | 127 | | | | 127 | | |
Receive | | 3-month USD-LIBOR | | Quarterly | | | 1.628 | | | Semi-Annual | | 12/31/31 | | USD | 538,400 | | | | (2,706 | ) | | | (2,706 | ) | |
Receive | | 3-month USD-LIBOR | | Quarterly | | | 1.578 | | | Semi-Annual | | 01/05/32 | | USD | 89,800 | | | | — | | | | — | | |
Receive | | 1-month USD-LIBOR | | Monthly | | | 2.390 | | | Monthly | | 12/11/32 | | USD | 400,000 | | | | (37,757 | ) | | | (37,757 | ) | |
Receive | | 1-month USD-LIBOR | | Monthly | | | 2.962 | | | Monthly | | 04/30/33 | | USD | 530,000 | | | | (83,227 | ) | | | (83,227 | ) | |
Receive | | 1-month USD-LIBOR | | Monthly | | | 3.148 | | | Monthly | | 10/18/33 | | USD | 520,000 | | | | (94,532 | ) | | | (94,532 | ) | |
| | | | | | | | | | | | | | | $ | (778,883 | ) | | $ | (779,057 | ) | |
At December 31, 2021, the following OTC total return swaps were outstanding for Voya Global Bond Portfolio:
Pay/Receive
Total Return(1) | | Reference
Entity | | Reference
Entity
Payment
Frequency | | (Pay)/
Receive
Financing
Rate | | Floating
Rate
Payment
Frequency | | Counterparty | | Termination
Date | | Notional
Amount | | Fair
Value | | Upfront
Payments
Paid/
(Received) | | Unrealized
Appreciation/
(Depreciation) | |
Receive | | U.K.
Conventional
Gilt | | At
Maturity | | | (0.25 | )% | | At
Maturity | | BNP Paribas | | 02/09/22 | | GBP | 1,800,000 | | | $ | (188,841 | ) | | $ | — | | | $ | (188,841 | ) | |
Receive | | U.K.
Conventional
Gilt | | At
Maturity | | | (0.09 | )% | | At
Maturity | | Goldman
Sachs
International | | 02/09/22 | | GBP | 900,000 | | | | (3,954 | ) | | | — | | | | (3,954 | ) | |
Pay | | Japanese
Government
2-year
Issue | | At
Maturity | | | 0.2 | % | | At
Maturity | | Nomura
Global
Financial
Products Inc. | | 01/21/22 | | JPY | 800,000,000 | | | | 2,507 | | | | — | | | | 2,507 | | |
Receive | | Japanese
Government
5-year
Issue | | At
Maturity | | | (0.05 | )% | | At
Maturity | | BNP Paribas | | 03/17/22 | | JPY | 1,457,000,000 | | | | (3,513 | ) | | | — | | | | (3,513 | ) | |
Receive | | Japanese
Government
20-year
Issue | | At
Maturity | | | (0.1 | )% | | At
Maturity | | Citibank N.A. | | 01/14/22 | | JPY | 345,000,000 | | | | 7,648 | | | | — | | | | 7,648 | | |
Receive | | Japanese
Government
20-year
Issue | | At
Maturity | | | (0.1 | )% | | At
Maturity | | Nomura
Global
Financial
Products Inc. | | 01/21/22 | | JPY | 400,000,000 | | | | (10,446 | ) | | | — | | | | (10,446 | ) | |
Receive | | Japanese
Government
30-year
Issue | | At
Maturity | | | (0.1 | )% | | At
Maturity | | Nomura
Global
Financial
Products Inc. | | 02/17/22 | | JPY | 230,000,000 | | | | 5,520 | | | | — | | | | 5,520 | | |
Receive | | Japanese
Government
20-year
Issue | | At
Maturity | | | (0.1 | )% | | At
Maturity | | Nomura
Global
Financial
Products Inc. | | 03/09/22 | | JPY | 50,000,000 | | | | (256 | ) | | | — | | | | (256 | ) | |
| | | $ | (191,335 | ) | | $ | — | | | $ | (191,335 | ) | |
See Accompanying Notes to Financial Statements
107
PORTFOLIO OF INVESTMENTS
VOYA GLOBAL BOND PORTFOLIO AS OF DECEMBER 31, 2021 (CONTINUED)
At December 31, 2021, the following OTC volatility swaps were outstanding for Voya Global Bond Portfolio:
Pay/Receive
Volatility(2) | | Reference Entity | | Volatility
Strike Rate | | Counterparty | | Maturity
Date | | Currency | | Notional
Amount | | Fair Value | | Unrealized
Appreciation
(Depreciation) | |
Receive | | EUR vs. USD | | | 6.500 | % | | BNP Paribas | | 03/14/22 | | EUR | | | | | 1,233,200 | | | $ | (5,431 | ) | | $ | (5,431 | ) | |
Receive | | EUR vs. USD | | | 6.400 | % | | Goldman Sachs
International | | |
06/14/22 | | | EUR | | | | | 1,094,100 | | | | (4,537 | ) | | | (4,537 | ) | |
Receive | | EUR vs. USD | | | 6.300 | % | | Standard
Chartered Bank | | |
06/14/22 | | | EUR | | | | | 1,238,200 | | | | (4,225 | ) | | | (4,225 | ) | |
| | | | | | | | | | | | | | | $ | (14,193 | ) | | $ | (14,193 | ) | |
At December 31, 2021, the following OTC purchased equity options were outstanding for Voya Global Bond Portfolio:
Description | | Counterparty | | Put/Call | | Expiration
Date | | Exercise
Price | | Number of
Contracts | | Notional
Amount | | Cost | | Fair Value | |
iShares iBoxx $ High Yield
Corporate Bond ETF | | Citibank N.A. | | Put | | 03/18/22 | | USD | 80.500 | | | | 133,534 | | | USD | 11,618,793 | | | $ | 68,817 | | | $ | 37,770 | | |
| | | $ | 68,817 | | | $ | 37,770 | | |
At December 31, 2021, the following OTC written equity options were outstanding for Voya Global Bond Portfolio:
Description | | Counterparty | | Put/Call | | Expiration
Date | | Exercise
Price | | Number of
Contracts | | Notional
Amount | | Premiums
Received | | Fair Value | |
iShares iBoxx $ High Yield
Corporate Bond ETF | | Citibank N.A. | | Put | | 01/21/22 | | USD | 85.250 | | | | 72,531 | | | USD | 6,310,922 | | | $ | 36,991 | | | $ | (9,675 | ) | |
| | | $ | 36,991 | | | $ | (9,675 | ) | |
At December 31, 2021, the following OTC written interest rate swaptions were outstanding for Voya Global Bond Portfolio:
Description | | Counterparty | | Pay/
Receive
Exercise
Rate | | Exercise
Rate | | Floating
Rate
Index | | Expiration
Date | | Notional
Amount | | Premiums
Received | | Fair Value | |
Call on 10-Year
Interest Rate
Swap(3) | | Goldman
Sachs
International | | Pay | | | 1.497 | % | | 3-month
USD-LIBOR | | 01/06/22 | | USD | 2,067,000 | | | $ | 13,254 | | | $ | (1,950 | ) | |
Put on 10-Year
Interest Rate
Swap(4) | | Goldman
Sachs
International | | Receive | | | 1.497 | % | | 3-month
USD-LIBOR | | 01/06/22 | | USD | 2,067,000 | | | | 13,255 | | | | (18,105 | ) | |
| | | | | | | | | | | | | | | $ | 26,509 | | | $ | (20,055 | ) | |
(1) The Portfolio will pay or receive the total return of the reference entity depending on whether the return is positive or negative. Where the Portfolio has elected to receive the total return of the reference entity if positive, it will be responsible for paying the floating rate and the total return of the reference entity, if negative. If the Portfolio has elected to pay the total return of the reference entity if positive, it will receive the floating rate and the total return of the reference entity, if negative.
(2) Payments made at maturity date.
(3) Portfolio pays the exercise rate semi-annually and receives the floating rate index quarterly.
(4) Portfolio receives the exercise rate semi-annually and pays the floating rate index quarterly.
Currency Abbreviations
AUD — Australian Dollar
BRL — Brazilian Real
CAD — Canadian Dollar
CHF — Swiss Franc
CLP — Chilean Peso
COP — Colombian Peso
CNY — Chinese Yuan
CZK — Czech Koruna
DKK — Danish Krone
EUR — EU Euro
GBP — British Pound
HKD — Hong Kong Sar Dollar
HUF — Hungarian Forint
IDR — Indonesian Rupiah
ILS — Israeli New Shekel
See Accompanying Notes to Financial Statements
108
PORTFOLIO OF INVESTMENTS
VOYA GLOBAL BOND PORTFOLIO AS OF DECEMBER 31, 2021 (CONTINUED)
JPY — Japanese Yen
KRW — South Korean Won
MXN — Mexican Peso
MYR — Malaysian Ringgit
NOK — Norwegian Krone
NZD — New Zealand Dollar
PEN — Peruvian Nuevo Sol
PHP — Philippine Peso
PLN — Polish Zloty
RON — Romanian New Leu
RUB — Russian Ruble
SEK — Swedish Krona
SGD — Singapore Dollar
THB — Thai Baht
TRY — Turkish Lira
USD — United States Dollar
ZAR — South African Rand
A summary of derivative instruments by primary risk exposure is outlined in the following tables.
The fair value of derivative instruments as of December 31, 2021 was as follows:
Derivatives not accounted
for as hedging instruments | | Location on Statement of Assets and Liabilities | | Fair Value | |
Asset Derivatives | |
Equity contracts | | Investments in securities at value* | | $ | 37,770 | | |
Foreign exchange contracts | | Unrealized appreciation on forward foreign currency contracts | | | 1,666,480 | | |
Interest rate contracts | | Variation margin receivable on futures contracts** | | | 96,423 | | |
Interest rate contracts | | Variation margin receivable on centrally cleared swaps** | | | 820,323 | | |
Interest rate contracts | | Unrealized appreciation on OTC swap agreements | | | 15,675 | | |
Total Asset Derivatives | | | | $ | 2,636,671 | | |
Liability Derivatives | |
Foreign exchange contracts | | Unrealized depreciation on forward foreign currency contracts | | $ | 1,883,321 | | |
Interest rate contracts | | Variation margin payable on futures contracts** | | | 459,465 | | |
Interest rate contracts | | Variation margin payable on centrally cleared swaps** | | | 1,599,381 | | |
Interest rate contracts | | Unrealized depreciation on OTC swap agreements | | | 207,010 | | |
Foreign exchange contracts | | Unrealized depreciation on OTC swap agreements | | | 14,193 | | |
Interest rate contracts | | Written options, at fair value | | | 20,055 | | |
Equity contracts | | Written options, at fair value | | | 9,675 | | |
Total Liability Derivatives | | | | $ | 4,193,100 | | |
* Includes purchased options.
** The fair value presented above represents the cumulative unrealized appreciation (depreciation) on futures contracts and centrally cleared swaps as reported in the tables within the Portfolio of Investments. In the Statement of Assets and Liabilities, only current day's unsettled variation margin is reported in receivables or payables on futures contracts and centrally cleared swaps and the net cumulative unrealized appreciation (depreciation) is included in total distributable earnings (loss).
The effect of derivative instruments on the Portfolio's Statement of Operations for the year ended December 31, 2021 was as follows:
Amount of Realized Gain or (Loss) on Derivatives Recognized in Income | |
Derivatives not
accounted for as
hedging instruments | | Investments* | | Forward foreign
currency contracts | | Futures | | Swaps | | Written
options | | Total | |
Equity contracts | | $ | (11,359 | ) | | $ | — | | | $ | — | | | $ | — | | | $ | 12,800 | | | $ | 1,441 | | |
Credit Contracts | | | (99,104 | ) | | | — | | | | — | | | | 16,310 | | | | — | | | | (82,794 | ) | |
Foreign exchange contracts | | | (42,313 | ) | | | (4,734,543 | ) | | | — | | | | — | | | | 38,322 | | | | (4,738,534 | ) | |
Interest rate contracts | | | 104,392 | | | | — | | | | 518,890 | | | | (1,084,145 | ) | | | 1,363,131 | | | | 902,268 | | |
Total | | $ | (48,384 | ) | | $ | (4,734,543 | ) | | $ | 518,890 | | | $ | (1,067,835 | ) | | $ | 1,414,253 | | | $ | (3,917,619 | ) | |
See Accompanying Notes to Financial Statements
109
PORTFOLIO OF INVESTMENTS
VOYA GLOBAL BOND PORTFOLIO AS OF DECEMBER 31, 2021 (CONTINUED)
Change in Unrealized Appreciation or (Depreciation) on Derivatives Recognized in Income | |
Derivatives not
accounted for as
hedging instruments | | Investments* | | Forward foreign
currency contracts | | Futures | | Swaps | | Written
options | | Total | |
Equity contracts | | $ | (31,047 | ) | | $ | — | | | $ | — | | | $ | — | | | $ | 27,316 | | | $ | (3,731 | ) | |
Credit contracts | | | 15,407 | | | | — | | | | — | | | | — | | | | — | | | | 15,407 | | |
Foreign exchange contracts | | | 43,338 | | | | (955,231 | ) | | | — | | | | (14,193 | ) | | | (30,242 | ) | | | (956,328 | ) | |
Interest rate contracts | | | — | | | | — | | | | (445,844 | ) | | | (635,578 | ) | | | 6,454 | | | | (1,074,968 | ) | |
Total | | $ | 27,698 | | | $ | (955,231 | ) | | $ | (445,844 | ) | | $ | (649,771 | ) | | $ | 3,528 | | | $ | (2,019,620 | ) | |
* Amounts recognized for purchased options are included in net realized gain (loss) on investments and net change in unrealized appreciation or depreciation on investments.
The following is a summary by counterparty of the fair value of OTC derivative instruments subject to Master Netting Agreements and collateral pledged (received), if any, at December 31, 2021:
| | | Barclays
Bank
PLC | | BNP
Paribas | | Brown
Brothers
Harriman &
Co. | | Citibank
N.A. | | Deutsche
Bank
AG | | Goldman
Sachs
International | | HSBC
Bank
USA N.A. | | JPMorgan
Chase
Bank N.A. | | Morgan
Stanley
Capital
Services
LLC | | Nomura
Global
Financial
Products
Inc. | | Standard
Chartered
Bank | | State
Street
Bank
and
Trust Co. | | Totals | |
Assets: | |
Purchased options | | $ | — | | | $ | — | | | $ | — | | | $ | 37,770 | | | $ | — | | | $ | — | | | $ | — | | | $ | — | | | $ | — | | | $ | — | | | $ | — | | | $ | — | | | $ | 37,770 | | |
Forward foreign
currency contracts | | | 1,373 | | | | 612,184 | | | | 40,946 | | | | 83,756 | | | | 10,970 | | | | 161,577 | | | | 6,687 | | | | 17,886 | | | | 565,634 | | | | | | 7,742 | | | | 157,725 | | | | 1,666,480 | | |
Total return swaps | | | — | | | | — | | | | — | | | | 7,648 | | | | — | | | | — | | | | — | | | | — | | | | — | | | | 8,027 | | | | — | | | | — | | | | 15,675 | | |
Total Assets | | $ | 1,373 | | | $ | 612,184 | | | $ | 40,946 | | | $ | 129,174 | | | $ | 10,970 | | | $ | 161,577 | | | $ | 6,687 | | | $ | 17,886 | | | $ | 565,634 | | | $ | 8,027 | | | $ | 7,742 | | | $ | 157,725 | | | $ | 1,719,925 | | |
Liabilities: | |
Forward foreign
currency
contracts | | $ | 31,771 | | | $ | 302,228 | | | $ | 20,363 | | | $ | 187,515 | | | $ | 5,946 | | | $ | 124,951 | | | $ | 7,912 | | | $ | 4,439 | | | $ | 490,620 | | | | | $ | 397,179 | | | $ | 310,397 | | | $ | 1,883,321 | | |
Total return swaps | | | — | | | | 192,354 | | | | — | | | | — | | | | — | | | | 3,954 | | | | — | | | | — | | | | — | | | | 10,702 | | | | — | | | | — | | | | 207,010 | | |
Volatility swaps | | | | | 5,431 | | | | — | | | | — | | | | — | | | | 4,537 | | | | — | | | | — | | | | — | | | | — | | | | 4,225 | | | | — | | | | 14,193 | | |
Written options | | | — | | | | — | | | | — | | | | 9,675 | | | | — | | | | 20,055 | | | | — | | | | — | | | | — | | | | — | | | | — | | | | — | | | | 29,730 | | |
Total Liabilities | | $ | 31,771 | | | $ | 500,013 | | | $ | 20,363 | | | $ | 197,190 | | | $ | 5,946 | | | $ | 153,497 | | | $ | 7,912 | | | $ | 4,439 | | | $ | 490,620 | | | $ | 10,702 | | | $ | 401,404 | | | $ | 310,397 | | | $ | 2,134,254 | | |
Net OTC derivative
instruments by
counterparty, at
fair value | | $ | (30,398 | ) | | $ | 112,171 | | | $ | 20,583 | | | $ | (68,016 | ) | | $ | 5,024 | | | $ | 8,080 | | | $ | (1,225 | ) | | $ | 13,447 | | | $ | 75,014 | | | $ | (2,675 | ) | | $ | (393,662 | ) | | $ | (152,672 | ) | | $ | (414,329 | ) | |
Total collateral
pledged by
the Portfolio/
(Received from
counterparty) | | $ | — | | | $ | — | | | $ | — | | | $ | — | | | $ | — | | | $ | — | | | $ | — | | | $ | — | | | $ | — | | | $ | — | | | $ | 260,000 | | | $ | — | | | $ | 260,000 | | |
Net Exposure(1)(2) | | $ | (30,398 | ) | | $ | 112,171 | | | $ | 20,583 | | | $ | (68,016 | ) | | $ | 5,024 | | | $ | 8,080 | | | $ | (1,225 | ) | | $ | 13,447 | | | $ | 75,014 | | | $ | (2,675 | ) | | $ | (133,662 | ) | | $ | (152,672 | ) | | $ | (154,329 | ) | |
(1) Positive net exposure represents amounts due from each respective counterparty. Negative exposure represents amounts due from the Portfolio. Please refer to Note 2 for additional details regarding counterparty credit risk and credit related contingent features.
(2) At December 31, 2021 the Portfolio had pledged $260,000 and $120,000 in cash collateral to BNP Paribas and Morgan Stanley Capital Services LLC, respectively. Excess cash collateral is not shown for financial reporting purposes.
The following table presents additional information about valuation techniques and inputs used for investments that are measured at fair value and categorized within Level 3 at December 31, 2021:
Investments,
at fair value | | Fair Value at
December 31, 2021 | | Valuation
Technique(s)* | | Significant
Unobservable
Input(s) | | Value or
Range of
Input(s) | | Weighted
Average
of Inputs** | | Impact to
Valuation
from an
Increase
in Input*** | |
Commercial
Mortgage-Backed
Securities | | $ | 2,052,255 | | |
Market Approach | |
Recent Comparable
Transaction Price(s) | | $ | 93.425-$100.00 | | | $ | 93.425-$100.00 | | |
Increase | |
Corporate Bonds/Notes | | | 1,858 | | | n/a**** | | n/a**** | | | n/a**** | | | | n/a**** | | | | n/a**** | | |
| | | $ | 2,054,113 | | | | | | | | | | | | |
* Valuation techniques may change in order to reflect management's judgment of current market participant assumptions.
** Unobservable inputs were weighted by the relative fair value of the instruments.
See Accompanying Notes to Financial Statements
110
PORTFOLIO OF INVESTMENTS
VOYA GLOBAL BOND PORTFOLIO AS OF DECEMBER 31, 2021 (CONTINUED)
*** Represents the directional change in the fair value of the Level 3 investment(s) that would result from an increase in the corresponding input. A decrease to the unobservable input would have the opposite effect. Significant increases and decreases in these inputs in isolation could result in signficantly higher or lower fair value measurements.
**** Security is fair valued based on a single quotation obtained from a broker. The Portfolio does not have access to the unobservable inputs and therefore cannot disclose such inputs used in formulating such quotation.
The following is a reconciliation of the fair valuations using significant unobservable inputs (Level 3) for the Portfolio's assets and liabilities during the year ended December 31, 2021:
| | | Commercial
Mortgage-Backed
Securities | | Corporate
Bonds/Notes | | Total | |
Assets: | |
Beginning balance at December 31, 2020 | | $ | — | | | $ | — | | | $ | — | | |
Purchases | | | 2,066,578 | | | | 9,354 | | | | 2,075,932 | | |
Sales | | | — | | | | — | | | | — | | |
Total realized gain (loss) | | | — | | | | — | | | | — | | |
Net change in unrealized appreciation (depreciation)***** | | | (14,323 | ) | | | (7,496 | ) | | | (21,819 | ) | |
Transfers into Level 3 | | | — | | | | — | | | | — | | |
Transfers out of Level 3 | | | — | | | | — | | | | — | | |
Ending balance at December 31, 2021 | | $ | 2,052,255 | | | $ | 1,858 | | | $ | 2,054,113 | | |
Net change in unrealized appreciation (depreciation) on
Level 3 securities still held as of December 31, 2021***** | | $ | (14,323 | ) | | $ | (7,496 | ) | | $ | (21,819 | ) | |
***** Any difference between net change in unrealized apprecation (depreciation) and net change in unrealized appreciation (depreciation) on Level 3 securities still held at December 31, 2021 may be due to securities no longer held or categorized as Level 3 at year end.
At December 31, 2021, the aggregate cost of securities and other investments and the composition of unrealized appreciation and depreciation of securities and other investments on a tax basis were:
Cost for federal income tax purposes was $168,113,254.
Net unrealized appreciation consisted of: | |
Gross Unrealized Appreciation | | $ | 8,503,103 | | |
Gross Unrealized Depreciation | | | (8,461,563 | ) | |
Net Unrealized Appreciation | | $ | 41,540 | | |
See Accompanying Notes to Financial Statements
111
VOYA INTERNATIONAL HIGH PORTFOLIO OF INVESTMENTS
DIVIDEND LOW VOLATILITY PORTFOLIO AS OF DECEMBER 31, 2021
Shares | |
| |
| | Value | | Percentage
of Net
Assets | |
COMMON STOCK: 96.7% | | | |
| | | | | Austrialia: 7.6% | |
| | 36,251 | | | | | | | ASX Ltd. | | $ | 2,449,989 | | | | 0.6 | | |
| | 960,330 | | | | | | | Aurizon Holdings Ltd. | | | 2,439,834 | | | | 0.6 | | |
| | 132,139 | | | | (1 | ) | | BHP Group Ltd. | | | 3,989,494 | | | | 1.0 | | |
| | 282,890 | | | | | | | Brambles Ltd. | | | 2,188,522 | | | | 0.5 | | |
| | 174,089 | | | | | | | Coles Group Ltd. | | | 2,271,522 | | | | 0.6 | | |
| | 9,876 | | | | | | | CSL Ltd. | | | 2,088,772 | | | | 0.5 | | |
| | 29,024 | | | | | | | Fortescue Metals
Group Ltd. | | | 407,982 | | | | 0.1 | | |
| | 115,375 | | | | | | | Goodman Group | | | 2,224,057 | | | | 0.5 | | |
| | 162,376 | | | | | | | GPT Group | | | 640,279 | | | | 0.2 | | |
| | 892,670 | | | | | | | Medibank Pvt Ltd. | | | 2,174,183 | | | | 0.5 | | |
| | 97,551 | | | | | | | Rio Tinto Ltd. | | | 7,118,495 | | | | 1.7 | | |
| | 644,114 | | | | | | | Telstra Corp., Ltd. | | | 1,957,585 | | | | 0.5 | | |
| | 30,123 | | | | | | | Wesfarmers Ltd. | | | 1,299,696 | | | | 0.3 | | |
| | | | | | | | | | 31,250,410 | | | | 7.6 | | |
| | | | | Austria: 0.4% | |
| | 26,070 | | | | | | | OMV AG | | | 1,474,329 | | | | 0.4 | | |
| | | | | Belgium: 0.6% | |
| | 7,197 | | | | | | | Elia Group SA/NV | | | 948,606 | | | | 0.2 | | |
| | 15,406 | | | | | | | Groupe Bruxelles
Lambert S.A. | | | 1,720,645 | | | | 0.4 | | |
| | | | | | | | | | 2,669,251 | | | | 0.6 | | |
| | | | | China: 0.7% | |
| | 907,500 | | | | | | | BOC Hong Kong
Holdings Ltd. | | | 2,976,152 | | | | 0.7 | | |
| | | | | Denmark: 2.8% | |
| | 867 | | | | | | | AP Moller - Maersk
A/S - Class B | | | 3,094,595 | | | | 0.7 | | |
| | 3,873 | | | | | | | Coloplast A/S | | | 681,939 | | | | 0.2 | | |
| | 125,816 | | | | | | | Danske Bank A/S | | | 2,172,088 | | | | 0.5 | | |
| | 6,811 | | | | | | | DSV A/S | | | 1,587,156 | | | | 0.4 | | |
| | 27,738 | | | | | | | Novozymes A/S | | | 2,277,562 | | | | 0.6 | | |
| | 62,860 | | | | | | | Tryg A/S | | | 1,551,236 | | | | 0.4 | | |
| | | | | | | | | | 11,364,576 | | | | 2.8 | | |
| | | | | Finland: 2.4% | |
| | 24,118 | | | | | | | Elisa OYJ | | | 1,485,087 | | | | 0.3 | | |
| | 34,310 | | | | | | | Kone Oyj | | | 2,462,039 | | | | 0.6 | | |
| | 360,722 | | | | | | | Nordea Bank Abp | | | 4,400,285 | | | | 1.1 | | |
| | 40,408 | | | | | | | Orion Oyj | | | 1,678,498 | | | | 0.4 | | |
| | | | | | | | | | 10,025,909 | | | | 2.4 | | |
| | | | | France: 8.9% | |
| | 24,285 | | | | | | | Air Liquide SA | | | 4,235,404 | | | | 1.0 | | |
| | 16,205 | | | | (2 | ) | | Amundi SA | | | 1,336,659 | | | | 0.3 | | |
| | 72,033 | | | | | | | AXA S.A. | | | 2,143,935 | | | | 0.5 | | |
| | 26,074 | | | | | | | BNP Paribas | | | 1,802,781 | | | | 0.4 | | |
Shares | |
| |
| | Value | | Percentage
of Net
Assets | |
| | 26,053 | | | | | | | Bureau Veritas SA | | $ | 864,931 | | | | 0.2 | | |
| | 12,621 | | | | | | | Cie de Saint-Gobain | | | 887,843 | | | | 0.2 | | |
| | 21,792 | | | | | | | Cie Generale des
Etablissements
Michelin SCA | | | 3,569,182 | | | | 0.9 | | |
| | 108,063 | | | | | | | Credit Agricole SA | | | 1,540,686 | | | | 0.4 | | |
| | 38,865 | | | | | | | Dassault Systemes SE | | | 2,306,454 | | | | 0.6 | | |
| | 172,037 | | | | | | | Engie SA | | | 2,547,072 | | | | 0.6 | | |
| | 7,780 | | | | | | | Ipsen SA | | | 711,945 | | | | 0.2 | | |
| | 13,180 | | | | (2 | ) | | La Francaise
des Jeux SAEM | | | 584,107 | | | | 0.1 | | |
| | 19,606 | | | | | | | Legrand S.A. | | | 2,296,273 | | | | 0.5 | | |
| | 2,391 | | | | | | | L'Oreal S.A. | | | 1,140,058 | | | | 0.3 | | |
| | 292,317 | | | | | | | Orange SA | | | 3,122,580 | | | | 0.8 | | |
| | 60,433 | | | | | | | Sanofi | | | 6,064,082 | | | | 1.5 | | |
| | 2,109 | | | | | | | Schneider Electric SE | | | 414,619 | | | | 0.1 | | |
| | 7,662 | | | | | | | SEB SA | | | 1,193,976 | | | | 0.3 | | |
| | | | | | | | | | 36,762,587 | | | | 8.9 | | |
| | | | | Germany: 8.4% | |
| | 31,072 | | | | | | | Bayerische Motoren
Werke AG | | | 3,108,509 | | | | 0.8 | | |
| | 17,395 | | | | (2 | ) | | Covestro AG | | | 1,070,627 | | | | 0.3 | | |
| | 48,130 | | | | | | | Daimler AG | | | 3,677,329 | | | | 0.9 | | |
| | 17,530 | | | | (3 | ) | | Daimler Truck
Holding AG | | | 644,440 | | | | 0.2 | | |
| | 13,608 | | | | | | | Deutsche Boerse AG | | | 2,272,185 | | | | 0.5 | | |
| | 79,487 | | | | | | | Deutsche Post AG | | | 5,112,660 | | | | 1.2 | | |
| | 209,524 | | | | | | | Deutsche Telekom AG | | | 3,871,475 | | | | 0.9 | | |
| | 33,461 | | | | | | | E.ON AG | | | 465,022 | | | | 0.1 | | |
| | 78,538 | | | | | | | Evonik Industries AG | | | 2,537,205 | | | | 0.6 | | |
| | 23,935 | | | | | | | GEA Group AG | | | 1,307,313 | | | | 0.3 | | |
| | 10,064 | | | | | | | Hannover Rueck SE | | | 1,908,097 | | | | 0.5 | | |
| | 10,636 | | | | | | | HeidelbergCement AG | | | 719,812 | | | | 0.2 | | |
| | 10,842 | | | | | | | LEG Immobilien SE | | | 1,511,621 | | | | 0.4 | | |
| | 6,319 | | | | | | | Muenchener
Rueckversicherungs-
Gesellschaft AG | | | 1,865,422 | | | | 0.5 | | |
| | 8,726 | | | | (2 | ) | | Scout24 SE | | | 609,304 | | | | 0.1 | | |
| | 14,909 | | | | | | | Symrise AG | | | 2,204,959 | | | | 0.5 | | |
| | 608,922 | | | | | | | Telefonica Deutschland
Holding AG | | | 1,689,020 | | | | 0.4 | | |
| | | | | | | | | | 34,575,000 | | | | 8.4 | | |
| | | | | Hong Kong: 3.7% | |
| | 103,500 | | | | | | | CK Infrastructure
Holdings Ltd. | | | 659,421 | | | | 0.2 | | |
| | 295,000 | | | | | | | CLP Holdings Ltd. | | | 2,980,907 | | | | 0.7 | | |
| | 416,500 | | | | | | | HK Electric
Investments & HK
Electric Investments
Ltd. - Stapled Security | | | 408,619 | | | | 0.1 | | |
| | 596,000 | | | | | | | HKT Trust & HKT
Ltd. - Stapled Security | | | 800,828 | | | | 0.2 | | |
See Accompanying Notes to Financial Statements
112
VOYA INTERNATIONAL HIGH PORTFOLIO OF INVESTMENTS
DIVIDEND LOW VOLATILITY PORTFOLIO AS OF DECEMBER 31, 2021 (CONTINUED)
Shares | |
| |
| | Value | | Percentage
of Net
Assets | |
| | | | | Hong Kong (continued) | |
| | 240,900 | | | | | | | Hongkong Land
Holdings Ltd. -
HKHGF | | $ | 1,252,587 | | | | 0.3 | | |
| | 26,900 | | | | | | | Jardine Matheson
Holdings Ltd. | | | 1,479,167 | | | | 0.4 | | |
| | 352,300 | | | | | | | Link REIT | | | 3,103,506 | | | | 0.7 | | |
| | 306,000 | | | | | | | Power Assets
Holdings Ltd. | | | 1,907,399 | | | | 0.5 | | |
| | 159,000 | | | | | | | Sun Hung Kai
Properties Ltd. | | | 1,929,346 | | | | 0.5 | | |
| | 233,600 | | | | | | | Swire Properties Ltd. | | | 585,608 | | | | 0.1 | | |
| | | | | | | | | | 15,107,388 | | | | 3.7 | | |
| | | | | Ireland: 1.0% | |
| | 32,567 | | | | | | | CRH PLC | | | 1,724,096 | | | | 0.4 | | |
| | 19,692 | | | | | | | DCC PLC | | | 1,612,046 | | | | 0.4 | | |
| | 15,900 | | | | | | | Smurfit Kappa PLC | | | 876,350 | | | | 0.2 | | |
| | | | | | | | | | 4,212,492 | | | | 1.0 | | |
| | | | | Israel: 2.3% | |
| | 262,358 | | | | | | | Bank Hapoalim BM | | | 2,700,179 | | | | 0.7 | | |
| | 284,355 | | | | | | | Bank Leumi
Le-Israel BM | | | 3,049,997 | | | | 0.7 | | |
| | 329,526 | | | | | | | Israel Discount
Bank Ltd. | | | 2,212,525 | | | | 0.5 | | |
| | 42,286 | | | | | | | Mizrahi Tefahot
Bank Ltd. | | | 1,628,461 | | | | 0.4 | | |
| | | | | | | | | | 9,591,162 | | | | 2.3 | | |
| | | | | Italy: 4.4% | |
| | 163,520 | | | | | | | Assicurazioni
Generali S.p.A. | | | 3,455,948 | | | | 0.9 | | |
| | 300,292 | | | | | | | ENI S.p.A. | | | 4,173,389 | | | | 1.0 | | |
| | 1,537 | | | | | | | Ferrari NV | | | 395,633 | | | | 0.1 | | |
| | 132,469 | | | | | | | FinecoBank
Banca Fineco SpA | | | 2,319,865 | | | | 0.6 | | |
| | 195,939 | | | | (2 | ) | | Poste Italiane SpA | | | 2,566,851 | | | | 0.6 | | |
| | 26,777 | | | | | | | Recordati Industria
Chimica e
Farmaceutica SpA | | | 1,719,460 | | | | 0.4 | | |
| | 95,861 | | | | | | | Snam SpA | | | 577,387 | | | | 0.1 | | |
| | 358,438 | | | | | | | Terna - Rete
Elettrica Nazionale | | | 2,899,631 | | | | 0.7 | | |
| | | | | | | | | | 18,108,164 | | | | 4.4 | | |
| | | | | Japan: 22.7% | |
| | 87,900 | | | | | | | Ajinomoto Co., Inc. | | | 2,675,863 | | | | 0.6 | | |
| | 76,600 | | | | (1 | ) | | Bridgestone Corp. | | | 3,288,643 | | | | 0.8 | | |
| | 30,200 | | | | | | | Brother Industries Ltd. | | | 582,091 | | | | 0.1 | | |
| | 67,700 | | | | | | | Capcom Co., Ltd. | | | 1,594,426 | | | | 0.4 | | |
| | 52,900 | | | | | | | Dai Nippon Printing
Co., Ltd. | | | 1,331,324 | | | | 0.3 | | |
| | 41,700 | | | | | | | Daiwa House
Industry Co., Ltd. | | | 1,198,420 | | | | 0.3 | | |
Shares | |
| |
| | Value | | Percentage
of Net
Assets | |
| | 723,500 | | | | | | | ENEOS Holdings, Inc. | | $ | 2,702,859 | | | | 0.7 | | |
| | 14,000 | | | | | | | Honda Motor Co., Ltd. | | | 398,310 | | | | 0.1 | | |
| | 14,100 | | | | | | | Hoya Corp. | | | 2,092,325 | | | | 0.5 | | |
| | 91,900 | | | | | | | Idemitsu Kosan
Co., Ltd. | | | 2,345,266 | | | | 0.6 | | |
| | 260,800 | | | | | | | Japan Post Bank
Co. Ltd. | | | 2,390,662 | | | | 0.6 | | |
| | 173,100 | | | | (1 | ) | | Japan Tobacco, Inc. | | | 3,495,227 | | | | 0.8 | | |
| | 13,300 | | | | | | | KDDI Corp. | | | 388,942 | | | | 0.1 | | |
| | 37,200 | | | | | | | Lawson, Inc. | | | 1,765,117 | | | | 0.4 | | |
| | 46,000 | | | | | | | Mitsubishi Corp. | | | 1,460,643 | | | | 0.4 | | |
| | 376,300 | | | | | | | Mitsubishi HC
Capital, Inc. | | | 1,861,758 | | | | 0.4 | | |
| | 996,600 | | | | | | | Mitsubishi UFJ
Financial Group, Inc. | | | 5,423,774 | | | | 1.3 | | |
| | 275,800 | | | | | | | Mizuho Financial
Group, Inc. | | | 3,503,007 | | | | 0.8 | | |
| | 90,500 | | | | | | | MS&AD Insurance
Group Holdings, Inc. | | | 2,786,703 | | | | 0.7 | | |
| | 4,700 | | | | | | | Nintendo Co., Ltd. | | | 2,198,930 | | | | 0.5 | | |
| | 144,000 | | | | | | | Nippon Telegraph &
Telephone Corp. | | | 3,938,150 | | | | 1.0 | | |
| | 20,400 | | | | | | | Nippon Yusen KK | | | 1,555,560 | | | | 0.4 | | |
| | 16,400 | | | | | | | Nitto Denko Corp. | | | 1,266,941 | | | | 0.3 | | |
| | 32,800 | | | | | | | Nomura Real Estate
Holdings, Inc. | | | 755,776 | | | | 0.2 | | |
| | 92,800 | | | | | | | Osaka Gas Co., Ltd. | | | 1,534,844 | | | | 0.4 | | |
| | 44,500 | | | | | | | Otsuka Holdings
Co. Ltd. | | | 1,618,952 | | | | 0.4 | | |
| | 39,800 | | | | (1 | ) | | Pola Orbis Holdings,
Inc. | | | 663,299 | | | | 0.2 | | |
| | 4,200 | | | | | | | Rohm Co., Ltd. | | | 382,072 | | | | 0.1 | | |
| | 58,300 | | | | | | | Santen Pharmaceutical
Co., Ltd. | | | 711,770 | | | | 0.2 | | |
| | 34,300 | | | | | | | Secom Co., Ltd. | | | 2,383,379 | | | | 0.6 | | |
| | 120,500 | | | | | | | Sekisui House Ltd. | | | 2,592,648 | | | | 0.6 | | |
| | 94,300 | | | | | | | SG Holdings Co. Ltd. | | | 2,211,189 | | | | 0.5 | | |
| | 124,700 | | | | | | | SoftBank Corp. | | | 1,575,033 | | | | 0.4 | | |
| | 16,200 | | | | | | | Sohgo Security
Services Co., Ltd. | | | 643,720 | | | | 0.2 | | |
| | 66,200 | | | | | | | Sompo Holdings, Inc. | | | 2,791,899 | | | | 0.7 | | |
| | 89,900 | | | | | | | Subaru Corp. | | | 1,606,316 | | | | 0.4 | | |
| | 149,400 | | | | | | | Sumitomo Chemical
Co., Ltd. | | | 704,542 | | | | 0.2 | | |
| | 172,400 | | | | | | | Sumitomo Corp. | | | 2,551,416 | | | | 0.6 | | |
| | 128,000 | | | | | | | Sumitomo Mitsui
Financial Group, Inc. | | | 4,370,855 | | | | 1.1 | | |
| | 81,600 | | | | | | | Sumitomo Mitsui Trust
Holdings, Inc. | | | 2,728,570 | | | | 0.7 | | |
| | 70,200 | | | | | | | Takeda Pharmaceutical
Co., Ltd. | | | 1,917,043 | | | | 0.5 | | |
| | 53,600 | | | | | | | Tokio Marine Holdings,
Inc. | | | 2,983,893 | | | | 0.7 | | |
| | 80,500 | | | | | | | Tokyo Gas Co., Ltd. | | | 1,445,005 | | | | 0.3 | | |
| | 20,400 | | | | | | | Toyo Suisan Kaisha Ltd. | | | 864,927 | | | | 0.2 | | |
See Accompanying Notes to Financial Statements
113
VOYA INTERNATIONAL HIGH PORTFOLIO OF INVESTMENTS
DIVIDEND LOW VOLATILITY PORTFOLIO AS OF DECEMBER 31, 2021 (CONTINUED)
Shares | |
| |
| | Value | | Percentage
of Net
Assets | |
| | | | | Japan (continued) | |
| | 46,100 | | | | (1 | ) | | Trend Micro, Inc. | | $ | 2,559,290 | | | | 0.6 | | |
| | 12,900 | | | | | | | Tsuruha Holdings, Inc. | | | 1,238,642 | | | | 0.3 | | |
| | 88,500 | | | | | | | Yamato Holdings Co.,
Ltd. | | | 2,079,000 | | | | 0.5 | | |
| | | | | | | | | | 93,159,021 | | | | 22.7 | | |
| | | | | Netherlands: 3.2% | |
| | 966 | | | | | | | ASM International NV | | | 426,409 | | | | 0.1 | | |
| | 113,542 | | | | | | | Koninklijke Ahold
Delhaize NV | | | 3,896,342 | | | | 0.9 | | |
| | 29,211 | | | | | | | Koninklijke Philips NV | | | 1,081,145 | | | | 0.3 | | |
| | 54,460 | | | | | | | NN Group NV | | | 2,945,209 | | | | 0.7 | | |
| | 37,448 | | | | | | | Randstad NV | | | 2,554,596 | | | | 0.6 | | |
| | 19,241 | | | | | | | Wolters Kluwer NV | | | 2,264,682 | | | | 0.6 | | |
| | | | | | | | | | 13,168,383 | | | | 3.2 | | |
| | | | | New Zealand: 0.4% | |
| | 20,537 | | | | | | | Fisher & Paykel
Healthcare Corp. Ltd. | | | 460,101 | | | | 0.1 | | |
| | 349,627 | | | | | | | Spark New Zealand Ltd. | | | 1,081,216 | | | | 0.3 | | |
| | | | | | | | | | 1,541,317 | | | | 0.4 | | |
| | | | | Norway: 0.2% | |
| | 18,767 | | | | | | | Yara International ASA | | | 946,198 | | | | 0.2 | | |
| | | | | Portugal: 0.5% | |
| | 199,975 | | | | | | | Galp Energia SGPS SA | | | 1,940,384 | | | | 0.5 | | |
| | | | | Singapore: 0.5% | |
| | 127,900 | | | | | | | Oversea-Chinese
Banking Corp., Ltd. | | | 1,082,513 | | | | 0.3 | | |
| | 58,400 | | | | | | | Singapore Exchange Ltd. | | | 403,133 | | | | 0.1 | | |
| | 20,000 | | | | | | | United Overseas
Bank Ltd. | | | 399,435 | | | | 0.1 | | |
| | | | | | | | | | 1,885,081 | | | | 0.5 | | |
| | | | | Spain: 1.4% | |
| | 70,632 | | | | | | | Enagas | | | 1,640,873 | | | | 0.4 | | |
| | 17,769 | | | | | | | Endesa S.A. | | | 409,067 | | | | 0.1 | | |
| | 47,918 | | | | | | | Iberdrola S.A. - IBEE | | | 567,348 | | | | 0.1 | | |
| | 91,005 | | | | | | | Red Electrica Corp. SA | | | 1,967,926 | | | | 0.5 | | |
| | 84,172 | | | | | | | Repsol SA | | | 996,859 | | | | 0.3 | | |
| | | | | | | | | | 5,582,073 | | | | 1.4 | | |
| | | | | Sweden: 0.9% | |
| | 54,125 | | | | | | | Lundin Energy AB | | | 1,936,743 | | | | 0.5 | | |
| | 139,124 | | | | | | | Swedish Match AB | | | 1,104,461 | | | | 0.2 | | |
| | 60,398 | | | | | | | Tele2 AB | | | 861,618 | | | | 0.2 | | |
| | | | | | | | | | 3,902,822 | | | | 0.9 | | |
| | | | | Switzerland: 6.7% | |
| | 42,483 | | | | | | | ABB Ltd. | | | 1,619,147 | | | | 0.4 | | |
Shares | |
| |
| | Value | | Percentage
of Net
Assets | |
| | 2,660 | | | | | | | Geberit AG - Reg | | $ | 2,168,256 | | | | 0.5 | | |
| | 52,594 | | | | | | | Holcim Ltd. | | | 2,674,882 | | | | 0.7 | | |
| | 9,217 | | | | | | | Nestle SA | | | 1,286,853 | | | | 0.3 | | |
| | 55,682 | | | | | | | Novartis AG | | | 4,892,890 | | | | 1.2 | | |
| | 5,274 | | | | | | | Roche Holding AG | | | 2,187,978 | | | | 0.5 | | |
| | 5,408 | | | | | | | Sika AG | | | 2,247,659 | | | | 0.5 | | |
| | 2,759 | | | | | | | Sonova Holding
AG - Reg | | | 1,078,209 | | | | 0.3 | | |
| | 5,084 | | | | | | | Swisscom AG | | | 2,868,007 | | | | 0.7 | | |
| | 67,379 | | | | | | | UBS Group AG | | | 1,209,406 | | | | 0.3 | | |
| | 12,360 | | | | | | | Zurich Insurance
Group AG | | | 5,414,656 | | | | 1.3 | | |
| | | | | | | | | | 27,647,943 | | | | 6.7 | | |
| | | | | United Kingdom: 17.0% | |
| | 139,173 | | | | | | | 3i Group PLC | | | 2,728,237 | | | | 0.7 | | |
| | 525,283 | | | | | | | Abrdn PLC | | | 1,711,376 | | | | 0.4 | | |
| | 61,682 | | | | | | | Admiral Group Plc | | | 2,640,258 | | | | 0.6 | | |
| | 113,901 | | | | (2 | ) | | Auto Trader Group PLC | | | 1,140,701 | | | | 0.3 | | |
| | 458,955 | | | | | | | BAE Systems PLC | | | 3,422,510 | | | | 0.8 | | |
| | 538,805 | | | | | | | Barclays PLC | | | 1,372,474 | | | | 0.3 | | |
| | 1,033,311 | | | | | | | BP PLC | | | 4,629,865 | | | | 1.1 | | |
| | 162,327 | | | | | | | British American
Tobacco PLC | | | 6,027,466 | | | | 1.5 | | |
| | 282,385 | | | | | | | Evraz PLC | | | 2,308,722 | | | | 0.6 | | |
| | 7,300 | | | | | | | Ferguson PLC | | | 1,296,672 | | | | 0.3 | | |
| | 354,352 | | | | | | | GlaxoSmithKline PLC | | | 7,715,200 | | | | 1.9 | | |
| | 23,001 | | | | | | | Hargreaves
Lansdown PLC | | | 422,669 | | | | 0.1 | | |
| | 54,925 | | | | | | | Hikma
Pharmaceuticals PLC | | | 1,649,451 | | | | 0.4 | | |
| | 152,635 | | | | | | | Imperial Brands PLC | | | 3,344,956 | | | | 0.8 | | |
| | 685,121 | | | | | | | J Sainsbury Plc | | | 2,560,952 | | | | 0.6 | | |
| | 345,346 | | | | | | | National Grid PLC | | | 4,979,631 | | | | 1.2 | | |
| | 486,465 | | | | | | | Natwest Group PLC | | | 1,489,706 | | | | 0.4 | | |
| | 74,572 | | | | | | | Persimmon PLC | | | 2,890,332 | | | | 0.7 | | |
| | 58,275 | | | | | | | Relx PLC
(GBP Exchange) | | | 1,902,495 | | | | 0.5 | | |
| | 225,769 | | | | | | | Sage Group PLC/The | | | 2,612,354 | | | | 0.6 | | |
| | 28,744 | | | | | | | Schroders PLC | | | 1,387,395 | | | | 0.3 | | |
| | 146,397 | | | | | | | Segro PLC | | | 2,849,132 | | | | 0.7 | | |
| | 10,671 | | | | | | | Severn Trent PLC | | | 426,112 | | | | 0.1 | | |
| | 120,350 | | | | | | | Standard
Chartered PLC | | | 731,821 | | | | 0.2 | | |
| | 37,026 | | | | | | | Unilever PLC | | | 1,984,823 | | | | 0.5 | | |
| | 180,514 | | | | | | | United Utilities
Group PLC | | | 2,663,559 | | | | 0.7 | | |
| | 1,891,836 | | | | | | | Vodafone Group PLC | | | 2,849,546 | | | | 0.7 | | |
| | | | | | | | | | 69,738,415 | | | | 17.0 | | |
| | | | | | | | | Total Common Stock
(Cost $354,765,883) | | | 397,629,057 | | | | 96.7 | | |
See Accompanying Notes to Financial Statements
114
VOYA INTERNATIONAL HIGH PORTFOLIO OF INVESTMENTS
DIVIDEND LOW VOLATILITY PORTFOLIO AS OF DECEMBER 31, 2021 (CONTINUED)
Shares | |
| |
| | Value | | Percentage
of Net
Assets | |
EXCHANGE-TRADED FUNDS: 1.0% | | | |
| | 83,600 | | | | | | | iShares MSCI EAFE
Value Index ETF | | $ | 4,212,604 | | | | 1.0 | | |
| | | | | | | | | Total Exchange-Traded
Funds
(Cost $4,217,024) | | | 4,212,604 | | | | 1.0 | | |
PREFERRED STOCK: 0.9% | | | |
| | | | | Germany: 0.9% | |
| | 10,905 | | | | | | | Fuchs Petrolub SE | | | 492,786 | | | | 0.1 | | |
| | 40,358 | | | | | | | Henkel AG & Co. KGaA | | | 3,256,528 | | | | 0.8 | | |
| | | | | | | | | Total Preferred Stock
(Cost $4,289,522) | | | 3,749,314 | | | | 0.9 | | |
| | | | | | | | | Total Long-Term
Investments
(Cost $363,272,429) | | | 405,590,975 | | | | 98.6 | | |
Principal
Amount† | |
| |
| | Value | | Percentage
of Net
Assets | |
SHORT-TERM INVESTMENTS: 3.3% | | | |
| | | | | Repurchase Agreements: 3.3% | |
| | 2,190,127 | | | | (4 | ) | | Bank of America Inc.,
Repurchase Agreement
dated 12/31/21, 0.05%,
due 01/03/22
(Repurchase Amount
$2,190,136,
collateralized by various
U.S. Government
Agency Obligations,
1.000%-5.000%,
Market Value plus
accrued interest
$2,233,930, due
09/01/28-01/01/61) | | $ | 2,190,127 | | | | 0.5 | | |
| | 2,190,100 | | | | (4 | ) | | Cantor Fitzgerald
Securities, Repurchase
Agreement dated
12/31/21, 0.05%,
due 01/03/22
(Repurchase Amount
$2,190,109,
collateralized by various
U.S. Government/
U.S. Government
Agency Obligations,
0.000%-9.000%,
Market Value plus
accrued interest
$2,233,902, due
02/01/22-07/20/71) | | | 2,190,100 | | | | 0.5 | | |
Principal
Amount† | |
| |
| | Value | | Percentage
of Net
Assets | |
| | 2,190,100 | | | | (4 | ) | | Citadel Securities LLC,
Repurchase Agreement
dated 12/31/21, 0.07%,
due 01/03/22
(Repurchase Amount
$2,190,113,
collateralized by various
U.S. Government
Securities,
0.000%-7.250%,
Market Value plus
accrued interest
$2,233,915, due
01/04/22-11/15/51) | | $ | 2,190,100 | | | | 0.5 | | |
| | 2,190,127 | | | | (4 | ) | | Daiwa Capital Markets,
Repurchase Agreement
dated 12/31/21, 0.04%,
due 01/03/22
(Repurchase Amount
$2,190,134,
collateralized by various
U.S. Government/
U.S. Government
Agency Obligations,
0.000%-6.500%,
Market Value plus
accrued interest
$2,233,930, due
02/10/22-01/01/52) | | | 2,190,127 | | | | 0.5 | | |
| | 376,701 | | | | (4 | ) | | JPMorgan Securities LLC,
Repurchase Agreement
dated 12/31/21, 0.05%,
due 01/03/22
(Repurchase Amount
$376,703,
collateralized by various
U.S. Government
Securities,
0.000%-4.375%,
Market Value plus
accrued interest
$384,235, due
01/18/22-05/15/40) | | | 376,701 | | | | 0.1 | | |
| | 2,190,127 | | | | (4 | ) | | MUFG Securities
America Inc.,
Repurchase Agreement
dated 12/31/21, 0.05%,
due 01/03/22
(Repurchase Amount
$2,190,136,
collateralized by various
U.S. Government/
U.S. Government
Agency Obligations,
2.500%-6.500%,
Market Value plus
accrued interest
$2,233,930, due
05/20/24-10/01/51) | | | 2,190,127 | | | | 0.6 | | |
See Accompanying Notes to Financial Statements
115
VOYA INTERNATIONAL HIGH PORTFOLIO OF INVESTMENTS
DIVIDEND LOW VOLATILITY PORTFOLIO AS OF DECEMBER 31, 2021 (CONTINUED)
Principal
Amount† | |
| |
| | Value | | Percentage
of Net
Assets | |
| | | | | Repurchase Agreements (continued) | |
| | 2,190,127 | | | | (4 | ) | | RBC Dominion
Securities Inc.,
Repurchase Agreement
dated 12/31/21, 0.05%,
due 01/03/22
(Repurchase Amount
$2,190,136,
collateralized by various
U.S. Government/
U.S. Government
Agency Obligations,
0.000%-6.500%,
Market Value plus
accrued interest
$2,233,929, due
05/15/22-12/01/51) | | $ | 2,190,127 | | | | 0.6 | | |
| | | | | | | Total Repurchase
Agreements | | | | | | | | | |
| | | | | | | Total Short-Term
Investments
(Cost $13,517,409) | | | 13,517,409 | | | | 3.3 | | |
| | | | | | | Total Investments in
Securities
(Cost $376,789,838) | | $ | 419,108,384 | | | | 101.9 | | |
| | | | | | | Liabilities in Excess of
Other Assets | | | (7,902,955 | ) | | | (1.9 | ) | |
| | | | | | | Net Assets | | $ | 411,205,429 | | | | 100.0 | | |
† Unless otherwise indicated, principal amount is shown in USD.
(1) Security, or a portion of the security, is on loan.
(2) Securities with purchases pursuant to Rule 144A or section 4(a)(2), under the Securities Act of 1933 and may not be resold subject to that rule except to qualified institutional buyers.
(3) Non-income producing security.
(4) All or a portion of the security represents securities purchased with cash collateral received for securities on loan.
Sector Diversification | | Percentage of
Net Assets | |
Financials | | | 24.6 | % | |
Industrials | | | 13.6 | | |
Health Care | | | 9.3 | | |
Materials | | | 9.2 | | |
Consumer Staples | | | 9.1 | | |
Communication Services | | | 7.8 | | |
Utilities | | | 7.1 | | |
Consumer Discretionary | | | 6.0 | | |
Energy | | | 4.9 | | |
Real Estate | | | 3.9 | | |
Information Technology | | | 2.1 | | |
Exchange-Traded Funds | | | 1.0 | | |
Short-Term Investments | | | 3.3 | | |
Liabilities in Excess of Other Assets | | | (1.9 | ) | |
Net Assets | | | 100.0 | % | |
Portfolio holdings are subject to change daily.
Fair Value Measurements^
The following is a summary of the fair valuations according to the inputs used as of December 31, 2021 in valuing the assets and liabilities:
| | | Quoted Prices
in Active Markets
for Identical Investments
(Level 1) | | Significant Other
Observable
Inputs#
(Level 2) | | Significant
Unobservable
Inputs
(Level 3) | | Fair Value
at
December 31, 2021 | |
Asset Table | |
Investments, at fair value | |
Common Stock | |
Australia | | $ | — | | | $ | 31,250,410 | | | $ | — | | | $ | 31,250,410 | | |
Austria | | | — | | | | 1,474,329 | | | | — | | | | 1,474,329 | | |
Belgium | | | — | | | | 2,669,251 | | | | — | | | | 2,669,251 | | |
China | | | — | | | | 2,976,152 | | | | — | | | | 2,976,152 | | |
Denmark | | | — | | | | 11,364,576 | | | | — | | | | 11,364,576 | | |
Finland | | | — | | | | 10,025,909 | | | | — | | | | 10,025,909 | | |
France | | | — | | | | 36,762,587 | | | | — | | | | 36,762,587 | | |
Germany | | | 644,440 | | | | 33,930,560 | | | | — | | | | 34,575,000 | | |
Hong Kong | | | 408,619 | | | | 14,698,769 | | | | — | | | | 15,107,388 | | |
Ireland | | | — | | | | 4,212,492 | | | | — | | | | 4,212,492 | | |
Israel | | | — | | | | 9,591,162 | | | | — | | | | 9,591,162 | | |
Italy | | | — | | | | 18,108,164 | | | | — | | | | 18,108,164 | | |
Japan | | | — | | | | 93,159,021 | | | | — | | | | 93,159,021 | | |
Netherlands | | | — | | | | 13,168,383 | | | | — | | | | 13,168,383 | | |
New Zealand | | | — | | | | 1,541,317 | | | | — | | | | 1,541,317 | | |
Norway | | | — | | | | 946,198 | | | | — | | | | 946,198 | | |
Portugal | | | — | | | | 1,940,384 | | | | — | | | | 1,940,384 | | |
Singapore | | | — | | | | 1,885,081 | | | | — | | | | 1,885,081 | | |
Spain | | | — | | | | 5,582,073 | | | | — | | | | 5,582,073 | | |
Sweden | | | — | | | | 3,902,822 | | | | — | | | | 3,902,822 | | |
Switzerland | | | — | | | | 27,647,943 | | | | — | | | | 27,647,943 | | |
United Kingdom | | | — | | | | 69,738,415 | | | | — | | | | 69,738,415 | | |
Total Common Stock | | | 1,053,059 | | | | 396,575,998 | | | | — | | | | 397,629,057 | | |
See Accompanying Notes to Financial Statements
116
VOYA INTERNATIONAL HIGH PORTFOLIO OF INVESTMENTS
DIVIDEND LOW VOLATILITY PORTFOLIO AS OF DECEMBER 31, 2021 (CONTINUED)
| | | Quoted Prices
in Active Markets
for Identical Investments
(Level 1) | | Significant Other
Observable
Inputs#
(Level 2) | | Significant
Unobservable
Inputs
(Level 3) | | Fair Value
at
December 31, 2021 | |
Exchange-Traded Funds | | $ | 4,212,604 | | | $ | — | | | $ | — | | | $ | 4,212,604 | | |
Preferred Stock | | | — | | | | 3,749,314 | | | | — | | | | 3,749,314 | | |
Short-Term Investments | | | — | | | | 13,517,409 | | | | — | | | | 13,517,409 | | |
Total Investments, at fair value | | $ | 5,265,663 | | | $ | 413,842,721 | | | $ | — | | | $ | 419,108,384 | | |
Liabilities Table | |
Other Financial Instruments+ | |
Forward Foreign Currency Contracts | | | — | | | | (371 | ) | | | — | | | | (371 | ) | |
Total Liabilities | | $ | — | | | $ | (371 | ) | | $ | — | | | $ | (371 | ) | |
^ See Note 2, "Significant Accounting Policies" in the Notes to Financial Statements for additional information.
+ Other Financial Instruments may include open forward foreign currency contracts, futures, centrally cleared swaps, OTC swaps and written options. Forward foreign currency contracts, futures and centrally cleared swaps are fair valued at the unrealized appreciation (depreciation) on the instrument. OTC swaps and written options are valued at the fair value of the instrument.
# The earlier close of the foreign markets gives rise to the possibility that significant events, including broad market moves, may have occurred in the interim and may materially affect the value of those securities. To account for this, the Portfolio may frequently value many of its foreign equity securities using fair value prices based on third party vendor modeling tools to the extent available. Accordingly, a portion of the Portfolio's investments are categorized as Level 2 investments.
At December 31, 2021, the following forward foreign currency contracts were outstanding for Voya International High Dividend Low Volatility Portfolio:
Currency
Purchased | | Currency Sold | | Counterparty | | Settlement
Date | | Unrealized
Appreciation
(Depreciation) | |
USD | 101,432 | | | GBP | 75,211 | | | The Bank of New York Mellon | | 01/04/22 | | $ | (371 | ) | |
| | | | | | | | | $ | (371 | ) | |
Currency Abbreviations
GBP — British Pound
USD — United States Dollar
A summary of derivative instruments by primary risk exposure is outlined in the following tables.
The fair value of derivative instruments as of December 31, 2021 was as follows:
Derivatives not accounted
for as hedging instruments | | Location on Statement of Assets and Liabilities | | Fair Value | |
Liability Derivatives | |
Foreign exchange contracts | | Unrealized depreciation on forward foreign currency contracts | | $ | 371 | | |
Total Liability Derivatives | | | | $ | 371 | | |
The effect of derivative instruments on the Portfolio's Statement of Operations for the year ended December 31, 2021 was as follows:
| | | Amount of Realized Gain or (Loss) on Derivatives Recognized in Income | |
Derivatives not accounted
for as hedging instruments | | Forward foreign currency contracts | |
Foreign exchange contracts | | $ | (1,629 | ) | |
Total | | $ | (1,629 | ) | |
| | | Change in Unrealized Appreciation or (Depreciation) on Derivatives Recognized in Income | |
Derivatives not accounted
for as hedging instruments | | Forward foreign currency contracts | |
Foreign exchange contracts | | $ | (381 | ) | |
Total | | $ | (381 | ) | |
See Accompanying Notes to Financial Statements
117
VOYA INTERNATIONAL HIGH PORTFOLIO OF INVESTMENTS
DIVIDEND LOW VOLATILITY PORTFOLIO AS OF DECEMBER 31, 2021 (CONTINUED)
The following is a summary by counterparty of the fair value of OTC derivative instruments subject to Master Netting Agreements and collateral pledged (received), if any, at December 31, 2021:
| | | The Bank of
New York Mellon | |
Liabilities: | |
Forward foreign currency contracts | | $ | 371 | | |
Total Liabilities | | $ | 371 | | |
Net OTC derivative instruments by counterparty, at fair value | | $ | (371 | ) | |
Total collateral pledged by the Portfolio/(Received from counterparty) | | $ | — | | |
Net Exposure(1) | | $ | (371 | ) | |
(1) Positive net exposure represents amounts due from each respective counterparty. Negative exposure represents amounts due from the Portfolio. Please refer to Note 2 for additional details regarding counterparty credit risk and credit related contingent features.
At December 31, 2021, the aggregate cost of securities and other investments and the composition of unrealized appreciation and depreciation of securities and other investments on a tax basis were:
Cost for federal income tax purposes was $380,247,615.
Net unrealized appreciation consisted of: | |
Gross Unrealized Appreciation | | $ | 48,900,349 | | |
Gross Unrealized Depreciation | | | (9,713,906 | ) | |
Net Unrealized Appreciation | | $ | 39,186,443 | | |
See Accompanying Notes to Financial Statements
118
VY® AMERICAN CENTURY PORTFOLIO OF INVESTMENTS
SMALL-MID CAP VALUE PORTFOLIO AS OF DECEMBER 31, 2021
Shares | |
| |
| | Value | | Percentage
of Net
Assets | |
COMMON STOCK: 98.3% | | | |
| | | | | Communication Services: 1.2% | |
| | 138,818 | | | | | | | Entravision
Communications Corp. | | $ | 941,186 | | | | 0.2 | | |
| | 112,068 | | | | | | | Fox Corp. - Class B | | | 3,840,570 | | | | 1.0 | | |
| | 14,777 | | | | (1 | ) | | Townsquare Media, Inc. | | | 196,978 | | | | 0.0 | | |
| | | | | | | | | | 4,978,734 | | | | 1.2 | | |
| | | | | Consumer Discretionary: 9.9% | |
| | 69,672 | | | | (1 | ) | | Accel Entertainment, Inc. | | | 907,129 | | | | 0.2 | | |
| | 22,735 | | | | | | | Advance Auto Parts, Inc. | | | 5,453,672 | | | | 1.4 | | |
| | 13,732 | | | | (1 | ) | | BJ's Restaurants, Inc. | | | 474,441 | | | | 0.1 | | |
| | 90,021 | | | | | | | BorgWarner, Inc. | | | 4,057,246 | | | | 1.0 | | |
| | 31,400 | | | | (2 | ) | | Bridgestone Corp. | | | 1,348,086 | | | | 0.3 | | |
| | 20,559 | | | | | | | Brunswick Corp. | | | 2,070,908 | | | | 0.5 | | |
| | 11,001 | | | | | | | Cracker Barrel Old
Country Store, Inc. | | | 1,415,169 | | | | 0.4 | | |
| | 43,236 | | | | (1 | ) | | Dave & Buster's
Entertainment, Inc. | | | 1,660,262 | | | | 0.4 | | |
| | 25,331 | | | | (1 | ) | | Dollar Tree, Inc. | | | 3,559,512 | | | | 0.9 | | |
| | 47,250 | | | | | | | Honda Motor Co.,
Ltd. ADR | | | 1,344,263 | | | | 0.3 | | |
| | 19,390 | | | | (1 | ) | | Malibu Boats, Inc. | | | 1,332,675 | | | | 0.3 | | |
| | 29,173 | | | | (1 | ) | | MarineMax, Inc. | | | 1,722,374 | | | | 0.4 | | |
| | 3,843 | | | | (1 | ) | | Mohawk Industries, Inc. | | | 700,118 | | | | 0.2 | | |
| | 23,777 | | | | | | | OneWater Marine, Inc. | | | 1,449,684 | | | | 0.4 | | |
| | 8,558 | | | | (1 | ) | | Penn National Gaming,
Inc. | | | 443,732 | | | | 0.1 | | |
| | 24,447 | | | | | | | Penske Auto Group, Inc. | | | 2,621,207 | | | | 0.7 | | |
| | 18,020 | | | | | | | Polaris, Inc. | | | 1,980,578 | | | | 0.5 | | |
| | 36,912 | | | | (1 | ) | | Red Robin Gourmet
Burgers, Inc. | | | 610,155 | | | | 0.1 | | |
| | 20,117 | | | | (1 | ) | | Skyline Champion Corp. | | | 1,588,841 | | | | 0.4 | | |
| | 30,963 | | | | | | | Sodexo SA | | | 2,714,461 | | | | 0.7 | | |
| | 16,414 | | | | (1 | ),(2) | | Solo Brands, Inc. | | | 256,551 | | | | 0.1 | | |
| | 49,095 | | | | | | | Tapestry, Inc. | | | 1,993,257 | | | | 0.5 | | |
| | | | | | | | | | 39,704,321 | | | | 9.9 | | |
| | | | | Consumer Staples: 7.2% | |
| | 169,250 | | | | | | | Conagra Brands, Inc. | | | 5,779,887 | | | | 1.4 | | |
| | 48,649 | | | | | | | Edgewell Personal
Care Co. | | | 2,223,746 | | | | 0.6 | | |
| | 30,817 | | | | | | | General Mills, Inc. | | | 2,076,449 | | | | 0.5 | | |
| | 15,375 | | | | (1 | ) | | Honest Co., Inc./The | | | 124,384 | | | | 0.0 | | |
| | 16,248 | | | | | | | JM Smucker Co. | | | 2,206,803 | | | | 0.6 | | |
| | 28,306 | | | | | | | Kellogg Co. | | | 1,823,473 | | | | 0.5 | | |
| | 21,977 | | | | | | | Kimberly-Clark Corp. | | | 3,140,953 | | | | 0.8 | | |
| | 116,672 | | | | | | | Koninklijke Ahold
Delhaize NV | | | 4,003,753 | | | | 1.0 | | |
| | 210,669 | | | | | | | Orkla ASA | | | 2,111,654 | | | | 0.5 | | |
| | 31,288 | | | | | | | Spectrum Brands
Holdings, Inc. | | | 3,182,615 | | | | 0.8 | | |
| | 26,418 | | | | | | | Sysco Corp. | | | 2,075,134 | | | | 0.5 | | |
| | | | | | | | | | 28,748,851 | | | | 7.2 | | |
Shares | |
| |
| | Value | | Percentage
of Net
Assets | |
| | | | | Energy: 3.8% | |
| | 118,042 | | | | | | | Baker Hughes Co. | | $ | 2,840,090 | | | | 0.7 | | |
| | 56,103 | | | | (1 | ) | | ChampionX Corp. | | | 1,133,842 | | | | 0.3 | | |
| | 53,923 | | | | | | | ConocoPhillips | | | 3,892,162 | | | | 1.0 | | |
| | 80,371 | | | | | | | Devon Energy Corp. | | | 3,540,343 | | | | 0.9 | | |
| | 23,451 | | | | (1 | ) | | Earthstone Energy, Inc. | | | 256,554 | | | | 0.1 | | |
| | 12,669 | | | | (2 | ),(3) | | Enviva Partners L.P. | | | 892,151 | | | | 0.2 | | |
| | 1,538 | | | | (1 | ) | | NCS Multistage
Holdings, Inc. | | | 44,602 | | | | 0.0 | | |
| | 13,504 | | | | | | | Pioneer Natural
Resources Co. | | | 2,456,107 | | | | 0.6 | | |
| | | | | | | | | | 15,055,851 | | | | 3.8 | | |
| | | | | Financials: 21.7% | |
| | 81,972 | | | | | | | Aflac, Inc. | | | 4,786,345 | | | | 1.2 | | |
| | 25,755 | | | | | | | Allstate Corp. | | | 3,030,076 | | | | 0.8 | | |
| | 8,102 | | | | | | | A-Mark Precious Metals,
Inc. | | | 495,032 | | | | 0.1 | | |
| | 9,558 | | | | | | | Ameriprise Financial, Inc. | | | 2,883,266 | | | | 0.7 | | |
| | 25,738 | | | | | | | Ameris Bancorp. | | | 1,278,664 | | | | 0.3 | | |
| | 6,400 | | | | | | | Arthur J. Gallagher & Co. | | | 1,085,888 | | | | 0.3 | | |
| | 35,589 | | | | | | | Axis Capital Holdings
Ltd. | | | 1,938,533 | | | | 0.5 | | |
| | 93,890 | | | | | | | Bank of New York
Mellon Corp. | | | 5,453,131 | | | | 1.4 | | |
| | 38,844 | | | | | | | BankUnited, Inc. | | | 1,643,490 | | | | 0.4 | | |
| | 99,729 | | | | | | | Capitol Federal
Financial, Inc. | | | 1,129,929 | | | | 0.3 | | |
| | 22,031 | | | | | | | Chubb Ltd. | | | 4,258,813 | | | | 1.1 | | |
| | 7,036 | | | | | | | Commerce Bancshares,
Inc. | | | 483,655 | | | | 0.1 | | |
| | 83,086 | | | | (3 | ) | | Compass Diversified
Holdings | | | 2,540,770 | | | | 0.6 | | |
| | 28,112 | | | | | | | CVB Financial Corp. | | | 601,878 | | | | 0.1 | | |
| | 33,758 | | | | (1 | ) | | Donnelley Financial
Solutions, Inc. | | | 1,591,352 | | | | 0.4 | | |
| | 21,481 | | | | | | | Enact Holdings, Inc. | | | 444,012 | | | | 0.1 | | |
| | 88,809 | | | | | | | First BanCorp. Puerto
Rico | | | 1,223,788 | | | | 0.3 | | |
| | 99,906 | | | | | | | First Hawaiian, Inc. | | | 2,730,431 | | | | 0.7 | | |
| | 5,924 | | | | | | | First Mid Bancshares,
Inc. | | | 253,488 | | | | 0.1 | | |
| | 135,594 | | | | | | | FNB Corp. | | | 1,644,755 | | | | 0.4 | | |
| | 52,206 | | | | | | | Home Bancshares, Inc./
Conway AR | | | 1,271,216 | | | | 0.3 | | |
| | 8,519 | | | | | | | Independent Bank Corp. | | | 694,554 | | | | 0.2 | | |
| | 23,567 | | | | | | | Independent Bank
Group, Inc. | | | 1,700,359 | | | | 0.4 | | |
| | 12,682 | | | | | | | James River Group
Holdings Ltd. | | | 365,368 | | | | 0.1 | | |
| | 20,950 | | | | | | | M&T Bank Corp. | | | 3,217,501 | | | | 0.8 | | |
| | 55,836 | | | | | | | Northern Trust Corp. | | | 6,678,544 | | | | 1.7 | | |
| | 95,084 | | | | | | | Old National Bancorp. | | | 1,722,922 | | | | 0.4 | | |
| | 12,728 | | | | | | | Origin Bancorp, Inc. | | | 546,286 | | | | 0.1 | | |
See Accompanying Notes to Financial Statements
119
VY® AMERICAN CENTURY PORTFOLIO OF INVESTMENTS
SMALL-MID CAP VALUE PORTFOLIO AS OF DECEMBER 31, 2021 (CONTINUED)
Shares | |
| |
| | Value | | Percentage
of Net
Assets | |
| | | | | Financials (continued) | |
| | 37,425 | | | | | | | Pacific Premier
Bancorp, Inc. | | $ | 1,498,123 | | | | 0.4 | | |
| | 13,799 | | | | | | | Patria Investments Ltd. | | | 223,544 | | | | 0.0 | | |
| | 14,060 | | | | | | | Premier Financial Corp. | | | 434,594 | | | | 0.1 | | |
| | 31,034 | | | | | | | ProAssurance Corp. | | | 785,160 | | | | 0.2 | | |
| | 14,797 | | | | | | | Progressive Corp. | | | 1,518,912 | | | | 0.4 | | |
| | 38,754 | | | | | | | Prosperity Bancshares,
Inc. | | | 2,801,914 | | | | 0.7 | | |
| | 20,755 | | | | | | | Provident Financial
Services, Inc. | | | 502,686 | | | | 0.1 | | |
| | 6,177 | | | | | | | QCR Holdings, Inc. | | | 345,912 | | | | 0.1 | | |
| | 41,424 | | | | | | | Reinsurance Group of
America, Inc. | | | 4,535,514 | | | | 1.1 | | |
| | 7,591 | | | | | | | Renasant Corp. | | | 288,078 | | | | 0.1 | | |
| | 25,948 | | | | | | | SouthState Corp. | | | 2,078,694 | | | | 0.5 | | |
| | 15,673 | | | | | | | State Street Corp. | | | 1,457,589 | | | | 0.4 | | |
| | 16,390 | | | | | | | T. Rowe Price Group,
Inc. | | | 3,222,930 | | | | 0.8 | | |
| | 14,515 | | | | | | | TowneBank/
Portsmouth VA | | | 458,529 | | | | 0.1 | | |
| | 73,923 | | | | | | | Truist Financial Corp. | | | 4,328,192 | | | | 1.1 | | |
| | 19,154 | | | | | | | UMB Financial Corp. | | | 2,032,431 | | | | 0.5 | | |
| | 172,297 | | | | | | | Valley National Bancorp | | | 2,369,084 | | | | 0.6 | | |
| | 16,546 | | | | | | | Veritex Holdings, Inc. | | | 658,200 | | | | 0.2 | | |
| | 28,645 | | | | | | | Westamerica Bancorp. | | | 1,653,676 | | | | 0.4 | | |
| | | | | | | | | | 86,887,808 | | | | 21.7 | | |
| | | | | Health Care: 12.8% | |
| | 14,965 | | | | | | | AmerisourceBergen
Corp. | | | 1,988,699 | | | | 0.5 | | |
| | 4,732 | | | | (1 | ) | | AMN Healthcare
Services, Inc. | | | 578,866 | | | | 0.1 | | |
| | 31,131 | | | | (1 | ) | | Apria, Inc. | | | 1,014,871 | | | | 0.3 | | |
| | 11,825 | | | | | | | Becton Dickinson & Co. | | | 2,973,751 | | | | 0.7 | | |
| | 60,125 | | | | | | | Cardinal Health, Inc. | | | 3,095,836 | | | | 0.8 | | |
| | 24,423 | | | | (1 | ) | | Centene Corp. | | | 2,012,455 | | | | 0.5 | | |
| | 69,705 | | | | | | | Cerner Corp. | | | 6,473,503 | | | | 1.6 | | |
| | 57,393 | | | | (1 | ) | | Envista Holdings Corp. | | | 2,586,129 | | | | 0.7 | | |
| | 57,480 | | | | (1 | ) | | Henry Schein, Inc. | | | 4,456,424 | | | | 1.1 | | |
| | 48,135 | | | | | | | Koninklijke Philips
Electronics NV | | | 1,773,775 | | | | 0.4 | | |
| | 17,116 | | | | | | | McKesson Corp. | | | 4,254,524 | | | | 1.1 | | |
| | 6,464 | | | | | | | National Healthcare
Corp. | | | 439,164 | | | | 0.1 | | |
| | 42,016 | | | | | | | Patterson Cos., Inc. | | | 1,233,170 | | | | 0.3 | | |
| | 25,013 | | | | | | | Quest Diagnostics, Inc. | | | 4,327,499 | | | | 1.1 | | |
| | 37,473 | | | | | | | Universal Health
Services, Inc. | | | 4,858,749 | | | | 1.2 | | |
| | 9,443 | | | | (1 | ) | | Varex Imaging Corp. | | | 297,927 | | | | 0.1 | | |
| | 67,836 | | | | | | | Zimmer Biomet
Holdings, Inc. | | | 8,617,885 | | | | 2.2 | | |
| | | | | | | | | | 50,983,227 | | | | 12.8 | | |
Shares | |
| |
| | Value | | Percentage
of Net
Assets | |
| | | | | Industrials: 15.9% | |
| | 6,421 | | | | | | | Albany International
Corp. | | $ | 567,938 | | | | 0.1 | | |
| | 13,874 | | | | | | | Arcosa, Inc. | | | 731,160 | | | | 0.2 | | |
| | 384,578 | | | | | | | BAE Systems PLC | | | 2,867,867 | | | | 0.7 | | |
| | 7,307 | | | | | | | Barrett Business
Services, Inc. | | | 504,621 | | | | 0.1 | | |
| | 58,509 | | | | (1 | ) | | Beacon Roofing Supply,
Inc. | | | 3,355,491 | | | | 0.8 | | |
| | 32,519 | | | | | | | Brink's Co. | | | 2,132,271 | | | | 0.5 | | |
| | 6,419 | | | | | | | Cadre Holdings, Inc. | | | 163,171 | | | | 0.0 | | |
| | 34,470 | | | | (1 | ) | | Ceco Environmental
Corp. | | | 214,748 | | | | 0.1 | | |
| | 39,011 | | | | (1 | ) | | Charah Solutions, Inc. | | | 184,522 | | | | 0.0 | | |
| | 36,886 | | | | (1 | ) | | Colfax Corp. | | | 1,695,649 | | | | 0.4 | | |
| | 75,928 | | | | (1 | ) | | Cornerstone Building
Brands, Inc. | | | 1,324,184 | | | | 0.3 | | |
| | 5,914 | | | | | | | Cummins, Inc. | | | 1,290,080 | | | | 0.3 | | |
| | 44,187 | | | | | | | Deluxe Corp. | | | 1,418,845 | | | | 0.4 | | |
| | 79,057 | | | | (1 | ) | | DIRTT Environmental
Solutions | | | 172,344 | | | | 0.0 | | |
| | 23,407 | | | | (1 | ) | | DXP Enterprises, Inc. | | | 600,858 | | | | 0.2 | | |
| | 16,502 | | | | (1 | ) | | Dycom Industries, Inc. | | | 1,547,228 | | | | 0.4 | | |
| | 53,136 | | | | | | | Emerson Electric Co. | | | 4,940,054 | | | | 1.2 | | |
| | 4,612 | | | | | | | EnPro Industries, Inc. | | | 507,643 | | | | 0.1 | | |
| | 89,320 | | | | (1 | ) | | Gates Industrial Corp.
PLC | | | 1,421,081 | | | | 0.4 | | |
| | 18,189 | | | | | | | General Dynamics Corp. | | | 3,791,861 | | | | 1.0 | | |
| | 17,030 | | | | (1 | ) | | GMS, Inc. | | | 1,023,673 | | | | 0.3 | | |
| | 14,901 | | | | | | | Graham Corp. | | | 185,368 | | | | 0.0 | | |
| | 25,155 | | | | | | | Healthcare Services
Group, Inc. | | | 447,508 | | | | 0.1 | | |
| | 110,552 | | | | | | | Heartland Express, Inc. | | | 1,859,485 | | | | 0.5 | | |
| | 7,475 | | | | | | | Hubbell, Inc. | | | 1,556,818 | | | | 0.4 | | |
| | 8,078 | | | | | | | IMI PLC | | | 190,511 | | | | 0.1 | | |
| | 82,890 | | | | (1 | ) | | KAR Auction Services,
Inc. | | | 1,294,742 | | | | 0.3 | | |
| | 7,853 | | | | (1 | ) | | Karat Packaging, Inc. | | | 158,709 | | | | 0.0 | | |
| | 21,151 | | | | | | | KBR, Inc. | | | 1,007,211 | | | | 0.3 | | |
| | 20,451 | | | | | | | Korn Ferry | | | 1,548,754 | | | | 0.4 | | |
| | 30,914 | | | | | | | Loomis AB | | | 823,466 | | | | 0.2 | | |
| | 13,075 | | | | | | | Luxfer Holdings PLC | | | 252,478 | | | | 0.1 | | |
| | 455 | | | | | | | Luxfer Holdings PLC
ADR | | | 8,786 | | | | 0.0 | | |
| | 49,866 | | | | | | | MSC Industrial Direct Co. | | | 4,191,736 | | | | 1.1 | | |
| | 112,519 | | | | | | | nVent Electric PLC | | | 4,275,722 | | | | 1.1 | | |
| | 23,268 | | | | | | | Oshkosh Corp. | | | 2,622,536 | | | | 0.7 | | |
| | 29,367 | | | | | | | Paccar, Inc. | | | 2,591,931 | | | | 0.6 | | |
| | 10,761 | | | | | | | Republic Services, Inc. | | | 1,500,621 | | | | 0.4 | | |
| | 119,897 | | | | (1 | ) | | Southwest Airlines Co. | | | 5,136,388 | | | | 1.3 | | |
| | 34,568 | | | | (2 | ) | | Tecnoglass, Inc. | | | 905,336 | | | | 0.2 | | |
| | 36,155 | | | | | | | Timken Co. | | | 2,505,180 | | | | 0.6 | | |
| | | | | | | | | | 63,518,575 | | | | 15.9 | | |
See Accompanying Notes to Financial Statements
120
VY® AMERICAN CENTURY PORTFOLIO OF INVESTMENTS
SMALL-MID CAP VALUE PORTFOLIO AS OF DECEMBER 31, 2021 (CONTINUED)
Shares | |
| |
| | Value | | Percentage
of Net
Assets | |
| | | | | Information Technology: 8.7% | |
| | 5,595 | | | | | | | Advanced Energy
Industries, Inc. | | $ | 509,481 | | | | 0.1 | | |
| | 24,994 | | | | | | | Amdocs Ltd. | | | 1,870,551 | | | | 0.5 | | |
| | 72,584 | | | | (1 | ) | | Avaya Holdings Corp. | | | 1,437,163 | | | | 0.4 | | |
| | 51,202 | | | | | | | Avnet, Inc. | | | 2,111,058 | | | | 0.5 | | |
| | 5,977 | | | | | | | Belden, Inc. | | | 392,868 | | | | 0.1 | | |
| | 42,498 | | | | | | | CDK Global, Inc. | | | 1,773,867 | | | | 0.4 | | |
| | 6,972 | | | | (1 | ) | | Coherent, Inc. | | | 1,858,317 | | | | 0.5 | | |
| | 12,078 | | | | (1 | ) | | Cohu, Inc. | | | 460,051 | | | | 0.1 | | |
| | 19,459 | | | | | | | Corning, Inc. | | | 724,459 | | | | 0.2 | | |
| | 21,772 | | | | (1 | ) | | Euronet Worldwide, Inc. | | | 2,594,569 | | | | 0.6 | | |
| | 53,167 | | | | | | | EVERTEC, Inc. | | | 2,657,287 | | | | 0.7 | | |
| | 11,927 | | | | (1 | ) | | F5, Inc. | | | 2,918,656 | | | | 0.7 | | |
| | 103,502 | | | | | | | HP, Inc. | | | 3,898,920 | | | | 1.0 | | |
| | 17,639 | | | | (1 | ) | | IBEX Holdings Ltd. | | | 227,367 | | | | 0.0 | | |
| | 44,777 | | | | (1 | ),(2) | | II-VI, Inc. | | | 3,059,612 | | | | 0.8 | | |
| | 45,323 | | | | | | | Juniper Networks, Inc. | | | 1,618,484 | | | | 0.4 | | |
| | 25,163 | | | | | | | Kulicke & Soffa
Industries, Inc. | | | 1,523,368 | | | | 0.4 | | |
| | 61,374 | | | | | | | Open Text Corp. | | | 2,914,038 | | | | 0.7 | | |
| | 43,801 | | | | (1 | ) | | Teradata Corp. | | | 1,860,229 | | | | 0.5 | | |
| | 17,162 | | | | | | | Vontier Corp. | | | 527,388 | | | | 0.1 | | |
| | | | | | | | | | 34,937,733 | | | | 8.7 | | |
| | | | | Materials: 5.1% | |
| | 87,038 | | | | | | | Amcor PLC | | | 1,045,326 | | | | 0.3 | | |
| | 76,528 | | | | (1 | ) | | Axalta Coating Systems
Ltd. | | | 2,534,607 | | | | 0.6 | | |
| | 136,233 | | | | | | | Graphic Packaging
Holding Co. | | | 2,656,544 | | | | 0.7 | | |
| | 16,059 | | | | | | | Minerals Technologies,
Inc. | | | 1,174,716 | | | | 0.3 | | |
| | 160,164 | | | | | | | Mondi PLC | | | 3,972,685 | | | | 1.0 | | |
| | 20,731 | | | | | | | Packaging Corp. of
America | | | 2,822,526 | | | | 0.7 | | |
| | 96,661 | | | | | | | Pactiv Evergreen, Inc. | | | 1,225,661 | | | | 0.3 | | |
| | 85,355 | | | | | | | Sonoco Products Co. | | | 4,941,201 | | | | 1.2 | | |
| | | | | | | | | | 20,373,266 | | | | 5.1 | | |
| | | | | Real Estate: 6.4% | |
| | 82,317 | | | | | | | Brandywine Realty Trust | | | 1,104,694 | | | | 0.3 | | |
| | 30,659 | | | | | | | CareTrust REIT, Inc. | | | 699,945 | | | | 0.2 | | |
| | 20,733 | | | | | | | Cousins Properties, Inc. | | | 835,125 | | | | 0.2 | | |
| | 20,323 | | | | | | | Easterly Government
Properties, Inc. | | | 465,803 | | | | 0.1 | | |
| | 2,893 | | | | | | | Equinix, Inc. | | | 2,447,015 | | | | 0.6 | | |
| | 7,572 | | | | | | | Essex Property Trust,
Inc. | | | 2,667,086 | | | | 0.7 | | |
| | 32,926 | | | | | | | Four Corners Property
Trust, Inc. | | | 968,354 | | | | 0.2 | | |
| | 14,939 | | | | | | | Getty Realty Corp. | | | 479,393 | | | | 0.1 | | |
| | 10,929 | | | | | | | Healthcare Realty Trust,
Inc. | | | 345,794 | | | | 0.1 | | |
Shares | |
| |
| | Value | | Percentage
of Net
Assets | |
| | 88,310 | | | | | | | Healthcare Trust of
America, Inc. | | $ | 2,948,671 | | | | 0.7 | | |
| | 104,194 | | | | | | | Healthpeak Properties,
Inc. | | | 3,760,361 | | | | 0.9 | | |
| | 9,639 | | | | | | | Highwoods Properties,
Inc. | | | 429,803 | | | | 0.1 | | |
| | 25,485 | | | | | | | Kite Realty Group Trust | | | 555,063 | | | | 0.1 | | |
| | 72,210 | | | | | | | MGM Growth
Properties LLC | | | 2,949,778 | | | | 0.7 | | |
| | 9,910 | | | | | | | National Health
Investors, Inc. | | | 569,528 | | | | 0.2 | | |
| | 13,670 | | | | | | | Physicians Realty Trust | | | 257,406 | | | | 0.1 | | |
| | 34,788 | | | | | | | Regency Centers Corp. | | | 2,621,276 | | | | 0.7 | | |
| | 18,634 | | | | | | | Sabra Healthcare REIT,
Inc. | | | 252,304 | | | | 0.1 | | |
| | 26,139 | | | | (1 | ) | | Summit Hotel
Properties, Inc. | | | 255,117 | | | | 0.1 | | |
| | 23,241 | | | | | | | Weyerhaeuser Co. | | | 957,064 | | | | 0.2 | | |
| | | | | | | | | | 25,569,580 | | | | 6.4 | | |
| | | | | Utilities: 5.6% | |
| | 24,499 | | | | | | | Atmos Energy Corp. | | | 2,566,760 | | | | 0.6 | | |
| | 79,732 | | | | | | | Edison International | | | 5,441,709 | | | | 1.4 | | |
| | 28,074 | | | | | | | Evergy, Inc. | | | 1,926,157 | | | | 0.5 | | |
| | 20,715 | | | | | | | Eversource Energy | | | 1,884,651 | | | | 0.5 | | |
| | 69,513 | | | | | | | NorthWestern Corp. | | | 3,973,363 | | | | 1.0 | | |
| | 36,656 | | | | | | | Pinnacle West Capital
Corp. | | | 2,587,547 | | | | 0.6 | | |
| | 23,645 | | | | | | | South Jersey Industries,
Inc. | | | 617,608 | | | | 0.2 | | |
| | 30,123 | | | | | | | Spire, Inc. | | | 1,964,622 | | | | 0.5 | | |
| | 18,692 | | | | | | | Xcel Energy, Inc. | | | 1,265,448 | | | | 0.3 | | |
| | | | | | | | | | 22,227,865 | | | | 5.6 | | |
| | | | | | | | | Total Common Stock
(Cost $327,585,076) | | | 392,985,811 | | | | 98.3 | | |
Principal
Amount† | |
| |
| | Value | | Percentage
of Net
Assets | |
SHORT-TERM INVESTMENTS: 3.4% | | | |
| | | | | Repurchase Agreements: 1.5% | |
| | 1,381,020 | | | | (4 | ) | | Bank of America Inc.,
Repurchase
Agreement dated
12/31/21, 0.05%, due
01/03/22 (Repurchase
Amount $1,381,026,
collateralized by
various U.S.
Government Agency
Obligations,
1.000%-5.000%,
Market Value plus
accrued interest
$1,408,640, due
09/01/28-01/01/61) | | $ | 1,381,020 | | | | 0.3 | | |
See Accompanying Notes to Financial Statements
121
VY® AMERICAN CENTURY PORTFOLIO OF INVESTMENTS
SMALL-MID CAP VALUE PORTFOLIO AS OF DECEMBER 31, 2021 (CONTINUED)
Principal
Amount† | |
| |
| | Value | | Percentage
of Net
Assets | |
| | | | | Repurchase Agreements (continued) | |
| | 409,404 | | | | (4 | ) | | Bank of Nova Scotia,
Repurchase
Agreement dated
12/31/21, 0.06%, due
01/03/22 (Repurchase
Amount $409,406,
collateralized by
various U.S.
Government/U.S.
Government Agency
Obligations,
0.000%-7.000%,
Market Value plus
accrued interest
$417,594, due
04/07/22-04/01/51) | | $ | 409,404 | | | | 0.1 | | |
| | 1,381,020 | | | | (4 | ) | | Daiwa Capital Markets,
Repurchase
Agreement dated
12/31/21, 0.04%, due
01/03/22 (Repurchase
Amount $1,381,025,
collateralized by
various U.S.
Government/U.S.
Government Agency
Obligations,
0.000%-6.500%,
Market Value plus
accrued interest
$1,408,640, due
02/10/22-01/01/52) | | | 1,381,020 | | | | 0.3 | | |
| | 1,381,020 | | | | (4 | ) | | HSBC Securities USA,
Repurchase
Agreement dated
12/31/21, 0.05%, due
01/03/22 (Repurchase
Amount $1,381,026,
collateralized by
various U.S.
Government Agency
Obligations,
1.875%-6.500%,
Market Value plus
accrued interest
$1,408,640, due
01/20/27-05/20/51) | | | 1,381,020 | | | | 0.4 | | |
Principal
Amount† | |
| |
| | Value | | Percentage
of Net
Assets | |
| | 1,381,020 | | | | (4 | ) | | RBC Dominion
Securities Inc.,
Repurchase
Agreement dated
12/31/21, 0.05%, due
01/03/22 (Repurchase
Amount $1,381,026,
collateralized by
various U.S.
Government/U.S.
Government Agency
Obligations,
0.000%-6.500%,
Market Value plus
accrued interest
$1,408,640, due
05/15/22-12/01/51) | | $ | 1,381,020 | | | | 0.4 | | |
| | | | | Total Repurchase
Agreements
(Cost $5,933,484) | | | 5,933,484 | | | | 1.5 | | |
Shares | |
| |
| | Value | | Percentage
of Net
Assets | |
| | | | | Mutual Funds: 1.9% | |
| | 7,589,129 | | | | (5 | ) | | BlackRock Liquidity Funds,
FedFund, Institutional
Class, 0.030%
(Cost $7,589,129) | | $ | 7,589,129 | | | | 1.9 | | |
| | | | | Total Short-Term
Investments
(Cost $13,522,613) | | | 13,522,613 | | | | 3.4 | | |
| | | | | Total Investments in
Securities
(Cost $341,107,689) | | $ | 406,508,424 | | | | 101.7 | | |
| | | | | Liabilities in Excess of
Other Assets | | | (6,814,637 | ) | | | (1.7 | ) | |
| | | | | Net Assets | | $ | 399,693,787 | | | | 100.0 | | |
† Unless otherwise indicated, principal amount is shown in USD.
ADR American Depositary Receipt
(1) Non-income producing security.
(2) Security, or a portion of the security, is on loan.
(3) Security is a Master Limited Partnership.
(4) All or a portion of the security represents securities purchased with cash collateral received for securities on loan.
(5) Rate shown is the 7-day yield as of December 31, 2021.
See Accompanying Notes to Financial Statements
122
VY® AMERICAN CENTURY PORTFOLIO OF INVESTMENTS
SMALL-MID CAP VALUE PORTFOLIO AS OF DECEMBER 31, 2021 (CONTINUED)
Fair Value Measurements^
The following is a summary of the fair valuations according to the inputs used as of December 31, 2021 in valuing the assets and liabilities:
| | | Quoted Prices
in Active Markets
for Identical Investments
(Level 1) | | Significant Other
Observable
Inputs#
(Level 2) | | Significant
Unobservable
Inputs
(Level 3) | | Fair Value
at
December 31, 2021 | |
Asset Table | |
Investments, at fair value | |
Common Stock | |
Communication Services | | $ | 4,978,734 | | | $ | — | | | $ | — | | | $ | 4,978,734 | | |
Consumer Discretionary | | | 35,641,774 | | | | 4,062,547 | | | | — | | | | 39,704,321 | | |
Consumer Staples | | | 22,633,444 | | | | 6,115,407 | | | | — | | | | 28,748,851 | | |
Energy | | | 15,055,851 | | | | — | | | | — | | | | 15,055,851 | | |
Financials | | | 86,887,808 | | | | — | | | | — | | | | 86,887,808 | | |
Health Care | | | 50,983,227 | | | | — | | | | — | | | | 50,983,227 | | |
Industrials | | | 60,460,197 | | | | 3,058,378 | | | | — | | | | 63,518,575 | | |
Information Technology | | | 34,937,733 | | | | — | | | | — | | | | 34,937,733 | | |
Materials | | | 16,400,581 | | | | 3,972,685 | | | | — | | | | 20,373,266 | | |
Real Estate | | | 25,569,580 | | | | — | | | | — | | | | 25,569,580 | | |
Utilities | | | 22,227,865 | | | | — | | | | — | | | | 22,227,865 | | |
Total Common Stock | | | 375,776,794 | | | | 17,209,017 | | | | — | | | | 392,985,811 | | |
Short-Term Investments | | | 7,589,129 | | | | 5,933,484 | | | | — | | | | 13,522,613 | | |
Total Investments, at fair value | | $ | 383,365,923 | | | $ | 23,142,501 | | | $ | — | | | $ | 406,508,424 | | |
Other Financial Instruments+ | |
Forward Foreign Currency Contracts | | | — | | | | 30,762 | | | | — | | | | 30,762 | | |
Total Assets | | $ | 383,365,923 | | | $ | 23,173,263 | | | $ | — | | | $ | 406,539,186 | | |
Liabilities Table | |
Other Financial Instruments+ | |
Forward Foreign Currency Contracts | | $ | — | | | $ | (237,171 | ) | | $ | — | | | $ | (237,171 | ) | |
Total Liabilities | | $ | — | | | $ | (237,171 | ) | | $ | — | | | $ | (237,171 | ) | |
^ See Note 2, "Significant Accounting Policies" in the Notes to Financial Statements for additional information.
+ Other Financial Instruments may include open forward foreign currency contracts, futures, centrally cleared swaps, OTC swaps and written options. Forward foreign currency contracts, futures and centrally cleared swaps are fair valued at the unrealized appreciation (depreciation) on the instrument. OTC swaps and written options are valued at the fair value of the instrument.
# The earlier close of the foreign markets gives rise to the possibility that significant events, including broad market moves, may have occurred in the interim and may materially affect the value of those securities. To account for this, the Portfolio may frequently value many of its foreign equity securities using fair value prices based on third party vendor modeling tools to the extent available. Accordingly, a portion of the Portfolio's investments are categorized as Level 2 investments.
At December 31, 2021, the following forward foreign currency contracts were outstanding for VY® American Century Small-Mid Cap Value Portfolio:
Currency
Purchased | | Currency Sold | | Counterparty | | Settlement
Date | | Unrealized
Appreciation
(Depreciation) | |
USD | 58,157 | | | JPY | 6,667,968 | | | Bank of America N.A. | | 03/31/22 | | $ | 144 | | |
USD | 53,460 | | | JPY | 6,110,174 | | | Bank of America N.A. | | 03/31/22 | | | 301 | | |
JPY | 9,589,362 | | | USD | 84,423 | | | Bank of America N.A. | | 03/31/22 | | | (994 | ) | |
USD | 2,302,199 | | | JPY | 261,224,801 | | | Bank of America N.A. | | 03/31/22 | | | 29,492 | | |
USD | 7,076,792 | | | EUR | 6,249,651 | | | Credit Suisse International | | 03/31/22 | | | (51,437 | ) | |
USD | 177,327 | | | EUR | 155,984 | | | Credit Suisse International | | 03/31/22 | | | 825 | | |
USD | 144,848 | | | GBP | 107,448 | | | JPMorgan Chase Bank N.A. | | 03/31/22 | | | (532 | ) | |
USD | 5,701,476 | | | GBP | 4,312,080 | | | JPMorgan Chase Bank N.A. | | 03/31/22 | | | (132,871 | ) | |
USD | 51,128 | | | NOK | 451,253 | | | UBS AG | | 03/31/22 | | | (30 | ) | |
USD | 16,528 | | | SEK | 149,778 | | | UBS AG | | 03/31/22 | | | (60 | ) | |
USD | 16,215 | | | SEK | 147,151 | | | UBS AG | | 03/31/22 | | | (82 | ) | |
USD | 658,312 | | | SEK | 6,004,272 | | | UBS AG | | 03/31/22 | | | (6,652 | ) | |
USD | 1,696,473 | | | NOK | 15,356,928 | | | UBS AG | | 03/31/22 | | | (44,513 | ) | |
| | | | | | | | | | | $ | (206,409 | ) | |
See Accompanying Notes to Financial Statements
123
VY® AMERICAN CENTURY PORTFOLIO OF INVESTMENTS
SMALL-MID CAP VALUE PORTFOLIO AS OF DECEMBER 31, 2021 (CONTINUED)
Currency Abbreviations
EUR — EU Euro
GBP — British Pound
JPY — Japanese Yen
SEK — Swedish Krona
USD — United States Dollar
A summary of derivative instruments by primary risk exposure is outlined in the following tables.
The fair value of derivative instruments as of December 31, 2021 was as follows:
Derivatives not accounted
for as hedging instruments | | Location on Statement of Assets and Liabilities | | Fair Value | |
Asset Derivatives | |
Foreign exchange contracts | | Unrealized appreciation on forward foreign currency contracts | | $ | 30,762 | | |
Total Asset Derivatives | | | | $ | 30,762 | | |
Liability Derivatives | |
Foreign exchange contracts | | Unrealized depreciation on forward foreign currency contracts | | $ | 237,171 | | |
Total Liability Derivatives | | | | $ | 237,171 | | |
The effect of derivative instruments on the Portfolio's Statement of Operations for the year ended December 31, 2021 was as follows:
| | | Amount of Realized Gain or (Loss) on Derivatives Recognized in Income | |
Derivatives not accounted
for as hedging instruments | | Forward foreign currency contracts | |
Foreign exchange contracts | | $ | 1,058,873 | | |
Total | | $ | 1,058,873 | | |
| | | Change in Unrealized Appreciation or (Depreciation) on Derivatives Recognized in Income | |
Derivatives not accounted
for as hedging instruments | | Forward foreign currency contracts | |
Foreign exchange contracts | | $ | (86,344 | ) | |
Total | | $ | (86,344 | ) | |
At December 31, 2021, the aggregate cost of securities and other investments and the composition of unrealized appreciation and depreciation of securities and other investments on a tax basis were:
Cost for federal income tax purposes was $346,284,095.
Net unrealized appreciation consisted of: | |
Gross Unrealized Appreciation | | $ | 71,634,053 | | |
Gross Unrealized Depreciation | | | (11,512,575 | ) | |
Net Unrealized Appreciation | | $ | 60,121,478 | | |
See Accompanying Notes to Financial Statements
124
PORTFOLIO OF INVESTMENTS
VY® BARON GROWTH PORTFOLIO AS OF DECEMBER 31, 2021
Shares | |
| |
| | Value | | Percentage
of Net
Assets | |
COMMON STOCK: 100.0% | | | |
| | | | | Communication Services: 3.6% | |
| | 510,000 | | | | (1 | ) | | Iridium
Communications,
Inc. | | $ | 21,057,900 | | | | 3.2 | | |
| | 152,351 | | | | | | | Manchester United
PLC - Class A | | | 2,169,478 | | | | 0.4 | | |
| | | | | | | | | | 23,227,378 | | | | 3.6 | | |
| | | | | Consumer Discretionary: 22.2% | |
| | 88,500 | | | | (1 | ) | | Bright Horizons
Family Solutions,
Inc. | | | 11,140,380 | | | | 1.7 | | |
| | 292,500 | | | | | | | Choice Hotels
International, Inc. | | | 45,627,075 | | | | 7.0 | | |
| | 31,693 | | | | | | | Krispy Kreme, Inc. | | | 599,632 | | | | 0.1 | | |
| | 84,900 | | | | | | | Marriott Vacations
Worldwide Corp. | | | 14,346,402 | | | | 2.2 | | |
| | 380,000 | | | | (1 | ) | | Penn National
Gaming, Inc. | | | 19,703,000 | | | | 3.0 | | |
| | 82,500 | | | | | | | Red Rock Resorts,
Inc. | | | 4,538,325 | | | | 0.7 | | |
| | 15,000 | | | | (1 | ) | | Sweetgreen, Inc. | | | 480,000 | | | | 0.1 | | |
| | 146,000 | | | | | | | Vail Resorts, Inc. | | | 47,873,400 | | | | 7.3 | | |
| | 10,000 | | | | (1 | ) | | Warby Parker, Inc. | | | 465,600 | | | | 0.1 | | |
| | | | | | | | | | 144,773,814 | | | | 22.2 | | |
| | | | | Financials: 31.4% | |
| | 394,000 | | | | (1 | ) | | Arch Capital Group
Ltd. | | | 17,513,300 | | | | 2.7 | | |
| | 129,700 | | | | | | | Carlyle Group,
Inc./The | | | 7,120,530 | | | | 1.1 | | |
| | 139,000 | | | | | | | Cohen & Steers, Inc. | | | 12,858,890 | | | | 2.0 | | |
| | 35,400 | | | | | | | Essent Group Ltd. | | | 1,611,762 | | | | 0.2 | | |
| | 77,848 | | | | | | | Factset Research
Systems, Inc. | | | 37,834,906 | | | | 5.8 | | |
| | 30,325 | | | | | | | Houlihan Lokey, Inc. | | | 3,139,244 | | | | 0.5 | | |
| | 72,130 | | | | | | | Kinsale Capital
Group, Inc. | | | 17,159,006 | | | | 2.6 | | |
| | 34,260 | | | | | | | Moelis & Co. | | | 2,141,593 | | | | 0.3 | | |
| | 65,871 | | | | | | | Morningstar, Inc. | | | 22,527,223 | | | | 3.4 | | |
| | 108,500 | | | | | | | MSCI, Inc. - Class A | | | 66,476,865 | | | | 10.2 | | |
| | 109,400 | | | | | | | Primerica, Inc. | | | 16,767,738 | | | | 2.6 | | |
| | | | | | | | | | 205,151,057 | | | | 31.4 | | |
| | | | | Health Care: 14.6% | |
| | 48,200 | | | | | | | Bio-Techne Corp. | | | 24,935,788 | | | | 3.8 | | |
| | 110,800 | | | | | | | Dechra
Pharmaceuticals
PLC | | | 8,008,015 | | | | 1.2 | | |
| | 43,000 | | | | (1 | ) | | Denali Therapeutics,
Inc. | | | 1,917,800 | | | | 0.3 | | |
| | 44,500 | | | | (1 | ) | | Idexx Laboratories,
Inc. | | | 29,301,470 | | | | 4.5 | | |
Shares | |
| |
| | Value | | Percentage
of Net
Assets | |
| | 6,013 | | | | (1 | ) | | Mettler Toledo
International, Inc. | | $ | 10,205,324 | | | | 1.6 | | |
| | 83,100 | | | | (1 | ) | | Neogen Corp. | | | 3,773,571 | | | | 0.6 | | |
| | 46,000 | | | | (1 | ) | | Schrodinger, Inc./
United States | | | 1,602,180 | | | | 0.2 | | |
| | 33,500 | | | | | | | West Pharmaceutical
Services, Inc. | | | 15,711,835 | | | | 2.4 | | |
| | | | | | | | | | 95,455,983 | | | | 14.6 | | |
| | | | | Industrials: 7.4% | |
| | 63,153 | | | | (1 | ) | | BrightView
Holdings, Inc. | | | 889,194 | | | | 0.1 | | |
| | 347,500 | | | | (1 | ) | | CoStar Group, Inc. | | | 27,462,925 | | | | 4.2 | | |
| | 475,725 | | | | (2 | ) | | Marel HF | | | 3,217,176 | | | | 0.5 | | |
| | 4,129,898 | | | | (1 | ),(3),(4) | | Northvolt AB -
Series E | | | 1,151,345 | | | | 0.2 | | |
| | 103,000 | | | | (1 | ) | | Trex Co., Inc. | | | 13,908,090 | | | | 2.1 | | |
| | 237,578 | | | | (1 | ) | | Velo3D, Inc. | | | 1,855,484 | | | | 0.3 | | |
| | | | | | | | | | 48,484,214 | | | | 7.4 | | |
| | | | | Information Technology: 14.6% | |
| | 53,870 | | | | (1 | ) | | Altair Engineering,
Inc. | | | 4,165,229 | | | | 0.6 | | |
| | 75,000 | | | | (1 | ) | | ANSYS, Inc. | | | 30,084,000 | | | | 4.6 | | |
| | 108,732 | | | | (1 | ) | | Gartner, Inc. | | | 36,351,282 | | | | 5.6 | | |
| | 100,000 | | | | (1 | ) | | Guidewire Software,
Inc. | | | 11,353,000 | | | | 1.8 | | |
| | 4,500 | | | | | | | Littelfuse, Inc. | | | 1,416,060 | | | | 0.2 | | |
| | 191,696 | | | | (1 | ) | | Mirion
Technologies, Inc. | | | 2,007,057 | | | | 0.3 | | |
| | 122,020 | | | | | | | SS&C Technologies
Holdings, Inc. | | | 10,003,200 | | | | 1.5 | | |
| | | | | | | | | | 95,379,828 | | | | 14.6 | | |
| | | | | Real Estate: 6.2% | |
| | 64,824 | | | | | | | Alexandria Real
Estate Equities, Inc. | | | 14,453,159 | | | | 2.2 | | |
| | 278,500 | | | | | | | Douglas Emmett, Inc. | | | 9,329,750 | | | | 1.5 | | |
| | 337,835 | | | | | | | Gaming and Leisure
Properties, Inc. | | | 16,439,051 | | | | 2.5 | | |
| | | | | | | | | | 40,221,960 | | | | 6.2 | | |
| | | | | | | Total Common Stock
(Cost $112,437,049) | | | 652,694,234 | | | | 100.0 | | |
| | | | | | | Assets in Excess
of Other Liabilities | | | 223,207 | | | | 0.0 | | |
| | | | | | | Net Assets | | $ | 652,917,441 | | | | 100.0 | | |
(1) Non-income producing security.
(2) Securities with purchases pursuant to Rule 144A or section 4(a)(2), under the Securities Act of 1933 and may not be resold subject to that rule except to qualified institutional buyers.
(3) For fair value measurement disclosure purposes, security is categorized as Level 3, whose value was determined using significant unobservable inputs.
(4) Restricted security as to resale, excluding Rule 144A securities. As of December 31, 2021, the Portfolio held restricted securities with a fair value of $1,151,345 or 0.2% of net assets. Please refer to the table below for additional details.
See Accompanying Notes to Financial Statements
125
PORTFOLIO OF INVESTMENTS
VY® BARON GROWTH PORTFOLIO AS OF DECEMBER 31, 2021 (CONTINUED)
Fair Value Measurements^
The following is a summary of the fair valuations according to the inputs used as of December 31, 2021 in valuing the assets and liabilities:
| | | Quoted Prices
in Active Markets
for Identical Investments
(Level 1) | | Significant Other
Observable
Inputs#
(Level 2) | | Significant
Unobservable
Inputs
(Level 3) | | Fair Value
at
December 31, 2021 | |
Asset Table | |
Investments, at fair value | |
Common Stock | |
Communication Services | | $ | 23,227,378 | | | $ | — | | | $ | — | | | $ | 23,227,378 | | |
Consumer Discretionary | | | 144,773,814 | | | | — | | | | — | | | | 144,773,814 | | |
Financials | | | 205,151,057 | | | | — | | | | — | | | | 205,151,057 | | |
Health Care | | | 87,447,968 | | | | 8,008,015 | | | | — | | | | 95,455,983 | | |
Industrials | | | 47,332,869 | | | | — | | | | 1,151,345 | | | | 48,484,214 | | |
Information Technology | | | 95,379,828 | | | | — | | | | — | | | | 95,379,828 | | |
Real Estate | | | 40,221,960 | | | | — | | | | — | | | | 40,221,960 | | |
Total Common Stock | | | 643,534,874 | | | | 8,008,015 | | | | 1,151,345 | | | | 652,694,234 | | |
Total Investments, at fair value | | $ | 643,534,874 | | | $ | 8,008,015 | | | $ | 1,151,345 | | | $ | 652,694,234 | | |
^ See Note 2, "Significant Accounting Policies" in the Notes to Financial Statements for additional information.
# The earlier close of the foreign markets gives rise to the possibility that significant events, including broad market moves, may have occurred in the interim and may materially affect the value of those securities. To account for this, the Portfolio may frequently value many of its foreign equity securities using fair value prices based on third party vendor modeling tools to the extent available. Accordingly, a portion of the Portfolio's investments are categorized as Level 2 investments.
At December 31, 2021, VY® Baron Growth Portfolio held the following restricted securities:
Security | | Acquisition Date | | Acquisition Cost | | Fair Value | |
Northvolt AB - Series E | | 9/21/2020 | | $ | 651,737 | | | $ | 1,151,345 | | |
| | | | | $ | 651,737 | | | $ | 1,151,345 | | |
At December 31, 2021, the aggregate cost of securities and other investments and the composition of unrealized appreciation and depreciation of securities and other investments on a tax basis were:
Cost for federal income tax purposes was $114,535,511.
Net unrealized appreciation consisted of: | |
Gross Unrealized Appreciation | | $ | 539,031,809 | | |
Gross Unrealized Depreciation | | | (873,086 | ) | |
Net Unrealized Appreciation | | $ | 538,158,723 | | |
See Accompanying Notes to Financial Statements
126
VY® COLUMBIA PORTFOLIO OF INVESTMENTS
CONTRARIAN CORE PORTFOLIO AS OF DECEMBER 31, 2021
Shares | |
| |
| | Value | | Percentage
of Net
Assets | |
COMMON STOCK: 98.5% | | | |
| | | | | Communication Services: 11.8% | |
| | 5,306 | | | | | | | Activision Blizzard,
Inc. | | $ | 353,008 | | | | 0.2 | | |
| | 1,946 | | | | (1 | ) | | Alphabet, Inc. -
Class A | | | 5,637,640 | | | | 2.6 | | |
| | 2,081 | | | | (1 | ) | | Alphabet, Inc. -
Class C | | | 6,021,561 | | | | 2.8 | | |
| | 42,580 | | | | | | | AT&T, Inc. | | | 1,047,468 | | | | 0.5 | | |
| | 54,016 | | | | | | | Comcast Corp. -
Class A | | | 2,718,625 | | | | 1.3 | | |
| | 24,190 | | | | (1 | ) | | Endeavor Group
Holdings, Inc. | | | 843,989 | | | | 0.4 | | |
| | 14,544 | | | | (1 | ) | | Meta Platforms, Inc. | | | 4,891,875 | | | | 2.3 | | |
| | 19,358 | | | | (1 | ) | | T-Mobile US, Inc. | | | 2,245,141 | | | | 1.1 | | |
| | 8,270 | | | | (1 | ) | | Walt Disney Co. | | | 1,280,940 | | | | 0.6 | | |
| | | | | | | | | | 25,040,247 | | | | 11.8 | | |
| | | | | Consumer Discretionary: 9.2% | |
| | 2,826 | | | | (1 | ) | | Amazon.com, Inc. | | | 9,422,845 | | | | 4.4 | | |
| | 17,012 | | | | | | | eBay, Inc. | | | 1,131,298 | | | | 0.5 | | |
| | 40,913 | | | | | | | Gap, Inc. | | | 722,114 | | | | 0.4 | | |
| | 7,698 | | | | | | | Lowe's Cos, Inc. | | | 1,989,779 | | | | 0.9 | | |
| | 11,303 | | | | | | | McDonald's Corp. | | | 3,029,995 | | | | 1.4 | | |
| | 45,765 | | | | | | | Tapestry, Inc. | | | 1,858,059 | | | | 0.9 | | |
| | 1,808 | | | | (1 | ) | | Ulta Beauty, Inc. | | | 745,511 | | | | 0.4 | | |
| | 30,079 | | | | (1 | ) | | Under Armour, Inc. -
Class A | | | 637,374 | | | | 0.3 | | |
| | | | | | | | | | 19,536,975 | | | | 9.2 | | |
| | | | | Consumer Staples: 4.5% | |
| | 46,470 | | | | | | | Mondelez
International, Inc. | | | 3,081,426 | | | | 1.5 | | |
| | 23,352 | | | | | | | Philip Morris
International, Inc. | | | 2,218,440 | | | | 1.0 | | |
| | 53,561 | | | | | | | Sysco Corp. | | | 4,207,216 | | | | 2.0 | | |
| | | | | | | | | | 9,507,082 | | | | 4.5 | | |
| | | | | Energy: 3.0% | |
| | 41,348 | | | | | | | Canadian Natural
Resources Ltd. | | | 1,746,953 | | | | 0.8 | | |
| | 25,056 | | | | | | | Chevron Corp. | | | 2,940,321 | | | | 1.4 | | |
| | 17,971 | | | | | | | EOG Resources, Inc. | | | 1,596,364 | | | | 0.8 | | |
| | | | | | | | | | 6,283,638 | | | | 3.0 | | |
| | | | | Financials: 10.0% | |
| | 3,837 | | | | | | | American Express Co. | | | 627,733 | | | | 0.3 | | |
| | 1,784 | | | | | | | Aon PLC | | | 536,199 | | | | 0.2 | | |
| | 85,787 | | | | | | | Bank of America Corp. | | | 3,816,664 | | | | 1.8 | | |
| | 18,964 | | | | (1 | ) | | Berkshire Hathaway,
Inc. - Class B | | | 5,670,236 | | | | 2.7 | | |
| | 2,235 | | | | | | | Blackrock, Inc. | | | 2,046,277 | | | | 1.0 | | |
Shares | |
| |
| | Value | | Percentage
of Net
Assets | |
| | 19,650 | | | | | | | JPMorgan Chase & Co. | | $ | 3,111,577 | | | | 1.5 | | |
| | 10,297 | | | | | | | Morgan Stanley | | | 1,010,754 | | | | 0.5 | | |
| | 30,289 | | | | | | | State Street Corp. | | | 2,816,877 | | | | 1.3 | | |
| | 6,574 | | | | | | | Willis Towers Watson
PLC | | | 1,561,259 | | | | 0.7 | | |
| | | | | | | | | | 21,197,576 | | | | 10.0 | | |
| | | | | Health Care: 13.4% | |
| | 26,478 | | | | | | | Abbott Laboratories | | | 3,726,514 | | | | 1.7 | | |
| | 5,041 | | | | | | | Anthem, Inc. | | | 2,336,705 | | | | 1.1 | | |
| | 18,781 | | | | | | | Baxter International,
Inc. | | | 1,612,161 | | | | 0.8 | | |
| | 3,554 | | | | (1 | ) | | Biogen, Inc. | | | 852,676 | | | | 0.4 | | |
| | 16,766 | | | | (1 | ) | | BioMarin
Pharmaceutical, Inc. | | | 1,481,276 | | | | 0.7 | | |
| | 27,901 | | | | | | | CVS Health Corp. | | | 2,878,267 | | | | 1.3 | | |
| | 33,877 | | | | | | | Dentsply Sirona, Inc. | | | 1,889,998 | | | | 0.9 | | |
| | 11,764 | | | | | | | Eli Lilly & Co. | | | 3,249,452 | | | | 1.5 | | |
| | 30,956 | | | | | | | Johnson & Johnson | | | 5,295,643 | | | | 2.5 | | |
| | 28,438 | | | | | | | Medtronic PLC | | | 2,941,911 | | | | 1.4 | | |
| | 10,466 | | | | (1 | ) | | Vertex
Pharmaceuticals, Inc. | | | 2,298,333 | | | | 1.1 | | |
| | | | | | | | | | 28,562,936 | | | | 13.4 | | |
| | | | | Industrials: 8.3% | |
| | 15,537 | | | | | | | Carrier Global Corp. | | | 842,727 | | | | 0.4 | | |
| | 10,573 | | | | | | | Honeywell
International, Inc. | | | 2,204,576 | | | | 1.0 | | |
| | 65,540 | | | | | | | Raytheon
Technologies Corp. | | | 5,640,372 | | | | 2.7 | | |
| | 50,890 | | | | (1 | ) | | Southwest Airlines Co. | | | 2,180,128 | | | | 1.0 | | |
| | 9,946 | | | | | | | Stanley Black &
Decker, Inc. | | | 1,876,014 | | | | 0.9 | | |
| | 65,347 | | | | (1 | ) | | Uber Technologies, Inc. | | | 2,740,000 | | | | 1.3 | | |
| | 8,664 | | | | | | | Union Pacific Corp. | | | 2,182,722 | | | | 1.0 | | |
| | | | | | | | | | 17,666,539 | | | | 8.3 | | |
| | | | | Information Technology: 32.3% | |
| | 4,857 | | | | (1 | ) | | Adobe, Inc. | | | 2,754,211 | | | | 1.3 | | |
| | 9,070 | | | | (1 | ) | | Akamai
Technologies, Inc. | | | 1,061,553 | | | | 0.5 | | |
| | 76,550 | | | | | | | Apple, Inc. | | | 13,592,984 | | | | 6.4 | | |
| | 6,884 | | | | (1 | ) | | Autodesk, Inc. | | | 1,935,712 | | | | 0.9 | | |
| | 33,135 | | | | | | | Cisco Systems, Inc. | | | 2,099,765 | | | | 1.0 | | |
| | 16,242 | | | | | | | Fidelity National
Information Services,
Inc. | | | 1,772,814 | | | | 0.8 | | |
| | 11,469 | | | | | | | Global Payments, Inc. | | | 1,550,379 | | | | 0.7 | | |
| | 10,291 | | | | (1 | ) | | GLOBALFOUNDRIES,
Inc. | | | 668,606 | | | | 0.3 | | |
| | 13,355 | | | | | | | International Business
Machines Corp. | | | 1,785,029 | | | | 0.8 | | |
See Accompanying Notes to Financial Statements
127
VY® COLUMBIA PORTFOLIO OF INVESTMENTS
CONTRARIAN CORE PORTFOLIO AS OF DECEMBER 31, 2021 (CONTINUED)
Shares | |
| |
| | Value | | Percentage
of Net
Assets | |
| | | | | Information Technology (continued) | |
| | 3,209 | | | | | | | Intuit, Inc. | | $ | 2,064,093 | | | | 1.0 | | |
| | 3,172 | | | | | | | Lam Research Corp. | | | 2,281,144 | | | | 1.1 | | |
| | 14,431 | | | | | | | Marvell Technology, Inc. | | | 1,262,568 | | | | 0.6 | | |
| | 12,443 | | | | | | | Mastercard, Inc. -
Class A | | | 4,471,019 | | | | 2.1 | | |
| | 16,147 | | | | | | | Micron
Technology, Inc. | | | 1,504,093 | | | | 0.7 | | |
| | 44,982 | | | | | | | Microsoft Corp. | | | 15,128,346 | | | | 7.1 | | |
| | 12,239 | | | | | | | Nvidia Corp. | | | 3,599,612 | | | | 1.7 | | |
| | 5,608 | | | | (1 | ) | | Palo Alto Networks, Inc. | | | 3,122,310 | | | | 1.5 | | |
| | 7,710 | | | | (1 | ) | | PayPal Holdings, Inc. | | | 1,453,952 | | | | 0.7 | | |
| | 29,246 | | | | | | | TE Connectivity Ltd. | | | 4,718,550 | | | | 2.2 | | |
| | 8,728 | | | | | | | Visa, Inc. - Class A | | | 1,891,445 | | | | 0.9 | | |
| | | | | | | | | | 68,718,185 | | | | 32.3 | | |
| | | | | Materials: 3.1% | |
| | 1,907 | | | | | | | Air Products &
Chemicals, Inc. | | | 580,224 | | | | 0.3 | | |
| | 40,732 | | | | | | | Corteva, Inc. | | | 1,925,809 | | | | 0.9 | | |
| | 10,861 | | | | | | | International Flavors &
Fragrances, Inc. | | | 1,636,210 | | | | 0.8 | | |
| | 17,669 | | | | | | | Newmont Corp. | | | 1,095,831 | | | | 0.5 | | |
| | 17,641 | | | | | | | Nutrien Ltd. | | | 1,326,603 | | | | 0.6 | | |
| | | | | | | | | | 6,564,677 | | | | 3.1 | | |
| | | | | Real Estate: 1.2% | |
| | 5,686 | | | | | | | American Tower Corp. | | | 1,663,155 | | | | 0.8 | | |
| | 14,868 | | | | (1 | ) | | Zillow Group, Inc. -
Class C | | | 949,322 | | | | 0.4 | | |
| | | | | | | | | | 2,612,477 | | | | 1.2 | | |
| | | | | Utilities: 1.7% | |
| | 28,249 | | | | | | | American Electric
Power Co., Inc. | | | 2,513,314 | | | | 1.2 | | |
| | 17,677 | | | | | | | Public Service
Enterprise Group, Inc. | | | 1,179,586 | | | | 0.5 | | |
| | | | | | | | | | 3,692,900 | | | | 1.7 | | |
| | | | | | | Total Common Stock
(Cost $157,903,994) | | | 209,383,232 | | | | 98.5 | | |
OTHER(2): —% | | | |
| | | | | Materials: —% | |
| | 649,000 | | | | (3 | ),(4) | | SINO Forest Corp.
(Escrow) | | | — | | | | — | | |
| | | | | | | | | Total Other
(Cost $—) | | | — | | | | — | | |
| | | | | | | | | Total Long-Term
Investments
(Cost $157,903,994) | | | 209,383,232 | | | | 98.5 | | |
Shares | |
| |
| | Value | | Percentage
of Net
Assets | |
SHORT-TERM INVESTMENTS: 1.6% | |
| | | | | Mutual Funds: 1.6% | |
| | 3,303,059 | | | | (5 | ) | | BlackRock Liquidity
Funds, FedFund,
Institutional Class,
0.030%
(Cost $3,303,059) | | $ | 3,303,059 | | | | 1.6 | | |
| | | | | | | Total Short-Term
Investments
(Cost $3,303,059) | | | 3,303,059 | | | | 1.6 | | |
| | | | | | | Total Investments in
Securities
(Cost $161,207,053) | | $ | 212,686,291 | | | | 100.1 | | |
| | | | | | | Liabilities in Excess of
Other Assets | | | (155,282 | ) | | | (0.1 | ) | |
| | | | | | | Net Assets | | $ | 212,531,009 | | | | 100.0 | | |
(1) Non-income producing security.
(2) Represents an escrow position for future entitlements, if any, on the defaulted bond. The escrow position was received in exchange for the defaulted bond as part of the bankruptcy reorganization of the bond issuer. These holdings are non-income producing.
(3) For fair value measurement disclosure purposes, security is categorized as Level 3, whose value was determined using significant unobservable inputs.
(4) Restricted security as to resale, excluding Rule 144A securities. As of December 31, 2021, the Portfolio held restricted securities with a fair value of $— or 0.0% of net assets. Please refer to the table below for additional details.
(5) Rate shown is the 7-day yield as of December 31, 2021.
See Accompanying Notes to Financial Statements
128
VY® COLUMBIA PORTFOLIO OF INVESTMENTS
CONTRARIAN CORE PORTFOLIO AS OF DECEMBER 31, 2021 (CONTINUED)
Fair Value Measurements^
The following is a summary of the fair valuations according to the inputs used as of December 31, 2021 in valuing the assets and liabilities:
| | | Quoted Prices
in Active Markets
for Identical Investments
(Level 1) | | Significant Other
Observable
Inputs
(Level 2) | | Significant
Unobservable
Inputs
(Level 3) | | Fair Value
at
December 31, 2021 | |
Asset Table | |
Investments, at fair value | |
Common Stock* | | $ | 209,383,232 | | | $ | — | | | $ | — | | | $ | 209,383,232 | | |
Other | | | — | | | | — | | | | — | | | | — | | |
Short-Term Investments | | | 3,303,059 | | | | — | | | | — | | | | 3,303,059 | | |
Total Investments, at fair value | | $ | 212,686,291 | | | $ | — | | | $ | — | | | $ | 212,686,291 | | |
^ See Note 2, "Significant Accounting Policies" in the Notes to Financial Statements for additional information.
* For further breakdown of Common Stock by sector, please refer to the Portfolio of Investments.
At December 31, 2021, VY® Columbia Contrarian Core Portfolio held the following restricted securities:
Security | | Acquisition Date | | Acquisition Cost | | Fair Value | |
SINO Forest Corp. (Escrow) | | 3/1/2013 | | $ | — | | | $ | — | | |
| | | | | $ | — | | | $ | — | | |
At December 31, 2021, the aggregate cost of securities and other investments and the composition of unrealized appreciation and depreciation of securities and other investments on a tax basis were:
Cost for federal income tax purposes was $161,540,234.
Net unrealized appreciation consisted of: | |
Gross Unrealized Appreciation | | $ | 52,876,743 | | |
Gross Unrealized Depreciation | | | (1,730,686 | ) | |
Net Unrealized Appreciation | | $ | 51,146,057 | | |
See Accompanying Notes to Financial Statements
129
VY® COLUMBIA PORTFOLIO OF INVESTMENTS
SMALL CAP VALUE II PORTFOLIO AS OF DECEMBER 31, 2021
Shares | | | | | | Value | | Percentage
of Net
Assets | |
COMMON STOCK: 99.8% | | | |
| | | | | Communication Services: 1.1% | |
| | 14,500 | | | | | | | Nexstar Media Group,
Inc. | | $ | 2,189,210 | | | | 1.1 | | |
| | | | | Consumer Discretionary: 7.8% | |
| | 16,800 | | | | (1 | ) | | Childrens Place,
Inc./The | | | 1,332,072 | | | | 0.7 | | |
| | 59,199 | | | | | | | Dana, Inc. | | | 1,350,921 | | | | 0.7 | | |
| | 133,310 | | | | (1 | ) | | F45 Training Holdings,
Inc. | | | 1,451,746 | | | | 0.7 | | |
| | 17,700 | | | | (1 | ) | | Genesco, Inc. | | | 1,135,809 | | | | 0.6 | | |
| | 53,900 | | | | (1 | ) | | Goodyear Tire &
Rubber Co. | | | 1,149,148 | | | | 0.6 | | |
| | 50,900 | | | | | | | International Game
Technology PLC | | | 1,471,519 | | | | 0.8 | | |
| | 25,900 | | | | | | | KB Home | | | 1,158,507 | | | | 0.6 | | |
| | 74,800 | | | | | | | Macy's, Inc. | | | 1,958,264 | | | | 1.0 | | |
| | 122,200 | | | | (1 | ) | | Petco Health &
Wellness Co., Inc. | | | 2,418,338 | | | | 1.2 | | |
| | 21,800 | | | | | | | Red Rock Resorts, Inc. | | | 1,199,218 | | | | 0.6 | | |
| | 14,800 | | | | | | | Rocky Brands, Inc. | | | 589,040 | | | | 0.3 | | |
| | | | | | | | | | 15,214,582 | | | | 7.8 | | |
| | | | | Consumer Staples: 3.8% | |
| | 37,500 | | | | (1 | ) | | BellRing Brands, Inc. | | | 1,069,875 | | | | 0.5 | | |
| | 35,100 | | | | (1 | ) | | BJ's Wholesale Club
Holdings, Inc. | | | 2,350,647 | | | | 1.2 | | |
| | 39,300 | | | | (1 | ) | | Chefs' Warehouse
Holdings, Inc. | | | 1,308,690 | | | | 0.7 | | |
| | 55,100 | | | | (1 | ) | | United Natural Foods,
Inc. | | | 2,704,308 | | | | 1.4 | | |
| | | | | | | | | | 7,433,520 | | | | 3.8 | | |
| | | | | Energy: 6.5% | |
| | 72,300 | | | | (1 | ) | | Antero Resources Corp. | | | 1,265,250 | | | | 0.6 | | |
| | 131,593 | | | | | | | Coterra Energy, Inc. | | | 2,500,267 | | | | 1.3 | | |
| | 51,500 | | | | | | | Matador Resources Co. | | | 1,901,380 | | | | 1.0 | | |
| | 92,500 | | | | | | | Ovintiv, Inc. | | | 3,117,250 | | | | 1.6 | | |
| | 45,300 | | | | | | | PDC Energy, Inc. | | | 2,209,734 | | | | 1.1 | | |
| | 59,300 | | | | | | | SM Energy Co. | | | 1,748,164 | | | | 0.9 | | |
| | | | | | | | | | 12,742,045 | | | | 6.5 | | |
| | | | | Financials: 29.0% | |
| | 42,400 | | | | | | | Ameris Bancorp. | | | 2,106,432 | | | | 1.1 | | |
| | 22,700 | | | | | | | Amerisafe, Inc. | | | 1,221,941 | | | | 0.6 | | |
| | 41,000 | | | | | | | Argo Group International
Holdings Ltd. | | | 2,382,510 | | | | 1.2 | | |
| | 59,000 | | | | | | | Atlantic Union
Bankshares Corp. | | | 2,200,110 | | | | 1.1 | | |
| | 56,100 | | | | (1 | ) | | Axos Financial, Inc. | | | 3,136,551 | | | | 1.6 | | |
| | 83,800 | | | | (1 | ) | | Bancorp, Inc. | | | 2,120,978 | | | | 1.1 | | |
| | 61,500 | | | | | | | Blackstone Mortgage
Trust, Inc. | | | 1,883,130 | | | | 1.0 | | |
Shares | | | | | | Value | | Percentage
of Net
Assets | |
| | 50,600 | | | | | | | Cathay General
Bancorp. | | $ | 2,175,294 | | | | 1.1 | | |
| | 28,600 | | | | | | | Community Bank
System, Inc. | | | 2,130,128 | | | | 1.1 | | |
| | 36,500 | | | | | | | Cowen, Inc. | | | 1,317,650 | | | | 0.7 | | |
| | 45,300 | | | | (1 | ) | | Focus Financial
Partners, Inc. | | | 2,705,316 | | | | 1.4 | | |
| | 43,700 | | | | | | | Hancock Whitney Corp. | | | 2,185,874 | | | | 1.1 | | |
| | 40,000 | | | | | | | Hannon Armstrong
Sustainable
Infrastructure Capital,
Inc. | | | 2,124,800 | | | | 1.1 | | |
| | 22,800 | | | | | | | Houlihan Lokey, Inc. | | | 2,360,256 | | | | 1.2 | | |
| | 21,500 | | | | | | | Independent Bank Corp. | | | 1,752,895 | | | | 0.9 | | |
| | 27,300 | | | | | | | Independent Bank
Group, Inc. | | | 1,969,695 | | | | 1.0 | | |
| | 127,700 | | | | | | | MGIC Investment Corp. | | | 1,841,434 | | | | 0.9 | | |
| | 44,102 | | | | | | | Pacific Premier Bancorp,
Inc. | | | 1,765,403 | | | | 0.9 | | |
| | 29,200 | | | | | | | Popular, Inc. | | | 2,395,568 | | | | 1.2 | | |
| | 61,800 | | | | | | | Radian Group, Inc. | | | 1,305,834 | | | | 0.7 | | |
| | 43,700 | | | | | | | Renasant Corp. | | | 1,658,415 | | | | 0.8 | | |
| | 52,800 | | | | | | | Sandy Spring Bancorp,
Inc. | | | 2,538,624 | | | | 1.3 | | |
| | 83,400 | | | | | | | SLM Corp. | | | 1,640,478 | | | | 0.8 | | |
| | 48,100 | | | | | | | Starwood Property Trust,
Inc. | | | 1,168,830 | | | | 0.6 | | |
| | 21,950 | | | | | | | Stifel Financial Corp. | | | 1,545,719 | | | | 0.8 | | |
| | 19,452 | | | | (1 | ) | | Triumph Bancorp, Inc. | | | 2,316,344 | | | | 1.2 | | |
| | 26,600 | | | | | | | UMB Financial Corp. | | | 2,822,526 | | | | 1.4 | | |
| | 41,300 | | | | | | | WSFS Financial Corp. | | | 2,069,956 | | | | 1.1 | | |
| | | | | | | | | | 56,842,691 | | | | 29.0 | | |
| | | | | Health Care: 5.6% | |
| | 12,200 | | | | (1 | ) | | Apellis Pharmaceuticals,
Inc. | | | 576,816 | | | | 0.3 | | |
| | 7,769 | | | | (1 | ) | | Arcutis Biotherapeutics,
Inc. | | | 161,129 | | | | 0.1 | | |
| | 16,900 | | | | (1 | ) | | Arena Pharmaceuticals,
Inc. | | | 1,570,686 | | | | 0.8 | | |
| | 36,900 | | | | (1 | ) | | Atara Biotherapeutics,
Inc. | | | 581,544 | | | | 0.3 | | |
| | 14,600 | | | | (1 | ) | | Cytokinetics, Inc. | | | 665,468 | | | | 0.3 | | |
| | 8,700 | | | | (1 | ) | | Integer Holdings Corp. | | | 744,633 | | | | 0.4 | | |
| | 40,200 | | | | (1 | ) | | Invitae Corp. | | | 613,854 | | | | 0.3 | | |
| | 29,600 | | | | (1 | ) | | Iovance Biotherapeutics,
Inc. | | | 565,064 | | | | 0.3 | | |
| | 33,000 | | | | (1 | ) | | Merit Medical Systems,
Inc. | | | 2,055,900 | | | | 1.1 | | |
| | 33,300 | | | | (1 | ) | | Myriad Genetics, Inc. | | | 919,080 | | | | 0.5 | | |
| | 22,200 | | | | (1 | ) | | Tenet Healthcare Corp. | | | 1,813,518 | | | | 0.9 | | |
| | 19,800 | | | | (1 | ) | | Varex Imaging Corp. | | | 624,690 | | | | 0.3 | | |
| | | | | | | | | | 10,892,382 | | | | 5.6 | | |
See Accompanying Notes to Financial Statements
130
VY® COLUMBIA PORTFOLIO OF INVESTMENTS
SMALL CAP VALUE II PORTFOLIO AS OF DECEMBER 31, 2021 (CONTINUED)
Shares | | | | | | Value | | Percentage
of Net
Assets | |
| | | | | Industrials: 18.7% | |
| | 30,100 | | | | | | | Altra Industrial Motion
Corp. | | $ | 1,552,257 | | | | 0.8 | | |
| | 78,600 | | | | (1 | ) | | API Group Corp. | | | 2,025,522 | | | | 1.0 | | |
| | 23,900 | | | | | | | ArcBest Corp. | | | 2,864,415 | | | | 1.5 | | |
| | 11,800 | | | | (1 | ) | | Atlas Air Worldwide
Holdings, Inc. | | | 1,110,616 | | | | 0.6 | | |
| | 22,700 | | | | (1 | ) | | Beacon Roofing Supply,
Inc. | | | 1,301,845 | | | | 0.7 | | |
| | 43,100 | | | | (1 | ) | | Bloom Energy Corp. | | | 945,183 | | | | 0.5 | | |
| | 63,100 | | | | (1 | ) | | Core & Main, Inc. | | | 1,914,454 | | | | 1.0 | | |
| | 17,500 | | | | | | | EMCOR Group, Inc. | | | 2,229,325 | | | | 1.1 | | |
| | 46,200 | | | | (1 | ) | | Evoqua Water
Technologies Corp. | | | 2,159,850 | | | | 1.1 | | |
| | 15,700 | | | | | | | Herc Holdings, Inc. | | | 2,457,835 | | | | 1.3 | | |
| | 21,900 | | | | | | | ICF International, Inc. | | | 2,245,845 | | | | 1.1 | | |
| | 54,300 | | | | | | | KBR, Inc. | | | 2,585,766 | | | | 1.3 | | |
| | 36,841 | | | | | | | Kforce, Inc. | | | 2,771,180 | | | | 1.4 | | |
| | 11,600 | | | | (1 | ) | | Masonite International
Corp. | | | 1,368,220 | | | | 0.7 | | |
| | 11,200 | | | | (1 | ) | | Mastec, Inc. | | | 1,033,536 | | | | 0.5 | | |
| | 21,700 | | | | | | | Moog, Inc. | | | 1,757,049 | | | | 0.9 | | |
| | 12,500 | | | | | | | Science Applications
International Corp. | | | 1,044,875 | | | | 0.5 | | |
| | 26,700 | | | | (1 | ) | | Skywest, Inc. | | | 1,049,310 | | | | 0.5 | | |
| | 21,700 | | | | (1 | ) | | Sunrun, Inc. | | | 744,310 | | | | 0.4 | | |
| | 39,500 | | | | | | | Triton International Ltd. | | | 2,379,085 | | | | 1.2 | | |
| | 65,400 | | | | (1 | ) | | Triumph Group, Inc. | | | 1,211,862 | | | | 0.6 | | |
| | | | | | | | | | 36,752,340 | | | | 18.7 | | |
| | | | | Information Technology: 9.1% | |
| | 13,200 | | | | (1 | ) | | Cerence, Inc. | | | 1,011,648 | | | | 0.5 | | |
| | 25,000 | | | | (1 | ) | | Diodes, Inc. | | | 2,745,250 | | | | 1.4 | | |
| | 15,500 | | | | (1 | ) | | ExlService Holdings, Inc. | | | 2,243,935 | | | | 1.2 | | |
| | 16,200 | | | | | | | Kulicke & Soffa
Industries, Inc. | | | 980,748 | | | | 0.5 | | |
| | 109,800 | | | | (1 | ) | | Magnachip
Semiconductor Corp. | | | 2,302,506 | | | | 1.2 | | |
| | 13,900 | | | | (1 | ) | | Marathon Digital
Holdings, Inc. | | | 456,754 | | | | 0.2 | | |
| | 41,865 | | | | (1 | ) | | SMART Global
Holdings, Inc. | | | 2,971,996 | | | | 1.5 | | |
| | 38,800 | | | | (1 | ) | | SunPower Corp. | | | 809,756 | | | | 0.4 | | |
| | 8,600 | | | | (1 | ) | | Synaptics, Inc. | | | 2,489,786 | | | | 1.3 | | |
| | 31,000 | | | | (1 | ) | | Ultra Clean Holdings,
Inc. | | | 1,778,160 | | | | 0.9 | | |
| | | | | | | | | | 17,790,539 | | | | 9.1 | | |
| | | | | Materials: 6.6% | |
| | 24,200 | | | | (1 | ) | | Arconic Corp. | | | 798,842 | | | | 0.4 | | |
| | 9,000 | | | | | | | Ashland Global
Holdings, Inc. | | | 968,940 | | | | 0.5 | | |
| | 32,700 | | | | | | | Avient Corp. | | | 1,829,565 | | | | 0.9 | | |
| | 52,800 | | | | (1 | ) | | Cleveland-Cliffs, Inc. | | | 1,149,456 | | | | 0.6 | | |
Shares | | | | | | Value | | Percentage
of Net
Assets | |
| | 12,800 | | | | | | | HB Fuller Co. | | $ | 1,036,800 | | | | 0.5 | | |
| | 30,520 | | | | (1 | ) | | Intrepid Potash, Inc. | | | 1,304,120 | | | | 0.7 | | |
| | 23,100 | | | | (1 | ) | | Livent Corp. | | | 563,178 | | | | 0.3 | | |
| | 22,149 | | | | | | | Materion Corp. | | | 2,036,379 | | | | 1.0 | | |
| | 46,800 | | | | (1 | ) | | Orion Engineered
Carbons SA | | | 859,248 | | | | 0.4 | | |
| | 62,200 | | | | (1 | ) | | Summit Materials, Inc. | | | 2,496,708 | | | | 1.3 | | |
| | | | | | | | | | 13,043,236 | | | | 6.6 | | |
| | | | | Real Estate: 7.0% | |
| | 54,100 | | | | | | | American Assets Trust,
Inc. | | | 2,030,373 | | | | 1.0 | | |
| | 24,300 | | | | | | | Centerspace | | | 2,694,870 | | | | 1.4 | | |
| | 46,500 | | | | | | | First Industrial Realty
Trust, Inc. | | | 3,078,300 | | | | 1.6 | | |
| | 29,600 | | | | | | | Hudson Pacific
Properties, Inc. | | | 731,416 | | | | 0.4 | | |
| | 10,900 | | | | | | | PS Business Parks, Inc. | | | 2,007,453 | | | | 1.0 | | |
| | 54,600 | | | | (1 | ) | | Sunstone Hotel
Investors, Inc. | | | 640,458 | | | | 0.3 | | |
| | 132,600 | | | | | | | Tanger Factory Outlet
Centers, Inc. | | | 2,556,528 | | | | 1.3 | | |
| | | | | | | | | | 13,739,398 | | | | 7.0 | | |
| | | | | Utilities: 4.6% | |
| | 49,800 | | | | | | | Clearway Energy,
Inc. - Class C | | | 1,794,294 | | | | 0.9 | | |
| | 37,900 | | | | | | | New Jersey Resources
Corp. | | | 1,556,174 | | | | 0.8 | | |
| | 20,000 | | | | | | | ONE Gas, Inc. | | | 1,551,800 | | | | 0.8 | | |
| | 44,900 | | | | | | | Portland General
Electric Co. | | | 2,376,108 | | | | 1.2 | | |
| | 66,965 | | | | | | | South Jersey Industries,
Inc. | | | 1,749,126 | | | | 0.9 | | |
| | | | | | | | | | 9,027,502 | | | | 4.6 | | |
| | | | | | | | | Total Common Stock
(Cost $135,954,576) | | | 195,667,445 | | | | 99.8 | | |
SHORT-TERM INVESTMENTS: 1.1% | | | |
| | | | | Mutual Funds: 1.1% | |
| | 2,254,436 | | | | (2 | ) | | BlackRock Liquidity
Funds, FedFund,
Institutional Class,
0.030%
(Cost $2,254,436) | | | 2,254,436 | | | | 1.1 | | |
| | | | | | | Total Short-Term
Investments
(Cost $2,254,436) | | | 2,254,436 | | | | 1.1 | | |
| | | | | | | Total Investments in
Securities
(Cost $138,209,012) | | $ | 197,921,881 | | | | 100.9 | | |
| | | | | | | Liabilities in Excess of
Other Assets | | | (1,677,878 | ) | | | (0.9 | ) | |
| | | | | | | Net Assets | | $ | 196,244,003 | | | | 100.0 | | |
(1) Non-income producing security.
(2) Rate shown is the 7-day yield as of December 31, 2021.
See Accompanying Notes to Financial Statements
131
VY® COLUMBIA PORTFOLIO OF INVESTMENTS
SMALL CAP VALUE II PORTFOLIO AS OF DECEMBER 31, 2021 (CONTINUED)
Fair Value Measurements^
The following is a summary of the fair valuations according to the inputs used as of December 31, 2021 in valuing the assets and liabilities:
| | | Quoted Prices
in Active Markets
for Identical Investments
(Level 1) | | Significant Other
Observable
Inputs
(Level 2) | | Significant
Unobservable
Inputs
(Level 3) | | Fair Value
at
December 31, 2021 | |
Asset Table | |
Investments, at fair value | |
Common Stock* | | $ | 195,667,445 | | | $ | — | | | $ | — | | | $ | 195,667,445 | | |
Short-Term Investments | | | 2,254,436 | | | | — | | | | — | | | | 2,254,436 | | |
Total Investments, at fair value | | $ | 197,921,881 | | | $ | — | | | $ | — | | | $ | 197,921,881 | | |
^ See Note 2, "Significant Accounting Policies" in the Notes to Financial Statements for additional information.
* For further breakdown of Common Stock by sector, please refer to the Portfolio of Investments.
At December 31, 2021, the aggregate cost of securities and other investments and the composition of unrealized appreciation and depreciation of securities and other investments on a tax basis were:
Cost for federal income tax purposes was $138,471,221.
Net unrealized appreciation consisted of: | |
Gross Unrealized Appreciation | | $ | 63,142,607 | | |
Gross Unrealized Depreciation | | | (3,691,948 | ) | |
Net Unrealized Appreciation | | $ | 59,450,659 | | |
See Accompanying Notes to Financial Statements
132
PORTFOLIO OF INVESTMENTS
VY® INVESCO COMSTOCK PORTFOLIO AS OF DECEMBER 31, 2021
Shares | |
| |
| | Value | | Percentage
of Net
Assets | |
COMMON STOCK: 97.5% | | | |
| | | | | Communication Services: 1.3% | |
| | 77,867 | | | | | | | Comcast Corp. -
Class A | | $ | 3,919,046 | | | | 1.3 | | |
| | | | | Consumer Discretionary: 4.5% | |
| | 1,649 | | | | (1 | ) | | Booking Holdings,
Inc. | | | 3,956,330 | | | | 1.3 | | |
| | 22,522 | | | | | | | eBay, Inc. | | | 1,497,713 | | | | 0.5 | | |
| | 100,418 | | | | (1 | ) | | General Motors Co. | | | 5,887,507 | | | | 2.0 | | |
| | 52,806 | | | | (1 | ) | | Las Vegas Sands
Corp. | | | 1,987,618 | | | | 0.7 | | |
| | | | | | | | | | 13,329,168 | | | | 4.5 | | |
| | | | | Consumer Staples: 8.7% | |
| | 77,565 | | | | | | | Altria Group, Inc. | | | 3,675,805 | | | | 1.2 | | |
| | 93,674 | | | | | | | Coca-Cola Co. | | | 5,546,438 | | | | 1.9 | | |
| | 26,347 | | | | | | | Colgate-Palmolive
Co. | | | 2,248,453 | | | | 0.8 | | |
| | 25,587 | | | | | | | Kimberly-Clark Corp. | | | 3,656,894 | | | | 1.2 | | |
| | 51,544 | | | | | | | Kraft Heinz Co. | | | 1,850,430 | | | | 0.6 | | |
| | 92,590 | | | | | | | Philip Morris
International, Inc. | | | 8,796,050 | | | | 3.0 | | |
| | | | | | | | | | 25,774,070 | | | | 8.7 | | |
| | | | | Energy: 11.4% | |
| | 67,487 | | | | | | | Canadian Natural
Resources Ltd. | | | 2,851,638 | | | | 1.0 | | |
| | 48,322 | | | | | | | Chevron Corp. | | | 5,670,587 | | | | 1.9 | | |
| | 35,995 | | | | | | | ConocoPhillips | | | 2,598,119 | | | | 0.9 | | |
| | 127,004 | | | | | | | Devon Energy Corp. | | | 5,594,526 | | | | 1.9 | | |
| | 44,139 | | | | | | | Hess Corp. | | | 3,267,610 | | | | 1.1 | | |
| | 289,713 | | | | | | | Marathon Oil Corp. | | | 4,757,087 | | | | 1.6 | | |
| | 26,753 | | | | | | | Pioneer Natural
Resources Co. | | | 4,865,836 | | | | 1.7 | | |
| | 156,853 | | | | | | | Suncor Energy, Inc. | | | 3,926,031 | | | | 1.3 | | |
| | | | | | | | | | 33,531,434 | | | | 11.4 | | |
| | | | | Financials: 23.3% | |
| | 20,879 | | | | | | | Allstate Corp. | | | 2,456,414 | | | | 0.8 | | |
| | 121,705 | | | | | | | American
International Group,
Inc. | | | 6,920,146 | | | | 2.3 | | |
| | 224,683 | | | | | | | Bank of America
Corp. | | | 9,996,147 | | | | 3.4 | | |
| | 90,632 | | | | | | | Bank of New York
Mellon Corp. | | | 5,263,907 | | | | 1.8 | | |
| | 8,143 | | | | | | | Capital One Financial
Corp. | | | 1,181,468 | | | | 0.4 | | |
| | 139,879 | | | | | | | Citigroup, Inc. | | | 8,447,293 | | | | 2.9 | | |
| | 85,576 | | | | | | | Citizens Financial
Group, Inc. | | | 4,043,466 | | | | 1.4 | | |
| | 92,150 | | | | | | | Fifth Third Bancorp | | | 4,013,132 | | | | 1.4 | | |
Shares | |
| |
| | Value | | Percentage
of Net
Assets | |
| | 12,230 | | | | | | | Goldman Sachs
Group, Inc. | | $ | 4,678,586 | | | | 1.6 | | |
| | 95,635 | | | | | | | Huntington
Bancshares, Inc. | | | 1,474,692 | | | | 0.5 | | |
| | 23,700 | | | | | | | JPMorgan Chase &
Co. | | | 3,752,895 | | | | 1.3 | | |
| | 43,489 | | | | | | | Metlife, Inc. | | | 2,717,628 | | | | 0.9 | | |
| | 41,777 | | | | | | | Morgan Stanley | | | 4,100,830 | | | | 1.4 | | |
| | 25,321 | | | | | | | State Street Corp. | | | 2,354,853 | | | | 0.8 | | |
| | 150,105 | | | | | | | Wells Fargo & Co. | | | 7,202,038 | | | | 2.4 | | |
| | | | | | | | | | 68,603,495 | | | | 23.3 | | |
| | | | | Health Care: 15.5% | |
| | 15,759 | | | | | | | Anthem, Inc. | | | 7,304,927 | | | | 2.5 | | |
| | 5,190 | | | | | | | Becton Dickinson &
Co. | | | 1,305,181 | | | | 0.4 | | |
| | 42,899 | | | | | | | Bristol-Myers Squibb
Co. | | | 2,674,753 | | | | 0.9 | | |
| | 57,310 | | | | | | | CVS Health Corp. | | | 5,912,100 | | | | 2.0 | | |
| | 32,801 | | | | | | | Dentsply Sirona, Inc. | | | 1,829,968 | | | | 0.6 | | |
| | 14,034 | | | | | | | HCA Healthcare, Inc. | | | 3,605,615 | | | | 1.2 | | |
| | 37,308 | | | | (1 | ) | | Henry Schein, Inc. | | | 2,892,489 | | | | 1.0 | | |
| | 28,915 | | | | | | | Johnson & Johnson | | | 4,946,489 | | | | 1.7 | | |
| | 17,708 | | | | | | | McKesson Corp. | | | 4,401,677 | | | | 1.5 | | |
| | 34,210 | | | | | | | Merck & Co., Inc. | | | 2,621,854 | | | | 0.9 | | |
| | 80,698 | | | | | | | Sanofi ADR | | | 4,042,970 | | | | 1.4 | | |
| | 2,804 | | | | | | | UnitedHealth Group,
Inc. | | | 1,408,001 | | | | 0.5 | | |
| | 21,386 | | | | | | | Universal Health
Services, Inc. | | | 2,772,909 | | | | 0.9 | | |
| | | | | | | | | | 45,718,933 | | | | 15.5 | | |
| | | | | Industrials: 12.9% | |
| | 24,687 | | | | | | | Caterpillar, Inc. | | | 5,103,790 | | | | 1.7 | | |
| | 32,927 | | | | | | | Eaton Corp. PLC | | | 5,690,444 | | | | 1.9 | | |
| | 54,200 | | | | | | | Emerson Electric Co. | | | 5,038,974 | | | | 1.7 | | |
| | 18,946 | | | | | | | FedEx Corp. | | | 4,900,194 | | | | 1.7 | | |
| | 36,951 | | | | | | | General Electric Co. | | | 3,490,761 | | | | 1.2 | | |
| | 70,740 | | | | | | | Johnson Controls
International plc | | | 5,751,870 | | | | 1.9 | | |
| | 48,936 | | | | | | | Textron, Inc. | | | 3,777,859 | | | | 1.3 | | |
| | 47,119 | | | | | | | Westinghouse Air
Brake Technologies
Corp. | | | 4,340,131 | | | | 1.5 | | |
| | | | | | | | | | 38,094,023 | | | | 12.9 | | |
| | | | | Information Technology: 12.7% | |
| | 75,057 | | | | | | | CDK Global, Inc. | | | 3,132,879 | | | | 1.1 | | |
| | 107,425 | | | | | | | Cisco Systems, Inc. | | | 6,807,522 | | | | 2.3 | | |
| | 72,328 | | | | | | | Cognizant Technology
Solutions Corp. | | | 6,416,940 | | | | 2.2 | | |
| | 111,974 | | | | (1 | ) | | DXC Technology Co. | | | 3,604,443 | | | | 1.2 | | |
| | 43,294 | | | | | | | Intel Corp. | | | 2,229,641 | | | | 0.7 | | |
| | 15,625 | | | | | | | Microsoft Corp. | | | 5,255,000 | | | | 1.8 | | |
See Accompanying Notes to Financial Statements
133
PORTFOLIO OF INVESTMENTS
VY® INVESCO COMSTOCK PORTFOLIO AS OF DECEMBER 31, 2021 (CONTINUED)
Shares | |
| |
| | Value | | Percentage
of Net
Assets | |
| | | | | Information Technology (continued) | |
| | 24,079 | | | | | | | NXP Semiconductor
NV - NXPI - US | | $ | 5,484,715 | | | | 1.9 | | |
| | 24,554 | | | | | | | Qualcomm, Inc. | | | 4,490,190 | | | | 1.5 | | |
| | | | | | | | | | 37,421,330 | | | | 12.7 | | |
| | | | | Materials: 4.5% | |
| | 62,883 | | | | | | | CF Industries
Holdings, Inc. | | | 4,450,859 | | | | 1.5 | | |
| | 99,684 | | | | | | | Corteva, Inc. | | | 4,713,059 | | | | 1.6 | | |
| | 85,724 | | | | | | | International Paper
Co. | | | 4,027,314 | | | | 1.4 | | |
| | | | | | | | | | 13,191,232 | | | | 4.5 | | |
| | | | | Real Estate: 1.0% | |
| | 176,514 | | | | (1 | ) | | Host Hotels &
Resorts, Inc. | | | 3,069,578 | | | | 1.0 | | |
| | | | | Utilities: 1.7% | |
| | 84,732 | | | | | | | Exelon Corp. | | | 4,894,120 | | | | 1.7 | | |
| | | | | | | Total Common Stock
(Cost $212,159,327) | | | 287,546,429 | | | | 97.5 | | |
Shares | |
| |
| | Value | | Percentage
of Net
Assets | |
SHORT-TERM INVESTMENTS: 3.5% | |
| | | | | Mutual Funds: 3.5% | |
| | 10,252,966 | | | | (2 | ) | | BlackRock Liquidity
Funds, FedFund,
Institutional Class,
0.030%
(Cost $10,252,966) | | $ | 10,252,966 | | | | 3.5 | | |
| | | | | Total Short-Term
Investments
(Cost $10,252,966) | | | 10,252,966 | | | | 3.5 | | |
| | | | | Total Investments in
Securities
(Cost $222,412,293) | | $ | 297,799,395 | | | | 101.0 | | |
| | | | | Liabilities in Excess
of Other Assets | | | (2,809,638 | ) | | | (1.0 | ) | |
| | | | | Net Assets | | $ | 294,989,757 | | | | 100.0 | | |
ADR American Depositary Receipt
(1) Non-income producing security.
(2) Rate shown is the 7-day yield as of December 31, 2021.
Fair Value Measurements^
The following is a summary of the fair valuations according to the inputs used as of December 31, 2021 in valuing the assets and liabilities:
| | | Quoted Prices
in Active Markets
for Identical Investments
(Level 1) | | Significant Other
Observable
Inputs
(Level 2) | | Significant
Unobservable
Inputs
(Level 3) | | Fair Value
at
December 31, 2021 | |
Asset Table | |
Investments, at fair value | |
Common Stock* | | $ | 287,546,429 | | | $ | — | | | $ | — | | | $ | 287,546,429 | | |
Short-Term Investments | | | 10,252,966 | | | | — | | | | — | | | | 10,252,966 | | |
Total Investments, at fair value | | $ | 297,799,395 | | | $ | — | | | $ | — | | | $ | 297,799,395 | | |
Other Financial Instruments+ | |
Forward Foreign Currency Contracts | | | — | | | | 4,727 | | | | — | | | | 4,727 | | |
Total Assets | | $ | 297,799,395 | | | $ | 4,727 | | | $ | — | | | $ | 297,804,122 | | |
Liabilities Table | |
Other Financial Instruments+ | |
Forward Foreign Currency Contracts | | $ | — | | | $ | (52,328 | ) | | $ | — | | | $ | (52,328 | ) | |
Total Liabilities | | $ | — | | | $ | (52,328 | ) | | $ | — | | | $ | (52,328 | ) | |
^ See Note 2, "Significant Accounting Policies" in the Notes to Financial Statements for additional information.
+ Other Financial Instruments may include open forward foreign currency contracts, futures, centrally cleared swaps, OTC swaps and written options. Forward foreign currency contracts, futures and centrally cleared swaps are fair valued at the unrealized appreciation (depreciation) on the instrument. OTC swaps and written options are valued at the fair value of the instrument.
* For further breakdown of Common Stock by sector, please refer to the Portfolio of Investments.
See Accompanying Notes to Financial Statements
134
PORTFOLIO OF INVESTMENTS
VY® INVESCO COMSTOCK PORTFOLIO AS OF DECEMBER 31, 2021 (CONTINUED)
At December 31, 2021, the following forward foreign currency contracts were outstanding for VY® Invesco Comstock Portfolio:
Currency
Purchased | | Currency Sold | | Counterparty | | Settlement
Date | | Unrealized
Appreciation
(Depreciation) | |
CAD | 172,528 | | | USD | 135,249 | | | CIBC World Markets Corp. | | 01/07/22 | | $ | 1,141 | | |
USD | 3,317,988 | | | CAD | 4,249,268 | | | CIBC World Markets Corp. | | 01/07/22 | | | (41,239 | ) | |
USD | 54,272 | | | EUR | 47,986 | | | Deutsche Bank AG | | 01/07/22 | | | (364 | ) | |
CAD | 92,380 | | | USD | 71,876 | | | Deutsche Bank AG | | 01/07/22 | | | 1,154 | | |
USD | 63,981 | | | EUR | 56,635 | | | Deutsche Bank AG | | 01/07/22 | | | (502 | ) | |
CAD | 120,915 | | | USD | 95,032 | | | Deutsche Bank AG | | 01/07/22 | | | 557 | | |
USD | 90,660 | | | CAD | 114,640 | | | Goldman Sachs International | | 01/07/22 | | | 33 | | |
CAD | 90,073 | | | USD | 69,606 | | | JPMorgan Chase Bank N.A. | | 01/07/22 | | | 1,601 | | |
USD | 103,660 | | | CAD | 132,808 | | | RBC Capital Markets Corp. | | 01/07/22 | | | (1,330 | ) | |
USD | 87,625 | | | CAD | 110,782 | | | RBC Capital Markets Corp. | | 01/07/22 | | | 47 | | |
USD | 1,904,493 | | | EUR | 1,679,394 | | | RBC Capital Markets Corp. | | 01/07/22 | | | (7,614 | ) | |
USD | 87,640 | | | CAD | 112,478 | | | State Street Bank and Trust Co. | | 01/07/22 | | | (1,279 | ) | |
CAD | 33,985 | | | USD | 26,672 | | | UBS AG | | 01/04/22 | | | 194 | | |
| | | | | | | | | | | $ | (47,601 | ) | |
Currency Abbreviations
CAD — Canadian Dollar
EUR — EU Euro
USD — United States Dollar
A summary of derivative instruments by primary risk exposure is outlined in the following tables.
The fair value of derivative instruments as of December 31, 2021 was as follows:
Derivatives not accounted
for as hedging instruments | | Location on Statement of Assets and Liabilities | | Fair Value | |
Asset Derivatives | |
Foreign exchange contracts | | Unrealized appreciation on forward foreign currency contracts | | $ | 4,727 | | |
Total Asset Derivatives | | | | $ | 4,727 | | |
Liability Derivatives | |
Foreign exchange contracts | | Unrealized depreciation on forward foreign currency contracts | | $ | 52,328 | | |
Total Liability Derivatives | | | | $ | 52,328 | | |
The effect of derivative instruments on the Portfolio's Statement of Operations for the year ended December 31, 2021 was as follows:
| | | Amount of Realized Gain or (Loss) on Derivatives Recognized in Income | |
Derivatives not accounted
for as hedging instruments | | Forward foreign currency contracts | |
Foreign exchange contracts | | $ | 178,219 | | |
Total | | $ | 178,219 | | |
| | | Change in Unrealized Appreciation or (Depreciation) on Derivatives Recognized in Income | |
Derivatives not accounted
for as hedging instruments | | Forward foreign currency contracts | |
Foreign exchange contracts | | $ | 41,646 | | |
Total | | $ | 41,646 | | |
See Accompanying Notes to Financial Statements
135
PORTFOLIO OF INVESTMENTS
VY® INVESCO COMSTOCK PORTFOLIO AS OF DECEMBER 31, 2021 (CONTINUED)
The following is a summary by counterparty of the fair value of OTC derivative instruments subject to Master Netting Agreements and collateral pledged (received), if any, at December 31, 2021:
| | | CIBC World
Markets Corp. | | Deutsche
Bank
AG | | Goldman
Sachs
International | | JPMorgan
Chase
Bank N.A. | | RBC Capital
Markets
Corp. | | State Street
Bank and
Trust Co. | | UBS AG | | Totals | |
Assets: | |
Forward foreign currency contracts | | $ | 1,141 | | | $ | 1,711 | | | $ | 33 | | | $ | 1,601 | | | $ | 47 | | | $ | — | | | $ | 194 | | | $ | 4,727 | | |
Total Assets | | $ | 1,141 | | | $ | 1,711 | | | $ | 33 | | | $ | 1,601 | | | $ | 47 | | | $ | — | | | $ | 194 | | | $ | 4,727 | | |
Liabilities: | |
Forward foreign currency contracts | | $ | 41,239 | | | $ | 866 | | | $ | — | | | $ | — | | | $ | 8,944 | | | $ | 1,279 | | | $ | — | | | $ | 52,328 | | |
Total Liabilities | | $ | 41,239 | | | $ | 866 | | | $ | — | | | $ | — | | | $ | 8,944 | | | $ | 1,279 | | | $ | — | | | $ | 52,328 | | |
Net OTC derivative instruments by
counterparty, at fair value | | $ | (40,098 | ) | | $ | 845 | | | $ | 33 | | | $ | 1,601 | | | $ | (8,897 | ) | | $ | (1,279 | ) | | $ | 194 | | | $ | (47,601 | ) | |
Total collateral pledged by
the Portfolio/(Received from
counterparty) | | $ | — | | | | | | | | | $ | — | | | | | | | $ | — | | |
Net Exposure(1) | | $ | (40,098 | ) | | $ | 845 | | | $ | 33 | | | $ | 1,601 | | | $ | (8,897 | ) | | $ | (1,279 | ) | | $ | 194 | | | $ | (47,601 | ) | |
(1) Positive net exposure represents amounts due from each respective counterparty. Negative exposure represents amounts due from the Portfolio. Please refer to Note 2 for additional details regarding counterparty credit risk and credit related contingent features.
At December 31, 2021, the aggregate cost of securities and other investments and the composition of unrealized appreciation and depreciation of securities and other investments on a tax basis were:
Cost for federal income tax purposes was $229,280,137.
Net unrealized appreciation consisted of: | |
Gross Unrealized Appreciation | | $ | 77,225,302 | | |
Gross Unrealized Depreciation | | | (8,750,357 | ) | |
Net Unrealized Appreciation | | $ | 68,474,945 | | |
See Accompanying Notes to Financial Statements
136
VY® INVESCO PORTFOLIO OF INVESTMENTS
EQUITY AND INCOME PORTFOLIO AS OF DECEMBER 31, 2021
Shares | | | | | | Value | | Percentage
of Net
Assets | |
COMMON STOCK: 63.2% | | | |
| | | | | Communication Services: 4.5% | |
| | 18,158 | | | | (1 | ) | | Charter
Communications,
Inc. | | $ | 11,838,471 | | | | 0.9 | | |
| | 271,096 | | | | | | | Comcast Corp. -
Class A | | | 13,644,262 | | | | 1.0 | | |
| | 15,371 | | | | (1 | ) | | NetFlix, Inc. | | | 9,260,105 | | | | 0.7 | | |
| | 92,060 | | | | (1 | ) | | T-Mobile US, Inc. | | | 10,677,119 | | | | 0.8 | | |
| | 89,565 | | | | (1 | ) | | Walt Disney Co. | | | 13,872,723 | | | | 1.1 | | |
| | | | | | | | | | 59,292,680 | | | | 4.5 | | |
| | | | | Consumer Discretionary: 5.2% | |
| | 1,905 | | | | (1 | ) | | Amazon.com, Inc. | | | 6,351,918 | | | | 0.5 | | |
| | 4,621 | | | | (1 | ) | | Booking Holdings, Inc. | | | 11,086,842 | | | | 0.8 | | |
| | 513,797 | | | | (1 | ) | | General Motors Co. | | | 30,123,918 | | | | 2.3 | | |
| | 156,569 | | | | (1 | ) | | Las Vegas Sands
Corp. | | | 5,893,257 | | | | 0.5 | | |
| | 196,669 | | | | | | | TJX Cos., Inc. | | | 14,931,110 | | | | 1.1 | | |
| | | | | | | | | | 68,387,045 | | | | 5.2 | | |
| | | | | Consumer Staples: 3.3% | |
| | 186,927 | | | | | | | Diageo PLC | | | 10,220,405 | | | | 0.8 | | |
| | 187,692 | | | | | | | Philip Morris
International, Inc. | | | 17,830,740 | | | | 1.3 | | |
| | 97,358 | | | | | | | Sysco Corp. | | | 7,647,471 | | | | 0.6 | | |
| | 215,448 | | | | (1 | ) | | US Foods Holding
Corp. | | | 7,504,054 | | | | 0.6 | | |
| | | | | | | | | | 43,202,670 | | | | 3.3 | | |
| | | | | Energy: 4.5% | |
| | 164,015 | | | | | | | Canadian Natural
Resources Ltd. | | | 6,930,394 | | | | 0.5 | | |
| | 115,740 | | | | | | | Chevron Corp. | | | 13,582,089 | | | | 1.1 | | |
| | 238,917 | | | | | | | ConocoPhillips | | | 17,245,029 | | | | 1.3 | | |
| | 274,397 | | | | | | | Devon Energy Corp. | | | 12,087,188 | | | | 0.9 | | |
| | 46,520 | | | | | | | Pioneer Natural
Resources Co. | | | 8,461,057 | | | | 0.7 | | |
| | | | | | | | | | 58,305,757 | | | | 4.5 | | |
| | | | | Financials: 14.1% | |
| | 79,521 | | | | | | | American Express Co. | | | 13,009,636 | | | | 1.0 | | |
| | 355,365 | | | | | | | American International
Group, Inc. | | | 20,206,054 | | | | 1.5 | | |
| | 565,552 | | | | | | | Bank of America Corp. | | | 25,161,409 | | | | 1.9 | | |
| | 145,128 | | | | | | | Charles Schwab Corp. | | | 12,205,265 | | | | 0.9 | | |
| | 364,805 | | | | | | | Citizens Financial
Group, Inc. | | | 17,237,036 | | | | 1.3 | | |
| | 43,753 | | | | | | | Goldman Sachs
Group, Inc. | | | 16,737,710 | | | | 1.3 | | |
| | 166,656 | | | | | | | Morgan Stanley | | | 16,358,953 | | | | 1.3 | | |
| | 40,227 | | | | | | | PNC Financial
Services Group, Inc. | | | 8,066,318 | | | | 0.6 | | |
| | 240,735 | | | | | | | Truist Financial Corp. | | | 14,095,034 | | | | 1.1 | | |
Shares | | | | | | Value | | Percentage
of Net
Assets | |
| | 662,194 | | | | | | | Wells Fargo & Co. | | $ | 31,772,068 | | | | 2.4 | | |
| | 41,154 | | | | | | | Willis Towers
Watson PLC | | | 9,773,663 | | | | 0.8 | | |
| | | | | | | | | | 184,623,146 | | | | 14.1 | | |
| | | | | Health Care: 9.9% | |
| | 21,388 | | | | | | | Anthem, Inc. | | | 9,914,194 | | | | 0.8 | | |
| | 211,810 | | | | | | | Bristol-Myers
Squibb Co. | | | 13,206,354 | | | | 1.0 | | |
| | 96,633 | | | | (1 | ) | | Centene Corp. | | | 7,962,559 | | | | 0.6 | | |
| | 49,202 | | | | | | | Cigna Corp. | | | 11,298,255 | | | | 0.9 | | |
| | 96,001 | | | | | | | CVS Health Corp. | | | 9,903,463 | | | | 0.8 | | |
| | 318,652 | | | | | | | GlaxoSmithKline PLC | | | 6,937,914 | | | | 0.5 | | |
| | 41,708 | | | | | | | Johnson & Johnson | | | 7,134,988 | | | | 0.5 | | |
| | 43,581 | | | | | | | McKesson Corp. | | | 10,832,929 | | | | 0.8 | | |
| | 83,949 | | | | | | | Medtronic PLC | | | 8,684,524 | | | | 0.7 | | |
| | 179,807 | | | | | | | Merck & Co., Inc. | | | 13,780,408 | | | | 1.1 | | |
| | 119,822 | | | | | | | Pfizer, Inc. | | | 7,075,489 | | | | 0.5 | | |
| | 106,065 | | | | | | | Sanofi | | | 10,642,974 | | | | 0.8 | | |
| | 49,586 | | | | | | | Universal Health
Services, Inc. | | | 6,429,321 | | | | 0.5 | | |
| | 46,494 | | | | | | | Zimmer Biomet
Holdings, Inc. | | | 5,906,598 | | | | 0.4 | | |
| | | | | | | | | | 129,709,970 | | | | 9.9 | | |
| | | | | Industrials: 7.8% | |
| | 546,125 | | | | | | | CSX Corp. | | | 20,534,300 | | | | 1.6 | | |
| | 76,582 | | | | | | | Emerson Electric Co. | | | 7,119,829 | | | | 0.5 | | |
| | 32,908 | | | | | | | General Dynamics
Corp. | | | 6,860,331 | | | | 0.5 | | |
| | 159,362 | | | | | | | Johnson Controls
International plc | | | 12,957,724 | | | | 1.0 | | |
| | 34,304 | | | | | | | Parker Hannifin Corp. | | | 10,912,788 | | | | 0.8 | | |
| | 88,113 | | | | | | | Quanta Services, Inc. | | | 10,103,037 | | | | 0.8 | | |
| | 215,651 | | | | | | | Raytheon
Technologies Corp. | | | 18,558,925 | | | | 1.4 | | |
| | 197,815 | | | | | | | Textron, Inc. | | | 15,271,318 | | | | 1.2 | | |
| | | | | | | | | | 102,318,252 | | | | 7.8 | | |
| | | | | Information Technology: 8.5% | |
| | 306,560 | | | | | | | Cisco Systems, Inc. | | | 19,426,707 | | | | 1.5 | | |
| | 298,322 | | | | | | | Cognizant Technology
Solutions Corp. | | | 26,467,128 | | | | 2.0 | | |
| | 166,069 | | | | | | | Corning, Inc. | | | 6,182,749 | | | | 0.5 | | |
| | 80,759 | | | | (1 | ) | | Fiserv, Inc. | | | 8,381,976 | | | | 0.6 | | |
| | 254,327 | | | | | | | Intel Corp. | | | 13,097,840 | | | | 1.0 | | |
| | 43,647 | | | | | | | NXP Semiconductor
NV - NXPI - US | | | 9,941,914 | | | | 0.7 | | |
| | 70,310 | | | | | | | Qualcomm, Inc. | | | 12,857,590 | | | | 1.0 | | |
| | 54,257 | | | | (1 | ) | | Splunk, Inc. | | | 6,278,620 | | | | 0.5 | | |
| | 55,894 | | | | | | | TE Connectivity Ltd. | | | 9,017,938 | | | | 0.7 | | |
| | | | | | | | | | 111,652,462 | | | | 8.5 | | |
See Accompanying Notes to Financial Statements
137
VY® INVESCO PORTFOLIO OF INVESTMENTS
EQUITY AND INCOME PORTFOLIO AS OF DECEMBER 31, 2021 (CONTINUED)
Shares | | | | | | Value | | Percentage
of Net
Assets | |
| | | | | Materials: 1.9% | |
| | 209,153 | | | | (1 | ) | | Axalta Coating
Systems Ltd. | | $ | 6,927,147 | | | | 0.5 | | |
| | 301,355 | | | | | | | Barrick Gold Corp. | | | 5,725,745 | | | | 0.5 | | |
| | 247,918 | | | | | | | Corteva, Inc. | | | 11,721,563 | | | | 0.9 | | |
| | | | | | | | | | 24,374,455 | | | | 1.9 | | |
| | | | | Real Estate: 1.9% | |
| | 226,998 | | | | (1 | ) | | CBRE Group, Inc. | | | 24,631,553 | | | | 1.9 | | |
| | | | | Utilities: 1.6% | |
| | 77,535 | | | | | | | American Electric
Power Co., Inc. | | | 6,898,289 | | | | 0.5 | | |
| | 125,234 | | | | | | | Exelon Corp. | | | 7,233,516 | | | | 0.6 | | |
| | 170,332 | | | | | | | FirstEnergy Corp. | | | 7,084,108 | | | | 0.5 | | |
| | | | | | | | | | 21,215,913 | | | | 1.6 | | |
| | | | | | | | | Total Common Stock
(Cost $583,540,881) | | | 827,713,903 | | | | 63.2 | | |
PREFERRED STOCK: 0.9% | | | |
| | | | | Energy: 0.5% | |
| | 140,612 | | | | (2 | ) | | El Paso Energy
Capital Trust I | | | 7,113,561 | | | | 0.5 | | |
| | | | | Financials: 0.4% | |
| | 75,900 | | | | | | | AMG Capital Trust II | | | 4,454,381 | | | | 0.4 | | |
| | 4,000 | | | | (2 | ),(3) | | Wells Fargo & Co. | | | 107,160 | | | | 0.0 | | |
| | | | | | | | | | 4,561,541 | | | | 0.4 | | |
| | | | | | | | | Total Preferred Stock
(Cost $10,847,296) | | | 11,675,102 | | | | 0.9 | | |
Principal
Amount† | |
| |
| | Value | | Percentage
of Net
Assets | |
CORPORATE BONDS/NOTES: 11.9% | | | |
| | | | | Basic Materials: 0.1% | |
| | 441,000 | | | | (4 | ) | | LYB Finance Co. BV,
8.100%, 03/15/2027 | | $ | 565,962 | | | | 0.1 | | |
| | 195,000 | | | | | | | International Paper
Co., 6.000%,
11/15/2041 | | | 269,944 | | | | 0.0 | | |
| | 150,000 | | | | | | | Rio Tinto Finance
USA Ltd., 7.125%,
07/15/2028 | | | 195,713 | | | | 0.0 | | |
| | 211,000 | | | | | | | Sherwin-Williams
Co/The, 4.500%,
06/01/2047 | | | 263,626 | | | | 0.0 | | |
| | | | | | | | | | 1,295,245 | | | | 0.1 | | |
| | | | | Communications: 1.4% | |
| | 2,307,000 | | | | | | | Amazon.com, Inc.,
2.875%, 05/12/2041 | | | 2,400,215 | | | | 0.2 | | |
Principal
Amount† | | | | | | Value | | Percentage
of Net
Assets | |
| | 455,000 | | | | | | | America Movil
SAB de CV,
4.375%, 07/16/2042 | | $ | 541,303 | | | | 0.0 | | |
| | 837,000 | | | | | | | AT&T, Inc., 3.000%,
06/30/2022 | | | 843,442 | | | | 0.1 | | |
| | 125,000 | | | | | | | AT&T, Inc., 3.500%,
09/15/2053 | | | 126,348 | | | | 0.0 | | |
| | 334,000 | | | | | | | AT&T, Inc., 3.550%,
09/15/2055 | | | 335,776 | | | | 0.0 | | |
| | 533,000 | | | | | | | AT&T, Inc., 4.300%,
02/15/2030 | | | 600,504 | | | | 0.0 | | |
| | 958,000 | | | | | | | Charter
Communications
Operating LLC /
Charter
Communications
Operating Capital,
3.850%, 04/01/2061 | | | 906,126 | | | | 0.1 | | |
| | 1,635,000 | | | | | | | Charter
Communications
Operating LLC /
Charter
Communications
Operating Capital,
4.464%, 07/23/2022 | | | 1,659,301 | | | | 0.1 | | |
| | 171,000 | | | | (4 | ) | | Comcast Corp.,
2.887%, 11/01/2051 | | | 165,836 | | | | 0.0 | | |
| | 283,000 | | | | (4 | ) | | Comcast Corp.,
2.937%, 11/01/2056 | | | 270,305 | | | | 0.0 | | |
| | 910,000 | | | | | | | Comcast Corp.,
3.900%, 03/01/2038 | | | 1,031,621 | | | | 0.1 | | |
| | 1,055,000 | | | | | | | Comcast Corp.,
4.150%, 10/15/2028 | | | 1,198,428 | | | | 0.1 | | |
| | 188,000 | | | | (4 | ) | | Cox Communications,
Inc., 2.950%,
10/01/2050 | | | 176,036 | | | | 0.0 | | |
| | 910,000 | | | | | | | Rogers
Communications,
Inc., 4.300%,
02/15/2048 | | | 1,043,935 | | | | 0.1 | | |
| | 415,000 | | | | | | | Rogers
Communications,
Inc., 4.500%,
03/15/2043 | | | 477,316 | | | | 0.0 | | |
| | 390,000 | | | | | | | Telefonica
Emisiones SAU,
4.665%, 03/06/2038 | | | 449,487 | | | | 0.0 | | |
| | 860,000 | | | | | | | Telefonica
Emisiones SAU,
5.213%, 03/08/2047 | | | 1,070,294 | | | | 0.1 | | |
| | 1,025,000 | | | | (4 | ) | | T-Mobile USA, Inc.,
2.700%, 03/15/2032 | | | 1,032,472 | | | | 0.1 | | |
| | 714,000 | | | | (4 | ) | | T-Mobile USA, Inc.,
3.400%, 10/15/2052 | | | 712,035 | | | | 0.1 | | |
| | 539,000 | | | | | | | Verizon
Communications,
Inc., 3.400%,
03/22/2041 | | | 565,308 | | | | 0.0 | | |
| | 535,000 | | | | | | | Verizon
Communications,
Inc., 4.400%,
11/01/2034 | | | 624,129 | | | | 0.1 | | |
See Accompanying Notes to Financial Statements
138
VY® INVESCO PORTFOLIO OF INVESTMENTS
EQUITY AND INCOME PORTFOLIO AS OF DECEMBER 31, 2021 (CONTINUED)
Principal
Amount† | | | | | | Value | | Percentage
of Net
Assets | |
| | | | | Communications (continued) | |
| | 833,000 | | | | | | | Verizon
Communications,
Inc., 4.812%,
03/15/2039 | | $ | 1,046,456 | | | | 0.1 | | |
| | 1,350,000 | | | | | | | Walt Disney Co/The,
3.000%, 09/15/2022 | | | 1,373,745 | | | | 0.1 | | |
| | | | | | | | | | 18,650,418 | | | | 1.4 | | |
| | | | | Consumer, Cyclical: 0.7% | |
| | 472,151 | | | | | | | American Airlines
2014-1 Class A Pass
Through Trust,
3.700%, 04/01/2028 | | | 479,996 | | | | 0.0 | | |
| | 595,000 | | | | | | | Dollar General Corp.,
3.250%, 04/15/2023 | | | 609,571 | | | | 0.0 | | |
| | 563,000 | | | | | | | General Motors Co.,
6.600%, 04/01/2036 | | | 762,672 | | | | 0.1 | | |
| | 713,000 | | | | | | | General Motors
Financial Co., Inc.,
5.250%, 03/01/2026 | | | 800,306 | | | | 0.1 | | |
| | 1,920,000 | | | | | | | Home Depot, Inc./The,
2.625%, 06/01/2022 | | | 1,934,898 | | | | 0.1 | | |
| | 740,000 | | | | | | | Starbucks Corp.,
3.550%, 08/15/2029 | | | 809,047 | | | | 0.1 | | |
| | 2,400,000 | | | | | | | Toyota Motor Credit
Corp., 2.600%,
01/11/2022 | | | 2,401,025 | | | | 0.2 | | |
| | 232,656 | | | | | | | United Airlines 2012-1
Class A Pass
Through Trust,
4.150%, 10/11/2025 | | | 241,462 | | | | 0.0 | | |
| | 586,639 | | | | | | | United Airlines 2014-2
Class A Pass
Through Trust,
3.750%, 03/03/2028 | | | 614,014 | | | | 0.0 | | |
| | 515,207 | | | | | | | United Airlines 2018-1
Class AA Pass
Through Trust,
3.500%, 09/01/2031 | | | 538,411 | | | | 0.0 | | |
| | 737,000 | | | | | | | Walgreens Boots
Alliance, Inc.,
4.500%, 11/18/2034 | | | 848,850 | | | | 0.1 | | |
| | | | | | | | | | 10,040,252 | | | | 0.7 | | |
| | | | | Consumer, Non-cyclical: 1.5% | |
| | 1,299,000 | | | | | | | AbbVie, Inc.,
4.050%, 11/21/2039 | | | 1,493,307 | | | | 0.1 | | |
| | 1,137,000 | | | | | | | AbbVie, Inc.,
4.500%, 05/14/2035 | | | 1,362,283 | | | | 0.1 | | |
| | 185,000 | | | | | | | AbbVie, Inc.,
4.850%, 06/15/2044 | | | 232,362 | | | | 0.0 | | |
| | 1,273,000 | | | | | | | Altria Group, Inc.,
5.800%, 02/14/2039 | | | 1,532,353 | | | | 0.1 | | |
| | 1,475,000 | | | | | | | Anheuser-Busch Cos
LLC / Anheuser-
Busch InBev
Worldwide, Inc.,
4.700%, 02/01/2036 | | | 1,782,868 | | | | 0.1 | | |
Principal
Amount† | | | | | | Value | | Percentage
of Net
Assets | |
| | 216,000 | | | | | | | Anheuser-Busch Cos
LLC / Anheuser-
Busch InBev
Worldwide, Inc.,
4.900%, 02/01/2046 | | $ | 273,639 | | | | 0.0 | | |
| | 2,770,000 | | | | | | | AstraZeneca PLC,
2.375%, 06/12/2022 | | | 2,787,698 | | | | 0.2 | | |
| | 498,000 | | | | (4 | ) | | Bayer US Finance II
LLC, 4.375%,
12/15/2028 | | | 556,733 | | | | 0.1 | | |
| | 218,000 | | | | | | | Becton Dickinson &
Co., 4.875%,
05/15/2044 | | | 262,159 | | | | 0.0 | | |
| | 654,000 | | | | | | | Bristol-Myers
Squibb Co.,
4.125%, 06/15/2039 | | | 774,992 | | | | 0.1 | | |
| | 107,000 | | | | | | | Cigna Corp.,
4.800%, 08/15/2038 | | | 131,847 | | | | 0.0 | | |
| | 620,000 | | | | | | | CVS Health Corp.,
3.375%, 08/12/2024 | | | 651,986 | | | | 0.1 | | |
| | 393,818 | | | | | | | CVS Pass-Through
Trust, 6.036%,
12/10/2028 | | | 449,105 | | | | 0.0 | | |
| | 1,975,000 | | | | | | | Gilead Sciences, Inc.,
3.250%, 09/01/2022 | | | 2,001,879 | | | | 0.2 | | |
| | 80,000 | | | | | | | GlaxoSmithKline
Capital, Inc.,
6.375%, 05/15/2038 | | | 117,261 | | | | 0.0 | | |
| | 1,232,000 | | | | (4 | ) | | Heineken NV,
3.500%, 01/29/2028 | | | 1,327,774 | | | | 0.1 | | |
| | 240,000 | | | | | | | Ingredion, Inc.,
6.625%, 04/15/2037 | | | 335,866 | | | | 0.0 | | |
| | 423,000 | | | | | | | Laboratory Corp.
of America Holdings,
4.700%, 02/01/2045 | | | 516,036 | | | | 0.1 | | |
| | 92,000 | | | | | | | Mead Johnson
Nutrition Co.,
4.125%, 11/15/2025 | | | 100,343 | | | | 0.0 | | |
| | 413,000 | | | | | | | Medtronic, Inc.,
4.375%, 03/15/2035 | | | 508,843 | | | | 0.0 | | |
| | 513,000 | | | | | | | Molson Coors
Beverage Co.,
4.200%, 07/15/2046 | | | 570,050 | | | | 0.1 | | |
| | 275,000 | | | | | | | Philip Morris
International, Inc.,
3.600%, 11/15/2023 | | | 288,531 | | | | 0.0 | | |
| | 820,000 | | | | | | | Philip Morris
International, Inc.,
4.875%, 11/15/2043 | | | 1,000,191 | | | | 0.1 | | |
| | 155,000 | | | | | | | UnitedHealth
Group, Inc.,
3.500%, 08/15/2039 | | | 172,187 | | | | 0.0 | | |
| | 79,000 | | | | | | | Zoetis, Inc.,
4.700%, 02/01/2043 | | | 100,916 | | | | 0.0 | | |
| | | | | | | | | | 19,331,209 | | | | 1.5 | | |
See Accompanying Notes to Financial Statements
139
VY® INVESCO PORTFOLIO OF INVESTMENTS
EQUITY AND INCOME PORTFOLIO AS OF DECEMBER 31, 2021 (CONTINUED)
Principal
Amount† | | | | | | Value | | Percentage
of Net
Assets | |
| | | | | Energy: 1.0% | |
| | 927,000 | | | | | | | BP Capital Markets
America, Inc.,
2.939%, 06/04/2051 | | $ | 892,271 | | | | 0.1 | | |
| | 612,000 | | | | (4 | ) | | Cameron LNG LLC,
3.701%, 01/15/2039 | | | 661,059 | | | | 0.0 | | |
| | 1,275,000 | | | | | | | Chevron Corp.,
2.498%, 03/03/2022 | | | 1,277,280 | | | | 0.1 | | |
| | 392,000 | | | | | | | ConocoPhillips Co.,
4.150%, 11/15/2034 | | | 445,209 | | | | 0.0 | | |
| | 182,000 | | | | | | | Energy Transfer L.P.,
4.200%, 09/15/2023 | | | 190,134 | | | | 0.0 | | |
| | 570,000 | | | | | | | Energy Transfer L.P.,
4.900%, 03/15/2035 | | | 645,916 | | | | 0.0 | | |
| | 723,000 | | | | | | | Energy Transfer L.P.,
5.000%, 05/15/2050 | | | 833,978 | | | | 0.1 | | |
| | 835,000 | | | | | | | Energy Transfer L.P.,
5.300%, 04/01/2044 | | | 958,241 | | | | 0.1 | | |
| | 833,000 | | | | | | | Enterprise Products
Operating LLC,
4.250%, 02/15/2048 | | | 945,182 | | | | 0.1 | | |
| | 700,000 | | | | | | | Kinder Morgan, Inc.,
5.300%, 12/01/2034 | | | 843,676 | | | | 0.1 | | |
| | 2,340,000 | | | | | | | MPLX L.P.,
4.500%, 07/15/2023 | | | 2,436,831 | | | | 0.2 | | |
| | 973,000 | | | | | | | MPLX L.P.,
4.500%, 04/15/2038 | | | 1,091,547 | | | | 0.1 | | |
| | 295,000 | | | | | | | Plains All American
Pipeline L.P. / PAA
Finance Corp.,
3.650%, 06/01/2022 | | | 296,461 | | | | 0.0 | | |
| | 858,000 | | | | | | | Spectra Energy
Partners L.P.,
4.500%, 03/15/2045 | | | 994,199 | | | | 0.1 | | |
| | 215,000 | | | | | | | Texas Eastern
Transmission L.P.,
7.000%, 07/15/2032 | | | 291,588 | | | | 0.0 | | |
| | | | | | | | | | 12,803,572 | | | | 1.0 | | |
| | | | | Financial: 4.5% | |
| | 391,000 | | | | | | | AerCap Ireland
Capital DAC /
AerCap Global
Aviation Trust,
3.850%, 10/29/2041 | | | 407,998 | | | | 0.0 | | |
| | 231,000 | | | | | | | Air Lease Corp.,
3.000%, 09/15/2023 | | | 237,166 | | | | 0.0 | | |
| | 1,870,000 | | | | | | | Air Lease Corp.,
4.250%, 09/15/2024 | | | 1,990,435 | | | | 0.2 | | |
| | 885,000 | | | | | | | Aircastle Ltd.,
4.400%, 09/25/2023 | | | 927,650 | | | | 0.1 | | |
| | 410,000 | | | | | | | Allstate Corp./The,
3.280%, 12/15/2026 | | | 440,619 | | | | 0.0 | | |
| | 393,000 | | | | | | | American Equity
Investment Life
Holding Co.,
5.000%, 06/15/2027 | | | 445,336 | | | | 0.0 | | |
Principal
Amount† | | | | | | Value | | Percentage
of Net
Assets | |
| | 543,000 | | | | | | | American Express Co.,
3.625%, 12/05/2024 | | $ | 580,629 | | | | 0.0 | | |
| | 1,140,000 | | | | | | | American International
Group, Inc.,
4.375%, 01/15/2055 | | | 1,402,319 | | | | 0.1 | | |
| | 831,000 | | | | | | | American Tower Corp.,
1.600%, 04/15/2026 | | | 823,319 | | | | 0.1 | | |
| | 455,000 | | | | (4 | ) | | ANZ New Zealand
Int'l Ltd./London,
2.875%, 01/25/2022 | | | 455,623 | | | | 0.0 | | |
| | 440,000 | | | | (4 | ) | | Apollo Management
Holdings L.P.,
4.000%, 05/30/2024 | | | 466,412 | | | | 0.0 | | |
| | 285,000 | | | | (4 | ) | | Athene Global
Funding, 2.750%,
06/25/2024 | | | 293,928 | | | | 0.0 | | |
| | 1,555,000 | | | | (4 | ) | | Athene Global
Funding, 4.000%,
01/25/2022 | | | 1,558,275 | | | | 0.1 | | |
| | 1,128,000 | | | | | | | Athene Holding Ltd.,
3.450%, 05/15/2052 | | | 1,135,746 | | | | 0.1 | | |
| | 1,095,000 | | | | (4 | ) | | Aviation Capital
Group LLC,
4.875%, 10/01/2025 | | $ | 1,185,031 | | | | 0.1 | | |
| | 834,000 | | | | (3 | ) | | Bank of America
Corp., 2.572%,
10/20/2032 | | | 838,613 | | | | 0.1 | | |
| | 720,000 | | | | | | | Bank of America
Corp., 3.248%,
10/21/2027 | | | 766,885 | | | | 0.1 | | |
| | 725,000 | | | | (4 | ) | | BBVA Bancomer
SA/Texas,
4.375%, 04/10/2024 | | | 771,085 | | | | 0.1 | | |
| | 1,760,000 | | | | | | | Brighthouse
Financial, Inc.,
3.850%, 12/22/2051 | | | 1,739,963 | | | | 0.1 | | |
| | 765,000 | | | | | | | Brookfield Asset
Management, Inc.,
4.000%, 01/15/2025 | | | 818,258 | | | | 0.1 | | |
| | 1,140,000 | | | | | | | Capital One
Financial Corp.,
3.200%, 01/30/2023 | | | 1,167,932 | | | | 0.1 | | |
| | 630,000 | | | | (3 | ) | | Citigroup, Inc.,
3.668%, 07/24/2028 | | | 679,997 | | | | 0.1 | | |
| | 1,930,000 | | | | | | | Citigroup, Inc.,
4.000%, 08/05/2024 | | | 2,057,820 | | | | 0.2 | | |
| | 520,000 | | | | | | | Citigroup, Inc.,
4.750%, 05/18/2046 | | | 640,993 | | | | 0.0 | | |
| | 260,000 | | | | | | | Citigroup, Inc.,
5.300%, 05/06/2044 | | | 340,046 | | | | 0.0 | | |
| | 560,000 | | | | | | | Citigroup, Inc.,
6.675%, 09/13/2043 | | | 845,560 | | | | 0.1 | | |
| | 472,000 | | | | (4 | ) | | Credit Suisse AG,
6.500%, 08/08/2023 | | | 509,125 | | | | 0.0 | | |
| | 1,348,000 | | | | | | | Crown Castle
International Corp.,
2.500%, 07/15/2031 | | | 1,339,494 | | | | 0.1 | | |
| | 60,000 | | | | | | | Crown Castle
International Corp.,
4.750%, 05/15/2047 | | | 73,798 | | | | 0.0 | | |
See Accompanying Notes to Financial Statements
140
VY® INVESCO PORTFOLIO OF INVESTMENTS
EQUITY AND INCOME PORTFOLIO AS OF DECEMBER 31, 2021 (CONTINUED)
Principal
Amount† | | | | | | Value | | Percentage
of Net
Assets | |
| | | | | Financial (continued) | |
| | 1,013,000 | | | | | | | CubeSmart L.P.,
2.500%, 02/15/2032 | | $ | 1,009,702 | | | | 0.1 | | |
| | 2,088,000 | | | | (4 | ) | | Delaware Life
Global Funding,
2.662%, 06/29/2026 | | | 2,055,988 | | | | 0.2 | | |
| | 620,000 | | | | | | | Discover Bank,
3.350%, 02/06/2023 | | | 634,986 | | | | 0.0 | | |
| | 2,275,000 | | | | | | | EPR Properties,
4.750%, 12/15/2026 | | | 2,432,881 | | | | 0.2 | | |
| | 307,000 | | | | (3 | ) | | Goldman Sachs
Group, Inc./The,
2.908%, 07/21/2042 | | | 305,802 | | | | 0.0 | | |
| | 820,000 | | | | | | | Goldman Sachs
Group, Inc.,
4.250%, 10/21/2025 | | | 895,088 | | | | 0.1 | | |
| | 755,000 | | | | (4 | ) | | Guardian Life
Global Funding,
2.900%, 05/06/2024 | | | 788,215 | | | | 0.1 | | |
| | 1,790,000 | | | | (3 | ) | | HSBC Holdings PLC,
2.633%, 11/07/2025 | | | 1,837,164 | | | | 0.1 | | |
| | 620,000 | | | | (4 | ) | | Jackson National Life
Global Funding,
3.250%, 01/30/2024 | | | 646,515 | | | | 0.1 | | |
| | 550,000 | | | | | | | JPMorgan Chase &
Co., 3.200%,
06/15/2026 | | | 583,816 | | | | 0.0 | | |
| | 1,270,000 | | | | (3 | ) | | JPMorgan Chase &
Co., 3.509%,
01/23/2029 | | | 1,361,547 | | | | 0.1 | | |
| | 665,000 | | | | (3 | ) | | JPMorgan Chase &
Co., 3.534%,
12/31/2199 | | | 667,485 | | | | 0.1 | | |
| | 1,270,000 | | | | (3 | ) | | JPMorgan Chase &
Co., 3.897%,
01/23/2049 | | | 1,474,905 | | | | 0.1 | | |
| | 675,000 | | | | (3 | ) | | JPMorgan Chase &
Co., 4.260%,
02/22/2048 | | | 827,207 | | | | 0.1 | | |
| | 443,000 | | | | (4 | ) | | KKR Group Finance
Co. III LLC,
5.125%, 06/01/2044 | | | 572,727 | | | | 0.0 | | |
| | 950,000 | | | | (4 | ) | | Liberty Mutual
Group, Inc.,
3.950%, 05/15/2060 | | | 1,046,688 | | | | 0.1 | | |
| | 587,000 | | | | | | | Lifestorage L.P./CA,
3.500%, 07/01/2026 | | | 628,683 | | | | 0.0 | | |
| | 285,000 | | | | | | | Markel Corp.,
5.000%, 03/30/2043 | | | 348,481 | | | | 0.0 | | |
| | 525,000 | | | | | | | Markel Corp.,
5.000%, 05/20/2049 | | | 670,915 | | | | 0.1 | | |
| | 2,360,000 | | | | (4 | ) | | Mizuho Financial
Group Cayman 3
Ltd., 4.600%,
03/27/2024 | | | 2,508,793 | | | | 0.2 | | |
| | 1,040,000 | | | | | | | Morgan Stanley,
4.000%, 07/23/2025 | | | 1,128,041 | | | | 0.1 | | |
Principal
Amount† | | | | | | Value | | Percentage
of Net
Assets | |
| | 1,000,000 | | | | (4 | ) | | Nationwide Financial
Services, Inc.,
5.300%, 11/18/2044 | | $ | 1,278,812 | | | | 0.1 | | |
| | 835,000 | | | | | | | Office Properties
Income Trust,
4.000%, 07/15/2022 | | | 846,196 | | | | 0.1 | | |
| | 590,000 | | | | | | | PartnerRe
Finance B LLC,
3.700%, 07/02/2029 | | | 643,296 | | | | 0.1 | | |
| | 755,000 | | | | | | | PNC Financial
Services Group,
Inc./The, 3.450%,
04/23/2029 | | | 822,822 | | | | 0.1 | | |
| | 1,780,000 | | | | (4 | ) | | Protective Life
Global Funding,
2.615%, 08/22/2022 | | | 1,804,440 | | | | 0.1 | | |
| | 200,000 | | | | | | | Regency Centers
L.P., 2.950%,
09/15/2029 | | | 207,793 | | | | 0.0 | | |
| | 300,000 | | | | | | | Regency Centers
L.P., 4.650%,
03/15/2049 | | | 373,583 | | | | 0.0 | | |
| | 259,000 | | | | | | | Reinsurance Group of
America, Inc.,
4.700%, 09/15/2023 | | | 274,356 | | | | 0.0 | | |
| | 240,000 | | | | | | | Service Properties
Trust, 5.000%,
08/15/2022 | | | 240,018 | | | | 0.0 | | |
| | 805,000 | | | | (4 | ) | | Societe Generale SA,
5.000%, 01/17/2024 | | | 857,265 | | | | 0.1 | | |
| | 670,000 | | | | | | | Synchrony Financial,
3.950%, 12/01/2027 | | | 720,032 | | | | 0.1 | | |
| | 445,000 | | | | | | | Travelers Cos, Inc.,
4.600%, 08/01/2043 | | | 569,882 | | | | 0.0 | | |
| | 585,000 | | | | (4 | ) | | UBS Group AG,
4.125%, 04/15/2026 | | | 639,005 | | | | 0.0 | | |
| | 410,000 | | | | | | | US Bancorp,
3.100%, 04/27/2026 | | | 433,696 | | | | 0.0 | | |
| | 965,000 | | | | | | | Wells Fargo & Co.,
3.550%, 09/29/2025 | | | 1,029,200 | | | | 0.1 | | |
| | 470,000 | | | | | | | Wells Fargo & Co.,
4.100%, 06/03/2026 | | | 512,784 | | | | 0.0 | | |
| | 300,000 | | | | | | | Wells Fargo & Co.,
4.650%, 11/04/2044 | | | 364,010 | | | | 0.0 | | |
| | 315,000 | | | | | | | Willis North
America, Inc.,
3.600%, 05/15/2024 | | | 330,108 | | | | 0.0 | | |
| | 350,000 | | | | | | | WR Berkley Corp.,
4.625%, 03/15/2022 | | | 352,801 | | | | 0.0 | | |
| | | | | | | | | | 59,665,783 | | | | 4.5 | | |
| | | | | Industrial: 0.8% | |
| | 970,000 | | | | | | | Avnet, Inc.,
4.625%, 04/15/2026 | | | 1,064,236 | | | | 0.1 | | |
| | 1,585,000 | | | | | | | Boeing Co/The,
5.805%, 05/01/2050 | | | 2,150,380 | | | | 0.2 | | |
See Accompanying Notes to Financial Statements
141
VY® INVESCO PORTFOLIO OF INVESTMENTS
EQUITY AND INCOME PORTFOLIO AS OF DECEMBER 31, 2021 (CONTINUED)
Principal
Amount† | | | | | | Value | | Percentage
of Net
Assets | |
| | | | | Industrial (continued) | |
| | 381,000 | | | | | | | Canadian Pacific
Railway Co.,
3.000%, 12/02/2041 | | $ | 390,342 | | | | 0.0 | | |
| | 330,000 | | | | | | | CSX Corp.,
5.500%, 04/15/2041 | | | 440,775 | | | | 0.0 | | |
| | 1,015,000 | | | | | | | Deere & Co.,
2.600%, 06/08/2022 | | | 1,019,551 | | | | 0.1 | | |
| | 295,000 | | | | | | | FedEx Corp.,
4.900%, 01/15/2034 | | | 356,492 | | | | 0.0 | | |
| | 461,000 | | | | | | | Honeywell
International, Inc.,
0.483%, 08/19/2022 | | | 461,067 | | | | 0.1 | | |
| | 459,000 | | | | | | | Norfolk Southern
Corp., 3.400%,
11/01/2049 | | | 493,956 | | | | 0.1 | | |
| | 285,000 | | | | | | | Precision Castparts
Corp., 2.500%,
01/15/2023 | | | 289,260 | | | | 0.0 | | |
| | 345,000 | | | | | | | Raytheon
Technologies Corp.,
4.450%, 11/16/2038 | | | 416,644 | | | | 0.0 | | |
| | 262,000 | | | | | | | Rockwell Automation,
Inc., 1.750%,
08/15/2031 | | | 254,864 | | | | 0.0 | | |
| | 970,000 | | | | | | | Union Pacific Corp.,
3.200%, 05/20/2041 | | | 1,034,622 | | | | 0.1 | | |
| | 157,000 | | | | | | | Union Pacific Corp.,
3.646%, 02/15/2024 | | | 164,164 | | | | 0.0 | | |
| | 375,000 | | | | | | | Union Pacific Corp.,
3.839%, 03/20/2060 | | | 442,947 | | | | 0.0 | | |
| | 730,000 | | | | | | | Union Pacific Corp.,
4.150%, 01/15/2045 | | | 868,623 | | | | 0.1 | | |
| | 330,000 | | | | | | | United Parcel
Service, Inc.,
3.400%, 11/15/2046 | | | 372,071 | | | | 0.0 | | |
| | | | | | | | | | 10,219,994 | | | | 0.8 | | |
| | | | | Technology: 1.3% | |
| | 1,146,000 | | | | | | | Apple, Inc.,
2.150%, 02/09/2022 | | | 1,148,082 | | | | 0.1 | | |
| | 435,000 | | | | | | | Apple, Inc.,
3.350%, 02/09/2027 | | | 472,371 | | | | 0.0 | | |
| | 1,030,000 | | | | (4 | ) | | Broadcom, Inc.,
3.469%, 04/15/2034 | | | 1,079,435 | | | | 0.1 | | |
| | 1,185,000 | | | | | | | Broadcom, Inc.,
4.250%, 04/15/2026 | | | 1,293,531 | | | | 0.1 | | |
| | 242,000 | | | | | | | Dell International
LLC / EMC Corp.,
5.450%, 06/15/2023 | | | 255,369 | | | | 0.0 | | |
| | 2,025,000 | | | | | | | Dell International
LLC / EMC Corp.,
6.020%, 06/15/2026 | | | 2,342,921 | | | | 0.2 | | |
| | 9,000 | | | | | | | Dell International
LLC / EMC Corp.,
8.350%, 07/15/2046 | | | 14,995 | | | | 0.0 | | |
| | 1,630,000 | | | | | | | Fiserv, Inc.,
3.800%, 10/01/2023 | | | 1,704,540 | | | | 0.1 | | |
Principal
Amount† | | | | | | Value | | Percentage
of Net
Assets | |
| | 1,385,000 | | | | | | | International Business
Machines Corp.,
2.875%, 11/09/2022 | | $ | 1,412,578 | | | | 0.1 | | |
| | 1,152,000 | | | | | | | Marvell Technology,
Inc., 2.450%,
04/15/2028 | | | 1,169,258 | | | | 0.1 | | |
| | 170,000 | | | | | | | Micron Technology,
Inc., 3.366%,
11/01/2041 | | | 174,812 | | | | 0.0 | | |
| | 200,000 | | | | | | | Micron Technology,
Inc., 4.663%,
02/15/2030 | | | 230,789 | | | | 0.0 | | |
| | 649,000 | | | | | | | Microsoft Corp.,
3.500%, 02/12/2035 | | | 742,346 | | | | 0.1 | | |
| | 795,000 | | | | (4 | ) | | NXP BV / NXP
Funding LLC,
5.350%, 03/01/2026 | | | 899,124 | | | | 0.1 | | |
| | 985,000 | | | | | | | Oracle Corp.,
3.600%, 04/01/2040 | | | 989,533 | | | | 0.1 | | |
| | 1,000,000 | | | | | | | salesforce.com, Inc.,
2.700%, 07/15/2041 | | | 1,000,661 | | | | 0.1 | | |
| | 285,000 | | | | | | | Texas Instruments,
Inc., 2.625%,
05/15/2024 | | | 296,121 | | | | 0.0 | | |
| | 1,441,000 | | | | | | | VMware, Inc.,
1.000%, 08/15/2024 | | | 1,427,921 | | | | 0.1 | | |
| | | | | | | | | | 16,654,387 | | | | 1.3 | | |
| | | | | Utilities: 0.6% | |
| | 620,000 | | | | (4 | ) | | Electricite de
France SA,
4.875%, 01/22/2044 | | | 772,211 | | | | 0.1 | | |
| | 345,000 | | | | | | | Georgia Power Co.,
3.700%, 01/30/2050 | | | 367,804 | | | | 0.0 | | |
| | 2,410,000 | | | | | | | NextEra Energy
Capital Holdings,
Inc., 0.650%,
03/01/2023 | | | 2,405,641 | | | | 0.2 | | |
| | 703,000 | | | | | | | NextEra Energy
Capital Holdings,
Inc., 3.550%,
05/01/2027 | | | 762,125 | | | | 0.1 | | |
| | 760,000 | | | | | | | NiSource, Inc.,
4.375%, 05/15/2047 | | | 897,188 | | | | 0.1 | | |
| | 605,000 | | | | | | | Oglethorpe Power
Corp., 4.550%,
06/01/2044 | | | 687,515 | | | | 0.0 | | |
| | 667,000 | | | | | | | Sempra Energy,
3.800%, 02/01/2038 | | | 733,214 | | | | 0.1 | | |
| | 529,000 | | | | | | | Xcel Energy, Inc.,
0.500%, 10/15/2023 | | | 525,663 | | | | 0.0 | | |
| | 274,000 | | | | | | | Xcel Energy, Inc.,
3.500%, 12/01/2049 | | | 292,154 | | | | 0.0 | | |
| | | | | | | | | | 7,443,515 | | | | 0.6 | | |
| | | | | | | Total Corporate
Bonds/Notes
(Cost $144,695,678) | | | 156,104,375 | | | | 11.9 | | |
See Accompanying Notes to Financial Statements
142
VY® INVESCO PORTFOLIO OF INVESTMENTS
EQUITY AND INCOME PORTFOLIO AS OF DECEMBER 31, 2021 (CONTINUED)
Principal
Amount† | | | | | | Value | | Percentage
of Net
Assets | |
MUNICIPAL BONDS: 0.0% | | | |
| | | | | Georgia: 0.0% | |
| | 317,000 | | | | | | | Municipal Electric
Authority of
Georgia, 6.655%,
04/01/2057 | | $ | 491,072 | | | | 0.0 | | |
| | | | | | | Total Municipal Bonds
(Cost $317,000) | | | 491,072 | | | | 0.0 | | |
U.S. TREASURY OBLIGATIONS: 10.4% | | | |
| | | | | U.S. Treasury Bonds: 1.7% | |
| | 10,287,900 | | | | (5 | ) | | 1.375%,11/15/2031 | | | 10,160,909 | | | | 0.8 | | |
| | 6,065,900 | | | | | | | 2.000%,08/15/2051 | | | 6,185,322 | | | | 0.5 | | |
| | 5,746,700 | | | | | | | 2.000%,11/15/2041 | | | 5,814,044 | | | | 0.4 | | |
| | 425,000 | | | | | | | 4.500%,02/15/2036 | | | 584,242 | | | | 0.0 | | |
| | | | | | | | | | 22,744,517 | | | | 1.7 | | |
| | | | | U.S. Treasury Notes: 8.7% | |
| | 11,135,000 | | | | (5 | ) | | 0.500%,11/30/2023 | | | 11,093,244 | | | | 0.8 | | |
| | 26,887,000 | | | | | | | 1.000%,12/15/2024 | | | 26,919,559 | | | | 2.1 | | |
| | 49,714,800 | | | | (5 | ) | | 1.250%,11/30/2026 | | | 49,691,496 | | | | 3.8 | | |
| | 25,656,000 | | | | | | | 1.500%,11/30/2028 | | | 25,764,236 | | | | 2.0 | | |
| | | | | | | | | | 113,468,535 | | | | 8.7 | | |
| | | | | | | Total U.S. Treasury
Obligations
(Cost $135,926,004) | | | 136,213,052 | | | | 10.4 | | |
CONVERTIBLE BONDS/NOTES: 8.4% | | | |
| | | | | Communications: 4.0% | |
| | 438,000 | | | | (5 | ) | | Booking Holdings, Inc.,
0.750%, 05/01/2025 | | | 645,393 | | | | 0.1 | | |
| | 5,339,000 | | | | (4 | ),(6) | | Cable One, Inc.,
0.950%, 03/15/2026 | | | 5,130,779 | | | | 0.4 | | |
| | 2,761,000 | | | | (4 | ) | | Cable One, Inc.,
1.125%, 03/15/2028 | | | 2,746,714 | | | | 0.2 | | |
| | 7,840,000 | | | | | | | DISH Network
Corp., 3.375%,
08/15/2026 | | | 7,440,576 | | | | 0.6 | | |
| | 2,642,000 | | | | (4 | ) | | Liberty Broadband
Corp., 1.250%,
09/30/2050 | | | 2,618,222 | | | | 0.2 | | |
| | 2,950,000 | | | | (5 | ) | | Liberty Latin America
Ltd., 2.000%,
07/15/2024 | | | 2,913,125 | | | | 0.2 | | |
| | 9,559,000 | | | | | | | Liberty Media Corp.,
1.375%, 10/15/2023 | | | 14,432,071 | | | | 1.1 | | |
| | 673,000 | | | | | | | Liberty Media Corp.-
Liberty Formula One,
1.000%, 01/30/2023 | | | 1,163,144 | | | | 0.1 | | |
| | 2,501,000 | | | | | | | Mandiant, Inc.,
1.000%, 06/01/2035 | | | 2,467,511 | | | | 0.2 | | |
| | 2,692,000 | | | | | | | Mandiant, Inc.,
1.625%, 06/01/2035 | | | 2,698,949 | | | | 0.2 | | |
| | 3,000,000 | | | | (5 | ) | | Shopify, Inc.,
0.125%, 11/01/2025 | | | 3,757,500 | | | | 0.3 | | |
Principal
Amount† | | | | | | Value | | Percentage
of Net
Assets | |
| | 3,989,000 | | | | | | | Trip.com Group Ltd.,
1.250%, 09/15/2022 | | $ | 3,801,455 | | | | 0.3 | | |
| | 338,000 | | | | (4 | ),(5) | | TripAdvisor, Inc.,
0.250%, 04/01/2026 | | | 298,285 | | | | 0.0 | | |
| | 2,009,000 | | | | (4 | ),(6) | | Twitter, Inc.,
2.520%, 03/15/2026 | | | 1,809,305 | | | | 0.1 | | |
| | | | | | | | | | 51,923,029 | | | | 4.0 | | |
| | | | | Consumer, Cyclical: 0.8% | |
| | 1,697,000 | | | | (4 | ) | | JetBlue Airways Corp.,
0.500%, 04/01/2026 | | | 1,590,458 | | | | 0.1 | | |
| | 2,264,000 | | | | | | | Live Nation
Entertainment, Inc.,
2.500%, 03/15/2023 | | | 4,097,840 | | | | 0.3 | | |
| | 3,881,000 | | | | (4 | ),(6) | | Peloton Interactive,
Inc., 3.940%,
02/15/2026 | | | 3,308,553 | | | | 0.3 | | |
| | 1,154,000 | | | | (5 | ) | | Spirit Airlines, Inc.,
1.000%, 05/15/2026 | | | 1,000,565 | | | | 0.1 | | |
| | | | | | | | | | 9,997,416 | | | | 0.8 | | |
| | | | | Consumer, Non-cyclical: 1.2% | |
| | 3,457,000 | | | | | | | Integra LifeSciences
Holdings Corp.,
0.500%, 08/15/2025 | | | 3,761,562 | | | | 0.3 | | |
| | 1,699,000 | | | | | | | Jazz Investments I
Ltd., 2.000%,
06/15/2026 | | | 1,926,241 | | | | 0.1 | | |
| | 2,257,000 | | | | | | | Neurocrine
Biosciences, Inc.,
2.250%, 05/15/2024 | | | 2,836,767 | | | | 0.2 | | |
| | 2,405,000 | | | | | | | Pacira BioSciences,
Inc., 0.750%,
08/01/2025 | | | 2,671,053 | | | | 0.2 | | |
| | 1,323,000 | | | | | | | Supernus
Pharmaceuticals,
Inc., 0.625%,
04/01/2023 | | | 1,310,597 | | | | 0.1 | | |
| | 380,000 | | | | (4 | ) | | Tandem Diabetes
Care, Inc., 1.500%,
05/01/2025 | | | 565,250 | | | | 0.0 | | |
| | 3,735,000 | | | | | | | Teladoc Health, Inc.,
1.250%, 06/01/2027 | | | 3,419,859 | | | | 0.3 | | |
| | | | | | | | | | 16,491,329 | | | | 1.2 | | |
| | | | | Financial: 0.4% | |
| | 2,241,000 | | | | | | | BofA Finance LLC,
0.125%, 09/01/2022 | | | 2,523,366 | | | | 0.2 | | |
| | 3,689,000 | | | | (6 | ) | | Redfin Corp.,
2.950%, 10/15/2025 | | | 3,303,961 | | | | 0.2 | | |
| | | | | | | | | | 5,827,327 | | | | 0.4 | | |
| | | | | Technology: 2.0% | |
| | 5,205,000 | | | | (4 | ),(6) | | Dropbox, Inc.,
0.550%, 03/01/2026 | | | 5,087,887 | | | | 0.4 | | |
See Accompanying Notes to Financial Statements
143
VY® INVESCO PORTFOLIO OF INVESTMENTS
EQUITY AND INCOME PORTFOLIO AS OF DECEMBER 31, 2021 (CONTINUED)
Principal
Amount† | | | | | | Value | | Percentage
of Net
Assets | |
| | | | | Technology (continued) | |
| | 4,780,000 | | | | (5 | ) | | Microchip Technology,
Inc., 0.125%,
11/15/2024 | | $ | 5,939,150 | | | | 0.4 | | |
| | 6,706,000 | | | | | | | Splunk, Inc., 1.125%,
06/15/2027 | | | 6,286,875 | | | | 0.5 | | |
| | 2,444,000 | | | | | | | Western Digital Corp.,
1.500%, 02/01/2024 | | | 2,479,133 | | | | 0.2 | | |
| | 7,080,000 | | | | (6 | ) | | Zynga, Inc., 1.750%,
12/15/2026 | | | 6,496,546 | | | | 0.5 | | |
| | | | | | | | | | 26,289,591 | | | | 2.0 | | |
| | | | | | | Total Convertible
Bonds/Notes
(Cost $101,372,619) | | | 110,528,692 | | | | 8.4 | | |
EQUITY-LINKED NOTES: 1.0% | | | |
| | | | | Financial: 1.0% | |
| | 4,397,000 | | | | (4 | ),(7) | | Credit Suisse AG,
Convertible
Basket (Basket of
5 Common
Stocks), 0.500%,
06/24/2024 | | | 4,326,208 | | | | 0.4 | | |
| | 6,746,000 | | | | (7 | ) | | GS Finance Corp
(Guarantor: The
Goldman Sachs
Group, Inc.),
Exchangeable
Basket (Basket
of 5 Common
Stocks), 0.250%,
07/08/2024 | | | 8,205,160 | | | | 0.6 | | |
| | | | | | | Total Equity-Linked
Notes
(Cost $11,143,000) | | | 12,531,368 | | | | 1.0 | | |
STRUCTURED NOTES: 1.0% | | | |
| | | | | Financial: 1.0% | |
| | 6,016,000 | | | | (7 | ) | | Wells Fargo Bank
N.A., Convertible
Trust - Energy
Series 2019-1
(Linked to a basket
of 4 Stocks), 0.330%,
09/19/2024 | | | 6,834,176 | | | | 0.5 | | |
| | 5,968,000 | | | | (7 | ) | | Wells Fargo Bank
N.A., Convertible
Trust - Media
Series 2019-1
(Linked to a basked
of 3 Stocks), 0.250%,
12/04/2024 | | | 7,003,448 | | | | 0.5 | | |
| | | | | | | Total Structured Notes
(Cost $12,341,630) | | | 13,837,624 | | | | 1.0 | | |
Principal
Amount† | | | | | | Value | | Percentage
of Net
Assets | |
U.S. GOVERNMENT AGENCY OBLIGATIONS: 0.1% | | | |
| | | | | | | Federal National Mortgage
Association: 0.1%(8) | | | | | |
| | 915,000 | | | | | | | 6.625%,11/15/2030 | | $ | 1,293,100 | | | | 0.1 | | |
| | | | | | | Total U.S. Government
Agency Obligations
(Cost $1,001,240) | | | 1,293,100 | | | | 0.1 | | |
| | | | | | | Total Long-Term
Investments
(Cost
$1,001,185,348) | | | 1,270,388,288 | | | | 96.9 | | |
SHORT-TERM INVESTMENTS: 3.5% | | | |
| | | | | Repurchase Agreements: 0.4% | |
| | 1,232,474 | | | | (9 | ) | | Bank of America
Inc., Repurchase
Agreement dated
12/31/21, 0.05%,
due 01/03/22
(Repurchase Amount
$1,232,479,
collateralized by
various U.S.
Government Agency
Obligations,
1.000%-5.000%,
Market Value plus
accrued interest
$1,257,123, due
09/01/28-01/01/61) | | | 1,232,474 | | | | 0.1 | | |
| | 1,135,787 | | | | (9 | ) | | Citigroup, Inc.,
Repurchase
Agreement dated
12/31/21, 0.06%,
due 01/03/22
(Repurchase Amount
$1,135,793,
collateralized by
various U.S.
Government/U.S.
Government Agency
Obligations,
0.000%-3.500%,
Market Value plus
accrued interest
$1,158,503, due
02/15/22-12/20/51) | | $ | 1,135,787 | | | | 0.1 | | |
See Accompanying Notes to Financial Statements
144
VY® INVESCO PORTFOLIO OF INVESTMENTS
EQUITY AND INCOME PORTFOLIO AS OF DECEMBER 31, 2021 (CONTINUED)
Principal
Amount† | | | | | | Value | | Percentage
of Net
Assets | |
| | | | | Repurchase Agreements (continued) | |
| | 1,232,474 | | | | (9 | ) | | Daiwa Capital
Markets, Repurchase
Agreement dated
12/31/21, 0.04%,
due 01/03/22
(Repurchase Amount
$1,232,478,
collateralized by
various U.S.
Government/U.S.
Government Agency
Obligations,
0.000%-6.500%,
Market Value plus
accrued interest
$1,257,124, due
02/10/22-01/01/52) | | $ | 1,232,474 | | | | 0.1 | | |
| | 1,232,474 | | | | (9 | ) | | RBC Dominion
Securities Inc.,
Repurchase
Agreement dated
12/31/21, 0.05%,
due 01/03/22
(Repurchase
Amount $1,232,479,
collateralized by
various U.S.
Government/U.S.
Government Agency
Obligations,
0.000%-6.500%,
Market Value plus
accrued interest
$1,257,124, due
05/15/22-12/01/51) | | | 1,232,474 | | | | 0.1 | | |
| | | | | | | Total Repurchase
Agreements
(Cost $4,833,209) | | | 4,833,209 | | | | 0.4 | | |
Shares | | | | | | Value | | Percentage
of Net
Assets | |
| | | | | Mutual Funds: 3.1% | |
| | 40,275,506 | | | | (9 | ),(10) | | BlackRock Liquidity
Funds, FedFund,
Institutional
Class, 0.030% | | $ | 40,275,506 | | | | 3.1 | | |
| | 154,000 | | | | (9 | ),(10) | | Goldman Sachs
Financial Square
Government
Fund - Institutional
Shares, 0.020% | | | 154,000 | | | | 0.0 | | |
Shares | | | | | | Value | | Percentage
of Net
Assets | |
| | 154,000 | | | | (9 | ),(10) | | Morgan Stanley
Institutional Liquidity
Funds - Government
Portfolio (Institutional
Share Class),
0.030% | | $ | 154,000 | | | | 0.0 | | |
| | | | | Total Mutual Funds
(Cost $40,583,506) | | | 40,583,506 | | | | 3.1 | | |
| | | | | Total Short-Term
Investments
(Cost $45,416,715) | | | 45,416,715 | | | | 3.5 | | |
| | | | | Total Investments
in Securities
(Cost
$1,046,602,063) | | $ | 1,315,805,003 | | | | 100.4 | | |
| | | | | Liabilities in Excess
of Other Assets | | | (5,577,325 | ) | | | (0.4 | ) | |
| | | | | Net Assets | | $ | 1,310,227,678 | | | | 100.0 | | |
† Unless otherwise indicated, principal amount is shown in USD.
(1) Non-income producing security.
(2) Preferred Stock may be called prior to convertible date.
(3) Variable rate security. Rate shown is the rate in effect as of December 31, 2021.
(4) Securities with purchases pursuant to Rule 144A or section 4(a)(2), under the Securities Act of 1933 and may not be resold subject to that rule except to qualified institutional buyers.
(5) Security, or a portion of the security, is on loan.
(6) Represents a zero coupon bond. Rate shown reflects the effective yield as of December 31, 2021.
(7) For fair value measurement disclosure purposes, security is categorized as Level 3, whose value was determined using significant unobservable inputs.
(8) The Federal Housing Finance Agency ("FHFA") placed the Federal Home Loan Mortgage Corporation and Federal National Mortgage Association into conservatorship with FHFA as the conservator. As such, the FHFA oversees the continuing affairs of these companies.
(9) All or a portion of the security represents securities purchased with cash collateral received for securities on loan.
(10) Rate shown is the 7-day yield as of December 31, 2021.
See Accompanying Notes to Financial Statements
145
VY® INVESCO PORTFOLIO OF INVESTMENTS
EQUITY AND INCOME PORTFOLIO AS OF DECEMBER 31, 2021 (CONTINUED)
Fair Value Measurements^
The following is a summary of the fair valuations according to the inputs used as of December 31, 2021 in valuing the assets and liabilities:
| | | Quoted Prices
in Active Markets
for Identical Investments
(Level 1) | | Significant Other
Observable
Inputs#
(Level 2) | | Significant
Unobservable
Inputs
(Level 3) | | Fair Value
at
December 31, 2021 | |
Asset Table | |
Investments, at fair value | |
Common Stock | |
Communication Services | | $ | 59,292,680 | | | $ | — | | | $ | — | | | $ | 59,292,680 | | |
Consumer Discretionary | | | 68,387,045 | | | | — | | | | — | | | | 68,387,045 | | |
Consumer Staples | | | 32,982,265 | | | | 10,220,405 | | | | — | | | | 43,202,670 | | |
Energy | | | 58,305,757 | | | | — | | | | — | | | | 58,305,757 | | |
Financials | | | 184,623,146 | | | | — | | | | — | | | | 184,623,146 | | |
Health Care | | | 112,129,082 | | | | 17,580,888 | | | | — | | | | 129,709,970 | | |
Industrials | | | 102,318,252 | | | | — | | | | — | | | | 102,318,252 | | |
Information Technology | | | 111,652,462 | | | | — | | | | — | | | | 111,652,462 | | |
Materials | | | 24,374,455 | | | | — | | | | — | | | | 24,374,455 | | |
Real Estate | | | 24,631,553 | | | | — | | | | — | | | | 24,631,553 | | |
Utilities | | | 21,215,913 | | | | — | | | | — | | | | 21,215,913 | | |
Total Common Stock | | | 799,912,610 | | | | 27,801,293 | | | | — | | | | 827,713,903 | | |
Preferred Stock | | | 11,675,102 | | | | — | | | | — | | | | 11,675,102 | | |
Corporate Bonds/Notes | | | — | | | | 156,104,375 | | | | — | | | | 156,104,375 | | |
Municipal Bonds | | | — | | | | 491,072 | | | | — | | | | 491,072 | | |
Convertible Bonds/Notes | | | — | | | | 110,528,692 | | | | — | | | | 110,528,692 | | |
Structured Notes | | | — | | | | — | | | | 13,837,624 | | | | 13,837,624 | | |
Equity-Linked Notes | | | — | | | | — | | | | 12,531,368 | | | | 12,531,368 | | |
U.S. Government Agency Obligations | | | — | | | | 1,293,100 | | | | — | | | | 1,293,100 | | |
U.S. Treasury Obligations | | | — | | | | 136,213,052 | | | | — | | | | 136,213,052 | | |
Short-Term Investments | | | 40,583,506 | | | | 4,833,209 | | | | — | | | | 45,416,715 | | |
Total Investments, at fair value | | $ | 852,171,218 | | | $ | 437,264,793 | | | $ | 26,368,992 | | | $ | 1,315,805,003 | | |
Other Financial Instruments+ | |
Forward Foreign Currency Contracts | | | — | | | | 28,364 | | | | — | | | | 28,364 | | |
Total Assets | | $ | 852,171,218 | | | $ | 437,293,157 | | | $ | 26,368,992 | | | $ | 1,315,833,367 | | |
Liabilities Table | |
Other Financial Instruments+ | |
Forward Foreign Currency Contracts | | $ | — | | | $ | (433,668 | ) | | $ | — | | | $ | (433,668 | ) | |
Total Liabilities | | $ | — | | | $ | (433,668 | ) | | $ | — | | | $ | (433,668 | ) | |
^ See Note 2, "Significant Accounting Policies" in the Notes to Financial Statements for additional information.
+ Other Financial Instruments may include open forward foreign currency contracts, futures, centrally cleared swaps, OTC swaps and written options. Forward foreign currency contracts, futures and centrally cleared swaps are fair valued at the unrealized appreciation (depreciation) on the instrument. OTC swaps and written options are valued at the fair value of the instrument.
# The earlier close of the foreign markets gives rise to the possibility that significant events, including broad market moves, may have occurred in the interim and may materially affect the value of those securities. To account for this, the Portfolio may frequently value many of its foreign equity securities using fair value prices based on third party vendor modeling tools to the extent available. Accordingly, a portion of the Portfolio's investments are categorized as Level 2 investments.
See Accompanying Notes to Financial Statements
146
VY® INVESCO PORTFOLIO OF INVESTMENTS
EQUITY AND INCOME PORTFOLIO AS OF DECEMBER 31, 2021 (CONTINUED)
At December 31, 2021, the following forward foreign currency contracts were outstanding for VY® Invesco Equity and Income Portfolio:
Currency
Purchased | | Currency Sold | | Counterparty | | Settlement
Date | | Unrealized
Appreciation
(Depreciation) | |
| USD205,552 GBP | | | 152,276 | | | State Street Bank and Trust Co. | | 01/07/22 | | $ | (559 | ) | |
| USD87,496 CAD | | | 111,520 | | | State Street Bank and Trust Co. | | 01/07/22 | | | (666 | ) | |
| USD100,384 CAD | | | 128,452 | | | State Street Bank and Trust Co. | | 01/07/22 | | | (1,163 | ) | |
| USD148,205 CAD | | | 190,208 | | | State Street Bank and Trust Co. | | 01/07/22 | | | (2,162 | ) | |
| CAD137,098 USD | | | 105,947 | | | State Street Bank and Trust Co. | | 01/07/22 | | | 2,435 | | |
| CAD88,279 USD | | | 68,482 | | | State Street Bank and Trust Co. | | 01/07/22 | | | 1,306 | | |
| GBP142,638 USD | | | 189,158 | | | State Street Bank and Trust Co. | | 01/07/22 | | | 3,908 | | |
| CAD529,319 USD | | | 411,773 | | | State Street Bank and Trust Co. | | 01/07/22 | | | 6,676 | | |
| CAD 91,242 USD | | | 70,973 | | | State Street Bank and Trust Co. | | 01/07/22 | | | 1,158 | | |
| USD 176,145 EUR | | | 155,918 | | | State Street Bank and Trust Co. | | 01/07/22 | | | (1,379 | ) | |
| CAD 220,281 USD | | | 173,141 | | | State Street Bank and Trust Co. | | 01/07/22 | | | 1,000 | | |
| CAD 168,818 USD | | | 132,891 | | | State Street Bank and Trust Co. | | 01/07/22 | | | 567 | | |
| EUR 158,197 USD | | | 178,753 | | | State Street Bank and Trust Co. | | 01/07/22 | | | 1,366 | | |
| USD 196,621 GBP | | | 148,500 | | | State Street Bank and Trust Co. | | 01/07/22 | | | (4,379 | ) | |
| USD 147,950 EUR | | | 130,255 | | | State Street Bank and Trust Co. | | 01/07/22 | | | (354 | ) | |
| USD 133,048 CAD | | | 168,204 | | | State Street Bank and Trust Co. | | 01/07/22 | | | 75 | | |
| USD 236,696 GBP | | | 178,695 | | | State Street Bank and Trust Co. | | 01/07/22 | | | (5,175 | ) | |
| USD 194,741 CAD | | | 246,249 | | | State Street Bank and Trust Co. | | 01/07/22 | | | 71 | | |
| EUR 169,576 USD | | | 191,554 | | | State Street Bank and Trust Co. | | 01/07/22 | | | 1,520 | | |
| USD 74,880 CAD | | | 95,540 | | | State Street Bank and Trust Co. | | 01/07/22 | | | (648 | ) | |
| CAD 148,951 USD | | | 116,339 | | | State Street Bank and Trust Co. | | 01/07/22 | | | 1,413 | | |
| CAD 373,405 USD | | | 291,675 | | | State Street Bank and Trust Co. | | 01/07/22 | | | 3,518 | | |
| USD 749,412 GBP | | | 562,985 | | | State Street Bank and Trust Co. | | 01/07/22 | | | (12,609 | ) | |
| USD 183,490 EUR | | | 162,202 | | | State Street Bank and Trust Co. | | 01/07/22 | | | (1,189 | ) | |
| CAD 168,810 USD | | | 131,720 | | | State Street Bank and Trust Co. | | 01/07/22 | | | 1,731 | | |
| EUR 143,360 USD | | | 162,401 | | | State Street Bank and Trust Co. | | 01/07/22 | | | 824 | | |
| USD 11,375,163 GBP | | | 8,588,399 | | | State Street Bank and Trust Co. | | 01/07/22 | | | (249,554 | ) | |
| USD 5,813,113 CAD | | | 7,441,832 | | | State Street Bank and Trust Co. | | 01/07/22 | | | (69,971 | ) | |
| USD 7,850,570 EUR | | | 6,964,040 | | | State Street Bank and Trust Co. | | 01/07/22 | | | (78,476 | ) | |
| USD 155,549 GBP | | | 117,486 | | | State Street Bank and Trust Co. | | 01/07/22 | | | (3,472 | ) | |
| USD 55,486 EUR | | | 49,152 | | | State Street Bank and Trust Co. | | 01/07/22 | | | (477 | ) | |
| USD 107,345 CAD | | | 137,602 | | | State Street Bank and Trust Co. | | 01/07/22 | | | (1,435 | ) | |
| USD 113,468 EUR | | | 99,746 | | | State Street Bank and Trust Co. | | 01/07/22 | | | 796 | | |
| | | | | | | | | $ | (405,304 | ) | |
Currency Abbreviations
CAD — Canadian Dollar
EUR — EU Euro
GBP — British Pound
USD — United States Dollar
A summary of derivative instruments by primary risk exposure is outlined in the following tables.
The fair value of derivative instruments as of December 31, 2021 was as follows:
Derivatives not accounted
for as hedging instruments | | Location on Statement of Assets and Liabilities | | Fair Value | |
Asset Derivatives | |
Foreign exchange contracts | | Unrealized appreciation on forward foreign currency contracts | | $ | 28,364 | | |
Total Asset Derivatives | | | | $ | 28,364 | | |
Liability Derivatives | |
Foreign exchange contracts | | Unrealized depreciation on forward foreign currency contracts | | $ | 433,668 | | |
Total Liability Derivatives | | | | $ | 433,668 | | |
See Accompanying Notes to Financial Statements
147
VY® INVESCO PORTFOLIO OF INVESTMENTS
EQUITY AND INCOME PORTFOLIO AS OF DECEMBER 31, 2021 (CONTINUED)
The effect of derivative instruments on the Portfolio's Statement of Operations for the year ended December 31, 2021 was as follows:
| | | Amount of Realized Gain or (Loss) on Derivatives Recognized in Income | |
Derivatives not accounted
for as hedging instruments | | Forward foreign currency contracts | |
Foreign exchange contracts | | $ | 1,064,187 | | |
Total | | $ | 1,064,187 | | |
| | | Change in Unrealized Appreciation or (Depreciation) on Derivatives Recognized in Income | |
Derivatives not accounted
for as hedging instruments | | Forward foreign currency contracts | |
Foreign exchange contracts | | $ | 53,542 | | |
Total | | $ | 53,542 | | |
The following is a summary by counterparty of the fair value of OTC derivative instruments subject to Master Netting Agreements and collateral pledged (received), if any, at December 31, 2021:
| | | State Street Bank
and Trust Co. | | Totals | |
Assets: | |
Forward foreign currency contracts | | $ | 28,364 | | | $ | 28,364 | | |
Total Assets | | $ | 28,364 | | | $ | 28,364 | | |
Liabilities: | |
Forward foreign currency contracts | | $ | 433,668 | | | $ | 433,668 | | |
Total Liabilities | | $ | 433,668 | | | $ | 433,668 | | |
Net OTC derivative instruments by counterparty, at fair value | | $ | (405,304 | ) | | | (405,304 | ) | |
Total collateral pledged by the Portfolio/(Received from counterparty) | | $ | — | | | $ | — | | |
Net Exposure(1) | | $ | (405,304 | ) | | $ | (405,304 | ) | |
(1) Positive net exposure represents amounts due from each respective counterparty. Negative exposure represents amounts due from the Portfolio. Please refer to Note 2 for additional details regarding counterparty credit risk and credit related contingent features.
The following is a reconciliation of the fair valuations using significant unobservable inputs (Level 3) for the Portfolio's assets and liabilities during the year ended December 31, 2021:
| | | Equity-Linked
Notes* | | Structured
Products* | | Total | |
Assets: | |
Beginning balance at December 31, 2020 | | $ | 11,377,989 | | | $ | 21,388,478 | | | $ | 32,766,467 | | |
Purchases | | | — | | | | — | | | | — | | |
Sales | | | — | | | | (7,039,845 | ) | | | (7,039,845 | ) | |
Accrued discounts/(premiums) | | | — | | | | (128,109 | ) | | | (128,109 | ) | |
Total realized gain (loss) | | | — | | | | 894,812 | | | | 894,812 | | |
Net change in unrealized appreciation (depreciation)** | | | 1,153,379 | | | | (1,277,712 | ) | | | (124,333 | ) | |
Transfers into Level 3 | | | — | | | | — | | | | — | | |
Transfers out of Level 3 | | | — | | | | — | | | | — | | |
Ending balance at December 31, 2021 | | $ | 12,531,368 | | | $ | 13,837,624 | | | $ | 26,368,992 | | |
Net change in unrealized appreciation (depreciation) on Level 3
securities still held as of December 31, 2021** | | $ | 1,153,379 | | | $ | (542,571 | ) | | $ | 610,808 | | |
* Securities categorized as Level 3 were fair valued based on a single quotation obtained from a broker. The Portfolio does not have access to the unobservable inputs and therefore cannot disclose such inputs used in formulating such quotation.
** Any difference between net change in unrealized apprecation (depreciation) and net change in unrealized appreciation (depreciation) on Level 3 securities still held at December 31, 2021 may be due to securities no longer held or categorized as Level 3 at year end.
See Accompanying Notes to Financial Statements
148
VY® INVESCO PORTFOLIO OF INVESTMENTS
EQUITY AND INCOME PORTFOLIO AS OF DECEMBER 31, 2021 (CONTINUED)
At December 31, 2021, the aggregate cost of securities and other investments and the composition of unrealized appreciation and depreciation of securities and other investments on a tax basis were:
Cost for federal income tax purposes was $1,051,233,634.
Net unrealized appreciation consisted of: | |
Gross Unrealized Appreciation | | $ | 279,697,930 | | |
Gross Unrealized Depreciation | | | (15,515,850 | ) | |
Net Unrealized Appreciation | | $ | 264,182,080 | | |
See Accompanying Notes to Financial Statements
149
PORTFOLIO OF INVESTMENTS
VY® INVESCO GLOBAL PORTFOLIO AS OF DECEMBER 31, 2021
Shares | | | | | | Value | | Percentage
of Net
Assets | |
COMMON STOCK: 99.5% | | | |
| | | | | Brazil: 0.2% | |
| | 240,017 | | | | (1 | ) | | StoneCo Ltd. | | $ | 4,046,687 | | | | 0.2 | | |
| | | | | China: 3.6% | |
| | 804,174 | | | | (1 | ) | | JD.com, Inc. ADR | | | 56,348,472 | | | | 3.3 | | |
| | 203,200 | | | | (1 | ),(2) | | Meituan Class B | | | 5,876,034 | | | | 0.3 | | |
| | | | | | | | | | 62,224,506 | | | | 3.6 | | |
| | | | | Denmark: 0.2% | |
| | 148,908 | | | | (3 | ) | | Ambu A/S | | | 3,930,250 | | | | 0.2 | | |
| | | | | France: 8.5% | |
| | 112,935 | | | | | | | Dassault Systemes SE | | | 6,702,158 | | | | 0.4 | | |
| | 61,315 | | | | | | | Kering SA | | | 49,196,162 | | | | 2.8 | | |
| | 109,566 | | | | | | | LVMH Moet
Hennessy Louis
Vuitton SE | | | 90,548,923 | | | | 5.3 | | |
| | | | | | | | | | 146,447,243 | | | | 8.5 | | |
| | | | | Germany: 2.5% | |
| | 304,601 | | | | | | | SAP SE | | | 42,869,344 | | | | 2.5 | | |
| | | | | India: 4.5% | |
| | 8,911,196 | | | | | | | DLF Ltd. | | | 46,576,679 | | | | 2.7 | | |
| | 1,507,825 | | | | | | | ICICI Bank Ltd. ADR | | | 29,839,857 | | | | 1.8 | | |
| | | | | | | | | | 76,416,536 | | | | 4.5 | | |
| | | | | Italy: 0.4% | |
| | 97,923 | | | | (1 | ) | | Brunello Cucinelli SpA | | | 6,730,541 | | | | 0.4 | | |
| | | | | Japan: 12.0% | |
| | 32,800 | | | | | | | Fanuc Ltd. | | | 6,972,034 | | | | 0.4 | | |
| | 83,104 | | | | | | | Keyence Corp. | | | 52,252,322 | | | | 3.0 | | |
| | 548,500 | | | | | | | Murata Manufacturing
Co., Ltd. | | | 43,749,710 | | | | 2.5 | | |
| | 483,800 | | | | | | | Nidec Corp. | | | 57,230,833 | | | | 3.3 | | |
| | 284,600 | | | | | | | Omron Corp. | | | 28,359,649 | | | | 1.7 | | |
| | 469,200 | | | | | | | TDK Corp. | | | 18,310,946 | | | | 1.1 | | |
| | | | | | | | | | 206,875,494 | | | | 12.0 | | |
| | | | | Netherlands: 3.7% | |
| | 396,330 | | | | (1 | ) | | Airbus SE | | | 50,707,916 | | | | 2.9 | | |
| | 16,097 | | | | | | | ASML Holding NV | | | 12,894,014 | | | | 0.8 | | |
| | | | | | | | | | 63,601,930 | | | | 3.7 | | |
| | | | | Spain: 0.2% | |
| | 108,185 | | | | | | | Industria de
Diseno Textil SA | | | 3,488,966 | | | | 0.2 | | |
Shares | | | | | | Value | | Percentage
of Net
Assets | |
| | | | | Sweden: 3.5% | |
| | 810,823 | | | | | | | Assa Abloy AB | | $ | 24,714,679 | | | | 1.5 | | |
| | 506,504 | | | | | | | Atlas Copco AB -
A Shares | | | 34,999,853 | | | | 2.0 | | |
| | | | | | | | | | 59,714,532 | | | | 3.5 | | |
| | | | | Switzerland: 1.0% | |
| | 13,479 | | | | | | | Lonza Group AG | | | 11,222,459 | | | | 0.7 | | |
| | 21,891 | | | | (1 | ) | | Zur Rose Group AG | | | 5,642,036 | | | | 0.3 | | |
| | | | | | | | | | 16,864,495 | | | | 1.0 | | |
| | | | | United Kingdom: 1.1% | |
| | 465,144 | | | | (1 | ) | | Farfetch Ltd. - Class A | | | 15,549,764 | | | | 0.9 | | |
| | 222,669 | | | | | | | Prudential PLC | | | 3,850,573 | | | | 0.2 | | |
| | | | | | | | | | 19,400,337 | | | | 1.1 | | |
| | | | | United States: 58.1% | |
| | 129,110 | | | | (1 | ) | | Adobe, Inc. | | | 73,213,117 | | | | 4.3 | | |
| | 235,167 | | | | | | | Agilent Technologies,
Inc. | | | 37,544,412 | | | | 2.2 | | |
| | 66,908 | | | | (1 | ) | | Alphabet, Inc. -
Class A | | | 193,835,152 | | | | 11.3 | | |
| | 4,647 | | | | (1 | ) | | Amazon.com, Inc. | | | 15,494,678 | | | | 0.9 | | |
| | 332,422 | | | | | | | Analog Devices, Inc. | | | 58,429,815 | | | | 3.4 | | |
| | 744,036 | | | | (1 | ) | | Avantor, Inc. | | | 31,353,677 | | | | 1.8 | | |
| | 212,217 | | | | (1 | ) | | Boston Scientific Corp. | | | 9,014,978 | | | | 0.5 | | |
| | 51,528 | | | | (1 | ) | | Castle
Biosciences, Inc. | | | 2,209,005 | | | | 0.1 | | |
| | 23,873 | | | | (1 | ) | | Charles River
Laboratories
International, Inc. | | | 8,994,869 | | | | 0.5 | | |
| | 20,377 | | | | | | | Danaher Corp. | | | 6,704,237 | | | | 0.4 | | |
| | 127,047 | | | | (1 | ) | | Dun & Bradstreet
Holdings, Inc. | | | 2,603,193 | | | | 0.1 | | |
| | 132,723 | | | | | | | Equifax, Inc. | | | 38,859,967 | | | | 2.3 | | |
| | 259,694 | | | | (1 | ) | | Meta Platforms, Inc. | | | 87,348,077 | | | | 5.1 | | |
| | 148,104 | | | | | | | Fidelity National
Information
Services, Inc. | | | 16,165,552 | | | | 0.9 | | |
| | 33,148 | | | | (1 | ) | | Illumina, Inc. | | | 12,610,825 | | | | 0.7 | | |
| | 173,356 | | | | | | | Intuit, Inc. | | | 111,506,046 | | | | 6.5 | | |
| | 25,557 | | | | (1 | ) | | Intuitive Surgical, Inc. | | | 9,182,630 | | | | 0.5 | | |
| | 48,687 | | | | (1 | ) | | IQVIA Holdings, Inc. | | | 13,736,550 | | | | 0.8 | | |
| | 15,845 | | | | (1 | ) | | Marriott International,
Inc. | | | 2,618,228 | | | | 0.1 | | |
| | 114,133 | | | | | | | Marvell Technology, Inc. | | | 9,985,496 | | | | 0.6 | | |
| | 61,957 | | | | | | | Microsoft Corp. | | | 20,837,378 | | | | 1.2 | | |
| | 54,007 | | | | (1 | ) | | Natera, Inc. | | | 5,043,714 | | | | 0.3 | | |
| | 32,498 | | | | | | | Nvidia Corp. | | | 9,557,987 | | | | 0.6 | | |
| | 43,339 | | | | (1 | ) | | Omnicell, Inc. | | | 7,820,089 | | | | 0.5 | | |
| | 98,405 | | | | (1 | ) | | PayPal Holdings, Inc. | | | 18,557,215 | | | | 1.1 | | |
| | 142,290 | | | | (1 | ) | | Phathom
Pharmaceuticals, Inc. | | | 2,798,844 | | | | 0.2 | | |
See Accompanying Notes to Financial Statements
150
PORTFOLIO OF INVESTMENTS
VY® INVESCO GLOBAL PORTFOLIO AS OF DECEMBER 31, 2021 (CONTINUED)
Shares | | | | | | Value | | Percentage
of Net
Assets | |
| | | | | United States (continued) | |
| | 199,953 | | | | (1 | ) | | Qualtrics
International, Inc. | | $ | 7,078,336 | | | | 0.4 | | |
| | 192,476 | | | | | | | S&P Global, Inc. | | | 90,835,199 | | | | 5.3 | | |
| | 52,490 | | | | (1 | ) | | Splunk, Inc. | | | 6,074,143 | | | | 0.3 | | |
| | 130,700 | | | | (1 | ),(3) | | Uniqure B.V. | | | 2,710,718 | | | | 0.2 | | |
| | 184,365 | | | | | | | United Parcel Service,
Inc. - Class B | | | 39,516,794 | | | | 2.3 | | |
| | 209,936 | | | | (1 | ) | | Veracyte, Inc. | | | 8,649,363 | | | | 0.5 | | |
| | 97,894 | | | | | | | Visa, Inc. - Class A | | | 21,214,609 | | | | 1.2 | | |
| | 113,324 | | | | (1 | ) | | Walt Disney Co. | | | 17,552,754 | | | | 1.0 | | |
| | | | | | | | | | 999,657,647 | | | | 58.1 | | |
| | | | | | | Total Common Stock
(Cost
$603,940,265) | | | 1,712,268,508 | | | | 99.5 | | |
PREFERRED STOCK: 0.0% | | | |
| | | | | India: 0.0% | |
| | 2,598,630 | | | | | | | Zee Entertainment
Enterprises Ltd. | | | 73,062 | | | | 0.0 | | |
| | | | | | | Total Preferred Stock
(Cost $335,416) | | | 73,062 | | | | 0.0 | | |
| | | | | | | Total Long-Term
Investments
(Cost
$604,275,681) | | | 1,712,341,570 | | | | 99.5 | | |
Principal
Amount† | |
| |
| |
Value | | Percentage
of Net
Assets | |
SHORT-TERM INVESTMENTS: 0.8% | | | |
| | | | | Repurchase Agreements: 0.2% | |
| | 1,030,025 | | | | (4 | ) | | Bank of America Inc.,
Repurchase
Agreement dated
12/31/21, 0.05%,
due 01/03/22
(Repurchase
Amount $1,030,029,
collateralized by
various U.S.
Government
Agency Obligations,
1.000%-5.000%,
Market Value plus
accrued interest
$1,050,625, due
09/01/28-01/01/61) | | $ | 1,030,025 | | | | 0.1 | | |
Principal
Amount† | |
| |
| |
Value | | Percentage
of Net
Assets | |
| | 305,351 | | | | (4 | ) | | Bank of Nova Scotia,
Repurchase
Agreement dated
12/31/21, 0.06%,
due 01/03/22
(Repurchase
Amount $305,353,
collateralized by
various U.S.
Government/U.S.
Government
Agency Obligations,
0.000%-7.000%,
Market Value plus
accrued interest
$311,459, due
04/07/22-04/01/51) | | $ | 305,351 | | | | 0.0 | | |
| | 1,030,025 | | | | (4 | ) | | HSBC Securities
USA, Repurchase
Agreement dated
12/31/21, 0.05%,
due 01/03/22
(Repurchase
Amount $1,030,029,
collateralized by
various U.S.
Government
Agency Obligations,
1.875%-6.500%,
Market Value plus
accrued interest
$1,050,626, due
01/20/27-05/20/51) | | | 1,030,025 | | | | 0.0 | | |
| | 1,030,025 | | | | (4 | ) | | MUFG Securities
America Inc.,
Repurchase
Agreement dated
12/31/21, 0.05%,
due 01/03/22
(Repurchase
Amount $1,030,029,
collateralized by
various U.S.
Government/U.S.
Government
Agency Obligations,
2.500%-6.500%,
Market Value plus
accrued interest
$1,050,626, due
05/20/24-10/01/51) | | | 1,030,025 | | | | 0.0 | | |
See Accompanying Notes to Financial Statements
151
PORTFOLIO OF INVESTMENTS
VY® INVESCO GLOBAL PORTFOLIO AS OF DECEMBER 31, 2021 (CONTINUED)
Principal
Amount† | |
| |
| |
Value | | Percentage
of Net
Assets | |
| | | | | Repurchase Agreements (continued) | |
| | 1,030,025 | | | | (4 | ) | | RBC Dominion
Securities Inc.,
Repurchase
Agreement dated
12/31/21, 0.05%,
due 01/03/22
(Repurchase
Amount $1,030,029,
collateralized by
various U.S.
Government/U.S.
Government
Agency Obligations,
0.000%-6.500%,
Market Value plus
accrued interest
$1,050,626, due
05/15/22-12/01/51) | | $ | 1,030,025 | | | | 0.1 | | |
| | | | | Total Repurchase
Agreements
(Cost $4,425,451) | | | 4,425,451 | | | | 0.2 | | |
Shares | | | | | | Value | | Percentage
of Net
Assets | |
| | | | | Mutual Funds: 0.6% | |
| | 9,638,868 | | | | (5 | ) | | BlackRock Liquidity
Funds, FedFund,
Institutional Class,
0.030%
(Cost $9,638,868) | | $ | 9,638,868 | | | | 0.6 | | |
| | | | | Total Short-Term
Investments
(Cost $14,064,319) | | | 14,064,319 | | | | 0.8 | | |
| | | | | Total Investments
in Securities
(Cost
$618,340,000) | | $ | 1,726,405,889 | | | | 100.3 | | |
| | | | | Liabilities in Excess
of Other Assets | | | (5,215,284 | ) | | | (0.3 | ) | |
| | | | | Net Assets | | $ | 1,721,190,605 | | | | 100.0 | | |
† Unless otherwise indicated, principal amount is shown in USD.
ADR American Depositary Receipt
(1) Non-income producing security.
(2) Securities with purchases pursuant to Rule 144A or section 4(a)(2), under the Securities Act of 1933 and may not be resold subject to that rule except to qualified institutional buyers.
(3) Security, or a portion of the security, is on loan.
(4) All or a portion of the security represents securities purchased with cash collateral received for securities on loan.
(5) Rate shown is the 7-day yield as of December 31, 2021.
Sector Diversification | | Percentage of
Net Assets | |
Information Technology | | | 32.6 | % | |
Communication Services | | | 17.4 | | |
Industrials | | | 14.9 | | |
Consumer Discretionary | | | 14.3 | | |
Health Care | | | 10.1 | | |
Financials | | | 7.2 | | |
Real Estate | | | 2.7 | | |
Consumer Staples | | | 0.3 | | |
Short-Term Investments | | | 0.8 | | |
Liabilities in Excess of Other Assets | | | (0.3 | ) | |
Net Assets | | | 100.0 | % | |
Portfolio holdings are subject to change daily.
See Accompanying Notes to Financial Statements
152
PORTFOLIO OF INVESTMENTS
VY® INVESCO GLOBAL PORTFOLIO AS OF DECEMBER 31, 2021 (CONTINUED)
Fair Value Measurements^
The following is a summary of the fair valuations according to the inputs used as of December 31, 2021 in valuing the assets and liabilities:
| | | Quoted Prices
in Active Markets
for Identical Investments
(Level 1) | | Significant Other
Observable
Inputs#
(Level 2) | | Significant
Unobservable
Inputs
(Level 3) | | Fair Value
at
December 31, 2021 | |
Asset Table | |
Investments, at fair value | |
Common Stock | |
Brazil | | $ | 4,046,687 | | | $ | — | | | $ | — | | | $ | 4,046,687 | | |
China | | | 56,348,472 | | | | 5,876,034 | | | | — | | | | 62,224,506 | | |
Denmark | | | — | | | | 3,930,250 | | | | — | | | | 3,930,250 | | |
France | | | — | | | | 146,447,243 | | | | — | | | | 146,447,243 | | |
Germany | | | — | | | | 42,869,344 | | | | — | | | | 42,869,344 | | |
India | | | 29,839,857 | | | | 46,576,679 | | | | — | | | | 76,416,536 | | |
Italy | | | — | | | | 6,730,541 | | | | — | | | | 6,730,541 | | |
Japan | | | — | | | | 206,875,494 | | | | — | | | | 206,875,494 | | |
Netherlands | | | — | | | | 63,601,930 | | | | — | | | | 63,601,930 | | |
Spain | | | — | | | | 3,488,966 | | | | — | | | | 3,488,966 | | |
Sweden | | | — | | | | 59,714,532 | | | | — | | | | 59,714,532 | | |
Switzerland | | | — | | | | 16,864,495 | | | | — | | | | 16,864,495 | | |
United Kingdom | | | 15,549,764 | | | | 3,850,573 | | | | — | | | | 19,400,337 | | |
United States | | | 999,657,647 | | | | — | | | | — | | | | 999,657,647 | | |
Total Common Stock | | | 1,105,442,427 | | | | 606,826,081 | | | | — | | | | 1,712,268,508 | | |
Preferred Stock | | | 73,062 | | | | — | | | | — | | | | 73,062 | | |
Short-Term Investments | | | 9,638,868 | | | | 4,425,451 | | | | — | | | | 14,064,319 | | |
Total Investments, at fair value | | $ | 1,115,154,357 | | | $ | 611,251,532 | | | $ | — | | | $ | 1,726,405,889 | | |
^ See Note 2, "Significant Accounting Policies" in the Notes to Financial Statements for additional information.
# The earlier close of the foreign markets gives rise to the possibility that significant events, including broad market moves, may have occurred in the interim and may materially affect the value of those securities. To account for this, the Portfolio may frequently value many of its foreign equity securities using fair value prices based on third party vendor modeling tools to the extent available. Accordingly, a portion of the Portfolio's investments are categorized as Level 2 investments.
The effect of derivative instruments on the Portfolio's Statement of Operations for the year ended December 31, 2021 was as follows:
| | | Amount of Realized Gain or (Loss) on Derivatives Recognized in Income | |
Derivatives not accounted
for as hedging instruments | | Forward foreign currency contracts | |
Foreign exchange contracts | | $ | 37,903 | | |
Total | | $ | 37,903 | | |
| | | Change in Unrealized Appreciation or (Depreciation) on Derivatives Recognized in Income | |
Derivatives not accounted
for as hedging instruments | | Forward foreign currency contracts | |
Foreign exchange contracts | | $ | 4,449 | | |
Total | | $ | 4,449 | | |
At December 31, 2021, the aggregate cost of securities and other investments and the composition of unrealized appreciation and depreciation of securities and other investments on a tax basis were:
Cost for federal income tax purposes was $623,647,863.
Net unrealized appreciation consisted of: | |
Gross Unrealized Appreciation | | $ | 1,122,033,734 | | |
Gross Unrealized Depreciation | | | (19,289,508 | ) | |
Net Unrealized Appreciation | | $ | 1,102,744,226 | | |
See Accompanying Notes to Financial Statements
153
VY® JPMORGAN PORTFOLIO OF INVESTMENTS
MID CAP VALUE PORTFOLIO AS OF DECEMBER 31, 2021
Shares | |
| |
| | Value | | Percentage
of Net
Assets | |
COMMON STOCK: 99.1% | | | |
| | | | | Communication Services: 4.1% | |
| | 29,735 | | | | (1 | ) | | IAC/InterActiveCorp | | $ | 3,886,662 | | | | 0.9 | | |
| | 84,238 | | | | (1 | ) | | Liberty Media Corp.-
Liberty SiriusXM C
Tracking Stock | | | 4,283,502 | | | | 1.0 | | |
| | 35,960 | | | | (1 | ) | | Liberty Broadband
Corp. - Series C | | | 5,793,156 | | | | 1.4 | | |
| | 547,617 | | | | (1 | ) | | Zynga, Inc. - Class A | | | 3,504,749 | | | | 0.8 | | |
| | | | | | | | | | 17,468,069 | | | | 4.1 | | |
| | | | | Consumer Discretionary: 11.3% | |
| | 3,280 | | | | (1 | ) | | Autozone, Inc. | | | 6,876,159 | | | | 1.6 | | |
| | 37,420 | | | | | | | Best Buy Co., Inc. | | | 3,801,872 | | | | 0.9 | | |
| | 35,840 | | | | | | | Carter's, Inc. | | | 3,627,725 | | | | 0.9 | | |
| | 15,340 | | | | | | | Darden Restaurants, Inc. | | | 2,310,818 | | | | 0.5 | | |
| | 10,780 | | | | (1 | ) | | Expedia Group, Inc. | | | 1,948,162 | | | | 0.5 | | |
| | 149,370 | | | | | | | Gap, Inc. | | | 2,636,380 | | | | 0.6 | | |
| | 19,290 | | | | | | | Genuine Parts Co. | | | 2,704,458 | | | | 0.6 | | |
| | 63,781 | | | | | | | Kohl's Corp. | | | 3,150,143 | | | | 0.7 | | |
| | 89,480 | | | | | | | LKQ Corp. | | | 5,371,484 | | | | 1.3 | | |
| | 22,170 | | | | (1 | ) | | Mohawk Industries, Inc. | | | 4,038,931 | | | | 1.0 | | |
| | 203,586 | | | | | | | Newell Brands, Inc. | | | 4,446,318 | | | | 1.1 | | |
| | 30,700 | | | | | | | Ralph Lauren Corp. | | | 3,649,002 | | | | 0.9 | | |
| | 77,390 | | | | | | | Tapestry, Inc. | | | 3,142,034 | | | | 0.7 | | |
| | | | | | | | | | 47,703,486 | | | | 11.3 | | |
| | | | | Consumer Staples: 4.1% | |
| | 14,320 | | | | | | | Constellation Brands, Inc. | | | 3,593,890 | | | | 0.8 | | |
| | 49,562 | | | | | | | Energizer Holdings, Inc. | | | 1,987,436 | | | | 0.5 | | |
| | 67,710 | | | | | | | Keurig Dr Pepper, Inc. | | | 2,495,791 | | | | 0.6 | | |
| | 68,710 | | | | | | | Kroger Co. | | | 3,109,815 | | | | 0.7 | | |
| | 32,710 | | | | (1 | ) | | Post Holdings, Inc. | | | 3,687,398 | | | | 0.9 | | |
| | 72,920 | | | | (1 | ) | | US Foods Holding Corp. | | | 2,539,804 | | | | 0.6 | | |
| | | | | | | | | | 17,414,134 | | | | 4.1 | | |
| | | | | Energy: 4.0% | |
| | 293,230 | | | | | | | Coterra Energy, Inc. | | | 5,571,370 | | | | 1.3 | | |
| | 53,794 | | | | | | | Diamondback Energy, Inc. | | | 5,801,683 | | | | 1.4 | | |
| | 208,580 | | | | | | | Williams Cos., Inc. | | | 5,431,423 | | | | 1.3 | | |
| | | | | | | | | | 16,804,476 | | | | 4.0 | | |
| | | | | Financials: 22.3% | |
| | 3,273 | | | | (1 | ) | | Alleghany Corp. | | | 2,185,022 | | | | 0.5 | | |
| | 26,620 | | | | | | | Ameriprise Financial, Inc. | | | 8,030,189 | | | | 1.9 | | |
| | 48,210 | | | | (1 | ) | | Arch Capital Group Ltd. | | | 2,142,935 | | | | 0.5 | | |
| | 105,800 | | | | | | | Citizens Financial Group,
Inc. | | | 4,999,050 | | | | 1.2 | | |
| | 37,850 | | | | | | | Discover Financial
Services | | | 4,373,946 | | | | 1.0 | | |
| | 145,370 | | | | | | | Fifth Third Bancorp | | | 6,330,863 | | | | 1.5 | | |
| | 59,550 | | | | | | | Hartford Financial
Services Group, Inc. | | | 4,111,332 | | | | 1.0 | | |
Shares | |
| |
| | Value | | Percentage
of Net
Assets | |
| | 441,105 | | | | | | | Huntington Bancshares,
Inc. | | $ | 6,801,839 | | | | 1.6 | | |
| | 48,010 | | | | | | | Lincoln National Corp. | | | 3,277,163 | | | | 0.8 | | |
| | 112,682 | | | | | | | Loews Corp. | | | 6,508,512 | | | | 1.5 | | |
| | 43,333 | | | | | | | M&T Bank Corp. | | | 6,655,082 | | | | 1.6 | | |
| | 134,030 | | | | | | | MGIC Investment Corp. | | | 1,932,713 | | | | 0.5 | | |
| | 42,540 | | | | | | | Northern Trust Corp. | | | 5,088,209 | | | | 1.2 | | |
| | 26,940 | | | | | | | Progressive Corp. | | | 2,765,391 | | | | 0.7 | | |
| | 53,465 | | | | | | | Raymond James
Financial, Inc. | | | 5,367,886 | | | | 1.3 | | |
| | 239,780 | | | | | | | Regions Financial Corp. | | | 5,227,204 | | | | 1.2 | | |
| | 13,460 | | | | | | | RenaissanceRe Holdings
Ltd. | | | 2,279,182 | | | | 0.5 | | |
| | 54,033 | | | | | | | State Street Corp. | | | 5,025,069 | | | | 1.2 | | |
| | 22,380 | | | | | | | T. Rowe Price Group, Inc. | | | 4,400,803 | | | | 1.0 | | |
| | 39,005 | | | | | | | WR Berkley Corp. | | | 3,213,622 | | | | 0.8 | | |
| | 53,710 | | | | | | | Zions Bancorp NA | | | 3,392,324 | | | | 0.8 | | |
| | | | | | | | | | 94,108,336 | | | | 22.3 | | |
| | | | | Health Care: 6.8% | |
| | 38,380 | | | | | | | AmerisourceBergen Corp. | | | 5,100,318 | | | | 1.2 | | |
| | 48,490 | | | | (1 | ) | | Henry Schein, Inc. | | | 3,759,430 | | | | 0.9 | | |
| | 5,030 | | | | | | | Humana, Inc. | | | 2,333,216 | | | | 0.5 | | |
| | 18,640 | | | | (1 | ) | | Jazz Pharmaceuticals PLC | | | 2,374,736 | | | | 0.6 | | |
| | 20,760 | | | | (1 | ) | | Laboratory Corp. of
America Holdings | | | 6,522,999 | | | | 1.5 | | |
| | 34,390 | | | | | | | Universal Health
Services, Inc. | | | 4,459,007 | | | | 1.1 | | |
| | 34,320 | | | | | | | Zimmer Biomet Holdings,
Inc. | | | 4,360,013 | | | | 1.0 | | |
| | | | | | | | | | 28,909,719 | | | | 6.8 | | |
| | | | | Industrials: 14.1% | |
| | 26,611 | | | | | | | Acuity Brands, Inc. | | | 5,634,081 | | | | 1.3 | | |
| | 30,190 | | | | | | | Ametek, Inc. | | | 4,439,138 | | | | 1.0 | | |
| | 25,500 | | | | | | | Carlisle Cos., Inc. | | | 6,327,060 | | | | 1.5 | | |
| | 59,990 | | | | | | | Fortune Brands Home &
Security, Inc. | | | 6,412,931 | | | | 1.5 | | |
| | 27,920 | | | | | | | Hubbell, Inc. | | | 5,814,898 | | | | 1.4 | | |
| | 14,040 | | | | | | | IDEX Corp. | | | 3,317,933 | | | | 0.8 | | |
| | 51,060 | | | | | | | ITT, Inc. | | | 5,217,821 | | | | 1.2 | | |
| | 39,220 | | | | | | | Leidos Holdings, Inc. | | | 3,486,658 | | | | 0.8 | | |
| | 31,960 | | | | | | | Lincoln Electric Holdings,
Inc. | | | 4,457,461 | | | | 1.1 | | |
| | 23,230 | | | | (1 | ) | | Middleby Corp. | | | 4,570,735 | | | | 1.1 | | |
| | 21,491 | | | | | | | Snap-On, Inc. | | | 4,628,732 | | | | 1.1 | | |
| | 45,620 | | | | (1 | ) | | Southwest Airlines Co. | | | 1,954,361 | | | | 0.5 | | |
| | 49,780 | | | | | | | Timken Co. | | | 3,449,256 | | | | 0.8 | | |
| | | | | | | | | | 59,711,065 | | | | 14.1 | | |
| | | | | Information Technology: 7.3% | |
| | 53,290 | | | | | | | Amphenol Corp. | | | 4,660,743 | | | | 1.1 | | |
| | 14,610 | | | | | | | Analog Devices, Inc. | | | 2,568,000 | | | | 0.6 | | |
| | 18,160 | | | | | | | CDW Corp. | | | 3,718,805 | | | | 0.9 | | |
See Accompanying Notes to Financial Statements
154
VY® JPMORGAN PORTFOLIO OF INVESTMENTS
MID CAP VALUE PORTFOLIO AS OF DECEMBER 31, 2021 (CONTINUED)
Shares | |
| |
| | Value | | Percentage
of Net
Assets | |
| | | | | Information Technology (continued) | |
| | 19,870 | | | | (1 | ) | | FleetCor Technologies,
Inc. | | $ | 4,447,701 | | | | 1.0 | | |
| | 24,820 | | | | | | | Motorola Solutions, Inc. | | | 6,743,594 | | | | 1.6 | | |
| | 149,640 | | | | | | | NortonLifeLock, Inc. | | | 3,887,647 | | | | 0.9 | | |
| | 42,820 | | | | | | | TD SYNNEX Corp. | | | 4,896,895 | | | | 1.2 | | |
| | | | | | | | | | 30,923,385 | | | | 7.3 | | |
| | | | | Materials: 4.9% | |
| | 23,140 | | | | | | | Celanese Corp. - Series A | | | 3,888,909 | | | | 0.9 | | |
| | 92,600 | | | | | | | Freeport-McMoRan, Inc. | | | 3,864,198 | | | | 0.9 | | |
| | 9,695 | | | | | | | Martin Marietta Materials,
Inc. | | | 4,270,841 | | | | 1.0 | | |
| | 21,860 | | | | | | | Packaging Corp. of
America | | | 2,976,239 | | | | 0.7 | | |
| | 20,530 | | | | | | | RPM International, Inc. | | | 2,073,530 | | | | 0.5 | | |
| | 86,480 | | | | | | | Silgan Holdings, Inc. | | | 3,704,803 | | | | 0.9 | | |
| | | | | | | | | | 20,778,520 | | | | 4.9 | | |
| | | | | Real Estate: 12.1% | |
| | 92,010 | | | | | | | American Homes 4 Rent | | | 4,012,556 | | | | 1.0 | | |
| | 15,830 | | | | | | | AvalonBay Communities,
Inc. | | | 3,998,500 | | | | 1.0 | | |
| | 30,410 | | | | | | | Boston Properties, Inc. | | | 3,502,624 | | | | 0.8 | | |
| | 105,950 | | | | | | | Brixmor Property Group,
Inc. | | | 2,692,189 | | | | 0.6 | | |
| | 41,200 | | | | (1 | ) | | CBRE Group, Inc. | | | 4,470,612 | | | | 1.1 | | |
| | 7,460 | | | | | | | Essex Property Trust, Inc. | | | 2,627,636 | | | | 0.6 | | |
| | 15,420 | | | | | | | Federal Realty
Investment Trust | | | 2,102,054 | | | | 0.5 | | |
| | 76,660 | | | | (1 | ) | | Host Hotels & Resorts,
Inc. | | | 1,333,117 | | | | 0.3 | | |
| | 53,713 | | | | | | | JBG SMITH Properties | | | 1,542,100 | | | | 0.4 | | |
| | 127,050 | | | | | | | Kimco Realty Corp. | | | 3,131,783 | | | | 0.7 | | |
| | 10,990 | | | | | | | Mid-America Apartment
Communities, Inc. | | | 2,521,546 | | | | 0.6 | | |
| | 97,500 | | | | | | | Rayonier, Inc. | | | 3,935,100 | | | | 0.9 | | |
| | 29,350 | | | | | | | Regency Centers Corp. | | | 2,211,523 | | | | 0.5 | | |
Shares | |
| |
| | Value | | Percentage
of Net
Assets | |
| | 30,440 | | | | | | | Rexford Industrial Realty,
Inc. | | $ | 2,468,988 | | | | 0.6 | | |
| | 10,610 | | | | | | | Sun Communities, Inc. | | | 2,227,782 | | | | 0.5 | | |
| | 30,610 | | | | | | | Ventas, Inc. | | | 1,564,783 | | | | 0.4 | | |
| | 104,300 | | | | | | | Weyerhaeuser Co. | | | 4,295,074 | | | | 1.0 | | |
| | 33,240 | | | | | | | WP Carey, Inc. | | | 2,727,342 | | | | 0.6 | | |
| | | | | | | | | | 51,365,309 | | | | 12.1 | | |
| | | | | Utilities: 8.1% | |
| | 87,150 | | | | | | | CMS Energy Corp. | | | 5,669,107 | | | | 1.3 | | |
| | 51,270 | | | | | | | Edison International | | | 3,499,178 | | | | 0.8 | | |
| | 44,580 | | | | | | | Entergy Corp. | | | 5,021,937 | | | | 1.2 | | |
| | 90,905 | | | | | | | National Fuel Gas Co. | | | 5,812,466 | | | | 1.4 | | |
| | 16,690 | | | | | | | Sempra Energy | | | 2,207,753 | | | | 0.5 | | |
| | 58,710 | | | | | | | WEC Energy Group, Inc. | | | 5,698,980 | | | | 1.4 | | |
| | 93,610 | | | | | | | Xcel Energy, Inc. | | | 6,337,397 | | | | 1.5 | | |
| | | | | | | | | | 34,246,818 | | | | 8.1 | | |
| | | | | | | Total Common Stock
(Cost $282,704,509) | | | 419,433,317 | | | | 99.1 | | |
SHORT-TERM INVESTMENTS: 1.2% | | | |
| | | | | Mutual Funds: 1.2% | |
| | 4,996,940 | | | | (2 | ) | | BlackRock Liquidity
Funds, FedFund,
Institutional Class,
0.030%
(Cost $4,996,940) | | | 4,996,940 | | | | 1.2 | | |
| | | | | | | Total Short-Term
Investments
(Cost $4,996,940) | | | 4,996,940 | | | | 1.2 | | |
| | | | | | | Total Investments in
Securities
(Cost $287,701,449) | | $ | 424,430,257 | | | | 100.3 | | |
| | | | | | | Liabilities in Excess of
Other Assets | | | (1,431,995 | ) | | | (0.3 | ) | |
| | | | | | | Net Assets | | $ | 422,998,262 | | | | 100.0 | | |
(1) Non-income producing security.
(2) Rate shown is the 7-day yield as of December 31, 2021.
Fair Value Measurements^
The following is a summary of the fair valuations according to the inputs used as of December 31, 2021 in valuing the assets and liabilities:
| | | Quoted Prices
in Active Markets
for Identical Investments
(Level 1) | | Significant Other
Observable
Inputs
(Level 2) | | Significant
Unobservable
Inputs
(Level 3) | | Fair Value
at
December 31, 2021 | |
Asset Table | |
Investments, at fair value | |
Common Stock* | | $ | 419,433,317 | | | $ | — | | | $ | — | | | $ | 419,433,317 | | |
Short-Term Investments | | | 4,996,940 | | | | — | | | | — | | | | 4,996,940 | | |
Total Investments, at fair value | | $ | 424,430,257 | | | $ | — | | | $ | — | | | $ | 424,430,257 | | |
^ See Note 2, "Significant Accounting Policies" in the Notes to Financial Statements for additional information.
* For further breakdown of Common Stock by sector, please refer to the Portfolio of Investments.
See Accompanying Notes to Financial Statements
155
VY® JPMORGAN PORTFOLIO OF INVESTMENTS
MID CAP VALUE PORTFOLIO AS OF DECEMBER 31, 2021 (CONTINUED)
At December 31, 2021, the aggregate cost of securities and other investments and the composition of unrealized appreciation and depreciation of securities and other investments on a tax basis were:
Cost for federal income tax purposes was $289,016,570.
Net unrealized appreciation consisted of: | |
Gross Unrealized Appreciation | | $ | 143,927,684 | | |
Gross Unrealized Depreciation | | | (8,513,997 | ) | |
Net Unrealized Appreciation | | $ | 135,413,687 | | |
See Accompanying Notes to Financial Statements
156
VY® T. ROWE PRICE DIVERSIFIED PORTFOLIO OF INVESTMENTS
MID CAP GROWTH PORTFOLIO AS OF DECEMBER 31, 2021
Shares | |
| |
| | Value | | Percentage
of Net
Assets | |
COMMON STOCK: 99.0% | | | |
| | | | | Communication Services: 5.0% | |
| | 151,494 | | | | (1 | ) | | Altice USA, Inc. | | $ | 2,451,173 | | | | 0.2 | | |
| | 39,254 | | | | (1 | ) | | Bumble, Inc. | | | 1,329,140 | | | | 0.1 | | |
| | 7,575 | | | | (2 | ) | | Cable One, Inc. | | | 13,358,134 | | | | 0.9 | | |
| | 13,600 | | | | | | | Electronic Arts, Inc. | | | 1,793,840 | | | | 0.1 | | |
| | 30,800 | | | | (1 | ) | | IAC/InterActiveCorp | | | 4,025,868 | | | | 0.3 | | |
| | 103,331 | | | | (1 | ) | | Match Group, Inc. | | | 13,665,525 | | | | 1.0 | | |
| | 193,900 | | | | (1 | ) | | Pinterest, Inc. | | | 7,048,265 | | | | 0.5 | | |
| | 43,700 | | | | (1 | ) | | Roku, Inc. | | | 9,972,340 | | | | 0.7 | | |
| | 51,400 | | | | (1 | ) | | Spotify Technology SA | | | 12,029,142 | | | | 0.8 | | |
| | 10,300 | | | | (1 | ) | | Take-Two Interactive
Software, Inc. | | | 1,830,516 | | | | 0.1 | | |
| | 91,430 | | | | (1 | ) | | Vimeo, Inc. | | | 1,642,083 | | | | 0.1 | | |
| | 29,968 | | | | (1 | ) | | ZoomInfo
Technologies, Inc. | | | 1,923,945 | | | | 0.1 | | |
| | 240,100 | | | | (1 | ) | | Zynga, Inc. - Class A | | | 1,536,640 | | | | 0.1 | | |
| | | | | | | | | | 72,606,611 | | | | 5.0 | | |
| | | | | Consumer Discretionary: 15.5% | |
| | 19,900 | | | | (1 | ) | | Aptiv PLC | | | 3,282,505 | | | | 0.2 | | |
| | 4,850 | | | | (1 | ) | | Autozone, Inc. | | | 10,167,492 | | | | 0.7 | | |
| | 20,200 | | | | (1 | ) | | Bright Horizons Family
Solutions, Inc. | | | 2,542,776 | | | | 0.2 | | |
| | 27,500 | | | | (1 | ) | | Burlington Stores, Inc. | | | 8,016,525 | | | | 0.6 | | |
| | 56,800 | | | | (1 | ) | | Caesars
Entertainment, Inc. | | | 5,312,504 | | | | 0.4 | | |
| | 29,700 | | | | (1 | ) | | Carmax, Inc. | | | 3,867,831 | | | | 0.3 | | |
| | 27,200 | | | | (1 | ),(2) | | Carvana Co. | | | 6,304,688 | | | | 0.4 | | |
| | 47,819 | | | | (1 | ),(2) | | Chewy, Inc. | | | 2,819,886 | | | | 0.2 | | |
| | 10,450 | | | | (1 | ) | | Chipotle Mexican
Grill, Inc. | | | 18,269,213 | | | | 1.3 | | |
| | 10,400 | | | | (1 | ) | | Dollar Tree, Inc. | | | 1,461,408 | | | | 0.1 | | |
| | 20,500 | | | | | | | Domino's Pizza, Inc. | | | 11,568,765 | | | | 0.8 | | |
| | 147,200 | | | | (1 | ),(2) | | DraftKings, Inc. -
Class A | | | 4,043,584 | | | | 0.3 | | |
| | 44,200 | | | | (1 | ) | | Etsy, Inc. | | | 9,677,148 | | | | 0.7 | | |
| | 28,469 | | | | (1 | ) | | Five Below, Inc. | | | 5,889,951 | | | | 0.4 | | |
| | 28,800 | | | | (1 | ) | | Floor & Decor
Holdings, Inc. | | | 3,744,288 | | | | 0.3 | | |
| | 88,100 | | | | (1 | ) | | Hilton Worldwide
Holdings, Inc. | | | 13,742,719 | | | | 0.9 | | |
| | 42,800 | | | | (1 | ) | | Lululemon Athletica,
Inc. | | | 16,754,060 | | | | 1.1 | | |
| | 325,600 | | | | | | | MGM Resorts
International | | | 14,612,928 | | | | 1.0 | | |
| | 1,819 | | | | (1 | ) | | NVR, Inc. | | | 10,748,235 | | | | 0.7 | | |
| | 70,100 | | | | (1 | ),(2) | | Ollie's Bargain Outlet
Holdings, Inc. | | | 3,588,419 | | | | 0.2 | | |
| | 16,300 | | | | (1 | ) | | O'Reilly
Automotive, Inc. | | | 11,511,549 | | | | 0.8 | | |
| | 23,000 | | | | | | | Papa Johns
International, Inc. | | | 3,069,810 | | | | 0.2 | | |
| | 3,600 | | | | | | | Pool Corp. | | | 2,037,600 | | | | 0.1 | | |
Shares | |
| |
| | Value | | Percentage
of Net
Assets | |
| | 59,281 | | | | (2 | ) | | Restaurant Brands
International, Inc. | | $ | 3,597,171 | | | | 0.2 | | |
| | 5,700 | | | | (1 | ),(2) | | RH | | | 3,054,858 | | | | 0.2 | | |
| | 29,200 | | | | | | | Ross Stores, Inc. | | | 3,336,976 | | | | 0.2 | | |
| | 25,700 | | | | | | | Service Corp.
International | | | 1,824,443 | | | | 0.1 | | |
| | 52,800 | | | | | | | Tractor Supply Co. | | | 12,598,080 | | | | 0.9 | | |
| | 30,821 | | | | (1 | ) | | Ulta Beauty, Inc. | | | 12,708,731 | | | | 0.9 | | |
| | 8,638 | | | | (1 | ),(2) | | Warby Parker, Inc. | | | 402,185 | | | | 0.0 | | |
| | 14,700 | | | | (1 | ),(2) | | Wayfair, Inc. | | | 2,792,559 | | | | 0.2 | | |
| | 22,800 | | | | (2 | ) | | Williams-Sonoma, Inc. | | | 3,856,164 | | | | 0.3 | | |
| | 37,100 | | | | (1 | ),(2) | | Wynn Resorts Ltd. | | | 3,154,984 | | | | 0.2 | | |
| | 32,600 | | | | | | | Yum China Holdings,
Inc. | | | 1,624,784 | | | | 0.1 | | |
| | 30,100 | | | | | | | Yum! Brands, Inc. | | | 4,179,686 | | | | 0.3 | | |
| | | | | | | | | | 226,164,505 | | | | 15.5 | | |
| | | | | Consumer Staples: 2.4% | |
| | 72,800 | | | | (1 | ) | | BJ's Wholesale Club
Holdings, Inc. | | | 4,875,416 | | | | 0.3 | | |
| | 3,989 | | | | (1 | ) | | Boston Beer Co., Inc. | | | 2,014,844 | | | | 0.1 | | |
| | 78,275 | | | | | | | Brown-Forman Corp. -
Class B | | | 5,703,117 | | | | 0.4 | | |
| | 6,600 | | | | | | | Casey's General
Stores, Inc. | | | 1,302,510 | | | | 0.1 | | |
| | 17,300 | | | | | | | Church & Dwight Co.,
Inc. | | | 1,773,250 | | | | 0.1 | | |
| | 12,100 | | | | | | | Clorox Co. | | | 2,109,756 | | | | 0.2 | | |
| | 8,300 | | | | | | | Constellation Brands,
Inc. | | | 2,083,051 | | | | 0.1 | | |
| | 79,600 | | | | (1 | ) | | Darling Ingredients,
Inc. | | | 5,515,484 | | | | 0.4 | | |
| | 35,900 | | | | | | | Hershey Co. | | | 6,945,573 | | | | 0.5 | | |
| | 16,800 | | | | | | | McCormick & Co., Inc. | | | 1,623,048 | | | | 0.1 | | |
| | 17,389 | | | | | | | Tyson Foods, Inc. | | | 1,515,625 | | | | 0.1 | | |
| | | | | | | | | | 35,461,674 | | | | 2.4 | | |
| | | | | Energy: 2.0% | |
| | 347,500 | | | | | | | Devon Energy Corp. | | | 15,307,375 | | | | 1.1 | | |
| | 58,800 | | | | | | | Pioneer Natural
Resources Co. | | | 10,694,544 | | | | 0.7 | | |
| | 44 | | | | (1 | ),(3),(4) | | Venture Global
LNG, Inc. - Series B | | | 261,808 | | | | 0.0 | | |
| | 560 | | | | (1 | ),(3),(4) | | Venture Global LNG,
Inc. - Series C | | | 3,332,095 | | | | 0.2 | | |
| | | | | | | | | | 29,595,822 | | | | 2.0 | | |
| | | | | Financials: 4.3% | |
| | 46,400 | | | | | | | Arthur J. Gallagher &
Co. | | | 7,872,688 | | | | 0.5 | | |
| | 11,500 | | | | | | | Assurant, Inc. | | | 1,792,390 | | | | 0.1 | | |
| | 13,833 | | | | | | | Cboe Global Markets,
Inc. | | | 1,803,823 | | | | 0.1 | | |
| | 66,200 | | | | | | | Discover Financial
Services | | | 7,650,072 | | | | 0.5 | | |
See Accompanying Notes to Financial Statements
157
VY® T. ROWE PRICE DIVERSIFIED PORTFOLIO OF INVESTMENTS
MID CAP GROWTH PORTFOLIO AS OF DECEMBER 31, 2021 (CONTINUED)
Shares | |
| |
| | Value | | Percentage
of Net
Assets | |
| | | | | Financials (continued) | |
| | 4,300 | | | | | | | Factset Research
Systems, Inc. | | $ | 2,089,843 | | | | 0.2 | | |
| | 10,100 | | | | | | | First Republic Bank | | | 2,085,751 | | | | 0.1 | | |
| | 79,200 | | | | | | | Hartford Financial
Services Group, Inc. | | | 5,467,968 | | | | 0.4 | | |
| | 21,200 | | | | | | | MarketAxess
Holdings, Inc. | | | 8,718,924 | | | | 0.6 | | |
| | 22,200 | | | | | | | MSCI, Inc. - Class A | | | 13,601,718 | | | | 0.9 | | |
| | 11,400 | | | | | | | Nasdaq, Inc. | | | 2,394,114 | | | | 0.2 | | |
| | 3,200 | | | | (1 | ) | | SVB Financial Group | | | 2,170,368 | | | | 0.2 | | |
| | 69,419 | | | | | | | Tradeweb Markets,
Inc. | | | 6,951,619 | | | | 0.5 | | |
| | | | | | | | | | 62,599,278 | | | | 4.3 | | |
| | | | | Health Care: 18.0% | |
| | 15,700 | | | | (1 | ) | | Abiomed, Inc. | | | 5,638,969 | | | | 0.4 | | |
| | 24,099 | | | | (1 | ) | | Acadia Healthcare
Co., Inc. | | | 1,462,809 | | | | 0.1 | | |
| | 53,800 | | | | (1 | ) | | Acadia
Pharmaceuticals, Inc. | | | 1,255,692 | | | | 0.1 | | |
| | 44,959 | | | | (1 | ) | | Adaptive
Biotechnologies Corp. | | | 1,261,550 | | | | 0.1 | | |
| | 45,400 | | | | | | | Agilent Technologies,
Inc. | | | 7,248,110 | | | | 0.5 | | |
| | 50,167 | | | | (1 | ),(2) | | agilon health, Inc. | | | 1,354,509 | | | | 0.1 | | |
| | 2,800 | | | | (1 | ) | | Align Technology, Inc. | | | 1,840,104 | | | | 0.1 | | |
| | 32,200 | | | | (1 | ),(2) | | Alnylam
Pharmaceuticals, Inc. | | | 5,460,476 | | | | 0.4 | | |
| | 14,700 | | | | (1 | ) | | Amedisys, Inc. | | | 2,379,636 | | | | 0.2 | | |
| | 12,585 | | | | (1 | ) | | Argenx SE ADR | | | 4,407,141 | | | | 0.3 | | |
| | 15,600 | | | | (1 | ) | | Ascendis Pharma
A/S ADR | | | 2,098,668 | | | | 0.1 | | |
| | 224,343 | | | | (1 | ) | | Avantor, Inc. | | | 9,453,814 | | | | 0.6 | | |
| | 17,500 | | | | (1 | ) | | BioMarin
Pharmaceutical, Inc. | | | 1,546,125 | | | | 0.1 | | |
| | 16,500 | | | | (1 | ) | | BioNTech SE ADR | | | 4,253,700 | | | | 0.3 | | |
| | 8,300 | | | | (1 | ) | | Bio-Rad Laboratories,
Inc. | | | 6,271,231 | | | | 0.4 | | |
| | 15,000 | | | | | | | Bio-Techne Corp. | | | 7,760,100 | | | | 0.5 | | |
| | 22,800 | | | | (1 | ) | | Blueprint Medicines
Corp. | | | 2,442,108 | | | | 0.2 | | |
| | 23,900 | | | | | | | Bruker Corp. | | | 2,005,449 | | | | 0.1 | | |
| | 41,984 | | | | (1 | ) | | Catalent, Inc. | | | 5,375,212 | | | | 0.4 | | |
| | 24,228 | | | | (1 | ) | | Centene Corp. | | | 1,996,387 | | | | 0.1 | | |
| | 4,500 | | | | | | | Cooper Cos., Inc. | | | 1,885,230 | | | | 0.1 | | |
| | 16,400 | | | | (1 | ) | | DaVita, Inc. | | | 1,865,664 | | | | 0.1 | | |
| | 16,044 | | | | (1 | ) | | Denali Therapeutics,
Inc. | | | 715,562 | | | | 0.0 | | |
| | 34,100 | | | | (1 | ) | | DexCom, Inc. | | | 18,309,995 | | | | 1.2 | | |
| | 69,110 | | | | (1 | ) | | Elanco Animal Health,
Inc. | | | 1,961,342 | | | | 0.1 | | |
| | 49,500 | | | | (1 | ),(2) | | Exact Sciences Corp. | | | 3,852,585 | | | | 0.3 | | |
Shares | |
| |
| | Value | | Percentage
of Net
Assets | |
| | 82,700 | | | | (1 | ) | | Exelixis, Inc. | | $ | 1,511,756 | | | | 0.1 | | |
| | 16,500 | | | | (1 | ),(2) | | Fate Therapeutics,
Inc. | | | 965,415 | | | | 0.1 | | |
| | 105,800 | | | | (1 | ) | | Genmab A/S ADR | | | 4,185,448 | | | | 0.3 | | |
| | 26,500 | | | | (1 | ),(2) | | Guardant Health, Inc. | | | 2,650,530 | | | | 0.2 | | |
| | 30,300 | | | | (1 | ) | | Hologic, Inc. | | | 2,319,768 | | | | 0.2 | | |
| | 27,900 | | | | (1 | ) | | Horizon Therapeutics
Plc | | | 3,006,504 | | | | 0.2 | | |
| | 5,775 | | | | (1 | ) | | ICU Medical, Inc. | | | 1,370,639 | | | | 0.1 | | |
| | 19,600 | | | | (1 | ) | | Idexx Laboratories,
Inc. | | | 12,905,816 | | | | 0.9 | | |
| | 44,900 | | | | (1 | ) | | Incyte Corp., Ltd. | | | 3,295,660 | | | | 0.2 | | |
| | 31,200 | | | | (1 | ),(2) | | Ionis Pharmaceuticals,
Inc. | | | 949,416 | | | | 0.1 | | |
| | 18,600 | | | | (1 | ) | | IQVIA Holdings, Inc. | | | 5,247,804 | | | | 0.4 | | |
| | 9,722 | | | | (1 | ),(2) | | Kodiak Sciences, Inc. | | | 824,231 | | | | 0.1 | | |
| | 75,491 | | | | | | | McKesson Corp. | | | 18,764,798 | | | | 1.3 | | |
| | 7,400 | | | | (1 | ) | | Mettler Toledo
International, Inc. | | | 12,559,354 | | | | 0.9 | | |
| | 6,400 | | | | (1 | ) | | Mirati Therapeutics,
Inc. | | | 938,816 | | | | 0.1 | | |
| | 11,100 | | | | (1 | ) | | Molina Healthcare,
Inc. | | | 3,530,688 | | | | 0.2 | | |
| | 183,000 | | | | (1 | ),(2) | | Multiplan Corp. | | | 810,690 | | | | 0.0 | | |
| | 25,700 | | | | (1 | ),(2) | | Natera, Inc. | | | 2,400,123 | | | | 0.2 | | |
| | 34,079 | | | | (1 | ) | | Neurocrine
Biosciences, Inc. | | | 2,902,508 | | | | 0.2 | | |
| | 32,500 | | | | (1 | ),(2) | | Novocure Ltd. | | | 2,440,100 | | | | 0.2 | | |
| | 84,191 | | | | (1 | ) | | Ortho Clinical
Diagnostics
Holdings PLC | | | 1,800,845 | | | | 0.1 | | |
| | 46,700 | | | | (1 | ),(2) | | Pacific Biosciences of
California, Inc. | | | 955,482 | | | | 0.1 | | |
| | 17,000 | | | | (1 | ),(2) | | Penumbra, Inc. | | | 4,884,440 | | | | 0.3 | | |
| | 12,500 | | | | (1 | ),(2) | | Quidel Corp. | | | 1,687,375 | | | | 0.1 | | |
| | 36,886 | | | | (1 | ),(2) | | Repligen Corp. | | | 9,768,888 | | | | 0.7 | | |
| | 45,600 | | | | | | | Resmed, Inc. | | | 11,877,888 | | | | 0.8 | | |
| | 35,088 | | | | (2 | ) | | Royalty Pharma PLC | | | 1,398,257 | | | | 0.1 | | |
| | 43,380 | | | | (1 | ) | | Seagen, Inc. | | | 6,706,548 | | | | 0.5 | | |
| | 7,700 | | | | (1 | ) | | Shockwave Medical,
Inc. | | | 1,373,141 | | | | 0.1 | | |
| | 14,500 | | | | | | | STERIS Public Ltd.
Co. | | | 3,529,445 | | | | 0.2 | | |
| | 12,712 | | | | (1 | ),(2) | | Teladoc Health, Inc. | | | 1,167,216 | | | | 0.1 | | |
| | 7,500 | | | | | | | Teleflex, Inc. | | | 2,463,600 | | | | 0.2 | | |
| | 19,692 | | | | (1 | ),(2) | | Ultragenyx
Pharmaceutical, Inc. | | | 1,655,900 | | | | 0.1 | | |
| | 9,000 | | | | (1 | ) | | United Therapeutics
Corp. | | | 1,944,720 | | | | 0.1 | | |
| | 53,500 | | | | (1 | ) | | Veeva Systems, Inc. | | | 13,668,180 | | | | 0.9 | | |
| | 22,200 | | | | | | | West Pharmaceutical
Services, Inc. | | | 10,412,022 | | | | 0.7 | | |
| | | | | | | | | | 262,976,179 | | | | 18.0 | | |
See Accompanying Notes to Financial Statements
158
VY® T. ROWE PRICE DIVERSIFIED PORTFOLIO OF INVESTMENTS
MID CAP GROWTH PORTFOLIO AS OF DECEMBER 31, 2021 (CONTINUED)
Shares | |
| |
| | Value | | Percentage
of Net
Assets | |
| | | | | Industrials: 12.8% | |
| | 49,800 | | | | (1 | ) | | Alaska Air Group, Inc. | | $ | 2,594,580 | | | | 0.2 | | |
| | 11,500 | | | | | | | Allegion Public Ltd. | | | 1,523,060 | | | | 0.1 | | |
| | 11,962 | | | | | | | Ametek, Inc. | | | 1,758,892 | | | | 0.1 | | |
| | 24,700 | | | | | | | AO Smith Corp. | | | 2,120,495 | | | | 0.1 | | |
| | 66,564 | | | | | | | Booz Allen Hamilton
Holding Corp. | | | 5,643,962 | | | | 0.4 | | |
| | 32,300 | | | | | | | BWX Technologies,
Inc. | | | 1,546,524 | | | | 0.1 | | |
| | 28,600 | | | | | | | Cintas Corp. | | | 12,674,662 | | | | 0.9 | | |
| | 51,178 | | | | (1 | ),(2) | | Clarivate PLC | | | 1,203,707 | | | | 0.1 | | |
| | 90,300 | | | | (1 | ) | | Copart, Inc. | | | 13,691,286 | | | | 0.9 | | |
| | 145,845 | | | | (1 | ) | | CoStar Group, Inc. | | | 11,526,130 | | | | 0.8 | | |
| | 23,087 | | | | | | | Equifax, Inc. | | | 6,759,643 | | | | 0.5 | | |
| | 17,000 | | | | | | | Expeditors
International
Washington, Inc. | | | 2,282,930 | | | | 0.1 | | |
| | 31,600 | | | | | | | Fastenal Co. | | | 2,024,296 | | | | 0.1 | | |
| | 38,175 | | | | | | | Fortune Brands
Home & Security, Inc. | | | 4,080,907 | | | | 0.3 | | |
| | 26,700 | | | | (1 | ) | | Generac Holdings, Inc. | | | 9,396,264 | | | | 0.6 | | |
| | 18,000 | | | | | | | Graco, Inc. | | | 1,451,160 | | | | 0.1 | | |
| | 36,400 | | | | (1 | ) | | Hexcel Corp. | | | 1,885,520 | | | | 0.1 | | |
| | 11,500 | | | | | | | Hubbell, Inc. | | | 2,395,105 | | | | 0.2 | | |
| | 10,700 | | | | | | | Huntington Ingalls
Industries, Inc. | | | 1,998,118 | | | | 0.1 | | |
| | 86,500 | | | | (1 | ) | | IAA, Inc. | | | 4,378,630 | | | | 0.3 | | |
| | 6,900 | | | | | | | IDEX Corp. | | | 1,630,608 | | | | 0.1 | | |
| | 8,500 | | | | | | | JB Hunt Transport
Services, Inc. | | | 1,737,400 | | | | 0.1 | | |
| | 11,300 | | | | | | | Landstar System, Inc. | | | 2,022,926 | | | | 0.1 | | |
| | 33,469 | | | | (1 | ),(2) | | Legalzoom.com, Inc. | | | 537,847 | | | | 0.0 | | |
| | 21,800 | | | | | | | Leidos Holdings, Inc. | | | 1,938,020 | | | | 0.1 | | |
| | 14,600 | | | | (1 | ) | | Middleby Corp. | | | 2,872,696 | | | | 0.2 | | |
| | 27,150 | | | | | | | Old Dominion Freight
Line | | | 9,730,017 | | | | 0.7 | | |
| | 30,700 | | | | | | | Otis Worldwide Corp. | | | 2,673,049 | | | | 0.2 | | |
| | 20,000 | | | | | | | Paccar, Inc. | | | 1,765,200 | | | | 0.1 | | |
| | 48,700 | | | | | | | Republic Services,
Inc. | | | 6,791,215 | | | | 0.5 | | |
| | 20,300 | | | | | | | Ritchie Bros
Auctioneers, Inc. | | | 1,242,563 | | | | 0.1 | | |
| | 21,700 | | | | | | | Rockwell Automation,
Inc. | | | 7,570,045 | | | | 0.5 | | |
| | 35,237 | | | | (2 | ) | | Rollins, Inc. | | | 1,205,458 | | | | 0.1 | | |
| | 47,198 | | | | (1 | ) | | Shoals Technologies
Group, Inc. | | | 1,146,911 | | | | 0.1 | | |
| | 57,300 | | | | (1 | ) | | Southwest Airlines Co. | | | 2,454,732 | | | | 0.2 | | |
| | 16,900 | | | | | | | Toro Co. | | | 1,688,479 | | | | 0.1 | | |
| | 26,500 | | | | | | | Trane Technologies
PLC | | | 5,353,795 | | | | 0.4 | | |
| | 8,196 | | | | (1 | ) | | TransDigm Group,
Inc. | | | 5,214,951 | | | | 0.4 | | |
| | | | | | 72,100 | | | TransUnion | | | 8,549,618 | | | | 0.6 | | |
Shares | |
| |
| | Value | | Percentage
of Net
Assets | |
| | 17,100 | | | | (1 | ) | | United Rentals, Inc. | | $ | 5,682,159 | | | | 0.4 | | |
| | 39,600 | | | | (1 | ) | | Upwork, Inc. | | | 1,352,736 | | | | 0.1 | | |
| | 11,200 | | | | | | | Valmont Industries,
Inc. | | | 2,805,600 | | | | 0.2 | | |
| | 36,256 | | | | | | | Verisk Analytics, Inc. | | | 8,292,835 | | | | 0.6 | | |
| | 53,650 | | | | | | | Waste Connections,
Inc. | | | 7,310,885 | | | | 0.5 | | |
| | 8,000 | | | | | | | Watsco, Inc. | | | 2,503,040 | | | | 0.2 | | |
| | 17,600 | | | | | | | Woodward, Inc. | | | 1,926,496 | | | | 0.1 | | |
| | | | | | | | | | 186,935,152 | | | | 12.8 | | |
| | | | | Information Technology: 34.7% | |
| | 20,559 | | | | (1 | ),(2) | | Affirm Holdings, Inc. | | | 2,067,413 | | | | 0.1 | | |
| | 18,900 | | | | (1 | ) | | Akamai Technologies,
Inc. | | | 2,212,056 | | | | 0.1 | | |
| | 179,100 | | | | (2 | ) | | Amphenol Corp. | | | 15,664,086 | | | | 1.1 | | |
| | 75,700 | | | | (1 | ) | | Anaplan, Inc. | | | 3,470,845 | | | | 0.2 | | |
| | 16,800 | | | | (1 | ) | | ANSYS, Inc. | | | 6,738,816 | | | | 0.5 | | |
| | 56,300 | | | | (1 | ),(2) | | AppLovin Corp. | | | 5,306,838 | | | | 0.4 | | |
| | 28,199 | | | | (1 | ) | | Aspen Technology,
Inc. | | | 4,291,888 | | | | 0.3 | | |
| | 35,500 | | | | (1 | ) | | Avalara, Inc. | | | 4,583,405 | | | | 0.3 | | |
| | 27,281 | | | | (2 | ) | | Bentley Systems, Inc. | | | 1,318,491 | | | | 0.1 | | |
| | 37,100 | | | | (1 | ) | | Bill.com Holdings, Inc. | | | 9,243,465 | | | | 0.6 | | |
| | 46,434 | | | | (1 | ) | | Black Knight, Inc. | | | 3,848,914 | | | | 0.3 | | |
| | 45,400 | | | | | | | Broadridge Financial
Solutions, Inc. ADR | | | 8,300,028 | | | | 0.6 | | |
| | 105,000 | | | | (1 | ) | | Cadence Design
Systems, Inc. | | | 19,566,750 | | | | 1.3 | | |
| | 46,036 | | | | (1 | ) | | CCC Intelligent
Solutions Holdings,
Inc. | | | 524,350 | | | | 0.0 | | |
| | 62,600 | | | | | | | CDW Corp. | | | 12,819,228 | | | | 0.9 | | |
| | 38,103 | | | | (1 | ) | | Ceridian HCM
Holding, Inc. | | | 3,980,239 | | | | 0.3 | | |
| | 20,500 | | | | | | | Citrix Systems, Inc. | | | 1,939,095 | | | | 0.1 | | |
| | 30,100 | | | | | | | Cognex Corp. | | | 2,340,576 | | | | 0.2 | | |
| | 18,248 | | | | (1 | ),(2) | | Confluent, Inc. | | | 1,391,227 | | | | 0.1 | | |
| | 33,223 | | | | (1 | ) | | Coupa Software, Inc. | | | 5,250,895 | | | | 0.4 | | |
| | 61,597 | | | | (1 | ) | | Crowdstrike Holdings,
Inc. | | | 12,611,986 | | | | 0.9 | | |
| | 11,320 | | | | (1 | ),(3),(4) | | Databricks, Inc. | | | 2,495,521 | | | | 0.2 | | |
| | 76,246 | | | | (1 | ) | | Datadog, Inc. | | | 13,580,175 | | | | 0.9 | | |
| | 62,853 | | | | (1 | ) | | DocuSign, Inc. | | | 9,573,140 | | | | 0.6 | | |
| | 52,600 | | | | (1 | ) | | DoubleVerify
Holdings, Inc. | | | 1,750,528 | | | | 0.1 | | |
| | 34,137 | | | | (1 | ) | | Dynatrace, Inc. | | | 2,060,168 | | | | 0.1 | | |
| | 52,600 | | | | (1 | ) | | Enphase Energy, Inc. | | | 9,622,644 | | | | 0.7 | | |
| | 91,500 | | | | | | | Entegris, Inc. | | | 12,680,070 | | | | 0.9 | | |
| | 22,200 | | | | (1 | ) | | EPAM Systems, Inc. | | | 14,839,590 | | | | 1.0 | | |
| | 15,800 | | | | (1 | ) | | Euronet Worldwide,
Inc. | | | 1,882,886 | | | | 0.1 | | |
| | 28,595 | | | | (1 | ) | | Five9, Inc. | | | 3,926,665 | | | | 0.3 | | |
| | 22,400 | | | | (1 | ) | | FleetCor
Technologies, Inc. | | | 5,014,016 | | | | 0.3 | | |
See Accompanying Notes to Financial Statements
159
VY® T. ROWE PRICE DIVERSIFIED PORTFOLIO OF INVESTMENTS
MID CAP GROWTH PORTFOLIO AS OF DECEMBER 31, 2021 (CONTINUED)
Shares | |
| |
| | Value | | Percentage
of Net
Assets | |
| | | | | Information Technology (continued) | |
| | 55,700 | | | | (1 | ) | | Fortinet, Inc. | | $ | 20,018,580 | | | | 1.4 | | |
| | 25,600 | | | | (1 | ) | | Gartner, Inc. | | | 8,558,592 | | | | 0.6 | | |
| | 36,000 | | | | | | | Genpact Ltd. | | | 1,910,880 | | | | 0.1 | | |
| | 11,260 | | | | (1 | ),(2) | | Gitlab, Inc. | | | 979,620 | | | | 0.1 | | |
| | 34,129 | | | | (1 | ),(4) | | Gitlab, Inc., Class B -
Lockup Shares | | | 2,820,762 | | | | 0.2 | | |
| | 21,100 | | | | (1 | ) | | GoDaddy, Inc. | | | 1,790,546 | | | | 0.1 | | |
| | 12,300 | | | | (1 | ),(2) | | Guidewire Software,
Inc. | | | 1,396,419 | | | | 0.1 | | |
| | 2,391 | | | | (1 | ) | | HashiCorp, Inc. | | | 217,677 | | | | 0.0 | | |
| | 16,950 | | | | (1 | ) | | HubSpot, Inc. | | | 11,172,592 | | | | 0.8 | | |
| | 77,700 | | | | (1 | ) | | Informatica, Inc. | | | 2,873,346 | | | | 0.2 | | |
| | 6,400 | | | | (1 | ) | | IPG Photonics Corp. | | | 1,101,696 | | | | 0.1 | | |
| | 26,650 | | | | (1 | ) | | Keysight
Technologies, Inc. | | | 5,503,491 | | | | 0.4 | | |
| | 8,300 | | | | | | | KLA Corp. | | | 3,569,913 | | | | 0.2 | | |
| | 27,300 | | | | (1 | ) | | Lattice Semiconductor
Corp. | | | 2,103,738 | | | | 0.1 | | |
| | 5,100 | | | | | | | Littelfuse, Inc. | | | 1,604,868 | | | | 0.1 | | |
| | 30,900 | | | | (1 | ) | | Manhattan Associates,
Inc. | | | 4,804,641 | | | | 0.3 | | |
| | 42,748 | | | | | | | Marvell Technology,
Inc. | | | 3,740,023 | | | | 0.3 | | |
| | 183,634 | | | | | | | Microchip Technology,
Inc. | | | 15,987,176 | | | | 1.1 | | |
| | 11,000 | | | | | | | MKS Instruments, Inc. | | | 1,915,870 | | | | 0.1 | | |
| | 3,206 | | | | (1 | ),(2) | | Monday.com Ltd. | | | 989,756 | | | | 0.1 | | |
| | 22,639 | | | | (1 | ),(2) | | MongoDB, Inc. | | | 11,983,955 | | | | 0.8 | | |
| | 24,200 | | | | | | | Monolithic Power
Systems, Inc. | | | 11,938,586 | | | | 0.8 | | |
| | 25,400 | | | | | | | Motorola Solutions,
Inc. | | | 6,901,180 | | | | 0.5 | | |
| | 67,682 | | | | (1 | ),(2) | | nCino, Inc. | | | 3,713,035 | | | | 0.2 | | |
| | 42,700 | | | | (1 | ),(2) | | Okta, Inc. | | | 9,572,059 | | | | 0.6 | | |
| | 95,000 | | | | (1 | ) | | ON Semiconductor
Corp. | | | 6,452,400 | | | | 0.4 | | |
| | 30,700 | | | | (1 | ),(2) | | Palo Alto Networks,
Inc. | | | 17,092,532 | | | | 1.2 | | |
| | 29,900 | | | | | | | Paychex, Inc. | | | 4,081,350 | | | | 0.3 | | |
| | 25,700 | | | | (1 | ) | | Paycom Software, Inc. | | | 10,670,383 | | | | 0.7 | | |
| | 50,100 | | | | (1 | ),(2) | | Paycor HCM, Inc. | | | 1,443,381 | | | | 0.1 | | |
| | 23,000 | | | | (1 | ) | | Paylocity Holding
Corp. | | | 5,431,680 | | | | 0.4 | | |
| | 16,536 | | | | (1 | ),(2) | | Procore Technologies,
Inc. | | | 1,322,384 | | | | 0.1 | | |
| | 44,075 | | | | (1 | ) | | PTC, Inc. | | | 5,339,686 | | | | 0.4 | | |
| | 66,502 | | | | (1 | ) | | Qualtrics International,
Inc. | | | 2,354,171 | | | | 0.2 | | |
| | 29,000 | | | | (1 | ) | | RingCentral, Inc. | | | 5,433,150 | | | | 0.4 | | |
| | 51,771 | | | | (1 | ),(2) | | SentinelOne, Inc. | | | 2,613,918 | | | | 0.2 | | |
| | 10,300 | | | | (1 | ),(2) | | Silicon Laboratories,
Inc. | | | 2,126,126 | | | | 0.1 | | |
| | 30,900 | | | | | | | Skyworks Solutions,
Inc. | | | 4,793,826 | | | | 0.3 | | |
Shares | |
| |
| | Value | | Percentage
of Net
Assets | |
| | 58,300 | | | | (1 | ) | | Smartsheet, Inc. | | $ | 4,515,335 | | | | 0.3 | | |
| | 12,100 | | | | (1 | ) | | Splunk, Inc. | | | 1,400,212 | | | | 0.1 | | |
| | 15,488 | | | | (1 | ) | | Squarespace, Inc. | | | 456,896 | | | | 0.0 | | |
| | 46,035 | | | | | | | SS&C Technologies
Holdings, Inc. | | | 3,773,949 | | | | 0.3 | | |
| | 55,221 | | | | (1 | ),(2) | | StoneCo Ltd. | | | 931,026 | | | | 0.1 | | |
| | 39,200 | | | | (1 | ) | | Synopsys, Inc. | | | 14,445,200 | | | | 1.0 | | |
| | 31,626 | | | | (1 | ),(3),(4) | | Tanium, Inc. Class B | | | 291,592 | | | | 0.0 | | |
| | 59,100 | | | | (2 | ) | | Teradyne, Inc. | | | 9,664,623 | | | | 0.7 | | |
| | 6,136 | | | | (1 | ),(2) | | Toast, Inc. | | | 212,981 | | | | 0.0 | | |
| | 176,500 | | | | (1 | ) | | Trade Desk, Inc./The | | | 16,174,460 | | | | 1.1 | | |
| | 4,400 | | | | (1 | ) | | Twilio, Inc. | | | 1,158,696 | | | | 0.1 | | |
| | 14,700 | | | | (1 | ) | | Tyler Technologies,
Inc. | | | 7,907,865 | | | | 0.5 | | |
| | 78,661 | | | | (1 | ),(2) | | UiPath, Inc. | | | 3,392,649 | | | | 0.2 | | |
| | 6,400 | | | | (1 | ) | | VeriSign, Inc. | | | 1,624,448 | | | | 0.1 | | |
| | 12,999 | | | | (1 | ) | | WEX, Inc. | | | 1,824,930 | | | | 0.1 | | |
| | 9,553 | | | | (1 | ) | | Wix.com Ltd. | | | 1,507,368 | | | | 0.1 | | |
| | 16,300 | | | | (1 | ),(2) | | Workiva, Inc. | | | 2,126,987 | | | | 0.1 | | |
| | 21,000 | | | | (1 | ) | | Zebra Technologies
Corp. | | | 12,499,200 | | | | 0.9 | | |
| | 39,400 | | | | (1 | ) | | Zscaler, Inc. | | | 12,660,402 | | | | 0.9 | | |
| | | | | | | | | | 507,788,801 | | | | 34.7 | | |
| | | | | Materials: 2.5% | |
| | 7,900 | | | | | | | Albemarle Corp. | | | 1,846,783 | | | | 0.1 | | |
| | 165,947 | | | | (1 | ) | | Ardagh Metal
Packaging SA | | | 1,498,501 | | | | 0.1 | | |
| | 18,300 | | | | | | | Avery Dennison Corp. | | | 3,963,231 | | | | 0.3 | | |
| | 39,980 | | | | | | | Ball Corp. | | | 3,848,875 | | | | 0.3 | | |
| | 47,100 | | | | | | | CF Industries
Holdings, Inc. | | | 3,333,738 | | | | 0.2 | | |
| | 42,500 | | | | | | | PPG Industries, Inc. | | | 7,328,700 | | | | 0.5 | | |
| | 46,800 | | | | | | | RPM International, Inc. | | | 4,726,800 | | | | 0.3 | | |
| | 44,300 | | | | | | | Sealed Air Corp. | | | 2,988,921 | | | | 0.2 | | |
| | 42,500 | | | | | | | Steel Dynamics, Inc. | | | 2,637,975 | | | | 0.2 | | |
| | 21,300 | | | | | | | Vulcan Materials Co. | | | 4,421,454 | | | | 0.3 | | |
| | | | | | | | | | 36,594,978 | | | | 2.5 | | |
| | | | | Real Estate: 1.8% | |
| | 17,900 | | | | | | | Alexandria Real Estate
Equities, Inc. | | | 3,990,984 | | | | 0.3 | | |
| | 122,400 | | | | | | | CubeSmart | | | 6,965,784 | | | | 0.5 | | |
| | 85,200 | | | | | | | Equity Lifestyle
Properties, Inc. | | | 7,468,632 | | | | 0.5 | | |
| | 30,900 | | | | (2 | ) | | eXp World Holdings,
Inc. | | | 1,041,021 | | | | 0.1 | | |
| | 16,800 | | | | | | | SBA Communications
Corp. | | | 6,535,536 | | | | 0.4 | | |
| | | | | | | | | | 26,001,957 | | | | 1.8 | | |
| | | | | | | Total Common Stock
(Cost
$1,014,213,001) | | | 1,446,724,957 | | | | 99.0 | | |
See Accompanying Notes to Financial Statements
160
VY® T. ROWE PRICE DIVERSIFIED PORTFOLIO OF INVESTMENTS
MID CAP GROWTH PORTFOLIO AS OF DECEMBER 31, 2021 (CONTINUED)
Shares | |
| |
| | Value | | Percentage
of Net
Assets | |
PREFERRED STOCK: 0.9% | | | |
| | | | | Consumer Discretionary: 0.2% | |
| | 32,438 | | | | (1 | ),(3),(4) | | Rappi, Inc. - Series E | | $ | 2,089,758 | | | | 0.2 | | |
| | | | | Health Care: 0.1% | |
| | 123,878 | | | | (1 | ),(3),(4) | | Caris Life Sciences,
Inc. Series D | | | 1,003,412 | | | | 0.1 | | |
| | | | | Information Technology: 0.6% | |
| | 24,459 | | | | (1 | ),(3),(4) | | Databricks, Inc.,
Series F | | | 5,392,045 | | | | 0.4 | | |
| | 2,636 | | | | (1 | ),(3),(4) | | Databricks, Inc.,
Series G | | | 581,113 | | | | 0.0 | | |
| | 353,970 | | | | (1 | ),(3),(4) | | Tanium, Inc. - Series G | | | 3,263,603 | | | | 0.2 | | |
| | | | | | | | | | 9,236,761 | | | | 0.6 | | |
| | | | | | | Total Preferred Stock
(Cost $6,216,684) | | | 12,329,931 | | | | 0.9 | | |
| | | | | | | Total Long-Term
Investments
(Cost
$1,020,429,685) | | | 1,459,054,888 | | | | 99.9 | | |
Principal
Amount† | |
| |
| | Value | | Percentage
of Net
Assets | |
SHORT-TERM INVESTMENTS: 8.0% | | | |
| | | | | Commercial Paper: 1.6% | |
| | 500,000 | | | | (5 | ) | | ANZ Bank, 0.120%,
01/25/2022 | | $ | 499,976 | | | | 0.0 | | |
| | 750,000 | | | | (5 | ) | | ANZ Bank, 0.120%,
02/10/2022 | | | 749,927 | | | | 0.1 | | |
| | 475,000 | | | | (5 | ) | | Caisse des Dépôts et
Consignations,
0.120%, 01/26/2022 | | | 474,974 | | | | 0.0 | | |
| | 500,000 | | | | (5 | ) | | Collateralized
Commercial Paper
FLEX Co., LLC,
0.150%, 03/08/2022 | | | 499,803 | | | | 0.0 | | |
| | 600,000 | | | | (5 | ) | | Collateralized
Commercial
Paper V Co., LLC,
0.360%, 06/08/2022 | | | 599,099 | | | | 0.0 | | |
| | 725,000 | | | | (5 | ) | | Credit Suisse AG,
0.330%, 06/09/2022 | | | 724,001 | | | | 0.1 | | |
| | 750,000 | | | | (5 | ) | | DBS Bank Ltd.,
0.120%, 02/01/2022 | | | 749,931 | | | | 0.1 | | |
| | 725,000 | | | | (5 | ) | | DNB Bank ASA,
0.140%, 03/16/2022 | | | 724,781 | | | | 0.1 | | |
| | 575,000 | | | | (5 | ) | | DNB Bank ASA,
0.140%, 03/22/2022 | | | 574,805 | | | | 0.0 | | |
| | 625,000 | | | | (5 | ) | | HSBC Bank PLC,
0.140%, 03/03/2022 | | | 624,748 | | | | 0.0 | | |
| | 725,000 | | | | (5 | ) | | JPMorgan Securities
LLC, 0.220%,
03/14/2022 | | | 724,668 | | | | 0.1 | | |
Principal
Amount† | |
| |
| | Value | | Percentage
of Net
Assets | |
| | 400,000 | | | | (5 | ) | | Liberty Street Funding
LLC, 0.220%,
03/17/2022 | | $ | 399,808 | | | | 0.0 | | |
| | 425,000 | | | | (5 | ) | | Lloyds Bank PLC,
0.150%, 03/14/2022 | | | 424,848 | | | | 0.0 | | |
| | 400,000 | | | | (5 | ) | | Lloyds Bank PLC,
0.150%, 03/29/2022 | | | 399,798 | | | | 0.0 | | |
| | 525,000 | | | | (5 | ) | | LMA-Americas LLC,
0.150%, 03/14/2022 | | | 524,764 | | | | 0.0 | | |
| | 500,000 | | | | (5 | ) | | LMA-Americas LLC,
0.270%, 05/04/2022 | | | 499,528 | | | | 0.0 | | |
| | 700,000 | | | | (5 | ) | | Matchpoint Finance
PLC, 0.150%,
03/15/2022 | | | 699,679 | | | | 0.1 | | |
| | 525,000 | | | | (5 | ) | | Mizuho Bank Ltd.,
0.150%, 03/16/2022 | | | 524,743 | | | | 0.0 | | |
| | 725,000 | | | | (5 | ) | | National Australia
Bank Ltd., 0.120%,
02/18/2022 | | | 724,890 | | | | 0.1 | | |
| | 750,000 | | | | (5 | ) | | Nieuw Amsterdam
Receivables
Corporation B.V.,
0.100%, 01/07/2022 | | | 749,988 | | | | 0.1 | | |
| | 625,000 | | | | (5 | ) | | Nieuw Amsterdam
Receivables
Corporation B.V.,
0.100%, 01/11/2022 | | | 624,984 | | | | 0.0 | | |
| | 750,000 | | | | (5 | ) | | NRW.Bank, 0.130%,
03/21/2022 | | | 749,822 | | | | 0.1 | | |
| | 750,000 | | | | (5 | ) | | Old Line Funding LLC,
0.130%, 03/10/2022 | | | 749,691 | | | | 0.1 | | |
| | 250,000 | | | | (5 | ) | | Old Line Funding LLC,
0.250%, 04/27/2022 | | | 249,782 | | | | 0.0 | | |
| | 425,000 | | | | (5 | ) | | Santander UK PLC,
0.130%, 02/01/2022 | | | 424,968 | | | | 0.0 | | |
| | 500,000 | | | | (5 | ) | | Santander UK PLC,
0.300%, 05/03/2022 | | | 499,553 | | | | 0.0 | | |
| | 700,000 | | | | (5 | ) | | Sheffield Receivables
Company LLC,
0.240%, 03/15/2022 | | | 699,679 | | | | 0.0 | | |
| | 800,000 | | | | (5 | ) | | Skandinaviska
Enskilda Banken AB,
0.140%, 04/04/2022 | | | 799,574 | | | �� | 0.1 | | |
| | 300,000 | | | | (5 | ) | | Skandinaviska
Enskilda Banken AB,
0.220%, 03/15/2022 | | | 299,900 | | | | 0.0 | | |
| | 750,000 | | | | (5 | ) | | Societe Generale,
0.170%, 03/31/2022 | | | 749,737 | | | | 0.1 | | |
| | 525,000 | | | | (5 | ) | | Starbird Funding
Corp., 0.250%,
03/21/2022 | | | 524,728 | | | | 0.0 | | |
| | 600,000 | | | | (5 | ) | | Sumitomo Mitsui
Trust Bank Ltd.,
0.150%, 03/07/2022 | | | 599,831 | | | | 0.0 | | |
| | 525,000 | | | | (5 | ) | | Sumitomo Mitsui
Trust Bank Ltd.,
0.290%, 04/08/2022 | | | 524,681 | | | | 0.0 | | |
| | 725,000 | | | | (5 | ) | | Swedbank AB,
0.150%, 03/23/2022 | | | 724,754 | | | | 0.1 | | |
See Accompanying Notes to Financial Statements
161
VY® T. ROWE PRICE DIVERSIFIED PORTFOLIO OF INVESTMENTS
MID CAP GROWTH PORTFOLIO AS OF DECEMBER 31, 2021 (CONTINUED)
Principal
Amount† | |
| |
| | Value | | Percentage
of Net
Assets | |
| | | | | Commercial Paper (continued) | |
| | 750,000 | | | | (5 | ) | | Swedbank AB,
0.150%, 03/24/2022 | | $ | 749,739 | | | | 0.1 | | |
| | 750,000 | | | | (5 | ) | | Thunder Bay Funding
LLC, 0.130%,
03/18/2022 | | | 749,666 | | | | 0.1 | | |
| | 625,000 | | | | (5 | ) | | Victory Receivables
Corporation,
0.120%, 01/06/2022 | | | 624,992 | | | | 0.0 | | |
| | 725,000 | | | | (5 | ) | | Westpac Banking
Corp., 0.130%,
03/25/2022 | | | 724,726 | | | | 0.1 | | |
| | | | | | | Total Commercial
Paper
(Cost $22,965,566) | | | 22,965,566 | | | | 1.6 | | |
| | | | | Floating Rate Notes: 0.4% | |
| | 675,000 | | | | (5 | ) | | Bank of Montreal,
0.120%, 01/05/2022 | | | 675,015 | | | | 0.0 | | |
| | 800,000 | | | | (5 | ) | | Bank of Nova Scotia,
0.130%, 02/28/2022 | | | 800,080 | | | | 0.1 | | |
| | 400,000 | | | | (5 | ) | | Barclays Bank PLC,
0.140%, 03/03/2022 | | | 399,992 | | | | 0.0 | | |
| | 700,000 | | | | (5 | ) | | Barclays Bank PLC,
0.160%, 03/22/2022 | | | 699,983 | | | | 0.1 | | |
| | 725,000 | | | | (5 | ) | | Canadian Imperial
Bank of Commerce,
0.130%, 02/10/2022 | | | 725,052 | | | | 0.1 | | |
| | 725,000 | | | | (5 | ) | | DBS Bank Ltd.,
0.140%, 03/16/2022 | | | 724,962 | | | | 0.1 | | |
| | 500,000 | | | | (5 | ) | | National Australia
Bank Ltd., 0.130%,
03/10/2022 | | | 499,991 | | | | 0.0 | | |
| | 600,000 | | | | (5 | ) | | Sumitomo Mitsui
Trust Bank Ltd.,
0.150%, 03/14/2022 | | | 600,009 | | | | 0.0 | | |
| | 375,000 | | | | (5 | ) | | Sumitomo Mitsui
Trust Bank Ltd.,
0.150%, 03/22/2022 | | | 374,999 | | | | 0.0 | | |
| | 500,000 | | | | (5 | ) | | Sumitomo Mitsui
Trust Bank Ltd.,
0.160%, 03/08/2022 | | | 500,021 | | | | 0.0 | | |
| | 600,000 | | | | (5 | ) | | Sumitomo Mitsui
Trust Bank Ltd.,
0.270%, 06/24/2022 | | | 600,052 | | | | 0.0 | | |
| | | | | | | Total Floating Rate
Notes
(Cost $6,600,156) | | | 6,600,156 | | | | 0.4 | | |
Principal
Amount† | |
| |
| | Value | | Percentage
of Net
Assets | |
| | | | | Repurchase Agreements: 4.5% | |
| | 3,141,102 | | | | (5 | ) | | Bethesda Securities
LLC, Repurchase
Agreement dated
12/31/21, 0.09%,
due 01/03/22
(Repurchase
Amount $3,141,125,
collateralized by
various U.S.
Government Agency
Obligations,
2.000%-5.500%,
Market Value plus
accrued interest
$3,203,924, due
01/01/25-12/01/51) | | $ | 3,141,102 | | | | 0.2 | | |
| | 15,717,351 | | | | (5 | ) | | Cantor Fitzgerald
Securities,
Repurchase
Agreement dated
12/31/21, 0.05%,
due 01/03/22
(Repurchase
Amount
$15,717,416,
collateralized by
various U.S.
Government/U.S.
Government Agency
Obligations,
0.000%-9.000%,
Market Value plus
accrued interest
$16,031,698, due
02/01/22-07/20/71) | | | 15,717,351 | | | | 1.1 | | |
| | 5,407,152 | | | | (5 | ) | | CF Secured LLC,
Repurchase
Agreement dated
12/31/21, 0.05%,
due 01/03/22
(Repurchase
Amount $5,407,174,
collateralized by
various U.S.
Government/U.S.
Government Agency
Obligations,
0.000%-5.500%,
Market Value plus
accrued interest
$5,515,296, due
01/20/22-06/20/69) | | | 5,407,152 | | | | 0.4 | | |
See Accompanying Notes to Financial Statements
162
VY® T. ROWE PRICE DIVERSIFIED PORTFOLIO OF INVESTMENTS
MID CAP GROWTH PORTFOLIO AS OF DECEMBER 31, 2021 (CONTINUED)
Principal
Amount† | |
| |
| | Value | | Percentage
of Net
Assets | |
| | | | | Repurchase Agreements (continued) | |
| | 7,191,647 | | | | (5 | ) | | Citadel Securities
LLC, Repurchase
Agreement dated
12/31/21, 0.07%,
due 01/03/22
(Repurchase
Amount $7,191,688,
collateralized by
various U.S.
Government
Securities,
0.000%-7.250%,
Market Value plus
accrued interest
$7,335,523, due
01/04/22-11/15/51) | | $ | 7,191,647 | | | | 0.5 | | |
| | 10,350,520 | | | | (5 | ) | | Citigroup, Inc.,
Repurchase
Agreement dated
12/31/21, 0.06%,
due 01/03/22
(Repurchase
Amount
$10,350,571,
collateralized by
various U.S.
Government/U.S.
Government Agency
Obligations,
0.000%-3.500%,
Market Value plus
accrued interest
$10,557,531, due
02/15/22-12/20/51) | | | 10,350,520 | | | | 0.7 | | |
| | 7,077,802 | | | | (5 | ) | | Mirae Asset
Securities USA Inc.,
Repurchase
Agreement dated
12/31/21, 0.06%,
due 01/03/22
(Repurchase
Amount $7,077,837,
collateralized by
various U.S.
Government Agency
Obligations,
0.550%-7.500%,
Market Value plus
accrued interest
$7,219,394, due
01/01/23-10/20/71) | | | 7,077,802 | | | | 0.5 | | |
Principal
Amount† | |
| |
| | Value | | Percentage
of Net
Assets | |
| | 13,366,030 | | | | (5 | ) | | State of Wisconsin
Investment Board,
Repurchase
Agreement dated
12/31/21, 0.07%,
due 01/03/22
(Repurchase
Amount
$13,366,107,
collateralized by
various U.S.
Government
Securities,
0.125%-3.875%,
Market Value plus
accrued interest
$13,633,420, due
07/15/23-02/15/48) | | $ | 13,366,030 | | | | 0.9 | | |
| | 3,192,575 | | | | (5 | ) | | Stonex Financial Inc.,
Repurchase
Agreement dated
12/31/21, 0.09%,
due 01/03/22
(Repurchase
Amount $3,192,599,
collateralized by
various U.S.
Government/U.S.
Government Agency
Obligations,
0.000%-9.000%,
Market Value plus
accrued interest
$3,256,427, due
01/13/22-11/20/71) | | | 3,192,575 | | | | 0.2 | | |
| | | | | | | Total Repurchase
Agreements
(Cost $65,444,179) | | | 65,444,179 | | | | 4.5 | | |
| | | | | Certificates of Deposit: 0.8% | |
| | 400,000 | | | | (5 | ) | | Bank of Montreal,
0.130%, 02/28/2022 | | | 399,988 | | | | 0.0 | | |
| | 725,000 | | | | (5 | ) | | Bank of Montreal,
0.220%, 03/21/2022 | | | 725,028 | | | | 0.1 | | |
| | 550,000 | | | | (5 | ) | | BNP Paribas,
0.130%, 03/03/2022 | | | 550,005 | | | | 0.0 | | |
| | 300,000 | | | | (5 | ) | | Commonwealth
Bank of Australia,
0.130%, 02/11/2022 | | | 300,007 | | | | 0.0 | | |
| | 725,000 | | | | (5 | ) | | Credit Agricole,
0.230%, 03/09/2022 | | | 725,097 | | | | 0.1 | | |
| | 400,000 | | | | (5 | ) | | Landesbank
Baden-Wurttemberg,
0.160%, 02/07/2022 | | | 400,019 | | | | 0.0 | | |
| | 725,000 | | | | (5 | ) | | Landesbank
Baden-Wurttemberg,
0.160%, 03/21/2022 | | | 724,984 | | | | 0.1 | | |
| | 550,000 | | | | (5 | ) | | Lloyds Bank PLC,
0.130%, 02/22/2022 | | | 550,096 | | | | 0.0 | | |
See Accompanying Notes to Financial Statements
163
VY® T. ROWE PRICE DIVERSIFIED PORTFOLIO OF INVESTMENTS
MID CAP GROWTH PORTFOLIO AS OF DECEMBER 31, 2021 (CONTINUED)
Principal
Amount† | |
| |
| | Value | | Percentage
of Net
Assets | |
| | | | | Certificates of Deposit (continued) | |
| | 500,000 | | | | (5 | ) | | Mitsubishi UFJ Trust
and Banking Corp.,
0.130%, 01/26/2022 | | $ | 500,022 | | | | 0.0 | | |
| | 300,000 | | | | (5 | ) | | Mitsubishi UFJ Trust
and Banking Corp.,
0.150%, 03/02/2022 | | | 299,994 | | | | 0.0 | | |
| | 400,000 | | | | (5 | ) | | Mitsubishi UFJ Trust
and Banking Corp.,
0.150%, 03/03/2022 | | | 399,990 | | | | 0.0 | | |
| | 575,000 | | | | (5 | ) | | Mizuho Bank Ltd.,
0.150%, 03/07/2022 | | | 574,977 | | | | 0.0 | | |
| | 725,000 | | | | (5 | ) | | Mizuho Bank Ltd.,
0.150%, 03/14/2022 | | | 724,947 | | | | 0.1 | | |
| | 725,000 | | | | (5 | ) | | Norinchukin Bank of
New York, 0.110%,
01/27/2022 | | | 725,003 | | | | 0.1 | | |
| | 800,000 | | | | (5 | ) | | Norinchukin Bank of
New York, 0.240%,
03/14/2022 | | | 800,099 | | | | 0.1 | | |
| | 425,000 | | | | (5 | ) | | Oversea-Chinese
Banking Corp. Ltd.,
0.140%, 02/24/2022 | | | 425,021 | | | | 0.0 | | |
| | 700,000 | | | | (5 | ) | | Oversea-Chinese
Banking Corp. Ltd.,
0.250%, 03/17/2022 | | | 700,096 | | | | 0.1 | | |
| | 700,000 | | | | (5 | ) | | Oversea-Chinese
Banking Corp. Ltd.,
0.260%, 03/24/2022 | | | 700,069 | | | | 0.1 | | |
| | 350,000 | | | | (5 | ) | | Sumitomo Mitsui
Trust Bank Ltd.,
0.150%, 03/04/2022 | | | 350,001 | | | | 0.0 | | |
| | 640,000 | | | | (5 | ) | | Svenska
Handelsbanken AB,
0.110%, 02/10/2022 | | | 640,071 | | | | 0.0 | | |
| | 525,000 | | | | (5 | ) | | Toronto-Dominion
Bank, 0.150%,
03/03/2022 | | | 525,059 | | | | 0.0 | | |
| | 325,000 | | | | (5 | ) | | Toronto-Dominion
Bank, 0.280%,
05/10/2022 | | | 324,988 | | | | 0.0 | | |
| | | | | | | Total Certificates of
Deposit
(Cost $12,065,561) | | | 12,065,561 | | | | 0.8 | | |
Shares | |
| |
| | Value | | Percentage
of Net
Assets | |
| | | | | Mutual Funds: 0.7% | |
| | 3,222,000 | | | | (5 | ),(6) | | BlackRock Liquidity
Funds, FedFund,
Institutional Class,
0.030% | | $ | 3,222,000 | | | | 0.2 | | |
| | 3,222,000 | | | | (5 | ),(6) | | Goldman Sachs
Financial Square
Government
Fund - Institutional
Shares, 0.020% | | | 3,222,000 | | | | 0.2 | | |
| | 3,022,000 | | | | (5 | ),(6) | | Morgan Stanley
Institutional Liquidity
Funds - Government
Portfolio
(Institutional Share
Class), 0.030% | | | 3,022,000 | | | | 0.2 | | |
| | 492,122 | | | | (6 | ) | | T. Rowe Price
Government
Reserve Fund,
0.070% | | | 492,122 | | | | 0.1 | | |
| | | | | | | Total Mutual Funds
(Cost $9,958,122) | | | 9,958,122 | | | | 0.7 | | |
| | | | | | | Total Short-Term
Investments
(Cost $117,033,584) | | | 117,033,584 | | | | 8.0 | | |
| | | | | | | Total Investments in
Securities
(Cost
$1,137,463,269) | | $ | 1,576,088,472 | | | | 107.9 | | |
| | | | | | | Liabilities in Excess
of Other Assets | | | (114,816,686 | ) | | | (7.9 | ) | |
| | | | | | | Net Assets | | $ | 1,461,271,786 | | | | 100.0 | | |
† Unless otherwise indicated, principal amount is shown in USD.
ADR American Depositary Receipt
(1) Non-income producing security.
(2) Security, or a portion of the security, is on loan.
(3) For fair value measurement disclosure purposes, security is categorized as Level 3, whose value was determined using significant unobservable inputs.
(4) Restricted security as to resale, excluding Rule 144A securities. As of December 31, 2021, the Portfolio held restricted securities with a fair value of $21,531,709 or 1.5% of net assets. Please refer to the table below for additional details.
(5) All or a portion of the security represents securities purchased with cash collateral received for securities on loan.
(6) Rate shown is the 7-day yield as of December 31, 2021.
See Accompanying Notes to Financial Statements
164
VY® T. ROWE PRICE DIVERSIFIED PORTFOLIO OF INVESTMENTS
MID CAP GROWTH PORTFOLIO AS OF DECEMBER 31, 2021 (CONTINUED)
Fair Value Measurements^
The following is a summary of the fair valuations according to the inputs used as of December 31, 2021 in valuing the assets and liabilities:
| | | Quoted Prices
in Active Markets
for Identical Investments
(Level 1) | | Significant Other
Observable
Inputs#
(Level 2) | | Significant
Unobservable
Inputs
(Level 3) | | Fair Value
at
December 31, 2021 | |
Asset Table | |
Investments, at fair value | |
Common Stock | |
Communication Services | | $ | 72,606,611 | | | $ | — | | | $ | — | | | $ | 72,606,611 | | |
Consumer Discretionary | | | 226,164,505 | | | | — | | | | — | | | | 226,164,505 | | |
Consumer Staples | | | 35,461,674 | | | | — | | | | — | | | | 35,461,674 | | |
Energy | | | 26,001,919 | | | | — | | | | 3,593,903 | | | | 29,595,822 | | |
Financials | | | 62,599,278 | | | | — | | | | — | | | | 62,599,278 | | |
Health Care | | | 262,976,179 | | | | — | | | | — | | | | 262,976,179 | | |
Industrials | | | 186,935,152 | | | | — | | | | — | | | | 186,935,152 | | |
Information Technology | | | 502,180,926 | | | | 2,820,762 | | | | 2,787,113 | | | | 507,788,801 | | |
Materials | | | 36,594,978 | | | | — | | | | — | | | | 36,594,978 | | |
Real Estate | | | 26,001,957 | | | | — | | | | — | | | | 26,001,957 | | |
Total Common Stock | | | 1,437,523,179 | | | | 2,820,762 | | | | 6,381,016 | | | | 1,446,724,957 | | |
Preferred Stock | | | — | | | | — | | | | 12,329,931 | | | | 12,329,931 | | |
Short-Term Investments | | | 9,958,122 | | | | 107,075,462 | | | | — | | | | 117,033,584 | | |
Total Investments, at fair value | | $ | 1,447,481,301 | | | $ | 109,896,224 | | | $ | 18,710,947 | | | $ | 1,576,088,472 | | |
^ See Note 2, "Significant Accounting Policies" in the Notes to Financial Statements for additional information.
# The earlier close of the foreign markets gives rise to the possibility that significant events, including broad market moves, may have occurred in the interim and may materially affect the value of those securities. To account for this, the Portfolio may frequently value many of its foreign equity securities using fair value prices based on third party vendor modeling tools to the extent available. Accordingly, a portion of the Portfolio's investments are categorized as Level 2 investments.
At December 31, 2021, VY® T. Rowe Price Diversified Mid Cap Growth Portfolio held the following restricted securities:
Security | | Acquisition
Date | | Acquisition
Cost | | Fair Value | |
Caris Life Sciences, Inc. Series D | | 5/11/2021 | | $ | 1,003,412 | | | $ | 1,003,412 | | |
Databricks, Inc. | | 7/24/2020 | | | 543,644 | | | | 2,495,521 | | |
Databricks, Inc., Series F | | 10/22/2019 | | | 1,050,475 | | | | 5,392,045 | | |
Databricks, Inc., Series G | | 2/1/2021 | | | 467,542 | | | | 581,113 | | |
Gitlab, Inc., Class B - Lockup Shares | | 12/15/2020 | | | 1,375,399 | | | | 2,820,762 | | |
Rappi, Inc. - Series E | | 9/8/2020 | | | 1,938,042 | | | | 2,089,758 | | |
Tanium, Inc. - Series G | | 8/26/2015 | | | 1,757,213 | | | | 3,263,603 | | |
Tanium, Inc. Class B | | 9/24/2020 | | | 360,384 | | | | 291,592 | | |
Venture Global LNG, Inc. - Series B | | 3/8/2018 | | | 132,880 | | | | 261,808 | | |
Venture Global LNG, Inc. - Series C | | 10/16/2017 | | | 2,083,973 | | | | 3,332,095 | | |
| | | | | $ | 10,712,964 | | | $ | 21,531,709 | | |
The following table presents additional information about valuation techniques and inputs used for investments that are measured at fair value and categorized within Level 3 at December 31, 2021:
Investments, at fair value | | Fair Value at
December 31,
2021 | | Valuation
Technique(s)* | | Significant
Unobservable
Input(s) | | Value or
Range of
Input(s) | | Weighted
Average
of Inputs*** | | Impact to Valuation
from an Increase
in Input**** | |
Common Stocks
| | $6,381,016
| | Market Approach
| | Recent Comparable
Transaction Price(s) | | | — | ** | | | — | ** | | | — | ** | |
| | | | Market Approach
| | Enterprise Value to
EBITDA Multiple | | | 10.5 | x | | | 10.5 | x | | |
Increase | | |
| | | | Market Approach
| | Projected Enterprise
Value to EBITDA
Multiple | | | 12.5 | x | | | 12.5 | x | | |
Increase | | |
| | | | Market Approach
| | Enterprise Value to
Gross Profit Multiple | | | 14.2 | x | | | 14.2 | x | | |
Increase | | |
| | | | Market Approach
| | Enterprise Value to
Sales Multiple | | | 11.2 | x | | | 11.2 | x | | |
Increase | | |
| | | | Market Approach
| | Discount Rate for
Cost of Equity | | | 20 | % | | | 20 | % | | |
Decrease | | |
| | | | Market Approach
| | Discount for
lack of marketability | | | 10 | % | | | 10 | % | | |
Decrease | | |
See Accompanying Notes to Financial Statements
165
VY® T. ROWE PRICE DIVERSIFIED PORTFOLIO OF INVESTMENTS
MID CAP GROWTH PORTFOLIO AS OF DECEMBER 31, 2021 (CONTINUED)
Investments, at fair value | | Fair Value at
December 31,
2021 | | Valuation
Technique(s)* | | Significant
Unobservable
Input(s) | | Value or
Range of
Input(s) | | Weighted
Average
of Inputs*** | | Impact to Valuation
from an Increase
in Input**** | |
Preferred Stocks
| | $ | 12,329,931
| | | Market Approach
| | Recent Comparable
Transaction Price(s) | | | — | ** | | | — | ** | | | — | ** | |
| | | | | | Market Approach
| | Enterprise Value to
Gross Profit Multiple | | | 14.2 | x | | | 14.2 | x | | |
Increase | | |
| | | | | | Market Approach
| | Enterprise Value to
Sales Multiple | | | 11.2 | x | | | 11.2 | x | | |
Increase | | |
| | | | | | Market Approach
| | Discount for
lack of marketability | | | 10 | % | | | 10 | % | | |
Decrease | | |
Total Investments, at fair value | | $ | 18,710,947 | | | | | | | | | | | | |
* Valuation techniques may change in order to reflect management's judgment of current market participant assumptions.
** No quantitative unobservable inputs significant to the valuation technique were created by the Portfolio's management.
*** Unobservable inputs were weighted by the relative fair value of the instruments.
**** Represents the directional change in the fair value of the Level 3 investment(s) that would result from an increase in the corresponding input. A decrease to the unobservable input would have the opposite effect. Significant increases and decreases in these inputs in isolation could result in signficantly higher or lower fair value measurements.
The following is a reconciliation of the fair valuations using significant unobservable inputs (Level 3) for the Portfolio's assets and liabilities during the year ended December 31, 2021:
| | | Common Stocks | | Preferred Stocks | | Total | |
Assets: | |
Beginning balance at December 31, 2020 | | $ | 6,238,425 | | | $ | 9,847,301 | | | $ | 16,085,726 | | |
Purchases | | | 1,173,818 | | | | 1,900,407 | | | | 3,074,225 | | |
Sales | | | — | | | | — | | | | — | | |
Total realized gain (loss) | | | — | | | | — | | | | — | | |
Net change in unrealized appreciation (depreciation)***** | | | 2,115,836 | | | | 3,713,345 | | | | 5,829,181 | | |
Transfers into Level 3 | | | — | | | | — | | | | — | | |
Transfers out of Level 3 | | | (3,147,063 | ) | | | (3,131,122 | ) | | | (6,278,185 | ) | |
Ending balance at December 31, 2021 | | $ | 6,381,016 | | | $ | 12,329,931 | | | $ | 18,710,947 | | |
Net change in unrealized appreciation (depreciation) on Level 3 securities
still held as of December 31, 2021***** | | $ | 2,115,836 | | | $ | 3,713,345 | | | $ | 5,829,181 | | |
***** Any difference between net change in unrealized apprecation (depreciation) and net change in unrealized appreciation (depreciation) on Level 3 securities still held at December 31, 2021 may be due to securities no longer held or categorized as Level 3 at year end.
At December 31, 2021, the aggregate cost of securities and other investments and the composition of unrealized appreciation and depreciation of securities and other investments on a tax basis were:
Cost for federal income tax purposes was $1,137,784,700.
Net unrealized appreciation consisted of: | |
Gross Unrealized Appreciation | | $ | 501,726,759 | | |
Gross Unrealized Depreciation | | | (63,422,987 | ) | |
Net Unrealized Appreciation | | $ | 438,303,772 | | |
See Accompanying Notes to Financial Statements
166
VY® T. ROWE PRICE PORTFOLIO OF INVESTMENTS
GROWTH EQUITY PORTFOLIO AS OF DECEMBER 31, 2021
Shares | |
| |
| | Value | | Percentage
of Net
Assets | |
COMMON STOCK: 98.1% | | | |
| | | | | Communication Services: 20.7% | |
| | 32,309 | | | | (1 | ) | | Alphabet, Inc. -
Class A | | $ | 93,600,465 | | | | 4.2 | | |
| | 32,260 | | | | (1 | ) | | Alphabet, Inc. -
Class C | | | 93,347,213 | | | | 4.2 | | |
| | 5,531 | | | | (1 | ),(2),(3) | | Epic Games, Inc. | | | 5,318,665 | | | | 0.2 | | |
| | 318,723 | | | | (1 | ) | | Meta Platforms, Inc. | | | 107,202,481 | | | | 4.8 | | |
| | 8,156 | | | | (1 | ) | | IAC/InterActiveCorp | | | 1,066,071 | | | | 0.0 | | |
| | 21,400 | | | | (1 | ),(4) | | Kuaishou Technology | | | 198,410 | | | | 0.0 | | |
| | 99,990 | | | | (1 | ) | | Match Group, Inc. | | | 13,223,677 | | | | 0.6 | | |
| | 68,641 | | | | (1 | ) | | NetFlix, Inc. | | | 41,352,084 | | | | 1.9 | | |
| | 114,970 | | | | (1 | ) | | Pinterest, Inc. | | | 4,179,160 | | | | 0.2 | | |
| | 120,233 | | | | (1 | ) | | ROBLOX Corp. | | | 12,403,236 | | | | 0.6 | | |
| | 154,439 | | | | (1 | ) | | Sea Ltd. ADR | | | 34,549,549 | | | | 1.6 | | |
| | 646,696 | | | | (1 | ) | | Snap, Inc. | | | 30,414,113 | | | | 1.4 | | |
| | 90,399 | | | | (1 | ) | | Spotify Technology SA | | | 21,156,078 | | | | 1.0 | | |
| | 46,176 | | | | (1 | ) | | Vimeo, Inc. | | | 829,321 | | | | 0.0 | | |
| | | | | | | | | | 458,840,523 | | | | 20.7 | | |
| | | | | Consumer Discretionary: 25.0% | |
| | 64,616 | | | | (1 | ) | | Airbnb, Inc. | | | 10,757,918 | | | | 0.5 | | |
| | 65,159 | | | | (1 | ) | | Amazon.com, Inc. | | | 217,262,260 | | | | 9.8 | | |
| | 5,755 | | | | (1 | ) | | Booking Holdings, Inc. | | | 13,807,569 | | | | 0.6 | | |
| | 36,608 | | | | (1 | ) | | Carvana Co. | | | 8,485,368 | | | | 0.4 | | |
| | 8,158 | | | | (1 | ) | | Chipotle Mexican
Grill, Inc. | | | 14,262,223 | | | | 0.6 | | |
| | 240,487 | | | | (1 | ),(5) | | Coupang, Inc. | | | 7,065,508 | | | | 0.3 | | |
| | 80,950 | | | | (1 | ) | | DoorDash, Inc. | | | 12,053,455 | | | | 0.5 | | |
| | 125,818 | | | | (1 | ) | | DraftKings, Inc. -
Class A | | | 3,456,220 | | | | 0.2 | | |
| | 58,689 | | | | (1 | ) | | Expedia Group, Inc. | | | 10,606,276 | | | | 0.5 | | |
| | 261,583 | | | | (1 | ) | | Farfetch Ltd. - Class A | | | 8,744,720 | | | | 0.4 | | |
| | 68,949 | | | | | | | Ferrari NV | | | 17,845,380 | | | | 0.8 | | |
| | 171,673 | | | | (1 | ) | | Las Vegas Sands
Corp. | | | 6,461,772 | | | | 0.3 | | |
| | 42,955 | | | | (1 | ) | | Lululemon Athletica,
Inc. | | | 16,814,735 | | | | 0.8 | | |
| | 151,200 | | | | (1 | ),(4) | | Meituan Class B | | | 4,372,325 | | | | 0.2 | | |
| | 66,648 | | | | | | | Nike, Inc. - Class B | | | 11,108,222 | | | | 0.5 | | |
| | 113,487 | | | | (1 | ) | | Peloton Interactive, Inc. | | | 4,058,295 | | | | 0.2 | | |
| | 47,200 | | | | (1 | ) | | Pinduoduo, Inc. ADR | | | 2,751,760 | | | | 0.1 | | |
| | 90,525 | | | | (1 | ),(5) | | Rivian Automotive, Inc. | | | 9,386,537 | | | | 0.4 | | |
| | 1,333,316 | | | | (1 | ),(3) | | Rivian Automotive, Inc.
Lockup Shares | | | 131,338,959 | | | | 5.9 | | |
| | 272,221 | | | | | | | Ross Stores, Inc. | | | 31,109,416 | | | | 1.4 | | |
| | 154,646 | | | | (1 | ),(5) | | Wynn Resorts Ltd. | | | 13,151,096 | | | | 0.6 | | |
| | | | | | | | | | 554,900,014 | | | | 25.0 | | |
| | | | | Financials: 1.7% | |
| | 1,669,750 | | | | (1 | ),(2),(3) | | Ant International Co.,
Limited- Class C | | | 6,114,458 | | | | 0.3 | | |
Shares | |
| |
| | Value | | Percentage
of Net
Assets | |
| | 12,749 | | | | (1 | ),(2),(3) | | Maplebear, Inc.,
dba Instacart | | $ | 1,513,944 | | | | 0.1 | | |
| | 666 | | | | (1 | ),(2),(3) | | Maplebear, Inc.,
dba Instacart -
Non-Voting | | | 79,087 | | | | 0.0 | | |
| | 9,189 | | | | | | | MarketAxess
Holdings, Inc. | | | 3,779,160 | | | | 0.2 | | |
| | 5,427 | | | | | | | MSCI, Inc. - Class A | | | 3,325,069 | | | | 0.1 | | |
| | 25,508 | | | | | | | S&P Global, Inc. | | | 12,037,990 | | | | 0.5 | | |
| | 379,590 | | | | (1 | ),(5) | | SoFi Technologies,
Inc. | | | 6,001,318 | | | | 0.3 | | |
| | 38,540 | | | | | | | Tradeweb Markets,
Inc. | | | 3,859,395 | | | | 0.2 | | |
| | | | | | | | | | 36,710,421 | | | | 1.7 | | |
| | | | | Health Care: 7.8% | |
| | 6,802 | | | | (1 | ) | | Align Technology, Inc. | | | 4,470,138 | | | | 0.2 | | |
| | 20,757 | | | | | | | Anthem, Inc. | | | 9,621,700 | | | | 0.4 | | |
| | 13,672 | | | | (1 | ) | | Argenx SE ADR | | | 4,787,798 | | | | 0.2 | | |
| | 105,278 | | | | | | | AstraZeneca PLC | | | 12,293,220 | | | | 0.6 | | |
| | 248,846 | | | | (1 | ) | | Avantor, Inc. | | | 10,486,371 | | | | 0.5 | | |
| | 39,071 | | | | | | | Cigna Corp. | | | 8,971,874 | | | | 0.4 | | |
| | 82,983 | | | | | | | Eli Lilly & Co. | | | 22,921,564 | | | | 1.0 | | |
| | 80,524 | | | | | | | HCA Healthcare, Inc. | | | 20,688,226 | | | | 0.9 | | |
| | 14,365 | | | | | | | Humana, Inc. | | | 6,663,349 | | | | 0.3 | | |
| | 91,570 | | | | (1 | ) | | Intuitive Surgical, Inc. | | | 32,901,101 | | | | 1.5 | | |
| | 89,577 | | | | | | | Stryker Corp. | | | 23,954,681 | | | | 1.1 | | |
| | 29,685 | | | | | | | UnitedHealth Group,
Inc. | | | 14,906,026 | | | | 0.7 | | |
| | | | | | | | | | 172,666,048 | | | | 7.8 | | |
| | | | | Industrials: 4.2% | |
| | 116,801 | | | | (1 | ) | | Airbus SE | | | 14,943,949 | | | | 0.7 | | |
| | 353,868 | | | | (1 | ),(3) | | Aurora Innovation, Inc.
Lockup Shares | | | 3,785,326 | | | | 0.2 | | |
| | 23,941 | | | | | | | Cintas Corp. | | | 10,609,933 | | | | 0.4 | | |
| | 68,026 | | | | (1 | ),(3) | | Didi Global, Inc.,
Lockup Shares | | | 1,314,426 | | | | 0.0 | | |
| | 68,602 | | | | | | | FedEx Corp. | | | 17,743,221 | | | | 0.8 | | |
| | 36,533 | | | | (1 | ) | | Generac Holdings, Inc. | | | 12,856,693 | | | | 0.6 | | |
| | 40,281 | | | | | | | Roper Technologies,
Inc. | �� | | 19,812,613 | | | | 0.9 | | |
| | 109,483 | | | | | | | TransUnion | | | 12,982,494 | | | | 0.6 | | |
| | | | | | | | | | 94,048,655 | | | | 4.2 | | |
| | | | | Information Technology: 38.7% | |
| | 155,594 | | | | (1 | ) | | Advanced Micro
Devices, Inc. | | | 22,389,977 | | | | 1.0 | | |
| | 27,999 | | | | (1 | ) | | Affirm Holdings, Inc. | | | 2,815,579 | | | | 0.1 | | |
| | 188,031 | | | | (1 | ) | | Afterpay Ltd. | | | 11,350,877 | | | | 0.5 | | |
| | 727,763 | | | | | | | Apple, Inc. | | | 129,228,876 | | | | 5.8 | | |
| | 40,802 | | | | | | | ASML Holding NV -
NY Reg | | | 32,484,104 | | | | 1.5 | | |
| | 15,700 | | | | (1 | ) | | Atlassian Corp. PLC | | | 5,986,253 | | | | 0.3 | | |
| | 35,156 | | | | (1 | ) | | Avalara, Inc. | | | 4,538,991 | | | | 0.2 | | |
See Accompanying Notes to Financial Statements
167
VY® T. ROWE PRICE PORTFOLIO OF INVESTMENTS
GROWTH EQUITY PORTFOLIO AS OF DECEMBER 31, 2021 (CONTINUED)
Shares | |
| |
| | Value | | Percentage
of Net
Assets | |
| | | | | Information Technology (continued) | |
| | 7,556 | | | | (1 | ) | | Bill.com Holdings,
Inc. | | $ | 1,882,577 | | | | 0.1 | | |
| | 167,178 | | | | (1 | ) | | Black Knight, Inc. | | | 13,857,384 | | | | 0.6 | | |
| | 28,100 | | | | (1 | ) | | Block, Inc. | | | 4,538,431 | | | | 0.2 | | |
| | 57,285 | | | | (1 | ) | | Ceridian HCM
Holding, Inc. | | | 5,983,991 | | | | 0.3 | | |
| | 69,054 | | | | (1 | ) | | Datadog, Inc. | | | 12,299,208 | | | | 0.6 | | |
| | 178,883 | | | | (1 | ) | | Fiserv, Inc. | | | 18,566,267 | | | | 0.8 | | |
| | 77,029 | | | | | | | Global Payments,
Inc. | | | 10,412,780 | | | | 0.5 | | |
| | 17,420 | | | | (1 | ) | | HashiCorp, Inc. | | | 1,585,917 | | | | 0.1 | | |
| | 80,893 | | | | | | | Intuit, Inc. | | | 52,031,995 | | | | 2.3 | | |
| | 7,871 | | | | (1 | ),(2),(3) | | Magic Leap, Inc. -
Class A | | | 151,138 | | | | 0.0 | | |
| | 79,729 | | | | | | | Mastercard, Inc. -
Class A | | | 28,648,224 | | | | 1.3 | | |
| | 691,948 | | | | | | | Microsoft Corp. | | | 232,715,951 | | | | 10.5 | | |
| | 7,152 | | | | (1 | ),(5) | | Monday.com Ltd. | | | 2,207,965 | | | | 0.1 | | |
| | 28,776 | | | | (1 | ) | | MongoDB, Inc. | | | 15,232,576 | | | | 0.7 | | |
| | 136,636 | | | | | | | Nvidia Corp. | | | 40,186,014 | | | | 1.8 | | |
| | 11,262 | | | | (1 | ) | | Paycom Software,
Inc. | | | 4,675,870 | | | | 0.2 | | |
| | 54,831 | | | | (1 | ) | | PayPal Holdings, Inc. | | | 10,340,030 | | | | 0.5 | | |
| | 108,103 | | | | (1 | ) | | Salesforce.com, Inc. | | | 27,472,215 | | | | 1.2 | | |
| | 191,600 | | | | (1 | ),(5) | | SentinelOne, Inc. | | | 9,673,884 | | | | 0.4 | | |
| | 45,443 | | | | (1 | ) | | ServiceNow, Inc. | | | 29,497,506 | | | | 1.3 | | |
| | 8,845 | | | | (1 | ) | | Shopify, Inc. | | | 12,183,015 | | | | 0.6 | | |
| | 14,557 | | | | (1 | ) | | Snowflake, Inc. -
Class A | | | 4,931,184 | | | | 0.2 | | |
| | 51,440 | | | | (1 | ),(2),(3) | | Stripe, Inc. - Class B | | | 3,325,596 | | | | 0.2 | | |
| | 101,930 | | | | | | | Taiwan
Semiconductor
Manufacturing
Co., Ltd. ADR | | | 12,263,198 | | | | 0.6 | | |
| | 40,861 | | | | (1 | ) | | Teledyne
Technologies, Inc. | | | 17,851,762 | | | | 0.8 | | |
| | 9,017 | | | | (1 | ),(5) | | Toast, Inc. | | | 312,980 | | | | 0.0 | | |
| | 95,454 | | | | (1 | ) | | Trade Desk, Inc./The | | | 8,747,405 | | | | 0.4 | | |
| | 19,000 | | | | (1 | ) | | Twilio, Inc. | | | 5,003,460 | | | | 0.2 | | |
| | 238,712 | | | | (1 | ) | | UiPath, Inc. | | | 10,295,649 | | | | 0.5 | | |
| | 157,581 | | | | | | | Visa, Inc. - Class A | | | 34,149,379 | | | | 1.5 | | |
| | 22,906 | | | | (1 | ) | | Workday, Inc. | | | 6,257,461 | | | | 0.3 | | |
| | 60,293 | | | | (1 | ) | | Zoom Video
Communications,
Inc. | | | 11,088,486 | | | | 0.5 | | |
| | | | | | | | | | 857,164,155 | | | | 38.7 | | |
| | | | | | | Total Common Stock
(Cost
$1,219,329,204) | | | 2,174,329,816 | | | | 98.1 | | |
Shares | |
| |
| | Value | | Percentage
of Net
Assets | |
PREFERRED STOCK: 0.8% | | | |
| | | | | Consumer Discretionary: 0.3% | |
| | 38,487 | | | | (1 | ),(2),(3) | | Rappi, Inc. -
Series E | | $ | 2,479,453 | | | | 0.1 | | |
| | 37,201 | | | | (1 | ),(2),(3) | | Sila Nanotechnologies,
Inc., Series F | | | 1,535,389 | | | | 0.1 | | |
| | 18,931 | | | | (1 | ),(2),(3) | | Waymo LLC.,
Series A-2 | | | 1,736,390 | | | | 0.1 | | |
| | | | | | | | | | 5,751,232 | | | | 0.3 | | |
| | | | | Financials: 0.2% | |
| | 1,855 | | | | (1 | ),(2),(3) | | Maplebear, Inc., dba
Instacart - Series A | | | 220,281 | | | | 0.0 | | |
| | 26,036 | | | | (1 | ),(2),(3) | | Maplebear, Inc., dba
Instacart - Series G | | | 3,091,775 | | | | 0.2 | | |
| | | | | | | | | | 3,312,056 | | | | 0.2 | | |
| | | | | Industrials: 0.3% | |
| | 159,700 | | | | (1 | ),(2),(3) | | GM Cruise Holdings,
LLC - Class F | | | 4,208,095 | | | | 0.2 | | |
| | 132,943 | | | | (1 | ),(2),(3) | | Nuro, Inc. - Series C | | | 2,771,293 | | | | 0.1 | | |
| | | | | | | | | | 6,979,388 | | | | 0.3 | | |
| | | | | | | Total Preferred Stock
(Cost $11,475,729) | | | 16,042,676 | | | | 0.8 | | |
| | | | | | | Total Long-Term
Investments
(Cost
$1,230,804,933) | | | 2,190,372,492 | | | | 98.9 | | |
Principal
Amount† | |
| |
| | Value | | Percentage
of Net
Assets | |
SHORT-TERM INVESTMENTS: 3.2% | | | |
| | | | | Repurchase Agreements: 1.8% | |
| | 9,576,047 | | | | (6 | ) | | Cantor Fitzgerald
Securities,
Repurchase
Agreement dated
12/31/21, 0.05%,
due 01/03/22
(Repurchase
Amount $9,576,086,
collateralized by
various U.S.
Government/
U.S. Government
Agency Obligations,
0.000%-9.000%,
Market Value plus
accrued interest
$9,767,568, due
02/01/22-07/20/71) | | $ | 9,576,047 | | | | 0.4 | | |
See Accompanying Notes to Financial Statements
168
VY® T. ROWE PRICE PORTFOLIO OF INVESTMENTS
GROWTH EQUITY PORTFOLIO AS OF DECEMBER 31, 2021 (CONTINUED)
Principal
Amount† | |
| |
| | Value | | Percentage
of Net
Assets | |
| | | | | Repurchase Agreements (continued) | |
| | 6,613,337 | | | | (6 | ) | | Citadel Securities
LLC, Repurchase
Agreement dated
12/31/21, 0.07%,
due 01/03/22
(Repurchase
Amount $6,613,375,
collateralized by
various U.S.
Government
Securities,
0.000%-7.250%,
Market Value plus
accrued interest
$6,745,643, due
01/04/22-11/15/51) | | $ | 6,613,337 | | | | 0.3 | | |
| | 4,312,263 | | | | (6 | ) | | Mirae Asset
Securities USA Inc.,
Repurchase
Agreement dated
12/31/21, 0.06%,
due 01/03/22
(Repurchase
Amount $4,312,284,
collateralized by
various U.S.
Government
Agency Obligations,
0.550%-7.500%,
Market Value plus
accrued interest
$4,398,530, due
01/01/23-10/20/71) | | | 4,312,263 | | | | 0.2 | | |
| | 8,280,066 | | | | (6 | ) | | RBC Dominion
Securities Inc.,
Repurchase
Agreement dated
12/31/21, 0.05%,
due 01/03/22
(Repurchase
Amount $8,280,100,
collateralized by
various U.S.
Government/
U.S. Government
Agency Obligations,
0.000%-6.500%,
Market Value plus
accrued interest
$8,445,667, due
05/15/22-12/01/51) | | | 8,280,066 | | | | 0.4 | | |
Principal
Amount† | |
| |
| | Value | | Percentage
of Net
Assets | |
| | 8,143,470 | | | | (6 | ) | | State of Wisconsin
Investment Board,
Repurchase
Agreement dated
12/31/21, 0.07%,
due 01/03/22
(Repurchase
Amount $8,143,517,
collateralized by
various U.S.
Government
Securities,
0.125%-3.875%,
Market Value plus
accrued interest
$8,306,382, due
07/15/23-02/15/48) | | $ | 8,143,470 | | | | 0.4 | | |
| | 2,433,328 | | | | (6 | ) | | Stonex Financial Inc.,
Repurchase
Agreement dated
12/31/21, 0.09%,
due 01/03/22
(Repurchase
Amount $2,433,346,
collateralized by
various U.S.
Government/
U.S. Government
Agency Obligations,
0.000%-9.000%,
Market Value plus
accrued interest
$2,481,995, due
01/13/22-11/20/71) | | | 2,433,328 | | | | 0.1 | | |
| | | | | | | Total Repurchase
Agreements
(Cost $39,358,511) | | | 39,358,511 | | | | 1.8 | | |
| | | | | Time Deposits: 0.1% | |
| | 1,280,000 | | | | (6 | ) | | Mizuho Bank LTD,
0.050%, 01/03/2022 | | | 1,280,000 | | | | 0.1 | | |
| | 1,270,000 | | | | (6 | ) | | Mizuho Bank LTD,
0.070%, 01/03/2022 | | | 1,270,000 | | | | 0.0 | | |
| | 1,240,000 | | | | (6 | ) | | Mizuho Bank LTD,
0.070%, 01/03/2022 | | | 1,240,000 | | | | 0.0 | | |
| | | | | | | Total Time Deposits
(Cost $3,790,000) | | | 3,790,000 | | | | 0.1 | | |
Shares | |
| |
| | Value | | Percentage
of Net
Assets | |
| | | | | Mutual Funds: 1.3% | |
| | 1,120,000 | | | | (6 | ),(7) | | BlackRock Liquidity
Funds, FedFund,
Institutional Class,
0.030% | | $ | 1,120,000 | | | | 0.1 | | |
| | 500,000 | | | | (6 | ),(7) | | Goldman Sachs
Financial Square
Government Fund -
Institutional Shares,
0.020% | | | 500,000 | | | | 0.0 | | |
See Accompanying Notes to Financial Statements
169
VY® T. ROWE PRICE PORTFOLIO OF INVESTMENTS
GROWTH EQUITY PORTFOLIO AS OF DECEMBER 31, 2021 (CONTINUED)
Shares | |
| |
| | Value | | Percentage
of Net
Assets | |
| | | | | Mutual Funds (continued) | |
| | 500,000 | | | | (6 | ),(7) | | Morgan Stanley
Institutional
Liquidity Funds -
Government
Portfolio
(Institutional
Share Class),
0.030% | | $ | 500,000 | | | | 0.0 | | |
| | 26,686,634 | | | | (7 | ) | | T. Rowe Price
Government
Reserve Fund,
0.070% | | | 26,686,634 | | | | 1.2 | | |
| | | | | Total Mutual Funds
(Cost $28,806,634) | | | 28,806,634 | | | | 1.3 | | |
| | | | | Total Short-Term
Investments
(Cost $71,955,145) | | | 71,955,145 | | | | 3.2 | | |
| | | | | Total Investments in
Securities
(Cost
$1,302,760,078) | | $ | 2,262,327,637 | | | | 102.1 | | |
| | | | | Liabilities in Excess
of Other Assets | | | (46,098,794 | ) | | | (2.1 | ) | |
| | | | | Net Assets | | $ | 2,216,228,843 | | | | 100.0 | | |
† Unless otherwise indicated, principal amount is shown in USD.
ADR American Depositary Receipt
(1) Non-income producing security.
(2) For fair value measurement disclosure purposes, security is categorized as Level 3, whose value was determined using significant unobservable inputs.
(3) Restricted security as to resale, excluding Rule 144A securities. As of December 31, 2021, the Portfolio held restricted securities with a fair value of $168,984,275 or 7.6% of net assets. Please refer to the table below for additional details.
(4) Securities with purchases pursuant to Rule 144A or section 4(a)(2), under the Securities Act of 1933 and may not be resold subject to that rule except to qualified institutional buyers.
(5) Security, or a portion of the security, is on loan.
(6) All or a portion of the security represents securities purchased with cash collateral received for securities on loan.
(7) Rate shown is the 7-day yield as of December 31, 2021.
Fair Value Measurements^
The following is a summary of the fair valuations according to the inputs used as of December 31, 2021 in valuing the assets and liabilities:
| | | Quoted Prices
in Active Markets
for Identical Investments
(Level 1) | | Significant Other
Observable
Inputs#
(Level 2) | | Significant
Unobservable
Inputs
(Level 3) | | Fair Value
at
December 31, 2021 | |
Asset Table | |
Investments, at fair value | |
Common Stock | |
Communication Services | | $ | 453,323,448 | | | $ | 198,410 | | | $ | 5,318,665 | | | $ | 458,840,523 | | |
Consumer Discretionary | | | 419,188,730 | | | | 135,711,284 | | | | — | | | | 554,900,014 | | |
Financials | | | 29,002,932 | | | | — | | | | 7,707,489 | | | | 36,710,421 | | |
Health Care | | | 160,372,828 | | | | 12,293,220 | | | | — | | | | 172,666,048 | | |
Industrials | | | 74,004,954 | | | | 20,043,701 | | | | — | | | | 94,048,655 | | |
Information Technology | | | 842,336,544 | | | | 11,350,877 | | | | 3,476,734 | | | | 857,164,155 | | |
Total Common Stock | | | 1,978,229,436 | | | | 179,597,492 | | | | 16,502,888 | | | | 2,174,329,816 | | |
Preferred Stock | | | — | | | | — | | | | 16,042,676 | | | | 16,042,676 | | |
Short-Term Investments | | | 28,806,634 | | | | 43,148,511 | | | | — | | | | 71,955,145 | | |
Total Investments, at fair value | | $ | 2,007,036,070 | | | $ | 222,746,003 | | | $ | 32,545,564 | | | $ | 2,262,327,637 | | |
^ See Note 2, "Significant Accounting Policies" in the Notes to Financial Statements for additional information.
# The earlier close of the foreign markets gives rise to the possibility that significant events, including broad market moves, may have occurred in the interim and may materially affect the value of those securities. To account for this, the Portfolio may frequently value many of its foreign equity securities using fair value prices based on third party vendor modeling tools to the extent available. Accordingly, a portion of the Portfolio's investments are categorized as Level 2 investments.
See Accompanying Notes to Financial Statements
170
VY® T. ROWE PRICE PORTFOLIO OF INVESTMENTS
GROWTH EQUITY PORTFOLIO AS OF DECEMBER 31, 2021 (CONTINUED)
At December 31, 2021, VY® T. Rowe Price Growth Equity Portfolio held the following restricted securities:
Security | | Acquisition
Date | | Acquisition
Cost | | Fair Value | |
Ant International Co., Limited - Class C | | 6/7/2018 | | $ | 6,364,043 | | | $ | 6,114,458 | | |
Aurora Innovation, Inc. Lockup Shares | | 3/1/2019 | | | 1,506,258 | | | | 3,785,326 | | |
Didi Global, Inc., Lockup Shares | | 10/19/2015 | | | 1,865,695 | | | | 1,314,426 | | |
Epic Games, Inc. | | 6/18/2020 | | | 3,180,325 | | | | 5,318,665 | | |
GM Cruise Holdings, LLC - Class F | | 5/7/2019 | | | 2,914,525 | | | | 4,208,095 | | |
Magic Leap, Inc. - Class A | | 1/20/2016 | | | 3,824,971 | | | | 151,138 | | |
Maplebear, Inc., dba Instacart | | 8/7/2020 | | | 590,711 | | | | 1,513,944 | | |
Maplebear, Inc., dba Instacart - Non-Voting | | 8/7/2020 | | | 30,858 | | | | 79,087 | | |
Maplebear, Inc., dba Instacart - Series A | | 11/18/2020 | | | 113,178 | | | | 220,281 | | |
Maplebear, Inc., dba Instacart - Series G | | 7/2/2020 | | | 1,252,121 | | | | 3,091,775 | | |
Nuro, Inc. - Series C | | 10/30/2020 | | | 1,735,518 | | | | 2,771,293 | | |
Rappi, Inc. - Series E | | 9/8/2020 | | | 2,299,446 | | | | 2,479,453 | | |
Rivian Automotive, Inc. Lockup Shares | | 12/23/2019 | | | 20,686,703 | | | | 131,338,959 | | |
Sila Nanotechnologies, Inc., Series F | | 1/7/2021 | | | 1,535,389 | | | | 1,535,389 | | |
Stripe, Inc. - Class B | | 12/17/2019 | | | 807,094 | | | | 3,325,596 | | |
Waymo LLC., Series A-2 | | 5/8/2020 | | | 1,625,552 | | | | 1,736,390 | | |
| | | | | $ | 50,332,387 | | | $ | 168,984,275 | | |
The effect of derivative instruments on the Portfolio's Statement of Operations for the year ended December 31, 2021 was as follows:
| | | Amount of Realized Gain or (Loss) on Derivatives Recognized in Income | |
Derivatives not accounted
for as hedging instruments | | Forward foreign currency contracts | |
Foreign exchange contracts | | $ | (12,134 | ) | |
Total | | $ | (12,134 | ) | |
The following table presents additional information about valuation techniques and inputs used for investments that are measured at fair value and categorized within Level 3 at December 31, 2021:
Investments, at fair value | | Fair Value at
December 31,
2021 | | Valuation
Technique(s)* | | Significant
Unobservable
Input(s) | | Value or
Range of
Input(s) | | Weighted
Average of
Inputs*** | | Impact to Valuation
from an Increase
in Input**** | |
Common Stocks
| | $ | 16,502,888
| | | Market Approach
| | Recent Comparable
Transaction Price(s) | | | — | ** | | | — | ** | | | — | ** | |
| | | | | | Market Approach
| | Discount for lack of
marketability | | | 10 | % | | | 10 | % | | |
Decrease | | |
| | | | | | Market Approach
| | Enterprise Value to
EBITDA Multiple | | | 22.0 | x - 25.4x | | | 22.0 | x - 25.4x | | |
Increase | | |
| | | | | | Market Approach
| | Enterprise Value to
Sales Multiple | | | 6.4 | x - 7.5x | | | 6.4 | x - 7.5x | | |
Increase | | |
| | | | | | Market Approach | | Sales growth rate | | | 25 | % | | | 25 | % | | | Increase | | |
| | | | | | Market Approach | | EBITDA growth rate | | | 32 | % | | | 32 | % | | | Increase | | |
| | | | | | Market Approach
| | Enterprise Value to
Gross Profit Multiple | | | 43.4 | x - 58.1x | | | 43.4 | x - 58.1x | | |
Increase | | |
| | | | | | Market Approach
| | Gross profit
growth rate | | | 40 | % | | | 40 | % | | |
Increase | | |
| | | | | | Market Approach
| | Segment Based
Price to Earnings
Multiple | | | 9.5 | x - 36.8x | | | 9.5 | x - 36.8x | | |
Increase | | |
| | | | | | Market Approach
| | Whole Company
Price to Earnings
Multiple | | | 18.1 | x | | | 18.1 | x | | |
Increase | | |
Preferred Stocks
| | $ | 16,042,676
| | | Market Approach
| | Recent Comparable
Transaction Price(s) | | | — | ** | | | — | ** | | | — | ** | |
Total Investments, at fair value | | $ | 32,545,564 | | | | | | | | | | | | |
* Valuation techniques may change in order to reflect management's judgment of current market participant assumptions.
** No quantitative unobservable inputs significant to the valuation technique were created by the Portfolio's management.
*** Unobservable inputs were weighted by the relative fair value of the instruments.
**** Represents the directional change in the fair value of the Level 3 investment(s) that would result from an increase in the corresponding input. A decrease to the unobservable input would have the opposite effect. Significant increases and decreases in these inputs in isolation could result in signficantly higher or lower fair value measurements.
See Accompanying Notes to Financial Statements
171
VY® T. ROWE PRICE PORTFOLIO OF INVESTMENTS
GROWTH EQUITY PORTFOLIO AS OF DECEMBER 31, 2021 (CONTINUED)
The following is a reconciliation of the fair valuations using significant unobservable inputs (Level 3) for the Portfolio's assets and liabilities during the year ended December 31, 2021:
| | | Common Stocks | | Preferred Stocks | | Total | |
Assets: | |
Beginning balance at December 31, 2020 | | $ | 19,155,080 | | | $ | 41,961,073 | | | $ | 61,116,153 | | |
Purchases | | | 3,824,971 | | | | 6,094,729 | | | | 9,919,700 | | |
Sales | | | — | | | | — | | | | — | | |
Total realized gain (loss) | | | — | | | | — | | | | — | | |
Net change in unrealized appreciation (depreciation)***** | | | (2,050,852 | ) | | | 4,119,333 | | | | 2,068,481 | | |
Transfers into Level 3 | | | — | | | | — | | | | — | | |
Transfers out of Level 3****** | | | (4,426,311 | ) | | | (36,132,459 | ) | | | (40,558,770 | ) | |
Ending balance at December 31, 2021 | | $ | 16,502,888 | | | $ | 16,042,676 | | | $ | 32,545,564 | | |
Net change in unrealized appreciation (depreciation) on Level 3 securities
still held as of December 31, 2021***** | | $ | (2,050,852 | ) | | $ | 4,119,333 | | | $ | 2,068,481 | | |
***** Any difference between net change in unrealized apprecation (depreciation) and net change in unrealized appreciation (depreciation) on Level 3 securities still held at December 31, 2021 may be due to securities no longer held or categorized as Level 3 at year end.
****** During the year ended December 31, 2021, certain securities fair valued at $35,999,430 transferred out of Level 3 because observable market data became available for the securities.
At December 31, 2021, the aggregate cost of securities and other investments and the composition of unrealized appreciation and depreciation of securities and other investments on a tax basis were:
Cost for federal income tax purposes was $1,308,575,120.
Net unrealized appreciation consisted of: | |
Gross Unrealized Appreciation | | $ | 1,014,080,147 | | |
Gross Unrealized Depreciation | | | (60,327,509 | ) | |
Net Unrealized Appreciation | | $ | 953,752,638 | | |
See Accompanying Notes to Financial Statements
172
TAX INFORMATION (UNAUDITED)
Dividends and distributions paid during the year ended December 31, 2021 were as follows:
Portfolio Name | | Type | | Per Share Amount | |
Voya Global Bond Portfolio | |
Class ADV | | NII | | $ | 0.4928 | | |
Class I | | NII | | $ | 0.5523 | | |
Class S | | NII | | $ | 0.5245 | | |
All Classes | | ROC | | $ | 0.0779 | | |
Voya International High Dividend Low Volatility Portfolio | |
Class ADV | | NII | | $ | 0.2042 | | |
Class I | | NII | | $ | 0.2515 | | |
Class S | | NII | | $ | 0.2264 | | |
Class S2 | | NII | | $ | 0.2049 | | |
VY® American Century Small-Mid Cap Value Portfolio | |
Class ADV | | NII | | $ | 0.0911 | | |
Class I | | NII | | $ | 0.1443 | | |
Class S | | NII | | $ | 0.1165 | | |
Class S2 | | NII | | $ | 0.0882 | | |
VY® Baron Growth Portfolio | |
Class ADV | | NII | | $ | — | | |
Class I | | NII | | $ | — | | |
Class R6 | | NII | | $ | — | | |
Class S | | NII | | $ | — | | |
Class S2 | | NII | | $ | — | | |
All Classes | | LTCG | | $ | 2.4374 | | |
VY® Columbia Contrarian Core Portfolio | |
Class ADV | | NII | | $ | 0.0519 | | |
Class I | | NII | | $ | 0.1398 | | |
Class S | | NII | | $ | 0.0911 | | |
All Classes | | STCG | | $ | 1.1377 | | |
All Classes | | LTCG | | $ | 1.3423 | | |
VY® Columbia Small Cap Value II Portfolio | |
Class ADV | | NII | | $ | 0.0345 | | |
Class I | | NII | | $ | 0.0873 | | |
Class R6 | | NII | | $ | 0.0926 | | |
Class S | | NII | | $ | 0.0495 | | |
Class S2 | | NII | | $ | 0.0313 | | |
All Classes | | LTCG | | $ | 0.0734 | | |
VY® Invesco Comstock Portfolio | |
Class ADV | | NII | | $ | 0.2435 | | |
Class I | | NII | | $ | 0.3464 | | |
Class S | | NII | | $ | 0.2954 | | |
Portfolio Name | | Type | | Per Share Amount | |
VY® Invesco Equity and Income Portfolio | |
Class ADV | | NII | | $ | 0.4972 | | |
Class I | | NII | | $ | 0.7431 | | |
Class S | | NII | | $ | 0.6070 | | |
Class S2 | | NII | | $ | 0.5343 | | |
All Classes | | STCG | | $ | 0.5731 | | |
All Classes | | LTCG | | $ | 0.0265 | | |
VY® Invesco Global Portfolio | |
Class ADV | | NII | | $ | — | | |
Class I | | NII | | $ | — | | |
Class S | | NII | | $ | — | | |
Class S2 | | NII | | $ | — | | |
All Classes | | LTCG | | $ | 1.1471 | | |
VY® JPMorgan Mid Cap Value Portfolio | |
Class ADV | | NII | | $ | 0.0524 | | |
Class I | | NII | | $ | 0.1437 | | |
Class S | | NII | | $ | 0.0945 | | |
Class S2 | | NII | | $ | 0.0928 | | |
All Classes | | STCG | | $ | 0.0290 | | |
All Classes | | LTCG | | $ | 0.6725 | | |
VY® T. Rowe Price Diversified Mid Cap Growth Portfolio | |
Class ADV | | NII | | $ | — | | |
Class I | | NII | | $ | 0.0006 | | |
Class R6 | | NII | | $ | 0.0011 | | |
Class S | | NII | | $ | — | | |
Class S2 | | NII | | $ | — | | |
All Classes | | STCG | | $ | 0.1808 | | |
All Classes | | LTCG | | $ | 2.2679 | | |
VY® T. Rowe Price Growth Equity Portfolio | |
Class ADV | | NII | | $ | — | | |
Class I | | NII | | $ | — | | |
Class S | | NII | | $ | — | | |
Class S2 | | NII | | $ | — | | |
All Classes | | STCG | | $ | 1.4833 | | |
All Classes | | LTCG | | $ | 8.0628 | | |
NII — Net investment income
STCG — Short-term capital gain
LTCG — Long-term capital gain
ROC — Return of capital
Of the ordinary distributions made during the year ended December 31, 2021, the following percentages qualify for the dividends received deduction (DRD) available to corporate shareholders:
VY® American Century Small-Mid Cap Value Portfolio | | | 99.98 | % | |
VY® Columbia Contrarian Core Portfolio | | | 17.78 | % | |
VY® Columbia Small Cap Value II Portfolio | | | 99.99 | % | |
VY® Invesco Comstock Portfolio | | | 100.00 | % | |
VY® Invesco Equity and Income Portfolio | | | 45.14 | % | |
VY® JPMorgan Mid Cap Value Portfolio | | | 93.88 | % | |
VY® T. Rowe Price Diversified Mid Cap Growth Portfolio | | | 42.21 | % | |
VY® T. Rowe Price Growth Equity Portfolio | | | 24.87 | % | |
The Portfolios designate the following amounts of long-term capital gain distributions as 20% rate long-term capital gain dividends under Internal Revenue Code Section 852(b)(3)(C):
VY® Baron Growth Portfolio | | $ | 47,211,796 | | |
VY® Columbia Contrarian Core Portfolio | | $ | 11,113,782 | | |
VY® Columbia Small Cap Value II Portfolio | | $ | 705,596 | | |
VY® Invesco Equity and Income Portfolio | | $ | 683,015 | | |
VY® Invesco Global Portfolio | | $ | 75,568,927 | | |
VY® JPMorgan Mid Cap Value Portfolio | | $ | 14,717,757 | | |
VY® T. Rowe Price Diversified Mid Cap Growth Portfolio | | $ | 205,600,547 | | |
VY® T. Rowe Price Growth Equity Portfolio | | $ | 148,632,231 | | |
173
TAX INFORMATION (UNAUDITED) (CONTINUED)
Pursuant to Section 853 of the Internal Revenue Code, the Portfolios designate the following amounts as foreign taxes paid for the year ended December 31, 2021. Foreign taxes paid for purposes of Section 853 may be less than actual foreign taxes paid for financial statement purposes.
| | | Creditable
Foreign
Taxes Paid | | Per Share
Amount | | Portion of Ordinary
Income Distribution
Derived from Foreign
Sourced Income* | |
Voya International High Dividend Low Volatility Portfolio | | $ | 716,555 | | | $ | 0.0182 | | | | 92.67 | % | |
* None of the Portfolio's income was derived from ineligible foreign sources as defined under Section 901(j) of the Internal Revenue Code.
Foreign taxes paid or withheld must be included in taxable income with an offsetting deduction from gross income or as a credit for taxes paid to foreign governments. Shareholders are strongly advised to consult their own tax advisors regarding the appropriate treatment of foreign taxes paid.
Above figures may differ from those cited elsewhere in this report due to differences in the calculation of income and gains under U.S. generally accepted accounting principles (book) purposes and Internal Revenue Service (tax) purposes.
Shareholders are strongly advised to consult their own tax advisers with respect to the tax consequences of their investments in the Portfolios. In January, shareholders, excluding corporate shareholders, receive an IRS 1099-DIV regarding the federal tax status of the dividends and distributions they received in the calendar year.
174
DIRECTOR AND OFFICER INFORMATION (UNAUDITED)
The business and affairs of the Company are managed under the direction of the Board. A Director, who is not an interested person of the Company, as defined in the 1940 Act, is an independent director ("Independent Director"). The Directors and Officers of the Company are listed below. The Statement of Additional Information includes additional information about Directors of the Company and is available, without charge, upon request at (800) 262-3862.
Name, Address
and Age | | Position(s)
held with the
Company | | Term of
Office and
Length of
Time
Served(1) | | Principal
Occupation(s) -
during the
Past 5 Years | | Number of
Funds in
Fund Complex
Overseen
by Director(2) | | Other Board
Positions
held by
Director | |
Independent Directors: | |
Colleen D. Baldwin
7337 East Doubletree Ranch Rd.
Suite 100
Scottsdale, Arizona 85258
Age: 61 | | Director
Chairperson | | November 2007 - Present
January 2020 - Present | | President, Glantuam Partners, LLC, a business consulting firm (January 2009 - Present). | | | 131 | | | Dentaquest (February 2014 - Present); RSR Partners, Inc. (2016 - Present). | |
John V. Boyer
7337 East Doubletree Ranch Rd.
Suite 100
Scottsdale, Arizona 85258
Age: 68 | | Director | | November 1997 - Present | | Retired. Formerly, President and Chief Executive Officer, Bechtler Arts Foundation, an arts and education foundation (January 2008 -
December 2019). | | | 131 | | | None. | |
Patricia W. Chadwick
7337 East Doubletree Ranch Rd.
Suite 100
Scottsdale, Arizona 85258
Age: 73 | | Director | | January 2006 - Present | | Consultant and President, Ravengate Partners LLC, a consulting firm that provides advice regarding financial markets and the global economy (January 2000 - Present). | | | 131 | | | Wisconsin Energy Corporation (June 2006 - Present); The Royce Funds (22 funds) (December 2009 - Present); and AMICA Mutual Insurance Company (1992 - Present). | |
Martin J. Gavin
7337 East Doubletree Ranch Rd.
Suite 100
Scottsdale, AZ 85258
Age: 71 | | Director | | August 2015 - Present | | Retired. | | | 131 | | | None. | |
Joseph E. Obermeyer
7337 East Doubletree Ranch Rd.
Suite 100
Scottsdale, Arizona 85258
Age: 64 | | Director | | May 2013 - Present | | President, Obermeyer & Associates, Inc., a provider of financial and economic consulting services (November 1999 - Present). | | | 131 | | | None. | |
Sheryl K. Pressler
7337 East Doubletree Ranch Rd.
Suite 100
Scottsdale, Arizona 85258
Age: 71 | | Director | | January 2006 - Present | | Consultant (May 2001 - Present). | | | 131 | | | Centerra Gold Inc. (May 2008 - Present). | |
Christopher P. Sullivan
7337 East Doubletree Ranch Rd.
Suite 100
Scottsdale, Arizona 85258
Age: 68 | | Director | | October 2015 - Present | | Retired. | | | 131 | | | None. | |
175
DIRECTOR AND OFFICER INFORMATION (UNAUDITED) (CONTINUED)
Name, Address
and Age | | Position(s)
held with the
Company | | Term of
Office and
Length of
Time
Served(1) | | Principal
Occupation(s) -
during the
Past 5 Years | | Number of
Funds in
Fund Complex
Overseen
by Director(2) | | Other Board
Positions
held by
Director | |
Director who is an "interested person": | |
Dina Santoro
230 Park Avenue
New York, New York 10169
Age: 48 | | Director | | July 2018 -
Present | | President, Voya Investments, LLC and Voya Capital, LLC (March 2018 - Present); Senior Vice President, Voya Investments Distributor, LLC (April 2018 - Present); Chief Operating Officer and Senior Managing Director, Voya Investment Management (January 2022 - Present). Formerly, Senior Managing Director, Head of Product and Marketing Strategy, Voya Investment Management (September 2017 -
January 2022); Managing Director, Quantitative Management Associates, LLC (January 2004 - August 2017). | | | 131 | | | Voya Investments, LLC, Voya Capital, LLC, and Voya Funds Services, LLC (March 2018 - Present); Voya Investments Distributor, LLC (April 2018 - Present). | |
(1) Directors serve until their successors are duly elected and qualified. The tenure of each Director who is not an "interested person" as defined in the 1940 Act, of each Portfolio ("Independent Director") is subject to the Board's retirement policy which states that each duly elected or appointed Independent Director shall retire from and cease to be a member of the Board of Directors at the close of business on December 31 of the calendar year in which the Independent Director attains the age of 75. A majority vote of the Board's other Independent Directors may extend the retirement date of an Independent Director if the retirement would trigger a requirement to hold a meeting of shareholders of the Company under applicable law, whether for the purposes of appointing a successor to the Independent Director or otherwise comply under applicable law, in which case the extension would apply until such time as the shareholder meeting can be held or is no longer required (as determined by a vote of a majority of the other Independent Directors).
(2) For the purposes of this table, "Fund Complex" means the Voya family of funds including the following investment companies: Voya Asia Pacific High Dividend Equity Income Fund; Voya Balanced Portfolio, Inc.; Voya Emerging Markets High Dividend Equity Fund; Voya Equity Trust; Voya Funds Trust; Voya Global Advantage and Premium Opportunity Fund; Voya Global Equity Dividend and Premium Opportunity Fund; Voya Government Money Market Portfolio; Voya Infrastructure, Industrials and Materials Fund; Voya Intermediate Bond Portfolio; Voya Investors Trust; Voya Mutual Funds; Voya Partners, Inc.; Voya Senior Income Fund; Voya Separate Portfolios Trust; Voya Strategic Allocation Portfolios, Inc.; Voya Variable Funds; Voya Variable Insurance Trust; Voya Variable Portfolios, Inc.; and Voya Variable Products Trust. The number of funds in the Fund Complex is as of January 31, 2022.
176
DIRECTOR AND OFFICER INFORMATION (UNAUDITED) (CONTINUED)
Name, Address
and Age | | Position(s)
Held with the Company | | Term of Office and
Length of Time Served(1) | | Principal Occupation(s) - during the
Past 5 Years | |
Michael Bell
One Orange Way
Windsor, Connecticut 06095
Age: 53 | | Chief Executive Officer | | March 2018 - Present | | Chief Executive Officer and Director, Voya Investments, LLC, Voya Capital, LLC, and Voya Funds Services, LLC (March 2018 -Present); Senior Vice President, Voya Investments Distributor, LLC (March 2020 - Present); Chief Financial Officer, Voya Investment Management (September 2014 - Present). Formerly, Senior Vice President and Chief Financial Officer, Voya Investments Distributor, LLC (September 2019 - March 2020); Senior Vice President and Treasurer, Voya Investments Distributor, LLC (November 2015 - September 2019); Senior Vice President, Chief Financial Officer and Treasurer, Voya Investments, LLC (November 2015 - March 2018). | |
Dina Santoro
230 Park Avenue
New York, New York 10169
Age: 48 | | President | | March 2018 - Present | | President and Director, Voya Investments, LLC and Voya Capital, LLC (March 2018 - Present); Director, Voya Funds Services, LLC (March 2018 - Present); Director and Senior Vice President, Voya Investments Distributor, LLC (April 2018 - Present); Chief Operating Officer and Senior Managing Director, Voya Investment Management (January 2022 - Present). Formerly, Senior Managing Director, Head of Product and Marketing Strategy, Voya Investment Management (September 2017 - January 2022); Managing Director, Quantitative Management Associates, LLC (January 2004 - August 2017). | |
Jonathan Nash
230 Park Avenue
New York, New York 10169
Age: 54 | | Executive Vice President
Chief Investment Risk Officer | | March 2020 - Present
March 2020 - Present | | Executive Vice President and Chief Investment Risk Officer, Voya Investments, LLC (March 2020 - Present) and Senior Vice President, Investment Risk Management, Voya Investment Management (March 2017 - Present). Formerly, Vice President, Voya Investments, LLC (September 2018 - March 2020); Consultant, DA Capital LLC (January 2016 - March 2017). | |
James M. Fink
5780 Powers Ferry Road NW
Atlanta, Georgia 30327
Age: 63 | | Executive Vice President | | March 2018 - Present | | Managing Director, Voya Investments, LLC, Voya Capital, LLC, and Voya Funds Services, LLC (March 2018 - Present) and Senior Vice President, Voya Investments Distributor, LLC (April 2018 - Present); Chief Administrative Officer, Voya Investment Management (September 2017 - Present). Formerly, Managing Director, Operations, Voya Investment Management (March 1999 - September 2017). | |
Kevin M. Gleason
7337 East Doubletree Ranch Rd.
Suite 100
Scottsdale, Arizona 85258
Age: 55 | | Chief Compliance Officer | | February 2012 - Present | | Senior Vice President, Voya Investment Management and Chief Compliance Officer, Voya Family of Funds (February 2012 - Present). | |
Todd Modic
7337 East Doubletree Ranch Rd.
Suite 100
Scottsdale, Arizona 85258
Age:54 | | Senior Vice President, Chief/Principal Financial Officer and Assistant Secretary | | March 2005 - Present | | President, Voya Funds Services, LLC (March 2018 - Present) and Senior Vice President, Voya Investments, LLC (April 2005 - Present). | |
Kimberly A. Anderson
7337 East Doubletree Ranch Rd.
Suite 100
Scottsdale, Arizona 85258
Age: 57 | | Senior Vice President | | January 2005 - Present | | Senior Vice President, Voya Investments, LLC (September 2003 - Present). | |
177
DIRECTOR AND OFFICER INFORMATION (UNAUDITED) (CONTINUED)
Name, Address
and Age | | Position(s)
Held with the Company | | Term of Office and
Length of Time Served(1) | | Principal Occupation(s) - during the
Past 5 Years | |
Micheline S. Faver
7337 East Doubletree Ranch Rd.
Suite 100
Scottsdale, Arizona 85258
Age: 44 | | Senior Vice President | | September 2020 - Present | | Senior Vice President, Head of Fund Compliance and Chief Compliance Officer, Voya Investments, LLC (March 2021 - Present). Formerly, Vice President, Head of Fund Compliance and Chief Compliance Officer, Voya Investments, LLC (June 2016 - March 2021). | |
Robert Terris
5780 Powers Ferry Road NW
Atlanta, Georgia 30327
Age: 51 | | Senior Vice President | | May 2006 - Present | | Senior Vice President, Voya Investments Distributor, LLC (April 2018 - Present); Senior Vice President, Head of Investment Services, Voya Investments, LLC (April 2018 - Present) and Voya Funds Services, LLC (March 2006 - Present). Formerly, Senior Vice President, Head of Division Operations, Voya Investments, LLC (October 2015 - April 2018). | |
Fred Bedoya
7337 East Doubletree Ranch Rd.
Suite 100
Scottsdale, Arizona 85258
Age: 49 | | Vice President
Treasurer | | September 2012 - Present | | Vice President, Voya Investments, LLC (October 2015 - Present) and Voya Funds Services, LLC (July 2012 - Present). | |
Maria M. Anderson
7337 East Doubletree Ranch Rd.
Suite 100
Scottsdale, Arizona 85258
Age: 63 | | Vice President | | January 2005 - Present | | Vice President, Voya Investments, LLC (October 2015 - Present) and Voya Funds Services, LLC (September 2004 - Present). | |
Sara M. Donaldson
7337 East Doubletree Ranch Rd.
Suite 100
Scottsdale, Arizona 85258
Age: 62 | | Vice President | | September 2014 - Present | | Vice President, Voya Investments, LLC (October 2015 - Present). | |
Robyn L. Ichilov
7337 East Doubletree Ranch Rd.
Suite 100
Scottsdale, Arizona 85258
Age: 54 | | Vice President | | January 2005 - Present | | Vice President, Voya Funds Services, LLC (November 1995 - Present) and Voya Investments, LLC (August 1997 - Present). | |
Jason Kadavy
7337 East Doubletree Ranch Rd.
Suite 100
Scottsdale, Arizona 85258
Age: 45 | | Vice President | | September 2012 - Present | | Vice President, Voya Investments, LLC (October 2015 - Present) and Voya Funds Services, LLC (July 2007 - Present). | |
Andrew K. Schlueter
7337 East Doubletree Ranch Rd.
Suite 100
Scottsdale, Arizona 85258
Age: 45 | | Vice President | | March 2018 - Present | | Vice President, Voya Investments Distributor, LLC (April 2018 - Present); Vice President, Voya Investments, LLC and Voya Funds Services, LLC (March 2018 - Present); Vice President, Head of Mutual Fund Operations, Voya Investment Management (February 2018 - Present). Formerly, Vice President, Voya Investment Management (March 2014 - February 2018). | |
Craig Wheeler
7337 East Doubletree Ranch Rd.
Suite 100
Scottsdale, Arizona 85258
Age: 52 | | Vice President | | May 2013 - Present | | Vice President - Director of Tax, Voya Investments, LLC (October 2015 - Present). | |
Monia Piacenti
One Orange Way
Windsor, Connecticut 06095
Age: 45 | | Anti-Money Laundering Officer | | June 2018 - Present | | Anti-Money Laundering Officer, Voya Investments Distributor, LLC, Voya Investment Management and Voya Investment Management Trust Co. (June 2018 - Present); Compliance Consultant, Voya Financial, Inc. (January 2019 - Present). Formerly, Senior Compliance Officer, Voya Investment Management (December 2009 - December 2018). | |
178
DIRECTOR AND OFFICER INFORMATION (UNAUDITED) (CONTINUED)
Name, Address
and Age | | Position(s)
Held with the Company | | Term of Office and
Length of Time Served(1) | | Principal Occupation(s) - during the
Past 5 Years | |
Joanne F. Osberg
7337 East Doubletree Ranch Rd.
Suite 100
Scottsdale, Arizona 85258
Age: 40 | | Secretary | | September 2020 - Present | | Vice President and Senior Counsel, Voya Investment Management - Mutual Fund Legal Department (September 2020 - Present). Formerly, Vice President, Counsel, Voya Investment Management - Mutual Fund Legal Department (January 2013 - September 2020). | |
Paul A. Caldarelli
7337 East Doubletree Ranch Rd.
Suite 100
Scottsdale, Arizona 85258
Age: 70 | | Assistant Secretary | | June 2010 - Present | | Vice President and Senior Counsel, Voya Investment Management - Mutual Fund Legal Department (March 2010 - Present). | |
(1) The Officers hold office until the next annual meeting of the Board of Directors and until their successors shall have been elected and qualified.
179
SHAREHOLDER MEETING INFORMATION (UNAUDITED)
Proposal:
1 At this meeting, a proposal was submitted to approve a change in the sub-classification under the Investment Company Act of 1940, as amended, of their respective Portfolio from "diversified" to "non-diversified", including the elimination of the related fundamental investment restriction.
A shareholder meeting of VY® T. Rowe Price Growth Equity Portfolio was held virtually on October 7, 2021.
| | | Proposal | | Shares voted for | | Shares voted
against or
withheld | | Shares
abstained | | Broker
non-vote | | Total Shares
Voted | |
VY® T. Rowe Price Growth
Equity Portfolio | | | 1 | * | | | 8,144,898.896 | | | | 1,028,559.772 | | | | 546,334.369 | | | | 0.000 | | | | 9,719,793.037 | | |
* Proposal Passed
180
ADVISORY AND SUB-ADVISORY CONTRACT APPROVAL DISCUSSION (UNAUDITED)
BOARD CONSIDERATION AND APPROVAL OF INVESTMENT MANAGEMENT CONTRACTS AND SUB-ADVISORY CONTRACTS
At a meeting held on November 18, 2021, the Board of Directors ("Board") of Voya Partners, Inc. (the "Company"), including a majority of the Board members who have no direct or indirect interest in the investment management and sub-advisory contracts, and who are not "interested persons" of Voya Global Bond Portfolio, Voya International High Dividend Low Volatility Portfolio, VY® American Century Small-Mid Cap Value Portfolio, VY® Baron Growth Portfolio, VY® Columbia Contrarian Core Portfolio, VY® Columbia Small Cap Value II Portfolio, VY® Invesco Comstock Portfolio, VY® Invesco Equity and Income Portfolio, VY® Invesco Global Portfolio, VY® JPMorgan Mid Cap Value Portfolio, VY® T. Rowe Price Diversified Mid Cap Growth Portfolio, and VY® T. Rowe Price Growth Equity Portfolio, each a series of the Company (the "Portfolios"), as such term is defined under the Investment Company Act of 1940, as amended (the "Independent Directors"), considered and approved the renewal of the investment management contracts (the "Management Contracts") between Voya Investments, LLC (the "Manager") and the Company, on behalf of the Portfolios, and the sub-advisory contracts (the "Sub-Advisory Contracts," and together with the Management Contracts, the "Contracts") with Voya Investment Management Co. LLC, American Century Investment Management, Inc., BAMCO, Inc., Columbia Management Investment Advisers, LLC, Invesco Advisers, Inc., J.P. Morgan Investment Management Inc., and T. Rowe Price Associates, Inc., the respective sub-advisers to each Portfolio (the "Sub-Advisers") for an additional one year period ending November 30, 2022.
In addition to the Board meeting on November 18, 2021, the Independent Directors also held meetings outside the presence of representatives of the Manager and Sub-Advisers (collectively, such persons are referred to herein as "management") on October 7-8, 2021, and November 16, 2021. At those meetings, the Board members reviewed and considered materials related to the proposed continuance of the Contracts that they had requested and believed to be relevant to the renewal of the Contracts in light of their own business judgment and the legal advice furnished to them by K&L Gates LLP, their independent legal counsel. The Board also considered information furnished to it throughout the year at meetings of the Board and its committees, including information regarding performance, expenses, and other relevant matters. While the Board considered the renewal of the management contracts and sub-advisory contracts for all of the applicable investment companies in the Voya family of funds at the same meetings, the Board
considered each Voya fund's investment management and sub-advisory relationships separately.
The Board has established a Contracts Committee and two Investment Review Committees (the "IRCs"), each of which includes only Independent Directors as members. The Contracts Committee meets several times throughout the year to provide oversight with respect to the management and sub-advisory contracts approval and renewal process for the Voya funds, among other functions, and each IRC meets several times throughout the year with respect to each Voya fund (assigned to that IRC) to provide oversight regarding the investment performance of the sub-advisers, as well as the Manager's role in monitoring the sub-advisers.
The Contracts Committee oversees, and annually recommends Board approval of updates to, a methodology guide for the Voya funds ("Methodology Guide"), which sets out a framework pursuant to which the Independent Directors request, and management provides, certain information that the Independent Directors deem to be important or potentially relevant. The Independent Directors retain the services of an independent consultant with experience in the mutual fund industry to assist the Contracts Committee in developing and recommending to the Board: (1) a selected peer group of investment companies for each Portfolio ("Selected Peer Group") based on that Portfolio's particular attributes, such as fund type and size, fund category (as determined by Morningstar, Inc., an independent provider of mutual fund data ("Morningstar")), sales channels and structure and the Portfolio share class being compared to the Selected Peer Group; and (2) updates to the Methodology Guide with respect to the content and format of various data prepared in connection with the renewal process, including, but not limited to, investment performance, fee structure, and expense information. In addition, the Independent Directors periodically have retained an independent firm to test and verify the accuracy of certain information presented to the Board for a representative sample of the Voya funds.
The Manager or a Sub-Adviser may not have been able to, or opted not to, provide information in response to certain information requests, in which case the Board conducted its evaluation based on the information that was provided. In such cases, the Board determined that the omission of any such information was not material to its considerations. Additionally, the Board considered the impact of significant market volatility that occurred during and after the period for which information was requested in conducting its evaluation of the Manager and a Sub-Adviser.
181
ADVISORY AND SUB-ADVISORY CONTRACT APPROVAL DISCUSSION (UNAUDITED) (CONTINUED)
Provided below is an overview of certain material factors that the Board considered at its meetings regarding the renewal of the Contracts and the compensation to be paid thereunder. The Board members did not identify any particular information or factor that was most relevant to its consideration, and each Board member may have accorded different weight to the various factors in reaching his or her conclusions with respect to each Portfolio's investment management and sub-advisory arrangements.
Nature, Extent and Quality of Services
The Manager oversees, subject to the authority of the Board, and is responsible for the provision of, all investment advisory and portfolio management services for the Portfolios, but may delegate certain of these responsibilities to one or more sub-advisers. In addition, the Manager provides administrative services reasonably necessary for the operation of the Portfolios as set forth in the Management Contracts, including oversight of the Portfolios' operations and risk management and the oversight of their various other service providers.
The Board considered the "manager-of-managers" structure of the Voya funds that has been developed by the Manager pursuant to which the Manager selects, subject to the Board's approval, sub-advisers to provide day-to-day management services to all or a portion of each Voya fund. The Board recognized that the Manager is responsible for monitoring the Sub-Advisers' investment program, performance, developments, ongoing operations, and compliance with applicable regulations and investment policies and restrictions with respect to the Portfolios under this manager-of-managers arrangement. The Board also considered the techniques and resources that the Manager has developed to provide this ongoing due diligence and oversight with respect to the sub-advisers and to recommend appropriate changes in investment strategies, sub-advisers, or allocation among sub-advisers in an effort to improve a Voya fund's performance. In connection with the Manager's performance of these duties, the Board considered that the Manager has developed an oversight process formulated by its Manager Research & Selection Group that reviews, among other matters, performance data, each Sub-Adviser's management team, portfolio data and attribution analysis related to each Sub-Adviser through various means, including, but not limited to, in-person meetings, on-site or virtual visits, and telephonic meetings with the Sub-Adviser.
Further, the Board considered periodic compliance reports it receives from the Company's Chief Compliance Officer evaluating whether the regulatory compliance systems and procedures of the Manager and
Sub-Advisers are reasonably designed to ensure compliance with the federal securities laws and whether the investment policies and restrictions for each Portfolio are consistently complied with, and other periodic reports covering related matters.
The Board considered the portfolio management team assigned by the Sub-Advisers to the Portfolios and the level of resources committed to the Portfolios (and other relevant funds in the Voya funds) by the Manager and the Sub-Advisers, and whether those resources are sufficient to provide high-quality services to the Portfolios.
Based on their deliberations and the materials presented to them, the Board concluded that the nature, extent and quality of the overall services provided by the Manager and each Sub-Adviser under the Contracts were appropriate.
Portfolio Performance
In assessing the investment management and sub-advisory relationships, the Board placed emphasis on the investment returns of each Portfolio, including its investment performance over certain time periods compared to the Portfolio's Morningstar category and primary benchmark, a broad-based securities market index identified in the Portfolio's prospectus. In addition, the Board considered Voya Global Bond Portfolio's investment performance compared to an additional performance peer group that is approved by the Portfolios' IRC due to the investment structure or strategy of that Portfolio. The Board also considered information from the Manager Research & Selection Group and received reports summarizing a separate analysis of each Portfolio's performance and risk, including risk-adjusted investment return information, from the Company's Chief Investment Risk Officer.
Economies of Scale
When evaluating the reasonableness of the management fee schedules, the Board considered whether economies of scale have been or likely will be realized by the Manager and the Sub-Advisers as a Portfolio grows larger and the extent to which any such economies are shared with the Portfolio. In this regard, the Board noted any breakpoints in the management fee schedules that will result in a lower management fee rate when a Portfolio achieves sufficient asset levels to receive a breakpoint discount. The Board also considered that, while some of the Portfolios do not have management fee breakpoints, they may have fee waiver and expense reimbursement arrangements. The Board considered the extent to which economies of scale realized by the Manager or the Sub-Advisers could be shared with each Portfolio through such fee waivers, expense
182
ADVISORY AND SUB-ADVISORY CONTRACT APPROVAL DISCUSSION (UNAUDITED) (CONTINUED)
reimbursements or other expense reductions. In evaluating these matters, the Board also considered periodic management reports, Selected Peer Group comparisons, and industry information regarding economies of scale. In the case of sub-advisory fees, the Board considered that breakpoints, if any, would inure to the benefit of the Manager.
Information Regarding Services, Performance, and Fee Schedules Offered to Other Clients
The Board considered comparative information regarding the nature of services, performance, and fee schedules offered by the Manager and Sub-Advisers to other clients with similar investment objectives, if applicable, including other registered investment companies and relevant institutional accounts. When the fee schedules offered to or the performance of such other clients differed materially from a Portfolio, the Board took into account the underlying rationale provided by the Manager or Sub-Advisers, as applicable, for these differences. For the non-Voya-affiliated Sub-Advisers, the Board viewed the information related to any material differences in the fee schedules as not being a key factor in its deliberations because of the arm's-length nature of negotiations between the Manager and non-Voya-affiliated Sub-Advisers with respect to sub-advisory fee schedules and that the Manager is responsible for paying the fees of the Sub-Advisers.
Fee Schedules, Profitability, and Fall-out Benefits
The Board reviewed and considered the contractual management fee schedule and net management fee rate payable by each Portfolio to the Manager compared to the Portfolio's Selected Peer Group. The Board also considered the compensation payable by the Manager to each Sub-Adviser for sub-advisory services for each Portfolio, including the portion of the contractual and net management fee rates that are paid to each Sub-Adviser, as compared to the compensation paid to the Manager. In addition, the Board considered any fee waivers, expense limitations, and/or recoupment arrangements that apply to the fees payable by the Portfolios, including whether the Manager intends to propose any changes thereto. For each Portfolio, the Board separately determined that the fees payable to the Manager and the fee schedule payable to each Sub-Adviser are reasonable for the services that each performs, which were considered in light of the nature, extent and quality of the services that each has performed and is expected to perform.
For each Portfolio, the Board considered information on revenues, costs and profits or losses realized by the Manager and the Voya-affiliated Sub-Adviser related to
their services to the Portfolio. In analyzing the profitability of the Manager and its affiliates in connection with services they render to a Portfolio, the Board took into account the sub-advisory fee rate payable by the Manager to each Sub-Adviser. The Board also considered the profitability of the Manager and its affiliated Sub-Adviser attributable to servicing each Portfolio both with and without taking into account the profitability of the distributor of the Portfolios and any revenue sharing payments made by the Manager and both before and after giving effect to any expenses incurred by the Manager or the affiliated Sub-Adviser in making payments to affiliated insurance companies. The Board did not request profitability data from the Sub-Advisers that are not affiliated with the Manager because the Board did not view this data as a key factor to its deliberations given the arm's-length nature of the relationship between the Manager and these non-Voya-affiliated Sub-Advisers with respect to the negotiation of sub-advisory fee schedules. In addition, the Board noted that non-Voya-affiliated sub-advisers may not account for their profits on an account-by-account basis and those that do often employ different methodologies in connection with these calculations.
Although the Methodology Guide establishes a framework for profit calculation, the Board recognized that there is no uniform methodology within the asset management industry for determining profitability for this purpose. The Board also recognized that the use of different reasonable methodologies can give rise to dramatically different reported profit and loss results with respect to the Manager and the Voya-affiliated Sub-Adviser, as well as other industry participants with whom the profits of the Manager and its affiliated Sub-Adviser could be compared. In addition, the Board recognized that management's calculations regarding its costs incurred in establishing the infrastructure necessary for the Portfolios' operations may not be fully reflected in the expenses allocated to each Portfolio in determining profitability. The Board also recognized that the information presented may not portray all of the costs borne by the Manager or reflect all of the risks associated with offering and managing a mutual fund complex in the current regulatory and market environment, including entrepreneurial, regulatory, legal and operational risks.
The Board also considered that the Manager and the Voya-affiliated Sub-Adviser are entitled to earn a reasonable level of profits for the services that they provide to the Portfolios. The Board also considered information regarding the potential fall-out benefits to the Manager and Sub-Advisers and their respective affiliates from their association with the Portfolios, including their ability to engage in soft-dollar transactions on behalf of
183
ADVISORY AND SUB-ADVISORY CONTRACT APPROVAL DISCUSSION (UNAUDITED) (CONTINUED)
the Portfolios. Following its reviews, the Board determined that the Manager's and the Voya-affiliated Sub-Adviser's profitability with respect to their services to the Portfolios and the Manager and Sub-Advisers' potential fall-out benefits were not unreasonable.
Portfolio-by-Portfolio Analysis
Set forth below are certain of the specific factors that the Board considered at its October 7-8, 2021, November 16, 2021, and/or November 18, 2021 meetings in relation to approving each Portfolio's Contracts and the conclusions reached by the Board. These specific factors are in addition to those considerations discussed above. In each case, the Portfolio's performance was compared to its Morningstar category, as well as its primary benchmark and, as applicable, a performance peer group. The performance data provided to the Board primarily was for various periods ended March 31, 2021. In addition, the Board also considered at its October 7-8, 2021, November 16, 2021, and/or November 18, 2021 meetings certain additional data regarding each Portfolio's more recent performance, asset levels and asset flows. Each Portfolio's management fee rate and expense ratio were compared to the management fee rates and expense ratios of the funds in its Selected Peer Group. With respect to the quintile rankings noted below, the first quintile represents the range of funds with the highest performance or the lowest management fee rate or expense ratio, as applicable, and the fifth quintile represents the range of funds with the lowest performance or the highest management fee rate or expense ratio, as applicable.
Voya Global Bond Portfolio
In considering whether to approve the renewal of the Contracts for Voya Global Bond Portfolio, the Board considered that, based on performance data for the periods ended March 31, 2021: (1) the Portfolio is ranked in the first quintile of its Morningstar category for the five-year period, the second quintile for the ten-year period, the third quintile for the one-year and three-year periods, and the fourth quintile for the year-to-date period; and (2) the Portfolio outperformed its primary benchmark for the one-year, five-year and ten-year periods and underperformed for the year-to-date and three-year periods. In analyzing this performance data, the Board also took into account that the Portfolio outperformed its performance peer group average for the one-year, five-year and ten-year periods and underperformed for the year-to-date and three-year periods.
In considering the fees payable under the Contracts for the Portfolio, the Board took into account the factors
described above and also considered: (1) the fairness of the compensation under a Management Contract with a breakpoint fee schedule where the asset level necessary to achieve a breakpoint discount had not been reached by the Portfolio; and (2) the pricing structure (including the net expense ratio to be borne by shareholders) of the Portfolio, as compared to its Selected Peer Group, including that: (a) the net management fee rate for the Portfolio is ranked in the first quintile of net management fee rates of the funds in its Selected Peer Group; (b) the contractual management fee rate for the Portfolio is ranked in the second quintile of contractual management fee rates of the funds in its Selected Peer Group; and (c) the net expense ratio for the Portfolio is ranked in the second quintile of net expense ratios of the funds in its Selected Peer Group.
Voya International High Dividend Low Volatility Portfolio
In considering whether to approve the renewal of the Contracts for Voya International High Dividend Low Volatility Portfolio, the Board considered that, based on performance data for the periods ended March 31, 2021: (1) the Portfolio is ranked in the fourth quintile of its Morningstar category for the year-to-date, three-year, five-year and ten-year periods and the fifth quintile for the one-year period; and (2) the Portfolio underperformed its primary benchmark for all periods presented, with the exception of the three-year period, during which it outperformed. In analyzing this performance data, the Board took into account management's representations regarding: (1) the impact of stock selection and sector allocation on the Portfolio's performance; (2) the fact that performance prior to May 1, 2019, reflects a different investment strategy and portfolio management team; (3) the recent change in the Portfolio's primary benchmark which may provide shareholders with stronger relative returns; and (4) its confidence in the ability of the Sub-Adviser to execute the Portfolio's investment strategy.
In considering the fees payable under the Contracts for the Portfolio, the Board took into account the factors described above and also considered: (1) the fairness of the compensation under a Management Contract with a level fee rate that does not include breakpoints; and (2) the pricing structure (including the net expense ratio to be borne by shareholders) of the Portfolio, as compared to its Selected Peer Group, including that: (a) the net management fee rate for the Portfolio is ranked in the second quintile of net management fee rates of the funds in its Selected Peer Group; (b) the contractual management fee rate for the Portfolio is ranked in the second quintile of contractual management
184
ADVISORY AND SUB-ADVISORY CONTRACT APPROVAL DISCUSSION (UNAUDITED) (CONTINUED)
fee rates of the funds in its Selected Peer Group; and (c) the net expense ratio for the Portfolio is ranked in the second quintile of net expense ratios of the funds in its Selected Peer Group.
VY® American Century Small-Mid Cap Value Portfolio
In considering whether to approve the renewal of the Contracts for VY® American Century Small-Mid Cap Value Portfolio, the Board considered that, based on performance data for the periods ended March 31, 2021: (1) the Portfolio is ranked in the first quintile of its Morningstar category for the ten-year period, the second quintile for the year-to-date, three-year and five-year periods, and the fourth quintile for the one-year period; and (2) the Portfolio outperformed its primary benchmark for all periods presented, with the exception of the year-to-date and one-year periods, during which it underperformed. In analyzing this performance data, the Board took into account management's representations regarding the competitiveness of the Portfolio's performance during certain periods.
In considering the fees payable under the Contracts for the Portfolio, the Board took into account the factors described above and also considered: (1) the economies of scale benefits to the Portfolio and its shareholders from breakpoint discounts applicable to the Portfolio's management fee rate, which result in lower fees at higher asset levels; and (2) the pricing structure (including the net expense ratio to be borne by shareholders) of the Portfolio, as compared to its Selected Peer Group, including that: (a) the net management fee rate for the Portfolio is ranked in the first quintile of net management fee rates of the funds in its Selected Peer Group; (b) the contractual management fee rate for the Portfolio is ranked in the fifth quintile of contractual management fee rates of the funds in its Selected Peer Group; and (c) the net expense ratio for the Portfolio is ranked in the third quintile of net expense ratios of the funds in its Selected Peer Group. In analyzing this fee data, the Board took into account management's representations regarding the competitiveness of the Portfolio's management fee rate and net expense ratio.
VY® Baron Growth Portfolio
In considering whether to approve the renewal of the Contracts for VY Baron® Growth Portfolio, the Board considered that, based on performance data for the periods ended March 31, 2021: (1) the Portfolio is ranked in the second quintile of its Morningstar category for the three-year, five-year and ten-year periods, the third quintile for the one-year period, and the fourth quintile for the year-to-date period; and (2) the Portfolio outperformed its primary benchmark for the three-year,
five-year and ten-year periods and underperformed for the year-to-date and one-year periods. In analyzing this performance data, the Board took into account management's representations regarding the competitiveness of the Portfolio's performance during certain periods.
In considering the fees payable under the Contracts for the Portfolio, the Board took into account the factors described above and also considered: (1) the fairness of the compensation under a Management Contract with a breakpoint fee schedule where the asset level necessary to achieve a breakpoint discount had not been reached by the Portfolio; and (2) the pricing structure (including the net expense ratio to be borne by shareholders) of the Portfolio, as compared to its Selected Peer Group, including that: (a) the net management fee rate for the Portfolio is ranked in the fourth quintile of net management fee rates of the funds in its Selected Peer Group; (b) the contractual management fee rate for the Portfolio is ranked in the fifth quintile of contractual management fee rates of the funds in its Selected Peer Group; and (c) the net expense ratio for the Portfolio is ranked in the fifth quintile of net expense ratios of the funds in its Selected Peer Group. In analyzing this fee data, the Board took into account management's representations regarding its belief that the Portfolio's pricing is competitive when compared to peers identified by management.
VY® Columbia Contrarian Core Portfolio
In considering whether to approve the renewal of the Contracts for VY® Columbia Contrarian Core Portfolio, the Board considered that, based on performance data for the periods ended March 31, 2021: (1) the Portfolio is ranked in the first quintile of its Morningstar category for the three-year period, the second quintile for the year-to-date, one-year and five-year periods, and the third quintile for the ten-year period; and (2) the Portfolio outperformed its primary benchmark for the year-to-date and three-year periods and underperformed for the one-year, five-year and ten-year periods.
In considering the fees payable under the Contracts for the Portfolio, the Board took into account the factors described above and also considered: (1) the fairness of the compensation under a Management Contract with a breakpoint fee schedule where the asset level necessary to achieve a breakpoint discount had not been reached by the Portfolio; and (2) the pricing structure (including the net expense ratio to be borne by shareholders) of the Portfolio, as compared to its Selected Peer Group, including that: (a) the net management fee rate for the Portfolio is ranked in the third quintile of net management fee rates of the funds in its Selected Peer Group; (b) the
185
ADVISORY AND SUB-ADVISORY CONTRACT APPROVAL DISCUSSION (UNAUDITED) (CONTINUED)
contractual management fee rate for the Portfolio is ranked in the fifth quintile of contractual management fee rates of the funds in its Selected Peer Group; and (c) the net expense ratio for the Portfolio is ranked in the second quintile of net expense ratios of the funds in its Selected Peer Group.
VY® Columbia Small Cap Value II Portfolio
In considering whether to approve the renewal of the Contracts for VY® Columbia Small Cap Value II Portfolio, the Board considered that, based on performance data for the periods ended March 31, 2021: (1) the Portfolio is ranked in the second quintile of its Morningstar category for the one-year, three-year, five-year and ten-year periods, and the third quintile for the year-to-date period; and (2) the Portfolio outperformed its primary benchmark for the one-year and ten-year periods and underperformed the year-to-date, three-year and five-year periods.
In considering the fees payable under the Contracts for the Portfolio, the Board took into account the factors described above and also considered: (1) the fairness of the compensation under a Management Contract with a level fee rate that does not include breakpoints; and (2) the pricing structure (including the net expense ratio to be borne by shareholders) of the Portfolio, as compared to its Selected Peer Group, including that: (a) the net management fee rate for the Portfolio is ranked in the third quintile of net management fee rates of the funds in its Selected Peer Group; (b) the contractual management fee rate for the Portfolio is ranked in the second quintile of contractual management fee rates of the funds in its Selected Peer Group; and (c) the net expense ratio for the Portfolio is ranked in the third quintile of net expense ratios of the funds in its Selected Peer Group.
VY® Invesco Comstock Portfolio
In considering whether to approve the renewal of the Contracts for VY® Invesco Comstock Portfolio, the Board considered that, based on performance data for the periods ended March 31, 2021: (1) the Portfolio is ranked in the first quintile of its Morningstar category for the year-to-date and one-year periods, the second quintile for the five-year period, the third quintile for the ten-year period, and the fourth quintile for the three-year period; and (2) the Portfolio outperformed its primary benchmark for all periods presented, with the exception of the three-year and ten-year periods, during which it underperformed. In analyzing this performance data, the Board took into account management's representations regarding the competitiveness of the Portfolio's performance during certain periods.
In considering the fees payable under the Contracts for the Portfolio, the Board took into account the factors described above and also considered: (1) the fairness of the compensation under a Management Contract with a level fee rate that does not include breakpoints; and (2) the pricing structure (including the net expense ratio to be borne by shareholders) of the Portfolio, as compared to its Selected Peer Group, including that: (a) the net management fee rate for the Portfolio is ranked in the second quintile of net management fee rates of the funds in its Selected Peer Group; (b) the contractual management fee rate for the Portfolio is ranked in the third quintile of contractual management fee rates of the funds in its Selected Peer Group; and (c) the net expense ratio for the Portfolio is ranked in the first quintile of net expense ratios of the funds in its Selected Peer Group.
VY® Invesco Equity and Income Portfolio
In considering whether to approve the renewal of the Contracts for VY® Invesco Equity and Income Portfolio, the Board considered that, based on performance data for the periods ended March 31, 2021: (1) the Portfolio is ranked in the first quintile of its Morningstar category for the year-to-date, one-year and five-year periods, the second quintile for the ten-year period, and the third quintile for the three-year period; and (2) the Portfolio underperformed its primary benchmark for all periods presented.
In considering the fees payable under the Contracts for the Portfolio, the Board took into account the factors described above and also considered: (1) the economies of scale benefits to the Portfolio and its shareholders from breakpoint discounts applicable to the Portfolio's management fee rate, which result in lower fees at higher asset levels; and (2) the pricing structure (including the net expense ratio to be borne by shareholders) of the Portfolio, as compared to its Selected Peer Group, including that: (a) the net management fee rate for the Portfolio is ranked in the first quintile of net management fee rates of the funds in its Selected Peer Group; (b) the contractual management fee rate for the Portfolio is ranked in the second quintile of contractual management fee rates of the funds in its Selected Peer Group; and (c) the net expense ratio for the Portfolio is ranked in the second quintile of net expense ratios of the funds in its Selected Peer Group.
VY® Invesco Global Portfolio
In considering whether to approve the renewal of the Contracts for VY® Invesco Global Portfolio (formerly, VY® Invesco Oppenheimer Global Portfolio), the Board considered that, based on performance data for the
186
ADVISORY AND SUB-ADVISORY CONTRACT APPROVAL DISCUSSION (UNAUDITED) (CONTINUED)
periods ended March 31, 2021: (1) the Portfolio is ranked in the first quintile of its Morningstar category for the one-year, five-year and ten-year periods, the second quintile for the three-year period, and the fifth quintile for the year-to-date period; and (2) the Portfolio outperformed its primary benchmark for all periods presented, with the exception of the year-to-date period, during which it underperformed.
In considering the fees payable under the Contracts for the Portfolio, the Board took into account the factors described above and also considered: (1) the fairness of the compensation under a Management Contract with a breakpoint fee schedule where the asset level necessary to achieve a breakpoint discount had not been reached by the Portfolio; and (2) the pricing structure (including the net expense ratio to be borne by shareholders) of the Portfolio, as compared to its Selected Peer Group, including that: (a) the net management fee rate for the Portfolio is ranked in the second quintile of net management fee rates of the funds in its Selected Peer Group; (b) the contractual management fee rate for the Portfolio is ranked in the second quintile of contractual management fee rates of the funds in its Selected Peer Group; and (c) the net expense ratio for the Portfolio is ranked in the third quintile of net expense ratios of the funds in its Selected Peer Group.
VY® JPMorgan Mid Cap Value Portfolio
In considering whether to approve the renewal of the Contracts for VY® JPMorgan Mid Cap Value Portfolio, the Board considered that, based on performance data for the periods ended March 31, 2021: (1) the Portfolio is ranked in the first quintile of its Morningstar category for the ten-year period, the third quintile for the year-to-date and three-year periods, and the fourth quintile for the one-year and five-year periods; and (2) the Portfolio underperformed its primary benchmark for all periods presented, with the exception of the year-to-date and ten-year periods, during which it outperformed. In analyzing this performance data, the Board took into account management's representations regarding: (1) the impact of security selection and sector positioning on the Portfolio's performance; and (2) the competitiveness of the Portfolio's performance during certain periods.
In considering the fees payable under the Contracts for the Portfolio, the Board took into account the factors described above and also considered: (1) the fairness of the compensation under a Management Contract with a breakpoint fee schedule where the asset level necessary to achieve a breakpoint discount had not been reached by the Portfolio; and (2) the pricing structure (including the net expense ratio to be borne by shareholders) of the Portfolio, as compared to its Selected Peer Group,
including that: (a) the net management fee rate for the Portfolio is ranked in the second quintile of net management fee rates of the funds in its Selected Peer Group; (b) the contractual management fee rate for the Portfolio is ranked in the fourth quintile of contractual management fee rates of the funds in its Selected Peer Group; and (c) the net expense ratio for the Portfolio is ranked in the third quintile of net expense ratios of the funds in its Selected Peer Group. In analyzing this fee data, the Board took into account management's representations regarding the competitiveness of the Portfolio's management fee rate and net expense ratio.
VY® T. Rowe Price Diversified Mid Cap Growth Portfolio
In considering whether to approve the renewal of the Contracts for VY® T. Rowe Price Diversified Mid Cap Growth Portfolio, the Board considered that, based on performance data for the periods ended March 31, 2021: (1) the Portfolio is ranked in the second quintile of its Morningstar category for the ten-year period, the third quintile for the three-year and five-year periods, and the fourth quintile for the year-to-date and one-year periods; and (2) the Portfolio outperformed its primary benchmark for all periods presented, with the exception of the year-to-date and one-year periods, during which it underperformed. In analyzing this performance data, the Board took into account management's representations regarding the competitiveness of the Portfolio's performance during certain periods.
In considering the fees payable under the Contracts for the Portfolio, the Board took into account the factors described above and also considered: (1) the fairness of the compensation under a Management Contract with a level fee rate that does not include breakpoints; and (2) the pricing structure (including the net expense ratio to be borne by shareholders) of the Portfolio, as compared to its Selected Peer Group, including that: (a) the net management fee rate for the Portfolio is ranked in the first quintile of net management fee rates of the funds in its Selected Peer Group; (b) the contractual management fee rate for the Portfolio is ranked in the second quintile of contractual management fee rates of the funds in its Selected Peer Group; and (c) the net expense ratio for the Portfolio is ranked in the second quintile of net expense ratios of the funds in its Selected Peer Group.
VY® T. Rowe Price Growth Equity Portfolio
In considering whether to approve the renewal of the Contracts for VY® T. Rowe Price Growth Equity Portfolio, the Board considered that, based on performance data for the periods ended March 31, 2021: (1) the Portfolio is
187
ADVISORY AND SUB-ADVISORY CONTRACT APPROVAL DISCUSSION (UNAUDITED) (CONTINUED)
ranked in the first quintile of its Morningstar category for the ten-year period, the second quintile for the year-to-date, one-year and five-year periods, and the third quintile for the three-year period; and (2) the Portfolio outperformed its primary benchmark for all periods presented, with the exception of the year-to-date period, during which it underperformed.
In considering the fees payable under the Contracts for the Portfolio, the Board took into account the factors described above and also considered: (1) the fairness of the compensation under a Management Contract with a level fee rate that does not include breakpoints; and (2) the pricing structure (including the net expense ratio to be borne by shareholders) of the Portfolio, as compared to its Selected Peer Group, including that: (a) the net management fee rate for the Portfolio is ranked in the second quintile of net management fee rates of the funds in its Selected Peer Group; (b) the contractual management fee rate for the Portfolio is ranked in the third quintile of contractual management fee rates of the funds in its Selected Peer Group; and (c) the net expense ratio for the Portfolio is ranked in the fourth quintile of net expense ratios of the funds in its Selected Peer Group. In analyzing this fee data, the Board took into account management's representations regarding the competitiveness of the Portfolio's management fee rate and net expense ratio.
Board Conclusions
After its deliberation, the Board concluded that, in its business judgment, the terms of the Contracts are fair and reasonable to each Portfolio and that approval of the continuation of the Contracts is in the best interests of each Portfolio and its shareholders. In doing so, the Board reviewed all factors it considered to be material, including those discussed above. Within the context of its overall conclusions regarding the Contracts, and based on the information provided and management's related representations, the Board concluded that it was satisfied with management's responses relating to each Portfolio's investment performance and the fees payable under the Contracts. During this renewal process, different Board members may have given different weight to different individual factors and related conclusions. Based on these conclusions and other factors, the Board voted to renew the Contracts for each Portfolio for the year ending November 30, 2022.
188
Investment Adviser
Voya Investments, LLC
7337 East Doubletree Ranch Road, Suite 100
Scottsdale, Arizona 85258
Distributor
Voya Investments Distributor, LLC
7337 East Doubletree Ranch Road, Suite 100
Scottsdale, Arizona 85258
Transfer Agent
BNY Mellon Investment Servicing (U.S.) Inc.
301 Bellevue Parkway
Wilmington, Delaware 19809
Independent Registered Public Accounting Firm
Ernst & Young LLP
200 Clarendon Street
Boston, Massachusetts 02116
Custodian
The Bank of New York Mellon
225 Liberty Street
New York, New York 10286
Legal Counsel
Ropes & Gray LLP
Prudential Tower
800 Boylston Street
Boston, Massachusetts 02199
Before investing, carefully consider the investment objectives, risks, charges and expenses of the variable annuity contract or variable life insurance policy and the underlying variable investment options. This and other information is contained in the prospectus for the variable annuity contract or variable life insurance policy and the underlying variable investment options. Obtain these prospectuses from your agent/registered representative and read them carefully before investing.
RETIREMENT | INVESTMENTS | INSURANCE
voyainvestments.com

Annual Report
December 31, 2021
Classes ADV, I, R6, S, S2 and T
Voya Partners, Inc.
| | ■
Voya Solution Aggressive Portfolio | | | ■
Voya Solution 2035 Portfolio | |
| | ■
Voya Solution Balanced Portfolio | | | ■
Voya Solution 2040 Portfolio | |
| | ■
Voya Solution Conservative Portfolio | | | ■
Voya Solution 2045 Portfolio | |
| | ■
Voya Solution Income Portfolio | | | ■
Voya Solution 2050 Portfolio | |
| | ■
Voya Solution Moderately Aggressive Portfolio | | | ■
Voya Solution 2055 Portfolio | |
| | ■
Voya Solution Moderately Conservative Portfolio | | | ■
Voya Solution 2060 Portfolio | |
| | ■
Voya Solution 2025 Portfolio | | | ■
Voya Solution 2065 Portfolio | |
| | ■
Voya Solution 2030 Portfolio | | | | |
| | | As permitted by regulations adopted by the U.S. Securities and Exchange Commission, paper copies of each portfolio’s annual and semi-annual shareholder reports, like this annual report, are not sent by mail, unless you specifically request paper copies of the reports. Instead, the reports will be made available on a website and you will be notified by mail each time a report is posted and provided with a website link to access the report. | | |
| | | If you already elected to receive shareholder reports electronically, you need not take any action. You may elect to receive shareholder reports and other communications from your insurance carrier electronically by contacting them directly. | | |
| | | You may elect to receive all future reports in paper free of charge. If you received this document in the mail, please follow the instructions provided to elect to continue receiving paper copies of your shareholder reports. You can inform us that you wish to continue receiving paper copies by calling 1-866-345-5954. Your election to receive reports in paper will apply to all the funds in which you invest. | | |
| | | This report is submitted for general information to shareholders of the Voya mutual funds. It is not authorized for distribution to prospective shareholders unless accompanied or preceded by a prospectus which includes details regarding the funds’ investment objectives, risks, charges, expenses and other information. This information should be read carefully. | | |
PROXY VOTING INFORMATION
A description of the policies and procedures that the Portfolios use to determine how to vote proxies related to portfolio securities is available: (1) without charge, upon request, by calling Shareholder Services toll-free at (800) 992-0180; (2) on the Portfolios’ website at www.voyainvestments.com; and (3) on the U.S. Securities and Exchange Commission’s (“SEC’s”) website at www.sec.gov. Information regarding how the Portfolios voted proxies related to portfolio securities during the most recent 12-month period ended June 30 is available without charge on the Portfolios’ website at www.voyainvestments.com and on the SEC’s website at www.sec.gov.
QUARTERLY PORTFOLIO HOLDINGS
The Portfolios file their complete schedule of portfolio holdings with the SEC for the first and third quarters of each fiscal year on Form NPORT-P. The Portfolios’ Forms NPORT-P are available on the SEC’s website at www.sec.gov. Each Portfolio’s complete schedule of portfolio holdings is available at: www.voyainvestments.com and without charge upon request from the Portfolio by calling Shareholder Services toll-free at (800) 992-0180.
A Solid Year Ends for the Financial Markets, Gauging the Policy Shifts to Come
Dear Shareholder,
The 12-month period ended December 31, 2021 marked another strong year for stocks. Forcefully accommodative and persistent monetary and fiscal policy, along with the COVID-19 vaccine rollouts and an impressively adaptable global economy, drove big gains within risk assets. The ascent wasn’t particularly smooth, as several new COVID-19 variants thwarted attempts at a full-fledged reopening. Besides the distress induced by a public health crisis, prolongation of the pandemic negatively impacted the supply of labor and costs of core goods. These two factors, combined with others such as economic stimulus and rising commodity prices, drove inflation higher. As economic activity proved resilient, however, investors shrugged off soaring prices and continued to buy stocks.
The U.S. unemployment rate declined to 3.9% in December and job openings continued to exceed job seekers, indicating the labor market is approaching full employment. This dynamic is pressuring wages upward and has contributed to inflation running above the U.S Federal Reserve Board’s (the “Fed”) 2% target since April. Sharply higher prices have caused the Fed to hasten its plans to withdraw stimulus. We recognize that in 2022, monetary and fiscal policy are likely to become less supportive of the global economy. Yet in our view, we also see potential offsets to tightening financial conditions, including consumer spending and corporate inventory rebuilding, which make us believe there is scope for continued global equity gains.
The pace and path to policy normalization will be a key market factor for the year ahead. A sharp rise in wages from prolonged labor market tightness is possible, but firms, particularly larger ones, have been able to pass through rising input costs to maintain margins. In our view, this is likely to continue and, combined with still above trend GDP growth, will support earnings growth in 2022.
As we’ve often noted, it’s important to have a plan for investing consistently through headwinds and tailwinds. Keep focused on your long-term goals and don’t get distracted by short-term fluctuations, however compelling or distracting they may seem. Should your long-term goals change, discuss the situation thoroughly with your investment advisor before making any changes to your investment portfolio.
Regardless of events, at Voya we remain well prepared for and fully committed to serving our clients without disruption. We appreciate your continued confidence in us, and we look forward to working with you in the future.
Sincerely,
Dina Santoro
President
Voya Family of Funds
January 21, 2022
The views expressed in the President’s Letter reflect those of the President as of the date of the letter. Any such views are subject to change at any time based upon market or other conditions and the Voya mutual funds disclaim any responsibility to update such views. These views may not be relied on as investment advice and because investment decisions for a Voya mutual fund are based on numerous factors, may not be relied on as an indication of investment intent on behalf of any Voya mutual fund. Reference to specific company securities should not be construed as recommendations or investment advice.
International investing poses special risks including currency fluctuation, economic and political risks not found in investments that are solely domestic.
| | | Index | | | | Description | | |
| | | Bloomberg U.S. Aggregate Bond Index
(“Bloomberg U.S. Aggregate Bond”) | | | | An index of publicly issued investment grade U.S. government, mortgage-backed, asset-backed and corporate debt securities. | | |
| | | MSCI Europe, Australasia and Far East®
(“MSCI EAFE®”) Index | | | | An index that measures the performance of securities listed on exchanges in Europe, Australasia and the Far East. It includes the reinvestment of dividends net of withholding taxes, but does not reflect fees, brokerage commissions or other expenses of investing. | | |
| | | Russell 3000® Index | | | | An index that measures the performance of the largest 3000 U.S. companies representing approximately 98% of the investable U.S. equity market. | | |
| | | S&P Target Date Retirement Income Index | | | | Seeks to represent asset allocations which target an immediate retirement horizon. | | |
| | | S&P Target Risk Aggressive® Index | | | | Seeks to emphasize exposure to equity securities, maximizing opportunities for long-term capital accumulation. It may include small allocations in fixed-income securities to enhance portfolio efficiency. | | |
| | | S&P Target Risk® Conservative Index | | | | Seeks to emphasize exposure to fixed income securities in order to produce a current income stream and avoid excessive volatility of returns. Equity securities are included to protect long-term purchasing power. | | |
| | | S&P Target Risk® Growth Index | | | | Seeks to measure the performance of an asset allocation strategy targeted to a growth focused risk profile. | | |
| | | S&P Target Risk® Moderate Index | | | | Seeks to measure the performance of an asset allocation strategy targeted to a moderate risk profile. | | |
| | | S&P Target Date 2025 Index,
S&P Target Date 2030 Index,
S&P Target Date 2035 Index,
S&P Target Date 2040 Index,
S&P Target Date 2045 Index,
S&P Target Date 2050 Index,
S&P Target Date 2055 Index and
S&P Target Date 2060+ Index | | | | Each index seeks to represent the market consensus for asset allocations which target an approximate 2025, 2030, 2035, 2040, 2045, 2050, 2055, 2060 and beyond the 2060 retirement horizon, respectively. | | |
| Portfolio Managers’ Report | Voya Solution Portfolios |
The Voya Solution Portfolios consist of Voya Solution Aggressive Portfolio, Voya Solution Balanced Portfolio, Voya Solution Conservative Portfolio, Voya Solution Income Portfolio, Voya Solution Moderately Aggressive Portfolio, Voya Solution Moderately Conservative Portfolio, Voya Solution 2025 Portfolio, Voya Solution 2030 Portfolio, Voya Solution 2035 Portfolio, Voya Solution 2040 Portfolio, Voya Solution 2045 Portfolio, Voya Solution 2050 Portfolio, Voya Solution 2055 Portfolio, Voya Solution 2060 Portfolio, and Voya Solution 2065 Portfolio (each a “Portfolio” or collectively, the “Portfolios” or the “Solution Portfolios”). Each Portfolio seeks to achieve its investment objective by investing in a combination of underlying funds which are actively managed funds or passively managed funds (index funds)(1). Each Portfolio uses an asset allocation strategy designed for investors expecting to retire around the year or have the risk profile applicable to that Portfolio resulting in target investment allocations (“Target Asset Allocations”). These Target Asset Allocations as of December 31, 2021 are set out in the table on page 6. The Portfolios are managed by Halvard Kvaale, CIMA, Paul Zemsky, CFA and Chief Investment Officer, and Barbara Reinhard, CFA, Portfolio Managers* of Voya Investment Management Co. LLC (“Voya IM”) the Sub-Adviser (“Sub-Adviser”).
Performance: Each Portfolio’s performance against its respective benchmarks can be found on page 6.
Portfolio Specifics: The Portfolio managers attempt to enhance investment returns by tactically deviating from Target Asset Allocations to take advantage of opportunities or reduce risk. The following tactics were among those employed in 2021.
The Portfolios started the year overweight to equities in the 2065-2040 Portfolio vintages, but flat or modestly underweight in equities in the near-dated vintages. Within equities, the Portfolios were overweight to domestic small cap across all vintages and developed international in far-dated vintages, as well as underweight in domestic large cap across all vintages. Within fixed income, the Portfolios were overweight to core U.S. fixed income and long government bonds in the near-dated Portfolios, while being underweight in core U.S. fixed income in the far-dated Portfolios.
At the close of January, the Portfolios implemented a modest overweight to emerging market (“EM”) equities funded by selling down domestic large cap equities. The rationale underpinning the trade was our belief that the U.S. dollar (“USD”) would continue to depreciate and that the COVID-19 vaccine rollout would benefit EM equities more than U.S. large cap equities. The EM index is more heavily weighted toward industrial stocks and less heavily weighted toward technology stocks, and we believed that industrial companies stood to benefit more as the vaccine would allow employees to return to worksites.
In March, the Portfolios trimmed their overweight position in domestic small cap equities and purchased domestic large cap with the proceeds. At the time of the trade, domestic small caps had outperformed domestic large caps by over 22% since we initiated the overweight in October 2020. With the trade, the Portfolios increase their overweight to domestic large cap equities — reflective of our view that growth will continue for mega cap growth stocks while also having more dollar resiliency.
In April, as part of their annual review process, the Portfolios glided down the equity portion of the 2040-2025 Portfolios, reducing total equity between 1-3% in favor of fixed income. Within equities, the Portfolios rotated from U.S. large cap into U.S. mid, U.S. small and EM equities. Within fixed income, we reduced the position in U.S. long government bonds within the near-dated vintages in favor of core U.S. fixed income.
At the end of May, the Portfolios rotated a portion of their U.S. small cap and EM equities into European equities. We have been cautious on Europe for years. By March 2021, Europe had wiped out the heady gains made in the fourth quarter of 2020. Since then, with more successful COVID-19 vaccine rollouts, re-opening of tourism in the summer and additional stimulus through the European recovery fund, Europe looks to be in the next leg of the global growth recovery, in our opinion.
In July, the Portfolios unwound their overweight equity exposure to the euro zone as optimism for its outperformance, relative to domestic equities, waned, given continued USD strength and increased fears over the impact of the COVID-19 Delta variant. EM equity exposures were also reduced, as increasing regulatory risk and tightening credit conditions in China, as well as low vaccination rates in the EM have amplified concerns for the asset class. Proceeds from the trades were incorporated into U.S. large cap equities.
In October, the Portfolios conducted their semi-annual strategic asset allocation review, resulting in a shift of assets into domestic large cap equities and away from U.S. mid and small cap, developed international and EM equities and core U.S. fixed income in varying degrees depending on the Portfolios.
| Voya Solution Portfolios | Portfolio Managers’ Report |
In December, the Portfolios further increased their U.S. large cap overweight, while lowering exposure to U.S. small cap. With rising wages, small cap companies will have a harder time passing on rising costs to consumers relative to their larger counterparts. In addition, we expect higher volatility caused by the U.S. Federal Reserve Board (the “Fed”) tapering, justifying a lower allocation to the higher-beta asset class.
During the year, tactical moves relative to our strategic benchmarks have had a positive impact across the Portfolios.
During the year, the Portfolios utilized various futures to enact tactical positions. Futures were utilized to avoid significant manager disruption and provide the Portfolios with greater liquidity. The impact of the derivatives was in line with expectations of the tactical asset allocation positions. Overall, tactical positions contributed to performance for the year.
From a holdings standpoint, overall performance from underlying strategies detracted from results. Underlying funds with top benchmark-relative performance include VY® Invesco Comstock Portfolio, VY® JPMorgan Small Cap Core Equity Portfolio and VY® BrandywineGLOBAL-Bond Portfolio. Bottom benchmark-relative performers include VY® Columbia Contrarian Core Portfolio, VY® T. Rowe Price Growth Equity and Voya Multi-Manager International Equity Fund.
Current Strategy and Outlook: In our opinion, COVID-19 could be with us for the long run, but we are learning to live with it: successive waves of infection from new mutations have exerted diminishing impacts on economic activity. U.S. consumer balance sheets have improved dramatically from the early days of the pandemic. In our view, with less risk of lockdowns, expected high demand for labor and more than $2 trillion in excess savings, we think there are more self-sufficient individuals who are well-positioned to contribute to the next leg of growth in 2022. In addition, capital goods orders have taken off, in our view; when considered alongside exceedingly slim inventories, we believe that capital expenditures are likely to be strong in the coming year. We recognize that monetary and fiscal policy will likely continue to become less accommodative in 2022, leaving economies with fewer supports. In our view, this could lead to bouts of fragility and volatility. However, we also see potentially powerful offsets to tightening financial conditions, including a drawdown of consumer savings and corporate inventory rebuilding. These factors make us believe there is scope for continued global equity gains. What is more, we think equity market risk premia have room to absorb modestly higher rates. Though certain pockets of the market are vulnerable to tighter financial conditions, it is our opinion that sell-offs in those pockets should not crash the entire equity market. Funding costs are rising, but remain near record lows, and we think strong fundamentals should insulate credit spreads from rising rates. Still, we believe inflation and profit dynamics are critical variables affecting this outlook.
The economy only re-opens once; in our view, we project 2022 above-trend inflation will generally be supply driven and abate as bottlenecks ease. The Fed’s policy tools are not tuned to resolve supply side issues — that is why we believe the Fed will look past impermanent price pressures and allow inflation to decelerate naturally, as delivery costs come down, more supply comes online, and more workers re-enter the labor force. Furthermore, we expect the handoff from goods to services to happen gradually. We believe that a sharp rise in wages from prolonged labor market tightness is possible, but firms, particularly larger ones, have been able to pass through rising input costs to maintain margins. We also believe that this is likely to continue and, combined with still above-trend GDP growth, will support earnings growth in 2022. S&P 500® Index companies have historically demonstrated greater pricing power than smaller companies; this fact underpins the retention of our overweight to U.S. large cap stocks.
(1)
The investment objective of each Portfolio is described in the Portfolios’ prospectuses, each dated May 1, 2021.
*
Effective on or about May 31, 2022, Halvard Kvaale will retire and no longer be a portfolio manager for the Portfolios.
The views expressed in this commentary are informed opinions. They should not be considered promises or advice. The views expressed reflect those of the portfolio managers, only through the end of the period as stated on the cover. The portfolio managers’ views are subject to change at any time based on market and other conditions.
Portfolio holdings and characteristics are subject to change and may not be representative of current holdings and characteristics. Portfolio holdings are subject to change daily. The outlook for this Portfolio may differ from that presented for other Voya mutual funds. This report contains statements that may be “forward-looking” statements. Actual results may differ materially from those projected in the “forward-looking” statements. The Portfolio’s performance returns shown reflect applicable fee waivers and/or expense limits in effect during this period. Absent such fee waivers/expense limitations, if any, performance would have been lower. Performance for the different classes of shares will vary based on differences in fees associated with each class. An index has no cash in its portfolio and imposes no sales charges. An investor cannot invest directly in an index.
| Portfolio Managers’ Report | Voya Solution Portfolios |
| | | Annual Target Asset Allocation as of December 31, 2021(1)
(as a percentage of net assets) | | |
| | | Sub Asset Class | | | 2065 | | | 2060 | | | 2055 | | | 2050 | | | 2045 | | | 2040 | | | 2035 | | | 2030 | | | 2025 | | | Income | | |
| | | US Large Blend | | | | | 38.5% | | | | | | 38.5% | | | | | | 38.5% | | | | | | 38.5% | | | | | | 37.5% | | | | | | 33.5% | | | | | | 30.0% | | | | | | 26.0% | | | | | | 20.0% | | | | | | 13.0% | | | |
| | | US Large Growth | | | | | 9.3% | | | | | | 9.3% | | | | | | 9.3% | | | | | | 9.3% | | | | | | 9.3% | | | | | | 9.3% | | | | | | 8.0% | | | | | | 7.0% | | | | | | 7.0% | | | | | | 4.5% | | | |
| | | US Large Value | | | | | 9.3% | | | | | | 9.3% | | | | | | 9.3% | | | | | | 9.3% | | | | | | 9.3% | | | | | | 9.3% | | | | | | 8.0% | | | | | | 7.0% | | | | | | 7.0% | | | | | | 4.5% | | | |
| | | US Mid Cap Blend | | | | | 5.0% | | | | | | 5.0% | | | | | | 5.0% | | | | | | 5.0% | | | | | | 4.0% | | | | | | 4.0% | | | | | | 4.0% | | | | | | 4.0% | | | | | | 3.0% | | | | | | 2.0% | | | |
| | | US Small Cap | | | | | 4.0% | | | | | | 4.0% | | | | | | 4.0% | | | | | | 4.0% | | | | | | 4.0% | | | | | | 4.0% | | | | | | 3.0% | | | | | | 3.0% | | | | | | 2.0% | | | | | | — | | | |
| | | International | | | | | 25.0% | | | | | | 25.0% | | | | | | 25.0% | | | | | | 25.0% | | | | | | 25.0% | | | | | | 23.0% | | | | | | 21.0% | | | | | | 18.0% | | | | | | 14.0% | | | | | | 7.0% | | | |
| | | Emerging Markets | | | | | 6.0% | | | | | | 6.0% | | | | | | 6.0% | | | | | | 6.0% | | | | | | 6.0% | | | | | | 5.0% | | | | | | 5.0% | | | | | | 4.0% | | | | | | 4.0% | | | | | | 2.0% | | | |
| | | Core Fixed Income | | | | | 3.0% | | | | | | 3.0% | | | | | | 3.0% | | | | | | 3.0% | | | | | | 3.0% | | | | | | 9.0% | | | | | | 17.0% | | | | | | 26.0% | | | | | | 35.0% | | | | | | 44.0% | | | |
| | | High Yield | | | | | — | | | | | | — | | | | | | — | | | | | | — | | | | | | 2.0% | | | | | | 3.0% | | | | | | 4.0% | | | | | | 5.0% | | | | | | 5.0% | | | | | | 5.0% | | | |
| | | International Bonds | | | | | — | | | | | | — | | | | | | — | | | | | | — | | | | | | — | | | | | | — | | | | | | — | | | | | | — | | | | | | 3.0% | | | | | | 3.0% | | | |
| | | TIPS | | | | | — | | | | | | — | | | | | | — | | | | | | — | | | | | | — | | | | | | — | | | | | | — | | | | | | — | | | | | | — | | | | | | 3.0% | | | |
| | | Short Duration | | | | | — | | | | | | — | | | | | | — | | | | | | — | | | | | | — | | | | | | — | | | | | | — | | | | | | — | | | | | | — | | | | | | 10.0% | | | |
| | | Long Govt Bonds | | | | | — | | | | | | — | | | | | | — | | | | | | — | | | | | | — | | | | | | — | | | | | | — | | | | | | — | | | | | | — | | | | | | 2.0% | | | |
| | | Total Equity | | | | | 97.0% | | | | | | 97.0% | | | | | | 97.0% | | | | | | 97.0% | | | | | | 95.0% | | | | | | 88.0% | | | | | | 79.0% | | | | | | 69.0% | | | | | | 57.0% | | | | | | 33.0% | | | |
| | | Total Fixed Income | | | | | 3.0% | | | | | | 3.0% | | | | | | 3.0% | | | | | | 3.0% | | | | | | 5.0% | | | | | | 12.0% | | | | | | 21.0% | | | | | | 31.0% | | | | | | 43.0% | | | | | | 67.0% | | | |
| | | Total | | | | | 100.0% | | | | | | 100.0% | | | | | | 100.0% | | | | | | 100.0% | | | | | | 100.0% | | | | | | 100.0% | | | | | | 100.0% | | | | | | 100.0% | | | | | | 100.0% | | | | | | 100.0% | | | |
| | | | | | | | | | | | | | | | | | | |
(1)
As these are target allocations, the actual allocations of each Portfolio’s assets may deviate from the percentages shown. Although the Portfolios expect to be fully invested at all times, they may maintain liquidity reserves to meet redemption requests.
Portfolio holdings are subject to change daily.
| Voya Solution Portfolios | Portfolio Managers’ Report |
| | | Total Returns for the Year Ended December 31, 2021 | | |
| | | | | | 1 Year | | |
| | | Voya Solution Aggressive Portfolio, Class S | | | 19.62% | | |
| | | S&P Target Risk Aggressive® Index | | | 15.62% | | |
| | | Voya Solution Balanced Portfolio, Class S | | | 13.96% | | |
| | | S&P Target Risk® Growth Index | | | 11.37% | | |
| | | Voya Solution Conservative Portfolio, Class S | | | 5.52% | | |
| | | S&P Target Risk® Conservative Index | | | 4.99% | | |
| | | Voya Solution Income Portfolio, Class S | | | 6.37% | | |
| | | S&P Target Date Retirement Income Index | | | 5.11% | | |
| | | Russell 3000® Index | | | 25.66% | | |
| | | MSCI EAFE® | | | 11.26% | | |
| | | Bloomberg U.S. Aggregate Bond | | | -1.54% | | |
| | | Voya Solution Moderately Aggressive Portfolio, Class S | | | 17.16% | | |
| | | S&P Target Risk Aggressive® Index | | | 15.62% | | |
| | | Voya Solution Moderately Conservative Portfolio, Class S | | | 9.41% | | |
| | | S&P Target Risk® Moderate Index | | | 7.12% | | |
| | | Voya Solution 2025 Portfolio, Class S | | | 10.67% | | |
| | | S&P Target Date 2025 Index | | | 10.67% | | |
| | | Russell 3000® Index | | | 25.66% | | |
| | | MSCI EAFE® | | | 11.26% | | |
| | | Bloomberg U.S. Aggregate Bond | | | -1.54% | | |
| | | Voya Solution 2030 Portfolio, Class S | | | 12.49% | | |
| | | S&P Target Date 2030 Index | | | 12.61% | | |
| | | Voya Solution 2035 Portfolio, Class S | | | 14.08% | | |
| | | S&P Target Date 2035 Index | | | 14.92% | | |
| | | Russell 3000® Index | | | 25.66% | | |
| | | MSCI EAFE® | | | 11.26% | | |
| | | Bloomberg U.S. Aggregate Bond | | | -1.54% | | |
| | | Voya Solution 2040 Portfolio, Class S | | | 16.10% | | |
| | | S&P Target Date 2040 Index | | | 16.55% | | |
| | | Voya Solution 2045 Portfolio, Class S | | | 17.26% | | |
| | | S&P Target Date 2045 Index | | | 17.51% | | |
| | | Russell 3000® Index | | | 25.66% | | |
| | | MSCI EAFE® | | | 11.26% | | |
| | | Bloomberg U.S. Aggregate Bond | | | -1.54% | | |
| | | Voya Solution 2050 Portfolio, Class S | | | 17.10% | | |
| | | S&P Target Date 2050 Index | | | 17.99% | | |
| | | Voya Solution 2055 Portfolio, Class S | | | 17.32% | | |
| | | S&P Target Date 2055 Index | | | 18.19% | | |
| | | Voya Solution 2060 Portfolio, Class S | | | 17.15% | | |
| | | S&P Target Date 2060+ Index | | | 18.05% | | |
| | | Voya Solution 2065 Portfolio, Class S | | | 17.30% | | |
| | | S&P Target Date 2060+ Index | | | 18.05% | | |
| | | | | | | | |
| Portfolio Managers’ Report | Voya Solution Aggressive Portfolio |
| | | Average Annual Total Returns for the Periods Ended December 31, 2021 | | |
| | | | | | 1 Year | | | 5 Year | | | Since Inception
of Classes ADV, I, S, and S2
May 1, 2013 | | |
| | | Class ADV | | | | | 19.31% | | | | | | 13.23% | | | | | | 10.61% | | | |
| | | Class I | | | | | 19.87% | | | | | | 13.78% | | | | | | 11.21% | | | |
| | | Class R6(1) | | | | | 19.86% | | | | | | 13.79% | | | | | | 13.26% | | | |
| | | Class S | | | | | 19.62% | | | | | | 13.51% | | | | | | 10.94% | | | |
| | | Class S2 | | | | | 19.42% | | | | | | 13.33% | | | | | | 10.70% | | | |
| | | S&P Target Risk Aggressive® Index | | | | | 15.62% | | | | | | 12.23% | | | | | | 9.98% | | | |
| | | | | |
Based on a $10,000 initial investment, the graph and table above illustrate the total return of Voya Solution Aggressive Portfolio against the index indicated. The index is unmanaged, has no cash in its portfolio and imposes no sales charges. An investor cannot invest directly in an index.
The Portfolio’s performance is shown without the imposition of any expenses or charges which are, or may be, imposed under your variable annuity contract or variable life insurance policy. Total returns would have been lower if such expenses or charges were included.
The performance graph and table do not reflect the deduction of taxes that a shareholder will pay on Portfolio distributions or the redemption of Portfolio shares.
The performance shown includes, if applicable, the effect of fee waivers and/or expense reimbursements by the Investment Adviser and/or other service providers, which have the effect of increasing total return. Had all fees and expenses been considered, the total returns would have been lower.
The performance update illustrates performance for a variable investment option available through a variable annuity contract or a variable life insurance policy. The performance shown indicates past performance and is not a projection or prediction of future results. Actual investment returns and principal value will fluctuate so that shares and/or units, at redemption, may be worth more or less than their original cost. Please log on to www.voyainvestments.com or call (800) 262-3862 to get performance through the most recent month end.
Portfolio holdings are subject to change daily.
(1)
Class R6 incepted on May 2, 2016. The Class R6 shares performance shown for the period prior to their inception date is the performance of Class I shares without adjustment for any differences in the expenses between the two classes. If adjusted for such differences, returns would be different.
| Voya Solution Balanced Portfolio | Portfolio Managers’ Report |
| | | Average Annual Total Returns for the Periods Ended December 31, 2021 | | |
| | | | | | 1 Year | | | 5 Year | | | 10 Year | | |
| | | Class ADV | | | | | 13.63% | | | | | | 10.20% | | | | | | 9.04% | | | |
| | | Class I | | | | | 14.15% | | | | | | 10.74% | | | | | | 9.58% | | | |
| | | Class R6(1) | | | | | 14.15% | | | | | | 10.77% | | | | | | 10.35% | | | |
| | | Class S | | | | | 13.96% | | | | | | 10.48% | | | | | | 9.32% | | | |
| | | Class S2 | | | | | 13.80% | | | | | | 10.32% | | | | | | 9.15% | | | |
| | | S&P Target Risk® Growth Index | | | | | 11.37% | | | | | | 10.17% | | | | | | 8.96% | | | |
| | | | | |
Based on a $10,000 initial investment, the graph and table above illustrate the total return of Voya Solution Balanced Portfolio against the index indicated. The index is unmanaged and has no cash in its portfolio and imposes no sales charges. An investor cannot invest directly in an index.
The Portfolio’s performance is shown without the imposition of any expenses or charges which are, or may be, imposed under your variable annuity contract or variable life insurance policy. Total returns would have been lower if such expenses or charges were included.
The performance graph and table do not reflect the deduction of taxes that a shareholder will pay on Portfolio distributions or the redemption of Portfolio shares.
The performance shown includes, if applicable, the effect of fee waivers and/or expense reimbursements by the Investment Adviser and/or other service providers, which have the effect of increasing total return. Had all fees and expenses been considered, the total returns would have been lower.
The performance update illustrates performance for a variable investment option available through a variable annuity contract or a variable life insurance policy. The performance shown indicates past performance and is not a projection or prediction of future results. Actual investment returns and principal value will fluctuate so that shares and/or units, at redemption, may be worth more or less than their original cost. Please log on to www.voyainvestments.com or call (800) 262-3862 to get performance through the most recent month end.
Portfolio holdings are subject to change daily.
(1)
Class R6 incepted on May 2, 2016. The Class R6 shares performance shown for the period prior to their inception date is the performance of Class I shares without adjustment for any differences in the expenses between the two classes. If adjusted for such differences, returns would be different.
| Portfolio Managers’ Report | Voya Solution Conservative Portfolio |
| | | Average Annual Total Returns for the Periods Ended December 31, 2021 | | |
| | | | | | 1 Year | | | 5 Year | | | 10 Year | | |
| | | Class ADV | | | | | 5.26% | | | | | | 5.99% | | | | | | 5.44% | | | |
| | | Class I | | | | | 5.85% | | | | | | 6.52% | | | | | | 5.96% | | | |
| | | Class R6(1) | | | | | 5.77% | | | | | | 6.53% | | | | | | 6.22% | | | |
| | | Class S | | | | | 5.52% | | | | | | 6.26% | | | | | | 5.71% | | | |
| | | Class S2 | | | | | 5.34% | | | | | | 6.11% | | | | | | 5.56% | | | |
| | | S&P Target Risk® Conservative Index | | | | | 4.99% | | | | | | 6.97% | | | | | | 5.60% | | | |
| | | | | |
Based on a $10,000 initial investment, the graph and table above illustrate the total return of Voya Solution Conservative Portfolio against the index indicated. The index is unmanaged and has no cash in its portfolio and imposes no sales charges. An investor cannot invest directly in an index.
The Portfolio’s performance is shown without the imposition of any expenses or charges which are, or may be, imposed under your variable annuity contract or variable life insurance policy. Total returns would have been lower if such expenses or charges were included.
The performance graph and table do not reflect the deduction of taxes that a shareholder will pay on Portfolio distributions or the redemption of Portfolio shares.
The performance shown includes, if applicable, the effect of fee waivers and/or expense reimbursements by the Investment Adviser and/or other service providers, which have the effect of increasing total return. Had all fees and expenses been considered, the total returns would have been lower.
The performance update illustrates performance for a variable investment option available through a variable annuity contract or a variable life insurance policy. The performance shown indicates past performance and is not a projection or prediction of future results. Actual investment returns and principal value will fluctuate so that shares and/or units, at redemption, may be worth more or less than their original cost. Please log on to www.voyainvestments.com or call (800) 262-3862 to get performance through the most recent month end.
Portfolio holdings are subject to change daily.
(1)
Class R6 incepted on May 2, 2016. The Class R6 shares performance shown for the period prior to their inception date is the performance of Class I shares without adjustment for any differences in the expenses between the two classes. If adjusted for such differences, returns would be different.
| Voya Solution Income Portfolio | Portfolio Managers’ Report |
| | | Average Annual Total Returns for the Periods Ended December 31, 2021 | | |
| | | | | | 1 Year | | | 5 Year | | | 10 Year | | |
| | | Class ADV | | | | | 6.16% | | | | | | 7.13% | | | | | | 6.11% | | | |
| | | Class I | | | | | 6.69% | | | | | | 7.66% | | | | | | 6.64% | | | |
| | | Class S | | | | | 6.37% | | | | | | 7.38% | | | | | | 6.37% | | | |
| | | Class S2 | | | | | 6.25% | | | | | | 7.23% | | | | | | 6.21% | | | |
| | | Class T | | | | | 6.03% | | | | | | 6.91% | | | | | | 5.90% | | | |
| | | S&P Target Date Retirement Income Index | | | | | 5.11% | | | | | | 6.52% | | | | | | 5.59% | | | |
| | | Russell 3000® Index | | | | | 25.66% | | | | | | 17.97% | | | | | | 16.30% | | | |
| | | MSCI EAFE® | | | | | 11.26% | | | | | | 9.55% | | | | | | 8.03% | | | |
| | | Bloomberg U.S. Aggregate Bond | | | | | -1.54% | | | | | | 3.57% | | | | | | 2.90% | | | |
| | | | | |
Based on a $10,000 initial investment, the graph and table above illustrate the total return of Voya Solution Income Portfolio against the indices indicated. An index is unmanaged and has no cash in its portfolio and imposes no sales charges. An investor cannot invest directly in an index.
The Portfolio’s performance is shown without the imposition of any expenses or charges which are, or may be, imposed under your variable annuity contract or variable life insurance policy. Total returns would have been lower if such expenses or charges were included.
The performance graph and table do not reflect the deduction of taxes that a shareholder will pay on Portfolio distributions or the redemption of Portfolio shares.
The performance shown includes, if applicable, the effect of fee waivers and/or expense reimbursements by the Investment
Adviser and/or other service providers, which have the effect of increasing total return. Had all fees and expenses been considered, the total returns would have been lower.
The performance update illustrates performance for a variable investment option available through a variable annuity contract or a variable life insurance policy. The performance shown indicates past performance and is not a projection or prediction of future results. Actual investment returns and principal value will fluctuate so that shares and/or units, at redemption, may be worth more or less than their original cost. Please log on to www.voyainvestments.com or call (800) 262-3862 to get performance through the most recent month end.
Portfolio holdings are subject to change daily.
| Portfolio Managers’ Report | Voya Solution Moderately Aggressive Portfolio |
| | | Average Annual Total Returns for the Periods Ended December 31, 2021 | | |
| | | | | | 1 Year | | | 5 Year | | | 10 Year | | |
| | | Class ADV | | | | | 16.87% | | | | | | 11.63% | | | | | | 10.29% | | | |
| | | Class I | | | | | 17.42% | | | | | | 12.21% | | | | | | 10.85% | | | |
| | | Class R6(1) | | | | | 17.44% | | | | | | 12.22% | | | | | | 11.71% | | | |
| | | Class S | | | | | 17.16% | | | | | | 11.92% | | | | | | 10.57% | | | |
| | | Class S2 | | | | | 16.99% | | | | | | 11.77% | | | | | | 10.41% | | | |
| | | S&P Target Risk Aggressive® Index | | | | | 15.62% | | | | | | 12.23% | | | | | | 11.04% | | | |
| | | | | |
Based on a $10,000 initial investment, the graph and table above illustrate the total return of Voya Solution Moderately Aggressive Portfolio against the index indicated. The index is unmanaged and has no cash in its portfolio and imposes no sales charges. An investor cannot invest directly in an index.
The Portfolio’s performance is shown without the imposition of any expenses or charges which are, or may be, imposed under your variable annuity contract or variable life insurance policy. Total returns would have been lower if such expenses or charges were included.
The performance graph and table do not reflect the deduction of taxes that a shareholder will pay on Portfolio distributions or the redemption of Portfolio shares.
The performance shown includes, if applicable, the effect of fee waivers and/or expense reimbursements by the Investment Adviser and/or other service providers, which have the effect of increasing total return. Had all fees and expenses been considered, the total returns would have been lower.
The performance update illustrates performance for a variable investment option available through a variable annuity contract or a variable life insurance policy. The performance shown indicates past performance and is not a projection or prediction of future results. Actual investment returns and principal value will fluctuate so that shares and/or units, at redemption, may be worth more or less than their original cost. Please log on to www.voyainvestments.com or call (800) 262-3862 to get performance through the most recent month end.
Portfolio holdings are subject to change daily.
(1)
Class R6 incepted on May 2, 2016. The Class R6 shares performance shown for the period prior to their inception date is the performance of Class I shares without adjustment for any differences in the expenses between the two classes. If adjusted for such differences, returns would be different.
| Voya Solution Moderately Conservative Portfolio | Portfolio Managers’ Report |
| | | Average Annual Total Returns for the Periods Ended December 31, 2021 | | |
| | | | | | 1 Year | | | 5 Year | | | 10 Year | | |
| | | Class ADV | | | | | 9.16% | | | | | | 7.86% | | | | | | 7.01% | | | |
| | | Class I | | | | | 9.69% | | | | | | 8.40% | | | | | | 7.52% | | | |
| | | Class R6(1) | | | | | 9.69% | | | | | | 8.41% | | | | | | 8.05% | | | |
| | | Class S | | | | | 9.41% | | | | | | 8.14% | | | | | | 7.28% | | | |
| | | Class S2 | | | | | 9.22% | | | | | | 7.98% | | | | | | 7.12% | | | |
| | | S&P Target Risk® Moderate Index | | | | | 7.12% | | | | | | 8.05% | | | | | | 6.81% | | | |
| | | | | |
Based on a $10,000 initial investment, the graph and table above illustrate the total return of Voya Solution Moderately Conservative Portfolio against the index indicated. The index is unmanaged and has no cash in its portfolio and imposes no sales charges. An investor cannot invest directly in an index.
The Portfolio’s performance is shown without the imposition of any expenses or charges which are, or may be, imposed under your variable annuity contract or variable life insurance policy. Total returns would have been lower if such expenses or charges were included.
The performance graph and table do not reflect the deduction of taxes that a shareholder will pay on Portfolio distributions or the redemption of Portfolio shares.
The performance shown includes, if applicable, the effect of fee waivers and/or expense reimbursements by the Investment Adviser and/or other service providers, which have the effect of increasing total return. Had all fees and expenses been considered, the total returns would have been lower.
The performance update illustrates performance for a variable investment option available through a variable annuity contract or a variable life insurance policy. The performance shown indicates past performance and is not a projection or prediction of future results. Actual investment returns and principal value will fluctuate so that shares and/or units, at redemption, may be worth more or less than their original cost. Please log on to www.voyainvestments.com or call (800) 262-3862 to get performance through the most recent month end.
Portfolio holdings are subject to change daily.
(1)
Class R6 incepted on May 2, 2016. The Class R6 shares performance shown for the period prior to their inception date is the performance of Class I shares without adjustment for any differences in the expenses between the two classes. If adjusted for such differences, returns would be different.
| Portfolio Managers’ Report | Voya Solution 2025 Portfolio |
| | | Average Annual Total Returns for the Periods Ended December 31, 2021 | | |
| | | | | | 1 Year | | | 5 Year | | | 10 Year | | |
| | | Class ADV | | | | | 10.40% | | | | | | 9.76% | | | | | | 8.78% | | | |
| | | Class I | | | | | 10.96% | | | | | | 10.31% | | | | | | 9.32% | | | |
| | | Class S | | | | | 10.67% | | | | | | 10.04% | | | | | | 9.05% | | | |
| | | Class S2 | | | | | 10.49% | | | | | | 9.86% | | | | | | 8.88% | | | |
| | | Class T | | | | | 10.19% | | | | | | 9.53% | | | | | | 8.55% | | | |
| | | S&P Target Date 2025 Index | | | | | 10.67% | | | | | | 9.65% | | | | | | 9.01% | | | |
| | | Russell 3000® Index | | | | | 25.66% | | | | | | 17.97% | | | | | | 16.30% | | | |
| | | MSCI EAFE® | | | | | 11.26% | | | | | | 9.55% | | | | | | 8.03% | | | |
| | | Bloomberg U.S. Aggregate Bond | | | | | -1.54% | | | | | | 3.57% | | | | | | 2.90% | | | |
| | | | | |
Based on a $10,000 initial investment, the graph and table above illustrate the total return of Voya Solution 2025 Portfolio against the indices indicated. An index is unmanaged and has no cash in its portfolio and imposes no sales charges. An investor cannot invest directly in an index.
The Portfolio’s performance is shown without the imposition of any expenses or charges which are, or may be, imposed under your variable annuity contract or variable life insurance policy. Total returns would have been lower if such expenses or charges were included.
The performance graph and table do not reflect the deduction of taxes that a shareholder will pay on Portfolio distributions or the redemption of Portfolio shares.
The performance shown includes, if applicable, the effect of fee waivers and/or expense reimbursements by the Investment
Adviser and/or other service providers, which have the effect of increasing total return. Had all fees and expenses been considered, the total returns would have been lower.
The performance update illustrates performance for a variable investment option available through a variable annuity contract or a variable life insurance policy. The performance shown indicates past performance and is not a projection or prediction of future results. Actual investment returns and principal value will fluctuate so that shares and/or units, at redemption, may be worth more or less than their original cost. Please log on to www.voyainvestments.com or call (800) 262-3862 to get performance through the most recent month end.
Portfolio holdings are subject to change daily.
| Voya Solution 2030 Portfolio | Portfolio Managers’ Report |
| | | Average Annual Total Returns for the Periods Ended December 31, 2021 | | |
| | | | | | 1 Year | | | 5 Year | | | 10 Year | | |
| | | Class ADV | | | | | 12.26% | | | | | | 10.77% | | | | | | 9.75% | | | |
| | | Class I | | | | | 12.80% | | | | | | 11.33% | | | | | | 10.31% | | | |
| | | Class S | | | | | 12.49% | | | | | | 11.05% | | | | | | 10.01% | | | |
| | | Class S2 | | | | | 12.35% | | | | | | 10.88% | | | | | | 9.84% | | | |
| | | Class T | | | | | 12.05% | | | | | | 10.55% | | | | | | 9.56% | | | |
| | | S&P Target Date 2030 Index | | | | | 12.61% | | | | | | 10.63% | | | | | | 9.83% | | | |
| | | | | |
Based on a $10,000 initial investment, the graph and table above illustrate the total return of Voya Solution 2030 Portfolio against the index indicated. The index is unmanaged, has no cash in its portfolio and imposes no sales charges. An investor cannot invest directly in an index.
The Portfolio’s performance is shown without the imposition of any expenses or charges which are, or may be, imposed under your variable annuity contract or variable life insurance policy. Total returns would have been lower if such expenses or charges were included.
The performance graph and table do not reflect the deduction of taxes that a shareholder will pay on Portfolio distributions or the redemption of Portfolio shares.
The performance shown includes, if applicable, the effect of fee waivers and/or expense reimbursements by the
Investment Adviser and/or other service providers, which have the effect of increasing total return. Had all fees and expenses been considered, the total returns would have been lower.
The performance update illustrates performance for a variable investment option available through a variable contract or a variable life insurance policy. The performance shown indicates past performance and is not a projection or prediction of future results. Actual investment returns and principal value will fluctuate so that shares and/or units, at redemption, may be worth more or less than their original cost. Please log on to www.voyainvestments.com or call (800) 262-3862 to get performance through the most recent month end.
Portfolio holdings are subject to change daily.
| Portfolio Managers’ Report | Voya Solution 2035 Portfolio |
| | | Average Annual Total Returns for the Periods Ended December 31, 2021 | | |
| | | | | | 1 Year | | | 5 Year | | | 10 Year | | |
| | | Class ADV | | | | | 13.81% | | | | | | 11.47% | | | | | | 10.16% | | | |
| | | Class I | | | | | 14.35% | | | | | | 12.03% | | | | | | 10.70% | | | |
| | | Class S | | | | | 14.08% | | | | | | 11.75% | | | | | | 10.43% | | | |
| | | Class S2 | | | | | 13.91% | | | | | | 11.59% | | | | | | 10.27% | | | |
| | | Class T | | | | | 13.42% | | | | | | 11.25% | | | | | | 9.93% | | | |
| | | S&P Target Date 2035 Index | | | | | 14.92% | | | | | | 11.67% | | | | | | 10.63% | | | |
| | | Russell 3000® Index | | | | | 25.66% | | | | | | 17.97% | | | | | | 16.30% | | | |
| | | MSCI EAFE® | | | | | 11.26% | | | | | | 9.55% | | | | | | 8.03% | | | |
| | | Bloomberg U.S. Aggregate Bond | | | | | -1.54% | | | | | | 3.57% | | | | | | 2.90% | | | |
| | | | | |
Based on a $10,000 initial investment, the graph and table above illustrate the total return of Voya Solution 2035 Portfolio against the indices indicated. An index is unmanaged, has no cash in its portfolio and imposes no sales charges. An investor cannot invest directly in an index.
The Portfolio’s performance is shown without the imposition of any expenses or charges which are, or may be, imposed under your variable annuity contract or variable life insurance policy. Total returns would have been lower if such expenses or charges were included.
The performance graph and table do not reflect the deduction of taxes that a shareholder will pay on Portfolio distributions or the redemption of Portfolio shares.
The performance shown includes, if applicable, the effect of fee waivers and/or expense reimbursements by the Investment
Adviser and/or other service providers, which have the effect of increasing total return. Had all fees and expenses been considered, the total returns would have been lower.
The performance update illustrates performance for a variable investment option available through a variable contract or a variable life insurance policy. The performance shown indicates past performance and is not a projection or prediction of future results. Actual investment returns and principal value will fluctuate so that shares and/or units, at redemption, may be worth more or less than their original cost. Please log on to www.voyainvestments.com or call (800) 262-3862 to get performance through the most recent month end.
Portfolio holdings are subject to change daily.
| Voya Solution 2040 Portfolio | Portfolio Managers’ Report |
| | | Average Annual Total Returns for the Periods Ended December 31, 2021 | | |
| | | | | | 1 Year | | | 5 Year | | | 10 Year | | |
| | | Class ADV | | | | | 15.78% | | | | | | 12.43% | | | | | | 11.04% | | | |
| | | Class I | | | | | 16.34% | | | | | | 12.99% | | | | | | 11.61% | | | |
| | | Class S | | | | | 16.10% | | | | | | 12.71% | | | | | | 11.30% | | | |
| | | Class S2 | | | | | 15.88% | | | | | | 12.53% | | | | | | 11.14% | | | |
| | | Class T | | | | | 15.48% | | | | | | 12.20% | | | | | | 10.82% | | | |
| | | S&P Target Date 2040 Index | | | | | 16.55% | | | | | | 12.40% | | | | | | 11.19% | | | |
| | | | | |
Based on a $10,000 initial investment, the graph and table above illustrate the total return of Voya Solution 2040 Portfolio against the index indicated. The index is unmanaged and has no cash in its portfolio and imposes no sales charges. An investor cannot invest directly in an index.
The Portfolio’s performance is shown without the imposition of any expenses or charges which are, or may be, imposed under your variable annuity contract or variable life insurance policy. Total returns would have been lower if such expenses or charges were included.
The performance graph and table do not reflect the deduction of taxes that a shareholder will pay on Portfolio distributions or the redemption of Portfolio shares.
The performance shown includes, if applicable, the effect of fee waivers and/or expense reimbursements by the
Investment Adviser and/or other service providers, which have the effect of increasing total return. Had all fees and expenses been considered, the total returns would have been lower.
The performance update illustrates performance for a variable investment option available through a variable annuity contract or a variable life insurance policy. The performance shown indicates past performance and is not a projection or prediction of future results. Actual investment returns and principal value will fluctuate so that shares and/or units, at redemption, may be worth more or less than their original cost. Please log on to www.voyainvestments.com or call (800) 262-3862 to get performance through the most recent month end.
Portfolio holdings are subject to change daily.
| Portfolio Managers’ Report | Voya Solution 2045 Portfolio |
| | | Average Annual Total Returns for the Periods Ended December 31, 2021 | | |
| | | | | | 1 Year | | | 5 Year | | | 10 Year | | |
| | | Class ADV | | | | | 16.95% | | | | | | 12.66% | | | | | | 11.08% | | | |
| | | Class I | | | | | 17.51% | | | | | | 13.22% | | | | | | 11.63% | | | |
| | | Class S | | | | | 17.26% | | | | | | 12.96% | | | | | | 11.35% | | | |
| | | Class S2 | | | | | 17.10% | | | | | | 12.79% | | | | | | 11.19% | | | |
| | | Class T | | | | | 16.73% | | | | | | 12.44% | | | | | | 10.85% | | | |
| | | S&P Target Date 2045 Index | | | | | 17.51% | | | | | | 12.81% | | | | | | 11.56% | | | |
| | | Russell 3000® Index | | | | | 25.66% | | | | | | 17.97% | | | | | | 16.30% | | | |
| | | MSCI EAFE® | | | | | 11.26% | | | | | | 9.55% | | | | | | 8.03% | | | |
| | | Bloomberg U.S. Aggregate Bond | | | | | -1.54% | | | | | | 3.57% | | | | | | 2.90% | | | |
| | | | | |
Based on a $10,000 initial investment, the graph and table above illustrate the total return of Voya Solution 2045 Portfolio against the indices indicated. An index is unmanaged and has no cash in its portfolio and imposes no sales charges. An investor cannot invest directly in an index.
The Portfolio’s performance is shown without the imposition of any expenses or charges which are, or may be, imposed under your variable annuity contract or variable life insurance policy. Total returns would have been lower if such expenses or charges were included.
The performance graph and table do not reflect the deduction of taxes that a shareholder will pay on Portfolio distributions or the redemption of Portfolio shares.
The performance shown includes, if applicable, the effect of fee waivers and/or expense reimbursements by the Investment
Adviser and/or other service providers, which have the effect of increasing total return. Had all fees and expenses been considered, the total returns would have been lower.
The performance update illustrates performance for a variable investment option available through a variable annuity contract or a variable life insurance policy. The performance shown indicates past performance and is not a projection or prediction of future results. Actual investment returns and principal value will fluctuate so that shares and/or units, at redemption, may be worth more or less than their original cost. Please log on to www.voyainvestments.com or call (800) 262-3862 to get performance through the most recent month end.
Portfolio holdings are subject to change daily.
| Voya Solution 2050 Portfolio | Portfolio Managers’ Report |
| | | Average Annual Total Returns for the Periods Ended December 31, 2021 | | |
| | | | | | 1 Year | | | 5 Year | | | 10 Year | | |
| | | Class ADV | | | | | 16.82% | | | | | | 12.68% | | | | | | 11.22% | | | |
| | | Class I | | | | | 17.42% | | | | | | 13.26% | | | | | | 11.82% | | | |
| | | Class S | | | | | 17.10% | | | | | | 12.96% | | | | | | 11.49% | | | |
| | | Class S2 | | | | | 16.91% | | | | | | 12.79% | | | | | | 11.32% | | | |
| | | Class T | | | | | 16.55% | | | | | | 12.45% | | | | | | 11.03% | | | |
| | | S&P Target Date 2050 Index | | | | | 17.99% | | | | | | 13.07% | | | | | | 11.83% | | | |
| | | | | |
Based on a $10,000 initial investment, the graph and table above illustrate the total return of Voya Solution 2050 Portfolio against the index indicated. The index is unmanaged and has no cash in its portfolio and imposes no sales charges. An investor cannot invest directly in an index.
The Portfolio’s performance is shown without the imposition of any expenses or charges which are, or may be, imposed under your variable annuity contract or variable life insurance policy. Total returns would have been lower if such expenses or charges were included.
The performance graph and table do not reflect the deduction of taxes that a shareholder will pay on Portfolio distributions or the redemption of Portfolio shares.
The performance shown includes, if appllicable, the effect of fee waivers and/or expense reimbursements by the
Investment Adviser and/or other service providers, which have the effect of increasing total return. Had all fees and expenses been considered, the total returns would have been lower.
The performance update illustrates performance for a variable investment option available through a variable annuity contract or a variable life insurance policy. The performance shown indicates past performance and is not a projection or prediction of future results. Actual investment returns and principal value will fluctuate so that shares and/or units, at redemption, may be worth more or less than their original cost. Please log on to www.voyainvestments.com or call (800) 262-3862 to get performance through the most recent month end.
Portfolio holdings are subject to change daily.
| Portfolio Managers’ Report | Voya Solution 2055 Portfolio |
| | | Average Annual Total Returns for the Periods Ended December 31, 2021 | | |
| | | | | | 1 Year | | | 5 Year | | | 10 Year | | |
| | | Class ADV | | | | | 17.03% | | | | | | 12.75% | | | | | | 11.15% | | | |
| | | Class I | | | | | 17.53% | | | | | | 13.30% | | | | | | 11.71% | | | |
| | | Class S | | | | | 17.32% | | | | | | 13.02% | | | | | | 11.43% | | | |
| | | Class S2 | | | | | 17.09% | | | | | | 12.85% | | | | | | 11.25% | | | |
| | | Class T | | | | | 16.77% | | | | | | 12.51% | | | | | | 10.94% | | | |
| | | S&P Target Date 2055 Index | | | | | 18.19% | | | | | | 13.18% | | | | | | 12.00% | | | |
| | | | | |
Based on a $10,000 initial investment, the graph and table above illustrate the total return of Voya Solution 2055 Portfolio against the index indicated. The index is unmanaged and has no cash in its portfolio and imposes no sales charges. An investor cannot invest directly in an index.
The Portfolio’s performance is shown without the imposition of any expenses or charges which are, or may be, imposed under your variable annuity contract or variable life insurance policy. Total returns would have been lower if such expenses or charges were included.
The performance graph and table do not reflect the deduction of taxes that a shareholder will pay on Portfolio distributions or the redemption of Portfolio shares.
The performance shown includes, if applicable, the effect of fee waivers and/or expense reimbursements by the
Investment Adviser and/or other service providers, which have the effect of increasing total return. Had all fees and expenses been considered, the total returns would have been lower.
The performance update illustrates performance for a variable investment option available through a variable annuity contract or a variable life insurance policy. The performance shown indicates past performance and is not a projection or prediction of future results. Actual investment returns and principal value will fluctuate so that shares and/or units, at redemption, may be worth more or less than their original cost. Please log on to www.voyainvestments.com or call (800) 262-3862 to get performance through the most recent month end.
Portfolio holdings are subject to change daily.
| Voya Solution 2060 Portfolio | Portfolio Managers’ Report |
| | | Average Annual Total Returns for the Periods Ended December 31, 2021 | | |
| | | | | | 1 Year | | | 5 Year | | | Since Inception
of Classes ADV, I, S, S2 and T
February 9, 2015 | | |
| | | Class ADV | | | | | 16.83% | | | | | | 12.68% | | | | | | 9.85% | | | |
| | | Class I | | | | | 17.46% | | | | | | 13.26% | | | | | | 10.37% | | | |
| | | Class S | | | | | 17.15% | | | | | | 12.97% | | | | | | 10.04% | | | |
| | | Class S2 | | | | | 16.93% | | | | | | 12.79% | | | | | | 9.93% | | | |
| | | Class T | | | | | 16.50% | | | | | | 12.42% | | | | | | 9.55% | | | |
| | | S&P Target Date 2060+ Index | | | | | 18.05% | | | | | | 13.28% | | | | | | 10.78% | | | |
| | | | | |
Based on a $10,000 initial investment, the graph and table above illustrate the total return of Voya Solution 2060 Portfolio against the index indicated. The index is unmanaged and has no cash in its portfolio and imposes no sales charges. An investor cannot invest directly in an index.
The Portfolio’s performance is shown without the imposition of any expenses or charges which are, or may be, imposed under your variable annuity contract or variable life insurance policy. Total returns would have been lower if such expenses or charges were included.
The performance graph and table do not reflect the deduction of taxes that a shareholder will pay on Portfolio distributions or the redemption of Portfolio shares.
The performance shown includes, if applicable, the effect of fee waivers and/or expense reimbursements by the
Investment Adviser and/or other service providers, which have the effect of increasing total return. Had all fees and expenses been considered, the total returns would have been lower.
The performance update illustrates performance for a variable investment option available through a variable annuity contract or a variable life insurance policy. The performance shown indicates past performance and is not a projection or prediction of future results. Actual investment returns and principal value will fluctuate so that shares and/or units, at redemption, may be worth more or less than their original cost. Please log on to www.voyainvestments.com or call (800) 262-3862 to get performance through the most recent month end.
Portfolio holdings are subject to change daily.
| Portfolio Managers’ Report | Voya Solution 2065 Portfolio |
| | | Average Annual Total Returns for the Periods Ended December 31, 2021 | | |
| | | | | | 1 Year | | | Since Inception
of Classes ADV, I, S, S2 and T
July 29, 2020 | | |
| | | Class ADV | | | | | 17.05% | | | | | | 25.06% | | | |
| | | Class I | | | | | 17.64% | | | | | | 25.70% | | | |
| | | Class S | | | | | 17.30% | | | | | | 25.39% | | | |
| | | Class S2 | | | | | 17.17% | | | | | | 25.22% | | | |
| | | Class T | | | | | 16.67% | | | | | | 24.75% | | | |
| | | S&P Target Date 2060+ Index | | | | | 18.05% | | | | | | 24.81% | | | |
| | | | | |
Based on a $10,000 initial investment, the graph and table above illustrate the total return of Voya Solution 2065 Portfolio against the index indicated. The index is unmanaged and has no cash in its portfolio and imposes no sales charges. An investor cannot invest directly in an index.
The Portfolio’s performance is shown without the imposition of any expenses or charges which are, or may be, imposed under your variable annuity contract or variable life insurance policy. Total returns would have been lower if such expenses or charges were included.
The performance graph and table do not reflect the deduction of taxes that a shareholder will pay on Portfolio distributions or the redemption of Portfolio shares.
The performance shown includes, if applicable, the effect of fee waivers and/or expense reimbursements by the Investment Adviser and/or other service providers, which have
the effect of increasing total return. Had all fees and expenses been considered, the total returns would have been lower.
It is important to note that the Fund has a limited operating history. Performance over a longer period of time may be more meaningful than short-term performance.
The performance update illustrates performance for a variable investment option available through a variable annuity contract or a variable life insurance policy. The performance shown indicates past performance and is not a projection or prediction of future results. Actual investment returns and principal value will fluctuate so that shares and/or units, at redemption, may be worth more or less than their original cost. Please log on to www.voyainvestments.com or call (800) 262-3862 to get performance through the most recent month end.
Portfolio holdings are subject to change daily.
SHAREHOLDER EXPENSE EXAMPLES (Unaudited)
As a shareholder of a Portfolio, you incur two types of costs: (1) transaction costs, including redemption fees and exchange fees; and (2) ongoing costs including management fees, distribution and/or service (12b-1) fees, and other Portfolio expenses. These Examples are intended to help you understand your ongoing costs (in dollars) of investing in a Portfolio and to compare these costs with the ongoing costs of investing in other mutual funds.
The Examples are based on an investment of $1,000 invested at the beginning of the period and held for the entire period from July 1, 2021 to December 31, 2021. The Portfolios’ expenses are shown without the imposition of any charges which are, or may be, imposed under your variable annuity contract, variable life insurance policy, qualified pension or retirement plan. Expenses would have been higher if such charges were included.
Actual Expenses
The left section of the table shown below, “Actual Portfolio Return,” provides information about actual account values and actual expenses. You may use the information in this section, together with the amount you invested, to estimate the expenses that you paid over the period. Simply divide your account value by $1,000 (for example, an $8,600 account value divided by $1,000 = 8.6), then multiply the result by the number in the first section under the heading entitled “Expenses Paid During the Period” to estimate the expenses you paid on your account during this period.
Hypothetical Example for Comparison Purposes
The right section of the table shown below, “Hypothetical (5% return before expenses),” provides information about hypothetical account values and hypothetical expenses based on a Portfolio’s actual expense ratio and an assumed rate of return of 5% per year before expenses, which is not a Portfolio’s actual return. The hypothetical account values and expenses may not be used to estimate the actual ending account balance or expenses you paid for the period. You may use this information to compare the ongoing costs of investing in a Portfolio and other mutual funds. To do so, compare this 5% hypothetical example with the 5% hypothetical examples that appear in the shareholder reports of the other mutual funds.
Please note that the expenses shown in the table are meant to highlight your ongoing costs only and do not reflect any transactional costs, such as redemption fees or exchange fees. Therefore, the hypothetical section of the table is useful in comparing ongoing costs only, and will not help you determine the relative total costs of owning different mutual funds. In addition, if these transactional costs were included, your costs would have been higher.
| | | | Actual Portfolio Return | | | Hypothetical (5% return before expenses) | |
| | | | Beginning
Account
Value
July 1,
2021 | | | Ending
Account
Value
December 31,
2021 | | | Annualized
Expense
Ratio* | | | Expenses Paid
During the
Period Ended
December 31,
2021** | | | Beginning
Account
Value
July 1,
2021 | | | Ending
Account
Value
December 31,
2021 | | | Annualized
Expense
Ratio* | | | Expenses Paid
During the
Period Ended
December 31,
2021** | |
| Voya Solution Aggressive Portfolio | |
| Class ADV | | | | $ | 1,000.00 | | | | | $ | 1,053.70 | | | | | | 0.81% | | | | | $ | 4.19 | | | | | $ | 1,000.00 | | | | | $ | 1,021.12 | | | | | | 0.81% | | | | | $ | 4.13 | | |
| Class I | | | | | 1,000.00 | | | | | | 1,056.00 | | | | | | 0.31 | | | | | | 1.61 | | | | | | 1,000.00 | | | | | | 1,023.64 | | | | | | 0.31 | | | | | | 1.58 | | |
| Class R6 | | | | | 1,000.00 | | | | | | 1,056.00 | | | | | | 0.31 | | | | | | 1.61 | | | | | | 1,000.00 | | | | | | 1,023.64 | | | | | | 0.31 | | | | | | 1.58 | | |
| Class S | | | | | 1,000.00 | | | | | | 1,055.50 | | | | | | 0.56 | | | | | | 2.90 | | | | | | 1,000.00 | | | | | | 1,022.38 | | | | | | 0.56 | | | | | | 2.85 | | |
| Class S2 | | | | | 1,000.00 | | | | | | 1,054.40 | | | | | | 0.71 | | | | | | 3.68 | | | | | | 1,000.00 | | | | | | 1,021.63 | | | | | | 0.71 | | | | | | 3.62 | | |
| Voya Solution Balanced Portfolio | |
| Class ADV | | | | $ | 1,000.00 | | | | | $ | 1,044.70 | | | | | | 0.80% | | | | | $ | 4.12 | | | | | $ | 1,000.00 | | | | | $ | 1,021.17 | | | | | | 0.80% | | | | | $ | 4.08 | | |
| Class I | | | | | 1,000.00 | | | | | | 1,046.60 | | | | | | 0.30 | | | | | | 1.55 | | | | | | 1,000.00 | | | | | | 1,023.69 | | | | | | 0.30 | | | | | | 1.53 | | |
| Class R6 | | | | | 1,000.00 | | | | | | 1,046.60 | | | | | | 0.30 | | | | | | 1.55 | | | | | | 1,000.00 | | | | | | 1,023.69 | | | | | | 0.30 | | | | | | 1.53 | | |
| Class S | | | | | 1,000.00 | | | | | | 1,045.00 | | | | | | 0.55 | | | | | | 2.83 | | | | | | 1,000.00 | | | | | | 1,022.43 | | | | | | 0.55 | | | | | | 2.80 | | |
| Class S2 | | | | | 1,000.00 | | | | | | 1,045.10 | | | | | | 0.70 | | | | | | 3.61 | | | | | | 1,000.00 | | | | | | 1,021.68 | | | | | | 0.70 | | | | | | 3.57 | | |
| Voya Solution Conservative Portfolio | |
| Class ADV | | | | $ | 1,000.00 | | | | | $ | 1,017.30 | | | | | | 0.69% | | | | | $ | 3.51 | | | | | $ | 1,000.00 | | | | | $ | 1,021.73 | | | | | | 0.69% | | | | | $ | 3.52 | | |
| Class I | | | | | 1,000.00 | | | | | | 1,020.00 | | | | | | 0.19 | | | | | | 0.97 | | | | | | 1,000.00 | | | | | | 1,024.25 | | | | | | 0.19 | | | | | | 0.97 | | |
| Class R6 | | | | | 1,000.00 | | | | | | 1,020.10 | | | | | | 0.19 | | | | | | 0.97 | | | | | | 1,000.00 | | | | | | 1,024.25 | | | | | | 0.19 | | | | | | 0.97 | | |
| Class S | | | | | 1,000.00 | | | | | | 1,018.30 | | | | | | 0.44 | | | | | | 2.24 | | | | | | 1,000.00 | | | | | | 1,022.99 | | | | | | 0.44 | | | | | | 2.24 | | |
| Class S2 | | | | | 1,000.00 | | | | | | 1,017.80 | | | | | | 0.59 | | | | | | 3.00 | | | | | | 1,000.00 | | | | | | 1,022.23 | | | | | | 0.59 | | | | | | 3.01 | | |
SHAREHOLDER EXPENSE EXAMPLES (Unaudited) (continued)
| | | | Actual Portfolio Return | | | Hypothetical (5% return before expenses) | |
| | | | Beginning
Account
Value
July 1,
2021 | | | Ending
Account
Value
December 31,
2021 | | | Annualized
Expense
Ratio* | | | Expenses Paid
During the
Period Ended
December 31,
2021** | | | Beginning
Account
Value
July 1,
2021 | | | Ending
Account
Value
December 31,
2021 | | | Annualized
Expense
Ratio* | | | Expenses Paid
During the
Period Ended
December 31,
2021** | |
| Voya Solution Income Portfolio | |
| Class ADV | | | | $ | 1,000.00 | | | | | $ | 1,020.20 | | | | | | 0.72% | | | | | $ | 3.67 | | | | | $ | 1,000.00 | | | | | $ | 1,021.58 | | | | | | 0.72% | | | | | $ | 3.67 | | |
| Class I | | | | | 1,000.00 | | | | | | 1,022.50 | | | | | | 0.22 | | | | | | 1.12 | | | | | | 1,000.00 | | | | | | 1,024.10 | | | | | | 0.22 | | | | | | 1.12 | | |
| Class S | | | | | 1,000.00 | | | | | | 1,021.40 | | | | | | 0.47 | | | | | | 2.39 | | | | | | 1,000.00 | | | | | | 1,022.84 | | | | | | 0.47 | | | | | | 2.40 | | |
| Class S2 | | | | | 1,000.00 | | | | | | 1,020.80 | | | | | | 0.62 | | | | | | 3.16 | | | | | | 1,000.00 | | | | | | 1,022.08 | | | | | | 0.62 | | | | | | 3.16 | | |
| Class T | | | | | 1,000.00 | | | | | | 1,019.70 | | | | | | 0.92 | | | | | | 4.68 | | | | | | 1,000.00 | | | | | | 1,020.57 | | | | | | 0.92 | | | | | | 4.69 | | |
| Voya Solution Moderately Aggressive Portfolio | |
| Class ADV | | | | $ | 1,000.00 | | | | | $ | 1,047.70 | | | | | | 0.81% | | | | | $ | 4.18 | | | | | $ | 1,000.00 | | | | | $ | 1,021.12 | | | | | | 0.81% | | | | | $ | 4.13 | | |
| Class I | | | | | 1,000.00 | | | | | | 1,050.10 | | | | | | 0.31 | | | | | | 1.60 | | | | | | 1,000.00 | | | | | | 1,023.64 | | | | | | 0.31 | | | | | | 1.58 | | |
| Class R6 | | | | | 1,000.00 | | | | | | 1,050.20 | | | | | | 0.30 | | | | | | 1.55 | | | | | | 1,000.00 | | | | | | 1,023.69 | | | | | | 0.30 | | | | | | 1.53 | | |
| Class S | | | | | 1,000.00 | | | | | | 1,049.20 | | | | | | 0.56 | | | | | | 2.89 | | | | | | 1,000.00 | | | | | | 1,022.38 | | | | | | 0.56 | | | | | | 2.85 | | |
| Class S2 | | | | | 1,000.00 | | | | | | 1,048.60 | | | | | | 0.71 | | | | | | 3.67 | | | | | | 1,000.00 | | | | | | 1,021.63 | | | | | | 0.71 | | | | | | 3.62 | | |
| Voya Solution Moderately Conservative Portfolio | |
| Class ADV | | | | $ | 1,000.00 | | | | | $ | 1,029.00 | | | | | | 0.73% | | | | | $ | 3.73 | | | | | $ | 1,000.00 | | | | | $ | 1,021.53 | | | | | | 0.73% | | | | | $ | 3.72 | | |
| Class I | | | | | 1,000.00 | | | | | | 1,032.20 | | | | | | 0.23 | | | | | | 1.18 | | | | | | 1,000.00 | | | | | | 1,024.05 | | | | | | 0.23 | | | | | | 1.17 | | |
| Class R6 | | | | | 1,000.00 | | | | | | 1,032.20 | | | | | | 0.23 | | | | | | 1.18 | | | | | | 1,000.00 | | | | | | 1,024.05 | | | | | | 0.23 | | | | | | 1.17 | | |
| Class S | | | | | 1,000.00 | | | | | | 1,030.80 | | | | | | 0.48 | | | | | | 2.46 | | | | | | 1,000.00 | | | | | | 1,022.79 | | | | | | 0.48 | | | | | | 2.45 | | |
| Class S2 | | | | | 1,000.00 | | | | | | 1,029.70 | | | | | | 0.63 | | | | | | 3.22 | | | | | | 1,000.00 | | | | | | 1,022.03 | | | | | | 0.63 | | | | | | 3.21 | | |
| Voya Solution 2025 Portfolio | |
| Class ADV | | | | $ | 1,000.00 | | | | | $ | 1,030.00 | | | | | | 0.70% | | | | | $ | 3.58 | | | | | $ | 1,000.00 | | | | | $ | 1,021.68 | | | | | | 0.70% | | | | | $ | 3.57 | | |
| Class I | | | | | 1,000.00 | | | | | | 1,032.00 | | | | | | 0.20 | | | | | | 1.02 | | | | | | 1,000.00 | | | | | | 1,024.20 | | | | | | 0.20 | | | | | | 1.02 | | |
| Class S | | | | | 1,000.00 | | | | | | 1,031.40 | | | | | | 0.45 | | | | | | 2.30 | | | | | | 1,000.00 | | | | | | 1,022.94 | | | | | | 0.45 | | | | | | 2.29 | | |
| Class S2 | | | | | 1,000.00 | | | | | | 1,030.00 | | | | | | 0.60 | | | | | | 3.07 | | | | | | 1,000.00 | | | | | | 1,022.18 | | | | | | 0.60 | | | | | | 3.06 | | |
| Class T | | | | | 1,000.00 | | | | | | 1,028.90 | | | | | | 0.90 | | | | | | 4.60 | | | | | | 1,000.00 | | | | | | 1,020.67 | | | | | | 0.90 | | | | | | 4.58 | | |
| Voya Solution 2030 Portfolio | |
| Class ADV | | | | $ | 1,000.00 | | | | | $ | 1,035.80 | | | | | | 0.67% | | | | | $ | 3.44 | | | | | $ | 1,000.00 | | | | | $ | 1,021.83 | | | | | | 0.67% | | | | | $ | 3.41 | | |
| Class I | | | | | 1,000.00 | | | | | | 1,038.30 | | | | | | 0.17 | | | | | | 0.87 | | | | | | 1,000.00 | | | | | | 1,024.35 | | | | | | 0.17 | | | | | | 0.87 | | |
| Class S | | | | | 1,000.00 | | | | | | 1,037.10 | | | | | | 0.42 | | | | | | 2.16 | | | | | | 1,000.00 | | | | | | 1,023.09 | | | | | | 0.42 | | | | | | 2.14 | | |
| Class S2 | | | | | 1,000.00 | | | | | | 1,036.40 | | | | | | 0.57 | | | | | | 2.93 | | | | | | 1,000.00 | | | | | | 1,022.33 | | | | | | 0.57 | | | | | | 2.91 | | |
| Class T | | | | | 1,000.00 | | | | | | 1,034.90 | | | | | | 0.87 | | | | | | 4.46 | | | | | | 1,000.00 | | | | | | 1,020.82 | | | | | | 0.87 | | | | | | 4.43 | | |
| Voya Solution 2035 Portfolio | |
| Class ADV | | | | $ | 1,000.00 | | | | | $ | 1,037.70 | | | | | | 0.65% | | | | | $ | 3.34 | | | | | $ | 1,000.00 | | | | | $ | 1,021.93 | | | | | | 0.65% | | | | | $ | 3.31 | | |
| Class I | | | | | 1,000.00 | | | | | | 1,040.20 | | | | | | 0.15 | | | | | | 0.77 | | | | | | 1,000.00 | | | | | | 1,024.45 | | | | | | 0.15 | | | | | | 0.77 | | |
| Class S | | | | | 1,000.00 | | | | | | 1,039.60 | | | | | | 0.40 | | | | | | 2.06 | | | | | | 1,000.00 | | | | | | 1,023.19 | | | | | | 0.40 | | | | | | 2.04 | | |
| Class S2 | | | | | 1,000.00 | | | | | | 1,038.60 | | | | | | 0.55 | | | | | | 2.83 | | | | | | 1,000.00 | | | | | | 1,022.43 | | | | | | 0.55 | | | | | | 2.80 | | |
| Class T | | | | | 1,000.00 | | | | | | 1,035.70 | | | | | | 0.85 | | | | | | 4.36 | | | | | | 1,000.00 | | | | | | 1,020.92 | | | | | | 0.85 | | | | | | 4.33 | | |
| Voya Solution 2040 Portfolio | |
| Class ADV | | | | $ | 1,000.00 | | | | | $ | 1,041.50 | | | | | | 0.64% | | | | | $ | 3.29 | | | | | $ | 1,000.00 | | | | | $ | 1,021.98 | | | | | | 0.64% | | | | | $ | 3.26 | | |
| Class I | | | | | 1,000.00 | | | | | | 1,044.40 | | | | | | 0.14 | | | | | | 0.72 | | | | | | 1,000.00 | | | | | | 1,024.50 | | | | | | 0.14 | | | | | | 0.71 | | |
| Class S | | | | | 1,000.00 | | | | | | 1,043.20 | | | | | | 0.39 | | | | | | 2.01 | | | | | | 1,000.00 | | | | | | 1,023.24 | | | | | | 0.39 | | | | | | 1.99 | | |
| Class S2 | | | | | 1,000.00 | | | | | | 1,042.00 | | | | | | 0.54 | | | | | | 2.78 | | | | | | 1,000.00 | | | | | | 1,022.48 | | | | | | 0.54 | | | | | | 2.75 | | |
| Class T | | | | | 1,000.00 | | | | | | 1,040.10 | | | | | | 0.84 | | | | | | 4.32 | | | | | | 1,000.00 | | | | | | 1,020.97 | | | | | | 0.84 | | | | | | 4.28 | | |
SHAREHOLDER EXPENSE EXAMPLES (Unaudited) (continued)
| | | | Actual Portfolio Return | | | Hypothetical (5% return before expenses) | |
| | | | Beginning
Account
Value
July 1,
2021 | | | Ending
Account
Value
December 31,
2021 | | | Annualized
Expense
Ratio* | | | Expenses Paid
During the
Period Ended
December 31,
2021** | | | Beginning
Account
Value
July 1,
2021 | | | Ending
Account
Value
December 31,
2021 | | | Annualized
Expense
Ratio* | | | Expenses Paid
During the
Period Ended
December 31,
2021** | |
| Voya Solution 2045 Portfolio | |
| Class ADV | | | | $ | 1,000.00 | | | | | $ | 1,044.60 | | | | | | 65.00% | | | | | $ | 334.98 | | | | | $ | 1,000.00 | | | | | $ | 697.53 | | | | | | 65.00% | | | | | $ | 278.12 | | |
| Class I | | | | | 1,000.00 | | | | | | 1,046.80 | | | | | | 0.15 | | | | | | 0.77 | | | | | | 1,000.00 | | | | | | 1,024.45 | | | | | | 0.15 | | | | | | 0.77 | | |
| Class S | | | | | 1,000.00 | | | | | | 1,046.20 | | | | | | 0.40 | | | | | | 2.06 | | | | | | 1,000.00 | | | | | | 1,023.19 | | | | | | 0.40 | | | | | | 2.04 | | |
| Class S2 | | | | | 1,000.00 | | | | | | 1,045.30 | | | | | | 0.55 | | | | | | 2.84 | | | | | | 1,000.00 | | | | | | 1,022.43 | | | | | | 0.55 | | | | | | 2.80 | | |
| Class T | | | | | 1,000.00 | | | | | | 1,043.80 | | | | | | 0.85 | | | | | | 4.38 | | | | | | 1,000.00 | | | | | | 1,020.92 | | | | | | 0.85 | | | | | | 4.33 | | |
| Voya Solution 2050 Portfolio | |
| Class ADV | | | | $ | 1,000.00 | | | | | $ | 1,043.30 | | | | | | 0.65% | | | | | $ | 3.35 | | | | | $ | 1,000.00 | | | | | $ | 1,021.93 | | | | | | 0.65% | | | | | $ | 3.31 | | |
| Class I | | | | | 1,000.00 | | | | | | 1,045.80 | | | | | | 0.15 | | | | | | 0.77 | | | | | | 1,000.00 | | | | | | 1,024.45 | | | | | | 0.15 | | | | | | 0.77 | | |
| Class S | | | | | 1,000.00 | | | | | | 1,044.60 | | | | | | 0.40 | | | | | | 2.06 | | | | | | 1,000.00 | | | | | | 1,023.19 | | | | | | 0.40 | | | | | | 2.04 | | |
| Class S2 | | | | | 1,000.00 | | | | | | 1,043.80 | | | | | | 0.55 | | | | | | 2.83 | | | | | | 1,000.00 | | | | | | 1,022.43 | | | | | | 0.55 | | | | | | 2.80 | | |
| Class T | | | | | 1,000.00 | | | | | | 1,042.10 | | | | | | 0.85 | | | | | | 4.38 | | | | | | 1,000.00 | | | | | | 1,020.92 | | | | | | 0.85 | | | | | | 4.33 | | |
| Voya Solution 2055 Portfolio | |
| Class ADV | | | | $ | 1,000.00 | | | | | $ | 1,042.90 | | | | | | 0.66% | | | | | $ | 3.40 | | | | | $ | 1,000.00 | | | | | $ | 1,021.88 | | | | | | 0.66% | | | | | $ | 3.36 | | |
| Class I | | | | | 1,000.00 | | | | | | 1,045.40 | | | | | | 0.16 | | | | | | 0.82 | | | | | | 1,000.00 | | | | | | 1,024.40 | | | | | | 0.16 | | | | | | 0.82 | | |
| Class S | | | | | 1,000.00 | | | | | | 1,044.30 | | | | | | 0.41 | | | | | | 2.11 | | | | | | 1,000.00 | | | | | | 1,023.14 | | | | | | 0.41 | | | | | | 2.09 | | |
| Class S2 | | | | | 1,000.00 | | | | | | 1,043.00 | | | | | | 0.56 | | | | | | 2.88 | | | | | | 1,000.00 | | | | | | 1,022.38 | | | | | | 0.56 | | | | | | 2.85 | | |
| Class T | | | | | 1,000.00 | | | | | | 1,041.80 | | | | | | 0.86 | | | | | | 4.43 | | | | | | 1,000.00 | | | | | | 1,020.87 | | | | | | 0.86 | | | | | | 4.38 | | |
| Voya Solution 2060 Portfolio | |
| Class ADV | | | | $ | 1,000.00 | | | | | $ | 1,043.00 | | | | | | 0.68% | | | | | $ | 3.50 | | | | | $ | 1,000.00 | | | | | $ | 1,021.78 | | | | | | 0.68% | | | | | $ | 3.47 | | |
| Class I | | | | | 1,000.00 | | | | | | 1,045.20 | | | | | | 0.18 | | | | | | 0.93 | | | | | | 1,000.00 | | | | | | 1,024.30 | | | | | | 0.18 | | | | | | 0.92 | | |
| Class S | | | | | 1,000.00 | | | | | | 1,044.20 | | | | | | 0.43 | | | | | | 2.22 | | | | | | 1,000.00 | | | | | | 1,023.04 | | | | | | 0.43 | | | | | | 2.19 | | |
| Class S2 | | | | | 1,000.00 | | | | | | 1,042.80 | | | | | | 0.58 | | | | | | 2.99 | | | | | | 1,000.00 | | | | | | 1,022.28 | | | | | | 0.58 | | | | | | 2.96 | | |
| Class T | | | | | 1,000.00 | | | | | | 1,041.30 | | | | | | 0.88 | | | | | | 4.53 | | | | | | 1,000.00 | | | | | | 1,020.77 | | | | | | 0.88 | | | | | | 4.48 | | |
| Voya Solution 2065 Portfolio | |
| Class ADV | | | | $ | 1,000.00 | | | | | $ | 1,043.90 | | | | | | 0.67% | | | | | $ | 2.93 | | | | | $ | 1,000.00 | | | | | $ | 1,021.83 | | | | | | 0.67% | | | | | $ | 3.41 | | |
| Class I | | | | | 1,000.00 | | | | | | 1,046.90 | | | | | | 0.17 | | | | | | 0.74 | | | | | | 1,000.00 | | | | | | 1,024.35 | | | | | | 0.17 | | | | | | 0.87 | | |
| Class S | | | | | 1,000.00 | | | | | | 1,045.50 | | | | | | 0.42 | | | | | | 1.84 | | | | | | 1,000.00 | | | | | | 1,023.09 | | | | | | 0.42 | | | | | | 2.14 | | |
| Class S2 | | | | | 1,000.00 | | | | | | 1,045.10 | | | | | | 0.06 | | | | | | 0.25 | | | | | | 1,000.00 | | | | | | 1,024.92 | | | | | | 0.06 | | | | | | 0.29 | | |
| Class T | | | | | 1,000.00 | | | | | | 1,042.30 | | | | | | 0.87 | | | | | | 3.80 | | | | | | 1,000.00 | | | | | | 1,020.82 | | | | | | 0.87 | | | | | | 4.43 | | |
*
The annualized expense ratios do not include expenses of the underlying funds.
**
Expenses are equal to each Portfolio’s respective annualized expense ratios multiplied by the average account value over the period, multiplied by 184/366 to reflect the most recent fiscal half-year.
REPORT OF INDEPENDENT REGISTERED PUBLIC ACCOUNTING FIRM
To the Shareholders of Voya Solution Aggressive Portfolio, Voya Solution Balanced Portfolio, Voya Solution Conservative Portfolio, Voya Solution Income Portfolio, Voya Solution Moderately Aggressive Portfolio, Voya Solution Moderately Conservative Portfolio, Voya Solution 2025 Portfolio, Voya Solution 2030 Portfolio, Voya Solution 2035 Portfolio, Voya Solution 2040 Portfolio, Voya Solution 2045 Portfolio, Voya Solution 2050 Portfolio, Voya Solution 2055 Portfolio, Voya Solution 2060 Portfolio and Voya Solution 2065 Portfolio and the Board of Directors of Voya Partners, Inc.
Opinion on the Financial Statements
We have audited the accompanying statements of assets and liabilities of Voya Solution Aggressive Portfolio, Voya Solution Balanced Portfolio, Voya Solution Conservative Portfolio, Voya Solution Income Portfolio, Voya Solution Moderately Aggressive Portfolio, Voya Solution Moderately Conservative Portfolio, Voya Solution 2025 Portfolio, Voya Solution 2030 Portfolio, Voya Solution 2035 Portfolio, Voya Solution 2040 Portfolio, Voya Solution 2045 Portfolio, Voya Solution 2050 Portfolio, Voya Solution 2055 Portfolio, Voya Solution 2060 Portfolio and Voya Solution 2065 Portfolio (collectively referred to as the “Portfolios”) (fifteen of the portfolios constituting Voya Partners, Inc. (the “Company”)), including the portfolios of investments, as of December 31, 2021, and the related statements of operations and changes in net assets and the financial highlights for each of the periods indicated in the table below and the related notes (collectively referred to as the “financial statements”). In our opinion, the financial statements present fairly, in all material respects, the financial position of the Portfolios (fifteen of the portfolios constituting Voya Partners, Inc.) at December 31, 2021, and the results of their operations, the changes in their net assets and their financial highlights for each of the periods indicated in the table below, in conformity with U.S. generally accepted accounting principles.
| Individual portfolio constituting Voya Partners, Inc. | | | Statement of Operations | | | Statements of changes
in net assets | | | Financial highlights | |
| Voya Solution Aggressive Portfolio | | | For the year ended December 31, 2021 | | | For each of the two years in the period ended
December 31, 2021 | |
| Voya Solution Balanced Portfolio | | | For the year ended December 31, 2021 | | | For each of the two years in the period ended
December 31, 2021 | |
| Voya Solution Conservative Portfolio | | | For the year ended December 31, 2021 | | | For each of the two years in the period ended
December 31, 2021 | |
| Voya Solution Income Portfolio | | | For the year ended December 31, 2021 | | | For each of the two years in the period ended
December 31, 2021 | |
| Voya Solution Moderately Aggressive Portfolio | | | For the year ended December 31, 2021 | | | For each of the two years in the period ended
December 31, 2021 | |
| Voya Solution Moderately Conservative Portfolio | | | For the year ended December 31, 2021 | | | For each of the two years in the period ended
December 31, 2021 | |
| Voya Solution 2025 Portfolio | | | For the year ended December 31, 2021 | | | For each of the two years in the period ended
December 31, 2021 | |
| Voya Solution 2030 Portfolio | | | For the year ended December 31, 2021 | | | For each of the two years in the period ended
December 31, 2021 | |
| Voya Solution 2035 Portfolio | | | For the year ended December 31, 2021 | | | For each of the two years in the period ended
December 31, 2021 | |
| Voya Solution 2040 Portfolio | | | For the year ended December 31, 2021 | | | For each of the two years in the period ended
December 31, 2021 | |
| Voya Solution 2045 Portfolio | | | For the year ended December 31, 2021 | | | For each of the two years in the period ended
December 31, 2021 | |
| Voya Solution 2050 Portfolio | | | For the year ended December 31, 2021 | | | For each of the two years in the period ended
December 31, 2021 | |
| Voya Solution 2055 Portfolio | | | For the year ended December 31, 2021 | | | For each of the two years in the period ended
December 31, 2021 | |
| Voya Solution 2060 Portfolio | | | For the year ended December 31, 2021 | | | For each of the two years in the period ended
December 31, 2021 | |
| Voya Solution 2065 Portfolio | | | For the year ended December 31, 2021 | | | For the year ended December 31, 2021 and the period from July 29, 2020 (commencement of operations) through December 31, 2020 | |
REPORT OF INDEPENDENT REGISTERED PUBLIC ACCOUNTING FIRM (continued)
The financial highlights for each of the periods in the three-year period ended December 31, 2019, were audited by another independent registered public accounting firm whose report, dated February 26, 2020, expressed an unqualified opinion on those financial highlights.
Basis for Opinion
These financial statements are the responsibility of the Company’s management. Our responsibility is to express an opinion on the Portfolios’ financial statements based on our audits. We are a public accounting firm registered with the Public Company Accounting Oversight Board (United States) (“PCAOB”) and are required to be independent with respect to the Company in accordance with the U.S. federal securities laws and the applicable rules and regulations of the Securities and Exchange Commission and the PCAOB.
We conducted our audits in accordance with the standards of the PCAOB. Those standards require that we plan and perform the audits to obtain reasonable assurance about whether the financial statements are free of material misstatement, whether due to error or fraud. The Company is not required to have, nor were we engaged to perform, an audit of the Company’s internal control over financial reporting. As part of our audits, we are required to obtain an understanding of internal control over financial reporting, but not for the purpose of expressing an opinion on the effectiveness of the Company’s internal control over financial reporting. Accordingly, we express no such opinion.
Our audits included performing procedures to assess the risks of material misstatement of the financial statements, whether due to error or fraud, and performing procedures that respond to those risks. Such procedures included examining, on a test basis, evidence regarding the amounts and disclosures in the financial statements. Our procedures included confirmation of securities owned as of December 31, 2021, by correspondence with the custodian and others or by other appropriate auditing procedures where replies from others were not received. Our audits also included evaluating the accounting principles used and significant estimates made by management, as well as evaluating the overall presentation of the financial statements. We believe that our audits provide a reasonable basis for our opinion.
We have served as the auditor of one or more Voya investment companies since 2019.
Boston, Massachusetts
February 24, 2022
STATEMENTS OF ASSETS AND LIABILITIES as of December 31, 2021
| | | | Voya Solution
Aggressive
Portfolio | | | Voya Solution
Balanced
Portfolio | | | Voya Solution
Conservative
Portfolio | | | Voya Solution
Income
Portfolio | |
| ASSETS: | | | | | | | | | | | | | | | | | | | | | | | | | |
| Investments in affiliated underlying funds at fair value* | | | | $ | 25,889,808 | | | | | $ | 53,391,322 | | | | | $ | 16,209,954 | | | | | $ | 247,243,637 | | |
| Investments in unaffiliated underlying funds at fair value** | | | | | 5,917,595 | | | | | | 10,929,165 | | | | | | 1,531,156 | | | | | | 36,111,622 | | |
| Cash | | | | | 32,878 | | | | | | 85,168 | | | | | | 20,893 | | | | | | 330,793 | | |
| Receivables: | | | | | | | | | | | | | | | | | | | | | | | | | |
| Fund shares sold | | | | | 141,194 | | | | | | 65,567 | | | | | | 2,404 | | | | | | 205,234 | | |
| Prepaid expenses | | | | | — | | | | | | — | | | | | | — | | | | | | 27 | | |
| Reimbursement due from Investment Adviser | | | | | 844 | | | | | | — | | | | | | 3,073 | | | | | | 17,521 | | |
| Other assets | | | | | 395 | | | | | | 1,827 | | | | | | 556 | | | | | | 22,735 | | |
| Total assets | | | | | 31,982,714 | | | | | | 64,473,049 | | | | | | 17,768,036 | | | | | | 283,931,569 | | |
| LIABILITIES: | | | | | | | | | | | | | | | | | | | | | | | | | |
| Payable for investments in affiliated underlying funds purchased | | | | | 141,186 | | | | | | 65,566 | | | | | | 2,402 | | | | | | 59,506 | | |
| Payable for fund shares redeemed | | | | | 8 | | | | | | — | | | | | | — | | | | | | 145,728 | | |
| Payable for investment management fees | | | | | 8,709 | | | | | | 19,377 | | | | | | 3,270 | | | | | | 54,178 | | |
| Payable for distribution and shareholder service fees | | | | | 3,248 | | | | | | 10,061 | | | | | | 2,612 | | | | | | 82,937 | | |
| Payable for directors fees | | | | | 144 | | | | | | 305 | | | | | | 83 | | | | | | 1,488 | | |
| Payable to directors under the deferred compensation plan (Note 6) | | | | | 395 | | | | | | 1,827 | | | | | | 556 | | | | | | 22,735 | | |
| Other accrued expenses and liabilities | | | | | 13,218 | | | | | | 28,710 | | | | | | 10,713 | | | | | | 156,970 | | |
| Total liabilities | | | | | 166,908 | | | | | | 125,846 | | | | | | 19,636 | | | | | | 523,542 | | |
| NET ASSETS | | | | $ | 31,815,806 | | | | | $ | 64,347,203 | | | | | $ | 17,748,400 | | | | | $ | 283,408,027 | | |
| NET ASSETS WERE COMPRISED OF: | | | | | | | | | | | | | | | | | | | | | | | | | |
| Paid-in capital | | | | $ | 23,803,565 | | | | | $ | 50,750,041 | | | | | $ | 15,875,152 | | | | | $ | 239,715,243 | | |
| Total distributable earnings | | | | | 8,012,241 | | | | | | 13,597,162 | | | | | | 1,873,248 | | | | | | 43,692,784 | | |
| NET ASSETS | | | | $ | 31,815,806 | | | | | $ | 64,347,203 | | | | | $ | 17,748,400 | | | | | $ | 283,408,027 | | |
*
Cost of investments in affiliated underlying funds | | | | $ | 23,292,298 | | | | | $ | 49,966,078 | | | | | $ | 16,112,838 | | | | | $ | 236,373,306 | | |
**
Cost of investments in unaffiliated underlying funds | | | | $ | 5,022,930 | | | | | $ | 8,620,314 | | | | | $ | 1,357,583 | | | | | $ | 32,579,367 | | |
See Accompanying Notes to Financial Statements
STATEMENTS OF ASSETS AND LIABILITIES as of December 31, 2021 (continued)
| | | | Voya Solution
Aggressive
Portfolio | | | Voya Solution
Balanced
Portfolio | | | Voya Solution
Conservative
Portfolio | | | Voya Solution
Income
Portfolio | |
| Class ADV | | | | | | | | | | | | | | | | | | | | | | | | | |
| Net assets | | | | $ | 4,406,175 | | | | | $ | 10,712,780 | | | | | $ | 4,030,156 | | | | | $ | 144,001,425 | | |
| Shares authorized | | | | | 100,000,000 | | | | | | 100,000,000 | | | | | | 100,000,000 | | | | | | 100,000,000 | | |
| Par value | | | | $ | 0.001 | | | | | $ | 0.001 | | | | | $ | 0.001 | | | | | $ | 0.001 | | |
| Shares outstanding | | | | | 267,907 | | | | | | 933,517 | | | | | | 336,947 | | | | | | 11,296,045 | | |
| Net asset value and redemption price per share | | | | $ | 16.45 | | | | | $ | 11.48 | | | | | $ | 11.96 | | | | | $ | 12.75 | | |
| Class I | | | | | | | | | | | | | | | | | | | | | | | | | |
| Net assets | | | | $ | 488,199 | | | | | $ | 3,830,584 | | | | | $ | 913,456 | | | | | $ | 40,086,068 | | |
| Shares authorized | | | | | 100,000,000 | | | | | | 100,000,000 | | | | | | 100,000,000 | | | | | | 100,000,000 | | |
| Par value | | | | $ | 0.001 | | | | | $ | 0.001 | | | | | $ | 0.001 | | | | | $ | 0.001 | | |
| Shares outstanding | | | | | 28,851 | | | | | | 319,760 | | | | | | 75,678 | | | | | | 3,059,059 | | |
| Net asset value and redemption price per share | | | | $ | 16.92 | | | | | $ | 11.98 | | | | | $ | 12.07 | | | | | $ | 13.10 | | |
| Class R6 | | | | | | | | | | | | | | | | | | | | | | | | | |
| Net assets | | | | $ | 21,062,317 | | | | | $ | 24,204,256 | | | | | $ | 9,364,690 | | | | | | n/a | | |
| Shares authorized | | | | | 100,000,000 | | | | | | 100,000,000 | | | | | | 100,000,000 | | | | | | n/a | | |
| Par value | | | | $ | 0.001 | | | | | $ | 0.001 | | | | | $ | 0.001 | | | | | | n/a | | |
| Shares outstanding | | | | | 1,244,466 | | | | | | 2,020,702 | | | | | | 775,941 | | | | | | n/a | | |
| Net asset value and redemption price per share | | | | $ | 16.92 | | | | | $ | 11.98 | | | | | $ | 12.07 | | | | | | n/a | | |
| Class S | | | | | | | | | | | | | | | | | | | | | | | | | |
| Net assets | | | | $ | 4,425,569 | | | | | $ | 24,043,737 | | | | | $ | 2,202,822 | | | | | $ | 93,573,447 | | |
| Shares authorized | | | | | 100,000,000 | | | | | | 100,000,000 | | | | | | 100,000,000 | | | | | | 100,000,000 | | |
| Par value | | | | $ | 0.001 | | | | | $ | 0.001 | | | | | $ | 0.001 | | | | | $ | 0.001 | | |
| Shares outstanding | | | | | 265,231 | | | | | | 2,067,857 | | | | | | 183,402 | | | | | | 7,206,363 | | |
| Net asset value and redemption price per share | | | | $ | 16.69 | | | | | $ | 11.63 | | | | | $ | 12.01 | | | | | $ | 12.98 | | |
| Class S2 | | | | | | | | | | | | | | | | | | | | | | | | | |
| Net assets | | | | $ | 1,433,546 | | | | | $ | 1,555,846 | | | | | $ | 1,237,276 | | | | | $ | 5,629,178 | | |
| Shares authorized | | | | | 100,000,000 | | | | | | 100,000,000 | | | | | | 100,000,000 | | | | | | 100,000,000 | | |
| Par value | | | | $ | 0.001 | | | | | $ | 0.001 | | | | | $ | 0.001 | | | | | $ | 0.001 | | |
| Shares outstanding | | | | | 87,642 | | | | | | 134,182 | | | | | | 104,432 | | | | | | 446,063 | | |
| Net asset value and redemption price per share | | | | $ | 16.36 | | | | | $ | 11.60 | | | | | $ | 11.85 | | | | | $ | 12.62 | | |
| Class T | | | | | | | | | | | | | | | | | | | | | | | | | |
| Net assets | | | | | n/a | | | | | | n/a | | | | | | n/a | | | | | $ | 117,909 | | |
| Shares authorized | | | | | n/a | | | | | | n/a | | | | | | n/a | | | | | | 100,000,000 | | |
| Par value | | | | | n/a | | | | | | n/a | | | | | | n/a | | | | | $ | 0.001 | | |
| Shares outstanding | | | | | n/a | | | | | | n/a | | | | | | n/a | | | | | | 8,503 | | |
| Net asset value and redemption price per share | | | | | n/a | | | | | | n/a | | | | | | n/a | | | | | $ | 13.87 | | |
See Accompanying Notes to Financial Statements
STATEMENTS OF ASSETS AND LIABILITIES as of December 31, 2021
| | | | Voya Solution
Moderately
Aggressive
Portfolio | | | Voya Solution
Moderately
Conservative
Portfolio | | | Voya Solution
2025 Portfolio | | | Voya Solution
2030 Portfolio | |
| ASSETS: | | | | | | | | | | | | | | | | | | | | | | | | | |
| Investments in affiliated underlying funds at fair value* | | | | $ | 507,925,614 | | | | | $ | 38,162,306 | | | | | $ | 556,727,974 | | | | | $ | 50,449,246 | | |
| Investments in unaffiliated underlying funds at fair value** | | | | | 117,466,733 | | | | | | 4,797,304 | | | | | | 57,376,034 | | | | | | 6,709,865 | | |
| Cash | | | | | 748,820 | | | | | | 20,606 | | | | | | 584,099 | | | | | | 68,376 | | |
| Receivables: | | | | | | | | | | | | | | | | | | | | | | | | | |
| Investments in affiliated underlying funds sold | | | | | 784,381 | | | | | | — | | | | | | — | | | | | | — | | |
| Fund shares sold | | | | | 51,201 | | | | | | 11,870 | | | | | | 209,895 | | | | | | 39,441 | | |
| Prepaid expenses | | | | | 53 | | | | | | 4 | | | | | | 56 | | | | | | 6 | | |
| Reimbursement due from Investment Adviser | | | | | — | | | | | | 3,624 | | | | | | 43,421 | | | | | | 11,089 | | |
| Other assets | | | | | 33,634 | | | | | | 1,290 | | | | | | 37,366 | | | | | | 775 | | |
| Total assets | | | | | 627,010,436 | | | | | | 42,997,004 | | | | | | 614,978,845 | | | | | | 57,278,798 | | |
| LIABILITIES: | | | | | | | | | | | | | | | | | | | | | | | | | |
| Payable for investments in affiliated underlying funds purchased | | | | | — | | | | | | 11,870 | | | | | | 187,968 | | | | | | 39,413 | | |
| Payable for fund shares redeemed | | | | | 835,582 | | | | | | — | | | | | | 21,928 | | | | | | 28 | | |
| Payable for investment management fees | | | | | 148,954 | | | | | | 8,026 | | | | | | 112,316 | | | | | | 10,791 | | |
| Payable for distribution and shareholder service fees | | | | | 129,755 | | | | | | 8,708 | | | | | | 166,147 | | | | | | 14,970 | | |
| Payable for directors fees | | | | | 3,135 | | | | | | 213 | | | | | | 3,146 | | | | | | 290 | | |
| Payable to directors under the deferred compensation plan (Note 6) | | | | | 33,634 | | | | | | 1,290 | | | | | | 37,366 | | | | | | 775 | | |
| Other accrued expenses and liabilities | | | | | 87,651 | | | | | | 32,925 | | | | | | 203,653 | | | | | | 66,499 | | |
| Total liabilities | | | | | 1,238,711 | | | | | | 63,032 | | | | | | 732,524 | | | | | | 132,766 | | |
| NET ASSETS | | | | $ | 625,771,725 | | | | | $ | 42,933,972 | | | | | $ | 614,246,321 | | | | | $ | 57,146,032 | | |
| NET ASSETS WERE COMPRISED OF: | | | | | | | | | | | | | | | | | | | | | | | | | |
| Paid-in capital | | | | $ | 465,360,923 | | | | | $ | 35,687,858 | | | | | $ | 486,325,680 | | | | | $ | 45,130,094 | | |
| Total distributable earnings | | | | | 160,410,802 | | | | | | 7,246,114 | | | | | | 127,920,641 | | | | | | 12,015,938 | | |
| NET ASSETS | | | | $ | 625,771,725 | | | | | $ | 42,933,972 | | | | | $ | 614,246,321 | | | | | $ | 57,146,032 | | |
*
Cost of investments in affiliated underlying funds | | | | $ | 450,561,756 | | | | | $ | 36,814,081 | | | | | $ | 528,964,128 | | | | | $ | 48,570,252 | | |
**
Cost of investments in unaffiliated underlying funds | | | | $ | 94,480,848 | | | | | $ | 4,114,275 | | | | | $ | 45,584,105 | | | | | $ | 5,626,073 | | |
See Accompanying Notes to Financial Statements
STATEMENTS OF ASSETS AND LIABILITIES as of December 31, 2021 (continued)
| | | | Voya Solution
Moderately
Aggressive
Portfolio | | | Voya Solution
Moderately
Conservative
Portfolio | | | Voya Solution
2025 Portfolio | | | Voya Solution
2030 Portfolio | |
| Class ADV | | | | | | | | | | | | | | | | | | | | | | | | | |
| Net assets | | | | $ | 26,263,088 | | | | | $ | 5,956,586 | | | | | $ | 234,207,183 | | | | | $ | 25,213,505 | | |
| Shares authorized | | | | | 100,000,000 | | | | | | 100,000,000 | | | | | | 100,000,000 | | | | | | 100,000,000 | | |
| Par value | | | | $ | 0.001 | | | | | $ | 0.001 | | | | | $ | 0.001 | | | | | $ | 0.001 | | |
| Shares outstanding | | | | | 1,755,058 | | | | | | 520,500 | | | | | | 18,825,463 | | | | | | 1,398,462 | | |
| Net asset value and redemption price per share | | | | $ | 14.96 | | | | | $ | 11.44 | | | | | $ | 12.44 | | | | | $ | 18.03 | | |
| Class I | | | | | | | | | | | | | | | | | | | | | | | | | |
| Net assets | | | | $ | 5,089,676 | | | | | $ | 373,469 | | | | | $ | 64,534,462 | | | | | $ | 12,248,362 | | |
| Shares authorized | | | | | 100,000,000 | | | | | | 100,000,000 | | | | | | 100,000,000 | | | | | | 100,000,000 | | |
| Par value | | | | $ | 0.001 | | | | | $ | 0.001 | | | | | $ | 0.001 | | | | | $ | 0.001 | | |
| Shares outstanding | | | | | 331,920 | | | | | | 31,195 | | | | | | 5,009,687 | | | | | | 655,649 | | |
| Net asset value and redemption price per share | | | | $ | 15.33 | | | | | $ | 11.97 | | | | | $ | 12.88 | | | | | $ | 18.68 | | |
| Class R6 | | | | | | | | | | | | | | | | | | | | | | | | | |
| Net assets | | | | $ | 30,359,793 | | | | | $ | 10,245,125 | | | | | | n/a | | | | | | n/a | | |
| Shares authorized | | | | | 100,000,000 | | | | | | 100,000,000 | | | | | | n/a | | | | | | n/a | | |
| Par value | | | | $ | 0.001 | | | | | $ | 0.001 | | | | | | n/a | | | | | | n/a | | |
| Shares outstanding | | | | | 1,981,575 | | | | | | 855,981 | | | | | | n/a | | | | | | n/a | | |
| Net asset value and redemption price per share | | | | $ | 15.32 | | | | | $ | 11.97 | | | | | | n/a | | | | | | n/a | | |
| Class S | | | | | | | | | | | | | | | | | | | | | | | | | |
| Net assets | | | | $ | 562,208,339 | | | | | $ | 21,640,415 | | | | | $ | 303,655,511 | | | | | $ | 18,032,220 | | |
| Shares authorized | | | | | 200,000,000 | | | | | | 100,000,000 | | | | | | 100,000,000 | | | | | | 100,000,000 | | |
| Par value | | | | $ | 0.001 | | | | | $ | 0.001 | | | | | $ | 0.001 | | | | | $ | 0.001 | | |
| Shares outstanding | | | | | 37,150,972 | | | | | | 1,854,466 | | | | | | 23,951,226 | | | | | | 974,183 | | |
| Net asset value and redemption price per share | | | | $ | 15.13 | | | | | $ | 11.67 | | | | | $ | 12.68 | | | | | $ | 18.51 | | |
| Class S2 | | | | | | | | | | | | | | | | | | | | | | | | | |
| Net assets | | | | $ | 1,850,829 | | | | | $ | 4,718,377 | | | | | $ | 11,469,077 | | | | | $ | 1,596,289 | | |
| Shares authorized | | | | | 100,000,000 | | | | | | 100,000,000 | | | | | | 100,000,000 | | | | | | 100,000,000 | | |
| Par value | | | | $ | 0.001 | | | | | $ | 0.001 | | | | | $ | 0.001 | | | | | $ | 0.001 | | |
| Shares outstanding | | | | | 122,313 | | | | | | 411,648 | | | | | | 935,226 | | | | | | 87,610 | | |
| Net asset value and redemption price per share | | | | $ | 15.13 | | | | | $ | 11.46 | | | | | $ | 12.26 | | | | | $ | 18.22 | | |
| Class T | | | | | | | | | | | | | | | | | | | | | | | | | |
| Net assets | | | | | n/a | | | | | | n/a | | | | | $ | 380,088 | | | | | $ | 55,656 | | |
| Shares authorized | | | | | n/a | | | | | | n/a | | | | | | 100,000,000 | | | | | | 100,000,000 | | |
| Par value | | | | | n/a | | | | | | n/a | | | | | $ | 0.001 | | | | | $ | 0.001 | | |
| Shares outstanding | | | | | n/a | | | | | | n/a | | | | | | 28,683 | | | | | | 3,092 | | |
| Net asset value and redemption price per share | | | | | n/a | | | | | | n/a | | | | | $ | 13.25 | | | | | $ | 18.00 | | |
See Accompanying Notes to Financial Statements
STATEMENTS OF ASSETS AND LIABILITIES as of December 31, 2021
| | | | Voya Solution
2035 Portfolio | | | Voya Solution
2040 Portfolio | | | Voya Solution
2045 Portfolio | | | Voya Solution
2050 Portfolio | |
| ASSETS: | | | | | | | | | | | | | | | | | | | | | | | | | |
| Investments in affiliated underlying funds at fair value* | | | | $ | 587,873,760 | | | | | $ | 35,703,912 | | | | | $ | 436,543,598 | | | | | $ | 29,162,170 | | |
| Investments in unaffiliated underlying funds at fair value** | | | | | 94,023,521 | | | | | | 7,112,321 | | | | | | 91,396,897 | | | | | | 6,937,212 | | |
| Cash | | | | | 980,566 | | | | | | 69,136 | | | | | | 794,289 | | | | | | 63,197 | | |
| Receivables: | | | | | | | | | | | | | | | | | | | | | | | | | |
| Fund shares sold | | | | | 318,527 | | | | | | 35,503 | | | | | | 305,522 | | | | | | 51,298 | | |
| Prepaid expenses | | | | | 59 | | | | | | — | | | | | | 44 | | | | | | 2 | | |
| Reimbursement due from Investment Adviser | | | | | 81,637 | | | | | | 9,374 | | | | | | 76,917 | | | | | | 9,735 | | |
| Other assets | | | | | 35,141 | | | | | | 607 | | | | | | 24,815 | | | | | | 480 | | |
| Total assets | | | | | 683,313,211 | | | | | | 42,930,853 | | | | | | 529,142,082 | | | | | | 36,224,094 | | |
| LIABILITIES: | | | | | | | | | | | | | | | | | | | | | | | | | |
| Payable for investments in affiliated underlying funds purchased | | | | | 312,682 | | | | | | 32,634 | | | | | | 302,203 | | | | | | 41,827 | | |
| Payable for fund shares redeemed | | | | | 5,876 | | | | | | 2,869 | | | | | | 3,320 | | | | | | 9,471 | | |
| Payable for investment management fees | | | | | 130,131 | | | | | | 8,286 | | | | | | 103,316 | | | | | | 7,169 | | |
| Payable for distribution and shareholder service fees | | | | | 174,157 | | | | | | 10,616 | | | | | | 131,595 | | | | | | 8,748 | | |
| Payable for directors fees | | | | | 3,414 | | | | | | 211 | | | | | | 2,603 | | | | | | 182 | | |
| Payable to directors under the deferred compensation plan (Note 6) | | | | | 35,141 | | | | | | 607 | | | | | | 24,815 | | | | | | 480 | | |
| Other accrued expenses and liabilities | | | | | 213,839 | | | | | | 30,470 | | | | | | 162,967 | | | | | | 30,277 | | |
| Total liabilities | | | | | 875,240 | | | | | | 85,693 | | | | | | 730,819 | | | | | | 98,154 | | |
| NET ASSETS | | | | $ | 682,437,971 | | | | | $ | 42,845,160 | | | | | $ | 528,411,263 | | | | | $ | 36,125,940 | | |
| NET ASSETS WERE COMPRISED OF: | | | | | | | | | | | | | | | | | | | | | | | | | |
| Paid-in capital | | | | $ | 509,043,568 | | | | | $ | 32,080,258 | | | | | $ | 382,397,155 | | | | | $ | 26,332,866 | | |
| Total distributable earnings | | | | | 173,394,403 | | | | | | 10,764,902 | | | | | | 146,014,108 | | | | | | 9,793,074 | | |
| NET ASSETS | | | | $ | 682,437,971 | | | | | $ | 42,845,160 | | | | | $ | 528,411,263 | | | | | $ | 36,125,940 | | |
*
Cost of investments in affiliated underlying funds | | | | $ | 542,716,162 | | | | | $ | 34,183,837 | | | | | $ | 402,046,785 | | | | | $ | 27,429,915 | | |
**
Cost of investments in unaffiliated underlying funds | | | | $ | 75,271,310 | | | | | $ | 5,849,087 | | | | | $ | 70,865,074 | | | | | $ | 5,757,740 | | |
See Accompanying Notes to Financial Statements
STATEMENTS OF ASSETS AND LIABILITIES as of December 31, 2021 (continued)
| | | | Voya Solution
2035 Portfolio | | | Voya Solution
2040 Portfolio | | | Voya Solution
2045 Portfolio | | | Voya Solution
2050 Portfolio | |
| Class ADV | | | | | | | | | | | | | | | | | | | | | | | | | |
| Net assets | | | | $ | 219,940,433 | | | | | $ | 17,364,148 | | | | | $ | 162,479,748 | | | | | $ | 15,351,524 | | |
| Shares authorized | | | | | 100,000,000 | | | | | | 100,000,000 | | | | | | 100,000,000 | | | | | | 100,000,000 | | |
| Par value | | | | $ | 0.001 | | | | | $ | 0.001 | | | | | $ | 0.001 | | | | | $ | 0.001 | | |
| Shares outstanding | | | | | 16,826,755 | | | | | | 883,764 | | | | | | 12,386,628 | | | | | | 750,694 | | |
| Net asset value and redemption price per share | | | | $ | 13.07 | | | | | $ | 19.65 | | | | | $ | 13.12 | | | | | $ | 20.45 | | |
| Class I | | | | | | | | | | | | | | | | | | | | | | | | | |
| Net assets | | | | $ | 78,910,159 | | | | | $ | 10,092,050 | | | | | $ | 65,611,476 | | | | | $ | 9,999,110 | | |
| Shares authorized | | | | | 100,000,000 | | | | | | 100,000,000 | | | | | | 100,000,000 | | | | | | 100,000,000 | | |
| Par value | | | | $ | 0.001 | | | | | $ | 0.001 | | | | | $ | 0.001 | | | | | $ | 0.001 | | |
| Shares outstanding | | | | | 5,826,536 | | | | | | 495,263 | | | | | | 4,798,706 | | | | | | 469,465 | | |
| Net asset value and redemption price per share | | | | $ | 13.54 | | | | | $ | 20.38 | | | | | $ | 13.67 | | | | | $ | 21.30 | | |
| Class S | | | | | | | | | | | | | | | | | | | | | | | | | |
| Net assets | | | | $ | 369,502,154 | | | | | $ | 13,324,841 | | | | | $ | 289,192,515 | | | | | $ | 9,740,374 | | |
| Shares authorized | | | | | 100,000,000 | | | | | | 100,000,000 | | | | | | 100,000,000 | | | | | | 100,000,000 | | |
| Par value | | | | $ | 0.001 | | | | | $ | 0.001 | | | | | $ | 0.001 | | | | | $ | 0.001 | | |
| Shares outstanding | | | | | 27,724,161 | | | | | | 661,653 | | | | | | 21,632,108 | | | | | | 464,069 | | |
| Net asset value and redemption price per share | | | | $ | 13.33 | | | | | $ | 20.14 | | | | | $ | 13.37 | | | | | $ | 20.99 | | |
| Class S2 | | | | | | | | | | | | | | | | | | | | | | | | | |
| Net assets | | | | $ | 14,062,010 | | | | | $ | 2,051,345 | | | | | $ | 10,947,113 | | | | | $ | 1,022,014 | | |
| Shares authorized | | | | | 100,000,000 | | | | | | 100,000,000 | | | | | | 100,000,000 | | | | | | 100,000,000 | | |
| Par value | | | | $ | 0.001 | | | | | $ | 0.001 | | | | | $ | 0.001 | | | | | $ | 0.001 | | |
| Shares outstanding | | | | | 1,107,270 | | | | | | 103,902 | | | | | | 846,899 | | | | | | 49,531 | | |
| Net asset value and redemption price per share | | | | $ | 12.70 | | | | | $ | 19.74 | | | | | $ | 12.93 | | | | | $ | 20.63 | | |
| Class T | | | | | | | | | | | | | | | | | | | | | | | | | |
| Net assets | | | | $ | 23,215 | | | | | $ | 12,776 | | | | | $ | 180,411 | | | | | $ | 12,918 | | |
| Shares authorized | | | | | 100,000,000 | | | | | | 100,000,000 | | | | | | 100,000,000 | | | | | | 100,000,000 | | |
| Par value | | | | $ | 0.001 | | | | | $ | 0.001 | | | | | $ | 0.001 | | | | | $ | 0.001 | | |
| Shares outstanding | | | | | 1,673 | | | | | | 653 | | | | | | 13,002 | | | | | | 625 | | |
| Net asset value and redemption price per share | | | | $ | 13.88 | | | | | $ | 19.56 | | | | | $ | 13.88 | | | | | $ | 20.67 | | |
See Accompanying Notes to Financial Statements
STATEMENTS OF ASSETS AND LIABILITIES as of December 31, 2021
| | | | Voya Solution
2055 Portfolio | | | Voya Solution
2060 Portfolio | | | Voya Solution
2065 Portfolio | |
| ASSETS: | | | | | | | | | | | | | | | | | | | |
| Investments in affiliated underlying funds at fair value* | | | | $ | 145,918,715 | | | | | $ | 21,935,355 | | | | | $ | 4,926,079 | | |
| Investments in unaffiliated underlying funds at fair value** | | | | | 31,149,633 | | | | | | 4,635,859 | | | | | | 895,516 | | |
| Cash | | | | | 287,450 | | | | | | 58,417 | | | | | | 17,651 | | |
| Receivables: | | | | | | | | | | | | | | | | | | | |
| Fund shares sold | | | | | 93,818 | | | | | | 47,272 | | | | | | 8,010 | | |
| Prepaid expenses | | | | | 13 | | | | | | — | | | | | | — | | |
| Reimbursement due from Investment Adviser | | | | | 34,508 | | | | | | 937 | | | | | | 2,926 | | |
| Other assets | | | | | 5,491 | | | | | | 265 | | | | | | 9 | | |
| Total assets | | | | | 177,489,628 | | | | | | 26,678,105 | | | | | | 5,850,191 | | |
| LIABILITIES: | | | | | | | | | | | | | | | | | | | |
| Payable for investments in affiliated underlying funds purchased | | | | | 70,913 | | | | | | 47,270 | | | | | | 6,813 | | |
| Payable for fund shares redeemed | | | | | 22,905 | | | | | | — | | | | | | 1,197 | | |
| Payable for investment management fees | | | | | 34,800 | | | | | | 5,182 | | | | | | 1,088 | | |
| Payable for distribution and shareholder service fees | | | | | 43,946 | | | | | | 6,426 | | | | | | 1,146 | | |
| Payable for directors fees | | | | | 865 | | | | | | 127 | | | | | | 21 | | |
| Payable to directors under the deferred compensation plan (Note 6) | | | | | 5,491 | | | | | | 265 | | | | | | 9 | | |
| Other accrued expenses and liabilities | | | | | 142,066 | | | | | | 24,544 | | | | | | 16,423 | | |
| Total liabilities | | | | | 320,986 | | | | | | 83,814 | | | | | | 26,697 | | |
| NET ASSETS | | | | $ | 177,168,642 | | | | | $ | 26,594,291 | | | | | $ | 5,823,494 | | |
| NET ASSETS WERE COMPRISED OF: | | | | | | | | | | | | | | | | | | | |
| Paid-in capital | | | | $ | 130,504,195 | | | | | $ | 19,737,892 | | | | | $ | 5,522,972 | | |
| Total distributable earnings | | | | | 46,664,447 | | | | | | 6,856,399 | | | | | | 300,522 | | |
| NET ASSETS | | | | $ | 177,168,642 | | | | | $ | 26,594,291 | | | | | $ | 5,823,494 | | |
*
Cost of investments in affiliated underlying funds | | | | $ | 135,735,004 | | | | | $ | 20,951,113 | | | | | $ | 4,911,815 | | |
**
Cost of investments in unaffiliated underlying funds | | | | $ | 25,830,374 | | | | | $ | 3,923,581 | | | | | $ | 778,311 | | |
See Accompanying Notes to Financial Statements
STATEMENTS OF ASSETS AND LIABILITIES as of December 31, 2021 (continued)
| | | | Voya Solution
2055 Portfolio | | | Voya Solution
2060 Portfolio | | | Voya Solution
2065 Portfolio | |
| Class ADV | | | | | | | | | | | | | | | | | | | |
| Net assets | | | | $ | 58,046,069 | | | | | $ | 10,458,544 | | | | | $ | 1,582,843 | | |
| Shares authorized | | | | | 100,000,000 | | | | | | 100,000,000 | | | | | | 100,000,000 | | |
| Par value | | | | $ | 0.001 | | | | | $ | 0.001 | | | | | $ | 0.001 | | |
| Shares outstanding | | | | | 3,834,848 | | | | | | 699,154 | | | | | | 132,557 | | |
| Net asset value and redemption price per share | | | | $ | 15.14 | | | | | $ | 14.96 | | | | | $ | 11.94 | | |
| Class I | | | | | | | | | | | | | | | | | | | |
| Net assets | | | | $ | 27,701,352 | | | | | $ | 6,684,918 | | | | | $ | 1,691,663 | | |
| Shares authorized | | | | | 100,000,000 | | | | | | 100,000,000 | | | | | | 100,000,000 | | |
| Par value | | | | $ | 0.001 | | | | | $ | 0.001 | | | | | $ | 0.001 | | |
| Shares outstanding | | | | | 1,762,032 | | | | | | 437,321 | | | | | | 141,343 | | |
| Net asset value and redemption price per share | | | | $ | 15.72 | | | | | $ | 15.29 | | | | | $ | 11.97 | | |
| Class S | | | | | | | | | | | | | | | | | | | |
| Net assets | | | | $ | 86,020,987 | | | | | $ | 8,210,827 | | | | | $ | 2,431,106 | | |
| Shares authorized | | | | | 100,000,000 | | | | | | 100,000,000 | | | | | | 100,000,000 | | |
| Par value | | | | $ | 0.001 | | | | | $ | 0.001 | | | | | $ | 0.001 | | |
| Shares outstanding | | | | | 5,612,969 | | | | | | 546,422 | | | | | | 203,415 | | |
| Net asset value and redemption price per share | | | | $ | 15.33 | | | | | $ | 15.03 | | | | | $ | 11.95 | | |
| Class S2 | | | | | | | | | | | | | | | | | | | |
| Net assets | | | | $ | 5,376,665 | | | | | $ | 1,234,375 | | | | | $ | 113,772 | | |
| Shares authorized | | | | | 100,000,000 | | | | | | 100,000,000 | | | | | | 100,000,000 | | |
| Par value | | | | $ | 0.001 | | | | | $ | 0.001 | | | | | $ | 0.001 | | |
| Shares outstanding | | | | | 353,150 | | | | | | 82,492 | | | | | | 9,520 | | |
| Net asset value and redemption price per share | | | | $ | 15.22 | | | | | $ | 14.96 | | | | | $ | 11.95 | | |
| Class T | | | | | | | | | | | | | | | | | | | |
| Net assets | | | | $ | 23,569 | | | | | $ | 5,627 | | | | | $ | 4,110 | | |
| Shares authorized | | | | | 100,000,000 | | | | | | 100,000,000 | | | | | | 100,000,000 | | |
| Par value | | | | $ | 0.001 | | | | | $ | 0.001 | | | | | $ | 0.001 | | |
| Shares outstanding | | | | | 1,506 | | | | | | 377 | | | | | | 344 | | |
| Net asset value and redemption price per share | | | | $ | 15.65 | | | | | $ | 14.91 | | | | | $ | 11.95 | | |
See Accompanying Notes to Financial Statements
STATEMENTS OF OPERATIONS for the year ended December 31, 2021
| | | | Voya Solution
Aggressive
Portfolio | | | Voya Solution
Balanced
Portfolio | | | Voya Solution
Conservative
Portfolio | | | Voya Solution
Income
Portfolio | |
| INVESTMENT INCOME: | | | | | | | | | | | | | | | | | | | | | | | | | |
| Dividends from affiliated underlying funds | | | | $ | 271,826 | | | | | $ | 891,567 | | | | | $ | 321,018 | | | | | $ | 5,178,353 | | |
| Dividends from unaffiliated underlying funds | | | | | 81,167 | | | | | | 161,890 | | | | | | 31,136 | | | | | | 778,588 | | |
| Total investment income | | | | | 352,993 | | | | | | 1,053,457 | | | | | | 352,154 | | | | | | 5,956,941 | | |
| EXPENSES: | | | | | | | | | | | | | | | | | | | | | | | | | |
| Investment management fees | | | | | 67,755 | | | | | | 139,734 | | | | | | 35,763 | | | | | | 658,054 | | |
| Distribution and shareholder service fees: | | | | | | | | | | | | | | | | | | | | | | | | | |
| Class ADV | | | | | 20,676 | | | | | | 50,373 | | | | | | 20,025 | | | | | | 739,182 | | |
| Class S | | | | | 10,719 | | | | | | 56,460 | | | | | | 5,730 | | | | | | 252,656 | | |
| Class S2 | | | | | 6,075 | | | | | | 6,044 | | | | | | 5,080 | | | | | | 22,837 | | |
| Class T | | | | | — | | | | | | — | | | | | | — | | | | | | 876 | | |
| Transfer agent fees: | | | | | | | | | | | | | | | | | | | | | | | | | |
| Class ADV | | | | | 4,389 | | | | | | 6,409 | | | | | | 3,181 | | | | | | 77,169 | | |
| Class I | | | | | 405 | | | | | | 2,194 | | | | | | 424 | | | | | | 22,370 | | |
| Class R6 | | | | | 514 | | | | | | 82 | | | | | | 181 | | | | | | — | | |
| Class S | | | | | 4,542 | | | | | | 14,362 | | | | | | 1,822 | | | | | | 52,753 | | |
| Class S2 | | | | | 1,633 | | | | | | 965 | | | | | | 1,007 | | | | | | 2,980 | | |
| Class T | | | | | — | | | | | | — | | | | | | — | | | | | | 64 | | |
| Shareholder reporting expense | | | | | 349 | | | | | | 1,080 | | | | | | 880 | | | | | | 4,760 | | |
| Registration fees | | | | | 6 | | | | | | — | | | | | | — | | | | | | — | | |
| Professional fees | | | | | 5,009 | | | | | | 8,761 | | | | | | 4,836 | | | | | | 33,640 | | |
| Custody and accounting expense | | | | | 9,855 | | | | | | 12,046 | | | | | | 10,826 | | | | | | 21,900 | | |
| Directors fees | | | | | 1,153 | | | | | | 2,438 | | | | | | 659 | | | | | | 11,904 | | |
| Miscellaneous expense | | | | | 9,135 | | | | | | 15,098 | | | | | | 8,153 | | | | | | 42,867 | | |
| Interest expense | | | | | — | | | | | | — | | | | | | — | | | | | | 124 | | |
| Total expenses | | | | | 142,215 | | | | | | 316,046 | | | | | | 98,567 | | | | | | 1,944,136 | | |
| Waived and reimbursed fees | | | | | (14,869) | | | | | | (20,907) | | | | | | (36,009) | | | | | | (270,803) | | |
| Net expenses | | | | | 127,346 | | | | | | 295,139 | | | | | | 62,558 | | | | | | 1,673,333 | | |
| Net investment income | | | | | 225,647 | | | | | | 758,318 | | | | | | 289,596 | | | | | | 4,283,608 | | |
| REALIZED AND UNREALIZED GAIN (LOSS): | | | | | | | | | | | | | | | | | | | | | | | | | |
| Net realized gain (loss) on: | | | | | | | | | | | | | | | | | | | | | | | | | |
| Sale of affiliated underlying funds | | | | | 2,033,668 | | | | | | 3,461,165 | | | | | | 760,393 | | | | | | 12,177,347 | | |
| Sale of unaffiliated underlying funds | | | | | 948,381 | | | | | | 704,833 | | | | | | 186,104 | | | | | | 3,294,807 | | |
| Capital gain distributions from affiliated underlying funds | | | | | 2,422,114 | | | | | | 4,291,318 | | | | | | 576,737 | | | | | | 13,248,584 | | |
| Futures | | | | | — | | | | | | — | | | | | | — | | | | | | 608,427 | | |
| Net realized gain | | | | | 5,404,163 | | | | | | 8,457,316 | | | | | | 1,523,234 | | | | | | 29,329,165 | | |
| Net change in unrealized appreciation (depreciation) on: | | | | | | | | | | | | | | | | | | | | | | | | | |
| Affiliated underlying funds | | | | | (574,936) | | | | | | (2,375,285) | | | | | | (879,154) | | | | | | (14,940,300) | | |
| Unaffiliated underlying funds | | | | | 38,318 | | | | | | 1,016,956 | | | | | | (50,201) | | | | | | (99,338) | | |
| Futures | | | | | — | | | | | | — | | | | | | — | | | | | | (88,219) | | |
| Net change in unrealized appreciation (depreciation) | | | | | (536,618) | | | | | | (1,358,329) | | | | | | (929,355) | | | | | | (15,127,857) | | |
| Net realized and unrealized gain | | | | | 4,867,545 | | | | | | 7,098,987 | | | | | | 593,879 | | | | | | 14,201,308 | | |
| Increase in net assets resulting from operations | | | | $ | 5,093,192 | | | | | $ | 7,857,305 | | | | | $ | 883,475 | | | | | $ | 18,484,916 | | |
See Accompanying Notes to Financial Statements
STATEMENTS OF OPERATIONS for the year ended December 31, 2021
| | | | Voya Solution
Moderately
Aggressive
Portfolio | | | Voya Solution
Moderately
Conservative
Portfolio | | | Voya Solution
2025 Portfolio | | | Voya Solution
2030 Portfolio | |
| INVESTMENT INCOME: | | | | | | | | | | | | | | | | | | | | | | | | | |
| Dividends from affiliated underlying funds | | | | $ | 7,399,293 | | | | | $ | 803,535 | | | | | $ | 10,833,388 | | | | | $ | 916,808 | | |
| Dividends from unaffiliated underlying funds | | | | | 1,750,751 | | | | | | 97,494 | | | | | | 923,721 | | | | | | 120,110 | | |
| Total investment income | | | | | 9,150,044 | | | | | | 901,029 | | | | | | 11,757,109 | | | | | | 1,036,918 | | |
| EXPENSES: | | | | | | | | | | | | | | | | | | | | | | | | | |
| Investment management fees | | | | | 1,453,983 | | | | | | 93,799 | | | | | | 1,371,311 | | | | | | 129,146 | | |
| Distribution and shareholder service fees: | | | | | | | | | | | | | | | | | | | | | | | | | |
| Class ADV | | | | | 129,023 | | | | | | 31,944 | | | | | | 1,212,257 | | | | | | 122,037 | | |
| Class S | | | | | 1,419,323 | | | | | | 52,466 | | | | | | 764,263 | | | | | | 47,834 | | |
| Class S2 | | | | | 6,779 | | | | | | 20,525 | | | | | | 43,377 | | | | | | 4,357 | | |
| Class T | | | | | — | | | | | | — | | | | | | 2,822 | | | | | | 359 | | |
| Transfer agent fees: | | | | | | | | | | | | | | | | | | | | | | | | | |
| Class ADV | | | | | 1,534 | | | | | | 5,607 | | | | | | 106,165 | | | | | | 18,108 | | |
| Class I | | | | | 311 | | | | | | 73 | | | | | | 30,575 | | | | | | 9,775 | | |
| Class R6 | | | | | 38 | | | | | | 30 | | | | | | — | | | | | | — | | |
| Class S | | | | | 33,756 | | | | | | 18,414 | | | | | | 133,863 | | | | | | 14,194 | | |
| Class S2 | | | | | 98 | | | | | | 4,501 | | | | | | 4,749 | | | | | | 805 | | |
| Class T | | | | | — | | | | | | — | | | | | | 176 | | | | | | 38 | | |
| Shareholder reporting expense | | | | | 13,303 | | | | | | 3,620 | | | | | | 14,325 | | | | | | 753 | | |
| Registration fees | | | | | 10 | | | | | | 1 | | | | | | — | | | | | | 7 | | |
| Professional fees | | | | | 55,851 | | | | | | 10,220 | | | | | | 65,702 | | | | | | 12,545 | | |
| Custody and accounting expense | | | | | 37,609 | | | | | | 10,220 | | | | | | 31,898 | | | | | | 28,470 | | |
| Directors fees | | | | | 25,079 | | | | | | 1,707 | | | | | | 25,169 | | | | | | 2,314 | | |
| Miscellaneous expense | | | | | 102,322 | | | | | | 13,822 | | | | | | 136,635 | | | | | | 17,770 | | |
| Interest expense | | | | | 305 | | | | | | — | | | | | | 336 | | | | | | — | | |
| Total expenses | | | | | 3,279,324 | | | | | | 266,949 | | | | | | 3,943,623 | | | | | | 408,512 | | |
| Recouped/(Waived and reimbursed fees) | | | | | 233,629 | | | | | | (63,394) | | | | | | (651,162) | | | | | | (134,483) | | |
| Net expenses | | | | | 3,512,953 | | | | | | 203,555 | | | | | | 3,292,461 | | | | | | 274,029 | | |
| Net investment income | | | | | 5,637,091 | | | | | | 697,474 | | | | | | 8,464,648 | | | | | | 762,889 | | |
| REALIZED AND UNREALIZED GAIN (LOSS): | | | | | | | | | | | | | | | | | | | | | | | | | |
| Net realized gain (loss) on: | | | | | | | | | | | | | | | | | | | | | | | | | |
| Sale of affiliated underlying funds | | | | | 40,947,221 | | | | | | 2,407,151 | | | | | | 32,047,615 | | | | | | 4,157,101 | | |
| Sale of unaffiliated underlying funds | | | | | 9,861,539 | | | | | | 755,657 | | | | | | 13,820,863 | | | | | | 1,052,848 | | |
| Capital gain distributions from affiliated underlying funds | | | | | 46,139,145 | | | | | | 2,263,054 | | | | | | 43,073,675 | | | | | | 4,366,900 | | |
| Futures | | | | | 995,029 | | | | | | — | | | | | | 980,271 | | | | | | — | | |
| Net realized gain | | | | | 97,942,934 | | | | | | 5,425,862 | | | | | | 89,922,424 | | | | | | 9,576,849 | | |
| Net change in unrealized appreciation (depreciation) on: | | | | | | | | | | | | | | | | | | | | | | | | | |
| Affiliated underlying funds | | | | | (13,789,498) | | | | | | (2,231,287) | | | | | | (32,465,504) | | | | | | (3,720,721) | | |
| Unaffiliated underlying funds | | | | | 9,415,587 | | | | | | (62,839) | | | | | | (2,065,285) | | | | | | 102,828 | | |
| Futures | | | | | (154,350) | | | | | | — | | | | | | (134,978) | | | | | | — | | |
| Net change in unrealized appreciation (depreciation) | | | | | (4,528,261) | | | | | | (2,294,126) | | | | | | (34,665,767) | | | | | | (3,617,893) | | |
| Net realized and unrealized gain | | | | | 93,414,673 | | | | | | 3,131,736 | | | | | | 55,256,657 | | | | | | 5,958,956 | | |
| Increase in net assets resulting from operations | | | | $ | 99,051,764 | | | | | $ | 3,829,210 | | | | | $ | 63,721,305 | | | | | $ | 6,721,845 | | |
See Accompanying Notes to Financial Statements
STATEMENTS OF OPERATIONS for the year ended December 31, 2021
| | | | Voya Solution
2035 Portfolio | | | Voya Solution
2040 Portfolio | | | Voya Solution
2045 Portfolio | | | Voya Solution
2050 Portfolio | |
| INVESTMENT INCOME: | | | | | | | | | | | | | | | | | | | | | | | | | |
| Dividends from affiliated underlying funds | | | | $ | 10,182,977 | | | | | $ | 551,609 | | | | | $ | 6,353,307 | | | | | $ | 381,781 | | |
| Dividends from unaffiliated underlying funds | | | | | 1,586,330 | | | | | | 114,281 | | | | | | 1,520,791 | | | | | | 102,415 | | |
| Total investment income | | | | | 11,769,307 | | | | | | 665,890 | | | | | | 7,874,098 | | | | | | 484,196 | | |
| EXPENSES: | | | | | | | | | | | | | | | | | | | | | | | | | |
| Investment management fees | | | | | 1,545,029 | | | | | | 97,570 | | | | | | 1,221,656 | | | | | | 84,861 | | |
| Distribution and shareholder service fees: | | | | | | | | | | | | | | | | | | | | | | | | | |
| Class ADV | | | | | 1,118,105 | | | | | | 84,114 | | | | | | 807,288 | | | | | | 78,494 | | |
| Class S | | | | | 903,272 | | | | | | 30,783 | | | | | | 696,567 | | | | | | 23,294 | | |
| Class S2 | | | | | 52,959 | | | | | | 6,649 | | | | | | 37,996 | | | | | | 3,317 | | |
| Class T | | | | | 1,298 | | | | | | 170 | | | | | | 1,223 | | | | | | 88 | | |
| Transfer agent fees: | | | | | | | | | | | | | | | | | | | | | | | | | |
| Class ADV | | | | | 119,339 | | | | | | 18,068 | | | | | | 120,032 | | | | | | 24,479 | | |
| Class I | | | | | 45,025 | | | | | | 12,317 | | | | | | 52,930 | | | | | | 16,342 | | |
| Class S | | | | | 192,818 | | | | | | 13,157 | | | | | | 206,927 | | | | | | 14,479 | | |
| Class S2 | | | | | 7,065 | | | | | | 1,755 | | | | | | 7,021 | | | | | | 1,272 | | |
| Class T | | | | | 98 | | | | | | 27 | | | | | | 130 | | | | | | 19 | | |
| Shareholder reporting expense | | | | | 17,723 | | | | | | 750 | | | | | | 10,300 | | | | | | 1,750 | | |
| Registration fees | | | | | — | | | | | | 2 | | | | | | — | | | | | | — | | |
| Professional fees | | | | | 81,951 | | | | | | 8,213 | | | | | | 60,972 | | | | | | 8,533 | | |
| Custody and accounting expense | | | | | 50,175 | | | | | | 10,950 | | | | | | 39,316 | | | | | | 9,194 | | |
| Directors fees | | | | | 27,309 | | | | | | 1,686 | | | | | | 20,827 | | | | | | 1,453 | | |
| Miscellaneous expense | | | | | 140,236 | | | | | | 15,721 | | | | | | 100,237 | | | | | | 13,517 | | |
| Interest expense | | | | | 773 | | | | | | 57 | | | | | | 589 | | | | | | 52 | | |
| Total expenses | | | | | 4,303,175 | | | | | | 301,989 | | | | | | 3,384,011 | | | | | | 281,144 | | |
| Waived and reimbursed fees | | | | | (1,196,677) | | | | | | (121,137) | | | | | | (1,061,585) | | | | | | (121,285) | | |
| Net expenses | | | | | 3,106,498 | | | | | | 180,852 | | | | | | 2,322,426 | | | | | | 159,859 | | |
| Net investment income | | | | | 8,662,809 | | | | | | 485,038 | | | | | | 5,551,672 | | | | | | 324,337 | | |
| REALIZED AND UNREALIZED GAIN (LOSS): | | | | | | | | | | | | | | | | | | | | | | | | | |
| Net realized gain (loss) on: | | | | | | | | | | | | | | | | | | | | | | | | | |
| Investments | | | | | — | | | | | | — | | | | | | — | | | | | | (17,865) | | |
| Sale of affiliated underlying funds | | | | | 41,468,023 | | | | | | 4,043,268 | | | | | | 31,183,433 | | | | | | 3,632,939 | | |
| Sale of unaffiliated underlying funds | | | | | 13,975,938 | | | | | | 1,223,181 | | | | | | 14,249,834 | | | | | | 1,031,139 | | |
| Capital gain distributions from affiliated underlying funds | | | | | 52,643,964 | | | | | | 3,459,982 | | | | | | 45,421,111 | | | | | | 3,221,450 | | |
| Futures | | | | | 687,882 | | | | | | — | | | | | | 2,245,433 | | | | | | — | | |
| Net realized gain | | | | | 108,775,807 | | | | | | 8,726,431 | | | | | | 93,099,811 | | | | | | 7,867,663 | | |
| Net change in unrealized appreciation (depreciation) on: | | | | | | | | | | | | | | | | | | | | | | | | | |
| Affiliated underlying funds | | | | | (28,953,959) | | | | | | (3,144,026) | | | | | | (19,960,300) | | | | | | (2,566,173) | | |
| Unaffiliated underlying funds | | | | | 988,523 | | | | | | 104,979 | | | | | | 3,764,663 | | | | | | 102,326 | | |
| Futures | | | | | (12,373) | | | | | | — | | | | | | (227,219) | | | | | | — | | |
| Net change in unrealized appreciation (depreciation) | | | | | (27,977,809) | | | | | | (3,039,047) | | | | | | (16,422,856) | | | | | | (2,463,847) | | |
| Net realized and unrealized gain | | | | | 80,797,998 | | | | | | 5,687,384 | | | | | | 76,676,955 | | | | | | 5,403,816 | | |
| Increase in net assets resulting from operations | | | | $ | 89,460,807 | | | | | $ | 6,172,422 | | | | | $ | 82,228,627 | | | | | $ | 5,728,153 | | |
See Accompanying Notes to Financial Statements
STATEMENTS OF OPERATIONS for the year ended December 31, 2021
| | | | Voya Solution
2055 Portfolio | | | Voya Solution
2060 Portfolio | | | Voya Solution
2065 Portfolio | |
| INVESTMENT INCOME: | | | | | | | | | | | | | | | | | | | |
| Dividends from affiliated underlying funds | | | | $ | 1,873,213 | | | | | $ | 276,029 | | | | | $ | 59,451 | | |
| Dividends from unaffiliated underlying funds | | | | | 452,178 | | | | | | 66,648 | | | | | | 10,905 | | |
| Total investment income | | | | | 2,325,391 | | | | | | 342,677 | | | | | | 70,356 | | |
| EXPENSES: | | | | | | | | | | | | | | | | | | | |
| Investment management fees | | | | | 400,479 | | | | | | 58,645 | | | | | | 9,812 | | |
| Distribution and shareholder service fees: | | | | | | | | | | | | | | | | | | | |
| Class ADV | | | | | 289,504 | | | | | | 49,269 | | | | | | 6,171 | | |
| Class S | | | | | 205,374 | | | | | | 19,363 | | | | | | 3,937 | | |
| Class S2 | | | | | 17,759 | | | | | | 3,566 | | | | | | 311 | | |
| Class T | | | | | 176 | | | | | | 40 | | | | | | 28 | | |
| Transfer agent fees: | | | | | | | | | | | | | | | | | | | |
| Class ADV | | | | | 82,413 | | | | | | 23,976 | | | | | | 1,016 | | |
| Class I | | | | | 40,690 | | | | | | 16,795 | | | | | | 1,111 | | |
| Class S | | | | | 116,635 | | | | | | 18,838 | | | | | | 1,364 | | |
| Class S2 | | | | | 6,228 | | | | | | 2,155 | | | | | | 72 | | |
| Class T | | | | | 36 | | | | | | 14 | | | | | | 4 | | |
| Shareholder reporting expense | | | | | 8,235 | | | | | | 1,473 | | | | | | 68 | | |
| Registration fees | | | | | 2 | | | | | | 8 | | | | | | — | | |
| Professional fees | | | | | 23,142 | | | | | | 3,937 | | | | | | 4,862 | | |
| Custody and accounting expense | | | | | 15,330 | | | | | | 9,618 | | | | | | 9,425 | | |
| Directors fees | | | | | 6,917 | | | | | | 1,015 | | | | | | 169 | | |
| Offering expense | | | | | — | | | | | | — | | | | | | 7,624 | | |
| Miscellaneous expense | | | | | 45,060 | | | | | | 11,972 | | | | | | 11,461 | | |
| Interest expense | | | | | 279 | | | | | | — | | | | | | — | | |
| Total expenses | | | | | 1,258,259 | | | | | | 220,684 | | | | | | 57,435 | | |
| Waived and reimbursed fees | | | | | (467,820) | | | | | | (102,625) | | | | | | (40,182) | | |
| Net expenses | | | | | 790,439 | | | | | | 118,059 | | | | | | 17,253 | | |
| Net investment income | | | | | 1,534,952 | | | | | | 224,618 | | | | | | 53,103 | | |
| REALIZED AND UNREALIZED GAIN (LOSS): | | | | | | | | | | | | | | | | | | | |
| Net realized gain (loss) on: | | | | | | | | | | | | | | | | | | | |
| Sale of affiliated underlying funds | | | | | 10,852,923 | | | | | | 2,640,030 | | | | | | 229,728 | | |
| Sale of unaffiliated underlying funds | | | | | 5,405,740 | | | | | | 722,070 | | | | | | 59,641 | | |
| Capital gain distributions from affiliated underlying funds | | | | | 16,192,812 | | | | | | 2,383,910 | | | | | | 458,444 | | |
| Futures | | | | | 448,295 | | | | | | — | | | | | | — | | |
| Net realized gain | | | | | 32,899,770 | | | | | | 5,746,010 | | | | | | 747,813 | | |
| Net change in unrealized appreciation (depreciation) on: | | | | | | | | | | | | | | | | | | | |
| Affiliated underlying funds | | | | | (6,956,638) | | | | | | (2,001,103) | | | | | | (230,858) | | |
| Unaffiliated underlying funds | | | | | (285,371) | | | | | | (1,284) | | | | | | 52,343 | | |
| Futures | | | | | (30,995) | | | | | | — | | | | | | — | | |
| Net change in unrealized appreciation (depreciation) | | | | | (7,273,004) | | | | | | (2,002,387) | | | | | | (178,515) | | |
| Net realized and unrealized gain | | | | | 25,626,766 | | | | | | 3,743,623 | | | | | | 569,298 | | |
| Increase in net assets resulting from operations | | | | $ | 27,161,718 | | | | | $ | 3,968,241 | | | | | $ | 622,401 | | |
See Accompanying Notes to Financial Statements
STATEMENTS OF CHANGES IN NET ASSETS
| | | | Voya Solution Aggressive Portfolio | | | Voya Solution Balanced Portfolio | |
| | | | Year Ended
December 31,
2021 | | | Year Ended
December 31,
2020 | | | Year Ended
December 31,
2021 | | | Year Ended
December 31,
2020 | |
| FROM OPERATIONS: | | | | | | | | | | | | | | | | | | | | | | | | | |
| Net investment income | | | | $ | 225,647 | | | | | $ | 215,309 | | | | | $ | 758,318 | | | | | $ | 822,003 | | |
| Net realized gain (loss) | | | | | 5,404,163 | | | | | | (484,560) | | | | | | 8,457,316 | | | | | | 303,108 | | |
| Net change in unrealized appreciation (depreciation) | | | | | (536,618) | | | | | | 3,852,787 | | | | | | (1,358,329) | | | | | | 5,569,560 | | |
| Increase in net assets resulting from operations | | | | | 5,093,192 | | | | | | 3,583,536 | | | | | | 7,857,305 | | | | | | 6,694,671 | | |
| FROM DISTRIBUTIONS TO SHAREHOLDERS: | | | | | | | | | | | | | | | | | | | | | | | | | |
| Total distributions (excluding return of capital): | | | | | | | | | | | | | | | | | | | | | | | | | |
| Class ADV | | | | | (36,612) | | | | | | (256,190) | | | | | | (155,467) | | | | | | (641,988) | | |
| Class I | | | | | (5,299) | | | | | | (16,865) | | | | | | (66,254) | | | | | | (159,522) | | |
| Class R6 | | | | | (231,482) | | | | | | (1,063,984) | | | | | | (451,989) | | | | | | (1,431,759) | | |
| Class S | | | | | (46,644) | | | | | | (285,893) | | | | | | (425,470) | | | | | | (1,304,764) | | |
| Class S2 | | | | | (10,846) | | | | | | (136,405) | | | | | | (20,938) | | | | | | (158,546) | | |
| Total distributions | | | | | (330,883) | | | | | | (1,759,337) | | | | | | (1,120,118) | | | | | | (3,696,579) | | |
| FROM CAPITAL SHARE TRANSACTIONS: | | | | | | | | | | | | | | | | | | | | | | | | | |
| Net proceeds from sale of shares | | | | | 6,740,195 | | | | | | 6,686,500 | | | | | | 9,206,125 | | | | | | 8,281,566 | | |
| Reinvestment of distributions | | | | | 330,883 | | | | | | 1,759,337 | | | | | | 1,120,118 | | | | | | 3,696,579 | | |
| | | | | | 7,071,078 | | | | | | 8,445,837 | | | | | | 10,326,243 | | | | | | 11,978,145 | | |
| Cost of shares redeemed | | | | | (5,947,741) | | | | | | (5,799,833) | | | | | | (9,237,889) | | | | | | (14,970,813) | | |
| Net increase (decrease) in net assets resulting from capital share transactions | | | | | 1,123,337 | | | | | | 2,646,004 | | | | | | 1,088,354 | | | | | | (2,992,668) | | |
| Net increase in net assets | | | | | 5,885,646 | | | | | | 4,470,203 | | | | | | 7,825,541 | | | | | | 5,424 | | |
| NET ASSETS: | | | | | | | | | | | | | | | | | | | | | | | | | |
| Beginning of year or period | | | | | 25,930,160 | | | | | | 21,459,957 | | | | | | 56,521,662 | | | | | | 56,516,238 | | |
| End of year or period | | | | $ | 31,815,806 | | | | | $ | 25,930,160 | | | | | $ | 64,347,203 | | | | | $ | 56,521,662 | | |
See Accompanying Notes to Financial Statements
STATEMENTS OF CHANGES IN NET ASSETS
| | | | Voya Solution Conservative Portfolio | | | Voya Solution Income Portfolio | |
| | | | Year Ended
December 31,
2021 | | | Year Ended
December 31,
2020 | | | Year Ended
December 31,
2021 | | | Year Ended
December 31,
2020 | |
| FROM OPERATIONS: | | | | | | | | | | | | | | | | | | | | | | | | | |
| Net investment income | | | | $ | 289,596 | | | | | $ | 359,463 | | | | | $ | 4,283,608 | | | | | $ | 6,172,216 | | |
| Net realized gain | | | | | 1,523,234 | | | | | | 420,995 | | | | | | 29,329,165 | | | | | | 14,295,401 | | |
| Net change in unrealized appreciation (depreciation) | | | | | (929,355) | | | | | | 714,255 | | | | | | (15,127,857) | | | | | | 15,169,329 | | |
| Increase in net assets resulting from operations | | | | | 883,475 | | | | | | 1,494,713 | | | | | | 18,484,916 | | | | | | 35,636,946 | | |
| FROM DISTRIBUTIONS TO SHAREHOLDERS: | | | | | | | | | | | | | | | | | | | | | | | | | |
| Total distributions (excluding return of capital): | | | | | | | | | | | | | | | | | | | | | | | | | |
| Class ADV | | | | | (146,010) | | | | | | (195,577) | | | | | | (9,308,131) | | | | | | (3,264,320) | | |
| Class I | | | | | (18,830) | | | | | | (6,223) | | | | | | (2,702,478) | | | | | | (2,162,299) | | |
| Class R6 | | | | | (385,201) | | | | | | (354,405) | | | | | | — | | | | | | — | | |
| Class S | | | | | (98,834) | | | | | | (110,012) | | | | | | (6,498,676) | | | | | | (2,446,178) | | |
| Class S2 | | | | | (53,159) | | | | | | (56,750) | | | | | | (399,483) | | | | | | (107,658) | | |
| Class T | | | | | — | | | | | | — | | | | | | (6,032) | | | | | | (1,483) | | |
| Total distributions | | | | | (702,034) | | | | | | (722,967) | | | | | | (18,914,800) | | | | | | (7,981,938) | | |
| FROM CAPITAL SHARE TRANSACTIONS: | | | | | | | | | | | | | | | | | | | | | | | | | |
| Net proceeds from sale of shares | | | | | 5,343,901 | | | | | | 7,395,917 | | | | | | 22,002,385 | | | | | | 23,115,685 | | |
| Proceeds from shares issued in merger (Note 11) | | | | | — | | | | | | — | | | | | | — | | | | | | 29,460,111 | | |
| Reinvestment of distributions | | | | | 702,034 | | | | | | 722,967 | | | | | | 18,914,584 | | | | | | 7,981,938 | | |
| | | | | | 6,045,935 | | | | | | 8,118,884 | | | | | | 40,916,969 | | | | | | 60,557,734 | | |
| Cost of shares redeemed | | | | | (4,574,482) | | | | | | (10,386,426) | | | | | | (64,160,912) | | | | | | (111,500,211) | | |
| Net increase (decrease) in net assets resulting from capital share transactions | | | | | 1,471,453 | | | | | | (2,267,542) | | | | | | (23,243,943) | | | | | | (50,942,477) | | |
| Net increase (decrease) in net assets | | | | | 1,652,894 | | | | | | (1,495,796) | | | | | | (23,673,827) | | | | | | (23,287,469) | | |
| NET ASSETS: | | | | | | | | | | | | | | | | | | | | | | | | | |
| Beginning of year or period | | | | | 16,095,506 | | | | | | 17,591,302 | | | | | | 307,081,854 | | | | | | 330,369,323 | | |
| End of year or period | | | | $ | 17,748,400 | | | | | $ | 16,095,506 | | | | | $ | 283,408,027 | | | | | $ | 307,081,854 | | |
See Accompanying Notes to Financial Statements
STATEMENTS OF CHANGES IN NET ASSETS
| | | | Voya Solution Moderately
Aggressive Portfolio | | | Voya Solution Moderately
Conservative Portfolio | |
| | | | Year Ended
December 31,
2021 | | | Year Ended
December 31,
2020 | | | Year Ended
December 31,
2021 | | | Year Ended
December 31,
2020 | |
| FROM OPERATIONS: | | | | | | | | | | | | | | | | | | | | | | | | | |
| Net investment income | | | | $ | 5,637,091 | | | | | $ | 7,018,765 | | | | | $ | 697,474 | | | | | $ | 776,907 | | |
| Net realized gain (loss) | | | | | 97,942,934 | | | | | | (10,634,496) | | | | | | 5,425,862 | | | | | | 43,391 | | |
| Net change in unrealized appreciation (depreciation) | | | | | (4,528,261) | | | | | | 75,482,179 | | | | | | (2,294,126) | | | | | | 3,248,340 | | |
| Increase in net assets resulting from operations | | | | | 99,051,764 | | | | | | 71,866,448 | | | | | | 3,829,210 | | | | | | 4,068,638 | | |
| FROM DISTRIBUTIONS TO SHAREHOLDERS: | | | | | | | | | | | | | | | | | | | | | | | | | |
| Total distributions (excluding return of capital): | | | | | | | | | | | | | | | | | | | | | | | | | |
| Class ADV | | | | | (356,936) | | | | | | (1,962,248) | | | | | | (122,461) | | | | | | (314,149) | | |
| Class I | | | | | (94,189) | | | | | | (378,760) | | | | | | (1,270) | | | | | | (959) | | |
| Class R6 | | | | | (485,492) | | | | | | (1,857,459) | | | | | | (259,334) | | | | | | (381,248) | | |
| Class S | | | | | (9,011,067) | | | | | | (45,876,550) | | | | | | (481,441) | | | | | | (939,184) | | |
| Class S2 | | | | | (28,117) | | | | | | (85,953) | | | | | | (111,682) | | | | | | (250,747) | | |
| Total distributions | | | | | (9,975,801) | | | | | | (50,160,970) | | | | | | (976,188) | | | | | | (1,886,287) | | |
| FROM CAPITAL SHARE TRANSACTIONS: | | | | | | | | | | | | | | | | | | | | | | | | | |
| Net proceeds from sale of shares | | | | | 11,333,934 | | | | | | 12,389,989 | | | | | | 5,842,625 | | | | | | 5,714,788 | | |
| Reinvestment of distributions | | | | | 9,975,801 | | | | | | 50,160,970 | | | | | | 976,188 | | | | | | 1,886,287 | | |
| | | | | | 21,309,735 | | | | | | 62,550,959 | | | | | | 6,818,813 | | | | | | 7,601,075 | | |
| Cost of shares redeemed | | | | | (91,023,574) | | | | | | (82,894,066) | | | | | | (7,774,332) | | | | | | (7,155,969) | | |
| Net increase (decrease) in net assets resulting from capital share transactions | | | | | (69,713,839) | | | | | | (20,343,107) | | | | | | (955,519) | | | | | | 445,106 | | |
| Net increase in net assets | | | | | 19,362,124 | | | | | | 1,362,371 | | | | | | 1,897,503 | | | | | | 2,627,457 | | |
| NET ASSETS: | | | | | | | | | | | | | | | | | | | | | | | | | |
| Beginning of year or period | | | | | 606,409,601 | | | | | | 605,047,230 | | | | | | 41,036,469 | | | | | | 38,409,012 | | |
| End of year or period | | | | $ | 625,771,725 | | | | | $ | 606,409,601 | | | | | $ | 42,933,972 | | | | | $ | 41,036,469 | | |
See Accompanying Notes to Financial Statements
STATEMENTS OF CHANGES IN NET ASSETS
| | | | Voya Solution 2025 Portfolio | | | Voya Solution 2030 Portfolio | |
| | | | Year Ended
December 31,
2021 | | | Year Ended
December 31,
2020 | | | Year Ended
December 31,
2021 | | | Year Ended
December 31,
2020 | |
| FROM OPERATIONS: | | | | | | | | | | | | | | | | | | | | | | | | | |
| Net investment income | | | | $ | 8,464,648 | | | | | $ | 12,392,851 | | | | | $ | 762,889 | | | | | $ | 665,627 | | |
| Net realized gain | | | | | 89,922,424 | | | | | | 37,038,538 | | | | | | 9,576,849 | | | | | | 256,090 | | |
| Net change in unrealized appreciation (depreciation) | | | | | (34,665,767) | | | | | | 47,926,409 | | | | | | (3,617,893) | | | | | | 5,589,011 | | |
| Increase in net assets resulting from operations | | | | | 63,721,305 | | | | | | 97,357,798 | | | | | | 6,721,845 | | | | | | 6,510,728 | | |
| FROM DISTRIBUTIONS TO SHAREHOLDERS: | | | | | | | | | | | | | | | | | | | | | | | | | |
| Total distributions (excluding return of capital): | | | | | | | | | | | | | | | | | | | | | | | | | |
| Class ADV | | | | | (17,210,023) | | | | | | (14,227,528) | | | | | | (591,672) | | | | | | (1,092,015) | | |
| Class I | | | | | (4,665,157) | | | | | | (16,158,946) | | | | | | (351,715) | | | | | | (721,318) | | |
| Class S | | | | | (22,412,706) | | | | | | (17,355,345) | | | | | | (505,141) | | | | | | (801,977) | | |
| Class S2 | | | | | (851,206) | | | | | | (543,386) | | | | | | (33,902) | | | | | | (27,984) | | |
| Class T | | | | | (23,232) | | | | | | (21,508) | | | | | | (1,237) | | | | | | (2,121) | | |
| Total distributions | | | | | (45,162,324) | | | | | | (48,306,713) | | | | | | (1,483,667) | | | | | | (2,645,415) | | |
| FROM CAPITAL SHARE TRANSACTIONS: | | | | | | | | | | | | | | | | | | | | | | | | | |
| Net proceeds from sale of shares | | | | | 47,546,483 | | | | | | 63,355,665 | | | | | | 14,205,790 | | | | | | 15,093,882 | | |
| Reinvestment of distributions | | | | | 45,162,324 | | | | | | 48,306,713 | | | | | | 1,483,538 | | | | | | 2,645,155 | | |
| | | | | | 92,708,807 | | | | | | 111,662,378 | | | | | | 15,689,328 | | | | | | 17,739,037 | | |
| Cost of shares redeemed | | | | | (130,258,912) | | | | | | (359,854,136) | | | | | | (17,879,726) | | | | | | (14,119,348) | | |
| Net increase (decrease) in net assets resulting from capital share transactions | | | | | (37,550,105) | | | | | | (248,191,758) | | | | | | (2,190,398) | | | | | | 3,619,689 | | |
| Net increase (decrease) in net assets | | | | | (18,991,124) | | | | | | (199,140,673) | | | | | | 3,047,780 | | | | | | 7,485,002 | | |
| NET ASSETS: | | | | | | | | | | | | | | | | | | | | | | | | | |
| Beginning of year or period | | | | | 633,237,445 | | | | | | 832,378,118 | | | | | | 54,098,252 | | | | | | 46,613,250 | | |
| End of year or period | | | | $ | 614,246,321 | | | | | $ | 633,237,445 | | | | | $ | 57,146,032 | | | | | $ | 54,098,252 | | |
See Accompanying Notes to Financial Statements
STATEMENTS OF CHANGES IN NET ASSETS
| | | | Voya Solution 2035 Portfolio | | | Voya Solution 2040 Portfolio | |
| | | | Year Ended
December 31,
2021 | | | Year Ended
December 31,
2020 | | | Year Ended
December 31,
2021 | | | Year Ended
December 31,
2020 | |
| FROM OPERATIONS: | | | | | | | | | | | | | | | | | | | | | | | | | |
| Net investment income | | | | $ | 8,662,809 | | | | | $ | 9,786,357 | | | | | $ | 485,038 | | | | | $ | 411,638 | | |
| Net realized gain (loss) | | | | | 108,775,807 | | | | | | 36,410,535 | | | | | | 8,726,431 | | | | | | (154,313) | | |
| Net change in unrealized appreciation (depreciation) | | | | | (27,977,809) | | | | | | 69,229,480 | | | | | | (3,039,047) | | | | | | 5,214,178 | | |
| Increase in net assets resulting from operations | | | | | 89,460,807 | | | | | | 115,426,372 | | | | | | 6,172,422 | | | | | | 5,471,503 | | |
| FROM DISTRIBUTIONS TO SHAREHOLDERS: | | | | | | | | | | | | | | | | | | | | | | | | | |
| Total distributions (excluding return of capital): | | | | | | | | | | | | | | | | | | | | | | | | | |
| Class ADV | | | | | (13,377,292) | | | | | | (17,064,874) | | | | | | (401,451) | | | | | | (1,024,164) | | |
| Class I | | | | | (4,627,389) | | | | | | (25,557,984) | | | | | | (278,849) | | | | | | (732,390) | | |
| Class S | | | | | (22,256,497) | | | | | | (25,432,218) | | | | | | (328,274) | | | | | | (583,691) | | |
| Class S2 | | | | | (862,847) | | | | | | (1,021,548) | | | | | | (46,978) | | | | | | (72,338) | | |
| Class T | | | | | (1,154) | | | | | | (34,001) | | | | | | (277) | | | | | | (2,323) | | |
| Total distributions | | | | | (41,125,179) | | | | | | (69,110,625) | | | | | | (1,055,829) | | | | | | (2,414,906) | | |
| FROM CAPITAL SHARE TRANSACTIONS: | | | | | | | | | | | | | | | | | | | | | | | | | |
| Net proceeds from sale of shares | | | | | 47,375,867 | | | | | | 65,367,566 | | | | | | 12,776,643 | | | | | | 10,906,398 | | |
| Reinvestment of distributions | | | | | 41,125,179 | | | | | | 69,110,625 | | | | | | 1,055,698 | | | | | | 2,414,576 | | |
| | | | | | 88,501,046 | | | | | | 134,478,191 | | | | | | 13,832,341 | | | | | | 13,320,974 | | |
| Cost of shares redeemed | | | | | (122,487,364) | | | | | | (382,740,378) | | | | | | (16,251,010) | | | | | | (11,884,083) | | |
| Net increase (decrease) in net assets resulting from capital share transactions | | | | | (33,986,318) | | | | | | (248,262,187) | | | | | | (2,418,669) | | | | | | 1,436,891 | | |
| Net increase (decrease) in net assets | | | | | 14,349,310 | | | | | | (201,946,440) | | | | | | 2,697,924 | | | | | | 4,493,488 | | |
| NET ASSETS: | | | | | | | | | | | | | | | | | | | | | | | | | |
| Beginning of year or period | | | | | 668,088,661 | | | | | | 870,035,101 | | | | | | 40,147,236 | | | | | | 35,653,748 | | |
| End of year or period | | | | $ | 682,437,971 | | | | | $ | 668,088,661 | | | | | $ | 42,845,160 | | | | | $ | 40,147,236 | | |
See Accompanying Notes to Financial Statements
STATEMENTS OF CHANGES IN NET ASSETS
| | | | Voya Solution 2045 Portfolio | | | Voya Solution 2050 Portfolio | |
| | | | Year Ended
December 31,
2021 | | | Year Ended
December 31,
2020 | | | Year Ended
December 31,
2021 | | | Year Ended
December 31,
2020 | |
| FROM OPERATIONS: | | | | | | | | | | | | | | | | | | | | | | | | | |
| Net investment income | | | | $ | 5,551,672 | | | | | $ | 6,024,492 | | | | | $ | 324,337 | | | | | $ | 306,781 | | |
| Net realized gain (loss) | | | | | 93,099,811 | | | | | | 40,038,089 | | | | | | 7,867,663 | | | | | | (141,996) | | |
| Net change in unrealized appreciation (depreciation) | | | | | (16,422,856) | | | | | | 57,354,060 | | | | | | (2,463,847) | | | | | | 4,935,252 | | |
| Increase in net assets resulting from operations | | | | | 82,228,627 | | | | | | 103,416,641 | | | | | | 5,728,153 | | | | | | 5,100,037 | | |
| FROM DISTRIBUTIONS TO SHAREHOLDERS: | | | | | | | | | | | | | | | | | | | | | | | | | |
| Total distributions (excluding return of capital): | | | | | | | | | | | | | | | | | | | | | | | | | |
| Class ADV | | | | | (14,358,057) | | | | | | (10,669,545) | | | | | | (407,828) | | | | | | (884,091) | | |
| Class I | | | | | (5,597,625) | | | | | | (21,965,537) | | | | | | (292,715) | | | | | | (652,158) | | |
| Class S | | | | | (25,285,756) | | | | | | (17,862,735) | | | | | | (266,356) | | | | | | (478,997) | | |
| Class S2 | | | | | (990,625) | | | | | | (477,241) | | | | | | (28,288) | | | | | | (23,826) | | |
| Class T | | | | | (14,355) | | | | | | (9,066) | | | | | | (302) | | | | | | (627) | | |
| Total distributions | | | | | (46,246,418) | | | | | | (50,984,124) | | | | | | (995,489) | | | | | | (2,039,699) | | |
| FROM CAPITAL SHARE TRANSACTIONS: | | | | | | | | | | | | | | | | | | | | | | | | | |
| Net proceeds from sale of shares | | | | | 39,159,002 | | | | | | 63,768,655 | | | | | | 9,181,341 | | | | | | 9,784,250 | | |
| Reinvestment of distributions | | | | | 46,246,418 | | | | | | 50,984,123 | | | | | | 995,344 | | | | | | 2,039,405 | | |
| | | | | | 85,405,420 | | | | | | 114,752,778 | | | | | | 10,176,685 | | | | | | 11,823,655 | | |
| Cost of shares redeemed | | | | | (92,965,289) | | | | | | (331,891,640) | | | | | | (14,614,819) | | | | | | (10,741,819) | | |
| Net increase (decrease) in net assets resulting from capital share transactions | | | | | (7,559,869) | | | | | | (217,138,862) | | | | | | (4,438,134) | | | | | | 1,081,836 | | |
| Net increase (decrease) in net assets | | | | | 28,422,340 | | | | | | (164,706,345) | | | | | | 294,530 | | | | | | 4,142,174 | | |
| NET ASSETS: | | | | | | | | | | | | | | | | | | | | | | | | | |
| Beginning of year or period | | | | | 499,988,923 | | | | | | 664,695,268 | | | | | | 35,831,410 | | | | | | 31,689,236 | | |
| End of year or period | | | | $ | 528,411,263 | | | | | $ | 499,988,923 | | | | | $ | 36,125,940 | | | | | $ | 35,831,410 | | |
See Accompanying Notes to Financial Statements
STATEMENTS OF CHANGES IN NET ASSETS
| | | | Voya Solution 2055 Portfolio | | | Voya Solution 2060 Portfolio | |
| | | | Year Ended
December 31,
2021 | | | Year Ended
December 31,
2020 | | | Year Ended
December 31,
2021 | | | Year Ended
December 31,
2020 | |
| FROM OPERATIONS: | | | | | | | | | | | | | | | | | | | | | | | | | |
| Net investment income | | | | $ | 1,534,952 | | | | | $ | 2,139,642 | | | | | $ | 224,618 | | | | | $ | 210,671 | | |
| Net realized gain | | | | | 32,899,770 | | | | | | 21,239,174 | | | | | | 5,746,010 | | | | | | 43,428 | | |
| Net change in unrealized appreciation (depreciation) | | | | | (7,273,004) | | | | | | 18,444,792 | | | | | | (2,002,387) | | | | | | 3,363,142 | | |
| Increase in net assets resulting from operations | | | | | 27,161,718 | | | | | | 41,823,608 | | | | | | 3,968,241 | | | | | | 3,617,241 | | |
| FROM DISTRIBUTIONS TO SHAREHOLDERS: | | | | | | | | | | | | | | | | | | | | | | | | | |
| Total distributions (excluding return of capital): | | | | | | | | | | | | | | | | | | | | | | | | | |
| Class ADV | | | | | (8,173,952) | | | | | | (3,090,178) | | | | | | (278,652) | | | | | | (412,239) | | |
| Class I | | | | | (3,511,066) | | | | | | (9,250,529) | | | | | | (199,058) | | | | | | (365,911) | | |
| Class S | | | | | (11,778,271) | | | | | | (4,155,976) | | | | | | (231,483) | | | | | | (321,696) | | |
| Class S2 | | | | | (701,880) | | | | | | (139,214) | | | | | | (32,424) | | | | | | (19,875) | | |
| Class T | | | | | (2,823) | | | | | | (1,502) | | | | | | (138) | | | | | | (215) | | |
| Total distributions | | | | | (24,167,992) | | | | | | (16,637,399) | | | | | | (741,755) | | | | | | (1,119,936) | | |
| FROM CAPITAL SHARE TRANSACTIONS: | | | | | | | | | | | | | | | | | | | | | | | | | |
| Net proceeds from sale of shares | | | | | 25,063,582 | | | | | | 52,513,500 | | | | | | 8,648,215 | | | | | | 9,090,858 | | |
| Reinvestment of distributions | | | | | 24,167,993 | | | | | | 16,637,399 | | | | | | 741,755 | | | | | | 1,119,936 | | |
| | | | | | 49,231,575 | | | | | | 69,150,900 | | | | | | 9,389,970 | | | | | | 10,210,794 | | |
| Cost of shares redeemed | | | | | (40,353,988) | | | | | | (161,089,782) | | | | | | (10,332,678) | | | | | | (5,732,191) | | |
| Net increase (decrease) in net assets resulting from capital share transactions | | | | | 8,877,587 | | | | | | (91,938,883) | | | | | | (942,708) | | | | | | 4,478,603 | | |
| Net increase (decrease) in net assets | | | | | 11,871,313 | | | | | | (66,752,674) | | | | | | 2,283,778 | | | | | | 6,975,908 | | |
| NET ASSETS: | | | | | | | | | | | | | | | | | | | | | | | | | |
| Beginning of year or period | | | | | 165,297,329 | | | | | | 232,050,003 | | | | | | 24,310,513 | | | | | | 17,334,605 | | |
| End of year or period | | | | $ | 177,168,642 | | | | | $ | 165,297,329 | | | | | $ | 26,594,291 | | | | | $ | 24,310,513 | | |
See Accompanying Notes to Financial Statements
STATEMENTS OF CHANGES IN NET ASSETS
| | | | Voya Solution 2065 Portfolio | |
| | | | Year Ended
December 31,
2021 | | | July 29, 2020(1) to
December 31,
2020 | |
| FROM OPERATIONS: | | | | | | | | | | | | | |
| Net investment income | | | | $ | 53,103 | | | | | $ | 26,897 | | |
| Net realized gain | | | | | 747,813 | | | | | | 71,335 | | |
| Net change in unrealized appreciation (depreciation) | | | | | (178,515) | | | | | | 309,985 | | |
| Increase in net assets resulting from operations | | | | | 622,401 | | | | | | 408,217 | | |
| FROM DISTRIBUTIONS TO SHAREHOLDERS: | | | | | | | | | | | | | |
| Total distributions (excluding return of capital): | | | | | | | | | | | | | |
| Class ADV | | | | | (182,982) | | | | | | (16,550) | | |
| Class I | | | | | (200,791) | | | | | | (18,505) | | |
| Class S | | | | | (283,529) | | | | | | (16,346) | | |
| Class S2 | | | | | (13,311) | | | | | | (422) | | |
| Class T | | | | | (472) | | | | | | (54) | | |
| Total distributions | | | | | (681,085) | | | | | | (51,877) | | |
| FROM CAPITAL SHARE TRANSACTIONS: | | | | | | | | | | | | | |
| Net proceeds from sale of shares | | | | | 2,725,314 | | | | | | 2,795,806 | | |
| Reinvestment of distributions | | | | | 681,085 | | | | | | 51,877 | | |
| | | | | | 3,406,399 | | | | | | 2,847,683 | | |
| Cost of shares redeemed | | | | | (565,627) | | | | | | (162,617) | | |
| Net increase in net assets resulting from capital share transactions | | | | | 2,840,772 | | | | | | 2,685,066 | | |
| Net increase in net assets | | | | | 2,782,088 | | | | | | 3,041,406 | | |
| NET ASSETS: | | | | | | | | | | | | | |
| Beginning of year or period | | | | | 3,041,406 | | | | | | — | | |
| End of year or period | | | | $ | 5,823,494 | | | | | $ | 3,041,406 | | |
(1)
Commencement of operations.
See Accompanying Notes to Financial Statements
Selected data for a share of beneficial interest outstanding throughout each year or period.
| | | | | | | | | | Income
(loss) from
investment
operations | | | | | | | | | Less
Distributions | | | | | | | | | | | | | | | | | | | | | | | | | | | Ratios to average
net assets | | | Supplemental
Data | |
| | | | Net asset value, beginning of year
or period | | | Net investment income (loss) | | | Net realized and unrealized
gain (loss) | | | Total from investment operations | | | From net investment income | | | From net realized gains | | | From return of capital | | | Total distributions | | | Payment by affiliate | | | Net asset value, end of year
or period | | | Total Return(1) | | | Expenses before
reductions/additions(2)(3)(4) | | | Expenses net of fee waivers
and/or recoupments if any(2)(3)(4) | | | Expenses net of all
reductions/additions(2)(3)(4) | | | Net investment income (loss)(2)(3) | | | Net assets, end of year or period | | | Portfolio turnover rate | |
Year or
period ended | | | ($) | | | ($) | | | ($) | | | ($) | | | ($) | | | ($) | | | ($) | | | ($) | | | ($) | | | ($) | | | (%) | | | (%) | | | (%) | | | (%) | | | (%) | | | ($000’s) | | | (%) | |
| Voya Solution Aggressive Portfolio | | | | | | | | | | | | | | | | | | | | | | | | | | | | | | | | | | | | | | | | | | | | | | | | | | | | | | | | | | | | | | | | | | | | | | | | | | | | | | | | | | | | | | | | | | | | | | | | | | | | | | | |
| Class ADV | | | | | | | | | | | | | | | | | | | | | | | | | | | | | | | | | | | | | | | | | | | | | | | | | | | | | | | | | | | | | | | | | | | | | | | | | | | | | | | | | | | | | | | | | | | | | | | | | | | | | | | |
| 12-31-21 | | | | | 13.91 | | | | | | 0.06• | | | | | | 2.62 | | | | | | 2.68 | | | | | | 0.14 | | | | | | — | | | | | | — | | | | | | 0.14 | | | | | | — | | | | | | 16.45 | | | | | | 19.31 | | | | | | 0.93 | | | | | | 0.81 | | | | | | 0.81 | | | | | | 0.37 | | | | | | 4,406 | | | | | | 58 | | |
| 12-31-20 | | | | | 13.08 | | | | | | 0.10 | | | | | | 1.76 | | | | | | 1.86 | | | | | | 0.15 | | | | | | 0.88 | | | | | | — | | | | | | 1.03 | | | | | | — | | | | | | 13.91 | | | | | | 15.53 | | | | | | 1.00 | | | | | | 0.81 | | | | | | 0.81 | | | | | | 0.64 | | | | | | 3,744 | | | | | | 85 | | |
| 12-31-19 | | | | | 11.47 | | | | | | 0.11 | | | | | | 2.65 | | | | | | 2.76 | | | | | | 0.16 | | | | | | 0.99 | | | | | | — | | | | | | 1.15 | | | | | | — | | | | | | 13.08 | | | | | | 24.94 | | | | | | 0.92 | | | | | | 0.75 | | | | | | 0.75 | | | | | | 0.96 | | | | | | 3,760 | | | | | | 85 | | |
| 12-31-18 | | | | | 13.56 | | | | | | 0.10 | | | | | | (1.53) | | | | | | (1.43) | | | | | | 0.11 | | | | | | 0.55 | | | | | | — | | | | | | 0.66 | | | | | | — | | | | | | 11.47 | | | | | | (11.18) | | | | | | 0.90 | | | | | | 0.69 | | | | | | 0.69 | | | | | | 0.79 | | | | | | 3,159 | | | | | | 79 | | |
| 12-31-17 | | | | | 11.33 | | | | | | 0.11• | | | | | | 2.34 | | | | | | 2.45 | | | | | | 0.05 | | | | | | 0.17 | | | | | | — | | | | | | 0.22 | | | | | | — | | | | | | 13.56 | | | | | | 21.71 | | | | | | 0.91 | | | | | | 0.66 | | | | | | 0.66 | | | | | | 0.85 | | | | | | 3,467 | | | | | | 52 | | |
| Class I | | | | | | | | | | | | | | | | | | | | | | | | | | | | | | | | | | | | | | | | | | | | | | | | | | | | | | | | | | | | | | | | | | | | | | | | | | | | | | | | | | | | | | | | | | | | | | | | | | | | | | | |
| 12-31-21 | | | | | 14.29 | | | | | | 0.13• | | | | | | 2.70 | | | | | | 2.83 | | | | | | 0.20 | | | | | | — | | | | | | — | | | | | | 0.20 | | | | | | — | | | | | | 16.92 | | | | | | 19.87 | | | | | | 0.43 | | | | | | 0.31 | | | | | | 0.31 | | | | | | 0.82 | | | | | | 488 | | | | | | 58 | | |
| 12-31-20 | | | | | 13.42 | | | | | | 0.12• | | | | | | 1.85 | | | | | | 1.97 | | | | | | 0.22 | | | | | | 0.88 | | | | | | — | | | | | | 1.10 | | | | | | — | | | | | | 14.29 | | | | | | 16.09 | | | | | | 0.50 | | | | | | 0.31 | | | | | | 0.31 | | | | | | 0.94 | | | | | | 294 | | | | | | 85 | | |
| 12-31-19 | | | | | 11.74 | | | | | | 0.22• | | | | | | 2.67 | | | | | | 2.89 | | | | | | 0.22 | | | | | | 0.99 | | | | | | — | | | | | | 1.21 | | | | | | — | | | | | | 13.42 | | | | | | 25.54 | | | | | | 0.42 | | | | | | 0.25 | | | | | | 0.25 | | | | | | 1.73 | | | | | | 600 | | | | | | 85 | | |
| 12-31-18 | | | | | 13.85 | | | | | | 0.16• | | | | | | (1.55) | | | | | | (1.39) | | | | | | 0.17 | | | | | | 0.55 | | | | | | — | | | | | | 0.72 | | | | | | — | | | | | | 11.74 | | | | | | (10.72) | | | | | | 0.40 | | | | | | 0.19 | | | | | | 0.19 | | | | | | 1.17 | | | | | | 325 | | | | | | 79 | | |
| 12-31-17 | | | | | 11.56 | | | | | | 0.18• | | | | | | 2.38 | | | | | | 2.56 | | | | | | 0.10 | | | | | | 0.17 | | | | | | — | | | | | | 0.27 | | | | | | — | | | | | | 13.85 | | | | | | 22.28 | | | | | | 0.41 | | | | | | 0.16 | | | | | | 0.16 | | | | | | 1.41 | | | | | | 444 | | | | | | 52 | | |
| Class R6 | | | | | | | | | | | | | | | | | | | | | | | | | | | | | | | | | | | | | | | | | | | | | | | | | | | | | | | | | | | | | | | | | | | | | | | | | | | | | | | | | | | | | | | | | | | | | | | | | | | | | | | |
| 12-31-21 | | | | | 14.29 | | | | | | 0.15• | | | | | | 2.68 | | | | | | 2.83 | | | | | | 0.20 | | | | | | — | | | | | | — | | | | | | 0.20 | | | | | | — | | | | | | 16.92 | | | | | | 19.86 | | | | | | 0.33 | | | | | | 0.31 | | | | | | 0.31 | | | | | | 0.94 | | | | | | 21,062 | | | | | | 58 | | |
| 12-31-20 | | | | | 13.41 | | | | | | 0.16• | | | | | | 1.82 | | | | | | 1.98 | | | | | | 0.22 | | | | | | 0.88 | | | | | | — | | | | | | 1.10 | | | | | | — | | | | | | 14.29 | | | | | | 16.19 | | | | | | 0.38 | | | | | | 0.31 | | | | | | 0.31 | | | | | | 1.23 | | | | | | 16,188 | | | | | | 85 | | |
| 12-31-19 | | | | | 11.74 | | | | | | 0.20• | | | | | | 2.68 | | | | | | 2.88 | | | | | | 0.22 | | | | | | 0.99 | | | | | | — | | | | | | 1.21 | | | | | | — | | | | | | 13.41 | | | | | | 25.45 | | | | | | 0.42 | | | | | | 0.25 | | | | | | 0.25 | | | | | | 1.57 | | | | | | 11,636 | | | | | | 85 | | |
| 12-31-18 | | | | | 13.85 | | | | | | 0.19• | | | | | | (1.58) | | | | | | (1.39) | | | | | | 0.17 | | | | | | 0.55 | | | | | | — | | | | | | 0.72 | | | | | | — | | | | | | 11.74 | | | | | | (10.72) | | | | | | 0.40 | | | | | | 0.19 | | | | | | 0.19 | | | | | | 1.42 | | | | | | 7,177 | | | | | | 79 | | |
| 12-31-17 | | | | | 11.56 | | | | | | 0.24• | | | | | | 2.32 | | | | | | 2.56 | | | | | | 0.10 | | | | | | 0.17 | | | | | | — | | | | | | 0.27 | | | | | | — | | | | | | 13.85 | | | | | | 22.28 | | | | | | 0.41 | | | | | | 0.16 | | | | | | 0.16 | | | | | | 1.82 | | | | | | 5,015 | | | | | | 52 | | |
| Class S | | | | | | | | | | | | | | | | | | | | | | | | | | | | | | | | | | | | | | | | | | | | | | | | | | | | | | | | | | | | | | | | | | | | | | | | | | | | | | | | | | | | | | | | | | | | | | | | | | | | | | | |
| 12-31-21 | | | | | 14.10 | | | | | | 0.10• | | | | | | 2.66 | | | | | | 2.76 | | | | | | 0.17 | | | | | | — | | | | | | — | | | | | | 0.17 | | | | | | — | | | | | | 16.69 | | | | | | 19.62 | | | | | | 0.68 | | | | | | 0.56 | | | | | | 0.56 | | | | | | 0.64 | | | | | | 4,426 | | | | | | 58 | | |
| 12-31-20 | | | | | 13.25 | | | | | | 0.10• | | | | | | 1.82 | | | | | | 1.92 | | | | | | 0.19 | | | | | | 0.88 | | | | | | — | | | | | | 1.07 | | | | | | — | | | | | | 14.10 | | | | | | 15.83 | | | | | | 0.75 | | | | | | 0.56 | | | | | | 0.56 | | | | | | 0.80 | | | | | | 3,666 | | | | | | 85 | | |
| 12-31-19 | | | | | 11.60 | | | | | | 0.15 | | | | | | 2.67 | | | | | | 2.82 | | | | | | 0.18 | | | | | | 0.99 | | | | | | — | | | | | | 1.17 | | | | | | — | | | | | | 13.25 | | | | | | 25.21 | | | | | | 0.67 | | | | | | 0.50 | | | | | | 0.50 | | | | | | 1.27 | | | | | | 3,925 | | | | | | 85 | | |
| 12-31-18 | | | | | 13.69 | | | | | | 0.12• | | | | | | (1.52) | | | | | | (1.40) | | | | | | 0.14 | | | | | | 0.55 | | | | | | — | | | | | | 0.69 | | | | | | — | | | | | | 11.60 | | | | | | (10.91) | | | | | | 0.65 | | | | | | 0.44 | | | | | | 0.44 | | | | | | 0.93 | | | | | | 3,123 | | | | | | 79 | | |
| 12-31-17 | | | | | 11.44 | | | | | | 0.12• | | | | | | 2.37 | | | | | | 2.49 | | | | | | 0.07 | | | | | | 0.17 | | | | | | — | | | | | | 0.24 | | | | | | — | | | | | | 13.69 | | | | | | 21.92 | | | | | | 0.66 | | | | | | 0.41 | | | | | | 0.41 | | | | | | 0.99 | | | | | | 4,300 | | | | | | 52 | | |
| Class S2 | | | | | | | | | | | | | | | | | | | | | | | | | | | | | | | | | | | | | | | | | | | | | | | | | | | | | | | | | | | | | | | | | | | | | | | | | | | | | | | | | | | | | | | | | | | | | | | | | | | | | | | |
| 12-31-21 | | | | | 13.81 | | | | | | 0.06• | | | | | | 2.62 | | | | | | 2.68 | | | | | | 0.13 | | | | | | — | | | | | | — | | | | | | 0.13 | | | | | | — | | | | | | 16.36 | | | | | | 19.42 | | | | | | 0.83 | | | | | | 0.71 | | | | | | 0.71 | | | | | | 0.37 | | | | | | 1,434 | | | | | | 58 | | |
| 12-31-20 | | | | | 13.01 | | | | | | 0.10• | | | | | | 1.76 | | | | | | 1.86 | | | | | | 0.18 | | | | | | 0.88 | | | | | | — | | | | | | 1.06 | | | | | | — | | | | | | 13.81 | | | | | | 15.70 | | | | | | 0.90 | | | | | | 0.71 | | | | | | 0.71 | | | | | | 0.80 | | | | | | 2,038 | | | | | | 85 | | |
| 12-31-19 | | | | | 11.43 | | | | | | 0.16• | | | | | | 2.60 | | | | | | 2.76 | | | | | | 0.19 | | | | | | 0.99 | | | | | | — | | | | | | 1.18 | | | | | | — | | | | | | 13.01 | | | | | | 25.05 | | | | | | 0.82 | | | | | | 0.65 | | | | | | 0.65 | | | | | | 1.28 | | | | | | 1,539 | | | | | | 85 | | |
| 12-31-18 | | | | | 13.52 | | | | | | 0.13• | | | | | | (1.54) | | | | | | (1.41) | | | | | | 0.13 | | | | | | 0.55 | | | | | | — | | | | | | 0.68 | | | | | | — | | | | | | 11.43 | | | | | | (11.08) | | | | | | 0.80 | | | | | | 0.59 | | | | | | 0.59 | | | | | | 0.96 | | | | | | 800 | | | | | | 79 | | |
| 12-31-17 | | | | | 11.32 | | | | | | 0.12• | | | | | | 2.32 | | | | | | 2.44 | | | | | | 0.07 | | | | | | 0.17 | | | | | | — | | | | | | 0.24 | | | | | | — | | | | | | 13.52 | | | | | | 21.71 | | | | | | 0.81 | | | | | | 0.56 | | | | | | 0.56 | | | | | | 0.99 | | | | | | 681 | | | | | | 52 | | |
See Accompanying Notes to Financial Statements
Financial Highlights (continued)
| | | | | | | | | | Income
(loss) from
investment
operations | | | | | | | | | Less
Distributions | | | | | | | | | | | | | | | | | | | | | | | | | | | Ratios to average
net assets | | | Supplemental
Data | |
| | | | Net asset value, beginning of year
or period | | | Net investment income (loss) | | | Net realized and unrealized
gain (loss) | | | Total from investment operations | | | From net investment income | | | From net realized gains | | | From return of capital | | | Total distributions | | | Payment by affiliate | | | Net asset value, end of year
or period | | | Total Return(1) | | | Expenses before
reductions/additions(2)(3)(4) | | | Expenses net of fee waivers
and/or recoupments if any(2)(3)(4) | | | Expenses net of all
reductions/additions(2)(3)(4) | | | Net investment income (loss)(2)(3) | | | Net assets, end of year or period | | | Portfolio turnover rate | |
Year or
period ended | | | ($) | | | ($) | | | ($) | | | ($) | | | ($) | | | ($) | | | ($) | | | ($) | | | ($) | | | ($) | | | (%) | | | (%) | | | (%) | | | (%) | | | (%) | | | ($000’s) | | | (%) | |
| Voya Solution Balanced Portfolio | | | | | | | | | | | | | | | | | | | | | | | | | | | | | | | | | | | | | | | | | | | | | | | | | | | | | | | | | | | | | | | | | | | | | | | | | | | | | | | | | | | | | | | | | | | | | | | | | | | | | | | |
| Class ADV | | | | | | | | | | | | | | | | | | | | | | | | | | | | | | | | | | | | | | | | | | | | | | | | | | | | | | | | | | | | | | | | | | | | | | | | | | | | | | | | | | | | | | | | | | | | | | | | | | | | | | | |
| 12-31-21 | | | | | 10.26 | | | | | | 0.10• | | | | | | 1.29 | | | | | | 1.39 | | | | | | 0.17 | | | | | | — | | | | | | — | | | | | | 0.17 | | | | | | — | | | | | | 11.48 | | | | | | 13.63 | | | | | | 0.86 | | | | | | 0.80 | | | | | | 0.80 | | | | | | 0.92 | | | | | | 10,713 | | | | | | 50 | | |
| 12-31-20 | | | | | 9.74 | | | | | | 0.11• | | | | | | 1.06 | | | | | | 1.17 | | | | | | 0.17 | | | | | | 0.48 | | | | | | — | | | | | | 0.65 | | | | | | — | | | | | | 10.26 | | | | | | 12.75 | | | | | | 0.89 | | | | | | 0.81 | | | | | | 0.81 | | | | | | 1.22 | | | | | | 9,774 | | | | | | 79 | | |
| 12-31-19 | | | | | 8.89 | | | | | | 0.14• | | | | | | 1.51 | | | | | | 1.65 | | | | | | 0.19 | | | | | | 0.61 | | | | | | — | | | | | | 0.80 | | | | | | — | | | | | | 9.74 | | | | | | 19.13 | | | | | | 0.82 | | | | | | 0.75 | | | | | | 0.75 | | | | | | 1.45 | | | | | | 10,913 | | | | | | 85 | | |
| 12-31-18 | | | | | 10.08 | | | | | | 0.14• | | | | | | (0.80) | | | | | | (0.66) | | | | | | 0.16 | | | | | | 0.37 | | | | | | — | | | | | | 0.53 | | | | | | — | | | | | | 8.89 | | | | | | (6.98) | | | | | | 0.80 | | | | | | 0.69 | | | | | | 0.69 | | | | | | 1.39 | | | | | | 11,984 | | | | | | 60 | | |
| 12-31-17 | | | | | 9.06 | | | | | | 0.13• | | | | | | 1.16 | | | | | | 1.29 | | | | | | 0.11 | | | | | | 0.16 | | | | | | — | | | | | | 0.27 | | | | | | — | | | | | | 10.08 | | | | | | 14.46 | | | | | | 0.78 | | | | | | 0.66 | | | | | | 0.66 | | | | | | 1.32 | | | | | | 19,020 | | | | | | 48 | | |
| Class I | | | | | | | | | | | | | | | | | | | | | | | | | | | | | | | | | | | | | | | | | | | | | | | | | | | | | | | | | | | | | | | | | | | | | | | | | | | | | | | | | | | | | | | | | | | | | | | | | | | | | | | |
| 12-31-21 | | | | | 10.70 | | | | | | 0.17• | | | | | | 1.34 | | | | | | 1.51 | | | | | | 0.23 | | | | | | — | | | | | | — | | | | | | 0.23 | | | | | | — | | | | | | 11.98 | | | | | | 14.15 | | | | | | 0.36 | | | | | | 0.30 | | | | | | 0.30 | | | | | | 1.49 | | | | | | 3,831 | | | | | | 50 | | |
| 12-31-20 | | | | | 10.14 | | | | | | 0.18• | | | | | | 1.09 | | | | | | 1.27 | | | | | | 0.23 | | | | | | 0.48 | | | | | | — | | | | | | 0.71 | | | | | | — | | | | | | 10.70 | | | | | | 13.30 | | | | | | 0.39 | | | | | | 0.31 | | | | | | 0.31 | | | | | | 1.88 | | | | | | 3,224 | | | | | | 79 | | |
| 12-31-19 | | | | | 9.24 | | | | | | 0.18• | | | | | | 1.59 | | | | | | 1.77 | | | | | | 0.26 | | | | | | 0.61 | | | | | | — | | | | | | 0.87 | | | | | | — | | | | | | 10.14 | | | | | | 19.75 | | | | | | 0.32 | | | | | | 0.25 | | | | | | 0.25 | | | | | | 1.78 | | | | | | 2,482 | | | | | | 85 | | |
| 12-31-18 | | | | | 10.45 | | | | | | 0.20• | | | | | | (0.82) | | | | | | (0.62) | | | | | | 0.22 | | | | | | 0.37 | | | | | | — | | | | | | 0.59 | | | | | | — | | | | | | 9.24 | | | | | | (6.38) | | | | | | 0.30 | | | | | | 0.19 | | | | | | 0.19 | | | | | | 1.97 | | | | | | 3,689 | | | | | | 60 | | |
| 12-31-17 | | | | | 9.40 | | | | | | 0.21• | | | | | | 1.17 | | | | | | 1.38 | | | | | | 0.17 | | | | | | 0.16 | | | | | | — | | | | | | 0.33 | | | | | | — | | | | | | 10.45 | | | | | | 14.89 | | | | | | 0.28 | | | | | | 0.16 | | | | | | 0.16 | | | | | | 2.06 | | | | | | 4,683 | | | | | | 48 | | |
| Class R6 | | | | | | | | | | | | | | | | | | | | | | | | | | | | | | | | | | | | | | | | | | | | | | | | | | | | | | | | | | | | | | | | | | | | | | | | | | | | | | | | | | | | | | | | | | | | | | | | | | | | | | | |
| 12-31-21 | | | | | 10.70 | | | | | | 0.16• | | | | | | 1.35 | | | | | | 1.51 | | | | | | 0.23 | | | | | | — | | | | | | — | | | | | | 0.23 | | | | | | — | | | | | | 11.98 | | | | | | 14.15 | | | | | | 0.30 | | | | | | 0.30 | | | | | | 0.30 | | | | | | 1.42 | | | | | | 24,204 | | | | | | 50 | | |
| 12-31-20 | | | | | 10.14 | | | | | | 0.17• | | | | | | 1.10 | | | | | | 1.27 | | | | | | 0.23 | | | | | | 0.48 | | | | | | — | | | | | | 0.71 | | | | | | — | | | | | | 10.70 | | | | | | 13.30 | | | | | | 0.32 | | | | | | 0.31 | | | | | | 0.31 | | | | | | 1.77 | | | | | | 22,189 | | | | | | 79 | | |
| 12-31-19 | | | | | 9.24 | | | | | | 0.21��� | | | | | | 1.56 | | | | | | 1.77 | | | | | | 0.26 | | | | | | 0.61 | | | | | | — | | | | | | 0.87 | | | | | | — | | | | | | 10.14 | | | | | | 19.76 | | | | | | 0.32 | | | | | | 0.25 | | | | | | 0.25 | | | | | | 2.09 | | | | | | 20,185 | | | | | | 85 | | |
| 12-31-18 | | | | | 10.45 | | | | | | 0.18 | | | | | | (0.80) | | | | | | (0.62) | | | | | | 0.22 | | | | | | 0.37 | | | | | | — | | | | | | 0.59 | | | | | | — | | | | | | 9.24 | | | | | | (6.38) | | | | | | 0.30 | | | | | | 0.19 | | | | | | 0.19 | | | | | | 2.00 | | | | | | 13,738 | | | | | | 60 | | |
| 12-31-17 | | | | | 9.39 | | | | | | 0.22• | | | | | | 1.17 | | | | | | 1.39 | | | | | | 0.17 | | | | | | 0.16 | | | | | | — | | | | | | 0.33 | | | | | | — | | | | | | 10.45 | | | | | | 15.01 | | | | | | 0.28 | | | | | | 0.16 | | | | | | 0.16 | | | | | | 2.20 | | | | | | 13,145 | | | | | | 48 | | |
| Class S | | | | | | | | | | | | | | | | | | | | | | | | | | | | | | | | | | | | | | | | | | | | | | | | | | | | | | | | | | | | | | | | | | | | | | | | | | | | | | | | | | | | | | | | | | | | | | | | | | | | | | | |
| 12-31-21 | | | | | 10.39 | | | | | | 0.13• | | | | | | 1.31 | | | | | | 1.44 | | | | | | 0.20 | | | | | | — | | | | | | — | | | | | | 0.20 | | | | | | — | | | | | | 11.63 | | | | | | 13.96 | | | | | | 0.61 | | | | | | 0.55 | | | | | | 0.55 | | | | | | 1.18 | | | | | | 24,044 | | | | | | 50 | | |
| 12-31-20 | | | | | 9.87 | | | | | | 0.16 | | | | | | 1.04 | | | | | | 1.20 | | | | | | 0.20 | | | | | | 0.48 | | | | | | — | | | | | | 0.68 | | | | | | — | | | | | | 10.39 | | | | | | 12.95 | | | | | | 0.64 | | | | | | 0.56 | | | | | | 0.56 | | | | | | 1.49 | | | | | | 19,713 | | | | | | 79 | | |
| 12-31-19 | | | | | 9.01 | | | | | | 0.17• | | | | | | 1.53 | | | | | | 1.70 | | | | | | 0.23 | | | | | | 0.61 | | | | | | — | | | | | | 0.84 | | | | | | — | | | | | | 9.87 | | | | | | 19.47 | | | | | | 0.57 | | | | | | 0.50 | | | | | | 0.50 | | | | | | 1.76 | | | | | | 20,388 | | | | | | 85 | | |
| 12-31-18 | | | | | 10.21 | | | | | | 0.17• | | | | | | (0.81) | | | | | | (0.64) | | | | | | 0.19 | | | | | | 0.37 | | | | | | — | | | | | | 0.56 | | | | | | — | | | | | | 9.01 | | | | | | (6.70) | | | | | | 0.55 | | | | | | 0.44 | | | | | | 0.44 | | | | | | 1.69 | | | | | | 19,594 | | | | | | 60 | | |
| 12-31-17 | | | | | 9.18 | | | | | | 0.15• | | | | | | 1.19 | | | | | | 1.34 | | | | | | 0.15 | | | | | | 0.16 | | | | | | — | | | | | | 0.31 | | | | | | — | | | | | | 10.21 | | | | | | 14.75 | | | | | | 0.53 | | | | | | 0.41 | | | | | | 0.41 | | | | | | 1.54 | | | | | | 23,906 | | | | | | 48 | | |
| Class S2 | | | | | | | | | | | | | | | | | | | | | | | | | | | | | | | | | | | | | | | | | | | | | | | | | | | | | | | | | | | | | | | | | | | | | | | | | | | | | | | | | | | | | | | | | | | | | | | | | | | | | | | |
| 12-31-21 | | | | | 10.34 | | | | | | 0.11• | | | | | | 1.31 | | | | | | 1.42 | | | | | | 0.16 | | | | | | — | | | | | | — | | | | | | 0.16 | | | | | | — | | | | | | 11.60 | | | | | | 13.80 | | | | | | 0.76 | | | | | | 0.70 | | | | | | 0.70 | | | | | | 1.00 | | | | | | 1,556 | | | | | | 50 | | |
| 12-31-20 | | | | | 9.83 | | | | | | 0.11• | | | | | | 1.08 | | | | | | 1.19 | | | | | | 0.20 | | | | | | 0.48 | | | | | | — | | | | | | 0.68 | | | | | | — | | | | | | 10.34 | | | | | | 12.81 | | | | | | 0.79 | | | | | | 0.71 | | | | | | 0.71 | | | | | | 1.22 | | | | | | 1,621 | | | | | | 79 | | |
| 12-31-19 | | | | | 9.00 | | | | | | 0.18• | | | | | | 1.49 | | | | | | 1.67 | | | | | | 0.23 | | | | | | 0.61 | | | | | | — | | | | | | 0.84 | | | | | | — | | | | | | 9.83 | | | | | | 19.22 | | | | | | 0.72 | | | | | | 0.65 | | | | | | 0.65 | | | | | | 1.90 | | | | | | 2,548 | | | | | | 85 | | |
| 12-31-18 | | | | | 10.17 | | | | | | 0.13• | | | | | | (0.79) | | | | | | (0.66) | | | | | | 0.14 | | | | | | 0.37 | | | | | | — | | | | | | 0.51 | | | | | | — | | | | | | 9.00 | | | | | | (6.89) | | | | | | 0.70 | | | | | | 0.59 | | | | | | 0.59 | | | | | | 1.30 | | | | | | 856 | | | | | | 60 | | |
| 12-31-17 | | | | | 9.16 | | | | | | 0.14• | | | | | | 1.18 | | | | | | 1.32 | | | | | | 0.15 | | | | | | 0.16 | | | | | | — | | | | | | 0.31 | | | | | | — | | | | | | 10.17 | | | | | | 14.63 | | | | | | 0.68 | | | | | | 0.56 | | | | | | 0.56 | | | | | | 1.43 | | | | | | 2,004 | | | | | | 48 | | |
See Accompanying Notes to Financial Statements
Financial Highlights (continued)
| | | | | | | | | | Income
(loss) from
investment
operations | | | | | | | | | Less
Distributions | | | | | | | | | | | | | | | | | | | | | | | | | | | Ratios to average
net assets | | | Supplemental
Data | |
| | | | Net asset value, beginning of year
or period | | | Net investment income (loss) | | | Net realized and unrealized
gain (loss) | | | Total from investment operations | | | From net investment income | | | From net realized gains | | | From return of capital | | | Total distributions | | | Payment by affiliate | | | Net asset value, end of year
or period | | | Total Return(1) | | | Expenses before
reductions/additions(2)(3)(4) | | | Expenses net of fee waivers
and/or recoupments if any(2)(3)(4) | | | Expenses net of all
reductions/additions(2)(3)(4) | | | Net investment income (loss)(2)(3) | | | Net assets, end of year or period | | | Portfolio turnover rate | |
Year or
period ended | | | ($) | | | ($) | | | ($) | | | ($) | | | ($) | | | ($) | | | ($) | | | ($) | | | ($) | | | ($) | | | (%) | | | (%) | | | (%) | | | (%) | | | (%) | | | ($000’s) | | | (%) | |
| Voya Solution Conservative Portfolio | | | | | | | | | | | | | | | | | | | | | | | | | | | | | | | | | | | | | | | | | | | | | | | | | | | | | | | | | | | | | | | | | | | | | | | | | | | | | | | | | | | | | | | | | | | | | | | | | | | | | | | |
| Class ADV | | | | | | | | | | | | | | | | | | | | | | | | | | | | | | | | | | | | | | | | | | | | | | | | | | | | | | | | | | | | | | | | | | | | | | | | | | | | | | | | | | | | | | | | | | | | | | | | | | | | | | | |
| 12-31-21 | | | | | 11.80 | | | | | | 0.17• | | | | | | 0.45 | | | | | | 0.62 | | | | | | 0.27 | | | | | | 0.19 | | | | | | — | | | | | | 0.46 | | | | | | — | | | | | | 11.96 | | | | | | 5.26 | | | | | | 0.95 | | | | | | 0.69 | | | | | | 0.69 | | | | | | 1.42 | | | | | | 4,030 | | | | | | 54 | | |
| 12-31-20 | | | | | 11.24 | | | | | | 0.21• | | | | | | 0.84 | | | | | | 1.05 | | | | | | 0.28 | | | | | | 0.21 | | | | | | — | | | | | | 0.49 | | | | | | — | | | | | | 11.80 | | | | | | 9.59 | | | | | | 0.95 | | | | | | 0.70 | | | | | | 0.70 | | | | | | 1.90 | | | | | | 4,658 | | | | | | 91 | | |
| 12-31-19 | | | | | 10.40 | | | | | | 0.24 | | | | | | 0.90 | | | | | | 1.14 | | | | | | 0.21 | | | | | | 0.09 | | | | | | — | | | | | | 0.30 | | | | | | — | | | | | | 11.24 | | | | | | 10.99 | | | | | | 0.92 | | | | | | 0.67 | | | | | | 0.67 | | | | | | 2.10 | | | | | | 8,336 | | | | | | 75 | | |
| 12-31-18 | | | | | 11.06 | | | | | | 0.22 | | | | | | (0.47) | | | | | | (0.25) | | | | | | 0.22 | | | | | | 0.19 | | | | | | — | | | | | | 0.41 | | | | | | — | | | | | | 10.40 | | | | | | (2.39) | | | | | | 0.89 | | | | | | 0.63 | | | | | | 0.63 | | | | | | 1.92 | | | | | | 7,912 | | | | | | 67 | | |
| 12-31-17 | | | | | 10.60 | | | | | | 0.20• | | | | | | 0.55 | | | | | | 0.75 | | | | | | 0.22 | | | | | | 0.07 | | | | | | — | | | | | | 0.29 | | | | | | — | | | | | | 11.06 | | | | | | 7.06 | | | | | | 0.86 | | | | | | 0.62 | | | | | | 0.62 | | | | | | 1.84 | | | | | | 8,486 | | | | | | 63 | | |
| Class I | | | | | | | | | | | | | | | | | | | | | | | | | | | | | | | | | | | | | | | | | | | | | | | | | | | | | | | | | | | | | | | | | | | | | | | | | | | | | | | | | | | | | | | | | | | | | | | | | | | | | | | |
| 12-31-21 | | | | | 11.92 | | | | | | 0.27• | | | | | | 0.42 | | | | | | 0.69 | | | | | | 0.35 | | | | | | 0.19 | | | | | | — | | | | | | 0.54 | | | | | | — | | | | | | 12.07 | | | | | | 5.85 | | | | | | 0.45 | | | | | | 0.19 | | | | | | 0.19 | | | | | | 2.24 | | | | | | 913 | | | | | | 54 | | |
| 12-31-20 | | | | | 11.41 | | | | | | 0.24• | | | | | | 0.86 | | | | | | 1.10 | | | | | | 0.38 | | | | | | 0.21 | | | | | | — | | | | | | 0.59 | | | | | | — | | | | | | 11.92 | | | | | | 9.99 | | | | | | 0.45 | | | | | | 0.20 | | | | | | 0.20 | | | | | | 2.17 | | | | | | 238 | | | | | | 91 | | |
| 12-31-19 | | | | | 10.54 | | | | | | 0.31• | | | | | | 0.91 | | | | | | 1.22 | | | | | | 0.26 | | | | | | 0.09 | | | | | | — | | | | | | 0.35 | | | | | | — | | | | | | 11.41 | | | | | | 11.65 | | | | | | 0.42 | | | | | | 0.17 | | | | | | 0.17 | | | | | | 2.82 | | | | | | 658 | | | | | | 75 | | |
| 12-31-18 | | | | | 11.21 | | | | | | 0.28• | | | | | | (0.49) | | | | | | (0.21) | | | | | | 0.27 | | | | | | 0.19 | | | | | | — | | | | | | 0.46 | | | | | | — | | | | | | 10.54 | | | | | | (1.94) | | | | | | 0.39 | | | | | | 0.13 | | | | | | 0.13 | | | | | | 2.62 | | | | | | 274 | | | | | | 67 | | |
| 12-31-17 | | | | | 10.74 | | | | | | 0.25• | | | | | | 0.56 | | | | | | 0.81 | | | | | | 0.27 | | | | | | 0.07 | | | | | | — | | | | | | 0.34 | | | | | | — | | | | | | 11.21 | | | | | | 7.60 | | | | | | 0.36 | | | | | | 0.12 | | | | | | 0.12 | | | | | | 2.31 | | | | | | 90 | | | | | | 63 | | |
| Class R6 | | | | | | | | | | | | | | | | | | | | | | | | | | | | | | | | | | | | | | | | | | | | | | | | | | | | | | | | | | | | | | | | | | | | | | | | | | | | | | | | | | | | | | | | | | | | | | | | | | | | | | | |
| 12-31-21 | | | | | 11.93 | | | | | | 0.24• | | | | | | 0.44 | | | | | | 0.68 | | | | | | 0.35 | | | | | | 0.19 | | | | | | — | | | | | | 0.54 | | | | | | — | | | | | | 12.07 | | | | | | 5.77 | | | | | | 0.37 | | | | | | 0.19 | | | | | | 0.19 | | | | | | 1.95 | | | | | | 9,365 | | | | | | 54 | | |
| 12-31-20 | | | | | 11.41 | | | | | | 0.28• | | | | | | 0.83 | | | | | | 1.11 | | | | | | 0.38 | | | | | | 0.21 | | | | | | — | | | | | | 0.59 | | | | | | — | | | | | | 11.93 | | | | | | 10.09 | | | | | | 0.39 | | | | | | 0.20 | | | | | | 0.20 | | | | | | 2.46 | | | | | | 7,547 | | | | | | 91 | | |
| 12-31-19 | | | | | 10.54 | | | | | | 0.30 | | | | | | 0.92 | | | | | | 1.22 | | | | | | 0.26 | | | | | | 0.09 | | | | | | — | | | | | | 0.35 | | | | | | — | | | | | | 11.41 | | | | | | 11.65 | | | | | | 0.42 | | | ��� | | | 0.17 | | | | | | 0.17 | | | | | | 2.61 | | | | | | 5,365 | | | | | | 75 | | |
| 12-31-18 | | | | | 11.21 | | | | | | 0.28• | | | | | | (0.49) | | | | | | (0.21) | | | | | | 0.27 | | | | | | 0.19 | | | | | | — | | | | | | 0.46 | | | | | | — | | | | | | 10.54 | | | | | | (1.94) | | | | | | 0.39 | | | | | | 0.13 | | | | | | 0.13 | | | | | | 2.52 | | | | | | 5,056 | | | | | | 67 | | |
| 12-31-17 | | | | | 10.74 | | | | | | 0.27• | | | | | | 0.54 | | | | | | 0.81 | | | | | | 0.27 | | | | | | 0.07 | | | | | | — | | | | | | 0.34 | | | | | | — | | | | | | 11.21 | | | | | | 7.60 | | | | | | 0.36 | | | | | | 0.12 | | | | | | 0.12 | | | | | | 2.42 | | | | | | 3,439 | | | | | | 63 | | |
| Class S | | | | | | | | | | | | | | | | | | | | | | | | | | | | | | | | | | | | | | | | | | | | | | | | | | | | | | | | | | | | | | | | | | | | | | | | | | | | | | | | | | | | | | | | | | | | | | | | | | | | | | | |
| 12-31-21 | | | | | 11.87 | | | | | | 0.20• | | | | | | 0.45 | | | | | | 0.65 | | | | | | 0.32 | | | | | | 0.19 | | | | | | — | | | | | | 0.51 | | | | | | — | | | | | | 12.01 | | | | | | 5.52 | | | | | | 0.70 | | | | | | 0.44 | | | | | | 0.44 | | | | | | 1.67 | | | | | | 2,203 | | | | | | 54 | | |
| 12-31-20 | | | | | 11.34 | | | | | | 0.24• | | | | | | 0.84 | | | | | | 1.08 | | | | | | 0.34 | | | | | | 0.21 | | | | | | — | | | | | | 0.55 | | | | | | — | | | | | | 11.87 | | | | | | 9.83 | | | | | | 0.70 | | | | | | 0.45 | | | | | | 0.45 | | | | | | 2.14 | | | | | | 2,215 | | | | | | 91 | | |
| 12-31-19 | | | | | 10.48 | | | | | | 0.25• | | | | | | 0.93 | | | | | | 1.18 | | | | | | 0.23 | | | | | | 0.09 | | | | | | — | | | | | | 0.32 | | | | | | — | | | | | | 11.34 | | | | | | 11.31 | | | | | | 0.67 | | | | | | 0.42 | | | | | | 0.42 | | | | | | 2.30 | | | | | | 2,839 | | | | | | 75 | | |
| 12-31-18 | | | | | 11.13 | | | | | | 0.24• | | | | | | (0.47) | | | | | | (0.23) | | | | | | 0.23 | | | | | | 0.19 | | | | | | — | | | | | | 0.42 | | | | | | — | | | | | | 10.48 | | | | | | (2.14) | | | | | | 0.64 | | | | | | 0.38 | | | | | | 0.38 | | | | | | 2.16 | | | | | | 3,508 | | | | | | 67 | | |
| 12-31-17 | | | | | 10.66 | | | | | | 0.22• | | | | | | 0.56 | | | | | | 0.78 | | | | | | 0.24 | | | | | | 0.07 | | | | | | — | | | | | | 0.31 | | | | | | — | | | | | | 11.13 | | | | | | 7.31 | | | | | | 0.61 | | | | | | 0.37 | | | | | | 0.37 | | | | | | 2.04 | | | | | | 4,020 | | | | | | 63 | | |
| Class S2 | | | | | | | | | | | | | | | | | | | | | | | | | | | | | | | | | | | | | | | | | | | | | | | | | | | | | | | | | | | | | | | | | | | | | | | | | | | | | | | | | | | | | | | | | | | | | | | | | | | | | | | |
| 12-31-21 | | | | | 11.73 | | | | | | 0.18• | | | | | | 0.44 | | | | | | 0.62 | | | | | | 0.31 | | | | | | 0.19 | | | | | | — | | | | | | 0.50 | | | | | | — | | | | | | 11.85 | | | | | | 5.34 | | | | | | 0.85 | | | | | | 0.59 | | | | | | 0.59 | | | | | | 1.53 | | | | | | 1,237 | | | | | | 54 | | |
| 12-31-20 | | | | | 11.25 | | | | | | 0.24• | | | | | | 0.82 | | | | | | 1.06 | | | | | | 0.37 | | | | | | 0.21 | | | | | | — | | | | | | 0.58 | | | | | | — | | | | | | 11.73 | | | | | | 9.69 | | | | | | 0.85 | | | | | | 0.60 | | | | | | 0.60 | | | | | | 2.19 | | | | | | 1,438 | | | | | | 91 | | |
| 12-31-19 | | | | | 10.39 | | | | | | 0.23• | | | | | | 0.93 | | | | | | 1.16 | | | | | | 0.21 | | | | | | 0.09 | | | | | | — | | | | | | 0.30 | | | | | | — | | | | | | 11.25 | | | | | | 11.21 | | | | | | 0.82 | | | | | | 0.57 | | | | | | 0.57 | | | | | | 2.14 | | | | | | 393 | | | | | | 75 | | |
| 12-31-18 | | | | | 11.04 | | | | | | 0.21• | | | | | | (0.46) | | | | | | (0.25) | | | | | | 0.21 | | | | | | 0.19 | | | | | | — | | | | | | 0.40 | | | | | | — | | | | | | 10.39 | | | | | | (2.34) | | | | | | 0.79 | | | | | | 0.53 | | | | | | 0.53 | | | | | | 1.97 | | | | | | 438 | | | | | | 67 | | |
| 12-31-17 | | | | | 10.59 | | | | | | 0.21• | | | | | | 0.55 | | | | | | 0.76 | | | | | | 0.24 | | | | | | 0.07 | | | | | | — | | | | | | 0.31 | | | | | | — | | | | | | 11.04 | | | | | | 7.20 | | | | | | 0.76 | | | | | | 0.52 | | | | | | 0.52 | | | | | | 1.92 | | | | | | 635 | | | | | | 63 | | |
See Accompanying Notes to Financial Statements
Financial Highlights (continued)
| | | | | | | | | | Income
(loss) from
investment
operations | | | | | | | | | Less
Distributions | | | | | | | | | | | | | | | | | | | | | | | | | | | Ratios to average
net assets | | | Supplemental
Data | |
| | | | Net asset value, beginning of year
or period | | | Net investment income (loss) | | | Net realized and unrealized
gain (loss) | | | Total from investment operations | | | From net investment income | | | From net realized gains | | | From return of capital | | | Total distributions | | | Payment by affiliate | | | Net asset value, end of year
or period | | | Total Return(1) | | | Expenses before
reductions/additions(2)(3)(4) | | | Expenses net of fee waivers
and/or recoupments if any(2)(3)(4) | | | Expenses net of all
reductions/additions(2)(3)(4) | | | Net investment income (loss)(2)(3) | | | Net assets, end of year or period | | | Portfolio turnover rate | |
Year or
period ended | | | ($) | | | ($) | | | ($) | | | ($) | | | ($) | | | ($) | | | ($) | | | ($) | | | ($) | | | ($) | | | (%) | | | (%) | | | (%) | | | (%) | | | (%) | | | ($000’s) | | | (%) | |
| Voya Solution Income Portfolio | | | | | | | | | | | | | | | | | | | | | | | | | | | | | | | | | | | | | | | | | | | | | | | | | | | | | | | | | | | | | | | | | | | | | | | | | | | | | | | | | | | | | | | | | | | | | | | | | | | | | | | |
| Class ADV | | | | | | | | | | | | | | | | | | | | | | | | | | | | | | | | | | | | | | | | | | | | | | | | | | | | | | | | | | | | | | | | | | | | | | | | | | | | | | | | | | | | | | | | | | | | | | | | | | | | | | | |
| 12-31-21 | | | | | 12.81 | | | | | | 0.17• | | | | | | 0.62 | | | | | | 0.79 | | | | | | 0.36 | | | | | | 0.49 | | | | | | — | | | | | | 0.85 | | | | | | — | | | | | | 12.75 | | | | | | 6.16 | | | | | | 0.81 | | | | | | 0.72 | | | | | | 0.72 | | | | | | 1.29 | | | | | | 144,001 | | | | | | 35 | | |
| 12-31-20 | | | | | 11.76 | | | | | | 0.21• | | | | | | 1.13 | | | | | | 1.34 | | | | | | 0.26 | | | | | | 0.03 | | | | | | — | | | | | | 0.29 | | | | | | — | | | | | | 12.81 | | | | | | 11.61 | | | | | | 0.81 | | | | | | 0.71 | | | | | | 0.71 | | | | | | 1.75 | | | | | | 150,215 | | | | | | 50 | | |
| 12-31-19 | | | | | 10.92 | | | | | | 0.22• | | | | | | 1.17 | | | | | | 1.39 | | | | | | 0.31 | | | | | | 0.24 | | | | | | — | | | | | | 0.55 | | | | | | — | | | | | | 11.76 | | | | | | 12.87 | | | | | | 0.76 | | | | | | 0.69 | | | | | | 0.69 | | | | | | 1.88 | | | | | | 143,202 | | | | | | 39 | | |
| 12-31-18 | | | | | 11.85 | | | | | | 0.20• | | | | | | (0.57) | | | | | | (0.37) | | | | | | 0.26 | | | | | | 0.30 | | | | | | — | | | | | | 0.56 | | | | | | — | | | | | | 10.92 | | | | | | (3.35) | | | | | | 0.75 | | | | | | 0.62 | | | | | | 0.62 | | | | | | 1.77 | | | | | | 148,720 | | | | | | 38 | | |
| 12-31-17 | | | | | 11.11 | | | | | | 0.18• | | | | | | 0.83 | | | | | | 1.01 | | | | | | 0.23 | | | | | | 0.04 | | | | | | — | | | | | | 0.27 | | | | | | — | | | | | | 11.85 | | | | | | 9.15 | | | | | | 0.75 | | | | | | 0.61 | | | | | | 0.61 | | | | | | 1.59 | | | | | | 182,912 | | | | | | 36 | | |
| Class I | | | | | | | | | | | | | | | | | | | | | | | | | | | | | | | | | | | | | | | | | | | | | | | | | | | | | | | | | | | | | | | | | | | | | | | | | | | | | | | | | | | | | | | | | | | | | | | | | | | | | | | |
| 12-31-21 | | | | | 13.13 | | | | | | 0.23• | | | | | | 0.64 | | | | | | 0.87 | | | | | | 0.41 | | | | | | 0.49 | | | | | | — | | | | | | 0.90 | | | | | | — | | | | | | 13.10 | | | | | | 6.69 | | | | | | 0.31 | | | | | | 0.22 | | | | | | 0.22 | | | | | | 1.77 | | | | | | 40,086 | | | | | | 35 | | |
| 12-31-20 | | | | | 12.05 | | | | | | 0.26• | | | | | | 1.18 | | | | | | 1.44 | | | | | | 0.33 | | | | | | 0.03 | | | | | | — | | | | | | 0.36 | | | | | | — | | | | | | 13.13 | | | | | | 12.18 | | | | | | 0.31 | | | | | | 0.21 | | | | | | 0.21 | | | | | | 2.15 | | | | | | 46,389 | | | | | | 50 | | |
| 12-31-19 | | | | | 11.19 | | | | | | 0.28• | | | | | | 1.19 | | | | | | 1.47 | | | | | | 0.37 | | | | | | 0.24 | | | | | | — | | | | | | 0.61 | | | | | | — | | | | | | 12.05 | | | | | | 13.38 | | | | | | 0.26 | | | | | | 0.19 | | | | | | 0.19 | | | | | | 2.41 | | | | | | 78,441 | | | | | | 39 | | |
| 12-31-18 | | | | | 12.13 | | | | | | 0.27• | | | | | | (0.59) | | | | | | (0.32) | | | | | | 0.32 | | | | | | 0.30 | | | | | | — | | | | | | 0.62 | | | | | | — | | | | | | 11.19 | | | | | | (2.80) | | | | | | 0.25 | | | | | | 0.12 | | | | | | 0.12 | | | | | | 2.29 | | | | | | 75,592 | | | | | | 38 | | |
| 12-31-17 | | | | | 11.38 | | | | | | 0.25 | | | | | | 0.84 | | | | | | 1.09 | | | | | | 0.30 | | | | | | 0.04 | | | | | | — | | | | | | 0.34 | | | | | | — | | | | | | 12.13 | | | | | | 9.66 | | | | | | 0.25 | | | | | | 0.11 | | | | | | 0.11 | | | | | | 2.09 | | | | | | 85,891 | | | | | | 36 | | |
| Class S | | | | | | | | | | | | | | | | | | | | | | | | | | | | | | | | | | | | | | | | | | | | | | | | | | | | | | | | | | | | | | | | | | | | | | | | | | | | | | | | | | | | | | | | | | | | | | | | | | | | | | | |
| 12-31-21 | | | | | 13.03 | | | | | | 0.20• | | | | | | 0.63 | | | | | | 0.83 | | | | | | 0.39 | | | | | | 0.49 | | | | | | — | | | | | | 0.88 | | | | | | — | | | | | | 12.98 | | | | | | 6.37 | | | | | | 0.56 | | | | | | 0.47 | | | | | | 0.47 | | | | | | 1.52 | | | | | | 93,573 | | | | | | 35 | | |
| 12-31-20 | | | | | 11.95 | | | | | | 0.24• | | | | | | 1.16 | | | | | | 1.40 | | | | | | 0.29 | | | | | | 0.03 | | | | | | — | | | | | | 0.32 | | | | | | — | | | | | | 13.03 | | | | | | 11.94 | | | | | | 0.56 | | | | | | 0.46 | | | | | | 0.46 | | | | | | 2.00 | | | | | | 105,135 | | | | | | 50 | | |
| 12-31-19 | | | | | 11.09 | | | | | | 0.25• | | | | | | 1.18 | | | | | | 1.43 | | | | | | 0.33 | | | | | | 0.24 | | | | | | — | | | | | | 0.57 | | | | | | — | | | | | | 11.95 | | | | | | 13.13 | | | | | | 0.51 | | | | | | 0.44 | | | | | | 0.44 | | | | | | 2.10 | | | | | | 103,157 | | | | | | 39 | | |
| 12-31-18 | | | | | 12.03 | | | | | | 0.24• | | | | | | (0.59) | | | | | | (0.35) | | | | | | 0.29 | | | | | | 0.30 | | | | | | — | | | | | | 0.59 | | | | | | — | | | | | | 11.09 | | | | | | (3.14) | | | | | | 0.50 | | | | | | 0.37 | | | | | | 0.37 | | | | | | 2.01 | | | | | | 118,451 | | | | | | 38 | | |
| 12-31-17 | | | | | 11.28 | | | | | | 0.21• | | | | | | 0.85 | | | | | | 1.06 | | | | | | 0.27 | | | | | | 0.04 | | | | | | — | | | | | | 0.31 | | | | | | — | | | | | | 12.03 | | | | | | 9.41 | | | | | | 0.50 | | | | | | 0.36 | | | | | | 0.36 | | | | | | 1.83 | | | | | | 155,100 | | | | | | 36 | | |
| Class S2 | | | | | | | | | | | | | | | | | | | | | | | | | | | | | | | | | | | | | | | | | | | | | | | | | | | | | | | | | | | | | | | | | | | | | | | | | | | | | | | | | | | | | | | | | | | | | | | | | | | | | | | |
| 12-31-21 | | | | | 12.70 | | | | | | 0.18• | | | | | | 0.61 | | | | | | 0.79 | | | | | | 0.38 | | | | | | 0.49 | | | | | | — | | | | | | 0.87 | | | | | | — | | | | | | 12.62 | | | | | | 6.25 | | | | | | 0.71 | | | | | | 0.62 | | | | | | 0.62 | | | | | | 1.43 | | | | | | 5,629 | | | | | | 35 | | |
| 12-31-20 | | | | | 11.65 | | | | | | 0.22• | | | | | | 1.12 | | | | | | 1.34 | | | | | | 0.26 | | | | | | 0.03 | | | | | | — | | | | | | 0.29 | | | | | | — | | | | | | 12.70 | | | | | | 11.74 | | | | | | 0.71 | | | | | | 0.61 | | | | | | 0.61 | | | | | | 1.84 | | | | | | 5,194 | | | | | | 50 | | |
| 12-31-19 | | | | | 10.82 | | | | | | 0.22• | | | | | | 1.16 | | | | | | 1.38 | | | | | | 0.31 | | | | | | 0.24 | | | | | | — | | | | | | 0.55 | | | | | | — | | | | | | 11.65 | | | | | | 12.96 | | | | | | 0.66 | | | | | | 0.59 | | | | | | 0.59 | | | | | | 1.95 | | | | | | 5,310 | | | | | | 39 | | |
| 12-31-18 | | | | | 11.72 | | | | | | 0.21• | | | | | | (0.56) | | | | | | (0.35) | | | | | | 0.25 | | | | | | 0.30 | | | | | | — | | | | | | 0.55 | | | | | | — | | | | | | 10.82 | | | | | | (3.21) | | | | | | 0.65 | | | | | | 0.52 | | | | | | 0.52 | | | | | | 1.82 | | | | | | 6,111 | | | | | | 38 | | |
| 12-31-17 | | | | | 10.99 | | | | | | 0.19• | | | | | | 0.82 | | | | | | 1.01 | | | | | | 0.24 | | | | | | 0.04 | | | | | | — | | | | | | 0.28 | | | | | | — | | | | | | 11.72 | | | | | | 9.23 | | | | | | 0.65 | | | | | | 0.51 | | | | | | 0.51 | | | | | | 1.67 | | | | | | 9,533 | | | | | | 36 | | |
| Class T | | | | | | | | | | | | | | | | | | | | | | | | | | | | | | | | | | | | | | | | | | | | | | | | | | | | | | | | | | | | | | | | | | | | | | | | | | | | | | | | | | | | | | | | | | | | | | | | | | | | | | | |
| 12-31-21 | | | | | 13.81 | | | | | | 0.15• | | | | | | 0.68 | | | | | | 0.83 | | | | | | 0.28 | | | | | | 0.49 | | | | | | — | | | | | | 0.77 | | | | | | — | | | | | | 13.87 | | | | | | 6.03 | | | | | | 1.01 | | | | | | 0.92 | | | | | | 0.92 | | | | | | 1.04 | | | | | | 118 | | | | | | 35 | | |
| 12-31-20 | | | | | 12.56 | | | | | | 0.18• | | | | | | 1.24 | | | | | | 1.42 | | | | | | 0.14 | | | | | | 0.03 | | | | | | — | | | | | | 0.17 | | | | | | — | | | | | | 13.81 | | | | | | 11.39 | | | | | | 1.01 | | | | | | 0.91 | | | | | | 0.91 | | | | | | 1.41 | | | | | | 148 | | | | | | 50 | | |
| 12-31-19 | | | | | 11.65 | | | | | | 0.20 | | | | | | 1.24 | | | | | | 1.44 | | | | | | 0.29 | | | | | | 0.24 | | | | | | — | | | | | | 0.53 | | | | | | — | | | | | | 12.56 | | | | | | 12.54 | | | | | | 0.96 | | | | | | 0.89 | | | | | | 0.89 | | | | | | 1.74 | | | | | | 259 | | | | | | 39 | | |
| 12-31-18 | | | | | 12.60 | | | | | | 0.19 | | | | | | (0.60) | | | | | | (0.41) | | | | | | 0.24 | | | | | | 0.30 | | | | | | — | | | | | | 0.54 | | | | | | — | | | | | | 11.65 | | | | | | (3.45) | | | | | | 0.95 | | | | | | 0.82 | | | | | | 0.82 | | | | | | 1.62 | | | | | | 218 | | | | | | 38 | | |
| 12-31-17 | | | | | 11.73 | | | | | | 0.17 | | | | | | 0.87 | | | | | | 1.04 | | | | | | 0.13 | | | | | | 0.04 | | | | | | — | | | | | | 0.17 | | | | | | — | | | | | | 12.60 | | | | | | 8.84 | | | | | | 0.95 | | | | | | 0.81 | | | | | | 0.81 | | | | | | 1.40 | | | | | | 222 | | | | | | 36 | | |
See Accompanying Notes to Financial Statements
Financial Highlights (continued)
| | | | | | | | | | Income
(loss) from
investment
operations | | | | | | | | | Less
Distributions | | | | | | | | | | | | | | | | | | | | | | | | | | | Ratios to average
net assets | | | Supplemental
Data | |
| | | | Net asset value, beginning of year
or period | | | Net investment income (loss) | | | Net realized and unrealized
gain (loss) | | | Total from investment operations | | | From net investment income | | | From net realized gains | | | From return of capital | | | Total distributions | | | Payment by affiliate | | | Net asset value, end of year
or period | | | Total Return(1) | | | Expenses before
reductions/additions(2)(3)(4) | | | Expenses net of fee waivers
and/or recoupments if any(2)(3)(4) | | | Expenses net of all
reductions/additions(2)(3)(4) | | | Net investment income (loss)(2)(3) | | | Net assets, end of year or period | | | Portfolio turnover rate | |
Year or
period ended | | | ($) | | | ($) | | | ($) | | | ($) | | | ($) | | | ($) | | | ($) | | | ($) | | | ($) | | | ($) | | | (%) | | | (%) | | | (%) | | | (%) | | | (%) | | | ($000’s) | | | (%) | |
| Voya Solution Moderately Aggressive Portfolio | | | | | | | | | | | | | | | | | | | | | | | | | | | | | | | | | | | | | | | | | | | | | | | | | | | | | | | | | | | | | | | | | | | | | | | | | | | | | | | | | | | | | | | | | | | | | | | | | | | | | | | |
| Class ADV | | | | | | | | | | | | | | | | | | | | | | | | | | | | | | | | | | | | | | | | | | | | | | | | | | | | | | | | | | | | | | | | | | | | | | | | | | | | | | | | | | | | | | | | | | | | | | | | | | | | | | | |
| 12-31-21 | | | | | 12.98 | | | | | | 0.09• | | | | | | 2.09 | | | | | | 2.18 | | | | | | 0.20 | | | | | | — | | | | | | — | | | | | | 0.20 | | | | | | — | | | | | | 14.96 | | | | | | 16.87 | | | | | | 0.78 | | | | | | 0.81 | | | | | | 0.81 | | | | | | 0.66 | | | | | | 26,263 | | | | | | 41 | | |
| 12-31-20 | | | | | 12.54 | | | | | | 0.14 | | | | | | 1.40 | | | | | | 1.54 | | | | | | 0.21 | | | | | | 0.89 | | | | | | — | | | | | | 1.10 | | | | | | — | | | | | | 12.98 | | | | | | 13.59 | | | | | | 0.77 | | | | | | 0.81 | | | | | | 0.81 | | | | | | 1.03 | | | | | | 24,171 | | | | | | 47 | | |
| 12-31-19 | | | | | 11.39 | | | | | | 0.16 | | | | | | 2.28 | | | | | | 2.44 | | | | | | 0.26 | | | | | | 1.03 | | | | | | — | | | | | | 1.29 | | | | | | — | | | | | | 12.54 | | | | | | 22.32 | | | | | | 0.76 | | | | | | 0.76 | | | | | | 0.76 | | | | | | 1.28 | | | | | | 24,168 | | | | | | 55 | | |
| 12-31-18 | | | | | 13.39 | | | | | | 0.14• | | | | | | (1.32) | | | | | | (1.18) | | | | | | 0.20 | | | | | | 0.62 | | | | | | — | | | | | | 0.82 | | | | | | — | | | | | | 11.39 | | | | | | (9.44) | | | | | | 0.75 | | | | | | 0.71 | | | | | | 0.71 | | | | | | 1.09 | | | | | | 21,418 | | | | | | 46 | | |
| 12-31-17 | | | | | 11.62 | | | | | | 0.13• | | | | | | 1.93 | | | | | | 2.06 | | | | | | 0.15 | | | | | | 0.14 | | | | | | — | | | | | | 0.29 | | | | | | — | | | | | | 13.39 | | | | | | 17.89 | | | | | | 0.75 | | | | | | 0.71 | | | | | | 0.71 | | | | | | 1.04 | | | | | | 27,468 | | | | | | 31 | | |
| Class I | | | | | | | | | | | | | | | | | | | | | | | | | | | | | | | | | | | | | | | | | | | | | | | | | | | | | | | | | | | | | | | | | | | | | | | | | | | | | | | | | | | | | | | | | | | | | | | | | | | | | | | |
| 12-31-21 | | | | | 13.29 | | | | | | 0.17• | | | | | | 2.14 | | | | | | 2.31 | | | | | | 0.27 | | | | | | — | | | | | | — | | | | | | 0.27 | | | | | | — | | | | | | 15.33 | | | | | | 17.42 | | | | | | 0.28 | | | | | | 0.31 | | | | | | 0.31 | | | | | | 1.19 | | | | | | 5,090 | | | | | | 41 | | |
| 12-31-20 | | | | | 12.81 | | | | | | 0.18• | | | | | | 1.46 | | | | | | 1.64 | | | | | | 0.27 | | | | | | 0.89 | | | | | | — | | | | | | 1.16 | | | | | | — | | | | | | 13.29 | | | | | | 14.23 | | | | | | 0.27 | | | | | | 0.31 | | | | | | 0.31 | | | | | | 1.54 | | | | | | 4,726 | | | | | | 47 | | |
| 12-31-19 | | | | | 11.61 | | | | | | 0.22 | | | | | | 2.34 | | | | | | 2.56 | | | | | | 0.33 | | | | | | 1.03 | | | | | | — | | | | | | 1.36 | | | | | | — | | | | | | 12.81 | | | | | | 22.99 | | | | | | 0.26 | | | | | | 0.26 | | | | | | 0.26 | | | | | | 1.84 | | | | | | 4,862 | | | | | | 55 | | |
| 12-31-18 | | | | | 13.64 | | | | | | 0.21• | | | | | | (1.35) | | | | | | (1.14) | | | | | | 0.27 | | | | | | 0.62 | | | | | | — | | | | | | 0.89 | | | | | | — | | | | | | 11.61 | | | | | | (9.02) | | | | | | 0.25 | | | | | | 0.21 | | | | | | 0.21 | | | | | | 1.60 | | | | | | 3,898 | | | | | | 46 | | |
| 12-31-17 | | | | | 11.83 | | | | | | 0.21• | | | | | | 1.95 | | | | | | 2.16 | | | | | | 0.21 | | | | | | 0.14 | | | | | | — | | | | | | 0.35 | | | | | | — | | | | | | 13.64 | | | | | | 18.50 | | | | | | 0.25 | | | | | | 0.21 | | | | | | 0.21 | | | | | | 1.62 | | | | | | 6,062 | | | | | | 31 | | |
| Class R6 | | | | | | | | | | | | | | | | | | | | | | | | | | | | | | | | | | | | | | | | | | | | | | | | | | | | | | | | | | | | | | | | | | | | | | | | | | | | | | | | | | | | | | | | | | | | | | | | | | | | | | | |
| 12-31-21 | | | | | 13.28 | | | | | | 0.18• | | | | | | 2.13 | | | | | | 2.31 | | | | | | 0.27 | | | | | | — | | | | | | — | | | | | | 0.27 | | | | | | — | | | | | | 15.32 | | | | | | 17.44 | | | | | | 0.27 | | | | | | 0.30 | | | | | | 0.30 | | | | | | 1.25 | | | | | | 30,360 | | | | | | 41 | | |
| 12-31-20 | | | | | 12.80 | | | | | | 0.19• | | | | | | 1.45 | | | | | | 1.64 | | | | | | 0.27 | | | | | | 0.89 | | | | | | — | | | | | | 1.16 | | | | | | — | | | | | | 13.28 | | | | | | 14.24 | | | | | | 0.26 | | | | | | 0.30 | | | | | | 0.30 | | | | | | 1.58 | | | | | | 23,965 | | | | | | 47 | | |
| 12-31-19 | | | | | 11.61 | | | | | | 0.23• | | | | | | 2.32 | | | | | | 2.55 | | | | | | 0.33 | | | | | | 1.03 | | | | | | — | | | | | | 1.36 | | | | | | — | | | | | | 12.80 | | | | | | 22.91 | | | | | | 0.26 | | | | | | 0.26 | | | | | | 0.26 | | | | | | 1.87 | | | | | | 17,843 | | | | | | 55 | | |
| 12-31-18 | | | | | 13.63 | | | | | | 0.23• | | | | | | (1.36) | | | | | | (1.13) | | | | | | 0.27 | | | | | | 0.62 | | | | | | — | | | | | | 0.89 | | | | | | — | | | | | | 11.61 | | | | | | (8.94) | | | | | | 0.25 | | | | | | 0.21 | | | | | | 0.21 | | | | | | 1.76 | | | | | | 12,083 | | | | | | 46 | | |
| 12-31-17 | | | | | 11.82 | | | | | | 0.25• | | | | | | 1.91 | | | | | | 2.16 | | | | | | 0.21 | | | | | | 0.14 | | | | | | — | | | | | | 0.35 | | | | | | — | | | | | | 13.63 | | | | | | 18.51 | | | | | | 0.25 | | | | | | 0.21 | | | | | | 0.21 | | | | | | 1.95 | | | | | | 8,217 | | | | | | 31 | | |
| Class S | | | | | | | | | | | | | | | | | | | | | | | | | | | | | | | | | | | | | | | | | | | | | | | | | | | | | | | | | | | | | | | | | | | | | | | | | | | | | | | | | | | | | | | | | | | | | | | | | | | | | | | |
| 12-31-21 | | | | | 13.12 | | | | | | 0.13• | | | | | | 2.11 | | | | | | 2.24 | | | | | | 0.23 | | | | | | — | | | | | | — | | | | | | 0.23 | | | | | | — | | | | | | 15.13 | | | | | | 17.16 | | | | | | 0.53 | | | | | | 0.56 | | | | | | 0.56 | | | | | | 0.89 | | | | | | 562,208 | | | | | | 41 | | |
| 12-31-20 | | | | | 12.66 | | | | | | 0.17 | | | | | | 1.42 | | | | | | 1.59 | | | | | | 0.24 | | | | | | 0.89 | | | | | | — | | | | | | 1.13 | | | | | | — | | | | | | 13.12 | | | | | | 13.92 | | | | | | 0.52 | | | | | | 0.56 | | | | | | 0.56 | | | | | | 1.27 | | | | | | 552,268 | | | | | | 47 | | |
| 12-31-19 | | | | | 11.49 | | | | | | 0.19• | | | | | | 2.30 | | | | | | 2.49 | | | | | | 0.29 | | | | | | 1.03 | | | | | | — | | | | | | 1.32 | | | | | | — | | | | | | 12.66 | | | | | | 22.61 | | | | | | 0.51 | | | | | | 0.51 | | | | | | 0.51 | | | | | | 1.51 | | | | | | 557,294 | | | | | | 55 | | |
| 12-31-18 | | | | | 13.50 | | | | | | 0.18• | | | | | | (1.33) | | | | | | (1.15) | | | | | | 0.24 | | | | | | 0.62 | | | | | | — | | | | | | 0.86 | | | | | | — | | | | | | 11.49 | | | | | | (9.20) | | | | | | 0.50 | | | | | | 0.46 | | | | | | 0.46 | | | | | | 1.34 | | | | | | 525,590 | | | | | | 46 | | |
| 12-31-17 | | | | | 11.71 | | | | | | 0.16• | | | | | | 1.95 | | | | | | 2.11 | | | | | | 0.18 | | | | | | 0.14 | | | | | | — | | | | | | 0.32 | | | | | | — | | | | | | 13.50 | | | | | | 18.22 | | | | | | 0.50 | | | | | | 0.46 | | | | | | 0.46 | | | | | | 1.28 | | | | | | 670,319 | | | | | | 31 | | |
| Class S2 | | | | | | | | | | | | | | | | | | | | | | | | | | | | | | | | | | | | | | | | | | | | | | | | | | | | | | | | | | | | | | | | | | | | | | | | | | | | | | | | | | | | | | | | | | | | | | | | | | | | | | | |
| 12-31-21 | | | | | 13.14 | | | | | | 0.12• | | | | | | 2.10 | | | | | | 2.22 | | | | | | 0.23 | | | | | | — | | | | | | — | | | | | | 0.23 | | | | | | — | | | | | | 15.13 | | | | | | 16.99 | | | | | | 0.68 | | | | | | 0.71 | | | | | | 0.71 | | | | | | 0.84 | | | | | | 1,851 | | | | | | 41 | | |
| 12-31-20 | | | | | 12.69 | | | | | | 0.16• | | | | | | 1.41 | | | | | | 1.57 | | | | | | 0.23 | | | | | | 0.89 | | | | | | — | | | | | | 1.12 | | | | | | — | | | | | | 13.14 | | | | | | 13.70 | | | | | | 0.67 | | | | | | 0.71 | | | | | | 0.71 | | | | | | 1.32 | | | | | | 1,280 | | | | | | 47 | | |
| 12-31-19 | | | | | 11.50 | | | | | | 0.17• | | | | | | 2.32 | | | | | | 2.49 | | | | | | 0.27 | | | | | | 1.03 | | | | | | — | | | | | | 1.30 | | | | | | — | | | | | | 12.69 | | | | | | 22.49 | | | | | | 0.66 | | | | | | 0.66 | | | | | | 0.66 | | | | | | 1.35 | | | | | | 879 | | | | | | 55 | | |
| 12-31-18 | | | | | 13.47 | | | | | | 0.15• | | | | | | (1.32) | | | | | | (1.17) | | | | | | 0.18 | | | | | | 0.62 | | | | | | — | | | | | | 0.80 | | | | | | — | | | | | | 11.50 | | | | | | (9.31) | | | | | | 0.65 | | | | | | 0.61 | | | | | | 0.61 | | | | | | 1.10 | | | | | | 732 | | | | | | 46 | | |
| 12-31-17 | | | | | 11.70 | | | | | | 0.15• | | | | | | 1.94 | | | | | | 2.09 | | | | | | 0.18 | | | | | | 0.14 | | | | | | — | | | | | | 0.32 | | | | | | — | | | | | | 13.47 | | | | | | 18.05 | | | | | | 0.65 | | | | | | 0.61 | | | | | | 0.61 | | | | | | 1.20 | | | | | | 1,695 | | | | | | 31 | | |
See Accompanying Notes to Financial Statements
Financial Highlights (continued)
| | | | | | | | | | Income
(loss) from
investment
operations | | | | | | | | | Less
Distributions | | | | | | | | | | | | | | | | | | | | | | | | | | | Ratios to average
net assets | | | Supplemental
Data | |
| | | | Net asset value, beginning of year
or period | | | Net investment income (loss) | | | Net realized and unrealized
gain (loss) | | | Total from investment operations | | | From net investment income | | | From net realized gains | | | From return of capital | | | Total distributions | | | Payment by affiliate | | | Net asset value, end of year
or period | | | Total Return(1) | | | Expenses before
reductions/additions(2)(3)(4) | | | Expenses net of fee waivers
and/or recoupments if any(2)(3)(4) | | | Expenses net of all
reductions/additions(2)(3)(4) | | | Net investment income (loss)(2)(3) | | | Net assets, end of year or period | | | Portfolio turnover rate | |
Year or
period ended | | | ($) | | | ($) | | | ($) | | | ($) | | | ($) | | | ($) | | | ($) | | | ($) | | | ($) | | | ($) | | | (%) | | | (%) | | | (%) | | | (%) | | | (%) | | | ($000’s) | | | (%) | |
| Voya Solution Moderately Conservative Portfolio | | | | | | | | | | | | | | | | | | | | | | | | | | | | | | | | | | | | | | | | | | | | | | | | | | | | | | | | | | | | | | | | | | | | | | | | | | | | | | | | | | | | | | | | | | | | | | | | | | | | | | | |
| Class ADV | | | | | | | | | | | | | | | | | | | | | | | | | | | | | | | | | | | | | | | | | | | | | | | | | | | | | | | | | | | | | | | | | | | | | | | | | | | | | | | | | | | | | | | | | | | | | | | | | | | | | | | |
| 12-31-21 | | | | | 10.69 | | | | | | 0.15• | | | | | | 0.83 | | | | | | 0.98 | | | | | | 0.23 | | | | | | — | | | | | | — | | | | | | 0.23 | | | | | | — | | | | | | 11.44 | | | | | | 9.16 | | | | | | 0.90 | | | | | | 0.73 | | | | | | 0.73 | | | | | | 1.35 | | | | | | 5,957 | | | | | | 46 | | |
| 12-31-20 | | | | | 10.09 | | | | | | 0.17• | | | | | | 0.90 | | | | | | 1.07 | | | | | | 0.19 | | | | | | 0.28 | | | | | | — | | | | | | 0.47 | | | | | | — | | | | | | 10.69 | | | | | | 11.01 | | | | | | 0.92 | | | | | | 0.73 | | | | | | 0.73 | | | | | | 1.76 | | | | | | 6,505 | | | | | | 72 | | |
| 12-31-19 | | | | | 9.13 | | | | | | 0.18• | | | | | | 1.14 | | | | | | 1.32 | | | | | | 0.16 | | | | | | 0.20 | | | | | | — | | | | | | 0.36 | | | | | | — | | | | | | 10.09 | | | | | | 14.61 | | | | | | 0.84 | | | | | | 0.70 | | | | | | 0.70 | | | | | | 1.83 | | | | | | 7,507 | | | | | | 81 | | |
| 12-31-18 | | | | | 9.99 | | | | | | 0.17• | | | | | | (0.60) | | | | | | (0.43) | | | | | | 0.20 | | | | | | 0.23 | | | | | | — | | | | | | 0.43 | | | | | | — | | | | | | 9.13 | | | | | | (4.52) | | | | | | 0.83 | | | | | | 0.67 | | | | | | 0.67 | | | | | | 1.79 | | | | | | 9,033 | | | | | | 59 | | |
| 12-31-17 | | | | | 9.24 | | | | | | 0.15• | | | | | | 0.78 | | | | | | 0.93 | | | | | | 0.18 | | | | | | — | | | | | | — | | | | | | 0.18 | | | | | | — | | | | | | 9.99 | | | | | | 10.09 | | | | | | 0.83 | | | | | | 0.65 | | | | | | 0.65 | | | | | | 1.57 | | | | | | 11,134 | | | | | | 47 | | |
| Class I | | | | | | | | | | | | | | | | | | | | | | | | | | | | | | | | | | | | | | | | | | | | | | | | | | | | | | | | | | | | | | | | | | | | | | | | | | | | | | | | | | | | | | | | | | | | | | | | | | | | | | | |
| 12-31-21 | | | | | 11.18 | | | | | | 0.41• | | | | | | 0.67 | | | | | | 1.08 | | | | | | 0.29 | | | | | | — | | | | | | — | | | | | | 0.29 | | | | | | — | | | | | | 11.97 | | | | | | 9.69 | | | | | | 0.40 | | | | | | 0.23 | | | | | | 0.23 | | | | | | 3.56 | | | | | | 373 | | | | | | 46 | | |
| 12-31-20 | | | | | 10.55 | | | | | | 0.23• | | | | | | 0.93 | | | | | | 1.16 | | | | | | 0.25 | | | | | | 0.28 | | | | | | — | | | | | | 0.53 | | | | | | — | | | | | | 11.18 | | | | | | 11.50 | | | | | | 0.42 | | | | | | 0.23 | | | | | | 0.23 | | | | | | 2.27 | | | | | | 43 | | | | | | 72 | | |
| 12-31-19 | | | | | 9.54 | | | | | | 0.29• | | | | | | 1.14 | | | | | | 1.43 | | | | | | 0.22 | | | | | | 0.20 | | | | | | — | | | | | | 0.42 | | | | | | — | | | | | | 10.55 | | | | | | 15.17 | | | | | | 0.34 | | | | | | 0.20 | | | | | | 0.20 | | | | | | 2.83 | | | | | | 69 | | | | | | 81 | | |
| 12-31-18 | | | | | 10.42 | | | | | | 0.24• | | | | | | (0.64) | | | | | | (0.40) | | | | | | 0.25 | | | | | | 0.23 | | | | | | — | | | | | | 0.48 | | | | | | — | | | | | | 9.54 | | | | | | (4.04) | | | | | | 0.33 | | | | | | 0.17 | | | | | | 0.17 | | | | | | 2.35 | | | | | | 31 | | | | | | 59 | | |
| 12-31-17 | | | | | 9.65 | | | | | | 0.21• | | | | | | 0.82 | | | | | | 1.03 | | | | | | 0.26 | | | | | | — | | | | | | — | | | | | | 0.26 | | | | | | — | | | | | | 10.42 | | | | | | 10.73 | | | | | | 0.33 | | | | | | 0.15 | | | | | | 0.15 | | | | | | 2.06 | | | | | | 27 | | | | | | 47 | | |
| Class R6 | | | | | | | | | | | | | | | | | | | | | | | | | | | | | | | | | | | | | | | | | | | | | | | | | | | | | | | | | | | | | | | | | | | | | | | | | | | | | | | | | | | | | | | | | | | | | | | | | | | | | | | |
| 12-31-21 | | | | | 11.18 | | | | | | 0.22• | | | | | | 0.86 | | | | | | 1.08 | | | | | | 0.29 | | | | | | — | | | | | | — | | | | | | 0.29 | | | | | | — | | | | | | 11.97 | | | | | | 9.69 | | | | | | 0.31 | | | | | | 0.23 | | | | | | 0.23 | | | | | | 1.89 | | | | | | 10,245 | | | | | | 46 | | |
| 12-31-20 | | | | | 10.54 | | | | | | 0.25• | | | | | | 0.92 | | | | | | 1.17 | | | | | | 0.25 | | | | | | 0.28 | | | | | | — | | | | | | 0.53 | | | | | | — | | | | | | 11.18 | | | | | | 11.61 | | | | | | 0.33 | | | | | | 0.23 | | | | | | 0.23 | | | | | | 2.38 | | | | | | 9,068 | | | | | | 72 | | |
| 12-31-19 | | | | | 9.53 | | | | | | 0.25• | | | | | | 1.18 | | | | | | 1.43 | | | | | | 0.22 | | | | | | 0.20 | | | | | | — | | | | | | 0.42 | | | | | | — | | | | | | 10.54 | | | | | | 15.18 | | | | | | 0.34 | | | | | | 0.20 | | | | | | 0.20 | | | | | | 2.47 | | | | | | 6,045 | | | | | | 81 | | |
| 12-31-18 | | | | | 10.41 | | | | | | 0.25• | | | | | | (0.65) | | | | | | (0.40) | | | | | | 0.25 | | | | | | 0.23 | | | | | | — | | | | | | 0.48 | | | | | | — | | | | | | 9.53 | | | | | | (4.05) | | | | | | 0.33 | | | | | | 0.17 | | | | | | 0.17 | | | | | | 2.45 | | | | | | 3,780 | | | | | | 59 | | |
| 12-31-17 | | | | | 9.64 | | | | | | 0.24• | | | | | | 0.78 | | | | | | 1.02 | | | | | | 0.25 | | | | | | — | | | | | | — | | | | | | 0.25 | | | | | | — | | | | | | 10.41 | | | | | | 10.68 | | | | | | 0.33 | | | | | | 0.15 | | | | | | 0.15 | | | | | | 2.37 | | | | | | 2,164 | | | | | | 47 | | |
| Class S | | | | | | | | | | | | | | | | | | | | | | | | | | | | | | | | | | | | | | | | | | | | | | | | | | | | | | | | | | | | | | | | | | | | | | | | | | | | | | | | | | | | | | | | | | | | | | | | | | | | | | | |
| 12-31-21 | | | | | 10.91 | | | | | | 0.19• | | | | | | 0.83 | | | | | | 1.02 | | | | | | 0.26 | | | | | | — | | | | | | — | | | | | | 0.26 | | | | | | — | | | | | | 11.67 | | | | | | 9.41 | | | | | | 0.65 | | | | | | 0.48 | | | | | | 0.48 | | | | | | 1.64 | | | | | | 21,640 | | | | | | 46 | | |
| 12-31-20 | | | | | 10.30 | | | | | | 0.21 | | | | | | 0.91 | | | | | | 1.12 | | | | | | 0.23 | | | | | | 0.28 | | | | | | — | | | | | | 0.51 | | | | | | — | | | | | | 10.91 | | | | | | 11.33 | | | | | | 0.67 | | | | | | 0.48 | | | | | | 0.48 | | | | | | 2.06 | | | | | | 20,347 | | | | | | 72 | | |
| 12-31-19 | | | | | 9.32 | | | | | | 0.22• | | | | | | 1.16 | | | | | | 1.38 | | | | | | 0.20 | | | | | | 0.20 | | | | | | — | | | | | | 0.40 | | | | | | — | | | | | | 10.30 | | | | | | 14.96 | | | | | | 0.59 | | | | | | 0.45 | | | | | | 0.45 | | | | | | 2.24 | | | | | | 19,349 | | | | | | 81 | | |
| 12-31-18 | | | | | 10.19 | | | | | | 0.20• | | | | | | (0.63) | | | | | | (0.43) | | | | | | 0.21 | | | | | | 0.23 | | | | | | — | | | | | | 0.44 | | | | | | — | | | | | | 9.32 | | | | | | (4.35) | | | | | | 0.58 | | | | | | 0.42 | | | | | | 0.42 | | | | | | 2.05 | | | | | | 14,452 | | | | | | 59 | | |
| 12-31-17 | | | | | 9.44 | | | | | | 0.18• | | | | | | 0.79 | | | | | | 0.97 | | | | | | 0.22 | | | | | | — | | | | | | — | | | | | | 0.22 | | | | | | — | | | | | | 10.19 | | | | | | 10.40 | | | | | | 0.58 | | | | | | 0.40 | | | | | | 0.40 | | | | | | 1.80 | | | | | | 17,134 | | | | | | 47 | | |
| Class S2 | | | | | | | | | | | | | | | | | | | | | | | | | | | | | | | | | | | | | | | | | | | | | | | | | | | | | | | | | | | | | | | | | | | | | | | | | | | | | | | | | | | | | | | | | | | | | | | | | | | | | | | |
| 12-31-21 | | | | | 10.72 | | | | | | 0.16• | | | | | | 0.82 | | | | | | 0.98 | | | | | | 0.24 | | | | | | — | | | | | | — | | | | | | 0.24 | | | | | | — | | | | | | 11.46 | | | | | | 9.22 | | | | | | 0.80 | | | | | | 0.63 | | | | | | 0.63 | | | | | | 1.44 | | | | | | 4,718 | | | | | | 46 | | |
| 12-31-20 | | | | | 10.14 | | | | | | 0.19• | | | | | | 0.89 | | | | | | 1.08 | | | | | | 0.22 | | | | | | 0.28 | | | | | | — | | | | | | 0.50 | | | | | | — | | | | | | 10.72 | | | | | | 11.13 | | | | | | 0.82 | | | | | | 0.63 | | | | | | 0.63 | | | | | | 1.89 | | | | | | 5,074 | | | | | | 72 | | |
| 12-31-19 | | | | | 9.21 | | | | | | 0.24• | | | | | | 1.10 | | | | | | 1.34 | | | | | | 0.21 | | | | | | 0.20 | | | | | | — | | | | | | 0.41 | | | | | | — | | | | | | 10.14 | | | | | | 14.74 | | | | | | 0.74 | | | | | | 0.60 | | | | | | 0.60 | | | | | | 2.39 | | | | | | 5,439 | | | | | | 81 | | |
| 12-31-18 | | | | | 10.08 | | | | | | 0.18 | | | | | | (0.61) | | | | | | (0.43) | | | | | | 0.21 | | | | | | 0.23 | | | | | | — | | | | | | 0.44 | | | | | | — | | | | | | 9.21 | | | | | | (4.46) | | | | | | 0.73 | | | | | | 0.57 | | | | | | 0.57 | | | | | | 1.96 | | | | | | 1,072 | | | | | | 59 | | |
| 12-31-17 | | | | | 9.34 | | | | | | 0.17• | | | | | | 0.79 | | | | | | 0.96 | | | | | | 0.22 | | | | | | — | | | | | | — | | | | | | 0.22 | | | | | | — | | | | | | 10.08 | | | | | | 10.33 | | | | | | 0.73 | | | | | | 0.55 | | | | | | 0.55 | | | | | | 1.71 | | | | | | 1,021 | | | | | | 47 | | |
See Accompanying Notes to Financial Statements
Financial Highlights (continued)
| | | | | | | | | | Income
(loss) from
investment
operations | | | | | | | | | Less
Distributions | | | | | | | | | | | | | | | | | | | | | | | | | | | Ratios to average
net assets | | | Supplemental
Data | |
| | | | Net asset value, beginning of year
or period | | | Net investment income (loss) | | | Net realized and unrealized
gain (loss) | | | Total from investment operations | | | From net investment income | | | From net realized gains | | | From return of capital | | | Total distributions | | | Payment by affiliate | | | Net asset value, end of year
or period | | | Total Return(1) | | | Expenses before
reductions/additions(2)(3)(4) | | | Expenses net of fee waivers
and/or recoupments if any(2)(3)(4) | | | Expenses net of all
reductions/additions(2)(3)(4) | | | Net investment income (loss)(2)(3) | | | Net assets, end of year or period | | | Portfolio turnover rate | |
Year or
period ended | | | ($) | | | ($) | | | ($) | | | ($) | | | ($) | | | ($) | | | ($) | | | ($) | | | ($) | | | ($) | | | (%) | | | (%) | | | (%) | | | (%) | | | (%) | | | ($000’s) | | | (%) | |
| Voya Solution 2025 Portfolio | | | | | | | | | | | | | | | | | | | | | | | | | | | | | | | | | | | | | | | | | | | | | | | | | | | | | | | | | | | | | | | | | | | | | | | | | | | | | | | | | | | | | | | | | | | | | | | | | | | | | | | |
| Class ADV | | | | | | | | | | | | | | | | | | | | | | | | | | | | | | | | | | | | | | | | | | | | | | | | | | | | | | | | | | | | | | | | | | | | | | | | | | | | | | | | | | | | | | | | | | | | | | | | | | | | | | | |
| 12-31-21 | | | | | 12.12 | | | | | | 0.14• | | | | | | 1.10 | | | | | | 1.24 | | | | | | 0.33 | | | | | | 0.59 | | | | | | — | | | | | | 0.92 | | | | | | — | | | | | | 12.44 | | | | | | 10.40 | | | | | | 0.81 | | | | | | 0.70 | | | | | | 0.70 | | | | | | 1.16 | | | | | | 234,207 | | | | | | 36 | | |
| 12-31-20 | | | | | 11.37 | | | | | | 0.15• | | | | | | 1.29 | | | | | | 1.44 | | | | | | 0.21 | | | | | | 0.48 | | | | | | — | | | | | | 0.69 | | | | | | — | | | | | | 12.12 | | | | | | 13.30 | | | | | | 0.80 | | | | | | 0.71 | | | | | | 0.71 | | | | | | 1.38 | | | | | | 246,302 | | | | | | 60 | | |
| 12-31-19 | | | | | 10.48 | | | | | | 0.18• | | | | | | 1.64 | | | | | | 1.82 | | | | | | 0.25 | | | | | | 0.68 | | | | | | — | | | | | | 0.93 | | | | | | — | | | | | | 11.37 | | | | | | 17.79 | | | | | | 0.75 | | | | | | 0.71 | | | | | | 0.71 | | | | | | 1.59 | | | | | | 260,690 | | | | | | 44 | | |
| 12-31-18 | | | | | 11.72 | | | | | | 0.16• | | | | | | (0.82) | | | | | | (0.66) | | | | | | 0.21 | | | | | | 0.37 | | | | | | — | | | | | | 0.58 | | | | | | — | | | | | | 10.48 | | | | | | (5.97) | | | | | | 0.74 | | | | | | 0.67 | | | | | | 0.67 | | | | | | 1.38 | | | | | | 244,883 | | | | | | 47 | | |
| 12-31-17 | | | | | 10.66 | | | | | | 0.15• | | | | | | 1.42 | | | | | | 1.57 | | | | | | 0.19 | | | | | | 0.32 | | | | | | — | | | | | | 0.51 | | | | | | — | | | | | | 11.72 | | | | | | 15.02 | | | | | | 0.74 | | | | | | 0.66 | | | | | | 0.66 | | | | | | 1.36 | | | | | | 300,453 | | | | | | 46 | | |
| Class I | | | | | | | | | | | | | | | | | | | | | | | | | | | | | | | | | | | | | | | | | | | | | | | | | | | | | | | | | | | | | | | | | | | | | | | | | | | | | | | | | | | | | | | | | | | | | | | | | | | | | | | |
| 12-31-21 | | | | | 12.50 | | | | | | 0.21• | | | | | | 1.14 | | | | | | 1.35 | | | | | | 0.38 | | | | | | 0.59 | | | | | | — | | | | | | 0.97 | | | | | | — | | | | | | 12.88 | | | | | | 10.96 | | | | | | 0.31 | | | | | | 0.20 | | | | | | 0.20 | | | | | | 1.61 | | | | | | 64,534 | | | | | | 36 | | |
| 12-31-20 | | | | | 11.71 | | | | | | 0.20• | | | | | | 1.34 | | | | | | 1.54 | | | | | | 0.27 | | | | | | 0.48 | | | | | | — | | | | | | 0.75 | | | | | | — | | | | | | 12.50 | | | | | | 13.85 | | | | | | 0.30 | | | | | | 0.21 | | | | | | 0.21 | | | | | | 1.71 | | | | | | 77,673 | | | | | | 60 | | |
| 12-31-19 | | | | | 10.78 | | | | | | 0.24 | | | | | | 1.68 | | | | | | 1.92 | | | | | | 0.31 | | | | | | 0.68 | | | | | | — | | | | | | 0.99 | | | | | | — | | | | | | 11.71 | | | | | | 18.33 | | | | | | 0.25 | | | | | | 0.21 | | | | | | 0.21 | | | | | | 2.14 | | | | | | 260,767 | | | | | | 44 | | |
| 12-31-18 | | | | | 12.04 | | | | | | 0.23• | | | | | | (0.85) | | | | | | (0.62) | | | | | | 0.27 | | | | | | 0.37 | | | | | | — | | | | | | 0.64 | | | | | | — | | | | | | 10.78 | | | | | | (5.48) | | | | | | 0.24 | | | | | | 0.17 | | | | | | 0.17 | | | | | | 1.93 | | | | | | 219,811 | | | | | | 47 | | |
| 12-31-17 | | | | | 10.94 | | | | | | 0.22• | | | | | | 1.46 | | | | | | 1.68 | | | | | | 0.26 | | | | | | 0.32 | | | | | | — | | | | | | 0.58 | | | | | | — | | | | | | 12.04 | | | | | | 15.62 | | | | | | 0.24 | | | | | | 0.16 | | | | | | 0.16 | | | | | | 1.92 | | | | | | 243,053 | | | | | | 46 | | |
| Class S | | | | | | | | | | | | | | | | | | | | | | | | | | | | | | | | | | | | | | | | | | | | | | | | | | | | | | | | | | | | | | | | | | | | | | | | | | | | | | | | | | | | | | | | | | | | | | | | | | | | | | | |
| 12-31-21 | | | | | 12.34 | | | | | | 0.18• | | | | | | 1.12 | | | | | | 1.30 | | | | | | 0.37 | | | | | | 0.59 | | | | | | — | | | | | | 0.96 | | | | | | — | | | | | | 12.68 | | | | | | 10.67 | | | | | | 0.56 | | | | | | 0.45 | | | | | | 0.45 | | | | | | 1.43 | | | | | | 303,656 | | | | | | 36 | | |
| 12-31-20 | | | | | 11.57 | | | | | | 0.21 | | | | | | 1.28 | | | | | | 1.49 | | | | | | 0.24 | | | | | | 0.48 | | | | | | — | | | | | | 0.72 | | | | | | — | | | | | | 12.34 | | | | | | 13.54 | | | | | | 0.55 | | | | | | 0.46 | | | | | | 0.46 | | | | | | 1.65 | | | | | | 299,333 | | | | | | 60 | | |
| 12-31-19 | | | | | 10.65 | | | | | | 0.21• | | | | | | 1.67 | | | | | | 1.88 | | | | | | 0.28 | | | | | | 0.68 | | | | | | — | | | | | | 0.96 | | | | | | — | | | | | | 11.57 | | | | | | 18.12 | | | | | | 0.50 | | | | | | 0.46 | | | | | | 0.46 | | | | | | 1.82 | | | | | | 299,655 | | | | | | 44 | | |
| 12-31-18 | | | | | 11.90 | | | | | | 0.19• | | | | | | (0.83) | | | | | | (0.64) | | | | | | 0.24 | | | | | | 0.37 | | | | | | — | | | | | | 0.61 | | | | | | — | | | | | | 10.65 | | | | | | (5.73) | | | | | | 0.49 | | | | | | 0.42 | | | | | | 0.42 | | | | | | 1.64 | | | | | | 294,102 | | | | | | 47 | | |
| 12-31-17 | | | | | 10.82 | | | | | | 0.18• | | | | | | 1.45 | | | | | | 1.63 | | | | | | 0.23 | | | | | | 0.32 | | | | | | — | | | | | | 0.55 | | | | | | — | | | | | | 11.90 | | | | | | 15.29 | | | | | | 0.49 | | | | | | 0.41 | | | | | | 0.41 | | | | | | 1.60 | | | | | | 359,764 | | | | | | 46 | | |
| Class S2 | | | | | | | | | | | | | | | | | | | | | | | | | | | | | | | | | | | | | | | | | | | | | | | | | | | | | | | | | | | | | | | | | | | | | | | | | | | | | | | | | | | | | | | | | | | | | | | | | | | | | | | |
| 12-31-21 | | | | | 11.97 | | | | | | 0.16• | | | | | | 1.08 | | | | | | 1.24 | | | | | | 0.36 | | | | | | 0.59 | | | | | | — | | | | | | 0.95 | | | | | | — | | | | | | 12.26 | | | | | | 10.49 | | | | | | 0.71 | | | | | | 0.60 | | | | | | 0.60 | | | | | | 1.33 | | | | | | 11,469 | | | | | | 36 | | |
| 12-31-20 | | | | | 11.23 | | | | | | 0.16• | | | | | | 1.27 | | | | | | 1.43 | | | | | | 0.21 | | | | | | 0.48 | | | | | | — | | | | | | 0.69 | | | | | | — | | | | | | 11.97 | | | | | | 13.42 | | | | | | 0.70 | | | | | | 0.61 | | | | | | 0.61 | | | | | | 1.47 | | | | | | 9,493 | | | | | | 60 | | |
| 12-31-19 | | | | | 10.35 | | | | | | 0.18• | | | | | | 1.63 | | | | | | 1.81 | | | | | | 0.25 | | | | | | 0.68 | | | | | | — | | | | | | 0.93 | | | | | | — | | | | | | 11.23 | | | | | | 17.92 | | | | | | 0.65 | | | | | | 0.61 | | | | | | 0.61 | | | | | | 1.63 | | | | | | 10,745 | | | | | | 44 | | |
| 12-31-18 | | | | | 11.56 | | | | | | 0.15• | | | | | | (0.79) | | | | | | (0.64) | | | | | | 0.20 | | | | | | 0.37 | | | | | | — | | | | | | 0.57 | | | | | | — | | | | | | 10.35 | | | | | | (5.88) | | | | | | 0.64 | | | | | | 0.57 | | | | | | 0.57 | | | | | | 1.34 | | | | | | 11,715 | | | | | | 47 | | |
| 12-31-17 | | | | | 10.52 | | | | | | 0.16• | | | | | | 1.40 | | | | | | 1.56 | | | | | | 0.20 | | | | | | 0.32 | | | | | | — | | | | | | 0.52 | | | | | | — | | | | | | 11.56 | | | | | | 15.07 | | | | | | 0.64 | | | | | | 0.56 | | | | | | 0.56 | | | | | | 1.40 | | | | | | 16,911 | | | | | | 46 | | |
| Class T | | | | | | | | | | | | | | | | | | | | | | | | | | | | | | | | | | | | | | | | | | | | | | | | | | | ��� | | | | | | | | | | | | | | | | | | | | | | | | | | | | | | | | | | | | | | | | | | | | | | | | | | | | |
| 12-31-21 | | | | | 12.83 | | | | | | 0.12• | | | | | | 1.17 | | | | | | 1.29 | | | | | | 0.28 | | | | | | 0.59 | | | | | | — | | | | | | 0.87 | | | | | | — | | | | | | 13.25 | | | | | | 10.19 | | | | | | 1.01 | | | | | | 0.90 | | | | | | 0.90 | | | | | | 0.92 | | | | | | 380 | | | | | | 36 | | |
| 12-31-20 | | | | | 11.98 | | | | | | 0.13• | | | | | | 1.36 | | | | | | 1.49 | | | | | | 0.16 | | | | | | 0.48 | | | | | | — | | | | | | 0.64 | | | | | | — | | | | | | 12.83 | | | | | | 13.02 | | | | | | 1.00 | | | | | | 0.91 | | | | | | 0.91 | | | | | | 1.13 | | | | | | 436 | | | | | | 60 | | |
| 12-31-19 | | | | | 10.96 | | | | | | 0.16• | | | | | | 1.72 | | | | | | 1.88 | | | | | | 0.18 | | | | | | 0.68 | | | | | | — | | | | | | 0.86 | | | | | | — | | | | | | 11.98 | | | | | | 17.51 | | | | | | 0.95 | | | | | | 0.91 | | | | | | 0.91 | | | | | | 1.36 | | | | | | 521 | | | | | | 44 | | |
| 12-31-18 | | | | | 12.23 | | | | | | 0.13• | | | | | | (0.84) | | | | | | (0.71) | | | | | | 0.19 | | | | | | 0.37 | | | | | | — | | | | | | 0.56 | | | | | | — | | | | | | 10.96 | | | | | | (6.14) | | | | | | 0.94 | | | | | | 0.87 | | | | | | 0.87 | | | | | | 1.11 | | | | | | 575 | | | | | | 47 | | |
| 12-31-17 | | | | | 11.10 | | | | | | 0.14• | | | | | | 1.48 | | | | | | 1.62 | | | | | | 0.17 | | | | | | 0.32 | | | | | | — | | | | | | 0.49 | | | | | | — | | | | | | 12.23 | | | | | | 14.78 | | | | | | 0.94 | | | | | | 0.86 | | | | | | 0.86 | | | | | | 1.18 | | | | | | 821 | | | | | | 46 | | |
See Accompanying Notes to Financial Statements
Financial Highlights (continued)
| | | | | | | | | | Income
(loss) from
investment
operations | | | | | | | | | Less
Distributions | | | | | | | | | | | | | | | | | | | | | | | | | | | Ratios to average
net assets | | | Supplemental
Data | |
| | | | Net asset value, beginning of year
or period | | | Net investment income (loss) | | | Net realized and unrealized
gain (loss) | | | Total from investment operations | | | From net investment income | | | From net realized gains | | | From return of capital | | | Total distributions | | | Payment by affiliate | | | Net asset value, end of year
or period | | | Total Return(1) | | | Expenses before
reductions/additions(2)(3)(4) | | | Expenses net of fee waivers
and/or recoupments if any(2)(3)(4) | | | Expenses net of all
reductions/additions(2)(3)(4) | | | Net investment income (loss)(2)(3) | | | Net assets, end of year or period | | | Portfolio turnover rate | |
Year or
period ended | | | ($) | | | ($) | | | ($) | | | ($) | | | ($) | | | ($) | | | ($) | | | ($) | | | ($) | | | ($) | | | (%) | | | (%) | | | (%) | | | (%) | | | (%) | | | ($000’s) | | | (%) | |
| Voya Solution 2030 Portfolio | | | | | | | | | | | | | | | | | | | | | | | | | | | | | | | | | | | | | | | | | | | | | | | | | | | | | | | | | | | | | | | | | | | | | | | | | | | | | | | | | | | | | | | | | | | | | | | | | | | | | | | |
| Class ADV | | | | | | | | | | | | | | | | | | | | | | | | | | | | | | | | | | | | | | | | | | | | | | | | | | | | | | | | | | | | | | | | | | | | | | | | | | | | | | | | | | | | | | | | | | | | | | | | | | | | | | | |
| 12-31-21 | | | | | 16.46 | | | | | | 0.20• | | | | | | 1.81 | | | | | | 2.01 | | | | | | 0.27 | | | | | | 0.17 | | | | | | — | | | | | | 0.44 | | | | | | — | | | | | | 18.03 | | | | | | 12.26 | | | | | | 0.90 | | | | | | 0.67 | | | | | | 0.67 | | | | | | 1.15 | | | | | | 25,214 | | | | | | 54 | | |
| 12-31-20 | | | | | 15.30 | | | | | | 0.18• | | | | | | 1.86 | | | | | | 2.04 | | | | | | 0.23 | | | | | | 0.65 | | | | | | — | | | | | | 0.88 | | | | | | — | | | | | | 16.46 | | | | | | 13.99 | | | | | | 0.94 | | | | | | 0.71 | | | | | | 0.71 | | | | | | 1.24 | | | | | | 22,015 | | | | | | 90 | | |
| 12-31-19 | | | | | 13.79 | | | | | | 0.23• | | | | | | 2.46 | | | | | | 2.69 | | | | | | 0.25 | | | | | | 0.93 | | | | | | — | | | | | | 1.18 | | | | | | — | | | | | | 15.30 | | | | | | 20.13 | | | | | | 0.83 | | | | | | 0.71 | | | | | | 0.71 | | | | | | 1.55 | | | | | | 18,792 | | | | | | 79 | | |
| 12-31-18 | | | | | 15.96 | | | | | | 0.21 | | | | | | (1.31) | | | | | | (1.10) | | | | | | 0.23 | | | | | | 0.84 | | | | | | — | | | | | | 1.07 | | | | | | — | | | | | | 13.79 | | | | | | (7.47) | | | | | | 0.81 | | | | | | 0.66 | | | | | | 0.66 | | | | | | 1.38 | | | | | | 12,630 | | | | | | 87 | | |
| 12-31-17 | | | | | 13.94 | | | | | | 0.23• | | | | | | 2.15 | | | | | | 2.38 | | | | | | 0.12 | | | | | | 0.24 | | | | | | — | | | | | | 0.36 | | | | | | — | | | | | | 15.96 | | | | | | 17.22 | | | | | | 0.83 | | | | | | 0.64 | | | | | | 0.64 | | | | | | 1.50 | | | | | | 13,589 | | | | | | 63 | | |
| Class I | | | | | | | | | | | | | | | | | | | | | | | | | | | | | | | | | | | | | | | | | | | | | | | | | | | | | | | | | | | | | | | | | | | | | | | | | | | | | | | | | | | | | | | | | | | | | | | | | | | | | | | |
| 12-31-21 | | | | | 17.02 | | | | | | 0.28• | | | | | | 1.88 | | | | | | 2.16 | | | | | | 0.33 | | | | | | 0.17 | | | | | | — | | | | | | 0.50 | | | | | | — | | | | | | 18.68 | | | | | | 12.80 | | | | | | 0.40 | | | | | | 0.17 | | | | | | 0.17 | | | | | | 1.57 | | | | | | 12,248 | | | | | | 54 | | |
| 12-31-20 | | | | | 15.77 | | | | | | 0.26• | | | | | | 1.93 | | | | | | 2.19 | | | | | | 0.29 | | | | | | 0.65 | | | | | | — | | | | | | 0.94 | | | | | | — | | | | | | 17.02 | | | | | | 14.61 | | | | | | 0.44 | | | | | | 0.21 | | | | | | 0.21 | | | | | | 1.69 | | | | | | 13,812 | | | | | | 90 | | |
| 12-31-19 | | | | | 14.18 | | | | | | 0.33• | | | | | | 2.51 | | | | | | 2.84 | | | | | | 0.32 | | | | | | 0.93 | | | | | | — | | | | | | 1.25 | | | | | | — | | | | | | 15.77 | | | | | | 20.65 | | | | | | 0.33 | | | | | | 0.21 | | | | | | 0.21 | | | | | | 2.18 | | | | | | 13,781 | | | | | | 79 | | |
| 12-31-18 | | | | | 16.36 | | | | | | 0.31• | | | | | | (1.36) | | | | | | (1.05) | | | | | | 0.29 | | | | | | 0.84 | | | | | | — | | | | | | 1.13 | | | | | | — | | | | | | 14.18 | | | | | | (6.98) | | | | | | 0.31 | | | | | | 0.16 | | | | | | 0.16 | | | | | | 1.95 | | | | | | 7,333 | | | | | | 87 | | |
| 12-31-17 | | | | | 14.23 | | | | | | 0.32• | | | | | | 2.19 | | | | | | 2.51 | | | | | | 0.14 | | | | | | 0.24 | | | | | | — | | | | | | 0.38 | | | | | | — | | | | | | 16.36 | | | | | | 17.86 | | | | | | 0.33 | | | | | | 0.14 | | | | | | 0.14 | | | | | | 2.07 | | | | | | 8,625 | | | | | | 63 | | |
| Class S | | | | | | | | | | | | | | | | | | | | | | | | | | | | | | | | | | | | | | | | | | | | | | | | | | | | | | | | | | | | | | | | | | | | | | | | | | | | | | | | | | | | | | | | | | | | | | | | | | | | | | | |
| 12-31-21 | | | | | 16.89 | | | | | | 0.24• | | | | | | 1.86 | | | | | | 2.10 | | | | | | 0.31 | | | | | | 0.17 | | | | | | — | | | | | | 0.48 | | | | | | — | | | | | | 18.51 | | | | | | 12.49 | | | | | | 0.65 | | | | | | 0.42 | | | | | | 0.42 | | | | | | 1.35 | | | | | | 18,032 | | | | | | 54 | | |
| 12-31-20 | | | | | 15.66 | | | | | | 0.23• | | | | | | 1.91 | | | | | | 2.14 | | | | | | 0.26 | | | | | | 0.65 | | | | | | — | | | | | | 0.91 | | | | | | — | | | | | | 16.89 | | | | | | 14.34 | | | | | | 0.69 | | | | | | 0.46 | | | | | | 0.46 | | | | | | 1.54 | | | | | | 17,584 | | | | | | 90 | | |
| 12-31-19 | | | | | 14.09 | | | | | | 0.27• | | | | | | 2.51 | | | | | | 2.78 | | | | | | 0.28 | | | | | | 0.93 | | | | | | — | | | | | | 1.21 | | | | | | — | | | | | | 15.66 | | | | | | 20.36 | | | | | | 0.58 | | | | | | 0.46 | | | | | | 0.46 | | | | | | 1.78 | | | | | | 13,558 | | | | | | 79 | | |
| 12-31-18 | | | | | 16.28 | | | | | | 0.28• | | | | | | (1.36) | | | | | | (1.08) | | | | | | 0.27 | | | | | | 0.84 | | | | | | — | | | | | | 1.11 | | | | | | — | | | | | | 14.09 | | | | | | (7.23) | | | | | | 0.56 | | | | | | 0.41 | | | | | | 0.41 | | | | | | 1.81 | | | | | | 10,589 | | | | | | 87 | | |
| 12-31-17 | | | | | 14.18 | | | | | | 0.26• | | | | | | 2.21 | | | | | | 2.47 | | | | | | 0.13 | | | | | | 0.24 | | | | | | — | | | | | | 0.37 | | | | | | — | | | | | | 16.28 | | | | | | 17.59 | | | | | | 0.58 | | | | | | 0.39 | | | | | | 0.39 | | | | | | 1.72 | | | | | | 8,484 | | | | | | 63 | | |
| Class S2 | | | | | | | | | | | | | | | | | | | | | | | | | | | | | | | | | | | | | | | | | | | | | | | | | | | | | | | | | | | | | | | | | | | | | | | | | | | | | | | | | | | | | | | | | | | | | | | | | | | | | | | |
| 12-31-21 | | | | | 16.66 | | | | | | 0.27• | | | | | | 1.77 | | | | | | 2.04 | | | | | | 0.31 | | | | | | 0.17 | | | | | | — | | | | | | 0.48 | | | | | | — | | | | | | 18.22 | | | | | | 12.35 | | | | | | 0.80 | | | | | | 0.57 | | | | | | 0.57 | | | | | | 1.53 | | | | | | 1,596 | | | | | | 54 | | |
| 12-31-20 | | | | | 15.46 | | | | | | 0.22• | | | | | | 1.87 | | | | | | 2.09 | | | | | | 0.24 | | | | | | 0.65 | | | | | | — | | | | | | 0.89 | | | | | | — | | | | | | 16.66 | | | | | | 14.17 | | | | | | 0.84 | | | | | | 0.61 | | | | | | 0.61 | | | | | | 1.47 | | | | | | 642 | | | | | | 90 | | |
| 12-31-19 | | | | | 13.90 | | | | | | 0.25• | | | | | | 2.48 | | | | | | 2.73 | | | | | | 0.24 | | | | | | 0.93 | | | | | | — | | | | | | 1.17 | | | | | | — | | | | | | 15.46 | | | | | | 20.24 | | | | | | 0.73 | | | | | | 0.61 | | | | | | 0.61 | | | | | | 1.66 | | | | | | 450 | | | | | | 79 | | |
| 12-31-18 | | | | | 16.08 | | | | | | 0.25• | | | | | | (1.35) | | | | | | (1.10) | | | | | | 0.24 | | | | | | 0.84 | | | | | | — | | | | | | 1.08 | | | | | | — | | | | | | 13.90 | | | | | | (7.40) | | | | | | 0.71 | | | | | | 0.56 | | | | | | 0.56 | | | | | | 1.62 | | | | | | 439 | | | | | | 87 | | |
| 12-31-17 | | | | | 14.01 | | | | | | 0.21• | | | | | | 2.20 | | | | | | 2.41 | | | | | | 0.10 | | | | | | 0.24 | | | | | | — | | | | | | 0.34 | | | | | | — | | | | | | 16.08 | | | | | | 17.38 | | | | | | 0.73 | | | | | | 0.54 | | | | | | 0.54 | | | | | | 1.42 | | | | | | 588 | | | | | | 63 | | |
| Class T | | | | | | | | | | | | | | | | | | | | | | | | | | | | | | | | | | | | | | | | | | | | | | | | | | | | | | | | | | | | | | | | | | | | | | | | | | | | | | | | | | | | | | | | | | | | | | | | | | | | | | | |
| 12-31-21 | | | | | 16.45 | | | | | | 0.18• | | | | | | 1.79 | | | | | | 1.97 | | | | | | 0.25 | | | | | | 0.17 | | | | | | — | | | | | | 0.42 | | | | | | — | | | | | | 18.00 | | | | | | 12.05 | | | | | | 1.10 | | | | | | 0.87 | | | | | | 0.87 | | | | | | 1.01 | | | | | | 56 | | | | | | 54 | | |
| 12-31-20 | | | | | 15.31 | | | | | | 0.16• | | | | | | 1.85 | | | | | | 2.01 | | | | | | 0.22 | | | | | | 0.65 | | | | | | — | | | | | | 0.87 | | | | | | — | | | | | | 16.45 | | | | | | 13.74 | | | | | | 1.14 | | | | | | 0.91 | | | | | | 0.91 | | | | | | 1.10 | | | | | | 45 | | | | | | 90 | | |
| 12-31-19 | | | | | 13.82 | | | | | | 0.21• | | | | | | 2.45 | | | | | | 2.66 | | | | | | 0.24 | | | | | | 0.93 | | | | | | — | | | | | | 1.17 | | | | | | — | | | | | | 15.31 | | | | | | 19.86 | | | | | | 1.03 | | | | | | 0.91 | | | | | | 0.91 | | | | | | 1.41 | | | | | | 32 | | | | | | 79 | | |
| 12-31-18 | | | | | 16.02 | | | | | | 0.22• | | | | | | (1.36) | | | | | | (1.14) | | | | | | 0.22 | | | | | | 0.84 | | | | | | — | | | | | | 1.06 | | | | | | — | | | | | | 13.82 | | | | | | (7.67) | | | | | | 1.01 | | | | | | 0.86 | | | | | | 0.86 | | | | | | 1.44 | | | | | | 20 | | | | | | 87 | | |
| 12-31-17 | | | | | 13.98 | | | | | | 0.19• | | | | | | 2.17 | | | | | | 2.36 | | | | | | 0.08 | | | | | | 0.24 | | | | | | — | | | | | | 0.32 | | | | | | — | | | | | | 16.02 | | | | | | 17.05 | | | | | | 1.03 | | | | | | 0.84 | | | | | | 0.84 | | | | | | 1.23 | | | | | | 15 | | | | | | 63 | | |
See Accompanying Notes to Financial Statements
Financial Highlights (continued)
| | | | | | | | | | Income
(loss) from
investment
operations | | | | | | | | | Less
Distributions | | | | | | | | | | | | | | | | | | | | | | | | | | | Ratios to average
net assets | | | Supplemental
Data | |
| | | | Net asset value, beginning of year
or period | | | Net investment income (loss) | | | Net realized and unrealized
gain (loss) | | | Total from investment operations | | | From net investment income | | | From net realized gains | | | From return of capital | | | Total distributions | | | Payment by affiliate | | | Net asset value, end of year
or period | | | Total Return(1) | | | Expenses before
reductions/additions(2)(3)(4) | | | Expenses net of fee waivers
and/or recoupments if any(2)(3)(4) | | | Expenses net of all
reductions/additions(2)(3)(4) | | | Net investment income (loss)(2)(3) | | | Net assets, end of year or period | | | Portfolio turnover rate | |
Year or
period ended | | | ($) | | | ($) | | | ($) | | | ($) | | | ($) | | | ($) | | | ($) | | | ($) | | | ($) | | | ($) | | | (%) | | | (%) | | | (%) | | | (%) | | | (%) | | | ($000’s) | | | (%) | |
| Voya Solution 2035 Portfolio | | | | | | | | | | | | | | | | | | | | | | | | | | | | | | | | | | | | | | | | | | | | | | | | | | | | | | | | | | | | | | | | | | | | | | | | | | | | | | | | | | | | | | | | | | | | | | | | | | | | | | | |
| Class ADV | | | | | | | | | | | | | | | | | | | | | | | | | | | | | | | | | | | | | | | | | | | | | | | | | | | | | | | | | | | | | | | | | | | | | | | | | | | | | | | | | | | | | | | | | | | | | | | | | | | | | | | |
| 12-31-21 | | | | | 12.20 | | | | | | 0.14• | | | | | | 1.53 | | | | | | 1.67 | | | | | | 0.26 | | | | | | 0.54 | | | | | | — | | | | | | 0.80 | | | | | | — | | | | | | 13.07 | | | | | | 13.81 | | | | | | 0.83 | | | | | | 0.65 | | | | | | 0.65 | | | | | | 1.05 | | | | | | 219,940 | | | | | | 42 | | |
| 12-31-20 | | | | | 11.63 | | | | | | 0.13 | | | | | | 1.39 | | | | | | 1.52 | | | | | | 0.19 | | | | | | 0.76 | | | | | | — | | | | | | 0.95 | | | | | | — | | | | | | 12.20 | | | | | | 14.13 | | | | | | 0.81 | | | | | | 0.69 | | | | | | 0.69 | | | | | | 0.96 | | | | | | 220,485 | | | | | | 65 | | |
| 12-31-19 | | | | | 10.60 | | | | | | 0.16• | | | | | | 2.04 | | | | | | 2.20 | | | | | | 0.24 | | | | | | 0.93 | | | | | | — | | | | | | 1.17 | | | | | | — | | | | | | 11.63 | | | | | | 21.53 | | | | | | 0.75 | | | | | | 0.71 | | | | | | 0.71 | | | | | | 1.38 | | | | | | 226,096 | | | | | | 52 | | |
| 12-31-18 | | | | | 12.27 | | | | | | 0.14• | | | | | | (1.12) | | | | | | (0.98) | | | | | | 0.19 | | | | | | 0.50 | | | | | | — | | | | | | 0.69 | | | | | | — | | | | | | 10.60 | | | | | | (8.54) | | | | | | 0.75 | | | | | | 0.68 | | | | | | 0.68 | | | | | | 1.21 | | | | | | 212,084 | | | | | | 50 | | |
| 12-31-17 | | | | | 10.71 | | | | | | 0.13• | | | | | | 1.90 | | | | | | 2.03 | | | | | | 0.16 | | | | | | 0.31 | | | | | | — | | | | | | 0.47 | | | | | | — | | | | | | 12.27 | | | | | | 19.22 | | | | | | 0.74 | | | | | | 0.65 | | | | | | 0.65 | | | | | | 1.12 | | | | | | 267,229 | | | | | | 36 | | |
| Class I | | | | | | | | | | | | | | | | | | | | | | | | | | | | | | | | | | | | | | | | | | | | | | | | | | | | | | | | | | | | | | | | | | | | | | | | | | | | | | | | | | | | | | | | | | | | | | | | | | | | | | | |
| 12-31-21 | | | | | 12.59 | | | | | | 0.20• | | | | | | 1.59 | | | | | | 1.79 | | | | | | 0.30 | | | | | | 0.54 | | | | | | — | | | | | | 0.84 | | | | | | — | | | | | | 13.54 | | | | | | 14.35 | | | | | | 0.33 | | | | | | 0.15 | | | | | | 0.15 | | | | | | 1.48 | | | | | | 78,910 | | | | | | 42 | | |
| 12-31-20 | | | | | 11.98 | | | | | | 0.15• | | | | | | 1.47 | | | | | | 1.62 | | | | | | 0.25 | | | | | | 0.76 | | | | | | — | | | | | | 1.01 | | | | | | — | | | | | | 12.59 | | | | | | 14.65 | | | | | | 0.31 | | | | | | 0.19 | | | | | | 0.19 | | | | | | 1.30 | | | | | | 93,880 | | | | | | 65 | | |
| 12-31-19 | | | | | 10.89 | | | | | | 0.22 | | | | | | 2.10 | | | | | | 2.32 | | | | | | 0.30 | | | | | | 0.93 | | | | | | — | | | | | | 1.23 | | | | | | — | | | | | | 11.98 | | | | | | 22.22 | | | | | | 0.25 | | | | | | 0.21 | | | | | | 0.21 | | | | | | 1.97 | | | | | | 304,111 | | | | | | 52 | | |
| 12-31-18 | | | | | 12.59 | | | | | | 0.22 | | | | | | (1.17) | | | | | | (0.95) | | | | | | 0.25 | | | | | | 0.50 | | | | | | — | | | | | | 0.75 | | | | | | — | | | | | | 10.89 | | | | | | (8.09) | | | | | | 0.25 | | | | | | 0.18 | | | | | | 0.18 | | | | | | 1.75 | | | | | | 247,475 | | | | | | 50 | | |
| 12-31-17 | | | | | 10.98 | | | | | | 0.20• | | | | | | 1.94 | | | | | | 2.14 | | | | | | 0.22 | | | | | | 0.31 | | | | | | — | | | | | | 0.53 | | | | | | — | | | | | | 12.59 | | | | | | 19.82 | | | | | | 0.24 | | | | | | 0.15 | | | | | | 0.15 | | | | | | 1.69 | | | | | | 274,900 | | | | | | 36 | | |
| Class S | | | | | | | | | | | | | | | | | | | | | | | | | | | | | | | | | | | | | | | | | | | | | | | | | | | | | | | | | | | | | | | | | | | | | | | | | | | | | | | | | | | | | | | | | | | | | | | | | | | | | | | |
| 12-31-21 | | | | | 12.43 | | | | | | 0.18• | | | | | | 1.55 | | | | | | 1.73 | | | | | | 0.29 | | | | | | 0.54 | | | | | | — | | | | | | 0.83 | | | | | | — | | | | | | 13.33 | | | | | | 14.08 | | | | | | 0.58 | | | | | | 0.40 | | | | | | 0.40 | | | | | | 1.35 | | | | | | 369,502 | | | | | | 42 | | |
| 12-31-20 | | | | | 11.83 | | | | | | 0.15 | | | | | | 1.43 | | | | | | 1.58 | | | | | | 0.22 | | | | | | 0.76 | | | | | | — | | | | | | 0.98 | | | | | | — | | | | | | 12.43 | | | | | | 14.46 | | | | | | 0.56 | | | | | | 0.44 | | | | | | 0.44 | | | | | | 1.24 | | | | | | 341,146 | | | | | | 65 | | |
| 12-31-19 | | | | | 10.76 | | | | | | 0.19• | | | | | | 2.08 | | | | | | 2.27 | | | | | | 0.27 | | | | | | 0.93 | | | | | | — | | | | | | 1.20 | | | | | | — | | | | | | 11.83 | | | | | | 21.94 | | | | | | 0.50 | | | | | | 0.46 | | | | | | 0.46 | | | | | | 1.64 | | | | | | 324,783 | | | | | | 52 | | |
| 12-31-18 | | | | | 12.45 | | | | | | 0.18• | | | | | | (1.15) | | | | | | (0.97) | | | | | | 0.22 | | | | | | 0.50 | | | | | | — | | | | | | 0.72 | | | | | | — | | | | | | 10.76 | | | | | | (8.34) | | | | | | 0.50 | | | | | | 0.43 | | | | | | 0.43 | | | | | | 1.46 | | | | | | 297,721 | | | | | | 50 | | |
| 12-31-17 | | | | | 10.87 | | | | | | 0.16• | | | | | | 1.92 | | | | | | 2.08 | | | | | | 0.19 | | | | | | 0.31 | | | | | | — | | | | | | 0.50 | | | | | | — | | | | | | 12.45 | | | | | | 19.44 | | | | | | 0.49 | | | | | | 0.40 | | | | | | 0.40 | | | | | | 1.38 | | | | | | 368,554 | | | | | | 36 | | |
| Class S2 | | | | | | | | | | | | | | | | | | | | | | | | | | | | | | | | | | | | | | | | | | | | | | | | | | | | | | | | | | | | | | | | | | | | | | | | | | | | | | | | | | | | | | | | | | | | | | | | | | | | | | | |
| 12-31-21 | | | | | 11.88 | | | | | | 0.15• | | | | | | 1.49 | | | | | | 1.64 | | | | | | 0.28 | | | | | | 0.54 | | | | | | — | | | | | | 0.82 | | | | | | — | | | | | | 12.70 | | | | | | 13.91 | | | | | | 0.73 | | | | | | 0.55 | | | | | | 0.55 | | | | | | 1.23 | | | | | | 14,062 | | | | | | 42 | | |
| 12-31-20 | | | | | 11.34 | | | | | | 0.11• | | | | | | 1.38 | | | | | | 1.49 | | | | | | 0.19 | | | | | | 0.76 | | | | | | — | | | | | | 0.95 | | | | | | — | | | | | | 11.88 | | | | | | 14.30 | | | | | | 0.71 | | | | | | 0.59 | | | | | | 0.59 | | | | | | 1.01 | | | | | | 12,050 | | | | | | 65 | | |
| 12-31-19 | | | | | 10.36 | | | | | | 0.16• | | | | | | 1.99 | | | | | | 2.15 | | | | | | 0.24 | | | | | | 0.93 | | | | | | — | | | | | | 1.17 | | | | | | — | | | | | | 11.34 | | | | | | 21.63 | | | | | | 0.65 | | | | | | 0.61 | | | | | | 0.61 | | | | | | 1.46 | | | | | | 14,599 | | | | | | 52 | | |
| 12-31-18 | | | | | 12.00 | | | | | | 0.15• | | | | | | (1.09) | | | | | | (0.94) | | | | | | 0.20 | | | | | | 0.50 | | | | | | — | | | | | | 0.70 | | | | | | — | | | | | | 10.36 | | | | | | (8.42) | | | | | | 0.65 | | | | | | 0.58 | | | | | | 0.58 | | | | | | 1.28 | | | | | | 14,521 | | | | | | 50 | | |
| 12-31-17 | | | | | 10.49 | | | | | | 0.14• | | | | | | 1.85 | | | | | | 1.99 | | | | | | 0.17 | | | | | | 0.31 | | | | | | — | | | | | | 0.48 | | | | | | — | | | | | | 12.00 | | | | | | 19.28 | | | | | | 0.64 | | | | | | 0.55 | | | | | | 0.55 | | | | | | 1.22 | | | | | | 19,146 | | | | | | 36 | | |
| Class T | | | | | | | | | | | | | | | | | | | | | | | | | | | | | | | | | | | | | | | | | | | | | | | | | | | | | | | | | | | | | | | | | | | | | | | | | | | | | | | | | | | | | | | | | | | | | | | | | | | | | | | |
| 12-31-21 | | | | | 12.93 | | | | | | (0.01)• | | | | | | 1.73 | | | | | | 1.72 | | | | | | 0.23 | | | | | | 0.54 | | | | | | — | | | | | | 0.77 | | | | | | — | | | | | | 13.88 | | | | | | 13.42 | | | | | | 1.03 | | | | | | 0.85 | | | | | | 0.85 | | | | | | (0.08) | | | | | | 23 | | | | | | 42 | | |
| 12-31-20 | | | | | 12.27 | | | | | | 0.10• | | | | | | 1.49 | | | | | | 1.59 | | | | | | 0.17 | | | | | | 0.76 | | | | | | — | | | | | | 0.93 | | | | | | — | | | | | | 12.93 | | | | | | 13.98 | | | | | | 1.01 | | | | | | 0.89 | | | | | | 0.89 | | | | | | 0.83 | | | | | | 528 | | | | | | 65 | | |
| 12-31-19 | | | | | 11.07 | | | | | | 0.14 | | | | | | 2.15 | | | | | | 2.29 | | | | | | 0.16 | | | | | | 0.93 | | | | | | — | | | | | | 1.09 | | | | | | — | | | | | | 12.27 | | | | | | 21.36 | | | | | | 0.95 | | | | | | 0.91 | | | | | | 0.91 | | | | | | 1.27 | | | | | | 447 | | | | | | 52 | | |
| 12-31-18 | | | | | 12.79 | | | | | | 0.10• | | | | | | (1.16) | | | | | | (1.06) | | | | | | 0.16 | | | | | | 0.50 | | | | | | — | | | | | | 0.66 | | | | | | — | | | | | | 11.07 | | | | | | (8.76) | | | | | | 0.95 | | | | | | 0.88 | | | | | | 0.88 | | | | | | 0.77 | | | | | | 373 | | | | | | 50 | | |
| 12-31-17 | | | | | 11.14 | | | | | | 0.11• | | | | | | 1.98 | | | | | | 2.09 | | | | | | 0.13 | | | | | | 0.31 | | | | | | — | | | | | | 0.44 | | | | | | — | | | | | | 12.79 | | | | | | 19.03 | | | | | | 0.94 | | | | | | 0.85 | | | | | | 0.85 | | | | | | 0.95 | | | | | | 700 | | | | | | 36 | | |
See Accompanying Notes to Financial Statements
Financial Highlights (continued)
| | | | | | | | | | Income
(loss) from
investment
operations | | | | | | | | | Less
Distributions | | | | | | | | | | | | | | | | | | | | | | | | | | | Ratios to average
net assets | | | Supplemental
Data | |
| | | | Net asset value, beginning of year
or period | | | Net investment income (loss) | | | Net realized and unrealized
gain (loss) | | | Total from investment operations | | | From net investment income | | | From net realized gains | | | From return of capital | | | Total distributions | | | Payment by affiliate | | | Net asset value, end of year
or period | | | Total Return(1) | | | Expenses before
reductions/additions(2)(3)(4) | | | Expenses net of fee waivers
and/or recoupments if any(2)(3)(4) | | | Expenses net of all
reductions/additions(2)(3)(4) | | | Net investment income (loss)(2)(3) | | | Net assets, end of year or period | | | Portfolio turnover rate | |
Year or
period ended | | | ($) | | | ($) | | | ($) | | | ($) | | | ($) | | | ($) | | | ($) | | | ($) | | | ($) | | | ($) | | | (%) | | | (%) | | | (%) | | | (%) | | | (%) | | | ($000’s) | | | (%) | |
| Voya Solution 2040 Portfolio | | | | | | | | | | | | | | | | | | | | | | | | | | | | | | | | | | | | | | | | | | | | | | | | | | | | | | | | | | | | | | | | | | | | | | | | | | | | | | | | | | | | | | | | | | | | | | | | | | | | | | | |
| Class ADV | | | | | | | | | | | | | | | | | | | | | | | | | | | | | | | | | | | | | | | | | | | | | | | | | | | | | | | | | | | | | | | | | | | | | | | | | | | | | | | | | | | | | | | | | | | | | | | | | | | | | | | |
| 12-31-21 | | | | | 17.38 | | | | | | 0.18• | | | | | | 2.55 | | | | | | 2.73 | | | | | | 0.24 | | | | | | 0.22 | | | | | | — | | | | | | 0.46 | | | | | | — | | | | | | 19.65 | | | | | | 15.78 | | | | | | 0.93 | | | | | | 0.64 | | | | | | 0.64 | | | | | | 0.95 | | | | | | 17,364 | | | | | | 63 | | |
| 12-31-20 | | | | | 16.09 | | | | | | 0.15• | | | | | | 2.25 | | | | | | 2.40 | | | | | | 0.24 | | | | | | 0.87 | | | | | | — | | | | | | 1.11 | | | | | | — | | | | | | 17.38 | | | | | | 15.98 | | | | | | 0.96 | | | | | | 0.70 | | | | | | 0.70 | | | | | | 0.95 | | | | | | 15,773 | | | | | | 91 | | |
| 12-31-19 | | | | | 14.26 | | | | | | 0.23• | | | | | | 2.92 | | | | | | 3.15 | | | | | | 0.26 | | | | | | 1.06 | | | | | | — | | | | | | 1.32 | | | | | | — | | | | | | 16.09 | | | | | | 22.82 | | | | | | 0.84 | | | | | | 0.72 | | | | | | 0.72 | | | | | | 1.47 | | | | | | 14,324 | | | | | | 82 | | |
| 12-31-18 | | | | | 17.11 | | | | | | 0.20• | | | | | | (1.66) | | | | | | (1.46) | | | | | | 0.22 | | | | | | 1.17 | | | | | | — | | | | | | 1.39 | | | | | | — | | | | | | 14.26 | | | | | | (9.41) | | | | | | 0.84 | | | | | | 0.66 | | | | | | 0.66 | | | | | | 1.19 | | | | | | 8,662 | | | | | | 81 | | |
| 12-31-17 | | | | | 14.55 | | | | | | 0.19• | | | | | | 2.73 | | | | | | 2.92 | | | | | | 0.08 | | | | | | 0.28 | | | | | | — | | | | | | 0.36 | | | | | | — | | | | | | 17.11 | | | | | | 20.23 | | | | | | 0.86 | | | | | | 0.63 | | | | | | 0.63 | | | | | | 1.17 | | | | | | 8,696 | | | | | | 68 | | |
| Class I | | | | | | | | | | | | | | | | | | | | | | | | | | | | | | | | | | | | | | | | | | | | | | | | | | | | | | | | | | | | | | | | | | | | | | | | | | | | | | | | | | | | | | | | | | | | | | | | | | | | | | | |
| 12-31-21 | | | | | 17.99 | | | | | | 0.25• | | | | | | 2.67 | | | | | | 2.92 | | | | | | 0.31 | | | | | | 0.22 | | | | | | — | | | | | | 0.53 | | | | | | — | | | | | | 20.38 | | | | | | 16.34 | | | | | | 0.43 | | | | | | 0.14 | | | | | | 0.14 | | | | | | 1.30 | | | | | | 10,092 | | | | | | 63 | | |
| 12-31-20 | | | | | 16.60 | | | | | | 0.26 | | | | | | 2.31 | | | | | | 2.57 | | | | | | 0.31 | | | | | | 0.87 | | | | | | — | | | | | | 1.18 | | | | | | — | | | | | | 17.99 | | | | | | 16.55 | | | | | | 0.46 | | | | | | 0.20 | | | | | | 0.20 | | | | | | 1.48 | | | | | | 12,621 | | | | | | 91 | | |
| 12-31-19 | | | | | 14.66 | | | | | | 0.32• | | | | | | 3.00 | | | | | | 3.32 | | | | | | 0.32 | | | | | | 1.06 | | | | | | — | | | | | | 1.38 | | | | | | — | | | | | | 16.60 | | | | | | 23.44 | | | | | | 0.34 | | | | | | 0.22 | | | | | | 0.22 | | | | | | 1.97 | | | | | | 11,825 | | | | | | 82 | | |
| 12-31-18 | | | | | 17.53 | | | | | | 0.30• | | | | | | (1.72) | | | | | | (1.42) | | | | | | 0.28 | | | | | | 1.17 | | | | | | — | | | | | | 1.45 | | | | | | — | | | | | | 14.66 | | | | | | (8.95) | | | | | | 0.34 | | | | | | 0.16 | | | | | | 0.16 | | | | | | 1.77 | | | | | | 7,134 | | | | | | 81 | | |
| 12-31-17 | | | | | 14.86 | | | | | | 0.29• | | | | | | 2.78 | | | | | | 3.07 | | | | | | 0.12 | | | | | | 0.28 | | | | | | — | | | | | | 0.40 | | | | | | — | | | | | | 17.53 | | | | | | 20.85 | | | | | | 0.36 | | | | | | 0.13 | | | | | | 0.13 | | | | | | 1.76 | | | | | | 7,753 | | | | | | 68 | | |
| Class S | | | | | | | | | | | | | | | | | | | | | | | | | | | | | | | | | | | | | | | | | | | | | | | | | | | | | | | | | | | | | | | | | | | | | | | | | | | | | | | | | | | | | | | | | | | | | | | | | | | | | | | |
| 12-31-21 | | | | | 17.80 | | | | | | 0.25• | | | | | | 2.60 | | | | | | 2.85 | | | | | | 0.29 | | | | | | 0.22 | | | | | | — | | | | | | 0.51 | | | | | | — | | | | | | 20.14 | | | | | | 16.10 | | | | | | 0.68 | | | | | | 0.39 | | | | | | 0.39 | | | | | | 1.28 | | | | | | 13,325 | | | | | | 63 | | |
| 12-31-20 | | | | | 16.44 | | | | | | 0.20• | | | | | | 2.29 | | | | | | 2.49 | | | | | | 0.26 | | | | | | 0.87 | | | | | | — | | | | | | 1.13 | | | | | | — | | | | | | 17.80 | | | | | | 16.23 | | | | | | 0.71 | | | | | | 0.45 | | | | | | 0.45 | | | | | | 1.26 | | | | | | 10,486 | | | | | | 91 | | |
| 12-31-19 | | | | | 14.54 | | | | | | 0.23 | | | | | | 3.02 | | | | | | 3.25 | | | | | | 0.29 | | | | | | 1.06 | | | | | | — | | | | | | 1.35 | | | | | | — | | | | | | 16.44 | | | | | | 23.07 | | | | | | 0.59 | | | | | | 0.47 | | | | | | 0.47 | | | | | | 1.44 | | | | | | 8,500 | | | | | | 82 | | |
| 12-31-18 | | | | | 17.40 | | | | | | 0.26• | | | | | | (1.70) | | | | | | (1.44) | | | | | | 0.25 | | | | | | 1.17 | | | | | | — | | | | | | 1.42 | | | | | | — | | | | | | 14.54 | | | | | | (9.13) | | | | | | 0.59 | | | | | | 0.41 | | | | | | 0.41 | | | | | | 1.54 | | | | | | 7,641 | | | | | | 81 | | |
| 12-31-17 | | | | | 14.78 | | | | | | 0.23• | | | | | | 2.78 | | | | | | 3.01 | | | | | | 0.11 | | | | | | 0.28 | | | | | | — | | | | | | 0.39 | | | | | | — | | | | | | 17.40 | | | | | | 20.53 | | | | | | 0.61 | | | | | | 0.38 | | | | | | 0.38 | | | | | | 1.45 | | | | | | 6,732 | | | | | | 68 | | |
| Class S2 | | | | | | | | | | | | | | | | | | | | | | | | | | | | | | | | | | | | | | | | | | | | | | | | | | | | | | | | | | | | | | | | | | | | | | | | | | | | | | | | | | | | | | | | | | | | | | | | | | | | | | | |
| 12-31-21 | | | | | 17.48 | | | | | | 0.24• | | | | | | 2.52 | | | | | | 2.76 | | | | | | 0.28 | | | | | | 0.22 | | | | | | — | | | | | | 0.50 | | | | | | — | | | | | | 19.74 | | | | | | 15.88 | | | | | | 0.83 | | | | | | 0.54 | | | | | | 0.54 | | | | | | 1.25 | | | | | | 2,051 | | | | | | 63 | | |
| 12-31-20 | | | | | 16.17 | | | | | | 0.17• | | | | | | 2.26 | | | | | | 2.43 | | | | | | 0.25 | | | | | | 0.87 | | | | | | — | | | | | | 1.12 | | | | | | — | | | | | | 17.48 | | | | | | 16.07 | | | | | | 0.86 | | | | | | 0.60 | | | | | | 0.60 | | | | | | 1.07 | | | | | | 1,219 | | | | | | 91 | | |
| 12-31-19 | | | | | 14.31 | | | | | | 0.25• | | | | | | 2.93 | | | | | | 3.18 | | | | | | 0.26 | | | | | | 1.06 | | | | | | — | | | | | | 1.32 | | | | | | — | | | | | | 16.17 | | | | | | 22.93 | | | | | | 0.74 | | | | | | 0.62 | | | | | | 0.62 | | | | | | 1.57 | | | | | | 973 | | | | | | 82 | | |
| 12-31-18 | | | | | 17.18 | | | | | | 0.23• | | | | | | (1.68) | | | | | | (1.45) | | | | | | 0.25 | | | | | | 1.17 | | | | | | — | | | | | | 1.42 | | | | | | — | | | | | | 14.31 | | | | | | (9.30) | | | | | | 0.74 | | | | | | 0.56 | | | | | | 0.56 | | | | | | 1.42 | | | | | | 939 | | | | | | 81 | | |
| 12-31-17 | | | | | 14.62 | | | | | | 0.26• | | | | | | 2.69 | | | | | | 2.95 | | | | | | 0.11 | | | | | | 0.28 | | ��� | | | | — | | | | | | 0.39 | | | | | | — | | | | | | 17.18 | | | | | | 20.31 | | | | | | 0.76 | | | | | | 0.53 | | | | | | 0.53 | | | | | | 1.61 | | | | | | 721 | | | | | | 68 | | |
| Class T | | | | | | | | | | | | | | | | | | | | | | | | | | | | | | | | | | | | | | | | | | | | | | | | | | | | | | | | | | | | | | | | | | | | | | | | | | | | | | | | | | | | | | | | | | | | | | | | | | | | | | | |
| 12-31-21 | | | | | 17.33 | | | | | | 0.04• | | | | | | 2.63 | | | | | | 2.67 | | | | | | 0.22 | | | | | | 0.22 | | | | | | — | | | | | | 0.44 | | | | | | — | | | | | | 19.56 | | | | | | 15.48 | | | | | | 1.13 | | | | | | 0.84 | | | | | | 0.84 | | | | | | 0.20 | | | | | | 13 | | | | | | 63 | | |
| 12-31-20 | | | | | 16.06 | | | | | | 0.15• | | | | | | 2.22 | | | | | | 2.37 | | | | | | 0.23 | | | | | | 0.87 | | | | | | — | | | | | | 1.10 | | | | | | — | | | | | | 17.33 | | | | | | 15.79 | | | | | | 1.16 | | | | | | 0.90 | | | | | | 0.90 | | | | | | 0.95 | | | | | | 49 | | | | | | 91 | | |
| 12-31-19 | | | | | 14.22 | | | | | | 0.20• | | | | | | 2.90 | | | | | | 3.10 | | | | | | 0.20 | | | | | | 1.06 | | | | | | — | | | | | | 1.26 | | | | | | — | | | | | | 16.06 | | | | | | 22.50 | | | | | | 1.04 | | | | | | 0.92 | | | | | | 0.92 | | | | | | 1.28 | | | | | | 32 | | | | | | 82 | | |
| 12-31-18 | | | | | 17.08 | | | | | | 0.15 | | | | | | (1.64) | | | | | | (1.49) | | | | | | 0.20 | | | | | | 1.17 | | | | | | — | | | | | | 1.37 | | | | | | — | | | | | | 14.22 | | | | | | (9.57) | | | | | | 1.04 | | | | | | 0.86 | | | | | | 0.86 | | | | | | 1.00 | | | | | | 17 | | | | | | 81 | | |
| 12-31-17 | | | | | 14.53 | | | | | | 0.17• | | | | | | 2.72 | | | | | | 2.89 | | | | | | 0.06 | | | | | | 0.28 | | | | | | — | | | | | | 0.34 | | | | | | — | | | | | | 17.08 | | | | | | 20.05 | | | | | | 1.06 | | | | | | 0.83 | | | | | | 0.83 | | | | | | 1.08 | | | | | | 20 | | | | | | 68 | | |
See Accompanying Notes to Financial Statements
Financial Highlights (continued)
| | | | | | | | | | Income
(loss) from
investment
operations | | | | | | | | | Less
Distributions | | | | | | | | | | | | | | | | | | | | | | | | | | | Ratios to average
net assets | | | Supplemental
Data | |
| | | | Net asset value, beginning of year
or period | | | Net investment income (loss) | | | Net realized and unrealized
gain (loss) | | | Total from investment operations | | | From net investment income | | | From net realized gains | | | From return of capital | | | Total distributions | | | Payment by affiliate | | | Net asset value, end of year
or period | | | Total Return(1) | | | Expenses before
reductions/additions(2)(3)(4) | | | Expenses net of fee waivers
and/or recoupments if any(2)(3)(4) | | | Expenses net of all
reductions/additions(2)(3)(4) | | | Net investment income (loss)(2)(3) | | | Net assets, end of year or period | | | Portfolio turnover rate | |
Year or
period ended | | | ($) | | | ($) | | | ($) | | | ($) | | | ($) | | | ($) | | | ($) | | | ($) | | | ($) | | | ($) | | | (%) | | | (%) | | | (%) | | | (%) | | | (%) | | | ($000’s) | | | (%) | |
| Voya Solution 2045 Portfolio | | | | | | | | | | | | | | | | | | | | | | | | | | | | | | | | | | | | | | | | | | | | | | | | | | | | | | | | | | | | | | | | | | | | | | | | | | | | | | | | | | | | | | | | | | | | | | | | | | | | | | | |
| Class ADV | | | | | | | | | | | | | | | | | | | | | | | | | | | | | | | | | | | | | | | | | | | | | | | | | | | | | | | | | | | | | | | | | | | | | | | | | | | | | | | | | | | | | | | | | | | | | | | | | | | | | | | |
| 12-31-21 | | | | | 12.29 | | | | | | 0.11• | | | | | | 1.94 | | | | | | 2.05 | | | | | | 0.23 | | | | | | 0.99 | | | | | | — | | | | | | 1.22 | | | | | | — | | | | | | 13.12 | | | | | | 16.95 | | | | | | 0.85 | | | | | | 0.65 | | | | | | 0.65 | | | | | | 0.86 | | | | | | 162,480 | | | | | | 42 | | |
| 12-31-20 | | | | | 11.47 | | | | | | 0.09 | | | | | | 1.61 | | | | | | 1.70 | | | | | | 0.16 | | | | | | 0.72 | | | | | | — | | | | | | 0.88 | | | | | | — | | | | | | 12.29 | | | | | | 16.07 | | | | | | 0.83 | | | | | | 0.70 | | | | | | 0.70 | | | | | | 0.71 | | | | | | 155,503 | | | | | | 61 | | |
| 12-31-19 | | | | | 10.42 | | | | | | 0.15 | | | | | | 2.20 | | | | | | 2.35 | | | | | | 0.20 | | | | | | 1.10 | | | | | | — | | | | | | 1.30 | | | | | | — | | | | | | 11.47 | | | | | | 23.59 | | | | | | 0.75 | | | | | | 0.72 | | | | | | 0.72 | | | | | | 1.26 | | | | | | 150,005 | | | | | | 67 | | |
| 12-31-18 | | | | | 12.40 | | | | | | 0.11• | | | | | | (1.33) | | | | | | (1.22) | | | | | | 0.15 | | | | | | 0.61 | | | | | | — | | | | | | 0.76 | | | | | | — | | | | | | 10.42 | | | | | | (10.53) | | | | | | 0.75 | | | | | | 0.69 | | | | | | 0.69 | | | | | | 0.93 | | | | | | 134,754 | | | | | | 53 | | |
| 12-31-17 | | | | | 10.63 | | | | | | 0.10• | | | | | | 2.09 | | | | | | 2.19 | | | | | | 0.10 | | | | | | 0.32 | | | | | | — | | | | | | 0.42 | | | | | | — | | | | | | 12.40 | | | | | | 20.92 | | | | | | 0.75 | | | | | | 0.67 | | | | | | 0.67 | | | | | | 0.84 | | | | | | 177,624 | | | | | | 37 | | |
| Class I | | | | | | | | | | | | | | | | | | | | | | | | | | | | | | | | | | | | | | | | | | | | | | | | | | | | | | | | | | | | | | | | | | | | | | | | | | | | | | | | | | | | | | | | | | | | | | | | | | | | | | | |
| 12-31-21 | | | | | 12.72 | | | | | | 0.17• | | | | | | 2.02 | | | | | | 2.19 | | | | | | 0.25 | | | | | | 0.99 | | | | | | — | | | | | | 1.24 | | | | | | — | | | | | | 13.67 | | | | | | 17.51 | | | | | | 0.35 | | | | | | 0.15 | | | | | | 0.15 | | | | | | 1.24 | | | | | | 65,611 | | | | | | 42 | | |
| 12-31-20 | | | | | 11.85 | | | | | | 0.12• | | | | | | 1.69 | | | | | | 1.81 | | | | | | 0.22 | | | | | | 0.72 | | | | | | — | | | | | | 0.94 | | | | | | — | | | | | | 12.72 | | | | | | 16.57 | | | | | | 0.33 | | | | | | 0.20 | | | | | | 0.20 | | | | | | 1.06 | | | | | | 82,473 | | | | | | 61 | | |
| 12-31-19 | | | | | 10.73 | | | | | | 0.20 | | | | | | 2.29 | | | | | | 2.49 | | | | | | 0.27 | | | | | | 1.10 | | | | | | — | | | | | | 1.37 | | | | | | — | | | | | | 11.85 | | | | | | 24.29 | | | | | | 0.25 | | | | | | 0.22 | | | | | | 0.22 | | | | | | 1.86 | | | | | | 269,670 | | | | | | 67 | | |
| 12-31-18 | | | | | 12.75 | | | | | | 0.18 | | | | | | (1.37) | | | | | | (1.19) | | | | | | 0.22 | | | | | | 0.61 | | | | | | — | | | | | | 0.83 | | | | | | — | | | | | | 10.73 | | | | | | (10.08) | | | | | | 0.25 | | | | | | 0.19 | | | | | | 0.19 | | | | | | 1.49 | | | | | | 211,781 | | | | | | 53 | | |
| 12-31-17 | | | | | 10.92 | | | | | | 0.17• | | | | | | 2.14 | | | | | | 2.31 | | | | | | 0.16 | | | | | | 0.32 | | | | | | — | | | | | | 0.48 | | | | | | — | | | | | | 12.75 | | | | | | 21.53 | | | | | | 0.25 | | | | | | 0.17 | | | | | | 0.17 | | | | | | 1.42 | | | | | | 235,122 | | | | | | 37 | | |
| Class S | | | | | | | | | | | | | | | | | | | | | | | | | | | | | | | | | | | | | | | | | | | | | | | | | | | | | | | | | | | | | | | | | | | | | | | | | | | | | | | | | | | | | | | | | | | | | | | | | | | | | | | |
| 12-31-21 | | | | | 12.50 | | | | | | 0.15• | | | | | | 1.97 | | | | | | 2.12 | | | | | | 0.26 | | | | | | 0.99 | | | | | | — | | | | | | 1.25 | | | | | | — | | | | | | 13.37 | | | | | | 17.26 | | | | | | 0.60 | | | | | | 0.40 | | | | | | 0.40 | | | | | | 1.14 | | | | | | 289,193 | | | | | | 42 | | |
| 12-31-20 | | | | | 11.66 | | | | | | 0.11 | | | | | | 1.64 | | | | | | 1.75 | | | | | | 0.19 | | | | | | 0.72 | | | | | | — | | | | | | 0.91 | | | | | | — | | | | | | 12.50 | | | | | | 16.29 | | | | | | 0.58 | | | | | | 0.45 | | | | | | 0.45 | | | | | | 0.95 | | | | | | 254,990 | | | | | | 61 | | |
| 12-31-19 | | | | | 10.58 | | | | | | 0.18 | | | | | | 2.23 | | | | | | 2.41 | | | | | | 0.23 | | | | | | 1.10 | | | | | | — | | | | | | 1.33 | | | | | | — | | | | | | 11.66 | | | | | | 23.90 | | | | | | 0.50 | | | | | | 0.47 | | | | | | 0.47 | | | | | | 1.51 | | | | | | 237,496 | | | | | | 67 | | |
| 12-31-18 | | | | | 12.57 | | | | | | 0.15• | | | | | | (1.35) | | | | | | (1.20) | | | | | | 0.18 | | | | | | 0.61 | | | | | | — | | | | | | 0.79 | | | | | | — | | | | | | 10.58 | | | | | | (10.23) | | | | | | 0.50 | | | | | | 0.44 | | | | | | 0.44 | | | | | | 1.20 | | | | | | 209,647 | | | | | | 53 | | |
| 12-31-17 | | | | | 10.77 | | | | | | 0.13• | | | | | | 2.12 | | | | | | 2.25 | | | | | | 0.13 | | | | | | 0.32 | | | | | | — | | | | | | 0.45 | | | | | | — | | | | | | 12.57 | | | | | | 21.25 | | | | | | 0.50 | | | | | | 0.42 | | | | | | 0.42 | | | | | | 1.11 | | | | | | 269,521 | | | | | | 37 | | |
| Class S2 | | | | | | | | | | | | | | | | | | | | | | | | | | | | | | | | | | | | | | | | | | | | | | | | | | | | | | | | | | | | | | | | | | | | | | | | | | | | | | | | | | | | | | | | | | | | | | | | | | | | | | | |
| 12-31-21 | | | | | 12.14 | | | | | | 0.14• | | | | | | 1.90 | | | | | | 2.04 | | | | | | 0.26 | | | | | | 0.99 | | | | | | — | | | | | | 1.25 | | | | | | — | | | | | | 12.93 | | | | | | 17.10 | | | | | | 0.75 | | | | | | 0.55 | | | | | | 0.55 | | | | | | 1.12 | | | | | | 10,947 | | | | | | 42 | | |
| 12-31-20 | | | | | 11.34 | | | | | | 0.09• | | | | | | 1.60 | | | | | | 1.69 | | | | | | 0.17 | | | | | | 0.72 | | | | | | — | | | | | | 0.89 | | | | | | — | | | | | | 12.14 | | | | | | 16.13 | | | | | | 0.73 | | | | | | 0.60 | | | | | | 0.60 | | | | | | 0.82 | | | | | | 6,867 | | | | | | 61 | | |
| 12-31-19 | | | | | 10.31 | | | | | | 0.15• | | | | | | 2.18 | | | | | | 2.33 | | | | | | 0.20 | | | | | | 1.10 | | | | | | — | | | | | | 1.30 | | | | | | — | | | | | | 11.34 | | | | | | 23.68 | | | | | | 0.65 | | | | | | 0.62 | | | | | | 0.62 | | | | | | 1.31 | | | | | | 7,234 | | | | | | 67 | | |
| 12-31-18 | | | | | 12.25 | | | | | | 0.12• | | | | | | (1.30) | | | | | | (1.18) | | | | | | 0.15 | | | | | | 0.61 | | | | | | — | | | | | | 0.76 | | | | | | — | | | | | | 10.31 | | | | | | (10.34) | | | | | | 0.65 | | | | | | 0.59 | | | | | | 0.59 | | | | | | 1.03 | | | | | | 7,504 | | | | | | 53 | | |
| 12-31-17 | | | | | 10.51 | | | | | | 0.09• | | | | | | 2.08 | | | | | | 2.17 | | | | | | 0.11 | | | | | | 0.32 | | | | | | — | | | | | | 0.43 | | | | | | — | | | | | | 12.25 | | | | | | 21.02 | | | | | | 0.65 | | | | | | 0.57 | | | | | | 0.57 | | | | | | 0.82 | | | | | | 9,902 | | | | | | 37 | | |
| Class T | | | | | | | | | | | | | | | | | | | | | | | | | | | | | | | | | | | | | | | | | | | | | | | | | | | | | | | | | | | | | | | | | | | | | | | | | | | | | | | | | | | | | | | | | | | | | | | | | | | | | | | |
| 12-31-21 | | | | | 12.93 | | | | | | 0.12• | | | | | | 2.01 | | | | | | 2.13 | | | | | | 0.19 | | | | | | 0.99 | | | | | | — | | | | | | 1.18 | | | | | | — | | | | | | 13.88 | | | | | | 16.73 | | | | | | 1.05 | | | | | | 0.85 | | | | | | 0.85 | | | | | | 0.90 | | | | | | 180 | | | | | | 42 | | |
| 12-31-20 | | | | | 11.95 | | | | | | 0.03• | | | | | | 1.74 | | | | | | 1.77 | | | | | | 0.07 | | | | | | 0.72 | | | | | | — | | | | | | 0.79 | | | | | | — | | | | | | 12.93 | | | | | | 15.85 | | | | | | 1.03 | | | | | | 0.90 | | | | | | 0.90 | | | | | | 0.29 | | | | | | 156 | | | | | | 61 | | |
| 12-31-19 | | | | | 10.74 | | | | | | 0.14• | | | | | | 2.26 | | | | | | 2.40 | | | | | | 0.09 | | | | | | 1.10 | | | | | | — | | | | | | 1.19 | | | | | | — | | | | | | 11.95 | | | | | | 23.31 | | | | | | 0.95 | | | | | | 0.92 | | | | | | 0.92 | | | | | | 1.19 | | | | | | 290 | | | | | | 67 | | |
| 12-31-18 | | | | | 12.77 | | | | | | 0.06• | | | | | | (1.34) | | | | | | (1.28) | | | | | | 0.14 | | | | | | 0.61 | | | | | | — | | | | | | 0.75 | | | | | | — | | | | | | 10.74 | | | | | | (10.72) | | | | | | 0.95 | | | | | | 0.89 | | | | | | 0.89 | | | | | | 0.44 | | | | | | 220 | | | | | | 53 | | |
| 12-31-17 | | | | | 10.95 | | | | | | 0.08 | | | | | | 2.15 | | | | | | 2.23 | | | | | | 0.09 | | | | | | 0.32 | | | | | | — | | | | | | 0.41 | | | | | | — | | | | | | 12.77 | | | | | | 20.69 | | | | | | 0.95 | | | | | | 0.87 | | | | | | 0.87 | | | | | | 0.70 | | | | | | 508 | | | | | | 37 | | |
See Accompanying Notes to Financial Statements
Financial Highlights (continued)
| | | | | | | | | | Income
(loss) from
investment
operations | | | | | | | | | Less
Distributions | | | | | | | | | | | | | | | | | | | | | | | | | | | Ratios to average
net assets | | | Supplemental
Data | |
| | | | Net asset value, beginning of year
or period | | | Net investment income (loss) | | | Net realized and unrealized
gain (loss) | | | Total from investment operations | | | From net investment income | | | From net realized gains | | | From return of capital | | | Total distributions | | | Payment by affiliate | | | Net asset value, end of year
or period | | | Total Return(1) | | | Expenses before
reductions/additions(2)(3)(4) | | | Expenses net of fee waivers
and/or recoupments if any(2)(3)(4) | | | Expenses net of all
reductions/additions(2)(3)(4) | | | Net investment income (loss)(2)(3) | | | Net assets, end of year or period | | | Portfolio turnover rate | |
Year or
period ended | | | ($) | | | ($) | | | ($) | | | ($) | | | ($) | | | ($) | | | ($) | | | ($) | | | ($) | | | ($) | | | (%) | | | (%) | | | (%) | | | (%) | | | (%) | | | ($000’s) | | | (%) | |
| Voya Solution 2050 Portfolio | | | | | | | | | | | | | | | | | | | | | | | | | | | | | | | | | | | | | | | | | | | | | | | | | | | | | | | | | | | | | | | | | | | | | | | | | | | | | | | | | | | | | | | | | | | | | | | | | | | | | | | |
| Class ADV | | | | | | | | | | | | | | | | | | | | | | | | | | | | | | | | | | | | | | | | | | | | | | | | | | | | | | | | | | | | | | | | | | | | | | | | | | | | | | | | | | | | | | | | | | | | | | | | | | | | | | | |
| 12-31-21 | | | | | 17.96 | | | | | | 0.14• | | | | | | 2.86 | | | | | | 3.00 | | | | | | 0.21 | | | | | | 0.30 | | | | | | — | | | | | | 0.51 | | | | | | — | | | | | | 20.45 | | | | | | 16.82 | | | | | | 0.98 | | | | | | 0.65 | | | | | | 0.65 | | | | | | 0.71 | | | | | | 15,352 | | | | | | 60 | | |
| 12-31-20 | | | | | 16.63 | | | | | | 0.13• | | | | | | 2.32 | | | | | | 2.45 | | | | | | 0.23 | | | | | | 0.89 | | | | | | — | | | | | | 1.12 | | | | | | — | | | | | | 17.96 | | | | | | 15.79 | | | | | | 1.03 | | | | | | 0.71 | | | | | | 0.71 | | | | | | 0.81 | | | | | | 15,402 | | | | | | 80 | | |
| 12-31-19 | | | | | 14.58 | | | | | | 0.23• | | | | | | 3.17 | | | | | | 3.40 | | | | | | 0.22 | | | | | | 1.13 | | | | | | — | | | | | | 1.35 | | | | | | — | | | | | | 16.63 | | | | | | 24.13 | | | | | | 0.86 | | | | | | 0.73 | | | | | | 0.73 | | | | | | 1.45 | | | | | | 12,951 | | | | | | 84 | | |
| 12-31-18 | | | | | 17.33 | | | | | | 0.17• | | | | | | (1.93) | | | | | | (1.76) | | | | | | 0.16 | | | | | | 0.83 | | | | | | — | | | | | | 0.99 | | | | | | — | | | | | | 14.58 | | | | | | (10.82) | | | | | | 0.86 | | | | | | 0.68 | | | | | | 0.68 | | | | | | 1.03 | | | | | | 8,144 | | | | | | 86 | | |
| 12-31-17 | | | | | 14.57 | | | | | | 0.18• | | | | | | 2.89 | | | | | | 3.07 | | | | | | 0.06 | | | | | | 0.25 | | | | | | — | | | | | | 0.31 | | | | | | — | | | | | | 17.33 | | | | | | 21.30 | | | | | | 0.93 | | | | | | 0.65 | | | | | | 0.65 | | | | | | 1.11 | | | | | | 6,983 | | | | | | 52 | | |
| Class I | | | | | | | | | | | | | | | | | | | | | | | | | | | | | | | | | | | | | | | | | | | | | | | | | | | | | | | | | | | | | | | | | | | | | | | | | | | | | | | | | | | | | | | | | | | | | | | | | | | | | | | |
| 12-31-21 | | | | | 18.66 | | | | | | 0.22• | | | | | | 3.01 | | | | | | 3.23 | | | | | | 0.29 | | | | | | 0.30 | | | | | | — | | | | | | 0.59 | | | | | | — | | | | | | 21.30 | | | | | | 17.42 | | | | | | 0.48 | | | | | | 0.15 | | | | | | 0.15 | | | | | | 1.09 | | | | | | 9,999 | | | | | | 60 | | |
| 12-31-20 | | | | | 17.22 | | | | | | 0.24 | | | | | | 2.38 | | | | | | 2.62 | | | | | | 0.29 | | | | | | 0.89 | | | | | | — | | | | | | 1.18 | | | | | | — | | | | | | 18.66 | | | | | | 16.36 | | | | | | 0.53 | | | | | | 0.21 | | | | | | 0.21 | | | | | | 1.31 | | | | | | 11,647 | | | | | | 80 | | |
| 12-31-19 | | | | | 15.04 | | | | | | 0.34• | | | | | | 3.25 | | | | | | 3.59 | | | | | | 0.28 | | | | | | 1.13 | | | | | | — | | | | | | 1.41 | | | | | | — | | | | | | 17.22 | | | | | | 24.74 | | | | | | 0.36 | | | | | | 0.23 | | | | | | 0.23 | | | | | | 2.04 | | | | | | 10,912 | | | | | | 84 | | |
| 12-31-18 | | | | | 17.81 | | | | | | 0.27• | | | | | | (1.99) | | | | | | (1.72) | | | | | | 0.22 | | | | | | 0.83 | | | | | | — | | | | | | 1.05 | | | | | | — | | | | | | 15.04 | | | | | | (10.37) | | | | | | 0.36 | | | | | | 0.18 | | | | | | 0.18 | | | | | | 1.55 | | | | | | 6,320 | | | | | | 86 | | |
| 12-31-17 | | | | | 14.91 | | | | | | 0.28• | | | | | | 2.97 | | | | | | 3.25 | | | | | | 0.10 | | | | | | 0.25 | | | | | | — | | | | | | 0.35 | | | | | | — | | | | | | 17.81 | | | | | | 21.99 | | | | | | 0.43 | | | | | | 0.15 | | | | | | 0.15 | | | | | | 1.70 | | | | | | 5,705 | | | | | | 52 | | |
| Class S | | | | | | | | | | | | | | | | | | | | | | | | | | | | | | | | | | | | | | | | | | | | | | | | | | | | | | | | | | | | | | | | | | | | | | | | | | | | | | | | | | | | | | | | | | | | | | | | | | | | | | | |
| 12-31-21 | | | | | 18.42 | | | | | | 0.20• | | | | | | 2.93 | | | | | | 3.13 | | | | | | 0.26 | | | | | | 0.30 | | | | | | — | | | | | | 0.56 | | | | | | — | | | | | | 20.99 | | | | | | 17.10 | | | | | | 0.73 | | | | | | 0.40 | | | | | | 0.40 | | | | | | 0.97 | | | | | | 9,740 | | | | | | 60 | | |
| 12-31-20 | | | | | 17.01 | | | | | | 0.17• | | | | | | 2.39 | | | | | | 2.56 | | | | | | 0.26 | | | | | | 0.89 | | | | | | — | | | | | | 1.15 | | | | | | — | | | | | | 18.42 | | | | | | 16.11 | | | | | | 0.78 | | | | | | 0.46 | | | | | | 0.46 | | | | | | 1.04 | | | | | | 8,339 | | | | | | 80 | | |
| 12-31-19 | | | | | 14.88 | | | | | | 0.26• | | | | | | 3.25 | | | | | | 3.51 | | | | | | 0.25 | | | | | | 1.13 | | | | | | — | | | | | | 1.38 | | | | | | — | | | | | | 17.01 | | | | | | 24.41 | | | | | | 0.61 | | | | | | 0.48 | | | | | | 0.48 | | | | | | 1.58 | | | | | | 7,397 | | | | | | 84 | | |
| 12-31-18 | | | | | 17.65 | | | | | | 0.23• | | | | | | (1.98) | | | | | | (1.75) | | | | | | 0.19 | | | | | | 0.83 | | | | | | — | | | | | | 1.02 | | | | | | — | | | | | | 14.88 | | | | | | (10.61) | | | | | | 0.61 | | | | | | 0.43 | | | | | | 0.43 | | | | | | 1.34 | | | | | | 5,413 | | | | | | 86 | | |
| 12-31-17 | | | | | 14.81 | | | | | | 0.22• | | | | | | 2.95 | | | | | | 3.17 | | | | | | 0.08 | | | | | | 0.25 | | | | | | — | | | | | | 0.33 | | | | | | — | | | | | | 17.65 | | | | | | 21.63 | | | | | | 0.68 | | | | | | 0.40 | | | | | | 0.40 | | | | | | 1.33 | | | | | | 4,424 | | | | | | 52 | | |
| Class S2 | | | | | | | | | | | | | | | | | | | | | | | | | | | | | | | | | | | | | | | | | | | | | | | | | | | | | | | | | | | | | | | | | | | | | | | | | | | | | | | | | | | | | | | | | | | | | | | | | | | | | | | |
| 12-31-21 | | | | | 18.16 | | | | | | 0.20• | | | | | | 2.85 | | | | | | 3.05 | | | | | | 0.28 | | | | | | 0.30 | | | | | | — | | | | | | 0.58 | | | | | | — | | | | | | 20.63 | | | | | | 16.91 | | | | | | 0.88 | | | | | | 0.55 | | | | | | 0.55 | | | | | | 0.99 | | | | | | 1,022 | | | | | | 60 | | |
| 12-31-20 | | | | | 16.78 | | | | | | 0.17 | | | | | | 2.32 | | | | | | 2.49 | | | | | | 0.22 | | | | | | 0.89 | | | | | | — | | | | | | 1.11 | | | | | | — | | | | | | 18.16 | | | | | | 15.91 | | | | | | 0.93 | | | | | | 0.61 | | | | | | 0.61 | | | | | | 0.89 | | | | | | 432 | | | | | | 80 | | |
| 12-31-19 | | | | | 14.67 | | | | | | 0.23• | | | | | | 3.21 | | | | | | 3.44 | | | | | | 0.20 | | | | | | 1.13 | | | | | | — | | | | | | 1.33 | | | | | | — | | | | | | 16.78 | | | | | | 24.25 | | | | | | 0.76 | | | | | | 0.63 | | | | | | 0.63 | | | | | | 1.40 | | | | | | 419 | | | | | | 84 | | |
| 12-31-18 | | | | | 17.43 | | | | | | 0.22• | | | | | | (1.97) | | | | | | (1.75) | | | | | | 0.18 | | | | | | 0.83 | | | | | | — | | | | | | 1.01 | | | | | | — | | | | | | 14.67 | | | | | | (10.75) | | | | | | 0.76 | | | | | | 0.58 | | | | | | 0.58 | | | | | | 1.32 | | | | | | 423 | | | | | | 86 | | |
| 12-31-17 | | | | | 14.64 | | | | | | 0.20• | | | | | | 2.91 | | | | | | 3.11 | | | | | | 0.07 | | | | | | 0.25 | | | | | | — | | | | | | 0.32 | | | | | | — | | | | | | 17.43 | | | | | | 21.47 | | | | | | 0.83 | | | | | | 0.55 | | | | | | 0.55 | | | | | | 1.21 | | | | | | 309 | | | | | | 52 | | |
| Class T | | | | | | | | | | | | | | | | | | | | | | | | | | | | | | | | | | | | | | | | | | | | | | | | | | | | | | | | | | | | | | | | | | | | | | | | | | | | | | | | | | | | | | | | | | | | | | | | | | | | | | | |
| 12-31-21 | | | | | 18.16 | | | | | | 0.10• | | | | | | 2.89 | | | | | | 2.99 | | | | | | 0.18 | | | | | | 0.30 | | | | | | — | | | | | | 0.48 | | | | | | — | | | | | | 20.67 | | | | | | 16.55 | | | | | | 1.18 | | | | | | 0.85 | | | | | | 0.85 | | | | | | 0.50 | | | | | | 13 | | | | | | 60 | | |
| 12-31-20 | | | | | 16.69 | | | | | | 0.09 | | | | | | 2.36 | | | | | | 2.45 | | | | | | 0.09 | | | | | | 0.89 | | | | | | — | | | | | | 0.98 | | | | | | — | | | | | | 18.16 | | | | | | 15.59 | | | | | | 1.23 | | | | | | 0.91 | | | | | | 0.91 | | | | | | 0.57 | | | | | | 12 | | | | | | 80 | | |
| 12-31-19 | | | | | 14.63 | | | | | | 0.09• | | | | | | 3.28 | | | | | | 3.37 | | | | | | 0.18 | | | | | | 1.13 | | | | | | — | | | | | | 1.31 | | | | | | — | | | | | | 16.69 | | | | | | 23.80 | | | | | | 1.06 | | | | | | 0.93 | | | | | | 0.93 | | | | | | 0.54 | | | | | | 11 | | | | | | 84 | | |
| 12-31-18 | | | | | 17.39 | | | | | | 0.14 | | | | | | (1.94) | | | | | | (1.80) | | | | | | 0.13 | | | | | | 0.83 | | | | | | — | | | | | | 0.96 | | | | | | — | | | | | | 14.63 | | | | | | (11.01) | | | | | | 1.06 | | | | | | 0.88 | | | | | | 0.88 | | | | | | 0.89 | | | | | | 20 | | | | | | 86 | | |
| 12-31-17 | | | | | 14.60 | | | | | | 0.17• | | | | | | 2.89 | | | | | | 3.06 | | | | | | 0.02 | | | | | | 0.25 | | | | | | — | | | | | | 0.27 | | | | | | — | | | | | | 17.39 | | | | | | 21.15 | | | | | | 1.13 | | | | | | 0.85 | | | | | | 0.85 | | | | | | 1.05 | | | | | | 20 | | | | | | 52 | | |
See Accompanying Notes to Financial Statements
Financial Highlights (continued)
| | | | | | | | | | Income
(loss) from
investment
operations | | | | | | | | | Less
Distributions | | | | | | | | | | | | | | | | | | | | | | | | | | | Ratios to average
net assets | | | Supplemental
Data | |
| | | | Net asset value, beginning of year
or period | | | Net investment income (loss) | | | Net realized and unrealized
gain (loss) | | | Total from investment operations | | | From net investment income | | | From net realized gains | | | From return of capital | | | Total distributions | | | Payment by affiliate | | | Net asset value, end of year
or period | | | Total Return(1) | | | Expenses before
reductions/additions(2)(3)(4) | | | Expenses net of fee waivers
and/or recoupments if any(2)(3)(4) | | | Expenses net of all
reductions/additions(2)(3)(4) | | | Net investment income (loss)(2)(3) | | | Net assets, end of year or period | | | Portfolio turnover rate | |
Year or
period ended | | | ($) | | | ($) | | | ($) | | | ($) | | | ($) | | | ($) | | | ($) | | | ($) | | | ($) | | | ($) | | | (%) | | | (%) | | | (%) | | | (%) | | | (%) | | | ($000’s) | | | (%) | |
| Voya Solution 2055 Portfolio | | | | | | | | | | | | | | | | | | | | | | | | | | | | | | | | | | | | | | | | | | | | | | | | | | | | | | | | | | | | | | | | | | | | | | | | | | | | | | | | | | | | | | | | | | | | | | | | | | | | | | | |
| Class ADV | | | | | | | | | | | | | | | | | | | | | | | | | | | | | | | | | | | | | | | | | | | | | | | | | | | | | | | | | | | | | | | | | | | | | | | | | | | | | | | | | | | | | | | | | | | | | | | | | | | | | | | |
| 12-31-21 | | | | | 14.99 | | | | | | 0.10• | | | | | | 2.38 | | | | | | 2.48 | | | | | | 0.31 | | | | | | 2.02 | | | | | | — | | | | | | 2.33 | | | | | | — | | | | | | 15.14 | | | | | | 17.03 | | | | | | 0.93 | | | | | | 0.66 | | | | | | 0.66 | | | | | | 0.67 | | | | | | 58,046 | | | | | | 51 | | |
| 12-31-20 | | | | | 13.85 | | | | | | 0.08 | | | | | | 1.95 | | | | | | 2.03 | | | | | | 0.15 | | | | | | 0.74 | | | | | | — | | | | | | 0.89 | | | | | | — | | | | | | 14.99 | | | | | | 15.75 | | | | | | 0.96 | | | | | | 0.69 | | | | | | 0.69 | | | | | | 0.63 | | | | | | 54,540 | | | | | | 67 | | |
| 12-31-19 | | | | | 12.35 | | | | | | 0.16 | | | | | | 2.70 | | | | | | 2.86 | | | | | | 0.20 | | | | | | 1.16 | | | | | | — | | | | | | 1.36 | | | | | | — | | | | | | 13.85 | | | | | | 24.13 | | | | | | 0.77 | | | | | | 0.72 | | | | | | 0.72 | | | | | | 1.29 | | | | | | 49,315 | | | | | | 61 | | |
| 12-31-18 | | | | | 14.49 | | | | | | 0.13 | | | | | | (1.60) | | | | | | (1.47) | | | | | | 0.15 | | | | | | 0.52 | | | | | | — | | | | | | 0.67 | | | | | | — | | | | | | 12.35 | | | | | | (10.72) | | | | | | 0.76 | | | | | | 0.68 | | | | | | 0.68 | | | | | | 0.90 | | | | | | 39,621 | | | | | | 62 | | |
| 12-31-17 | | | | | 12.27 | | | | | | 0.11• | | | | | | 2.49 | | | | | | 2.60 | | | | | | 0.10 | | | | | | 0.28 | | | | | | — | | | | | | 0.38 | | | | | | — | | | | | | 14.49 | | | | | | 21.40 | | | | | | 0.76 | | | | | | 0.66 | | | | | | 0.66 | | | | | | 0.82 | | | | | | 47,367 | | | | | | 40 | | |
| Class I | | | | | | | | | | | | | | | | | | | | | | | | | | | | | | | | | | | | | | | | | | | | | | | | | | | | | | | | | | | | | | | | | | | | | | | | | | | | | | | | | | | | | | | | | | | | | | | | | | | | | | | |
| 12-31-21 | | | | | 15.37 | | | | | | 0.18• | | | | | | 2.45 | | | | | | 2.63 | | | | | | 0.26 | | | | | | 2.02 | | | | | | — | | | | | | 2.28 | | | | | | — | | | | | | 15.72 | | | | | | 17.53 | | | | | | 0.43 | | | | | | 0.16 | | | | | | 0.16 | | | | | | 1.10 | | | | | | 27,701 | | | | | | 51 | | |
| 12-31-20 | | | | | 14.17 | | | | | | 0.13• | | | | | | 2.03 | | | | | | 2.16 | | | | | | 0.22 | | | | | | 0.74 | | | | | | — | | | | | | 0.96 | | | | | | — | | | | | | 15.37 | | | | | | 16.38 | | | | | | 0.46 | | | | | | 0.19 | | | | | | 0.19 | | | | | | 1.00 | | | | | | 34,329 | | | | | | 67 | | |
| 12-31-19 | | | | | 12.61 | | | | | | 0.27• | | | | | | 2.72 | | | | | | 2.99 | | | | | | 0.27 | | | | | | 1.16 | | | | | | — | | | | | | 1.43 | | | | | | — | | | | | | 14.17 | | | | | | 24.76 | | | | | | 0.27 | | | | | | 0.22 | | | | | | 0.22 | | | | | | 1.93 | | | | | | 119,915 | | | | | | 61 | | |
| 12-31-18 | | | | | 14.78 | | | | | | 0.21• | | | | | | (1.64) | | | | | | (1.43) | | | | | | 0.22 | | | | | | 0.52 | | | | | | — | | | | | | 0.74 | | | | | | — | | | | | | 12.61 | | | | | | (10.29) | | | | | | 0.26 | | | | | | 0.18 | | | | | | 0.18 | | | | | | 1.48 | | | | | | 77,961 | | | | | | 62 | | |
| 12-31-17 | | | | | 12.51 | | | | | | 0.20• | | | | | | 2.51 | | | | | | 2.71 | | | | | | 0.16 | | | | | | 0.28 | | | | | | — | | | | | | 0.44 | | | | | | — | | | | | | 14.78 | | | | | | 21.94 | | | | | | 0.26 | | | | | | 0.16 | | | | | | 0.16 | | | | | | 1.42 | | | | | | 73,894 | | | | | | 40 | | |
| Class S | | | | | | | | | | | | | | | | | | | | | | | | | | | | | | | | | | | | | | | | | | | | | | | | | | | | | | | | | | | | | | | | | | | | | | | | | | | | | | | | | | | | | | | | | | | | | | | | | | | | | | | |
| 12-31-21 | | | | | 15.15 | | | | | | 0.15• | | | | | | 2.40 | | | | | | 2.55 | | | | | | 0.35 | | | | | | 2.02 | | | | | | — | | | | | | 2.37 | | | | | | — | | | | | | 15.33 | | | | | | 17.32 | | | | | | 0.68 | | | | | | 0.41 | | | | | | 0.41 | | | | | | 0.96 | | | | | | 86,021 | | | | | | 51 | | |
| 12-31-20 | | | | | 13.99 | | | | | | 0.12• | | | | | | 1.97 | | | | | | 2.09 | | | | | | 0.19 | | | | | | 0.74 | | | | | | — | | | | | | 0.93 | | | | | | — | | | | | | 15.15 | | | | | | 16.04 | | | | | | 0.71 | | | | | | 0.44 | | | | | | 0.44 | | | | | | 0.90 | | | | | | 73,361 | | | | | | 67 | | |
| 12-31-19 | | | | | 12.46 | | | | | | 0.20 | | | | | | 2.72 | | | | | | 2.92 | | | | | | 0.23 | | | | | | 1.16 | | | | | | — | | | | | | 1.39 | | | | | | — | | | | | | 13.99 | | | | | | 24.50 | | | | | | 0.52 | | | | | | 0.47 | | | | | | 0.47 | | | | | | 1.52 | | | | | | 59,923 | | | | | | 61 | | |
| 12-31-18 | | | | | 14.62 | | | | | | 0.17• | | | | | | (1.63) | | | | | | (1.46) | | | | | | 0.18 | | | | | | 0.52 | | | | | | — | | | | | | 0.70 | | | | | | — | | | | | | 12.46 | | | | | | (10.56) | | | | | | 0.51 | | | | | | 0.43 | | | | | | 0.43 | | | | | | 1.19 | | | | | | 49,077 | | | | | | 62 | | |
| 12-31-17 | | | | | 12.38 | | | | | | 0.15• | | | | | | 2.50 | | | | | | 2.65 | | | | | | 0.13 | | | | | | 0.28 | | | | | | — | | | | | | 0.41 | | | | | | — | | | | | | 14.62 | | | | | | 21.66 | | | | | | 0.51 | | | | | | 0.41 | | | | | | 0.41 | | | | | | 1.08 | | | | | | 58,217 | | | | | | 40 | | |
| Class S2 | | | | | | | | | | | | | | | | | | | | | | | | | | | | | | | | | | | | | | | | | | | | | | | | | | | | | | | | | | | | | | | | | | | | | | | | | | | | | | | | | | | | | | | | | | | | | | | | | | | | | | | |
| 12-31-21 | | | | | 15.09 | | | | | | 0.15• | | | | | | 2.36 | | | | | | 2.51 | | | | | | 0.36 | | | | | | 2.02 | | | | | | — | | | | | | 2.38 | | | | | | — | | | | | | 15.22 | | | | | | 17.09 | | | | | | 0.83 | | | | | | 0.56 | | | | | | 0.56 | | | | | | 0.97 | | | | | | 5,377 | | | | | | 51 | | |
| 12-31-20 | | | | | 13.92 | | | | | | 0.13 | | | | | | 1.93 | | | | | | 2.06 | | | | | | 0.15 | | | | | | 0.74 | | | | | | — | | | | | | 0.89 | | | | | | — | | | | | | 15.09 | | | | | | 15.86 | | | | | | 0.86 | | | | | | 0.59 | | | | | | 0.59 | | | | | | 0.80 | | | | | | 3,036 | | | | | | 67 | | |
| 12-31-19 | | | | | 12.39 | | | | | | 0.18• | | | | | | 2.70 | | | | | | 2.88 | | | | | | 0.19 | | | | | | 1.16 | | | | | | — | | | | | | 1.35 | | | | | | — | | | | | | 13.92 | | | | | | 24.28 | | | | | | 0.67 | | | | | | 0.62 | | | | | | 0.62 | | | | | | 1.33 | | | | | | 2,876 | | | | | | 61 | | |
| 12-31-18 | | | | | 14.54 | | | | | | 0.15 | | | | | | (1.62) | | | | | | (1.47) | | | | | | 0.16 | | | | | | 0.52 | | | | | | — | | | | | | 0.68 | | | | | | — | | | | | | 12.39 | | | | | | (10.68) | | | | | | 0.66 | | | | | | 0.58 | | | | | | 0.58 | | | | | | 1.03 | | | | | | 2,720 | | | | | | 62 | | |
| 12-31-17 | | | | | 12.31 | | | | | | 0.12• | | | | | | 2.50 | | | | | | 2.62 | | | | | | 0.11 | | | | | | 0.28 | | | | | | — | | | | | | 0.39 | | | | | | — | | | | | | 14.54 | | | | | | 21.52 | | | | | | 0.66 | | | | | | 0.56 | | | | | | 0.56 | | | | | | 0.89 | | | | | | 3,250 | | | | | | 40 | | |
| Class T | | | | | | | | | | | | | | | | | | | | | | | | | | | | | | | | | | | | | | | | | | | | | | | | | | | | | | | | | | | | | | | | | | | | | | | | | | | | | | | | | | | | | | | | | | | | | | | | | | | | | | | |
| 12-31-21 | | | | | 15.39 | | | | | | 0.06• | | | | | | 2.46 | | | | | | 2.52 | | | | | | 0.24 | | | | | | 2.02 | | | | | | — | | | | | | 2.26 | | | | | | — | | | | | | 15.65 | | | | | | 16.77 | | | | | | 1.13 | | | | | | 0.86 | | | | | | 0.86 | | | | | | 0.38 | | | | | | 24 | | | | | | 51 | | |
| 12-31-20 | | | | | 14.22 | | | | | | 0.07• | | | | | | 1.99 | | | | | | 2.06 | | | | | | 0.15 | | | | | | 0.74 | | | | | | — | | | | | | 0.89 | | | | | | — | | | | | | 15.39 | | | | | | 15.50 | | | | | | 1.16 | | | | | | 0.89 | | | | | | 0.89 | | | | | | 0.51 | | | | | | 30 | | | | | | 67 | | |
| 12-31-19 | | | | | 12.58 | | | | | | 0.17• | | | | | | 2.73 | | | | | | 2.90 | | | | | | 0.10 | | | | | | 1.16 | | | | | | — | | | | | | 1.26 | | | | | | — | | | | | | 14.22 | | | | | | 23.93 | | | | | | 0.97 | | | | | | 0.92 | | | | | | 0.92 | | | | | | 1.27 | | | | | | 22 | | | | | | 61 | | |
| 12-31-18 | | | | | 14.73 | | | | | | 0.08• | | | | | | (1.61) | | | | | | (1.53) | | | | | | 0.10 | | | | | | 0.52 | | | | | | — | | | | | | 0.62 | | | | | | — | | | | | | 12.58 | | | | | | (10.91) | | | | | | 0.96 | | | | | | 0.88 | | | | | | 0.88 | | | | | | 0.58 | | | | | | 18 | | | | | | 62 | | |
| 12-31-17 | | | | | 12.50 | | | | | | 0.09• | | | | | | 2.52 | | | | | | 2.61 | | | | | | 0.10 | | | | | | 0.28 | | | | | | — | | | | | | 0.38 | | | | | | — | | | | | | 14.73 | | | | | | 21.08 | | | | | | 0.96 | | | | | | 0.86 | | | | | | 0.86 | | | | | | 0.67 | | | | | | 32 | | | | | | 40 | | |
See Accompanying Notes to Financial Statements
Financial Highlights (continued)
| | | | | | | | | | Income
(loss) from
investment
operations | | | | | | | | | Less
Distributions | | | | | | | | | | | | | | | | | | | | | | | | | | | Ratios to average
net assets | | | Supplemental
Data | |
| | | | Net asset value, beginning of year
or period | | | Net investment income (loss) | | | Net realized and unrealized
gain (loss) | | | Total from investment operations | | | From net investment income | | | From net realized gains | | | From return of capital | | | Total distributions | | | Payment by affiliate | | | Net asset value, end of year
or period | | | Total Return(1) | | | Expenses before
reductions/additions(2)(3)(4) | | | Expenses net of fee waivers
and/or recoupments if any(2)(3)(4) | | | Expenses net of all
reductions/additions(2)(3)(4) | | | Net investment income (loss)(2)(3) | | | Net assets, end of year or period | | | Portfolio turnover rate | |
Year or
period ended | | | ($) | | | ($) | | | ($) | | | ($) | | | ($) | | | ($) | | | ($) | | | ($) | | | ($) | | | ($) | | | (%) | | | (%) | | | (%) | | | (%) | | | (%) | | | ($000’s) | | | (%) | |
| Voya Solution 2060 Portfolio | | | | | | | | | | | | | | | | | | | | | | | | | | | | | | | | | | | | | | | | | | | | | | | | | | | | | | | | | | | | | | | | | | | | | | | | | | | | | | | | | | | | | | | | | | | | | | | | | | | | | | | |
| Class ADV | | | | | | | | | | | | | | | | | | | | | | | | | | | | | | | | | | | | | | | | | | | | | | | | | | | | | | | | | | | | | | | | | | | | | | | | | | | | | | | | | | | | | | | | | | | | | | | | | | | | | | | |
| 12-31-21 | | | | | 13.16 | | | | | | 0.10• | | | | | | 2.11 | | | | | | 2.21 | | | | | | 0.16 | | | | | | 0.25 | | | | | | — | | | | | | 0.41 | | | | | | — | | | | | | 14.96 | | | | | | 16.83 | | | | | | 1.08 | | | | | | 0.68 | | | | | | 0.68 | | | | | | 0.73 | | | | | | 10,459 | | | | | | 68 | | |
| 12-31-20 | | | | | 12.04 | | | | | | 0.10• | | | | | | 1.67 | | | | | | 1.77 | | | | | | 0.12 | | | | | | 0.53 | | | | | | — | | | | | | 0.65 | | | | | | — | | | | | | 13.16 | | | | | | 15.62 | | | | | | 1.14 | | | | | | 0.70 | | | | | | 0.70 | | | | | | 0.85 | | | | | | 8,999 | | | | | | 74 | | |
| 12-31-19 | | | | | 10.45 | | | | | | 0.16• | | | | | | 2.28 | | | | | | 2.44 | | | | | | 0.15 | | | | | | 0.70 | | | | | | — | | | | | | 0.85 | | | | | | — | | | | | | 12.04 | | | | | | 24.12 | | | | | | 0.95 | | | | | | 0.74 | | | | | | 0.74 | | | | | | 1.39 | | | | | | 6,976 | | | | | | 89 | | |
| 12-31-18 | | | | | 12.39 | | | | | | 0.13• | | | | | | (1.38) | | | | | | (1.25) | | | | | | 0.11 | | | | | | 0.58 | | | | | | — | | | | | | 0.69 | | | | | | — | | | | | | 10.45 | | | | | | (10.76) | | | | | | 0.96 | | | | | | 0.69 | | | | | | 0.69 | | | | | | 1.12 | | | | | | 4,593 | | | | | | 84 | | |
| 12-31-17 | | | | | 10.42 | | | | | | 0.13• | | | | | | 2.08 | | | | | | 2.21 | | | | | | 0.04 | | | | | | 0.20 | | | | | | — | | | | | | 0.24 | | | | | | — | | | | | | 12.39 | | | | | | 21.42 | | | | | | 1.10 | | | | | | 0.67 | | | | | | 0.67 | | | | | | 1.11 | | | | | | 3,202 | | | | | | 65 | | |
| Class I | | | | | | | | | | | | | | | | | | | | | | | | | | | | | | | | | | | | | | | | | | | | | | | | | | | | | | | | | | | | | | | | | | | | | | | | | | | | | | | | | | | | | | | | | | | | | | | | | | | | | | | |
| 12-31-21 | | | | | 13.41 | | | | | | 0.15• | | | | | | 2.18 | | | | | | 2.33 | | | | | | 0.20 | | | | | | 0.25 | | | | | | — | | | | | | 0.45 | | | | | | — | | | | | | 15.29 | | | | | | 17.46 | | | | | | 0.58 | | | | | | 0.18 | | | | | | 0.18 | | | | | | 1.04 | | | | | | 6,685 | | | | | | 68 | | |
| 12-31-20 | | | | | 12.25 | | | | | | 0.17• | | | | | | 1.69 | | | | | | 1.86 | | | | | | 0.17 | | | | | | 0.53 | | | | | | — | | | | | | 0.70 | | | | | | — | | | | | | 13.41 | | | | | | 16.14 | | | | | | 0.64 | | | | | | 0.20 | | | | | | 0.20 | | | | | | 1.42 | | | | | | 7,950 | | | | | | 74 | | |
| 12-31-19 | | | | | 10.60 | | | | | | 0.25• | | | | | | 2.29 | | | | | | 2.54 | | | | | | 0.19 | | | | | | 0.70 | | | | | | — | | | | | | 0.89 | | | | | | — | | | | | | 12.25 | | | | | | 24.79 | | | | | | 0.45 | | | | | | 0.24 | | | | | | 0.24 | | | | | | 2.14 | | | | | | 5,184 | | | | | | 89 | | |
| 12-31-18 | | | | | 12.53 | | | | | | 0.19• | | | | | | (1.41) | | | | | | (1.22) | | | | | | 0.13 | | | | | | 0.58 | | | | | | — | | | | | | 0.71 | | | | | | — | | | | | | 10.60 | | | | | | (10.35) | | | | | | 0.46 | | | | | | 0.19 | | | | | | 0.19 | | | | | | 1.57 | | | | | | 2,570 | | | | | | 84 | | |
| 12-31-17 | | | | | 10.49 | | | | | | 0.20• | | | | | | 2.10 | | | | | | 2.30 | | | | | | 0.06 | | | | | | 0.20 | | | | | | — | | | | | | 0.26 | | | | | | — | | | | | | 12.53 | | | | | | 22.15 | | | | | | 0.60 | | | | | | 0.17 | | | | | | 0.17 | | | | | | 1.73 | | | | | | 2,160 | | | | | | 65 | | |
| Class S | | | | | | | | | | | | | | | | | | | | | | | | | | | | | | | | | | | | | | | | | | | | | | | | | | | | | | | | | | | | | | | | | | | | | | | | | | | | | | | | | | | | | | | | | | | | | | | | | | | | | | | |
| 12-31-21 | | | | | 13.21 | | | | | | 0.13• | | | | | | 2.12 | | | | | | 2.25 | | | | | | 0.18 | | | | | | 0.25 | | | | | | — | | | | | | 0.43 | | | | | | — | | | | | | 15.03 | | | | | | 17.15 | | | | | | 0.83 | | | | | | 0.43 | | | | | | 0.43 | | | | | | 0.93 | | | | | | 8,211 | | | | | | 68 | | |
| 12-31-20 | | | | | 12.08 | | | | | | 0.13• | | | | | | 1.68 | | | | | | 1.81 | | | | | | 0.15 | | | | | | 0.53 | | | | | | — | | | | | | 0.68 | | | | | | — | | | | | | 13.21 | | | | | | 15.90 | | | | | | 0.89 | | | | | | 0.45 | | | | | | 0.45 | | | | | | 1.15 | | | | | | 6,886 | | | | | | 74 | | |
| 12-31-19 | | | | | 10.47 | | | | | | 0.18• | | | | | | 2.30 | | | | | | 2.48 | | | | | | 0.17 | | | | | | 0.70 | | | | | | — | | | | | | 0.87 | | | | | | — | | | | | | 12.08 | | | | | | 24.45 | | | | | | 0.70 | | | | | | 0.49 | | | | | | 0.49 | | | | | | 1.56 | | | | | | 4,901 | | | | | | 89 | | |
| 12-31-18 | | | | | 12.40 | | | | | | 0.16• | | | | | | (1.39) | | | | | | (1.23) | | | | | | 0.12 | | | | | | 0.58 | | | | | | — | | | | | | 0.70 | | | | | | — | | | | | | 10.47 | | | | | | (10.60) | | | | | | 0.71 | | | | | | 0.44 | | | | | | 0.44 | | | | | | 1.30 | | | | | | 3,440 | | | | | | 84 | | |
| 12-31-17 | | | | | 10.41 | | | | | | 0.15• | | | | | | 2.10 | | | | | | 2.25 | | | | | | 0.06 | | | | | | 0.20 | | | | | | — | | | | | | 0.26 | | | | | | — | | | | | | 12.40 | | | | | | 21.81 | | | | | | 0.85 | | | | | | 0.42 | | | | | | 0.42 | | | | | | 1.30 | | | | | | 2,825 | | | | | | 65 | | |
| Class S2 | | | | | | | | | | | | | | | | | | | | | | | | | | | | | | | | | | | | | | | | | | | | | | | | | | | | | | | | | | | | | | | | | | | | | | | | | | | | | | | | | | | | | | | | | | | | | | | | | | | | | | | |
| 12-31-21 | | | | | 13.19 | | | | | | 0.16• | | | | | | 2.06 | | | | | | 2.22 | | | | | | 0.20 | | | | | | 0.25 | | | | | | — | | | | | | 0.45 | | | | | | — | | | | | | 14.96 | | | | | | 16.93 | | | | | | 0.98 | | | | | | 0.58 | | | | | | 0.58 | | | | | | 1.08 | | | | | | 1,234 | | | | | | 68 | | |
| 12-31-20 | | | | | 12.07 | | | | | | 0.12• | | | | | | 1.67 | | | | | | 1.79 | | | | | | 0.14 | | | | | | 0.53 | | | | | | — | | | | | | 0.67 | | | | | | — | | | | | | 13.19 | | | | | | 15.73 | | | | | | 1.04 | | | | | | 0.60 | | | | | | 0.60 | | | | | | 1.07 | | | | | | 471 | | | | | | 74 | | |
| 12-31-19 | | | | | 10.46 | | | | | | 0.18 | | | | | | 2.28 | | | | | | 2.46 | | | | | | 0.15 | | | | | | 0.70 | | | | | | — | | | | | | 0.85 | | | | | | — | | | | | | 12.07 | | | | | | 24.26 | | | | | | 0.85 | | | | | | 0.64 | | | | | | 0.64 | | | | | | 1.44 | | | | | | 269 | | | | | | 89 | | |
| 12-31-18 | | | | | 12.40 | | | | | | 0.15• | | | | | | (1.40) | | | | | | (1.25) | | | | | | 0.11 | | | | | | 0.58 | | | | | | — | | | | | | 0.69 | | | | | | — | | | | | | 10.46 | | | | | | (10.70) | | | | | | 0.86 | | | | | | 0.59 | | | | | | 0.59 | | | | | | 1.23 | | | | | | 247 | | | | | | 84 | | |
| 12-31-17 | | | | | 10.42 | | | | | | 0.17• | | | | | | 2.05 | | | | | | 2.22 | | | | | | 0.04 | | | | | | 0.20 | | | | | | — | | | | | | 0.24 | | | | | | — | | | | | | 12.40 | | | | | | 21.56 | | | | | | 1.00 | | | | | | 0.57 | | | | | | 0.57 | | | | | | 1.45 | | | | | | 180 | | | | | | 65 | | |
| Class T | | | | | | | | | | | | | | | | | | | | | | | | | | | | | | | | | | | | | | | | | | | | | | | | | | | | | | | | | | | | | | | | | | | | | | | | | | | | | | | | | | | | | | | | | | | | | | | | | | | | | | | |
| 12-31-21 | | | | | 13.13 | | | | | | 0.06• | | | | | | 2.10 | | | | | | 2.16 | | | | | | 0.13 | | | | | | 0.25 | | | | | | — | | | | | | 0.38 | | | | | | — | | | | | | 14.91 | | | | | | 16.50 | | | | | | 1.28 | | | | | | 0.88 | | | | | | 0.88 | | | | | | 0.42 | | | | | | 6 | | | | | | 68 | | |
| 12-31-20 | | | | | 12.01 | | | | | | 0.08• | | | | | | 1.66 | | | | | | 1.74 | | | | | | 0.09 | | | | | | 0.53 | | | | | | — | | | | | | 0.62 | | | | | | — | | | | | | 13.13 | | | | | | 15.32 | | | | | | 1.34 | | | | | | 0.90 | | | | | | 0.90 | | | | | | 0.67 | | | | | | 5 | | | | | | 74 | | |
| 12-31-19 | | | | | 10.40 | | | | | | 0.11 | | | | | | 2.30 | | | | | | 2.41 | | | | | | 0.10 | | | | | | 0.70 | | | | | | — | | | | | | 0.80 | | | | | | — | | | | | | 12.01 | | | | | | 23.96 | | | | | | 1.15 | | | | | | 0.94 | | | | | | 0.94 | | | | | | 1.07 | | | | | | 4 | | | | | | 89 | | |
| 12-31-18 | | | | | 12.33 | | | | | | 0.08 | | | | | | (1.37) | | | | | | (1.29) | | | | | | 0.06 | | | | | | 0.58 | | | | | | — | | | | | | 0.64 | | | | | | — | | | | | | 10.40 | | | | | | (11.08) | | | | | | 1.16 | | | | | | 0.89 | | | | | | 0.89 | | | | | | 0.73 | | | | | | 3 | | | | | | 84 | | |
| 12-31-17 | | | | | 10.35 | | | | | | 0.08• | | | | | | 2.10 | | | | | | 2.18 | | | | | | — | | | | | | 0.20 | | | | | | — | | | | | | 0.20 | | | | | | — | | | | | | 12.33 | | | | | | 21.24 | | | | | | 1.30 | | | | | | 0.87 | | | | | | 0.87 | | | | | | 0.69 | | | | | | 4 | | | | | | 65 | | |
See Accompanying Notes to Financial Statements
Financial Highlights (continued)
| | | | | | | | | | Income
(loss) from
investment
operations | | | | | | | | | Less
Distributions | | | | | | | | | | | | | | | | | | | | | | | | | | | Ratios to average
net assets | | | Supplemental
Data | |
| | | | Net asset value, beginning of year
or period | | | Net investment income (loss) | | | Net realized and unrealized
gain (loss) | | | Total from investment operations | | | From net investment income | | | From net realized gains | | | From return of capital | | | Total distributions | | | Payment by affiliate | | | Net asset value, end of year
or period | | | Total Return(1) | | | Expenses before
reductions/additions(2)(3)(4) | | | Expenses net of fee waivers
and/or recoupments if any(2)(3)(4) | | | Expenses net of all
reductions/additions(2)(3)(4) | | | Net investment income (loss)(2)(3) | | | Net assets, end of year or period | | | Portfolio turnover rate | |
Year or
period ended | | | ($) | | | ($) | | | ($) | | | ($) | | | ($) | | | ($) | | | ($) | | | ($) | | | ($) | | | ($) | | | (%) | | | (%) | | | (%) | | | (%) | | | (%) | | | ($000’s) | | | (%) | |
| Voya Solution 2065 Portfolio | | | | | | | | | | | | | | | | | | | | | | | | | | | | | | | | | | | | | | | | | | | | | | | | | | | | | | | | | | | | | | | | | | | | | | | | | | | | | | | | | | | | | | | | | | | | | | | | | | | | | | | |
| Class ADV | | | | | | | | | | | | | | | | | | | | | | | | | | | | | | | | | | | | | | | | | | | | | | | | | | | | | | | | | | | | | | | | | | | | | | | | | | | | | | | | | | | | | | | | | | | | | | | | | | | | | | | |
| 12-31-21 | | | | | 11.55 | | | | | | 0.11• | | | | | | 1.86 | | | | | | 1.97 | | | | | | 0.41 | | | | | | 1.17 | | | | | | — | | | | | | 1.58 | | | | | | — | | | | | | 11.94 | | | | | | 17.05 | | | | | | 1.61 | | | | | | 0.67 | | | | | | 0.67 | | | | | | 0.90 | | | | | | 1,583 | | | | | | 53 | | |
| 07-29-20(5)- 12-31-20 | | | | | 10.00 | | | | | | 0.12• | | | | | | 1.62 | | | | | | 1.74 | | | | | | 0.14 | | | | | | 0.05 | | | | | | — | | | | | | 0.19 | | | | | | — | | | | | | 11.55 | | | | | | 17.42 | | | | | | 1.97 | | | | | | 0.72 | | | | | | 0.72 | | | | | | 2.64 | | | | | | 1,012 | | | | | | 24 | | |
| Class I | | | | | | | | | | | | | | | | | | | | | | | | | | | | | | | | | | | | | | | | | | | | | | | | | | | | | | | | | | | | | | | | | | | | | | | | | | | | | | | | | | | | | | | | | | | | | | | | | | | | | | | |
| 12-31-21 | | | | | 11.56 | | | | | | 0.18• | | | | | | 1.86 | | | | | | 2.04 | | | | | | 0.46 | | | | | | 1.17 | | | | | | — | | | | | | 1.63 | | | | | | — | | | | | | 11.97 | | | | | | 17.64 | | | | | | 1.11 | | | | | | 0.17 | | | | | | 0.17 | | | | | | 1.38 | | | | | | 1,692 | | | | | | 53 | | |
| 07-29-20(5)- 12-31-20 | | | | | 10.00 | | | | | | 0.12• | | | | | | 1.65 | | | | | | 1.77 | | | | | | 0.16 | | | | | | 0.05 | | | | | | — | | | | | | 0.21 | | | | | | — | | | | | | 11.56 | | | | | | 17.69 | | | | | | 1.47 | | | | | | 0.22 | | | | | | 0.22 | | | | | | 2.60 | | | | | | 1,045 | | | | | | 24 | | |
| Class S | | | | | | | | | | | | | | | | | | | | | | | | | | | | | | | | | | | | | | | | | | | | | | | | | | | | | | | | | | | | | | | | | | | | | | | | | | | | | | | | | | | | | | | | | | | | | | | | | | | | | | | |
| 12-31-21 | | | | | 11.56 | | | | | | 0.18• | | | | | | 1.82 | | | | | | 2.00 | | | | | | 0.44 | | | | | | 1.17 | | | | | | — | | | | | | 1.61 | | | | | | — | | | | | | 11.95 | | | | | | 17.30 | | | | | | 1.36 | | | | | | 0.42 | | | | | | 0.42 | | | | | | 1.41 | | | | | | 2,431 | | | | | | 53 | | |
| 07-29-20(5)- 12-31-20 | | | | | 10.00 | | | | | | 0.13• | | | | | | 1.63 | | | | | | 1.76 | | | | | | 0.15 | | | | | | 0.05 | | | | | | — | | | | | | 0.20 | | | | | | — | | | | | | 11.56 | | | | | | 17.61 | | | | | | 1.72 | | | | | | 0.47 | | | | | | 0.47 | | | | | | 2.84 | | | | | | 955 | | | | | | 24 | | |
| Class S2 | | | | | | | | | | | | | | | | | | | | | | | | | | | | | | | | | | | | | | | | | | | | | | | | | | | | | | | | | | | | | | | | | | | | | | | | | | | | | | | | | | | | | | | | | | | | | | | | | | | | | | | |
| 12-31-21 | | | | | 11.56 | | | | | | 0.16• | | | | | | 1.82 | | | | | | 1.98 | | | | | | 0.42 | | | | | | 1.17 | | | | | | — | | | | | | 1.59 | | | | | | — | | | | | | 11.95 | | | | | | 17.17 | | | | | | 1.51 | | | | | | 0.57 | | | | | | 0.57 | | | | | | 1.26 | | | | | | 114 | | | | | | 53 | | |
| 07-29-20(5)- 12-31-20 | | | | | 10.00 | | | | | | 0.10• | | | | | | 1.65 | | | | | | 1.75 | | | | | | 0.14 | | | | | | 0.05 | | | | | | — | | | | | | 0.19 | | | | | | — | | | | | | 11.56 | | | | | | 17.52 | | | | | | 1.87 | | | | | | 0.62 | | | | | | 0.62 | | | | | | 2.18 | | | | | | 26 | | | | | | 24 | | |
| Class T | | | | | | | | | | | | | | | | | | | | | | | | | | | | | | | | | | | | | | | | | | | | | | | | | | | | | | | | | | | | | | | | | | | | | | | | | | | | | | | | | | | | | | | | | | | | | | | | | | | | | | | |
| 12-31-21 | | | | | 11.56 | | | | | | 0.06• | | | | | | 1.86 | | | | | | 1.92 | | | | | | 0.36 | | | | | | 1.17 | | | | | | — | | | | | | 1.53 | | | | | | — | | | | | | 11.95 | | | | | | 16.67 | | | | | | 1.81 | | | | | | 0.87 | | | | | | 0.87 | | | | | | 0.51 | | | | | | 4 | | | | | | 53 | | |
| 07-29-20(5)- 12-31-20 | | | | | 10.00 | | | | | | 0.09• | | | | | | 1.65 | | | | | | 1.74 | | | | | | 0.13 | | | | | | 0.05 | | | | | | — | | | | | | 0.18 | | | | | | — | | | | | | 11.56 | | | | | | 17.40 | | | | | | 2.17 | | | | | | 0.92 | | | | | | 0.92 | | | | | | 1.88 | | | | | | 4 | | | | | | 24 | | |
(1)
Total return is calculated assuming reinvestment of all dividends, capital gain distributions and return of capital distributions, if any, at net asset value and does not reflect the effect of insurance contract charges. Total return for periods less than one year is not annualized.
(2)
Annualized for periods less than one year.
(3)
Ratios reflect operating expenses of a Portfolio. Expenses before reductions/additions do not reflect amounts reimbursed or recouped by the Investment Adviser and/or Distributor or reductions from brokerage service arrangements or other expense offset arrangements and do not represent the amount paid by a Portfolio during periods when reimbursements or reductions occur. Expenses net of fee waivers reflect expenses after reimbursement by the Investment Adviser and/or Distributor or recoupment of previously reimbursed fees by the Investment Adviser, but prior to reductions from brokerage service arrangements or other expense offset arrangements. Expenses net of all reductions/additions represent the net expenses paid by a Portfolio. Net investment income (loss) is net of all such additions or reductions.
(4)
Ratios do not include expenses of underlying funds and do not include fees and expenses charged under the variable annuity contract or variable life insurance policy.
(5)
Commencement of operations.
•
Calculated using average number of shares outstanding throughout the year or period.
See Accompanying Notes to Financial Statements
NOTES TO FINANCIAL STATEMENTS as of December 31, 2021
NOTE 1 — ORGANIZATION
Voya Partners, Inc. (the “Company”) is an open-end management investment company registered under the Investment Company Act of 1940, as amended (the “1940 Act”). It was incorporated under the laws of Maryland on May 7, 1997. The Articles of Incorporation permit the Company to offer separate series, each of which has its own investment objective, policies and restrictions. The Company currently consists of thirty-seven active separate investment series. The fifteen series (each, a “Portfolio” and collectively, the “Portfolios”) included in this report are: Voya Solution Aggressive Portfolio (“Solution Aggressive”), Voya Solution Balanced Portfolio (“Solution Balanced”), Voya Solution Conservative Portfolio (“Solution Conservative”), Voya Solution Income Portfolio (“Solution Income”), Voya Solution Moderately Aggressive Portfolio (“Solution Moderately Aggressive”), Voya Solution Moderately Conservative Portfolio (“Solution Moderately Conservative”), Voya Solution 2025 Portfolio (“Solution 2025”), Voya Solution 2030 Portfolio (“Solution 2030”), Voya Solution 2035 Portfolio (“Solution 2035”), Voya Solution 2040 Portfolio (“Solution 2040”), Voya Solution 2045 Portfolio (“Solution 2045”), Voya Solution 2050 Portfolio (“Solution 2050”), Voya Solution 2055 Portfolio (“Solution 2055”), Voya Solution 2060 Portfolio (“Solution 2060”) and Voya Solution 2065 Portfolio (“Solution 2065”). Each Portfolio is a diversified series of the Company.
Solution 2025, Solution 2030, Solution 2035, Solution 2040, Solution 2045, Solution 2050, Solution 2055, Solution 2060 and Solution 2065 are structured and managed around a specific target retirement or financial goal date (“Target Date”). When these Portfolios reach their respective Target Date, they may be combined with Solution Income, without a vote of shareholders, if approved by the Portfolios’ Board of Directors (the “Board”).
The classes of shares included in this report are: Adviser (“Class ADV”), Initial (“Class I”), Class R6, Service (“Class S”), Service 2 (“Class S2”) and Class T; however, each Portfolio may not offer all share classes. Shares of the Portfolios may be offered to separate accounts (“Separate Accounts”) of insurance companies as investment options in connection with variable annuity contracts and variable life insurance policies (“Variable Contracts”) and to certain of the Portfolios’ investment advisers and their affiliates. In the future, shares may also be offered to qualified pension and retirement plans (“Qualified Plans”) outside the Separate Account context. With the exception of class specific matters, each class has equal voting rights as to voting privileges. For class specific proposals, only the applicable class would have voting privileges. The classes differ principally in the
applicable distribution and shareholder service fees, as well as differences in the amount of waiver of fees and reimbursement of expenses, if any. Generally, shareholders of each class also bear certain expenses that pertain to that particular class. All shareholders are allocated the common expenses of a portfolio and earn income and realized gains/losses from a portfolio pro rata based on the daily ending net assets of each class, without distinction between share classes. Expenses that are specific to a portfolio or a class are charged directly to that portfolio or class. Other operating expenses shared by several portfolios are generally allocated among those portfolios based on average net assets. Distributions are determined separately for each class based on income and expenses allocated to each class. Realized gain distributions are allocated to each class pro rata based on the shares outstanding of each class on the date of distribution. Differences in per share dividend rates generally result from differences in separate class expenses, including distribution and shareholder service fees, if any, as well as differences in the amount of waiver of fees and reimbursement of expenses between the separate classes, if any.
Voya Investments, LLC (“Voya Investments” or the “Investment Adviser”), an Arizona limited liability company, serves as the Investment Adviser to the Portfolios. Voya Investment Management Co. LLC (“Voya IM” or the “Sub-Adviser”), a Delaware limited liability company, serves as the Sub-Adviser to the Portfolios. Voya Investments Distributor, LLC (“VID” or the “Distributor”), a Delaware limited liability company, serves as the principal underwriter to the Portfolios.
Each Portfolio seeks to achieve its investment objective by investing in other investment companies (“Underlying Funds”) and uses asset allocation strategies to determine how much to invest in the Underlying Funds. The investment objective of the Portfolios is described in the respective Portfolio’s Prospectus.
NOTE 2 — SIGNIFICANT ACCOUNTING POLICIES
The following significant accounting policies are consistently followed by the Portfolios in the preparation of their financial statements. Each Portfolio is considered an investment company under U.S. generally accepted accounting principles (“GAAP”) and follows the accounting and reporting guidance applicable to investment companies.
A. Security Valuation. Each Portfolio is open for business every day the New York Stock Exchange (“NYSE”) opens for regular trading (each such day, a “Business Day”). The net asset value (“NAV”) per share for each class of each Portfolio is determined each Business Day as of the close
NOTES TO FINANCIAL STATEMENTS as of December 31, 2021 (continued)
NOTE 2 — SIGNIFICANT ACCOUNTING POLICIES (continued)
of the regular trading session (“Market Close”), as determined by the Consolidated Tape Association (“CTA”), the central distributor of transaction prices for exchange-traded securities (normally 4:00 p.m. Eastern time unless otherwise designated by the CTA). The data reflected on the consolidated tape provided by the CTA is generated by various market centers, including all securities exchanges, electronic communications networks, and third-market broker-dealers. The NAV per share of each class of each Portfolio is calculated by taking the value of the Portfolio’s assets attributable to that class, subtracting the Portfolio’s liabilities attributable to that class, and dividing by the number of shares of that class that are outstanding. On days when a Portfolio is closed for business, Portfolio shares will not be priced and a Portfolio does not transact purchase and redemption orders. To the extent a Portfolio’s assets are traded in other markets on days when a Portfolio does not price its shares, the value of a Portfolio’s assets will likely change and you will not be able to purchase or redeem shares of a Portfolio.
Assets for which market quotations are readily available are valued at market value. A security listed or traded on an exchange is valued at its last sales price or official closing price as of the close of the regular trading session on the exchange where the security is principally traded or, if such price is not available, at the last sale price as of the Market Close for such security provided by the CTA. Bank loans are valued at the average of the averages of the bid and ask prices provided to an independent loan pricing service by brokers. Futures contracts are valued at the final settlement price set by an exchange on which they are principally traded. Listed options are valued at the mean between the last bid and ask prices from the exchange on which they are principally traded. Investments in open-end registered investment companies that do not trade on an exchange are valued at the end of day NAV per share. Investments in registered investment companies that trade on an exchange are valued at the last sales price or official closing price as of the close of the regular trading session on the exchange where the security is principally traded.
When a market quotation is not readily available or is deemed unreliable, each Portfolio will determine a fair value for the relevant asset in accordance with procedures adopted by the Portfolios’ Board. Such procedures provide, for example, that: (a) Exchange-traded securities are valued at the mean of the closing bid and ask; (b) Debt obligations are valued using an evaluated price provided by an independent pricing service. Evaluated prices provided by the pricing service may be determined without exclusive reliance on quoted prices, and may reflect factors
such as institution-size trading in similar groups of securities, developments related to specific securities, benchmark yield, quality, type of issue, coupon rate, maturity, individual trading characteristics and other market data; (c) Securities traded in the over-the-counter (“OTC”) market are valued based on prices provided by independent pricing services or market makers; (d) Options not listed on an exchange are valued by an independent source using an industry accepted model, such as Black-Scholes; (e) Centrally cleared swap agreements are valued using a price provided by an independent pricing service; (f) OTC swap agreements are valued using a price provided by an independent pricing service; (g) Forward foreign currency exchange contracts are valued utilizing current and forward rates obtained from an independent pricing service. Such prices from the third party pricing service are for specific settlement periods and each Portfolio’s forward foreign currency exchange contracts are valued at an interpolated rate between the closest preceding and subsequent period reported by the independent pricing service; and (h) Securities for which market prices are not provided by any of the above methods may be valued based upon quotes furnished by brokers.
The prospectuses of the open-end registered investment companies in which each Portfolio may invest explain the circumstances under which they will use fair value pricing and the effects of using fair value pricing.
Foreign securities’ (including forward foreign currency exchange contracts) prices are converted into U.S. dollar amounts using the applicable exchange rates as of Market Close. If market quotations are available and believed to be reliable for foreign exchange-traded equity securities, the securities will be valued at the market quotations. Because trading hours for certain foreign securities end before Market Close, closing market quotations may become unreliable. An independent pricing service determines the degree of certainty, based on historical data, that the closing price in the principal market where a foreign security trades is not the current value as of Market Close. Foreign securities’ prices meeting the approved degree of certainty that the price is not reflective of current value will be valued by the independent pricing service using pricing models designed to estimate likely changes in the values of those securities between the times in which the trading in those securities is substantially completed and Market Close. Multiple factors may be considered by the independent pricing service in determining the value of such securities and may include information relating to sector indices, American Depositary Receipts and domestic and foreign index futures.
All other assets for which market quotations are not readily available or became unreliable (or if the above fair
NOTES TO FINANCIAL STATEMENTS as of December 31, 2021 (continued)
NOTE 2 — SIGNIFICANT ACCOUNTING POLICIES (continued)
valuation methods are unavailable or determined to be unreliable) are valued at fair value as determined in good faith by or under the supervision of the Board following procedures approved by the Board. The Board has delegated to the Investment Adviser responsibility for overseeing the implementation of the Portfolios’ valuation procedures; a “Pricing Committee” comprised of employees of the Investment Adviser or its affiliates has responsibility for applying the fair valuation methods set forth in the procedures and, if a fair valuation cannot be determined pursuant to the fair valuation methods, determining the fair value of assets held by the Portfolios. Issuer specific events, transaction price, position size, nature and duration of restrictions on disposition of the security, market trends, bid/ask quotes of brokers and other market data may be reviewed in the course of making a good faith determination of a security’s fair value. Valuations change in response to many factors including the historical and prospective earnings of the issuer, the value of the issuer’s assets, general economic conditions, interest rates, investor perceptions and market liquidity. Because of the inherent uncertainties of fair valuation, the values used to determine each Portfolio’s NAV may materially differ from the value received upon actual sale of those investments. Thus, fair valuation may have an unintended dilutive or accretive effect on the value of shareholders’ investments in each Portfolio.
Each investment asset or liability of the Portfolios is assigned a level at measurement date based on the significance and source of the inputs to its valuation. Quoted prices in active markets for identical securities are classified as “Level 1,” inputs other than quoted prices for an asset or liability that are observable are classified as “Level 2” and significant unobservable inputs, including the Sub-Adviser’s or Pricing Committee’s judgment about the assumptions that a market participant would use in pricing an asset or liability are classified as “Level 3.” The inputs used for valuing securities are not necessarily an indication of the risks associated with investing in those securities. Short-term securities of sufficient credit quality are generally considered to be Level 2 securities under applicable accounting rules. The Portfolios classify each of their investments in the Underlying Funds as Level 1, without consideration as to the classification level of the specific investments held by the Underlying Funds. A table summarizing the Portfolios’ investments under these levels of classification is included within the Portfolio of Investments.
GAAP requires a reconciliation of the beginning to ending balances for reported fair values that presents changes
attributable to total realized and unrealized gains or losses, purchases and sales, and transfers in or out of the Level 3 category during the period. A reconciliation of Level 3 investments within the Portfolio of Investments is presented only when a Portfolio has a significant amount of Level 3 investments.
B. Securities Transactions and Revenue Recognition. Securities transactions are accounted for on the trade date. Dividend income received from the Underlying Funds is recognized on the ex-dividend date and is recorded as dividends from underlying funds in the Statements of Operations. Capital gain distributions received from the Underlying Funds are recognized on the ex-dividend date and are recorded on the Statements of Operations as such. Realized gains and losses are reported on the basis of identified cost of securities sold.
C. Distributions to Shareholders. The Portfolios record distributions to their shareholders on the ex-dividend date. Each Portfolio declares and pays dividends from net investment income and capital gain distributions, if any, annually. The Portfolios may make distributions on a more frequent basis to comply with the distribution requirements of the Internal Revenue Code. The characteristics of income and gains to be distributed are determined in accordance with income tax regulations, which may differ from GAAP for investment companies.
D. Federal Income Taxes. It is the policy of each Portfolio to comply with the requirements of subchapter M of the Internal Revenue Code that are applicable to regulated investment companies and to distribute substantially all of its net investment income and any net realized capital gains to its shareholders. Therefore, a federal income tax or excise tax provision is not required. Management has considered the sustainability of the Portfolios’ tax positions taken on federal income tax returns for all open tax years in making this determination. No capital gain distributions shall be made until the capital loss carryforwards have been fully utilized.
The Portfolios may utilize equalization accounting for tax purposes, whereby a portion of redemption payments are treated as distributions of income or gain.
E. Use of Estimates. The preparation of financial statements in conformity with GAAP requires management to make estimates and assumptions that affect the reported amounts of assets and liabilities and disclosure of contingent assets and liabilities at the date of the financial statements and the reported amounts of increases and decreases in net assets from operations during the reporting period. Actual results could differ from those estimates.
NOTES TO FINANCIAL STATEMENTS as of December 31, 2021 (continued)
NOTE 2 — SIGNIFICANT ACCOUNTING POLICIES (continued)
F. Risk Exposures and the Use of Derivative Instruments. Each Portfolio’s investment strategies permit it to enter into various types of derivatives contracts, including, but not limited to, futures contracts. In doing so, a Portfolio will employ strategies in differing combinations to permit it to increase or decrease the level of risk, or change the level or types of exposure to risk factors. This may allow a Portfolio to pursue its objectives more quickly and efficiently than if it were to make direct purchases or sales of securities capable of affecting a similar response to market or credit factors.
In pursuit of its investment objectives, a Portfolio may seek to increase or decrease its exposure to the following market or credit risk factors:
Equity Risk. Stock prices may be volatile or have reduced liquidity in response to real or perceived impacts of factors including, but not limited to, economic conditions, changes in market interest rates, and political events. Stock markets tend to be cyclical, with periods when stock prices generally rise and periods when stock prices generally decline. Any given stock market segment may remain out of favor with investors for a short or long period of time, and stocks as an asset class may underperform bonds or other asset classes during some periods. Additionally, legislative, regulatory or tax policies or developments in these areas may adversely impact the investment techniques available to a manager, add to costs and impair the ability of a Portfolio to achieve its investment objectives.
Risks of Investing in Derivatives. Each Portfolio’s use of derivatives can result in losses due to unanticipated changes in the market or credit risk factors and the overall market. In instances where a Portfolio is using derivatives to decrease, or hedge, exposures to market or credit risk factors for securities held by a Portfolio, there are also risks that those derivatives may not perform as expected resulting in losses for the combined or hedged positions.
Derivative instruments are subject to a number of risks, including the risk of changes in the market price of the underlying securities, credit risk with respect to the counterparty, risk of loss due to changes in market interest rates and liquidity and volatility risk. The amounts required to purchase certain derivatives may be small relative to the magnitude of exposure assumed by a Portfolio. Therefore, the purchase of certain derivatives may have an economic leveraging effect on a Portfolio and exaggerate any increase or decrease in the NAV. Derivatives may not perform as expected, so a Portfolio may not realize the intended benefits. When used for hedging purposes, the change in value of a derivative may not correlate as expected with the currency, security or other risk being
hedged. When used as an alternative or substitute for direct cash investments, the return provided by the derivative may not provide the same return as direct cash investment. In addition, given their complexity, derivatives expose a Portfolio to the risk of improper valuation.
Generally, derivatives are sophisticated financial instruments whose performance is derived, at least in part, from the performance of an underlying asset or assets. Derivatives include, among other things, swap agreements, options, forwards and futures. Investments in derivatives are generally negotiated OTC with a single counterparty and as a result are subject to credit risks related to the counterparty’s ability or willingness to perform its obligations; any deterioration in the counterparty’s creditworthiness could adversely affect the value of the derivative. In addition, derivatives and their underlying securities may experience periods of illiquidity which could cause a Portfolio to hold a security it might otherwise sell, or to sell a security it otherwise might hold at inopportune times or at an unanticipated price. A manager might imperfectly judge the direction of the market. For instance, if a derivative is used as a hedge to offset investment risk in another security, the hedge might not correlate to the market’s movements and may have unexpected or undesired results such as a loss or a reduction in gains.
G. Futures Contracts. Certain Portfolios may enter into futures contracts involving foreign currency, interest rates, securities and security indices. A futures contract is a commitment to buy or sell a specific amount of a financial instrument at a negotiated price on a stipulated future date. A Portfolio may buy and sell futures contracts. Futures contracts traded on a commodities or futures exchange will be valued at the final settlement price or official closing price on the principal exchange as reported by such principal exchange at its trading session ending at, or most recently prior to, the time when each Portfolio’s assets are valued.
Upon entering into a futures contract, a Portfolio is required to deposit either cash or securities (initial margin) in an amount equal to a certain percentage of the contract value. Subsequent payments (variation margin) are made or received by a Portfolio each day. The variation margin payments are equal to the daily changes in the contract value and are recorded as unrealized gains and losses and, if any, shown as variation margin receivable or payable on futures contracts on the Statement of Assets and Liabilities. Open futures contracts are reported on a table following each Portfolio’s Portfolio of Investments. Securities held in collateralized accounts to cover initial margin requirements on open futures contracts, if any, are footnoted in the Portfolio of Investments. Cash collateral
NOTES TO FINANCIAL STATEMENTS as of December 31, 2021 (continued)
NOTE 2 — SIGNIFICANT ACCOUNTING POLICIES (continued)
held by the broker to cover initial margin requirements on open futures contracts are noted in the Statements of Assets and Liabilities. The net change in unrealized appreciation and depreciation is reported in the Statements of Operations. Realized gains (losses) are reported in the Statements of Operations at the closing or expiration of futures contracts.
Futures contracts are exposed to the market risk factor of the underlying financial instrument. During the year ended December 31, 2021, certain Portfolios used futures to enact tactical positions and to provide the Portfolios with greater liquidity. Certain Portfolios had purchased and sold futures contracts on various equity indices and also purchased and sold futures contracts on various U.S. Treasury Notes and Bonds. Futures contracts are purchased to provide immediate market exposure proportionate to the size of the Portfolio’s respective cash flows and residual cash balances in order to decrease potential tracking error if the cash remained uninvested in the market. Additional associated risks of entering into futures contracts include the possibility that there may be an illiquid market where the Portfolios are unable to liquidate the contract or enter into an offsetting position and, if used for hedging purposes, the risk that the price of the contract will correlate imperfectly with the prices of the Portfolios’ securities. With futures, there is minimal counterparty credit risk to the Portfolios since futures are exchange traded and the exchange’s clearinghouse, as counterparty to all exchange traded futures, guarantees the futures against default.
During the year ended December 31, 2021, the following Portfolios had average notional values on futures contracts purchased and sold as disclosed below. There were no open futures contracts for any Portfolio at December 31, 2021.
| | | | Purchased | | | Sold | |
| Solution Income | | | | $ | 4,945,455 | | | | | $ | 4,957,647 | | |
| Solution Moderately Aggressive | | | | | 9,443,465 | | | | | | 9,104,230 | | |
| Solution 2025 | | | | | 9,443,465 | | | | | | 9,453,010 | | |
| Solution 2035 | | | | | 13,527,380 | | | | | | 13,495,680 | | |
| Solution 2045 | | | | | 13,180,880 | | | | | | 13,096,877 | | |
| Solution 2055 | | | | | 3,498,000 | | | | | | 3,488,886 | | |
H. Offering Costs. Costs incurred with the offering of shares of a Portfolio are deferred and amortized over a twelve month period on a straight-line basis starting at the commencement of operations.
I. Indemnifications. In the normal course of business, the Company may enter into contracts that provide certain indemnifications. The Company’s maximum exposure under these arrangements is dependent on future claims
that may be made against the Portfolios and, therefore, cannot be estimated; however, based on experience, management considers the risk of loss from such claims remote.
NOTE 3 — INVESTMENTS IN UNDERLYING FUNDS
For the year ended December 31, 2021, the cost of purchases and the proceeds from sales of the Underlying Funds were as follows:
| | | | Purchases | | | Sales | |
| Solution Aggressive | | | | $ | 17,465,548 | | | | | $ | 16,588,369 | | |
| Solution Balanced | | | | | 30,702,943 | | | | | | 30,089,942 | | |
| Solution Conservative | | | | | 9,914,880 | | | | | | 8,886,552 | | |
| Solution Income | | | | | 104,170,728 | | | | | | 141,339,530 | | |
| Solution Moderately Aggressive | | | | | 255,982,993 | | | | | | 326,745,997 | | |
| Solution Moderately Conservative | | | | | 19,658,502 | | | | | | 20,918,551 | | |
| Solution 2025 | | | | | 222,408,031 | | | | | | 295,236,904 | | |
| Solution 2030 | | | | | 30,695,049 | | | | | | 33,659,091 | | |
| Solution 2035 | | | | | 285,599,496 | | | | | | 351,988,750 | | |
| Solution 2040 | | | | | 26,234,007 | | | | | | 29,266,520 | | |
| Solution 2045 | | | | | 217,744,525 | | | | | | 263,177,058 | | |
| Solution 2050 | | | | | 21,583,822 | | | | | | 26,741,068 | | |
| Solution 2055 | | | | | 88,105,977 | | | | | | 101,225,870 | | |
| Solution 2060 | | | | | 17,058,770 | | | | | | 18,560,225 | | |
| Solution 2065 | | | | | 4,453,276 | | | | | | 2,246,652 | | |
NOTE 4 — INVESTMENT MANAGEMENT FEES
The Portfolios have entered into an investment management agreement (“Management Agreement”) with the Investment Adviser. The Investment Adviser has overall responsibility for the management of the Portfolios. The Investment Adviser oversees all investment management and portfolio management services for the Portfolios and assists in managing and supervising all aspects of the general day-to-day business activities and operations of the Portfolios, including custodial, transfer agency, dividend disbursing, accounting, auditing, compliance and related services. This Management Agreement compensates the Investment Adviser with a management fee, computed daily and payable monthly, based on the average daily net assets of each Portfolio, at the following annual rates: 0.20% of each Portfolio’s average daily nets assets invested in affiliated Underlying Funds and 0.40% of each Portfolio’s average daily net assets invested in unaffiliated Underlying Funds and/or other direct investments.
The Investment Adviser has entered into a sub-advisory agreement with Voya IM with respect to each Portfolio. Voya IM provides investment advice for the Portfolios and is paid by the Investment Adviser based on the average daily net assets of each respective Portfolio. Subject to such policies as the Board or the Investment Adviser may determine, Voya IM manages the Portfolios’ assets in accordance with the Portfolios’ investment objectives, policies, and limitations.
NOTES TO FINANCIAL STATEMENTS as of December 31, 2021 (continued)
NOTE 5 — DISTRIBUTION AND SERVICE FEES
Classes ADV, S2 and T of the respective Portfolios have a plan of distribution (each a “Plan” and collectively, the “Plans”), whereby the Distributor is reimbursed or compensated by the Portfolios for expenses incurred in the distribution of each Portfolio’s shares. The Distributor may pay, on behalf of each Portfolio, out of its distribution fee, compensation to certain financial institutions for providing distribution assistance pursuant to a Distribution Services Agreement. Under the Plans, each Portfolio makes payments to the Distributor at an annual rate of 0.25% of each Portfolio’s average daily net assets attributable to its Class ADV shares and each Portfolio makes payments to the Distributor at an annual rate of 0.15% and 0.45% of each Portfolio’s average daily net assets attributable to its Class S2 and Class T shares, respectively.
The Company has a shareholder servicing plan (“Service Plan”) for the Classes ADV, S, S2 and T shares of each respective Portfolio. The Service Plan allows the Distributor to enter into shareholder servicing agreements with insurance companies, broker dealers or other financial intermediaries that provide administrative services related to Classes ADV, S, S2 and T shares and their shareholders including Variable Contract owners or Qualified Plan participants with interests in the Portfolios. Under the Service Plan, each Portfolio makes payments to the Distributor which shall not exceed an annual rate of 0.25% of each applicable Portfolio’s average daily net assets attributable to its Classes ADV, S, S2 and T shares.
NOTE 6 — OTHER TRANSACTIONS WITH AFFILIATES AND RELATED PARTIES
At December 31, 2021, the following direct or indirect, wholly-owned subsidiaries of Voya Financial, Inc. owned more than 5% of the following Portfolios:
| Subsidiary | | | Portfolio | | | Percentage | |
| Voya Institutional Trust Company | | | Solution Balanced | | | | | 7.20% | | |
| | | | Solution Conservative | | | | | 7.55 | | |
| | | | Solution Income | | | | | 40.60 | | |
| | | | Solution 2025 | | | | | 27.50 | | |
| | | | Solution 2030 | | | | | 22.42 | | |
| | | | Solution 2035 | | | | | 23.70 | | |
| | | | Solution 2040 | | | | | 20.80 | | |
| | | | Solution 2045 | | | | | 21.22 | | |
| | | | Solution 2050 | | | | | 21.64 | | |
| | | | Solution 2055 | | | | | 17.11 | | |
| | | | Solution 2060 | | | | | 17.75 | | |
| | | | Solution 2065 | | | | | 8.01 | | |
| Voya Investment Management Co. LLC | | | Solution 2065 | | | | | 47.44 | | |
| Voya Retirement Insurance and Annuity Company | | | Solution Aggressive | | | | | 97.16 | | |
| | | | Solution Balanced | | | | | 92.80 | | |
| Subsidiary | | | Portfolio | | | Percentage | |
Voya Retirement Insurance and
Annuity Company (continued) | | | Solution Conservative | | | | | 92.45 | | |
| | | | Solution Income | | | | | 53.65 | | |
| | | | Solution Moderately Aggressive | | | | | 7.70 | | |
| | | | Solution Moderately Conservative | | | | | 98.89 | | |
| | | | Solution 2025 | | | | | 68.93 | | |
| | | | Solution 2030 | | | | | 77.44 | | |
| | | | Solution 2035 | | | | | 73.34 | | |
| | | | Solution 2040 | | | | | 79.17 | | |
| | | | Solution 2045 | | | | | 77.51 | | |
| | | | Solution 2050 | | | | | 78.35 | | |
| | | | Solution 2055 | | | | | 82.72 | | |
| | | | Solution 2060 | | | | | 82.23 | | |
| | | | Solution 2065 | | | | | 44.55 | | |
The Portfolios have adopted a deferred compensation plan (the “DC Plan”), which allows eligible independent directors, as described in the DC Plan, to defer the receipt of all or a portion of the directors’ fees that they are entitled to receive from the Portfolios. For purposes of determining the amount owed to the director under the DC Plan, the amounts deferred are invested in shares of the funds selected by the director (the “Notional Funds”). When the Portfolios purchase shares of the Notional Funds, which are all advised by Voya Investments, in amounts equal to the directors’ deferred fees, this results in a Portfolio asset equal to the deferred compensation liability. Such assets, if applicable, are included as a component of “Other assets” on the accompanying Statements of Assets and Liabilities. Deferral of directors’ fees under the DC Plan will not affect net assets of the Portfolios, and will not materially affect the Portfolios’ assets, liabilities or net investment income per share. Amounts will be deferred until distributed in accordance with the DC Plan.
The Portfolios may pay per account fees to affiliates of Voya Investments for recordkeeping services provided on certain assets. For the year ended December 31, 2021, the per account fees for affiliated recordkeeping services paid by each Portfolio were as follows:
| Portfolio | | | Amount | |
| Solution Aggressive | | | | $ | 10,683 | | |
| Solution Balanced | | | | | 23,791 | | |
| Solution Conservative | | | | | 6,259 | | |
| Solution Income | | | | | 152,057 | | |
| Solution Moderately Aggressive | | | | | 34,844 | | |
| Solution Moderately Conservative | | | | | 28,471 | | |
| Solution 2025 | | | | | 274,362 | | |
| Solution 2030 | | | | | 42,596 | | |
| Solution 2035 | | | | | 363,100 | | |
| Solution 2040 | | | | | 44,807 | | |
NOTES TO FINANCIAL STATEMENTS as of December 31, 2021 (continued)
NOTE 6 — OTHER TRANSACTIONS WITH AFFILIATES AND RELATED PARTIES (continued)
| Portfolio | | | Amount | |
| Solution 2045 | | | | $ | 386,389 | | |
| Solution 2050 | | | | | 56,024 | | |
| Solution 2055 | | | | | 244,742 | | |
| Solution 2060 | | | | | 61,230 | | |
| Solution 2065 | | | | | 2,974 | | |
NOTE 7 — EXPENSE LIMITATION AGREEMENT
The Investment Adviser has entered into a written expense limitation agreement (“Expense Limitation Agreement”) with each Portfolio whereby the Investment Adviser has agreed to limit expenses, excluding interest, taxes, investment-related costs, leverage expenses, and extraordinary expenses to the levels listed below:
Portfolio(1) | | | Class
ADV | | | Class
I | | | Class
R6 | | | Class
S | | | Class
S2 | | | Class
T | |
| Solution Aggressive | | | | | 1.39% | | | | | | 0.89% | | | | | | 0.89% | | | | | | 1.14% | | | | | | 1.29% | | | | | | N/A | | |
| Solution Balanced | | | | | 1.30% | | | | | | 0.80% | | | | | | 0.80% | | | | | | 1.05% | | | | | | 1.20% | | | | | | N/A | | |
| Solution Conservative | | | | | 1.16% | | | | | | 0.66% | | | | | | 0.66% | | | | | | 0.91% | | | | | | 1.06% | | | | | | N/A | | |
| Solution Income | | | | | 1.18% | | | | | | 0.68% | | | | | | N/A | | | | | | 0.93% | | | | | | 1.08% | | | | | | 1.38% | | |
| Solution Moderately Aggressive | | | | | 1.38% | | | | | | 0.88% | | | | | | 0.88% | | | | | | 1.13% | | | | | | 1.28% | | | | | | N/A | | |
| Solution Moderately Conservative | | | | | 1.24% | | | | | | 0.74% | | | | | | 0.74% | | | | | | 0.99% | | | | | | 1.14% | | | | | | N/A | | |
| Solution 2025 | | | | | 1.28% | | | | | | 0.78% | | | | | | N/A | | | | | | 1.03% | | | | | | 1.18% | | | | | | 1.48% | | |
| Solution 2030 | | | | | 1.29% | | | | | | 0.79% | | | | | | N/A | | | | | | 1.04% | | | | | | 1.19% | | | | | | 1.49% | | |
| Solution 2035 | | | | | 1.33% | | | | | | 0.83% | | | | | | N/A | | | | | | 1.08% | | | | | | 1.23% | | | | | | 1.53% | | |
| Solution 2040 | | | | | 1.33% | | | | | | 0.83% | | | | | | N/A | | | | | | 1.08% | | | | | | 1.23% | | | | | | 1.53% | | |
| Solution 2045 | | | | | 1.36% | | | | | | 0.86% | | | | | | N/A | | | | | | 1.11% | | | | | | 1.26% | | | | | | 1.56% | | |
| Solution 2050 | | | | | 1.36% | | | | | | 0.86% | | | | | | N/A | | | | | | 1.11% | | | | | | 1.26% | | | | | | 1.56% | | |
| Solution 2055 | | | | | 1.36% | | | | | | 0.86% | | | | | | N/A | | | | | | 1.11% | | | | | | 1.26% | | | | | | 1.56% | | |
| Solution 2060 | | | | | 1.37% | | | | | | 0.87% | | | | | | N/A | | | | | | 1.12% | | | | | | 1.27% | | | | | | 1.57% | | |
| Solution 2065 | | | | | 1.37% | | | | | | 0.87% | | | | | | N/A | | | | | | 1.12% | | | | | | 1.27% | | | | | | 1.57% | | |
Pursuant to a side letter agreement, through May 1, 2022, the Investment Adviser has further lowered the expense limits for the following Portfolios. If the Investment Adviser elects not to renew the side letter agreement, the expense limits will revert to the limits listed in the table above. There is no guarantee that this side letter agreements will continue. Termination or modification of this obligation requires approval by the Board.
Portfolio(1)(2)(3) | | | Class
ADV | | | Class
I | | | Class
S | | | Class
S2 | | | Class
T | |
| Solution 2025 | | | | | 1.22% | | | | | | 0.72% | | | | | | 0.97% | | | | | | 1.12% | | | | | | 1.42% | | |
| Solution 2030 | | | | | 1.22% | | | | | | 0.72% | | | | | | 0.97% | | | | | | 1.12% | | | | | | 1.42% | | |
| Solution 2035 | | | | | 1.23% | | | | | | 0.73% | | | | | | 0.98% | | | | | | 1.13% | | | | | | 1.43% | | |
| Solution 2040 | | | | | 1.23% | | | | | | 0.73% | | | | | | 0.98% | | | | | | 1.13% | | | | | | 1.43% | | |
| Solution 2045 | | | | | 1.25% | | | | | | 0.75% | | | | | | 1.00% | | | | | | 1.15% | | | | | | 1.45% | | |
Portfolio(1)(2)(3) | | | Class
ADV | | | Class
I | | | Class
S | | | Class
S2 | | | Class
T | |
| Solution 2050 | | | | | 1.26% | | | | | | 0.76% | | | | | | 1.01% | | | | | | 1.16% | | | | | | 1.46% | | |
| Solution 2055 | | | | | 1.28% | | | | | | 0.78% | | | | | | 1.03% | | | | | | 1.18% | | | | | | 1.48% | | |
| Solution 2060 | | | | | 1.30% | | | | | | 0.80% | | | | | | 1.05% | | | | | | 1.20% | | | | | | 1.50% | | |
| Solution 2065 | | | | | 1.30% | | | | | | 0.80% | | | | | | 1.05% | | | | | | 1.20% | | | | | | 1.50% | | |
(1)
The operating expense limits take into account the operating expenses incurred at the Underlying Fund level. The amount of fees and expenses of an Underlying Fund borne by each Portfolio will vary based on each Portfolio’s allocation of assets to, and the net expenses of, a particular Underlying Fund.
(2)
Any fees waived pursuant to the side letter agreement shall not be eligible for recoupment.
(3)
Prior to January 1, 2021, the side letter expense limits for the following Portfolios were as follows:
| Portfolio | | | Class
ADV | | | Class
I | | | Class
S | | | Class
S2 | | | Class
T | |
| Solution 2025 | | | | | 1.24% | | | | | | 0.74% | | | | | | 0.99% | | | | | | 1.14% | | | | | | 1.44% | | |
| Solution 2030 | | | | | 1.24% | | | | | | 0.74% | | | | | | 0.99% | | | | | | 1.14% | | | | | | 1.44% | | |
| Solution 2035 | | | | | 1.27% | | | | | | 0.77% | | | | | | 1.02% | | | | | | 1.17% | | | | | | 1.47% | | |
| Solution 2040 | | | | | 1.27% | | | | | | 0.77% | | | | | | 1.02% | | | | | | 1.17% | | | | | | 1.47% | | |
| Solution 2045 | | | | | 1.30% | | | | | | 0.80% | | | | | | 1.05% | | | | | | 1.20% | | | | | | 1.50% | | |
| Solution 2050 | | | | | 1.30% | | | | | | 0.80% | | | | | | 1.05% | | | | | | 1.20% | | | | | | 1.50% | | |
| Solution 2055 | | | | | 1.30% | | | | | | 0.80% | | | | | | 1.05% | | | | | | 1.20% | | | | | | 1.50% | | |
Unless otherwise specified above, the Investment Adviser may at a later date recoup from a Portfolio for fees waived and/or other expenses reimbursed by the Investment Adviser during the previous 36 months, but only if, after such recoupment, a Portfolio’s expense ratio does not exceed the percentage described above. Waived and reimbursed fees net of any recoupment by the Investment Adviser of such waived and reimbursed fees are reflected on the accompanying Statements of Operations. Amounts payable by the Investment Adviser are reflected on the accompanying Statements of Assets and Liabilities.
As of December 31, 2021 the amounts of waived and/or reimbursed fees that are subject to possible recoupment by the Investment Adviser and the related expiration dates are as follows:
| | | | December 31, | | | | | | | |
| | | | 2022 | | | 2023 | | | 2024 | | | Total | |
| Solution Aggressive | | | | $ | 32,432 | | | | | $ | 14,037 | | | | | $ | 4,182 | | | | | $ | 50,651 | | |
| Solution Balanced | | | | | 37,237 | | | | | | 5,312 | | | | | | 90 | | | | | | 42,639 | | |
| Solution Conservative | | | | | 46,641 | | | | | | 33,047 | | | | | | 29,745 | | | | | | 109,433 | | |
| Solution Income | | | | | 235,911 | | | | | | 310,007 | | | | | | 270,803 | | | | | | 816,721 | | |
| Solution Moderately Conservative | | | | | 48,667 | | | | | | 38,599 | | | | | | 34,837 | | | | | | 122,103 | | |
In addition to the above waived and/or reimbursed fees, the amount of class specific fees waived or reimbursed that are subject to possible recoupment by the Investment Adviser, and the related expiration dates, as of December 31, 2021, are as follows:
NOTES TO FINANCIAL STATEMENTS as of December 31, 2021 (continued)
NOTE 7 — EXPENSE LIMITATION AGREEMENT (continued)
| | | | December 31, | | | | | | | |
| | | | 2022 | | | 2023 | | | 2024 | | | Total | |
| Solution Aggressive | | | | | | | | | | | | | | | | | | | | | | | | | |
| Class ADV | | | | $ | — | | | | | $ | 3,688 | | | | | $ | 4,275 | | | | | $ | 7,963 | | |
| Class I | | | | | — | | | | | | 356 | | | | | | 394 | | | | | | 750 | | |
| Class S | | | | | — | | | | | | 4,005 | | | | | | 4,422 | | | | | | 8,427 | | |
| Class S2 | | | | | — | | | | | | 1,849 | | | | | | 1,596 | | | | | | 3,445 | | |
| Solution Balanced | | | | | | | | | | | | | | | | | | | | | | | | | |
| Class ADV | | | | | — | | | | | | 6,023 | | | | | | 5,606 | | | | | | 11,629 | | |
| Class I | | | | | — | | | | | | 1,469 | | | | | | 1,884 | | | | | | 3,353 | | |
| Class S | | | | | — | | | | | | 11,837 | | | | | | 12,465 | | | | | | 24,302 | | |
| Class S2 | | | | | — | | | | | | 1,316 | | | | | | 862 | | | | | | 2,178 | | |
| Solution Conservative | | | | | | | | | | | | | | | | | | | | | | | | | |
| Class ADV | | | | | — | | | | | | 2,791 | | | | | | 3,101 | | | | | | 5,892 | | |
| Class I | | | | | — | | | | | | 200 | | | | | | 407 | | | | | | 607 | | |
| Class S | | | | | — | | | | | | 1,238 | | | | | | 1,770 | | | | | | 3,008 | | |
| Class S2 | | | | | — | | | | | | 526 | | | | | | 986 | | | | | | 1,512 | | |
| Solution Moderately Conservative | | | | | | | | | | | | | | | | | | | |
| Class ADV | | | | | — | | | | | | 5,919 | | | | | | 5,600 | | | | | | 11,519 | | |
| Class I | | | | | — | | | | | | 33 | | | | | | 71 | | | | | | 104 | | |
| Class S | | | | | — | | | | | | 16,528 | | | | | | 18,389 | | | | | | 34,917 | | |
| Class S2 | | | | | — | | | | | | 4,380 | | | | | | 4,497 | | | | | | 8,877 | | |
The Expense Limitation Agreement is contractual through May 1, 2022 for all Portfolios and shall renew automatically for one-year terms. Termination or modification of this obligation requires approval by the Board.
NOTE 8 — LINE OF CREDIT
Effective June 14, 2021, the Portfolios, in addition to certain other funds managed by the Investment Adviser, entered into a 364-day unsecured committed revolving line of credit agreement (the “Credit Agreement”) with The
Bank of New York Mellon (“BNY”) for an aggregate amount of $400,000,000 through June 13, 2022. The proceeds may be used only to finance temporarily: (1) the purchase or sale of investment securities; or (2) the repurchase or redemption of shares of a Portfolio or certain other funds managed by the Investment Adviser. The funds to which the line of credit is available pay a commitment fee equal to 0.15% per annum on the daily unused portion of the committed line amount payable quarterly in arrears. Prior to June 14, 2021, the predecessor line of credit was for an aggregate amount of $400,000,000 and the funds to which the line of credit was available paid a commitment fee equal to 0.15% per annum on the daily unused portion of the committed line amount through June 14, 2021.
Borrowings under the Credit Agreement accrue interest at the federal funds rate plus a specified margin. Repayments generally must be made within 60 days after the date of a revolving credit advance.
The following Portfolios utilized the line of credit during the year ended December 31, 2021:
| Portfolio | | | Days
Utilized | | | Approximate
Average
Daily
Balance For
Days Utilized | | | Approximate
Weighted
Average
Interest Rate
For Days
Utilized | |
| Solution Income | | | | | 2 | | | | | $ | 1,704,500 | | | | | | 1.31% | | |
| Solution Moderately Aggressive | | | | | 3 | | | | | | 2,812,000 | | | | | | 1.30 | | |
| Solution 2025 | | | | | 2 | | | | | | 4,676,500 | | | | | | 1.29 | | |
| Solution 2035 | | | | | 4 | | | | | | 5,434,750 | | | | | | 1.28 | | |
| Solution 2040 | | | | | 2 | | | | | | 791,500 | | | | | | 1.30 | | |
| Solution 2045 | | | | | 3 | | | | | | 5,432,333 | | | | | | 1.30 | | |
| Solution 2050 | | | | | 2 | | | | | | 724,000 | | | | | | 1.30 | | |
| Solution 2055 | | | | | 3 | | | | | | 2,618,667 | | | | | | 1.28 | | |
NOTE 9 — CAPITAL SHARES
Transactions in capital shares and dollars were as follows:
| | | | Shares
sold | | | Shares
issued in
merger | | | Reinvestment
of
distributions | | | Shares
redeemed | | | Net increase
(decrease)
in shares
outstanding | | | Shares
sold | | | Proceeds
from shares
issued in
merger | | | Reinvestment
of
distributions | | | Shares
redeemed | | | Net increase
(decrease) | |
Year or
period ended | | | # | | | # | | | # | | | # | | | # | | | ($) | | | ($) | | | ($) | | | ($) | | | ($) | |
| Solution Aggressive | |
| Class ADV | | | | | | | | | | | | | | | | | | | | | | | | | | | | | | | | | | | | | | | | | | | | | | | | | | | | | | | | | | | | | |
| 12/31/2021 | | | | | 61,555 | | | | | | — | | | | | | 2,313 | | | | | | (65,115) | | | | | | (1,247) | | | | | | 952,159 | | | | | | — | | | | | | 36,612 | | | | | | (1,005,199) | | | | | | (16,428) | | |
| 12/31/2020 | | | | | 89,098 | | | | | | — | | | | | | 21,601 | | | | | | (129,063) | | | | | | (18,364) | | | | | | 1,087,710 | | | | | | — | | | | | | 256,190 | | | | | | (1,602,218) | | | | | | (258,318) | | |
| Class I | | | | | | | | | | | | | | | | | | | | | | | | | | | | | | | | | | | | | | | | | | | | | | | | | | | | | | | | | | | | | |
| 12/31/2021 | | | | | 9,515 | | | | | | — | | | | | | 326 | | | | | | (1,549) | | | | | | 8,292 | | | | | | 153,652 | | | | | | — | | | | | | 5,299 | | | | | | (25,111) | | | | | | 133,840 | | |
| 12/31/2020 | | | | | 9,644 | | | | | | — | | | | | | 1,387 | | | | | | (35,192) | | | | | | (24,161) | | | | | | 123,057 | | | | | | — | | | | | | 16,865 | | | | | | (358,654) | | | | | | (218,732) | | |
| Class R6 | | | | | | | | | | | | | | | | | | | | | | | | | | | | | | | | | | | | | | | | | | | | | | | | | | | | | | | | | | | | | |
| 12/31/2021 | | | | | 285,716 | | | | | | — | | | | | | 14,236 | | | | | | (188,103) | | | | | | 111,849 | | | | | | 4,569,068 | | | | | | — | | | | | | 231,482 | | | | | | (2,972,817) | | | | | | 1,827,733 | | |
| 12/31/2020 | | | | | 337,209 | | | | | | — | | | | | | 87,498 | | | | | | (159,540) | | | | | | 265,167 | | | | | | 4,255,365 | | | | | | — | | | | | | 1,063,984 | | | | | | (2,068,046) | | | | | | 3,251,303 | | |
| Class S | | | | | | | | | | | | | | | | | | | | | | | | | | | | | | | | | | | | | | | | | | | | | | | | | | | | | | | | | | | | | |
| 12/31/2021 | | | | | 49,740 | | | | | | — | | | | | | 2,906 | | | | | | (47,375) | | | | | | 5,271 | | | | | | 771,813 | | | | | | — | | | | | | 46,644 | | | | | | (751,172) | | | | | | 67,285 | | |
| 12/31/2020 | | | | | 53,653 | | | | | | — | | | | | | 23,804 | | | | | | (113,791) | | | | | | (36,334) | | | | | | 652,888 | | | | | | — | | | | | | 285,893 | | | | | | (1,417,509) | | | | | | (478,728) | | |
| Class S2 | | | | | | | | | | | | | | | | | | | | | | | | | | | | | | | | | | | | | | | | | | | | | | | | | | | | | | | | | | | | | |
| 12/31/2021 | | | | | 19,489 | | | | | | — | | | | | | 689 | | | | | | (80,107) | | | | | | (59,929) | | | | | | 293,503 | | | | | | — | | | | | | 10,846 | | | | | | (1,193,442) | | | | | | (889,093) | | |
| 12/31/2020 | | | | | 47,125 | | | | | | — | | | | | | 11,589 | | | | | | (29,393) | | | | | | 29,321 | | | | | | 567,480 | | | | | | — | | | | | | 136,405 | | | | | | (353,406) | | | | | | 350,479 | | |
NOTES TO FINANCIAL STATEMENTS as of December 31, 2021 (continued)
NOTE 9 — CAPITAL SHARES (continued)
| | | | Shares
sold | | | Shares
issued in
merger | | | Reinvestment
of
distributions | | | Shares
redeemed | | | Net increase
(decrease)
in shares
outstanding | | | Shares
sold | | | Proceeds
from shares
issued in
merger | | | Reinvestment
of
distributions | | | Shares
redeemed | | | Net increase
(decrease) | |
Year or
period ended | | | # | | | # | | | # | | | # | | | # | | | ($) | | | ($) | | | ($) | | | ($) | | | ($) | |
| Solution Balanced | |
| Class ADV | | | | | | | | | | | | | | | | | | | | | | | | | | | | | | | | | | | | | | | | | | | | | | | | | | | | | | | | | | | | | |
| 12/31/2021 | | | | | 113,708 | | | | | | — | | | | | | 13,943 | | | | | | (146,888) | | | | | | (19,237) | | | | | | 1,242,911 | | | | | | — | | | | | | 155,467 | | | | | | (1,579,480) | | | | | | (181,102) | | |
| 12/31/2020 | | | | | 94,757 | | | | | | — | | | | | | 69,781 | | | | | | (332,053) | | | | | | (167,515) | | | | | | 890,391 | | | | | | — | | | | | | 641,988 | | | | | | (3,189,844) | | | | | | (1,657,465) | | |
| Class I | | | | | | | | | | | | | | | | | | | | | | | | | | | | | | | | | | | | | | | | | | | | | | | | | | | | | | | | | | | | | |
| 12/31/2021 | | | | | 41,710 | | | | | | — | | | | | | 5,702 | | | | | | (29,023) | | | | | | 18,389 | | | | | | 479,551 | | | | | | — | | | | | | 66,254 | | | | | | (326,375) | | | | | | 219,430 | | |
| 12/31/2020 | | | | | 119,774 | | | | | | — | | | | | | 16,669 | | | | | | (79,913) | | | | | | 56,530 | | | | | | 1,231,503 | | | | | | — | | | | | | 159,522 | | | | | | (781,833) | | | | | | 609,192 | | |
| Class R6 | | | | | | | | | | | | | | | | | | | | | | | | | | | | | | | | | | | | | | | | | | | | | | | | | | | | | | | | | | | | | |
| 12/31/2021 | | | | | 326,721 | | | | | | — | | | | | | 38,898 | | | | | | (419,515) | | | | | | (53,896) | | | | | | 3,710,784 | | | | | | — | | | | | | 451,989 | | | | | | (4,762,062) | | | | | | (599,289) | | |
| 12/31/2020 | | | | | 442,113 | | | | | | — | | | | | | 149,609 | | | | | | (508,665) | | | | | | 83,057 | | | | | | 4,241,291 | | | | | | — | | | | | | 1,431,759 | | | | | | (5,023,701) | | | | | | 649,349 | | |
| Class S | | | | | | | | | | | | | | | | | | | | | | | | | | | | | | | | | | | | | | | | | | | | | | | | | | | | | | | | | | | | | |
| 12/31/2021 | | | | | 319,745 | | | | | | — | | | | | | 37,686 | | | | | | (186,138) | | | | | | 171,293 | | | | | | 3,573,955 | | | | | | — | | | | | | 425,470 | | | | | | (2,110,009) | | | | | | 1,889,416 | | |
| 12/31/2020 | | | | | 165,753 | | | | | | — | | | | | | 140,147 | | | | | | (475,466) | | | | | | (169,566) | | | | | | 1,553,525 | | | | | | — | | | | | | 1,304,764 | | | | | | (4,482,352) | | | | | | (1,624,063) | | |
| Class S2 | | | | | | | | | | | | | | | | | | | | | | | | | | | | | | | | | | | | | | | | | | | | | | | | | | | | | | | | | | | | | |
| 12/31/2021 | | | | | 17,837 | | | | | | — | | | | | | 1,858 | | | | | | (42,238) | | | | | | (22,543) | | | | | | 198,924 | | | | | | — | | | | | | 20,938 | | | | | | (459,963) | | | | | | (240,101) | | |
| 12/31/2020 | | | | | 38,703 | | | | | | — | | | | | | 17,103 | | | | | | (158,139) | | | | | | (102,333) | | | | | | 364,856 | | | | | | — | | | | | | 158,546 | | | | | | (1,493,083) | | | | | | (969,681) | | |
| Solution Conservative | |
| Class ADV | | | | | | | | | | | | | | | | | | | | | | | | | | | | | | | | | | | | | | | | | | | | | | | | | | | | | | | | | | | | | |
| 12/31/2021 | | | | | 53,123 | | | | | | — | | | | | | 12,311 | | | | | | (123,198) | | | | | | (57,764) | | | | | | 634,400 | | | | | | — | | | | | | 146,010 | | | | | | (1,468,478) | | | | | | (688,068) | | |
| 12/31/2020 | | | | | 52,501 | | | | | | — | | | | | | 17,557 | | | | | | (416,710) | | | | | | (346,652) | | | | | | 584,107 | | | | | | — | | | | | | 195,578 | | | | | | (4,743,058) | | | | | | (3,963,374) | | |
| Class I | | | | | | | | | | | | | | | | | | | | | | | | | | | | | | | | | | | | | | | | | | | | | | | | | | | | | | | | | | | | | |
| 12/31/2021 | | | | | 95,445 | | | | | | — | | | | | | 1,577 | | | | | | (41,279) | | | | | | 55,743 | | | | | | 1,158,541 | | | | | | — | | | | | | 18,829 | | | | | | (509,029) | | | | | | 668,341 | | |
| 12/31/2020 | | | | | 13,918 | | | | | | — | | | | | | 554 | | | | | | (52,202) | | | | | | (37,730) | | | | | | 161,370 | | | | | | — | | | | | | 6,223 | | | | | | (586,834) | | | | | | (419,241) | | |
| Class R6 | | | | | | | | | | | | | | | | | | | | | | | | | | | | | | | | | | | | | | | | | | | | | | | | | | | | | | | | | | | | | |
| 12/31/2021 | | | | | 221,357 | | | | | | — | | | | | | 32,261 | | | | | | (110,457) | | | | | | 143,161 | | | | | | 2,685,988 | | | | | | — | | | | | | 385,202 | | | | | | (1,330,478) | | | | | | 1,740,712 | | |
| 12/31/2020 | | | | | 404,463 | | | | | | — | | | | | | 31,559 | | | | | | (273,663) | | | | | | 162,359 | | | | | | 4,639,656 | | | | | | — | | | | | | 354,405 | | | | | | (3,140,906) | | | | | | 1,853,155 | | |
| Class S | | | | | | | | | | | | | | | | | | | | | | | | | | | | | | | | | | | | | | | | | | | | | | | | | | | | | | | | | | | | | |
| 12/31/2021 | | | | | 51,005 | | | | | | — | | | | | | 8,305 | | | | | | (62,536) | | | | | | (3,226) | | | | | | 616,065 | | | | | | — | | | | | | 98,834 | | | | | | (747,010) | | | | | | (32,111) | | |
| 12/31/2020 | | | | | 80,278 | | | | | | — | | | | | | 9,831 | | | | | | (153,880) | | | | | | (63,771) | | | | | | 904,470 | | | | | | — | | | | | | 110,012 | | | | | | (1,692,256) | | | | | | (677,774) | | |
| Class S2 | | | | | | | | | | | | | | | | | | | | | | | | | | | | | | | | | | | | | | | | | | | | | | | | | | | | | | | | | | | | | |
| 12/31/2021 | | | | | 21,088 | | | | | | — | | | | | | 4,528 | | | | | | (43,807) | | | | | | (18,191) | | | | | | 248,907 | | | | | | — | | | | | | 53,159 | | | | | | (519,487) | | | | | | (217,421) | | |
| 12/31/2020 | | | | | 102,428 | | | | | | — | | | | | | 5,131 | | | | | | (19,899) | | | | | | 87,660 | | | | | | 1,106,315 | | | | | | — | | | | | | 56,749 | | | | | | (223,372) | | | | | | 939,692 | | |
| Solution Income | |
| Class ADV | | | | | | | | | | | | | | | | | | | | | | | | | | | | | | | | | | | | | | | | | | | | | | | | | | | | | | | | | | | | | |
| 12/31/2021 | | | | | 675,984 | | | | | | — | | | | | | 735,821 | | | | | | (1,846,022) | | | | | | (434,217) | | | | | | 8,686,612 | | | | | | — | | | | | | 9,308,131 | | | | | | (23,814,304) | | | | | | (5,819,561) | | |
| 12/31/2020 | | | | | 499,574 | | | | | | 973,643 | | | | | | 272,254 | | | | | | (2,196,869) | | | | | | (451,398) | | | | | | 5,916,380 | | | | | | 11,732,481 | | | | | | 3,264,320 | | | | | | (25,688,891) | | | | | | (4,775,710) | | |
| Class I | | | | | | | | | | | | | | | | | | | | | | | | | | | | | | | | | | | | | | | | | | | | | | | | | | | | | | | | | | | | | |
| 12/31/2021 | | | | | 487,391 | | | | | | — | | | | | | 208,364 | | | | | | (1,169,532) | | | | | | (473,777) | | | | | | 6,476,050 | | | | | | — | | | | | | 2,702,478 | | | | | | (15,589,002) | | | | | | (6,410,474) | | |
| 12/31/2020 | | | | | 919,878 | | | | | | 631,142 | | | | | | 176,227 | | | | | | (4,704,456) | | | | | | (2,977,209) | | | | | | 11,174,951 | | | | | | 7,781,780 | | | | | | 2,162,299 | | | | | | (60,069,442) | | | | | | (38,950,412) | | |
| Class S | | | | | | | | | | | | | | | | | | | | | | | | | | | | | | | | | | | | | | | | | | | | | | | | | | | | | | | | | | | | | |
| 12/31/2021 | | | | | 401,543 | | | | | | — | | | | | | 504,948 | | | | | | (1,771,685) | | | | | | (865,194) | | | | | | 5,303,129 | | | | | | — | | | | | | 6,498,676 | | | | | | (23,267,459) | | | | | | (11,465,654) | | |
| 12/31/2020 | | | | | 462,318 | | | | | | 773,830 | | | | | | 200,671 | | | | | | (1,997,040) | | | | | | (560,221) | | | | | | 5,586,152 | | | | | | 9,475,047 | | | | | | 2,446,178 | | | | | | (24,068,794) | | | | | | (6,561,417) | | |
| Class S2 | | | | | | | | | | | | | | | | | | | | | | | | | | | | | | | | | | | | | | | | | | | | | | | | | | | | | | | | | | | | | |
| 12/31/2021 | | | | | 117,603 | | | | | | — | | | | | | 31,933 | | | | | | (112,576) | | | | | | 36,960 | | | | | | 1,529,126 | | | | | | — | | | | | | 399,483 | | | | | | (1,445,471) | | | | | | 483,138 | | |
| 12/31/2020 | | | | | 35,927 | | | | | | 37,941 | | | | | | 9,062 | | | | | | (129,729) | | | | | | (46,799) | | | | | | 426,312 | | | | | | 453,071 | | | | | | 107,658 | | | | | | (1,533,250) | | | | | | (546,209) | | |
| Class T | | | | | | | | | | | | | | | | | | | | | | | | | | | | | | | | | | | | | | | | | | | | | | | | | | | | | | | | | | | | | |
| 12/31/2021 | | | | | 538 | | | | | | — | | | | | | 422 | | | | | | (3,174) | | | | | | (2,214) | | | | | | 7,468 | | | | | | — | | | | | | 5,816 | | | | | | (44,676) | | | | | | (31,392) | | |
| 12/31/2020 | | | | | 938 | | | | | | 1,363 | | | | | | 114 | | | | | | (12,332) | | | | | | (9,917) | | | | | | 11,890 | | | | | | 17,732 | | | | | | 1,483 | | | | | | (139,834) | | | | | | (108,729) | | |
| Solution Moderately Aggressive | |
| Class ADV | | | | | | | | | | | | | | | | | | | | | | | | | | | | | | | | | | | | | | | | | | | | | | | | | | | | | | | | | | | | | |
| 12/31/2021 | | | | | 219,131 | | | | | | — | | | | | | 24,650 | | | | | | (350,681) | | | | | | (106,900) | | | | | | 3,085,826 | | | | | | — | | | | | | 356,936 | | | | | | (4,997,545) | | | | | | (1,554,783) | | |
| 12/31/2020 | | | | | 196,866 | | | | | | — | | | | | | 174,267 | | | | | | (436,342) | | | | | | (65,209) | | | | | | 2,297,028 | | | | | | — | | | | | | 1,962,248 | | | | | | (5,012,717) | | | | | | (753,441) | | |
| Class I | | | | | | | | | | | | | | | | | | | | | | | | | | | | | | | | | | | | | | | | | | | | | | | | | | | | | | | | | | | | | |
| 12/31/2021 | | | | | 34,732 | | | | | | — | | | | | | 6,360 | | | | | | (64,880) | | | | | | (23,788) | | | | | | 504,927 | | | | | | — | | | | | | 94,189 | | | | | | (959,559) | | | | | | (360,443) | | |
| 12/31/2020 | | | | | 34,551 | | | | | | — | | | | | | 32,936 | | | | | | (91,257) | | | | | | (23,770) | | | | | | 414,057 | | | | | | — | | | | | | 378,760 | | | | | | (966,414) | | | | | | (173,597) | | |
| Class R6 | | | | | | | | | | | | | | | | | | | | | | | | | | | | | | | | | | | | | | | | | | | | | | | | | | | | | | | | | | | | | |
| 12/31/2021 | | | | | 417,375 | | | | | | — | | | | | | 32,826 | | | | | | (273,853) | | | | | | 176,348 | | | | | | 6,100,490 | | | | | | — | | | | | | 485,492 | | | | | | (3,888,342) | | | | | | 2,697,640 | | |
| 12/31/2020 | | | | | 564,724 | | | | | | — | | | | | | 161,659 | | | | | | (314,905) | | | | | | 411,478 | | | | | | 6,921,450 | | | | | | — | | | | | | 1,857,459 | | | | | | (3,720,594) | | | | | | 5,058,315 | | |
| Class S | | | | | | | | | | | | | | | | | | | | | | | | | | | | | | | | | | | | | | | | | | | | | | | | | | | | | | | | | | | | | |
| 12/31/2021 | | | | | 75,126 | | | | | | — | | | | | | 615,931 | | | | | | (5,635,898) | | | | | | (4,944,841) | | | | | | 1,061,875 | | | | | | — | | | | | | 9,011,067 | | | | | | (80,914,364) | | | | | | (70,841,422) | | |
| 12/31/2020 | | | | | 204,767 | | | | | | — | | | | | | 4,034,877 | | | | | | (6,154,699) | | | | | | (1,915,055) | | | | | | 2,309,295 | | | | | | — | | | | | | 45,876,550 | | | | | | (72,983,967) | | | | | | (24,798,122) | | |
| Class S2 | | | | | | | | | | | | | | | | | | | | | | | | | | | | | | | | | | | | | | | | | | | | | | | | | | | | | | | | | | | | | |
| 12/31/2021 | | | | | 41,980 | | | | | | — | | | | | | 1,922 | | | | | | (18,980) | | | | | | 24,922 | | | | | | 580,816 | | | | | | — | | | | | | 28,117 | | | | | | (263,764) | | | | | | 345,169 | | |
| 12/31/2020 | | | | | 37,790 | | | | | | — | | | | | | 7,546 | | | | | | (17,263) | | | | | | 28,073 | | | | | | 448,159 | | | | | | — | | | | | | 85,953 | | | | | | (210,374) | | | | | | 323,738 | | |
| Solution Moderately Conservative | |
| Class ADV | | | | | | | | | | | | | | | | | | | | | | | | | | | | | | | | | | | | | | | | | | | | | | | | | | | | | | | | | | | | | |
| 12/31/2021 | | | | | 53,984 | | | | | | — | | | | | | 10,895 | | | | | | (152,616) | | | | | | (87,737) | | | | | | 603,076 | | | | | | — | | | | | | 122,461 | | | | | | (1,716,450) | | | | | | (990,913) | | |
| 12/31/2020 | | | | | 56,038 | | | | | | — | | | | | | 31,926 | | | | | | (223,402) | | | | | | (135,438) | | | | | | 559,807 | | | | | | — | | | | | | 314,149 | | | | | | (2,214,131) | | | | | | (1,340,175) | | |
| Class I | | | | | | | | | | | | | | | | | | | | | | | | | | | | | | | | | | | | | | | | | | | | | | | | | | | | | | | | | | | | | |
| 12/31/2021 | | | | | 27,936 | | | | | | — | | | | | | 108 | | | | | | (677) | | | | | | 27,367 | | | | | | 331,441 | | | | | | — | | | | | | 1,270 | | | | | | (7,730) | | | | | | 324,981 | | |
| 12/31/2020 | | | | | 5,194 | | | | | | — | | | | | | 93 | | | | | | (7,959) | | | | | | (2,672) | | | | | | 53,806 | | | | | | — | | | | | | 959 | | | | | | (72,225) | | | | | | (17,460) | | |
NOTES TO FINANCIAL STATEMENTS as of December 31, 2021 (continued)
NOTE 9 — CAPITAL SHARES (continued)
| | | | Shares
sold | | | Shares
issued in
merger | | | Reinvestment
of
distributions | | | Shares
redeemed | | | Net increase
(decrease)
in shares
outstanding | | | Shares
sold | | | Proceeds
from shares
issued in
merger | | | Reinvestment
of
distributions | | | Shares
redeemed | | | Net increase
(decrease) | |
Year or
period ended | | | # | | | # | | | # | | | # | | | # | | | ($) | | | ($) | | | ($) | | | ($) | | | ($) | |
| Solution Moderately Conservative (continued) | |
| Class R6 | | | | | | | | | | | | | | | | | | | | | | | | | | | | | | | | | | | | | | | | | | | | | | | | | | | | | | | | | | | | | |
| 12/31/2021 | | | | | 252,719 | | | | | | — | | | | | | 22,090 | | | | | | (230,125) | | | | | | 44,684 | | | | | | 2,954,723 | | | | | | — | | | | | | 259,334 | | | | | | (2,694,834) | | | | | | 519,223 | | |
| 12/31/2020 | | | | | 294,779 | | | | | | — | | | | | | 37,122 | | | | | | (94,052) | | | | | | 237,849 | | | | | | 3,066,609 | | | | | | — | | | | | | 381,248 | | | | | | (964,932) | | | | | | 2,482,925 | | |
| Class S | | | | | | | | | | | | | | | | | | | | | | | | | | | | | | | | | | | | | | | | | | | | | | | | | | | | | | | | | | | | | |
| 12/31/2021 | | | | | 141,640 | | | | | | — | | | | | | 42,047 | | | | | | (194,521) | | | | | | (10,834) | | | | | | 1,614,812 | | | | | | — | | | | | | 481,441 | | | | | | (2,206,455) | | | | | | (110,202) | | |
| 12/31/2020 | | | | | 152,429 | | | | | | — | | | | | | 93,638 | | | | | | (258,880) | | | | | | (12,813) | | | | | | 1,534,888 | | | | | | — | | | | | | 939,184 | | | | | | (2,530,859) | | | | | | (56,787) | | |
| Class S2 | | | | | | | | | | | | | | | | | | | | | | | | | | | | | | | | | | | | | | | | | | | | | | | | | | | | | | | | | | | | | |
| 12/31/2021 | | | | | 30,748 | | | | | | — | | | | | | 9,919 | | | | | | (102,412) | | | | | | (61,745) | | | | | | 338,573 | | | | | | — | | | | | | 111,682 | | | | | | (1,148,863) | | | | | | (698,608) | | |
| 12/31/2020 | | | | | 49,781 | | | | | | — | | | | | | 25,431 | | | | | | (138,329) | | | | | | (63,117) | | | | | | 499,678 | | | | | | — | | | | | | 250,747 | | | | | | (1,373,822) | | | | | | (623,397) | | |
| Solution 2025 | |
| Class ADV | | | | | | | | | | | | | | | | | | | | | | | | | | | | | | | | | | | | | | | | | | | | | | | | | | | | | | | | | | | | | |
| 12/31/2021 | | | | | 1,196,751 | | | | | | — | | | | | | 1,404,900 | | | | | | (4,098,268) | | | | | | (1,496,617) | | | | | | 14,923,433 | | | | | | — | | | | | | 17,210,023 | | | | | | (51,142,877) | | | | | | (19,009,421) | | |
| 12/31/2020 | | | | | 1,041,966 | | | | | ��� | — | | | | | | 1,295,768 | | | | | | (4,936,510) | | | | | | (2,598,776) | | | | | | 11,559,828 | | | | | | — | | | | | | 14,227,528 | | | | | | (54,463,054) | | | | | | (28,675,698) | | |
| Class I | | | | | | | | | | | | | | | | | | | | | | | | | | | | | | | | | | | | | | | | | | | | | | | | | | | | | | | | | | | | | |
| 12/31/2021 | | | | | 720,869 | | | | | | — | | | | | | 368,787 | | | | | | (2,292,768) | | | | | | (1,203,112) | | | | | | 9,297,777 | | | | | | — | | | | | | 4,665,157 | | | | | | (29,932,125) | | | | | | (15,969,191) | | |
| 12/31/2020 | | | | | 2,994,244 | | | | | | — | | | | | | 1,429,995 | | | | | | (20,472,700) | | | | | | (16,048,461) | | | | | | 34,210,086 | | | | | | — | | | | | | 16,158,946 | | | | | | (249,947,335) | | | | | | (199,578,303) | | |
| Class S | | | | | | | | | | | | | | | | | | | | | | | | | | | | | | | | | | | | | | | | | | | | | | | | | | | | | | | | | | | | | |
| 12/31/2021 | | | | | 1,636,001 | | | | | | — | | | | | | 1,797,330 | | | | | | (3,746,456) | | | | | | (313,125) | | | | | | 20,835,014 | | | | | | — | | | | | | 22,412,706 | | | | | | (47,528,117) | | | | | | (4,280,397) | | |
| 12/31/2020 | | | | | 1,446,795 | | | | | | — | | | | | | 1,555,138 | | | | | | (4,643,941) | | | | | | (1,642,008) | | | | | | 16,382,976 | | | | | | — | | | | | | 17,355,345 | | | | | | (51,982,211) | | | | | | (18,243,890) | | |
| Class S2 | | | | | | | | | | | | | | | | | | | | | | | | | | | | | | | | | | | | | | | | | | | | | | | | | | | | | | | | | | | | | |
| 12/31/2021 | | | | | 191,987 | | | | | | — | | | | | | 70,522 | | | | | | (120,329) | | | | | | 142,180 | | | | | | 2,408,557 | | | | | | — | | | | | | 851,206 | | | | | | (1,476,600) | | | | | | 1,783,163 | | |
| 12/31/2020 | | | | | 108,315 | | | | | | — | | | | | | 50,128 | | | | | | (321,829) | | | | | | (163,386) | | | | | | 1,186,999 | | | | | | — | | | | | | 543,386 | | | | | | (3,321,569) | | | | | | (1,591,184) | | |
| Class T | | | | | | | | | | | | | | | | | | | | | | | | | | | | | | | | | | | | | | | | | | | | | | | | | | | | | | | | | | | | | |
| 12/31/2021 | | | | | 6,239 | | | | | | — | | | | | | 1,780 | | | | | | (13,338) | | | | | | (5,319) | | | | | | 81,702 | | | | | | — | | | | | | 23,232 | | | | | | (179,193) | | | | | | (74,259) | | |
| 12/31/2020 | | | | | 1,353 | | | | | | — | | | | | | 1,849 | | | | | | (12,702) | | | | | | (9,500) | | | | | | 15,776 | | | | | | — | | | | | | 21,508 | | | | | | (139,967) | | | | | | (102,683) | | |
| Solution 2030 | |
| Class ADV | | | | | | | | | | | | | | | | | | | | | | | | | | | | | | | | | | | | | | | | | | | | | | | | | | | | | | | | | | | | | |
| 12/31/2021 | | | | | 357,147 | | | | | | — | | | | | | 33,523 | | | | | | (329,507) | | | | | | 61,163 | | | | | | 6,220,950 | | | | | | — | | | | | | 591,672 | | | | | | (5,803,659) | | | | | | 1,008,963 | | |
| 12/31/2020 | | | | | 366,092 | | | | | | — | | | | | | 74,337 | | | | | | (331,665) | | | | | | 108,764 | | | | | | 5,451,415 | | | | | | — | | | | | | 1,092,015 | | | | | | (4,949,160) | | | | | | 1,594,270 | | |
| Class I | | | | | | | | | | | | | | | | | | | | | | | | | | | | | | | | | | | | | | | | | | | | | | | | | | | | | | | | | | | | | |
| 12/31/2021 | | | | | 166,972 | | | | | | — | | | | | | 19,272 | | | | | | (342,047) | | | | | | (155,803) | | | | | | 3,003,862 | | | | | | — | | | | | | 351,715 | | | | | | (6,190,361) | | | | | | (2,834,784) | | |
| 12/31/2020 | | | | | 185,684 | | | | | | — | | | | | | 47,580 | | | | | | (295,587) | | | | | | (62,323) | | | | | | 2,822,986 | | | | | | — | | | | | | 721,318 | | | | | | (4,517,908) | | | | | | (973,604) | | |
| Class S | | | | | | | | | | | | | | | | | | | | | | | | | | | | | | | | | | | | | | | | | | | | | | | | | | | | | | | | | | | | | |
| 12/31/2021 | | | | | 226,647 | | | | | | — | | | | | | 27,908 | | | | | | (321,691) | | | | | | (67,136) | | | | | | 4,063,787 | | | | | | — | | | | | | 505,140 | | | | | | (5,813,976) | | | | | | (1,245,049) | | |
| 12/31/2020 | | | | | 411,257 | | | | | | — | | | | | | 53,288 | | | | | | (289,095) | | | | | | 175,450 | | | | | | 6,408,420 | | | | | | — | | | | | | 801,977 | | | | | | (4,346,924) | | | | | | 2,863,473 | | |
| Class S2 | | | | | | | | | | | | | | | | | | | | | | | | | | | | | | | | | | | | | | | | | | | | | | | | | | | | | | | | | | | | | |
| 12/31/2021 | | | | | 51,020 | | | | | | — | | | | | | 1,901 | | | | | | (3,850) | | | | | | 49,071 | | | | | | 909,309 | | | | | | — | | | | | | 33,902 | | | | | | (68,713) | | | | | | 874,498 | | |
| 12/31/2020 | | | | | 29,743 | | | | | | — | | | | | | 1,883 | | | | | | (22,160) | | | | | | 9,466 | | | | | | 403,391 | | | | | | — | | | | | | 27,984 | | | | | | (304,825) | | | | | | 126,550 | | |
| Class T | | | | | | | | | | | | | | | | | | | | | | | | | | | | | | | | | | | | | | | | | | | | | | | | | | | | | | | | | | | | | |
| 12/31/2021 | | | | | 454 | | | | | | — | | | | | | 63 | | | | | | (173) | | | | | | 344 | | | | | | 7,882 | | | | | | — | | | | | | 1,109 | | | | | | (3,017) | | | | | | 5,974 | | |
| 12/31/2020 | | | | | 538 | | | | | | — | | | | | | 127 | | | | | | (36) | | | | | | 629 | | | | | | 7,670 | | | | | | — | | | | | | 1,861 | | | | | | (531) | | | | | | 9,000 | | |
| Solution 2035 | |
| Class ADV | | | | | | | | | | | | | | | | | | | | | | | | | | | | | | | | | | | | | | | | | | | | | | | | | | | | | | | | | | | | | |
| 12/31/2021 | | | | | 887,309 | | | | | | — | | | | | | 1,048,377 | | | | | | (3,174,158) | | | | | | (1,238,472) | | | | | | 11,453,592 | | | | | | — | | | | | | 13,377,292 | | | | | | (40,852,909) | | | | | | (16,022,025) | | |
| 12/31/2020 | | | | | 944,816 | | | | | | — | | | | | | 1,591,872 | | | | | | (3,912,785) | | | | | | (1,376,097) | | | | | | 10,293,999 | | | | | | — | | | | | | 17,064,874 | | | | | | (43,614,127) | | | | | | (16,255,254) | | |
| Class I | | | | | | | | | | | | | | | | | | | | | | | | | | | | | | | | | | | | | | | | | | | | | | | | | | | | | | | | | | | | | |
| 12/31/2021 | | | | | 946,521 | | | | | | — | | | | | | 350,560 | | | | | | (2,924,583) | | | | | | (1,627,502) | | | | | | 12,559,297 | | | | | | — | | | | | | 4,627,389 | | | | | | (39,239,255) | | | | | | (22,052,569) | | |
| 12/31/2020 | | | | | 3,430,663 | | | | | | — | | | | | | 2,312,940 | | | | | | (23,678,053) | | | | | | (17,934,450) | | | | | | 38,613,364 | | | | | | — | | | | | | 25,557,984 | | | | | | (292,423,757) | | | | | | (228,252,409) | | |
| Class S | | | | | | | | | | | | | | | | | | | | | | | | | | | | | | | | | | | | | | | | | | | | | | | | | | | | | | | | | | | | | |
| 12/31/2021 | | | | | 1,592,622 | | | | | | — | | | | | | 1,712,038 | | | | | | (3,025,225) | | | | | | 279,435 | | | | | | 20,942,710 | | | | | | — | | | | | | 22,256,496 | | | | | | (39,775,963) | | | | | | 3,423,243 | | |
| 12/31/2020 | | | | | 1,359,249 | | | | | | — | | | | | | 2,331,093 | | | | | | (3,702,429) | | | | | | (12,087) | | | | | | 15,080,765 | | | | | | — | | | | | | 25,432,218 | | | | | | (41,385,016) | | | | | | (872,033) | | |
| Class S2 | | | | | | | | | | | | | | | | | | | | | | | | | | | | | | | | | | | | | | | | | | | | | | | | | | | | | | | | | | ��� | | | |
| 12/31/2021 | | | | | 189,683 | | | | | | — | | | | | | 69,584 | | | | | | (166,075) | | | | | | 93,192 | | | | | | 2,413,853 | | | | | | — | | | | | | 862,848 | | | | | | (2,071,180) | | | | | | 1,205,521 | | |
| 12/31/2020 | | | | | 126,111 | | | | | | — | | | | | | 97,849 | | | | | | (497,023) | | | | | | (273,063) | | | | | | 1,356,763 | | | | | | — | | | | | | 1,021,548 | | | | | | (5,312,720) | | | | | | (2,934,409) | | |
| Class T | | | | | | | | | | | | | | | | | | | | | | | | | | | | | | | | | | | | | | | | | | | | | | | | | | | | | | | | | | | | | |
| 12/31/2021 | | | | | 471 | | | | | | — | | | | | | 85 | | | | | | (39,752) | | | | | | (39,196) | | | | | | 6,415 | | | | | | — | | | | | | 1,154 | | | | | | (548,057) | | | | | | (540,488) | | |
| 12/31/2020 | | | | | 1,967 | | | | | | — | | | | | | 2,990 | | | | | | (475) | | | | | | 4,482 | | | | | | 22,675 | | | | | | — | | | | | | 34,001 | | | | | | (4,758) | | | | | | 51,918 | | |
| Solution 2040 | |
| Class ADV | | | | | | | | | | | | | | | | | | | | | | | | | | | | | | | | | | | | | | | | | | | | | | | | | | | | | | | | | | | | | |
| 12/31/2021 | | | | | 230,749 | | | | | | — | | | | | | 20,996 | | | | | | (275,542) | | | | | | (23,797) | | | | | | 4,373,331 | | | | | | — | | | | | | 401,451 | | | | | | (5,211,010) | | | | | | (436,228) | | |
| 12/31/2020 | | | | | 296,802 | | | | | | — | | | | | | 68,051 | | | | | | (347,476) | | | | | | 17,377 | | | | | | 4,558,764 | | | | | | — | | | | | | 1,024,164 | | | | | | (5,369,506) | | | | | | 213,422 | | |
| Class I | | | | | | | | | | | | | | | | | | | | | | | | | | | | | | | | | | | | | | | | | | | | | | | | | | | | | | | | | | | | | |
| 12/31/2021 | | | | | 176,548 | | | | | | — | | | | | | 14,090 | | | | | | (397,118) | | | | | | (206,480) | | | | | | 3,394,552 | | | | | | — | | | | | | 278,849 | | | | | | (7,701,423) | | | | | | (4,028,022) | | |
| 12/31/2020 | | | | | 195,258 | | | | | | — | | | | | | 47,129 | | | | | | (253,137) | | | | | | (10,750) | | | | | | 3,102,664 | | | | | | — | | | | | | 732,390 | | | | | | (3,948,698) | | | | | | (113,644) | | |
| Class S | | | | | | | | | | | | | | | | | | | | | | | | | | | | | | | | | | | | | | | | | | | | | | | | | | | | | | | | | | | | | |
| 12/31/2021 | | | | | 220,498 | | | | | | — | | | | | | 16,766 | | | | | | (164,535) | | | | | | 72,729 | | | | | | 4,278,546 | | | | | | — | | | | | | 328,275 | | | | | | (3,177,367) | | | | | | 1,429,454 | | |
| 12/31/2020 | | | | | 189,719 | | | | | | — | | | | | | 37,902 | | | | | | (155,785) | | | | | | 71,836 | | | | | | 2,994,848 | | | | | | — | | | | | | 583,691 | | | | | | (2,398,286) | | | | | | 1,180,253 | | |
| Class S2 | | | | | | | | | | | | | | | | | | | | | | | | | | | | | | | | | | | | | | | | | | | | | | | | | | | | | | | | | | | | | |
| 12/31/2021 | | | | | 38,077 | | | | | | — | | | | | | 2,447 | | | | | | (6,354) | | | | | | 34,170 | | | | | | 727,754 | | | | | | — | | | | | | 46,978 | | | | | | (118,433) | | | | | | 656,299 | | |
| 12/31/2020 | | | | | 15,641 | | | | | | — | | | | | | 4,781 | | | | | | (10,857) | | | | | | 9,565 | | | | | | 236,829 | | | | | | — | | | | | | 72,338 | | | | | | (164,384) | | | | | | 144,783 | | |
NOTES TO FINANCIAL STATEMENTS as of December 31, 2021 (continued)
NOTE 9 — CAPITAL SHARES (continued)
| | | | Shares
sold | | | Shares
issued in
merger | | | Reinvestment
of
distributions | | | Shares
redeemed | | | Net increase
(decrease)
in shares
outstanding | | | Shares
sold | | | Proceeds
from shares
issued in
merger | | | Reinvestment
of
distributions | | | Shares
redeemed | | | Net increase
(decrease) | |
Year or
period ended | | | # | | | # | | | # | | | # | | | # | | | ($) | | | ($) | | | ($) | | | ($) | | | ($) | |
| Solution 2040 (continued) | |
| Class T | | | | | | | | | | | | | | | | | | | | | | | | | | | | | | | | | | | | | | | | | | | | | | | | | | | | | | | | | | | | | |
| 12/31/2021 | | | | | 133 | | | | | | — | | | | | | 8 | | | | | | (2,292) | | | | | | (2,151) | | | | | | 2,460 | | | | | | — | | | | | | 145 | | | | | | (42,777) | | | | | | (40,172) | | |
| 12/31/2020 | | | | | 878 | | | | | | — | | | | | | 133 | | | | | | (197) | | | | | | 814 | | | | | | 13,293 | | | | | | — | | | | | | 1,993 | | | | | | (3,209) | | | | | | 12,077 | | |
| Solution 2045 | |
| Class ADV | | | | | | | | | | | | | | | | | | | | | | | | | | | | | | | | | | | | | | | | | | | | | | | | | | | | | | | | | | | | | |
| 12/31/2021 | | | | | 845,600 | | | | | | — | | | | | | 1,127,891 | | | | | | (2,239,730) | | | | | | (266,239) | | | | | | 11,083,381 | | | | | | — | | | | | | 14,358,057 | | | | | | (29,328,049) | | | | | | (3,886,611) | | |
| 12/31/2020 | | | | | 833,851 | | | | | | — | | | | | | 1,011,331 | | | | | | (2,265,543) | | | | | | (420,361) | | | | | | 9,067,559 | | | | | | — | | | | | | 10,669,545 | | | | | | (24,578,928) | | | | | | (4,841,824) | | |
| Class I | | | | | | | | | | | | | | | | | | | | | | | | | | | | | | | | | | | | | | | | | | | | | | | | | | | | | | | | | | | | | |
| 12/31/2021 | | | | | 682,994 | | | | | | — | | | | | | 422,781 | | | | | | (2,789,732) | | | | | | (1,683,957) | | | | | | 9,295,851 | | | | | | — | | | | | | 5,597,625 | | | | | | (38,154,366) | | | | | | (23,260,890) | | |
| 12/31/2020 | | | | | 3,557,942 | | | | | | — | | | | | | 2,015,187 | | | | | | (21,852,796) | | | | | | (16,279,667) | | | | | | 39,191,495 | | | | | | — | | | | | | 21,965,536 | | | | | | (271,756,675) | | | | | | (210,599,644) | | |
| Class S | | | | | | | | | | | | | | | | | | | | | | | | | | | | | | | | | | | | | | | | | | | | | | | | | | | | | | | | | | | | | |
| 12/31/2021 | | | | | 1,083,001 | | | | | | — | | | | | | 1,951,062 | | | | | | (1,797,621) | | | | | | 1,236,442 | | | | | | 14,374,392 | | | | | | — | | | | | | 25,285,757 | | | | | | (23,822,326) | | | | | | 15,837,823 | | |
| 12/31/2020 | | | | | 1,337,418 | | | | | | — | | | | | | 1,666,300 | | | | | | (2,977,403) | | | | | | 26,315 | | | | | | 14,405,327 | | | | | | — | | | | | | 17,862,735 | | | | | | (33,076,803) | | | | | | (808,741) | | |
| Class S2 | | | | | | | | | | | | | | | | | | | | | | | | | | | | | | | | | | | | | | | | | | | | | | | | | | | | | | | | | | | | | |
| 12/31/2021 | | | | | 331,093 | | | | | | — | | | | | | 78,997 | | | | | | (128,843) | | | | | | 281,247 | | | | | | 4,394,706 | | | | | | — | | | | | | 990,625 | | | | | | (1,648,553) | | | | | | 3,736,778 | | |
| 12/31/2020 | | | | | 103,434 | | | | | | — | | | | | | 45,800 | | | | | | (221,553) | | | | | | (72,319) | | | | | | 1,086,292 | | | | | | — | | | | | | 477,241 | | | | | | (2,342,796) | | | | | | (779,263) | | |
| Class T | | | | | | | | | | | | | | | | | | | | | | | | | | | | | | | | | | | | | | | | | | | | | | | | | | | | | | | | | | | | | |
| 12/31/2021 | | | | | 781 | | | | | | — | | | | | | 1,065 | | | | | | (878) | | | | | | 968 | | | | | | 10,672 | | | | | | — | | | | | | 14,354 | | | | | | (11,995) | | | | | | 13,031 | | |
| 12/31/2020 | | | | | 1,585 | | | | | | — | | | | | | 816 | | | | | | (14,639) | | | | | | (12,238) | | | | | | 17,982 | | | | | | — | | | | | | 9,066 | | | | | | (136,438) | | | | | | (109,390) | | |
| Solution 2050 | |
| Class ADV | | | | | | | | | | | | | | | | | | | | | | | | | | | | | | | | | | | | | | | | | | | | | | | | | | | | | | | | | | | | | |
| 12/31/2021 | | | | | 163,733 | | | | | | — | | | | | | 20,535 | | | | | | (291,113) | | | | | | (106,845) | | | | | | 3,218,451 | | | | | | — | | | | | | 407,828 | | | | | | (5,729,756) | | | | | | (2,103,477) | | |
| 12/31/2020 | | | | | 261,472 | | | | | | — | | | | | | 57,371 | | | | | | (240,083) | | | | | | 78,760 | | | | | | 4,064,197 | | | | | | — | | | | | | 884,091 | | | | | | (3,927,893) | | | | | | 1,020,395 | | |
| Class I | | | | | | | | | | | | | | | | | | | | | | | | | | | | | | | | | | | | | | | | | | | | | | | | | | | | | | | | | | | | | |
| 12/31/2021 | | | | | 144,521 | | | | | | — | | | | | | 14,182 | | | | | | (313,274) | | | | | | (154,571) | | | | | | 2,933,406 | | | | | | — | | | | | | 292,715 | | | | | | (6,314,663) | | | | | | (3,088,542) | | |
| 12/31/2020 | | | | | 218,069 | | | | | | — | | | | | | 40,811 | | | | | | (268,542) | | | | | | (9,662) | | | | | | 3,520,006 | | | | | | — | | | | | | 652,158 | | | | | | (4,361,079) | | | | | | (188,915) | | |
| Class S | | | | | | | | | | | | | | | | | | | | | | | | | | | | | | | | | | | | | | | | | | | | | | | | | | | | | | | | | | | | | |
| 12/31/2021 | | | | | 115,952 | | | | | | — | | | | | | 13,083 | | | | | | (117,677) | | | | | | 11,358 | | | | | | 2,337,815 | | | | | | — | | | | | | 266,356 | | | | | | (2,365,351) | | | | | | 238,820 | | |
| 12/31/2020 | | | | | 130,272 | | | | | | — | | | | | | 30,335 | | | | | | (142,681) | | | | | | 17,926 | | | | | | 2,080,512 | | | | | | — | | | | | | 478,997 | | | | | | (2,283,576) | | | | | | 275,933 | | |
| Class S2 | | | | | | | | | | | | | | | | | | | | | | | | | | | | | | | | | | | | | | | | | | | | | | | | | | | | | | | | | | | | | |
| 12/31/2021 | | | | | 34,601 | | | | | | — | | | | | | 1,412 | | | | | | (10,295) | | | | | | 25,718 | | | | | | 691,669 | | | | | | — | | | | | | 28,288 | | | | | | (204,476) | | | | | | 515,481 | | |
| 12/31/2020 | | | | | 7,538 | | | | | | — | | | | | | 1,530 | | | | | | (10,201) | | | | | | (1,133) | | | | | | 119,535 | | | | | | — | | | | | | 23,826 | | | | | | (168,868) | | | | | | (25,507) | | |
| Class T | | | | | | | | | | | | | | | | | | | | | | | | | | | | | | | | | | | | | | | | | | | | | | | | | | | | | | | | | | | | | |
| 12/31/2021 | | | | | — | | | | | | — | | | | | | 8 | | | | | | (29) | | | | | | (21) | | | | | | — | | | | | | — | | | | | | 157 | | | | | | (573) | | | | | | (416) | | |
| 12/31/2020 | | | | | — | | | | | | — | | | | | | 21 | | | | | | (23) | | | | | | (2) | | | | | | — | | | | | | — | | | | | | 333 | | | | | | (403) | | | | | | (70) | | |
| Solution 2055 | |
| Class ADV | | | | | | | | | | | | | | | | | | | | | | | | | | | | | | | | | | | | | | | | | | | | | | | | | | | | | | | | | | | | | |
| 12/31/2021 | | | | | 441,406 | | | | | | — | | | | | | 556,051 | | | | | | (800,323) | | | | | | 197,134 | | | | | | 6,939,080 | | | | | | — | | | | | | 8,173,952 | | | | | | (12,437,823) | | | | | | 2,675,209 | | |
| 12/31/2020 | | | | | 499,545 | | | | | | — | | | | | | 240,856 | | | | | | (663,500) | | | | | | 76,901 | | | | | | 6,485,108 | | | | | | — | | | | | | 3,090,178 | | | | | | (8,900,873) | | | | | | 674,413 | | |
| Class I | | | | | | | | | | | | | | | | | | | | | | | | | | | | | | | | | | | | | | | | | | | | | | | | | | | | | | | | | | | | | |
| 12/31/2021 | | | | | 359,722 | | | | | | — | | | | | | 230,385 | | | | | | (1,061,900) | | | | | | (471,793) | | | | | | 5,805,593 | | | | | | — | | | | | | 3,511,066 | | | | | | (17,214,017) | | | | | | (7,897,358) | | |
| 12/31/2020 | | | | | 2,653,382 | | | | | | — | | | | | | 705,071 | | | | | | (9,587,365) | | | | | | (6,228,912) | | | | | | 34,992,948 | | | | | | — | | | | | | 9,250,529 | | | | | | (144,045,909) | | | | | | (99,802,432) | | |
| Class S | | | | | | | | | | | | | | | | | | | | | | | | | | | | | | | | | | | | | | | | | | | | | | | | | | | | | | | | | | | | | |
| 12/31/2021 | | | | | 635,802 | | | | | | — | | | | | | 792,083 | | | | | | (656,547) | | | | | | 771,338 | | | | | | 10,071,477 | | | | | | — | | | | | | 11,778,271 | | | | | | (10,166,962) | | | | | | 11,682,786 | | |
| 12/31/2020 | | | | | 779,560 | | | | | | — | | | | | | 320,925 | | | | | | (542,858) | | | | | | 557,627 | | | | | | 10,182,899 | | | | | | — | | | | | | 4,155,976 | | | | | | (7,198,051) | | | | | | 7,140,824 | | |
| Class S2 | | | | | | | | | | | | | | | | | | | | | | | | | | | | | | | | | | | | | | | | | | | | | | | | | | | | | | | | | | | | | |
| 12/31/2021 | | | | | 138,026 | | | | | | — | | | | | | 47,488 | | | | | | (33,529) | | | | | | 151,985 | | | | | | 2,245,802 | | | | | | — | | | | | | 701,880 | | | | | | (522,613) | | | | | | 2,425,069 | | |
| 12/31/2020 | | | | | 63,528 | | | | | | — | | | | | | 10,784 | | | | | | (79,763) | | | | | | (5,451) | | | | | | 847,963 | | | | | | — | | | | | | 139,214 | | | | | | (944,472) | | | | | | 42,705 | | |
| Class T | | | | | | | | | | | | | | | | | | | | | | | | | | | | | | | | | | | | | | | | | | | | | | | | | | | | | | | | | | | | | |
| 12/31/2021 | | | | | 105 | | | | | | — | | | | | | 186 | | | | | | (756) | | | | | | (465) | | | | | | 1,630 | | | | | | — | | | | | | 2,823 | | | | | | (12,573) | | | | | | (8,120) | | |
| 12/31/2020 | | | | | 350 | | | | | | — | | | | | | 114 | | | | | | (34) | | | | | | 430 | | | | | | 4,582 | | | | | | — | | | | | | 1,502 | | | | | | (477) | | | | | | 5,607 | | |
| Solution 2060 | |
| Class ADV | | | | | | | | | | | | | | | | | | | | | | | | | | | | | | | | | | | | | | | | | | | | | | | | | | | | | | | | | | | | | |
| 12/31/2021 | | | | | 192,852 | | | | | | — | | | | | | 19,178 | | | | | | (196,910) | | | | | | 15,120 | | | | | | 2,782,491 | | | | | | — | | | | | | 278,652 | | | | | | (2,835,213) | | | | | | 225,930 | | |
| 12/31/2020 | | | | | 266,536 | | | | | | — | | | | | | 36,578 | | | | | | (198,454) | | | | | | 104,660 | | | | | | 3,031,702 | | | | | | — | | | | | | 412,239 | | | | | | (2,327,329) | | | | | | 1,116,612 | | |
| Class I | | | | | | | | | | | | | | | | | | | | | | | | | | | | | | | | | | | | | | | | | | | | | | | | | | | | | | | | | | | | | |
| 12/31/2021 | | | | | 160,272 | | | | | | — | | | | | | 13,432 | | | | | | (329,261) | | | | | | (155,557) | | | | | | 2,340,656 | | | | | | — | | | | | | 199,058 | | | | | | (4,758,971) | | | | | | (2,219,257) | | |
| 12/31/2020 | | | | | 292,971 | | | | | | — | | | | | | 31,929 | | | | | | (155,379) | | | | | | 169,521 | | | | | | 3,366,031 | | | | | | — | | | | | | 365,911 | | | | | | (1,803,499) | | | | | | 1,928,443 | | |
| Class S | | | | | | | | | | | | | | | | | | | | | | | | | | | | | | | | | | | | | | | | | | | | | | | | | | | | | | | | | | | | | |
| 12/31/2021 | | | | | 193,794 | | | | | | — | | | | | | 15,877 | | | | | | (184,676) | | | | | | 24,995 | | | | | | 2,767,125 | | | | | | — | | | | | | 231,483 | | | | | | (2,629,097) | | | | | | 369,511 | | |
| 12/31/2020 | | | | | 223,987 | | | | | | — | | | | | | 28,469 | | | | | | (136,731) | | | | | | 115,725 | | | | | | 2,525,781 | | | | | | — | | | | | | 321,696 | | | | | | (1,565,966) | | | | | | 1,281,511 | | |
| Class S2 | | | | | | | | | | | | | | | | | | | | | | | | | | | | | | | | | | | | | | | | | | | | | | | | | | | | | | | | | | | | | |
| 12/31/2021 | | | | | 52,152 | | | | | | — | | | | | | 2,231 | | | | | | (7,578) | | | | | | 46,805 | | | | | | 757,943 | | | | | | — | | | | | | 32,424 | | | | | | (108,984) | | | | | | 681,383 | | |
| 12/31/2020 | | | | | 14,826 | | | | | | — | | | | | | 1,760 | | | | | | (3,225) | | | | | | 13,361 | | | | | | 166,978 | | | | | | — | | | | | | 19,875 | | | | | | (35,397) | | | | | | 151,456 | | |
| Class T | | | | | | | | | | | | | | | | | | | | | | | | | | | | | | | | | | | | | | | | | | | | | | | | | | | | | | | | | | | | | |
| 12/31/2021 | | | | | — | | | | | | — | | | | | | 9 | | | | | | (29) | | | | | | (20) | | | | | | — | | | | | | — | | | | | | 138 | | | | | | (413) | | | | | | (275) | | |
| 12/31/2020 | | | | | 29 | | | | | | — | | | | | | 19 | | | | | | —* | | | | | | 48 | | | | | | 366 | | | | | | — | | | | | | 215 | | | | | | —* | | | | | | 581 | | |
NOTES TO FINANCIAL STATEMENTS as of December 31, 2021 (continued)
NOTE 9 — CAPITAL SHARES (continued)
| | | | Shares
sold | | | Shares
issued in
merger | | | Reinvestment
of
distributions | | | Shares
redeemed | | | Net increase
(decrease)
in shares
outstanding | | | Shares
sold | | | Proceeds
from shares
issued in
merger | | | Reinvestment
of
distributions | | | Shares
redeemed | | | Net increase
(decrease) | |
Year or
period ended | | | # | | | # | | | # | | | # | | | # | | | ($) | | | ($) | | | ($) | | | ($) | | | ($) | |
| Solution 2065 | |
| Class ADV | | | | | | | | | | | | | | | | | | | | | | | | | | | | | | | | | | | | | | | | | | | | | | | | | | | | | | | | | | | | | |
| 12/31/2021 | | | | | 50,556 | | | | | | — | | | | | | 15,228 | | | | | | (20,839) | | | | | | 44,945 | | | | | | 647,774 | | | | | | — | | | | | | 182,982 | | | | | | (262,122) | | | | | | 568,634 | | |
7/29/2020(1) -
12/31/2020 | | | | | 88,970 | | | | | | — | | | | | | 1,433 | | | | | | (2,790) | | | | | | 87,613 | | | | | | 915,673 | | | | | | — | | | | | | 16,550 | | | | | | (31,818) | | | | | | 900,405 | | |
| Class I | | | | | | | | | | | | | | | | | | | | | | | | | | | | | | | | | | | | | | | | | | | | | | | | | | | | | | | | | | | | | |
| 12/31/2021 | | | | | 44,094 | | | | | | — | | | | | | 16,672 | | | | | | (9,783) | | | | | | 50,983 | | | | | | 568,820 | | | | | | — | | | | | | 200,791 | | | | | | (127,336) | | | | | | 642,275 | | |
7/29/2020(1) -
12/31/2020 | | | | | 88,759 | | | | | | — | | | | | | 1,601 | | | | | | —* | | | | | | 90,360 | | | | | | 889,326 | | | | | | — | | | | | | 18,505 | | | | | | —* | | | | | | 907,831 | | |
| Class S | | | | | | | | | | | | | | | | | | | | | | | | | | | | | | | | | | | | | | | | | | | | | | | | | | | | | | | | | | | | | |
| 12/31/2021 | | | | | 110,904 | | | | | | — | | | | | | 23,596 | | | | | | (13,688) | | | | | | 120,812 | | | | | | 1,424,530 | | | | | | — | | | | | | 283,529 | | | | | | (171,152) | | | | | | 1,536,907 | | |
7/29/2020(1) -
12/31/2020 | | | | | 93,025 | | | | | | — | | | | | | 1,414 | | | | | | (11,836) | | | | | | 82,603 | | | | | | 965,808 | | | | | | — | | | | | | 16,346 | | | | | | (130,798) | | | | | | 851,355 | | |
| Class S2 | | | | | | | | | | | | | | | | | | | | | | | | | | | | | | | | | | | | | | | | | | | | | | | | | | | | | | | | | | | | | |
| 12/31/2021 | | | | | 6,571 | | | | | | — | | | | | | 1,107 | | | | | | (394) | | | | | | 7,284 | | | | | | 84,190 | | | | | | — | | | | | | 13,310 | | | | | | (5,017) | | | | | | 92,483 | | |
7/29/2020(1) -
12/31/2020 | | | | | 2,200 | | | | | | — | | | | | | 36 | | | | | | — | | | | | | 2,236 | | | | | | 21,999 | | | | | | — | | | | | | 422 | | | | | | — | | | | | | 22,421 | | |
| Class T | | | | | | | | | | | | | | | | | | | | | | | | | | | | | | | | | | | | | | | | | | | | | | | | | | | | | | | | | | | | | |
| 12/31/2021 | | | | | — | | | | | | — | | | | | | 39 | | | | | | — | | | | | | 39 | | | | | | — | | | | | | — | | | | | | 472 | | | | | | — | | | | | | 472 | | |
7/29/2020(1) -
12/31/2020 | | | | | 300 | | | | | | — | | | | | | 5 | | | | | | — | | | | | | 305 | | | | | | 3,000 | | | | | | — | | | | | | 54 | | | | | | — | | | | | | 3,054 | | |
(1)
Commencement of operations
*
Amount is less than 0.500 per share or $0.50.
NOTE 10 — FEDERAL INCOME TAXES
The amount of distributions from net investment income and net realized capital gains are determined in accordance with federal income tax regulations, which may differ from GAAP for investment companies. These book/tax differences may be either temporary or permanent. Permanent differences are reclassified within the capital accounts based on their federal tax-basis treatment; temporary differences are not reclassified. Key differences include the treatment of short-term capital gains, straddle loss deferrals and wash sale deferrals.
Dividends paid by the Portfolios from net investment income and distributions of net realized short-term capital gains are, for federal income tax purposes, taxable as ordinary income to shareholders.
The tax composition of dividends and distributions to shareholders was as follows:
| | | | Year Ended
December 31, 2021 | | | Year Ended
December 31, 2020 | |
| | | | Ordinary
Income | | | Long-term
Capital Gains | | | Ordinary
Income | | | Long-term
Capital Gains | |
| Solution Aggressive | | | | $ | 330,883 | | | | | $ | — | | | | | $ | 394,195 | | | | | $ | 1,365,142 | | |
| Solution Balanced | | | | | 1,120,118 | | | | | | — | | | | | | 1,564,710 | | | | | | 2,131,869 | | |
| Solution Conservative | | | | | 628,379 | | | | | | 73,655 | | | | | | 535,080 | | | | | | 187,887 | | |
| Solution Income | | | | | 12,324,645 | | | | | | 6,590,155 | | | | | | 7,420,988 | | | | | | 560,950 | | |
Solution Moderately
Aggressive | | | | | 9,975,801 | | | | | | — | | | | | | 10,679,656 | | | | | | 39,481,314 | | |
Solution Moderately
Conservative | | | | | 976,188 | | | | | | — | | | | | | 1,031,400 | | | | | | 854,887 | | |
| Solution 2025 | | | | | 28,643,871 | | | | | | 16,518,453 | | | | | | 17,407,400 | | | | | | 30,899,313 | | |
| Solution 2030 | | | | | 1,454,818 | | | | | | 28,849 | | | | | | 926,283 | | | | | | 1,719,132 | | |
| Solution 2035 | | | | | 28,980,536 | | | | | | 12,144,643 | | | | | | 15,624,659 | | | | | | 53,485,966 | | |
| Solution 2040 | | | | | 904,629 | | | | | | 151,200 | | | | | | 691,140 | | | | | | 1,723,766 | | |
| Solution 2045 | | | | | 26,216,481 | | | | | | 20,029,937 | | | | | | 10,941,963 | | | | | | 40,042,161 | | |
| Solution 2050 | | | | | 597,936 | | | | | | 397,553 | | | | | | 528,816 | | | | | | 1,510,883 | | |
| Solution 2055 | | | | | 11,699,237 | | | | | | 12,468,755 | | | | | | 3,516,199 | | | | | | 13,121,200 | | |
| Solution 2060 | | | | | 368,140 | | | | | | 373,615 | | | | | | 302,676 | | | | | | 817,260 | | |
| Solution 2065 | | | | | 399,683 | | | | | | 281,402 | | | | | | 41,291 | | | | | | 10,586 | | |
The tax-basis components of distributable earnings as of December 31, 2021 were:
| | | | Undistributed
Ordinary
Income | | | Undistributed
Long-term
Capital Gains | | | Unrealized
Appreciation/
(Depreciation) | | | Other | | | Total
Distributable
Earnings/(Loss) | |
| Solution Aggressive | | | | $ | 1,706,591 | | | | | $ | 3,537,803 | | | | | $ | 2,768,040 | | | | | $ | (193) | | | | | $ | 8,012,241 | | |
| Solution Balanced | | | | | 3,421,524 | | | | | | 5,025,986 | | | | | | 5,150,582 | | | | | | (930) | | | | | | 13,597,162 | | |
| Solution Conservative | | | | | 983,372 | | | | | | 753,987 | | | | | | 136,181 | | | | | | (292) | | | | | | 1,873,248 | | |
| Solution Income | | | | | 14,497,060 | | | | | | 18,204,098 | | | | | | 11,004,341 | | | | | | (12,715) | | | | | | 43,692,784 | | |
| Solution Moderately Aggressive | | | | | 24,090,454 | | | | | | 61,576,573 | | | | | | 75,364,925 | | | | | | (621,150) | | | | | | 160,410,802 | | |
| Solution Moderately Conservative | | | | | 2,767,123 | | | | | | 2,754,009 | | | | | | 1,725,646 | | | | | | (664) | | | | | | 7,246,114 | | |
| Solution 2025 | | | | | 35,123,143 | | | | | | 60,566,542 | | | | | | 32,251,509 | | | | | | (20,553) | | | | | | 127,920,641 | | |
NOTES TO FINANCIAL STATEMENTS as of December 31, 2021 (continued)
NOTE 10 — FEDERAL INCOME TAXES (continued)
| | | | Undistributed
Ordinary
Income | | | Undistributed
Long-term
Capital Gains | | | Unrealized
Appreciation/
(Depreciation) | | | Other | | | Total
Distributable
Earnings/(Loss) | |
| Solution 2030 | | | | | 3,472,781 | | | | | | 6,208,073 | | | | | | 2,335,514 | | | | | | (430) | | | | | | 12,015,938 | | |
| Solution 2035 | | | | | 37,717,252 | | | | | | 76,387,702 | | | | | | 59,309,916 | | | | | | (20,467) | | | | | | 173,394,403 | | |
| Solution 2040 | | | | | 2,936,429 | | | | | | 5,606,359 | | | | | | 2,222,451 | | | | | | (337) | | | | | | 10,764,902 | | |
| Solution 2045 | | | | | 32,693,408 | | | | | | 63,506,716 | | | | | | 49,828,268 | | | | | | (14,284) | | | | | | 146,014,108 | | |
| Solution 2050 | | | | | 2,442,525 | | | | | | 5,049,415 | | | | | | 2,301,404 | | | | | | (270) | | | | | | 9,793,074 | | |
| Solution 2055 | | | | | 12,597,977 | | | | | | 20,972,628 | | | | | | 13,096,778 | | | | | | (2,936) | | | | | | 46,664,447 | | |
| Solution 2060 | | | | | 1,895,775 | | | | | | 3,616,568 | | | | | | 1,344,208 | | | | | | (152) | | | | | | 6,856,399 | | |
| Solution 2065 | | | | | — | | | | | | 169,120 | | | | | | 131,409 | | | | | | (7) | | | | | | 300,522 | | |
At December 31, 2021, the Portfolios did not have any capital loss carryovers for U.S. federal income tax purposes.
The Portfolios’ major tax jurisdictions are U.S. federal and Arizona state.
As of December 31, 2021, no provision for income tax is required in the Portfolios’ financial statements as a result of tax positions taken on federal and state income tax returns for open tax years. The Portfolios’ federal and state income and federal excise tax returns for tax years for which the applicable statutes of limitations have not expired are subject to examination by the Internal Revenue Service and state department of revenue. Generally, the preceding four tax years remain subject to examination by these jurisdictions.
NOTE 11 — REORGANIZATIONS
On August 7, 2020, Solution Income (“Acquiring Portfolio”) acquired all of the net assets and assumed all liabilities of Voya Solution 2020 Portfolio (“Acquired Portfolio”), an open-end investment company that is not included in this report, in a tax-free reorganization in exchange for shares of the Acquiring Portfolio. For financial reporting purposes, assets received and shares issued by the Acquiring Portfolio were recorded at fair value; however, the cost basis of the investments received from the Acquired Portfolio were carried forward to align ongoing reporting of the Acquiring Portfolio’s realized and unrealized gains and losses with amounts distributable to shareholders for tax purposes.
Assuming the acquisition had been completed on January 1, 2020, the beginning of the annual reporting period of the Acquiring Portfolio, the Acquiring Portfolio’s pro forma results of operations for the year ended December 31, 2020, are as follows (Unaudited):
| | Net investment income | | | | $ | 6,530,477 | | |
| | Net realized and unrealized loss on investments | | | | $ | 30,068,364 | | |
| | Net decrease in net assets resulting from operations | | | | $ | 36,598,841 | | |
Because the combined investment portfolios have been managed as a single integrated portfolio since the acquisition was completed, it is not practicable to separate the amounts of revenue and earnings of the Acquired Portfolio that have been included in the Acquiring Portfolio’s statement of operations since August 7, 2020. Net assets and unrealized appreciation or depreciation as of the reorganization date were as follows:
| | Total Net
Assets of
Acquired
Portfolio
(000s) | | | Total Net
Assets of
Acquiring
Portfolio
(000s) | | | Acquired
Portfolio’s
Capital Loss
Carryforwards
(000s) | | | Acquired
Portfolio’s
Unrealized
Appreciation
(000s) | | | Portfolio’s
Conversion
Ratio | |
| | $29,460 | | | | $ | 311,448 | | | | | $ | 62 | | | | | $ | 1,929 | | | | | | 1.0138 | | |
The net assets of the Acquiring Portfolio after the acquisition of Acquired Portfolio were $340,908,109.
NOTE 12 — LONDON INTERBANK OFFERED RATE (“LIBOR”)
In 2017, the UK Financial Conduct Authority announced its intention to cease compelling banks to provide the quotations needed to sustain LIBOR after 2021. On March 5, 2021, ICE Benchmark Administration, the administrator of LIBOR, stated that non-U.S. dollar LIBOR reference rates and the one-week and two-month LIBOR reference rates will cease to be provided or no longer be representative immediately after December 31, 2021 and the remaining more commonly used LIBOR settings will cease to be provided or no longer be representative immediately after June 30, 2023. In addition, global regulators have announced that, with limited exceptions, no new LIBOR-based contracts should be entered into after 2021. Actions by regulators have resulted in the establishment of alternative reference rates to LIBOR in most major currencies (e.g., the Secured Overnight Financing Rate for U.S. Dollar LIBOR and the Sterling Overnight Interbank Average Rate for Sterling LIBOR).
Discontinuance of LIBOR and adoption/implementation of alternative rates pose a number of risks, including among others whether any substitute rate will experience the
NOTES TO FINANCIAL STATEMENTS as of December 31, 2021 (continued)
NOTE 12 — LONDON INTERBANK OFFERED RATE (“LIBOR”) (continued)
market participation and liquidity necessary to provide a workable substitute for LIBOR; the effect on parties’ existing contractual arrangements, hedging transactions, and investment strategies generally from a conversion from LIBOR to alternative rates; the effect on a Portfolio’s existing investments (including, for example, fixed-income investments; senior loans; CLOs and CDOs; and derivatives transactions), including the possibility that some of those investments may terminate or their terms may be adjusted to the disadvantage of a Portfolio; and the risk of general market disruption during the period of the conversion. It is difficult to predict at this time the likely impact of the transition away from LIBOR on a Portfolio.
NOTE 13 — MARKET DISRUPTION
A Portfolio is subject to the risk that geopolitical events will disrupt securities markets and adversely affect global economies and markets. Due to the increasing interdependence among global economies and markets, conditions in one country, market, or region might adversely impact markets, issuers and/or foreign exchange rates in other countries, including the United States. Wars, terrorism, global health crises and pandemics, and other geopolitical events have led, and in the future may lead, to increased market volatility and may have adverse short- or long-term effects on U.S. and world economies and markets generally. For example, the COVID-19 pandemic has resulted, and may continue to result, in significant market volatility, exchange trading suspensions and closures, declines in global financial markets, higher default rates, and a substantial economic downturn in economies throughout the world. Natural and environmental disasters and systemic market dislocations are also highly disruptive to economies and markets. Those events as well as other changes in non-U.S. and domestic economic, social, and political conditions also could adversely affect individual issuers or related groups
of issuers, securities markets, interest rates, credit ratings, inflation, investor sentiment, and other factors affecting the value of the investments of the portfolio and of the Portfolios. Any of these occurrences could disrupt the operations of a Portfolio and of the Portfolios’ service providers.
NOTE 14 — OTHER ACCOUNTING PRONOUNCEMENTS
In March 2020, the Financial Accounting Standards Board issued Accounting Standards Update No. 2020-04 (“ASU 2020-04”), Reference Rate Reform (Topic 848) — Facilitation of the Effects of Reference Rate Reform on Financial Reporting. The amendments in ASU 2020-04 provides optional temporary financial reporting relief from the effect of certain types of contract modifications due to the planned discontinuation of LIBOR and other interbank-offered based reference rates as of the end of 2021. ASU 2020-04 is effective for certain reference rate-related contract modifications that occur during the period March 12, 2020 through December 31, 2022. Management is currently evaluating the impact, if any, of applying ASU 2020-04.
NOTE 15 — SUBSEQUENT EVENTS
Expense Limitation Agreement: On January 27, 2022, the Board approved a revised side letter expense limitation agreement with respect to Solution 2060 and Solution 2065, effective January 1, 2022 through May 1, 2023. The new non-recoupable side letter expense limits for each Portfolio are 1.28%, 0.78%, 1.03%, 1.18%, and 1.48% for Class ADV, Class I, Class S, Class S2, and Class T, respectively.
The Portfolios have evaluated events occurring after the Statements of Assets and Liabilities date (“subsequent events”), to determine whether any subsequent events necessitated adjustment to or disclosure in the financial statements. Other than above, no such subsequent events were identified.
PORTFOLIO OF INVESTMENTS
| Voya Solution Aggressive Portfolio | as of December 31, 2021 |
| Shares | | | Value | | | Percentage
of Net
Assets | |
| EXCHANGE-TRADED FUNDS: 18.6% | |
| 3,862 | | | iShares Russell 2000 ETF | | | | $ | 859,102 | | | | | | 2.7 | | |
| 10,054 | | | Vanguard Russell 1000 Growth
ETF | | | | | 789,641 | | | | | | 2.5 | | |
| 6,889 | | | Vanguard S&P 500 ETF | | | | | 3,007,531 | | | | | | 9.4 | | |
| 8,574 | | | Vanguard Value ETF | | | | | 1,261,321 | | | | | | 4.0 | | |
| | | | Total Exchange-Traded
Funds
(Cost $5,022,930) | | | | | 5,917,595 | | | | | | 18.6 | | |
| MUTUAL FUNDS: 81.4% | |
| | | | Affiliated Investment Companies: 81.4% | |
| 76,643 | | | Voya Multi-Manager Emerging
Markets Equity Fund - Class I | | | | | 902,854 | | | | | | 2.8 | | |
| 324,055 | | | Voya Multi-Manager International
Equity Fund - Class I | | | | | 3,707,194 | | | | | | 11.7 | | |
| 95,841 | | | Voya Multi-Manager International
Factors Fund - Class I | | | | | 942,121 | | | | | | 3.0 | | |
| 167,152 | | | Voya Multi-Manager Mid Cap
Value Fund - Class I | | | | | 1,795,209 | | | | | | 5.6 | | |
| 330,825 | | | Voya U.S. Stock Index Portfolio -
Class I | | | | | 7,235,150 | | | | | | 22.8 | | |
| 104,402 | | | VY® Columbia Contrarian Core
Portfolio - Class I | | | | | 2,421,072 | | | | | | 7.6 | | |
| Shares | | | Value | | | Percentage
of Net
Assets | |
| MUTUAL FUNDS: (continued) | |
| | | | Affiliated Investment Companies (continued) | |
| 91,884 | | | VY® Invesco Comstock
Portfolio - Class I | | | | $ | 1,952,542 | | | | | | 6.1 | | |
| 60,990 | | | VY® JPMorgan Small Cap Core
Equity Portfolio - Class R6 | | | | | 1,296,039 | | | | | | 4.1 | | |
| 48,268 | | | VY® T. Rowe Price Capital
Appreciation Portfolio - Class R6 | | | | | 1,591,887 | | | | | | 5.0 | | |
| 113,872 | | | VY® T. Rowe Price Diversified Mid
Cap Growth Portfolio - Class R6 | | | | | 1,689,862 | | | | | | 5.3 | | |
| 19,789 | | | VY® T. Rowe Price Growth Equity
Portfolio - Class I | | | | | 2,355,878 | | | | | | 7.4 | | |
| | | | Total Mutual Funds | | | | | | | | | | | | | |
| | | | (Cost $23,292,298) | | | | | 25,889,808 | | | | | | 81.4 | | |
| | | | Total Investments in
Securities
(Cost $28,315,228) | | | | $ | 31,807,403 | | | | | | 100.0 | | |
| | | | Assets in Excess of Other
Liabilities | | | | | 8,403 | | | | | | 0.0 | | |
| | | | Net Assets | | | | $ | 31,815,806 | | | | | | 100.0 | | |
| |
Fair Value Measurements^
The following is a summary of the fair valuations according to the inputs used as of December 31, 2021 in valuing the assets and liabilities:
| | | | Quoted Prices
in Active Markets
for Identical
Investments
(Level 1) | | | Significant
Other
Observable
Inputs
(Level 2) | | | Significant
Unobservable
Inputs
(Level 3) | | | Fair Value
at
December 31, 2021 | |
| Asset Table | | | | | | | | | | | | | | | | | | | | | | | | | |
| Investments, at fair value | | | | | | | | | | | | | | | | | | | | | | | | | |
| Exchange-Traded Funds | | | | $ | 5,917,595 | | | | | $ | — | | | | | $ | — | | | | | $ | 5,917,595 | | |
| Mutual Funds | | | | | 25,889,808 | | | | | | — | | | | | | — | | | | | | 25,889,808 | | |
| Total Investments, at fair value | | | | $ | 31,807,403 | | | | | $ | — | | | | | $ | — | | | | | $ | 31,807,403 | | |
^
See Note 2, “Significant Accounting Policies” in the Notes to Financial Statements for additional information.
See Accompanying Notes to Financial Statements
PORTFOLIO OF INVESTMENTS
| Voya Solution Aggressive Portfolio | as of December 31, 2021 (continued) |
Transactions with Affiliates
An investment of at least 5% of the voting securities of an issuer, or a company which is under common control with the issuer, results in that issuer becoming an affiliated person as defined by the 1940 Act.
The following table provides transactions during the year ended December 31, 2021, where the following issuers were considered an affiliate:
| Issuer | | | Beginning
Fair Value
at 12/31/2020 | | | Purchases
at Cost | | | Sales
at Cost | | | Change in
Unrealized
Appreciation/
(Depreciation) | | | Ending
Fair Value
at 12/31/2021 | | | Investment
Income | | | Realized
Gains/
(Losses) | | | Net Capital
Gain
Distributions | |
| Voya High Yield Bond Fund - Class R6 | | | | $ | 253,644 | | | | | $ | 35,607 | | | | | $ | (263,662) | | | | | $ | (25,589) | | | | | $ | — | | | | | $ | 4,128 | | | | | $ | 25,464 | | | | | $ | — | | |
| Voya Large-Cap Growth Fund - Class R6 | | | | | 652,849 | | | | | | 137,068 | | | | | | (710,375) | | | | | | (79,542) | | | | | | — | | | | | | — | | | | | | 195,656 | | | | | | — | | |
Voya Multi-Manager Emerging Markets Equity Fund -
Class I | | | | | 1,580,140 | | | | | | 1,222,956 | | | | | | (1,450,140) | | | | | | (450,102) | | | | | | 902,854 | | | | | | 18,868 | | | | | | 301,845 | | | | | | 126,641 | | |
| Voya Multi-Manager International Equity Fund - Class I | | | | | 2,604,628 | | | | | | 2,177,752 | | | | | | (429,705) | | | | | | (645,481) | | | | | | 3,707,194 | | | | | | 51,240 | | | | | | 139,782 | | | | | | 631,642 | | |
| Voya Multi-Manager International Factors Fund - Class I | | | | | 1,297,591 | | | | | | 391,413 | | | | | | (638,014) | | | | | | (108,869) | | | | | | 942,121 | | | | | | 37,817 | | | | | | 112,711 | | | | | | 89,525 | | |
| Voya Multi-Manager Mid Cap Value Fund - Class I | | | | | 1,302,001 | | | | | | 818,019 | | | | | | (394,662) | | | | | | 69,851 | | | | | | 1,795,209 | | | | | | 21,779 | | | | | | 75,610 | | | | | | 219,296 | | |
| Voya U.S. Stock Index Portfolio - Class I | | | | | 4,686,382 | | | | | | 3,567,432 | | | | | | (1,351,858) | | | | | | 333,194 | | | | | | 7,235,150 | | | | | | 73,866 | | | | | | 485,880 | | | | | | 473,602 | | |
| VY® Columbia Contrarian Core Portfolio - Class I | | | | | 1,935,588 | | | | | | 705,574 | | | | | | (319,026) | | | | | | 98,936 | | | | | | 2,421,072 | | | | | | 12,684 | | | | | | 131,685 | | | | | | 225,006 | | |
| VY® Invesco Comstock Portfolio - Class I | | | | | 1,326,708 | | | | | | 895,710 | | | | | | (587,893) | | | | | | 318,017 | | | | | | 1,952,542 | | | | | | 31,241 | | | | | | 86,451 | | | | | | — | | |
VY® JPMorgan Small Cap Core Equity Portfolio Class R6 | | | | | 1,627,338 | | | | | | 557,463 | | | | | | (889,702) | | | | | | 940 | | | | | | 1,296,039 | | | | | | 4,278 | | | | | | 214,025 | | | | | | 54,151 | | |
VY® T. Rowe Price Capital Appreciation Portfolio - Class R6 | | | | | 1,272,427 | | | | | | 536,443 | | | | | | (246,514) | | | | | | 29,531 | | | | | | 1,591,887 | | | | | | 15,811 | | | | | | 37,049 | | | | | | 165,103 | | |
VY® T. Rowe Price Diversified Mid Cap Growth Portfolio - Class R6 | | | | | 1,317,577 | | | | | | 891,763 | | | | | | (381,204) | | | | | | (138,274) | | | | | | 1,689,862 | | | | | | 114 | | | | | | 84,747 | | | | | | 254,238 | | |
| VY® T. Rowe Price Growth Equity Portfolio - Class I | | | | | 1,673,156 | | | | | | 1,104,225 | | | | | | (443,955) | | | | | | 22,452 | | | | | | 2,355,878 | | | | | | — | | | | | | 142,763 | | | | | | 182,910 | | |
| | | | | $ | 21,530,029 | | | | | $ | 13,041,425 | | | | | $ | (8,106,710) | | | | | $ | (574,936) | | | | | $ | 25,889,808 | | | | | $ | 271,826 | | | | | $ | 2,033,668 | | | | | $ | 2,422,114 | | |
The financial statements for the above mutual fund[s] can be found at www.sec.gov.
At December 31, 2021, the aggregate cost of securities and other investments and the composition of unrealized appreciation and depreciation of securities and other investments on a tax basis were:
| | Cost for federal income tax purposes was $29,039,363. | | | | | | | |
| | Net unrealized appreciation consisted of: | | | | | | | |
| | Gross Unrealized Appreciation | | | | $ | 3,976,016 | | |
| | Gross Unrealized Depreciation | | | | | (1,207,976) | | |
| | Net Unrealized Appreciation | | | | $ | 2,768,040 | | |
See Accompanying Notes to Financial Statements
PORTFOLIO OF INVESTMENTS
| Voya Solution Balanced Portfolio | as of December 31, 2021 |
| Shares | | | Value | | | Percentage
of Net
Assets | |
| EXCHANGE-TRADED FUNDS: 17.0% | |
| 2,639 | | | iShares Russell 2000 ETF | | | | $ | 587,046 | | | | | | 0.9 | | |
| 16,708 | | | Vanguard Russell 1000 Growth
ETF | | | | | 1,312,246 | | | | | | 2.1 | | |
| 12,431 | | | Vanguard S&P 500 ETF | | | | | 5,427,002 | | | | | | 8.4 | | |
| 24,491 | | | Vanguard Value ETF | | | | | 3,602,871 | | | | | | 5.6 | | |
| | | | Total Exchange-Traded Funds
(Cost $8,620,314) | | | | | 10,929,165 | | | | | | 17.0 | | |
| MUTUAL FUNDS: 83.0% | |
| | | | Affiliated Investment Companies: 83.0% | |
| 639,910 | | | Voya High Yield Bond Fund -
Class R6 | | | | | 5,144,876 | | | | | | 8.0 | | |
| 682,378 | | | Voya Intermediate Bond Fund -
Class R6 | | | | | 7,001,195 | | | | | | 10.9 | | |
| 83,617 | | | Voya MidCap Opportunities
Portfolio - Class R6 | | | | | 1,514,295 | | | | | | 2.3 | | |
| 103,026 | | | Voya Multi-Manager Emerging
Markets Equity Fund - Class I | | | | | 1,213,652 | | | | | | 1.9 | | |
| 273,053 | | | Voya Multi-Manager International
Equity Fund - Class I | | | | | 3,123,731 | | | | | | 4.8 | | |
| 193,879 | | | Voya Multi-Manager International
Factors Fund - Class I | | | | | 1,905,827 | | | | | | 3.0 | | |
| 153,704 | | | Voya Multi-Manager Mid Cap
Value Fund - Class I | | | | | 1,650,784 | | | | | | 2.6 | | |
| 128,458 | | | Voya Short Term Bond Fund -
Class R6 | | | | | 1,269,161 | | | | | | 2.0 | | |
| Shares | | | Value | | | Percentage
of Net
Assets | |
| MUTUAL FUNDS: (continued) | |
| | | | Affiliated Investment Companies (continued) | |
| 194,096 | | | Voya U.S. High Dividend Low
Volatility Fund - Class R6 | | | | $ | 2,311,685 | | | | | | 3.6 | | |
| 429,769 | | | Voya U.S. Stock Index Portfolio -
Class I | | | | | 9,399,043 | | | | | | 14.6 | | |
| 395,614 | | | VY® BrandywineGLOBAL - Bond
Portfolio - Class I | | | | | 4,438,792 | | | | | | 6.9 | | |
| 98,639 | | | VY® Columbia Contrarian Core
Portfolio - Class I | | | | | 2,287,438 | | | | | | 3.6 | | |
| 59,992 | | | VY® JPMorgan Small Cap Core
Equity Portfolio - Class R6 | | | | | 1,274,840 | | | | | | 2.0 | | |
| 195,425 | | | VY® T. Rowe Price Capital
Appreciation Portfolio - Class R6 | | | | | 6,445,109 | | | | | | 10.0 | | |
| 37,051 | | | VY® T. Rowe Price Growth Equity
Portfolio - Class I | | | | | 4,410,894 | | | | | | 6.8 | | |
| | | | Total Mutual Funds
(Cost $49,966,078) | | | | | 53,391,322 | | | | | | 83.0 | | |
| | | | Total Investments in
Securities
(Cost $58,586,392) | | | | $ | 64,320,487 | | | | | | 100.0 | | |
| | | | Assets in Excess of Other
Liabilities | | | | | 26,716 | | | | | | 0.0 | | |
| | | | Net Assets | | | | $ | 64,347,203 | | | | | | 100.0 | | |
| |
Fair Value Measurements^
The following is a summary of the fair valuations according to the inputs used as of December 31, 2021 in valuing the assets and liabilities:
| | | | Quoted Prices
in Active Markets
for Identical
Investments
(Level 1) | | | Significant
Other
Observable
Inputs
(Level 2) | | | Significant
Unobservable
Inputs
(Level 3) | | | Fair Value
at
December 31, 2021 | |
| Asset Table | | | | | | | | | | | | | | | | | | | | | | | | | |
| Investments, at fair value | | | | | | | | | | | | | | | | | | | | | | | | | |
| Exchange-Traded Funds | | | | $ | 10,929,165 | | | | | $ | — | | | | | $ | — | | | | | $ | 10,929,165 | | |
| Mutual Funds | | | | | 53,391,322 | | | | | | — | | | | | | — | | | | | | 53,391,322 | | |
| Total Investments, at fair value | | | | $ | 64,320,487 | | | | | $ | — | | | | | $ | — | | | | | $ | 64,320,487 | | |
^
See Note 2, “Significant Accounting Policies” in the Notes to Financial Statements for additional information.
See Accompanying Notes to Financial Statements
PORTFOLIO OF INVESTMENTS
| Voya Solution Balanced Portfolio | as of December 31, 2021 (continued) |
Transactions with Affiliates
An investment of at least 5% of the voting securities of an issuer, or a company which is under common control with the issuer, results in that issuer becoming an affiliated person as defined by the 1940 Act.
The following table provides transactions during the year ended December 31, 2021, where the following issuers were considered an affiliate:
| Issuer | | | Beginning
Fair Value
at 12/31/2020 | | | Purchases
at Cost | | | Sales
at Cost | | | Change in
Unrealized
Appreciation/
(Depreciation) | | | Ending
Fair Value
at 12/31/2021 | | | Investment
Income | | | Realized
Gains/
(Losses) | | | Net Capital
Gain
Distributions | |
| Voya High Yield Bond Fund - Class R6 | | | | $ | 4,471,055 | | | | | $ | 1,300,676 | | | | | $ | (608,579) | | | | | $ | (18,276) | | | | | $ | 5,144,876 | | | | | $ | 244,311 | | | | | $ | 8,390 | | | | | $ | — | | |
| Voya Intermediate Bond Fund - Class R6 | | | | | 5,548,318 | | | | | | 2,544,803 | | | | | | (884,790) | | | | | | (207,136) | | | | | | 7,001,195 | | | | | | 163,606 | | | | | | (1,158) | | | | | | — | | |
| Voya Large-Cap Growth Fund - Class R6 | | | | | 2,302,258 | | | | | | 247,903 | | | | | | (2,200,610) | | | | | | (349,551) | | | | | | — | | | | | | — | | | | | | 676,573 | | | | | | — | | |
| Voya MidCap Opportunities Portfolio - Class R6 | | | | | 1,171,235 | | | | | | 1,001,892 | | | | | | (422,434) | | | | | | (236,398) | | | | | | 1,514,295 | | | | | | — | | | | | | 166,342 | | | | | | 236,650 | | |
| Voya Multi-Manager Emerging Markets Equity Fund - Class I | | | | | 2,322,190 | | | | | | 1,907,525 | | | | | | (2,355,438) | | | | | | (660,625) | | | | | | 1,213,652 | | | | | | 25,572 | | | | | | 447,515 | | | | | | 171,646 | | |
| Voya Multi-Manager International Equity Fund - Class I | | | | | 2,869,868 | | | | | | 1,142,430 | | | | | | (377,209) | | | | | | (511,358) | | | | | | 3,123,731 | | | | | | 43,525 | | | | | | 122,591 | | | | | | 536,547 | | |
| Voya Multi-Manager International Factors Fund - Class I | | | | | 1,715,644 | | | | | | 535,617 | | | | | | (238,287) | | | | | | (107,147) | | | | | | 1,905,827 | | | | | | 77,109 | | | | | | 42,322 | | | | | | 182,542 | | |
| Voya Multi-Manager Mid Cap Value Fund - Class I | | | | | 1,147,943 | | | | | | 971,355 | | | | | | (476,082) | | | | | | 7,568 | | | | | | 1,650,784 | | | | | | 20,182 | | | | | | 118,072 | | | | | | 202,380 | | |
| Voya Short Term Bond Fund - Class R6 | | | | | 1,105,850 | | | | | | 330,203 | | | | | | (153,121) | | | | | | (13,771) | | | | | | 1,269,161 | | | | | | 17,812 | | | | | | 1,121 | | | | | | — | | |
| Voya U.S. High Dividend Low Volatility Fund - Class R6 | | | | | 2,556,338 | | | | | | 1,919,852 | | | | | | (1,771,418) | | | | | | (393,087) | | | | | | 2,311,685 | | | | | | 46,369 | | | | | | 339,591 | | | | | | 535,706 | | |
| Voya U.S. Stock Index Portfolio - Class I | | | | | 7,360,877 | | | | | | 2,968,401 | | | | | | (1,581,389) | | | | | | 651,154 | | | | | | 9,399,043 | | | | | | 95,843 | | | | | | 570,287 | | | | | | 828,887 | | |
| VY® BrandywineGLOBAL - Bond Portfolio - Class I | | | | | 3,875,521 | | | | | | 2,017,374 | | | | | | (971,422) | | | | | | (482,681) | | | | | | 4,438,792 | | | | | | 76,472 | | | | | | 152,861 | | | | | | 304,407 | | |
| VY® Columbia Contrarian Core Portfolio - Class I | | | | | 1,421,894 | | | | | | 1,064,110 | | | | | | (234,778) | | | | | | 36,212 | | | | | | 2,287,438 | | | | | | 12,566 | | | | | | 95,068 | | | | | | 222,910 | | |
| VY® Invesco Comstock Portfolio - Class I | | | | | — | | | | | | 636,628 | | | | | | (636,628) | | | | | | — | | | | | | — | | | | | | 1,880 | | | | | | 38,636 | | | | | | — | | |
VY® JPMorgan Small Cap Core Equity Portfolio - Class R6 | | | | | 1,174,228 | | | | | | 1,506,905 | | | | | | (1,177,498) | | | | | | (228,795) | | | | | | 1,274,840 | | | | | | 2,107 | | | | | | 360,410 | | | | | | 26,677 | | |
VY® T. Rowe Price Capital Appreciation Portfolio - Class R6 | | | | | 5,607,104 | | | | | | 1,645,514 | | | | | | (898,471) | | | | | | 90,962 | | | | | | 6,445,109 | | | | | | 64,213 | | | | | | 188,634 | | | | | | 702,959 | | |
| VY® T. Rowe Price Growth Equity Portfolio - Class I | | | | | 2,268,824 | | | | | | 2,572,289 | | | | | | (477,863) | | | | | | 47,644 | | | | | | 4,410,894 | | | | | | — | | | | | | 133,910 | | | | | | 340,007 | | |
| | | | | $ | 46,919,147 | | | | | $ | 24,313,477 | | | | | $ | (15,466,017) | | | | | $ | (2,375,285) | | | | | $ | 53,391,322 | | | | | $ | 891,567 | | | | | $ | 3,461,165 | | | | | $ | 4,291,318 | | |
The financial statements for the above mutual fund[s] can be found at www.sec.gov.
At December 31, 2021, the aggregate cost of securities and other investments and the composition of unrealized appreciation and depreciation of securities and other investments on a tax basis were:
| | Cost for federal income tax purposes was $59,169,905. | | |
| | Net unrealized appreciation consisted of: | | |
| | Gross Unrealized Appreciation | | | | $ | 6,473,500 | | |
| | Gross Unrealized Depreciation | | | | | (1,322,918) | | |
| | Net Unrealized Appreciation | | | | $ | 5,150,582 | | |
See Accompanying Notes to Financial Statements
PORTFOLIO OF INVESTMENTS
| Voya Solution Conservative Portfolio | as of December 31, 2021 |
| Shares | | | Value | | | Percentage
of Net
Assets | |
| EXCHANGE-TRADED FUNDS: 8.6% | |
| 5,575 | | | Schwab U.S. TIPS ETF | | | | $ | 350,612 | | | | | | 2.0 | | |
| 4,616 | | | Vanguard Russell 1000 Growth
ETF | | | | | 362,540 | | | | | | 2.0 | | |
| 1,252 | | | Vanguard S&P 500 ETF | | | | | 546,586 | | | | | | 3.1 | | |
| 1,845 | | | Vanguard Value ETF | | | | | 271,418 | | | | | | 1.5 | | |
| | | | Total Exchange-Traded Funds
(Cost $1,357,583) | | | | | 1,531,156 | | | | | | 8.6 | | |
| MUTUAL FUNDS: 91.4% | |
| | | | Affiliated Investment Companies: 91.4% | |
| 95,171 | | | Voya Global Bond Fund -
Class R6 | | | | | 874,620 | | | | | | 4.9 | | |
| 288,454 | | | Voya High Yield Bond Fund -
Class R6 | | | | | 2,319,172 | | | | | | 13.1 | | |
| 318,450 | | | Voya Intermediate Bond Fund -
Class R6 | | | | | 3,267,297 | | | | | | 18.4 | | |
| 9,296 | | | Voya MidCap Opportunities
Portfolio - Class R6 | | | | | 168,349 | | | | | | 0.9 | | |
| 15,146 | | | Voya Multi-Manager
International Equity Fund -
Class I | | | | | 173,275 | | | | | | 1.0 | | |
| 35,855 | | | Voya Multi-Manager
International Factors Fund -
Class I | | | | | 352,453 | | | | | | 2.0 | | |
| 17,024 | | | Voya Multi-Manager Mid Cap
Value Fund - Class I | | | | | 182,839 | | | | | | 1.0 | | |
| Shares | | | Value | | | Percentage
of Net
Assets | |
| MUTUAL FUNDS: (continued) | |
| | | | Affiliated Investment Companies (continued) | |
| 302,892 | | | Voya Short Term Bond Fund -
Class R6 | | | | $ | 2,992,574 | | | | | | 16.9 | | |
| 30,931 | | | Voya U.S. High Dividend Low
Volatility Fund - Class R6 | | | | | 368,389 | | | | | | 2.1 | | |
| 33,527 | | | Voya U.S. Stock Index
Portfolio - Class I | | | | | 733,232 | | | | | | 4.1 | | |
| 243,019 | | | VY®BrandywineGLOBAL -
Bond Portfolio - Class I | | | | | 2,726,672 | | | | | | 15.4 | | |
| 54,217 | | | VY®T. Rowe Price Capital
Appreciation Portfolio -
Class R6 | | | | | 1,788,093 | | | | | | 10.1 | | |
| 2,209 | | | VY®T. Rowe Price Growth
Equity Portfolio - Class I | | | | | 262,989 | | | | | | 1.5 | | |
| | | | Total Mutual Funds
(Cost $16,112,838) | | | | | 16,209,954 | | | | | | 91.4 | | |
| | | | Total Investments in
Securities
(Cost $17,470,421) | | | | $ | 17,741,110 | | | | | | 100.0 | | |
| | | | Assets in Excess of Other
Liabilities | | | | | 7,290 | | | | | | 0.0 | | |
| | | | Net Assets | | | | $ | 17,748,400 | | | | | | 100.0 | | |
| |
Fair Value Measurements^
The following is a summary of the fair valuations according to the inputs used as of December 31, 2021 in valuing the assets and liabilities:
| | | | Quoted Prices
in Active Markets
for Identical
Investments
(Level 1) | | | Significant
Other
Observable
Inputs
(Level 2) | | | Significant
Unobservable
Inputs
(Level 3) | | | Fair Value
at
December 31, 2021 | |
| Asset Table | | | | | | | | | | | | | | | | | | | | | | | | | |
| Investments, at fair value | | | | | | | | | | | | | | | | | | | | | | | | | |
| Exchange-Traded Funds | | | | $ | 1,531,156 | | | | | $ | — | | | | | $ | — | | | | | $ | 1,531,156 | | |
| Mutual Funds | | | | | 16,209,954 | | | | | | — | | | | | | — | | | | | | 16,209,954 | | |
| Total Investments, at fair value | | | | $ | 17,741,110 | | | | | $ | — | | | | | $ | — | | | | | $ | 17,741,110 | | |
^
See Note 2, “Significant Accounting Policies” in the Notes to Financial Statements for additional information.
See Accompanying Notes to Financial Statements
PORTFOLIO OF INVESTMENTS
| Voya Solution Conservative Portfolio | as of December 31, 2021 (continued) |
Transactions with Affiliates
An investment of at least 5% of the voting securities of an issuer, or a company which is under common control with the issuer, results in that issuer becoming an affiliated person as defined by the 1940 Act.
The following table provides transactions during the year ended December 31, 2021, where the following issuers were considered an affiliate:
| Issuer | | | Beginning
Fair Value
at 12/31/2020 | | | Purchases
at Cost | | | Sales
at Cost | | | Change in
Unrealized
Appreciation/
(Depreciation) | | | Ending
Fair Value
at 12/31/2021 | | | Investment
Income | | | Realized
Gains/
(Losses) | | | Net Capital
Gain
Distributions | |
| Voya Global Bond Fund - Class R6 | | | | $ | 804,209 | | | | | $ | 301,546 | | | | | $ | (175,126) | | | | | $ | (56,009) | | | | | $ | 874,620 | | | | | $ | 4,521 | | | | | $ | 10,872 | | | | | $ | — | | |
| Voya High Yield Bond Fund - Class R6 | | | | | 2,088,707 | | | | | | 737,761 | | | | | | (453,070) | | | | | | (54,226) | | | | | | 2,319,172 | | | | | | 108,002 | | | | | | 49,887 | | | | | | — | | |
| Voya Intermediate Bond Fund - Class R6 | | | | | 2,635,756 | | | | | | 1,594,902 | | | | | | (863,696) | | | | | | (99,665) | | | | | | 3,267,297 | | | | | | 74,473 | | | | | | 6,228 | | | | | | — | | |
| Voya Large-Cap Growth Fund - Class R6 | | | | | 496,483 | | | | | | 191,334 | | | | | | (620,917) | | | | | | (66,900) | | | | | | — | | | | | | — | | | | | | 151,396 | | | | | | — | | |
| Voya MidCap Opportunities Portfolio - Class R6 | | | | | 168,404 | | | | | | 158,760 | | | | | | (108,357) | | | | | | (50,458) | | | | | | 168,349 | | | | | | — | | | | | | 44,342 | | | | | | 31,192 | | |
| Voya Multi-Manager Emerging Markets Equity Fund - Class I | | | | | 333,927 | | | | | | 252,708 | | | | | | (549,017) | | | | | | (37,618) | | | | | | — | | | | | | — | | | | | | 45,752 | | | | | | — | | |
| Voya Multi-Manager International Equity Fund - Class I | | | | | 165,040 | | | | | | 79,789 | | | | | | (36,670) | | | | | | (34,884) | | | | | | 173,275 | | | | | | 2,407 | | | | | | 13,265 | | | | | | 29,676 | | |
| Voya Multi-Manager International Factors Fund - Class I | | | | | 328,877 | | | | | | 137,185 | | | | | | (65,401) | | | | | | (48,208) | | | | | | 352,453 | | | | | | 14,220 | | | | | | 35,183 | | | | | | 33,663 | | |
| Voya Multi-Manager Mid Cap Value Fund - Class I | | | | | 165,043 | | | | | | 147,699 | | | | | | (106,252) | | | | | | (23,651) | | | | | | 182,839 | | | | | | 2,229 | | | | | | 44,233 | | | | | | 22,406 | | |
| Voya Short Term Bond Fund - Class R6 | | | | | 2,702,245 | | | | | | 951,841 | | | | | | (612,603) | | | | | | (48,909) | | | | | | 2,992,574 | | | | | | 41,111 | | | | | | 19,790 | | | | | | — | | |
| Voya U.S. High Dividend Low Volatility Fund - Class R6 | | | | | 447,602 | | | | | | 308,778 | | | | | | (314,247) | | | | | | (73,744) | | | | | | 368,389 | | | | | | 8,287 | | | | | | 72,225 | | | | | | 85,075 | | |
| Voya U.S. Stock Index Portfolio - Class I | | | | | — | | | | | | 1,069,890 | | | | | | (373,163) | | | | | | 36,505 | | | | | | 733,232 | | | | | | 7,503 | | | | | | 25,599 | | | | | | — | | |
| VY® BrandywineGLOBAL - Bond Portfolio - Class I | | | | | 1,511,996 | | | | | | 1,847,270 | | | | | | (381,866) | | | | | | (250,728) | | | | | | 2,726,672 | | | | | | 39,872 | | | | | | 74,571 | | | | | | 158,711 | | |
VY®JPMorgan Small Cap Core Equity Portfolio - Class R6 | | | | | 337,879 | | | | | | 107,178 | | | | | | (382,233) | | | | | | (62,824) | | | | | | — | | | | | | 579 | | | | | | 101,792 | | | | | | 7,336 | | |
VY® T. Rowe Price Capital Appreciation Portfolio - Class R6 | | | | | 1,612,147 | | | | | | 661,950 | | | | | | (490,590) | | | | | | 4,586 | | | | | | 1,788,093 | | | | | | 17,814 | | | | | | 67,722 | | | | | | 189,083 | | |
| VY® T. Rowe Price Growth Equity Portfolio - Class I | | | | | — | | | | | | 312,169 | | | | | | (36,759) | | | | | | (12,421) | | | | | | 262,989 | | | | | | — | | | | | | (2,464) | | | | | | 19,595 | | |
| | | | | $ | 13,798,315 | | | | | $ | 8,860,760 | | | | | $ | (5,569,967) | | | | | $ | (879,154) | | | | | $ | 16,209,954 | | | | | $ | 321,018 | | | | | $ | 760,393 | | | | | $ | 576,737 | | |
The financial statements for the above mutual fund[s] can be found at www.sec.gov.
At December 31, 2021, the aggregate cost of securities and other investments and the composition of unrealized appreciation and depreciation of securities and other investments on a tax basis were:
| | Cost for federal income tax purposes was $17,604,930. | | | | | | | |
| | Net unrealized appreciation consisted of: | | | | | | | |
| | Gross Unrealized Appreciation | | | | $ | 501,115 | | |
| | Gross Unrealized Depreciation | | | | | (364,934) | | |
| | Net Unrealized Appreciation | | | | $ | 136,181 | | |
See Accompanying Notes to Financial Statements
PORTFOLIO OF INVESTMENTS
| Voya Solution Income Portfolio | as of December 31, 2021 |
| Shares | | | Value | | | Percentage
of Net
Assets | |
| EXCHANGE-TRADED FUNDS: 12.8% | |
| 39,279 | | | iShares 20+ Year Treasury
Bond ETF | | | | $ | 5,820,755 | | | | | | 2.1 | | |
| 137,503 | | | Schwab U.S. TIPS ETF | | | | | 8,647,564 | | | | | | 3.0 | | |
| 75,897 | | | Vanguard Russell 1000
Growth ETF | | | | | 5,960,950 | | | | | | 2.1 | | |
| 20,586 | | | Vanguard S&P 500 ETF | | | | | 8,987,230 | | | | | | 3.2 | | |
| 45,511 | | | Vanguard Value ETF | | | | | 6,695,123 | | | | | | 2.4 | | |
| | | | Total Exchange-Traded Funds
(Cost $32,579,367) | | | | | 36,111,622 | | | | | | 12.8 | | |
| MUTUAL FUNDS: 87.2% | |
| | | | Affiliated Investment Companies: 87.2% | |
| 912,418 | | | Voya Global Bond Fund -
Class R6 | | | | | 8,385,124 | | | | | | 3.0 | | |
| 1,773,100 | | | Voya High Yield Bond Fund -
Class R6 | | | | | 14,255,725 | | | | | | 5.0 | | |
| 7,113,392 | | | Voya Intermediate Bond
Fund - Class R6 | | | | | 72,983,404 | | | | | | 25.7 | | |
| 459,740 | | | Voya Multi-Manager Emerging
Markets Equity Fund - Class I | | | | | 5,415,735 | | | | | | 1.9 | | |
| 483,947 | | | Voya Multi-Manager
International Equity Fund -
Class I | | | | | 5,536,354 | | | | | | 1.9 | | |
| 1,431,773 | | | Voya Multi-Manager
International Factors Fund -
Class I | | | | | 14,074,329 | | | | | | 5.0 | | |
| 272,988 | | | Voya Multi-Manager Mid Cap
Value Fund - Class I | | | | | 2,931,891 | | | | | | 1.0 | | |
| Shares | | | Value | | | Percentage
of Net
Assets | |
| MUTUAL FUNDS: (continued) | |
| | | | Affiliated Investment Companies (continued) | |
| 2,857,361 | | | Voya Short Term Bond Fund -
Class R6 | | | | $ | 28,230,724 | | | | | | 10.0 | | |
| 540,311 | | | Voya U.S. High Dividend Low
Volatility Fund - Class R6 | | | | | 6,435,103 | | | | | | 2.3 | | |
| 524,865 | | | Voya U.S. Stock Index
Portfolio - Class I | | | | | 11,478,806 | | | | | | 4.0 | | |
| 3,507,292 | | | VY® BrandywineGLOBAL -
Bond Portfolio - Class I | | | | | 39,351,812 | | | | | | 13.9 | | |
| 866,326 | | | VY® T. Rowe Price Capital
Appreciation Portfolio -
Class R6 | | | | | 28,571,446 | | | | | | 10.1 | | |
| 185,447 | | | VY® T. Rowe Price Diversified
Mid Cap Growth Portfolio -
Class R6 | | | | | 2,752,028 | | | | | | 1.0 | | |
| 57,465 | | | VY® T. Rowe Price Growth
Equity Portfolio - Class I | | | | | 6,841,156 | | | | | | 2.4 | | |
| | | | Total Mutual Funds
(Cost $236,373,306) | | | | | 247,243,637 | | | | | | 87.2 | | |
| | | | Total Investments in
Securities
(Cost $268,952,673) | | | | $ | 283,355,259 | | | | | | 100.0 | | |
| | | | Assets in Excess of
Other Liabilities | | | | | 52,768 | | | | | | 0.0 | | |
| | | | Net Assets | | | | $ | 283,408,027 | | | | | | 100.0 | | |
| |
Fair Value Measurements^
The following is a summary of the fair valuations according to the inputs used as of December 31, 2021 in valuing the assets and liabilities:
| | | | Quoted Prices
in Active Markets
for Identical
Investments
(Level 1) | | | Significant
Other
Observable
Inputs
(Level 2) | | | Significant
Unobservable
Inputs
(Level 3) | | | Fair Value
at
December 31, 2021 | |
| Asset Table | | | | | | | | | | | | | | | | | | | | | | | | | |
| Investments, at fair value | | | | | | | | | | | | | | | | | | | | | | | | | |
| Exchange-Traded Funds | | | | $ | 36,111,622 | | | | | $ | — | | | | | $ | — | | | | | $ | 36,111,622 | | |
| Mutual Funds | | | | | 247,243,637 | | | | | | — | | | | | | — | | | | | | 247,243,637 | | |
| Total Investments, at fair value | | | | $ | 283,355,259 | | | | | $ | — | | | | | $ | — | | | | | $ | 283,355,259 | | |
^
See Note 2, “Significant Accounting Policies” in the Notes to Financial Statements for additional information.
See Accompanying Notes to Financial Statements
PORTFOLIO OF INVESTMENTS
| Voya Solution Income Portfolio | as of December 31, 2021 (continued) |
Transactions with Affiliates
An investment of at least 5% of the voting securities of an issuer, or a company which is under common control with the issuer, results in that issuer becoming an affiliated person as defined by the 1940 Act.
The following table provides transactions during the year ended December 31, 2021, where the following issuers were considered an affiliate:
| Issuer | | | Beginning
Fair Value
at 12/31/2020 | | | Purchases
at Cost | | | Sales
at Cost | | | Change in
Unrealized
Appreciation/
(Depreciation) | | | Ending
Fair Value
at 12/31/2021 | | | Investment
Income | | | Realized
Gains/
(Losses) | | | Net Capital
Gain
Distributions | |
| Voya Global Bond Fund - Class R6 | | | | $ | 9,208,164 | | | | | $ | 1,221,065 | | | | | $ | (1,486,306) | | | | | $ | (557,799) | | | | | $ | 8,385,124 | | | | | $ | 35,162 | | | | | $ | 77,117 | | | | | $ | — | | |
| Voya High Yield Bond Fund - Class R6 | | | | | 15,351,134 | | | | | | 1,624,842 | | | | | | (2,406,694) | | | | | | (313,557) | | | | | | 14,255,725 | | | | | | 749,060 | | | | | | 286,855 | | | | | | — | | |
| Voya Intermediate Bond Fund - Class R6 | | | | | 75,845,948 | | | | | | 15,886,270 | | | | | | (15,476,252) | | | | | | (3,272,562) | | | | | | 72,983,404 | | | | | | 1,909,265 | | | | | | 679,122 | | | | | | — | | |
| Voya Large-Cap Growth Fund - Class R6 | | | | | 7,646,044 | | | | | | 385,969 | | | | | | (6,836,078) | | | | | | (1,195,935) | | | | | | — | | | | | | — | | | | | | 2,428,360 | | | | | | — | | |
Voya Multi-Manager Emerging Markets Equity
Fund - Class I | | | | | 6,219,711 | | | | | | 1,903,183 | | | | | | (1,292,117) | | | | | | (1,415,042) | | | | | | 5,415,735 | | | | | | 114,696 | | | | | | 425,158 | | | | | | 769,857 | | |
| Voya Multi-Manager International Equity Fund - Class I | | | | | 6,112,977 | | | | | | 1,356,511 | | | | | | (890,601) | | | | | | (1,042,533) | | | | | | 5,536,354 | | | | | | 77,527 | | | | | | 422,722 | | | | | | 955,694 | | |
| Voya Multi-Manager International Factors Fund - Class I | | | | | 18,273,439 | | | | | | 2,458,632 | | | | | | (5,498,157) | | | | | | (1,159,585) | | | | | | 14,074,329 | | | | | | 572,230 | | | | | | 1,111,101 | | | | | | 1,354,658 | | |
Voya Multi-Manager Mid Cap Value Fund -
Class I | | | | | — | | | | | | 3,506,268 | | | | | | (402,723) | | | | | | (171,654) | | | | | | 2,931,891 | | | | | | 36,015 | | | | | | 9,023 | | | | | | 361,726 | | |
| Voya Securitized Credit Fund - Class R6 | | | | | — | | | | | | 14,719,483 | | | | | | (14,719,483) | | | | | | — | | | | | | — | | | | | | 53,658 | | | | | | (14,765) | | | | | | — | | |
| Voya Short Term Bond Fund - Class R6 | | | | | 30,565,932 | | | | | | 16,664,172 | | | | | | (18,362,832) | | | | | | (636,548) | | | | | | 28,230,724 | | | | | | 414,475 | | | | | | 422,540 | | | | | | — | | |
| Voya U.S. High Dividend Low Volatility Fund - Class R6 | | | | | 6,932,168 | | | | | | 2,352,390 | | | | | | (2,173,958) | | | | | | (675,497) | | | | | | 6,435,103 | | | | | | 148,694 | | | | | | 625,143 | | | | | | 1,506,890 | | |
| Voya U.S. Stock Index Portfolio - Class I | | | | | 14,606,353 | | | | | | 1,674,161 | | | | | | (4,973,995) | | | | | | 172,287 | | | | | | 11,478,806 | | | | | | 117,733 | | | | | | 1,778,789 | | | | | | 1,120,578 | | |
VY® BrandywineGLOBAL - Bond Portfolio -
Class I | | | | | 42,745,645 | | | | | | 6,953,963 | | | | | | (6,489,140) | | | | | | (3,858,656) | | | | | | 39,351,812 | | | | | | 651,494 | | | | | | 1,103,738 | | | | | | 2,593,357 | | |
VY® JPMorgan Small Cap Core Equity Portfolio - Class R6 | | | | | 2,231,195 | | | | | | 4,556,240 | | | | | | (6,345,698) | | | | | | (441,737) | | | | | | — | | | | | | 10,507 | | | | | | 708,368 | | | | | | 133,012 | | |
VY® T. Rowe Price Capital Appreciation Portfolio - Class R6 | | | | | 30,753,381 | | | | | | 4,786,268 | | | | | | (7,013,254) | | | | | | 45,051 | | | | | | 28,571,446 | | | | | | 287,638 | | | | | | 1,420,733 | | | | | | 3,422,067 | | |
VY® T. Rowe Price Diversified Mid Cap Growth Portfolio - Class R6 | | | | | — | | | | | | 3,597,906 | | | | | | (613,487) | | | | | | (232,391) | | | | | | 2,752,028 | | | | | | 199 | | | | | | (50,323) | | | | | | 442,473 | | |
VY® T. Rowe Price Growth Equity Portfolio -
Class I | | | | | 6,107,132 | | | | | | 2,338,801 | | | | | | (1,420,635) | | | | | | (184,142) | | | | | | 6,841,156 | | | | | | — | | | | | | 743,666 | | | | | | 588,272 | | |
| | | | | $ | 272,599,223 | | | | | $ | 85,986,124 | | | | | $ | (96,401,410) | | | | | $ | (14,940,300) | | | | | $ | 247,243,637 | | | | | $ | 5,178,353 | | | | | $ | 12,177,347 | | | | | $ | 13,248,584 | | |
The financial statements for the above mutual fund[s] can be found at www.sec.gov.
The effect of derivative instruments on the Portfolio’s Statement of Operations for the year ended December 31, 2021 was as follows:
| | | | Amount of Realized Gain or (Loss) on
Derivatives Recognized in Income | |
| Derivatives not accounted for as hedging instruments | | | Futures | |
| Equity contracts | | | | $ | 579,265 | | |
| Interest rate contracts | | | | | 29,162 | | |
| Total | | | | $ | 608,427 | | |
| | | | Change in Unrealized Appreciation or (Depreciation)
on Derivatives Recognized in Income | |
| Derivatives not accounted for as hedging instruments | | | Futures | |
| Equity contracts | | | | $ | (88,929) | | |
| Interest rate contracts | | | | | 710 | | |
| Total | | | | $ | (88,219) | | |
See Accompanying Notes to Financial Statements
PORTFOLIO OF INVESTMENTS
| Voya Solution Income Portfolio | as of December 31, 2021 (continued) |
At December 31, 2021, the aggregate cost of securities and other investments and the composition of unrealized appreciation and depreciation of securities and other investments on a tax basis were:
| | Cost for federal income tax purposes was $272,350,918. | | |
| | Net unrealized appreciation consisted of: | | |
| | Gross Unrealized Appreciation | | | | $ | 16,733,544 | | |
| | Gross Unrealized Depreciation | | | | | (5,729,203) | | |
| | Net Unrealized Appreciation | | | | $ | 11,004,341 | | |
See Accompanying Notes to Financial Statements
| Voya Solution Moderately | PORTFOLIO OF INVESTMENTS |
| Aggressive Portfolio | As of December 31, 2021 |
| Shares | | | Value | | | Percentage
of Net
Assets | |
| EXCHANGE-TRADED FUNDS: 18.8% | |
| 82,003 | | | iShares Russell 2000 ETF | | | | $ | 18,241,567 | | | | | | 2.9 | | |
| 165,688 | | | Vanguard Russell 1000 Growth
ETF | | | | | 13,013,136 | | | | | | 2.1 | | |
| 130,518 | | | Vanguard S&P 500 ETF | | | | | 56,980,243 | | | | | | 9.1 | | |
| 198,707 | | | Vanguard Value ETF | | | | | 29,231,787 | | | | | | 4.7 | | |
| | | | Total Exchange-Traded Funds
(Cost $94,480,848) | | | | | 117,466,733 | | | | | | 18.8 | | |
| MUTUAL FUNDS: 81.1% | |
| | | | Affiliated Investment Companies: 81.1% | |
| 4,665,479 | | | Voya High Yield Bond Fund -
Class R6 | | | | | 37,510,454 | | | | | | 6.0 | | |
| 2,412,129 | | | Voya Intermediate Bond Fund -
Class R6 | | | | | 24,748,449 | | | | | | 3.9 | | |
| 1,504,955 | | | Voya Multi-Manager Emerging
Markets Equity Fund - Class I | | | | | 17,728,371 | | | | | | 2.8 | | |
| 4,771,512 | | | Voya Multi-Manager
International Equity
Fund ‑ Class I | | | | | 54,586,096 | | | | | | 8.7 | | |
| 1,884,129 | | | Voya Multi-Manager
International Factors
Fund ‑ Class I | | | | | 18,520,991 | | | | | | 3.0 | | |
| 2,390,783 | | | Voya Multi-Manager Mid Cap
Value Fund - Class I | | | | | 25,677,014 | | | | | | 4.1 | | |
| 5,010,069 | | | Voya U.S. Stock Index Portfolio
- Class I | | | | | 109,570,210 | | | | | | 17.5 | | |
| 1,098,729 | | | VY® BrandywineGLOBAL -
Bond Portfolio - Class I | | | | | 12,327,745 | | | | | | 2.0 | | |
| Shares | | | Value | | | Percentage
of Net
Assets | |
| MUTUAL FUNDS: (continued) | |
| | | | Affiliated Investment Companies (continued) | |
| 1,644,016 | | | VY® Columbia Contrarian
Core Portfolio - Class I | | | | $ | 38,124,725 | | | | | | 6.1 | | |
| 1,305,242 | | | VY® Invesco Comstock
Portfolio - Class I | | | | | 27,736,382 | | | | | | 4.4 | | |
| 561,676 | | | VY® JPMorgan Small Cap
Core Equity Portfolio -
Class R6 | | | | | 11,935,614 | | | | | | 1.9 | | |
| 1,899,681 | | | VY® T. Rowe Price Capital
Appreciation Portfolio -
Class R6 | | | | | 62,651,484 | | | | | | 10.0 | | |
| 1,628,653 | | | VY® T. Rowe Price Diversified
Mid Cap Growth Portfolio -
Class R6 | | | | | 24,169,210 | | | | | | 3.9 | | |
| 358,159 | | | VY® T. Rowe Price Growth
Equity Portfolio - Class I | | | | | 42,638,869 | | | | | | 6.8 | | |
| | | | Total Mutual Funds
(Cost $450,561,756) | | | | | 507,925,614 | | | | | | 81.1 | | |
| | | | Total Investments in
Securities
(Cost $545,042,604) | | | | $ | 625,392,347 | | | | | | 99.9 | | |
| | | | Assets in Excess of Other
Liabilities | | | | | 379,378 | | | | | | 0.1 | | |
| | | | Net Assets | | | | $ | 625,771,725 | | | | | | 100.0 | | |
| |
Fair Value Measurements^
The following is a summary of the fair valuations according to the inputs used as of December 31, 2021 in valuing the assets and liabilities:
| | | | Quoted Prices
in Active Markets
for Identical
Investments
(Level 1) | | | Significant
Other
Observable
Inputs
(Level 2) | | | Significant
Unobservable
Inputs
(Level 3) | | | Fair Value
at
December 31, 2021 | |
| Asset Table | | | | | | | | | | | | | | | | | | | | | | | | | |
| Investments, at fair value | | | | | | | | | | | | | | | | | | | | | | | | | |
| Exchange-Traded Funds | | | | $ | 117,466,733 | | | | | $ | — | | | | | $ | — | | | | | $ | 117,466,733 | | |
| Mutual Funds | | | | | 507,925,614 | | | | | | — | | | | | | — | | | | | | 507,925,614 | | |
| Total Investments, at fair value | | | | $ | 625,392,347 | | | | | $ | — | | | | | $ | — | | | | | $ | 625,392,347 | | |
^
See Note 2, “Significant Accounting Policies” in the Notes to Financial Statements for additional information.
See Accompanying Notes to Financial Statements
| Voya Solution Moderately | PORTFOLIO OF INVESTMENTS |
| Aggressive Portfolio | As of December 31, 2021 (continued) |
Transactions with Affiliates
An investment of at least 5% of the voting securities of an issuer, or a company which is under common control with the issuer, results in that issuer becoming an affiliated person as defined by the 1940 Act.
The following table provides transactions during the year ended December 31, 2021, where the following issuers were considered an affiliate:
| Issuer | | | Beginning
Fair Value
at 12/31/2020 | | | Purchases
at Cost | | | Sales
at Cost | | | Change in
Unrealized
Appreciation/
(Depreciation) | | | Ending
Fair Value
at 12/31/2021 | | | Investment
Income | | | Realized
Gains/
(Losses) | | | Net Capital
Gain
Distributions | |
| Voya High Yield Bond Fund - Class R6 | | | | $ | 35,646,425 | | | | | $ | 6,993,198 | | | | | $ | (4,989,162) | | | | | $ | (140,007) | | | | | $ | 37,510,454 | | | | | $ | 1,878,924 | | | | | $ | 79,140 | | | | | $ | — | | |
| Voya Intermediate Bond Fund - Class R6 | | | | | 23,568,155 | | | | | | 5,402,772 | | | | | | (3,208,465) | | | | | | (1,014,013) | | | | | | 24,748,449 | | | | | | 625,958 | | | | | | 170,403 | | | | | | — | | |
| Voya Large-Cap Growth Fund - Class R6 | | | | | 18,365,251 | | | | | | 610,058 | | | | | | (16,057,591) | | | | | | (2,917,718) | | | | | | — | | | | | | — | | | | | | 6,046,174 | | | | | | — | | |
Voya Multi-Manager Emerging Markets Equity Fund -
Class I | | | | | 30,872,205 | | | | | | 19,215,859 | | | | | | (23,464,132) | | | | | | (8,895,561) | | | | | | 17,728,371 | | | | | | 376,219 | | | | | | 5,774,557 | | | | | | 2,525,228 | | |
| Voya Multi-Manager International Equity Fund - Class I | | | | | 48,869,138 | | | | | | 26,768,656 | | | | | | (10,783,922) | | | | | | (10,267,776) | | | | | | 54,586,096 | | | | | | 765,890 | | | | | | 3,353,007 | | | | | | 9,441,314 | | |
| Voya Multi-Manager International Factors Fund - Class I | | | | | 30,440,143 | | | | | | 3,556,671 | | | | | | (13,996,872) | | | | | | (1,478,951) | | | | | | 18,520,991 | | | | | | 754,479 | | | | | | 1,883,703 | | | | | | 1,786,100 | | |
| Voya Multi-Manager Mid Cap Value Fund - Class I | | | | | 24,416,999 | | | | | | 9,285,437 | | | | | | (10,942,814) | | | | | | 2,917,392 | | | | | | 25,677,014 | | | | | | 316,003 | | | | | | 316,717 | | | | | | 3,169,945 | | |
| Voya U.S. Stock Index Portfolio - Class I | | | | | 89,869,678 | | | | | | 30,596,079 | | | | | | (19,735,026) | | | | | | 8,839,479 | | | | | | 109,570,210 | | | | | | 1,125,335 | | | | | | 5,398,968 | | | | | | 8,323,320 | | |
| VY® Brandywine Global - Bond Portfolio - Class I | | | | | 11,769,859 | | | | | | 3,076,157 | | | | | | (1,596,756) | | | | | | (921,515) | | | | | | 12,327,745 | | | | | | 195,327 | | | | | | 92,677 | | | | | | 777,524 | | |
| VY® Columbia Contrarian Core Portfolio - Class I | | | | | 30,236,222 | | | | | | 10,775,230 | | | | | | (4,270,898) | | | | | | 1,384,171 | | | | | | 38,124,725 | | | | | | 218,719 | | | | | | 1,733,083 | | | | | | 3,879,994 | | |
| VY® Invesco Comstock Portfolio - Class I | | | | | 20,736,054 | | | | | | 15,584,824 | | | | | | (11,447,267) | | | | | | 2,862,771 | | | | | | 27,736,382 | | | | | | 433,517 | | | | | | 2,992,503 | | | | | | — | | |
VY® JPMorgan Small Cap Core Equity Portfolio - Class R6 | | | | | 37,078,081 | | | | | | 2,734,037 | | | | | | (25,159,786) | | | | | | (2,716,718) | | | | | | 11,935,614 | | | | | | 77,614 | | | | | | 7,579,972 | | | | | | 982,567 | | |
VY® T. Rowe Price Capital Appreciation Portfolio - Class R6 | | | | | 59,604,321 | | | | | | 10,501,839 | | | | | | (8,872,874) | | | | | | 1,418,198 | | | | | | 62,651,484 | | | | | | 629,235 | | | | | | 1,574,218 | | | | | | 7,182,499 | | |
VY® T. Rowe Price Diversified Mid Cap Growth Portfolio - Class R6 | | | | | 24,727,532 | | | | | | 11,774,978 | | | | | | (9,097,677) | | | | | | (3,235,623) | | | | | | 24,169,210 | | | | | | 2,073 | | | | | | 2,342,400 | | | | | | 4,614,556 | | |
| VY® T. Rowe Price Growth Equity Portfolio - Class I | | | | | 24,127,893 | | | | | | 23,155,138 | | | | | | (5,020,535) | | | | | | 376,373 | | | | | | 42,638,869 | | | | | | — | | | | | | 1,609,699 | | | | | | 3,456,098 | | |
| | | | | $ | 510,327,956 | | | | | $ | 180,030,933 | | | | | $ | (168,643,777) | | | | | $ | (13,789,498) | | | | | $ | 507,925,614 | | | | | $ | 7,399,293 | | | | | $ | 40,947,221 | | | | | $ | 46,139,145 | | |
The financial statements for the above mutual fund[s] can be found at www.sec.gov.
The effect of derivative instruments on the Portfolio’s Statement of Operations for the year ended December 31, 2021 was as follows:
| | | | Amount of Realized Gain or (Loss) on
Derivatives Recognized in Income | |
| Derivatives not accounted for as hedging instruments | | | Futures | |
| Equity contracts | | | | $ | 995,029 | | |
| Total | | | | $ | 995,029 | | |
| | | | Change in Unrealized Appreciation or (Depreciation)
on Derivatives Recognized in Income | |
| Derivatives not accounted for as hedging instruments | | | Futures | |
| Equity contracts | | | | $ | (154,350) | | |
| Total | | | | $ | (154,350) | | |
At December 31, 2021, the aggregate cost of securities and other investments and the composition of unrealized appreciation and depreciation of securities and other investments on a tax basis were:
| | Cost for federal income tax purposes was $550,027,422. | | |
| | Net unrealized appreciation consisted of: | | |
| | Gross Unrealized Appreciation | | | | $ | 86,680,118 | | |
| | Gross Unrealized Depreciation | | | | | (11,315,193) | | |
| | Net Unrealized Appreciation | | | | $ | 75,364,925 | | |
See Accompanying Notes to Financial Statements
| Voya Solution Moderately | PORTFOLIO OF INVESTMENTS |
| Conservative Portfolio | as of December 31, 2021 |
| Shares | | | Value | | | Percentage
of Net
Assets | |
| EXCHANGE-TRADED FUNDS: 11.2% | |
| 13,486 | | | Schwab U.S. TIPS ETF | | | | $ | 848,135 | | | | | | 2.0 | | |
| 11,166 | | | Vanguard Russell 1000 Growth
ETF | | | | | 876,978 | | | | | | 2.0 | | |
| 4,029 | | | Vanguard S&P 500 ETF | | | | | 1,758,940 | | | | | | 4.1 | | |
| 8,927 | | | Vanguard Value ETF | | | | | 1,313,251 | | | | | | 3.1 | | |
| | | | Total Exchange-Traded Funds
(Cost $4,114,275) | | | | | 4,797,304 | | | | | | 11.2 | | |
| MUTUAL FUNDS: 88.9% | |
| | | | Affiliated Investment Companies: 88.9% | |
| 183,882 | | | Voya Global Bond Fund -
Class R6 | | | | | 1,689,876 | | | | | | 3.9 | | |
| 696,737 | | | Voya High Yield Bond Fund -
Class R6 | | | | | 5,601,768 | | | | | | 13.1 | | |
| 623,434 | | | Voya Intermediate Bond Fund -
Class R6 | | | | | 6,396,432 | | | | | | 14.9 | | |
| 33,672 | | | Voya MidCap Opportunities
Portfolio - Class R6 | | | | | 609,791 | | | | | | 1.4 | | |
| 69,558 | | | Voya Multi-Manager Emerging
Markets Equity Fund - Class I | | | | | 819,395 | | | | | | 1.9 | | |
| 91,504 | | | Voya Multi-Manager
International Equity Fund -
Class I | | | | | 1,046,808 | | | | | | 2.4 | | |
| 195,369 | | | Voya Multi-Manager
International Factors Fund -
Class I | | | | | 1,920,473 | | | | | | 4.5 | | |
| 61,758 | | | Voya Multi-Manager Mid Cap
Value Fund - Class I | | | | | 663,281 | | | | | | 1.5 | | |
| Shares | | | Value | | | Percentage
of Net
Assets | |
| MUTUAL FUNDS: (continued) | |
| | | | Affiliated Investment Companies (continued) | |
| 215,154 | | | Voya Short Term Bond Fund -
Class R6 | | | | $ | 2,125,722 | | | | | | 5.0 | | |
| 111,959 | | | Voya U.S. High Dividend Low
Volatility Fund - Class R6 | | | | | 1,333,437 | | | | | | 3.1 | | |
| 202,219 | | | Voya U.S. Stock Index
Portfolio - Class I | | | | | 4,422,535 | | | | | | 10.3 | | |
| 416,487 | | | VY® BrandywineGLOBAL -
Bond Portfolio - Class I | | | | | 4,672,981 | | | | | | 10.9 | | |
| 39,990 | | | VY® JPMorgan Small Cap Core
Equity Portfolio - Class R6 | | | | | 849,777 | | | | | | 2.0 | | |
| 130,944 | | | VY® T. Rowe Price Capital
Appreciation Portfolio -
Class R6 | | | | | 4,318,527 | | | | | | 10.1 | | |
| 14,208 | | | VY® T. Rowe Price Growth
Equity Portfolio - Class I | | | | | 1,691,503 | | | | | | 3.9 | | |
| | | | Total Mutual Funds
(Cost $36,814,081) | | | | | 38,162,306 | | | | | | 88.9 | | |
| | | | Total Investments in
Securities
(Cost $40,928,356) | | | | $ | 42,959,610 | | | | | | 100.1 | | |
| | | | Liabilities in Excess of Other
Assets | | | | | (25,638) | | | | | | (0.1) | | |
| | | | Net Assets | | | | $ | 42,933,972 | | | | | | 100.0 | | |
| |
Fair Value Measurements^
The following is a summary of the fair valuations according to the inputs used as of December 31, 2021 in valuing the assets and liabilities:
| | | | Quoted Prices
in Active Markets
for Identical
Investments
(Level 1) | | | Significant
Other
Observable
Inputs
(Level 2) | | | Significant
Unobservable
Inputs
(Level 3) | | | Fair Value
at
December 31, 2021 | |
| Asset Table | | | | | | | | | | | | | | | | | | | | | | | | | |
| Investments, at fair value | | | | | | | | | | | | | | | | | | | | | | | | | |
| Exchange-Traded Funds | | | | $ | 4,797,304 | | | | | $ | — | | | | | $ | — | | | | | $ | 4,797,304 | | |
| Mutual Funds | | | | | 38,162,306 | | | | | | — | | | | | | — | | | | | | 38,162,306 | | |
| Total Investments, at fair value | | | | $ | 42,959,610 | | | | | $ | — | | | | | $ | — | | | | | $ | 42,959,610 | | |
^
See Note 2, “Significant Accounting Policies” in the Notes to Financial Statements for additional information.
See Accompanying Notes to Financial Statements
| Voya Solution Moderately | PORTFOLIO OF INVESTMENTS |
| Conservative Portfolio | as of December 31, 2021 (continued) |
Transactions with Affiliates
An investment of at least 5% of the voting securities of an issuer, or a company which is under common control with the issuer, results in that issuer becoming an affiliated person as defined by the 1940 Act.
The following table provides transactions during the year ended December 31, 2021, where the following issuers were considered an affiliate:
| Issuer | | | Beginning
Fair Value
at 12/31/2020 | | | Purchases
at Cost | | | Sales
at Cost | | | Change in
Unrealized
Appreciation/
(Depreciation) | | | Ending
Fair Value
at 12/31/2021 | | | Investment
Income | | | Realized
Gains/
(Losses) | | | Net Capital
Gain
Distributions | |
| Voya Global Bond Fund - Class R6 | | | | $ | 1,632,792 | | | | | $ | 422,703 | | | | | $ | (259,436) | | | | | $ | (106,183) | | | | | $ | 1,689,876 | | | | | $ | 8,457 | | | | | $ | 13,703 | | | | | $ | — | | |
| Voya High Yield Bond Fund - Class R6 | | | | | 5,301,014 | | | | | | 1,200,611 | | | | | | (876,314) | | | | | | (23,543) | | | | | | 5,601,768 | | | | | | 279,143 | | | | | | 13,903 | | | | | | — | | |
| Voya Intermediate Bond Fund - Class R6 | | | | | 5,664,178 | | | | | | 2,114,648 | | | | | | (1,144,783) | | | | | | (237,611) | | | | | | 6,396,432 | | | | | | 157,732 | | | | | | 32,067 | | | | | | — | | |
| Voya Large-Cap Growth Fund - Class R6 | | | | | 1,365,407 | | | | | | 109,675 | | | | | | (1,231,340) | | | | | | (243,742) | | | | | | — | | | | | | — | | | | | | 421,921 | | | | | | — | | |
| Voya MidCap Opportunities Portfolio - Class R6 | | | | | 427,493 | | | | | | 596,036 | | | | | | (266,149) | | | | | | (147,589) | | | | | | 609,791 | | | | | | — | | | | | | 108,583 | | | | | | 109,022 | | |
| Voya Multi-Manager Emerging Markets Equity Fund - Class I | | | | | 1,271,212 | | | | | | 1,198,211 | | | | | | (1,254,073) | | | | | | (395,955) | | | | | | 819,395 | | | | | | 17,395 | | | | | | 259,154 | | | | | | 116,756 | | |
| Voya Multi-Manager International Equity Fund - Class I | | | | | 837,912 | | | | | | 558,792 | | | | | | (154,198) | | | | | | (195,698) | | | | | | 1,046,808 | | | | | | 14,693 | | | | | | 54,839 | | | | | | 181,126 | | |
| Voya Multi-Manager International Factors Fund - Class I | | | | | 1,669,724 | | | | | | 886,391 | | | | | | (476,424) | | | | | | (159,218) | | | | | | 1,920,473 | | | | | | 78,261 | | | | | | 78,717 | | | | | | 185,271 | | |
| Voya Multi-Manager Mid Cap Value Fund - Class I | | | | | 418,887 | | | | | | 567,558 | | | | | | (291,534) | | | | | | (31,630) | | | | | | 663,281 | | | | | | 8,166 | | | | | | 77,681 | | | | | | 81,874 | | |
| Voya Short Term Bond Fund - Class R6 | | | | | 2,016,956 | | | | | | 472,174 | | | | | | (333,808) | | | | | | (29,600) | | | | | | 2,125,722 | | | | | | 31,390 | | | | | | 7,615 | | | | | | — | | |
| Voya U.S. High Dividend Low Volatility Fund - Class R6 | | | | | 2,164,698 | | | | | | 732,608 | | | | | | (1,377,499) | | | | | | (186,370) | | | | | | 1,333,437 | | | | | | 36,217 | | | | | | 255,042 | | | | | | 313,572 | | |
| Voya U.S. Stock Index Portfolio - Class I | | | | | 2,475,674 | | | | | | 2,933,022 | | | | | | (1,122,520) | | | | | | 136,359 | | | | | | 4,422,535 | | | | | | 45,175 | | | | | | 414,072 | | | | | | 283,532 | | |
| VY® BrandywineGLOBAL - Bond Portfolio - Class I | | | | | 4,443,131 | | | | | | 1,744,174 | | | | | | (1,001,910) | | | | | | (512,414) | | | | | | 4,672,981 | | | | | | 80,628 | | | | | | 167,540 | | | | | | 320,949 | | |
VY® JPMorgan Small Cap Core Equity Portfolio - Class R6 | | | | | 854,047 | | | | | | 1,067,894 | | | | | | (903,789) | | | | | | (168,375) | | | | | | 849,777 | | | | | | 3,065 | | | | | | 248,971 | | | | | | 38,803 | | |
VY® T. Rowe Price Capital Appreciation Portfolio - Class R6 | | | | | 4,091,366 | | | | | | 1,075,609 | | | | | | (874,309) | | | | | | 25,861 | | | | | | 4,318,527 | | | | | | 43,213 | | | | | | 175,204 | | | | | | 494,040 | | |
| VY® T. Rowe Price Growth Equity Portfolio - Class I | | | | | 1,138,400 | | | | | | 829,132 | | | | | | (320,450) | | | | | | 44,421 | | | | | | 1,691,503 | | | | | | — | | | | | | 78,139 | | | | | | 138,109 | | |
| | | | | $ | 35,772,891 | | | | | $ | 16,509,238 | | | | | $ | (11,888,536) | | | | | $ | (2,231,287) | | | | | $ | 38,162,306 | | | | | $ | 803,535 | | | | | $ | 2,407,151 | | | | | $ | 2,263,054 | | |
The financial statements for the above mutual fund[s] can be found at www.sec.gov.
At December 31, 2021, the aggregate cost of securities and other investments and the composition of unrealized appreciation and depreciation of securities and other investments on a tax basis were:
| | Cost for federal income tax purposes was $41,233,964. | | | | | | | |
| | Net unrealized appreciation consisted of: | | | | | | | |
| | Gross Unrealized Appreciation | | | | $ | 2,432,960 | | |
| | Gross Unrealized Depreciation | | | | | (707,314) | | |
| | Net Unrealized Appreciation | | | | $ | 1,725,646 | | |
See Accompanying Notes to Financial Statements
PORTFOLIO OF INVESTMENTS
| Voya Solution 2025 Portfolio | as of December 31, 2021 |
| Shares | | | Value | | | Percentage
of Net
Assets | |
| EXCHANGE-TRADED FUNDS: 9.4% | |
| 162,657 | | | Vanguard Russell 1000 Growth
ETF | | | | $ | 12,775,081 | | | | | | 2.1 | | |
| 65,644 | | | Vanguard S&P 500 ETF | | | | | 28,658,201 | | | | | | 4.7 | | |
| 108,373 | | | Vanguard Value ETF | | | | | 15,942,752 | | | | | | 2.6 | | |
| | | | Total Exchange-Traded Funds
(Cost $45,584,105) | | | | | 57,376,034 | | | | | | 9.4 | | |
| MUTUAL FUNDS: 90.6% | |
| | | | Affiliated Investment Companies: 90.6% | |
| 1,973,803 | | | Voya Global Bond Fund -
Class R6 | | | | | 18,139,252 | | | | | | 2.9 | | |
| 3,835,244 | | | Voya High Yield Bond Fund -
Class R6 | | | | | 30,835,364 | | | | | | 5.0 | | |
| 12,492,701 | | | Voya Intermediate Bond Fund -
Class R6 | | | | | 128,175,110 | | | | | | 20.9 | | |
| 1,989,892 | | | Voya Multi-Manager Emerging
Markets Equity Fund - Class I | | | | | 23,440,922 | | | | | | 3.8 | | |
| 2,617,778 | | | Voya Multi-Manager
International Equity Fund -
Class I | | | | | 29,947,377 | | | | | | 4.9 | | |
| 5,575,904 | | | Voya Multi-Manager
International Factors Fund -
Class I | | | | | 54,811,137 | | | | | | 8.9 | | |
| 883,888 | | | Voya Multi-Manager Mid Cap
Value Fund - Class I | | | | | 9,492,954 | | | | | | 1.5 | | |
| 2,378,415 | | | Voya U.S. High Dividend Low
Volatility Fund - Class R6 | | | | | 28,326,919 | | | | | | 4.6 | | |
| Shares | | | Value | | | Percentage
of Net
Assets | |
| MUTUAL FUNDS: (continued) | |
| | | | Affiliated Investment Companies (continued) | |
| 2,733,667 | | | Voya U.S. Stock Index
Portfolio - Class I | | | | $ | 59,785,292 | | | | | | 9.7 | | |
| 5,419,630 | | | VY® BrandywineGLOBAL -
Bond Portfolio - Class I | | | | | 60,808,246 | | | | | | 9.9 | | |
| 573,165 | | | VY® JPMorgan Small Cap
Core Equity Portfolio -
Class R6 | | | | | 12,179,759 | | | | | | 2.0 | | |
| 1,874,010 | | | VY® T. Rowe Price Capital
Appreciation Portfolio -
Class R6 | | | | | 61,804,860 | | | | | | 10.1 | | |
| 602,927 | | | VY® T. Rowe Price Diversified
Mid Cap Growth Portfolio -
Class R6 | | | | | 8,947,441 | | | | | | 1.5 | | |
| 252,275 | | | VY® T. Rowe Price Growth
Equity Portfolio - Class I | | | | | 30,033,341 | | | | | | 4.9 | | |
| | | | Total Mutual Funds
(Cost $528,964,128) | | | | | 556,727,974 | | | | | | 90.6 | | |
| | | | Total Investments in
Securities
(Cost $574,548,233) | | | | $ | 614,104,008 | | | | | | 100.0 | | |
| | | | Assets in Excess of Other
Liabilities | | | | | 142,313 | | | | | | 0.0 | | |
| | | | Net Assets | | | | $ | 614,246,321 | | | | | | 100.0 | | |
| |
Fair Value Measurements^
The following is a summary of the fair valuations according to the inputs used as of December 31, 2021 in valuing the assets and liabilities:
| | | | Quoted Prices
in Active Markets
for Identical
Investments
(Level 1) | | | Significant
Other
Observable
Inputs
(Level 2) | | | Significant
Unobservable
Inputs
(Level 3) | | | Fair Value
at
December 31, 2021 | |
| Asset Table | | | | | | | | | | | | | | | | | | | | | | | | | |
| Investments, at fair value | | | | | | | | | | | | | | | | | | | | | | | | | |
| Exchange-Traded Funds | | | | $ | 57,376,034 | | | | | $ | — | | | | | $ | — | | | | | $ | 57,376,034 | | |
| Mutual Funds | | | | | 556,727,974 | | | | | | — | | | | | | — | | | | | | 556,727,974 | | |
| Total Investments, at fair value | | | | $ | 614,104,008 | | | | | $ | — | | | | | $ | — | | | | | $ | 614,104,008 | | |
^
See Note 2, “Significant Accounting Policies” in the Notes to Financial Statements for additional information.
See Accompanying Notes to Financial Statements
PORTFOLIO OF INVESTMENTS
| Voya Solution 2025 Portfolio | as of December 31, 2021 (continued) |
Transactions with Affiliates
An investment of at least 5% of the voting securities of an issuer, or a company which is under common control with the issuer, results in that issuer becoming an affiliated person as defined by the 1940 Act.
The following table provides transactions during the year ended December 31, 2021, where the following issuers were considered an affiliate:
| Issuer | | | Beginning
Fair Value
at 12/31/2020 | | | Purchases
at Cost | | | Sales at
Cost | | | Change in
Unrealized
Appreciation/
(Depreciation) | | | Ending
Fair Value
at 12/31/2021 | | | Investment
Income | | | Realized
Gains/
(Losses) | | | Net Capital
Gain
Distributions | |
| Voya Global Bond Fund - Class R6 | | | | $ | 18,971,632 | | | | | $ | 3,432,370 | | | | | $ | (3,129,726) | | | | | $ | (1,135,024) | | | | | $ | 18,139,252 | | | | | $ | 69,197 | | | | | $ | 128,776 | | | | | $ | — | | |
| Voya High Yield Bond Fund - Class R6 | | | | | 25,306,709 | | | | | | 10,968,075 | | | | | | (4,811,691) | | | | | | (627,729) | | | | | | 30,835,364 | | | | | | 1,483,258 | | | | | | 575,182 | | | | | | — | | |
| Voya Intermediate Bond Fund - Class R6 | | | | | 113,595,343 | | | | | | 41,123,661 | | | | | | (22,490,565) | | | | | | (4,053,329) | | | | | | 128,175,110 | | | | | | 3,185,799 | | | | | | 37,498 | | | | | | — | | |
| Voya Large-Cap Growth Fund - Class R6 | | | | | 22,041,792 | | | | | | 1,248,910 | | | | | | (19,326,315) | | | | | | (3,964,387) | | | | | | — | | | | | | — | | | | | | 7,437,145 | | | | | | — | | |
| Voya Multi-Manager Emerging Markets Equity Fund - Class I | | | | | 22,412,490 | | | | | | 10,061,794 | | | | | | (3,548,717) | | | | | | (5,484,645) | | | | | | 23,440,922 | | | | | | 493,740 | | | | | | 905,695 | | | | | | 3,314,046 | | |
| Voya Multi-Manager International Equity Fund - Class I | | | | | 37,763,947 | | | | | | 7,814,816 | | | | | | (9,362,987) | | | | | | (6,268,399) | | | | | | 29,947,377 | | | | | | 417,124 | | | | | | 3,303,472 | | | | | | 5,141,989 | | |
Voya Multi-Manager International Factors Fund -
Class I | | | | | 56,458,454 | | | | | | 10,353,803 | | | | | | (9,188,279) | | | | | | (2,812,841) | | | | | | 54,811,137 | | | | | | 2,216,822 | | | | | | 1,609,998 | | | | | | 5,247,949 | | |
| Voya Multi-Manager Mid Cap Value Fund - Class I | | | | | 7,952,515 | | | | | | 6,219,291 | | | | | | (4,486,825) | | | | | | (192,027) | | | | | | 9,492,954 | | | | | | 116,019 | | | | | | 1,214,570 | | | | | | 1,162,260 | | |
| Voya U.S. High Dividend Low Volatility Fund - Class R6 | | | | | 25,295,240 | | | | | | 12,716,874 | | | | | | (6,985,441) | | | | | | (2,699,754) | | | | | | 28,326,919 | | | | | | 579,869 | | | | | | 1,707,479 | | | | | | 6,570,803 | | |
| Voya U.S. Stock Index Portfolio - Class I | | | | | 66,272,799 | | | | | | 9,910,531 | | | | | | (19,778,176) | | | | | | 3,380,138 | | | | | | 59,785,292 | | | | | | 611,042 | | | | | | 6,240,516 | | | | | | 5,594,099 | | |
VY® BrandywineGLOBAL - Bond Portfolio - Class I | | | | | 56,581,919 | | | | | | 19,104,630 | | | | | | (9,112,535) | | | | | | (5,765,768) | | | | | | 60,808,246 | | | | | | 992,939 | | | | | | 1,513,913 | | | | | | 3,952,522 | | |
VY® JPMorgan Small Cap Core Equity Portfolio -
Class R6 | | | | | 2,000,686 | | | | | | 25,951,312 | | | | | | (15,293,350) | | | | | | (478,889) | | | | | | 12,179,759 | | | | | | 46,751 | | | | | | 638,565 | | | | | | 591,850 | | |
VY® T. Rowe Price Capital Appreciation Portfolio -
Class R6 | | | | | 63,325,545 | | | | | | 11,252,014 | | | | | | (12,420,464) | | | | | | (352,235) | | | | | | 61,804,860 | | | | | | 620,005 | | | | | | 3,357,427 | | | | | | 7,264,080 | | |
VY® T. Rowe Price Diversified Mid Cap Growth Portfolio - Class R6 | | | | | 7,895,658 | | | | | | 7,064,578 | | | | | | (4,058,516) | | | | | | (1,954,279) | | | | | | 8,947,441 | | | | | | 823 | | | | | | 1,467,680 | | | | | | 1,831,320 | | |
VY® T. Rowe Price Growth Equity Portfolio - Class I | | | | | 22,006,815 | | | | | | 13,188,322 | | | | | | (5,105,460) | | | | | | (56,336) | | | | | | 30,033,341 | | | | | | — | | | | | | 1,909,699 | | | | | | 2,402,757 | | |
| | | | | $ | 547,881,544 | | | | | $ | 190,410,981 | | | | | $ | (149,099,047) | | | | | $ | (32,465,504) | | | | | $ | 556,727,974 | | | | | $ | 10,833,388 | | | | | $ | 32,047,615 | | | | | $ | 43,073,675 | | |
The financial statements for the above mutual fund[s] can be found at www.sec.gov.
The effect of derivative instruments on the Portfolio’s Statement of Operations for the year ended December 31, 2021 was as follows:
| | | | Amount of Realized Gain or (Loss) on
Derivatives Recognized in Income | |
| Derivatives not accounted for as hedging instruments | | | Futures | |
| Equity contracts | | | | $ | 980,271 | | |
| Total | | | | $ | 980,271 | | |
| | | | Change in Unrealized Appreciation or (Depreciation)
on Derivatives Recognized in Income | |
| Derivatives not accounted for as hedging instruments | | | Futures | |
| Equity contracts | | | | $ | (134,978) | | |
| Total | | | | $ | (134,978) | | |
At December 31, 2021, the aggregate cost of securities and other investments and the composition of unrealized appreciation and depreciation of securities and other investments on a tax basis were:
| | Cost for federal income tax purposes was $581,852,498. | | |
| | Net unrealized appreciation consisted of: | | |
| | Gross Unrealized Appreciation | | | | $ | 44,504,919 | | |
| | Gross Unrealized Depreciation | | | | | (12,253,410) | | |
| | Net Unrealized Appreciation | | | | $ | 32,251,509 | | |
See Accompanying Notes to Financial Statements
PORTFOLIO OF INVESTMENTS
| Voya Solution 2030 Portfolio | as of December 31, 2021 |
| Shares | | | Value | | | Percentage
of Net
Assets | |
| EXCHANGE-TRADED FUNDS: 11.7% | |
| 15,235 | | | Vanguard Russell 1000
Growth ETF | | | | $ | 1,196,557 | | | | | | 2.1 | | |
| 7,156 | | | Vanguard S&P 500 ETF | | | | | 3,124,095 | | | | | | 5.4 | | |
| 16,241 | | | Vanguard Value ETF | | | | | 2,389,213 | | | | | | 4.2 | | |
| | | | Total Exchange-Traded Funds
(Cost $5,626,073) | | | | | 6,709,865 | | | | | | 11.7 | | |
| MUTUAL FUNDS: 88.3% | |
| | | | Affiliated Investment Companies: 88.3% | |
| 356,491 | | | Voya High Yield Bond
Fund - Class R6 | | | | | 2,866,184 | | | | | | 5.0 | | |
| 719,493 | | | Voya Intermediate Bond
Fund - Class R6 | | | | | 7,381,994 | | | | | | 12.9 | | |
| 184,857 | | | Voya Multi-Manager Emerging
Markets Equity Fund - Class I | | | | | 2,177,620 | | | | | | 3.8 | | |
| 389,051 | | | Voya Multi-Manager
International Equity Fund -
Class I | | | | | 4,450,745 | | | | | | 7.8 | | |
| 575,068 | | | Voya Multi-Manager
International Factors Fund -
Class I | | | | | 5,652,916 | | | | | | 9.9 | | |
| 109,620 | | | Voya Multi-Manager Mid Cap
Value Fund - Class I | | | | | 1,177,318 | | | | | | 2.1 | | |
| 143,992 | | | Voya U.S. High Dividend Low
Volatility Fund - Class R6 | | | | | 1,714,944 | | | | | | 3.0 | | |
| 300,459 | | | Voya U.S. Stock Index
Portfolio - Class I | | | | | 6,571,040 | | | | | | 11.5 | | |
| Shares | | | Value | | | Percentage
of Net
Assets | |
| MUTUAL FUNDS: (continued) | |
| | | | Affiliated Investment Companies (continued) | |
| 453,669 | | | VY® BrandywineGLOBAL -
Bond Portfolio - Class I | | | | $ | 5,090,169 | | | | | | 8.9 | | |
| 87,959 | | | VY® Columbia Contrarian Core
Portfolio - Class I | | | | | 2,039,760 | | | | | | 3.6 | | |
| 79,466 | | | VY® JPMorgan Small Cap Core
Equity Portfolio - Class R6 | | | | | 1,688,659 | | | | | | 2.9 | | |
| 174,283 | | | VY® T. Rowe Price Capital
Appreciation Portfolio -
Class R6 | | | | | 5,747,841 | | | | | | 10.1 | | |
| 74,617 | | | VY® T. Rowe Price Diversified
Mid Cap Growth Portfolio -
Class R6 | | | | | 1,107,316 | | | | | | 1.9 | | |
| 23,375 | | | VY® T. Rowe Price Growth
Equity Portfolio - Class I | | | | | 2,782,740 | | | | | | 4.9 | | |
| | | | Total Mutual Funds
(Cost $48,570,252) | | | | | 50,449,246 | | | | | | 88.3 | | |
| | | | Total Investments in
Securities
(Cost $54,196,325) | | | | $ | 57,159,111 | | | | | | 100.0 | | |
| | | | Liabilities in Excess of Other
Assets | | | | | (13,079) | | | | | | — | | |
| | | | Net Assets | | | | $ | 57,146,032 | | | | | | 100.0 | | |
| |
Fair Value Measurements^
The following is a summary of the fair valuations according to the inputs used as of December 31, 2021 in valuing the assets and liabilities:
| | | | Quoted Prices
in Active Markets
for Identical
Investments
(Level 1) | | | Significant
Other
Observable
Inputs
(Level 2) | | | Significant
Unobservable
Inputs
(Level 3) | | | Fair Value
at
December 31, 2021 | |
| Asset Table | | | | �� | | | | | | | | | | | | | | | | | | | | | |
| Investments, at fair value | | | | | | | | | | | | | | | | | | | | | | | | | |
| Exchange-Traded Funds | | | | $ | 6,709,865 | | | | | $ | — | | | | | $ | — | | | | | $ | 6,709,865 | | |
| Mutual Funds | | | | | 50,449,246 | | | | | | — | | | | | | — | | | | | | 50,449,246 | | |
| Total Investments, at fair value | | | | $ | 57,159,111 | | | | | $ | — | | | | | $ | — | | | | | $ | 57,159,111 | | |
^
See Note 2, “Significant Accounting Policies” in the Notes to Financial Statements for additional information.
See Accompanying Notes to Financial Statements
PORTFOLIO OF INVESTMENTS
| Voya Solution 2030 Portfolio | as of December 31, 2021 (continued) |
Transactions with Affiliates
An investment of at least 5% of the voting securities of an issuer, or a company which is under common control with the issuer, results in that issuer becoming an affiliated person as defined by the 1940 Act.
The following table provides transactions during the year ended December 31, 2021, where the following issuers were considered an affiliate:
| Issuer | | | Beginning
Fair Value
at 12/31/2020 | | | Purchases
at Cost | | | Sales
at Cost | | | Change in
Unrealized
Appreciation
/(Depreciation) | | | Ending
Fair Value
at 12/31/2021 | | | Investment
Income | | | Realized
Gains/
(Losses) | | | Net Capital
Gain
Distributions | |
| Voya High Yield Bond Fund - Class R6 | | | | $ | 2,135,880 | | | | | $ | 1,341,041 | | | | | $ | (534,563) | | | | | $ | (76,174) | | | | | $ | 2,866,184 | | | | | $ | 121,074 | | | | | $ | 73,346 | | | | | $ | — | | |
| Voya Intermediate Bond Fund - Class R6 | | | | | 6,897,950 | | | | | | 3,103,393 | | | | | | (2,361,973) | | | | | | (257,376) | | | | | | 7,381,994 | | | | | | 198,031 | | | | | | 9,290 | | | | | | — | | |
| Voya Large-Cap Growth Fund - Class R6 | | | | | 1,649,606 | | | | | | 253,126 | | | | | | (1,705,355) | | | | | | (197,377) | | | | | | — | | | | | | — | | | | | | 474,810 | | | | | | — | | |
Voya Multi-Manager Emerging Markets Equity
Fund - Class I | | | | | 2,772,956 | | | | | | 1,047,150 | | | | | | (1,030,368) | | | | | | (612,118) | | | | | | 2,177,620 | | | | | | 45,459 | | | | | | 226,512 | | | | | | 305,126 | | |
| Voya Multi-Manager International Equity Fund - Class I | | | | | 4,935,066 | | | | | | 1,861,876 | | | | | | (1,446,471) | | | | | | (899,726) | | | | | | 4,450,745 | | | | | | 61,449 | | | | | | 416,465 | | | | | | 757,502 | | |
| Voya Multi-Manager International Factors Fund - Class I | | | | | 5,463,458 | | | | | | 2,458,134 | | | | | | (1,787,388) | | | | | | (481,288) | | | | | | 5,652,916 | | | | | | 226,659 | | | | | | 359,412 | | | | | | 536,576 | | |
| Voya Multi-Manager Mid Cap Value Fund - Class I | | | | | 822,578 | | | | | | 927,781 | | | | | | (539,506) | | | | | | (33,535) | | | | | | 1,177,318 | | | | | | 14,268 | | | | | | 131,779 | | | | | | 142,728 | | |
| Voya U.S. High Dividend Low Volatility Fund - Class R6 | | | | | 1,106,541 | | | | | | 1,838,215 | | | | | | (890,619) | | | | | | (339,193) | | | | | | 1,714,944 | | | | | | 29,014 | | | | | | 218,472 | | | | | | 389,230 | | |
| Voya U.S. Stock Index Portfolio - Class I | | | | | 6,505,117 | | | | | | 2,272,657 | | | | | | (2,356,872) | | | | | | 150,138 | | | | | | 6,571,040 | | | | | | 67,228 | | | | | | 851,508 | | | | | | 617,070 | | |
| VY® BrandywineGLOBAL - Bond Portfolio - Class I | | | | | 3,702,916 | | | | | | 2,958,269 | | | | | | (1,063,372) | | | | | | (507,644) | | | | | | 5,090,169 | | | | | | 83,150 | | | | | | 148,094 | | | | | | 330,988 | | |
| VY® Columbia Contrarian Core Portfolio - Class I | | | | | 1,358,557 | | | | | | 992,157 | | | | | | (342,583) | | | | | | 31,629 | | | | | | 2,039,760 | | | | | | 8,326 | | | | | | 143,213 | | | | | | 147,694 | | |
VY® JPMorgan Small Cap Core Equity Portfolio - Class R6 | | | | | 1,691,147 | | | | | | 1,144,668 | | | | | | (977,376) | | | | | | (169,780) | | | | | | 1,688,659 | | | | | | 4,357 | | | | | | 391,857 | | | | | | 55,153 | | |
VY® T. Rowe Price Capital Appreciation Portfolio - Class R6 | | | | | 5,357,782 | | | | | | 1,899,196 | | | | | | (1,464,035) | | | | | | (45,102) | | | | | | 5,747,841 | | | | | | 57,699 | | | | | | 310,575 | | | | | | 675,873 | | |
VY® T. Rowe Price Diversified Mid Cap Growth Portfolio - Class R6 | | | | | 832,461 | | | | | | 1,001,232 | | | | | | (488,077) | | | | | | (238,300) | | | | | | 1,107,316 | | | | | | 94 | | | | | | 175,852 | | | | | | 210,251 | | |
| VY® T. Rowe Price Growth Equity Portfolio - Class I | | | | | 1,896,749 | | | | | | 1,519,317 | | | | | | (588,451) | | | | | | (44,875) | | | | | | 2,782,740 | | | | | | — | | | | | | 225,916 | | | | | | 198,709 | | |
| | | | | $ | 47,128,764 | | | | | $ | 24,618,212 | | | | | $ | (17,577,009) | | | | | $ | (3,720,721) | | | | | $ | 50,449,246 | | | | | $ | 916,808 | | | | | $ | 4,157,101 | | | | | $ | 4,366,900 | | |
The financial statements for the above mutual fund[s] can be found at www.sec.gov.
At December 31, 2021, the aggregate cost of securities and other investments and the composition of unrealized appreciation and depreciation of securities and other investments on a tax basis were:
| | Cost for federal income tax purposes was $54,823,597. | | |
| | Net unrealized appreciation consisted of: | | |
| | Gross Unrealized Appreciation | | | | $ | 3,811,498 | | |
| | Gross Unrealized Depreciation | | | | | (1,475,984) | | |
| | Net Unrealized Appreciation | | | | $ | 2,335,514 | | |
See Accompanying Notes to Financial Statements
PORTFOLIO OF INVESTMENTS
| Voya Solution 2035 Portfolio | as of December 31, 2021 |
| Shares | | | Value | | | Percentage
of Net
Assets | |
| EXCHANGE-TRADED FUNDS: 13.8% | |
| 178,924 | | | Vanguard Russell 1000
Growth ETF | | | | $ | 14,052,691 | | | | | | 2.1 | | |
| 102,839 | | | Vanguard S&P 500 ETF | | | | | 44,896,422 | | | | | | 6.6 | | |
| 238,423 | | | Vanguard Value ETF | | | | | 35,074,408 | | | | | | 5.1 | | |
| | | | Total Exchange-Traded Funds
(Cost $75,271,310) | | | | | 94,023,521 | | | | | | 13.8 | | |
| MUTUAL FUNDS: 86.1% | |
| | | | Affiliated Investment Companies: 86.1% | |
| 3,406,361 | | | Voya High Yield Bond Fund -
Class R6 | | | | | 27,387,145 | | | | | | 4.0 | | |
| 5,944,248 | | | Voya Intermediate Bond
Fund - Class R6 | | | | | 60,987,983 | | | | | | 8.9 | | |
| 2,762,230 | | | Voya Multi-Manager Emerging
Markets Equity Fund - Class I | | | | | 32,539,072 | | | | | | 4.8 | | |
| 6,394,974 | | | Voya Multi-Manager
International Equity Fund -
Class I | | | | | 73,158,500 | | | | | | 10.7 | | |
| 6,879,696 | | | Voya Multi-Manager
International Factors Fund -
Class I | | | | | 67,627,412 | | | | | | 9.9 | | |
| 1,306,952 | | | Voya Multi-Manager Mid Cap
Value Fund - Class I | | | | | 14,036,669 | | | | | | 2.1 | | |
| 3,684,174 | | | Voya U.S. Stock Index
Portfolio - Class I | | | | | 80,572,885 | | | | | | 11.8 | | |
| 2,406,808 | | | VY® BrandywineGLOBAL -
Bond Portfolio - Class I | | | | | 27,004,383 | | | | | | 4.0 | | |
| Shares | | | Value | | | Percentage
of Net
Assets | |
| MUTUAL FUNDS: (continued) | |
| | | | Affiliated Investment Companies (continued) | |
| 1,800,165 | | | VY® Columbia Contrarian
Core Portfolio - Class I | | | | $ | 41,745,822 | | | | | | 6.1 | | |
| 961,328 | | | VY® Invesco Comstock
Portfolio - Class I | | | | | 20,428,220 | | | | | | 3.0 | | |
| 957,219 | | | VY® JPMorgan Small Cap
Core Equity Portfolio -
Class R6 | | | | | 20,340,899 | | | | | | 3.0 | | |
| 2,080,501 | | | VY® T. Rowe Price Capital
Appreciation Portfolio -
Class R6 | | | | | 68,614,921 | | | | | | 10.0 | | |
| 893,333 | | | VY® T. Rowe Price Diversified
Mid Cap Growth Portfolio -
Class R6 | | | | | 13,257,061 | | | | | | 1.9 | | |
| 337,445 | | | VY® T. Rowe Price Growth
Equity Portfolio - Class I | | | | | 40,172,788 | | | | | | 5.9 | | |
| | | | Total Mutual Funds
(Cost $542,716,162) | | | | | 587,873,760 | | | | | | 86.1 | | |
| | | | Total Investments in
Securities
(Cost $617,987,472) | | | | $ | 681,897,281 | | | | | | 99.9 | | |
| | | | Assets in Excess of Other
Liabilities | | | | | 540,690 | | | | | | 0.1 | | |
| | | | Net Assets | | | | $ | 682,437,971 | | | | | | 100.0 | | |
| |
Fair Value Measurements^
The following is a summary of the fair valuations according to the inputs used as of December 31, 2021 in valuing the assets and liabilities:
| | | | Quoted Prices
in Active Markets
for Identical
Investments
(Level 1) | | | Significant
Other
Observable
Inputs
(Level 2) | | | Significant
Unobservable
Inputs
(Level 3) | | | Fair Value
at
December 31, 2021 | |
| Asset Table | | | | | | | | | | | | | | | | | | | | | | | | | |
| Investments, at fair value | | | | | | | | | | | | | | | | | | | | | | | | | |
| Exchange-Traded Funds | | | | $ | 94,023,521 | | | | | $ | — | | | | | $ | — | | | | | $ | 94,023,521 | | |
| Mutual Funds | | | | | 587,873,760 | | | | | | — | | | | | | — | | | | | | 587,873,760 | | |
| Total Investments, at fair value | | | | $ | 681,897,281 | | | | | $ | — | | | | | $ | — | | | | | $ | 681,897,281 | | |
^
See Note 2, “Significant Accounting Policies” in the Notes to Financial Statements for additional information.
See Accompanying Notes to Financial Statements
PORTFOLIO OF INVESTMENTS
| Voya Solution 2035 Portfolio | as of December 31, 2021 (continued) |
Transactions with Affiliates
An investment of at least 5% of the voting securities of an issuer, or a company which is under common control with the issuer, results in that issuer becoming an affiliated person as defined by the 1940 Act.
The following table provides transactions during the year ended December 31, 2021, where the following issuers were considered an affiliate:
| Issuer | | | Beginning
Fair Value
at 12/31/2020 | | | Purchases
at Cost | | | Sales
at Cost | | | Change in
Unrealized
Appreciation/
(Depreciation) | | | Ending
Fair Value
at 12/31/2021 | | | Investment
Income | | | Realized
Gains/
(Losses) | | | Net Capital
Gain
Distributions | |
| Voya High Yield Bond Fund - Class R6 | | | | $ | 26,737,499 | | | | | $ | 4,987,655 | | | | | $ | (3,798,600) | | | | | $ | (539,409) | | | | | $ | 27,387,145 | | | | | $ | 1,418,810 | | | | | $ | 448,323 | | | | | $ | — | | |
| Voya Intermediate Bond Fund - Class R6 | | | | | 39,907,631 | | | | | | 31,582,305 | | | | | | (8,882,324) | | | | | | (1,619,629) | | | | | | 60,987,983 | | | | | | 1,517,023 | | | | | | (2,650) | | | | | | — | | |
| Voya Large-Cap Growth Fund - Class R6 | | | | | 18,293,169 | | | | | | 1,152,194 | | | | | | (16,086,734) | | | | | | (3,358,629) | | | | | | — | | | | | | — | | | | | | 6,253,629 | | | | | | — | | |
Voya Multi-Manager Emerging Markets Equity Fund -
Class I | | | | | 40,580,520 | | | | | | 18,452,672 | | | | | | (16,085,298) | | | | | | (10,408,822) | | | | | | 32,539,072 | | | | | | 687,507 | | | | | | 4,880,904 | | | | | | 4,614,636 | | |
| Voya Multi-Manager International Equity Fund - Class I | | | | | 79,754,301 | | | | | | 19,466,129 | | | | | | (13,948,568) | | | | | | (12,113,362) | | | | | | 73,158,500 | | | | | | 1,022,114 | | | | | | 3,995,361 | | | | | | 12,599,853 | | |
| Voya Multi-Manager International Factors Fund - Class I | | | | | 59,602,838 | | | | | | 20,506,090 | | | | | | (9,009,753) | | | | | | (3,471,763) | | | | | | 67,627,412 | | | | | | 2,743,410 | | | | | | 1,246,194 | | | | | | 6,494,554 | | |
| Voya Multi-Manager Mid Cap Value Fund - Class I | | | | | 13,439,801 | | | | | | 9,112,184 | | | | | | (8,160,544) | | | | | | (354,772) | | | | | | 14,036,669 | | | | | | 172,052 | | | | | | 2,261,619 | | | | | | 1,718,766 | | |
| Voya U.S. High Dividend Low Volatility Fund - Class R6 | | | | | 13,097,236 | | | | | | 1,862,953 | | | | | | (13,862,875) | | | | | | (1,097,314) | | | | | | — | | | | | | 98,866 | | | | | | 2,632,640 | | | | | | — | | |
| Voya U.S. Stock Index Portfolio - Class I | | | | | 86,658,039 | | | | | | 13,193,666 | | | | | | (23,761,582) | | | | | | 4,482,762 | | | | | | 80,572,885 | | | | | | 823,766 | | | | | | 8,377,659 | | | | | | 7,345,466 | | |
| VY® BrandywineGLOBAL - Bond Portfolio - Class I | | | | | 26,562,282 | | | | | | 6,337,604 | | | | | | (3,855,126) | | | | | | (2,040,377) | | | | | | 27,004,383 | | | | | | 430,761 | | | | | | 209,843 | | | | | | 1,714,701 | | |
| VY® Columbia Contrarian Core Portfolio - Class I | | | | | 33,418,763 | | | | | | 11,685,804 | | | | | | (5,200,702) | | | | | | 1,841,957 | | | | | | 41,745,822 | | | | | | 197,420 | | | | | | 2,142,642 | | | | | | 3,502,156 | | |
| VY® Invesco Comstock Portfolio - Class I | | | | | — | | | | | | 24,443,797 | | | | | | (5,456,267) | | | | | | 1,440,690 | | | | | | 20,428,220 | | | | | | 331,920 | | | | | | 221,688 | | | | | | — | | |
VY® JPMorgan Small Cap Core Equity Portfolio - Class R6 | | | | | 8,151,704 | | | | | | 15,193,246 | | | | | | (3,335,917) | | | | | | 331,866 | | | | | | 20,340,899 | | | | | | 50,702 | | | | | | 1,290,045 | | | | | | 641,862 | | |
VY® T. Rowe Price Capital Appreciation Portfolio - Class R6 | | | | | 66,889,052 | | | | | | 12,350,960 | | | | | | (11,604,385) | | | | | | 979,294 | | | | | | 68,614,921 | | | | | | 687,282 | | | | | | 2,265,801 | | | | | | 7,878,337 | | |
VY® T. Rowe Price Diversified Mid Cap Growth Portfolio - Class R6 | | | | | 13,343,679 | | | | | | 10,632,788 | | | | | | (7,363,475) | | | | | | (3,355,931) | | | | | | 13,257,061 | | | | | | 1,344 | | | | | | 2,652,392 | | | | | | 2,991,939 | | |
| VY® T. Rowe Price Growth Equity Portfolio - Class I | | | | | 31,547,323 | | | | | | 15,254,430 | | | | | | (6,958,445) | | | | | | 329,480 | | | | | | 40,172,788 | | | | | | — | | | | | | 2,591,933 | | | | | | 3,141,694 | | |
| | | | | $ | 557,983,837 | | | | | $ | 216,214,477 | | | | | $ | (157,370,595) | | | | | $ | (28,953,959) | | | | | $ | 587,873,760 | | | | | $ | 10,182,977 | | | | | $ | 41,468,023 | | | | | $ | 52,643,964 | | |
The financial statements for the above mutual fund[s] can be found at www.sec.gov.
The effect of derivative instruments on the Portfolio’s Statement of Operations for the year ended December 31, 2021 was as follows:
| | | | Amount of Realized Gain or (Loss) on Derivatives
Recognized in Income | |
| Derivatives not accounted for as hedging instruments | | | Futures | |
| Equity contracts | | | | $ | 687,882 | | |
| Total | | | | $ | 687,882 | | |
| | | | Change in Unrealized Appreciation or (Depreciation)
on Derivatives Recognized in Income | |
| Derivatives not accounted for as hedging instruments | | | Futures | |
| Equity contracts | | | | $ | (12,373) | | |
| Total | | | | $ | (12,373) | | |
At December 31, 2021, the aggregate cost of securities and other investments and the composition of unrealized appreciation and depreciation of securities and other investments on a tax basis were:
| | Cost for federal income tax purposes was $622,587,365. | | |
| | Net unrealized appreciation consisted of: | | |
| | Gross Unrealized Appreciation | | | | $ | 69,003,661 | | |
| | Gross Unrealized Depreciation | | | | | (9,693,745) | | |
| | Net Unrealized Appreciation | | | | $ | 59,309,916 | | |
See Accompanying Notes to Financial Statements
PORTFOLIO OF INVESTMENTS
| Voya Solution 2040 Portfolio | as of December 31, 2021 |
| Shares | | | Value | | | Percentage
of Net
Assets | |
| EXCHANGE-TRADED FUNDS: 16.6% | |
| 1,749 | | | iShares Russell 2000 ETF | | | | $ | 389,065 | | | | | | 0.9 | | |
| 11,036 | | | Vanguard Russell 1000
Growth ETF | | | | | 866,767 | | | | | | 2.0 | | |
| 8,707 | | | Vanguard S&P 500 ETF | | | | | 3,801,215 | | | | | | 8.9 | | |
| 13,971 | | | Vanguard Value ETF | | | | | 2,055,274 | | | | | | 4.8 | | |
| | | | Total Exchange-Traded Funds | | | | | | | | | | | | | |
| | | | (Cost $5,849,087) | | | | | 7,112,321 | | | | | | 16.6 | | |
| MUTUAL FUNDS: 83.3% | |
| | | | Affiliated Investment Companies: 83.3% | |
| 160,202 | | | Voya High Yield Bond Fund -
Class R6 | | | | | 1,288,027 | | | | | | 3.0 | | |
| 165,695 | | | Voya Intermediate Bond
Fund - Class R6 | | | | | 1,700,030 | | | | | | 4.0 | | |
| 172,831 | | | Voya Multi-Manager Emerging
Markets Equity Fund - Class I | | | | | 2,035,954 | | | | | | 4.8 | | |
| 510,632 | | | Voya Multi-Manager
International Equity Fund -
Class I | | | | | 5,841,631 | | | | | | 13.6 | | |
| 388,391 | | | Voya Multi-Manager
International Factors Fund -
Class I | | | | | 3,817,886 | | | | | | 8.9 | | |
| 81,814 | | | Voya Multi-Manager Mid Cap
Value Fund - Class I | | | | | 878,680 | | | | | | 2.1 | | |
| 278,438 | | | Voya U.S. Stock Index
Portfolio - Class I | | | | | 6,089,443 | | | | | | 14.2 | | |
| 75,479 | | | VY® BrandywineGLOBAL -
Bond Portfolio - Class I | | | | | 846,869 | | | | | | 2.0 | | |
| Shares | | | Value | | | Percentage
of Net
Assets | |
| MUTUAL FUNDS: (continued) | |
| | | | Affiliated Investment Companies (continued) | |
| 122,263 | | | VY® Columbia Contrarian
Core Portfolio - Class I | | | | $ | 2,835,273 | | | | | | 6.6 | | |
| 92,504 | | | VY® Invesco Comstock
Portfolio - Class I | | | | | 1,965,719 | | | | | | 4.6 | | |
| 60,507 | | | VY® JPMorgan Small Cap
Core Equity Portfolio -
Class R6 | | | | | 1,285,781 | | | | | | 3.0 | | |
| 97,848 | | | VY® T. Rowe Price Capital
Appreciation Portfolio -
Class R6 | | | | | 3,227,025 | | | | | | 7.5 | | |
| 56,123 | | | VY® T. Rowe Price Diversified
Mid Cap Growth Portfolio -
Class R6 | | | | | 832,864 | | | | | | 1.9 | | |
| 25,693 | | | VY® T. Rowe Price Growth
Equity Portfolio - Class I | | | | | 3,058,730 | | | | | | 7.1 | | |
| | | | Total Mutual Funds | | | | | | | | | | | | | |
| | | | (Cost $34,183,837) | | | | | 35,703,912 | | | | | | 83.3 | | |
| | | | Total Investments in
Securities
(Cost $40,032,924) | | | | $ | 42,816,233 | | | | | | 99.9 | | |
| | | | Assets in Excess of Other
Liabilities | | | | | 28,927 | | | | | | 0.1 | | |
| | | | Net Assets | | | �� | $ | 42,845,160 | | | | | | 100.0 | | |
| |
Fair Value Measurements^
The following is a summary of the fair valuations according to the inputs used as of December 31, 2021 in valuing the assets and liabilities:
| | | | Quoted Prices
in Active Markets
for Identical
Investments
(Level 1) | | | Significant
Other
Observable
Inputs
(Level 2) | | | Significant
Unobservable
Inputs
(Level 3) | | | Fair Value
at
December 31, 2021 | |
| Asset Table | | | | | | | | | | | | | | | | | | | | | | | | | |
| Investments, at fair value | | | | | | | | | | | | | | | | | | | | | | | | | |
| Exchange-Traded Funds | | | | $ | 7,112,321 | | | | | $ | — | | | | | $ | — | | | | | $ | 7,112,321 | | |
| Mutual Funds | | | | | 35,703,912 | | | | | | — | | | | | | — | | | | | | 35,703,912 | | |
| Total Investments, at fair value | | | | $ | 42,816,233 | | | | | $ | — | | | | | $ | — | | | | | $ | 42,816,233 | | |
^
See Note 2, “Significant Accounting Policies” in the Notes to Financial Statements for additional information.
See Accompanying Notes to Financial Statements
PORTFOLIO OF INVESTMENTS
| Voya Solution 2040 Portfolio | as of December 31, 2021 (continued) |
Transactions with Affiliates
An investment of at least 5% of the voting securities of an issuer, or a company which is under common control with the issuer, results in that issuer becoming an affiliated person as defined by the 1940 Act.
The following table provides transactions during the year ended December 31, 2021, where the following issuers were considered an affiliate:
| Issuer | | | Beginning
Fair Value
at 12/31/2020 | | | Purchases
at Cost | | | Sales
at Cost | | | Change in
Unrealized
Appreciation/
(Depreciation) | | | Ending
Fair Value
at 12/31/2021 | | | Investment
Income | | | Realized
Gains/
(Losses) | | | Net Capital
Gain
Distributions | |
| Voya High Yield Bond Fund - Class R6 | | | | $ | 1,181,441 | | | | | $ | 505,843 | | | | | $ | (348,294) | | | | | $ | (50,963) | | | | | $ | 1,288,027 | | | | | $ | 65,473 | | | | | $ | 47,417 | | | | | $ | — | | |
| Voya Intermediate Bond Fund - Class R6 | | | | | 1,171,591 | | | | | | 1,067,180 | | | | | | (506,399) | | | | | | (32,342) | | | | | | 1,700,030 | | | | | | 42,960 | | | | | | (13,854) | | | | | | — | | |
| Voya Large-Cap Growth Fund - Class R6 | | | | | 1,014,774 | | | | | | 216,772 | | | | | | (1,114,949) | | | | | | (116,597) | | | | | | — | | | | | | — | | | | | | 290,086 | | | | | | — | | |
| Voya Multi-Manager Emerging Markets Equity Fund - Class I | | | | | 2,661,661 | | | | | | 1,873,683 | | | | | | (1,686,348) | | | | | | (813,042) | | | | | | 2,035,954 | | | | | | 42,682 | | | | | | 444,510 | | | | | | 286,490 | | |
| Voya Multi-Manager International Equity Fund - Class I | | | | | 5,667,052 | | | | | | 2,820,473 | | | | | | (1,570,667) | | | | | | (1,075,227) | | | | | | 5,841,631 | | | | | | 80,993 | | | | | | 370,707 | | | | | | 998,418 | | |
| Voya Multi-Manager International Factors Fund - Class I | | | | | 3,629,336 | | | | | | 1,505,587 | | | | | | (1,013,794) | | | | | | (303,243) | | | | | | 3,817,886 | | | | | | 153,719 | | | | | | 196,113 | | | | | | 363,902 | | |
| Voya Multi-Manager Mid Cap Value Fund - Class I | | | | | 809,469 | | | | | | 1,011,077 | | | | | | (822,004) | | | | | | (119,862) | | | | | | 878,680 | | | | | | 10,692 | | | | | | 238,069 | | | | | | 106,907 | | |
| Voya U.S. Stock Index Portfolio - Class I | | | | | 6,022,955 | | | | | | 3,308,350 | | | | | | (3,114,566) | | | | | | (127,296) | | | | | | 6,089,443 | | | | | | 62,124 | | | | | | 1,024,229 | | | | | | 534,082 | | |
VY® BrandywineGLOBAL -Bond Portfolio - Class I | | | | | 780,093 | | | | | | 389,722 | | | | | | (252,573) | | | | | | (70,373) | | | | | | 846,869 | | | | | | 13,830 | | | | | | 11,234 | | | | | | 55,051 | | |
VY® Columbia Contrarian Core Portfolio - Class I | | | | | 2,205,165 | | | | | | 1,225,621 | | | | | | (607,371) | | | | | | 11,858 | | | | | | 2,835,273 | | | | | | 13,465 | | | | | | 251,726 | | | | | | 238,858 | | |
| VY® Invesco Comstock Portfolio - Class I | | | | | 767,556 | | | | | | 2,165,761 | | | | | | (931,423) | | | | | | (36,175) | | | | | | 1,965,719 | | | | | | 30,025 | | | | | | 313,454 | | | | | | — | | |
VY® JPMorgan Small Cap Core Equity Portfolio -
Class R6 | | | | | 1,215,301 | | | | | | 959,096 | | | | | | (751,540) | | | | | | (137,076) | | | | | | 1,285,781 | | | | | | 3,194 | | | | | | 301,405 | | | | | | 40,431 | | |
VY® T. Rowe Price Capital Appreciation Portfolio -
Class R6 | | | | | 2,963,472 | | | | | | 1,242,403 | | | | | | (989,113) | | | | | | 10,263 | | | | | | 3,227,025 | | | | | | 32,356 | | | | | | 122,139 | | | | | | 381,361 | | |
VY® T. Rowe Price Diversified Mid Cap Growth Portfolio - Class R6 | | | | | 819,746 | | | | | | 1,136,426 | | | | | | (883,919) | | | | | | (239,389) | | | | | | 832,864 | | | | | | 96 | | | | | | 184,035 | | | | | | 214,532 | | |
VY® T. Rowe Price Growth Equity Portfolio - Class I | | | | | 2,299,484 | | | | | | 1,587,987 | | | | | | (784,179) | | | | | | (44,562) | | | | | | 3,058,730 | | | | | | — | | | | | | 261,998 | | | | | | 239,950 | | |
| | | | | $ | 33,209,096 | | | | | $ | 21,015,981 | | | | | $ | (15,377,139) | | | | | $ | (3,144,026) | | | | | $ | 35,703,912 | | | | | $ | 551,609 | | | | | $ | 4,043,268 | | | | | $ | 3,459,982 | | |
The financial statements for the above mutual fund[s] can be found at www.sec.gov.
At December 31, 2021, the aggregate cost of securities and other investments and the composition of unrealized appreciation and depreciation of securities and other investments on a tax basis were:
| | Cost for federal income tax purposes was $40,593,782. | | | | | | | |
| | Net unrealized appreciation consisted of: | | | | | | | |
| | Gross Unrealized Appreciation | | | | $ | 3,559,077 | | |
| | Gross Unrealized Depreciation | | | | | (1,336,626) | | |
| | Net Unrealized Appreciation | | | | $ | 2,222,451 | | |
See Accompanying Notes to Financial Statements
PORTFOLIO OF INVESTMENTS
| Voya Solution 2045 Portfolio | as of December 31, 2021 |
| Shares | | | Value | | | Percentage
of Net
Assets | |
| EXCHANGE-TRADED FUNDS: 17.3% | |
| 21,983 | | | iShares Russell 2000 ETF | | | | $ | 4,890,118 | | | | | | 0.9 | | |
| 137,580 | | | Vanguard Russell 1000 Growth
ETF | | | | | 10,805,533 | | | | | | 2.1 | | |
| 120,890 | | | Vanguard S&P 500 ETF | | | | | 52,776,947 | | | | | | 10.0 | | |
| 155,831 | | | Vanguard Value ETF | | | | | 22,924,299 | | | | | | 4.3 | | |
| | | | Total Exchange-Traded Funds
(Cost $70,865,074) | | | | | 91,396,897 | | | | | | 17.3 | | |
| MUTUAL FUNDS: 82.6% | |
| | | | Affiliated Investment Companies: 82.6% | |
| 1,316,120 | | | Voya High Yield Bond Fund -
Class R6 | | | | | 10,581,607 | | | | | | 2.0 | | |
| 2,555,738 | | | Voya Multi-Manager Emerging
Markets Equity Fund - Class I | | | | | 30,106,595 | | | | | | 5.7 | | |
| 7,189,176 | | | Voya Multi-Manager
International Equity Fund -
Class I | | | | | 82,244,175 | | | | | | 15.6 | | |
| 4,790,933 | | | Voya Multi-Manager
International Factors Fund -
Class I | | | | | 47,094,868 | | | | | | 8.9 | | |
| 1,008,452 | | | Voya Multi-Manager Mid Cap
Value Fund - Class I | | | | | 10,830,778 | | | | | | 2.1 | | |
| 3,904,776 | | | Voya U.S. Stock Index Portfolio -
Class I | | | | | 85,397,460 | | | | | | 16.2 | | |
| Shares | | | Value | | | Percentage
of Net
Assets | |
| MUTUAL FUNDS: (continued) | |
| | | | Affiliated Investment Companies (continued) | |
| 1,738,865 | | | VY® Columbia Contrarian Core
Portfolio - Class I | | | | $ | 40,324,275 | | | | | | 7.6 | | |
| 1,252,132 | | | VY® Invesco Comstock
Portfolio - Class I | | | | | 26,607,798 | | | | | | 5.0 | | |
| 741,161 | | | VY® JPMorgan Small Cap Core
Equity Portfolio - Class R6 | | | | | 15,749,664 | | | | | | 3.0 | | |
| 1,205,781 | | | VY® T. Rowe Price Capital
Appreciation Portfolio -
Class R6 | | | | | 39,766,646 | | | | | | 7.5 | | |
| 691,288 | | | VY® T. Rowe Price Diversified
Mid Cap Growth Portfolio -
Class R6 | | | | | 10,258,720 | | | | | | 1.9 | | |
| 315,674 | | | VY® T. Rowe Price Growth
Equity Portfolio - Class I | | | | | 37,581,012 | | | | | | 7.1 | | |
| | | | Total Mutual Funds
(Cost $402,046,785) | | | | | 436,543,598 | | | | | | 82.6 | | |
| | | | Total Investments in
Securities
(Cost $472,911,859) | | | | $ | 527,940,495 | | | | | | 99.9 | | |
| | | | Assets in Excess of Other
Liabilities | | | | | 470,768 | | | | | | 0.1 | | |
| | | | Net Assets | | | | $ | 528,411,263 | | | | | | 100.0 | | |
| |
Fair Value Measurements^
The following is a summary of the fair valuations according to the inputs used as of December 31, 2021 in valuing the assets and liabilities:
| | | | Quoted Prices
in Active Markets
for Identical
Investments
(Level 1) | | | Significant
Other
Observable
Inputs
(Level 2) | | | Significant
Unobservable
Inputs
(Level 3) | | | Fair Value
at
December 31, 2021 | |
| Asset Table | | | | | | | | | | | | | | | | | | | | | | | | | |
| Investments, at fair value | | | | | | | | | | | | | | | | | | | | | | | | | |
| Exchange-Traded Funds | | | | $ | 91,396,897 | | | | | $ | — | | | | | $ | — | | | | | $ | 91,396,897 | | |
| Mutual Funds | | | | | 436,543,598 | | | | | | — | | | | | | — | | | | | | 436,543,598 | | |
| Total Investments, at fair value | | | | $ | 527,940,495 | | | | | $ | — | | | | | $ | — | | | | | $ | 527,940,495 | | |
^
See Note 2, “Significant Accounting Policies” in the Notes to Financial Statements for additional information.
See Accompanying Notes to Financial Statements
PORTFOLIO OF INVESTMENTS
| Voya Solution 2045 Portfolio | as of December 31, 2021 (continued) |
Transactions with Affiliates
An investment of at least 5% of the voting securities of an issuer, or a company which is under common control with the issuer, results in that issuer becoming an affiliated person as defined by the 1940 Act.
The following table provides transactions during the year ended December 31, 2021, where the following issuers were considered an affiliate:
| Issuer | | | Beginning
Fair Value
at 12/31/2020 | | | Purchases
at Cost | | | Sales
at Cost | | | Change in
Unrealized
Appreciation/
(Depreciation) | | | Ending
Fair Value
at 12/31/2021 | | | Investment
Income | | | Realized
Gains/
(Losses) | | | Net Capital
Gain
Distributions | |
| Voya High Yield Bond Fund - Class R6 | | | | $ | 9,981,965 | | | | | $ | 2,122,804 | | | | | $ | (1,331,974) | | | | | $ | (191,188) | | | | | $ | 10,581,607 | | | | | $ | 538,478 | | | | | $ | 157,049 | | | | | $ | — | | |
| Voya Index Plus LargeCap Portfolio - Class I | | | | | — | | | | | | — | | | | | | — | | | | | | — | | | | | | — | | | | | | — | | | | | | — | | | | | | — | | |
| Voya Intermediate Bond Fund - Class R6 | | | | | 6,248,176 | | | | | | 303,366 | | | | | | (6,570,533) | | | | | | 18,991 | | | | | | — | | | | | | 64,313 | | | | | | (221,538) | | | | | | — | | |
| Voya Large-Cap Growth Fund - Class R6 | | | | | 12,412,291 | | | | | | 1,019,520 | | | | | | (11,544,618) | | | | | | (1,887,193) | | | | | | — | | | | | | — | | | | | | 4,005,952 | | | | | | — | | |
| Voya MidCap Opportunities Portfolio - Class I | | | | | — | | | | | | — | | | | | | — | | | | | | — | | | | | | — | | | | | | — | | | | | | — | | | | | | — | | |
| Voya Multi-Manager Emerging Markets Equity Fund - Class I | | | | | 35,330,626 | | | | | | 21,334,972 | | | | | | (16,213,100) | | | | | | (10,345,903) | | | | | | 30,106,595 | | | | | | 634,119 | | | | | | 4,733,796 | | | | | | 4,256,289 | | |
| Voya Multi-Manager International Equity Fund - Class I | | | | | 74,396,707 | | | | | | 30,548,554 | | | | | | (10,144,911) | | | | | | (12,556,175) | | | | | | 82,244,175 | | | | | | 1,145,518 | | | | | | 2,417,106 | | | | | | 14,121,076 | | |
Voya Multi-Manager International Factors Fund -
Class I | | | | | 44,476,663 | | | | | | 15,662,202 | | | | | | (9,867,999) | | | | | | (3,175,998) | | | | | | 47,094,868 | | | | | | 1,904,704 | | | | | | 1,748,007 | | | | | | 4,509,060 | | |
| Voya Multi-Manager Mid Cap Value Fund - Class I | | | | | 11,284,081 | | | | | | 8,417,200 | | | | | | (7,783,337) | | | | | | (1,087,166) | | | | | | 10,830,778 | | | | | | 132,365 | | | | | | 2,839,854 | | | | | | 1,319,403 | | |
| Voya Short Term Bond Fund - Class R6 | | | | | — | | | | | | — | | | | | | — | | | | | | — | | | | | | — | | | | | | — | | | | | | — | | | | | | — | | |
| Voya Strategic Income Opportunities Fund - Class R6 | | | | | — | | | | | | — | | | | | | — | | | | | | — | | | | | | — | | | | | | — | | | | | | — | | | | | | — | | |
| Voya U.S. High Dividend Low Volatility Fund - Class R6 | | | | | — | | | | | | — | | | | | | — | | | | | | — | | | | | | — | | | | | | — | | | | | | — | | | | | | — | | |
| Voya U.S. Stock Index Portfolio - Class I | | | | | 70,854,992 | | | | | | 22,086,402 | | | | | | (14,250,859) | | | | | | 6,706,925 | | | | | | 85,397,460 | | | | | | 873,195 | | | | | | 4,581,581 | | | | | | 6,843,291 | | |
VY® BrandywineGLOBAL - Bond Portfolio - Class I | | | | | 4,979,972 | | | | | | 67,907 | | | | | | (4,758,350) | | | | | | (289,529) | | | | | | — | | | | | | — | | | | | | 318,860 | | | | | | — | | |
VY® Columbia Contrarian Core Portfolio - Class I | | | | | 34,918,940 | | | | | | 8,163,379 | | | | | | (4,819,926) | | | | | | 2,061,882 | | | | | | 40,324,275 | | | | | | 212,887 | | | | | | 1,993,789 | | | | | | 3,776,527 | | |
| VY® Invesco Comstock Portfolio - Class I | | | | | 12,454,815 | | | | | | 16,890,336 | | | | | | (4,343,736) | | | | | | 1,606,383 | | | | | | 26,607,798 | | | | | | 412,730 | | | | | | 2,567,023 | | | | | | — | | |
VY® JPMorgan Small Cap Core Equity Portfolio -
Class R6 | | | | | 9,875,859 | | | | | | 7,941,513 | | | | | | (2,436,887) | | | | | | 369,179 | | | | | | 15,749,664 | | | | | | 36,040 | | | | | | 946,348 | | | | | | 456,254 | | |
VY® T. Rowe Price Capital Appreciation
Portfolio - Class R6 | | | | | 37,441,627 | | | | | | 7,216,142 | | | | | | (5,880,412) | | | | | | 989,289 | | | | | | 39,766,646 | | | | | | 397,753 | | | | | | 883,658 | | | | | | 4,472,916 | | |
VY® T. Rowe Price Diversified Mid Cap Growth Portfolio - Class R6 | | | | | 11,203,948 | | | | | | 10,290,276 | | | | | | (8,030,016) | | | | | | (3,205,488) | | | | | | 10,258,720 | | | | | | 1,205 | | | | | | 2,569,490 | | | | | | 2,682,178 | | |
VY® T. Rowe Price Growth Equity Portfolio - Class I | | | | | 28,503,530 | | | | | | 12,975,350 | | | | | | (4,923,559) | | | | | | 1,025,691 | | | | | | 37,581,012 | | | | | | — | | | | | | 1,642,458 | | | | | | 2,984,117 | | |
| | | | | $ | 404,364,192 | | | | | $ | 165,039,923 | | | | | $ | (112,900,217) | | | | | $ | (19,960,300) | | | | | $ | 436,543,598 | | | | | $ | 6,353,307 | | | | | $ | 31,183,433 | | | | | $ | 45,421,111 | | |
The financial statements for the above mutual fund[s] can be found at www.sec.gov.
The effect of derivative instruments on the Portfolio’s Statement of Operations for the year ended December 31, 2021 was as follows:
| | | | Amount of Realized Gain or (Loss) on
Derivatives Recognized in Income | |
| Derivatives not accounted for as hedging instruments | | | Futures | |
| Equity contracts | | | | $ | 1,850,139 | | |
| Interest rate contracts | | | | | 395,294 | | |
| Total | | | | $ | 2,245,433 | | |
| | | | Change in Unrealized Appreciation or (Depreciation)
on Derivatives Recognized in Income | |
| Derivatives not accounted for as hedging instruments | | | Futures | |
| Equity contracts | | | | $ | (244,363) | | |
| Interest rate contracts | | | | | 17,144 | | |
| Total | | | | $ | (227,219) | | |
See Accompanying Notes to Financial Statements
PORTFOLIO OF INVESTMENTS
| Voya Solution 2045 Portfolio | as of December 31, 2021 (continued) |
At December 31, 2021, the aggregate cost of securities and other investments and the composition of unrealized appreciation and depreciation of securities and other investments on a tax basis were:
| | Cost for federal income tax purposes was $478,112,228. | | |
| | Net unrealized appreciation consisted of: | | |
| | Gross Unrealized Appreciation | | | | $ | 59,608,984 | | |
| | Gross Unrealized Depreciation | | | | | (9,780,716) | | |
| | Net Unrealized Appreciation | | | | $ | 49,828,268 | | |
See Accompanying Notes to Financial Statements
PORTFOLIO OF INVESTMENTS
| Voya Solution 2050 Portfolio | as of December 31, 2021 |
| Shares | | | Value | | | Percentage
of Net
Assets | |
| EXCHANGE-TRADED FUNDS: 19.2% | |
| 3,105 | | | iShares Russell 2000 ETF | | | | $ | 690,707 | | | | | | 1.9 | | |
| 9,525 | | | Vanguard Russell 1000 Growth
ETF | | | | | 748,093 | | | | | | 2.1 | | |
| 9,173 | | | Vanguard S&P 500 ETF | | | | | 4,004,657 | | | | | | 11.1 | | |
| 10,154 | | | Vanguard Value ETF | | | | | 1,493,755 | | | | | | 4.1 | | |
| | | | Total Exchange-Traded Funds
(Cost $5,757,740) | | | | | 6,937,212 | | | | | | 19.2 | | |
| MUTUAL FUNDS: 80.7% | |
| | | | Affiliated Investment Companies: 80.7% | |
| 174,955 | | | Voya Multi-Manager Emerging
Markets Equity Fund - Class I | | | | | 2,060,972 | | | | | | 5.7 | | |
| 553,724 | | | Voya Multi-Manager International
Equity Fund - Class I | | | | | 6,334,599 | | | | | | 17.5 | | |
| 254,781 | | | Voya Multi-Manager International
Factors Fund - Class I | | | | | 2,504,499 | | | | | | 6.9 | | |
| 86,489 | | | Voya Multi-Manager Mid Cap
Value Fund - Class I | | | | | 928,895 | | | | | | 2.6 | | |
| 265,933 | | | Voya U.S. Stock Index Portfolio -
Class I | | | | | 5,815,953 | | | | | | 16.1 | | |
| 119,061 | | | VY® Columbia Contrarian Core
Portfolio - Class I | | | | | 2,761,026 | | | | | | 7.7 | | |
| Shares | | | Value | | | Percentage
of Net
Assets | |
| MUTUAL FUNDS: (continued) | |
| | | | Affiliated Investment Companies (continued) | |
| 89,229 | | | VY® Invesco Comstock Portfolio -
Class I | | | | $ | 1,896,123 | | | | | | 5.3 | | |
| 32,717 | | | VY® JPMorgan Small Cap Core
Equity Portfolio - Class R6 | | | | | 695,245 | | | | | | 1.9 | | |
| 82,555 | | | VY® T. Rowe Price Capital
Appreciation Portfolio - Class R6 | | | | | 2,722,669 | | | | | | 7.5 | | |
| 59,063 | | | VY® T. Rowe Price Diversified Mid
Cap Growth Portfolio - Class R6 | | | | | 876,491 | | | | | | 2.4 | | |
| 21,551 | | | VY® T. Rowe Price Growth Equity
Portfolio - Class I | | | | | 2,565,698 | | | | | | 7.1 | | |
| | | | Total Mutual Funds
(Cost $27,429,915) | | | | | 29,162,170 | | | | | | 80.7 | | |
| | | | Total Investments in Securities
(Cost $33,187,655) | | | | $ | 36,099,382 | | | | | | 99.9 | | |
| | | | Assets in Excess of Other
Liabilities | | | | | 26,558 | | | | | | 0.1 | | |
| | | | Net Assets | | | | $ | 36,125,940 | | | | | | 100.0 | | |
| |
Fair Value Measurements^
The following is a summary of the fair valuations according to the inputs used as of December 31, 2021 in valuing the assets and liabilities:
| | | | Quoted Prices
in Active Markets
for Identical
Investments
(Level 1) | | | Significant
Other
Observable
Inputs
(Level 2) | | | Significant
Unobservable
Inputs
(Level 3) | | | Fair Value
at
December 31, 2021 | |
| Asset Table | | | | | | | | | | | | | | | | | | | | | | | | | |
| Investments, at fair value | | | | | | | | | | | | | | | | | | | | | | | | | |
| Exchange-Traded Funds | | | | $ | 6,937,212 | | | | | $ | — | | | | | $ | — | | | | | $ | 6,937,212 | | |
| Mutual Funds | | | | | 29,162,170 | | | | | | — | | | | | | — | | | | | | 29,162,170 | | |
| Total Investments, at fair value | | | | $ | 36,099,382 | | | | | $ | — | | | | | $ | — | | | | | $ | 36,099,382 | | |
^
See Note 2, “Significant Accounting Policies” in the Notes to Financial Statements for additional information.
See Accompanying Notes to Financial Statements
PORTFOLIO OF INVESTMENTS
| Voya Solution 2050 Portfolio | as of December 31, 2021 (continued) |
Transactions with Affiliates
An investment of at least 5% of the voting securities of an issuer, or a company which is under common control with the issuer, results in that issuer becoming an affiliated person as defined by the 1940 Act.
The following table provides transactions during the year ended December 31, 2021, where the following issuers were considered an affiliate:
| Issuer | | | Beginning
Fair Value
at 12/31/2020 | | | Purchases
at Cost | | | Sales
at Cost | | | Change in
Unrealized
Appreciation/
(Depreciation) | | | Ending
Fair Value
at 12/31/2021 | | | Investment
Income | | | Realized
Gains/
(Losses) | | | Net Capital
Gain
Distributions | |
| Voya Intermediate Bond Fund - Class R6 | | | | $ | 347,930 | | | | | $ | 58,329 | | | | | $ | (408,147) | | | | | $ | 1,888 | | | | | $ | — | | | | | $ | 3,558 | | | | | $ | (13,110) | | | | | $ | — | | |
| Voya Large-Cap Growth Fund - Class R6 | | | | | 723,006 | | | | | | 131,645 | | | | | | (765,329) | | | | | | (89,322) | | | | | | — | | | | | | — | | | | | | 211,719 | | | | | | — | | |
| Voya Multi-Manager Emerging Markets Equity Fund - Class I | | | | | 2,552,709 | | | | | | 1,849,515 | | | | | | (1,542,410) | | | | | | (798,842) | | | | | | 2,060,972 | | | | | | 43,229 | | | | | | 421,569 | | | | | | 290,161 | | |
| Voya Multi-Manager International Equity Fund - Class I | | | | | 5,948,607 | | | | | | 3,389,434 | | | | | | (1,789,659) | | | | | | (1,213,783) | | | | | | 6,334,599 | | | | | | 87,873 | | | | | | 448,212 | | | | | | 1,083,236 | | |
| Voya Multi-Manager International Factors Fund - Class I | | | | | 3,412,005 | | | | | | 971,364 | | | | | | (1,600,722) | | | | | | (278,148) | | | | | | 2,504,499 | | | | | | 100,890 | | | | | | 287,901 | | | | | | 238,838 | | |
| Voya Multi-Manager Mid Cap Value Fund - Class I | | | | | 811,141 | | | | | | 765,156 | | | | | | (577,745) | | | | | | (69,657) | | | | | | 928,895 | | | | | | 11,309 | | | | | | 178,421 | | | | | | 112,870 | | |
| Voya U.S. Stock Index Portfolio - Class I | | | | | 5,471,299 | | | | | | 2,971,104 | | | | | | (2,749,009) | | | | | | 122,559 | | | | | | 5,815,953 | | | | | | 59,210 | | | | | | 720,492 | | | | | | 480,108 | | |
VY® Columbia Contrarian Core Portfolio - Class I | | | | | 2,499,812 | | | | | | 943,280 | | | | | | (685,843) | | | | | | 3,777 | | | | | | 2,761,026 | | | | | | 15,146 | | | | | | 274,515 | | | | | | 268,686 | | |
| VY® Invesco Comstock Portfolio - Class I | | | | | 1,331,921 | | | | | | 1,260,878 | | | | | | (793,774) | | | | | | 97,098 | | | | | | 1,896,123 | | | | | | 30,784 | | | | | | 321,572 | | | | | | — | | |
VY® JPMorgan Small Cap Core Equity Portfolio -
Class R6 | | | | | 1,090,264 | | | | | | 455,601 | | | | | | (710,583) | | | | | | (140,037) | | | | | | 695,245 | | | | | | 2,470 | | | | | | 289,708 | | | | | | 31,265 | | |
VY® T. Rowe Price Capital Appreciation Portfolio -
Class R6 | | | | | 2,639,892 | | | | | | 937,772 | | | | | | (867,833) | | | | | | 12,838 | | | | | | 2,722,669 | | | | | | 27,227 | | | | | | 115,716 | | | | | | 315,282 | | |
VY® T. Rowe Price Diversified Mid Cap Growth Portfolio Class R6 | | | | | 821,356 | | | | | | 862,787 | | | | | | (607,498) | | | | | | (200,154) | | | | | | 876,491 | | | | | | 85 | | | | | | 148,832 | | | | | | 189,055 | | |
VY® T. Rowe Price Growth Equity Portfolio - Class I | | | | | 2,226,341 | | | | | | 1,085,902 | | | | | | (732,156) | | | | | | (14,389) | | | | | | 2,565,698 | | | | | | — | | | | | | 227,392 | | | | | | 211,949 | | |
| | | | | $ | 29,876,283 | | | | | $ | 15,682,767 | | | | | $ | (13,830,708) | | | | | $ | (2,566,172) | | | | | $ | 29,162,170 | | | | | $ | 381,781 | | | | | $ | 3,632,939 | | | | | $ | 3,221,450 | | |
The financial statements for the above mutual fund[s] can be found at www.sec.gov.
At December 31, 2021, the aggregate cost of securities and other investments and the composition of unrealized appreciation and depreciation of securities and other investments on a tax basis were:
| | Cost for federal income tax purposes was $33,797,978. | | | | | | | |
| | Net unrealized appreciation consisted of: | | |
| | Gross Unrealized Appreciation | | | | $ | 3,618,585 | | |
| | Gross Unrealized Depreciation | | | | | (1,317,181) | | |
| | Net Unrealized Appreciation | | | | $ | 2,301,404 | | |
See Accompanying Notes to Financial Statements
PORTFOLIO OF INVESTMENTS
| Voya Solution 2055 Portfolio | as of December 31, 2021 |
| Shares | | | Value | | | Percentage
of Net
Assets | |
| EXCHANGE-TRADED FUNDS: 17.6% | |
| 15,004 | | | iShares Russell 2000 ETF | | | | $ | 3,337,640 | | | | | | 1.9 | | |
| 46,549 | | | Vanguard Russell
1000 Growth ETF | | | | | 3,655,959 | | | | | | 2.1 | | |
| 39,655 | | | Vanguard S&P 500 ETF | | | | | 17,312,183 | | | | | | 9.8 | | |
| 46,522 | | | Vanguard Value ETF | | | | | 6,843,851 | | | | | | 3.8 | | |
| | | | Total Exchange-Traded Funds
(Cost $25,830,374) | | | | | 31,149,633 | | | | | | 17.6 | | |
| MUTUAL FUNDS: 82.3% | |
| | | | Affiliated Investment Companies: 82.3% | |
| 858,219 | | | Voya Multi-Manager Emerging
Markets Equity Fund - Class I | | | | | 10,109,823 | | | | | | 5.7 | | |
| 2,866,915 | | | Voya Multi-Manager International
Equity Fund - Class I | | | | | 32,797,508 | | | | | | 18.5 | | |
| 1,071,338 | | | Voya Multi-Manager International
Factors Fund - Class I | | | | | 10,531,256 | | | | | | 5.9 | | |
| 424,310 | | | Voya Multi-Manager Mid Cap
Value Fund - Class I | | | | | 4,557,094 | | | | | | 2.6 | | |
| 1,411,729 | | | Voya U.S. Stock Index
Portfolio - Class I | | | | | 30,874,516 | | | | | | 17.4 | | |
| 584,104 | | | VY® Columbia Contrarian Core
Portfolio - Class I | | | | | 13,545,373 | | | | | | 7.7 | | |
| Shares | | | Value | | | Percentage
of Net
Assets | |
| MUTUAL FUNDS: (continued) | |
| | | | Affiliated Investment Companies (continued) | |
| 460,354 | | | VY® Invesco Comstock
Portfolio - Class I | | | | $ | 9,782,524 | | | | | | 5.5 | | |
| 162,865 | | | VY® JPMorgan Small Cap
Core Equity Portfolio - Class R6 | | | | | 3,460,884 | | | | | | 2.0 | | |
| 405,016 | | | VY® T. Rowe Price Capital
Appreciation Portfolio - Class R6 | | | | | 13,357,413 | | | | | | 7.5 | | |
| 289,692 | | | VY® T. Rowe Price Diversified
Mid Cap Growth Portfolio -
Class R6 | | | | | 4,299,035 | | | | | | 2.4 | | |
| 105,866 | | | VY® T. Rowe Price Growth
Equity Portfolio - Class I | | | | | 12,603,289 | | | | | | 7.1 | | |
| | | | Total Mutual Funds
(Cost $135,735,004) | | | | | 145,918,715 | | | | | | 82.3 | | |
| | | | Total Investments
in Securities(Cost
$161,565,378) | | | | $ | 177,068,348 | | | | | | 99.9 | | |
| | | | Assets in Excess of Other
Liabilities | | | | | 100,294 | | | | | | 0.1 | | |
| | | | Net Assets | | | | $ | 177,168,642 | | | | | | 100.0 | | |
| |
Fair Value Measurements^
The following is a summary of the fair valuations according to the inputs used as of December 31, 2021 in valuing the assets and liabilities:
| | | | Quoted Prices
in Active Markets
for Identical
Investments
(Level 1) | | | Significant
Other
Observable
Inputs
(Level 2) | | | Significant
Unobservable
Inputs
(Level 3) | | | Fair Value
at
December 31, 2021 | |
| Asset Table | | | | | | | | | | | | | | | | | | | | | | | | | |
| Investments, at fair value | | | | | | | | | | | | | | | | | | | | | | | | | |
| Exchange-Traded Funds | | | | $ | 31,149,633 | | | | | $ | — | | | | | $ | — | | | | | $ | 31,149,633 | | |
| Mutual Funds | | | | | 145,918,715 | | | | | | — | | | | | | — | | | | | | 145,918,715 | | |
| Total Investments, at fair value | | | | $ | 177,068,348 | | | | | $ | — | | | | | $ | — | | | | | $ | 177,068,348 | | |
^
See Note 2, “Significant Accounting Policies” in the Notes to Financial Statements for additional information.
See Accompanying Notes to Financial Statements
PORTFOLIO OF INVESTMENTS
| Voya Solution 2055 Portfolio | as of December 31, 2021 (continued) |
Transactions with Affiliates
An investment of at least 5% of the voting securities of an issuer, or a company which is under common control with the issuer, results in that issuer becoming an affiliated person as defined by the 1940 Act.
The following table provides transactions during the year ended December 31, 2021, where the following issuers were considered an affiliate:
| Issuer | | | Beginning
Fair Value
at 12/31/2020 | | | Purchases
at Cost | | | Sales
at Cost | | | Change in
Unrealized
Appreciation/
(Depreciation) | | | Ending
Fair Value
at 12/31/2021 | | | Investment
Income | | | Realized
Gains/
(Losses) | | | Net Capital
Gain
Distributions | |
| Voya Intermediate Bond Fund - Class R6 | | | | $ | 2,067,615 | | | | | $ | 89,936 | | | | | $ | (2,173,002) | | | | | $ | 15,451 | | | | | $ | — | | | | | $ | 21,017 | | | | | $ | (81,600) | | | | | $ | — | | |
| Voya Large-Cap Growth Fund - Class R6 | | | | | 3,285,304 | | | | | | 417,744 | | | | | | (3,382,914) | | | | | | (320,134) | | | | | | — | | | | | | — | | | | | | 856,128 | | | | | | — | | |
| Voya Multi-Manager Emerging Markets Equity Fund - Class I | | | | | 12,523,944 | | | | | | 6,961,661 | | | | | | (5,786,379) | | | | | | (3,589,403) | | | | | | 10,109,823 | | | | | | 213,318 | | | | | | 1,734,395 | | | | | | 1,431,819 | | |
Voya Multi-Manager International Equity
Fund - Class I | | | | | 26,256,423 | | | | | | 16,964,191 | | | | | | (4,916,024) | | | | | | (5,507,082) | | | | | | 32,797,508 | | | | | | 457,607 | | | | | | 1,167,227 | | | | | | 5,641,033 | | |
Voya Multi-Manager International Factors
Fund - Class I | | | | | 14,715,996 | | | | | | 3,307,781 | | | | | | (6,498,100) | | | | | | (994,421) | | | | | | 10,531,256 | | | | | | 426,651 | | | | | | 1,051,333 | | | | | | 1,010,023 | | |
| Voya Multi-Manager Mid Cap Value Fund - Class I | | | | | 4,148,105 | | | | | | 2,754,333 | | | | | | (2,190,622) | | | | | | (154,722) | | | | | | 4,557,094 | | | | | | 55,786 | | | | | | 715,254 | | | | | | 552,999 | | |
| Voya U.S. Stock Index Portfolio - Class I | | | | | 25,105,906 | | | | | | 10,186,071 | | | | | | (7,413,882) | | | | | | 2,996,421 | | | | | | 30,874,516 | | | | | | 316,555 | | | | | | 958,647 | | | | | | 2,498,406 | | |
VY® Columbia Contrarian Core Portfolio - Class I | | | | | 11,552,918 | | | | | | 3,295,751 | | | | | | (1,865,186) | | | | | | 561,890 | | | | | | 13,545,373 | | | | | | 76,654 | | | | | | 719,259 | | | | | | 1,359,817 | | |
| VY® Invesco Comstock Portfolio - Class I | | | | | 6,629,753 | | | | | | 4,213,154 | | | | | | (2,022,144) | | | | | | 961,761 | | | | | | 9,782,524 | | | | | | 159,115 | | | | | | 1,113,052 | | | | | | — | | |
VY® JPMorgan Small Cap Core Equity
Portfolio - Class R6 | | | | | 742,004 | | | | | | 4,098,152 | | | | | | (1,505,850) | | | | | | 126,578 | | | | | | 3,460,884 | | | | | | 12,274 | | | | | | 260,439 | | | | | | 155,384 | | |
VY® T. Rowe Price Capital Appreciation
Portfolio - Class R6 | | | | | 12,387,414 | | | | | | 3,168,129 | | | | | | (2,443,010) | | | | | | 244,880 | | | | | | 13,357,413 | | | | | | 133,832 | | | | | | 349,324 | | | | | | 1,504,268 | | |
VY® T. Rowe Price Diversified Mid Cap Growth Portfolio Class R6 | | | | | 4,118,795 | | | | | | 3,283,008 | | | | | | (2,285,295) | | | | | | (817,473) | | | | | | 4,299,035 | | | | | | 404 | | | | | | 609,068 | | | | | | 900,395 | | |
VY® T. Rowe Price Growth Equity Portfolio - Class I | | | | | 10,250,511 | | | | | | 6,061,984 | | | | | | (3,228,822) | | | | | | (480,384) | | | | | | 12,603,289 | | | | | | — | | | | | | 1,400,397 | | | | | | 1,138,668 | | |
| | | | | $ | 133,784,688 | | | | | $ | 64,801,895 | | | | | $ | (45,711,230) | | | | | $ | (6,956,638) | | | | | $ | 145,918,715 | | | | | $ | 1,873,213 | | | | | $ | 10,852,923 | | | | | $ | 16,192,812 | | |
The financial statements for the above mutual fund[s] can be found at www.sec.gov.
The effect of derivative instruments on the Portfolio’s Statement of Operations for the year ended December 31, 2021 was as follows:
| | | | Amount of Realized Gain or (Loss) on
Derivatives Recognized in Income | |
| Derivatives not accounted for as hedging instruments | | | Futures | |
| Equity contracts | | | | $ | 375,716 | | |
| Interest rate contracts | | | | | 72,579 | | |
| Total | | | | $ | 448,295 | | |
| | | | Change in Unrealized Appreciation or (Depreciation)
on Derivatives Recognized in Income | |
| Derivatives not accounted for as hedging instruments | | | Futures | |
| Equity contracts | | | | $ | (34,390) | | |
| Interest rate contracts | | | | | 3,395 | | |
| Total | | | | $ | (30,995) | | |
See Accompanying Notes to Financial Statements
PORTFOLIO OF INVESTMENTS
| Voya Solution 2055 Portfolio | as of December 31, 2021 (continued) |
At December 31, 2021, the aggregate cost of securities and other investments and the composition of unrealized appreciation and depreciation of securities and other investments on a tax basis were:
| | Cost for federal income tax purposes was $163,971,570. | | | | | | | |
| | Net unrealized appreciation consisted of: | | | | | | | |
| | Gross Unrealized Appreciation | | | | $ | 17,943,500 | | |
| | Gross Unrealized Depreciation | | | | | (4,846,722) | | |
| | Net Unrealized Appreciation | | | | $ | 13,096,778 | | |
See Accompanying Notes to Financial Statements
PORTFOLIO OF INVESTMENTS
| Voya Solution 2060 Portfolio | as of December 31, 2021 |
| Shares | | | Value | | | Percentage
of Net
Assets | |
| EXCHANGE-TRADED FUNDS: 17.4% | |
| 2,232 | | | iShares Russell 2000 ETF | | | | $ | 496,508 | | | | | | 1.9 | | |
| 6,928 | | | Vanguard Russell 1000 Growth
ETF | | | | | 544,125 | | | | | | 2.0 | | |
| 5,902 | | | Vanguard S&P 500 ETF | | | | | 2,576,636 | | | | | | 9.7 | | |
| 6,924 | | | Vanguard Value ETF | | | | | 1,018,590 | | | | | | 3.8 | | |
| | | | Total Exchange-Traded Funds
(Cost $3,923,581) | | | | | 4,635,859 | | | | | | 17.4 | | |
| MUTUAL FUNDS: 82.5% | |
| | | | Affiliated Investment Companies: 82.5% | |
| 128,918 | | | Voya Multi-Manager Emerging
Markets Equity Fund - Class I | | | | | 1,518,650 | | | | | | 5.7 | | |
| 430,567 | | | Voya Multi-Manager
International Equity Fund -
Class I | | | | | 4,925,684 | | | | | | 18.5 | | |
| 160,859 | | | Voya Multi-Manager
International Factors Fund -
Class I | | | | | 1,581,241 | | | | | | 6.0 | | |
| 63,687 | | | Voya Multi-Manager Mid Cap
Value Fund - Class I | | | | | 684,001 | | | | | | 2.6 | | |
| 212,233 | | | Voya U.S. Stock Index
Portfolio - Class I | | | | | 4,641,536 | | | | | | 17.5 | | |
| 87,671 | | | VY® Columbia Contrarian Core
Portfolio - Class I | | | | | 2,033,082 | | | | | | 7.6 | | |
| Shares | | | Value | | | Percentage
of Net
Assets | |
| MUTUAL FUNDS: (continued) | |
| | | | Affiliated Investment Companies (continued) | |
| 69,519 | | | VY® Invesco Comstock
Portfolio - Class I | | | | $ | 1,477,270 | | | | | | 5.6 | | |
| 24,713 | | | VY® JPMorgan Small Cap Core
Equity Portfolio - Class R6 | | | | | 525,150 | | | | | | 2.0 | | |
| 60,793 | | | VY® T. Rowe Price Capital
Appreciation Portfolio -
Class R6 | | | | | 2,004,945 | | | | | | 7.5 | | |
| 43,519 | | | VY® T. Rowe Price Diversified
Mid Cap Growth Portfolio -
Class R6 | | | | | 645,818 | | | | | | 2.4 | | |
| 15,943 | | | VY® T. Rowe Price Growth
Equity Portfolio - Class I | | | | | 1,897,978 | | | | | | 7.1 | | |
| | | | Total Mutual Funds
(Cost $20,951,113) | | | | | 21,935,355 | | | | | | 82.5 | | |
| | | | Total Investments in
Securities
(Cost $24,874,694) | | | | $ | 26,571,214 | | | | | | 99.9 | | |
| | | | Assets in Excess of Other
Liabilities | | | | | 23,077 | | | | | | 0.1 | | |
| | | | Net Assets | | | | $ | 26,594,291 | | | | | | 100.0 | | |
| |
Fair Value Measurements^
The following is a summary of the fair valuations according to the inputs used as of December 31, 2021 in valuing the assets and liabilities:
| | | | Quoted Prices
in Active Markets
for Identical
Investments
(Level 1) | | | Significant
Other
Observable
Inputs
(Level 2) | | | Significant
Unobservable
Inputs
(Level 3) | | | Fair Value
at
December 31, 2021 | |
| Asset Table | | | | | | | | | | | | | | | | | | | | | | | | | |
| Investments, at fair value | | | | | | | | | | | | | | | | | | | | | | | | | |
| Exchange-Traded Funds | | | | $ | 4,635,859 | | | | | $ | — | | | | | $ | — | | | | | $ | 4,635,859 | | |
| Mutual Funds | | | | | 21,935,355 | | | | | | — | | | | | | — | | | | | | 21,935,355 | | |
| Total Investments, at fair value | | | | $ | 26,571,214 | | | | | $ | — | | | | | $ | — | | | | | $ | 26,571,214 | | |
^
See Note 2, “Significant Accounting Policies” in the Notes to Financial Statements for additional information.
See Accompanying Notes to Financial Statements
PORTFOLIO OF INVESTMENTS
| Voya Solution 2060 Portfolio | as of December 31, 2021 (continued) |
Transactions with Affiliates
An investment of at least 5% of the voting securities of an issuer, or a company which is under common control with the issuer, results in that issuer becoming an affiliated person as defined by the 1940 Act.
The following table provides transactions during the year ended December 31, 2021, where the following issuers were considered an affiliate:
| Issuer | | | Beginning
Fair Value
at 12/31/2020 | | | Purchases
at Cost | | | Sales
at Cost | | | Change in
Unrealized
Appreciation/
(Depreciation) | | | Ending
Fair Value
at 12/31/2021 | | | Investment
Income | | | Realized
Gains/
(Losses) | | | Net Capital
Gain
Distributions | |
| Voya Large-Cap Growth Fund - Class R6 | | | | $ | 489,912 | | | | | $ | 113,777 | | | | | $ | (548,238) | | | | | $ | (55,451) | | | | | $ | — | | | | | $ | — | | | | | $ | 132,919 | | | | | $ | — | | |
Voya Multi-Manager Emerging Markets Equity Fund -
Class I | | | | | 1,853,471 | | | | | | 1,322,951 | | | | | | (1,085,187) | | | | | | (572,585) | | | | | | 1,518,650 | | | | | | 31,816 | | | | | | 298,208 | | | | | | 213,555 | | |
| Voya Multi-Manager International Equity Fund - Class I | | | | | 4,031,013 | | | | | | 3,073,105 | | | | | | (1,234,393) | | | | | | (944,041) | | | | | | 4,925,684 | | | | | | 68,251 | | | | | | 305,778 | | | | | | 841,349 | | |
| Voya Multi-Manager International Factors Fund - Class I | | | | | 2,312,162 | | | | | | 768,141 | | | | | | (1,244,334) | | | | | | (254,728) | | | | | | 1,581,241 | | | | | | 63,626 | | | | | | 270,671 | | | | | | 150,624 | | |
| Voya Multi-Manager Mid Cap Value Fund - Class I | | | | | 610,807 | | | | | | 522,412 | | | | | | (407,052) | | | | | | (42,166) | | | | | | 684,001 | | | | | | 8,318 | | | | | | 123,494 | | | | | | 82,673 | | |
| Voya U.S. Stock Index Portfolio - Class I | | | | | 3,595,231 | | | | | | 2,513,125 | | | | | | (1,581,471) | | | | | | 114,651 | | | | | | 4,641,536 | | | | | | 47,172 | | | | | | 465,518 | | | | | | 354,048 | | |
| VY® Columbia Contrarian Core Portfolio - Class I | | | | | 1,815,110 | | | | | | 712,641 | | | | | | (500,027) | | | | | | 5,358 | | | | | | 2,033,082 | | | | | | 11,344 | | | | | | 195,773 | | | | | | 201,230 | | |
| VY® Invesco Comstock Portfolio - Class I | | | | | 967,262 | | | | | | 947,681 | | | | | | (536,157) | | | | | | 98,484 | | | | | | 1,477,270 | | | | | | 23,769 | | | | | | 207,368 | | | | | | — | | |
VY® JPMorgan Small Cap Core Equity Portfolio Class R6 | | | | | 741,216 | | | | | | 377,988 | | | | | | (494,696) | | | | | | (99,358) | | | | | | 525,150 | | | | | | 1,742 | | | | | | 199,948 | | | | | | 22,047 | | |
VY® T. Rowe Price Capital Appreciation Portfolio - Class R6 | | | | | 1,789,302 | | | | | | 796,379 | | | | | | (586,780) | | | | | | 6,044 | | | | | | 2,004,945 | | | | | | 19,932 | | | | | | 83,737 | | | | | | 218,338 | | |
VY® T. Rowe Price Diversified Mid Cap Growth Portfolio - Class R6 | | | | | 618,384 | | | | | | 589,854 | | | | | | (423,922) | | | | | | (138,498) | | | | | | 645,818 | | | | | | 59 | | | | | | 105,861 | | | | | | 132,133 | | |
| VY® T. Rowe Price Growth Equity Portfolio - Class I | | | | | 1,508,784 | | | | | | 1,172,587 | | | | | | (664,580) | | | | | | (118,813) | | | | | | 1,897,978 | | | | | | — | | | | | | 250,755 | | | | | | 167,913 | | |
| | | | | $ | 20,332,654 | | | | | $ | 12,910,641 | | | | | $ | (9,306,837) | | | | | $ | (2,001,103) | | | | | $ | 21,935,355 | | | | | $ | 276,029 | | | | | $ | 2,640,030 | | | | | $ | 2,383,910 | | |
The financial statements for the above mutual fund[s] can be found at www.sec.gov.
At December 31, 2021, the aggregate cost of securities and other investments and the composition of unrealized appreciation and depreciation of securities and other investments on a tax basis were:
| | Cost for federal income tax purposes was $25,227,006. | | | | | | | |
| | Net unrealized appreciation consisted of: | | | | | | | |
| | Gross Unrealized Appreciation | | | | $ | 2,315,119 | | |
| | Gross Unrealized Depreciation | | | | | (970,911) | | |
| | Net Unrealized Appreciation | | | | $ | 1,344,208 | | |
See Accompanying Notes to Financial Statements
PORTFOLIO OF INVESTMENTS
| Voya Solution 2065 Portfolio | as of December 31, 2021 |
| Shares | | | Value | | | Percentage
of Net
Assets | |
| EXCHANGE-TRADED FUNDS: 15.4% | |
| 386 | | | iShares Russell 2000 ETF | | | | $ | 85,866 | | | | | | 1.5 | | |
| 1,338 | | | Vanguard Russell 1000
Growth ETF | | | | | 105,086 | | | | | | 1.8 | | |
| 1,163 | | | Vanguard S&P 500 ETF | | | | | 507,731 | | | | | | 8.7 | | |
| 1,338 | | | Vanguard Value ETF | | | | | 196,833 | | | | | | 3.4 | | |
| | | | Total Exchange-Traded Funds
(Cost $778,311) | | | | | 895,516 | | | | | | 15.4 | | |
| MUTUAL FUNDS: 84.6% | |
| | | | Affiliated Investment Companies: 84.6% | |
| 28,389 | | | Voya Multi-Manager Emerging
Markets Equity Fund - Class I | | | | | 334,426 | | | | | | 5.7 | | |
| 94,504 | | | Voya Multi-Manager
International Equity Fund -
Class I | | | | | 1,081,129 | | | | | | 18.6 | | |
| 35,304 | | | Voya Multi-Manager
International Factors Fund -
Class I | | | | | 347,043 | | | | | | 6.0 | | |
| 13,921 | | | Voya Multi-Manager Mid Cap
Value Fund - Class I | | | | | 149,511 | | | | | | 2.6 | | |
| 49,086 | | | Voya U.S. Stock Index
Portfolio - Class I | | | | | 1,073,502 | | | | | | 18.4 | | |
| 19,173 | | | VY® Columbia Contrarian
Core Portfolio - Class I | | | | | 444,632 | | | | | | 7.6 | | |
| Shares | | | Value | | | Percentage
of Net
Assets | |
| MUTUAL FUNDS: (continued) | |
| | | | Affiliated Investment Companies (continued) | |
| 16,443 | | | VY® Invesco Comstock
Portfolio - Class I | | | | $ | 349,424 | | | | | | 6.0 | | |
| 6,508 | | | VY® JPMorgan Small Cap
Core Equity Portfolio -
Class R6 | | | | | 138,296 | | | | | | 2.4 | | |
| 13,311 | | | VY® T. Rowe Price Capital
Appreciation Portfolio -
Class R6 | | | | | 439,002 | | | | | | 7.5 | | |
| 9,535 | | | VY® T. Rowe Price Diversified
Mid Cap Growth Portfolio -
Class R6 | | | | | 141,504 | | | | | | 2.4 | | |
| 3,592 | | | VY® T. Rowe Price Growth
Equity Portfolio - Class I | | | | | 427,610 | | | | | | 7.4 | | |
| | | | Total Mutual Funds
(Cost $4,911,815) | | | | | 4,926,079 | | | | | | 84.6 | | |
| | | | Total Investments in
Securities
(Cost $5,690,126) | | | | $ | 5,821,595 | | | | | | 100.0 | | |
| | | | Assets in Excess of Other
Liabilities | | | | | 1,899 | | | | | | 0.0 | | |
| | | | Net Assets | | | | $ | 5,823,494 | | | | | | 100.0 | | |
| |
Fair Value Measurements^
The following is a summary of the fair valuations according to the inputs used as of December 31, 2021 in valuing the assets and liabilities:
| | | | Quoted Prices
in Active Markets
for Identical
Investments
(Level 1) | | | Significant
Other
Observable
Inputs
(Level 2) | | | Significant
Unobservable
Inputs
(Level 3) | | | Fair Value
at
December 31, 2021 | |
| Asset Table | | | | | | | | | | | | | | | | | | | | | | | | | |
| Investments, at fair value | | | | | | | | | | | | | | | | | | | | | | | | | |
| Exchange-Traded Funds | | | | $ | 895,516 | | | | | $ | — | | | | | $ | — | | | | | $ | 895,516 | | |
| Mutual Funds | | | | | 4,926,079 | | | | | | — | | | | | | — | | | | | | 4,926,079 | | |
| Total Investments, at fair value | | | | $ | 5,821,595 | | | | | $ | — | | | | | $ | — | | | | | $ | 5,821,595 | | |
^
See Note 2, “Significant Accounting Policies” in the Notes to Financial Statements for additional information.
See Accompanying Notes to Financial Statements
PORTFOLIO OF INVESTMENTS
| Voya Solution 2065 Portfolio | as of December 31, 2021 (continued) |
Transactions with Affiliates
An investment of at least 5% of the voting securities of an issuer, or a company which is under common control with the issuer, results in that issuer becoming an affiliated person as defined by the 1940 Act.
The following table provides transactions during the year ended December 31, 2021, where the following issuers were considered an affiliate:
| Issuer | | | Beginning
Fair Value
at 12/31/2020 | | | Purchases
at Cost | | | Sales
at Cost | | | Change in
Unrealized
Appreciation/
(Depreciation) | | | Ending
Fair Value
at 12/31/2021 | | | Investment
Income | | | Realized
Gains/
(Losses) | | | Net Capital
Gain
Distributions | |
| Voya Large-Cap Growth Fund - Class R6 | | | | $ | 61,313 | | | | | $ | 30,558 | | | | | $ | (91,055) | | | | | $ | (816) | | | | | $ | — | | | | | $ | — | | | | | $ | 13,318 | | | | | $ | — | | |
| Voya Multi-Manager Emerging Markets Equity Fund - Class I | | | | | 231,894 | | | | | | 320,967 | | | | | | (132,060) | | | | | | (86,375) | | | | | | 334,426 | | | | | | 6,802 | | | | | | 23,470 | | | | | | 45,656 | | |
| Voya Multi-Manager International Equity Fund - Class I | | | | | 504,406 | | | | | | 833,344 | | | | | | (78,696) | | | | | | (177,925) | | | | | | 1,081,129 | | | | | | 14,550 | | | | | | 18,717 | | | | | | 179,363 | | |
| Voya Multi-Manager International Factors Fund - Class I | | | | | 289,331 | | | | | | 238,445 | | | | | | (142,097) | | | | | | (38,636) | | | | | | 347,043 | | | | | | 13,570 | | | | | | 26,833 | | | | | | 32,125 | | |
| Voya Multi-Manager Mid Cap Value Fund - Class I | | | | | 76,424 | | | | | | 129,445 | | | | | | (45,325) | | | | | | (11,033) | | | | | | 149,511 | | | | | | 1,768 | | | | | | 18,454 | | | | | | 17,486 | | |
| Voya U.S. Stock Index Portfolio - Class I | | | | | 455,180 | | | | | | 745,286 | | | | | | (182,227) | | | | | | 55,263 | | | | | | 1,073,502 | | | | | | 10,860 | | | | | | 43,042 | | | | | | 59,100 | | |
| VY® Columbia Contrarian Core Portfolio - Class I | | | | | 227,183 | | | | | | 224,292 | | | | | | (29,561) | | | | | | 22,718 | | | | | | 444,632 | | | | | | 1,930 | | | | | | 6,976 | | | | | | 34,230 | | |
| VY® Invesco Comstock Portfolio - Class I | | | | | 123,095 | | | | | | 270,336 | | | | | | (67,086) | | | | | | 23,079 | | | | | | 349,424 | | | | | | 5,377 | | | | | | 24,027 | | | | | | — | | |
VY® JPMorgan Small Cap Core Equity Portfolio - Class R6 | | | | | 94,314 | | | | | | 121,767 | | | | | | (66,814) | | | | | | (10,971) | | | | | | 138,296 | | | | | | 316 | | | | | | 24,286 | | | | | | 4,002 | | |
VY® T. Rowe Price Capital Appreciation Portfolio - Class R6 | | | | | 223,979 | | | | | | 234,938 | | | | | | (29,513) | | | | | | 9,598 | | | | | | 439,002 | | | | | | 4,268 | | | | | | 4,360 | | | | | | 35,224 | | |
VY® T. Rowe Price Diversified Mid Cap Growth Portfolio - Class R6 | | | | | 77,355 | | | | | | 135,693 | | | | | | (56,919) | | | | | | (14,625) | | | | | | 141,504 | | | | | | 10 | | | | | | 8,290 | | | | | | 22,650 | | |
| VY® T. Rowe Price Growth Equity Portfolio - Class I | | | | | 188,828 | | | | | | 308,010 | | | | | | (68,093) | | | | | | (1,135) | | | | | | 427,610 | | | | | | — | | | | | | 17,955 | | | | | | 28,608 | | |
| | | | | $ | 2,553,302 | | | | | $ | 3,593,081 | | | | | $ | (989,446) | | | | | $ | (230,858) | | | | | $ | 4,926,079 | | | | | $ | 59,451 | | | | | $ | 229,728 | | | | | $ | 458,444 | | |
The financial statements for the above mutual fund[s] can be found at www.sec.gov.
At December 31, 2021, the aggregate cost of securities and other investments and the composition of unrealized appreciation and depreciation of securities and other investments on a tax basis were:
| | Cost for federal income tax purposes was $5,690,187. | | |
| | Net unrealized appreciation consisted of: | | |
| | Gross Unrealized Appreciation | | | | $ | 347,630 | | |
| | Gross Unrealized Depreciation | | | | | (216,221) | | |
| | Net Unrealized Appreciation | | | | $ | 131,409 | | |
See Accompanying Notes to Financial Statements
TAX INFORMATION (Unaudited)
Dividends and distributions paid during the year ended December 31, 2021 were as follows:
| Portfolio Name | | | Type | | | Per Share
Amount | |
| Voya Solution Aggressive Portfolio | |
| Class ADV | | | NII | | | | $ | 0.1400 | | |
| Class I | | | NII | | | | $ | 0.2008 | | |
| Class R6 | | | NII | | | | $ | 0.2006 | | |
| Class S | | | NII | | | | $ | 0.1696 | | |
| Class S2 | | | NII | | | | $ | 0.1263 | | |
| Voya Solution Balanced Portfolio | |
| Class ADV | | | NII | | | | $ | 0.1734 | | |
| Class I | | | NII | | | | $ | 0.2265 | | |
| Class R6 | | | NII | | | | $ | 0.2265 | | |
| Class S | | | NII | | | | $ | 0.2041 | | |
| Class S2 | | | NII | | | | $ | 0.1625 | | |
| Voya Solution Conservative Portfolio | |
| Class ADV | | | NII | | | | $ | 0.2658 | | |
| Class I | | | NII | | | | $ | 0.3501 | | |
| Class R6 | | | NII | | | | $ | 0.3515 | | |
| Class S | | | NII | | | | $ | 0.3195 | | |
| Class S2 | | | NII | | | | $ | 0.3110 | | |
| All Classes | | | STCG | | | | $ | 0.1370 | | |
| All Classes | | | LTCG | | | | $ | 0.0540 | | |
| Voya Solution Income Portfolio | |
| Class ADV | | | NII | | | | $ | 0.3568 | | |
| Class I | | | NII | | | | $ | 0.4131 | | |
| Class S | | | NII | | | | $ | 0.3865 | | |
| Class S2 | | | NII | | | | $ | 0.3807 | | |
| Class T | | | NII | | | | $ | 0.2807 | | |
| All Classes | | | STCG | | | | $ | 0.1860 | | |
| All Classes | | | LTCG | | | | $ | 0.3000 | | |
| Voya Solution Moderately Aggressive Portfolio | |
| Class ADV | | | NII | | | | $ | 0.2034 | | |
| Class I | | | NII | | | | $ | 0.2654 | | |
| Class R6 | | | NII | | | | $ | 0.2661 | | |
| Class S | | | NII | | | | $ | 0.2328 | | |
| Class S2 | | | NII | | | | $ | 0.2345 | | |
| Voya Solution Moderately Conservative Portfolio | |
| Class ADV | | | NII | | | | $ | 0.2253 | | |
| Class I | | | NII | | | | $ | 0.2874 | | |
| Class R6 | | | NII | | | | $ | 0.2873 | | |
| Class S | | | NII | | | | $ | 0.2618 | | |
| Class S2 | | | NII | | | | $ | 0.2438 | | |
| Portfolio Name | | | Type | | | Per Share
Amount | |
| Voya Solution 2025 Portfolio | |
| Class ADV | | | NII | | | | $ | 0.3323 | | |
| Class I | | | NII | | | | $ | 0.3793 | | |
| Class S | | | NII | | | | $ | 0.3667 | | |
| Class S2 | | | NII | | | | $ | 0.3573 | | |
| Class T | | | NII | | | | $ | 0.2805 | | |
| All Classes | | | STCG | | | | $ | 0.2467 | | |
| All Classes | | | LTCG | | | | $ | 0.3466 | | |
| Voya Solution 2030 Portfolio | |
| Class ADV | | | NII | | | | $ | 0.2651 | | |
| Class I | | | NII | | | | $ | 0.3332 | | |
| Class S | | | NII | | | | $ | 0.3058 | | |
| Class S2 | | | NII | | | | $ | 0.3141 | | |
| Class T | | | NII | | | | $ | 0.2497 | | |
| All Classes | | | STCG | | | | $ | 0.1643 | | |
| All Classes | | | LTCG | | | | $ | 0.0091 | | |
| Voya Solution 2035 Portfolio | |
| Class ADV | | | NII | | | | $ | 0.2572 | | |
| Class I | | | NII | | | | $ | 0.2968 | | |
| Class S | | | NII | | | | $ | 0.2908 | | |
| Class S2 | | | NII | | | | $ | 0.2751 | | |
| Class T | | | NII | | | | $ | 0.2301 | | |
| All Classes | | | STCG | | | | $ | 0.2964 | | |
| All Classes | | | LTCG | | | | $ | 0.2415 | | |
| Voya Solution 2040 Portfolio | |
| Class ADV | | | NII | | | | $ | 0.2352 | | |
| Class I | | | NII | | | | $ | 0.3106 | | |
| Class S | | | NII | | | | $ | 0.2869 | | |
| Class S2 | | | NII | | | | $ | 0.2781 | | |
| Class T | | | NII | | | | $ | 0.2162 | | |
| All Classes | | | STCG | | | | $ | 0.1531 | | |
| All Classes | | | LTCG | | | | $ | 0.0709 | | |
| Voya Solution 2045 Portfolio | |
| Class ADV | | | NII | | | | $ | 0.2275 | | |
| Class I | | | NII | | | | $ | 0.2489 | | |
| Class S | | | NII | | | | $ | 0.2588 | | |
| Class S2 | | | NII | | | | $ | 0.2586 | | |
| Class T | | | NII | | | | $ | 0.1899 | | |
| All Classes | | | STCG | | | | $ | 0.4532 | | |
| All Classes | | | LTCG | | | | $ | 0.5355 | | |
TAX INFORMATION (Unaudited) (continued)
| Portfolio Name | | | Type | | | Per Share
Amount | |
| Voya Solution 2050 Portfolio | |
| Class ADV | | | NII | | | | $ | 0.2140 | | |
| Class I | | | NII | | | | $ | 0.2907 | | |
| Class S | | | NII | | | | $ | 0.2627 | | |
| Class S2 | | | NII | | | | $ | 0.2827 | | |
| Class T | | | NII | | | | $ | 0.1813 | | |
| All Classes | | | STCG | | | | $ | 0.0809 | | |
| All Classes | | | LTCG | | | | $ | 0.2197 | | |
| Voya Solution 2055 Portfolio | |
| Class ADV | | | NII | | | | $ | 0.3148 | | |
| Class I | | | NII | | | | $ | 0.2551 | | |
| Class S | | | NII | | | | $ | 0.3531 | | |
| Class S2 | | | NII | | | | $ | 0.3598 | | |
| Class T | | | NII | | | | $ | 0.2382 | | |
| All Classes | | | STCG | | | | $ | 0.8088 | | |
| All Classes | | | LTCG | | | | $ | 1.2090 | | |
| Portfolio Name | | | Type | | | Per Share
Amount | |
| Voya Solution 2060 Portfolio | |
| Class ADV | | | NII | | | | $ | 0.1551 | | |
| Class I | | | NII | | | | $ | 0.2000 | | |
| Class S | | | NII | | | | $ | 0.1846 | | |
| Class S2 | | | NII | | | | $ | 0.2028 | | |
| Class T | | | NII | | | | $ | 0.1287 | | |
| All Classes | | | STCG | | | | $ | 0.0333 | | |
| All Classes | | | LTCG | | | | $ | 0.2140 | | |
| Voya Solution 2065 Portfolio | |
| Class ADV | | | NII | | | | $ | 0.4058 | | |
| Class I | | | NII | | | | $ | 0.4555 | | |
| Class S | | | NII | | | | $ | 0.4364 | | |
| Class S2 | | | NII | | | | $ | 0.4213 | | |
| Class T | | | NII | | | | $ | 0.3638 | | |
| All Classes | | | STCG | | | | $ | 0.5027 | | |
| All Classes | | | LTCG | | | | $ | 0.6658 | | |
NII – Net investment income
STCG – Short-term capital gain
LTCG – Long-term capital gain
Of the ordinary distributions made during the year ended December 31, 2021, the following percentages qualify for the dividends received deduction (DRD) available to corporate shareholders:
| | Voya Solution Aggressive Portfolio | | | | | 66.62% | | |
| | Voya Solution Balanced Portfolio | | | | | 36.57% | | |
| | Voya Solution Conservative Portfolio | | | | | 6.50% | | |
| | Voya Solution Income Portfolio | | | | | 6.87% | | |
| | Voya Solution Moderately Aggressive Portfolio | | | | | 50.45% | | |
| | Voya Solution Moderately Conservative Portfolio | | | | | 19.61% | | |
| | Voya Solution 2025 Portfolio | | | | | 12.20% | | |
| | Voya Solution 2030 Portfolio | | | | | 19.46% | | |
| | Voya Solution 2035 Portfolio | | | | | 15.82% | | |
| | Voya Solution 2040 Portfolio | | | | | 30.94% | | |
| | Voya Solution 2045 Portfolio | | | | | 15.56% | | |
| | Voya Solution 2050 Portfolio | | | | | 42.16% | | |
| | Voya Solution 2055 Portfolio | | | | | 12.85% | | |
| | Voya Solution 2060 Portfolio | | | | | 45.92% | | |
| | Voya Solution 2065 Portfolio | | | | | 10.25% | | |
TAX INFORMATION (Unaudited) (continued)
The Portfolios designate the following amounts of long-term capital gain distributions as 20% rate long-term capital gain dividends under Internal Revenue Code Section 852(b)(3)(C):
| | Voya Solution Conservative Portfolio | | | | $ | 73,655 | | |
| | Voya Solution Income Portfolio | | | | | 6,590,155 | | |
| | Voya Solution 2025 Portfolio | | | | | 16,518,453 | | |
| | Voya Solution 2030 Portfolio | | | | | 28,849 | | |
| | Voya Solution 2035 Portfolio | | | | | 12,144,643 | | |
| | Voya Solution 2040 Portfolio | | | | | 151,200 | | |
| | Voya Solution 2045 Portfolio | | | | | 20,029,937 | | |
| | Voya Solution 2050 Portfolio | | | | | 397,553 | | |
| | Voya Solution 2055 Portfolio | | | | | 12,468,755 | | |
| | Voya Solution 2060 Portfolio | | | | | 373,615 | | |
| | Voya Solution 2065 Portfolio | | | | | 281,402 | | |
The Regulated Investment Company Modernization Act of 2010 allows qualified fund-of-funds to elect to pass through the ability to take foreign tax credits (or deductions) to the extent that foreign taxes are passed through from underlying funds.
A qualified fund-of-funds is a regulated investment company that has at least 50% of the value of its total assets invested in other regulated investment companies at the end of each quarter of the taxable year. Pursuant to Section 853 of the Internal Revenue Code, the Portfolios designate the following amounts as foreign taxes paid for the year ended December 31, 2021:
| | | | Creditable
Foreign Taxes
Paid | | | Per Share
Amount | | | Portion of Ordinary Income
Distribution Derived from
Foreign Sourced Income* | |
| Voya Solution Aggressive Portfolio | | | | $ | 11,824 | | | | | $ | 0.0063 | | | | | | 6.77% | | |
| Voya Solution Balanced Portfolio | | | | | 14,295 | | | | | | 0.0026 | | | | | | 4.26% | | |
| Voya Solution Conservative Portfolio | | | | | 951 | | | | | | 0.0006 | | | | | | 1.50% | | |
| Voya Solution Income Portfolio | | | | | 61,442 | | | | | | 0.0028 | | | | | | 4.39% | | |
| Voya Solution Moderately Aggressive Portfolio | | | | | 206,577 | | | | | | 0.0050 | | | | | | 7.78% | | |
| Voya Solution Moderately Conservative Portfolio | | | | | 9,248 | | | | | | 0.0025 | | | | | | 3.52% | | |
| Voya Solution 2025 Portfolio | | | | | 262,294 | | | | | | 0.0054 | | | | | | 7.56% | | |
| Voya Solution 2030 Portfolio | | | | | 27,852 | | | | | | 0.0089 | | | | | | 8.55% | | |
| Voya Solution 2035 Portfolio | | | | | 399,282 | | | | | | 0.0078 | | | | | | 10.75% | | |
| Voya Solution 2040 Portfolio | | | | | 26,001 | | | | | | 0.0121 | | | | | | 9.09% | | |
| Voya Solution 2045 Portfolio | | | | | 363,245 | | | | | | 0.0092 | | | | | | 11.06% | | |
| Voya Solution 2050 Portfolio | | | | | 24,507 | | | | | | 0.0141 | | | | | | 9.81% | | |
| Voya Solution 2055 Portfolio | | | | | 120,253 | | | | | | 0.0104 | | | | | | 9.21% | | |
| Voya Solution 2060 Portfolio | | | | | 17,935 | | | | | | 0.0102 | | | | | | 9.13% | | |
| Voya Solution 2065 Portfolio | | | | | 3,823 | | | | | | 0.0079 | | | | | | 9.84% | | |
*
None of the Portfolios listed above derived any income from ineligible foreign sources as defined under Section 901(j) of the Internal Revenue Code.
TAX INFORMATION (Unaudited) (continued)
Foreign taxes paid or withheld must be included in taxable income with an offsetting deduction from gross income or as a credit for taxes paid to foreign governments. Shareholders are strongly advised to consult their own tax advisors regarding the appropriate treatment of foreign taxes paid.
Above figures may differ from those cited elsewhere in this report due to differences in the calculation of income and gains under U.S. generally accepted accounting principles (book) purposes and Internal Revenue Service (tax) purposes.
Shareholders are strongly advised to consult their own tax advisers with respect to the tax consequences of their investments in the Portfolios. In January, shareholders, excluding corporate shareholders, receive an IRS 1099-DIV regarding the federal tax status of the dividends and distributions they received in the calendar year.
DIRECTOR AND OFFICER INFORMATION (Unaudited)
The business and affairs of the Company are managed under the direction of the Board. A Director, who is not an interested person of the Company, as defined in the 1940 Act, is an independent director (“Independent Director”). The Directors and Officers of the Company are listed below. The Statement of Additional Information includes additional information about Directors of the Company and is available, without charge, upon request at (800) 262-3862.
| Name, Address and Age | | | Position(s)
Held with the
Company | | | Term of Office and
Length of Time
Served(1) | | | Principal
Occupation(s) −
During the Past 5 Years | | | Number of
funds in
Fund
Complex
Overseen by
Director(2) | | | Other Board Positions
Held by Director | |
| Independent Directors: | | | | | |
Colleen D. Baldwin
7337 East Doubletree Ranch Rd.
Suite 100
Scottsdale, Arizona 85258
Age: 61 | | | Director
Chairperson | | | November 2007 –
Present
January 2020 –
Present | | | President, Glantuam Partners, LLC, a business consulting firm (January 2009 – Present). | | | 131 | | | Dentaquest (February 2014 – Present);
RSR Partners, Inc. (2016 – Present). | |
John V. Boyer
7337 East Doubletree Ranch Rd.
Suite 100
Scottsdale, Arizona 85258
Age: 68 | | | Director | | | November 1997 –
Present | | | Retired. Formerly, President and Chief Executive Officer, Bechtler Arts Foundation, an arts and education foundation (January 2008 –
December 2019). | | | 131 | | | None. | |
Patricia W. Chadwick
7337 East Doubletree Ranch Rd.
Suite 100
Scottsdale, Arizona 85258
Age: 73 | | | Director | | | January 2006 –
Present | | | Consultant and President, Ravengate Partners LLC, a consulting firm that provides advice regarding financial markets and the global economy (January 2000 –
Present). | | | 131 | | | Wisconsin Energy Corporation (June 2006 –
Present); The Royce Funds (22 funds) (December
2009 – Present); and AMICA Mutual Insurance Company (1992 − Present). | |
Martin J. Gavin
7337 East Doubletree Ranch Rd. Suite 100
Scottsdale, AZ 85258
Age: 71 | | | Director | | | August 2015 –
Present | | | Retired. | | | 131 | | | None. | |
Joseph E. Obermeyer
7337 East Doubletree Ranch Rd.
Suite 100
Scottsdale, Arizona 85258
Age: 64 | | | Director | | | May 2013 – Present | | | President, Obermeyer & Associates, Inc., a provider of financial and economic consulting services (November 1999 – Present). | | | 131 | | | None. | |
Sheryl K. Pressler
7337 East Doubletree Ranch Rd.
Suite 100
Scottsdale, Arizona 85258
Age: 71 | | | Director | | | January 2006 –
Present | | | Consultant (May 2001 –
Present). | �� | | 131 | | | Centerra Gold Inc. (May 2008 – Present). | |
Christopher P. Sullivan
7337 East Doubletree Ranch Rd.
Suite 100
Scottsdale, Arizona 85258
Age: 68 | | | Director | | | October 2015 –
Present | | | Retired. | | | 131 | | | None. | |
DIRECTOR AND OFFICER INFORMATION (Unaudited) (continued)
| Name, Address and Age | | | Position(s)
Held with the
Company | | | Term of Office and
Length of Time
Served(1) | | | Principal
Occupation(s) −
During the Past 5 Years | | | Number of
funds in
Fund
Complex
Overseen by
Director(2) | | | Other Board Positions
Held by Director | | |
| Director who is an “interested person”: | | | | | | | | | | | | | | | | |
Dina Santoro
230 Park Avenue
New York, New York 10169
Age: 48 | | | Director | | | July 2018 –
Present | | | President, Voya Investments, LLC and Voya Capital, LLC (March 2018 –
Present); Senior Vice President, Voya Investments Distributor, LLC (April 2018 –
Present); Chief Operating Officer and Senior Managing Director, Voya Investment Management (January 2022 –
Present). Formerly, Senior Managing Director, Head of Product and Marketing Strategy, Voya Investment Management (September 2017 – January 2022); Managing Director, Quantitative Management Associates, LLC (January 2004 – August 2017). | | | 131 | | | Voya Investments, LLC, Voya Capital, LLC, and Voya Funds Services, LLC (March 2018 – Present); Voya Investments Distributor, LLC (April
2018 – Present). | | |
(1)
Directors serve until their successors are duly elected and qualified. The tenure of each Director who is not an “interested person” as defined in the 1940 Act, of each Portfolio (“Independent Director”) is subject to the Board’s retirement policy which states that each duly elected or appointed Independent Director shall retire from and cease to be a member of the Board of Directors at the close of business on December 31 of the calendar year in which the Independent Director attains the age of 75. A majority vote of the Board’s other Independent Directors may extend the retirement date of an Independent Director if the retirement would trigger a requirement to hold a meeting of shareholders of the Company under applicable law, whether for the purposes of appointing a successor to the Independent Director or otherwise comply under applicable law, in which case the extension would apply until such time as the shareholder meeting can be held or is no longer required (as determined by a vote of a majority of the other Independent Directors).
(2)
For the purposes of this table, “Fund Complex” means the Voya family of funds including the following investment companies: Voya Asia Pacific High Dividend Equity Income Fund; Voya Balanced Portfolio, Inc.; Voya Emerging Markets High Dividend Equity Fund; Voya Equity Trust; Voya Funds Trust; Voya Global Advantage and Premium Opportunity Fund; Voya Global Equity Dividend and Premium Opportunity Fund; Voya Government Money Market Portfolio; Voya Infrastructure, Industrials and Materials Fund; Voya Intermediate Bond Portfolio; Voya Investors Trust; Voya Mutual Funds; Voya Partners, Inc.; Voya Senior Income Fund; Voya Separate Portfolios Trust; Voya Strategic Allocation Portfolios, Inc.; Voya Variable Funds; Voya Variable Insurance Trust; Voya Variable Portfolios, Inc.; and Voya Variable Products Trust. The number of funds in the Fund Complex is as of January 31, 2022.
DIRECTOR AND OFFICER INFORMATION (Unaudited) (continued)
| Name, Address and Age | | | Position(s) Held With
the Company | | | Term of Office and
Length of Time Served(1) | | | Principal Occupation(s) −
During the Past 5 Years | |
Michael Bell
One Orange Way
Windsor, Connecticut 06095
Age: 53 | | | Chief Executive Officer | | | March 2018 – Present | | | Chief Executive Officer and Director, Voya Investments, LLC, Voya Capital, LLC, and Voya Funds Services, LLC (March 2018 – Present); Senior Vice President, Voya Investments Distributor, LLC (March 2020 – Present); Chief Financial Officer, Voya Investment Management (September 2014 – Present). Formerly, Senior Vice President and Chief Financial Officer, Voya Investments Distributor, LLC (September 2019 – March 2020); Senior Vice President and Treasurer, Voya Investments Distributor, LLC (November 2015 – September 2019); Senior Vice President, Chief Financial Officer and Treasurer, Voya Investments, LLC (November 2015 – March 2018). | |
Dina Santoro
230 Park Avenue
New York, New York 10169
Age: 48 | | | President | | | March 2018 – Present | | | President and Director, Voya Investments, LLC and Voya Capital, LLC (March 2018 – Present); Director, Voya Funds Services, LLC (March 2018 – Present); Director and Senior Vice President, Voya Investments Distributor, LLC (April 2018 –
Present); Chief Operating Officer and Senior Managing Director, Voya Investment Management (January 2022 –
Present). Formerly, Senior Managing Director, Head of Product and Marketing Strategy, Voya Investment Management (September 2017 – January 2022); Managing Director, Quantitative Management Associates, LLC (January 2004 – August 2017). | |
Jonathan Nash
230 Park Avenue
New York, New York 10169
Age: 54 | | | Executive Vice President | | | March 2020 – Present | | | Executive Vice President and Chief Investment Risk Officer, Voya Investments, LLC (March 2020 – Present) and Senior Vice President, Investment Risk Management, Voya Investment Management (March 2017 – Present). Formerly, Vice President, Voya Investments, LLC (September 2018 – March 2020); Consultant, DA Capital LLC (January 2016 – March 2017). | |
| | Chief Investment Risk Officer | | | March 2020 – Present | |
James M. Fink
5780 Powers Ferry Road NW
Atlanta, Georgia 30327
Age: 63 | | | Executive Vice President | | | March 2018 – Present | | | Managing Director, Voya Investments, LLC, Voya Capital, LLC, and Voya Funds Services, LLC (March 2018 – Present) and Senior Vice President, Voya Investments Distributor, LLC (April 2018 – Present); Chief Administrative Officer, Voya Investment Management (September 2017 – Present). Formerly, Managing Director, Operations, Voya Investment Management (March 1999 – September 2017). | |
Kevin M. Gleason
7337 East Doubletree Ranch Rd.
Suite 100
Scottsdale, Arizona 85258
Age: 55 | | | Chief Compliance Officer | | | February 2012 – Present | | | Senior Vice President, Voya Investment Management and Chief Compliance Officer, Voya Family of Funds (February 2012 – Present). | |
Todd Modic
7337 East Doubletree Ranch Rd.
Suite 100
Scottsdale, Arizona 85258
Age:54 | | | Senior Vice President, Chief/Principal Financial Officer and Assistant Secretary | | | March 2005 – Present | | | President, Voya Funds Services, LLC (March 2018 – Present) and Senior Vice President, Voya Investments, LLC
(April 2005 – Present). | |
Kimberly A. Anderson
7337 East Doubletree Ranch Rd.
Suite 100
Scottsdale, Arizona 85258
Age: 57 | | | Senior Vice President | | | January 2005 – Present | | | Senior Vice President, Voya Investments, LLC
(September 2003 – Present). | |
Micheline S. Faver
7337 East Doubletree Ranch Rd.
Suite 100
Scottsdale, Arizona 85258
Age: 44 | | | Senior Vice President | | | September 2020 – Present | | | Senior Vice President, Head of Fund Compliance and Chief Compliance Officer, Voya Investments, LLC (March 2021 –
Present). Formerly, Vice President, Head of Fund Compliance and Chief Compliance Officer, Voya Investments, LLC
(June 2016 – March 2021). | |
DIRECTOR AND OFFICER INFORMATION (Unaudited) (continued)
| Name, Address and Age | | | Position(s) Held With
the Company | | | Term of Office and
Length of Time Served(1) | | | Principal Occupation(s) −
During the Past 5 Years | |
Robert Terris
5780 Powers Ferry Road NW
Atlanta, Georgia 30327
Age: 51 | | | Senior Vice President | | | May 2006 – Present | | | Senior Vice President, Voya Investments Distributor, LLC (April 2018 – Present); Senior Vice President, Head of Investment Services, Voya Investments, LLC (April 2018 –
Present) and Voya Funds Services, LLC (March 2006 – Present). Formerly, Senior Vice President, Head of Division Operations, Voya Investments, LLC (October 2015 – April 2018). | |
Fred Bedoya
7337 East Doubletree Ranch Rd.
Suite 100
Scottsdale, Arizona 85258
Age: 49 | | | Vice President Treasurer | | | September 2012 – Present | | | Vice President, Voya Investments, LLC (October 2015 – Present) and Voya Funds Services, LLC (July 2012 – Present). | |
Maria M. Anderson
7337 East Doubletree Ranch Rd.
Suite 100
Scottsdale, Arizona 85258
Age: 63 | | | Vice President | | | January 2005 – Present | | | Vice President, Voya Investments, LLC (October 2015 –
Present) and Voya Funds Services, LLC (September 2004 –
Present). | |
Sara M. Donaldson
7337 East Doubletree Ranch Rd.
Suite 100
Scottsdale, Arizona 85258
Age: 62 | | | Vice President | | | September 2014 – Present | | | Vice President, Voya Investments, LLC (October 2015 –
Present). | |
Robyn L. Ichilov
7337 East Doubletree Ranch Rd.
Suite 100
Scottsdale, Arizona 85258
Age: 54 | | | Vice President | | | January 2005 – Present | | | Vice President, Voya Funds Services, LLC (November 1995 –
Present) and Voya Investments, LLC (August 1997 – Present). | |
Jason Kadavy
7337 East Doubletree Ranch Rd.
Suite 100
Scottsdale, Arizona 85258
Age: 45 | | | Vice President | | | September 2012 – Present | | | Vice President, Voya Investments, LLC (October 2015 –
Present) and Voya Funds Services, LLC (July 2007 – Present). | |
Andrew K. Schlueter
7337 East Doubletree Ranch Rd.
Suite 100
Scottsdale, Arizona 85258
Age: 45 | | | Vice President | | | March 2018 – Present | | | Vice President, Voya Investments Distributor, LLC (April 2018 – Present); Vice President, Voya Investments, LLC and Voya Funds Services, LLC (March 2018 – Present); Vice President, Head of Mutual Fund Operations, Voya Investment Management (February 2018 – Present). Formerly, Vice President, Voya Investment Management (March 2014 –
February 2018). | |
Craig Wheeler
7337 East Doubletree Ranch Rd.
Suite 100
Scottsdale, Arizona 85258
Age: 52 | | | Vice President | | | May 2013 – Present | | | Vice President – Director of Tax, Voya Investments, LLC (October 2015 – Present). | |
Monia Piacenti
One Orange Way
Windsor, Connecticut 06095
Age: 45 | | | Anti-Money Laundering Officer | | | June 2018 – Present | | | Anti – Money Laundering Officer, Voya Investments Distributor, LLC, Voya Investment Management and Voya Investment Management Trust Co. (June 2018 – Present); Compliance Consultant, Voya Financial, Inc. (January 2019 – Present). Formerly, Senior Compliance Officer, Voya Investment Management (December 2009 – December 2018). | |
Joanne F. Osberg
7337 East Doubletree Ranch Rd.
Suite 100
Scottsdale, Arizona 85258
Age: 40 | | | Secretary | | | September 2020 – Present | | | Vice President and Senior Counsel, Voya Investment Management – Mutual Fund Legal Department (September 2020 – Present). Formerly, Vice President, Counsel, Voya Investment Management – Mutual Fund Legal Department (January 2013 – September 2020). | |
DIRECTOR AND OFFICER INFORMATION (Unaudited) (continued)
| Name, Address and Age | | | Position(s) Held With
the Company | | | Term of Office and
Length of Time Served(1) | | | Principal Occupation(s) −
During the Past 5 Years | |
Paul A. Caldarelli
7337 East Doubletree Ranch Rd.
Suite 100
Scottsdale, Arizona 85258
Age: 70 | | | Assistant Secretary | | | June 2010 – Present | | | Vice President and Senior Counsel, Voya Investment Management – Mutual Fund Legal Department (March 2010 – Present). | |
(1)
The Officers hold office until the next annual meeting of the Board of Directors and until their successors shall have been elected and qualified.
ADVISORY AND SUB-ADVISORY CONTRACT APPROVAL DISCUSSION (Unaudited)
BOARD CONSIDERATION AND APPROVAL OF INVESTMENT MANAGEMENT CONTRACTS AND SUB-ADVISORY CONTRACTS
At a meeting held on November 18, 2021, the Board of Directors (“Board”) of Voya Partners, Inc. (the “Company”), including a majority of the Board members who have no direct or indirect interest in the investment management and sub-advisory contracts, and who are not “interested persons” of Voya Solution Aggressive Portfolio, Voya Solution Balanced Portfolio, Voya Solution Conservative Portfolio, Voya Solution Income Portfolio, Voya Solution Moderately Aggressive Portfolio, Voya Solution Moderately Conservative Portfolio, Voya Solution 2025 Portfolio, Voya Solution 2030 Portfolio, Voya Solution 2035 Portfolio, Voya Solution 2040 Portfolio, Voya Solution 2045 Portfolio, Voya Solution 2050 Portfolio, Voya Solution 2055 Portfolio, Voya Solution 2060 Portfolio, and Voya Solution 2065 Portfolio, each a series of the Company (the “Portfolios”), as such term is defined under the Investment Company Act of 1940, as amended (the “Independent Directors”), considered and approved the renewal of the investment management contracts (the “Management Contracts”) between Voya Investments, LLC (the “Manager”) and the Company, on behalf of the Portfolios, and the sub-advisory contracts (the “Sub-Advisory Contracts,” and together with the Management Contracts, the “Contracts”) with Voya Investment Management Co. LLC, the sub-adviser to each Portfolio (the “Sub-Adviser”) for an additional one year period ending November 30, 2022.
In addition to the Board meeting on November 18, 2021, the Independent Directors also held meetings outside the presence of representatives of the Manager and Sub-Adviser (collectively, such persons are referred to herein as “management”) on October 7-8, 2021, and November 16, 2021. At those meetings, the Board members reviewed and considered materials related to the proposed continuance of the Contracts that they had requested and believed to be relevant to the renewal of the Contracts in light of their own business judgment and the legal advice furnished to them by K&L Gates LLP, their independent legal counsel. The Board also considered information furnished to it throughout the year at meetings of the Board and its committees, including information regarding performance, expenses, and other relevant matters. While the Board considered the renewal of the management contracts and sub-advisory contracts for all of the applicable investment companies in the Voya family of funds at the same meetings, the Board considered each Voya fund’s investment management and sub-advisory relationships separately.
The Board has established a Contracts Committee and two Investment Review Committees (the “IRCs”), each of which includes only Independent Directors as members. The Contracts Committee meets several times throughout
the year to provide oversight with respect to the management and sub-advisory contracts approval and renewal process for the Voya funds, among other functions, and each IRC meets several times throughout the year with respect to each Voya fund (assigned to that IRC) to provide oversight regarding the investment performance of the sub-advisers, as well as the Manager’s role in monitoring the sub-advisers.
The Contracts Committee oversees, and annually recommends Board approval of updates to, a methodology guide for the Voya funds (“Methodology Guide”), which sets out a framework pursuant to which the Independent Directors request, and management provides, certain information that the Independent Directors deem to be important or potentially relevant. The Independent Directors retain the services of an independent consultant with experience in the mutual fund industry to assist the Contracts Committee in developing and recommending to the Board: (1) a selected peer group of investment companies for each Portfolio (“Selected Peer Group”) based on that Portfolio’s particular attributes, such as fund type and size, fund category (as determined by Morningstar, Inc., an independent provider of mutual fund data (“Morningstar”)), sales channels and structure and the Portfolio share class being compared to the Selected Peer Group; and (2) updates to the Methodology Guide with respect to the content and format of various data prepared in connection with the renewal process, including, but not limited to, investment performance, fee structure, and expense information. In addition, the Independent Directors periodically have retained an independent firm to test and verify the accuracy of certain information presented to the Board for a representative sample of the Voya funds.
The Manager or Sub-Adviser may not have been able to, or opted not to, provide information in response to certain information requests, in which case the Board conducted its evaluation based on the information that was provided. In such cases, the Board determined that the omission of any such information was not material to its considerations. Additionally, the Board considered the impact of significant market volatility that occurred during and after the period for which information was requested in conducting its evaluation of the Manager and Sub-Adviser.
Provided below is an overview of certain material factors that the Board considered at its meetings regarding the renewal of the Contracts and the compensation to be paid thereunder. The Board members did not identify any particular information or factor that was most relevant to its consideration, and each Board member may have accorded different weight to the various factors in reaching his or her conclusions with respect to each Portfolio’s investment management and sub-advisory arrangements.
ADVISORY AND SUB-ADVISORY CONTRACT APPROVAL DISCUSSION (Unaudited) (continued)
Nature, Extent and Quality of Services
The Manager oversees, subject to the authority of the Board, and is responsible for the provision of, all investment advisory and portfolio management services for the Portfolios, but may delegate certain of these responsibilities to one or more sub-advisers. In addition, the Manager provides administrative services reasonably necessary for the operation of the Portfolios as set forth in the Management Contracts, including oversight of the Portfolios’ operations and risk management and the oversight of their various other service providers.
The Board considered the “manager-of-managers” structure of the Voya funds that has been developed by the Manager pursuant to which the Manager selects, subject to the Board’s approval, sub-advisers to provide day-to-day management services to all or a portion of each Voya fund. The Board recognized that the Manager is responsible for monitoring the Sub-Adviser’s investment program, performance, developments, ongoing operations, and compliance with applicable regulations and investment policies and restrictions with respect to the Portfolios under this manager-of-managers arrangement. The Board also considered the techniques and resources that the Manager has developed to provide this ongoing due diligence and oversight with respect to the sub-advisers and to recommend appropriate changes in investment strategies, sub-advisers, or allocation among sub-advisers in an effort to improve a Voya fund’s performance. In connection with the Manager’s performance of these duties, the Board considered that the Manager has developed an oversight process formulated by its Manager Research & Selection Group that reviews, among other matters, performance data, the Sub-Adviser’s management team, portfolio data and attribution analysis related to the Sub-Adviser through various means, including, but not limited to, in-person meetings, on-site or virtual visits, and telephonic meetings with the Sub-Adviser.
Further, the Board considered periodic compliance reports it receives from the Company’s Chief Compliance Officer evaluating whether the regulatory compliance systems and procedures of the Manager and Sub-Adviser are reasonably designed to ensure compliance with the federal securities laws and whether the investment policies and restrictions for each Portfolio are consistently complied with, and other periodic reports covering related matters.
The Board considered the portfolio management team assigned by the Sub-Adviser to the Portfolios and the level of resources committed to the Portfolios (and other relevant funds in the Voya funds) by the Manager and the Sub-Adviser, and whether those resources are sufficient to provide high-quality services to the Portfolios.
Based on their deliberations and the materials presented to them, the Board concluded that the nature, extent and
quality of the overall services provided by the Manager and Sub-Adviser under the Contracts were appropriate.
Portfolio Performance
In assessing the investment management and sub-advisory relationships, the Board placed emphasis on the investment returns of each Portfolio, including its investment performance over certain time periods compared to the Portfolio’s Morningstar category and primary benchmark, a broad-based securities market index identified in the Portfolio’s prospectus. The Board also considered information from the Manager Research & Selection Group and received reports summarizing a separate analysis of each Portfolio’s performance and risk, including risk-adjusted investment return information, from the Company’s Chief Investment Risk Officer.
Economies of Scale
When evaluating the reasonableness of the management fee schedules, the Board considered whether economies of scale have been or likely will be realized by the Manager and the Sub-Adviser as a Portfolio grows larger and the extent to which any such economies are shared with the Portfolio. The Board considered that, while the Portfolios do not have management fee breakpoints, they have fee waiver and expense reimbursement arrangements. The Board considered the extent to which economies of scale realized by the Manager could be shared with each Portfolio through such fee waivers, expense reimbursements or other expense reductions. The Board also considered the impact of fee waiver and expense reimbursement arrangements in instances where a share class of a Portfolio is operating such that its expense ratio is below the expense limit applicable to that share class. In evaluating these matters, the Board also considered periodic management reports, Selected Peer Group comparisons, and industry information regarding economies of scale.
Information Regarding Services, Performance, and Fee Schedules Offered to Other Clients
The Board considered comparative information regarding the nature of services, performance, and fee schedules offered by the Manager and Sub-Adviser to other clients with similar investment objectives, if applicable, including other registered investment companies and relevant institutional accounts. When the fee schedules offered to or the performance of such other clients differed materially from a Portfolio, the Board took into account the underlying rationale provided by the Manager or Sub-Adviser, as applicable, for these differences.
Fee Schedules, Profitability, and Fall-out Benefits
The Board reviewed and considered the contractual management fee schedule and net management fee rate
ADVISORY AND SUB-ADVISORY CONTRACT APPROVAL DISCUSSION (Unaudited) (continued)
payable by each Portfolio to the Manager compared to the Portfolio’s Selected Peer Group. In addition, the Board considered certain Portfolio’s contractual management fee schedule compared to other third-party sub-advised funds, other funds the Sub-Adviser manages and/or their proprietary funds (if applicable) identified by the Manager. The Board also considered the compensation payable by the Manager to the Sub-Adviser for sub-advisory services for each Portfolio, including the portion of the contractual and net management fee rates that are paid to the Sub-Adviser, as compared to the compensation paid to the Manager. In addition, the Board considered any fee waivers, expense limitations, and recoupment arrangements that apply to the fees payable by the Portfolios, including whether the Manager intends to propose any changes thereto. For each Portfolio, the Board separately determined that the fees payable to the Manager and the fee schedule payable to the Sub-Adviser are reasonable for the services that each performs, which were considered in light of the nature, extent and quality of the services that each has performed and is expected to perform.
For each Portfolio, the Board considered information on revenues, costs and profits or losses realized by the Manager and the Voya-affiliated Sub-Adviser related to their services to the Portfolio. In analyzing the profitability of the Manager and its affiliates in connection with services they render to a Portfolio, the Board took into account the sub-advisory fee rate payable by the Manager to the Sub-Adviser. The Board also considered the profitability of the Manager and its affiliated Sub-Adviser attributable to servicing each Portfolio both with and without taking into account the profitability of the distributor of the Portfolios and any revenue sharing payments made by the Manager and both before and after giving effect to any expenses incurred by the Manager or the affiliated Sub-Adviser in making payments to affiliated insurance companies.
Although the Methodology Guide establishes a framework for profit calculation, the Board recognized that there is no uniform methodology within the asset management industry for determining profitability for this purpose. The Board also recognized that the use of different reasonable methodologies can give rise to dramatically different reported profit and loss results with respect to the Manager and the Voya-affiliated Sub-Adviser, as well as other industry participants with whom the profits of the Manager and its affiliated Sub-Adviser could be compared. In addition, the Board recognized that management’s calculations regarding its costs incurred in establishing the infrastructure necessary for the Portfolios’ operations may not be fully reflected in the expenses allocated to each Portfolio in determining profitability. The Board also
recognized that the information presented may not portray all of the costs borne by the Manager or reflect all of the risks associated with offering and managing a mutual fund complex in the current regulatory and market environment, including entrepreneurial, regulatory, legal and operational risks.
The Board also considered that the Manager and the Voya-affiliated Sub-Adviser are entitled to earn a reasonable level of profits for the services that they provide to the Portfolios. The Board also considered information regarding the potential fall-out benefits to the Manager and Sub-Adviser and their respective affiliates from their association with the Portfolios, including their ability to engage in soft-dollar transactions on behalf of the Portfolios. Following its reviews, the Board determined that the Manager’s and the Voya-affiliated Sub-Adviser’s profitability with respect to their services to the Portfolios and the Manager and Sub-Adviser’s potential fall-out benefits were not unreasonable.
Portfolio-by-Portfolio Analysis
Set forth below are certain of the specific factors that the Board considered at its October 7-8, 2021, November 16, 2021, and/or November 18, 2021 meetings in relation to approving each Portfolio’s Contracts and the conclusions reached by the Board. These specific factors are in addition to those considerations discussed above. In each case, the Portfolio’s performance was compared to its Morningstar category, as well as its primary benchmark. The performance data provided to the Board primarily was for various periods ended March 31, 2021. In addition, the Board also considered at its October 7-8, 2021, November 16, 2021, and/or November 18, 2021 meetings certain additional data regarding each Portfolio’s more recent performance, asset levels and asset flows. Each Portfolio’s management fee rate and expense ratio were compared to the management fee rates and expense ratios of the funds in its Selected Peer Group. With respect to the quintile rankings noted below, the first quintile represents the range of funds with the highest performance or the lowest management fee rate or expense ratio, as applicable, and the fifth quintile represents the range of funds with the lowest performance or the highest management fee rate or expense ratio, as applicable.
Voya Solution Aggressive Portfolio
In considering whether to approve the renewal of the Contracts for Voya Solution Aggressive Portfolio, the Board considered that, based on performance data for the periods ended March 31, 2021: (1) the Portfolio is ranked in the second quintile of its Morningstar category for the year-to-date and one-year periods and the third quintile for
ADVISORY AND SUB-ADVISORY CONTRACT APPROVAL DISCUSSION (Unaudited) (continued)
the three-year and five-year periods; and (2) the Portfolio outperformed its primary benchmark for all periods presented.
In considering the fees payable under the Contracts for the Portfolio, the Board took into account the factors described above and also considered: (1) the fairness of the compensation under a Management Contract with a level fee rate that does not include breakpoints; and (2) the pricing structure (including the net expense ratio to be borne by shareholders) of the Portfolio, as compared to its Selected Peer Group, including that: (a) the net management fee rate for the Portfolio is ranked in the first quintile of net management fee rates of the funds in its Selected Peer Group; (b) the contractual management fee rate for the Portfolio is ranked in the fourth quintile of contractual management fee rates of the funds in its Selected Peer Group; and (c) the all-in net expense ratio for the Portfolio, inclusive of the Acquired Fund Fees and Expenses (“AFFE”), is ranked in the second quintile of all-in net expense ratios of the funds in its Selected Peer Group, and the net expense ratio for the Portfolio, not inclusive of AFFE, is above the median of net expense ratios of the funds in its Selected Peer Group. In analyzing this fee data, the Board took into account that, as reflected in the AFFE, the Portfolio indirectly bears the fees payable by the underlying funds in which the Portfolio invests.
Voya Solution Balanced Portfolio
In considering whether to approve the renewal of the Contracts for Voya Solution Balanced Portfolio, the Board considered that, based on performance data for the periods ended March 31, 2021: (1) the Portfolio is ranked in the first quintile of its Morningstar category for the one-year period, and the third quintile for the year-to-date, three-year, five-year and ten-year periods; and (2) the Portfolio outperformed its primary benchmark for all periods presented.
In considering the fees payable under the Contracts for the Portfolio, the Board took into account the factors described above and also considered: (1) the fairness of the compensation under a Management Contract with a level fee rate that does not include breakpoints; and (2) the pricing structure (including the net expense ratio to be borne by shareholders) of the Portfolio, as compared to its Selected Peer Group, including that: (a) the net management fee rate for the Portfolio is ranked in the fifth quintile of net management fee rates of the funds in its Selected Peer Group; (b) the contractual management fee rate for the Portfolio is ranked in the fifth quintile of contractual management fee rates of the funds in its Selected Peer Group; and (c) the all-in net expense ratio for the Portfolio, inclusive of the Acquired Fund Fees and Expenses (“AFFE”), is ranked in the second quintile of all-in net expense ratios of the funds in its Selected Peer
Group, and the net expense ratio for the Portfolio, not inclusive of AFFE, is above the median of net expense ratios of the funds in its Selected Peer Group. In analyzing this fee data, the Board took into account: (1) that, as reflected in the AFFE, the Portfolio indirectly bears the fees payable by the underlying funds in which the Portfolio invests; and (2) management’s representations regarding its belief that the Portfolio’s pricing is competitive.
Voya Solution Conservative Portfolio
In considering whether to approve the renewal of the Contracts for Voya Solution Conservative Portfolio, the Board considered that, based on performance data for the periods ended March 31, 2021: (1) the Portfolio is ranked in the first quintile of its Morningstar category for the three-year and five-year periods, and the second quintile for the year-to-date, one-year and ten-year periods; and (2) the Portfolio outperformed its primary benchmark for the year-to-date and one-year periods and underperformed for the three-year, five-year and ten-year periods.
In considering the fees payable under the Contracts for the Portfolio, the Board took into account the factors described above and also considered: (1) the fairness of the compensation under a Management Contract with a level fee rate that does not include breakpoints; and (2) the pricing structure (including the net expense ratio to be borne by shareholders) of the Portfolio, as compared to its Selected Peer Group, including that: (a) the net management fee rate for the Portfolio is ranked in the first quintile of net management fee rates of the funds in its Selected Peer Group; (b) the contractual management fee rate for the Portfolio is ranked in the fourth quintile of contractual management fee rates of the funds in its Selected Peer Group; and (c) the all-in net expense ratio for the Portfolio, inclusive of the Acquired Fund Fees and Expenses (“AFFE”), is ranked in the first quintile of all-in net expense ratios of the funds in its Selected Peer Group, and the net expense ratio for the Portfolio, not inclusive of AFFE, is below the median of net expense ratios of the funds in its Selected Peer Group. In analyzing this fee data, the Board took into account that, as reflected in the AFFE, the Portfolio indirectly bears the fees payable by the underlying funds in which the Portfolio invests.
Voya Solution Income Portfolio
In considering whether to approve the renewal of the Contracts for Voya Solution Income Portfolio, the Board considered that, based on performance data for the periods ended March 31, 2021: (1) the Portfolio is ranked in the first quintile of its Morningstar category for all periods presented; and (2) the Portfolio outperformed its primary benchmark for all periods presented.
ADVISORY AND SUB-ADVISORY CONTRACT APPROVAL DISCUSSION (Unaudited) (continued)
In considering the fees payable under the Contracts for the Portfolio, the Board took into account the factors described above and also considered: (1) the fairness of the compensation under a Management Contract with a level fee rate that does not include breakpoints; and (2) the pricing structure (including the net expense ratio to be borne by shareholders) of the Portfolio, as compared to its Selected Peer Group, including that: (a) the net management fee rate for the Portfolio is ranked in the fifth quintile of net management fee rates of the funds in its Selected Peer Group; (b) the contractual management fee rate for the Portfolio is ranked in the third quintile of contractual management fee rates of the funds in its Selected Peer Group; and (c) the all-in net expense ratio for the Portfolio, inclusive of the Acquired Fund Fees and Expenses (“AFFE”), is ranked in the fourth quintile of all-in net expense ratios of the funds in its Selected Peer Group, and the net expense ratio for the Portfolio, not inclusive of AFFE, is above the median of net expense ratios of the funds in its Selected Peer Group. In analyzing this fee data, the Board took into account: (1) that, as reflected in the AFFE, the Portfolio indirectly bears the fees payable by the underlying funds in which the Portfolio invests; and (2) management’s representations regarding its belief that the Portfolio’s pricing is competitive and the competitiveness of the Voya Solution Portfolios’ expense ratios when compared to peers identified by management.
Voya Solution Moderately Aggressive Portfolio
In considering whether to approve the renewal of the Contracts for Voya Solution Moderately Aggressive Portfolio, the Board considered that, based on performance data for the periods ended March 31, 2021: (1) the Portfolio is ranked in the first quintile of its Morningstar category for the one-year period, the second quintile for the year-to-date and three-year periods, and the third quintile for the five-year and ten-year periods; and (2) the Portfolio outperformed its primary benchmark for the year-to-date, one-year and three-year periods and underperformed for the five-year and ten-year periods.
In considering the fees payable under the Contracts for the Portfolio, the Board took into account the factors described above and also considered: (1) the fairness of the compensation under a Management Contract with a level fee rate that does not include breakpoints; and (2) the pricing structure (including the net expense ratio to be borne by shareholders) of the Portfolio, as compared to its Selected Peer Group, including that: (a) the net management fee rate for the Portfolio is ranked in the fifth quintile of net management fee rates of the funds in its Selected Peer Group; (b) the contractual management fee rate for the Portfolio is ranked in the fourth quintile of contractual management fee rates of the funds in its Selected Peer Group; and (c) the all-in net expense ratio
for the Portfolio, inclusive of the Acquired Fund Fees and Expenses (“AFFE”), is ranked in the third quintile of all-in net expense ratios of the funds in its Selected Peer Group, and the net expense ratio for the Portfolio, not inclusive of AFFE, is above the median of net expense ratios of the funds in its Selected Peer Group. In analyzing this fee data, the Board took into account: (1) that, as reflected in the AFFE, the Portfolio indirectly bears the fees payable by the underlying funds in which the Portfolio invests; and (2) management’s representations regarding its belief that the Portfolio’s pricing is competitive.
Voya Solution Moderately Conservative Portfolio
In considering whether to approve the renewal of the Contracts for Voya Solution Moderately Conservative Portfolio, the Board considered that, based on performance data for the periods ended March 31, 2021: (1) the Portfolio is ranked in the first quintile of its Morningstar category for the one-year period, and the second quintile for the year-to-date, three-year, five-year and ten-year periods; and (2) the Portfolio outperformed its primary benchmark for all periods presented.
In considering the fees payable under the Contracts for the Portfolio, the Board took into account the factors described above and also considered: (1) the fairness of the compensation under a Management Contract with a level fee rate that does not include breakpoints; and (2) the pricing structure (including the net expense ratio to be borne by shareholders) of the Portfolio, as compared to its Selected Peer Group, including that: (a) the net management fee rate for the Portfolio is ranked in the second quintile of net management fee rates of the funds in its Selected Peer Group; (b) the contractual management fee rate for the Portfolio is ranked in the fourth quintile of contractual management fee rates of the funds in its Selected Peer Group; and (c) the all-in net expense ratio for the Portfolio, inclusive of the Acquired Fund Fees and Expenses (“AFFE”), is ranked in the first quintile of all-in net expense ratios of the funds in its Selected Peer Group, and the net expense ratio for the Portfolio, not inclusive of AFFE, is above the median of net expense ratios of the funds in its Selected Peer Group. In analyzing this fee data, the Board took into account that, as reflected in the AFFE, the Portfolio indirectly bears the fees payable by the underlying funds in which the Portfolio invests.
Voya Solution 2025 Portfolio
In considering whether to approve the renewal of the Contracts for Voya Solution 2025 Portfolio, the Board considered that, based on performance data for the periods ended March 31, 2021: (1) the Portfolio is ranked in the first quintile of its Morningstar category for the one-year period, the second quintile for the year-to-date,
ADVISORY AND SUB-ADVISORY CONTRACT APPROVAL DISCUSSION (Unaudited) (continued)
three-year and five-year periods, and the third quintile for the ten-year period; and (2) the Portfolio outperformed its primary benchmark for all periods presented, with the exception of the ten-year period, during which it underperformed.
In considering the fees payable under the Contracts for the Portfolio, the Board took into account the factors described above and also considered: (1) the fairness of the compensation under a Management Contract with a level fee rate that does not include breakpoints; and (2) the pricing structure (including the net expense ratio to be borne by shareholders) of the Portfolio, as compared to its Selected Peer Group, including that: (a) the net management fee rate for the Portfolio is ranked in the fifth quintile of net management fee rates of the funds in its Selected Peer Group; (b) the contractual management fee rate for the Portfolio is ranked in the third quintile of contractual management fee rates of the funds in its Selected Peer Group; and (c) the all-in net expense ratio for the Portfolio, inclusive of the Acquired Fund Fees and Expenses (“AFFE”), is ranked in the fourth quintile of all-in net expense ratios of the funds in its Selected Peer Group, and the net expense ratio for the Fund, not inclusive of AFFE, is above the median of net expense ratios of the funds in its Selected Peer Group. In analyzing this fee data, the Board took into account: (1) that, as reflected in the AFFE, the Portfolio indirectly bears the fees payable by the underlying funds in which the Portfolio invests; (2) that, as a result of the Board’s request during the 2020 annual contract renewal cycle, lower expense limits were implemented for the Portfolio, effective January 1, 2021; and (3) management’s representations regarding its belief that the Portfolio’s pricing is competitive and the competitiveness of the Voya Solution Portfolios’ expense ratios when compared to peers identified by management.
Voya Solution 2030 Portfolio
In considering whether to approve the renewal of the Contracts for Voya Solution 2030 Portfolio, the Board considered that, based on performance data for the periods ended March 31, 2021: (1) the Portfolio is ranked in the first quintile of its Morningstar category for the one-year period, the second quintile for the year-to-date and five-year periods, and the third quintile for the three-year period; and (2) the Portfolio outperformed its primary benchmark for all periods presented, with the exception of the year-to-date period, during which it underperformed.
In considering the fees payable under the Contracts for the Portfolio, the Board took into account the factors described above and also considered: (1) the fairness of the compensation under a Management Contract with a level fee rate that does not include breakpoints; and (2) the pricing structure (including the net expense ratio to be
borne by shareholders) of the Portfolio, as compared to its Selected Peer Group, including that: (a) the net management fee rate for the Portfolio is ranked in the third quintile of net management fee rates of the funds in its Selected Peer Group; (b) the contractual management fee rate for the Portfolio is ranked in the third quintile of contractual management fee rates of the funds in its Selected Peer Group; and (c) the all-in net expense ratio for the Portfolio, inclusive of the Acquired Fund Fees and Expenses (“AFFE”), is ranked in the fourth quintile of all-in net expense ratios of the funds in its Selected Peer Group, and the net expense ratio for the Portfolio, not inclusive of AFFE, is above the median of net expense ratios of the funds in its Selected Peer Group. In analyzing this fee data, the Board took into account: (1) that the Portfolio indirectly bears the fees payable by the underlying funds in which the Portfolio invests; (2) that, as a result of the Board’s request during the 2020 annual contract renewal cycle, lower expense limits were implemented for the Portfolio, effective January 1, 2021; and (3) management’s representations regarding the competitiveness of the Portfolio’s management fee rate and all-in net expense ratio and the competitiveness of the Voya Solution Portfolios’ expense ratios when compared to peers identified by management.
Voya Solution 2035 Portfolio
In considering whether to approve the renewal of the Contracts for Voya Solution 2035 Portfolio, the Board considered that, based on performance data for the periods ended March 31, 2021: (1) the Portfolio is ranked in the first quintile of its Morningstar category for the one-year period, the second quintile for the year-to-date period, and the third quintile for the three-year, five-year and ten-year periods; and (2) the Portfolio underperformed its primary benchmark for all periods presented, with the exception of the one-year and five-year periods, during which it outperformed.
In considering the fees payable under the Contracts for the Portfolio, the Board took into account the factors described above and also considered: (1) the fairness of the compensation under a Management Contract with a level fee rate that does not include breakpoints; and (2) the pricing structure (including the net expense ratio to be borne by shareholders) of the Portfolio, as compared to its Selected Peer Group, including that: (a) the net management fee rate for the Portfolio is ranked in the fourth quintile of net management fee rates of the funds in its Selected Peer Group; (b) the contractual management fee rate for the Portfolio is ranked in the third quintile of contractual management fee rates of the funds in its Selected Peer Group; and (c) the all-in net expense ratio for the Portfolio, inclusive of the Acquired Fund Fees and Expenses (“AFFE”), is ranked in the fourth quintile of all-in
ADVISORY AND SUB-ADVISORY CONTRACT APPROVAL DISCUSSION (Unaudited) (continued)
net expense ratios of the funds in its Selected Peer Group, and the net expense ratio for the Fund, not inclusive of AFFE, is above the median of net expense ratios of the funds in its Selected Peer Group. In analyzing this fee data, the Board took into account: (1) that, as reflected in the AFFE, the Portfolio indirectly bears the fees payable by the underlying funds in which the Portfolio invests; (2) that, at the Board’s direction during the 2020 annual contract renewal cycle, the Portfolio’s expense limits were lowered, effective January 1, 2021; and (3) management’s representations regarding its belief that the Portfolio’s pricing is competitive and the competitiveness of the Voya Solution Portfolios’ expense ratios when compared to peers identified by management.
Voya Solution 2040 Portfolio
In considering whether to approve the renewal of the Contracts for Voya Solution 2040 Portfolio, the Board considered that, based on performance data for the periods ended March 31, 2021: (1) the Portfolio is ranked in the first quintile of its Morningstar category for the one-year period, the second quintile for the year-to-date period, and the third quintile for the three-year and five-year periods; and (2) the Portfolio outperformed its primary benchmark for all periods presented, with the exception of the year-to-date period, during which it underperformed.
In considering the fees payable under the Contracts for the Portfolio, the Board took into account the factors described above and also considered: (1) the fairness of the compensation under a Management Contract with a level fee rate that does not include breakpoints; and (2) the pricing structure (including the net expense ratio to be borne by shareholders) of the Portfolio, as compared to its Selected Peer Group, including that: (a) the net management fee rate for the Portfolio is ranked in the third quintile of net management fee rates of the funds in its Selected Peer Group; (b) the contractual management fee rate for the Portfolio is ranked in the third quintile of contractual management fee rates of the funds in its Selected Peer Group; and (c) the all-in net expense ratio for the Portfolio, inclusive of the Acquired Fund Fees and Expenses (“AFFE”), is ranked in the fourth quintile of all-in net expense ratios of the funds in its Selected Peer Group, and the net expense ratio for the Portfolio, not inclusive of AFFE, is above the median of net expense ratios of the funds in its Selected Peer Group. In analyzing this fee data, the Board took into account: (1) that the Portfolio indirectly bears the fees payable by the underlying funds in which the Portfolio invests; (2) that, as a result of the Board’s request during the 2020 annual contract renewal cycle, lower expense limits were implemented for the Portfolio, effective January 1, 2021; and (3) management’s representations regarding the competitiveness of the Portfolio’s management fee rate and all-in net expense ratio and the
competitiveness of the Voya Solution Portfolios’ expense ratios when compared to peers identified by management.
Voya Solution 2045 Portfolio
In considering whether to approve the renewal of the Contracts for Voya Solution 2045 Portfolio, the Board considered that, based on performance data for the periods ended March 31, 2021: (1) the Portfolio is ranked in the first quintile of its Morningstar category for the one-year period, the second quintile for the year-to-date period, and the third quintile for the three-year, five-year and ten-year periods; and (2) the Portfolio outperformed its primary benchmark for all periods presented, with the exception of the ten-year period, during which it underperformed.
In considering the fees payable under the Contracts for the Portfolio, the Board took into account the factors described above and also considered: (1) the fairness of the compensation under a Management Contract with a level fee rate that does not include breakpoints; and (2) the pricing structure (including the net expense ratio to be borne by shareholders) of the Portfolio, as compared to its Selected Peer Group, including that: (a) the net management fee rate for the Portfolio is ranked in the fourth quintile of net management fee rates of the funds in its Selected Peer Group; (b) the contractual management fee rate for the Portfolio is ranked in the third quintile of contractual management fee rates of the funds in its Selected Peer Group; and (c) the all-in net expense ratio for the Portfolio, inclusive of the Acquired Fund Fees and Expenses (“AFFE”), is ranked in the fourth quintile of all-in net expense ratios of the funds in its Selected Peer Group, and the net expense ratio for the Fund, not inclusive of AFFE, is equal to the median of net expense ratios of the funds in its Selected Peer Group. In analyzing this fee data, the Board took into account: (1) that, as reflected in the AFFE, the Portfolio indirectly bears the fees payable by the underlying funds in which the Portfolio invests; (2) that, at the Board’s direction during the 2020 annual contract renewal cycle, the Portfolio’s expense limits were lowered, effective January 1, 2021; and (3) management’s representations regarding its belief that the Portfolio’s pricing is competitive and the competitiveness of the Voya Solution Portfolios’ expense ratios when compared to peers identified by management.
Voya Solution 2050 Portfolio
In considering whether to approve the renewal of the Contracts for Voya Solution 2050 Portfolio, the Board considered that, based on performance data for the periods ended March 31, 2021: (1) the Portfolio is ranked in the first quintile of its Morningstar category for the one-year period, the second quintile for the year-to-date period, the third quintile for the five-year period, and the
ADVISORY AND SUB-ADVISORY CONTRACT APPROVAL DISCUSSION (Unaudited) (continued)
fourth quintile for the three-year period; and (2) the Portfolio outperformed its primary benchmark for the one-year and five-year periods and underperformed for the year-to-date and three-year periods. In analyzing this performance data, the Board took into account management’s representations regarding the competitiveness of the Portfolio’s performance during certain periods.
In considering the fees payable under the Contracts for the Portfolio, the Board took into account the factors described above and also considered: (1) the fairness of the compensation under a Management Contract with a level fee rate that does not include breakpoints; and (2) the pricing structure (including the net expense ratio to be borne by shareholders) of the Portfolio, as compared to its Selected Peer Group, including that: (a) the net management fee rate for the Portfolio is ranked in the third quintile of net management fee rates of the funds in its Selected Peer Group; (b) the contractual management fee rate for the Portfolio is ranked in the third quintile of contractual management fee rates of the funds in its Selected Peer Group; and (c) the all-in net expense ratio for the Portfolio, inclusive of the Acquired Fund Fees and Expenses (“AFFE”), is ranked in the fourth quintile of all-in net expense ratios of the funds in its Selected Peer Group, and the net expense ratio for the Fund, not inclusive of AFFE, is above the median of net expense ratios of the funds in its Selected Peer Group. In analyzing this fee data, the Board took into account: (1) that, as reflected in the AFFE, the Portfolio indirectly bears the fees payable by the underlying funds in which the Portfolio invests; (2) that, as a result of the Board’s direction during the 2020 annual contract renewal cycle, lower the Portfolio’s expense limits were implemented for the Portfolio, effective January 1, 2021; and (3) management’s representations regarding the competitiveness of the Portfolio’s management fee rate and the competitiveness of the Voya Solution Portfolios’ expense ratios when compared to the peers identified by management.
Voya Solution 2055 Portfolio
In considering whether to approve the renewal of the Contracts for Voya Solution 2055 Portfolio, the Board considered that, based on performance data for the periods ended March 31, 2021: (1) the Portfolio is ranked in the first quintile of its Morningstar category for the one-year period, the second quintile for the year-to-date period, the third quintile for the five-year and ten-year periods, and the fourth quintile for the three-year period; and (2) the Portfolio underperformed its primary benchmark for all periods presented, with the exception of the one-year period, during which it outperformed. In analyzing this performance data, the Board took into
account management’s representations regarding the competitiveness of the Portfolio’s performance during certain periods.
In considering the fees payable under the Contracts for the Portfolio, the Board took into account the factors described above and also considered: (1) the fairness of the compensation under a Management Contract with a level fee rate that does not include breakpoints; and (2) the pricing structure (including the net expense ratio to be borne by shareholders) of the Portfolio, as compared to its Selected Peer Group, including that: (a) the net management fee rate for the Portfolio is ranked in the fourth quintile of net management fee rates of the funds in its Selected Peer Group; (b) the contractual management fee rate for the Portfolio is ranked in the third quintile of contractual management fee rates of the funds in its Selected Peer Group; and (c) the all-in net expense ratio for the Portfolio, inclusive of the Acquired Fund Fees and Expenses (“AFFE”), is ranked in the fourth quintile of all-in net expense ratios of the funds in its Selected Peer Group, and the net expense ratio for the Fund, not inclusive of AFFE, is above the median of net expense ratios of the funds in its Selected Peer Group. In analyzing this fee data, the Board took into account: (1) that, as reflected in the AFFE, the Portfolio indirectly bears the fees payable by the underlying funds in which the Portfolio invests; (2) that, at the Board’s direction during the 2020 annual contract renewal cycle, the Portfolio’s expense limits were lowered, effective January 1, 2021; and (3) management’s representations regarding its belief that the Portfolio’s pricing is competitive and the competitiveness of the Voya Solution Portfolios’ expense ratios when compared to peers identified by management.
Voya Solution 2060 Portfolio
In considering whether to approve the renewal of the Contracts for Voya Solution 2060 Portfolio, the Board considered that, based on performance data for the periods ended March 31, 2021: (1) the Portfolio is ranked in the first quintile of its Morningstar category for the one-year period, the second quintile for the year-to-date period, and the fourth quintile for the three-year and five-year periods; and (2) the Portfolio underperformed its primary benchmark for all periods presented, with the exception of the one-year period, during which it outperformed. In analyzing this performance data, the Board took into account management’s representations regarding the competitiveness of the Portfolio’s performance during certain periods.
In considering the fees payable under the Contracts for the Portfolio, the Board took into account the factors described above and also considered: (1) the fairness of the compensation under a Management Contract with a
ADVISORY AND SUB-ADVISORY CONTRACT APPROVAL DISCUSSION (Unaudited) (continued)
level fee rate that does not include breakpoints; and (2) the pricing structure (including the net expense ratio to be borne by shareholders) of the Portfolio, as compared to its Selected Peer Group, including that: (a) the net management fee rate for the Portfolio is ranked in the fourth quintile of net management fee rates of the funds in its Selected Peer Group; (b) the contractual management fee rate for the Portfolio is ranked in the third quintile of contractual management fee rates of the funds in its Selected Peer Group; and (c) the all-in net expense ratio for the Portfolio, inclusive of the Acquired Fund Fees and Expenses (“AFFE”), is ranked in the fourth quintile of all-in net expense ratios of the funds in its Selected Peer Group, and the net expense ratio for the Fund, not inclusive of AFFE, is above the median of net expense ratios of the funds in its Selected Peer Group. In analyzing this fee data, the Board took into account: (1) that, as reflected in the AFFE, the Portfolio indirectly bears the fees payable by the underlying funds in which the Portfolio invests; (2) that, at the Board’s direction during the 2021 annual contract renewal cycle, the Portfolio’s expense limits were lowered, effective January 1, 2022; and (3) management’s representations regarding its belief that the Portfolio’s pricing is competitive and the competitiveness of the Voya Solution Portfolios’ expense ratios when compared to peers identified by management.
Voya Solution 2065 Portfolio
In considering whether to approve the renewal of the Contracts for Voya Solution 2065 Portfolio, the Board considered that, based on performance data for the periods ended March 31, 2021: (1) the Portfolio is ranked in the second quintile of its Morningstar category for the year-to-date period; and (2) the Portfolio underperformed its primary benchmark for the year-to-date period. In analyzing this performance data, the Board took into account that the Portfolio commenced operations in August 2020, and therefore had a limited operating history for the purpose of analyzing its performance.
In considering the fees payable under the Contracts for the Portfolio, the Board took into account the factors described above and also considered: (1) the fairness of the compensation under a Management Contract with a level fee rate that does not include breakpoints; and (2) the
pricing structure (including the net expense ratio to be borne by shareholders) of the Portfolio, as compared to its Selected Peer Group, including that: (a) the net management fee rate for the Portfolio is ranked in the third quintile of net management fee rates of the funds in its Selected Peer Group; (b) the contractual management fee rate for the Portfolio is ranked in the third quintile of contractual management fee rates of the funds in its Selected Peer Group; and (c) the all-in net expense ratio for the Portfolio, inclusive of the Acquired Fund Fees and Expenses (“AFFE”), is ranked in the fourth quintile of all-in net expense ratios of the funds in its Selected Peer Group, and the net expense ratio for the Fund, not inclusive of AFFE, is above the median of net expense ratios of the funds in its Selected Peer Group. In analyzing this fee data, the Board took into account: (1) that, as reflected in the AFFE, the Portfolio indirectly bears the fees payable by the underlying funds in which the Portfolio invests; (2) that, at the Board’s direction during the 2021 annual contract renewal cycle, the Portfolio’s expense limits were lowered, effective January 1, 2022; and (3) management’s representations regarding its belief that the Portfolio’s pricing is competitive and the competitiveness of the Voya Solution Portfolios’ expense ratios when compared to peers identified by management.
Board Conclusions
After its deliberation, the Board concluded that, in its business judgment, the terms of the Contracts are fair and reasonable to each Portfolio and that approval of the continuation of the Contracts is in the best interests of each Portfolio and its shareholders. In doing so, the Board reviewed all factors it considered to be material, including those discussed above. Within the context of its overall conclusions regarding the Contracts, and based on the information provided and management’s related representations, the Board concluded that it was satisfied with management’s responses relating to each Portfolio’s investment performance and the fees payable under the Contracts. During this renewal process, different Board members may have given different weight to different individual factors and related conclusions. Based on these conclusions and other factors, the Board voted to renew the Contracts for each Portfolio for the year ending November 30, 2022.
Investment Adviser
Voya Investments, LLC
7337 East Doubletree Ranch Road, Suite 100
Scottsdale, Arizona 85258
Distributor
Voya Investments Distributor, LLC
7337 East Doubletree Ranch Road, Suite 100
Scottsdale, Arizona 85258
Transfer Agent
BNY Mellon Investment Servicing (U.S.) Inc.
301 Bellevue Parkway
Wilmington, Delaware 19809
Independent Registered Public Accounting Firm
Ernst & Young LLP
200 Clarendon Street
Boston, Massachusetts 02116
Custodian
The Bank of New York Mellon
225 Liberty Street
New York, New York 10286
Legal Counsel
Ropes & Gray LLP
Prudential Tower
800 Boylston Street
Boston, Massachusetts 02199
Before investing, carefully consider the investment objectives, risks, charges and expenses of the variable annuity contract or variable life insurance policy and the underlying variable investment options. This and other information is contained in the prospectus for the variable annuity contract or variable life insurance policy and the underlying variable investment options. Obtain these prospectuses from your agent/registered representative and read them carefully before investing.
RETIREMENT | INVESTMENTS | INSURANCE
voyainvestments.com
ANNUAL REPORT
December 31, 2021
Classes ADV, I, S, S2 and Z
Voya Partners, Inc.
| | ■
Voya Index Solution Income Portfolio | | | ■
Voya Index Solution 2045 Portfolio | |
| | ■
Voya Index Solution 2025 Portfolio | | | ■
Voya Index Solution 2050 Portfolio | |
| | ■
Voya Index Solution 2030 Portfolio | | | ■
Voya Index Solution 2055 Portfolio | |
| | ■
Voya Index Solution 2035 Portfolio | | | ■
Voya Index Solution 2060 Portfolio | |
| | ■
Voya Index Solution 2040 Portfolio | | | ■
Voya Index Solution 2065 Portfolio | |
| | | As permitted by regulations adopted by the U.S. Securities and Exchange Commission, paper copies of each portfolio’s annual and semi-annual shareholder reports, like this annual report, are not sent by mail, unless you specifically request paper copies of the reports. Instead, the reports will be made available on a website and you will be notified by mail each time a report is posted and provided with a website link to access the report. | | |
| | | If you already elected to receive shareholder reports electronically, you need not take any action. You may elect to receive shareholder reports and other communications from your insurance carrier electronically by contacting them directly. | | |
| | | You may elect to receive all future reports in paper free of charge. If you received this document in the mail, please follow the instructions provided to elect to continue receiving paper copies of your shareholder reports. You can inform us that you wish to continue receiving paper copies by calling 1-866-345-5954. Your election to receive reports in paper will apply to all the funds in which you invest. | | |
| | | This report is submitted for general information to shareholders of the Voya mutual funds. It is not authorized for distribution to prospective shareholders unless accompanied or preceded by a prospectus which includes details regarding the funds’ investment objectives, risks, charges, expenses and other information. This information should be read carefully. | | |
| | | | | | | 1 | | |
| | | | | | | 3 | | |
| | | | | | | 16 | | |
| | | | | | | 18 | | |
| | | | | | | 20 | | |
| | | | | | | 26 | | |
| | | | | | | 29 | | |
| | | | | | | 34 | | |
| | | | | | | 43 | | |
| | | | | | | 56 | | |
| | | | | | | 79 | | |
| | | | | | | 82 | | |
| | | | | | | 87 | | |
PROXY VOTING INFORMATION
A description of the policies and procedures that the Portfolios use to determine how to vote proxies related to portfolio securities is available: (1) without charge, upon request, by calling Shareholder Services toll-free at (800) 992-0180; (2) on the Portfolios’ website at www.voyainvestments.com; and (3) on the U.S. Securities and Exchange Commission’s (“SEC’s”) website at www.sec.gov. Information regarding how the Portfolios voted proxies related to portfolio securities during the most recent 12-month period ended June 30 is available without charge on the Portfolios’ website at www.voyainvestments.com and on the SEC’s website at www.sec.gov.
QUARTERLY PORTFOLIO HOLDINGS
The Portfolios file their complete schedule of portfolio holdings with the SEC for the first and third quarters of each fiscal year on Form NPORT-P. The Portfolios’ Forms NPORT-P are available on the SEC’s website at www.sec.gov. Each Portfolio’s complete schedule of portfolio holdings is available at: www.voyainvestments.com and without charge upon request from the Portfolio by calling Shareholder Services toll-free at (800) 992-0180.
A Solid Year Ends for the Financial Markets, Gauging the Policy Shifts to Come
Dear Shareholder,
The 12-month period ended December 31, 2021 marked another strong year for stocks. Forcefully accommodative and persistent monetary and fiscal policy, along with the COVID-19 vaccine rollouts and an impressively adaptable global economy, drove big gains within risk assets. The ascent wasn’t particularly smooth, as several new COVID-19 variants thwarted attempts at a full-fledged reopening. Besides the distress induced by a public health crisis, prolongation of the pandemic negatively impacted the supply of labor and costs of core goods. These two factors, combined with others such as economic stimulus and rising commodity prices, drove inflation higher. As economic activity proved resilient, however, investors shrugged off soaring prices and continued to buy stocks.
The U.S. unemployment rate declined to 3.9% in December and job openings continued to exceed job seekers, indicating the labor market is approaching full employment. This dynamic is pressuring wages upward and has contributed to inflation running above the U.S Federal Reserve Board’s (the “Fed”) 2% target since April. Sharply higher prices have caused the Fed to hasten its plans to withdraw stimulus. We recognize that in 2022, monetary and fiscal policy are likely to become less supportive of the global economy. Yet in our view, we also see potential offsets to tightening financial conditions, including consumer spending and corporate inventory rebuilding, which make us believe there is scope for continued global equity gains.
The pace and path to policy normalization will be a key market factor for the year ahead. A sharp rise in wages from prolonged labor market tightness is possible, but firms, particularly larger ones, have been able to pass through rising input costs to maintain margins. In our view, this is likely to continue and, combined with still above trend GDP growth, will support earnings growth in 2022.
As we’ve often noted, it’s important to have a plan for investing consistently through headwinds and tailwinds. Keep focused on your long-term goals and don’t get distracted by short-term fluctuations, however compelling or distracting they may seem. Should your long-term goals change, discuss the situation thoroughly with your investment advisor before making any changes to your investment portfolio.
Regardless of events, at Voya we remain well prepared for and fully committed to serving our clients without disruption. We appreciate your continued confidence in us, and we look forward to working with you in the future.
Sincerely,
Dina Santoro
President
Voya Family of Funds
January 21, 2022
The views expressed in the President’s Letter reflect those of the President as of the date of the letter. Any such views are subject to change at any time based upon market or other conditions and the Voya mutual funds disclaim any responsibility to update such views. These views may not be relied on as investment advice and because investment decisions for a Voya mutual fund are based on numerous factors, may not be relied on as an indication of investment intent on behalf of any Voya mutual fund. Reference to specific company securities should not be construed as recommendations or investment advice.
International investing poses special risks including currency fluctuation, economic and political risks not found in investments that are solely domestic.
| | | Index | | | | Description | | |
| | | Bloomberg U.S. 1-3 Year Government/Credit Bond Index | | | | A widely recognized index of publicly issued fixed rate, investment grade debt securities, including Treasuries, Agencies and credit securities with a maturity of one to three years. | | |
| | | Bloomberg U.S. Aggregate Bond Index (“Bloomberg U.S. Aggregate Bond”) | | | | An index of publicly issued investment grade U.S. government, mortgage-backed, asset-backed and corporate debt securities. | | |
| | | S&P Target Date Retirement Income Index | | | | Seeks to represent asset allocations which target an immediate retirement horizon. | | |
| | | S&P Target Date 2025 Index,
S&P Target Date 2030 Index,
S&P Target Date 2035 Index,
S&P Target Date 2040 Index,
S&P Target Date 2045 Index,
S&P Target Date 2050 Index,
S&P Target Date 2055 Index and
S&P Target Date 2060+ Index | | | | Each index seeks to represent the market consensus for asset allocations which target an approximate 2025, 2030, 2035, 2040, 2045, 2050, 2055, 2060 and beyond the 2060 retirement horizon, respectively. | | |
| Portfolio Managers’ Report | Voya Index Solution Portfolios |
The Voya Index Solution Portfolios consist of Voya Index Solution Income Portfolio, Voya Index Solution 2025 Portfolio, Voya Index Solution 2030 Portfolio, Voya Index Solution 2035 Portfolio, Voya Index Solution 2040 Portfolio, Voya Index Solution 2045 Portfolio, Voya Index Solution 2050 Portfolio, Voya Index Solution 2055 Portfolio, Voya Index Solution 2060 Portfolio, and Voya Index Solution 2065 Portfolio (each a “Portfolio” or collectively, the “Portfolios”). Each Portfolio seeks to achieve its investment objective by investing in a combination of underlying funds which are passively managed funds (index funds)(1). Each Portfolio uses an asset allocation strategy (“Target Asset Allocation”) designed for investors expecting to retire around the year applicable to that Portfolio. These Target Asset Allocations as of December 31, 2021 are set out in the table on page 5. The Portfolios are managed by Halvard Kvaale, CIMA, Paul Zemsky, CFA and Chief Investment Officer, and Barbara Reinhard, CFA, Portfolio Managers* of Voya Investment Management Co. LLC (“Voya IM”) — the Sub-Adviser.
Performance: Each Portfolio’s performance against its respective benchmark can be found on page 5.
Portfolio Specifics**: The Portfolio managers attempt to enhance investment returns by tactically deviating from Target Asset Allocations to take advantage of opportunities or reduce risk. The following tactics were among those employed in 2021.
The Portfolios started the year overweight to equities in the 2065-2040 vintages, but flat or modestly underweight in equities in the near-dated vintages. Within equities, the Portfolios were overweight to domestic small cap across all vintages and emerging market (“EM”) equities, and underweight in developed international and domestic large cap across all vintages. Within fixed income, the Portfolios were overweight to core U.S. fixed income and long government bonds in the near-dated vintages, while being underweight in core U.S. fixed income in the far-dated vintages and Treasury inflation-protected securities in the near-dated portfolios.
At the close of January, the Portfolios implemented an overweight to EM equities funded by selling down domestic large cap equities. The rationale underpinning the trade was our belief that the U.S. dollar (“USD”) would continue to depreciate and that the COVID-19 vaccine rollout would benefit EM equities more than U.S. large cap equities. The EM index is more heavily weighted toward industrial stocks and less heavily weighted toward technology stocks, and we believed that industrial companies stood to benefit more as the vaccine would allow employees to return to worksites. At the beginning of February, and again in early March, the Portfolios increased exposure to small cap equities by selling U.S. large cap equities.
Near the close of March, the Portfolios slightly trimmed their overweight position in domestic small cap equities and purchased domestic large cap with the proceeds. At the time of the trade, domestic small caps had outperformed domestic large cap by over 22% since we initiated the overweight in October 2020. With the trade, the Portfolios increase their overweight to domestic large cap; reflective of our view that growth will continue for mega cap growth stocks while also having more dollar resiliency.
In April, as part of their annual review process, the Portfolios glided down the equity portion of the 2040-2025 Portfolios, reducing total equity between 1-3% in favor of fixed income. Within equities, the Portfolios rotated from U.S. large cap into U.S. mid, U.S. small and EM equities. Within fixed income, we reduced the position in U.S. long government bonds within the near-dated vintages in favor of core U.S. fixed income.
At the end of May, the Portfolios rotated a portion of its U.S. small cap and EM equities into European equities. We have been cautious on Europe for years. By March 2021, Europe had wiped out the heavy gains made in the fourth quarter 2020. Since then, with more successful COVID-19 vaccine rollouts, re-opening for tourism in the summer and additional stimulus through the European recovery fund, Europe looks to be in the next leg of the global growth recovery, in our opinion.
In July, the Portfolios unwound their overweight equity exposure to the euro zone as optimism for its outperformance, relative to domestic equities, waned, given continued USD strength and increased fears over the impact of the COVID-19 Delta variant. EM equity exposures were also reduced, as increasing regulatory risk and tightening credit conditions in China, as well as low vaccination rates in the EMs have amplified concerns for the asset class. Proceeds from the trades were incorporated into U.S. large cap equities.
At the end of August, a strategic allocation to funding agreements was introduced in the 2030, 2025 and Income Portfolios. We believe the addition of the funding agreements will help to reduce volatility while increasing yields relative to other short-term fixed income instruments. This investment was a benefit to 2030, 2025, and Income returning approximately 0.52% over the past four months of the reporting year, outperforming the Bloomberg U.S. Aggregate Bond and the Bloomberg U.S. 1-3 Year Government/Credit Bond Index. In addition, the allocation to high yield was increased, while core U.S. fixed income was reduced for these three Portfolios.
| Voya Index Solution Portfolios | Portfolio Managers’ Report |
In October, the Portfolios conducted its semi-annual strategic asset allocation review, resulting in a shift of assets into domestic large cap equities and away from U.S. mid and small cap, developed international and EM equities and core U.S. fixed income in varying degrees depending on the Portfolios.
In December, the strategy further increased its U.S. large cap overweight, while lowering exposure to U.S. small cap. With rising wages, small cap companies will have a harder time passing on rising costs to consumers relative to their larger counterparts. In addition, we expect higher volatility caused by the U.S. Federal Reserve Board (the “Fed”) tapering, justifying a lower allocation to the higher-beta asset class.
During the year, tactical moves relative to our strategic benchmarks have had a negative impact across the Portfolios.
During the year, the Portfolios utilized various futures to enact tactical positions. Futures were utilized to avoid significant manager disruption and provide the Portfolios with greater liquidity. The impact of the derivatives was in line with expectations of the tactical asset allocation positions. Overall, tactical positions detracted from overall performance for the year.
Current Strategy and Outlook: In our opinion, COVID-19 could be with us for the long run, but we are learning to live with it: successive waves of infection from new mutations have exerted diminishing impacts on economic activity. U.S. consumer balance sheets have improved dramatically from the early days of the pandemic. With less risk of lockdowns, expected high demand for labor and more than $2 trillion in excess savings, we believe there are more self-sufficient individuals who are well positioned to contribute to the next leg of growth in 2022. In addition, capital goods orders have taken off, in our view; when considered alongside exceedingly slim inventories, we believe that capital expenditures are likely to be strong in the coming year. We recognize that monetary and fiscal policy will likely continue to become less accommodative in 2022, leaving economies with fewer supports. In our view, this could lead to bouts of fragility and volatility. However, we also see potentially powerful offsets to tightening financial conditions, including a drawdown of consumer savings and corporate inventory rebuilding. These factors make us believe there is scope for continued global equity gains. What is more, we think equity market risk premia have room to absorb modestly higher rates. Though certain pockets of the market are vulnerable to tighter financial conditions, it is our opinion that sell-offs in those pockets should not crash the entire equity market. Funding costs are rising, but remain near record lows, and we believe strong fundamentals should insulate credit spreads from rising rates. Still, inflation and profit dynamics are critical variables affecting this outlook.
The economy only re-opens once; in our view, we project 2022 above-trend inflation will generally be supply driven and abate as bottlenecks ease. The Fed’s policy tools are not tuned to resolve supply side issues — that is why we think the Fed will look past impermanent price pressures and allow inflation to decelerate naturally, as delivery costs come down, more supply comes online, and more workers re-enter the labor force. Furthermore, we expect the handoff from goods to services to happen gradually. We believe that a sharp rise in wages from prolonged labor market tightness is possible, but firms, particularly larger ones, have been able to pass through rising input costs to maintain margins. We also believe that this is likely to continue and, combined with still above-trend GDP growth, will support earnings growth in 2022. S&P 500® Index companies have historically demonstrated greater pricing power than smaller companies; this fact underpins the retention of our overweight to U.S. large cap stocks.
(1)
The investment objective of each Portfolio is described in the Portfolios’ prospectuses, each dated May 1, 2021.
*
Effective on or about May 31, 2022, Halvard Kvaale will retire and no longer be a portfolio manager for the Portfolios.
**
On May 27, 2021, the Board of Directors of Voya Partners, Inc. approved changes with respect to the Portfolios’ investment strategies to allow each Portfolio to invest in funding agreements with affiliated or unaffiliated (if available) insurance companies, effective on or about August 31, 2021.
The views expressed in this commentary are informed opinions. They should not be considered promises or advice. The views expressed reflect those of the portfolio managers, only through the end of the period as stated on the cover. The portfolio managers’ views are subject to change at any time based on market and other conditions.
Portfolio holdings and characteristics are subject to change and may not be representative of current holdings and characteristics. Portfolio holdings are subject to change daily. The outlook for this Portfolio may differ from that presented for other Voya mutual funds. This report contains statements that may be “forward-looking” statements. Actual results may differ materially from those projected in the “forward-looking” statements. The Portfolio’s performance returns shown reflect applicable fee waivers and/or expense limits in effect during this period. Absent such fee waivers/expense limitations, if any, performance would have been lower. Performance for the different classes of shares will vary based on differences in fees associated with each class. An index has no cash in its portfolio and imposes no sales charges. An investor cannot invest directly in an index.
| Portfolio Managers’ Report | Voya Index Solution Portfolios |
| | | Total Returns for the Year Ended December 31, 2021 | | |
| | | | | | 1 Year | | |
| | | Voya Index Solution Income Portfolio, Class S | | | 5.81% | | |
| | | S&P Target Date Retirement Income Index | | | 5.11% | | |
| | | Voya Index Solution 2025 Portfolio, Class S | | | 10.42% | | |
| | | S&P Target Date 2025 Index | | | 10.67% | | |
| | | Voya Index Solution 2030 Portfolio, Class S | | | 12.18% | | |
| | | S&P Target Date 2030 Index | | | 12.61% | | |
| | | Voya Index Solution 2035 Portfolio, Class S | | | 13.87% | | |
| | | S&P Target Date 2035 Index | | | 14.92% | | |
| | | Voya Index Solution 2040 Portfolio, Class S | | | 16.30% | | |
| | | S&P Target Date 2040 Index | | | 16.55% | | |
| | | Voya Index Solution 2045 Portfolio, Class S | | | 17.56% | | |
| | | S&P Target Date 2045 Index | | | 17.51% | | |
| | | Voya Index Solution 2050 Portfolio, Class S | | | 17.50% | | |
| | | S&P Target Date 2050 Index | | | 17.99% | | |
| | | Voya Index Solution 2055 Portfolio, Class S | | | 17.64% | | |
| | | S&P Target Date 2055 Index | | | 18.19% | | |
| | | Voya Index Solution 2060 Portfolio, Class S | | | 17.96% | | |
| | | S&P Target Date 2060+ Index | | | 18.05% | | |
| | | Voya Index Solution 2065 Portfolio, Class S | | | 18.08% | | |
| | | S&P Target Date 2060+ Index | | | 18.05% | | |
| | | | | | | | |
| | | Annual Target Asset Allocation as of December 31, 2021(1)
(as a percentage of net assets) | | |
| | | Sub Asset Class | | | 2065 | | | 2060 | | | 2055 | | | 2050 | | | 2045 | | | 2040 | | | 2035 | | | 2030 | | | 2025 | | | Income | | |
| | | US Large Blend | | | | | 56.0% | | | | | | 56.0% | | | | | | 55.0% | | | | | | 55.0% | | | | | | 54.0% | | | | | | 50.0% | | | | | | 44.0% | | | | | | 38.0% | | | | | | 34.0% | | | | | | 22.0% | | | |
| | | US Mid Cap Blend | | | | | 5.0% | | | | | | 5.0% | | | | | | 5.0% | | | | | | 5.0% | | | | | | 4.0% | | | | | | 4.0% | | | | | | 4.0% | | | | | | 4.0% | | | | | | 3.0% | | | | | | 2.0% | | | |
| | | US Small Cap | | | | | 6.0% | | | | | | 6.0% | | | | | | 6.0% | | | | | | 6.0% | | | | | | 6.0% | | | | | | 6.0% | | | | | | 5.0% | | | | | | 5.0% | | | | | | 2.0% | | | | | | — | | | |
| | | International | | | | | 20.0% | | | | | | 20.0% | | | | | | 20.0% | | | | | | 20.0% | | | | | | 20.0% | | | | | | 18.0% | | | | | | 16.0% | | | | | | 14.0% | | | | | | 10.0% | | | | | | 6.0% | | | |
| | | International Small Cap | | | | | 2.0% | | | | | | 2.0% | | | | | | 2.0% | | | | | | 2.0% | | | | | | 2.0% | | | | | | 2.0% | | | | | | 2.0% | | | | | | 2.0% | | | | | | 2.0% | | | | | | — | | | |
| | | Emerging Markets | | | | | 9.0% | | | | | | 9.0% | | | | | | 9.0% | | | | | | 9.0% | | | | | | 9.0% | | | | | | 8.0% | | | | | | 8.0% | | | | | | 6.0% | | | | | | 6.0% | | | | | | 3.0% | | | |
| | | Funding Agreement | | | | | — | | | | | | — | | | | | | — | | | | | | — | | | | | | — | | | | | | — | | | | | | — | | | | | | 5.0% | | | | | | 5.0% | | | | | | 5.0% | | | |
| | | Core Fixed Income | | | | | 2.0% | | | | | | 2.0% | | | | | | 3.0% | | | | | | 3.0% | | | | | | 3.0% | | | | | | 9.0% | | | | | | 17.0% | | | | | | 19.0% | | | | | | 31.0% | | | | | | 47.0% | | | |
| | | High Yield | | | | | — | | | | | | — | | | | | | — | | | | | | — | | | | | | 2.0% | | | | | | 3.0% | | | | | | 4.0% | | | | | | 7.0% | | | | | | 7.0% | | | | | | 7.0% | | | |
| | | TIPS | | | | | — | | | | | | — | | | | | | — | | | | | | — | | | | | | — | | | | | | — | | | | | | — | | | | | | — | | | | | | — | | | | | | 3.0% | | | |
| | | Short Duration | | | | | — | | | | | | — | | | | | | — | | | | | | — | | | | | | — | | | | | | — | | | | | | — | | | | | | — | | | | | | — | | | | | | 3.0% | | | |
| | | Long Govt Bonds | | | | | — | | | | | | — | | | | | | — | | | | | | — | | | | | | — | | | | | | — | | | | | | — | | | | | | — | | | | | | — | | | | | | 2.0% | | | |
| | | Total Equity | | | | | 98.0% | | | | | | 98.0% | | | | | | 97.0% | | | | | | 97.0% | | | | | | 95.0% | | | | | | 88.0% | | | | | | 79.0% | | | | | | 69.0% | | | | | | 57.0% | | | | | | 33.0% | | | |
| | | Total Fixed Income | | | | | 2.0% | | | | | | 2.0% | | | | | | 3.0% | | | | | | 3.0% | | | | | | 5.0% | | | | | | 12.0% | | | | | | 21.0% | | | | | | 31.0% | | | | | | 43.0% | | | | | | 67.0% | | | |
| | | Total | | | | | 100.0% | | | | | | 100.0% | | | | | | 100.0% | | | | | | 100.0% | | | | | | 100.0% | | | | | | 100.0% | | | | | | 100.0% | | | | | | 100.0% | | | | | | 100.0% | | | | | | 100.0% | | | |
| | | | | | | | | | | | | | | | | | | | | | | | | | | | | | | | | | | | | | | | | | | | | | | | | | | | | | | | | | | | | | | | | |
(1)
As these are target allocations, the actual allocations of each Portfolio’s assets may deviate from the percentages shown. Although the Portfolios expect to be fully invested at all times, they may maintain liquidity reserves to meet redemption requests.
| Voya Index Solution Income Portfolio | Portfolio Managers’ Report |
| | | Average Annual Total Returns for the Periods Ended December 31, 2021 | | |
| | | | | | 1 Year | | | 5 Year | | | 10 Year | | |
| | | Class ADV | | | | | 5.62% | | | | | | 6.68% | | | | | | 5.79% | | | |
| | | Class I | | | | | 6.09% | | | | | | 7.22% | | | | | | 6.32% | | | |
| | | Class S | | | | | 5.81% | | | | | | 6.95% | | | | | | 6.05% | | | |
| | | Class S2 | | | | | 5.69% | | | | | | 6.78% | | | | | | 5.89% | | | |
| | | Class Z(1) | | | | | 6.41% | | | | | | 7.46% | | | | | | 6.46% | | | |
| | | S&P Target Date Retirement Income Index | | | | | 5.11% | | | | | | 6.52% | | | | | | 5.59% | | | |
| | | | | |
Based on a $10,000 initial investment, the graph and table above illustrate the total return of Voya Index Solution Income Portfolio against the index indicated. The index is unmanaged and has no cash in its portfolio and imposes no sales charges. An investor cannot invest directly in an index.
The Portfolio’s performance is shown without the imposition of any expenses or charges which are, or may be, imposed under your variable annuity contract or variable life insurance policy. Total returns would have been lower if such expenses or charges were included.
The performance graph and table do not reflect the deduction of taxes that a shareholder will pay on Portfolio distributions or the redemption of Portfolio shares.
The performance shown includes, if applicable, the effect of fee waivers and/or expense reimbursements by the Investment Adviser and/or other service providers, which have the effect of increasing total return. Had all fees and expenses been considered, the total returns would have been lower.
The performance update illustrates performance for a variable investment option available through a variable annuity contract or a variable life insurance policy. The performance shown indicates past performance and is not a projection or prediction of future results. Actual investment returns and principal value will fluctuate so that shares and/or units, at redemption, may be worth more or less than their original cost. Please log on to www.voyainvestments.com or call (800) 262-3862 to get performance through the most recent month end.
Portfolio holdings are subject to change daily.
(1)
Class Z incepted on May 1, 2015. The Class Z shares performance shown for the period prior to their inception date is the performance of Class I shares without adjustment for any differences in the expenses between the two classes. If adjusted for such differences, returns would be different.
| Portfolio Managers’ Report | Voya Index Solution 2025 Portfolio |
| | | Average Annual Total Returns for the Periods Ended December 31, 2021 | | |
| | | | | | 1 Year | | | 5 Year | | | 10 Year | | |
| | | Class ADV | | | | | 10.20% | | | | | | 9.64% | | | | | | 8.70% | | | |
| | | Class I | | | | | 10.70% | | | | | | 10.17% | | | | | | 9.23% | | | |
| | | Class S | | | | | 10.42% | | | | | | 9.91% | | | | | | 8.97% | | | |
| | | Class S2 | | | | | 10.24% | | | | | | 9.74% | | | | | | 8.81% | | | |
| | | Class Z(1) | | | | | 11.03% | | | | | | 10.42% | | | | | | 9.39% | | | |
| | | S&P Target Date 2025 Index | | | | | 10.67% | | | | | | 9.65% | | | | | | 9.01% | | | |
| | | | | |
Based on a $10,000 initial investment, the graph and table above illustrate the total return of Voya Index Solution 2025 Portfolio against the index indicated. The index is unmanaged and has no cash in its portfolio and imposes no sales charges. An investor cannot invest directly in an index.
The Portfolio’s performance is shown without the imposition of any expenses or charges which are, or may be, imposed under your variable annuity contract or variable life insurance policy. Total returns would have been lower if such expenses or charges were included.
The performance graph and table do not reflect the deduction of taxes that a shareholder will pay on Portfolio distributions or the redemption of Portfolio shares.
The performance shown includes, if applicable, the effect of fee waivers and/or expense reimbursements by the Investment Adviser and/or other service providers, which have the effect of increasing total return. Had all fees and expenses been considered, the total returns would have been lower.
The performance update illustrates performance for a variable investment option available through a variable annuity contract or a variable life insurance policy. The performance shown indicates past performance and is not a projection or prediction of future results. Actual investment returns and principal value will fluctuate so that shares and/or units, at redemption, may be worth more or less than their original cost. Please log on to www.voyainvestments.com or call (800) 262-3862 to get performance through the most recent month end.
Portfolio holdings are subject to change daily.
(1)
Class Z incepted on May 1, 2015. The Class Z shares performance shown for the period prior to their inception date is the performance of Class I shares without adjustment for any differences in the expenses between the two classes. If adjusted for such differences, returns would be different.
| Voya Index Solution 2030 Portfolio | Portfolio Managers’ Report |
| | | Average Annual Total Returns for the Periods Ended December 31, 2021 | | |
| | | | | | 1 Year | | | 5 Year | | | 10 Year | | |
| | | Class ADV | | | | | 11.80% | | | | | | 10.66% | | | | | | 9.63% | | | |
| | | Class I | | | | | 12.40% | | | | | | 11.21% | | | | | | 10.16% | | | |
| | | Class S | | | | | 12.18% | | | | | | 10.94% | | | | | | 9.87% | | | |
| | | Class S2 | | | | | 12.01% | | | | | | 10.78% | | | | | | 9.71% | | | |
| | | Class Z(1) | | | | | 12.64% | | | | | | 11.45% | | | | | | 10.29% | | | |
| | | S&P Target Date 2030 Index | | | | | 12.61% | | | | | | 10.63% | | | | | | 9.83% | | | |
| | | | | |
Based on a $10,000 initial investment, the graph and table above illustrate the total return of Voya Index Solution 2030 Portfolio against the index indicated. The index is unmanaged and has no cash in its portfolio and imposes no sales charges. An investor cannot invest directly in an index.
The Portfolio’s performance is shown without the imposition of any expenses or charges which are, or may be, imposed under your variable annuity contract or variable life insurance policy. Total returns would have been lower if such expenses or charges were included.
The performance graph and table do not reflect the deduction of taxes that a shareholder will pay on Portfolio distributions or the redemption of Portfolio shares.
The performance shown includes, if applicable, the effect of fee waivers and/or expense reimbursements by the Investment Adviser and/or other service providers, which have the effect of increasing total return. Had all fees and expenses been considered, the total returns would have been lower.
The performance update illustrates performance for a variable investment option available through a variable annuity contract or a variable life insurance policy. The performance shown indicates past performance and is not a projection or prediction of future results. Actual investment returns and principal value will fluctuate so that shares and/or units, at redemption, may be worth more or less than their original cost. Please log on to www.voyainvestments.com or call (800) 262-3862 to get performance through the most recent month end.
Portfolio holdings are subject to change daily.
(1)
Class Z incepted on May 1, 2015. The Class Z shares performance shown for the period prior to their inception date is the performance of Class I shares without adjustment for any differences in the expenses between the two classes. If adjusted for such differences, returns would be different.
| Portfolio Managers’ Report | Voya Index Solution 2035 Portfolio |
| | | Average Annual Total Returns for the Periods Ended December 31, 2021 | | |
| | | | | | 1 Year | | | 5 Year | | | 10 Year | | |
| | | Class ADV | | | | | 13.56% | | | | | | 11.51% | | | | | | 10.39% | | | |
| | | Class I | | | | | 14.17% | | | | | | 12.09% | | | | | | 10.95% | | | |
| | | Class S | | | | | 13.87% | | | | | | 11.82% | | | | | | 10.67% | | | |
| | | Class S2 | | | | | 13.65% | | | | | | 11.64% | | | | | | 10.51% | | | |
| | | Class Z(1) | | | | | 14.41% | | | | | | 12.33% | | | | | | 11.11% | | | |
| | | S&P Target Date 2035 Index | | | | | 14.92% | | | | | | 11.67% | | | | | | 10.63% | | | |
| | | | | |
Based on a $10,000 initial investment, the graph and table above illustrate the total return of Voya Index Solution 2035 Portfolio against the index indicated. The index is unmanaged and has no cash in its portfolio and imposes no sales charges. An investor cannot invest directly in an index.
The Portfolio’s performance is shown without the imposition of any expenses or charges which are, or may be, imposed under your variable annuity contract or variable life insurance policy. Total returns would have been lower if such expenses or charges were included.
The performance graph and table do not reflect the deduction of taxes that a shareholder will pay on Portfolio distributions or the redemption of Portfolio shares.
The performance shown includes, if applicable, the effect of fee waivers and/or expense reimbursements by the Investment Adviser and/or other service providers, which have the effect of increasing total return. Had all fees and expenses been considered, the total returns would have been lower.
The performance update illustrates performance for a variable investment option available through a variable annuity contract or a variable life insurance policy. The performance shown indicates past performance and is not a projection or prediction of future results. Actual investment returns and principal value will fluctuate so that shares and/or units, at redemption, may be worth more or less than their original cost. Please log on to www.voyainvestments.com or call (800) 262-3862 to get performance through the most recent month end.
Portfolio holdings are subject to change daily.
(1)
Class Z incepted on May 1, 2015. The Class Z shares performance shown for the period prior to their inception date is the performance of Class I shares without adjustment for any differences in the expenses between the two classes. If adjusted for such differences, returns would be different.
| Voya Index Solution 2040 Portfolio | Portfolio Managers’ Report |
| | | Average Annual Total Returns for the Periods Ended December 31, 2021 | | |
| | | | | | 1 Year | | | 5 Year | | | 10 Year | | |
| | | Class ADV | | | | | 15.95% | | | | | | 12.50% | | | | | | 11.06% | | | |
| | | Class I | | | | | 16.58% | | | | | | 13.06% | | | | | | 11.60% | | | |
| | | Class S | | | | | 16.30% | | | | | | 12.79% | | | | | | 11.32% | | | |
| | | Class S2 | | | | | 16.09% | | | | | | 12.61% | | | | | | 11.15% | | | |
| | | Class Z(1) | | | | | 16.86% | | | | | | 13.31% | | | | | | 11.75% | | | |
| | | S&P Target Date 2040 Index | | | | | 16.55% | | | | | | 12.40% | | | | | | 11.19% | | | |
| | | | | |
Based on a $10,000 initial investment, the graph and table above illustrate the total return of Voya Index Solution 2040 Portfolio against the index indicated. The index is unmanaged and has no cash in its portfolio and imposes no sales charges. An investor cannot invest directly in an index.
The Portfolio’s performance is shown without the imposition of any expenses or charges which are, or may be, imposed under your variable annuity contract or variable life insurance policy. Total returns would have been lower if such expenses or charges were included.
The performance graph and table do not reflect the deduction of taxes that a shareholder will pay on Portfolio distributions or the redemption of Portfolio shares.
The performance shown includes, if applicable, the effect of fee waivers and/or expense reimbursements by the Investment Adviser and/or other service providers, which have the effect of increasing total return. Had all fees and expenses been considered, the total returns would have been lower.
The performance update illustrates performance for a variable investment option available through a variable annuity contract or a variable life insurance policy. The performance shown indicates past performance and is not a projection or prediction of future results. Actual investment returns and principal value will fluctuate so that shares and/or units, at redemption, may be worth more or less than their original cost. Please log on to www.voyainvestments.com or call (800) 262-3862 to get performance through the most recent month end.
Portfolio holdings are subject to change daily.
(1)
Class Z incepted on May 1, 2015. The Class Z shares performance shown for the period prior to their inception date is the performance of Class I shares without adjustment for any differences in the expenses between the two classes. If adjusted for such differences, returns would be different.
| Portfolio Managers’ Report | Voya Index Solution 2045 Portfolio |
| | | Average Annual Total Returns for the Periods Ended December 31, 2021 | | |
| | | | | | 1 Year | | | 5 Year | | | 10 Year | | |
| | | Class ADV | | | | | 17.25% | | | | | | 12.96% | | | | | | 11.37% | | | |
| | | Class I | | | | | 17.86% | | | | | | 13.52% | | | | | | 11.93% | | | |
| | | Class S | | | | | 17.56% | | | | | | 13.23% | | | | | | 11.64% | | | |
| | | Class S2 | | | | | 17.28% | | | | | | 13.05% | | | | | | 11.47% | | | |
| | | Class Z(1) | | | | | 18.14% | | | | | | 13.79% | | | | | | 12.09% | | | |
| | | S&P Target Date 2045 Index | | | | | 17.51% | | | | | | 12.81% | | | | | | 11.56% | | | |
| | | | | |
Based on a $10,000 initial investment, the graph and table above illustrate the total return of Voya Index Solution 2045 Portfolio against the index indicated. The index is unmanaged and has no cash in its portfolio and imposes no sales charges. An investor cannot invest directly in an index.
The Portfolio’s performance is shown without the imposition of any expenses or charges which are, or may be, imposed under your variable annuity contract or variable life insurance policy. Total returns would have been lower if such expenses or charges were included.
The performance graph and table do not reflect the deduction of taxes that a shareholder will pay on Portfolio distributions or the redemption of Portfolio shares.
The performance shown includes, if applicable, the effect of fee waivers and/or expense reimbursements by the Investment Adviser and/or other service providers, which have the effect of increasing total return. Had all fees and expenses been considered, the total returns would have been lower.
The performance update illustrates performance for a variable investment option available through a variable annuity contract or a variable life insurance policy. The performance shown indicates past performance and is not a projection or prediction of future results. Actual investment returns and principal value will fluctuate so that shares and/or units, at redemption, may be worth more or less than their original cost. Please log on to www.voyainvestments.com or call (800) 262-3862 to get performance through the most recent month end.
Portfolio holdings are subject to change daily.
(1)
Class Z incepted on May 1, 2015. The Class Z shares performance shown for the period prior to their inception date is the performance of Class I shares without adjustment for any differences in the expenses between the two classes. If adjusted for such differences, returns would be different.
| Voya Index Solution 2050 Portfolio | Portfolio Managers’ Report |
| | | Average Annual Total Returns for the Periods Ended December 31, 2021 | | |
| | | | | | 1 Year | | | 5 Year | | | 10 Year | | |
| | | Class ADV | | | | | 17.22% | | | | | | 12.87% | | | | | | 11.31% | | | |
| | | Class I | | | | | 17.81% | | | | | | 13.44% | | | | | | 11.88% | | | |
| | | Class S | | | | | 17.50% | | | | | | 13.17% | | | | | | 11.59% | | | |
| | | Class S2 | | | | | 17.33% | | | | | | 12.98% | | | | | | 11.41% | | | |
| | | Class Z(1) | | | | | 18.12% | | | | | | 13.71% | | | | | | 12.02% | | | |
| | | S&P Target Date 2050 Index | | | | | 17.99% | | | | | | 13.07% | | | | | | 11.83% | | | |
| | | | | |
Based on a $10,000 initial investment, the graph and table above illustrate the total return of Voya Index Solution 2050 Portfolio against the index indicated. The index is unmanaged and has no cash in its portfolio and imposes no sales charges. An investor cannot invest directly in an index.
The Portfolio’s performance is shown without the imposition of any expenses or charges which are, or may be, imposed under your variable annuity contract or variable life insurance policy. Total returns would have been lower if such expenses or charges were included.
The performance graph and table do not reflect the deduction of taxes that a shareholder will pay on Portfolio distributions or the redemption of Portfolio shares.
The performance shown includes, if applicable, the effect of fee waivers and/or expense reimbursements by the Investment Adviser and/or other service providers, which have the effect of increasing total return. Had all fees and expenses been considered, the total returns would have been lower.
The performance update illustrates performance for a variable investment option available through a variable annuity contract or a variable life insurance policy. The performance shown indicates past performance and is not a projection or prediction of future results. Actual investment returns and principal value will fluctuate so that shares and/or units, at redemption, may be worth more or less than their original cost. Please log on to www.voyainvestments.com or call (800) 262-3862 to get performance through the most recent month end.
Portfolio holdings are subject to change daily.
(1)
Class Z incepted on May 1, 2015. The Class Z shares performance shown for the period prior to their inception date is the performance of Class I shares without adjustment for any differences in the expenses between the two classes. If adjusted for such differences, returns would be different.
| Portfolio Managers’ Report | Voya Index Solution 2055 Portfolio |
| | | Average Annual Total Returns for the Periods Ended December 31, 2021 | | |
| | | | | | 1 Year | | | 5 Year | | | 10 year | | |
| | | Class ADV | | | | | 17.32% | | | | | | 12.98% | | | | | | 11.39% | | | |
| | | Class I | | | | | 17.95% | | | | | | 13.56% | | | | | | 11.95% | | | |
| | | Class S | | | | | 17.64% | | | | | | 13.27% | | | | | | 11.68% | | | |
| | | Class S2 | | | | | 17.43% | | | | | | 13.10% | | | | | | 11.51% | | | |
| | | Class Z(1) | | | | | 18.19% | | | | | | 13.82% | | | | | | 12.11% | | | |
| | | S&P Target Date 2055 Index | | | | | 18.19% | | | | | | 13.18% | | | | | | 12.00% | | | |
| | | | | |
Based on a $10,000 initial investment, the graph and table above illustrate the total return of Voya Index Solution 2055 Portfolio against the index indicated. The index is unmanaged and has no cash in its portfolio and imposes no sales charges. An investor cannot invest directly in an index.
The Portfolio’s performance is shown without the imposition of any expenses or charges which are, or may be, imposed under your variable annuity contract or variable life insurance policy. Total returns would have been lower if such expenses or charges were included.
The performance graph and table do not reflect the deduction of taxes that a shareholder will pay on Portfolio distributions or the redemption of Portfolio shares.
The performance shown includes, if applicable, the effect of fee waivers and/or expense reimbursements by the Investment Adviser and/or other service providers, which have the effect of increasing total return. Had all fees and expenses been considered, the total returns would have been lower.
The performance update illustrates performance for a variable investment option available through a variable annuity contract or a variable life insurance policy. The performance shown indicates past performance and is not a projection or prediction of future results. Actual investment returns and principal value will fluctuate so that shares and/or units, at redemption, may be worth more or less than their original cost. Please log on to www.voyainvestments.com or call (800) 262-3862 to get performance through the most recent month end.
Portfolio holdings are subject to change daily.
(1)
Class Z incepted on May 1, 2015. The Class Z shares performance shown for the period prior to their inception date is the performance of Class I shares without adjustment for any differences in the expenses between the two classes. If adjusted for such differences, returns would be different.
| Voya Index Solution 2060 Portfolio | Portfolio Managers’ Report |
| | | Average Annual Total Returns for the Periods Ended December 31, 2021 | | |
| | | | | | 1 Year | | | 5 Year | | | Since Inception
of Classes ADV, I, and S
February 9, 2015 | | |
| | | Class ADV | | | | | 17.65% | | | | | | 13.12% | | | | 10.19% | | |
| | | Class I | | | | | 18.18% | | | | | | 13.69% | | | | 10.74% | | |
| | | Class S | | | | | 17.96% | | | | | | 13.39% | | | | 10.45% | | |
| | | Class S2 | | | | | 17.78% | | | | | | 13.23% | | | | 10.28% | | |
| | | Class Z(1) | | | | | 18.50% | | | | | | 13.92% | | | | 10.95% | | |
| | | S&P Target Date 2060+ Index | | | | | 18.05% | | | | | | 13.28% | | | | 10.78% | | |
| | | | | |
Based on a $10,000 initial investment, the graph and table above illustrate the total return of Voya Index Solution 2060 Portfolio against the index indicated. The index is unmanaged and has no cash in its portfolio and imposes no sales charges. An investor cannot invest directly in an index.
The Portfolio’s performance is shown without the imposition of any expenses or charges which are, or may be, imposed under your variable annuity contract or variable life insurance policy. Total returns would have been lower if such expenses or charges were included.
The performance graph and table do not reflect the deduction of taxes that a shareholder will pay on Portfolio distributions or the redemption of Portfolio shares.
The performance shown includes, if applicable, the effect of fee waivers and/or expense reimbursements by the Investment Adviser and/or other service providers, which have the effect of increasing total return. Had all fees and expenses been considered, the total returns would have been lower.
The performance update illustrates performance for a variable investment option available through a variable annuity contract or a variable life insurance policy. The performance shown indicates past performance and is not a projection or prediction of future results. Actual investment returns and principal value will fluctuate so that shares and/or units, at redemption, may be worth more or less than their original cost. Please log on to www.voyainvestments.com or call (800) 262-3862 to get performance through the most recent month end.
Portfolio holdings are subject to change daily.
(1)
Class Z incepted on May 1, 2015. The Class Z shares performance shown for the period prior to their inception date is the performance of Class I shares without adjustment for any differences in the expenses between the two classes. If adjusted for such differences, returns would be different.
| Portfolio Managers’ Report | Voya Index Solution 2065 Portfolio |
| | | Average Annual Total Returns for the Period Ended December 31, 2021 | | |
| | | | | | 1 Year | | | Since Inception
of Classes ADV, I, S, S2 and Z
July 29, 2020 | | |
| | | Class ADV | | | | | 17.74% | | | | 24.98% | | |
| | | Class I | | | | | 18.45% | | | | 25.63% | | |
| | | Class S | | | | | 18.08% | | | | 25.30% | | |
| | | Class S2 | | | | | 17.87% | | | | 25.06% | | |
| | | Class Z | | | | | 18.69% | | | | 25.89% | | |
| | | S&P Target Date 2060+ Index | | | | | 18.05% | | | | 24.81% | | |
| | | | | |
Based on a $10,000 initial investment, the graph and table above illustrate the total return of Voya Index Solution 2065 Portfolio against the index indicated. The index is unmanaged and has no cash in its portfolio and imposes no sales charges. An investor cannot invest directly in an index.
The Portfolio’s performance is shown without the imposition of any expenses or charges which are, or may be, imposed under your variable annuity contract or variable life insurance policy. Total returns would have been lower if such expenses or charges were included.
The performance graph and table do not reflect the deduction of taxes that a shareholder will pay on Portfolio distributions or the redemption of Portfolio shares.
The performance shown includes, if applicable, the effect of fee waivers and/or expense reimbursements by the Investment Adviser and/or other service providers, which have the effect of increasing total return. Had all fees and expenses been considered, the total returns would have been lower.
It is important to note that the Fund has a limited operating history. Performance over a longer period of time may be more meaningful than short-term performance. The performance update illustrates performance for a variable investment option available through a variable annuity contract or a variable life insurance policy. The performance shown indicates past performance and is not a projection or prediction of future results. Actual investment returns and principal value will fluctuate so that shares and/or units, at redemption, may be worth more or less than their original cost. Please log on to www.voyainvestments.com or call (800) 262-3862 to get performance through the most recent month end.
Portfolio holdings are subject to change daily.
Shareholder Expense Examples (Unaudited)
As a shareholder of a Portfolio, you incur two types of costs: (1) transaction costs, including redemption fees and exchange fees; and (2) ongoing costs including management fees, distribution and/or service (12b-1) fees, and other Portfolio expenses. These Examples are intended to help you understand your ongoing costs (in dollars) of investing in a Portfolio and to compare these costs with the ongoing costs of investing in other mutual funds.
The Examples are based on an investment of $1,000 invested at the beginning of the period and held for the entire period from July 1, 2021 to December 31, 2021. The Portfolios’ expenses are shown without the imposition of any charges which are, or may be, imposed under your variable annuity contract, variable life insurance policy, qualified pension or retirement plan. Expenses would have been higher if such charges were included.
Actual Expenses
The left section of the table shown below, “Actual Portfolio Return,” provides information about actual account values and actual expenses. You may use the information in this section, together with the amount you invested, to estimate the expenses that you paid over the period. Simply divide your account value by $1,000 (for example, an $8,600 account value divided by $1,000 = 8.6), then multiply the result by the number in the first section under the heading entitled “Expenses Paid During the Period” to estimate the expenses you paid on your account during this period.
Hypothetical Example for Comparison Purposes
The right section of the table shown below, “Hypothetical (5% return before expenses),” provides information about hypothetical account values and hypothetical expenses based on a Portfolio’s actual expense ratio and an assumed rate of return of 5% per year before expenses, which is not a Portfolio’s actual return. The hypothetical account values and expenses may not be used to estimate the actual ending account balance or expenses you paid for the period. You may use this information to compare the ongoing costs of investing in a Portfolio and other mutual funds. To do so, compare this 5% hypothetical example with the 5% hypothetical examples that appear in the shareholder reports of the other mutual funds.
Please note that the expenses shown in the table are meant to highlight your ongoing costs only and do not reflect any transactional costs, such as redemption fees or exchange fees. Therefore, the hypothetical section of the table is useful in comparing ongoing costs only, and will not help you determine the relative total costs of owning different mutual funds. In addition, if these transactional costs were included, your costs would have been higher.
| | | | Actual Portfolio Return | | | Hypothetical (5% return before expenses) | |
| | | | Beginning
Account
Value
July 1,
2021 | | | Ending
Account
Value
December 31,
2021 | | | Annualized
Expense
Ratio* | | | Expenses Paid
During the
Period Ended
December 31,
2021** | | | Beginning
Account
Value
July 1,
2021 | | | Ending
Account
Value
December 31,
2021 | | | Annualized
Expense
Ratio* | | | Expenses Paid
During the
Period Ended
December 31,
2021** | |
| Voya Index Solution Income Portfolio | |
| Class ADV | | | | $ | 1,000.00 | | | | | $ | 1,022.70 | | | | | | 0.74% | | | | | $ | 3.77 | | | | | $ | 1,000.00 | | | | | $ | 1,021.48 | | | | | | 0.74% | | | | | $ | 3.77 | | |
| Class I | | | | | 1,000.00 | | | | | | 1,024.70 | | | | | | 0.24 | | | | | | 1.22 | | | | | | 1,000.00 | | | | | | 1,024.00 | | | | | | 0.24 | | | | | | 1.22 | | |
| Class S | | | | | 1,000.00 | | | | | | 1,023.30 | | | | | | 0.49 | | | | | | 2.50 | | | | | | 1,000.00 | | | | | | 1,022.74 | | | | | | 0.49 | | | | | | 2.50 | | |
| Class S2 | | | | | 1,000.00 | | | | | | 1,022.20 | | | | | | 0.64 | | | | | | 3.26 | | | | | | 1,000.00 | | | | | | 1,021.98 | | | | | | 0.64 | | | | | | 3.26 | | |
| Class Z | | | | | 1,000.00 | | | | | | 1,025.60 | | | | | | 0.00 | | | | | | 0.00 | | | | | | 1,000.00 | | | | | | 1,025.21 | | | | | | 0.00 | | | | | | 0.00 | | |
| Voya Index Solution 2025 Portfolio | |
| Class ADV | | | | $ | 1,000.00 | | | | | $ | 1,032.70 | | | | | | 0.74% | | | | | $ | 3.79 | | | | | $ | 1,000.00 | | | | | $ | 1,021.48 | | | | | | 0.74% | | | | | $ | 3.77 | | |
| Class I | | | | | 1,000.00 | | | | | | 1,034.40 | | | | | | 0.24 | | | | | | 1.23 | | | | | | 1,000.00 | | | | | | 1,024.00 | | | | | | 0.24 | | | | | | 1.22 | | |
| Class S | | | | | 1,000.00 | | | | | | 1,033.40 | | | | | | 0.49 | | | | | | 2.51 | | | | | | 1,000.00 | | | | | | 1,022.74 | | | | | | 0.49 | | | | | | 2.50 | | |
| Class S2 | | | | | 1,000.00 | | | | | | 1,032.80 | | | | | | 0.64 | | | | | | 3.28 | | | | | | 1,000.00 | | | | | | 1,021.98 | | | | | | 0.64 | | | | | | 3.26 | | |
| Class Z | | | | | 1,000.00 | | | | | | 1,036.00 | | | | | | 0.00 | | | | | | 0.00 | | | | | | 1,000.00 | | | | | | 1,025.21 | | | | | | 0.00 | | | | | | 0.00 | | |
| Voya Index Solution 2030 Portfolio | |
| Class ADV | | | | $ | 1,000.00 | | | | | $ | 1,036.20 | | | | | | 0.74% | | | | | $ | 3.80 | | | | | $ | 1,000.00 | | | | | $ | 1,021.48 | | | | | | 0.74% | | | | | $ | 3.77 | | |
| Class I | | | | | 1,000.00 | | | | | | 1,039.30 | | | | | | 0.24 | | | | | | 1.23 | | | | | | 1,000.00 | | | | | | 1,024.00 | | | | | | 0.24 | | | | | | 1.22 | | |
| Class S | | | | | 1,000.00 | | | | | | 1,038.20 | | | | | | 0.49 | | | | | | 2.52 | | | | | | 1,000.00 | | | | | | 1,022.74 | | | | | | 0.49 | | | | | | 2.50 | | |
| Class S2 | | | | | 1,000.00 | | | | | | 1,037.60 | | | | | | 0.64 | | | | | | 3.29 | | | | | | 1,000.00 | | | | | | 1,021.98 | | | | | | 0.64 | | | | | | 3.26 | | |
| Class Z | | | | | 1,000.00 | | | | | | 1,040.60 | | | | | | 0.00 | | | | | | 0.00 | | | | | | 1,000.00 | | | | | | 1,025.21 | | | | | | 0.00 | | | | | | 0.00 | | |
Shareholder Expense Examples (Unaudited) (continued)
| | | | Actual Portfolio Return | | | Hypothetical (5% return before expenses) | |
| | | | Beginning
Account
Value
July 1,
2021 | | | Ending
Account
Value
December 31,
2021 | | | Annualized
Expense
Ratio* | | | Expenses Paid
During the
Period Ended
December 31,
2021** | | | Beginning
Account
Value
July 1,
2021 | | | Ending
Account
Value
December 31,
2021 | | | Annualized
Expense
Ratio* | | | Expenses Paid
During the
Period Ended
December 31,
2021** | |
| Voya Index Solution 2035 Portfolio | |
| Class ADV | | | | $ | 1,000.00 | | | | | $ | 1,039.00 | | | | | | 0.74% | | | | | $ | 3.80 | | | | | $ | 1,000.00 | | | | | $ | 1,021.48 | | | | | | 0.74% | | | | | $ | 3.77 | | |
| Class I | | | | | 1,000.00 | | | | | | 1,042.00 | | | | | | 0.24 | | | | | | 1.24 | | | | | | 1,000.00 | | | | | | 1,024.00 | | | | | | 0.24 | | | | | | 1.22 | | |
| Class S | | | | | 1,000.00 | | | | | | 1,041.00 | | | | | | 0.49 | | | | | | 2.52 | | | | | | 1,000.00 | | | | | | 1,022.74 | | | | | | 0.49 | | | | | | 2.50 | | |
| Class S2 | | | | | 1,000.00 | | | | | | 1,039.60 | | | | | | 0.64 | | | | | | 3.29 | | | | | | 1,000.00 | | | | | | 1,021.98 | | | | | | 0.64 | | | | | | 3.26 | | |
| Class Z | | | | | 1,000.00 | | | | | | 1,043.40 | | | | | | 0.00 | | | | | | 0.00 | | | | | | 1,000.00 | | | | | | 1,025.21 | | | | | | 0.00 | | | | | | 0.00 | | |
| Voya Index Solution 2040 Portfolio | |
| Class ADV | | | | $ | 1,000.00 | | | | | $ | 1,046.40 | | | | | | 0.74% | | | | | $ | 3.82 | | | | | $ | 1,000.00 | | | | | $ | 1,021.48 | | | | | | 0.74% | | | | | $ | 3.77 | | |
| Class I | | | | | 1,000.00 | | | | | | 1,049.00 | | | | | | 0.24 | | | | | | 1.24 | | | | | | 1,000.00 | | | | | | 1,024.00 | | | | | | 0.24 | | | | | | 1.22 | | |
| Class S | | | | | 1,000.00 | | | | | | 1,047.70 | | | | | | 0.49 | | | | | | 2.53 | | | | | | 1,000.00 | | | | | | 1,022.74 | | | | | | 0.49 | | | | | | 2.50 | | |
| Class S2 | | | | | 1,000.00 | | | | | | 1,046.70 | | | | | | 0.64 | | | | | | 3.30 | | | | | | 1,000.00 | | | | | | 1,021.98 | | | | | | 0.64 | | | | | | 3.26 | | |
| Class Z | | | | | 1,000.00 | | | | | | 1,050.30 | | | | | | 0.00 | | | | | | 0.00 | | | | | | 1,000.00 | | | | | | 1,025.21 | | | | | | 0.00 | | | | | | 0.00 | | |
| Voya Index Solution 2045 Portfolio | |
| Class ADV | | | | $ | 1,000.00 | | | | | $ | 1,050.20 | | | | | | 0.74% | | | | | $ | 3.82 | | | | | $ | 1,000.00 | | | | | $ | 1,021.48 | | | | | | 0.74% | | | | | $ | 3.77 | | |
| Class I | | | | | 1,000.00 | | | | | | 1,052.80 | | | | | | 0.24 | | | | | | 1.24 | | | | | | 1,000.00 | | | | | | 1,024.00 | | | | | | 0.24 | | | | | | 1.22 | | |
| Class S | | | | | 1,000.00 | | | | | | 1,051.70 | | | | | | 0.49 | | | | | | 2.53 | | | | | | 1,000.00 | | | | | | 1,022.74 | | | | | | 0.49 | | | | | | 2.50 | | |
| Class S2 | | | | | 1,000.00 | | | | | | 1,050.60 | | | | | | 0.64 | | | | | | 3.31 | | | | | | 1,000.00 | | | | | | 1,021.98 | | | | | | 0.64 | | | | | | 3.26 | | |
| Class Z | | | | | 1,000.00 | | | | | | 1,054.20 | | | | | | 0.00 | | | | | | 0.00 | | | | | | 1,000.00 | | | | | | 1,025.21 | | | | | | 0.00 | | | | | | 0.00 | | |
| Voya Index Solution 2050 Portfolio | |
| Class ADV | | | | $ | 1,000.00 | | | | | $ | 1,049.70 | | | | | | 0.74% | | | | | $ | 3.82 | | | | | $ | 1,000.00 | | | | | $ | 1,021.48 | | | | | | 0.74% | | | | | $ | 3.77 | | |
| Class I | | | | | 1,000.00 | | | | | | 1,052.30 | | | | | | 0.24 | | | | | | 1.24 | | | | | | 1,000.00 | | | | | | 1,024.00 | | | | | | 0.24 | | | | | | 1.22 | | |
| Class S | | | | | 1,000.00 | | | | | | 1,051.10 | | | | | | 0.49 | | | | | | 2.53 | | | | | | 1,000.00 | | | | | | 1,022.74 | | | | | | 0.49 | | | | | | 2.50 | | |
| Class S2 | | | | | 1,000.00 | | | | | | 1,050.30 | | | | | | 0.64 | | | | | | 3.31 | | | | | | 1,000.00 | | | | | | 1,021.98 | | | | | | 0.64 | | | | | | 3.26 | | |
| Class Z | | | | | 1,000.00 | | | | | | 1,053.90 | | | | | | 0.00 | | | | | | 0.00 | | | | | | 1,000.00 | | | | | | 1,025.21 | | | | | | 0.00 | | | | | | 0.00 | | |
| Voya Index Solution 2055 Portfolio | |
| Class ADV | | | | $ | 1,000.00 | | | | | $ | 1,050.00 | | | | | | 0.74% | | | | | $ | 3.82 | | | | | $ | 1,000.00 | | | | | $ | 1,021.48 | | | | | | 0.74% | | | | | $ | 3.77 | | |
| Class I | | | | | 1,000.00 | | | | | | 1,052.80 | | | | | | 0.24 | | | | | | 1.24 | | | | | | 1,000.00 | | | | | | 1,024.00 | | | | | | 0.24 | | | | | | 1.22 | | |
| Class S | | | | | 1,000.00 | | | | | | 1,051.20 | | | | | | 0.49 | | | | | | 2.53 | | | | | | 1,000.00 | | | | | | 1,022.74 | | | | | | 0.49 | | | | | | 2.50 | | |
| Class S2 | | | | | 1,000.00 | | | | | | 1,050.40 | | | | | | 0.64 | | | | | | 3.31 | | | | | | 1,000.00 | | | | | | 1,021.98 | | | | | | 0.64 | | | | | | 3.26 | | |
| Class Z | | | | | 1,000.00 | | | | | | 1,053.90 | | | | | | 0.00 | | | | | | 0.00 | | | | | | 1,000.00 | | | | | | 1,025.21 | | | | | | 0.00 | | | | | | 0.00 | | |
| Voya Index Solution 2060 Portfolio | |
| Class ADV | | | | $ | 1,000.00 | | | | | $ | 1,051.40 | | | | | | 0.74% | | | | | $ | 3.83 | | | | | $ | 1,000.00 | | | | | $ | 1,021.48 | | | | | | 0.74% | | | | | $ | 3.77 | | |
| Class I | | | | | 1,000.00 | | | | | | 1,053.50 | | | | | | 0.24 | | | | | | 1.24 | | | | | | 1,000.00 | | | | | | 1,024.00 | | | | | | 0.24 | | | | | | 1.22 | | |
| Class S | | | | | 1,000.00 | | | | | | 1,052.00 | | | | | | 0.49 | | | | | | 2.53 | | | | | | 1,000.00 | | | | | | 1,022.74 | | | | | | 0.49 | | | | | | 2.50 | | |
| Class S2 | | | | | 1,000.00 | | | | | | 1,051.90 | | | | | | 0.64 | | | | | | 3.31 | | | | | | 1,000.00 | | | | | | 1,021.98 | | | | | | 0.64 | | | | | | 3.26 | | |
| Class Z | | | | | 1,000.00 | | | | | | 1,055.10 | | | | | | 0.00 | | | | | | 0.00 | | | | | | 1,000.00 | | | | | | 1,025.21 | | | | | | 0.00 | | | | | | 0.00 | | |
| Voya Index Solution 2065 Portfolio | |
| Class ADV | | | | $ | 1,000.00 | | | | | $ | 1,052.10 | | | | | | 0.74% | | | | | $ | 3.83 | | | | | $ | 1,000.00 | | | | | $ | 1,021.48 | | | | | | 0.74% | | | | | $ | 3.77 | | |
| Class I | | | | | 1,000.00 | | | | | | 1,055.10 | | | | | | 0.24 | | | | | | 1.24 | | | | | | 1,000.00 | | | | | | 1,024.00 | | | | | | 0.24 | | | | | | 1.22 | | |
| Class S | | | | | 1,000.00 | | | | | | 1,053.40 | | | | | | 0.49 | | | | | | 2.54 | | | | | | 1,000.00 | | | | | | 1,022.74 | | | | | | 0.49 | | | | | | 2.50 | | |
| Class S2 | | | | | 1,000.00 | | | | | | 1,052.30 | | | | | | 0.64 | | | | | | 3.31 | | | | | | 1,000.00 | | | | | | 1,021.98 | | | | | | 0.64 | | | | | | 3.26 | | |
| Class Z | | | | | 1,000.00 | | | | | | 1,056.50 | | | | | | 0.00 | | | | | | 0.00 | | | | | | 1,000.00 | | | | | | 1,025.21 | | | | | | 0.00 | | | | | | 0.00 | | |
*
The annualized expense ratios do not include expenses of underlying funds.
**
Expenses are equal to each Portfolio’s respective annualized expense ratios multiplied by the average account value over the period, multiplied by 184/365 to reflect the most recent fiscal half-year
REPORT OF INDEPENDENT REGISTERED PUBLIC ACCOUNTING FIRM
To the Shareholders of Voya Index Solution Income Portfolio, Voya Index Solution 2025 Portfolio, Voya Index Solution 2030 Portfolio, Voya Index Solution 2035 Portfolio, Voya Index Solution 2040 Portfolio, Voya Index Solution 2045 Portfolio, Voya Index Solution 2050 Portfolio, Voya Index Solution 2055 Portfolio, Voya Index Solution 2060 Portfolio and Voya Index Solution 2065 Portfolio and the Board of Directors of Voya Partners, Inc.
Opinion on the Financial Statements
We have audited the accompanying statements of assets and liabilities of Voya Index Solution Income Portfolio, Voya Index Solution 2025 Portfolio, Voya Index Solution 2030 Portfolio, Voya Index Solution 2035 Portfolio, Voya Index Solution 2040 Portfolio, Voya Index Solution 2045 Portfolio, Voya Index Solution 2050 Portfolio, Voya Index Solution 2055 Portfolio, Voya Index Solution 2060 Portfolio and Voya Index Solution 2065 Portfolio (collectively referred to as the “Portfolios”) (ten of the portfolios constituting Voya Partners, Inc. (the “Company”)), including the portfolios of investments, as of December 31, 2021, and the related statements of operations and changes in net assets and the financial highlights for each of the periods indicated in the table below and the related notes (collectively referred to as the “financial statements”). In our opinion, the financial statements present fairly, in all material respects, the financial position of the Portfolios (ten of the portfolios constituting Voya Partners, Inc.) at December 31, 2021, and the results of their operations, the changes in their net assets and their financial highlights for each of the periods indicated in the table below, in conformity with U.S. generally accepted accounting principles.
| Individual portfolio constituting Voya Partners, Inc. | | | Statement of Operations | | | Statements of changes in
net assets | | | Financial highlights | | |
| Voya Index Solution Income Portfolio | | | For the year ended December 31, 2021 | | | For each of the two years in the period ended December 31, 2021 | | | | |
| Voya Index Solution 2025 Portfolio | | | For the year ended December 31, 2021 | | | For each of the two years in the period ended December 31, 2021 | | | | |
| Voya Index Solution 2030 Portfolio | | | For the year ended December 31, 2021 | | | For each of the two years in the period ended December 31, 2021 | | | | |
| Voya Index Solution 2035 Portfolio | | | For the year ended December 31, 2021 | | | For each of the two years in the period ended December 31, 2021 | | | | |
| Voya Index Solution 2040 Portfolio | | | For the year ended December 31, 2021 | | | For each of the two years in the period ended December 31, 2021 | | | | |
| Voya Index Solution 2045 Portfolio | | | For the year ended December 31, 2021 | | | For each of the two years in the period ended December 31, 2021 | | | | |
| Voya Index Solution 2050 Portfolio | | | For the year ended December 31, 2021 | | | For each of the two years in the period ended December 31, 2021 | | | | |
| Voya Index Solution 2055 Portfolio | | | For the year ended December 31, 2021 | | | For each of the two years in the period ended December 31, 2021 | | | | |
| Voya Index Solution 2060 Portfolio | | | For the year ended December 31, 2021 | | | For each of the two years in the period ended December 31, 2021 | | | | |
| Voya Index Solution 2065 Portfolio | | | For the year ended December 31, 2021 | | | For the year ended December 31, 2021 and the period from July 29, 2020
(commencement of operations) through December 31, 2020 | | | | |
The financial highlights for each of the periods in the three-year period ended December 31, 2019, were audited by another independent registered public accounting firm whose report, dated February 26, 2020, expressed an unqualified opinion on those financial highlights.
REPORT OF INDEPENDENT REGISTERED PUBLIC ACCOUNTING FIRM
Basis for Opinion
These financial statements are the responsibility of the Company’s management. Our responsibility is to express an opinion on the Portfolios’ financial statements based on our audits. We are a public accounting firm registered with the Public Company Accounting Oversight Board (United States) (“PCAOB”) and are required to be independent with respect to the Company in accordance with the U.S. federal securities laws and the applicable rules and regulations of the Securities and Exchange Commission and the PCAOB.
We conducted our audits in accordance with the standards of the PCAOB. Those standards require that we plan and perform the audits to obtain reasonable assurance about whether the financial statements are free of material misstatement, whether due to error or fraud. The Company is not required to have, nor were we engaged to perform, an audit of the Company’s internal control over financial reporting. As part of our audits, we are required to obtain an understanding of internal control over financial reporting, but not for the purpose of expressing an opinion on the effectiveness of the Company’s internal control over financial reporting. Accordingly, we express no such opinion.
Our audits included performing procedures to assess the risks of material misstatement of the financial statements, whether due to error or fraud, and performing procedures that respond to those risks. Such procedures included examining, on a test basis, evidence regarding the amounts and disclosures in the financial statements. Our procedures included confirmation of securities owned as of December 31, 2021, by correspondence with the custodian and others or by other appropriate auditing procedures where replies from others were not received. Our audits also included evaluating the accounting principles used and significant estimates made by management, as well as evaluating the overall presentation of the financial statements. We believe that our audits provide a reasonable basis for our opinion.
We have served as the auditor of one or more Voya investment companies since 2019.
Boston, Massachusetts
February 24, 2022
STATEMENTS OF ASSETS AND LIABILITIES as of December 31, 2021
| | | | Voya Index
Solution Income
Portfolio | | | Voya Index
Solution 2025
Portfolio | | | Voya Index
Solution 2030
Portfolio | | | Voya Index
Solution 2035
Portfolio | |
| ASSETS: | | | | | | | | | | | | | | | | | | | | | | | | | |
| Investments in affiliated underlying funds at fair value* | | | | $ | 769,481,817 | | | | | $ | 1,146,744,992 | | | | | $ | 812,043,699 | | | | | $ | 1,382,217,515 | | |
| Investments in unaffiliated underlying funds at fair value** | | | | | 114,512,360 | | | | | | 119,455,859 | | | | | | 82,854,756 | | | | | | 86,648,250 | | |
| Investments in affiliated funding agreements*** | | | | | 46,268,502 | | | | | | 66,219,843 | | | | | | 46,784,734 | | | | | | — | | |
| Short-term investments at fair value† | | | | | 1,856,949 | | | | | | — | | | | | | — | | | | | | — | | |
| Cash | | | | | — | | | | | | 2,394,220 | | | | | | 1,742,489 | | | | | | 2,229,494 | | |
| Receivables: | | | | | | | | | | | | | | | | | | | | | | | | | |
| Investments in affiliated underlying funds sold | | | | | 7,570,432 | | | | | | 5,680,147 | | | | | | 1,063,548 | | | | | | 3,428,003 | | |
| Fund shares sold | | | | | 126,415 | | | | | | 146,427 | | | | | | 32,593 | | | | | | 486,548 | | |
| Dividends | | | | | — | | | | | | 22,437 | | | | | | 15,634 | | | | | | 24,684 | | |
| Prepaid expenses | | | | | 89 | | | | | | 110 | | | | | | 69 | | | | | | 114 | | |
| Reimbursement due from Investment Adviser | | | | | 128,931 | | | | | | 170,036 | | | | | | 152,479 | | | | | | 218,866 | | |
| Other assets | | | | | 22,290 | | | | | | 26,144 | | | | | | 9,388 | | | | | | 23,863 | | |
| Total assets | | | | | 939,967,785 | | | | | | 1,340,860,215 | | | | | | 944,699,389 | | | | | | 1,475,277,337 | | |
| LIABILITIES: | | | | | | | | | | | | | | | | | | | | | | | | | |
| Payable for fund shares redeemed | | | | | 7,696,847 | | | | | | 5,826,575 | | | | | | 1,096,141 | | | | | | 3,914,551 | | |
| Payable for investment management fees | | | | | 178,372 | | | | | | 245,331 | | | | | | 172,290 | | | | | | 260,971 | | |
| Payable for distribution and shareholder service fees | | | | | 76,149 | | | | | | 116,068 | | | | | | 28,364 | | | | | | 109,073 | | |
| Payable for directors fees | | | | | 4,822 | | | | | | 6,531 | | | | | | 4,380 | | | | | | 6,956 | | |
| Payable to directors under the deferred compensation plan (Note 6) | | | | | 22,290 | | | | | | 26,144 | | | | | | 9,388 | | | | | | 23,863 | | |
| Other accrued expenses and liabilities | | | | | 110,806 | | | | | | 124,981 | | | | | | 63,263 | | | | | | 129,705 | | |
| Total liabilities | | | | | 8,089,286 | | | | | | 6,345,630 | | | | | | 1,373,826 | | | | | | 4,445,119 | | |
| NET ASSETS | | | | $ | 931,878,499 | | | | | $ | 1,334,514,585 | | | | | $ | 943,325,563 | | | | | $ | 1,470,832,218 | | |
| NET ASSETS WERE COMPRISED OF: | | | | | | | | | | | | | | | | | | | | | | | | | |
| Paid-in capital | | | | $ | 805,889,678 | | | | | $ | 1,081,695,047 | | | | | $ | 757,078,646 | | | | | $ | 1,137,580,979 | | |
| Total distributable earnings | | | | | 125,988,821 | | | | | | 252,819,538 | | | | | | 186,246,917 | | | | | | 333,251,239 | | |
| NET ASSETS | | | | $ | 931,878,499 | | | | | $ | 1,334,514,585 | | | | | $ | 943,325,563 | | | | | $ | 1,470,832,218 | | |
*
Cost of investments in affiliated underlying funds | | | | $ | 722,055,740 | | | | | $ | 1,009,733,441 | | | | | $ | 708,232,669 | | | | | $ | 1,194,350,035 | | |
**
Cost of investments in unaffiliated underlying funds | | | | $ | 110,015,736 | | | | | $ | 117,436,651 | | | | | $ | 81,727,719 | | | | | $ | 84,348,759 | | |
***
Cost of investments in affiliated funding agreements | | | | $ | 46,026,709 | | | | | $ | 65,874,597 | | | | | $ | 46,543,459 | | | | | $ | — | | |
†
Cost of short-term investments | | | | $ | 1,856,949 | | | | | $ | — | | | | | $ | — | | | | | $ | — | | |
See Accompanying Notes to Financial Statements
STATEMENTS OF ASSETS AND LIABILITIES as of December 31, 2021 (continued)
| | | | Voya Index
Solution Income
Portfolio | | | Voya Index
Solution 2025
Portfolio | | | Voya Index
Solution 2030
Portfolio | | | Voya Index
Solution 2035
Portfolio | |
| Class ADV | | | | | | | | | | | | | | | | | | | | | | | | | |
| Net assets | | | | $ | 96,648,970 | | | | | $ | 176,976,490 | | | | | $ | 46,914,684 | | | | | $ | 169,629,149 | | |
| Shares authorized | | | | | 100,000,000 | | | | | | 100,000,000 | | | | | | 100,000,000 | | | | | | 100,000,000 | | |
| Par value | | | | $ | 0.001 | | | | | $ | 0.001 | | | | | $ | 0.001 | | | | | $ | 0.001 | | |
| Shares outstanding | | | | | 8,442,701 | | | | | | 14,127,960 | | | | | | 2,553,222 | | | | | | 12,477,476 | | |
| Net asset value and redemption price per share | | | | $ | 11.45 | | | | | $ | 12.53 | | | | | $ | 18.37 | | | | | $ | 13.59 | | |
| Class I | | | | | | | | | | | | | | | | | | | | | | | | | |
| Net assets | | | | $ | 15,866,905 | | | | | $ | 53,067,472 | | | | | $ | 10,579,173 | | | | | $ | 60,968,762 | | |
| Shares authorized | | | | | 100,000,000 | | | | | | 100,000,000 | | | | | | 100,000,000 | | | | | | 100,000,000 | | |
| Par value | | | | $ | 0.001 | | | | | $ | 0.001 | | | | | $ | 0.001 | | | | | $ | 0.001 | | |
| Shares outstanding | | | | | 1,346,931 | | | | | | 4,119,132 | | | | | | 556,160 | | | | | | 4,345,344 | | |
| Net asset value and redemption price per share | | | | $ | 11.78 | | | | | $ | 12.88 | | | | | $ | 19.02 | | | | | $ | 14.03 | | |
| Class S | | | | | | | | | | | | | | | | | | | | | | | | | |
| Net assets | | | | $ | 131,693,855 | | | | | $ | 134,628,596 | | | | | $ | 20,843,092 | | | | | $ | 114,671,358 | | |
| Shares authorized | | | | | 100,000,000 | | | | | | 100,000,000 | | | | | | 100,000,000 | | | | | | 100,000,000 | | |
| Par value | | | | $ | 0.001 | | | | | $ | 0.001 | | | | | $ | 0.001 | | | | | $ | 0.001 | | |
| Shares outstanding | | | | | 11,301,211 | | | | | | 10,584,275 | | | | | | 1,105,941 | | | | | | 8,292,528 | | |
| Net asset value and redemption price per share | | | | $ | 11.65 | | | | | $ | 12.72 | | | | | $ | 18.85 | | | | | $ | 13.83 | | |
| Class S2 | | | | | | | | | | | | | | | | | | | | | | | | | |
| Net assets | | | | $ | 18,519,022 | | | | | $ | 36,074,153 | | | | | $ | 14,117,517 | | | | | $ | 40,800,786 | | |
| Shares authorized | | | | | 100,000,000 | | | | | | 100,000,000 | | | | | | 100,000,000 | | | | | | 100,000,000 | | |
| Par value | | | | $ | 0.001 | | | | | $ | 0.001 | | | | | $ | 0.001 | | | | | $ | 0.001 | | |
| Shares outstanding | | | | | 1,629,743 | | | | | | 2,898,028 | | | | | | 762,902 | | | | | | 3,012,467 | | |
| Net asset value and redemption price per share | | | | $ | 11.36 | | | | | $ | 12.45 | | | | | $ | 18.51 | | | | | $ | 13.54 | | |
| Class Z | | | | | | | | | | | | | | | | | | | | | | | | | |
| Net assets | | | | $ | 669,149,747 | | | | | $ | 933,767,874 | | | | | $ | 850,871,097 | | | | | $ | 1,084,762,163 | | |
| Shares authorized | | | | | 300,000,000 | | | | | | 300,000,000 | | | | | | 100,000,000 | | | | | | 300,000,000 | | |
| Par value | | | | $ | 0.001 | | | | | $ | 0.001 | | | | | $ | 0.001 | | | | | $ | 0.001 | | |
| Shares outstanding | | | | | 55,944,817 | | | | | | 71,361,506 | | | | | | 44,192,722 | | | | | | 76,017,192 | | |
| Net asset value and redemption price per share | | | | $ | 11.96 | | | | | $ | 13.09 | | | | | $ | 19.25 | | | | | $ | 14.27 | | |
See Accompanying Notes to Financial Statements
STATEMENTS OF ASSETS AND LIABILITIES as of December 31, 2021
| | | | Voya Index
Solution 2040
Portfolio | | | Voya Index
Solution 2045
Portfolio | | | Voya Index
Solution 2050
Portfolio | | | Voya Index
Solution 2055
Portfolio | |
| ASSETS: | | | | | | | | | | | | | | | | | | | | | | | | | |
| Investments in affiliated underlying funds at fair value* | | | | $ | 779,602,223 | | | | | $ | 1,082,730,142 | | | | | $ | 583,136,776 | | | | | $ | 608,574,307 | | |
| Investments in unaffiliated underlying funds at fair value** | | | | | 39,192,885 | | | | | | 43,798,260 | | | | | | 11,111,215 | | | | | | 11,622,114 | | |
| Cash | | | | | 1,175,699 | | | | | | 1,476,058 | | | | | | 695,160 | | | | | | 699,457 | | |
| Receivables: | | | | | | | | | | | | | | | | | | | | | | | | | |
| Investments in affiliated underlying funds sold | | | | | — | | | | | | 2,360,765 | | | | | | 125,325 | | | | | | 911,162 | | |
| Fund shares sold | | | | | 1,511,761 | | | | | | 62,124 | | | | | | 398,725 | | | | | | 130,245 | | |
| Dividends | | | | | 13,510 | | | | | | 18,814 | | | | | | 9,752 | | | | | | 10,202 | | |
| Prepaid expenses | | | | | 55 | | | | | | 82 | | | | | | 39 | | | | | | 42 | | |
| Reimbursement due from Investment Adviser | | | | | 153,779 | | | | | | 177,308 | | | | | | 101,798 | | | | | | 89,115 | | |
| Other assets | | | | | 6,828 | | | | | | 16,099 | | | | | | 4,560 | | | | | | 6,330 | | |
| Total assets | | | | | 821,656,740 | | | | | | 1,130,639,652 | | | | | | 595,583,350 | | | | | | 622,042,974 | | |
| LIABILITIES: | | | | | | | | | | | | | | | | | | | | | | | | | |
| Payable for investments in affiliated underlying funds purchased | | | | | 749,684 | | | | | | — | | | | | | — | | | | | | — | | |
| Payable for fund shares redeemed | | | | | 762,076 | | | | | | 2,422,889 | | | | | | 524,050 | | | | | | 1,041,407 | | |
| Payable for investment management fees | | | | | 142,575 | | | | | | 195,656 | | | | | | 100,363 | | | | | | 104,785 | | |
| Payable for distribution and shareholder service fees | | | | | 17,037 | | | | | | 83,228 | | | | | | 14,311 | | | | | | 42,410 | | |
| Payable for directors fees | | | | | 3,688 | | | | | | 5,227 | | | | | | 2,638 | | | | | | 2,782 | | |
| Payable to directors under the deferred compensation plan (Note 6) | | | | | 6,828 | | | | | | 16,099 | | | | | | 4,560 | | | | | | 6,330 | | |
| Other accrued expenses and liabilities | | | | | 48,181 | | | | | | 109,574 | | | | | | 46,078 | | | | | | 67,345 | | |
| Total liabilities | | | | | 1,730,069 | | | | | | 2,832,673 | | | | | | 692,000 | | | | | | 1,265,059 | | |
| NET ASSETS | | | | $ | 819,926,671 | | | | | $ | 1,127,806,979 | | | | | $ | 594,891,350 | | | | | $ | 620,777,915 | | |
| NET ASSETS WERE COMPRISED OF: | | | | | | | | | | | | | | | | | | | | | | | | | |
| Paid-in capital | | | | $ | 630,094,417 | | | | | $ | 836,508,122 | | | | | $ | 451,273,017 | | | | | $ | 467,461,495 | | |
| Total distributable earnings | | | | | 189,832,254 | | | | | | 291,298,857 | | | | | | 143,618,333 | | | | | | 153,316,420 | | |
| NET ASSETS | | | | $ | 819,926,671 | | | | | $ | 1,127,806,979 | | | | | $ | 594,891,350 | | | | | $ | 620,777,915 | | |
*
Cost of investments in affiliated underlying funds | | | | $ | 671,819,397 | | | | | $ | 915,480,138 | | | | | $ | 499,300,007 | | | | | $ | 518,874,366 | | |
**
Cost of investments in unaffiliated underlying funds | | | | $ | 38,644,471 | | | | | $ | 43,596,647 | | | | | $ | 11,745,627 | | | | | $ | 12,285,697 | | |
See Accompanying Notes to Financial Statements
STATEMENTS OF ASSETS AND LIABILITIES as of December 31, 2021 (continued)
| | | | Voya Index
Solution 2040
Portfolio | | | Voya Index
Solution 2045
Portfolio | | | Voya Index
Solution 2050
Portfolio | | | Voya Index
Solution 2055
Portfolio | |
| Class ADV | | | | | | | | | | | | | | | | | | | | | | | | | |
| Net assets | | | | $ | 28,988,955 | | | | | $ | 132,543,465 | | | | | $ | 23,790,857 | | | | | $ | 63,320,862 | | |
| Shares authorized | | | | | 100,000,000 | | | | | | 100,000,000 | | | | | | 100,000,000 | | | | | | 100,000,000 | | |
| Par value | | | | $ | 0.001 | | | | | $ | 0.001 | | | | | $ | 0.001 | | | | | $ | 0.001 | | |
| Shares outstanding | | | | | 1,412,796 | | | | | | 8,974,596 | | | | | | 1,117,341 | | | | | | 3,228,890 | | |
| Net asset value and redemption price per share | | | | $ | 20.52 | | | | | $ | 14.77 | | | | | $ | 21.29 | | | | | $ | 19.61 | | |
| Class I | | | | | | | | | | | | | | | | | | | | | | | | | |
| Net assets | | | | $ | 9,660,364 | | | | | $ | 54,109,610 | | | | | $ | 11,548,343 | | | | | $ | 42,496,188 | | |
| Shares authorized | | | | | 100,000,000 | | | | | | 100,000,000 | | | | | | 100,000,000 | | | | | | 100,000,000 | | |
| Par value | | | | $ | 0.001 | | | | | $ | 0.001 | | | | | $ | 0.001 | | | | | $ | 0.001 | | |
| Shares outstanding | | | | | 455,928 | | | | | | 3,520,774 | | | | | | 527,802 | | | | | | 2,103,784 | | |
| Net asset value and redemption price per share | | | | $ | 21.19 | | | | | $ | 15.37 | | | | | $ | 21.88 | | | | | $ | 20.20 | | |
| Class S | | | | | | | | | | | | | | | | | | | | | | | | | |
| Net assets | | | | $ | 16,775,358 | | | | | $ | 84,022,616 | | | | | $ | 15,697,905 | | | | | $ | 43,919,367 | | |
| Shares authorized | | | | | 100,000,000 | | | | | | 100,000,000 | | | | | | 100,000,000 | | | | | | 100,000,000 | | |
| Par value | | | | $ | 0.001 | | | | | $ | 0.001 | | | | | $ | 0.001 | | | | | $ | 0.001 | | |
| Shares outstanding | | | | | 794,461 | | | | | | 5,568,142 | | | | | | 720,711 | | | | | | 2,207,027 | | |
| Net asset value and redemption price per share | | | | $ | 21.12 | | | | | $ | 15.09 | | | | | $ | 21.78 | | | | | $ | 19.90 | | |
| Class S2 | | | | | | | | | | | | | | | | | | | | | | | | | |
| Net assets | | | | $ | 4,353,946 | | | | | $ | 29,627,581 | | | | | $ | 3,918,383 | | | | | $ | 20,878,142 | | |
| Shares authorized | | | | | 100,000,000 | | | | | | 100,000,000 | | | | | | 100,000,000 | | | | | | 100,000,000 | | |
| Par value | | | | $ | 0.001 | | | | | $ | 0.001 | | | | | $ | 0.001 | | | | | $ | 0.001 | | |
| Shares outstanding | | | | | 210,017 | | | | | | 2,006,741 | | | | | | 182,976 | | | | | | 1,061,340 | | |
| Net asset value and redemption price per share | | | | $ | 20.73 | | | | | $ | 14.76 | | | | | $ | 21.41 | | | | | $ | 19.67 | | |
| Class Z | | | | | | | | | | | | | | | | | | | | | | | | | |
| Net assets | | | | $ | 760,148,048 | | | | | $ | 827,503,707 | | | | | $ | 539,935,862 | | | | | $ | 450,163,356 | | |
| Shares authorized | | | | | 100,000,000 | | | | | | 100,000,000 | | | | | | 100,000,000 | | | | | | 100,000,000 | | |
| Par value | | | | $ | 0.001 | | | | | $ | 0.001 | | | | | $ | 0.001 | | | | | $ | 0.001 | | |
| Shares outstanding | | | | | 35,379,684 | | | | | | 52,992,435 | | | | | | 24,368,727 | | | | | | 21,946,430 | | |
| Net asset value and redemption price per share | | | | $ | 21.49 | | | | | $ | 15.62 | | | | | $ | 22.16 | | | | | $ | 20.51 | | |
See Accompanying Notes to Financial Statements
STATEMENTS OF ASSETS AND LIABILITIES as of December 31, 2021
| | | | Voya Index
Solution 2060
Portfolio | | | Voya Index
Solution 2065
Portfolio | |
| ASSETS: | | | | | | | | | | | | | |
| Investments in affiliated underlying funds at fair value* | | | | $ | 285,419,089 | | | | | $ | 20,834,549 | | |
| Investments in unaffiliated underlying funds at fair value** | | | | | 5,369,411 | | | | | | 349,590 | | |
| Cash | | | | | 349,066 | | | | | | 23,211 | | |
| Receivables: | | | | | | | | | | | | | |
| Investments in affiliated underlying funds sold | | | | | 117,320 | | | | | | — | | |
| Fund shares sold | | | | | 191,431 | | | | | | 62,525 | | |
| Dividends | | | | | 4,713 | | | | | | 307 | | |
| Prepaid expenses | | | | | 18 | | | | | | 2 | | |
| Reimbursement due from Investment Adviser | | | | | 39,006 | | | | | | 4,340 | | |
| Other assets | | | | | 1,505 | | | | | | 22 | | |
| Total assets | | | | | 291,491,559 | | | | | | 21,274,546 | | |
| LIABILITIES: | | | | | | | | | | | | | |
| Payable for investments in affiliated underlying funds purchased | | | | | — | | | | | | 41,351 | | |
| Payable for fund shares redeemed | | | | | 308,752 | | | | | | 21,174 | | |
| Payable for investment management fees | | | | | 48,865 | | | | | | 3,423 | | |
| Payable for distribution and shareholder service fees | | | | | 8,950 | | | | | | 1,144 | | |
| Payable for directors fees | | | | | 1,229 | | | | | | 61 | | |
| Payable to directors under the deferred compensation plan (Note 6) | | | | | 1,505 | | | | | | 22 | | |
| Other accrued expenses and liabilities | | | | | 38,047 | | | | | | 19,766 | | |
| Total liabilities | | | | | 407,348 | | | | | | 86,941 | | |
| NET ASSETS | | | | $ | 291,084,211 | | | | | $ | 21,187,605 | | |
| NET ASSETS WERE COMPRISED OF: | | | | | | | | | | | | | |
| Paid-in capital | | | | $ | 226,959,339 | | | | | $ | 20,373,446 | | |
| Total distributable earnings | | | | | 64,124,872 | | | | | | 814,159 | | |
| NET ASSETS | | | | $ | 291,084,211 | | | | | $ | 21,187,605 | | |
*
Cost of investments in affiliated underlying funds | | | | $ | 250,284,911 | | | | | $ | 20,084,764 | | |
**
Cost of investments in unaffiliated underlying funds | | | | $ | 5,675,986 | | | | | $ | 369,550 | | |
See Accompanying Notes to Financial Statements
STATEMENTS OF ASSETS AND LIABILITIES as of December 31, 2021 (continued)
| | | | Voya Index
Solution 2060
Portfolio | | | Voya Index
Solution 2065
Portfolio | |
| Class ADV | | | | | | | | | | | | | |
| Net assets | | | | $ | 15,085,467 | | | | | $ | 1,684,442 | | |
| Shares authorized | | | | | 100,000,000 | | | | | | 100,000,000 | | |
| Par value | | | | $ | 0.001 | | | | | $ | 0.001 | | |
| Shares outstanding | | | | | 893,343 | | | | | | 131,683 | | |
| Net asset value and redemption price per share | | | | $ | 16.89 | | | | | $ | 12.79 | | |
| Class I | | | | | | | | | | | | | |
| Net assets | | | | $ | 20,266,872 | | | | | $ | 1,418,890 | | |
| Shares authorized | | | | | 100,000,000 | | | | | | 100,000,000 | | |
| Par value | | | | $ | 0.001 | | | | | $ | 0.001 | | |
| Shares outstanding | | | | | 1,174,686 | | | | | | 110,717 | | |
| Net asset value and redemption price per share | | | | $ | 17.25 | | | | | $ | 12.82 | | |
| Class S | | | | | | | | | | | | | |
| Net assets | | | | $ | 9,659,489 | | | | | $ | 1,626,022 | | |
| Shares authorized | | | | | 100,000,000 | | | | | | 100,000,000 | | |
| Par value | | | | $ | 0.001 | | | | | $ | 0.001 | | |
| Shares outstanding | | | | | 566,819 | | | | | | 127,066 | | |
| Net asset value and redemption price per share | | | | $ | 17.04 | | | | | $ | 12.80 | | |
| Class S2 | | | | | | | | | | | | | |
| Net assets | | | | $ | 2,295,568 | | | | | $ | 428,328 | | |
| Shares authorized | | | | | 100,000,000 | | | | | | 100,000,000 | | |
| Par value | | | | $ | 0.001 | | | | | $ | 0.001 | | |
| Shares outstanding | | | | | 135,302 | | | | | | 33,505 | | |
| Net asset value and redemption price per share | | | | $ | 16.97 | | | | | $ | 12.78 | | |
| Class Z | | | | | | | | | | | | | |
| Net assets | | | | $ | 243,776,815 | | | | | $ | 16,029,923 | | |
| Shares authorized | | | | | 100,000,000 | | | | | | 100,000,000 | | |
| Par value | | | | $ | 0.001 | | | | | $ | 0.001 | | |
| Shares outstanding | | | | | 13,943,722 | | | | | | 1,247,731 | | |
| Net asset value and redemption price per share | | | | $ | 17.48 | | | | | $ | 12.85 | | |
See Accompanying Notes to Financial Statements
STATEMENTS OF OPERATIONS for the year ended December 31, 2021
| | | | Voya Index
Solution Income
Portfolio | | | Voya Index
Solution 2025
Portfolio | | | Voya Index
Solution 2030
Portfolio | | | Voya Index
Solution 2035
Portfolio | |
| INVESTMENT INCOME: | | | | | | | | | | | | | | | | | | | | | | | | | |
| Dividends from affiliated underlying funds | | | | $ | 16,509,466 | | | | | $ | 19,947,213 | | | | | $ | 12,881,488 | | | | | $ | 19,687,995 | | |
| Dividends from unaffiliated underlying funds | | | | | 4,175,376 | | | | | | 3,953,820 | | | | | | 2,566,995 | | | | | | 3,456,855 | | |
| Total investment income | | | | | 20,684,842 | | | | | | 23,901,033 | | | | | | 15,448,483 | | | | | | 23,144,850 | | |
| EXPENSES: | | | | | | | | | | | | | | | | | | | | | | | | | |
| Investment management fees | | | | | 2,149,246 | | | | | | 2,787,030 | | | | | | 1,868,247 | | | | | | 2,943,814 | | |
| Distribution and shareholder service fees: | | | | | | | | | | | | | | | | | | | | | | | | | |
| Class ADV | | | | | 499,840 | | | | | | 912,270 | | | | | | 231,128 | | | | | | 857,626 | | |
| Class S | | | | | 354,540 | | | | | | 349,663 | | | | | | 47,331 | | | | | | 287,860 | | |
| Class S2 | | | | | 70,337 | | | | | | 148,318 | | | | | | 51,362 | | | | | | 177,055 | | |
| Transfer agent fees: | | | | | | | | | | | | | | | | | | | | | | | | | |
| Class ADV | | | | | 43,194 | | | | | | 83,357 | | | | | | 29,696 | | | | | | 96,610 | | |
| Class I | | | | | 8,118 | | | | | | 25,183 | | | | | | 6,372 | | | | | | 34,315 | | |
| Class S | | | | | 61,276 | | | | | | 63,900 | | | | | | 11,988 | | | | | | 64,853 | | |
| Class S2 | | | | | 7,596 | | | | | | 16,939 | | | | | | 8,115 | | | | | | 24,931 | | |
| Class Z | | | | | 1,481 | | | | | | 1,236 | | | | | | 1,606 | | | | | | 1,450 | | |
| Shareholder reporting expense | | | | | 9,294 | | | | | | 7,875 | | | | | | 3,560 | | | | | | 6,410 | | |
| Registration fees | | | | | — | | | | | | 38 | | | | | | 147 | | | | | | 102 | | |
| Professional fees | | | | | 50,337 | | | | | | 60,225 | | | | | | 45,735 | | | | | | 74,110 | | |
| Custody and accounting expense | | | | | 58,152 | | | | | | 67,525 | | | | | | 55,445 | | | | | | 71,410 | | |
| Directors fees | | | | | 38,577 | | | | | | 52,255 | | | | | | 35,038 | | | | | | 55,647 | | |
| Miscellaneous expense | | | | | 180,058 | | | | | | 239,547 | | | | | | 159,467 | | | | | | 251,654 | | |
| Interest expense | | | | | 90 | | | | | | — | | | | | | — | | | | | | — | | |
| Total expenses | | | | | 3,532,136 | | | | | | 4,815,361 | | | | | | 2,555,237 | | | | | | 4,947,847 | | |
| Waived and reimbursed fees | | | | | (1,914,696) | | | | | | (2,372,955) | | | | | | (1,988,094) | | | | | | (2,644,142) | | |
| Net expenses | | | | | 1,617,440 | | | | | | 2,442,406 | | | | | | 567,143 | | | | | | 2,303,705 | | |
| Net investment income | | | | | 19,067,402 | | | | | | 21,458,627 | | | | | | 14,881,340 | | | | | | 20,841,145 | | |
| REALIZED AND UNREALIZED GAIN (LOSS): | | | | | | | | | | | | | | | | | | | | | | | | | |
| Net realized gain (loss) on: | | | | | | | | | | | | | | | | | | | | | | | | | |
| Sale of affiliated underlying funds | | | | | 45,261,338 | | | | | | 66,641,418 | | | | | | 42,944,690 | | | | | | 79,472,608 | | |
| Sale of affiliated funding agreements | | | | | 10,525 | | | | | | 9,702 | | | | | | 4,802 | | | | | | — | | |
| Sale of unaffiliated underlying funds | | | | | 955,117 | | | | | | (4,015,227) | | | | | | (2,159,018) | | | | | | (3,521,229) | | |
| Capital gain distributions from affiliated underlying funds | | | | | 24,951,663 | | | | | | 49,725,137 | | | | | | 34,760,604 | | | | | | 60,284,198 | | |
| Futures | | | | | (262,331) | | | | | | 2,024,735 | | | | | | 852,753 | | | | | | 1,380,504 | | |
| Net realized gain | | | | | 70,916,312 | | | | | | 114,385,765 | | | | | | 76,403,831 | | | | | | 137,616,081 | | |
| Net change in unrealized appreciation (depreciation) on: | | | | | | | | | | | | | | | | | | | | | | | | | |
| Affiliated underlying funds | | | | | (30,356,640) | | | | | | (2,759,543) | | | | | | 11,280,780 | | | | | | 23,944,569 | | |
| Affiliated funding agreements | | | | | 241,793 | | | | | | 345,246 | | | | | | 241,275 | | | | | | — | | |
| Unaffiliated underlying funds | | | | | (1,991,625) | | | | | | (890,760) | | | | | | (711,217) | | | | | | (715,214) | | |
| Futures | | | | | 87,795 | | | | | | (310,748) | | | | | | (48,956) | | | | | | (76,962) | | |
| Net change in unrealized appreciation (depreciation) | | | | | (32,018,677) | | | | | | (3,615,805) | | | | | | 10,761,882 | | | | | | 23,152,393 | | |
| Net realized and unrealized gain | | | | | 38,897,635 | | | | | | 110,769,960 | | | | | | 87,165,713 | | | | | | 160,768,474 | | |
| Increase in net assets resulting from operations | | | | $ | 57,965,037 | | | | | $ | 132,228,587 | | | | | $ | 102,047,053 | | | | | $ | 181,609,619 | | |
See Accompanying Notes to Financial Statements
STATEMENTS OF OPERATIONS for the year ended December 31, 2021
| | | | Voya Index
Solution 2040
Portfolio | | | Voya Index
Solution 2045
Portfolio | | | Voya Index
Solution 2050
Portfolio | | | Voya Index
Solution 2055
Portfolio | |
| INVESTMENT INCOME: | | | | | | | | | | | | | | | | | | | | | | | | | |
| Dividends from affiliated underlying funds | | | | $ | 10,352,947 | | | | | $ | 14,243,528 | | | | | $ | 7,482,060 | | | | | $ | 7,813,693 | | |
| Dividends from unaffiliated underlying funds | | | | | 1,457,274 | | | | | | 1,609,379 | | | | | | 355,150 | | | | | | 381,112 | | |
| Total investment income | | | | | 11,810,221 | | | | | | 15,852,907 | | | | | | 7,837,210 | | | | | | 8,194,805 | | |
| EXPENSES: | | | | | | | | | | | | | | | | | | | | | | | | | |
| Investment management fees | | | | | 1,537,693 | | | | | | 2,158,864 | | | | | | 1,068,592 | | | | | | 1,130,338 | | |
| Distribution and shareholder service fees: | | | | | | | | | | | | | | | | | | | | | | | | | |
| Class ADV | | | | | 141,987 | | | | | | 658,248 | | | | | | 110,315 | | | | | | 306,982 | | |
| Class S | | | | | 38,300 | | | | | | 206,473 | | | | | | 37,221 | | | | | | 111,157 | | |
| Class S2 | | | | | 19,326 | | | | | | 112,545 | | | | | | 15,878 | | | | | | 79,328 | | |
| Transfer agent fees: | | | | | | | | | | | | | | | | | | | | | | | | | |
| Class ADV | | | | | 29,203 | | | | | | 100,262 | | | | | | 28,610 | | | | | | 69,307 | | |
| Class I | | | | | 9,101 | | | | | | 39,749 | | | | | | 13,648 | | | | | | 43,564 | | |
| Class S | | | | | 15,748 | | | | | | 62,867 | | | | | | 19,311 | | | | | | 50,391 | | |
| Class S2 | | | | | 4,971 | | | | | | 21,393 | | | | | | 5,166 | | | | | | 22,284 | | |
| Class Z | | | | | 1,525 | | | | | | 1,210 | | | | | | 894 | | | | | | 1,029 | | |
| Shareholder reporting expense | | | | | 3,560 | | | | | | 6,320 | | | | | | 4,931 | | | | | | 12,255 | | |
| Registration fees | | | | | 147 | | | | | | 102 | | | | | | 117 | | | | | | 113 | | |
| Professional fees | | | | | 38,208 | | | | | | 52,713 | | | | | | 25,467 | | | | | | 23,160 | | |
| Custody and accounting expense | | | | | 36,740 | | | | | | 56,535 | | | | | | 36,640 | | | | | | 33,850 | | |
| Directors fees | | | | | 29,507 | | | | | | 41,812 | | | | | | 21,100 | | | | | | 22,256 | | |
| Miscellaneous expense | | | | | 123,804 | | | | | | 175,081 | | | | | | 89,331 | | | | | | 96,094 | | |
| Interest expense | | | | | — | | | | | | 19 | | | | | | — | | | | | | — | | |
| Total expenses | | | | | 2,029,820 | | | | | | 3,694,193 | | | | | | 1,477,221 | | | | | | 2,002,108 | | |
| Waived and reimbursed fees | | | | | (1,675,006) | | | | | | (1,985,880) | | | | | | (1,177,774) | | | | | | (1,097,560) | | |
| Net expenses | | | | | 354,814 | | | | | | 1,708,313 | | | | | | 299,447 | | | | | | 904,548 | | |
| Net investment income | | | | | 11,455,407 | | | | | | 14,144,594 | | | | | | 7,537,763 | | | | | | 7,290,257 | | |
| REALIZED AND UNREALIZED GAIN (LOSS): | | | | | | | | | | | | | | | | | | | | | | | | | |
| Net realized gain (loss) on: | | | | | | | | | | | | | | | | | | | | | | | | | |
| Sale of affiliated underlying funds | | | | | 38,428,468 | | | | | | 60,146,357 | | | | | | 28,958,507 | | | | | | 30,076,866 | | |
| Sale of unaffiliated underlying funds | | | | | 483,116 | | | | | | 672,270 | | | | | | 351,688 | | | | | | 2,154,155 | | |
| Capital gain distributions from affiliated underlying funds | | | | | 35,373,247 | | | | | | 53,173,766 | | | | | | 26,908,565 | | | | | | 28,433,128 | | |
| Futures | | | | | 2,685,458 | | | | | | 4,261,791 | | | | | | 1,251,772 | | | | | | 1,331,728 | | |
| Net realized gain | | | | | 76,970,289 | | | | | | 118,254,184 | | | | | | 57,470,532 | | | | | | 61,995,877 | | |
| Net change in unrealized appreciation (depreciation) on: | | | | | | | | | | | | | | | | | | | | | | | | | |
| Affiliated underlying funds | | | | | 24,218,524 | | | | | | 38,075,904 | | | | | | 20,541,171 | | | | | | 22,203,646 | | |
| Unaffiliated underlying funds | | | | | (1,003,090) | | | | | | (1,344,969) | | | | | | (634,412) | | | | | | (2,024,370) | | |
| Futures | | | | | (334,242) | | | | | | (448,806) | | | | | | (92,362) | | | | | | (102,122) | | |
| Net change in unrealized appreciation (depreciation) | | | | | 22,881,192 | | | | | | 36,282,129 | | | | | | 19,814,397 | | | | | | 20,077,154 | | |
| Net realized and unrealized gain | | | | | 99,851,481 | | | | | | 154,536,313 | | | | | | 77,284,929 | | | | | | 82,073,031 | | |
| Increase in net assets resulting from operations | | | | $ | 111,306,888 | | | | | $ | 168,680,907 | | | | | $ | 84,822,692 | | | | | $ | 89,363,288 | | |
See Accompanying Notes to Financial Statements
STATEMENTS OF OPERATIONS for the year ended December 31, 2021
| | | | Voya Index
Solution 2060
Portfolio | | | Voya Index
Solution 2065
Portfolio | |
| INVESTMENT INCOME: | | | | | | | | | | | | | |
| Dividends from affiliated underlying funds | | | | $ | 3,478,060 | | | | | $ | 199,655 | | |
| Dividends from unaffiliated underlying funds | | | | | 172,573 | | | | | | 10,159 | | |
| Total investment income | | | | | 3,650,633 | | | | | | 209,814 | | |
| EXPENSES: | | | | | | | | | | | | | |
| Investment management fees | | | | | 499,023 | | | | | | 24,974 | | |
| Distribution and shareholder service fees: | | | | | | | | | | | | | |
| Class ADV | | | | | 64,615 | | | | | | 6,213 | | |
| Class S | | | | | 22,572 | | | | | | 2,617 | | |
| Class S2 | | | | | 9,207 | | | | | | 1,180 | | |
| Transfer agent fees: | | | | | | | | | | | | | |
| Class ADV | | | | | 21,467 | | | | | | 1,729 | | |
| Class I | | | | | 28,459 | | | | | | 1,146 | | |
| Class S | | | | | 15,033 | | | | | | 1,528 | | |
| Class S2 | | | | | 3,844 | | | | | | 433 | | |
| Class Z | | | | | 550 | | | | | | 1,010 | | |
| Shareholder reporting expense | | | | | 3,028 | | | | | | 365 | | |
| Registration fees | | | | | 101 | | | | | | 4 | | |
| Professional fees | | | | | 13,908 | | | | | | 4,115 | | |
| Custody and accounting expense | | | | | 21,520 | | | | | | 9,735 | | |
| Directors fees | | | | | 9,826 | | | | | | 492 | | |
| Offering expense | | | | | — | | | | | | 7,624 | | |
| Miscellaneous expense | | | | | 45,376 | | | | | | 11,278 | | |
| Total expenses | | | | | 758,529 | | | | | | 74,443 | | |
| Waived and reimbursed fees | | | | | (556,630) | | | | | | (56,451) | | |
| Net expenses | | | | | 201,899 | | | | | | 17,992 | | |
| Net investment income | | | | | 3,448,734 | | | | | | 191,822 | | |
| REALIZED AND UNREALIZED GAIN (LOSS): | | | | | | | | | | | | | |
| Net realized gain (loss) on: | | | | | | | | | | | | | |
| Sale of affiliated underlying funds | | | | | 14,130,715 | | | | | | 564,540 | | |
| Sale of unaffiliated underlying funds | | | | | 845,999 | | | | | | 22,621 | | |
| Capital gain distributions from affiliated underlying funds | | | | | 12,709,782 | | | | | | 641,578 | | |
| Futures | | | | | 724,068 | | | | | | — | | |
| Net realized gain | | | | | 28,410,564 | | | | | | 1,228,739 | | |
| Net change in unrealized appreciation (depreciation) on: | | | | | | | | | | | | | |
| Affiliated underlying funds | | | | | 8,886,279 | | | | | | 350,210 | | |
| Unaffiliated underlying funds | | | | | (801,638) | | | | | | (24,498) | | |
| Futures | | | | | (64,059) | | | | | | — | | |
| Net change in unrealized appreciation (depreciation) | | | | | 8,020,582 | | | | | | 325,712 | | |
| Net realized and unrealized gain | | | | | 36,431,146 | | | | | | 1,554,451 | | |
| Increase in net assets resulting from operations | | | | $ | 39,879,880 | | | | | $ | 1,746,273 | | |
See Accompanying Notes to Financial Statements
STATEMENTS OF CHANGES IN NET ASSETS
| | | | Voya Index Solution Income Portfolio | | | Voya Index Solution 2025 Portfolio | |
| | | | Year Ended
December 31,
2021 | | | Year Ended
December 31,
2020 | | | Year Ended
December 31,
2021 | | | Year Ended
December 31,
2020 | |
| FROM OPERATIONS: | | | | | | | | | | | | | | | | | | | | | | | | | |
| Net investment income | | | | $ | 19,067,402 | | | | | $ | 15,765,695 | | | | | $ | 21,458,627 | | | | | $ | 25,305,300 | | |
| Net realized gain | | | | | 70,916,312 | | | | | | 20,255,267 | | | | | | 114,385,765 | | | | | | 44,200,979 | | |
| Net change in unrealized appreciation (depreciation) | | | | | (32,018,677) | | | | | | 37,915,760 | | | | | | (3,615,805) | | | | | | 72,538,172 | | |
| Increase in net assets resulting from operations | | | | | 57,965,037 | | | | | | 73,936,722 | | | | | | 132,228,587 | | | | | | 142,044,451 | | |
| FROM DISTRIBUTIONS TO SHAREHOLDERS: | | | | | | | | | | | | | | | | | | | | | | | | | |
| Total distributions (excluding return of capital): | | | | | | | | | | | | | | | | | | | | | | | | | |
| Class ADV | | | | | (3,839,468) | | | | | | (2,739,970) | | | | | | (10,806,715) | | | | | | (7,813,249) | | |
| Class I | | | | | (771,721) | | | | | | (722,414) | | | | | | (3,537,550) | | | | | | (2,714,034) | | |
| Class S | | | | | (5,555,663) | | | | | | (4,982,635) | | | | | | (8,623,634) | | | | | | (5,835,868) | | |
| Class S2 | | | | | (756,222) | | | | | | (304,139) | | | | | | (2,347,558) | | | | | | (1,641,507) | | |
| Class Z | | | | | (28,759,436) | | | | | | (9,349,344) | | | | | | (56,670,753) | | | | | | (34,391,146) | | |
| Total distributions | | | | | (39,682,510) | | | | | | (18,098,502) | | | | | | (81,986,210) | | | | | | (52,395,804) | | |
| FROM CAPITAL SHARE TRANSACTIONS: | | | | | | | | | | | | | | | | | | | | | | | | | |
| Net proceeds from sale of shares | | | | | 75,963,411 | | | | | | 131,831,050 | | | | | | 153,227,809 | | | | | | 181,881,107 | | |
| Proceeds from shares issued in merger (Note 15) | | | | | — | | | | | | 441,776,493 | | | | | | — | | | | | | — | | |
| Reinvestment of distributions | | | | | 39,682,510 | | | | | | 18,098,502 | | | | | | 81,986,210 | | | | | | 52,395,804 | | |
| | | | | | 115,645,921 | | | | | | 591,706,045 | | | | | | 235,214,019 | | | | | | 234,276,911 | | |
| Cost of shares redeemed | | | | | (196,133,245) | | | | | | (128,486,210) | | | | | | (188,594,277) | | | | | | (191,725,403) | | |
Net increase (decrease) in net assets resulting from capital share
transactions | | | | | (80,487,324) | | | | | | 463,219,835 | | | | | | 46,619,742 | | | | | | 42,551,508 | | |
| Net increase (decrease) in net assets | | | | | (62,204,797) | | | | | | 519,058,055 | | | | | | 96,862,119 | | | | | | 132,200,155 | | |
| NET ASSETS: | | | | | | | | | | | | | | | | | | | | | | | | | |
| Beginning of year or period | | | | | 994,083,296 | | | | | | 475,025,241 | | | | | | 1,237,652,466 | | | | | | 1,105,452,311 | | |
| End of year or period | | | | $ | 931,878,499 | | | | | $ | 994,083,296 | | | | | $ | 1,334,514,585 | | | | | $ | 1,237,652,466 | | |
See Accompanying Notes to Financial Statements
STATEMENTS OF CHANGES IN NET ASSETS
| | | | Voya Index Solution 2030 Portfolio | | | Voya Index Solution 2035 Portfolio | |
| | | | Year Ended
December 31,
2021 | | | Year Ended
December 31,
2020 | | | Year Ended
December 31,
2021 | | | Year Ended
December 31,
2020 | |
| FROM OPERATIONS: | | | | | | | | | | | | | | | | | | | | | | | | | |
| Net investment income | | | | $ | 14,881,340 | | | | | $ | 15,914,817 | | | | | $ | 20,841,145 | | | | | $ | 23,954,970 | | |
| Net realized gain | | | | | 76,403,831 | | | | | | 19,891,612 | | | | | | 137,616,081 | | | | | | 52,317,584 | | |
| Net change in unrealized appreciation (depreciation) | | | | | 10,761,882 | | | | | | 58,809,247 | | | | | | 23,152,393 | | | | | | 84,257,335 | | |
| Increase in net assets resulting from operations | | | | | 102,047,053 | | | | | | 94,615,676 | | | | | | 181,609,619 | | | | | | 160,529,889 | | |
| FROM DISTRIBUTIONS TO SHAREHOLDERS: | | | | | | | | | | | | | | | | | | | | | | | | | |
| Total distributions (excluding return of capital): | | | | | | | | | | | | | | | | | | | | | | | | | |
| Class ADV | | | | | (2,288,149) | | | | | | (1,626,967) | | | | | | (9,891,643) | | | | | | (8,357,037) | | |
| Class I | | | | | (506,369) | | | | | | (409,433) | | | | | | (3,819,146) | | | | | | (3,457,004) | | |
| Class S | | | | | (895,282) | | | | | | (671,172) | | | | | | (6,800,155) | | | | | | (5,329,917) | | |
| Class S2 | | | | | (642,134) | | | | | | (335,167) | | | | | | (2,812,027) | | | | | | (1,886,218) | | |
| Class Z | | | | | (39,398,935) | | | | | | (27,537,089) | | | | | | (61,202,550) | | | | | | (39,169,338) | | |
| Total distributions | | | | | (43,730,869) | | | | | | (30,579,828) | | | | | | (84,525,521) | | | | | | (58,199,514) | | |
| FROM CAPITAL SHARE TRANSACTIONS: | | | | | | | | | | | | | | | | | | | | | | | | | |
| Net proceeds from sale of shares | | | | | 143,922,966 | | | | | | 140,373,100 | | | | | | 175,092,134 | | | | | | 188,359,365 | | |
| Reinvestment of distributions | | | | | 43,730,869 | | | | | | 30,579,828 | | | | | | 84,525,521 | | | | | | 58,199,514 | | |
| | | | | | 187,653,835 | | | | | | 170,952,928 | | | | | | 259,617,655 | | | | | | 246,558,879 | | |
| Cost of shares redeemed | | | | | (82,201,435) | | | | | | (79,365,913) | | | | | | (143,063,124) | | | | | | (175,307,423) | | |
| Net increase in net assets resulting from capital share transactions | | | | | 105,452,400 | | | | | | 91,587,015 | | | | | | 116,554,531 | | | | | | 71,251,456 | | |
| Net increase in net assets | | | | | 163,768,584 | | | | | | 155,622,863 | | | | | | 213,638,629 | | | | | | 173,581,831 | | |
| NET ASSETS: | | | | | | | | | | | | | | | | | | | | | | | | | |
| Beginning of year or period | | | | | 779,556,979 | | | | | | 623,934,116 | | | | | | 1,257,193,589 | | | | | | 1,083,611,758 | | |
| End of year or period | | | | $ | 943,325,563 | | | | | $ | 779,556,979 | | | | | $ | 1,470,832,218 | | | | | $ | 1,257,193,589 | | |
See Accompanying Notes to Financial Statements
STATEMENTS OF CHANGES IN NET ASSETS
| | | | Voya Index Solution 2040 Portfolio | | | Voya Index Solution 2045 Portfolio | |
| | | | Year Ended
December 31,
2021 | | | Year Ended
December 31,
2020 | | | Year Ended
December 31,
2021 | | | Year Ended
December 31,
2020 | |
| FROM OPERATIONS: | | | | | | | | | | | | | | | | | | | | | | | | | |
| Net investment income | | | | $ | 11,455,407 | | | | | $ | 11,932,978 | | | | | $ | 14,144,594 | | | | | $ | 16,340,579 | | |
| Net realized gain | | | | | 76,970,289 | | | | | | 17,347,476 | | | | | | 118,254,184 | | | | | | 38,749,191 | | |
| Net change in unrealized appreciation (depreciation) | | | | | 22,881,192 | | | | | | 56,766,366 | | | | | | 36,282,129 | | | | | | 71,679,396 | | |
| Increase in net assets resulting from operations | | | | | 111,306,888 | | | | | | 86,046,820 | | | | | | 168,680,907 | | | | | | 126,769,166 | | |
| FROM DISTRIBUTIONS TO SHAREHOLDERS: | | | | | | | | | | | | | | | | | | | | | | | | | |
| Total distributions (excluding return of capital): | | | | | | | | | | | | | | | | | | | | | | | | | |
| Class ADV | | | | | (1,250,768) | | | | | | (1,035,335) | | | | | | (7,176,007) | | | | | | (6,283,226) | | |
| Class I | | | | | (417,084) | | | | | | (321,833) | | | | | | (2,972,561) | | | | | | (3,063,168) | | |
| Class S | | | | | (683,959) | | | | | | (519,370) | | | | | | (4,580,764) | | | | | | (3,773,890) | | |
| Class S2 | | | | | (231,822) | | | | | | (138,265) | | | | | | (1,610,486) | | | | | | (1,178,350) | | |
| Class Z | | | | | (32,448,073) | | | | | | (22,211,017) | | | | | | (42,981,726) | | | | | | (27,811,102) | | |
| Total distributions | | | | | (35,031,706) | | | | | | (24,225,820) | | | | | | (59,321,544) | | | | | | (42,109,736) | | |
| FROM CAPITAL SHARE TRANSACTIONS: | | | | | | | | | | | | | | | | | | | | | | | | | |
| Net proceeds from sale of shares | | | | | 132,447,571 | | | | | | 127,966,528 | | | | | | 137,700,779 | | | | | | 176,126,996 | | |
| Reinvestment of distributions | | | | | 35,031,706 | | | | | | 24,225,820 | | | | | | 59,321,544 | | | | | | 42,109,736 | | |
| | | | | | 167,479,277 | | | | | | 152,192,348 | | | | | | 197,022,323 | | | | | | 218,236,732 | | |
| Cost of shares redeemed | | | | | (54,186,808) | | | | | | (54,212,607) | | | | | | (107,534,231) | | | | | | (121,140,377) | | |
| Net increase in net assets resulting from capital share transactions | | | | | 113,292,469 | | | | | | 97,979,741 | | | | | | 89,488,092 | | | | | | 97,096,355 | | |
| Net increase in net assets | | | | | 189,567,651 | | | | | | 159,800,741 | | | | | | 198,847,455 | | | | | | 181,755,785 | | |
| NET ASSETS: | | | | | | | | | | | | | | | | | | | | | | | | | |
| Beginning of year or period | | | | | 630,359,020 | | | | | | 470,558,279 | | | | | | 928,959,524 | | | | | | 747,203,739 | | |
| End of year or period | | | | $ | 819,926,671 | | | | | $ | 630,359,020 | | | | | $ | 1,127,806,979 | | | | | $ | 928,959,524 | | |
See Accompanying Notes to Financial Statements
STATEMENTS OF CHANGES IN NET ASSETS
| | | | Voya Index Solution 2050 Portfolio | | | Voya Index Solution 2055 Portfolio | |
| | | | Year Ended
December 31,
2021 | | | Year Ended
December 31,
2020 | | | Year Ended
December 31,
2021 | | | Year Ended
December 31,
2020 | |
| FROM OPERATIONS: | | | | | | | | | | | | | | | | | | | | | | | | | |
| Net investment income | | | | $ | 7,537,763 | | | | | $ | 7,978,125 | | | | | $ | 7,290,257 | | | | | $ | 8,002,619 | | |
| Net realized gain | | | | | 57,470,532 | | | | | | 10,358,760 | | | | | | 61,995,877 | | | | | | 15,810,552 | | |
| Net change in unrealized appreciation (depreciation) | | | | | 19,814,397 | | | | | | 42,996,640 | | | | | | 20,077,154 | | | | | | 43,015,775 | | |
| Increase in net assets resulting from operations | | | | | 84,822,692 | | | | | | 61,333,525 | | | | | | 89,363,288 | | | | | | 66,828,946 | | |
| FROM DISTRIBUTIONS TO SHAREHOLDERS: | | | | | | | | | | | | | | | | | | | | | | | | | |
| Total distributions (excluding return of capital): | | | | | | | | | | | | | | | | | | | | | | | | | |
| Class ADV | | | | | (838,663) | | | | | | (775,910) | | | | | | (2,706,151) | | | | | | (2,421,084) | | |
| Class I | | | | | (428,229) | | | | | | (348,884) | | | | | | (1,828,389) | | | | | | (1,744,199) | | |
| Class S | | | | | (589,859) | | | | | | (519,111) | | | | | | (2,098,710) | | | | | | (1,713,622) | | |
| Class S2 | | | | | (154,127) | | | | | | (127,088) | | | | | | (961,382) | | | | | | (624,512) | | |
| Class Z | | | | | (19,735,291) | | | | | | (14,963,072) | | | | | | (18,962,412) | | | | | | (12,189,910) | | |
| Total distributions | | | | | (21,746,169) | | | | | | (16,734,065) | | | | | | (26,557,044) | | | | | | (18,693,327) | | |
| FROM CAPITAL SHARE TRANSACTIONS: | | | | | | | | | | | | | | | | | | | | | | | | | |
| Net proceeds from sale of shares | | | | | 107,713,612 | | | | | | 105,675,567 | | | | | | 111,457,278 | | | | | | 114,774,349 | | |
| Reinvestment of distributions | | | | | 21,746,169 | | | | | | 16,734,065 | | | | | | 26,557,044 | | | | | | 18,693,327 | | |
| | | | | | 129,459,781 | | | | | | 122,409,632 | | | | | | 138,014,322 | | | | | | 133,467,676 | | |
| Cost of shares redeemed | | | | | (40,985,486) | | | | | | (48,387,465) | | | | | | (55,192,501) | | | | | | (56,481,022) | | |
| Net increase in net assets resulting from capital share transactions | | | | | 88,474,295 | | | | | | 74,022,167 | | | | | | 82,821,821 | | | | | | 76,986,654 | | |
| Net increase in net assets | | | | | 151,550,818 | | | | | | 118,621,627 | | | ��� | | | 145,628,065 | | | | | | 125,122,273 | | |
| NET ASSETS: | | | | | | | | | | | | | | | | | | | | | | | | | |
| Beginning of year or period | | | | | 443,340,532 | | | | | | 324,718,905 | | | | | | 475,149,850 | | | | | | 350,027,577 | | |
| End of year or period | | | | $ | 594,891,350 | | | | | $ | 443,340,532 | | | | | $ | 620,777,915 | | | | | $ | 475,149,850 | | |
See Accompanying Notes to Financial Statements
STATEMENTS OF CHANGES IN NET ASSETS
| | | | Voya Index Solution 2060 Portfolio | | | Voya Index Solution 2065 Portfolio | |
| | | | Year Ended
December 31,
2021 | | | Year Ended
December 31,
2020 | | | Year Ended
December 31,
2021 | | | July 29, 2020(1) to
December 31,
2020 | |
| FROM OPERATIONS: | | | | | | | | | | | | | | | | | | | | | | | | | |
| Net investment income | | | | $ | 3,448,734 | | | | | $ | 3,007,762 | | | | | $ | 191,822 | | | | | $ | 31,655 | | |
| Net realized gain | | | | | 28,410,564 | | | | | | 3,624,556 | | | | | | 1,228,739 | | | | | | 33,593 | | |
| Net change in unrealized appreciation (depreciation) | | | | | 8,020,582 | | | | | | 20,533,492 | | | | | | 325,712 | | | | | | 404,113 | | |
| Increase in net assets resulting from operations | | | | | 39,879,880 | | | | | | 27,165,810 | | | | | | 1,746,273 | | | | | | 469,361 | | |
| FROM DISTRIBUTIONS TO SHAREHOLDERS: | | | | | | | | | | | | | | | | | | | | | | | | | |
| Total distributions (excluding return of capital): | | | | | | | | | | | | | | | | | | | | | | | | | |
| Class ADV | | | | | (391,665) | | | | | | (374,965) | | | | | | (102,873) | | | | | | (2,696) | | |
| Class I | | | | | (589,841) | | | | | | (389,656) | | | | | | (91,623) | | | | | | (2,881) | | |
| Class S | | | | | (298,973) | | | | | | (254,832) | | | | | | (103,041) | | | | | | (2,954) | | |
| Class S2 | | | | | (74,446) | | | | | | (55,293) | | | | | | (27,062) | | | | | | (1,341) | | |
| Class Z | | | | | (7,315,564) | | | | | | (4,123,271) | | | | | | (1,042,492) | | | | | | (25,485) | | |
| Total distributions | | | | | (8,670,489) | | | | | | (5,198,017) | | | | | | (1,367,091) | | | | | | (35,357) | | |
| FROM CAPITAL SHARE TRANSACTIONS: | | | | | | | | | | | | | | | | | | | | | | | | | |
| Net proceeds from sale of shares | | | | | 79,342,429 | | | | | | 75,479,359 | | | | | | 17,085,615 | | | | | | 4,299,579 | | |
| Reinvestment of distributions | | | | | 8,670,489 | | | | | | 5,198,017 | | | | | | 1,367,091 | | | | | | 35,357 | | |
| | | | | | 88,012,918 | | | | | | 80,677,376 | | | | | | 18,452,706 | | | | | | 4,334,936 | | |
| Cost of shares redeemed | | | | | (23,039,438) | | | | | | (16,986,595) | | | | | | (2,114,217) | | | | | | (299,006) | | |
| Net increase in net assets resulting from capital share transactions | | | | | 64,973,480 | | | | | | 63,690,781 | | | | | | 16,338,489 | | | | | | 4,035,930 | | |
| Net increase in net assets | | | | | 96,182,871 | | | | | | 85,658,574 | | | | | | 16,717,671 | | | | | | 4,469,934 | | |
| NET ASSETS: | | | | | | | | | | | | | | | | | | | | | | | | | |
| Beginning of year or period | | | | | 194,901,340 | | | | | | 109,242,766 | | | | | | 4,469,934 | | | | | | — | | |
| End of year or period | | | | $ | 291,084,211 | | | | | $ | 194,901,340 | | | | | $ | 21,187,605 | | | | | $ | 4,469,934 | | |
(1)
Commencement of operations.
See Accompanying Notes to Financial Statements
Selected data for a share of beneficial interest outstanding throughout each year or period.
| | | | | | | | | | Income (loss)
from
investment
operations | | | | | | | | | Less Distributions | | | | | | | | | | | | | | | | | | | | | | | | | | | Ratios to average net assets | | | Supplemental
Data | |
| | | | Net asset value, beginning of year
or period | | | Net investment income (loss) | | | Net realized and unrealized
gain (loss) | | | Total from investment operations | | | From net investment income | | | From net realized gains | | | From return of capital | | | Total distributions | | | Payment by affiliate | | | Net asset value, end of year
or period | | | Total Return(1) | | | Expenses before
reductions/additions(2)(3)(4) | | | Expenses net of fee waivers
and/or recoupments if any(2)(3)(4) | | | Expenses net of all
reductions/additions(2)(3)(4) | | | Net investment income (loss)(2)(3) | | | Net assets, end of year or period | | | Portfolio turnover rate | |
Year or
period ended | | | ($) | | | ($) | | | ($) | | | ($) | | | ($) | | | ($) | | | ($) | | | ($) | | | ($) | | | ($) | | | (%) | | | (%) | | | (%) | | | (%) | | | (%) | | | ($000’s) | | | (%) | |
| Voya Index Solution Income Portfolio | | | | | | | | | | | | | | | | | | | | | | | | | | | | | | | | | | | | | | | | | | | | | | | | | | | | | | | | | | | | | | | | | | | | | | | | | | | | | | | | | | | | | | | | | | | | | | | | | | | | | | | |
| Class ADV | | | | | | | | | | | | | | | | | | | | | | | | | | | | | | | | | | | | | | | | | | | | | | | | | | | | | | | | | | | | | | | | | | | | | | | | | | | | | | | | | | | | | | | | | | | | | | | | | | | | | | | |
| 12-31-21 | | | | | 11.27 | | | | | | 0.16• | | | | | | 0.47 | | | | | | 0.63 | | | | | | 0.16 | | | | | | 0.29 | | | | | | — | | | | | | 0.45 | | | | | | — | | | | | | 11.45 | | | | | | 5.62 | | | | | | 0.80 | | | | | | 0.74 | | | | | | 0.74 | | | | | | 1.40 | | | | | | 96,649 | | | | | | 30 | | |
| 12-31-20 | | | | | 10.54 | | | | | | 0.20• | | | | | | 0.91 | | | | | | 1.11 | | | | | | 0.17 | | | | | | 0.21 | | | | | | — | | | | | | 0.38 | | | | | | — | | | | | | 11.27 | | | | | | 10.74 | | | | | | 0.79 | | | | | | 0.74 | | | | | | 0.74 | | | | | | 1.85 | | | | | | 104,557 | | | | | | 45 | | |
| 12-31-19 | | | | | 9.66 | | | | | | 0.16• | | | | | | 1.05 | | | | | | 1.21 | | | | | | 0.18 | | | | | | 0.15 | | | | | | — | | | | | | 0.33 | | | | | | — | | | | | | 10.54 | | | | | | 12.62 | | | | | | 0.76 | | | | | | 0.74 | | | | | | 0.74 | | | | | | 1.52 | | | | | | 81,027 | | | | | | 38 | | |
| 12-31-18 | | | | | 10.34 | | | | | | 0.16• | | | | | | (0.51) | | | | | | (0.35) | | | | | | 0.17 | | | | | | 0.16 | | | | | | — | | | | | | 0.33 | | | | | | — | | | | | | 9.66 | | | | | | (3.50) | | | | | | 0.77 | | | | | | 0.71 | | | | | | 0.71 | | | | | | 1.59 | | | | | | 87,697 | | | | | | 38 | | |
| 12-31-17 | | | | | 9.71 | | | | | | 0.16• | | | | | | 0.68 | | | | | | 0.84 | | | | | | 0.16 | | | | | | 0.05 | | | | | | — | | | | | | 0.21 | | | | | | — | | | | | | 10.34 | | | | | | 8.69 | | | | | | 0.76 | | | | | | 0.68 | | | | | | 0.68 | | | | | | 1.64 | | | | | | 110,507 | | | | | | 32 | | |
| Class I | | | | | | | | | | | | | | | | | | | | | | | | | | | | | | | | | | | | | | | | | | | | | | | | | | | | | | | | | | | | | | | | | | | | | | | | | | | | | | | | | | | | | | | | | | | | | | | | | | | | | | | |
| 12-31-21 | | | | | 11.58 | | | | | | 0.22• | | | | | | 0.48 | | | | | | 0.70 | | | | | | 0.21 | | | | | | 0.29 | | | | | | — | | | | | | 0.50 | | | | | | — | | | | | | 11.78 | | | | | | 6.09 | | | | | | 0.30 | | | | | | 0.24 | | | | | | 0.24 | | | | | | 1.87 | | | | | | 15,867 | | | | | | 30 | | |
| 12-31-20 | | | | | 10.82 | | | | | | 0.25• | | | | | | 0.95 | | | | | | 1.20 | | | | | | 0.23 | | | | | | 0.21 | | | | | | — | | | | | | 0.44 | | | | | | — | | | | | | 11.58 | | | | | | 11.32 | | | | | | 0.29 | | | | | | 0.24 | | | | | | 0.24 | | | | | | 2.31 | | | | | | 20,513 | | | | | | 45 | | |
| 12-31-19 | | | | | 9.92 | | | | | | 0.21• | | | | | | 1.08 | | | | | | 1.29 | | | | | | 0.24 | | | | | | 0.15 | | | | | | — | | | | | | 0.39 | | | | | | — | | | | | | 10.82 | | | | | | 13.16 | | | | | | 0.26 | | | | | | 0.24 | | | | | | 0.24 | | | | | | 2.02 | | | | | | 18,653 | | | | | | 38 | | |
| 12-31-18 | | | | | 10.62 | | | | | | 0.23 | | | | | | (0.54) | | | | | | (0.31) | | | | | | 0.23 | | | | | | 0.16 | | | | | | — | | | | | | 0.39 | | | | | | — | | | | | | 9.92 | | | | | | (3.04) | | | | | | 0.27 | | | | | | 0.21 | | | | | | 0.21 | | | | | | 2.11 | | | | | | 21,140 | | | | | | 38 | | |
| 12-31-17 | | | | | 9.96 | | | | | | 0.22• | | | | | | 0.71 | | | | | | 0.93 | | | | | | 0.22 | | | | | | 0.05 | | | | | | — | | | | | | 0.27 | | | | | | — | | | | | | 10.62 | | | | | | 9.36 | | | | | | 0.26 | | | | | | 0.18 | | | | | | 0.18 | | | | | | 2.11 | | | | | | 22,916 | | | | | | 32 | | |
| Class S | | | | | | | | | | | | | | | | | | | | | | | | | | | | | | | | | | | | | | | | | | | | | | | | | | | | | | | | | | | | | | | | | | | | | | | | | | | | | | | | | | | | | | | | | | | | | | | | | | | | | | | |
| 12-31-21 | | | | | 11.46 | | | | | | 0.19• | | | | | | 0.47 | | | | | | 0.66 | | | | | | 0.18 | | | | | | 0.29 | | | | | | — | | | | | | 0.47 | | | | | | — | | | | | | 11.65 | | | | | | 5.81 | | | | | | 0.55 | | | | | | 0.49 | | | | | | 0.49 | | | | | | 1.65 | | | | | | 131,694 | | | | | | 30 | | |
| 12-31-20 | | | | | 10.71 | | | | | | 0.23 | | | | | | 0.93 | | | | | | 1.16 | | | | | | 0.20 | | | | | | 0.21 | | | | | | — | | | | | | 0.41 | | | | | | — | | | | | | 11.46 | | | | | | 11.05 | | | | | | 0.54 | | | | | | 0.49 | | | | | | 0.49 | | | | | | 2.10 | | | | | | 147,405 | | | | | | 45 | | |
| 12-31-19 | | | | | 9.82 | | | | | | 0.19• | | | | | | 1.06 | | | | | | 1.25 | | | | | | 0.21 | | | | | | 0.15 | | | | | | — | | | | | | 0.36 | | | | | | — | | | | | | 10.71 | | | | | | 12.88 | | | | | | 0.51 | | | | | | 0.49 | | | | | | 0.49 | | | | | | 1.78 | | | | | | 136,385 | | | | | | 38 | | |
| 12-31-18 | | | | | 10.51 | | | | | | 0.19• | | | | | | (0.52) | | | | | | (0.33) | | | | | | 0.20 | | | | | | 0.16 | | | | | | — | | | | | | 0.36 | | | | | | — | | | | | | 9.82 | | | | | | (3.25) | | | | | | 0.52 | | | | | | 0.46 | | | | | | 0.46 | | | | | | 1.84 | | | | | | 140,647 | | | | | | 38 | | |
| 12-31-17 | | | | | 9.86 | | | | | | 0.19• | | | | | | 0.70 | | | | | | 0.89 | | | | | | 0.19 | | | | | | 0.05 | | | | | | — | | | | | | 0.24 | | | | | | — | | | | | | 10.51 | | | | | | 9.06 | | | | | | 0.51 | | | | | | 0.43 | | | | | | 0.43 | | | | | | 1.89 | | | | | | 168,730 | | | | | | 32 | | |
| Class S2 | | | | | | | | | | | | | | | | | | | | | | | ��� | | | | | | | | | | | | | | | | | | | | | | | | | | | | | | | | | | | | | | | | | | | | | | | | | | | | | | | | | | | | | | | | | | | | | | | | | | | | | | | | |
| 12-31-21 | | | | | 11.20 | | | | | | 0.17• | | | | | | 0.47 | | | | | | 0.64 | | | | | | 0.19 | | | | | | 0.29 | | | | | | — | | | | | | 0.48 | | | | | | — | | | | | | 11.36 | | | | | | 5.69 | | | | | | 0.70 | | | | | | 0.64 | | | | | | 0.64 | | | | | | 1.50 | | | | | | 18,519 | | | | | | 30 | | |
| 12-31-20 | | | | | 10.48 | | | | | | 0.21• | | | | | | 0.90 | | | | | | 1.11 | | | | | | 0.18 | | | | | | 0.21 | | | | | | — | | | | | | 0.39 | | | | | | — | | | | | | 11.20 | | | | | | 10.79 | | | | | | 0.69 | | | | | | 0.64 | | | | | | 0.64 | | | | | | 1.99 | | | | | | 16,526 | | | | | | 45 | | |
| 12-31-19 | | | | | 9.61 | | | | | | 0.16• | | | | | | 1.05 | | | | | | 1.21 | | | | | | 0.19 | | | | | | 0.15 | | | | | | — | | | | | | 0.34 | | | | | | — | | | | | | 10.48 | | | | | | 12.70 | | | | | | 0.66 | | | | | | 0.64 | | | | | | 0.64 | | | | | | 1.55 | | | | | | 8,387 | | | | | | 38 | | |
| 12-31-18 | | | | | 10.29 | | | | | | 0.19• | | | | | | (0.52) | | | | | | (0.33) | | | | | | 0.19 | | | | | | 0.16 | | | | | | — | | | | | | 0.35 | | | | | | — | | | | | | 9.61 | | | | | | (3.39) | | | | | | 0.67 | | | | | | 0.61 | | | | | | 0.61 | | | | | | 1.85 | | | | | | 16,240 | | | | | | 38 | | |
| 12-31-17 | | | | | 9.66 | | | | | | 0.18• | | | | | | 0.68 | | | | | | 0.86 | | | | | | 0.18 | | | | | | 0.05 | | | | | | — | | | | | | 0.23 | | | | | | — | | | | | | 10.29 | | | | | | 8.89 | | | | | | 0.66 | | | | | | 0.58 | | | | | | 0.58 | | | | | | 1.75 | | | | | | 12,928 | | | | | | 32 | | |
| Class Z | | | | | | | | | | | | | | | | | | | | | | | | | | | | | | | | | | | | | | | | | | | | | | | | | | | | | | | | | | | | | | | | | | | | | | | | | | | | | | | | | | | | | | | | | | | | | | | | | | | | | | | |
| 12-31-21 | | | | | 11.72 | | | | | | 0.25• | | | | | | 0.50 | | | | | | 0.75 | | | | | | 0.22 | | | | | | 0.29 | | | | | | — | | | | | | 0.51 | | | | | | — | | | | | | 11.96 | | | | | | 6.41 | | | | | | 0.26 | | | | | | 0.00* | | | | | | 0.00* | | | | | | 2.14 | | | | | | 669,150 | | | | | | 30 | | |
| 12-31-20 | | | | | 10.93 | | | | | | 0.30• | | | | | | 0.93 | | | | | | 1.23 | | | | | | 0.23 | | | | | | 0.21 | | | | | | — | | | | | | 0.44 | | | | | | — | | | | | | 11.72 | | | | | | 11.48 | | | | | | 0.25 | | | | | | 0.00* | | | | | | 0.00* | | | | | | 2.66 | | | | | | 705,082 | | | | | | 45 | | |
| 12-31-19 | | | | | 9.99 | | | | | | 0.25• | | | | | | 1.08 | | | | | | 1.33 | | | | | | 0.24 | | | | | | 0.15 | | | | | | — | | | | | | 0.39 | | | | | | — | | | | | | 10.93 | | | | | | 13.47 | | | | | | 0.26 | | | | | | 0.00* | | | | | | 0.00* | | | | | | 2.32 | | | | | | 230,574 | | | | | | 38 | | |
| 12-31-18 | | | | | 10.67 | | | | | | 0.24• | | | | | | (0.53) | | | | | | (0.29) | | | | | | 0.23 | | | | | | 0.16 | | | | | | — | | | | | | 0.39 | | | | | | — | | | | | | 9.99 | | | | | | (2.83) | | | | | | 0.27 | | | | | | 0.00* | | | | | | 0.00* | | | | | | 2.33 | | | | | | 178,763 | | | | | | 38 | | |
| 12-31-17 | | | | | 9.99 | | | | | | 0.25• | | | | | | 0.70 | | | | | | 0.95 | | | | | | 0.22 | | | | | | 0.05 | | | | | | — | | | | | | 0.27 | | | | | | — | | | | | | 10.67 | | | | | | 9.54 | | | | | | 0.26 | | | | | | 0.00* | | | | | | 0.00* | | | | | | 2.45 | �� | | | | | 169,194 | | | | | | 32 | | |
| Voya Index Solution 2025 Portfolio | | | | | | | | | | | | | | | | | | | | | | | | | | | | | | | | | | | | | | | | | | | | | | | | | | | | | | | | | | | | | | | | | | | | | | | | | | | | | | | | | | | | | | | | | | | | | | | | | | | | | | | |
| Class ADV | | | | | | | | | | | | | | | | | | | | | | | | | | | | | | | | | | | | | | | | | | | | | | | | | | | | | | | | | | | | | | | | | | | | | | | | | | | | | | | | | | | | | | | | | | | | | | | | | | | | | | | |
| 12-31-21 | | | | | 12.08 | | | | | | 0.13• | | | | | | 1.09 | | | | | | 1.22 | | | | | | 0.22 | | | | | | 0.55 | | | | | | — | | | | | | 0.77 | | | | | | — | | | | | | 12.53 | | | | | | 10.20 | | | | | | 0.79 | | | | | | 0.74 | | | | | | 0.74 | | | | | | 1.07 | | | | | | 176,976 | | | | | | 40 | | |
| 12-31-20 | | | | | 11.22 | | | | | | 0.19• | | | | | | 1.17 | | | | | | 1.36 | | | | | | 0.17 | | | | | | 0.33 | | | | | | — | | | | | | 0.50 | | | | | | — | | | | | | 12.08 | | | | | | 12.50 | | | | | | 0.79 | | | | | | 0.74 | | | | | | 0.74 | | | | | | 1.70 | | | | | | 186,131 | | | | | | 50 | | |
| 12-31-19 | | | | | 9.99 | | | | | | 0.17• | | | | | | 1.61 | | | | | | 1.78 | | | | | | 0.16 | | | | | | 0.39 | | | | | | — | | | | | | 0.55 | | | | | | — | | | | | | 11.22 | | | | | | 18.15 | | | | | | 0.75 | | | | | | 0.72 | | | | | | 0.72 | | | | | | 1.55 | | | | | | 193,477 | | | | | | 28 | | |
| 12-31-18 | | | | | 10.94 | | | | | | 0.17• | | | | | | (0.73) | | | | | | (0.56) | | | | | | 0.14 | | | | | | 0.25 | | | | | | — | | | | | | 0.39 | | | | | | — | | | | | | 9.99 | | | | | | (5.37) | | | | | | 0.76 | | | | | | 0.70 | | | | | | 0.70 | | | | | | 1.53 | | | | | | 196,102 | | | | | | 35 | | |
| 12-31-17 | | | | | 9.89 | | | | | | 0.15• | | | | | | 1.25 | | | | | | 1.40 | | | | | | 0.14 | | | | | | 0.21 | | | | | | — | | | | | | 0.35 | | | | | | — | | | | | | 10.94 | | | | | | 14.32 | | | | | | 0.76 | | | | | | 0.68 | | | | | | 0.68 | | | | | | 1.44 | | | | | | 232,790 | | | | | | 32 | | |
| | | | | | | | | | | | | | | | | | |
See Accompanying Notes to Financial Statements
Financial Highlights (continued)
| | | | | | | | | | Income (loss)
from
investment
operations | | | | | | | | | Less Distributions | | | | | | | | | | | | | | | | | | | | | | | | | | | Ratios to average net assets | | | Supplemental
Data | |
| | | | Net asset value, beginning of year
or period | | | Net investment income (loss) | | | Net realized and unrealized
gain (loss) | | | Total from investment operations | | | From net investment income | | | From net realized gains | | | From return of capital | | | Total distributions | | | Payment by affiliate | | | Net asset value, end of year
or period | | | Total Return(1) | | | Expenses before
reductions/additions(2)(3)(4) | | | Expenses net of fee waivers
and/or recoupments if any(2)(3)(4) | | | Expenses net of all
reductions/additions(2)(3)(4) | | | Net investment income (loss)(2)(3) | | | Net assets, end of year or period | | | Portfolio turnover rate | |
Year or
period ended | | | ($) | | | ($) | | | ($) | | | ($) | | | ($) | | | ($) | | | ($) | | | ($) | | | ($) | | | ($) | | | (%) | | | (%) | | | (%) | | | (%) | | | (%) | | | ($000’s) | | | (%) | |
| Voya Index Solution 2025 Portfolio (continued) | | | | | | | | | | | | | | | | | | | | | | | | | | | | | | | | | | | | | | | | | | | | | | | | | | | | | | | | | | | | | | | | | | | | | | | | | | | | | | | | | | | | | | | | | | | | | | | | | | | | | | | |
| Class I | | | | | | | | | | | | | | | | | | | | | | | | | | | | | | | | | | | | | | | | | | | | | | | | | | | | | | | | | | | | | | | | | | | | | | | | | | | | | | | | | | | | | | | | | | | | | | | | | | | | | | | |
| 12-31-21 | | | | | 12.40 | | | | | | 0.20• | | | | | | 1.11 | | | | | | 1.31 | | | | | | 0.28 | | | | | | 0.55 | | | | | | — | | | | | | 0.83 | | | | | | — | | | | | | 12.88 | | | | | | 10.70 | | | | | | 0.29 | | | | | | 0.24 | | | | | | 0.24 | | | | | | 1.56 | | | | | | 53,067 | | | | | | 40 | | |
| 12-31-20 | | | | | 11.51 | | | | | | 0.24• | | | | | | 1.21 | | | | | | 1.45 | | | | | | 0.23 | | | | | | 0.33 | | | | | | — | | | | | | 0.56 | | | | | | — | | | | | | 12.40 | | | | | | 13.05 | | | | | | 0.29 | | | | | | 0.24 | | | | | | 0.24 | | | | | | 2.13 | | | | | | 52,341 | | | | | | 50 | | |
| 12-31-19 | | | | | 10.24 | | | | | | 0.23• | | | | | | 1.65 | | | | | | 1.88 | | | | | | 0.22 | | | | | | 0.39 | | | | | | — | | | | | | 0.61 | | | | | | — | | | | | | 11.51 | | | | | | 18.78 | | | | | | 0.25 | | | | | | 0.22 | | | | | | 0.22 | | | | | | 2.07 | | | | | | 60,504 | | | | | | 28 | | |
| 12-31-18 | | | | | 11.21 | | | | | | 0.23 | | | | | | (0.76) | | | | | | (0.53) | | | | | | 0.19 | | | | | | 0.25 | | | | | | — | | | | | | 0.44 | | | | | | — | | | | | | 10.24 | | | | | | (4.94) | | | | | | 0.26 | | | | | | 0.20 | | | | | | 0.20 | | | | | | 2.06 | | | | | | 56,645 | | | | | | 35 | | |
| 12-31-17 | | | | | 10.13 | | | | | | 0.21• | | | | | | 1.27 | | | | | | 1.48 | | | | | | 0.19 | | | | | | 0.21 | | | | | | — | | | | | | 0.40 | | | | | | — | | | | | | 11.21 | | | | | | 14.84 | | | | | | 0.26 | | | | | | 0.18 | | | | | | 0.18 | | | | | | 1.94 | | | | | | 60,664 | | | | | | 32 | | |
| Class S | | | | | | | | | | | | | | | | | | | | | | | | | | | | | | | | | | | | | | | | | | | | | | | | | | | | | | | | | | | | | | | | | | | | | | | | | | | | | | | | | | | | | | | | | | | | | | | | | | | | | | | |
| 12-31-21 | | | | | 12.26 | | | | | | 0.17• | | | | | | 1.09 | | | | | | 1.26 | | | | | | 0.25 | | | | | | 0.55 | | | | | | — | | | | | | 0.80 | | | | | | — | | | | | | 12.72 | | | | | | 10.42 | | | | | | 0.54 | | | | | | 0.49 | | | | | | 0.49 | | | | | | 1.33 | | | | | | 134,629 | | | | | | 40 | | |
| 12-31-20 | | | | | 11.38 | | | | | | 0.24 | | | | | | 1.17 | | | | | | 1.41 | | | | | | 0.20 | | | | | | 0.33 | | | | | | — | | | | | | 0.53 | | | | | | — | | | | | | 12.26 | | | | | | 12.83 | | | | | | 0.54 | | | | | | 0.49 | | | | | | 0.49 | | | | | | 1.97 | | | | | | 135,558 | | | | | | 50 | | |
| 12-31-19 | | | | | 10.13 | | | | | | 0.21 | | | | | | 1.62 | | | | | | 1.83 | | | | | | 0.19 | | | | | | 0.39 | | | | | | — | | | | | | 0.58 | | | | | | — | | | | | | 11.38 | | | | | | 18.46 | | | | | | 0.50 | | | | | | 0.47 | | | | | | 0.47 | | | | | | 1.82 | | | | | | 133,118 | | | | | | 28 | | |
| 12-31-18 | | | | | 11.09 | | | | | | 0.19• | | | | | | (0.74) | | | | | | (0.55) | | | | | | 0.16 | | | | | | 0.25 | | | | | | — | | | | | | 0.41 | | | | | | — | | | | | | 10.13 | | | | | | (5.17) | | | | | | 0.51 | | | | | | 0.45 | | | | | | 0.45 | | | | | | 1.78 | | | | | | 120,905 | | | | | | 35 | | |
| 12-31-17 | | | | | 10.02 | | | | | | 0.18• | | | | | | 1.26 | | | | | | 1.44 | | | | | | 0.16 | | | | | | 0.21 | | | | | | — | | | | | | 0.37 | | | | | | — | | | | | | 11.09 | | | | | | 14.62 | | | | | | 0.51 | | | | | | 0.43 | | | | | | 0.43 | | | | | | 1.69 | | | | | | 149,827 | | | | | | 32 | | |
| Class S2 | | | | | | | | | | | | | | | | | | | | | | | | | | | | | | | | | | | | | | | | | | | | | | | | | | | | | | | | | | | | | | | | | | | | | | | | | | | | | | | | | | | | | | | | | | | | | | | | | | | | | | | |
| 12-31-21 | | | | | 12.02 | | | | | | 0.14• | | | | | | 1.07 | | | | | | 1.21 | | | | | | 0.23 | | | | | | 0.55 | | | | | | — | | | | | | 0.78 | | | | | | — | | | | | | 12.45 | | | | | | 10.24 | | | | | | 0.69 | | | | | | 0.64 | | | | | | 0.64 | | | | | | 1.17 | | | | | | 36,074 | | | | | | 40 | | |
| 12-31-20 | | | | | 11.17 | | | | | | 0.20• | | | | | | 1.18 | | | | | | 1.38 | | | | | | 0.20 | | | | | | 0.33 | | | | | | — | | | | | | 0.53 | | | | | | — | | | | | | 12.02 | | | | | | 12.71 | | | | | | 0.69 | | | | | | 0.64 | | | | | | 0.64 | | | | | | 1.85 | | | | | | 36,080 | | | | | | 50 | | |
| 12-31-19 | | | | | 9.96 | | | | | | 0.18• | | | | | | 1.60 | | | | | | 1.78 | | | | | | 0.18 | | | | | | 0.39 | | | | | | — | | | | | | 0.57 | | | | | | — | | | | | | 11.17 | | | | | | 18.23 | | | | | | 0.65 | | | | | | 0.62 | | | | | | 0.62 | | | | | | 1.70 | | | | | | 32,859 | | | | | | 28 | | |
| 12-31-18 | | | | | 10.90 | | | | | | 0.17• | | | | | | (0.72) | | | | | | (0.55) | | | | | | 0.14 | | | | | | 0.25 | | | | | | — | | | | | | 0.39 | | | | | | — | | | | | | 9.96 | | | | | | (5.29) | | | | | | 0.66 | | | | | | 0.60 | | | | | | 0.60 | | | | | | 1.61 | | | | | | 26,038 | | | | | | 35 | | |
| 12-31-17 | | | | | 9.86 | | | | | | 0.16• | | | | | | 1.24 | | | | | | 1.40 | | | | | | 0.15 | | | | | | 0.21 | | | | | | — | | | | | | 0.36 | | | | | | — | | | | | | 10.90 | | | | | | 14.41 | | | | | | 0.66 | | | | | | 0.58 | | | | | | 0.58 | | | | | | 1.55 | | | | | | 34,197 | | | | | | 32 | | |
| Class Z | | | | | | | | | | | | | | | | | | | | | | | | | | | | | | | | | | | | | | | | | | | | | | | | | | | | | | | | | | | | | | | | | | | | | | | | | | | | | | | | | | | | | | | | | | | | | | | | | | | | | | | |
| 12-31-21 | | | | | 12.56 | | | | | | 0.24• | | | | | | 1.12 | | | | | | 1.36 | | | | | | 0.28 | | | | | | 0.55 | | | | | | — | | | | | | 0.83 | | | | | | — | | | | | | 13.09 | | | | | | 11.03 | | | | | | 0.25 | | | | | | 0.00* | | | | | | 0.00* | | | | | | 1.83 | | | | | | 933,768 | | | | | | 40 | | |
| 12-31-20 | | | | | 11.62 | | | | | | 0.29• | | | | | | 1.21 | | | | | | 1.50 | | | | | | 0.23 | | | | | | 0.33 | | | | | | — | | | | | | 0.56 | | | | | | — | | | | | | 12.56 | | | | | | 13.36 | | | | | | 0.24 | | | | | | 0.00* | | | | | | 0.00* | | | | | | 2.49 | | | | | | 827,543 | | | | | | 50 | | |
| 12-31-19 | | | | | 10.31 | | | | | | 0.26• | | | | | | 1.66 | | | | | | 1.92 | | | | | | 0.22 | | | | | | 0.39 | | | | | | — | | | | | | 0.61 | | | | | | — | | | | | | 11.62 | | | | | | 19.04 | | | | | | 0.25 | | | | | | 0.00* | | | | | | 0.00* | | | | | | 2.35 | | | | | | 685,495 | | | | | | 28 | | |
| 12-31-18 | | | | | 11.26 | | | | | | 0.26• | | | | | | (0.77) | | | | | | (0.51) | | | | | | 0.19 | | | | | | 0.25 | | | | | | — | | | | | | 0.44 | | | | | | — | | | | | | 10.31 | | | | | | (4.74) | | | | | | 0.26 | | | | | | 0.00* | | | | | | 0.00* | | | | | | 2.31 | | | | | | 452,255 | | | | | | 35 | | |
| 12-31-17 | | | | | 10.16 | | | | | | 0.25• | | | | | | 1.25 | | | | | | 1.50 | | | | | | 0.19 | | | | | | 0.21 | | | | | | — | | | | | | 0.40 | | | | | | — | | | | | | 11.26 | | | | | | 15.00 | | | | | | 0.26 | | | | | | 0.00* | | | | | | 0.00* | | | | | | 2.31 | | | | | | 371,838 | | | | | | 32 | | |
| Voya Index Solution 2030 Portfolio | | | | | | | | | | | | | | | | | | | | | | | | | | | | | | | | | | | | | | | | | | | | | | | | | | | | | | | | | | | | | | | | | | | | | | | | | | | | | | | | | | | | | | | | | | | | | | | | | | | | | | | |
| Class ADV | | | | | | | | | | | | | | | | | | | | | | | | | | | | | | | | | | | | | | | | | | | | | | | | | | | | | | | | | | | | | | | | | | | | | | | | | | | | | | | | | | | | | | | | | | | | | | | | | | | | | | | |
| 12-31-21 | | | | | 17.23 | | | | | | 0.18• | | | | | | 1.84 | | | | | | 2.02 | | | | | | 0.29 | | | | | | 0.59 | | | | | | — | | | | | | 0.88 | | | | | | — | | | | | | 18.37 | | | | | | 11.80 | | | | | | 0.81 | | | | | | 0.74 | | | | | | 0.74 | | | | | | 1.00 | | | | | | 46,915 | | | | | | 41 | | |
| 12-31-20 | | | | | 15.89 | | | | | | 0.26• | | | | | | 1.77 | | | | | | 2.03 | | | | | | 0.23 | | | | | | 0.46 | | | | | | — | | | | | | 0.69 | | | | | | — | | | | | | 17.23 | | | | | | 13.22 | | | | | | 0.83 | | | | | | 0.74 | | | | | | 0.74 | | | | | | 1.69 | | | | | | 42,311 | | | | | | 45 | | |
| 12-31-19 | | | | | 13.81 | | | | | | 0.23• | | | | | | 2.53 | | | | | | 2.76 | | | | | | 0.20 | | | | | | 0.48 | | | | | | — | | | | | | 0.68 | | | | | | — | | | | | | 15.89 | | | | | | 20.35 | | | | | | 0.74 | | | | | | 0.73 | | | | | | 0.73 | | | | | | 1.55 | | | | | | 36,621 | | | | | | 29 | | |
| 12-31-18 | | | | | 15.28 | | | | | | 0.24• | | | | | | (1.21) | | | | | | (0.97) | | | | | | 0.15 | | | | | | 0.35 | | | | | | — | | | | | | 0.50 | | | | | | — | | | | | | 13.81 | | | | | | (6.60) | | | | | | 0.75 | | | | | | 0.70 | | | | | | 0.70 | | | | | | 1.61 | | | | | | 27,143 | | | | | | 33 | | |
| 12-31-17 | | | | | 13.22 | | | | | | 0.21• | | | | | | 1.98 | | | | | | 2.19 | | | | | | 0.05 | | | | | | 0.08 | | | | | | — | | | | | | 0.13 | | | | | | — | | | | | | 15.28 | | | | | | 16.62 | | | | | | 0.76 | | | | | | 0.69 | | | | | | 0.69 | | | | | | 1.48 | | | | | | 20,939 | | | | | | 32 | | |
| Class I | | | | | | | | | | | | | | | | | | | | | | | | | | | | | | | | | | | | | | | | | | | | | | | | | | | | | | | | | | | | | | | | | | | | | | | | | | | | | | | | | | | | | | | | | | | | | | | | | | | | | | | |
| 12-31-21 | | | | | 17.78 | | | | | | 0.28• | | | | | | 1.90 | | | | | | 2.18 | | | | | | 0.35 | | | | | | 0.59 | | | | | | — | | | | | | 0.94 | | | | | | — | | | | | | 19.02 | | | | | | 12.40 | | | | | | 0.31 | | | | | | 0.24 | | | | | | 0.24 | | | | | | 1.51 | | | | | | 10,579 | | | | | | 41 | | |
| 12-31-20 | | | | | 16.37 | | | | | | 0.34• | | | | | | 1.82 | | | | | | 2.16 | | | | | | 0.29 | | | | | | 0.46 | | | | | | — | | | | | | 0.75 | | | | | | — | | | | | | 17.78 | | | | | | 13.72 | | | | | | 0.33 | | | | | | 0.24 | | | | | | 0.24 | | | | | | 2.13 | | | | | | 9,372 | | | | | | 45 | | |
| 12-31-19 | | | | | 14.19 | | | | | | 0.31• | | | | | | 2.61 | | | | | | 2.92 | | | | | | 0.26 | | | | | | 0.48 | | | | | | — | | | | | | 0.74 | | | | | | — | | | | | | 16.37 | | | | | | 21.02 | | | | | | 0.24 | | | | | | 0.23 | | | | | | 0.23 | | | | | | 2.01 | | | | | | 8,674 | | | | | | 29 | | |
| 12-31-18 | | | | | 15.65 | | | | | | 0.31• | | | | | | (1.23) | | | | | | (0.92) | | | | | | 0.19 | | | | | | 0.35 | | | | | | — | | | | | | 0.54 | | | | | | — | | | | | | 14.19 | | | | | | (6.11) | | | | | | 0.25 | | | | | | 0.20 | | | | | | 0.20 | | | | | | 2.03 | | | | | | 6,304 | | | | | | 33 | | |
| 12-31-17 | | | | | 13.50 | | | | | | 0.31• | | | | | | 1.99 | | | | | | 2.30 | | | | | | 0.07 | | | | | | 0.08 | | ��� | | | | — | | | | | | 0.15 | | | | | | — | | | | | | 15.65 | | | | | | 17.14 | | | | | | 0.26 | | | | | | 0.19 | | | | | | 0.19 | | | | | | 2.10 | | | | | | 4,953 | | | | | | 32 | | |
| | | | | | | | | | | | | | | | | | |
See Accompanying Notes to Financial Statements
Financial Highlights (continued)
| | | | | | | | | | Income (loss)
from
investment
operations | | | | | | | | | Less Distributions | | | | | | | | | | | | | | | | | | | | | | | | | | | Ratios to average net assets | | | Supplemental
Data | |
| | | | Net asset value, beginning of year
or period | | | Net investment income (loss) | | | Net realized and unrealized
gain (loss) | | | Total from investment operations | | | From net investment income | | | From net realized gains | | | From return of capital | | | Total distributions | | | Payment by affiliate | | | Net asset value, end of year
or period | | | Total Return(1) | | | Expenses before
reductions/additions(2)(3)(4) | | | Expenses net of fee waivers
and/or recoupments if any(2)(3)(4) | | | Expenses net of all
reductions/additions(2)(3)(4) | | | Net investment income (loss)(2)(3) | | | Net assets, end of year or period | | | Portfolio turnover rate | |
Year or
period ended | | | ($) | | | ($) | | | ($) | | | ($) | | | ($) | | | ($) | | | ($) | | | ($) | | | ($) | | | ($) | | | (%) | | | (%) | | | (%) | | | (%) | | | (%) | | | ($000’s) | | | (%) | |
| Voya Index Solution 2030 Portfolio (continued) | | | | | | | | | | | | | | | | | | | | | | | | | | | | | | | | | | | | | | | | | | | | | | | | | | | | | | | | | | | | | | | | | | | | | | | | | | | | | | | | | | | | | | | | | | | | | | | | | | | | | | | |
| Class S | | | | | | | | | | | | | | | | | | | | | | | | | | | | | | | | | | | | | | | | | | | | | | | | | | | | | | | | | | | | | | | | | | | | | | | | | | | | | | | | | | | | | | | | | | | | | | | | | | | | | | | |
| 12-31-21 | | | | | 17.63 | | | | | | 0.23• | | | | | | 1.90 | | | | | | 2.13 | | | | | | 0.32 | | | | | | 0.59 | | | | | | — | | | | | | 0.91 | | | | | | — | | | | | | 18.85 | | | | | | 12.18 | | | | | | 0.56 | | | | | | 0.49 | | | | | | 0.49 | | | | | | 1.24 | | | | | | 20,843 | | | | | | 41 | | |
| 12-31-20 | | | | | 16.24 | | | | | | 0.31• | | | | | | 1.79 | | | | | | 2.10 | | | | | | 0.25 | | | | | | 0.46 | | | | | | — | | | | | | 0.71 | | | | | | — | | | | | | 17.63 | | | | | | 13.45 | | | | | | 0.58 | | | | | | 0.49 | | | | | | 0.49 | | | | | | 1.96 | | | | | | 17,414 | | | | | | 45 | | |
| 12-31-19 | | | | | 14.09 | | | | | | 0.28• | | | | | | 2.58 | | | | | | 2.86 | | | | | | 0.23 | | | | | | 0.48 | | | | | | — | | | | | | 0.71 | | | | | | — | | | | | | 16.24 | | | | | | 20.67 | | | | | | 0.49 | | | | | | 0.48 | | | | | | 0.48 | | | | | | 1.79 | | | | | | 14,570 | | | | | | 29 | | |
| 12-31-18 | | | | | 15.56 | | | | | | 0.28 | | | | | | (1.24) | | | | | | (0.96) | | | | | | 0.16 | | | | | | 0.35 | | | | | | — | | | | | | 0.51 | | | | | | — | | | | | | 14.09 | | | | | | (6.40) | | | | | | 0.50 | | | | | | 0.45 | | | | | | 0.45 | | | | | | 1.77 | | | | | | 11,224 | | | | | | 33 | | |
| 12-31-17 | | | | | 13.44 | | | | | | 0.27• | | | | | | 1.99 | | | | | | 2.26 | | | | | | 0.06 | | | | | | 0.08 | | | | | | — | | | | | | 0.14 | | | | | | — | | | | | | 15.56 | | | | | | 16.91 | | | | | | 0.51 | | | | | | 0.44 | | | | | | 0.44 | | | | | | 1.82 | | | | | | 12,320 | | | | | | 32 | | |
| Class S2 | | | | | | | | | | | | | | | | | | | | | | | | | | | | | | | | | | | | | | | | | | | | | | | | | | | | | | | | | | | | | | | | | | | | | | | | | | | | | | | | | | | | | | | | | | | | | | | | | | | | | | | |
| 12-31-21 | | | | | 17.35 | | | | | | 0.20• | | | | | | 1.87 | | | | | | 2.07 | | | | | | 0.32 | | | | | | 0.59 | | | | | | — | | | | | | 0.91 | | | | | | — | | | | | | 18.51 | | | | | | 12.01 | | | | | | 0.71 | | | | | | 0.64 | | | | | | 0.64 | | | | | | 1.12 | | | | | | 14,118 | | | | | | 41 | | |
| 12-31-20 | | | | | 16.02 | | | | | | 0.31• | | | | | | 1.73 | | | | | | 2.04 | | | | | | 0.25 | | | | | | 0.46 | | | | | | — | | | | | | 0.71 | | | | | | — | | | | | | 17.35 | | | | | | 13.26 | | | | | | 0.73 | | | | | | 0.64 | | | | | | 0.64 | | | | | | 1.96 | | | | | | 10,670 | | | | | | 45 | | |
| 12-31-19 | | | | | 13.94 | | | | | | 0.27• | | | | | | 2.53 | | | | | | 2.80 | | | | | | 0.24 | | | | | | 0.48 | | | | | | — | | | | | | 0.72 | | | | | | — | | | | | | 16.02 | | | | | | 20.50 | | | | | | 0.64 | | | | | | 0.63 | | | | | | 0.63 | | | | | | 1.77 | | | | | | 5,688 | | | | | | 29 | | |
| 12-31-18 | | | | | 15.37 | | | | | | 0.26• | | | | | | (1.22) | | | | | | (0.96) | | | | | | 0.12 | | | | | | 0.35 | | | | | | — | | | | | | 0.47 | | | | | | — | | | | | | 13.94 | | | | | | (6.47) | | | | | | 0.65 | | | | | | 0.60 | | | | | | 0.60 | | | | | | 1.74 | | | | | | 2,239 | | | | | | 33 | | |
| 12-31-17 | | | | | 13.29 | | | | | | 0.22• | | | | | | 1.99 | | | | | | 2.21 | | | | | | 0.05 | | | | | | 0.08 | | | | | | — | | | | | | 0.13 | | | | | | — | | | | | | 15.37 | | | | | | 16.69 | | | | | | 0.66 | | | | | | 0.59 | | | | | | 0.59 | | | | | | 1.54 | | | | | | 1,800 | | | | | | 32 | | |
| Class Z | | | | | | | | | | | | | | | | | | | | | | | | | | | | | | | | | | | | | | | | | | | | | | | | | | | | | | | | | | | | | | | | | | | | | | | | | | | | | | | | | | | | | | | | | | | | | | | | | | | | | | | |
| 12-31-21 | | | | | 17.96 | | | | | | 0.33• | | | | | | 1.92 | | | | | | 2.25 | | | | | | 0.37 | | | | | | 0.59 | | | | | | — | | | | | | 0.96 | | | | | | — | | | | | | 19.25 | | | | | | 12.64 | | | | | | 0.25 | | | | | | 0.00* | | | | | | 0.00* | | | | | | 1.76 | | | | | | 850,871 | | | | | | 41 | | |
| 12-31-20 | | | | | 16.48 | | | | | | 0.40• | | | | | | 1.83 | | | | | | 2.23 | | | | | | 0.29 | | | | | | 0.46 | | | | | | — | | | | | | 0.75 | | | | | | — | | | | | | 17.96 | | | | | | 14.06 | | | | | | 0.24 | | | | | | 0.00* | | | | | | 0.00* | | | | | | 2.45 | | | | | | 699,789 | | | | | | 45 | | |
| 12-31-19 | | | | | 14.26 | | | | | | 0.36• | | | | | | 2.60 | | | | | | 2.96 | | | | | | 0.26 | | | | | | 0.48 | | | | | | — | | | | | | 0.74 | | | | | | — | | | | | | 16.48 | | | | | | 21.20 | | | | | | 0.24 | | | | | | 0.00* | | | | | | 0.00* | | | | | | 2.30 | | | | | | 558,381 | | | | | | 29 | | |
| 12-31-18 | | | | | 15.69 | | | | | | 0.36• | | | | | | (1.25) | | | | | | (0.89) | | | | | | 0.19 | | | | | | 0.35 | | | | | | — | | | | | | 0.54 | | | | | | — | | | | | | 14.26 | | | | | | (5.90) | | | | | | 0.25 | | | | | | 0.00* | | | | | | 0.00* | | | | | | 2.29 | | | | | | 348,273 | | | | | | 33 | | |
| 12-31-17 | | | | | 13.51 | | | | | | 0.35• | | | | | | 1.98 | | | | | | 2.33 | | | | | | 0.07 | | | | | | 0.08 | | | | | | — | | | | | | 0.15 | | | | | | — | | | | | | 15.69 | | | | | | 17.35 | | | | | | 0.26 | | | | | | 0.00* | | | | | | 0.00* | | | | | | 2.36 | | | | | | 267,328 | | | | | | 32 | | |
| Voya Index Solution 2035 Portfolio | | | | | | | | | | | | | | | | | | | | | | | | | | | | | | | | | | | | | | | | | | | | | | | | | | | | | | | | | | | | | | | | | | | | | | | | | | | | | | | | | | | | | | | | | | | | | | | | | | | | | | | |
| Class ADV | | | | | | | | | | | | | | | | | | | | | | | | | | | | | | | | | | | | | | | | | | | | | | | | | | | | | | | | | | | | | | | | | | | | | | | | | | | | | | | | | | | | | | | | | | | | | | | | | | | | | | | |
| 12-31-21 | | | | | 12.69 | | | | | | 0.12• | | | | | | 1.58 | | | | | | 1.70 | | | | | | 0.19 | | | | | | 0.61 | | | | | | — | | | | | | 0.80 | | | | | | — | | | | | | 13.59 | | | | | | 13.56 | | | | | | 0.80 | | | | | | 0.74 | | | | | | 0.74 | | | | | | 0.89 | | | | | | 169,629 | | | | | | 38 | | |
| 12-31-20 | | | | | 11.72 | | | | | | 0.18• | | | | | | 1.37 | | | | | | 1.55 | | | | | | 0.16 | | | | | | 0.42 | | | | | | — | | | | | | 0.58 | | | | | | — | | | | | | 12.69 | | | | | | 13.85 | | | | | | 0.80 | | | | | | 0.74 | | | | | | 0.74 | | | | | | 1.58 | | | | | | 172,517 | | | | | | 45 | | |
| 12-31-19 | | | | | 10.14 | | | | | | 0.17• | | | | | | 2.00 | | | | | | 2.17 | | | | | | 0.15 | | | | | | 0.44 | | | | | | — | | | | | | 0.59 | | | | | | — | | | | | | 11.72 | | | | | | 21.91 | | | | | | 0.74 | | | | | | 0.73 | | | | | | 0.73 | | | | | | 1.51 | | | | | | 186,455 | | | | | | 28 | | |
| 12-31-18 | | | | | 11.34 | | | | | | 0.16• | | | | | | (0.94) | | | | | | (0.78) | | | | | | 0.13 | | | | | | 0.29 | | | | | | — | | | | | | 0.42 | | | | | | — | | | | | | 10.14 | | | | | | (7.26) | | | | | | 0.75 | | | | | | 0.70 | | | | | | 0.70 | | | | | | 1.45 | | | | | | 176,145 | | | | | | 33 | | |
| 12-31-17 | | | | | 9.98 | | | | | | 0.15• | | | | | | 1.61 | | | | | | 1.76 | | | | | | 0.13 | | | | | | 0.27 | | | | | | — | | | | | | 0.40 | | | | | | — | | | | | | 11.34 | | | | | | 17.95 | | | | | | 0.76 | | | | | | 0.68 | | | | | | 0.68 | | | | | | 1.37 | | | | | | 215,074 | | | | | | 25 | | |
| Class I | | | | | | | | | | | | | | | | | | | | | | | | | | | | | | | | | | | | | | | | | | | | | | | | | | | | | | | | | | | | | | | | | | | | | | | | | | | | | | | | | | | | | | | | | | | | | | | | | | | | | | | |
| 12-31-21 | | | | | 13.07 | | | | | | 0.19• | | | | | | 1.64 | | | | | | 1.83 | | | | | | 0.26 | | | | | | 0.61 | | | | | | — | | | | | | 0.87 | | | | | | — | | | | | | 14.03 | | | | | | 14.17 | | | | | | 0.30 | | | | | | 0.24 | | | | | | 0.24 | | | | | | 1.40 | | | | | | 60,969 | | | | | | 38 | | |
| 12-31-20 | | | | | 12.06 | | | | | | 0.23• | | | | | | 1.43 | | | | | | 1.66 | | | | | | 0.23 | | | | | | 0.42 | | | | | | — | | | | | | 0.65 | | | | | | — | | | | | | 13.07 | | | | | | 14.41 | | | | | | 0.30 | | | | | | 0.24 | | | | | | 0.24 | | | | | | 2.01 | | | | | | 54,401 | | | | | | 45 | | |
| 12-31-19 | | | | | 10.42 | | | | | | 0.24 | | | | | | 2.05 | | | | | | 2.29 | | | | | | 0.21 | | | | | | 0.44 | | | | | | — | | | | | | 0.65 | | | | | | — | | | | | | 12.06 | | | | | | 22.58 | | | | | | 0.24 | | | | | | 0.23 | | | | | | 0.23 | | | | | | 2.00 | | | | | | 64,433 | | | | | | 28 | | |
| 12-31-18 | | | | | 11.65 | | | | | | 0.22 | | | | | | (0.98) | | | | | | (0.76) | | | | | | 0.18 | | | | | | 0.29 | | | | | | — | | | | | | 0.47 | | | | | | — | | | | | | 10.42 | | | | | | (6.86) | | | | | | 0.25 | | | | | | 0.20 | | | | | | 0.20 | | | | | | 1.99 | | | | | | 55,982 | | | | | | 33 | | |
| 12-31-17 | | | | | 10.23 | | | | | | 0.20 | | | | | | 1.68 | | | | | | 1.88 | | | | | | 0.19 | | | | | | 0.27 | | | | | | — | | | | | | 0.46 | | | | | | — | | | | | | 11.65 | | | | | | 18.65 | | | | | | 0.26 | | | | | | 0.18 | | | | | | 0.18 | | | | | | 1.89 | | | | | | 58,021 | | | | | | 25 | | |
| Class S | | | | | | | | | | | | | | | | | | | | | | | | | | | | | | | | | | | | | | | | | | | | | | | | | | | | | | | | | | | | | | | | | | | | | | | | | | | | | | | | | | | | | | | | | | | | | | | | | | | | | | | |
| 12-31-21 | | | | | 12.90 | | | | | | 0.16• | | | | | | 1.61 | | | | | | 1.77 | | | | | | 0.23 | | | | | | 0.61 | | | | | | — | | | | | | 0.84 | | | | | | — | | | | | | 13.83 | | | | | | 13.87 | | | | | | 0.55 | | | | | | 0.49 | | | | | | 0.49 | | | | | | 1.16 | | | | | | 114,671 | | | | | | 38 | | |
| 12-31-20 | | | | | 11.91 | | | | | | 0.23 | | | | | | 1.37 | | | | | | 1.60 | | | | | | 0.19 | | | | | | 0.42 | | | | | | — | | | | | | 0.61 | | | | | | — | | | | | | 12.90 | | | | | | 14.12 | | | | | | 0.55 | | | | | | 0.49 | | | | | | 0.49 | | | | | | 1.86 | | | | | | 112,188 | | | | | | 45 | | |
| 12-31-19 | | | | | 10.29 | | | | | | 0.21 | | | | | | 2.03 | | | | | | 2.24 | | | | | | 0.18 | | | | | | 0.44 | | | | | | — | | | | | | 0.62 | | | | | | — | | | | | | 11.91 | | | | | | 22.36 | | | | | | 0.49 | | | | | | 0.48 | | | | | | 0.48 | | | | | | 1.76 | | | | | | 110,305 | | | | | | 28 | | |
| 12-31-18 | | | | | 11.51 | | | | | | 0.19• | | | | | | (0.97) | | | | | | (0.78) | | | | | | 0.15 | | | | | | 0.29 | | | | | | — | | | | | | 0.44 | | | | | | — | | | | | | 10.29 | | | | | | (7.12) | | | | | | 0.50 | | | | | | 0.45 | | | | | | 0.45 | | | | | | 1.70 | | | | | | 96,259 | | | | | | 33 | | |
| 12-31-17 | | | | | 10.11 | | | | | | 0.17• | | | | | | 1.66 | | | | | | 1.83 | | | | | | 0.16 | | | | | | 0.27 | | | | | | — | | | | | | 0.43 | | | | | | — | | | | | | 11.51 | | | | | | 18.39 | | | | | | 0.51 | | | | | | 0.43 | | | | | | 0.43 | | | | | | 1.61 | | | | | | 121,702 | | | | | | 25 | | |
| | | | �� | | | | | | | | | | | | | | |
See Accompanying Notes to Financial Statements
Financial Highlights (continued)
| | | | | | | | | | Income (loss)
from
investment
operations | | | | | | | | | Less Distributions | | | | | | | | | | | | | | | | | | | | | | | | | | | Ratios to average net assets | | | Supplemental
Data | |
| | | | Net asset value, beginning of year
or period | | | Net investment income (loss) | | | Net realized and unrealized
gain (loss) | | | Total from investment operations | | | From net investment income | | | From net realized gains | | | From return of capital | | | Total distributions | | | Payment by affiliate | | | Net asset value, end of year
or period | | | Total Return(1) | | | Expenses before
reductions/additions(2)(3)(4) | | | Expenses net of fee waivers
and/or recoupments if any(2)(3)(4) | | | Expenses net of all
reductions/additions(2)(3)(4) | | | Net investment income (loss)(2)(3) | | | Net assets, end of year or period | | | Portfolio turnover rate | |
Year or
period ended | | | ($) | | | ($) | | | ($) | | | ($) | | | ($) | | | ($) | | | ($) | | | ($) | | | ($) | | | ($) | | | (%) | | | (%) | | | (%) | | | (%) | | | (%) | | | ($000’s) | | | (%) | |
| Voya Index Solution 2035 Portfolio (continued) | | | | | | | | | | | | | | | | | | | | | | | | | | | | | | | | | | | | | | | | | | | | | | | | | | | | | | | | | | | | | | | | | | | | | | | | | | | | | | | | | | | | | | | | | | | | | | | | | | | | | | | |
| Class S2 | | | | | | | | | | | | | | | | | | | | | | | | | | | | | | | | | | | | | | | | | | | | | | | | | | | | | | | | | | | | | | | | | | | | | | | | | | | | | | | | | | | | | | | | | | | | | | | | | | | | | | | |
| 12-31-21 | | | | | 12.66 | | | | | | 0.13• | | | | | | 1.58 | | | | | | 1.71 | | | | | | 0.22 | | | | | | 0.61 | | | | | | — | | | | | | 0.83 | | | | | | — | | | | | | 13.54 | | | | | | 13.65 | | | | | | 0.70 | | | | | | 0.64 | | | | | | 0.64 | | | | | | 0.96 | | | | | | 40,801 | | | | | | 38 | | |
| 12-31-20 | | | | | 11.71 | | | | | | 0.20• | | | | | | 1.36 | | | | | | 1.56 | | | | | | 0.19 | | | | | | 0.42 | | | | | | — | | | | | | 0.61 | | | | | | — | | | | | | 12.66 | | | | | | 13.93 | | | | | | 0.70 | | | | | | 0.64 | | | | | | 0.64 | | | | | | 1.79 | | | | | | 41,739 | | | | | | 45 | | |
| 12-31-19 | | | | | 10.13 | | | | | | 0.18• | | | | | | 2.00 | | | | | | 2.18 | | | | | | 0.16 | | | | | | 0.44 | | | | | | — | | | | | | 0.60 | | | | | | — | | | | | | 11.71 | | | | | | 22.09 | | | | | | 0.64 | | | | | | 0.63 | | | | | | 0.63 | | | | | | 1.62 | | | | | | 33,877 | | | | | | 28 | | |
| 12-31-18 | | | | | 11.32 | | | | | | 0.17• | | | | | | (0.94) | | | | | | (0.77) | | | | | | 0.13 | | | | | | 0.29 | | | | | | — | | | | | | 0.42 | | | | | | — | | | | | | 10.13 | | | | | | (7.14) | | | | | | 0.65 | | | | | | 0.60 | | | | | | 0.60 | | | | | | 1.52 | | | | | | 29,751 | | | | | | 33 | | |
| 12-31-17 | | | | | 9.96 | | | | | | 0.16 | | | | | | 1.62 | | | | | | 1.78 | | | | | | 0.15 | | | | | | 0.27 | | | | | | — | | | | | | 0.42 | | | | | | — | | | | | | 11.32 | | | | | | 18.14 | | | | | | 0.66 | | | | | | 0.58 | | | | | | 0.58 | | | | | | 1.50 | | | | | | 37,316 | | | | | | 25 | | |
| Class Z | | | | | | | | | | | | | | | | | | | | | | | | | | | | | | | | | | | | | | | | | | | | | | | | | | | | | | | | | | | | | | | | | | | | | | | | | | | | | | | | | | | | | | | | | | | | | | | | | | | | | | | |
| 12-31-21 | | | | | 13.26 | | | | | | 0.23• | | | | | | 1.66 | | | | | | 1.89 | | | | | | 0.27 | | | | | | 0.61 | | | | | | — | | | | | | 0.88 | | | | | | — | | | | | | 14.27 | | | | | | 14.41 | | | | | | 0.24 | | | | | | 0.00* | | | | | | 0.00* | | | | | | 1.67 | | | | | | 1,084,762 | | | | | | 38 | | |
| 12-31-20 | | | | | 12.20 | | | | | | 0.28• | | | | | | 1.43 | | | | | | 1.71 | | | | | | 0.23 | | | | | | 0.42 | | | | | | — | | | | | | 0.65 | | | | | | — | | | | | | 13.26 | | | | | | 14.66 | | | | | | 0.24 | | | | | | 0.00* | | | | | | 0.00* | | | | | | 2.40 | | | | | | 876,349 | | | | | | 45 | | |
| 12-31-19 | | | | | 10.51 | | | | | | 0.27• | | | | | | 2.07 | | | | | | 2.34 | | | | | | 0.21 | | | | | | 0.44 | | | | | | — | | | | | | 0.65 | | | | | | — | | | | | | 12.20 | | | | | | 22.88 | | | | | | 0.24 | | | | | | 0.00* | | | | | | 0.00* | | | | | | 2.31 | | | | | | 688,542 | | | | | | 28 | | |
| 12-31-18 | | | | | 11.72 | | | | | | 0.26• | | | | | | (1.00) | | | | | | (0.74) | | | | | | 0.18 | | | | | | 0.29 | | | | | | — | | | | | | 0.47 | | | | | | — | | | | | | 10.51 | | | | | | (6.64) | | | | | | 0.25 | | | | | | 0.00* | | | | | | 0.00* | | | | | | 2.24 | | | | | | 412,024 | | | | | | 33 | | |
| 12-31-17 | | | | | 10.27 | | | | | | 0.25• | | | | | | 1.66 | | | | | | 1.91 | | | | | | 0.19 | | | | | | 0.27 | | | | | | — | | | | | | 0.46 | | | | | | — | | | | | | 11.72 | | | | | | 18.88 | | | | | | 0.26 | | | | | | 0.00* | | | | | | 0.00* | | | | | | 2.26 | | | | | | 327,540 | | | | | | 25 | | |
| Voya Index Solution 2040 Portfolio | | | | | | | | | | | | | | | | | | | | | | | | | | | | | | | | | | | | | | | | | | | | | | | | | | | | | | | | | | | | | | | | | | | | | | | | | | | | | | | | | | | | | | | | | | | | | | | | | | | | | | | |
| Class ADV | | | | | | | | | | | | | | | | | | | | | | | | | | | | | | | | | | | | | | | | | | | | | | | | | | | | | | | | | | | | | | | | | | | | | | | | | | | | | | | | | | | | | | | | | | | | | | | | | | | | | | | |
| 12-31-21 | | | | | 18.49 | | | | | | 0.16• | | | | | | 2.76 | | | | | | 2.92 | | | | | | 0.25 | | | | | | 0.64 | | | | | | — | | | | | | 0.89 | | | | | | — | | | | | | 20.52 | | | | | | 15.95 | | | | | | 0.84 | | | | | | 0.74 | | | | | | 0.74 | | | | | | 0.83 | | | | | | 28,989 | | | | | | 35 | | |
| 12-31-20 | | | | | 16.81 | | | | | | 0.27 | | | | | | 2.16 | | | | | | 2.43 | | | | | | 0.22 | | | | | | 0.53 | | | | | | — | | | | | | 0.75 | | | | | | — | | | | | | 18.49 | | | | | | 15.08 | | | | | | 0.86 | | | | | | 0.74 | | | | | | 0.74 | | | | | | 1.62 | | | | | | 26,276 | | | | | | 32 | | |
| 12-31-19 | | | | | 14.29 | | | | | | 0.24• | | | | | | 3.01 | | | | | | 3.25 | | | | | | 0.19 | | | | | | 0.54 | | | | | | — | | | | | | 0.73 | | | | | | — | | | | | | 16.81 | | | | | | 23.19 | | | | | | 0.74 | | | | | | 0.73 | | | | | | 0.73 | | | | | | 1.48 | | | | | | 24,422 | | | | | | 23 | | |
| 12-31-18 | | | | | 16.00 | | | | | | 0.23• | | | | | | (1.45) | | | | | | (1.22) | | | | | | 0.13 | | | | | | 0.36 | | | | | | — | | | | | | 0.49 | | | | | | — | | | | | | 14.29 | | | | | | (7.94) | | | | | | 0.75 | | | | | | 0.71 | | | | | | 0.71 | | | | | | 1.48 | | | | | | 15,441 | | | | | | 30 | | |
| 12-31-17 | | | | | 13.57 | | | | | | 0.21• | | | | | | 2.36 | | | | | | 2.57 | | | | | | 0.05 | | | | | | 0.09 | | | | | | — | | | | | | 0.14 | | | | | | — | | | | | | 16.00 | | | | | | 19.05 | | | | | | 0.77 | | | | | | 0.68 | | | | | | 0.68 | | | | | | 1.44 | | | | | | 11,117 | | | | | | 29 | | |
| Class I | | | | | | | | | | | | | | | | | | | | | | | | | | | | | | | | | | | | | | | | | | | | | | | | | | | | | | | | | | | | | | | | | | | | | | | | | | | | | | | | | | | | | | | | | | | | | | | | | | | | | | | |
| 12-31-21 | | | | | 19.04 | | | | | | 0.28• | | | | | | 2.85 | | | | | | 3.13 | | | | | | 0.34 | | | | | | 0.64 | | | | | | — | | | | | | 0.98 | | | | | | — | | | | | | 21.19 | | | | | | 16.58 | | | | | | 0.34 | | | | | | 0.24 | | | | | | 0.24 | | | | | | 1.35 | | | | | | 9,660 | | | | | | 35 | | |
| 12-31-20 | | | | | 17.28 | | | | | | 0.37• | | | | | | 2.21 | | | | | | 2.58 | | | | | | 0.29 | | | | | | 0.53 | | | | | | — | | | | | | 0.82 | | | | | | — | | | | | | 19.04 | | | | | | 15.62 | | | | | | 0.36 | | | | | | 0.24 | | | | | | 0.24 | | | | | | 2.20 | | | | | | 7,830 | | | | | | 32 | | |
| 12-31-19 | | | | | 14.65 | | | | | | 0.32• | | | | | | 3.09 | | | | | | 3.41 | | | | | | 0.24 | | | | | | 0.54 | | | | | | — | | | | | | 0.78 | | | | | | — | | | | | | 17.28 | | | | | | 23.82 | | | | | | 0.24 | | | | | | 0.23 | | | | | | 0.23 | | | | | | 1.95 | | | | | | 5,832 | | | | | | 23 | | |
| 12-31-18 | | | | | 16.36 | | | | | | 0.32• | | | | | | (1.50) | | | | | | (1.18) | | | | | | 0.17 | | | | | | 0.36 | | | | | | — | | | | | | 0.53 | | | | | | — | | | | | | 14.65 | | | | | | (7.53) | | | | | | 0.25 | | | | | | 0.21 | | | | | | 0.21 | | | | | | 1.97 | | | | | | 3,952 | | | | | | 30 | | |
| 12-31-17 | | | | | 13.82 | | | | | | 0.32• | | | | | | 2.38 | | | | | | 2.70 | | | | | | 0.07 | | | | | | 0.09 | | | | | | — | | | | | | 0.16 | | | | | | — | | | | | | 16.36 | | | | | | 19.68 | | | | | | 0.27 | | | | | | 0.18 | | | | | | 0.18 | | | | | | 2.12 | | | | | | 2,612 | | | | | | 29 | | |
| Class S | | | | | | | | | | | | | | | | | | | | | | | | | | | | | | | | | | | | | | | | | | | | | | | | | | | | | | | | | | | | | | | | | | | | | | | | | | | | | | | | | | | | | | | | | | | | | | | | | | | | | | | |
| 12-31-21 | | | | | 18.99 | | | | | | 0.23• | | | | | | 2.84 | | | | | | 3.07 | | | | | | 0.30 | | | | | | 0.64 | | | | | | — | | | | | | 0.94 | | | | | | — | | | | | | 21.12 | | | | | | 16.30 | | | | | | 0.59 | | | | | | 0.49 | | | | | | 0.49 | | | | | | 1.12 | | | | | | 16,775 | | | | | | 35 | | |
| 12-31-20 | | | | | 17.24 | | | | | | 0.32• | | | | | | 2.21 | | | | | | 2.53 | | | | | | 0.25 | | | | | | 0.53 | | | | | | — | | | | | | 0.78 | | | | | | — | | | | | | 18.99 | | | | | | 15.34 | | | | | | 0.61 | | | | | | 0.49 | | | | | | 0.49 | | | | | | 1.94 | | | | | | 13,728 | | | | | | 32 | | |
| 12-31-19 | | | | | 14.62 | | | | | | 0.28• | | | | | | 3.09 | | | | | | 3.37 | | | | | | 0.21 | | | | | | 0.54 | | | | | | — | | | | | | 0.75 | | | | | | — | | | | | | 17.24 | | | | | | 23.53 | | | | | | 0.49 | | | | | | 0.48 | | | | | | 0.48 | | | | | | 1.71 | | | | | | 11,372 | | | | | | 23 | | |
| 12-31-18 | | | | | 16.33 | | | | | | 0.26 | | | | | | (1.47) | | | | | | (1.21) | | | | | | 0.14 | | | | | | 0.36 | | | | | | — | | | | | | 0.50 | | | | | | — | | | | | | 14.62 | | | | | | (7.73) | | | | | | 0.50 | | | | | | 0.46 | | | | | | 0.46 | | | | | | 1.64 | | | | | | 7,981 | | | | | | 30 | | |
| 12-31-17 | | | | | 13.82 | | | | | | 0.25• | | | | | | 2.41 | | | | | | 2.66 | | | | | | 0.06 | | | | | | 0.09 | | | | | | — | | | | | | 0.15 | | | | | | — | | | | | | 16.33 | | | | | | 19.39 | | | | | | 0.52 | | | | | | 0.43 | | | | | | 0.43 | | | | | | 1.64 | | | | | | 8,832 | | | | | | 29 | | |
| Class S2 | | | | | | | | | | | | | | | | | | | | | | | | | | | | | | | | | | | | | | | | | | | | | | | | | | | | | | | | | | | | | | | | | | | | | | | | | | | | | | | | | | | | | | | | | | | | | | | | | | | | | | | |
| 12-31-21 | | | | | 18.68 | | | | | | 0.18• | | | | | | 2.80 | | | | | | 2.98 | | | | | | 0.29 | | | | | | 0.64 | | | | | | — | | | | | | 0.93 | | | | | | — | | | | | | 20.73 | | | | | | 16.09 | | | | | | 0.74 | | | | | | 0.64 | | | | | | 0.64 | | | | | | 0.89 | | | | | | 4,354 | | | | | | 35 | | |
| 12-31-20 | | | | | 16.98 | | | | | | 0.31• | | | | | | 2.16 | | | | | | 2.47 | | | | | | 0.24 | | | | | | 0.53 | | | | | | — | | | | | | 0.77 | | | | | | — | | | | | | 18.68 | | | | | | 15.17 | | | | | | 0.76 | | | | | | 0.64 | | | | | | 0.64 | | | | | | 1.89 | | | | | | 4,557 | | | | | | 32 | | |
| 12-31-19 | | | | | 14.42 | | | | | | 0.24• | | | | | | 3.06 | | | | | | 3.30 | | | | | | 0.20 | | | | | | 0.54 | | | | | | — | | | | | | 0.74 | | | | | | — | | | | | | 16.98 | | | | | | 23.36 | | | | | | 0.64 | | | | | | 0.63 | | | | | | 0.63 | | | | | | 1.51 | | | | | | 2,896 | | | | | | 23 | | |
| 12-31-18 | | | | | 16.13 | | | | | | 0.23• | | | | | | (1.46) | | | | | | (1.23) | | | | | | 0.12 | | | | | | 0.36 | | | | | | — | | | | | | 0.48 | | | | | | — | | | | | | 14.42 | | | | | | (7.90) | | | | | | 0.65 | | | | | | 0.61 | | | | | | 0.61 | | | | | | 1.47 | | | | | | 1,905 | | | | | | 30 | | |
| 12-31-17 | | | | | 13.67 | | | | | | 0.23• | | | | | | 2.38 | | | | | | 2.61 | | | | | | 0.06 | | | | | | 0.09 | | | | | | — | | | | | | 0.15 | | | | | | — | | | | | | 16.13 | | | | | | 19.21 | | | | | | 0.67 | | | | | | 0.58 | | | | | | 0.58 | | | | | | 1.50 | | | | | | 1,688 | | | | | | 29 | | |
| | | | | | | | | | | | | | | | | | |
See Accompanying Notes to Financial Statements
Financial Highlights (continued)
| | | | | | | | | | Income (loss)
from
investment
operations | | | | | | | | | Less Distributions | | | | | | | | | | | | | | | | | | | | | | | | | | | Ratios to average net assets | | | Supplemental
Data | |
| | | | Net asset value, beginning of year
or period | | | Net investment income (loss) | | | Net realized and unrealized
gain (loss) | | | Total from investment operations | | | From net investment income | | | From net realized gains | | | From return of capital | | | Total distributions | | | Payment by affiliate | | | Net asset value, end of year
or period | | | Total Return(1) | | | Expenses before
reductions/additions(2)(3)(4) | | | Expenses net of fee waivers
and/or recoupments if any(2)(3)(4) | | | Expenses net of all
reductions/additions(2)(3)(4) | | | Net investment income (loss)(2)(3) | | | Net assets, end of year or period | | | Portfolio turnover rate | |
Year or
period ended | | | ($) | | | ($) | | | ($) | | | ($) | | | ($) | | | ($) | | | ($) | | | ($) | | | ($) | | | ($) | | | (%) | | | (%) | | | (%) | | | (%) | | | (%) | | | ($000’s) | | | (%) | |
| Voya Index Solution 2040 Portfolio (continued) | | | | | | | | | | | | | | | | | | | | | | | | | | | | | | | | | | | | | | | | | | | | | | | | | | | | | | | | | | | | | | | | | | | | | | | | | | | | | | | | | | | | | | | | | | | | | | | | | | | | | | | |
| Class Z | | | | | | | | | | | | | | | | | | | | | | | | | | | | | | | | | | | | | | | | | | | | | | | | | | | | | | | | | | | | | | | | | | | | | | | | | | | | | | | | | | | | | | | | | | | | | | | | | | | | | | | |
| 12-31-21 | | | | | 19.27 | | | | | | 0.33• | | | | | | 2.89 | | | | | | 3.22 | | | | | | 0.36 | | | | | | 0.64 | | | | | | — | | | | | | 1.00 | | | | | | — | | | | | | 21.49 | | | | | | 16.86 | | | | | | 0.24 | | | | | | 0.00* | | | | | | 0.00* | | | | | | 1.60 | | | | | | 760,148 | | | | | | 35 | | |
| 12-31-20 | | | | | 17.43 | | | | | | 0.41• | | | | | | 2.25 | | | | | | 2.66 | | | | | | 0.29 | | | | | | 0.53 | | | | | | — | | | | | | 0.82 | | | | | | — | | | | | | 19.27 | | | | | | 15.96 | | | | | | 0.23 | | | | | | 0.00* | | | | | | 0.00* | | | | | | 2.41 | | | | | | 577,969 | | | | | | 32 | | |
| 12-31-19 | | | | | 14.74 | | | | | | 0.37• | | | | | | 3.10 | | | | | | 3.47 | | | | | | 0.24 | | | | | | 0.54 | | | | | | — | | | | | | 0.78 | | | | | | — | | | | | | 17.43 | | | | | | 24.08 | | | | | | 0.24 | | | | | | 0.00* | | | | | | 0.00* | | | | | | 2.25 | | | | | | 426,037 | | | | | | 23 | | |
| 12-31-18 | | | | | 16.42 | | | | | | 0.36• | | | | | | (1.51) | | | | | | (1.15) | | | | | | 0.17 | | | | | | 0.36 | | | | | | — | | | | | | 0.53 | | | | | | — | | | | | | 14.74 | | | | | | (7.32) | | | | | | 0.25 | | | | | | 0.00* | | | | | | 0.00* | | | | | | 2.22 | | | | | | 243,229 | | | | | | 30 | | |
| 12-31-17 | | | | | 13.85 | | | | | | 0.34• | | | | | | 2.39 | | | | | | 2.73 | | | | | | 0.07 | | | | | | 0.09 | | | | | | — | | | | | | 0.16 | | | | | | — | | | | | | 16.42 | | | | | | 19.86 | | | | | | 0.27 | | | | | | 0.00* | | | | | | 0.00* | | | | | | 2.21 | | | | | | 169,065 | | | | | | 29 | | |
| Voya Index Solution 2045 Portfolio | | | | | | | | | | | | | | | | | | | | | | | | | | | | | | | | | | | | | | | | | | | | | | | | | | | | | | | | | | | | | | | | | | | | | | | | | | | | | | | | | | | | | | | | | | | | | | | | | | | | | | | |
| Class ADV | | | | | | | | | | | | | | | | | | | | | | | | | | | | | | | | | | | | | | | | | | | | | | | | | | | | | | | | | | | | | | | | | | | | | | | | | | | | | | | | | | | | | | | | | | | | | | | | | | | | | | | |
| 12-31-21 | | | | | 13.31 | | | | | | 0.11• | | | | | | 2.16 | | | | | | 2.27 | | | | | | 0.19 | | | | | | 0.62 | | | | | | — | | | | | | 0.81 | | | | | | — | | | | | | 14.77 | | | | | | 17.25 | | | | | | 0.81 | | | | | | 0.74 | | | | | | 0.74 | | | | | | 0.73 | | | | | | 132,543 | | | | | | 38 | | |
| 12-31-20 | | | | | 12.17 | | | | | | 0.18• | | | | | | 1.58 | | | | | | 1.76 | | | | | | 0.15 | | | | | | 0.47 | | | | | | — | | | | | | 0.62 | | | | | | — | | | | | | 13.31 | | | | | | 15.23 | | | | | | 0.81 | | | | | | 0.74 | | | | | | 0.74 | | | | | | 1.54 | | | | | | 129,548 | | | | | | 34 | | |
| 12-31-19 | | | | | 10.38 | | | | | | 0.16• | | | | | | 2.29 | | | | | | 2.45 | | | | | | 0.14 | | | | | | 0.52 | | | | | | — | | | | | | 0.66 | | | | | | — | | | | | | 12.17 | | | | | | 24.29 | | | | | | 0.73 | | | | | | 0.73 | | | | | | 0.73 | | | | | | 1.39 | | | | | | 134,331 | | | | | | 24 | | |
| 12-31-18 | | | | | 11.79 | | | | | | 0.15• | | | | | | (1.13) | | | | | | (0.98) | | | | | | 0.11 | | | | | | 0.32 | | | | | | — | | | | | | 0.43 | | | | | | — | | | | | | 10.38 | | | | | | (8.70) | | | | | | 0.74 | | | | | | 0.72 | | | | | | 0.72 | | | | | | 1.31 | | | | | | 122,905 | | | | | | 31 | | |
| 12-31-17 | | | | | 10.22 | | | | | | 0.13• | | | | | | 1.88 | | | | | | 2.01 | | | | | | 0.12 | | | | | | 0.32 | | | | | | — | | | | | | 0.44 | | | | | | — | | | | | | 11.79 | | | | | | 19.96 | | | | | | 0.75 | | | | | | 0.69 | | | | | | 0.69 | | | | | | 1.20 | | | | | | 148,205 | | | | | | 25 | | |
| Class I | | | | | | | | | | | | | | | | | | | | | | | | | | | | | | | | | | | | | | | | | | | | | | | | | | | | | | | | | | | | | | | | | | | | | | | | | | | | | | | | | | | | | | | | | | | | | | | | | | | | | | | |
| 12-31-21 | | | | | 13.81 | | | | | | 0.19• | | | | | | 2.24 | | | | | | 2.43 | | | | | | 0.25 | | | | | | 0.62 | | | | | | — | | | | | | 0.87 | | | | | | — | | | | | | 15.37 | | | | | | 17.86 | | | | | | 0.31 | | | | | | 0.24 | | | | | �� | 0.24 | | | | | | 1.25 | | | | | | 54,110 | | | | | | 38 | | |
| 12-31-20 | | | | | 12.61 | | | | | | 0.23• | | | | | | 1.66 | | | | | | 1.89 | | | | | | 0.22 | | | | | | 0.47 | | | | | | — | | | | | | 0.69 | | | | | | — | | | | | | 13.81 | | | | | | 15.78 | | | | | | 0.31 | | | | | | 0.24 | | | | | | 0.24 | | | | | | 1.92 | | | | | | 46,883 | | | | | | 34 | | |
| 12-31-19 | | | | | 10.74 | | | | | | 0.22 | | | | | | 2.38 | | | | | | 2.60 | | | | | | 0.21 | | | | | | 0.52 | | | | | | — | | | | | | 0.73 | | | | | | — | | | | | | 12.61 | | | | | | 24.89 | | | | | | 0.23 | | | | | | 0.23 | | | | | | 0.23 | | | | | | 1.89 | | | | | | 53,784 | | | | | | 24 | | |
| 12-31-18 | | | | | 12.17 | | | | | | 0.22 | | | | | | (1.16) | | | | | | (0.94) | | | | | | 0.17 | | | | | | 0.32 | | | | | | — | | | | | | 0.49 | | | | | | — | | | | | | 10.74 | | | | | | (8.16) | | | | | | 0.24 | | | | | | 0.22 | | | | | | 0.22 | | | | | | 1.84 | | | | | | 43,658 | | | | | | 31 | | |
| 12-31-17 | | | | | 10.54 | | | | | | 0.20• | | | | | | 1.93 | | | | | | 2.13 | | | | | | 0.18 | | | | | | 0.32 | | | | | | — | | | | | | 0.50 | | | | | | — | | | | | | 12.17 | | | | | | 20.48 | | | | | | 0.25 | | | | | | 0.19 | | | | | | 0.19 | | | | | | 1.76 | | | | | | 48,317 | | | | | | 25 | | |
| Class S | | | | | | | | | | | | | | | | | | | | | | | | | | | | | | | | | | | | | | | | | | | | | | | | | | | | | | | | | | | | | | | | | | | | | | | | | | | | | | | | | | | | | | | | | | | | | | | | | | | | | | | |
| 12-31-21 | | | | | 13.58 | | | | | | 0.15• | | | | | | 2.20 | | | | | | 2.35 | | | | | | 0.22 | | | | | | 0.62 | | | | | | — | | | | | | 0.84 | | | | | | — | | | | | | 15.09 | | | | | | 17.56 | | | | | | 0.56 | | | | | | 0.49 | | | | | | 0.49 | | | | | | 1.02 | | | | | | 84,023 | | | | | | 38 | | |
| 12-31-20 | | | | | 12.41 | | | | | | 0.23 | | | | | | 1.60 | | | | | | 1.83 | | | | | | 0.19 | | | | | | 0.47 | | | | | | — | | | | | | 0.66 | | | | | | — | | | | | | 13.58 | | | | | | 15.49 | | | | | | 0.56 | | | | | | 0.49 | | | | | | 0.49 | | | | | | 1.80 | | | | | | 77,113 | | | | | | 34 | | |
| 12-31-19 | | | | | 10.58 | | | | | | 0.20 | | | | | | 2.33 | | | | | | 2.53 | | | | | | 0.18 | | | | | | 0.52 | | | | | | — | | | | | | 0.70 | | | | | | — | | | | | | 12.41 | | | | | | 24.55 | | | | | | 0.48 | | | | | | 0.48 | | | | | | 0.48 | | | | | | 1.64 | | | | | | 74,022 | | | | | | 24 | | |
| 12-31-18 | | | | | 12.00 | | | | | | 0.18• | | | | | | (1.14) | | | | | | (0.96) | | | | | | 0.14 | | | | | | 0.32 | | | | | | — | | | | | | 0.46 | | | | | | — | | | | | | 10.58 | | | | | | (8.44) | | | | | | 0.49 | | | | | | 0.47 | | | | | | 0.47 | | | | | | 1.53 | | | | | | 65,002 | | | | | | 31 | | |
| 12-31-17 | | | | | 10.40 | | | | | | 0.17 | | | | | | 1.90 | | | | | | 2.07 | | | | | | 0.15 | | | | | | 0.32 | | | | | | — | | | | | | 0.47 | | | | | | — | | | | | | 12.00 | | | | | | 20.21 | | | | | | 0.50 | | | | | | 0.44 | | | | | | 0.44 | | | | | | 1.46 | | | | | | 87,386 | | | | | | 25 | | |
| Class S2 | | | | | | | | | | | | | | | | | | | | | | | | | | | | | | | | | | | | | | | | | | | | | | | | | | | | | | | | | | | | | | | | | | | | | | | | | | | | | | | | | | | | | | | | | | | | | | | | | | | | | | | |
| 12-31-21 | | | | | 13.32 | | | | | | 0.12• | | | | | | 2.15 | | | | | | 2.27 | | | | | | 0.21 | | | | | | 0.62 | | | | | | — | | | | | | 0.83 | | | | | | — | | | | | | 14.76 | | | | | | 17.28 | | | | | | 0.71 | | | | | | 0.64 | | | | | | 0.64 | | | | | | 0.85 | | | | | | 29,628 | | | | | | 38 | | |
| 12-31-20 | | | | | 12.19 | | | | | | 0.20• | | | | | | 1.58 | | | | | | 1.78 | | | | | | 0.18 | | | | | | 0.47 | | | | | | — | | | | | | 0.65 | | | | | | — | | | | | | 13.32 | | | | | | 15.35 | | | | | | 0.71 | | | | | | 0.64 | | | | | | 0.64 | | | | | | 1.72 | | | | | | 25,318 | | | | | | 34 | | |
| 12-31-19 | | | | | 10.41 | | | | | | 0.16 | | | | | | 2.30 | | | | | | 2.46 | | | | | | 0.16 | | | | | | 0.52 | | | | | | — | | | | | | 0.68 | | | | | | — | | | | | | 12.19 | | | | | | 24.34 | | | | | | 0.63 | | | | | | 0.63 | | | | | | 0.63 | | | | | | 1.50 | | | | | | 20,384 | | | | | | 24 | | |
| 12-31-18 | | | | | 11.80 | | | | | | 0.16• | | | | | | (1.12) | | | | | | (0.96) | | | | | | 0.11 | | | | | | 0.32 | | | | | | — | | | | | | 0.43 | | | | | | — | | | | | | 10.41 | | | | | | (8.52) | | | | | | 0.64 | | | | | | 0.62 | | | | | | 0.62 | | | | | | 1.40 | | | | | | 16,121 | | | | | | 31 | | |
| 12-31-17 | | | | | 10.24 | | | | | | 0.14• | | | | | | 1.88 | | | | | | 2.02 | | | | | | 0.14 | | | | | | 0.32 | | | | | | — | | | | | | 0.46 | | | | | | — | | | | | | 11.80 | | | | | | 19.97 | | | | | | 0.65 | | | | | | 0.59 | | | | | | 0.59 | | | | | | 1.26 | | | | | | 19,206 | | | | | | 25 | | |
| Class Z | | | | | | | | | | | | | | | | | | | | | | | | | | | | | | | | | | | | | | | | | | | | | | | | | | | | | | | | | | | | | | | | | | | | | | | | | | | | | | | | | | | | | | | | | | | | | | | | | | | | | | | |
| 12-31-21 | | | | | 14.00 | | | | | | 0.23• | | | | | | 2.27 | | | | | | 2.50 | | | | | | 0.26 | | | | | | 0.62 | | | | | | — | | | | | | 0.88 | | | | | | — | | | | | | 15.62 | | | | | | 18.14 | | | | | | 0.24 | | | | | | 0.00* | | | | | | 0.00* | | | | | | 1.52 | | | | | | 827,504 | | | | | | 38 | | |
| 12-31-20 | | | | | 12.74 | | | | | | 0.29• | | | | | | 1.66 | | | | | | 1.95 | | | | | | 0.22 | | | | | | 0.47 | | | | | | — | | | | | | 0.69 | | | | | | — | | | | | | 14.00 | | | | | | 16.09 | | | | | | 0.23 | | | | | | 0.00* | | | | | | 0.00* | | | | | | 2.36 | | | | | | 650,098 | | | | | | 34 | | |
| 12-31-19 | | | | | 10.82 | | | | | | 0.27• | | | | | | 2.38 | | | | | | 2.65 | | | | | | 0.21 | | | | | | 0.52 | | | | | | — | | | | | | 0.73 | | | | | | — | | | | | | 12.74 | | | | | | 25.17 | | | | | | 0.23 | | | | | | 0.00* | | | | | | 0.00* | | | | | | 2.21 | | | | | | 464,683 | | | | | | 24 | | |
| 12-31-18 | | | | | 12.24 | | | | | | 0.26• | | | | | | (1.19) | | | | | | (0.93) | | | | | | 0.17 | | | | | | 0.32 | | | | | | — | | | | | | 0.49 | | | | | | — | | | | | | 10.82 | | | | | | (8.03) | | | | | | 0.24 | | | | | | 0.00* | | | | | | 0.00* | | | | | | 2.14 | | | | | | 273,348 | | | | | | 31 | | |
| 12-31-17 | | | | | 10.57 | | | | | | 0.24• | | | | | | 1.93 | | | | | | 2.17 | | | | | | 0.18 | | | | | | 0.32 | | | | | | — | | | | | | 0.50 | | | | | | — | | | | | | 12.24 | | | | | | 20.81 | | | | | | 0.25 | | | | | | 0.00* | | | | | | 0.00* | | | | | | 2.12 | | | | | | 208,189 | | | | | | 25 | | |
| | | | | | | | | | | | | | | | | | |
See Accompanying Notes to Financial Statements
Financial Highlights (continued)
| | | | | | | | | | Income (loss)
from
investment
operations | | | | | | | | | Less Distributions | | | | | | | | | | | | | | | | | | | | | | | | | | | Ratios to average net assets | | | Supplemental
Data | |
| | | | Net asset value, beginning of year
or period | | | Net investment income (loss) | | | Net realized and unrealized
gain (loss) | | | Total from investment operations | | | From net investment income | | | From net realized gains | | | From return of capital | | | Total distributions | | | Payment by affiliate | | | Net asset value, end of year
or period | | | Total Return(1) | | | Expenses before
reductions/additions(2)(3)(4) | | | Expenses net of fee waivers
and/or recoupments if any(2)(3)(4) | | | Expenses net of all
reductions/additions(2)(3)(4) | | | Net investment income (loss)(2)(3) | | | Net assets, end of year or period | | | Portfolio turnover rate | |
Year or
period ended | | | ($) | | | ($) | | | ($) | | | ($) | | | ($) | | | ($) | | | ($) | | | ($) | | | ($) | | | ($) | | | (%) | | | (%) | | | (%) | | | (%) | | | (%) | | | ($000’s) | | | (%) | |
| Voya Index Solution 2050 Portfolio | | | | | | | | | | | | | | | | | | | | | | | | | | | | | | | | | | | | | | | | | | | | | | | | | | | | | | | | | | | | | | | | | | | | | | | | | | | | | | | | | | | | | | | | | | | | | | | | | | | | | | | |
| Class ADV | | | | | | | | | | | | | | | | | | | | | | | | | | | | | | | | | | | | | | | | | | | | | | | | | | | | | | | | | | | | | | | | | | | | | | | | | | | | | | | | | | | | | | | | | | | | | | | | | | | | | | | |
| 12-31-21 | | | | | 18.85 | | | | | | 0.15• | | | | | | 3.06 | | | | | | 3.21 | | | | | | 0.23 | | | | | | 0.54 | | | | | | — | | | | | | 0.77 | | | | | | — | | | | | | 21.29 | | | | | | 17.22 | | | | | | 0.87 | | | | | | 0.74 | | | | | | 0.74 | | | | | | 0.72 | | | | | | 23,791 | | | | | | 38 | | |
| 12-31-20 | | | | | 17.18 | | | | | | 0.25• | | | | | | 2.15 | | | | | | 2.40 | | | | | | 0.20 | | | | | | 0.53 | | | | | | — | | | | | | 0.73 | | | | | | — | | | | | | 18.85 | | | | | | 14.66 | | | | | | 0.91 | | | | | | 0.74 | | | | | | 0.74 | | | | | | 1.53 | | | | | | 19,574 | | | | | | 29 | | |
| 12-31-19 | | | | | 14.39 | | | | | | 0.24• | | | | | | 3.24 | | | | | | 3.48 | | | | | | 0.17 | | | | | | 0.52 | | | | | | — | | | | | | 0.69 | | | | | | — | | | | | | 17.18 | | | | | | 24.60 | | | | | | 0.74 | | | | | | 0.74 | | | | | | 0.74 | | | | | | 1.47 | | | | | | 17,450 | | | | | | 22 | | |
| 12-31-18 | | | | | 16.26 | | | | | | 0.22• | | | | | | (1.62) | | | | | | (1.40) | | | | | | 0.11 | | | | | | 0.36 | | | | | | — | | | | | | 0.47 | | | | | | — | | | | | | 14.39 | | | | | | (8.92) | | | | | | 0.75 | | | | | | 0.73 | | | | | | 0.73 | | | | | | 1.39 | | | | | | 11,155 | | | | | | 28 | | |
| 12-31-17 | | | | | 13.65 | | | | | | 0.20• | | | | | | 2.53 | | | | | | 2.73 | | | | | | 0.04 | | | | | | 0.08 | | | | | | — | | | | | | 0.12 | | | | | | — | | | | | | 16.26 | | | | | | 20.12 | | | | | | 0.78 | | | | | | 0.70 | | | | | | 0.70 | | | | | | 1.31 | | | | | | 7,817 | | | | | | 26 | | |
| Class I | | | | | | | | | | | | | | | | | | | | | | | | | | | | | | | | | | | | | | | | | | | | | | | | | | | | | | | | | | | | | | | | | | | | | | | | | | | | | | | | | | | | | | | | | | | | | | | | | | | | | | | |
| 12-31-21 | | | | | 19.33 | | | | | | 0.26• | | | | | | 3.15 | | | | | | 3.41 | | | | | | 0.32 | | | | | | 0.54 | | | | | | — | | | | | | 0.86 | | | | | | — | | | | | | 21.88 | | | | | | 17.81 | | | | | | 0.37 | | | | | | 0.24 | | | | | | 0.24 | | | | | | 1.23 | | | | | | 11,548 | | | | | | 38 | | |
| 12-31-20 | | | | | 17.58 | | | | | | 0.35• | | | | | | 2.20 | | | | | | 2.55 | | | | | | 0.27 | | | | | | 0.53 | | | | | | — | | | | | | 0.80 | | | | | | — | | | | | | 19.33 | | | | | | 15.25 | | | | | | 0.41 | | | | | | 0.24 | | | | | | 0.24 | | | | | | 2.07 | | | | | | 8,770 | | | | | | 29 | | |
| 12-31-19 | | | | | 14.69 | | | | | | 0.32• | | | | | | 3.31 | | | | | | 3.63 | | | | | | 0.22 | | | | | | 0.52 | | | | | | — | | | | | | 0.74 | | | | | | — | | | | | | 17.58 | | | | | | 25.21 | | | | | | 0.24 | | | | | | 0.24 | | | | | | 0.24 | | | | | | 1.97 | | | | | | 6,367 | | | | | | 22 | | |
| 12-31-18 | | | | | 16.55 | | | | | | 0.30• | | | | | | (1.65) | | | | | | (1.35) | | | | | | 0.15 | | | | | | 0.36 | | | | | | — | | | | | | 0.51 | | | | | | — | | | | | | 14.69 | | | | | | (8.49) | | | | | | 0.25 | | | | | | 0.23 | | | | | | 0.23 | | | | | | 1.82 | | | | | | 3,851 | | | | | | 28 | | |
| 12-31-17 | | | | | 13.84 | | | | | | 0.31• | | | | | | 2.55 | | | | | | 2.86 | | | | | | 0.07 | | | | | | 0.08 | | | | | | — | | | | | | 0.15 | | | | | | — | | | | | | 16.55 | | | | | | 20.75 | | | | | | 0.28 | | | | | | 0.20 | | | | | | 0.20 | | | | | | 2.00 | | | | | | 3,195 | | | | | | 26 | | |
| Class S | | | | | | | | | | | | | | | | | | | | | | | | | | | | | | | | | | | | | | | | | | | | | | | | | | | | | | | | | | | | | | | | | | | | | | | | | | | | | | | | | | | | | | | | | | | | | | | | | | | | | | | |
| 12-31-21 | | | | | 19.26 | | | | | | 0.20• | | | | | | 3.14 | | | | | | 3.34 | | | | | | 0.28 | | | | | | 0.54 | | | | | | — | | | | | | 0.82 | | | | | | — | | | | | | 21.78 | | | | | | 17.50 | | | | | | 0.62 | | | | | | 0.49 | | | | | | 0.49 | | | | | | 0.96 | | | | | | 15,698 | | | | | | 38 | | |
| 12-31-20 | | | | | 17.53 | | | | | | 0.30• | | | | | | 2.20 | | | | | | 2.50 | | | | | | 0.24 | | | | | | 0.53 | | | | | | — | | | | | | 0.77 | | | | | | — | | | | | | 19.26 | | | | | | 14.94 | | | | | | 0.66 | | | | | | 0.49 | | | | | | 0.49 | | | | | | 1.80 | | | | | | 12,575 | | | | | | 29 | | |
| 12-31-19 | | | | | 14.65 | | | | | | 0.28• | | | | | | 3.31 | | | | | | 3.59 | | | | | | 0.19 | | | | | | 0.52 | | | | | | — | | | | | | 0.71 | | | | | | — | | | | | | 17.53 | | | | | | 24.94 | | | | | | 0.49 | | | | | | 0.49 | | | | | | 0.49 | | | | | | 1.70 | | | | | | 10,885 | | | | | | 22 | | |
| 12-31-18 | | | | | 16.51 | | | | | | 0.25 | | | | | | (1.63) | | | | | | (1.38) | | | | | | 0.12 | | | | | | 0.36 | | | | | | — | | | | | | 0.48 | | | | | | — | | | | | | 14.65 | | | | | | (8.68) | | | | | | 0.50 | | | | | | 0.48 | | | | | | 0.48 | | | | | | 1.53 | | | | | | 7,477 | | | | | | 28 | | |
| 12-31-17 | | | | | 13.83 | | | | | | 0.24• | | | | | | 2.58 | | | | | | 2.82 | | | | | | 0.06 | | | | | | 0.08 | | | | | | — | | | | | | 0.14 | | | | | | — | | | | | | 16.51 | | | | | | 20.47 | | | | | | 0.53 | | | | | | 0.45 | | | | | | 0.45 | | | | | | 1.56 | | | | | | 8,090 | | | | | | 26 | | |
| Class S2 | | | | | | | | | | | | | | | | | | | | | | | | | | | | | | | | | | | | | | | | | | | | | | | | | | | | | | | | | | | | | | | | | | | | | | | | | | | | | | | | | | | | | | | | | | | | | | | | | | | | | | | |
| 12-31-21 | | | | | 18.95 | | | | | | 0.19• | | | | | | 3.06 | | | | | | 3.25 | | | | | | 0.25 | | | | | | 0.54 | | | | | | — | | | | | | 0.79 | | | | | | — | | | | | | 21.41 | | | | | | 17.33 | | | | | | 0.77 | | | | | | 0.64 | | | | | | 0.64 | | | | | | 0.93 | | | | | | 3,918 | | | | | | 38 | | |
| 12-31-20 | | | | | 17.26 | | | | | | 0.29• | | | | | | 2.14 | | | | | | 2.43 | | | | | | 0.21 | | | | | | 0.53 | | | | | | — | | | | | | 0.74 | | | | | | — | | | | | | 18.95 | | | | | | 14.77 | | | | | | 0.81 | | | | | | 0.64 | | | | | | 0.64 | | | | | | 1.77 | | | | | | 3,563 | | | | | | 29 | | |
| 12-31-19 | | | | | 14.45 | | | | | | 0.25• | | | | | | 3.25 | | | | | | 3.50 | | | | | | 0.17 | | | | | | 0.52 | | | | | | — | | | | | | 0.69 | | | | | | — | | | | | | 17.26 | | | | | | 24.69 | | | | | | 0.64 | | | | | | 0.64 | | | | | | 0.64 | | | | | | 1.53 | | | | | | 3,072 | | | | | | 22 | | |
| 12-31-18 | | | | | 16.30 | | | | | | 0.22• | | | | | | (1.60) | | | | | | (1.38) | | | | | | 0.11 | | | | | | 0.36 | | | | | | — | | | | | | 0.47 | | | | | | — | | | | | | 14.45 | | | | | | (8.80) | | | | | | 0.65 | | | | | | 0.63 | | | | | | 0.63 | | | | | | 1.36 | | | | | | 2,023 | | | | | | 28 | | |
| 12-31-17 | | | | | 13.68 | | | | | | 0.23• | | | | | | 2.52 | | | | | | 2.75 | | | | | | 0.05 | | | | | | 0.08 | | | | | | — | | | | | | 0.13 | | | | | | — | | | | | | 16.30 | | | | | | 20.21 | | | | | | 0.68 | | | | | | 0.60 | | | | | | 0.60 | | | | | | 1.50 | | | | | | 1,973 | | | | | | 26 | | |
| Class Z | | | | | | | | | | | | | | | | | | | | | | | | | | | | | | | | | | | | | | | | | | | | | | | | | | | | | | | | | | | | | | | | | | | | | | | | | | | | | | | | | | | | | | | | | | | | | | | | | | | | | | | |
| 12-31-21 | | | | | 19.54 | | | | | | 0.32• | | | | | | 3.18 | | | | | | 3.50 | | | | | | 0.34 | | | | | | 0.54 | | | | | | — | | | | | | 0.88 | | | | | | — | | | | | | 22.16 | | | | | | 18.12 | | | | | | 0.24 | | | | | | 0.00* | | | | | | 0.00* | | | | | | 1.48 | | | | | | 539,936 | | | | | | 38 | | |
| 12-31-20 | | | | | 17.73 | | | | | | 0.40• | | | | | | 2.21 | | | | | | 2.61 | | | | | | 0.27 | | | | | | 0.53 | | | | | | — | | | | | | 0.80 | | | | | | — | | | | | | 19.54 | | | | | | 15.46 | | | | | | 0.23 | | | | | | 0.00* | | | | | | 0.00* | | | | | | 2.32 | | | | | | 398,859 | | | | | | 29 | | |
| 12-31-19 | | | | | 14.77 | | | | | | 0.37• | | | | | | 3.33 | | | | | | 3.70 | | | | | | 0.22 | | | | | | 0.52 | | | | | | — | | | | | | 0.74 | | | | | | — | | | | | | 17.73 | | | | | | 25.56 | | | | | | 0.24 | | | | | | 0.00* | | | | | | 0.00* | | | | | | 2.23 | | | | | | 286,945 | | | | | | 22 | | |
| 12-31-18 | | | | | 16.60 | | | | | | 0.35• | | | | | | (1.67) | | | | | | (1.32) | | | | | | 0.15 | | | | | | 0.36 | | | | | | — | | | | | | 0.51 | | | | | | — | | | | | | 14.77 | | | | | | (8.28) | | | | | | 0.25 | | | | | | 0.00* | | | | | | 0.00* | | | | | | 2.15 | | | | | | 153,539 | | | | | | 28 | | |
| 12-31-17 | | | | | 13.85 | | | | | | 0.33• | | | | | | 2.57 | | | | | | 2.90 | | | | | | 0.07 | | | | | | 0.08 | | | | | | — | | | | | | 0.15 | | | | | | — | | | | | | 16.60 | | | | | | 21.03 | | | | | | 0.28 | | | | | | 0.00* | | | | | | 0.00* | | | | | | 2.13 | | | | | | 97,126 | | | | | | 26 | | |
| Voya Index Solution 2055 Portfolio | | | | | | | | | | | | | | | | | | | | | | | | | | | | | | | | | | | | | | | | | | | | | | | | | | | | | | | | | | | | | | | | | | | | | | | | | | | | | | | | | | | | | | | | | | | | | | | | | | | | | | | |
| Class ADV | | | | | | | | | | | | | | | | | | | | | | | | | | | | | | | | | | | | | | | | | | | | | | | | | | | | | | | | | | | | | | | | | | | | | | | | | | | | | | | | | | | | | | | | | | | | | | | | | | | | | | | |
| 12-31-21 | | | | | 17.47 | | | | | | 0.13• | | | | | | 2.87 | | | | | | 3.00 | | | | | | 0.21 | | | | | | 0.65 | | | | | | — | | | | | | 0.86 | | | | | | — | | | | | | 19.61 | | | | | | 17.32 | | | | | | 0.85 | | | | | | 0.74 | | | | | | 0.74 | | | | | | 0.69 | | | | | | 63,321 | | | | | | 38 | | |
| 12-31-20 | | | | | 15.91 | | | | | | 0.24 | | | | | | 2.03 | | | | | | 2.27 | | | | | | 0.18 | | | | | | 0.53 | | | | | | — | | | | | | 0.71 | | | | | | — | | | | | | 17.47 | | | | | | 14.90 | | | | | | 0.89 | | | | | | 0.74 | | | | | | 0.74 | | | | | | 1.49 | | | | | | 58,091 | | | | | | 29 | | |
| 12-31-19 | | | | | 13.42 | | | | | | 0.22 | | | | | | 3.00 | | | | | | 3.22 | | | | | | 0.15 | | | | | | 0.58 | | | | | | — | | | | | | 0.73 | | | | | | — | | | | | | 15.91 | | | | | | 24.52 | | | | | | 0.74 | | | | | | 0.74 | | | | | | 0.74 | | | | | | 1.40 | | | | | | 54,378 | | | | | | 20 | | |
| 12-31-18 | | | | | 15.18 | | | | | | 0.19 | | | | | | (1.49) | | | | | | (1.30) | | | | | | 0.12 | | | | | | 0.34 | | | | | | — | | | | | | 0.46 | | | | | | — | | | | | | 13.42 | | | | | | (8.87) | | | | | | 0.75 | | | | | | 0.73 | | | | | | 0.73 | | | | | | 1.27 | | | | | | 46,688 | | | | | | 29 | | |
| 12-31-17 | | | | | 13.01 | | | | | | 0.16 | | | | | | 2.46 | | | | | | 2.62 | | | | | | 0.14 | | | | | | 0.31 | | | | | | — | | | | | | 0.45 | | | | | | — | | | | | | 15.18 | | | | | | 20.37 | | | | | | 0.76 | | | | | | 0.70 | | | | | | 0.70 | | | | | | 1.19 | | | | | | 52,886 | | | | | | 25 | | |
| | | | | | | | | | | | | | | | | | |
See Accompanying Notes to Financial Statements
Financial Highlights (continued)
| | | | | | | | | | Income (loss)
from
investment
operations | | | | | | | | | Less Distributions | | | | | | | | | | | | | | | | | | | | | | | | | | | Ratios to average net assets | | | Supplemental
Data | |
| | | | Net asset value, beginning of year
or period | | | Net investment income (loss) | | | Net realized and unrealized
gain (loss) | | | Total from investment operations | | | From net investment income | | | From net realized gains | | | From return of capital | | | Total distributions | | | Payment by affiliate | | | Net asset value, end of year
or period | | | Total Return(1) | | | Expenses before
reductions/additions(2)(3)(4) | | | Expenses net of fee waivers
and/or recoupments if any(2)(3)(4) | | | Expenses net of all
reductions/additions(2)(3)(4) | | | Net investment income (loss)(2)(3) | | | Net assets, end of year or period | | | Portfolio turnover rate | |
Year or
period ended | | | ($) | | | ($) | | | ($) | | | ($) | | | ($) | | | ($) | | | ($) | | | ($) | | | ($) | | | ($) | | | (%) | | | (%) | | | (%) | | | (%) | | | (%) | | | ($000’s) | | | (%) | |
| Voya Index Solution 2055 Portfolio (continued) | | | | | | | | | | | | | | | | | | | | | | | | | | | | | | | | | | | | | | | | | | | | | | | | | | | | | | | | | | | | | | | | | | | | | | | | | | | | | | | | | | | | | | | | | | | | | | | | | | | | | | | |
| Class I | | | | | | | | | | | | | | | | | | | | | | | | | | | | | | | | | | | | | | | | | | | | | | | | | | | | | | | | | | | | | | | | | | | | | | | | | | | | | | | | | | | | | | | | | | | | | | | | | | | | | | | |
| 12-31-21 | | | | | 17.95 | | | | | | 0.24• | | | | | | 2.95 | | | | | | 3.19 | | | | | | 0.29 | | | | | | 0.65 | | | | | | — | | | | | | 0.94 | | | | | | — | | | | | | 20.20 | | | | | | 17.95 | | | | | | 0.35 | | | | | | 0.24 | | | | | | 0.24 | | | | | | 1.22 | | | | | | 42,496 | | | | | | 38 | | |
| 12-31-20 | | | | | 16.33 | | | | | | 0.31• | | | | | | 2.09 | | | | | | 2.40 | | | | | | 0.25 | | | | | | 0.53 | | | | | | — | | | | | | 0.78 | | | | | | — | | | | | | 17.95 | | | | | | 15.43 | | | | | | 0.39 | | | | | | 0.24 | | | | | | 0.24 | | | | | | 1.95 | | | | | | 35,009 | | | | | | 29 | | |
| 12-31-19 | | | | | 13.75 | | | | | | 0.30• | | | | | | 3.09 | | | | | | 3.39 | | | | | | 0.23 | | | | | | 0.58 | | | | | | — | | | | | | 0.81 | | | | | | — | | | | | | 16.33 | | | | | | 25.22 | | | | | | 0.24 | | | | | | 0.24 | | | | | | 0.24 | | | | | | 1.95 | | | | | | 31,202 | | | | | | 20 | | |
| 12-31-18 | | | | | 15.54 | | | | | | 0.28• | | | | | | (1.54) | | | | | | (1.26) | | | | | | 0.19 | | | | | | 0.34 | | | | | | — | | | | | | 0.53 | | | | | | — | | | | | | 13.75 | | | | | | (8.48) | | | | | | 0.25 | | | | | | 0.23 | | | | | | 0.23 | | | | | | 1.82 | | | | | | 21,247 | | | | | | 29 | | |
| 12-31-17 | | | | | 13.29 | | | | | | 0.27• | | | | | | 2.49 | | | | | | 2.76 | | | | | | 0.20 | | | | | | 0.31 | | | | | | — | | | | | | 0.51 | | | | | | — | | | | | | 15.54 | | | | | | 21.03 | | | | | | 0.26 | | | | | | 0.20 | | | | | | 0.20 | | | | | | 1.87 | | | | | | 19,100 | | | | | | 25 | | |
| Class S | | | | | | | | | | | | | | | | | | | | | | | | | | | | | | | | | | | | | | | | | | | | | | | | | | | | | | | | | | | | | | | | | | | | | | | | | | | | | | | | | | | | | | | | | | | | | | | | | | | | | | | |
| 12-31-21 | | | | | 17.71 | | | | | | 0.18• | | | | | | 2.91 | | | | | | 3.09 | | | | | | 0.25 | | | | | | 0.65 | | | | | | — | | | | | | 0.90 | | | | | | — | | | | | | 19.90 | | | | | | 17.64 | | | | | | 0.60 | | | | | | 0.49 | | | | | | 0.49 | | | | | | 0.93 | | | | | | 43,919 | | | | | | 38 | | |
| 12-31-20 | | | | | 16.13 | | | | | | 0.27• | | | | | | 2.06 | | | | | | 2.33 | | | | | | 0.22 | | | | | | 0.53 | | | | | | — | | | | | | 0.75 | | | | | | — | | | | | | 17.71 | | | | | | 15.11 | | | | | | 0.64 | | | | | | 0.49 | | | | | | 0.49 | | | | | | 1.76 | | | | | | 40,587 | | | | | | 29 | | |
| 12-31-19 | | | | | 13.59 | | | | | | 0.25• | | | | | | 3.06 | | | | | | 3.31 | | | | | | 0.19 | | | | | | 0.58 | | | | | | — | | | | | | 0.77 | | | | | | — | | | | | | 16.13 | | | | | | 24.94 | | | | | | 0.49 | | | | | | 0.49 | | | | | | 0.49 | | | | | | 1.66 | | | | | | 35,423 | | | | | | 20 | | |
| 12-31-18 | | | | | 15.36 | | | | | | 0.23 | | | | | | (1.51) | | | | | | (1.28) | | | | | | 0.15 | | | | | | 0.34 | | | | | | — | | | | | | 0.49 | | | | | | — | | | | | | 13.59 | | | | | | (8.66) | | | | | | 0.50 | | | | | | 0.48 | | | | | | 0.48 | | | | | | 1.55 | | | | | | 26,744 | | | | | | 29 | | |
| 12-31-17 | | | | | 13.16 | | | | | | 0.20• | | | | | | 2.48 | | | | | | 2.68 | | | | | | 0.17 | | | | | | 0.31 | | | | | | — | | | | | | 0.48 | | | | | | — | | | | | | 15.36 | | | | | | 20.63 | | | | | | 0.51 | | | | | | 0.45 | | | | | | 0.45 | | | | | | 1.40 | | | | | | 29,602 | | | | | | 25 | | |
| Class S2 | | | | | | | | | | | | | | | | | | | | | | | | | | | | | | | | | | | | | | | | | | | | | | | | | | | | | | | | | | | | | | | | | | | | | | | | | | | | | | | | | | | | | | | | | | | | | | | | | | | | | | | |
| 12-31-21 | | | | | 17.54 | | | | | | 0.15• | | | | | | 2.88 | | | | | | 3.03 | | | | | | 0.25 | | | | | | 0.65 | | | | | | — | | | | | | 0.90 | | | | | | — | | | | | | 19.67 | | | | | | 17.43 | | | | | | 0.75 | | | | | | 0.64 | | | | | | 0.64 | | | | | | 0.78 | | | | | | 20,878 | | | | | | 38 | | |
| 12-31-20 | | | | | 15.99 | | | | | | 0.27• | | | | | | 2.01 | | | | | | 2.28 | | | | | | 0.20 | | | | | | 0.53 | | | | | | — | | | | | | 0.73 | | | | | | — | | | | | | 17.54 | | | | | | 14.97 | | | | | | 0.79 | | | | | | 0.64 | | | | | | 0.64 | | | | | | 1.73 | | | | | | 17,208 | | | | | | 29 | | |
| 12-31-19 | | | | | 13.49 | | | | | | 0.23• | | | | | | 3.03 | | | | | | 3.26 | | | | | | 0.18 | | | | | | 0.58 | | | | | | — | | | | | | 0.76 | | | | | | — | | | | | | 15.99 | | | | | | 24.68 | | | | | | 0.64 | | | | | | 0.64 | | | | | | 0.64 | | | | | | 1.53 | | | | | | 11,439 | | | | | | 20 | | |
| 12-31-18 | | | | | 15.24 | | | | | | 0.20• | | | | | | (1.49) | | | | | | (1.29) | | | | | | 0.12 | | | | | | 0.34 | | | | | | — | | | | | | 0.46 | | | | | | — | | | | | | 13.49 | | | | | | (8.77) | | | | | | 0.65 | | | | | | 0.63 | | | | | | 0.63 | | | | | | 1.30 | | | | | | 7,943 | | | | | | 29 | | |
| 12-31-17 | | | | | 13.06 | | | | | | 0.19• | | | | | | 2.45 | | | | | | 2.64 | | | | | | 0.15 | | | | | | 0.31 | | | | | | — | | | | | | 0.46 | | | | | | — | | | | | | 15.24 | | | | | | 20.50 | | | | | | 0.66 | | | | | | 0.60 | | | | | | 0.60 | | | | | | 1.35 | | | | | | 10,327 | | | | | | 25 | | |
| Class Z | | | | | | | | | | | | | | | | | | | | | | | | | | | | | | | | | | | | | | | | | | | | | | | | | | | | | | | | | | | | | | | | | | | | | | | | | | | | | | | | | | | | | | | | | | | | | | | | | | | | | | | |
| 12-31-21 | | | | | 18.20 | | | | | | 0.29• | | | | | | 2.99 | | | | | | 3.28 | | | | | | 0.32 | | | | | | 0.65 | | | | | | — | | | | | | 0.97 | | | | | | — | | | | | | 20.51 | | | | | | 18.19 | | | | | | 0.24 | | | | | | 0.00* | | | | | | 0.00* | | | | | | 1.49 | | | | | | 450,163 | | | | | | 38 | | |
| 12-31-20 | | | | | 16.51 | | | | | | 0.37• | | | | | | 2.10 | | | | | | 2.47 | | | | | | 0.25 | | | | | | 0.53 | | | | | | — | | | | | | 0.78 | | | | | | — | | | | | | 18.20 | | | | | | 15.69 | | | | | | 0.23 | | | | | | 0.00* | | | | | | 0.00* | | | | | | 2.32 | | | | | | 324,254 | | | | | | 29 | | |
| 12-31-19 | | | | | 13.86 | | | | | | 0.35• | | | | | | 3.11 | | | | | | 3.46 | | | | | | 0.23 | | | | | | 0.58 | | | | | | — | | | | | | 0.81 | | | | | | — | | | | | | 16.51 | | | | | | 25.54 | | | | | | 0.24 | | | | | | 0.00* | | | | | | 0.00* | | | | | | 2.23 | | | | | | 217,585 | | | | | | 20 | | |
| 12-31-18 | | | | | 15.62 | | | | | | 0.33• | | | | | | (1.56) | | | | | | (1.23) | | | | | | 0.19 | | | | | | 0.34 | | | | | | — | | | | | | 0.53 | | | | | | — | | | | | | 13.86 | | | | | | (8.24) | | | | | | 0.25 | | | | | | 0.00* | | | | | | 0.00* | | | | | | 2.15 | | | | | | 111,996 | | | | | | 29 | | |
| 12-31-17 | | | | | 13.33 | | | | | | 0.30• | | | | | | 2.50 | | | | | | 2.80 | | | | | | 0.20 | | | | | | 0.31 | | | | | | — | | | | | | 0.51 | | | | | | — | | | | | | 15.62 | | | | | | 21.27 | | | | | | 0.26 | | | | | | 0.00* | | | | | | 0.00* | | | | | | 2.07 | | | | | | 68,540 | | | | | | 25 | | |
| Voya Index Solution 2060 Portfolio | | | | | | | | | | | | | | | | | | | | | | | | | | | | | | | | | | | | | | | | | | | | | | | | | | | | | | | | | | | | | | | | | | | | | | | | | | | | | | | | | | | | | | | | | | | | | | | | | | | | | | | |
| Class ADV | | | | | | | | | | | | | | | | | | | | | | | | | | | | | | | | | | | | | | | | | | | | | | | | | | | | | | | | | | | | | | | | | | | | | | | | | | | | | | | | | | | | | | | | | | | | | | | | | | | | | | | |
| 12-31-21 | | | | | 14.80 | | | | | | 0.12• | | | | | | 2.47 | | | | | | 2.59 | | | | | | 0.13 | | | | | | 0.37 | | | | | | — | | | | | | 0.50 | | | | | | — | | | | | | 16.89 | | | | | | 17.65 | | | | | | 0.91 | | | | | | 0.74 | | | | | | 0.74 | | | | | | 0.72 | | | | | | 15,085 | | | | | | 37 | | |
| 12-31-20 | | | | | 13.31 | | | | | | 0.18• | | | | | | 1.76 | | | | | | 1.94 | | | | | | 0.12 | | | | | | 0.33 | | | | | | — | | | | | | 0.45 | | | | | | — | | | | | | 14.80 | | | | | | 15.11 | | | | | | 0.92 | | | | | | 0.74 | | | | | | 0.74 | | | | | | 1.42 | | | | | | 11,253 | | | | | | 34 | | |
| 12-31-19 | | | | | 11.02 | | | | | | 0.18• | | | | | | 2.50 | | | | | | 2.68 | | | | | | 0.09 | | | | | | 0.30 | | | | | | — | | | | | | 0.39 | | | | | | — | | | | | | 13.31 | | | | | | 24.62 | | | | | | 0.77 | | | | | | 0.74 | | | | | | 0.74 | | | | | | 1.45 | | | | | | 9,576 | | | | | | 36 | | |
| 12-31-18 | | | | | 12.49 | | | | | | 0.17• | | | | | | (1.23) | | | | | | (1.06) | | | | | | 0.07 | | | | | | 0.34 | | | | | | — | | | | | | 0.41 | | | | | | — | | | | | | 11.02 | | | | | | (8.88) | | | | | | 0.81 | | | | | | 0.72 | | | | | | 0.72 | | | | | | 1.42 | | | | | | 6,029 | | | | | | 40 | | |
| 12-31-17 | | | | | 10.48 | | | | | | 0.16• | | | | | | 1.97 | | | | | | 2.13 | | | | | | 0.03 | | | | | | 0.09 | | | | | | — | | | | | | 0.12 | | | | | | — | | | | | | 12.49 | | | | | | 20.44 | | | | | | 0.90 | | | | | | 0.70 | | | | | | 0.70 | | | | | | 1.40 | | | | | | 4,579 | | | | | | 51 | | |
| Class I | | | | | | | | | | | | | | | | | | | | | | | | | | | | | | | | | | | | | | | | | | | | | | | | | | | | | | | | | | | | | | | | | | | | | | | | | | | | | | | | | | | | | | | | | | | | | | | | | | | | | | | |
| 12-31-21 | | | | | 15.10 | | | | | | 0.21• | | | | | | 2.51 | | | | | | 2.72 | | | | | | 0.20 | | | | | | 0.37 | | | | | | — | | | | | | 0.57 | | | | | | — | | | | | | 17.25 | | | | | | 18.18 | | | | | | 0.41 | | | | | | 0.24 | | | | | | 0.24 | | | | | | 1.26 | | | | | | 20,267 | | | | | | 37 | | |
| 12-31-20 | | | | | 13.55 | | | | | | 0.28• | | | | | | 1.77 | | | | | | 2.05 | | | | | | 0.17 | | | | | | 0.33 | | | | | | — | | | | | | 0.50 | | | | | | — | | | | | | 15.10 | | | | | | 15.69 | | | | | | 0.43 | | | | | | 0.24 | | | | | | 0.24 | | | | | | 2.11 | | | | | | 13,765 | | | | | | 34 | | |
| 12-31-19 | | | | | 11.19 | | | | | | 0.27• | | | | | | 2.52 | | | | | | 2.79 | | | | | | 0.13 | | | | | | 0.30 | | | | | | — | | | | | | 0.43 | | | | | | — | | | | | | 13.55 | | | | | | 25.32 | | | | | | 0.27 | | | | | | 0.24 | | | | | | 0.24 | | | | | | 2.18 | | | | | | 7,603 | | | | | | 36 | | |
| 12-31-18 | | | | | 12.65 | | | | | | 0.25• | | | | | | (1.27) | | | | | | (1.02) | | | | | | 0.10 | | | | | | 0.34 | | | | | | — | | | | | | 0.44 | | | | | | — | | | | | | 11.19 | | | | | | (8.46) | | | | | | 0.31 | | | | | | 0.22 | | | | | | 0.22 | | | | | | 2.05 | | | | | | 3,020 | | | | | | 40 | | |
| 12-31-17 | | | | | 10.57 | | | | | | 0.31• | | | | | | 1.91 | | | | | | 2.22 | | | | | | 0.05 | | | | | | 0.09 | | | | | | — | | | | | | 0.14 | | | | | | — | | | | | | 12.65 | | | | | | 21.11 | | | | | | 0.40 | | | | | | 0.20 | | | | | | 0.20 | | | | | | 2.60 | | | | | | 1,563 | | | | | | 51 | | |
| | | | | | | | | | | | | | | | | | |
See Accompanying Notes to Financial Statements
Financial Highlights (continued)
| | | | | | | | | | Income (loss)
from
investment
operations | | | | | | | | | Less Distributions | | | | | | | | | | | | | | | | | | | | | | | | | | | Ratios to average net assets | | | Supplemental
Data | |
| | | | Net asset value, beginning of year
or period | | | Net investment income (loss) | | | Net realized and unrealized
gain (loss) | | | Total from investment operations | | | From net investment income | | | From net realized gains | | | From return of capital | | | Total distributions | | | Payment by affiliate | | | Net asset value, end of year
or period | | | Total Return(1) | | | Expenses before
reductions/additions(2)(3)(4) | | | Expenses net of fee waivers
and/or recoupments if any(2)(3)(4) | | | Expenses net of all
reductions/additions(2)(3)(4) | | | Net investment income (loss)(2)(3) | | | Net assets, end of year or period | | | Portfolio turnover rate | |
Year or
period ended | | | ($) | | | ($) | | | ($) | | | ($) | | | ($) | | | ($) | | | ($) | | | ($) | | | ($) | | | ($) | | | (%) | | | (%) | | | (%) | | | (%) | | | (%) | | | ($000’s) | | | (%) | |
| Voya Index Solution 2060 Portfolio (continued) | | | | | | | | | | | | | | | | | | | | | | | | | | | | | | | | | | | | | | | | | | | | | | | | | | | | | | | | | | | | | | | | | | | | | | | | | | | | | | | | | | | | | | | | | | | | | | | | | | | | | | | |
| Class S | | | | | | | | | | | | | | | | | | | | | | | | | | | | | | | | | | | | | | | | | | | | | | | | | | | | | | | | | | | | | | | | | | | | | | | | | | | | | | | | | | | | | | | | | | | | | | | | | | | | | | | |
| 12-31-21 | | | | | 14.92 | | | | | | 0.15• | | | | | | 2.51 | | | | | | 2.66 | | | | | | 0.17 | | | | | | 0.37 | | | | | | — | | | | | | 0.54 | | | | | | — | | | | | | 17.04 | | | | | | 17.96 | | | | | | 0.66 | | | | | | 0.49 | | | | | | 0.49 | | | | | | 0.95 | | | | | | 9,659 | | | | | | 37 | | |
| 12-31-20 | | | | | 13.41 | | | | | | 0.24• | | | | | | 1.75 | | | | | | 1.99 | | | | | | 0.15 | | | | | | 0.33 | | | | | | — | | | | | | 0.48 | | | | | | — | | | | | | 14.92 | | | | | | 15.37 | | | | | | 0.68 | | | | | | 0.49 | | | | | | 0.49 | | | | | | 1.83 | | | | | | 8,248 | | | | | | 34 | | |
| 12-31-19 | | | | | 11.10 | | | | | | 0.22• | | | | | | 2.50 | | | | | | 2.72 | | | | | | 0.11 | | | | | | 0.30 | | | | | | — | | | | | | 0.41 | | | | | | — | | | | | | 13.41 | | | | | | 24.87 | | | | | | 0.52 | | | | | | 0.49 | | | | | | 0.49 | | | | | | 1.74 | | | | | | 5,693 | | | | | | 36 | | |
| 12-31-18 | | | | | 12.56 | | | | | | 0.21• | | | | | | (1.25) | | | | | | (1.04) | | | | | | 0.08 | | | | | | 0.34 | | | | | | — | | | | | | 0.42 | | | | | | — | | | | | | 11.10 | | | | | | (8.66) | | | | | | 0.56 | | | | | | 0.47 | | | | | | 0.47 | | | | | | 1.70 | | | | | | 3,057 | | | | | | 40 | | |
| 12-31-17 | | | | | 10.52 | | | | | | 0.18• | | | | | | 1.99 | | | | | | 2.17 | | | | | | 0.04 | | | | | | 0.09 | | | | | | — | | | | | | 0.13 | | | | | | — | | | | | | 12.56 | | | | | | 20.76 | | | | | | 0.65 | | | | | | 0.45 | | | | | | 0.45 | | | | | | 1.51 | | | | | | 2,294 | | | | | | 51 | | |
| Class S2 | | | | | | | | | | | | | | | | | | | | | | | | | | | | | | | | | | | | | | | | | | | | | | | | | | | | | | | | | | | | | | | | | | | | | | | | | | | | | | | | | | | | | | | | | | | | | | | | | | | | | | | |
| 12-31-21 | | | | | 14.87 | | | | | | 0.13• | | | | | | 2.49 | | | | | | 2.62 | | | | | | 0.15 | | | | | | 0.37 | | | | | | — | | | | | | 0.52 | | | | | | — | | | | | | 16.97 | | | | | | 17.78 | | | | | | 0.81 | | | | | | 0.64 | | | | | | 0.64 | | | | | | 0.80 | | | | | | 2,296 | | | | | | 37 | | |
| 12-31-20 | | | | | 13.37 | | | | | | 0.22• | | | | | | 1.74 | | | | | | 1.96 | | | | | | 0.13 | | | | | | 0.33 | | | | | | — | | | | | | 0.46 | | | | | | — | | | | | | 14.87 | | | | | | 15.17 | | | | | | 0.83 | | | | | | 0.64 | | | | | | 0.64 | | | | | | 1.74 | | | | | | 2,098 | | | | | | 34 | | |
| 12-31-19 | | | | | 11.07 | | | | | | 0.19• | | | | | | 2.51 | | | | | | 2.70 | | | | | | 0.10 | | | | | | 0.30 | | | | | | — | | | | | | 0.40 | | | | | | — | | | | | | 13.37 | | | | | | 24.76 | | | | | | 0.67 | | | | | | 0.64 | | | | | | 0.64 | | | | | | 1.56 | | | | | | 1,545 | | | | | | 36 | | |
| 12-31-18 | | | | | 12.51 | | | | | | 0.15• | | | | | | (1.20) | | | | | | (1.05) | | | | | | 0.05 | | | | | | 0.34 | | | | | | — | | | | | | 0.39 | | | | | | — | | | | | | 11.07 | | | | | | (8.75) | | | | | | 0.71 | | | | | | 0.62 | | | | | | 0.62 | | | | | | 1.18 | | | | | | 751 | | | | | | 40 | | |
| 12-31-17 | | | | | 10.50 | | | | | | 0.20• | | | | | | 1.95 | | | | | | 2.15 | | | | | | 0.05 | | | | | | 0.09 | | | | | | — | | | | | | 0.14 | | | | | | — | | | | | | 12.51 | | | | | | 20.54 | | | | | | 0.80 | | | | | | 0.60 | | | | | | 0.60 | | | | | | 1.68 | | | | | | 993 | | | | | | 51 | | |
| Class Z | | | | | | | | | | | | | | | | | | | | | | | | | | | | | | | | | | | | | | | | | | | | | | | | | | | | | | | | | | | | | | | | | | | | | | | | | | | | | | | | | | | | | | | | | | | | | | | | | | | | | | | |
| 12-31-21 | | | | | 15.27 | | | | | | 0.25• | | | | | | 2.55 | | | | | | 2.80 | | | | | | 0.22 | | | | | | 0.37 | | | | | | — | | | | | | 0.59 | | | | | | — | | | | | | 17.48 | | | | | | 18.50 | | | | | | 0.24 | | | | | | 0.00* | | | | | | 0.00* | | | | | | 1.49 | | | | | | 243,777 | | | | | | 37 | | |
| 12-31-20 | | | | | 13.67 | | | | | | 0.31• | | | | | | 1.79 | | | | | | 2.10 | | | | | | 0.17 | | | | | | 0.33 | | | | | | — | | | | | | 0.50 | | | | | | — | | | | | | 15.27 | | | | | | 15.92 | | | | | | 0.25 | | | | | | 0.00* | | | | | | 0.00* | | | | | | 2.35 | | | | | | 159,536 | | | | | | 34 | | |
| 12-31-19 | | | | | 11.26 | | | | | | 0.29• | | | | | | 2.55 | | | | | | 2.84 | | | | | | 0.13 | | | | | | 0.30 | | | | | | — | | | | | | 0.43 | | | | | | — | | | | | | 13.67 | | | | | | 25.61 | | | | | | 0.27 | | | | | | 0.00* | | | | | | 0.00* | | | | | | 2.31 | | | | | | 84,826 | | | | | | 36 | | |
| 12-31-18 | | | | | 12.70 | | | | | | 0.29• | | | | | | (1.29) | | | | | | (1.00) | | | | | | 0.10 | | | | | | 0.34 | | | | | | — | | | | | | 0.44 | | | | | | — | | | | | | 11.26 | | | | | | (8.27) | | | | | | 0.31 | | | | | | 0.00* | | | | | | 0.00* | | | | | | 2.29 | | | | | | 32,971 | | | | | | 40 | | |
| 12-31-17 | | | | | 10.60 | | | | | | 0.26• | | | | | | 1.98 | | | | | | 2.24 | | | | | | 0.05 | | | | | | 0.09 | | | | | | — | | | | | | 0.14 | | | | | | — | | | | | | 12.70 | | | | | | 21.24 | | | | | | 0.40 | | | | | | 0.00* | | | | | | 0.00* | | | | | | 2.16 | | | | | | 15,056 | | | | | | 51 | | |
| Voya Index Solution 2065 Portfolio | | | | | | | | | | | | | | | | | | | | | | | | | | | | | | | | | | | | | | | | | | | | | | | | | | | | | | | | | | | | | | | | | | | | | | | | | | | | | | | | | | | | | | | | | | | | | | | | | | | | | | | |
| Class ADV | | | | | | | | | | | | | | | | | | | | | | | | | | | | | | | | | | | | | | | | | | | | | | | | | | | | | | | | | | | | | | | | | | | | | | | | | | | | | | | | | | | | | | | | | | | | | | | | | | | | | | | |
| 12-31-21 | | | | | 11.58 | | | | | | 0.12• | | | | | | 1.93 | | | | | | 2.05 | | | | | | 0.08 | | | | | | 0.76 | | | | | | — | | | | | | 0.84 | | | | | | — | | | | | | 12.79 | | | | | | 17.74 | | | | | | 1.12 | | | | | | 0.74 | | | | | | 0.74 | | | | | | 0.92 | | | | | | 1,684 | | | | | | 42 | | |
07-29-20(5) -
12-31-20 | | | | | 10.00 | | | | | | 0.08• | | | | | | 1.58 | | | | | | 1.66 | | | | | | 0.07 | | | | | | 0.01 | | | | | | — | | | | | | 0.08 | | | | | | — | | | | | | 11.58 | | | | | | 16.62 | | | | | | 2.09 | | | | | | 0.74 | | | | | | 0.74 | | | | | | 1.87 | | | | | | 382 | | | | | | 17 | | |
| Class I | | | | | | | | | | | | | | | | | | | | | | | | | | | | | | | | | | | | | | | | | | | | | | | | | | | | | | | | | | | | | | | | | | | | | | | | | | | | | | | | | | | | | | | | | | | | | | | | | | | | | | | |
| 12-31-21 | | | | | 11.58 | | | | | | 0.20• | | | | | | 1.93 | | | | | | 2.13 | | | | | | 0.13 | | | | | | 0.76 | | | | | | — | | | | | | 0.89 | | | | | | — | | | | | | 12.82 | | | | | | 18.45 | | | | | | 0.62 | | | | | | 0.24 | | | | | | 0.24 | | | | | | 1.51 | | | | | | 1,419 | | | | | | 42 | | |
07-29-20(5) -
12-31-20 | | | | | 10.00 | | | | | | 0.13• | | | | | | 1.55 | | | | | | 1.68 | | | | | | 0.09 | | | | | | 0.01 | | | | | | — | | | | | | 0.10 | | | | | | — | | | | | | 11.58 | | | | | | 16.79 | | | | | | 1.59 | | | | | | 0.24 | | | | | | 0.24 | | | | | | 2.76 | | | | | | 341 | | | | | | 17 | | |
| Class S | | | | | | | | | | | | | | | | | | | | | | | | | | | | | | | | | | | | | | | | | | | | | | | | | | | | | | | | | | | | | | | | | | | | | | | | | | | | | | | | | | | | | | | | | | | | | | | | | | | | | | | |
| 12-31-21 | | | | | 11.58 | | | | | | 0.16• | | | | | | 1.93 | | | | | | 2.09 | | | | | | 0.11 | | | | | | 0.76 | | | | | | — | | | | | | 0.87 | | | | | | — | | | | | | 12.80 | | | | | | 18.08 | | | | | | 0.87 | | | | | | 0.49 | | | | | | 0.49 | | | | | | 1.21 | | | | | | 1,626 | | | | | | 42 | | |
07-29-20(5) -
12-31-20 | | | | | 10.00 | | | | | | 0.11• | | | | | | 1.56 | | | | | | 1.67 | | | | | | 0.08 | | | | | | 0.01 | | | | | | — | | | | | | 0.09 | | | | | | — | | | | | | 11.58 | | | | | | 16.72 | | | | | | 1.84 | | | | | | 0.49 | | | | | | 0.49 | | | | | | 2.50 | | | | | | 382 | | | | | | 17 | | |
| Class S2 | | | | | | | | | | | | | | | | | | | | | | | | | | | | | | | | | | | | | | | | | | | | | | | | | | | | | | | | | | | | | | | | | | | | | | | | | | | | | | | | | | | | | | | | | | | | | | | | | | | | | | | |
| 12-31-21 | | | | | 11.57 | | | | | | 0.09• | | | | | | 1.97 | | | | | | 2.06 | | | | | | 0.09 | | | | | | 0.76 | | | | | | — | | | | | | 0.85 | | | | | | — | | | | | | 12.78 | | | | | | 17.87 | | | | | | 1.02 | | | | | | 0.64 | | | | | | 0.64 | | | | | | 0.70 | | | | | | 428 | | | | | | 42 | | |
07-29-20(5) -
12-31-20 | | | | | 10.00 | | | | | | 0.13• | | | | | | 1.53 | | | | | | 1.66 | | | | | | 0.08 | | | | | | 0.01 | | | | | | — | | | | | | 0.09 | | | | | | — | | | | | | 11.57 | | | | | | 16.59 | | | | | | 1.99 | | | | | | 0.64 | | | | | | 0.64 | | | | | | 2.80 | | | | | | 175 | | | | | | 17 | | |
| Class Z | | | | | | | | | | | | | | | | | | | | | | | | | | | | | | | | | | | | | | | | | | | | | | | | | | | | | | | | | | | | | | | | | | | | | | | | | | | | | | | | | | | | | | | | | | | | | | | | | | | | | | | |
| 12-31-21 | | | | | 11.59 | | | | | | 0.22• | | | | | | 1.94 | | | | | | 2.16 | | | | | | 0.14 | | | | | | 0.76 | | | | | | — | | | | | | 0.90 | | | | | | — | | | | | | 12.85 | | | | | | 18.69 | | | | | | 0.48 | | | | | | 0.00* | | | | | | 0.00* | | | | | | 1.72 | | | | | | 16,030 | | | | | | 42 | | |
07-29-20(5) -
12-31-20 | | | | | 10.00 | | | | | | 0.12• | | | | | | 1.57 | | | | | | 1.69 | | | | | | 0.09 | | | | | | 0.01 | | | | | | — | | | | | | 0.10 | | | | | | — | | | | | | 11.59 | | | | | | 16.89 | | | | | | 1.57 | | | | | | 0.00* | | | | | | 0.00* | | | | | | 2.74 | | | | | | 3,190 | | | | | | 17 | | |
| | | | | | | | | | | | | | | | | | | |
(1)
Total return is calculated assuming reinvestment of all dividends, capital gain distributions and return of capital distributions, if any, at net asset value and does not reflect the effect of insurance contract charges. Total return for periods less than one year is not annualized.
(2)
Annualized for periods less than one year.
See Accompanying Notes to Financial Statements
Financial Highlights (continued)
(3)
Ratios reflect operating expenses of a Portfolio. Expenses before reductions/additions do not reflect amounts reimbursed or recouped by the Investment Adviser and/or Distributor or reductions from brokerage service arrangements or other expense offset arrangements and do not represent the amount paid by a Portfolio during periods when reimbursements or reductions occur. Expenses net of fee waivers reflect expenses after reimbursement by the Investment Adviser and/or Distributor or recoupment of previously reimbursed fees by the Investment Adviser, but prior to reductions from brokerage service arrangements or other expense offset arrangements. Expenses net of all reductions/additions represent the net expenses paid by a Portfolio. Net investment income (loss) is net of all such additions or reductions.
(4)
Ratios do not include expenses of underlying funds and do not include fees and expenses charged under the variable annuity contract or variable life insurance policy.
(5)
Commencement of operations.
•
Calculated using average number of shares outstanding throughout the year or period.
*
Amount is less than $0.005 or 0.005% or more than $(0.005) or (0.005)%.
See Accompanying Notes to Financial Statements
NOTES TO FINANCIAL STATEMENTS as of December 31, 2021
NOTE 1 — ORGANIZATION
Voya Partners, Inc. (the “Company”) is an open-end management investment company registered under the Investment Company Act of 1940, as amended (the “1940 Act”). It was incorporated under the laws of Maryland on May 7, 1997. The Articles of Incorporation permit the Company to offer separate series, each of which has its own investment objective, policies and restrictions. The Company currently consists of thirty-seven active separate investment series. The ten series (each, a “Portfolio” and collectively, the “Portfolios”) included in this report are: Voya Index Solution Income Portfolio (“Index Solution Income”), Voya Index Solution 2025 Portfolio (“Index Solution 2025”), Voya Index Solution 2030 Portfolio (“Index Solution 2030”), Voya Index Solution 2035 Portfolio (“Index Solution 2035”), Voya Index Solution 2040 Portfolio (“Index Solution 2040”), Voya Index Solution 2045 Portfolio (“Index Solution 2045”), Voya Index Solution 2050 Portfolio (“Index Solution 2050”), Voya Index Solution 2055 Portfolio (“Index Solution 2055”), Voya Index Solution 2060 Portfolio (“Index Solution 2060”) and Voya Index Solution 2065 Portfolio (“Index Solution 2065”), each a diversified series of the Company.
Index Solution 2025, Index Solution 2030, Index Solution 2035, Index Solution 2040, Index Solution 2045, Index Solution 2050, Index Solution 2055, Index Solution 2060 and Index Solution 2065 are structured and managed around a specific target retirement or financial goal date (“Target Date”). When these Portfolios reach their respective Target Date, they may be combined with Index Solution Income, without a vote of shareholders, if approved by the Board of Directors (the “Board”).
The classes of shares included in this report are: Adviser (“Class ADV”), Initial (“Class I”), Service (“Class S”), Service 2 (“Class S2”) and Class Z. Shares of the Portfolios may be offered to separate accounts (“Separate Accounts”) of insurance companies as investment options in connection with variable annuity contracts and variable life insurance policies (“Variable Contracts”) and to certain of the Portfolios’ investment advisers and their affiliates. In the future, shares may also be offered to qualified pension and retirement plans (“Qualified Plans”) outside the Separate Account context.With the exception of class specific matters, each class has equal voting rights as to voting privileges. For class specific proposals, only the applicable class would have voting privileges. The classes differ principally in the applicable distribution and shareholder service fees, as well as differences in the amount of waiver of fees and reimbursement of expenses, if any. Generally, shareholders of each class also bear certain expenses that pertain to that particular class. All shareholders are allocated the common expenses of a
portfolio and earn income and realized gains/losses from a portfolio pro rata based on the daily ending net assets of each class, without distinction between share classes. Expenses that are specific to a portfolio or a class are charged directly to that portfolio or class. Other operating expenses shared by several portfolios are generally allocated among those portfolios based on average net assets. Distributions are determined separately for each class based on income and expenses allocated to each class. Realized gain distributions are allocated to each class pro rata based on the shares outstanding of each class on the date of distribution. Differences in per share dividend rates generally result from differences in separate class expenses, including distribution and shareholder service fees, if any, as well as differences in the amount of waiver of fees and reimbursement of expenses between the separate classes, if any.
Voya Investments, LLC (“Voya Investments” or the “Investment Adviser”), an Arizona limited liability company serves as the Investment Adviser to the Portfolios. Voya Investment Management Co. LLC (“Voya IM” or the “Sub-Adviser”), a Delaware limited liability company, serves as the Sub-Adviser to the Portfolios. Voya Investments Distributor, LLC (“VID” or the “Distributor”), a Delaware limited liability company, serves as the principal underwriter to the Portfolios.
Each Portfolio seeks to achieve its investment objective by investing in other investment companies (“Underlying Funds”) and uses asset allocation strategies to determine how much to invest in the Underlying Funds. In establishing its exposure to debt instruments, each Portfolio may invest up to 20% of its assets directly in funding agreements (“Funding Agreements”) with affiliated or unaffiliated (if available) insurance companies (but only 10% of its assets directly in Funding Agreements with affiliated insurance companies). The investment objective of the Portfolios is described in the respective Portfolio’s Prospectus.
NOTE 2 — SIGNIFICANT ACCOUNTING POLICIES
The following significant accounting policies are consistently followed by the Portfolios in the preparation of their financial statements. Each Portfolio is considered an investment company under U.S. generally accepted accounting principles (“GAAP”) and follows the accounting and reporting guidance applicable to investment companies.
A. Security Valuation. Each Portfolio is open for business every day the New York Stock Exchange (“NYSE”) opens for regular trading (each such day, a “Business Day”). The net asset value (“NAV”) per share for each class of each Portfolio is determined each Business Day as of the close
NOTES TO FINANCIAL STATEMENTS as of December 31, 2021 (continued)
NOTE 2 — SIGNIFICANT ACCOUNTING POLICIES (continued)
of the regular trading session (“Market Close”), as determined by the Consolidated Tape Association (“CTA”), the central distributor of transaction prices for exchange-traded securities (normally 4:00 p.m. Eastern time unless otherwise designated by the CTA). The data reflected on the consolidated tape provided by the CTA is generated by various market centers, including all securities exchanges, electronic communications networks, and third-market broker-dealers. The NAV per share of each class of each Portfolio is calculated by taking the value of the Portfolio’s assets attributable to that class, subtracting the Portfolio’s liabilities attributable to that class, and dividing by the number of shares of that class that are outstanding. On days when a Portfolio is closed for business, Portfolio shares will not be priced and a Portfolio does not transact purchase and redemption orders. To the extent a Portfolio’s assets are traded in other markets on days when a Portfolio does not price its shares, the value of a Portfolio’s assets will likely change and you will not be able to purchase or redeem shares of a Portfolio.
Assets for which market quotations are readily available are valued at market value. A security listed or traded on an exchange is valued at its last sales price or official closing price as of the close of the regular trading session on the exchange where the security is principally traded or, if such price is not available, at the last sale price as of the Market Close for such security provided by the CTA. Bank loans are valued at the average of the averages of the bid and ask prices provided to an independent loan pricing service by brokers. Futures contracts are valued at the final settlement price set by an exchange on which they are principally traded. Listed options are valued at the mean between the last bid and ask prices from the exchange on which they are principally traded. Investments in open-end registered investment companies that do not trade on an exchange are valued at the end of day NAV per share. Investments in registered investment companies that trade on an exchange are valued at the last sales price or official closing price as of the close of the regular trading session on the exchange where the security is principally traded.
When a market quotation is not readily available or is deemed unreliable, each Portfolio will determine a fair value for the relevant asset in accordance with procedures adopted by the Portfolios’ Board. Such procedures provide, for example, that: (a) Exchange-traded securities are valued at the mean of the closing bid and ask; (b) Debt obligations are valued using an evaluated price provided by an independent pricing service. Evaluated prices provided by the pricing service may be determined without exclusive reliance on quoted prices, and may reflect factors
such as institution-size trading in similar groups of securities, developments related to specific securities, benchmark yield, quality, type of issue, coupon rate, maturity, individual trading characteristics and other market data; (c) Securities traded in the over-the-counter (“OTC”) market are valued based on prices provided by independent pricing services or market makers; (d) Options not listed on an exchange are valued by an independent source using an industry accepted model, such as Black-Scholes; (e) Centrally cleared swap agreements are valued using a price provided by an independent pricing service; (f) OTC swap agreements are valued using a price provided by an independent pricing service; (g) Forward foreign currency exchange contracts are valued utilizing current and forward rates obtained from an independent pricing service. Such prices from the third party pricing service are for specific settlement periods and each Portfolio’s forward foreign currency exchange contracts are valued at an interpolated rate between the closest preceding and subsequent period reported by the independent pricing service; and (h) Securities for which market prices are not provided by any of the above methods may be valued based upon quotes furnished by brokers.
The prospectuses of the open-end registered investment companies in which each Portfolio may invest explain the circumstances under which they will use fair value pricing and the effects of using fair value pricing.
Foreign securities’ (including forward foreign currency exchange contracts) prices are converted into U.S. dollar amounts using the applicable exchange rates as of Market Close. If market quotations are available and believed to be reliable for foreign exchange-traded equity securities, the securities will be valued at the market quotations. Because trading hours for certain foreign securities end before Market Close, closing market quotations may become unreliable. An independent pricing service determines the degree of certainty, based on historical data, that the closing price in the principal market where a foreign security trades is not the current value as of Market Close. Foreign securities’ prices meeting the approved degree of certainty that the price is not reflective of current value will be valued by the independent pricing service using pricing models designed to estimate likely changes in the values of those securities between the times in which the trading in those securities is substantially completed and Market Close. Multiple factors may be considered by the independent pricing service in determining the value of such securities and may include information relating to sector indices, American Depositary Receipts and domestic and foreign index futures.
All other assets for which market quotations are not readily available or became unreliable (or if the above fair
NOTES TO FINANCIAL STATEMENTS as of December 31, 2021 (continued)
NOTE 2 — SIGNIFICANT ACCOUNTING POLICIES (continued)
valuation methods are unavailable or determined to be unreliable) are valued at fair value as determined in good faith by or under the supervision of the Board following procedures approved by the Board. The Board has delegated to the Investment Adviser responsibility for overseeing the implementation of the Portfolios’ valuation procedures; a “Pricing Committee” comprised of employees of the Investment Adviser or its affiliates has responsibility for applying the fair valuation methods set forth in the procedures and, if a fair valuation cannot be determined pursuant to the fair valuation methods, determining the fair value of assets held by the Portfolios. Issuer specific events, transaction price, position size, nature and duration of restrictions on disposition of the security, market trends, bid/ask quotes of brokers and other market data may be reviewed in the course of making a good faith determination of a security’s fair value. Valuations change in response to many factors including the historical and prospective earnings of the issuer, the value of the issuer’s assets, general economic conditions, interest rates, investor perceptions and market liquidity. Because of the inherent uncertainties of fair valuation, the values used to determine each Portfolio’s NAV may materially differ from the value received upon actual sale of those investments. Thus, fair valuation may have an unintended dilutive or accretive effect on the value of shareholders’ investments in each Portfolio.
Each investment asset or liability of the Portfolios is assigned a level at measurement date based on the significance and source of the inputs to its valuation. Quoted prices in active markets for identical securities are classified as “Level 1,” inputs other than quoted prices for an asset or liability that are observable are classified as “Level 2” and significant unobservable inputs, including the Sub-Adviser’s or Pricing Committee’s judgment about the assumptions that a market participant would use in pricing an asset or liability are classified as “Level 3.” The inputs used for valuing securities are not necessarily an indication of the risks associated with investing in those securities. Short-term securities of sufficient credit quality are generally considered to be Level 2 securities under applicable accounting rules. The Portfolios classify each of their investments in the Underlying Funds as Level 1, without consideration as to the classification level of the specific investments held by the Underlying Funds. A table summarizing the Portfolios’ investments under these levels of classification is included within the Portfolio of Investments.
GAAP requires a reconciliation of the beginning to ending balances for reported fair values that presents changes attributable to total realized and unrealized gains or losses,
purchases and sales, and transfers in or out of the Level 3 category during the period. A reconciliation of Level 3 investments within the Portfolio of Investments is presented only when a Portfolio has a significant amount of Level 3 investments.
B. Securities Transactions and Revenue Recognition. Security transactions are accounted for on the trade date. Dividend income received from the Underlying Funds is recognized on the ex-dividend date and is recorded as dividends from underlying funds in the Statements of Operations. Capital gain distributions received from the Underlying Funds are recognized on the ex-dividend date and are recorded on the Statements of Operations as such. Realized gains and losses are reported on the basis of identified cost of securities sold.
C. Distributions to Shareholders. The Portfolios record distributions to their shareholders on the ex-dividend date. Dividends from net investment income and capital gain distributions, if any, are declared and paid annually. The Portfolios may make distributions on a more frequent basis to comply with the distribution requirements of the Internal Revenue Code. The characteristics of income and gains to be distributed are determined in accordance with income tax regulations, which may differ from GAAP for investment companies.
D. Federal Income Taxes. It is the policy of each Portfolio to comply with the requirements of subchapter M of the Internal Revenue Code that are applicable to regulated investment companies and to distribute substantially all of its net investment income and any net realized capital gains to its shareholders. Therefore, a federal income tax or excise tax provision is not required. Management has considered the sustainability of the Portfolios’ tax positions taken on federal income tax returns for all open tax years in making this determination. No capital gain distributions shall be made until the capital loss carryforwards have been fully utilized.
The Portfolios may utilize equalization accounting for tax purposes, whereby a portion of redemption payments are treated as distributions of income or gain.
E. Use of Estimates. The preparation of financial statements in conformity with GAAP requires management to make estimates and assumptions that affect the reported amounts of assets and liabilities and disclosure of contingent assets and liabilities at the date of the financial statements and the reported amounts of increases and decreases in net assets from operations during the reporting period. Actual results could differ from those estimates.
F. Risk Exposures and the Use of Derivative Instruments. Each Portfolio’s investment strategies permit
NOTES TO FINANCIAL STATEMENTS as of December 31, 2021 (continued)
NOTE 2 — SIGNIFICANT ACCOUNTING POLICIES (continued)
it to enter into various types of derivatives contracts, including, but not limited to, futures contracts. In doing so, a Portfolio will employ strategies in differing combinations to permit it to increase or decrease the level of risk, or change the level or types of exposure to risk factors. This may allow a Portfolio to pursue its objectives more quickly and efficiently than if it were to make direct purchases or sales of securities capable of affecting a similar response to market or credit factors.
In pursuit of its investment objectives, a Portfolio may seek to increase or decrease its exposure to the following market or credit risk factors:
Equity Risk. Stock prices may be volatile or have reduced liquidity in response to real or perceived impacts of factors including, but not limited to, economic conditions, changes in market interest rates, and political events. Stock markets tend to be cyclical, with periods when stock prices generally rise and periods when stock prices generally decline. Any given stock market segment may remain out of favor with investors for a short or long period of time, and stocks as an asset class may underperform bonds or other asset classes during some periods. Additionally, legislative, regulatory or tax policies or developments in these areas may adversely impact the investment techniques available to a manager, add to costs and impair the ability of a Portfolio to achieve its investment objectives.
Risks of Investing in Derivatives. Each Portfolio’s use of derivatives can result in losses due to unanticipated changes in the market or credit risk factors and the overall market. In instances where a Portfolio is using derivatives to decrease, or hedge, exposures to market or credit risk factors for securities held by a Portfolio, there are also risks that those derivatives may not perform as expected resulting in losses for the combined or hedged positions.
Derivative instruments are subject to a number of risks, including the risk of changes in the market price of the underlying securities, credit risk with respect to the counterparty, risk of loss due to changes in market interest rates and liquidity and volatility risk. The amounts required to purchase certain derivatives may be small relative to the magnitude of exposure assumed by a Portfolio. Therefore, the purchase of certain derivatives may have an economic leveraging effect on a Portfolio and exaggerate any increase or decrease in the NAV. Derivatives may not perform as expected, so a Portfolio may not realize the intended benefits. When used for hedging purposes, the change in value of a derivative may not correlate as expected with the currency, security or other risk being hedged. When used as an alternative or substitute for
direct cash investments, the return provided by the derivative may not provide the same return as direct cash investment. In addition, given their complexity, derivatives expose a Portfolio to the risk of improper valuation.
Generally, derivatives are sophisticated financial instruments whose performance is derived, at least in part, from the performance of an underlying asset or assets. Derivatives include, among other things, swap agreements, options, forwards and futures. Investments in derivatives are generally negotiated OTC with a single counterparty and as a result are subject to credit risks related to the counterparty’s ability or willingness to perform its obligations; any deterioration in the counterparty’s creditworthiness could adversely affect the value of the derivative. In addition, derivatives and their underlying securities may experience periods of illiquidity which could cause a Portfolio to hold a security it might otherwise sell, or to sell a security it otherwise might hold at inopportune times or at an unanticipated price. A manager might imperfectly judge the direction of the market. For instance, if a derivative is used as a hedge to offset investment risk in another security, the hedge might not correlate to the market’s movements and may have unexpected or undesired results such as a loss or a reduction in gains.
G. Futures Contracts. Certain Portfolios may enter into futures contracts involving foreign currency, interest rates, securities and security indices. A futures contract is a commitment to buy or sell a specific amount of a financial instrument at a negotiated price on a stipulated future date. A Portfolio may buy and sell futures contracts. Futures contracts traded on a commodities or futures exchange will be valued at the final settlement price or official closing price on the principal exchange as reported by such principal exchange at its trading session ending at, or most recently prior to, the time when each Portfolio’s assets are valued.
Upon entering into a futures contract, a Portfolio is required to deposit either cash or securities (initial margin) in an amount equal to a certain percentage of the contract value. Subsequent payments (variation margin) are made or received by a Portfolio each day. The variation margin payments are equal to the daily changes in the contract value and are recorded as unrealized gains and losses and, if any, shown as variation margin receivable or payable on futures contracts on the Statement of Assets and Liabilities.Open futures contracts are reported on a table following each Portfolio’s Portfolio of Investments. Securities held in collateralized accounts to cover initial margin requirements on open futures contracts, if any, are footnoted in the Portfolio of Investments. Cash collateral held by the broker to cover initial margin requirements on
NOTES TO FINANCIAL STATEMENTS as of December 31, 2021 (continued)
NOTE 2 — SIGNIFICANT ACCOUNTING POLICIES (continued)
open futures contracts are noted in the Statements of Assets and Liabilities. The net change in unrealized appreciation and depreciation is reported in the Statements of Operations. Realized gains (losses) are reported in the Statements of Operations at the closing or expiration of futures contracts.
Futures contracts are exposed to the market risk factor of the underlying financial instrument. During the year ended December 31, 2021, certain Portfolios used futures to enact tactical positions and to provide the Portfolios with greater liquidity. Certain Portfolios had purchased and sold futures contracts on various equity indices and also purchased and sold futures contracts on various U.S. Treasury Notes and Bonds. Futures contracts are purchased to provide immediate market exposure proportionate to the size of the Portfolio’s respective cash flows and residual cash balances in order to decrease potential tracking error if the cash remained uninvested in the market. Additional associated risks of entering into futures contracts include the possibility that there may be an illiquid market where the Portfolios are unable to liquidate the contract or enter into an offsetting position and, if used for hedging purposes, the risk that the price of the contract will correlate imperfectly with the prices of the Portfolios’ securities. With futures, there is minimal counterparty credit risk to the Portfolios since futures are exchange traded and the exchange’s clearinghouse, as counterparty to all exchange traded futures, guarantees the futures against default.
During the year ended December 31, 2021, the following Portfolios had average notional values on futures contracts purchased and sold as disclosed below. There were no open futures contracts for any Portfolio at December 31, 2021.
| | | | Purchased | | | Sold | |
| Index Solution Income | | | | $ | 4,808,350 | | | | | $ | 4,822,625 | | |
| Index Solution 2025 | | | | | 19,232,965 | | | | | | 18,557,240 | | |
| Index Solution 2030 | | | | | 16,193,360 | | | | | | 15,370,080 | | |
| Index Solution 2035 | | | | | 26,363,580 | | | | | | 25,116,960 | | |
| Index Solution 2040 | | | | | 12,319,830 | | | | | | 11,692,510 | | |
| Index Solution 2045 | | | | | 24,768,595 | | | | | | 23,624,216 | | |
| Index Solution 2050 | | | | | 9,722,005 | | | | | | 9,415,669 | | |
| Index Solution 2055 | | | | | 10,289,165 | | | | | | 9,937,593 | | |
| Index Solution 2060 | | | | | 4,715,515 | | | | | | 4,411,156 | | |
H. Offering Costs. Costs incurred with the offering of shares of a Portfolio are deferred and amortized over a twelve month period on a straight-line basis starting at the commencement of operations.
I. Indemnifications. In the normal course of business, the Company may enter into contracts that provide certain
indemnifications. The Company’s maximum exposure under these arrangements is dependent on future claims that may be made against the Portfolios and, therefore, cannot be estimated; however, based on experience, management considers the risk of loss from such claims remote.
NOTE 3 — INVESTMENTS IN UNDERLYING FUNDS AND FUNDING AGREEMENTS
For the year ended December 31, 2021, the cost of purchases and the proceeds from sales of the Underlying Funds and Funding Agreements were as follows:
| | | | Purchases | | | Sales | |
| Index Solution Income | | | | $ | 291,433,220 | | | | | $ | 385,988,826 | | |
| Index Solution 2025 | | | | | 513,304,724 | | | | | | 517,749,226 | | |
| Index Solution 2030 | | | | | 434,950,080 | | | | | | 356,559,905 | | |
| Index Solution 2035 | | | | | 584,026,815 | | | | | | 525,689,227 | | |
| Index Solution 2040 | | | | | 345,925,401 | | | | | | 253,581,723 | | |
| Index Solution 2045 | | | | | 446,693,189 | | | | | | 393,744,656 | | |
| Index Solution 2050 | | | | | 275,595,682 | | | | | | 199,224,172 | | |
| Index Solution 2055 | | | | | 276,395,049 | | | | | | 209,770,940 | | |
| Index Solution 2060 | | | | | 151,795,328 | | | | | | 90,890,224 | | |
| Index Solution 2065 | | | | | 20,286,794 | | | | | | 5,169,512 | | |
NOTE 4 — INVESTMENT MANAGEMENT FEES
The Portfolios have entered into an investment management agreement (“Management Agreement”) with the Investment Adviser. The Investment Adviser has overall responsibility for the management of the Portfolios. The Investment Adviser oversees all investment management and portfolio management services for the Portfolios and assists in managing and supervising all aspects of the general day-to-day business activities and operations of the Portfolios, including custodial, transfer agency, dividend disbursing, accounting, auditing, compliance and related services. This Management Agreement compensates the Investment Adviser with a management fee, computed daily and payable monthly, based on the average daily net assets of each Portfolio, at the following annual rates: 0.20% of each Portfolio’s average daily nets assets invested in affiliated Underlying Funds and/or Funding Agreements and 0.40% of each Portfolio’s average daily net assets invested in unaffiliated Underlying Funds and/or other direct investments.
The Investment Adviser has entered into a sub-advisory agreement with Voya IM with respect to each Portfolio. Voya IM provides investment advice for the Portfolios and is paid by the Investment Adviser based on the average daily net assets of each respective Portfolio. Subject to such policies as the Board or the Investment Adviser may determine, Voya IM manages the Portfolios’ assets in accordance with the Portfolios’ investment objectives, policies, and limitations.
NOTES TO FINANCIAL STATEMENTS as of December 31, 2021 (continued)
NOTE 5 — DISTRIBUTION AND SERVICE FEES
Classes ADV and S2 of the Portfolios have a plan of distribution (the “Plans”), whereby the Distributor is reimbursed or compensated by the Portfolios for expenses incurred in the distribution of each respective Portfolio’s shares. The Distributor may pay, on behalf of each Portfolio, out of its distribution fee, compensation to certain financial institutions for providing distribution assistance pursuant to a Distribution Services Agreement. Under the Plans each Portfolio makes payments to the Distributor at an annual rate of 0.25% of each Portfolio’s average daily net assets attributable to its Class ADV shares and each Portfolio makes payments to the Distributor at an annual rate of 0.15% of each Portfolio’s average daily net assets attributable to its Class S2 shares.
The Company has a shareholder servicing plan (“Service Plan”) for the Classes ADV, S and S2 shares of each respective Portfolio. The Service Plan allows the Distributor to enter into shareholder servicing agreements with insurance companies, broker dealers or other financial intermediaries that provide administrative services related to Classes ADV, S and S2 shares and their shareholders including Variable Contract owners or Qualified Plan participants with interests in the Portfolios. Under the Service Plan, each Portfolio makes payments to the Distributor which shall not exceed an annual rate of 0.25% of each Portfolio’s average daily net assets attributable to its Classes ADV, S and S2 shares.
NOTE 6 — OTHER TRANSACTIONS WITH AFFILIATES AND RELATED PARTIES
At December 31, 2021, the following direct or indirect, wholly-owned subsidiaries of Voya Financial, Inc. owned more than 5% of the following Portfolios:
| Subsidiary | | | Portfolio | | | Percentage | |
| Voya Institutional Trust Company | | | Index Solution Income | | | | | 30.39% | | |
| | | | Index Solution 2025 | | | | | 17.75 | | |
| | | | Index Solution 2030 | | | | | 12.02 | | |
| | | | Index Solution 2035 | | | | | 16.07 | | |
| | | | Index Solution 2040 | | | | | 12.63 | | |
| | | | Index Solution 2045 | | | | | 17.81 | | |
| | | | Index Solution 2050 | | | | | 12.35 | | |
| | | | Index Solution 2055 | | | | | 14.97 | | |
| | | | Index Solution 2060 | | | | | 14.74 | | |
| | | | Index Solution 2065 | | | | | 7.78 | | |
Voya Investment Management Co.
LLC | | | Index Solution 2065 | | | | | 13.09 | | |
| Voya Retirement Insurance and Annuity Company | | | Index Solution Income | | | | | 69.59 | | |
| | | | Index Solution 2025 | | | | | 82.25 | | |
| | | | Index Solution 2030 | | | | | 87.96 | | |
| | | | Index Solution 2035 | | | | | 83.92 | | |
| | | | Index Solution 2040 | | | | | 87.35 | | |
| Subsidiary | | | Portfolio | | | Percentage | |
| Voya Retirement Insurance and Annuity Company (continued) | | | Index Solution 2045 | | | | | 82.19 | | |
| | | | Index Solution 2050 | | | | | 87.65 | | |
| | | | Index Solution 2055 | | | | | 85.03 | | |
| | | | Index Solution 2060 | | | | | 85.26 | | |
| | | | Index Solution 2065 | | | | | 79.13 | | |
The Portfolios have adopted a deferred compensation plan (the “DC Plan”), which allows eligible independent directors, as described in the DC Plan, to defer the receipt of all or a portion of the directors’ fees that they are entitled to receive from the Portfolios. For purposes of determining the amount owed to the director under the DC Plan, the amounts deferred are invested in shares of the funds selected by the director (the “Notional Funds”). When the Portfolios purchase shares of the Notional Funds, which are all advised by Voya Investments, in amounts equal to the directors’ deferred fees, this results in a Portfolio asset equal to the deferred compensation liability. Such assets, if applicable, are included as a component of “Other assets” on the accompanying Statements of Assets and Liabilities. Deferral of directors’ fees under the DC Plan will not affect net assets of the Portfolios, and will not materially affect the Portfolios’ assets, liabilities or net investment income per share. Amounts will be deferred until distributed in accordance with the DC Plan.
The Portfolios may pay per account fees to affiliates of Voya Investments for recordkeeping services provided on certain assets. For the year ended December 31, 2021, the per account fees for affiliated recordkeeping services paid by each Portfolio were as follows:
| Portfolio | | | Amount | |
| Index Solution Income | | | | $ | 119,618 | | |
| Index Solution 2025 | | | | | 188,805 | | |
| Index Solution 2030 | | | | | 55,994 | | |
| Index Solution 2035 | | | | | 220,093 | | |
| Index Solution 2040 | | | | | 58,897 | | |
| Index Solution 2045 | | | | | 223,795 | | |
| Index Solution 2050 | | | | | 66,638 | | |
| Index Solution 2055 | | | | | 185,113 | | |
| Index Solution 2060 | | | | | 68,689 | | |
| Index Solution 2065 | | | | | 4,441 | | |
NOTE 7 — FUNDING AGREEMENTS
Effective August 31, 2021, Index Solution Income, Index Solution 2025 and Index Solution 2030 each invest in a Funding Agreement issued by Voya Retirement Insurance and Annuity Company (“VRIAC”). VRIAC is a subsidiary of Voya Financial, Inc.
The Funding Agreements have a stable principal value and typically pay interest at a relatively short-term rate, which is subject to change periodically. If VRIAC becomes unable
NOTES TO FINANCIAL STATEMENTS as of December 31, 2021 (continued)
NOTE 7 — FUNDING AGREEMENTS (continued)
to pay interest or repay principal under each contract, Index Solution Income, Index Solution 2025 and/or Index Solution 2030 may lose money. In a rising interest rate environment, the interest rate provided by a Funding Agreement may not increase as quickly as the yields of other short-term investments. Investing in a Funding Agreement in such an environment could adversely affect each Portfolio’s relative performance. In the case of a Funding Agreement with VRIAC, there can be no guarantee that the interest rate a Portfolio receives under the Funding Agreement will be as favorable to each Portfolio as the rate that might be paid under a Funding Agreement with another, unaffiliated insurer. Neither a Portfolio, the Investment Adviser, VRIAC, nor any of its affiliates guarantee each Portfolio’s performance or that a Portfolio will provide a certain level of income. In the event of an insolvency of the insurer, it is possible that insurance policy holders and other preferred claimants will be paid before each Portfolio. Each Portfolio may withdraw any amount in the Funding Agreements for any reason, at any time.
Interest is credited each calendar day based on the end of day balance and is reinvested in the Funding Agreements. The interest rate is determined by VRIAC and may be revised at any time subject to a 30-day advance notice of any change. If there is a change to the interest rate, VRIAC will not apply a subsequent decrease in the interest rate prior to the last day of the three-month period measured from the first day of the month such prior change was effective. Interest will be accrued to the account value daily at a guaranteed minimum interest rate.
The current day price of each unit of the Funding Agreements issued by VRIAC is determined by applying the current interest rate to the previous day’s price. The significant unobservable input used in the fair value measurement of each Portfolio’s investment in the Funding Agreements issued by VRIAC is the interest rate. Please refer to the tables within each respective Portfolio of Investments for fair value measurements.
During the period ended December 31, 2021, the interest rate for the Funding Agreements issued by VRIAC was 1.60%.
NOTE 8 — EXPENSE LIMITATION AGREEMENTS
The Investment Adviser has entered into a written expense limitation agreement (“Expense Limitation Agreement”) with each Portfolio whereby the Investment Adviser has agreed to limit expenses to the levels listed in the table below.
| Portfolio | | | Class
ADV(1)(2) | | | Class
I(1)(2) | | | Class
S(1)(2) | | | Class
S2(1)(2) | | | Class
Z(3)(4) | |
| Index Solution Income | | | | | 0.89% | | | | | | 0.39% | | | | | | 0.64% | | | | | | 0.79% | | | | | | 0.00% | | |
| Index Solution 2025 | | | | | 0.89% | | | | | | 0.39% | | | | | | 0.64% | | | | | | 0.79% | | | | | | 0.00% | | |
| Index Solution 2030 | | | | | 0.89% | | | | | | 0.39% | | | | | | 0.64% | | | | | | 0.79% | | | | | | 0.00% | | |
| Index Solution 2035 | | | | | 0.89% | | | | | | 0.39% | | | | | | 0.64% | | | | | | 0.79% | | | | | | 0.00% | | |
| Index Solution 2040 | | | | | 0.89% | | | | | | 0.39% | | | | | | 0.64% | | | | | | 0.79% | | | | | | 0.00% | | |
| Index Solution 2045 | | | | | 0.89% | | | | | | 0.39% | | | | | | 0.64% | | | | | | 0.79% | | | | | | 0.00% | | |
| Index Solution 2050 | | | | | 0.89% | | | | | | 0.39% | | | | | | 0.64% | | | | | | 0.79% | | | | | | 0.00% | | |
| Index Solution 2055 | | | | | 0.89% | | | | | | 0.39% | | | | | | 0.64% | | | | | | 0.79% | | | | | | 0.00% | | |
| Index Solution 2060 | | | | | 0.89% | | | | | | 0.39% | | | | | | 0.64% | | | | | | 0.79% | | | | | | 0.00% | | |
| Index Solution 2065 | | | | | 0.89% | | | | | | 0.39% | | | | | | 0.64% | | | | | | 0.79% | | | | | | 0.00% | | |
(1)
The operating expense limits take into account the operating expenses incurred at the Underlying Fund level. The amount of fees and expenses of an Underlying Fund borne by each Portfolio will vary based on each Portfolio’s allocation of assets to, and the net expenses of, a particular Underlying Fund. The limits exclude interest, taxes, investment-related costs, leverage expenses, and extraordinary expenses.
(2)
Any fees waived pursuant to the Expense Limitation Agreement shall not be eligible for recoupment.
(3)
Pursuant to a side letter agreement, through May 1, 2022, the Investment Adviser has agreed to waive all or a portion of the management fee and/or reimburse expenses so that the direct expense limits are 0.00% for all Portfolios. Any fees waived pursuant to the side letter agreement shall not be eligible for recoupment. Termination or modification of this obligation requires approval by the Board.
(4)
The operating expense limits shown apply only at each Portfolio level and do not include the fees payable by the Underlying Funds in which each Portfolio invests, investment-related costs and extraordinary expenses, such as litigation and other expenses not incurred in the ordinary course of each Portfolio’s business.
The Expense Limitation Agreement is contractual through May 1, 2022 and shall renew automatically for one-year terms. Termination or modification of this obligation requires approval by the Board.
NOTE 9 — LINE OF CREDIT
Effective June 14, 2021, the Portfolios, in addition to certain other funds managed by the Investment Adviser, entered into a 364-day unsecured committed revolving line of credit agreement (the “Credit Agreement”) with The Bank of New York Mellon (“BNY”) for an aggregate amount of $400,000,000 through June 13, 2022. The proceeds may be used only to finance temporarily: (1) the purchase or sale of investment securities; or (2) the repurchase or redemption of shares of a Portfolio or certain other funds managed by the Investment Adviser. The funds to which the line of credit is available pay a commitment fee equal to 0.15% per annum on the daily unused portion of the committed line amount payable quarterly in arrears. Prior to June 14, 2021, the predecessor line of credit was for an aggregate amount of $400,000,000 and the funds to which the line of credit was available paid a commitment fee equal to 0.15% per annum on the daily unused portion of the committed line amount through June 14, 2021.
NOTES TO FINANCIAL STATEMENTS as of December 31, 2021 (continued)
NOTE 9 — LINE OF CREDIT (continued)
Borrowings under the Credit Agreement accrue interest at the federal funds rate plus a specified margin. Repayments generally must be made within 60 days after the date of a revolving credit advance.
The following Portfolios utilized the line of credit during the year ended December 31, 2021.
| Portfolio | | | Days
Utilized | | | Approximate
Average
Daily
Balance For
Days
Utilized | | | Approximate
Weighted
Average
Interest Rate
For Days
Utilized | |
| Index Solution Income | | | | | 1 | | | | | $ | 2,441,000 | | | | | | 1.33% | | |
| Index Solution 2045 | | | | | 1 | | | | | | 546,000 | | | | | | 1.26 | | |
NOTE 10 — CAPITAL SHARES
Transactions in capital shares and dollars were as follows:
| | | | Shares
sold | | | Shares
issued in
merger | | | Reinvestment
of
distributions | | | Shares
redeemed | | | Net increase
(decrease)
in shares
outstanding | | | Shares
sold | | | Proceeds
from shares
issued in
merger | | | Reinvestment
of
distributions | | | Shares
redeemed | | | Net increase
(decrease) | |
| Year or period ended | | | # | | | # | | | # | | | # | | | # | | | ($) | | | ($) | | | ($) | | | ($) | | | ($) | |
| Index Solution Income | |
| Class ADV | | | | | | | | | | | | | | | | | | | | | | | | | | | | | | | | | | | | | | | | | | | | | | | | | | | | | | | | | | | | | |
| 12/31/2021 | | | | | 448,474 | | | | | | — | | | | | | 338,279 | | | | | | (1,621,093) | | | | | | (834,340) | | | | | | 5,109,216 | | | | | | — | | | | | | 3,839,468 | | | | | | (18,470,481) | | | | | | (9,521,797) | | |
| 12/31/2020 | | | | | 717,747 | | | | | | 2,687,004 | | | | | | 256,072 | | | | | | (2,069,779) | | | | | | 1,591,044 | | | | | | 7,609,479 | | | | | | 28,842,421 | | | | | | 2,739,970 | | | | | | (22,117,134) | | | | | | 17,074,736 | | |
| Class I | | | | | | | | | | | | | | | | | | | | | | | | | | | | | | | | | | | | | | | | | | | | | | | | | | | | | | | | | | | | | |
| 12/31/2021 | | | | | 167,642 | | | | | | — | | | | | | 66,185 | | | | | | (658,714) | | | | | | (424,887) | | | | | | 1,970,276 | | | | | | — | | | | | | 771,721 | | | | | | (7,714,945) | | | | | | (4,972,948) | | |
| 12/31/2020 | | | | | 487,107 | | | | | | 562,341 | | | | | | 65,854 | | | | | | (1,067,247) | | | | | | 48,055 | | | | | | 5,459,262 | | | | | | 6,187,741 | | | | | | 722,414 | | | | | | (11,842,053) | | | | | | 527,364 | | |
| Class S | | | | | | | | | | | | | | | | | | | | | | | | | | | | | | | | | | | | | | | | | | | | | | | | | | | | | | | | | | | | | |
| 12/31/2021 | | | | | 217,530 | | | | | | — | | | | | | 481,010 | | | | | | (2,262,925) | | | | | | (1,564,385) | | | | | | 2,515,739 | | | | | | — | | | | | | 5,555,663 | | | | | | (26,324,900) | | | | | | (18,253,498) | | |
| 12/31/2020 | | | | | 707,770 | | | | | | 888,803 | | | | | | 458,384 | | | | | | (1,920,879) | | | | | | 134,078 | | | | | | 7,683,317 | | | | | | 9,688,951 | | | | | | 4,982,635 | | | | | | (20,857,605) | | | | | | 1,497,298 | | |
| Class S2 | | | | | | | | | | | | | | | | | | | | | | | | | | | | | | | | | | | | | | | | | | | | | | | | | | | | | | | | | | | | | |
| 12/31/2021 | | | | | 502,106 | | | | | | — | | | | | | 67,100 | | | | | | (414,779) | | | | | | 154,427 | | | | | | 5,713,537 | | | | | | — | | | | | | 756,222 | | | | | | (4,698,325) | | | | | | 1,771,434 | | |
| 12/31/2020 | | | | | 469,538 | | | | | | 981,176 | | | | | | 28,612 | | | | | | (804,493) | | | | | | 674,833 | | | | | | 5,006,516 | | | | | | 10,462,773 | | | | | | 304,139 | | | | | | (8,562,092) | | | | | | 7,211,337 | | |
| Class Z | | | | | | | | | | | | | | | | | | | | | | | | | | | | | | | | | | | | | | | | | | | | | | | | | | | | | | | | | | | | | |
| 12/31/2021 | | | | | 5,071,310 | | | | | | — | | | | | | 2,431,060 | | | | | | (11,694,957) | | | | | | (4,192,587) | | | | | | 60,654,643 | | | | | | — | | | | | | 28,759,436 | | | | | | (138,924,594) | | | | | | (49,510,515) | | |
| 12/31/2020 | | | | | 9,306,166 | | | | | | 34,721,940 | | | | | | 842,283 | | | | | | (5,830,726) | | | | | | 39,039,663 | | | | | | 106,072,476 | | | | | | 386,594,608 | | | | | | 9,349,344 | | | | | | (65,107,326) | | | | | | 436,909,100 | | |
| Index Solution 2025 | |
| Class ADV | | | | | | | | | | | | | | | | | | | | | | | | | | | | | | | | | | | | | | | | | | | | | | | | | | | | | | | | | | | | | |
| 12/31/2021 | | | | | 1,024,576 | | | | | | — | | | | | | 878,595 | | | | | | (3,178,930) | | | | | | (1,275,759) | | | | | | 12,675,726 | | | | | | — | | | | | | 10,806,715 | | | | | | (39,555,819) | | | | | | (16,073,378) | | |
| 12/31/2020 | | | | | 1,898,294 | | | | | | — | | | | | | 706,442 | | | | | | (4,447,311) | | | | | | (1,842,575) | | | | | | 21,147,829 | | | | | | — | | | | | | 7,813,249 | | | | | | (48,793,153) | | | | | | (19,832,075) | | |
| Class I | | | | | | | | | | | | | | | | | | | | | | | | | | | | | | | | | | | | | | | | | | | | | | | | | | | | | | | | | | | | | |
| 12/31/2021 | | | | | 674,477 | | | | | | — | | | | | | 280,091 | | | | | | (1,055,001) | | | | | | (100,433) | | | | | | 8,683,047 | | | | | | — | | | | | | 3,537,550 | | | | | | (13,490,514) | | | | | | (1,269,917) | | |
| 12/31/2020 | | | | | 1,410,329 | | | | | | — | | | | | | 239,544 | | | | | | (2,688,052) | | | | | | (1,038,179) | | | | | | 16,542,295 | | | | | | — | | | | | | 2,714,034 | | | | | | (30,884,496) | | | | | | (11,628,168) | | |
| Class S | | | | | | | | | | | | | | | | | | | | | | | | | | | | | | | | | | | | | | | | | | | | | | | | | | | | | | | | | | | | | |
| 12/31/2021 | | | | | 793,951 | | | | | | — | | | | | | 690,996 | | | | | | (1,957,242) | | | | | | (472,295) | | | | | | 10,014,318 | | | | | | — | | | | | | 8,623,634 | | | | | | (24,728,139) | | | | | | (6,090,187) | | |
| 12/31/2020 | | | | | 992,489 | | | | | | — | | | | | | 520,595 | | | | | | (2,154,621) | | | | | | (641,537) | | | | | | 11,098,047 | | | | | | — | | | | | | 5,835,868 | | | | | | (24,039,641) | | | | | | (7,105,726) | | |
| Class S2 | | | | | | | | | | | | | | | | | | | | | | | | | | | | | | | | | | | | | | | | | | | | | | | | | | | | | | | | | | | | | |
| 12/31/2021 | | | | | 660,546 | | | | | | — | | | | | | 192,108 | | | | | | (957,029) | | | | | | (104,375) | | | | | | 8,209,547 | | | | | | — | | | | | | 2,347,558 | | | | | | (11,832,103) | | | | | | (1,274,998) | | |
| 12/31/2020 | | | | | 881,102 | | | | | | — | | | | | | 149,228 | | | | | | (969,139) | | | | | | 61,191 | | | | | | 9,679,413 | | | | | | — | | | | | | 1,641,507 | | | | | | (10,675,295) | | | | | | 645,625 | | |
| Class Z | | | | | | | | | | | | | | | | | | | | | | | | | | | | | | | | | | | | | | | | | | | | | | | | | | | | | | | | | | | | | |
| 12/31/2021 | | | | | 8,730,674 | | | | | | — | | | | | | 4,423,946 | | | | | | (7,662,881) | | | | | | 5,491,739 | | | | | | 113,645,171 | | | | | | — | | | | | | 56,670,753 | | | | | | (98,987,702) | | | | | | 71,328,222 | | |
| 12/31/2020 | | | | | 10,748,070 | | | | | | — | | | | | | 2,998,356 | | | | | | (6,868,965) | | | | | | 6,877,461 | | | | | | 123,413,523 | | | | | | — | | | | | | 34,391,146 | | | | | | (77,332,818) | | | | | | 80,471,852 | | |
| Index Solution 2030 | |
| Class ADV | | | | | | | | | | | | | | | | | | | | | | | | | | | | | | | | | | | | | | | | | | | | | | | | | | | | | | | | | | | | | |
| 12/31/2021 | | | | | 482,643 | | | | | | — | | | | | | 127,403 | | | | | | (513,072) | | | | | | 96,974 | | | | | | 8,707,380 | | | | | | — | | | | | | 2,288,149 | | | | | | (9,215,809) | | | | | | 1,779,720 | | |
| 12/31/2020 | | | | | 774,801 | | | | | | — | | | | | | 104,898 | | | | | | (727,448) | | | | | | 152,251 | | | | | | 11,983,019 | | | | | | — | | | | | | 1,626,967 | | | | | | (11,079,347) | | | | | | 2,530,639 | | |
| Class I | | | | | | | | | | | | | | | | | | | | | | | | | | | | | | | | | | | | | | | | | | | | | | | | | | | | | | | | | | | | | |
| 12/31/2021 | | | | | 108,259 | | | | | | — | | | | | | 27,298 | | | | | | (106,527) | | | | | | 29,030 | | | | | | 2,028,383 | | | | | | — | | | | | | 506,369 | | | | | | (1,968,454) | | | | | | 566,298 | | |
| 12/31/2020 | | | | | 296,207 | | | | | | — | | | | | | 25,622 | | | | | | (324,707) | | | | | | (2,878) | | | | | | 4,757,963 | | | | | | — | | | | | | 409,433 | | | | | | (5,262,693) | | | | | | (95,297) | | |
| Class S | | | | | | | | | | | | | | | | | | | | | | | | | | | | | | | | | | | | | | | | | | | | | | | | | | | | | | | | | | | | | |
| 12/31/2021 | | | | | 298,056 | | | | | | — | | | | | | 48,657 | | | | | | (228,334) | | | | | | 118,379 | | | | | | 5,486,199 | | | | | | — | | | | | | 895,282 | | | | | | (4,208,511) | | | | | | 2,172,970 | | |
| 12/31/2020 | | | | | 286,151 | | | | | | — | | | | | | 42,318 | | | | | | (237,809) | | | | | | 90,660 | | | | | | 4,549,495 | | | | | | — | | | | | | 671,172 | | | | | | (3,775,271) | | | | | | 1,445,395 | | |
| Class S2 | | | | | | | | | | | | | | | | | | | | | | | | | | | | | | | | | | | | | | | | | | | | | | | | | | | | | | | | | | | | | |
| 12/31/2021 | | | | | 313,201 | | | | | | — | | | | | | 35,516 | | | | | | (200,722) | | | | | | 147,995 | | | | | | 5,690,660 | | | | | | — | | | | | | 642,134 | | | | | | (3,621,527) | | | | | | 2,711,267 | | |
| 12/31/2020 | | | | | 370,305 | | | | | | — | | | | | | 21,457 | | | | | | (131,949) | | | | | | 259,813 | | | | | | 5,815,982 | | | | | | — | | | | | | 335,167 | | | | | | (2,064,055) | | | | | | 4,087,095 | | |
NOTES TO FINANCIAL STATEMENTS as of December 31, 2021 (continued)
NOTE 10 — CAPITAL SHARES (continued)
| | | | Shares
sold | | | Shares
issued in
merger | | | Reinvestment
of
distributions | | | Shares
redeemed | | | Net increase
(decrease)
in shares
outstanding | | | Shares
sold | | | Proceeds
from shares
issued in
merger | | | Reinvestment
of
distributions | | | Shares
redeemed | | | Net increase
(decrease) | |
| Year or period ended | | | # | | | # | | | # | | | # | | | # | | | ($) | | | ($) | | | ($) | | | ($) | | | ($) | |
| Index Solution 2030 (continued) | |
| Class Z | | | | | | | | | | | | | | | | | | | | | | | | | | | | | | | | | | | | | | | | | | | | | | | | | | | | | | | | | | | | | |
| 12/31/2021 | | | | | 6,472,391 | | | | | | — | | | | | | 2,100,156 | | | | | | (3,352,144) | | | | | | 5,220,403 | | | | | | 122,010,344 | | | | | | — | | | | | | 39,398,935 | | | | | | (63,187,134) | | | | | | 98,222,145 | | |
| 12/31/2020 | | | | | 6,915,969 | | | | | | — | | | | | | 1,708,256 | | | | | | (3,526,141) | | | | | | 5,098,084 | | | | | | 113,266,641 | | | | | | — | | | | | | 27,537,089 | | | | | | (57,184,547) | | | | | | 83,619,183 | | |
| Index Solution 2035 | |
| Class ADV | | | | | | | | | | | | | | | | | | | | | | | | | | | | | | | | | | | | | | | | | | | | | | | | | | | | | | | | | | | | | |
| 12/31/2021 | | | | | 822,601 | | | | | | — | | | | | | 747,668 | | | | | | (2,683,246) | | | | | | (1,112,977) | | | | | | 11,004,007 | | | | | | — | | | | | | 9,891,643 | | | | | | (35,786,364) | | | | | | (14,890,714) | | |
| 12/31/2020 | | | | | 1,152,250 | | | | | | — | | | | | | 741,529 | | | | | | (4,206,112) | | | | | | (2,312,333) | | | | | | 13,111,891 | | | | | | — | | | | | | 8,357,037 | | | | | | (47,882,272) | | | | | | (26,413,344) | | |
| Class I | | | | | | | | | | | | | | | | | | | | | | | | | | | | | | | | | | | | | | | | | | | | | | | | | | | | | | | | | | | | | |
| 12/31/2021 | | | | | 642,827 | | | | | | — | | | | | | 280,201 | | | | | | (738,630) | | | | | | 184,398 | | | | | | 8,849,484 | | | | | | — | | | | | | 3,819,146 | | | | | | (10,133,109) | | | | | | 2,535,521 | | |
| 12/31/2020 | | | | | 1,426,897 | | | | | | — | | | | | | 298,532 | | | | | | (2,905,565) | | | | | | (1,180,136) | | | | | | 17,241,026 | | | | | | — | | | | | | 3,457,004 | | | | | | (34,971,857) | | | | | | (14,273,827) | | |
| Class S | | | | | | | | | | | | | | | | | | | | | | | | | | | | | | | | | | | | | | | | | | | | | | | | | | | | | | | | | | | | | |
| 12/31/2021 | | | | | 827,678 | | | | | | — | | | | | | 505,588 | | | | | | (1,737,192) | | | | | | (403,926) | | | | | | 11,223,225 | | | | | | — | | | | | | 6,800,155 | | | | | | (23,555,823) | | | | | | (5,532,443) | | |
| 12/31/2020 | | | | | 762,527 | | | | | | — | | | | | | 465,902 | | | | | | (1,793,853) | | | | | | (565,424) | | | | | | 8,853,175 | | | | | | — | | | | | | 5,329,917 | | | | | | (20,473,784) | | | | | | (6,290,692) | | |
| Class S2 | | | | | | | | | | | | | | | | | | | | | | | | | | | | | | | | | | | | | | | | | | | | | | | | | | | | | | | | | | | | | |
| 12/31/2021 | | | | | 622,333 | | | | | | — | | | | | | 213,356 | | | | | | (1,119,869) | | | | | | (284,180) | | | | | | 8,323,500 | | | | | | — | | | | | | 2,812,027 | | | | | | (14,853,546) | | | | | | (3,718,019) | | |
| 12/31/2020 | | | | | 663,682 | | | | | | — | | | | | | 167,813 | | | | | | (428,428) | | | | | | 403,067 | | | | | | 7,431,450 | | | | | | — | | | | | | 1,886,218 | | | | | | (5,015,552) | | | | | | 4,302,116 | | |
| Class Z | | | | | | | | | | | | | | | | | | | | | | | | | | | | | | | | | | | | | | | | | | | | | | | | | | | | | | | | | | | | | |
| 12/31/2021 | | | | | 9,690,252 | | | | | | — | | | | | | 4,418,957 | | | | | | (4,182,892) | | | | | | 9,926,317 | | | | | | 135,691,918 | | | | | | — | | | | | | 61,202,550 | | | | | | (58,734,282) | | | | | | 138,160,186 | | |
| 12/31/2020 | | | | | 11,852,084 | | | | | | — | | | | | | 3,336,400 | | | | | | (5,553,756) | | | | | | 9,634,728 | | | | | | 141,721,823 | | | | | | — | | | | | | 39,169,338 | | | | | | (66,963,958) | | | | | | 113,927,203 | | |
| Index Solution 2040 | |
| Class ADV | | | | | | | | | | | | | | | | | | | | | | | | | | | | | | | | | | | | | | | | | | | | | | | | | | | | | | | | | | | | | |
| 12/31/2021 | | | | | 296,537 | | | | | | — | | | | | | 63,011 | | | | | | (368,190) | | | | | | (8,642) | | | | | | 5,846,672 | | | | | | — | | | | | | 1,250,768 | | | | | | (7,309,898) | | | | | | (212,458) | | |
| 12/31/2020 | | | | | 367,613 | | | | | | — | | | | | | 64,028 | | | | | | (463,431) | | | | | | (31,790) | | | | | | 6,014,710 | | | | | | — | | | | | | 1,035,335 | | | | | | (7,509,583) | | | | | | (459,538) | | |
| Class I | | | | | | | | | | | | | | | | | | | | | | | | | | | | | | | | | | | | | | | | | | | | | | | | | | | | | | | | | | | | | |
| 12/31/2021 | | | | | 83,917 | | | | | | — | | | | | | 20,385 | | | | | | (59,548) | | | | | | 44,754 | | | | | | 1,720,524 | | | | | | — | | | | | | 417,084 | | | | | | (1,210,093) | | | | | | 927,515 | | |
| 12/31/2020 | | | | | 292,906 | | | | | | — | | | | | | 19,353 | | | | | | (238,628) | | | | | | 73,631 | | | | | | 5,023,794 | | | | | | — | | | | | | 321,833 | | | | | | (4,184,472) | | | | | | 1,161,156 | | |
| Class S | | | | | | | | | | | | | | | | | | | | | | | | | | | | | | | | | | | | | | | | | | | | | | | | | | | | | | | | | | | | | |
| 12/31/2021 | | | | | 217,703 | | | | | | — | | | | | | 33,511 | | | | | | (179,589) | | | | | | 71,625 | | | | | | 4,447,787 | | | | | | — | | | | | | 683,959 | | | | | | (3,656,280) | | | | | | 1,475,466 | | |
| 12/31/2020 | | | | | 231,022 | | | | | | — | | | | | | 31,287 | | | | | | (199,247) | | | | | | 63,062 | | | | | | 3,852,194 | | | | | | — | | | | | | 519,370 | | | | | | (3,259,973) | | | | | | 1,111,591 | | |
| Class S2 | | | | | | | | | | | | | | | | | | | | | | | | | | | | | | | | | | | | | | | | | | | | | | | | | | | | | | | | | | | | | |
| 12/31/2021 | | | | | 64,990 | | | | | | — | | | | | | 11,562 | | | | | | (110,433) | | | | | | (33,881) | | | | | | 1,301,229 | | | | | | — | | | | | | 231,822 | | | | | | (2,196,478) | | | | | | (663,427) | | |
| 12/31/2020 | | | | | 107,659 | | | | | | — | | | | | | 8,462 | | | | | | (42,771) | | | | | | 73,350 | | | | | | 1,790,287 | | | | | | — | | | | | | 138,265 | | | | | | (679,975) | | | | | | 1,248,577 | | |
| Class Z | | | | | | | | | | | | | | | | | | | | | | | | | | | | | | | | | | | | | | | | | | | | | | | | | | | | | | | | | | | | | |
| 12/31/2021 | | | | | 5,740,937 | | | | | | — | | | | | | 1,566,027 | | | | | | (1,920,890) | | | | | | 5,386,074 | | | | | | 119,131,359 | | | | | | — | | | | | | 32,448,073 | | | | | | (39,814,059) | | | | | | 111,765,373 | | |
| 12/31/2020 | | | | | 6,437,206 | | | | | | — | | | | | | 1,321,298 | | | | | | (2,204,285) | | | | | | 5,554,219 | | | | | | 111,285,543 | | | | | | — | | | | | | 22,211,017 | | | | | | (38,578,604) | | | | | | 94,917,955 | | |
| Index Solution 2045 | |
| Class ADV | | | | | | | | | | | | | | | | | | | | | | | | | | | | | | | | | | | | | | | | | | | | | | | | | | | | | | | | | | | | | |
| 12/31/2021 | | | | | 712,976 | | | | | | — | | | | | | 503,933 | | | | | | (1,975,664) | | | | | | (758,755) | | | | | | 10,226,109 | | | | | | — | | | | | | 7,176,007 | | | | | | (28,116,117) | | | | | | (10,714,001) | | |
| 12/31/2020 | | | | | 783,324 | | | | | | — | | | | | | 543,531 | | | | | | (2,632,874) | | | | | | (1,306,019) | | | | | | 9,165,407 | | | | | | — | | | | | | 6,283,226 | | | | | | (30,744,555) | | | | | | (15,295,921) | | |
| Class I | | | | | | | | | | | | | | | | | | | | | | | | | | | | | | | | | | | | | | | | | | | | | | | | | | | | | | | | | | | | | |
| 12/31/2021 | | | | | 519,981 | | | | | | — | | | | | | 200,985 | | | | | | (594,569) | | | | | | 126,397 | | | | | | 7,663,361 | | | | | | — | | | | | | 2,972,561 | | | | | | (8,826,086) | | | | | | 1,809,836 | | |
| 12/31/2020 | | | | | 1,042,204 | | | | | | — | | | | | | 255,904 | | | | | | (2,170,367) | | | | | | (872,259) | | | | | | 13,059,759 | | | | | | — | | | | | | 3,063,168 | | | | | | (27,420,403) | | | | | | (11,297,477) | | |
| Class S | | | | | | | | | | | | | | | | | | | | | | | | | | | | | | | | | | | | | | | | | | | | | | | | | | | | | | | | | | | | | |
| 12/31/2021 | | | | | 493,136 | | | | | | — | | | | | | 315,263 | | | | | | (917,460) | | | | | | (109,061) | | | | | | 7,201,616 | | | | | | — | | | | | | 4,580,764 | | | | | | (13,478,520) | | | | | | (1,696,140) | | |
| 12/31/2020 | | | | | 628,835 | | | | | | — | | | | | | 320,364 | | | | | | (1,237,416) | | | | | | (288,217) | | | | | | 7,386,658 | | | | | | — | | | | | | 3,773,890 | | | | | | (14,600,438) | | | | | | (3,439,890) | | |
| Class S2 | | | | | | | | | | | | | | | | | | | | | | | | | | | | | | | | | | | | | | | | | | | | | | | | | | | | | | | | | | | | | |
| 12/31/2021 | | | | | 439,214 | | | | | | — | | | | | | 113,175 | | | | | | (447,108) | | | | | | 105,281 | | | | | | 6,290,657 | | | | | | — | | | | | | 1,610,486 | | | | | | (6,417,708) | | | | | | 1,483,435 | | |
| 12/31/2020 | | | | | 458,455 | | | | | | — | | | | | | 101,934 | | | | | | (331,729) | | | | | | 228,660 | | | | | | 5,332,678 | | | | | | — | | | | | | 1,178,350 | | | | | | (3,851,749) | | | | | | 2,659,279 | | |
| Class Z | | | | | | | | | | | | | | | | | | | | | | | | | | | | | | | | | | | | | | | | | | | | | | | | | | | | | | | | | | | | | |
| 12/31/2021 | | | | | 7,028,476 | | | | | | — | | | | | | 2,863,539 | | | | | | (3,336,204) | | | | | | 6,555,811 | | | | | | 106,319,036 | | | | | | — | | | | | | 42,981,726 | | | | | | (50,695,800) | | | | | | 98,604,962 | | |
| 12/31/2020 | | | | | 11,110,829 | | | | | | — | | | | | | 2,294,645 | | | | | | (3,445,551) | | | | | | 9,959,923 | | | | | | 141,182,494 | | | | | | — | | | | | | 27,811,102 | | | | | | (44,523,232) | | | | | | 124,470,364 | | |
| Index Solution 2050 | |
| Class ADV | | | | | | | | | | | | | | | | | | | | | | | | | | | | | | | | | | | | | | | | | | | | | | | | | | | | | | | | | | | | | |
| 12/31/2021 | | | | | 262,261 | | | | | | — | | | | | | 40,851 | | | | | | (224,031) | | | | | | 79,081 | | | | | | 5,329,530 | | | | | | — | | | | | | 838,663 | | | | | | (4,557,924) | | | | | | 1,610,269 | | |
| 12/31/2020 | | | | | 332,763 | | | | | | — | | | | | | 47,427 | | | | | | (357,517) | | | | | | 22,673 | | | | | | 5,555,351 | | | | | | — | | | | | | 775,910 | | | | | | (5,918,896) | | | | | | 412,365 | | |
NOTES TO FINANCIAL STATEMENTS as of December 31, 2021 (continued)
NOTE 10 — CAPITAL SHARES (continued)
| | | | Shares
sold | | | Shares
issued in
merger | | | Reinvestment
of
distributions | | | Shares
redeemed | | | Net increase
(decrease)
in shares
outstanding | | | Shares
sold | | | Proceeds
from shares
issued in
merger | | | Reinvestment
of
distributions | | | Shares
redeemed | | | Net increase
(decrease) | | | | | | | | | | | |
| Year or period ended | | | # | | | # | | | # | | | # | | | # | | | ($) | | | ($) | | | ($) | | | ($) | | | ($) | | | | | | | | | | | |
| Index Solution 2050 (continued) | | | | | | | | | | | |
| Class I | | | | | | | | | | | | | | | | | | | | | | | | | | | | | | | | | | | | | | | | | | | | | | | | | | | | | | | | | | | | | | | | | | | | | | | |
| 12/31/2021 | | | | | 139,014 | | | | | | — | | | | | | 20,343 | | | | | | (85,252) | | | | | | 74,105 | | | | | | 2,897,058 | | | | | | — | | | | | | 428,229 | | | | | | (1,786,274) | | | | | | 1,539,013 | | | | | | | | | | | | |
| 12/31/2020 | | | | | 320,202 | | | | | | — | | | | | | 20,829 | | | | | | (249,425) | | | | | | 91,606 | | | | | | 5,606,277 | | | | | | — | | | | | | 348,884 | | | | | | (4,421,218) | | | | | | 1,533,943 | | | | | | | | | | | | |
| Class S | | | | | | | | | | | | | | | | | | | | | | | | | | | | | | | | | | | | | | | | | | | | | | | | | | | | | | | | | | | | | | | | | | | | | | | |
| 12/31/2021 | | | | | 198,293 | | | | | | — | | | | | | 28,115 | | | | | | (158,608) | | | | | | 67,800 | | | | | | 4,114,575 | | | | | | — | | | | | | 589,859 | | | | | | (3,308,370) | | | | | | 1,396,064 | | | | | | | | | | | | |
| 12/31/2020 | | | | | 236,906 | | | | | | — | | | | | | 31,084 | | | | | | (236,018) | | | | | | 31,972 | | | | | | 3,933,194 | | | | | | — | | | | | | 519,111 | | | | | | (3,903,999) | | | | | | 548,305 | | | | | | | | | | | | |
| Class S2 | | | | | | | | | | | | | | | | | | | | | | | | | | | | | | | | | | | | | | | | | | | | | | | | | | | | | | | | | | | | | | | | | | | | | | | |
| 12/31/2021 | | | | | 47,957 | | | | | | — | | | | | | 7,467 | | | | | | (60,411) | | | | | | (4,987) | | | | | | 983,206 | | | | | | — | | | | | | 154,127 | | | | | | (1,257,941) | | | | | | (120,608) | | | | | | | | | | | | |
| 12/31/2020 | | | | | 67,185 | | | | | | — | | | | | | 7,726 | | | | | | (64,902) | | | | | | 10,009 | | | | | | 1,098,357 | | | | | | — | | | | | | 127,088 | | | | | | (1,024,000) | | | | | | 201,445 | | | | | | | | | | | | |
| Class Z | | | | | | | | | | | | | | | | | | | | | | | | | | | | | | | | | | | | | | | | | | | | | | | | | | | | | | | | | | | | | | | | | | | | | | | |
| 12/31/2021 | | | | | 4,446,626 | | | | | | — | | | | | | 926,540 | | | | | | (1,414,268) | | | | | | 3,958,898 | | | | | | 94,389,243 | | | | | | — | | | | | | 19,735,291 | | | | | | (30,074,977) | | | | | | 84,049,557 | | | | | | | | | | | | |
| 12/31/2020 | | | | | 5,166,662 | | | | | | — | | | | | | 884,866 | | | | | | (1,829,622) | | | | | | 4,221,906 | | | | | | 89,482,388 | | | | | | — | | | | | | 14,963,072 | | | | | | (33,119,352) | | | | | | 71,326,109 | | | | | | | | | | | | |
| Index Solution 2055 | | | | | | | | | | | |
| Class ADV | | | | | | | | | | | | | | | | | | | | | | | | | | | | | | | | | | | | | | | | | | | | | | | | | | | | | | | | | | | | | | | | | | | | | | | |
| 12/31/2021 | | | | | 403,284 | | | | | | — | | | | | | 143,107 | | | | | | (642,901) | | | | | | (96,510) | | | | | | 7,613,567 | | | | | | — | | | | | | 2,706,151 | | | | | | (12,101,033) | | | | | | (1,781,315) | | | | | | | | | | | | |
| 12/31/2020 | | | | | 472,726 | | | | | | — | | | | | | 160,019 | | | | | | (724,215) | | | | | | (91,470) | | | �� | | | 7,163,062 | | | | | | — | | | | | | 2,421,084 | | | | | | (10,992,537) | | | | | | (1,408,390) | | | | | | | | | | | | |
| Class I | | | | | | | | | | | | | | | | | | | | | | | | | | | | | | | | | | | | | | | | | | | | | | | | | | | | | | | | | | | | | | | | | | | | | | | |
| 12/31/2021 | | | | | 364,088 | | | | | | — | | | | | | 94,053 | | | | | | (304,229) | | | | | | 153,912 | | | | | | 7,090,718 | | | | | | — | | | | | | 1,828,389 | | | | | | (5,872,620) | | | | | | 3,046,487 | | | | | | | | | | | | |
| 12/31/2020 | | | | | 915,394 | | | | | | — | | | | | | 112,384 | | | | | | (988,266) | | | | | | 39,512 | | | | | | 14,753,294 | | | | | | — | | | | | | 1,744,199 | | | | | | (16,431,171) | | | | | | 66,321 | | | | | | | | | | | | |
| Class S | | | | | | | | | | | | | | | | | | | | | | | | | | | | | | | | | | | | | | | | | | | | | | | | | | | | | | | | | | | | | | | | | | | | | | | |
| 12/31/2021 | | | | | 347,808 | | | | | | — | | | | | | 109,479 | | | | | | (541,628) | | | | | | (84,341) | | | | | | 6,653,836 | | | | | | — | | | | | | 2,098,710 | | | | | | (10,321,505) | | | | | | (1,568,959) | | | | | | | | | | | | |
| 12/31/2020 | | | | | 428,155 | | | | | | — | | | | | | 111,782 | | | | | | (444,908) | | | | | | 95,029 | | | | | | 6,515,419 | | | | | | — | | | | | | 1,713,622 | | | | | | (6,937,103) | | | | | | 1,291,938 | | | | | | | | | | | | |
| Class S2 | | | | | | | | | | | | | | | | | | | | | | | | | | | | | | | | | | | | | | | | | | | | | | | | | | | | | | | | | | | | | | | | | | | | | | | |
| 12/31/2021 | | | | | 288,458 | | | | | | — | | | | | | 50,706 | | | | | | (258,962) | | | | | | 80,202 | | | | | | 5,501,725 | | | | | | — | | | | | | 961,382 | | | | | | (4,948,390) | | | | | | 1,514,717 | | | | | | | | | | | | |
| 12/31/2020 | | | | | 353,606 | | | | | | — | | | | | | 41,113 | | | | | | (129,067) | | | | | | 265,652 | | | | | | 5,330,443 | | | | | | — | | | | | | 624,512 | | | | | | (1,929,801) | | | | | | 4,025,154 | | | | | | | | | | | | |
| Class Z | | | | | | | | | | | | | | | | | | | | | | | | | | | | | | | | | | | | | | | | | | | | | | | | | | | | | | | | | | | | | | | | | | | | | | | |
| 12/31/2021 | | | | | 4,275,315 | | | | | | — | | | | | | 961,583 | | | | | | (1,106,640) | | | | | | 4,130,258 | | | | | | 84,597,432 | | | | | | — | | | | | | 18,962,412 | | | | | | (21,948,953) | | | | | | 81,610,891 | | | | | | | | | | | | |
| 12/31/2020 | | | | | 5,048,444 | | | | | | — | | | | | | 775,440 | | | | | | (1,189,440) | | | | | | 4,634,444 | | | | | | 81,012,131 | | | | | | — | | | | | | 12,189,910 | | | | | | (20,190,410) | | | | | | 73,011,631 | | | | | | | | | | | | |
| Index Solution 2060 | | | | | | | | | | | |
| Class ADV | | | | | | | | | | | | | | | | | | | | | | | | | | | | | | | | | | | | | | | | | | | | | | | | | | | | | | | | | | | | | | | | | | | | | | | |
| 12/31/2021 | | | | | 281,399 | | | | | | — | | | | | | 24,073 | | | | | | (172,613) | | | | | | 132,859 | | | | | | 4,553,678 | | | | | | — | | | | | | 391,665 | | | | | | (2,760,326) | | | | | | 2,185,017 | | | | | | | | | | | | |
| 12/31/2020 | | | | | 304,319 | | | | | | — | | | | | | 29,294 | | | | | | (292,586) | | | | | | 41,027 | | | | | | 3,888,207 | | | | | | — | | | | | | 374,965 | | | | | | (3,812,505) | | | | | | 450,667 | | | | | | | | | | | | |
| Class I | | | | | | | | | | | | | | | | | | | | | | | | | | | | | | | | | | | | | | | | | | | | | | | | | | | | | | | | | | | | | | | | | | | | | | | |
| 12/31/2021 | | | | | 390,140 | | | | | | — | | | | | | 35,554 | | | | | | (162,864) | | | | | | 262,830 | | | | | | 6,410,349 | | | | | | — | | | | | | 589,841 | | | | | | (2,684,499) | | | | | | 4,315,691 | | | | | | | | | | | | |
| 12/31/2020 | | | | | 512,245 | | | | | | — | | | | | | 29,904 | | | | | | (191,443) | | | | | | 350,706 | | | | | | 6,744,561 | | | | | | — | | | | | | 389,656 | | | | | | (2,667,250) | | | | | | 4,466,967 | | | | | | | | | | | | |
| Class S | | | | | | | | | | | | | | | | | | | | | | | | | | | | | | | | | | | | | | | | | | | | | | | | | | | | | | | | | | | | | | | | | | | | | | | |
| 12/31/2021 | | | | | 182,215 | | | | | | — | | | | | | 18,230 | | | | | | (186,324) | | | | | | 14,121 | | | | | | 2,960,517 | | | | | | — | | | | | | 298,973 | | | | | | (3,003,990) | | | | | | 255,500 | | | | | | | | | | | | |
| 12/31/2020 | | | | | 264,003 | | | | | | — | | | | | | 19,754 | | | | | | (155,472) | | | | | | 128,285 | | | | | | 3,343,706 | | | | | | — | | | | | | 254,832 | | | | | | (1,980,056) | | | | | | 1,618,482 | | | | | | | | | | | | |
| Class S2 | | | | | | | | | | | | | | | | | | | | | | | | | | | | | | | | | | | | | | | | | | | | | | | | | | | | | | | | | | | | | | | | | | | | | | | |
| 12/31/2021 | | | | | 45,859 | | | | | | — | | | | | | 4,556 | | | | | | (56,213) | | | | | | (5,798) | | | | | | 742,084 | | | | | | — | | | | | | 74,446 | | | | | | (918,223) | | | | | | (101,693) | | | | | | | | | | | | |
| 12/31/2020 | | | | | 66,512 | | | | | | — | | | | | | 4,299 | | | | | | (45,313) | | | | | | 25,498 | | | | | | 849,307 | | | | | | — | | | | | | 55,293 | | | | | | (559,069) | | | | | | 345,531 | | | | | | | | | | | | |
| Class Z | | | | | | | | | | | | | | | | | | | | | | | | | | | | | | | | | | | | | | | | | | | | | | | | | | | | | | | | | | | | | | | | | | | | | | | |
| 12/31/2021 | | | | | 3,877,842 | | | | | | — | | | | | | 435,710 | | | | | | (817,621) | | | | | | 3,495,931 | | | | | | 64,675,801 | | | | | | — | | | | | | 7,315,564 | | | | | | (13,672,400) | | | | | | 58,318,965 | | | | | | | | | | | | |
| 12/31/2020 | | | | | 4,509,084 | | | | | | — | | | | | | 313,081 | | | | | | (580,792) | | | | | | 4,241,373 | | | | | | 60,653,578 | | | | | | — | | | | | | 4,123,271 | | | | | | (7,967,715) | | | | | | 56,809,134 | | | | | | | | | | | | |
| Index Solution 2065 | | | | | | | | | | | | | | | | | | | | | | | | | | | | | | | |
| Class ADV | | | | | | | | | | | | | | | | | | | | | | | | | | | | | | | | | | | | | | | | | | | | | | | | | | | | | | | | | | | | | | | | | | | | | | | |
| 12/31/2021 | | | | | 114,259 | | | | | | — | | | | | | 8,038 | | | | | | (23,611) | | | | | | 98,686 | | | | | | 1,426,604 | | | | | | — | | | | | | 102,873 | | | | | | (308,054) | | | | | | 1,221,423 | | | | | | | | | | | | |
7/29/2020(1) -
12/31/2020 | | | | | 34,032 | | | | | | — | | | | | | 233 | | | | | | (1,269) | | | | | | 32,996 | | | | | | 352,799 | | | | | | — | | | | | | 2,696 | | | | | | (14,370) | | | | | | 341,125 | | | | | | | | | | | | |
| Class I | | | | | | | | | | | | | | | | | | | | | | | | | | | | | | | | | | | | | | | | | | | | | | | | | | | | | | | | | | | | | | | | | | | | | | | |
| 12/31/2021 | | | | | 81,631 | | | | | | — | | | | | | 7,143 | | | | | | (7,498) | | | | | | 81,276 | | | | | | 1,056,465 | | | | | | — | | | | | | 91,623 | | | | | | (97,334) | | | | | | 1,050,754 | | | | | | | | | | | | |
7/29/2020(1) -
12/31/2020 | | | | | 29,195 | | | | | | — | | | | | | 249 | | | | | | (4) | | | | | | 29,440 | | | | | | 305,166 | | | | | | — | | | | | | 2,881 | | | | | | (42) | | | | | | 308,005 | | | | | | | | | | | | |
| Class S | | | | | | | | | | | | | | | | | | | | | | | | | | | | | | | | | | | | | | | | | | | | | | | | | | | | | | | | | | | | | | | | | | | | | | | |
| 12/31/2021 | | | | | 115,202 | | | | | | — | | | | | | 8,045 | | | | | | (29,194) | | | | | | 94,053 | | | | | | 1,481,961 | | | | | | — | | | | | | 103,041 | | | | | | (366,190) | | | | | | 1,218,812 | | | | | | | | | | | | |
7/29/2020(1) -
12/31/2020 | | | | | 35,831 | | | | | | — | | | | | | 255 | | | | | | (3,073) | | | | | | 33,013 | | | | | | 379,194 | | | | | | — | | | | | | 2,954 | | | | | | (35,111) | | | | | | 347,037 | | | | | | | | | | | | |
NOTES TO FINANCIAL STATEMENTS as of December 31, 2021 (continued)
NOTE 10 — CAPITAL SHARES (continued)
| | | | Shares
sold | | | Shares
issued in
merger | | | Reinvestment
of
distributions | | | Shares
redeemed | | | Net increase
(decrease)
in shares
outstanding | | | Shares
sold | | | Proceeds
from shares
issued in
merger | | | Reinvestment
of
distributions | | | Shares
redeemed | | | Net increase
(decrease) | |
| Year or period ended | | | # | | | # | | | # | | | # | | | # | | | ($) | | | ($) | | | ($) | | | ($) | | | ($) | |
| Index Solution 2065 (continued) | |
| Class S2 | | | | | | | | | | | | | | | | | | | | | | | | | | | | | | | | | | | | | | | | | | | | | | | | | | | | | | | | | | | | | |
| 12/31/2021 | | | | | 32,698 | | | | | | — | | | | | | 2,116 | | | | | | (16,406) | | | | | | 18,408 | | | | | | 423,191 | | | | | | — | | | | | | 27,062 | | | | | | (210,200) | | | | | | 240,053 | | |
7/29/2020(1) -
12/31/2020 | | | | | 14,982 | | | | | | — | | | | | | 116 | | | | | | —* | | | | | | 15,098 | | | | | | 158,323 | | | | | | — | | | | | | 1,341 | | | | | | (1) | | | | | | 159,663 | | |
| Class Z | | | | | | | | | | | | | | | | | | | | | | | | | | | | | | | | | | | | | | | | | | | | | | | | | | | | | | | | | | | | | |
| 12/31/2021 | | | | | 979,761 | | | | | | — | | | | | | 81,085 | | | | | | (88,284) | | | | | | 972,562 | | | | | | 12,697,394 | | | | | | — | | | | | | 1,042,492 | | | | | | (1,132,439) | | | | | | 12,607,447 | | |
7/29/2020(1) -
12/31/2020 | | | | | 296,058 | | | | | | — | | | | | | 2,199 | | | | | | (23,088) | | | | | | 275,169 | | | | | | 3,104,097 | | | | | | — | | | | | | 25,485 | | | | | | (249,482) | | | | | | 2,880,100 | | |
(1)
Commencement of operations.
*
Amount is less than 0.50 or $0.50.
NOTE 11 — FEDERAL INCOME TAXES
The amount of distributions from net investment income and net realized capital gains are determined in accordance with federal income tax regulations, which may differ from GAAP for investment companies. These book/tax differences may be either temporary or permanent. Permanent differences are reclassified within the capital accounts based on their federal tax-basis treatment; temporary differences are not reclassified. Key differences include the treatment of short-term capital gains, straddle loss deferrals and wash sale deferrals.
Dividends paid by the Portfolios from net investment income and distributions of net realized short-term capital gains are, for federal income tax purposes, taxable as ordinary income to shareholders.
The tax composition of dividends and distributions to shareholders was as follows:
| | | | Year Ended
December 31, 2021 | | | Year Ended
December 31, 2020 | |
| | | | Ordinary
Income | | | Long-term
Capital
Gains | | | Ordinary
Income | | | Long-term
Capital
Gains | |
| Index Solution Income | | | | $ | 20,542,949 | | | | | $ | 19,139,561 | | | | | $ | 9,804,300 | | | | | $ | 8,294,202 | | |
| Index Solution 2025 | | | | | 36,229,106 | | | | | | 45,757,104 | | | | | | 21,041,791 | | | | | | 31,354,013 | | |
| Index Solution 2030 | | | | | 21,798,077 | | | | | | 21,932,792 | | | | | | 11,711,879 | | | | | | 18,867,949 | | |
| Index Solution 2035 | | | | | 36,045,594 | | | | | | 48,479,927 | | | | | | 19,549,662 | | | | | | 38,649,852 | | |
| Index Solution 2040 | | | | | 15,253,649 | | | | | | 19,778,057 | | | | | | 8,470,606 | | | | | | 15,755,214 | | |
| Index Solution 2045 | | | | | 22,872,769 | | | | | | 36,448,775 | | | | | | 12,788,216 | | | | | | 29,321,520 | | |
| Index Solution 2050 | | | | | 9,464,511 | | | | | | 12,281,658 | | | | | | 5,636,539 | | | | | | 11,097,526 | | |
| Index Solution 2055 | | | | | 10,256,797 | | | | | | 16,300,247 | | | | | | 5,773,945 | | | | | | 12,919,382 | | |
| Index Solution 2060 | | | | | 3,970,064 | | | | | | 4,700,425 | | | | | | 2,019,439 | | | | | | 3,178,578 | | |
| Index Solution 2065 | | | | | 607,528 | | | | | | 759,563 | | | | | | 35,357 | | | | | | — | | |
The tax-basis components of distributable earnings as of December 31, 2021 were:
| | | | Undistributed
Ordinary
Income | | | Undistributed
Long-term
Capital Gains | | | Unrealized
Appreciation/
(Depreciation) | | | Other | | | Total
Distributable
Earnings/
(Loss) | |
| Index Solution Income | | | | $ | 42,271,439 | | | | | $ | 42,529,210 | | | | | $ | 45,617,437 | | | | | $ | (4,429,265) | | | | | $ | 125,988,821 | | |
| Index Solution 2025 | | | | | 29,663,588 | | | | | | 100,276,205 | | | | | | 133,009,717 | | | | | | (10,129,972) | | | | | | 252,819,538 | | |
| Index Solution 2030 | | | | | 19,395,493 | | | | | | 67,657,299 | | | | | | 100,974,655 | | | | | | (1,780,530) | | | | | | 186,246,917 | | |
| Index Solution 2035 | | | | | 25,927,348 | | | | | | 123,621,049 | | | | | | 184,907,724 | | | | | | (1,204,882) | | | | | | 333,251,239 | | |
| Index Solution 2040 | | | | | 16,743,337 | | | | | | 67,089,166 | | | | | | 106,697,938 | | | | | | (698,187) | | | | | | 189,832,254 | | |
| Index Solution 2045 | | | | | 21,500,287 | | | | | | 106,588,359 | | | | | | 163,219,170 | | | | | | (8,959) | | | | | | 291,298,857 | | |
NOTES TO FINANCIAL STATEMENTS as of December 31, 2021 (continued)
NOTE 11 — FEDERAL INCOME TAXES (continued)
| | | | Undistributed
Ordinary
Income | | | Undistributed
Long-term
Capital Gains | | | Unrealized
Appreciation/
(Depreciation) | | | Other | | | Total
Distributable
Earnings/
(Loss) | |
| Index Solution 2050 | | | | | 10,870,864 | | | | | | 51,762,332 | | | | | | 80,987,261 | | | | | | (2,124) | | | | | | 143,618,333 | | |
| Index Solution 2055 | | | | | 12,707,672 | | | | | | 54,217,516 | | | | | | 86,394,259 | | | | | | (3,027) | | | | | | 153,316,420 | | |
| Index Solution 2060 | | | | | 5,895,507 | | | | | | 25,027,743 | | | | | | 33,202,327 | | | | | | (705) | | | | | | 64,124,872 | | |
| Index Solution 2065 | | | | | 16,864 | | | | | | 83,198 | | | | | | 714,115 | | | | | | (18) | | | | | | 814,159 | | |
At December 31, 2021, the Portfolios did not have any capital loss carryovers for U.S. federal income tax purposes.
The Portfolios’ major tax jurisdictions are U.S. federal and Arizona state.
As of December 31, 2021, no provision for income tax is required in the Portfolios’ financial statements as a result of tax positions taken on federal and state income tax returns for open tax years. The Portfolios’ federal and state income and federal excise tax returns for tax years for which the applicable statutes of limitations have not expired are subject to examination by the Internal Revenue Service and state department of revenue. Generally, the preceding four tax years remain subject to examination by these jurisdictions.
NOTE 12 — LONDON INTERBANK OFFERED RATE (“LIBOR”)
In 2017, the UK Financial Conduct Authority announced its intention to cease compelling banks to provide the quotations needed to sustain LIBOR after 2021. On March 5, 2021, ICE Benchmark Administration, the administrator of LIBOR, stated that non-U.S. dollar LIBOR reference rates and the one-week and two-month LIBOR reference rates will cease to be provided or no longer be representative immediately after December 31, 2021 and the remaining more commonly used LIBOR settings will cease to be provided or no longer be representative immediately after June 30, 2023. In addition, global regulators have announced that, with limited exceptions, no new LIBOR-based contracts should be entered into after 2021. Actions by regulators have resulted in the establishment of alternative reference rates to LIBOR in most major currencies (e.g., the Secured Overnight Financing Rate for U.S. Dollar LIBOR and the Sterling Overnight Interbank Average Rate for Sterling LIBOR).
Discontinuance of LIBOR and adoption/implementation of alternative rates pose a number of risks, including among others whether any substitute rate will experience the market participation and liquidity necessary to provide a workable substitute for LIBOR; the effect on parties’ existing contractual arrangements, hedging transactions,
and investment strategies generally from a conversion from LIBOR to alternative rates; the effect on a Portfolio’s existing investments (including, for example, fixed-income investments; senior loans; CLOs and CDOs; and derivatives transactions), including the possibility that some of those investments may terminate or their terms may be adjusted to the disadvantage of a Portfolio; and the risk of general market disruption during the period of the conversion. It is difficult to predict at this time the likely impact of the transition away from LIBOR on a Portfolio.
NOTE 13 — MARKET DISRUPTION
A Portfolio is subject to the risk that geopolitical events will disrupt securities markets and adversely affect global economies and markets. Due to the increasing interdependence among global economies and markets, conditions in one country, market, or region might adversely impact markets, issuers and/or foreign exchange rates in other countries, including the United States. Wars, terrorism, global health crises and pandemics, and other geopolitical events have led, and in the future may lead, to increased market volatility and may have adverse short- or long-term effects on U.S. and world economies and markets generally. For example, the COVID-19 pandemic has resulted, and may continue to result, in significant market volatility, exchange trading suspensions and closures, declines in global financial markets, higher default rates, and a substantial economic downturn in economies throughout the world. Natural and environmental disasters and systemic market dislocations are also highly disruptive to economies and markets. Those events as well as other changes in non-U.S. and domestic economic, social, and political conditions also could adversely affect individual issuers or related groups of issuers, securities markets, interest rates, credit ratings, inflation, investor sentiment, and other factors affecting the value of the investments of the portfolio and of the Portfolios. Any of these occurrences could disrupt the operations of a Portfolio and of the Portfolios’ service providers.
NOTES TO FINANCIAL STATEMENTS as of December 31, 2021 (continued)
NOTE 14 — OTHER ACCOUNTING PRONOUNCEMENTS
In March 2020, the Financial Accounting Standards Board issued Accounting Standards Update No. 2020-04 (“ASU 2020-04”), Reference Rate Reform (Topic 848) — Facilitation of the Effects of Reference Rate Reform on Financial Reporting. The amendments in ASU 2020-04 provides optional temporary financial reporting relief from the effect of certain types of contract modifications due to the planned discontinuation of LIBOR and other interbank-offered based reference rates as of the end of 2021. ASU 2020-04 is effective for certain reference rate-related contract modifications that occur during the period March 12, 2020 through December 31, 2022. Management is currently evaluating the impact, if any, of applying ASU 2020-04.
NOTE 15 — REORGANIZATIONS
On August 7, 2020, Index Solution Income (“Acquiring Portfolio”) acquired all of the net assets and assumed all liabilities of Voya Index Solution 2020 Portfolio (“Acquired Portfolio”), an open-end investment company that is not included in this report, in a tax-free reorganization in exchange for shares of the Acquiring Portfolio. For financial reporting purposes, assets received and shares issued by the Acquiring Portfolio were recorded at fair value; however, the cost basis of the investments received from the Acquired Portfolio were carried forward to align ongoing reporting of the Acquiring Portfolio’s realized and unrealized gains and losses with amounts distributable to shareholders for tax purposes.
Assuming the acquisition had been completed on January 1, 2020, the beginning of the annual reporting period of the Acquiring Portfolio, the Acquiring Portfolio’s pro forma results of operations for the year ended December 31, 2020, are as follows (Unaudited):
| | Net investment income | | | | $ | 21,633,383 | | |
| | Net realized and unrealized loss on investments | | | | $ | 73,977,064 | | |
| | Net decrease in net assets resulting from operations | | | | $ | 95,610,447 | | |
Because the combined investment portfolios have been managed as a single integrated portfolio since the acquisition was completed, it is not practicable to separate the amounts of revenue and earnings of the Acquired Portfolio that have been included in the Acquiring Portfolio’s statement of operations since August 7, 2020. Net assets and unrealized appreciation or depreciation as of the reorganization date were as follows:
| | Total Net
Assets of
Acquired
Portfolio
(000s) | | | Total Net
Assets of
Acquiring
Portfolio
(000s) | | | Acquired
Portfolio’s
Capital
Loss
Carryforwards
(000s) | | | Acquired
Portfolio’s
Unrealized
Appreciation
(000s) | | | Portfolios’
Conversion
Ratio | |
| | $441,776 | | | | $ | 489,072 | | | | | $ | 0 | | | | | $ | 34,254 | | | | | | 1.2354 | | |
The net assets of the Acquiring Portfolio after the acquisition of Acquired Portfolio were $930,848,682.
NOTE 16 — SUBSEQUENT EVENTS
The Portfolios have evaluated events occurring after the Statements of Assets and Liabilities date (“subsequent events”), to determine whether any subsequent events necessitated adjustment to or disclosure in the financial statements. No such subsequent events were identified.
PORTFOLIO OF INVESTMENTS
| Voya Index Solution Income Portfolio | as of December 31, 2021 |
| Shares | | | Value | | | Percentage
of Net
Assets | |
| EXCHANGE-TRADED FUNDS: 12.3% | |
| 129,641 | | | iShares 20+ Year
Treasury Bond ETF | | | | $ | 19,211,500 | | | | | | 2.0 | | |
| 453,837 | | | Schwab U.S. TIPS ETF | | | | | 28,541,809 | | | | | | 3.1 | | |
| 1,675,679 | | | Xtrackers USD High
Yield Corporate Bond
ETF | | | | | 66,759,051 | | | | | | 7.2 | | |
| | | | Total Exchange-Traded
Funds
(Cost $110,015,736) | | | | | 114,512,360 | | | | | | 12.3 | | |
| MUTUAL FUNDS: 82.6% | |
| | | | Affiliated Investment Companies: 82.6% | |
| 1,978,179 | | | Voya Emerging Markets
Index Portfolio - Class P2 | | | | | 26,586,722 | | | | | | 2.9 | | |
| 4,494,958 | | | Voya International Index
Portfolio - Class P2 | | | | | 54,928,386 | | | | | | 5.9 | | |
| 1,257,849 | | | Voya Russell Mid Cap
Index Portfolio - Class P2 | | | | | 18,528,116 | | | | | | 2.0 | | |
| 2,832,606 | | | Voya Short Term Bond
Fund - Class P2 | | | | | 27,674,560 | | | | | | 3.0 | | |
| 40,069,391 | | | Voya U.S. Bond Index
Portfolio - Class P2 | | | | | 430,745,952 | | | | | | 46.2 | | |
| 9,587,373 | | | Voya U.S. Stock Index
Portfolio - Class P2 | | | | | 211,018,081 | | | | | | 22.6 | | |
| | | | Total Mutual Funds
(Cost $722,055,740) | | | | | 769,481,817 | | | | | | 82.6 | | |
| Units | | | Value | | | Percentage
of Net
Assets | |
| FUNDING AGREEMENTS: 4.9% | |
| | | | Investment Contract: 4.9% | |
4,602,367 (1)(2)(3) | | | VRIAC Contract, 1.600% | | | | | 46,268,502 | | | | | | 4.9 | | |
| | | | Total Funding
Agreements
(Cost $46,026,709) | | | | | 46,268,502 | | | | | | 4.9 | | |
| | | | Total Long-Term
Investments
(Cost $878,098,185) | | | | | 930,262,679 | | | | | | 99.8 | | |
| Shares | | | Value | | | Percentage
of Net
Assets | |
| SHORT-TERM INVESTMENTS: 0.2% | |
| | | | Mutual Funds: 0.2% | |
| 1,856,949 (4) | | | BlackRock Liquidity
Funds, FedFund,
Institutional Class,
0.030%
(Cost $1,856,949) | | | | $ | 1,856,949 | | | | | | 0.2 | | |
| | | | Total Short-Term
Investments
(Cost $1,856,949) | | | | | 1,856,949 | | | | | | 0.2 | | |
| | | | Total Investments in
Securities
(Cost $879,955,134) | | | | $ | 932,119,628 | | | | | | 100.0 | | |
| | | | Liabilities in Excess of
Other Assets | | | | | (241,129) | | | | | | — | | |
| | | | Net Assets | | | | $ | 931,878,499 | | | | | | 100.0 | | |
(1)
For fair value measurement disclosure purposes, security is categorized as Level 3, whose value was determined using significant unobservable inputs.
(2)
The Funding Agreement is issued by Voya Retirement Insurance and Annuity Company (“VRIAC”). The interest rate is assessed and may change quarterly.
(3)
Investment in affiliate.
(4)
Rate shown is the 7-day yield as of December 31, 2021.
See Accompanying Notes to Financial Statements
PORTFOLIO OF INVESTMENTS
| Voya Index Solution Income Portfolio | as of December 31, 2021 (continued) |
Fair Value Measurements^
The following is a summary of the fair valuations according to the inputs used as of December 31, 2021 in valuing the assets and liabilities:
| | | | Quoted Prices
in Active Markets
for Identical
Investments
(Level 1) | | | Significant
Other
Observable
Inputs
(Level 2) | | | Significant
Unobservable
Inputs
(Level 3) | | | Fair Value
at
December 31, 2021 | |
| Asset Table | | | | | | | | | | | | | | | | | | | | | | | | | |
| Investments, at fair value | | | | | | | | | | | | | | | | | | | | | | | | | |
| Exchange-Traded Funds | | | | $ | 114,512,360 | | | | | $ | — | | | | | $ | — | | | | | $ | 114,512,360 | | |
| Mutual Funds | | | | | 769,481,817 | | | | | | — | | | | | | — | | | | | | 769,481,817 | | |
| Funding Agreements | | | | | — | | | | | | — | | | | | | 46,268,502 | | | | | | 46,268,502 | | |
| Short-Term Investments | | | | | 1,856,949 | | | | | | — | | | | | | — | | | | | | 1,856,949 | | |
| Total Investments, at fair value | | | | $ | 885,851,126 | | | | | $ | — | | | | | $ | 46,268,502 | | | | | $ | 932,119,628 | | |
^
See Note 2, “Significant Accounting Policies” in the Notes to Financial Statements for additional information.
The following table presents additional information about valuation techniques and inputs used for investments that are measured at fair value and categorized within Level 3 at December 31, 2021:
| Investments, at fair value | | | Fair Value
at
December 31, 2021 | | | Valuation
Technique(s)* | | | Significant
Unobservable
Input(s) | | | Value or
Range of
Input(s) | | | Weighted
Average of
Inputs** | | | Impact to Valuation from
an Increase in Input*** | |
| Funding Agreements | | | $46,268,502 | | | Cost Approach | | | Interest rate | | | 1.600% | | | 1.600% | | | Increase** | |
*
Valuation techniques may change in order to reflect management’s judgment of current market participant assumptions.
**
Unobservable inputs were weighted by the relative fair value of the instruments.
***
Represents the directional change in the fair value of the Level 3 investment(s) that would result from an increase in the corresponding input. A decrease to the unobservable input would have the opposite effect. Significant increases and decreases in these inputs in isolation could result in signficantly higher or lower fair value measurements.
The following is a reconciliation of the fair valuations using significant unobservable inputs (Level 3) for the Portfolio’s assets and liabilities during the year ended December 31, 2021:
| | | | Funding Agreements | |
| Assets: | | | | | | | |
| Beginning balance at December 31, 2020 | | | | $ | — | | |
| Purchases | | | | | 49,766,837 | | |
| Sales | | | | | (3,750,653) | | |
| Total realized gain (loss) | | | | | 10,525 | | |
| Net change in unrealized appreciation (depreciation)**** | | | | | 241,793 | | |
| Transfers into Level 3 | | | | | — | | |
| Transfers out of Level 3 | | | | | — | | |
| Ending balance at December 31, 2021 | | | | $ | 46,268,502 | | |
| Net change in unrealized appreciation (depreciation) on Level 3 securities still held as of December 31, 2021**** | | | | $ | 241,793 | | |
****
Any difference between net change in unrealized apprecation (depreciation) and net change in unrealized appreciation (depreciation) on Level 3 securities still held at December 31, 2021 may be due to securities no longer held or categorized as Level 3 at year end.
See Accompanying Notes to Financial Statements
PORTFOLIO OF INVESTMENTS
| Voya Index Solution Income Portfolio | as of December 31, 2021 (continued) |
Transactions with Affiliates
An investment of at least 5% of the voting securities of an issuer, or a company which is under common control with the issuer, results in that issuer becoming an affiliated person as defined by the 1940 Act.
The following table provides transactions during the year ended December 31, 2021, where the following issuers were considered an affiliate:
| Issuer | | | Beginning
Fair
Value at
12/31/2020 | | | Purchases
at Cost | | | Sales
at Cost | | | Change in
Unrealized
Appreciation/
(Depreciation) | | | Ending
Fair
Value at
12/31/2021 | | | Investment
Income | | | Realized
Gains/
(Losses) | | | Net
Capital
Gain
Distributions | |
| Voya Emerging Markets Index Portfolio - Class P2 | | | | $ | 30,839,526 | | | | | $ | 3,906,556 | | | | | $ | (5,529,631) | | | | | $ | (2,629,729) | | | | | $ | 26,586,722 | | | | | $ | 257,878 | | | | | $ | 1,662,005 | | | | | $ | — | | |
| Voya International Index Portfolio - Class P2 | | | | | 55,689,531 | | | | | | 7,666,185 | | | | | | (10,667,166) | | | | | | 2,239,836 | | | | | | 54,928,386 | | | | | | 1,172,496 | | | | | | 2,448,522 | | | | | | — | | |
| Voya Russell Mid Cap Index Portfolio - Class P2 | | | | | — | | | | | | 22,009,720 | | | | | | (3,032,422) | | | | | | (449,182) | | | | | | 18,528,116 | | | | | | 192,942 | | | | | | (200,206) | | | | | | 1,698,466 | | |
| Voya Russell Small Cap Index Portfolio - Class P2 | | | | | 52,498,559 | | | | | | 1,250,286 | | | | | | (42,684,398) | | | | | | (11,064,447) | | | | | | — | | | | | | 126,272 | | | | | | 17,033,987 | | | | | | — | | |
| Voya Short Term Bond - Class P2 | | | | | 98,126,274 | | | | | | 11,739,602 | | | | | | (80,067,308) | | | | | | (2,124,008) | | | | | | 27,674,560 | | | | | | 1,978,650 | | | | | | 1,078,458 | | | | | | — | | |
| Voya U.S. Bond Index Portfolio - Class P2 | | | | | 461,103,872 | | | | | | 88,113,462 | | | | | | (90,153,228) | | | | | | (28,318,154) | | | | | | 430,745,952 | | | | | | 10,615,949 | | | | | | 5,134,023 | | | | | | 5,179,943 | | |
| Voya U.S. Stock Index Portfolio - Class P2 | | | | | 195,353,038 | | | | | | 62,121,369 | | | | | | (58,445,370) | | | | | | 11,989,044 | | | | | | 211,018,081 | | | | | | 2,165,279 | | | | | | 18,104,549 | | | | | | 18,073,254 | | |
| VRIAC Contract | | | | | — | | | | | | 49,766,837 | | | | | | (3,740,128) | | | | | | 241,793 | | | | | | 46,268,502 | | | | | | — | | | | | | 10,525 | | | | | | — | | |
| | | | | $ | 893,610,800 | | | | | $ | 246,574,017 | | | | | $ | (294,319,651) | | | | | $ | (30,114,847) | | | | | $ | 815,750,319 | | | | | $ | 16,509,466 | | | | | $ | 45,271,863 | | | | | $ | 24,951,663 | | |
The financial statements for the above mutual fund[s] can be found at www.sec.gov.
The effect of derivative instruments on the Portfolio’s Statement of Operations for the year ended December 31, 2021 was as follows:
| | | | Amount of Realized Gain or (Loss) on
Derivatives Recognized in Income | |
| Derivatives not accounted for as hedging instruments | | | Futures | |
| Equity contracts | | | | $ | (262,331) | | |
| Total | | | | $ | (262,331) | | |
| | | | Change in Unrealized Appreciation or (Depreciation)
on Derivatives Recognized in Income | |
| Derivatives not accounted for as hedging instruments | | | Futures | |
| Equity contracts | | | | $ | 87,795 | | |
| Total | | | | $ | 87,795 | | |
At December 31, 2021, the aggregate cost of securities and other investments and the composition of unrealized appreciation and depreciation of securities and other investments on a tax basis were:
| | Cost for federal income tax purposes was $886,502,191. | | | | | | | |
| | Net unrealized appreciation consisted of: | | | | | | | |
| | Gross Unrealized Appreciation | | | | $ | 63,718,226 | | |
| | Gross Unrealized Depreciation | | | | | (18,100,789) | | |
| | Net Unrealized Appreciation | | | | $ | 45,617,437 | | |
See Accompanying Notes to Financial Statements
PORTFOLIO OF INVESTMENTS
| Voya Index Solution 2025 Portfolio | as of December 31, 2021 |
| Shares | | | Value | | | Percentage
of Net
Assets | |
| EXCHANGE-TRADED FUNDS: 8.9% | |
| 350,489 | | | iShares MSCI EAFE
Small-Cap ETF | | | | $ | 25,617,241 | | | | | | 1.9 | | |
| 2,355,387 | | | Xtrackers USD High Yield
Corporate Bond ETF | | | | | 93,838,618 | | | | | | 7.0 | | |
| | | | Total Exchange-Traded
Funds
(Cost $117,436,651) | | | | | 119,455,859 | | | | | | 8.9 | | |
| MUTUAL FUNDS: 85.9% | |
| | | | Affiliated Investment Companies: 85.9% | |
| 5,664,960 | | | Voya Emerging Markets
Index Portfolio - Class P2 | | | | | 76,137,068 | | | | | | 5.7 | | |
| 10,687,172 | | | Voya International Index
Portfolio - Class P2 | | | | | 130,597,241 | | | | | | 9.8 | | |
| 2,699,312 | | | Voya Russell Mid Cap
Index Portfolio - Class P2 | | | | | 39,760,871 | | | | | | 3.0 | | |
| 1,414,399 | | | Voya Russell Small Cap
Index Portfolio - Class P2 | | | | | 25,346,037 | | | | | | 1.9 | | |
| 38,019,858 | | | Voya U.S. Bond Index
Portfolio - Class P2 | | | | | 408,713,469 | | | | | | 30.6 | | |
| 21,180,841 | | | Voya U.S. Stock Index
Portfolio - Class P2 | | | | | 466,190,306 | | | | | | 34.9 | | |
| | | | Total Mutual Funds
(Cost $1,009,733,441) | | | | | 1,146,744,992 | | | | | | 85.9 | | |
| Units | | | Value | | | Percentage
of Net
Assets | |
| FUNDING AGREEMENTS: 5.0% | |
| | | | Investment Contract: 5.0% | |
| 6,586,944 (1)(2)(3) | | | VRIAC Contract,
1.600% | | | | $ | 66,219,843 | | | | | | 5.0 | | |
| | | | Total Funding
Agreements
(Cost $65,874,597) | | | | | 66,219,843 | | | | | | 5.0 | | |
| | | | Total Investments
in Securities
(Cost $1,193,044,689) | | | | $ | 1,332,420,694 | | | | | | 99.8 | | |
| | | | Assets in Excess
of Other Liabilities | | | | | 2,093,891 | | | | | | 0.2 | | |
| | | | Net Assets | | | | $ | 1,334,514,585 | | | | | | 100.0 | | |
(1)
For fair value measurement disclosure purposes, security is categorized as Level 3, whose value was determined using significant unobservable inputs.
(2)
The Funding Agreement is issued by Voya Retirement Insurance and Annuity Company (“VRIAC”). The interest rate is assessed and may change quarterly.
(3)
Investment in affiliate.
Fair Value Measurements^
The following is a summary of the fair valuations according to the inputs used as of December 31, 2021 in valuing the assets and liabilities:
| | | | Quoted Prices
in Active Markets
for Identical
Investments
(Level 1) | | | Significant
Other
Observable
Inputs
(Level 2) | | | Significant
Unobservable
Inputs
(Level 3) | | | Fair Value
at
December 31, 2021 | |
| Asset Table | | | | | | | | | | | | | | | | | | | | | | | | | |
| Investments, at fair value | | | | | | | | | | | | | | | | | | | | | | | | | |
| Exchange-Traded Funds | | | | $ | 119,455,859 | | | | | $ | — | | | | | $ | — | | | | | $ | 119,455,859 | | |
| Mutual Funds | | | | | 1,146,744,992 | | | | | | — | | | | | | — | | | | | | 1,146,744,992 | | |
| Funding Agreements | | | | | — | | | | | | — | | | | | | 66,219,843 | | | | | | 66,219,843 | | |
| Total Investments, at fair value | | | | $ | 1,266,200,851 | | | | | $ | — | | | | | $ | 66,219,843 | | | | | $ | 1,332,420,694 | | |
^
See Note 2, “Significant Accounting Policies” in the Notes to Financial Statements for additional information.
See Accompanying Notes to Financial Statements
PORTFOLIO OF INVESTMENTS
| Voya Index Solution 2025 Portfolio | as of December 31, 2021 (continued) |
The following table presents additional information about valuation techniques and inputs used for investments that are measured at fair value and categorized within Level 3 at December 31, 2021:
| Investments, at fair value | | | Fair Value at
December 31, 2021 | | | Valuation
Technique(s)* | | | Significant
Unobservable
Input(s) | | | Value
or Range
of Input(s) | | | Weighted
Average
of Inputs** | | | Impact to
Valuation from an
Increase in Input*** | |
| Funding Agreements | | | | $ | 66,219,843 | | | | Cost Approach | | | Interest rate | | | | | 1.600% | | | | | | 1.600% | | | | Increase** | |
*
Valuation techniques may change in order to reflect management’s judgment of current market participant assumptions.
**
Unobservable inputs were weighted by the relative fair value of the instruments.
***
Represents the directional change in the fair value of the Level 3 investment(s) that would result from an increase in the corresponding input. A decrease to the unobservable input would have the opposite effect. Significant increases and decreases in these inputs in isolation could result in signficantly higher or lower fair value measurements.
The following is a reconciliation of the fair valuations using significant unobservable inputs (Level 3) for the Portfolio’s assets and liabilities during the year ended December 31, 2021:
| | | | Funding
Agreements | |
| Assets: | | | | | | | |
| Beginning balance at December 31, 2020 | | | | $ | — | | |
| Purchases | | | | | 69,609,531 | | |
| Sales | | | | | (3,744,636) | | |
| Total realized gain (loss) | | | | | 9,702 | | |
| Net change in unrealized appreciation (depreciation)**** | | | | | 345,246 | | |
| Transfers into Level 3 | | | | | — | | |
| Transfers out of Level 3 | | | | | — | | |
| Ending balance at December 31, 2021 | | | | $ | 66,219,843 | | |
| Net change in unrealized appreciation (depreciation) on Level 3 securities still held as of December 31, 2021**** | | | | $ | 345,246 | | |
****
Any difference between net change in unrealized apprecation (depreciation) and net change in unrealized appreciation (depreciation) on Level 3 securities still held at December 31, 2021 may be due to securities no longer held or categorized as Level 3 at year end.
Transactions with Affiliates
An investment of at least 5% of the voting securities of an issuer, or a company which is under common control with the issuer, results in that issuer becoming an affiliated person as defined by the 1940 Act.
The following table provides transactions during the year ended December 31, 2021, where the following issuers were considered an affiliate:
| Issuer | | | Beginning
Fair Value
at 12/31/2020 | | | Purchases
at Cost | | | Sales
at Cost | | | Change in
Unrealized
Appreciation/
(Depreciation) | | | Ending
Fair Value
at 12/31/2021 | | | Investment
Income | | | Realized
Gains/
(Losses) | | | Net Capital
Gain
Distributions | |
| Voya Emerging Markets Index Portfolio - Class P2 | | | | $ | 69,909,060 | | | | | $ | 20,215,123 | | | | | $ | (9,195,840) | | | | | $ | (4,791,275) | | | | | $ | 76,137,068 | | | | | $ | 696,994 | | | | | $ | 1,228,564 | | | | | $ | — | | |
| Voya International Index Portfolio - Class P2 | | | | | 161,964,096 | | | | | | 15,605,869 | | | | | | (52,194,530) | | | | | | 5,221,806 | | | | | | 130,597,241 | | | | | | 3,166,828 | | | | | | 9,269,569 | | | | | | — | | |
| Voya Russell Mid Cap Index Portfolio - Class P2 | | | | | 31,334,886 | | | | | | 26,542,028 | | | | | | (18,748,304) | | | | | | 632,261 | | | | | | 39,760,871 | | | | | | 521,347 | | | | | | 2,043,746 | | | | | | 4,589,406 | | |
| Voya Russell Small Cap Index Portfolio - Class P2 | | | | | 38,962,189 | | | | | | 18,144,219 | | | | | | (25,227,841) | | | | | | (6,532,530) | | | | | | 25,346,037 | | | | | | 255,812 | | | | | | 10,751,258 | | | | | | — | | |
| Voya U.S. Bond Index Portfolio - Class P2 | | | | | 411,615,746 | | | | | | 167,015,740 | | | | | | (140,324,531) | | | | | | (29,593,486) | | | | | | 408,713,469 | | | | | | 10,541,348 | | | | | | 8,208,379 | | | | | | 5,724,647 | | |
| Voya U.S. Stock Index Portfolio - Class P2 | | | | | 445,949,352 | | | | | | 93,996,547 | | | | | | (106,059,274) | | | | | | 32,303,681 | | | | | | 466,190,306 | | | | | | 4,764,884 | | | | | | 35,139,902 | | | | | | 39,411,084 | | |
| VRIAC Contract | | | | | — | | | | | | 69,609,531 | | | | | | (3,734,934) | | | | | | 345,246 | | | | | | 66,219,843 | | | | | | — | | | | | | 9,702 | | | | | | — | | |
| | | | | $ | 1,159,735,329 | | | | | $ | 411,129,057 | | | | | $ | (355,485,254) | | | | | $ | (2,414,297) | | | | | $ | 1,212,964,835 | | | | | $ | 19,947,213 | | | | | $ | 66,651,120 | | | | | $ | 49,725,137 | | |
The financial statements for the above mutual fund[s] can be found at www.sec.gov.
See Accompanying Notes to Financial Statements
PORTFOLIO OF INVESTMENTS
| Voya Index Solution 2025 Portfolio | as of December 31, 2021 (continued) |
The effect of derivative instruments on the Portfolio’s Statement of Operations for the year ended December 31, 2021 was as follows:
| | | | Amount of Realized Gain or (Loss) on
Derivatives Recognized in Income | |
| Derivatives not accounted for as hedging instruments | | | Futures | |
| Equity contracts | | | | $ | 2,024,735 | | |
| Total | | | | $ | 2,024,735 | | |
| | | | Change in Unrealized Appreciation or (Depreciation)
on Derivatives Recognized in Income | |
| Derivatives not accounted for as hedging instruments | | | Futures | |
| Equity contracts | | | | $ | (310,748) | | |
| Total | | | | $ | (310,748) | | |
At December 31, 2021, the aggregate cost of securities and other investments and the composition of unrealized appreciation and depreciation of securities and other investments on a tax basis were:
| | Cost for federal income tax purposes was $1,199,410,977. | | |
| | Net unrealized appreciation consisted of: | | |
| | Gross Unrealized Appreciation | | | | $ | 152,876,167 | | |
| | Gross Unrealized Depreciation | | | | | (19,866,450) | | |
| | Net Unrealized Appreciation | | | | $ | 133,009,717 | | |
See Accompanying Notes to Financial Statements
PORTFOLIO OF INVESTMENTS
| Voya Index Solution 2030 Portfolio | as of December 31, 2021 |
| Shares | | | | | | Value | | | Percentage
of Net
Assets | |
| EXCHANGE-TRADED FUNDS: 8.8% | |
| 244,072 | | | iShares MSCI EAFE
Small-Cap ETF | | | | $ | 17,839,223 | | | | | | 1.9 | | |
| 1,631,916 | | | Xtrackers USD High Yield
Corporate Bond ETF | | | | | 65,015,533 | | | | | | 6.9 | | |
| | | | Total Exchange-Traded
Funds
(Cost $81,727,719) | | | | | 82,854,756 | | | | | | 8.8 | | |
| MUTUAL FUNDS: 86.1% | |
| | | | Affiliated Investment Companies: 86.1% | |
| 4,004,732 | | | Voya Emerging Markets
Index Portfolio - Class P2 | | | | | 53,823,592 | | | | | | 5.7 | | |
| 10,601,361 | | | Voya International Index
Portfolio - Class P2 | | | | | 129,548,637 | | | | | | 13.7 | | |
| 2,543,176 | | | Voya Russell Mid Cap Index
Portfolio - Class P2 | | | | | 37,460,983 | | | | | | 4.0 | | |
| 2,530,268 | | | Voya Russell Small Cap
Index Portfolio - Class P2 | | | | | 45,342,404 | | | | | | 4.8 | | |
| 16,546,669 | | | Voya U.S. Bond Index
Portfolio - Class P2 | | | | | 177,876,687 | | | | | | 18.9 | | |
| 16,719,282 | | | Voya U.S. Stock Index
Portfolio - Class P2 | | | | | 367,991,396 | | | | | | 39.0 | | |
| | | | Total Mutual Funds
(Cost $708,232,669) | | | | | 812,043,699 | | | | | | 86.1 | | |
| Units | | | Value | | | Percentage
of Net
Assets | |
| FUNDING AGREEMENTS: 4.9% | |
| | | | Investment Contract: 4.9% | |
| 4,653,717 (1)(2)(3) | | | VRIAC Contract,
1.600% | | | | $ | 46,784,734 | | | | | | 4.9 | | |
| | | | Total Funding
Agreements
(Cost $46,543,459) | | | | | 46,784,734 | | | | | | 4.9 | | |
| | | | Total Investments in
Securities
(Cost $836,503,847) | | | | $ | 941,683,189 | | | | | | 99.8 | | |
| | | | Assets in Excess of
Other Liabilities | | | | | 1,642,374 | | | | | | 0.2 | | |
| | | | Net Assets | | | | $ | 943,325,563 | | | | | | 100.0 | | |
(1)
For fair value measurement disclosure purposes, security is categorized as Level 3, whose value was determined using significant unobservable inputs.
(2)
The Funding Agreement is issued by Voya Retirement Insurance and Annuity Company (“VRIAC”). The interest rate is assessed and may change quarterly.
(3)
Investment in affiliate.
Fair Value Measurements^
The following is a summary of the fair valuations according to the inputs used as of December 31, 2021 in valuing the assets and liabilities:
| | | | Quoted Prices
in Active Markets
for Identical
Investments
(Level 1) | | | Significant
Other
Observable
Inputs
(Level 2) | | | Significant
Unobservable
Inputs
(Level 3) | | | Fair Value
at
December 31, 2021 | |
| Asset Table | | | | | | | | | | | | | | | | | | | | | | | | | |
| Investments, at fair value | | | | | | | | | | | | | | | | | | | | | | | | | |
| Exchange-Traded Funds | | | | $ | 82,854,756 | | | | | $ | — | | | | | $ | — | | | | | $ | 82,854,756 | | |
| Mutual Funds | | | | | 812,043,699 | | | | | | — | | | | | | — | | | | | | 812,043,699 | | |
| Funding Agreements | | | | | — | | | | | | — | | | | | | 46,784,734 | | | | | | 46,784,734 | | |
| Total Investments, at fair value | | | | $ | 894,898,455 | | | | | $ | — | | | | | $ | 46,784,734 | | | | | $ | 941,683,189 | | |
^
See Note 2, “Significant Accounting Policies” in the Notes to Financial Statements for additional information.
See Accompanying Notes to Financial Statements
PORTFOLIO OF INVESTMENTS
| Voya Index Solution 2030 Portfolio | as of December 31, 2021 (continued) |
The following table presents additional information about valuation techniques and inputs used for investments that are measured at fair value and categorized within Level 3 at December 31, 2021:
| Investments, at fair value | | | Fair Value at
December 31, 2021 | | | Valuation
Technique(s)* | | | Significant
Unobservable
Input(s) | | | Value
or Range
of Input(s) | | | Weighted
Average
of Inputs** | | | Impact to
Valuation from an
Increase in Input*** | |
| Funding Agreements | | | | $ | 46,784,734 | | | | Cost Approach | | | Interest rate | | | | | 1.600% | | | | | | 1.600% | | | | | | Increase** | | |
*
Valuation techniques may change in order to reflect management’s judgment of current market participant assumptions.
**
Unobservable inputs were weighted by the relative fair value of the instruments.
***
Represents the directional change in the fair value of the Level 3 investment(s) that would result from an increase in the corresponding input. A decrease to the unobservable input would have the opposite effect. Significant increases and decreases in these inputs in isolation could result in signficantly higher or lower fair value measurements.
The following is a reconciliation of the fair valuations using significant unobservable inputs (Level 3) for the Portfolio’s assets and liabilities during the year ended December 31, 2021:
| | | | Funding
Agreements | |
| Assets: | | | | | | | |
| Beginning balance at December 31, 2020 | | | | $ | — | | |
| Purchases | | | | | 48,602,067 | | |
| Sales | | | | | (2,063,410) | | |
| Total realized gain (loss) | | | | | 4,802 | | |
| Net change in unrealized appreciation (depreciation)**** | | | | | 241,275 | | |
| Transfers into Level 3 | | | | | — | | |
| Transfers out of Level 3 | | | | | — | | |
| Ending balance at December 31, 2021 | | | | $ | 46,784,734 | | |
| Net change in unrealized appreciation (depreciation) on Level 3 securities still held as of December 31, 2021**** | | | | $ | 241,275 | | |
****
Any difference between net change in unrealized apprecation (depreciation) and net change in unrealized appreciation (depreciation) on Level 3 securities still held at December 31, 2021 may be due to securities no longer held or categorized as Level 3 at year end.
Transactions with Affiliates
An investment of at least 5% of the voting securities of an issuer, or a company which is under common control with the issuer, results in that issuer becoming an affiliated person as defined by the 1940 Act.
The following table provides transactions during the year ended December 31, 2021, where the following issuers were considered an affiliate:
| Issuer | | | Beginning
Fair Value
at 12/31/2020 | | | Purchases
at Cost | | | Sales
at Cost | | | Change in
Unrealized
Appreciation/
(Depreciation) | | | Ending
Fair Value
at 12/31/2021 | | | Investment
Income | | | Realized
Gains/
(Losses) | | | Net Capital
Gain
Distributions | |
| Voya Emerging Markets Index Portfolio - Class P2 | | | | $ | 55,922,987 | | | | | $ | 14,325,103 | | | | | $ | (11,390,583) | | | | | $ | (5,033,915) | | | | | $ | 53,823,592 | | | | | $ | 537,927 | | | | | $ | 2,889,313 | | | | | $ | — | | |
| Voya International Index Portfolio - Class P2 | | | | | 133,127,676 | | | | | | 23,541,472 | | | | | | (34,235,386) | | | | | | 7,114,875 | | | | | | 129,548,637 | | | | | | 2,972,732 | | | | | | 5,369,027 | | | | | | — | | |
| Voya Russell Mid Cap Index Portfolio - Class P2 | | | | | 23,635,901 | | | | | | 25,385,198 | | | | | | (12,510,759) | | | | | | 950,643 | | | | | | 37,460,983 | | | | | | 432,218 | | | | | | 1,122,994 | | | | | | 3,804,804 | | |
| Voya Russell Small Cap Index Portfolio - Class P2 | | | | | 32,821,464 | | | | | | 34,535,609 | | | | | | (18,511,749) | | | | | | (3,502,920) | | | | | | 45,342,404 | | | | | | 338,540 | | | | | | 7,877,515 | | | | | | — | | |
| Voya U.S. Bond Index Portfolio - Class P2 | | | | | 183,218,356 | | | | | | 91,199,468 | | | | | | (83,901,155) | | | | | | (12,639,982) | | | | | | 177,876,687 | | | | | | 4,848,388 | | | | | | 3,047,263 | | | | | | 2,749,402 | | |
| Voya U.S. Stock Index Portfolio - Class P2 | | | | | 303,549,466 | | | | | | 105,579,195 | | | | | | (65,529,344) | | | | | | 24,392,079 | | | | | | 367,991,396 | | | | | | 3,751,683 | | | | | | 22,638,578 | | | | | | 28,206,398 | | |
| VRIAC Contract | | | | | — | | | | | | 48,602,067 | | | | | | (2,058,608) | | | | | | 241,275 | | | | | | 46,784,734 | | | | | | — | | | | | | 4,802 | | | | | | — | | |
| | | | | $ | 732,275,850 | | | | | $ | 343,168,112 | | | | | $ | (228,137,584) | | | | | $ | 11,522,055 | | | | | $ | 858,828,433 | | | | | $ | 12,881,488 | | | | | $ | 42,949,492 | | | | | $ | 34,760,604 | | |
The financial statements for the above mutual fund[s] can be found at www.sec.gov.
See Accompanying Notes to Financial Statements
PORTFOLIO OF INVESTMENTS
| Voya Index Solution 2030 Portfolio | as of December 31, 2021 (continued) |
The effect of derivative instruments on the Portfolio’s Statement of Operations for the year ended December 31, 2021 was as follows:
| | | | Amount of Realized Gain or (Loss) on
Derivatives Recognized in Income | |
| Derivatives not accounted for as hedging instruments | | | Futures | |
| Equity contracts | | | | $ | 852,753 | | |
| Total | | | | $ | 852,753 | | |
| | | | Change in Unrealized Appreciation or (Depreciation)
on Derivatives Recognized in Income | |
| Derivatives not accounted for as hedging instruments | | | Futures | |
| Equity contracts | | | | $ | (48,956) | | |
| Total | | | | $ | (48,956) | | |
At December 31, 2021, the aggregate cost of securities and other investments and the composition of unrealized appreciation and depreciation of securities and other investments on a tax basis were:
| | Cost for federal income tax purposes was $840,708,534. | | | | | | | |
| | Net unrealized appreciation consisted of: | | | | | | | |
| | Gross Unrealized Appreciation | | | | $ | 112,404,744 | | |
| | Gross Unrealized Depreciation | | | | | (11,430,089) | | |
| | Net Unrealized Appreciation | | | | $ | 100,974,655 | | |
See Accompanying Notes to Financial Statements
PORTFOLIO OF INVESTMENTS
| Voya Index Solution 2035 Portfolio | as of December 31, 2021 |
| Shares | | | Value | | | Percentage
of Net
Assets | |
| EXCHANGE-TRADED FUNDS: 5.9% | |
| 384,218 | | | iShares MSCI EAFE
Small-Cap ETF | | | | $ | 28,082,494 | | | | | | 1.9 | | |
| 1,470,024 | | | Xtrackers USD High Yield
Corporate Bond
ETF | | | | | 58,565,756 | | | | | | 4.0 | | |
| | | | Total Exchange-Traded
Funds
(Cost $84,348,759) | | | | | 86,648,250 | | | | | | 5.9 | | |
| MUTUAL FUNDS: 94.0% | |
| | | | Affiliated Investment Companies: 94.0% | |
| 8,322,067 | | | Voya Emerging Markets
Index Portfolio - Class P2 | | | | | 111,848,577 | | | | | | 7.6 | | |
| 18,872,919 | | | Voya International Index
Portfolio - Class P2 | | | | | 230,627,069 | | | | | | 15.7 | | |
| 3,963,891 | | | Voya Russell Mid Cap Index
Portfolio - Class P2 | | | | | 58,388,120 | | | | | | 4.0 | | |
| 3,920,804 | | | Voya Russell Small Cap
Index Portfolio - Class P2 | | | | | 70,260,812 | | | | | | 4.8 | | |
| Shares | | | Value | | | Percentage
of Net
Assets | |
| MUTUAL FUNDS: (continued) | |
| | | | Affiliated Investment Companies (continued) | |
| 23,002,427 | | | Voya U.S. Bond Index
Portfolio - Class P2 | | | | $ | 247,276,088 | | | | | | 16.8 | | |
| 30,159,784 | | | Voya U.S. Stock Index
Portfolio - Class P2 | | | | | 663,816,849 | | | | | | 45.1 | | |
| | | | Total Mutual Funds
(Cost $1,194,350,035) | | | | | 1,382,217,515 | | | | | | 94.0 | | |
| | | | Total Investments in
Securities
(Cost $1,278,698,794) | | | | $ | 1,468,865,765 | | | | | | 99.9 | | |
| | | | Assets in Excess of
Other Liabilities | | | | | 1,966,453 | | | | | | 0.1 | | |
| | | | Net Assets | | | | $ | 1,470,832,218 | | | | | | 100.0 | | |
| |
Fair Value Measurements^
The following is a summary of the fair valuations according to the inputs used as of December 31, 2021 in valuing the assets and liabilities:
| | | | Quoted Prices
in Active Markets
for Identical
Investments
(Level 1) | | | Significant
Other
Observable
Inputs
(Level 2) | | | Significant
Unobservable
Inputs
(Level 3) | | | Fair Value
at
December 31, 2021 | |
| Asset Table | | | | | | | | | | | | | | | | | | | | | | | | | |
| Investments, at fair value | | | | | | | | | | | | | | | | | | | | | | | | | |
| Exchange-Traded Funds | | | | $ | 86,648,250 | | | | | $ | — | | | | | $ | — | | | | | $ | 86,648,250 | | |
| Mutual Funds | | | | | 1,382,217,515 | | | | | | — | | | | | | — | | | | | | 1,382,217,515 | | |
| Total Investments, at fair value | | | | $ | 1,468,865,765 | | | | | $ | — | | | | | $ | — | | | | | $ | 1,468,865,765 | | |
^
See Note 2, “Significant Accounting Policies” in the Notes to Financial Statements for additional information.
See Accompanying Notes to Financial Statements
PORTFOLIO OF INVESTMENTS
| Voya Index Solution 2035 Portfolio | as of December 31, 2021 (continued) |
Transactions with Affiliates
An investment of at least 5% of the voting securities of an issuer, or a company which is under common control with the issuer, results in that issuer becoming an affiliated person as defined by the 1940 Act.
The following table provides transactions during the year ended December 31, 2021, where the following issuers were considered an affiliate:
| Issuer | | | Beginning
Fair Value
at 12/31/2020 | | | Purchases
at Cost | | | Sales
at Cost | | | Change in
Unrealized
Appreciation/
(Depreciation) | | | Ending
Fair Value
at 12/31/2021 | | | Investment
Income | | | Realized
Gains/
(Losses) | | | Net Capital
Gain
Distributions | |
| Voya Emerging Markets Index Portfolio - Class P2 | | | | $ | 115,625,379 | | | | | $ | 51,854,467 | | | | | $ | (41,724,855) | | | | | $ | (13,906,414) | | | | | $ | 111,848,577 | | | | | $ | 1,355,703 | | | | | $ | 9,352,507 | | | | | $ | — | | |
| Voya International Index Portfolio - Class P2 | | | | | 226,657,508 | | | | | | 32,604,690 | | | | | | (42,364,409) | | | | | | 13,729,280 | | | | | | 230,627,069 | | | | | | 5,048,509 | | | | | | 7,420,126 | | | | | | — | | |
| Voya Russell Mid Cap Index Portfolio - Class P2 | | | | | 50,680,655 | | | | | | 40,538,835 | | | | | | (34,711,845) | | | | | | 1,880,475 | | | | | | 58,388,120 | | | | | | 831,909 | | | | | | 2,705,934 | | | | | | 7,323,280 | | |
| Voya Russell Small Cap Index Portfolio - Class P2 | | | | | 52,450,509 | | | | | | 66,694,727 | | | | | | (38,716,679) | | | | | | (10,167,745) | | | | | | 70,260,812 | | | | | | 542,948 | | | | | | 16,564,842 | | | | | | — | | |
| Voya U.S. Bond Index Portfolio - Class P2 | | | | | 171,068,994 | | | | | | 106,869,651 | | | | | | (19,167,601) | | | | | | (11,494,956) | | | | | | 247,276,088 | | | | | | 5,142,652 | | | | | | 1,351,964 | | | | | | 2,745,911 | | |
| Voya U.S. Stock Index Portfolio - Class P2 | | | | | 563,522,769 | | | | | | 186,516,048 | | | | | | (130,125,897) | | | | | | 43,903,929 | | | | | | 663,816,849 | | | | | | 6,766,274 | | | | | | 42,077,235 | | | | | | 50,215,007 | | |
| | | | | $ | 1,180,005,814 | | | | | $ | 485,078,418 | | | | | $ | (306,811,286) | | | | | $ | 23,944,569 | | | | | $ | 1,382,217,515 | | | | | $ | 19,687,995 | | | | | $ | 79,472,608 | | | | | $ | 60,284,198 | | |
The financial statements for the above mutual fund[s] can be found at www.sec.gov.
The effect of derivative instruments on the Portfolio’s Statement of Operations for the year ended December 31, 2021 was as follows:
| | | | Amount of Realized Gain or (Loss) on
Derivatives Recognized in Income | |
| Derivatives not accounted for as hedging instruments | | | Futures | |
| Equity contracts | | | | $ | 1,380,504 | | |
| Total | | | | $ | 1,380,504 | | |
| | | | Change in Unrealized Appreciation or (Depreciation)
on Derivatives Recognized in Income | |
| Derivatives not accounted for as hedging instruments | | | Futures | |
| Equity contracts | | | | $ | (76,962) | | |
| Total | | | | $ | (76,962) | | |
At December 31, 2021, the aggregate cost of securities and other investments and the composition of unrealized appreciation and depreciation of securities and other investments on a tax basis were:
| | Cost for federal income tax purposes was $1,283,958,041. | | | | | | | |
| | Net unrealized appreciation consisted of: | | | | | | | |
| | Gross Unrealized Appreciation | | | | $ | 197,558,596 | | |
| | Gross Unrealized Depreciation | | | | | (12,650,872) | | |
| | Net Unrealized Appreciation | | | | $ | 184,907,724 | | |
See Accompanying Notes to Financial Statements
PORTFOLIO OF INVESTMENTS
| Voya Index Solution 2040 Portfolio | as of December 31, 2021 |
| Shares | | | Value | | | Percentage
of Net
Assets | |
| EXCHANGE-TRADED FUNDS: 4.8% | |
| 209,682 | | | iShares MSCI EAFE
Small-Cap ETF | | | | $ | 15,325,657 | | | | | | 1.9 | | |
| 599,077 | | | Xtrackers USD High Yield
Corporate Bond ETF | | | | | 23,867,228 | | | | | | 2.9 | | |
| | | | Total Exchange-Traded
Funds
(Cost $38,644,471) | | | | | 39,192,885 | | | | | | 4.8 | | |
| MUTUAL FUNDS: 95.1% | |
| | | | Affiliated Investment Companies: 95.1% | |
| 4,624,063 | | | Voya Emerging Markets
Index Portfolio - Class P2 | | | | | 62,147,413 | | | | | | 7.6 | | |
| 11,840,735 | | | Voya International Index
Portfolio - Class P2 | | | | | 144,693,779 | | | | | | 17.6 | | |
| 2,204,428 | | | Voya Russell Mid Cap Index
Portfolio - Class P2 | | | | | 32,471,224 | | | | | | 4.0 | | |
| 2,638,177 | | | Voya Russell Small Cap
Index Portfolio - Class P2 | | | | | 47,276,136 | | | | | | 5.8 | | |
| Shares | | | Value | | | Percentage
of Net
Assets | |
| MUTUAL FUNDS: (continued) | |
| | | | Affiliated Investment Companies (continued) | |
| 6,818,846 | | | Voya U.S. Bond Index
Portfolio - Class P2 | | | | $ | 73,302,591 | | | | | | 8.9 | | |
| 19,069,109 | | | Voya U.S. Stock Index
Portfolio - Class P2 | | | | | 419,711,080 | | | | | | 51.2 | | |
| | | | Total Mutual Funds
(Cost $671,819,397) | | | | | 779,602,223 | | | | | | 95.1 | | |
| | | | Total Investments in
Securities
(Cost $710,463,868) | | | | $ | 818,795,108 | | | | | | 99.9 | | |
| | | | Assets in Excess of
Other Liabilities | | | | | 1,131,563 | | | | | | 0.1 | | |
| | | | Net Assets | | | | $ | 819,926,671 | | | | | | 100.0 | | |
Fair Value Measurements^
The following is a summary of the fair valuations according to the inputs used as of December 31, 2021 in valuing the assets and liabilities:
| | | | Quoted Prices
in Active Markets
for Identical
Investments
(Level 1) | | | Significant
Other
Observable
Inputs
(Level 2) | | | Significant
Unobservable
Inputs
(Level 3) | | | Fair Value
at
December 31, 2021 | |
| Asset Table | | | | | | | | | | | | | | | | | | | | | | | | | |
| Investments, at fair value | | | | | | | | | | | | | | | | | | | | | | | | | |
| Exchange-Traded Funds | | | | $ | 39,192,885 | | | | | $ | — | | | | | $ | — | | | | | $ | 39,192,885 | | |
| Mutual Funds | | | | | 779,602,223 | | | | | | — | | | | | | — | | | | | | 779,602,223 | | |
| Total Investments, at fair value | | | | $ | 818,795,108 | | | | | $ | — | | | | | $ | — | | | | | $ | 818,795,108 | | |
^
See Note 2, “Significant Accounting Policies” in the Notes to Financial Statements for additional information.
Transactions with Affiliates
An investment of at least 5% of the voting securities of an issuer, or a company which is under common control with the issuer, results in that issuer becoming an affiliated person as defined by the 1940 Act.
See Accompanying Notes to Financial Statements
PORTFOLIO OF INVESTMENTS
| Voya Index Solution 2040 Portfolio | as of December 31, 2021 (continued) |
The following table provides transactions during the year ended December 31, 2021, where the following issuers were considered an affiliate:
| Issuer | | | Beginning
Fair Value
at 12/31/2020 | | | Purchases
at Cost | | | Sales
at Cost | | | Change in
Unrealized
Appreciation/
(Depreciation) | | | Ending
Fair Value
at 12/31/2021 | | | Investment
Income | | | Realized
Gains/
(Losses) | | | Net Capital
Gain
Distributions | |
| Voya Emerging Markets Index Portfolio - Class P2 | | | | $ | 60,972,646 | | | | | $ | 36,538,838 | | | | | $ | (26,017,773) | | | | | $ | (9,346,298) | | | | | $ | 62,147,413 | | | | | $ | 780,862 | | | | | $ | 6,346,214 | | | | | $ | — | | |
| Voya International Index Portfolio - Class P2 | | | | | 125,873,091 | | | | | | 29,430,666 | | | | | | (19,853,718) | | | | | | 9,243,740 | | | | | | 144,693,779 | | | | | | 2,957,150 | | | | | | 2,974,932 | | | | | | — | | |
| Voya Russell Mid Cap Index Portfolio - Class P2 | | | | | 25,327,314 | | | | | | 31,739,541 | | | | | | (22,172,242) | | | | | | (2,423,389) | | | | | | 32,471,224 | | | | | | 511,050 | | | | | | 4,564,878 | | | | | | 4,498,760 | | |
| Voya Russell Small Cap Index Portfolio - Class P2 | | | | | 26,571,124 | | | | | | 38,122,187 | | | | | | (14,588,708) | | | | | | (2,828,467) | | | | | | 47,276,136 | | | | | | 286,611 | | | | | | 6,200,519 | | | | | | — | | |
| Voya U.S. Bond Index Portfolio - Class P2 | | | | | 56,839,731 | | | | | | 23,160,003 | | | | | | (3,343,227) | | | | | | (3,353,916) | | | | | | 73,302,591 | | | | | | 1,553,105 | | | | | | 129,502 | | | | | | 772,595 | | |
| Voya U.S. Stock Index Portfolio - Class P2 | | | | | 314,484,448 | | | | | | 135,743,347 | | | | | | (63,443,569) | | | | | | 32,926,854 | | | | | | 419,711,080 | | | | | | 4,264,169 | | | | | | 18,212,423 | | | | | | 30,101,892 | | |
| | | | | $ | 610,068,354 | | | | | $ | 294,734,582 | | | | | $ | (149,419,237) | | | | | $ | 24,218,524 | | | | | $ | 779,602,223 | | | | | $ | 10,352,947 | | | | | $ | 38,428,468 | | | | | $ | 35,373,247 | | |
The financial statements for the above mutual fund[s] can be found at www.sec.gov.
The effect of derivative instruments on the Portfolio’s Statement of Operations for the year ended December 31, 2021 was as follows:
| | | | Amount of Realized Gain or (Loss) on
Derivatives Recognized in Income | |
| Derivatives not accounted for as hedging instruments | | | Futures | |
| Equity contracts | | | | $ | 2,290,512 | | |
| Interest rate contracts | | | | | 394,946 | | |
| Total | | | | $ | 2,685,458 | | |
| | | | Change in Unrealized Appreciation or (Depreciation)
on Derivatives Recognized in Income | |
| Derivatives not accounted for as hedging instruments | | | Futures | |
| Equity contracts | | | | $ | (348,095) | | |
| Interest rate contracts | | | | | 13,853 | | |
| Total | | | | $ | (334,242) | | |
At December 31, 2021, the aggregate cost of securities and other investments and the composition of unrealized appreciation and depreciation of securities and other investments on a tax basis were:
| | Cost for federal income tax purposes was $712,097,170. | | | | | | | |
| | Net unrealized appreciation consisted of: | | | | | | | |
| | Gross Unrealized Appreciation | | | | $ | 111,438,509 | | |
| | Gross Unrealized Depreciation | | | | | (4,740,571) | | |
| | Net Unrealized Appreciation | | | | $ | 106,697,938 | | |
See Accompanying Notes to Financial Statements
PORTFOLIO OF INVESTMENTS
| Voya Index Solution 2045 Portfolio | as of December 31, 2021 |
| Shares | | | | | | Value | | | Percentage
of Net
Assets | |
| EXCHANGE-TRADED FUNDS: 3.9% | |
| 293,432 | | | iShares MSCI EAFE
Small-Cap ETF | | | | $ | 21,446,945 | | | | | | 1.9 | | |
| 561,027 | | | Xtrackers USD High Yield
Corporate Bond ETF | | | | | 22,351,315 | | | | | | 2.0 | | |
| | | | Total Exchange-Traded
Funds
(Cost $43,596,647) | | | | | 43,798,260 | | | | | | 3.9 | | |
| MUTUAL FUNDS: 96.0% | |
| | | | Affiliated Investment Companies: 96.0% | |
| 7,146,976 | | | Voya Emerging Markets
Index Portfolio - Class P2 | | | | | 96,055,358 | | | | | | 8.5 | | |
| 18,041,731 | | | Voya International Index
Portfolio - Class P2 | | | | | 220,469,948 | | | | | | 19.5 | | |
| 3,029,510 | | | Voya Russell Mid Cap
Index Portfolio - Class P2 | | | | | 44,624,686 | | | | | | 4.0 | | |
| Shares | | | | | | Value | | | Percentage
of Net
Assets | |
| MUTUAL FUNDS: (continued) | |
| | | | Affiliated Investment Companies (continued) | |
| 3,625,176 | | | Voya Russell Small Cap
Index Portfolio - Class P2 | | | | $ | 64,963,157 | | | | | | 5.8 | | |
| 3,096,079 | | | Voya U.S. Bond Index
Portfolio - Class P2 | | | | | 33,282,854 | | | | | | 2.9 | | |
| 28,320,497 | | | Voya U.S. Stock Index
Portfolio - Class P2 | | | | | 623,334,139 | | | | | | 55.3 | | |
| | | | Total Mutual Funds
(Cost $915,480,138) | | | | | 1,082,730,142 | | | | | | 96.0 | | |
| | | | Total Investments in
Securities
(Cost $959,076,785) | | | | $ | 1,126,528,402 | | | | | | 99.9 | | |
| | | | Assets in Excess of
Other Liabilities | | | | | 1,278,577 | | | | | | 0.1 | | |
| | | | Net Assets | | | | $ | 1,127,806,979 | | | | | | 100.0 | | |
| |
Fair Value Measurements^
The following is a summary of the fair valuations according to the inputs used as of December 31, 2021 in valuing the assets and liabilities:
| | | | Quoted Prices
in Active Markets
for Identical
Investments
(Level 1) | | | Significant
Other
Observable
Inputs
(Level 2) | | | Significant
Unobservable
Inputs
(Level 3) | | | Fair Value
at
December 31, 2021 | |
| Asset Table | | | | | | | | | | | | | | | | | | | | | | | | | |
| Investments, at fair value | | | | | | | | | | | | | | | | | | | | | | | | | |
| Exchange-Traded Funds | | | | $ | 43,798,260 | | | | | $ | — | | | | | $ | — | | | | | $ | 43,798,260 | | |
| Mutual Funds | | | | | 1,082,730,142 | | | | | | — | | | | | | — | | | | | | 1,082,730,142 | | |
| Total Investments, at fair value | | | | $ | 1,126,528,402 | | | | | $ | — | | | | | $ | — | | | | | $ | 1,126,528,402 | | |
^
See Note 2, “Significant Accounting Policies” in the Notes to Financial Statements for additional information.
Transactions with Affiliates
An investment of at least 5% of the voting securities of an issuer, or a company which is under common control with the issuer, results in that issuer becoming an affiliated person as defined by the 1940 Act.
See Accompanying Notes to Financial Statements
PORTFOLIO OF INVESTMENTS
| Voya Index Solution 2045 Portfolio | as of December 31, 2021 (continued) |
The following table provides transactions during the year ended December 31, 2021, where the following issuers were considered an affiliate:
| Issuer | | | Beginning
Fair Value
at 12/31/2020 | | | Purchases
at Cost | | | Sales
at Cost | | | Change in
Unrealized
Appreciation/
(Depreciation) | | | Ending
Fair Value
at 12/31/2021 | | | Investment
Income | | | Realized
Gains/
(Losses) | | | Net Capital
Gain
Distributions | |
| Voya Emerging Markets Index Portfolio - Class P2 | | | | $ | 94,397,219 | | | | | $ | 55,041,209 | | | | | $ | (39,467,224) | | | | | $ | (13,915,846) | | | | | $ | 96,055,358 | | | | | $ | 1,204,386 | | | | | $ | 9,157,508 | | | | | $ | — | | |
| Voya International Index Portfolio - Class P2 | | | | | 194,755,051 | | | | | | 45,829,192 | | | | | | (32,419,855) | | | | | | 12,305,560 | | | | | | 220,469,948 | | | | | | 4,629,716 | | | | | | 6,214,495 | | | | | | — | | |
| Voya Russell Mid Cap Index Portfolio - Class P2 | | | | | 41,917,329 | | | | | | 37,727,230 | | | | | | (33,541,338) | | | | | | (1,478,535) | | | | | | 44,624,686 | | | | | | 726,969 | | | | | | 5,207,879 | | | | | | 6,399,496 | | |
| Voya Russell Small Cap Index Portfolio - Class P2 | | | | | 39,213,332 | | | | | | 51,462,610 | | | | | | (21,523,744) | | | | | | (4,189,041) | | | | | | 64,963,157 | | | | | | 407,998 | | | | | | 9,160,296 | | | | | | — | | |
| Voya U.S. Bond Index Portfolio - Class P2 | | | | | 47,221,159 | | | | | | 11,850,398 | | | | | | (23,916,711) | | | | | | (1,871,992) | | | | | | 33,282,854 | | | | | | 922,131 | | | | | | (387,792) | | | | | | 363,458 | | |
| Voya U.S. Stock Index Portfolio - Class P2 | | | | | 490,122,350 | | | | | | 175,086,921 | | | | | | (89,100,890) | | | | | | 47,225,758 | | | | | | 623,334,139 | | | | | | 6,352,328 | | | | | | 30,793,971 | | | | | | 46,410,812 | | |
| | | | | $ | 907,626,440 | | | | | $ | 376,997,560 | | | | | $ | (239,969,762) | | | | | $ | 38,075,904 | | | | | $ | 1,082,730,142 | | | | | $ | 14,243,528 | | | | | $ | 60,146,357 | | | | | $ | 53,173,766 | | |
The financial statements for the above mutual fund[s] can be found at www.sec.gov.
The effect of derivative instruments on the Portfolio’s Statement of Operations for the year ended December 31, 2021 was as follows:
| | | | Amount of Realized Gain or (Loss) on
Derivatives Recognized in Income | |
| Derivatives not accounted for as hedging instruments | | | Futures | |
| Equity contracts | | | | $ | 3,522,222 | | |
| Interest rate contracts | | | | | 739,569 | | |
| Total | | | | $ | 4,261,791 | | |
| | | | Change in Unrealized Appreciation or (Depreciation)
on Derivatives Recognized in Income | |
| Derivatives not accounted for as hedging instruments | | | Futures | |
| Equity contracts | | | | $ | (473,169) | | |
| Interest rate contracts | | | | | 24,363 | | |
| Total | | | | $ | (448,806) | | |
At December 31, 2021, the aggregate cost of securities and other investments and the composition of unrealized appreciation and depreciation of securities and other investments on a tax basis were:
| | Cost for federal income tax purposes was $963,309,232. | | | | | | | |
| | Net unrealized appreciation consisted of: | | | | | | | |
| | Gross Unrealized Appreciation | | | | $ | 170,137,599 | | |
| | Gross Unrealized Depreciation | | | | | (6,918,429) | | |
| | Net Unrealized Appreciation | | | | $ | 163,219,170 | | |
See Accompanying Notes to Financial Statements
PORTFOLIO OF INVESTMENTS
| Voya Index Solution 2050 Portfolio | as of December 31, 2021 |
| Shares | | | | | | Value | | | Percentage
of Net
Assets | |
| EXCHANGE-TRADED FUNDS: 1.9% | |
| 152,021 | | | iShares MSCI EAFE
Small-Cap ETF | | | | $ | 11,111,215 | | | | | | 1.9 | | |
| | | | Total Exchange-Traded
Funds(Cost $11,745,627) | | | | | 11,111,215 | | | | | | 1.9 | | |
| MUTUAL FUNDS: 98.0% | |
| | | | Affiliated Investment Companies: 98.0% | |
| 3,775,852 | | | Voya Emerging Markets
Index Portfolio - Class P2 | | | | | 50,747,456 | | | | | | 8.5 | | |
| 9,543,461 | | | Voya International Index
Portfolio - Class P2 | | | | | 116,621,089 | | | | | | 19.6 | | |
| 1,999,793 | | | Voya Russell Mid Cap
Index Portfolio - Class P2 | | | | | 29,456,956 | | | | | | 4.9 | | |
| 1,896,463 | | | Voya Russell Small Cap
Index Portfolio - Class P2 | | | | | 33,984,621 | | | | | | 5.7 | | |
| Shares | | | | | | Value | | | Percentage
of Net
Assets | |
| MUTUAL FUNDS: (continued) | |
| | | | Affiliated Investment Companies (continued) | |
| 1,640,871 | | | Voya U.S. Bond Index
Portfolio - Class P2 | | | | $ | 17,639,360 | | | | | | 3.0 | | |
| 15,206,147 | | | Voya U.S. Stock Index
Portfolio - Class P2 | | | | | 334,687,294 | | | | | | 56.3 | | |
| | | | Total Mutual Funds
(Cost $499,300,007) | | | | | 583,136,776 | | | | | | 98.0 | | |
| | | | Total Investments in
Securities
(Cost $511,045,634) | | | | $ | 594,247,991 | | | | | | 99.9 | | |
| | | | Assets in Excess of
Other Liabilities | | | | | 643,359 | | | | | | 0.1 | | |
| | | | Net Assets | | | | $ | 594,891,350 | | | | | | 100.0 | | |
| |
Fair Value Measurements^
The following is a summary of the fair valuations according to the inputs used as of December 31, 2021 in valuing the assets and liabilities:
| | | | Quoted Prices
in Active Markets
for Identical
Investments
(Level 1) | | | Significant
Other
Observable
Inputs
(Level 2) | | | Significant
Unobservable
Inputs
(Level 3) | | | Fair Value
at
December 31, 2021 | |
| Asset Table | | | | | | | | | | | | | | | | | | | | | | | | | |
| Investments, at fair value | | | | | | | | | | | | | | | | | | | | | | | | | |
| Exchange-Traded Funds | | | | $ | 11,111,215 | | | | | $ | — | | | | | $ | — | | | | | $ | 11,111,215 | | |
| Mutual Funds | | | | | 583,136,776 | | | | | | — | | | | | | — | | | | | | 583,136,776 | | |
| Total Investments, at fair value | | | | $ | 594,247,991 | | | | | $ | — | | | | | $ | — | | | | | $ | 594,247,991 | | |
^
See Note 2, “Significant Accounting Policies” in the Notes to Financial Statements for additional information.
Transactions with Affiliates
An investment of at least 5% of the voting securities of an issuer, or a company which is under common control with the issuer, results in that issuer becoming an affiliated person as defined by the 1940 Act.
The following table provides transactions during the year ended December 31, 2021, where the following issuers were considered an affiliate:
| Issuer | | | Beginning
Fair Value
at 12/31/2020 | | | Purchases
at Cost | | | Sales
at Cost | | | Change in
Unrealized
Appreciation/
(Depreciation) | | | Ending
Fair Value
at 12/31/2021 | | | Investment
Income | | | Realized
Gains/
(Losses) | | | Net Capital
Gain
Distributions | |
| Voya Emerging Markets Index Portfolio - Class P2 | | | | $ | 45,093,486 | | | | | $ | 31,883,713 | | | | | $ | (18,695,568) | | | | | $ | (7,534,175) | | | | | $ | 50,747,456 | | | | | $ | 601,486 | | | | | $ | 4,938,918 | | | | | $ | — | | |
| Voya International Index Portfolio - Class P2 | | | | | 97,298,476 | | | | | | 31,858,992 | | | | | | (18,978,719) | | | | | | 6,442,340 | | | | | | 116,621,089 | | | | | | 2,419,154 | | | | | | 3,161,032 | | | | | | — | | |
| Voya Russell Mid Cap Index Portfolio - Class P2 | | | | | 20,015,149 | | | | | | 21,235,329 | | | | | | (12,126,401) | | | | | | 332,879 | | | | | | 29,456,956 | | | | | | 363,580 | | | | | | 1,558,509 | | | | | | 3,200,584 | | |
| Voya Russell Small Cap Index Portfolio - Class P2 | | | | | 18,529,697 | | | | | | 34,328,776 | | | | | | (14,910,907) | | | | | | (3,962,945) | | | | | | 33,984,621 | | | | | | 237,719 | | | | | | 6,053,955 | | | | | | — | | |
| Voya U.S. Bond Index Portfolio - Class P2 | | | | | 22,507,824 | | | | | | 6,828,764 | | | | | | (10,813,100) | | | | | | (884,128) | | | | | | 17,639,360 | | | | | | 459,645 | | | | | | (224,531) | | | | | | 183,153 | | |
| Voya U.S. Stock Index Portfolio - Class P2 | | | | | 238,404,054 | | | | | | 116,395,688 | | | | | | (46,259,648) | | | | | | 26,147,200 | | | | | | 334,687,294 | | | | | | 3,400,476 | | | | | | 13,470,624 | | | | | | 23,524,828 | | |
| | | | | $ | 441,848,686 | | | | | $ | 242,531,262 | | | | | $ | (121,784,343) | | | | | $ | 20,541,171 | | | | | $ | 583,136,776 | | | | | $ | 7,482,060 | | | | | $ | 28,958,507 | | | | | $ | 26,908,565 | | |
See Accompanying Notes to Financial Statements
PORTFOLIO OF INVESTMENTS
| Voya Index Solution 2050 Portfolio | as of December 31, 2021 (continued) |
The financial statements for the above mutual fund[s] can be found at www.sec.gov.
The effect of derivative instruments on the Portfolio’s Statement of Operations for the year ended December 31, 2021 was as follows:
| | | | Amount of Realized Gain or (Loss) on
Derivatives Recognized in Income | |
| Derivatives not accounted for as hedging instruments | | | Futures | |
| Equity contracts | | | | $ | 1,053,054 | | |
| Interest rate contracts | | | | | 198,718 | | |
| Total | | | | $ | 1,251,772 | | |
| | | | Change in Unrealized Appreciation or (Depreciation)
on Derivatives Recognized in Income | |
| Derivatives not accounted for as hedging instruments | | | Futures | |
| Equity contracts | | | | $ | (99,677) | | |
| Interest rate contracts | | | | | 7,315 | | |
| Total | | | | $ | (92,362) | | |
At December 31, 2021, the aggregate cost of securities and other investments and the composition of unrealized appreciation and depreciation of securities and other investments on a tax basis were:
| | Cost for federal income tax purposes was $513,260,730. | | | | | | | |
| | Net unrealized appreciation consisted of: | | | | | | | |
| | Gross Unrealized Appreciation | | | | $ | 84,592,342 | | |
| | Gross Unrealized Depreciation | | | | | (3,605,081) | | |
| | Net Unrealized Appreciation | | | | $ | 80,987,261 | | |
See Accompanying Notes to Financial Statements
PORTFOLIO OF INVESTMENTS
| Voya Index Solution 2055 Portfolio | as of December 31, 2021 |
| Shares | | | | | | Value | | | Percentage
of Net
Assets | |
| EXCHANGE-TRADED FUNDS: 1.9% | |
| 159,011 | | | iShares MSCI EAFE
Small-Cap ETF | | | | $ | 11,622,114 | | | | | | 1.9 | | |
| | | | Total Exchange-Traded
Funds
(Cost $12,285,697) | | | | | 11,622,114 | | | | | | 1.9 | | |
| MUTUAL FUNDS: 98.0% | |
| | | | Affiliated Investment Companies: 98.0% | |
| 3,940,533 | | | Voya Emerging Markets
Index Portfolio - Class P2 | | | | | 52,960,763 | | | | | | 8.5 | | |
| 9,957,446 | | | Voya International Index
Portfolio - Class P2 | | | | | 121,679,985 | | | | | | 19.6 | | |
| 2,087,129 | | | Voya Russell Mid Cap
Index Portfolio - Class P2 | | | | | 30,743,404 | | | | | | 4.9 | | |
| 1,979,187 | | | Voya Russell Small Cap
Index Portfolio - Class P2 | | | | | 35,467,036 | | | | | | 5.7 | | |
| Shares | | | | | | Value | | | Percentage
of Net
Assets | |
| MUTUAL FUNDS: (continued) | |
| | | | Affiliated Investment Companies (continued) | |
| 1,712,519 | | | Voya U.S. Bond Index
Portfolio - Class P2 | | | | $ | 18,409,582 | | | | | | 3.0 | | |
| 15,870,674 | | | Voya U.S. Stock Index
Portfolio - Class P2 | | | | | 349,313,537 | | | | | | 56.3 | | |
| | | | Total Mutual Funds
(Cost $518,874,366) | | | | | 608,574,307 | | | | | | 98.0 | | |
| | | | Total Investments in
Securities
(Cost $531,160,063) | | | | $ | 620,196,421 | | | | | | 99.9 | | |
| | | | Assets in Excess of
Other Liabilities | | | | | 581,494 | | | | | | 0.1 | | |
| | | | Net Assets | | | | $ | 620,777,915 | | | | | | 100.0 | | |
| |
Fair Value Measurements^
The following is a summary of the fair valuations according to the inputs used as of December 31, 2021 in valuing the assets and liabilities:
| | | | Quoted Prices
in Active Markets
for Identical
Investments
(Level 1) | | | Significant
Other
Observable
Inputs
(Level 2) | | | Significant
Unobservable
Inputs
(Level 3) | | | Fair Value
at
December 31, 2021 | |
| Asset Table | | | | | | | | | | | | | | | | | | | | | | | | | |
| Investments, at fair value | | | | | | | | | | | | | | | | | | | | | | | | | |
| Exchange-Traded Funds | | | | $ | 11,622,114 | | | | | $ | — | | | | | $ | — | | | | | $ | 11,622,114 | | |
| Mutual Funds | | | | | 608,574,307 | | | | | | — | | | | | | — | | | | | | 608,574,307 | | |
| Total Investments, at fair value | | | | $ | 620,196,421 | | | | | $ | — | | | | | $ | — | | | | | $ | 620,196,421 | | |
^
See Note 2, “Significant Accounting Policies” in the Notes to Financial Statements for additional information.
Transactions with Affiliates
An investment of at least 5% of the voting securities of an issuer, or a company which is under common control with the issuer, results in that issuer becoming an affiliated person as defined by the 1940 Act.
The following table provides transactions during the year ended December 31, 2021, where the following issuers were considered an affiliate:
| Issuer | | | Beginning
Fair Value
at 12/31/2020 | | | Purchases
at Cost | | | Sales
at Cost | | | Change in
Unrealized
Appreciation/
(Depreciation) | | | Ending
Fair Value
at 12/31/2021 | | | Investment
Income | | | Realized
Gains/
(Losses) | | | Net Capital
Gain
Distributions | |
| Voya Emerging Markets Index Portfolio - Class P2 | | | | $ | 50,715,063 | | | | | $ | 30,244,515 | | | | | $ | (20,443,826) | | | | | $ | (7,554,989) | | | | | $ | 52,960,763 | | | | | $ | 634,521 | | | | | $ | 4,986,647 | | | | | $ | — | | |
| Voya International Index Portfolio - Class P2 | | | | | 104,299,310 | | | | | | 31,707,848 | | | | | | (21,358,933) | | | | | | 7,031,760 | | | | | | 121,679,985 | | | | | | 2,552,066 | | | | | | 3,104,495 | | | | | | — | | |
| Voya Russell Mid Cap Index Portfolio - Class P2 | | | | | 23,826,181 | | | | | | 19,357,917 | | | | | | (13,696,323) | | | | | | 1,255,629 | | | | | | 30,743,404 | | | | | | 383,580 | | | | | | 1,097,690 | | | | | | 3,376,645 | | |
| Voya Russell Small Cap Index Portfolio - Class P2 | | | | | 19,947,316 | | | | | | 35,668,818 | | | | | | (15,946,304) | | | | | | (4,202,794) | | | | | | 35,467,036 | | | | | | 250,777 | | | | | | 6,460,212 | | | | | | — | | |
| Voya U.S. Bond Index Portfolio - Class P2 | | | | | 19,453,539 | | | | | | 6,156,988 | | | | | | (6,313,066) | | | | | | (887,879) | | | | | | 18,409,582 | | | | | | 440,756 | | | | | | (119,193) | | | | | | 193,210 | | |
| Voya U.S. Stock Index Portfolio - Class P2 | | | | | 250,742,214 | | | | | | 118,089,600 | | | | | | (46,080,196) | | | | | | 26,561,919 | | | | | | 349,313,537 | | | | | | 3,551,993 | | | | | | 14,547,015 | | | | | | 24,863,273 | | |
| | | | | $ | 468,983,623 | | | | | $ | 241,225,686 | | | | | $ | (123,838,648) | | | | | $ | 22,203,646 | | | | | $ | 608,574,307 | | | | | $ | 7,813,693 | | | | | $ | 30,076,866 | | | | | $ | 28,433,128 | | |
The financial statements for the above mutual fund[s] can be found at www.sec.gov.
See Accompanying Notes to Financial Statements
PORTFOLIO OF INVESTMENTS
| Voya Index Solution 2055 Portfolio | as of December 31, 2021 (continued) |
The effect of derivative instruments on the Portfolio’s Statement of Operations for the year ended December 31, 2021 was as follows:
| | | | Amount of Realized Gain or (Loss) on
Derivatives Recognized in Income | |
| Derivatives not accounted for as hedging instruments | | | Futures | |
| Equity contracts | | | | $ | 1,118,758 | | |
| Interest rate contracts | | | | | 212,970 | | |
| Total | | | | $ | 1,331,728 | | |
| | | | Change in Unrealized Appreciation or (Depreciation)
on Derivatives Recognized in Income | |
| Derivatives not accounted for as hedging instruments | | | Futures | |
| Equity contracts | | | | $ | (109,133) | | |
| Interest rate contracts | | | | | 7,011 | | |
| Total | | | | $ | (102,122) | | |
At December 31, 2021, the aggregate cost of securities and other investments and the composition of unrealized appreciation and depreciation of securities and other investments on a tax basis were:
| | Cost for federal income tax purposes was $533,802,162. | | |
| | Net unrealized appreciation consisted of: | | |
| | Gross Unrealized Appreciation | | | | $ | 90,515,810 | | |
| | Gross Unrealized Depreciation | | | | | (4,121,551) | | |
| | Net Unrealized Appreciation | | | | $ | 86,394,259 | | |
See Accompanying Notes to Financial Statements
PORTFOLIO OF INVESTMENTS
| Voya Index Solution 2060 Portfolio | as of December 31, 2021 |
| Shares | | | | | | Value | | | Percentage
of Net
Assets | |
| EXCHANGE-TRADED FUNDS: 1.8% | |
| 73,463 | | | iShares MSCI EAFE
Small-Cap ETF | | | | $ | 5,369,411 | | | | | | 1.8 | | |
| | | | Total Exchange-Traded Funds
(Cost $5,675,986) | | | | | 5,369,411 | | | | | | 1.8 | | |
| MUTUAL FUNDS: 98.1% | |
| | | | Affiliated Investment Companies: 98.1% | |
| 1,847,891 | | | Voya Emerging Markets Index
Portfolio - Class P2 | | | | | 24,835,656 | | | | | | 8.5 | | |
| 4,675,283 | | | Voya International Index
Portfolio - Class P2 | | | | | 57,131,964 | | | | | | 19.6 | | |
| 978,320 | | | Voya Russell Mid Cap Index
Portfolio - Class P2 | | | | | 14,410,659 | | | | | | 5.0 | | |
| 927,925 | | | Voya Russell Small Cap Index
Portfolio - Class P2 | | | | | 16,628,412 | | | | | | 5.7 | | |
| Shares | | | | | | Value | | | Percentage
of Net
Assets | |
| MUTUAL FUNDS: (continued) | |
| | | | Affiliated Investment Companies (continued) | |
| 535,067 | | | Voya U.S. Bond Index
Portfolio - Class P2 | | | | $ | 5,751,971 | | | | | | 2.0 | | |
| 7,572,032 | | | Voya U.S. Stock Index
Portfolio - Class P2 | | | | | 166,660,427 | | | | | | 57.3 | | |
| | | | Total Mutual Funds
(Cost $250,284,911) | | | | | 285,419,089 | | | | | | 98.1 | | |
| | | | Total Investments in
Securities
(Cost $255,960,897) | | | | $ | 290,788,500 | | | | | | 99.9 | | |
| | | | Assets in Excess of Other
Liabilities | | | | | 295,711 | | | | | | 0.1 | | |
| | | | Net Assets | | | | $ | 291,084,211 | | | | | | 100.0 | | |
| |
Fair Value Measurements^
The following is a summary of the fair valuations according to the inputs used as of December 31, 2021 in valuing the assets and liabilities:
| | | | Quoted Prices
in Active Markets
for Identical
Investments
(Level 1) | | | Significant
Other
Observable
Inputs
(Level 2) | | | Significant
Unobservable
Inputs
(Level 3) | | | Fair Value
at
December 31, 2021 | |
| Asset Table | | | | | | | | | | | | | | | | | | | | | | | | | |
| Investments, at fair value | | | | | | | | | | | | | | | | | | | | | | | | | |
| Exchange-Traded Funds | | | | $ | 5,369,411 | | | | | $ | — | | | | | $ | — | | | | | $ | 5,369,411 | | |
| Mutual Funds | | | | | 285,419,089 | | | | | | — | | | | | | — | | | | | | 285,419,089 | | |
| Total Investments, at fair value | | | | $ | 290,788,500 | | | | | $ | — | | | | | $ | — | | | | | $ | 290,788,500 | | |
^
See Note 2, “Significant Accounting Policies” in the Notes to Financial Statements for additional information.
Transactions with Affiliates
An investment of at least 5% of the voting securities of an issuer, or a company which is under common control with the issuer, results in that issuer becoming an affiliated person as defined by the 1940 Act.
See Accompanying Notes to Financial Statements
PORTFOLIO OF INVESTMENTS
| Voya Index Solution 2060 Portfolio | as of December 31, 2021 (continued) |
The following table provides transactions during the year ended December 31, 2021, where the following issuers were considered an affiliate:
| Issuer | | | Beginning
Fair Value
at 12/31/2020 | | | Purchases
at Cost | | | Sales
at Cost | | | Change in
Unrealized
Appreciation/
(Depreciation) | | | Ending
Fair Value
at 12/31/2021 | | | Investment
Income | | | Realized
Gains/
(Losses) | | | Net Capital
Gain
Distributions | |
| Voya Emerging Markets Index Portfolio - Class P2 | | | | $ | 20,774,263 | | | | | $ | 16,331,119 | | | | | $ | (8,566,974) | | | | | $ | (3,702,752) | | | | | $ | 24,835,656 | | | | | $ | 273,151 | | | | | $ | 2,457,291 | | | | | $ | — | | |
| Voya International Index Portfolio - Class P2 | | | | | 42,870,030 | | | | | | 20,452,069 | | | | | | (8,415,191) | | | | | | 2,225,056 | | | | | | 57,131,964 | | | | | | 1,098,169 | | | | | | 2,138,664 | | | | | | — | | |
| Voya Russell Mid Cap Index Portfolio - Class P2 | | | | | 9,766,176 | | | | | | 10,141,143 | | | | | | (5,314,160) | | | | | | (182,500) | | | | | | 14,410,659 | | | | | | 164,999 | | | | | | 1,231,569 | | | | | | 1,452,485 | | |
| Voya Russell Small Cap Index Portfolio - Class P2 | | | ��� | | 8,368,023 | | | | | | 17,541,913 | | | | | | (7,627,922) | | | | | | (1,653,602) | | | | | | 16,628,412 | | | | | | 107,945 | | | | | | 2,568,149 | | | | | | — | | |
| Voya U.S. Bond Index Portfolio - Class P2 | | | | | 6,841,994 | | | | | | 2,839,665 | | | | | | (3,721,338) | | | | | | (208,350) | | | | | | 5,751,971 | | | | | | 144,524 | | | | | | (141,835) | | | | | | 56,660 | | |
| Voya U.S. Stock Index Portfolio - Class P2 | | | | | 103,805,244 | | | | | | 68,505,155 | | | | | | (18,058,399) | | | | | | 12,408,427 | | | | | | 166,660,427 | | | | | | 1,689,272 | | | | | | 5,876,877 | | | | | | 11,200,637 | | |
| | | | | $ | 192,425,730 | | | | | $ | 135,811,064 | | | | | $ | (51,703,984) | | | | | $ | 8,886,279 | | | | | $ | 285,419,089 | | | | | $ | 3,478,060 | | | | | $ | 14,130,715 | | | | | $ | 12,709,782 | | |
The financial statements for the above mutual fund[s] can be found at www.sec.gov.
The effect of derivative instruments on the Portfolio’s Statement of Operations for the year ended December 31, 2021 was as follows:
| | | | Amount of Realized Gain or (Loss) on
Derivatives Recognized in Income | |
| Derivatives not accounted for as hedging instruments | | | Futures | |
| Equity contracts | | | | $ | 604,197 | | |
| Interest rate contracts | | | | | 119,871 | | |
| Total | | | | $ | 724,068 | | |
| | | | Change in Unrealized Appreciation or (Depreciation)
on Derivatives Recognized in Income | |
| Derivatives not accounted for as hedging instruments | | | Futures | |
| Equity contracts | | | | $ | (68,282) | | |
| Interest rate contracts | | | | | 4,223 | | |
| Total | | | | $ | (64,059) | | |
At December 31, 2021, the aggregate cost of securities and other investments and the composition of unrealized appreciation and depreciation of securities and other investments on a tax basis were:
| | Cost for federal income tax purposes was $257,586,173. | | |
| | Net unrealized appreciation consisted of: | | |
| | Gross Unrealized Appreciation | | | | $ | 35,780,321 | | |
| | Gross Unrealized Depreciation | | | | | (2,577,994) | | |
| | Net Unrealized Appreciation | | | | $ | 33,202,327 | | |
See Accompanying Notes to Financial Statements
PORTFOLIO OF INVESTMENTS
| Voya Index Solution 2065 Portfolio | as of December 31, 2021 |
| Shares | | | Value | | | Percentage
of Net
Assets | |
| EXCHANGE-TRADED FUNDS: 1.7% | |
| 4,783 | | | iShares MSCI EAFE
Small-Cap ETF | | | | $ | 349,590 | | | | | | 1.7 | | |
| | | | Total Exchange-Traded Funds
(Cost $369,550) | | | | | 349,590 | | | | | | 1.7 | | |
| MUTUAL FUNDS: 98.3% | |
| | | | Affiliated Investment Companies: 98.3% | |
| 135,249 | | | Voya Emerging Markets Index
Portfolio - Class P2 | | | | | 1,817,749 | | | | | | 8.6 | | |
| 344,971 | | | Voya International Index
Portfolio - Class P2 | | | | | 4,215,542 | | | | | | 19.9 | | |
| 71,311 | | | Voya Russell Mid Cap Index
Portfolio - Class P2 | | | | | 1,050,405 | | | | | | 4.9 | | |
| Shares | | | Value | | | Percentage
of Net
Assets | |
| MUTUAL FUNDS: (continued) | |
| | | | Affiliated Investment Companies (continued) | |
| 67,689 | | | Voya Russell Small Cap Index
Portfolio - Class P2 | | | | $ | 1,212,985 | | | | | | 5.7 | | |
| 38,968 | | | Voya U.S. Bond Index
Portfolio - Class P2 | | | | | 418,910 | | | | | | 2.0 | | |
| 550,611 | | | Voya U.S. Stock Index
Portfolio - Class P2 | | | | | 12,118,958 | | | | | | 57.2 | | |
| | | | Total Mutual Funds
(Cost $20,084,764) | | | | | 20,834,549 | | | | | | 98.3 | | |
| | | | Total Investments in
Securities
(Cost $20,454,314) | | | | $ | 21,184,139 | | | | | | 100.0 | | |
| | | | Assets in Excess of
Other Liabilities | | | | | 3,466 | | | | | | 0.0 | | |
| | | | Net Assets | | | | $ | 21,187,605 | | | | | | 100.0 | | |
| |
Fair Value Measurements^
The following is a summary of the fair valuations according to the inputs used as of December 31, 2021 in valuing the assets and liabilities:
| | | | Quoted Prices
in Active Markets
for Identical
Investments
(Level 1) | | | Significant
Other
Observable
Inputs
(Level 2) | | | Significant
Unobservable
Inputs
(Level 3) | | | Fair Value
at
December 31, 2021 | |
| Asset Table | | | | | | | | | | | | | | | | | | | | | | | | | |
| Investments, at fair value | | | | | | | | | | | | | | | | | | | | | | | | | |
| Exchange-Traded Funds | | | | $ | 349,590 | | | | | $ | — | | | | | $ | — | | | | | $ | 349,590 | | |
| Mutual Funds | | | | | 20,834,549 | | | | | | — | | | | | | — | | | | | | 20,834,549 | | |
| Total Investments, at fair value | | | | $ | 21,184,139 | | | | | $ | — | | | | | $ | — | | | | | $ | 21,184,139 | | |
^
See Note 2, “Significant Accounting Policies” in the Notes to Financial Statements for additional information.
Transactions with Affiliates
An investment of at least 5% of the voting securities of an issuer, or a company which is under common control with the issuer, results in that issuer becoming an affiliated person as defined by the 1940 Act.
The following table provides transactions during the year ended December 31, 2021, where the following issuers were considered an affiliate:
| Issuer | | | Beginning
Fair Value
at 12/31/2020 | | | Purchases at
Cost | | | Sales
at Cost | | | Change in
Unrealized
Appreciation/
(Depreciation) | | | Ending
Fair Value
at 12/31/2021 | | | Investment
Income | | | Realized
Gains/
(Losses) | | | Net Capital
Gain
Distributions | |
| Voya Emerging Markets Index Portfolio - Class P2 | | | | $ | 477,055 | | | | | $ | — | | | | | $ | 1,515,551 | | | | | $ | (174,857) | | | | | $ | 1,817,749 | | | | | $ | 12,009 | | | | | $ | 60,432 | | | | | $ | — | | |
| Voya International Index Portfolio - Class P2 | | | | | 1,026,959 | | | | | | — | | | | | | 3,166,093 | | | | | | 22,490 | | | | | | 4,215,542 | | | | | | 48,348 | | | | | | 140,477 | | | | | | — | | |
| Voya Russell Mid Cap Index Portfolio - Class P2 | | | | | 224,341 | | | | | | — | | | | | | 833,107 | | | | | | (7,043) | | | | | | 1,050,405 | | | | | | 7,276 | | | | | | 50,697 | | | | | | 64,047 | | |
| Voya Russell Small Cap Index Portfolio - Class P2 | | | | | 277,598 | | | | | | 1 | | | | | | 997,849 | | | | | | (62,463) | | | | | | 1,212,985 | | | | | | 4,748 | | | | | | 70,776 | | | | | | — | | |
| Voya U.S. Bond Index Portfolio - Class P2 | | | | | 87,068 | | | | | | — | | | | | | 340,438 | | | | | | (8,596) | | | | | | 418,910 | | | | | | 5,366 | | | | | | (855) | | | | | | 2,889 | | |
| Voya U.S. Stock Index Portfolio - Class P2 | | | | | 2,340,728 | | | | | | — | | | | | | 9,197,551 | | | | | | 580,679 | | | | | | 12,118,958 | | | | | | 121,908 | | | | | | 243,013 | | | | | | 574,642 | | |
| | | | | $ | 4,433,749 | | | | | $ | 1 | | | | | $ | 16,050,589 | | | | | $ | 350,210 | | | | | $ | 20,834,549 | | | | | $ | 199,655 | | | | | $ | 564,540 | | | | | $ | 641,578 | | |
See Accompanying Notes to Financial Statements
PORTFOLIO OF INVESTMENTS
| Voya Index Solution 2065 Portfolio | as of December 31, 2021 (continued) |
The financial statements for the above mutual fund[s] can be found at www.sec.gov.
At December 31, 2021, the aggregate cost of securities and other investments and the composition of unrealized appreciation and depreciation of securities and other investments on a tax basis were:
| | Cost for federal income tax purposes was $20,470,024. | | | | | | | |
| | Net unrealized appreciation consisted of: | | | | | | | |
| | Gross Unrealized Appreciation | | | | $ | 897,923 | | |
| | Gross Unrealized Depreciation | | | | | (183,808) | | |
| | Net Unrealized Appreciation | | | | $ | 714,115 | | |
See Accompanying Notes to Financial Statements
TAX INFORMATION (Unaudited)
Dividends and distributions paid during the year ended December 31, 2021 were as follows:
| Portfolio Name | | | Type | | | Per Share
Amount | |
| Voya Index Solution Income Portfolio | |
| Class ADV | | | NII | | | | $ | 0.1615 | | |
| Class I | | | NII | | | | $ | 0.2123 | | |
| Class S | | | NII | | | | $ | 0.1836 | | |
| Class S2 | | | NII | | | | $ | 0.1855 | | |
| Class Z | | | NII | | | | $ | 0.2180 | | |
| All Classes | | | STCG | | | | $ | 0.0498 | | |
| All Classes | | | LTCG | | | | $ | 0.2385 | | |
| Voya Index Solution 2025 Portfolio | |
| Class ADV | | | NII | | | | $ | 0.2150 | | |
| Class I | | | NII | | | | $ | 0.2779 | | |
| Class S | | | NII | | | | $ | 0.2492 | | |
| Class S2 | | | NII | | | | $ | 0.2335 | | |
| Class Z | | | NII | | | | $ | 0.2840 | | |
| All Classes | | | STCG | | | | $ | 0.0942 | | |
| All Classes | | | LTCG | | | | $ | 0.4584 | | |
| Voya Index Solution 2030 Portfolio | |
| Class ADV | | | NII | | | | $ | 0.2857 | | |
| Class I | | | NII | | | | $ | 0.3542 | | |
| Class S | | | NII | | | | $ | 0.3176 | | |
| Class S2 | | | NII | | | | $ | 0.3155 | | |
| Class Z | | | NII | | | | $ | 0.3679 | | |
| All Classes | | | STCG | | | | $ | 0.1114 | | |
| All Classes | | | LTCG | | | | $ | 0.4755 | | |
| Voya Index Solution 2035 Portfolio | |
| Class ADV | | | NII | | | | $ | 0.1938 | | |
| Class I | | | NII | | | | $ | 0.2609 | | |
| Class S | | | NII | | | | $ | 0.2301 | | |
| Class S2 | | | NII | | | | $ | 0.2204 | | |
| Class Z | | | NII | | | | $ | 0.2688 | | |
| All Classes | | | STCG | | | | $ | 0.1125 | | |
| All Classes | | | LTCG | | | | $ | 0.4931 | | |
| Voya Index Solution 2040 Portfolio | |
| Class ADV | | | NII | | | | $ | 0.2526 | | |
| Class I | | | NII | | | | $ | 0.3356 | | |
| Class S | | �� | NII | | | | $ | 0.2956 | | |
| Class S2 | | | NII | | | | $ | 0.2877 | | |
| Class Z | | | NII | | | | $ | 0.3551 | | |
| All Classes | | | STCG | | | | $ | 0.0804 | | |
| All Classes | | | LTCG | | | | $ | 0.5569 | | |
| Portfolio Name | | | Type | | | Per Share
Amount | |
| Voya Index Solution 2045 Portfolio | |
| Class ADV | | | NII | | | | $ | 0.1858 | | |
| Class I | | | NII | | | | $ | 0.2520 | | |
| Class S | | | NII | | | | $ | 0.2221 | | |
| Class S2 | | | NII | | | | $ | 0.2114 | | |
| Class Z | | | NII | | | | $ | 0.2643 | | |
| All Classes | | | STCG | | | | $ | 0.0862 | | |
| All Classes | | | LTCG | | | | $ | 0.5335 | | |
| Voya Index Solution 2050 Portfolio | |
| Class ADV | | | NII | | | | $ | 0.2345 | | |
| Class I | | | NII | | | | $ | 0.3157 | | |
| Class S | | | NII | | | | $ | 0.2760 | | |
| Class S2 | | | NII | | | | $ | 0.2514 | | |
| Class Z | | | NII | | | | $ | 0.3418 | | |
| All Classes | | | STCG | | | | $ | 0.0477 | | |
| All Classes | | | LTCG | | | | $ | 0.4953 | | |
| Voya Index Solution 2055 Portfolio | |
| Class ADV | | | NII | | | | $ | 0.2080 | | |
| Class I | | | NII | | | | $ | 0.2894 | | |
| Class S | | | NII | | | | $ | 0.2542 | | |
| Class S2 | | | NII | | | | $ | 0.2483 | | |
| Class Z | | | NII | | | | $ | 0.3162 | | |
| All Classes | | | STCG | | | | $ | 0.0687 | | |
| All Classes | | | LTCG | | | | $ | 0.5772 | | |
| Voya Index Solution 2060 Portfolio | |
| Class ADV | | | NII | | | | $ | 0.1299 | | |
| Class I | | | NII | | | | $ | 0.2002 | | |
| Class S | | | NII | | | | $ | 0.1662 | | |
| Class S2 | | | NII | | | | $ | 0.1508 | | |
| Class Z | | | NII | | | | $ | 0.2175 | | |
| All Classes | | | STCG | | | | $ | 0.0573 | | |
| All Classes | | | LTCG | | | | $ | 0.3155 | | |
| Voya Index Solution 2065 Portfolio | |
| Class ADV | | | NII | | | | $ | 0.0804 | | |
| Class I | | | NII | | | | $ | 0.1316 | | |
| Class S | | | NII | | | | $ | 0.1091 | | |
| Class S2 | | | NII | | | | $ | 0.0934 | | |
| Class Z | | | NII | | | | $ | 0.1411 | | |
| All Classes | | | STCG | | | | $ | 0.2712 | | |
| All Classes | | | LTCG | | | | $ | 0.4921 | | |
NII – Net investment income
STCG – Short-term capital gain
LTCG – Long-term capital gain
TAX INFORMATION (Unaudited) (continued)
Of the ordinary distributions made during the year ended December 31, 2021, the following percentages qualify for the dividends received deduction (DRD) available to corporate shareholders:
| | Voya Index Solution Income Portfolio | | | | | 13.95% | | |
| | Voya Index Solution 2025 Portfolio | | | | | 21.49% | | |
| | Voya Index Solution 2030 Portfolio | | | | | 23.82% | | |
| | Voya Index Solution 2035 Portfolio | | | | | 27.11% | | |
| | Voya Index Solution 2040 Portfolio | | | | | 33.56% | | |
| | Voya Index Solution 2045 Portfolio | | | | | 34.92% | | |
| | Voya Index Solution 2050 Portfolio | | | | | 40.76% | | |
| | Voya Index Solution 2055 Portfolio | | | | | 40.09% | | |
| | Voya Index Solution 2060 Portfolio | | | | | 39.25% | | |
| | Voya Index Solution 2065 Portfolio | | | | | 21.76% | | |
The Portfolios designate the following amounts of long-term capital gain distributions as 20% rate long-term capital gain dividends under Internal Revenue Code Section 852(b)(3)(C):
| | Voya Index Solution Income Portfolio | | | | $ | 19,139,561 | | |
| | Voya Index Solution 2025 Portfolio | | | | | 45,757,104 | | |
| | Voya Index Solution 2030 Portfolio | | | | | 21,932,792 | | |
| | Voya Index Solution 2035 Portfolio | | | | | 48,479,927 | | |
| | Voya Index Solution 2040 Portfolio | | | | | 19,778,057 | | |
| | Voya Index Solution 2045 Portfolio | | | | | 36,448,775 | | |
| | Voya Index Solution 2050 Portfolio | | | | | 12,281,658 | | |
| | Voya Index Solution 2055 Portfolio | | | | | 16,300,247 | | |
| | Voya Index Solution 2060 Portfolio | | | | | 4,700,425 | | |
| | Voya Index Solution 2065 Portfolio | | | | | 759,563 | | |
The Regulated Investment Company Modernization Act of 2010 allows qualified fund-of-funds to elect to pass through the ability to take foreign tax credits (or deductions) to the extent that foreign taxes are passed through from underlying funds.
A qualified fund-of-funds is a regulated investment company that has at least 50% of the value of its total assets invested in other regulated investment companies at the end of each quarter of the taxable year. Pursuant to Section 853 of the Internal Revenue Code, the Portfolios designate the following amounts as foreign taxes paid for the year ended December 31, 2021:
| | | | Creditable
Foreign Taxes
Paid | | | Per Share
Amount | | | Portion of Ordinary Income
Distribution Derived from
Foreign Sourced Income* | |
| Voya Index Solution Income Portfolio | | | | $ | 155,374 | | | | | $ | 0.0020 | | | | | | 3.37% | | |
| Voya Index Solution 2025 Portfolio | | | | | 418,871 | | | | | | 0.0040 | | | | | | 13.04% | | |
| Voya Index Solution 2030 Portfolio | | | | | 355,290 | | | | | | 0.0072 | | | | | | 18.66% | | |
| Voya Index Solution 2035 Portfolio | | | | | 669,923 | | | | | | 0.0064 | | | | | | 23.87% | | |
| Voya Index Solution 2040 Portfolio | | | | | 397,525 | | | | | | 0.0104 | | | | | | 22.89% | | |
| Voya Index Solution 2045 Portfolio | | | | | 609,588 | | | | | | 0.0083 | | | | | | 25.98% | | |
| Voya Index Solution 2050 Portfolio | | | | | 321,477 | | | | | | 0.0119 | | | | | | 27.87% | | |
| Voya Index Solution 2055 Portfolio | | | | | 335,923 | | | | | | 0.0110 | | | | | | 24.20% | | |
| Voya Index Solution 2060 Portfolio | | | | | 157,406 | | | | | | 0.0094 | | | | | | 23.49% | | |
| Voya Index Solution 2065 Portfolio | | | | | 11,515 | | | | | | 0.0070 | | | | | | 11.32% | | |
*
None of the Portfolios listed above derived any income from ineligible foreign sources as defined under Section 901(j) of the Internal Revenue Code.
TAX INFORMATION (Unaudited) (continued)
Foreign taxes paid or withheld must be included in taxable income with an offsetting deduction from gross income or as a credit for taxes paid to foreign governments. Shareholders are strongly advised to consult their own tax advisors regarding the appropriate treatment of foreign taxes paid.
Above figures may differ from those cited elsewhere in this report due to differences in the calculation of income and gains under U.S. generally accepted accounting principles (book) purposes and Internal Revenue Service (tax) purposes.
Shareholders are strongly advised to consult their own tax advisers with respect to the tax consequences of their investments in the Portfolios. In January, shareholders, excluding corporate shareholders, receive an IRS 1099-DIV regarding the federal tax status of the dividends and distributions they received in the calendar year.
DIRECTOR AND OFFICER INFORMATION (Unaudited)
The business and affairs of the Company are managed under the direction of the Board. A Director, who is not an interested person of the Company, as defined in the 1940 Act, is an independent director (“Independent Director”). The Directors and Officers of the Company are listed below. The Statement of Additional Information includes additional information about Directors of the Company and is available, without charge, upon request at (800) 262-3862.
| Name, Address and Age | | | Position(s)
Held with the
Company | | | Term of Office and
Length of
Time Served(1) | | | Principal
Occupation(s) –
During the Past 5 Years | | | Number of
funds in Fund
Complex
Overseen by
Director(2) | | | Other Board Positions
Held by Director | |
| Independent Directors: | | | | | | | | | | | | | | | | |
Colleen D. Baldwin
7337 East Doubletree Ranch Rd.
Suite 100
Scottsdale, Arizona 85258
Age: 61 | | | Director Chairperson | | | November 2007 –
Present January 2020 –
Present | | | President, Glantuam Partners, LLC, a business consulting firm (January 2009 — Present). | | | 131 | | | Dentaquest (February 2014 – Present); RSR Partners, Inc. (2016 – Present). | |
John V. Boyer
7337 East Doubletree Ranch Rd.
Suite 100
Scottsdale, Arizona 85258
Age: 68 | | | Director | | | November 1997 –
Present | | | Retired. Formerly, President and Chief Executive Officer, Bechtler Arts Foundation, an arts and education foundation (January 2008 – December 2019). | | | 131 | | | None. | |
Patricia W. Chadwick
7337 East Doubletree Ranch Rd.
Suite 100
Scottsdale, Arizona 85258
Age: 73 | | | Director | | | January 2006 –
Present | | | Consultant and President, Ravengate Partners LLC, a consulting firm that provides advice regarding financial markets and the global economy (January 2000 – Present). | | | 131 | | | Wisconsin Energy Corporation (June 2006 – Present); The Royce Funds (22 funds) (December 2009 – Present); and AMICA Mutual Insurance Company (1992 – Present). | |
Martin J. Gavin
7337 East Doubletree Ranch Rd. Suite 100
Scottsdale, AZ 85258
Age: 71 | | | Director | | | August 2015 –
Present | | | Retired. | | | 131 | | | None. | |
Joseph E. Obermeyer
7337 East Doubletree Ranch Rd.
Suite 100
Scottsdale, Arizona 85258
Age: 64 | | | Director | | | May 2013 – Present | | | President, Obermeyer & Associates, Inc., a provider of financial and economic consulting services (November 1999 –
Present). | | | 131 | | | None. | |
Sheryl K. Pressler
7337 East Doubletree Ranch Rd.
Suite 100
Scottsdale, Arizona 85258
Age: 71 | | | Director | | | January 2006 –
Present | | | Consultant (May 2001 – Present). | | | 131 | | | Centerra Gold Inc. (May 2008 – Present). | |
Christopher P. Sullivan
7337 East Doubletree Ranch Rd.
Suite 100
Scottsdale, Arizona 85258
Age: 68 | | | Director | | | October 2015 –
Present | | | Retired. | | | 131 | | | None. | |
DIRECTOR AND OFFICER INFORMATION (Unaudited) (continued)
| Name, Address and Age | | | Position(s)
Held with the
Company | | | Term of Office and
Length of
Time Served(1) | | | Principal
Occupation(s) –
During the Past 5 Years | | | Number of
funds in Fund
Complex
Overseen by
Director(2) | | | Other Board Positions
Held by Director | |
| Director who is an “interested person”: | | | | | | | | | | | | | |
Dina Santoro
230 Park Avenue
New York, New York 10169
Age: 48 | | | Director | | | July 2018 – Present | | | President, Voya Investments, LLC and Voya Capital, LLC (March 2018 – Present); Senior Vice President, Voya Investments Distributor, LLC (April 2018 – Present); Chief Operating Officer and Senior Managing Director, Voya Investment Management (January 2022 – Present). Formerly, Senior Managing Director, Head of Product and Marketing Strategy, Voya Investment Management (September 2017 – January 2022); Managing Director, Quantitative Management Associates, LLC (January 2004 – August 2017). | | | 131 | | | Voya Investments, LLC, Voya Capital, LLC, and Voya Funds Services, LLC (March 2018 – Present); Voya Investments Distributor, LLC (April 2018 – Present). | |
(1)
Directors serve until their successors are duly elected and qualified. The tenure of each Director who is not an “interested person” as defined in the 1940 Act, of each Portfolio (“Independent Director”) is subject to the Board’s retirement policy which states that each duly elected or appointed Independent Director shall retire from and cease to be a member of the Board of Directors at the close of business on December 31 of the calendar year in which the Independent Director attains the age of 75. A majority vote of the Board’s other Independent Directors may extend the retirement date of an Independent Director if the retirement would trigger a requirement to hold a meeting of shareholders of the Company under applicable law, whether for the purposes of appointing a successor to the Independent Director or otherwise comply under applicable law, in which case the extension would apply until such time as the shareholder meeting can be held or is no longer required (as determined by a vote of a majority of the other Independent Directors).
(2)
For the purposes of this table, “Fund Complex” means the Voya family of funds including the following investment companies: Voya Asia Pacific High Dividend Equity Income Fund; Voya Balanced Portfolio, Inc.; Voya Emerging Markets High Dividend Equity Fund; Voya Equity Trust; Voya Funds Trust; Voya Global Advantage and Premium Opportunity Fund; Voya Global Equity Dividend and Premium Opportunity Fund; Voya Government Money Market Portfolio; Voya Infrastructure, Industrials and Materials Fund; Voya Intermediate Bond Portfolio; Voya Investors Trust; Voya Mutual Funds; Voya Partners, Inc.; Voya Senior Income Fund; Voya Separate Portfolios Trust; Voya Strategic Allocation Portfolios, Inc.; Voya Variable Funds; Voya Variable Insurance Trust; Voya Variable Portfolios, Inc.; and Voya Variable Products Trust. The number of funds in the Fund Complex is as of January 31, 2022.
DIRECTOR AND OFFICER INFORMATION (Unaudited) (continued)
| Name, Address and Age | | | Position(s) Held With
the Company | | | Term of Office and
Length of Time Served(1) | | | Principal Occupation(s) – During the Past 5 Years | |
Michael Bell
One Orange Way
Windsor, Connecticut 06095
Age: 53 | | | Chief Executive Officer | | | March 2018 – Present | | | Chief Executive Officer and Director, Voya Investments, LLC, Voya Capital, LLC, and Voya Funds Services, LLC (March 2018 – Present); Senior Vice President, Voya Investments Distributor, LLC (March 2020 – Present); Chief Financial Officer, Voya Investment Management (September 2014 – Present). Formerly, Senior Vice President and Chief Financial Officer, Voya Investments Distributor, LLC (September 2019 – March 2020); Senior Vice President and Treasurer, Voya Investments Distributor, LLC (November 2015 – September 2019); Senior Vice President, Chief Financial Officer and Treasurer, Voya Investments, LLC (November 2015 – March 2018). | |
Dina Santoro
230 Park Avenue
New York, New York 10169
Age: 48 | | | President | | | March 2018 – Present | | | President and Director, Voya Investments, LLC and Voya Capital, LLC (March 2018 – Present); Director, Voya Funds Services, LLC (March 2018 – Present); Director and Senior Vice President, Voya Investments Distributor, LLC (April 2018 – Present); Chief Operating Officer and Senior Managing Director, Voya Investment Management (January 2022 – Present). Formerly, Senior Managing Director, Head of Product and Marketing Strategy, Voya Investment Management (September 2017 – January 2022); Managing Director, Quantitative Management Associates, LLC (January 2004 –
August 2017). | |
Jonathan Nash
230 Park Avenue
New York, New York 10169
Age: 54 | | | Executive Vice President Chief Investment Risk Officer | | | March 2020 – Present March 2020 – Present | | | Executive Vice President and Chief Investment Risk Officer, Voya Investments, LLC (March 2020 – Present) and Senior Vice President, Investment Risk Management, Voya Investment Management (March 2017 – Present). Formerly, Vice President, Voya Investments, LLC (September 2018 – March 2020); Consultant, DA Capital LLC (January 2016 – March 2017). | |
James M. Fink
5780 Powers Ferry Road NW
Atlanta, Georgia 30327
Age: 63 | | | Executive Vice President | | | March 2018 – Present | | | Managing Director, Voya Investments, LLC, Voya Capital, LLC, and Voya Funds Services, LLC (March 2018 – Present) and Senior Vice President, Voya Investments Distributor, LLC (April 2018 – Present); Chief Administrative Officer, Voya Investment Management (September 2017 – Present). Formerly, Managing Director, Operations, Voya Investment Management (March 1999 – September 2017). | |
Kevin M. Gleason
7337 East Doubletree Ranch Rd.
Suite 100
Scottsdale, Arizona 85258
Age: 55 | | | Chief Compliance Officer | | | February 2012 – Present | | | Senior Vice President, Voya Investment Management and Chief Compliance Officer, Voya Family of Funds (February 2012 – Present). | |
Todd Modic
7337 East Doubletree Ranch Rd.
Suite 100
Scottsdale, Arizona 85258
Age:54 | | | Senior Vice President, Chief/Principal Financial Officer and Assistant Secretary | | | March 2005 – Present | | | President, Voya Funds Services, LLC (March 2018 – Present) and Senior Vice President, Voya Investments, LLC (April 2005 – Present). | |
Kimberly A. Anderson
7337 East Doubletree Ranch Rd.
Suite 100
Scottsdale, Arizona 85258
Age: 57 | | | Senior Vice President | | | January 2005 – Present | | | Senior Vice President, Voya Investments, LLC (September 2003 – Present). | |
DIRECTOR AND OFFICER INFORMATION (Unaudited) (continued)
| Name, Address and Age | | | Position(s) Held With
the Company | | | Term of Office and
Length of Time Served(1) | | | Principal Occupation(s) – During the Past 5 Years | |
Micheline S. Faver
7337 East Doubletree Ranch Rd.
Suite 100
Scottsdale, Arizona 85258
Age: 44 | | | Senior Vice President | | | September 2020 – Present | | | Senior Vice President, Head of Fund Compliance and Chief Compliance Officer, Voya Investments, LLC (March 2021 – Present). Formerly, Vice President, Head of Fund Compliance and Chief Compliance Officer, Voya Investments, LLC (June 2016 – March 2021). | |
Robert Terris
5780 Powers Ferry Road NW
Atlanta, Georgia 30327
Age: 51 | | | Senior Vice President | | | May 2006 – Present | | | Senior Vice President, Voya Investments Distributor, LLC (April 2018 – Present); Senior Vice President, Head of Investment Services, Voya Investments, LLC (April 2018 – Present) and Voya Funds Services, LLC (March 2006 – Present). Formerly, Senior Vice President, Head of Division Operations, Voya Investments, LLC (October 2015 – April 2018). | |
Fred Bedoya
7337 East Doubletree Ranch Rd.
Suite 100
Scottsdale, Arizona 85258
Age: 49 | | | Vice President Treasurer | | | September 2012 – Present | | | Vice President, Voya Investments, LLC (October 2015 – Present) and Voya Funds Services, LLC (July 2012 – Present). | |
Maria M. Anderson
7337 East Doubletree Ranch Rd.
Suite 100
Scottsdale, Arizona 85258
Age: 63 | | | Vice President | | | January 2005 – Present | | | Vice President, Voya Investments, LLC (October 2015 – Present) and Voya Funds Services, LLC (September 2004 – Present). | |
Sara M. Donaldson
7337 East Doubletree Ranch Rd.
Suite 100
Scottsdale, Arizona 85258
Age: 62 | | | Vice President | | | September 2014 – Present | | | Vice President, Voya Investments, LLC (October 2015 – Present). | |
Robyn L. Ichilov
7337 East Doubletree Ranch Rd.
Suite 100
Scottsdale, Arizona 85258
Age: 54 | | | Vice President | | | January 2005 – Present | | | Vice President, Voya Funds Services, LLC (November 1995 – Present) and Voya Investments, LLC (August 1997 – Present). | |
Jason Kadavy
7337 East Doubletree Ranch Rd.
Suite 100
Scottsdale, Arizona 85258
Age: 45 | | | Vice President | | | September 2012 – Present | | | Vice President, Voya Investments, LLC (October 2015 – Present) and Voya Funds Services, LLC (July 2007 – Present). | |
Andrew K. Schlueter
7337 East Doubletree Ranch Rd.
Suite 100
Scottsdale, Arizona 85258
Age: 45 | | | Vice President | | | March 2018 – Present | | | Vice President, Voya Investments Distributor, LLC (April 2018 – Present); Vice President, Voya Investments, LLC and Voya Funds Services, LLC (March 2018 – Present); Vice President, Head of Mutual Fund Operations, Voya Investment Management (February 2018 – Present). Formerly, Vice President, Voya Investment Management (March 2014 – February 2018). | |
Craig Wheeler
7337 East Doubletree Ranch Rd.
Suite 100
Scottsdale, Arizona 85258
Age: 52 | | | Vice President | | | May 2013 – Present | | | Vice President – Director of Tax, Voya Investments, LLC (October 2015 – Present). | |
Monia Piacenti
One Orange Way
Windsor, Connecticut 06095
Age: 45 | | | Anti-Money Laundering Officer | | | June 2018 – Present | | | Anti-Money Laundering Officer, Voya Investments Distributor, LLC, Voya Investment Management and Voya Investment Management Trust Co. (June 2018 – Present); Compliance Consultant, Voya Financial, Inc. (January 2019 – Present). Formerly, Senior Compliance Officer, Voya Investment Management (December 2009 – December 2018). | |
DIRECTOR AND OFFICER INFORMATION (Unaudited) (continued)
| Name, Address and Age | | | Position(s) Held With
the Company | | | Term of Office and
Length of Time Served(1) | | | Principal Occupation(s) – During the Past 5 Years | |
Joanne F. Osberg
7337 East Doubletree Ranch Rd.
Suite 100
Scottsdale, Arizona 85258
Age: 40 | | | Secretary | | | September 2020 – Present | | | Vice President and Senior Counsel, Voya Investment Management – Mutual Fund Legal Department (September 2020 – Present). Formerly, Vice President, Counsel, Voya Investment Management – Mutual Fund Legal Department (January 2013 – September 2020). | |
Paul A. Caldarelli
7337 East Doubletree Ranch Rd.
Suite 100
Scottsdale, Arizona 85258
Age: 70 | | | Assistant Secretary | | | June 2010 – Present | | | Vice President and Senior Counsel, Voya Investment Management – Mutual Fund Legal Department (March 2010 – Present). | |
(1)
The Officers hold office until the next annual meeting of the Board of Directors and until their successors shall have been elected and qualified.
ADVISORY AND SUB-ADVISORY CONTRACT APPROVAL DISCUSSION (Unaudited)
BOARD CONSIDERATION AND APPROVAL OF INVESTMENT MANAGEMENT CONTRACTS AND SUB-ADVISORY CONTRACTS
At a meeting held on November 18, 2021, the Board of Directors (“Board”) of Voya Partners, Inc. (the “Company”), including a majority of the Board members who have no direct or indirect interest in the investment management and sub-advisory contracts, and who are not “interested persons” of Voya Index Solution Income Portfolio, Voya Index Solution 2025 Portfolio, Voya Index Solution 2030 Portfolio, Voya Index Solution 2035 Portfolio, Voya Index Solution 2040 Portfolio, Voya Index Solution 2045 Portfolio, Voya Index Solution 2050 Portfolio, Voya Index Solution 2055 Portfolio, Voya Index Solution 2060 Portfolio, and Voya Index Solution 2065 Portfolio, each a series of the Company (the “Portfolios”), as such term is defined under the Investment Company Act of 1940, as amended (the “Independent Directors”), considered and approved the renewal of the investment management contracts (the “Management Contracts”) between Voya Investments, LLC (the “Manager”) and the Company, on behalf of the Portfolios, and the sub-advisory contracts (the “Sub-Advisory Contracts,” and together with the Management Contracts, the “Contracts”) with Voya Investment Management Co. LLC, the sub-adviser to each Portfolio (the “Sub-Adviser”) for an additional one year period ending November 30, 2022.
In addition to the Board meeting on November 18, 2021, the Independent Directors also held meetings outside the presence of representatives of the Manager and Sub-Adviser (collectively, such persons are referred to herein as “management”) on October 7-8, 2021, and November 16, 2021. At those meetings, the Board members reviewed and considered materials related to the proposed continuance of the Contracts that they had requested and believed to be relevant to the renewal of the Contracts in light of their own business judgment and the legal advice furnished to them by K&L Gates LLP, their independent legal counsel. The Board also considered information furnished to it throughout the year at meetings of the Board and its committees, including information regarding performance, expenses, and other relevant matters. While the Board considered the renewal of the management contracts and sub-advisory contracts for all of the applicable investment companies in the Voya family of funds at the same meetings, the Board considered each Voya fund’s investment management and sub-advisory relationships separately.
The Board has established a Contracts Committee and two Investment Review Committees (the “IRCs”), each of which includes only Independent Directors as members. The Contracts Committee meets several times throughout the year to provide oversight with respect to the management and
sub-advisory contracts approval and renewal process for the Voya funds, among other functions, and each IRC meets several times throughout the year with respect to each Voya fund (assigned to that IRC) to provide oversight regarding the investment performance of the sub-advisers, as well as the Manager’s role in monitoring the sub-advisers.
The Contracts Committee oversees, and annually recommends Board approval of updates to, a methodology guide for the Voya funds (“Methodology Guide”), which sets out a framework pursuant to which the Independent Directors request, and management provides, certain information that the Independent Directors deem to be important or potentially relevant. The Independent Directors retain the services of an independent consultant with experience in the mutual fund industry to assist the Contracts Committee in developing and recommending to the Board: (1) a selected peer group of investment companies for each Portfolio (“Selected Peer Group”) based on that Portfolio’s particular attributes, such as fund type and size, fund category (as determined by Morningstar, Inc., an independent provider of mutual fund data (“Morningstar”)), sales channels and structure and the Portfolio share class being compared to the Selected Peer Group; and (2) updates to the Methodology Guide with respect to the content and format of various data prepared in connection with the renewal process, including, but not limited to, investment performance, fee structure, and expense information. In addition, the Independent Directors periodically have retained an independent firm to test and verify the accuracy of certain information presented to the Board for a representative sample of the Voya funds.
The Manager or Sub-Adviser may not have been able to, or opted not to, provide information in response to certain information requests, in which case the Board conducted its evaluation based on the information that was provided. In such cases, the Board determined that the omission of any such information was not material to its considerations. Additionally, the Board considered the impact of significant market volatility that occurred during and after the period for which information was requested in conducting its evaluation of the Manager and Sub-Adviser.
Provided below is an overview of certain material factors that the Board considered at its meetings regarding the renewal of the Contracts and the compensation to be paid thereunder. The Board members did not identify any particular information or factor that was most relevant to its consideration, and each Board member may have accorded different weight to the various factors in reaching his or her conclusions with respect to each Portfolio’s investment management and sub-advisory arrangements.
ADVISORY AND SUB-ADVISORY CONTRACT APPROVAL DISCUSSION (Unaudited) (continued)
Nature, Extent and Quality of Services
The Manager oversees, subject to the authority of the Board, and is responsible for the provision of, all investment advisory and portfolio management services for the Portfolios, but may delegate certain of these responsibilities to one or more sub-advisers. In addition, the Manager provides administrative services reasonably necessary for the operation of the Portfolios as set forth in the Management Contracts, including oversight of the Portfolios’ operations and risk management and the oversight of their various other service providers.
The Board considered the “manager-of-managers” structure of the Voya funds that has been developed by the Manager pursuant to which the Manager selects, subject to the Board’s approval, sub-advisers to provide day-to-day management services to all or a portion of each Voya fund. The Board recognized that the Manager is responsible for monitoring the Sub-Adviser’s investment program, performance, developments, ongoing operations, and compliance with applicable regulations and investment policies and restrictions with respect to the Portfolios under this manager-of-managers arrangement. The Board also considered the techniques and resources that the Manager has developed to provide this ongoing due diligence and oversight with respect to the sub-advisers and to recommend appropriate changes in investment strategies, sub-advisers, or allocation among sub-advisers in an effort to improve a Voya fund’s performance. In connection with the Manager’s performance of these duties, the Board considered that the Manager has developed an oversight process formulated by its Manager Research & Selection Group that reviews, among other matters, performance data, the Sub-Adviser’s management team, portfolio data and attribution analysis related to the Sub-Adviser through various means, including, but not limited to, in-person meetings, on-site or virtual visits, and telephonic meetings with the Sub-Adviser.
Further, the Board considered periodic compliance reports it receives from the Company’s Chief Compliance Officer evaluating whether the regulatory compliance systems and procedures of the Manager and Sub-Adviser are reasonably designed to ensure compliance with the federal securities laws and whether the investment policies and restrictions for each Portfolio are consistently complied with, and other periodic reports covering related matters.
The Board considered the portfolio management team assigned by the Sub-Adviser to the Portfolios and the level of resources committed to the Portfolios (and other relevant funds in the Voya funds) by the Manager and the Sub-Adviser, and whether those resources are sufficient to provide high-quality services to the Portfolios.
Based on their deliberations and the materials presented to them, the Board concluded that the nature, extent and quality of the overall services provided by the Manager and Sub-Adviser under the Contracts were appropriate.
Portfolio Performance
In assessing the investment management and sub-advisory relationships, the Board placed emphasis on the investment returns of each Portfolio, including its investment performance over certain time periods compared to the Portfolio’s Morningstar category and primary benchmark, a broad-based securities market index identified in the Portfolio’s prospectus. The Board also considered information from the Manager Research & Selection Group and received reports summarizing a separate analysis of each Portfolio’s performance and risk, including risk-adjusted investment return information, from the Company’s Chief Investment Risk Officer.
Economies of Scale
When evaluating the reasonableness of the management fee schedules, the Board considered whether economies of scale have been or likely will be realized by the Manager and the Sub-Adviser as a Portfolio grows larger and the extent to which any such economies are shared with the Portfolio. The Board considered that, while the Portfolios do not have management fee breakpoints, they have fee waiver and expense reimbursement arrangements. The Board considered the extent to which economies of scale realized by the Manager could be shared with each Portfolio through such fee waivers, expense reimbursements or other expense reductions. In evaluating these matters, the Board also considered periodic management reports, Selected Peer Group comparisons, and industry information regarding economies of scale.
Information Regarding Services, Performance, and Fee Schedules Offered to Other Clients
The Board considered comparative information regarding the nature of services, performance, and fee schedules offered by the Manager and Sub-Adviser to other clients with similar investment objectives, if applicable, including other registered investment companies and relevant institutional accounts. When the fee schedules offered to or the performance of such other clients differed materially from a Portfolio, the Board took into account the underlying rationale provided by the Manager or Sub-Adviser, as applicable, for these differences.
Fee Schedules, Profitability, and Fall-out Benefits
The Board reviewed and considered the contractual management fee schedule and net management fee rate
ADVISORY AND SUB-ADVISORY CONTRACT APPROVAL DISCUSSION (Unaudited) (continued)
payable by each Portfolio to the Manager compared to the Portfolio’s Selected Peer Group. In addition, the Board considered each Portfolio’s contractual management fee schedule compared to other third-party sub-advised funds, other funds the Sub-Adviser manages and/or their proprietary funds (if applicable) identified by the Manager. The Board also considered the compensation payable by the Manager to the Sub-Adviser for sub-advisory services for each Portfolio, including the portion of the contractual and net management fee rates that are paid to the Sub-Adviser, as compared to the compensation paid to the Manager. In addition, the Board considered the fee waivers, expense limitations, and/or recoupment arrangements that apply to the fees payable by the Portfolios, including whether the Manager intends to propose any changes thereto. The Board also considered the extent to which the Manager currently waives management fees and/or reimburses a Portfolio for other Portfolio-level expenses at different rates for different share classes (“Differential Fee Waiver”), including the basis for the Manager’s determination that any Differential Fee Waiver does not and will not result in any cross-subsidization by one share class of another share class. For each Portfolio, the Board separately determined that the fees payable to the Manager and the fee schedule payable to the Sub-Adviser are reasonable for the services that each performs, which were considered in light of the nature, extent and quality of the services that each has performed and is expected to perform.
For each Portfolio, the Board considered information on revenues, costs and profits or losses realized by the Manager and the Voya-affiliated Sub-Adviser related to their services to the Portfolio. In analyzing the profitability of the Manager and its affiliates in connection with services they render to a Portfolio, the Board took into account the sub-advisory fee rate payable by the Manager to the Sub-Adviser. The Board also considered the profitability of the Manager and its affiliated Sub-Adviser attributable to servicing each Portfolio both with and without taking into account the profitability of the distributor of the Portfolios and any revenue sharing payments made by the Manager and both before and after giving effect to any expenses incurred by the Manager or the affiliated Sub-Adviser in making payments to affiliated insurance companies.
Although the Methodology Guide establishes a framework for profit calculation, the Board recognized that there is no uniform methodology within the asset management industry for determining profitability for this purpose. The Board also recognized that the use of different reasonable methodologies can give rise to dramatically different reported profit and loss results with respect to the Manager and the Voya-affiliated
Sub-Adviser, as well as other industry participants with whom the profits of the Manager and its affiliated Sub-Adviser could be compared. In addition, the Board recognized that management’s calculations regarding its costs incurred in establishing the infrastructure necessary for the Portfolios’ operations may not be fully reflected in the expenses allocated to each Portfolio in determining profitability. The Board also recognized that the information presented may not portray all of the costs borne by the Manager or reflect all of the risks associated with offering and managing a mutual fund complex in the current regulatory and market environment, including entrepreneurial, regulatory, legal and operational risks.
The Board also considered that the Manager and the Voya-affiliated Sub-Adviser are entitled to earn a reasonable level of profits for the services that they provide to the Portfolios. The Board also considered information regarding the potential fall-out benefits to the Manager and Sub-Adviser and their respective affiliates from their association with the Portfolios, including their ability to engage in soft-dollar transactions on behalf of the Portfolios. Following its reviews, the Board determined that the Manager’s and the Voya-affiliated Sub-Adviser’s profitability with respect to their services to the Portfolios and the Manager and Sub-Advisers’ potential fall-out benefits were not unreasonable.
Portfolio-by-Portfolio Analysis
Set forth below are certain of the specific factors that the Board considered at its October 7-8, 2021, November 16, 2021, and/or November 18, 2021 meetings in relation to approving each Portfolio’s Contracts and the conclusions reached by the Board. These specific factors are in addition to those considerations discussed above. In each case, the Portfolio’s performance was compared to its Morningstar category, as well as its primary benchmark. The performance data provided to the Board primarily was for various periods ended March 31, 2021. In addition, the Board also considered at its October 7-8, 2021, November 16, 2021, and/or November 18, 2021 meetings certain additional data regarding each Portfolio’s more recent performance, asset levels and asset flows. Each Portfolio’s management fee rate and expense ratio were compared to the management fee rates and expense ratios of the funds in its Selected Peer Group. With respect to the quintile rankings noted below, the first quintile represents the range of funds with the highest performance or the lowest management fee rate or expense ratio, as applicable, and the fifth quintile represents the range of funds with the lowest performance or the highest management fee rate or expense ratio, as applicable.
ADVISORY AND SUB-ADVISORY CONTRACT APPROVAL DISCUSSION (Unaudited) (continued)
Voya Index Solution Income Portfolio
In considering whether to approve the renewal of the Contracts for Voya Index Solution Income Portfolio, the Board considered that, based on performance data for the periods ended March 31, 2021: (1) the Portfolio is ranked in the first quintile of its Morningstar category for the ten-year period, the second quintile for the three-year and five-year periods, and the third quintile for the year-to-date and one-year periods; and (2) the Portfolio outperformed its primary benchmark for all periods presented.
In considering the fees payable under the Contracts for the Portfolio, the Board took into account the factors described above and also considered: (1) the fairness of the compensation under a Management Contract with a level fee rate that does not include breakpoints; and (2) the pricing structure (including the net expense ratio to be borne by shareholders) of the Portfolio, as compared to its Selected Peer Group, including that: (a) the net management fee rate for the Portfolio is ranked in the fifth quintile of net management fee rates of the funds in its Selected Peer Group; (b) the contractual management fee rate for the Portfolio is ranked in the fifth quintile of contractual management fee rates of the funds in its Selected Peer Group; and (c) the all-in net expense ratio for the Portfolio, inclusive of the Acquired Fund Fees and Expenses (“AFFE”), is ranked in the third quintile of all-in net expense ratios of the funds in its Selected Peer Group, and the net expense ratio for the Fund, not inclusive of AFFE, is above the median of net expense ratios of the funds in its Selected Peer Group. In analyzing this fee data, the Board took into account: (1) that, as reflected in the AFFE, the Portfolio indirectly bears the fees payable by the underlying funds in which the Portfolio invests; and (2) management’s representations regarding its belief that the Portfolio’s pricing is competitive and the competitiveness of the Voya Index Solution Portfolios’ expense ratios when compared to peers identified by management.
Voya Index Solution 2025 Portfolio
In considering whether to approve the renewal of the Contracts for Voya Index Solution 2025 Portfolio, the Board considered that, based on performance data for the periods ended March 31, 2021: (1) the Portfolio is ranked in the second quintile of its Morningstar category for the year-to-date, three-year, and ten-year periods, and the third quintile for the one-year and five-year periods; and (2) the Portfolio outperformed its primary benchmark for all periods presented, with the exception of the year-to-date period, during which it underperformed.
In considering the fees payable under the Contracts for the Portfolio, the Board took into account the factors described above and also considered: (1) the fairness of the
compensation under a Management Contract with a level fee rate that does not include breakpoints; and (2) the pricing structure (including the net expense ratio to be borne by shareholders) of the Portfolio, as compared to its Selected Peer Group, including that: (a) the net management fee rate for the Portfolio is ranked in the fifth quintile of net management fee rates of the funds in its Selected Peer Group; (b) the contractual management fee rate for the Portfolio is ranked in the fifth quintile of contractual management fee rates of the funds in its Selected Peer Group; and (c) the all-in net expense ratio for the Portfolio, inclusive of the Acquired Fund Fees and Expenses (“AFFE”), is ranked in the third quintile of all-in net expense ratios of the funds in its Selected Peer Group, and the net expense ratio for the Fund, not inclusive of AFFE, is above the median of net expense ratios of the funds in its Selected Peer Group. In analyzing this fee data, the Board took into account: (1) that, as reflected in the AFFE, the Portfolio indirectly bears the fees payable by the underlying funds in which the Portfolio invests; and (2) management’s representations regarding its belief that the Portfolio’s pricing is competitive and the competitiveness of the Voya Index Solution Portfolios’ expense ratios when compared to peers identified by management.
Voya Index Solution 2030 Portfolio
In considering whether to approve the renewal of the Contracts for Voya Index Solution 2030 Portfolio, the Board considered that, based on performance data for the periods ended March 31, 2021: (1) the Portfolio is ranked in the second quintile of its Morningstar category for the year-to-date, three-year and five-year periods, and the third quintile for the one-year period; and (2) the Portfolio outperformed its primary benchmark for all periods presented, with the exception of the year-to-date period, during which it underperformed.
In considering the fees payable under the Contracts for the Portfolio, the Board took into account the factors described above and also considered: (1) the fairness of the compensation under a Management Contract with a level fee rate that does not include breakpoints; and (2) the pricing structure (including the net expense ratio to be borne by shareholders) of the Portfolio, as compared to its Selected Peer Group, including that: (a) the net management fee rate for the Portfolio is ranked in the fifth quintile of net management fee rates of the funds in its Selected Peer Group; (b) the contractual management fee rate for the Portfolio is ranked in the fifth quintile of contractual management fee rates of the funds in its Selected Peer Group; and (c) the all-in net expense ratio for the Portfolio, inclusive of the Acquired Fund Fees and Expenses (“AFFE”), is ranked in the second quintile of
ADVISORY AND SUB-ADVISORY CONTRACT APPROVAL DISCUSSION (Unaudited) (continued)
all-in net expense ratios of the funds in its Selected Peer Group, and the net expense ratio for the Fund, not inclusive of AFFE, is above the median of net expense ratios of the funds in its Selected Peer Group. In analyzing this fee data, the Board took into account: (1) that, as reflected in the AFFE, the Portfolio indirectly bears the fees payable by the underlying funds in which the Portfolio invests; and (2) management’s representations regarding its belief that the Portfolio’s pricing is competitive and the competitiveness of the Voya Index Solution Portfolios’ expense ratios when compared to peers identified by management.
Voya Index Solution 2035 Portfolio
In considering whether to approve the renewal of the Contracts for Voya Index Solution 2035 Portfolio, the Board considered that, based on performance data for the periods ended March 31, 2021: (1) the Portfolio is ranked in the second quintile of its Morningstar category for the three-year and ten-year periods, and the third quintile for the year-to-date, one-year and five-year periods; and (2) the Portfolio outperformed its primary benchmark for all periods presented, with the exception of the year-to-date period, during which it underperformed.
In considering the fees payable under the Contracts for the Portfolio, the Board took into account the factors described above and also considered: (1) the fairness of the compensation under a Management Contract with a level fee rate that does not include breakpoints; and (2) the pricing structure (including the net expense ratio to be borne by shareholders) of the Portfolio, as compared to its Selected Peer Group, including that: (a) the net management fee rate for the Portfolio is ranked in the fifth quintile of net management fee rates of the funds in its Selected Peer Group; (b) the contractual management fee rate for the Portfolio is ranked in the fifth quintile of contractual management fee rates of the funds in its Selected Peer Group; and (c) the all-in net expense ratio for the Portfolio, inclusive of the Acquired Fund Fees and Expenses (“AFFE”), is ranked in the third quintile of all-in net expense ratios of the funds in its Selected Peer Group, and the net expense ratio for the Fund, not inclusive of AFFE, is above the median of net expense ratios of the funds in its Selected Peer Group. In analyzing this fee data, the Board took into account: (1) that, as reflected in the AFFE, the Portfolio indirectly bears the fees payable by the underlying funds in which the Portfolio invests; and (2) management’s representations regarding its belief that the Portfolio’s pricing is competitive and the competitiveness of the Voya Index Solution Portfolios’ expense ratios when compared to peers identified by management.
Voya Index Solution 2040 Portfolio
In considering whether to approve the renewal of the Contracts for Voya Index Solution 2040 Portfolio, the Board considered that, based on performance data for the periods ended March 31, 2021: (1) the Portfolio is ranked in the second quintile of its Morningstar category for all periods presented; and (2) the Portfolio outperformed its primary benchmark for all periods presented, with the exception of the year-to-date period, during which it underperformed.
In considering the fees payable under the Contracts for the Portfolio, the Board took into account the factors described above and also considered: (1) the fairness of the compensation under a Management Contract with a level fee rate that does not include breakpoints; and (2) the pricing structure (including the net expense ratio to be borne by shareholders) of the Portfolio, as compared to its Selected Peer Group, including that: (a) the net management fee rate for the Portfolio is ranked in the fourth quintile of net management fee rates of the funds in its Selected Peer Group; (b) the contractual management fee rate for the Portfolio is ranked in the fifth quintile of contractual management fee rates of the funds in its Selected Peer Group; and (c) the all-in net expense ratio for the Portfolio, inclusive of the Acquired Fund Fees and Expenses (“AFFE”), is ranked in the third quintile of all-in net expense ratios of the funds in its Selected Peer Group, and the net expense ratio for the Fund, not inclusive of AFFE, is above the median of net expense ratios of the funds in its Selected Peer Group. In analyzing this fee data, the Board took into account: (1) that, as reflected in the AFFE, the Portfolio indirectly bears the fees payable by the underlying funds in which the Portfolio invests; and (2) management’s representations regarding its belief that the Portfolio’s pricing is competitive and the competitiveness of the Voya Index Solution Portfolios’ expense ratios when compared to peers identified by management.
Voya Index Solution 2045 Portfolio
In considering whether to approve the renewal of the Contracts for Voya Index Solution 2045 Portfolio, the Board considered that, based on performance data for the periods ended March 31, 2021: (1) the Portfolio is ranked in the second quintile of its Morningstar category for the three-year and ten-year periods, and the third quintile for the year-to-date, one-year and five-year periods; and (2) the Portfolio outperformed its primary benchmark for all periods presented, with the exception of the year-to-date period, during which it underperformed.
In considering the fees payable under the Contracts for the Portfolio, the Board took into account the factors described
ADVISORY AND SUB-ADVISORY CONTRACT APPROVAL DISCUSSION (Unaudited) (continued)
above and also considered: (1) the fairness of the compensation under a Management Contract with a level fee rate that does not include breakpoints; and (2) the pricing structure (including the net expense ratio to be borne by shareholders) of the Portfolio, as compared to its Selected Peer Group, including that: (a) the net management fee rate for the Portfolio is ranked in the fifth quintile of net management fee rates of the funds in its Selected Peer Group; (b) the contractual management fee rate for the Portfolio is ranked in the fifth quintile of contractual management fee rates of the funds in its Selected Peer Group; and (c) the all-in net expense ratio for the Portfolio, inclusive of the Acquired Fund Fees and Expenses (“AFFE”), is ranked in the third quintile of all-in net expense ratios of the funds in its Selected Peer Group, and the net expense ratio for the Fund, not inclusive of AFFE, is above the median of net expense ratios of the funds in its Selected Peer Group. In analyzing this fee data, the Board took into account: (1) that, as reflected in the AFFE, the Portfolio indirectly bears the fees payable by the underlying funds in which the Portfolio invests; and (2) management’s representations regarding its belief that the Portfolio’s pricing is competitive and the competitiveness of the Voya Index Solution Portfolios’ expense ratios when compared to peers identified by management.
Voya Index Solution 2050 Portfolio
In considering whether to approve the renewal of the Contracts for Voya Index Solution 2050 Portfolio, the Board considered that, based on performance data for the periods ended March 31, 2021: (1) the Portfolio is ranked in the third quintile of its Morningstar category for all periods presented; and (2) the Portfolio outperformed its primary benchmark for all periods presented, with the exception of the year-to-date period, during which it underperformed.
In considering the fees payable under the Contracts for the Portfolio, the Board took into account the factors described above and also considered: (1) the fairness of the compensation under a Management Contract with a level fee rate that does not include breakpoints; and (2) the pricing structure (including the net expense ratio to be borne by shareholders) of the Portfolio, as compared to its Selected Peer Group, including that: (a) the net management fee rate for the Portfolio is ranked in the second quintile of net management fee rates of the funds in its Selected Peer Group; (b) the contractual management fee rate for the Portfolio is ranked in the fourth quintile of contractual management fee rates of the funds in its Selected Peer Group; and (c) the all-in net expense ratio for the Portfolio, inclusive of the Acquired Fund Fees and Expenses (“AFFE”), is ranked in the third
quintile of all-in net expense ratios of the funds in its Selected Peer Group, and the net expense ratio for the Fund, not inclusive of AFFE, is above the median of net expense ratios of the funds in its Selected Peer Group. In analyzing this fee data, the Board took into account: (1) that, as reflected in the AFFE, the Portfolio indirectly bears the fees payable by the underlying funds in which the Portfolio invests; and (2) Management’s representations regarding its belief that the Portfolio’s pricing is competitive and the competitiveness of the Voya Index Solution Portfolios’ expense ratios when compared to peers identified by management.
Voya Index Solution 2055 Portfolio
In considering whether to approve the renewal of the Contracts for Voya Index Solution 2055 Portfolio, the Board considered that, based on performance data for the periods ended March 31, 2021: (1) the Portfolio is ranked in the second quintile of its Morningstar category for the ten-year period, and the third quintile for the year-to-date, one-year, three-year, and five-year periods; and (2) the Portfolio outperformed its primary benchmark for all periods presented, with the exception of the year-to-date and ten-year periods, during which it underperformed.
In considering the fees payable under the Contracts for the Portfolio, the Board took into account the factors described above and also considered: (1) the fairness of the compensation under a Management Contract with a level fee rate that does not include breakpoints; and (2) the pricing structure (including the net expense ratio to be borne by shareholders) of the Portfolio, as compared to its Selected Peer Group, including that: (a) the net management fee rate for the Portfolio is ranked in the third quintile of net management fee rates of the funds in its Selected Peer Group; (b) the contractual management fee rate for the Portfolio is ranked in the fifth quintile of contractual management fee rates of the funds in its Selected Peer Group; and (c) the all-in net expense ratio for the Portfolio, inclusive of the Acquired Fund Fees and Expenses (“AFFE”), is ranked in the third quintile of all-in net expense ratios of the funds in its Selected Peer Group, and the net expense ratio for the Fund, not inclusive of AFFE, is above the median of net expense ratios of the funds in its Selected Peer Group. In analyzing this fee data, the Board took into account: (1) that, as reflected in the AFFE, the Portfolio indirectly bears the fees payable by the underlying funds in which the Portfolio invests; and (2) management’s representations regarding its belief that the Portfolio’s pricing is competitive and the competitiveness of the Voya Index Solution Portfolios’ expense ratios when compared to peers identified by management.
ADVISORY AND SUB-ADVISORY CONTRACT APPROVAL DISCUSSION (Unaudited) (continued)
Voya Index Solution 2060 Portfolio
In considering whether to approve the renewal of the Contracts for Voya Index Solution 2060 Portfolio, the Board considered that, based on performance data for the periods ended March 31, 2021: (1) the Portfolio is ranked in the third quintile of its Morningstar category for the year-to-date and three-year periods, and the fourth quintile for the one-year and five-year periods; and (2) the Portfolio outperformed its primary benchmark for all periods presented, with the exception of the year-to-date period, during which it underperformed. In analyzing this performance data, the Board took into account management’s representations regarding the competitiveness of the Portfolio’s performance during certain periods.
In considering the fees payable under the Contracts for the Portfolio, the Board took into account the factors described above and also considered: (1) the fairness of the compensation under a Management Contract with a level fee rate that does not include breakpoints; and (2) the pricing structure (including the net expense ratio to be borne by shareholders) of the Portfolio, as compared to its Selected Peer Group, including that: (a) the net management fee rate for the Portfolio is ranked in the fourth quintile of net management fee rates of the funds in its Selected Peer Group; (b) the contractual management fee rate for the Portfolio is ranked in the fifth quintile of contractual management fee rates of the funds in its Selected Peer Group; and (c) the all-in net expense ratio for the Portfolio, inclusive of the Acquired Fund Fees and Expenses (“AFFE”), is ranked in the third quintile of all-in net expense ratios of the funds in its Selected Peer Group, and the net expense ratio for the Fund, not inclusive of AFFE, is above the median of net expense ratios of the funds in its Selected Peer Group. In analyzing this fee data, the Board took into account: (1) that, as reflected in the AFFE, the Portfolio indirectly bears the fees payable by the underlying funds in which the Portfolio invests; and (2) management’s representations regarding its belief that the Portfolio’s pricing is competitive and the competitiveness of the Voya Index Solution Portfolios’ expense ratios when compared to peers identified by management.
Voya Index Solution 2065 Portfolio
In considering whether to approve the renewal of the Contracts for Voya Index Solution 2065 Portfolio, the Board considered that, based on performance data for the periods ended March 31, 2021: (1) the Portfolio is ranked in the third quintile of its Morningstar category for the year-to-date period; and (2) the Portfolio underperformed its primary benchmark for the year-to-date period. In analyzing this performance data, the Board took into
account: (1) that the Portfolio commenced operations in August 2020, and therefore had a limited operating history for the purpose of analyzing its performance; and (2) management’s representations regarding the competitiveness of the Portfolio’s performance during its limited operating history.
In considering the fees payable under the Contracts for the Portfolio, the Board took into account the factors described above and also considered: (1) the fairness of the compensation under a Management Contract with a level fee rate that does not include breakpoints; and (2) the pricing structure (including the net expense ratio to be borne by shareholders) of the Portfolio, as compared to its Selected Peer Group, including that: (a) the net management fee rate for the Portfolio is ranked in the fourth quintile of net management fee rates of the funds in its Selected Peer Group; (b) the contractual management fee rate for the Portfolio is ranked in the fourth quintile of contractual management fee rates of the funds in its Selected Peer Group; and (c) the all-in net expense ratio for the Portfolio, inclusive of the Acquired Fund Fees and Expenses (“AFFE”), is ranked in the third quintile of all-in net expense ratios of the funds in its Selected Peer Group, and the net expense ratio for the Portfolio, not inclusive of AFFE, is above the median of net expense ratios of the funds in its Selected Peer Group. In analyzing this fee data, the Board took into account: (1) that, as reflected in the AFFE, the Portfolio indirectly bears the fees payable by the underlying funds in which the Portfolio invests; and (2) management’s representations regarding its belief that the Portfolio’s pricing is competitive and the competitiveness of the Voya Index Solution Portfolios’ expense ratios when compared to peers identified by management.
Board Conclusions
After its deliberation, the Board concluded that, in its business judgment, the terms of the Contracts are fair and reasonable to each Portfolio and that approval of the continuation of the Contracts is in the best interests of each Portfolio and its shareholders. In doing so, the Board reviewed all factors it considered to be material, including those discussed above. Within the context of its overall conclusions regarding the Contracts, and based on the information provided and management’s related representations, the Board concluded that it was satisfied with management’s responses relating to each Portfolio’s investment performance and the fees payable under the Contracts. During this renewal process, different Board members may have given different weight to different individual factors and related conclusions. Based on these conclusions and other factors, the Board voted to renew the Contracts for each Portfolio for the year ending November 30, 2022.
Investment Adviser
Voya Investments, LLC
7337 East Doubletree Ranch Road, Suite 100
Scottsdale, Arizona 85258
Distributor
Voya Investments Distributor, LLC
7337 East Doubletree Ranch Road, Suite 100
Scottsdale, Arizona 85258
Transfer Agent
BNY Mellon Investment Servicing (U.S.) Inc.
301 Bellevue Parkway
Wilmington, Delaware 19809
Independent Registered Public Accounting Firm
Ernst & Young LLP
200 Clarendon Street
Boston, Massachusetts 02116
Custodian
The Bank of New York Mellon
225 Liberty Street
New York, New York 10286
Legal Counsel
Ropes & Gray LLP
Prudential Tower
800 Boylston Street
Boston, Massachusetts 02199
Before investing, carefully consider the investment objectives, risks, charges and expenses of the variable annuity contract or variable life insurance policy and the underlying variable investment options. This and other information is contained in the prospectus for the variable annuity contract or variable life insurance policy and the underlying variable investment options. Obtain these prospectuses from your agent/registered representative and read them carefully before investing.
RETIREMENT | INVESTMENTS | INSURANCE
voyainvestments.com
VPAR-VINDSOL (1221-022322)
Item 2. Code of Ethics.
As of the end of the period covered by this report, Registrant had adopted a code of ethics, as defined in Item 2 of Form N-CSR, that applies to the Registrant’s principal executive officer and principal financial officer. There were no amendments to the Code during the period covered by the report. The Registrant did not grant any waivers, including implicit waivers, from any provisions of the Code during the period covered by this report. The code of ethics is filed herewith pursuant to Item 10(a)(1), Ex-99.CODE ETH.
Item 3. Audit Committee Financial Expert.
The Board of Trustees has determined that Colleen D. Baldwin, Martin J. Gavin, and Joseph E. Obermeyer are audit committee financial experts, as defined in Item 3 of Form N-CSR. Ms. Baldwin, Mr. Gavin, and Mr. Obermeyer are “independent” for purposes of Item 3 of Form N-CSR.
Item 4. Principal Accountant Fees and Services.
Below are the amount of fees that Ernst & Young LLP (“EY”), the Fund’s current Independent Registered Public Accounting Firm, billed to the Fund during the Fund’s fiscal year ended December 31, 2021 and December 31, 2020 and the amount of fees that the previous independent public accounting firm billed to the Fund during the Fund’s fiscal year ended December 31, 2021 and December 31, 2020.
| (a) | Audit Fees: The aggregate fees billed for each of the last two fiscal years for professional services rendered by EY, the principal accountant for the audit of the registrant’s annual financial statements or services that are normally provided by the accountant in connection with statutory and regulatory filings or engagements for those fiscal years were $710,600 for the year ended December 31, 2021 and $710,600 for the year ended December 31, 2020. |
| (b) | Audit-Related Fees: The aggregate fees billed in each of the last two fiscal years for assurance and related services by EY that are reasonably related to the performance of the audit of each respective registrant’s financial statements and are not reported under paragraph (a) of this Item were $0 for the year ended December 31, 2021 and $0 for the year ended December 31, 2020. |
| (c) | Tax Fees(1): The aggregate fees billed in each of the last two fiscal years for professional services rendered by EY for tax compliance, tax advice, and tax planning were $167,191 for the year ended December 31, 2021 and $47,754 for the year ended December 31, 2020. Such services included review of excise distribution calculations (if applicable), preparation of the Funds’ federal, state, and excise tax returns, tax services related to mergers and routine consulting. |
| (d) | All Other Fees: The aggregate fees billed in each of the last two fiscal years for products and services provided by EY, other than the services reported in paragraphs (a) through (c) of this Item were $0 for the year ended December 31, 2021 and $0 for the year ended December 31, 2020. |
(1) For the fiscal years ended December 31, 2021, and December 31, 2020, the previous independent public accounting firm billed $0 and $18,758, respectively, for Tax Fees.
| (e)(1) | Audit Committee Pre-Approval Policies and Procedures |
Appendix A
AUDIT AND NON-AUDIT SERVICES
PRE-APPROVAL POLICY
I. Statement of Principles
Under the Sarbanes-Oxley Act of 2002 (the “Act”), the Audit Committee of the Board of Directors or Trustees (the “Committee”) of the Voya funds (each a “Fund,” collectively, the “Funds”) set out on Exhibit A to this Audit and Non-Audit Services Pre-Approval Policy (“Policy”) is responsible for the oversight of the work of the Funds’ independent auditors. As part of its responsibilities, the Committee must pre-approve the audit and non-audit services performed by the auditors in order to assure that the provision of these services does not impair the auditors’ independence from the Funds. The Committee has adopted, and the Board has ratified, this Policy, which sets out the procedures and conditions under which the services of the independent auditors may be pre-approved.
Under Securities and Exchange Commission (“SEC”) rules promulgated in accordance with the Act, the Funds may establish two different approaches to pre-approving audit and non-audit services. The Committee may approve services without consideration of specific case-by-case services (“general pre-approval”) or it may pre-approve specific services (“specific pre-approval”). The Committee believes that the combination of these approaches contemplated in this Policy results in an effective and efficient method for pre-approving audit and non-audit services to be performed by the Funds’ independent auditors. Under this Policy, services that are not of a type that may receive general pre-approval require specific pre-approval by the Committee. Any proposed services that exceed pre-approved cost levels or budgeted amounts will also require the Committee’s specific pre-approval.
For both types of approval, the Committee considers whether the subject services are consistent with the SEC’s rules on auditor independence and that such services are compatible with maintaining the auditors independence. The Committee also considers whether a particular audit firm is in the best position to provide effective and efficient services to the Funds. Reasons that the auditors are in the best position include the auditors’ familiarity with the Funds’ business, personnel, culture, accounting systems, risk profile, and other factors, and whether the services will enhance the Funds’ ability to manage and control risk or improve audit quality. Such factors will be considered as a whole, with no one factor being determinative.
The appendices attached to this Policy describe the audit, audit-related, tax-related, and other services that have the Committee’s general pre-approval. For any service that has been approved through general pre-approval, the general pre-approval will remain in place for a period 12 months from the date of pre-approval, unless the Committee determines that a different period is appropriate. The Committee will annually review and pre-approve the services that may be provided by the independent auditors without specific pre-approval. The Committee will revise the list of services subject to general pre-approval as appropriate. This Policy does not serve as a delegation to Fund management of the Committee’s duty to pre-approve services performed by the Funds’ independent auditors.
II. Audit Services
The annual audit services engagement terms and fees are subject to the Committee’s specific pre-approval. Audit services are those services that are normally provided by auditors in connection with statutory and regulatory filings or engagements or those that generally only independent auditors can reasonably provide. They include the Funds’ annual financial statement audit and procedures that the independent auditors must perform in order to form an opinion on the Funds’ financial statements (e.g., information systems and procedural reviews and testing). The Committee will monitor the audit services engagement and approve any changes in terms, conditions or fees deemed by the Committee to be necessary or appropriate.
The Committee may grant general pre-approval to other audit services, such as statutory audits and services associated with SEC registration statements, periodic reports and other documents filed with the SEC or issued in connection with securities offerings.
The Committee has pre-approved the audit services listed on Appendix A. The Committee must specifically approve all audit services not listed on Appendix A.
III. Audit-related Services
Audit-related services are assurance and related services that are reasonably related to the performance of the audit or the review of the Funds’ financial statements or are traditionally performed by the independent auditors. The Committee believes that the provision of audit-related services will not impair the independent auditors’ independence, and therefore may grant pre-approval to audit-related services. Audit-related services include accounting consultations related to accounting, financial reporting or disclosure matters not classified as “audit services;” assistance with understanding and implementing new accounting and financial reporting guidance from rulemaking authorities; agreed-upon or expanded audit procedures relating to accounting and/or billing records required to respond to or comply with financial, accounting or regulatory reporting matters; and assistance with internal control reporting requirements under Form N-CEN or Form N-CSR.
The Committee has pre-approved the audit-related services listed on Appendix B. The Committee must specifically approve all audit-related services not listed on Appendix B.
IV. Tax Services
The Committee believes the independent auditors can provide tax services to the Funds, including tax compliance, tax planning, and tax advice, without compromising the auditors’ independence. Therefore, the Committee may grant general pre-approval with respect to tax services historically provided by the Funds’ independent auditors that do not, in the Committee’s view, impair auditor independence and that are consistent with the SEC’s rules on auditor independence.
The Committee will not grant pre-approval if the independent auditors initially recommends a transaction the sole business purpose of which is tax avoidance and the tax treatment of which may not be supported in the Internal Revenue Code and related regulations. The Committee may consult outside counsel to determine that tax planning and reporting positions are consistent with this Policy.
The Committee has pre-approved the tax-related services listed on Appendix C. The Committee must specifically approve all tax-related services not listed on Appendix C.
V. Other Services
The Committee believes it may grant approval of non-audit services that are permissible services for independent auditors to a Fund. The Committee has determined to grant general pre-approval to other services that it believes are routine and recurring, do not impair auditor independence, and are consistent with SEC rules on auditor independence.
The Committee has pre-approved the non-audit services listed on Appendix D. The Committee must specifically approve all non-audit services not listed on Appendix D.
A list of the SEC’s prohibited non-audit services is attached to this Policy as Appendix E. The SEC’s rules and relevant guidance should be consulted to determine the precise definitions of these impermissible services and the applicability of exceptions to certain of the SEC’s prohibitions.
VI. Pre-approval of Fee levels and Budgeted Amounts
The Committee will annually establish pre-approval fee levels or budgeted amounts for audit, audit-related, tax and non-audit services to be provided to the Funds by the independent auditors. Any proposed services exceeding these levels or amounts require the Committee’s specific pre-approval. The Committee considers fees for audit and non-audit services when deciding whether to pre-approve services. The Committee may determine, for a pre-approval period of 12 months, the appropriate ratio between the total amount of fees for the Fund’s audit, audit-related, and tax services (including fees for services provided to Fund affiliates that are subject to pre-approval), and the total amount of fees for certain permissible non-audit services for the Fund classified as other services (including any such services provided to Fund affiliates that are subject to pre-approval).
VII. Procedures
Requests or applications for services to be provided by the independent auditors will be submitted to management. If management determines that the services do not fall within those services generally pre-approved by the Committee and set out in the appendices to these procedures, management will submit the services to the Committee or its delagee. Any such submission will include a detailed description of the services to be rendered. Notwithstanding this paragraph, the Committee will, on a quarterly basis, receive from the independent auditors a list of services provided for the previous calendar quarter on a cumulative basis by the auditors during the Pre-Approval Period.
VIII. Delegation
The Committee may delegate pre-approval authority to one or more of the Committee’s members. Any member or members to whom such pre-approval authority is delegated must report any pre-approval decisions, including any pre-approved services, to the Committee at its next scheduled meeting. The Committee will identify any member to whom pre-approval authority is delegated in writing. The member will retain such authority for a period of 12 months from the date of pre-approval unless the Committee determines that a different period is appropriate. The period of delegated authority may be terminated by the Committee or at the option of the member.
IX. Additional Requirements
The Committee will take any measures the Committee deems necessary or appropriate to oversee the work of the independent auditors and to assure the auditors’ independence from the Funds. This may include reviewing a formal written statement from the independent auditors delineating all relationships between the auditors and the Funds, consistent with Independence Standards Board No. 1, and discussing with the auditors their methods and procedures for ensuring independence.
Last Approved: November 19, 2020
Appendix A
Pre-Approved Audit Services for the Pre-Approval Period January 1, 2021 through December 31, 2021
| Service |
| | The Fund(s) | Fee Range |
| Statutory audits or financial audits (including tax services associated with audit services) | √ | As presented to Audit Committee1 |
| Services associated with SEC registration statements, periodic reports and other documents filed with the SEC or other documents issued in connection with securities offerings (e.g., consents), and assistance in responding to SEC comment letters. | √ | Not to exceed $9,750 per filing |
| Consultations by Fund management with respect to accounting or disclosure treatment of transactions or events and/or the actual or potential effect of final or proposed rules, standards or interpretations by the SEC, Financial Accounting Standards Board, or other regulatory or standard setting bodies. | √ | Not to exceed $8,000 during the Pre-Approval Period |
| Seed capital audit and related review and issuance of consent on the N-2 registration statement | √ | Not to exceed $14,750 per audit |
| Audit of summary portfolio of investments | √ | Not to exceed $750 per fund |
| | 1 | For new Funds launched during the Pre-Approval Period, the fee ranges pre-approved will be the same as those for existing Funds, pro-rated in accordance with inception dates as provided in the auditors’ Proposal or any Engagement Letter covering the period at issue. Fees in the Engagement Letter will be controlling. |
Appendix B
Pre-Approved Audit-Related Services for the Pre-Approval Period January 1, 2021 through December 31, 2021
| Service |
| | The Fund(s) | Fund Affiliates | Fee Range |
| Services related to Fund mergers (Excludes tax services - See Appendix C for tax services associated with Fund mergers) | √ | √ | Not to exceed $10,000 per merger |
| Consultations by Fund management with respect to accounting or disclosure treatment of transactions or events and/or the actual or potential effect of final or proposed rules, standards or interpretations by the SEC, Financial Accounting Standards Board, or other regulatory or standard setting bodies. [Note: Under SEC rules some consultations may be “audit” services and others may be “audit-related” services.] | √ | | Not to exceed $5,000 per occurrence during the Pre-Approval Period |
| Review of the Funds’ semi-annual and quarterly financial statements | √ | | Not to exceed $2,700 per set of financial statements per fund |
| Reports to regulatory or government agencies related to the annual engagement | √ | | Up to $5,000 per occurrence during the Pre-Approval Period |
| Regulatory compliance assistance | √ | √ | Not to exceed $5,000 per quarter |
| Training courses | | √ | Not to exceed $5,000 per course |
| | | | |
Appendix C
Pre-Approved Tax Services for the Pre-Approval Period January 1, 2021 through December 31, 2021
| Service |
| | The Fund(s) | Fund Affiliates | Fee Range |
| Preparation of federal and state income tax returns and federal excise tax returns for the Funds including assistance and review with excise tax distributions | √ | | As presented to Audit Committee2 |
| Review of IRC Sections 851(b) and 817(h) diversification testing on a real-time basis | √ | | As presented to Audit Committee2 |
| Tax assistance and advice regarding statutory, regulatory or administrative developments | √ | √ | Not to exceed $5,000 for the Funds or for the Funds’ investment adviser during the Pre-Approval Period |
| | 2 | For new Funds launched during the Pre-Approval Period, the fee ranges pre-approved will be the same as those for existing Funds, pro-rated in accordance with inception dates as provided in the auditors’ Proposal or any Engagement Letter covering the period at issue. Fees in the Engagement Letter will be controlling. |
Appendix C, continued
Pre-Approved Tax Services for the Pre-Approval Period January 1, 2021 through December 31, 2021
| Service |
| | The Fund(s) | Fund Affiliates | Fee Range |
| Tax and technology training sessions | | √ | Not to exceed $5,000 per course during the Pre-Approval Period |
| Tax services associated with Fund mergers | √ | √ | Not to exceed $4,000 per fund per merger during the Pre-Approval Period |
| Ernst & Young LLP Passive Foreign Investment Company (“PFIC”) Analyzer | | √ | Not to exceed $95,000 during the Pre-Approval Period |
| Other tax-related assistance and consultation, including, without limitation, assistance in evaluating derivative financial instruments and international tax issues, qualification and distribution issues, year-end reporting for 1099’s, tax compliance services in foreign jurisdictions and similar routine tax consultations as requested. | √ | | Not to exceed $300,000 during the Pre-Approval Period |
Appendix D
Pre-Approved Other Services for the Pre-Approval Period January 1, 2021 through December 31, 2021
| Service |
| | The Fund(s) | Fund Affiliates | Fee Range |
| Agreed-upon procedures for Class B share 12b-1 programs | | √ | Not to exceed $60,000 during the Pre-Approval Period |
Security counts performed pursuant to Rule 17f-2 of the 1940 Act (i.e., counts for Funds holding securities with affiliated sub-custodians) Cost to be borne 50% by the Funds and 50% by Voya Investments, LLC. | √ | √ | Not to exceed $5,700 per Fund during the Pre-Approval Period |
| Agreed upon procedures for 15 (c) FACT Books | √ | | Not to exceed $50,000 during the Pre-Approval Period |
Appendix E
Prohibited Non-Audit Services
Dated: January 1, 2021 to December 31, 2021
| | ● | Bookkeeping or other services related to the accounting records or financial statements of the Funds |
| | ● | Financial information systems design and implementation |
| | ● | Appraisal or valuation services, fairness opinions, or contribution-in-kind reports |
| | ● | Internal audit outsourcing services |
| | ● | Broker-dealer, investment adviser, or investment banking services |
| | ● | Expert services unrelated to the audit |
| | ● | Any other service that the Public Company Accounting Oversight Board determines, by regulation, is impermissible |
EXHIBIT A
VOYA ASIA PACIFIC HIGH DIVIDEND EQUITY INCOME FUND
VOYA BALANCED PORTFOLIO, INC.
VOYA EMERGING MARKETS HIGH DIVIDEND EQUITY FUND
VOYA EQUITY TRUST
VOYA FUNDS TRUST
VOYA GLOBAL ADVANTAGE AND PREMIUM OPPORTUNITY FUND
VOYA GLOBAL EQUITY DIVIDEND AND PREMIUM OPPORTUNITY FUND
VOYA INFRASTRUCTURE, INDUSTRIALS, AND MATERIALS FUND
VOYA INTERMEDIATE BOND PORTFOLIO
VOYA INVESTORS TRUST
VOYA GOVERNMENT MONEY MARKET PORTFOLIO
VOYA MUTUAL FUNDS
VOYA PARTNERS, INC.
VOYA SENIOR INCOME FUND
VOYA SEPARATE PORTFOLIOS TRUST
VOYA STRATEGIC ALLOCATIONS PORTFOLIOS, INC.
VOYA VARIABLE FUNDS
VOYA VARIABLE INSURANCE TRUST
VOYA VARIABLE PORTFOLIOS INC.
VOYA VARIABLE PRODUCTS TRUST
| (e)(2) | Percentage of services referred to in 4(b) – (4)(d) that were approved by the audit committee |
100% of the services were approved by the audit committee.
| (f) | Percentage of hours expended attributable to work performed by other than full time employees of EY if greater than 50% |
Not applicable.
| (g) | Non-Audit Fees: The following table presents (i) the aggregate non-audit fees (i.e., fees for audit-related, tax, and other services) billed to each Registrant by the independent registered public accounting firm for each Registrant’s fiscal years ended December 31, 2021 and December 31, 2020; and (ii) the aggregate non-audit fees billed to the investment adviser, or any of its affiliates that provide ongoing services to the registrant, by the independent registered public accounting firm for the same time periods. |
| Registrant/Investment Adviser | | | 2021(1) | | | | 2020(1) | |
| Voya Partners, Inc. | | $ | 167,191 | | | $ | 47,754 | |
| Voya Investments, LLC (2) | | $ | 13,583,983 | | | $ | 14,804,511 | |
(1) For the years ended December 31, 2021 and December 31, 2020, the previous independent public accounting firm billed the Registrant $0 and $18,758, respectively, for Non-Audit Fees.
(2) Each Registrant’s investment adviser and any of its affiliates, which are subsidiaries of Voya Financial, Inc.
| (h) | Principal Accountants Independence: The Registrant’s Audit committee has considered whether the provision of non-audit services that were rendered to the registrant’s investment adviser and any entity controlling, controlled by, or under common control with the investment adviser that provides ongoing services to the registrant that were not pre-approved pursuant to Rule 2-01(c)(7)(ii) of Regulation S-X is compatible with maintaining EY’s independence. |
Item 5. Audit Committee of Listed Registrants.
Not applicable.
Item 6. Schedule of Investments.
Schedule is included as part of the report to shareholders filed under Item 1 of this Form.
Item 7. Disclosure of Proxy Voting Policies and Procedures for Closed-End Management Investment Companies.
Not applicable.
Item 8. Portfolio Managers of Closed-End Management Investment Companies.
Not applicable.
Item 9. Purchases of Equity Securities by Closed-End Management Investment Company and Affiliated Purchasers.
Not applicable.
Item 10. Submission of Matters to a Vote of Security Holders.
Not applicable.
Item 11. Controls and Procedures.
| (a) | Based on our evaluation conducted within 90 days of the filing date, hereof, the design and operation of the registrant’s disclosure controls and procedures are effective to ensure that material information relating to the registrant is made known to the certifying officers by others within the appropriate entities, particularly during the period in which Forms N-CSR are being prepared, and the registrant’s disclosure controls and procedures allow timely preparation and review of the information for the registrant’s Form N-CSR and the officer certifications of such Form N-CSR. |
| (b) | There were no significant changes in the registrant’s internal controls that occurred during the second fiscal quarter of the period covered by this report that has materially affected, or is reasonably likely to materially affect, the registrant’s internal control over financial reporting. |
Item 12. Disclosure of Securities Lending Activities for Closed-End Management Investment Companies.
Not applicable.
Item 13. Exhibits.
SIGNATURES
Pursuant to the requirements of the Securities Exchange Act of 1934 and the Investment Company Act of 1940, the registrant has duly caused this report to be signed on its behalf by the undersigned, thereunto duly authorized.
| (Registrant): Voya Partners, Inc. | |
| | |
| By | /s/ Michael Bell | |
| | Michael Bell | |
| | Chief Executive Officer | |
Date: March 4, 2022
Pursuant to the requirements of the Securities Exchange Act of 1934 and the Investment Company Act of 1940, this report has been signed below by the following persons on behalf of the registrant and in the capacities and on the dates indicated.
| By | /s/ Michael Bell | |
| | Michael Bell | |
| | Chief Executive Officer | |
Date: March 4, 2022
| By | /s/ Todd Modic | |
| | Todd Modic | |
| | Senior Vice President and Chief Financial Officer | |
Date: March 4, 2022
![[MISSING IMAGE: ing_cov.jpg]](https://capedge.com/proxy/N-CSR/0001104659-22-030433/ing_cov.jpg)
![[MISSING IMAGE: voya_covinvmgt.jpg]](https://capedge.com/proxy/N-CSR/0001104659-22-030433/voya_covinvmgt.jpg)
![[MISSING IMAGE: ph_dina-santoro.jpg]](https://capedge.com/proxy/N-CSR/0001104659-22-030433/ph_dina-santoro.jpg)
![[MISSING IMAGE: sg_dina-santoro.jpg]](https://capedge.com/proxy/N-CSR/0001104659-22-030433/sg_dina-santoro.jpg)
![[MISSING IMAGE: tm222386d6-lc_aggressivebw.jpg]](https://capedge.com/proxy/N-CSR/0001104659-22-030433/tm222386d6-lc_aggressivebw.jpg)
![[MISSING IMAGE: tm222386d6-lc_balancebw.jpg]](https://capedge.com/proxy/N-CSR/0001104659-22-030433/tm222386d6-lc_balancebw.jpg)
![[MISSING IMAGE: tm222386d6-lc_conservatbw.jpg]](https://capedge.com/proxy/N-CSR/0001104659-22-030433/tm222386d6-lc_conservatbw.jpg)
![[MISSING IMAGE: tm222386d6-lc_incomebw.jpg]](https://capedge.com/proxy/N-CSR/0001104659-22-030433/tm222386d6-lc_incomebw.jpg)
![[MISSING IMAGE: tm222386d6-lc_moderatebw.jpg]](https://capedge.com/proxy/N-CSR/0001104659-22-030433/tm222386d6-lc_moderatebw.jpg)
![[MISSING IMAGE: tm222386d6-lc_moderateconbw.jpg]](https://capedge.com/proxy/N-CSR/0001104659-22-030433/tm222386d6-lc_moderateconbw.jpg)
![[MISSING IMAGE: tm222386d6-lc_index2025bw.jpg]](https://capedge.com/proxy/N-CSR/0001104659-22-030433/tm222386d6-lc_index2025bw.jpg)
![[MISSING IMAGE: tm222386d6-lc_index2030bw.jpg]](https://capedge.com/proxy/N-CSR/0001104659-22-030433/tm222386d6-lc_index2030bw.jpg)
![[MISSING IMAGE: tm222386d6-lc_index2035bw.jpg]](https://capedge.com/proxy/N-CSR/0001104659-22-030433/tm222386d6-lc_index2035bw.jpg)
![[MISSING IMAGE: tm222386d6-lc_index2040bw.jpg]](https://capedge.com/proxy/N-CSR/0001104659-22-030433/tm222386d6-lc_index2040bw.jpg)
![[MISSING IMAGE: tm222386d6-lc_index2045bw.jpg]](https://capedge.com/proxy/N-CSR/0001104659-22-030433/tm222386d6-lc_index2045bw.jpg)
![[MISSING IMAGE: tm222386d6-lc_index2050bw.jpg]](https://capedge.com/proxy/N-CSR/0001104659-22-030433/tm222386d6-lc_index2050bw.jpg)
![[MISSING IMAGE: tm222386d6-lc_index2055bw.jpg]](https://capedge.com/proxy/N-CSR/0001104659-22-030433/tm222386d6-lc_index2055bw.jpg)
![[MISSING IMAGE: tm222386d6-lc_index2060bw.jpg]](https://capedge.com/proxy/N-CSR/0001104659-22-030433/tm222386d6-lc_index2060bw.jpg)
![[MISSING IMAGE: tm222386d6-lc_index2065bw.jpg]](https://capedge.com/proxy/N-CSR/0001104659-22-030433/tm222386d6-lc_index2065bw.jpg)
![[MISSING IMAGE: sg_ernst-young.jpg]](https://capedge.com/proxy/N-CSR/0001104659-22-030433/sg_ernst-young.jpg)
![[MISSING IMAGE: lg_voya-r.jpg]](https://capedge.com/proxy/N-CSR/0001104659-22-030433/lg_voya-r.jpg)
![[MISSING IMAGE: tm222386d7-lc_solutionbw.jpg]](https://capedge.com/proxy/N-CSR/0001104659-22-030433/tm222386d7-lc_solutionbw.jpg)
![[MISSING IMAGE: tm222386d7-lc_index2025bw.jpg]](https://capedge.com/proxy/N-CSR/0001104659-22-030433/tm222386d7-lc_index2025bw.jpg)
![[MISSING IMAGE: tm222386d7-lc_index2030bw.jpg]](https://capedge.com/proxy/N-CSR/0001104659-22-030433/tm222386d7-lc_index2030bw.jpg)
![[MISSING IMAGE: tm222386d7-lc_index2035bw.jpg]](https://capedge.com/proxy/N-CSR/0001104659-22-030433/tm222386d7-lc_index2035bw.jpg)
![[MISSING IMAGE: tm222386d7-lc_index2040bw.jpg]](https://capedge.com/proxy/N-CSR/0001104659-22-030433/tm222386d7-lc_index2040bw.jpg)
![[MISSING IMAGE: tm222386d7-lc_index2045bw.jpg]](https://capedge.com/proxy/N-CSR/0001104659-22-030433/tm222386d7-lc_index2045bw.jpg)
![[MISSING IMAGE: tm222386d7-lc_index2050bw.jpg]](https://capedge.com/proxy/N-CSR/0001104659-22-030433/tm222386d7-lc_index2050bw.jpg)
![[MISSING IMAGE: tm222386d7-lc_index2055bw.jpg]](https://capedge.com/proxy/N-CSR/0001104659-22-030433/tm222386d7-lc_index2055bw.jpg)
![[MISSING IMAGE: tm222386d7-lc_index2060bw.jpg]](https://capedge.com/proxy/N-CSR/0001104659-22-030433/tm222386d7-lc_index2060bw.jpg)
![[MISSING IMAGE: tm222386d7-lc_index2065bw.jpg]](https://capedge.com/proxy/N-CSR/0001104659-22-030433/tm222386d7-lc_index2065bw.jpg)
![[MISSING IMAGE: sg_ernestyoungllp-bw.jpg]](https://capedge.com/proxy/N-CSR/0001104659-22-030433/sg_ernestyoungllp-bw.jpg)