UNITED STATES
SECURITIES AND EXCHANGE COMMISSION
Washington, D.C. 20549
Form N-CSR
CERTIFIED SHAREHOLDER REPORT OF
REGISTERED MANAGEMENT INVESTMENT COMPANIES
Investment Company Act file number:811-08319
Voya Partners, Inc.
(Exact name of registrant as specified in charter)
| 7337 East Doubletree Ranch Road, Suite 100, Scottsdale, AZ | 85258 |
| (Address of principal executive offices) | (Zip code) |
The Corporation Trust Company, 1209 Orange Street, Wilmington, DE 19801
(Name and address of agent for service)
Registrant’s telephone number, including area code:1-800-262-3862
Date of fiscal year end:December 31
Date of reporting period:December 31, 2019
Item 1. Reports to Stockholders.
The following is a copy of the report transmitted to stockholders pursuant to Rule 30e-1 under the Act (17 CFR 270.30e-1):


Voya Investment Management
Annual Report
December 31, 2019
Classes ADV, I, R6, S and S2
Voya Partners, Inc.
n Voya Global Bond Portfolio
n Voya International High Dividend Low Volatility Portfolio
n VY® American Century Small-Mid Cap Value Portfolio
n VY® Baron Growth Portfolio
n VY® Columbia Contrarian Core Portfolio
n VY® Columbia Small Cap Value II Portfolio
n VY® Invesco Comstock Portfolio
n VY® Invesco Equity and Income Portfolio
n VY® Invesco Oppenheimer Global Portfolio
n VY® JPMorgan Mid Cap Value Portfolio
n VY® T. Rowe Price Diversified Mid Cap Growth Portfolio
n VY® T. Rowe Price Growth Equity Portfolio
Beginning on January 1, 2021, as permitted by regulations adopted by the U.S. Securities and Exchange Commission, paper copies of each Portfolio's annual and semi-annual shareholder reports, like this annual report, will no longer be sent by mail, unless you specifically request paper copies of the reports. Instead, the reports will be made available on a website and you will be notified by mail each time a report is posted and provided with a website link to access the report.
If you already elected to receive shareholder reports electronically, you will not be affected by this change and you need not take any action. You may elect to receive shareholder reports and other communications from your insurance carrier electronically by contacting them directly.
You may elect to receive all future reports in paper free of charge. If you received this document in the mail, please follow the instructions provided to elect to continue receiving paper copies of your shareholder reports. You can inform us that you wish to continue receiving paper copies by calling 1-800-283-3427. Your election to receive reports in paper will apply to all the funds in which you invest.
This report is submitted for general information to shareholders of the Voya mutual funds. It is not authorized for distribution to prospective shareholders unless accompanied or preceded by a prospectus which includes details regarding the funds' investment objectives, risks, charges, expenses and other information. This information should be read carefully.
INVESTMENT MANAGEMENT
voyainvestments.com

TABLE OF CONTENTS
PROXY VOTING INFORMATION
A description of the policies and procedures that the Portfolios use to determine how to vote proxies related to portfolio securities is available: (1) without charge, upon request, by calling Shareholder Services toll-free at (800) 992-0180; (2) on the Portfolios' website at www.voyainvestments.com; and (3) on the U.S. Securities and Exchange Commission's ("SEC's") website at www.sec.gov. Information regarding how the Portfolios voted proxies related to portfolio securities during the most recent 12-month period ended June 30 is available without charge on the Portfolios' website at www.voyainvestments.com and on the SEC's website at www.sec.gov.
QUARTERLY PORTFOLIO HOLDINGS
The Portfolios file their complete schedule of portfolio holdings with the SEC for the first and third quarters of each fiscal year on Form N-Q or Form N-PORT, available for filings after March 31, 2019. This report contains a summary portfolio of investments for the Portfolios. The Portfolios' Form N-Q or Form N-PORT is available on the SEC's website at www.sec.gov. The Portfolios' complete schedule of portfolio holdings, as filed on Form N-Q or Form N-PORT, are available: on www.voyainvestments.com and without charge upon request from the Portfolio by calling Shareholder Services toll-free at (800) 992-0180.
TABLE OF CONTENTS

New season, last year's plot
Dear Shareholder,
The financial markets delivered strong performance in 2019, and at this juncture, in our view, the outlook for 2020 seems upbeat. Thanks to supportive central bank policies around the world, global economic growth is reaccelerating; manufacturing activity, a key metric for setting market expectations, appears to be strengthening. Recent progress in the trade negotiations between China and the U.S. also helps brighten the outlook as 2020 gets underway.
So expect smooth sailing, right? Maybe. Barely into the first week of the new year, the world faced the prospect of escalating conflict in the Middle East, though tensions appear to have eased since then. Markets initially pulled back in response to heightened uncertainty but regrouped quickly. Follow-on events, if they occur, may not impact markets that much: during 2019, investors generally did well by downplaying geopolitical concerns, and we could see the same behavior in 2020.
Still, we believe that turbulence seems to be the world's modus operandi: economic and market uncertainty are still with us, trade issues remain unresolved and the upcoming U.S. presidential election adds another dimension of political uncertainty. Even though market participants have become more comfortable accepting risk, we have observed persistent preferences for higher-quality, lower-volatility assets. This tells us that investors perceive significant risks they wish to avoid, and points to the potential for volatile reactions to adverse news.
With potential surprises from anywhere, we believe investors should continue to diversify their portfolios as broadly as practicable, and not attempt to time the markets. At the start of 2019, in our opinion, many investors did not believe U.S. equities offered attractive return potential — acting on that belief would have resulted in missed opportunities. Remember that your portfolio is structured to meet your long-term objectives; changing it in response to short-term market conditions may put your long-term goals at risk. If your goals have changed, please discuss them thoroughly with your investment advisor before making any changes to your portfolio.
Voya seeks to remain a reliable partner committed to reliable investing, helping you and your investment advisor achieve your goals. We appreciate your continued confidence in us, and we look forward to serving your investment actualneeds in the future.
Sincerely,

Dina Santoro
President
Voya Family of Funds
January 21, 2020
The views expressed in the President's Letter reflect those of the President as of the date of the letter. Any such views are subject to change at any time based upon market or other conditions and the Voya mutual funds disclaim any responsibility to update such views. These views may not be relied on as investment advice and because investment decisions for a Voya mutual fund are based on numerous factors, may not be relied on as an indication of investment intent on behalf of any Voya mutual fund. Reference to specific company securities should not be construed as recommendations or investment advice.
International investing poses special risks including currency fluctuation, economic and political risks not found in investments that are solely domestic.
2
TABLE OF CONTENTS
MARKET PERSPECTIVE: YEAR ENDED DECEMBER 31, 2019
In our semi-annual report, we described how global equities, in the form of the MSCI World IndexSM (the "Index") measured in local currencies, including net reinvested dividends, rose 16.69% for the half-year after a nervous start.
A trade war between the U.S. and China had been ongoing for more than a year, with U.S. tariffs on some $250 billion of Chinese goods in place together with Chinese tariffs on $110 billion of U.S. goods. The war was being waged against a backdrop of slowing global growth, in part the result of uncertainties caused by the trade war itself.
Fears on both fronts: the trade war and slowing global growth, would ebb and flow in the second half; yet the Index rose five months out of six, ending the year up 27.34%, just below the record set a few days earlier. (The Index returned 27.67% for the year ended December 31, 2019, measured in U.S. dollars.)
Entering May, trade talks had appeared to be going reasonably well and the path of least resistance for the Index still seemed upwards. This all changed when the President tweeted his intention to raise the existing 10% tariff on $200 billion of the $250 billion to 25% of Chinese goods. Trade negotiations had evidently broken down. Later he unexpectedly threatened tariffs on Mexican goods for reasons unrelated to trade.
On perceived slowing global growth, there was still plenty to worry about.
In Europe, manufacturing was in contraction. The euro zone's annual growth in gross domestic product ("GDP") in the second and third quarters of 2019 was just 1.2%. In the U.K., chronic disagreement about whether and how to leave the European Union ("Brexit") culminated in a general election called for December.
Japan, with manufacturing also in contraction, managed GDP growth of 2.0% annualized in the second quarter, slipping to 1.8% in the third. Exports and imports were both falling and core inflation languished at 0.8%, with a demand-dampening sales tax increase effective on October 1.
China's GDP grew at 6.0% in the third quarter, the smallest advance in 27 years. Industrial production was expanding near the slowest pace in 17 years, retail sales in 16 years.
In the U.S., manufacturing fell into contraction in September. Corporate profits were flat to falling year-over-year. While annualized first quarter growth had surprised to the upside at 3.1%, it fell to 2.0% and 2.1% in the second and third quarters, respectively. Growth was heavily dependent on consumer spending, supported by the lowest unemployment rate since 1969.
Back in the markets, after May's slump, central banks came to the rescue in June. On June 19 the Federal Open Market Committee ("FOMC") left rates unchanged, but markets heard Chairman Powell signal a cut in July. The European Central Bank announced its willingness to cut its already negative deposit rate and resume bond purchases. The Japanese government also promised increased stimulus. Plans for tariffs on Mexican imports were "indefinitely suspended", and investors were finally left to cheer a truce in the U.S.-China trade conflict, agreed on June 29.
July was a comparatively quiet month. The FOMC duly cut the federal funds rate by 25 basis points (0.25%), but disappointed some, including the President, by referring to it as only a "mid-cycle adjustment". And it was back to trade-war angst in August, as first the President announced 10% tariffs on the approximately $300 billion of Chinese imports as yet
unaffected, and then increased existing and planned tariffs by 5% when China retaliated.
The market rollercoaster lurched back up in September and October, when high-level trade talks between the U.S. and China resumed. Both sides expressed confidence that "Phase 1" of a deal was possible by year-end. The FOMC cut rates again in both months.
And as year-end approached, a more positive narrative was increasingly heard. Markets were rising despite trade tensions, sluggish global growth, declining profits and political uncertainties in the U.S. and elsewhere. Perhaps, some commentators ventured, this was a signal that the worst was over. The Phase 1 trade deal was announced, amid some skepticism on the details, as was agreement on USMCA, the replacement for NAFTA. The U.K. government's emphatic election victory might offer more clarity on Brexit. Central banks were all supportive and some of the economic data were starting to improve.
In U.S. fixed income markets, the Treasury yield curve fell. For the year, the Bloomberg Barclays U.S. Aggregate Bond Index rose 8.72%. The Bloomberg Barclays Long-Term U.S. Treasury sub-index returned 14.83%, the 30-year yield briefly dipping below 2% in August. The 10-year yield on Japanese and some euro zone government bonds ended below zero.
U.S. equities, represented by the S&P 500® Index, including dividends, surged 31.49%. Technology was by far the top performer, up 50.29%, led by Apple and Microsoft. Energy, exposed to slowing global economic activity, was the weakest, but still rose 11.81%.
In currencies, the dollar rose 2.04% against the euro, but lost 3.80% against the pound and 0.97% against the yen. On a trade-weighted basis, according to Reuters, the dollar had the smallest annual move ever in 2019.
In international markets, the MSCI Japan® Index ended up 18.48% for the year, supported by the Bank of Japan's purchases of exchange-traded funds, but pressured by Japan's own vulnerability to a trade war. The MSCI Europe ex U.K.® Index advanced 26.43%, powered by capital goods and pharmaceuticals companies. The MSCI U.K.® Index rose 16.37%, dampened by Brexit concerns, but also affected by the company-specific fortunes of MSCI U.K.'s market heavyweights. Among the largest contributors were pharmaceuticals, AstraZeneca and GlaxoSmithKline; the biggest detractors were miner Glencore and HSBC.
All indices are unmanaged and investors cannot invest directly in an index. Past performance does not guarantee future results. The performance quoted represents past performance.
Investment return and principal value of an investment will fluctuate, and shares, when redeemed, may be worth more or less than their original cost. Each Portfolio's performance is subject to change since the period's end and may be lower or higher than the performance data shown. Please call (800) 262-3862 or log on to www.voyainvestments.com to obtain performance data current to the most recent month end.
Market Perspective reflects the views of Voya Investment Management's Chief Investment Risk Officer only through the end of the period, and is subject to change based on market and other conditions.
3
TABLE OF CONTENTS
Index | | Description | |
Bloomberg Barclays Global Aggregate Index | | Provides a broad-based measure of the global investment-grade fixed-rate debt markets. | |
Bloomberg Barclays U.S. Aggregate Bond Index | | An index of publicly issued investment grade U.S. government, mortgage-backed, asset-backed and corporate debt securities. | |
Bloomberg Barclays U.S. Government/Credit Index | | An index made up of the Barclays Government and Credit indices, including securities issued by the U.S. government and its agencies and publicly issued U.S. corporate and foreign debentures and secured notes that meet specified maturity, liquidity and quality requirements. | |
Bloomberg Barclays Long-Term U.S. Treasury Index | | This index measures the performance of U.S. Treasury bills with long-term maturity. The credit level for this index is investment grade. The rebalance scheme is monthly. | |
MSCI All Country World IndexSM | | A free-float adjusted market capitalization index that is designed to measure equity performance in the global developed and emerging markets. | |
MSCI All Country World ex-U.S. IndexSM | | A free float-adjusted market capitalization index that is designed to measure equity market performance in the global developed and emerging markets, excluding the U.S. It includes the reinvestment of dividends and distributions net of withholding taxes, but does not reflect fees, brokerage commissions or other expenses of investing. | |
MSCI Europe, Australasia and Far East® ("MSCI EAFE") Index | | An index that measures the performance of securities listed on exchanges in Europe, Australasia and the Far East. It includes the reinvestment of dividends net of withholding taxes, but does not reflect fees, brokerage commissions or other expenses of investing. | |
MSCI Europe ex U.K.® Index | | A free float-adjusted market capitalization index that is designed to measure developed market equity performance in Europe, excluding the UK. | |
MSCI Japan® Index | | A free float-adjusted market capitalization index that is designed to measure developed market equity performance in Japan. | |
MSCI U.K.® Index | | A free float-adjusted market capitalization index that is designed to measure developed market equity performance in the UK. | |
MSCI World IndexSM | | An index that measures the performance of over 1,600 securities listed on exchanges in the U.S., Europe, Canada, Australia, New Zealand and the Far East. | |
Russell 1000® Index | | A comprehensive large-cap index measuring the performance of the largest 1,000 U.S. incorporated companies. | |
Russell 1000® Growth Index | | Measures the performance of the 1,000 largest companies in the Russell 3000® Index with higher price-to-book ratios and higher forecasted growth. | |
Russell 1000® Value Index | | An index that measures the performance of those Russell 1000® securities with lower price-to-book ratios and lower forecasted growth values. | |
Russell 2000® Growth Index | | An index that measures the performance of securities of smaller U.S. companies with greater than average growth orientation. | |
Russell 2000® Value Index | | An index that measures the performance of those Russell 2000® companies with lower price-to-book ratios and lower than forecasted growth values. | |
Russell 2500TM Growth Index | | Measures the performance of the small- to mid-cap growth segment of the U.S. equity universe. It includes those Russell 2500TM Index companies with higher price-to-book ratios and higher forecasted growth values. | |
Russell 2500TM Value Index | | Measures the performance of those Russell 2500 companies with lower price-to-book ratios and lower forecasted growth values. | |
Russell Midcap® Growth Index | | An index that measures the performance of those companies included in the Russell Midcap® Index with relatively higher price-to-book ratios and higher forecasted growth values. | |
Russell Midcap® Value Index | | Measures the performance of those Russell Midcap companies with lower price-to-book ratios and lower forecasted growth values. | |
4
TABLE OF CONTENTS
BENCHMARK DESCRIPTIONS (CONTINUED)
Index | | Description | |
S&P 500® Index | | An index that measures the performance of securities of approximately 500 large-capitalization companies whose securities are traded on major U.S. stock markets. | |
S&P MidCap 400® Index | | An index that measures the performance of the mid-size company segment of the U.S. market. | |
S&P SmallCap 600® Value Index | | Measures the performance of those S&P SmallCap 600® Index companies with lower price-to-book ratios. | |
5
TABLE OF CONTENTS
VOYA GLOBAL BOND PORTFOLIO
PORTFOLIO MANAGERS' REPORT
Voya Global Bond Portfolio (the "Portfolio") seeks to maximize total return through a combination of current income and capital appreciation. The Portfolio is managed by Mustafa Chowdhury, Sean Banai, CFA, and Brian Timberlake, Ph.D., CFA, Portfolio Managers* of Voya Investment Management Co. LLC ("Voya IM") — the Sub-Adviser.
Performance: For the year ended December 31, 2019, the Portfolio's Class S shares provided a total return of 7.64% compared to the Bloomberg Barclays Global Aggregate Index, which returned 6.84% for the same period.
Portfolio Specifics: The Portfolio's outperformance versus the Bloomberg Barclays Global Aggregate Index was due primarily to sector allocation, whereas currency positioning did not meaningfully impact results over the period. On the downside, duration/yield curve positioning that was defensive earlier in the year, detracted from performance.
Fixed income markets witnessed an about face, as the U.S. Federal Reserve Board ("Fed") pivoted from raising rates four times in 2018 to instituting the first of three 2019 rate cuts in July. Elevated tensions between the U.S. and China drove concerns on the risk of recession in the U.S., which saw the 10-year Treasury yield go below 1.5% in the summer months. The European Central Bank ("ECB") continued its dovish tone, as leadership transitioned to Christine LaGarde and the ECB cut rates, pushing official rates into further negative territory. Economic data in the fourth quarter alleviated many of those fears and global Treasury yields rose. Non-government sectors outperformed over the reporting period, supported by accommodative central banks and steady demand for higher yielding sectors as the global economy posted positive growth.
Sector allocation, which included overweights to spread sectors and underweights to global Treasury securities, was the dominant driver of outperformance for the year. Favorable security selection within corporate bonds was the largest contributor, as the Fund capitalized on weakness in corporate markets early in the year and benefited throughout 2019. The Portfolio also benefited from an overweight to and favorable security selection within commercial mortgage-backed securities. Securitized sector allocations were less pronounced. Positive contributions from security selection within agency mortgages were offset by detractions from positioning in agency residential mortgage-backed securities.
Duration/yield curve positioning in emerging markets contributed to performance, while the Portfolio's positioning in developed markets detracted from results. In particular, defensive strategies implemented in the first quarter of 2019 were a headwind for returns as rates declined. Finally, currency positioning did not meaningfully impact performance during the reporting period.
The Portfolio used derivatives, such as futures, swaps, options and forward contracts, for hedging and overall risk management. The use of derivatives positively impacted performance for the period.
Current Strategy and Outlook: Entering 2020, we believe that there are signs of steadying economic growth, especially outside the U.S. However, while we believe this positive outlook for growth will prove supportive to spread sectors, we also believe geopolitical and monetary policy uncertainty, coupled with somewhat rich valuations across many sectors, will limit potential upside. Meanwhile, the lack of inflationary pressures will permit global developed central banks to remain accommodative, in our view.
Emerging markets, while supported by the macroeconomic environment, are no stranger to political upheaval that can cause disruption and create opportunities. Heading into 2020, we believe fiscal responsiveness to social unrest needs to be closely monitored. From our perspective, separating winners from losers in emerging markets requires identifying countries that will use fiscal stimulus that is investment-oriented rather than implementing consumption-based government programs. In addition, in our opinion, the degree of stimulus must be monitored and cannot threaten a country's debt sustainability, as well as the sovereign's credit profile.
We continue to believe corporate credit risk is idiosyncratic, not systemic. We believe the path to future investment success will be paved by security selection, as this backdrop favors idiosyncratic opportunities over broad market risk taking. We expect that, when volatility does strike, perceived "losers" will be excessively punished and avoiding these investments will be critical. As we have over the past year, we will continue to view episodes of volatility in credit markets as fertile ground for identifying oversold individual credits with strong fundamentals.
Based on current valuations, we continue to favor securitized credit over corporate credit on a relative basis. Fundamentally, we believe agency mortgage-backed securities ("MBS") are attractive relative to Treasuries and other high-grade assets. In addition, we see opportunities in non-agency residential MBS, commercial mortgage-backed securities and asset-backed securities as an attractive source of durable yield to capture while we diligently surveil markets for new opportunities.
With regard to currencies, we believe the U.S. dollar is likely to decline versus major developed currencies, as the Fed has indicated it is on hold for the foreseeable future. In addition, we will look to capitalize on emerging market currency opportunities, while being mindful of volatility connected to geopolitical risks.
Geographic Diversification
as of December 31, 2019
(as a percentage of net assets)
United States | | | 81.8 | % | |
Germany | | | 4.8 | % | |
Spain | | | 1.2 | % | |
United Kingdom | | | 1.1 | % | |
Cayman Islands | | | 1.1 | % | |
Brazil | | | 1.0 | % | |
Peru | | | 1.0 | % | |
Japan | | | 0.9 | % | |
Netherlands | | | 0.8 | % | |
Portugal | | | 0.7 | % | |
Countries between 0.0%-0.7%^ | | | 4.6 | % | |
Assets in Excess of Other Liabilities*,** | | | 1.0 | % | |
Net Assets | | | 100.0 | % | |
* Includes short-term investments.
** Includes purchased options.
^ Includes 13 countries, which each represents 0.0%-0.7% of net assets.
Portfolio holdings are subject to change daily.
Top Ten Holdings
as of December 31, 2019
(as a percentage of net assets)
Voya Emerging Markets Local Currency Debt
Fund — Class P | | | 6.9 | % | |
Voya Emerging Markets Hard Currency Debt
Fund — Class P | | | 5.5 | % | |
Voya High Yield Bond Fund — Class P | | | 3.6 | % | |
Bundesrepublik Deutschland, 0.500%, 02/15/25 | | | 3.4 | % | |
Voya Emerging Markets Corporate Debt
Fund — Class P | | | 3.3 | % | |
United States Treasury Inflation Indexed Bonds,
0.250%, 07/15/29 | | | 3.1 | % | |
Uniform Mortgage-Backed Securities,
3.500%, 08/01/49 | | | 2.1 | % | |
Ginnie Mae, 3.000%, 01/20/50 | | | 2.1 | % | |
United States Treasury Note, 1.750%, 11/15/29 | | | 2.0 | % | |
United States Treasury Bond, 2.250%, 08/15/49 | | | 1.7 | % | |
Portfolio holdings are subject to change daily.
* Effective March 1, 2019, Sean Banai was added as a portfolio manager for the Portfolio. Effective August 31, 2019, Mustafa Chowdhury was removed as a portfolio manager for the Portfolio.
The views expressed in this commentary are informed opinions. They should not be considered promises or advice. The views expressed reflect those of the portfolio managers, only through the end of the period as stated on the cover. The portfolio managers' views are subject to change at any time based on market and other conditions.
Portfolio holdings and characteristics are subject to change and may not be representative of current holdings and characteristics. Portfolio holdings are subject to change daily. The outlook for this Portfolio may differ from that presented for other Voya mutual funds. This report contains statements that may be "forward-looking" statements. Actual results may differ materially from those projected in the "forward-looking" statements. The Portfolio's performance returns shown reflect applicable fee waivers and/or expense limits in effect during this period. Absent such fee waivers/expense limitations, if any, performance would have been lower. Performance for the different classes of shares will vary based on differences in fees associated with each class. An index has no cash in its portfolio and imposes no sales charges. An investor cannot invest directly in an index.
6
TABLE OF CONTENTS
PORTFOLIO MANAGERS' REPORT
VOYA GLOBAL BOND PORTFOLIO

Average Annual Total Returns for the Periods Ended December 31, 2019 | |
| | 1 Year | | 5 Year | | 10 Year | |
Class ADV | | | 7.36 | % | | | 2.84 | % | | | 3.44 | % | |
Class I | | | 7.90 | % | | | 3.36 | % | | | 3.96 | % | |
Class S | | | 7.64 | % | | | 3.11 | % | | | 3.70 | % | |
Blooomberg Barclays Global Aggregate Index | | | 6.84 | % | | | 2.31 | % | | | 2.48 | % | |
Based on a $10,000 initial investment, the graph and table above illustrate the total return of Voya Global Bond Portfolio against the index indicated. The index is unmanaged and has no cash in its portfolio and imposes no sales charges. An investor cannot invest directly in an index.
The Portfolio's performance is shown without the imposition of any expenses or charges which are, or may be, imposed under your variable annuity contract or variable life insurance policy. Total returns would have been lower if such expenses or charges were included.
The performance graph and table do not reflect the deduction of taxes that a shareholder will pay on Portfolio distributions or the redemption of Portfolio shares.
The performance shown may include the effect of fee waivers and/or expense reimbursements by the Investment Adviser and/or other service providers, which have the
effect of increasing total return. Had all fees and expenses been considered, the total returns would have been lower.
The performance update illustrates performance for a variable investment option available through a variable annuity contract or a variable life insurance policy. The performance shown indicates past performance and is not a projection or prediction of future results. Actual investment returns and principal value will fluctuate so that shares and/or units, at redemption, may be worth more or less than their original cost. Please log on to www.voyainvestments.com or call (800) 262-3862 to get performance through the most recent month end.
Portfolio holdings are subject to change daily.
Prior to January 21, 2011, the Portfolio was managed by a different sub-adviser.
7
TABLE OF CONTENTS
VOYA INTERNATIONAL HIGH DIVIDEND LOW VOLATILITY PORTFOLIO
PORTFOLIO MANAGERS' REPORT
Voya International High Dividend Low Volatility Portfolio (the "Portfolio") seeks maximum total return. The Portfolio is managed by Vincent Costa, CFA, Kai Yee Wong, Peg DiOrio, CFA, and Steve Wetter, Portfolio Managers of Voya Investment Management Co. LLC ("VIM") — the Sub-Adviser*.
Performance: For the year ended December 31, 2019, the Portfolio's Class I shares provided a total return of 16.75% compared to the MSCI EAFE® Index** and the MSCI All Country World ex-U.S. IndexSM ("MSCI ACWI ex-U.S."), which returned 22.01% and 21.51%, respectively, for the same period.
Portfolio Specifics — Templeton Investment Counsel LLC ("Templeton") January 1, 2019 — April 16, 2019: During the period in which Templeton managed the Portfolio, the Portfolio underperformed the MSCI ACWI ex-U.S.) by approximately 329 basis points (-3.29%). Stock selection and an unfavorable overweight allocation in the communication services sector detracted from relative performance. Shares of SES, a Luxembourg-based satellite operator, declined due to regulatory challenges facing the company's efforts to monetize its potentially valuable spectrum. While the best procedure for reallocating spectrum has yet to be decided, we believe the firm will ultimately recognize significant value from these important assets.
Stock selection and an unfavorable overweight allocation in the health care sector detracted from relative results. Israeli generic pharmaceuticals firm Teva was a significant detractor in the sector.
Stock selection among underweight consumer staples holdings also detracted from relative results. Shares of Japanese convenience store owner Seven & I declined after analysts downgraded the stock following a disappointing profit forecast.
In contrast, stock selection in the materials sector contributed to relative returns. Irish building materials firm CRH was a significant contributor to relative returns in the sector.
Stock selection in overweight utilities and underweight information technology and industrials holdings also contributed to relative performance.
From a regional standpoint, stock selection in underweight Asian holdings detracted from relative performance, pressured by Japanese and Chinese holdings. In Europe, stock selection detracted from relative results, offsetting a favorable overweight allocation.
Portfolio Specifics*** — VIM — May 1, 2019 — December 31, 2019: During the period in which VIM managed the Portfolio, the Portfolio underperformed the MSCI EAFE® Index by approximately 203 basis points (-2.03%). In terms of the Portfolio's performance, both low beta and dividend yield outperformed for the period while the stock ranking model underperformed. The Portfolio's stock specific exposures and smaller size further drove relative underperformance. On the regional level, stock selection within Japan, and to a lesser extent Asia/Pacific ex Japan, had the largest negative impact on relative performance. On the sector level, Portfolio holdings within the real estate and financial sectors had the largest positive impact on performance. On an individual stock level basis, an overweight position in Sekisui House, Ltd., an underweight position in BP plc and not owning HSBC Holdings Plc were among the key contributors. By contrast, stock selection within the health care and materials sectors had the largest negative impact on returns. Key detractors for the period include overweight positions in Evraz plc and Konica Minolta, Inc. as well as not owning benchmark holding ASML Holding NV.
Current Strategy and Outlook: This is an actively managed international quantitative equity strategy that seeks to generate higher dividend income and total returns, with lower volatility and better downside capture, than the benchmark. The investment process seeks to create a universe of sustainable dividend-paying stocks and utilizes fundamentally driven sector-specific alpha models to identify the most attractive stocks within each region-sector. The Portfolio is then optimized to achieve its dividend, alpha, and volatility objectives.
Geographic Diversification
as of December 31, 2019
(as a percentage of net assets)
Japan | | | 25.2 | % | |
United Kingdom | | | 13.5 | % | |
Switzerland | | | 9.3 | % | |
France | | | 8.3 | % | |
Australia | | | 7.8 | % | |
Netherlands | | | 6.1 | % | |
Germany | | | 5.6 | % | |
Italy | | | 4.1 | % | |
Denmark | | | 3.5 | % | |
Finland | | | 3.1 | % | |
Countries between 0.2%-3.1%^ | | | 12.2 | % | |
Assets in Excess of Other Liabilities* | | | 1.3 | % | |
Net Assets | | | 100.0 | % | |
* Includes short-term investments and exchange-traded funds.
^ Includes 9 countries, which each represents 0.2%-3.1% of net assets.
Portfolio holdings are subject to change daily.
Top Ten Holdings
as of December 31, 2019
(as a percentage of net assets)
Nestle SA | | | 2.7 | % | |
Royal Dutch Shell PLC — Class A | | | 2.1 | % | |
Roche Holding AG | | | 2.1 | % | |
Novartis AG | | | 1.6 | % | |
GlaxoSmithKline PLC | | | 1.4 | % | |
| BP PLC | | | 1.4 | % | |
Sanofi | | | 1.4 | % | |
Novo Nordisk A/S | | | 1.3 | % | |
Rio Tinto Ltd. | | | 1.2 | % | |
Unilever NV | | | 1.1 | % | |
Portfolio holdings are subject to change daily.
* The Board of Trustees of the Portfolio approved an investment objective change, strategy change and sub-adviser replacement of Templeton, with VIM effective May 1, 2019.
In conjunction with the investment objective change, strategy change and sub-adviser replacement, effective May 1, 2019, Vincent Costa, Kai Yee Wong, Peg DiOrio, and Steve Wetter were added as portfolio managers to the Portfolio and Antonio T. Docal, Peter A. Nori, and Matthew R. Nagle were removed as portfolio managers to the Portfolio.
In conjunction with the sub-adviser change, the Portfolio's name changed to "Voya International High Dividend Low Volatility Portfolio".
** Effective May 1, 2019, the sub-adviser changed the primary benchmark from the MSCI ACWI Ex-U.S. to the MSCI EAFE® Index because the MSCI EAFE® Index is considered by the sub-adviser to be a more appropriate benchmark reflecting the type of securities in which the Portfolio invests.
*** Beginning April 16, 2019, through the close of business on April 30, 2019, the Portfolio was in a transition period and may have held a large portion of the Portfolio's assets in temporary investments.
The views expressed in this commentary are informed opinions. They should not be considered promises or advice. The views expressed reflect those of the portfolio managers, only through the end of the period as stated on the cover. The portfolio managers' views are subject to change at any time based on market and other conditions.
Portfolio holdings and characteristics are subject to change and may not be representative of current holdings and characteristics. Portfolio holdings are subject to change daily. The outlook for this Portfolio may differ from that presented for other Voya mutual funds. This report contains statements that may be "forward-looking" statements. Actual results may differ materially from those projected in the "forward-looking" statements. The Portfolio's performance returns shown reflect applicable fee waivers and/or expense limits in effect during this period. Absent such fee waivers/expense limitations, if any, performance would have been lower. Performance for the different classes of shares will vary based on differences in fees associated with each class. An index has no cash in its portfolio and imposes no sales charges. An investor cannot invest directly in an index.
8
TABLE OF CONTENTS
PORTFOLIO MANAGERS' REPORT
VOYA INTERNATIONAL HIGH DIVIDEND LOW VOLATILITY PORTFOLIO

Average Annual Total Returns for the Periods Ended December 31, 2019 | |
| | 1 Year | | 5 Year | | 10 Year | |
Class ADV | | | 16.13 | % | | | 3.11 | % | | | 3.82 | % | |
Class I | | | 16.75 | % | | | 3.64 | % | | | 4.35 | % | |
Class S | | | 16.40 | % | | | 3.38 | % | | | 4.08 | % | |
Class S2 | | | 16.28 | % | | | 3.23 | % | | | 3.95 | % | |
MSCI EAFE® Index | | | 22.01 | % | | | 5.67 | % | | | 5.50 | % | |
MSCI ACWI ex-U.S. | | | 21.51 | % | | | 5.51 | % | | | 4.97 | % | |
Based on a $10,000 initial investment, the graph and table above illustrate the total return of Voya International High Dividend Low Volatility Portfolio against the indices indicated. An index is unmanaged and has no cash in its portfolio and imposes no sales charges. An investor cannot invest directly in an index.
The Portfolio's performance is shown without the imposition of any expenses or charges which are, or may be, imposed under your variable annuity contract or variable life insurance policy. Total returns would have been lower if such expenses or charges were included.
The performance graph and table do not reflect the deduction of taxes that a shareholder will pay on Portfolio distributions or the redemption of Portfolio shares.
The performance shown may include the effect of fee waivers and/or expense reimbursements by the Investment Adviser and/or other service providers, which have the effect of increasing total return. Had all fees and expenses been considered, the total returns would have been lower.
The performance update illustrates performance for a variable investment option available through a variable annuity contract or a variable life insurance policy. The performance shown indicates past performance and is not a projection or prediction of future results. Actual investment returns and principal value will fluctuate so that shares and/or units, at redemption, may be worth more or less than their original cost. Please log on to www.voyainvestments.com or call (800) 262-3862 to get performance through the most recent month end.
Portfolio holdings are subject to change daily.
Effective May 1, 2019, the Adviser changed the primary benchmark from the MSCI ACWI Ex-U.S. to the MSCI EAFE® Index because the MSCI EAFE® Index is considered by the Sub-Adviser to be a more appropriate benchmark reflecting the type of securities in which the Portfolio invests.
Prior to May 1, 2019, the Portfolio was managed by a different sub-adviser.
9
TABLE OF CONTENTS
VY® AMERICAN CENTURY SMALL-MID CAP VALUE PORTFOLIO
PORTFOLIO MANAGERS' REPORT
VY® American Century Small-Mid Cap Value Portfolio (the "Portfolio") seeks long-term capital growth. Income is a secondary objective. The Portfolio is managed by a team of portfolio managers comprised of Miles Lewis, CFA and Vice President, and Jeff John, CFA, Vice President (responsible for the management of the Small Cap Value portion of the Portfolio) and Kevin Toney, CFA, Chief Investment Officer — Global Value Equity and Senior Vice President, Phillip N. Davidson, CFA, Senior Vice President and Executive Portfolio Manager — Global Value Equity and Senior Vice President, Michael Liss, CFA, CPA and Vice President, and Brian Woglom, CFA, Vice President (responsible for the Mid Cap Value portion of the Portfolio) (each a "Sleeve"), Portfolio Managers of American Century Investment Management, Inc. — the Sub-Adviser.
Performance: For the year ended December 31, 2019, the Portfolio's Class S shares provided a total return of 30.67% compared to the Russell 2500TM Value Index and the S&P SmallCap 600® Value Index, which returned 23.56% and 24.54%, respectively, for the same period.
Portfolio Specifics: Resilient U.S. economic growth and positive earnings fueled strong stock market performance for 2019, despite periods of volatility sparked by trade tensions and global economic uncertainty. The U.S. Federal Reserve Board cut interest rates three times in response to global economic risks, but central bank policymakers signaled a pause in the fourth quarter as economic data improved. Stocks ended the year on a strong note as news of a potential U.S.-China trade deal helped ease trade-related uncertainty. According to the FTSE Russell indices, large-cap stocks outperformed both mid and small caps for the year. Generally, value stocks underperformed growth.
The Portfolio outperformed the Russell 2500TM Value Index. Although the Russell 2500TM Value Index is the overall portfolio benchmark, the Small Cap Value and Mid Cap Value sleeves are managed against the Russell 2000® Value and Russell Midcap Value® indices, respectively.
The Mid Cap Value sleeve outperformed its benchmark, the Russell Midcap® Value Index, for the year. Stock selection in health care lifted relative performance. Stock selection in consumer staples also contributed positively to relative performance. Stock selection in financials detracted.
The Small Cap Value sleeve also outperformed its benchmark, the Russell 2000® Value Index. Stock selection in financials was a strong contributor to relative performance. Stock selection and an overweight in the materials sector also aided relative results. Stock selection in information technology detracted from relative performance.
The overall Portfolio's performance for the year exceeded that of its benchmark, the Russell 2500TM Value Index. Stock selection drove relative outperformance, especially in the financials sector where Compass Diversified Holdings was a top relative contributor. This publicly traded private equity firm reported solid revenue and profitability from its branded consumer businesses. In addition, Compass sold some businesses from its Portfolio, resulting in a strong balance sheet with significantly less leverage. Elsewhere in the Portfolio, Applied Materials was a top contributor. This semiconductor company was a strong performer, as it delivered solid financial results despite an uncertain global economic environment. We believe this semiconductor company remains well positioned, supported by greenfield investments and share gain from its new tool offering.
Despite the strength in Applied Materials, stock selection in the overall information technology sector detracted from relative performance. Sector detractors included data warehousing company Teradata, which suffered earnings volatility. The stock fell further in the fourth quarter after the company lowered earnings guidance due to the trade war, and its CEO was fired. Despite these events, we believe Teradata continues to make progress in transitioning to a subscription business. Communications equipment company Casa Systems, another sector detractor, lagged after some of its customers reduced spending early in the year. It also made a large acquisition that we believe may not have been beneficial to the business. The stock declined further in the fourth quarter after the company reported poor quarterly results.
Current Strategy and Outlook: We follow a stock-specific, valuation-driven strategy. The Portfolio's sector allocation is a result of our bottom-up investment process.
We continue to hold a considerable overweight in financials. According to our metrics, our bank holdings remain, in our view, attractive as valuations have been pressured by low interest rates and a relatively flat interest rate curve. Our Portfolio also has a notable overweight to health care. We have found what we believe to be attractive opportunities in the sector due to increased political rhetoric as well as company-specific issues. The vast majority of our holdings are in two industries: 1) health care equipment and supplies and 2) health care providers and services.
Real estate is a prominent underweight. According to our metrics, we believe that real estate stocks remain expensive relative to their historical valuation and to other areas of the equity market. Therefore, we hold a limited number of higher-quality real estate stocks that offer compelling valuations. Consumer discretionary is also a sector underweight. Most companies in the consumer discretionary sector do not meet our quality criteria. Our metrics also show that valuations throughout the communication services sector are unattractive, and the sector is also a portfolio underweight. Additionally, many stocks in the sector have volatile business models, leading to a wider range of potential outcomes.
Sector Diversification
as of December 31, 2019
(as a percentage of net assets)
Financials | | | 26.4 | % | |
Industrials | | | 15.7 | % | |
Health Care | | | 9.0 | % | |
Information Technology | | | 8.0 | % | |
Consumer Discretionary | | | 7.5 | % | |
Real Estate | | | 7.1 | % | |
Utilities | | | 6.9 | % | |
Consumer Staples | | | 5.8 | % | |
Materials | | | 4.9 | % | |
Energy | | | 4.5 | % | |
Exchange-Traded Funds | | | 2.1 | % | |
Communication Services | | | 0.8 | % | |
Assets in Excess of Other Liabilities* | | | 1.3 | % | |
Net Assets | | | 100.0 | % | |
* Includes short-term investments and exchange-traded funds.
Portfolio holdings are subject to change daily.
Top Ten Holdings
as of December 31, 2019*
(as a percentage of net assets)
iShares Russell Mid-Cap Value ETF | | | 2.1 | % | |
Zimmer Biomet Holdings, Inc. | | | 2.0 | % | |
Truist Financial Corp. | | | 1.7 | % | |
Northern Trust Corp. | | | 1.7 | % | |
First Hawaiian, Inc. | | | 1.5 | % | |
ProAssurance Corp. | | | 1.4 | % | |
Xcel Energy, Inc. | | | 1.4 | % | |
Weyerhaeuser Co. | | | 1.3 | % | |
Emerson Electric Co. | | | 1.3 | % | |
Hubbell, Inc. | | | 1.1 | % | |
* Excludes short-term investments.
Portfolio holdings are subject to change daily.
The views expressed in this commentary are informed opinions. They should not be considered promises or advice. The views expressed reflect those of the portfolio managers, only through the end of the period as stated on the cover. The portfolio managers' views are subject to change at any time based on market and other conditions.
Portfolio holdings and characteristics are subject to change and may not be representative of current holdings and characteristics. Portfolio holdings are subject to change daily. The outlook for this Portfolio may differ from that presented for other Voya mutual funds. This report contains statements that may be "forward-looking" statements. Actual results may differ materially from those projected in the "forward-looking" statements. The Portfolio's performance returns shown reflect applicable fee waivers and/or expense limits in effect during this period. Absent such fee waivers/expense limitations, if any, performance would have been lower. Performance for the different classes of shares will vary based on differences in fees associated with each class. An index has no cash in its portfolio and imposes no sales charges. An investor cannot invest directly in an index.
10
TABLE OF CONTENTS
VY® AMERICAN CENTURY SMALL-MID CAP VALUE PORTFOLIO
PORTFOLIO MANAGERS' REPORT
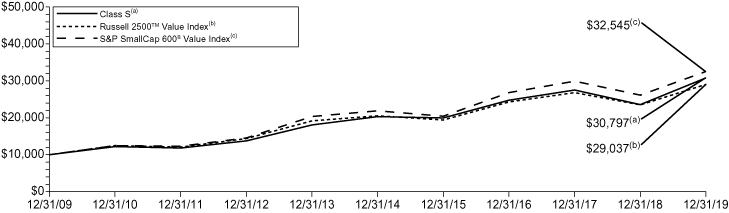
Average Annual Total Returns for the Periods Ended December 31, 2019 | |
| | 1 Year | | 5 Year | | 10 Year | |
Class ADV | | | 30.17 | % | | | 8.40 | % | | | 11.63 | % | |
Class I | | | 30.96 | % | | | 8.94 | % | | | 12.18 | % | |
Class S | | | 30.67 | % | | | 8.68 | % | | | 11.91 | % | |
Class S2 | | | 30.42 | % | | | 8.51 | % | | | 11.74 | % | |
Russell 2500TM Value Index | | | 23.56 | % | | | 7.18 | % | | | 11.25 | % | |
S&P SmallCap 600® Value Index | | | 24.54 | % | | | 8.26 | % | | | 12.52 | % | |
Based on a $10,000 initial investment, the graph and table above illustrate the total return of VY® American Century Small-Mid Cap Value Portfolio against the indices indicated. An index is unmanaged and has no cash in its portfolio and imposes no sales charges. An investor cannot invest directly in an index.
The Portfolio's performance is shown without the imposition of any expenses or charges which are, or may be, imposed under your variable annuity contract or variable life insurance policy. Total returns would have been lower if such expenses or charges were included.
The performance graph and table do not reflect the deduction of taxes that a shareholder will pay on Portfolio distributions or the redemption of Portfolio shares.
The performance shown may include the effect of fee waivers and/or expense reimbursements by the Investment
Adviser and/or other service providers, which have the effect of increasing total return. Had all fees and expenses been considered, the total returns would have been lower.
The performance update illustrates performance for a variable investment option available through a variable annuity contract or a variable life insurance policy. The performance shown indicates past performance and is not a projection or prediction of future results. Actual investment returns and principal value will fluctuate so that shares and/or units, at redemption, may be worth more or less than their original cost. Please log on to www.voyainvestments.com or call (800) 262-3862 to get performance through the most recent month end.
Portfolio holdings are subject to change daily.
11
TABLE OF CONTENTS
VY® BARON GROWTH PORTFOLIO
PORTFOLIO MANAGERS' REPORT
VY® Baron Growth Portfolio (the "Portfolio") seeks capital appreciation. The Portfolio is managed by Ronald Baron, Founder, Chief Executive Officer, Chief Investment Officer, Chairman, and Portfolio Manager and Neal Rosenberg, Portfolio Manager of BAMCO, Inc. — the Sub-Adviser.
Performance: For the year ended December 31, 2019, the Portfolio's Class S shares provided a total return of 38.52% compared to the Russell 2000® Growth Index and the Russell 2500TM Growth Index, which returned 28.48% and 32.65%, respectively, for the same period.
Portfolio Specifics: After a steep sell-off in December 2018, the U.S. stock market rebounded in 2019. The rally was fueled in large part by a policy shift at the U.S. Federal Reserve Board, which lowered rates three times in 2019. Better-than-expected corporate earnings also helped buoy investor sentiment. We believe that these headwinds outweighed uncertainty surrounding ongoing trade wars, turmoil in Washington, and fears of a global economic slowdown.
Absolute Performance: Top contributors within the Portfolio included real estate information and marketing services company CoStar Group, Inc., driven by excellent business results. Additionally, shares of MSCI Inc., a leading provider of investment decision support tools, rose in response to positive earnings momentum, an upbeat investor day presentation, and the announcement of a new ten-year contract extension with BlackRock. Shares of simulation software company ANSYS, Inc. rose steadily throughout the year on healthy sales growth. An analyst event held mid-year also boosted investor confidence in the company's growth prospects.
Top detractors within the Portfolio included shares of benefits enrollment platform Benefitfocus, Inc. which were down sharply after revenue growth fell short of Street expectations. We retain conviction, as we believe this is a short-term issue. Additionally, shares of Covetrus, Inc., a newly formed global animal health technology and services company, fell sharply as investors reacted to a first quarter revenue and EBITDA miss and guidance reset. We exited our position.
Relative Performance: The Portfolio was up sharply for the year and outperformed the Russell 2000® Growth Index primarily due to stock selection. Style biases also added value, driven by overexposure to strong performing mid-cap stocks and underexposure to the weak performing earnings variation factor.
Outperformance of investments in financials, industrials, and real estate added the most value. Stock selection in financials contributed almost 675 basis points (6.75%) to relative results, driven by the outperformance of financial exchanges & data companies MSCI, Inc. and Morningstar, Inc. Asset managers Cohen & Steers, Inc. and The Carlyle Group as well as insurers Arch Capital Group Ltd., Kinsale Capital Group, Inc. and Primerica, Inc. also boosted relative results. Strength in industrials came from CoStar Group, Inc. Real Estate holdings outperformed after appreciating more than 36% as group, led by specialized REITs Gaming and Leisure Properties, Inc. and Alexandria Real Estate Equities, Inc.
Information technology investments were the only detractors from relative performance with most of the weakness coming from Benefitfocus, Inc. and syndicated research provider Gartner, Inc.
Current Strategy and Outlook: As long-term investors in what we view as high quality growth stocks, we are always actively looking for what we believe to be good investment ideas. We continue to position the Portfolio to benefit from what we believe to be strong, long-term growth opportunities.
Sector Diversification
as of December 31, 2019
(as a percentage of net assets)
Financials | | | 26.1 | % | |
Consumer Discretionary | | | 23.6 | % | |
Information Technology | | | 17.1 | % | |
Health Care | | | 10.2 | % | |
Industrials | | | 9.4 | % | |
Real Estate | | | 8.6 | % | |
Communication Services | | | 3.9 | % | |
Consumer Staples | | | 0.7 | % | |
Assets in Excess of Other Liabilities* | | | 0.4 | % | |
Net Assets | | | 100.0 | % | |
* Includes short-term investments.
Portfolio holdings are subject to change daily.
Top Ten Holdings
as of December 31, 2019
(as a percentage of net assets)
Vail Resorts, Inc. | | | 7.8 | % | |
CoStar Group, Inc. | | | 6.6 | % | |
Choice Hotels International, Inc. | | | 6.6 | % | |
MSCI, Inc. — Class A | | | 6.4 | % | |
ANSYS, Inc. | | | 5.0 | % | |
Gartner, Inc. | | | 4.7 | % | |
Factset Research Systems, Inc. | | | 4.3 | % | |
Idexx Laboratories, Inc. | | | 3.8 | % | |
Bright Horizons Family Solutions, Inc. | | | 3.6 | % | |
Arch Capital Group Ltd. | | | 3.5 | % | |
Portfolio holdings are subject to change daily.
The views expressed in this commentary are informed opinions. They should not be considered promises or advice. The views expressed reflect those of the portfolio managers, only through the end of the period as stated on the cover. The portfolio managers' views are subject to change at any time based on market and other conditions.
Portfolio holdings and characteristics are subject to change and may not be representative of current holdings and characteristics. Portfolio holdings are subject to change daily. The outlook for this Portfolio may differ from that presented for other Voya mutual funds. This report contains statements that may be "forward-looking" statements. Actual results may differ materially from those projected in the "forward-looking" statements. The Portfolio's performance returns shown reflect applicable fee waivers and/or expense limits in effect during this period. Absent such fee waivers/expense limitations, if any, performance would have been lower. Performance for the different classes of shares will vary based on differences in fees associated with each class. An index has no cash in its portfolio and imposes no sales charges. An investor cannot invest directly in an index.
12
TABLE OF CONTENTS
PORTFOLIO MANAGERS' REPORT
VY® BARON GROWTH PORTFOLIO
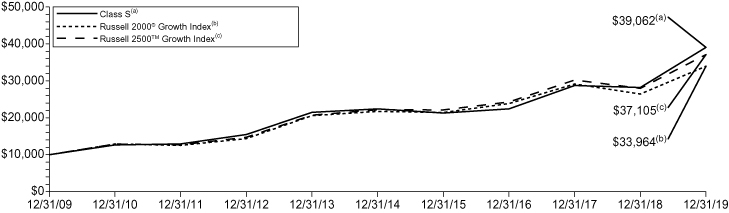
Average Annual Total Returns for the Periods Ended December 31, 2019 | |
| | 1 Year | | 5 Year | | 10 Year | |
Class ADV | | | 38.24 | % | | | 11.47 | % | | | 14.31 | % | |
Class I | | | 38.97 | % | | | 12.04 | % | | | 14.89 | % | |
Class R6(1) | | | 38.94 | % | | | 12.04 | % | | | 14.89 | % | |
Class S | | | 38.52 | % | | | 11.75 | % | | | 14.60 | % | |
Class S2 | | | 38.37 | % | | | 11.59 | % | | | 14.43 | % | |
Russell 2000® Growth Index | | | 28.48 | % | | | 9.34 | % | | | 13.01 | % | |
Russell 2500TM Growth Index | | | 32.65 | % | | | 10.84 | % | | | 14.01 | % | |
Based on a $10,000 initial investment, the graph and table above illustrate the total return of VY® Baron Growth Portfolio against the indices indicated. An index is unmanaged and has no cash in its portfolio and imposes no sales charges. An investor cannot invest directly in an index.
The Portfolio's performance is shown without the imposition of any expenses or charges which are, or may be, imposed under your variable annuity contract or variable life insurance policy. Total returns would have been lower if such expenses or charges were included.
The performance graph and table do not reflect the deduction of taxes that a shareholder will pay on Portfolio distributions or the redemption of Portfolio shares.
The performance shown may include the effect of fee waivers and/or expense reimbursements by the Investment Adviser and/or other service providers, which have the effect of increasing total return. Had all fees and expenses been considered, the total returns would have been lower.
The performance update illustrates performance for a variable investment option available through a variable annuity contract or a variable life insurance policy. The performance shown indicates past performance and is not a projection or prediction of future results. Actual investment returns and principal value will fluctuate so that shares and/or units, at redemption, may be worth more or less than their original cost. Please log on to www.voyainvestments.com or call (800) 262-3862 to get performance through the most recent month end.
Portfolio holdings are subject to change daily.
(1) Class R6 incepted on May 3, 2016. The Class R6 shares performance shown for the period prior to their inception date is the performance of Class I shares without adjustment for any differences in the expenses between the two classes. If adjusted for such differences, returns would be different.
13
TABLE OF CONTENTS
VY® COLUMBIA CONTRARIAN CORE PORTFOLIO
PORTFOLIO MANAGERS' REPORT
VY® Columbia Contrarian Core Portfolio (the "Portfolio") seeks total return consisting of long-term capital appreciation and current income. The Portfolio is managed by Guy W. Pope, CFA, Senior Portfolio Manager and Head of Contrarian Core Strategy with Columbia Management Investment Advisers, LLC — the Sub-Adviser.
Performance: For the year ended December 31, 2019, the Portfolio's Class S shares provided a total return of 33.06% compared to the Russell 1000® Index, which returned 31.43% for the same period.
Portfolio Specifics: The Portfolio's relative outperformance for the year was largely attributable to strong stock selection in all but a few sectors and positive sector allocation in eight out of 11 sectors as well. Stock selection was most notably positive in information technology, communication services and consumer staples, followed by real estate, energy and financials. The Portfolio's stock selection detracted most in health care and detracted to a much lesser degree in materials and consumer discretionary. While sector allocation is, for the most part, a result of the Portfolio's bottom-up stock selection process, it was nonetheless positive in 2019, with longstanding underweights to utilities and industrials having a positive impact. Underweights to consumer staples and real estate and the overweight to information technology also helped relative performance.
Several of the Portfolio's holdings in information technology performed well in 2019, including our stocks in the payments and financial software industry where consolidation paid off handsomely for First Data Corporation, Fidelity National Information Services, Fiserv and Total System Services. A wide range of other technology holdings performed well throughout the year. Microsoft continues to benefit from all facets of its businesses, but primarily from businesses moving to the cloud. A number of the Portfolio's companies in the very eclectic communications services sector also did well in 2019. Facebook did very well, AT&T was up approximately 45% for the year and Comcast was up approximately 34%.
Energy was the worst performing sector in 2019, up only approximately 11%, and EOG Resources simply lagged with the sector and the general exploration and production area for much of the year. Health care was the most difficult sector for the Portfolio in 2019 — a tough sector from the standpoint of stock selection throughout the year, and Pfizer was down 6.%. Materials was the only other negative sector for the Portfolio overall, and DuPont was the Portfolio's worst-performing stock in the sector, down approximately 14%.
Current Strategy and Outlook: Throughout 2019 we saw slowing economic and earnings growth, increased geopolitical uncertainty, and increased domestic political uncertainty. Factors offsetting slowing growth and political uncertainty included lower interest rates and a strong U.S. consumer. Going into 2020, it would not surprise us to see more volatility in the months ahead as investors grapple with these issues as well as a presidential election now only months away with key primaries coming early in the year. As always, we will look to take advantage of this potential volatility as we deploy our contrarian process that has served us well over the long term.
Sector Diversification
as of December 31, 2019
(as a percentage of net assets)
Information Technology | | | 25.8 | % | |
Financials | | | 14.9 | % | |
Communication Services | | | 14.2 | % | |
Health Care | | | 12.3 | % | |
Consumer Discretionary | | | 7.7 | % | |
Industrials | | | 7.5 | % | |
Energy | | | 5.5 | % | |
Consumer Staples | | | 4.5 | % | |
Materials | | | 3.2 | % | |
Real Estate | | | 1.1 | % | |
Utilities | | | 0.8 | % | |
Assets in Excess of Other Liabilities* | | | 2.5 | % | |
Net Assets | | | 100.0 | % | |
* Includes short-term investments.
Portfolio holdings are subject to change daily.
Top Ten Holdings
as of December 31, 2019*
(as a percentage of net assets)
Microsoft Corp. | | | 5.7 | % | |
Apple, Inc. | | | 4.9 | % | |
Berkshire Hathaway, Inc. — Class B | | | 4.0 | % | |
JPMorgan Chase & Co. | | | 3.3 | % | |
Citigroup, Inc. | | | 3.0 | % | |
Amazon.com, Inc. | | | 2.9 | % | |
Medtronic PLC | | | 2.9 | % | |
Comcast Corp. — Class A | | | 2.5 | % | |
Facebook, Inc. — Class A | | | 2.5 | % | |
Mastercard, Inc. — Class A | | | 2.3 | % | |
* Excludes short-term investments.
Portfolio holdings are subject to change daily.
The views expressed in this commentary are informed opinions. They should not be considered promises or advice. The views expressed reflect those of the portfolio managers, only through the end of the period as stated on the cover. The portfolio managers' views are subject to change at any time based on market and other conditions.
Portfolio holdings and characteristics are subject to change and may not be representative of current holdings and characteristics. Portfolio holdings are subject to change daily. The outlook for this Portfolio may differ from that presented for other Voya mutual funds. This report contains statements that may be "forward-looking" statements. Actual results may differ materially from those projected in the "forward-looking" statements. The Portfolio's performance returns shown reflect applicable fee waivers and/or expense limits in effect during this period. Absent such fee waivers/expense limitations, if any, performance would have been lower. Performance for the different classes of shares will vary based on differences in fees associated with each class. An index has no cash in its portfolio and imposes no sales charges. An investor cannot invest directly in an index.
14
TABLE OF CONTENTS
VY® COLUMBIA CONTRARIAN CORE PORTFOLIO
PORTFOLIO MANAGERS' REPORT

Average Annual Total Returns for the Periods Ended December 31, 2019 | |
| | 1 Year | | 5 Year | | 10 Year | |
Class ADV | | | 32.41 | % | | | 10.13 | % | | | 11.29 | % | |
Class I | | | 33.05 | % | | | 10.68 | % | | | 11.85 | % | |
Class S | | | 33.06 | % | | | 10.45 | % | | | 11.60 | % | |
Russell 1000® Index | | | 31.43 | % | | | 11.48 | % | | | 13.54 | % | |
Based on a $10,000 initial investment, the graph and table above illustrate the total return of VY® Columbia Contrarian Core Portfolio against the index indicated. The index is unmanaged and has no cash in its portfolio and imposes no sales charges. An investor cannot invest directly in an index.
The Portfolio's performance is shown without the imposition of any expenses or charges which are, or may be, imposed under your variable annuity contract or variable life insurance policy. Total returns would have been lower if such expenses or charges were included.
The performance graph and table do not reflect the deduction of taxes that a shareholder will pay on Portfolio distributions or the redemption of Portfolio shares.
The performance shown may include the effect of fee waivers and/or expense reimbursements by the Investment Adviser and/or other service providers, which have the
effect of increasing total return. Had all fees and expenses been considered, the total returns would have been lower.
The performance update illustrates performance for a variable investment option available through a variable annuity contract or a variable life insurance policy. The performance shown indicates past performance and is not a projection or prediction of future results. Actual investment returns and principal value will fluctuate so that shares and/or units, at redemption, may be worth more or less than their original cost. Please log on to www.voyainvestments.com or call (800) 262-3862 to get performance through the most recent month end.
Portfolio holdings are subject to change daily.
Prior to April 30, 2013, the Portfolio was managed by a different sub-adviser.
15
TABLE OF CONTENTS
VY® COLUMBIA SMALL CAP VALUE II PORTFOLIO
PORTFOLIO MANAGERS' REPORT
VY® Columbia Small Cap Value II Portfolio (the "Portfolio") seeks long-term growth of capital. The Portfolio is managed by Christian K. Stadlinger, Ph.D., CFA, and Jarl Ginsberg, CFA, CAIA, Portfolio Managers, of Columbia Management Investment Advisers, LLC — the Sub-Adviser.
Performance: For the year ended December 31, 2019, the Portfolio's Class I shares provided a total return of 20.42% compared to the Russell 2000® Value Index, which returned 22.39% for the same period.
Portfolio Specifics: For the year, the Portfolio underperformed the Russell 2000® Value Index. Underperformance was primarily driven by stock selection. Stock selection was strong within healthcare, communication services, and information technology, however selection within materials, financials, real estate, and industrials offset these relative results. Sector allocation modestly added to relative results, helped along by our overweight to information technology (which was the best performing sector in the benchmark by a significant margin), and our underweight to energy.
In general, much of the relative underperformance came during the month of September. During the beginning of September yields rose and there was a sharp spike in the small cap value market. During this time, smaller and more volatile names outperformed. Through our process, we have historically benefited over the long term from avoiding these types of names — even if it meant giving up some upside in the short term.
In terms of specific securities, one of the top contributors to relative performance was our position in industrials company Armstrong World Industries. The company, which designs and manufacturers ceilings and walls, saw its shares rise steadily over the first half of the year as investors rewarded their continued growth and healthy margins.
The biggest detractor from relative performance was our position in Merit Medical Systems. The company, which manufacturers and markets disposable medical devices, reported earnings over the summer that underwhelmed. Results were driven by lower than expected sales from two recent acquisitions by the company. The company had been a steady performer over the past few years and we expect the current earnings dislocation to be rectified by the company.
Current Strategy and Outlook: Our outlook continues to remain cautiously positive. Chief among our concerns continue to be the potential for a prolonged trade conflict, levels of debt, and political dysfunction that could derail pro-growth policy.
Regardless of what transpires, we will continue our longstanding philosophy of bottom-up, fundamental analysis. We continue to look for what we believe to be undervalued companies with strong underlying earnings prospects that are exhibiting evidence of upward inflection. In doing so, we believe we will be able to avoid value traps and deliver strong returns for our clients. As of the end of the quarter, we continue to be overweight technology, materials, and industrials while remaining underweight real estate and financials.
Sector Diversification
as of December 31, 2019
(as a percentage of net assets)
Financials | | | 28.1 | % | |
Information Technology | | | 14.0 | % | |
Industrials | | | 13.5 | % | |
Consumer Discretionary | | | 8.6 | % | |
Real Estate | | | 8.2 | % | |
Materials | | | 5.6 | % | |
Utilities | | | 5.2 | % | |
Health Care | | | 5.1 | % | |
Energy | | | 4.8 | % | |
Consumer Staples | | | 2.9 | % | |
Communication Services | | | 2.2 | % | |
Assets in Excess of Other Liabilities* | | | 1.8 | % | |
Net Assets | | | 100.0 | % | |
* Includes short-term investments.
Portfolio holdings are subject to change daily.
Top Ten Holdings
as of December 31, 2019*
(as a percentage of net assets)
TCF Financial Corp. | | | 1.7 | % | |
Community Bank System, Inc. | | | 1.7 | % | |
First Industrial Realty Trust, Inc. | | | 1.6 | % | |
Atlantic Union Bankshares Corp. | | | 1.6 | % | |
Independent Bank Corp. | | | 1.5 | % | |
Nexstar Media Group, Inc. | | | 1.5 | % | |
SYNNEX Corp. | | | 1.4 | % | |
MGIC Investment Corp. | | | 1.4 | % | |
Sandy Spring Bancorp, Inc. | | | 1.3 | % | |
LHC Group, Inc. | | | 1.3 | % | |
* Excludes short-term investments.
Portfolio holdings are subject to change daily.
The views expressed in this commentary are informed opinions. They should not be considered promises or advice. The views expressed reflect those of the portfolio managers, only through the end of the period as stated on the cover. The portfolio managers' views are subject to change at any time based on market and other conditions.
Portfolio holdings and characteristics are subject to change and may not be representative of current holdings and characteristics. Portfolio holdings are subject to change daily. The outlook for this Portfolio may differ from that presented for other Voya mutual funds. This report contains statements that may be "forward-looking" statements. Actual results may differ materially from those projected in the "forward-looking" statements. The Portfolio's performance returns shown reflect applicable fee waivers and/or expense limits in effect during this period. Absent such fee waivers/expense limitations, if any, performance would have been lower. Performance for the different classes of shares will vary based on differences in fees associated with each class. An index has no cash in its portfolio and imposes no sales charges. An investor cannot invest directly in an index.
16
TABLE OF CONTENTS
PORTFOLIO MANAGERS' REPORT
VY® COLUMBIA SMALL CAP VALUE II PORTFOLIO
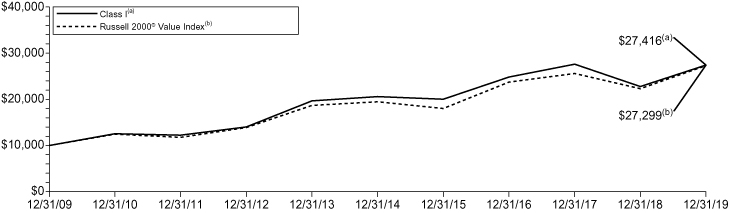
Average Annual Total Returns for the Periods Ended December 31, 2019 | |
| | 1 Year | | 5 Year | | 10 Year | |
Class ADV | | | 19.88 | % | | | 5.39 | % | | | 10.08 | % | |
Class I | | | 20.42 | % | | | 5.90 | % | | | 10.61 | % | |
Class R6(1) | | | 20.48 | % | | | 5.90 | % | | | 10.61 | % | |
Class S | | | 20.21 | % | | | 5.65 | % | | | 10.35 | % | |
Class S2 | | | 19.95 | % | | | 5.48 | % | | | 10.17 | % | |
Russell 2000® Value Index | | | 22.39 | % | | | 6.99 | % | | | 10.56 | % | |
Based on a $10,000 initial investment, the graph and table above illustrate the total return of VY® Columbia Small Cap Value II Portfolio against the index indicated. The index is unmanaged and has no cash in its portfolio and imposes no sales charges. An investor cannot invest directly in an index.
The Portfolio's performance is shown without the imposition of any expenses or charges which are, or may be, imposed under your variable annuity contract or variable life insurance policy. Total returns would have been lower if such expenses or charges were included.
The performance graph and table do not reflect the deduction of taxes that a shareholder will pay on Portfolio distributions or the redemption of Portfolio shares.
The performance shown may include the effect of fee waivers and/or expense reimbursements by the Investment Adviser and/or other service providers, which have the effect of increasing total return. Had all fees and expenses been considered, the total returns would have been lower.
The performance update illustrates performance for a variable investment option available through a variable annuity contract or a variable life insurance policy. The performance shown indicates past performance and is not a projection or prediction of future results. Actual investment returns and principal value will fluctuate so that shares and/or units, at redemption, may be worth more or less than their original cost. Please log on to www.voyainvestments.com or call (800) 262-3862 to get performance through the most recent month end.
Portfolio holdings are subject to change daily.
(1) Class R6 incepted on May 3, 2016. The Class R6 shares performance shown for the period prior to their inception date is the performance of Class I shares without adjustment for any differences in the expenses between the two classes. If adjusted for such differences, returns would be different.
17
TABLE OF CONTENTS
VY® INVESCO COMSTOCK PORTFOLIO
PORTFOLIO MANAGERS' REPORT
VY® Invesco Comstock Portfolio (the "Portfolio") seeks capital growth and income. The Portfolio is managed by Kevin Holt, Lead Portfolio Manager, and Devin Armstrong, James Warwick, and Charles DyReyes, each a Portfolio Manager of Invesco Advisers, Inc. — the Sub-Adviser.
Performance: For the year ended December 31, 2019, the Portfolio's Class S shares provided a total return of 25.24% compared to the Russell 1000® Value Index and the S&P 500® Index, which returned 26.54% and 31.49%, respectively, for the same period.
Portfolio Specifics: For the year ended December 31, 2019, the Portfolio underperformed the Russell 1000® Value Index, the Portfolio's style-specific benchmark. All sectors posted positive returns within the Russell 1000® Value Index. Information technology, industrials and financials were the strongest performing sectors, with energy being the worst performing sector.
Strong stock selection within financials was a large contributor to relative performance within the Portfolio. Citigroup, Bank of America and not owning Berkshire Hathaway were the top relative contributors in the sector. Large banks performed well during the period, as interest rates have stabilized, and investors have benefited from return of capital back to shareholders. Stock selection within industrials also boosted relative performance for the year. Johnson Controls International was a notable contributor as the company beat earnings estimates in the first half of the period. Stock selection within communication services also enhanced relative performance.
The allocation to cash was a large detractor to performance within the Portfolio. This would be expected in a strong equity market. Stock selection within consumer discretionary also detracted from relative performance. Carnival Corp. and Gap Inc. were two of the largest detractors in the sector. An overweight to energy stocks was the largest relative detractor. Energy stocks underperformed during most of the period and was the worst performing sector within the Russell 1000® Value Index. Our long-term view on energy is these companies continue to offer what we believe to be attractive valuations and improving prospects, as management continues to move towards a focus on profitability versus production growth.
We used currency forward contracts during the reporting period for the purpose of hedging currency exposure of non-U.S.-based companies held in the Portfolio. Derivatives were not used for speculative purposes or leverage. The use of currency forward contracts had a slightly negative impact on the Portfolio's performance relative to the Russell 1000® Value Index for the reporting period.
Current Strategy and Outlook: At the close of the reporting period, the Portfolio's financials sector weighting was overweight relative to the Russell 1000® Value Index, as we have a favorable view of large banks. We also maintain a constructive view on the long — term prospects for our energy holdings as believe supply and demand for oil should balance over time. The Portfolio's exposure to each sector has a higher beta than the benchmark. Therefore, we believe that the Portfolio should be more sensitive to broad moves within these sectors for the foreseeable future.
Sector Diversification
as of December 31, 2019
(as a percentage of net assets)
Financials | | | 30.2 | % | |
Energy | | | 15.8 | % | |
Health Care | | | 11.2 | % | |
Industrials | | | 8.5 | % | |
Information Technology | | | 8.1 | % | |
Consumer Staples | | | 6.8 | % | |
Consumer Discretionary | | | 5.9 | % | |
Communication Services | | | 5.5 | % | |
Materials | | | 3.2 | % | |
Utilities | | | 0.5 | % | |
Assets in Excess of Other Liabilities* | | | 4.3 | % | |
Net Assets | | | 100.0 | % | |
* Includes short-term investments.
Portfolio holdings are subject to change daily.
Top Ten Holdings
as of December 31, 2019*
(as a percentage of net assets)
Citigroup, Inc. | | | 5.3 | % | |
Bank of America Corp. | | | 5.1 | % | |
JPMorgan Chase & Co. | | | 3.5 | % | |
Philip Morris International, Inc. | | | 2.7 | % | |
Chevron Corp. | | | 2.2 | % | |
Suncor Energy, Inc. | | | 2.1 | % | |
Anthem, Inc. | | | 2.1 | % | |
Morgan Stanley | | | 2.0 | % | |
| BP PLC ADR | | | 2.0 | % | |
General Motors Co. | | | 2.0 | % | |
* Excludes short-term investments.
Portfolio holdings are subject to change daily.
The views expressed in this commentary are informed opinions. They should not be considered promises or advice. The views expressed reflect those of the portfolio managers, only through the end of the period as stated on the cover. The portfolio managers' views are subject to change at any time based on market and other conditions.
Portfolio holdings and characteristics are subject to change and may not be representative of current holdings and characteristics. Portfolio holdings are subject to change daily. The outlook for this Portfolio may differ from that presented for other Voya mutual funds. This report contains statements that may be "forward-looking" statements. Actual results may differ materially from those projected in the "forward-looking" statements. The Portfolio's performance returns shown reflect applicable fee waivers and/or expense limits in effect during this period. Absent such fee waivers/expense limitations, if any, performance would have been lower. Performance for the different classes of shares will vary based on differences in fees associated with each class. An index has no cash in its portfolio and imposes no sales charges. An investor cannot invest directly in an index.
18
TABLE OF CONTENTS
PORTFOLIO MANAGERS' REPORT
VY® INVESCO COMSTOCK PORTFOLIO
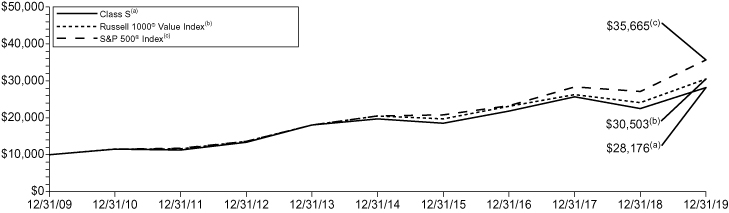
Average Annual Total Returns for the Periods Ended December 31, 2019 | |
| | 1 Year | | 5 Year | | 10 Year | |
Class ADV | | | 24.86 | % | | | 7.14 | % | | | 10.64 | % | |
Class I | | | 25.51 | % | | | 7.68 | % | | | 11.19 | % | |
Class S | | | 25.24 | % | | | 7.41 | % | | | 10.92 | % | |
Russell 1000® Value Index | | | 26.54 | % | | | 8.29 | % | | | 11.80 | % | |
S&P 500® Index | | | 31.49 | % | | | 11.70 | % | | | 13.56 | % | |
Based on a $10,000 initial investment, the graph and table above illustrate the total return of VY® Invesco Comstock Portfolio against the indices indicated. An index is unmanaged and has no cash in its portfolio and imposes no sales charges. An investor cannot invest directly in an index.
The Portfolio's performance is shown without the imposition of any expenses or charges which are, or may be, imposed under your variable annuity contract or variable life insurance policy. Total returns would have been lower if such expenses or charges were included.
The performance graph and table do not reflect the deduction of taxes that a shareholder will pay on Portfolio distributions or the redemption of Portfolio shares.
The performance shown may include the effect of fee waivers and/or expense reimbursements by the Investment
Adviser and/or other service providers, which have the effect of increasing total return. Had all fees and expenses been considered, the total returns would have been lower.
The performance update illustrates performance for a variable investment option available through a variable annuity contract or a variable life insurance policy. The performance shown indicates past performance and is not a projection or prediction of future results. Actual investment returns and principal value will fluctuate so that shares and/or units, at redemption, may be worth more or less than their original cost. Please log on to www.voyainvestments.com or call (800) 262-3862 to get performance through the most recent month end.
Portfolio holdings are subject to change daily.
19
TABLE OF CONTENTS
VY® INVESCO EQUITY AND INCOME PORTFOLIO
PORTFOLIO MANAGERS' REPORT
VY® Invesco Equity and Income Portfolio (the "Portfolio") seeks total return consisting of long-term capital appreciation and current income. The Portfolio is managed* by Brian Jurkash, Co-lead Portfolio Manager, Matthew Titus, Co-lead Portfolio Manager, Sergio Marcheli and Chuck Burge, Portfolio Managers of Invesco Advisers, Inc. — the Sub-Adviser.
Performance: For the year ended December 31, 2019, the Portfolio's Class S shares provided a total return of 19.80% compared to the Russell 1000® Value Index, Bloomberg Barclays U.S. Government/Credit Index and the 60% Russell 1000® Value Index/40% Bloomberg Barclays U.S. Government/Credit Index, which returned 26.54%, 9.71% and 19.87%, respectively, for the same period.
Portfolio Specifics: For the year ended December 31, 2019, before fees and expenses, the Portfolio outperformed the 60% Russell 1000® Value Index/40% Bloomberg Barclays U.S. Government/Credit Index. Net of fees and expenses, the Portfolio underperformed the 60% Russell 1000® Value Index/40% Bloomberg Barclays U.S. Government/Credit Index for the year.
The equities sleeve outperformed the Russell 1000® Value Index for the year.
Stock selection in consumer discretionary was a negative contributor of underperformance, due largely to Capri Holdings and Carnival Corporation. Capri's Michael Kors brand has suffered from declining sales, and the company reduced its outlook for the brand in 2020. Shares of cruise operator Carnival sold off after the company reported profit declines and a weaker outlook for the full year.
Security selection in information technology, materials and industrials also detracted from performance. Within materials, The Mosaic Company was a key detractor. The company announced plans to reduce phosphate production, which is intended to benefit the company long term, but has the potential to negatively affect short-term earnings.
Stock selection in financials, particularly banks, was the largest positive contributor to the Portfolio's relative return. Following a sharp selloff in the fourth quarter of 2018, banks rebounded in the first quarter of 2019, and performed well throughout the year as revenues have generally improved and companies continue to return capital to shareholders through stock buybacks and increased dividends.
Health care was another contributor, and Celgene performed well. The company was acquired by Bristol Meyers Squibb at a significant premium, and shares of the acquisition target rose sharply following the announcement.
The Portfolio's non-equity sleeve consisting of high-grade bonds, convertibles and cash outperformed the Bloomberg Barclays U.S. Government/Credit Index. Although the bonds suffered from relatively low duration in a falling interest rate environment and the cash allocation was a drag on returns in strong markets, this was more than offset by the sleeve's allocation to convertibles, which provided returns similar to equities.
The Portfolio held currency forward contracts during the year for the purpose of hedging currency exposure of non-US-based companies held in the Portfolio. These derivatives were not for speculative purposes or leverage, and these positions had a small negative impact on the Portfolio's relative performance for the year.
Current Strategy and Outlook: During the fiscal year, within the equity portion of the Portfolio, the team reduced relative overweights in financials and energy, and increased exposure to consumer staples, communication services and materials. At the end of the year, the Portfolio's largest equity overweight exposures relative to the Russell 1000® Value Index were in the information technology, health care and financials sectors, while the largest underweight exposures were in the real estate, utilities and communication services sectors.
Sector Diversification
as of December 31, 2019
(as a percentage of net assets)
Financials | | | 24.6 | % | |
Health Care | | | 10.3 | % | |
U.S. Treasury Notes | | | 9.6 | % | |
Energy | | | 8.2 | % | |
Information Technology | | | 6.6 | % | |
Communications | | | 5.5 | % | |
Consumer Discretionary | | | 5.4 | % | |
Industrials | | | 5.3 | % | |
Consumer Staples | | | 4.9 | % | |
Consumer, Non-cyclical | | | 4.7 | % | |
Technology | | | 2.9 | % | |
Materials | | | 2.6 | % | |
Communication Services | | | 2.5 | % | |
Utilities | | | 1.8 | % | |
Consumer, Cyclical | | | 1.4 | % | |
U.S. Treasury Bonds | | | 0.7 | % | |
Basic Materials | | | 0.1 | % | |
Federal National Mortgage Association | | | 0.1 | % | |
Municipal Bonds | | | 0.0 | % | |
Assets in Excess of Other Liabilities* | | | 2.8 | % | |
Net Assets | | | 100.0 | % | |
* Includes short-term investments.
Portfolio holdings are subject to change daily.
Top Ten Holdings
as of December 31, 2019*
(as a percentage of net assets)
United States Treasury Note, 1.625%, 12/15/22 | | | 3.8 | % | |
United States Treasury Note, 1.625%, 12/31/21 | | | 3.1 | % | |
United States Treasury Note, 1.750%, 12/31/24 | | | 2.4 | % | |
Johnson & Johnson | | | 2.3 | % | |
Bank of America Corp. | | | 2.1 | % | |
Philip Morris International, Inc. | | | 2.0 | % | |
Citigroup, Inc. | | | 1.9 | % | |
American International Group, Inc. | | | 1.8 | % | |
Morgan Stanley | | | 1.7 | % | |
General Motors Co. | | | 1.6 | % | |
* Excludes short-term investments.
Portfolio holdings are subject to change daily.
* Effective December 31, 2019, Thomas B. Bastian was removed as a portfolio manager to the Portfolio.
The views expressed in this commentary are informed opinions. They should not be considered promises or advice. The views expressed reflect those of the portfolio managers, only through the end of the period as stated on the cover. The portfolio managers' views are subject to change at any time based on market and other conditions.
Portfolio holdings and characteristics are subject to change and may not be representative of current holdings and characteristics. Portfolio holdings are subject to change daily. The outlook for this Portfolio may differ from that presented for other Voya mutual funds. This report contains statements that may be "forward-looking" statements. Actual results may differ materially from those projected in the "forward-looking" statements. The Portfolio's performance returns shown reflect applicable fee waivers and/or expense limits in effect during this period. Absent such fee waivers/expense limitations, if any, performance would have been lower. Performance for the different classes of shares will vary based on differences in fees associated with each class. An index has no cash in its portfolio and imposes no sales charges. An investor cannot invest directly in an index.
20
TABLE OF CONTENTS
VY® INVESCO EQUITY AND INCOME PORTFOLIO
PORTFOLIO MANAGERS' REPORT
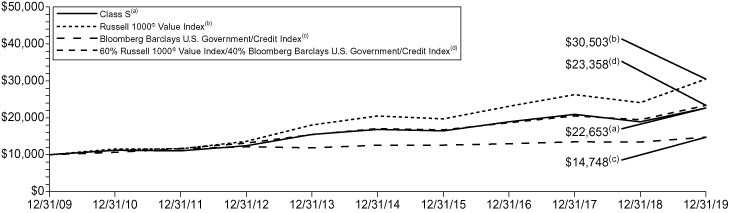
Average Annual Total Returns for the Periods Ended December 31, 2019 | |
| | 1 Year | | 5 Year | | 10 Year | |
Class ADV | | | 19.50 | % | | | 5.83 | % | | | 8.25 | % | |
Class I | | | 20.10 | % | | | 6.37 | % | | | 8.79 | % | |
Class S | | | 19.80 | % | | | 6.10 | % | | | 8.52 | % | |
Class S2 | | | 19.63 | % | | | 5.96 | % | | | 8.37 | % | |
Russell 1000® Value Index | | | 26.54 | % | | | 8.29 | % | | | 11.80 | % | |
Bloomberg Barclays U.S. Government/Credit Index | | | 9.71 | % | | | 3.23 | % | | | 3.96 | % | |
60% Russell 1000® Value Index/40% Bloomberg Barclays U.S. Government/Credit Index | | | 19.87 | % | | | 6.46 | % | | | 8.85 | % | |
Based on a $10,000 initial investment, the graph and table above illustrate the total return of VY® Invesco Equity and Income Portfolio against the indices indicated. An index is unmanaged and has no cash in its portfolio and imposes no sales charges. An investor cannot invest directly in an index.
The Portfolio's performance is shown without the imposition of any expenses or charges which are, or may be, imposed under your variable annuity contract or variable life insurance policy. Total returns would have been lower if such expenses or charges were included.
The performance graph and table do not reflect the deduction of taxes that a shareholder will pay on Portfolio distributions or the redemption of Portfolio shares.
The performance shown may include the effect of fee waivers and/or expense reimbursements by the Investment
Adviser and/or other service providers, which have the effect of increasing total return. Had all fees and expenses been considered, the total returns would have been lower.
The performance update illustrates performance for a variable investment option available through a variable annuity contract or a variable life insurance policy. The performance shown indicates past performance and is not a projection or prediction of future results. Actual investment returns and principal value will fluctuate so that shares and/or units, at redemption, may be worth more or less than their original cost. Please log on to www.voyainvestments.com or call (800) 262-3862 to get performance through the most recent month end.
Portfolio holdings are subject to change daily.
21
TABLE OF CONTENTS
VY® INVESCO OPPENHEIMER GLOBAL PORTFOLIO
PORTFOLIO MANAGERS' REPORT
VY® Invesco Oppenheimer Global Portfolio* (the "Portfolio") seeks capital appreciation. The Portfolio is managed by John Delano, CFA. Vice President and Portfolio Manager** of Invesco Advisers, Inc. ("Invesco") — the Sub-Adviser.
Performance: For the year ended December 31, 2019, the Portfolio's Class S shares provided a total return of 31.44% compared to the MSCI All Country World IndexSM (the "Index"), which returned 26.60% for the same period.
Portfolio Specifics: For the reporting period, the Portfolio outperformed the Index. Our positions outperformed 9 of the 11 economic sectors within the Index. The exceptions were our holdings in information technology and consumer staples. Within each, our stock selection was largely the determining factor, though neither was significant.
The top individual positions that contributed to our results were: LVMH Moet Hennessy Louis Vuitton SE, the French luxury company which continues to thrive, Airbus SE, which competes with Boeing and has benefited from Boeing's recent 737 max woes, and Facebook, Inc..
Even in a good year, things don't always go as well as hoped for and this year was no exception. Our top three detractors from performance this year were Baidu Inc, the Chinese version of Google, which we sold during the year after a series of problems led us to conclude, in our view, that the management team was not as capable as necessary. Elsewhere our holding of Farfetch Ltd, an online luxury goods business, disappointed. It has been challenged by heavy discounting in the brick and mortar retail business, however, we continue to hold it. The third meaningful detractor was Bayerische Motoren Werke Akitiengesellschaft, otherwise known as BMW, the car maker. BMW like many other car makers around the world has been challenged by weakness in new car demand. We reduced our position in the company during the year, though it remains a minor holding.
Current Strategy and Outlook: Our thematic, long-term investment style leads us towards what we believe to be quality businesses with sustainability of both enterprise and advantaged position. We hope to buy these at prices that do not fully reflect their future value, usually because the current understanding of that value by the market is misestimated for a reason that is temporary. Unpopularity is a price we are willing to incur for a while. Additionally, it has been our experience that competitively advantaged companies in ascendant industries can create economic value that can go on for decades. This is why we think and behave with a long-term focus.
Geographic Diversification
as of December 31, 2019
(as a percentage of net assets)
United States | | | 49.2 | % | |
Japan | | | 14.2 | % | |
France | | | 7.8 | % | |
Germany | | | 6.0 | % | |
India | | | 4.5 | % | |
Netherlands | | | 4.1 | % | |
United Kingdom | | | 3.8 | % | |
Sweden | | | 2.4 | % | |
China | | | 1.9 | % | |
Spain | | | 1.7 | % | |
Countries between 0.2%-1.4%^ | | | 2.2 | % | |
Assets in Excess of Other Liabilities* | | | 2.2 | % | |
Net Assets | | | 100.0 | % | |
* Includes short-term investments.
^ Includes 3 countries, which each represents 0.2%-1.4% of net assets.
Portfolio holdings are subject to change daily.
Top Ten Holdings
as of December 31, 2019
(as a percentage of net assets)
Alphabet, Inc. — Class A | | | 7.2 | % | |
LVMH Moet Hennessy Louis Vuitton SE | | | 4.3 | % | |
Airbus SE | | | 4.1 | % | |
S&P Global, Inc. | | | 3.6 | % | |
Adobe, Inc. | | | 3.6 | % | |
Facebook, Inc. — Class A | | | 3.5 | % | |
Intuit, Inc. | | | 3.2 | % | |
SAP SE | | | 2.9 | % | |
Anthem, Inc. | | | 2.8 | % | |
Kering SA | | | 2.7 | % | |
Portfolio holdings are subject to change daily.
* Effective May 24, 2019, Invesco finalized an acquisition (the "Transaction") of OppenheimerFunds, Inc. ("Oppenheimer"). Prior to May 24, 2019, Oppenheimer was owned by Massachusetts Mutual Life Insurance Company. The Transaction resulted in a change of control of Oppenheimer and therefore an assignment, as such term is defined for purposes of the Investment Company Act of 1940, as amended, which triggered the automatic termination of the Portfolio's sub-advisory agreement previously in place with Oppenheimer. Effective May 24, 2019, Voya Investments, LLC, the Portfolio's investment adviser, entered into a new sub-advisory agreement with Invesco Advisers, Inc., a direct subsidiary of Invesco Ltd., on the same terms, compensation structure and with the same portfolio management teams as were in place under the Portfolio's agreement with Oppenheimer. Effective June 27, 2019, the name of the Portfolio was changed to "VY® Invesco Oppenheimer Global Portfolio."
** Effective March 31, 2019, Rajeev Bhaman was removed as a portfolio manager of the Portfolio.
The views expressed in this commentary are informed opinions. They should not be considered promises or advice. The views expressed reflect those of the portfolio managers, only through the end of the period as stated on the cover. The portfolio managers' views are subject to change at any time based on market and other conditions.
Portfolio holdings and characteristics are subject to change and may not be representative of current holdings and characteristics. Portfolio holdings are subject to change daily. The outlook for this Portfolio may differ from that presented for other Voya mutual funds. This report contains statements that may be "forward-looking" statements. Actual results may differ materially from those projected in the "forward-looking" statements. The Portfolio's performance returns shown reflect applicable fee waivers and/or expense limits in effect during this period. Absent such fee waivers/expense limitations, if any, performance would have been lower. Performance for the different classes of shares will vary based on differences in fees associated with each class. An index has no cash in its portfolio and imposes no sales charges. An investor cannot invest directly in an index.
22
TABLE OF CONTENTS
PORTFOLIO MANAGERS' REPORT
VY® INVESCO OPPENHEIMER GLOBAL PORTFOLIO
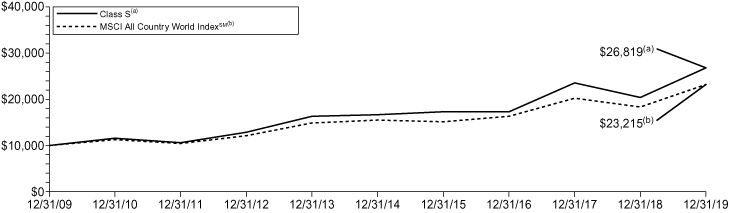
Average Annual Total Returns for the Periods Ended December 31, 2019 | |
| | 1 Year | | 5 Year | | 10 Year | |
Class ADV | | | 31.10 | % | | | 9.69 | % | | | 10.09 | % | |
Class I | | | 31.80 | % | | | 10.26 | % | | | 10.65 | % | |
Class S | | | 31.44 | % | | | 9.97 | % | | | 10.37 | % | |
Class S2 | | | 31.26 | % | | | 9.81 | % | | | 10.20 | % | |
MSCI All Country World IndexSM | | | 26.60 | % | | | 8.41 | % | | | 8.79 | % | |
Based on a $10,000 initial investment, the graph and table above illustrate the total return of VY® Invesco Oppenheimer Global Portfolio against the index indicated. The index is unmanaged and has no cash in its portfolio and imposes no sales charges. An investor cannot invest directly in an index.
The Portfolio's performance is shown without the imposition of any expenses or charges which are, or may be, imposed under your variable annuity contract or variable life insurance policy. Total returns would have been lower if such expenses or charges were included.
The performance graph and table do not reflect the deduction of taxes that a shareholder will pay on Portfolio distributions or the redemption of Portfolio shares.
The performance shown may include the effect of fee waivers and/or expense reimbursements by the Investment Adviser and/or other service providers, which have the
effect of increasing total return. Had all fees and expenses been considered, the total returns would have been lower.
The performance update illustrates performance for a variable investment option available through a variable annuity contract or a variable life insurance policy. The performance shown indicates past performance and is not a projection or prediction of future results. Actual investment returns and principal value will fluctuate so that shares and/or units, at redemption, may be worth more or less than their original cost. Please log on to www.voyainvestments.com or call (800) 262-3862 to get performance through the most recent month end.
Portfolio holdings are subject to change daily.
Prior to June 27, 2019, the Portfolio was managed by a different sub-adviser.
23
TABLE OF CONTENTS
VY® JPMORGAN MID CAP VALUE PORTFOLIO
PORTFOLIO MANAGERS' REPORT
VY® JPMorgan Mid Cap Value Portfolio (the "Portfolio") seeks growth from capital appreciation. The Portfolio is managed by Jonathan K.L. Simon and Lawrence Playford, CFA, Managing Directors and Portfolio Managers* of J.P. Morgan Investment Management Inc. — the Sub-Adviser.
Performance: For the year ended December 31, 2019, the Portfolio's Class S shares provided a total return of 26.21% compared to the Russell Midcap® Value Index (the "Index" or "Russell Midcap® Value"), which returned 27.06% for the same period.
Portfolio Specifics: Net of fees and expenses, the Portfolio underperformed the Russell Midcap® Value Index during the year. Gross of those fees and expenses, the Portfolio outperformed the Russell Midcap® Value Index for the year. The Portfolio benefited from positive stock selection in materials, as our more conservative approach in combination with an underweight exposure proved beneficial in navigating this turbulent area of the marketplace. Stock selection in utilities was also a contributor while stock selection in consumer discretionary and energy detracted from Portfolio results.
Strong stock selection in utilities, especially from the Portfolio's positioning in WEC Energy, contributed the most to performance. As the interest rate outlook is exceedingly murky, we believe high quality regulated utilities with strong management teams and stable, predictable earnings growth patterns merit a spot in the Portfolio. Importantly, WEC operates in favorable regulatory jurisdictions and is poised to benefit from renewable energy trends moving forward.
The top stock-specific detractor for the year was EQT Corp. The macroeconomic environment was particularly difficult for natural gas producers as supply is elevated while demand remains low against the backdrop of mild weather, which has depressed share prices for EQT Corp. As such, we believe the consolidated positioning reflects quality companies with the right assets and disciplined management teams that are more inclined towards shareholder returns. The new management team led by Toby Rice has rebased expectations and appears to be making the right moves in executing a turnaround, in our view. At this point, in our opinion, the valuation remains sufficiently attractive and we're comfortable enough with the new management team to warrant a continued position in the Portfolio.
Current Strategy and Outlook: Financials still represent what we believe to be an attractive opportunity as the combination of undemanding valuations, solid earnings growth and underappreciated capital return potential remains compelling. We continue to take profits within information technology as solid outperformance has left valuations a bit stretched, in our view. We've trimmed REITs and utilities for the same reason. While the consumer has been challenging to navigate, we're on the lookout for brands that can be competitively positioned in the omni-channel world. The inherent volatility and cyclicality of industrials, materials, and energy make it difficult for us to find companies meeting our investment criteria; we'd note that these sectors represent an increasingly large allocation in the Russell Midcap® Value Index (~25%), which explains the relative underweight position.
Sector Diversification
as of December 31, 2019
(as a percentage of net assets)
Financials | | | 21.8 | % | |
Real Estate | | | 14.1 | % | |
Consumer Discretionary | | | 12.0 | % | |
Utilities | | | 10.9 | % | |
Industrials | | | 8.8 | % | |
Information Technology | | | 6.7 | % | |
Health Care | | | 6.6 | % | |
Energy | | | 5.4 | % | |
Materials | | | 4.8 | % | |
Consumer Staples | | | 3.9 | % | |
Communication Services | | | 2.9 | % | |
Assets in Excess of Other Liabilities* | | | 2.1 | % | |
Net Assets | | | 100.0 | % | |
* Includes short-term investments.
Portfolio holdings are subject to change daily.
Top Ten Holdings
as of December 31, 2019*
(as a percentage of net assets)
Xcel Energy, Inc. | | | 2.2 | % | |
WEC Energy Group, Inc. | | | 2.1 | % | |
CMS Energy Corp. | | | 2.0 | % | |
Loews Corp. | | | 1.9 | % | |
M&T Bank Corp. | | | 1.9 | % | |
Diamondback Energy, Inc. | �� | | 1.7 | % | |
Williams Cos., Inc. | | | 1.6 | % | |
T. Rowe Price Group, Inc. | | | 1.6 | % | |
Sempra Energy | | | 1.6 | % | |
Autozone, Inc. | | | 1.5 | % | |
* Excludes short-term investments.
Portfolio holdings are subject to change daily.
* Effective February 12, 2019, Gloria Fu was removed as a portfolio manager for the Portfolio.
The views expressed in this commentary are informed opinions. They should not be considered promises or advice. The views expressed reflect those of the portfolio managers, only through the end of the period as stated on the cover. The portfolio managers' views are subject to change at any time based on market and other conditions.
Portfolio holdings and characteristics are subject to change and may not be representative of current holdings and characteristics. Portfolio holdings are subject to change daily. The outlook for this Portfolio may differ from that presented for other Voya mutual funds. This report contains statements that may be "forward-looking" statements. Actual results may differ materially from those projected in the "forward-looking" statements. The Portfolio's performance returns shown reflect applicable fee waivers and/or expense limits in effect during this period. Absent such fee waivers/expense limitations, if any, performance would have been lower. Performance for the different classes of shares will vary based on differences in fees associated with each class. An index has no cash in its portfolio and imposes no sales charges. An investor cannot invest directly in an index.
24
TABLE OF CONTENTS
VY® JPMORGAN MID CAP VALUE PORTFOLIO
PORTFOLIO MANAGERS' REPORT

Average Annual Total Returns for the Periods Ended December 31, 2019 | |
| | 1 Year | | 5 Year | | 10 Year | |
Class ADV | | | 25.81 | % | | | 6.71 | % | | | 12.00 | % | |
Class I | | | 26.46 | % | | | 7.25 | % | | | 12.57 | % | |
Class S | | | 26.21 | % | | | 6.98 | % | | | 12.28 | % | |
Class S2 | | | 25.96 | % | | | 6.82 | % | | | 12.11 | % | |
Russell Midcap® Value | | | 27.06 | % | | | 7.62 | % | | | 12.41 | % | |
Based on a $10,000 initial investment, the graph and table above illustrate the total return of VY® JPMorgan Mid Cap Value Portfolio against the index indicated. The index is unmanaged and has no cash in its portfolio and imposes no sales charges. An investor cannot invest directly in an index.
The Portfolio's performance is shown without the imposition of any expenses or charges which are, or may be, imposed under your variable annuity contract or variable life insurance policy. Total returns would have been lower if such expenses or charges were included.
The performance graph and table do not reflect the deduction of taxes that a shareholder will pay on Portfolio distributions or the redemption of Portfolio shares.
The performance shown may include the effect of fee waivers and/or expense reimbursements by the Investment
Adviser and/or other service providers, which have the effect of increasing total return. Had all fees and expenses been considered, the total returns would have been lower.
The performance update illustrates performance for a variable investment option available through a variable annuity contract or a variable life insurance policy. The performance shown indicates past performance and is not a projection or prediction of future results. Actual investment returns and principal value will fluctuate so that shares and/or units, at redemption, may be worth more or less than their original cost. Please log on to www.voyainvestments.com or call (800) 262-3862 to get performance through the most recent month end.
Portfolio holdings are subject to change daily.
25
TABLE OF CONTENTS
VY® T. ROWE PRICE DIVERSIFIED MID CAP GROWTH PORTFOLIO
PORTFOLIO MANAGERS' REPORT
VY® T. Rowe Price Diversified Mid Cap Growth Portfolio (the "Portfolio") seeks long-term capital appreciation. The Portfolio is managed by Donald J. Peters, Vice President, and Donald J. Easley, CFA, Vice President, Portfolio Managers of T. Rowe Price Associates, Inc. — the Sub-Adviser.
Performance: For the year ended December 31, 2019, the Portfolio's Class S shares provided a total return of 36.88% compared to the S&P MidCap 400® Index and the Russell Midcap® Growth Index, which returned 26.20% and 35.47%, respectively, for the same period.
Portfolio Specifics: The Portfolio outperformed the Russell Midcap Growth® Index for the reporting period. Broadly speaking, stock selection drove relative outperformance.
Information technology benefited relative results, due to stock selection. Shares of e-commerce platform Shopify continued to drive higher over the period as investors rewarded stable revenue trends, a large and growing total addressable market, and a long growth runway. The company is in the early stages of expanding internationally and accumulating traction with its Shopify Plus offering for high-volume merchants. The introduction of the Shopify Fulfillment Network at the company's Unite conference analyst day highlights Shopify's dedication to improving and streamlining the warehousing and shipping process for merchants while enabling the company to capture additional economies around the fulfillment process.
Security selection and an underweight allocation in communication services supported relative performance.
Stock choices, such as Aptiv and Grubhub, in the consumer discretionary sector also boosted relative results.
Conversely, energy hindered relative results, due to security selection. Our small allocation to Permian producer Centennial Resources weighed on relative performance as shares trended persistently downward over the period. Our thesis, which included a bet on former EOG Resources CEO Mark Papa, came into question as the management team remains, in our view, overly optimistic on the outlook for oil prices and continues to add debt that would weigh on the stock in a lower oil price environment or economic downturn.
Stock choices, such as Iron Mountain and CubeSmart, within real estate also detracted from relative returns.
Current Strategy and Outlook: At a recent press briefing in New York, T. Rowe Price managers observed that the long duration of the current bull market is not a particular concern, in their opinion. Rather than dying of old age, in our view, bull markets often succumb to one of four ills: an economic downturn, regulatory or policy uncertainty, U.S. Federal Reserve Board ("Fed") policy errors, or valuation excess. On balance, we believe that current signals suggest slightly positive returns for the market in 2020, with a highly accommodative Fed likely to offset significant volatility caused by the regulatory and political environment. Nevertheless, in our opinion, the possibility of extreme outcomes in either a negative or positive direction appears higher than in recent years.
Sector Diversification
as of December 31, 2019
(as a percentage of net assets)
Information Technology | | | 32.4 | % | |
Industrials | | | 17.8 | % | |
Consumer Discretionary | | | 14.8 | % | |
Health Care | | | 14.5 | % | |
Financials | | | 7.3 | % | |
Materials | | | 3.6 | % | |
Consumer Staples | | | 3.1 | % | |
Communication Services | | | 2.6 | % | |
Real Estate | | | 1.8 | % | |
Energy | | | 1.4 | % | |
Utilities | | | 0.6 | % | |
Assets in Excess of Other Liabilities* | | | 0.1 | % | |
Net Assets | | | 100.0 | % | |
* Includes short-term investments.
Portfolio holdings are subject to change daily.
Top Ten Holdings
as of December 31, 2019*
(as a percentage of net assets)
Global Payments, Inc. | | | 1.7 | % | |
Fiserv, Inc. | | | 1.1 | % | |
Burlington Stores, Inc. | | | 1.1 | % | |
Dollar General Corp. | | | 1.0 | % | |
Microchip Technology, Inc. | | | 1.0 | % | |
Hilton Worldwide Holdings, Inc. | | | 0.9 | % | |
Amphenol Corp. | | | 0.9 | % | |
KLA Corp. | | | 0.9 | % | |
L3Harris Technologies, Inc. | | | 0.9 | % | |
Lam Research Corp. | | | 0.9 | % | |
* Excludes short-term investments.
Portfolio holdings are subject to change daily.
The views expressed in this commentary are informed opinions. They should not be considered promises or advice. The views expressed reflect those of the portfolio managers, only through the end of the period as stated on the cover. The portfolio managers' views are subject to change at any time based on market and other conditions.
Portfolio holdings and characteristics are subject to change and may not be representative of current holdings and characteristics. Portfolio holdings are subject to change daily. The outlook for this Portfolio may differ from that presented for other Voya mutual funds. This report contains statements that may be "forward-looking" statements. Actual results may differ materially from those projected in the "forward-looking" statements. The Portfolio's performance returns shown reflect applicable fee waivers and/or expense limits in effect during this period. Absent such fee waivers/expense limitations, if any, performance would have been lower. Performance for the different classes of shares will vary based on differences in fees associated with each class. An index has no cash in its portfolio and imposes no sales charges. An investor cannot invest directly in an index.
26
TABLE OF CONTENTS
PORTFOLIO MANAGERS' REPORT
VY® T. ROWE PRICE DIVERSIFIED MID CAP GROWTH PORTFOLIO

Average Annual Total Returns for the Periods Ended December 31, 2019 | |
| | 1 Year | | 5 Year | | 10 Year | |
Class ADV | | | 36.56 | % | | | 12.10 | % | | | 14.14 | % | |
Class I | | | 37.20 | % | | | 12.67 | % | | | 14.71 | % | |
Class R6(1) | | | 37.31 | % | | | 12.71 | % | | | 14.73 | % | |
Class S | | | 36.88 | % | | | 12.39 | % | | | 14.43 | % | |
Class S2 | | | 36.69 | % | | | 12.21 | % | | | 14.26 | % | |
S&P MidCap 400® Index | | | 26.20 | % | | | 9.03 | % | | | 12.72 | % | |
Russell Midcap® Growth Index | | | 35.47 | % | | | 11.60 | % | | | 14.24 | % | |
Based on a $10,000 initial investment, the graph and table above illustrate the total return of VY® T. Rowe Price Diversified Mid Cap Growth Portfolio against the indices indicated. An index is unmanaged and has no cash in its portfolio and imposes no sales charges. An investor cannot invest directly in an index.
The Portfolio's performance is shown without the imposition of any expenses or charges which are, or may be, imposed under your variable annuity contract or variable life insurance policy. Total returns would have been lower if such expenses or charges were included.
The performance graph and table do not reflect the deduction of taxes that a shareholder will pay on Portfolio distributions or the redemption of Portfolio shares.
The performance shown may include the effect of fee waivers and/or expense reimbursements by the Investment Adviser and/or other service providers, which have the effect of increasing total return. Had all fees and expenses been considered, the total returns would have been lower.
The performance update illustrates performance for a variable investment option available through a variable annuity contract or a variable life insurance policy. The performance shown indicates past performance and is not a projection or prediction of future results. Actual investment returns and principal value will fluctuate so that shares and/or units, at redemption, may be worth more or less than their original cost. Please log on to www.voyainvestments.com or call (800) 262-3862 to get performance through the most recent month end.
Portfolio holdings are subject to change daily.
(1) Class R6 incepted on May 3, 2016. The Class R6 shares performance shown for the period prior to their inception date is the performance of Class I shares without adjustment for any differences in the expenses between the two classes. If adjusted for such differences, returns would be different.
27
TABLE OF CONTENTS
VY® T. ROWE PRICE GROWTH EQUITY PORTFOLIO
PORTFOLIO MANAGERS' REPORT
VY® T. Rowe Price Growth Equity Portfolio (the "Portfolio") seeks long-term growth through investments in stocks. The Portfolio is managed by Joseph B. Fath, Vice President and Portfolio Manager of T. Rowe Price Associates, Inc. — the Sub-Adviser.
Performance: For the year ended December 31, 2019, the Portfolio's Class I shares, provided a total return of 30.83% compared to the S&P 500® Index and the Russell 1000® Growth Index, which returned 31.49% and 36.39%, respectively, for the same period.
Portfolio Specifics: Gross of fees and expenses, the Portfolio performed in line with the S&P 500® Index for the reporting period. Sector allocation was positive, while stock selection was negative. Energy was the leading relative contributor, due to an underweight position against the S&P 500® Index. Information technology also bolstered relative results, owing to a beneficial overweight, although weak security selection partially offset the impact. Conversely, financials was the most significant detractor from relative returns primarily on stock selection. Industrials and business services also weighed on relative performance, due to stock choices.
The energy sector was the strongest relative performer during the period. We continue to maintain a minimal exposure to the energy sector on the view that global oversupply persists.
Financials was the largest relative detractor. Shares of TD Ameritrade underperformed over the past year due to unfavorable interest rate cuts by the U.S. Federal Reserve Board ("Fed") and fee pressure among online brokers that eventually pressured the company to drop its trading commissions to zero. TD Ameritrade boasts a defensible, capital-light, and scalable model with what we believe to be attractive operating margins that we feel should drive organic growth and return value to shareholders without taking on credit or balance sheet risk.
Current Strategy and Outlook: At a recent press briefing in New York, T. Rowe Price managers observed that the long duration of the current bull market is not a particular concern. Rather than dying of old age, in our view, bull markets often succumb to one of four ills: an economic downturn, regulatory or policy uncertainty, Fed policy errors, or valuation excess. On balance, we believe current signals suggest slightly positive returns for the market in 2020, with a highly accommodative Fed likely to offset significant volatility caused by the regulatory and political environment. Nevertheless, in our opinion, the possibility of extreme outcomes in either a negative or positive direction appears higher than in recent years.
Sector Diversification
as of December 31, 2019
(as a percentage of net assets)
Information Technology | | | 34.6 | % | |
Consumer Discretionary | | | 19.4 | % | |
Communication Services | | | 19.5 | % | |
Health Care | | | 12.2 | % | |
Industrials | | | 8.7 | % | |
Financials | | | 2.2 | % | |
Utilities | | | 1.4 | % | |
Energy | | | 0.7 | % | |
Materials | | | 0.6 | % | |
Consumer Staples | | | 0.5 | % | |
Real Estate | | | 0.0 | % | |
Assets in Excess of Other Liabilities* | | | 0.2 | % | |
Net Assets | | | 100.0 | % | |
* Includes short-term investments.
Portfolio holdings are subject to change daily.
Top Ten Holdings
as of December 31, 2019
(as a percentage of net assets)
Amazon.com, Inc. | | | 6.4 | % | |
Microsoft Corp. | | | 6.1 | % | |
Facebook, Inc. — Class A | | | 5.7 | % | |
Apple, Inc. | | | 4.6 | % | |
Visa, Inc. — Class A | | | 3.8 | % | |
Mastercard, Inc. — Class A | | | 3.4 | % | |
Alphabet, Inc. — Class A | | | 3.2 | % | |
Alphabet, Inc. — Class C | | | 3.1 | % | |
Alibaba Group Holding Ltd. ADR | | | 3.0 | % | |
Boeing Co. | | | 2.7 | % | |
Portfolio holdings are subject to change daily.
The views expressed in this commentary are informed opinions. They should not be considered promises or advice. The views expressed reflect those of the portfolio managers, only through the end of the period as stated on the cover. The portfolio managers' views are subject to change at any time based on market and other conditions.
Portfolio holdings and characteristics are subject to change and may not be representative of current holdings and characteristics. Portfolio holdings are subject to change daily. The outlook for this Portfolio may differ from that presented for other Voya mutual funds. This report contains statements that may be "forward-looking" statements. Actual results may differ materially from those projected in the "forward-looking" statements. The Portfolio's performance returns shown reflect applicable fee waivers and/or expense limits in effect during this period. Absent such fee waivers/expense limitations, if any, performance would have been lower. Performance for the different classes of shares will vary based on differences in fees associated with each class. An index has no cash in its portfolio and imposes no sales charges. An investor cannot invest directly in an index.
28
TABLE OF CONTENTS
PORTFOLIO MANAGERS' REPORT
VY® T. ROWE PRICE GROWTH EQUITY PORTFOLIO
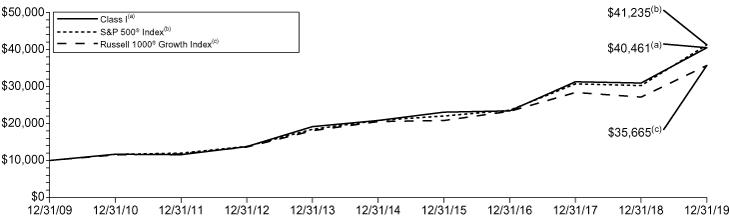
Average Annual Total Returns for the Periods Ended December 31, 2019 | |
| | 1 Year | | 5 Year | | 10 Year | |
Class ADV | | | 30.15 | % | | | 13.65 | % | | | 14.42 | % | |
Class I | | | 30.83 | % | | | 14.22 | % | | | 15.00 | % | |
Class S | | | 30.47 | % | | | 13.94 | % | | | 14.71 | % | |
Class S2 | | | 30.27 | % | | | 13.77 | % | | | 14.54 | % | |
S&P 500® Index | | | 31.49 | % | | | 11.70 | % | | | 13.56 | % | |
Russell 1000® Growth Index | | | 36.39 | % | | | 14.63 | % | | | 15.22 | % | |
Based on a $10,000 initial investment, the graph and table above illustrate the total return of VY® T. Rowe Price Growth Equity Portfolio against the indices indicated. An index is unmanaged and has no cash in its portfolio and imposes no sales charges. An investor cannot invest directly in an index.
The Portfolio's performance is shown without the imposition of any expenses or charges which are, or may be, imposed under your variable annuity contract or variable life insurance policy. Total returns would have been lower if such expenses or charges were included.
The performance graph and table do not reflect the deduction of taxes that a shareholder will pay on Portfolio distributions or the redemption of Portfolio shares.
The performance shown may include the effect of fee waivers and/or expense reimbursements by the Investment
Adviser and/or other service providers, which have the effect of increasing total return. Had all fees and expenses been considered, the total returns would have been lower.
The performance update illustrates performance for a variable investment option available through a variable annuity contract or a variable life insurance policy. The performance shown indicates past performance and is not a projection or prediction of future results. Actual investment returns and principal value will fluctuate so that shares and/or units, at redemption, may be worth more or less than their original cost. Please log on to www.voyainvestments.com or call (800) 262-3862 to get performance through the most recent month end.
Portfolio holdings are subject to change daily.
29
TABLE OF CONTENTS
SHAREHOLDER EXPENSE EXAMPLES (UNAUDITED)
As a shareholder of a Portfolio, you incur two types of costs: (1) transaction costs, including redemption fees and exchange fees; and (2) ongoing costs, including management fees, distribution and/or service (12b-1) fees, and other Portfolio expenses. These Examples are intended to help you understand your ongoing costs (in dollars) of investing in a Portfolio and to compare these costs with the ongoing costs of investing in other mutual funds.
The Examples are based on an investment of $1,000 invested at the beginning of the period and held for the entire period from July 1, 2019 to December 31, 2019. The Portfolios' expenses are shown without the imposition of any charges which are, or may be, imposed under your variable annuity contract, variable life insurance policy, qualified pension, or retirement plan. Expenses would have been higher if such charges were included.
Actual Expenses
The left section of the table shown below, "Actual Portfolio Return," provides information about actual account values and actual expenses. You may use the information in this section, together with the amount you invested, to estimate the expenses that you paid over the period. Simply divide your account value by $1,000 (for example, an $8,600 account value divided by $1,000 = 8.6), then multiply the result by the number in the first section under the heading entitled "Expenses Paid During the Period" to estimate the expenses you paid on your account during this period.
Hypothetical Example for Comparison Purposes
The right section of the table shown below, "Hypothetical (5% return before expenses)," provides information about hypothetical account values and hypothetical expenses based on a Portfolio's actual expense ratio and an assumed rate of return of 5% per year before expenses, which is not a Portfolio's actual return. The hypothetical account values and expenses may not be used to estimate the actual ending account balance or expenses you paid for the period. You may use this information to compare the ongoing costs of investing in a Portfolio and other mutual funds. To do so, compare this 5% hypothetical example with the 5% hypothetical examples that appear in the shareholder reports of the other mutual funds.
Please note that the expenses shown in the table are meant to highlight your ongoing costs only and do not reflect any transactional costs, such as redemption fees or exchange fees. Therefore, the hypothetical section of the table is useful in comparing ongoing costs only, and will not help you determine the relative total costs of owning different mutual funds. In addition, if these transactional costs were included, your costs would have been higher.
| | | Actual Portfolio Return | | Hypothetical (5% return before expenses) | |
Voya Global Bond Portfolio | | Beginning
Account
Value
July 1,
2019 | | Ending
Account
Value
December 31,
2019 | | Annualized
Expense
Ratio | | Expenses Paid
During the
Period Ended
December 31,
2019* | | Beginning
Account
Value
July 1,
2019 | | Ending
Account
Value
December 31,
2019 | | Annualized
Expense
Ratio | | Expenses Paid
During the
Period Ended
December 31,
2019* | |
Class ADV | | $ | 1,000.00 | | | $ | 1,008.30 | | | | 1.16 | % | | $ | 5.87 | | | $ | 1,000.00 | | | $ | 1,019.36 | | | | 1.16 | % | | $ | 5.90 | | |
Class I | | | 1,000.00 | | | | 1,010.90 | | | | 0.66 | | | | 3.35 | | | | 1,000.00 | | | | 1,021.88 | | | | 0.66 | | | | 3.36 | | |
Class S | | | 1,000.00 | | | | 1,009.60 | | | | 0.91 | | | | 4.61 | | | | 1,000.00 | | | | 1,020.62 | | | | 0.91 | | | | 4.63 | | |
Voya International High Dividend Low Volatility Portfolio | |
Class ADV | | $ | 1,000.00 | | | $ | 1,054.60 | | | | 1.26 | % | | $ | 6.53 | | | $ | 1,000.00 | | | $ | 1,018.85 | | | | 1.26 | % | | $ | 6.41 | | |
Class I | | | 1,000.00 | | | | 1,057.90 | | | | 0.76 | | | | 3.94 | | | | 1,000.00 | | | | 1,021.37 | | | | 0.76 | | | | 3.87 | | |
Class S | | | 1,000.00 | | | | 1,055.80 | | | | 1.01 | | | | 5.23 | | | | 1,000.00 | | | | 1,020.11 | | | | 1.01 | | | | 5.14 | | |
Class S2 | | | 1,000.00 | | | | 1,055.20 | | | | 1.16 | | | | 6.01 | | | | 1,000.00 | | | | 1,019.36 | | | | 1.16 | | | | 5.90 | | |
VY® American Century Small-Mid Cap Value Portfolio | |
Class ADV | | $ | 1,000.00 | | | $ | 1,096.90 | | | | 1.34 | % | | $ | 7.08 | | | $ | 1,000.00 | | | $ | 1,018.45 | | | | 1.34 | % | | $ | 6.82 | | |
Class I | | | 1,000.00 | | | | 1,099.30 | | | | 0.84 | | | | 4.44 | | | | 1,000.00 | | | | 1,020.97 | | | | 0.84 | | | | 4.28 | | |
Class S | | | 1,000.00 | | | | 1,098.70 | | | | 1.09 | | | | 5.77 | | | | 1,000.00 | | | | 1,019.71 | | | | 1.09 | | | | 5.55 | | |
Class S2 | | | 1,000.00 | | | | 1,097.70 | | | | 1.24 | | | | 6.56 | | | | 1,000.00 | | | | 1,018.95 | | | | 1.24 | | | | 6.31 | | |
30
TABLE OF CONTENTS
SHAREHOLDER EXPENSE EXAMPLES (UNAUDITED) (CONTINUED)
| | | Actual Portfolio Return | | Hypothetical (5% return before expenses) | |
VY® Baron Growth Portfolio | | Beginning
Account
Value
July 1,
2019 | | Ending
Account
Value
December 31,
2019 | | Annualized
Expense
Ratio | | Expenses Paid
During the
Period Ended
December 31,
2019* | | Beginning
Account
Value
July 1,
2019 | | Ending
Account
Value
December 31,
2019 | | Annualized
Expense
Ratio | | Expenses Paid
During the
Period Ended
December 31,
2019* | |
Class ADV | | $ | 1,000.00 | | | $ | 1,077.80 | | | | 1.49 | % | | $ | 7.80 | | | $ | 1,000.00 | | | $ | 1,017.69 | | | | 1.49 | % | | $ | 7.58 | | |
Class I | | | 1,000.00 | | | | 1,080.60 | | | | 0.99 | | | | 5.19 | | | | 1,000.00 | | | | 1,020.21 | | | | 0.99 | | | | 5.04 | | |
Class R6 | | | 1,000.00 | | | | 1,080.60 | | | | 0.99 | | | | 5.19 | | | | 1,000.00 | | | | 1,020.21 | | | | 0.99 | | | | 5.04 | | |
Class S | | | 1,000.00 | | | | 1,078.90 | | | | 1.24 | | | | 6.50 | | | | 1,000.00 | | | | 1,018.95 | | | | 1.24 | | | | 6.31 | | |
Class S2 | | | 1,000.00 | | | | 1,078.40 | | | | 1.39 | | | | 7.28 | | | | 1,000.00 | | | | 1,018.20 | | | | 1.39 | | | | 7.07 | | |
VY® Columbia Contrarian Core Portfolio | |
Class ADV | | $ | 1,000.00 | | | $ | 1,110.70 | | | | 1.23 | % | | $ | 6.54 | | | $ | 1,000.00 | | | $ | 1,019.00 | | | | 1.23 | % | | $ | 6.26 | | |
Class I | | | 1,000.00 | | | | 1,113.50 | | | | 0.73 | | | | 3.89 | | | | 1,000.00 | | | | 1,021.53 | | | | 0.73 | | | | 3.72 | | |
Class S | | | 1,000.00 | | | | 1,114.60 | | | | 0.96 | | | | 5.12 | | | | 1,000.00 | | | | 1,020.37 | | | | 0.96 | | | | 4.89 | | |
VY® Columbia Small Cap Value II Portfolio | |
Class ADV | | $ | 1,000.00 | | | $ | 1,039.50 | | | | 1.38 | % | | $ | 7.09 | | | $ | 1,000.00 | | | $ | 1,018.25 | | | | 1.38 | % | | $ | 7.02 | | |
Class I | | | 1,000.00 | | | | 1,041.10 | | | | 0.88 | | | | 4.53 | | | | 1,000.00 | | | | 1,020.77 | | | | 0.88 | | | | 4.48 | | |
Class R6 | | | 1,000.00 | | | | 1,041.10 | | | | 0.88 | | | | 4.53 | | | | 1,000.00 | | | | 1,020.77 | | | | 0.88 | | | | 4.48 | | |
Class S | | | 1,000.00 | | | | 1,040.40 | | | | 1.13 | | | | 5.81 | | | | 1,000.00 | | | | 1,019.51 | | | | 1.13 | | | | 5.75 | | |
Class S2 | | | 1,000.00 | | | | 1,039.20 | | | | 1.28 | | | | 6.58 | | | | 1,000.00 | | | | 1,018.75 | | | | 1.28 | | | | 6.51 | | |
VY® Invesco Comstock Portfolio | |
Class ADV | | $ | 1,000.00 | | | $ | 1,087.30 | | | | 1.23 | % | | $ | 6.47 | | | $ | 1,000.00 | | | $ | 1,019.00 | | | | 1.23 | % | | $ | 6.26 | | |
Class I | | | 1,000.00 | | | | 1,090.20 | | | | 0.73 | | | | 3.85 | | | | 1,000.00 | | | | 1,021.53 | | | | 0.73 | | | | 3.72 | | |
Class S | | | 1,000.00 | | | | 1,088.90 | | | | 0.98 | | | | 5.16 | | | | 1,000.00 | | | | 1,020.27 | | | | 0.98 | | | | 4.99 | | |
VY® Invesco Equity and Income Portfolio | |
Class ADV | | $ | 1,000.00 | | | $ | 1,060.00 | | | | 1.14 | % | | $ | 5.92 | | | $ | 1,000.00 | | | $ | 1,019.46 | | | | 1.14 | % | | $ | 5.80 | | |
Class I | | | 1,000.00 | | | | 1,062.60 | | | | 0.64 | | | | 3.33 | | | | 1,000.00 | | | | 1,021.98 | | | | 0.64 | | | | 3.26 | | |
Class S | | | 1,000.00 | | | | 1,061.40 | | | | 0.89 | | | | 4.62 | | | | 1,000.00 | | | | 1,020.72 | | | | 0.89 | | | | 4.53 | | |
Class S2 | | | 1,000.00 | | | | 1,060.50 | | | | 1.02 | | | | 5.30 | | | | 1,000.00 | | | | 1,020.06 | | | | 1.02 | | | | 5.19 | | |
VY® Invesco Oppenheimer Global Portfolio | |
Class ADV | | $ | 1,000.00 | | | $ | 1,081.50 | | | | 1.25 | % | | $ | 6.56 | | | $ | 1,000.00 | | | $ | 1,018.90 | | | | 1.25 | % | | $ | 6.36 | | |
Class I | | | 1,000.00 | | | | 1,084.80 | | | | 0.75 | | | | 3.94 | | | | 1,000.00 | | | | 1,021.42 | | | | 0.75 | | | | 3.82 | | |
Class S | | | 1,000.00 | | | | 1,083.00 | | | | 1.00 | | | | 5.25 | | | | 1,000.00 | | | | 1,020.16 | | | | 1.00 | | | | 5.09 | | |
Class S2 | | | 1,000.00 | | | | 1,082.10 | | | | 1.15 | | | | 6.04 | | | | 1,000.00 | | | | 1,019.41 | | | | 1.15 | | | | 5.85 | | |
VY® JPMorgan Mid Cap Value Portfolio | |
Class ADV | | $ | 1,000.00 | | | $ | 1,066.90 | | | | 1.39 | % | | $ | 7.24 | | | $ | 1,000.00 | | | $ | 1,018.20 | | | | 1.39 | % | | $ | 7.07 | | |
Class I | | | 1,000.00 | | | | 1,069.60 | | | | 0.89 | | | | 4.64 | | | | 1,000.00 | | | | 1,020.72 | | | | 0.89 | | | | 4.53 | | |
Class S | | | 1,000.00 | | | | 1,068.50 | | | | 1.14 | | | | 5.94 | | | | 1,000.00 | | | | 1,019.46 | | | | 1.14 | | | | 5.80 | | |
Class S2 | | | 1,000.00 | | | | 1,067.20 | | | | 1.29 | | | | 6.72 | | | | 1,000.00 | | | | 1,018.70 | | | | 1.29 | | | | 6.56 | | |
31
TABLE OF CONTENTS
SHAREHOLDER EXPENSE EXAMPLES (UNAUDITED) (CONTINUED)
| | | Actual Portfolio Return | | Hypothetical (5% return before expenses) | |
VY® T. Rowe Price Diversified
Mid Cap Growth Portfolio | | Beginning
Account
Value
July 1,
2019 | | Ending
Account
Value
December 31,
2019 | | Annualized
Expense
Ratio | | Expenses Paid
During the
Period Ended
December 31,
2019* | | Beginning
Account
Value
July 1,
2019 | | Ending
Account
Value
December 31,
2019 | | Annualized
Expense
Ratio | | Expenses Paid
During the
Period Ended
December 31,
2019* | |
Class ADV | | $ | 1,000.00 | | | $ | 1,071.70 | | | | 1.27 | % | | $ | 6.63 | | | $ | 1,000.00 | | | $ | 1,018.80 | | | | 1.27 | % | | $ | 6.46 | | |
Class I | | | 1,000.00 | | | | 1,074.30 | | | | 0.77 | | | | 4.03 | | | | 1,000.00 | | | | 1,021.32 | | | | 0.77 | | | | 3.92 | | |
Class R6 | | | 1,000.00 | | | | 1,075.10 | | | | 0.77 | | | | 4.03 | | | | 1,000.00 | | | | 1,021.32 | | | | 0.77 | | | | 3.92 | | |
Class S | | | 1,000.00 | | | | 1,073.50 | | | | 1.02 | | | | 5.33 | | | | 1,000.00 | | | | 1,020.06 | | | | 1.02 | | | | 5.19 | | |
Class S2 | | | 1,000.00 | | | | 1,072.20 | | | | 1.17 | | | | 6.11 | | | | 1,000.00 | | | | 1,019.31 | | | | 1.17 | | | | 5.96 | | |
VY® T. Rowe Price Growth Equity Portfolio | |
Class ADV | | $ | 1,000.00 | | | $ | 1,084.40 | | | | 1.21 | % | | $ | 6.36 | | | $ | 1,000.00 | | | $ | 1,019.11 | | | | 1.21 | % | | $ | 6.16 | | |
Class I | | | 1,000.00 | | | | 1,087.30 | | | | 0.71 | | | | 3.74 | | | | 1,000.00 | | | | 1,021.63 | | | | 0.71 | | | | 3.62 | | |
Class S | | | 1,000.00 | | | | 1,085.80 | | | | 0.96 | | | | 5.05 | | | | 1,000.00 | | | | 1,020.37 | | | | 0.96 | | | | 4.89 | | |
Class S2 | | | 1,000.00 | | | | 1,085.00 | | | | 1.11 | | | | 5.83 | | | | 1,000.00 | | | | 1,019.61 | | | | 1.11 | | | | 5.65 | | |
* Expenses are equal to each Portfolio's respective annualized expense ratios multiplied by the average account value over the period, multiplied by 184/365 to reflect the most recent fiscal half-year.
32
TABLE OF CONTENTS
REPORT OF INDEPENDENT REGISTERED PUBLIC ACCOUNTING FIRM
To the Shareholders of the Funds and Board of Directors
Voya Partners, Inc.:
Opinion on the Financial Statements
We have audited the accompanying statements of assets and liabilities of Voya Global Bond Portfolio, Voya International High Dividend Low Volatility Portfolio (formerly VY® Templeton Foreign Equity Portfolio), VY® American Century Small-Mid Cap Value Portfolio, VY® Baron Growth Portfolio, VY® Columbia Contrarian Core Portfolio, VY® Columbia Small Cap Value II Portfolio, VY® Invesco Comstock Portfolio, VY® Invesco Equity and Income Portfolio, VY® Invesco Oppenheimer Global Portfolio (formerly VY® Oppenheimer Global Portfolio), VY® JPMorgan Mid Cap Value Portfolio, VY® T. Rowe Price Diversified Mid Cap Growth Portfolio, and VY® T. Rowe Price Growth Equity Portfolio (the Funds), each a series of Voya Partners, Inc., including the summary portfolios of investments, as of December 31, 2019, the related statements of operations for the year then ended, the statements of changes in net assets for each of the years in the two-year period then ended, and the related notes (collectively, the financial statements), and the financial highlights for each of the years or periods in the five-year period then ended. In our opinion, the financial statements and financial highlights present fairly, in all material respects, the financial position of the Funds as of December 31, 2019, the results of their operations for the year then ended, the changes in their net assets for each of the years in the two-year period then ended, and the financial highlights for each of the years or periods in the five-year period then ended, in conformity with U.S. generally accepted accounting principles.
Basis for Opinion
These financial statements and financial highlights are the responsibility of the Funds' management. Our responsibility is to express an opinion on these financial statements and financial highlights based on our audits. We are a public accounting firm registered with the Public Company Accounting Oversight Board (United States) (PCAOB) and are required to be independent with respect to the Funds in accordance with the U.S. federal securities laws and the applicable rules and regulations of the Securities and Exchange Commission and the PCAOB.
We conducted our audits in accordance with the standards of the PCAOB. Those standards require that we plan and perform the audit to obtain reasonable assurance about whether the financial statements and financial highlights are free of material misstatement, whether due to error or fraud. Our audits included performing procedures to assess the risks of material misstatement of the financial statements and financial highlights, whether due to error or fraud, and performing procedures that respond to those risks. Such procedures included examining, on a test basis, evidence regarding the amounts and disclosures in the financial statements and financial highlights. Such procedures also included confirmation of securities owned as of December 31, 2019, by correspondence with the custodian, transfer agent and brokers or by other appropriate auditing procedures when replies from brokers were not received. Our audits also included evaluating the accounting principles used and significant estimates made by management, as well as evaluating the overall presentation of the financial statements and financial highlights. We believe that our audits provide a reasonable basis for our opinion.

We have served as the auditor of one or more Voya investment companies since 1975.
Boston, Massachusetts
February 26, 2020
33
TABLE OF CONTENTS
STATEMENTS OF ASSETS AND LIABILITIES AS OF DECEMBER 31, 2019
| | | Voya
Global Bond
Portfolio | | Voya
International
High Dividend
Low Volatility
Portfolio | | VY®
American Century
Small-Mid Cap Value
Portfolio | | VY®
Baron
Growth
Portfolio | |
ASSETS: | |
Investments in securities at fair value+* | | $ | 160,615,434 | | | $ | 472,703,547 | | | $ | 376,111,911 | | | $ | 515,230,709 | | |
Investments in affiliated underlying funds at fair value** | | | 38,709,816 | | | | — | | | | — | | | | — | | |
Short-term investments at fair value*** | | | 6,116,320 | | | | 3,512,449 | | | | 12,003,280 | | | | 1,869,679 | | |
Cash | | | 18,109 | | | | 180,121 | | | | — | | | | — | | |
Cash collateral for futures | | | 894,336 | | | | — | | | | — | | | | — | | |
Cash pledged for centrally cleared swaps (Note 2) | | | 1,631,000 | | | | — | | | | — | | | | — | | |
Cash pledged as collateral for OTC derivatives (Note 2) | | | 20,000 | | | | — | | | | — | | | | — | | |
Foreign currencies at value**** | | | 114,221 | | | | — | | | | 126,913 | | | | 2 | | |
Receivables: | |
Investment securities sold | | | — | | | | 1,219,235 | | | | — | | | | 852,500 | | |
Investment securities and currencies sold | | | — | | | | — | | | | 1,224,803 | | | | — | | |
Fund shares sold | | | 323,081 | | | | 3,034,640 | | | | 97,051 | | | | 177,635 | | |
Dividends | | | 860 | | | | 820,681 | | | | 809,766 | | | | 246,546 | | |
Interest | | | 1,160,819 | | | | 380 | | | | — | | | | — | | |
Foreign tax reclaims | | | 5,299 | | | | 1,136,447 | | | | 4,340 | | | | — | | |
Unrealized appreciation on forward foreign currency
contracts | | | 1,589,016 | | | | — | | | | 2,326 | | | | — | | |
Variation margin receivable on centrally cleared swaps | | | 147,853 | | | | — | | | | — | | | | — | | |
Prepaid expenses | | | 1,474 | | | | 3,565 | | | | 2,495 | | | | 5,254 | | |
Reimbursement due from manager | | | — | | | | — | | | | 42,134 | | | | — | | |
Receivable due from manager | | | — | | | | — | | | | — | | | | 81,963 | | |
Other assets | | | 13,160 | | | | 49,610 | | | | 11,535 | | | | 31,792 | | |
Total assets | | | 211,360,798 | | | | 482,660,675 | | | | 390,436,554 | | | | 518,496,080 | | |
LIABILITIES: | |
Payable for investment securities purchased | | | — | | | | 117,206 | | | | — | | | | — | | |
Payable for investment securities and currencies
purchased | | | — | | | | — | | | | 1,183,270 | | | | — | | |
Payable for investment securities purchased on a
delayed-delivery or when-issued basis | | | 4,207,465 | | | | — | | | | — | | | | — | | |
Payable for fund shares redeemed | | | 158,638 | | | | 117,048 | | | | 900,061 | | | | 748,836 | | |
Payable for foreign cash collateral for futures***** | | | 136,949 | | | | — | | | | — | | | | — | | |
Payable upon receipt of securities loaned | | | 4,199,320 | | | | 3,512,449 | | | | 6,809,732 | | | | — | | |
Unrealized depreciation on forward foreign currency
contracts | | | 790,727 | | | | — | | | | 193,818 | | | | — | | |
Unrealized depreciation on forward premium swaptions | | | 1,061 | | | | — | | | | — | | | | — | | |
Unrealized depreciation on OTC swap agreements | | | 37,156 | | | | — | | | | — | | | | — | | |
Cash received as collateral for OTC derivatives (Note 2) | | | 300,000 | | | | — | | | | — | | | | — | | |
Payable for investment management fees | | | 101,489 | | | | 241,546 | | | | 294,260 | | | | 545,974 | | |
Payable for distribution and shareholder service fees | | | 16,130 | | | | 77,531 | | | | 66,555 | | | | 127,974 | | |
Payable to custodian due to foreign currency
overdraft****** | | | — | | | | 211 | | | | — | | | | — | | |
Payable to directors under the deferred compensation
plan (Note 6) | | | 13,160 | | | | 49,610 | | | | 11,535 | | | | 31,792 | | |
Payable for directors fees | | | 1,015 | | | | 2,406 | | | | 1,800 | | | | 3,877 | | |
Other accrued expenses and liabilities | | | 56,870 | | | | 260,194 | | | | 97,907 | | | | 119,555 | | |
Written options, at fair value^ | | | 2,276 | | | | — | | | | — | | | | — | | |
Total liabilities | | | 10,022,256 | | | | 4,378,201 | | | | 9,558,938 | | | | 1,578,008 | | |
NET ASSETS | | $ | 201,338,542 | | | $ | 478,282,474 | | | $ | 380,877,616 | | | $ | 516,918,072 | | |
NET ASSETS WERE COMPRISED OF: | |
Paid-in capital | | $ | 202,278,066 | | | $ | 387,563,418 | | | $ | 341,674,405 | | | $ | 148,553,951 | | |
Total distributable earnings (loss) | | | (939,524 | ) | | | 90,719,056 | | | | 39,203,211 | | | | 368,364,121 | | |
NET ASSETS | | $ | 201,338,542 | | | $ | 478,282,474 | | | $ | 380,877,616 | | | $ | 516,918,072 | | |
| + Including securities loaned at value | | $ | 4,108,691 | | | $ | 3,339,558 | | | $ | 6,654,164 | | | $ | — | | |
| * Cost of investments in securities | | $ | 157,090,389 | | | $ | 444,212,633 | | | $ | 336,781,707 | | | $ | 143,789,138 | | |
| ** Cost of investments in affiliated underlying funds | | $ | 40,499,130 | | | $ | — | | | $ | — | | | $ | — | | |
| *** Cost of short-term investments | | $ | 6,116,320 | | | $ | 3,512,449 | | | $ | 12,003,280 | | | $ | 1,869,679 | | |
| **** Cost of foreign currencies | | $ | 113,409 | | | $ | — | | | $ | 126,913 | | | $ | 2 | | |
| ***** Cost of foreign currency overdraft | | $ | — | | | $ | 209 | | | $ | — | | | $ | — | | |
| ****** Cost of payable for foreign cash collateral for futures | | $ | 136,949 | | | $ | — | | | $ | — | | | $ | — | | |
| ^ Premiums received on written options | | $ | 64,400 | | | $ | — | | | $ | — | | | $ | — | | |
See Accompanying Notes to Financial Statements
34
TABLE OF CONTENTS
STATEMENTS OF ASSETS AND LIABILITIES AS OF DECEMBER 31, 2019 (CONTINUED)
| | | Voya
Global Bond
Portfolio | | Voya
International
High Dividend
Low Volatility
Portfolio | | VY®
American Century
Small-Mid Cap Value
Portfolio | | VY®
Baron
Growth
Portfolio | |
Class ADV: | |
Net assets | | $ | 21,660,653 | | | $ | 29,899,831 | | | $ | 108,459,697 | | | $ | 105,270,881 | | |
Shares authorized | | | 100,000,000 | | | | 100,000,000 | | | | 100,000,000 | | | | 100,000,000 | | |
Par value | | $ | 0.001 | | | $ | 0.001 | | | $ | 0.001 | | | $ | 0.001 | | |
Shares outstanding | | | 2,035,623 | | | | 2,631,704 | | | | 9,751,882 | | | | 5,385,845 | | |
Net asset value and redemption price per share | | $ | 10.64 | | | $ | 11.36 | | | $ | 11.12 | | | $ | 19.55 | | |
Class I: | |
Net assets | | $ | 146,354,454 | | | $ | 139,862,369 | | | $ | 175,916,865 | | | $ | 147,370,005 | | |
Shares authorized | | | 100,000,000 | | | | 100,000,000 | | | | 100,000,000 | | | | 100,000,000 | | |
Par value | | $ | 0.001 | | | $ | 0.001 | | | $ | 0.001 | | | $ | 0.001 | | |
Shares outstanding | | | 13,509,381 | | | | 12,174,303 | | | | 14,671,861 | | | | 6,250,930 | | |
Net asset value and redemption price per share | | $ | 10.83 | | | $ | 11.49 | | | $ | 11.99 | | | $ | 23.58 | | |
Class R6: | |
Net assets | | | n/a | | | | n/a | | | | n/a | | | $ | 33,763,506 | | |
Shares authorized | | | n/a | | | | n/a | | | | n/a | | | | 100,000,000 | | |
Par value | | | n/a | | | | n/a | | | | n/a | | | $ | 0.001 | | |
Shares outstanding | | | n/a | | | | n/a | | | | n/a | | | | 1,430,829 | | |
Net asset value and redemption price per share | | | n/a | | | | n/a | | | | n/a | | | $ | 23.60 | | |
Class S: | |
Net assets | | $ | 33,323,435 | | | $ | 308,131,540 | | | $ | 93,230,458 | | | $ | 228,140,575 | | |
Shares authorized | | | 100,000,000 | | | | 100,000,000 | | | | 100,000,000 | | | | 100,000,000 | | |
Par value | | $ | 0.001 | | | $ | 0.001 | | | $ | 0.001 | | | $ | 0.001 | | |
Shares outstanding | | | 3,079,806 | | | | 26,997,203 | | | | 7,909,635 | | | | 10,536,716 | | |
Net asset value and redemption price per share | | $ | 10.82 | | | $ | 11.41 | | | $ | 11.79 | | | $ | 21.65 | | |
Class S2: | |
Net assets | | | n/a | | | $ | 388,734 | | | $ | 3,270,596 | | | $ | 2,373,105 | | |
Shares authorized | | | n/a | | | | 100,000,000 | | | | 100,000,000 | | | | 100,000,000 | | |
Par value | | | n/a | | | $ | 0.001 | | | $ | 0.001 | | | $ | 0.001 | | |
Shares outstanding | | | n/a | | | | 33,755 | | | | 294,117 | | | | 119,221 | | |
Net asset value and redemption price per share | | | n/a | | | $ | 11.52 | | | $ | 11.12 | | | $ | 19.91 | | |
See Accompanying Notes to Financial Statements
35
TABLE OF CONTENTS
STATEMENTS OF ASSETS AND LIABILITIES AS OF DECEMBER 31, 2019
| | | VY®
Columbia
Contrarian Core
Portfolio | | VY®
Columbia Small
Cap Value II
Portfolio | | VY®
Invesco
Comstock
Portfolio | | VY®
Invesco
Equity and Income
Portfolio | |
ASSETS: | |
Investments in securities at fair value+* | | $ | 49,540,799 | | | $ | 157,032,300 | | | $ | 295,176,758 | | | $ | 1,294,334,588 | | |
Short-term investments at fair value** | | | 1,198,041 | | | | 3,086,638 | | | | 16,137,897 | | | | 66,587,066 | | |
Cash | | | — | | | | — | | | | 3,304,824 | | | | 2,284,419 | | |
Foreign currencies at value*** | | | — | | | | — | | | | 609 | | | | 447,665 | | |
Receivables: | |
Investment securities sold | | | 273,355 | | | | — | | | | — | | | | — | | |
Fund shares sold | | | 9,953 | | | | 374,068 | | | | 70,236 | | | | 232,666 | | |
Dividends | | | 100,379 | | | | 266,644 | | | | 508,984 | | | | 1,180,265 | | |
Interest | | | 136 | | | | — | | | | 77 | | | | 2,512,308 | | |
Foreign tax reclaims | | | — | | | | — | | | | 85,438 | | | | 283,492 | | |
Other | | | — | | | | 154,006 | | | | — | | | | — | | |
Unrealized appreciation on forward foreign currency
contracts | | | — | | | | — | | | | 70,049 | | | | 15,088 | | |
Prepaid expenses | | | 1,927 | | | | 1,241 | | | | 3,553 | | | | 9,825 | | |
Reimbursement due from manager | | | 72,945 | | | | — | | | | — | | | | 13,232 | | |
Receivable due from manager | | | 27,523 | | | | — | | | | 66,631 | | | | — | | |
Other assets | | | 13,436 | | | | 8,831 | | | | 23,235 | | | | 80,610 | | |
Total assets | | | 51,238,494 | | | | 160,923,728 | | | | 315,448,291 | | | | 1,367,981,224 | | |
LIABILITIES: | |
Payable for investment securities purchased | | | — | | | | 277,735 | | | | — | | | | 69,524 | | |
Payable for fund shares redeemed | | | 220,725 | | | | 562,726 | | | | 495,237 | | | | 290,107 | | |
Payable upon receipt of securities loaned | | | — | | | | — | | | | 5,606,719 | | | | 33,057,900 | | |
Unrealized depreciation on forward foreign currency
contracts | | | — | | | | — | | | | 539,282 | | | | 1,272,367 | | |
Payable for investment management fees | | | 124,934 | | | | 110,757 | | | | 221,990 | | | | 704,339 | | |
Payable for distribution and shareholder service fees | | | 38,878 | | | | 30,273 | | | | 45,470 | | | | 224,751 | | |
Payable to directors under the deferred compensation
plan (Note 6) | | | 13,436 | | | | 8,831 | | | | 23,235 | | | | 80,610 | | |
Payable for directors fees | | | 1,323 | | | | 830 | | | | 2,293 | | | | 6,712 | | |
Other accrued expenses and liabilities | | | 56,363 | | | | 42,382 | | | | 127,072 | | | | 330,384 | | |
Total liabilities | | | 455,659 | | | | 1,033,534 | | | | 7,061,298 | | | | 36,036,694 | | |
NET ASSETS | | $ | 50,782,835 | | | $ | 159,890,194 | | | $ | 308,386,993 | | | $ | 1,331,944,530 | | |
NET ASSETS WERE COMPRISED OF: | |
Paid-in capital | | $ | 35,488,866 | | | $ | 129,679,904 | | | $ | 261,678,172 | | | $ | 1,124,384,872 | | |
Total distributable earnings | | | 15,293,969 | | | | 30,210,290 | | | | 46,708,821 | | | | 207,559,658 | | |
NET ASSETS | | $ | 50,782,835 | | | $ | 159,890,194 | | | $ | 308,386,993 | | | $ | 1,331,944,530 | | |
| + Including securities loaned at value | | $ | — | | | $ | — | | | $ | 5,481,878 | | | $ | 32,254,718 | | |
| * Cost of investments in securities | | $ | 39,859,994 | | | $ | 132,960,402 | | | $ | 251,735,557 | | | $ | 1,138,981,147 | | |
| ** Cost of short-term investments | | $ | 1,198,041 | | | $ | 3,086,638 | | | $ | 16,137,897 | | | $ | 66,587,066 | | |
| *** Cost of foreign currencies | | $ | — | | | $ | — | | | $ | 608 | | | $ | 441,632 | | |
See Accompanying Notes to Financial Statements
36
TABLE OF CONTENTS
STATEMENTS OF ASSETS AND LIABILITIES AS OF DECEMBER 31, 2019 (CONTINUED)
| | | VY®
Columbia
Contrarian Core
Portfolio | | VY®
Columbia Small
Cap Value II
Portfolio | | VY®
Invesco
Comstock
Portfolio | | VY®
Invesco
Equity and Income
Portfolio | |
Class ADV: | |
Net assets | | $ | 23,960,989 | | | $ | 25,615,473 | | | $ | 31,201,957 | | | $ | 44,825,442 | | |
Shares authorized | | | 100,000,000 | | | | 100,000,000 | | | | 100,000,000 | | | | 100,000,000 | | |
Par value | | $ | 0.001 | | | $ | 0.001 | | | $ | 0.001 | | | $ | 0.001 | | |
Shares outstanding | | | 1,462,610 | | | | 1,701,357 | | | | 1,834,069 | | | | 1,033,756 | | |
Net asset value and redemption price per share | | $ | 16.38 | | | $ | 15.06 | | | $ | 17.01 | | | $ | 43.36 | | |
Class I: | |
Net assets | | $ | 8,547,637 | | | $ | 36,201,034 | | | $ | 203,509,825 | | | $ | 484,839,363 | | |
Shares authorized | | | 100,000,000 | | | | 100,000,000 | | | | 100,000,000 | | | | 100,000,000 | | |
Par value | | $ | 0.001 | | | $ | 0.001 | | | $ | 0.001 | | | $ | 0.001 | | |
Shares outstanding | | | 483,629 | | | | 2,312,706 | | | | 11,837,903 | | | | 10,997,898 | | |
Net asset value and redemption price per share | | $ | 17.67 | | | $ | 15.65 | | | $ | 17.19 | | | $ | 44.08 | | |
Class R6: | |
Net assets | | | n/a | | | $ | 6,701,284 | | | | n/a | | | | n/a | | |
Shares authorized | | | n/a | | | | 100,000,000 | | | | n/a | | | | n/a | | |
Par value | | | n/a | | | $ | 0.001 | | | | n/a | | | | n/a | | |
Shares outstanding | | | n/a | | | | 427,837 | | | | n/a | | | | n/a | | |
Net asset value and redemption price per share | | | n/a | | | $ | 15.66 | | | | n/a | | | | n/a | | |
Class S: | |
Net assets | | $ | 18,274,209 | | | $ | 89,701,867 | | | $ | 73,675,211 | | | $ | 473,464,769 | | |
Shares authorized | | | 100,000,000 | | | | 100,000,000 | | | | 100,000,000 | | | | 100,000,000 | | |
Par value | | $ | 0.001 | | | $ | 0.001 | | | $ | 0.001 | | | $ | 0.001 | | |
Shares outstanding | | | 1,063,681 | | | | 5,758,566 | | | | 4,288,245 | | | | 10,813,239 | | |
Net asset value and redemption price per share | | $ | 17.18 | | | $ | 15.58 | | | $ | 17.18 | | | $ | 43.79 | | |
Class S2: | |
Net assets | | | n/a | | | $ | 1,670,536 | | | | n/a | | | $ | 328,814,956 | | |
Shares authorized | | | n/a | | | | 100,000,000 | | | | n/a | | | | 100,000,000 | | |
Par value | | | n/a | | | $ | 0.001 | | | | n/a | | | $ | 0.001 | | |
Shares outstanding | | | n/a | | | | 111,211 | | | | n/a | | | | 7,623,201 | | |
Net asset value and redemption price per share | | | n/a | | | $ | 15.02 | | | | n/a | | | $ | 43.13 | | |
See Accompanying Notes to Financial Statements
37
TABLE OF CONTENTS
STATEMENTS OF ASSETS AND LIABILITIES AS OF DECEMBER 31, 2019
| | | VY®
Invesco
Oppenheimer
Global
Portfolio | | VY®
JPMorgan
Mid Cap Value
Portfolio | | VY®
T. Rowe Price
Diversified Mid Cap
Growth
Portfolio | | VY®
T. Rowe Price
Growth Equity
Portfolio | |
ASSETS: | |
Investments in securities at fair value+* | | $ | 1,500,614,237 | | | $ | 433,130,905 | | | $ | 1,158,599,495 | | | $ | 1,664,574,817 | | |
Short-term investments at fair value** | | | 83,043,049 | | | | 10,773,663 | | | | 97,330,978 | | | | 69,628,839 | | |
Cash | | | — | | | | — | | | | 502,756 | | | | 2,904,602 | | |
Foreign currencies at value*** | | | — | | | | — | | | | — | | | | 14,221 | | |
Receivables: | |
Investment securities sold | | | — | | | | 723,660 | | | | — | | | | 567,409 | | |
Investment securities and currencies sold | | | 3,370,330 | | | | — | | | | — | | | | — | | |
Fund shares sold | | | 11,230 | | | | 48,434 | | | | 26,453 | | | | 277,406 | | |
Dividends | | | 285,405 | | | | 910,787 | | | | 1,039,923 | | | | 599,212 | | |
Interest | | | 27 | | | | — | | | | 309 | | | | 1,825 | | |
Foreign tax reclaims | | | 1,723,425 | | | | — | | | | — | | | | — | | |
Other | | | — | | | | 120,447 | | | | — | | | | — | | |
Prepaid expenses | | | 10,463 | | | | 3,204 | | | | 7,036 | | | | 13,091 | | |
Receivable due from manager | | | — | | | | — | | | | — | | | | 27,110 | | |
Other assets | | | 72,327 | | | | 20,214 | | | | 39,615 | | | | 64,781 | | |
Total assets | | | 1,589,130,493 | | | | 445,731,314 | | | | 1,257,546,565 | | | | 1,738,673,313 | | |
LIABILITIES: | |
Payable for investment securities purchased | | | — | | | | — | | | | 312 | | | | 2,545,752 | | |
Payable for investment securities and currencies
purchased | | | 834,899 | | | | — | | | | — | | | | — | | |
Payable for fund shares redeemed | | | 2,589,741 | | | | 369,689 | | | | 601,281 | | | | 2,936,000 | | |
Payable upon receipt of securities loaned | | | 49,668,469 | | | | 2,266,832 | | | | 96,821,637 | | | | 64,308,606 | | |
Payable for investment management fees | | | 907,549 | | | | 316,281 | | | | 721,827 | | | | 1,046,251 | | |
Payable for distribution and shareholder service fees | | | 92,829 | | | | 80,532 | | | | 49,880 | | | | 175,307 | | |
Payable to directors under the deferred compensation
plan (Note 6) | | | 72,327 | | | | 20,214 | | | | 39,615 | | | | 64,781 | | |
Payable for directors fees | | | 7,357 | | | | 2,206 | | | | 5,354 | | | | 9,390 | | |
Payable for Indian capital gains tax | | | 280,257 | | | | — | | | | — | | | | — | | |
Other accrued expenses and liabilities | | | 357,283 | | | | 87,347 | | | | 119,975 | | | | 238,250 | | |
Total liabilities | | | 54,810,711 | | | | 3,143,101 | | | | 98,359,881 | | | | 71,324,337 | | |
NET ASSETS | | $ | 1,534,319,782 | | | $ | 442,588,213 | | | $ | 1,159,186,684 | | | $ | 1,667,348,976 | | |
NET ASSETS WERE COMPRISED OF: | |
Paid-in capital | | $ | 719,901,929 | | | $ | 296,483,194 | | | $ | 674,257,461 | | | $ | 1,137,941,752 | | |
Total distributable earnings | | | 814,417,853 | | | | 146,105,019 | | | | 484,929,223 | | | | 529,407,224 | | |
NET ASSETS | | $ | 1,534,319,782 | | | $ | 442,588,213 | | | $ | 1,159,186,684 | | | $ | 1,667,348,976 | | |
| + Including securities loaned at value | | $ | 48,407,183 | | | $ | 2,216,769 | | | $ | 94,606,399 | | | $ | 62,884,969 | | |
| * Cost of investments in securities | | $ | 737,812,311 | | | $ | 315,650,941 | | | $ | 768,979,235 | | | $ | 1,198,114,746 | | |
| ** Cost of short-term investments | | $ | 83,043,049 | | | $ | 10,773,663 | | | $ | 97,330,978 | | | $ | 69,628,839 | | |
| *** Cost of foreign currencies | | $ | — | | | $ | — | | | $ | — | | | $ | 14,140 | | |
See Accompanying Notes to Financial Statements
38
TABLE OF CONTENTS
STATEMENTS OF ASSETS AND LIABILITIES AS OF DECEMBER 31, 2019 (CONTINUED)
| | | VY®
Invesco
Oppenheimer
Global
Portfolio | | VY®
JPMorgan
Mid Cap Value
Portfolio | | VY®
T. Rowe Price
Diversified Mid Cap
Growth
Portfolio | | VY®
T. Rowe Price
Growth Equity
Portfolio | |
Class ADV: | |
Net assets | | $ | 123,466,783 | | | $ | 89,967,146 | | | $ | 90,526,280 | | | $ | 302,258,374 | | |
Shares authorized | | | 100,000,000 | | | | 100,000,000 | | | | 100,000,000 | | | | 100,000,000 | | |
Par value | | $ | 0.001 | | | $ | 0.001 | | | $ | 0.001 | | | $ | 0.001 | | |
Shares outstanding | | | 6,705,626 | | | | 5,245,998 | | | | 8,226,413 | | | | 4,204,102 | | |
Net asset value and redemption price per share | | $ | 18.41 | | | $ | 17.15 | | | $ | 11.00 | | | $ | 71.90 | | |
Class I: | |
Net assets | | $ | 1,225,196,536 | | | $ | 150,534,879 | | | $ | 985,212,844 | | | $ | 1,290,657,097 | | |
Shares authorized | | | 250,000,000 | | | | 100,000,000 | | | | 250,000,000 | | | | 100,000,000 | | |
Par value | | $ | 0.001 | | | $ | 0.001 | | | $ | 0.001 | | | $ | 0.001 | | |
Shares outstanding | | | 62,973,408 | | | | 8,495,376 | | | | 78,791,983 | | | | 15,850,613 | | |
Net asset value and redemption price per share | | $ | 19.46 | | | $ | 17.72 | | | $ | 12.50 | | | $ | 81.43 | | |
Class R6: | |
Net assets | | | n/a | | | | n/a | | | $ | 30,761,136 | | | | n/a | | |
Shares authorized | | | n/a | | | | n/a | | | | 100,000,000 | | | | n/a | | |
Par value | | | n/a | | | | n/a | | | $ | 0.001 | | | | n/a | | |
Shares outstanding | | | n/a | | | | n/a | | | | 2,458,913 | | | | n/a | | |
Net asset value and redemption price per share | | | n/a | | | | n/a | | | $ | 12.51 | | | | n/a | | |
Class S: | |
Net assets | | $ | 181,045,322 | | | $ | 200,303,894 | | | $ | 47,100,785 | | | $ | 65,359,239 | | |
Shares authorized | | | 100,000,000 | | | | 100,000,000 | | | | 100,000,000 | | | | 100,000,000 | | |
Par value | | $ | 0.001 | | | $ | 0.001 | | | $ | 0.001 | | | $ | 0.001 | | |
Shares outstanding | | | 9,755,812 | | | | 11,442,584 | | | | 3,949,086 | | | | 851,090 | | |
Net asset value and redemption price per share | | $ | 18.56 | | | $ | 17.51 | | | $ | 11.93 | | | $ | 76.79 | | |
Class S2: | |
Net assets | | $ | 4,611,141 | | | $ | 1,782,294 | | | $ | 5,585,639 | | | $ | 9,074,266 | | |
Shares authorized | | | 100,000,000 | | | | 100,000,000 | | | | 100,000,000 | | | | 100,000,000 | | |
Par value | | $ | 0.001 | | | $ | 0.001 | | | $ | 0.001 | | | $ | 0.001 | | |
Shares outstanding | | | 257,685 | | | | 104,211 | | | | 503,927 | | | | 123,504 | | |
Net asset value and redemption price per share | | $ | 17.89 | | | $ | 17.10 | | | $ | 11.08 | | | $ | 73.47 | | |
See Accompanying Notes to Financial Statements
39
TABLE OF CONTENTS
STATEMENTS OF OPERATIONS FOR THE YEAR ENDED DECEMBER 31, 2019
| | | Voya
Global Bond
Portfolio | | Voya
International
High Dividend
Low Volatility
Portfolio | | VY®
American Century
Small-Mid Cap Value
Portfolio | | VY®
Baron
Growth
Portfolio | |
INVESTMENT INCOME: | |
Dividends, net of foreign taxes withheld* | | $ | 58,219 | | | $ | 17,236,877 | | | $ | 8,271,440 | | | $ | 8,605,428 | | |
Dividends from affiliated underlying funds | | | 1,883,778 | | | | — | | | | — | | | | — | | |
Interest, net of foreign taxes withheld* | | | 5,625,726 | | | | 52,188 | | | | 50 | | | | — | | |
Securities lending income, net | | | 34,067 | | | | 102,557 | | | | 132,302 | | | | — | | |
Total investment income | | | 7,601,790 | | | | 17,391,622 | | | | 8,403,792 | | | | 8,605,428 | | |
EXPENSES: | |
Investment management fees | | | 1,218,378 | | | | 3,376,318 | | | | 3,906,097 | | | | 7,366,647 | | |
Distribution and shareholder service fees: | | | | | | | | | |
Class ADV | | | 109,013 | | | | 152,570 | | | | 516,797 | | | | 493,356 | | |
Class S | | | 87,657 | | | | 779,699 | | | | 221,353 | | | | 1,271,013 | | |
Class S2 | | | — | | | | 1,505 | | | | 12,999 | | | | 8,697 | | |
Transfer agent fees | | | 321 | | | | 1,026 | | | | 1,249 | | | | 1,377 | | |
Shareholder reporting expense | | | 24,999 | | | | 61,550 | | | | 37,595 | | | | 64,428 | | |
Professional fees | | | 21,913 | | | | 50,705 | | | | 32,485 | | | | 52,855 | | |
Custody and accounting expense | | | 59,690 | | | | 195,895 | | | | 142,192 | | | | 79,480 | | |
Directors fees | | | 8,122 | | | | 19,250 | | | | 14,404 | | | | 31,017 | | |
Shareholder Notification cost (Note 6) | | | — | | | | 92,750 | | | | — | | | | — | | |
Miscellaneous expense | | | 11,898 | | | | 29,882 | | | | 26,593 | | | | 23,499 | | |
Interest expense | | | 1,364 | | | | 1,581 | | | | — | | | | 17,975 | | |
Total expenses | | | 1,543,355 | | | | 4,762,731 | | | | 4,911,764 | | | | 9,410,344 | | |
Waived and reimbursed fees | | | (6,193 | ) | | | (192,434 | ) | | | (1,118,006 | ) | | | — | | |
Brokerage commission recapture | | | — | | | | (9,033 | ) | | | — | | | | — | | |
Net expenses | | | 1,537,162 | | | | 4,561,264 | | | | 3,793,758 | | | | 9,410,344 | | |
Net investment income (loss) | | | 6,064,628 | | | | 12,830,358 | | | | 4,610,034 | | | | (804,916 | ) | |
REALIZED AND UNREALIZED GAIN (LOSS): | |
Net realized gain (loss) on: | |
Investments (net of Indonesian and Colombian capital
gains tax withheld^) | | | 2,431,903 | | | | 52,049,265 | | | | (13,750 | ) | | | 282,762,810 | | |
Sale of affiliated underlying funds | | | (936,339 | ) | | | — | | | | — | | | | — | | |
Forward foreign currency contracts | | | (2,321,527 | ) | | | (516,949 | ) | | | 363,607 | | | | — | | |
Foreign currency related transactions | | | 218,156 | | | | 148,674 | | | | (10,032 | ) | | | 7,087 | | |
Futures | | | 1,405,763 | | | | — | | | | — | | | | — | | |
Swaps | | | (285,358 | ) | | | — | | | | — | | | | — | | |
Written options | | | 450,158 | | | | — | | | | — | | | | — | | |
Net realized gain | | | 962,756 | | | | 51,680,990 | | | | 339,825 | | | | 282,769,897 | | |
Net change in unrealized appreciation (depreciation) on: | |
Investments | | | 6,287,147 | | | | 9,074,619 | | | | 88,788,525 | | | | (40,754,154 | ) | |
Affiliated underlying funds | | | 4,676,668 | | | | — | | | | — | | | | — | | |
Forward foreign currency contracts | | | 176,540 | | | | — | | | | (75,365 | ) | | | — | | |
Foreign currency related transactions | | | (118,781 | ) | | | 14,601 | | | | 1,153 | | | | — | | |
Futures | | | (339,323 | ) | | | — | | | | — | | | | — | | |
Swaps | | | (3,929,267 | ) | | | — | | | | — | | | | — | | |
Written options | | | 1,586,596 | | | | — | | | | — | | | | — | | |
Net change in unrealized appreciation (depreciation) | | | 8,339,580 | | | | 9,089,220 | | | | 88,714,313 | | | | (40,754,154 | ) | |
Net realized and unrealized gain | | | 9,302,336 | | | | 60,770,210 | | | | 89,054,138 | | | | 242,015,743 | | |
Increase in net assets resulting from operations | | $ | 15,366,964 | | | $ | 73,600,568 | | | $ | 93,664,172 | | | $ | 241,210,827 | | |
| * Foreign taxes withheld | | $ | 4,621 | | | $ | 1,671,173 | | | $ | 70,163 | | | $ | — | | |
^ Foreign taxes on sale of Indonesian and Colombian
investments | | $ | 16,305 | | | $ | 25,558 | | | $ | — | | | $ | — | | |
See Accompanying Notes to Financial Statements
40
TABLE OF CONTENTS
STATEMENTS OF OPERATIONS FOR THE YEAR ENDED DECEMBER 31, 2019
| | | VY®
Columbia
Contrarian Core
Portfolio | | VY®
Columbia Small
Cap Value II
Portfolio | | VY®
Invesco
Comstock
Portfolio | | VY®
Invesco
Equity and Income
Portfolio | |
INVESTMENT INCOME: | |
Dividends, net of foreign taxes withheld* | | $ | 4,964,178 | | | $ | 2,743,121 | | | $ | 13,000,206 | | | $ | 23,441,741 | | |
Interest | | | 192 | | | | — | | | | 301 | | | | 11,438,901 | | |
Securities lending income, net | | | — | | | | — | | | | 18,706 | | | | 132,838 | | |
Total investment income | | | 4,964,370 | | | | 2,743,121 | | | | 13,019,213 | | | | 35,013,480 | | |
EXPENSES: | |
Investment management fees | | | 2,382,304 | | | | 1,410,684 | | | | 3,209,654 | | | | 8,538,822 | | |
Distribution and shareholder service fees: | | | | | | | | | |
Class ADV | | | 114,462 | | | | 140,275 | | | | 150,353 | | | | 221,716 | | |
Class S | | | 585,359 | | | | 233,989 | | | | 559,643 | | | | 1,202,807 | | |
Class S2 | | | — | | | | 9,685 | | | | — | | | | 1,334,024 | | |
Transfer agent fees | | | 627 | | | | 640 | | | | 1,170 | | | | 2,023 | | |
Shareholder reporting expense | | | 27,542 | | | | 22,850 | | | | 39,160 | | | | 124,634 | | |
Professional fees | | | 23,177 | | | | 18,038 | | | | 42,705 | | | | 93,996 | | |
Custody and accounting expense | | | 38,807 | | | | 27,594 | | | | 94,860 | | | | 165,390 | | |
Directors fees | | | 10,588 | | | | 6,639 | | | | 18,341 | | | | 53,697 | | |
Miscellaneous expense | | | 14,940 | | | | 15,333 | | | | 27,347 | | | | 62,622 | | |
Interest expense | | | 410 | | | | — | | | | 458 | | | | 215 | | |
Total expenses | | | 3,198,216 | | | | 1,885,727 | | | | 4,143,691 | | | | 11,799,946 | | |
Waived and reimbursed fees | | | (612,215 | ) | | | (47,144 | ) | | | (88,423 | ) | | | (485,274 | ) | |
Brokerage commission recapture | | | (14,239 | ) | | | (5,181 | ) | | | (2,452 | ) | | | (2,828 | ) | |
Net expenses | | | 2,571,762 | | | | 1,833,402 | | | | 4,052,816 | | | | 11,311,844 | | |
Net investment income | | | 2,392,608 | | | | 909,719 | | | | 8,966,397 | | | | 23,701,636 | | |
REALIZED AND UNREALIZED GAIN (LOSS): | |
Net realized gain (loss) on: | |
Investments | | | 73,142,134 | | | | 5,242,199 | | | | 58,420,506 | | | | 55,180,583 | | |
Forward foreign currency contracts | | | — | | | | — | | | | 451,647 | | | | 584,543 | | |
Foreign currency related transactions | | | — | | | | — | | | | 100,477 | | | | 3,222 | | |
Net realized gain | | | 73,142,134 | | | | 5,242,199 | | | | 58,972,630 | | | | 55,768,348 | | |
Net change in unrealized appreciation (depreciation) on: | |
Investments | | | (4,370,814 | ) | | | 24,150,957 | | | | 36,532,316 | | | | 164,211,167 | | |
Forward foreign currency contracts | | | — | | | | — | | | | (395,948 | ) | | | (1,136,767 | ) | |
Foreign currency related transactions | | | — | | | | — | | | | 4,890 | | | | 19,543 | | |
Net change in unrealized appreciation (depreciation) | | | (4,370,814 | ) | | | 24,150,957 | | | | 36,141,258 | | | | 163,093,943 | | |
Net realized and unrealized gain | | | 68,771,320 | | | | 29,393,156 | | | | 95,113,888 | | | | 218,862,291 | | |
Increase in net assets resulting from operations | | $ | 71,163,928 | | | $ | 30,302,875 | | | $ | 104,080,285 | | | $ | 242,563,927 | | |
| * Foreign taxes withheld | | $ | 19,952 | | | $ | 8,040 | | | $ | 220,077 | | | $ | 349,194 | | |
See Accompanying Notes to Financial Statements
41
TABLE OF CONTENTS
STATEMENTS OF OPERATIONS FOR THE YEAR ENDED DECEMBER 31, 2019
| | | VY®
Invesco
Oppenheimer
Global
Portfolio | | VY®
JPMorgan
Mid Cap Value
Portfolio | | VY®
T. Rowe Price
Diversified Mid Cap
Growth
Portfolio | | VY®
T. Rowe Price
Growth Equity
Portfolio | |
INVESTMENT INCOME: | |
Dividends, net of foreign taxes withheld* | | $ | 21,942,113 | | | $ | 9,227,464 | | | $ | 10,428,688 | | | $ | 14,520,393 | | |
Interest | | | 174 | | | | — | | | | 1,002 | | | | 14,225 | | |
Securities lending income, net | | | 328,784 | | | | 13,323 | | | | 160,329 | | | | 140,422 | | |
Total investment income | | | 22,271,071 | | | | 9,240,787 | | | | 10,590,019 | | | | 14,675,040 | | |
EXPENSES: | |
Investment management fees | | | 10,298,792 | | | | 3,750,481 | | | | 7,923,769 | | | | 13,145,605 | | |
Distribution and shareholder service fees: | | | | | | | | | |
Class ADV | | | 572,431 | | | | 439,239 | | | | 394,831 | | | | 1,399,186 | | |
Class S | | | 452,330 | | | | 499,833 | | | | 114,841 | | | | 861,745 | | |
Class S2 | | | 18,153 | | | | 7,581 | | | | 20,654 | | | | 38,321 | | |
Transfer agent fees | | | 2,515 | | | | 896 | | | | 1,617 | | | | 2,926 | | |
Shareholder reporting expense | | | 145,600 | | | | 41,975 | | | | 89,450 | | | | 153,266 | | |
Professional fees | | | 123,977 | | | | 34,584 | | | | 74,883 | | | | 120,889 | | |
Custody and accounting expense | | | 307,787 | | | | 53,239 | | | | 118,121 | | | | 187,439 | | |
Directors fees | | | 58,850 | | | | 17,649 | | | | 42,831 | | | | 75,118 | | |
Miscellaneous expense | | | 77,283 | | | | 18,622 | | | | 39,603 | | | | 73,458 | | |
Interest expense | | | 1,238 | | | | 240 | | | | 1,148 | | | | 1,940 | | |
Total expenses | | | 12,058,956 | | | | 4,864,339 | | | | 8,821,748 | | | | 16,059,893 | | |
Waived and reimbursed fees | | | — | | | | — | | | | — | | | | (356,498 | ) | |
Brokerage commission recapture | | | — | | | | (3,750 | ) | | | (55 | ) | | | — | | |
Net expenses | | | 12,058,956 | | | | 4,860,589 | | | | 8,821,693 | | | | 15,703,395 | | |
Net investment income (loss) | | | 10,212,115 | | | | 4,380,198 | | | | 1,768,326 | | | | (1,028,355 | ) | |
REALIZED AND UNREALIZED GAIN (LOSS): | |
Net realized gain (loss) on: | |
Investments | | | 53,178,684 | | | | 29,243,363 | | | | 96,946,314 | | | | 276,185,559 | | |
Forward foreign currency contracts | | | (50,738 | ) | | | — | | | | — | | | | — | | |
Foreign currency related transactions | | | (53,238 | ) | | | — | | | | — | | | | 9,509 | | |
Net realized gain | | | 53,074,708 | | | | 29,243,363 | | | | 96,946,314 | | | | 276,195,068 | | |
Net change in unrealized appreciation (depreciation) on: | |
Investments (net of Indian capital gains tax accrued#) | | | 335,757,568 | | | | 68,257,947 | | | | 223,091,270 | | | | 209,834,711 | | |
Foreign currency related transactions | | | (24,137 | ) | | | — | | | | — | | | | 157 | | |
Net change in unrealized appreciation (depreciation) | | | 335,733,431 | | | | 68,257,947 | | | | 223,091,270 | | | | 209,834,868 | | |
Net realized and unrealized gain | | | 388,808,139 | | | | 97,501,310 | | | | 320,037,584 | | | | 486,029,936 | | |
Increase in net assets resulting from operations | | $ | 399,020,254 | | | $ | 101,881,508 | | | $ | 321,805,910 | | | $ | 485,001,581 | | |
| * Foreign taxes withheld | | $ | 1,643,961 | | | $ | — | | | $ | — | | | $ | 80,074 | | |
| # Foreign taxes accrued on Indian investments | | $ | 280,257 | | | $ | — | | | $ | — | | | $ | — | | |
See Accompanying Notes to Financial Statements
42
TABLE OF CONTENTS
STATEMENTS OF CHANGES IN NET ASSETS
| | | Voya Global Bond Portfolio | | Voya International High Dividend
Low Volatility Portfolio | |
| | | Year
Ended
December 31,
2019 | | Year
Ended
December 31,
2018 | | Year
Ended
December 31,
2019 | | Year
Ended
December 31,
2018 | |
FROM OPERATIONS: | |
Net investment income | | $ | 6,064,628 | | | $ | 6,813,827 | | | $ | 12,830,358 | | | $ | 8,990,733 | | |
Net realized gain (loss) | | | 962,756 | | | | (5,154,958 | ) | | | 51,680,990 | | | | 39,105,623 | | |
Net change in unrealized appreciation (depreciation) | | | 8,339,580 | | | | (6,303,437 | ) | | | 9,089,220 | | | | (134,006,113 | ) | |
Increase (decrease) in net assets resulting from operations | | | 15,366,964 | | | | (4,644,568 | ) | | | 73,600,568 | | | | (85,909,757 | ) | |
FROM DISTRIBUTIONS TO SHAREHOLDERS: | |
Total distributions (excluding return of capital): | |
Class ADV | | | (898,537 | ) | | | (769,925 | ) | | | (2,960,724 | ) | | | (573,585 | ) | |
Class I | | | (6,738,560 | ) | | | (5,803,370 | ) | | | (13,951,881 | ) | | | (3,467,151 | ) | |
Class S | | | (1,515,590 | ) | | | (1,366,597 | ) | | | (31,143,088 | ) | | | (6,719,064 | ) | |
Class S2 | | | — | | | | — | | | | (34,369 | ) | | | (2,851 | ) | |
Total distributions | | | (9,152,687 | ) | | | (7,939,892 | ) | | | (48,090,062 | ) | | | (10,762,651 | ) | |
FROM CAPITAL SHARE TRANSACTIONS: | |
Net proceeds from sale of shares | | | 10,863,585 | | | | 15,122,844 | | | | 11,733,829 | | | | 18,768,528 | | |
Reinvestment of distributions | | | 9,152,687 | | | | 7,939,892 | | | | 48,090,062 | | | | 10,762,651 | | |
| | | | 20,016,272 | | | | 23,062,736 | | | | 59,823,891 | | | | 29,531,179 | | |
Cost of shares redeemed | | | (29,375,489 | ) | | | (34,417,143 | ) | | | (81,887,305 | ) | | | (85,626,571 | ) | |
Net decrease in net assets resulting from capital
share transactions | | | (9,359,217 | ) | | | (11,354,407 | ) | | | (22,063,414 | ) | | | (56,095,392 | ) | |
Net increase (decrease) in net assets | | | (3,144,940 | ) | | | (23,938,867 | ) | | | 3,447,092 | | | | (152,767,800 | ) | |
NET ASSETS: | |
Beginning of year or period | | | 204,483,482 | | | | 228,422,349 | | | | 474,835,382 | | | | 627,603,182 | | |
End of year or period | | $ | 201,338,542 | | | $ | 204,483,482 | | | $ | 478,282,474 | | | $ | 474,835,382 | | |
See Accompanying Notes to Financial Statements
43
TABLE OF CONTENTS
STATEMENTS OF CHANGES IN NET ASSETS
| | | VY® American Century Small-Mid
Cap Value Portfolio | | VY® Baron Growth Portfolio | |
| | | Year
Ended
December 31,
2019 | | Year
Ended
December 31,
2018 | | Year
Ended
December 31,
2019 | | Year
Ended
December 31,
2018 | |
FROM OPERATIONS: | |
Net investment income (loss) | | $ | 4,610,034 | | | $ | 3,927,997 | | | $ | (804,916 | ) | | $ | (452,012 | ) | |
Net realized gain | | | 339,825 | | | | 34,841,089 | | | | 282,769,897 | | | | 68,149,880 | | |
Net change in unrealized appreciation (depreciation) | | | 88,714,313 | | | | (92,265,050 | ) | | | (40,754,154 | ) | | | (79,072,995 | ) | |
Increase (decrease) in net assets resulting from operations | | | 93,664,172 | | | | (53,495,964 | ) | | | 241,210,827 | | | | (11,375,127 | ) | |
FROM DISTRIBUTIONS TO SHAREHOLDERS: | |
Total distributions (excluding return of capital): | |
Class ADV | | | (11,753,088 | ) | | | (12,531,586 | ) | | | (46,984,247 | ) | | | (9,617,517 | ) | |
Class I | | | (18,296,197 | ) | | | (18,924,313 | ) | | | (58,663,771 | ) | | | (12,799,676 | ) | |
Class R6 | | | — | | | | — | | | | (13,079,032 | ) | | | (1,297,132 | ) | |
Class S | | | (9,783,372 | ) | | | (11,088,373 | ) | | | (228,177,414 | ) | | | (51,924,632 | ) | |
Class S2 | | | (345,747 | ) | | | (448,005 | ) | | | (1,039,818 | ) | | | (234,454 | ) | |
Return of capital: | |
Class ADV | | | — | | | | — | | | | (509,515 | ) | | | — | | |
Class I | | | — | | | | — | | | | (634,679 | ) | | | — | | |
Class R6 | | | — | | | | — | | | | (143,215 | ) | | | — | | |
Class S | | | — | | | | — | | | | (2,467,257 | ) | | | — | | |
Class S2 | | | — | | | | — | | | | (11,255 | ) | | | — | | |
Total distributions | | | (40,178,404 | ) | | | (42,992,277 | ) | | | (351,710,203 | ) | | | (75,873,411 | ) | |
FROM CAPITAL SHARE TRANSACTIONS: | |
Net proceeds from sale of shares | | | 38,939,041 | | | | 59,400,575 | | | | 58,899,565 | | | | 86,703,502 | | |
Reinvestment of distributions | | | 40,178,404 | | | | 42,992,277 | | | | 351,710,203 | | | | 75,873,411 | | |
| | | | 79,117,445 | | | | 102,392,852 | | | | 410,609,768 | | | | 162,576,913 | | |
Cost of shares redeemed | | | (68,264,768 | ) | | | (66,783,280 | ) | | | (452,379,993 | ) | | | (165,703,704 | ) | |
Net increase (decrease) in net assets resulting from capital
share transactions | | | 10,852,677 | | | | 35,609,572 | | | | (41,770,225 | ) | | | (3,126,791 | ) | |
Net increase (decrease) in net assets | | | 64,338,445 | | | | (60,878,669 | ) | | | (152,269,601 | ) | | | (90,375,329 | ) | |
NET ASSETS: | |
Beginning of year or period | | | 316,539,171 | | | | 377,417,840 | | | | 669,187,673 | | | | 759,563,002 | | |
End of year or period | | $ | 380,877,616 | | | $ | 316,539,171 | | | $ | 516,918,072 | | | $ | 669,187,673 | | |
See Accompanying Notes to Financial Statements
44
TABLE OF CONTENTS
STATEMENTS OF CHANGES IN NET ASSETS
| | | VY® Columbia Contrarian
Core Portfolio | | VY® Columbia Small Cap
Value II Portfolio | |
| | | Year
Ended
December 31,
2019 | | Year
Ended
December 31,
2018 | | Year
Ended
December 31,
2019 | | Year
Ended
December 31,
2018 | |
FROM OPERATIONS: | |
Net investment income | | $ | 2,392,608 | | | $ | 2,538,545 | | | $ | 909,719 | | | $ | 565,067 | | |
Net realized gain | | | 73,142,134 | | | | 31,116,313 | | | | 5,242,199 | | | | 20,249,835 | | |
Net change in unrealized appreciation (depreciation) | | | (4,370,814 | ) | | | (57,899,017 | ) | | | 24,150,957 | | | | (54,637,824 | ) | |
Increase (decrease) in net assets resulting from operations | | | 71,163,928 | | | | (24,244,159 | ) | | | 30,302,875 | | | | (33,822,922 | ) | |
FROM DISTRIBUTIONS TO SHAREHOLDERS: | |
Total distributions (excluding return of capital): | |
Class ADV | | | (8,811,227 | ) | | | (2,909,173 | ) | | | (3,495,796 | ) | | | (3,708,442 | ) | |
Class I | | | (2,960,790 | ) | | | (1,071,961 | ) | | | (4,571,559 | ) | | | (4,664,883 | ) | |
Class R6 | | | — | | | | — | | | | (773,170 | ) | | | (669,195 | ) | |
Class S | | | (90,737,866 | ) | | | (28,941,556 | ) | | | (11,647,424 | ) | | | (12,004,777 | ) | |
Class S2 | | | — | | | | — | | | | (344,194 | ) | | | (368,284 | ) | |
Total distributions | | | (102,509,883 | ) | | | (32,922,690 | ) | | | (20,832,143 | ) | | | (21,415,581 | ) | |
FROM CAPITAL SHARE TRANSACTIONS: | |
Net proceeds from sale of shares | | | 3,469,896 | | | | 5,769,940 | | | | 11,984,852 | | | | 24,634,720 | | |
Reinvestment of distributions | | | 102,509,883 | | | | 32,922,690 | | | | 20,832,143 | | | | 21,415,581 | | |
| | | | 105,979,779 | | | | 38,692,630 | | | | 32,816,995 | | | | 46,050,301 | | |
Cost of shares redeemed | | | (275,123,114 | ) | | | (54,892,340 | ) | | | (41,062,450 | ) | | | (45,851,085 | ) | |
Net increase (decrease) in net assets resulting from capital
share transactions | | | (169,143,335 | ) | | | (16,199,710 | ) | | | (8,245,455 | ) | | | 199,216 | | |
Net increase (decrease) in net assets | | | (200,489,290 | ) | | | (73,366,559 | ) | | | 1,225,277 | | | | (55,039,287 | ) | |
NET ASSETS: | |
Beginning of year or period | | | 251,272,125 | | | | 324,638,684 | | | | 158,664,917 | | | | 213,704,204 | | |
End of year or period | | $ | 50,782,835 | | | $ | 251,272,125 | | | $ | 159,890,194 | | | $ | 158,664,917 | | |
See Accompanying Notes to Financial Statements
45
TABLE OF CONTENTS
STATEMENTS OF CHANGES IN NET ASSETS
| | | VY® Invesco Comstock Portfolio | | VY® Invesco Equity and
Income Portfolio | |
| | | Year
Ended
December 31,
2019 | | Year
Ended
December 31,
2018 | | Year
Ended
December 31,
2019 | | Year
Ended
December 31,
2018 | |
FROM OPERATIONS: | |
Net investment income | | $ | 8,966,397 | | | $ | 8,030,430 | | | $ | 23,701,636 | | | $ | 26,345,545 | | |
Net realized gain | | | 58,972,630 | | | | 42,920,467 | | | | 55,768,348 | | | | 75,191,935 | | |
Net change in unrealized appreciation (depreciation) | | | 36,141,258 | | | | (113,328,174 | ) | | | 163,093,943 | | | | (241,086,245 | ) | |
Increase (decrease) in net assets resulting from operations | | | 104,080,285 | | | | (62,377,277 | ) | | | 242,563,927 | | | | (139,548,765 | ) | |
FROM DISTRIBUTIONS TO SHAREHOLDERS: | |
Total distributions (excluding return of capital): | |
Class ADV | | | (6,879,165 | ) | | | (343,478 | ) | | | (3,049,060 | ) | | | (3,961,563 | ) | |
Class I | | | (44,729,596 | ) | | | (3,805,062 | ) | | | (34,708,723 | ) | | | (44,057,761 | ) | |
Class S | | | (52,190,119 | ) | | | (3,279,768 | ) | | | (33,844,478 | ) | | | (42,757,248 | ) | |
Class S2 | | | — | | | | — | | | | (23,339,231 | ) | | | (29,253,116 | ) | |
Total distributions | | | (103,798,880 | ) | | | (7,428,308 | ) | | | (94,941,492 | ) | | | (120,029,688 | ) | |
FROM CAPITAL SHARE TRANSACTIONS: | |
Net proceeds from sale of shares | | | 29,938,266 | | | | 129,215,150 | | | | 13,778,245 | | | | 17,173,506 | | |
Reinvestment of distributions | | | 103,798,880 | | | | 7,428,308 | | | | 94,941,492 | | | | 120,029,688 | | |
| | | | 133,737,146 | | | | 136,643,458 | | | | 108,719,737 | | | | 137,203,194 | | |
Cost of shares redeemed | | | (288,332,436 | ) | | | (102,854,056 | ) | | | (221,494,026 | ) | | | (256,974,933 | ) | |
Net increase (decrease) in net assets resulting from capital
share transactions | | | (154,595,290 | ) | | | 33,789,402 | | | | (112,774,289 | ) | | | (119,771,739 | ) | |
Net increase (decrease) in net assets | | | (154,313,885 | ) | | | (36,016,183 | ) | | | 34,848,146 | | | | (379,350,192 | ) | |
NET ASSETS: | |
Beginning of year or period | | | 462,700,878 | | | | 498,717,061 | | | | 1,297,096,384 | | | | 1,676,446,576 | | |
End of year or period | | $ | 308,386,993 | | | $ | 462,700,878 | | | $ | 1,331,944,530 | | | $ | 1,297,096,384 | | |
See Accompanying Notes to Financial Statements
46
TABLE OF CONTENTS
STATEMENTS OF CHANGES IN NET ASSETS
| | | VY® Invesco Oppenheimer
Global Portfolio | | VY® JPMorgan Mid Cap
Value Portfolio | |
| | | Year
Ended
December 31,
2019 | | Year
Ended
December 31,
2018 | | Year
Ended
December 31,
2019 | | Year
Ended
December 31,
2018 | |
FROM OPERATIONS: | |
Net investment income | | $ | 10,212,115 | | | $ | 10,921,163 | | | $ | 4,380,198 | | | $ | 5,523,023 | | |
Net realized gain | | | 53,074,708 | | | | 253,555,506 | | | | 29,243,363 | | | | 54,383,439 | | |
Net change in unrealized appreciation (depreciation) | | | 335,733,431 | | | | (467,680,242 | ) | | | 68,257,947 | | | | (116,778,313 | ) | |
Increase (decrease) in net assets resulting from operations | | | 399,020,254 | | | | (203,203,573 | ) | | | 101,881,508 | | | | (56,871,851 | ) | |
FROM DISTRIBUTIONS TO SHAREHOLDERS: | |
Total distributions (excluding return of capital): | |
Class ADV | | | (20,072,596 | ) | | | (9,769,648 | ) | | | (11,709,923 | ) | | | (8,727,492 | ) | |
Class I | | | (201,831,773 | ) | | | (106,189,185 | ) | | | (20,246,539 | ) | | | (16,991,070 | ) | |
Class S | | | (32,134,460 | ) | | | (17,292,594 | ) | | | (26,438,369 | ) | | | (21,524,896 | ) | |
Class S2 | | | (850,475 | ) | | | (380,527 | ) | | | (249,114 | ) | | | (247,852 | ) | |
Total distributions | | | (254,889,304 | ) | | | (133,631,954 | ) | | | (58,643,945 | ) | | | (47,491,310 | ) | |
FROM CAPITAL SHARE TRANSACTIONS: | |
Net proceeds from sale of shares | | | 24,243,212 | | | | 53,037,519 | | | | 10,238,127 | | | | 20,875,714 | | |
Reinvestment of distributions | | | 254,889,304 | | | | 133,631,954 | | | | 58,643,945 | | | | 47,491,310 | | |
| | | | 279,132,516 | | | | 186,669,473 | | | | 68,882,072 | | | | 68,367,024 | | |
Cost of shares redeemed | | | (223,633,534 | ) | | | (262,406,375 | ) | | | (83,935,610 | ) | | | (120,615,767 | ) | |
Net increase (decrease) in net assets resulting from capital
share transactions | | | 55,498,982 | | | | (75,736,902 | ) | | | (15,053,538 | ) | | | (52,248,743 | ) | |
Net increase (decrease) in net assets | | | 199,629,932 | | | | (412,572,429 | ) | | | 28,184,025 | | | | (156,611,904 | ) | |
NET ASSETS: | |
Beginning of year or period | | | 1,334,689,850 | | | | 1,747,262,279 | | | | 414,404,188 | | | | 571,016,092 | | |
End of year or period | | $ | 1,534,319,782 | | | $ | 1,334,689,850 | | | $ | 442,588,213 | | | $ | 414,404,188 | | |
See Accompanying Notes to Financial Statements
47
TABLE OF CONTENTS
STATEMENTS OF CHANGES IN NET ASSETS
| | | VY® T. Rowe Price Diversified
Mid Cap Growth Portfolio | | VY® T. Rowe Price Growth
Equity Portfolio | |
| | | Year
Ended
December 31,
2019 | | Year
Ended
December 31,
2018 | | Year
Ended
December 31,
2019 | | Year
Ended
December 31,
2018 | |
FROM OPERATIONS: | |
Net investment income (loss) | | $ | 1,768,326 | | | $ | 3,184,925 | | | $ | (1,028,355 | ) | | $ | 2,631,363 | | |
Net realized gain | | | 96,946,314 | | | | 110,954,170 | | | | 276,195,068 | | | | 209,220,291 | | |
Net change in unrealized appreciation (depreciation) | | | 223,091,270 | | | | (139,167,658 | ) | | | 209,834,868 | | | | (227,279,367 | ) | |
Increase (decrease) in net assets resulting from operations | | | 321,805,910 | | | | (25,028,563 | ) | | | 485,001,581 | | | | (15,427,713 | ) | |
FROM DISTRIBUTIONS TO SHAREHOLDERS: | |
Total distributions (excluding return of capital): | |
Class ADV | | | (9,332,153 | ) | | | (7,077,906 | ) | | | (68,035,018 | ) | | | (45,353,718 | ) | |
Class I | | | (95,912,625 | ) | | | (84,724,065 | ) | | | (271,933,502 | ) | | | (195,495,575 | ) | |
Class R6 | | | (2,445,270 | ) | | | (1,316,053 | ) | | | — | | | | — | | |
Class S | | | (4,957,916 | ) | | | (5,077,125 | ) | | | (79,114,269 | ) | | | (65,810,841 | ) | |
Class S2 | | | (597,820 | ) | | | (452,699 | ) | | | (2,161,210 | ) | | | (1,626,233 | ) | |
Total distributions | | | (113,245,784 | ) | | | (98,647,848 | ) | | | (421,243,999 | ) | | | (308,286,367 | ) | |
FROM CAPITAL SHARE TRANSACTIONS: | |
Net proceeds from sale of shares | | | 64,775,614 | | | | 37,754,869 | | | | 107,592,876 | | | | 284,145,955 | | |
Reinvestment of distributions | | | 113,245,784 | | | | 98,647,848 | | | | 421,243,999 | | | | 308,286,367 | | |
| | | | 178,021,398 | | | | 136,402,717 | | | | 528,836,875 | | | | 592,432,322 | | |
Cost of shares redeemed | | | (114,398,729 | ) | | | (136,060,334 | ) | | | (595,638,461 | ) | | | (337,400,591 | ) | |
Net increase (decrease) in net assets resulting from capital
share transactions | | | 63,622,669 | | | | 342,383 | | | | (66,801,586 | ) | | | 255,031,731 | | |
Net increase (decrease) in net assets | | | 272,182,795 | | | | (123,334,028 | ) | | | (3,044,004 | ) | | | (68,682,349 | ) | |
NET ASSETS: | |
Beginning of year or period | | | 887,003,889 | | | | 1,010,337,917 | | | | 1,670,392,980 | | | | 1,739,075,329 | | |
End of year or period | | $ | 1,159,186,684 | | | $ | 887,003,889 | | | $ | 1,667,348,976 | | | $ | 1,670,392,980 | | |
See Accompanying Notes to Financial Statements
48
TABLE OF CONTENTS
Selected data for a share of beneficial interest outstanding throughout each year or period.
| | | | | Income (loss)
from investment
operations | | | | Less distributions | |
| | | Net asset value, beginning of year or period | | Net investment income (loss) | | Net realized and unrealized gain (loss) | | Total from investment operations | | From net investment income | | From net realized gains | | From return of capital | |
Year or period ended | | ($) | | ($) | | ($) | | ($) | | ($) | | ($) | | ($) | |
Voya Global Bond Portfolio | | | |
Class ADV | | | |
12-31-19 | | | 10.33 | | | | 0.27 | • | | | 0.48 | | | | 0.75 | | | | 0.44 | | | | — | | | | — | | |
12-31-18 | | | 10.94 | | | | 0.29 | • | | | (0.55 | ) | | | (0.26 | ) | | | 0.35 | | | | — | | | | — | | |
12-31-17 | | | 10.24 | | | | 0.26 | • | | | 0.66 | | | | 0.92 | | | | 0.22 | | | | — | | | | — | | |
12-31-16 | | | 9.81 | | | | 0.24 | • | | | 0.33 | | | | 0.57 | | | | 0.06 | | | | — | | | | 0.08 | | |
12-31-15 | | | 10.31 | | | | 0.26 | • | | | (0.76 | ) | | | (0.50 | ) | | | — | | | | — | | | | — | | |
Class I | | | |
12-31-19 | | | 10.51 | | | | 0.33 | • | | | 0.49 | | | | 0.82 | | | | 0.50 | | | | — | | | | — | | |
12-31-18 | | | 11.14 | | | | 0.35 | • | | | (0.57 | ) | | | (0.22 | ) | | | 0.41 | | | | — | | | | — | | |
12-31-17 | | | 10.42 | | | | 0.32 | • | | | 0.68 | | | | 1.00 | | | | 0.28 | | | | — | | | | — | | |
12-31-16 | | | 9.97 | | | | 0.30 | • | | | 0.33 | | | | 0.63 | | | | 0.10 | | | | — | | | | 0.08 | | |
12-31-15 | | | 10.42 | | | | 0.32 | • | | | (0.77 | ) | | | (0.45 | ) | | | — | | | | — | | | | — | | |
Class S | | | |
12-31-19 | | | 10.50 | | | | 0.31 | • | | | 0.48 | | | | 0.79 | | | | 0.47 | | | | — | | | | — | | |
12-31-18 | | | 11.12 | | | | 0.32 | • | | | (0.56 | ) | | | (0.24 | ) | | | 0.38 | | | | — | | | | — | | |
12-31-17 | | | 10.41 | | | | 0.30 | • | | | 0.66 | | | | 0.96 | | | | 0.25 | | | | — | | | | — | | |
12-31-16 | | | 9.97 | | | | 0.27 | | | | 0.33 | | | | 0.60 | | | | 0.08 | | | | — | | | | 0.08 | | |
12-31-15 | | | 10.44 | | | | 0.29 | • | | | (0.76 | ) | | | (0.47 | ) | | | — | | | | — | | | | — | | |
Voya International High Dividend Low Volatility Portfolio | | | |
Class ADV | | | |
12-31-19 | | | 10.88 | | | | 0.27 | • | | | 1.38 | | | | 1.65 | | | | 0.19 | | | | 0.98 | | | | — | | |
12-31-18 | | | 13.06 | | | | 0.16 | • | | | (2.13 | ) | | | (1.97 | ) | | | 0.21 | | | | — | | | | — | | |
12-31-17 | | | 10.90 | | | | 0.19 | | | | 2.16 | | | | 2.35 | | | | 0.19 | | | | — | | | | — | | |
12-31-16 | | | 11.08 | | | | 0.20 | • | | | (0.07 | ) | | | 0.13 | | | | 0.31 | | | | — | | | | — | | |
12-31-15 | | | 11.91 | | | | 0.21 | • | | | (0.63 | ) | | | (0.42 | ) | | | 0.41 | | | | — | | | | — | | |
Class I | | | |
12-31-19 | | | 11.00 | | | | 0.33 | • | | | 1.40 | | | | 1.73 | | | | 0.26 | | | | 0.98 | | | | — | | |
12-31-18 | | | 13.21 | | | | 0.23 | • | | | (2.17 | ) | | | (1.94 | ) | | | 0.27 | | | | — | | | | — | | |
12-31-17 | | | 11.01 | | | | 0.25 | • | | | 2.20 | | | | 2.45 | | | | 0.25 | | | | — | | | | — | | |
12-31-16 | | | 11.20 | | | | 0.25 | • | | | (0.06 | ) | | | 0.19 | | | | 0.38 | | | | — | | | | — | | |
12-31-15 | | | 12.04 | | | | 0.28 | • | | | (0.64 | ) | | | (0.36 | ) | | | 0.48 | | | | — | | | | — | | |
Class S | | | |
12-31-19 | | | 10.93 | | | | 0.30 | • | | | 1.38 | | | | 1.68 | | | | 0.22 | | | | 0.98 | | | | — | | |
12-31-18 | | | 13.12 | | | | 0.19 | • | | | (2.15 | ) | | | (1.96 | ) | | | 0.23 | | | | — | | | | — | | |
12-31-17 | | | 10.94 | | | | 0.22 | • | | | 2.18 | | | | 2.40 | | | | 0.22 | | | | — | | | | — | | |
12-31-16 | | | 11.12 | | | | 0.22 | • | | | (0.05 | ) | | | 0.17 | | | | 0.35 | | | | — | | | | — | | |
12-31-15 | | | 11.95 | | | | 0.25 | • | | | (0.64 | ) | | | (0.39 | ) | | | 0.44 | | | | — | | | | — | | |
Class S2 | | | |
12-31-19 | | | 10.99 | | | | 0.27 | • | | | 1.41 | | | | 1.68 | | | | 0.17 | | | | 0.98 | | | | — | | |
12-31-18 | | | 13.05 | | | | 0.18 | • | | | (2.16 | ) | | | (1.98 | ) | | | 0.08 | | | | — | | | | — | | |
12-31-17 | | | 10.86 | | | | 0.19 | • | | | 2.18 | | | | 2.37 | | | | 0.18 | | | | — | | | | — | | |
12-31-16 | | | 11.06 | | | | 0.22 | | | | (0.08 | ) | | | 0.14 | | | | 0.34 | | | | — | | | | — | | |
12-31-15 | | | 11.90 | | | | 0.23 | • | | | (0.63 | ) | | | (0.40 | ) | | | 0.44 | | | | — | | | | — | | |
| VY® American Century Small-Mid Cap Value Portfolio | | | |
Class ADV | | | |
12-31-19 | | | 9.64 | | | | 0.11 | | | | 2.66 | | | | 2.77 | | | | 0.12 | | | | 1.17 | | | | — | | |
12-31-18 | | | 12.66 | | | | 0.09 | | | | (1.67 | ) | | | (1.58 | ) | | | 0.10 | | | | 1.34 | | | | — | | |
12-31-17 | | | 12.03 | | | | 0.11 | | | | 1.16 | | | | 1.27 | | | | 0.12 | | | | 0.52 | | | | — | | |
12-31-16 | | | 10.80 | | | | 0.08 | | | | 2.34 | | | | 2.42 | | | | 0.14 | | | | 1.05 | | | | — | | |
12-31-15 | | | 13.82 | | | | 0.08 | | | | (0.27 | ) | | | (0.19 | ) | | | 0.19 | | | | 2.64 | | | | — | | |
| | | | | Ratios to average net assets | | Supplemental
data | |
| | | Total distributions | | Payment by affiliate | | Net asset value, end of year or period | | Total Return(1) | | Expenses before reductions/additions(2)(3)(4) | | Expenses net of fee waivers and/or recoupments if any(2)(3)(4) | | Expenses net of all reductions/additions(2)(3)(4) | | Net investment income (loss)(2)(3) | | Net assets, end of year or period | | Portfolio turnover rate | |
Year or period ended | | ($) | | ($) | | ($) | | (%) | | (%) | | (%) | | (%) | | (%) | | ($000's) | | (%) | |
Voya Global Bond Portfolio | |
Class ADV | |
12-31-19 | | | 0.44 | | | | — | | | | 10.64 | | | | 7.36 | | | | 1.16 | | | | 1.16 | | | | 1.16 | | | | 2.58 | | | | 21,661 | | | | 228 | | |
12-31-18 | | | 0.35 | | | | — | | | | 10.33 | | | | (2.40 | ) | | | 1.17 | | | | 1.15 | | | | 1.15 | | | | 2.71 | | | | 22,161 | | | | 119 | | |
12-31-17 | | | 0.22 | | | | — | | | | 10.94 | | | | 9.05 | | | | 1.17 | | | | 1.10 | | | | 1.10 | | | | 2.48 | | | | 24,922 | | | | 127 | | |
12-31-16 | | | 0.14 | | | | — | | | | 10.24 | | | | 5.82 | | | | 1.16 | | | | 1.10 | | | | 1.10 | | | | 2.27 | | | | 24,365 | | | | 214 | | |
12-31-15 | | | — | | | | — | | | | 9.81 | | | | (4.85 | ) | | | 1.15 | | | | 1.10 | | | | 1.10 | | | | 2.58 | | | | 26,374 | | | | 335 | | |
Class I | |
12-31-19 | | | 0.50 | | | | — | | | | 10.83 | | | | 7.90 | | | | 0.66 | | | | 0.66 | | | | 0.66 | | | | 3.08 | | | | 146,354 | | | | 228 | | |
12-31-18 | | | 0.41 | | | | — | | | | 10.51 | | | | (2.01 | ) | | | 0.67 | | | | 0.65 | | | | 0.65 | | | | 3.21 | | | | 146,473 | | | | 119 | | |
12-31-17 | | | 0.28 | | | | — | | | | 11.14 | | | | 9.67 | | | | 0.67 | | | | 0.60 | | | | 0.60 | | | | 2.98 | | | | 161,715 | | | | 127 | | |
12-31-16 | | | 0.18 | | | | — | | | | 10.42 | | | | 6.30 | | | | 0.66 | | | | 0.60 | | | | 0.60 | | | | 2.78 | | | | 163,397 | | | | 214 | | |
12-31-15 | | | — | | | | — | | | | 9.97 | | | | (4.32 | ) | | | 0.65 | | | | 0.60 | | | | 0.60 | | | | 3.08 | | | | 168,739 | | | | 335 | | |
Class S | |
12-31-19 | | | 0.47 | | | | — | | | | 10.82 | | | | 7.64 | | | | 0.91 | | | | 0.91 | | | | 0.91 | | | | 2.83 | | | | 33,323 | | | | 228 | | |
12-31-18 | | | 0.38 | | | | — | | | | 10.50 | | | | (2.17 | ) | | | 0.92 | | | | 0.90 | | | | 0.90 | | | | 2.97 | | | | 35,849 | | | | 119 | | |
12-31-17 | | | 0.25 | | | | — | | | | 11.12 | | | | 9.31 | | | | 0.92 | | | | 0.85 | | | | 0.85 | | | | 2.73 | | | | 41,785 | | | | 127 | | |
12-31-16 | | | 0.16 | | | | — | | | | 10.41 | | | | 6.03 | | | | 0.91 | | | | 0.85 | | | | 0.85 | | | | 2.53 | | | | 40,635 | | | | 214 | | |
12-31-15 | | | — | | | | — | | | | 9.97 | | | | (4.50 | ) | | | 0.90 | | | | 0.85 | | | | 0.85 | | | | 2.83 | | | | 43,169 | | | | 335 | | |
Voya International High Dividend Low Volatility Portfolio | |
Class ADV | |
12-31-19 | | | 1.17 | | | | — | | | | 11.36 | | | | 16.13 | | | | 1.30 | | | | 1.26 | | | | 1.25 | | | | 2.36 | | | | 29,900 | | | | 143 | | |
12-31-18 | | | 0.21 | | | | — | | | | 10.88 | | | | (15.32 | ) | | | 1.47 | | | | 1.40 | | | | 1.40 | | | | 1.26 | | | | 30,149 | | | | 16 | | |
12-31-17 | | | 0.19 | | | | — | | | | 13.06 | | | | 21.66 | (a) | | | 1.46 | | | | 1.40 | | | | 1.40 | | | | 1.50 | | | | 37,898 | | | | 14 | | |
12-31-16 | | | 0.31 | | | | — | | | | 10.90 | | | | 1.33 | | | | 1.46 | | | | 1.41 | | | | 1.41 | | | | 1.84 | | | | 31,937 | | | | 15 | | |
12-31-15 | | | 0.41 | | | | — | | | | 11.08 | | | | (3.83 | )(b) | | | 1.45 | | | | 1.43 | | | | 1.43 | | | | 1.76 | | | | 35,751 | | | | 10 | | |
Class I | |
12-31-19 | | | 1.24 | | | | — | | | | 11.49 | | | | 16.75 | | | | 0.80 | | | | 0.76 | | | | 0.75 | | | | 2.86 | | | | 139,862 | | | | 143 | | |
12-31-18 | | | 0.27 | | | | — | | | | 11.00 | | | | (14.95 | ) | | | 0.97 | | | | 0.90 | | | | 0.90 | | | | 1.77 | | | | 135,229 | | | | 16 | | |
12-31-17 | | | 0.25 | | | | — | | | | 13.21 | | | | 22.35 | (a) | | | 0.96 | | | | 0.90 | | | | 0.90 | | | | 2.00 | | | | 183,905 | | | | 14 | | |
12-31-16 | | | 0.38 | | | | — | | | | 11.01 | | | | 1.85 | | | | 0.96 | | | | 0.91 | | | | 0.91 | | | | 2.33 | | | | 170,231 | | | | 15 | | |
12-31-15 | | | 0.48 | | | | — | | | | 11.20 | | | | (3.34 | )(b) | | | 0.95 | | | | 0.93 | | | | 0.93 | | | | 2.29 | | | | 186,602 | | | | 10 | | |
Class S | |
12-31-19 | | | 1.20 | | | | — | | | | 11.41 | | | | 16.40 | | | | 1.05 | | | | 1.01 | | | | 1.00 | | | | 2.61 | | | | 308,132 | | | | 143 | | |
12-31-18 | | | 0.23 | | | | — | | | | 10.93 | | | | (15.15 | ) | | | 1.22 | | | | 1.15 | | | | 1.15 | | | | 1.52 | | | | 309,059 | | | | 16 | | |
12-31-17 | | | 0.22 | | | | — | | | | 13.12 | | | | 22.00 | (a) | | | 1.21 | | | | 1.15 | | | | 1.15 | | | | 1.76 | | | | 404,801 | | | | 14 | | |
12-31-16 | | | 0.35 | | | | — | | | | 10.94 | | | | 1.63 | | | | 1.21 | | | | 1.16 | | | | 1.16 | | | | 2.09 | | | | 423,390 | | | | 15 | | |
12-31-15 | | | 0.44 | | | | — | | | | 11.12 | | | | (3.57 | )(b) | | | 1.20 | | | | 1.18 | | | | 1.18 | | | | 2.03 | | | | 497,824 | | | | 10 | | |
Class S2 | |
12-31-19 | | | 1.15 | | | | — | | | | 11.52 | | | | 16.28 | | | | 1.20 | | | | 1.16 | | | | 1.15 | | | | 2.39 | | | | 389 | | | | 143 | | |
12-31-18 | | | 0.08 | | | | — | | | | 10.99 | | | | (15.26 | ) | | | 1.37 | | | | 1.30 | | | | 1.30 | | | | 1.41 | | | | 397 | | | | 16 | | |
12-31-17 | | | 0.18 | | | | — | | | | 13.05 | | | | 21.90 | (a) | | | 1.36 | | | | 1.30 | | | | 1.30 | | | | 1.57 | | | | 999 | | | | 14 | | |
12-31-16 | | | 0.34 | | | | — | | | | 10.86 | | | | 1.39 | | | | 1.39 | | | | 1.31 | | | | 1.31 | | | | 1.94 | | | | 2,321 | | | | 15 | | |
12-31-15 | | | 0.44 | | | | — | | | | 11.06 | | | | (3.72 | )(b) | | | 1.45 | | | | 1.33 | | | | 1.33 | | | | 1.88 | | | | 2,510 | | | | 10 | | |
| VY® American Century Small-Mid Cap Value Portfolio | |
Class ADV | |
12-31-19 | | | 1.29 | | | | — | | | | 11.12 | | | | 30.17 | | | | 1.66 | | | | 1.34 | | | | 1.34 | | | | 0.99 | | | | 108,460 | | | | 52 | | |
12-31-18 | | | 1.44 | | | | — | | | | 9.64 | | | | (14.49 | ) | | | 1.65 | | | | 1.36 | | | | 1.36 | | | | 0.77 | | | | 91,283 | | | | 76 | | |
12-31-17 | | | 0.64 | | | | — | | | | 12.66 | | | | 10.90 | | | | 1.65 | | | | 1.36 | | | | 1.36 | | | | 0.95 | | | | 115,235 | | | | 57 | | |
12-31-16 | | | 1.19 | | | | — | | | | 12.03 | | | | 23.69 | | | | 1.65 | | | | 1.36 | | | | 1.36 | | | | 0.78 | | | | 101,948 | | | | 68 | | |
12-31-15 | | | 2.83 | | | | — | | | | 10.80 | | | | (1.97 | ) | | | 1.66 | | | | 1.36 | | | | 1.36 | | | | 0.72 | | | | 79,901 | | | | 71 | | |
See Accompanying Notes to Financial Statements
49
TABLE OF CONTENTS
FINANCIAL HIGHLIGHTS (CONTINUED)
Selected data for a share of beneficial interest outstanding throughout each year or period.
| | | | | Income (loss)
from investment
operations | | | | Less distributions | |
| | | Net asset value, beginning of year or period | | Net investment income (loss) | | Net realized and unrealized gain (loss) | | Total from investment operations | | From net investment income | | From net realized gains | | From return of capital | |
Year or period ended | | ($) | | ($) | | ($) | | ($) | | ($) | | ($) | | ($) | |
| VY® American Century Small-Mid Cap Value Portfolio (continued) | | | |
Class I | | | |
12-31-19 | | | 10.30 | | | | 0.17 | | | | 2.87 | | | | 3.04 | | | | 0.18 | | | | 1.17 | | | | — | | |
12-31-18 | | | 13.44 | | | | 0.17 | • | | | (1.81 | ) | | | (1.64 | ) | | | 0.16 | | | | 1.34 | | | | — | | |
12-31-17 | | | 12.72 | | | | 0.19 | • | | | 1.22 | | | | 1.41 | | | | 0.17 | | | | 0.52 | | | | — | | |
12-31-16 | | | 11.35 | | | | 0.15 | • | | | 2.47 | | | | 2.62 | | | | 0.20 | | | | 1.05 | | | | — | | |
12-31-15 | | | 14.40 | | | | 0.16 | • | | | (0.31 | ) | | | (0.15 | ) | | | 0.26 | | | | 2.64 | | | | — | | |
Class S | | | |
12-31-19 | | | 10.14 | | | | 0.15 | | | | 2.81 | | | | 2.96 | | | | 0.14 | | | | 1.17 | | | | — | | |
12-31-18 | | | 13.25 | | | | 0.13 | • | | | (1.77 | ) | | | (1.64 | ) | | | 0.13 | | | | 1.34 | | | | — | | |
12-31-17 | | | 12.56 | | | | 0.16 | | | | 1.19 | | | | 1.35 | | | | 0.14 | | | | 0.52 | | | | — | | |
12-31-16 | | | 11.22 | | | | 0.11 | | | | 2.44 | | | | 2.55 | | | | 0.16 | | | | 1.05 | | | | — | | |
12-31-15 | | | 14.25 | | | | 0.13 | • | | | (0.30 | ) | | | (0.17 | ) | | | 0.22 | | | | 2.64 | | | | — | | |
Class S2 | | | |
12-31-19 | | | 9.62 | | | | 0.12 | • | | | 2.67 | | | | 2.79 | | | | 0.12 | | | | 1.17 | | | | — | | |
12-31-18 | | | 12.64 | | | | 0.10 | • | | | (1.67 | ) | | | (1.57 | ) | | | 0.11 | | | | 1.34 | | | | — | | |
12-31-17 | | | 12.01 | | | | 0.12 | • | | | 1.15 | | | | 1.27 | | | | 0.12 | | | | 0.52 | | | | — | | |
12-31-16 | | | 10.78 | | | | 0.09 | | | | 2.35 | | | | 2.44 | | | | 0.16 | | | | 1.05 | | | | — | | |
12-31-15 | | | 13.79 | | | | 0.11 | • | | | (0.30 | ) | | | (0.19 | ) | | | 0.18 | | | | 2.64 | | | | — | | |
VY® Baron Growth Portfolio | | | |
Class ADV | | | |
12-31-19 | | | 24.63 | | | | (0.07 | ) | | | 9.03 | | | | 8.96 | | | | — | | | | 13.89 | | | | 0.15 | | |
12-31-18 | | | 27.88 | | | | (0.09 | ) | | | 0.00 | * | | | (0.09 | ) | | | — | | | | 3.16 | | | | — | | |
12-31-17 | | | 24.82 | | | | (0.10 | )• | | | 6.72 | | | | 6.62 | | | | 0.16 | | | | 3.40 | | | | — | | |
12-31-16 | | | 26.58 | | | | (0.11 | ) | | | 1.50 | | | | 1.39 | | | | — | | | | 3.15 | | | | — | | |
12-31-15 | | | 30.35 | | | | (0.16 | ) | | | (1.23 | ) | | | (1.39 | ) | | | 0.02 | | | | 2.36 | | | | — | | |
Class I | | | |
12-31-19 | | | 27.41 | | | | 0.01 | | | | 10.20 | | | | 10.21 | | | | — | | | | 13.89 | | | | 0.15 | | |
12-31-18 | | | 30.58 | | | | 0.05 | | | | (0.06 | ) | | | (0.01 | ) | | | — | | | | 3.16 | | | | — | | |
12-31-17 | | | 26.92 | | | | 0.03 | • | | | 7.34 | | | | 7.37 | | | | 0.31 | | | | 3.40 | | | | — | | |
12-31-16 | | | 28.45 | | | | 0.04 | | | | 1.58 | | | | 1.62 | | | | — | | | | 3.15 | | | | — | | |
12-31-15 | | | 32.31 | | | | (0.01 | ) | | | (1.31 | ) | | | (1.32 | ) | | | 0.18 | | | | 2.36 | | | | — | | |
Class R6 | | | |
12-31-19 | | | 27.43 | | | | 0.04 | | | | 10.17 | | | | 10.21 | | | | — | | | | 13.89 | | | | 0.15 | | |
12-31-18 | | | 30.59 | | | | 0.06 | | | | (0.06 | ) | | | 0.00 | * | | | — | | | | 3.16 | | | | — | | |
12-31-17 | | | 26.93 | | | | 0.13 | • | | | 7.24 | | | | 7.37 | | | | 0.31 | | | | 3.40 | | | | — | | |
| 05-03-16(5)-12-31-16 | | | 28.86 | | | | 0.23 | • | | | 0.99 | | | | 1.22 | | | | — | | | | 3.15 | | | | — | | |
Class S | | | |
12-31-19 | | | 26.10 | | | | (0.03 | )• | | | 9.62 | | | | 9.59 | | | | — | | | | 13.89 | | | | 0.15 | | |
12-31-18 | | | 29.31 | | | | (0.02 | ) | | | (0.03 | ) | | | (0.05 | ) | | | — | | | | 3.16 | | | | — | | |
12-31-17 | | | 25.93 | | | | (0.04 | )• | | | 7.05 | | | | 7.01 | | | | 0.23 | | | | 3.40 | | | | — | | |
12-31-16 | | | 27.57 | | | | (0.05 | ) | | | 1.56 | | | | 1.51 | | | | — | | | | 3.15 | | | | — | | |
12-31-15 | | | 31.39 | | | | (0.08 | ) | | | (1.29 | ) | | | (1.37 | ) | | | 0.09 | | | | 2.36 | | | | — | | |
Class S2 | | | |
12-31-19 | | | 24.87 | | | | (0.45 | )• | | | 9.53 | | | | 9.08 | | | | — | | | | 13.89 | | | | 0.15 | | |
12-31-18 | | | 28.10 | | | | (0.08 | ) | | | 0.01 | | | | (0.07 | ) | | | — | | | | 3.16 | | | | — | | |
12-31-17 | | | 24.92 | | | | (0.09 | )• | | | 6.78 | | | | 6.69 | | | | 0.11 | | | | 3.40 | | | | — | | |
12-31-16 | | | 26.65 | | | | (0.10 | )• | | | 1.52 | | | | 1.42 | | | | — | | | | 3.15 | | | | — | | |
12-31-15 | | | 30.43 | | | | (0.13 | ) | | | (1.24 | ) | | | (1.37 | ) | | | 0.05 | | | | 2.36 | | | | — | | |
| | | | | Ratios to average net assets | | Supplemental
data | |
| | | Total distributions | | Payment by affiliate | | Net asset value, end of year or period | | Total Return(1) | | Expenses before reductions/additions(2)(3)(4) | | Expenses net of fee waivers and/or recoupments if any(2)(3)(4) | | Expenses net of all reductions/additions(2)(3)(4) | | Net investment income (loss)(2)(3) | | Net assets, end of year or period | | Portfolio turnover rate | |
Year or period ended | | ($) | | ($) | | ($) | | (%) | | (%) | | (%) | | (%) | | (%) | | ($000's) | | (%) | |
| VY® American Century Small-Mid Cap Value Portfolio (continued) | |
Class I | |
12-31-19 | | | 1.35 | | | | — | | | | 11.99 | | | | 30.96 | | | | 1.16 | | | | 0.84 | | | | 0.84 | | | | 1.49 | | | | 175,917 | | | | 52 | | |
12-31-18 | | | 1.50 | | | | — | | | | 10.30 | | | | (14.15 | ) | | | 1.15 | | | | 0.86 | | | | 0.86 | | | | 1.30 | | | | 142,379 | | | | 76 | | |
12-31-17 | | | 0.69 | | | | — | | | | 13.44 | | | | 11.44 | | | | 1.15 | | | | 0.86 | | | | 0.86 | | | | 1.44 | | | | 151,054 | | | | 57 | | |
12-31-16 | | | 1.25 | | | | — | | | | 12.72 | | | | 24.38 | | | | 1.15 | | | | 0.86 | | | | 0.86 | | | | 1.28 | | | | 156,657 | | | | 68 | | |
12-31-15 | | | 2.90 | | | | — | | | | 11.35 | | | | (1.54 | ) | | | 1.16 | | | | 0.86 | | | | 0.86 | | | | 1.21 | | | | 115,279 | | | | 71 | | |
Class S | |
12-31-19 | | | 1.31 | | | | — | | | | 11.79 | | | | 30.67 | | | | 1.41 | | | | 1.09 | | | | 1.09 | | | | 1.24 | | | | 93,230 | | | | 52 | | |
12-31-18 | | | 1.47 | | | | — | | | | 10.14 | | | | (14.34 | ) | | | 1.40 | | | | 1.11 | | | | 1.11 | | | | 1.02 | | | | 79,986 | | | | 76 | | |
12-31-17 | | | 0.66 | | | | — | | | | 13.25 | | | | 11.12 | | | | 1.40 | | | | 1.11 | | | | 1.11 | | | | 1.20 | | | | 106,501 | | | | 57 | | |
12-31-16 | | | 1.21 | | | | — | | | | 12.56 | | | | 24.06 | | | | 1.40 | | | | 1.11 | | | | 1.11 | | | | 1.03 | | | | 99,089 | | | | 68 | | |
12-31-15 | | | 2.86 | | | | — | | | | 11.22 | | | | (1.74 | ) | | | 1.41 | | | | 1.11 | | | | 1.11 | | | | 0.96 | | | | 78,646 | | | | 71 | | |
Class S2 | |
12-31-19 | | | 1.29 | | | | — | | | | 11.12 | | | | 30.42 | | | | 1.56 | | | | 1.24 | | | | 1.24 | | | | 1.07 | | | | 3,271 | | | | 52 | | |
12-31-18 | | | 1.45 | | | | — | | | | 9.62 | | | | (14.48 | ) | | | 1.55 | | | | 1.26 | | | | 1.26 | | | | 0.84 | | | | 2,891 | | | | 76 | | |
12-31-17 | | | 0.64 | | | | — | | | | 12.64 | | | | 10.96 | | | | 1.55 | | | | 1.26 | | | | 1.26 | | | | 1.01 | | | | 4,627 | | | | 57 | | |
12-31-16 | | | 1.21 | | | | — | | | | 12.01 | | | | 23.92 | | | | 1.58 | | | | 1.26 | | | | 1.26 | | | | 0.90 | | | | 4,881 | | | | 68 | | |
12-31-15 | | | 2.82 | | | | — | | | | 10.78 | | | | (1.91 | ) | | | 1.66 | | | | 1.26 | | | | 1.26 | | | | 0.85 | | | | 3,573 | | | | 71 | | |
VY® Baron Growth Portfolio | |
Class ADV | |
12-31-19 | | | 14.04 | | | | — | | | | 19.55 | | | | 38.24 | | | | 1.49 | | | | 1.49 | | | | 1.49 | | | | (0.40 | ) | | | 105,271 | | | | 23 | | |
12-31-18 | | | 3.16 | | | | — | | | | 24.63 | | | | (2.15 | ) | | | 1.49 | | | | 1.49 | | | | 1.49 | | | | (0.32 | ) | | | 82,126 | | | | 4 | | |
12-31-17 | | | 3.56 | | | | — | | | | 27.88 | | | | 27.86 | | | | 1.49 | | | | 1.49 | | | | 1.49 | | | | (0.38 | ) | | | 88,499 | | | | 3 | | |
12-31-16 | | | 3.15 | | | | — | | | | 24.82 | | | | 5.06 | | | | 1.48 | | | | 1.48 | | | | 1.48 | | | | (0.41 | ) | | | 77,655 | | | | 4 | | |
12-31-15 | | | 2.38 | | | | — | | | | 26.58 | | | | (5.27 | ) | | | 1.49 | | | | 1.49 | | | | 1.49 | | | | (0.54 | ) | | | 90,914 | | | | 5 | | |
Class I | |
12-31-19 | | | 14.04 | | | | — | | | | 23.58 | | | | 38.97 | | | | 0.99 | | | | 0.99 | | | | 0.99 | | | | 0.04 | | | | 147,370 | | | | 23 | | |
12-31-18 | | | 3.16 | | | | — | | | | 27.41 | | | | (1.68 | ) | | | 0.99 | | | | 0.99 | | | | 0.99 | | | | 0.17 | | | | 118,743 | | | | 4 | | |
12-31-17 | | | 3.71 | | | | — | | | | 30.58 | | | | 28.52 | | | | 0.99 | | | | 0.99 | | | | 0.99 | | | | 0.11 | | | | 145,389 | | | | 3 | | |
12-31-16 | | | 3.15 | | | | — | | | | 26.92 | | | | 5.57 | | | | 0.98 | | | | 0.98 | | | | 0.98 | | | | 0.12 | | | | 150,672 | | | | 4 | | |
12-31-15 | | | 2.54 | | | | — | | | | 28.45 | | | | (4.75 | ) | | | 0.99 | | | | 0.99 | | | | 0.99 | | | | (0.04 | ) | | | 193,601 | | | | 5 | | |
Class R6 | |
12-31-19 | | | 14.04 | | | | — | | | | 23.60 | | | | 38.94 | | | | 0.99 | | | | 0.99 | | | | 0.99 | | | | 0.20 | | | | 33,764 | | | | 23 | | |
12-31-18 | | | 3.16 | | | | — | | | | 27.43 | | | | (1.64 | ) | | | 0.99 | | | | 0.99 | | | | 0.99 | | | | 0.23 | | | | 15,007 | | | | 4 | | |
12-31-17 | | | 3.71 | | | | — | | | | 30.59 | | | | 28.51 | | | | 0.99 | | | | 0.99 | | | | 0.99 | | | | 0.43 | | | | 11,442 | | | | 3 | | |
| 05-03-16(5)-12-31-16 | | | 3.15 | | | | — | | | | 26.93 | | | | 4.10 | | | | 0.98 | | | | 0.98 | | | | 0.98 | | | | 1.39 | | | | 879 | | | | 4 | | |
Class S | |
12-31-19 | | | 14.04 | | | | — | | | | 21.65 | | | | 38.52 | | | | 1.24 | | | | 1.24 | | | | 1.24 | | | | (0.10 | ) | | | 228,141 | | | | 23 | | |
12-31-18 | | | 3.16 | | | | — | | | | 26.10 | | | | (1.89 | ) | | | 1.24 | | | | 1.24 | | | | 1.24 | | | | (0.08 | ) | | | 451,687 | | | | 4 | | |
12-31-17 | | | 3.63 | | | | — | | | | 29.31 | | | | 28.20 | | | | 1.24 | | | | 1.24 | | | | 1.24 | | | | (0.13 | ) | | | 512,397 | | | | 3 | | |
12-31-16 | | | 3.15 | | | | — | | | | 25.93 | | | | 5.33 | | | | 1.23 | | | | 1.23 | | | | 1.23 | | | | (0.17 | ) | | | 478,020 | | | | 4 | | |
12-31-15 | | | 2.45 | | | | — | | | | 27.57 | | | | (5.03 | ) | | | 1.24 | | | | 1.24 | | | | 1.24 | | | | (0.29 | ) | | | 559,237 | | | | 5 | | |
Class S2 | |
12-31-19 | | | 14.04 | | | | — | | | | 19.91 | | | | 38.37 | | | | 1.39 | | | | 1.39 | | | | 1.39 | | | | (1.58 | ) | | | 2,373 | | | | 23 | | |
12-31-18 | | | 3.16 | | | | — | | | | 24.87 | | | | (2.05 | ) | | | 1.39 | | | | 1.39 | | | | 1.39 | | | | (0.25 | ) | | | 1,625 | | | | 4 | | |
12-31-17 | | | 3.51 | | | | — | | | | 28.10 | | | | 28.02 | | | | 1.39 | | | | 1.39 | | | | 1.39 | | | | (0.32 | ) | | | 1,835 | | | | 3 | | |
12-31-16 | | | 3.15 | | | | — | | | | 24.92 | | | | 5.17 | | | | 1.42 | | | | 1.38 | | | | 1.38 | | | | (0.38 | ) | | | 2,609 | | | | 4 | | |
12-31-15 | | | 2.41 | | | | — | | | | 26.65 | | | | (5.17 | ) | | | 1.49 | | | | 1.39 | | | | 1.39 | | | | (0.44 | ) | | | 5,696 | | | | 5 | | |
See Accompanying Notes to Financial Statements
50
TABLE OF CONTENTS
FINANCIAL HIGHLIGHTS (CONTINUED)
Selected data for a share of beneficial interest outstanding throughout each year or period.
| | | | | Income (loss)
from investment
operations | | | | Less distributions | |
| | | Net asset value, beginning of year or period | | Net investment income (loss) | | Net realized and unrealized gain (loss) | | Total from investment operations | | From net investment income | | From net realized gains | | From return of capital | |
Year or period ended | | ($) | | ($) | | ($) | | ($) | | ($) | | ($) | | ($) | |
| VY® Columbia Contrarian Core Portfolio | | | |
Class ADV | | | |
12-31-19 | | | 18.94 | | | | 0.13 | • | | | 5.51 | | | | 5.64 | | | | 0.29 | | | | 7.91 | | | | — | | |
12-31-18 | | | 23.40 | | | | 0.14 | • | | | (1.97 | ) | | | (1.83 | ) | | | 0.15 | | | | 2.48 | | | | — | | |
12-31-17 | | | 20.66 | | | | 0.13 | | | | 4.17 | | | | 4.30 | | | | 0.20 | | | | 1.36 | | | | — | | |
12-31-16 | | | 21.73 | | | | 0.15 | • | | | 1.55 | | | | 1.70 | | | | 0.74 | | | | 2.03 | | | | — | | |
12-31-15 | | | 24.00 | | | | 0.12 | • | | | 0.58 | | | | 0.70 | | | | 0.18 | | | | 2.79 | | | | — | | |
Class I | | | |
12-31-19 | | | 20.01 | | | | 0.25 | • | | | 5.84 | | | | 6.09 | | | | 0.52 | | | | 7.91 | | | | — | | |
12-31-18 | | | 24.58 | | | | 0.26 | • | | | (2.07 | ) | | | (1.81 | ) | | | 0.28 | | | | 2.48 | | | | — | | |
12-31-17 | | | 21.61 | | | | 0.25 | • | | | 4.37 | | | | 4.62 | | | | 0.29 | | | | 1.36 | | | | — | | |
12-31-16 | | | 22.59 | | | | 0.27 | • | | | 1.62 | | | | 1.89 | | | | 0.84 | | | | 2.03 | | | | — | | |
12-31-15 | | | 24.82 | | | | 0.24 | • | | | 0.60 | | | | 0.84 | | | | 0.28 | | | | 2.79 | | | | — | | |
Class S | | | |
12-31-19 | | | 19.56 | | | | 0.20 | • | | | 5.73 | | | | 5.93 | | | | 0.40 | | | | 7.91 | | | | — | | |
12-31-18 | | | 24.08 | | | | 0.20 | • | | | (2.03 | ) | | | (1.83 | ) | | | 0.21 | | | | 2.48 | | | | — | | |
12-31-17 | | | 21.21 | | | | 0.19 | • | | | 4.27 | | | | 4.46 | | | | 0.23 | | | | 1.36 | | | | — | | |
12-31-16 | | | 22.21 | | | | 0.21 | • | | | 1.59 | | | | 1.80 | | | | 0.77 | | | | 2.03 | | | | — | | |
12-31-15 | | | 24.45 | | | | 0.18 | • | | | 0.58 | | | | 0.76 | | | | 0.21 | | | | 2.79 | | | | — | | |
| VY® Columbia Small Cap Value II Portfolio | | | |
Class ADV | | | |
12-31-19 | | | 14.42 | | | | 0.05 | | | | 2.67 | | | | 2.72 | | | | 0.01 | | | | 2.07 | | | | — | | |
12-31-18 | | | 19.57 | | | | 0.00 | * | | | (3.06 | ) | | | (3.06 | ) | | | 0.00 | * | | | 2.09 | | | | — | | |
12-31-17 | | | 18.50 | | | | 0.00 | *• | | | 1.89 | | | | 1.89 | | | | 0.03 | | | | 0.79 | | | | — | | |
12-31-16 | | | 15.67 | | | | 0.01 | | | | 3.55 | | | | 3.56 | | | | 0.01 | | | | 0.72 | | | | — | | |
12-31-15 | | | 16.23 | | | | 0.00 | * | | | (0.52 | ) | | | (0.52 | ) | | | 0.04 | | | | — | | | | — | | |
Class I | | | |
12-31-19 | | | 14.94 | | | | 0.13 | | | | 2.76 | | | | 2.89 | | | | 0.11 | | | | 2.07 | | | | — | | |
12-31-18 | | | 20.20 | | | | 0.10 | • | | | (3.16 | ) | | | (3.06 | ) | | | 0.11 | | | | 2.09 | | | | — | | |
12-31-17 | | | 19.05 | | | | 0.10 | • | | | 1.95 | | | | 2.05 | | | | 0.11 | | | | 0.79 | | | | — | | |
12-31-16 | | | 16.12 | | | | 0.10 | | | | 3.64 | | | | 3.74 | | | | 0.09 | | | | 0.72 | | | | — | | |
12-31-15 | | | 16.67 | | | | 0.09 | | | | (0.54 | ) | | | (0.45 | ) | | | 0.10 | | | | — | | | | — | | |
Class R6 | | | |
12-31-19 | | | 14.94 | | | | 0.12 | | | | 2.78 | | | | 2.90 | | | | 0.11 | | | | 2.07 | | | | — | | |
12-31-18 | | | 20.21 | | | | 0.09 | | | | (3.16 | ) | | | (3.07 | ) | | | 0.11 | | | | 2.09 | | | | — | | |
12-31-17 | | | 19.06 | | | | 0.13 | • | | | 1.92 | | | | 2.05 | | | | 0.11 | | | | 0.79 | | | | — | | |
| 05-03-16(5)-12-31-16 | | | 16.28 | | | | 0.19 | • | | | 3.40 | | | | 3.59 | | | | 0.09 | | | | 0.72 | | | | — | | |
Class S | | | |
12-31-19 | | | 14.86 | | | | 0.09 | | | | 2.76 | | | | 2.85 | | | | 0.06 | | | | 2.07 | | | | — | | |
12-31-18 | | | 20.10 | | | | 0.05 | | | | (3.15 | ) | | | (3.10 | ) | | | 0.05 | | | | 2.09 | | | | — | | |
12-31-17 | | | 18.96 | | | | 0.05 | • | | | 1.94 | | | | 1.99 | | | | 0.06 | | | | 0.79 | | | | — | | |
12-31-16 | | | 16.04 | | | | 0.06 | | | | 3.63 | | | | 3.69 | | | | 0.05 | | | | 0.72 | | | | — | | |
12-31-15 | | | 16.58 | | | | 0.05 | | | | (0.54 | ) | | | (0.49 | ) | | | 0.05 | | | | — | | | | — | | |
Class S2 | | | |
12-31-19 | | | 14.40 | | | | 0.05 | • | | | 2.67 | | | | 2.72 | | | | 0.03 | | | | 2.07 | | | | — | | |
12-31-18 | | | 19.52 | | | | 0.02 | | | | (3.05 | ) | | | (3.03 | ) | | | — | | | | 2.09 | | | | — | | |
12-31-17 | | | 18.44 | | | | 0.01 | • | | | 1.90 | | | | 1.91 | | | | 0.04 | | | | 0.79 | | | | — | | |
12-31-16 | | | 15.62 | | | | 0.03 | | | | 3.54 | | | | 3.57 | | | | 0.03 | | | | 0.72 | | | | — | | |
12-31-15 | | | 16.20 | | | | 0.02 | • | | | (0.53 | ) | | | (0.51 | ) | | | 0.07 | | | | — | | | | — | | |
| | | | | Ratios to average net assets | | Supplemental
data | |
| | | Total distributions | | Payment by affiliate | | Net asset value, end of year or period | | Total Return(1) | | Expenses before reductions/additions(2)(3)(4) | | Expenses net of fee waivers and/or recoupments if any(2)(3)(4) | | Expenses net of all reductions/additions(2)(3)(4) | | Net investment income (loss)(2)(3) | | Net assets, end of year or period | | Portfolio turnover rate | |
Year or period ended | | ($) | | ($) | | ($) | | (%) | | (%) | | (%) | | (%) | | (%) | | ($000's) | | (%) | |
| VY® Columbia Contrarian Core Portfolio | |
Class ADV | |
12-31-19 | | | 8.20 | | | | — | | | | 16.38 | | | | 32.41 | | | | 1.46 | | | | 1.23 | | | | 1.23 | | | | 0.64 | | | | 23,961 | | | | 45 | | |
12-31-18 | | | 2.63 | | | | — | | | | 18.94 | | | | (9.23 | ) | | | 1.44 | | | | 1.22 | | | | 1.21 | | | | 0.61 | | | | 21,088 | | | | 64 | | |
12-31-17 | | | 1.56 | | | | — | | | | 23.40 | | | | 21.32 | | | | 1.44 | | | | 1.21 | | | | 1.20 | | | | 0.58 | | | | 29,515 | | | | 45 | | |
12-31-16 | | | 2.77 | | | | — | | | | 20.66 | | | | 8.12 | | | | 1.44 | | | | 1.20 | | | | 1.19 | | | | 0.71 | | | | 25,432 | | | | 53 | | |
12-31-15 | | | 2.97 | | | | — | | | | 21.73 | | | | 2.75 | | | | 1.44 | | | | 1.18 | | | | 1.17 | | | | 0.51 | | | | 22,738 | | | | 65 | | |
Class I | |
12-31-19 | | | 8.43 | | | | — | | | | 17.67 | | | | 33.05 | | | | 0.96 | | | | 0.73 | | | | 0.73 | | | | 1.14 | | | | 8,548 | | | | 45 | | |
12-31-18 | | | 2.76 | | | | — | | | | 20.01 | | | | (8.77 | ) | | | 0.94 | | | | 0.72 | | | | 0.71 | | | | 1.11 | | | | 7,982 | | | | 64 | | |
12-31-17 | | | 1.65 | | | | — | | | | 24.58 | | | | 21.96 | | | | 0.94 | | | | 0.71 | | | | 0.70 | | | | 1.08 | | | | 10,099 | | | | 45 | | |
12-31-16 | | | 2.87 | | | | — | | | | 21.61 | | | | 8.64 | | | | 0.94 | | | | 0.70 | | | | 0.69 | | | | 1.21 | | | | 10,629 | | | | 53 | | |
12-31-15 | | | 3.07 | | | | — | | | | 22.59 | | | | 3.25 | | | | 0.94 | | | | 0.68 | | | | 0.67 | | | | 1.01 | | | | 10,628 | | | | 65 | | |
Class S | |
12-31-19 | | | 8.31 | | | | — | | | | 17.18 | | | | 33.06 | | | | 1.19 | | | | 0.96 | | | | 0.96 | | | | 0.92 | | | | 18,274 | | | | 45 | | |
12-31-18 | | | 2.69 | | | | — | | | | 19.56 | | | | (8.99 | ) | | | 1.19 | | | | 0.97 | | | | 0.96 | | | | 0.86 | | | | 222,203 | | | | 64 | | |
12-31-17 | | | 1.59 | | | | — | | | | 24.08 | | | | 21.58 | | | | 1.19 | | | | 0.96 | | | | 0.95 | | | | 0.83 | | | | 285,025 | | | | 45 | | |
12-31-16 | | | 2.80 | | | | — | | | | 21.21 | | | | 8.41 | | | | 1.19 | | | | 0.95 | | | | 0.94 | | | | 0.96 | | | | 289,864 | | | | 53 | | |
12-31-15 | | | 3.00 | | | | — | | | | 22.21 | | | | 2.98 | | | | 1.19 | | | | 0.93 | | | | 0.92 | | | | 0.76 | | | | 304,352 | | | | 65 | | |
| VY® Columbia Small Cap Value II Portfolio | |
Class ADV | |
12-31-19 | | | 2.08 | | | | — | | | | 15.06 | | | | 19.88 | | | | 1.41 | | | | 1.38 | | | | 1.37 | | | | 0.27 | | | | 25,615 | | | | 25 | | |
12-31-18 | | | 2.09 | | | | — | | | | 14.42 | | | | (17.96 | ) | | | 1.40 | | | | 1.37 | | | | 1.36 | | | | 0.02 | | | | 27,725 | | | | 41 | | |
12-31-17 | | | 0.82 | | | | — | | | | 19.57 | | | | 10.65 | | | | 1.40 | | | | 1.37 | | | | 1.36 | | | | 0.01 | | | | 37,004 | | | | 44 | | |
12-31-16 | | | 0.73 | | | | — | | | | 18.50 | | | | 23.41 | | | | 1.39 | | | | 1.36 | | | | 1.34 | | | | 0.10 | | | | 36,304 | | | | 61 | | |
12-31-15 | | | 0.04 | | | | — | | | | 15.67 | | | | (3.21 | ) | | | 1.39 | | | | 1.36 | | | | 1.35 | | | | 0.00 | * | | | 27,978 | | | | 53 | | |
Class I | |
12-31-19 | | | 2.18 | | | | — | | | | 15.65 | | | | 20.42 | | | | 0.91 | | | | 0.88 | | | | 0.87 | | | | 0.79 | | | | 36,201 | | | | 25 | | |
12-31-18 | | | 2.20 | | | | — | | | | 14.94 | | | | (17.53 | ) | | | 0.90 | | | | 0.87 | | | | 0.86 | | | | 0.53 | | | | 33,887 | | | | 41 | | |
12-31-17 | | | 0.90 | | | | — | | | | 20.20 | | | | 11.21 | | | | 0.90 | | | | 0.87 | | | | 0.86 | | | | 0.50 | | | | 43,897 | | | | 44 | | |
12-31-16 | | | 0.81 | | | | — | | | | 19.05 | | | | 24.00 | | | | 0.89 | | | | 0.86 | | | | 0.84 | | | | 0.59 | | | | 49,625 | | | | 61 | | |
12-31-15 | | | 0.10 | | | | — | | | | 16.12 | | | | (2.74 | ) | | | 0.89 | | | | 0.86 | | | | 0.85 | | | | 0.50 | | | | 42,845 | | | | 53 | | |
Class R6 | |
12-31-19 | | | 2.18 | | | | — | | | | 15.66 | | | | 20.48 | | | | 0.91 | | | | 0.88 | | | | 0.87 | | | | 0.81 | | | | 6,701 | | | | 25 | | |
12-31-18 | | | 2.20 | | | | — | | | | 14.94 | | | | (17.57 | ) | | | 0.90 | | | | 0.87 | | | | 0.86 | | | | 0.56 | | | | 5,349 | | | | 41 | | |
12-31-17 | | | 0.90 | | | | — | | | | 20.21 | | | | 11.20 | | | | 0.90 | | | | 0.87 | | | | 0.86 | | | | 0.69 | | | | 4,389 | | | | 44 | | |
| 05-03-16(5)-12-31-16 | | | 0.81 | | | | — | | | | 19.06 | | | | 22.85 | | | | 0.89 | | | | 0.86 | | | | 0.84 | | | | 1.57 | | | | 402 | | | | 61 | | |
Class S | |
12-31-19 | | | 2.13 | | | | — | | | | 15.58 | | | | 20.21 | | | | 1.16 | | | | 1.13 | | | | 1.12 | | | | 0.53 | | | | 89,702 | | | | 25 | | |
12-31-18 | | | 2.14 | | | | — | | | | 14.86 | | | | (17.76 | ) | | | 1.15 | | | | 1.12 | | | | 1.11 | | | | 0.26 | | | | 89,274 | | | | 41 | | |
12-31-17 | | | 0.85 | | | | — | | | | 20.10 | | | | 10.92 | | | | 1.15 | | | | 1.12 | | | | 1.11 | | | | 0.25 | | | | 124,984 | | | | 44 | | |
12-31-16 | | | 0.77 | | | | — | | | | 18.96 | | | | 23.70 | | | | 1.14 | | | | 1.11 | | | | 1.09 | | | | 0.33 | | | | 145,816 | | | | 61 | | |
12-31-15 | | | 0.05 | | | | — | | | | 16.04 | | | | (2.95 | ) | | | 1.14 | | | | 1.11 | | | | 1.10 | | | | 0.24 | | | | 135,313 | | | | 53 | | |
Class S2 | |
12-31-19 | | | 2.10 | | | | — | | | | 15.02 | | | | 19.95 | | | | 1.31 | | | | 1.28 | | | | 1.27 | | | | 0.34 | | | | 1,671 | | | | 25 | | |
12-31-18 | | | 2.09 | | | | — | | | | 14.40 | | | | (17.87 | ) | | | 1.30 | | | | 1.27 | | | | 1.26 | | | | 0.11 | | | | 2,431 | | | | 41 | | |
12-31-17 | | | 0.83 | | | | — | | | | 19.52 | | | | 10.77 | | | | 1.30 | | | | 1.27 | | | | 1.26 | | | | 0.06 | | | | 3,431 | | | | 44 | | |
12-31-16 | | | 0.75 | | | | — | | | | 18.44 | | | | 23.57 | | | | 1.32 | | | | 1.26 | | | | 1.24 | | | | 0.18 | | | | 5,849 | | | | 61 | | |
12-31-15 | | | 0.07 | | | | — | | | | 15.62 | | | | (3.19 | ) | | | 1.39 | | | | 1.26 | | | | 1.25 | | | | 0.12 | | | | 4,834 | | | | 53 | | |
See Accompanying Notes to Financial Statements
51
TABLE OF CONTENTS
FINANCIAL HIGHLIGHTS (CONTINUED)
Selected data for a share of beneficial interest outstanding throughout each year or period.
| | | | | Income (loss)
from investment
operations | | | | Less distributions | |
| | | Net asset value, beginning of year or period | | Net investment income (loss) | | Net realized and unrealized gain (loss) | | Total from investment operations | | From net investment income | | From net realized gains | | From return of capital | |
Year or period ended | | ($) | | ($) | | ($) | | ($) | | ($) | | ($) | | ($) | |
| VY® Invesco Comstock Portfolio | | | |
Class ADV | | | |
12-31-19 | | | 17.39 | | | | 0.30 | • | | | 3.74 | | | | 4.04 | | | | 0.41 | | | | 4.01 | | | | — | | |
12-31-18 | | | 20.14 | | | | 0.24 | • | | | (2.77 | ) | | | (2.53 | ) | | | 0.22 | | | | — | | | | — | | |
12-31-17 | | | 17.33 | | | | 0.19 | | | | 2.80 | | | | 2.99 | | | | 0.18 | | | | — | | | | — | | |
12-31-16 | | | 15.07 | | | | 0.28 | | | | 2.35 | | | | 2.63 | | | | 0.37 | | | | — | | | | — | | |
12-31-15 | | | 16.42 | | | | 0.17 | • | | | (1.18 | ) | | | (1.01 | ) | | | 0.34 | | | | — | | | | — | | |
Class I | | | |
12-31-19 | | | 17.52 | | | | 0.40 | • | | | 3.78 | | | | 4.18 | | | | 0.50 | | | | 4.01 | | | | — | | |
12-31-18 | | | 20.32 | | | | 0.33 | | | | (2.80 | ) | | | (2.47 | ) | | | 0.33 | | | | — | | | | — | | |
12-31-17 | | | 17.47 | | | | 0.28 | • | | | 2.85 | | | | 3.13 | | | | 0.28 | | | | — | | | | — | | |
12-31-16 | | | 15.18 | | | | 0.34 | • | | | 2.41 | | | | 2.75 | | | | 0.46 | | | | — | | | | — | | |
12-31-15 | | | 16.55 | | | | 0.26 | • | | | (1.20 | ) | | | (0.94 | ) | | | 0.43 | | | | — | | | | — | | |
Class S | | | |
12-31-19 | | | 17.51 | | | | 0.36 | • | | | 3.77 | | | | 4.13 | | | | 0.45 | | | | 4.01 | | | | — | | |
12-31-18 | | | 20.30 | | | | 0.29 | • | | | (2.81 | ) | | | (2.52 | ) | | | 0.27 | | | | — | | | | — | | |
12-31-17 | | | 17.45 | | | | 0.23 | • | | | 2.85 | | | | 3.08 | | | | 0.23 | | | | — | | | | — | | |
12-31-16 | | | 15.17 | | | | 0.30 | • | | | 2.39 | | | | 2.69 | | | | 0.41 | | | | — | | | | — | | |
12-31-15 | | | 16.53 | | | | 0.22 | • | | | (1.20 | ) | | | (0.98 | ) | | | 0.38 | | | | — | | | | — | | |
| VY® Invesco Equity and Income Portfolio | | | |
Class ADV | | | |
12-31-19 | | | 38.95 | | | | 0.62 | • | | | 6.82 | | | | 7.44 | | | | 0.68 | | | | 2.35 | | | | — | | |
12-31-18 | | | 46.81 | | | | 0.64 | • | | | (4.95 | ) | | | (4.31 | ) | | | 0.66 | | | | 2.89 | | | | — | | |
12-31-17 | | | 44.06 | | | | 0.65 | | | | 3.84 | | | | 4.49 | | | | 0.61 | | | | 1.13 | | | | — | | |
12-31-16 | | | 40.80 | | | | 0.53 | | | | 5.28 | | | | 5.81 | | | | 0.68 | | | | 1.87 | | | | — | | |
12-31-15 | | | 46.25 | | | | 0.46 | | | | (1.47 | ) | | | (1.01 | ) | | | 0.79 | | | | 3.65 | | | | — | | |
Class I | | | |
12-31-19 | | | 39.54 | | | | 0.85 | • | | | 6.94 | | | | 7.79 | | | | 0.90 | | | | 2.35 | | | | — | | |
12-31-18 | | | 47.51 | | | | 0.88 | • | | | (5.06 | ) | | | (4.18 | ) | | | 0.90 | | | | 2.89 | | | | — | | |
12-31-17 | | | 44.86 | | | | 0.89 | • | | | 3.93 | | | | 4.82 | | | | 1.04 | | | | 1.13 | | | | — | | |
12-31-16 | | | 41.47 | | | | 0.74 | • | | | 5.41 | | | | 6.15 | | | | 0.89 | | | | 1.87 | | | | — | | |
12-31-15 | | | 46.93 | | | | 0.70 | • | | | (1.50 | ) | | | (0.80 | ) | | | 1.01 | | | | 3.65 | | | | — | | |
Class S | | | |
12-31-19 | | | 39.30 | | | | 0.74 | • | | | 6.88 | | | | 7.62 | | | | 0.78 | | | | 2.35 | | | | — | | |
12-31-18 | | | 47.22 | | | | 0.76 | • | | | (5.01 | ) | | | (4.25 | ) | | | 0.78 | | | | 2.89 | | | | — | | |
12-31-17 | | | 44.48 | | | | 0.77 | • | | | 3.89 | | | | 4.66 | | | | 0.79 | | | | 1.13 | | | | — | | |
12-31-16 | | | 41.14 | | | | 0.62 | • | | | 5.37 | | | | 5.99 | | | | 0.78 | | | | 1.87 | | | | — | | |
12-31-15 | | | 46.59 | | | | 0.58 | • | | | (1.49 | ) | | | (0.91 | ) | | | 0.89 | | | | 3.65 | | | | — | | |
Class S2 | | | |
12-31-19 | | | 38.75 | | | | 0.67 | • | | | 6.78 | | | | 7.45 | | | | 0.72 | | | | 2.35 | | | | — | | |
12-31-18 | | | 46.59 | | | | 0.69 | • | | | (4.93 | ) | | | (4.24 | ) | | | 0.71 | | | | 2.89 | | | | — | | |
12-31-17 | | | 43.85 | | | | 0.70 | • | | | 3.83 | | | | 4.53 | | | | 0.66 | | | | 1.13 | | | | — | | |
12-31-16 | | | 40.60 | | | | 0.56 | • | | | 5.28 | | | | 5.84 | | | | 0.72 | | | | 1.87 | | | | — | | |
12-31-15 | | | 46.03 | | | | 0.51 | • | | | (1.46 | ) | | | (0.95 | ) | | | 0.83 | | | | 3.65 | | | | — | | |
| VY® Invesco Oppenheimer Global Portfolio | | | |
Class ADV | | | |
12-31-19 | | | 17.06 | | | | 0.04 | | | | 4.89 | | | | 4.93 | | | | — | | | | 3.58 | | | | — | | |
12-31-18 | | | 21.42 | | | | 0.04 | | | | (2.66 | ) | | | (2.62 | ) | | | 0.25 | | | | 1.49 | | | | — | | |
12-31-17 | | | 15.90 | | | | 0.04 | | | | 5.64 | | | | 5.68 | | | | 0.13 | | | | 0.03 | | | | — | | |
12-31-16 | | | 17.30 | | | | 0.09 | • | | | (0.17 | ) | | | (0.08 | ) | | | 0.12 | | | | 1.20 | | | | — | | |
12-31-15 | | | 18.21 | | | | 0.08 | | | | 0.69 | | | | 0.77 | | | | 0.19 | | | | 1.49 | | | | — | | |
| | | | | Ratios to average net assets | | Supplemental
data | |
| | | Total distributions | | Payment by affiliate | | Net asset value, end of year or period | | Total Return(1) | | Expenses before reductions/additions(2)(3)(4) | | Expenses net of fee waivers and/or recoupments if any(2)(3)(4) | | Expenses net of all reductions/additions(2)(3)(4) | | Net investment income (loss)(2)(3) | | Net assets, end of year or period | | Portfolio turnover rate | |
Year or period ended | | ($) | | ($) | | ($) | | (%) | | (%) | | (%) | | (%) | | (%) | | ($000's) | | (%) | |
| VY® Invesco Comstock Portfolio | |
Class ADV | |
12-31-19 | | | 4.42 | | | | — | | | | 17.01 | | | | 24.86 | | | | 1.25 | | | | 1.23 | | | | 1.23 | | | | 1.60 | | | | 31,202 | | | | 25 | | |
12-31-18 | | | 0.22 | | | | — | | | | 17.39 | | | | (12.56 | ) | | | 1.25 | | | | 1.23 | | | | 1.23 | | | | 1.16 | | | | 28,006 | | | | 29 | | |
12-31-17 | | | 0.18 | | | | — | | | | 20.14 | | | | 17.31 | | | | 1.25 | | | | 1.23 | | | | 1.23 | | | | 1.00 | | | | 36,178 | | | | 14 | | |
12-31-16 | | | 0.37 | | | | — | | | | 17.33 | | | | 17.51 | | | | 1.25 | | | | 1.23 | | | | 1.23 | | | | 1.66 | | | | 34,490 | | | | 18 | | |
12-31-15 | | | 0.34 | | | | — | | | | 15.07 | | | | (6.19 | ) | | | 1.24 | | | | 1.22 | | | | 1.22 | | | | 1.08 | | | | 34,395 | | | | 24 | | |
Class I | |
12-31-19 | | | 4.51 | | | | — | | | | 17.19 | | | | 25.51 | | | | 0.75 | | | | 0.73 | | | | 0.73 | | | | 2.09 | | | | 203,510 | | | | 25 | | |
12-31-18 | | | 0.33 | | | | — | | | | 17.52 | | | | (12.16 | ) | | | 0.75 | | | | 0.73 | | | | 0.73 | | | | 1.72 | | | | 219,086 | | | | 29 | | |
12-31-17 | | | 0.28 | | | | — | | | | 20.32 | | | | 17.95 | | | | 0.75 | | | | 0.73 | | | | 0.73 | | | | 1.50 | | | | 188,040 | | | | 14 | | |
12-31-16 | | | 0.46 | | | | — | | | | 17.47 | | | | 18.13 | | | | 0.75 | | | | 0.73 | | | | 0.73 | | | | 2.16 | | | | 194,504 | | | | 18 | | |
12-31-15 | | | 0.43 | | | | — | | | | 15.18 | | | | (5.76 | ) | | | 0.74 | | | | 0.72 | | | | 0.72 | | | | 1.62 | | | | 198,367 | | | | 24 | | |
Class S | |
12-31-19 | | | 4.46 | | | | — | | | | 17.18 | | | | 25.24 | | | | 1.00 | | | | 0.98 | | | | 0.98 | | | | 1.88 | | | | 73,675 | | | | 25 | | |
12-31-18 | | | 0.27 | | | | — | | | | 17.51 | | | | (12.39 | ) | | | 1.00 | | | | 0.98 | | | | 0.98 | | | | 1.41 | | | | 215,609 | | | | 29 | | |
12-31-17 | | | 0.23 | | | | — | | | | 20.30 | | | | 17.68 | | | | 1.00 | | | | 0.98 | | | | 0.98 | | | | 1.25 | | | | 274,498 | | | | 14 | | |
12-31-16 | | | 0.41 | | | | — | | | | 17.45 | | | | 17.79 | | | | 1.00 | | | | 0.98 | | | | 0.98 | | | | 1.91 | | | | 291,208 | | | | 18 | | |
12-31-15 | | | 0.38 | | | | — | | | | 15.17 | | | | (5.97 | ) | | | 0.99 | | | | 0.97 | | | | 0.97 | | | | 1.33 | | | | 302,784 | | | | 24 | | |
| VY® Invesco Equity and Income Portfolio | |
Class ADV | |
12-31-19 | | | 3.03 | | | | — | | | | 43.36 | | | | 19.50 | | | | 1.17 | | | | 1.14 | | | | 1.14 | | | | 1.47 | | | | 44,825 | | | | 143 | | |
12-31-18 | | | 3.55 | | | | — | | | | 38.95 | | | | (9.90 | ) | | | 1.17 | | | | 1.14 | | | | 1.14 | | | | 1.40 | | | | 43,200 | | | | 161 | | |
12-31-17 | | | 1.74 | | | | — | | | | 46.81 | | | | 10.32 | | | | 1.17 | | | | 1.14 | | | | 1.14 | | | | 1.43 | | | | 54,583 | | | | 134 | | |
12-31-16 | | | 2.55 | | | | — | | | | 44.06 | | | | 14.69 | | | | 1.17 | | | | 1.14 | | | | 1.14 | | | | 1.24 | | | | 49,628 | | | | 134 | | |
12-31-15 | | | 4.44 | | | | — | | | | 40.80 | | | | (2.55 | ) | | | 1.16 | | | | 1.14 | | | | 1.14 | | | | 1.04 | | | | 49,572 | | | | 140 | | |
Class I | |
12-31-19 | | | 3.25 | | | | — | | | | 44.08 | | | | 20.10 | | | | 0.67 | | | | 0.64 | | | | 0.64 | | | | 1.97 | | | | 484,839 | | | | 143 | | |
12-31-18 | | | 3.79 | | | | — | | | | 39.54 | | | | (9.46 | ) | | | 0.67 | | | | 0.64 | | | | 0.64 | | | | 1.90 | | | | 468,289 | | | | 161 | | |
12-31-17 | | | 2.17 | | | | — | | | | 47.51 | | | | 10.90 | | | | 0.67 | | | | 0.64 | | | | 0.64 | | | | 1.92 | | | | 594,834 | | | | 134 | | |
12-31-16 | | | 2.76 | | | | — | | | | 44.86 | | | | 15.28 | | | | 0.67 | | | | 0.64 | | | | 0.64 | | | | 1.74 | | | | 594,456 | | | | 134 | | |
12-31-15 | | | 4.66 | | | | — | | | | 41.47 | | | | (2.06 | ) | | | 0.66 | | | | 0.64 | | | | 0.64 | | | | 1.53 | | | | 600,309 | | | | 140 | | |
Class S | |
12-31-19 | | | 3.13 | | | | — | | | | 43.79 | | | | 19.80 | | | | 0.92 | | | | 0.89 | | | | 0.89 | | | | 1.72 | | | | 473,465 | | | | 143 | | |
12-31-18 | | | 3.67 | | | | — | | | | 39.30 | | | | (9.67 | ) | | | 0.92 | | | | 0.89 | | | | 0.89 | | | | 1.65 | | | | 463,989 | | | | 161 | | |
12-31-17 | | | 1.92 | | | | — | | | | 47.22 | | | | 10.62 | | | | 0.92 | | | | 0.89 | | | | 0.89 | | | | 1.67 | | | | 606,503 | | | | 134 | | |
12-31-16 | | | 2.65 | | | | — | | | | 44.48 | | | | 15.00 | | | | 0.92 | | | | 0.89 | | | | 0.89 | | | | 1.49 | | | | 682,465 | | | | 134 | | |
12-31-15 | | | 4.54 | | | | — | | | | 41.14 | | | | (2.31 | ) | | | 0.91 | | | | 0.89 | | | | 0.89 | | | | 1.28 | | | | 720,086 | | | | 140 | | |
Class S2 | |
12-31-19 | | | 3.07 | | | | — | | | | 43.13 | | | | 19.63 | | | | 1.07 | | | | 1.02 | | | | 1.02 | | | | 1.59 | | | | 328,815 | | | | 143 | | |
12-31-18 | | | 3.60 | | | | — | | | | 38.75 | | | | (9.79 | ) | | | 1.07 | | | | 1.02 | | | | 1.02 | | | | 1.52 | | | | 321,618 | | | | 161 | | |
12-31-17 | | | 1.79 | | | | — | | | | 46.59 | | | | 10.48 | | | | 1.07 | | | | 1.02 | | | | 1.02 | | | | 1.54 | | | | 420,527 | | | | 134 | | |
12-31-16 | | | 2.59 | | | | — | | | | 43.85 | | | | 14.84 | | | | 1.10 | | | | 1.02 | | | | 1.02 | | | | 1.36 | | | | 446,998 | | | | 134 | | |
12-31-15 | | | 4.48 | | | | — | | | | 40.60 | | | | (2.44 | ) | | | 1.16 | | | | 1.02 | | | | 1.02 | | | | 1.15 | | | | 443,119 | | | | 140 | | |
| VY® Invesco Oppenheimer Global Portfolio | |
Class ADV | |
12-31-19 | | | 3.58 | | | | — | | | | 18.41 | | | | 31.10 | | | | 1.25 | | | | 1.25 | | | | 1.25 | | | | 0.26 | | | | 123,467 | | | | 8 | | |
12-31-18 | | | 1.74 | | | | — | | | | 17.06 | | | | (13.62 | ) | | | 1.25 | | | | 1.25 | | | | 1.25 | | | | 0.22 | | | | 101,759 | | | | 17 | | |
12-31-17 | | | 0.16 | | | | — | | | | 21.42 | | | | 35.82 | | | | 1.25 | | | | 1.25 | | | | 1.25 | | | | 0.17 | | | | 120,344 | | | | 9 | | |
12-31-16 | | | 1.32 | | | | — | | | | 15.90 | | | | (0.29 | ) | | | 1.25 | | | | 1.25 | | | | 1.25 | | | | 0.58 | | | | 90,660 | | | | 6 | | |
12-31-15 | | | 1.68 | | | | — | | | | 17.30 | | | | 3.56 | | | | 1.25 | | | | 1.25 | | | | 1.25 | | | | 0.51 | | | | 110,372 | | | | 12 | | |
See Accompanying Notes to Financial Statements
52
TABLE OF CONTENTS
FINANCIAL HIGHLIGHTS (CONTINUED)
Selected data for a share of beneficial interest outstanding throughout each year or period.
| | | | | Income (loss)
from investment
operations | | | | Less distributions | |
| | | Net asset value, beginning of year or period | | Net investment income (loss) | | Net realized and unrealized gain (loss) | | Total from investment operations | | From net investment income | | From net realized gains | | From return of capital | |
Year or period ended | | ($) | | ($) | | ($) | | ($) | | ($) | | ($) | | ($) | |
| VY® Invesco Oppenheimer Global Portfolio (continued) | | | |
Class I | | | |
12-31-19 | | | 17.86 | | | | 0.15 | | | | 5.13 | | | | 5.28 | | | | 0.10 | | | | 3.58 | | | | — | | |
12-31-18 | | | 22.33 | | | | 0.16 | • | | | (2.80 | ) | | | (2.64 | ) | | | 0.34 | | | | 1.49 | | | | — | | |
12-31-17 | | | 16.56 | | | | 0.15 | | | | 5.87 | | | | 6.02 | | | | 0.22 | | | | 0.03 | | | | — | | |
12-31-16 | | | 17.97 | | | | 0.20 | | | | (0.20 | ) | | | 0.00 | * | | | 0.21 | | | | 1.20 | | | | — | | |
12-31-15 | | | 18.84 | | | | 0.20 | • | | | 0.71 | | | | 0.91 | | | | 0.29 | | | | 1.49 | | | | — | | |
Class S | | | |
12-31-19 | | | 17.17 | | | | 0.10 | | | | 4.91 | | | | 5.01 | | | | 0.04 | | | | 3.58 | | | | — | | |
12-31-18 | | | 21.53 | | | | 0.10 | • | | | (2.68 | ) | | | (2.58 | ) | | | 0.29 | | | | 1.49 | | | | — | | |
12-31-17 | | | 15.98 | | | | 0.08 | | | | 5.67 | | | | 5.75 | | | | 0.17 | | | | 0.03 | | | | — | | |
12-31-16 | | | 17.38 | | | | 0.13 | • | | | (0.17 | ) | | | (0.04 | ) | | | 0.16 | | | | 1.20 | | | | — | | |
12-31-15 | | | 18.28 | | | | 0.15 | • | | | 0.68 | | | | 0.83 | | | | 0.24 | | | | 1.49 | | | | — | | |
Class S2 | | | |
12-31-19 | | | 16.67 | | | | 0.06 | | | | 4.77 | | | | 4.83 | | | | 0.03 | | | | 3.58 | | | | — | | |
12-31-18 | | | 20.97 | | | | 0.06 | • | | | (2.60 | ) | | | (2.54 | ) | | | 0.27 | | | | 1.49 | | | | — | | |
12-31-17 | | | 15.58 | | | | 0.05 | | | | 5.53 | | | | 5.58 | | | | 0.16 | | | | 0.03 | | | | — | | |
12-31-16 | | | 16.97 | | | | 0.10 | • | | | (0.17 | ) | | | (0.07 | ) | | | 0.12 | | | | 1.20 | | | | — | | |
12-31-15 | | | 17.88 | | | | 0.11 | • | | | 0.69 | | | | 0.80 | | | | 0.22 | | | | 1.49 | | | | — | | |
| VY® JPMorgan Mid Cap Value Portfolio | | | |
Class ADV | | | |
12-31-19 | | | 15.74 | | | | 0.12 | | | | 3.74 | | | | 3.86 | | | | 0.12 | | | | 2.33 | | | | — | | |
12-31-18 | | | 19.78 | | | | 0.15 | | | | (2.35 | ) | | | (2.20 | ) | | | 0.16 | | | | 1.68 | | | | — | | |
12-31-17 | | | 19.31 | | | | 0.07 | | | | 2.41 | | | | 2.48 | | | | 0.07 | | | | 1.94 | | | | — | | |
12-31-16 | | | 18.66 | | | | 0.08 | | | | 2.50 | | | | 2.58 | | | | 0.08 | | | | 1.85 | | | | — | | |
12-31-15 | | | 22.47 | | | | 0.06 | | | | (0.63 | ) | | | (0.57 | ) | | | 0.08 | | | | 3.16 | | | | — | | |
Class I | | | |
12-31-19 | | | 16.18 | | | | 0.22 | | | | 3.86 | | | | 4.08 | | | | 0.21 | | | | 2.33 | | | | — | | |
12-31-18 | | | 20.30 | | | | 0.25 | • | | | (2.43 | ) | | | (2.18 | ) | | | 0.26 | | | | 1.68 | | | | — | | |
12-31-17 | | | 19.75 | | | | 0.18 | • | | | 2.48 | | | | 2.66 | | | | 0.17 | | | | 1.94 | | | | — | | |
12-31-16 | | | 19.04 | | | | 0.18 | | | | 2.56 | | | | 2.74 | | | | 0.18 | | | | 1.85 | | | | — | | |
12-31-15 | | | 22.85 | | | | 0.17 | | | | (0.64 | ) | | | (0.47 | ) | | | 0.18 | | | | 3.16 | | | | — | | |
Class S | | | |
12-31-19 | | | 16.01 | | | | 0.17 | | | | 3.82 | | | | 3.99 | | | | 0.16 | | | | 2.33 | | | | — | | |
12-31-18 | | | 20.10 | | | | 0.20 | • | | | (2.40 | ) | | | (2.20 | ) | | | 0.21 | | | | 1.68 | | | | — | | |
12-31-17 | | | 19.58 | | | | 0.12 | • | | | 2.46 | | | | 2.58 | | | | 0.12 | | | | 1.94 | | | | — | | |
12-31-16 | | | 18.89 | | | | 0.13 | | | | 2.54 | | | | 2.67 | | | | 0.13 | | | | 1.85 | | | | — | | |
12-31-15 | | | 22.70 | | | | 0.12 | | | | (0.65 | ) | | | (0.53 | ) | | | 0.12 | | | | 3.16 | | | | — | | |
Class S2 | | | |
12-31-19 | | | 15.69 | | | | 0.14 | • | | | 3.73 | | | | 3.87 | | | | 0.13 | | | | 2.33 | | | | — | | |
12-31-18 | | | 19.72 | | | | 0.16 | • | | | (2.33 | ) | | | (2.17 | ) | | | 0.18 | | | | 1.68 | | | | — | | |
12-31-17 | | | 19.25 | | | | 0.09 | • | | | 2.41 | | | | 2.50 | | | | 0.09 | | | | 1.94 | | | | — | | |
12-31-16 | | | 18.60 | | | | 0.10 | | | | 2.50 | | | | 2.60 | | | | 0.10 | | | | 1.85 | | | | — | | |
12-31-15 | | | 22.40 | | | | 0.08 | • | | | (0.63 | ) | | | (0.55 | ) | | | 0.09 | | | | 3.16 | | | | — | | |
| | | | | Ratios to average net assets | | Supplemental
data | |
| | | Total distributions | | Payment by affiliate | | Net asset value, end of year or period | | Total Return(1) | | Expenses before reductions/additions(2)(3)(4) | | Expenses net of fee waivers and/or recoupments if any(2)(3)(4) | | Expenses net of all reductions/additions(2)(3)(4) | | Net investment income (loss)(2)(3) | | Net assets, end of year or period | | Portfolio turnover rate | |
Year or period ended | | ($) | | ($) | | ($) | | (%) | | (%) | | (%) | | (%) | | (%) | | ($000's) | | (%) | |
| VY® Invesco Oppenheimer Global Portfolio (continued) | |
Class I | |
12-31-19 | | | 3.68 | | | | — | | | | 19.46 | | | | 31.80 | | | | 0.75 | | | | 0.75 | | | | 0.75 | | | | 0.76 | | | | 1,225,197 | | | | 8 | | |
12-31-18 | | | 1.83 | | | | — | | | | 17.86 | | | | (13.19 | ) | | | 0.75 | | | | 0.75 | | | | 0.75 | | | | 0.72 | | | | 1,061,448 | | | | 17 | | |
12-31-17 | | | 0.25 | | | | — | | | | 22.33 | | | | 36.49 | | | | 0.75 | | | | 0.75 | | | | 0.75 | | | | 0.68 | | | | 1,384,452 | | | | 9 | | |
12-31-16 | | | 1.41 | | | | — | | | | 16.56 | | | | 0.22 | | | | 0.75 | | | | 0.75 | | | | 0.75 | | | | 1.07 | | | | 1,091,478 | | | | 6 | | |
12-31-15 | | | 1.78 | | | | — | | | | 17.97 | | | | 4.13 | | | | 0.75 | | | | 0.75 | | | | 0.75 | | | | 1.04 | | | | 1,254,238 | | | | 12 | | |
Class S | |
12-31-19 | | | 3.62 | | | | — | | | | 18.56 | | | | 31.44 | | | | 1.00 | | | | 1.00 | | | | 1.00 | | | | 0.52 | | | | 181,045 | | | | 8 | | |
12-31-18 | | | 1.78 | | | | — | | | | 17.17 | | | | (13.39 | ) | | | 1.00 | | | | 1.00 | | | | 1.00 | | | | 0.49 | | | | 167,520 | | | | 17 | | |
12-31-17 | | | 0.20 | | | | — | | | | 21.53 | | | | 36.13 | | | | 1.00 | | | | 1.00 | | | | 1.00 | | | | 0.41 | | | | 238,436 | | | | 9 | | |
12-31-16 | | | 1.36 | | | | — | | | | 15.98 | | | | (0.04 | ) | | | 1.00 | | | | 1.00 | | | | 1.00 | | | | 0.82 | | | | 174,417 | | | | 6 | | |
12-31-15 | | | 1.73 | | | | — | | | | 17.38 | | | | 3.84 | | | | 1.00 | | | | 1.00 | | | | 1.00 | | | | 0.77 | | | | 231,621 | | | | 12 | | |
Class S2 | |
12-31-19 | | | 3.61 | | | | — | | | | 17.89 | | | | 31.26 | | | | 1.15 | | | | 1.15 | | | | 1.15 | | | | 0.37 | | | | 4,611 | | | | 8 | | |
12-31-18 | | | 1.76 | | | | — | | | | 16.67 | | | | (13.56 | ) | | | 1.15 | | | | 1.15 | | | | 1.15 | | | | 0.30 | | | | 3,963 | | | | 17 | | |
12-31-17 | | | 0.19 | | | | — | | | | 20.97 | | | | 35.92 | | | | 1.15 | | | | 1.15 | | | | 1.15 | | | | 0.27 | | | | 4,030 | | | | 9 | | |
12-31-16 | | | 1.32 | | | | — | | | | 15.58 | | | | (0.20 | ) | | | 1.18 | | | | 1.15 | | | | 1.15 | | | | 0.66 | | | | 3,415 | | | | 6 | | |
12-31-15 | | | 1.71 | | | | — | | | | 16.97 | | | | 3.74 | | | | 1.25 | | | | 1.15 | | | | 1.15 | | | | 0.61 | | | | 4,371 | | | | 12 | | |
| VY® JPMorgan Mid Cap Value Portfolio | |
Class ADV | |
12-31-19 | | | 2.45 | | | | — | | | | 17.15 | | | | 25.81 | | | | 1.39 | | | | 1.39 | | | | 1.39 | | | | 0.71 | | | | 89,967 | | | | 9 | | |
12-31-18 | | | 1.84 | | | | — | | | | 15.74 | | | | (12.37 | ) | | | 1.38 | | | | 1.38 | | | | 1.38 | | | | 0.79 | | | | 80,243 | | | | 12 | | |
12-31-17 | | | 2.01 | | | | — | | | | 19.78 | | | | 13.41 | | | | 1.37 | | | | 1.37 | | | | 1.37 | | | | 0.37 | | | | 99,801 | | | | 10 | | |
12-31-16 | | | 1.93 | | | | — | | | | 19.31 | | | | 14.42 | | | | 1.37 | | | | 1.37 | | | | 1.37 | | | | 0.42 | | | | 98,003 | | | | 19 | | |
12-31-15 | | | 3.24 | | | | — | | | | 18.66 | | | | (3.27 | ) | | | 1.36 | | | | 1.36 | | | | 1.36 | | | | 0.31 | | | | 90,818 | | | | 14 | | |
Class I | |
12-31-19 | | | 2.54 | | | | — | | | | 17.72 | | | | 26.46 | | | | 0.89 | | | | 0.89 | | | | 0.89 | | | | 1.21 | | | | 150,535 | | | | 9 | | |
12-31-18 | | | 1.94 | | | | — | | | | 16.18 | | | | (11.96 | ) | | | 0.88 | | | | 0.88 | | | | 0.88 | | | | 1.28 | | | | 144,880 | | | | 12 | | |
12-31-17 | | | 2.11 | | | | — | | | | 20.30 | | | | 14.04 | | | | 0.87 | | | | 0.87 | | | | 0.87 | | | | 0.87 | | | | 210,989 | | | | 10 | | |
12-31-16 | | | 2.03 | | | | — | | | | 19.75 | | | | 14.94 | | | | 0.87 | | | | 0.87 | | | | 0.87 | | | | 0.92 | | | | 215,892 | | | | 19 | | |
12-31-15 | | | 3.34 | | | | — | | | | 19.04 | | | | (2.77 | ) | | | 0.86 | | | | 0.86 | | | | 0.86 | | | | 0.80 | | | | 227,935 | | | | 14 | | |
Class S | |
12-31-19 | | | 2.49 | | | | — | | | | 17.51 | | | | 26.21 | | | | 1.14 | | | | 1.14 | | | | 1.14 | | | | 0.96 | | | | 200,304 | | | | 9 | | |
12-31-18 | | | 1.89 | | | | — | | | | 16.01 | | | | (12.19 | ) | | | 1.13 | | | | 1.13 | | | | 1.13 | | | | 1.03 | | | | 187,165 | | | | 12 | | |
12-31-17 | | | 2.06 | | | | — | | | | 20.10 | | | | 13.72 | | | | 1.12 | | | | 1.12 | | | | 1.12 | | | | 0.61 | | | | 256,845 | | | | 10 | | |
12-31-16 | | | 1.98 | | | | — | | | | 19.58 | | | | 14.69 | | | | 1.12 | | | | 1.12 | | | | 1.12 | | | | 0.67 | | | | 291,725 | | | | 19 | | |
12-31-15 | | | 3.28 | | | | — | | | | 18.89 | | | | (3.04 | ) | | | 1.11 | | | | 1.11 | | | | 1.11 | | | | 0.55 | | | | 298,607 | | | | 14 | | |
Class S2 | |
12-31-19 | | | 2.46 | | | | — | | | | 17.10 | | | | 25.96 | | | | 1.29 | | | | 1.29 | | | | 1.29 | | | | 0.81 | | | | 1,782 | | | | 9 | | |
12-31-18 | | | 1.86 | | | | — | | | | 15.69 | | | | (12.30 | ) | | | 1.28 | | | | 1.28 | | | | 1.28 | | | | 0.86 | | | | 2,116 | | | | 12 | | |
12-31-17 | | | 2.03 | | | | — | | | | 19.72 | | | | 13.52 | | | | 1.27 | | | | 1.27 | | | | 1.27 | | | | 0.45 | | | | 3,382 | | | | 10 | | |
12-31-16 | | | 1.95 | | | | — | | | | 19.25 | | | | 14.56 | | | | 1.30 | | | | 1.27 | | | | 1.27 | | | | 0.52 | | | | 3,810 | | | | 19 | | |
12-31-15 | | | 3.25 | | | | — | | | | 18.60 | | | | (3.20 | ) | | | 1.36 | | | | 1.26 | | | | 1.26 | | | | 0.40 | | | | 3,906 | | | | 14 | | |
See Accompanying Notes to Financial Statements
53
TABLE OF CONTENTS
FINANCIAL HIGHLIGHTS (CONTINUED)
Selected data for a share of beneficial interest outstanding throughout each year or period.
| | | | | Income (loss)
from investment
operations | | | | Less distributions | |
| | | Net asset value, beginning of year or period | | Net investment income (loss) | | Net realized and unrealized gain (loss) | | Total from investment operations | | From net investment income | | From net realized gains | | From return of capital | |
Year or period ended | | ($) | | ($) | | ($) | | ($) | | ($) | | ($) | | ($) | |
| VY® T. Rowe Price Diversified Mid Cap Growth Portfolio | | | |
Class ADV | | | |
12-31-19 | | | 9.08 | | | | (0.03 | ) | | | 3.26 | | | | 3.23 | | | | 0.03 | | | | 1.28 | | | | — | | |
12-31-18 | | | 10.50 | | | | (0.02 | ) | | | (0.24 | ) | | | (0.26 | ) | | | — | | | | 1.16 | | | | — | | |
12-31-17 | | | 9.19 | | | | (0.03 | ) | | | 2.17 | | | | 2.14 | | | | 0.03 | | | | 0.80 | | | | — | | |
12-31-16 | | | 9.83 | | | | (0.01 | )• | | | 0.68 | | | | 0.67 | | | | 0.00 | * | | | 1.31 | | | | — | | |
12-31-15 | | | 11.43 | | | | (0.04 | ) | | | 0.31 | | | | 0.27 | | | | — | | | | 1.87 | | | | — | | |
Class I | | | |
12-31-19 | | | 10.14 | | | | 0.03 | | | | 3.65 | | | | 3.68 | | | | 0.04 | | | | 1.28 | | | | — | | |
12-31-18 | | | 11.56 | | | | 0.04 | | | | (0.28 | ) | | | (0.24 | ) | | | 0.02 | | | | 1.16 | | | | — | | |
12-31-17 | | | 10.03 | | | | 0.02 | | | | 2.38 | | | | 2.40 | | | | 0.07 | | | | 0.80 | | | | — | | |
12-31-16 | | | 10.60 | | | | 0.04 | | | | 0.73 | | | | 0.77 | | | | 0.03 | | | | 1.31 | | | | — | | |
12-31-15 | | | 12.13 | | | | 0.02 | | | | 0.32 | | | | 0.34 | | | | — | | | | 1.87 | | | | — | | |
Class R6 | | | |
12-31-19 | | | 10.14 | | | | 0.02 | | | | 3.67 | | | | 3.69 | | | | 0.04 | | | | 1.28 | | | | — | | |
12-31-18 | | | 11.56 | | | | 0.03 | | | | (0.27 | ) | | | (0.24 | ) | | | 0.02 | | | | 1.16 | | | | — | | |
12-31-17 | | | 10.03 | | | | 0.02 | • | | | 2.38 | | | | 2.40 | | | | 0.07 | | | | 0.80 | | | | — | | |
| 05-03-16(5)-12-31-16 | | | 10.58 | | | | 0.03 | • | | | 0.76 | | | | 0.79 | | | | 0.03 | | | | 1.31 | | | | — | | |
Class S | | | |
12-31-19 | | | 9.74 | | | | (0.00 | )* | | | 3.50 | | | | 3.50 | | | | 0.03 | | | | 1.28 | | | | — | | |
12-31-18 | | | 11.15 | | | | 0.02 | | | | (0.27 | ) | | | (0.25 | ) | | | — | | | | 1.16 | | | | — | | |
12-31-17 | | | 9.71 | | | | (0.01 | )• | | | 2.30 | | | | 2.29 | | | | 0.05 | | | | 0.80 | | | | — | | |
12-31-16 | | | 10.30 | | | | 0.01 | • | | | 0.72 | | | | 0.73 | | | | 0.01 | | | | 1.31 | | | | — | | |
12-31-15 | | | 11.87 | | | | (0.01 | ) | | | 0.31 | | | | 0.30 | | | | — | | | | 1.87 | | | | — | | |
Class S2 | | | |
12-31-19 | | | 9.13 | | | | (0.02 | ) | | | 3.28 | | | | 3.26 | | | | 0.03 | | | | 1.28 | | | | — | | |
12-31-18 | | | 10.54 | | | | (0.01 | ) | | | (0.24 | ) | | | (0.25 | ) | | | — | | | | 1.16 | | | | — | | |
12-31-17 | | | 9.22 | | | | (0.02 | ) | | | 2.18 | | | | 2.16 | | | | 0.04 | | | | 0.80 | | | | — | | |
12-31-16 | | | 9.85 | | | | (0.01 | ) | | | 0.69 | | | | 0.68 | | | | — | | | | 1.31 | | | | — | | |
12-31-15 | | | 11.44 | | | | (0.02 | ) | | | 0.30 | | | | 0.28 | | | | — | | | | 1.87 | | | | — | | |
| VY® T. Rowe Price Growth Equity Portfolio | | | |
Class ADV | | | |
12-31-19 | | | 70.96 | | | | (0.31 | ) | | | 20.51 | | | | 20.20 | | | | — | | | | 19.26 | | | | — | | |
12-31-18 | | | 86.22 | | | | (0.20 | )• | | | 0.81 | | | | 0.61 | | | | — | | | | 15.87 | | | | — | | |
12-31-17 | | | 72.53 | | | | (0.23 | ) | | | 23.41 | | | | 23.18 | | | | — | | | | 9.49 | | | | — | | |
12-31-16 | | | 81.69 | | | | (0.25 | ) | | | 0.93 | | | | 0.68 | | | | — | | | | 9.84 | | | | — | | |
12-31-15 | | | 86.54 | | | | (0.46 | )• | | | 9.58 | | | | 9.12 | | | | — | | | | 13.97 | | | | — | | |
Class I | | | |
12-31-19 | | | 78.04 | | | | 0.07 | | | | 22.75 | | | | 22.82 | | | | 0.17 | | | | 19.26 | | | | — | | |
12-31-18 | | | 93.19 | | | | 0.24 | | | | 0.71 | | | | 0.95 | | | | 0.23 | | | | 15.87 | | | | — | | |
12-31-17 | | | 77.44 | | | | 0.19 | | | | 25.10 | | | | 25.29 | | | | 0.05 | | | | 9.49 | | | | — | | |
12-31-16 | | | 86.14 | | | | 0.13 | | | | 1.01 | | | | 1.14 | | | | — | | | | 9.84 | | | | — | | |
12-31-15 | | | 90.15 | | | | (0.03 | ) | | | 9.99 | | | | 9.96 | | | | — | | | | 13.97 | | | | — | | |
Class S | | | |
12-31-19 | | | 74.54 | | | | (0.15 | )• | | | 21.66 | | | | 21.51 | | | | — | | | | 19.26 | | | | — | | |
12-31-18 | | | 89.69 | | | | 0.00 | * | | | 0.76 | | | | 0.76 | | | | 0.04 | | | | 15.87 | | | | — | | |
12-31-17 | | | 74.96 | | | | (0.03 | ) | | | 24.25 | | | | 24.22 | | | | — | | | | 9.49 | | | | — | | |
12-31-16 | | | 83.90 | | | | (0.08 | ) | | | 0.98 | | | | 0.90 | | | | — | | | | 9.84 | | | | — | | |
12-31-15 | | | 88.33 | | | | (0.25 | )• | | | 9.79 | | | | 9.54 | | | | — | | | | 13.97 | | | | — | | |
| | | | | Ratios to average net assets | | Supplemental
data | |
| | | Total distributions | | Payment by affiliate | | Net asset value, end of year or period | | Total Return(1) | | Expenses before reductions/additions(2)(3)(4) | | Expenses net of fee waivers and/or recoupments if any(2)(3)(4) | | Expenses net of all reductions/additions(2)(3)(4) | | Net investment income (loss)(2)(3) | | Net assets, end of year or period | | Portfolio turnover rate | |
Year or period ended | | ($) | | ($) | | ($) | | (%) | | (%) | | (%) | | (%) | | (%) | | ($000's) | | (%) | |
| VY® T. Rowe Price Diversified Mid Cap Growth Portfolio | |
Class ADV | |
12-31-19 | | | 1.31 | | | | — | | | | 11.00 | | | | 36.56 | | | | 1.27 | | | | 1.27 | | | | 1.27 | | | | (0.28 | ) | | | 90,526 | | | | 16 | | |
12-31-18 | | | 1.16 | | | | — | | | | 9.08 | | | | (3.77 | ) | | | 1.27 | | | | 1.27 | | | | 1.27 | | | | (0.14 | ) | | | 61,179 | | | | 19 | | |
12-31-17 | | | 0.83 | | | | — | | | | 10.50 | | | | 24.12 | | | | 1.27 | | | | 1.27 | | | | 1.27 | | | | (0.32 | ) | | | 62,022 | | | | 28 | | |
12-31-16 | | | 1.31 | | | | — | | | | 9.19 | | | | 6.93 | | | | 1.27 | | | | 1.27 | | | | 1.27 | | | | (0.15 | ) | | | 49,418 | | | | 26 | | |
12-31-15 | | | 1.87 | | | | — | | | | 9.83 | | | | 1.51 | | | | 1.27 | | | | 1.27 | | | | 1.27 | | | | (0.34 | ) | | | 27,217 | | | | 26 | | |
Class I | |
12-31-19 | | | 1.32 | | | | — | | | | 12.50 | | | | 37.20 | | | | 0.77 | | | | 0.77 | | | | 0.77 | | | | 0.21 | | | | 985,213 | | | | 16 | | |
12-31-18 | | | 1.18 | | | | — | | | | 10.14 | | | | (3.23 | ) | | | 0.77 | | | | 0.77 | | | | 0.77 | | | | 0.36 | | | | 763,686 | | | | 19 | | |
12-31-17 | | | 0.87 | | | | — | | | | 11.56 | | | | 24.81 | | | | 0.77 | | | | 0.77 | | | | 0.77 | | | | 0.18 | | | | 879,678 | | | | 28 | | |
12-31-16 | | | 1.34 | | | | — | | | | 10.03 | | | | 7.41 | | | | 0.77 | | | | 0.77 | | | | 0.77 | | | | 0.34 | | | | 737,054 | | | | 26 | | |
12-31-15 | | | 1.87 | | | | — | | | | 10.60 | | | | 2.02 | | | | 0.77 | | | | 0.77 | | | | 0.77 | | | | 0.17 | | | | 766,591 | | | | 26 | | |
Class R6 | |
12-31-19 | | | 1.32 | | | | — | | | | 12.51 | | | | 37.31 | | | | 0.77 | | | | 0.77 | | | | 0.77 | | | | 0.24 | | | | 30,761 | | | | 16 | | |
12-31-18 | | | 1.18 | | | | — | | | | 10.14 | | | | (3.24 | ) | | | 0.77 | | | | 0.77 | | | | 0.77 | | | | 0.38 | | | | 15,642 | | | | 19 | | |
12-31-17 | | | 0.87 | | | | — | | | | 11.56 | | | | 24.81 | | | | 0.77 | | | | 0.77 | | | | 0.77 | | | | 0.18 | | | | 9,313 | | | | 28 | | |
| 05-03-16(5)-12-31-16 | | | 1.34 | | | | — | | | | 10.03 | | | | 7.62 | | | | 0.77 | | | | 0.77 | | | | 0.77 | | | | 0.53 | | | | 1,084 | | | | 26 | | |
Class S | |
12-31-19 | | | 1.31 | | | | — | | | | 11.93 | | | | 36.88 | | | | 1.02 | | | | 1.02 | | | | 1.02 | | | | (0.04 | ) | | | 47,101 | | | | 16 | | |
12-31-18 | | | 1.16 | | | | — | | | | 9.74 | | | | (3.44 | ) | | | 1.02 | | | | 1.02 | | | | 1.02 | | | | 0.11 | | | | 42,403 | | | | 19 | | |
12-31-17 | | | 0.85 | | | | — | | | | 11.15 | | | | 24.46 | | | | 1.02 | | | | 1.02 | | | | 1.02 | | | | (0.07 | ) | | | 55,222 | | | | 28 | | |
12-31-16 | | | 1.32 | | | | — | | | | 9.71 | | | | 7.19 | | | | 1.02 | | | | 1.02 | | | | 1.02 | | | | 0.12 | | | | 56,578 | | | | 26 | | |
12-31-15 | | | 1.87 | | | | — | | | | 10.30 | | | | 1.72 | | | | 1.02 | | | | 1.02 | | | | 1.02 | | | | (0.08 | ) | | | 30,614 | | | | 26 | | |
Class S2 | |
12-31-19 | | | 1.31 | | | | — | | | | 11.08 | | | | 36.69 | | | | 1.17 | | | | 1.17 | | | | 1.17 | | | | (0.18 | ) | | | 5,586 | | | | 16 | | |
12-31-18 | | | 1.16 | | | | — | | | | 9.13 | | | | (3.65 | ) | | | 1.17 | | | | 1.17 | | | | 1.17 | | | | (0.03 | ) | | | 4,094 | | | | 19 | | |
12-31-17 | | | 0.84 | | | | — | | | | 10.54 | | | | 24.28 | | | | 1.17 | | | | 1.17 | | | | 1.17 | | | | (0.21 | ) | | | 4,103 | | | | 28 | | |
12-31-16 | | | 1.31 | | | | — | | | | 9.22 | | | | 6.99 | | | | 1.20 | | | | 1.17 | | | | 1.17 | | | | (0.06 | ) | | | 4,451 | | | | 26 | | |
12-31-15 | | | 1.87 | | | | — | | | | 9.85 | | | | 1.60 | | | | 1.27 | | | | 1.17 | | | | 1.17 | | | | (0.23 | ) | | | 4,095 | | | | 26 | | |
| VY® T. Rowe Price Growth Equity Portfolio | |
Class ADV | |
12-31-19 | | | 19.26 | | | | — | | | | 71.90 | | | | 30.15 | | | | 1.23 | | | | 1.21 | | | | 1.21 | | | | (0.43 | ) | | | 302,258 | | | | 26 | | |
12-31-18 | | | 15.87 | | | | — | | | | 70.96 | | | | (1.57 | ) | | | 1.23 | | | | 1.21 | | | | 1.21 | | | | (0.24 | ) | | | 239,404 | | | | 47 | | |
12-31-17 | | | 9.49 | | | | — | | | | 86.22 | | | | 32.91 | | | | 1.24 | | | | 1.23 | | | | 1.23 | | | | (0.29 | ) | | | 248,624 | | | | 51 | | |
12-31-16 | | | 9.84 | | | | — | | | | 72.53 | | | | 1.01 | | | | 1.24 | | | | 1.23 | | | | 1.23 | | | | (0.34 | ) | | | 192,546 | | | | 40 | | |
12-31-15 | | | 13.97 | | | | — | | | | 81.69 | | | | 10.25 | | | | 1.24 | | | | 1.23 | | | | 1.23 | | | | (0.54 | ) | | | 202,307 | | | | 42 | | |
Class I | |
12-31-19 | | | 19.43 | | | | — | | | | 81.43 | | | | 30.83 | | | | 0.73 | | | | 0.71 | | | | 0.71 | | | | 0.07 | | | | 1,290,657 | | | | 26 | | |
12-31-18 | | | 16.10 | | | | — | | | | 78.04 | | | | (1.09 | ) | | | 0.73 | | | | 0.71 | | | | 0.71 | | | | 0.27 | | | | 1,092,998 | | | | 47 | | |
12-31-17 | | | 9.54 | | | | — | | | | 93.19 | | | | 33.58 | | | | 0.74 | | | | 0.73 | | | | 0.73 | | | | 0.21 | | | | 1,101,965 | | | | 51 | | |
12-31-16 | | | 9.84 | | | | — | | | | 77.44 | | | | 1.51 | | | | 0.74 | | | | 0.73 | | | | 0.73 | | | | 0.16 | | | | 989,826 | | | | 40 | | |
12-31-15 | | | 13.97 | | | | — | | | | 86.14 | | | | 10.81 | | | | 0.74 | | | | 0.73 | | | | 0.73 | | | | (0.04 | ) | | | 1,124,421 | | | | 42 | | |
Class S | |
12-31-19 | | | 19.26 | | | | — | | | | 76.79 | | | | 30.47 | | | | 0.98 | | | | 0.96 | | | | 0.96 | | | | (0.18 | ) | | | 65,359 | | | | 26 | | |
12-31-18 | | | 15.91 | | | | — | | | | 74.54 | | | | (1.33 | ) | | | 0.98 | | | | 0.96 | | | | 0.96 | | | | 0.01 | | | | 329,427 | | | | 47 | | |
12-31-17 | | | 9.49 | | | | — | | | | 89.69 | | | | 33.25 | | | | 0.99 | | | | 0.98 | | | | 0.98 | | | | (0.04 | ) | | | 379,473 | | | | 51 | | |
12-31-16 | | | 9.84 | | | | — | | | | 74.96 | | | | 1.26 | | | | 0.99 | | | | 0.98 | | | | 0.98 | | | | (0.10 | ) | | | 336,810 | | | | 40 | | |
12-31-15 | | | 13.97 | | | | — | | | | 83.90 | | | | 10.54 | | | | 0.99 | | | | 0.98 | | | | 0.98 | | | | (0.29 | ) | | | 427,186 | | | | 42 | | |
See Accompanying Notes to Financial Statements
54
TABLE OF CONTENTS
FINANCIAL HIGHLIGHTS (CONTINUED)
Selected data for a share of beneficial interest outstanding throughout each year or period.
| | | | | Income (loss)
from investment
operations | | | | Less distributions | |
| | | Net asset value, beginning of year or period | | Net investment income (loss) | | Net realized and unrealized gain (loss) | | Total from investment operations | | From net investment income | | From net realized gains | | From return of capital | |
Year or period ended | | ($) | | ($) | | ($) | | ($) | | ($) | | ($) | | ($) | |
| VY® T. Rowe Price Growth Equity Portfolio (continued) | | | |
Class S2 | | | |
12-31-19 | | | 72.10 | | | | (0.27 | )• | | | 20.90 | | | | 20.63 | | | | — | | | | 19.26 | | | | — | | |
12-31-18 | | | 87.30 | | | | (0.12 | )• | | | 0.79 | | | | 0.67 | | | | — | | | | 15.87 | | | | — | | |
12-31-17 | | | 73.27 | | | | (0.16 | )• | | | 23.68 | | | | 23.52 | | | | — | | | | 9.49 | | | | — | | |
12-31-16 | | | 82.35 | | | | (0.17 | )• | | | 0.93 | | | | 0.76 | | | | — | | | | 9.84 | | | | — | | |
12-31-15 | | | 87.05 | | | | (0.38 | )• | | | 9.65 | | | | 9.27 | | | | — | | | | 13.97 | | | | — | | |
| | | | | Ratios to average net assets | | Supplemental
data | |
| | | Total distributions | | Payment by affiliate | | Net asset value, end of year or period | | Total Return(1) | | Expenses before reductions/additions(2)(3)(4) | | Expenses net of fee waivers and/or recoupments if any(2)(3)(4) | | Expenses net of all reductions/additions(2)(3)(4) | | Net investment income (loss)(2)(3) | | Net assets, end of year or period | | Portfolio turnover rate | |
Year or period ended | | ($) | | ($) | | ($) | | (%) | | (%) | | (%) | | (%) | | (%) | | ($000's) | | (%) | |
| VY® T. Rowe Price Growth Equity Portfolio (continued) | |
Class S2 | |
12-31-19 | | | 19.26 | | | | — | | | | 73.47 | | | | 30.27 | | | | 1.13 | | | | 1.11 | | | | 1.11 | | | | (0.33 | ) | | | 9,074 | | | | 26 | | |
12-31-18 | | | 15.87 | | | | — | | | | 72.10 | | | | (1.47 | ) | | | 1.13 | | | | 1.11 | | | | 1.11 | | | | (0.14 | ) | | | 8,564 | | | | 47 | | |
12-31-17 | | | 9.49 | | | | — | | | | 87.30 | | | | 33.06 | | | | 1.14 | | | | 1.13 | | | | 1.13 | | | | (0.19 | ) | | | 9,014 | | | | 51 | | |
12-31-16 | | | 9.84 | | | | — | | | | 73.27 | | | | 1.10 | | | | 1.17 | | | | 1.13 | | | | 1.13 | | | | (0.23 | ) | | | 8,597 | | | | 40 | | |
12-31-15 | | | 13.97 | | | | — | | | | 82.35 | | | | 10.38 | | | | 1.24 | | | | 1.13 | | | | 1.13 | | | | (0.44 | ) | | | 5,361 | | | | 42 | | |
(1) Total return is calculated assuming reinvestment of all dividends, capital gain distributions and return of capital distributions, if any, at net asset value and does not reflect the effect of insurance contract charges. Total return for periods less than one year is not annualized.
(2) Annualized for periods less than one year.
(3) Ratios reflect operating expenses of a Portfolio. Expenses before reductions/additions do not reflect amounts reimbursed or recouped by the Investment Adviser and/or Distributor or reductions from brokerage service arrangements or other expense offset arrangements and do not represent the amount paid by a Portfolio during periods when reimbursements or reductions occur. Expenses net of fee waivers reflect expenses after reimbursement by the Investment Adviser and/or Distributor or recoupment of previously reimbursed fees by the Investment Adviser, but prior to reductions from brokerage service arrangements or other expense offset arrangements. Expenses net of all reductions/additions represent the net expenses paid by a Portfolio. Net investment income (loss) is net of all such additions or reductions.
(4) Ratios do not include fees and expenses charged under the variable annuity contract or variable life insurance policy.
(5) Commencement of operations.
(a) Excluding amounts from foreign withholding tax claims received in the year ended December 31, 2017, total return for Voya International High Dividend Low Volatility Portfolio would have been 21.38%, 21.98%, 21.63%, and 21.53% for Classes ADV, I, S, and S2, respectively.
(b) Excluding amounts related to a foreign currency settlement recorded in the fiscal year ended December 31, 2015, total return for Voya International High Dividend Low Volatility Portfolio would have been (4.09)%, (3.60)%, (3.83)% and (3.99)% for Classes ADV, I, S and S2, respectively.
• Calculated using average number of shares outstanding throughout the year or period.
* Amount is less than $0.005 or 0.005% or more than $(0.005) or (0.005)%.
See Accompanying Notes to Financial Statements
55
TABLE OF CONTENTS
NOTES TO FINANCIAL STATEMENTS AS OF DECEMBER 31, 2019
Voya Partners, Inc. (the "Company") is an open-end management investment company registered under the Investment Company Act of 1940, as amended (the "1940 Act"). It was incorporated under the laws of Maryland on May 7, 1997. The Articles of Incorporation permit the Company to offer separate series, each of which has its own investment objective, policies and restrictions. The Company currently consists of thirty-seven active separate investment series. The twelve series (each, a "Portfolio" and collectively, the "Portfolios") included in this report are: Voya Global Bond Portfolio ("Global Bond"), Voya International High Dividend Low Volatility Portfolio ("International High Dividend Low Volatility"), VY® American Century Small-Mid Cap Value Portfolio ("American Century Small-Mid Cap Value"), VY® Baron Growth Portfolio ("Baron Growth"), VY® Columbia Contrarian Core Portfolio ("Columbia Contrarian Core"), VY® Columbia Small Cap Value II Portfolio ("Columbia Small Cap Value II"), VY® Invesco Comstock Portfolio ("Invesco Comstock"), VY® Invesco Equity and Income Portfolio ("Invesco Equity and Income"), VY® Invesco Oppenheimer Global Portfolio ("Invesco Oppenheimer Global"), VY® JPMorgan Mid Cap Value Portfolio ("JPMorgan Mid Cap Value"), VY® T. Rowe Price Diversified Mid Cap Growth Portfolio ("T. Rowe Price Diversified Mid Cap Growth") and VY® T. Rowe Price Growth Equity Portfolio ("T. Rowe Price Growth Equity"), each a diversified series of the Company. The investment objective of the Portfolios is described in the respective Portfolio's Prospectus. Prior to May 1, 2019 International High Dividend Low Volatility was known as VY® Templeton Foreign Equity Portfolio and prior to June 27, 2019, Invesco Oppenheimer Global was known as VY® Oppenheimer Global Portfolio.
The classes of shares included in this report are: Adviser ("Class ADV"), Initial ("Class I"), Class R6, Service ("Class S") and Service 2 ("Class S2"); however, each Portfolio may not offer all share classes. Shares of the Portfolios may be offered to separate accounts ("Separate Accounts") of insurance companies as investment options in connection with variable annuity contracts and variable life insurance policies ("Variable Contracts") and to certain of the Portfolios' investment advisers and their affiliates. In the future, shares may also be offered to qualified pension and retirement plans ("Qualified Plans") outside the Separate Account context. With the exception of class specific matters, each class has equal voting rights as to voting privileges. For class specific proposals, only the applicable class would have voting privileges. The classes differ principally in the applicable distribution and shareholder service fees. Generally, shareholders of each class also bear certain expenses that pertain to that particular class. All
shareholders are allocated the common expenses of a portfolio and earn income and realized gains/losses from a portfolio pro rata based on the daily ending net assets of each class, without distinction between share classes. Distributions are determined separately for each class based on income and expenses allocated to each class. Expenses that are specific to a portfolio or a class are charged directly to that portfolio or class. Other operating expenses shared by several portfolios are generally allocated among those portfolios based on average net assets. Realized gain distributions are allocated to each class pro rata based on the shares outstanding of each class on the date of distribution. Differences in per share dividend rates generally result from differences in separate class expenses, including distribution and shareholder service fees, if applicable.
Voya Investments, LLC ("Voya Investments" or the "Investment Adviser"), an Arizona limited liability company, serves as the Investment Adviser to the Portfolios. Voya Investment Management Co. LLC ("Voya IM"), a Delaware limited liability company, serves as the sub-adviser to Global Bond and, as of May 1, 2019, International High Dividend Low Volatility. Voya Investments Distributor, LLC ("VID" or the "Distributor"), a Delaware limited liability company, serves as the principal underwriter to the Portfolios.
NOTE 2 — SIGNIFICANT ACCOUNTING POLICIES
The following significant accounting policies are consistently followed by the Portfolios in the preparation of their financial statements. Each Portfolio is considered an investment company under U.S. generally accepted accounting principles ("GAAP") and follows the accounting and reporting guidance applicable to investment companies.
A. Security Valuation. Each Portfolio is open for business every day the New York Stock Exchange ("NYSE") opens for regular trading (each such day, a "Business Day"). The net asset value ("NAV") per share for each class of each Portfolio is determined each Business Day as of the close of the regular trading session ("Market Close"), as determined by the Consolidated Tape Association ("CTA"), the central distributor of transaction prices for exchange-traded securities (normally 4:00 p.m. Eastern time unless otherwise designated by the CTA). The data reflected on the consolidated tape provided by the CTA is generated by various market centers, including all securities exchanges, electronic communications networks, and third-market broker-dealers. The NAV per share of each class of each Portfolio is calculated by taking the value of the Portfolio's assets attributable to that class, subtracting the Portfolio's liabilities attributable to that
56
TABLE OF CONTENTS
NOTES TO FINANCIAL STATEMENTS AS OF DECEMBER 31, 2019 (CONTINUED)
NOTE 2 — SIGNIFICANT ACCOUNTING POLICIES (continued)
class, and dividing by the number of shares of that class that are outstanding. On days when a Portfolio is closed for business, Portfolio shares will not be priced and a Portfolio does not transact purchase and redemption orders. To the extent a Portfolio's assets are traded in other markets on days when a Portfolio does not price its shares, the value of a Portfolio's assets will likely change and you will not be able to purchase or redeem shares of a Portfolio.
Assets for which market quotations are readily available are valued at market value. A security listed or traded on an exchange is valued at its last sales price or official closing price as of the close of the regular trading session on the exchange where the security is principally traded or, if such price is not available, at the last sale price as of the Market Close for such security provided by the CTA. Bank loans are valued at the average of the averages of the bid and ask prices provided to an independent loan pricing service by brokers. Futures contracts are valued at the final settlement price set by an exchange on which they are principally traded. Listed options are valued at the mean between the last bid and ask prices from the exchange on which they are principally traded. Investments in open-end registered investment companies that do not trade on an exchange are valued at the end of day NAV per share. Investments in registered investment companies that trade on an exchange are valued at the last sales price or official closing price as of the close of the regular trading session on the exchange where the security is principally traded.
When a market quotation is not readily available or is deemed unreliable, each Portfolio will determine a fair value for the relevant asset in accordance with procedures adopted by the Portfolios' Board of Directors ("Board"). Such procedures provide, for example, that: (a) Exchange-traded securities are valued at the mean of the closing bid and ask; (b) Debt obligations are valued using an evaluated price provided by an independent pricing service. Evaluated prices provided by the pricing service may be determined without exclusive reliance on quoted prices, and may reflect factors such as institution-size trading in similar groups of securities, developments related to specific securities, benchmark yield, quality, type of issue, coupon rate, maturity, individual trading characteristics and other market data; (c) Securities traded in the over-the-counter ("OTC") market are valued based on prices provided by independent pricing services or market makers; (d) Options not listed on an exchange are valued by an independent source using an industry accepted model, such as Black-Scholes; (e) Centrally
cleared swap agreements are valued using a price provided by the central counterparty clearinghouse; (f) OTC swap agreements are valued using a price provided by an independent pricing service; (g) Forward foreign currency exchange contracts are valued utilizing current and forward rates obtained from an independent pricing service. Such prices from the third party pricing service are for specific settlement periods and each Portfolio's forward foreign currency exchange contracts are valued at an interpolated rate between the closest preceding and subsequent period reported by the independent pricing service; and (h) Securities for which market prices are not provided by any of the above methods may be valued based upon quotes furnished by brokers.
The prospectuses of the open-end registered investment companies in which each Portfolio may invest explain the circumstances under which they will use fair value pricing and the effects of using fair value pricing.
Foreign securities' (including forward foreign currency exchange contracts) prices are converted into U.S. dollar amounts using the applicable exchange rates as of Market Close. If market quotations are available and believed to be reliable for foreign exchange-traded equity securities, the securities will be valued at the market quotations. Because trading hours for certain foreign securities end before Market Close, closing market quotations may become unreliable. An independent pricing service determines the degree of certainty, based on historical data, that the closing price in the principal market where a foreign security trades is not the current value as of Market Close. Foreign securities' prices meeting the approved degree of certainty that the price is not reflective of current value will be valued by the independent pricing service using pricing models designed to estimate likely changes in the values of those securities between the times in which the trading in those securities is substantially completed and Market Close. Multiple factors may be considered by the independent pricing service in determining the value of such securities and may include information relating to sector indices, American Depositary Receipts and domestic and foreign index futures.
All other assets for which market quotations are not readily available or became unreliable (or if the above fair valuation methods are unavailable or determined to be unreliable) are valued at fair value as determined in good faith by or under the supervision of the Board following procedures approved by the Board. The Board has delegated to the Investment Adviser responsibility for overseeing the implementation of the Portfolios' valuation procedures; a "Pricing Committee" comprised of employees of the Investment Adviser or its affiliates has
57
TABLE OF CONTENTS
NOTES TO FINANCIAL STATEMENTS AS OF DECEMBER 31, 2019 (CONTINUED)
NOTE 2 — SIGNIFICANT ACCOUNTING POLICIES (continued)
responsibility for applying the fair valuation methods set forth in the procedures and, if a fair valuation cannot be determined pursuant to the fair valuation methods, determining the fair value of assets held by the Portfolios. Issuer specific events, transaction price, position size, nature and duration of restrictions on disposition of the security, market trends, bid/ask quotes of brokers and other market data may be reviewed in the course of making a good faith determination of a security's fair value. Valuations change in response to many factors including the historical and prospective earnings of the issuer, the value of the issuer's assets, general economic conditions, interest rates, investor perceptions and market liquidity. Because of the inherent uncertainties of fair valuation, the values used to determine each Portfolio's NAV may materially differ from the value received upon actual sale of those investments. Thus, fair valuation may have an unintended dilutive or accretive effect on the value of shareholders' investments in each Portfolio.
Each investment asset or liability of the Portfolios is assigned a level at measurement date based on the significance and source of the inputs to its valuation. Quoted prices in active markets for identical securities are classified as "Level 1," inputs other than quoted prices for an asset or liability that are observable are classified as "Level 2" and significant unobservable inputs, including the sub-advisers' or Pricing Committee's judgment about the assumptions that a market participant would use in pricing an asset or liability are classified as "Level 3." The inputs used for valuing securities are not necessarily an indication of the risks associated with investing in those securities. Short-term securities of sufficient credit quality are generally considered to be Level 2 securities under applicable accounting rules. A table summarizing the Portfolios' investments under these levels of classification is included within the Summary Portfolio of Investments.
GAAP requires a reconciliation of the beginning to ending balances for reported fair values that presents changes attributable to total realized and unrealized gains or losses, purchases and sales, and transfers in or out of the Level 3 category during the period. A reconciliation of Level 3 investments within the Summary Portfolio of Investments is presented only when a Portfolio has a significant amount of Level 3 investments.
B. Securities Transactions and Revenue Recognition. Securities transactions are accounted for on the trade date. Realized gains and losses are reported on the basis of identified cost of securities sold. Interest income is
recorded on an accrual basis. Dividend income is recorded on the ex-dividend date, or for certain foreign securities, when the information becomes available to the Portfolios. Premium amortization and discount accretion are determined by the effective yield method.
C. Foreign Currency Translation. The books and records of the Portfolios are maintained in U.S. dollars. Any foreign currency amounts are translated into U.S. dollars on the following basis:
(1) Market value of investment securities, other assets and liabilities — at the exchange rates prevailing at Market Close.
(2) Purchases and sales of investment securities, income and expenses — at the rates of exchange prevailing on the respective dates of such transactions.
Although the net assets and the market values are presented at the foreign exchange rates at Market Close, the Portfolios do not isolate the portion of the results of operations resulting from changes in foreign exchange rates on investments from the fluctuations arising from changes in market prices of securities held. Such fluctuations are included with the net realized and unrealized gains or losses from investments. For securities, which are subject to foreign withholding tax upon disposition, liabilities are recorded on the Statements of Assets and Liabilities for the estimated tax withholding based on the securities' current market value. Upon disposition, realized gains or losses on such securities are recorded net of foreign withholding tax.
Reported net realized foreign exchange gains or losses arise from sales of foreign currencies, currency gains or losses realized between the trade and settlement dates on securities transactions, the difference between the amounts of dividends, interest, and foreign withholding tax reclaims recorded on the Portfolios' books, and the U.S. dollar equivalent of the amounts actually received or paid. Net unrealized foreign exchange gains and losses arise from changes in the value of assets and liabilities other than investments in securities, resulting from changes in the exchange rate. Foreign security and currency transactions may involve certain considerations and risks not typically associated with investing in U.S. companies and U.S. government securities. These risks include, but are not limited to, revaluation of currencies and future adverse political and economic developments, which could cause securities and their markets to be less liquid and prices more volatile than those of comparable U.S. companies and U.S. government securities. The foregoing risks are even greater with respect to securities of issuers in emerging markets.
58
TABLE OF CONTENTS
NOTES TO FINANCIAL STATEMENTS AS OF DECEMBER 31, 2019 (CONTINUED)
NOTE 2 — SIGNIFICANT ACCOUNTING POLICIES (continued)
D. Distributions to Shareholders. The Portfolios record distributions to their shareholders on the ex-dividend date. Dividends from net investment income, if any, are declared daily and paid monthly and net capital gains distributions, if any, are declared and paid annually by Global Bond. Dividends from net investment income, if any, are declared and paid semi-annually and net capital gains distributions, if any, are declared and paid annually by Invesco Comstock, Invesco Equity and Income, JPMorgan Mid Cap Value, T. Rowe Price Diversified Mid Cap Growth and T. Rowe Price Growth Equity. For all other Portfolios, dividends from net investment income and net capital gain distributions, if any, are declared and paid annually. The Portfolios may make distributions on a more frequent basis to comply with the distribution requirements of subchapter M of the Internal Revenue Code. The characteristics of income and gains to be distributed are determined in accordance with income tax regulations, which may differ from GAAP for investment companies.
E. Federal Income Taxes. It is the policy of each Portfolio to comply with the requirements of subchapter M of the Internal Revenue Code that are applicable to regulated investment companies and to distribute substantially all of its net investment income and any net realized capital gains to its shareholders. Therefore, a federal income tax or excise tax provision is not required. Management has considered the sustainability of the Portfolios' tax positions taken on federal income tax returns for all open tax years in making this determination. No capital gain distributions shall be made until the capital loss carryforwards have been fully utilized or expire.
The Portfolios may utilize equalization accounting for tax purposes, whereby a portion of redemption payments are treated as distributions of income or gain.
F. Use of Estimates. Management of the Portfolios has made certain estimates and assumptions relating to the reporting of assets, liabilities, income, and expenses to prepare these financial statements in conformity with GAAP for investment companies. Actual results could differ from these estimates.
G. Risk Exposures and the Use of Derivative Instruments. The Portfolios' investment strategies permit the Portfolios to enter into various types of derivatives contracts, including, but not limited to, futures contracts, forward foreign currency exchange contracts, credit default swaps, interest rate swaps, total return swaps, and purchased and written options. In doing so, a Portfolio will employ strategies in differing combinations
to permit it to increase or decrease the level of risk, or change the level or types of exposure to risk factors. This may allow a Portfolio to pursue its objectives more quickly, and efficiently than if it were to make direct purchases or sales of securities capable of affecting a similar response to market or credit factors.
In pursuit of its investment objectives, a Portfolio may seek to increase or decrease its exposure to the following market or credit risk factors:
Credit Risk. The price of a bond or other debt instrument is likely to fall if the issuer's actual or perceived financial health deteriorates, whether because of broad economic or issuer-specific reasons. In certain cases, the issuer could be late in paying interest or principal, or could fail to pay its financial obligations altogether.
Equity Risk. Stock prices may be volatile or have reduced liquidity in response to real or perceived impacts of factors including, but not limited to, economic conditions, changes in market interest rates, and political events. Stock markets tend to be cyclical, with periods when stock prices generally rise and periods when stock prices generally decline. Any given stock market segment may remain out of favor with investors for a short or long period of time, and stocks as an asset class may underperform bonds or other asset classes during some periods. Additionally, legislative, regulatory or tax policies or developments in these areas may adversely impact the investment techniques available to a manager, add to costs and impair the ability of a Portfolio to achieve its investment objectives.
Foreign Exchange Rate Risk. To the extent that a Portfolio invests directly in foreign (non-U.S.) currencies or in securities denominated in, or that trade in, foreign (non-U.S.) currencies, it is subject to the risk that those foreign (non-U.S.) currencies will decline in value relative to the U.S. dollar or, in the case of hedging positions, that the U.S. dollar will decline in value relative to the currency being hedged by a Portfolio through foreign currency exchange transactions.
Currency rates may fluctuate significantly over short periods of time. Currency rates may be affected by changes in market interest rates, intervention (or the failure to intervene) by U.S. or foreign governments, central banks or supranational entities such as the International Monetary Fund, by the imposition of currency controls, or other political or economic developments in the United States or abroad.
Interest Rate Risk. With bonds and other fixed rate debt instruments, a rise in market interest rates generally causes values to fall; conversely, values generally rise as market interest rates fall. The higher the credit quality of
59
TABLE OF CONTENTS
NOTES TO FINANCIAL STATEMENTS AS OF DECEMBER 31, 2019 (CONTINUED)
NOTE 2 — SIGNIFICANT ACCOUNTING POLICIES (continued)
the instrument, and the longer its maturity or duration, the more sensitive it is likely to be to interest rate risk. In the case of inverse securities, the interest rate paid by the securities is a floating rate, which generally will decrease when the market rate of interest to which the inverse security is indexed increases and will increase when the market rate of interest to which the inverse security is indexed decreases. As of the date of this report, the United States experiences a low interest rate environment, which may increase a Portfolio's exposure to risks associated with rising market interest rates. Rising market interest rates could have unpredictable effects on the markets and may expose fixed-income and related markets to heightened volatility. For a fund that invests in fixed-income securities, an increase in market interest rates may lead to increased redemptions and increased portfolio turnover, which could reduce liquidity for certain investments, adversely affect values, and increase costs. If dealer capacity in fixed-income markets is insufficient for market conditions, it may further inhibit liquidity and increase volatility in the fixed-income markets. Further, recent and potential changes in government policy may affect interest rates.
Risks of Investing in Derivatives. A Portfolio's use of derivatives can result in losses due to unanticipated changes in the market or credit risk factors and the overall market. In instances where a Portfolio is using derivatives to decrease, or hedge, exposures to market or credit risk factors for securities held by a Portfolio, there are also risks that those derivatives may not perform as expected resulting in losses for the combined or hedged positions.
Derivative instruments are subject to a number of risks, including the risk of changes in the market price of the underlying securities, credit risk with respect to the counterparty, risk of loss due to changes in market interest rates and liquidity and volatility risk. The amounts required to purchase certain derivatives may be small relative to the magnitude of exposure assumed by a Portfolio. Therefore, the purchase of certain derivatives may have an economic leveraging effect on a Portfolio and exaggerate any increase or decrease in the NAV. Derivatives may not perform as expected, so a Portfolio may not realize the intended benefits. When used for hedging purposes, the change in value of a derivative may not correlate as expected with the currency, security or other risk being hedged. When used as an alternative or substitute for direct cash investments, the return provided by the derivative may not provide the same return as direct cash investment. In addition, given their complexity, derivatives expose a Portfolio to the risk of improper valuation.
Generally, derivatives are sophisticated financial instruments whose performance is derived, at least in part, from the performance of an underlying asset or assets. Derivatives include, among other things, swap agreements, options, forwards and futures. Investments in derivatives are generally negotiated OTC with a single counterparty and as a result are subject to credit risks related to the counterparty's ability or willingness to perform its obligations; any deterioration in the counterparty's creditworthiness could adversely affect the value of the derivative. In addition, derivatives and their underlying securities may experience periods of illiquidity which could cause a Portfolio to hold a security it might otherwise sell, or to sell a security it otherwise might hold at inopportune times or at an unanticipated price. A manager might imperfectly judge the direction of the market. For instance, if a derivative is used as a hedge to offset investment risk in another security, the hedge might not correlate to the market's movements and may have unexpected or undesired results such as a loss or a reduction in gains.
Counterparty Credit Risk and Credit Related Contingent Features. Certain derivative positions are subject to counterparty credit risk, which is the risk that the counterparty will not fulfill its obligation to a Portfolio. Each Portfolio's derivative counterparties are financial institutions who are subject to market conditions that may weaken their financial position. A Portfolio intends to enter into financial transactions with counterparties it believes to be creditworthy at the time of the transaction. To reduce this risk, a Portfolio has entered into master netting arrangements, established within each Portfolio's International Swap and Derivatives Association, Inc. ("ISDA") Master Agreements ("Master Agreements"). These Master Agreements are with select counterparties and they govern transactions, including certain OTC derivative and forward foreign currency contracts, entered into by a Portfolio and the counterparty. The Master Agreements maintain provisions for general obligations, representations, agreements, collateral, and events of default or termination. The occurrence of a specified event of termination may give a counterparty the right to terminate all of its contracts and affect settlement of all outstanding transactions under the applicable Master Agreement.
A Portfolio may also enter into collateral agreements with certain counterparties to further mitigate counterparty credit risk on OTC derivative and forward foreign currency contracts. Subject to established minimum levels, collateral is generally determined based on the net aggregate unrealized gain or loss on contracts with a certain counterparty. Collateral pledged to or from a Portfolio is held in a segregated account by a third-party
60
TABLE OF CONTENTS
NOTES TO FINANCIAL STATEMENTS AS OF DECEMBER 31, 2019 (CONTINUED)
NOTE 2 — SIGNIFICANT ACCOUNTING POLICIES (continued)
agent and can be in the form of cash or debt securities issued by the U.S. government or related agencies.
As of December 31, 2019, the maximum amount of loss that Global Bond, Invesco Comstock, and Invesco Equity and Income would incur if the counterparties to its derivative transactions failed to perform would be $1,631,525, $70,049 and $15,088, respectively, which represents the gross payments to be received by the Portfolios on open forward foreign currency contracts and purchased options were they to be unwound as of December 31, 2019. To reduce the amount of potential loss to Global Bond, the Portfolio had received $300,000 in cash collateral for open OTC transactions at December 31, 2019. There was no cash collateral received by any other Portfolio at December 31, 2019.
Each Portfolio has credit related contingent features that if triggered would allow its derivative counterparties to close out and demand payment or additional collateral to cover their exposure from a Portfolio. Credit related contingent features are established between each Portfolio and their derivatives counterparties to reduce the risk that a Portfolio will not fulfill its payment obligations to its counterparties. These triggering features include, but are not limited to, a percentage decrease in a Portfolio's net assets and/or a percentage decrease in a Portfolio's NAV, which could cause a Portfolio to accelerate payment of any net liability owed to the counterparty. The contingent features are established within each Portfolio's Master Agreements.
As of December 31, 2019, Global Bond, Invesco Comstock and Invesco Equity and Income had a liability position of $831,220, $539,282 and $1,272,367, respectively, on open forward foreign currency contracts, OTC written options, OTC swaps and forward premium swaptions with credit related contingent features. If a contingent feature would have been triggered as of December 31, 2019, the Portfolios could have been required to pay this amount in cash to its counterparties. As of December 31, 2019, Global Bond had pledged $20,000 in cash collateral for open OTC derivatives transactions with its respective counterparties. There was no cash collateral pledged by any other Portfolio at December 31, 2019.
H. Forward Foreign Currency Contracts. Certain Portfolios may enter into forward foreign currency contracts primarily to hedge against foreign currency exchange rate risks on their non-U.S. dollar denominated investment securities. When entering into a forward currency contract, a Portfolio agrees to receive or deliver a fixed quantity of foreign currency for an agreed-upon
price on an agreed future date. These contracts are valued daily and a Portfolio's net equity therein, representing unrealized gain or loss on the contracts as measured by the difference between the forward foreign exchange rates at the dates of entry into the contracts and the forward rates at the reporting date, is included in the Statement of Assets and Liabilities. Realized and unrealized gains and losses are included in the Statement of Operations. These instruments involve market and/or credit risk in excess of the amount recognized in the Statement of Assets and Liabilities. Risks arise from the possible inability of counterparties to meet the terms of their contracts and from movement in currency and securities values and interest rates. Open forward foreign currency contracts are presented following the Summary Portfolio of Investments.
During the year ended December 31, 2019, the following Portfolios had average contract amounts on forward foreign currency contracts purchased and sold as disclosed below:
| | | Purchased | | Sold | |
Global Bond* | | $ | 135,673,411 | | | $ | 55,549,445 | | |
International High Dividend
Low Volatility** | | | 560,028 | | | | 1,074,213 | | |
American Century Small-Mid Cap
Value** | | | 274,851 | | | | 17,441,130 | | |
Invesco Comstock** | | | 9,211,992 | | | | 32,619,081 | | |
Invesco Equity and Income** | | | 1,958,528 | | | | 61,835,913 | | |
Invesco Oppenheimer Global** | | | 2,195,892 | | | | — | | |
* For the year ended December 31, 2019, the Portfolio used forward foreign currency contracts primarily to protect any non-U.S. dollar-denominated holdings from adverse currency movements and to gain exposure to currencies for the purposes of risk management or enhanced return. Please refer to the tables within the Portfolio of Investments for open forward foreign currency contracts at December 31, 2019.
** For the year ended December 31, 2019, the Portfolios used forward foreign currency contracts primarily to protect any non-U.S. dollar-denominated holdings from adverse currency movements. Please refer to the tables within each respective Portfolio of Investments for open forward foreign currency contracts at December 31, 2019. There were no open forward foreign currency contracts for International High Dividend Low Volatility and Invesco Oppenheimer Global at December 31, 2019.
I. Futures Contracts. Certain Portfolios may enter into futures contracts involving foreign currency, interest rates, securities and security indices. A futures contract is a commitment to buy or sell a specific amount of a financial instrument at a negotiated price on a stipulated future date. A Portfolio may buy and sell futures contracts. Futures contracts traded on a commodities or futures exchange will be valued at the final settlement price or official closing price on the principal exchange as reported by such principal exchange at its trading session ending at, or most recently prior to, the time when each Portfolio's assets are valued.
61
TABLE OF CONTENTS
NOTES TO FINANCIAL STATEMENTS AS OF DECEMBER 31, 2019 (CONTINUED)
NOTE 2 — SIGNIFICANT ACCOUNTING POLICIES (continued)
Upon entering into a futures contract, a Portfolio is required to deposit either cash or securities (initial margin) in an amount equal to a certain percentage of the contract value. Subsequent payments (variation margin) are made or received by a Portfolio each day. The variation margin payments are equal to the daily changes in the contract value and are recorded as unrealized gains and losses. Open futures contracts are reported on a table following each Portfolio's Summary Portfolio of Investments. Securities held in collateralized accounts to cover initial margin requirements on open futures contracts are footnoted in the Summary Portfolio of Investments. Cash collateral held by the broker to cover initial margin requirements on open futures contracts are noted in the Statements of Assets and Liabilities. The net change in unrealized appreciation and depreciation is reported in the Statements of Operations. Realized gains (losses) are reported in the Statements of Operations at the closing or expiration of futures contracts.
Futures contracts are exposed to the market risk factor of the underlying financial instrument. During the year ended December 31, 2019, Global Bond had purchased and sold futures contracts on various notes and bonds as part of their respective duration strategy. Additional associated risks of entering into futures contracts include the possibility that there may be an illiquid market where each Portfolio is unable to liquidate the contract or enter into an offsetting position and, if used for hedging purposes, the risk that the price of the contract will correlate imperfectly with the prices of each Portfolios' securities. With futures, there is minimal counterparty credit risk to the Portfolios since futures are exchange traded and the exchange's clearinghouse, as counterparty to all exchange traded futures, guarantees the futures against default.
During the year ended December 31, 2019, Global Bond had an average notional value of $55,862,383 and $31,099,713, respectively, on futures contracts purchased and sold. Please refer to the table within the Portfolio of Investments for open futures contracts at December 31, 2019
J. Securities Lending. Each Portfolio may temporarily loan up to 331/3% of its total assets to brokers, dealers or other financial institutions in exchange for a negotiated lender's fee. Securities lending involves two primary risks: "investment risk" and "borrower default risk." When lending securities, the Portfolios will receive cash or U.S. government securities as collateral. Investment risk is the risk that the Portfolios will lose money from the investment of the cash collateral received from the
borrower. Borrower default risk is the risk that the Portfolios will lose money due to the failure of a borrower to return a borrowed security. Loans are subject to termination at the option of the borrower or the Portfolios. Securities lending may result in leverage. The use of leverage may exaggerate any increase or decrease in the NAV, causing the Portfolios to be more volatile. The use of leverage may increase expenses and increase the impact of the Portfolios' other risks.
K. Restricted Securities. The Portfolios may invest in restricted securities which include those sold under Rule 144A of the Securities Act of 1933, as amended ("1933 Act") or securities offered pursuant to Section 4(a)(2) of the 1933 Act, and/or are subject to legal or contractual restrictions on resale and may not be publicly sold without registration under the 1933 Act. Restricted securities are fair valued using market quotations when readily available. In the absence of market quotations, the securities are valued based upon their fair value determined in good faith under procedures approved by the Board.
Securities that are not registered for sale to the public under the 1933 Act are referred to as "restricted securities." These securities may be sold in private placement transactions between issuers and their purchasers and may be neither listed on an exchange nor traded in other established markets. Many times these securities are subject to legal or contractual restrictions on resale. As a result of the absence of a public trading market, the prices of these securities may be more volatile, less liquid and more difficult to value than publicly traded securities. The price realized from the sale of these securities could be less than the amount originally paid or less than their fair value if they are resold in privately negotiated transactions. In addition, these securities may not be subject to disclosure and other investment protection requirements that are afforded to publicly traded securities. Certain investments may include investment in smaller, less seasoned issuers, which may involve greater risk.
L. Delayed-Delivery and When-Issued Transactions. Certain Portfolios may purchase or sell securities on a when-issued or forward commitment basis. The price of the underlying securities and date when the securities will be delivered and paid for are fixed at the time the transaction is negotiated. The fair value of such is identified in the Portfolios' Summary Portfolio of Investments. Losses may arise due to changes in the fair value of the securities or from the inability of counterparties to meet the terms of the contract. In connection with such purchases, the Portfolios are required to hold liquid assets as collateral with the
62
TABLE OF CONTENTS
NOTES TO FINANCIAL STATEMENTS AS OF DECEMBER 31, 2019 (CONTINUED)
NOTE 2 — SIGNIFICANT ACCOUNTING POLICIES (continued)
Portfolios' custodian sufficient to cover the purchase price.
To mitigate counterparty risk, certain Portfolios have entered into Master Securities Forward Transaction Agreements ("MSFTA") with their respective counterparties that provide for collateral and the right to offset amounts due to or from those counterparties under specified conditions. Subject to minimum transfer amounts, collateral requirements are determined and transfers made based on the net aggregate unrealized gain or loss on all the when-issued or delayed-delivery transactions with a particular counterparty. Cash collateral, if any, is presented on the Statement of Assets and Liabilities as an asset (Cash pledged as collateral for delayed-delivery or when-issued securities) and a liability (Cash received as collateral for delayed-delivery or when-issued securities). At December 31, 2019, there was no cash collateral pledged to or received by any Portfolio.
M. Mortgage Dollar Roll Transactions. Certain Portfolios may engage in dollar roll transactions with respect to mortgage-backed securities issued by Government National Mortgage Association, Federal National Mortgage Association and Federal Home Loan Mortgage Corp. In a dollar roll transaction, a Portfolio sells a mortgage-backed security to a financial institution, such as a bank or broker/dealer, and simultaneously agrees to repurchase a substantially similar (i.e., same type, coupon, and maturity) security from the institution on a delayed delivery basis at an agreed upon price. The mortgage-backed securities that are repurchased will bear the same interest rate as those sold, but generally will be collateralized by different pools of mortgages with different prepayment histories. The Portfolios account for dollar roll transactions as purchases and sales. For fee based dollar roll transactions, the fee is recorded as income.
N. Options Contracts. Certain Portfolios may purchase put and call options and may write (sell) put options and covered call options on futures, swaps ("swaptions"), securities, commodities or foreign currencies. The Portfolios may engage in option transactions as a hedge against adverse movements in the value of portfolio holdings or to increase market exposure. Option contracts are valued daily and unrealized gains or losses are recorded based upon the last sales price on the principal exchange on which the options are traded. An amount equal to the proceeds of the premium received by the Portfolios upon the writing of a put or call option is included in the Statements of Assets and Liabilities as an
asset and equivalent liability which is subsequently marked-to-market until it is exercised or closed, or it expires. Forward premium swaptions include premiums that have extended settlement dates. The delayed settlement of the premiums is factored into the daily valuation of the option contracts. Premiums received from writing options which expire are treated as realized gains. The Portfolios will realize a gain or loss upon the expiration or closing of the option contract. When an option is exercised, the proceeds on sales of the underlying security for a written call option, the purchase cost of the security for a written put option, or the cost of the security for a purchased put or call option is adjusted by the amount of premium received or paid. Realized and unrealized gains or losses on option contracts are reflected in the accompanying financial statements. The risk in writing a covered call option is that the Portfolios give up the opportunity for profit if the market price of the security increases and the option is exercised. The risk in writing a put option is that the Portfolios may incur a loss if the market price of the security decreases and the option is exercised. The risk in buying an option is that the Portfolios pay a premium whether or not the option is exercised. Risks may also arise from an illiquid secondary market or from the inability of counterparties to meet the terms of the contract.
During the year ended December 31, 2019, Global Bond had purchased and written interest rate swaptions with an average notional value of $92,793,908 and $190,571,701, respectively, to gain exposure to interest rates and to generate income. There were no open purchased or written interest rate swaptions at December 31, 2019.
During the year ended December 31, 2019, Global Bond had purchased forward premium swaptions with an average notional value of $38,235,000 to manage duration and yield curve exposures. Please refer to the tables within the Portfolio of Investments for open purchased forward premium swaptions at December 31, 2019.
During the year ended December 31, 2019, Global Bond had purchased and written foreign currency options with an average notional value of $13,125,000 and $7,875,000, respectively, to gain exposure to foreign currencies and to generate income. Please refer to the tables within the Portfolio of Investments for open purchased and written foreign currency options at December 31, 2019.
O. Swap Agreements. Certain Portfolios may enter into swap agreements. A swap is an agreement between two parties pursuant to which each party agrees to make one
63
TABLE OF CONTENTS
NOTES TO FINANCIAL STATEMENTS AS OF DECEMBER 31, 2019 (CONTINUED)
NOTE 2 — SIGNIFICANT ACCOUNTING POLICIES (continued)
or more payments to the other at specified future intervals based on the return of an asset (such as a stock, bond or currency) or non-asset reference (such as an interest rate or index). Swap agreements are privately negotiated in the OTC market and may be executed in a multilateral or other trade facility platform, such as a registered commodities exchange ("centrally cleared swaps").
The swap agreement will specify the "notional" amount of the asset or non-asset reference to which the contract relates. Subsequent changes in fair value, if any, are calculated based upon changes in the performance of the asset or non-asset reference multiplied by the notional value of the contract. A Portfolio may enter into credit default, interest rate, total return and currency swaps to manage its exposure to credit, currency and interest rate risk. All outstanding swap agreements are reported following each Portfolio's Summary Portfolio of Investments.
Swaps are marked to market daily using quotations primarily from third party pricing services, registered commodities exchange(s), counterparties or brokers. The fair value of an OTC swap contract is recorded on each Portfolio's Statements of Assets and Liabilities. Daily changes in the value of centrally cleared swaps, if any, are recorded as variation margin receivable or payable on the Statement of Assets and Liabilities. During the term of the swap, changes in the value of the swap, if any, are recorded as unrealized gains or losses on the Statements of Operations. Upfront payments paid or received on OTC swaps by a Portfolio when entering into the agreements are reported on the Statements of Assets and Liabilities and as a component of the changes in unrealized gains or losses on the Statements of Operations. These upfront payments represent the amounts paid or received when initially entering into the swap agreement to compensate for differences between the stated terms of the swap agreement and the prevailing market conditions. The upfront payments are included as a component in the realized gains or losses on each Portfolio's Statement of Operations upon termination or maturity of the swap. A Portfolio also records net periodic payments paid or received on the swap contract as a realized gain or loss on the Statements of Operations.
In a centrally cleared swap, immediately following execution of the swap agreement, the swap agreement is novated to a central counterparty (the "CCP") and the
Portfolio's counterparty on the swap agreement becomes the CCP. The Portfolios are required to interface with the CCP through a broker. Upon entering into a centrally cleared swap, the Portfolios are required to deposit initial margin with the broker in the form of cash or securities in an amount that varies depending on the size and risk profile of the particular swap. Securities deposited as initial margin are footnoted as pledged on the Portfolio of Investments and cash deposited is recorded on the Statements of Assets and Liabilities as cash pledged for centrally cleared swaps. The daily change in valuation of centrally cleared swaps is recorded as a receivable or payable for variation margin in the Statements of Assets and Liabilities. Payments received from (paid to) the counterparty, including at termination, are recorded as realized gain (loss) on the Statements of Operations.
Entering into swap agreements involves the risk that the maximum potential loss of an investment exceeds the current value of the investment as reported on each Portfolio's Statements of Assets and Liabilities. Other risks involve the possibility that the counterparty to the agreements may default on its obligation to perform, that there will be no liquid market for these investments and that unfavorable changes in the market will have a negative impact on the value of the index or securities underlying the respective swap agreement.
Credit Default Swap Contracts. A credit default swap is a bilateral agreement between counterparties in which the buyer of the protection agrees to make a stream of periodic payments to the seller of protection in exchange for the right to receive a specified return in the event of a default or other credit event for a referenced entity, obligation or index. As a seller of protection on credit default swaps, a Portfolio will generally receive from the buyer a fixed payment stream based on the notional amount of the swap contract. This fixed payment stream will continue until the swap contract expires or a defined credit event occurs.
A Portfolio is subject to credit risk in the normal course of pursuing its investment objectives. As a seller of protection in a credit default swap, a Portfolio may execute these contracts to manage its exposure to the market or certain sectors of the market. Certain Portfolios may also enter into credit default swaps to speculate on changes in an issuer's credit quality, to take advantage of perceived spread advantages, or to offset an existing short equivalent (i.e. buying protection on an equivalent reference entity).
Certain Portfolios may sell credit default swaps which expose these Portfolios to the risk of loss from credit
64
TABLE OF CONTENTS
NOTES TO FINANCIAL STATEMENTS AS OF DECEMBER 31, 2019 (CONTINUED)
NOTE 2 — SIGNIFICANT ACCOUNTING POLICIES (continued)
risk-related events specified in the contract. Although contract specific, credit events are generally defined as bankruptcy, failure to pay, restructuring, obligation acceleration, obligation default or repudiation/moratorium. If a Portfolio is a seller of protection, and a credit event occurs, as defined under the terms of that particular swap agreement, a Portfolio will generally either (i) pay to the buyer an amount equal to the notional amount of the swap and take delivery of the referenced obligation, other deliverable obligations, or underlying securities comprising a referenced index or (ii) pay a net settlement amount in the form of cash or securities equal to the notional amount of the swap less the recovery value of the referenced obligation or underlying securities comprising a referenced index. If a Portfolio is a buyer of protection and a credit event occurs, as defined under the terms of that particular swap agreement, a Portfolio will either (i) receive from the seller of protection an amount equal to the notional amount of the swap and deliver the referenced obligation, other deliverable obligations or underlying securities comprising the referenced index or (ii) receive a net settlement amount in the form of cash or securities equal to the notional amount of the swap less the recovery value of the referenced obligation or underlying securities comprising the referenced index. Recovery values are assumed by market makers considering either industry standard recovery rates or entity specific factors and considerations until a credit event occurs. If a credit event has occurred, the recovery value is determined by a facilitated auction whereby a minimum number of allowable broker bids, together with a specified valuation method, are used to calculate the settlement value.
Implied credit spreads, represented in absolute terms, utilized in determining the fair value of credit default swap agreements on corporate issues or sovereign issues are disclosed in each Portfolio's Portfolio of Investments and serve as an indicator of the current status of the payment/performance risk and represent the likelihood or risk of default for the credit derivative. The implied credit spread of a particular referenced entity reflects the cost of buying/selling protection and may include upfront payments required to be made to enter into the agreement. For credit default swaps on asset-backed securities or credit indices, the quoted market prices and resulting fair values serve as the indicator of the current status of the payment/performance risk. Wider credit spreads and increasing fair values, in absolute terms when compared to the notional amount of the swap,
represent a deterioration of the referenced entity's credit soundness and a greater likelihood or risk of default or other credit event occurring as defined under the terms of the agreement.
The maximum amount of future payments (undiscounted) that a Portfolio as seller of protection could be required to make under a credit default swap agreement would be an amount equal to the notional amount of the agreement. These potential amounts would be partially offset by any recovery values of the respective referenced obligations, upfront payments received upon entering into the agreements, or net amounts received from the settlement of buy protection credit default swap agreements entered into by a Portfolio for the same referenced entity or entities.
For the year ended December 31, 2019, Global Bond had purchased and sold credit protection with an average notional value of $10,196,064 and $9,867,805, respectively, on various credit default swap indices to hedge or to gain additional exposure to the credit risk associated with certain sectors of the markets. Please refer to the tables within the Portfolio of Investments for open credit default swaps to buy and sell protection at December 31, 2019.
Interest Rate Swap Contracts. An interest rate swap involves the agreement between counterparties to exchange periodic payments based on interest rates. One payment will be based on a floating rate of a specified interest rate while the other will be a fixed rate. Risks involve the future fluctuations of interest rates in which a Portfolio may make payments that are greater than what a Portfolio received from the counterparty. Other risks include credit, liquidity and market risk.
For the year ended December 31, 2019, Global Bond had entered into interest rate swaps in which it pays a floating interest rate and receives a fixed interest rate ("Long interest rate swap") in order to increase exposure to interest rate risk. Average notional amounts on long interest rate swaps was $174,258,166.
For the year ended December 31, 2019, Global Bond had entered into interest rate swaps in which it pays a fixed interest rate and receives a floating interest rate ("Short interest rate swap") in order to decrease exposure to interest rate risk. Average notional amounts on short interest rate swaps was $95,287,450.
Global Bond entered into interest rate swaps to adjust interest rate and yield curve exposures and to substitute for physical fixed-income securities. Please refer to the tables within the Portfolio of Investments for Global Bond
65
TABLE OF CONTENTS
NOTES TO FINANCIAL STATEMENTS AS OF DECEMBER 31, 2019 (CONTINUED)
NOTE 2 — SIGNIFICANT ACCOUNTING POLICIES (continued)
for open centrally cleared interest rate swaps at December 31, 2019.
At December 31, 2019, Global Bond had pledged $1,631,000 in cash collateral for open centrally cleared swaps.
Total Return Swap Contracts. A total return swap is an agreement that gives a Portfolio the right to receive the appreciation in the value of a specified security, index or other instrument in return for a fee paid to the counterparty, which will typically be an agreed upon interest rate. If the underlying asset declines in value over the term of the swap, a Portfolio may also be required to pay the dollar value of that decline to the counterparty. Risks of total return swaps include credit, liquidity and market risks.
For the year ended December 31, 2019, Global Bond entered into total return swaps on sovereign bonds with an average notional amount of $14,265,335. Please refer to the tables within the Portfolio of Investments for open total return swaps at December 31, 2019.
Volatility Swap Contracts. Certain Portfolios may enter into volatility swaps. Volatility swaps are agreements in which the counterparties agree to make payments in connection with changes in the volatility (i.e., the magnitude of change over a specified period of time) of an underlying referenced instrument, such as a currency, rate, index, security or other financial instrument. Volatility swaps permit the parties to attempt to hedge volatility risk and/or take positions on the projected future volatility of an underlying referenced instrument. As a receiver of the realized price volatility, a Portfolio would receive the payoff amount when the realized price volatility of the referenced instrument is greater than the strike and would owe the payoff amount when the volatility is less than the strike. As a payer of the realized price volatility, a Portfolio would owe the payoff amount when the realized price volatility of the referenced instrument is greater than the strike and would receive the payoff amount when the volatility is less than the strike.
During the year ended December 31, 2019, Global Bond had an average notional amount of $60,000 on foreign currency volatility swaps (receiver). Please refer to the tables within the Portfolio of Investments for open volatility swaps at December 31, 2019.
P. Equity-Linked Notes. Invesco Equity and Income invests in equity-linked notes. Equity-linked notes are
hybrid financial instruments that generally combine both debt and equity characteristics into a single note form. Income earned from equity-linked notes is recorded as Interest income in the Statements of Operations and may be based on the performance of an underlying equity security, an equity index, or an option position. The Portfolio records the net change in the fair value of the equity-linked note on the accompanying Statements of Operations as a change in unrealized appreciation or depreciation on investments. The Portfolio records a realized gain or loss on the Statements of Operations upon the sale or maturity of the equity-linked note. The risks of investing in equity-linked notes include unfavorable price movements in the underlying security and the credit risk of the issuing financial institution. There may be no guarantee of a return of principal with equity- linked notes and the appreciation potential may be limited. Equity-linked notes may be more volatile and less liquid than other investments held by the Portfolio. Please refer to the Portfolio of Investments for open equity-linked notes at December 31, 2019.
Q. Structured Notes. Global Bond and Invesco Equity and Income invest in structured notes whose principal payments or interest payments are linked to the performance of underlying foreign currencies, interest rate spreads, stock market indices, prices of individual securities, commodities or other financial instruments or the occurrence of other specific events. The terms and conditions of these notes may be 'structured' by the purchaser (a Portfolio) and the borrower issuing the note. The market value of these notes will increase or decrease based on the performance of the underlying asset or reference. A Portfolio records the net change in the market value of the structured note on the accompanying Statements of Operations as a change in unrealized appreciation or depreciation on investments. A Portfolio records a realized gain or loss on the Statements of Operations upon the sale or maturity of the structured note. Please refer to the Portfolio of Investments for structured notes held by Global Bond and Invesco Equity and Income at December 31, 2019.
R. Indemnifications. In the normal course of business, the Company may enter into contracts that provide certain indemnifications. The Company's maximum exposure under these arrangements is dependent on future claims that may be made against the Portfolios and, therefore, cannot be estimated; however, based on experience, management considers the risk of loss from such claims remote.
66
TABLE OF CONTENTS
NOTES TO FINANCIAL STATEMENTS AS OF DECEMBER 31, 2019 (CONTINUED)
NOTE 3 — INVESTMENT TRANSACTIONS
For the year ended December 31, 2019, the cost of purchases and the proceeds from the sales of securities, excluding U.S. government and short-term securities, were as follows:
| | | Purchases | | Sales | |
Global Bond | | $ | 49,224,143 | | | $ | 70,068,794 | | |
International High Dividend
Low Volatility | | | 678,895,631 | | | | 721,117,394 | | |
American Century Small-Mid
Cap Value | | | 181,263,641 | | | | 200,276,444 | | |
Baron Growth | | | 177,144,284 | | | | 567,531,756 | | |
Columbia Contrarian Core | | | 113,704,140 | | | | 378,364,413 | | |
Columbia Small Cap Value II | | | 40,868,675 | | | | 65,346,714 | | |
Invesco Comstock | | | 105,864,717 | | | | 333,663,022 | | |
Invesco Equity and Income | | | 243,270,263 | | | | 393,848,614 | | |
Invesco Oppenheimer Global | | | 110,144,092 | | | | 315,327,896 | | |
JPMorgan Mid Cap Value | | | 39,397,510 | | | | 111,433,520 | | |
T. Rowe Price Diversified Mid
Cap Growth | | | 174,831,301 | | | | 221,338,241 | | |
T. Rowe Price Growth Equity | | | 488,576,727 | | | | 972,725,992 | | |
U.S. government securities not included above were as follows:
| | | Purchases | | Sales | |
Global Bond | | $ | 399,409,989 | | | $ | 382,277,737 | | |
Invesco Equity and Income | | | 1,589,751,823 | | | | 1,619,036,858 | | |
NOTE 4 — INVESTMENT MANAGEMENT FEES
The Portfolios have entered into an investment management agreement ("Management Agreement") with the Investment Adviser. The Investment Adviser has overall responsibility for the management of the Portfolios. The Investment Adviser oversees all investment management and portfolio management services for the Portfolios and assists in managing and supervising all aspects of the general day-to-day business activities and operations of the Portfolios, including custodial, transfer agency, dividend disbursing, accounting, auditing, compliance and related services. This Management Agreement compensates the Investment Adviser with a management fee, computed daily and payable monthly, based on the average daily net assets of each Portfolio, at the following annual rates:
Portfolio | | Fee | |
Global Bond | | 0.600% on the first $4 billion; | |
| | | 0.575% on the next $1 billion; | |
| | | 0.550% on the next $1 billion; | |
| | | 0.530% on assets over $6 billion | |
International High Dividend
Low Volatility(1) | | 0.60% on all assets | |
American Century Small-Mid
Cap Value | | 1.10% on the first $250 million; | |
| | | 1.05% on the next $250 million; | |
| | | 1.00% on assets over $500 million | |
Baron Growth | | 0.950% on the first $1 billion; | |
| | | 0.925% on the next $1 billion; | |
| | | 0.900% on assets over $2 billion | |
Portfolio | | Fee | |
Columbia Contrarian Core | | 0.90% on the first $500 million; | |
| | | 0.85% on the next $500 million; | |
| | | 0.80% on assets over $1 billion | |
Columbia Small Cap Value II | | 0.85% on all assets | |
Invesco Comstock | | 0.70% on all assets | |
Invesco Equity and Income(2) | | 0.65% on the first $750 million; | |
| | | 0.63% on the next $250 million; | |
| | | 0.61% on assets over $1 billion | |
Invesco Oppenheimer Global | | 0.70% on the first $3 billion; | |
| | | 0.68% on the next $1 billion; | |
| | | 0.67% on the next $4 billion; | |
| | | 0.66% on assets over $8 billion | |
JPMorgan Mid Cap Value | | 0.85% on the first $500 million; | |
| | | 0.75% on the next $500 million; | |
| | | 0.70% on assets over $1 billion | |
T. Rowe Price Diversified
Mid Cap Growth | | 0.74% on all assets | |
T. Rowe Price Growth Equity | | 0.70% on all assets | |
(1) Prior to May 1, 2019, the management fee for International High Dividend Low Volatility was 0.90% on the first $500 million; and 0.85% on assets over $500 million.
(2) The Investment Adviser has contractually agreed to waive 0.01% of the management fee for Invesco Equity and Income. Any fees waived or reimbursed are not eligible for recoupment. Termination or modification of this obligation requires approval by the Board.
Effective May 1, 2019, the Investment Adviser has contractually agreed to waive 0.003%, 0.165%, 0.023%, 0.027%, 0.017%, and 0.019% of the management fee for Global Bond, American Century Small-Mid Cap Value, Columbia Contrarian Core, Columbia Small Cap Value II, Invesco Comstock, and T. Rowe Price Growth Equity, respectively. Any fees waived or reimbursed are not eligible for recoupment. Termination or modification of this obligation requires approval by the Board. These waivers replace the management fee waivers in connection with the sub-advisory fee reductions.
Prior to May 1, 2019, the Investment Adviser had contractually agreed to waive a portion of the management fee for Global Bond, International High Dividend Low Volatility, American Century Small-Mid Cap Value, Columbia Contrarian Core, Columbia Small Cap Value II, Invesco Comstock, and T. Rowe Price Growth Equity in connection with sub-advisory fee reductions for these Portfolios. The waiver was calculated as follows: Waiver = 50% x (former sub-advisory fee rate minus new sub-advisory fee rate) x average daily net assets as of the calculation date. In addition, the Investment Adviser had agreed to further waive a portion of the advisory fee for T. Rowe Price Growth Equity, which was based on the total savings in excess of $500,000 as a result of the aggregated sub-advisory fee schedule of T. Rowe Price Growth Equity and VY® T. Rowe Price Equity Income Portfolio, which is not included in this report. The aggregated amount of savings was allocated to the two Portfolios pro rata based on each Portfolio's contribution to the amount saved. For the period ended April 30, 2019, the Investment Adviser waived $2,105, $34,449,
67
TABLE OF CONTENTS
NOTES TO FINANCIAL STATEMENTS AS OF DECEMBER 31, 2019 (CONTINUED)
NOTE 4 — INVESTMENT MANAGEMENT FEES (continued)
$236,669, $20,486, $17,823, $38,125 and $115,044 of management fees for Global Bond, International High Dividend Low Volatility, American Century Small-Mid Cap Value, Columbia Contrarian Core, Columbia Small Cap Value II, Invesco Comstock and T. Rowe Price Growth Equity, respectively based on the sub-advisory fee reductions. Effective May 1, 2019, the Investment Adviser is no longer obligated to waive a portion of the management fee for these Portfolios based on the sub-advisory fee reductions. The termination of these obligations was approved by the Board and, for all but International High Dividend Low Volatility, replaced with a management fee waiver.
Prior to May 1, 2019, International High Dividend Low Volatility (which was known as VY® Templeton Foreign Equity Portfolio) could invest its assets in Templeton Institutional Funds-Foreign Smaller Companies Series ("Foreign Smaller Companies Series"). The Portfolio's purchase of shares of Foreign Smaller Companies Series would result in the Portfolio paying a proportionate share of the expenses of Foreign Smaller Companies Series. The Investment Adviser had agreed to waive its management fee in an amount equal to the advisory fee received by the adviser of the Foreign Smaller Companies Series resulting from the Portfolio's investment into the Foreign Smaller Companies Series. There were no such waivers for the year ended December 30, 2019.
The Investment Adviser has entered into a sub-advisory agreement with each respective sub-adviser. These sub-advisers provide investment advice for certain Portfolios and are paid by the Investment Adviser based on the average daily net assets of the respective Portfolios. Subject to such policies as the Board or the Investment Adviser may determine, the sub-advisers manage each respective Portfolio's assets in accordance with the Portfolio's investment objectives, policies, and limitations. The sub-advisers of the Portfolios are as follows (*denotes an affiliated sub-adviser):
Portfolio | | Sub-Adviser | |
Global Bond | | Voya Investment Management Co. LLC* | |
International High Dividend Low Volatility(1) | | Voya Investment Management Co. LLC* | |
American Century Small-Mid Cap Value | | American Century Investment Management, Inc. | |
Baron Growth | | BAMCO, Inc. | |
Columbia Contrarian Core & Columbia Small Cap Value II | | Columbia Management Investment Advisers, LLC | |
Portfolio | | Sub-Adviser | |
Invesco Comstock, Invesco Equity and Income & Invesco Oppenheimer Global(2) | | Invesco Advisers, Inc.(2) | |
JPMorgan Mid Cap Value | | J.P. Morgan Investment Management Inc. | |
T. Rowe Price Diversified Mid Cap Growth & T. Rowe Price Growth Equity | | T. Rowe Price Associates, Inc. | |
(1) Effective May 1, 2019, Templeton Investment Counsel, LLC was removed as a sub-adviser and Voya Investment Management Co. LLC was added as a sub-adviser to the Portfolio.
(2) Effective May 24, 2019, the Investment Adviser entered into a new sub-advisory agreement with Invesco Advisers, Inc. due to a change in control of OppenheimerFunds, Inc.
NOTE 5 — DISTRIBUTION AND SERVICE FEES
Class ADV and Class S2 shares of each respective Portfolio have a plan of distribution (the "Plan"), whereby the Distributor is reimbursed or compensated by the Portfolios for expenses incurred in the distribution of each Portfolio's shares. The Distributor may pay, on behalf of each Portfolio, out of its distribution fee, compensation to certain financial institutions for providing distribution assistance. Under the Plan, a Portfolio makes payments at an annual rate of 0.25% of the Portfolio's average daily net assets attributable to its Class ADV shares and a Portfolio makes payments at an annual rate of 0.15% of the Portfolio's average daily net assets attributable to its Class S2 shares. The Distributor has contractually agreed to waive 0.02% of the distribution fee for Class S2 shares of Invesco Equity and Income. Termination or modification of this obligation requires approval by the Board.
Class ADV, Class S and Class S2 shares are further subject to a shareholder servicing fee payable to shareholder organizations pursuant to the shareholder servicing plan adopted for Class ADV, Class S and Class S2 shares which shall not exceed an annual rate of 0.25% of the average daily net assets of each class, respectively.
NOTE 6 — OTHER TRANSACTIONS WITH AFFILIATES AND RELATED PARTIES
For the year ended December 31, 2019, International High Dividend Low Volatility incurred $92,750 of shareholder notification costs associated with changes to the Portfolio's name, sub-adviser and expense structure. The Investment Adviser reimbursed the Portfolio $49,655 of these costs.
68
TABLE OF CONTENTS
NOTES TO FINANCIAL STATEMENTS AS OF DECEMBER 31, 2019 (CONTINUED)
NOTE 6 — OTHER TRANSACTIONS WITH AFFILIATES AND RELATED PARTIES (continued)
At December 31, 2019, the following direct or indirect, wholly-owned subsidiaries of Voya Financial, Inc. or affiliated investment companies owned more than 5% of the following Portfolios:
Subsidiary/Affiliated
Investment Company | | Portfolio | | Percentage | |
ReliaStar Life Insurance
Company | | Invesco Oppenheimer Global | | | 6.35 | % | |
| | | T. Rowe Price Diversified
Mid Cap Growth | | | 11.52 | | |
Security Life of Denver
Insurance Company | | Global Bond | | | 7.03 | | |
| | | Columbia Small Cap Value II | | | 5.38 | | |
Voya Institutional Trust
Company | | Global Bond | | | 23.56 | | |
| | | International High
Dividend Low Volatility | | | 5.96 | | |
| | | American Century
Small-Mid Cap Value | | | 51.97 | | |
| | | Baron Growth | | | 31.25 | | |
| | | Columbia Contrarian Core | | | 47.33 | | |
| | | Columbia Small Cap Value II | | | 17.86 | | |
| | | Invesco Comstock | | | 10.24 | | |
| | | Invesco Oppenheimer Global | | | 14.29 | | |
| | | JPMorgan Mid Cap Value | | | 27.81 | | |
| | | T. Rowe Price Diversified
Mid Cap Growth | | | 13.81 | | |
| | | T. Rowe Price Growth Equity | | | 28.37 | | |
Voya Retirement Insurance
and Annuity Company | | Global Bond | | | 63.29 | | |
| | | International High
Dividend Low Volatility | | | 25.19 | | |
| | | American Century
Small-Mid Cap Value | | | 45.92 | | |
| | | Baron Growth | | | 62.57 | | |
| | | Columbia Contrarian Core | | | 46.12 | | |
| | | Columbia Small Cap Value II | | | 28.79 | | |
| | | Invesco Comstock | | | 27.20 | | |
| | | Invesco Equity and Income | | | 35.54 | | |
| | | Invesco Oppenheimer Global | | | 68.19 | | |
| | | JPMorgan Mid Cap Value | | | 42.47 | | |
| | | T. Rowe Price Diversified
Mid Cap Growth | | | 67.09 | | |
| | | T. Rowe Price Growth Equity | | | 57.22 | | |
Voya Solution 2035 Portfolio | | Invesco Comstock | | | 14.17 | | |
Voya Solution 2045 Portfolio | | Invesco Comstock | | | 16.15 | | |
Voya Solution 2055 Portfolio | | Invesco Comstock | | | 5.68 | | |
Voya Solution Moderately
Aggressive Portfolio | | Invesco Comstock | | | 14.59 | | |
Under the 1940 Act, the direct or indirect beneficial owner of more than 25% of the voting securities of a company (including a fund) is presumed to control such company. Companies under common control (e.g., companies with a common owner of greater than 25% of their respective voting securities) are affiliates under the 1940 Act.
The Investment Adviser may direct the Portfolios' sub-advisers to use their best efforts (subject to obtaining best execution of each transaction) to allocate a Portfolio's equity security transactions through certain designated broker-dealers. The designated broker-dealer, in turn,
will reimburse a portion of the brokerage commissions to pay certain expenses of that Portfolio. Any amounts credited to the Portfolios are reflected as brokerage commission recapture on the accompanying Statements of Operations.
The Portfolios have adopted a deferred compensation plan (the "DC Plan"), which allows eligible independent directors, as described in the DC Plan, to defer the receipt of all or a portion of the directors' fees that they are entitled to receive from the Portfolios. For purposes of determining the amount owed to the director under the DC Plan, the amounts deferred are invested in shares of the funds selected by the director (the "Notional Funds"). The Portfolios purchase shares of the Notional Funds, which are all advised by Voya Investments, in amounts equal to the directors' deferred fees, resulting in a Portfolio asset equal to the deferred compensation liability. Such assets, if applicable, are included as a component of "Other assets" on the accompanying Statements of Assets and Liabilities. Deferral of directors' fees under the DC Plan will not affect net assets of the Portfolio, and will not materially affect the Portfolios' assets, liabilities or net investment income per share. Amounts will be deferred until distributed in accordance with the DC Plan.
NOTE 7 — OTHER ACCRUED EXPENSES AND LIABILITIES
At December 31, 2019, the following Portfolio has the below payable included in Other Accrued Expenses and Liabilities on the Statement of Assets and Liabilities that exceeded 5% of total liabilities:
Portfolio | | Accrued
Expenses | | Amount | |
Columbia Contrarian Core | | Custody | | $ | 24,751 | | |
NOTE 8 — EXPENSE LIMITATION AGREEMENTS
The Investment Adviser has entered into a written expense limitation agreement ("Expense Limitation Agreement") with the following Portfolios, whereby the Investment Adviser has agreed to limit expenses, excluding interest, taxes, investment-related costs, leverage expenses, extraordinary expenses, and acquired fund fees and expenses to the levels listed below:
Portfolio | | Class ADV | | Class I | | Class R6 | | Class S | | Class S2 | |
Global Bond | | | 1.17 | % | | | 0.67 | % | | | N/A | | | | 0.92 | % | | | N/A | | |
International High
Dividend Low
Volatility(1) | | | 1.25 | % | | | 0.75 | % | | | N/A | | | | 1.00 | % | | | 1.15 | % | |
American Century
Small-Mid Cap
Value | | | 1.52 | % | | | 1.02 | % | | | N/A | | | | 1.27 | % | | | 1.42 | % | |
Baron Growth | | | 1.55 | % | | | 1.05 | % | | | 1.05 | % | | | 1.30 | % | | | 1.45 | % | |
69
TABLE OF CONTENTS
NOTES TO FINANCIAL STATEMENTS AS OF DECEMBER 31, 2019 (CONTINUED)
NOTE 8 — EXPENSE LIMITATION AGREEMENTS (continued)
Portfolio | | Class ADV | | Class I | | Class R6 | | Class S | | Class S2 | |
Columbia Contrarian
Core(2) | | | N/A | | | | N/A | | | | N/A | | | | N/A | | | | N/A | | |
Columbia Small Cap
Value II | | | 1.65 | % | | | 1.15 | % | | | 1.15 | % | | | 1.40 | % | | | 1.55 | % | |
Invesco Comstock(3) | | | N/A | | | | N/A | | | | N/A | | | | N/A | | | | N/A | | |
Invesco Equity and
Income | | | 1.15 | % | | | 0.65 | % | | | N/A | | | | 0.90 | % | | | 1.05 | % | |
Invesco Oppenheimer
Global | | | 1.30 | % | | | 0.80 | % | | | N/A | | | | 1.05 | % | | | 1.20 | % | |
JPMorgan Mid Cap
Value | | | 1.50 | % | | | 1.00 | % | | | N/A | | | | 1.25 | % | | | 1.40 | % | |
T. Rowe Price
Diversified
Mid Cap Growth | | | 1.30 | % | | | 0.80 | % | | | 0.80 | % | | | 1.05 | % | | | 1.20 | % | |
T. Rowe Price
Growth Equity | | | 1.25 | % | | | 0.75 | % | | | N/A | | | | 1.00 | % | | | 1.15 | % | |
(1) Prior to May 1, 2019, the expense limits for International High Dividend Low Volatility were 1.48%, 0.98%, 1.23% and 1.38% for Class ADV, Class I, Class S, and Class S2, respectively. Also prior to May 1, 2019, the expense limits for the Portfolio were pursuant to a side letter agreement so that the expense limits were 1.42%, 0.92%, 1.17% and 1.32% for Class ADV, Class I, Class S, and Class S2, respectively. Termination of the side letter agreement was approved by the Board. Any fees waived pursuant to the side letter agreement were not eligible for recoupment.
(2) Pursuant to a side letter agreement, through May 1, 2020, the Investment Adviser has agreed to waive all or a portion of the management fee and/or reimburse expenses so that the expense limits are 1.25%, 0.75% and 1.00% for Class ADV, Class I and Class S, respectively. Termination or modification of this obligation requires approval by the Board. Any fees waived pursuant to the side letter agreement shall not be eligible for recoupment.
(3) Pursuant to a side letter agreement, through May 1, 2020, the Investment Adviser has agreed to waive all or a portion of the management fee and/or reimburse expenses so that the expense limits are 1.31%, 0.81% and 1.06% for Class ADV, Class I, and Class S, respectively. Termination or modification of this obligation requires approval by the Board. Any fees waived pursuant to the side letter agreement shall not be eligible for recoupment.
Unless otherwise specified above and with the exception of the non-recoupable management fee waivers for certain Portfolios, the Investment Adviser may, at a later date, recoup from a Portfolio for fees waived and/or other expenses reimbursed by the Investment Adviser during the previous 36 months, but only if, after such recoupment, a Portfolio's expense ratio does not exceed the percentage described above. Waived and reimbursed fees net of any recoupment by the Investment Adviser of such waived and reimbursed fees are reflected on the accompanying Statements of Operations. Amounts payable by the Investment Adviser are reflected on the accompanying Statements of Assets and Liabilities.
At December 31, 2019, the amounts of waived and/or reimbursed fees that are subject to possible recoupment
by the Investment Adviser, and the related expiration dates are as follows:
| | | December 31, | |
Portfolio | | 2020 | | 2021 | | 2022 | | Total | |
Global Bond | | $ | 148,091 | | | $ | 48,917 | | | $ | — | | | $ | 197,008 | | |
American Century
Small-Mid Cap Value | | | 448,785 | | | | 471,897 | | | | 478,862 | | | | 1,399,544 | | |
Invesco Equity and
Income | | | 320,129 | | | | 338,591 | | | | 284,321 | | | | 943,041 | | |
The Expense Limitation Agreement is contractual through May 1, 2020 and shall renew automatically for one-year terms. Termination or modification of this obligation requires approval by the Board.
NOTE 9 — LINE OF CREDIT
Effective May 17, 2019, each Portfolio, in addition to certain other funds managed by the Investment Adviser, has entered into a 364-day unsecured committed revolving line of credit agreement (the "Credit Agreement") with The Bank of New York Mellon ("BNY") for an aggregate amount of $400,000,000 through May 15, 2020. The proceeds may be used only to finance temporarily: (1) the purchase or sale of investment securities; or (2) the repurchase or redemption of shares of a Portfolio or certain other funds managed by the Investment Adviser. The funds to which the line of credit is available pay a commitment fee equal to 0.15% per annum on the daily unused portion of the committed line amount payable quarterly in arrears. Prior to May 17, 2019, the predecessor line of credit was for an aggregate amount of $400,000,000 and paid a commitment fee equal to 0.15% per annum on the daily unused portion of the committed line amount through May 17, 2019.
Borrowings under the Credit Agreement accrue interest at the federal funds rate plus a specified margin. Repayments generally must be made within 60 days after the date of a revolving credit advance.
The below Portfolios utilized the line of credit during the year ended December 31, 2019 as follows:
Portfolio | | Days
Utilized | | Approximate
Average Daily
Balance For
Days Utilized | | Approximate
Weighted
Average
Interest Rate
For Days
Utilized | |
International High
Dividend Low Volatility | | | 11 | | | $ | 1,731,909 | | | | 3.25 | % | |
Baron Growth | | | 83 | | | | 2,746,277 | | | | 2.87 | | |
Columbia Contrarian Core | | | 2 | | | | 2,917,500 | | | | 2.55 | | |
Invesco Comstock | | | 2 | | | | 3,277,000 | | | | 2.55 | | |
Invesco Equity and Income | | | 2 | | | | 1,538,500 | | | | 2.55 | | |
Invesco Oppenheimer Global | | | 11 | | | | 1,604,727 | | | | 2.56 | | |
JPMorgan Mid Cap Value | | | 3 | | | | 859,333 | | | | 3.40 | | |
T. Rowe Price Diversified Mid
Cap Growth | | | 2 | | | | 1,974,000 | | | | 3.40 | | |
T. Rowe Price Growth Equity | | | 1 | | | | 27,659,000 | | | | 2.56 | | |
70
TABLE OF CONTENTS
NOTES TO FINANCIAL STATEMENTS AS OF DECEMBER 31, 2019 (CONTINUED)
NOTE 10 — CAPITAL SHARES
Transactions in capital shares and dollars were as follows:
| | | Shares sold | | Shares
issued
in merger | | Reinvestment
of
distributions | | Shares
redeemed | | Net increase
(decrease)
in shares
outstanding | | Shares sold | | Proceeds
from shares
issued
in merger | | Reinvestment
of
distributions | | Shares
redeemed | | Net increase
(decrease) | |
Year or period ended | | # | | # | | # | | # | | # | | ($) | | ($) | | ($) | | ($) | | ($) | |
Global Bond | |
Class ADV | |
12/31/2019 | | | 72,009 | | | | — | | | | 84,325 | | | | (266,977 | ) | | | (110,643 | ) | | | 764,849 | | | | — | | | | 898,538 | | | | (2,833,241 | ) | | | (1,169,854 | ) | |
12/31/2018 | | | 107,461 | | | | — | | | | 72,678 | | | | (311,313 | ) | | | (131,174 | ) | | | 1,157,396 | | | | — | | | | 769,925 | | | | (3,327,931 | ) | | | (1,400,610 | ) | |
Class I | |
12/31/2019 | | | 597,864 | | | | — | | | | 621,286 | | | | (1,647,146 | ) | | | (427,996 | ) | | | 6,481,829 | | | | — | | | | 6,738,559 | | | | (17,777,051 | ) | | | (4,556,663 | ) | |
12/31/2018 | | | 911,412 | | | | — | | | | 537,701 | | | | (2,033,504 | ) | | | (584,391 | ) | | | 10,018,950 | | | | — | | | | 5,803,370 | | | | (22,121,742 | ) | | | (6,299,422 | ) | |
Class S | |
12/31/2019 | | | 336,265 | | | | — | | | | 139,872 | | | | (811,640 | ) | | | (335,503 | ) | | | 3,616,907 | | | | — | | | | 1,515,590 | | | | (8,765,197 | ) | | | (3,632,700 | ) | |
12/31/2018 | | | 357,448 | | | | — | | | | 126,794 | | | | (825,761 | ) | | | (341,519 | ) | | | 3,946,498 | | | | — | | | | 1,366,597 | | | | (8,967,470 | ) | | | (3,654,375 | ) | |
International High Dividend Low Volatility | |
Class ADV | |
12/31/2019 | | | 101,081 | | | | — | | | | 283,594 | | | | (524,719 | ) | | | (140,044 | ) | | | 1,152,683 | | | | — | | | | 2,960,724 | | | | (5,968,607 | ) | | | (1,855,200 | ) | |
12/31/2018 | | | 204,397 | | | | — | | | | 45,777 | | | | (379,502 | ) | | | (129,328 | ) | | | 2,498,165 | | | | — | | | | 573,585 | | | | (4,728,970 | ) | | | (1,657,220 | ) | |
Class I | |
12/31/2019 | | | 409,616 | | | | — | | | | 1,323,708 | | | | (1,853,901 | ) | | | (120,577 | ) | | | 4,630,867 | | | | — | | | | 13,951,881 | | | | (21,407,289 | ) | | | (2,824,541 | ) | |
12/31/2018 | | | 338,766 | | | | — | | | | 274,300 | | | | (2,243,203 | ) | | | (1,630,137 | ) | | | 4,293,304 | | | | — | | | | 3,467,151 | | | | (28,466,112 | ) | | | (20,705,657 | ) | |
Class S | |
12/31/2019 | | | 512,206 | | | | — | | | | 2,971,669 | | | | (4,768,795 | ) | | | (1,284,920 | ) | | | 5,913,334 | | | | — | | | | 31,143,088 | | | | (54,407,215 | ) | | | (17,350,793 | ) | |
12/31/2018 | | | 996,742 | | | | — | | | | 534,532 | | | | (4,108,088 | ) | | | (2,576,814 | ) | | | 11,842,738 | | | | — | | | | 6,719,064 | | | | (51,763,740 | ) | | | (33,201,938 | ) | |
Class S2 | |
12/31/2019 | | | 3,211 | | | | — | | | | 3,248 | | | | (8,854 | ) | | | (2,395 | ) | | | 36,945 | | | | — | | | | 34,369 | | | | (104,194 | ) | | | (32,880 | ) | |
12/31/2018 | | | 10,549 | | | | — | | | | 225 | | | | (51,196 | ) | | | (40,422 | ) | | | 134,321 | | | | — | | | | 2,851 | | | | (667,749 | ) | | | (530,577 | ) | |
American Century Small-Mid Cap Value | |
Class ADV | |
12/31/2019 | | | 432,667 | | | | — | | | | 1,170,626 | | | | (1,325,279 | ) | | | 278,014 | | | | 4,678,820 | | | | — | | | | 11,753,088 | | | | (14,194,508 | ) | | | 2,237,400 | | |
12/31/2018 | | | 613,792 | | | | — | | | | 1,071,992 | | | | (1,311,960 | ) | | | 373,824 | | | | 6,960,016 | | | | — | | | | 12,531,586 | | | | (15,681,948 | ) | | | 3,809,654 | | |
Class I | |
12/31/2019 | | | 2,573,252 | | | | — | | | | 1,694,092 | | | | (3,413,910 | ) | | | 853,434 | | | | 30,245,938 | | | | — | | | | 18,296,197 | | | | (39,805,518 | ) | | | 8,736,617 | | |
12/31/2018 | | | 3,435,749 | | | | — | | | | 1,517,587 | | | | (2,373,300 | ) | | | 2,580,036 | | | | 45,855,002 | | | | — | | | | 18,924,313 | | | | (30,367,166 | ) | | | 34,412,149 | | |
Class S | |
12/31/2019 | | | 305,317 | | | | — | | | | 920,355 | | | | (1,201,312 | ) | | | 24,360 | | | | 3,489,126 | | | | — | | | | 9,783,372 | | | | (13,278,796 | ) | | | (6,298 | ) | |
12/31/2018 | | | 396,054 | | | | — | | | | 902,227 | | | | (1,448,064 | ) | | | (149,783 | ) | | | 5,116,135 | | | | — | | | | 11,088,373 | | | | (18,075,907 | ) | | | (1,871,399 | ) | |
Class S2 | |
12/31/2019 | | | 49,213 | | | | — | | | | 34,471 | | | | (90,026 | ) | | | (6,342 | ) | | | 525,157 | | | | — | | | | 345,747 | | | | (985,946 | ) | | | (115,042 | ) | |
12/31/2018 | | | 123,487 | | | | — | | | | 38,390 | | | | (227,466 | ) | | | (65,589 | ) | | | 1,469,422 | | | | — | | | | 448,005 | | | | (2,658,259 | ) | | | (740,832 | ) | |
Baron Growth | |
Class ADV | |
12/31/2019 | | | 249,033 | | | | — | | | | 2,319,700 | | | | (516,800 | ) | | | 2,051,933 | | | | 7,216,796 | | | | — | | | | 47,493,762 | | | | (14,581,393 | ) | | | 40,129,165 | | |
12/31/2018 | | | 300,567 | | | | — | | | | 328,131 | | | | (468,556 | ) | | | 160,142 | | | | 8,872,455 | | | | — | | | | 9,617,517 | | | | (13,262,712 | ) | | | 5,227,260 | | |
Class I | |
12/31/2019 | | | 815,944 | | | | — | | | | 2,422,716 | | | | (1,319,145 | ) | | | 1,919,515 | | | | 26,738,235 | | | | — | | | | 59,298,450 | | | | (42,168,001 | ) | | | 43,868,684 | | |
12/31/2018 | | | 1,026,844 | | | | — | | | | 393,231 | | | | (1,843,012 | ) | | | (422,937 | ) | | | 34,412,110 | | | | — | | | | 12,799,676 | | | | (59,860,928 | ) | | | (12,649,142 | ) | |
Class R6 | |
12/31/2019 | | | 392,920 | | | | — | | | | 541,324 | | | | (50,500 | ) | | | 883,744 | | | | 13,304,155 | | | | — | | | | 13,222,247 | | | | (1,630,115 | ) | | | 24,896,287 | | |
12/31/2018 | | | 207,770 | | | | — | | | | 39,826 | | | | (74,487 | ) | | | 173,109 | | | | 6,540,912 | | | | — | | | | 1,297,132 | | | | (2,403,899 | ) | | | 5,434,145 | | |
Class S | |
12/31/2019 | | | 353,135 | | | | — | | | | 10,213,853 | | | | (17,339,400 | ) | | | (6,772,412 | ) | | | 11,037,891 | | | | — | | | | 230,644,671 | | | | (393,504,343 | ) | | | (151,821,781 | ) | |
12/31/2018 | | | 1,119,922 | | | | — | | | | 1,673,908 | | | | (2,967,774 | ) | | | (173,944 | ) | | | 36,139,530 | | | | — | | | | 51,924,632 | | | | (89,260,707 | ) | | | (1,196,545 | ) | |
Class S2 | |
12/31/2019 | | | 20,386 | | | | — | | | | 50,409 | | | | (16,905 | ) | | | 53,890 | | | | 602,488 | | | | — | | | | 1,051,073 | | | | (496,141 | ) | | | 1,157,420 | | |
12/31/2018 | | | 23,784 | | | | — | | | | 7,926 | | | | (31,698 | ) | | | 12 | | | | 738,495 | | | | — | | | | 234,454 | | | | (915,458 | ) | | | 57,491 | | |
Columbia Contrarian Core | |
Class ADV | |
12/31/2019 | | | 42,856 | | | | — | | | | 521,026 | | | | (214,647 | ) | | | 349,235 | | | | 881,742 | | | | — | | | | 8,811,227 | | | | (4,374,539 | ) | | | 5,318,430 | | |
12/31/2018 | | | 49,081 | | | | — | | | | 134,249 | | | | (331,366 | ) | | | (148,036 | ) | | | 1,069,831 | | | | — | | | | 2,909,173 | | | | (7,381,566 | ) | | | (3,402,562 | ) | |
71
TABLE OF CONTENTS
NOTES TO FINANCIAL STATEMENTS AS OF DECEMBER 31, 2019 (CONTINUED)
NOTE 10 — CAPITAL SHARES (continued)
| | | Shares sold | | Shares
issued
in merger | | Reinvestment
of
distributions | | Shares
redeemed | | Net increase
(decrease)
in shares
outstanding | | Shares sold | | Proceeds
from shares
issued
in merger | | Reinvestment
of
distributions | | Shares
redeemed | | Net increase
(decrease) | |
Year or period ended | | # | | # | | # | | # | | # | | ($) | | ($) | | ($) | | ($) | | ($) | |
Columbia Contrarian Core (continued) | |
Class I | |
12/31/2019 | | | 24,564 | | | | — | | | | 163,159 | | | | (103,029 | ) | | | 84,694 | | | | 549,715 | | | | — | | | | 2,960,790 | | | | (2,130,862 | ) | | | 1,379,643 | | |
12/31/2018 | | | 29,872 | | | | — | | | | 46,913 | | | | (88,763 | ) | | | (11,978 | ) | | | 715,909 | | | | — | | | | 1,071,961 | | | | (2,093,065 | ) | | | (305,195 | ) | |
Class S | |
12/31/2019 | | | 91,456 | | | | — | | | | 5,137,224 | | | | (15,523,769 | ) | | | (10,295,089 | ) | | | 2,038,439 | | | | — | | | | 90,737,866 | | | | (268,617,713 | ) | | | (175,841,408 | ) | |
12/31/2018 | | | 184,454 | | | | — | | | | 1,294,345 | | | | (1,955,721 | ) | | | (476,922 | ) | | | 3,984,200 | | | | — | | | | 28,941,556 | | | | (45,417,709 | ) | | | (12,491,953 | ) | |
Columbia Small Cap Value II | |
Class ADV | |
12/31/2019 | | | 128,403 | | | | — | | | | 249,343 | | | | (599,378 | ) | | | (221,632 | ) | | | 2,008,512 | | | | — | | | | 3,495,796 | | | | (9,224,620 | ) | | | (3,720,312 | ) | |
12/31/2018 | | | 227,250 | | | | — | | | | 201,218 | | | | (396,799 | ) | | | 31,669 | | | | 4,035,866 | | | | — | | | | 3,708,442 | | | | (7,407,431 | ) | | | 336,877 | | |
Class I | |
12/31/2019 | | | 355,814 | | | | — | | | | 314,196 | | | | (625,983 | ) | | | 44,027 | | | | 5,690,798 | | | | — | | | | 4,571,559 | | | | (9,975,856 | ) | | | 286,501 | | |
12/31/2018 | | | 566,411 | | | | — | | | | 244,876 | | | | (715,737 | ) | | | 95,550 | | | | 11,432,694 | | | | — | | | | 4,664,883 | | | | (14,142,351 | ) | | | 1,955,226 | | |
Class R6 | |
12/31/2019 | | | 147,485 | | | | — | | | | 53,102 | | | | (130,644 | ) | | | 69,943 | | | | 2,329,093 | | | | — | | | | 773,170 | | | | (2,138,313 | ) | | | 963,950 | | |
12/31/2018 | | | 167,370 | | | | — | | | | 35,110 | | | | (61,775 | ) | | | 140,705 | | | | 3,303,461 | | | | — | | | | 669,195 | | | | (1,190,120 | ) | | | 2,782,536 | | |
Class S | |
12/31/2019 | | | 108,596 | | | | — | | | | 803,825 | | | | (1,160,500 | ) | | | (248,079 | ) | | | 1,738,590 | | | | — | | | | 11,647,424 | | | | (18,354,263 | ) | | | (4,968,249 | ) | |
12/31/2018 | | | 300,878 | | | | — | | | | 632,496 | | | | (1,144,288 | ) | | | (210,914 | ) | | | 5,236,661 | | | | — | | | | 12,004,777 | | | | (22,016,618 | ) | | | (4,775,180 | ) | |
Class S2 | |
12/31/2019 | | | 14,012 | | | | — | | | | 24,603 | | | | (96,255 | ) | | | (57,640 | ) | | | 217,859 | | | | — | | | | 344,194 | | | | (1,369,398 | ) | | | (807,345 | ) | |
12/31/2018 | | | 32,079 | | | | — | | | | 20,026 | | | | (59,021 | ) | | | (6,916 | ) | | | 626,038 | | | | — | | | | 368,284 | | | | (1,094,565 | ) | | | (100,243 | ) | |
Invesco Comstock | |
Class ADV | |
12/31/2019 | | | 23,490 | | | | — | | | | 405,684 | | | | (205,888 | ) | | | 223,286 | | | | 434,542 | | | | — | | | | 6,879,165 | | | | (3,877,190 | ) | | | 3,436,517 | | |
12/31/2018 | | | 51,425 | | | | — | | | | 19,900 | | | | (256,551 | ) | | | (185,226 | ) | | | 1,004,115 | | | | — | | | | 343,478 | | | | (5,197,952 | ) | | | (3,850,359 | ) | |
Class I | |
12/31/2019 | | | 1,465,835 | | | | — | | | | 2,611,188 | | | | (4,745,228 | ) | | | (668,205 | ) | | | 27,393,184 | | | | — | | | | 44,729,596 | | | | (93,025,245 | ) | | | (20,902,465 | ) | |
12/31/2018 | | | 5,430,306 | | | | — | | | | 218,682 | | | | (2,397,948 | ) | | | 3,251,040 | | | | 108,367,907 | | | | — | | | | 3,805,062 | | | | (49,370,454 | ) | | | 62,802,515 | | |
Class S | |
12/31/2019 | | | 110,332 | | | | — | | | | 3,046,424 | | | | (11,179,019 | ) | | | (8,022,263 | ) | | | 2,110,540 | | | | — | | | | 52,190,119 | | | | (191,430,001 | ) | | | (137,129,342 | ) | |
12/31/2018 | | | 967,823 | | | | — | | | | 188,601 | | | | (2,367,511 | ) | | | (1,211,087 | ) | | | 19,843,128 | | | | — | | | | 3,279,768 | | | | (48,285,650 | ) | | | (25,162,754 | ) | |
Invesco Equity and Income | |
Class ADV | |
12/31/2019 | | | 65,527 | | | | — | | | | 73,147 | | | | (214,017 | ) | | | (75,343 | ) | | | 2,800,010 | | | | — | | | | 3,049,060 | | | | (9,083,013 | ) | | | (3,233,943 | ) | |
12/31/2018 | | | 81,155 | | | | — | | | | 91,253 | | | | (229,247 | ) | | | (56,839 | ) | | | 3,648,189 | | | | — | | | | 3,961,563 | | | | (9,984,995 | ) | | | (2,375,243 | ) | |
Class I | |
12/31/2019 | | | 126,163 | | | | — | | | | 815,289 | | | | (1,785,659 | ) | | | (844,207 | ) | | | 5,492,160 | | | | — | | | | 34,708,723 | | | | (77,532,643 | ) | | | (37,331,760 | ) | |
12/31/2018 | | | 104,499 | | | | — | | | | 1,004,991 | | | | (1,787,520 | ) | | | (678,030 | ) | | | 4,853,395 | | | | — | | | | 44,057,761 | | | | (82,254,303 | ) | | | (33,343,147 | ) | |
Class S | |
12/31/2019 | | | 114,538 | | | | — | | | | 802,541 | | | | (1,910,974 | ) | | | (993,895 | ) | | | 4,882,090 | | | | — | | | | 33,844,478 | | | | (81,926,723 | ) | | | (43,200,155 | ) | |
12/31/2018 | | | 118,305 | | | | — | | | | 979,094 | | | | (2,134,911 | ) | | | (1,037,512 | ) | | | 5,275,466 | | | | — | | | | 42,757,248 | | | | (97,706,897 | ) | | | (49,674,183 | ) | |
Class S2 | |
12/31/2019 | | | 14,180 | | | | — | | | | 562,504 | | | | (1,253,710 | ) | | | (677,026 | ) | | | 603,985 | | | | — | | | | 23,339,231 | | | | (52,951,647 | ) | | | (29,008,431 | ) | |
12/31/2018 | | | 78,918 | | | | — | | | | 678,477 | | | | (1,483,010 | ) | | | (725,615 | ) | | | 3,396,456 | | | | — | | | | 29,253,116 | | | | (67,028,738 | ) | | | (34,379,166 | ) | |
Invesco Oppenheimer Global | |
Class ADV | |
12/31/2019 | | | 550,524 | | | | — | | | | 1,203,393 | | | | (1,013,913 | ) | | | 740,004 | | | | 9,958,994 | | | | — | | | | 20,072,596 | | | | (18,725,628 | ) | | | 11,305,962 | | |
12/31/2018 | | | 633,609 | | | | — | | | | 474,485 | | | | (760,606 | ) | | | 347,488 | | | | 13,358,244 | | | | — | | | | 9,769,648 | | | | (15,739,471 | ) | | | 7,388,421 | | |
Class I | |
12/31/2019 | | | 399,408 | | | | — | | | | 11,474,234 | | | | (8,341,131 | ) | | | 3,532,511 | | | | 7,869,571 | | | | — | | | | 201,831,773 | | | | (162,556,794 | ) | | | 47,144,550 | | |
12/31/2018 | | | 1,123,768 | | | | — | | | | 4,936,736 | | | | (8,624,635 | ) | | | (2,564,131 | ) | | | 25,291,868 | | | | — | | | | 106,189,185 | | | | (187,567,248 | ) | | | (56,086,195 | ) | |
Class S | |
12/31/2019 | | | 306,206 | | | | — | | | | 1,913,905 | | | | (2,223,422 | ) | | | (3,311 | ) | | | 5,893,628 | | | | — | | | | 32,134,460 | | | | (41,310,928 | ) | | | (3,282,840 | ) | |
12/31/2018 | | | 626,522 | | | | — | | | | 835,391 | | | | (2,776,365 | ) | | | (1,314,452 | ) | | | 13,220,396 | | | | — | | | | 17,292,594 | | | | (58,501,665 | ) | | | (27,988,675 | ) | |
Class S2 | |
12/31/2019 | | | 28,583 | | | | — | | | | 52,498 | | | | (61,091 | ) | | | 19,990 | | | | 521,019 | | | | — | | | | 850,475 | | | | (1,040,184 | ) | | | 331,310 | | |
12/31/2018 | | | 56,448 | | | | — | | | | 18,913 | | | | (29,829 | ) | | | 45,532 | | | | 1,167,011 | | | | — | | | | 380,527 | | | | (597,991 | ) | | | 949,547 | | |
72
TABLE OF CONTENTS
NOTES TO FINANCIAL STATEMENTS AS OF DECEMBER 31, 2019 (CONTINUED)
NOTE 10 — CAPITAL SHARES (continued)
| | | Shares sold | | Shares
issued
in merger | | Reinvestment
of
distributions | | Shares
redeemed | | Net increase
(decrease)
in shares
outstanding | | Shares sold | | Proceeds
from shares
issued
in merger | | Reinvestment
of
distributions | | Shares
redeemed | | Net increase
(decrease) | |
Year or period ended | | # | | # | | # | | # | | # | | ($) | | ($) | | ($) | | ($) | | ($) | |
JPMorgan Mid Cap Value | |
Class ADV | |
12/31/2019 | | | 147,351 | | | | — | | | | 735,530 | | | | (736,415 | ) | | | 146,466 | | | | 2,532,611 | | | | — | | | | 11,709,923 | | | | (12,683,921 | ) | | | 1,558,613 | | |
12/31/2018 | | | 284,401 | | | | — | | | | 475,470 | | | | (705,865 | ) | | | 54,006 | | | | 5,101,884 | | | | — | | | | 8,727,492 | | | | (13,480,108 | ) | | | 349,268 | | |
Class I | |
12/31/2019 | | | 278,141 | | | | — | | | | 1,225,099 | | | | (1,963,104 | ) | | | (459,864 | ) | | | 5,008,145 | | | | — | | | | 20,246,539 | | | | (34,862,252 | ) | | | (9,607,568 | ) | |
12/31/2018 | | | 624,104 | | | | — | | | | 904,875 | | | | (2,968,852 | ) | | | (1,439,873 | ) | | | 12,311,094 | | | | — | | | | 16,991,070 | | | | (59,119,229 | ) | | | (29,817,065 | ) | |
Class S | |
12/31/2019 | | | 145,484 | | | | — | | | | 1,623,123 | | | | (2,015,526 | ) | | | (246,919 | ) | | | 2,531,494 | | | | — | | | | 26,438,368 | | | | (35,426,352 | ) | | | (6,456,490 | ) | |
12/31/2018 | | | 171,038 | | | | — | | | | 1,155,320 | | | | (2,416,380 | ) | | | (1,090,022 | ) | | | 3,188,532 | | | | — | | | | 21,524,896 | | | | (46,776,268 | ) | | | (22,062,840 | ) | |
Class S2 | |
12/31/2019 | | | 9,591 | | | | — | | | | 15,685 | | | | (55,939 | ) | | | (30,663 | ) | | | 165,877 | | | | — | | | | 249,115 | | | | (963,085 | ) | | | (548,093 | ) | |
12/31/2018 | | | 14,255 | | | | — | | | | 13,541 | | | | (64,364 | ) | | | (36,568 | ) | | | 274,204 | | | | — | | | | 247,852 | | | | (1,240,162 | ) | | | (718,106 | ) | |
T. Rowe Price Diversified Mid Cap Growth | |
Class ADV | |
12/31/2019 | | | 1,089,397 | | | | — | | | | 911,358 | | | | (508,896 | ) | | | 1,491,859 | | | | 11,810,400 | | | | — | | | | 9,332,153 | | | | (5,384,313 | ) | | | 15,758,240 | | |
12/31/2018 | | | 798,669 | | | | — | | | | 688,512 | | | | (660,539 | ) | | | 826,642 | | | | 8,480,509 | | | | — | | | | 7,077,906 | | | | (6,722,707 | ) | | | 8,835,708 | | |
Class I | |
12/31/2019 | | | 2,944,906 | | | | — | | | | 8,249,833 | | | | (7,718,800 | ) | | | 3,475,939 | | | | 36,294,075 | | | | — | | | | 95,912,625 | | | | (91,646,082 | ) | | | 40,560,618 | | |
12/31/2018 | | | 1,199,176 | | | | — | | | | 7,399,482 | | | | (9,389,775 | ) | | | (791,117 | ) | | | 14,034,229 | | | | — | | | | 84,724,065 | | | | (109,632,993 | ) | | | (10,874,699 | ) | |
Class R6 | |
12/31/2019 | | | 963,467 | | | | — | | | | 210,303 | | | | (256,754 | ) | | | 917,016 | | | | 11,462,681 | | | | — | | | | 2,445,270 | | | | (3,021,502 | ) | | | 10,886,449 | | |
12/31/2018 | | | 859,308 | | | | — | | | | 114,839 | | | | (237,675 | ) | | | 736,472 | | | | 10,179,816 | | | | — | | | | 1,316,053 | | | | (2,802,680 | ) | | | 8,693,189 | | |
Class S | |
12/31/2019 | | | 404,626 | | | | — | | | | 447,472 | | | | (1,258,034 | ) | | | (405,936 | ) | | | 4,725,994 | | | | — | | | | 4,957,916 | | | | (13,837,027 | ) | | | (4,153,117 | ) | |
12/31/2018 | | | 356,278 | | | | — | | | | 461,138 | | | | (1,415,694 | ) | | | (598,278 | ) | | | 4,036,987 | | | | — | | | | 5,077,125 | | | | (16,026,103 | ) | | | (6,911,991 | ) | |
Class S2 | |
12/31/2019 | | | 44,777 | | | | — | | | | 57,985 | | | | (47,014 | ) | | | 55,748 | | | | 482,464 | | | | — | | | | 597,820 | | | | (509,805 | ) | | | 570,479 | | |
12/31/2018 | | | 94,906 | | | | — | | | | 43,824 | | | | (79,822 | ) | | | 58,908 | | | | 1,023,328 | | | | — | | | | 452,699 | | | | (875,851 | ) | | | 600,176 | | |
T. Rowe Price Growth Equity | |
Class ADV | |
12/31/2019 | | | 237,759 | | | | — | | | | 944,122 | | | | (351,642 | ) | | | 830,239 | | | | 18,796,348 | | | | — | | | | 68,035,018 | | | | (27,139,359 | ) | | | 59,692,007 | | |
12/31/2018 | | | 261,182 | | | | — | | | | 559,992 | | | | (330,772 | ) | | | 490,402 | | | | 22,951,628 | | | | — | | | | 45,353,718 | | | | (27,985,404 | ) | | | 40,319,942 | | |
Class I | |
12/31/2019 | | | 852,152 | | | | — | | | | 3,355,554 | | | | (2,362,090 | ) | | | 1,845,616 | | | | 76,097,980 | | | | — | | | | 271,933,502 | | | | (203,221,863 | ) | | | 144,809,619 | | |
12/31/2018 | | | 2,230,797 | | | | — | | | | 2,199,050 | | | | (2,249,562 | ) | | | 2,180,285 | | | | 213,234,651 | | | | — | | | | 195,495,575 | | | | (213,135,984 | ) | | | 195,594,242 | | |
Class S | |
12/31/2019 | | | 140,509 | | | | — | | | | 1,031,198 | | | | (4,740,057 | ) | | | (3,568,350 | ) | | | 11,705,589 | | | | — | | | | 79,114,269 | | | | (362,347,011 | ) | | | (271,527,153 | ) | |
12/31/2018 | | | 480,816 | | | | — | | | | 774,336 | | | | (1,066,587 | ) | | | 188,565 | | | | 46,196,756 | | | | — | | | | 65,810,841 | | | | (94,161,918 | ) | | | 17,845,679 | | |
Class S2 | |
12/31/2019 | | | 12,524 | | | | — | | | | 29,320 | | | | (37,118 | ) | | | 4,726 | | | | 992,959 | | | | — | | | | 2,161,210 | | | | (2,930,228 | ) | | | 223,941 | | |
12/31/2018 | | | 19,695 | | | | — | | | | 19,769 | | | | (23,934 | ) | | | 15,530 | | | | 1,762,920 | | | | — | | | | 1,626,233 | | | | (2,117,285 | ) | | | 1,271,868 | | |
NOTE 11 — SECURITIES LENDING
Under a Master Securities Lending Agreement (the "Agreement") with BNY, the Portfolios can lend their securities to approved brokers, dealers and other financial institutions. Loans are collateralized by cash and U.S. government securities. The collateral is equal to at least 105% of the market value of non-U.S. securities loaned and 102% of the market value of U.S. securities loaned. The market value of the loaned securities is determined at Market Close of the Portfolios at their last sale price or official closing price on the principal exchange or system on which they are traded and any
additional collateral is delivered to the Portfolios on the next business day. The cash collateral received is invested in approved investments as defined in the Agreement with BNY. The Portfolios bear the risk of loss with respect to the investment of collateral with the following exception: BNY provides the Portfolios indemnification from loss with respect to the investment of collateral to the extent the cash collateral is invested in overnight repurchase agreements.
Cash collateral received in connection with securities lending is invested in cash equivalents, money market funds, repurchase agreements with maturities of not
73
TABLE OF CONTENTS
NOTES TO FINANCIAL STATEMENTS AS OF DECEMBER 31, 2019 (CONTINUED)
NOTE 11 — SECURITIES LENDING (continued)
more than 99 days that are collateralized with U.S. Government securities, or certain short-term investments that have a remaining maturity of 190 days or less ("Permitted Investments"). Short-term investments include: securities, units, shares or other participations in short-term investment funds, pools or trusts; commercial paper, notes, bonds or other debt obligations, certificates of deposit, time deposits and other bank obligations and asset-backed commercial paper backed by diversified receivables and repurchase-backed programs. Permitted Investments are subject to certain guidelines established by the Adviser regarding liquidity, diversification, credit quality and average credit life/duration requirements. The securities purchased with cash collateral received are reflected in the Portfolio of Investments under Short-Term Investments.
Generally, in the event of counterparty default, the Portfolios have the right to use the collateral to offset losses incurred. The Agreement contains certain guarantees by BNY in the event of counterparty default and/or a borrower's failure to return a loaned security; however, there would be a potential loss to the Portfolios in the event the Portfolios are delayed or prevented from exercising their right to dispose of the collateral. Engaging in securities lending could have a leveraging effect, which may intensify the credit, market and other risks associated with investing in a Portfolio.
The following is a summary of each respective Portfolio's securities lending agreements by counterparty which are subject to offset under the Agreement as of December 31, 2019:
Global Bond
| Counterparty | | Securities
Loaned
at Value | | Cash
Collateral
Received(1) | | Net
Amount | |
Goldman Sachs & Co. LLC | | $ | 2,149 | | | $ | (2,149 | ) | | $ | — | | |
Societe Generale | | | 4,106,542 | | | | (4,106,542 | ) | | | — | | |
Total | | $ | 4,108,691 | | | $ | (4,108,691 | ) | | $ | — | | |
(1) Collateral with a fair value of $4,199,320 has been received in connection with the above securities lending transactions. Excess collateral received from the individual counterparty is not shown for financial reporting purposes.
International High Dividend Low Volatility
| Counterparty | | Securities
Loaned
at Value | | Cash
Collateral
Received(1) | | Net
Amount | |
Citigroup Global Markets Inc | | $ | 3,339,558 | | | $ | (3,339,558 | ) | | $ | — | | |
Total | | $ | 3,339,558 | | | $ | (3,339,558 | ) | | $ | — | | |
(1) Collateral with a fair value of $3,512,449 has been received in connection with the above securities lending transactions. Excess collateral received from the individual counterparty is not shown for financial reporting purposes.
American Century Small-Mid Cap Value
| Counterparty | | Securities
Loaned
at Value | | Cash
Collateral
Received(1) | | Net
Amount | |
Barclays Bank PLC | | $ | 25,079 | | | $ | (25,079 | ) | | $ | — | | |
Barclays Capital Inc | | | 67,014 | | | | (67,014 | ) | | | — | | |
Cantor Fitzgerald & Co | | | 68,530 | | | | (68,530 | ) | | | — | | |
Citadel Clearing LLC | | | 1,750,956 | | | | (1,750,956 | ) | | | — | | |
Citigroup Global Markets Inc | | | 42,194 | | | | (42,194 | ) | | | — | | |
Goldman Sachs & Co. LLC | | | 28,385 | | | | (28,385 | ) | | | — | | |
J.P. Morgan Securities LLC | | | 2,086,768 | | | | (2,086,768 | ) | | | — | | |
Morgan Stanley & Co. LLC | | | 214,312 | | | | (214,312 | ) | | | — | | |
Nomura Securities
International, Inc | | | 8,722 | | | | (8,722 | ) | | | — | | |
RBC Capital Markets, LLC | | | 815 | | | | (815 | ) | | | — | | |
Scotia Capital (USA) Inc | | | 2,177 | | | | (2,177 | ) | | | — | | |
Wells Fargo Bank NA | | | 53,002 | | | | (53,002 | ) | | | — | | |
Wells Fargo Securities LLC | | | 2,306,210 | | | | (2,306,210 | ) | | | — | | |
Total | | $ | 6,654,164 | | | $ | (6,654,164 | ) | | $ | — | | |
(1) Collateral with a fair value of $6,809,732 has been received in connection with the above securities lending transactions. Excess collateral received from the individual counterparty is not shown for financial reporting purposes.
Invesco Comstock
| Counterparty | | Securities
Loaned
at Value | | Cash
Collateral
Received(1) | | Net
Amount | |
BMO Capital Markets Corp | | $ | 12,474 | | | $ | (12,474 | ) | | $ | — | | |
Credit Suisse Securities
(USA) LLC | | | 1,675,040 | | | | (1,675,040 | ) | | | — | | |
National Bank of Canada
Financial Inc | | | 3,794,364 | | | | (3,794,364 | ) | | | — | | |
Total | | $ | 5,481,878 | | | $ | (5,481,878 | ) | | $ | — | | |
(1) Collateral with a fair value of $5,606,719 has been received in connection with the above securities lending transactions. Excess collateral received from the individual counterparty is not shown for financial reporting purposes.
Invesco Equity and Income
| Counterparty | | Securities
Loaned
at Value | | Cash
Collateral
Received(1) | | Net
Amount | |
BMO Capital Markets Corp | | $ | 270,400 | | | $ | (270,400 | ) | | $ | — | | |
BofA Securities Inc | | | 757,226 | | | | (757,226 | ) | | | — | | |
Citadel Clearing LLC | | | 1,197,669 | | | | (1,197,669 | ) | | | — | | |
Citadel Securities LLC | | | 38,066 | | | | (38,066 | ) | | | — | | |
Citigroup Global Markets Inc | | | 2,216,666 | | | | (2,216,666 | ) | | | — | | |
Deutsche Bank Securities Inc | | | 21,438 | | | | (21,438 | ) | | | — | | |
Goldman Sachs & Co. LLC | | | 6,196,412 | | | | (6,196,412 | ) | | | — | | |
HSBC Securities (USA) Inc | | | 808,515 | | | | (808,515 | ) | | | — | | |
J.P. Morgan Securities LLC | | | 1,790,486 | | | | (1,790,486 | ) | | | — | | |
Mizuho Securities USA LLC | | | 2,982,767 | | | | (2,982,767 | ) | | | — | | |
Nomura Securities
International, Inc | | | 4,897,279 | | | | (4,897,279 | ) | | | — | | |
Scotia Capital (USA) Inc | | | 256,007 | | | | (256,007 | ) | | | — | | |
Societe Generale | | | 3,800,826 | | | | (3,800,826 | ) | | | — | | |
State Street Bank and
Trust Company | | | 2,488,847 | | | | (2,488,847 | ) | | | — | | |
SunTrust Robinson
Humphrey, Inc | | | 750,984 | | | | (750,984 | ) | | | — | | |
74
TABLE OF CONTENTS
NOTES TO FINANCIAL STATEMENTS AS OF DECEMBER 31, 2019 (CONTINUED)
NOTE 11 — SECURITIES LENDING (continued)
Invesco Equity and Income (continued)
| Counterparty | | Securities
Loaned
at Value | | Cash
Collateral
Received(1) | | Net
Amount | |
Wells Fargo Bank NA | | $ | 1,096,460 | | | $ | (1,096,460 | ) | | $ | — | | |
Wells Fargo Securities LLC | | | 2,684,670 | | | | (2,684,670 | ) | | | — | | |
Total | | $ | 32,254,718 | | | $ | (32,254,718 | ) | | $ | — | | |
(1) Collateral with a fair value of $33,057,900 has been received in connection with the above securities lending transactions. Excess collateral received from the individual counterparty is not shown for financial reporting purposes.
Invesco Oppenheimer Global
| Counterparty | | Securities
Loaned
at Value | | Cash
Collateral
Received(1) | | Net
Amount | |
Barclays Bank PLC | | $ | 3,996,668 | | | $ | (3,996,668 | ) | | $ | — | | |
Barclays Capital Inc | | | 65,152 | | | | (65,152 | ) | | | — | | |
BNP Paribas Prime
Brokerage Intl Ltd | | | 875,514 | | | | (875,514 | ) | | | — | | |
BofA Securities Inc | | | 1,659,820 | | | | (1,659,820 | ) | | | — | | |
Citadel Securities LLC | | | 6,238,491 | | | | (6,238,491 | ) | | | — | | |
Citigroup Global Markets Inc | | | 5,610,355 | | | | (5,610,355 | ) | | | — | | |
Credit Suisse Securities
(USA) LLC | | | 5,767,876 | | | | (5,767,876 | ) | | | — | | |
J.P. Morgan Securities LLC | | | 4,810,757 | | | | (4,810,757 | ) | | | — | | |
Morgan Stanley & Co. LLC | | | 4,046,912 | | | | (4,046,912 | ) | | | — | | |
National Bank of Canada
Financial Inc | | | 66,221 | | | | (66,221 | ) | | | — | | |
State Street Bank and Trust
Company | | | 11,348,248 | | | | (11,348,248 | ) | | | — | | |
Wells Fargo Bank NA | | | 2,387,748 | | | | (2,387,748 | ) | | | — | | |
Wells Fargo Securities LLC | | | 1,533,421 | | | | (1,533,421 | ) | | | — | | |
Total | | $ | 48,407,183 | | | $ | (48,407,183 | ) | | $ | — | | |
(1) Collateral with a fair value of $49,668,469 has been received in connection with the above securities lending transactions. Excess collateral received from the individual counterparty is not shown for financial reporting purposes.
JPMorgan Mid Cap Value
| Counterparty | | Securities
Loaned
at Value | | Cash
Collateral
Received(1) | | Net
Amount | |
BofA Securities Inc | | $ | 1,863,732 | | | $ | (1,863,732 | ) | | $ | — | | |
Scotia Capital (USA) Inc | | | 353,037 | | | | (353,037 | ) | | | — | | |
Total | | $ | 2,216,769 | | | $ | (2,216,769 | ) | | $ | — | | |
(1) Collateral with a fair value of $2,266,832 has been received in connection with the above securities lending transactions. Excess collateral received from the individual counterparty is not shown for financial reporting purposes.
T. Rowe Price Diversified Mid Cap Growth
| Counterparty | | Securities
Loaned
at Value | | Cash
Collateral
Received(1) | | Net
Amount | |
Barclays Capital Inc | | $ | 2,872,997 | | | $ | (2,872,997 | ) | | $ | — | | |
BMO Capital Markets Corp | | | 636,792 | | | | (636,792 | ) | | | — | | |
BNP Paribas Prime
Brokerage Intl Ltd | | | 2,178,541 | | | | (2,178,541 | ) | | | — | | |
BofA Securities Inc | | | 2,038,315 | | | | (2,038,315 | ) | | | — | | |
Citadel Clearing LLC | | | 10,879,999 | | | | (10,879,999 | ) | | | — | | |
T. Rowe Price Diversified Mid Cap Growth (continued)
| Counterparty | | Securities
Loaned
at Value | | Cash
Collateral
Received(1) | | Net
Amount | |
Citadel Securities LLC | | $ | 2,049,802 | | | $ | (2,049,802 | ) | | $ | — | | |
Citigroup Global Markets Inc | | | 3,953,767 | | | | (3,953,767 | ) | | | — | | |
Credit Suisse AG | | | 5,666,423 | | | | (5,666,423 | ) | | | — | | |
Credit Suisse Securities
(USA) LLC | | | 1,325,230 | | | | (1,325,230 | ) | | | — | | |
Goldman Sachs & Co. LLC | | | 3,975,875 | | | | (3,975,875 | ) | | | — | | |
J.P. Morgan Securities LLC | | | 12,652,285 | | | | (12,652,285 | ) | | | — | | |
Jefferies LLC | | | 776,640 | | | | (776,640 | ) | | | — | | |
Morgan Stanley & Co. LLC | | | 12,870,906 | | | | (12,870,906 | ) | | | — | | |
National Bank of Canada
Financial Inc | | | 469,171 | | | | (469,171 | ) | | | — | | |
National Financial Services LLC | | | 1,281,385 | | | | (1,281,385 | ) | | | — | | |
Natixis Securities America LLC | | | 692,921 | | | | (692,921 | ) | | | — | | |
RBC Capital Markets, LLC | | | 205,788 | | | | (205,788 | ) | | | — | | |
State Street Bank and Trust
Company | | | 13,181,674 | | | | (13,181,674 | ) | | | — | | |
UBS Securities LLC | | | 2,815,788 | | | | (2,815,788 | ) | | | — | | |
Wells Fargo Bank NA | | | 4,422,832 | | | | (4,422,832 | ) | | | — | | |
Wells Fargo Securities LLC | | | 9,659,268 | | | | (9,659,268 | ) | | | — | | |
Total | | $ | 94,606,399 | | | $ | (94,606,399 | ) | | $ | — | | |
(1) Collateral with a fair value of $96,821,637 has been received in connection with the above securities lending transactions. Excess collateral received from the individual counterparty is not shown for financial reporting purposes.
T. Rowe Price Growth Equity
| Counterparty | | Securities
Loaned
at Value | | Cash
Collateral
Received(1) | | Net
Amount | |
Barclays Capital Inc | | $ | 693,440 | | | $ | (693,440 | ) | | $ | — | | |
BofA Securities Inc | | | 195,750 | | | | (195,750 | ) | | | — | | |
Citigroup Global Markets Inc | | | 7,230,270 | | | | (7,230,270 | ) | | | — | | |
Credit Suisse AG | | | 12,594,958 | | | | (12,594,958 | ) | | | — | | |
Goldman Sachs & Co. LLC | | | 2,324,498 | | | | (2,324,498 | ) | | | — | | |
J.P. Morgan Securities LLC | | | 1,276,031 | | | | (1,276,031 | ) | | | — | | |
Jefferies LLC | | | 101,601 | | | | (101,601 | ) | | | — | | |
Morgan Stanley & Co. LLC | | | 5,809,486 | | | | (5,809,486 | ) | | | — | | |
Natixis Securities America LLC | | | 4,747,729 | | | | (4,747,729 | ) | | | — | | |
State Street Bank and Trust
Company | | | 6,594,544 | | | | (6,594,544 | ) | | | — | | |
Wells Fargo Securities LLC | | | 21,316,662 | | | | (21,316,662 | ) | | | — | | |
Total | | $ | 62,884,969 | | | $ | (62,884,969 | ) | | $ | — | | |
(1) Collateral with a fair value of $64,308,606 has been received in connection with the above securities lending transactions. Excess collateral received from the individual counterparty is not shown for financial reporting purposes.
NOTE 12 — FEDERAL INCOME TAXES
The amount of distributions from net investment income and net realized capital gains are determined in accordance with federal income tax regulations, which may differ from GAAP for investment companies. These book/tax differences may be either temporary or permanent. Permanent differences are reclassified within the capital accounts based on their federal tax-basis treatment; temporary differences are not reclassified. Key differences include the treatment of short-term capital gains, foreign currency transactions, paydowns, income from passive foreign investment companies (PFICs), and
75
TABLE OF CONTENTS
NOTES TO FINANCIAL STATEMENTS AS OF DECEMBER 31, 2019 (CONTINUED)
NOTE 12 — FEDERAL INCOME TAXES (continued)
wash sale deferrals. Distributions in excess of net investment income and/or net realized capital gains for tax purposes are reported as return of capital.
The following permanent tax differences have been reclassified as of December 31, 2019:
| | | Paid-in
Capital | | Distributable
Earnings | |
Baron Growth | | $ | (800,543 | ) | | $ | 800,543 | | |
T. Rowe Price Growth Equity | | | (145,066 | ) | | | 145,066 | | |
Dividends paid by the Portfolios from net investment income and distributions of net realized short-term capital gains are, for federal income tax purposes, taxable as ordinary income to shareholders.
The tax composition of dividends and distributions to shareholders was as follows:
| | | Year Ended December 31, 2019 | | Year Ended December 31, 2018 | |
| | | Ordinary
Income | | Long-term
Capital
Gains | | Return of
Capital | | Ordinary
Income | | Long-term
Capital
Gains | |
Global Bond | | $ | 9,152,687 | | | $ | — | | | $ | — | | | $ | 7,939,892 | | | $ | — | | |
International High Dividend Low Volatility | | | 9,130,872 | | | | 38,959,190 | | | | — | | | | 10,762,651 | | | | — | | |
American Century Small-Mid Cap Value | | | 13,787,968 | | | | 26,390,436 | | | | — | | | | 15,059,560 | | | | 27,932,717 | | |
Baron Growth | | | — | | | | 347,944,282 | | | | 3,765,921 | | | | 3,009,782 | | | | 72,863,629 | | |
Columbia Contrarian Core | | | 8,509,463 | | | | 94,000,420 | | | | — | | | | 4,280,361 | | | | 28,642,329 | | |
Columbia Small Cap Value II | | | 587,957 | | | | 20,244,186 | | | | — | | | | 3,298,285 | | | | 18,117,296 | | |
Invesco Comstock | | | 12,865,602 | | | | 90,933,278 | | | | — | | | | 7,428,308 | | | | — | | |
Invesco Equity and Income | | | 24,218,223 | | | | 70,723,269 | | | | — | | | | 26,090,360 | | | | 93,939,328 | | |
Invesco Oppenheimer Global | | | 7,804,476 | | | | 247,084,828 | | | | — | | | | 28,967,304 | | | | 104,664,650 | | |
JPMorgan Mid Cap Value | | | 6,411,421 | | | | 52,232,524 | | | | — | | | | 7,147,783 | | | | 40,343,527 | | |
T. Rowe Price Diversified Mid Cap Growth | | | 6,834,529 | | | | 106,411,255 | | | | — | | | | 7,473,924 | | | | 91,173,924 | | |
T. Rowe Price Growth Equity | | | 2,350,307 | | | | 418,893,692 | | | | — | | | | 8,462,876 | | | | 299,823,491 | | |
The tax-basis components of distributable earnings and the capital loss carryforwards which may be used to offset future realized capital gains for federal income tax purposes as of December 31, 2019 were:
| | | Undistributed | | Undistributed
Long-term | | Unrealized
Appreciation/ | | Capital Loss Carryforwards | |
| | | Ordinary Income | | Capital Gains | | (Depreciation) | | Amount | | Character | | Expiration | |
Global Bond | | $ | 4,115,946 | | | $ | — | | | $ | 1,968,768 | | | $ | (1,205,330 | ) | | Short-term | | | None | | |
| | | | | | | | | | (5,808,433 | ) | | Long-term | | | None | | |
| | | | | | | | | $ | (7,013,763 | ) | | | | | | | | | |
International High Dividend Low Volatility | | | 13,912,805 | | | | 50,295,767 | | | | 26,551,112 | | | | — | | | | — | | | | — | | |
American Century Small-Mid Cap Value | | | 6,041,866 | | | | — | | | | 33,169,294 | | | | — | | | | — | | | | — | | |
Baron Growth | | | — | | | | — | | | | 368,305,014 | | | | — | | | | — | | | | — | | |
Columbia Contrarian Core | | | 5,738,711 | | | | — | | | | 9,537,488 | | | | — | | | | — | | | | — | | |
Columbia Small Cap Value II | | | 908,378 | | | | 5,237,516 | | | | 24,070,667 | | | | — | | | | — | | | | — | | |
Invesco Comstock | | | 1,831,301 | | | | 4,671,973 | | | | 40,156,837 | | | | — | | | | — | | | | — | | |
Invesco Equity and Income | | | 8,154,377 | | | | 47,794,633 | | | | 151,671,599 | | | | — | | | | — | | | | — | | |
Invesco Oppenheimer Global | | | 15,525,835 | | | | 51,240,232 | | | | 747,707,154 | | | | — | | | | — | | | | — | | |
JPMorgan Mid Cap Value | | | 678,025 | | | | 29,286,392 | | | | 116,154,624 | | | | — | | | | — | | | | — | | |
T. Rowe Price Diversified Mid Cap Growth | | | 3,781,909 | | | | 94,213,163 | | | | 386,963,632 | | | | — | | | | — | | | | — | | |
T. Rowe Price Growth Equity | | | — | | | | 67,430,272 | | | | 461,996,572 | | | | — | | | | — | | | | — | | |
76
TABLE OF CONTENTS
NOTES TO FINANCIAL STATEMENTS AS OF DECEMBER 31, 2019 (CONTINUED)
NOTE 12 — FEDERAL INCOME TAXES (continued)
The Portfolios' major tax jurisdictions are U.S. federal and Arizona state.
As of December 31, 2019, no provision for income tax is required in the Portfolios' financial statements as a result of tax positions taken on federal and state income tax returns for open tax years. The Portfolios' federal and state income and federal excise tax returns for tax years for which the applicable statutes of limitations have not expired are subject to examination by the Internal Revenue Service and state department of revenue. Generally, the earliest tax year that remains subject to examination by these jurisdictions is 2015.
NOTE 13 — OTHER ACCOUNTING PRONOUNCEMENTS
The Portfolios have made a change in accounting principle and adopted the provisions of Financial Accounting Standards Board ("FASB") Accounting Standards Update 2017-08 ("ASU 2017-08"), Premium Amortization on Purchased Callable Debt Securities. ASU 2017-08 shortens the amortization period for certain callable debt securities held at a premium; specifically, requiring the premium to be amortized to the earliest call date. Prior to ASU 2017-08, premiums on callable debt securities were generally amortized to maturity date. ASU 2017-08 is intended to more closely align the amortization period with the expectations incorporated into the market pricing on the underlying security. ASU 2017-08 does not require an accounting change for securities held at a discount; the discount continues to be amortized to maturity date. Upon evaluation, the Portfolios have concluded that the change in accounting principle does not materially impact the financial statement amounts.
Also, in August 2018, the FASB issued Accounting Standards Update 2018-13, Fair Value Measurement (Topic 820): Disclosure Framework — Changes to the Disclosure Requirements for Fair Value Measurement ("ASU 2018-13"). The update provides guidance that eliminates, adds and modifies certain disclosure requirements for fair value measurements. ASU 2018-13 will be effective for annual periods beginning after December 15, 2019 and interim periods within those annual periods. At this time, the Portfolios have elected to early adopt the amendments that allow for removal of disclosure requirements related to transfers between Level 1 and Level 2 of the fair value hierarchy and the timing of transfers between levels of the fair value hierarchy. These changes did not have a material impact
on the Portfolios' financial statements. The Portfolios plan to adopt the amendments that require additional fair value measurement disclosures for annual periods beginning after December 15, 2019, and interim periods within those annual periods. The Portfolios are currently evaluating the impact of these changes on the financial statements.
NOTE 14 — AUDITOR CHANGE (UNAUDITED)
On September 12, 2019, KPMG LLP ("KPMG") was dismissed as the independent registered public accounting firm to the Company, on behalf of the Portfolios, upon completion of the audit for the fiscal year ended December 31, 2019. The decision to change independent registered public accounting firms was recommended by the Audit Committee of the Board and was approved by the Board.
KPMG's reports on the Portfolios' financial statements for the fiscal years ended December 31, 2019 and December 31, 2018 contained no adverse opinion or disclaimer of opinion nor were they qualified or modified as to uncertainty, audit scope or accounting principle.
During the fiscal years ended December 31, 2019 and December 31, 2018: (i) there were no disagreements with KPMG on any matter of accounting principles or practices, financial statement disclosure or auditing scope or procedure, which disagreements, if not resolved to the satisfaction of KPMG, would have caused KPMG to make reference to the subject matter of the disagreements in connection with its reports on the Portfolios' financial statements for such periods; and (ii) there were no "reportable events" of the kind described in Item 304(a)(1)(v) of Regulation S-K under the Securities Exchange Act of 1934, as amended.
On September 12, 2019, based on the recommendation of the Audit Committee of the Board, the Board approved the selection of Ernst & Young LLP ("EY") as the Portfolios' independent registered public accounting firm for the fiscal year ending December 31, 2020. During the Portfolios' fiscal years ended December 31, 2019 and December 31, 2018, neither the Portfolios, nor anyone on their behalf, consulted with EY on items which: (i) concerned the application of accounting principles to a specified transaction, either completed or proposed, or the type of audit opinion that might be rendered on the Portfolios' financial statements; or (ii) concerned the subject of a disagreement (as described in paragraph (a)(1)(iv) of Item 304 of Regulation S-K) or reportable events (as described in paragraph (a)(1)(v) of said Item 304).
77
TABLE OF CONTENTS
NOTES TO FINANCIAL STATEMENTS AS OF DECEMBER 31, 2019 (CONTINUED)
NOTE 15 — SUBSEQUENT EVENTS
Dividends: Subsequent to December 31, 2019, the following Portfolio paid dividends from net investment income of:
| | | Per Share
Amount | | Payable Date | | Record Date | |
Global Bond | |
Class ADV | | $ | 0.0217 | | | February 3, 2020 | | Daily | |
Class I | | $ | 0.0267 | | | February 3, 2020 | | Daily | |
Class S | | $ | 0.0244 | | | February 3, 2020 | | Daily | |
Expense Limitation Agreement: The Board approved revised expense limits for each class of Baron Growth. Effective January 1, 2020, through May 1, 2021, the Investment Adviser has further lowered the expense limits to 1.49%, 0.99%, 0.99%, 1.24%, and 1.39% for Class ADV, Class I, Class R6, Class S, and Class S2, respectively.
The Board approved revised expense limits for each class of Columbia Small Cap Value II. Effective January 1, 2020, through May 1, 2021, the Investment Adviser has further lowered the expense limits to 1.45%,
0.95%, 0.95%, 1.20%, and 1.35% for Class ADV, Class I, Class R6, Class S, and Class S2, respectively.
The Board approved revised expense limits for each class of JPMorgan Mid Cap Value. Effective January 1, 2020, through May 1, 2021, the Investment Adviser has further lowered the expense limits to 1.38%, 0.88%, 1.13%, and 1.28% for Class ADV, Class I, Class S, and Class S2, respectively.
The Board approved a new side letter expense limitation agreement with respect to Invesco Comstock. Effective January 1, 2020, the new non-recoupable side letter agreement, through May 1, 2021, is 1.29% 0.79%, 0.79%, 1.04%, and 1.19% for Class ADV, Class I, Class R6, Class S and Class S2, respectively.
The Portfolios have evaluated events occurring after the Statements of Assets and Liabilities date ("subsequent events") to determine whether any subsequent events necessitated adjustment to or disclosure in the financial statements. Other than above, no such subsequent events were identified.
78
TABLE OF CONTENTS
SUMMARY PORTFOLIO OF INVESTMENTS
VOYA GLOBAL BOND PORTFOLIO AS OF DECEMBER 31, 2019
Principal
Amount† | |
| |
| | Value | | Percentage
of Net
Assets | |
CORPORATE BONDS/NOTES: 21.1% | | | |
| | | | | Canada: 0.2% | |
| | 377,000 | | | | | | | Other
Securities | | $ | 392,242 | | | | 0.2 | | |
| | | | | China: 0.3% | |
| | 601,000 | | | | | | | Alibaba Group
Holding Ltd.,
3.600%,
11/28/2024 | | | 632,889 | | | | 0.3 | | |
| | | | | France: 0.7% | |
| | 572,000 | | | | (1 | ) | | BNP Paribas
SA, 3.500%,
03/01/2023 | | | 591,935 | | | | 0.3 | | |
| | 265,000 | | | | (1 | ) | | BPCE SA,
2.700%,
10/01/2029 | | | 262,807 | | | | 0.1 | | |
| | 287,000 | | | | (1 | ) | | BPCE SA,
5.150%,
07/21/2024 | | | 314,958 | | | | 0.2 | | |
| | 226,000 | | | | (1 | ) | | Electricite de
France SA,
2.350%,
10/13/2020 | | | 226,457 | | | | 0.1 | | |
| | | | | | | | | | 1,396,157 | | | | 0.7 | | |
| | | | | Guernsey: 0.4% | |
| | 716,000 | | | | | | | Credit Suisse
Group
Funding
Guernsey
Ltd., 2.750%,
03/26/2020 | | | 716,937 | | | | 0.4 | | |
| | | | | Ireland: 0.2% | |
| | 370,000 | | | | | | | Other Securities | | | 381,224 | | | | 0.2 | | |
| | | | | Japan: 0.9% | |
| | 200,000 | | | | (1 | ) | | Mizuho Bank
Ltd., 3.200%,
03/26/2025 | | | 207,681 | | | | 0.1 | | |
| | 790,000 | | | | (1 | ) | | MUFG Bank
Ltd., 2.300%,
03/05/2020 | | | 790,474 | | | | 0.4 | | |
| | 200,000 | | | | | | | Sumitomo
Mitsui
Financial
Group, Inc.,
2.448%,
09/27/2024 | | | 200,463 | | | | 0.1 | | |
| | 639,000 | | | | | | | Sumitomo
Mitsui
Financial
Group, Inc.,
3.784%,
03/09/2026 | | | 683,080 | | | | 0.3 | | |
| | | | | | | | | | 1,881,698 | | | | 0.9 | | |
Principal
Amount† | |
| |
| | Value | | Percentage
of Net
Assets | |
| | | | | Mexico: 0.0% | |
MXN | 59,796 | | | | (2 | ) | | JP Morgan /
Hipotecaria
su Casita,
6.100%,
09/25/2035 | | $ | 3,108 | | | | 0.0 | | |
MXN | 1,007,437 | | | | (3 | ),(4) | | Other Securities | | | — | | | | — | | |
| | | | | | | | | | 3,108 | | | | 0.0 | | |
| | | | | Netherlands: 0.8% | |
| | 690,000 | | | | | | | Shell
International
Finance BV,
3.250%,
05/11/2025 | | | 730,184 | | | | 0.4 | | |
| | 361,000 | | | | | | | Shell
International
Finance BV,
4.000%,
05/10/2046 | | | 411,366 | | | | 0.2 | | |
| | 300,000 | | | | (1 | ) | | Siemens
Financieringsmaatschappij
NV, 2.350%,
10/15/2026 | | | 298,341 | | | | 0.1 | | |
| | 270,000 | | | | | | | Other Securities | | | 271,629 | | | | 0.1 | | |
| | | | | | | | | | 1,711,520 | | | | 0.8 | | |
| | | | | Norway: 0.2% | |
| | 380,000 | | | | | | | Other Securities | | | 385,977 | | | | 0.2 | | |
| | | | | South Africa: 0.0% | |
ZAR | 1,000,000 | | | | | | | Other Securities | | | 76,502 | | | | 0.0 | | |
| | | | | Switzerland: 0.4% | |
| | 400,000 | | | | (1 | ) | | Credit Suisse
AG, 6.500%,
08/08/2023 | | | 446,970 | | | | 0.2 | | |
| | 250,000 | | | | | | | Other Securities | | | 281,926 | | | | 0.2 | | |
| | | | | | | | | | 728,896 | | | | 0.4 | | |
| | | | | United Kingdom: 1.1% | |
| | 200,000 | | | | (1 | ) | | Reckitt
Benckiser
Treasury
Services PLC,
3.000%,
06/26/2027 | | | 204,907 | | | | 0.1 | | |
| | 1,002,000 | | | | | | | Santander UK
PLC, 2.375%,
03/16/2020 | | | 1,002,593 | | | | 0.5 | | |
| | 230,000 | | | | (1 | ) | | Standard
Chartered
PLC, 5.300%,
01/09/2043 | | | 277,349 | | | | 0.1 | | |
| | 688,000 | | | | | | | Other Securities | | | 722,386 | | | | 0.4 | | |
| | | | | | | | | | 2,207,235 | | | | 1.1 | | |
See Accompanying Notes to Financial Statements
79
TABLE OF CONTENTS
SUMMARY PORTFOLIO OF INVESTMENTS
VOYA GLOBAL BOND PORTFOLIO AS OF DECEMBER 31, 2019 (CONTINUED)
Principal
Amount† | |
| |
| | Value | | Percentage
of Net
Assets | |
| | | | | United States: 15.9% | |
| | 185,000 | | | | (1 | ) | | AbbVie, Inc.,
3.200%,
11/21/2029 | | $ | 188,318 | | | | 0.1 | | |
| | 471,000 | | | | | | | AbbVie, Inc.,
3.600%-
4.300%,
05/14/2025-
05/14/2036 | | | 513,618 | | | | 0.3 | | |
| | 1,033,000 | | | | | | | AT&T, Inc.,
4.300%-
5.450%,
02/15/2030-
03/01/2047 | | | 1,220,945 | | | | 0.6 | | |
| | 1,700,000 | | | | (5 | ) | | Bank of
America
Corp.,
3.300%-
4.330%,
01/11/2023-
03/15/2050 | | | 1,825,203 | | | | 0.9 | | |
| | 266,000 | | | | (1 | ) | | Bristol-Myers
Squibb Co.,
3.875%,
08/15/2025 | | | 287,760 | | | | 0.1 | | |
| | 1,313,000 | | | | | | | Citigroup, Inc.,
4.000%-
5.500%,
08/05/2024-
07/25/2028 | | | 1,445,242 | | | | 0.7 | | |
| | 278,000 | | | | (1 | ) | | Cleveland
Electric
Illuminating
Co/The,
3.500%,
04/01/2028 | | | 289,436 | | | | 0.1 | | |
| | 665,000 | | | | | | | Comcast Corp.,
2.350%-
5.650%,
01/15/2027-
06/15/2035 | | | 746,301 | | | | 0.4 | | |
| | 1,184,000 | | | | | | | CVS Health
Corp.,
2.800%,
07/20/2020 | | | 1,187,466 | | | | 0.6 | | |
| | 510,000 | | | | | | | CVS Health
Corp.,
4.300%,
03/25/2028 | | | 556,984 | | | | 0.3 | | |
| | 313,000 | | | | (1 | ) | | Dell
International
LLC / EMC
Corp.,
6.020%,
06/15/2026 | | | 360,253 | | | | 0.2 | | |
| | 1,026,000 | | | | | | | Energy
Transfer
Operating
L.P., 4.900%,
02/01/2024 | | | 1,100,883 | | | | 0.5 | | |
Principal
Amount† | |
| |
| | Value | | Percentage
of Net
Assets | |
| | 280,000 | | | | | | | Energy
Transfer
Partners
L.P. /
Regency
Energy
Finance
Corp.,
4.500%,
11/01/2023 | | $ | 296,625 | | | | 0.2 | | |
| | 558,000 | | | | | | | Entergy Corp.,
5.125%,
09/15/2020 | | | 565,663 | | | | 0.3 | | |
| | 200,000 | | | | | | | Entergy
Louisiana
LLC, 4.200%,
04/01/2050 | | | 235,977 | | | | 0.1 | | |
| | 281,000 | | | | (1 | ) | | Fairfax US,
Inc., 4.875%,
08/13/2024 | | | 300,346 | | | | 0.2 | | |
| | 569,000 | | | | | | | Ford Motor
Credit Co.
LLC, 3.200%,
01/15/2021 | | | 572,216 | | | | 0.3 | | |
| | 240,000 | | | | | | | Goldman Sachs
Group, Inc./
The, 2.625%,
04/25/2021 | | | 242,102 | | | | 0.1 | | |
| | 945,000 | | | | | | | Goldman Sachs
Group, Inc./
The, 3.000%,
04/26/2022 | | | 956,802 | | | | 0.5 | | |
| | 250,000 | | | | (5 | ) | | JPMorgan
Chase Bank
NA, 2.604%,
02/01/2021 | | | 250,133 | | | | 0.1 | | |
| | 595,000 | | | | (5 | ) | | JPMorgan
Chase & Co.,
2.550%-
6.000%,
03/01/2021-
12/31/2199 | | | 631,503 | | | | 0.3 | | |
| | 135,000 | | | | (1 | ) | | Kraft Heinz
Foods Co.,
4.875%,
10/01/2049 | | | 142,293 | | | | 0.1 | | |
| | 380,000 | | | | (1 | ) | | Metropolitan
Edison Co.,
4.000%,
04/15/2025 | | | 404,610 | | | | 0.2 | | |
| | 990,000 | | | | | | | Morgan
Stanley,
3.750%-
4.100%,
02/25/2023-
05/22/2023 | | | 1,042,491 | | | | 0.5 | | |
| | 70,000 | | | | (1 | ) | | MPLX L.P.,
5.250%,
01/15/2025 | | | 73,479 | | | | 0.0 | | |
See Accompanying Notes to Financial Statements
80
TABLE OF CONTENTS
SUMMARY PORTFOLIO OF INVESTMENTS
VOYA GLOBAL BOND PORTFOLIO AS OF DECEMBER 31, 2019 (CONTINUED)
Principal
Amount† | |
| |
| | Value | | Percentage
of Net
Assets | |
| | | | | United States (continued) | |
| | 561,000 | | | | | | | Verizon
Communications,
Inc., 4.125%-
4.522%,
03/16/2027-
09/15/2048 | | $ | 651,791 | | | | 0.3 | | |
| | 670,000 | | | | (5 | ) | | Wells Fargo &
Co., 2.406%-
4.100%,
10/30/2025-
06/03/2026 | | | 703,841 | | | | 0.4 | | |
| | 14,068,824 | | | | | | | Other Securities | | | 15,124,867 | | | | 7.5 | | |
| | | | | | | | | | 31,917,148 | | | | 15.9 | | |
| | | | | | | Total Corporate
Bonds/Notes
(Cost
$40,439,972) | | | 42,431,533 | | | | 21.1 | | |
COLLATERALIZED MORTGAGE OBLIGATIONS: 15.4% | | | |
| | | | | United States: 15.4% | |
| | 230,576 | | | | | | | Alternative
Loan Trust
2005-51
3A2A,
3.530%,
(12MTA +
1.290%),
11/20/2035 | | | 225,603 | | | | 0.1 | | |
| | 470,839 | | | | | | | Banc of
America
Funding
2005-1
Trust 1A1,
5.500%,
02/25/2035 | | | 480,578 | | | | 0.2 | | |
| | 69,096 | | | | (5 | ) | | Citigroup
Mortgage
Loan Trust,
Inc. 2005-2
1A3, 4.759%,
05/25/2035 | | | 70,571 | | | | 0.0 | | |
| | 297,106 | | | | | | | CitiMortgage
Alternative
Loan Trust
Series
2006-A3 1A7,
6.000%,
07/25/2036 | | | 292,876 | | | | 0.2 | | |
| | 49,090 | | | | | | | Countrywide
Alternative
Loan Trust
2005-
53T2 2A6,
2.292%,
(US0001M +
0.500%),
11/25/2035 | | | 27,626 | | | | 0.0 | | |
Principal
Amount† | |
| |
| | Value | | Percentage
of Net
Assets | |
| | 246,233 | | | | | | | Countrywide
Asset-Backed
Certificates
2005-IM1 M1,
2.512%,
(US0001M +
0.720%),
11/25/2035 | | $ | 245,204 | | | | 0.1 | | |
| | 266,654 | | | | (1 | ),(5) | | CSMC Trust
2015-3 B1,
3.934%,
03/25/2045 | | | 277,726 | | | | 0.1 | | |
| | 4,228 | | | | (1 | ) | | Deutsche ALT-
A Securities,
Inc. ALT2007-
RS1 A2,
2.200%,
(US0001M +
0.500%),
01/27/2037 | | | 7,213 | | | | 0.0 | | |
| | 666,673 | | | | | | | Fannie Mae
Connecticut
Avenue
Securities
2016-C05
2M2, 6.242%,
(US0001M +
4.450%),
01/25/2029 | | | 704,866 | | | | 0.4 | | |
| | 754,862 | | | | | | | Fannie Mae
Connecticut
Avenue
Securities
2016-C07
2M2, 6.142%,
(US0001M +
4.350%),
05/25/2029 | | | 796,643 | | | | 0.4 | | |
| | 400,000 | | | | | | | Fannie Mae
Connecticut
Avenue
Securities
2017-C02
2M2, 5.442%,
(US0001M +
3.650%),
09/25/2029 | | | 421,709 | | | | 0.2 | | |
| | 500,000 | | | | | | | Fannie Mae
Connecticut
Avenue
Securities
2017-C03
1M2, 4.792%,
(US0001M +
3.000%),
10/25/2029 | | | 522,793 | | | | 0.3 | | |
See Accompanying Notes to Financial Statements
81
TABLE OF CONTENTS
SUMMARY PORTFOLIO OF INVESTMENTS
VOYA GLOBAL BOND PORTFOLIO AS OF DECEMBER 31, 2019 (CONTINUED)
Principal
Amount† | |
| |
| | Value | | Percentage
of Net
Assets | |
| | | | | United States (continued) | |
| | 500,000 | | | | | | | Fannie Mae
Connecticut
Avenue
Securities
2017-C05
1M2, 3.992%,
(US0001M +
2.200%),
01/25/2030 | | $ | 509,006 | | | | 0.3 | | |
| | 300,000 | | | | | | | Fannie Mae
Connecticut
Avenue
Securities
2017-C07
1M2, 4.192%,
(US0001M +
2.400%),
05/28/2030 | | | 305,833 | | | | 0.2 | | |
| | 596,142 | | | | | | | Fannie Mae
Connecticut
Avenue
Securities
2017-C07
2M2, 4.292%,
(US0001M +
2.500%),
05/25/2030 | | | 605,760 | | | | 0.3 | | |
| | 600,000 | | | | | | | Fannie Mae
Connecticut
Avenue
Securities
2018-C04
2M2, 4.342%,
(US0001M +
2.550%),
12/25/2030 | | | 611,193 | | | | 0.3 | | |
| | 379,617 | | | | | | | Fannie Mae
Connecticut
Avenue
Securities
2018-C06
1M2, 3.792%,
(US0001M +
2.000%),
03/25/2031 | | | 381,513 | | | | 0.2 | | |
| | 400,000 | | | | (1 | ) | | Fannie Mae
Connecticut
Avenue
Securities
2019-R02
1M2, 4.092%,
(US0001M +
2.300%),
08/25/2031 | | | 404,043 | | | | 0.2 | | |
Principal
Amount† | |
| |
| | Value | | Percentage
of Net
Assets | |
| | 659,170 | | | | (1 | ) | | Fannie Mae
Connecticut
Avenue
Securities
Trust
2018-R07
1M2, 4.192%,
(US0001M +
2.400%),
04/25/2031 | | $ | 667,360 | | | | 0.3 | | |
| | 87,872 | | | | (6 | ) | | Fannie Mae
Interest Strip
Series 254 2,
7.500%,
01/25/2024 | | | 9,445 | | | | 0.0 | | |
| | 17,663 | | | | (6 | ) | | Fannie Mae
Interest Strip
Series 294 2,
7.000%,
02/25/2028 | | | 3,474 | | | | 0.0 | | |
| | 153,515 | | | | (6 | ) | | Fannie Mae
Interest Strip
Series 319 2,
6.500%,
02/25/2032 | | | 31,991 | | | | 0.0 | | |
| | 55,562 | | | | (6 | ) | | Fannie Mae
Interest Strip
Series 328 2,
6.000%,
12/25/2032 | | | 12,369 | | | | 0.0 | | |
| | 24,337 | | | | (6 | ) | | Fannie Mae
Interest Strip
Series 331 5,
6.000%,
02/25/2033 | | | 4,840 | | | | 0.0 | | |
| | 29,789 | | | | (6 | ) | | Fannie Mae
Interest Strip
Series 332 2,
6.000%,
03/25/2033 | | | 6,810 | | | | 0.0 | | |
| | 23,911 | | | | (6 | ) | | Fannie Mae
Interest Strip
Series 334 12,
6.000%,
03/25/2033 | | | 5,181 | | | | 0.0 | | |
| | 29,617 | | | | (6 | ) | | Fannie Mae
Interest Strip
Series 338 2,
5.500%,
07/25/2033 | | | 6,016 | | | | 0.0 | | |
| | 12,567 | | | | (6 | ) | | Fannie Mae
Interest Strip
Series 356 10,
5.500%,
06/25/2035 | | | 2,441 | | | | 0.0 | | |
| | 13,526 | | | | (6 | ) | | Fannie Mae
Interest Strip
Series 364 15,
6.000%,
09/25/2035 | | | 2,684 | | | | 0.0 | | |
See Accompanying Notes to Financial Statements
82
TABLE OF CONTENTS
SUMMARY PORTFOLIO OF INVESTMENTS
VOYA GLOBAL BOND PORTFOLIO AS OF DECEMBER 31, 2019 (CONTINUED)
Principal
Amount† | |
| |
| | Value | | Percentage
of Net
Assets | |
| | | | | United States (continued) | |
| | 438,967 | | | | (6 | ) | | Fannie Mae
Interest Strip
Series 418 5,
3.500%,
08/25/2043 | | $ | 69,805 | | | | 0.0 | | |
| | 641,856 | | | | (5 | ),(6) | | Fannie Mae
Interest Strip
Series 418 80,
3.500%,
08/25/2033 | | | 82,704 | | | | 0.0 | | |
| | 8,294 | | | | | | | Fannie Mae
REMIC Trust
1999-14 MB,
6.500%,
04/25/2029 | | | 9,060 | | | | 0.0 | | |
| | 11,906 | | | | | | | Fannie Mae
REMIC Trust
2001-80 ZB,
6.000%,
01/25/2032 | | | 13,259 | | | | 0.0 | | |
| | 57,177 | | | | (6 | ) | | Fannie Mae
REMIC Trust
2002-12 SB,
5.958%,
(-1.000*
US0001M +
7.750%),
07/25/2031 | | | 12,024 | | | | 0.0 | | |
| | 34,236 | | | | (6 | ) | | Fannie Mae
REMIC Trust
2002-2 SW,
5.958%,
(-1.000*
US0001M +
7.750%),
02/25/2032 | | | 7,438 | | | | 0.0 | | |
| | 14,619 | | | | | | | Fannie Mae
REMIC Trust
2002-21 PE,
6.500%,
04/25/2032 | | | 16,595 | | | | 0.0 | | |
| | 6,036 | | | | | | | Fannie Mae
REMIC Trust
2002-29 F,
2.792%,
(US0001M +
1.000%),
04/25/2032 | | | 6,164 | | | | 0.0 | | |
| | 18,671 | | | | (6 | ) | | Fannie Mae
REMIC Trust
2002-41 S,
6.158%,
(-1.000*
US0001M +
7.950%),
07/25/2032 | | | 3,442 | | | | 0.0 | | |
Principal
Amount† | |
| |
| | Value | | Percentage
of Net
Assets | |
| | 1,858 | | | | | | | Fannie Mae
REMIC Trust
2002-64 FJ,
2.792%,
(US0001M +
1.000%),
04/25/2032 | | $ | 1,897 | | | | 0.0 | | |
| | 3,924 | | | | | | | Fannie Mae
REMIC Trust
2002-68 FH,
2.245%,
(US0001M +
0.500%),
10/18/2032 | | | 3,930 | | | | 0.0 | | |
| | 672,454 | | | | (6 | ) | | Fannie Mae
REMIC Trust
2002-77 JS,
6.255%,
(-1.000*
US0001M +
8.000%),
12/18/2032 | | | 141,055 | | | | 0.1 | | |
| | 16,951 | | | | | | | Fannie Mae
REMIC Trust
2002-84 FB,
2.792%,
(US0001M +
1.000%),
12/25/2032 | | | 17,312 | | | | 0.0 | | |
| | 16,948 | | | | | | | Fannie Mae
REMIC Trust
2003-11 FA,
2.792%,
(US0001M +
1.000%),
09/25/2032 | | | 17,310 | | | | 0.0 | | |
| | 3,631 | | | | | | | Fannie Mae
REMIC Trust
2003-116 FA,
2.192%,
(US0001M +
0.400%),
11/25/2033 | | | 3,626 | | | | 0.0 | | |
| | 23,374 | | | | (6 | ) | | Fannie Mae
REMIC Trust
2003-13 IO,
7.000%,
03/25/2033 | | | 5,996 | | | | 0.0 | | |
| | 17,089 | | | | (6 | ) | | Fannie Mae
REMIC Trust
2003-26 IK,
7.000%,
04/25/2033 | | | 3,926 | | | | 0.0 | | |
| | 7,831 | | | | (6 | ) | | Fannie Mae
REMIC Trust
2003-52 NS,
5.308%,
(-1.000*
US0001M +
7.100%),
06/25/2023 | | | 360 | | | | 0.0 | | |
See Accompanying Notes to Financial Statements
83
TABLE OF CONTENTS
SUMMARY PORTFOLIO OF INVESTMENTS
VOYA GLOBAL BOND PORTFOLIO AS OF DECEMBER 31, 2019 (CONTINUED)
Principal
Amount† | |
| |
| | Value | | Percentage
of Net
Assets | |
| | | | | United States (continued) | |
| | 414,072 | | | | (6 | ) | | Fannie Mae
REMIC Trust
2004-56 SE,
5.758%,
(-1.000*
US0001M +
7.550%),
10/25/2033 | | $ | 79,646 | | | | 0.0 | | |
| | 24,925 | | | | | | | Fannie Mae
REMIC Trust
2005-25 PS,
20.275%,
(-4.400*
US0001M +
28.160%),
04/25/2035 | | | 42,015 | | | | 0.0 | | |
| | 11,926 | | | | (6 | ) | | Fannie Mae
REMIC Trust
2005-40 SB,
4.958%,
(-1.000*
US0001M +
6.750%),
05/25/2035 | | | 1,713 | | | | 0.0 | | |
| | 38,286 | | | | | | | Fannie Mae
REMIC Trust
2005-71 DB,
4.500%,
08/25/2025 | | | 39,131 | | | | 0.0 | | |
| | 112,127 | | | | | | | Fannie Mae
REMIC Trust
2005-74 DK,
16.832%,
(-4.000*
US0001M +
24.000%),
07/25/2035 | | | 175,273 | | | | 0.1 | | |
| | 301,887 | | | | | | | Fannie Mae
REMIC Trust
2005-87 SB,
17.263%,
(-3.667*
US0001M +
23.833%),
10/25/2035 | | | 471,514 | | | | 0.2 | | |
| | 185,880 | | | | | | | Fannie Mae
REMIC Trust
2006-104 ES,
24.490%,
(-5.000*
US0001M +
33.450%),
11/25/2036 | | | 335,063 | | | | 0.2 | | |
| | 13,536 | | | | | | | Fannie Mae
REMIC Trust
2006-11 PS,
17.996%,
(-3.667*
US0001M +
24.567%),
03/25/2036 | | | 22,028 | | | | 0.0 | | |
Principal
Amount† | |
| |
| | Value | | Percentage
of Net
Assets | |
| | 34,665 | | | | | | | Fannie Mae
REMIC Trust
2006-46 SW,
17.629%,
(-3.667*
US0001M +
24.199%),
06/25/2036 | | $ | 52,111 | | | | 0.0 | | |
| | 7,455,744 | | | | (6 | ) | | Fannie Mae
REMIC Trust
2006-51 SA,
4.778%,
(-1.000*
US0001M +
6.570%),
06/25/2036 | | | 1,397,595 | | | | 0.7 | | |
| | 62,422 | | | | (6 | ) | | Fannie Mae
REMIC Trust
2006-90 SX,
5.438%,
(-1.000*
US0001M +
7.230%),
09/25/2036 | | | 11,581 | | | | 0.0 | | |
| | 7,426,407 | | | | (6 | ) | | Fannie Mae
REMIC Trust
2007-116 DI,
4.148%,
(-1.000*
US0001M +
5.940%),
01/25/2038 | | | 1,396,826 | | | | 0.7 | | |
| | 53,125 | | | | (6 | ) | | Fannie Mae
REMIC Trust
2007-88 XI,
4.748%,
(-1.000*
US0001M +
6.540%),
06/25/2037 | | | 11,046 | | | | 0.0 | | |
| | 683,108 | | | | (6 | ) | | Fannie Mae
REMIC Trust
2007-89 SB,
4.758%,
(-1.000*
US0001M +
6.550%),
09/25/2037 | | | 109,218 | | | | 0.1 | | |
| | 1,449,472 | | | | (6 | ) | | Fannie Mae
REMIC Trust
2007-94 SG,
4.658%,
(-1.000*
US0001M +
6.450%),
10/25/2037 | | | 290,474 | | | | 0.2 | | |
| | 248,774 | | | | | | | Fannie Mae
REMIC Trust
2010-109 SN,
16.544%,
(-5.000*
US0001M +
25.000%),
10/25/2040 | | | 634,878 | | | | 0.3 | | |
See Accompanying Notes to Financial Statements
84
TABLE OF CONTENTS
SUMMARY PORTFOLIO OF INVESTMENTS
VOYA GLOBAL BOND PORTFOLIO AS OF DECEMBER 31, 2019 (CONTINUED)
Principal
Amount† | |
| |
| | Value | | Percentage
of Net
Assets | |
| | | | | United States (continued) | |
| | 93,347 | | | | | | | Fannie Mae
REMIC Trust
2010-155 PL,
5.000%,
07/25/2040 | | $ | 99,746 | | | | 0.1 | | |
| | 2,808,115 | | | | (6 | ) | | Fannie Mae
REMIC Trust
2011-55 SK,
4.768%,
(-1.000*
US0001M +
6.560%),
06/25/2041 | | | 572,205 | | | | 0.3 | | |
| | 2,235,555 | | | | (6 | ) | | Fannie Mae
REMIC Trust
2011-86 NS,
4.158%,
(-1.000*
US0001M +
5.950%),
09/25/2041 | | | 356,487 | | | | 0.2 | | |
| | 1,441,018 | | | | (6 | ) | | Fannie Mae
REMIC Trust
2012-10 US,
4.658%,
(-1.000*
US0001M +
6.450%),
02/25/2042 | | | 186,471 | | | | 0.1 | | |
| | 1,168,695 | | | | (6 | ) | | Fannie Mae
REMIC Trust
2012-110 JI,
4.000%,
06/25/2042 | | | 156,123 | | | | 0.1 | | |
| | 3,843,466 | | | | (6 | ) | | Fannie Mae
REMIC Trust
2012-133 PS,
4.408%,
(-1.000*
US0001M +
6.200%),
03/25/2042 | | | 373,538 | | | | 0.2 | | |
| | 1,919,059 | | | | (6 | ) | | Fannie Mae
REMIC Trust
2012-144 SB,
4.308%,
(-1.000*
US0001M +
6.100%),
01/25/2043 | | | 427,387 | | | | 0.2 | | |
| | 1,988,279 | | | | (6 | ) | | Fannie Mae
REMIC Trust
2012-27 SB,
4.188%,
(-1.000*
US0001M +
5.980%),
11/25/2041 | | | 272,676 | | | | 0.1 | | |
Principal
Amount† | |
| |
| | Value | | Percentage
of Net
Assets | |
| | 23,601 | | | | | | | Fannie Mae
REMIC Trust
2013-130 ST,
8.000%,
(-16.000*
US0001M +
64.000%),
05/25/2043 | | $ | 26,437 | | | | 0.0 | | |
| | 1,267,031 | | | | (6 | ) | | Fannie Mae
REMIC Trust
2013-64 LI,
3.000%,
06/25/2033 | | | 145,748 | | | | 0.1 | | |
| | 7,393,218 | | | | (6 | ) | | Fannie Mae
REMICS
2012-138 DI,
3.000%,
12/25/2027 | | | 482,820 | | | | 0.2 | | |
| | 6,700,497 | | | | (6 | ) | | Freddie Mac
3502 DL,
4.260%,
(-1.000*
US0001M +
6.000%),
01/15/2039 | | | 1,234,061 | | | | 0.6 | | |
| | 24,568 | | | | | | | Freddie Mac
REMIC Trust
1360 PZ,
7.500%,
09/15/2022 | | | 25,782 | | | | 0.0 | | |
| | 16,301 | | | | | | | Freddie Mac
REMIC Trust
1674 Z,
6.750%,
02/15/2024 | | | 17,279 | | | | 0.0 | | |
| | 32,553 | | | | | | | Freddie Mac
REMIC Trust
1897 K,
7.000%,
09/15/2026 | | | 35,695 | | | | 0.0 | | |
| | 7,245 | | | | (6 | ) | | Freddie Mac
REMIC Trust
2035 PE,
7.000%,
03/15/2028 | | | 1,408 | | | | 0.0 | | |
| | 37,761 | | | | (6 | ) | | Freddie Mac
REMIC Trust
2049 PL,
7.000%,
04/15/2028 | | | 7,077 | | | | 0.0 | | |
| | 19,762 | | | | | | | Freddie Mac
REMIC Trust
2122 F,
2.190%,
(US0001M +
0.450%),
02/15/2029 | | | 19,435 | | | | 0.0 | | |
See Accompanying Notes to Financial Statements
85
TABLE OF CONTENTS
SUMMARY PORTFOLIO OF INVESTMENTS
VOYA GLOBAL BOND PORTFOLIO AS OF DECEMBER 31, 2019 (CONTINUED)
Principal
Amount† | |
| |
| | Value | | Percentage
of Net
Assets | |
| | | | | United States (continued) | |
| | 59,403 | | | | (6 | ) | | Freddie Mac
REMIC Trust
2134 SB,
5.960%,
(-1.000*
US0001M +
7.700%),
03/15/2029 | | $ | 8,681 | | | | 0.0 | | |
| | 63,313 | | | | (6 | ) | | Freddie Mac
REMIC Trust
2136 SG,
5.910%,
(-1.000*
US0001M +
7.650%),
03/15/2029 | | | 10,515 | | | | 0.0 | | |
| | 85,181 | | | | (6 | ) | | Freddie Mac
REMIC Trust
2177 SB,
7.210%,
(-1.000*
US0001M +
8.950%),
08/15/2029 | | | 16,202 | | | | 0.0 | | |
| | 10,107 | | | | | | | Freddie Mac
REMIC Trust
2344 FP,
2.690%,
(US0001M +
0.950%),
08/15/2031 | | | 10,299 | | | | 0.0 | | |
| | 4,357 | | | | | | | Freddie Mac
REMIC Trust
2412 GF,
2.690%,
(US0001M +
0.950%),
02/15/2032 | | | 4,441 | | | | 0.0 | | |
| | 35,904 | | | | | | | Freddie Mac
REMIC Trust
2415 ZA,
6.500%,
02/15/2032 | | | 41,583 | | | | 0.0 | | |
| | 5,554 | | | | | | | Freddie Mac
REMIC Trust
2464 FI,
2.740%,
(US0001M +
1.000%),
02/15/2032 | | | 5,671 | | | | 0.0 | | |
| | 5,697 | | | | | | | Freddie Mac
REMIC Trust
2470 LF,
2.740%,
(US0001M +
1.000%),
02/15/2032 | | | 5,817 | | | | 0.0 | | |
Principal
Amount† | |
| |
| | Value | | Percentage
of Net
Assets | |
| | 8,091 | | | | | | | Freddie Mac
REMIC Trust
2471 FD,
2.740%,
(US0001M +
1.000%),
03/15/2032 | | $ | 8,261 | | | | 0.0 | | |
| | 6,578 | | | | | | | Freddie Mac
REMIC Trust
2504 FP,
2.240%,
(US0001M +
0.500%),
03/15/2032 | | | 6,588 | | | | 0.0 | | |
| | 23,605 | | | | | | | Freddie Mac
REMIC Trust
2551 LF,
2.240%,
(US0001M +
0.500%),
01/15/2033 | | | 23,663 | | | | 0.0 | | |
| | 46,649 | | | | | | | Freddie Mac
REMIC Trust
2676 KY,
5.000%,
09/15/2023 | | | 48,434 | | | | 0.0 | | |
| | 315,473 | | | | | | | Freddie Mac
REMIC Trust
2750 XG,
5.000%,
02/15/2034 | | | 350,388 | | | | 0.2 | | |
| | 260,755 | | | | | | | Freddie Mac
REMIC Trust
2890 PE,
5.000%,
11/15/2034 | | | 286,676 | | | | 0.1 | | |
| | 51,461 | | | | | | | Freddie Mac
REMIC Trust
3001 HT,
8.000%,
(-6.667*
US0001M +
44.667%),
05/15/2035 | | | 58,169 | | | | 0.0 | | |
| | 52,483 | | | | (6 | ) | | Freddie Mac
REMIC Trust
3004 SB,
4.410%,
(-1.000*
US0001M +
6.150%),
07/15/2035 | | | 6,428 | | | | 0.0 | | |
| | 11,984 | | | | | | | Freddie Mac
REMIC Trust
3025 SJ,
18.371%,
(-3.667*
US0001M +
24.750%),
08/15/2035 | | | 19,365 | | | | 0.0 | | |
See Accompanying Notes to Financial Statements
86
TABLE OF CONTENTS
SUMMARY PORTFOLIO OF INVESTMENTS
VOYA GLOBAL BOND PORTFOLIO AS OF DECEMBER 31, 2019 (CONTINUED)
Principal
Amount† | |
| |
| | Value | | Percentage
of Net
Assets | |
| | | | | United States (continued) | |
| | 660,387 | | | | (6 | ) | | Freddie Mac
REMIC Trust
3223 S,
4.210%,
(-1.000*
US0001M +
5.950%),
10/15/2036 | | $ | 97,387 | | | | 0.1 | | |
| | 1,961,439 | | | | (6 | ) | | Freddie Mac
REMIC Trust
3505 SA,
4.260%,
(-1.000*
US0001M +
6.000%),
01/15/2039 | | | 384,188 | | | | 0.2 | | |
| | 2,231,095 | | | | (6 | ) | | Freddie Mac
REMIC Trust
3702 S,
2.710%,
(-1.000*
US0001M +
4.450%),
05/15/2036 | | | 242,467 | | | | 0.1 | | |
| | 489,567 | | | | (6 | ) | | Freddie Mac
REMIC Trust
3710 SL,
4.260%,
(-1.000*
US0001M +
6.000%),
05/15/2036 | | | 5,859 | | | | 0.0 | | |
| | 2,205,813 | | | | (6 | ) | | Freddie Mac
REMIC Trust
3925 SD,
4.310%,
(-1.000*
US0001M +
6.050%),
07/15/2040 | | | 220,366 | | | | 0.1 | | |
| | 1,098,907 | | | | (6 | ) | | Freddie Mac
REMIC Trust
4136 SW,
4.510%,
(-1.000*
US0001M +
6.250%),
11/15/2032 | | | 150,606 | | | | 0.1 | | |
| | 543,096 | | | | (6 | ) | | Freddie Mac
REMIC Trust
4161 CI,
4.000%,
02/15/2043 | | | 92,378 | | | | 0.1 | | |
| | 8,197,353 | | | | (6 | ) | | Freddie Mac
REMIC Trust
4194 GI,
4.000%,
04/15/2043 | | | 1,186,749 | | | | 0.6 | | |
| | 991,102 | | | | (6 | ) | | Freddie Mac
Series 4120
IK, 3.000%,
10/15/2032 | | | 107,039 | | | | 0.1 | | |
Principal
Amount† | |
| |
| | Value | | Percentage
of Net
Assets | |
| | 250,000 | | | | | | | Freddie Mac
Structured
Agency
Credit Risk
Debt Notes
2015-DNA2
M3, 5.692%,
(US0001M +
3.900%),
12/25/2027 | | $ | 258,724 | | | | 0.1 | | |
| | 100,000 | | | | | | | Freddie Mac
Structured
Agency
Credit Risk
Debt Notes
2015-DNA3
M3, 6.492%,
(US0001M +
4.700%),
04/25/2028 | | | 110,882 | | | | 0.1 | | |
| | 168,807 | | | | | | | Freddie Mac
Structured
Agency
Credit Risk
Debt Notes
2015-HQ1
M3, 5.592%,
(US0001M +
3.800%),
03/25/2025 | | | 173,232 | | | | 0.1 | | |
| | 500,000 | | | | | | | Freddie Mac
Structured
Agency
Credit Risk
Debt Notes
2017-DNA2
M2, 5.242%,
(US0001M +
3.450%),
10/25/2029 | | | 533,114 | | | | 0.3 | | |
| | 400,000 | | | | | | | Freddie Mac
Structured
Agency
Credit Risk
Debt Notes
2017-DNA3
M2, 4.292%,
(US0001M +
2.500%),
03/25/2030 | | | 409,771 | | | | 0.2 | | |
| | 600,000 | | | | | | | Freddie Mac
Structured
Agency
Credit Risk
Debt Notes
2017-HQA2
M2, 4.442%,
(US0001M +
2.650%),
12/25/2029 | | | 617,068 | | | | 0.3 | | |
See Accompanying Notes to Financial Statements
87
TABLE OF CONTENTS
SUMMARY PORTFOLIO OF INVESTMENTS
VOYA GLOBAL BOND PORTFOLIO AS OF DECEMBER 31, 2019 (CONTINUED)
Principal
Amount† | |
| |
| | Value | | Percentage
of Net
Assets | |
| | | | | United States (continued) | |
| | 55,496 | | | | (5 | ) | | Freddie Mac
Whole Loan
Securities
Trust
2016-SC02
M1, 3.601%,
10/25/2046 | | $ | 55,848 | | | | 0.0 | | |
| | 346,044 | | | | | | | Ginnie Mae
Series 2007-8
SP, 16.327%,
(-3.242*
US0001M +
22.049%),
03/20/2037 | | | 541,406 | | | | 0.3 | | |
| | 214,589 | | | | (6 | ) | | Ginnie Mae
Series
2010-165 IP,
4.000%,
04/20/2038 | | | 708 | | | | 0.0 | | |
| | 1,791,448 | | | | (6 | ) | | Ginnie Mae
Series
2010-68 MS,
4.085%,
(-1.000*
US0001M +
5.850%),
06/20/2040 | | | 305,039 | | | | 0.1 | | |
| | 1,260,408 | | | | (6 | ) | | Ginnie Mae
Series
2012-97 SC,
4.960%,
(-1.000*
US0001M +
6.700%),
07/16/2041 | | | 219,507 | | | | 0.1 | | |
| | 215,339 | | | | | | | GreenPoint
Mortgage
Funding Trust
2006-AR3
4A1, 2.002%,
(US0001M +
0.210%),
04/25/2036 | | | 207,738 | | | | 0.1 | | |
| | 220,041 | | | | (1 | ),(5) | | GS Mortgage-
Backed
Securities
Corp. Trust
2019-PJ2 A1,
4.000%,
11/25/2049 | | | 223,449 | | | | 0.1 | | |
| | 191,044 | | | | (1 | ),(5) | | GS Mortgage-
Backed
Securities
Corp. Trust
2019-PJ3 A1,
3.500%,
03/25/2050 | | | 193,947 | | | | 0.1 | | |
Principal
Amount† | |
| |
| | Value | | Percentage
of Net
Assets | |
| | 559,317 | | | | | | | IndyMac INDX
Mortgage
Loan Trust
2006-AR2
1A1B,
2.002%,
(US0001M +
0.210%),
04/25/2046 | | $ | 531,263 | | | | 0.3 | | |
| | 200,000 | | | | (1 | ),(5) | | JP Morgan
Mortgage
Trust
2019-INV3
A15, 3.500%,
05/25/2050 | | | 203,094 | | | | 0.1 | | |
| | 400,000 | | | | (1 | ),(5) | | JP Morgan
Mortgage
Trust
2019-INV3
A3, 3.500%,
05/25/2050 | | | 407,687 | | | | 0.2 | | |
| | 288,631 | | | | (1 | ),(5) | | JP Morgan
Mortgage
Trust
2019-LTV3
A15, 3.500%,
12/31/2049 | | | 292,336 | | | | 0.2 | | |
| | 615,843 | | | | (5 | ) | | JP Morgan
Mortgage
Trust
2005-A4 B1,
4.329%,
07/25/2035 | | | 625,906 | | | | 0.3 | | |
| | 63,388 | | | | (5 | ) | | JP Morgan
Mortgage
Trust
2007-A1 7A1,
4.459%,
07/25/2035 | | | 64,316 | | | | 0.1 | | |
| | 253,002 | | | | (1 | ),(5) | | JP Morgan
Mortgage
Trust 2017-3
1A13,
3.500%,
08/25/2047 | | | 254,431 | | | | 0.1 | | |
| | 282,766 | | | | (1 | ),(5) | | JP Morgan
Mortgage
Trust 2017-3
B1, 3.845%,
08/25/2047 | | | 295,115 | | | | 0.2 | | |
| | 257,765 | | | | (1 | ),(5) | | JP Morgan
Mortgage
Trust
2019-LTV2
A18, 4.000%,
12/25/2049 | | | 264,572 | | | | 0.1 | | |
| | 138,105 | | | | | | | Lehman XS
Trust Series
2005-5N 1A2,
2.152%,
(US0001M +
0.360%),
11/25/2035 | | | 127,853 | | | | 0.1 | | |
See Accompanying Notes to Financial Statements
88
TABLE OF CONTENTS
SUMMARY PORTFOLIO OF INVESTMENTS
VOYA GLOBAL BOND PORTFOLIO AS OF DECEMBER 31, 2019 (CONTINUED)
Principal
Amount† | |
| |
| | Value | | Percentage
of Net
Assets | |
| | | | | United States (continued) | |
| | 59,020 | | | | (1 | ),(5) | | Sequoia
Mortgage
Trust
2018-CH1
A19, 4.000%,
02/25/2048 | | $ | 59,894 | | | | 0.0 | | |
| | 5,993,590 | | | | (5 | ),(6) | | WaMu
Mortgage
Pass-Through
Certificates
Series
2005-AR11 X,
1.276%,
08/25/2045 | | | 216,834 | | | | 0.1 | | |
| | 37,808 | | | | (5 | ) | | WaMu
Mortgage
Pass-Through
Certificates
Series
2006-AR12
1A1, 3.693%,
10/25/2036 | | | 37,237 | | | | 0.0 | | |
| | 709,490 | | | | (5 | ) | | WaMu
Mortgage
Pass-Through
Certificates
Series
2006-AR16
3A1, 3.522%,
12/25/2036 | | | 684,874 | | | | 0.3 | | |
| | 130,284 | | | | (5 | ) | | WaMu
Mortgage
Pass-Through
Certificates
Series
2006-AR8
1A4, 3.875%,
08/25/2046 | | | 126,517 | | | | 0.1 | | |
| | 290,352 | | | | (5 | ) | | WaMu
Mortgage
Pass-Through
Certificates
Series
2007-HY2
1A1, 3.804%,
12/25/2036 | | | 290,949 | | | | 0.2 | | |
| | 79,955 | | | | (5 | ) | | WaMu
Mortgage
Pass-Through
Certificates
Series
2007-HY4
1A1, 3.501%,
04/25/2037 | | | 73,758 | | | | 0.0 | | |
Principal
Amount† | |
| |
| | Value | | Percentage
of Net
Assets | |
| | 96,763 | | | | | | | Wells Fargo
Alternative
Loan
2007-PA2
2A1, 2.222%,
(US0001M +
0.430%),
06/25/2037 | | $ | 80,386 | | | | 0.0 | | |
| | 181,417 | | | | (1 | ),(5) | | WinWater
Mortgage
Loan Trust
2015-5 B4,
3.777%,
08/20/2045 | | | 181,041 | | | | 0.1 | | |
| | 3,644,141 | | | | | | | Other Securities | | | 1,318,228 | | | | 0.7 | | |
| | | | | | | Total
Collateralized
Mortgage
Obligations
(Cost
$28,696,758) | | | 30,954,701 | | | | 15.4 | | |
SOVEREIGN BONDS: 10.9% | | | |
| | | | | Brazil: 1.0% | |
BRL | 7,000,000 | | | | | | | Brazil Notas do
Tesouro
Nacional
Serie F,
10.000%,
01/01/2027 | | | 1,956,881 | | | | 1.0 | | |
| | | | | Chile: 0.1% | |
CLP | 155,000,000 | | | | | | | Other Securities | | | 249,832 | | | | 0.1 | | |
| | | | | Germany: 4.8% | |
EUR | 1,010,000 | | | | (7) | | | Bundesobligation,
-0.620%,
10/08/2021 | | | 1,145,550 | | | | 0.6 | | |
EUR | 660,000 | | | | | | | Bundesrepublik
Deutschland
Bundesanleihe,
2.500%,
08/15/2046 | | | 1,160,885 | | | | 0.6 | | |
EUR | 5,770,000 | | | | | | | Bundesrepublik
Deutschland,
0.500%,
02/15/2025 | | | 6,798,348 | | | | 3.4 | | |
EUR | 360,000 | | | | | | | Bundesrepublik
Deutschland
Bundesanleihe,
0.000%-
2.000%,
08/15/2023-
08/15/2048 | | | 468,048 | | | | 0.2 | | |
EUR | 10,000 | | | | | | | Other Securities | | | 11,231 | | | | 0.0 | | |
| | | | | | | | | | 9,584,062 | | | | 4.8 | | |
| | | | | Indonesia: 0.2% | |
IDR | 6,452,000,000 | | | | | | | Other Securities | | | 498,453 | | | | 0.2 | | |
See Accompanying Notes to Financial Statements
89
TABLE OF CONTENTS
SUMMARY PORTFOLIO OF INVESTMENTS
VOYA GLOBAL BOND PORTFOLIO AS OF DECEMBER 31, 2019 (CONTINUED)
Principal
Amount† | |
| |
| | Value | | Percentage
of Net
Assets | |
| | | | | Italy: 0.7% | |
EUR | 438,000 | | | | (1 | ) | | Italy Buoni
Poliennali
Del Tesoro,
3.850%,
09/01/2049 | | $ | 636,608 | | | | 0.3 | | |
EUR | 438,000 | | | | (1 | ) | | Italy Buoni
Poliennali
Del Tesoro,
5.000%,
08/01/2034 | | | 690,841 | | | | 0.4 | | |
| | | | | | | | | | 1,327,449 | | | | 0.7 | | |
| | | | | Mexico: 0.5% | |
MXN | 18,580,000 | | | | | | | Mexican Bonos,
7.750%,
11/13/2042 | | | 1,043,104 | | | | 0.5 | | |
| | | | | Peru: 1.0% | |
PEN | 5,649,000 | | | | (1 | ) | | Peru
Government
Bond,
6.150%,
08/12/2032 | | | 1,933,840 | | | | 1.0 | | |
| | | | | Portugal: 0.7% | |
EUR | 1,135,000 | | | | (1 | ) | | Portugal
Obrigacoes
do Tesouro
OT, 2.250%,
04/18/2034 | | | 1,523,141 | | | | 0.7 | | |
| | | | | Russia: 0.7% | |
RUB | 76,937,000 | | | | | | | Russian
Federal
Bond - OFZ,
7.250%,
05/10/2034 | | | 1,336,903 | | | | 0.7 | | |
| | | | | Spain: 1.2% | |
EUR | 870,000 | | | | (1 | ) | | Spain
Government
Bond,
1.450%,
04/30/2029 | | | 1,067,001 | | | | 0.5 | | |
EUR | 908,000 | | | | (1 | ) | | Spain
Government
Bond,
2.700%,
10/31/2048 | | | 1,354,718 | | | | 0.7 | | |
| | | | | | | | | | 2,421,719 | | | | 1.2 | | |
| | | | | | | Total Sovereign
Bonds
(Cost
$21,625,098) | | | 21,875,384 | | | | 10.9 | | |
Principal
Amount† | |
| |
| | Value | | Percentage
of Net
Assets | |
U.S. TREASURY OBLIGATIONS: 11.4% | | | | | |
| | | | | Treasury Inflation Indexed
Protected Securities: 3.1% | |
| | 6,199,403 | | | | | | | 0.250%,
07/15/2029 | | $ | 6,261,830 | | | | 3.1 | | |
| | | | | U.S. Treasury Bonds: 1.8% | |
| | 3,505,000 | | | | | | | 2.250%,
08/15/2049 | | | 3,397,174 | | | | 1.7 | | |
| | 250,000 | | | | | | | 3.500%,
02/15/2039 | | | 299,401 | | | | 0.1 | | |
| | | | | | | | | | 3,696,575 | | | | 1.8 | | |
| | | | | U.S. Treasury Notes: 6.5% | |
| | 2,399,600 | | | | | | | 1.625%,
12/31/2021 | | | 2,402,021 | | | | 1.2 | | |
| | 1,691,000 | | | | | | | 1.625%,
12/15/2022 | | | 1,691,803 | | | | 0.8 | | |
| | 1,927,500 | | | | | | | 1.750%,
12/31/2024 | | | 1,931,873 | | | | 1.0 | | |
| | 2,730,000 | | | | | | | 1.750%,
12/31/2026 | | | 2,714,213 | | | | 1.4 | | |
| | 4,152,000 | | | | (8 | ) | | 1.750%,
11/15/2029 | | | 4,086,637 | | | | 2.0 | | |
| | 278,000 | | | | | | | 1.500%-
2.125%,
01/31/2021-
10/31/2024 | | | 279,313 | | | | 0.1 | | |
| | | | | | | | | | 13,105,860 | | | | 6.5 | | |
| | | | | | | Total U.S.
Treasury
Obligations
(Cost
$23,086,125) | | | 23,064,265 | | | | 11.4 | | |
U.S. GOVERNMENT AGENCY OBLIGATIONS: 7.5% | | | | | |
| | | | | Federal Home Loan Mortgage
Corporation: 0.4%(9) | |
| | 806,761 | | | | | | | 4.000%-6.500%,
01/01/2020-
05/01/2046 | | | 857,305 | | | | 0.4 | | |
| | | | | Federal National Mortgage
Association: 0.0% | |
| | 88,597 | | | | | | | 4.521%,
(US0012M +
1.777%),
10/01/2036 | | | 93,426 | | | | 0.0 | | |
| | | | | Government National Mortgage
Association: 2.1% | |
| | 4,100,000 | | | | (10 | ) | | 3.000%,
01/20/2050 | | | 4,209,046 | | | | 2.1 | | |
| | 46,625 | | | | | | | 5.000%-
6.500%,
04/15/2034-
02/20/2035 | | | 52,242 | | | | 0.0 | | |
| | | | | | | | | | 4,261,288 | | | | 2.1 | | |
See Accompanying Notes to Financial Statements
90
TABLE OF CONTENTS
SUMMARY PORTFOLIO OF INVESTMENTS
VOYA GLOBAL BOND PORTFOLIO AS OF DECEMBER 31, 2019 (CONTINUED)
Principal
Amount† | |
| |
| | Value | | Percentage
of Net
Assets | |
| | | | | Uniform Mortgage-Backed
Securities: 5.0% | |
| | 4,173,683 | | | | | | | 3.500%,
08/01/2049 | | $ | 4,290,799 | | | | 2.1 | | |
| | 2,312,985 | | | | | | | 3.500%,
09/01/2049 | | | 2,378,652 | | | | 1.2 | | |
| | 2,531,980 | | | | | | | 4.000%,
06/01/2049 | | | 2,632,414 | | | | 1.3 | | |
| | 650,772 | | | | | | | 2.500%-
7.500%,
05/01/2021-
05/01/2045 | | | 709,468 | | | | 0.4 | | |
| | | | | | | | | | 10,011,333 | | | | 5.0 | | |
| | | | | | | Total U.S.
Government
Agency
Obligations
(Cost
$15,142,874) | | | 15,223,352 | | | | 7.5 | | |
COMMERCIAL MORTGAGE-BACKED SECURITIES: 9.1% | | | | | |
| | | | | United States: 9.1% | |
| | 6,909,108 | | | | (5 | ),(6) | | BANK 2017-
BNK5 XA,
1.082%,
06/15/2060 | | | 391,581 | | | | 0.2 | | |
| | 900,000 | | | | (1 | ),(5) | | BANK 2017-
BNK6 E,
2.653%,
07/15/2060 | | | 654,448 | | | | 0.3 | | |
| | 1,948,000 | | | | (1 | ),(5),(6) | | BANK 2017-
BNK6 XE,
1.500%,
07/15/2060 | | | 184,765 | | | | 0.1 | | |
| | 995,608 | | | | (5 | ),(6) | | BANK 2019-
BNK16 XA,
0.967%,
02/15/2052 | | | 69,766 | | | | 0.1 | | |
| | 8,020,000 | | | | (1 | ),(5),(6) | | BBCCRE Trust
2015-GTP
XA, 0.597%,
08/10/2033 | | | 265,846 | | | | 0.1 | | |
| | 210,000 | | | | (1 | ) | | Benchmark
2019-B9 D
Mortgage
Trust,
3.000%,
03/15/2052 | | | 187,755 | | | | 0.1 | | |
| | 1,197,424 | | | | (5 | ),(6) | | Benchmark
2019-B9 XA
Mortgage
Trust,
1.047%,
03/15/2052 | | | 94,565 | | | | 0.0 | | |
Principal
Amount† | |
| |
| | Value | | Percentage
of Net
Assets | |
| | 690,000 | | | | (1 | ) | | BX Commercial
Mortgage
Trust
2019-XL J,
4.390%,
(US0001M +
2.650%),
10/15/2036 | | $ | 692,611 | | | | 0.3 | | |
| | 270,000 | | | | (1 | ) | | BX Trust
2019-OC11 E,
4.076%,
12/09/2041 | | | 262,206 | | | | 0.1 | | |
| | 1,834,338 | | | | (5 | ),(6) | | CD 2016-CD1
Mortgage
Trust XA,
1.409%,
08/10/2049 | | | 130,551 | | | | 0.1 | | |
| | 7,900,000 | | | | (5 | ),(6) | | Citigroup
Commercial
Mortgage
Trust
2016-C2 XB,
0.846%,
08/10/2049 | | | 406,043 | | | | 0.2 | | |
| | 3,208,075 | | | | (5 | ),(6) | | Citigroup
Commercial
Mortgage
Trust
2017-C4 XA,
1.109%,
10/12/2050 | | | 203,994 | | | | 0.1 | | |
| | 3,244,376 | | | | (5 | ),(6) | | COMM 2012-
CR1 XA,
1.856%,
05/15/2045 | | | 119,811 | | | | 0.0 | | |
| | 9,501,587 | | | | (1 | ),(5),(6) | | COMM 2012-
LTRT XA,
0.930%,
10/05/2030 | | | 184,180 | | | | 0.1 | | |
| | 11,181,226 | | | | (5 | ),(6) | | COMM 2014-
CR16 XA,
0.978%,
04/10/2047 | | | 398,668 | | | | 0.2 | | |
| | 570,000 | | | | (1 | ),(5) | | COMM 2014-
LC15 D
Mortgage
Trust,
4.984%,
04/10/2047 | | | 579,591 | | | | 0.3 | | |
| | 570,000 | | | | (5 | ) | | COMM 2016-
COR1 C,
4.383%,
10/10/2049 | | | 591,346 | | | | 0.3 | | |
| | 4,398,398 | | | | (5 | ),(6) | | COMM 2016-
CR28 XA,
0.687%,
02/10/2049 | | | 137,854 | | | | 0.1 | | |
| | 1,000,000 | | | | (5 | ) | | COMM 2017-
COR2 C,
4.562%,
09/10/2050 | | | 1,061,870 | | | | 0.5 | | |
See Accompanying Notes to Financial Statements
91
TABLE OF CONTENTS
SUMMARY PORTFOLIO OF INVESTMENTS
VOYA GLOBAL BOND PORTFOLIO AS OF DECEMBER 31, 2019 (CONTINUED)
Principal
Amount† | |
| |
| | Value | | Percentage
of Net
Assets | |
| | | | | United States (continued) | |
| | 290,000 | | | | (1 | ),(5) | | DBJPM 16-C3
Mortgage
Trust,
3.491%,
08/10/2049 | | $ | 279,017 | | | | 0.1 | | |
| | 1,269,940 | | | | (1 | ),(5),(6) | | DBUBS 2011-
LC1A XA,
0.700%,
11/10/2046 | | | 4,891 | | | | 0.0 | | |
| | 270,000 | | | | (1 | ) | | Fontainebleau
Miami Beach
Trust 2019-
FBLU F,
4.095%,
12/10/2036 | | | 265,241 | | | | 0.1 | | |
| | 3,840,000 | | | | (5 | ),(6) | | Freddie Mac
Multifamily
Structured
Pass Through
Certificates
K013 X3,
2.815%,
01/25/2043 | | | 109,266 | | | | 0.1 | | |
| | 7,000,000 | | | | (5 | ),(6) | | Freddie Mac
Multifamily
Structured
Pass Through
Certificates
K035 X3,
1.791%,
12/25/2041 | | | 426,569 | | | | 0.2 | | |
| | 36,859,883 | | | | (1 | ),(6) | | FREMF
Mortgage
Trust 2012-
K17 X2A,
0.100%,
12/25/2044 | | | 54,844 | | | | 0.0 | | |
| | 255,000 | | | | (1 | ) | | GPT 2018-
GPP D
Mortgage
Trust,
3.590%,
(US0001M +
1.850%),
06/15/2035 | | | 252,932 | | | | 0.1 | | |
| | 450,000 | | | | (1 | ),(5) | | GRACE 2014-
GRCE F
Mortgage
Trust,
3.590%,
06/10/2028 | | | 451,670 | | | | 0.2 | | |
| | 100,000 | | | | (1 | ),(5) | | GS Mortgage
Securities
Trust 2010-
C2 F, 4.548%,
12/10/2043 | | | 98,860 | | | | 0.0 | | |
Principal
Amount† | |
| |
| | Value | | Percentage
of Net
Assets | |
| | 1,934,226 | | | | (5 | ),(6) | | GS Mortgage
Securities
Trust 2012-
GCJ7 XA,
2.161%,
05/10/2045 | | $ | 54,077 | | | | 0.0 | | |
| | 180,000 | | | | (1 | ) | | GS Mortgage
Securities
Trust 2013-
GC16 G,
3.500%,
11/10/2046 | | | 156,717 | | | | 0.1 | | |
| | 3,952,071 | | | | (5 | ),(6) | | GS Mortgage
Securities
Trust 2013-
GC16 XA,
1.035%,
11/10/2046 | | | 135,135 | | | | 0.1 | | |
| | 690,000 | | | | (1 | ),(5) | | GS Mortgage
Securities
Trust 2016-
GS4 E,
3.800%,
11/10/2049 | | | 553,680 | | | | 0.3 | | |
| | 2,313,067 | | | | (5 | ),(6) | | GS Mortgage
Securities
Trust 2017-
GS6 XA,
1.042%,
05/10/2050 | | | 150,576 | | | | 0.1 | | |
| | 410,000 | | | | (1 | ),(5) | | GS Mortgage
Securities
Trust 2019-
GC40 DBD,
3.550%,
07/10/2052 | | | 408,858 | | | | 0.2 | | |
| | 310,000 | | | | (1 | ),(5) | | GS Mortgage
Securities
Trust 2019-
GC40 DBE,
3.550%,
07/10/2052 | | | 302,346 | | | | 0.1 | | |
| | 360,000 | | | | (1 | ),(5) | | Jackson Park
Trust 2019-
LIC F,
3.242%,
10/14/2039 | | | 310,809 | | | | 0.2 | | |
| | 1,740,000 | | | | (1 | ),(5) | | JP Morgan
Chase
Commercial
Mortgage
Securities
Trust 2011-
C5 E,
4.000%,
08/15/2046 | | | 1,707,112 | | | | 0.8 | | |
See Accompanying Notes to Financial Statements
92
TABLE OF CONTENTS
SUMMARY PORTFOLIO OF INVESTMENTS
VOYA GLOBAL BOND PORTFOLIO AS OF DECEMBER 31, 2019 (CONTINUED)
Principal
Amount† | |
| |
| | Value | | Percentage
of Net
Assets | |
| | | | | United States (continued) | |
| | 5,715,174 | | | | (5 | ),(6) | | JP Morgan
Chase
Commercial
Mortgage
Securities
Trust 2012-
CIBX XA,
1.478%,
06/15/2045 | | $ | 126,374 | | | | 0.1 | | |
| | 660,000 | | | | (5 | ) | | JPMBB
Commercial
Mortgage
Securities
Trust 2014-
C18 AS,
4.439%,
02/15/2047 | | | 703,060 | | | | 0.4 | | |
| | 3,024,022 | | | | (1 | ),(5),(6) | | LSTAR
Commercial
Mortgage
Trust 2017-
5 X, 1.084%,
03/10/2050 | | | 119,413 | | | | 0.1 | | |
| | 1,090,000 | | | | (1 | ),(5) | | Morgan
Stanley
Bank of
America
Merrill Lynch
Trust 2012-
C6 E,
4.608%,
11/15/2045 | | | 1,100,551 | | | | 0.6 | | |
| | 18,750,000 | | | | (1 | ),(5),(6) | | Morgan
Stanley
Bank of
America
Merrill Lynch
Trust 2014
C19 XB,
0.455%,
12/15/2047 | | | 410,893 | | | | 0.2 | | |
| | 440,000 | | | | (1 | ),(5) | | Morgan
Stanley
Bank of
America
Merrill Lynch
Trust 2014-
C15 D,
4.910%,
04/15/2047 | | | 461,706 | | | | 0.2 | | |
| | 570,000 | | | | (1 | ),(5) | | Morgan
Stanley
Capital I Trust
2011-C1 D,
5.375%,
09/15/2047 | | | 584,265 | | | | 0.3 | | |
Principal
Amount† | |
| |
| | Value | | Percentage
of Net
Assets | |
| | 170,000 | | | | (1 | ) | | MRCD 2019-
PARK E
Mortgage
Trust,
2.718%,
12/15/2036 | | $ | 160,911 | | | | 0.1 | | |
| | 320,000 | | | | (1 | ) | | MRCD 2019-
PARK F
Mortgage
Trust,
2.718%,
12/15/2036 | | | 297,747 | | | | 0.2 | | |
| | 220,000 | | | | (1 | ) | | Wells Fargo
Commercial
Mortgage
Trust 2010-
C1 F, 4.000%,
11/15/2043 | | | 217,836 | | | | 0.1 | | |
| | 3,123,618 | | | | (1 | ),(5),(6) | | WFRBS
Commercial
Mortgage
Trust 2012-
C8 XA,
1.811%,
08/15/2045 | | | 112,769 | | | | 0.0 | | |
| | 550,000 | | | | (1 | ),(5) | | WFRBS
Commercial
Mortgage
Trust 2013-
C11 F,
4.261%,
03/15/2045 | | | 531,150 | | | | 0.3 | | |
| | 330,000 | | | | (1 | ),(5) | | WFRBS
Commercial
Mortgage
Trust 2013-
C14 D,
3.977%,
06/15/2046 | | | 314,981 | | | | 0.2 | | |
| | 9,269,806 | | | | (5 | ),(6) | | WFRBS
Commercial
Mortgage
Trust 2014-
C19 XA,
1.032%,
03/15/2047 | | | 293,335 | | | | 0.1 | | |
| | 534,698 | | | | | | | Other Securities | | | 529,084 | | | | 0.3 | | |
| | | | | | | | | Total
Commercial
Mortgage-
Backed
Securities
(Cost
$17,838,337) | | | 18,304,126 | | | | 9.1 | | |
See Accompanying Notes to Financial Statements
93
TABLE OF CONTENTS
SUMMARY PORTFOLIO OF INVESTMENTS
VOYA GLOBAL BOND PORTFOLIO AS OF DECEMBER 31, 2019 (CONTINUED)
Principal
Amount† | |
| |
| | Value | | Percentage
of Net
Assets | |
ASSET-BACKED SECURITIES: 4.3% | | | |
| | | | | Cayman Islands: 1.1% | |
| | 500,000 | | | | (1 | ) | | Barings Clo
Ltd. 2019-
4A C,
4.703%,
(US0003M +
2.800%),
01/15/2033 | | $ | 499,980 | | | | 0.3 | | |
| | 400,000 | | | | (1 | ) | | Clear Creek
CLO 2015-
1A CR,
3.916%,
(US0003M +
1.950%),
10/20/2030 | | | 386,419 | | | | 0.2 | | |
| | 400,000 | | | | (1 | ) | | Galaxy XXI
CLO Ltd.
2015-21A CR,
3.716%,
(US0003M +
1.750%),
04/20/2031 | | | 380,219 | | | | 0.2 | | |
| | 500,000 | | | | (1 | ) | | Jay Park CLO
Ltd. 2016-
1A BR,
3.966%,
(US0003M +
2.000%),
10/20/2027 | | | 487,852 | | | | 0.2 | | |
| | 400,000 | | | | (1 | ) | | Shackleton
CLO Ltd.
2019-15A C,
4.703%,
(US0003M +
2.800%),
01/15/2030 | | | 399,984 | | | | 0.2 | | |
| | | | | | | | | | 2,154,454 | | | | 1.1 | | |
| | | | | United States: 3.2% | |
| | 500,000 | | | | (1 | ) | | AMMC CLO
16 Ltd. 2015-
16A CR,
4.351%,
(US0003M +
2.350%),
04/14/2029 | | | 497,478 | | | | 0.3 | | |
| | 412,500 | | | | (1 | ) | | BlueMountain
CLO 2013-
2A CR,
3.903%,
(US0003M +
1.950%),
10/22/2030 | | | 395,011 | | | | 0.2 | | |
| | 400,000 | | | | (1 | ) | | CIFC Funding
2013-IA
BR Ltd.,
4.401%,
(US0003M +
2.400%),
07/16/2030 | | | 390,420 | | | | 0.2 | | |
Principal
Amount† | |
| |
| | Value | | Percentage
of Net
Assets | |
| | 281,072 | | | | (5 | ) | | Citigroup
Mortgage
Loan Trust
2006-WF1
A2E, 4.866%,
03/25/2036 | | $ | 194,696 | | | | 0.1 | | |
| | 1,040,000 | | | | (1 | ) | | Invitation
Homes 2018-
SFR1 D
Trust,
3.187%,
(US0001M +
1.450%),
03/17/2037 | | | 1,039,471 | | | | 0.5 | | |
| | 500,000 | | | | (1 | ) | | LCM XXIV Ltd.
24A C,
4.216%,
(US0003M +
2.250%),
03/20/2030 | | | 482,812 | | | | 0.2 | | |
| | 250,000 | | | | (1 | ) | | Madison Park
Funding
XXVII Ltd.
2018-27A B,
3.766%,
(US0003M +
1.800%),
04/20/2030 | | | 240,910 | | | | 0.1 | | |
| | 400,000 | | | | (1 | ) | | Madison Park
Funding
XXXI Ltd.
2018-31A C,
4.084%,
(US0003M +
2.150%),
01/23/2031 | | | 397,132 | | | | 0.2 | | |
| | 200,000 | | | | (1 | ),(5) | | Mill City
Mortgage
Loan Trust
2017-2 M2,
3.250%,
07/25/2059 | | | 204,365 | | | | 0.1 | | |
| | 575,000 | | | | (1 | ) | | Palmer Square
Loan Funding
2017-1A D
Ltd., 6.851%,
(US0003M +
4.850%),
10/15/2025 | | | 571,651 | | | | 0.3 | | |
| | 250,000 | | | | (1 | ) | | Palmer Square
Loan Funding
2018-1A C
Ltd., 3.851%,
(US0003M +
1.850%),
04/15/2026 | | | 242,378 | | | | 0.1 | | |
| | 1,060,000 | | | | (1 | ) | | Progress
Residential
2018-SFR2 E
Trust,
4.656%,
08/17/2035 | | | 1,084,110 | | | | 0.5 | | |
See Accompanying Notes to Financial Statements
94
TABLE OF CONTENTS
SUMMARY PORTFOLIO OF INVESTMENTS
VOYA GLOBAL BOND PORTFOLIO AS OF DECEMBER 31, 2019 (CONTINUED)
Principal
Amount† | |
| |
| | Value | | Percentage
of Net
Assets | |
| | | | | United States (continued) | |
| | 250,000 | | | | (1 | ) | | THL Credit
Wind River
2013-2A CR
CLO Ltd.,
4.003%,
(US0003M +
2.000%),
10/18/2030 | | $ | 234,943 | | | | 0.1 | | |
| | 560,000 | | | | (1 | ) | | THL Credit
Wind River
2017-3A C
CLO Ltd.,
4.201%,
(US0003M +
2.200%),
10/15/2030 | | | 551,369 | | | | 0.3 | | |
| | | | | | | | | | 6,526,746 | | | | 3.2 | | |
| | | | | | | Total Asset-
Backed
Securities
(Cost
$8,741,366) | | | 8,681,200 | | | | 4.3 | | |
STRUCTURED NOTES: 0.0% | | | |
| | | | | Russia: 0.0% | |
RUB | 3,958,045 | | | | (2 | ) | | Morgan
Stanley & Co.
International
PLC - EM
Whole Loan
SA /Russian
Federation
Total Return
Linked Bonds,
Series 007,
Cl. VR,
5.000%,
08/22/2034 | | | 10,692 | | | | 0.0 | | |
| | | | | | | Total Structured
Notes
(Cost
$141,849) | | | 10,692 | | | | 0.0 | | |
Shares | | | | | | Value | | Percentage
of Net
Assets | |
COMMON STOCK: 0.0% | | | |
| | | | | United States: 0.0% | |
| | 48,209 | | | | (4 | ),(11),(12) | | Other
Securities | | $ | 27,672 | | | | 0.0 | | |
| | | | | | | Total Common
Stock
(Cost
$1,305,735) | | | 27,672 | | | | 0.0 | | |
Shares | |
| |
| | Value | | Percentage
of Net
Assets | |
MUTUAL FUNDS: 19.3% | | | |
| | | | | United States: 19.3% | |
| | 643,128 | | | | | | | Voya Emerging
Markets
Corporate
Debt Fund -
Class P | | $ | 6,534,186 | | | | 3.3 | | |
| | 1,127,507 | | | | | | | Voya Emerging
Markets Hard
Currency
Debt Fund -
Class P | | | 11,083,391 | | | | 5.5 | | |
| | 1,853,229 | | | | | | | Voya Emerging
Markets Local
Currency
Debt Fund -
Class P | | | 13,806,553 | | | | 6.9 | | |
| | 905,054 | | | | | | | Voya High
Yield Bond
Fund -
Class P | | | 7,285,686 | | | | 3.6 | | |
| | | | | | | Total Mutual
Funds
(Cost
$40,499,130) | | | 38,709,816 | | | | 19.3 | | |
| | | | | | | Value | | Percentage
of Net
Assets | |
PURCHASED OPTIONS(13): 0.0% | | | |
| | | | | | | Total
Purchased
Options
(Cost
$72,275) | | $ | 42,509 | | | | 0.0 | | |
| | | | | | | Total Long-
Term
Investments
(Cost
$197,589,519) | | | 199,325,250 | | | | 99.0 | | |
See Accompanying Notes to Financial Statements
95
TABLE OF CONTENTS
SUMMARY PORTFOLIO OF INVESTMENTS
VOYA GLOBAL BOND PORTFOLIO AS OF DECEMBER 31, 2019 (CONTINUED)
Principal
Amount† | |
| |
| | Value | | Percentage
of Net
Assets | |
SHORT-TERM INVESTMENTS: 3.0% | |
| | | | | Repurchase Agreements: 2.1% | |
| | 1,000,000 | | | | (14 | ) | | Bank of
Montreal,
Repurchase
Agreement
dated
12/31/19,
1.57%, due
01/02/20
(Repurchase
Amount
$1,000,086,
collateralized
by various
U.S.
Government
Agency
Obligations,
2.500%-
5.000%,
Market Value
plus accrued
interest
$1,020,000,
due 04/20/49-
12/01/49) | | $ | 1,000,000 | | | | 0.5 | | |
| | 1,000,000 | | | | (14 | ) | | Bank of Nova
Scotia,
Repurchase
Agreement
dated
12/31/19,
1.57%, due
01/02/20
(Repurchase
Amount
$1,000,086,
collateralized
by various
U.S.
Government
Agency
Obligations,
2.500%-
6.500%,
Market Value
plus accrued
interest
$1,020,089,
due 09/01/24-
11/01/49) | | | 1,000,000 | | | | 0.5 | | |
Principal
Amount† | |
| |
| | Value | | Percentage
of Net
Assets | |
| | 199,320 | | | | (14 | ) | | Citadel
Securities
LLC,
Repurchase
Agreement
dated
12/31/19,
1.60%, due
01/02/20
(Repurchase
Amount
$199,337,
collateralized
by various
U.S.
Government
Securities,
0.000%-
8.500%,
Market Value
plus accrued
interest
$203,324,
due 01/15/20-
11/15/48) | | $ | 199,320 | | | | 0.1 | | |
| | 1,000,000 | | | | (14 | ) | | Citigroup, Inc.,
Repurchase
Agreement
dated
12/31/19,
1.57%, due
01/02/20
(Repurchase
Amount
$1,000,086,
collateralized
by various
U.S.
Government/
U.S.
Government
Agency
Obligations,
0.000%-
9.000%,
Market Value
plus accrued
interest
$1,020,000,
due 02/13/20-
09/20/69) | | | 1,000,000 | | | | 0.5 | | |
See Accompanying Notes to Financial Statements
96
TABLE OF CONTENTS
SUMMARY PORTFOLIO OF INVESTMENTS
VOYA GLOBAL BOND PORTFOLIO AS OF DECEMBER 31, 2019 (CONTINUED)
Principal
Amount† | |
| |
| | Value | | Percentage
of Net
Assets | |
| | | | | Repurchase Agreements (continued) | |
| | 1,000,000 | | | | (14 | ) | | Morgan
Stanley,
Repurchase
Agreement
dated
12/31/19,
1.57%, due
01/02/20
(Repurchase
Amount
$1,000,086,
collateralized
by various
U.S.
Government
Agency
Obligations,
2.000%-
6.500%,
Market Value
plus accrued
interest
$1,020,000,
due 07/01/27-
01/01/50) | | $ | 1,000,000 | | | | 0.5 | | |
| | | | | Total
Repurchase
Agreements
(Cost
$4,199,320) | | | 4,199,320 | | | | 2.1 | | |
Shares | | | | | | Value | | Percentage
of Net
Assets | |
| | | | | Mutual Funds: 0.9% | |
| | 1,917,000 | | | | (15 | ) | | Goldman
Sachs
Financial
Square
Government
Fund -
Institutional
Shares,
1.500%
(Cost
$1,917,000) | | $ | 1,917,000 | | | | 0.9 | | |
| | | | | Total Short-
Term
Investments
(Cost
$6,116,320) | | | 6,116,320 | | | | 3.0 | | |
| | | | | Total
Investments
in Securities
(Cost
$203,705,839) | | $ | 205,441,570 | | | | 102.0 | | |
| | | | | Liabilities in
Excess of
Other Assets | | | (4,103,028 | ) | | | (2.0 | ) | |
| | | | | Net Assets | | $ | 201,338,542 | | | | 100.0 | | |
"Other Securities" represents issues not identified as the top 50 holdings in terms of market value and issues or issuers not exceeding 1% of net assets individually or in aggregate respectively as of December 31, 2019.
The following footnotes apply to either the individual securities noted or one or more of the securities aggregated and listed as a single line item.
† Unless otherwise indicated, principal amount is shown in USD.
(1) Securities with purchases pursuant to Rule 144A or section 4(a)(2), under the Securities Act of 1933 and may not be resold subject to that rule except to qualified institutional buyers.
(2) For fair value measurement disclosure purposes, security is categorized as Level 3, whose value was determined using significant unobservable inputs.
(3) The grouping contains securities in default.
(4) The grouping contains Level 3 securities.
(5) Variable rate security. Rate shown is the rate in effect as of December 31, 2019.
(6) Interest only securities represent the right to receive the monthly interest payments on an underlying pool of mortgage loans. Principal amount shown represents the notional amount on which current interest is calculated. Payments of principal on the pool reduce the value of the interest only security.
(7) Represents a zero coupon bond. Rate shown reflects the effective yield as of December 31, 2019.
(8) Security, or a portion of the security, is on loan.
(9) The Federal Housing Finance Agency ("FHFA") placed the Federal Home Loan Mortgage Corporation and Federal National Mortgage Association into conservatorship with FHFA as the conservator. As such, the FHFA oversees the continuing affairs of these companies.
(10) Settlement is on a when-issued or delayed-delivery basis.
(11) The grouping contains securities on loan.
(12) The grouping contains non-income producing securities.
(13) The tables within the Portfolio of Investments detail open purchased options which are non-income producing securities.
(14) All or a portion of the security represents securities purchased with cash collateral received for securities on loan.
(15) Rate shown is the 7-day yield as of December 31, 2019.
Currency Abbreviations:
BRL Brazilian Real
CLP Chilean Peso
EUR EU Euro
IDR Indonesian Rupiah
MXN Mexican Peso
PEN Peruvian Nuevo Sol
RUB Russian Ruble
ZAR South African Rand
Reference Rate Abbreviations:
12MTA 12-month Treasury Average
US0001M 1-month LIBOR
US0003M 3-month LIBOR
US0012M 12-month LIBOR
See Accompanying Notes to Financial Statements
97
TABLE OF CONTENTS
SUMMARY PORTFOLIO OF INVESTMENTS
VOYA GLOBAL BOND PORTFOLIO AS OF DECEMBER 31, 2019 (CONTINUED)
Sector Diversification | | Percentage
of Net Assets | |
Affiliated Investment Companies | | | 19.2 | % | |
Collateralized Mortgage Obligations | | | 15.4 | | |
Sovereign Bonds | | | 10.9 | | |
Commercial Mortgage-Backed Securities | | | 9.1 | | |
Financial | | | 8.5 | | |
U.S. Treasury Obligations | | | 8.3 | | |
Uniform Mortgage-Backed Securities | | | 5.0 | | |
Other Asset-Backed Securities | | | 4.3 | | |
Consumer, Non-cyclical | | | 3.4 | | |
Treasury Inflation Indexed Protected Securities | | | 3.1 | | |
U.S. Government Agency Obligations | | | 2.6 | | |
Communications | | | 2.5 | | |
Energy | | | 2.3 | | |
Utilities | | | 2.0 | | |
Consumer, Cyclical | | | 1.1 | | |
Technology | | | 0.6 | | |
Industrial | | | 0.5 | | |
Basic Materials | | | 0.2 | | |
Materials | | | 0.0 | | |
Communication Services | | | 0.0 | | |
Purchased Options | | | 0.0 | | |
Structured Notes | | | 0.0 | | |
Short-Term Investments | | | 3.0 | | |
Liabilities in Excess of Other Assets | | | (2.0 | ) | |
Net Assets | | | 100.0 | % | |
Fair Value Measurements^
The following is a summary of the fair valuations according to the inputs used as of December 31, 2019 in valuing the assets and liabilities:
| | | Quoted Prices
in Active Markets
for Identical Investments
(Level 1) | | Significant Other
Observable
Inputs
(Level 2) | | Significant
Unobservable
Inputs
(Level 3) | | Fair Value
at
December 31, 2019 | |
Asset Table | |
Investments, at fair value | |
Common Stock | |
United States | | $ | 27,672 | | | $ | — | | | $ | — | | | $ | 27,672 | | |
Total Common Stock | | | 27,672 | | | | — | | | | — | | | | 27,672 | | |
Mutual Funds | | | 38,709,816 | | | | — | | | | — | | | | 38,709,816 | | |
Purchased Options | | | — | | | | 42,509 | | | | — | | | | 42,509 | | |
Corporate Bonds/Notes | | | — | | | | 42,428,425 | | | | 3,108 | | | | 42,431,533 | | |
Collateralized Mortgage Obligations | | | — | | | | 30,954,701 | | | | — | | | | 30,954,701 | | |
Asset-Backed Securities | | | — | | | | 8,681,200 | | | | — | | | | 8,681,200 | | |
Commercial Mortgage-Backed Securities | | | — | | | | 18,304,126 | | | | — | | | | 18,304,126 | | |
U.S. Government Agency Obligations | | | — | | | | 15,223,352 | | | | — | | | | 15,223,352 | | |
Sovereign Bonds | | | — | | | | 21,875,384 | | | | — | | | | 21,875,384 | | |
U.S. Treasury Obligations | | | — | | | | 23,064,265 | | | | — | | | | 23,064,265 | | |
Structured Notes | | | — | | | | — | | | | 10,692 | | | | 10,692 | | |
Short-Term Investments | | | 1,917,000 | | | | 4,199,320 | | | | — | | | | 6,116,320 | | |
Total Investments, at fair value | | $ | 40,654,488 | | | $ | 164,773,282 | | | $ | 13,800 | | | $ | 205,441,570 | | |
Other Financial Instruments+ | |
Centrally Cleared Swaps | | | — | | | | 2,234,359 | | | | — | | | | 2,234,359 | | |
Forward Foreign Currency Contracts | | | — | | | | 1,589,016 | | | | — | | | | 1,589,016 | | |
Futures | | | 225,219 | | | | — | | | | — | | | | 225,219 | | |
Total Assets | | $ | 40,879,707 | | | $ | 168,596,657 | | | $ | 13,800 | | | $ | 209,490,164 | | |
See Accompanying Notes to Financial Statements
98
TABLE OF CONTENTS
SUMMARY PORTFOLIO OF INVESTMENTS
VOYA GLOBAL BOND PORTFOLIO AS OF DECEMBER 31, 2019 (CONTINUED)
| | | Quoted Prices
in Active Markets
for Identical Investments
(Level 1) | | Significant Other
Observable
Inputs
(Level 2) | | Significant
Unobservable
Inputs
(Level 3) | | Fair Value
at
December 31, 2019 | |
Liabilities Table | |
Other Financial Instruments+ | |
Centrally Cleared Swaps | | $ | — | | | $ | (1,392,652 | ) | | $ | — | | | $ | (1,392,652 | ) | |
Forward Foreign Currency Contracts | | | — | | | | (790,727 | ) | | | — | | | | (790,727 | ) | |
Forward Premium Swaptions | | | — | | | | (1,061 | ) | | | — | | | | (1,061 | ) | |
Futures | | | (405,741 | ) | | | — | | | | — | | | | (405,741 | ) | |
OTC Swaps | | | — | | | | (5,341 | ) | | | — | | | | (5,341 | ) | |
Volatility Swaps | | | — | | | | (31,815 | ) | | | — | | | | (31,815 | ) | |
Written Options | | | — | | | | (2,276 | ) | | | — | | | | (2,276 | ) | |
Total Liabilities | | $ | (405,741 | ) | | $ | (2,223,872 | ) | | $ | — | | | $ | (2,629,613 | ) | |
^ See Note 2, "Significant Accounting Policies" in the Notes to Financial Statements for additional information.
+ Other Financial Instruments may include open forward foreign currency contracts, futures, centrally cleared swaps, OTC swaps and written options. Forward foreign currency contracts, futures and centrally cleared swaps are valued at the unrealized gain (loss) on the instrument. OTC swaps and written options are valued at the fair value of the instrument.
Transactions with Affiliates
An investment of at least 5% of the voting securities of an issuer, or a company which is under common control results in that issuer becoming an affiliated person as defined by the 1940 Act.
The following table provides transactions during the year ended December 31, 2019, where the following issuers were considered an affiliate:
Issuer | | Beginning
Fair
Value at
12/31/18 | | Purchases
at Cost | | Sales
at Cost | | Change in
Unrealized
Appreciation/
(Depreciation) | | Ending
Fair
Value at
12/31/19 | | Investment
Income | | Realized
Gains/
(Losses) | | Net Capital
Gain
Distributions | |
Voya Emerging Markets
Corporate Debt
Fund — Class P | | $ | 10,570,022 | | | $ | 356,963 | | | $ | (5,232,154 | ) | | $ | 839,355 | | | $ | 6,534,186 | | | $ | 356,954 | | | $ | (228,650 | ) | | $ | — | | |
Voya Emerging Markets
Hard Currency Debt
Fund — Class P | | | 15,377,081 | | | | 583,024 | | | | (6,639,600 | ) | | | 1,762,886 | | | | 11,083,391 | | | | 583,015 | | | | (639,603 | ) | | | — | | |
Voya Emerging Markets
Local Currency Debt
Fund — Class P | | | 12,193,671 | | | | 455,122 | | | | — | | | | 1,157,760 | | | | 13,806,553 | | | | 455,117 | | | | — | | | | — | | |
Voya High Yield Bond
Fund — Class P | | | 11,948,411 | | | | 488,693 | | | | (6,068,085 | ) | | | 916,667 | | | | 7,285,686 | | | | 488,692 | | | | (68,086 | ) | | | — | | |
| | | $ | 50,089,185 | | | $ | 1,883,802 | | | $ | (17,939,839 | ) | | $ | 4,676,668 | | | $ | 38,709,816 | | | $ | 1,883,778 | | | $ | (936,339 | ) | | $ | — | | |
The financial statements for the above mutual fund[s] can be found at www.sec.gov.
At December 31, 2019, the following forward foreign currency contracts were outstanding for Voya Global Bond Portfolio:
Currency
Purchased | | Currency Sold | | Counterparty | | Settlement
Date | | Unrealized
Appreciation
(Depreciation) | |
UAH | | | | | 8,564,560 | | | USD | | | | | 360,917 | | | Bank of America N.A. | | 02/07/20 | | $ | 43,801 | | |
USD | | | | | 1,065,000 | | | GBP | | | | | 817,773 | | | Barclays Bank PLC | | 01/17/20 | | | (18,678 | ) | |
NZD | | | | | 2,092,724 | | | USD | | | | | 1,396,000 | | | Barclays Bank PLC | | 01/17/20 | | | 13,125 | | |
EUR | | | | | 1,276,620 | | | USD | | | | | 1,420,000 | | | Barclays Bank PLC | | 01/17/20 | | | 13,276 | | |
AUD | | | | | 2,262,175 | | | USD | | | | | 1,571,000 | | | Barclays Bank PLC | | 01/17/20 | | | 17,063 | | |
USD | | | | | 827,000 | | | SEK | | | | | 7,720,912 | | | Barclays Bank PLC | | 01/17/20 | | | 2,097 | | |
USD | | | | | 76,000 | | | KRW | | | | | 88,274,760 | | | Barclays Bank PLC | | 02/07/20 | | | (435 | ) | |
USD | | | | | 1,212,750 | | | ZAR | | | | | 18,110,110 | | | Barclays Bank PLC | | 02/07/20 | | | (74,154 | ) | |
USD | | | | | 496,628 | | | MXN | | | | | 9,652,636 | | | Barclays Bank PLC | | 02/07/20 | | | (11,119 | ) | |
USD | | | | | 1,663,571 | | | RUB | | | | | 106,686,321 | | | Barclays Bank PLC | | 02/07/20 | | | (47,748 | ) | |
USD | | | | | 992,792 | | | COP | | | | | 3,308,469,590 | | | Barclays Bank PLC | | 02/07/20 | | | (12,338 | ) | |
USD | | | | | 442,587 | | | HUF | | | | | 130,737,444 | | | Barclays Bank PLC | | 02/07/20 | | | (1,288 | ) | |
ZAR | | | | | 7,578,053 | | | USD | | | | | 511,000 | | | Barclays Bank PLC | | 02/07/20 | | | 27,496 | | |
IDR | | | | | 245,079,044 | | | USD | | | | | 17,408 | | | Barclays Bank PLC | | 02/07/20 | | | 257 | | |
USD | | | | | 40,000 | | | RUB | | | | | 2,566,456 | | | Barclays Bank PLC | | 02/07/20 | | | (1,168 | ) | |
USD | | | | | 2,607,210 | | | PEN | | | | | 8,725,659 | | | Barclays Bank PLC | | 02/07/20 | | | (23,325 | ) | |
USD | | | | | 33,583 | | | MYR | | | | | 138,881 | | | Barclays Bank PLC | | 02/07/20 | | | (444 | ) | |
NOK | | | | | 30,702,931 | | | USD | | | | | 3,358,335 | | | BNP Paribas | | 01/17/20 | | | 139,090 | | |
SEK | | | | | 69,646,518 | | | USD | | | | | 7,331,091 | | | BNP Paribas | | 01/17/20 | | | 109,945 | | |
USD | | | | | 612,973 | | | IDR | | | | | 8,637,397,808 | | | BNP Paribas | | 02/07/20 | | | (9,602 | ) | |
USD | | | | | 54,711 | | | PHP | | | | | 2,765,071 | | | BNP Paribas | | 02/07/20 | | | 217 | | |
HKD | | | | | 379,429 | | | USD | | | | | 48,416 | | | BNP Paribas | | 02/07/20 | | | 259 | | |
USD | | | | | 3,772,257 | | | BRL | | | | | 15,199,946 | | | BNP Paribas | | 02/07/20 | | | (2,136 | ) | |
See Accompanying Notes to Financial Statements
99
TABLE OF CONTENTS
SUMMARY PORTFOLIO OF INVESTMENTS
VOYA GLOBAL BOND PORTFOLIO AS OF DECEMBER 31, 2019 (CONTINUED)
Currency
Purchased | | Currency Sold | | Counterparty | | Settlement
Date | | Unrealized
Appreciation
(Depreciation) | |
RUB | | | | | 21,752,413 | | | USD | | | | | 338,000 | | | BNP Paribas | | 02/07/20 | | $ | 10,923 | | |
USD | | | | | 340,000 | | | CLP | | | | | 261,926,137 | | | BNP Paribas | | 02/07/20 | | | (8,485 | ) | |
MXN | | | | | 3,111 | | | USD | | | | | 163 | | | BNP Paribas | | 02/07/20 | | | 1 | | |
KRW | | | | | 2,838,992,607 | | | USD | | | | | 2,462,420 | | | BNP Paribas | | 02/07/20 | | | (4,190 | ) | |
USD | | | | | 605,933 | | | CLP | | | | | 451,644,585 | | | BNP Paribas | | 02/07/20 | | | 5,033 | | |
USD | | | | | 209,259 | | | THB | | | | | 6,315,606 | | | BNP Paribas | | 02/07/20 | | | (1,769 | ) | |
USD | | | | | 487,302 | | | TRY | | | | | 2,872,504 | | | BNP Paribas | | 02/07/20 | | | 8,843 | | |
USD | | | | | 527,898 | | | PLN | | | | | 2,025,044 | | | BNP Paribas | | 02/07/20 | | | (5,928 | ) | |
USD | | | | | 322,178 | | | RON | | | | | 1,382,861 | | | BNP Paribas | | 02/07/20 | | | (1,269 | ) | |
EGP | | | | | 10,050,949 | | | USD | | | | | 621,580 | | | BNP Paribas | | 02/10/20 | | | 1,335 | | |
USD | | | | | 2,100,000 | | | GBP | | | | | 1,602,697 | | | Brown Brothers Harriman & Co. | | 01/17/20 | | | (23,827 | ) | |
USD | | | | | 2,357,000 | | | NOK | | | | | 20,776,085 | | | Brown Brothers Harriman & Co. | | 01/17/20 | | | (9,640 | ) | |
USD | | | | | 1,051,000 | | | CHF | | | | | 1,030,100 | | | Brown Brothers Harriman & Co. | | 01/17/20 | | | (14,473 | ) | |
EUR | | | | | 651,074 | | | USD | | | | | 723,000 | | | Brown Brothers Harriman & Co. | | 01/17/20 | | | 7,968 | | |
USD | | | | | 2,695,000 | | | CAD | | | | | 3,517,398 | | | Brown Brothers Harriman & Co. | | 01/17/20 | | | (13,917 | ) | |
CHF | | | | | 1,001,121 | | | USD | | | | | 1,021,000 | | | Brown Brothers Harriman & Co. | | 01/17/20 | | | 14,499 | | |
CHF | | | | | 1,061,198 | | | USD | | | | | 1,081,000 | | | Brown Brothers Harriman & Co. | | 01/17/20 | | | 16,640 | | |
USD | | | | | 848,000 | | | CAD | | | | | 1,115,821 | | | Brown Brothers Harriman & Co. | | 01/17/20 | | | (11,347 | ) | |
USD | | | | | 1,045,000 | | | CHF | | | | | 1,023,784 | | | Brown Brothers Harriman & Co. | | 01/17/20 | | | (13,941 | ) | |
USD | | | | | 1,068,000 | | | CHF | | | | | 1,044,470 | | | Brown Brothers Harriman & Co. | | 01/17/20 | | | (12,337 | ) | |
SEK | | | | | 9,994,278 | | | USD | | | | | 1,064,000 | | | Brown Brothers Harriman & Co. | | 01/17/20 | | | 3,789 | | |
USD | | | | | 1,022,000 | | | SEK | | | | | 9,610,535 | | | Brown Brothers Harriman & Co. | | 01/17/20 | | | (4,790 | ) | |
USD | | | | | 458,000 | | | NZD | | | | | 680,350 | | | Brown Brothers Harriman & Co. | | 01/17/20 | | | (110 | ) | |
SEK | | | | | 9,963,172 | | | USD | | | | | 1,067,000 | | | Brown Brothers Harriman & Co. | | 01/17/20 | | | (2,534 | ) | |
USD | | | | | 1,981,000 | | | CAD | | | | | 2,611,097 | | | Brown Brothers Harriman & Co. | | 01/17/20 | | | (29,930 | ) | |
NZD | | | | | 1,305,883 | | | USD | | | | | 860,000 | | | Brown Brothers Harriman & Co. | | 01/17/20 | | | 19,310 | | |
AUD | | | | | 1,171,479 | | | USD | | | | | 799,000 | | | Brown Brothers Harriman & Co. | | 01/17/20 | | | 23,386 | | |
CAD | | | | | 9,979,864 | | | USD | | | | | 7,530,694 | | | Brown Brothers Harriman & Co. | | 01/17/20 | | | 155,277 | | |
USD | | | | | 835,000 | | | JPY | | | | | 90,512,998 | | | Brown Brothers Harriman & Co. | | 01/17/20 | | | 1,309 | | |
JPY | | | | | 1,247,599 | | | USD | | | | | 11,527 | | | Brown Brothers Harriman & Co. | | 01/17/20 | | | (36 | ) | |
GBP | | | | | 2,160,462 | | | USD | | | | | 2,845,000 | | | Brown Brothers Harriman & Co. | | 01/17/20 | | | 17,953 | | |
CHF | | | | | 4,540,021 | | | USD | | | | | 4,600,303 | | | Brown Brothers Harriman & Co. | | 01/17/20 | | | 95,622 | | |
AUD | | | | | 1,877,619 | | | USD | | | | | 1,291,000 | | | Brown Brothers Harriman & Co. | | 01/17/20 | | | 27,102 | | |
EUR | | | | | 684,726 | | | USD | | | | | 761,000 | | | Brown Brothers Harriman & Co. | | 01/17/20 | | | 7,750 | | |
GBP | | | | | 398,613 | | | USD | | | | | 527,000 | | | Citibank N.A. | | 01/17/20 | | | 1,225 | | |
CLP | | | | | 78,017,450 | | | USD | | | | | 101,000 | | | Citibank N.A. | | 02/07/20 | | | 2,800 | | |
USD | | | | | 513,298 | | | MXN | | | | | 9,910,957 | | | Citibank N.A. | | 02/07/20 | | | (8,037 | ) | |
UYU | | | | | 13,714,846 | | | USD | | | | | 360,917 | | | Citibank N.A. | | 02/07/20 | | | 5,545 | | |
PLN | | | | | 665,377 | | | USD | | | | | 172,000 | | | Citibank N.A. | | 02/07/20 | | | 3,401 | | |
USD | | | | | 520,058 | | | MXN | | | | | 9,962,023 | | | Citibank N.A. | | 02/07/20 | | | (3,963 | ) | |
ILS | | | | | 869,335 | | | USD | | | | | 249,512 | | | Citibank N.A. | | 02/07/20 | | | 2,682 | | |
MXN | | | | | 15,729 | | | USD | | | | | 802 | | | Citibank N.A. | | 02/07/20 | | | 25 | | |
USD | | | | | 626,362 | | | CZK | | | | | 14,372,154 | | | Credit Suisse International | | 02/07/20 | | | (7,624 | ) | |
CNY | | | | | 5,073,786 | | | USD | | | | | 719,339 | | | Credit Suisse International | | 02/07/20 | | | 8,911 | | |
RUB | | | | | 1,943,135 | | | USD | | | | | 30,305 | | | HSBC Bank USA N.A. | | 02/07/20 | | | 864 | | |
USD | | | | | 387,546 | | | RUB | | | | | 24,797,285 | | | HSBC Bank USA N.A. | | 02/07/20 | | | (10,219 | ) | |
PEN | | | | | 802,112 | | | USD | | | | | 236,842 | | | HSBC Bank USA N.A. | | 02/07/20 | | | 4,972 | | |
COP | | | | | 1,257,056,280 | | | USD | | | | | 366,000 | | | JPMorgan Chase Bank N.A. | | 02/07/20 | | | 15,900 | | |
CNY | | | | | 30,372,792 | | | USD | | | | | 4,329,559 | | | JPMorgan Chase Bank N.A. | | 02/07/20 | | | 29,902 | | |
USD | | | | | 611,800 | | | IDR | | | | | 8,637,397,808 | | | JPMorgan Chase Bank N.A. | | 02/07/20 | | | (10,775 | ) | |
PHP | | | | | 21,251,680 | | | USD | | | | | 419,000 | | | JPMorgan Chase Bank N.A. | | 02/07/20 | | | (170 | ) | |
PKR | | | 37,475,319 | | | USD | | | | | 240,612 | | | JPMorgan Chase Bank N.A. | | 02/07/20 | | | (964 | ) | |
USD | | | | | 77,000 | | | PEN | | | | | 260,491 | | | JPMorgan Chase Bank N.A. | | 02/07/20 | | | (1,531 | ) | |
USD | | | | | 7,015 | | | JPY | | | | | 768,000 | | | Morgan Stanley Capital Services LLC | | 01/06/20 | | | (53 | ) | |
SEK | | | | | 9,524,465 | | | USD | | | | | 1,011,000 | | | Morgan Stanley Capital Services LLC | | 01/17/20 | | | 6,594 | | |
USD | | | | | 3,064,000 | | | CHF | | | | | 3,000,215 | | | Morgan Stanley Capital Services LLC | | 01/17/20 | | | (39,242 | ) | |
EUR | | | | | 528,416 | | | USD | | | | | 586,000 | | | Morgan Stanley Capital Services LLC | | 01/17/20 | | | 7,258 | | |
AUD | | | | | 678,673 | | | USD | | | | | 468,000 | | | Morgan Stanley Capital Services LLC | | 01/17/20 | | | 8,433 | | |
SEK | | | | | 3,596,644 | | | USD | | | | | 383,000 | | | Morgan Stanley Capital Services LLC | | 01/17/20 | | | 1,265 | | |
USD | | | | | 11,527 | | | JPY | | | | | 1,247,598 | | | Morgan Stanley Capital Services LLC | | 02/07/20 | | | 22 | | |
BRL | | | | | 833,140 | | | USD | | | | | 200,000 | | | Morgan Stanley Capital Services LLC | | 02/07/20 | | | 6,882 | | |
KZT | | | | | 163,585,695 | | | USD | | | | | 421,070 | | | Morgan Stanley Capital Services LLC | | 02/07/20 | | | 3,371 | | |
USD | | | | | 240,000 | | | COP | | | | | 824,366,400 | | | Morgan Stanley Capital Services LLC | | 02/07/20 | | | (10,447 | ) | |
ZAR | | | | | 54,000 | | | USD | | | | | 3,659 | | | Standard Chartered Bank | | 02/07/20 | | | 178 | | |
USD | | | | | 1,683,000 | | | AUD | | | | | 2,403,394 | | | State Street Bank and Trust Co. | | 01/17/20 | | | (4,199 | ) | |
USD | | | | | 479,000 | | | CAD | | | | | 633,374 | | | State Street Bank and Trust Co. | | 01/17/20 | | | (8,791 | ) | |
AUD | | | | | 627,700 | | | USD | | | | | 428,663 | | | State Street Bank and Trust Co. | | 01/17/20 | | | 11,987 | | |
DKK | | | | | 3,145,127 | | | USD | | | | | 467,420 | | | State Street Bank and Trust Co. | | 01/17/20 | | | 5,154 | | |
EUR | | | | | 23,443,043 | | | USD | | | | | 26,028,806 | | | State Street Bank and Trust Co. | | 01/17/20 | | | 290,956 | | |
See Accompanying Notes to Financial Statements
100
TABLE OF CONTENTS
SUMMARY PORTFOLIO OF INVESTMENTS
VOYA GLOBAL BOND PORTFOLIO AS OF DECEMBER 31, 2019 (CONTINUED)
Currency
Purchased | | Currency Sold | | Counterparty | | Settlement
Date | | Unrealized
Appreciation
(Depreciation) | |
EUR | | | | | 7,643,934 | | | USD | | | | | 8,483,000 | | | State Street Bank and Trust Co. | | 01/17/20 | | $ | 98,928 | | |
JPY | | | | | 3,402,203,664 | | | USD | | | | | 31,444,529 | | | State Street Bank and Trust Co. | | 01/17/20 | | | (107,736 | ) | |
NZD | | | | | 2,044,484 | | | USD | | | | | 1,340,057 | | | State Street Bank and Trust Co. | | 01/17/20 | | | 36,586 | | |
USD | | | | | 1,154,000 | | | AUD | | | | | 1,687,816 | | | State Street Bank and Trust Co. | | 01/17/20 | | | (30,859 | ) | |
USD | | | | | 481,000 | | | CAD | | | | | 636,127 | | | State Street Bank and Trust Co. | | 01/17/20 | | | (8,912 | ) | |
USD | | | | | 1,465,000 | | | SEK | | | | | 13,736,735 | | | State Street Bank and Trust Co. | | 01/17/20 | | | (2,633 | ) | |
USD | | | | | 1,234,000 | | | JPY | | | | | 134,545,180 | | | State Street Bank and Trust Co. | | 01/17/20 | | | (5,260 | ) | |
USD | | | | | 1,338,000 | | | CAD | | | | | 1,758,054 | | | State Street Bank and Trust Co. | | 01/17/20 | | | (15,962 | ) | |
AUD | | | | | 1,483,207 | | | USD | | | | | 1,019,000 | | | State Street Bank and Trust Co. | | 01/17/20 | | | 22,222 | | |
CHF | | | | | 789,116 | | | USD | | | | | 816,000 | | | State Street Bank and Trust Co. | | 01/17/20 | | | 214 | | |
CHF | | | | | 2,105,526 | | | USD | | | | | 2,176,000 | | | State Street Bank and Trust Co. | | 01/17/20 | | | 1,830 | | |
EUR | | | | | 1,300,417 | | | USD | | | | | 1,458,000 | | | State Street Bank and Trust Co. | | 01/17/20 | | | 1,993 | | |
GBP | | | | | 1,433,463 | | | USD | | | | | 1,882,000 | | | State Street Bank and Trust Co. | | 01/17/20 | | | 17,564 | | |
NOK | | | | | 23,732,348 | | | USD | | | | | 2,609,000 | | | State Street Bank and Trust Co. | | 01/17/20 | | | 94,393 | | |
USD | | | | | 546,000 | | | CHF | | | | | 536,922 | | | State Street Bank and Trust Co. | | 01/17/20 | | | (9,360 | ) | |
GBP | | | | | 4,521,615 | | | USD | | | | | 5,956,742 | | | State Street Bank and Trust Co. | | 01/17/20 | | | 35,110 | | |
USD | | | | | 449,000 | | | JPY | | | | | 48,929,551 | | | State Street Bank and Trust Co. | | 01/17/20 | | | (1,677 | ) | |
USD | | | | | 1,087,000 | | | SEK | | | | | 10,162,141 | | | State Street Bank and Trust Co. | | 01/17/20 | | | 1,277 | | |
EUR | | | | | 6,895,657 | | | USD | | | | | 7,709,000 | | | State Street Bank and Trust Co. | | 01/17/20 | | | 32,830 | | |
USD | | | | | 994,000 | | | JPY | | | | | 107,722,106 | | | State Street Bank and Trust Co. | | 01/17/20 | | | 1,800 | | |
CHF | | | | | 1,039,442 | | | USD | | | | | 1,063,000 | | | State Street Bank and Trust Co. | | 01/17/20 | | | 12,136 | | |
USD | | | | | 730,000 | | | GBP | | | | | 560,408 | | | State Street Bank and Trust Co. | | 01/17/20 | | | (12,630 | ) | |
USD | | | | | 744,000 | | | GBP | | | | | 574,634 | | | State Street Bank and Trust Co. | | 01/17/20 | | | (17,481 | ) | |
USD | | | | | 7,671,000 | | | EUR | | | | | 6,867,096 | | | State Street Bank and Trust Co. | | 01/17/20 | | | (38,764 | ) | |
USD | | | | | 735,000 | | | GBP | | | | | 566,784 | | | State Street Bank and Trust Co. | | 01/17/20 | | | (16,078 | ) | |
USD | | | | | 3,021,000 | | | SEK | | | | | 28,216,941 | | | State Street Bank and Trust Co. | | 01/17/20 | | | 6,301 | | |
JPY | | | | | 172,846,256 | | | USD | | | | | 1,589,000 | | | State Street Bank and Trust Co. | | 01/17/20 | | | 3,041 | | |
USD | | | | | 882,000 | | | CAD | | | | | 1,155,728 | | | State Street Bank and Trust Co. | | 01/17/20 | | | (8,081 | ) | |
USD | | | | | 1,848,000 | | | CAD | | | | | 2,436,090 | | | State Street Bank and Trust Co. | | 01/17/20 | | | (28,149 | ) | |
CZK | | | | | 6,406,157 | | | USD | | | | | 277,000 | | | State Street Bank and Trust Co. | | 02/07/20 | | | 5,589 | | |
USD | | | | | 439,000 | | | PLN | | | | | 1,697,703 | | | State Street Bank and Trust Co. | | 02/07/20 | | | (8,534 | ) | |
SGD | | | | | 537,066 | | | USD | | | | | 396,129 | | | State Street Bank and Trust Co. | | 02/07/20 | | | 3,302 | | |
MXN | | | | | 5,347,755 | | | USD | | | | | 275,000 | | | State Street Bank and Trust Co. | | 02/07/20 | | | 6,302 | | |
USD | | | | | 539,000 | | | MXN | | | | | 10,468,043 | | | State Street Bank and Trust Co. | | 02/07/20 | | | (11,638 | ) | |
CNY | | | | | 3,573,461 | | | USD | | | | | 507,000 | | | State Street Bank and Trust Co. | | 02/07/20 | | | 5,905 | | |
| | | | | | | | | | | | | $ | 798,289 | | |
At December 31, 2019, the following futures contracts were outstanding for Voya Global Bond Portfolio:
Description | | Number
of Contracts | | Expiration Date | | Notional
Value | | Unrealized
Appreciation/
(Depreciation) | |
Long Contracts: | |
Australia 10-Year Bond | | | 11 | | | 03/16/20 | | $ | 1,103,529 | | | $ | (21,488 | ) | |
Australia 3-Year Bond | | | 36 | | | 03/16/20 | | | 2,905,588 | | | | (19,357 | ) | |
Canada 10-Year Bond | | | 25 | | | 03/20/20 | | | 2,646,798 | | | | (58,883 | ) | |
Euro-Bobl 5-Year | | | 48 | | | 03/06/20 | | | 7,194,885 | | | | (36,493 | ) | |
Euro-Buxl® 30-year German Government Bond | | | 12 | | | 03/06/20 | | | 2,670,286 | | | | (81,947 | ) | |
Euro-OAT | | | 56 | | | 03/06/20 | | | 10,224,476 | | | | (122,539 | ) | |
Euro-Schatz | | | 74 | | | 03/06/20 | | | 9,288,805 | | | | (7,545 | ) | |
Japanese Government Bonds 10-Year Mini | | | 32 | | | 03/12/20 | | | 4,474,493 | | | | (13,033 | ) | |
Long Gilt | | | 19 | | | 03/27/20 | | | 3,306,514 | | | | (14,942 | ) | |
Long-Term Euro-BTP | | | 19 | | | 03/06/20 | | | 3,036,164 | | | | (6,857 | ) | |
Short Gilt | | | 20 | | | 03/27/20 | | | 2,741,940 | | | | (6,711 | ) | |
U.S. Treasury 2-Year Note | | | 17 | | | 03/31/20 | | | 3,663,500 | | | | 1,315 | | |
U.S. Treasury Long Bond | | | 5 | | | 03/20/20 | | | 779,531 | | | | (15,946 | ) | |
| | | | | | | $ | 54,036,509 | | | $ | (404,426 | ) | |
Short Contracts: | |
Euro-Bund | | | (14 | ) | | 03/06/20 | | | (2,677,353 | ) | | | 36,220 | | |
U.S. Treasury 10-Year Note | | | (26 | ) | | 03/20/20 | | | (3,338,969 | ) | | | 28,215 | | |
U.S. Treasury 5-Year Note | | | (40 | ) | | 03/31/20 | | | (4,744,375 | ) | | | 15,267 | | |
U.S. Treasury Ultra 10-Year Note | | | (71 | ) | | 03/20/20 | | | (9,989,922 | ) | | | 116,867 | | |
U.S. Treasury Ultra Long Bond | | | (5 | ) | | 03/20/20 | | | (908,281 | ) | | | 27,335 | | |
| | | | | | | $ | (21,658,900 | ) | | $ | 223,904 | | |
See Accompanying Notes to Financial Statements
101
TABLE OF CONTENTS
SUMMARY PORTFOLIO OF INVESTMENTS
VOYA GLOBAL BOND PORTFOLIO AS OF DECEMBER 31, 2019 (CONTINUED)
At December 31, 2019, the following centrally cleared credit default swaps were outstanding for Voya Global Bond Portfolio:
Centrally Cleared Credit Default Swaps on Credit Indices — Buy Protection(1)
Reference
Entity/Obligation | | Buy/Sell
Protection | | (Pay)/
Receive
Financing
Rate (%)(2) | | Termination
Date | | Notional
Amount(3) | | Fair
Value(4) | | Unrealized
Appreciation/
(Depreciation) | |
iTraxx Cross-over Index,
Series 32, Version 1 | | Buy | | | (5.000 | ) | | 12/20/24 | | EUR | 8,268,000 | | | $ | (1,263,720 | ) | | $ | (26,673 | ) | |
| | | | | | | $ | (1,263,720 | ) | | $ | (26,673 | ) | |
Centrally Cleared Credit Default Swaps on Credit Indices — Sell Protection(5)
Reference
Entity/Obligation | | Buy/Sell
Protection | | (Pay)/
Receive
Financing
Rate (%)(6) | | Termination
Date | | Notional
Amount(3) | | Fair
Value(4) | | Unrealized
Appreciation/
(Depreciation) | |
CDX North American High Yield Index,
Series 33, Version 2 | | Sell | | | 5.000 | | | 12/20/24 | | USD | 3,305,610 | | | $ | 318,446 | | | $ | 98,776 | | |
| | | | | | | $ | 318,446 | | | $ | 98,776 | | |
(1) If a Portfolio is a buyer of protection and a credit event occurs, as defined under the terms of that particular swap agreement, a Portfolio will either i) receive from the seller of protection an amount equal to the notional amount of the swap and deliver the referenced obligation, other deliverable obligations or underlying securities comprising the referenced index or ii) receive a net settlement amount in the form of cash or securities equal to the notional amount of the swap less the recovery value of the referenced obligation or underlying securities comprising the referenced index.
(2) Payments made quarterly.
(3) The maximum amount of future payments (undiscounted) that a Portfolio as seller of protection could be required to make or receive as a buyer of credit protection under a credit default swap agreement would be an amount equal to the notional amount of the agreement.
(4) The fair values for credit default swap agreements serve as an indicator of the current status of the payment/performance risk and represent the likelihood or risk of default for the credit derivative. Increasing fair values, in absolute terms, when compared to the notional amount of the agreement, represent a deterioration of the referenced obligation's credit soundness and a greater likelihood or risk of default or other credit event occurring.
(5) If the Portfolio is a seller of protection and a credit event occurs, as defined under the terms of that particular swap agreement, the Portfolio will generally either i) Pay to the buyer an amount equal to the notional amount of the swap and take delivery of the referenced obligation, other deliverable obligations, or underlying securities comprising a referenced index or ii) Pay a net settlement amount in the form of cash or securities equal to the notional amount of the swap less the recovery value of the referenced obligation or underlying securities comprising a referenced index.
(6) Payments received quarterly.
At December 31, 2019, the following centrally cleared interest rate swaps were outstanding for Voya Global Bond Portfolio:
Pay/Receive
Floating Rate | | Floating Rate Index | | Floating Rate
Index
Payment
Frequency | | Fixed Rate | | Fixed Rate
Payment
Frequency | | Maturity
Date | | Notional
Amount | | Fair
Value | | Unrealized
Appreciation/
(Depreciation) | |
Pay | | 3-month CAD-CDOR | | Semi-Annual | | | 2.960 | % | | Semi-Annual | | 11/21/44 | | CAD | 1,000,000 | | | $ | 99,391 | | | $ | 85,168 | | |
Pay | | 6-month EUR-EURIBOR | | Semi-Annual | | | 0.294 | | | Annual | | 02/10/23 | | EUR | 2,400,000 | | | | 44,656 | | | | 45,805 | | |
Pay | | 6-month EUR-EURIBOR | | Semi-Annual | | | 0.325 | | | Annual | | 02/16/23 | | EUR | 100,000 | | | | 1,982 | | | | 2,026 | | |
Pay | | 6-month GBP-LIBOR | | Semi-Annual | | | 2.899 | | | Semi-Annual | | 08/22/44 | | GBP | 2,000,000 | | | | 1,052,086 | | | | 1,130,431 | | |
Pay | | 6-month JPY-LIBOR | | Semi-Annual | | | 0.328 | | | Semi-Annual | | 02/13/34 | | JPY | 403,500,000 | | | | 49,837 | | | | 52,454 | | |
Pay | | 6-month JPY-LIBOR | | Semi-Annual | | | 0.519 | | | Semi-Annual | | 02/15/39 | | JPY | 65,000,000 | | | | 20,621 | | | | 21,228 | | |
Pay | | 6-month JPY-LIBOR | | Semi-Annual | | | 0.583 | | | Semi-Annual | | 02/13/44 | | JPY | 349,200,000 | | | | 137,823 | | | | 142,757 | | |
Pay | | 6-month JPY-LIBOR | | Semi-Annual | | | 0.670 | | | Semi-Annual | | 02/07/49 | | JPY | 180,000,000 | | | | 105,218 | | | | 108,181 | | |
Pay | | 1-month USD-LIBOR | | Monthly | | | 2.726 | | | Monthly | | 12/27/28 | | USD | 1,250,000 | | | | 102,513 | | | | 102,513 | | |
Pay | | 1-month USD-LIBOR | | Monthly | | | 2.466 | | | Monthly | | 01/07/29 | | USD | 584,000 | | | | 35,177 | | | | 35,177 | | |
Pay | | 3-month USD-LIBOR | | Quarterly | | | 1.997 | | | Semi-Annual | | 06/25/29 | | USD | 3,950,000 | | | | 42,472 | | | | 42,472 | | |
Pay | | 1-month USD-LIBOR | | Monthly | | | 2.400 | | | Monthly | | 10/27/32 | | USD | 690,000 | | | | 43,653 | | | | 43,742 | | |
Pay | | 1-month USD-LIBOR | | Monthly | | | 2.488 | | | Monthly | | 10/27/47 | | USD | 800,000 | | | | 89,786 | | | | 89,897 | | |
Receive | | 6-month EUR-EURIBOR | | Semi-Annual | | | 0.056 | | | Annual | | 02/10/21 | | EUR | 100,000 | | | | (483 | ) | | | (512 | ) | |
Receive | | 6-month EUR-EURIBOR | | Semi-Annual | | | 1.143 | | | Annual | | 02/04/46 | | EUR | 500,000 | | | | (71,679 | ) | | | (74,738 | ) | |
Receive | | 1-month USD-LIBOR | | Monthly | | | 2.656 | | | Monthly | | 06/19/20 | | USD | 8,150,000 | | | | (36,184 | ) | | | (36,184 | ) | |
Receive | | 1-month USD-LIBOR | | Monthly | | | 2.798 | | | Monthly | | 09/14/20 | | USD | 4,000,000 | | | | (31,306 | ) | | | (31,306 | ) | |
Receive | | 1-month USD-LIBOR | | Monthly | | | 1.079 | | | Monthly | | 04/04/21 | | USD | 7,500,000 | | | | 48,282 | | | | 48,282 | | |
Receive | | 1-month USD-LIBOR | | Monthly | | | 1.493 | | | Monthly | | 09/12/21 | | USD | 11,000,000 | | | | 15,030 | | | | 15,030 | | |
Receive | | 1-month USD-LIBOR | | Monthly | | | 1.983 | | | Monthly | | 10/27/22 | | USD | 23,590,000 | | | | (275,186 | ) | | | (277,132 | ) | |
Receive | | 1-month USD-LIBOR | | Monthly | | | 2.816 | | | Monthly | | 06/19/23 | | USD | 1,716,000 | | | | (72,547 | ) | | | (72,547 | ) | |
Receive | | 1-month USD-LIBOR | | Monthly | | | 2.514 | | | Monthly | | 01/24/25 | | USD | 1,210,000 | | | | (52,363 | ) | | | (52,363 | ) | |
Receive | | 1-month USD-LIBOR | | Monthly | | | 2.728 | | | Monthly | | 03/01/25 | | USD | 4,110,000 | | | | (224,959 | ) | | | (224,959 | ) | |
Receive | | 1-month USD-LIBOR | | Monthly | | | 2.210 | | | Monthly | | 10/27/26 | | USD | 3,590,000 | | | | (124,377 | ) | | | (124,764 | ) | |
Receive | | 1-month USD-LIBOR | | Monthly | | | 2.681 | | | Monthly | | 02/02/28 | | USD | 1,690,000 | | | | (123,491 | ) | | | (123,491 | ) | |
Receive | | 1-month USD-LIBOR | | Monthly | | | 2.884 | | | Monthly | | 06/19/28 | | USD | 910,000 | | | | (83,309 | ) | | | (83,309 | ) | |
See Accompanying Notes to Financial Statements
102
TABLE OF CONTENTS
SUMMARY PORTFOLIO OF INVESTMENTS
VOYA GLOBAL BOND PORTFOLIO AS OF DECEMBER 31, 2019 (CONTINUED)
Pay/Receive
Floating Rate | | Floating Rate Index | | Floating Rate
Index
Payment
Frequency | | Fixed Rate | | Fixed Rate
Payment
Frequency | | Maturity
Date | | Notional
Amount | | Fair
Value | | Unrealized
Appreciation/
(Depreciation) | |
Receive | | 1-month USD-LIBOR | | Monthly | | | 3.099 | % | | Monthly | | 10/18/28 | | USD | 780,000 | | | $ | (87,097 | ) | | $ | (87,097 | ) | |
Receive | | 3-month USD-LIBOR | | Quarterly | | | 1.816 | | | Semi-Annual | | 08/05/29 | | USD | 3,294,000 | | | | 19,479 | | | | 19,479 | | |
Receive | | 3-month USD-LIBOR | | Quarterly | | | 1.533 | | | Semi-Annual | | 08/09/29 | | USD | 3,081,000 | | | | 95,766 | | | | 95,766 | | |
Receive | | 1-month USD-LIBOR | | Monthly | | | 1.646 | | | Monthly | | 10/30/29 | | USD | 3,000,000 | | | | 37,157 | | | | 37,395 | | |
Receive | | 3-month USD-LIBOR | | Quarterly | | | 1.807 | | | Semi-Annual | | 12/18/29 | | USD | 2,250,000 | | | | 17,780 | | | | 17,780 | | |
Receive | | 1-month USD-LIBOR | | Monthly | | | 2.390 | | | Monthly | | 12/11/32 | | USD | 400,000 | | | | (24,953 | ) | | | (24,953 | ) | |
Receive | | 1-month USD-LIBOR | | Monthly | | | 2.962 | | | Monthly | | 04/30/33 | | USD | 530,000 | | | | (70,764 | ) | | | (70,764 | ) | |
Receive | | 1-month USD-LIBOR | | Monthly | | | 3.148 | | | Monthly | | 10/18/33 | | USD | 520,000 | | | | (81,860 | ) | | | (81,860 | ) | |
| | | | | | | | | | | | | | | $ | 698,151 | | | $ | 769,604 | | |
At December 31, 2019, the following over-the-counter-total return swaps were outstanding for Voya Global Bond Portfolio:
Pay/Receive
Total Return(1) | | Reference
Entity | | Reference
Entity
Payment
Frequency | | Fixed/
Floating
Rate | | Floating
Rate
Payment
Frequency | | Counterparty | | Termination
Date | | Notional
Amount | | Fair
Value | | Upfront
Payments
Paid/
(Received) | | Unrealized
Appreciation/
(Depreciation) | |
Receive | | Japanese
Government
5-Year
Treasury
Bond | | At
Termination | | | -0.1 | % | | At
Termination | | BNP Paribas | | 03/05/20 | | JPY | 1,550,000,000 | | | $ | (5,341 | ) | | $ | — | | | $ | (5,341 | ) | |
| | | $ | (5,341 | ) | | $ | — | | | $ | (5,341 | ) | |
At December 31, 2019, the following over-the-counter volatility swaps were outstanding for Voya Global Bond Portfolio:
Pay/Receive
Volatility(2) | | Reference
Entity | | Volatility
Strike Rate | | Counterparty | | Maturity
Date | | Currency | | Notional
Amount | | Fair Value | | Unrealized
Appreciation
(Depreciation) | |
Receive | | USD vs. JPY Spot
Exchange Rate | | | 5.800 | % | | Citibank N.A. | | 01/27/20 | | USD | | | | | 20,000 | | | $ | (22,909 | ) | | $ | (22,909 | ) | |
Receive | | USD vs. CAD Spot
Exchange Rate | | | 4.050 | % | | Citibank N.A. | | 01/09/20 | | USD | | | | | 20,000 | | | | (3,046 | ) | | | (3,046 | ) | |
Receive | | USD vs. CAD Spot
Exchange Rate | | | 4.100 | % | | Morgan Stanley
Capital
Services LLC | | 01/08/20 | | USD | | | | | 20,000 | | | | (5,860 | ) | | | (5,860 | ) | |
| | | | | | | | | | | | | | | $ | (31,815 | ) | | $ | (31,815 | ) | |
At December 31, 2019, the following over-the-counter purchased foreign currency options were outstanding for Voya Global Bond Portfolio:
Description | | Counterparty | | Expiration
Date | | Exercise
Price | | Notional
Amount | | Cost | | Fair Value | |
Call USD vs. Put JPY | | BNP Paribas | | 02/26/20 | | | 108.500 | USD | | | 5,250,000 | | | $ | 35,262 | | | $ | 41,619 | | |
Put USD vs. Call JPY | | BNP Paribas | | 02/26/20 | | | 97.000 | USD | | | 7,875,000 | | | | 37,013 | | | | 890 | | |
| | | | | $ | 72,275 | | | $ | 42,509 | | |
At December 31, 2019, the following OTC written foreign currency options were outstanding for Voya Global Bond Portfolio:
Description | | Counterparty | | Expiration
Date | | Exercise
Price | | Notional
Amount | | Premiums
Received | | Fair Value | |
Put USD vs. Call JPY | | BNP Paribas | | 02/26/20 | | | 100.000 | USD | | | 7,875,000 | | | $ | 64,400 | | | $ | (2,276 | ) | |
| | | | | | | $ | 64,400 | | | $ | (2,276 | ) | |
At December 31, 2019, the following over-the-counter forward premium swaptions were outstanding for Voya Global Bond Portfolio:
Description | | Counterparty | | Exercise
Rate(3) | | Pay/
Receive
Exercise
Rate | | Floating
Rate
Index | | Expiration
Date | | Notional
Amount | | Premium
receivable/
(payable) at
expiration(4) | | Unrealized
Appreciation/
(Depreciation) | |
Call on 5-Year
Interest Rate
Swap
(Purchased) | | Morgan Stanley
Capital Services
LLC | | | 4.960 | % | | Receive | | |
3-month
USD-LIBOR | | | 04/29/20 | | USD | 11,869,000 | | | $ | (610,902 | ) | | $ | (1,061 | ) | |
| | | | | | | | | | | | | | | $ | (610,902 | ) | | $ | (1,061 | ) | |
See Accompanying Notes to Financial Statements
103
TABLE OF CONTENTS
SUMMARY PORTFOLIO OF INVESTMENTS
VOYA GLOBAL BOND PORTFOLIO AS OF DECEMBER 31, 2019 (CONTINUED)
(1) The Portfolio will pay or receive the total return of the reference entity depending on whether the return is positive or negative. Where the Portfolio has elected to receive the total return of the reference entity if positive, it will be responsible for paying the floating rate and the total return of the reference entity, if negative. If the Portfolio has elected to pay the total return of the reference entity if positive, it will receive the floating rate and the total return of the reference entity, if negative.
(2) Payments made at maturity date.
(3) Forward premium swaption exercise rates represent the premium price on each respective swaption contract. Final exercise rate will be determined at the expiration of each respective swaption contract.
(4) Forward premium swaptions include premiums receivable/(payable) that have extended settlement dates. Premiums are not exchanged until the expiration date of each respective forward premium swaption contract.
Currency Abbreviations
AUD — Australian Dollar
BRL — Brazilian Real
CAD — Canadian Dollar
CHF — Swiss Franc
CLP — Chilean Peso
COP — Colombian Peso
CNY — Chinese Yuan
CZK — Czech Koruna
DKK — Danish Krone
EGP — Egyptian Pound
EUR — EU Euro
GBP — British Pound
HKD — Hong Kong Sar Dollar
HUF — Hungarian Forint
IDR — Indonesian Rupiah
ILS — Israeli New Shekel
JPY — Japanese Yen
KRW — South Korean Won
KZT — Kazakhstani Tenge
MXN — Mexican Peso
MYR — Malaysian Ringgit
NOK — Norwegian Krone
NZD — New Zealand Dollar
PEN — Peruvian Nuevo Sol
PHP — Philippine Peso
PKR — Pakistan Rupee
PLN — Polish Zloty
RON — Romanian New Leu
RUB — Russian Ruble
SEK — Swedish Krona
SGD — Singapore Dollar
THB — Thai Baht
TRY — Turkish Lira
UAH — Ukrainian Hryvnia
USD — United States Dollar
UYU — Uruguayan Peso
ZAR — South African Rand
A summary of derivative instruments by primary risk exposure is outlined in the following tables.
The fair value of derivative instruments as of December 31, 2019 was as follows:
Derivatives not accounted
for as hedging instruments | | Location on Statement of Assets and Liabilities | | Fair Value | |
Asset Derivatives | |
Foreign exchange contracts | | Investments in securities at value* | | $ | 42,509 | | |
Foreign exchange contracts | | Unrealized appreciation on forward foreign currency contracts | | | 1,589,016 | | |
Interest rate contracts | | Net Assets — Unrealized appreciation*** | | | 225,219 | | |
Credit contracts | | Net Assets — Unrealized appreciation**** | | | 98,776 | | |
Interest rate contracts | | Net Assets — Unrealized appreciation**** | | | 2,135,583 | | |
Total Asset Derivatives | | | | $ | 4,091,103 | | |
Liability Derivatives | |
Foreign exchange contracts | | Unrealized depreciation on forward foreign currency contracts | | $ | 790,727 | | |
Interest rate contracts | | Unrealized depreciation on forward premium swaptions** | | | 1,061 | | |
Interest rate contracts | | Net Assets — Unrealized depreciation*** | | | 405,741 | | |
Credit contracts | | Net Assets — Unrealized depreciation**** | | | 26,673 | | |
Interest rate contracts | | Net Assets — Unrealized depreciation**** | | | 1,365,979 | | |
Interest rate contracts | | Unrealized depreciation on OTC swap agreements | | | 5,341 | | |
Foreign exchange contracts | | Unrealized depreciation on OTC swap agreements | | | 31,815 | | |
Foreign exchange contracts | | Written options, at fair value | | | 2,276 | | |
Total Liability Derivatives | | | | $ | 2,629,613 | | |
See Accompanying Notes to Financial Statements
104
TABLE OF CONTENTS
SUMMARY PORTFOLIO OF INVESTMENTS
VOYA GLOBAL BOND PORTFOLIO AS OF DECEMBER 31, 2019 (CONTINUED)
* Includes purchased options.
** Includes cumulative appreciation/depreciation of forward premium swaptions as reported in the table within the Portfolio of Investments.
*** Includes cumulative appreciation/depreciation of futures contracts as reported in the table within the Portfolio of Investments.
**** Includes cumulative appreciation/depreciation of centrally cleared swaps as reported in the table within the Portfolio of Investments. Only current day's variation margin receivable/payable is shown on the Statement of Assets and Liabilities.
The effect of derivative instruments on the Portfolio's Statement of Operations for the year ended December 31, 2019 was as follows:
Amount of Realized Gain or (Loss) on Derivatives Recognized in Income | |
Derivatives not
accounted for as
hedging instruments | | Investments* | | Forward foreign
currency contracts | | Futures | | Swaps | | Written
options | | Total | |
Equity contracts | | $ | — | | | $ | — | | | $ | (114,734 | ) | | $ | — | | | $ | — | | | $ | (114,734 | ) | |
Credit Contracts | | | — | | | | — | | | | — | | | | 208,683 | | | | — | | | | 208,683 | | |
Foreign exchange contracts | | | — | | | | (2,321,527 | ) | | | — | | | | (12,701 | ) | | | — | | | | (2,334,228 | ) | |
Interest rate contracts | | | (139,449 | ) | | | — | | | | 1,520,497 | | | | (481,340 | ) | | | 450,158 | | | | 1,349,866 | | |
Total | | $ | (139,449 | ) | | $ | (2,321,527 | ) | | $ | 1,405,763 | | | $ | (285,358 | ) | | $ | 450,158 | | | $ | (890,413 | ) | |
| | | Change in Unrealized Appreciation or (Depreciation) on Derivatives Recognized in Income | |
Derivatives not
accounted for as
hedging instruments | | Investments* | | Forward foreign
currency contracts | | Futures | | Swaps | | Written
options | | Total | |
Credit contracts | | $ | — | | | $ | — | | | $ | — | | | $ | 81,587 | | | $ | — | | | $ | 81,587 | | |
Foreign exchange contracts | | | (29,766 | ) | | | 176,540 | | | | — | | | | (31,815 | ) | | | 62,124 | | | | 177,083 | | |
Interest rate contracts | | | (39,329 | ) | | | — | | | | (339,323 | ) | | | (3,979,039 | ) | | | 1,524,472 | | | | (2,833,219 | ) | |
Total | | $ | (69,095 | ) | | $ | 176,540 | | | $ | (339,323 | ) | | $ | (3,929,267 | ) | | $ | 1,586,596 | | | $ | (2,574,549 | ) | |
* Amounts recognized for purchased options are included in net realized gain (loss) on investments and net change in unrealized appreciation or depreciation on investments.
The following is a summary by counterparty of the fair value of OTC derivative instruments subject to Master Netting Agreements and collateral pledged (received), if any, at December 31, 2019:
| | | Bank of
America
N.A. | | Barclays
Bank
PLC | | BNP
Paribas | | Brown
Brothers
Harrmian &
Co. | | Citibank
N.A. | | Credit
Suisse
International | | HSBC
Bank
USA
N.A. | | JPMorgan
Chase
Bank N.A. | | Morgan
Stanley
Capital
Services
LLC | | Standard
Chartered
Bank | | State
Street
Bank &
Trust Co. | | Totals | |
Assets: | |
Purchased options | | $ | — | | | $ | — | | | $ | 42,509 | | | $ | — | | | $ | — | | | $ | — | | | $ | — | | | $ | — | | | $ | — | | | $ | — | | | $ | — | | | $ | 42,509 | | |
Forward foreign
currency
contracts | | | 43,801 | | | | 73,314 | | | | 275,646 | | | | 390,605 | | | | 15,678 | | | | 8,911 | | | | 5,836 | | | | 45,802 | | | | 33,825 | | | | 178 | | | | 695,420 | | | | 1,589,016 | | |
Total Assets | | $ | 43,801 | | | $ | 73,314 | | | $ | 318,155 | | | $ | 390,605 | | | $ | 15,678 | | | $ | 8,911 | | | $ | 5,836 | | | $ | 45,802 | | | $ | 33,825 | | | $ | 178 | | | $ | 695,420 | | | $ | 1,631,525 | | |
Liabilities: | |
Forward foreign
currency
contracts | | $ | — | | | $ | 190,697 | | | $ | 33,379 | | | $ | 136,882 | | | $ | 12,000 | | | $ | 7,624 | | | $ | 10,219 | | | $ | 13,440 | | | $ | 49,742 | | | $ | — | | | $ | 336,744 | | | $ | 790,727 | | |
Forward premium
swaptions | | | — | | | | — | | | | — | | | | — | | | | — | | | | — | | | | — | | | | — | | | | 1,061 | | | | — | | | | — | | | | 1,061 | | |
Total return swaps | | | — | | | | — | | | | 5,341 | | | | — | | | | — | | | | — | | | | — | | | | — | | | | — | | | | — | | | | — | | | | 5,341 | | |
Volatility swaps | | | — | | | | — | | | | — | | | | — | | | | 25,955 | | | | — | | | | — | | | | — | | | | 5,860 | | | | — | | | | — | | | | 31,815 | | |
Written options | | | — | | | | — | | | | 2,276 | | | | — | | | | — | | | | — | | | | — | | | | — | | | | — | | | | — | | | | — | | | | 2,276 | | |
Total Liabilities | | $ | — | | | $ | 190,697 | | | $ | 40,996 | | | $ | 136,882 | | | $ | 37,955 | | | $ | 7,624 | | | $ | 10,219 | | | $ | 13,440 | | | $ | 56,663 | | | $ | — | | | $ | 336,744 | | | $ | 831,220 | | |
Net OTC derivative
instruments by
counterparty,
at fair value | | $ | 43,801 | | | $ | (117,383 | ) | | $ | 277,159 | | | $ | 253,723 | | | $ | (22,277 | ) | | $ | 1,287 | | | $ | (4,383 | ) | | $ | 32,362 | | | $ | (22,838 | ) | | $ | 178 | | | $ | 358,676 | | | $ | 800,305 | | |
Total collateral
pledged by
the Portfolio/
(Received
from
counterparty) | | $ | — | | | $ | 20,000 | | | $ | (277,159 | ) | | $ | — | | | $ | — | | | $ | — | | | $ | — | | | $ | — | | | $ | — | | | $ | — | | | $ | — | | | $ | (257,159 | ) | |
Net Exposure(1)(2) | | $ | 43,801 | | | $ | (97,383 | ) | | $ | — | | | $ | 253,723 | | | $ | (22,277 | ) | | $ | 1,287 | | | $ | (4,383 | ) | | $ | 32,362 | | | $ | (22,838 | ) | | $ | 178 | | | $ | 358,676 | | | $ | 543,146 | | |
See Accompanying Notes to Financial Statements
105
TABLE OF CONTENTS
SUMMARY PORTFOLIO OF INVESTMENTS
VOYA GLOBAL BOND PORTFOLIO AS OF DECEMBER 31, 2019 (CONTINUED)
(1) Positive net exposure represents amounts due from each respective counterparty. Negative exposure represents amounts due from the Portfolio. Please refer to Note 2 for additional details regarding counterparty credit risk and credit related contingent features.
(2) At December 31, 2019, the Portfolio received $300,000 in cash collateral from BNP Paribas. Excess cash collateral is not shown for financial reporting purposes.
At December 31, 2019, the aggregate cost of securities and other investments and the composition of unrealized appreciation and depreciation of securities and other investments at year end were:
Cost for federal income tax purposes was $204,015,319.
Net unrealized appreciation consisted of: | |
Gross Unrealized Appreciation | | $ | 10,304,376 | | |
Gross Unrealized Depreciation | | | (8,335,608 | ) | |
Net Unrealized Appreciation | | $ | 1,968,768 | | |
See Accompanying Notes to Financial Statements
106
TABLE OF CONTENTS
VOYA INTERNATIONAL HIGH SUMMARY PORTFOLIO OF INVESTMENTS
DIVIDEND LOW VOLATILITY PORTFOLIO AS OF DECEMBER 31, 2019
Shares | |
| |
| | Value | | Percentage
of Net
Assets | |
COMMON STOCK: 98.7% | | | |
| | | | | Australia: 7.8% | |
| | 82,357 | | | | | | | Rio Tinto Ltd. | | $ | 5,826,757 | | | | 1.2 | | |
| | 515,758 | | | | | | | Sydney Airport | | | 3,133,600 | | | | 0.6 | | |
| | 6,564,828 | | | | | | | Other Securities | | | 28,533,000 | | | | 6.0 | | |
| | | | | | | | | | 37,493,357 | | | | 7.8 | | |
| | | | | Belgium: 0.3% | |
| | 29,195 | | | | | | | Other Securities | | | 1,522,135 | | | | 0.3 | | |
| | | | | China: 0.4% | |
| | 516,500 | | | | | | | Other Securities | | | 1,792,992 | | | | 0.4 | | |
| | | | | Denmark: 3.5% | |
| | 20,380 | | | | | | | Carlsberg A/S | | | 3,041,429 | | | | 0.7 | | |
| | 24,466 | | | | | | | Coloplast A/S | | | 3,035,278 | | | | 0.6 | | |
| | 104,830 | | | | | | | Novo Nordisk A/S | | | 6,074,776 | | | | 1.3 | | |
| | 106,426 | | | | | | | Other Securities | | | 4,389,941 | | | | 0.9 | | |
| | | | | | | | | | 16,541,424 | | | | 3.5 | | |
| | | | | Finland: 3.1% | |
| | 87,180 | | | | | | | Neste OYJ | | | 3,033,453 | | | | 0.6 | | |
| | 72,966 | | | | | | | Sampo OYJ | | | 3,185,938 | | | | 0.7 | | |
| | 227,382 | | | | | | | Other Securities | | | 8,631,289 | | | | 1.8 | | |
| | | | | | | | | | 14,850,680 | | | | 3.1 | | |
| | | | | France: 8.3% | |
| | 40,044 | | | | | | | Danone | | | 3,325,507 | | | | 0.7 | | |
| | 28,761 | | | | | | | Eiffage SA | | | 3,299,674 | | | | 0.7 | | |
| | 196,047 | | | | | | | Engie SA | | | 3,175,649 | | | | 0.7 | | |
| | 66,466 | | | | | | | Sanofi | | | 6,675,042 | | | | 1.4 | | |
| | 25,815 | | | | | | | Sodexo SA | | | 3,059,287 | | | | 0.6 | | |
| | 1,030,689 | | | | (1 | ) | | Other Securities | | | 20,151,075 | | | | 4.2 | | |
| | | | | | | | | | 39,686,234 | | | | 8.3 | | |
| | | | | Germany: 5.6% | |
| | 51,073 | | | | | | | BASF SE | | | 3,847,685 | | | | 0.8 | | |
| | 24,435 | | | | | | | Deutsche Boerse AG | | | 3,831,734 | | | | 0.8 | | |
| | 107,825 | | | | | | | Deutsche Post AG | | | 4,099,976 | | | | 0.9 | | |
| | 839,755 | | | | (1 | ) | | Other Securities | | | 14,940,080 | | | | 3.1 | | |
| | | | | | | | | | 26,719,475 | | | | 5.6 | | |
| | | | | Hong Kong: 2.7% | |
| | 3,247,700 | | | | | | | Other Securities | | | 13,090,872 | | | | 2.7 | | |
| | | | | Israel: 1.2% | |
| | 832,303 | | | | | | | Other Securities | | | 5,682,159 | | | | 1.2 | | |
Shares | |
| |
| | Value | | Percentage
of Net
Assets | |
| | | | | Italy: 4.1% | |
| | 250,895 | | | | | | | ENI S.p.A. | | $ | 3,896,725 | | | | 0.8 | | |
| | 1,498,008 | | | | | | | Intesa Sanpaolo SpA | | | 3,946,056 | | | | 0.8 | | |
| | 275,041 | | | | | | | Mediobanca Banca di
Credito Finanziario SpA | | | 3,028,364 | | | | 0.6 | | |
| | 902,377 | | | | | | | Other Securities | | | 8,856,912 | | | | 1.9 | | |
| | | | | | | | | | 19,728,057 | | | | 4.1 | | |
| | | | | Japan: 25.2% | |
| | 123,100 | | | | (2 | ) | | Canon, Inc. | | | 3,369,060 | | | | 0.7 | | |
| | 69,100 | | | | | | | Fuji Film Holdings Corp. | | | 3,299,933 | | | | 0.7 | | |
| | 153,900 | | | | | | | Itochu Corp. | | | 3,566,892 | | | | 0.7 | | |
| | 233,600 | | | | | | | Mitsubishi Chemical
Holdings Corp. | | | 1,740,596 | | | | 0.4 | | |
| | 129,300 | | | | | | | Mitsubishi Corp. | | | 3,425,334 | | | | 0.7 | | |
| | 74,200 | | | | | | | Mitsubishi Heavy
Industries Ltd. | | | 2,877,243 | | | | 0.6 | | |
| | 209,200 | | | | | | | Mitsui & Co., Ltd. | | | 3,718,640 | | | | 0.8 | | |
| | 93,600 | | | | | | | MS&AD Insurance Group
Holdings, Inc. | | | 3,089,614 | | | | 0.6 | | |
| | 74,000 | | | | | | | NEC Corp. | | | 3,062,450 | | | | 0.6 | | |
| | 137,800 | | | | | | | NTT DoCoMo, Inc. | | | 3,838,576 | | | | 0.8 | | |
| | 147,600 | | | | | | | Sekisui House Ltd. | | | 3,151,977 | | | | 0.7 | | |
| | 210,900 | | | | | | | Sumitomo Corp. | | | 3,132,570 | | | | 0.7 | | |
| | 111,700 | | | | | | | Sumitomo Mitsui Financial
Group, Inc. | | | 4,125,681 | | | | 0.9 | | |
| | 2,543,077 | | | | (1 | ) | | Other Securities | | | 77,938,278 | | | | 16.3 | | |
| | | | | | | | | | 120,336,844 | | | | 25.2 | | |
| | | | | Netherlands: 6.1% | |
| | 156,930 | | | | (3 | ) | | ABN AMRO Bank NV | | | 2,860,272 | | | | 0.6 | | |
| | 341,728 | | | | | | | Royal Dutch Shell PLC -
Class A | | | 10,120,077 | | | | 2.1 | | |
| | 88,706 | | | | | | | Unilever NV | | | 5,090,924 | | | | 1.1 | | |
| | 47,823 | | | | | | | Wolters Kluwer NV | | | 3,491,837 | | | | 0.7 | | |
| | 738,093 | | | | | | | Other Securities | | | 7,862,583 | | | | 1.6 | | |
| | | | | | | | | | 29,425,693 | | | | 6.1 | | |
| | | | | New Zealand: 0.1% | |
| | 241,256 | | | | | | | Other Securities | | | 703,507 | | | | 0.1 | | |
| | | | | Norway: 0.4% | |
| | 204,489 | | | | | | | Other Securities | | | 2,073,686 | | | | 0.4 | | |
| | | | | Singapore: 2.6% | |
| | 5,765,100 | | | | | | | Other Securities | | | 12,239,792 | | | | 2.6 | | |
| | | | | Spain: 3.1% | |
| | 16,132 | | | | (3 | ) | | Aena SME SA | | | 3,092,808 | | | | 0.7 | | |
| | 113,155 | | | | | | | Ferrovial SA - FERE | | | 3,428,289 | | | | 0.7 | | |
| | 321,020 | | | | | | | Other Securities | | | 8,200,115 | | | | 1.7 | | |
| | | | | | | | | | 14,721,212 | | | | 3.1 | | |
See Accompanying Notes to Financial Statements
107
TABLE OF CONTENTS
VOYA INTERNATIONAL HIGH SUMMARY PORTFOLIO OF INVESTMENTS
DIVIDEND LOW VOLATILITY PORTFOLIO AS OF DECEMBER 31, 2019 (CONTINUED)
Shares | |
| |
| | Value | | Percentage
of Net
Assets | |
| | | | | Sweden: 1.4% | |
| | 216,196 | | | | | | | Swedbank AB | | $ | 3,213,966 | | | | 0.7 | | |
| | 275,289 | | | | | | | Other Securities | | | 3,476,775 | | | | 0.7 | | |
| | | | | | | | | | 6,690,741 | | | | 1.4 | | |
| | | | | Switzerland: 9.3% | |
| | 59,403 | | | | | | | LafargeHolcim Ltd.-CHF | | | 3,295,529 | | | | 0.7 | | |
| | 117,244 | | | | | | | Nestle SA | | | 12,693,453 | | | | 2.7 | | |
| | 81,982 | | | | | | | Novartis AG | | | 7,762,843 | | | | 1.6 | | |
| | 30,774 | | | | | | | Roche Holding AG | | | 10,001,637 | | | | 2.1 | | |
| | 11,322 | | | | | | | Zurich Insurance Group AG | | | 4,644,280 | | | | 1.0 | | |
| | 172,895 | | | | | | | Other Securities | | | 5,880,974 | | | | 1.2 | | |
| | | | | | | | | | 44,278,716 | | | | 9.3 | | |
| | | | | United Kingdom: 13.5% | |
| | 374,486 | | | | (3 | ) | | Auto Trader Group PLC | | | 2,957,392 | | | | 0.6 | | |
| | 613,784 | | | | | | | Aviva PLC | | | 3,406,860 | | | | 0.7 | | |
| | 449,332 | | | | | | | BAE Systems PLC | | | 3,364,314 | | | | 0.7 | | |
| | 1,065,415 | | | | | | | BP PLC | | | 6,702,364 | | | | 1.4 | | |
| | 1,279,613 | | | | | | | BT Group PLC | | | 3,260,720 | | | | 0.7 | | |
| | 150,497 | | | | | | | Compass Group PLC | | | 3,771,747 | | | | 0.8 | | |
| | 288,393 | | | | | | | GlaxoSmithKline PLC | | | 6,776,427 | | | | 1.4 | | |
| | 821,775 | | | | | | | Legal & General Group PLC | | | 3,301,139 | | | | 0.7 | | |
| | 35,397 | | | | | | | Next PLC | | | 3,298,411 | | | | 0.7 | | |
| | 1,049,984 | | | | | | | Royal Bank of Scotland
Group PLC | | | 3,368,312 | | | | 0.7 | | |
| | 76,304 | | | | | | | Unilever PLC | | | 4,367,873 | | | | 0.9 | | |
| | 2,431,181 | | | | | | | Other Securities | | | 19,813,277 | | | | 4.2 | | |
| | | | | | | | | | 64,388,836 | | | | 13.5 | | |
| | | | | | | Total Common Stock
(Cost $443,488,322) | | | 471,966,412 | | | | 98.7 | | |
EXCHANGE-TRADED FUNDS: 0.2% | | | |
| | 10,419 | | | | | | | Other Securities | | | 723,495 | | | | 0.2 | | |
| | | | | | | Total Exchange-Traded
Funds
(Cost $710,725) | | | 723,495 | | | | 0.2 | | |
RIGHTS: 0.0% | | | |
| | | | | Spain: 0.0% | |
| | 28,748 | | | | (1 | ) | | Other Securities | | | 13,640 | | | | 0.0 | | |
| | | | | | | Total Rights
(Cost $13,586) | | | 13,640 | | | | 0.0 | | |
| | | | | | | Total Long-Term
Investments
(Cost $444,212,633) | | | 472,703,547 | | | | 98.9 | | |
Principal
Amount† | |
| |
| | Value | | Percentage
of Net
Assets | |
SHORT-TERM INVESTMENTS: 0.7% | | | |
| | | | | Repurchase Agreements: 0.7% | |
| | 1,000,000 | | | | (4 | ) | | Bethesda Securities LLC,
Repurchase Agreement
dated 12/31/19, 1.65%,
due 01/02/20 (Repurchase
Amount $1,000,090,
collateralized by various
U.S. Government Agency
Obligations,
3.000%-4.500%, Market
Value plus accrued interest
$1,020,000, due
11/01/32-01/01/49) | | $ | 1,000,000 | | | | 0.2 | | |
| | 1,000,000 | | | | (4 | ) | | Cantor Fitzgerald Securities,
Repurchase Agreement
dated 12/31/19, 1.58%,
due 01/02/20 (Repurchase
Amount $1,000,087,
collateralized by various
U.S. Government/
U.S. Government Agency
Obligations,
0.000%-8.500%, Market
Value plus accrued interest
$1,020,000, due
01/25/20-10/15/60) | | | 1,000,000 | | | | 0.2 | | |
| | 1,000,000 | | | | (4 | ) | | Millennium Fixed Income
Ltd., Repurchase
Agreement dated
12/31/19, 1.75%, due
01/02/20 (Repurchase
Amount $1,000,096,
collateralized by various
U.S. Government
Securities, 0.125%-2.250%,
Market Value plus accrued
interest $1,020,000, due
04/15/20-03/31/21) | | | 1,000,000 | | | | 0.2 | | |
| | 512,449 | | | | (4 | ) | | RBC Dominion Securities
Inc., Repurchase
Agreement dated
12/31/19, 1.57%, due
01/02/20 (Repurchase
Amount $512,493,
collateralized by various
U.S. Government/
U.S. Government Agency
Obligations,
0.000%-6.500%, Market
Value plus accrued
interest $522,698, due
06/30/21-12/01/49) | | | 512,449 | | | | 0.1 | | |
| | | | | | | Total Short-Term
Investments
(Cost $3,512,449) | | | 3,512,449 | | | | 0.7 | | |
| | | | | | | Total Investments in
Securities
(Cost $447,725,082) | | $ | 476,215,996 | | | | 99.6 | | |
| | | | | | | Assets in Excess of
Other Liabilities | | | 2,066,478 | | | | 0.4 | | |
| | | | | | | Net Assets | | $ | 478,282,474 | | | | 100.0 | | |
See Accompanying Notes to Financial Statements
108
TABLE OF CONTENTS
VOYA INTERNATIONAL HIGH SUMMARY PORTFOLIO OF INVESTMENTS
DIVIDEND LOW VOLATILITY PORTFOLIO AS OF DECEMBER 31, 2019 (CONTINUED)
"Other Securities" represents issues not identified as the top 50 holdings in terms of market value and issues or issuers not exceeding 1% of net assets individually or in aggregate respectively as of December 31, 2019.
The following footnotes apply to either the individual securities noted or one or more of the securities aggregated and listed as a single line item.
† Unless otherwise indicated, principal amount is shown in USD.
(1) The grouping contains non-income producing securities.
(2) Security, or a portion of the security, is on loan.
(3) Securities with purchases pursuant to Rule 144A or section 4(a)(2), under the Securities Act of 1933 and may not be resold subject to that rule except to qualified institutional buyers.
(4) All or a portion of the security represents securities purchased with cash collateral received for securities on loan.
Sector Diversification | | Percentage of
Net Assets | |
Financials | | | 17.4 | % | |
Industrials | | | 17.3 | | |
Consumer Staples | | | 12.0 | | |
Health Care | | | 10.8 | | |
Consumer Discretionary | | | 7.7 | | |
Communication Services | | | 7.1 | | |
Materials | | | 6.6 | | |
Energy | | | 5.4 | | |
Information Technology | | | 5.3 | | |
Utilities | | | 4.7 | | |
Real Estate | | | 4.4 | | |
Exchange-Traded Funds | | | 0.2 | | |
Short-Term Investments | | | 0.7 | | |
Assets in Excess of Other Liabilities | | | 0.4 | | |
Net Assets | | | 100.0 | % | |
Fair Value Measurements^
The following is a summary of the fair valuations according to the inputs used as of December 31, 2019 in valuing the assets and liabilities:
| | | Quoted Prices
in Active Markets
for Identical Investments
(Level 1) | | Significant Other
Observable
Inputs#
(Level 2) | | Significant
Unobservable
Inputs
(Level 3) | | Fair Value
at
December 31, 2019 | |
Asset Table | |
Investments, at fair value | |
Common Stock | |
Australia | | $ | — | | | $ | 37,493,357 | | | $ | — | | | $ | 37,493,357 | | |
Belgium | | | 1,522,135 | | | | — | | | | — | | | | 1,522,135 | | |
China | | | — | | | | 1,792,992 | | | | — | | | | 1,792,992 | | |
Denmark | | | 2,651,064 | | | | 13,890,360 | | | | — | | | | 16,541,424 | | |
Finland | | | 4,994,227 | | | | 9,856,453 | | | | — | | | | 14,850,680 | | |
France | | | 4,637,047 | | | | 35,049,187 | | | | — | | | | 39,686,234 | | |
Germany | | | 4,599,374 | | | | 22,120,101 | | | | — | | | | 26,719,475 | | |
Hong Kong | | | — | | | | 13,090,872 | | | | — | | | | 13,090,872 | | |
Israel | | | — | | | | 5,682,159 | | | | — | | | | 5,682,159 | | |
Italy | | | — | | | | 19,728,057 | | | | — | | | | 19,728,057 | | |
Japan | | | — | | | | 120,336,844 | | | | — | | | | 120,336,844 | | |
Netherlands | | | — | | | | 29,425,693 | | | | — | | | | 29,425,693 | | |
New Zealand | | | — | | | | 703,507 | | | | — | | | | 703,507 | | |
Norway | | | — | | | | 2,073,686 | | | | — | | | | 2,073,686 | | |
Singapore | | | — | | | | 12,239,792 | | | | — | | | | 12,239,792 | | |
Spain | | | 2,332,540 | | | | 12,388,672 | | | | — | | | | 14,721,212 | | |
Sweden | | | 2,390,494 | | | | 4,300,247 | | | | — | | | | 6,690,741 | | |
Switzerland | | | 1,195,815 | | | | 43,082,901 | | | | — | | | | 44,278,716 | | |
United Kingdom | | | 5,388,334 | | | | 59,000,502 | | | | — | | | | 64,388,836 | | |
Total Common Stock | | | 29,711,030 | | | | 442,255,382 | | | | — | | | | 471,966,412 | | |
Exchange-Traded Funds | | | 723,495 | | | | — | | | | — | | | | 723,495 | | |
Rights | | | 13,640 | | | | — | | | | — | | | | 13,640 | | |
Short-Term Investments | | | — | | | | 3,512,449 | | | | — | | | | 3,512,449 | | |
Total Investments, at fair value | | $ | 30,448,165 | | | $ | 445,767,831 | | | $ | — | | | $ | 476,215,996 | | |
^ See Note 2, "Significant Accounting Policies" in the Notes to Financial Statements for additional information.
# The earlier close of the foreign markets gives rise to the possibility that significant events, including broad market moves, may have occurred in the interim and may materially affect the value of those securities. To account for this, the Portfolio may frequently value many of its foreign equity securities using fair value prices based on third party vendor modeling tools to the extent available. Accordingly, a portion of the Portfolio's investments are categorized as Level 2 investments.
See Accompanying Notes to Financial Statements
109
TABLE OF CONTENTS
VOYA INTERNATIONAL HIGH SUMMARY PORTFOLIO OF INVESTMENTS
DIVIDEND LOW VOLATILITY PORTFOLIO AS OF DECEMBER 31, 2019 (CONTINUED)
The effect of derivative instruments on the Portfolio's Statement of Operations for the year ended December 31, 2019 was as follows:
| | | Amount of Realized Gain or (Loss) on Derivatives Recognized in Income | |
Derivatives not accounted
for as hedging instruments | | Forward foreign currency contracts | |
Foreign exchange contracts | | $ | (516,949 | ) | |
Total | | $ | (516,949 | ) | |
At December 31, 2019, the aggregate cost of securities and other investments and the composition of unrealized appreciation and depreciation of securities and other investments at year end were:
Cost for federal income tax purposes was $449,670,768.
Net unrealized appreciation consisted of: | |
Gross Unrealized Appreciation | | $ | 41,550,301 | | |
Gross Unrealized Depreciation | | | (14,999,189 | ) | |
Net Unrealized Appreciation | | $ | 26,551,112 | | |
See Accompanying Notes to Financial Statements
110
TABLE OF CONTENTS
VY® AMERICAN CENTURY SUMMARY PORTFOLIO OF INVESTMENTS
SMALL-MID CAP VALUE PORTFOLIO AS OF DECEMBER 31, 2019
Shares | |
| |
| | Value | | Percentage
of Net
Assets | |
COMMON STOCK: 96.6% | | | |
| | | | | Communication Services: 0.8% | |
| | 476,377 | | | | | | | Other Securities | | $ | 3,160,382 | | | | 0.8 | | |
| | | | | Consumer Discretionary: 7.5% | |
| | 22,542 | | | | | | | Advance Auto Parts, Inc. | | | 3,610,327 | | | | 1.0 | | |
| | 29,574 | | | | | | | Genuine Parts Co. | | | 3,141,646 | | | | 0.8 | | |
| | 538,903 | | | | (1 | ),(2) | | Other Securities | | | 21,815,476 | | | | 5.7 | | |
| | | | | | | | | | 28,567,449 | | | | 7.5 | | |
| | | | | Consumer Staples: 5.8% | |
| | 87,189 | | | | | | | Conagra Brands, Inc. | | | 2,985,351 | | | | 0.8 | | |
| | 111,638 | | | | | | | Koninklijke Ahold
Delhaize NV | | | 2,799,045 | | | | 0.7 | | |
| | 273,799 | | | | | | | Orkla ASA | | | 2,776,545 | | | | 0.7 | | |
| | 207,602 | | | | (1 | ),(2) | | Other Securities | | | 13,718,009 | | | | 3.6 | | |
| | | | | | | | | | 22,278,950 | | | | 5.8 | | |
| | | | | Energy: 4.5% | |
| | 104,087 | | | | | | | Baker Hughes Co. | | | 2,667,750 | | | | 0.7 | | |
| | 56,706 | | | | | | | ConocoPhillips | | | 3,687,591 | | | | 1.0 | | |
| | 65,956 | | | | | | | Schlumberger Ltd. | | | 2,651,431 | | | | 0.7 | | |
| | 665,602 | | | | (1 | ),(2) | | Other Securities | | | 7,964,555 | | | | 2.1 | | |
| | | | | | | | | | 16,971,327 | | | | 4.5 | | |
| | | | | Financials: 26.4% | |
| | 24,472 | | | | | | | Ameriprise Financial, Inc. | | | 4,076,546 | | | | 1.1 | | |
| | 46,671 | | | | | | | Axis Capital Holdings Ltd. | | | 2,774,124 | | | | 0.7 | | |
| | 85,310 | | | | | | | BankUnited, Inc. | | | 3,118,934 | | | | 0.8 | | |
| | 25,848 | | | | | | | Chubb Ltd. | | | 4,023,500 | | | | 1.1 | | |
| | 57,588 | | | | | | | Comerica, Inc. | | | 4,131,939 | | | | 1.1 | | |
| | 46,384 | | | | (3 | ) | | Commerce
Bancshares, Inc. | | | 3,151,329 | | | | 0.8 | | |
| | 132,895 | | | | (3 | ),(4) | | Compass Diversified
Holdings | | | 3,303,770 | | | | 0.9 | | |
| | 201,577 | | | | | | | First Hawaiian, Inc. | | | 5,815,496 | | | | 1.5 | | |
| | 157,696 | | | | | | | Home Bancshares, Inc./
Conway AR | | | 3,100,303 | | | | 0.8 | | |
| | 19,356 | | | | | | | M&T Bank Corp. | | | 3,285,681 | | | | 0.9 | | |
| | 60,610 | | | | | | | Northern Trust Corp. | | | 6,439,206 | | | | 1.7 | | |
| | 145,211 | | | | | | | ProAssurance Corp. | | | 5,247,925 | | | | 1.4 | | |
| | 19,667 | | | | | | | Reinsurance Group of
America, Inc. | | | 3,206,901 | | | | 0.8 | | |
| | 34,000 | | | | | | | State Street Corp. | | | 2,689,400 | | | | 0.7 | | |
| | 115,635 | | | | | | | Truist Financial Corp. | | | 6,512,563 | | | | 1.7 | | |
| | 55,904 | | | | | | | UMB Financial Corp. | | | 3,837,251 | | | | 1.0 | | |
| | 266,702 | | | | | | | Valley National Bancorp | | | 3,053,738 | | | | 0.8 | | |
| | 901,750 | | | | (1 | ),(2) | | Other Securities | | | 32,900,642 | | | | 8.6 | | |
| | | | | | | | | | 100,669,248 | | | | 26.4 | | |
Shares | |
| |
| | Value | | Percentage
of Net
Assets | |
| | | | | Health Care: 9.0% | |
| | 63,394 | | | | | | | Cardinal Health, Inc. | | $ | 3,206,469 | | | | 0.8 | | |
| | 39,629 | | | | | | | Cerner Corp. | | | 2,908,372 | | | | 0.7 | | |
| | 21,079 | | | | | | | McKesson Corp. | | | 2,915,647 | | | | 0.8 | | |
| | 38,172 | | | | | | | Quest Diagnostics, Inc. | | | 4,076,388 | | | | 1.1 | | |
| | 37,263 | | | | (5 | ) | | Siemens
Healthineers AG | | | 1,786,286 | | | | 0.5 | | |
| | 18,975 | | | | | | | Universal Health
Services, Inc. | | | 2,722,154 | | | | 0.7 | | |
| | 50,911 | | | | | | | Zimmer Biomet
Holdings, Inc. | | | 7,620,358 | | | | 2.0 | | |
| | 201,462 | | | | (2 | ) | | Other Securities | | | 9,041,206 | | | | 2.4 | | |
| | | | | | | | | | 34,276,880 | | | | 9.0 | | |
| | | | | Industrials: 15.7% | |
| | 15,698 | | | | | | | Cummins, Inc. | | | 2,809,314 | | | | 0.7 | | |
| | 63,929 | | | | | | | Emerson Electric Co. | | | 4,875,226 | | | | 1.3 | | |
| | 29,148 | | | | | | | Hubbell, Inc. | | | 4,308,657 | | | | 1.1 | | |
| | 93,182 | | | | | | | Johnson Controls
International plc | | | 3,793,439 | | | | 1.0 | | |
| | 36,108 | | | | | | | MSC Industrial Direct Co. | | | 2,833,395 | | | | 0.8 | | |
| | 152,527 | | | | | | | nVent Electric PLC | | | 3,901,641 | | | | 1.0 | | |
| | 73,563 | | | | | | | Southwest Airlines Co. | | | 3,970,931 | | | | 1.1 | | |
| | 1,411,696 | | | | (1 | ),(2) | | Other Securities | | | 33,293,788 | | | | 8.7 | | |
| | | | | | | | | | 59,786,391 | | | | 15.7 | | |
| | | | | Information Technology: 8.0% | |
| | 58,076 | | | | | | | Applied Materials, Inc. | | | 3,544,959 | | | | 0.9 | | |
| | 55,356 | | | | | | | Maxim Integrated
Products | | | 3,404,948 | | | | 0.9 | | |
| | 571,321 | | | | (1 | ),(2) | | Other Securities | | | 23,614,245 | | | | 6.2 | | |
| | | | | | | | | | 30,564,152 | | | | 8.0 | | |
| | | | | Materials: 4.9% | |
| | 252,311 | | | | | | | Graphic Packaging
Holding Co. | | | 4,200,978 | | | | 1.1 | | |
| | 433,328 | | | | (1 | ) | | Other Securities | | | 14,343,519 | | | | 3.8 | | |
| | | | | | | | | | 18,544,497 | | | | 4.9 | | |
| | | | | Real Estate: 7.1% | |
| | 93,009 | | | | | | | MGM Growth Properties
LLC | | | 2,880,489 | | | | 0.8 | | |
| | 40,859 | | | | | | | Welltower, Inc. | | | 3,341,449 | | | | 0.9 | | |
| | 162,419 | | | | | | | Weyerhaeuser Co. | | | 4,905,054 | | | | 1.3 | | |
| | 789,601 | | | | | | | Other Securities | | | 15,752,496 | | | | 4.1 | | |
| | | | | | | | | | 26,879,488 | | | | 7.1 | | |
| | | | | Utilities: 6.9% | |
| | 49,173 | | | | | | | Edison International | | | 3,708,136 | | | | 1.0 | | |
| | 39,373 | | | | | | | NorthWestern Corp. | | | 2,821,863 | | | | 0.7 | | |
| | 37,725 | | | | | | | Pinnacle West
Capital Corp. | | | 3,392,609 | | | | 0.9 | | |
| | 32,224 | | | | | | | Spire, Inc. | | | 2,684,581 | | | | 0.7 | | |
See Accompanying Notes to Financial Statements
111
TABLE OF CONTENTS
VY® AMERICAN CENTURY SUMMARY PORTFOLIO OF INVESTMENTS
SMALL-MID CAP VALUE PORTFOLIO AS OF DECEMBER 31, 2019 (CONTINUED)
Shares | |
| |
| | Value | | Percentage
of Net
Assets | |
| | | | | Utilities (continued) | |
| | 80,844 | | | | | | | Xcel Energy, Inc. | | $ | 5,132,786 | | | | 1.4 | | |
| | 95,524 | | | | | | | Other Securities | | | 8,533,566 | | | | 2.2 | | |
| | | | | | | | | | 26,273,541 | | | | 6.9 | | |
| | | | | | | Total Common Stock
(Cost $329,270,067) | | | 367,972,305 | | | | 96.6 | | |
EXCHANGE-TRADED FUNDS: 2.1% | | | |
| | 85,888 | | | | | | | iShares Russell Mid-Cap
Value ETF | | | 8,139,606 | | | | 2.1 | | |
| | | | | | | Total Exchange-Traded
Funds
(Cost $7,511,640) | | | 8,139,606 | | | | 2.1 | | |
| | | | | | | Total Long-Term
Investments
(Cost $336,781,707) | | | 376,111,911 | | | | 98.7 | | |
Principal
Amount† | |
| |
| | Value | | Percentage
of Net
Assets | |
SHORT-TERM INVESTMENTS: 3.2% | | | |
| | | | | Repurchase Agreements: 1.8% | |
| | 1,585,058 | | | | (6 | ) | | Bank of Nova Scotia,
Repurchase Agreement
dated 12/31/19,
1.57%, due 01/02/20
(Repurchase Amount
$1,585,194,
collateralized by various
U.S. Government
Agency Obligations,
2.500%-6.500%,
Market Value plus
accrued interest
$1,616,900, due
09/01/24-11/01/49) | | $ | 1,585,058 | | | | 0.4 | | |
| | 469,500 | | | | (6 | ) | | Citadel Securities LLC,
Repurchase Agreement
dated 12/31/19,
1.60%, due 01/02/20
(Repurchase Amount
$469,541,
collateralized by various
U.S. Government
Securities,
0.000%-8.500%,
Market Value plus
accrued interest
$478,933, due
01/15/20-11/15/48) | | | 469,500 | | | | 0.2 | | |
Principal
Amount† | |
| |
| | Value | | Percentage
of Net
Assets | |
| | 1,585,058 | | | | (6 | ) | | Citigroup, Inc.,
Repurchase Agreement
dated 12/31/19,
1.57%, due 01/02/20
(Repurchase Amount
$1,585,194,
collateralized by various
U.S. Government/
U.S. Government
Agency Obligations,
0.000%-9.000%,
Market Value plus
accrued interest
$1,616,759, due
02/13/20-09/20/69) | | $ | 1,585,058 | | | | 0.4 | | |
| | 1,585,058 | | | | (6 | ) | | Jefferies LLC,
Repurchase Agreement
dated 12/31/19,
1.58%, due 01/02/20
(Repurchase Amount
$1,585,195,
collateralized by various
U.S. Government
Securities,
0.000%-2.875%,
Market Value plus
accrued interest
$1,616,759, due
01/28/20-05/15/27) | | | 1,585,058 | | | | 0.4 | | |
| | 1,585,058 | | | | (6 | ) | | RBC Dominion
Securities Inc.,
Repurchase Agreement
dated 12/31/19,
1.57%, due 01/02/20
(Repurchase Amount
$1,585,194,
collateralized by various
U.S. Government/
U.S. Government
Agency Obligations,
0.000%-6.500%,
Market Value plus
accrued interest
$1,616,759, due
06/30/21-12/01/49) | | | 1,585,058 | | | | 0.4 | | |
| | | | | | | Total Repurchase
Agreements
(Cost $6,809,732) | | | 6,809,732 | | | | 1.8 | | |
See Accompanying Notes to Financial Statements
112
TABLE OF CONTENTS
VY® AMERICAN CENTURY SUMMARY PORTFOLIO OF INVESTMENTS
SMALL-MID CAP VALUE PORTFOLIO AS OF DECEMBER 31, 2019 (CONTINUED)
Shares | |
| |
| | Value | | Percentage
of Net
Assets | |
| | | | | Mutual Funds: 1.4% | |
| | 5,193,548 | | | | (7 | ) | | BlackRock Liquidity
Funds, FedFund,
Institutional Class,
1.520%
(Cost $5,193,548) | | $ | 5,193,548 | | | | 1.4 | | |
| | | | | Total Short-Term
Investments
(Cost $12,003,280) | | | 12,003,280 | | | | 3.2 | | |
| | | | | Total Investments in
Securities
(Cost $348,784,987) | | $ | 388,115,191 | | | | 101.9 | | |
| | | | | Liabilities in Excess of
Other Assets | | | (7,237,575 | ) | | | (1.9 | ) | |
| | | | | Net Assets | | $ | 380,877,616 | | | | 100.0 | | |
"Other Securities" represents issues not identified as the top 50 holdings in terms of market value and issues or issuers not exceeding 1% of net assets individually or in aggregate respectively as of December 31, 2019.
The following footnotes apply to either the individual securities noted or one or more of the securities aggregated and listed as a single line item.
† Unless otherwise indicated, principal amount is shown in USD.
(1) The grouping contains securities on loan.
(2) The grouping contains non-income producing securities.
(3) Security, or a portion of the security, is on loan.
(4) Security is a Master Limited Partnership.
(5) Securities with purchases pursuant to Rule 144A or section 4(a)(2), under the Securities Act of 1933 and may not be resold subject to that rule except to qualified institutional buyers.
(6) All or a portion of the security represents securities purchased with cash collateral received for securities on loan.
(7) Rate shown is the 7-day yield as of December 31, 2019.
Fair Value Measurements^
The following is a summary of the fair valuations according to the inputs used as of December 31, 2019 in valuing the assets and liabilities:
| | | Quoted Prices
in Active Markets
for Identical Investments
(Level 1) | | Significant Other
Observable
Inputs#
(Level 2) | | Significant
Unobservable
Inputs
(Level 3) | | Fair Value
at
December 31, 2019 | |
Asset Table | |
Investments, at fair value | |
Common Stock | |
Communication Services | | $ | 3,160,382 | | | $ | — | | | $ | — | | | $ | 3,160,382 | | |
Consumer Discretionary | | | 28,567,449 | | | | — | | | | — | | | | 28,567,449 | | |
Consumer Staples | | | 16,703,360 | | | | 5,575,590 | | | | — | | | | 22,278,950 | | |
Energy | | | 16,971,327 | | | | — | | | | — | | | | 16,971,327 | | |
Financials | | | 100,669,248 | | | | — | | | | — | | | | 100,669,248 | | |
Health Care | | | 32,490,594 | | | | 1,786,286 | | | | — | | | | 34,276,880 | | |
Industrials | | | 53,811,045 | | | | 5,975,346 | | | | — | | | | 59,786,391 | | |
Information Technology | | | 30,564,152 | | | | — | | | | — | | | | 30,564,152 | | |
Materials | | | 15,895,822 | | | | 2,648,675 | | | | — | | | | 18,544,497 | | |
Real Estate | | | 26,879,488 | | | | — | | | | — | | | | 26,879,488 | | |
Utilities | | | 26,273,541 | | | | — | | | | — | | | | 26,273,541 | | |
Total Common Stock | | | 351,986,408 | | | | 15,985,897 | | | | — | | | | 367,972,305 | | |
Exchange-Traded Funds | | | 8,139,606 | | | | — | | | | — | | | | 8,139,606 | | |
Short-Term Investments | | | 5,193,548 | | | | 6,809,732 | | | | — | | | | 12,003,280 | | |
Total Investments, at fair value | | $ | 365,319,562 | | | $ | 22,795,629 | | | $ | — | | | $ | 388,115,191 | | |
Other Financial Instruments+ | |
Forward Foreign Currency Contracts | | | — | | | | 2,326 | | | | — | | | | 2,326 | | |
Total Assets | | $ | 365,319,562 | | | $ | 22,797,955 | | | $ | — | | | $ | 388,117,517 | | |
Liabilities Table | |
Other Financial Instruments+ | |
Forward Foreign Currency Contracts | | $ | — | | | $ | (193,818 | ) | | $ | — | | | $ | (193,818 | ) | |
Total Liabilities | | $ | — | | | $ | (193,818 | ) | | $ | — | | | $ | (193,818 | ) | |
^ See Note 2, "Significant Accounting Policies" in the Notes to Financial Statements for additional information.
+ Other Financial Instruments may include open forward foreign currency contracts, futures, centrally cleared swaps, OTC swaps and written options. Forward foreign currency contracts, futures and centrally cleared swaps are valued at the unrealized gain (loss) on the instrument. OTC swaps and written options are valued at the fair value of the instrument.
# The earlier close of the foreign markets gives rise to the possibility that significant events, including broad market moves, may have occurred in the interim and may materially affect the value of those securities. To account for this, the Portfolio may frequently value many of its foreign equity securities using fair value prices based on third party vendor modeling tools to the extent available. Accordingly, a portion of the Portfolio's investments are categorized as Level 2 investments.
See Accompanying Notes to Financial Statements
113
TABLE OF CONTENTS
VY® AMERICAN CENTURY SUMMARY PORTFOLIO OF INVESTMENTS
SMALL-MID CAP VALUE PORTFOLIO AS OF DECEMBER 31, 2019 (CONTINUED)
At December 31, 2019, the following forward foreign currency contracts were outstanding for VY® American Century Small-Mid Cap Value Portfolio:
Currency
Purchased | | Currency Sold | | Counterparty | | Settlement
Date | | Unrealized
Appreciation
(Depreciation) | |
JPY | 6,199,189 | | | USD | 57,314 | | | Bank of America N.A. | | 03/31/20 | | $ | 29 | | |
USD | 1,539,086 | | | JPY | 167,433,983 | | | Bank of America N.A. | | 03/31/20 | | | (9,683 | ) | |
EUR | 191,304 | | | USD | 213,641 | | | Credit Suisse AG | | 03/31/20 | | | 2,143 | | |
USD | 7,472,918 | | | EUR | 6,656,558 | | | Credit Suisse AG | | 03/31/20 | | | (35,417 | ) | |
USD | 17,755 | | | NOK | 156,249 | | | Goldman Sachs & Co. | | 01/03/20 | | | (43 | ) | |
NOK | 565,710 | | | USD | 64,298 | | | Goldman Sachs & Co. | | 03/31/20 | | | 154 | | |
USD | 57,758 | | | NOK | 515,857 | | | Goldman Sachs & Co. | | 03/31/20 | | | (1,015 | ) | |
USD | 2,333,364 | | | NOK | 21,035,512 | | | Goldman Sachs & Co. | | 03/31/20 | | | (63,241 | ) | |
USD | 6,039,696 | | | GBP | 4,585,013 | | | JPMorgan Chase Bank N.A. | | 03/31/20 | | | (48,399 | ) | |
USD | 54,972 | | | NOK | 484,953 | | | Morgan Stanley | | 01/02/20 | | | (266 | ) | |
USD | 68,566 | | | CAD | 90,171 | | | Morgan Stanley | | 03/31/20 | | | (895 | ) | |
USD | 2,655,855 | | | CAD | 3,492,969 | | | Morgan Stanley | | 03/31/20 | | | (34,859 | ) | |
| | | | | | | | | $ | (191,492 | ) | |
Currency Abbreviations
CAD — Canadian Dollar
EUR — EU Euro
GBP — British Pound
JPY — Japanese Yen
NOK — Norwegian Krone
USD — United States Dollar
A summary of derivative instruments by primary risk exposure is outlined in the following tables.
The fair value of derivative instruments as of December 31, 2019 was as follows:
Derivatives not accounted
for as hedging instruments | | Location on Statement of Assets and Liabilities | | Fair Value | |
Asset Derivatives | |
Foreign exchange contracts | | Unrealized appreciation on forward foreign currency contracts | | $ | 2,326 | | |
Total Asset Derivatives | | | | $ | 2,326 | | |
Liability Derivatives | |
Foreign exchange contracts | | Unrealized depreciation on forward foreign currency contracts | | $ | 193,818 | | |
Total Liability Derivatives | | | | $ | 193,818 | | |
The effect of derivative instruments on the Portfolio's Statement of Operations for the year ended December 31, 2019 was as follows:
| | | Amount of Realized Gain or (Loss) on Derivatives Recognized in Income | |
Derivatives not accounted
for as hedging instruments | | Forward foreign currency contracts | |
Foreign exchange contracts | | $ | 363,607 | | |
Total | | $ | 363,607 | | |
| | | Change in Unrealized Appreciation or (Depreciation) on Derivatives Recognized in Income | |
Derivatives not accounted
for as hedging instruments | | Forward foreign currency contracts | |
Foreign exchange contracts | | $ | (75,365 | ) | |
Total | | $ | (75,365 | ) | |
At December 31, 2019, the aggregate cost of securities and other investments and the composition of unrealized appreciation and depreciation of securities and other investments at year end were:
Cost for federal income tax purposes was $354,882,057.
Net unrealized appreciation consisted of: | |
Gross Unrealized Appreciation | | $ | 48,073,020 | | |
Gross Unrealized Depreciation | | | (14,903,726 | ) | |
Net Unrealized Appreciation | | $ | 33,169,294 | | |
See Accompanying Notes to Financial Statements
114
TABLE OF CONTENTS
SUMMARY PORTFOLIO OF INVESTMENTS
VY® BARON GROWTH PORTFOLIO AS OF DECEMBER 31, 2019
Shares | |
| |
| | Value | | Percentage
of Net
Assets | |
COMMON STOCK: 99.6% | | | |
| | | | | Communication Services: 3.9% | |
| | 640,834 | | | | (1 | ) | | Iridium
Communications, Inc. | | $ | 15,790,150 | | | | 3.1 | | |
| | 215,250 | | | | | | | Manchester United
PLC - Class A | | | 4,289,932 | | | | 0.8 | | |
| | | | | | | | | | 20,080,082 | | | | 3.9 | | |
| | | | | Consumer Discretionary: 23.6% | |
| | 125,000 | | | | (1 | ) | | Bright Horizons Family
Solutions, Inc. | | | 18,786,250 | | | | 3.6 | | |
| | 327,290 | | | | | | | Choice Hotels
International, Inc. | | | 33,851,605 | | | | 6.6 | | |
| | 105,300 | | | | | | | Marriott Vacations
Worldwide Corp. | | | 13,558,428 | | | | 2.6 | | |
| | 21,650 | | | | (1 | ) | | Ollie's Bargain Outlet
Holdings, Inc. | | | 1,413,961 | | | | 0.3 | | |
| | 408,482 | | | | (1 | ) | | Penn National Gaming,
Inc. | | | 10,440,800 | | | | 2.0 | | |
| | 155,450 | | | | | | | Red Rock Resorts, Inc. | | | 3,723,028 | | | | 0.7 | | |
| | 167,500 | | | | | | | Vail Resorts, Inc. | | | 40,171,525 | | | | 7.8 | | |
| | | | | | | | | | 121,945,597 | | | | 23.6 | | |
| | | | | Consumer Staples: 0.7% | |
| | 70,150 | | | | (1 | ) | | Performance Food
Group Co. | | | 3,611,322 | | | | 0.7 | | |
| | | | | Financials: 26.1% | |
| | 427,881 | | | | (1 | ) | | Arch Capital Group Ltd. | | | 18,351,816 | | | | 3.5 | | |
| | 90,635 | | | | (1 | ) | | BRP Group, Inc. | | | 1,454,692 | | | | 0.3 | | |
| | 162,500 | | | | (2 | ) | | Carlyle Group L.P. | | | 5,213,000 | | | | 1.0 | | |
| | 179,000 | | | | | | | Cohen & Steers, Inc. | | | 11,234,040 | | | | 2.2 | | |
| | 40,050 | | | | | | | Essent Group Ltd. | | | 2,082,199 | | | | 0.4 | | |
| | 82,000 | | | | | | | Factset Research
Systems, Inc. | | | 22,000,600 | | | | 4.3 | | |
| | 33,125 | | | | | | | Houlihan Lokey, Inc. | | | 1,618,819 | | | | 0.3 | | |
| | 76,618 | | | | | | | Kinsale Capital Group,
Inc. | | | 7,788,986 | | | | 1.5 | | |
| | 7,950 | | | | (1 | ) | | LendingTree, Inc. | | | 2,412,348 | | | | 0.5 | | |
| | 52,025 | | | | | | | Moelis & Co. | | | 1,660,638 | | | | 0.3 | | |
| | 74,407 | | | | | | | Morningstar, Inc. | | | 11,258,523 | | | | 2.2 | | |
| | 128,875 | | | | | | | MSCI, Inc. - Class A | | | 33,272,947 | | | | 6.4 | | |
| | 127,969 | | | | | | | Primerica, Inc. | | | 16,707,633 | | | | 3.2 | | |
| | | | | | | | | | 135,056,241 | | | | 26.1 | | |
| | | | | Health Care: 10.2% | |
| | 28,043 | | | | (1 | ) | | Adaptive
Biotechnologies Corp. | | | 839,047 | | | | 0.1 | | |
| | 51,523 | | | | | | | Bio-Techne Corp. | | | 11,309,814 | | | | 2.2 | | |
Shares | |
| |
| | Value | | Percentage
of Net
Assets | |
| | 117,300 | | | | | | | Dechra
Pharmaceuticals PLC | | $ | 4,510,217 | | | | 0.9 | | |
| | 49,295 | | | | (1 | ) | | Denali Therapeutics,
Inc. | | | 858,719 | | | | 0.2 | | |
| | 75,500 | | | | (1 | ) | | Idexx Laboratories, Inc. | | | 19,715,315 | | | | 3.8 | | |
| | 7,800 | | | | (1 | ) | | Mettler Toledo
International, Inc. | | | 6,187,584 | | | | 1.2 | | |
| | 41,550 | | | | (1 | ) | | Neogen Corp. | | | 2,711,553 | | | | 0.5 | | |
| | 40,000 | | | | | | | West Pharmaceutical
Services, Inc. | | | 6,013,200 | | | | 1.2 | | |
| | 31,454 | | | | (3 | ) | | Other Securities | | | 541,952 | | | | 0.1 | | |
| | | | | | | | | | 52,687,401 | | | | 10.2 | | |
| | | | | Industrials: 9.4% | |
| | 29,727 | | | | | | | Air Lease Corp. | | | 1,412,627 | | | | 0.3 | | |
| | 35,427 | | | | (1 | ) | | BrightView Holdings, Inc. | | | 597,653 | | | | 0.1 | | |
| | 57,547 | | | | (1 | ) | | CoStar Group, Inc. | | | 34,430,370 | | | | 6.6 | | |
| | 501,725 | | | | (1 | ),(4) | | Marel HF | | | 2,560,683 | | | | 0.5 | | |
| | 103,150 | | | | (1 | ) | | Trex Co., Inc. | | | 9,271,122 | | | | 1.8 | | |
| | 7,000 | | | | | | | Other Securities | | | 531,440 | | | | 0.1 | | |
| | | | | | | | | | 48,803,895 | | | | 9.4 | | |
| | | | | Information Technology: 17.1% | |
| | 53,870 | | | | (1 | ) | | Altair Engineering, Inc. | | | 1,934,472 | | | | 0.4 | | |
| | 100,305 | | | | (1 | ) | | ANSYS, Inc. | | | 25,819,510 | | | | 5.0 | | |
| | 155,550 | | | | (1 | ) | | Benefitfocus, Inc. | | | 3,412,767 | | | | 0.7 | | |
| | 157,400 | | | | (1 | ) | | Gartner, Inc. | | | 24,255,340 | | | | 4.7 | | |
| | 122,318 | | | | (1 | ) | | Guidewire Software, Inc. | | | 13,426,847 | | | | 2.6 | | |
| | 8,950 | | | | | | | Littelfuse, Inc. | | | 1,712,135 | | | | 0.3 | | |
| | 236,422 | | | | | | | SS&C Technologies
Holdings, Inc. | | | 14,516,311 | | | | 2.8 | | |
| | 25,936 | | | | (1 | ) | | Wix.com Ltd. | | | 3,174,047 | | | | 0.6 | | |
| | | | | | | | | | 88,251,429 | | | | 17.1 | | |
| | | | | Real Estate: 8.6% | |
| | 3,878 | | | | | | | Alexander's, Inc. | | | 1,281,097 | | | | 0.2 | | |
| | 65,954 | | | | | | | Alexandria Real Estate
Equities, Inc. | | | 10,656,848 | | | | 2.0 | | |
| | 45,750 | | | | | | | American Assets Trust,
Inc. | | | 2,099,925 | | | | 0.4 | | |
| | 313,837 | | | | | | | Douglas Emmett, Inc. | | | 13,777,444 | | | | 2.7 | | |
| | 49,855 | | | | (1 | ) | | Forestar Group, Inc. | | | 1,039,477 | | | | 0.2 | | |
| | 370,266 | | | | | | | Gaming and Leisure
Properties, Inc. | | | 15,939,951 | | | | 3.1 | | |
| | | | | | | | | | 44,794,742 | | | | 8.6 | | |
| | | | | | | | | Total Common Stock
(Cost $143,789,138) | | | 515,230,709 | | | | 99.6 | | |
See Accompanying Notes to Financial Statements
115
TABLE OF CONTENTS
SUMMARY PORTFOLIO OF INVESTMENTS
VY® BARON GROWTH PORTFOLIO AS OF DECEMBER 31, 2019 (CONTINUED)
Shares | |
| |
| | Value | | Percentage
of Net
Assets | |
SHORT-TERM INVESTMENTS: 0.4% | |
| | | | | Mutual Funds: 0.4% | |
| | 1,869,679 | | | | (5 | ) | | BlackRock Liquidity
Funds, FedFund,
Institutional Class,
1.520%
(Cost $1,869,679) | | $ | 1,869,679 | | | | 0.4 | | |
| | | | | | | Total Short-Term
Investments
(Cost $1,869,679) | | | 1,869,679 | | | | 0.4 | | |
| | | | | | | Total Investments in
Securities
(Cost $145,658,817) | | $ | 517,100,388 | | | | 100.0 | | |
| | | | | | | Liabilities in Excess of
Other Assets | | | (182,316 | ) | | | — | | |
| | | | | | | Net Assets | | $ | 516,918,072 | | | | 100.0 | | |
"Other Securities" represents issues not identified as the top 50 holdings in terms of market value and issues or issuers not exceeding 1% of net assets individually or in aggregate respectively as of December 31, 2019.
The following footnotes apply to either the individual securities noted or one or more of the securities aggregated and listed as a single line item.
(1) Non-income producing security.
(2) Security is a Master Limited Partnership.
(3) The grouping contains non-income producing securities.
(4) Securities with purchases pursuant to Rule 144A or section 4(a)(2), under the Securities Act of 1933 and may not be resold subject to that rule except to qualified institutional buyers.
(5) Rate shown is the 7-day yield as of December 31, 2019.
Fair Value Measurements^
The following is a summary of the fair valuations according to the inputs used as of December 31, 2019 in valuing the assets and liabilities:
| | | Quoted Prices
in Active Markets
for Identical Investments
(Level 1) | | Significant Other
Observable
Inputs#
(Level 2) | | Significant
Unobservable
Inputs
(Level 3) | | Fair Value
at
December 31, 2019 | |
Asset Table | |
Investments, at fair value | |
Common Stock | |
Communication Services | | $ | 20,080,082 | | | $ | — | | | $ | — | | | $ | 20,080,082 | | |
Consumer Discretionary | | | 121,945,597 | | | | — | | | | — | | | | 121,945,597 | | |
Consumer Staples | | | 3,611,322 | | | | — | | | | — | | | | 3,611,322 | | |
Financials | | | 135,056,241 | | | | — | | | | — | | | | 135,056,241 | | |
Health Care | | | 48,177,184 | | | | 4,510,217 | | | | — | | | | 52,687,401 | | |
Industrials | | | 48,803,895 | | | | — | | | | — | | | | 48,803,895 | | |
Information Technology | | | 88,251,429 | | | | — | | | | — | | | | 88,251,429 | | |
Real Estate | | | 44,794,742 | | | | — | | | | — | | | | 44,794,742 | | |
Total Common Stock | | | 510,720,492 | | | | 4,510,217 | | | | — | | | | 515,230,709 | | |
Short-Term Investments | | | 1,869,679 | | | | — | | | | — | | | | 1,869,679 | | |
Total Investments, at fair value | | $ | 512,590,171 | | | $ | 4,510,217 | | | $ | — | | | $ | 517,100,388 | | |
^ See Note 2, "Significant Accounting Policies" in the Notes to Financial Statements for additional information.
# The earlier close of the foreign markets gives rise to the possibility that significant events, including broad market moves, may have occurred in the interim and may materially affect the value of those securities. To account for this, the Portfolio may frequently value many of its foreign equity securities using fair value prices based on third party vendor modeling tools to the extent available. Accordingly, a portion of the Portfolio's investments are categorized as Level 2 investments.
At December 31, 2019, the aggregate cost of securities and other investments and the composition of unrealized appreciation and depreciation of securities and other investments at year end were:
Cost for federal income tax purposes was $148,795,376.
Net unrealized appreciation consisted of: | |
Gross Unrealized Appreciation | | $ | 371,674,865 | | |
Gross Unrealized Depreciation | | | (3,369,851 | ) | |
Net Unrealized Appreciation | | $ | 368,305,014 | | |
See Accompanying Notes to Financial Statements
116
TABLE OF CONTENTS
VY® COLUMBIA SUMMARY PORTFOLIO OF INVESTMENTS
CONTRARIAN CORE PORTFOLIO AS OF DECEMBER 31, 2019
Shares | |
| |
| | Value | | Percentage
of Net
Assets | |
COMMON STOCK: 97.5% | | | |
| | | | | Communication Services: 14.2% | |
| | 11,260 | | | | | | | Activision Blizzard, Inc. | | $ | 669,069 | | | | 1.3 | | |
| | 663 | | | | (1 | ) | | Alphabet, Inc. - Class A | | | 888,016 | | | | 1.7 | | |
| | 829 | | | | (1 | ) | | Alphabet, Inc. - Class C | | | 1,108,390 | | | | 2.2 | | |
| | 17,140 | | | | | | | AT&T, Inc. | | | 669,831 | | | | 1.3 | | |
| | 27,999 | | | | | | | Comcast Corp. - Class A | | | 1,259,115 | | | | 2.5 | | |
| | 4,240 | | | | (1 | ) | | Electronic Arts, Inc. | | | 455,842 | | | | 0.9 | | |
| | 6,065 | | | | (1 | ) | | Facebook, Inc. - Class A | | | 1,244,841 | | | | 2.5 | | |
| | 6,582 | | | | | | | Verizon
Communications, Inc. | | | 404,135 | | | | 0.8 | | |
| | 9,325 | | | | (2 | ) | | Other Securities | | | 510,744 | | | | 1.0 | | |
| | | | | | | | | | 7,209,983 | | | | 14.2 | | |
| | | | | Consumer Discretionary: 7.7% | |
| | 805 | | | | (1 | ) | | Amazon.com, Inc. | | | 1,487,511 | | | | 2.9 | | |
| | 17,395 | | | | | | | eBay, Inc. | | | 628,134 | | | | 1.2 | | |
| | 7,779 | | | | | | | Lowe's Cos, Inc. | | | 931,613 | | | | 1.8 | | |
| | 15,712 | | | | (2 | ) | | Other Securities | | | 892,866 | | | | 1.8 | | |
| | | | | | | | | | 3,940,124 | | | | 7.7 | | |
| | | | | Consumer Staples: 4.5% | |
| | 9,140 | | | | | | | Mondelez
International, Inc. | | | 503,431 | | | | 1.0 | | |
| | 12,245 | | | | | | | Philip Morris
International, Inc. | | | 1,041,927 | | | | 2.1 | | |
| | 14,065 | | | | | | | Other Securities | | | 724,693 | | | | 1.4 | | |
| | | | | | | | | | 2,270,051 | | | | 4.5 | | |
| | | | | Energy: 5.5% | |
| | 13,493 | | | | | | | Canadian Natural
Resources Ltd. | | | 436,499 | | | | 0.9 | | |
| | 9,281 | | | | | | | Chevron Corp. | | | 1,118,453 | | | | 2.2 | | |
| | 7,354 | | | | | | | EOG Resources, Inc. | | | 615,971 | | | | 1.2 | | |
| | 12,335 | | | | | | | Other Securities | | | 627,574 | | | | 1.2 | | |
| | | | | | | | | | 2,798,497 | | | | 5.5 | | |
| | | | | Financials: 14.9% | |
| | 1,960 | | | | | | | Aon PLC | | | 408,249 | | | | 0.8 | | |
| | 8,978 | | | | (1 | ) | | Berkshire Hathaway,
Inc. - Class B | | | 2,033,517 | | | | 4.0 | | |
| | 1,461 | | | | | | | BlackRock, Inc. | | | 734,445 | | | | 1.4 | | |
| | 18,807 | | | | | | | Citigroup, Inc. | | | 1,502,491 | | | | 3.0 | | |
| | 11,913 | | | | | | | JPMorgan Chase & Co. | | | 1,660,672 | | | | 3.3 | | |
| | 17,210 | | | | | | | Morgan Stanley | | | 879,775 | | | | 1.7 | | |
| | 7,080 | | | | | | | Wells Fargo & Co. | | | 380,904 | | | | 0.7 | | |
| | | | | | | | | | 7,600,053 | | | | 14.9 | | |
| | | | | Health Care: 12.3% | |
| | 4,628 | | | | | | | Abbott Laboratories | | | 401,988 | | | | 0.8 | | |
| | 2,250 | | | | | | | Allergan plc | | | 430,133 | | | | 0.8 | | |
| | 1,462 | | | | | | | Anthem, Inc. | | | 441,568 | | | | 0.9 | | |
| | 2,290 | | | | | | | Becton Dickinson & Co. | | | 622,811 | | | | 1.2 | | |
Shares | |
| |
| | Value | | Percentage
of Net
Assets | |
| | 2,658 | | | | | | | Cigna Corp. | | $ | 543,534 | | | | 1.1 | | |
| | 8,630 | | | | | | | Dentsply Sirona, Inc. | | | 488,372 | | | | 1.0 | | |
| | 6,862 | | | | | | | Johnson & Johnson | | | 1,000,960 | | | | 2.0 | | |
| | 12,843 | | | | | | | Medtronic PLC | | | 1,457,038 | | | | 2.9 | | |
| | 13,676 | | | | | | | Pfizer, Inc. | | | 535,826 | | | | 1.0 | | |
| | 2,885 | | | | (2 | ) | | Other Securities | | | 312,013 | | | | 0.6 | | |
| | | | | | | | | | 6,234,243 | | | | 12.3 | | |
| | | | | Industrials: 7.5% | |
| | 3,360 | | | | | | | Caterpillar, Inc. | | | 496,205 | | | | 1.0 | | |
| | 9,000 | | | | | | | Emerson Electric Co. | | | 686,340 | | | | 1.3 | | |
| | 5,722 | | | | | | | Honeywell
International, Inc. | | | 1,012,794 | | | | 2.0 | | |
| | 2,200 | | | | | | | Northrop
Grumman Corp. | | | 756,734 | | | | 1.5 | | |
| | 12,458 | | | | (2 | ) | | Other Securities | | | 858,177 | | | | 1.7 | | |
| | | | | | | | | | 3,810,250 | | | | 7.5 | | |
| | | | | Information Technology: 25.8% | |
| | 1,930 | | | | (1 | ) | | Adobe, Inc. | | | 636,533 | | | | 1.3 | | |
| | 8,536 | | | | | | | Apple, Inc. | | | 2,506,597 | | | | 4.9 | | |
| | 8,990 | | | | | | | Cisco Systems, Inc. | | �� | 431,160 | | | | 0.8 | | |
| | 15,315 | | | | | | | Corning, Inc. | | | 445,820 | | | | 0.9 | | |
| | 6,890 | | | | | | | Fidelity National
Information
Services, Inc. | | | 958,330 | | | | 1.9 | | |
| | 5,837 | | | | (1 | ) | | Fiserv, Inc. | | | 674,932 | | | | 1.3 | | |
| | 2,765 | | | | | | | International Business
Machines Corp. | | | 370,621 | | | | 0.7 | | |
| | 1,845 | | | | | | | Lam Research Corp. | | | 539,478 | | | | 1.1 | | |
| | 3,956 | | | | | | | Mastercard, Inc. -
Class A | | | 1,181,222 | | | | 2.3 | | |
| | 18,350 | | | | | | | Microsoft Corp. | | | 2,893,795 | | | | 5.7 | | |
| | 4,400 | | | | | | | NXP Semiconductor
NV - NXPI - US | | | 559,944 | | | | 1.1 | | |
| | 1,495 | | | | (1 | ) | | Palo Alto Networks, Inc. | | | 345,719 | | | | 0.7 | | |
| | 26,667 | | | | (2 | ) | | Other Securities | | | 1,548,665 | | | | 3.1 | | |
| | | | | | | | | | 13,092,816 | | | | 25.8 | | |
| | | | | Materials: 3.2% | |
| | 12,195 | | | | | | | Newmont Goldcorp
Corp. | | | 529,873 | | | | 1.1 | | |
| | 16,279 | | | | | | | Other Securities | | | 1,080,185 | | | | 2.1 | | |
| | | | | | | | | | 1,610,058 | | | | 3.2 | | |
| | | | | Real Estate: 1.1% | |
| | 2,475 | | | | | | | American Tower Corp. | | | 568,804 | | | | 1.1 | | |
| | | | | Utilities: 0.8% | |
| | 4,295 | | | | | | | American Electric
Power Co., Inc. | | | 405,920 | | | | 0.8 | | |
| | | | | | | | | Total Common Stock
(Cost $39,859,994) | | | 49,540,799 | | | | 97.5 | | |
See Accompanying Notes to Financial Statements
117
TABLE OF CONTENTS
VY® COLUMBIA SUMMARY PORTFOLIO OF INVESTMENTS
CONTRARIAN CORE PORTFOLIO AS OF DECEMBER 31, 2019 (CONTINUED)
Shares | |
| |
| | Value | | Percentage
of Net
Assets | |
OTHER(3): —% | |
| | | | | Materials: —% | |
| | 649,000 | | | | (4 | ),(5) | | SINO Forest Corp.
(Escrow) | | $ | — | | | | — | | |
| | | | | | | Total Other
(Cost $—) | | | — | | | | — | | |
| | | | | | | Total Long-Term
Investments
(Cost $39,859,994) | | | 49,540,799 | | | | 97.5 | | |
SHORT-TERM INVESTMENTS: 2.4% | |
| | | | | Mutual Funds: 2.4% | |
| | 1,198,041 | | | | (6 | ) | | BlackRock Liquidity
Funds, FedFund,
Institutional Class,
1.520%
(Cost $1,198,041) | | | 1,198,041 | | | | 2.4 | | |
| | | | | | | Total Short-Term
Investments
(Cost $1,198,041) | | | 1,198,041 | | | | 2.4 | | |
| | | | | | | Total Investments in
Securities
(Cost $41,058,035) | | $ | 50,738,840 | | | | 99.9 | | |
| | | | | | | Assets in Excess of
Other Liabilities | | | 43,995 | | | | 0.1 | | |
| | | | | | | Net Assets | | $ | 50,782,835 | | | | 100.0 | | |
"Other Securities" represents issues not identified as the top 50 holdings in terms of market value and issues or issuers not exceeding 1% of net assets individually or in aggregate respectively as of December 31, 2019.
The following footnotes apply to either the individual securities noted or one or more of the securities aggregated and listed as a single line item.
(1) Non-income producing security.
(2) The grouping contains non-income producing securities.
(3) Represents an escrow position for future entitlements, if any, on the defaulted bond. The escrow position was received in exchange for the defaulted bond as part of the bankruptcy reorganization of the bond issuer. These holdings are non-income producing.
(4) For fair value measurement disclosure purposes, security is categorized as Level 3, whose value was determined using significant unobservable inputs.
(5) Restricted security as to resale, excluding Rule 144A securities. As of December 31, 2019, the Portfolio held restricted securities with a fair value of $— or 0.0% of net assets. Please refer to the table below for additional details.
(6) Rate shown is the 7-day yield as of December 31, 2019.
Fair Value Measurements^
The following is a summary of the fair valuations according to the inputs used as of December 31, 2019 in valuing the assets and liabilities:
| | | Quoted Prices
in Active Markets
for Identical Investments
(Level 1) | | Significant Other
Observable
Inputs
(Level 2) | | Significant
Unobservable
Inputs
(Level 3) | | Fair Value
at
December 31, 2019 | |
Asset Table | |
Investments, at fair value | |
Common Stock* | | $ | 49,540,799 | | | $ | — | | | $ | — | | | $ | 49,540,799 | | |
Other | | | — | | | | — | | | | — | | | | — | | |
Short-Term Investments | | | 1,198,041 | | | | — | | | | — | | | | 1,198,041 | | |
Total Investments, at fair value | | $ | 50,738,840 | | | $ | — | | | $ | — | | | $ | 50,738,840 | | |
^ See Note 2, "Significant Accounting Policies" in the Notes to Financial Statements for additional information.
* For further breakdown of Common Stock by sector, please refer to the Portfolio of Investments.
At December 31, 2019, VY® Columbia Contrarian Core Portfolio held the following restricted securities:
Security | | Acquisition Date | | Acquisition Cost | | Fair Value | |
SINO Forest Corp. (Escrow) | | 3/1/2013 | | $ | — | | | $ | — | | |
| | | | | $ | — | | | $ | — | | |
At December 31, 2019, the aggregate cost of securities and other investments and the composition of unrealized appreciation and depreciation of securities and other investments at year end were:
Cost for federal income tax purposes was $41,201,352.
Net unrealized appreciation consisted of: | |
Gross Unrealized Appreciation | | $ | 9,879,586 | | |
Gross Unrealized Depreciation | | | (342,098 | ) | |
Net Unrealized Appreciation | | $ | 9,537,488 | | |
See Accompanying Notes to Financial Statements
118
TABLE OF CONTENTS
VY® COLUMBIA SUMMARY PORTFOLIO OF INVESTMENTS
SMALL CAP VALUE II PORTFOLIO AS OF DECEMBER 31, 2019
Shares | | | | | | Value | | Percentage
of Net
Assets | |
COMMON STOCK: 98.2% | | | |
| | | | | Communication Services: 2.2% | |
| | 20,200 | | | | | | | Nexstar Media Group, Inc. | | $ | 2,368,450 | | | | 1.5 | | |
| | 145,000 | | | | (1 | ) | | Other Securities | | | 1,074,450 | | | | 0.7 | | |
| | | | | | | | | | 3,442,900 | | | | 2.2 | | |
| | | | | Consumer Discretionary: 8.6% | |
| | 15,600 | | | | (2 | ) | | TopBuild Corp. | | | 1,608,048 | | | | 1.0 | | |
| | 17,000 | | | | (2 | ) | | Visteon Corp. | | | 1,472,030 | | | | 0.9 | | |
| | 356,700 | | | | (1 | ) | | Other Securities | | | 10,749,655 | | | | 6.7 | | |
| | | | | | | | | | 13,829,733 | | | | 8.6 | | |
| | | | | Consumer Staples: 2.9% | |
| | 73,500 | | | | (2 | ) | | BellRing Brands, Inc. | | | 1,564,815 | | | | 1.0 | | |
| | 65,000 | | | | (2 | ) | | BJ's Wholesale Club
Holdings, Inc. | | | 1,478,100 | | | | 0.9 | | |
| | 34,000 | | | | (2 | ) | | TreeHouse Foods, Inc. | | | 1,649,000 | | | | 1.0 | | |
| | | | | | | | | | 4,691,915 | | | | 2.9 | | |
| | | | | Energy: 4.8% | |
| | 40,500 | | | | | | | Scorpio Tankers, Inc. | | | 1,593,270 | | | | 1.0 | | |
| | 660,600 | | | | (1 | ) | | Other Securities | | | 6,082,059 | | | | 3.8 | | |
| | | | | | | | | | 7,675,329 | | | | 4.8 | | |
| | | | | Financials: 28.1% | |
| | 44,500 | | | | | | | Ameris Bancorp. | | | 1,893,030 | | | | 1.2 | | |
| | 26,500 | | | | | | | Amerisafe, Inc. | | | 1,749,795 | | | | 1.1 | | |
| | 28,500 | | | | | | | Argo Group International
Holdings Ltd. | | | 1,873,875 | | | | 1.2 | | |
| | 68,500 | | | | | | | Atlantic Union
Bankshares Corp. | | | 2,572,175 | | | | 1.6 | | |
| | 43,500 | | | | | | | Blackstone Mortgage
Trust, Inc. | | | 1,619,070 | | | | 1.0 | | |
| | 53,000 | | | | | | | Cathay General Bancorp. | | | 2,016,650 | | | | 1.3 | | |
| | 38,500 | | | | | | | Community Bank
System, Inc. | | | 2,731,190 | | | | 1.7 | | |
| | 47,000 | | | | | | | Hancock Whitney Corp. | | | 2,062,360 | | | | 1.3 | | |
| | 39,000 | | | | | | | Houlihan Lokey, Inc. | | | 1,905,930 | | | | 1.2 | | |
| | 29,000 | | | | | | | Independent Bank Corp. | | | 2,414,250 | | | | 1.5 | | |
| | 157,000 | | | | | | | MGIC Investment Corp. | | | 2,224,690 | | | | 1.4 | | |
| | 54,500 | | | | | | | Pacific Premier Bancorp, Inc. | | | 1,776,972 | | | | 1.1 | | |
| | 58,000 | | | | | | | Renasant Corp. | | | 2,054,360 | | | | 1.3 | | |
| | 57,000 | | | | | | | Sandy Spring Bancorp, Inc. | | | 2,159,160 | | | | 1.3 | | |
| | 58,500 | | | | | | | TCF Financial Corp. | | | 2,737,800 | | | | 1.7 | | |
| | 29,500 | | | | | | | UMB Financial Corp. | | | 2,024,880 | | | | 1.3 | | |
| | 45,500 | | | | | | | WSFS Financial Corp. | | | 2,001,545 | | | | 1.2 | | |
| | 539,100 | | | | (1 | ) | | Other Securities | | | 9,155,283 | | | | 5.7 | | |
| | | | | | | | | | 44,973,015 | | | | 28.1 | | |
| | | | | Health Care: 5.1% | |
| | 48,000 | | | | (2 | ) | | Horizon Therapeutics Plc | | | 1,737,600 | | | | 1.1 | | |
| | 15,500 | | | | (2 | ) | | LHC Group, Inc. | | | 2,135,280 | | | | 1.3 | | |
Shares | | | | | | Value | | Percentage
of Net
Assets | |
| | 118,000 | | | | (2 | ) | | R1 RCM, Inc. | | $ | 1,531,640 | | | | 1.0 | | |
| | 83,000 | | | | (1 | ) | | Other Securities | | | 2,715,645 | | | | 1.7 | | |
| | | | | | | | | | 8,120,165 | | | | 5.1 | | |
| | | | | Industrials: 13.5% | |
| | 92,000 | | | | (2 | ) | | Evoqua Water
Technologies Corp. | | | 1,743,400 | | | | 1.1 | | |
| | 23,000 | | | | | | | ICF International, Inc. | | | 2,107,260 | | | | 1.3 | | |
| | 40,500 | | | | | | | Kforce, Inc. | | | 1,607,850 | | | | 1.0 | | |
| | 27,500 | | | | (2 | ) | | Mastec, Inc. | | | 1,764,400 | | | | 1.1 | | |
| | 32,000 | | | | | | | Skywest, Inc. | | | 2,068,160 | | | | 1.3 | | |
| | 108,000 | | | | (2 | ) | | Sunrun, Inc. | | | 1,491,480 | | | | 1.0 | | |
| | 502,200 | | | | (1 | ) | | Other Securities | | | 10,760,813 | | | | 6.7 | | |
| | | | | | | | | | 21,543,363 | | | | 13.5 | | |
| | | | | Information Technology: 14.0% | |
| | 78,000 | | | | | | | Cohu, Inc. | | | 1,782,300 | | | | 1.1 | | |
| | 59,000 | | | | | | | KBR, Inc. | | | 1,799,500 | | | | 1.1 | | |
| | 21,300 | | | | (2 | ) | | Lumentum Holdings, Inc. | | | 1,689,090 | | | | 1.1 | | |
| | 19,000 | | | | | | | Science Applications
International Corp. | | | 1,653,380 | | | | 1.0 | | |
| | 17,800 | | | | | | | SYNNEX Corp. | | | 2,292,640 | | | | 1.4 | | |
| | 111,000 | | | | (2 | ) | | Viavi Solutions, Inc. | | | 1,665,000 | | | | 1.1 | | |
| | 425,400 | | | | (1 | ) | | Other Securities | | | 11,442,764 | | | | 7.2 | | |
| | | | | | | | | | 22,324,674 | | | | 14.0 | | |
| | | | | Materials: 5.6% | |
| | 33,522 | | | | | | | Carpenter Technology Corp. | | | 1,668,725 | | | | 1.0 | | |
| | 25,500 | | | | | | | Materion Corp. | | | 1,515,975 | | | | 1.0 | | |
| | 66,000 | | | | (2 | ) | | Summit Materials, Inc. | | | 1,577,400 | | | | 1.0 | | |
| | 311,200 | | | | (1 | ) | | Other Securities | | | 4,226,950 | | | | 2.6 | | |
| | | | | | | | | | 8,989,050 | | | | 5.6 | | |
| | | | | Real Estate: 8.2% | |
| | 33,500 | | | | | | | American Assets Trust, Inc. | | | 1,537,650 | | | | 1.0 | | |
| | 63,000 | | | | | | | First Industrial Realty
Trust, Inc. | | | 2,615,130 | | | | 1.6 | | |
| | 77,000 | | | | | | | Mack-Cali Realty Corp. | | | 1,781,010 | | | | 1.1 | | |
| | 12,000 | | | | | | | PS Business Parks, Inc. | | | 1,978,440 | | | | 1.2 | | |
| | 120,000 | | | | | | | Sunstone Hotel
Investors, Inc. | | | 1,670,400 | | | | 1.1 | | |
| | 101,900 | | | | | | | Other Securities | | | 3,517,431 | | | | 2.2 | | |
| | | | | | | | | | 13,100,061 | | | | 8.2 | | |
| | | | | Utilities: 5.2% | |
| | 17,500 | | | | | | | ONE Gas, Inc. | | | 1,637,475 | | | | 1.0 | | |
| | 30,000 | | | | | | | PNM Resources, Inc. | | | 1,521,300 | | | | 1.0 | | |
| | 29,000 | | | | | | | Portland General Electric Co. | | | 1,617,910 | | | | 1.0 | | |
| | 83,000 | | | | | | | Other Securities | | | 3,565,410 | | | | 2.2 | | |
| | | | | | | | | | 8,342,095 | | | | 5.2 | | |
| | | | | | | Total Common Stock
(Cost $132,960,402) | | | 157,032,300 | | | | 98.2 | | |
See Accompanying Notes to Financial Statements
119
TABLE OF CONTENTS
VY® COLUMBIA SUMMARY PORTFOLIO OF INVESTMENTS
SMALL CAP VALUE II PORTFOLIO AS OF DECEMBER 31, 2019 (CONTINUED)
Shares | | | | | | Value | | Percentage
of Net
Assets | |
SHORT-TERM INVESTMENTS: 1.9% | |
| | | | | Mutual Funds: 1.9% | |
| | 3,086,638 | | | | (3 | ) | | BlackRock Liquidity
Funds, FedFund,
Institutional Class,
1.520%
(Cost $3,086,638) | | $ | 3,086,638 | | | | 1.9 | | |
| | | | | Total Short-Term
Investments
(Cost $3,086,638) | | | 3,086,638 | | | | 1.9 | | |
| | | | | Total Investments in
Securities
(Cost $136,047,040) | | $ | 160,118,938 | | | | 100.1 | | |
| | | | | Liabilities in Excess of
Other Assets | | | (228,744 | ) | | | (0.1 | ) | |
| | | | | Net Assets | | $ | 159,890,194 | | | | 100.0 | | |
"Other Securities" represents issues not identified as the top 50 holdings in terms of market value and issues or issuers not exceeding 1% of net assets individually or in aggregate respectively as of December 31, 2019.
The following footnotes apply to either the individual securities noted or one or more of the securities aggregated and listed as a single line item.
(1) The grouping contains non-income producing securities.
(2) Non-income producing security.
(3) Rate shown is the 7-day yield as of December 31, 2019.
Fair Value Measurements^
The following is a summary of the fair valuations according to the inputs used as of December 31, 2019 in valuing the assets and liabilities:
| | | Quoted Prices
in Active Markets
for Identical Investments
(Level 1) | | Significant Other
Observable
Inputs
(Level 2) | | Significant
Unobservable
Inputs
(Level 3) | | Fair Value
at
December 31, 2019 | |
Asset Table | |
Investments, at fair value | |
Common Stock* | | $ | 157,032,300 | | | $ | — | | | $ | — | | | $ | 157,032,300 | | |
Short-Term Investments | | | 3,086,638 | | | | — | | | | — | | | | 3,086,638 | | |
Total Investments, at fair value | | $ | 160,118,938 | | | $ | — | | | $ | — | | | $ | 160,118,938 | | |
^ See Note 2, "Significant Accounting Policies" in the Notes to Financial Statements for additional information.
* For further breakdown of Common Stock by sector, please refer to the Portfolio of Investments.
At December 31, 2019, the aggregate cost of securities and other investments and the composition of unrealized appreciation and depreciation of securities and other investments at year end were:
Cost for federal income tax purposes was $136,048,271.
Net unrealized appreciation consisted of: | |
Gross Unrealized Appreciation | | $ | 33,591,878 | | |
Gross Unrealized Depreciation | | | (9,521,211 | ) | |
Net Unrealized Appreciation | | $ | 24,070,667 | | |
See Accompanying Notes to Financial Statements
120
TABLE OF CONTENTS
SUMMARY PORTFOLIO OF INVESTMENTS
VY® INVESCO COMSTOCK PORTFOLIO AS OF DECEMBER 31, 2019
Shares | | | | | | Value | | Percentage
of Net
Assets | |
COMMON STOCK: 95.7% | | | |
| | | | | Communication Services: 5.5% | |
| | 130,680 | | | | | | | AT&T, Inc. | | $ | 5,106,974 | | | | 1.6 | | |
| | 9,538 | | | | (1 | ) | | Charter
Communications, Inc. | | | 4,626,693 | | | | 1.5 | | |
| | 80,622 | | | | | | | Comcast Corp. - Class A | | | 3,625,571 | | | | 1.2 | | |
| | 966,632 | | | | | | | Other Securities | | | 3,739,059 | | | | 1.2 | | |
| | | | | | | | | | 17,098,297 | | | | 5.5 | | |
| | | | | Consumer Discretionary: 5.9% | |
| | 115,848 | | | | | | | Carnival Corp. | | | 5,888,554 | | | | 1.9 | | |
| | 104,453 | | | | | | | eBay, Inc. | | | 3,771,798 | | | | 1.2 | | |
| | 167,083 | | | | | | | General Motors Co. | | | 6,115,238 | | | | 2.0 | | |
| | 81,148 | | | | (2 | ) | | Other Securities | | | 2,264,072 | | | | 0.8 | | |
| | | | | | | | | | 18,039,662 | | | | 5.9 | | |
| | | | | Consumer Staples: 6.8% | |
| | 91,819 | | | | | | | Archer-Daniels-
Midland Co. | | | 4,255,811 | | | | 1.4 | | |
| | 22,797 | | | | | | | Kimberly-Clark Corp. | | | 3,135,727 | | | | 1.0 | | |
| | 97,436 | | | | | | | Philip Morris
International, Inc. | | | 8,290,829 | | | | 2.7 | | |
| | 82,685 | | | | | | | Other Securities | | | 5,180,318 | | | | 1.7 | | |
| | | | | | | | | | 20,862,685 | | | | 6.8 | | |
| | | | | Energy: 15.8% | |
| | 166,185 | | | | | | | BP PLC ADR | | | 6,271,822 | | | | 2.0 | | |
| | 103,488 | | | | | | | Canadian Natural
Resources Ltd. | | | 3,347,192 | | | | 1.1 | | |
| | 55,184 | | | | | | | Chevron Corp. | | | 6,650,224 | | | | 2.2 | | |
| | 150,672 | | | | | | | Devon Energy Corp. | | | 3,912,952 | | | | 1.3 | | |
| | 66,646 | | | | | | | Hess Corp. | | | 4,452,619 | | | | 1.4 | | |
| | 360,914 | | | | | | | Marathon Oil Corp. | | | 4,901,212 | | | | 1.6 | | |
| | 131,632 | | | | | | | Noble Energy, Inc. | | | 3,269,739 | | | | 1.1 | | |
| | 91,749 | | | | | | | Royal Dutch Shell PLC -
Class A ADR | | | 5,411,356 | | | | 1.7 | | |
| | 200,425 | | | | | | | Suncor Energy, Inc. | | | 6,573,940 | | | | 2.1 | | |
| | 479,501 | | | | (2 | ) | | Other Securities | | | 3,935,531 | | | | 1.3 | | |
| | | | | | | | | | 48,726,587 | | | | 15.8 | | |
| | | | | Financials: 30.2% | |
| | 31,521 | | | | | | | Allstate Corp. | | | 3,544,537 | | | | 1.2 | | |
| | 115,850 | | | | | | | American International
Group, Inc. | | | 5,946,581 | | | | 1.9 | | |
| | 442,348 | | | | | | | Bank of America Corp. | | | 15,579,497 | | | | 5.1 | | |
| | 84,271 | | | | | | | Bank of New York
Mellon Corp. | | | 4,241,359 | | | | 1.4 | | |
| | 204,077 | | | | | | | Citigroup, Inc. | | | 16,303,712 | | | | 5.3 | | |
| | 102,116 | | | | | | | Citizens Financial
Group, Inc. | | | 4,146,931 | | | | 1.3 | | |
| | 140,750 | | | | | | | Fifth Third Bancorp | | | 4,326,655 | | | | 1.4 | | |
| | 18,340 | | | | | | | Goldman Sachs
Group, Inc. | | | 4,216,916 | | | | 1.4 | | |
Shares | | | | | | Value | | Percentage
of Net
Assets | |
| | 78,148 | | | | | | | JPMorgan Chase & Co. | | $ | 10,893,831 | | | | 3.5 | | |
| | 61,252 | | | | | | | Metlife, Inc. | | | 3,122,014 | | | | 1.0 | | |
| | 123,370 | | | | | | | Morgan Stanley | | | 6,306,674 | | | | 2.0 | | |
| | 19,304 | | | | | | | PNC Financial Services
Group, Inc. | | | 3,081,498 | | | | 1.0 | | |
| | 57,542 | | | | | | | State Street Corp. | | | 4,551,572 | | | | 1.5 | | |
| | 91,973 | | | | | | | Wells Fargo & Co. | | | 4,948,147 | | | | 1.6 | | |
| | 63,820 | | | | | | | Other Securities | | | 1,950,339 | | | | 0.6 | | |
| | | | | | | | | | 93,160,263 | | | | 30.2 | | |
| | | | | Health Care: 11.2% | |
| | 19,507 | | | | | | | Allergan plc | | | 3,729,153 | | | | 1.2 | | |
| | 21,104 | | | | | | | Anthem, Inc. | | | 6,374,041 | | | | 2.1 | | |
| | 70,149 | | | | | | | Bristol-Myers Squibb Co. | | | 4,502,864 | | | | 1.4 | | |
| | 40,805 | | | | | | | CVS Health Corp. | | | 3,031,404 | | | | 1.0 | | |
| | 53,179 | | | | | | | Gilead Sciences, Inc. | | | 3,455,572 | | | | 1.1 | | |
| | 106,497 | | | | (3 | ) | | Sanofi ADR | | | 5,346,149 | | | | 1.7 | | |
| | 173,127 | | | | (4 | ) | | Other Securities | | | 8,213,125 | | | | 2.7 | | |
| | | | | | | | | | 34,652,308 | | | | 11.2 | | |
| | | | | Industrials: 8.5% | |
| | 53,288 | | | | | | | Eaton Corp. PLC | | | 5,047,439 | | | | 1.6 | | |
| | 57,794 | | | | | | | Emerson Electric Co. | | | 4,407,370 | | | | 1.4 | | |
| | 289,453 | | | | | | | General Electric Co. | | | 3,230,296 | | | | 1.1 | | |
| | 111,060 | | | | | | | Johnson Controls
International plc | | | 4,521,253 | | | | 1.5 | | |
| | 77,130 | | | | | | | Textron, Inc. | | | 3,439,998 | | | | 1.1 | | |
| | 40,241 | | | | | | | Other Securities | | | 5,639,532 | | | | 1.8 | | |
| | | | | | | | | | 26,285,888 | | | | 8.5 | | |
| | | | | Information Technology: 8.1% | |
| | 101,896 | | | | | | | Cisco Systems, Inc. | | | 4,886,932 | | | | 1.6 | | |
| | 47,151 | | | | | | | Cognizant Technology
Solutions Corp. | | | 2,924,305 | | | | 1.0 | | |
| | 94,983 | | | | | | | Intel Corp. | | | 5,684,733 | | | | 1.8 | | |
| | 31,978 | | | | | | | Microsoft Corp. | | | 5,042,931 | | | | 1.6 | | |
| | 56,645 | | | | | | | Qualcomm, Inc. | | | 4,997,788 | | | | 1.6 | | |
| | 11,718 | | | | | | | Other Securities | | | 1,491,233 | | | | 0.5 | | |
| | | | | | | | | | 25,027,922 | | | | 8.1 | | |
| | | | | Materials: 3.2% | |
| | 129,772 | | | | | | | Corteva, Inc. | | | 3,836,060 | | | | 1.2 | | |
| | 79,781 | | | | | | | International Paper Co. | | | 3,673,915 | | | | 1.2 | | |
| | 49,535 | | | | | | | Other Securities | | | 2,364,801 | | | | 0.8 | | |
| | | | | | | | | | 9,874,776 | | | | 3.2 | | |
| | | | | Utilities: 0.5% | |
| | 63,000 | | | | | | | Other Securities | | | 1,448,370 | | | | 0.5 | | |
| | | | | | | Total Common Stock
(Cost $251,735,557) | | | 295,176,758 | | | | 95.7 | | |
121
TABLE OF CONTENTS
SUMMARY PORTFOLIO OF INVESTMENTS
VY® INVESCO COMSTOCK PORTFOLIO AS OF DECEMBER 31, 2019 (CONTINUED)
Principal
Amount† | | | | | | Value | | Percentage
of Net
Assets | |
SHORT-TERM INVESTMENTS: 5.2% | | | |
| | | | | Repurchase Agreements: 1.8% | |
| | 1,305,021 | | | | (5 | ) | | Bank of Montreal,
Repurchase
Agreement dated
12/31/19, 1.57%, due
01/02/20 (Repurchase
Amount $1,305,133,
collateralized by
various U.S.
Government Agency
Obligations,
2.500%-5.000%,
Market Value plus
accrued interest
$1,331,121, due
04/20/49-12/01/49) | | $ | 1,305,021 | | | | 0.4 | | |
| | 386,635 | | | | (5 | ) | | Citadel Securities LLC,
Repurchase
Agreement dated
12/31/19, 1.60%, due
01/02/20 (Repurchase
Amount $386,669,
collateralized by
various U.S.
Government Securities,
0.000%-8.500%,
Market Value plus
accrued interest
$394,403, due
01/15/20-11/15/48) | | | 386,635 | | | | 0.2 | | |
| | 1,305,021 | | | | (5 | ) | | Citigroup, Inc.,
Repurchase
Agreement dated
12/31/19, 1.57%, due
01/02/20 (Repurchase
Amount $1,305,133,
collateralized by
various U.S.
Government/U.S.
Government Agency
Obligations,
0.000%-9.000%,
Market Value plus
accrued interest
$1,331,121, due
02/13/20-09/20/69) | | | 1,305,021 | | | | 0.4 | | |
Principal
Amount† | | | | | | Value | | Percentage
of Net
Assets | |
| | 1,305,021 | | | | (5 | ) | | HSBC Securities USA,
Repurchase
Agreement dated
12/31/19, 1.57%, due
01/02/20 (Repurchase
Amount $1,305,133,
collateralized by
various U.S.
Government Agency
Obligations,
3.000%-4.000%,
Market Value plus
accrued interest
$1,331,121, due
07/20/47-06/20/48) | | $ | 1,305,021 | | | | 0.4 | | |
| | 1,305,021 | | | | (5 | ) | | Jefferies LLC,
Repurchase
Agreement dated
12/31/19, 1.58%, due
01/02/20 (Repurchase
Amount $1,305,134,
collateralized by
various U.S.
Government Securities,
0.000%-2.875%,
Market Value plus
accrued interest
$1,331,122, due
01/28/20-05/15/27) | | | 1,305,021 | | | | 0.4 | | |
| | | | | | | Total Repurchase
Agreements
(Cost $5,606,719) | | | 5,606,719 | | | | 1.8 | | |
Shares | | | | | | Value | | Percentage
of Net
Assets | |
| | | | | Mutual Funds: 3.4% | |
| | 10,531,178 | | | | (6 | ) | | BlackRock Liquidity
Funds, FedFund,
Institutional Class,
1.520%
(Cost $10,531,178) | | $ | 10,531,178 | | | | 3.4 | | |
| | | | | | | Total Short-Term
Investments
(Cost $16,137,897) | | | 16,137,897 | | | | 5.2 | | |
| | | | | | | Total Investments in
Securities
(Cost $267,873,454) | | $ | 311,314,655 | | | | 100.9 | | |
| | | | | | | Liabilities in Excess of
Other Assets | | | (2,927,662 | ) | | | (0.9 | ) | |
| | | | | | | Net Assets | | $ | 308,386,993 | | | | 100.0 | | |
"Other Securities" represents issues not identified as the top 50 holdings in terms of market value and issues or issuers not exceeding 1% of net assets individually or in aggregate respectively as of December 31, 2019.
The following footnotes apply to either the individual securities noted or one or more of the securities aggregated and listed as a single line item.
† Unless otherwise indicated, principal amount is shown in USD.
ADR American Depositary Receipt
See Accompanying Notes to Financial Statements
122
TABLE OF CONTENTS
SUMMARY PORTFOLIO OF INVESTMENTS
VY® INVESCO COMSTOCK PORTFOLIO AS OF DECEMBER 31, 2019 (CONTINUED)
(1) Non-income producing security.
(2) The grouping contains securities on loan.
(3) Security, or a portion of the security, is on loan.
(4) The grouping contains non-income producing securities.
(5) All or a portion of the security represents securities purchased with cash collateral received for securities on loan.
(6) Rate shown is the 7-day yield as of December 31, 2019.
Fair Value Measurements^
The following is a summary of the fair valuations according to the inputs used as of December 31, 2019 in valuing the assets and liabilities:
| | | Quoted Prices
in Active Markets
for Identical Investments
(Level 1) | | Significant Other
Observable
Inputs#
(Level 2) | | Significant
Unobservable
Inputs
(Level 3) | | Fair Value
at
December 31, 2019 | |
Asset Table | |
Investments, at fair value | |
Common Stock | |
Communication Services | | $ | 15,312,018 | | | $ | 1,786,279 | | | $ | — | | | $ | 17,098,297 | | |
Consumer Discretionary | | | 18,039,662 | | | | — | | | | — | | | | 18,039,662 | | |
Consumer Staples | | | 18,130,303 | | | | 2,732,382 | | | | — | | | | 20,862,685 | | |
Energy | | | 48,726,587 | | | | — | | | | — | | | | 48,726,587 | | |
Financials | | | 93,160,263 | | | | — | | | | — | | | | 93,160,263 | | |
Health Care | | | 33,253,837 | | | | 1,398,471 | | | | — | | | | 34,652,308 | | |
Industrials | | | 26,285,888 | | | | — | | | | — | �� | | | 26,285,888 | | |
Information Technology | | | 25,027,922 | | | | — | | | | — | | | | 25,027,922 | | |
Materials | | | 9,874,776 | | | | — | | | | — | | | | 9,874,776 | | |
Utilities | | | 1,448,370 | | | | — | | | | — | | | | 1,448,370 | | |
Total Common Stock | | | 289,259,626 | | | | 5,917,132 | | | | — | | | | 295,176,758 | | |
Short-Term Investments | | | 10,531,178 | | | | 5,606,719 | | | | — | | | | 16,137,897 | | |
Total Investments, at fair value | | $ | 299,790,804 | | | $ | 11,523,851 | | | $ | — | | | $ | 311,314,655 | | |
Other Financial Instruments+ | |
Forward Foreign Currency Contracts | | | — | | | | 70,049 | | | | — | | | | 70,049 | | |
Total Assets | | $ | 299,790,804 | | | $ | 11,593,900 | | | $ | — | | | $ | 311,384,704 | | |
Liabilities Table | |
Other Financial Instruments+ | |
Forward Foreign Currency Contracts | | $ | — | | | $ | (539,282 | ) | | $ | — | | | $ | (539,282 | ) | |
Total Liabilities | | $ | — | | | $ | (539,282 | ) | | $ | — | | | $ | (539,282 | ) | |
^ See Note 2, "Significant Accounting Policies" in the Notes to Financial Statements for additional information.
+ Other Financial Instruments may include open forward foreign currency contracts, futures, centrally cleared swaps, OTC swaps and written options. Forward foreign currency contracts, futures and centrally cleared swaps are valued at the unrealized gain (loss) on the instrument. OTC swaps and written options are valued at the fair value of the instrument.
# The earlier close of the foreign markets gives rise to the possibility that significant events, including broad market moves, may have occurred in the interim and may materially affect the value of those securities. To account for this, the Portfolio may frequently value many of its foreign equity securities using fair value prices based on third party vendor modeling tools to the extent available. Accordingly, a portion of the Portfolio's investments are categorized as Level 2 investments.
At December 31, 2019, the following forward foreign currency contracts were outstanding for VY® Invesco Comstock Portfolio:
Currency
Purchased | | Currency Sold | | Counterparty | | Settlement
Date | | Unrealized
Appreciation
(Depreciation) | |
USD | 15,142 | | | CHF | 14,813 | | | CIBC World Markets Corp. | | 01/16/20 | | $ | (179 | ) | |
USD | 7,833,094 | | | EUR | 7,084,522 | | | CIBC World Markets Corp. | | 01/16/20 | | | (120,268 | ) | |
GBP | 135,650 | | | USD | 179,667 | | | Deutsche Bank AG | | 01/16/20 | | | (1,391 | ) | |
USD | 125,810 | | | EUR | 113,386 | | | Deutsche Bank AG | | 01/16/20 | | | (1,481 | ) | |
CHF | 15,099 | | | USD | 15,614 | | | Deutsche Bank AG | | 01/16/20 | | | (61 | ) | |
EUR | 199,089 | | | USD | 221,211 | | | Deutsche Bank AG | | 01/16/20 | | | 2,294 | | |
USD | 135,350 | | | GBP | 102,999 | | | Goldman Sachs International | | 01/16/20 | | | (1,136 | ) | |
GBP | 854,395 | | | USD | 1,141,383 | | | Goldman Sachs International | | 01/16/20 | | | (9,208 | ) | |
USD | 7,071,510 | | | CAD | 9,398,568 | | | Goldman Sachs International | | 01/16/20 | | | (166,737 | ) | |
GBP | 201,025 | | | USD | 263,791 | | | Goldman Sachs International | | 01/16/20 | | | 2,591 | | |
USD | 2,655 | | | CHF | 2,637 | | | RBC Capital Markets Corp. | | 01/16/20 | | | (73 | ) | |
USD | 8,160,492 | | | GBP | 6,297,784 | | | RBC Capital Markets Corp. | | 01/16/20 | | | (184,818 | ) | |
USD | 1,039,989 | | | CHF | 1,033,406 | | | RBC Capital Markets Corp. | | 01/16/20 | | | (28,825 | ) | |
CHF | 29,373 | | | USD | 29,801 | | | RBC Capital Markets Corp. | | 01/16/20 | | | 578 | | |
USD | 201,809 | | | CAD | 267,015 | | | RBC Capital Markets Corp. | | 01/16/20 | | | (3,831 | ) | |
USD | 161,862 | | | CAD | 213,273 | | | RBC Capital Markets Corp. | | 01/16/20 | | | (2,389 | ) | |
See Accompanying Notes to Financial Statements
123
TABLE OF CONTENTS
SUMMARY PORTFOLIO OF INVESTMENTS
VY® INVESCO COMSTOCK PORTFOLIO AS OF DECEMBER 31, 2019 (CONTINUED)
Currency
Purchased | | Currency Sold | | Counterparty | | Settlement
Date | | Unrealized
Appreciation
(Depreciation) | |
EUR | 124,567 | | | USD | 139,825 | | | RBC Capital Markets Corp. | | 01/16/20 | | $ | (602 | ) | |
USD | 20,910 | | | CHF | 20,595 | | | RBC Capital Markets Corp. | | 01/16/20 | | | (391 | ) | |
USD | 278,393 | | | EUR | 249,350 | | | RBC Capital Markets Corp. | | 01/16/20 | | | (1,537 | ) | |
GBP | 1,219,424 | | | USD | 1,628,271 | | | RBC Capital Markets Corp. | | 01/16/20 | | | (12,390 | ) | |
EUR | 2,344,575 | | | USD | 2,613,282 | | | RBC Capital Markets Corp. | | 01/16/20 | | | 18,830 | | |
CAD | 3,269,413 | | | USD | 2,480,383 | | | RBC Capital Markets Corp. | | 01/16/20 | | | 37,535 | | |
CHF | 348,344 | | | USD | 355,222 | | | RBC Capital Markets Corp. | | 01/16/20 | | | 5,057 | | |
USD | 117,771 | | | CAD | 154,845 | | | RBC Capital Markets Corp. | | 01/16/20 | | | (1,482 | ) | |
CAD | 258,219 | | | USD | 195,702 | | | RBC Capital Markets Corp. | | 01/16/20 | | | 3,164 | | |
USD | 113,480 | | | GBP | 87,512 | | | RBC Capital Markets Corp. | | 01/16/20 | | | (2,483 | ) | |
| | | | | | | | | | | $ | (469,233 | ) | |
Currency Abbreviations
CAD — Canadian Dollar
CHF — Swiss Franc
EUR — EU Euro
GBP — British Pound
USD — United States Dollar
A summary of derivative instruments by primary risk exposure is outlined in the following tables.
The fair value of derivative instruments as of December 31, 2019 was as follows:
Derivatives not accounted
for as hedging instruments | | Location on Statement of Assets and Liabilities | | Fair Value | |
Asset Derivatives | |
Foreign exchange contracts | | Unrealized appreciation on forward foreign currency contracts | | $ | 70,049 | | |
Total Asset Derivatives | | | | $ | 70,049 | | |
Liability Derivatives | |
Foreign exchange contracts | | Unrealized depreciation on forward foreign currency contracts | | $ | 539,282 | | |
Total Liability Derivatives | | | | $ | 539,282 | | |
The effect of derivative instruments on the Portfolio's Statement of Operations for the year ended December 31, 2019 was as follows:
| | | Amount of Realized Gain or (Loss) on Derivatives Recognized in Income | |
Derivatives not accounted
for as hedging instruments | | Forward foreign currency contracts | |
Foreign exchange contracts | | $ | 451,647 | | |
Total | | $ | 451,647 | | |
| | | Change in Unrealized Appreciation or (Depreciation) on Derivatives Recognized in Income | |
Derivatives not accounted
for as hedging instruments | | Forward foreign currency contracts | |
Foreign exchange contracts | | $ | (395,948 | ) | |
Total | | $ | (395,948 | ) | |
See Accompanying Notes to Financial Statements
124
TABLE OF CONTENTS
SUMMARY PORTFOLIO OF INVESTMENTS
VY® INVESCO COMSTOCK PORTFOLIO AS OF DECEMBER 31, 2019 (CONTINUED)
The following is a summary by counterparty of the fair value of OTC derivative instruments subject to Master Netting Agreements and collateral pledged (received), if any, at December 31, 2019:
| | | CIBC World
Markets Corp. | | Deutsche
Bank AG | | Goldman
Sachs
International | | RBC Capital
Markets Corp. | | Totals | |
Assets: | |
Forward foreign currency contracts | | $ | — | | | $ | 2,294 | | | $ | 2,591 | | | $ | 65,164 | | | $ | 70,049 | | |
Total Assets | | $ | — | | | $ | 2,294 | | | $ | 2,591 | | | $ | 65,164 | | | $ | 70,049 | | |
Liabilities: | |
Forward foreign currency contracts | | $ | 120,447 | | | $ | 2,933 | | | $ | 177,081 | | | $ | 238,821 | | | $ | 539,282 | | |
Total Liabilities | | $ | 120,447 | | | $ | 2,933 | | | $ | 177,081 | | | $ | 238,821 | | | $ | 539,282 | | |
Net OTC derivative instruments by counterparty,
at fair value | | $ | (120,447 | ) | | $ | (639 | ) | | $ | (174,490 | ) | | $ | (173,657 | ) | | $ | (469,233 | ) | |
Total collateral pledged by the Portfolio/(Received
from counterparty) | | $ | — | | | $ | — | | | $ | — | | | $ | — | | | $ | — | | |
Net Exposure(1) | | $ | (120,447 | ) | | $ | (639 | ) | | $ | (174,490 | ) | | $ | (173,657 | ) | | $ | (469,233 | ) | |
(1) Positive net exposure represents amounts due from each respective counterparty. Negative exposure represents amounts due from the Portfolio. Please refer to Note 2 for additional details regarding counterparty credit risk and credit related contingent features.
At December 31, 2019, the aggregate cost of securities and other investments and the composition of unrealized appreciation and depreciation of securities and other investments at year end were:
Cost for federal income tax purposes was $270,691,591.
Net unrealized appreciation consisted of: | |
Gross Unrealized Appreciation | | $ | 53,035,071 | | |
Gross Unrealized Depreciation | | | (12,878,234 | ) | |
Net Unrealized Appreciation | | $ | 40,156,837 | | |
See Accompanying Notes to Financial Statements
125
TABLE OF CONTENTS
VY® INVESCO SUMMARY PORTFOLIO OF INVESTMENTS
EQUITY AND INCOME PORTFOLIO AS OF DECEMBER 31, 2019
Shares | | | | | | Value | | Percentage
of Net
Assets | |
COMMON STOCK: 60.3% | | | |
| | | | | Communication Services: 2.5% | |
| | 26,174 | | | | (1 | ) | | Charter
Communications,
Inc. | | $ | 12,696,484 | | | | 1.0 | | |
| | 223,027 | | | | | | | Comcast Corp. -
Class A | | | 10,029,524 | | | | 0.7 | | |
| | 5,400,655 | | | | | | | Vodafone
Group PLC | | | 10,484,764 | | | | 0.8 | | |
| | | | | | | | | | 33,210,772 | | | | 2.5 | | |
| | | | | Consumer Discretionary: 5.4% | |
| | 408,853 | | | | (1 | ),(2) | | Capri Holdings Ltd. | | | 15,597,742 | | | | 1.2 | | |
| | 336,594 | | | | (2 | ) | | Carnival Corp. | | | 17,109,073 | | | | 1.3 | | |
| | 294,584 | | | | | | | eBay, Inc. | | | 10,637,428 | | | | 0.8 | | |
| | 590,944 | | | | | | | General Motors Co. | | | 21,628,551 | | | | 1.6 | | |
| | 2,352,216 | | | | | | | Other Securities | | | 6,771,437 | | | | 0.5 | | |
| | | | | | | | | | 71,744,231 | | | | 5.4 | | |
| | | | | Consumer Staples: 4.9% | |
| | 286,638 | | | | | | | Mondelez
International, Inc. | | | 15,788,021 | | | | 1.2 | | |
| | 312,052 | | | | | | | Philip Morris
International, Inc. | | | 26,552,505 | | | | 2.0 | | |
| | 335,509 | | | | (1 | ) | | US Foods Holding
Corp. | | | 14,054,472 | | | | 1.0 | | |
| | 126,968 | | | | (3 | ) | | Other Securities | | | 8,781,107 | | | | 0.7 | | |
| | | | | | | | | | 65,176,105 | | | | 4.9 | | |
| | | | | Energy: 6.4% | |
| | 2,132,672 | | | | | | | BP PLC | | | 13,416,316 | | | | 1.0 | | |
| | 288,748 | | | | | | | Canadian Natural
Resources Ltd. | | | 9,339,198 | | | | 0.7 | | |
| | 104,964 | | | | | | | Chevron Corp. | | | 12,649,212 | | | | 1.0 | | |
| | 463,047 | | | | | | | Devon
Energy Corp. | | | 12,025,330 | | | | 0.9 | | |
| | 801,609 | | | | | | | Marathon Oil Corp. | | | 10,885,850 | | | | 0.8 | | |
| | 559,562 | | | | | | | Royal Dutch Shell
PLC - Class A | | | 16,571,104 | | | | 1.2 | | |
| | 478,947 | | | | | | | TechnipFMC PLC | | | 10,268,624 | | | | 0.8 | | |
| | | | | | | | | | 85,155,634 | | | | 6.4 | | |
| | | | | Financials: 16.1% | |
| | 474,667 | | | | | | | American
International
Group, Inc. | | | 24,364,657 | | | | 1.8 | | |
| | 810,644 | | | | | | | Bank of
America Corp. | | | 28,550,882 | | | | 2.1 | | |
| | 318,455 | | | | | | | Citigroup, Inc. | | | 25,441,370 | | | | 1.9 | | |
| | 409,444 | | | | | | | Citizens Financial
Group, Inc. | | | 16,627,521 | | | | 1.3 | | |
| | 73,943 | | | | | | | Goldman Sachs
Group, Inc. | | | 17,001,714 | | | | 1.3 | | |
Shares | | | | | | Value | | Percentage
of Net
Assets | |
| | 101,424 | | | | | | | JPMorgan
Chase & Co. | | $ | 14,138,505 | | | | 1.1 | | |
| | 432,104 | | | | | | | Morgan Stanley | | | 22,089,156 | | | | 1.7 | | |
| | 131,808 | | | | | | | PNC Financial
Services
Group, Inc. | | | 21,040,511 | | | | 1.6 | | |
| | 265,549 | | | | | | | Truist
Financial Corp. | | | 14,955,720 | | | | 1.1 | | |
| | 178,894 | | | | | | | Wells Fargo & Co. | | | 9,624,497 | | | | 0.7 | | |
| | 61,404 | | | | | | | Willis Towers
Watson PLC | | | 12,399,924 | | | | 0.9 | | |
| | 300,786 | | | | | | | Other Securities | | | 7,453,477 | | | | 0.6 | | |
| | | | | | | | | | 213,687,934 | | | | 16.1 | | |
| | | | | Health Care: 10.3% | |
| | 34,883 | | | | | | | Anthem, Inc. | | | 10,535,713 | | | | 0.8 | | |
| | 272,476 | | | | | | | Bristol-Myers
Squibb Co. | | | 17,490,234 | | | | 1.3 | | |
| | 179,337 | | | | | | | CVS Health Corp. | | | 13,322,946 | | | | 1.0 | | |
| | 209,151 | | | | | | | Johnson & Johnson | | | 30,508,856 | | | | 2.3 | | |
| | 83,890 | | | | | | | McKesson Corp. | | | 11,603,665 | | | | 0.9 | | |
| | 95,722 | | | | | | | Medtronic PLC | | | 10,859,661 | | | | 0.8 | | |
| | 119,948 | | | | | | | Sanofi | | | 12,046,127 | | | | 0.9 | | |
| | 77,988 | | | | | | | Zimmer Biomet
Holdings, Inc. | | | 11,673,244 | | | | 0.9 | | |
| | 557,964 | | | | (4 | ) | | Other Securities | | | 19,517,221 | | | | 1.4 | | |
| | | | | | | | | | 137,557,667 | | | | 10.3 | | |
| | | | | Industrials: 4.2% | |
| | 176,617 | | | | | | | CSX Corp. | | | 12,780,006 | | | | 1.0 | | |
| | 103,249 | | | | | | | General
Dynamics Corp. | | | 18,207,961 | | | | 1.4 | | |
| | 96,990 | | | | | | | Ingersoll-Rand
PLC - Class A | | | 12,891,911 | | | | 1.0 | | |
| | 280,143 | | | | | | | Johnson Controls
International plc | | | 11,404,621 | | | | 0.8 | | |
| | | | | | | | | | 55,284,499 | | | | 4.2 | | |
| | | | | Information Technology: 6.6% | |
| | 48,130 | | | | | | | Apple, Inc. | | | 14,133,374 | | | | 1.1 | | |
| | 210,927 | | | | | | | Cognizant
Technology
Solutions Corp. | | | 13,081,693 | | | | 1.0 | | |
| | 256,022 | | | | | | | Intel Corp. | | | 15,322,917 | | | | 1.1 | | |
| | 290,749 | | | | | | | Oracle Corp. | | | 15,403,882 | | | | 1.2 | | |
| | 143,050 | | | | | | | Qualcomm, Inc. | | | 12,621,301 | | | | 0.9 | | |
| | 251,173 | | | | | | | Other Securities | | | 17,600,984 | | | | 1.3 | | |
| | | | | | | | | | 88,164,151 | | | | 6.6 | | |
| | | | | Materials: 2.6% | |
| | 460,146 | | | | | | | Corteva, Inc. | | | 13,601,916 | | | | 1.0 | | |
| | 383,749 | | | | (3 | ) | | Other Securities | | | 21,146,201 | | | | 1.6 | | |
| | | | | | | | | | 34,748,117 | | | | 2.6 | | |
See Accompanying Notes to Financial Statements
126
TABLE OF CONTENTS
VY® INVESCO SUMMARY PORTFOLIO OF INVESTMENTS
EQUITY AND INCOME PORTFOLIO AS OF DECEMBER 31, 2019 (CONTINUED)
Shares | | | | | | Value | | Percentage
of Net
Assets | |
| | | | | Utilities: 1.3% | |
| | 330,047 | | | | | | | Other Securities | | $ | 17,776,674 | | | | 1.3 | | |
| | | | | | | Total Common
Stock
(Cost
$676,192,717) | | | 802,505,784 | | | | 60.3 | | |
PREFERRED STOCK: 0.8% | | | |
| | | | | Energy: 0.5% | |
| | 140,612 | | | | (4 | ) | | Other Securities | | | 7,235,893 | | | | 0.5 | | |
| | | | | Financials: 0.3% | |
| | 4,000 | | | | (1 | ),(2),(5),(6) | | Wells Fargo & Co. | | | 109,560 | | | | 0.0 | | |
| | 75,900 | | | | (4 | ) | | Other Securities | | | 3,681,150 | | | | 0.3 | | |
| | | | | | | | | | 3,790,710 | | | | 0.3 | | |
| | | | | | | Total Preferred
Stock
(Cost
$10,847,295) | | | 11,026,603 | | | | 0.8 | | |
Principal
Amount† | | | | | | Value | | Percentage
of Net
Assets | |
CORPORATE BONDS/NOTES: 13.9% | | | |
| | | | | Basic Materials: 0.1% | |
| | 770,000 | | | | (7 | ) | | LYB Finance Co.
BV, 8.100%,
03/15/2027 | | $ | 984,813 | | | | 0.1 | | |
| | 556,000 | | | | | | | Other Securities | | | 683,648 | | | | 0.0 | | |
| | | | | | | | | | 1,668,461 | | | | 0.1 | | |
| | | | | Communications: 1.6% | |
| | 19,583,000 | | | | (3 | ) | | Other Securities | | | 21,874,560 | | | | 1.6 | | |
| | | | | Consumer, Cyclical: 1.2% | |
| | 1,290,000 | | | | (7 | ) | | Daimler Finance
North America
LLC, 2.250%,
03/02/2020 | | | 1,290,351 | | | | 0.1 | | |
| | 14,586,882 | | | | (3 | ) | | Other Securities | | | 15,244,130 | | | | 1.1 | | |
| | | | | | | | | | 16,534,481 | | | | 1.2 | | |
| | | | | Consumer, Non-cyclical: 2.4% | |
| | 1,299,000 | | | | (7 | ) | | AbbVie, Inc.,
4.050%,
11/21/2039 | | | 1,377,454 | | | | 0.1 | | |
| | 498,000 | | | | (7 | ) | | Bayer US Finance II
LLC, 4.375%,
12/15/2028 | | | 543,360 | | | | 0.0 | | |
| | 981,000 | | | | (7 | ) | | Bayer US Finance
LLC, 3.000%,
10/08/2021 | | | 993,587 | | | | 0.1 | | |
Principal
Amount† | | | | | | Value | | Percentage
of Net
Assets | |
| | 654,000 | | | | (7 | ) | | Bristol-Myers
Squibb Co.,
4.125%,
06/15/2039 | | $ | 754,333 | | | | 0.1 | | |
| | 325,000 | | | | (7 | ) | | Bristol-Myers
Squibb Co.,
4.000%,
08/15/2023 | | | 346,252 | | | | 0.0 | | |
| | 1,445,000 | | | | (7 | ) | | Bristol-Myers
Squibb Co.,
4.625%,
05/15/2044 | | | 1,750,888 | | | | 0.1 | | |
| | 1,232,000 | | | | (7 | ) | | Heineken NV,
3.500%,
01/29/2028 | | | 1,305,281 | | | | 0.1 | | |
| | 150,000 | | | | (7 | ) | | Kraft Heinz Foods
Co., 4.625%,
10/01/2039 | | | 156,214 | | | | 0.0 | | |
| | 3,220,000 | | | | (2 | ),(7) | | Nestle Holdings,
Inc., 3.100%,
09/24/2021 | | | 3,292,176 | | | | 0.3 | | |
| | 1,095,000 | | | | | | | Philip Morris
International, Inc.,
3.600%-4.875%,
11/15/2023-
11/15/2043 | | | 1,269,556 | | | | 0.1 | | |
| | 18,109,932 | | | | (3 | ) | | Other Securities | | | 19,625,846 | | | | 1.5 | | |
| | | | | | | | | | 31,414,947 | | | | 2.4 | | |
| | | | | Energy: 1.1% | |
| | 612,000 | | | | (2 | ),(7) | | Cameron LNG LLC,
3.701%,
01/15/2039 | | | 625,048 | | | | 0.0 | | |
| | 13,718,000 | | | | (3 | ) | | Other Securities | | | 14,611,247 | | | | 1.1 | | |
| | | | | | | | | | 15,236,295 | | | | 1.1 | | |
| | | | | Financial: 5.1% | |
| | 455,000 | | | | (7 | ) | | ANZ New Zealand
Int'l Ltd./London,
2.875%,
01/25/2022 | | | 462,430 | | | | 0.0 | | |
| | 440,000 | | | | (7 | ) | | Apollo Management
Holdings L.P.,
4.000%,
05/30/2024 | | | 465,990 | | | | 0.0 | | |
| | 285,000 | | | | (7 | ) | | Athene Global
Funding, 2.750%,
06/25/2024 | | | 287,831 | | | | 0.0 | | |
| | 1,555,000 | | | | (7 | ) | | Athene Global
Funding, 4.000%,
01/25/2022 | | | 1,606,245 | | | | 0.1 | | |
| | 725,000 | | | | (7 | ) | | BBVA Bancomer
SA/Texas,
4.375%,
04/10/2024 | | | 773,339 | | | | 0.1 | | |
See Accompanying Notes to Financial Statements
127
TABLE OF CONTENTS
VY® INVESCO SUMMARY PORTFOLIO OF INVESTMENTS
EQUITY AND INCOME PORTFOLIO AS OF DECEMBER 31, 2019 (CONTINUED)
Principal
Amount† | | | | | | Value | | Percentage
of Net
Assets | |
| | | | | Financial (continued) | |
| | 130,000 | | | | (7 | ) | | Carlyle Holdings
Finance LLC,
3.875%,
02/01/2023 | | $ | 134,348 | | | | 0.0 | | |
| | 595,000 | | | | | | | Citizens Financial
Group, Inc.,
2.375%,
07/28/2021 | | | 597,923 | | | | 0.0 | | |
| | 1,335,000 | | | | (7 | ) | | Commonwealth
Bank of Australia,
2.250%,
03/10/2020 | | | 1,335,788 | | | | 0.1 | | |
| | 472,000 | | | | (7 | ) | | Credit Suisse AG,
6.500%,
08/08/2023 | | | 527,424 | | | | 0.0 | | |
| | 1,175,000 | | | | | | | Goldman Sachs
Group, Inc.,
4.250%-5.250%,
07/27/2021-
10/21/2025 | | | 1,262,962 | | | | 0.1 | | |
| | 755,000 | | | | (7 | ) | | Guardian Life
Global Funding,
2.900%,
05/06/2024 | | | 775,905 | | | | 0.1 | | |
| | 670,000 | | | | (7 | ) | | Jackson National
Life Global
Funding, 2.100%,
10/25/2021 | | | 671,645 | | | | 0.1 | | |
| | 620,000 | | | | (7 | ) | | Jackson National
Life Global
Funding, 3.250%,
01/30/2024 | | | 643,195 | | | | 0.0 | | |
| | 4,430,000 | | | | (2 | ),(6) | | JPMorgan Chase &
Co., 3.200%-
5.229%,
06/15/2026-
12/31/2199 | | | 4,821,560 | | | | 0.4 | | |
| | 443,000 | | | | (7 | ) | | KKR Group
Finance Co.
III LLC, 5.125%,
06/01/2044 | | | 524,023 | | | | 0.0 | | |
| | 2,335,000 | | | | (7 | ) | | Liberty Mutual
Group, Inc.,
4.850%,
08/01/2044 | | | 2,677,648 | | | | 0.2 | | |
| | 1,300,000 | | | | (7 | ) | | MassMutual Global
Funding II,
2.000%,
04/15/2021 | | | 1,302,130 | | | | 0.1 | | |
| | 670,000 | | | | (7 | ) | | Metropolitan Life
Global Funding I,
2.050%,
06/12/2020 | | | 670,446 | | | | 0.1 | | |
| | 2,360,000 | | | | (7 | ) | | Mizuho Financial
Group Cayman 3
Ltd., 4.600%,
03/27/2024 | | | 2,521,516 | | | | 0.2 | | |
Principal
Amount† | | | | | | Value | | Percentage
of Net
Assets | |
| | 1,040,000 | | | | | | | Morgan Stanley,
4.000%,
07/23/2025 | | $ | 1,125,366 | | | | 0.1 | | |
| | 1,000,000 | | | | (7 | ) | | Nationwide
Financial
Services, Inc.,
5.300%,
11/18/2044 | | | 1,139,612 | | | | 0.1 | | |
| | 690,000 | | | | (7 | ) | | Reliance Standard
Life Global
Funding II,
3.050%,
01/20/2021 | | | 697,456 | | | | 0.1 | | |
| | 1,360,000 | | | | (7 | ) | | Societe Generale
SA, 2.625%,
09/16/2020 | | | 1,366,010 | | | | 0.1 | | |
| | 805,000 | | | | (7 | ) | | Societe Generale
SA, 5.000%,
01/17/2024 | | | 868,083 | | | | 0.1 | | |
| | 985,000 | | | | (7 | ) | | Standard Chartered
PLC, 3.050%,
01/15/2021 | | | 993,255 | | | | 0.1 | | |
| | 585,000 | | | | (7 | ) | | UBS Group AG,
4.125%,
04/15/2026 | | | 636,109 | | | | 0.0 | | |
| | 36,326,000 | | | | (3 | ) | | Other Securities | | | 38,850,649 | | | | 2.9 | | |
| | | | | | | | | | 67,738,888 | | | | 5.1 | | |
| | | | | Industrial: 1.1% | |
| | 305,000 | | | | (7 | ) | | Aviation Capital
Group LLC,
2.875%,
01/20/2022 | | | 307,170 | | | | 0.0 | | |
| | 1,095,000 | | | | (7 | ) | | Aviation Capital
Group LLC,
4.875%,
10/01/2025 | | | 1,179,485 | | | | 0.1 | | |
| | 435,000 | | | | (7 | ) | | BAE Systems
Holdings, Inc.,
2.850%,
12/15/2020 | | | 437,997 | | | | 0.1 | | |
| | 410,000 | | | | (7 | ) | | SMBC Aviation
Capital Finance
DAC, 2.650%,
07/15/2021 | | | 412,886 | | | | 0.0 | | |
| | 375,000 | | | | (7 | ) | | Union Pacific Corp.,
3.839%,
03/20/2060 | | | 380,968 | | | | 0.0 | | |
| | 10,989,000 | | | | | | | Other Securities | | | 11,611,943 | | | | 0.9 | | |
| | | | | | | | | | 14,330,449 | | | | 1.1 | | |
| | | | | Technology: 0.8% | |
| | 1,581,000 | | | | | | | Apple, Inc.,
2.150%-3.350%,
02/09/2022-
02/09/2027 | | | 1,618,836 | | | | 0.1 | | |
See Accompanying Notes to Financial Statements
128
TABLE OF CONTENTS
VY® INVESCO SUMMARY PORTFOLIO OF INVESTMENTS
EQUITY AND INCOME PORTFOLIO AS OF DECEMBER 31, 2019 (CONTINUED)
Principal
Amount† | | | | | | Value | | Percentage
of Net
Assets | |
| | | | | Technology (continued) | |
| | 910,000 | | | | (7 | ) | | Dell International
LLC / EMC Corp.,
5.450%,
06/15/2023 | | $ | 987,045 | | | | 0.1 | | |
| | 35,000 | | | | (7 | ) | | Dell International
LLC / EMC Corp.,
8.350%,
07/15/2046 | | | 48,177 | | | | 0.0 | | |
| | 795,000 | | | | (7 | ) | | NXP BV / NXP
Funding LLC,
5.350%,
03/01/2026 | | | 896,470 | | | | 0.1 | | |
| | 6,324,000 | | | | | | | Other Securities | | | 6,561,241 | | | | 0.5 | | |
| | | | | | | | | | 10,111,769 | | | | 0.8 | | |
| | | | | Utilities: 0.5% | |
| | 150,000 | | | | (7 | ) | | Electricite de
France SA,
4.600%,
01/27/2020 | | | 150,254 | | | | 0.0 | | |
| | 620,000 | | | | (7 | ) | | Electricite de
France SA,
4.875%,
01/22/2044 | | | 710,881 | | | | 0.1 | | |
| | 350,000 | | | | (6 | ),(7) | | Electricite de
France SA,
5.625%,
12/31/2199 | | | 371,250 | | | | 0.0 | | |
| | 5,144,000 | | | | (3 | ) | | Other Securities | | | 5,333,100 | | | | 0.4 | | |
| | | | | | | | | | 6,565,485 | | | | 0.5 | | |
| | | | | | | Total Corporate
Bonds/Notes
(Cost
$173,661,895) | | | 185,475,335 | | | | 13.9 | | |
MUNICIPAL BONDS: 0.0% | | | |
| | | | | Georgia: 0.0% | |
| | 323,000 | | | | | | | Other Securities | | | 445,517 | | | | 0.0 | | |
| | | | | | | Total Municipal
Bonds
(Cost $323,000) | | | 445,517 | | | | 0.0 | | |
U.S. TREASURY OBLIGATIONS: 10.3% | | | |
| | | | | U.S. Treasury Bonds: 0.7% | |
| | 9,980,800 | | | | | | | 2.250%-4.500%,
02/15/2036-
08/15/2049 | | | 9,824,976 | | | | 0.7 | | |
| | | | | U.S. Treasury Notes: 9.6% | |
| | 180,000 | | | | | | | 2.625%,11/15/2020 | | | 181,517 | | | | 0.0 | | |
| | 41,470,000 | | | | | | | 1.625%,12/31/2021 | | | 41,511,844 | | | | 3.1 | | |
| | 50,770,000 | | | | | | | 1.625%,12/15/2022 | | | 50,794,109 | | | | 3.8 | | |
| | 30,846,700 | | | | | | | 1.750%,12/31/2024 | | | 30,916,678 | | | | 2.4 | | |
Principal
Amount† | | | | | | Value | | Percentage
of Net
Assets | |
| | 3,842,900 | | | | (2 | ) | | 1.750%,11/15/2029 | | $ | 3,782,403 | | | | 0.3 | | |
| | | | | | | | | | 127,186,551 | | | | 9.6 | | |
| | | | | | | Total U.S. Treasury
Obligations
(Cost
$136,771,606) | | | 137,011,527 | | | | 10.3 | | |
CONVERTIBLE BONDS/NOTES: 8.7% | | | |
| | | | | Communications: 3.9% | |
| | 2,954,000 | | | | (7 | ) | | GCI Liberty, Inc.,
1.750%,
09/30/2046 | | | 4,080,951 | | | | 0.3 | | |
| | 3,355,000 | | | | (7 | ) | | IAC Financeco 3,
Inc., 2.000%,
01/15/2030 | | | 3,927,363 | | | | 0.3 | | |
| | 2,512,000 | | | | (7 | ) | | JOYY, Inc.,
1.375%,
06/15/2026 | | | 2,272,561 | | | | 0.2 | | |
| | 2,665,000 | | | | (7 | ) | | Liberty Latin
America Ltd.,
2.000%,
07/15/2024 | | | 2,861,544 | | | | 0.2 | | |
| | 9,559,000 | | | | | | | Liberty Media Corp.,
1.375%,
10/15/2023 | | | 12,886,488 | | | | 1.0 | | |
| | 1,933,000 | | | | | | | Liberty Media Corp.,
2.250%,
09/30/2046 | | | 1,122,090 | | | | 0.1 | | |
| | 673,000 | | | | (2 | ) | | Liberty Media
Corp.-Liberty
Formula One,
1.000%,
01/30/2023 | | | 896,909 | | | | 0.0 | | |
| | 22,769,000 | | | | (3 | ) | | Other Securities | | | 23,667,801 | | | | 1.8 | | |
| | | | | | | | | | 51,715,707 | | | | 3.9 | | |
| | | | | Consumer, Cyclical: 0.2% | |
| | 2,264,000 | | | | | | | Other Securities | | | 2,766,382 | | | | 0.2 | | |
| | | | | Consumer, Non-cyclical: 2.3% | |
| | 617,000 | | | | (2 | ),(7) | | Euronet Worldwide,
Inc., 0.750%,
03/15/2049 | | | 737,491 | | | | 0.1 | | |
| | 23,037,000 | | | | (3 | ) | | Other Securities | | | 29,106,241 | | | | 2.2 | | |
| | | | | | | | | | 29,843,732 | | | | 2.3 | | |
| | | | | Energy: 0.2% | |
| | 3,036,000 | | | | | | | Other Securities | | | 2,969,557 | | | | 0.2 | | |
| | | | | Technology: 2.1% | |
| | 24,701,000 | | | | (3 | ) | | Other Securities | | | 28,073,770 | | | | 2.1 | | |
| | | | | | | Total Convertible
Bonds/Notes
(Cost
$99,771,141) | | | 115,369,148 | | | | 8.7 | | |
See Accompanying Notes to Financial Statements
129
TABLE OF CONTENTS
VY® INVESCO SUMMARY PORTFOLIO OF INVESTMENTS
EQUITY AND INCOME PORTFOLIO AS OF DECEMBER 31, 2019 (CONTINUED)
Principal
Amount† | | | | | | Value | | Percentage
of Net
Assets | |
EQUITY-LINKED NOTES: 1.2% | | | |
| | | | | Financial: 1.2% | |
| | 9,000,000 | | | | (7 | ) | | Credit Suisse AG,
Convertible
Basket (Basket of
5 Common
Stocks), 0.500%,
06/24/2024 | | $ | 8,631,000 | | | | 0.7 | | |
| | 6,746,000 | | | | | | | GS Finance Corp
(Guarantor: The
Goldman Sachs
Group, Inc.),
Exchangeable
Basket (Basket of
5 Common
Stocks), 0.250%,
07/08/2024 | | | 6,934,888 | | | | 0.5 | | |
| | | | | | | Total Equity-Linked
Notes
(Cost
$15,746,000) | | | 15,565,888 | | | | 1.2 | | |
STRUCTURED NOTES: 1.9% | | | |
| | | | | Diversified Finan Serv: 1.0% | |
| | 11,984,000 | | | | | | | Other Securities | | | 12,849,880 | | | | 1.0 | | |
| | | | | Financial: 0.9% | |
| | 12,054,000 | | | | | | | Other Securities | | | 12,781,370 | | | | 0.9 | | |
| | | | | | | Total Structured
Notes
(Cost
$24,651,651) | | | 25,631,250 | | | | 1.9 | | |
U.S. GOVERNMENT AGENCY OBLIGATIONS(8): 0.1% | | | |
| | | | | Federal National Mortgage Association: 0.1% | |
| | 915,000 | | | | | | | Other Securities | | | 1,303,536 | | | | 0.1 | | |
| | | | | | | Total U.S.
Government
Agency
Obligations
(Cost
$1,015,842) | | | 1,303,536 | | | | 0.1 | | |
| | | | | | | Total Long-Term
Investments
(Cost
$1,138,981,147) | | | 1,294,334,588 | | | | 97.2 | | |
Principal
Amount† | | | | | | Value | | Percentage
of Net
Assets | |
SHORT-TERM INVESTMENTS: 5.0% | | | |
| | | | | Commercial Paper: 0.3% | |
| | 990,000 | | | | (9 | ) | | DBS Bank Ltd.,
1.710%,
01/07/2020 | | $ | 989,688 | | | | 0.1 | | |
| | 990,000 | | | | (9 | ) | | Le Mouvement Des
Caisses
Desjardins,
1.750%,
01/09/2020 | | | 989,609 | | | | 0.1 | | |
| | 990,000 | | | | (9 | ) | | LMA Americas
LLC, 1.800%,
01/27/2020 | | | 988,548 | | | | 0.1 | | |
| | 450,000 | | | | (9 | ) | | Matchpoint Finance
PLC, 1.850%,
02/03/2020 | | | 449,237 | | | | 0.0 | | |
| | 325,000 | | | | (9 | ) | | Sheffield
Receivables
Company LLC,
1.950%,
02/27/2020 | | | 324,033 | | | | 0.0 | | |
| | 400,000 | | | | (9 | ) | | Sheffield
Receivables
Company LLC,
2.000%,
03/16/2020 | | | 398,434 | | | | 0.0 | | |
| | | | | | | Total Commercial
Paper
(Cost $4,139,549) | | | 4,139,549 | | | | 0.3 | | |
| | | | | Floating Rate Notes: 0.3% | |
| | 900,000 | | | | (9 | ) | | Bank of Nova
Scotia, 1.940%,
05/08/2020 | | | 899,933 | | | | 0.0 | | |
| | 900,000 | | | | (9 | ) | | Bedford Row
Funding, 1.920%,
03/13/2020 | | | 900,079 | | | | 0.1 | | |
| | 990,000 | | | | (9 | ) | | Commonwealth
Bank of Australia,
1.940%,
06/10/2020 | | | 989,998 | | | | 0.1 | | |
| | 625,000 | | | | (9 | ) | | Crédit Industriel et
Commercial,
1.990%,
04/24/2020 | | | 625,048 | | | | 0.0 | | |
| | 990,000 | | | | (9 | ) | | Mitsubishi UFJ
Financial Group,
Inc., 1.960%,
05/22/2020 | | | 990,074 | | | | 0.1 | | |
| | | | | | | Total Floating Rate
Notes
(Cost $4,405,132) | | | 4,405,132 | | | | 0.3 | | |
See Accompanying Notes to Financial Statements
130
TABLE OF CONTENTS
VY® INVESCO SUMMARY PORTFOLIO OF INVESTMENTS
EQUITY AND INCOME PORTFOLIO AS OF DECEMBER 31, 2019 (CONTINUED)
Principal
Amount† | | | | | | Value | | Percentage
of Net
Assets | |
| | | | | Repurchase Agreements: 1.5% | |
| | 2,324,956 | | | | (9 | ) | | Citadel Securities
LLC, Repurchase
Agreement dated
12/31/19, 1.60%,
due 01/02/20
(Repurchase
Amount
$2,325,160,
collateralized by
various U.S.
Government
Securities,
0.000%-8.500%,
Market Value
plus accrued
interest
$2,371,666, due
01/15/20-
11/15/48) | | $ | 2,324,956 | | | | 0.1 | | |
| | 7,703,092 | | | | (9 | ) | | Citigroup, Inc.,
Repurchase
Agreement dated
12/31/19, 1.57%,
due 01/02/20
(Repurchase
Amount
$7,703,755,
collateralized by
various U.S.
Government/U.S.
Government
Agency
Obligations,
0.000%-9.000%,
Market Value
plus accrued
interest
$7,857,154,
due 02/13/20-
09/20/69) | | | 7,703,092 | | | | 0.6 | | |
| | 7,703,092 | | | | (9 | ) | | Daiwa Capital
Markets,
Repurchase
Agreement dated
12/31/19, 1.58%,
due 01/02/20
(Repurchase
Amount
$7,703,759,
collateralized by
various U.S.
Government/U.S.
Government
Agency
Obligations,
0.000%-6.030%,
Market Value
plus accrued
interest
$7,857,154, due
01/14/20-
12/20/49) | | | 7,703,092 | | | | 0.6 | | |
Principal
Amount† | | | | | | Value | | Percentage
of Net
Assets | |
| | 2,612,029 | | | | (9 | ) | | State of Wisconsin
Investment Board,
Repurchase
Agreement dated
12/31/19, 1.75%,
due 01/02/20
(Repurchase
Amount
$2,612,279,
collateralized by
various U.S.
Government
Securities,
0.125%-3.875%,
Market Value
plus accrued
interest
$2,664,341, due
04/15/21-
02/15/47) | | $ | 2,612,029 | | | | 0.2 | | |
| | | | | | | Total Repurchase
Agreements
(Cost
$20,343,169) | | | 20,343,169 | | | | 1.5 | | |
| | | | | Certificates of Deposit: 0.2% | |
| | 990,000 | | | | (9 | ) | | Dz Bank Ag
Deutsche Zentral-
Genossenschaftsbank,
1.870%,
03/12/2020 | | | 989,914 | | | | 0.1 | | |
| | 900,000 | | | | (9 | ) | | Toronto-Dominion
Bank, 1.850%,
03/18/2020 | | | 900,136 | | | | 0.1 | | |
| | | | | | | Total Certificates of
Deposit
(Cost $1,890,050) | | | 1,890,050 | | | | 0.2 | | |
Shares | | | | | | Value | | Percentage
of Net
Assets | |
| | | | | Mutual Funds: 2.7% | |
| | 33,529,166 | | | | (10 | ) | | BlackRock Liquidity
Funds, FedFund,
Institutional Class,
1.520% | | $ | 33,529,166 | | | | 2.5 | | |
| | 1,250,000 | | | | (9 | ),(10) | | Goldman Sachs
Financial Square
Government
Fund - Institutional
Shares, 1.500% | | | 1,250,000 | | | | 0.1 | | |
See Accompanying Notes to Financial Statements
131
TABLE OF CONTENTS
VY® INVESCO SUMMARY PORTFOLIO OF INVESTMENTS
EQUITY AND INCOME PORTFOLIO AS OF DECEMBER 31, 2019 (CONTINUED)
Shares | | | | | | Value | | Percentage
of Net
Assets | |
| | | | | Mutual Funds (continued) | |
| | 1,030,000 | | | | (9 | ),(10) | | Morgan Stanley
Institutional
Liquidity Funds -
Government
Portfolio
(Institutional
Share Class),
1.510% | | $ | 1,030,000 | | | | 0.1 | | |
| | | | | Total Mutual Funds
(Cost
$35,809,166) | | | 35,809,166 | | | | 2.7 | | |
| | | | | Total Short-Term
Investments
(Cost
$66,587,066) | | | 66,587,066 | | | | 5.0 | | |
| | | | | Total Investments
in Securities
(Cost
$1,205,568,213) | | $ | 1,360,921,654 | | | | 102.2 | | |
| | | | | Liabilities in
Excess of Other
Assets | | | (28,977,124 | ) | | | (2.2 | ) | |
| | | | | Net Assets | | $ | 1,331,944,530 | | | | 100.0 | | |
"Other Securities" represents issues not identified as the top 50 holdings in terms of market value and issues or issuers not exceeding 1% of net assets individually or in aggregate respectively as of December 31, 2019.
The following footnotes apply to either the individual securities noted or one or more of the securities aggregated and listed as a single line item.
† Unless otherwise indicated, principal amount is shown in USD.
(1) Non-income producing security.
(2) Security, or a portion of the security, is on loan.
(3) The grouping contains securities on loan.
(4) The grouping contains non-income producing securities.
(5) Preferred Stock may be called prior to convertible date.
(6) Variable rate security. Rate shown is the rate in effect as of December 31, 2019.
(7) Securities with purchases pursuant to Rule 144A or section 4(a)(2), under the Securities Act of 1933 and may not be resold subject to that rule except to qualified institutional buyers.
(8) The Federal Housing Finance Agency ("FHFA") placed the Federal Home Loan Mortgage Corporation and Federal National Mortgage Association into conservatorship with FHFA as the conservator. As such, the FHFA oversees the continuing affairs of these companies.
(9) All or a portion of the security represents securities purchased with cash collateral received for securities on loan.
(10) Rate shown is the 7-day yield as of December 31, 2019.
Fair Value Measurements^
The following is a summary of the fair valuations according to the inputs used as of December 31, 2019 in valuing the assets and liabilities:
| | | Quoted Prices
in Active Markets
for Identical Investments
(Level 1) | | Significant Other
Observable
Inputs#
(Level 2) | | Significant
Unobservable
Inputs
(Level 3) | | Fair Value
at
December 31, 2019 | |
Asset Table | |
Investments, at fair value | |
Common Stock | |
Communication Services | | $ | 22,726,008 | | | $ | 10,484,764 | | | $ | — | | | $ | 33,210,772 | | |
Consumer Discretionary | | | 64,972,794 | | | | 6,771,437 | | | | — | | | | 71,744,231 | | |
Consumer Staples | | | 65,176,105 | | | | — | | | | — | | | | 65,176,105 | | |
Energy | | | 55,168,214 | | | | 29,987,420 | | | | — | | | | 85,155,634 | | |
Financials | | | 213,687,934 | | | | — | | | | — | | | | 213,687,934 | | |
Health Care | | | 113,583,916 | | | | 23,973,751 | | | | — | | | | 137,557,667 | | |
Industrials | | | 55,284,499 | | | | — | | | | — | | | | 55,284,499 | | |
Information Technology | | | 88,164,151 | | | | — | | | | — | | | | 88,164,151 | | |
Materials | | | 34,748,117 | | | | — | | | | — | | | | 34,748,117 | | |
Utilities | | | 17,776,674 | | | | — | | | | — | | | | 17,776,674 | | |
Total Common Stock | | | 731,288,412 | | | | 71,217,372 | | | | — | | | | 802,505,784 | | |
Preferred Stock | | | 7,345,453 | | | | 3,681,150 | | | | — | | | | 11,026,603 | | |
Corporate Bonds/Notes | | | — | | | | 185,475,335 | | | | — | | | | 185,475,335 | | |
Municipal Bonds | | | — | | | | 445,517 | | | | — | | | | 445,517 | | |
Convertible Bonds/Notes | | | — | | | | 115,369,148 | | | | — | | | | 115,369,148 | | |
Structured Notes | | | — | | | | 25,631,250 | | | | — | | | | 25,631,250 | | |
Equity-Linked Notes | | | — | | | | 15,565,888 | | | | — | | | | 15,565,888 | | |
U.S. Government Agency Obligations | | | — | | | | 1,303,536 | | | | — | | | | 1,303,536 | | |
U.S. Treasury Obligations | | | — | | | | 137,011,527 | | | | — | | | | 137,011,527 | | |
Short-Term Investments | | | 35,809,166 | | | | 30,777,900 | | | | — | | | | 66,587,066 | | |
Total Investments, at fair value | | $ | 774,443,031 | | | $ | 586,478,623 | | | $ | — | | | $ | 1,360,921,654 | | |
See Accompanying Notes to Financial Statements
132
TABLE OF CONTENTS
VY® INVESCO SUMMARY PORTFOLIO OF INVESTMENTS
EQUITY AND INCOME PORTFOLIO AS OF DECEMBER 31, 2019 (CONTINUED)
| | | Quoted Prices
in Active Markets
for Identical Investments
(Level 1) | | Significant Other
Observable
Inputs#
(Level 2) | | Significant
Unobservable
Inputs
(Level 3) | | Fair Value
at
December 31, 2019 | |
Other Financial Instruments+ | |
Forward Foreign Currency Contracts | | $ | — | | | $ | 15,088 | | | $ | — | | | $ | 15,088 | | |
Total Assets | | $ | 774,443,031 | | | $ | 586,493,711 | | | $ | — | | | $ | 1,360,936,742 | | |
Liabilities Table | |
Other Financial Instruments+ | |
Forward Foreign Currency Contracts | | $ | — | | | $ | (1,272,367 | ) | | $ | — | | | $ | (1,272,367 | ) | |
Total Liabilities | | $ | — | | | $ | (1,272,367 | ) | | $ | — | | | $ | (1,272,367 | ) | |
^ See Note 2, "Significant Accounting Policies" in the Notes to Financial Statements for additional information.
+ Other Financial Instruments may include open forward foreign currency contracts, futures, centrally cleared swaps, OTC swaps and written options. Forward foreign currency contracts, futures and centrally cleared swaps are valued at the unrealized gain (loss) on the instrument. OTC swaps and written options are valued at the fair value of the instrument.
# The earlier close of the foreign markets gives rise to the possibility that significant events, including broad market moves, may have occurred in the interim and may materially affect the value of those securities. To account for this, the Portfolio may frequently value many of its foreign equity securities using fair value prices based on third party vendor modeling tools to the extent available. Accordingly, a portion of the Portfolio's investments are categorized as Level 2 investments.
At December 31, 2019, the following forward foreign currency contracts were outstanding for VY® Invesco Equity and Income Portfolio:
Currency
Purchased | | Currency Sold | | Counterparty | | Settlement
Date | | Unrealized
Appreciation
(Depreciation) | |
USD | 616,131 | | | GBP | 471,018 | | | State Street Bank and Trust Co. | | 01/17/20 | | $ | (8,042 | ) | |
USD | 80,123 | | | CHF | 78,514 | | | State Street Bank and Trust Co. | | 01/17/20 | | | (1,087 | ) | |
USD | 237,181 | | | CAD | 311,848 | | | State Street Bank and Trust Co. | | 01/17/20 | | | (2,989 | ) | |
USD | 1,261,094 | | | GBP | 962,808 | | | State Street Bank and Trust Co. | | 01/17/20 | | | (14,779 | ) | |
USD | 145,770 | | | EUR | 130,444 | | | State Street Bank and Trust Co. | | 01/17/20 | | | (680 | ) | |
USD | 120,569 | | | EUR | 107,953 | | | State Street Bank and Trust Co. | | 01/17/20 | | | (631 | ) | |
USD | 198,870 | | | CAD | 262,038 | | | State Street Bank and Trust Co. | | 01/17/20 | | | (2,938 | ) | |
USD | 66,025 | | | CHF | 64,794 | | | State Street Bank and Trust Co. | | 01/17/20 | | | (994 | ) | |
USD | 129,458 | | | EUR | 116,050 | | | State Street Bank and Trust Co. | | 01/17/20 | | | (833 | ) | |
CHF | 74,703 | | | USD | 76,279 | | | State Street Bank and Trust Co. | | 01/17/20 | | | 989 | | |
USD | 482,152 | | | EUR | 431,813 | | | State Street Bank and Trust Co. | | 01/17/20 | | | (2,649 | ) | |
EUR | 182,621 | | | USD | 203,228 | | | State Street Bank and Trust Co. | | 01/17/20 | | | 1,802 | | |
USD | 1,274,663 | | | GBP | 967,835 | | | State Street Bank and Trust Co. | | 01/17/20 | | | (7,871 | ) | |
USD | 247,173 | | | CAD | 327,008 | | | State Street Bank and Trust Co. | | 01/17/20 | | | (4,672 | ) | |
USD | 195,616 | | | CAD | 257,707 | | | State Street Bank and Trust Co. | | 01/17/20 | | | (2,856 | ) | |
USD | 137,245 | | | EUR | 123,246 | | | State Street Bank and Trust Co. | | 01/17/20 | | | (1,124 | ) | |
CAD | 194,904 | | | USD | 147,711 | | | State Street Bank and Trust Co. | | 01/17/20 | | | 2,394 | | |
GBP | 569,913 | | | USD | 747,301 | | | State Street Bank and Trust Co. | | 01/17/20 | | | 7,924 | | |
EUR | 179,022 | | | USD | 199,011 | | | State Street Bank and Trust Co. | | 01/17/20 | | | 1,979 | | |
USD | 4,251,302 | | | CHF | 4,208,534 | | | State Street Bank and Trust Co. | | 01/17/20 | | | (101,753 | ) | |
USD | 6,046,413 | | | CAD | 8,036,578 | | | State Street Bank and Trust Co. | | 01/17/20 | | | (142,940 | ) | |
USD | 8,442,008 | | | EUR | 7,602,604 | | | State Street Bank and Trust Co. | | 01/17/20 | | | (93,520 | ) | |
USD | 18,803,456 | | | GBP | 14,517,757 | | | State Street Bank and Trust Co. | | 01/17/20 | | | (434,860 | ) | |
CHF | 99,858 | | | USD | 103,281 | | | State Street Bank and Trust Co. | | 01/17/20 | | | (412 | ) | |
GBP | 417,519 | | | USD | 553,020 | | | State Street Bank and Trust Co. | | 01/17/20 | | | (4,287 | ) | |
USD | 18,864,782 | | | GBP | 14,569,762 | | | The Bank of New York Mellon | | 01/17/20 | | | (442,450 | ) | |
| | | | | | | | | | | $ | (1,257,279 | ) | |
Currency Abbreviations
CAD — Canadian Dollar
CHF — Swiss Franc
EUR — EU Euro
GBP — British Pound
USD — United States Dollar
See Accompanying Notes to Financial Statements
133
TABLE OF CONTENTS
VY® INVESCO SUMMARY PORTFOLIO OF INVESTMENTS
EQUITY AND INCOME PORTFOLIO AS OF DECEMBER 31, 2019 (CONTINUED)
A summary of derivative instruments by primary risk exposure is outlined in the following tables.
The fair value of derivative instruments as of December 31, 2019 was as follows:
Derivatives not accounted
for as hedging instruments | | Location on Statement of Assets and Liabilities | | Fair Value | |
Asset Derivatives | |
Foreign exchange contracts | | Unrealized appreciation on forward foreign currency contracts | | $ | 15,088 | | |
Total Asset Derivatives | | | | $ | 15,088 | | |
Liability Derivatives | |
Foreign exchange contracts | | Unrealized depreciation on forward foreign currency contracts | | $ | 1,272,367 | | |
Total Liability Derivatives | | | | $ | 1,272,367 | | |
The effect of derivative instruments on the Portfolio's Statement of Operations for the year ended December 31, 2019 was as follows:
| | | Amount of Realized Gain or (Loss) on Derivatives Recognized in Income | |
Derivatives not accounted
for as hedging instruments | | Forward foreign currency contracts | |
Foreign exchange contracts | | $ | 584,543 | | |
Total | | $ | 584,543 | | |
| | | Change in Unrealized Appreciation or (Depreciation) on Derivatives Recognized in Income | |
Derivatives not accounted
for as hedging instruments | | Forward foreign currency contracts | |
Foreign exchange contracts | | $ | (1,136,767 | ) | |
Total | | $ | (1,136,767 | ) | |
The following is a summary by counterparty of the fair value of OTC derivative instruments subject to Master Netting Agreements and collateral pledged (received), if any, at December 31, 2019:
| | | State Street Bank
and Trust Co. | | The Bank of
New York Mellon | | Totals | |
Assets: | |
Forward foreign currency contracts | | $ | 15,088 | | | $ | — | | | $ | 15,088 | | |
Total Assets | | $ | 15,088 | | | $ | — | | | $ | 15,088 | | |
Liabilities: | |
Forward foreign currency contracts | | $ | 829,917 | | | $ | 442,450 | | | $ | 1,272,367 | | |
Total Liabilities | | $ | 829,917 | | | $ | 442,450 | | | $ | 1,272,367 | | |
Net OTC derivative instruments by counterparty, at fair value | | $ | (814,829 | ) | | $ | (442,450 | ) | | $ | (1,257,279 | ) | |
Total collateral pledged by the Portfolio/(Received from counterparty) | | $ | — | | | $ | — | | | $ | — | | |
Net Exposure(1) | | $ | (814,829 | ) | | $ | (442,450 | ) | | $ | (1,257,279 | ) | |
(1) Positive net exposure represents amounts due from each respective counterparty. Negative exposure represents amounts due from the Portfolio. Please refer to Note 2 for additional details regarding counterparty credit risk and credit related contingent features.
At December 31, 2019, the aggregate cost of securities and other investments and the composition of unrealized appreciation and depreciation of securities and other investments at year end were:
Cost for federal income tax purposes was $1,208,453,591.
Net unrealized appreciation consisted of: | |
Gross Unrealized Appreciation | | $ | 184,684,495 | | |
Gross Unrealized Depreciation | | | (33,012,896 | ) | |
Net Unrealized Appreciation | | $ | 151,671,599 | | |
See Accompanying Notes to Financial Statements
134
TABLE OF CONTENTS
VY® INVESCO SUMMARY PORTFOLIO OF INVESTMENTS
OPPENHEIMER GLOBAL PORTFOLIO AS OF DECEMBER 31, 2019
Shares | | | | | | Value | | Percentage
of Net
Assets | |
COMMON STOCK: 97.5% | | | |
| | | | | Brazil: 0.6% | |
| | 220,850 | | | | (1 | ),(2) | | Other Securities | | $ | 8,809,706 | | | | 0.6 | | |
| | | | | China: 1.9% | |
| | 830,559 | | | | (3 | ) | | JD.com, Inc. ADR | | | 29,260,594 | | | | 1.9 | | |
| | | | | France: 7.8% | |
| | 61,950 | | | | | | | Kering SA | | | 40,819,975 | | | | 2.7 | | |
| | 141,738 | | | | | | | LVMH Moet
Hennessy Louis
Vuitton SE | | | 66,043,671 | | | | 4.3 | | |
| | 369,290 | | | | | | | Societe Generale | | | 12,887,534 | | | | 0.8 | | |
| | | | | | | | | | 119,751,180 | | | | 7.8 | | |
| | | | | Germany: 5.7% | |
| | 123,030 | | | | | | | Allianz SE | | | 30,145,903 | | | | 2.0 | | |
| | 153,584 | | | | | | | Bayer AG | | | 12,485,920 | | | | 0.8 | | |
| | 327,572 | | | | | | | SAP SE | | | 44,090,817 | | | | 2.9 | | |
| | | | | | | | | | 86,722,640 | | | | 5.7 | | |
| | | | | India: 4.5% | |
| | 12,243,558 | | | | | | | DLF Ltd. | | | 39,613,906 | | | | 2.6 | | |
| | 1,986,682 | | | | (4 | ) | | ICICI Bank Ltd. ADR | | | 29,979,031 | | | | 1.9 | | |
| | | | | | | | | | 69,592,937 | | | | 4.5 | | |
| | | | | Italy: 0.2% | |
| | 104,433 | | | | | | | Other Securities | | | 3,699,753 | | | | 0.2 | | |
| | | | | Japan: 14.2% | |
| | 385,900 | | | | | | | Capcom Co., Ltd. | | | 10,681,720 | | | | 0.7 | | |
| | 80,900 | | | | | | | Fanuc Ltd. | | | 14,939,392 | | | | 1.0 | | |
| | 88,604 | | | | | | | Keyence Corp. | | | 31,112,283 | | | | 2.0 | | |
| | 585,000 | | | | | | | Murata Manufacturing
Co., Ltd. | | | 36,005,933 | | | | 2.4 | | |
| | 258,000 | | | | | | | Nidec Corp. | | | 35,238,622 | | | | 2.3 | | |
| | 38,700 | | | | | | | Nintendo Co., Ltd. | | | 15,478,458 | | | | 1.0 | | |
| | 303,400 | | | | | | | Omron Corp. | | | 17,684,636 | | | | 1.2 | | |
| | 353,841 | | | | | | | Takeda
Pharmaceutical
Co., Ltd. | | | 13,995,198 | | | | 0.9 | | |
| | 315,700 | | | | | | | TDK Corp. | | | 35,478,095 | | | | 2.3 | | |
| | 324,100 | | | | | | | Other Securities | | | 6,694,658 | | | | 0.4 | | |
| | | | | | | | | | 217,308,995 | | | | 14.2 | | |
| | | | | Netherlands: 4.1% | |
| | 426,403 | | | | | | | Airbus SE | | | 62,581,424 | | | | 4.1 | | |
| | | | | Spain: 1.7% | |
| | 750,211 | | | | | | | Industria de Diseno
Textil SA | | | 26,512,954 | | | | 1.7 | | |
Shares | | | | | | Value | | Percentage
of Net
Assets | |
| | | | | Sweden: 2.4% | |
| | 864,725 | | | | | | | Assa Abloy AB | | $ | 20,213,344 | | | | 1.3 | | |
| | 420,598 | | | | | | | Atlas Copco AB - A
Shares | | | 16,788,451 | | | | 1.1 | | |
| | | | | | | | | | 37,001,795 | | | | 2.4 | | |
| | | | | Switzerland: 1.4% | |
| | 1,391,246 | | | | | | | Credit Suisse
Group AG | | | 18,806,414 | | | | 1.2 | | |
| | 224,374 | | | | | | | Other Securities | | | 2,831,463 | | | | 0.2 | | |
| | | | | | | | | | 21,637,877 | | | | 1.4 | | |
| | | | | United Kingdom: 3.8% | |
| | 1,154,386 | | | | | | | Prudential PLC | | | 22,118,914 | | | | 1.5 | | |
| | 428,068 | | | | | | | Unilever PLC | | | 24,503,912 | | | | 1.6 | | |
| | 882,897 | | | | (1 | ),(2) | | Other Securities | | | 11,261,692 | | | | 0.7 | | |
| | | | | | | | | | 57,884,518 | | | | 3.8 | | |
| | | | | United States: 49.2% | |
| | 165,563 | | | | (3 | ) | | Adobe, Inc. | | | 54,604,333 | | | | 3.6 | | |
| | 250,800 | | | | | | | Agilent Technologies,
Inc. | | | 21,395,748 | | | | 1.4 | | |
| | 83,080 | | | | (3 | ) | | Alphabet, Inc. -
Class A | | | 111,276,521 | | | | 7.2 | | |
| | 7,191 | | | | (3 | ) | | Amazon.com, Inc. | | | 13,287,818 | | | | 0.9 | | |
| | 140,480 | | | | | | | Anthem, Inc. | | | 42,429,174 | | | | 2.8 | | |
| | 514,362 | | | | (3 | ) | | Avantor, Inc. | | | 9,335,670 | | | | 0.6 | | |
| | 233,220 | | | | (3 | ) | | Centene Corp. | | | 14,662,541 | | | | 1.0 | | |
| | 504,660 | | | | | | | Citigroup, Inc. | | | 40,317,287 | | | | 2.6 | | |
| | 330,999 | | | | | | | Colgate-Palmolive Co. | | | 22,785,971 | | | | 1.5 | | |
| | 106,844 | | | | (3 | ) | | Electronic Arts, Inc. | | | 11,486,798 | | | | 0.7 | | |
| | 143,475 | | | | | | | Equifax, Inc. | | | 20,103,717 | | | | 1.3 | | |
| | 258,520 | | | | (3 | ) | | Facebook, Inc. -
Class A | | | 53,061,230 | | | | 3.5 | | |
| | 64,029 | | | | | | | Fidelity National
Information
Services, Inc. | | | 8,905,794 | | | | 0.6 | | |
| | 126,130 | | | | (3 | ) | | Incyte Corp., Ltd. | | | 11,013,672 | | | | 0.7 | | |
| | 187,070 | | | | | | | Intuit, Inc. | | | 48,999,245 | | | | 3.2 | | |
| | 168,050 | | | | (3 | ) | | Ionis
Pharmaceuticals,
Inc. | | | 10,151,901 | | | | 0.7 | | |
| | 570,100 | | | | | | | Maxim Integrated
Products | | | 35,066,851 | | | | 2.3 | | |
| | 77,409 | | | | | | | Microsoft Corp. | | | 12,207,399 | | | | 0.8 | | |
| | 274,643 | | | | (3 | ) | | PayPal Holdings, Inc. | | | 29,708,133 | | | | 1.9 | | |
| | 205,270 | | | | | | | S&P Global, Inc. | | | 56,048,974 | | | | 3.6 | | |
| | 70,797 | | | | (3 | ),(4) | | Sarepta Therapeutics,
Inc. | | | 9,135,645 | | | | 0.6 | | |
| | 140,302 | | | | (3 | ) | | Uniqure B.V. | | | 10,054,041 | | | | 0.7 | | |
| | 170,630 | | | | | | | United Parcel Service,
Inc. - Class B | | | 19,973,948 | | | | 1.3 | | |
| | 195,520 | | | | | | | Walt Disney Co. | | | 28,278,058 | | | | 1.8 | | |
See Accompanying Notes to Financial Statements
135
TABLE OF CONTENTS
VY® INVESCO SUMMARY PORTFOLIO OF INVESTMENTS
OPPENHEIMER GLOBAL PORTFOLIO AS OF DECEMBER 31, 2019 (CONTINUED)
Shares | | | | | | Value | | Percentage
of Net
Assets | |
| | | | | United States (continued) | |
| | 116,777 | | | | | | | Zimmer Biomet
Holdings, Inc. | | $ | 17,479,181 | | | | 1.1 | | |
| | 1,328,723 | | | | (1 | ),(2) | | Other Securities | | | 42,869,914 | | | | 2.8 | | |
| | | | | | | | | | 754,639,564 | | | | 49.2 | | |
| | | | | | | Total Common Stock
(Cost $732,588,694) | | | 1,495,403,937 | | | | 97.5 | | |
PREFERRED STOCK: 0.3% | | | |
| | | | | Germany: 0.3% | |
| | 81,382 | | | | | | | Other Securities | | | 5,010,064 | | | | 0.3 | | |
| | | | | India: 0.0% | |
| | 2,598,630 | | | | (2 | ) | | Other Securities | | | 200,236 | | | | 0.0 | | |
| | | | | | | Total Preferred Stock
(Cost $5,223,617) | | | 5,210,300 | | | | 0.3 | | |
| | | | | | | Total Long-Term
Investments
(Cost $737,812,311) | | | 1,500,614,237 | | | | 97.8 | | |
Principal
Amount† | | | | | | Value | | Percentage
of Net
Assets | |
SHORT-TERM INVESTMENTS: 5.4% | | | |
| | | | | Commercial Paper: 0.4% | |
| | 900,000 | | | | (5 | ) | | Banco Santander
S.A.,
1.950%, 02/05/2020 | | $ | 898,382 | | | | 0.1 | | |
| | 600,000 | | | | (5 | ) | | Flex Co. LLC,
1.910%, 01/31/2020 | | | 599,070 | | | | 0.0 | | |
| | 850,000 | | | | (5 | ) | | Le Mouvement Des
Caisses Desjardins,
1.860%, 02/14/2020 | | | 848,162 | | | | 0.1 | | |
| | 900,000 | | | | (5 | ) | | LMA Americas LLC,
2.000%, 01/31/2020 | | | 898,529 | | | | 0.1 | | |
| | 150,000 | | | | (5 | ) | | Mitsubishi UFJ
Trust and Banking
Corp.,
1.910%, 02/04/2020 | | | 149,723 | | | | 0.0 | | |
| | 850,000 | | | | (5 | ) | | Nederlandse
Waterschapsbank,
1.870%, 02/12/2020 | | | 848,247 | | | | 0.1 | | |
| | 500,000 | | | | (5 | ) | | Oversea-Chinese
Banking Corp., Ltd.,
1.900%, 02/11/2020 | | | 498,922 | | | | 0.0 | | |
| | 823,000 | | | | (5 | ) | | Societe Generale,
1.970%, 01/09/2020 | | | 822,630 | | | | 0.0 | | |
| | 725,000 | | | | (5 | ) | | United Overseas Bnk
Group,
1.900%, 01/24/2020 | | | 724,219 | | | | 0.0 | | |
| | | | | | | Total Commercial
Paper
(Cost $6,287,884) | | | 6,287,884 | | | | 0.4 | | |
Principal
Amount† | | | | | | Value | | Percentage
of Net
Assets | |
| | | | | Floating Rate Notes: 0.5% | |
| | 825,000 | | | | (5 | ) | | Australia &
New Zealand
Banking Group Ltd.,
1.920%, 04/09/2020 | | $ | 825,239 | | | | 0.1 | | |
| | 575,000 | | | | (5 | ) | | Commonwealth
Bank of Australia,
1.920%, 03/16/2020 | | | 575,008 | | | | 0.0 | | |
| | 800,000 | | | | (5 | ) | | Coöperatieve
Rabobank U.A.,
1.980%, 04/20/2020 | | | 800,224 | | | | 0.1 | | |
| | 725,000 | | | | (5 | ) | | Crédit Industriel et
Commercial,
1.950%, 04/09/2020 | | | 725,122 | | | | 0.0 | | |
| | 700,000 | | | | (5 | ) | | Credit Suisse
Group AG,
1.890%, 04/17/2020 | | | 700,313 | | | | 0.0 | | |
| | 800,000 | | | | (5 | ) | | Mitsubishi UFJ
Financial Group,
Inc.,
1.930%, 01/16/2020 | | | 800,094 | | | | 0.1 | | |
| | 825,000 | | | | (5 | ) | | Mizuho Financial
Group Inc.,
1.960%, 05/05/2020 | | | 825,035 | | | | 0.1 | | |
| | 700,000 | | | | (5 | ) | | The Norinchukin
Bank,
2.050%, 04/24/2020 | | | 700,252 | | | | 0.0 | | |
| | 825,000 | | | | (5 | ) | | The Sumitomo
Mitsui Financial
Group, 1.960%,
05/06/2020 | | | 824,936 | | | | 0.1 | | |
| | 450,000 | | | | (5 | ) | | Toronto-Dominion
Bank,
1.980%, 04/16/2020 | | | 450,136 | | | | 0.0 | | |
| | | | | | | Total Floating Rate
Notes
(Cost $7,226,359) | | | 7,226,359 | | | | 0.5 | | |
| | | | | Repurchase Agreements: 2.1% | |
| | 4,549,628 | | | | (5 | ) | | Citadel Securities
LLC, Repurchase
Agreement dated
12/31/19, 1.60%,
due 01/02/20
(Repurchase
Amount $4,550,027,
collateralized by
various U.S.
Government
Securities,
0.000%-8.500%,
Market Value plus
accrued interest
$4,641,033,
due 01/15/20-
11/15/48) | | | 4,549,628 | | | | 0.3 | | |
See Accompanying Notes to Financial Statements
136
TABLE OF CONTENTS
VY® INVESCO SUMMARY PORTFOLIO OF INVESTMENTS
OPPENHEIMER GLOBAL PORTFOLIO AS OF DECEMBER 31, 2019 (CONTINUED)
Principal
Amount† | | | | | | Value | | Percentage
of Net
Assets | |
| | | | | Repurchase Agreements (continued) | |
| | 11,562,348 | | | | (5 | ) | | Citigroup, Inc.,
Repurchase
Agreement dated
12/31/19, 1.57%,
due 01/02/20
(Repurchase
Amount
$11,563,343,
collateralized by
various U.S.
Government/U.S.
Government
Agency Obligations,
0.000%-9.000%,
Market Value plus
accrued interest
$11,793,595,
due 02/13/20-
09/20/69) | | $ | 11,562,348 | | | | 0.7 | | |
| | 11,562,348 | | | | (5 | ) | | RBC Dominion
Securities Inc.,
Repurchase
Agreement dated
12/31/19, 1.57%,
due 01/02/20
(Repurchase
Amount
$11,563,343,
collateralized by
various U.S.
Government/U.S.
Government
Agency Obligations,
0.000%-6.500%,
Market Value plus
accrued interest
$11,793,595, due
06/30/21-12/01/49) | | | 11,562,348 | | | | 0.8 | | |
| | 4,079,834 | | | | (5 | ) | | State of Wisconsin
Investment Board,
Repurchase
Agreement dated
12/31/19, 1.75%,
due 01/02/20
(Repurchase
Amount $4,080,225,
collateralized by
various U.S.
Government
Securities,
0.125%-3.875%,
Market Value plus
accrued interest
$4,161,543, due
04/15/21-02/15/47) | | | 4,079,834 | | | | 0.3 | | |
| | | | | | | Total Repurchase
Agreements
(Cost $31,754,158) | | | 31,754,158 | | | | 2.1 | | |
Principal
Amount† | | | | | | Value | | Percentage
of Net
Assets | |
| | | | | Certificates of Deposit: 0.0% | |
| | 450,000 | | | | (5 | ) | | Toronto-Dominion
Bank,
1.850%, 03/18/2020
(Cost $450,068) | | $ | 450,068 | | | | 0.0 | | |
Shares | | | | | | Value | | Percentage
of Net
Assets | |
| | | | | Mutual Funds: 2.4% | |
| | 33,374,580 | | | | (6 | ) | | BlackRock Liquidity
Funds, FedFund,
Institutional Class,
1.520% | | $ | 33,374,580 | | | | 2.2 | | |
| | 2,040,000 | | | | (5 | ),(6) | | Invesco Short-Term
Investments Trust
Government &
Agency Portfolio -
Institutional Class,
1.510% | | | 2,040,000 | | | | 0.1 | | |
| | 1,910,000 | | | | (5 | ),(6) | | Morgan Stanley
Institutional
Liquidity Funds -
Government
Portfolio
(Institutional Share
Class), 1.510% | | | 1,910,000 | | | | 0.1 | | |
| | | | | | | Total Mutual Funds
(Cost $37,324,580) | | | 37,324,580 | | | | 2.4 | | |
| | | | | | | Total Short-Term
Investments
(Cost $83,043,049) | | | 83,043,049 | | | | 5.4 | | |
| | | | | | | Total Investments in
Securities
(Cost $820,855,360) | | $ | 1,583,657,286 | | | | 103.2 | | |
| | | | | | | Liabilities in Excess
of Other Assets | | | (49,337,504 | ) | | | (3.2 | ) | |
| | | | | | | Net Assets | | $ | 1,534,319,782 | | | | 100.0 | | |
"Other Securities" represents issues not identified as the top 50 holdings in terms of market value and issues or issuers not exceeding 1% of net assets individually or in aggregate respectively as of December 31, 2019.
The following footnotes apply to either the individual securities noted or one or more of the securities aggregated and listed as a single line item.
† Unless otherwise indicated, principal amount is shown in USD.
ADR American Depositary Receipt
(1) The grouping contains securities on loan.
(2) The grouping contains non-income producing securities.
(3) Non-income producing security.
(4) Security, or a portion of the security, is on loan.
(5) All or a portion of the security represents securities purchased with cash collateral received for securities on loan.
(6) Rate shown is the 7-day yield as of December 31, 2019.
See Accompanying Notes to Financial Statements
137
TABLE OF CONTENTS
VY® INVESCO SUMMARY PORTFOLIO OF INVESTMENTS
OPPENHEIMER GLOBAL PORTFOLIO AS OF DECEMBER 31, 2019 (CONTINUED)
Sector Diversification | | Percentage of
Net Assets | |
Information Technology | | | 23.6 | % | |
Communication Services | | | 15.0 | | |
Financials | | | 14.2 | | |
Health Care | | | 13.5 | | |
Industrials | | | 13.1 | | |
Consumer Discretionary | | | 12.7 | | |
Consumer Staples | | | 3.1 | | |
Real Estate | | | 2.6 | | |
Short-Term Investments | | | 5.4 | | |
Liabilities in Excess of Other Assets | | | (3.2 | ) | |
Net Assets | | | 100.0 | % | |
Fair Value Measurements^
The following is a summary of the fair valuations according to the inputs used as of December 31, 2019 in valuing the assets and liabilities:
| | | Quoted Prices
in Active Markets
for Identical Investments
(Level 1) | | Significant Other
Observable
Inputs#
(Level 2) | | Significant
Unobservable
Inputs
(Level 3) | | Fair Value
at
December 31, 2019 | |
Asset Table | |
Investments, at fair value | |
Common Stock | |
Brazil | | $ | 8,809,706 | | | $ | — | | | $ | — | | | $ | 8,809,706 | | |
China | | | 29,260,594 | | | | — | | | | — | | | | 29,260,594 | | |
France | | | — | | | | 119,751,180 | | | | — | | | | 119,751,180 | | |
Germany | | | — | | | | 86,722,640 | | | | — | | | | 86,722,640 | | |
India | | | 29,979,031 | | | | 39,613,906 | | | | — | | | | 69,592,937 | | |
Italy | | | — | | | | 3,699,753 | | | | — | | | | 3,699,753 | | |
Japan | | | — | | | | 217,308,995 | | | | — | | | | 217,308,995 | | |
Netherlands | | | — | | | | 62,581,424 | | | | — | | | | 62,581,424 | | |
Spain | | | — | | | | 26,512,954 | | | | — | | | | 26,512,954 | | |
Sweden | | | — | | | | 37,001,795 | | | | — | | | | 37,001,795 | | |
Switzerland | | | — | | | | 21,637,877 | | | | — | | | | 21,637,877 | | |
United Kingdom | | | 11,261,692 | | | | 46,622,826 | | | | — | | | | 57,884,518 | | |
United States | | | 754,639,564 | | | | — | | | | — | | | | 754,639,564 | | |
Total Common Stock | | | 833,950,587 | | | | 661,453,350 | | | | — | | | | 1,495,403,937 | | |
Preferred Stock | | | 200,236 | | | | 5,010,064 | | | | — | | | | 5,210,300 | | |
Short-Term Investments | | | 37,324,580 | | | | 45,718,469 | | | | — | | | | 83,043,049 | | |
Total Investments, at fair value | | $ | 871,475,403 | | | $ | 712,181,883 | | | $ | — | | | $ | 1,583,657,286 | | |
^ See Note 2, "Significant Accounting Policies" in the Notes to Financial Statements for additional information.
# The earlier close of the foreign markets gives rise to the possibility that significant events, including broad market moves, may have occurred in the interim and may materially affect the value of those securities. To account for this, the Portfolio may frequently value many of its foreign equity securities using fair value prices based on third party vendor modeling tools to the extent available. Accordingly, a portion of the Portfolio's investments are categorized as Level 2 investments.
The effect of derivative instruments on the Portfolio's Statement of Operations for the year ended December 31, 2019 was as follows:
| | | Amount of Realized Gain or (Loss) on Derivatives Recognized in Income | |
Derivatives not accounted
for as hedging instruments | | Forward foreign currency contracts | |
Foreign exchange contracts | | $ | (50,738 | ) | |
Total | | $ | (50,738 | ) | |
At December 31, 2019, the aggregate cost of securities and other investments and the composition of unrealized appreciation and depreciation of securities and other investments at year end were:
Cost for federal income tax purposes was $835,910,716.
Net unrealized appreciation consisted of: | |
Gross Unrealized Appreciation | | $ | 770,091,938 | | |
Gross Unrealized Depreciation | | | (22,384,784 | ) | |
Net Unrealized Appreciation | | $ | 747,707,154 | | |
See Accompanying Notes to Financial Statements
138
TABLE OF CONTENTS
VY® JPMORGAN SUMMARY PORTFOLIO OF INVESTMENTS
MID CAP VALUE PORTFOLIO AS OF DECEMBER 31, 2019
Shares | |
| |
| | Value | | Percentage
of Net
Assets | |
COMMON STOCK: 97.9% | | | |
| | | | | Communication Services: 2.9% | |
| | 98,050 | | | | (1 | ) | | Liberty Media Corp. -
SiriusXM C | | $ | 4,720,127 | | | | 1.1 | | |
| | 154,322 | | | | (2 | ) | | Other Securities | | | 7,933,669 | | | | 1.8 | | |
| | | | | | | | | | 12,653,796 | | | | 2.9 | | |
| | | | | Consumer Discretionary: 12.0% | |
| | 5,670 | | | | (1 | ) | | Autozone, Inc. | | | 6,754,728 | | | | 1.5 | | |
| | 56,420 | | | | | | | Best Buy Co., Inc. | | | 4,953,676 | | | | 1.1 | | |
| | 42,960 | | | | | | | Expedia Group, Inc. | | | 4,645,694 | | | | 1.1 | | |
| | 31,750 | | | | (1 | ) | | Mohawk Industries, Inc. | | | 4,330,065 | | | | 1.0 | | |
| | 35,590 | | | | | | | Ralph Lauren Corp. | | | 4,171,860 | | | | 0.9 | | |
| | 33,510 | | | | | | | Tiffany & Co. | | | 4,478,612 | | | | 1.0 | | |
| | 560,977 | | | | (3 | ) | | Other Securities | | | 23,703,892 | | | | 5.4 | | |
| | | | | | | | | | 53,038,527 | | | | 12.0 | | |
| | | | | Consumer Staples: 3.9% | |
| | 36,030 | | | | (1 | ) | | Post Holdings, Inc. | | | 3,930,873 | | | | 0.9 | | |
| | 372,485 | | | | (3 | ) | | Other Securities | | | 13,229,316 | | | | 3.0 | | |
| | | | | | | | | | 17,160,189 | | | | 3.9 | | |
| | | | | Energy: 5.4% | |
| | 82,034 | | | | | | | Diamondback Energy, Inc. | | | 7,617,677 | | | | 1.7 | | |
| | 301,760 | | | | | | | Williams Cos., Inc. | | | 7,157,747 | | | | 1.6 | | |
| | 522,514 | | | | | | | Other Securities | | | 9,169,869 | | | | 2.1 | | |
| | | | | | | | | | 23,945,293 | | | | 5.4 | | |
| | | | | Financials: 21.8% | |
| | 32,990 | | | | | | | Ameriprise Financial, Inc. | | | 5,495,474 | | | | 1.2 | | |
| | 122,470 | | | | | | | Citizens Financial
Group, Inc. | | | 4,973,507 | | | | 1.1 | | |
| | 214,520 | | | | | | | Fifth Third Bancorp | | | 6,594,345 | | | | 1.5 | | |
| | 41,230 | | | | | | | First Republic Bank | | | 4,842,463 | | | | 1.1 | | |
| | 96,570 | | | | | | | Hartford Financial
Services Group, Inc. | | | 5,868,559 | | | | 1.3 | | |
| | 160,840 | | | | | | | Loews Corp. | | | 8,442,491 | | | | 1.9 | | |
| | 49,433 | | | | | | | M&T Bank Corp. | | | 8,391,252 | | | | 1.9 | | |
| | 39,030 | | | | | | | Marsh & McLennan
Cos., Inc. | | | 4,348,332 | | | | 1.0 | | |
| | 48,290 | | | | | | | Northern Trust Corp. | | | 5,130,330 | | | | 1.2 | | |
| | 54,050 | | | | | | | Raymond James
Financial, Inc. | | | 4,835,313 | | | | 1.1 | | |
| | 57,620 | | | | | | | T. Rowe Price Group, Inc. | | | 7,020,421 | | | | 1.6 | | |
| | 117,027 | | | | | | | Truist Financial Corp. | | | 6,590,961 | | | | 1.5 | | |
| | 544,728 | | | | (2 | ) | | Other Securities | | | 24,094,467 | | | | 5.4 | | |
| | | | | | | | | | 96,627,915 | | | | 21.8 | | |
| | | | | Health Care: 6.6% | |
| | 51,100 | | | | | | | AmerisourceBergen Corp. | | | 4,344,522 | | | | 1.0 | | |
| | 18,550 | | | | | | | Cigna Corp. | | | 3,793,290 | | | | 0.8 | | |
| | 28,810 | | | | (1 | ) | | Laboratory Corp. of
America Holdings | | | 4,873,788 | | | | 1.1 | | |
| | 30,640 | | | | | | | Universal Health
Services, Inc. | | | 4,395,614 | | | | 1.0 | | |
Shares | |
| |
| | Value | | Percentage
of Net
Assets | |
| | 41,480 | | | | | | | Zimmer Biomet
Holdings, Inc. | | $ | 6,208,726 | | | | 1.4 | | |
| | 54,750 | | | | (2 | ) | | Other Securities | | | 5,589,628 | | | | 1.3 | | |
| | | | | | | | | | 29,205,568 | | | | 6.6 | | |
| | | | | Industrials: 8.8% | |
| | 30,230 | | | | | | | Acuity Brands, Inc. | | | 4,171,740 | | | | 0.9 | | |
| | 50,320 | | | | | | | Ametek, Inc. | | | 5,018,917 | | | | 1.1 | | |
| | 60,030 | | | | | | | Fortune Brands
Home & Security, Inc. | | | 3,922,360 | | | | 0.9 | | |
| | 24,160 | | | | | | | IDEX Corp. | | | 4,155,520 | | | | 0.9 | | |
| | 28,031 | | | | | | | Snap-On, Inc. | | | 4,748,451 | | | | 1.1 | | |
| | 161,820 | | | | (2 | ) | | Other Securities | | | 17,031,128 | | | | 3.9 | | |
| | | | | | | | | | 39,048,116 | | | | 8.8 | | |
| | | | | Information Technology: 6.7% | |
| | 40,680 | | | | | | | Amphenol Corp. | | | 4,402,796 | | | | 1.0 | | |
| | 33,540 | | | | | | | CDW Corp. | | | 4,790,854 | | | | 1.1 | | |
| | 27,306 | | | | | | | Jack Henry &
Associates, Inc. | | | 3,977,665 | | | | 0.9 | | |
| | 27,690 | | | | (1 | ) | | Synopsys, Inc. | | | 3,854,448 | | | | 0.9 | | |
| | 190,511 | | | | (2 | ) | | Other Securities | | | 12,644,634 | | | | 2.8 | | |
| | | | | | | | | | 29,670,397 | | | | 6.7 | | |
| | | | | Materials: 4.8% | |
| | 16,080 | | | | | | | Martin Marietta
Materials, Inc. | | | 4,496,611 | | | | 1.0 | | |
| | 8,950 | | | | | | | Sherwin-Williams Co. | | | 5,222,683 | | | | 1.2 | | |
| | 145,850 | | | | | | | Silgan Holdings, Inc. | | | 4,533,018 | | | | 1.0 | | |
| | 134,760 | | | | | | | Other Securities | | | 6,908,632 | | | | 1.6 | | |
| | | | | | | | | | 21,160,944 | | | | 4.8 | | |
| | | | | Real Estate: 14.1% | |
| | 28,500 | | | | | | | AvalonBay
Communities, Inc. | | | 5,976,450 | | | | 1.4 | | |
| | 42,250 | | | | | | | Boston Properties, Inc. | | | 5,824,585 | | | | 1.3 | | |
| | 97,490 | | | | (1 | ) | | CBRE Group, Inc. | | | 5,975,162 | | | | 1.4 | | |
| | 34,880 | | | | | | | Federal Realty
Investment Trust | | | 4,490,103 | | | | 1.0 | | |
| | 65,646 | | | | | | | Vornado Realty Trust | | | 4,365,459 | | | | 1.0 | | |
| | 1,049,425 | | | | (2 | ) | | Other Securities | | | 35,553,731 | | | | 8.0 | | |
| | | | | | | | | | 62,185,490 | | | | 14.1 | | |
| | | | | Utilities: 10.9% | |
| | 145,010 | | | | | | | CMS Energy Corp. | | | 9,112,428 | | | | 2.0 | | |
| | 69,000 | | | | | | | Edison International | | | 5,203,290 | | | | 1.2 | | |
| | 37,470 | | | | | | | Entergy Corp. | | | 4,488,906 | | | | 1.0 | | |
| | 46,180 | | | | | | | Sempra Energy | | | 6,995,346 | | | | 1.6 | | |
| | 101,240 | | | | | | | WEC Energy Group, Inc. | | | 9,337,365 | | | | 2.1 | | |
| | 151,230 | | | | | | | Xcel Energy, Inc. | | | 9,601,593 | | | | 2.2 | | |
| | 79,410 | | | | | | | Other Securities | | | 3,695,742 | | | | 0.8 | | |
| | | | | | | | | | 48,434,670 | | | | 10.9 | | |
| | | | | | | Total Common Stock
(Cost $315,650,941) | | | 433,130,905 | | | | 97.9 | | |
See Accompanying Notes to Financial Statements
139
TABLE OF CONTENTS
VY® JPMORGAN SUMMARY PORTFOLIO OF INVESTMENTS
MID CAP VALUE PORTFOLIO AS OF DECEMBER 31, 2019 (CONTINUED)
Principal
Amount† | |
| |
| | Value | | Percentage
of Net
Assets | |
SHORT-TERM INVESTMENTS: 2.4% | | | |
| | | | | Repurchase Agreements: 0.5% | |
| | 1,000,000 | | | | (4 | ) | | Cantor Fitzgerald
Securities, Repurchase
Agreement dated
12/31/19, 1.58%,
due 01/02/20
(Repurchase Amount
$1,000,087,
collateralized by
various U.S.
Government/U.S.
Government
Agency Obligations,
0.000%-8.500%,
Market Value plus
accrued interest
$1,020,000, due
01/25/20-10/15/60) | | $ | 1,000,000 | | | | 0.2 | | |
| | 266,832 | | | | (4 | ) | | Citadel Securities LLC,
Repurchase Agreement
dated 12/31/19, 1.60%,
due 01/02/20
(Repurchase Amount
$266,855,
collateralized by
various U.S.
Government Securities,
0.000%-8.500%,
Market Value plus
accrued interest
$272,193,
due 01/15/20-11/15/48) | | | 266,832 | | | | 0.1 | | |
| | 1,000,000 | | | | (4 | ) | | RBC Dominion Securities
Inc., Repurchase
Agreement
dated 12/31/19, 1.57%,
due 01/02/20
(Repurchase Amount
$1,000,086,
collateralized by
various U.S.
Government/U.S.
Government
Agency Obligations,
0.000%-6.500%,
Market Value plus
accrued interest
$1,020,000, due
06/30/21-12/01/49) | | | 1,000,000 | | | | 0.2 | | |
| | | | | | | Total Repurchase
Agreements
(Cost $2,266,832) | | | 2,266,832 | | | | 0.5 | | |
Shares | |
| |
| | Value | | Percentage
of Net
Assets | |
| | | | | Mutual Funds: 1.9% | |
| | 8,506,831 | | | | (5 | ) | | BlackRock Liquidity
Funds, FedFund,
Institutional Class,
1.520%
(Cost $8,506,831) | | $ | 8,506,831 | | | | 1.9 | | |
| | | | | Total Short-Term
Investments
(Cost $10,773,663) | | | 10,773,663 | | | | 2.4 | | |
| | | | | Total Investments in
Securities
(Cost $326,424,604) | | $ | 443,904,568 | | | | 100.3 | | |
| | | | | Liabilities in Excess of
Other Assets | | | (1,316,355 | ) | | | (0.3 | ) | |
| | | | | Net Assets | | $ | 442,588,213 | | | | 100.0 | | |
"Other Securities" represents issues not identified as the top 50 holdings in terms of market value and issues or issuers not exceeding 1% of net assets individually or in aggregate respectively as of December 31, 2019.
The following footnotes apply to either the individual securities noted or one or more of the securities aggregated and listed as a single line item.
† Unless otherwise indicated, principal amount is shown in USD.
(1) Non-income producing security.
(2) The grouping contains non-income producing securities.
(3) The grouping contains securities on loan.
(4) All or a portion of the security represents securities purchased with cash collateral received for securities on loan.
(5) Rate shown is the 7-day yield as of December 31, 2019.
See Accompanying Notes to Financial Statements
140
TABLE OF CONTENTS
VY® JPMORGAN SUMMARY PORTFOLIO OF INVESTMENTS
MID CAP VALUE PORTFOLIO AS OF DECEMBER 31, 2019 (CONTINUED)
Fair Value Measurements^
The following is a summary of the fair valuations according to the inputs used as of December 31, 2019 in valuing the assets and liabilities:
| | | Quoted Prices
in Active Markets
for Identical Investments
(Level 1) | | Significant Other
Observable
Inputs
(Level 2) | | Significant
Unobservable
Inputs
(Level 3) | | Fair Value
at
December 31, 2019 | |
Asset Table | |
Investments, at fair value | |
Common Stock* | | $ | 433,130,905 | | | $ | — | | | $ | — | | | $ | 433,130,905 | | |
Short-Term Investments | | | 8,506,831 | | | | 2,266,832 | | | | — | | | | 10,773,663 | | |
Total Investments, at fair value | | $ | 441,637,736 | | | $ | 2,266,832 | | | $ | — | | | $ | 443,904,568 | | |
^ See Note 2, "Significant Accounting Policies" in the Notes to Financial Statements for additional information.
* For further breakdown of Common Stock by sector, please refer to the Portfolio of Investments.
At December 31, 2019, the aggregate cost of securities and other investments and the composition of unrealized appreciation and depreciation of securities and other investments at year end were:
Cost for federal income tax purposes was $327,749,944.
Net unrealized appreciation consisted of: | |
Gross Unrealized Appreciation | | $ | 135,388,992 | | |
Gross Unrealized Depreciation | | | (19,234,368 | ) | |
Net Unrealized Appreciation | | $ | 116,154,624 | | |
See Accompanying Notes to Financial Statements
141
TABLE OF CONTENTS
VY® T. ROWE PRICE DIVERSIFIED SUMMARY PORTFOLIO OF INVESTMENTS
MID CAP GROWTH PORTFOLIO AS OF DECEMBER 31, 2019
Shares | |
| |
| | Value | | Percentage
of Net
Assets | |
COMMON STOCK: 99.0% | | | |
| | | | | Communication Services: 2.2% | |
| | 554,294 | | | | (1 | ),(2) | | Other Securities | | $ | 25,402,585 | | | | 2.2 | | |
| | | | | Consumer Discretionary: 14.8% | |
| | 90,200 | | | | | | | Aptiv PLC | | | 8,566,294 | | | | 0.7 | | |
| | 54,800 | | | | (3 | ) | | Burlington Stores, Inc. | | | 12,496,044 | | | | 1.1 | | |
| | 75,100 | | | | | | | Dollar General Corp. | | | 11,714,098 | | | | 1.0 | | |
| | 73,200 | | | | (3 | ) | | Dollar Tree, Inc. | | | 6,884,460 | | | | 0.6 | | |
| | 21,400 | | | | | | | Domino's Pizza, Inc. | | | 6,286,892 | | | | 0.6 | | |
| | 98,333 | | | | | | | Hilton Worldwide
Holdings, Inc. | | | 10,906,113 | | | | 0.9 | | |
| | 29,900 | | | | (3 | ) | | Lululemon
Athletica, Inc. | | | 6,926,933 | | | | 0.6 | | |
| | 21,600 | | | | (3 | ) | | O'Reilly
Automotive, Inc. | | | 9,466,416 | | | | 0.8 | | |
| | 26,021 | | | | (3 | ) | | Ulta Beauty, Inc. | | | 6,586,956 | | | | 0.6 | | |
| | 1,331,592 | | | | (1 | ),(2) | | Other Securities | | | 91,537,813 | | | | 7.9 | | |
| | | | | | | | | | 171,372,019 | | | | 14.8 | | |
| | | | | Consumer Staples: 3.1% | |
| | 389,864 | | | | (1 | ) | | Other Securities | | | 35,486,498 | | | | 3.1 | | |
| | | | | Energy: 1.4% | |
| | 44 | | | | (3 | ),(4),(5) | | Venture Global
LNG, Inc. - Series B | | | 228,800 | | | | 0.0 | | |
| | 560 | | | | (3 | ),(4),(5) | | Venture Global
LNG, Inc. - Series C | | | 2,912,000 | | | | 0.3 | | |
| | 534,052 | | | | (1 | ),(2) | | Other Securities | | | 12,658,230 | | | | 1.1 | | |
| | | | | | | | | | 15,799,030 | | | | 1.4 | | |
| | | | | Financials: 7.3% | |
| | 83,433 | | | | | | | Cboe Global
Markets, Inc. | | | 10,011,960 | | | | 0.9 | | |
| | 54,500 | | | | | | | First Republic Bank | | | 6,401,025 | | | | 0.5 | | |
| | 37,500 | | | | | | | Willis Towers
Watson PLC | | | 7,572,750 | | | | 0.6 | | |
| | 841,346 | | | | (1 | ),(2) | | Other Securities | | | 61,316,041 | | | | 5.3 | | |
| | | | | | | | | | 85,301,776 | | | | 7.3 | | |
| | | | | Health Care: 14.5% | |
| | 74,000 | | | | | | | Agilent
Technologies, Inc. | | | 6,312,940 | | | | 0.5 | | |
| | 22,100 | | | | (3 | ) | | Align Technology, Inc. | | | 6,166,784 | | | | 0.5 | | |
| | 157,000 | | | | (3 | ) | | Centene Corp. | | | 9,870,590 | | | | 0.9 | | |
| | 25,600 | | | | | | | Cooper Cos., Inc. | | | 8,225,024 | | | | 0.7 | | |
| | 26,500 | | | | (3 | ) | | Idexx
Laboratories, Inc. | | | 6,919,945 | | | | 0.6 | | |
| | 20,000 | | | | | | | Teleflex, Inc. | | | 7,528,800 | | | | 0.7 | | |
| | 45,000 | | | | (3 | ) | | Veeva Systems, Inc. | | | 6,329,700 | | | | 0.5 | | |
| | 1,705,672 | | | | (1 | ),(2) | | Other Securities | | | 117,265,572 | | | | 10.1 | | |
| | | | | | | | | | 168,619,355 | | | | 14.5 | | |
Shares | |
| |
| | Value | | Percentage
of Net
Assets | |
| | | | | Industrials: 17.8% | |
| | 31,200 | | | | | | | Cintas Corp. | | $ | 8,395,296 | | | | 0.7 | | |
| | 16,800 | | | | (3 | ) | | CoStar Group, Inc. | | | 10,051,440 | | | | 0.9 | | |
| | 51,610 | | | | | | | L3Harris Technologies,
Inc. | | | 10,212,071 | | | | 0.9 | | |
| | 15,200 | | | | | | | TransDigm Group, Inc. | | | 8,512,000 | | | | 0.7 | | |
| | 116,100 | | | | | | | TransUnion | | | 9,939,321 | | | | 0.9 | | |
| | 49,556 | | | | | | | Verisk Analytics, Inc. | | | 7,400,693 | | | | 0.6 | | |
| | 2,182,711 | | | | (1 | ),(2) | | Other Securities | | | 151,743,645 | | | | 13.1 | | |
| | | | | | | | | | 206,254,466 | | | | 17.8 | | |
| | | | | Information Technology: 32.0% | |
| | 97,500 | | | | | | | Amphenol Corp. | | | 10,552,425 | | | | 0.9 | | |
| | 69,379 | | | | (3 | ) | | Atlassian Corp. PLC | | | 8,349,069 | | | | 0.7 | | |
| | 99,470 | | | | (3 | ) | | Black Knight, Inc. | | | 6,413,826 | | | | 0.5 | | |
| | 94,664 | | | | | | | Booz Allen Hamilton
Holding Corp. | | | 6,733,450 | | | | 0.6 | | |
| | 95,800 | | | | (3 | ) | | Cadence Design
Systems, Inc. | | | 6,644,688 | | | | 0.6 | | |
| | 59,100 | | | | | | | CDW Corp. | | | 8,441,844 | | | | 0.7 | | |
| | 15,473 | | | | (3 | ),(5) | | Datadog, Inc. - Lockup
Shares | | | 578,724 | | | | 0.0 | | |
| | 109,500 | | | | (3 | ) | | Fiserv, Inc. | | | 12,661,485 | | | | 1.1 | | |
| | 33,400 | | | | (3 | ) | | FleetCor
Technologies, Inc. | | | 9,609,848 | | | | 0.8 | | |
| | 45,100 | | | | (3 | ) | | Gartner, Inc. | | | 6,949,910 | | | | 0.6 | | |
| | 107,127 | | | | | | | Global Payments, Inc. | | | 19,557,105 | | | | 1.7 | | |
| | 69,850 | | | | (3 | ) | | Keysight
Technologies, Inc. | | | 7,168,706 | | | | 0.6 | | |
| | 58,500 | | | | | | | KLA Corp. | | | 10,422,945 | | | | 0.9 | | |
| | 34,755 | | | | | | | Lam Research Corp. | | | 10,162,362 | | | | 0.9 | | |
| | 255,948 | | | | | | | Marvell Technology
Group Ltd. | | | 6,797,979 | | | | 0.6 | | |
| | 153,600 | | | | | | | Maxim Integrated
Products | | | 9,447,936 | | | | 0.8 | | |
| | 107,700 | | | | (6 | ) | | Microchip Technology,
Inc. | | | 11,278,344 | | | | 1.0 | | |
| | 47,700 | | | | | | | Motorola Solutions,
Inc. | | | 7,686,378 | | | | 0.7 | | |
| | 34,100 | | | | (3 | ) | | Palo Alto Networks,
Inc. | | | 7,885,625 | | | | 0.7 | | |
| | 79,200 | | | | | | | Skyworks Solutions,
Inc. | | | 9,573,696 | | | | 0.8 | | |
| | 66,500 | | | | (3 | ) | | Splunk, Inc. | | | 9,959,705 | | | | 0.9 | | |
| | 107,635 | | | | | | | SS&C Technologies
Holdings, Inc. | | | 6,608,789 | | | | 0.6 | | |
| | 79,700 | | | | | | | Xilinx, Inc. | | | 7,792,269 | | | | 0.7 | | |
| | 2,230,724 | | | | (1 | ),(2) | | Other Securities | | | 169,301,588 | | | | 14.6 | | |
| | | | | | | | | | 370,578,696 | | | | 32.0 | | |
See Accompanying Notes to Financial Statements
142
TABLE OF CONTENTS
VY® T. ROWE PRICE DIVERSIFIED SUMMARY PORTFOLIO OF INVESTMENTS
MID CAP GROWTH PORTFOLIO AS OF DECEMBER 31, 2019 (CONTINUED)
Shares | |
| |
| | Value | | Percentage
of Net
Assets | |
| | | | | Materials: 3.6% | |
| | 98,380 | | | | | | | Ball Corp. | | $ | 6,362,234 | | | | 0.6 | | |
| | 48,700 | | | | | | | Vulcan Materials Co. | | | 7,012,313 | | | | 0.6 | | |
| | 458,329 | | | | (1 | ),(2) | | Other Securities | | | 28,148,709 | | | | 2.4 | | |
| | | | | | | | | | 41,523,256 | | | | 3.6 | | |
| | | | | Real Estate: 1.7% | |
| | 32,250 | | | | | | | SBA Communications
Corp. | | | 7,771,928 | | | | 0.7 | | |
| | 6,575 | | | | (3 | ),(4),(5) | | WeWork Companies,
Inc. - Class A | | | 92,576 | | | | 0.0 | | |
| | 340,310 | | | | (1 | ) | | Other Securities | | | 11,867,171 | | | | 1.0 | | |
| | | | | | | | | | 19,731,675 | | | | 1.7 | | |
| | | | | Utilities: 0.6% | |
| | 103,626 | | | | | | | Other Securities | | | 7,637,846 | | | | 0.6 | | |
| | | | | | | Total Common Stock
(Cost $761,302,503) | | | 1,147,707,202 | | | | 99.0 | | |
PREFERRED STOCK: 0.9% | | | |
| | | | | Communication Services: 0.4% | |
| | 32,391 | | | | (3 | ),(4),(5) | | AirBNB, Inc. - Series D | | | 3,854,529 | | | | 0.3 | | |
| | 3,719 | | | | (3 | ),(4),(5) | | AirBNB, Inc. - Series E | | | 442,561 | | | | 0.1 | | |
| | | | | | | | | | 4,297,090 | | | | 0.4 | | |
| | | | | Information Technology: 0.4% | |
| | 24,459 | | | | (3 | ),(4),(5) | | Databricks, Inc.,
Series F | | | 1,050,475 | | | | 0.1 | | |
| | 353,970 | | | | (3 | ),(4),(5) | | Tanium, Inc. - Series G | | | 3,009,241 | | | | 0.2 | | |
| | 23,311 | | | | (3 | ),(4),(5) | | UiPath Inc., Series D-1 | | | 917,327 | | | | 0.1 | | |
| | 3,914 | | | | (3 | ),(4),(5) | | UiPath Inc., Series D-2 | | | 154,023 | | | | 0.0 | | |
| | | | | | | | | | 5,131,066 | | | | 0.4 | | |
| | | | | Real Estate: 0.1% | |
| | 44,396 | | | | (3 | ),(4),(5) | | WeWork Companies,
Inc. - Series D-1 | | | 625,096 | | | | 0.1 | | |
| | 34,882 | | | | (3 | ),(4),(5) | | WeWork Companies,
Inc. - Series D-2 | | | 491,138 | | | | 0.0 | | |
| | 24,709 | | | | (3 | ),(4),(5) | | WeWork Companies,
Inc. - Series E | | | 347,903 | | | | 0.0 | | |
| | | | | | | | | | 1,464,137 | | | | 0.1 | | |
| | | | | | | Total Preferred Stock
(Cost $7,676,732) | | | 10,892,293 | | | | 0.9 | | |
| | | | | | | Total Long-Term
Investments
(Cost $768,979,235) | | | 1,158,599,495 | | | | 99.9 | | |
Principal
Amount† | |
| |
| |
Value | | Percentage
of Net
Assets | |
SHORT-TERM INVESTMENTS: 8.4% | | | |
| | | | | Commercial Paper: 0.8% | |
| | 975,000 | | | | (7 | ) | | Banco Santander S.A.,
1.950%, 02/05/2020 | | $ | 973,247 | | | | 0.1 | | |
| | 950,000 | | | | (7 | ) | | DBS Bank Ltd.,
1.820%, 02/18/2020 | | | 947,688 | | | | 0.1 | | |
| | 700,000 | | | | (7 | ) | | Flex Co. LLC,
1.910%, 01/31/2020 | | | 698,915 | | | | 0.0 | | |
| | 975,000 | | | | (7 | ) | | Le Mouvement Des
Caisses Desjardins,
1.860%, 02/14/2020 | | | 972,892 | | | | 0.1 | | |
| | 900,000 | | | | (7 | ) | | LMA Americas LLC,
2.000%, 01/31/2020 | | | 898,529 | | | | 0.1 | | |
| | 725,000 | | | | (7 | ) | | Mitsubishi UFJ Trust
and Banking Corp.,
1.920%, 01/31/2020 | | | 723,814 | | | | 0.0 | | |
| | 950,000 | | | | (7 | ) | | Nederlandse
Waterschapsbank,
1.870%, 02/12/2020 | | | 948,041 | | | | 0.1 | | |
| | 850,000 | | | | (7 | ) | | Sheffield Receivables
Company LLC,
2.000%, 03/16/2020 | | | 846,671 | | | | 0.1 | | |
| | 987,000 | | | | (7 | ) | | Societe Generale,
1.970%, 01/09/2020 | | | 986,556 | | | | 0.1 | | |
| | 975,000 | | | | (7 | ) | | Starbird Funding Corp.,
1.910%, 02/20/2020 | | | 972,445 | | | | 0.1 | | |
| | 775,000 | | | | (7 | ) | | United Overseas
Bnk Group,
1.900%, 01/24/2020 | | | 774,165 | | | | 0.0 | | |
| | | | | | | Total Commercial
Paper
(Cost $9,742,963) | | | 9,742,963 | | | | 0.8 | | |
| | | | | Floating Rate Notes: 1.4% | |
| | 950,000 | | | | (7 | ) | | Australia &
New Zealand
Banking Group Ltd.,
1.920%, 04/09/2020 | | | 950,275 | | | | 0.1 | | |
| | 950,000 | | | | (7 | ) | | Bank of America Corp.,
1.910%, 05/07/2020 | | | 950,000 | | | | 0.1 | | |
| | 900,000 | | | | (7 | ) | | Bank of Nova Scotia,
1.940%, 05/08/2020 | | | 899,933 | | | | 0.1 | | |
| | 650,000 | | | | (7 | ) | | Bedford Row Funding,
1.960%, 05/18/2020 | | | 650,110 | | | | 0.0 | | |
| | 990,000 | | | | (7 | ) | | Commonwealth
Bank of Australia,
1.940%, 06/10/2020 | | | 989,998 | | | | 0.1 | | |
| | 800,000 | | | | (7 | ) | | Coöperatieve
Rabobank U.A.,
1.980%, 04/20/2020 | | | 800,224 | | | | 0.1 | | |
| | 625,000 | | | | (7 | ) | | Crédit Industriel
et Commercial,
1.990%, 04/24/2020 | | | 625,048 | | | | 0.0 | | |
| | 925,000 | | | | (7 | ) | | Credit Suisse
Group AG,
1.890%, 04/17/2020 | | | 925,414 | | | | 0.1 | | |
See Accompanying Notes to Financial Statements
143
TABLE OF CONTENTS
VY® T. ROWE PRICE DIVERSIFIED SUMMARY PORTFOLIO OF INVESTMENTS
MID CAP GROWTH PORTFOLIO AS OF DECEMBER 31, 2019 (CONTINUED)
Principal
Amount† | |
| |
| |
Value | | Percentage
of Net
Assets | |
| | | | | Floating Rate Notes (continued) | |
| | 1,000,000 | | | | (7 | ) | | DNB ASA,
1.930%, 02/14/2020 | | $ | 1,000,143 | | | | 0.1 | | |
| | 975,000 | | | | (7 | ) | | HSBC Bank PLC,
1.970%, 06/03/2020 | | | 974,997 | | | | 0.1 | | |
| | 250,000 | | | | (7 | ) | | Mitsubishi UFJ
Financial Group, Inc.,
2.050%, 02/25/2020 | | | 250,086 | | | | 0.0 | | |
| | 925,000 | | | | (7 | ) | | Mizuho Financial
Group Inc.,
1.960%, 05/05/2020 | | | 925,039 | | | | 0.1 | | |
| | 350,000 | | | | (7 | ) | | National Australia
Bank Ltd.,
1.890%, 02/10/2020 | | | 350,008 | | | | 0.0 | | |
| | 875,000 | | | | (7 | ) | | National Bank
Of Canada,
1.990%, 05/01/2020 | | | 875,113 | | | | 0.1 | | |
| | 325,000 | | | | (7 | ) | | Royal Bank
Of Canada,
1.860%, 04/29/2020 | | | 325,020 | | | | 0.0 | | |
| | 975,000 | | | | (7 | ) | | Skandinaviska
Enskilda Banken AB,
1.950%, 05/11/2020 | | | 975,031 | | | | 0.1 | | |
| | 975,000 | | | | (7 | ) | | The Norinchukin Bank,
2.050%, 04/24/2020 | | | 975,351 | | | | 0.1 | | |
| | 275,000 | | | | (7 | ) | | The Sumitomo Mitsui
Financial Group,
1.960%, 05/06/2020 | | | 274,979 | | | | 0.0 | | |
| | 675,000 | | | | (7 | ) | | The Sumitomo Mitsui
Financial Group,
2.010%, 05/01/2020 | | | 675,819 | | | | 0.1 | | |
| | 800,000 | | | | (7 | ) | | Toronto-Dominion
Bank,
2.000%, 04/30/2020 | | | 800,051 | | | | 0.0 | | |
| | 625,000 | | | | (7 | ) | | Westpac
Banking Corp,
1.830%, 02/10/2020 | | | 625,050 | | | | 0.1 | | |
| | 300,000 | | | | (7 | ) | | Westpac
Banking Corp,
1.970%, 06/03/2020 | | | 300,012 | | | | 0.0 | | |
| | | | | | | Total Floating Rate
Notes
(Cost $16,117,701) | | | 16,117,701 | | | | 1.4 | | |
Principal
Amount† | |
| |
| |
Value | | Percentage
of Net
Assets | |
| | | | | Repurchase Agreements: 5.0% | |
| | 22,543,635 | | | | (7 | ) | | Bank of Nova Scotia,
Repurchase
Agreement dated
12/31/19, 1.57%,
due 01/02/20
(Repurchase
Amount $22,545,574,
collateralized by
various U.S.
Government Agency
Obligations,
2.500%-6.500%,
Market Value plus
accrued interest
$22,996,513, due
09/01/24-11/01/49) | | $ | 22,543,635 | | | | 2.0 | | |
| | 5,133,490 | | | | (7 | ) | | Citadel Securities
LLC, Repurchase
Agreement dated
12/31/19, 1.60%,
due 01/02/20
(Repurchase
Amount $5,133,940,
collateralized by
various U.S.
Government
Securities,
0.000%-8.500%,
Market Value plus
accrued interest
$5,236,625, due
01/15/20-11/15/48) | | | 5,133,490 | | | | 0.4 | | |
| | 22,543,635 | | | | (7 | ) | | Citigroup, Inc.,
Repurchase
Agreement dated
12/31/19, 1.57%,
due 01/02/20
(Repurchase
Amount $22,545,574,
collateralized by
various U.S.
Government/U.S.
Government Agency
Obligations,
0.000%-9.000%,
Market Value plus
accrued interest
$22,994,508, due
02/13/20-09/20/69) | | | 22,543,635 | | | | 2.0 | | |
See Accompanying Notes to Financial Statements
144
TABLE OF CONTENTS
VY® T. ROWE PRICE DIVERSIFIED SUMMARY PORTFOLIO OF INVESTMENTS
MID CAP GROWTH PORTFOLIO AS OF DECEMBER 31, 2019 (CONTINUED)
Principal
Amount† | |
| |
| |
Value | | Percentage
of Net
Assets | |
| | | | | Repurchase Agreements (continued) | |
| | 7,393,850 | | | | (7 | ) | | State of Wisconsin
Investment Board,
Repurchase
Agreement dated
12/31/19, 1.75%,
due 01/02/20
(Repurchase
Amount $7,394,559,
collateralized by
various U.S.
Government
Securities,
0.125%-3.875%,
Market Value plus
accrued interest
$7,541,930, due
04/15/21-02/15/47) | | $ | 7,393,850 | | | | 0.6 | | |
| | | | | | | Total Repurchase
Agreements
(Cost $57,614,610) | | | 57,614,610 | | | | 5.0 | | |
| | | | | Certificates of Deposit: 0.3% | |
| | 950,000 | | | | (7 | ) | | Deutscher Sparkassen-
und Giroverband,
1.860%, 02/13/2020 | | | 950,269 | | | | 0.1 | | |
| | 950,000 | | | | (7 | ) | | Dz Bank Ag
Deutsche Zentral-
Genossenschaftsbank,
1.830%, 02/13/2020 | | | 949,923 | | | | 0.0 | | |
| | 950,000 | | | | (7 | ) | | Landesbank
Baden-Wurttemberg,
1.830%, 01/16/2020 | | | 950,033 | | | | 0.1 | | |
| | 950,000 | | | | (7 | ) | | Sumitomo Mitsui
Trust Holdings, Inc.,
1.950%, 01/27/2020 | | | 950,138 | | | | 0.1 | | |
| | | | | | | Total Certificates
of Deposit
(Cost $3,800,363) | | | 3,800,363 | | | | 0.3 | | |
Shares | |
| |
| | Value | | Percentage
of Net
Assets | |
| | | | | Mutual Funds: 0.9% | |
| | 2,140,000 | | | | (7 | ),(8) | | BlackRock Liquidity
Funds, FedFund,
Institutional Class,
1.520% | | $ | 2,140,000 | | | | 0.2 | | |
| | 890,000 | | | | (7 | ) | | Fidelity Investments
Money Market
Government Portfolio -
Institutional Class,
1.520% | | | 890,000 | | | | 0.1 | | |
| | 2,722,000 | | | | (7 | ),(8) | | Goldman Sachs
Financial Square
Government Fund -
Institutional Shares,
1.500% | | | 2,722,000 | | | | 0.2 | | |
Shares | |
| |
| |
Value | | Percentage
of Net
Assets | |
| | 3,794,000 | | | | (7 | ),(8) | | Morgan Stanley
Institutional Liquidity
Funds - Government
Portfolio (Institutional
Share Class),
1.510% | | $ | 3,794,000 | | | | 0.3 | | |
| | 509,341 | | | | (8 | ) | | T. Rowe Price
Government
Reserve Fund,
1.590% | | | 509,341 | | | | 0.1 | | |
| | | | | Total Mutual Funds
(Cost $10,055,341) | | | 10,055,341 | | | | 0.9 | | |
| | | | | Total Short-Term
Investments
(Cost $97,330,978) | | | 97,330,978 | | | | 8.4 | | |
| | | | | Total Investments
in Securities
(Cost
$866,310,213) | | $ | 1,255,930,473 | | | | 108.3 | | |
| | | | | Liabilities in Excess
of Other Assets | | | (96,743,789 | ) | | | (8.3 | ) | |
| | | | | Net Assets | | $ | 1,159,186,684 | | | | 100.0 | | |
"Other Securities" represents issues not identified as the top 50 holdings in terms of market value and issues or issuers not exceeding 1% of net assets individually or in aggregate respectively as of December 31, 2019.
The following footnotes apply to either the individual securities noted or one or more of the securities aggregated and listed as a single line item.
† Unless otherwise indicated, principal amount is shown in USD.
(1) The grouping contains securities on loan.
(2) The grouping contains non-income producing securities.
(3) Non-income producing security.
(4) For fair value measurement disclosure purposes, security is categorized as Level 3, whose value was determined using significant unobservable inputs.
(5) Restricted security as to resale, excluding Rule 144A securities. As of December 31, 2019, the Portfolio held restricted securities with a fair value of $14,704,393 or 1.3% of net assets. Please refer to the table below for additional details.
(6) Security, or a portion of the security, is on loan.
(7) All or a portion of the security represents securities purchased with cash collateral received for securities on loan.
(8) Rate shown is the 7-day yield as of December 31, 2019.
See Accompanying Notes to Financial Statements
145
TABLE OF CONTENTS
VY® T. ROWE PRICE DIVERSIFIED SUMMARY PORTFOLIO OF INVESTMENTS
MID CAP GROWTH PORTFOLIO AS OF DECEMBER 31, 2019 (CONTINUED)
Fair Value Measurements^
The following is a summary of the fair valuations according to the inputs used as of December 31, 2019 in valuing the assets and liabilities:
| | | Quoted Prices
in Active Markets
for Identical Investments
(Level 1) | | Significant Other
Observable
Inputs#
(Level 2) | | Significant
Unobservable
Inputs
(Level 3) | | Fair Value
at
December 31, 2019 | |
Asset Table | |
Investments, at fair value | |
Common Stock | |
Communication Services | | $ | 25,402,585 | | | $ | — | | | $ | — | | | $ | 25,402,585 | | |
Consumer Discretionary | | | 171,372,019 | | | | — | | | | — | | | | 171,372,019 | | |
Consumer Staples | | | 35,486,498 | | | | — | | | | — | | | | 35,486,498 | | |
Energy | | | 12,658,230 | | | | — | | | | 3,140,800 | | | | 15,799,030 | | |
Financials | | | 85,301,776 | | | | — | | | | — | | | | 85,301,776 | | |
Health Care | | | 168,619,355 | | | | — | | | | — | | | | 168,619,355 | | |
Industrials | | | 206,254,466 | | | | — | | | | — | | | | 206,254,466 | | |
Information Technology | | | 369,999,972 | | | | 578,724 | | | | — | | | | 370,578,696 | | |
Materials | | | 41,523,256 | | | | — | | | | — | | | | 41,523,256 | | |
Real Estate | | | 19,639,099 | | | | — | | | | 92,576 | | | | 19,731,675 | | |
Utilities | | | 7,637,846 | | | | — | | | | — | | | | 7,637,846 | | |
Total Common Stock | | | 1,143,895,102 | | | | 578,724 | | | | 3,233,376 | | | | 1,147,707,202 | | |
Preferred Stock | | | — | | | | — | | | | 10,892,293 | | | | 10,892,293 | | |
Short-Term Investments | | | 10,055,341 | | | | 87,275,637 | | | | — | | | | 97,330,978 | | |
Total Investments, at fair value | | $ | 1,153,950,443 | | | $ | 87,854,361 | | | $ | 14,125,669 | | | $ | 1,255,930,473 | | |
^ See Note 2, "Significant Accounting Policies" in the Notes to Financial Statements for additional information.
# The earlier close of the foreign markets gives rise to the possibility that significant events, including broad market moves, may have occurred in the interim and may materially affect the value of those securities. To account for this, the Portfolio may frequently value many of its foreign equity securities using fair value prices based on third party vendor modeling tools to the extent available. Accordingly, a portion of the Portfolio's investments are categorized as Level 2 investments.
At December 31, 2019, VY® T. Rowe Price Diversified Mid Cap Growth Portfolio held the following restricted securities:
Security | | Acquisition Date | | Acquisition Cost | | Fair Value | |
AirBNB, Inc. - Series D | | 4/16/2014 | | $ | 1,318,736 | | | $ | 3,854,529 | | |
AirBNB, Inc. - Series E | | 7/14/2015 | | | 346,218 | | | | 442,561 | | |
Databricks, Inc., Series F | | 10/22/2019 | | | 1,050,475 | | | | 1,050,475 | | |
Datadog, Inc. - Lockup Shares | | 5/7/2019 | | | 246,996 | | | | 578,724 | | |
Tanium, Inc. - Series G | | 8/26/2015 | | | 1,757,214 | | | | 3,009,241 | | |
UiPath Inc., Series D-1 | | 4/26/2019 | | | 917,327 | | | | 917,327 | | |
UiPath Inc., Series D-2 | | 4/26/2019 | | | 154,023 | | | | 154,023 | | |
Venture Global LNG, Inc. - Series B | | 3/8/2018 | | | 132,880 | | | | 228,800 | | |
Venture Global LNG, Inc. - Series C | | 10/16/2017 | | | 2,083,973 | | | | 2,912,000 | | |
WeWork Companies, Inc. - Class A | | 6/23/2015 | | | 144,501 | | | | 92,576 | | |
WeWork Companies, Inc. - Series D-1 | | 12/9/2014 | | | 739,245 | | | | 625,096 | | |
WeWork Companies, Inc. - Series D-2 | | 12/9/2014 | | | 580,826 | | | | 491,138 | | |
WeWork Companies, Inc. - Series E | | 6/23/2015 | | | 812,668 | | | | 347,903 | | |
| | | | | $ | 10,285,082 | | | $ | 14,704,393 | | |
See Accompanying Notes to Financial Statements
146
TABLE OF CONTENTS
VY® T. ROWE PRICE DIVERSIFIED SUMMARY PORTFOLIO OF INVESTMENTS
MID CAP GROWTH PORTFOLIO AS OF DECEMBER 31, 2019 (CONTINUED)
The following table presents additional information about valuation techniques and inputs used for investments that are measured at fair value and categorized within Level 3 at December 31, 2019:
Investments, at fair value | | Fair Value at
December 31,
2019 | | Valuation
Technique(s)* | | Significant
Unobservable
Input(s) | | Value or
Range of
Input(s) | | Impact to Valuation
from an Increase
in Input*** | |
Common Stocks | | $ | 3,233,376 | | | Recent Comparable
Transaction Price | | Discount factor | | | — | ** | | | — | ** | |
| | | | | Recent Comparable
Transaction Price | | Discount For
Uncertainty | | | 10 | % | | Decrease | |
Preferred Stocks | | $ | 10,892,293 | | | Recent Comparable
Transaction Price | | Discount factor | | | — | ** | | | — | ** | |
| | | | | Recent Comparable
Transaction Price | | Discount For
Uncertainty | | | 10 | % | | Decrease | |
| | | | | Market Comparable | | Discount for
Lack of Marketability | | | 10 | % | | Decrease | |
| | | | | Market Comparable | | Enterprise Value to
Gross Profit Multiple | | | 4.7 | x-5.6x | | Increase | |
| | | | | Market Comparable | | Enterprise Value to
Sales Multiple | | | 4.2 | x-5.0x | | Increase | |
| | | | | Market Comparable | | Sales Growth Rate | | | 19 | %-21% | | Increase | |
| | | | | Market Comparable | | Gross Profit
Growth Rate | | | 20 | %-23% | | Increase | |
Total Investments, at fair value | | $ | 14,125,669 | | | | | | | | | | |
* Valuation techniques may change in order to reflect management's judgment of current market participant assumptions.
** No quantitative unobservable inputs were significant to the fair valuation determination at December 31, 2019
*** Represents the directional change in the fair value of the Level 3 investment(s) that would result from an increase in the corresponding input. A decrease to the unobservable input would have the opposite effect. Significant increases and decreases in these inputs in isolation could result in signficantly higher or lower fair value measurements.
The following is a reconciliation of the fair valuations using significant unobservable inputs (Level 3) for the Portfolio's assets and liabilities during the year ended December 31, 2019:
| | | Common Stock | | Preferred Stock | | Total | |
Assets: | |
Beginning balance at December 31, 2018 | | $ | 4,087,680 | | | $ | 12,989,606 | | | $ | 17,077,286 | | |
Purchases | | | 308,740 | | | | 2,121,824 | | | | 2,430,564 | | |
Sales | | | (631,854 | ) | | | — | | | | (631,854 | ) | |
Accrued discounts/(premiums) | | | — | | | | — | | | | — | | |
Total realized gain (loss) | | | 464,772 | | | | — | | | | 464,772 | | |
Net change in unrealized appreciation (depreciation)**** | | | (687,222 | ) | | | (3,526,725 | ) | | | (4,213,947 | ) | |
Transfers into Level 3 | | | — | | | | — | | | | — | | |
Transfers out of Level 3 | | | (308,740 | ) | | | (692,412 | ) | | | (1,001,152 | ) | |
Ending balance at December 31, 2019 | | $ | 3,233,376 | | | $ | 10,892,293 | | | $ | 14,125,669 | | |
Net change in unrealized appreciation (depreciation) on Level 3 securities
still held as of December 31, 2019**** | | $ | (280,480 | ) | | $ | (3,526,727 | ) | | $ | (3,807,207 | ) | |
**** Any difference between net change in unrealized apprecation (depreciation) and net change in unrealized appreciation (depreciation) on Level 3 securities still held at December 31, 2019 may be due to securities no longer held or categorized as Level 3 at year end.
At December 31, 2019, the aggregate cost of securities and other investments and the composition of unrealized appreciation and depreciation of securities and other investments at year end were:
Cost for federal income tax purposes was $868,966,841.
Net unrealized appreciation consisted of: | |
Gross Unrealized Appreciation | | $ | 419,656,204 | | |
Gross Unrealized Depreciation | | | (32,692,572 | ) | |
Net Unrealized Appreciation | | $ | 386,963,632 | | |
See Accompanying Notes to Financial Statements
147
TABLE OF CONTENTS
VY® T. ROWE PRICE SUMMARY PORTFOLIO OF INVESTMENTS
GROWTH EQUITY PORTFOLIO AS OF DECEMBER 31, 2019
Shares | |
| |
| | Value | | Percentage
of Net
Assets | |
COMMON STOCK: 97.9% | | | |
| | | | | Communication Services: 18.7% | |
| | 39,440 | | | | (1 | ) | | Alphabet, Inc. -
Class A | | $ | 52,825,542 | | | | 3.2 | | |
| | 38,466 | | | | (1 | ) | | Alphabet, Inc. -
Class C | | �� | 51,429,811 | | | | 3.1 | | |
| | 465,916 | | | | (1 | ) | | Facebook, Inc. -
Class A | | | 95,629,259 | | | | 5.7 | | |
| | 45,447 | | | | (1 | ) | | IAC/InterActiveCorp | | | 11,321,302 | | | | 0.7 | | |
| | 110,344 | | | | (1 | ) | | Netflix, Inc. | | | 35,704,008 | | | | 2.1 | | |
| | 567,600 | | | | | | | Tencent Holdings Ltd. | | | 27,344,787 | | | | 1.6 | | |
| | 126,593 | | | | | | | Walt Disney Co. | | | 18,309,146 | | | | 1.1 | | |
| | 681,704 | | | | (2 | ),(3) | | Other Securities | | | 19,549,815 | | | | 1.2 | | |
| | | | | | | | | | 312,113,670 | | | | 18.7 | | |
| | | | | Consumer Discretionary: 18.9% | |
| | 231,876 | | | | (1 | ) | | Alibaba Group
Holding Ltd. ADR | | | 49,180,900 | | | | 3.0 | | |
| | 58,038 | | | | (1 | ) | | Amazon.com, Inc. | | | 107,244,938 | | | | 6.4 | | |
| | 164,099 | | | | | | | Aptiv PLC | | | 15,584,482 | | | | 0.9 | | |
| | 7,537 | | | | (1 | ) | | Booking Holdings, Inc. | | | 15,478,963 | | | | 0.9 | | |
| | 118,372 | | | | (1 | ) | | Dollar Tree, Inc. | | | 11,132,887 | | | | 0.7 | | |
| | 365,044 | | | | | | | Dollarama, Inc. | | | 12,546,235 | | | | 0.8 | | |
| | 89,212 | | | | (4 | ) | | Ferrari NV | | | 14,768,155 | | | | 0.9 | | |
| | 155,974 | | | | | | | Las Vegas
Sands Corp. | | | 10,768,445 | | | | 0.6 | | |
| | 42,881 | | | | (1 | ) | | Lululemon
Athletica, Inc. | | | 9,934,241 | | | | 0.6 | | |
| | 138,253 | | | | | | | Nike, Inc. | | | 14,006,411 | | | | 0.8 | | |
| | 23,200 | | | | (1 | ),(4) | | Tesla, Inc. | | | 9,705,256 | | | | 0.6 | | |
| | 117,517 | | | | | | | Wynn Resorts Ltd. | | | 16,319,586 | | | | 1.0 | | |
| | 349,779 | | | | (3 | ) | | Other Securities | | | 28,978,256 | | | | 1.7 | | |
| | | | | | | | | | 315,648,755 | | | | 18.9 | | |
| | | | | Consumer Staples: 0.5% | |
| �� | 105,914 | | | | | | | Other Securities | | | 9,012,222 | | | | 0.5 | | |
| | | | | Energy: 0.7% | |
| | 95,763 | | | | | | | Other Securities | | | 11,221,110 | | | | 0.7 | | |
| | | | | Financials: 2.2% | |
| | 1,134,411 | | | | (1 | ),(5),(6) | | Ant International Co.,
Limited - Class C | | | 7,294,263 | | | | 0.4 | | |
| | 69,022 | | | | | | | Chubb Ltd. | | | 10,743,964 | | | | 0.7 | | |
| | 317,156 | | | | (3 | ) | | Other Securities | | | 18,430,792 | | | | 1.1 | | |
| | | | | | | | | | 36,469,019 | | | | 2.2 | | |
| | | | | Health Care: 12.2% | |
| | 51,813 | | | | | | | Anthem, Inc. | | | 15,649,080 | | | | 0.9 | | |
| | 74,635 | | | | | | | Becton
Dickinson & Co. | | | 20,298,481 | | | | 1.2 | | |
| | 252,424 | | | | (1 | ) | | Centene Corp. | | | 15,869,897 | | | | 1.0 | | |
| | 69,991 | | | | | | | Cigna Corp. | | | 14,312,460 | | | | 0.9 | | |
Shares | |
| |
| | Value | | Percentage
of Net
Assets | |
| | 97,316 | | | | | | | HCA Healthcare, Inc. | | $ | 14,384,278 | | | | 0.9 | | |
| | 41,789 | | | | (1 | ) | | Intuitive Surgical, Inc. | | | 24,703,567 | | | | 1.5 | | |
| | 120,221 | | | | | | | Stryker Corp. | | | 25,239,197 | | | | 1.5 | | |
| | 103,378 | | | | | | | UnitedHealth Group,
Inc. | | | 30,391,064 | | | | 1.8 | | |
| | 109,491 | | | | (1 | ) | | Vertex
Pharmaceuticals,
Inc. | | | 23,973,054 | | | | 1.4 | | |
| | 202,120 | | | | (3 | ) | | Other Securities | | | 18,227,415 | | | | 1.1 | | |
| | | | | | | | | | 203,048,493 | | | | 12.2 | | |
| | | | | Industrials: 8.5% | |
| | 137,524 | | | | | | | Boeing Co. | | | 44,799,818 | | | | 2.7 | | |
| | 180,592 | | | | | | | Fortive Corp. | | | 13,795,423 | | | | 0.8 | | |
| | 55,009 | | | | | | | Roper Technologies,
Inc. | | | 19,485,838 | | | | 1.2 | | |
| | 191,747 | | | | | | | TransUnion | | | 16,415,461 | | | | 1.0 | | |
| | 182,419 | | | | (4 | ) | | Westinghouse
Air Brake
Technologies Corp. | | | 14,192,198 | | | | 0.8 | | |
| | 623,891 | | | | (3 | ) | | Other Securities | | | 33,246,995 | | | | 2.0 | | |
| | | | | | | | | | 141,935,733 | | | | 8.5 | | |
| | | | | Information Technology: 34.2% | |
| | 264,099 | | | | | | | Apple, Inc. | | | 77,552,671 | | | | 4.6 | | |
| | 60,440 | | | | (4 | ) | | ASML Holding
NV-NY REG | | | 17,886,614 | | | | 1.1 | | |
| | 244,315 | | | | | | | Fidelity National
Information
Services, Inc. | | | 33,981,773 | | | | 2.0 | | |
| | 185,204 | | | | (1 | ) | | Fiserv, Inc. | | | 21,415,139 | | | | 1.3 | | |
| | 80,532 | | | | | | | Global Payments, Inc. | | | 14,701,922 | | | | 0.9 | | |
| | 85,658 | | | | | | | Intuit, Inc. | | | 22,436,400 | | | | 1.3 | | |
| | 528,551 | | | | | | | Marvell Technology
Group Ltd. | | | 14,038,315 | | | | 0.8 | | |
| | 190,687 | | | | | | | Mastercard, Inc. -
Class A | | | 56,937,231 | | | | 3.4 | | |
| | 641,783 | | | | | | | Microsoft Corp. | | | 101,209,179 | | | | 6.1 | | |
| | 139,463 | | | | (1 | ) | | PayPal Holdings, Inc. | | | 15,085,713 | | | | 0.9 | | |
| | 179,743 | | | | (1 | ) | | Salesforce.com, Inc. | | | 29,233,402 | | | | 1.8 | | |
| | 68,839 | | | | (1 | ) | | ServiceNow, Inc. | | | 19,434,626 | | | | 1.2 | | |
| | 120,638 | | | | (1 | ) | | Splunk, Inc. | | | 18,067,953 | | | | 1.1 | | |
| | 51,440 | | | | (1 | ),(5),(6) | | Stripe, Inc. - Class B | | | 807,094 | | | | 0.0 | | |
| | 338,067 | | | | | | | Visa, Inc. - Class A | | | 63,522,789 | | | | 3.8 | | |
| | 85,873 | | | | (1 | ),(4) | | VMware, Inc. | | | 13,034,663 | | | | 0.8 | | |
| | 776,102 | | | | (2 | ),(3) | | Other Securities | | | 51,391,773 | | | | 3.1 | | |
| | | | | | | | | | 570,737,257 | | | | 34.2 | | |
| | | | | Materials: 0.6% | |
| | 43,952 | | | | | | | Other Securities | | | 9,357,381 | | | | 0.6 | | |
See Accompanying Notes to Financial Statements
148
TABLE OF CONTENTS
VY® T. ROWE PRICE SUMMARY PORTFOLIO OF INVESTMENTS
GROWTH EQUITY PORTFOLIO AS OF DECEMBER 31, 2019 (CONTINUED)
Shares | |
| |
| | Value | | Percentage
of Net
Assets | |
| | | | | Utilities: 1.4% | |
| | 42,121 | | | | | | | NextEra Energy, Inc. | | $ | 10,200,022 | | | | 0.6 | | |
| | 89,338 | | | | | | | Sempra Energy | | | 13,532,920 | | | | 0.8 | | |
| | | | | | | | | | 23,732,942 | | | | 1.4 | | |
| | | | | | | Total Common Stock
(Cost
$1,172,614,947) | | | 1,633,276,582 | | | | 97.9 | | |
PREFERRED STOCK: 1.9% | | | |
| | | | | Communication Services: 0.8% | |
| | 59,241 | | | | (1 | ),(5),(6) | | AirBNB, Inc. - Series D | | | 7,049,679 | | | | 0.5 | | |
| | 16,058 | | | | (1 | ),(5),(6) | | AirBNB, Inc. - Series E | | | 1,910,902 | | | | 0.1 | | |
| | 68,026 | | | | (1 | ),(5),(6) | | Xiaoju Kuaizhi, Inc.,
Series A-17
(DiDi Chuxing, Inc.) | | | 3,464,707 | | | | 0.2 | | |
| | | | | | | | | | 12,425,288 | | | | 0.8 | | |
| | | | | Consumer Discretionary: 0.5% | |
| | 163,010 | | | | (1 | ),(5),(6) | | Aurora Innovation,
Inc., - Series B | | | 1,506,261 | | | | 0.1 | | |
| | 8,132 | | | | (1 | ),(5),(6) | | DoorDash, Inc. -
Series G | | | 1,542,617 | | | | 0.1 | | |
| | 549,762 | | | | (1 | ),(5),(6) | | Rivian Automotive,
Inc. - Series D | | | 5,906,643 | | | | 0.3 | | |
| | | | | | | | | | 8,955,521 | | | | 0.5 | | |
| | | | | Industrials: 0.2% | |
| | 159,700 | | | | (1 | ),(5),(6) | | GM Cruise Holdings,
LLC - Class F | | | 2,914,525 | | | | 0.2 | | |
| | | | | Information Technology: 0.4% | |
| | 93,459 | | | | (1 | ),(5),(6) | | Magic Leap, Inc. -
Series C | | | 2,271,053 | | | | 0.2 | | |
| | 61,969 | | | | (1 | ),(5),(6) | | Magic Leap, Inc. -
Series D | | | 1,505,847 | | | | 0.1 | | |
| | 57,073 | | | | (1 | ),(5),(6) | | UiPath Inc., Series D-1 | | | 2,245,920 | | | | 0.1 | | |
| | 9,584 | | | | (1 | ),(5),(6) | | UiPath Inc., Series D-2 | | | 377,147 | | | | 0.0 | | |
| | | | | | | | | | 6,399,967 | | | | 0.4 | | |
| | | | | Real Estate: 0.0% | |
| | 42,822 | | | | (1 | ),(5),(6) | | WeWork Companies,
Inc. - Series E | | | 602,934 | | | | 0.0 | | |
| | | | | | | Total Preferred Stock
(Cost $25,499,799) | | | 31,298,235 | | | | 1.9 | | |
| | | | | | | Total Long-Term
Investments
(Cost
$1,198,114,746) | | | 1,664,574,817 | | | | 99.8 | | |
Principal
Amount† | |
| |
| | Value | | Percentage
of Net
Assets | |
SHORT-TERM INVESTMENTS: 4.2% | | | |
| | | | | Commercial Paper: 0.4% | |
| | 425,000 | | | | (7 | ) | | Banco Santander S.A.,
1.950%,
02/05/2020 | | $ | 424,236 | | | | 0.0 | | |
| | 300,000 | | | | (7 | ) | | Banco Santander S.A.,
1.950%, 02/06/2020 | | | 299,445 | | | | 0.0 | | |
| | 975,000 | | | | (7 | ) | | DBS Bank Ltd.,
1.820%, 02/18/2020 | | | 972,627 | | | | 0.1 | | |
| | 350,000 | | | | (7 | ) | | Le Mouvement Des
Caisses Desjardins,
1.850%, 02/10/2020 | | | 349,314 | | | | 0.0 | | |
| | 450,000 | | | | (7 | ) | | Le Mouvement Des
Caisses Desjardins,
1.860%, 02/14/2020 | | | 449,027 | | | | 0.1 | | |
| | 900,000 | | | | (7 | ) | | LMA Americas LLC,
1.810%, 01/23/2020 | | | 898,832 | | | | 0.1 | | |
| | 625,000 | | | | (7 | ) | | Matchpoint
Finance PLC,
1.850%, 02/03/2020 | | | 623,941 | | | | 0.0 | | |
| | 650,000 | | | | (7 | ) | | Mitsubishi UFJ Trust
and Banking Corp.,
1.910%, 02/04/2020 | | | 648,799 | | | | 0.0 | | |
| | 400,000 | | | | (7 | ) | | Nederlandse
Waterschapsbank,
1.870%, 02/12/2020 | | | 399,175 | | | | 0.0 | | |
| | 250,000 | | | | (7 | ) | | Sheffield Receivables
Company LLC,
1.950%, 02/27/2020 | | | 249,257 | | | | 0.0 | | |
| | 500,000 | | | | (7 | ) | | Sheffield Receivables
Company LLC,
2.000%, 03/16/2020 | | | 498,042 | | | | 0.1 | | |
| | | | | | | Total Commercial
Paper
(Cost $5,812,695) | | | 5,812,695 | | | | 0.4 | | |
| | | | | Floating Rate Notes: 0.7% | |
| | 775,000 | | | | (7 | ) | | Australia &
New Zealand
Banking Group Ltd.,
1.920%, 04/09/2020 | | | 775,224 | | | | 0.1 | | |
| | 750,000 | | | | (7 | ) | | Bank of
America Corp.,
1.910%, 05/07/2020 | | | 750,000 | | | | 0.0 | | |
| | 900,000 | | | | (7 | ) | | Bank of Nova Scotia,
1.940%, 05/08/2020 | | | 899,933 | | | | 0.1 | | |
| | 425,000 | | | | (7 | ) | | Commonwealth
Bank of Australia,
1.920%, 01/24/2020 | | | 425,054 | | | | 0.0 | | |
| | 550,000 | | | | (7 | ) | | Commonwealth
Bank of Australia,
1.940%, 06/10/2020 | | | 549,999 | | | | 0.1 | | |
| | 300,000 | | | | (7 | ) | | Coöperatieve
Rabobank U.A.,
1.980%, 04/20/2020 | | | 300,084 | | | | 0.0 | | |
| | 625,000 | | | | (7 | ) | | Crédit Industriel et
Commercial,
1.990%, 04/24/2020 | | | 625,048 | | | | 0.0 | | |
See Accompanying Notes to Financial Statements
149
TABLE OF CONTENTS
VY® T. ROWE PRICE SUMMARY PORTFOLIO OF INVESTMENTS
GROWTH EQUITY PORTFOLIO AS OF DECEMBER 31, 2019 (CONTINUED)
Principal
Amount† | |
| |
| | Value | | Percentage
of Net
Assets | |
| | | | | Floating Rate Notes (continued) | |
| | 600,000 | | | | (7 | ) | | Credit Suisse
Group AG,
1.720%,
01/16/2020 | | $ | 600,044 | | | | 0.1 | | |
| | 375,000 | | | | (7 | ) | | Credit Suisse
Group AG,
1.750%, 01/30/2020 | | | 375,040 | | | | 0.0 | | |
| | 300,000 | | | | (7 | ) | | Lloyds Bank PLC,
1.880%, 01/15/2020 | | | 300,029 | | | | 0.0 | | |
| | 300,000 | | | | (7 | ) | | Mitsubishi UFJ
Financial Group, Inc.,
2.070%, 02/28/2020 | | | 300,120 | | | | 0.0 | | |
| | 250,000 | | | | (7 | ) | | Mizuho Financial
Group Inc.,
1.960%, 05/05/2020 | | | 250,010 | | | | 0.0 | | |
| | 600,000 | | | | (7 | ) | | Mizuho Financial
Group Inc.,
2.020%, 05/26/2020 | | | 600,052 | | | | 0.1 | | |
| | 350,000 | | | | (7 | ) | | National Australia
Bank Ltd.,
1.890%, 02/10/2020 | | | 350,008 | | | | 0.0 | | |
| | 575,000 | | | | (7 | ) | | National Bank
Of Canada,
1.990%, 05/01/2020 | | | 575,074 | | | | 0.0 | | |
| | 550,000 | | | | (7 | ) | | Natixis S.A.,
2.030%, 01/24/2020 | | | 550,033 | | | | 0.0 | | |
| | 875,000 | | | | (7 | ) | | Skandinaviska
Enskilda Banken AB,
1.950%, 05/11/2020 | | | 875,028 | | | | 0.1 | | |
| | 650,000 | | | | (7 | ) | | Sumitomo Mitsui
Trust Holdings, Inc.,
1.980%, 05/07/2020 | | | 649,992 | | | | 0.0 | | |
| | 575,000 | | | | (7 | ) | | The Norinchukin Bank,
2.050%, 04/24/2020 | | | 575,207 | | | | 0.0 | | |
| | 450,000 | | | | (7 | ) | | The Sumitomo Mitsui
Financial Group,
1.840%, 01/10/2020 | | | 450,033 | | | | 0.0 | | |
| | 500,000 | | | | (7 | ) | | The Sumitomo Mitsui
Financial Group,
1.960%, 05/06/2020 | | | 499,961 | | | | 0.1 | | |
| | 575,000 | | | | (7 | ) | | Westpac
Banking Corp,
1.830%, 02/10/2020 | | | 575,046 | | | | 0.0 | | |
| | | | | | | Total Floating Rate
Notes
(Cost $11,851,019) | | | 11,851,019 | | | | 0.7 | | |
Principal
Amount† | |
| |
| | Value | | Percentage
of Net
Assets | |
| | | | | Repurchase Agreements: 2.2% | |
| | 14,973,682 | | | | (7 | ) | | Bank of Nova Scotia,
Repurchase
Agreement dated
12/31/19, 1.57%,
due 01/02/20
(Repurchase Amount
$14,974,970,
collateralized by
various U.S.
Government Agency
Obligations,
2.500%-6.500%,
Market Value plus
accrued interest
$15,274,488, due
09/01/24-11/01/49) | | $ | 14,973,682 | | | | 0.9 | | |
| | 2,645,054 | | | | (7 | ) | | Citadel Securities LLC,
Repurchase
Agreement dated
12/31/19, 1.60%,
due 01/02/20
(Repurchase Amount
$2,645,286,
collateralized by
various U.S.
Government
Securities,
0.000%-8.500%,
Market Value plus
accrued interest
$2,698,195, due
01/15/20-11/15/48) | | | 2,645,054 | | | | 0.1 | | |
| | 14,973,682 | | | | (7 | ) | | Citigroup, Inc.,
Repurchase
Agreement dated
12/31/19, 1.57%,
due 01/02/20
(Repurchase Amount
$14,974,970,
collateralized by
various U.S.
Government/U.S.
Government Agency
Obligations,
0.000%-9.000%,
Market Value plus
accrued interest
$15,273,156, due
02/13/20-09/20/69) | | | 14,973,682 | | | | 0.9 | | |
See Accompanying Notes to Financial Statements
150
TABLE OF CONTENTS
VY® T. ROWE PRICE SUMMARY PORTFOLIO OF INVESTMENTS
GROWTH EQUITY PORTFOLIO AS OF DECEMBER 31, 2019 (CONTINUED)
Principal
Amount† | |
| |
| | Value | | Percentage
of Net
Assets | |
| | | | | Repurchase Agreements (continued) | |
| | 4,796,180 | | | | (7 | ) | | State of Wisconsin
Investment Board,
Repurchase
Agreement dated
12/31/19, 1.75%,
due 01/02/20
(Repurchase Amount
$4,796,640,
collateralized by
various U.S.
Government
Securities,
0.125%-3.875%,
Market Value plus
accrued interest
$4,892,235, due
04/15/21-02/15/47) | | $ | 4,796,180 | | | | 0.3 | | |
| | | | | | | Total Repurchase
Agreements
(Cost $37,388,598) | | | 37,388,598 | | | | 2.2 | | |
| | | | | Certificates of Deposit: 0.2% | |
| | 650,000 | | | | (7 | ) | | Deutscher
Sparkassen-und
Giroverband,
1.860%, 02/13/2020 | | | 650,184 | | | | 0.0 | | |
| | 825,000 | | | | (7 | ) | | Dz Bank Ag
Deutsche Zentral-
Genossenschaftsbank,
1.830%, 02/13/2020 | | | 824,933 | | | | 0.0 | | |
| | 850,000 | | | | (7 | ) | | Landesbank
Baden-Wurttemberg,
1.830%, 01/16/2020 | | | 850,030 | | | | 0.1 | | |
| | 325,000 | | | | (7 | ) | | The Norinchukin Bank,
1.870%, 03/05/2020 | | | 325,011 | | | | 0.0 | | |
| | 900,000 | | | | (7 | ) | | Toronto-Dominion
Bank,
1.850%, 03/18/2020 | | | 900,136 | | | | 0.1 | | |
| | | | | | | Total Certificates of
Deposit
(Cost $3,550,294) | | | 3,550,294 | | | | 0.2 | | |
Shares | |
| |
| | Value | | Percentage
of Net
Assets | |
| | | | | Mutual Funds: 0.7% | |
| | 530,000 | | | | (7 | ) | | Fidelity Investments
Money Market
Government
Portfolio -
Institutional Class,
1.520% | | $ | 530,000 | | | | 0.1 | | |
| | 1,773,000 | | | | (7 | ),(8) | | Goldman Sachs
Financial Square
Government Fund -
Institutional Shares,
1.500% | | | 1,773,000 | | | | 0.1 | | |
Shares | |
| |
| | Value | | Percentage
of Net
Assets | |
| | 1,630,000 | | | | (7 | ),(8) | | Invesco Short-Term
Investments Trust
Government &
Agency Portfolio -
Institutional Class,
1.510% | | $ | 1,630,000 | | | | 0.1 | | |
| | 1,773,000 | | | | (7 | ),(8) | | Morgan Stanley
Institutional Liquidity
Funds - Government
Portfolio (Institutional
Share Class),
1.510% | | | 1,773,000 | | | | 0.1 | | |
| | 5,320,233 | | | | (8 | ) | | T. Rowe Price
Government
Reserve Fund,
1.590% | | | 5,320,233 | | | | 0.3 | | |
| | | | | | | Total Mutual Funds
(Cost $11,026,233) | | | 11,026,233 | | | | 0.7 | | |
| | | | | | | Total Short-Term
Investments
(Cost $69,628,839) | | | 69,628,839 | | | | 4.2 | | |
| | | | | | | Total Investments
in Securities
(Cost
$1,267,743,585) | | $ | 1,734,203,656 | | | | 104.0 | | |
| | | | | | | Liabilities in Excess
of Other Assets | | | (66,854,680 | ) | | | (4.0 | ) | |
| | | | | | | Net Assets | | $ | 1,667,348,976 | | | | 100.0 | | |
"Other Securities" represents issues not identified as the top 50 holdings in terms of market value and issues or issuers not exceeding 1% of net assets individually or in aggregate respectively as of December 31, 2019.
The following footnotes apply to either the individual securities noted or one or more of the securities aggregated and listed as a single line item.
† Unless otherwise indicated, principal amount is shown in USD.
ADR American Depositary Receipt
(1) Non-income producing security.
(2) The grouping contains securities on loan.
(3) The grouping contains non-income producing securities.
(4) Security, or a portion of the security, is on loan.
(5) For fair value measurement disclosure purposes, security is categorized as Level 3, whose value was determined using significant unobservable inputs.
(6) Restricted security as to resale, excluding Rule 144A securities. As of December 31, 2019, the Portfolio held restricted securities with a fair value of $39,399,592 or 2.4% of net assets. Please refer to the table below for additional details.
(7) All or a portion of the security represents securities purchased with cash collateral received for securities on loan.
(8) Rate shown is the 7-day yield as of December 31, 2019.
See Accompanying Notes to Financial Statements
151
TABLE OF CONTENTS
VY® T. ROWE PRICE SUMMARY PORTFOLIO OF INVESTMENTS
GROWTH EQUITY PORTFOLIO AS OF DECEMBER 31, 2019 (CONTINUED)
Fair Value Measurements^
The following is a summary of the fair valuations according to the inputs used as of December 31, 2019 in valuing the assets and liabilities:
| | | Quoted Prices
in Active Markets
for Identical Investments
(Level 1) | | Significant Other
Observable
Inputs#
(Level 2) | | Significant
Unobservable
Inputs
(Level 3) | | Fair Value
at
December 31, 2019 | |
Asset Table | |
Investments, at fair value | |
Common Stock | |
Communication Services | | $ | 284,768,883 | | | $ | 27,344,787 | | | $ | — | | | $ | 312,113,670 | | |
Consumer Discretionary | | | 315,648,755 | | | | — | | | | — | | | | 315,648,755 | | |
Consumer Staples | | | 9,012,222 | | | | — | | | | — | | | | 9,012,222 | | |
Energy | | | 11,221,110 | | | | — | | | | — | | | | 11,221,110 | | |
Financials | | | 29,174,756 | | | | — | | | | 7,294,263 | | | | 36,469,019 | | |
Health Care | | | 195,150,330 | | | | 7,898,163 | | | | — | | | | 203,048,493 | | |
Industrials | | | 141,935,733 | | | | — | | | | — | | | | 141,935,733 | | |
Information Technology | | | 553,073,018 | | | | 16,857,145 | | | | 807,094 | | | | 570,737,257 | | |
Materials | | | 9,357,381 | | | | — | | | | — | | | | 9,357,381 | | |
Utilities | | | 23,732,942 | | | | — | | | | — | | | | 23,732,942 | | |
Total Common Stock | | | 1,573,075,130 | | | | 52,100,095 | | | | 8,101,357 | | | | 1,633,276,582 | | |
Preferred Stock | | | — | | | | — | | | | 31,298,235 | | | | 31,298,235 | | |
Short-Term Investments | | | 11,026,233 | | | | 58,602,606 | | | | — | | | | 69,628,839 | | |
Total Investments, at fair value | | $ | 1,584,101,363 | | | $ | 110,702,701 | | | $ | 39,399,592 | | | $ | 1,734,203,656 | | |
^ See Note 2, "Significant Accounting Policies" in the Notes to Financial Statements for additional information.
# The earlier close of the foreign markets gives rise to the possibility that significant events, including broad market moves, may have occurred in the interim and may materially affect the value of those securities. To account for this, the Portfolio may frequently value many of its foreign equity securities using fair value prices based on third party vendor modeling tools to the extent available. Accordingly, a portion of the Portfolio's investments are categorized as Level 2 investments.
At December 31, 2019, VY® T. Rowe Price Growth Equity Portfolio held the following restricted securities:
Security | | Acquisition Date | | Acquisition Cost | | Fair Value | |
AirBNB, Inc. - Series D | | 4/16/2014 | | $ | 2,411,881 | | | $ | 7,049,679 | | |
AirBNB, Inc. - Series E | | 7/14/2015 | | | 1,494,910 | | | | 1,910,902 | | |
Ant International Co., Limited - Class C | | 6/7/2018 | | | 6,364,046 | | | | 7,294,263 | | |
Aurora Innovation, Inc., - Series B | | 3/1/2019 | | | 1,506,261 | | | | 1,506,261 | | |
DoorDash, Inc. - Series G | | 11/12/2019 | | | 1,542,617 | | | | 1,542,617 | | |
GM Cruise Holdings, LLC - Class F | | 5/7/2019 | | | 2,914,525 | | | | 2,914,525 | | |
Magic Leap, Inc. - Series C | | 1/20/2016 | | | 2,152,641 | | | | 2,271,053 | | |
Magic Leap, Inc. - Series D | | 10/12/2017 | | | 1,673,163 | | | | 1,505,847 | | |
Rivian Automotive, Inc. - Series D | | 12/23/2019 | | | 5,906,643 | | | | 5,906,643 | | |
Stripe, Inc. - Class B | | 12/17/2019 | | | 807,094 | | | | 807,094 | | |
UiPath Inc., Series D-1 | | 4/26/2019 | | | 2,245,920 | | | | 2,245,920 | | |
UiPath Inc., Series D-2 | | 4/26/2019 | | | 377,147 | | | | 377,147 | | |
WeWork Companies, Inc. - Series E | | 6/23/2015 | | | 1,408,397 | | | | 602,934 | | |
Xiaoju Kuaizhi, Inc., Series A-17 (DiDi Chuxing, Inc.) | | 10/19/2015 | | | 1,865,694 | | | | 3,464,707 | | |
| | | | | $ | 32,670,939 | | | $ | 39,399,592 | | |
See Accompanying Notes to Financial Statements
152
TABLE OF CONTENTS
VY® T. ROWE PRICE SUMMARY PORTFOLIO OF INVESTMENTS
GROWTH EQUITY PORTFOLIO AS OF DECEMBER 31, 2019 (CONTINUED)
The following table presents additional information about valuation techniques and inputs used for investments that are measured at fair value and categorized within Level 3 at December 31, 2019:
Investments, at fair value | | Fair Value at
December 31,
2019 | | Valuation
Technique(s)* | | Significant
Unobservable
Input(s) | | Value or
Range of
Input(s) | | Impact to Valuation
from an Increase
in Input*** | |
Common Stocks | | $ | 8,101,357 | | | Recent Comparable
Transaction Prices(s)
Market Comparable | |
Discount Factor | | —** | | —** | |
Preferred Stocks | | $ | 31,298,235 | | | Recent Comparable
Transaction Price | | —** | | —** | | —** | |
| | | | | Recent Comparable
Transaction Price | | Discount For
Uncertainty | | 10% | | Decrease | |
| | | | | Recent Comparable
Transaction Price | | Discount For
Uncertainty | | 15% | | Decrease | |
| | | | | Market Comparable | | Discount for
Lack of Marketability | | 10% | | Decrease | |
| | | | | Market Comparable | | Enterprise Value to
Gross Profit Multiple | | 4.7x-5.6x | | Increase | |
| | | | | Market Comparable | | Enterprise Value to
Sales Multiple | | 4.2x-5.0x | | Increase | |
| | | | | Market Comparable | | Sales Growth Rate | | 19%-21% | | Increase | |
| | | | | Market Comparable | | Gross Profit
Growth Rate | | 20%-23% | | Increase | |
Total Investments, at fair value | | $ | 39,399,592 | | | | | | | | | | |
* Valuation techniques may change in order to reflect management's judgment of current market participant assumptions.
** No quantitative unobservable inputs were significant to the fair valuation determination at December 31, 2019
*** Represents the directional change in the fair value of the Level 3 investment(s) that would result from an increase in the corresponding input. A decrease to the unobservable input would have the opposite effect. Significant increases and decreases in these inputs in isolation could result in signficantly higher or lower fair value measurements.
The following is a reconciliation of the fair valuations using significant unobservable inputs (Level 3) for the Portfolio's assets and liabilities during the year ended December 31, 2019:
| | | Common Stock | | Preferred Stock | | Total | |
Assets: | |
Beginning balance at December 31, 2018 | | $ | 6,615,863 | | | $ | 21,544,210 | | | $ | 28,160,073 | | |
Purchases | | | 807,094 | | | | 14,493,113 | | | | 15,300,207 | | |
Sales | | | (97,200 | ) | | | (147,528 | ) | | | (244,728 | ) | |
Accrued discounts/(premiums) | | | — | | | | — | | | | — | | |
Total realized gain (loss) | | | 37,999 | | | | 57,675 | | | | 95,674 | | |
Net change in unrealized appreciation (depreciation)**** | | | 896,160 | | | | (843,635 | ) | | | 52,525 | | |
Transfers into Level 3 | | | — | | | | — | | | | — | | |
Transfers out of Level 3 | | | (158,559 | ) | | | (3,805,600 | ) | | | (3,964,159 | ) | |
Ending balance at December 31, 2019 | | $ | 8,101,357 | | | $ | 31,298,235 | | | $ | 39,399,592 | | |
Net change in unrealized appreciation (depreciation) on Level 3 securities
still held as of December 31, 2019**** | | $ | 930,217 | | | $ | (791,944 | ) | | $ | 138,273 | | |
**** Any difference between net change in unrealized apprecation (depreciation) and net change in unrealized appreciation (depreciation) on Level 3 securities still held at December 31, 2019 may be due to securities no longer held or categorized as Level 3 at year end.
At December 31, 2019, the aggregate cost of securities and other investments and the composition of unrealized appreciation and depreciation of securities and other investments at year end were:
Cost for federal income tax purposes was $1,272,221,380.
Net unrealized appreciation consisted of: | |
Gross Unrealized Appreciation | | $ | 475,550,598 | | |
Gross Unrealized Depreciation | | | (13,554,026 | ) | |
Net Unrealized Appreciation | | $ | 461,996,572 | | |
See Accompanying Notes to Financial Statements
153
TABLE OF CONTENTS
TAX INFORMATION (UNAUDITED)
Dividends and distributions paid during the year ended December 31, 2019 were as follows:
Portfolio Name | | Type | | Per Share Amount | |
Voya Global Bond Portfolio | |
Class ADV | | NII | | $ | 0.4433 | | |
Class I | | NII | | $ | 0.5019 | | |
Class S | | NII | | $ | 0.4745 | | |
Voya International High Dividend Low Volatility Portfolio | |
Class ADV | | NII | | $ | 0.1884 | | |
Class I | | NII | | $ | 0.2581 | | |
Class S | | NII | | $ | 0.2225 | | |
Class S2 | | NII | | $ | 0.1730 | | |
All Classes | | LTCG | | $ | 0.9830 | | |
VY® American Century Small-Mid Cap Value Portfolio | |
Class ADV | | NII | | $ | 0.1183 | | |
Class I | | NII | | $ | 0.1784 | | |
Class S | | NII | | $ | 0.1448 | | |
Class S2 | | NII | | $ | 0.1153 | | |
All Classes | | STCG | | $ | 0.3024 | | |
All Classes | | LTCG | | $ | 0.8690 | | |
VY® Baron Growth Portfolio | |
All Classes | | LTCG | | $ | 13.8924 | | |
All Classes | | ROC | | $ | 0.1490 | | |
VY® Columbia Contrarian Core Portfolio | |
Class ADV | | NII | | $ | 0.2879 | | |
Class I | | NII | | $ | 0.5163 | | |
Class S | | NII | | $ | 0.4016 | | |
All Classes | | STCG | | $ | 0.2926 | | |
All Classes | | LTCG | | $ | 7.6144 | | |
VY® Columbia Small Cap Value II Portfolio | |
Class ADV | | NII | | $ | 0.0055 | | |
Class I | | NII | | $ | 0.1083 | | |
Class R6 | | NII | | $ | 0.1083 | | |
Class S | | NII | | $ | 0.0561 | | |
Class S2 | | NII | | $ | 0.0302 | | |
All Classes | | LTCG | | $ | 2.0675 | | |
VY® Invesco Comstock Portfolio | |
Class ADV | | NII | | $ | 0.4082 | | |
Class I | | NII | | $ | 0.4959 | | |
Class S | | NII | | $ | 0.4504 | | |
All Classes | | STCG | | $ | 0.0838 | | |
All Classes | | LTCG | | $ | 3.9228 | | |
Portfolio Name | | Type | | Per Share Amount | |
VY® Invesco Equity and Income Portfolio | |
Class ADV | | NII | | $ | 0.6805 | | |
Class I | | NII | | $ | 0.8975 | | |
Class S | | NII | | $ | 0.7848 | | |
Class S2 | | NII | | $ | 0.7205 | | |
All Classes | | LTCG | | $ | 2.3509 | | |
VY® Invesco Oppenheimer Global Portfolio | |
Class ADV | | NII | | $ | — | | |
Class I | | NII | | $ | 0.1045 | | |
Class S | | NII | | $ | 0.0427 | | |
Class S2 | | NII | | $ | 0.0295 | | |
All Classes | | STCG | | $ | 0.0245 | | |
All Classes | | LTCG | | $ | 3.5592 | | |
VY® JPMorgan Mid Cap Value Portfolio | |
Class ADV | | NII | | $ | 0.1214 | | |
Class I | | NII | | $ | 0.2055 | | |
Class S | | NII | | $ | 0.1615 | | |
Class S2 | | NII | | $ | 0.1320 | | |
All Classes | | STCG | | $ | 0.0954 | | |
All Classes | | LTCG | | $ | 2.2308 | | |
VY® T. Rowe Price Diversified Mid Cap Growth Portfolio | |
Class ADV | | NII | | $ | 0.0266 | | |
Class I | | NII | | $ | 0.0360 | | |
Class R6 | | NII | | $ | 0.0360 | | |
Class S | | NII | | $ | 0.0266 | | |
Class S2 | | NII | | $ | 0.0266 | | |
All Classes | | STCG | | $ | 0.0437 | | |
All Classes | | LTCG | | $ | 1.2321 | | |
VY® T. Rowe Price Growth Equity Portfolio | |
Class ADV | | NII | | $ | — | | |
Class I | | NII | | $ | 0.1745 | | |
Class S | | NII | | $ | — | | |
Class S2 | | NII | | $ | — | | |
All Classes | | LTCG | | $ | 19.2580 | | |
NII — Net investment income
STCG — Short-term capital gain
LTCG — Long-term capital gain
ROC — Return of capital
Of the ordinary distributions made during the year ended December 31, 2019, the following percentages qualify for the dividends received deduction (DRD) available to corporate shareholders:
VY® American Century Small-Mid Cap Value Portfolio | | | 38.09 | % | |
VY® Columbia Contrarian Core Portfolio | | | 55.90 | % | |
VY® Columbia Small Cap Value II Portfolio | | | 100.00 | % | |
VY® Invesco Comstock Portfolio | | | 83.43 | % | |
VY® Invesco Equity and Income Portfolio | | | 60.14 | % | |
VY® Invesco Oppenheimer Global Portfolio | | | 99.97 | % | |
VY® JPMorgan Mid Cap Value Portfolio | | | 100.00 | % | |
VY® T. Rowe Price Diversified Mid Cap Growth Portfolio | | | 100.00 | % | |
VY® T. Rowe Price Growth Equity Portfolio | | | 100.00 | % | |
The Portfolios designate the following amounts of long-term capital gain distributions as 20% rate long-term capital gain dividends under Internal Revenue Code Section 852(b)(3)(C):
Voya International High Dividend Low Volatility Portfolio | | $ | 38,959,190 | | |
VY® American Century Small-Mid Cap Value Portfolio | | $ | 26,390,436 | | |
VY® Baron Growth Portfolio | | $ | 347,944,282 | | |
VY® Columbia Contrarian Core Portfolio | | $ | 94,000,420 | | |
VY® Columbia Small Cap Value II Portfolio | | $ | 20,244,186 | | |
VY® Invesco Comstock Portfolio | | $ | 90,933,278 | | |
VY® Invesco Equity and Income Portfolio | | $ | 70,723,269 | | |
VY® Invesco Oppenheimer Global Portfolio | | $ | 247,084,828 | | |
VY® JPMorgan Mid Cap Value Portfolio | | $ | 52,232,524 | | |
VY® T. Rowe Price Diversified Mid Cap Growth Portfolio | | $ | 106,411,255 | | |
VY® T. Rowe Price Growth Equity Portfolio | | $ | 418,893,692 | | |
154
TABLE OF CONTENTS
TAX INFORMATION (UNAUDITED) (CONTINUED)
Pursuant to Section 853 of the Internal Revenue Code, the Portfolios designate the following amounts as foreign taxes paid for the year ended December 31, 2019. Foreign taxes paid for purposes of Section 853 may be less than actual foreign taxes paid for financial statement purposes.
| | | Creditable
Foreign
Taxes Paid | | Per Share
Amount | | Portion of Ordinary
Income Distribution
Derived from Foreign
Sourced Income* | |
Voya International High Dividend Low Volatility Portfolio | | $ | 1,101,503 | | | $ | 0.0265 | | | | 93.06 | % | |
* None of the Portfolio's income was derived from ineligible foreign sources as defined under Section 901(j) of the Internal Revenue Code.
Foreign taxes paid or withheld must be included in taxable income with an offsetting deduction from gross income or as a credit for taxes paid to foreign governments. Shareholders are strongly advised to consult their own tax advisors regarding the appropriate treatment of foreign taxes paid.
Above figures may differ from those cited elsewhere in this report due to differences in the calculation of income and gains under U.S. generally accepted accounting principles (book) purposes and Internal Revenue Service (tax) purposes.
Shareholders are strongly advised to consult their own tax advisers with respect to the tax consequences of their investments in the Portfolios. In January, shareholders, excluding corporate shareholders, receive an IRS 1099-DIV regarding the federal tax status of the dividends and distributions they received in the calendar year.
155
TABLE OF CONTENTS
DIRECTOR AND OFFICER INFORMATION (UNAUDITED)
The business and affairs of the Company are managed under the direction of the Board. A Director, who is not an interested person of the Company, as defined in the 1940 Act, is an independent director ("Independent Director"). The Directors and Officers of the Company are listed below. The Statement of Additional Information includes additional information about Directors of the Company and is available, without charge, upon request at (800) 262-3862.
Name, Address
and Age | | Position(s)
held with the
Company | | Term of
Office and
Length of
Time
Served(1) | | Principal
Occupation(s) -
during the
Past 5 Years | | Number of
Funds in
Fund Complex
Overseen
by Director(2) | | Other Board
Positions
held by
Director | |
Independent Directors*: | |
Colleen D. Baldwin
7337 East Doubletree Ranch Rd.
Suite 100
Scottsdale, Arizona 85258
Age: 59 | | Director
Chairperson | | November 2007 - Present
January 2020 - Present | | President, Glantuam Partners, LLC, a business consulting firm (January 2009 - Present). | | | 146 | | | Dentaquest (February 2014 - Present); RSR Partners, Inc. (2016 - Present). | |
John V. Boyer
7337 East Doubletree Ranch Rd.
Suite 100
Scottsdale, Arizona 85258
Age: 66 | | Director | | November 1997 - Present | | Retired. Formerly, President and Chief Executive Officer, Bechtler Arts Foundation, an arts and education foundation (January 2008 - December 2019). | | | 146 | | | None. | |
Patricia W. Chadwick
7337 East Doubletree Ranch Rd.
Suite 100
Scottsdale, Arizona 85258
Age: 71 | | Director | | January 2006 - Present | | Consultant and President, Ravengate Partners LLC, a consulting firm that provides advice regarding financial markets and the global economy (January 2000 - Present). | | | 146 | | | Wisconsin Energy Corporation (June 2006 - Present); The Royce Fund (22 funds) (December 2009 - Present); and AMICA Mutual Insurance Company (1992 - Present). | |
Martin J. Gavin
7337 East Doubletree Ranch Rd. Suite 100
Scottsdale, AZ 85258
Age: 69 | | Director | | August 2015 - Present | | Retired. Formerly, President and Chief Executive Officer, Connecticut Children's Medical Center (May 2006 - November 2015). | | | 146 | | | None. | |
Joseph E. Obermeyer
7337 East Doubletree Ranch Rd.
Suite 100
Scottsdale, Arizona 85258
Age: 62 | | Director | | May 2013 - Present | | President, Obermeyer & Associates, Inc., a provider of financial and economic consulting services (November 1999 - Present). | | | 146 | | | None. | |
Sheryl K. Pressler
7337 East Doubletree Ranch Rd.
Suite 100
Scottsdale, Arizona 85258
Age: 69 | | Director | | January 2006 - Present | | Consultant (May 2001 - Present). | | | 146 | | | None. | |
Christopher P. Sullivan
7337 East Doubletree Ranch Rd.
Suite 100
Scottsdale, Arizona 85258
Age: 66 | | Director | | October 2015 - Present | | Retired. | | | 146 | | | None. | |
156
TABLE OF CONTENTS
DIRECTOR AND OFFICER INFORMATION (UNAUDITED) (CONTINUED)
Name, Address
and Age | | Position(s)
held with the
Company | | Term of
Office and
Length of
Time
Served(1) | | Principal
Occupation(s) -
during the
Past 5 Years | | Number of
Funds in
Fund Complex
Overseen
by Director(2) | | Other Board
Positions
held by
Director | |
Director who is an "interested person": | |
Dina Santoro
230 Park Avenue
New York, New York 10169
Age: 46 | | Director | | July 2018 - Present | | President, Voya Investments, LLC and Voya Capital, LLC (March 2018 - Present); Senior Vice President, Voya Investments Distributor, LLC (April 2018 - Present); Senior Managing Director, Head of Product and Marketing Strategy, Voya Investment Management (September 2017 - Present). Formerly, Managing Director, Quantitative Management Associates, LLC (January 2004 - August 2017). | | | 146 | | | Voya Investments, LLC, Voya Capital, LLC, and Voya Funds Services, LLC (March 2018 - Present); Voya Investments Distributor, LLC (April 2018 - Present). | |
(1) Directors serve until their successors are duly elected and qualified. The tenure of each Director who is not an "interested person" as defined in the 1940 Act, of each Portfolio ("Independent Director") is subject to the Board's retirement policy which states that each duly elected or appointed Independent Director shall retire from and cease to be a member of the Board of Directors at the close of business on December 31 of the calendar year in which the Independent Director attains the age of 75. A majority vote of the Board's other Independent Directors may extend the retirement date of an Independent Director if the retirement would trigger a requirement to hold a meeting of shareholders of the Company under applicable law, whether for the purposes of appointing a successor to the Independent Director or otherwise comply under applicable law, in which case the extension would apply until such time as the shareholder meeting can be held or is no longer required (as determined by a vote of a majority of the other Independent Directors).
(2) For the purposes of this table, "Fund Complex" means the Voya family of funds including the following investment companies: Voya Asia Pacific High Dividend Equity Income Fund; Voya Balanced Portfolio, Inc.; Voya Emerging Markets High Dividend Equity Fund; Voya Equity Trust; Voya Funds Trust; Voya Global Advantage and Premium Opportunity Fund; Voya Global Equity Dividend and Premium Opportunity Fund; Voya Government Money Market Portfolio; Voya Infrastructure, Industrials and Materials Fund; Voya Intermediate Bond Portfolio; Voya International High Dividend Equity Income Fund; Voya Investors Trust; Voya Mutual Funds; Voya Natural Resources Equity Income Fund; Voya Partners, Inc.; Voya Prime Rate Trust; Voya Senior Income Fund; Voya Separate Portfolios Trust; Voya Strategic Allocation Portfolios, Inc.; Voya Variable Funds; Voya Variable Insurance Trust; Voya Variable Portfolios, Inc.; and Voya Variable Products Trust. The number of funds in the Fund Complex is as of January 31, 2020.
* Effective December 31, 2019, Russell H. Jones and Roger B. Vincent each retired as a Director of the Board.
157
TABLE OF CONTENTS
DIRECTOR AND OFFICER INFORMATION (UNAUDITED) (CONTINUED)
Name, Address
and Age | | Position(s)
Held with the Company | | Term of Office and
Length of Time Served(1) | | Principal Occupation(s) - during the
Past 5 Years | |
Michael Bell
One Orange Way
Windsor, Connecticut 06095
Age: 51 | | Chief Executive Officer | | March 2018 - Present | | Chief Executive Officer and Director, Voya Investments, LLC, Voya Capital, LLC, and Voya Funds Services, LLC (March 2018 - Present); Senior Vice President and Chief Financial Officer, Voya Investments Distributor, LLC (September 2019 - Present); Chief Financial Officer, Voya Investment Management (September 2014 - Present). Formerly, Senior Vice President, Chief Financial Officer and Treasurer, Voya Investments, LLC (November 2015 - March 2018). | |
Dina Santoro
230 Park Avenue
New York, New York 10169
Age: 46 | | President | | March 2018 - Present | | President and Director, Voya Investments, LLC and Voya Capital, LLC (March 2018-Present); Director, Voya Funds Services, LLC (March 2018 - Present); Director and Senior Vice President, Voya Investments Distributor, LLC (April 2018 - Present); Senior Managing Director, Head of Product and Marketing Strategy, Voya Investment Management (September 2017 - Present). Formerly, Managing Director, Quantitative Management Associates, LLC (January 2004 - August 2017). | |
Stanley D. Vyner
230 Park Avenue
New York, New York 10169
Age: 69 | | Executive Vice President
Chief Investment Risk Officer | | January 2005 - Present
September 2009 - Present | | Executive Vice President, Voya Investments, LLC (July 2000 - Present) and Chief Investment Risk Officer, Voya Investments, LLC (January 2003 - Present). | |
James M. Fink
5780 Powers Ferry Road NW
Atlanta, Georgia 30327
Age: 61 | | Executive Vice President | | March 2018 - Present | | Managing Director, Voya Investments, LLC, Voya Capital, LLC, and Voya Funds Services, LLC (March 2018 - Present); Senior Vice President, Voya Investments Distributor, LLC (April 2018 - Present); Chief Administrative Officer, Voya Investment Management (September 2017 - Present). Formerly, Managing Director, Operations, Voya Investment Management (March 1999 - September 2017). | |
Kevin M. Gleason
7337 East Doubletree Ranch Rd.
Suite 100
Scottsdale, Arizona 85258
Age: 53 | | Chief Compliance Officer | | February 2012 - Present | | Senior Vice President, Voya Investment Management and Chief Compliance Officer, Voya Family of Funds (February 2012 - Present). | |
Todd Modic
7337 East Doubletree Ranch Rd.
Suite 100
Scottsdale, Arizona 85258
Age:52 | | Senior Vice President, Chief/Principal Financial Officer and Assistant Secretary | | March 2005 - Present | | President, Voya Funds Services, LLC (March 2018 - Present) and Senior Vice President, Voya Investments, LLC (April 2005 - Present). | |
Kimberly A. Anderson
7337 East Doubletree Ranch Rd.
Suite 100
Scottsdale, Arizona 85258
Age: 55 | | Senior Vice President | | January 2005 - Present | | Senior Vice President, Voya Investments, LLC (September 2003 - Present). | |
Robert Terris
5780 Powers Ferry Road NW
Atlanta, Georgia 30327
Age: 49 | | Senior Vice President | | May 2006 - Present | | Senior Vice President, Voya Investments Distributor, LLC (April 2018 - Present); Senior Vice President, Head of Division Operations, Voya Investments, LLC (October 2015 - Present) and Voya Funds Services, LLC (March 2006 - Present). | |
Fred Bedoya
7337 East Doubletree Ranch Rd.
Suite 100
Scottsdale, Arizona 85258
Age: 47 | | Vice President and Treasurer | | September 2012 - Present | | Vice President, Voya Investments, LLC (October 2015 - Present) and Voya Funds Services, LLC (July 2012 - Present). | |
158
TABLE OF CONTENTS
DIRECTOR AND OFFICER INFORMATION (UNAUDITED) (CONTINUED)
Name, Address
and Age | | Position(s)
Held with the Company | | Term of Office and
Length of Time Served(1) | | Principal Occupation(s) - during the
Past 5 Years | |
Maria M. Anderson
7337 East Doubletree Ranch Rd.
Suite 100
Scottsdale, Arizona 85258
Age: 61 | | Vice President | | January 2005 - Present | | Vice President, Voya Investments, LLC (October 2015 - Present) and Voya Funds Services, LLC (September 2004 - Present). | |
Sara M. Donaldson
7337 East Doubletree Ranch Rd.
Suite 100
Scottsdale, Arizona 85258
Age: 60 | | Vice President | | September 2014 - Present | | Vice President, Voya Investments, LLC (October 2015 - Present). Formerly, Vice President, Voya Funds Services, LLC (April 2014 - October 2015). | |
Micheline S. Faver
7337 East Doubletree Ranch Rd.
Suite 100
Scottsdale, Arizona 85258
Age: 42 | | Vice President | | September 2016 - Present | | Vice President, Head of Fund Compliance and Chief Compliance Officer, Voya Investments, LLC (June 2016 - Present). Formerly, Vice President, Mutual Fund Compliance (March 2014 - June 2016). | |
Robyn L. Ichilov
7337 East Doubletree Ranch Rd.
Suite 100
Scottsdale, Arizona 85258
Age: 52 | | Vice President | | January 2005 - Present | | Vice President, Voya Funds Services, LLC (November 1995 - Present) and Voya Investments, LLC (August 1997 - Present). | |
Jason Kadavy
7337 East Doubletree Ranch Rd.
Suite 100
Scottsdale, Arizona 85258
Age: 43 | | Vice President | | September 2012 - Present | | Vice President, Voya Investments, LLC (October 2015 - Present) and Voya Funds Services, LLC (July 2007 - Present). | |
Andrew K. Schlueter
7337 East Doubletree Ranch Rd.
Suite 100
Scottsdale, Arizona 85258
Age: 43 | | Vice President | | March 2018 - Present | | Vice President, Voya Investments Distributor, LLC (April 2018 - Present); Vice President, Voya Investments, LLC and Voya Funds Services, LLC (March 2018 - Present); Vice President, Head of Mutual Fund Operations, Voya Investment Management (February 2018 - Present). Formerly, Vice President, Voya Investment Management (March 2014 - February 2018). | |
Craig Wheeler
7337 East Doubletree Ranch Rd.
Suite 100
Scottsdale, Arizona 85258
Age: 50 | | Vice President | | May 2013 - Present | | Vice President - Director of Tax, Voya Investments, LLC (October 2015 - Present). Formerly, Vice President - Director of Tax, Voya Funds Services, LLC (March 2013 - October 2015). | |
Monia Piacenti
One Orange Way
Windsor, Connecticut 06095
Age: 43 | | Anti-Money Laundering Officer | | June 2018 - Present | | Anti-Money Laundering Officer, Voya Investments Distributor, LLC, Voya Investment Management and Voya Investment Management Trust Co. (June 2018 - Present); Compliance Consultant, Voya Financial, Inc. (January 2019 - Present). Formerly, Senior Compliance Officer, Voya Investment Management (December 2009 - December 2018). | |
Theresa K. Kelety
7337 East Doubletree Ranch Rd.
Suite 100
Scottsdale, Arizona 85258
Age: 57 | | Secretary | | January 2020 - Present | | Vice President and Senior Counsel, Voya Investment Management - Mutual Fund Legal Department (March 2010 - Present). | |
Paul A. Caldarelli
7337 East Doubletree Ranch Rd.
Suite 100
Scottsdale, Arizona 85258
Age: 68 | | Assistant Secretary | | June 2010 - Present | | Vice President and Senior Counsel, Voya Investment Management - Mutual Fund Legal Department (March 2010 - Present). | |
Joanne F. Osberg
7337 East Doubletree Ranch Rd.
Suite 100
Scottsdale, Arizona 85258
Age: 38 | | Assistant Secretary | | January 2020 - Present | | Vice President and Counsel, Voya Investment Management - Mutual Fund Legal Department (January 2013 - Present). | |
(1) The Officers hold office until the next annual meeting of the Board of Directors and until their successors shall have been elected and qualified.
159
TABLE OF CONTENTS
ADVISORY AND SUB-ADVISORY CONTRACT APPROVAL DISCUSSION (UNAUDITED)
BOARD CONSIDERATION AND APPROVAL OF INVESTMENT MANAGEMENT CONTRACTS AND SUB-ADVISORY CONTRACTS
At a meeting held on November 21, 2019, the Board of Directors ("Board") of Voya Partners, Inc. (the "Company"), including a majority of the Independent Directors, considered and approved the renewal of the investment management contracts (the "Management Contracts") between Voya Investments, LLC (the "Manager") and the Company, on behalf of Voya Global Bond Portfolio, Voya International High Dividend Low Volatility Portfolio, VY® American Century Small-Mid Cap Value Portfolio, VY® Baron Growth Portfolio, VY® Columbia Contrarian Core Portfolio, VY® Columbia Small Cap Value II Portfolio, VY® Invesco Comstock Portfolio, VY® Invesco Equity and Income Portfolio, VY® Invesco Oppenheimer Global Portfolio, VY® JPMorgan Mid Cap Value Portfolio, VY® T. Rowe Price Diversified Mid Cap Growth Portfolio, and VY® T. Rowe Price Growth Equity Portfolio, each a series of the Company (the "Portfolios"), and the sub-advisory contracts (the "Sub-Advisory Contracts," and together with the Management Contracts, the "Contracts") with the sub-advisers to each Portfolio (the "Sub-Advisers") for an additional one year period ending November 30, 2020. In determining to renew such contracts, the Board considered information furnished to it throughout the year at meetings of the Board and its committees, including information regarding performance, expenses, and other matters.
In addition to the Board meeting on November 21, 2019, the Independent Directors also held meetings outside the presence of personnel representing the Manager or Sub-Advisers (collectively, such persons are referred to herein as "management") on October 9, 2019, and November 19, 2019, specifically to review and consider materials related to the proposed continuance of the Contracts that they believed to be relevant to the renewal of the Contracts in light of their own business judgment and the legal advice furnished to them by K&L Gates LLP, their independent legal counsel. Subsequent references herein to factors considered and determinations made by the Independent Directors and/or the Board include, as applicable, factors considered and determinations made at those meetings by the Independent Directors. While the Board considered the renewal of the management contracts and sub-advisory contracts for all of the applicable investment companies in the Voya family of funds at the same meetings, the Board considered each Voya fund's investment management and sub-advisory relationships separately.
The Board follows a process pursuant to which it seeks and considers relevant information when it evaluates whether to renew existing investment management and sub-advisory contracts for the Voya funds. The Board has established a Contracts Committee and Investment Review Committees (the "IRCs"), each of which includes only Independent Directors as members. The Contracts Committee meets several times throughout the year to provide oversight with respect to the management and sub-advisory contracts approval and renewal process, among other functions, and each IRC meets several times throughout the year to provide oversight regarding the investment performance of the sub-advisers, as well as the Manager's role in monitoring the sub-advisers, with respect to each Voya fund that is assigned to that IRC.
The Contracts Committee oversees, and annually recommends Board approval of updates to, a methodology guide for the Voya funds ("Methodology Guide") related to the investment management and sub-advisory contract renewal process. The Methodology Guide sets out a framework pursuant to which the Independent Directors request, and management provides, certain information that the Independent Directors deem to be important or potentially relevant. The Independent Directors retain the services of an independent consultant with experience in the mutual fund industry to assist the Contracts Committee in developing and recommending to the Board: (1) a selected peer group of investment companies for each Portfolio ("Selected Peer Group") based on that Portfolio's particular attributes, such as fund type and size, fund category (as determined by Morningstar, Inc., an independent provider of mutual fund data ("Morningstar")), sales channels and structure and the Portfolio share class being compared to the Selected Peer Group; and (2) updates to the Methodology Guide with respect to the content and format of various data including, but not limited to, investment performance, fee structure, and expense information prepared in connection with the renewal process. In addition, the Independent Directors periodically have retained, including most recently in 2018, an independent firm to test and verify the accuracy of certain information presented to the Board for a representative sample of the Voya funds.
Provided below is an overview of certain material factors that the Board considered at its meetings regarding the renewal of the Contracts and the compensation to be paid thereunder. The Board members did not identify any particular information or factor that was overarching, and each Board member may have accorded different weight to the various factors in reaching his or her conclusions
160
TABLE OF CONTENTS
ADVISORY AND SUB-ADVISORY CONTRACT APPROVAL DISCUSSION (UNAUDITED) (CONTINUED)
with respect to each Portfolio's investment management and sub-advisory arrangements.
Nature, Extent and Quality of Services
The Manager oversees, subject to the authority of the Board, and is responsible for the provision of all investment advisory and portfolio management services for the Portfolios, but may delegate certain of these responsibilities to one or more sub-advisers. In addition, the Manager provides administrative services reasonably necessary for the operation of the Portfolios as set forth in the Management Contracts, including oversight of the Portfolios' operations and risk management and the oversight of their various other service providers.
The Board considered the "manager-of-managers" platform of the Voya funds that has been developed by the Manager pursuant to which the Manager selects, subject to the Board's approval, sub-advisers to provide day-to-day management services to all or a portion of each Voya fund. The Board recognized that the Manager is responsible for monitoring the investment program, performance, developments, ongoing operations, and compliance with applicable regulations and investment policies and restrictions of the Sub-Advisers with respect to the Portfolios under this manager-of-managers arrangement. The Board also considered the techniques and resources that the Manager has developed to provide this ongoing oversight and due diligence with respect to the sub-advisers and to advocate or recommend, when it believes appropriate, changes in investment strategies or investment sub-advisers designed to assist in improving a Voya fund's performance. The Board was advised that, in connection with the Manager's performance of these duties, the Manager has developed an oversight process formulated by its Manager Research & Selection Group which reviews, among other matters, performance data, each Sub-Adviser's management team, portfolio data and attribution analysis related to each Sub-Adviser through various means, including, but not limited to, in-person meetings, on-site visits, and telephonic meetings with the Sub-Adviser.
Further, the Board considered periodic compliance reports it receives from the Company's Chief Compliance Officer evaluating whether the regulatory compliance systems and procedures of the Manager and the Sub-Advisers are reasonably designed to ensure compliance with the federal securities laws and whether the investment policies and restrictions for each Portfolio are consistently complied with, and other periodic reports covering related matters.
The Board considered the portfolio management team assigned by the Sub-Advisers to the Portfolios and the
level of resources committed to the Portfolios (and other relevant funds in the Voya funds) by the Manager and the Sub-Advisers, and whether those resources are sufficient to provide high-quality services to the Portfolios.
Based on their deliberations and the materials presented to them, the Board concluded that the nature, extent and quality of the overall services provided by the Manager and each Sub-Adviser under the Contracts were appropriate.
Portfolio Performance
In assessing the investment management and sub-advisory relationships, the Board placed emphasis on the investment returns of each Portfolio, including its investment performance over certain time periods compared to the Portfolio's Morningstar category and primary benchmark, a broad-based securities market index that appears in the Portfolio's prospectus. In addition, the Board considered the investment performance of Voya Global Bond Portfolio compared to an additional performance peer group that is approved by the Portfolio's IRC due to the unique investment structure or strategy of the Portfolio. The Board also considered information from the Manager Research & Selection Group and received reports summarizing a separate analysis of each Portfolio's performance and risk, including risk-adjusted investment return information, from the Company's Chief Investment Risk Officer.
Economies of Scale
When evaluating the reasonableness of the management fee schedules, the Board considered whether economies of scale have been or likely will be realized by the Manager and the Sub-Advisers as a Portfolio grows larger and the extent to which any such economies are shared with the Portfolio. In this regard, the Board noted any breakpoints in management fee schedules that will result in a lower management fee rate when a Portfolio achieves sufficient asset levels to receive a breakpoint discount. The Board also considered that, while some of the Portfolios do not have management fee breakpoints, they may have fee waiver and expense reimbursement arrangements. The Board considered the extent to which economies of scale realized by the Manager or the Sub-Advisers could be shared with each Portfolio through such fee waivers, expense reimbursements or other expense reductions. In evaluating these matters, the Independent Directors also considered periodic management reports, Selected Peer Group comparisons, and industry information regarding economies of scale. In the case of sub-advisory fees, the Board considered that breakpoints, if any, would inure to the benefit of the Manager and the relevant Sub-Adviser, respectively.
161
TABLE OF CONTENTS
ADVISORY AND SUB-ADVISORY CONTRACT APPROVAL DISCUSSION (UNAUDITED) (CONTINUED)
Information Regarding Services, Performance, and Fee Schedules Offered to Other Clients
The Board considered comparative information regarding the nature of services, performance, and fee schedules offered by the Manager and the Sub-Advisers to other clients with similar investment objectives, if applicable, including other registered investment companies and relevant institutional accounts. When the fee schedules offered to or the performance of such other clients differed materially from a Portfolio, the Board took into account the underlying rationale provided by the Manager or the Sub-Advisers, as applicable, for these differences. For the non-Voya-affiliated Sub-Advisers, the Board viewed the information related to any material differences in the fee schedules as not being a key factor in its deliberations because of the arm's-length nature of negotiations between the Manager and non-Voya-affiliated Sub-Advisers with respect to sub-advisory fee schedules and that the Manager is responsible for paying the fees of the Sub-Adviser.
Fee Schedules, Profitability, and Fall-out Benefits
The Board reviewed and considered the contractual management fee schedule and net management fee rate payable by each Portfolio to the Manager compared to the Portfolio's Selected Peer Group. In addition, the Board considered the contractual management fee schedule for VY® Baron Growth Portfolio compared to other funds its Sub-Adviser manages, as identified by the Manager. The Board also considered the compensation payable by the Manager to each Sub-Adviser for sub-advisory services for each Portfolio, including the portion of the contractual and net management fee rates that are paid to each Sub-Adviser, as compared to the compensation paid to the Manager. In addition, the Board considered any fee waivers, expense limitations, and/or recoupment arrangements that apply to the fees payable by the Portfolios, including whether the Manager intends to propose any changes thereto. For each Portfolio, the Board separately determined that the fees payable to the Manager and the fee schedule payable to the Sub-Adviser are reasonable for the services that each performs, which were considered in light of the nature, extent and quality of the services that each has performed and is expected to perform.
For each Portfolio, the Board considered information on revenues, costs and profits or losses realized by the Manager and the Voya-affiliated Sub-Adviser related to their services to the Portfolio. In analyzing the profitability of the Manager and its affiliated service providers in connection with services they render to a Portfolio, the Board took into account the sub-advisory fee rate payable by the Manager to each Sub-Adviser. The Board
also considered the profitability of the Manager and its affiliated Sub-Adviser attributable to servicing each Portfolio both with and without taking into account the profitability of the distributor of the Portfolios and any revenue sharing payments made by the Manager and both before and after giving effect to any expenses incurred by the Manager or the affiliated Sub-Adviser in making payments to affiliated insurance companies. The Board did not request profitability data from the Sub-Advisers that are not affiliated with the Manager because the Board did not view this data as a key factor to its deliberations given the arm's-length nature of the relationship between the Manager and these non-Voya-affiliated Sub-Advisers with respect to the negotiation of sub-advisory fee schedules. In addition, the Board noted that non-Voya-affiliated sub-advisers may not account for their profits on an account-by-account basis and those that do typically employ different methodologies in connection with these calculations.
Although the Methodology Guide establishes a framework for profit calculation, the Board recognized that there is no uniform methodology within the asset management industry for determining profitability for this purpose. The Board also recognized that the use of different reasonable methodologies can give rise to dramatically different reported profit and loss results with respect to the Manager and the Voya-affiliated Sub-Adviser, as well as other industry participants with whom the profits of the Manager and its affiliated Sub-Adviser could be compared. In addition, the Board recognized that management's calculations regarding its costs incurred in establishing the infrastructure necessary for the Portfolios' operations may not be fully reflected in the expenses allocated to each Portfolio in determining profitability, and that the information presented may not portray all of the costs borne by the Manager or reflect all risks, including entrepreneurial, regulatory, legal and operational risks, associated with offering and managing a mutual fund complex in the current regulatory and market environment.
The Board also considered that the Manager is entitled to earn a reasonable level of profits for the services that it provides to the Portfolios. The Board also considered information regarding the potential fall-out benefits to the Manager and Sub-Advisers and their respective affiliates from their association with the Portfolios, including their ability to engage in soft-dollar transactions on behalf of the Portfolios. Following its reviews, the Board determined that the Manager's and the Voya-affiliated Sub-Adviser's profitability with respect to their services to the Portfolios and the Manager and Sub-Advisers' potential fall-out benefits were not unreasonable.
162
TABLE OF CONTENTS
ADVISORY AND SUB-ADVISORY CONTRACT APPROVAL DISCUSSION (UNAUDITED) (CONTINUED)
Portfolio-by-Portfolio Analysis
Set forth below are certain of the specific factors that the Board considered at its October 9, 2019, November 19, 2019, and/or November 21, 2019 meetings in relation to approving each Portfolio's Contracts and the conclusions reached by the Board. These specific factors are in addition to those considerations discussed above. In each case, the Portfolio's performance was compared to its Morningstar category, as well as its primary benchmark. The performance data provided to the Board primarily was for various periods ended March 31, 2019. In addition, the Board also considered at its October 9, 2019, November 19, 2019, and November 21, 2019 meetings certain additional data regarding each Portfolio's more recent performance, asset levels and asset flows. Each Portfolio's management fee rate and expense ratio were compared to the management fee rates and expense ratios of the funds in its Selected Peer Group. With respect to the quintile rankings noted below, the first quintile represents the range of funds with the highest performance or the lowest management fee rate or expense ratio, as applicable, and the fifth quintile represents the range of funds with the lowest performance or the highest management fee rate or expense ratio, as applicable.
Voya Global Bond Portfolio
In considering whether to approve the renewal of the Contracts for Voya Global Bond Portfolio, the Board considered that, based on performance data for the periods ended March 31, 2019: (1) the Portfolio is ranked in the first quintile of its Morningstar category for the ten-year period, the second quintile for the three-year and five-year periods, the third quintile for the year-to-date period and the fourth quintile for the one-year period; and (2) the Portfolio outperformed its primary benchmark for all periods presented, with the exception of the one-year period, during which it underperformed.
In considering the fees payable under the Contracts for the Portfolio, the Board took into account the factors described above and also considered: (1) the fairness of the compensation under a Management Contract with a breakpoint fee schedule where the asset level necessary to achieve a breakpoint discount had not been reached by the Portfolio; and (2) the pricing structure (including the net expense ratio to be borne by shareholders) of the Portfolio, as compared to its Selected Peer Group, including that: (a) the net management fee rate for the Portfolio is ranked in the second quintile of net management fee rates of the funds in its Selected Peer Group; (b) the contractual management fee rate for the Portfolio is ranked in the first quintile of contractual management fee rates of the funds in its Selected Peer
Group; and (c) the net expense ratio for the Portfolio is ranked in the second quintile of net expense ratios of the funds in its Selected Peer Group.
After its deliberation, the Board reached the following conclusions: (1) the Portfolio's management fee rate is reasonable in the context of all factors considered by the Board; (2) the Portfolio's net expense ratio is reasonable in the context of all factors considered by the Board; (3) the Portfolio's performance is reasonable in the context of all factors considered by the Board; and (4) the sub-advisory fee rate payable by the Manager to the Sub-Adviser is reasonable in the context of all factors considered by the Board. Based on these conclusions and other factors, the Board voted to renew the Contracts for the Portfolio for the year ending November 30, 2020. During this renewal process, different Board members may have given different weight to different individual factors and related conclusions.
Voya International High Dividend Low Volatility Portfolio
In considering whether to approve the renewal of the Management Contract for Voya International High Dividend Low Volatility Portfolio (formerly, VY® Templeton Foreign Equity Portfolio), the Board considered that, based on performance data for the periods ended March 31, 2019: (1) the Portfolio is ranked in the third quintile of its Morningstar category for the one-year and ten-year periods, the fourth quintile for the three-year and five-year periods, and the fifth quintile for the year-to-date period; and (2) the Portfolio underperformed its primary benchmark for all periods presented. In analyzing this performance data, the Board took into account management's representations that there was a change in the Portfolio's Sub-Adviser and its investment strategies effective May 1, 2019, which means that performance prior to May 1, 2019 reflects the performance of a different Sub-Adviser.
In considering the fees payable under the Management Contract for the Portfolio, the Board took into account the factors described above and also considered: (1) the fairness of the compensation under a Management Contract with a level fee rate that does not include breakpoints; and (2) the pricing structure (including the net expense ratio to be borne by shareholders) of the Portfolio, as compared to its Selected Peer Group, including that: (a) the net management fee rate for the Portfolio is ranked in the second quintile of net management fee rates of the funds in its Selected Peer Group; (b) the contractual management fee rate for the Portfolio is ranked in the second quintile of contractual management fee rates of the funds in its Selected Peer Group; and (c) the net expense ratio for the Portfolio is
163
TABLE OF CONTENTS
ADVISORY AND SUB-ADVISORY CONTRACT APPROVAL DISCUSSION (UNAUDITED) (CONTINUED)
ranked in the second quintile of net expense ratios of the funds in its Selected Peer Group.
After its deliberation, the Board reached the following conclusions: (1) the Portfolio's management fee rate is reasonable in the context of all factors considered by the Board; (2) the Portfolio's net expense ratio is reasonable in the context of all factors considered by the Board; and (3) the Portfolio's performance is reasonable in the context of all factors considered by the Board. Based on these conclusions and other factors, the Board voted to renew the Management Contract for the Portfolio for the year ending November 30, 2020. During this renewal process, different Board members may have given different weight to different individual factors and related conclusions.
VY® American Century Small-Mid Cap Value Portfolio
In considering whether to approve the renewal of the Contracts for VY® American Century Small-Mid Cap Value Portfolio, the Board considered that, based on performance data for the periods ended March 31, 2019: (1) the Portfolio is ranked in the first quintile of its Morningstar category for the five-year period, the second quintile for the year-to-date, three-year and ten-year periods, and the third quintile for the one-year period; and (2) the Portfolio outperformed its primary benchmark for all periods presented, with the exception of the one-year and three-year periods, during which it underperformed.
In considering the fees payable under the Contracts for the Portfolio, the Board took into account the factors described above and also considered: (1) the economies of scale benefits to the Portfolio and its shareholders from breakpoint discounts applicable to the Portfolio's management fee rate, which result in lower fees at higher asset levels; and (2) the pricing structure (including the net expense ratio to be borne by shareholders) of the Portfolio, as compared to its Selected Peer Group, including that: (a) the net management fee rate for the Portfolio is ranked in the third quintile of net management fee rates of the funds in its Selected Peer Group; (b) the contractual management fee rate for the Portfolio is ranked in the fifth quintile of contractual management fee rates of the funds in its Selected Peer Group; and (c) the net expense ratio for the Portfolio is ranked in the third quintile of net expense ratios of the funds in its Selected Peer Group.
After its deliberation, the Board reached the following conclusions: (1) the Portfolio's management fee rate is reasonable in the context of all factors considered by the Board; (2) the Portfolio's net expense ratio is reasonable in the context of all factors considered by the Board; (3) the Portfolio's performance is reasonable in the
context of all factors considered by the Board; and (4) the sub-advisory fee rate payable by the Manager to the Sub-Adviser is reasonable in the context of all factors considered by the Board. Based on these conclusions and other factors, the Board voted to renew the Contracts for the Portfolio for the year ending November 30, 2020. During this renewal process, different Board members may have given different weight to different individual factors and related conclusions.
VY® Baron Growth Portfolio
In considering whether to approve the renewal of the Contracts for VY® Baron Growth Portfolio, the Board considered that, based on performance data for the periods ended March 31, 2019: (1) the Portfolio is ranked in the first quintile of its Morningstar category for the year-to-date, one-year, three-year and ten-year periods, and the second quintile for the five-year period; and (2) the Portfolio outperformed its primary benchmark for all periods presented.
In considering the fees payable under the Contracts for the Portfolio, the Board took into account the factors described above and also considered: (1) the fairness of the compensation under a Management Contract with a breakpoint fee schedule where the asset level necessary to achieve a breakpoint discount had not been reached by the Portfolio; and (2) the pricing structure (including the net expense ratio to be borne by shareholders) of the Portfolio, as compared to its Selected Peer Group, including that: (a) the net management fee rate for the Portfolio is ranked in the fifth quintile of net management fee rates of the funds in its Selected Peer Group; (b) the contractual management fee rate for the Portfolio is ranked in the fifth quintile of contractual management fee rates of the funds in its Selected Peer Group; and (c) the net expense ratio for the Portfolio is ranked in the fifth quintile of net expense ratios of the funds in its Selected Peer Group. In analyzing this fee data, the Board took into account management's representations regarding its belief that the Portfolio's pricing is competitive.
After its deliberation, the Board reached the following conclusions: (1) the Portfolio's management fee rate is reasonable in the context of all factors considered by the Board; (2) the Portfolio's net expense ratio is reasonable in the context of all factors considered by the Board; (3) the Portfolio's performance is reasonable in the context of all factors considered by the Board; and (4) the sub-advisory fee rate payable by the Manager to the Sub-Adviser is reasonable in the context of all factors considered by the Board. Based on these conclusions and other factors, the Board voted to renew the Contracts for the Portfolio for the year ending November 30, 2020. During this renewal process, different Board members
164
TABLE OF CONTENTS
ADVISORY AND SUB-ADVISORY CONTRACT APPROVAL DISCUSSION (UNAUDITED) (CONTINUED)
may have given different weight to different individual factors and related conclusions.
VY® Columbia Contrarian Core Portfolio
In considering whether to approve the renewal of the Contracts for VY® Columbia Contrarian Core Portfolio, the Board considered that, based on performance data for the periods ended March 31, 2019: (1) the Portfolio is ranked in the first quintile of its Morningstar category for the year-to-date period, the third quintile for the one-year, five-year and ten-year periods, and the fourth quintile for the three-year period; and (2) the Portfolio underperformed its primary benchmark for all periods presented, with the exception of the year-to-date period, during which it outperformed. In analyzing this performance data, the Board took into account management's representations regarding: (1) the impact of security selection on the Portfolio's performance; (2) its confidence in the Sub-Adviser's ability to deliver favorable long-term performance; and (3) the competitiveness of the Portfolio's performance during certain periods.
In considering the fees payable under the Contracts for the Portfolio, the Board took into account the factors described above and also considered: (1) the fairness of the compensation under a Management Contract with a breakpoint fee schedule where the asset level necessary to achieve a breakpoint discount had not been reached by the Portfolio; and (2) the pricing structure (including the net expense ratio to be borne by shareholders) of the Portfolio, as compared to its Selected Peer Group, including that: (a) the net management fee rate for the Portfolio is ranked in the third quintile of net management fee rates of the funds in its Selected Peer Group; (b) the contractual management fee rate for the Portfolio is ranked in the fifth quintile of contractual management fee rates of the funds in its Selected Peer Group; and (c) the net expense ratio for the Portfolio is ranked in the third quintile of net expense ratios of the funds in its Selected Peer Group. In analyzing this fee data, the Board took into account management's representations regarding its belief that the Portfolio's pricing is competitive.
After its deliberation, the Board reached the following conclusions: (1) the Portfolio's management fee rate is reasonable in the context of all factors considered by the Board; (2) the Portfolio's net expense ratio is reasonable in the context of all factors considered by the Board; (3) the Portfolio's performance is reasonable in the context of all factors considered by the Board; and (4) the sub-advisory fee rate payable by the Manager to the Sub-Adviser is reasonable in the context of all factors considered by the Board. Based on these conclusions and other factors, the Board voted to renew the Contracts
for the Portfolio for the year ending November 30, 2020. During this renewal process, different Board members may have given different weight to different individual factors and related conclusions.
VY® Columbia Small Cap Value II Portfolio
In considering whether to approve the renewal of the Contracts for VY® Columbia Small Cap Value II Portfolio, the Board considered that, based on performance data for the periods ended March 31, 2019: (1) the Portfolio is ranked in the second quintile of its Morningstar category for the year-to-date and five-year periods, the third quintile for the three-year and ten-year periods, and the fourth quintile for the one-year period; and (2) the Portfolio underperformed its primary benchmark for all periods presented, with the exception of the year-to-date and ten-year periods, during which it outperformed.
In considering the fees payable under the Contracts for the Portfolio, the Board took into account the factors described above and also considered: (1) the fairness of the compensation under a Management Contract with a level fee rate that does not include breakpoints; and (2) the pricing structure (including the net expense ratio to be borne by shareholders) of the Portfolio, as compared to its Selected Peer Group, including that: (a) the net management fee rate for the Portfolio is ranked in the third quintile of net management fee rates of the funds in its Selected Peer Group; (b) the contractual management fee rate for the Portfolio is ranked in the third quintile of contractual management fee rates of the funds in its Selected Peer Group; and (c) the net expense ratio for the Portfolio is ranked in the second quintile of net expense ratios of the funds in its Selected Peer Group.
After its deliberation, the Board reached the following conclusions: (1) the Portfolio's management fee rate is reasonable in the context of all factors considered by the Board; (2) the Portfolio's net expense ratio is reasonable in the context of all factors considered by the Board; (3) the Portfolio's performance is reasonable in the context of all factors considered by the Board; and (4) the sub-advisory fee rate payable by the Manager to the Sub-Adviser is reasonable in the context of all factors considered by the Board. Based on these conclusions and other factors, the Board voted to renew the Contracts for the Portfolio for the year ending November 30, 2020. During this renewal process, different Board members may have given different weight to different individual factors and related conclusions.
VY® Invesco Comstock Portfolio
In considering whether to approve the renewal of the Contracts for VY® Invesco Comstock Portfolio, the Board
165
TABLE OF CONTENTS
ADVISORY AND SUB-ADVISORY CONTRACT APPROVAL DISCUSSION (UNAUDITED) (CONTINUED)
considered that, based on performance data for the periods ended March 31, 2019: (1) the Portfolio is ranked in the first quintile of its Morningstar category for the three-year period, the second quintile for the year-to-date and ten-year periods, the fourth quintile for the five-year period, and the fifth quintile for the one-year period; and (2) the Portfolio underperformed its primary benchmark for all periods presented, with the exception of the three-year period, during which it outperformed, and the year-to-date period, during which its performance was equal to the performance of its primary benchmark.
In considering the fees payable under the Contracts for the Portfolio, the Board took into account the factors described above and also considered: (1) the fairness of the compensation under a Management Contract with a level fee rate that does not include breakpoints; and (2) the pricing structure (including the net expense ratio to be borne by shareholders) of the Portfolio, as compared to its Selected Peer Group, including that: (a) the net management fee rate for the Portfolio is ranked in the fourth quintile of net management fee rates of the funds in its Selected Peer Group; (b) the contractual management fee rate for the Portfolio is ranked in the third quintile of contractual management fee rates of the funds in its Selected Peer Group; and (c) the net expense ratio for the Portfolio is ranked in the third quintile of net expense ratios of the funds in its Selected Peer Group. In analyzing this fee data, the Board took into account management's representations regarding its belief that the Portfolio's pricing is competitive.
After its deliberation, the Board reached the following conclusions: (1) the Portfolio's management fee rate is reasonable in the context of all factors considered by the Board; (2) the Portfolio's net expense ratio is reasonable in the context of all factors considered by the Board; (3) the Portfolio's performance is reasonable in the context of all factors considered by the Board; and (4) the sub-advisory fee rate payable by the Manager to the Sub-Adviser is reasonable in the context of all factors considered by the Board. Based on these conclusions and other factors, the Board voted to renew the Contracts for the Portfolio for the year ending November 30, 2020. During this renewal process, different Board members may have given different weight to different individual factors and related conclusions.
VY® Invesco Equity and Income Portfolio
In considering whether to approve the renewal of the Contracts for VY® Invesco Equity and Income Portfolio, the Board considered that, based on performance data for the periods ended March 31, 2019: (1) the Portfolio is ranked in the second quintile of its Morningstar category for the year-to-date, three-year, five-year and ten-year
periods, and the fifth quintile for the one-year period; and (2) the Portfolio underperformed its primary benchmark for all periods presented.
In considering the fees payable under the Contracts for the Portfolio, the Board took into account the factors described above and also considered: (1) the economies of scale benefits to the Portfolio and its shareholders from breakpoint discounts applicable to the Portfolio's management fee rate, which result in lower fees at higher asset levels; and (2) the pricing structure (including the net expense ratio to be borne by shareholders) of the Portfolio, as compared to its Selected Peer Group, including that: (a) the net management fee rate for the Portfolio is ranked in the second quintile of net management fee rates of the funds in its Selected Peer Group; (b) the contractual management fee rate for the Portfolio is ranked in the third quintile of contractual management fee rates of the funds in its Selected Peer Group; and (c) the net expense ratio for the Portfolio is ranked in the second quintile of net expense ratios of the funds in its Selected Peer Group.
After its deliberation, the Board reached the following conclusions: (1) the Portfolio's management fee rate is reasonable in the context of all factors considered by the Board; (2) the Portfolio's net expense ratio is reasonable in the context of all factors considered by the Board; (3) the Portfolio's performance is reasonable in the context of all factors considered by the Board; and (4) the sub-advisory fee rate payable by the Manager to the Sub-Adviser is reasonable in the context of all factors considered by the Board. Based on these conclusions and other factors, the Board voted to renew the Contracts for the Portfolio for the year ending November 30, 2020. During this renewal process, different Board members may have given different weight to different individual factors and related conclusions.
VY® Invesco Oppenheimer Global Portfolio
In considering whether to approve the renewal of the Management Contract for VY® Invesco Oppenheimer Global Portfolio (formerly, VY® Oppenheimer Global Portfolio), the Board considered that, based on performance data for the periods ended March 31, 2019: (1) the Portfolio is ranked in the first quintile of its Morningstar category for the year-to-date, three-year, five-year and ten-year periods, and the third quintile for the one-year period; and (2) the Portfolio outperformed its primary benchmark for all periods presented, with the exception of the one-year period, during which it underperformed.
In considering the fees payable under the Management Contract for the Portfolio, the Board took into account the
166
TABLE OF CONTENTS
ADVISORY AND SUB-ADVISORY CONTRACT APPROVAL DISCUSSION (UNAUDITED) (CONTINUED)
factors described above and also considered: (1) the fairness of the compensation under a Management Contract with a breakpoint fee schedule where the asset level necessary to achieve a breakpoint discount had not been reached by the Portfolio; and (2) the pricing structure (including the net expense ratio to be borne by shareholders) of the Portfolio, as compared to its Selected Peer Group, including that: (a) the net management fee rate for the Portfolio is ranked in the second quintile of net management fee rates of the funds in its Selected Peer Group; (b) the contractual management fee rate for the Portfolio is ranked in the second quintile of contractual management fee rates of the funds in its Selected Peer Group; and (c) the net expense ratio for the Portfolio is ranked in the second quintile of net expense ratios of the funds in its Selected Peer Group.
After its deliberation, the Board reached the following conclusions: (1) the Portfolio's management fee rate is reasonable in the context of all factors considered by the Board; (2) the Portfolio's net expense ratio is reasonable in the context of all factors considered by the Board; and (3) the Portfolio's performance is reasonable in the context of all factors considered by the Board. Based on these conclusions and other factors, the Board voted to renew the Management Contract for the Portfolio for the year ending November 30, 2020. During this renewal process, different Board members may have given different weight to different individual factors and related conclusions.
VY® JPMorgan Mid Cap Value Portfolio
In considering whether to approve the renewal of the Contracts for VY® JPMorgan Mid Cap Value Portfolio, the Board considered that, based on performance data for the periods ended March 31, 2019: (1) the Portfolio is ranked in the second quintile of its Morningstar category for the year-to-date, five-year, and ten-year periods, the third quintile for the one-year period, and the fourth quintile for the three-year period; and (2) the Portfolio underperformed its primary benchmark for all periods presented, with the exception of the year-to-date and five-year periods, during which it outperformed. In analyzing this performance data, the Board took into account management's representations regarding: (1) the competitiveness of the Portfolio's performance during certain periods; and (2) the effect that a change in the Portfolio's Morningstar category in 2015 had on the Portfolio's performance relative to its Morningstar category.
In considering the fees payable under the Contracts for the Portfolio, the Board took into account the factors
described above and also considered: (1) the fairness of the compensation under a Management Contract with a breakpoint fee schedule where the asset level necessary to achieve a breakpoint discount had not been reached by the Portfolio; and (2) the pricing structure (including the net expense ratio to be borne by shareholders) of the Portfolio, as compared to its Selected Peer Group, including that: (a) the net management fee rate for the Portfolio is ranked in the fourth quintile of net management fee rates of the funds in its Selected Peer Group; (b) the contractual management fee rate for the Portfolio is ranked in the fourth quintile of contractual management fee rates of the funds in its Selected Peer Group; and (c) the net expense ratio for the Portfolio is ranked in the fourth quintile of net expense ratios of the funds in its Selected Peer Group. In analyzing this fee data, the Board took into account management's representations regarding its belief that the Portfolio's pricing is competitive.
After its deliberation, the Board reached the following conclusions: (1) the Portfolio's management fee rate is reasonable in the context of all factors considered by the Board; (2) the Portfolio's net expense ratio is reasonable in the context of all factors considered by the Board; (3) the Portfolio's performance is reasonable in the context of all factors considered by the Board; and (4) the sub-advisory fee rate payable by the Manager to the Sub-Adviser is reasonable in the context of all factors considered by the Board. Based on these conclusions and other factors, the Board voted to renew the Contracts for the Portfolio for the year ending November 30, 2020. During this renewal process, different Board members may have given different weight to different individual factors and related conclusions.
VY® T. Rowe Price Diversified Mid Cap Growth Portfolio
In considering whether to approve the renewal of the Contracts for VY® T. Rowe Price Diversified Mid Cap Growth Portfolio, the Board considered that, based on performance data for the periods ended March 31, 2019: (1) the Portfolio is ranked in the first quintile of its Morningstar category for the five-year and ten-year periods, and the second quintile for the year-to-date, one-year and three-year periods; and (2) the Portfolio outperformed its primary benchmark for all periods presented.
In considering the fees payable under the Contracts for the Portfolio, the Board took into account the factors described above and also considered: (1) the fairness of the compensation under a Management Contract with a level fee rate that does not include breakpoints; and (2) the pricing structure (including the net expense ratio
167
TABLE OF CONTENTS
ADVISORY AND SUB-ADVISORY CONTRACT APPROVAL DISCUSSION (UNAUDITED) (CONTINUED)
to be borne by shareholders) of the Portfolio, as compared to its Selected Peer Group, including that: (a) the net management fee rate for the Portfolio is ranked in the third quintile of net management fee rates of the funds in its Selected Peer Group; (b) the contractual management fee rate for the Portfolio is ranked in the second quintile of contractual management fee rates of the funds in its Selected Peer Group; and (c) the net expense ratio for the Portfolio is ranked in the third quintile of net expense ratios of the funds in its Selected Peer Group.
After its deliberation, the Board reached the following conclusions: (1) the Portfolio's management fee rate is reasonable in the context of all factors considered by the Board; (2) the Portfolio's net expense ratio is reasonable in the context of all factors considered by the Board; (3) the Portfolio's performance is reasonable in the context of all factors considered by the Board; and (4) the sub-advisory fee rate payable by the Manager to the Sub-Adviser is reasonable in the context of all factors considered by the Board. Based on these conclusions and other factors, the Board voted to renew the Contracts for the Portfolio for the year ending November 30, 2020. During this renewal process, different Board members may have given different weight to different individual factors and related conclusions.
VY® T. Rowe Price Growth Equity Portfolio
In considering whether to approve the renewal of the Contracts for VY® T. Rowe Price Growth Equity Portfolio, the Board considered that, based on performance data for the periods ended March 31, 2019: (1) the Portfolio is ranked in the first quintile of its Morningstar category for the five-year and ten-year periods, the second quintile for the three-year period, and the third quintile for the year-to-date and one-year periods; and (2) the Portfolio outperformed its primary benchmark for all periods presented.
In considering the fees payable under the Contracts for the Portfolio, the Board took into account the factors described above and also considered: (1) the fairness of the compensation under a Management Contract with a level fee rate that does not include breakpoints; and (2) the pricing structure (including the net expense ratio to be borne by shareholders) of the Portfolio, as compared to its Selected Peer Group, including that: (a) the net management fee rate for the Portfolio is ranked in the fourth quintile of net management fee rates of the funds in its Selected Peer Group; (b) the contractual management fee rate for the Portfolio is ranked in the fourth quintile of contractual management fee rates of the funds in its Selected Peer Group; and
(c) the net expense ratio for the Portfolio is ranked in the fourth quintile of net expense ratios of the funds in its Selected Peer. In analyzing this fee data, the Board took into account management's representations regarding its belief that the Portfolio's pricing is competitive.
After its deliberation, the Board reached the following conclusions: (1) the Portfolio's management fee rate is reasonable in the context of all factors considered by the Board; (2) the Portfolio's net expense ratio is reasonable in the context of all factors considered by the Board; (3) the Portfolio's performance is reasonable in the context of all factors considered by the Board; and (4) the sub-advisory fee rate payable by the Manager to the Sub-Adviser is reasonable in the context of all factors considered by the Board. Based on these conclusions and other factors, the Board voted to renew the Contracts for the Portfolio for the year ending November 30, 2020. During this renewal process, different Board members may have given different weight to different individual factors and related conclusions.
168
TABLE OF CONTENTS
Investment Adviser
Voya Investments, LLC
7337 East Doubletree Ranch Road, Suite 100
Scottsdale, Arizona 85258
Distributor
Voya Investments Distributor, LLC
7337 East Doubletree Ranch Road, Suite 100
Scottsdale, Arizona 85258
Transfer Agent
BNY Mellon Investment Servicing (U.S.) Inc.
301 Bellevue Parkway
Wilmington, Delaware 19809
Independent Registered Public Accounting Firm
KPMG LLP
Two Financial Center
60 South Street
Boston, Massachusetts 02111
Custodian
The Bank of New York Mellon
225 Liberty Street
New York, New York 10286
Legal Counsel
Ropes & Gray LLP
Prudential Tower
800 Boylston Street
Boston, Massachusetts 02199
Before investing, carefully consider the investment objectives, risks, charges and expenses of the variable annuity contract or variable life insurance policy and the underlying variable investment options. This and other information is contained in the prospectus for the variable annuity contract or variable life insurance policy and the underlying variable investment options. Obtain these prospectuses from your agent/registered representative and read them carefully before investing.
RETIREMENT | INVESTMENTS | INSURANCE
voyainvestments.com

Annual Report
December 31, 2019
Classes ADV, I, R6, S, S2 and T
Voya Partners, Inc.
| | ■
Voya Solution Aggressive Portfolio | | | ■
Voya Solution 2030 Portfolio | |
| | ■
Voya Solution Balanced Portfolio | | | ■
Voya Solution 2035 Portfolio | |
| | ■
Voya Solution Conservative Portfolio | | | ■
Voya Solution 2040 Portfolio | |
| | ■
Voya Solution Income Portfolio | | | ■
Voya Solution 2045 Portfolio | |
| | ■
Voya Solution Moderately Aggressive Portfolio | | | ■
Voya Solution 2050 Portfolio | |
| | ■
Voya Solution Moderately Conservative Portfolio | | | ■
Voya Solution 2055 Portfolio | |
| | ■
Voya Solution 2020 Portfolio | | | ■
Voya Solution 2060 Portfolio | |
| | ■
Voya Solution 2025 Portfolio | | |
| | | Beginning on January 1, 2021, as permitted by regulations adopted by the U.S. Securities and Exchange Commission, paper copies of each Portfolio’s annual and semi-annual shareholder reports, like this annual report, will no longer be sent by mail, unless you specifically request paper copies of the reports. Instead, the reports will be made available on a website and you will be notified by mail each time a report is posted and provided with a website link to access the report. | | |
| | | If you already elected to receive shareholder reports electronically, you will not be affected by this change and you need not take any action. You may elect to receive shareholder reports and other communications from your insurance carrier electronically by contacting them directly. | | |
| | | You may elect to receive all future reports in paper free of charge. If you received this document in the mail, please follow the instructions provided to elect to continue receiving paper copies of your shareholder reports. You can inform us that you wish to continue receiving paper copies by calling 1-800-283-3427. Your election to receive reports in paper will apply to all the funds in which you invest. | | |
| | | This report is submitted for general information to shareholders of the Voya mutual funds. It is not authorized for distribution to prospective shareholders unless accompanied or preceded by a prospectus which includes details regarding the funds’ investment objectives, risks, charges, expenses and other information. This information should be read carefully. | | |
PROXY VOTING INFORMATION
A description of the policies and procedures that the Portfolios use to determine how to vote proxies related to portfolio securities is available: (1) without charge, upon request, by calling Shareholder Services toll-free at (800) 992-0180; (2) on the Portfolios’ website at www.voyainvestments.com; and (3) on the U.S. Securities and Exchange Commission’s (“SEC’s”) website at www.sec.gov. Information regarding how the Portfolios voted proxies related to portfolio securities during the most recent 12-month period ended June 30 is available without charge on the Portfolios’ website at www.voyainvestments.com and on the SEC’s website at www.sec.gov.
QUARTERLY PORTFOLIO HOLDINGS
The Portfolios file their complete schedule of portfolio holdings with the SEC for the first and third quarters of each fiscal year on Form N-Q or Form N-PORT, available for filings after March 31, 2019. The Portfolios’ Form N-Q or Form N-PORT is available on the SEC’s website at www.sec.gov. The Portfolios’ complete schedule of portfolio holdings, as filed on Form N-Q or Form N-PORT, are available: on www.voyainvestments.com and without charge upon request from the Portfolio by calling Shareholder Services toll-free at (800) 992-0180.
New season, last year’s plot
Dear Shareholder,
The financial markets delivered strong performance in 2019, and at this juncture, in our view, the outlook for 2020 seems upbeat. Thanks to supportive central bank policies around the world, global economic growth is reaccelerating; manufacturing activity, a key metric for setting market expectations, appears to be strengthening. Recent progress in the trade negotiations between China and the U.S. also helps brighten the outlook as 2020 gets underway.
So expect smooth sailing, right? Maybe. Barely into the first week of the new year, the world faced the prospect of escalating conflict in the Middle East, though tensions appear to have eased since then. Markets initially pulled back in response to heightened uncertainty but regrouped quickly. Follow-on events, if they occur, may not impact markets that much: during 2019, investors generally did well by downplaying geopolitical concerns, and we could see the same behavior in 2020.
Still, we believe that turbulence seems to be the world’s modus operandi: economic and market uncertainty are still with us, trade issues remain unresolved and the upcoming U.S. presidential election adds another dimension of political uncertainty. Even though market participants have become more comfortable accepting risk, we have observed persistent preferences for higher-quality, lower-volatility assets. This tells us that investors perceive significant risks they wish to avoid, and points to the potential for volatile reactions to adverse news.
With potential surprises from anywhere, we believe investors should continue to diversify their portfolios as broadly as practicable, and not attempt to time the markets. At the start of 2019, in our opinion, many investors did not believe U.S. equities offered attractive return potential — acting on that belief would have resulted in missed opportunities. Remember that your portfolio is structured to meet your long-term objectives; changing it in response to short-term market conditions may put your long-term goals at risk. If your goals have changed, please discuss them thoroughly with your investment advisor before making any changes to your portfolio.
Voya seeks to remain a reliable partner committed to reliable investing, helping you and your investment advisor achieve your goals. We appreciate your continued confidence in us, and we look forward to serving your investment needs in the future.
Sincerely,
Dina Santoro
President
Voya Family of Funds
January 21, 2020
The views expressed in the President’s Letter reflect those of the President as of the date of the letter. Any such views are subject to change at any time based upon market or other conditions and the Voya mutual funds disclaim any responsibility to update such views. These views may not be relied on as investment advice and because investment decisions for a Voya mutual fund are based on numerous factors, may not be relied on as an indication of investment intent on behalf of any Voya mutual fund. Reference to specific company securities should not be construed as recommendations or investment advice.
International investing poses special risks including currency fluctuation, economic and political risks not found in investments that are solely domestic.
Market Perspective: Year Ended December 31, 2019
In our semi-annual report, we described how global equities, in the form of the MSCI World IndexSM (the “Index”) measured in local currencies, including net reinvested dividends, rose 16.69% for the half-year after a nervous start.
A trade war between the U.S. and China had been ongoing for more than a year, with U.S. tariffs on some $250 billion of Chinese goods in place together with Chinese tariffs on $110 billion of U.S. goods. The war was being waged against a backdrop of slowing global growth, in part the result of uncertainties caused by the trade war itself.
Fears on both fronts: the trade war and slowing global growth, would ebb and flow in the second half; yet the Index rose five months out of six, ending the year up 27.34%, just below the record set a few days earlier. (The Index returned 27.67% for the year ended December 31, 2019, measured in U.S. dollars.)
Entering May, trade talks had appeared to be going reasonably well and the path of least resistance for the Index still seemed upwards. This all changed when the President tweeted his intention to raise the existing 10% tariff on $200 billion of the $250 billion to 25% of Chinese goods. Trade negotiations had evidently broken down. Later he unexpectedly threatened tariffs on Mexican goods for reasons unrelated to trade.
On perceived slowing global growth, there was still plenty to worry about.
In Europe, manufacturing was in contraction. The euro zone’s annual growth in gross domestic product (“GDP”) in the second and third quarters of 2019 was just 1.2%. In the U.K., chronic disagreement about whether and how to leave the European Union (“Brexit”) culminated in a general election called for December.
Japan, with manufacturing also in contraction, managed GDP growth of 2.0% annualized in the second quarter, slipping to 1.8% in the third. Exports and imports were both falling and core inflation languished at 0.8%, with a demand-dampening sales tax increase effective on October 1.
China’s GDP grew at 6.0% in the third quarter, the smallest advance in 27 years. Industrial production was expanding near the slowest pace in 17 years, retail sales in 16 years.
In the U.S., manufacturing fell into contraction in September. Corporate profits were flat to falling year-over-year. While annualized first quarter growth had surprised to the upside at 3.1%, it fell to 2.0% and 2.1% in the second and third quarters, respectively. Growth was heavily dependent on consumer spending, supported by the lowest unemployment rate since 1969.
Back in the markets, after May’s slump, central banks came to the rescue in June. On June 19 the Federal Open Market Committee (“FOMC”) left rates unchanged, but markets heard Chairman Powell signal a cut in July. The European Central Bank announced its willingness to cut its already negative deposit rate and resume bond purchases. The Japanese government also promised increased stimulus. Plans for tariffs on Mexican imports were “indefinitely suspended”, and investors were finally left to cheer a truce in the U.S.-China trade conflict, agreed on June 29.
July was a comparatively quiet month. The FOMC duly cut the federal funds rate by 25 basis points (0.25%), but disappointed some, including the President, by referring to it as only a “mid-cycle adjustment”. And it was back to trade-war angst in
August, as first the President announced 10% tariffs on the approximately $300 billion of Chinese imports as yet unaffected, and then increased existing and planned tariffs by 5% when China retaliated.
The market rollercoaster lurched back up in September and October, when high-level trade talks between the U.S. and China resumed. Both sides expressed confidence that “Phase 1” of a deal was possible by year-end. The FOMC cut rates again in both months.
And as year-end approached, a more positive narrative was increasingly heard. Markets were rising despite trade tensions, sluggish global growth, declining profits and political uncertainties in the U.S. and elsewhere. Perhaps, some commentators ventured, this was a signal that the worst was over. The Phase 1 trade deal was announced, amid some skepticism on the details, as was agreement on USMCA, the replacement for NAFTA. The U.K. government’s emphatic election victory might offer more clarity on Brexit. Central banks were all supportive and some of the economic data were starting to improve.
In U.S. fixed income markets, the Treasury yield curve fell. For the year, the Bloomberg Barclays U.S. Aggregate Bond Index rose 8.72%. The Bloomberg Barclays Long-Term U.S. Treasury sub-index returned 14.83%, the 30-year yield briefly dipping below 2% in August. The 10-year yield on Japanese and some euro zone government bonds ended below zero.
U.S. equities, represented by the S&P 500® Index, including dividends, surged 31.49%. Technology was by far the top performer, up 50.29%, led by Apple and Microsoft. Energy, exposed to slowing global economic activity, was the weakest, but still rose 11.81%.
In currencies, the dollar rose 2.04% against the euro, but lost 3.80% against the pound and 0.97% against the yen. On a trade-weighted basis, according to Reuters, the dollar had the smallest annual move ever in 2019.
In international markets, the MSCI Japan® Index ended up 18.48% for the year, supported by the Bank of Japan’s purchases of exchange-traded funds, but pressured by Japan’s own vulnerability to a trade war. The MSCI Europe ex U.K.® Index advanced 26.43%, powered by capital goods and pharmaceuticals companies. The MSCI U.K.® Index rose 16.37%, dampened by Brexit concerns, but also affected by the company-specific fortunes of MSCI U.K.’s market heavyweights. Among the largest contributors were pharmaceuticals, AstraZeneca and GlaxoSmithKline; the biggest detractors were miner Glencore and HSBC.
All indices are unmanaged and investors cannot invest directly in an index. Past performance does not guarantee future results. The performance quoted represents past performance.
Investment return and principal value of an investment will fluctuate, and shares, when redeemed, may be worth more or less than their original cost. Each Portfolio’s performance is subject to change since the period’s end and may be lower or higher than the performance data shown. Please call (800) 262-3862 or log on to www.voyainvestments.com to obtain performance data current to the most recent month end.
Market Perspective reflects the views of Voya Investment Management’s Chief Investment Risk Officer only through the end of the period, and is subject to change based on market and other conditions.
| | | Index | | | | Description | | |
| | | Bloomberg Barclays U.S. Aggregate Bond Index | | | | An index of publicly issued investment grade U.S. government, mortgage-backed, asset-backed and corporate debt securities. | | |
| | | Bloomberg Barclays Long-Term U.S. Treasury Index | | | | This index measures the performance of U.S. Treasury bills with long-term maturity. The credit level for this index is investment grade. The rebalance scheme is monthly. | | |
| | | MSCI Europe, Australasia and Far East® (“MSCI EAFE”) Index | | | | An index that measures the performance of securities listed on exchanges in Europe, Australasia and the Far East. It includes the reinvestment of dividends net of withholding taxes, but does not reflect fees, brokerage commissions or other expenses of investing. | | |
| | | MSCI Europe ex UK® Index | | | | A free float-adjusted market capitalization index that is designed to measure developed market equity performance in Europe, excluding the UK. | | |
| | | MSCI Japan® Index | | | | A free float-adjusted market capitalization index that is designed to measure developed market equity performance in Japan. | | |
| | | MSCI U.K.® Index | | | | A free float-adjusted market capitalization index that is designed to measure developed market equity performance in the UK. | | |
| | | MSCI World IndexSM | | | | An index that measures the performance of over 1,600 securities listed on exchanges in the U.S., Europe, Canada, Australia, New Zealand and the Far East. | | |
| | | Russell 3000® Index | | | | An index that measures the performance of the largest 3000 U.S. companies representing approximately 98% of the investable U.S. equity market. | | |
| | | S&P 500® Index | | | | An index that measures the performance of securities of approximately 500 large-capitalization companies whose securities are traded on major U.S. stock markets. | | |
| | | S&P Target Date Retirement Income Index | | | | Seeks to represent asset allocations which target an immediate retirement horizon. | | |
| | | S&P Target Risk Aggressive® Index* | | | | Seeks to emphasize exposure to equity securities, maximizing opportunities for long-term capital accumulation. It may include small allocations in fixed-income securities to enhance portfolio efficiency. | | |
| | | S&P Target Risk® Conservative Index* | | | | Seeks to emphasize exposure to fixed income securities in order to produce a current income stream and avoid excessive volatility of returns. Equity securities are included to protect long-term purchasing power. | | |
| | | S&P Target Risk® Growth Index* | | | | Seeks to measure the performance of an asset allocation strategy targeted to a growth focused risk profile. | | |
| | | S&P Target Risk® Moderate Index* | | | | Seeks to measure the performance of an asset allocation strategy targeted to a moderate risk profile. | | |
| | | S&P Target Date 2020 Index,
S&P Target Date 2025 Index,
S&P Target Date 2030 Index,
S&P Target Date 2035 Index,
S&P Target Date 2040 Index,
S&P Target Date 2045 Index,
S&P Target Date 2050 Index,
S&P Target Date 2055 Index and
S&P Target Date 2060+ Index | | | | Each index seeks to represent the market consensus for asset allocations which target an approximate 2020, 2025, 2030, 2035, 2040, 2045, 2050, 2055, 2060 and beyond the 2060 retirement horizon, respectively. | | |
*
Total return and gross index returns are presented. Index returns include the reinvestment of dividends and distributions. Gross index returns reflect the addition of an amount estimated by the index sponsor to approximate the fees incurred by index components.
| Voya Solution Portfolios | Portfolio Managers’ Report |
The Voya Solution Portfolios consist of Voya Solution Aggressive Portfolio, Voya Solution Balanced Portfolio, Voya Solution Conservative Portfolio, Voya Solution Income Portfolio, Voya Solution Moderately Aggressive Portfolio, Voya Solution Moderately Conservative Portfolio, Voya Solution 2020 Portfolio*, Voya Solution 2025 Portfolio, Voya Solution 2030 Portfolio, Voya Solution 2035 Portfolio, Voya Solution 2040 Portfolio, Voya Solution 2045 Portfolio, Voya Solution 2050 Portfolio, Voya Solution 2055 Portfolio, and Voya Solution 2060 Portfolio (each a “Portfolio” or collectively, the “Portfolios” or the “Solution Portfolios”). Each Portfolio seeks to achieve its investment objective by investing in a combination of underlying funds which are actively managed funds or passively managed funds (index funds)(1). Each Portfolio uses an asset allocation strategy (“Strategic Asset Allocation”) designed for investors expecting to retire around the year or have the risk profile applicable to that Portfolio. These Target Asset Allocations as of December 31, 2019 are set out in the table below. The Portfolios are managed by Halvard Kvaale, CIMA, Paul Zemsky, CFA and Chief Investment Officer, and Barbara Reinhard, CFA, Portfolio Managers** of Voya Investment Management Co. LLC (“Voya IM”) the Sub-Adviser (“Sub-Adviser”).
Performance: Each Portfolio’s performance against its respective benchmarks can be found on page
6.
Portfolio Specifics: The Portfolio managers attempt to enhance investment returns by tactically deviating from Target Asset Allocations to take advantage of opportunities or reduce risk. The following tactics were among those employed in 2019.
The Portfolios started 2019 with overweight positions in domestic large blended equities, long-maturity government bonds and short-duration bonds. These were funded by underweight exposures to domestic mid-cap equities, international equities, real estate investment trusts (“REITs”), core U.S. fixed income and high yield bonds.
Three trades were placed in January across the Portfolios. In early January, the Portfolios initiated an underweight to senior loans, lowering overall credit exposure and realizing gains earned from the solid recovery in the loan market after the December 2018 sell-off. In addition to those considerations, in our opinion, there was less need for a floating-rate component to mitigate interest-rate risk, since the U.S. Federal Open Market Committee (“FOMC”) had moved closer to concluding its rate tightening cycle. Proceeds from the sale were moved into short-term bonds. In mid-January, the Portfolios reduced equity exposure by selling international developed equities for short-term bonds following a meaningful bounce off the December lows. At the end of January, the Portfolios unwound a portion of their underweights to REITs, funded by selling domestic large-cap equities.
In early February, we shortened duration across the Portfolios by swapping long-term U.S. Treasuries for core fixed income. The trade was primarily the result of our ten-year bond fair value model signaling overvaluation and a slightly more optimistic economic growth outlook. At the end of March, we eliminated the Portfolios’ allocation to commodities, as that asset class’ risk profile had become increasingly leveraged to emerging markets, giving it less of a diversifying property than in the past. Proceeds from the sale were used to purchase domestic large-cap equities.
As part of their annual review process, the Portfolios glided down at the end of April and also made adjustments to their strategic asset allocation targets to reflect revised long-term capital market expectations for a range of asset classes. This resulted in an overall decrease in equities across the 2045 – 2020 Portfolios and changes in the strategic sub-asset allocations. The most notable changes included increased allocations to U.S. large-cap equities, core fixed income and Treasury inflation protected securities, funded by decreased allocations to U.S. mid-cap equities, developed international equities, emerging market equities and senior loans. During the review, we also removed commodities as a strategic asset class from the Portfolios.
At the end of May, the Portfolios purchased long-maturity Treasury bonds, funded by selling intermediate bonds. At the time of the trade, the potential impacts of trade war actions, combined with recent weakness in U.S. capital investment and retail sales, were suggesting a lower trajectory for economic growth. We reversed this position in June as fears of a slowdown abated.
In June, we lowered equity exposure within the 2020 vintage as the first of a four-part equity glide-down to eventually merge the 2020 vintage into the Income vintage on or about August 7, 2020.
In early August, the Portfolios reduced allocations to emerging markets equity in favor of domestic large cap equity. At the time of the trade, FOMC policy indicated a less supportive stance than expected, supporting a stronger U.S. dollar — a historical headwind to equities in emerging markets. In the middle of August, the Portfolios reduced overall equity exposure by selling domestic large-cap equities in favor of core U.S. fixed income, reflective of expectations for soft industrial data and lack of support from sentiment measures. This trade was unwound at the beginning of September after reaching its stop-loss range.
In September, the Portfolios increased their exposure to domestic small-cap equity, after being underweight to the asset class over the course of two years. At the time of the trade, underperformance of small-cap equities had reached historical extremes and valuations had become what we believed to be attractive, indicating potential performance reversal. In addition, we expected lower interest rates driven by FOMC policy would be supportive of economic growth, which small-cap stock performance generally tracks closely. The final trade in the third quarter extended duration, or exposure to interest-rate risk, across the suite as a defensive measure in a volatile market punctuated by oil shocks.
Three trades were enacted across the Portfolios in October. The first trade reduced the existing duration underweight of the Portfolios through the purchase of long-maturity government bonds funded by selling intermediate bonds. This positioning reflected our belief that U.S. employment would likely weaken from its then current pace, leading to continued easing by the FOMC. The second and third trades
| Portfolio Managers’ Report | Voya Solution Portfolios |
of the month sought to diversify the Portfolios’ existing equity overweight, rotating a portion from domestic into both developed international and emerging market equities. At the time of the trades, recent foreign manufacturing data, such as global purchasing managers’ indexes (PMIs), supported the idea that the global economy had stopped slumping and was stabilizing.
During the year, tactical moves relative to our strategic benchmarks have had a negative impact across the Portfolios.
From a holdings standpoint, overall performance from underlying strategies contributed to results before fees and expenses. Managers with top benchmark-relative performance included Voya Multi-Manager Emerging Market Equity Fund, VY® T. Rowe Price Capital Appreciation Portfolio and Voya Multi-Manager International Equity Fund. Bottom benchmark-relative performers included Voya Multi-Manager International Factors Fund, VY® T. Rowe Price Growth Equity Portfolio and Voya U.S. High Dividend Low Volatility Fund.
During the year, the Portfolios utilized various futures to enact tactical positions. Futures were utilized to avoid significant manager disruption and provide the Portfolios with greater liquidity. The impact of the derivatives was in line with expectations of the tactical asset allocation positions.
Current Strategy and Outlook: After several months of easing in monetary policy from global central banks, the effects are beginning to trickle through to the real economy: in our view, the manufacturing sector is showing signs of life, while consumer demand remains strong. We believe relaxed financial conditions and a robust labor market are likely to keep the marginal improvement trend in place. We view the likelihood of a U.S. recession over the next 12 months as low. We believe that central banks appear willing to provide sufficient liquidity to prolong the cycle, inflation is tame and there are no materially worrisome signs of financial excess.
What’s more, in our opinion, the probability of an exogenous shock has declined as U.S. and Chinese officials appear to be making progress on trade. Assuring us of this opinion are strong non-farm payrolls, contained high yield spreads and decent consumer confidence, which is corroborated by strong auto sales. Furthermore, although we have discounted the yield curve as a leading indicator of recession given the distortions arising from unconventional central bank asset buying and negative term premiums, the areas of the curve most closely correlated with future recessions have reverted to a more normal shape.
As a result, we retain our modest overweight to stocks. Third quarter U.S. corporate earnings reports are coming in better than expected, as 75% of S&P 500® Index companies have reported positive earnings per share surprises and 60% have beaten revenue estimates. With profit margins for U.S. large cap companies well above their long-term average, further gains in S&P 500® Index stocks will, we believe, most likely need to come from revenue growth or earnings multiple expansion. We are reticent to rely much on top-line growth, given what we see as the lackluster, albeit improving, economic backdrop; yet we see scope for further tightening of the equity risk premium and higher valuations.
That said, the relative advantage U.S. large caps have held over smaller cap and foreign stocks is lessening. In our view, multiple financial indicators suggest economic activity is gaining momentum, such as a move-up in global PMIs, strong performance from global semiconductor stocks and high copper prices. Following a long bout of underperformance, non-U.S. stocks are under-owned and relatively cheap, in our opinion. Therefore, we have increased non-U.S. equity exposure by rotating our EAFE positioning back to neutral, funded by reducing our U.S. equity overweight. Additionally, supportive Chinese money and credit growth, easy global monetary policy and a range-bound U.S. dollar make us comfortable continuing our emerging market equity exposure.
(1)
The investment objective of each Portfolio is described in the Portfolios’ prospectuses, each dated May 1, 2019.
*
On November 21, 2019, the Board of Directors of Voya Partners, Inc. (the “Board”) approved a proposal to reorganize Voya Solution 2020 Portfolio with and into Voya Solution Income Portfolio on or about August 7, 2020.
**
Effective September 30, 2019, Barbara Reinhard was added as a portfolio manager to the Portfolios.
The views expressed in this commentary are informed opinions. They should not be considered promises or advice. The views expressed reflect those of the portfolio managers, only through the end of the period as stated on the cover. The portfolio managers’ views are subject to change at any time based on market and other conditions.
Portfolio holdings and characteristics are subject to change and may not be representative of current holdings and characteristics. Portfolio holdings are subject to change daily. The outlook for this Portfolio may differ from that presented for other Voya mutual funds. This report contains statements that may be “forward-looking” statements. Actual results may differ materially from those projected in the “forward-looking” statements. The Portfolio’s performance returns shown reflect applicable fee waivers and/or expense limits in effect during this period. Absent such fee waivers/expense limitations, if any, performance would have been lower. Performance for the different classes of shares will vary based on differences in fees associated with each class. An index has no cash in its portfolio and imposes no sales charges. An investor cannot invest directly in an index.
| Voya Solution Portfolios | Portfolio Managers’ Report |
| | | Total Returns for the Period Ended December 31, 2019 | | |
| | | | | | 1 Year | | |
| | | Voya Solution Aggressive Portfolio, Class S | | | 25.21% | | |
| | | S&P Target Risk Aggressive® Index Total Return | | | 22.79% | | |
| | | Voya Solution Balanced Portfolio, Class S | | | 19.47% | | |
| | | S&P Target Risk® Growth Index Total Return | | | 19.20% | | |
| | | Voya Solution Conservative Portfolio, Class S | | | 11.31% | | |
| | | S&P Target Risk® Conservative Index Total Return | | | 13.99 % | | |
| | | Voya Solution Income Portfolio, Class S | | | 13.13% | | |
| | | S&P Target Date Retirement Income Index | | | 13.33% | | |
| | | Russell 3000® Index | | | 31.02% | | |
| | | MSCI EAFE® Index | | | 22.01% | | |
| | | Bloomberg Barclays U.S. Aggregate Bond (“BCAB”) Index | | | 8.72% | | |
| | | Voya Solution Moderately Aggressive Portfolio, Class S | | | 22.61% | | |
| | | S&P Target Risk Aggressive® Index Total Return | | | 22.79% | | |
| | | Voya Solution Moderately Conservative Portfolio, Class S | | | 14.96% | | |
| | | S&P Target Risk® Moderate Index Total Return | | | 15.71% | | |
| | | Voya Solution 2020 Portfolio, Class S | | | 14.89% | | |
| | | S&P Target Date 2020 Index | | | 16.52% | | |
| | | Voya Solution 2025 Portfolio, Class S | | | 18.12% | | |
| | | S&P Target Date 2025 Index | | | 18.38% | | |
| | | Russell 3000® Index | | | 31.02% | | |
| | | MSCI EAFE® Index | | | 22.01% | | |
| | | BCAB Index | | | 8.72% | | |
| | | Voya Solution 2030 Portfolio, Class S | | | 20.36% | | |
| | | S&P Target Date 2030 Index | | | 20.38% | | |
| | | Voya Solution 2035 Portfolio, Class S | | | 21.94% | | |
| | | S&P Target Date 2035 Index | | | 22.18% | | |
| | | Russell 3000® Index | | | 31.02% | | |
| | | MSCI EAFE® Index | | | 22.01% | | |
| | | BCAB Index | | | 8.72% | | |
| | | Voya Solution 2040 Portfolio, Class S | | | 23.07% | | |
| | | S&P Target Date 2040 Index | | | 23.37% | | |
| | | Voya Solution 2045 Portfolio, Class S | | | 23.90% | | |
| | | S&P Target Date 2045 Index | | | 24.02% | | |
| | | Russell 3000® Index | | | 31.02% | | |
| | | MSCI EAFE® Index | | | 22.01% | | |
| | | BCAB Index | | | 8.72% | | |
| | | Voya Solution 2050 Portfolio, Class S | | | 24.41% | | |
| | | S&P Target Date 2050 Index | | | 24.35% | | |
| | | Voya Solution 2055 Portfolio, Class S | | | 24.50% | | |
| | | S&P Target Date 2055 Index | | | 24.48% | | |
| | | Voya Solution 2060 Portfolio, Class S | | | 24.45% | | |
| | | S&P Target Date 2060+ Index | | | 24.73% | | |
| | | | | | | | |
| Portfolio Managers’ Report | Voya Solution Portfolios |
Annual Target Asset Allocation as of December 31, 2019(1)
| | | Sub Asset Class | | | 2060 | | | 2055 | | | 2050 | | | 2045 | | | 2040 | | | 2035 | | | 2030 | | | 2025 | | | 2020 | | | Income | | |
| | | U.S. Large Blend | | | | | 23.55% | | | | | | 23.55% | | | | | | 24.05% | | | | | | 22.00% | | | | | | 20.00% | | | | | | 18.00% | | | | | | 17.00% | | | | | | 16.50% | | | | | | 8.75% | | | | | | 8.50% | | | |
| | | U.S. Large Growth | | | | | 14.00% | | | | | | 14.00% | | | | | | 13.50% | | | | | | 14.00% | | | | | | 14.00% | | | | | | 13.50% | | | | | | 11.75% | | | | | | 10.25% | | | | | | 7.25% | | | | | | 5.75% | | | |
| | | U.S. Large Value | | | | | 13.25% | | | | | | 13.25% | | | | | | 13.25% | | | | | | 13.75% | | | | | | 13.75% | | | | | | 13.00% | | | | | | 11.50% | | | | | | 9.75% | | | | | | 7.75% | | | | | | 6.50% | | | |
| | | U.S. Mid Cap Blend | | | | | 5.00% | | | | | | 5.00% | | | | | | 4.50% | | | | | | 4.50% | | | | | | 4.00% | | | | | | 4.00% | | | | | | 3.00% | | | | | | 2.50% | | | | | | 1.00% | | | | | | 0.00% | | | |
| | | U.S. Small Cap | | | | | 4.50% | | | | | | 4.50% | | | | | | 4.50% | | | | | | 4.50% | | | | | | 4.50% | | | | | | 3.50% | | | | | | 3.00% | | | | | | 3.00% | | | | | | 1.00% | | | | | | 1.00% | | | |
| | | International | | | | | 25.00% | | | | | | 25.00% | | | | | | 25.00% | | | | | | 24.00% | | | | | | 22.00% | | | | | | 20.00% | | | | | | 18.00% | | | | | | 13.00% | | | | | | 8.00% | | | | | | 6.00% | | | |
| | | Emerging Markets | | | | | 7.50% | | | | | | 7.50% | | | | | | 7.00% | | | | | | 7.00% | | | | | | 6.50% | | | | | | 6.00% | | | | | | 5.00% | | | | | | 3.50% | | | | | | 2.50% | | | | | | 2.00% | | | |
| | | Global Real Estate | | | | | 2.75% | | | | | | 2.25% | | | | | | 2.25% | | | | | | 2.25% | | | | | | 2.25% | | | | | | 2.00% | | | | | | 1.75% | | | | | | 1.50% | | | | | | 1.25% | | | | | | 1.25% | | | |
| | | Core Fixed Income | | | | | 3.20% | | | | | | 2.95% | | | | | | 4.20% | | | | | | 4.25% | | | | | | 9.00% | | | | | | 10.00% | | | | | | 19.00% | | | | | | 24.75% | | | | | | 36.50% | | | | | | 40.00% | | | |
| | | High Yield | | | | | 0.00% | | | | | | 0.00% | | | | | | 0.00% | | | | | | 0.00% | | | | | | 0.00% | | | | | | 0.00% | | | | | | 0.00% | | | | | | 0.00% | | | | | | 0.00% | | | | | | 0.00% | | | |
| | | Senior Debt | | | | | 0.00% | | | | | | 0.00% | | | | | | 0.00% | | | | | | 0.00% | | | | | | 0.00% | | | | | | 2.00% | | | | | | 2.00% | | | | | | 3.00% | | | | | | 3.00% | | | | | | 3.00% | | | |
| | | International Bonds | | | | | 0.00% | | | | | | 0.00% | | | | | | 0.00% | | | | | | 0.00% | | | | | | 0.00% | | | | | | 0.00% | | | | | | 0.00% | | | | | | 3.00% | | | | | | 3.00% | | | | | | 3.00% | | | |
| | | TIPS | | | | | 0.00% | | | | | | 0.00% | | | | | | 0.00% | | | | | | 0.00% | | | | | | 0.00% | | | | | | 4.00% | | | | | | 4.00% | | | | | | 4.00% | | | | | | 6.00% | | | | | | 7.00% | | | |
| | | Short Duration | | | | | 0.00% | | | | | | 0.00% | | | | | | 0.00% | | | | | | 1.75% | | | | | | 2.00% | | | | | | 2.00% | | | | | | 2.00% | | | | | | 3.25% | | | | | | 12.00% | | | | | | 14.00% | | | |
| | | Long Government Bonds | | | | | 1.25% | | | | | | 2.00% | | | | | | 1.75% | | | | | | 2.00% | | | | | | 2.00% | | | | | | 2.00% | | | | | | 2.00% | | | | | | 2.00% | | | | | | 2.00% | | | | | | 2.00% | | | |
| | | Total Equity | | | | | 95.55% | | | | | | 95.05% | | | | | | 94.05% | | | | | | 92.00% | | | | | | 87.00% | | | | | | 80.00% | | | | | | 71.00% | | | | | | 60.00% | | | | | | 37.50% | | | | | | 31.00% | | | |
| | | Total Fixed Income | | | | | 4.45% | | | | | | 4.95% | | | | | | 5.95% | | | | | | 8.00% | | | | | | 13.00% | | | | | | 20.00% | | | | | | 29.00% | | | | | | 40.00% | | | | | | 62.50% | | | | | | 69.00% | | | |
Annual Target Asset Allocation as of December 31, 2019(1)
| | | Sub Asset Class | | | Aggressive | | | Moderately
Aggressive | | | Balanced | | | Moderately
Conservative | | | Conservative | | |
| | | U.S. Large Blend | | | | | 15.00% | | | | | | 12.50% | | | | | | 10.50% | | | | | | 9.00% | | | | | | 7.00% | | | |
| | | U.S. Large Growth | | | | | 16.50% | | | | | | 14.00% | | | | | | 13.75% | | | | | | 6.00% | | | | | | 3.25% | | | |
| | | U.S. Large Value | | | | | 17.50% | | | | | | 20.50% | | | | | | 18.75% | | | | | | 12.50% | | | | | | 5.75% | | | |
| | | U.S. Mid Cap Blend | | | | | 13.00% | | | | | | 8.00% | | | | | | 4.00% | | | | | | 2.00% | | | | | | 2.00% | | | |
| | | U.S. Small Cap | | | | | 9.00% | | | | | | 7.00% | | | | | | 3.50% | | | | | | 3.00% | | | | | | 1.00% | | | |
| | | International | | | | | 17.00% | | | | | | 14.00% | | | | | | 9.50% | | | | | | 6.50% | | | | | | 4.00% | | | |
| | | Emerging Markets | | | | | 6.00% | | | | | | 5.00% | | | | | | 4.00% | | | | | | 3.00% | | | | | | 2.00% | | | |
| | | Global Real Estate | | | | | 2.00% | | | | | | 2.00% | | | | | | 2.00% | | | | | | 2.00% | | | | | | 0.00% | | | |
| | | Core Fixed Income | | | | | 2.00% | | | | | | 8.00% | | | | | | 18.00% | | | | | | 27.00% | | | | | | 30.50% | | | |
| | | High Yield | | | | | 0.00% | | | | | | 2.00% | | | | | | 4.00% | | | | | | 6.00% | | | | | | 6.00% | | | |
| | | Senior Debt | | | | | 0.00% | | | | | | 3.00% | | | | | | 3.00% | | | | | | 5.00% | | | | | | 5.00% | | | |
| | | International Bonds | | | | | 0.00% | | | | | | 0.00% | | | | | | 0.00% | | | | | | 4.00% | | | | | | 5.00% | | | |
| | | TIPS | | | | | 0.00% | | | | | | 0.00% | | | | | | 2.00% | | | | | | 5.00% | | | | | | 7.00% | | | |
| | | Short Duration | | | | | 0.50% | | | | | | 2.00% | | | | | | 5.00% | | | | | | 7.00% | | | | | | 19.50% | | | |
| | | Long Government Bonds | | | | | 1.50% | | | | | | 2.00% | | | | | | 2.00% | | | | | | 2.00% | | | | | | 2.00% | | | |
| | | Total Equity | | | | | 96.00% | | | | | | 83.00% | | | | | | 66.00% | | | | | | 44.00% | | | | | | 25.00% | | | |
| | | Total Fixed Income | | | | | 4.00% | | | | | | 17.00% | | | | | | 34.00% | | | | | | 56.00% | | | | | | 75.00% | | | |
(1)
As these are target allocations, the actual allocations of each Portfolio's assets may deviate from the percentages shown. Although the Portfolios expect to be fully invested at all times, they may maintain liquidity reserves to meet redemption requests.
Portfolio holdings are subject to change daily.
| Voya Solution Aggressive Portfolio | Portfolio Managers’ Report |
| | | Average Annual Total Returns for the Periods Ended December 31, 2019 | | |
| | | | | | 1 Year | | | 5 Year | | | Since Inception
of Classes ADV, I, S, and S2
May 1, 2013 | | |
| | | Class ADV | | | | | 24.94% | | | | | | 7.24% | | | | | | 8.65% | | | |
| | | Class I | | | | | 25.54% | | | | | | 7.76% | | | | | | 9.26% | | | |
| | | Class R6(1) | | | | | 25.45% | | | | | | 7.75% | | | | | | 9.25% | | | |
| | | Class S | | | | | 25.21% | | | | | | 7.50% | | | | | | 8.98% | | | |
| | | Class S2 | | | | | 25.05% | | | | | | 7.34% | | | | | | 8.73% | | | |
| | | S&P Target Risk Aggressive® Index Total Return | | | | | 22.79% | | | | | | 7.79% | | | | | | 8.70% | | | |
| | | S&P Target Risk Aggressive® Index Gross | | | | | 23.09% | | | | | | 8.06% | | | | | | 8.97% | | | |
| | | | | |
Based on a $10,000 initial investment, the graph and table above illustrate the total return of Voya Solution Aggressive Portfolio against the indices indicated. An index is unmanaged, has no cash in its portfolio and imposes no sales charges. An investor cannot invest directly in an index.
The Portfolio’s performance is shown without the imposition of any expenses or charges which are, or may be, imposed under your variable annuity contract or variable life insurance policy. Total returns would have been lower if such expenses or charges were included.
The performance graph and table do not reflect the deduction of taxes that a shareholder will pay on Portfolio distributions or the redemption of Portfolio shares.
The performance shown may include the effect of fee waivers and/or expense reimbursements by the Investment Adviser and/or other service providers, which have the effect of increasing total return. Had all fees and expenses been considered, the total returns would have been lower.
The performance update illustrates performance for a variable investment option available through a variable
annuity contract or a variable life insurance policy. The performance shown indicates past performance and is not a projection or prediction of future results. Actual investment returns and principal value will fluctuate so that shares and/or units, at redemption, may be worth more or less than their original cost. Please log on to www.voyainvestments.com or call (800) 262-3862 to get performance through the most recent month end.
Portfolio holdings are subject to change daily.
(1)
Class R6 incepted on May 2, 2016. The Class R6 shares performance shown for the period prior to their inception date is the performance of Class I shares without adjustment for any differences in the expenses between the two classes. If adjusted for such differences, returns would be different.
Effective May 1, 2019, the Adviser changed the primary benchmark from the S&P Target Risk Aggressive® Index Gross (“Gross Index”) to the S&P Target Risk Aggressive® Index Total Return as the Adviser believes it more accurately reflects the investment experience of an investor in the benchmark’s components. Index returns include the reinvestment of dividends and distributions. Gross index returns reflect the addition of an amount estimated by the index sponsor to approximate the fees incurred by index components.
| Portfolio Managers’ Report | Voya Solution Balanced Portfolio |
| | | Average Annual Total Returns for the Periods Ended December 31, 2019 | | |
| | | | | | 1 Year | | | 5 Year | | | 10 Year | | | Since Inception
of Class S2
April 30, 2010 | | |
| | | Class ADV | | | | | 19.13% | | | | | | 5.96% | | | | | | 7.30% | | | | | | — | | | |
| | | Class I | | | | | 19.75% | | | | | | 6.52% | | | | | | 7.89% | | | | | | — | | | |
| | | Class R6(1) | | | | | 19.76% | | | | | | 6.52% | | | | | | 7.89% | | | | | | — | | | |
| | | Class S | | | | | 19.47% | | | | | | 6.24% | | | | | | 7.61% | | | | | | — | | | |
| | | Class S2 | | | | | 19.22% | | | | | | 6.06% | | | | | | — | | | | | | 7.16% | | | |
| | | S&P Target Risk® Growth Index Total Return | | | | | 19.20% | | | | | | 6.63% | | | | | | 7.87% | | | | | | 7.69% | | | |
| | | S&P Target Risk® Growth Index Gross | | | | | 19.50% | | | | | | 6.90% | | | | | | 8.14% | | | | | | 7.96% | | | |
| | | | | |
Based on a $10,000 initial investment, the graph and table above illustrate the total return of Voya Solution Balanced Portfolio against the indices indicated. An index is unmanaged and has no cash in its portfolio and imposes no sales charges. An investor cannot invest directly in an index.
The Portfolio’s performance is shown without the imposition of any expenses or charges which are, or may be, imposed under your variable annuity contract or variable life insurance policy. Total returns would have been lower if such expenses or charges were included.
The performance graph and table do not reflect the deduction of taxes that a shareholder will pay on Portfolio distributions or the redemption of Portfolio shares.
The performance shown may include the effect of fee waivers and/or expense reimbursements by the Investment Adviser and/or other service providers, which have the effect of increasing total return. Had all fees and expenses been considered, the total returns would have been lower.
The performance update illustrates performance for a variable investment option available through a variable
annuity contract or a variable life insurance policy. The performance shown indicates past performance and is not a projection or prediction of future results. Actual investment returns and principal value will fluctuate so that shares and/or units, at redemption, may be worth more or less than their original cost. Please log on to www.voyainvestments.com or call (800) 262-3862 to get performance through the most recent month end.
Portfolio holdings are subject to change daily.
(1)
Class R6 incepted on May 2, 2016. The Class R6 shares performance shown for the period prior to their inception date is the performance of Class I shares without adjustment for any differences in the expenses between the two classes. If adjusted for such differences, returns would be different.
Effective May 1, 2019, the Adviser changed the primary benchmark from the S&P Target Risk® Growth Index Gross (“Gross Index”) to the S&P Target Risk® Growth Index Total Return as the Adviser believes it more accurately reflects the investment experience of an investor in the benchmark’s components. Index returns include the reinvestment of dividends and distributions. Gross index returns reflect the addition of an amount estimated by the index sponsor to approximate the fees incurred by index components.
| Voya Solution Conservative Portfolio | Portfolio Managers’ Report |
| | | Average Annual Total Returns for the Periods Ended December 31, 2019 | | |
| | | | | | 1 Year | | | 5 Year | | | Since Inception
of Classes ADV, I, S, and S2
April 30, 2010 | | |
| | | Class ADV | | | | | 10.99% | | | | | | 4.01% | | | | | | 4.63% | | | |
| | | Class I | | | | | 11.65% | | | | | | 4.54% | | | | | | 5.16% | | | |
| | | Class R6(1) | | | | | 11.65% | | | | | | 4.54% | | | | | | 5.16% | | | |
| | | Class S | | | | | 11.31% | | | | | | 4.29% | | | | | | 4.89% | | | |
| | | Class S2 | | | | | 11.21% | | | | | | 4.14% | | | | | | 4.74% | | | |
| | | S&P Target Risk® Conservative Index Total Return | | | | | 13.99% | | | | | | 4.84% | | | | | | 5.15% | | | |
| | | S&P Target Risk® Conservative Index Gross | | | | | 14.27% | | | | | | 5.10% | | | | | | 5.42% | | | |
| | | | | |
Based on a $10,000 initial investment, the graph and table above illustrate the total return of Voya Solution Conservative Portfolio against the indices indicated. An index is unmanaged and has no cash in its portfolio and imposes no sales charges. An investor cannot invest directly in an index.
The Portfolio’s performance is shown without the imposition of any expenses or charges which are, or may be, imposed under your variable annuity contract or variable life insurance policy. Total returns would have been lower if such expenses or charges were included.
The performance graph and table do not reflect the deduction of taxes that a shareholder will pay on Portfolio distributions or the redemption of Portfolio shares.
The performance shown may include the effect of fee waivers and/or expense reimbursements by the Investment Adviser and/or other service providers, which have the effect of increasing total return. Had all fees and expenses been considered, the total returns would have been lower.
The performance update illustrates performance for a variable investment option available through a variable
annuity contract or a variable life insurance policy. The performance shown indicates past performance and is not a projection or prediction of future results. Actual investment returns and principal value will fluctuate so that shares and/or units, at redemption, may be worth more or less than their original cost. Please log on to www.voyainvestments.com or call (800) 262-3862 to get performance through the most recent month end.
Portfolio holdings are subject to change daily.
(1)
Class R6 incepted on May 2, 2016. The Class R6 shares performance shown for the period prior to their inception date is the performance of Class I shares without adjustment for any differences in the expenses between the two classes. If adjusted for such differences, returns would be different.
Effective May 1, 2019, the Adviser changed the primary benchmark from the S&P Target Risk® Conservative Index Gross (“Gross Index”) to the S&P Target Risk® Conservative Index Total Return as the Adviser believes it more accurately reflects the investment experience of an investor in the benchmark’s components. Index returns include the reinvestment of dividends and distributions. Gross index returns reflect the addition of an amount estimated by the index sponsor to approximate the fees incurred by index components.
| Portfolio Managers’ Report | Voya Solution Income Portfolio |
| | | Average Annual Total Returns for the Periods Ended December 31, 2019 | | |
| | | | | | 1 Year | | | 5 Year | | | 10 Year | | |
| | | Class ADV | | | | | 12.87% | | | | | | 4.36% | | | | | | 5.27% | | | |
| | | Class I | | | | | 13.38% | | | | | | 4.87% | | | | | | 5.79% | | | |
| | | Class S | | | | | 13.13% | | | | | | 4.62% | | | | | | 5.53% | | | |
| | | Class S2 | | | | | 12.96% | | | | | | 4.46% | | | | | | 5.37% | | | |
| | | Class T | | | | | 12.54% | | | | | | 4.16% | | | | | | 5.06% | | | |
| | | S&P Target Date Retirement Income Index | | | | | 13.33% | | | | | | 4.67% | | | | | | 5.50% | | | |
| | | Russell 3000® Index | | | | | 31.02% | | | | | | 11.24% | | | | | | 13.42% | | | |
| | | MSCI EAFE® Index | | | | | 22.01% | | | | | | 5.67% | | | | | | 5.50% | | | |
| | | BCAB Index | | | | | 8.72% | | | | | | 3.05% | | | | | | 3.75% | | | |
| | | | | |
Based on a $10,000 initial investment, the graph and table above illustrate the total return of Voya Solution Income Portfolio against the indices indicated. An index is unmanaged and has no cash in its portfolio and imposes no sales charges. An investor cannot invest directly in an index.
The Portfolio’s performance is shown without the imposition of any expenses or charges which are, or may be, imposed under your variable annuity contract or variable life insurance policy. Total returns would have been lower if such expenses or charges were included.
The performance graph and table do not reflect the deduction of taxes that a shareholder will pay on Portfolio distributions or the redemption of Portfolio shares.
The performance shown may include the effect of fee waivers and/or expense reimbursements by the Investment Adviser and/or
other service providers, which have the effect of increasing total return. Had all fees and expenses been considered, the total returns would have been lower.
The performance update illustrates performance for a variable investment option available through a variable annuity contract or a variable life insurance policy. The performance shown indicates past performance and is not a projection or prediction of future results. Actual investment returns and principal value will fluctuate so that shares and/or units, at redemption, may be worth more or less than their original cost. Please log on to www.voyainvestments.com or call (800) 262-3862 to get performance through the most recent month end.
Portfolio holdings are subject to change daily.
| Voya Solution Moderately Aggressive Portfolio | Portfolio Managers’ Report |
| | | Average Annual Total Returns for the Periods Ended December 31, 2019 | | |
| | | | | | 1 Year | | | 5 Year | | | Since Inception
of Classes ADV, I, S, and S2
April 30, 2010 | | |
| | | Class ADV | | | | | 22.32% | | | | | | 6.41% | | | | | | 7.81% | | | |
| | | Class I | | | | | 22.99% | | | | | | 6.95% | | | | | | 8.36% | | | |
| | | Class R6(1) | | | | | 22.91% | | | | | | 6.93% | | | | | | 8.36% | | | |
| | | Class S | | | | | 22.61% | | | | | | 6.67% | | | | | | 8.09% | | | |
| | | Class S2 | | | | | 22.49% | | | | | | 6.54% | | | | | | 7.94% | | | |
| | | S&P Target Risk Aggressive® Index Total Return | | | | | 22.79% | | | | | | 7.79% | | | | | | 9.24% | | | |
| | | S&P Target Risk Aggressive® Index Gross | | | | | 23.09% | | | | | | 8.06% | | | | | | 9.51% | | | |
| | | | | |
Based on a $10,000 initial investment, the graph and table above illustrate the total return of Voya Solution Moderately Aggressive Portfolio against the indices indicated. An index is unmanaged and has no cash in its portfolio and imposes no sales charges. An investor cannot invest directly in an index.
The Portfolio’s performance is shown without the imposition of any expenses or charges which are, or may be, imposed under your variable annuity contract or variable life insurance policy. Total returns would have been lower if such expenses or charges were included.
The performance graph and table do not reflect the deduction of taxes that a shareholder will pay on Portfolio distributions or the redemption of Portfolio shares.
The performance shown may include the effect of fee waivers and/or expense reimbursements by the Investment Adviser and/or other service providers, which have the effect of increasing total return. Had all fees and expenses been considered, the total returns would have been lower.
The performance update illustrates performance for a variable investment option available through a variable
annuity contract or a variable life insurance policy. The performance shown indicates past performance and is not a projection or prediction of future results. Actual investment returns and principal value will fluctuate so that shares and/or units, at redemption, may be worth more or less than their original cost. Please log on to www.voyainvestments.com or call (800) 262-3862 to get performance through the most recent month end.
Portfolio holdings are subject to change daily.
(1)
Class R6 incepted on May 2, 2016. The Class R6 shares performance shown for the period prior to their inception date is the performance of Class I shares without adjustment for any differences in the expenses between the two classes. If adjusted for such differences, returns would be different.
Effective May 1, 2019, the Adviser changed the primary benchmark from the S&P Target Risk Aggressive® Index Gross (“Gross Index”) to the S&P Target Risk Aggressive® Index Total Return as the Adviser believes it more accurately reflects the investment experience of an investor in the benchmark’s components. Index returns include the reinvestment of dividends and distributions. Gross index returns reflect the addition of an amount estimated by the index sponsor to approximate the fees incurred by index components.
| Portfolio Managers’ Report | Voya Solution Moderately Conservative Portfolio |
| | | Average Annual Total Returns for the Periods Ended December 31, 2019 | | |
| | | | | | 1 Year | | | 5 Year | | | 10 Year | | | Since Inception
of Class S2
April 30, 2010 | | |
| | | Class ADV | | | | | 14.61% | | | | | | 4.81% | | | | | | 5.92% | | | | | | — | | | |
| | | Class I | | | | | 15.17% | | | | | | 5.35% | | | | | | 6.52% | | | | | | — | | | |
| | | Class R6(1) | | | | | 15.18% | | | | | | 5.32% | | | | | | 6.50% | | | | | | — | | | |
| | | Class S | | | | | 14.96% | | | | | | 5.07% | | | | | | 6.24% | | | | | | — | | | |
| | | Class S2 | | | | | 14.74% | | | | | | 4.91% | | | | | | — | | | | | | 5.82% | | | |
| | | S&P Target Risk® Moderate Index Total Return | | | | | 15.71% | | | | | | 5.44% | | | | | | 6.10% | | | | | | 6.00% | | | |
| | | S&P Target Risk® Moderate Index Gross | | | | | 16.00% | | | | | | 5.70% | | | | | | 6.36% | | | | | | 6.26% | | | |
| | | | | |
Based on a $10,000 initial investment, the graph and table above illustrate the total return of Voya Solution Moderately Conservative Portfolio against the indices indicated. An index is unmanaged and has no cash in its portfolio and imposes no sales charges. An investor cannot invest directly in an index.
The Portfolio’s performance is shown without the imposition of any expenses or charges which are, or may be, imposed under your variable annuity contract or variable life insurance policy. Total returns would have been lower if such expenses or charges were included.
The performance graph and table do not reflect the deduction of taxes that a shareholder will pay on Portfolio distributions or the redemption of Portfolio shares.
The performance shown may include the effect of fee waivers and/or expense reimbursements by the Investment Adviser and/or other service providers, which have the effect of increasing total return. Had all fees and expenses been considered, the total returns would have been lower.
The performance update illustrates performance for a variable investment option available through a variable
annuity contract or a variable life insurance policy. The performance shown indicates past performance and is not a projection or prediction of future results. Actual investment returns and principal value will fluctuate so that shares and/or units, at redemption, may be worth more or less than their original cost. Please log on to www.voyainvestments.com or call (800) 262-3862 to get performance through the most recent month end.
Portfolio holdings are subject to change daily.
(1)
Class R6 incepted on May 2, 2016. The Class R6 shares performance shown for the period prior to their inception date is the performance of Class I shares without adjustment for any differences in the expenses between the two classes. If adjusted for such differences, returns would be different.
Effective May 1, 2019, the Adviser changed the primary benchmark from the S&P Target Risk® Moderate Index Gross (“Gross Index”) to the S&P Target Risk® Moderate Index Total Return as the Adviser believes it more accurately reflects the investment experience of an investor in the benchmark’s components. Index returns include the reinvestment of dividends and distributions. Gross index returns reflect the addition of an amount estimated by the index sponsor to approximate the fees incurred by index components.
| Voya Solution 2020 Portfolio | Portfolio Managers’ Report |
| | | Average Annual Total Returns for the Periods Ended December 31, 2019 | | |
| | | | | | 1 Year | | | 5 Year | | | Since Inception
of Classes ADV, I, S, S2 and T
October 3, 2011 | | |
| | | Class ADV | | | | | 14.70% | | | | | | 5.50% | | | | | | 8.09% | | | |
| | | Class I | | | | | 15.22% | | | | | | 6.02% | | | | | | 8.63% | | | |
| | | Class S | | | | | 14.89% | | | | | | 5.78% | | | | | | 8.34% | | | |
| | | Class S2 | | | | | 14.79% | | | | | | 5.63% | | | | | | 8.21% | | | |
| | | Class T | | | | | 14.44% | | | | | | 5.29% | | | | | | 7.92% | | | |
| | | S&P Target Date 2020 Index | | | | | 16.52% | | | | | | 6.16% | | | | | | 8.71% | | | |
| | | | | |
Based on a $10,000 initial investment, the graph and table above illustrate the total return of Voya Solution 2020 Portfolio against the indices indicated. An index is unmanaged and has no cash in its portfolio and imposes no sales charges. An investor cannot invest directly in an index.
The Portfolio’s performance is shown without the imposition of any expenses or charges which are, or may be, imposed under your variable annuity contract or variable life insurance policy. Total returns would have been lower if such expenses or charges were included.
The performance graph and table do not reflect the deduction of taxes that a shareholder will pay on Portfolio distributions or the redemption of Portfolio shares.
The performance shown may include the effect of fee waivers and/or expense reimbursements by the Investment Adviser
and/or other service providers, which have the effect of increasing total return. Had all fees and expenses been considered, the total returns would have been lower.
The performance update illustrates performance for a variable investment option available through a variable annuity contract or a variable life insurance policy. The performance shown indicates past performance and is not a projection or prediction of future results. Actual investment returns and principal value will fluctuate so that shares and/or units, at redemption, may be worth more or less than their original cost. Please log on to www.voyainvestments.com or call (800) 262-3862 to get performance through the most recent month end.
Portfolio holdings are subject to change daily.
| Portfolio Managers’ Report | Voya Solution 2025 Portfolio |
| | | Average Annual Total Returns for the Periods Ended December 31, 2019 | | |
| | | | | | 1 Year | | | 5 Year | | | 10 Year | | |
| | | Class ADV | | | | | 17.79% | | | | | | 6.04% | | | | | | 7.36% | | | |
| | | Class I | | | | | 18.33% | | | | | | 6.58% | | | | | | 7.90% | | | |
| | | Class S | | | | | 18.12% | | | | | | 6.31% | | | | | | 7.63% | | | |
| | | Class S2 | | | | | 17.92% | | | | | | 6.15% | | | | | | 7.46% | | | |
| | | Class T | | | | | 17.51% | | | | | | 5.82% | | | | | | 7.15% | | | |
| | | S&P Target Date 2025 Index | | | | | 18.38% | | | | | | 6.73% | | | | | | 8.13% | | | |
| | | Russell 3000® Index | | | | | 31.02% | | | | | | 11.24% | | | | | | 13.42% | | | |
| | | MSCI EAFE® Index | | | | | 22.01% | | | | | | 5.67% | | | | | | 5.50% | | | |
| | | BCAB Index | | | | | 8.72% | | | | | | 3.05% | | | | | | 3.75% | | | |
| | | | | |
Based on a $10,000 initial investment, the graph and table above illustrate the total return of Voya Solution 2025 Portfolio against the indices indicated. An index is unmanaged and has no cash in its portfolio and imposes no sales charges. An investor cannot invest directly in an index.
The Portfolio’s performance is shown without the imposition of any expenses or charges which are, or may be, imposed under your variable annuity contract or variable life insurance policy. Total returns would have been lower if such expenses or charges were included.
The performance graph and table do not reflect the deduction of taxes that a shareholder will pay on Portfolio distributions or the redemption of Portfolio shares.
The performance shown may include the effect of fee waivers and/or expense reimbursements by the Investment Adviser
and/or other service providers, which have the effect of increasing total return. Had all fees and expenses been considered, the total returns would have been lower.
The performance update illustrates performance for a variable investment option available through a variable annuity contract or a variable life insurance policy. The performance shown indicates past performance and is not a projection or prediction of future results. Actual investment returns and principal value will fluctuate so that shares and/or units, at redemption, may be worth more or less than their original cost. Please log on to www.voyainvestments.com or call (800) 262-3862 to get performance through the most recent month end.
Portfolio holdings are subject to change daily.
| Voya Solution 2030 Portfolio | Portfolio Managers’ Report |
| | | Average Annual Total Returns for the Periods Ended December 31, 2019 | | |
| | | | | | 1 Year | | | 5 Year | | | Since Inception
of Classes ADV, I, S, S2 and T
October 3, 2011 | | |
| | | Class ADV | | | | | 20.13% | | | | | | 6.73% | | | | | | 9.99% | | | |
| | | Class I | | | | | 20.65% | | | | | | 7.24% | | | | | | 10.54% | | | |
| | | Class S | | | | | 20.36% | | | | | | 7.01% | | | | | | 10.23% | | | |
| | | Class S2 | | | | | 20.24% | | | | | | 6.82% | | | | | | 10.06% | | | |
| | | Class T | | | | | 19.86% | | | | | | 6.45% | | | | | | 9.80% | | | |
| | | S&P Target Date 2030 Index | | | | | 20.38% | | | | | | 7.27% | | | | | | 10.36% | | | |
| | | | | |
Based on a $10,000 initial investment, the graph and table above illustrate the total return of Voya Solution 2030 Portfolio against the index indicated. The index is unmanaged, has no cash in its portfolio and imposes no sales charges. An investor cannot invest directly in an index.
The Portfolio’s performance is shown without the imposition of any expenses or charges which are, or may be, imposed under your variable annuity contract or variable life insurance policy. Total returns would have been lower if such expenses or charges were included.
The performance graph and table do not reflect the deduction of taxes that a shareholder will pay on Portfolio distributions or the redemption of Portfolio shares.
The performance shown may include the effect of fee waivers and/or expense reimbursements by the Investment Adviser
and/or other service providers, which have the effect of increasing total return. Had all fees and expenses been considered, the total returns would have been lower.
The performance update illustrates performance for a variable investment option available through a variable contract or a variable life insurance policy. The performance shown indicates past performance and is not a projection or prediction of future results. Actual investment returns and principal value will fluctuate so that shares and/or units, at redemption, may be worth more or less than their original cost. Please log on to www.voyainvestments.com or call (800) 262-3862 to get performance through the most recent month end.
Portfolio holdings are subject to change daily.
| Portfolio Managers’ Report | Voya Solution 2035 Portfolio |
| | | Average Annual Total Returns for the Periods Ended December 31, 2019 | | |
| | | | | | 1 Year | | | 5 Year | | | 10 Year | | |
| | | Class ADV | | | | | 21.53% | | | | | | 6.87% | | | | | | 8.22% | | | |
| | | Class I | | | | | 22.22% | | | | | | 7.40% | | | | | | 8.75% | | | |
| | | Class S | | | | | 21.94% | | | | | | 7.13% | | | | | | 8.48% | | | |
| | | Class S2 | | | | | 21.63% | | | | | | 6.98% | | | | | | 8.33% | | | |
| | | Class T | | | | | 21.36% | | | | | | 6.65% | | | | | | 8.00% | | | |
| | | S&P Target Date 2035 Index | | | | | 22.18% | | | | | | 7.77% | | | | | | 9.13% | | | |
| | | Russell 3000® Index | | | | | 31.02% | | | | | | 11.24% | | | | | | 13.42% | | | |
| | | MSCI EAFE® Index | | | | | 22.01% | | | | | | 5.67% | | | | | | 5.50% | | | |
| | | BCAB Index | | | | | 8.72% | | | | | | 3.05% | | | | | | 3.75% | | | |
| | | | | |
Based on a $10,000 initial investment, the graph and table above illustrate the total return of Voya Solution 2035 Portfolio against the indices indicated. An index is unmanaged, has no cash in its portfolio and imposes no sales charges. An investor cannot invest directly in an index.
The Portfolio’s performance is shown without the imposition of any expenses or charges which are, or may be, imposed under your variable annuity contract or variable life insurance policy. Total returns would have been lower if such expenses or charges were included.
The performance graph and table do not reflect the deduction of taxes that a shareholder will pay on Portfolio distributions or the redemption of Portfolio shares.
The performance shown may include the effect of fee waivers and/or expense reimbursements by the Investment Adviser and/
or other service providers, which have the effect of increasing total return. Had all fees and expenses been considered, the total returns would have been lower.
The performance update illustrates performance for a variable investment option available through a variable contract or a variable life insurance policy. The performance shown indicates past performance and is not a projection or prediction of future results. Actual investment returns and principal value will fluctuate so that shares and/or units, at redemption, may be worth more or less than their original cost. Please log on to www.voyainvestments.com or call (800) 262-3862 to get performance through the most recent month end.
Portfolio holdings are subject to change daily.
| Voya Solution 2040 Portfolio | Portfolio Managers’ Report |
| | | Average Annual Total Returns for the Periods Ended December 31, 2019 | | |
| | | | | | 1 Year | | | 5 Year | | | Since Inception
of Classes ADV, I, S, S2 and T
October 3, 2011 | | |
| | | Class ADV | | | | | 22.82% | | | | | | 7.26% | | | | | | 11.11% | | | |
| | | Class I | | | | | 23.44% | | | | | | 7.82% | | | | | | 11.69% | | | |
| | | Class S | | | | | 23.07% | | | | | | 7.56% | | | | | | 11.37% | | | |
| | | Class S2 | | | | | 22.93% | | | | | | 7.35% | | | | | | 11.21% | | | |
| | | Class T | | | | | 22.50% | | | | | | 7.02% | | | | | | 10.89% | | | |
| | | S&P Target Date 2040 Index | | | | | 23.37% | | | | | | 8.11% | | | | | | 11.51% | | | |
| | | | | |
Based on a $10,000 initial investment, the graph and table above illustrate the total return of Voya Solution 2040 Portfolio against the index indicated. The index is unmanaged and has no cash in its portfolio and imposes no sales charges. An investor cannot invest directly in an index.
The Portfolio’s performance is shown without the imposition of any expenses or charges which are, or may be, imposed under your variable annuity contract or variable life insurance policy. Total returns would have been lower if such expenses or charges were included.
The performance graph and table do not reflect the deduction of taxes that a shareholder will pay on Portfolio distributions or the redemption of Portfolio shares.
The performance shown may include the effect of fee waivers and/or expense reimbursements by the Investment Adviser
and/or other service providers, which have the effect of increasing total return. Had all fees and expenses been considered, the total returns would have been lower.
The performance update illustrates performance for a variable investment option available through a variable annuity contract or a variable life insurance policy. The performance shown indicates past performance and is not a projection or prediction of future results. Actual investment returns and principal value will fluctuate so that shares and/or units, at redemption, may be worth more or less than their original cost. Please log on to www.voyainvestments.com or call (800) 262-3862 to get performance through the most recent month end.
Portfolio holdings are subject to change daily.
| Portfolio Managers’ Report | Voya Solution 2045 Portfolio |
| | | Average Annual Total Returns for the Periods Ended December 31, 2019 | | |
| | | | | | 1 Year | | | 5 Year | | | 10 Year | | |
| | | Class ADV | | | | | 23.59% | | | | | | 7.01% | | | | | | 8.64% | | | |
| | | Class I | | | | | 24.29% | | | | | | 7.56% | | | | | | 9.18% | | | |
| | | Class S | | | | | 23.90% | | | | | | 7.28% | | | | | | 8.91% | | | |
| | | Class S2 | | | | | 23.68% | | | | | | 7.13% | | | | | | 8.74% | | | |
| | | Class T | | | | | 23.31% | | | | | | 6.80% | | | | | | 8.41% | | | |
| | | S&P Target Date 2045 Index | | | | | 24.02% | | | | | | 8.32% | | | | | | 9.67% | | | |
| | | Russell 3000® Index | | | | | 31.02% | | | | | | 11.24% | | | | | | 13.42% | | | |
| | | MSCI EAFE® Index | | | | | 22.01% | | | | | | 5.67% | | | | | | 5.50% | | | |
| | | BCAB Index | | | | | 8.72% | | | | | | 3.05% | | | | | | 3.75% | | | |
| | | | | |
Based on a $10,000 initial investment, the graph and table above illustrate the total return of Voya Solution 2045 Portfolio against the indices indicated. An index is unmanaged and has no cash in its portfolio and imposes no sales charges. An investor cannot invest directly in an index.
The Portfolio’s performance is shown without the imposition of any expenses or charges which are, or may be, imposed under your variable annuity contract or variable life insurance policy. Total returns would have been lower if such expenses or charges were included.
The performance graph and table do not reflect the deduction of taxes that a shareholder will pay on Portfolio distributions or the redemption of Portfolio shares.
The performance shown may include the effect of fee waivers and/or expense reimbursements by the Investment Adviser
and/or other service providers, which have the effect of increasing total return. Had all fees and expenses been considered, the total returns would have been lower.
The performance update illustrates performance for a variable investment option available through a variable annuity contract or a variable life insurance policy. The performance shown indicates past performance and is not a projection or prediction of future results. Actual investment returns and principal value will fluctuate so that shares and/or units, at redemption, may be worth more or less than their original cost. Please log on to www.voyainvestments.com or call (800) 262-3862 to get performance through the most recent month end.
Portfolio holdings are subject to change daily.
| Voya Solution 2050 Portfolio | Portfolio Managers’ Report |
| | | Average Annual Total Returns for the Periods Ended December 31, 2019 | | |
| | | | | | 1 Year | | | 5 Year | | | Since Inception
of Classes ADV, I, S, S2 and T
October 3, 2011 | | |
| | | Class ADV | | | | | 24.13% | | | | | | 7.30% | | | | | | 11.23% | | | |
| | | Class I | | | | | 24.74% | | | | | | 7.89% | | | | | | 11.83% | | | |
| | | Class S | | | | | 24.41% | | | | | | 7.59% | | | | | | 11.49% | | | |
| | | Class S2 | | | | | 24.25% | | | | | | 7.41% | | | | | | 11.32% | | | |
| | | Class T | | | | | 23.80% | | | | | | 7.06% | | | | | | 11.04% | | | |
| | | S&P Target Date 2050 Index | | | | | 24.35% | | | | | | 8.49% | | | | | | 12.11% | | | |
| | | | | |
Based on a $10,000 initial investment, the graph and table above illustrate the total return of Voya Solution 2050 Portfolio against the index indicated. The index is unmanaged and has no cash in its portfolio and imposes no sales charges. An investor cannot invest directly in an index.
The Portfolio’s performance is shown without the imposition of any expenses or charges which are, or may be, imposed under your variable annuity contract or variable life insurance policy. Total returns would have been lower if such expenses or charges were included.
The performance graph and table do not reflect the deduction of taxes that a shareholder will pay on Portfolio distributions or the redemption of Portfolio shares.
The performance shown may include the effect of fee waivers and/or expense reimbursements by the Investment Adviser
and/or other service providers, which have the effect of increasing total return. Had all fees and expenses been considered, the total returns would have been lower.
The performance update illustrates performance for a variable investment option available through a variable annuity contract or a variable life insurance policy. The performance shown indicates past performance and is not a projection or prediction of future results. Actual investment returns and principal value will fluctuate so that shares and/or units, at redemption, may be worth more or less than their original cost. Please log on to www.voyainvestments.com or call (800) 262-3862 to get performance through the most recent month end.
Portfolio holdings are subject to change daily.
| Portfolio Managers’ Report | Voya Solution 2055 Portfolio |
| | | Average Annual Total Returns for the Periods Ended December 31, 2019 | | |
| | | | | | 1 Year | | | 5 Year | | | Since Inception
of Classes ADV, I, S, S2 and T
March 8, 2010 | | |
| | | Class ADV | | | | | 24.13% | | | | | | 7.14% | | | | | | 8.73% | | | |
| | | Class I | | | | | 24.76% | | | | | | 7.67% | | | | | | 9.27% | | | |
| | | Class S | | | | | 24.50% | | | | | | 7.41% | | | | | | 9.00% | | | |
| | | Class S2 | | | | | 24.28% | | | | | | 7.24% | | | | | | 8.84% | | | |
| | | Class T | | | | | 23.93% | | | | | | 6.92% | | | | | | 8.53% | | | |
| | | S&P Target Date 2055 Index | | | | | 24.48% | | | | | | 8.58% | | | | | | 9.91% | | | |
| | | | | |
Based on a $10,000 initial investment, the graph and table above illustrate the total return of Voya Solution 2055 Portfolio against the index indicated. The index is unmanaged and has no cash in its portfolio and imposes no sales charges. An investor cannot invest directly in an index.
The Portfolio’s performance is shown without the imposition of any expenses or charges which are, or may be, imposed under your variable annuity contract or variable life insurance policy. Total returns would have been lower if such expenses or charges were included.
The performance graph and table do not reflect the deduction of taxes that a shareholder will pay on Portfolio distributions or the redemption of Portfolio shares.
The performance shown may include the effect of fee waivers and/or expense reimbursements by the Investment Adviser
and/or other service providers, which have the effect of increasing total return. Had all fees and expenses been considered, the total returns would have been lower.
The performance update illustrates performance for a variable investment option available through a variable annuity contract or a variable life insurance policy. The performance shown indicates past performance and is not a projection or prediction of future results. Actual investment returns and principal value will fluctuate so that shares and/or units, at redemption, may be worth more or less than their original cost. Please log on to www.voyainvestments.com or call (800) 262-3862 to get performance through the most recent month end.
Portfolio holdings are subject to change daily.
| Voya Solution 2060 Portfolio | Portfolio Managers’ Report |
| | | Average Annual Total Returns for the Periods Ended December 31, 2019 | | |
| | | | | | 1 Year | | | Since Inception
of Classes ADV, I, S, S2 and T
February 9, 2015 | | |
| | | Class ADV | | | | | 24.12% | | | | | | 7.35% | | | |
| | | Class I | | | | | 24.79% | | | | | | 7.85% | | | |
| | | Class S | | | | | 24.45% | | | | | | 7.50% | | | |
| | | Class S2 | | | | | 24.26% | | | | | | 7.41% | | | |
| | | Class T | | | | | 23.96% | | | | | | 7.05% | | | |
| | | S&P Target Date 2060+ Index | | | | | 24.73% | | | | | | 8.72% | | | |
| | | | | |
Based on a $10,000 initial investment, the graph and table above illustrate the total return of Voya Solution 2060 Portfolio against the index indicated. The index is unmanaged and has no cash in its portfolio and imposes no sales charges. An investor cannot invest directly in an index.
The Portfolio’s performance is shown without the imposition of any expenses or charges which are, or may be, imposed under your variable annuity contract or variable life insurance policy. Total returns would have been lower if such expenses or charges were included.
The performance graph and table do not reflect the deduction of taxes that a shareholder will pay on Portfolio distributions or the redemption of Portfolio shares.
The performance shown may include the effect of fee waivers and/or expense reimbursements by the Investment Adviser
and/or other service providers, which have the effect of increasing total return. Had all fees and expenses been considered, the total returns would have been lower.
The performance update illustrates performance for a variable investment option available through a variable annuity contract or a variable life insurance policy. The performance shown indicates past performance and is not a projection or prediction of future results. Actual investment returns and principal value will fluctuate so that shares and/or units, at redemption, may be worth more or less than their original cost. Please log on to www.voyainvestments.com or call (800) 262-3862 to get performance through the most recent month end.
Portfolio holdings are subject to change daily.
shareholder expense examples (Unaudited)
As a shareholder of a Portfolio, you incur two types of costs: (1) transaction costs, including redemption fees and exchange fees; and (2) ongoing costs including management fees, distribution and/or service (12b-1) fees, and other Portfolio expenses. These Examples are intended to help you understand your ongoing costs (in dollars) of investing in a Portfolio and to compare these costs with the ongoing costs of investing in other mutual funds.
The Examples are based on an investment of $1,000 invested at the beginning of the period and held for the entire period from July 1, 2019 to December 31, 2019. The Portfolios’ expenses are shown without the imposition of any charges which are, or may be, imposed under your variable annuity contract, variable life insurance policy, qualified pension or retirement plan. Expenses would have been higher if such charges were included.
Actual Expenses
The left section of the table shown below, “Actual Portfolio Return,” provides information about actual account values and actual expenses. You may use the information in this section, together with the amount you invested, to estimate the expenses that you paid over the period. Simply divide your account value by $1,000 (for example, an $8,600 account value divided by $1,000 = 8.6), then multiply the result by the number in the first section under the heading entitled “Expenses Paid During the Period” to estimate the expenses you paid on your account during this period.
Hypothetical Example for Comparison Purposes
The right section of the table shown below, “Hypothetical (5% return before expenses),” provides information about hypothetical account values and hypothetical expenses based on a Portfolio’s actual expense ratio and an assumed rate of return of 5% per year before expenses, which is not a Portfolio’s actual return. The hypothetical account values and expenses may not be used to estimate the actual ending account balance or expenses you paid for the period. You may use this information to compare the ongoing costs of investing in a Portfolio and other mutual funds. To do so, compare this 5% hypothetical example with the 5% hypothetical examples that appear in the shareholder reports of the other mutual funds.
Please note that the expenses shown in the table are meant to highlight your ongoing costs only and do not reflect any transactional costs, such as redemption fees or exchange fees. Therefore, the hypothetical section of the table is useful in comparing ongoing costs only, and will not help you determine the relative total costs of owning different mutual funds. In addition, if these transactional costs were included, your costs would have been higher.
| | | | Actual Portfolio Return | | | Hypothetical (5% return before expenses) | |
| | | | Beginning
Account
Value
July 1,
2019 | | | Ending
Account
Value
December 31,
2019 | | | Annualized
Expense
Ratio* | | | Expenses Paid
During the
Period Ended
December 31,
2019** | | | Beginning
Account
Value
July 1,
2019 | | | Ending
Account
Value
December 31,
2019 | | | Annualized
Expense
Ratio* | | | Expenses Paid
During the
Period Ended
December 31,
2019** | |
| Voya Solution Aggressive Portfolio | |
| Class ADV | | | | $ | 1,000.00 | | | | | $ | 1,078.30 | | | | | | 0.75% | | | | | $ | 3.93 | | | | | $ | 1,000.00 | | | | | $ | 1,021.42 | | | | | | 0.75% | | | | | $ | 3.82 | | |
| Class I | | | | | 1,000.00 | | | | | | 1,081.40 | | | | | | 0.25 | | | | | | 1.31 | | | | | | 1,000.00 | | | | | | 1,023.95 | | | | | | 0.25 | | | | | | 1.28 | | |
| Class R6 | | | | | 1,000.00 | | | | | | 1,080.60 | | | | | | 0.25 | | | | | | 1.31 | | | | | | 1,000.00 | | | | | | 1,023.95 | | | | | | 0.25 | | | | | | 1.28 | | |
| Class S | | | | | 1,000.00 | | | | | | 1,079.90 | | | | | | 0.50 | | | | | | 2.62 | | | | | | 1,000.00 | | | | | | 1,022.68 | | | | | | 0.50 | | | | | | 2.55 | | |
| Class S2 | | | | | 1,000.00 | | | | | | 1,078.70 | | | | | | 0.65 | | | | | | 3.41 | | | | | | 1,000.00 | | | | | | 1,021.93 | | | | | | 0.65 | | | | | | 3.31 | | |
| Voya Solution Balanced Portfolio | |
| Class ADV | | | | $ | 1,000.00 | | | | | $ | 1,061.20 | | | | | | 0.75% | | | | | $ | 3.90 | | | | | $ | 1,000.00 | | | | | $ | 1,021.42 | | | | | | 0.75% | | | | | $ | 3.82 | | |
| Class I | | | | | 1,000.00 | | | | | | 1,064.00 | | | | | | 0.25 | | | | | | 1.30 | | | | | | 1,000.00 | | | | | | 1,023.95 | | | | | | 0.25 | | | | | | 1.28 | | |
| Class R6 | | | | | 1,000.00 | | | | | | 1,064.00 | | | | | | 0.25 | | | | | | 1.30 | | | | | | 1,000.00 | | | | | | 1,023.95 | | | | | | 0.25 | | | | | | 1.28 | | |
| Class S | | | | | 1,000.00 | | | | | | 1,062.60 | | | | | | 0.50 | | | | | | 2.60 | | | | | | 1,000.00 | | | | | | 1,022.68 | | | | | | 0.50 | | | | | | 2.55 | | |
| Class S2 | | | | | 1,000.00 | | | | | | 1,061.30 | | | | | | 0.65 | | | | | | 3.38 | | | | | | 1,000.00 | | | | | | 1,021.93 | | | | | | 0.65 | | | | | | 3.31 | | |
| Voya Solution Conservative Portfolio | |
| Class ADV | | | | $ | 1,000.00 | | | | | $ | 1,032.40 | | | | | | 0.67% | | | | | $ | 3.43 | | | | | $ | 1,000.00 | | | | | $ | 1,021.83 | | | | | | 0.67% | | | | | $ | 3.41 | | |
| Class I | | | | | 1,000.00 | | | | | | 1,036.00 | | | | | | 0.17 | | | | | | 0.87 | | | | | | 1,000.00 | | | | | | 1,024.35 | | | | | | 0.17 | | | | | | 0.87 | | |
| Class R6 | | | | | 1,000.00 | | | | | | 1,036.00 | | | | | | 0.17 | | | | | | 0.87 | | | | | | 1,000.00 | | | | | | 1,024.35 | | | | | | 0.17 | | | | | | 0.87 | | |
| Class S | | | | | 1,000.00 | | | | | | 1,034.10 | | | | | | 0.42 | | | | | | 2.15 | | | | | | 1,000.00 | | | | | | 1,023.09 | | | | | | 0.42 | | | | | | 2.14 | | |
| Class S2 | | | | | 1,000.00 | | | | | | 1,033.50 | | | | | | 0.57 | | | | | | 2.92 | | | | | | 1,000.00 | | | | | | 1,022.33 | | | | | | 0.57 | | | | | | 2.91 | | |
shareholder expense examples (Unaudited) (continued)
| | | | Actual Portfolio Return | | | Hypothetical (5% return before expenses) | |
| | | | Beginning
Account
Value
July 1,
2019 | | | Ending
Account
Value
December 31,
2019 | | | Annualized
Expense
Ratio* | | | Expenses Paid
During the
Period Ended
December 31,
2019** | | | Beginning
Account
Value
July 1,
2019 | | | Ending
Account
Value
December 31,
2019 | | | Annualized
Expense
Ratio* | | | Expenses Paid
During the
Period Ended
December 31,
2019** | |
| Voya Solution Income Portfolio | |
| Class ADV | | | | $ | 1,000.00 | | | | | $ | 1,037.50 | | | | | | 0.69% | | | | | $ | 3.54 | | | | | $ | 1,000.00 | | | | | $ | 1,021.73 | | | | | | 0.69% | | | | | $ | 3.52 | | |
| Class I | | | | | 1,000.00 | | | | | | 1,039.90 | | | | | | 0.19 | | | | | | 0.98 | | | | | | 1,000.00 | | | | | | 1,024.25 | | | | | | 0.19 | | | | | | 0.97 | | |
| Class S | | | | | 1,000.00 | | | | | | 1,037.70 | | | | | | 0.44 | | | | | | 2.26 | | | | | | 1,000.00 | | | | | | 1,022.99 | | | | | | 0.44 | | | | | | 2.24 | | |
| Class S2 | | | | | 1,000.00 | | | | | | 1,037.60 | | | | | | 0.59 | | | | | | 3.03 | | | | | | 1,000.00 | | | | | | 1,022.23 | | | | | | 0.59 | | | | | | 3.01 | | |
| Class T | | | | | 1,000.00 | | | | | | 1,035.60 | | | | | | 0.89 | | | | | | 4.57 | | | | | | 1,000.00 | | | | | | 1,020.72 | | | | | | 0.89 | | | | | | 4.53 | | |
| Voya Solution Moderately Aggressive Portfolio | |
| Class ADV | | | | $ | 1,000.00 | | | | | $ | 1,070.10 | | | | | | 0.76% | | | | | $ | 3.97 | | | | | $ | 1,000.00 | | | | | $ | 1,021.37 | | | | | | 0.76% | | | | | $ | 3.87 | | |
| Class I | | | | | 1,000.00 | | | | | | 1,072.80 | | | | | | 0.26 | | | | | | 1.36 | | | | | | 1,000.00 | | | | | | 1,023.89 | | | | | | 0.26 | | | | | | 1.33 | | |
| Class R6 | | | | | 1,000.00 | | | | | | 1,072.90 | | | | | | 0.26 | | | | | | 1.36 | | | | | | 1,000.00 | | | | | | 1,023.89 | | | | | | 0.26 | | | | | | 1.33 | | |
| Class S | | | | | 1,000.00 | | | | | | 1,071.30 | | | | | | 0.51 | | | | | | 2.66 | | | | | | 1,000.00 | | | | | | 1,022.63 | | | | | | 0.51 | | | | | | 2.60 | | |
| Class S2 | | | | | 1,000.00 | | | | | | 1,071.20 | | | | | | 0.66 | | | | | | 3.45 | | | | | | 1,000.00 | | | | | | 1,021.88 | | | | | | 0.66 | | | | | | 3.36 | | |
| Voya Solution Moderately Conservative Portfolio | |
| Class ADV | | | | $ | 1,000.00 | | | | | $ | 1,044.30 | | | | | | 0.70% | | | | | $ | 3.61 | | | | | $ | 1,000.00 | | | | | $ | 1,021.68 | | | | | | 0.70% | | | | | $ | 3.57 | | |
| Class I | | | | | 1,000.00 | | | | | | 1,047.40 | | | | | | 0.20 | | | | | | 1.03 | | | | | | 1,000.00 | | | | | | 1,024.20 | | | | | | 0.20 | | | | | | 1.02 | | |
| Class R6 | | | | | 1,000.00 | | | | | | 1,047.40 | | | | | | 0.20 | | | | | | 1.03 | | | | | | 1,000.00 | | | | | | 1,024.20 | | | | | | 0.20 | | | | | | 1.02 | | |
| Class S | | | | | 1,000.00 | | | | | | 1,046.30 | | | | | | 0.45 | | | | | | 2.32 | | | | | | 1,000.00 | | | | | | 1,022.94 | | | | | | 0.45 | | | | | | 2.29 | | |
| Class S2 | | | | | 1,000.00 | | | | | | 1,045.30 | | | | | | 0.60 | | | | | | 3.09 | | | | | | 1,000.00 | | | | | | 1,022.18 | | | | | | 0.60 | | | | | | 3.06 | | |
| Voya Solution 2020 Portfolio | |
| Class ADV | | | | $ | 1,000.00 | | | | | $ | 1,039.10 | | | | | | 0.71% | | | | | $ | 3.65 | | | | | $ | 1,000.00 | | | | | $ | 1,021.63 | | | | | | 0.71% | | | | | $ | 3.62 | | |
| Class I | | | | | 1,000.00 | | | | | | 1,041.40 | | | | | | 0.21 | | | | | | 1.08 | | | | | | 1,000.00 | | | | | | 1,024.15 | | | | | | 0.21 | | | | | | 1.07 | | |
| Class S | | | | | 1,000.00 | | | | | | 1,040.30 | | | | | | 0.46 | | | | | | 2.37 | | | | | | 1,000.00 | | | | | | 1,022.89 | | | | | | 0.46 | | | | | | 2.35 | | |
| Class S2 | | | | | 1,000.00 | | | | | | 1,039.80 | | | | | | 0.61 | | | | | | 3.14 | | | | | | 1,000.00 | | | | | | 1,022.13 | | | | | | 0.61 | | | | | | 3.11 | | |
| Class T | | | | | 1,000.00 | | | | | | 1,037.60 | | | | | | 0.91 | | | | | | 4.67 | | | | | | 1,000.00 | | | | | | 1,020.62 | | | | | | 0.91 | | | | | | 4.63 | | |
| Voya Solution 2025 Portfolio | |
| Class ADV | | | | $ | 1,000.00 | | | | | $ | 1,055.10 | | | | | | 0.71% | | | | | $ | 3.68 | | | | | $ | 1,000.00 | | | | | $ | 1,021.63 | | | | | | 0.71% | | | | | $ | 3.62 | | |
| Class I | | | | | 1,000.00 | | | | | | 1,057.70 | | | | | | 0.21 | | | | | | 1.09 | | | | | | 1,000.00 | | | | | | 1,024.15 | | | | | | 0.21 | | | | | | 1.07 | | |
| Class S | | | | | 1,000.00 | | | | | | 1,057.10 | | | | | | 0.46 | | | | | | 2.39 | | | | | | 1,000.00 | | | | | | 1,022.89 | | | | | | 0.46 | | | | | | 2.35 | | |
| Class S2 | | | | | 1,000.00 | | | | | | 1,054.80 | | | | | | 0.61 | | | | | | 3.16 | | | | | | 1,000.00 | | | | | | 1,022.13 | | | | | | 0.61 | | | | | | 3.11 | | |
| Class T | | | | | 1,000.00 | | | | | | 1,053.90 | | | | | | 0.91 | | | | | | 4.71 | | | | | | 1,000.00 | | | | | | 1,020.62 | | | | | | 0.91 | | | | | | 4.63 | | |
| Voya Solution 2030 Portfolio | |
| Class ADV | | | | $ | 1,000.00 | | | | | $ | 1,062.60 | | | | | | 0.71% | | | | | $ | 3.69 | | | | | $ | 1,000.00 | | | | | $ | 1,021.63 | | | | | | 0.71% | | | | | $ | 3.62 | | |
| Class I | | | | | 1,000.00 | | | | | | 1,065.20 | | | | | | 0.21 | | | | | | 1.09 | | | | | | 1,000.00 | | | | | | 1,024.15 | | | | | | 0.21 | | | | | | 1.07 | | |
| Class S | | | | | 1,000.00 | | | | | | 1,063.90 | | | | | | 0.46 | | | | | | 2.39 | | | | | | 1,000.00 | | | | | | 1,022.89 | | | | | | 0.46 | | | | | | 2.35 | | |
| Class S2 | | | | | 1,000.00 | | | | | | 1,063.10 | | | | | | 0.61 | | | | | | 3.17 | | | | | | 1,000.00 | | | | | | 1,022.13 | | | | | | 0.61 | | | | | | 3.11 | | |
| Class T | | | | | 1,000.00 | | | | | | 1,061.90 | | | | | | 0.91 | | | | | | 4.73 | | | | | | 1,000.00 | | | | | | 1,020.62 | | | | | | 0.91 | | | | | | 4.63 | | |
| Voya Solution 2035 Portfolio | |
| Class ADV | | | | $ | 1,000.00 | | | | | $ | 1,068.20 | | | | | | 0.71% | | | | | $ | 3.70 | | | | | $ | 1,000.00 | | | | | $ | 1,021.63 | | | | | | 0.71% | | | | | $ | 3.62 | | |
| Class I | | | | | 1,000.00 | | | | | | 1,070.80 | | | | | | 0.21 | | | | | | 1.10 | | | | | | 1,000.00 | | | | | | 1,024.15 | | | | | | 0.21 | | | | | | 1.07 | | |
| Class S | | | | | 1,000.00 | | | | | | 1,069.30 | | | | | | 0.46 | | | | | | 2.40 | | | | | | 1,000.00 | | | | | | 1,022.89 | | | | | | 0.46 | | | | | | 2.35 | | |
| Class S2 | | | | | 1,000.00 | | | | | | 1,067.90 | | | | | | 0.61 | | | | | | 3.18 | | | | | | 1,000.00 | | | | | | 1,022.13 | | | | | | 0.61 | | | | | | 3.11 | | |
| Class T | | | | | 1,000.00 | | | | | | 1,066.30 | | | | | | 0.91 | | | | | | 4.74 | | | | | | 1,000.00 | | | | | | 1,020.62 | | | | | | 0.91 | | | | | | 4.63 | | |
shareholder expense examples (Unaudited) (continued)
| | | | Actual Portfolio Return | | | Hypothetical (5% return before expenses) | |
| | | | Beginning
Account
Value
July 1,
2019 | | | Ending
Account
Value
December 31,
2019 | | | Annualized
Expense
Ratio* | | | Expenses Paid
During the
Period Ended
December 31,
2019** | | | Beginning
Account
Value
July 1,
2019 | | | Ending
Account
Value
December 31,
2019 | | | Annualized
Expense
Ratio* | | | Expenses Paid
During the
Period Ended
December 31,
2019** | |
| Voya Solution 2040 Portfolio | |
| Class ADV | | | | $ | 1,000.00 | | | | | $ | 1,071.80 | | | | | | 0.72% | | | | | $ | 3.76 | | | | | $ | 1,000.00 | | | | | $ | 1,021.58 | | | | | | 0.72% | | | | | $ | 3.67 | | |
| Class I | | | | | 1,000.00 | | | | | | 1,075.20 | | | | | | 0.22 | | | | | | 1.15 | | | | | | 1,000.00 | | | | | | 1,024.10 | | | | | | 0.22 | | | | | | 1.12 | | |
| Class S | | | | | 1,000.00 | | | | | | 1,073.50 | | | | | | 0.47 | | | | | | 2.46 | | | | | | 1,000.00 | | | | | | 1,022.84 | | | | | | 0.47 | | | | | | 2.40 | | |
| Class S2 | | | | | 1,000.00 | | | | | | 1,072.70 | | | | | | 0.62 | | | | | | 3.24 | | | | | | 1,000.00 | | | | | | 1,022.08 | | | | | | 0.62 | | | | | | 3.16 | | |
| Class T | | | | | 1,000.00 | | | | | | 1,070.60 | | | | | | 0.92 | | | | | | 4.80 | | | | | | 1,000.00 | | | | | | 1,020.57 | | | | | | 0.92 | | | | | | 4.69 | | |
| Voya Solution 2045 Portfolio | |
| Class ADV | | | | $ | 1,000.00 | | | | | $ | 1,075.00 | | | | | | 0.72% | | | | | $ | 3.77 | | | | | $ | 1,000.00 | | | | | $ | 1,021.58 | | | | | | 0.72% | | | | | $ | 3.67 | | |
| Class I | | | | | 1,000.00 | | | | | | 1,078.10 | | | | | | 0.22 | | | | | | 1.15 | | | | | | 1,000.00 | | | | | | 1,024.10 | | | | | | 0.22 | | | | | | 1.12 | | |
| Class S | | | | | 1,000.00 | | | | | | 1,076.20 | | | | | | 0.47 | | | | | | 2.46 | | | | | | 1,000.00 | | | | | | 1,022.84 | | | | | | 0.47 | | | | | | 2.40 | | |
| Class S2 | | | | | 1,000.00 | | | | | | 1,076.10 | | | | | | 0.62 | | | | | | 3.24 | | | | | | 1,000.00 | | | | | | 1,022.08 | | | | | | 0.62 | | | | | | 3.16 | | |
| Class T | | | | | 1,000.00 | | | | | | 1,074.10 | | | | | | 0.92 | | | | | | 4.81 | | | | | | 1,000.00 | | | | | | 1,020.57 | | | | | | 0.92 | | | | | | 4.69 | | |
| Voya Solution 2050 Portfolio | |
| Class ADV | | | | $ | 1,000.00 | | | | | $ | 1,076.60 | | | | | | 0.73% | | | | | $ | 3.82 | | | | | $ | 1,000.00 | | | | | $ | 1,021.53 | | | | | | 0.73% | | | | | $ | 3.72 | | |
| Class I | | | | | 1,000.00 | | | | | | 1,079.50 | | | | | | 0.23 | | | | | | 1.21 | | | | | | 1,000.00 | | | | | | 1,024.05 | | | | | | 0.23 | | | | | | 1.17 | | |
| Class S | | | | | 1,000.00 | | | | | | 1,078.10 | | | | | | 0.48 | | | | | | 2.51 | | | | | | 1,000.00 | | | | | | 1,022.79 | | | | | | 0.48 | | | | | | 2.45 | | |
| Class S2 | | | | | 1,000.00 | | | | | | 1,077.30 | | | | | | 0.63 | | | | | | 3.30 | | | | | | 1,000.00 | | | | | | 1,022.03 | | | | | | 0.63 | | | | | | 3.21 | | |
| Class T | | | | | 1,000.00 | | | | | | 1,074.90 | | | | | | 0.93 | | | | | | 4.86 | | | | | | 1,000.00 | | | | | | 1,020.52 | | | | | | 0.93 | | | | | | 4.74 | | |
| Voya Solution 2055 Portfolio | |
| Class ADV | | | | $ | 1,000.00 | | | | | $ | 1,078.10 | | | | | | 0.72% | | | | | $ | 3.77 | | | | | $ | 1,000.00 | | | | | $ | 1,021.58 | | | | | | 0.72% | | | | | $ | 3.67 | | |
| Class I | | | | | 1,000.00 | | | | | | 1,080.50 | | | | | | 0.22 | | | | | | 1.15 | | | | | | 1,000.00 | | | | | | 1,024.10 | | | | | | 0.22 | | | | | | 1.12 | | |
| Class S | | | | | 1,000.00 | | | | | | 1,079.50 | | | | | | 0.47 | | | | | | 2.46 | | | | | | 1,000.00 | | | | | | 1,022.84 | | | | | | 0.47 | | | | | | 2.40 | | |
| Class S2 | | | | | 1,000.00 | | | | | | 1,078.30 | | | | | | 0.62 | | | | | | 3.25 | | | | | | 1,000.00 | | | | | | 1,022.08 | | | | | | 0.62 | | | | | | 3.16 | | |
| Class T | | | | | 1,000.00 | | | | | | 1,076.70 | | | | | | 0.92 | | | | | | 4.82 | | | | | | 1,000.00 | | | | | | 1,020.57 | | | | | | 0.92 | | | | | | 4.69 | | |
| Voya Solution 2060 Portfolio | |
| Class ADV | | | | $ | 1,000.00 | | | | | $ | 1,078.10 | | | | | | 0.74% | | | | | $ | 3.88 | | | | | $ | 1,000.00 | | | | | $ | 1,021.48 | | | | | | 0.74% | | | | | $ | 3.77 | | |
| Class I | | | | | 1,000.00 | | | | | | 1,080.70 | | | | | | 0.24 | | | | | | 1.26 | | | | | | 1,000.00 | | | | | | 1,024.00 | | | | | | 0.24 | | | | | | 1.22 | | |
| Class S | | | | | 1,000.00 | | | | | | 1,079.60 | | | | | | 0.49 | | | | | | 2.57 | | | | | | 1,000.00 | | | | | | 1,022.74 | | | | | | 0.49 | | | | | | 2.50 | | |
| Class S2 | | | | | 1,000.00 | | | | | | 1,078.60 | | | | | | 0.64 | | | | | | 3.35 | | | | | | 1,000.00 | | | | | | 1,021.98 | | | | | | 0.64 | | | | | | 3.26 | | |
| Class T | | | | | 1,000.00 | | | | | | 1,077.00 | | | | | | 0.94 | | | | | | 4.92 | | | | | | 1,000.00 | | | | | | 1,020.47 | | | | | | 0.94 | | | | | | 4.79 | | |
*
The annualized expense ratios do not include expenses of the underlying funds.
**
Expenses are equal to each Portfolio’s respective annualized expense ratios multiplied by the average account value over the period, multiplied by 184/365 to reflect the most recent fiscal half-year.
REPORT OF INDEPENDENT REGISTERED PUBLIC ACCOUNTING FIRM
To the Shareholders of the Funds and Board of Directors
Voya Partners, Inc.:
Opinion on the Financial Statements
We have audited the accompanying statements of assets and liabilities of Voya Solution Aggressive Portfolio, Voya Solution Balanced Portfolio, Voya Solution Conservative Portfolio, Voya Solution Income Portfolio, Voya Solution Moderately Aggressive Portfolio, Voya Solution Moderately Conservative Portfolio, Voya Solution 2020 Portfolio, Voya Solution 2025 Portfolio, Voya Solution 2030 Portfolio, Voya Solution 2035 Portfolio, Voya Solution 2040 Portfolio, Voya Solution 2045 Portfolio, Voya Solution 2050 Portfolio, Voya Solution 2055 Portfolio, and Voya Solution 2060 Portfolio (the Funds), each a series of Voya Partners, Inc., including the portfolios of investments, as of December 31, 2019, the related statements of operations for the year then ended, the statements of changes in net assets for each of the years in the two-year period then ended, and the related notes (collectively, the financial statements) and the financial highlights for each of the years or periods in the five-year period then ended. In our opinion, the financial statements and financial highlights present fairly, in all material respects, the financial position of the Funds as of December 31, 2019, the results of their operations for the year then ended, the changes in their net assets for each of the years in the two-year period then ended, and the financial highlights for each of the years or periods in the five-year period then ended, in conformity with U.S. generally accepted accounting principles.
Basis for Opinion
These financial statements and financial highlights are the responsibility of the Funds’ management. Our responsibility is to express an opinion on these financial statements and financial highlights based on our audits. We are a public accounting firm registered with the Public Company Accounting Oversight Board (United States) (PCAOB) and are required to be independent with respect to the Funds in accordance with the U.S. federal securities laws and the applicable rules and regulations of the Securities and Exchange Commission and the PCAOB.
We conducted our audits in accordance with the standards of the PCAOB. Those standards require that we plan and perform the audit to obtain reasonable assurance about whether the financial statements and financial highlights are free of material misstatement, whether due to error or fraud. Our audits included performing procedures to assess the risks of material misstatement of the financial statements and financial highlights, whether due to error or fraud, and performing procedures that respond to those risks. Such procedures included examining, on a test basis, evidence regarding the amounts and disclosures in the financial statements and financial highlights. Such procedures also included confirmation of securities owned as of December 31, 2019, by correspondence with the custodian, transfer agent and brokers or by other appropriate auditing procedures when replies from brokers were not received. Our audits also included evaluating the accounting principles used and significant estimates made by management, as well as evaluating the overall presentation of the financial statements and financial highlights. We believe that our audits provide a reasonable basis for our opinion.
![[MISSING IMAGE: sg_kpmgllp.jpg]](https://capedge.com/proxy/N-CSR/0001104659-20-030730/sg_kpmgllp.jpg)
We have served as the auditor of one or more Voya investment companies since 1975.
Boston, Massachusetts
February 26, 2020
STATEMENTS OF ASSETS AND LIABILITIES as of December 31, 2019
| | | | Voya Solution
Aggressive
Portfolio | | | Voya Solution
Balanced
Portfolio | | | Voya Solution
Conservative
Portfolio | | | Voya Solution
Income
Portfolio | |
| ASSETS: | | | | | | | | | | | | | | | | | | | | | | | | | |
| Investments in affiliated underlying funds at fair value* | | | | $ | 17,386,168 | | | | | $ | 45,373,200 | | | | | $ | 15,331,451 | | | | | $ | 302,463,318 | | |
| Investments in unaffiliated underlying funds at fair value** | | | | | 4,031,548 | | | | | | 11,098,829 | | | | | | 2,239,953 | | | | | | 27,280,146 | | |
| Cash | | | | | 58,427 | | | | | | 82,507 | | | | | | 36,512 | | | | | | 513,213 | | |
| Cash collateral for futures | | | | | — | | | | | | — | | | | | | — | | | | | | 373,119 | | |
| Receivables: | | | | | | | | | | | | | | | | | | | | | | | | | |
| Investments in affiliated underlying funds sold | | | | | 108,903 | | | | | | 67,051 | | | | | | 821,298 | | | | | | 447,347 | | |
| Fund shares sold | | | | | 25,958 | | | | | | 16,543 | | | | | | 193 | | | | | | 106,139 | | |
| Interest | | | | | 30 | | | | | | 48 | | | | | | 17 | | | | | | 325 | | |
| Prepaid expenses | | | | | 121 | | | | | | 384 | | | | | | 132 | | | | | | 2,534 | | |
| Reimbursement due from manager | | | | | 2,641 | | | | | | 3,978 | | | | | | 3,831 | | | | | | 19,085 | | |
| Other assets | | | | | 286 | | | | | | 1,622 | | | | | | 501 | | | | | | 24,460 | | |
| Total assets | | | | | 21,614,082 | | | | | | 56,644,162 | | | | | | 18,433,888 | | | | | | 331,229,686 | | |
| LIABILITIES: | | | | | | | | | | | | | | | | | | | | | | | | | |
| Payable for fund shares redeemed | | | | | 134,864 | | | | | | 83,583 | | | | | | 821,475 | | | | | | 553,450 | | |
| Payable for investment management fees | | | | | 4,307 | | | | | | 11,688 | | | | | | 3,548 | | | | | | 61,251 | | |
| Payable for distribution and shareholder service fees | | | | | 2,925 | | | | | | 9,768 | | | | | | 4,331 | | | | | | 84,808 | | |
| Payable for directors fees | | | | | 95 | | | | | | 277 | | | | | | 94 | | | | | | 1,713 | | |
| Payable to directors under the deferred compensation plan (Note 6) | | | | | 286 | | | | | | 1,622 | | | | | | 501 | | | | | | 24,460 | | |
| Other accrued expenses and liabilities | | | | | 11,648 | | | | | | 20,986 | | | | | | 12,637 | | | | | | 134,681 | | |
| Total liabilities | | | | | 154,125 | | | | | | 127,924 | | | | | | 842,586 | | | | | | 860,363 | | |
| NET ASSETS | | | | $ | 21,459,957 | | | | | $ | 56,516,238 | | | | | $ | 17,591,302 | | | | | $ | 330,369,323 | | |
| NET ASSETS WERE COMPRISED OF: | | | | | | | | | | | | | | | | | | | | | | | | | |
| Paid-in capital | | | | $ | 20,034,224 | | | | | $ | 52,654,355 | | | | | $ | 16,671,241 | | | | | $ | 315,133,405 | | |
| Total distributable earnings | | | | | 1,425,733 | | | | | | 3,861,883 | | | | | | 920,061 | | | | | | 15,235,918 | | |
| NET ASSETS | | | | $ | 21,459,957 | | | | | $ | 56,516,238 | | | | | $ | 17,591,302 | | | | | $ | 330,369,323 | | |
*
Cost of investments in affiliated underlying funds | | | | $ | 17,484,027 | | | | | $ | 44,504,760 | | | | | $ | 14,914,067 | | | | | $ | 291,659,501 | | |
**
Cost of investments in unaffiliated underlying funds | | | | $ | 3,757,683 | | | | | $ | 10,444,404 | | | | | $ | 2,171,547 | | | | | $ | 25,567,556 | | |
See Accompanying Notes to Financial Statements
STATEMENTS OF ASSETS AND LIABILITIES as of December 31, 2019 (continued)
| | | | Voya Solution
Aggressive
Portfolio | | | Voya Solution
Balanced
Portfolio | | | Voya Solution
Conservative
Portfolio | | | Voya Solution
Income
Portfolio | |
| Class ADV | | | | | | | | | | | | | | | | | | | | | | | | | |
| Net assets | | | | $ | 3,759,616 | | | | | $ | 10,912,699 | | | | | $ | 8,335,932 | | | | | $ | 143,202,030 | | |
| Shares authorized | | | | | 100,000,000 | | | | | | 100,000,000 | | | | | | 100,000,000 | | | | | | 100,000,000 | | |
| Par value | | | | $ | 0.001 | | | | | $ | 0.001 | | | | | $ | 0.001 | | | | | $ | 0.001 | | |
| Shares outstanding | | | | | 287,519 | | | | | | 1,120,269 | | | | | | 741,363 | | | | | | 12,181,661 | | |
| Net asset value and redemption price per share | | | | $ | 13.08 | | | | | $ | 9.74 | | | | | $ | 11.24 | | | | | $ | 11.76 | | |
| Class I | | | | | | | | | | | | | | | | | | | | | | | | | |
| Net assets | | | | $ | 599,948 | | | | | $ | 2,482,122 | | | | | $ | 657,752 | | | | | $ | 78,441,005 | | |
| Shares authorized | | | | | 100,000,000 | | | | | | 100,000,000 | | | | | | 100,000,000 | | | | | | 100,000,000 | | |
| Par value | | | | $ | 0.001 | | | | | $ | 0.001 | | | | | $ | 0.001 | | | | | $ | 0.001 | | |
| Shares outstanding | | | | | 44,720 | | | | | | 244,840 | | | | | | 57,664 | | | | | | 6,510,045 | | |
| Net asset value and redemption price per share | | | | $ | 13.42 | | | | | $ | 10.14 | | | | | $ | 11.41 | | | | | $ | 12.05 | | |
| Class R6 | | | | | | | | | | | | | | | | | | | | | | | | | |
| Net assets | | | | $ | 11,636,426 | | | | | $ | 20,185,366 | | | | | $ | 5,365,155 | | | | | | n/a | | |
| Shares authorized | | | | | 100,000,000 | | | | | | 100,000,000 | | | | | | 100,000,000 | | | | | | n/a | | |
| Par value | | | | $ | 0.001 | | | | | $ | 0.001 | | | | | $ | 0.001 | | | | | | n/a | | |
| Shares outstanding | | | | | 867,449 | | | | | | 1,991,540 | | | | | | 470,421 | | | | | | n/a | | |
| Net asset value and redemption price per share | | | | $ | 13.41 | | | | | $ | 10.14 | | | | | $ | 11.41 | | | | | | n/a | | |
| Class S | | | | | | | | | | | | | | | | | | | | | | | | | |
| Net assets | | | | $ | 3,925,465 | | | | | $ | 20,388,413 | | | | | $ | 2,839,308 | | | | | $ | 103,157,281 | | |
| Shares authorized | | | | | 100,000,000 | | | | | | 100,000,000 | | | | | | 100,000,000 | | | | | | 100,000,000 | | |
| Par value | | | | $ | 0.001 | | | | | $ | 0.001 | | | | | $ | 0.001 | | | | | $ | 0.001 | | |
| Shares outstanding | | | | | 296,293 | | | | | | 2,066,131 | | | | | | 250,400 | | | | | | 8,631,780 | | |
| Net asset value and redemption price per share | | | | $ | 13.25 | | | | | $ | 9.87 | | | | | $ | 11.34 | | | | | $ | 11.95 | | |
| Class S2 | | | | | | | | | | | | | | | | | | | | | | | | | |
| Net assets | | | | $ | 1,538,502 | | | | | $ | 2,547,638 | | | | | $ | 393,155 | | | | | $ | 5,309,801 | | |
| Shares authorized | | | | | 100,000,000 | | | | | | 100,000,000 | | | | | | 100,000,000 | | | | | | 100,000,000 | | |
| Par value | | | | $ | 0.001 | | | | | $ | 0.001 | | | | | $ | 0.001 | | | | | $ | 0.001 | | |
| Shares outstanding | | | | | 118,250 | | | | | | 259,058 | | | | | | 34,962 | | | | | | 455,901 | | |
| Net asset value and redemption price per share | | | | $ | 13.01 | | | | | $ | 9.83 | | | | | $ | 11.25 | | | | | $ | 11.65 | | |
| Class T | | | | | | | | | | | | | | | | | | | | | | | | | |
| Net assets | | | | | n/a | | | | | | n/a | | | | | | n/a | | | | | $ | 259,206 | | |
| Shares authorized | | | | | n/a | | | | | | n/a | | | | | | n/a | | | | | | 100,000,000 | | |
| Par value | | | | | n/a | | | | | | n/a | | | | | | n/a | | | | | $ | 0.001 | | |
| Shares outstanding | | | | | n/a | | | | | | n/a | | | | | | n/a | | | | | | 20,633 | | |
| Net asset value and redemption price per share | | | | | n/a | | | | | | n/a | | | | | | n/a | | | | | $ | 12.56 | | |
See Accompanying Notes to Financial Statements
STATEMENTS OF ASSETS AND LIABILITIES as of December 31, 2019
| | | | Voya Solution
Moderately
Aggressive
Portfolio | | | Voya Solution
Moderately
Conservative
Portfolio | | | Voya Solution
2020 Portfolio | | | Voya Solution
2025 Portfolio | |
| ASSETS: | | | | | | | | | | | | | | | | | | | | | | | | | |
| Investments in affiliated underlying funds at fair value* | | | | $ | 514,788,983 | | | | | $ | 33,775,818 | | | | | $ | 31,799,852 | | | | | $ | 785,962,053 | | |
| Investments in unaffiliated underlying funds at fair value** | | | | | 88,472,425 | | | | | | 4,577,803 | | | | | | 4,371,937 | | | | | | 45,002,772 | | |
| Cash | | | | | 742,420 | | | | | | 88,827 | | | | | | 66,152 | | | | | | 1,009,455 | | |
| Cash collateral for futures | | | | | 1,424,832 | | | | | | — | | | | | | — | | | | | | 924,803 | | |
| Receivables: | | | | | | | | | | | | | | | | | | | | | | | | | |
| Investments in affiliated underlying funds sold | | | | | 1,842,281 | | | | | | 53,299 | | | | | | 124,207 | | | | | | 788,414 | | |
| Fund shares sold | | | | | 7,280 | | | | | | 2,493 | | | | | | 24,205 | | | | | | 365,198 | | |
| Interest | | | | | 277 | | | | | | 36 | | | | | | 35 | | | | | | 700 | | |
| Prepaid expenses | | | | | 4,307 | | | | | | 219 | | | | | | 247 | | | | | | 5,781 | | |
| Reimbursement due from manager | | | | | — | | | | | | 4,504 | | | | | | 4,605 | | | | | | — | | |
| Other assets | | | | | 28,650 | | | | | | 1,161 | | | | | | 601 | | | | | | 38,453 | | |
| Total assets | | | | | 607,311,455 | | | | | | 38,504,160 | | | | | | 36,391,841 | | | | | | 834,097,629 | | |
| LIABILITIES: | | | | | | | | | | | | | | | | | | | | | | | | | |
| Payable for fund shares redeemed | | | | | 1,849,565 | | | | | | 55,781 | | | | | | 148,403 | | | | | | 1,153,511 | | |
| Payable for investment management fees | | | | | 118,219 | | | | | | 7,369 | | | | | | 6,942 | | | | | | 199,337 | | |
| Payable for distribution and shareholder service fees | | | | | 128,104 | | | | | | 9,089 | | | | | | 9,516 | | | | | | 177,011 | | |
| Payable for directors fees | | | | | 2,992 | | | | | | 180 | | | | | | 170 | | | | | | 4,041 | | |
| Payable to directors under the deferred compensation plan (Note 6) | | | | | 28,650 | | | | | | 1,161 | | | | | | 601 | | | | | | 38,453 | | |
| Other accrued expenses and liabilities | | | | | 136,695 | | | | | | 21,568 | | | | | | 7,916 | | | | | | 147,158 | | |
| Total liabilities | | | | | 2,264,225 | | | | | | 95,148 | | | | | | 173,548 | | | | | | 1,719,511 | | |
| NET ASSETS | | | | $ | 605,047,230 | | | | | $ | 38,409,012 | | | | | $ | 36,218,293 | | | | | $ | 832,378,118 | | |
| NET ASSETS WERE COMPRISED OF: | | | | | | | | | | | | | | | | | | | | | | | | | |
| Paid-in capital | | | | $ | 555,417,869 | | | | | $ | 36,198,271 | | | | | $ | 34,238,015 | | | | | $ | 772,067,543 | | |
| Total distributable earnings | | | | | 49,629,361 | | | | | | 2,210,741 | | | | | | 1,980,278 | | | | | | 60,310,575 | | |
| NET ASSETS | | | | $ | 605,047,230 | | | | | $ | 38,409,012 | | | | | $ | 36,218,293 | | | | | $ | 832,378,118 | | |
*
Cost of investments in affiliated underlying funds | | | | $ | 512,110,424 | | | | | $ | 32,846,953 | | | | | $ | 30,857,002 | | | | | $ | 761,871,248 | | |
**
Cost of investments in unaffiliated underlying funds | | | | $ | 81,236,687 | | | | | $ | 4,429,628 | | | | | $ | 4,222,526 | | | | | $ | 42,583,784 | | |
See Accompanying Notes to Financial Statements
STATEMENTS OF ASSETS AND LIABILITIES as of December 31, 2019 (continued)
| | | | Voya Solution
Moderately
Aggressive
Portfolio | | | Voya Solution
Moderately
Conservative
Portfolio | | | Voya Solution
2020 Portfolio | | | Voya Solution
2025 Portfolio | |
| Class ADV | | | | | | | | | | | | | | | | | | | | | | | | | |
| Net assets | | | | $ | 24,168,147 | | | | | $ | 7,507,037 | | | | | $ | 15,204,502 | | | | | $ | 260,689,821 | | |
| Shares authorized | | | | | 100,000,000 | | | | | | 100,000,000 | | | | | | 100,000,000 | | | | | | 100,000,000 | | |
| Par value | | | | $ | 0.001 | | | | | $ | 0.001 | | | | | $ | 0.001 | | | | | $ | 0.001 | | |
| Shares outstanding | | | | | 1,927,167 | | | | | | 743,675 | | | | | | 1,202,998 | | | | | | 22,920,857 | | |
| Net asset value and redemption price per share | | | | $ | 12.54 | | | | | $ | 10.09 | | | | | $ | 12.64 | | | | | $ | 11.37 | | |
| Class I | | | | | | | | | | | | | | | | | | | | | | | | | |
| Net assets | | | | $ | 4,862,241 | | | | | $ | 68,563 | | | | | $ | 7,239,214 | | | | | $ | 260,766,921 | | |
| Shares authorized | | | | | 100,000,000 | | | | | | 100,000,000 | | | | | | 100,000,000 | | | | | | 100,000,000 | | |
| Par value | | | | $ | 0.001 | | | | | $ | 0.001 | | | | | $ | 0.001 | | | | | $ | 0.001 | | |
| Shares outstanding | | | | | 379,479 | | | | | | 6,500 | | | | | | 558,838 | | | | | | 22,261,260 | | |
| Net asset value and redemption price per share | | | | $ | 12.81 | | | | | $ | 10.55 | | | | | $ | 12.95 | | | | | $ | 11.71 | | |
| Class R6 | | | | | | | | | | | | | | | | | | | | | | | | | |
| Net assets | | | | $ | 17,843,249 | | | | | $ | 6,044,716 | | | | | | n/a | | | | | | n/a | | |
| Shares authorized | | | | | 100,000,000 | | | | | | 100,000,000 | | | | | | n/a | | | | | | n/a | | |
| Par value | | | | $ | 0.001 | | | | | $ | 0.001 | | | | | | n/a | | | | | | n/a | | |
| Shares outstanding | | | | | 1,393,750 | | | | | | 573,448 | | | | | | n/a | | | | | | n/a | | |
| Net asset value and redemption price per share | | | | $ | 12.80 | | | | | $ | 10.54 | | | | | | n/a | | | | | | n/a | | |
| Class S | | | | | | | | | | | | | | | | | | | | | | | | | |
| Net assets | | | | $ | 557,294,231 | | | | | $ | 19,349,207 | | | | | $ | 13,198,873 | | | | | $ | 299,654,942 | | |
| Shares authorized | | | | | 200,000,000 | | | | | | 100,000,000 | | | | | | 100,000,000 | | | | | | 100,000,000 | | |
| Par value | | | | $ | 0.001 | | | | | $ | 0.001 | | | | | $ | 0.001 | | | | | $ | 0.001 | | |
| Shares outstanding | | | | | 44,010,867 | | | | | | 1,878,114 | | | | | | 1,024,378 | | | | | | 25,906,359 | | |
| Net asset value and redemption price per share | | | | $ | 12.66 | | | | | $ | 10.30 | | | | | $ | 12.88 | | | | | $ | 11.57 | | |
| Class S2 | | | | | | | | | | | | | | | | | | | | | | | | | |
| Net assets | | | | $ | 879,362 | | | | | $ | 5,439,489 | | | | | $ | 559,182 | | | | | $ | 10,745,148 | | |
| Shares authorized | | | | | 100,000,000 | | | | | | 100,000,000 | | | | | | 100,000,000 | | | | | | 100,000,000 | | |
| Par value | | | | $ | 0.001 | | | | | $ | 0.001 | | | | | $ | 0.001 | | | | | $ | 0.001 | | |
| Shares outstanding | | | | | 69,318 | | | | | | 536,510 | | | | | | 43,805 | | | | | | 956,431 | | |
| Net asset value and redemption price per share | | | | $ | 12.69 | | | | | $ | 10.14 | | | | | $ | 12.77 | | | | | $ | 11.23 | | |
| Class T | | | | | | | | | | | | | | | | | | | | | | | | | |
| Net assets | | | | | n/a | | | | | | n/a | | | | | $ | 16,522 | | | | | $ | 521,286 | | |
| Shares authorized | | | | | n/a | | | | | | n/a | | | | | | 100,000,000 | | | | | | 100,000,000 | | |
| Par value | | | | | n/a | | | | | | n/a | | | | | $ | 0.001 | | | | | $ | 0.001 | | |
| Shares outstanding | | | | | n/a | | | | | | n/a | | | | | | 1,309 | | | | | | 43,502 | | |
| Net asset value and redemption price per share | | | | | n/a | | | | | | n/a | | | | | $ | 12.62 | | | | | $ | 11.98 | | |
See Accompanying Notes to Financial Statements
STATEMENTS OF ASSETS AND LIABILITIES as of December 31, 2019
| | | | Voya Solution
2030 Portfolio | | | Voya Solution
2035 Portfolio | | | Voya Solution
2040 Portfolio | | | Voya Solution
2045 Portfolio | |
| ASSETS: | | | | | | | | | | | | | | | | | | | | | | | | | |
| Investments in affiliated underlying funds at fair value* | | | | $ | 40,146,288 | | | | | $ | 781,063,565 | | | | | $ | 30,655,003 | | | | | $ | 603,509,213 | | |
| Investments in unaffiliated underlying funds at fair value** | | | | | 6,407,825 | | | | | | 87,525,647 | | | | | | 4,944,870 | | | | | | 58,870,918 | | |
| Cash | | | | | 77,863 | | | | | | 1,431,841 | | | | | | 78,806 | | | | | | 1,978,248 | | |
| Cash collateral for futures | | | | | — | | | | | | 439,111 | | | | | | — | | | | | | 657,168 | | |
| Receivables: | | | | | | | | | | | | | | | | | | | | | | | | | |
| Investments in affiliated underlying funds sold | | | | | — | | | | | | 265,524 | | | | | | — | | | | | | — | | |
| Fund shares sold | | | | | 157,611 | | | | | | 585,264 | | | | | | 63,870 | | | | | | 304,023 | | |
| Interest | | | | | 60 | | | | | | 1,066 | | | | | | 41 | | | | | | 1,170 | | |
| Prepaid expenses | | | | | 240 | | | | | | 5,843 | | | | | | 196 | | | | | | 4,332 | | |
| Reimbursement due from manager | | | | | 9,015 | | | | | | 27,750 | | | | | | 503 | | | | | | 14,354 | | |
| Other assets | | | | | 538 | | | | | | 35,209 | | | | | | 433 | | | | | | 24,301 | | |
| Total assets | | | | | 46,799,440 | | | | | | 871,380,820 | | | | | | 35,743,722 | | | | | | 665,363,727 | | |
| LIABILITIES: | | | | | | | | | | | | | | | | | | | | | | | | | |
| Payable for investments in affiliated underlying funds purchased | | | | | 157,510 | | | | | | — | | | | | | 53,972 | | | | | | 181,987 | | |
| Payable for fund shares redeemed | | | | | 71 | | | | | | 850,735 | | | | | | 9,876 | | | | | | 122,010 | | |
| Payable for investment management fees | | | | | 8,782 | | | | | | 161,981 | | | | | | 6,770 | | | | | | 121,900 | | |
| Payable for distribution and shareholder service fees | | | | | 10,541 | | | | | | 168,283 | | | | | | 7,894 | | | | | | 114,930 | | |
| Payable for directors fees | | | | | 192 | | | | | | 4,129 | | | | | | 153 | | | | | | 3,096 | | |
| Payable to directors under the deferred compensation plan (Note 6) | | | | | 538 | | | | | | 35,209 | | | | | | 433 | | | | | | 24,301 | | |
| Other accrued expenses and liabilities | | | | | 8,556 | | | | | | 125,382 | | | | | | 10,876 | | | | | | 100,235 | | |
| Total liabilities | | | | | 186,190 | | | | | | 1,345,719 | | | | | | 89,974 | | | | | | 668,459 | | |
| NET ASSETS | | | | $ | 46,613,250 | | | | | $ | 870,035,101 | | | | | $ | 35,653,748 | | | | | $ | 664,695,268 | | |
| NET ASSETS WERE COMPRISED OF: | | | | | | | | | | | | | | | | | | | | | | | | | |
| Paid-in capital | | | | $ | 43,700,803 | | | | | $ | 791,292,073 | | | | | $ | 33,062,036 | | | | | $ | 607,095,886 | | |
| Total distributable earnings | | | | | 2,912,447 | | | | | | 78,743,028 | | | | | | 2,591,712 | | | | | | 57,599,382 | | |
| NET ASSETS | | | | $ | 46,613,250 | | | | | $ | 870,035,101 | | | | | $ | 35,653,748 | | | | | $ | 664,695,268 | | |
*
Cost of investments in affiliated underlying funds | | | | $ | 39,389,109 | | | | | $ | 762,302,959 | | | | | $ | 30,294,078 | | | | | $ | 593,760,944 | | |
**
Cost of investments in unaffiliated underlying funds | | | | $ | 6,173,336 | | | | | $ | 83,227,110 | | | | | $ | 4,697,617 | | | | | $ | 54,228,120 | | |
See Accompanying Notes to Financial Statements
STATEMENTS OF ASSETS AND LIABILITIES as of December 31, 2019 (continued)
| | | | Voya Solution
2030 Portfolio | | | Voya Solution
2035 Portfolio | | | Voya Solution
2040 Portfolio | | | Voya Solution
2045 Portfolio | |
| Class ADV | | | | | | | | | | | | | | | | | | | | | | | | | |
| Net assets | | | | $ | 18,792,191 | | | | | $ | 226,095,866 | | | | | $ | 14,323,660 | | | | | $ | 150,004,634 | | |
| Shares authorized | | | | | 100,000,000 | | | | | | 100,000,000 | | | | | | 100,000,000 | | | | | | 100,000,000 | | |
| Par value | | | | $ | 0.001 | | | | | $ | 0.001 | | | | | $ | 0.001 | | | | | $ | 0.001 | | |
| Shares outstanding | | | | | 1,228,535 | | | | | | 19,441,323 | | | | | | 890,184 | | | | | | 13,073,227 | | |
| Net asset value and redemption price per share | | | | $ | 15.30 | | | | | $ | 11.63 | | | | | $ | 16.09 | | | | | $ | 11.47 | | |
| Class I | | | | | | | | | | | | | | | | | | | | | | | | | |
| Net assets | | | | $ | 13,780,653 | | | | | $ | 304,111,014 | | | | | $ | 11,824,862 | | | | | $ | 269,670,471 | | |
| Shares authorized | | | | | 100,000,000 | | | | | | 100,000,000 | | | | | | 100,000,000 | | | | | | 100,000,000 | | |
| Par value | | | | $ | 0.001 | | | | | $ | 0.001 | | | | | $ | 0.001 | | | | | $ | 0.001 | | |
| Shares outstanding | | | | | 873,775 | | | | | | 25,388,488 | | | | | | 712,494 | | | | | | 22,762,329 | | |
| Net asset value and redemption price per share | | | | $ | 15.77 | | | | | $ | 11.98 | | | | | $ | 16.60 | | | | | $ | 11.85 | | |
| Class S | | | | | | | | | | | | | | | | | | | | | | | | | |
| Net assets | | | | $ | 13,558,438 | | | | | $ | 324,783,138 | | | | | $ | 8,500,345 | | | | | $ | 237,495,554 | | |
| Shares authorized | | | | | 100,000,000 | | | | | | 100,000,000 | | | | | | 100,000,000 | | | | | | 100,000,000 | | |
| Par value | | | | $ | 0.001 | | | | | $ | 0.001 | | | | | $ | 0.001 | | | | | $ | 0.001 | | |
| Shares outstanding | | | | | 865,869 | | | | | | 27,456,812 | | | | | | 517,087 | | | | | | 20,369,351 | | |
| Net asset value and redemption price per share | | | | $ | 15.66 | | | | | $ | 11.83 | | | | | $ | 16.44 | | | | | $ | 11.66 | | |
| Class S2 | | | | | | | | | | | | | | | | | | | | | | | | | |
| Net assets | | | | $ | 449,523 | | | | | $ | 14,598,549 | | | | | $ | 972,923 | | | | | $ | 7,234,454 | | |
| Shares authorized | | | | | 100,000,000 | | | | | | 100,000,000 | | | | | | 100,000,000 | | | | | | 100,000,000 | | |
| Par value | | | | $ | 0.001 | | | | | $ | 0.001 | | | | | $ | 0.001 | | | | | $ | 0.001 | | |
| Shares outstanding | | | | | 29,072 | | | | | | 1,287,140 | | | | | | 60,167 | | | | | | 637,970 | | |
| Net asset value and redemption price per share | | | | $ | 15.46 | | | | | $ | 11.34 | | | | | $ | 16.17 | | | | | $ | 11.34 | | |
| Class T | | | | | | | | | | | | | | | | | | | | | | | | | |
| Net assets | | | | $ | 32,445 | | | | | $ | 446,534 | | | | | $ | 31,958 | | | | | $ | 290,155 | | |
| Shares authorized | | | | | 100,000,000 | | | | | | 100,000,000 | | | | | | 100,000,000 | | | | | | 100,000,000 | | |
| Par value | | | | $ | 0.001 | | | | | $ | 0.001 | | | | | $ | 0.001 | | | | | $ | 0.001 | | |
| Shares outstanding | | | | | 2,120 | | | | | | 36,388 | | | | | | 1,989 | | | | | | 24,273 | | |
| Net asset value and redemption price per share | | | | $ | 15.31 | | | | | $ | 12.27 | | | | | $ | 16.06 | | | | | $ | 11.95 | | |
See Accompanying Notes to Financial Statements
STATEMENTS OF ASSETS AND LIABILITIES as of December 31, 2019
| | | | Voya Solution
2050 Portfolio | | | Voya Solution
2055 Portfolio | | | Voya Solution
2060 Portfolio | |
| ASSETS: | | | | | | | | | | | | | | | | | | | |
| Investments in affiliated underlying funds at fair value* | | | | $ | 27,322,882 | | | | | $ | 210,082,521 | | | | | $ | 14,888,753 | | |
| Investments in unaffiliated underlying funds at fair value** | | | | | 4,315,633 | | | | | | 21,415,748 | | | | | | 2,413,755 | | |
| Cash | | | | | 70,060 | | | | | | 421,241 | | | | | | 39,222 | | |
| Cash collateral for futures | | | | | — | | | | | | 222,961 | | | | | | — | | |
| Receivables: | | | | | | | | | | | | | | | | | | | |
| Investments in affiliated underlying funds sold | | | | | — | | | | | | 3,608 | | | | | | — | | |
| Fund shares sold | | | | | 101,482 | | | | | | 153,202 | | | | | | 53,939 | | |
| Dividends | | | | | 625 | | | | | | — | | | | | | — | | |
| Interest | | | | | 31 | | | | | | 182 | | | | | | 13 | | |
| Prepaid expenses | | | | | 163 | | | | | | 1,338 | | | | | | 87 | | |
| Reimbursement due from manager | | | | | 2,841 | | | | | | 10,588 | | | | | | 8,733 | | |
| Other assets | | | | | 328 | | | | | | 4,524 | | | | | | 165 | | |
| Total assets | | | | | 31,814,045 | | | | | | 232,315,913 | | | | | | 17,404,667 | | |
| LIABILITIES: | | | | | | | | | | | | | | | | | | | |
| Payable for investments in affiliated underlying funds purchased | | | | | 87,655 | | | | | | — | | | | | | 42,159 | | |
| Payable for fund shares redeemed | | | | | 13,827 | | | | | | 156,801 | | | | | | 11,744 | | |
| Payable for investment management fees | | | | | 6,014 | | | | | | 42,389 | | | | | | 3,278 | | |
| Payable for distribution and shareholder service fees | | | | | 7,021 | | | | | | 33,919 | | | | | | 3,942 | | |
| Payable for directors fees | | | | | 131 | | | | | | 1,014 | | | | | | 71 | | |
| Payable to directors under the deferred compensation plan (Note 6) | | | | | 328 | | | | | | 4,524 | | | | | | 165 | | |
| Other accrued expenses and liabilities | | | | | 9,833 | | | | | | 27,263 | | | | | | 8,703 | | |
| Total liabilities | | | | | 124,809 | | | | | | 265,910 | | | | | | 70,062 | | |
| NET ASSETS | | | | $ | 31,689,236 | | | | | $ | 232,050,003 | | | | | $ | 17,334,605 | | |
| NET ASSETS WERE COMPRISED OF: | | | | | | | | | | | | | | | | | | | |
| Paid-in capital | | | | $ | 29,689,164 | | | | | $ | 213,565,491 | | | | | $ | 16,201,997 | | |
| Total distributable earnings | | | | | 2,000,072 | | | | | | 18,484,512 | | | | | | 1,132,608 | | |
| NET ASSETS | | | | $ | 31,689,236 | | | | | $ | 232,050,003 | | | | | $ | 17,334,605 | | |
*
Cost of investments in affiliated underlying funds | | | | $ | 27,133,528 | | | | | $ | 207,471,807 | | | | | $ | 14,708,912 | | |
**
Cost of investments in unaffiliated underlying funds | | | | $ | 4,064,665 | | | | | $ | 19,591,717 | | | | | $ | 2,257,831 | | |
See Accompanying Notes to Financial Statements
STATEMENTS OF ASSETS AND LIABILITIES as of December 31, 2019 (continued)
| | | | Voya Solution
2050 Portfolio | | | Voya Solution
2055 Portfolio | | | Voya Solution
2060 Portfolio | |
| Class ADV | | | | | | | | | | | | | | | | | | | |
| Net assets | | | | $ | 12,950,871 | | | | | $ | 49,314,621 | | | | | $ | 6,975,803 | | |
| Shares authorized | | | | | 100,000,000 | | | | | | 100,000,000 | | | | | | 100,000,000 | | |
| Par value | | | | $ | 0.001 | | | | | $ | 0.001 | | | | | $ | 0.001 | | |
| Shares outstanding | | | | | 778,779 | | | | | | 3,560,812 | | | | | | 579,374 | | |
| Net asset value and redemption price per share | | | | $ | 16.63 | | | | | $ | 13.85 | | | | | $ | 12.04 | | |
| Class I | | | | | | | | | | | | | | | | | | | |
| Net assets | | | | $ | 10,912,018 | | | | | $ | 119,915,088 | | | | | $ | 5,184,499 | | |
| Shares authorized | | | | | 100,000,000 | | | | | | 100,000,000 | | | | | | 100,000,000 | | |
| Par value | | | | $ | 0.001 | | | | | $ | 0.001 | | | | | $ | 0.001 | | |
| Shares outstanding | | | | | 633,699 | | | | | | 8,462,737 | | | | | | 423,357 | | |
| Net asset value and redemption price per share | | | | $ | 17.22 | | | | | $ | 14.17 | | | | | $ | 12.25 | | |
| Class S | | | | | | | | | | | | | | | | | | | |
| Net assets | | | | $ | 7,396,911 | | | | | $ | 59,922,564 | | | | | $ | 4,900,632 | | |
| Shares authorized | | | | | 100,000,000 | | | | | | 100,000,000 | | | | | | 100,000,000 | | |
| Par value | | | | $ | 0.001 | | | | | $ | 0.001 | | | | | $ | 0.001 | | |
| Shares outstanding | | | | | 434,786 | | | | | | 4,284,004 | | | | | | 405,703 | | |
| Net asset value and redemption price per share | | | | $ | 17.01 | | | | | $ | 13.99 | | | | | $ | 12.08 | | |
| Class S2 | | | | | | | | | | | | | | | | | | | |
| Net assets | | | | $ | 418,615 | | | | | $ | 2,875,809 | | | | | $ | 269,485 | | |
| Shares authorized | | | | | 100,000,000 | | | | | | 100,000,000 | | | | | | 100,000,000 | | |
| Par value | | | | $ | 0.001 | | | | | $ | 0.001 | | | | | $ | 0.001 | | |
| Shares outstanding | | | | | 24,945 | | | | | | 206,616 | | | | | | 22,325 | | |
| Net asset value and redemption price per share | | | | $ | 16.78 | | | | | $ | 13.92 | | | | | $ | 12.07 | | |
| Class T | | | | | | | | | | | | | | | | | | | |
| Net assets | | | | $ | 10,821 | | | | | $ | 21,921 | | | | | $ | 4,186 | | |
| Shares authorized | | | | | 100,000,000 | | | | | | 100,000,000 | | | | | | 100,000,000 | | |
| Par value | | | | $ | 0.001 | | | | | $ | 0.001 | | | | | $ | 0.001 | | |
| Shares outstanding | | | | | 648 | | | | | | 1,542 | | | | | | 349 | | |
| Net asset value and redemption price per share | | | | $ | 16.69 | | | | | $ | 14.22 | | | | | $ | 12.01 | | |
See Accompanying Notes to Financial Statements
STATEMENTS OF OPERATIONS for the year ended December 31, 2019
| | | | Voya Solution
Aggressive
Portfolio | | | Voya Solution
Balanced
Portfolio | | | Voya Solution
Conservative
Portfolio | | | Voya Solution
Income
Portfolio | |
| INVESTMENT INCOME: | | | | | | | | | | | | | | | | | | | | | | | | | |
| Dividends from affiliated underlying funds | | | | $ | 272,118 | | | | | $ | 1,012,399 | | | | | $ | 473,537 | | | | | $ | 8,084,724 | | |
| Dividends from unaffiliated underlying funds | | | | | 72,461 | | | | | | 244,427 | | | | | | 46,187 | | | | | | 696,351 | | |
| Interest | | | | | 75 | | | | | | 113 | | | | | | 33 | | | | | | 18,393 | | |
| Total investment income | | | | | 344,654 | | | | | | 1,256,939 | | | | | | 519,757 | | | | | | 8,799,468 | | |
| EXPENSES: | | | | | | | | | | | | | | | | | | | | | | | | | |
| Investment management fees | | | | | 43,424 | | | | | | 128,171 | | | | | | 41,535 | | | | | | 750,795 | | |
| Distribution and shareholder service fees: | | | | | | | | | | | | | | | | | | | | | | | | | |
| Class ADV | | | | | 18,386 | | | | | | 57,594 | | | | | | 42,144 | | | | | | 738,231 | | |
| Class S | | | | | 9,438 | | | | | | 50,703 | | | | | | 8,472 | | | | | | 278,311 | | |
| Class S2 | | | | | 5,064 | | | | | | 7,815 | | | | | | 1,870 | | | | | | 23,647 | | |
| Class T | | | | | — | | | | | | — | | | | | | — | | | | | | 1,673 | | |
| Transfer agent fees | | | | | 538 | | | | | | 204 | | | | | | 402 | | | | | | 3,793 | | |
| Shareholder reporting expense | | | | | 3,821 | | | | | | 8,569 | | | | | | 3,821 | | | | | | 22,050 | | |
| Registration fees | | | | | 168 | | | | | | — | | | | | | 84 | | | | | | — | | |
| Professional fees | | | | | 9,025 | | | | | | 13,143 | | | | | | 8,975 | | | | | | 51,082 | | |
| Custody and accounting expense | | | | | 13,289 | | | | | | 11,848 | | | | | | 13,273 | | | | | | 33,940 | | |
| Directors fees | | | | | 765 | | | | | | 2,217 | | | | | | 751 | | | | | | 13,703 | | |
| Miscellaneous expense | | | | | 9,612 | | | | | | 12,589 | | | | | | 9,577 | | | | | | 17,616 | | |
| Interest expense | | | | | — | | | | | | — | | | | | | 89 | | | | | | 1,232 | | |
| Total expenses | | | | | 113,530 | | | | | | 292,853 | | | | | | 130,993 | | | | | | 1,936,073 | | |
| Waived and reimbursed fees | | | | | (32,432) | | | | | | (37,237) | | | | | | (46,641) | | | | | | (235,911) | | |
| Net expenses | | | | | 81,098 | | | | | | 255,616 | | | | | | 84,352 | | | | | | 1,700,162 | | |
| Net investment income | | | | | 263,556 | | | | | | 1,001,323 | | | | | | 435,405 | | | | | | 7,099,306 | | |
| REALIZED AND UNREALIZED GAIN (LOSS): | | | | | | | | | | | | | | | | | | | | | | | | | |
| Net realized gain (loss) on: | | | | | | | | | | | | | | | | | | | | | | | | | |
| Sale of affiliated underlying funds | | | | | (233,296) | | | | | | (181,312) | | | | | | 91,425 | | | | | | 741,145 | | |
| Sale of unaffiliated underlying funds | | | | | 47,525 | | | | | | 249,537 | | | | | | (2,113) | | | | | | (432,529) | | |
| Capital gain distributions from affiliated underlying funds | | | | | 1,491,176 | | | | | | 2,205,703 | | | | | | 243,212 | | | | | | 3,787,487 | | |
| Futures | | | | | — | | | | | | — | | | | | | — | | | | | | (902,584) | | |
| Net realized gain | | | | | 1,305,405 | | | | | | 2,273,928 | | | | | | 332,524 | | | | | | 3,193,519 | | |
| Net change in unrealized appreciation (depreciation) on: | | | | | | | | | | | | | | | | | | | | | | | | | |
| Affiliated underlying funds | | | | | 2,165,162 | | | | | | 5,534,500 | | | | | | 1,115,690 | | | | | | 29,139,274 | | |
| Unaffiliated underlying funds | | | | | 325,940 | | | | | | 858,043 | | | | | | 109,382 | | | | | | 3,123,307 | | |
| Futures | | | | | — | | | | | | — | | | | | | — | | | | | | (343,425) | | |
| Net change in unrealized appreciation (depreciation) | | | | | 2,491,102 | | | | | | 6,392,543 | | | | | | 1,225,072 | | | | | | 31,919,156 | | |
| Net realized and unrealized gain | | | | | 3,796,507 | | | | | | 8,666,471 | | | | | | 1,557,596 | | | | | | 35,112,675 | | |
| Increase in net assets resulting from operations | | | | $ | 4,060,063 | | | | | $ | 9,667,794 | | | | | $ | 1,993,001 | | | | | $ | 42,211,981 | | |
See Accompanying Notes to Financial Statements
STATEMENTS OF OPERATIONS for the year ended December 31, 2019
| | | | Voya Solution
Moderately
Aggressive
Portfolio | | | Voya Solution
Moderately
Conservative
Portfolio | | | Voya Solution
2020 Portfolio | | | Voya Solution
2025 Portfolio | |
| INVESTMENT INCOME: | | | | | | | | | | | | | | | | | | | | | | | | | |
| Dividends from affiliated underlying funds | | | | $ | 9,974,209 | | | | | $ | 851,117 | | | | | $ | 740,154 | | | | | $ | 17,318,627 | | |
| Dividends from unaffiliated underlying funds | | | | | 2,132,263 | | | | | | 116,507 | | | | | | 83,838 | | | | | | 1,322,107 | | |
| Interest | | | | | 25,654 | | | | | | 70 | | | | | | 77 | | | | | | 42,491 | | |
| Total investment income | | | | | 12,132,126 | | | | | | 967,694 | | | | | | 824,069 | | | | | | 18,683,225 | | |
| EXPENSES: | | | | | | | | | | | | | | | | | | | | | | | | | |
| Investment management fees | | | | | 1,350,760 | | | | | | 79,649 | | | | | | 75,127 | | | | | | 1,722,995 | | |
| Distribution and shareholder service fees: | | | | | | | | | | | | | | | | | | | | | | | | | |
| Class ADV | | | | | 116,781 | | | | | | 43,985 | | | | | | 71,845 | | | | | | 1,276,531 | | |
| Class S | | | | | 1,383,078 | | | | | | 43,903 | | | | | | 30,331 | | | | | | 746,975 | | |
| Class S2 | | | | | 3,527 | | | | | | 15,700 | | | | | | 1,666 | | | | | | 44,719 | | |
| Class T | | | | | — | | | | | | — | | | | | | 99 | | | | | | 3,646 | | |
| Transfer agent fees | | | | | 5,841 | | | | | | 141 | | | | | | 60 | | | | | | 983 | | |
| Shareholder reporting expense | | | | | 25,550 | | | | | | 8,027 | | | | | | 7,063 | | | | | | 40,150 | | |
| Registration fees | | | | | 41 | | | | | | 9 | | | | | | 238 | | | | | | — | | |
| Professional fees | | | | | 82,270 | | | | | | 11,135 | | | | | | 12,410 | | | | | | 107,310 | | |
| Custody and accounting expense | | | | | 43,257 | | | | | | 9,662 | | | | | | 11,361 | | | | | | 68,871 | | |
| Directors fees | | | | | 23,936 | | | | | | 1,443 | | | | | | 1,366 | | | | | | 32,330 | | |
| Miscellaneous expense | | | | | 30,776 | | | | | | 11,206 | | | | | | 10,398 | | | | | | 35,248 | | |
| Interest expense | | | | | 178 | | | | | | 113 | | | | | | 159 | | | | | | 381 | | |
| Total expenses | | | | | 3,065,995 | | | | | | 224,973 | | | | | | 222,123 | | | | | | 4,080,139 | | |
| Waived and reimbursed fees | | | | | — | | | | | | (48,667) | | | | | | (45,854) | | | | | | (293,763) | | |
| Net expenses | | | | | 3,065,995 | | | | | | 176,306 | | | | | | 176,269 | | | | | | 3,786,376 | | |
| Net investment income | | | | | 9,066,131 | | | | | | 791,388 | | | | | | 647,800 | | | | | | 14,896,849 | | |
| REALIZED AND UNREALIZED GAIN (LOSS): | | | | | | | | | | | | | | | | | | | | | | | | | |
| Net realized gain (loss) on: | | | | | | | | | | | | | | | | | | | | | | | | | |
| Sale of affiliated underlying funds | | | | | 1,672,017 | | | | | | 12,774 | | | | | | (50,353) | | | | | | 9,399,931 | | |
| Sale of unaffiliated underlying funds | | | | | 3,054,093 | | | | | | 21,316 | | | | | | 25,080 | | | | | | 103,730 | | |
| Capital gain distributions from affiliated underlying funds | | | | | 37,009,503 | | | | | | 973,682 | | | | | | 668,204 | | | | | | 26,344,725 | | |
| Futures | | | | | (1,379,547) | | | | | | — | | | | | | — | | | | | | (2,046,293) | | |
| Net realized gain | | | | | 40,356,066 | | | | | | 1,007,772 | | | | | | 642,931 | | | | | | 33,802,093 | | |
| Net change in unrealized appreciation (depreciation) on: | | | | | | | | | | | | | | | | | | | | | | | | | |
| Affiliated underlying funds | | | | | 62,745,956 | | | | | | 2,709,707 | | | | | | 3,216,301 | | | | | | 79,442,623 | | |
| Unaffiliated underlying funds | | | | | 9,429,918 | | | | | | 227,283 | | | | | | 218,918 | | | | | | 6,295,646 | | |
| Futures | | | | | (475,374) | | | | | | — | | | | | | — | | | | | | (792,874) | | |
| Net change in unrealized appreciation (depreciation) | | | | | 71,700,500 | | | | | | 2,936,990 | | | | | | 3,435,219 | | | | | | 84,945,395 | | |
| Net realized and unrealized gain | | | | | 112,056,566 | | | | | | 3,944,762 | | | | | | 4,078,150 | | | | | | 118,747,488 | | |
| Increase in net assets resulting from operations | | | | $ | 121,122,697 | | | | | $ | 4,736,150 | | | | | $ | 4,725,950 | | | | | $ | 133,644,337 | | |
See Accompanying Notes to Financial Statements
STATEMENTS OF OPERATIONS for the year ended December 31, 2019
| | | | Voya Solution
2030 Portfolio | | | Voya Solution
2035 Portfolio | | | Voya Solution
2040 Portfolio | | | Voya Solution
2045 Portfolio | |
| INVESTMENT INCOME: | | | | | | | | | | | | | | | | | | | | | | | | | |
| Dividends from affiliated underlying funds | | | | $ | 767,976 | | | | | $ | 15,275,953 | | | | | $ | 549,793 | | | | | $ | 10,956,723 | | |
| Dividends from unaffiliated underlying funds | | | | | 108,646 | | | | | | 2,218,761 | | | | | | 100,492 | | | | | | 1,538,087 | | |
| Interest | | | | | 174 | | | | | | 41,750 | | | | | | 109 | | | | | | 32,568 | | |
| Total investment income | | | | | 876,796 | | | | | | 17,536,464 | | | | | | 650,394 | | | | | | 12,527,378 | | |
| EXPENSES: | | | | | | | | | | | | | | | | | | | | | | | | | |
| Investment management fees | | | | | 84,358 | | | | | | 1,793,416 | | | | | | 67,482 | | | | | | 1,340,357 | | |
| Distribution and shareholder service fees: | | | | | | | | | | | | | | | | | | | | | | | | | |
| Class ADV | | | | | 78,710 | | | | | | 1,105,388 | | | | | | 58,243 | | | | | | 721,636 | | |
| Class S | | | | | 28,996 | | | | | | 785,623 | | | | | | 21,394 | | | | | | 569,429 | | |
| Class S2 | | | | | 1,712 | | | | | | 58,524 | | | | | | 3,710 | | | | | | 29,046 | | |
| Class T | | | | | 189 | | | | | | 2,803 | | | | | | 162 | | | | | | 1,754 | | |
| Transfer agent fees | | | | | 72 | | | | | | 1,561 | | | | | | 429 | | | | | | 2,490 | | |
| Shareholder reporting expense | | | | | 7,298 | | | | | | 43,309 | | | | | | 6,567 | | | | | | 34,310 | | |
| Registration fees | | | | | 274 | | | | | | — | | | | | | 367 | | | | | | — | | |
| Professional fees | | | | | 12,045 | | | | | | 108,405 | | | | | | 8,927 | | | | | | 82,490 | | |
| Custody and accounting expense | | | | | 11,631 | | | | | | 52,948 | | | | | | 10,382 | | | | | | 41,254 | | |
| Directors fees | | | | | 1,532 | | | | | | 33,029 | | | | | | 1,230 | | | | | | 24,773 | | |
| Miscellaneous expense | | | | | 9,735 | | | | | | 37,443 | | | | | | 9,212 | | | | | | 31,063 | | |
| Interest expense | | | | | — | | | | | | 355 | | | | | | — | | | | | | 61 | | |
| Total expenses | | | | | 236,552 | | | | | | 4,022,804 | | | | | | 188,105 | | | | | | 2,878,663 | | |
| Waived and reimbursed fees | | | | | (46,580) | | | | | | (317,164) | | | | | | (36,444) | | | | | | (181,110) | | |
| Net expenses | | | | | 189,972 | | | | | | 3,705,640 | | | | | | 151,661 | | | | | | 2,697,553 | | |
| Net investment income | | | | | 686,824 | | | | | | 13,830,824 | | | | | | 498,733 | | | | | | 9,829,825 | | |
| REALIZED AND UNREALIZED GAIN (LOSS): | | | | | | | | | | | | | | | | | | | | | | | | | |
| Net realized gain (loss) on: | | | | | | | | | | | | | | | | | | | | | | | | | |
| Sale of affiliated underlying funds | | | | | (224,277) | | | | | | 16,407,577 | | | | | | (190,454) | | | | | | 5,224,868 | | |
| Sale of unaffiliated underlying funds | | | | | 102,522 | | | | | | 1,185,396 | | | | | | 92,366 | | | | | | 2,028,306 | | |
| Capital gain distributions from affiliated underlying funds | | | | | 1,647,095 | | | | | | 40,845,590 | | | | | | 1,750,405 | | | | | | 38,037,524 | | |
| Futures | | | | | — | | | | | | (1,998,997) | | | | | | — | | | | | | (1,331,347) | | |
| Net realized gain | | | | | 1,525,340 | | | | | | 56,439,566 | | | | | | 1,652,317 | | | | | | 43,959,351 | | |
| Net change in unrealized appreciation (depreciation) on: | | | | | | | | | | | | | | | | | | | | | | | | | |
| Affiliated underlying funds | | | | | 4,242,693 | | | | | | 83,927,182 | | | | | | 3,638,013 | | | | | | 70,814,526 | | |
| Unaffiliated underlying funds | | | | | 355,811 | | | | | | 8,526,613 | | | | | | 335,187 | | | | | | 6,889,990 | | |
| Futures | | | | | — | | | | | | (662,640) | | | | | | — | | | | | | (258,968) | | |
| Net change in unrealized appreciation (depreciation) | | | | | 4,598,504 | | | | | | 91,791,155 | | | | | | 3,973,200 | | | | | | 77,445,548 | | |
| Net realized and unrealized gain | | | | | 6,123,844 | | | | | | 148,230,721 | | | | | | 5,625,517 | | | | | | 121,404,899 | | |
| Increase in net assets resulting from operations | | | | $ | 6,810,668 | | | | | $ | 162,061,545 | | | | | $ | 6,124,250 | | | | | $ | 131,234,724 | | |
See Accompanying Notes to Financial Statements
STATEMENTS OF OPERATIONS for the year ended December 31, 2019
| | | | Voya Solution
2050 Portfolio | | | Voya Solution
2055 Portfolio | | | Voya Solution
2060 Portfolio | |
| INVESTMENT INCOME: | | | | | | | | | | | | | | | | | | | |
| Dividends from affiliated underlying funds | | | | $ | 483,772 | | | | | $ | 3,663,722 | | | | | $ | 255,231 | | |
| Dividends from unaffiliated underlying funds | | | | | 86,104 | | | | | | 528,678 | | | | | | 52,437 | | |
| Interest | | | | | 70 | | | | | | 9,901 | | | | | | 26 | | |
| Total investment income | | | | | 569,946 | | | | | | 4,202,301 | | | | | | 307,694 | | |
| EXPENSES: | | | | | | | | | | | | | | | | | | | |
| Investment management fees | | | | | 57,664 | | | | | | 440,861 | | | | | | 31,582 | | |
| Distribution and shareholder service fees: | | | | | | | | | | | | | | | | | | | |
| Class ADV | | | | | 53,461 | | | | | | 226,217 | | | | | | 29,543 | | |
| Class S | | | | | 16,409 | | | | | | 138,828 | | | | | | 10,671 | | |
| Class S2 | | | | | 1,566 | | | | | | 10,953 | | | | | | 942 | | |
| Class T | | | | | 133 | | | | | | 122 | | | | | | 28 | | |
| Transfer agent fees | | | | | 486 | | | | | | 1,601 | | | | | | 228 | | |
| Shareholder reporting expense | | | | | 6,354 | | | | | | 21,618 | | | | | | 6,073 | | |
| Registration fees | | | | | 389 | | | | | | — | | | | | | 226 | | |
| Professional fees | | | | | 8,443 | | | | | | 31,194 | | | | | | 7,011 | | |
| Custody and accounting expense | | | | | 10,077 | | | | | | 22,627 | | | | | | 9,995 | | |
| Directors fees | | | | | 1,047 | | | | | | 8,109 | | | | | | 567 | | |
| Miscellaneous expense | | | | | 8,683 | | | | | | 12,315 | | | | | | 8,574 | | |
| Interest expense | | | | | 153 | | | | | | 1,240 | | | | | | — | | |
| Total expenses | | | | | 164,865 | | | | | | 915,685 | | | | | | 105,440 | | |
| Waived and reimbursed fees | | | | | (32,675) | | | | | | (90,950) | | | | | | (30,284) | | |
| Net expenses | | | | | 132,190 | | | | | | 824,735 | | | | | | 75,156 | | |
| Net investment income | | | | | 437,756 | | | | | | 3,377,566 | | | | | | 232,538 | | |
| REALIZED AND UNREALIZED GAIN (LOSS): | | | | | | | | | | | | | | | | | | | |
| Net realized gain (loss) on: | | | | | | | | | | | | | | | | | | | |
| Sale of affiliated underlying funds | | | | | (479,029) | | | | | | 915,409 | | | | | | (280,864) | | |
| Sale of unaffiliated underlying funds | | | | | 66,904 | | | | | | 587,065 | | | | | | 37,314 | | |
| Capital gain distributions from affiliated underlying funds | | | | | 1,753,970 | | | | | | 13,030,685 | | | | | | 953,157 | | |
| Futures | | | | | — | | | | | | (431,790) | | | | | | — | | |
| Net realized gain | | | | | 1,341,845 | | | | | | 14,101,369 | | | | | | 709,607 | | |
| Net change in unrealized appreciation (depreciation) on: | | | | | | | | | | | | | | | | | | | |
| Affiliated underlying funds | | | | | 3,339,025 | | | | | | 23,440,456 | | | | | | 1,814,817 | | |
| Unaffiliated underlying funds | | | | | 341,721 | | | | | | 2,509,968 | | | | | | 203,099 | | |
| Futures | | | | | — | | | | | | (99,583) | | | | | | — | | |
| Net change in unrealized appreciation (depreciation) | | | | | 3,680,746 | | | | | | 25,850,841 | | | | | | 2,017,916 | | |
| Net realized and unrealized gain | | | | | 5,022,591 | | | | | | 39,952,210 | | | | | | 2,727,523 | | |
| Increase in net assets resulting from operations | | | | $ | 5,460,347 | | | | | $ | 43,329,776 | | | | | $ | 2,960,061 | | |
See Accompanying Notes to Financial Statements
STATEMENTS OF CHANGES IN NET ASSETS
| | | | Voya Solution Aggressive Portfolio | | | Voya Solution Balanced Portfolio | |
| | | | Year Ended
December 31,
2019 | | | Year Ended
December 31,
2018 | | | Year Ended
December 31,
2019 | | | Year Ended
December 31,
2018 | |
| FROM OPERATIONS: | | | | | | | | | | | | | | | | | | | | | | | | | |
| Net investment income | | | | $ | 263,556 | | | | | $ | 169,752 | | | | | $ | 1,001,323 | | | | | $ | 959,931 | | |
| Net realized gain | | | | | 1,305,405 | | | | | | 1,576,230 | | | | | | 2,273,928 | | | | | | 3,872,596 | | |
| Net change in unrealized appreciation (depreciation) | | | | | 2,491,102 | | | | | | (3,494,835) | | | | | | 6,392,543 | | | | | | (8,448,748) | | |
| Increase (decrease) in net assets resulting from operations | | | | | 4,060,063 | | | | | | (1,748,853) | | | | | | 9,667,794 | | | | | | (3,616,221) | | |
| FROM DISTRIBUTIONS TO SHAREHOLDERS: | | | | | | | | | | | | | | | | | | | | | | | | | |
| Total distributions (excluding return of capital): | | | | | | | | | | | | | | | | | | | | | | | | | |
| Class ADV | | | | | (334,099) | | | | | | (167,121) | | | | | | (907,520) | | | | | | (812,200) | | |
| Class I | | | | | (40,057) | | | | | | (24,011) | | | | | | (300,214) | | | | | | (226,396) | | |
| Class R6 | | | | | (926,037) | | | | | | (342,563) | | | | | | (1,564,757) | | | | | | (779,855) | | |
| Class S | | | | | (320,787) | | | | | | (223,244) | | | | | | (1,637,486) | | | | | | (1,182,749) | | |
| Class S2 | | | | | (124,823) | | | | | | (41,710) | | | | | | (199,400) | | | | | | (46,374) | | |
| Total distributions | | | | | (1,745,803) | | | | | | (798,649) | | | | | | (4,609,377) | | | | | | (3,047,574) | | |
| FROM CAPITAL SHARE TRANSACTIONS: | | | | | | | | | | | | | | | | | | | | | | | | | |
| Net proceeds from sale of shares | | | | | 7,563,814 | | | | | | 6,723,890 | | | | | | 14,845,779 | | | | | | 9,220,060 | | |
| Reinvestment of distributions | | | | | 1,745,803 | | | | | | 798,649 | | | | | | 4,609,377 | | | | | | 3,047,574 | | |
| | | | | | 9,309,617 | | | | | | 7,522,539 | | | | | | 19,455,156 | | | | | | 12,267,634 | | |
| Cost of shares redeemed | | | | | (4,746,888) | | | | | | (4,299,523) | | | | | | (17,857,490) | | | | | | (18,501,563) | | |
| Net increase (decrease) in net assets resulting from capital share transactions | | | | | 4,562,729 | | | | | | 3,223,016 | | | | | | 1,597,666 | | | | | | (6,233,929) | | |
| Net increase (decrease) in net assets | | | | | 6,876,989 | | | | | | 675,514 | | | | | | 6,656,083 | | | | | | (12,897,724) | | |
| NET ASSETS: | | | | | | | | | | | | | | | | | | | | | | | | | |
| Beginning of year or period | | | | | 14,582,968 | | | | | | 13,907,454 | | | | | | 49,860,155 | | | | | | 62,757,879 | | |
| End of year or period | | | | $ | 21,459,957 | | | | | $ | 14,582,968 | | | | | $ | 56,516,238 | | | | | $ | 49,860,155 | | |
See Accompanying Notes to Financial Statements
STATEMENTS OF CHANGES IN NET ASSETS
| | | | Voya Solution Conservative Portfolio | | | Voya Solution Income Portfolio | |
| | | | Year Ended
December 31,
2019 | | | Year Ended
December 31,
2018 | | | Year Ended
December 31,
2019 | | | Year Ended
December 31,
2018 | |
| FROM OPERATIONS: | | | | | | | | | | | | | | | | | | | | | | | | | |
| Net investment income | | | | $ | 435,405 | | | | | $ | 345,692 | | | | | $ | 7,099,306 | | | | | $ | 7,782,605 | | |
| Net realized gain | | | | | 332,524 | | | | | | 265,842 | | | | | | 3,193,519 | | | | | | 11,594,330 | | |
| Net change in unrealized appreciation (depreciation) | | | | | 1,225,072 | | | | | | (982,628) | | | | | | 31,919,156 | | | | | | (31,014,421) | | |
| Increase (decrease) in net assets resulting from operations | | | | | 1,993,001 | | | | | | (371,094) | | | | | | 42,211,981 | | | | | | (11,637,486) | | |
| FROM DISTRIBUTIONS TO SHAREHOLDERS: | | | | | | | | | | | | | | | | | | | | | | | | | |
| Total distributions (excluding return of capital): | | | | | | | | | | | | | | | | | | | | | | | | | |
| Class ADV | | | | | (222,397) | | | | | | (296,058) | | | | | | (6,817,626) | | | | | | (7,801,121) | | |
| Class I | | | | | (17,768) | | | | | | (5,173) | | | | | | (3,937,553) | | | | | | (4,124,148) | | |
| Class R6 | | | | | (189,519) | | | | | | (156,288) | | | | | | — | | | | | | — | | |
| Class S | | | | | (90,852) | | | | | | (133,797) | | | | | | (5,140,721) | | | | | | (6,606,738) | | |
| Class S2 | | | | | (11,531) | | | | | | (15,913) | | | | | | (274,095) | | | | | | (296,031) | | |
| Class T | | | | | — | | | | | | — | | | | | | (10,043) | | | | | | (9,336) | | |
| Total distributions | | | | | (532,067) | | | | | | (607,229) | | | | | | (16,180,038) | | | | | | (18,837,374) | | |
| FROM CAPITAL SHARE TRANSACTIONS: | | | | | | | | | | | | | | | | | | | | | | | | | |
| Net proceeds from sale of shares | | | | | 4,775,038 | | | | | | 5,508,633 | | | | | | 18,290,670 | | | | | | 29,428,011 | | |
| Reinvestment of distributions | | | | | 532,067 | | | | | | 607,229 | | | | | | 16,180,038 | | | | | | 18,837,374 | | |
| | | | | | 5,307,105 | | | | | | 6,115,862 | | | | | | 34,470,708 | | | | | | 48,265,385 | | |
| Cost of shares redeemed | | | | | (6,365,408) | | | | | | (4,618,096) | | | | | | (79,225,739) | | | | | | (102,355,652) | | |
| Net increase (decrease) in net assets resulting from capital share transactions | | | | | (1,058,303) | | | | | | 1,497,766 | | | | | | (44,755,031) | | | | | | (54,090,267) | | |
| Net increase (decrease) in net assets | | | | | 402,631 | | | | | | 519,443 | | | | | | (18,723,088) | | | | | | (84,565,127) | | |
| NET ASSETS: | | | | | | | | | | | | | | | | | | | | | | | | | |
| Beginning of year or period | | | | | 17,188,671 | | | | | | 16,669,228 | | | | | | 349,092,411 | | | | | | 433,657,538 | | |
| End of year or period | | | | $ | 17,591,302 | | | | | $ | 17,188,671 | | | | | $ | 330,369,323 | | | | | $ | 349,092,411 | | |
See Accompanying Notes to Financial Statements
STATEMENTS OF CHANGES IN NET ASSETS
| | | | Voya Solution Moderately
Aggressive Portfolio | | | Voya Solution Moderately
Conservative Portfolio | |
| | | | Year Ended
December 31,
2019 | | | Year Ended
December 31,
2018 | | | Year Ended
December 31,
2019 | | | Year Ended
December 31,
2018 | |
| FROM OPERATIONS: | | | | | | | | | | | | | | | | | | | | | | | | | |
| Net investment income | | | | $ | 9,066,131 | | | | | $ | 8,867,115 | | | | | $ | 791,388 | | | | | $ | 607,465 | | |
| Net realized gain | | | | | 40,356,066 | | | | | | 53,190,227 | | | | | | 1,007,772 | | | | | | 1,243,265 | | |
| Net change in unrealized appreciation (depreciation) | | | | | 71,700,500 | | | | | | (119,243,857) | | | | | | 2,936,990 | | | | | | (3,127,981) | | |
| Increase (decrease) in net assets resulting from operations | | | | | 121,122,697 | | | | | | (57,186,515) | | | | | | 4,736,150 | | | | | | (1,277,251) | | |
| FROM DISTRIBUTIONS TO SHAREHOLDERS: | | | | | | | | | | | | | | | | | | | | | | | | | |
| Total distributions (excluding return of capital): | | | | | | | | | | | | | | | | | | | | | | | | | |
| Class ADV | | | | | (2,334,348) | | | | | | (1,511,112) | | | | | | (317,739) | | | | | | (470,405) | | |
| Class I | | | | | (450,780) | | | | | | (276,815) | | | | | | (1,391) | | | | | | (1,336) | | |
| Class R6 | | | | | (1,790,820) | | | | | | (747,524) | | | | | | (239,164) | | | | | | (154,704) | | |
| Class S | | | | | (55,597,857) | | | | | | (39,199,340) | | | | | | (708,276) | | | | | | (677,443) | | |
| Class S2 | | | | | (92,304) | | | | | | (49,430) | | | | | | (207,982) | | | | | | (42,435) | | |
| Total distributions | | | | | (60,266,109) | | | | | | (41,784,221) | | | | | | (1,474,552) | | | | | | (1,346,323) | | |
| FROM CAPITAL SHARE TRANSACTIONS: | | | | | | | | | | | | | | | | | | | | | | | | | |
| Net proceeds from sale of shares | | | | | 10,707,918 | | | | | | 15,378,740 | | | | | | 13,598,489 | | | | | | 5,628,956 | | |
| Reinvestment of distributions | | | | | 60,266,109 | | | | | | 41,784,221 | | | | | | 1,474,552 | | | | | | 1,346,323 | | |
| | | | | | 70,974,027 | | | | | | 57,162,961 | | | | | | 15,073,041 | | | | | | 6,975,279 | | |
| Cost of shares redeemed | | | | | (90,505,058) | | | | | | (108,232,093) | | | | | | (8,294,050) | | | | | | (7,462,988) | | |
| Net increase (decrease) in net assets resulting from capital share transactions | | | | | (19,531,031) | | | | | | (51,069,132) | | | | | | 6,778,991 | | | | | | (487,709) | | |
| Net increase (decrease) in net assets | | | | | 41,325,557 | | | | | | (150,039,868) | | | | | | 10,040,589 | | | | | | (3,111,283) | | |
| NET ASSETS: | | | | | | | | | | | | | | | | | | | | | | | | | |
| Beginning of year or period | | | | | 563,721,673 | | | | | | 713,761,541 | | | | | | 28,368,423 | | | | | | 31,479,706 | | |
| End of year or period | | | | $ | 605,047,230 | | | | | $ | 563,721,673 | | | | | $ | 38,409,012 | | | | | $ | 28,368,423 | | |
See Accompanying Notes to Financial Statements
STATEMENTS OF CHANGES IN NET ASSETS
| | | | Voya Solution 2020 Portfolio | | | Voya Solution 2025 Portfolio | |
| | | | Year Ended
December 31,
2019 | | | Year Ended
December 31,
2018 | | | Year Ended
December 31,
2019 | | | Year Ended
December 31,
2018 | |
| FROM OPERATIONS: | | | | | | | | | | | | | | | | | | | | | | | | | |
| Net investment income | | | | $ | 647,800 | | | | | $ | 658,737 | | | | | $ | 14,896,849 | | | | | $ | 14,258,669 | | |
| Net realized gain | | | | | 642,931 | | | | | | 1,369,364 | | | | | | 33,802,093 | | | | | | 52,949,859 | | |
| Net change in unrealized appreciation (depreciation) | | | | | 3,435,219 | | | | | | (3,479,766) | | | | | | 84,945,395 | | | | | | (114,739,407) | | |
| Increase (decrease) in net assets resulting from operations | | | | | 4,725,950 | | | | | | (1,451,665) | | | | | | 133,644,337 | | | | | | (47,530,879) | | |
| FROM DISTRIBUTIONS TO SHAREHOLDERS: | | | | | | | | | | | | | | | | | | | | | | | | | |
| Total distributions (excluding return of capital): | | | | | | | | | | | | | | | | | | | | | | | | | |
| Class ADV | | | | | (973,056) | | | | | | (931,748) | | | | | | (20,017,470) | | | | | | (13,857,311) | | |
| Class I | | | | | (494,795) | | | | | | (428,868) | | | | | | (20,123,050) | | | | | | (12,546,303) | | |
| Class S | | | | | (817,201) | | | | | | (770,382) | | | | | | (23,516,734) | | | | | | (16,776,054) | | |
| Class S2 | | | | | (24,597) | | | | | | (34,283) | | | | | | (815,755) | | | | | | (620,761) | | |
| Class T | | | | | (971) | | | | | | (747) | | | | | | (33,957) | | | | | | (35,881) | | |
| Total distributions | | | | | (2,310,620) | | | | | | (2,166,028) | | | | | | (64,506,966) | | | | | | (43,836,310) | | |
| FROM CAPITAL SHARE TRANSACTIONS: | | | | | | | | | | | | | | | | | | | | | | | | | |
| Net proceeds from sale of shares | | | | | 12,243,253 | | | | | | 20,253,220 | | | | | | 70,156,056 | | | | | | 82,503,481 | | |
| Reinvestment of distributions | | | | | 2,310,345 | | | | | | 2,165,784 | | | | | | 64,506,966 | | | | | | 43,836,310 | | |
| | | | | | 14,553,598 | | | | | | 22,419,004 | | | | | | 134,663,022 | | | | | | 126,339,791 | | |
| Cost of shares redeemed | | | | | (14,632,349) | | | | | | (18,234,874) | | | | | | (142,508,557) | | | | | | (184,888,030) | | |
| Net increase (decrease) in net assets resulting from capital share transactions | | | | | (78,751) | | | | | | 4,184,130 | | | | | | (7,845,535) | | | | | | (58,548,239) | | |
| Net increase (decrease) in net assets | | | | | 2,336,579 | | | | | | 566,437 | | | | | | 61,291,836 | | | | | | (149,915,428) | | |
| NET ASSETS: | | | | | | | | | | | | | | | | | | | | | | | | | |
| Beginning of year or period | | | | | 33,881,714 | | | | | | 33,315,277 | | | | | | 771,086,282 | | | | | | 921,001,710 | | |
| End of year or period | | | | $ | 36,218,293 | | | | | $ | 33,881,714 | | | | | $ | 832,378,118 | | | | | $ | 771,086,282 | | |
See Accompanying Notes to Financial Statements
STATEMENTS OF CHANGES IN NET ASSETS
| | | | Voya Solution 2030 Portfolio | | | Voya Solution 2035 Portfolio | |
| | | | Year Ended
December 31,
2019 | | | Year Ended
December 31,
2018 | | | Year Ended
December 31,
2019 | | | Year Ended
December 31,
2018 | |
| FROM OPERATIONS: | | | | | | | | | | | | | | | | | | | | | | | | | |
| Net investment income | | | | $ | 686,824 | | | | | $ | 539,529 | | | | | $ | 13,830,824 | | | | | $ | 13,097,809 | | |
| Net realized gain | | | | | 1,525,340 | | | | | | 2,331,498 | | | | | | 56,439,566 | | | | | | 67,458,656 | | |
| Net change in unrealized appreciation (depreciation) | | | | | 4,598,504 | | | | | | (5,298,472) | | | | | | 91,791,155 | | | | | | (150,601,799) | | |
| Increase (decrease) in net assets resulting from operations | | | | | 6,810,668 | | | | | | (2,427,445) | | | | | | 162,061,545 | | | | | | (70,045,334) | | |
| FROM DISTRIBUTIONS TO SHAREHOLDERS: | | | | | | | | | | | | | | | | | | | | | | | | | |
| Total distributions (excluding return of capital): | | | | | | | | | | | | | | | | | | | | | | | | | |
| Class ADV | | | | | (1,222,789) | | | | | | (858,857) | | | | | | (21,225,678) | | | | | | (14,092,763) | | |
| Class I | | | | | (934,211) | | | | | | (505,749) | | | | | | (27,696,711) | | | | | | (16,103,710) | | |
| Class S | | | | | (892,833) | | | | | | (722,379) | | | | | | (30,312,804) | | | | | | (19,502,295) | | |
| Class S2 | | | | | (30,665) | | | | | | (38,574) | | | | | | (1,390,350) | | | | | | (1,008,708) | | |
| Class T | | | | | (2,099) | | | | | | (1,309) | | | | | | (34,551) | | | | | | (36,315) | | |
| Total distributions | | | | | (3,082,597) | | | | | | (2,126,868) | | | | | | (80,660,094) | | | | | | (50,743,791) | | |
| FROM CAPITAL SHARE TRANSACTIONS: | | | | | | | | | | | | | | | | | | | | | | | | | |
| Net proceeds from sale of shares | | | | | 20,284,933 | | | | | | 18,010,189 | | | | | | 66,049,031 | | | | | | 86,959,754 | | |
| Reinvestment of distributions | | | | | 3,082,243 | | | | | | 2,126,546 | | | | | | 80,660,094 | | | | | | 50,743,791 | | |
| | | | | | 23,367,176 | | | | | | 20,136,735 | | | | | | 146,709,125 | | | | | | 137,703,545 | | |
| Cost of shares redeemed | | | | | (11,492,485) | | | | | | (15,873,573) | | | | | | (130,249,164) | | | | | | (175,268,927) | | |
| Net increase (decrease) in net assets resulting from capital share transactions | | | | | 11,874,691 | | | | | | 4,263,162 | | | | | | 16,459,961 | | | | | | (37,565,382) | | |
| Net increase (decrease) in net assets | | | | | 15,602,762 | | | | | | (291,151) | | | | | | 97,861,412 | | | | | | (158,354,507) | | |
| NET ASSETS: | | | | | | | | | | | | | | | | | | | | | | | | | |
| Beginning of year or period | | | | | 31,010,488 | | | | | | 31,301,639 | | | | | | 772,173,689 | | | | | | 930,528,196 | | |
| End of year or period | | | | $ | 46,613,250 | | | | | $ | 31,010,488 | | | | | $ | 870,035,101 | | | | | $ | 772,173,689 | | |
See Accompanying Notes to Financial Statements
STATEMENTS OF CHANGES IN NET ASSETS
| | | | Voya Solution 2040 Portfolio | | | Voya Solution 2045 Portfolio | |
| | | | Year Ended
December 31,
2019 | | | Year Ended
December 31,
2018 | | | Year Ended
December 31,
2019 | | | Year Ended
December 31,
2018 | |
| FROM OPERATIONS: | | | | | | | | | | | | | | | | | | | | | | | | | |
| Net investment income | | | | $ | 498,733 | | | | | $ | 383,565 | | | | | $ | 9,829,825 | | | | | $ | 8,153,021 | | |
| Net realized gain | | | | | 1,652,317 | | | | | | 2,134,979 | | | | | | 43,959,351 | | | | | | 60,004,263 | | |
| Net change in unrealized appreciation (depreciation) | | | | | 3,973,200 | | | | | | (4,952,940) | | | | | | 77,445,548 | | | | | | (132,755,529) | | |
| Increase (decrease) in net assets resulting from operations | | | | | 6,124,250 | | | | | | (2,434,396) | | | | | | 131,234,724 | | | | | | (64,598,245) | | |
| FROM DISTRIBUTIONS TO SHAREHOLDERS: | | | | | | | | | | | | | | | | | | | | | | | | | |
| Total distributions (excluding return of capital): | | | | | | | | | | | | | | | | | | | | | | | | | |
| Class ADV | | | | | (974,788) | | | | | | (781,717) | | | | | | (15,768,200) | | | | | | (10,228,294) | | |
| Class I | | | | | (847,678) | | | | | | (556,292) | | | | | | (26,882,084) | | | | | | (15,367,932) | | |
| Class S | | | | | (721,532) | | | | | | (648,392) | | | | | | (24,987,205) | | | | | | (15,247,200) | | |
| Class S2 | | | | | (71,446) | | | | | | (78,518) | | | | | | (732,541) | | | | | | (561,006) | | |
| Class T | | | | | (1,506) | | | | | | (1,780) | | | | | | (24,095) | | | | | | (30,897) | | |
| Total distributions | | | | | (2,616,950) | | | | | | (2,066,699) | | | | | | (68,394,125) | | | | | | (41,435,329) | | |
| FROM CAPITAL SHARE TRANSACTIONS: | | | | | | | | | | | | | | | | | | | | | | | | | |
| Net proceeds from sale of shares | | | | | 13,658,442 | | | | | | 13,911,630 | | | | | | 64,919,282 | | | | �� | | 76,101,343 | | |
| Reinvestment of distributions | | | | | 2,616,572 | | | | | | 2,066,285 | | | | | | 68,394,125 | | | | | | 41,435,329 | | |
| | | | | | 16,275,014 | | | | | | 15,977,915 | | | | | | 133,313,407 | | | | | | 117,536,672 | | |
| Cost of shares redeemed | | | | | (8,520,943) | | | | | | (11,005,137) | | | | | | (95,365,331) | | | | | | (140,273,180) | | |
| Net increase (decrease) in net assets resulting from capital share transactions | | | | | 7,754,071 | | | | | | 4,972,778 | | | | | | 37,948,076 | | | | | | (22,736,508) | | |
| Net increase (decrease) in net assets | | | | | 11,261,371 | | | | | | 471,683 | | | | | | 100,788,675 | | | | | | (128,770,082) | | |
| NET ASSETS: | | | | | | | | | | | | | | | | | | | | | | | | | |
| Beginning of year or period | | | | | 24,392,377 | | | | | | 23,920,694 | | | | | | 563,906,593 | | | | | | 692,676,675 | | |
| End of year or period | | | | $ | 35,653,748 | | | | | $ | 24,392,377 | | | | | $ | 664,695,268 | | | | | $ | 563,906,593 | | |
See Accompanying Notes to Financial Statements
STATEMENTS OF CHANGES IN NET ASSETS
| | | | Voya Solution 2050 Portfolio | | | Voya Solution 2055 Portfolio | |
| | | | Year Ended
December 31,
2019 | | | Year Ended
December 31,
2018 | | | Year Ended
December 31,
2019 | | | Year Ended
December 31,
2018 | |
| FROM OPERATIONS: | | | | | | | | | | | | | | | | | | | | | | | | | |
| Net investment income | | | | $ | 437,756 | | | | | $ | 267,944 | | | | | $ | 3,377,566 | | | | | $ | 2,314,698 | | |
| Net realized gain | | | | | 1,341,845 | | | | | | 1,795,219 | | | | | | 14,101,369 | | | | | | 18,991,873 | | |
| Net change in unrealized appreciation (depreciation) | | | | | 3,680,746 | | | | | | (4,528,021) | | | | | | 25,850,841 | | | | | | (41,107,723) | | |
| Increase (decrease) in net assets resulting from operations | | | | | 5,460,347 | | | | | | (2,464,858) | | | | | | 43,329,776 | | | | | | (19,801,152) | | |
| FROM DISTRIBUTIONS TO SHAREHOLDERS: | | | | | | | | | | | | | | | | | | | | | | | | | |
| Total distributions (excluding return of capital): | | | | | | | | | | | | | | | | | | | | | | | | | |
| Class ADV | | | | | (891,921) | | | | | | (489,007) | | | | | | (4,328,696) | | | | | | (2,141,118) | | |
| Class I | | | | | (770,026) | | | | | | (359,200) | | | | | | (10,186,778) | | | | | | (4,093,046) | | |
| Class S | | | | | (532,912) | | | | | | (304,081) | | | | | | (5,387,644) | | | | | | (2,589,944) | | |
| Class S2 | | | | | (26,656) | | | | | | (22,915) | | | | | | (233,868) | | | | | | (152,185) | | |
| Class T | | | | | (1,933) | | | | | | (1,004) | | | | | | (1,456) | | | | | | (983) | | |
| Total distributions | | | | | (2,223,448) | | | | | | (1,176,207) | | | | | | (20,138,442) | | | | | | (8,977,276) | | |
| FROM CAPITAL SHARE TRANSACTIONS: | | | | | | | | | | | | | | | | | | | | | | | | | |
| Net proceeds from sale of shares | | | | | 12,340,798 | | | | | | 14,485,321 | | | | | | 49,679,440 | | | | | | 48,936,952 | | |
| Reinvestment of distributions | | | | | 2,223,053 | | | | | | 1,175,917 | | | | | | 20,138,442 | | | | | | 8,977,276 | | |
| | | | | | 14,563,851 | | | | | | 15,661,238 | | | | | | 69,817,882 | | | | | | 57,914,228 | | |
| Cost of shares redeemed | | | | | (6,431,311) | | | | | | (9,142,136) | | | | | | (30,355,951) | | | | | | (42,498,607) | | |
| Net increase in net assets resulting from capital share transactions | | | | | 8,132,540 | | | | | | 6,519,102 | | | | | | 39,461,931 | | | | | | 15,415,621 | | |
| Net increase (decrease) in net assets | | | | | 11,369,439 | | | | | | 2,878,037 | | | | | | 62,653,265 | | | | | | (13,362,807) | | |
| NET ASSETS: | | | | | | | | | | | | | | | | | | | | | | | | | |
| Beginning of year or period | | | | | 20,319,797 | | | | | | 17,441,760 | | | | | | 169,396,738 | | | | | | 182,759,545 | | |
| End of year or period | | | | $ | 31,689,236 | | | | | $ | 20,319,797 | | | | | $ | 232,050,003 | | | | | $ | 169,396,738 | | |
See Accompanying Notes to Financial Statements
STATEMENTS OF CHANGES IN NET ASSETS
| | | | Voya Solution 2060 Portfolio | |
| | | | Year Ended
December 31,
2019 | | | Year Ended
December 31,
2018 | |
| FROM OPERATIONS: | | | | | | | | | | | | | |
| Net investment income | | | | $ | 232,538 | | | | | $ | 135,054 | | |
| Net realized gain | | | | | 709,607 | | | | | | 809,952 | | |
| Net change in unrealized appreciation (depreciation) | | | | | 2,017,916 | | | | | | (2,208,460) | | |
| Increase (decrease) in net assets resulting from operations | | | | | 2,960,061 | | | | | | (1,263,454) | | |
| FROM DISTRIBUTIONS TO SHAREHOLDERS: | | | | | | | | | | | | | |
| Total distributions (excluding return of capital): | | | | | | | | | | | | | |
| Class ADV | | | | | (440,825) | | | | | | (257,511) | | |
| Class I | | | | | (304,947) | | | | | | (126,662) | | |
| Class S | | | | | (314,172) | | | | | | (205,097) | | |
| Class S2 | | | | | (17,202) | | | | | | (13,337) | | |
| Class T | | | | | (262) | | | | | | (197) | | |
| Total distributions | | | | | (1,077,408) | | | | | | (602,804) | | |
| FROM CAPITAL SHARE TRANSACTIONS: | | | | | | | | | | | | | |
| Net proceeds from sale of shares | | | | | 7,930,387 | | | | | | 8,221,311 | | |
| Reinvestment of distributions | | | | | 1,077,408 | | | | | | 602,804 | | |
| | | | | | 9,007,795 | | | | | | 8,824,115 | | |
| Cost of shares redeemed | | | | | (4,410,024) | | | | | | (4,474,377) | | |
| Net increase in net assets resulting from capital share transactions | | | | | 4,597,771 | | | | | | 4,349,738 | | |
| Net increase in net assets | | | | | 6,480,424 | | | | | | 2,483,480 | | |
| NET ASSETS: | | | | | | | | | | | | | |
| Beginning of year or period | | | | | 10,854,181 | | | | | | 8,370,701 | | |
| End of year or period | | | | $ | 17,334,605 | | | | | $ | 10,854,181 | | |
See Accompanying Notes to Financial Statements
Selected data for a share of beneficial interest outstanding throughout each year or period.
| | | | | | | | | | Income
(loss) from
investment
operations | | | | | | | | | Less
Distributions | | | | | | | | | | | | | | | | | | | | | | | | | | | Ratios to average
net assets | | | Supplemental
Data | |
| | | | Net asset value, beginning of year
or period | | | Net investment income (loss) | | | Net realized and unrealized
gain (loss) | | | Total from investment operations | | | From net investment income | | | From net realized gains | | | From return of capital | | | Total distributions | | | Payment by affiliate | | | Net asset value, end of year
or period | | | Total Return(1) | | | Expenses before
reductions/additions(2)(3)(4) | | | Expenses net of fee waivers
and/or recoupments if any(2)(3)(4) | | | Expenses net of all
reductions/additions(2)(3)(4) | | | Net investment income (loss)(2)(3) | | | Net assets, end of year or period | | | Portfolio turnover rate | |
Year or
period ended | | | ($) | | | ($) | | | ($) | | | ($) | | | ($) | | | ($) | | | ($) | | | ($) | | | ($) | | | ($) | | | (%) | | | (%) | | | (%) | | | (%) | | | (%) | | | ($000’s) | | | (%) | |
| Voya Solution Aggressive Portfolio | | | | | | | | | | | | | | | | | | | | | | | | | | | | | | | | | | | | | | | | | | | | | | | | | | | | | | | | | | | | | | | | | | | | | | | | | | | | | | | | | | | | | | | | | | | | | | | | | | | | | | | |
| Class ADV | | | | | | | | | | | | | | | | | | | | | | | | | | | | | | | | | | | | | | | | | | | | | | | | | | | | | | | | | | | | | | | | | | | | | | | | | | | | | | | | | | | | | | | | | | | | | | | | | | | | | | | |
| 12-31-19 | | | | | 11.47 | | | | | | 0.11 | | | | | | 2.65 | | | | | | 2.76 | | | | | | 0.16 | | | | | | 0.99 | | | | | | — | | | | | | 1.15 | | | | | | — | | | | | | 13.08 | | | | | | 24.94 | | | | | | 0.92 | | | | | | 0.75 | | | | | | 0.75 | | | | | | 0.96 | | | | | | 3,760 | | | | | | 85 | | |
| 12-31-18 | | | | | 13.56 | | | | | | 0.10 | | | | | | (1.53) | | | | | | (1.43) | | | | | | 0.11 | | | | | | 0.55 | | | | | | — | | | | | | 0.66 | | | | | | — | | | | | | 11.47 | | | | | | (11.18) | | | | | | 0.90 | | | | | | 0.69 | | | | | | 0.69 | | | | | | 0.79 | | | | | | 3,159 | | | | | | 79 | | |
| 12-31-17 | | | | | 11.33 | | | | | | 0.11• | | | | | | 2.34 | | | | | | 2.45 | | | | | | 0.05 | | | | | | 0.17 | | | | | | — | | | | | | 0.22 | | | | | | — | | | | | | 13.56 | | | | | | 21.71 | | | | | | 0.91 | | | | | | 0.66 | | | | | | 0.66 | | | | | | 0.85 | | | | | | 3,467 | | | | | | 52 | | |
| 12-31-16 | | | | | 11.35 | | | | | | 0.08 | | | | | | 0.63 | | | | | | 0.71 | | | | | | 0.12 | | | | | | 0.61 | | | | | | — | | | | | | 0.73 | | | | | | — | | | | | | 11.33 | | | | | | 6.41 | | | | | | 1.04 | | | | | | 0.68 | | | | | | 0.68 | | | | | | 0.77 | | | | | | 2,520 | | | | | | 61 | | |
| 12-31-15 | | | | | 12.13 | | | | | | 0.06• | | | | | | (0.19) | | | | | | (0.13) | | | | | | 0.21 | | | | | | 0.44 | | | | | | — | | | | | | 0.65 | | | | | | — | | | | | | 11.35 | | | | | | (1.32) | | | | | | 0.94 | | | | | | 0.68 | | | | | | 0.68 | | | | | | 0.53 | | | | | | 2,383 | | | | | | 78 | | |
| Class I | | | | | | | | | | | | | | | | | | | | | | | | | | | | | | | | | | | | | | | | | | | | | | | | | | | | | | | | | | | | | | | | | | | | | | | | | | | | | | | | | | | | | | | | | | | | | | | | | | | | | | | |
| 12-31-19 | | | | | 11.74 | | | | | | 0.22• | | | | | | 2.67 | | | | | | 2.89 | | | | | | 0.22 | | | | | | 0.99 | | | | | | — | | | | | | 1.21 | | | | | | — | | | | | | 13.42 | | | | | | 25.54 | | | | | | 0.42 | | | | | | 0.25 | | | | | | 0.25 | | | | | | 1.73 | | | | | | 600 | | | | | | 85 | | |
| 12-31-18 | | | | | 13.85 | | | | | | 0.16• | | | | | | (1.55) | | | | | | (1.39) | | | | | | 0.17 | | | | | | 0.55 | | | | | | — | | | | | | 0.72 | | | | | | — | | | | | | 11.74 | | | | | | (10.72) | | | | | | 0.40 | | | | | | 0.19 | | | | | | 0.19 | | | | | | 1.17 | | | | | | 325 | | | | | | 79 | | |
| 12-31-17 | | | | | 11.56 | | | | | | 0.18• | | | | | | 2.38 | | | | | | 2.56 | | | | | | 0.10 | | | | | | 0.17 | | | | | | — | | | | | | 0.27 | | | | | | — | | | | | | 13.85 | | | | | | 22.28 | | | | | | 0.41 | | | | | | 0.16 | | | | | | 0.16 | | | | | | 1.41 | | | | | | 444 | | | | | | 52 | | |
| 12-31-16 | | | | | 11.57 | | | | | | 0.17• | | | | | | 0.61 | | | | | | 0.78 | | | | | | 0.18 | | | | | | 0.61 | | | | | | — | | | | | | 0.79 | | | | | | — | | | | | | 11.56 | | | | | | 6.93 | | | | | | 0.54 | | | | | | 0.18 | | | | | | 0.18 | | | | | | 1.53 | | | | | | 258 | | | | | | 61 | | |
| 12-31-15 | | | | | 12.32 | | | | | | 0.19• | | | | | | (0.26) | | | | | | (0.07) | | | | | | 0.24 | | | | | | 0.44 | | | | | | — | | | | | | 0.68 | | | | | | — | | | | | | 11.57 | | | | | | (0.83) | | | | | | 0.44 | | | | | | 0.18 | | | | | | 0.18 | | | | | | 1.56 | | | | | | 138 | | | | | | 78 | | |
| Class R6 | | | | | | | | | | | | | | | | | | | | | | | | | | | | | | | | | | | | | | | | | | | | | | | | | | | | | | | | | | | | | | | | | | | | | | | | | | | | | | | | | | | | | | | | | | | | | | | | | | | | | | | |
| 12-31-19 | | | | | 11.74 | | | | | | 0.20• | | | | | | 2.68 | | | | | | 2.88 | | | | | | 0.22 | | | | | | 0.99 | | | | | | — | | | | | | 1.21 | | | | | | — | | | | | | 13.41 | | | | | | 25.45 | | | | | | 0.42 | | | | | | 0.25 | | | | | | 0.25 | | | | | | 1.57 | | | | | | 11,636 | | | | | | 85 | | |
| 12-31-18 | | | | | 13.85 | | | | | | 0.19• | | | | | | (1.58) | | | | | | (1.39) | | | | | | 0.17 | | | | | | 0.55 | | | | | | — | | | | | | 0.72 | | | | | | — | | | | | | 11.74 | | | | | | (10.72) | | | | | | 0.40 | | | | | | 0.19 | | | | | | 0.19 | | | | | | 1.42 | | | | | | 7,177 | | | | | | 79 | | |
| 12-31-17 | | | | | 11.56 | | | | | | 0.24• | | | | | | 2.32 | | | | | | 2.56 | | | | | | 0.10 | | | | | | 0.17 | | | | | | — | | | | | | 0.27 | | | | | | — | | | | | | 13.85 | | | | | | 22.28 | | | | | | 0.41 | | | | | | 0.16 | | | | | | 0.16 | | | | | | 1.82 | | | | | | 5,015 | | | | | | 52 | | |
| 05-02-16(5) - 12-31-16 | | | | | 11.66 | | | | | | 0.44• | | | | | | 0.25 | | | | | | 0.69 | | | | | | 0.18 | | | | | | 0.61 | | | | | | — | | | | | | 0.79 | | | | | | — | | | | | | 11.56 | | | | | | 6.11 | | | | | | 0.54 | | | | | | 0.18 | | | | | | 0.18 | | | | | | 5.93 | | | | | | 659 | | | | | | 61 | | |
| Class S | | | | | | | | | | | | | | | | | | | | | | | | | | | | | | | | | | | | | | | | | | | | | | | | | | | | | | | | | | | | | | | | | | | | | | | | | | | | | | | | | | | | | | | | | | | | | | | | | | | | | | | |
| 12-31-19 | | | | | 11.60 | | | | | | 0.15 | | | | | | 2.67 | | | | | | 2.82 | | | | | | 0.18 | | | | | | 0.99 | | | | | | — | | | | | | 1.17 | | | | | | — | | | | | | 13.25 | | | | | | 25.21 | | | | | | 0.67 | | | | | | 0.50 | | | | | | 0.50 | | | | | | 1.27 | | | | | | 3,925 | | | | | | 85 | | |
| 12-31-18 | | | | | 13.69 | | | | | | 0.12• | | | | | | (1.52) | | | | | | (1.40) | | | | | | 0.14 | | | | | | 0.55 | | | | | | — | | | | | | 0.69 | | | | | | — | | | | | | 11.60 | | | | | | (10.91) | | | | | | 0.65 | | | | | | 0.44 | | | | | | 0.44 | | | | | | 0.93 | | | | | | 3,123 | | | | | | 79 | | |
| 12-31-17 | | | | | 11.44 | | | | | | 0.12• | | | | | | 2.37 | | | | | | 2.49 | | | | | | 0.07 | | | | | | 0.17 | | | | | | — | | | | | | 0.24 | | | | | | — | | | | | | 13.69 | | | | | | 21.92 | | | | | | 0.66 | | | | | | 0.41 | | | | | | 0.41 | | | | | | 0.99 | | | | | | 4,300 | | | | | | 52 | | |
| 12-31-16 | | | | | 11.46 | | | | | | 0.12• | | | | | | 0.63 | | | | | | 0.75 | | | | | | 0.16 | | | | | | 0.61 | | | | | | — | | | | | | 0.77 | | | | | | — | | | | | | 11.44 | | | | | | 6.75 | | | | | | 0.79 | | | | | | 0.43 | | | | | | 0.43 | | | | | | 1.08 | | | | | | 3,954 | | | | | | 61 | | |
| 12-31-15 | | | | | 12.23 | | | | | | 0.13• | | | | | | (0.23) | | | | | | (0.10) | | | | | | 0.23 | | | | | | 0.44 | | | | | | — | | | | | | 0.67 | | | | | | — | | | | | | 11.46 | | | | | | (1.12) | | | | | | 0.69 | | | | | | 0.43 | | | | | | 0.43 | | | | | | 1.04 | | | | | | 2,417 | | | | | | 78 | | |
| Class S2 | | | | | | | | | | | | | | | | | | | | | | | | | | | | | | | | | | | | | | | | | | | | | | | | | | | | | | | | | | | | | | | | | | | | | | | | | | | | | | | | | | | | | | | | | | | | | | | | | | | | | | | |
| 12-31-19 | | | | | 11.43 | | | | | | 0.16• | | | | | | 2.60 | | | | | | 2.76 | | | | | | 0.19 | | | | | | 0.99 | | | | | | — | | | | | | 1.18 | | | | | | — | | | | | | 13.01 | | | | | | 25.05 | | | | | | 0.82 | | | | | | 0.65 | | | | | | 0.65 | | | | | | 1.28 | | | | | | 1,539 | | | | | | 85 | | |
| 12-31-18 | | | | | 13.52 | | | | | | 0.13• | | | | | | (1.54) | | | | | | (1.41) | | | | | | 0.13 | | | | | | 0.55 | | | | | | — | | | | | | 0.68 | | | | | | — | | | | | | 11.43 | | | | | | (11.08) | | | | | | 0.80 | | | | | | 0.59 | | | | | | 0.59 | | | | | | 0.96 | | | | | | 800 | | | | | | 79 | | |
| 12-31-17 | | | | | 11.32 | | | | | | 0.12• | | | | | | 2.32 | | | | | | 2.44 | | | | | | 0.07 | | | | | | 0.17 | | | | | | — | | | | | | 0.24 | | | | | | — | | | | | | 13.52 | | | | | | 21.71 | | | | | | 0.81 | | | | | | 0.56 | | | | | | 0.56 | | | | | | 0.99 | | | | | | 681 | | | | | | 52 | | |
| 12-31-16 | | | | | 11.36 | | | | | | 0.13• | | | | | | 0.60 | | | | | | 0.73 | | | | | | 0.16 | | | | | | 0.61 | | | | | | — | | | | | | 0.77 | | | | | | — | | | | | | 11.32 | | | | | | 6.57 | | | | | | 0.97 | | | | | | 0.58 | | | | | | 0.58 | | | | | | 1.15 | | | | | | 422 | | | | | | 61 | | |
| 12-31-15 | | | | | 12.14 | | | | | | 0.11• | | | | | | (0.22) | | | | | | (0.11) | | | | | | 0.23 | | | | | | 0.44 | | | | | | — | | | | | | 0.67 | | | | | | — | | | | | | 11.36 | | | | | | (1.20) | | | | | | 0.94 | | | | | | 0.58 | | | | | | 0.58 | | | | | | 0.93 | | | | | | 169 | | | | | | 78 | | |
| Voya Solution Balanced Portfolio | | | | | | | | | | | | | | | | | | | | | | | | | | | | | | | | | | | | | | | | | | | | | | | | | | | | | | | | | | | | | | | | | | | | | | | | | | | | | | | | | | | | | | | | | | | | | | | | | | | | | | | |
| Class ADV | | | | | | | | | | | | | | | | | | | | | | | | | | | | | | | | | | | | | | | | | | | | | | | | | | | | | | | | | | | | | | | | | | | | | | | | | | | | | | | | | | | | | | | | | | | | | | | | | | | | | | | |
| 12-31-19 | | | | | 8.89 | | | | | | 0.14• | | | | | | 1.51 | | | | | | 1.65 | | | | | | 0.19 | | | | | | 0.61 | | | | | | — | | | | | | 0.80 | | | | | | — | | | | | | 9.74 | | | | | | 19.13 | | | | | | 0.82 | | | | | | 0.75 | | | | | | 0.75 | | | | | | 1.45 | | | | | | 10,913 | | | | | | 85 | | |
| 12-31-18 | | | | | 10.08 | | | | | | 0.14• | | | | | | (0.80) | | | | | | (0.66) | | | | | | 0.16 | | | | | | 0.37 | | | | | | — | | | | | | 0.53 | | | | | | — | | | | | | 8.89 | | | | | | (6.98) | | | | | | 0.80 | | | | | | 0.69 | | | | | | 0.69 | | | | | | 1.39 | | | | | | 11,984 | | | | | | 60 | | |
| 12-31-17 | | | | | 9.06 | | | | | | 0.13• | | | | | | 1.16 | | | | | | 1.29 | | | | | | 0.11 | | | | | | 0.16 | | | | | | — | | | | | | 0.27 | | | | | | — | | | | | | 10.08 | | | | | | 14.46 | | | | | | 0.78 | | | | | | 0.66 | | | | | | 0.66 | | | | | | 1.32 | | | | | | 19,020 | | | | | | 48 | | |
| 12-31-16 | | | | | 9.39 | | | | | | 0.12• | | | | | | 0.44 | | | | | | 0.56 | | | | | | 0.20 | | | | | | 0.69 | | | | | | — | | | | | | 0.89 | | | | | | — | | | | | | 9.06 | | | | | | 6.08 | | | | | | 0.78 | | | | | | 0.64 | | | | | | 0.64 | | | | | | 1.25 | | | | | | 18,215 | | | | | | 78 | | |
| 12-31-15 | | | | | 10.57 | | | | | | 0.10• | | | | | | (0.14) | | | | | | (0.04) | | | | | | 0.28 | | | | | | 0.86 | | | | | | — | | | | | | 1.14 | | | | | | — | | | | | | 9.39 | | | | | | (0.72) | | | | | | 0.78 | | | | | | 0.65 | | | | | | 0.65 | | | | | | 0.97 | | | | | | 25,079 | | | | | | 49 | | |
See Accompanying Notes to Financial Statements
Financial Highlights (continued)
| | | | | | | | | | Income
(loss) from
investment
operations | | | | | | | | | Less
Distributions | | | | | | | | | | | | | | | | | | | | | | | | | | | Ratios to average
net assets | | | Supplemental
Data | |
| | | | Net asset value, beginning of year
or period | | | Net investment income (loss) | | | Net realized and unrealized
gain (loss) | | | Total from investment operations | | | From net investment income | | | From net realized gains | | | From return of capital | | | Total distributions | | | Payment by affiliate | | | Net asset value, end of year
or period | | | Total Return(1) | | | Expenses before
reductions/additions(2)(3)(4) | | | Expenses net of fee waivers
and/or recoupments if any(2)(3)(4) | | | Expenses net of all
reductions/additions(2)(3)(4) | | | Net investment income (loss)(2)(3) | | | Net assets, end of year or period | | | Portfolio turnover rate | |
Year or
period ended | | | ($) | | | ($) | | | ($) | | | ($) | | | ($) | | | ($) | | | ($) | | | ($) | | | ($) | | | ($) | | | (%) | | | (%) | | | (%) | | | (%) | | | (%) | | | ($000’s) | | | (%) | |
| Voya Solution Balanced Portfolio (continued) | | | | | | | | | | | | | �� | | | | | | | | | | | | | | | | | | | | | | | | | | | | | | | | | | | | | | | | | | | | | | | | | | | | | | | | | | | | | | | | | | | | | | | | | | | | | | | | | | | | | | | | | | |
| Class I | | | | | | | | | | | | | | | | | | | | | | | | | | | | | | | | | | | | | | | | | | | | | | | | | | | | | | | | | | | | | | | | | | | | | | | | | | | | | | | | | | | | | | | | | | | | | | | | | | | | | | | |
| 12-31-19 | | | | | 9.24 | | | | | | 0.18• | | | | | | 1.59 | | | | | | 1.77 | | | | | | 0.26 | | | | | | 0.61 | | | | | | — | | | | | | 0.87 | | | | | | — | | | | | | 10.14 | | | | | | 19.75 | | | | | | 0.32 | | | | | | 0.25 | | | | | | 0.25 | | | | | | 1.78 | | | | | | 2,482 | | | | | | 85 | | |
| 12-31-18 | | | | | 10.45 | | | | | | 0.20• | | | | | | (0.82) | | | | | | (0.62) | | | | | | 0.22 | | | | | | 0.37 | | | | | | — | | | | | | 0.59 | | | | | | — | | | | | | 9.24 | | | | | | (6.38) | | | | | | 0.30 | | | | | | 0.19 | | | | | | 0.19 | | | | | | 1.97 | | | | | | 3,689 | | | | | | 60 | | |
| 12-31-17 | | | | | 9.40 | | | | | | 0.21• | | | | | | 1.17 | | | | | | 1.38 | | | | | | 0.17 | | | | | | 0.16 | | | | | | — | | | | | | 0.33 | | | | | | — | | | | | | 10.45 | | | | | | 14.89 | | | | | | 0.28 | | | | | | 0.16 | | | | | | 0.16 | | | | | | 2.06 | | | | | | 4,683 | | | | | | 48 | | |
| 12-31-16 | | | | | 9.72 | | | | | | 0.28• | | | | | | 0.35 | | | | | | 0.63 | | | | | | 0.26 | | | | | | 0.69 | | | | | | — | | | | | | 0.95 | | | | | | — | | | | | | 9.40 | | | | | | 6.69 | | | | | | 0.28 | | | | | | 0.14 | | | | | | 0.14 | | | | | | 3.03 | | | | | | 2,092 | | | | | | 78 | | |
| 12-31-15 | | | | | 10.90 | | | | | | 0.18• | | | | | | (0.16) | | | | | | 0.02 | �� | | | | | 0.34 | | | | | | 0.86 | | | | | | — | | | | | | 1.20 | | | | | | — | | | | | | 9.72 | | | | | | (0.19) | | | | | | 0.28 | | | | | | 0.15 | | | | | | 0.15 | | | | | | 1.72 | | | | | | 59 | | | | | | 49 | | |
| Class R6 | | | | | | | | | | | | | | | | | | | | | | | | | | | | | | | | | | | | | | | | | | | | | | | | | | | | | | | | | | | | | | | | | | | | | | | | | | | | | | | | | | | | | | | | | | | | | | | | | | | | | | | |
| 12-31-19 | | | | | 9.24 | | | | | | 0.21• | | | | | | 1.56 | | | | | | 1.77 | | | | | | 0.26 | | | | | | 0.61 | | | | | | — | | | | | | 0.87 | | | | | | — | | | | | | 10.14 | | | | | | 19.76 | | | | | | 0.32 | | | | | | 0.25 | | | | | | 0.25 | | | | | | 2.09 | | | | | | 20,185 | | | | | | 85 | | |
| 12-31-18 | | | | | 10.45 | | | | | | 0.18 | | | | | | (0.80) | | | | | | (0.62) | | | | | | 0.22 | | | | | | 0.37 | | | | | | — | | | | | | 0.59 | | | | | | — | | | | | | 9.24 | | | | | | (6.38) | | | | | | 0.30 | | | | | | 0.19 | | | | | | 0.19 | | | | | | 2.00 | | | | | | 13,738 | | | | | | 60 | | |
| 12-31-17 | | | | | 9.39 | | | | | | 0.22• | | | | | | 1.17 | | | | | | 1.39 | | | | | | 0.17 | | | | | | 0.16 | | | | | | — | | | | | | 0.33 | | | | | | — | | | | | | 10.45 | | | | | | 15.01 | | | | | | 0.28 | | | | | | 0.16 | | | | | | 0.16 | | | | | | 2.20 | | | | | | 13,145 | | | | | | 48 | | |
| 05-02-16(5) - 12-31-16 | | | | | 9.89 | | | | | | 0.23• | | | | | | 0.22 | | | | | | 0.45 | | | | | | 0.26 | | | | | | 0.69 | | | | | | — | | | | | | 0.95 | | | | | | — | | | | | | 9.39 | | | | | | 4.75 | | | | | | 0.28 | | | | | | 0.14 | | | | | | 0.14 | | | | | | 3.74 | | | | | | 2,412 | | | | | | 78 | | |
| Class S | | | | | | | | | | | | | | | | | | | | | | | | | | | | | | | | | | | | | | | | | | | | | | | | | | | | | | | | | | | | | | | | | | | | | | | | | | | | | | | | | | | | | | | | | | | | | | | | | | | | | | | |
| 12-31-19 | | | | | 9.01 | | | | | | 0.17• | | | | | | 1.53 | | | | | | 1.70 | | | | | | 0.23 | | | | | | 0.61 | | | | | | — | | | | | | 0.84 | | | | | | — | | | | | | 9.87 | | | | | | 19.47 | | | | | | 0.57 | | | | | | 0.50 | | | | | | 0.50 | | | | | | 1.76 | | | | | | 20,388 | | | | | | 85 | | |
| 12-31-18 | | | | | 10.21 | | | | | | 0.17• | | | | | | (0.81) | | | | | | (0.64) | | | | | | 0.19 | | | | | | 0.37 | | | | | | — | | | | | | 0.56 | | | | | | — | | | | | | 9.01 | | | | | | (6.70) | | | | | | 0.55 | | | | | | 0.44 | | | | | | 0.44 | | | | | | 1.69 | | | | | | 19,594 | | | | | | 60 | | |
| 12-31-17 | | | | | 9.18 | | | | | | 0.15• | | | | | | 1.19 | | | | | | 1.34 | | | | | | 0.15 | | | | | | 0.16 | | | | | | — | | | | | | 0.31 | | | | | | — | | | | | | 10.21 | | | | | | 14.75 | | | | | | 0.53 | | | | | | 0.41 | | | | | | 0.41 | | | | | | 1.54 | | | | | | 23,906 | | | | | | 48 | | |
| 12-31-16 | | | | | 9.52 | | | | | | 0.16 | | | | | | 0.43 | | | | | | 0.59 | | | | | | 0.24 | | | | | | 0.69 | | | | | | — | | | | | | 0.93 | | | | | | — | | | | | | 9.18 | | | | | | 6.32 | | | | | | 0.53 | | | | | | 0.39 | | | | | | 0.39 | | | | | | 1.63 | | | | | | 25,331 | | | | | | 78 | | |
| 12-31-15 | | | | | 10.70 | | | | | | 0.13 | | | | | | (0.14) | | | | | | (0.01) | | | | | | 0.31 | | | | | | 0.86 | | | | | | — | | | | | | 1.17 | | | | | | — | | | | | | 9.52 | | | | | | (0.46) | | | | | | 0.53 | | | | | | 0.40 | | | | | | 0.40 | | | | | | 1.28 | | | | | | 22,552 | | | | | | 49 | | |
| Class S2 | | | | | | | | | | | | | | | | | | | | | | | | | | | | | | | | | | | | | | | | | | | | | | | | | | | | | | | | | | | | | | | | | | | | | | | | | | | | | | | | | | | | | | | | | | | | | | | | | | | | | | | |
| 12-31-19 | | | | | 9.00 | | | | | | 0.18• | | | | | | 1.49 | | | | | | 1.67 | | | | | | 0.23 | | | | | | 0.61 | | | | | | — | | | | | | 0.84 | | | | | | — | | | | | | 9.83 | | | | | | 19.22 | | | | | | 0.72 | | | | | | 0.65 | | | | | | 0.65 | | | | | | 1.90 | | | | | | 2,548 | | | | | | 85 | | |
| 12-31-18 | | | | | 10.17 | | | | | | 0.13• | | | | | | (0.79) | | | | | | (0.66) | | | | | | 0.14 | | | | | | 0.37 | | | | | | — | | | | | | 0.51 | | | | | | — | | | | | | 9.00 | | | | | | (6.89) | | | | | | 0.70 | | | | | | 0.59 | | | | | | 0.59 | | | | | | 1.30 | | | | | | 856 | | | | | | 60 | | |
| 12-31-17 | | | | | 9.16 | | | | | | 0.14• | | | | | | 1.18 | | | | | | 1.32 | | | | | | 0.15 | | | | | | 0.16 | | | | | | — | | | | | | 0.31 | | | | | | — | | | | | | 10.17 | | | | | | 14.63 | | | | | | 0.68 | | | | | | 0.56 | | | | | | 0.56 | | | | | | 1.43 | | | | | | 2,004 | | | | | | 48 | | |
| 12-31-16 | | | | | 9.50 | | | | | | 0.18• | | | | | | 0.39 | | | | | | 0.57 | | | | | | 0.22 | | | | | | 0.69 | | | | | | — | | | | | | 0.91 | | | | | | — | | | | | | 9.16 | | | | | | 6.10 | | | | | | 0.71 | | | | | | 0.54 | | | | | | 0.54 | | | | | | 1.96 | | | | | | 1,668 | | | | | | 78 | | |
| 12-31-15 | | | | | 10.67 | | | | | | 0.11• | | | | | | (0.13) | | | | | | (0.02) | | | | | | 0.29 | | | | | | 0.86 | | | | | | — | | | | | | 1.15 | | | | | | — | | | | | | 9.50 | | | | | | (0.60) | | | | | | 0.78 | | | | | | 0.55 | | | | | | 0.55 | | | | | | 1.06 | | | | | | 578 | | | | | | 49 | | |
| Voya Solution Conservative Portfolio | | | | | | | | | | | | | | | | | | | | | | | | | | | | | | | | | | | | | | | | | | | | | | | | | | | | | | | | | | | | | | | | | | | | | | | | | | | | | | | | | | | | | | | | | | | | | | | | | | | | | | | |
| Class ADV | | | | | | | | | | | | | | | | | | | | | | | | | | | | | | | | | | | | | | | | | | | | | | | | | | | | | | | | | | | | | | | | | | | | | | | | | | | | | | | | | | | | | | | | | | | | | | | | | | | | | | | |
| 12-31-19 | | | | | 10.40 | | | | | | 0.24 | | | | | | 0.90 | | | | | | 1.14 | | | | | | 0.21 | | | | | | 0.09 | | | | | | — | | | | | | 0.30 | | | | | | — | | | | | | 11.24 | | | | | | 10.99 | | | | | | 0.92 | | | | | | 0.67 | | | | | | 0.67 | | | | | | 2.10 | | | | | | 8,336 | | | | | | 75 | | |
| 12-31-18 | | | | | 11.06 | | | | | | 0.22 | | | | | | (0.47) | | | | | | (0.25) | | | | | | 0.22 | | | | | | 0.19 | | | | | | — | | | | | | 0.41 | | | | | | — | | | | | | 10.40 | | | | | | (2.39) | | | | | | 0.89 | | | | | | 0.63 | | | | | | 0.63 | | | | | | 1.92 | | | | | | 7,912 | | | | | | 67 | | |
| 12-31-17 | | | | | 10.60 | | | | | | 0.20• | | | | | | 0.55 | | | | | | 0.75 | | | | | | 0.22 | | | | | | 0.07 | | | | | | — | | | | | | 0.29 | | | | | | — | | | | | | 11.06 | | | | | | 7.06 | | | | | | 0.86 | | | | | | 0.62 | | | | | | 0.62 | | | | | | 1.84 | | | | | | 8,486 | | | | | | 63 | | |
| 12-31-16 | | | | | 10.45 | | | | | | 0.20 | | | | | | 0.40 | | | | | | 0.60 | | | | | | 0.19 | | | | | | 0.26 | | | | | | — | | | | | | 0.45 | | | | | | — | | | | | | 10.60 | | | | | | 5.76 | | | | | | 0.85 | | | | | | 0.62 | | | | | | 0.62 | | | | | | 1.79 | | | | | | 8,524 | | | | | | 58 | | |
| 12-31-15 | | | | | 11.15 | | | | | | 0.14• | | | | | | (0.22) | | | | | | (0.08) | | | | | | 0.27 | | | | | | 0.35 | | | | | | — | | | | | | 0.62 | | | | | | — | | | | | | 10.45 | | | | | | (0.76) | | | | | | 0.83 | | | | | | 0.61 | | | | | | 0.61 | | | | | | 1.29 | | | | | | 8,595 | | | | | | 51 | | |
| Class I | | | | | | | | | | | | | | | | | | | | | | | | | | | | | | | | | | | | | | | | | | | | | | | | | | | | | | | | | | | | | | | | | | | | | | | | | | | | | | | | | | | | | | | | | | | | | | | | | | | | | | | |
| 12-31-19 | | | | | 10.54 | | | | | | 0.31• | | | | | | 0.91 | | | | | | 1.22 | | | | | | 0.26 | | | | | | 0.09 | | | | | | — | | | | | | 0.35 | | | | | | — | | | | | | 11.41 | | | | | | 11.65 | | | | | | 0.42 | | | | | | 0.17 | | | | | | 0.17 | | | | | | 2.82 | | | | | | 658 | | | | | | 75 | | |
| 12-31-18 | | | | | 11.21 | | | | | | 0.28• | | | | | | (0.49) | | | | | | (0.21) | | | | | | 0.27 | | | | | | 0.19 | | | | | | — | | | | | | 0.46 | | | | | | — | | | | | | 10.54 | | | | | | (1.94) | | | | | | 0.39 | | | | | | 0.13 | | | | | | 0.13 | | | | | | 2.62 | | | | | | 274 | | | | | | 67 | | |
| 12-31-17 | | | | | 10.74 | | | | | | 0.25• | | | | | | 0.56 | | | | | | 0.81 | | | | | | 0.27 | | | | | | 0.07 | | | | | | — | | | | | | 0.34 | | | | | | — | | | | | | 11.21 | | | | | | 7.60 | | | | | | 0.36 | | | | | | 0.12 | | | | | | 0.12 | | | | | | 2.31 | | | | | | 90 | | | | | | 63 | | |
| 12-31-16 | | | | | 10.60 | | | | | | 0.29• | | | | | | 0.37 | | | | | | 0.66 | | | | | | 0.26 | | | | | | 0.26 | | | | | | — | | | | | | 0.52 | | | | | | — | | | | | | 10.74 | | | | | | 6.24 | | | | | | 0.35 | | | | | | 0.12 | | | | | | 0.12 | | | | | | 2.67 | | | | | | 109 | | | | | | 58 | | |
| 12-31-15 | | | | | 11.30 | | | | | | 0.21• | | | | | | (0.23) | | | | | | (0.02) | | | | | | 0.33 | | | | | | 0.35 | | | | | | — | | | | | | 0.68 | | | | | | — | | | | | | 10.60 | | | | | | (0.23) | | | | | | 0.33 | | | | | | 0.11 | | | | | | 0.11 | | | | | | 1.86 | | | | | | 13 | | | | | | 51 | | |
See Accompanying Notes to Financial Statements
Financial Highlights (continued)
| | | | | | | | | | Income
(loss) from
investment
operations | | | | | | | | | Less
Distributions | | | | | | | | | | | | | | | | | | | | | | | | | | | Ratios to average
net assets | | | Supplemental
Data | |
| | | | Net asset value, beginning of year
or period | | | Net investment income (loss) | | | Net realized and unrealized
gain (loss) | | | Total from investment operations | | | From net investment income | | | From net realized gains | | | From return of capital | | | Total distributions | | | Payment by affiliate | | | Net asset value, end of year
or period | | | Total Return(1) | | | Expenses before
reductions/additions(2)(3)(4) | | | Expenses net of fee waivers
and/or recoupments if any(2)(3)(4) | | | Expenses net of all
reductions/additions(2)(3)(4) | | | Net investment income (loss)(2)(3) | | | Net assets, end of year or period | | | Portfolio turnover rate | |
Year or
period ended | | | ($) | | | ($) | | | ($) | | | ($) | | | ($) | | | ($) | | | ($) | | | ($) | | | ($) | | | ($) | | | (%) | | | (%) | | | (%) | | | (%) | | | (%) | | | ($000’s) | | | (%) | |
| Voya Solution Conservative Portfolio (continued) | | | | | | | | | | | | | | | | | | | | | | | | | | | | | | | | | | | | | | | | | | | | | | | | | | | | | | | | | | | | | | | | | | | | | | | | | | | | | | | | | | | | | | | | | | | | | | | | | | | | | | | |
| Class R6 | | | | | | | | | | | | | | | | | | | | | | | | | | | | | | | | | | | | | | | | | | | | | | | | | | | | | | | | | | | | | | | | | | | | | | | | | | | | | | | | | | | | | | | | | | | | | | | | | | | | | | | |
| 12-31-19 | | | | | 10.54 | | | | | | 0.30 | | | | | | 0.92 | | | | | | 1.22 | | | | | | 0.26 | | | | | | 0.09 | | | | | | — | | | | | | 0.35 | | | | | | — | | | | | | 11.41 | | | | | | 11.65 | | | | | | 0.42 | | | | | | 0.17 | | | | | | 0.17 | | | | | | 2.61 | | | | | | 5,365 | | | | | | 75 | | |
| 12-31-18 | | | | | 11.21 | | | | | | 0.28• | | | | | | (0.49) | | | | | | (0.21) | | | | | | 0.27 | | | | | | 0.19 | | | | | | — | | | | | | 0.46 | | | | | | — | | | | | | 10.54 | | | | | | (1.94) | | | | | | 0.39 | | | | | | 0.13 | | | | | | 0.13 | | | | | | 2.52 | | | | | | 5,056 | | | | | | 67 | | |
| 12-31-17 | | | | | 10.74 | | | | | | 0.27• | | | | | | 0.54 | | | | | | 0.81 | | | | | | 0.27 | | | | | | 0.07 | | | | | | — | | | | | | 0.34 | | | | | | — | | | | | | 11.21 | | | | | | 7.60 | | | | | | 0.36 | | | | | | 0.12 | | | | | | 0.12 | | | | | | 2.42 | | | | | | 3,439 | | | | | | 63 | | |
| 05-02-16(5) - 12-31-16 | | | | | 10.98 | | | | | | 0.20• | | | | | | 0.08 | | | | | | 0.28 | | | | | | 0.26 | | | | | | 0.26 | | | | | | — | | | | | | 0.52 | | | | | | — | | | | | | 10.74 | | | | | | 2.57 | | | | | | 0.35 | | | | | | 0.12 | | | | | | 0.12 | | | | | | 2.81 | | | | | | 718 | | | | | | 58 | | |
| Class S | | | | | | | | | | | | | | | | | | | | | | | | | | | | | | | | | | | | | | | | | | | | | | | | | | | | | | | | | | | | | | | | | | | | | | | | | | | | | | | | | | | | | | | | | | | | | | | | | | | | | | | |
| 12-31-19 | | | | | 10.48 | | | | | | 0.25• | | | | | | 0.93 | | | | | | 1.18 | | | | | | 0.23 | | | | | | 0.09 | | | | | | — | | | | | | 0.32 | | | | | | — | | | | | | 11.34 | | | | | | 11.31 | | | | | | 0.67 | | | | | | 0.42 | | | | | | 0.42 | | | | | | 2.30 | | | | | | 2,839 | | | | | | 75 | | |
| 12-31-18 | | | | | 11.13 | | | | | | 0.24• | | | | | | (0.47) | | | | | | (0.23) | | | | | | 0.23 | | | | | | 0.19 | | | | | | — | | | | | | 0.42 | | | | | | — | | | | | | 10.48 | | | | | | (2.14) | | | | | | 0.64 | | | | | | 0.38 | | | | | | 0.38 | | | | | | 2.16 | | | | | | 3,508 | | | | | | 67 | | |
| 12-31-17 | | | | | 10.66 | | | | | | 0.22• | | | | | | 0.56 | | | | | | 0.78 | | | | | | 0.24 | | | | | | 0.07 | | | | | | — | | | | | | 0.31 | | | | | | — | | | | | | 11.13 | | | | | | 7.31 | | | | | | 0.61 | | | | | | 0.37 | | | | | | 0.37 | | | | | | 2.04 | | | | | | 4,020 | | | | | | 63 | | |
| 12-31-16 | | | | | 10.52 | | | | | | 0.22• | | | | | | 0.41 | | | | | | 0.63 | | | | | | 0.23 | | | | | | 0.26 | | | | | | — | | | | | | 0.49 | | | | | | — | | | | | | 10.66 | | | | | | 6.04 | | | | | | 0.60 | | | | | | 0.37 | | | | | | 0.37 | | | | | | 2.02 | | | | | | 6,513 | | | | | | 58 | | |
| 12-31-15 | | | | | 11.22 | | | | | | 0.17 | | | | | | (0.21) | | | | | | (0.04) | | | | | | 0.31 | | | | | | 0.35 | | | | | | — | | | | | | 0.66 | | | | | | — | | | | | | 10.52 | | | | | | (0.48) | | | | | | 0.58 | | | | | | 0.36 | | | | | | 0.36 | | | | | | 1.61 | | | | | | 5,539 | | | | | | 51 | | |
| Class S2 | | | | | | | | | | | | | | | | | | | | | | | | | | | | | | | | | | | | | | | | | | | | | | | | | | | | | | | | | | | | | | | | | | | | | | | | | | | | | | | | | | | | | | | | | | | | | | | | | | | | | | | |
| 12-31-19 | | | | | 10.39 | | | | | | 0.23• | | | | | | 0.93 | | | | | | 1.16 | | | | | | 0.21 | | | | | | 0.09 | | | | | | — | | | | | | 0.30 | | | | | | — | | | | | | 11.25 | | | | | | 11.21 | | | | | | 0.82 | | | | | | 0.57 | | | | | | 0.57 | | | | | | 2.14 | | | | | | 393 | | | | | | 75 | | |
| 12-31-18 | | | | | 11.04 | | | | | | 0.21• | | | | | | (0.46) | | | | | | (0.25) | | | | | | 0.21 | | | | | | 0.19 | | | | | | — | | | | | | 0.40 | | | | | | — | | | | | | 10.39 | | | | | | (2.34) | | | | | | 0.79 | | | | | | 0.53 | | | | | | 0.53 | | | | | | 1.97 | | | | | | 438 | | | | | | 67 | | |
| 12-31-17 | | | | | 10.59 | | | | | | 0.21• | | | | | | 0.55 | | | | | | 0.76 | | | | | | 0.24 | | | | | | 0.07 | | | | | | — | | | | | | 0.31 | | | | | | — | | | | | | 11.04 | | | | | | 7.20 | | | | | | 0.76 | | | | | | 0.52 | | | | | | 0.52 | | | | | | 1.92 | | | | | | 635 | | | | | | 63 | | |
| 12-31-16 | | | | | 10.46 | | | | | | 0.21• | | | | | | 0.40 | | | | | | 0.61 | | | | | | 0.22 | | | | | | 0.26 | | | | | | — | | | | | | 0.48 | | | | | | — | | | | | | 10.59 | | | | | | 5.90 | | | | | | 0.78 | | | | | | 0.52 | | | | | | 0.52 | | | | | | 1.94 | | | | | | 506 | | | | | | 58 | | |
| 12-31-15 | | | | | 11.17 | | | | | | 0.16• | | | | | | (0.22) | | | | | | (0.06) | | | | | | 0.30 | | | | | | 0.35 | | | | | | — | | | | | | 0.65 | | | | | | — | | | | | | 10.46 | | | | | | (0.67) | | | | | | 0.83 | | | | | | 0.51 | | | | | | 0.51 | | | | | | 1.43 | | | | | | 357 | | | | | | 51 | | |
| Voya Solution Income Portfolio | | | | | | | | | | | | | | | | | | | | | | | | | | | | | | | | | | | | | | | | | | | | | | | | | | | | | | | | | | | | | | | | | | | | | | | | | | | | | | | | | | | | | | | | | | | | | | | | | | | | | | | |
| Class ADV | | | | | | | | | | | | | | | | | | | | | | | | | | | | | | | | | | | | | | | | | | | | | | | | | | | | | | | | | | | | | | | | | | | | | | | | | | | | | | | | | | | | | | | | | | | | | | | | | | | | | | | |
| 12-31-19 | | | | | 10.92 | | | | | | 0.22• | | | | | | 1.17 | | | | | | 1.39 | | | | | | 0.31 | | | | | | 0.24 | | | | | | — | | | | | | 0.55 | | | | | | — | | | | | | 11.76 | | | | | | 12.87 | | | | | | 0.76 | | | | | | 0.69 | | | | | | 0.69 | | | | | | 1.88 | | | | | | 143,202 | | | | | | 39 | | |
| 12-31-18 | | | | | 11.85 | | | | | | 0.20• | | | | | | (0.57) | | | | | | (0.37) | | | | | | 0.26 | | | | | | 0.30 | | | | | | — | | | | | | 0.56 | | | | | | — | | | | | | 10.92 | | | | | | (3.35) | | | | | | 0.75 | | | | | | 0.62 | | | | | | 0.62 | | | | | | 1.77 | | | | | | 148,720 | | | | | | 38 | | |
| 12-31-17 | | | | | 11.11 | | | | | | 0.18• | | | | | | 0.83 | | | | | | 1.01 | | | | | | 0.23 | | | | | | 0.04 | | | | | | — | | | | | | 0.27 | | | | | | — | | | | | | 11.85 | | | | | | 9.15 | | | | | | 0.75 | | | | | | 0.61 | | | | | | 0.61 | | | | | | 1.59 | | | | | | 182,912 | | | | | | 36 | | |
| 12-31-16 | | | | | 10.88 | | | | | | 0.16• | | | | | | 0.31 | | | | | | 0.47 | | | | | | 0.11 | | | | | | 0.13 | | | | | | — | | | | | | 0.24 | | | | | | — | | | | | | 11.11 | | | | | | 4.26 | | | | | | 0.75 | | | | | | 0.62 | | | | | | 0.62 | | | | | | 1.41 | | | | | | 205,103 | | | | | | 46 | | |
| 12-31-15 | | | | | 11.61 | | | | | | 0.13• | | | | | | (0.15) | | | | | | (0.02) | | | | | | 0.29 | | | | | | 0.42 | | | | | | — | | | | | | 0.71 | | | | | | — | | | | | | 10.88 | | | | | | (0.30) | | | | | | 0.73 | | | | | | 0.63 | | | | | | 0.63 | | | | | | 1.16 | | | | | | 248,968 | | | | | | 31 | | |
| Class I | | | | | | | | | | | | | | | | | | | | | | | | | | | | | | | | | | | | | | | | | | | | | | | | | | | | | | | | | | | | | | | | | | | | | | | | | | | | | | | | | | | | | | | | | | | | | | | | | | | | | | | |
| 12-31-19 | | | | | 11.19 | | | | | | 0.28• | | | | | | 1.19 | | | | | | 1.47 | | | | | | 0.37 | | | | | | 0.24 | | | | | | — | | | | | | 0.61 | | | | | | — | | | | | | 12.05 | | | | | | 13.38 | | | | | | 0.26 | | | | | | 0.19 | | | | | | 0.19 | | | | | | 2.41 | | | | | | 78,441 | | | | | | 39 | | |
| 12-31-18 | | | | | 12.13 | | | | | | 0.27• | | | | | | (0.59) | | | | | | (0.32) | | | | | | 0.32 | | | | | | 0.30 | | | | | | — | | | | | | 0.62 | | | | | | — | | | | | | 11.19 | | | | | | (2.80) | | | | | | 0.25 | | | | | | 0.12 | | | | | | 0.12 | | | | | | 2.29 | | | | | | 75,592 | | | | | | 38 | | |
| 12-31-17 | | | | | 11.38 | | | | | | 0.25 | | | | | | 0.84 | | | | | | 1.09 | | | | | | 0.30 | | | | | | 0.04 | | | | | | — | | | | | | 0.34 | | | | | | — | | | | | | 12.13 | | | | | | 9.66 | | | | | | 0.25 | | | | | | 0.11 | | | | | | 0.11 | | | | | | 2.09 | | | | | | 85,891 | | | | | | 36 | | |
| 12-31-16 | | | | | 11.12 | | | | | | 0.22• | | | | | | 0.31 | | | | | | 0.53 | | | | | | 0.14 | | | | | | 0.13 | | | | | | — | | | | | | 0.27 | | | | | | — | | | | | | 11.38 | | | | | | 4.78 | | | | | | 0.25 | | | | | | 0.12 | | | | | | 0.12 | | | | | | 1.91 | | | | | | 82,426 | | | | | | 46 | | |
| 12-31-15 | | | | | 11.86 | | | | | | 0.19• | | | | | | (0.15) | | | | | | 0.04 | | | | | | 0.36 | | | | | | 0.42 | | | | | | — | | | | | | 0.78 | | | | | | — | | | | | | 11.12 | | | | | | 0.20 | | | | | | 0.23 | | | | | | 0.13 | | | | | | 0.13 | | | | | | 1.72 | | | | | | 98,321 | | | | | | 31 | | |
| Class S | | | | | | | | | | | | | | | | | | | | | | | | | | | | | | | | | | | | | | | | | | | | | | | | | | | | | | | | | | | | | | | | | | | | | | | | | | | | | | | | | | | | | | | | | | | | | | | | | | | | | | | |
| 12-31-19 | | | | | 11.09 | | | | | | 0.25• | | | | | | 1.18 | | | | | | 1.43 | | | | | | 0.33 | | | | | | 0.24 | | | | | | — | | | | | | 0.57 | | | | | | — | | | | | | 11.95 | | | | | | 13.13 | | | | | | 0.51 | | | | | | 0.44 | | | | | | 0.44 | | | | | | 2.10 | | | | | | 103,157 | | | | | | 39 | | |
| 12-31-18 | | | | | 12.03 | | | | | | 0.24• | | | | | | (0.59) | | | | | | (0.35) | | | | | | 0.29 | | | | | | 0.30 | | | | | | — | | | | | | 0.59 | | | | | | — | | | | | | 11.09 | | | | | | (3.14) | | | | | | 0.50 | | | | | | 0.37 | | | | | | 0.37 | | | | | | 2.01 | | | | | | 118,451 | | | | | | 38 | | |
| 12-31-17 | | | | | 11.28 | | | | | | 0.21• | | | | | | 0.85 | | | | | | 1.06 | | | | | | 0.27 | | | | | | 0.04 | | | | | | — | | | | | | 0.31 | | | | | | — | | | | | | 12.03 | | | | | | 9.41 | | | | | | 0.50 | | | | | | 0.36 | | | | | | 0.36 | | | | | | 1.83 | | | | | | 155,100 | | | | | | 36 | | |
| 12-31-16 | | | | | 11.04 | | | | | | 0.19• | | | | | | 0.31 | | | | | | 0.50 | | | | | | 0.13 | | | | | | 0.13 | | | | | | — | | | | | | 0.26 | | | | | | — | | | | | | 11.28 | | | | | | 4.47 | | | | | | 0.50 | | | | | | 0.37 | | | | | | 0.37 | | | | | | 1.66 | | | | | | 186,264 | | | | | | 46 | | |
| 12-31-15 | | | | | 11.76 | | | | | | 0.16• | | | | | | (0.14) | | | | | | 0.02 | | | | | | 0.32 | | | | | | 0.42 | | | | | | — | | | | | | 0.74 | | | | | | — | | | | | | 11.04 | | | | | | 0.10 | | | | | | 0.48 | | | | | | 0.38 | | | | | | 0.38 | | | | | | 1.43 | | | | | | 225,274 | | | | | | 31 | | |
See Accompanying Notes to Financial Statements
Financial Highlights (continued)
| | | | | | | | | | Income
(loss) from
investment
operations | | | | | | | | | Less
Distributions | | | | | | | | | | | | | | | | | | | | | | | | | | | Ratios to average
net assets | | | Supplemental
Data | |
| | | | Net asset value, beginning of year
or period | | | Net investment income (loss) | | | Net realized and unrealized
gain (loss) | | | Total from investment operations | | | From net investment income | | | From net realized gains | | | From return of capital | | | Total distributions | | | Payment by affiliate | | | Net asset value, end of year
or period | | | Total Return(1) | | | Expenses before
reductions/additions(2)(3)(4) | | | Expenses net of fee waivers
and/or recoupments if any(2)(3)(4) | | | Expenses net of all
reductions/additions(2)(3)(4) | | | Net investment income (loss)(2)(3) | | | Net assets, end of year or period | | | Portfolio turnover rate | |
Year or
period ended | | | ($) | | | ($) | | | ($) | | | ($) | | | ($) | | | ($) | | | ($) | | | ($) | | | ($) | | | ($) | | | (%) | | | (%) | | | (%) | | | (%) | | | (%) | | | ($000’s) | | | (%) | |
| Voya Solution Income Portfolio (continued) | | | | | | | | | | | | | | | | | | | | | | | | | | | | | | | | | | | | | | | | | | | | | | | | | | | | | | | | | | | | | | | | | | | | | | | | | | | | | | | | | | | | | | | | | | | | | | | | | | | | | | | |
| Class S2 | | | | | | | | | | | | | | | | | | | | | | | | | | | | | | | | | | | | | | | | | | | | | | | | | | | | | | | | | | | | | | | | | | | | | | | | | | | | | | | | | | | | | | | | | | | | | | | | | | | | | | | |
| 12-31-19 | | | | | 10.82 | | | | | | 0.22• | | | | | | 1.16 | | | | | | 1.38 | | | | | | 0.31 | | | | | | 0.24 | | | | | | — | | | | | | 0.55 | | | | | | — | | | | | | 11.65 | | | | | | 12.96 | | | | | | 0.66 | | | | | | 0.59 | | | | | | 0.59 | | | | | | 1.95 | | | | | | 5,310 | | | | | | 39 | | |
| 12-31-18 | | | | | 11.72 | | | | | | 0.21• | | | | | | (0.56) | | | | | | (0.35) | | | | | | 0.25 | | | | | | 0.30 | | | | | | — | | | | | | 0.55 | | | | | | — | | | | | | 10.82 | | | | | | (3.21) | | | | | | 0.65 | | | | | | 0.52 | | | | | | 0.52 | | | | | | 1.82 | | | | | | 6,111 | | | | | | 38 | | |
| 12-31-17 | | | | | 10.99 | | | | | | 0.19• | | | | | | 0.82 | | | | | | 1.01 | | | | | | 0.24 | | | | | | 0.04 | | | | | | — | | | | | | 0.28 | | | | | | — | | | | | | 11.72 | | | | | | 9.23 | | | | | | 0.65 | | | | | | 0.51 | | | | | | 0.51 | | | | | | 1.67 | | | | | | 9,533 | | | | | | 36 | | |
| 12-31-16 | | | | | 10.77 | | | | | | 0.16• | | | | | | 0.30 | | | | | | 0.46 | | | | | | 0.11 | | | | | | 0.13 | | | | | | — | | | | | | 0.24 | | | | | | — | | | | | | 10.99 | | | | | | 4.28 | | | | | | 0.68 | | | | | | 0.52 | | | | | | 0.52 | | | | | | 1.49 | | | | | | 11,670 | | | | | | 46 | | |
| 12-31-15 | | | | | 11.50 | | | | | | 0.14• | | | | | | (0.14) | | | | | | 0.00* | | | | | | 0.31 | | | | | | 0.42 | | | | | | — | | | | | | 0.73 | | | | | | — | | | | | | 10.77 | | | | | | (0.13) | | | | | | 0.73 | | | | | | 0.53 | | | | | | 0.53 | | | | | | 1.27 | | | | | | 15,377 | | | | | | 31 | | |
| Class T | | | | | | | | | | | | | | | | | | | | | | | | | | | | | | | | | | | | | | | | | | | | | | | | | | | | | | | | | | | | | | | | | | | | | | | | | | | | | | | | | | | | | | | | | | | | | | | | | | | | | | | |
| 12-31-19 | | | | | 11.65 | | | | | | 0.20 | | | | | | 1.24 | | | | | | 1.44 | | | | | | 0.29 | | | | | | 0.24 | | | | | | — | | | | | | 0.53 | | | | | | — | | | | | | 12.56 | | | | | | 12.54 | | | | | | 0.96 | | | | | | 0.89 | | | | | | 0.89 | | | | | | 1.74 | | | | | | 259 | | | | | | 39 | | |
| 12-31-18 | | | | | 12.60 | | | | | | 0.19 | | | | | | (0.60) | | | | | | (0.41) | | | | | | 0.24 | | | | | | 0.30 | | | | | | — | | | | | | 0.54 | | | | | | — | | | | | | 11.65 | | | | | | (3.45) | | | | | | 0.95 | | | | | | 0.82 | | | | | | 0.82 | | | | | | 1.62 | | | | | | 218 | | | | | | 38 | | |
| 12-31-17 | | | | | 11.73 | | | | | | 0.17 | | | | | | 0.87 | | | | | | 1.04 | | | | | | 0.13 | | | | | | 0.04 | | | | | | — | | | | | | 0.17 | | | | | | — | | | | | | 12.60 | | | | | | 8.84 | | | | | | 0.95 | | | | | | 0.81 | | | | | | 0.81 | | | | | | 1.40 | | | | | | 222 | | | | | | 36 | | |
| 12-31-16 | | | | | 11.39 | | | | | | 0.11• | | | | | | 0.36 | | | | | | 0.47 | | | | | | — | | | | | | 0.13 | | | | | | — | | | | | | 0.13 | | | | | | — | | | | | | 11.73 | | | | | | 4.11 | | | | | | 0.97 | | | | | | 0.82 | | | | | | 0.82 | | | | | | 0.92 | | | | | | 205 | | | | | | 46 | | |
| 12-31-15 | | | | | 12.07 | | | | | | 0.13• | | | | | | (0.17) | | | | | | (0.04) | | | | | | 0.22 | | | | | | 0.42 | | | | | | — | | | | | | 0.64 | | | | | | — | | | | | | 11.39 | | | | | | (0.40) | | | | | | 0.98 | | | | | | 0.83 | | | | | | 0.83 | | | | | | 1.09 | | | | | | 815 | | | | | | 31 | | |
| Voya Solution Moderately Aggressive Portfolio | | | | | | | | | | | | | | | | | | | | | | | | | | | | | | | | | | | | | | | | | | | | | | | | | | | | | | | | | | | | | | | | | | | | | | | | | | | | | | | | | | | | | | | | | | | | | | | | | | | | | | | |
| Class ADV | | | | | | | | | | | | | | | | | | | | | | | | | | | | | | | | | | | | | | | | | | | | | | | | | | | | | | | | | | | | | | | | | | | | | | | | | | | | | | | | | | | | | | | | | | | | | | | | | | | | | | | |
| 12-31-19 | | | | | 11.39 | | | | | | 0.16 | | | | | | 2.28 | | | | | | 2.44 | | | | | | 0.26 | | | | | | 1.03 | | | | | | — | | | | | | 1.29 | | | | | | — | | | | | | 12.54 | | | | | | 22.32 | | | | | | 0.76 | | | | | | 0.76 | | | | | | 0.76 | | | | | | 1.28 | | | | | | 24,168 | | | | | | 55 | | |
| 12-31-18 | | | | | 13.39 | | | | | | 0.14• | | | | | | (1.32) | | | | | | (1.18) | | | | | | 0.20 | | | | | | 0.62 | | | | | | — | | | | | | 0.82 | | | | | | — | | | | | | 11.39 | | | | | | (9.44) | | | | | | 0.75 | | | | | | 0.71 | | | | | | 0.71 | | | | | | 1.09 | | | | | | 21,418 | | | | | | 46 | | |
| 12-31-17 | | | | | 11.62 | | | | | | 0.13• | | | | | | 1.93 | | | | | | 2.06 | | | | | | 0.15 | | | | | | 0.14 | | | | | | — | | | | | | 0.29 | | | | | | — | | | | | | 13.39 | | | | | | 17.89 | | | | | | 0.75 | | | | | | 0.71 | | | | | | 0.71 | | | | | | 1.04 | | | | | | 27,468 | | | | | | 31 | | |
| 12-31-16 | | | | | 11.23 | | | | | | 0.11• | | | | | | 0.56 | | | | | | 0.67 | | | | | | 0.10 | | | | | | 0.18 | | | | | | — | | | | | | 0.28 | | | | | | — | | | | | | 11.62 | | | | | | 6.00 | | | | | | 0.75 | | | | | | 0.70 | | | | | | 0.70 | | | | | | 0.95 | | | | | | 24,645 | | | | | | 52 | | |
| 12-31-15 | | | | | 13.03 | | | | | | 0.11• | | | | | | (0.22) | | | | | | (0.11) | | | | | | 0.37 | | | | | | 1.32 | | | | | | — | | | | | | 1.69 | | | | | | — | | | | | | 11.23 | | | | | | (1.42) | | | | | | 0.74 | | | | | | 0.69 | | | | | | 0.69 | | | | | | 0.94 | | | | | | 31,416 | | | | | | 26 | | |
| Class I | | | | | | | | | | | | | | | | | | | | | | | | | | | | | | | | | | | | | | | | | | | | | | | | | | | | | | | | | | | | | | | | | | | | | | | | | | | | | | | | | | | | | | | | | | | | | | | | | | | | | | | |
| 12-31-19 | | | | | 11.61 | | | | | | 0.22 | | | | | | 2.34 | | | | | | 2.56 | | | | | | 0.33 | | | | | | 1.03 | | | | | | — | | | | | | 1.36 | | | | | | — | | | | | | 12.81 | | | | | | 22.99 | | | | | | 0.26 | | | | | | 0.26 | | | | | | 0.26 | | | | | | 1.84 | | | | | | 4,862 | | | | | | 55 | | |
| 12-31-18 | | | | | 13.64 | | | | | | 0.21• | | | | | | (1.35) | | | | | | (1.14) | | | | | | 0.27 | | | | | | 0.62 | | | | | | — | | | | | | 0.89 | | | | | | — | | | | | | 11.61 | | | | | | (9.02) | | | | | | 0.25 | | | | | | 0.21 | | | | | | 0.21 | | | | | | 1.60 | | | | | | 3,898 | | | | | | 46 | | |
| 12-31-17 | | | | | 11.83 | | | | | | 0.21• | | | | | | 1.95 | | | | | | 2.16 | | | | | | 0.21 | | | | | | 0.14 | | | | | | — | | | | | | 0.35 | | | | | | — | | | | | | 13.64 | | | | | | 18.50 | | | | | | 0.25 | | | | | | 0.21 | | | | | | 0.21 | | | | | | 1.62 | | | | | | 6,062 | | | | | | 31 | | |
| 12-31-16 | | | | | 11.44 | | | | | | 0.17 | | | | | | 0.55 | | | | | | 0.72 | | | | | | 0.15 | | | | | | 0.18 | | | | | | — | | | | | | 0.33 | | | | | | — | | | | | | 11.83 | | | | | | 6.40 | | | | | | 0.25 | | | | | | 0.20 | | | | | | 0.20 | | | | | | 1.55 | | | | | | 4,334 | | | | | | 52 | | |
| 12-31-15 | | | | | 13.23 | | | | | | 0.23• | | | | | | (0.27) | | | | | | (0.04) | | | | | | 0.43 | | | | | | 1.32 | | | | | | — | | | | | | 1.75 | | | | | | — | | | | | | 11.44 | | | | | | (0.85) | | | | | | 0.24 | | | | | | 0.19 | | | | | | 0.19 | | | | | | 2.00 | | | | | | 4,035 | | | | | | 26 | | |
| Class R6 | | | | | | | | | | | | | | | | | | | | | | | | | | | | | | | | | | | | | | | | | | | | | | | | | | | | | | | | | | | | | | | | | | | | | | | | | | | | | | | | | | | | | | | | | | | | | | | | | | | | | | | |
| 12-31-19 | | | | | 11.61 | | | | | | 0.23• | | | | | | 2.32 | | | | | | 2.55 | | | | | | 0.33 | | | | | | 1.03 | | | | | | — | | | | | | 1.36 | | | | | | — | | | | | | 12.80 | | | | | | 22.91 | | | | | | 0.26 | | | | | | 0.26 | | | | | | 0.26 | | | | | | 1.87 | | | | | | 17,843 | | | | | | 55 | | |
| 12-31-18 | | | | | 13.63 | | | | | | 0.23• | | | | | | (1.36) | | | | | | (1.13) | | | | | | 0.27 | | | | | | 0.62 | | | | | | — | | | | | | 0.89 | | | | | | — | | | | | | 11.61 | | | | | | (8.94) | | | | | | 0.25 | | | | | | 0.21 | | | | | | 0.21 | | | | | | 1.76 | | | | | | 12,083 | | | | | | 46 | | |
| 12-31-17 | | | | | 11.82 | | | | | | 0.25• | | | | | | 1.91 | | | | | | 2.16 | | | | | | 0.21 | | | | | | 0.14 | | | | | | — | | | | | | 0.35 | | | | | | — | | | | | | 13.63 | | | | | | 18.51 | | | | | | 0.25 | | | | | | 0.21 | | | | | | 0.21 | | | | | | 1.95 | | | | | | 8,217 | | | | | | 31 | | |
| 05-02-16(5) - 12-31-16 | | | | | 11.56 | | | | | | 0.39• | | | | | | 0.20 | | | | | | 0.59 | | | | | | 0.15 | | | | | | 0.18 | | | | | | — | | | | | | 0.33 | | | | | | — | | | | | | 11.82 | | | | | | 5.21 | | | | | | 0.25 | | | | | | 0.20 | | | | | | 0.20 | | | | | | 5.04 | | | | | | 1,287 | | | | | | 52 | | |
| Class S | | | | | | | | | | | | | | | | | | | | | | | | | ��� | | | | | | | | | | | | | | | | | | | | | | | | | | | | | | | | | | | | | | | | | | | | | | | | | | | | | | | | | | | | | | | | | | | | | | | | | | | | | | |
| 12-31-19 | | | | | 11.49 | | | | | | 0.19• | | | | | | 2.30 | | | | | | 2.49 | | | | | | 0.29 | | | | | | 1.03 | | | | | | — | | | | | | 1.32 | | | | | | — | | | | | | 12.66 | | | | | | 22.61 | | | | | | 0.51 | | | | | | 0.51 | | | | | | 0.51 | | | | | | 1.51 | | | | | | 557,294 | | | | | | 55 | | |
| 12-31-18 | | | | | 13.50 | | | | | | 0.18• | | | | | | (1.33) | | | | | | (1.15) | | | | | | 0.24 | | | | | | 0.62 | | | | | | — | | | | | | 0.86 | | | | | | — | | | | | | 11.49 | | | | | | (9.20) | | | | | | 0.50 | | | | | | 0.46 | | | | | | 0.46 | | | | | | 1.34 | | | | | | 525,590 | | | | | | 46 | | |
| 12-31-17 | | | | | 11.71 | | | | | | 0.16• | | | | | | 1.95 | | | | | | 2.11 | | | | | | 0.18 | | | | | | 0.14 | | | | | | — | | | | | | 0.32 | | | | | | — | | | | | | 13.50 | | | | | | 18.22 | | | | | | 0.50 | | | | | | 0.46 | | | | | | 0.46 | | | | | | 1.28 | | | | | | 670,319 | | | | | | 31 | | |
| 12-31-16 | | | | | 11.34 | | | | | | 0.14• | | | | | | 0.55 | | | | | | 0.69 | | | | | | 0.14 | | | | | | 0.18 | | | | | | — | | | | | | 0.32 | | | | | | — | | | | | | 11.71 | | | | | | 6.17 | | | | | | 0.50 | | | | | | 0.45 | | | | | | 0.45 | | | | | | 1.25 | | | | | | 661,798 | | | | | | 52 | | |
| 12-31-15 | | | | | 13.13 | | | | | | 0.21• | | | | | | (0.29) | | | | | | (0.08) | | | | | | 0.39 | | | | | | 1.32 | | | | | | — | | | | | | 1.71 | | | | | | — | | | | | | 11.34 | | | | | | (1.15) | | | | | | 0.49 | | | | | | 0.44 | | | | | | 0.44 | | | | | | 1.81 | | | | | | 719,319 | | | | | | 26 | | |
See Accompanying Notes to Financial Statements
Financial Highlights (continued)
| | | | | | | | | | Income
(loss) from
investment
operations | | | | | | | | | Less
Distributions | | | | | | | | | | | | | | | | | | | | | | | | | | | Ratios to average
net assets | | | Supplemental
Data | |
| | | | Net asset value, beginning of year
or period | | | Net investment income (loss) | | | Net realized and unrealized
gain (loss) | | | Total from investment operations | | | From net investment income | | | From net realized gains | | | From return of capital | | | Total distributions | | | Payment by affiliate | | | Net asset value, end of year
or period | | | Total Return(1) | | | Expenses before
reductions/additions(2)(3)(4) | | | Expenses net of fee waivers
and/or recoupments if any(2)(3)(4) | | | Expenses net of all
reductions/additions(2)(3)(4) | | | Net investment income (loss)(2)(3) | | | Net assets, end of year or period | | | Portfolio turnover rate | |
Year or
period ended | | | ($) | | | ($) | | | ($) | | | ($) | | | ($) | | | ($) | | | ($) | | | ($) | | | ($) | | | ($) | | | (%) | | | (%) | | | (%) | | | (%) | | | (%) | | | ($000’s) | | | (%) | |
| Voya Solution Moderately Aggressive Portfolio (continued) | | | | | | | | | | | | | | | | | | | | | | | | | | | | | | | | | | | | | | | | | | | | | | | | | | | | | | | | | | | | | | | | | | | | | | | | | | | | | | | | | | | | | | | | | | | | | | | | | | | | | | | |
| Class S2 | | | | | | | | | | | | | | | | | | | | | | | | | | | | | | | | | | | | | | | | | | | | | | | | | | | | | | | | | | | | | | | | | | | | | | | | | | | | | | | | | | | | | | | | | | | | | | | | | | | | | | | |
| 12-31-19 | | | | | 11.50 | | | | | | 0.17• | | | | | | 2.32 | | | | | | 2.49 | | | | | | 0.27 | | | | | | 1.03 | | | | | | — | | | | | | 1.30 | | | | | | — | | | | | | 12.69 | | | | | | 22.49 | | | | | | 0.66 | | | | | | 0.66 | | | | | | 0.66 | | | | | | 1.35 | | | | | | 879 | | | | | | 55 | | |
| 12-31-18 | | | | | 13.47 | | | | | | 0.15• | | | | | | (1.32) | | | | | | (1.17) | | | | | | 0.18 | | | | | | 0.62 | | | | | | — | | | | | | 0.80 | | | | | | — | | | | | | 11.50 | | | | | | (9.31) | | | | | | 0.65 | | | | | | 0.61 | | | | | | 0.61 | | | | | | 1.10 | | | | | | 732 | | | | | | 46 | | |
| 12-31-17 | | | | | 11.70 | | | | | | 0.15• | | | | | | 1.94 | | | | | | 2.09 | | | | | | 0.18 | | | | | | 0.14 | | | | | | — | | | | | | 0.32 | | | | | | — | | | | | | 13.47 | | | | | | 18.05 | | | | | | 0.65 | | | | | | 0.61 | | | | | | 0.61 | | | | | | 1.20 | | | | | | 1,695 | | | | | | 31 | | |
| 12-31-16 | | | | | 11.32 | | | | | | 0.13 | | | | | | 0.54 | | | | | | 0.67 | | | | | | 0.11 | | | | | | 0.18 | | | | | | — | | | | | | 0.29 | | | | | | — | | | | | | 11.70 | | | | | | 5.97 | | | | | | 0.68 | | | | | | 0.60 | | | | | | 0.60 | | | | | | 1.14 | | | | | | 1,132 | | | | | | 52 | | |
| 12-31-15 | | | | | 13.12 | | | | | | 0.12• | | | | | | (0.21) | | | | | | (0.09) | | | | | | 0.39 | | | | | | 1.32 | | | | | | — | | | | | | 1.71 | | | | | | — | | | | | | 11.32 | | | | | | (1.21) | | | | | | 0.74 | | | | | | 0.59 | | | | | | 0.59 | | | | | | 0.98 | | | | | | 1,040 | | | | | | 26 | | |
| Voya Solution Moderately Conservative Portfolio | | | | | | | | | | | | | | | | | | | | | | | | | | | | | | | | | | | | | | | | | | | | | | | | | | | | | | | | | | | | | | | | | | | | | | | | | | | | | | | | | | | | | | | | | | | | | | | | | | | | | | | |
| Class ADV | | | | | | | | | | | | | | | | | | | | | | | | | | | | | | | | | | | | | | | | | | | | | | | | | | | | | | | | | | | | | | | | | | | | | | | | | | | | | | | | | | | | | | | | | | | | | | | | | | | | | | | |
| 12-31-19 | | | | | 9.13 | | | | | | 0.18• | | | | | | 1.14 | | | | | | 1.32 | | | | | | 0.16 | | | | | | 0.20 | | | | | | — | | | | | | 0.36 | | | | | | — | | | | | | 10.09 | | | | | | 14.61 | | | | | | 0.84 | | | | | | 0.70 | | | | | | 0.70 | | | | | | 1.83 | | | | | | 7,507 | | | | | | 81 | | |
| 12-31-18 | | | | | 9.99 | | | | | | 0.17• | | | | | | (0.60) | | | | | | (0.43) | | | | | �� | 0.20 | | | | | | 0.23 | | | | | | — | | | | | | 0.43 | | | | | | — | | | | | | 9.13 | | | | | | (4.52) | | | | | | 0.83 | | | | | | 0.67 | | | | | | 0.67 | | | | | | 1.79 | | | | | | 9,033 | | | | | | 59 | | |
| 12-31-17 | | | | | 9.24 | | | | | | 0.15• | | | | | | 0.78 | | | | | | 0.93 | | | | | | 0.18 | | | | | | — | | | | | | — | | | | | | 0.18 | | | | | | — | | | | | | 9.99 | | | | | | 10.09 | | | | | | 0.83 | | | | | | 0.65 | | | | | | 0.65 | | | | | | 1.57 | | | | | | 11,134 | | | | | | 47 | | |
| 12-31-16 | | | | | 9.51 | | | | | | 0.13• | | | | | | 0.40 | | | | | | 0.53 | | | | | | 0.20 | | | | | | 0.60 | | | | | | — | | | | | | 0.80 | | | | | | — | | | | | | 9.24 | | | | | | 5.64 | | | | | | 0.80 | | | | | | 0.64 | | | | | | 0.64 | | | | | | 1.35 | | | | | | 13,487 | | | | | | 65 | | |
| 12-31-15 | | | | | 10.45 | | | | | | 0.10 | | | | | | (0.14) | | | | | | (0.04) | | | | | | 0.28 | | | | | | 0.62 | | | | | | — | | | | | | 0.90 | | | | | | — | | | | | | 9.51 | | | | | | (0.60) | | | | | | 0.78 | | | | | | 0.66 | | | | | | 0.66 | | | | | | 1.09 | | | | | | 22,005 | | | | | | 58 | | |
| Class I | | | | | | | | | | | | | | | | | | | | | | | | | | | | | | | | | | | | | | | | | | | | | | | | | | | | | | | | | | | | | | | | | | | | | | | | | | | | | | | | | | | | | | | | | | | | | | | | | | | | | | | |
| 12-31-19 | | | | | 9.54 | | | | | | 0.29• | | | | | | 1.14 | | | | | | 1.43 | | | | | | 0.22 | | | | | | 0.20 | | | | | | — | | | | | | 0.42 | | | | | | — | | | | | | 10.55 | | | | | | 15.17 | | | | | | 0.34 | | | | | | 0.20 | | | | | | 0.20 | | | | | | 2.83 | | | | | | 69 | | | | | | 81 | | |
| 12-31-18 | | | | | 10.42 | | | | | | 0.24• | | | | | | (0.64) | | | | | | (0.40) | | | | | | 0.25 | | | | | | 0.23 | | | | | | — | | | | | | 0.48 | | | | | | — | | | | | | 9.54 | | | | | | (4.04) | | | | | | 0.33 | | | | | | 0.17 | | | | | | 0.17 | | | | | | 2.35 | | | | | | 31 | | | | | | 59 | | |
| 12-31-17 | | | | | 9.65 | | | | | | 0.21• | | | | | | 0.82 | | | | | | 1.03 | | | | | | 0.26 | | | | | | — | | | | | | — | | | | | | 0.26 | | | | | | — | | | | | | 10.42 | | | | | | 10.73 | | | | | | 0.33 | | | | | | 0.15 | | | | | | 0.15 | | | | | | 2.06 | | | | | | 27 | | | | | | 47 | | |
| 12-31-16 | | | | | 9.93 | | | | | | 0.19 | | | | | | 0.41 | | | | | | 0.60 | | | | | | 0.28 | | | | | | 0.60 | | | | | | — | | | | | | 0.88 | | | | | | — | | | | | | 9.65 | | | | | | 6.12 | | | | | | 0.30 | | | | | | 0.14 | | | | | | 0.14 | | | | | | 1.93 | | | | | | 33 | | | | | | 65 | | |
| 12-31-15 | | | | | 10.87 | | | | | | 0.16 | | | | | | (0.15) | | | | | | 0.01 | | | | | | 0.33 | | | | | | 0.62 | | | | | | — | | | | | | 0.95 | | | | | | — | | | | | | 9.93 | | | | | | (0.09) | | | | | | 0.28 | | | | | | 0.16 | | | | | | 0.16 | | | | | | 1.58 | | | | | | 36 | | | | | | 58 | | |
| Class R6 | | | | | | | | | | | | | | | | | | | | | | | | | | | | | | | | | | | | | | | | | | | | | | | | | | | | | | | | | | | | | | | | | | | | | | | | | | | | | | | | | | | | | | | | | | | | | | | | | | | | | | | |
| 12-31-19 | | | | | 9.53 | | | | | | 0.25• | | | | | | 1.18 | | | | | | 1.43 | | | | | | 0.22 | | | | | | 0.20 | | | | | | — | | | | | | 0.42 | | | | | | — | | | | | | 10.54 | | | | | | 15.18 | | | | | | 0.34 | | | | | | 0.20 | | | | | | 0.20 | | | | | | 2.47 | | | | | | 6,045 | | | | | | 81 | | |
| 12-31-18 | | | | | 10.41 | | | | | | 0.25• | | | | | | (0.65) | | | | | | (0.40) | | | | | | 0.25 | | | | | | 0.23 | | | | | | — | | | | | | 0.48 | | | | | | — | | | | | | 9.53 | | | | | | (4.05) | | | | | | 0.33 | | | | | | 0.17 | | | | | | 0.17 | | | | | | 2.45 | | | | | | 3,780 | | | | | | 59 | | |
| 12-31-17 | | | | | 9.64 | | | | | | 0.24• | | | | | | 0.78 | | | | | | 1.02 | | | | | | 0.25 | | | | | | — | | | | | | — | | | | | | 0.25 | | | | | | — | | | | | | 10.41 | | | | | | 10.68 | | | | | | 0.33 | | | | | | 0.15 | | | | | | 0.15 | | | | | | 2.37 | | | | | | 2,164 | | | | | | 47 | | |
| 05-02-16(5) - 12-31-16 | | | | | 10.17 | | | | | | 0.36• | | | | | | (0.01) | | | | | | 0.35 | | | | | | 0.28 | | | | | | 0.60 | | | | | | — | | | | | | 0.88 | | | | | | — | | | | | | 9.64 | | | | | | 3.52 | | | | | | 0.30 | | | | | | 0.14 | | | | | | 0.14 | | | | | | 5.68 | | | | | | 287 | | | | | | 65 | | |
| Class S | | | | | | | | | | | | | | | | | | | | | | | | | | | | | | | | | | | | | | | | | | | | | | | | | | | | | | | | | | | | | | | | | | | | | | | | | | | | | | | | | | | | | | | | | | | | | | | | | | | | | | | |
| 12-31-19 | | | | | 9.32 | | | | | | 0.22• | | | | | | 1.16 | | | | | | 1.38 | | | | | | 0.20 | | | | | | 0.20 | | | | | | — | | | | | | 0.40 | | | | | | — | | | | | | 10.30 | | | | | | 14.96 | | | | | | 0.59 | | | | | | 0.45 | | | | | | 0.45 | | | | | | 2.24 | | | | | | 19,349 | | | | | | 81 | | |
| 12-31-18 | | | | | 10.19 | | | | | | 0.20• | | | | | | (0.63) | | | | | | (0.43) | | | | | | 0.21 | | | | | | 0.23 | | | | | | — | | | | | | 0.44 | | | | | | — | | | | | | 9.32 | | | | | | (4.35) | | | | | | 0.58 | | | | | | 0.42 | | | | | | 0.42 | | | | | | 2.05 | | | | | | 14,452 | | | | | | 59 | | |
| 12-31-17 | | | | | 9.44 | | | | | | 0.18• | | | | | | 0.79 | | | | | | 0.97 | | | | | | 0.22 | | | | | | — | | | | | | — | | | | | | 0.22 | | | | | | — | | | | | | 10.19 | | | | | | 10.40 | | | | | | 0.58 | | | | | | 0.40 | | | | | | 0.40 | | | | | | 1.80 | | | | | | 17,134 | | | | | | 47 | | |
| 12-31-16 | | | | | 9.73 | | | | | | 0.17 | | | | | | 0.39 | | | | | | 0.56 | | | | | | 0.25 | | | | | | 0.60 | | | | | | — | | | | | | 0.85 | | | | | | — | | | | | | 9.44 | | | | | | 5.87 | | | | | | 0.55 | | | | | | 0.39 | | | | | | 0.39 | | | | | | 1.74 | | | | | | 20,883 | | | | | | 65 | | |
| 12-31-15 | | | | | 10.67 | | | | | | 0.14• | | | | | | (0.16) | | | | | | (0.02) | | | | | | 0.30 | | | | | | 0.62 | | | | | | — | | | | | | 0.92 | | | | | | — | | | | | | 9.73 | | | | | | (0.38) | | | | | | 0.53 | | | | | | 0.41 | | | | | | 0.41 | | | | | | 1.33 | | | | | | 20,081 | | | | | | 58 | | |
| Class S2 | | | | | | | | | | | | | | | | | | | | | | | | | | | | | | | | | | | | | | | | | | | | | | | | | | | | | | | | | | | | | | | | | | | | | | | | | | | | | | | | | | | | | | | | | | | | | | | | | | | | | | | |
| 12-31-19 | | | | | 9.21 | | | | | | 0.24• | | | | | | 1.10 | | | | | | 1.34 | | | | | | 0.21 | | | | | | 0.20 | | | | | | — | | | | | | 0.41 | | | | | | — | | | | | | 10.14 | | | | | | 14.74 | | | | | | 0.74 | | | | | | 0.60 | | | | | | 0.60 | | | | | | 2.39 | | | | | | 5,439 | | | | | | 81 | | |
| 12-31-18 | | | | | 10.08 | | | | | | 0.18 | | | | | | (0.61) | | | | | | (0.43) | | | | | | 0.21 | | | | | | 0.23 | | | | | | — | | | | | | 0.44 | | | | | | — | | | | | | 9.21 | | | | | | (4.46) | | | | | | 0.73 | | | | | | 0.57 | | | | | | 0.57 | | | | | | 1.96 | | | | | | 1,072 | | | | | | 59 | | |
| 12-31-17 | | | | | 9.34 | | | | | | 0.17• | | | | | | 0.79 | | | | | | 0.96 | | | | | | 0.22 | | | | | | — | | | | | | — | | | | | | 0.22 | | | | | | — | | | | | | 10.08 | | | | | | 10.33 | | | | | | 0.73 | | | | | | 0.55 | | | | | | 0.55 | | | | | | 1.71 | | | | | | 1,021 | | | | | | 47 | | |
| 12-31-16 | | | | | 9.64 | | | | | | 0.14 | | | | | | 0.39 | | | | | | 0.53 | | | | | | 0.23 | | | | | | 0.60 | | | | | | — | | | | | | 0.83 | | | | | | — | | | | | | 9.34 | | | | | | 5.62 | | | | | | 0.73 | | | | | | 0.54 | | | | | | 0.54 | | | | | | 1.61 | | | | | | 845 | | | | | | 65 | | |
| 12-31-15 | | | | | 10.59 | | | | | | 0.10 | | | | | | (0.13) | | | | | | (0.03) | | | | | | 0.30 | | | | | | 0.62 | | | | | | — | | | | | | 0.92 | | | | | | — | | | | | | 9.64 | | | | | | (0.50) | | | | | | 0.78 | | | | | | 0.56 | | | | | | 0.56 | | | | | | 1.14 | | | | | | 751 | | | | | | 58 | | |
See Accompanying Notes to Financial Statements
Financial Highlights (continued)
| | | | | | | | | | Income
(loss) from
investment
operations | | | | | | | | | Less
Distributions | | | | | | | | | | | | | | | | | | | | | | | | | | | Ratios to average
net assets | | | Supplemental
Data | |
| | | | Net asset value, beginning of year
or period | | | Net investment income (loss) | | | Net realized and unrealized
gain (loss) | | | Total from investment operations | | | From net investment income | | | From net realized gains | | | From return of capital | | | Total distributions | | | Payment by affiliate | | | Net asset value, end of year
or period | | | Total Return(1) | | | Expenses before
reductions/additions(2)(3)(4) | | | Expenses net of fee waivers
and/or recoupments if any(2)(3)(4) | | | Expenses net of all
reductions/additions(2)(3)(4) | | | Net investment income (loss)(2)(3) | | | Net assets, end of year or period | | | Portfolio turnover rate | |
Year or
period ended | | | ($) | | | ($) | | | ($) | | | ($) | | | ($) | | | ($) | | | ($) | | | ($) | | | ($) | | | ($) | | | (%) | | | (%) | | | (%) | | | (%) | | | (%) | | | ($000’s) | | | (%) | |
| Voya Solution 2020 Portfolio | | | | | | | | | | | | | | | | | | | | | | | | | | | | | | | | | | | | | | | | | | | | | | | | | | | | | | | | | | | | | | | | | | | | | | | | | | | | | | | | | | | | | | | | | | | | | | | | | | | | | | | |
| Class ADV | | | | | | | | | | | | | | | | | | | | | | | | | | | | | | | | | | | | | | | | | | | | | | | | | | | | | | | | | | | | | | | | | | | | | | | | | | | | | | | | | | | | | | | | | | | | | | | | | | | | | | | |
| 12-31-19 | | | | | 11.85 | | | | | | 0.22 | | | | | | 1.49 | | | | | | 1.71 | | | | | | 0.31 | | | | | | 0.61 | | | | | | — | | | | | | 0.92 | | | | | | — | | | | | | 12.64 | | | | | | 14.70 | | | | | | 0.85 | | | | | | 0.71 | | | | | | 0.71 | | | | | | 1.72 | | | | | | 15,205 | | | | | | 92 | | |
| 12-31-18 | | | | | 13.23 | | | | | | 0.21 | | | | | | (0.77) | | | | | | (0.56) | | | | | | 0.20 | | | | | | 0.62 | | | | | | — | | | | | | 0.82 | | | | | | — | | | | | | 11.85 | | | | | | (4.50) | | | | | | 0.79 | | | | | | 0.64 | | | | | | 0.64 | | | | | | 1.67 | | | | | | 13,352 | | | | | | 83 | | |
| 12-31-17 | | | | | 12.15 | | | | | | 0.20• | | | | | | 1.30 | | | | | | 1.50 | | | | | | 0.14 | | | | | | 0.28 | | | | | | — | | | | | | 0.42 | | | | | | — | | | | | | 13.23 | | | | | | 12.43 | | | | | | 0.81 | | | | | | 0.61 | | | | | | 0.61 | | | | | | 1.59 | | | | | | 14,590 | | | | | | 72 | | |
| 12-31-16 | | | | | 11.65 | | | | | | 0.18• | | | | | | 0.43 | | | | | | 0.61 | | | | | | 0.05 | | | | | | 0.06 | | | | | | — | | | | | | 0.11 | | | | | | — | | | | | | 12.15 | | | | | | 5.21 | | | | | | 0.86 | | | | | | 0.64 | | | | | | 0.64 | | | | | | 1.53 | | | | | | 9,167 | | | | | | 84 | | |
| 12-31-15 | | | | | 12.87 | | | | | | 0.19• | | | | | | (0.05) | | | | | | 0.14 | | | | | | 0.57 | | | | | | 0.79 | | | | | | — | | | | | | 1.36 | | | | | | — | | | | | | 11.65 | | | | | | 0.88 | | | | | | 1.49 | | | | | | 0.63 | | | | | | 0.63 | | | | | | 1.60 | | | | | | 2,853 | | | | | | 86 | | |
| Class I | | | | | | | | | | | | | | | | | | | | | | | | | | | | | | | | | | | | | | | | | | | | | | | | | | | | | | | | | | | | | | | | | | | | | | | | | | | | | | | | | | | | | | | | | | | | | | | | | | | | | | | |
| 12-31-19 | | | | | 12.13 | | | | | | 0.28• | | | | | | 1.53 | | | | | | 1.81 | | | | | | 0.38 | | | | | | 0.61 | | | | | | — | | | | | | 0.99 | | | | | | — | | | | | | 12.95 | | | | | | 15.22 | | | | | | 0.35 | | | | | | 0.21 | | | | | | 0.21 | | | | | | 2.18 | | | | | | 7,239 | | | | | | 92 | | |
| 12-31-18 | | | | | 13.51 | | | | | | 0.28• | | | | | | (0.78) | | | | | | (0.50) | | | | | | 0.26 | | | | | | 0.62 | | | | | | — | | | | | | 0.88 | | | | | | — | | | | | | 12.13 | | | | | | (4.02) | | | | | | 0.29 | | | | | | 0.14 | | | | | | 0.14 | | | | | | 2.16 | | | | | | 7,160 | | | | | | 83 | | |
| 12-31-17 | | | | | 12.37 | | | | | | 0.26 | | | | | | 1.33 | | | | | | 1.59 | | | | | | 0.17 | | | | | | 0.28 | | | | | | — | | | | | | 0.45 | | | | | | — | | | | | | 13.51 | | | | | | 13.01 | | | | | | 0.31 | | | | | | 0.11 | | | | | | 0.11 | | | | | | 2.00 | | | | | | 7,487 | | | | | | 72 | | |
| 12-31-16 | | | | | 11.81 | | | | | | 0.26• | | | | | | 0.42 | | | | | | 0.68 | | | | | | 0.06 | | | | | | 0.06 | | | | | | — | | | | | | 0.12 | | | | | | — | | | | | | 12.37 | | | | | | 5.73 | | | | | | 0.36 | | | | | | 0.14 | | | | | | 0.14 | | | | | | 2.13 | | | | | | 6,377 | | | | | | 84 | | |
| 12-31-15 | | | | | 13.04 | | | | | | 0.32• | | | | | | (0.11) | | | | | | 0.21 | | | | | | 0.65 | | | | | | 0.79 | | | | | | — | | | | | | 1.44 | | | | | | — | | | | | | 11.81 | | | | | | 1.38 | | | | | | 0.99 | | | | | | 0.13 | | | | | | 0.13 | | | | | | 2.76 | | | | | | 2,157 | | | | | | 86 | | |
| Class S | | | | | | | | | | | | | | | | | | | | | | | | | | | | | | | | | | | | | | | | | | | | | | | | | | | | | | | | | | | | | | | | | | | | | | | | | | | | | | | | | | | | | | | | | | | | | | | | | | | | | | | |
| 12-31-19 | | | | | 12.07 | | | | | | 0.25• | | | | | | 1.51 | | | | | | 1.76 | | | | | | 0.34 | | | | | | 0.61 | | | | | | — | | | | | | 0.95 | | | | | | — | | | | | | 12.88 | | | | | | 14.89 | | | | | | 0.60 | | | | | | 0.46 | | | | | | 0.46 | | | | | | 1.94 | | | | | | 13,199 | | | | | | 92 | | |
| 12-31-18 | | | | | 13.46 | | | | | | 0.25• | | | | | | (0.78) | | | | | | (0.53) | | | | | | 0.24 | | | | | | 0.62 | | | | | | — | | | | | | 0.86 | | | | | | — | | | | | | 12.07 | | | | | | (4.27) | | | | | | 0.54 | | | | | | 0.39 | | | | | | 0.39 | | | | | | 1.94 | | | | | | 12,873 | | | | | | 83 | | |
| 12-31-17 | | | | | 12.33 | | | | | | 0.25• | | | | | | 1.31 | | | | | | 1.56 | | | | | | 0.15 | | | | | | 0.28 | | | | | | — | | | | | | 0.43 | | | | | | — | | | | | | 13.46 | | | | | | 12.78 | | | | | | 0.56 | | | | | | 0.36 | | | | | | 0.36 | | | | | | 1.91 | | | | | | 10,565 | | | | | | 72 | | |
| 12-31-16 | | | | | 11.80 | | | | | | 0.20• | | | | | | 0.44 | | | | | | 0.64 | | | | | | 0.05 | | | | | | 0.06 | | | | | | — | | | | | | 0.11 | | | | | | — | | | | | | 12.33 | | | | | | 5.46 | | | | | | 0.61 | | | | | | 0.39 | | | | | | 0.39 | | | | | | 1.65 | | | | | | 6,477 | | | | | | 84 | | |
| 12-31-15 | | | | | 13.01 | | | | | | 0.53• | | | | | | (0.34) | | | | | | 0.19 | | | | | | 0.61 | | | | | | 0.79 | | | | | | — | | | | | | 1.40 | | | | | | — | | | | | | 11.80 | | | | | | 1.23 | | | | | | 1.24 | | | | | | 0.38 | | | | | | 0.38 | | | | | | 4.58 | | | | | | 4,145 | | | | | | 86 | | |
| Class S2 | | | | | | | | | | | | | | | | | | | | | | | | | | | | | | | | | | | | | | | | | | | | | | | | | | | | | | | | | | | | | | | | | | | | | | | | | | | | | | | | | | | | | | | | | | | | | | | | | | | | | | | |
| 12-31-19 | | | | | 11.93 | | | | | | 0.24• | | | | | | 1.49 | | | | | | 1.73 | | | | | | 0.28 | | | | | | 0.61 | | | | | | — | | | | | | 0.89 | | | | | | — | | | | | | 12.77 | | | | | | 14.79 | | | | | | 0.75 | | | | | | 0.61 | | | | | | 0.61 | | | | | | 1.90 | | | | | | 559 | | | | | | 92 | | |
| 12-31-18 | | | | | 13.32 | | | | | | 0.21• | | | | | | (0.75) | | | | | | (0.54) | | | | | | 0.23 | | | | | | 0.62 | | | | | | — | | | | | | 0.85 | | | | | | — | | | | | | 11.93 | | | | | | (4.37) | | | | | | 0.69 | | | | | | 0.54 | | | | | | 0.54 | | | | | | 1.63 | | | | | | 485 | | | | | | 83 | | |
| 12-31-17 | | | | | 12.22 | | | | | | 0.26• | | | | | | 1.26 | | | | | | 1.52 | | | | | | 0.14 | | | | | | 0.28 | | | | | | — | | | | | | 0.42 | | | | | | — | | | | | | 13.32 | | | | | | 12.54 | | | | | | 0.71 | | | | | | 0.51 | | | | | | 0.51 | | | | | | 2.05 | | | | | | 660 | | | | | | 72 | | |
| 12-31-16 | | | | | 11.70 | | | | | | 0.14• | | | | | | 0.48 | | | | | | 0.62 | | | | | | 0.04 | | | | | | 0.06 | | | | | | — | | | | | | 0.10 | | | | | | — | | | | | | 12.22 | | | | | | 5.33 | | | | | | 0.79 | | | | | | 0.54 | | | | | | 0.54 | | | | | | 1.18 | | | | | | 148 | | | | | | 84 | | |
| 12-31-15 | | | | | 12.91 | | | | | | 0.36• | | | | | | (0.20) | | | | | | 0.16 | | | | | | 0.58 | | | | | | 0.79 | | | | | | — | | | | | | 1.37 | | | | | | — | | | | | | 11.70 | | | | | | 1.08 | | | | | | 1.49 | | | | | | 0.53 | | | | | | 0.53 | | | | | | 3.08 | | | | | | 283 | | | | | | 86 | | |
| Class T | | | | | | | | | | | | | | | | | | | | | | | | | | | | | | | | | | | | | | | | | | | | | | | | | | | | | | | | | | | | | | | | | | | | | | | | | | | | | | | | | | | | | | | | | | | | | | | | | | | | | | | |
| 12-31-19 | | | | | 11.85 | | | | | | 0.20• | | | | | | 1.48 | | | | | | 1.68 | | | | | | 0.30 | | | | | | 0.61 | | | | | | — | | | | | | 0.91 | | | | | | — | | | | | | 12.62 | | | | | | 14.44 | | | | | | 1.05 | | | | | | 0.91 | | | | | | 0.91 | | | | | | 1.58 | | | | | | 17 | | | | | | 92 | | |
| 12-31-18 | | | | | 13.24 | | | | | | 0.19• | | | | | | (0.77) | | | | | | (0.58) | | | | | | 0.19 | | | | | | 0.62 | | | | | | — | | | | | | 0.81 | | | | | | — | | | | | | 11.85 | | | | | | (4.71) | | | | | | 0.99 | | | | | | 0.84 | | | | | | 0.84 | | | | | | 1.51 | | | | | | 12 | | | | | | 83 | | |
| 12-31-17 | | | | | 12.16 | | | | | | 0.18• | | | | | | 1.29 | | | | | | 1.47 | | | | | | 0.11 | | | | | | 0.28 | | | | | | — | | | | | | 0.39 | | | | | | — | | | | | | 13.24 | | | | | | 12.22 | | | | | | 1.01 | | | | | | 0.81 | | | | | | 0.81 | | | | | | 1.42 | | | | | | 12 | | | | | | 72 | | |
| 12-31-16 | | | | | 11.64 | | | | | | 0.15• | | | | | | 0.43 | | | | | | 0.58 | | | | | | — | | | | | | 0.06 | | | | | | — | | | | | | 0.06 | | | | | | — | | | | | | 12.16 | | | | | | 4.99 | | | | | | 1.08 | | | | | | 0.84 | | | | | | 0.84 | | | | | | 1.29 | | | | | | 8 | | | | | | 84 | | |
| 12-31-15 | | | | | 12.87 | | | | | | 0.11• | | | | | | 0.01 | | | | | | 0.12 | | | | | | 0.56 | | | | | | 0.79 | | | | | | — | | | | | | 1.35 | | | | | | — | | | | | | 11.64 | | | | | | 0.72 | | | | | | 1.74 | | | | | | 0.83 | | | | | | 0.83 | | | | | | 0.91 | | | | | | 4 | | | | | | 86 | | |
| Voya Solution 2025 Portfolio | | | | | | | | | | | | | | | | | | | | | | | | | | | | | | | | | | | | | | | | | | | | | | | | | | | | | | | | | | | | | | | | | | | | | | | | | | | | | | | | | | | | | | | | | | | | | | | | | | | | | | | |
| Class ADV | | | | | | | | | | | | | | | | | | | | | | | | | | | | | | | | | | | | | | | | | | | | | | | | | | | | | | | | | | | | | | | | | | | | | | | | | | | | | | | | | | | | | | | | | | | | | | | | | | | | | | | |
| 12-31-19 | | | | | 10.48 | | | | | | 0.18• | | | | | | 1.64 | | | | | | 1.82 | | | | | | 0.25 | | | | | | 0.68 | | | | | | — | | | | | | 0.93 | | | | | | — | | | | | | 11.37 | | | | | | 17.79 | | | | | | 0.75 | | | | | | 0.71 | | | | | | 0.71 | | | | | | 1.59 | | | | | | 260,690 | | | | | | 44 | | |
| 12-31-18 | | | | | 11.72 | | | | | | 0.16• | | | | | | (0.82) | | | | | | (0.66) | | | | | | 0.21 | | | | | | 0.37 | | | | | | — | | | | | | 0.58 | | | | | | — | | | | | | 10.48 | | | | | | (5.97) | | | | | | 0.74 | | | | | | 0.67 | | | | | | 0.67 | | | | | | 1.38 | | | | | | 244,883 | | | | | | 47 | | |
| 12-31-17 | | | | | 10.66 | | | | | | 0.15• | | | | | | 1.42 | | | | | | 1.57 | | | | | | 0.19 | | | | | | 0.32 | | | | | | — | | | | | | 0.51 | | | | | | — | | | | | | 11.72 | | | | | | 15.02 | | | | | | 0.74 | | | | | | 0.66 | | | | | | 0.66 | | | | | | 1.36 | | | | | | 300,453 | | | | | | 46 | | |
| 12-31-16 | | | | | 11.17 | | | | | | 0.14• | | | | | | 0.47 | | | | | | 0.61 | | | | | | 0.21 | | | | | | 0.91 | | | | | | — | | | | | | 1.12 | | | | | | — | | | | | | 10.66 | | | | | | 5.53 | | | | | | 0.74 | | | | | | 0.64 | | | | | | 0.64 | | | | | | 1.31 | | | | | | 302,670 | | | | | | 43 | | |
| 12-31-15 | | | | | 12.83 | | | | | | 0.11• | | | | | | (0.09) | | | | | | 0.02 | | | | | | 0.37 | | | | | | 1.31 | | | | | | — | | | | | | 1.68 | | | | | | — | | | | | | 11.17 | | | | | | (0.26) | | | | | | 0.74 | | | | | | 0.65 | | | | | | 0.65 | | | | | | 0.89 | | | | | | 357,443 | | | | | | 42 | | |
See Accompanying Notes to Financial Statements
Financial Highlights (continued)
| | | | | | | | | | Income
(loss) from
investment
operations | | | | | | | | | Less
Distributions | | | | | | | | | | | | | | | | | | | | | | | | | | | Ratios to average
net assets | | | Supplemental
Data | |
| | | | Net asset value, beginning of year
or period | | | Net investment income (loss) | | | Net realized and unrealized
gain (loss) | | | Total from investment operations | | | From net investment income | | | From net realized gains | | | From return of capital | | | Total distributions | | | Payment by affiliate | | | Net asset value, end of year
or period | | | Total Return(1) | | | Expenses before
reductions/additions(2)(3)(4) | | | Expenses net of fee waivers
and/or recoupments if any(2)(3)(4) | | | Expenses net of all
reductions/additions(2)(3)(4) | | | Net investment income (loss)(2)(3) | | | Net assets, end of year or period | | | Portfolio turnover rate | |
Year or
period ended | | | ($) | | | ($) | | | ($) | | | ($) | | | ($) | | | ($) | | | ($) | | | ($) | | | ($) | | | ($) | | | (%) | | | (%) | | | (%) | | | (%) | | | (%) | | | ($000’s) | | | (%) | |
| Voya Solution 2025 Portfolio (continued) | | | | | | | | | | | | | | | | | | | | | | | | | | | | | | | | | | | | | | | | | | | | | | | | | | | | | | | | | | | | | | | | | | | | | | | | | | | | | | | | | | | | | | | | | | | | | | | | | | | | | | | |
| Class I | | | | | | | | | | | | | | | | | | | | | | | | | | | | | | | | | | | | | | | | | | | | | | | | | | | | | | | | | | | | | | | | | | | | | | | | | | | | | | | | | | | | | | | | | | | | | | | | | | | | | | | |
| 12-31-19 | | | | | 10.78 | | | | | | 0.24 | | | | | | 1.68 | | | | | | 1.92 | | | | | | 0.31 | | | | | | 0.68 | | | | | | — | | | | | | 0.99 | | | | | | — | | | | | | 11.71 | | | | | | 18.33 | | | | | | 0.25 | | | | | | 0.21 | | | | | | 0.21 | | | | | | 2.14 | | | | | | 260,767 | | | | | | 44 | | |
| 12-31-18 | | | | | 12.04 | | | | | | 0.23• | | | | | | (0.85) | | | | | | (0.62) | | | | | | 0.27 | | | | | | 0.37 | | | | | | — | | | | | | 0.64 | | | | | | — | | | | | | 10.78 | | | | | | (5.48) | | | | | | 0.24 | | | | | | 0.17 | | | | | | 0.17 | | | | | | 1.93 | | | | | | 219,811 | | | | | | 47 | | |
| 12-31-17 | | | | | 10.94 | | | | | | 0.22• | | | | | | 1.46 | | | | | | 1.68 | | | | | | 0.26 | | | | | | 0.32 | | | | | | — | | | | | | 0.58 | | | | | | — | | | | | | 12.04 | | | | | | 15.62 | | | | | | 0.24 | | | | | | 0.16 | | | | | | 0.16 | | | | | | 1.92 | | | | | | 243,053 | | | | | | 46 | | |
| 12-31-16 | | | | | 11.44 | | | | | | 0.21 | | | | | | 0.48 | | | | | | 0.69 | | | | | | 0.28 | | | | | | 0.91 | | | | | | — | | | | | | 1.19 | | | | | | — | | | | | | 10.94 | | | | | | 6.13 | | | | | | 0.24 | | | | | | 0.14 | | | | | | 0.14 | | | | | | 1.84 | | | | | | 193,795 | | | | | | 43 | | |
| 12-31-15 | | | | | 13.12 | | | | | | 0.18• | | | | | | (0.10) | | | | | | 0.08 | | | | | | 0.45 | | | | | | 1.31 | | | | | | — | | | | | | 1.76 | | | | | | — | | | | | | 11.44 | | | | | | 0.19 | | | | | | 0.24 | | | | | | 0.15 | | | | | | 0.15 | | | | | | 1.44 | | | | | | 204,693 | | | | | | 42 | | |
| Class S | | | | | | | | | | | | | | | | | | | | | | | | | | | | | | | | | | | | | | | | | | | | | | | | | | | | | | | | | | | | | | | | | | | | | | | | | | | | | | | | | | | | | | | | | | | | | | | | | | | | | | | |
| 12-31-19 | | | | | 10.65 | | | | | | 0.21• | | | | | | 1.67 | | | | | | 1.88 | | | | | | 0.28 | | | | | | 0.68 | | | | | | — | | | | | | 0.96 | | | | | | — | | | | | | 11.57 | | | | | | 18.12 | | | | | | 0.50 | | | | | | 0.46 | | | | | | 0.46 | | | | | | 1.82 | | | | | | 299,655 | | | | | | 44 | | |
| 12-31-18 | | | | | 11.90 | | | | | | 0.19• | | | | | | (0.83) | | | | | | (0.64) | | | | | | 0.24 | | | | | | 0.37 | | | | | | — | | | | | | 0.61 | | | | | | — | | | | | | 10.65 | | | | | | (5.73) | | | | | | 0.49 | | | | | | 0.42 | | | | | | 0.42 | | | | | | 1.64 | | | | | | 294,102 | | | | | | 47 | | |
| 12-31-17 | | | | | 10.82 | | | | | | 0.18• | | | | | | 1.45 | | | | | | 1.63 | | | | | | 0.23 | | | | | | 0.32 | | | | | | — | | | | | | 0.55 | | | | | | — | | | | | | 11.90 | | | | | | 15.29 | | | | | | 0.49 | | | | | | 0.41 | | | | | | 0.41 | | | | | | 1.60 | | | | | | 359,764 | | | | | | 46 | | |
| 12-31-16 | | | | | 11.32 | | | | | | 0.17• | | | | | | 0.48 | | | | | | 0.65 | | | | | | 0.24 | | | | | | 0.91 | | | | | | — | | | | | | 1.15 | | | | | | — | | | | | | 10.82 | | | | | | 5.88 | | | | | | 0.49 | | | | | | 0.39 | | | | | | 0.39 | | | | | | 1.58 | | | | | | 376,403 | | | | | | 43 | | |
| 12-31-15 | | | | | 13.00 | | | | | | 0.14• | | | | | | (0.10) | | | | | | 0.04 | | | | | | 0.41 | | | | | | 1.31 | | | | | | — | | | | | | 1.72 | | | | | | — | | | | | | 11.32 | | | | | | (0.09) | | | | | | 0.49 | | | | | | 0.40 | | | | | | 0.40 | | | | | | 1.14 | | | | | | 418,555 | | | | | | 42 | | |
| Class S2 | | | | | | | | | | | | | | | | | | | | | | | | | | | | | | | | | | | | | | | | | | | | | | | | | | | | | | | | | | | | | | | | | | | | | | | | | | | | | | | | | | | | | | | | | | | | | | | | | | | | | | | |
| 12-31-19 | | | | | 10.35 | | | | | | 0.18• | | | | | | 1.63 | | | | | | 1.81 | | | | | | 0.25 | | | | | | 0.68 | | | | | | — | | | | | | 0.93 | | | | | | — | | | | | | 11.23 | | | | | | 17.92 | | | | | | 0.65 | | | | | | 0.61 | | | | | | 0.61 | | | | | | 1.63 | | | | | | 10,745 | | | | | | 44 | | |
| 12-31-18 | | | | | 11.56 | | | | | | 0.15• | | | | | | (0.79) | | | | | | (0.64) | | | | | | 0.20 | | | | | | 0.37 | | | | | | — | | | | | | 0.57 | | | | | | — | | | | | | 10.35 | | | | | | (5.88) | | | | | | 0.64 | | | | | | 0.57 | | | | | | 0.57 | | | | | | 1.34 | | | | | | 11,715 | | | | | | 47 | | |
| 12-31-17 | | | | | 10.52 | | | | | | 0.16• | | | | | | 1.40 | | | | | | 1.56 | | | | | | 0.20 | | | | | | 0.32 | | | | | | — | | | | | | 0.52 | | | | | | — | | | | | | 11.56 | | | | | | 15.07 | | | | | | 0.64 | | | | | | 0.56 | | | | | | 0.56 | | | | | | 1.40 | | | | | | 16,911 | | | | | | 46 | | |
| 12-31-16 | | | | | 11.03 | | | | | | 0.15• | | | | | | 0.47 | | | | | | 0.62 | | | | | | 0.22 | | | | | | 0.91 | | | | | | — | | | | | | 1.13 | | | | | | — | | | | | | 10.52 | | | | | | 5.75 | | | | | | 0.67 | | | | | | 0.54 | | | | | | 0.54 | | | | | | 1.39 | | | | | | 22,356 | | | | | | 43 | | |
| 12-31-15 | | | | | 12.70 | | | | | | 0.12• | | | | | | (0.10) | | | | | | 0.02 | | | | | | 0.38 | | | | | | 1.31 | | | | | | — | | | | | | 1.69 | | | | | | — | | | | | | 11.03 | | | | | | (0.23) | | | | | | 0.74 | | | | | | 0.55 | | | | | | 0.55 | | | | | | 0.98 | | | | | | 27,673 | | | | | | 42 | | |
| Class T | | | | | | | | | | | | | | | | | | | | | | | | | | | | | | | | | | | | | | | | | | | | | | | | | | | | | | | | | | | | | | | | | | | | | | | | | | | | | | | | | | | | | | | | | | | | | | | | | | | | | | | |
| 12-31-19 | | | | | 10.96 | | | | | | 0.16• | | | | | | 1.72 | | | | | | 1.88 | | | | | | 0.18 | | | | | | 0.68 | | | | | | — | | | | | | 0.86 | | | | | | — | | | | | | 11.98 | | | | | | 17.51 | | | | | | 0.95 | | | | | | 0.91 | | | | | | 0.91 | | | | | | 1.36 | | | | | | 521 | | | | | | 44 | | |
| 12-31-18 | | | | | 12.23 | | | | | | 0.13• | | | | | | (0.84) | | | | | | (0.71) | | | | | | 0.19 | | | | | | 0.37 | | | | | | — | | | | | | 0.56 | | | | | | — | | | | | | 10.96 | | | | | | (6.14) | | | | | | 0.94 | | | | | | 0.87 | | | | | | 0.87 | | | | | | 1.11 | | | | | | 575 | | | | | | 47 | | |
| 12-31-17 | | | | | 11.10 | | | | | | 0.14• | | | | | | 1.48 | | | | | | 1.62 | | | | | | 0.17 | | | | | | 0.32 | | | | | | — | | | | | | 0.49 | | | | | | — | | | | | | 12.23 | | | | | | 14.78 | | | | | | 0.94 | | | | | | 0.86 | | | | | | 0.86 | | | | | | 1.18 | | | | | | 821 | | | | | | 46 | | |
| 12-31-16 | | | | | 11.58 | | | | | | 0.14 | | | | | | 0.48 | | | | | | 0.62 | | | | | | 0.19 | | | | | | 0.91 | | | | | | — | | | | | | 1.10 | | | | | | — | | | | | | 11.10 | | | | | | 5.43 | | | | | | 0.96 | | | | | | 0.84 | | | | | | 0.84 | | | | | | 1.14 | | | | | | 806 | | | | | | 43 | | |
| 12-31-15 | | | | | 13.07 | | | | | | 0.09• | | | | | | (0.12) | | | | | | (0.03) | | | | | | 0.15 | | | | | | 1.31 | | | | | | — | | | | | | 1.46 | | | | | | — | | | | | | 11.58 | | | | | | (0.56) | | | | | | 0.99 | | | | | | 0.85 | | | | | | 0.85 | | | | | | 0.70 | | | | | | 837 | | | | | | 42 | | |
| Voya Solution 2030 Portfolio | | | | | | | | | | | | | | | | | | | | | | | | | | | | | | | | | | | | | | | | | | | | | | | | | | | | | | | | | | | | | | | | | | | | | | | | | | | | | | | | | | | | | | | | | | | | | | | | | | | | | | | |
| Class ADV | | | | | | | | | | | | | | | | | | | | | | | | | | | | | | | | | | | | | | | | | | | | | | | | | | | | | | | | | | | | | | | | | | | | | | | | | | | | | | | | | | | | | | | | | | | | | | | | | | | | | | | |
| 12-31-19 | | | | | 13.79 | | | | | | 0.23• | | | | | | 2.46 | | | | | | 2.69 | | | | | | 0.25 | | | | | | 0.93 | | | | | | — | | | | | | 1.18 | | | | | | — | | | | | | 15.30 | | | | | | 20.13 | | | | | | 0.83 | | | | | | 0.71 | | | | | | 0.71 | | | | | | 1.55 | | | | | | 18,792 | | | | | | 79 | | |
| 12-31-18 | | | | | 15.96 | | | | | | 0.21 | | | | | | (1.31) | | | | | | (1.10) | | | | | | 0.23 | | | | | | 0.84 | | | | | | — | | | | | | 1.07 | | | | | | — | | | | | | 13.79 | | | | | | (7.47) | | | | | | 0.81 | | | | | | 0.66 | | | | | | 0.66 | | | | | | 1.38 | | | | | | 12,630 | | | | | | 87 | | |
| 12-31-17 | | | | | 13.94 | | | | | | 0.23• | | | | | | 2.15 | | | | | | 2.38 | | | | | | 0.12 | | | | | | 0.24 | | | | | | — | | | | | | 0.36 | | | | | | — | | | | | | 15.96 | | | | | | 17.22 | | | | | | 0.83 | | | | | | 0.64 | | | | | | 0.64 | | | | | | 1.50 | | | | | | 13,589 | | | | | | 63 | | |
| 12-31-16 | | | | | 13.24 | | | | | | 0.23• | | | | | | 0.57 | | | | | | 0.80 | | | | | | 0.04 | | | | | | 0.06 | | | | | | — | | | | | | 0.10 | | | | | | — | | | | | | 13.94 | | | | | | 6.09 | | | | | | 0.95 | | | | | | 0.66 | | | | | | 0.66 | | | | | | 1.71 | | | | | | 6,623 | | | | | | 67 | | |
| 12-31-15 | | | | | 13.94 | | | | | | 0.36• | | | | | | (0.31) | | | | | | 0.05 | | | | | | 0.19 | | | | | | 0.56 | | | | | | — | | | | | | 0.75 | | | | | | — | | | | | | 13.24 | | | | | | 0.18 | | | | | | 2.57 | | | | | | 0.66 | | | | | | 0.66 | | | | | | 2.65 | | | | | | 1,569 | | | | | | 69 | | |
| Class I | | | | | | | | | | | | | | | | | | | | | | | | | | | | | | | | | | | | | | | | | | | | | | | | | | | | | | | | | | | | | | | | | | | | | | | | | | | | | | | | | | | | | | | | | | | | | | | | | | | | | | | |
| 12-31-19 | | | | | 14.18 | | | | | | 0.33• | | | | | | 2.51 | | | | | | 2.84 | | | | | | 0.32 | | | | | | 0.93 | | | | | | — | | | | | | 1.25 | | | | | | — | | | | | | 15.77 | | | | | | 20.65 | | | | | | 0.33 | | | | | | 0.21 | | | | | | 0.21 | | | | | | 2.18 | | | | | | 13,781 | | | | | | 79 | | |
| 12-31-18 | | | | | 16.36 | | | | | | 0.31• | | | | | | (1.36) | | | | | | (1.05) | | | | | | 0.29 | | | | | | 0.84 | | | | | | — | | | | | | 1.13 | | | | | | — | | | | | | 14.18 | | | | | | (6.98) | | | | | | 0.31 | | | | | | 0.16 | | | | | | 0.16 | | | | | | 1.95 | | | | | | 7,333 | | | | | | 87 | | |
| 12-31-17 | | | | | 14.23 | | | | | | 0.32• | | | | | | 2.19 | | | | | | 2.51 | | | | | | 0.14 | | | | | | 0.24 | | | | | | — | | | | | | 0.38 | | | | | | — | | | | | | 16.36 | | | | | | 17.86 | | | | | | 0.33 | | | | | | 0.14 | | | | | | 0.14 | | | | | | 2.07 | | | | | | 8,625 | | | | | | 63 | | |
| 12-31-16 | | | | | 13.46 | | | | | | 0.35• | | | | | | 0.53 | | | | | | 0.88 | | | | | | 0.05 | | | | | | 0.06 | | | | | | — | | | | | | 0.11 | | | | | | — | | | | | | 14.23 | | | | | | 6.55 | | | | | | 0.45 | | | | | | 0.16 | | | | | | 0.16 | | | | | | 2.54 | | | | | | 3,247 | | | | | | 67 | | |
| 12-31-15 | | | | | 14.14 | | | | | | 0.39• | | | | | | (0.27) | | | | | | 0.12 | | | | | | 0.24 | | | | | | 0.56 | | | | | | — | | | | | | 0.80 | | | | | | — | | | | | | 13.46 | | | | | | 0.66 | | | | | | 2.07 | | | | | | 0.16 | | | | | | 0.16 | | | | | | 2.90 | | | | | | 861 | | | | | | 69 | | |
See Accompanying Notes to Financial Statements
Financial Highlights (continued)
| | | | | | | | | | Income
(loss) from
investment
operations | | | | | | | | | Less
Distributions | | | | | | | | | | | | | | | | | | | | | | | | | | | Ratios to average
net assets | | | Supplemental
Data | |
| | | | Net asset value, beginning of year
or period | | | Net investment income (loss) | | | Net realized and unrealized
gain (loss) | | | Total from investment operations | | | From net investment income | | | From net realized gains | | | From return of capital | | | Total distributions | | | Payment by affiliate | | | Net asset value, end of year
or period | | | Total Return(1) | | | Expenses before
reductions/additions(2)(3)(4) | | | Expenses net of fee waivers
and/or recoupments if any(2)(3)(4) | | | Expenses net of all
reductions/additions(2)(3)(4) | | | Net investment income (loss)(2)(3) | | | Net assets, end of year or period | | | Portfolio turnover rate | |
Year or
period ended | | | ($) | | | ($) | | | ($) | | | ($) | | | ($) | | | ($) | | | ($) | | | ($) | | | ($) | | | ($) | | | (%) | | | (%) | | | (%) | | | (%) | | | (%) | | | ($000’s) | | | (%) | |
| Voya Solution 2030 Portfolio (continued) | | | | | | | | | | | | | | | | | | | | | | | | | | | | | | | | | | | | | | | | | | | | | | | | | | | | | | | | | | | | | | | | | | | | | | | | | | | | | | | | | | | | | | | | | | | | | | | | | | | | | | | |
| Class S | | | | | | | | | | | | | | | | | | | | | | | | | | | | | | | | | | | | | | | | | | | | | | | | | | | | | | | | | | | | | | | | | | | | | | | | | | | | | | | | | | | | | | | | | | | | | | | | | | | | | | | |
| 12-31-19 | | | | | 14.09 | | | | | | 0.27• | | | | | | 2.51 | | | | | | 2.78 | | | | | | 0.28 | | | | | | 0.93 | | | | | | — | | | | | | 1.21 | | | | | | — | | | | | | 15.66 | | | | | | 20.36 | | | | | | 0.58 | | | | | | 0.46 | | | | | | 0.46 | | | | | | 1.78 | | | | | | 13,558 | | | | | | 79 | | |
| 12-31-18 | | | | | 16.28 | | | | | | 0.28• | | | | | | (1.36) | | | | | | (1.08) | | | | | | 0.27 | | | | | | 0.84 | | | | | | — | | | | | | 1.11 | | | | | | — | | | | | | 14.09 | | | | | | (7.23) | | | | | | 0.56 | | | | | | 0.41 | | | | | | 0.41 | | | | | | 1.81 | | | | | | 10,589 | | | | | | 87 | | |
| 12-31-17 | | | | | 14.18 | | | | | | 0.26• | | | | | | 2.21 | | | | | | 2.47 | | | | | | 0.13 | | | | | | 0.24 | | | | | | — | | | | | | 0.37 | | | | | | — | | | | | | 16.28 | | | | | | 17.59 | | | | | | 0.58 | | | | | | 0.39 | | | | | | 0.39 | | | | | | 1.72 | | | | | | 8,484 | | | | | | 63 | | |
| 12-31-16 | | | | | 13.44 | | | | | | 0.27• | | | | | | 0.58 | | | | | | 0.85 | | | | | | 0.05 | | | | | | 0.06 | | | | | | — | | | | | | 0.11 | | | | | | — | | | | | | 14.18 | | | | | | 6.32 | | | | | | 0.70 | | | | | | 0.41 | | | | | | 0.41 | | | | | | 2.00 | | | | | | 4,770 | | | | | | 67 | | |
| 12-31-15 | | | | | 14.07 | | | | | | 0.49• | | | | | | (0.39) | | | | | | 0.10 | | | | | | 0.17 | | | | | | 0.56 | | | | | | — | | | | | | 0.73 | | | | | | — | | | | | | 13.44 | | | | | | 0.52 | | | | | | 2.32 | | | | | | 0.41 | | | | | | 0.41 | | | | | | 3.69 | | | | | | 1,454 | | | | | | 69 | | |
| Class S2 | | | | | | | | | | | | | | | | | | | | | | | | | | | | | | | | | | | | | | | | | | | | | | | | | | | | | | | | | | | | | | | | | | | | | | | | | | | | | | | | | | | | | | | | | | | | | | | | | | | | | | | |
| 12-31-19 | | | | | 13.90 | | | | | | 0.25• | | | | | | 2.48 | | | | | | 2.73 | | | | | | 0.24 | | | | | | 0.93 | | | | | | — | | | | | | 1.17 | | | | | | — | | | | | | 15.46 | | | | | | 20.24 | | | | | | 0.73 | | | | | | 0.61 | | | | | | 0.61 | | | | | | 1.66 | | | | | | 450 | | | | | | 79 | | |
| 12-31-18 | | | | | 16.08 | | | | | | 0.25• | | | | | | (1.35) | | | | | | (1.10) | | | | | | 0.24 | | | | | | 0.84 | | | | | | — | | | | | | 1.08 | | | | | | — | | | | | | 13.90 | | | | | | (7.40) | | | | | | 0.71 | | | | | | 0.56 | | | | | | 0.56 | | | | | | 1.62 | | | | | | 439 | | | | | | 87 | | |
| 12-31-17 | | | | | 14.01 | | | | | | 0.21• | | | | | | 2.20 | | | | | | 2.41 | | | | | | 0.10 | | | | | | 0.24 | | | | | | — | | | | | | 0.34 | | | | | | — | | | | | | 16.08 | | | | | | 17.38 | | | | | | 0.73 | | | | | | 0.54 | | | | | | 0.54 | | | | | | 1.42 | | | | | | 588 | | | | | | 63 | | |
| 12-31-16 | | | | | 13.30 | | | | | | 0.18• | | | | | | 0.64 | | | | | | 0.82 | | | | | | 0.05 | | | | | | 0.06 | | | | | | — | | | | | | 0.11 | | | | | | — | | | | | | 14.01 | | | | | | 6.17 | | | | | | 0.88 | | | | | | 0.56 | | | | | | 0.56 | | | | | | 1.30 | | | | | | 255 | | | | | | 67 | | |
| 12-31-15 | | | | | 13.96 | | | | | | 0.28• | | | | | | (0.22) | | | | | | 0.06 | | | | | | 0.16 | | | | | | 0.56 | | | | | | — | | | | | | 0.72 | | | | | | — | | | | | | 13.30 | | | | | | 0.23 | | | | | | 2.57 | | | | | | 0.56 | | | | | | 0.56 | | | | | | 2.01 | | | | | | 41 | | | | | | 69 | | |
| Class T | | | | | | | | | | | | | | | | | | | | | | | | | | | | | | | | | | | | | | | | | | | | | | | | | | | | | | | | | | | | | | | | | | | | | | | | | | | | | | | | | | | | | | | | | | | | | | | | | | | | | | | |
| 12-31-19 | | | | | 13.82 | | | | | | 0.21• | | | | | | 2.45 | | | | | | 2.66 | | | | | | 0.24 | | | | | | 0.93 | | | | | | — | | | | | | 1.17 | | | | | | — | | | | | | 15.31 | | | | | | 19.86 | | | | | | 1.03 | | | | | | 0.91 | | | | | | 0.91 | | | | | | 1.41 | | | | | | 32 | | | | | | 79 | | |
| 12-31-18 | | | | | 16.02 | | | | | | 0.22• | | | | | | (1.36) | | | | | | (1.14) | | | | | | 0.22 | | | | | | 0.84 | | | | | | — | | | | | | 1.06 | | | | | | — | | | | | | 13.82 | | | | | | (7.67) | | | | | | 1.01 | | | | | | 0.86 | | | | | | 0.86 | | | | | | 1.44 | | | | | | 20 | | | | | | 87 | | |
| 12-31-17 | | | | | 13.98 | | | | | | 0.19• | | | | | | 2.17 | | | | | | 2.36 | | | | | | 0.08 | | | | | | 0.24 | | | | | | — | | | | | | 0.32 | | | | | | — | | | | | | 16.02 | | | | | | 17.05 | | | | | | 1.03 | | | | | | 0.84 | | | | | | 0.84 | | | | | | 1.23 | | | | | | 15 | | | | | | 63 | | |
| 12-31-16 | | | | | 13.27 | | | | | | 0.19• | | | | | | 0.58 | | | | | | 0.77 | | | | | | — | | | | | | 0.06 | | | | | | — | | | | | | 0.06 | | | | | | — | | | | | | 13.98 | | | | | | 5.81 | | | | | | 1.17 | | | | | | 0.86 | | | | | | 0.86 | | | | | | 1.43 | | | | | | 11 | | | | | | 67 | | |
| 12-31-15 | | | | | 13.97 | | | | | | 0.13 | | | | | | (0.14) | | | | | | (0.01) | | | | | | 0.13 | | | | | | 0.56 | | | | | | — | | | | | | 0.69 | | | | | | — | | | | | | 13.27 | | | | | | (0.26) | | | | | | 2.82 | | | | | | 0.86 | | | | | | 0.86 | | | | | | 0.92 | | | | | | 4 | | | | | | 69 | | |
| Voya Solution 2035 Portfolio | | | | | | | | | | | | | | | | | | | | | | | | | | | | | | | | | | | | | | | | | | | | | | | | | | | | | | | | | | | | | | | | | | | | | | | | | | | | | | | | | | | | | | | | | | | | | | | | | | | | | | | |
| Class ADV | | | | | | | | | | | | | | | | | | | | | | | | | | | | | | | | | | | | | | | | | | | | | | | | | | | | | | | | | | | | | | | | | | | | | | | | | | | | | | | | | | | | | | | | | | | | | | | | | | | | | | | |
| 12-31-19 | | | | | 10.60 | | | | | | 0.16• | | | | | | 2.04 | | | | | | 2.20 | | | | | | 0.24 | | | | | | 0.93 | | | | | | — | | | | | | 1.17 | | | | | | — | | | | | | 11.63 | | | | | | 21.53 | | | | | | 0.75 | | | | | | 0.71 | | | | | | 0.71 | | | | | | 1.38 | | | | | | 226,096 | | | | | | 52 | | |
| 12-31-18 | | | | | 12.27 | | | | | | 0.14• | | | | | | (1.12) | | | | | | (0.98) | | | | | | 0.19 | | | | | | 0.50 | | | | | | — | | | | | | 0.69 | | | | | | — | | | | | | 10.60 | | | | | | (8.54) | | | | | | 0.75 | | | | | | 0.68 | | | | | | 0.68 | | | | | | 1.21 | | | | | | 212,084 | | | | | | 50 | | |
| 12-31-17 | | | | | 10.71 | | | | | | 0.13• | | | | | | 1.90 | | | | | | 2.03 | | | | | | 0.16 | | | | | | 0.31 | | | | | | — | | | | | | 0.47 | | | | | | — | | | | | | 12.27 | | | | | | 19.22 | | | | | | 0.74 | | | | | | 0.65 | | | | | | 0.65 | | | | | | 1.12 | | | | | | 267,229 | | | | | | 36 | | |
| 12-31-16 | | | | | 11.27 | | | | | | 0.12• | | | | | | 0.53 | | | | | | 0.65 | | | | | | 0.21 | | | | | | 1.00 | | | | | | — | | | | | | 1.21 | | | | | | — | | | | | | 10.71 | | | | | | 6.00 | | | | | | 0.74 | | | | | | 0.66 | | | | | | 0.66 | | | | | | 1.11 | | | | | | 262,148 | | | | | | 44 | | |
| 12-31-15 | | | | | 13.22 | | | | | | 0.11• | | | | | | (0.13) | | | | | | (0.02) | | | | | | 0.38 | | | | | | 1.55 | | | | | | — | | | | | | 1.93 | | | | | | — | | | | | | 11.27 | | | | | | (0.77) | | | | | | 0.74 | | | | | | 0.67 | | | | | | 0.67 | | | | | | 0.84 | | | | | | 303,218 | | | | | | 46 | | |
| Class I | | | | | | | | | | | | | | | | | | | | | | | | | | | | | | | | | | | | | | | | | | | | | | | | | | | | | | | | | | | | | | | | | | | | | | | | | | | | | | | | | | | | | | | | | | | | | | | | | | | | | | | |
| 12-31-19 | | | | | 10.89 | | | | | | 0.22 | | | | | | 2.10 | | | | | | 2.32 | | | | | | 0.30 | | | | | | 0.93 | | | | | | — | | | | | | 1.23 | | | | | | — | | | | | | 11.98 | | | | | | 22.22 | | | | | | 0.25 | | | | | | 0.21 | | | | | | 0.21 | | | | | | 1.97 | | | | | | 304,111 | | | | | | 52 | | |
| 12-31-18 | | | | | 12.59 | | | | | | 0.22 | | | | | | (1.17) | | | | | | (0.95) | | | | | | 0.25 | | | | | | 0.50 | | | | | | — | | | | | | 0.75 | | | | | | — | | | | | | 10.89 | | | | | | (8.09) | | | | | | 0.25 | | | | | | 0.18 | | | | | | 0.18 | | | | | | 1.75 | | | | | | 247,475 | | | | | | 50 | | |
| 12-31-17 | | | | | 10.98 | | | | | | 0.20• | | | | | | 1.94 | | | | | | 2.14 | | | | | | 0.22 | | | | | | 0.31 | | | | | | — | | | | | | 0.53 | | | | | | — | | | | | | 12.59 | | | | | | 19.82 | | | | | | 0.24 | | | | | | 0.15 | | | | | | 0.15 | | | | | | 1.69 | | | | | | 274,900 | | | | | | 36 | | |
| 12-31-16 | | | | | 11.54 | | | | | | 0.19 | | | | | | 0.53 | | | | | | 0.72 | | | | | | 0.28 | | | | | | 1.00 | | | | | | — | | | | | | 1.28 | | | | | | — | | | | | | 10.98 | | | | | | 6.49 | | | | | | 0.24 | | | | | | 0.16 | | | | | | 0.16 | | | | | | 1.67 | | | | | | 210,863 | | | | | | 44 | | |
| 12-31-15 | | | | | 13.51 | | | | | | 0.18• | | | | | | (0.14) | | | | | | 0.04 | | | | | | 0.46 | | | | | | 1.55 | | | | | | — | | | | | | 2.01 | | | | | | — | | | | | | 11.54 | | | | | | (0.30) | | | | | | 0.24 | | | | | | 0.17 | | | | | | 0.17 | | | | | | 1.39 | | | | | | 218,051 | | | | | | 46 | | |
| Class S | | | | | | | | | | | | | | | | | | | | | | | | | | | | | | | | | | | | | | | | | | | | | | | | | | | | | | | | | | | | | | | | | | | | | | | | | | | | | | | | | | | | | | | | | | | | | | | | | | | | | | | |
| 12-31-19 | | | | | 10.76 | | | | | | 0.19• | | | | | | 2.08 | | | | | | 2.27 | | | | | | 0.27 | | | | | | 0.93 | | | | | | — | | | | | | 1.20 | | | | | | — | | | | | | 11.83 | | | | | | 21.94 | | | | | | 0.50 | | | | | | 0.46 | | | | | | 0.46 | | | | | | 1.64 | | | | | | 324,783 | | | | | | 52 | | |
| 12-31-18 | | | | | 12.45 | | | | | | 0.18• | | | | | | (1.15) | | | | | | (0.97) | | | | | | 0.22 | | | | | | 0.50 | | | | | | — | | | | | | 0.72 | | | | | | — | | | | | | 10.76 | | | | | | (8.34) | | | | | | 0.50 | | | | | | 0.43 | | | | | | 0.43 | | | | | | 1.46 | | | | | | 297,721 | | | | | | 50 | | |
| 12-31-17 | | | | | 10.87 | | | | | | 0.16• | | | | | | 1.92 | | | | | | 2.08 | | | | | | 0.19 | | | | | | 0.31 | | | | | | — | | | | | | 0.50 | | | | | | — | | | | | | 12.45 | | | | | | 19.44 | | | | | | 0.49 | | | | | | 0.40 | | | | | | 0.40 | | | | | | 1.38 | | | | | | 368,554 | | | | | | 36 | | |
| 12-31-16 | | | | | 11.43 | | | | | | 0.16• | | | | | | 0.53 | | | | | | 0.69 | | | | | | 0.25 | | | | | | 1.00 | | | | | | — | | | | | | 1.25 | | | | | | — | | | | | | 10.87 | | | | | | 6.23 | | | | | | 0.49 | | | | | | 0.41 | | | | | | 0.41 | | | | | | 1.41 | | | | | | 359,464 | | | | | | 44 | | |
| 12-31-15 | | | | | 13.39 | | | | | | 0.14• | | | | | | (0.13) | | | | | | 0.01 | | | | | | 0.42 | | | | | | 1.55 | | | | | | — | | | | | | 1.97 | | | | | | — | | | | | | 11.43 | | | | | | (0.48) | | | | | | 0.49 | | | | | | 0.42 | | | | | | 0.42 | | | | | | 1.10 | | | | | | 383,233 | | | | | | 46 | | |
See Accompanying Notes to Financial Statements
Financial Highlights (continued)
| | | | | | | | | | Income
(loss) from
investment
operations | | | | | | | | | Less
Distributions | | | | | | | | | | | | | | | | | | | | | | | | | | | Ratios to average
net assets | | | Supplemental
Data | |
| | | | Net asset value, beginning of year
or period | | | Net investment income (loss) | | | Net realized and unrealized
gain (loss) | | | Total from investment operations | | | From net investment income | | | From net realized gains | | | From return of capital | | | Total distributions | | | Payment by affiliate | | | Net asset value, end of year
or period | | | Total Return(1) | | | Expenses before
reductions/additions(2)(3)(4) | | | Expenses net of fee waivers
and/or recoupments if any(2)(3)(4) | | | Expenses net of all
reductions/additions(2)(3)(4) | | | Net investment income (loss)(2)(3) | | | Net assets, end of year or period | | | Portfolio turnover rate | |
Year or
period ended | | | ($) | | | ($) | | | ($) | | | ($) | | | ($) | | | ($) | | | ($) | | | ($) | | | ($) | | | ($) | | | (%) | | | (%) | | | (%) | | | (%) | | | (%) | | | ($000’s) | | | (%) | |
| Voya Solution 2035 Portfolio (continued) | | | | | | | | | | | | | | | | | | | | | | | | | | | | | | | | | | | | | | | | | | | | | | | | | | | | | | | | | | | | | | | | | | | | | | | | | | | | | | | | | | | | | | | | | | | | | | | | | | | | | | | |
| Class S2 | | | | | | | | | | | | | | | | | | | | | | | | | | | | | | | | | | | | | | | | | | | | | | | | | | | | | | | | | | | | | | | | | | | | | | | | | | | | | | | | | | | | | | | | | | | | | | | | | | | | | | | |
| 12-31-19 | | | | | 10.36 | | | | | | 0.16• | | | | | | 1.99 | | | | | | 2.15 | | | | | | 0.24 | | | | | | 0.93 | | | | | | — | | | | | | 1.17 | | | | | | — | | | | | | 11.34 | | | | | | 21.63 | | | | | | 0.65 | | | | | | 0.61 | | | | | | 0.61 | | | | | | 1.46 | | | | | | 14,599 | | | | | | 52 | | |
| 12-31-18 | | | | | 12.00 | | | | | | 0.15• | | | | | | (1.09) | | | | | | (0.94) | | | | | | 0.20 | | | | | | 0.50 | | | | | | — | | | | | | 0.70 | | | | | | — | | | | | | 10.36 | | | | | | (8.42) | | | | | | 0.65 | | | | | | 0.58 | | | | | | 0.58 | | | | | | 1.28 | | | | | | 14,521 | | | | | | 50 | | |
| 12-31-17 | | | | | 10.49 | | | | | | 0.14• | | | | | | 1.85 | | | | | | 1.99 | | | | | | 0.17 | | | | | | 0.31 | | | | | | — | | | | | | 0.48 | | | | | | — | | | | | | 12.00 | | | | | | 19.28 | | | | | | 0.64 | | | | | | 0.55 | | | | | | 0.55 | | | | | | 1.22 | | | | | | 19,146 | | | | | | 36 | | |
| 12-31-16 | | | | | 11.07 | | | | | | 0.14 | | | | | | 0.51 | | | | | | 0.65 | | | | | | 0.23 | | | | | | 1.00 | | | | | | — | | | | | | 1.23 | | | | | | — | | | | | | 10.49 | | | | | | 6.09 | | | | | | 0.67 | | | | | | 0.56 | | | | | | 0.56 | | | | | | 1.24 | | | | | | 20,809 | | | | | | 44 | | |
| 12-31-15 | | | | | 13.01 | | | | | | 0.11• | | | | | | (0.11) | | | | | | 0.00* | | | | | | 0.39 | | | | | | 1.55 | | | | | | — | | | | | | 1.94 | | | | | | — | | | | | | 11.07 | | | | | | (0.62) | | | | | | 0.74 | | | | | | 0.57 | | | | | | 0.57 | | | | | | 0.90 | | | | | | 22,289 | | | | | | 46 | | |
| Class T | | | | | | | | | | | | | | | | | | | | | | | | | | | | | | | | | | | | | | | | | | | | | | | | | | | | | | | | | | | | | | | | | | | | | | | | | | | | | | | | | | | | | | | | | | | | | | | | | | | | | | | |
| 12-31-19 | | | | | 11.07 | | | | | | 0.14 | | | | | | 2.15 | | | | | | 2.29 | | | | | | 0.16 | | | | | | 0.93 | | | | | | — | | | | | | 1.09 | | | | | | — | | | | | | 12.27 | | | | | | 21.36 | | | | | | 0.95 | | | | | | 0.91 | | | | | | 0.91 | | | | | | 1.27 | | | | | | 447 | | | | | | 52 | | |
| 12-31-18 | | | | | 12.79 | | | | | | 0.10• | | | | | | (1.16) | | | | | | (1.06) | | | | | | 0.16 | | | | | | 0.50 | | | | | | — | | | | | | 0.66 | | | | | | — | | | | | | 11.07 | | | | | | (8.76) | | | | | | 0.95 | | | | | | 0.88 | | | | | | 0.88 | | | | | | 0.77 | | | | | | 373 | | | | | | 50 | | |
| 12-31-17 | | | | | 11.14 | | | | | | 0.11• | | | | | | 1.98 | | | | | | 2.09 | | | | | | 0.13 | | | | | | 0.31 | | | | | | — | | | | | | 0.44 | | | | | | — | | | | | | 12.79 | | | | | | 19.03 | | | | | | 0.94 | | | | | | 0.85 | | | | | | 0.85 | | | | | | 0.95 | | | | | | 700 | | | | | | 36 | | |
| 12-31-16 | | | | | 11.65 | | | | | | 0.09• | | | | | | 0.56 | | | | | | 0.65 | | | | | | 0.16 | | | | | | 1.00 | | | | | | — | | | | | | 1.16 | | | | | | — | | | | | | 11.14 | | | | | | 5.73 | | | | | | 0.96 | | | | | | 0.86 | | | | | | 0.86 | | | | | | 0.83 | | | | | | 624 | | | | | | 44 | | |
| 12-31-15 | | | | | 13.50 | | | | | | 0.09• | | | | | | (0.15) | | | | | | (0.06) | | | | | | 0.24 | | | | | | 1.55 | | | | | | — | | | | | | 1.79 | | | | | | — | | | | | | 11.65 | | | | | | (1.00) | | | | | | 0.99 | | | | | | 0.87 | | | | | | 0.87 | | | | | | 0.69 | | | | | | 887 | | | | | | 46 | | |
| Voya Solution 2040 Portfolio | | | | | | | | | | | | | | | | | | | | | | | | | | | | | | | | | | | | | | | | | | | | | | | | | | | | | | | | | | | | | | | | | | | | | | | | | | | | | | | | | | | | | | | | | | | | | | | | | | | | | | | |
| Class ADV | | | | | | | | | | | | | | | | | | | | | | | | | | | | | | | | | | | | | | | | | | | | | | | | | | | | | | | | | | | | | | | | | | | | | | | | | | | | | | | | | | | | | | | | | | | | | | | | | | | | | | | |
| 12-31-19 | | | | | 14.26 | | | | | | 0.23• | | | | | | 2.92 | | | | | | 3.15 | | | | | | 0.26 | | | | | | 1.06 | | | | | | — | | | | | | 1.32 | | | | | | — | | | | | | 16.09 | | | | | | 22.82 | | | | | | 0.84 | | | | | | 0.72 | | | | | | 0.72 | | | | | | 1.47 | | | | | | 14,324 | | | | | | 82 | | |
| 12-31-18 | | | | | 17.11 | | | | | | 0.20• | | | | | | (1.66) | | | | | | (1.46) | | | | | | 0.22 | | | | | | 1.17 | | | | | | — | | | | | | 1.39 | | | | | | — | | | | | | 14.26 | | | | | | (9.41) | | | | | | 0.84 | | | | | | 0.66 | | | | | | 0.66 | | | | | | 1.19 | | | | | | 8,662 | | | | | | 81 | | |
| 12-31-17 | | | | | 14.55 | | | | | | 0.19• | | | | | | 2.73 | | | | | | 2.92 | | | | | | 0.08 | | | | | | 0.28 | | | | | | — | | | | | | 0.36 | | | | | | — | | | | | | 17.11 | | | | | | 20.23 | | | | | | 0.86 | | | | | | 0.63 | | | | | | 0.63 | | | | | | 1.17 | | | | | | 8,696 | | | | | | 68 | | |
| 12-31-16 | | | | | 13.84 | | | | | | 0.19• | | | | | | 0.71 | | | | | | 0.90 | | | | | | 0.06 | | | | | | 0.13 | | | | | | — | | | | | | 0.19 | | | | | | — | | | | | | 14.55 | | | | | | 6.48 | | | | | | 1.03 | | | | | | 0.66 | | | | | | 0.66 | | | | | | 1.34 | | | | | | 4,897 | | | | | | 72 | | |
| 12-31-15 | | | | | 14.89 | | | | | | 0.25• | | | | | | (0.26) | | | | | | (0.01) | | | | | | 0.35 | | | | | | 0.69 | | | | | | — | | | | | | 1.04 | | | | | | — | | | | | | 13.84 | | | | | | (0.33) | | | | | | 2.07 | | | | | | 0.67 | | | | | | 0.67 | | | | | | 1.72 | | | | | | 2,229 | | | | | | 108 | | |
| Class I | | | | | | | | | | | | | | | | | | | | | | | | | | | | | | | | | | | | | | | | | | | | | | | | | | | | | | | | | | | | | | | | | | | | | | | | | | | | | | | | | | | | | | | | | | | | | | | | | | | | | | | |
| 12-31-19 | | | | | 14.66 | | | | | | 0.32• | | | | | | 3.00 | | | | | | 3.32 | | | | | | 0.32 | | | | | | 1.06 | | | | | | — | | | | | | 1.38 | | | | | | — | | | | | | 16.60 | | | | | | 23.44 | | | | | | 0.34 | | | | | | 0.22 | | | | | | 0.22 | | | | | | 1.97 | | | | | | 11,825 | | | | | | 82 | | |
| 12-31-18 | | | | | 17.53 | | | | | | 0.30• | | | | | | (1.72) | | | | | | (1.42) | | | | | | 0.28 | | | | | | 1.17 | | | | | | — | | | | | | 1.45 | | | | | | — | | | | | | 14.66 | | | | | | (8.95) | | | | | | 0.34 | | | | | | 0.16 | | | | | | 0.16 | | | | | | 1.77 | | | | | | 7,134 | | | | | | 81 | | |
| 12-31-17 | | | | | 14.86 | | | | | | 0.29• | | | | | | 2.78 | | | | | | 3.07 | | | | | | 0.12 | | | | | | 0.28 | | | | | | — | | | | | | 0.40 | | | | | | — | | | | | | 17.53 | | | | | | 20.85 | | | | | | 0.36 | | | | | | 0.13 | | | | | | 0.13 | | | | | | 1.76 | | | | | | 7,753 | | | | | | 68 | | |
| 12-31-16 | | | | | 14.07 | | | | | | 0.31• | | | | | | 0.68 | | | | | | 0.99 | | | | | | 0.07 | | | | | | 0.13 | | | | | | — | | | | | | 0.20 | | | | | | — | | | | | | 14.86 | | | | | | 7.06 | | | | | | 0.53 | | | | | | 0.16 | | | | | | 0.16 | | | | | | 2.14 | | | | | | 2,887 | | | | | | 72 | | |
| 12-31-15 | | | | | 15.08 | | | | | | 0.43• | | | | | | (0.36) | | | | | | 0.07 | | | | | | 0.39 | | | | | | 0.69 | | | | | | — | | | | | | 1.08 | | | | | | — | | | | | | 14.07 | | | | | | 0.22 | | | | | | 1.57 | | | | | | 0.17 | | | | | | 0.17 | | | | | | 3.06 | | | | | | 487 | | | | | | 108 | | |
| Class S | | | | | | | | | | | | | | | | | | | | | | | | | | | | | | | | | | | | | | | | | | | | | | | | | | | | | | | | | | | | | | | | | | | | | | | | | | | | | | | | | | | | | | | | | | | | | | | | | | | | | | | |
| 12-31-19 | | | | | 14.54 | | | | | | 0.23 | | | | | | 3.02 | | | | | | 3.25 | | | | | | 0.29 | | | | | | 1.06 | | | | | | — | | | | | | 1.35 | | | | | | — | | | | | | 16.44 | | | | | | 23.07 | | | | | | 0.59 | | | | | | 0.47 | | | | | | 0.47 | | | | | | 1.44 | | | | | | 8,500 | | | | | | 82 | | |
| 12-31-18 | | | | | 17.40 | | | | | | 0.26• | | | | | | (1.70) | | | | | | (1.44) | | | | | | 0.25 | | | | | | 1.17 | | | | | | — | | | | | | 1.42 | | | | | | — | | | | | | 14.54 | | | | | | (9.13) | | | | | | 0.59 | | | | | | 0.41 | | | | | | 0.41 | | | | | | 1.54 | | | | | | 7,641 | | | | | | 81 | | |
| 12-31-17 | | | | | 14.78 | | | | | | 0.23• | | | | | | 2.78 | | | | | | 3.01 | | | | | | 0.11 | | | | | | 0.28 | | | | | | — | | | | | | 0.39 | | | | | | — | | | | | | 17.40 | | | | | | 20.53 | | | | | | 0.61 | | | | | | 0.38 | | | | | | 0.38 | | | | | | 1.45 | | | | | | 6,732 | | | | | | 68 | | |
| 12-31-16 | | | | | 14.03 | | | | | | 0.25• | | | | | | 0.70 | | | | | | 0.95 | | | | | | 0.07 | | | | | | 0.13 | | | | | | — | | | | | | 0.20 | | | | | | — | | | | | | 14.78 | | | | | | 6.79 | | | | | | 0.78 | | | | | | 0.41 | | | | | | 0.41 | | | | | | 1.75 | | | | | | 3,217 | | | | | | 72 | | |
| 12-31-15 | | | | | 15.02 | | | | | | 0.49• | | | | | | (0.45) | | | | | | 0.04 | | | | | | 0.34 | | | | | | 0.69 | | | | | | — | | | | | | 1.03 | | | | | | — | | | | | | 14.03 | | | | | | 0.03 | | | | | | 1.82 | | | | | | 0.42 | | | | | | 0.42 | | | | | | 3.50 | | | | | | 610 | | | | | | 108 | | |
| Class S2 | | | | | | | | | | | | | | | | | | | | | | | | | | | | | | | | | | | | | | | | | | | | | | | | | | | | | | | | | | | | | | | | | | | | | | | | | | | | | | | | | | | | | | | | | | | | | | | | | | | | | | | |
| 12-31-19 | | | | | 14.31 | | | | | | 0.25• | | | | | | 2.93 | | | | | | 3.18 | | | | | | 0.26 | | | | | | 1.06 | | | | | | — | | | | | | 1.32 | | | | | | — | | | | | | 16.17 | | | | | | 22.93 | | | | | | 0.74 | | | | | | 0.62 | | | | | | 0.62 | | | | | | 1.57 | | | | | | 973 | | | | | | 82 | | |
| 12-31-18 | | | | | 17.18 | | | | | | 0.23• | | | | | | (1.68) | | | | | | (1.45) | | | | | | 0.25 | | | | | | 1.17 | | | | | | — | | | | | | 1.42 | | | | | | — | | | | | | 14.31 | | | | | | (9.30) | | | | | | 0.74 | | | | | | 0.56 | | | | | | 0.56 | | | | | | 1.42 | | | | | | 939 | | | | | | 81 | | |
| 12-31-17 | | | | | 14.62 | | | | | | 0.26• | | | | | | 2.69 | | | | | | 2.95 | | | | | | 0.11 | | | | | | 0.28 | | | | | | — | | | | | | 0.39 | | | | | | — | | | | | | 17.18 | | | | | | 20.31 | | | | | | 0.76 | | | | | | 0.53 | | | | | | 0.53 | | | | | | 1.61 | | | | | | 721 | | | | | | 68 | | |
| 12-31-16 | | | | | 13.90 | | | | | | 0.20• | | | | | | 0.72 | | | | | | 0.92 | | | | | | 0.07 | | | | | | 0.13 | | | | | | — | | | | | | 0.20 | | | | | | — | | | | | | 14.62 | | | | | | 6.64 | | | | | | 0.96 | | | | | | 0.56 | | | | | | 0.56 | | | | | | 1.41 | | | | | | 183 | | | | | | 72 | | |
| 12-31-15 | | | | | 14.93 | | | | | | 0.22• | | | | | | (0.23) | | | | | | (0.01) | | | | | | 0.33 | | | | | | 0.69 | | | | | | — | | | | | | 1.02 | | | | | | — | | | | | | 13.90 | | | | | | (0.33) | | | | | | 2.07 | | | | | | 0.57 | | | | | | 0.57 | | | | | | 1.46 | | | | | | 9 | | | | | | 108 | | |
See Accompanying Notes to Financial Statements
Financial Highlights (continued)
| | | | | | | | | | Income
(loss) from
investment
operations | | | | | | | | | Less
Distributions | | | | | | | | | | | | | | | | | | | | | | | | | | | Ratios to average
net assets | | | Supplemental
Data | |
| | | | Net asset value, beginning of year
or period | | | Net investment income (loss) | | | Net realized and unrealized
gain (loss) | | | Total from investment operations | | | From net investment income | | | From net realized gains | | | From return of capital | | | Total distributions | | | Payment by affiliate | | | Net asset value, end of year
or period | | | Total Return(1) | | | Expenses before
reductions/additions(2)(3)(4) | | | Expenses net of fee waivers
and/or recoupments if any(2)(3)(4) | | | Expenses net of all
reductions/additions(2)(3)(4) | | | Net investment income (loss)(2)(3) | | | Net assets, end of year or period | | | Portfolio turnover rate | |
Year or
period ended | | | ($) | | | ($) | | | ($) | | | ($) | | | ($) | | | ($) | | | ($) | | | ($) | | | ($) | | | ($) | | | (%) | | | (%) | | | (%) | | | (%) | | | (%) | | | ($000’s) | | | (%) | |
| Voya Solution 2040 Portfolio (continued) | | | | | | | | | | | | | | | | | | | | | | | | | | | | | | | | | | | | | | | | | | | | | | | | | | | | | | | | | | | | | | | | | | | | | | | | | | | | | | | | | | | | | | | | | | | | | | | | | | | | | | | |
| Class T | | | | | | | | | | | | | | | | | | | | | | | | | | | | | | | | | | | | | | | | | | | | | | | | | | | | | | | | | | | | | | | | | | | | | | | | | | | | | | | | | | | | | | | | | | | | | | | | | | | | | | | |
| 12-31-19 | | | | | 14.22 | | | | | | 0.20• | | | | | | 2.90 | | | | | | 3.10 | | | | | | 0.20 | | | | | | 1.06 | | | | | | — | | | | | | 1.26 | | | | | | — | | | | | | 16.06 | | | | | | 22.50 | | | | | | 1.04 | | | | | | 0.92 | | | | | | 0.92 | | | | | | 1.28 | | | | | | 32 | | | | | | 82 | | |
| 12-31-18 | | | | | 17.08 | | | | | | 0.15 | | | | | | (1.64) | | | | | | (1.49) | | | | | | 0.20 | | | | | | 1.17 | | | | | | — | | | | | | 1.37 | | | | | | — | | | | | | 14.22 | | | | | | (9.57) | | | | | | 1.04 | | | | | | 0.86 | | | | | | 0.86 | | | | | | 1.00 | | | | | | 17 | | | | | | 81 | | |
| 12-31-17 | | | | | 14.53 | | | | | | 0.17• | | | | | | 2.72 | | | | | | 2.89 | | | | | | 0.06 | | | | | | 0.28 | | | | | | — | | | | | | 0.34 | | | | | | — | | | | | | 17.08 | | | | | | 20.05 | | | | | | 1.06 | | | | | | 0.83 | | | | | | 0.83 | | | | | | 1.08 | | | | | | 20 | | | | | | 68 | | |
| 12-31-16 | | | | | 13.81 | | | | | | 0.17• | | | | | | 0.70 | | | | | | 0.87 | | | | | | 0.02 | | | | | | 0.13 | | | | | | — | | | | | | 0.15 | | | | | | — | | | | | | 14.53 | | | | | | 6.27 | | | | | | 1.25 | | | | | | 0.86 | | | | | | 0.86 | | | | | | 1.19 | | | | | | 12 | | | | | | 72 | | |
| 12-31-15 | | | | | 14.85 | | | | | | 0.10• | | | | | | (0.16) | | | | | | (0.06) | | | | | | 0.29 | | | | | | 0.69 | | | | | | — | | | | | | 0.98 | | | | | | — | | | | | | 13.81 | | | | | | (0.66) | | | | | | 2.32 | | | | | | 0.87 | | | | | | 0.87 | | | | | | 0.67 | | | | | | 4 | | | | | | 108 | | |
| Voya Solution 2045 Portfolio | | | | | | | | | | | | | | | | | | | | | | | | | | | | | | | | | | | | | | | | | | | | | | | | | | | | | | | | | | | | | | | | | | | | | | | | | | | | | | | | | | | | | | | | | | | | | | | | | | | | | | | |
| Class ADV | | | | | | | | | | | | | | | | | | | | | | | | | | | | | | | | | | | | | | | | | | | | | | | | | | | | | | | | | | | | | | | | | | | | | | | | | | | | | | | | | | | | | | | | | | | | | | | | | | | | | | | |
| 12-31-19 | | | | | 10.42 | | | | | | 0.15 | | | | | | 2.20 | | | | | | 2.35 | | | | | | 0.20 | | | | | | 1.10 | | | | | | — | | | | | | 1.30 | | | | | | — | | | | | | 11.47 | | | | | | 23.59 | | | | | | 0.75 | | | | | | 0.72 | | | | | | 0.72 | | | | | | 1.26 | | | | | | 150,005 | | | | | | 67 | | |
| 12-31-18 | | | | | 12.40 | | | | | | 0.11• | | | | | | (1.33) | | | | | | (1.22) | | | | | | 0.15 | | | | | | 0.61 | | | | | | — | | | | | | 0.76 | | | | | | — | | | | | | 10.42 | | | | | | (10.53) | | | | | | 0.75 | | | | | | 0.69 | | | | | | 0.69 | | | | | | 0.93 | | | | | | 134,754 | | | | | | 53 | | |
| 12-31-17 | | | | | 10.63 | | | | | | 0.10• | | | | | | 2.09 | | | | | | 2.19 | | | | | | 0.10 | | | | | | 0.32 | | | | | | — | | | | | | 0.42 | | | | | | — | | | | | | 12.40 | | | | | | 20.92 | | | | | | 0.75 | | | | | | 0.67 | | | | | | 0.67 | | | | | | 0.84 | | | | | | 177,624 | | | | | | 37 | | |
| 12-31-16 | | | | | 11.15 | | | | | | 0.09• | | | | | | 0.56 | | | | | | 0.65 | | | | | | 0.15 | | | | | | 1.02 | | | | | | — | | | | | | 1.17 | | | | | | — | | | | | | 10.63 | | | | | | 6.16 | | | | | | 0.75 | | | | | | 0.68 | | | | | | 0.68 | | | | | | 0.86 | | | | | | 176,397 | | | | | | 45 | | |
| 12-31-15 | | | | | 13.60 | | | | | | 0.07• | | | | | | (0.11) | | | | | | (0.04) | | | | | | 0.38 | | | | | | 2.03 | | | | | | — | | | | | | 2.41 | | | | | | — | | | | | | 11.15 | | | | | | (1.15) | | | | | | 0.75 | | | | | | 0.69 | | | | | | 0.69 | | | | | | 0.58 | | | | | | 197,360 | | | | | | 41 | | |
| Class I | | | | | | | | | | | | | | | | | | | | | | | | | | | | | | | | | | | | | | | | | | | | | | | | | | | | | | | | | | | | | | | | | | | | | | | | | | | | | | | | | | | | | | | | | | | | | | | | | | | | | | | |
| 12-31-19 | | | | | 10.73 | | | | | | 0.20 | | | | | | 2.29 | | | | | | 2.49 | | | | | | 0.27 | | | | | | 1.10 | | | | | | — | | | | | | 1.37 | | | | | | — | | | | | | 11.85 | | | | | | 24.29 | | | | | | 0.25 | | | | | | 0.22 | | | | | | 0.22 | | | | | | 1.86 | | | | | | 269,670 | | | | | | 67 | | |
| 12-31-18 | | | | | 12.75 | | | | | | 0.18 | | | | | | (1.37) | | | | | | (1.19) | | | | | | 0.22 | | | | | | 0.61 | | | | | | — | | | | | | 0.83 | | | | | | — | | | | | | 10.73 | | | | | | (10.08) | | | | | | 0.25 | | | | | | 0.19 | | | | | | 0.19 | | | | | | 1.49 | | | | | | 211,781 | | | | | | 53 | | |
| 12-31-17 | | | | | 10.92 | | | | | | 0.17• | | | | | | 2.14 | | | | | | 2.31 | | | | | | 0.16 | | | | | | 0.32 | | | | | | — | | | | | | 0.48 | | | | | | — | | | | | | 12.75 | | | | | | 21.53 | | | | | | 0.25 | | | | | | 0.17 | | | | | | 0.17 | | | | | | 1.42 | | | | | | 235,122 | | | | | | 37 | | |
| 12-31-16 | | | | | 11.44 | | | | | | 0.15 | | | | | | 0.57 | | | | | | 0.72 | | | | | | 0.22 | | | | | | 1.02 | | | | | | — | | | | | | 1.24 | | | | | | — | | | | | | 10.92 | | | | | | 6.63 | | | | | | 0.25 | | | | | | 0.18 | | | | | | 0.18 | | | | | | 1.41 | | | | | | 171,475 | | | | | | 45 | | |
| 12-31-15 | | | | | 13.90 | | | | | | 0.15• | | | | | | (0.12) | | | | | | 0.03 | | | | | | 0.46 | | | | | | 2.03 | | | | | | — | | | | | | 2.49 | | | | | | — | | | | | | 11.44 | | | | | | (0.59) | | | | | | 0.25 | | | | | | 0.19 | | | | | | 0.19 | | | | | | 1.15 | | | | | | 169,325 | | | | | | 41 | | |
| Class S | | | | | | | | | | | | | | | | | | | | | | | | | | | | | | | | | | | | | | | | | | | | | | | | | | | | | | | | | | | | | | | | | | | | | | | | | | | | | | | | | | | | | | | | | | | | | | | | | | | | | | | |
| 12-31-19 | | | | | 10.58 | | | | | | 0.18 | | | | | | 2.23 | | | | | | 2.41 | | | | | | 0.23 | | | | | | 1.10 | | | | | | — | | | | | | 1.33 | | | | | | — | | | | | | 11.66 | | | | | | 23.90 | | | | | | 0.50 | | | | | | 0.47 | | | | | | 0.47 | | | | | | 1.51 | | | | | | 237,496 | | | | | | 67 | | |
| 12-31-18 | | | | | 12.57 | | | | | | 0.15• | | | | | | (1.35) | | | | | | (1.20) | | | | | | 0.18 | | | | | | 0.61 | | | | | | — | | | | | | 0.79 | | | | | | — | | | | | | 10.58 | | | | | | (10.23) | | | | | | 0.50 | | | | | | 0.44 | | | | | | 0.44 | | | | | | 1.20 | | | | | | 209,647 | | | | | | 53 | | |
| 12-31-17 | | | | | 10.77 | | | | | | 0.13• | | | | | | 2.12 | | | | | | 2.25 | | | | | | 0.13 | | | | | | 0.32 | | | | | | — | | | | | | 0.45 | | | | | | — | | | | | | 12.57 | | | | | | 21.25 | | | | | | 0.50 | | | | | | 0.42 | | | | | | 0.42 | | | | | | 1.11 | | | | | | 269,521 | | | | | | 37 | | |
| 12-31-16 | | | | | 11.29 | | | | | | 0.14 | | | | | | 0.55 | | | | | | 0.69 | | | | | | 0.19 | | | | | | 1.02 | | | | | | — | | | | | | 1.21 | | | | | | — | | | | | | 10.77 | | | | | | 6.40 | | | | | | 0.50 | | | | | | 0.43 | | | | | | 0.43 | | | | | | 1.14 | | | | | | 256,935 | | | | | | 45 | | |
| 12-31-15 | | | | | 13.76 | | | | | | 0.12 | | | | | | (0.14) | | | | | | (0.02) | | | | | | 0.42 | | | | | | 2.03 | | | | | | — | | | | | | 2.45 | | | | | | — | | | | | | 11.29 | | | | | | (0.95) | | | | | | 0.50 | | | | | | 0.44 | | | | | | 0.44 | | | | | | 0.85 | | | | | | 270,222 | | | | | | 41 | | |
| Class S2 | | | | | | | | | | | | | | | | | | | | | | | | | | | | | | | | | | | | | | | | | | | | | | | | | | | | | | | | | | | | | | | | | | | | | | | | | | | | | | | | | | | | | | | | | | | | | | | | | | | | | | | |
| 12-31-19 | | | | | 10.31 | | | | | | 0.15• | | | | | | 2.18 | | | | | | 2.33 | | | | | | 0.20 | | | | | | 1.10 | | | | | | — | | | | | | 1.30 | | | | | | — | | | | | | 11.34 | | | | | | 23.68 | | | | | | 0.65 | | | | | | 0.62 | | | | | | 0.62 | | | | | | 1.31 | | | | | | 7,234 | | | | | | 67 | | |
| 12-31-18 | | | | | 12.25 | | | | | | 0.12• | | | | | | (1.30) | | | | | | (1.18) | | | | | | 0.15 | | | | | | 0.61 | | | | | | — | | | | | | 0.76 | | | | | | — | | | | | | 10.31 | | | | | | (10.34) | | | | | | 0.65 | | | | | | 0.59 | | | | | | 0.59 | | | | | | 1.03 | | | | | | 7,504 | | | | | | 53 | | |
| 12-31-17 | | | | | 10.51 | | | | | | 0.09• | | | | | | 2.08 | | | | | | 2.17 | | | | | | 0.11 | | | | | | 0.32 | | | | | | — | | | | | | 0.43 | | | | | | — | | | | | | 12.25 | | | | | | 21.02 | | | | | | 0.65 | | | | | | 0.57 | | | | | | 0.57 | | | | | | 0.82 | | | | | | 9,902 | | | | | | 37 | | |
| 12-31-16 | | | | | 11.04 | | | | | | 0.11 | | | | | | 0.55 | | | | | | 0.66 | | | | | | 0.17 | | | | | | 1.02 | | | | | | — | | | | | | 1.19 | | | | | | — | | | | | | 10.51 | | | | | | 6.28 | | | | | | 0.68 | | | | | | 0.58 | | | | | | 0.58 | | | | | | 0.96 | | | | | | 12,687 | | | | | | 45 | | |
| 12-31-15 | | | | | 13.49 | | | | | | 0.08• | | | | | | (0.11) | | | | | | (0.03) | | | | | | 0.39 | | | | | | 2.03 | | | | | | — | | | | | | 2.42 | | | | | | — | | | | | | 11.04 | | | | | | (1.07) | | | | | | 0.75 | | | | | | 0.59 | | | | | | 0.59 | | | | | | 0.65 | | | | | | 13,402 | | | | | | 41 | | |
| Class T | | | | | | | | | | | | | | | | | | | | | | | | | | | | | | | | | | | | | | | | | | | | | | | | | | | | | | | | | | | | | | | | | | | | | | | | | | | | | | | | | | | | | | | | | | | | | | | | | | | | | | | |
| 12-31-19 | | | | | 10.74 | | | | | | 0.14• | | | | | | 2.26 | | | | | | 2.40 | | | | | | 0.09 | | | | | | 1.10 | | | | | | — | | | | | | 1.19 | | | | | | — | | | | | | 11.95 | | | | | | 23.31 | | | | | | 0.95 | | | | | | 0.92 | | | | | | 0.92 | | | | | | 1.19 | | | | | | 290 | | | | | | 67 | | |
| 12-31-18 | | | | | 12.77 | | | | | | 0.06• | | | | | | (1.34) | | | | | | (1.28) | | | | | | 0.14 | | | | | | 0.61 | | | | | | — | | | | | | 0.75 | | | | | | — | | | | | | 10.74 | | | | | | (10.72) | | | | | | 0.95 | | | | | | 0.89 | | | | | | 0.89 | | | | | | 0.44 | | | | | | 220 | | | | | | 53 | | |
| 12-31-17 | | | | | 10.95 | | | | | | 0.08 | | | | | | 2.15 | | | | | | 2.23 | | | | | | 0.09 | | | | | | 0.32 | | | | | | — | | | | | | 0.41 | | | | | | — | | | | | | 12.77 | | | | | | 20.69 | | | | | | 0.95 | | | | | | 0.87 | | | | | | 0.87 | | | | | | 0.70 | | | | | | 508 | | | | | | 37 | | |
| 12-31-16 | | | | | 11.46 | | | | | | 0.07 | | | | | | 0.58 | | | | | | 0.65 | | | | | | 0.14 | | | | | | 1.02 | | | | | | — | | | | | | 1.16 | | | | | | — | | | | | | 10.95 | | | | | | 5.94 | | | | | | 0.97 | | | | | | 0.88 | | | | | | 0.88 | | | | | | 0.70 | | | | | | 418 | | | | | | 45 | | |
| 12-31-15 | | | | | 13.77 | | | | | | 0.06• | | | | | | (0.13) | | | | | | (0.07) | | | | | | 0.21 | | | | | | 2.03 | | | | | | — | | | | | | 2.24 | | | | | | — | | | | | | 11.46 | | | | | | (1.31) | | | | | | 1.00 | | | | | | 0.89 | | | | | | 0.89 | | | | | | 0.44 | | | | | | 393 | | | | | | 41 | | |
See Accompanying Notes to Financial Statements
Financial Highlights (continued)
| | | | | | | | | | Income
(loss) from
investment
operations | | | | | | | | | Less
Distributions | | | | | | | | | | | | | | | | | | | | | | | | | | | Ratios to average
net assets | | | Supplemental
Data | |
| | | | Net asset value, beginning of year
or period | | | Net investment income (loss) | | | Net realized and unrealized
gain (loss) | | | Total from investment operations | | | From net investment income | | | From net realized gains | | | From return of capital | | | Total distributions | | | Payment by affiliate | | | Net asset value, end of year
or period | | | Total Return(1) | | | Expenses before
reductions/additions(2)(3)(4) | | | Expenses net of fee waivers
and/or recoupments if any(2)(3)(4) | | | Expenses net of all
reductions/additions(2)(3)(4) | | | Net investment income (loss)(2)(3) | | | Net assets, end of year or period | | | Portfolio turnover rate | |
Year or
period ended | | | ($) | | | ($) | | | ($) | | | ($) | | | ($) | | | ($) | | | ($) | | | ($) | | | ($) | | | ($) | | | (%) | | | (%) | | | (%) | | | (%) | | | (%) | | | ($000’s) | | | (%) | |
| Voya Solution 2050 Portfolio | | | | | | | | | | | | | | | | | | | | | | | | | | | | | | | | | | | | | | | | | | | | | | | | | | | | | | | | | | | | | | | | | | | | | | | | | | | | | | | | | | | | | | | | | | | | | | | | | | | | | | | |
| Class ADV | | | | | | | | | | | | | | | | | | | | | | | | | | | | | | | | | | | | | | | | | | | | | | | | | | | | | | | | | | | | | | | | | | | | | | | | | | | | | | | | | | | | | | | | | | | | | | | | | | | | | | | |
| 12-31-19 | | | | | 14.58 | | | | | | 0.23• | | | | | | 3.17 | | | | | | 3.40 | | | | | | 0.22 | | | | | | 1.13 | | | | | | — | | | | | | 1.35 | | | | | | — | | | | | | 16.63 | | | | | | 24.13 | | | | | | 0.86 | | | | | | 0.73 | | | | | | 0.73 | | | | | | 1.45 | | | | | | 12,951 | | | | | | 84 | | |
| 12-31-18 | | | | | 17.33 | | | | | | 0.17• | | | | | | (1.93) | | | | | | (1.76) | | | | | | 0.16 | | | | | | 0.83 | | | | | | — | | | | | | 0.99 | | | | | | — | | | | | | 14.58 | | | | | | (10.82) | | | | | | 0.86 | | | | | | 0.68 | | | | | | 0.68 | | | | | | 1.03 | | | | | | 8,144 | | | | | | 86 | | |
| 12-31-17 | | | | | 14.57 | | | | | | 0.18• | | | | | | 2.89 | | | | | | 3.07 | | | | | | 0.06 | | | | | | 0.25 | | | | | | — | | | | | | 0.31 | | | | | | — | | | | | | 17.33 | | | | | | 21.30 | | | | | | 0.93 | | | | | | 0.65 | | | | | | 0.65 | | | | | | 1.11 | | | | | | 6,983 | | | | | | 52 | | |
| 12-31-16 | | | | | 13.86 | | | | | | 0.18• | | | | | | 0.68 | | | | | | 0.86 | | | | | | 0.04 | | | | | | 0.11 | | | | | | — | | | | | | 0.15 | | | | | | — | | | | | | 14.57 | | | | | | 6.27 | | | | | | 1.22 | | | | | | 0.68 | | | | | | 0.68 | | | | | | 1.26 | | | | | | 3,184 | | | | | | 70 | | |
| 12-31-15 | | | | | 14.95 | | | | | | 0.18• | | | | | | (0.19) | | | | | | (0.01) | | | | | | 0.35 | | | | | | 0.73 | | | | | | — | | | | | | 1.08 | | | | | | — | | | | | | 13.86 | | | | | | (0.33) | | | | | | 3.24 | | | | | | 0.69 | | | | | | 0.69 | | | | | | 1.22 | | | | | | 960 | | | | | | 67 | | |
| Class I | | | | | | | | | | | | | | | | | | | | | | | | | | | | | | | | | | | | | | | | | | | | | | | | | | | | | | | | | | | | | | | | | | | | | | | | | | | | | | | | | | | | | | | | | | | | | | | | | | | | | | | |
| 12-31-19 | | | | | 15.04 | | | | | | 0.34• | | | | | | 3.25 | | | | | | 3.59 | | | | | | 0.28 | | | | | | 1.13 | | | | | | — | | | | | | 1.41 | | | | | | — | | | | | | 17.22 | | | | | | 24.74 | | | | | | 0.36 | | | | | | 0.23 | | | | | | 0.23 | | | | | | 2.04 | | | | | | 10,912 | | | | | | 84 | | |
| 12-31-18 | | | | | 17.81 | | | | | | 0.27• | | | | | | (1.99) | | | | | | (1.72) | | | | | | 0.22 | | | | | | 0.83 | | | | | | — | | | | | | 1.05 | | | | | | — | | | | | | 15.04 | | | | | | (10.37) | | | | | | 0.36 | | | | | | 0.18 | | | | | | 0.18 | | | | | | 1.55 | | | | | | 6,320 | | | | | | 86 | | |
| 12-31-17 | | | | | 14.91 | | | | | | 0.28• | | | | | | 2.97 | | | | | | 3.25 | | | | | | 0.10 | | | | | | 0.25 | | | | | | — | | | | | | 0.35 | | | | | | — | | | | | | 17.81 | | | | | | 21.99 | | | | | | 0.43 | | | | | | 0.15 | | | | | | 0.15 | | | | | | 1.70 | | | | | | 5,705 | | | | | | 52 | | |
| 12-31-16 | | | | | 14.13 | | | | | | 0.28• | | | | | | 0.67 | | | | | | 0.95 | | | | | | 0.06 | | | | | | 0.11 | | | | | | — | | | | | | 0.17 | | | | | | — | | | | | | 14.91 | | | | | | 6.75 | | | | | | 0.72 | | | | | | 0.18 | | | | | | 0.18 | | | | | | 1.92 | | | | | | 1,452 | | | | | | 70 | | |
| 12-31-15 | | | | | 15.15 | | | | | | 0.53• | | | | | | (0.43) | | | | | | 0.10 | | | | | | 0.39 | | | | | | 0.73 | | | | | | — | | | | | | 1.12 | | | | | | — | | | | | | 14.13 | | | | | | 0.38 | | | | | | 2.74 | | | | | | 0.19 | | | | | | 0.19 | | | | | | 3.80 | | | | | | 387 | | | | | | 67 | | |
| Class S | | | | | | | | | | | | | | | | | | | | | | | | | | | | | | | | | | | | | | | | | | | | | | | | | | | | | | | | | | | | | | | | | | | | | | | | | | | | | | | | | | | | | | | | | | | | | | | | | | | | | | | |
| 12-31-19 | | | | | 14.88 | | | | | | 0.26• | | | | | | 3.25 | | | | | | 3.51 | | | | | | 0.25 | | | | | | 1.13 | | | | | | — | | | | | | 1.38 | | | | | | — | | | | | | 17.01 | | | | | | 24.41 | | | | | | 0.61 | | | | | | 0.48 | | | | | | 0.48 | | | | | | 1.58 | | | | | | 7,397 | | | | | | 84 | | |
| 12-31-18 | | | | | 17.65 | | | | | | 0.23• | | | | | | (1.98) | | | | | | (1.75) | | | | | | 0.19 | | | | | | 0.83 | | | | | | — | | | | | | 1.02 | | | | | | — | | | | | | 14.88 | | | | | | (10.61) | | | | | | 0.61 | | | | | | 0.43 | | | | | | 0.43 | | | | | | 1.34 | | | | | | 5,413 | | | | | | 86 | | |
| 12-31-17 | | | | | 14.81 | | | | | | 0.22• | | | | | | 2.95 | | | | | | 3.17 | | | | | | 0.08 | | | | | | 0.25 | | | | | | — | | | | | | 0.33 | | | | | | — | | | | | | 17.65 | | | | | | 21.63 | | | | | | 0.68 | | | | | | 0.40 | | | | | | 0.40 | | | | | | 1.33 | | | | | | 4,424 | | | | | | 52 | | |
| 12-31-16 | | | | | 14.06 | | | | | | 0.24• | | | | | | 0.68 | | | | | | 0.92 | | | | | | 0.06 | | | | | | 0.11 | | | | | | — | | | | | | 0.17 | | | | | | — | | | | | | 14.81 | | | | | | 6.56 | | | | | | 0.97 | | | | | | 0.43 | | | | | | 0.43 | | | | | | 1.71 | | | | | | 1,996 | | | | | | 70 | | |
| 12-31-15 | | | | | 15.09 | | | | | | 0.38• | | | | | | (0.34) | | | | | | 0.04 | | | | | | 0.34 | | | | | | 0.73 | | | | | | — | | | | | | 1.07 | | | | | | — | | | | | | 14.06 | | | | | | 0.00 | | | | | | 2.99 | | | | | | 0.44 | | | | | | 0.44 | | | | | | 2.70 | | | | | | 317 | | | | | | 67 | | |
| Class S2 | | | | | | | | | | | | | | | | | | | | | | | | | | | | | | | | | | | | | | | | | | | | | | | | | | | | | | | | | | | | | | | | | | | | | | | | | | | | | | | | | | | | ��� | | | | | | | | | | | | | | | | | | | |
| 12-31-19 | | | | | 14.67 | | | | | | 0.23• | | | | | | 3.21 | | | | | | 3.44 | | | | | | 0.20 | | | | | | 1.13 | | | | | | — | | | | | | 1.33 | | | | | | — | | | | | | 16.78 | | | | | | 24.25 | | | | | | 0.76 | | | | | | 0.63 | | | | | | 0.63 | | | | | | 1.40 | | | | | | 419 | | | | | | 84 | | |
| 12-31-18 | | | | | 17.43 | | | | | | 0.22• | | | | | | (1.97) | | | | | | (1.75) | | | | | | 0.18 | | | | | | 0.83 | | | | | | — | | | | | | 1.01 | | | | | | — | | | | | | 14.67 | | | | | | (10.75) | | | | | | 0.76 | | | | | | 0.58 | | | | | | 0.58 | | | | | | 1.32 | | | | | | 423 | | | | | | 86 | | |
| 12-31-17 | | | | | 14.64 | | | | | | 0.20• | | | | | | 2.91 | | | | | | 3.11 | | | | | | 0.07 | | | | | | 0.25 | | | | | | — | | | | | | 0.32 | | | | | | — | | | | | | 17.43 | | | | | | 21.47 | | | | | | 0.83 | | | | | | 0.55 | | | | | | 0.55 | | | | | | 1.21 | | | | | | 309 | | | | | | 52 | | |
| 12-31-16 | | | | | 13.93 | | | | | | 0.20• | | | | | | 0.67 | | | | | | 0.87 | | | | | | 0.05 | | | | | | 0.11 | | | | | | — | | | | | | 0.16 | | | | | | — | | | | | | 14.64 | | | | | | 6.32 | | | | | | 1.15 | | | | | | 0.58 | | | | | | 0.58 | | | | | | 1.44 | | | | | | 142 | | | | | | 70 | | |
| 12-31-15 | | | | | 14.97 | | | | | | 0.13• | | | | | | (0.11) | | | | | | 0.02 | | | | | | 0.33 | | | | | | 0.73 | | | | | | — | | | | | | 1.06 | | | | | | — | | | | | | 13.93 | | | | | | (0.17) | | | | | | 3.24 | | | | | | 0.59 | | | | | | 0.59 | | | | | | 0.89 | | | | | | 9 | | | | | | 67 | | |
| Class T | | | | | | | | | | | | | | | | | | | | | | | | | | | | | | | | | | | | | | | | | | | | | | | | | | | | | | | | | | | | | | | | | | | | | | | | | | | | | | | | | | | | | | | | | | | | | | | | | | | | | | | |
| 12-31-19 | | | | | 14.63 | | | | | | 0.09• | | | | | | 3.28 | | | | | | 3.37 | | | | | | 0.18 | | | | | | 1.13 | | | | | | — | | | | | | 1.31 | | | | | | — | | | | | | 16.69 | | | | | | 23.80 | | | | | | 1.06 | | | | | | 0.93 | | | | | | 0.93 | | | | | | 0.54 | | | | | | 11 | | | | | | 84 | | |
| 12-31-18 | | | | | 17.39 | | | | | | 0.14 | | | | | | (1.94) | | | | | | (1.80) | | | | | | 0.13 | | | | | | 0.83 | | | | | | — | | | | | | 0.96 | | | | | | — | | | | | | 14.63 | | | | | | (11.01) | | | | | | 1.06 | | | | | | 0.88 | | | | | | 0.88 | | | | | | 0.89 | | | | | | 20 | | | | | | 86 | | |
| 12-31-17 | | | | | 14.60 | | | | | | 0.17• | | | | | | 2.89 | | | | | | 3.06 | | | | | | 0.02 | | | | | | 0.25 | | | | | | — | | | | | | 0.27 | | | | | | — | | | | | | 17.39 | | | | | | 21.15 | | | | | | 1.13 | | | | | | 0.85 | | | | | | 0.85 | | | | | | 1.05 | | | | | | 20 | | | | | | 52 | | |
| 12-31-16 | | | | | 13.88 | | | | | | 0.13• | | | | | | 0.70 | | | | | | 0.83 | | | | | | — | | | | | | 0.11 | | | | | | — | | | | | | 0.11 | | | | | | — | | | | | | 14.60 | | | | | | 6.02 | | | | | | 1.44 | | | | | | 0.88 | | | | | | 0.88 | | | | | | 0.96 | | | | | | 10 | | | | | | 70 | | |
| 12-31-15 | | | | | 14.95 | | | | | | 0.08 | | | | | | (0.13) | | | | | | (0.05) | | | | | | 0.29 | | | | | | 0.73 | | | | | | — | | | | | | 1.02 | | | | | | — | | | | | | 13.88 | | | | | | (0.60) | | | | | | 3.49 | | | | | | 0.89 | | | | | | 0.89 | | | | | | 0.51 | | | | | | 4 | | | | | | 67 | | |
| Voya Solution 2055 Portfolio | | | | | | | | | | | | | | | | | | | | | | | | | | | | | | | | | | | | | | | | | | | | | | | | | | | | | | | | | | | | | | | | | | | | | | | | | | | | | | | | | | | | | | | | | | | | | | | | | | | | | | | |
| Class ADV | | | | | | | | | | | | | | | | | | | | | | | | | | | | | | | | | | | | | | | | | | | | | | | | | | | | | | | | | | | | | | | | | | | | | | | | | | | | | | | | | | | | | | | | | | | | | | | | | | | | | | | |
| 12-31-19 | | | | | 12.35 | | | | | | 0.16 | | | | | | 2.70 | | | | | | 2.86 | | | | | | 0.20 | | | | | | 1.16 | | | | | | — | | | | | | 1.36 | | | | | | — | | | | | | 13.85 | | | | | | 24.13 | | | | | | 0.77 | | | | | | 0.72 | | | | | | 0.72 | | | | | | 1.29 | | | | | | 49,315 | | | | | | 61 | | |
| 12-31-18 | | | | | 14.49 | | | | | | 0.13 | | | | | | (1.60) | | | | | | (1.47) | | | | | | 0.15 | | | | | | 0.52 | | | | | | — | | | | | | 0.67 | | | | | | — | | | | | | 12.35 | | | | | | (10.72) | | | | | | 0.76 | | | | | | 0.68 | | | | | | 0.68 | | | | | | 0.90 | | | | | | 39,621 | | | | | | 62 | | |
| 12-31-17 | | | | | 12.27 | | | | | | 0.11• | | | | | | 2.49 | | | | | | 2.60 | | | | | | 0.10 | | | | | | 0.28 | | | | | | — | | | | | | 0.38 | | | | | | — | | | | | | 14.49 | | | | | | 21.40 | | | | | | 0.76 | | | | | | 0.66 | | | | | | 0.66 | | | | | | 0.82 | | | | | | 47,367 | | | | | | 40 | | |
| 12-31-16 | | | | | 12.52 | | | | | | 0.11 | | | | | | 0.64 | | | | | | 0.75 | | | | | | 0.15 | | | | | | 0.85 | | | | | | — | | | | | | 1.00 | | | | | | — | | | | | | 12.27 | | | | | | 6.13 | | | | | | 0.76 | | | | | | 0.69 | | | | | | 0.69 | | | | | | 0.88 | | | | | | 42,793 | | | | | | 58 | | |
| 12-31-15 | | | | | 14.27 | | | | | | 0.08• | | | | | | (0.17) | | | | | | (0.09) | | | | | | 0.32 | | | | | | 1.34 | | | | | | — | | | | | | 1.66 | | | | | | — | | | | | | 12.52 | | | | | | (1.15) | | | | | | 0.76 | | | | | | 0.70 | | | | | | 0.70 | | | | | | 0.61 | | | | | | 41,770 | | | | | | 41 | | |
See Accompanying Notes to Financial Statements
Financial Highlights (continued)
| | | | | | | | | | Income
(loss) from
investment
operations | | | | | | | | | Less
Distributions | | | | | | | | | | | | | | | | | | | | | | | | | | | Ratios to average
net assets | | | Supplemental
Data | |
| | | | Net asset value, beginning of year
or period | | | Net investment income (loss) | | | Net realized and unrealized
gain (loss) | | | Total from investment operations | | | From net investment income | | | From net realized gains | | | From return of capital | | | Total distributions | | | Payment by affiliate | | | Net asset value, end of year
or period | | | Total Return(1) | | | Expenses before
reductions/additions(2)(3)(4) | | | Expenses net of fee waivers
and/or recoupments if any(2)(3)(4) | | | Expenses net of all
reductions/additions(2)(3)(4) | | | Net investment income (loss)(2)(3) | | | Net assets, end of year or period | | | Portfolio turnover rate | |
Year or
period ended | | | ($) | | | ($) | | | ($) | | | ($) | | | ($) | | | ($) | | | ($) | | | ($) | | | ($) | | | ($) | | | (%) | | | (%) | | | (%) | | | (%) | | | (%) | | | ($000’s) | | | (%) | |
| Voya Solution 2055 Portfolio (continued) | | | | | | | | | | | | | | | | | | | | | | | | | | | | | | | | | | | | | | | | | | | | | | | | | | | | | | | | | | | | | | | | | | | | | | | | | | | | | | | | | | | | | | | | | | | | | | | | | | | | | | | |
| Class I | | | | | | | | | | | | | | | | | | | | | | | | | | | | | | | | | | | | | | | | | | | | | | | | | | | | | | | | | | | | | | | | | | | | | | | | | | | | | | | | | | | | | | | | | | | | | | | | | | | | | | | |
| 12-31-19 | | | | | 12.61 | | | | | | 0.27• | | | | | | 2.72 | | | | | | 2.99 | | | | | | 0.27 | | | | | | 1.16 | | | | | | — | | | | | | 1.43 | | | | | | — | | | | | | 14.17 | | | | | | 24.76 | | | | | | 0.27 | | | | | | 0.22 | | | | | | 0.22 | | | | | | 1.93 | | | | | | 119,915 | | | | | | 61 | | |
| 12-31-18 | | | | | 14.78 | | | | | | 0.21• | | | | | | (1.64) | | | | | | (1.43) | | | | | | 0.22 | | | | | | 0.52 | | | | | | — | | | | | | 0.74 | | | | | | — | | | | | | 12.61 | | | | | | (10.29) | | | | | | 0.26 | | | | | | 0.18 | | | | | | 0.18 | | | | | | 1.48 | | | | | | 77,961 | | | | | | 62 | | |
| 12-31-17 | | | | | 12.51 | | | | | | 0.20• | | | | | | 2.51 | | | | | | 2.71 | | | | | | 0.16 | | | | | | 0.28 | | | | | | — | | | | | | 0.44 | | | | | | — | | | | | | 14.78 | | | | | | 21.94 | | | | | | 0.26 | | | | | | 0.16 | | | | | | 0.16 | | | | | | 1.42 | | | | | | 73,894 | | | | | | 40 | | |
| 12-31-16 | | | | | 12.74 | | | | | | 0.18• | | | | | | 0.65 | | | | | | 0.83 | | | | | | 0.21 | | | | | | 0.85 | | | | | | — | | | | | | 1.06 | | | | | | — | | | | | | 12.51 | | | | | | 6.72 | | | | | | 0.26 | | | | | | 0.19 | | | | | | 0.19 | | | | | | 1.46 | | | | | | 44,519 | | | | | | 58 | | |
| 12-31-15 | | | | | 14.49 | | | | | | 0.17• | | | | | | (0.19) | | | | | | (0.02) | | | | | | 0.39 | | | | | | 1.34 | | | | | | — | | | | | | 1.73 | | | | | | — | | | | | | 12.74 | | | | | | (0.67) | | | | | | 0.26 | | | | | | 0.20 | | | | | | 0.20 | | | | | | 1.22 | | | | | | 36,692 | | | | | | 41 | | |
| Class S | | | | | | | | | | | | | | | | | | | | | | | | | | | | | | | | | | | | | | | | | | | | | | | | | | | | | | | | | | | | | | | | | | | | | | | | | | | | | | | | | | | | | | | | | | | | | | | | | | | | | | | |
| 12-31-19 | | | | | 12.46 | | | | | | 0.20 | | | | | | 2.72 | | | | | | 2.92 | | | | | | 0.23 | | | | | | 1.16 | | | | | | — | | | | | | 1.39 | | | | | | — | | | | | | 13.99 | | | | | | 24.50 | | | | | | 0.52 | | | | | | 0.47 | | | | | | 0.47 | | | | | | 1.52 | | | | | | 59,923 | | | | | | 61 | | |
| 12-31-18 | | | | | 14.62 | | | | | | 0.17• | | | | | | (1.63) | | | | | | (1.46) | | | | | | 0.18 | | | | | | 0.52 | | | | | | — | | | | | | 0.70 | | | | | | — | | | | | | 12.46 | | | | | | (10.56) | | | | | | 0.51 | | | | | | 0.43 | | | | | | 0.43 | | | | | | 1.19 | | | | | | 49,077 | | | | | | 62 | | |
| 12-31-17 | | | | | 12.38 | | | | | | 0.15• | | | | | | 2.50 | | | | | | 2.65 | | | | | | 0.13 | | | | | | 0.28 | | | | | | — | | | | | | 0.41 | | | | | | — | | | | | | 14.62 | | | | | | 21.66 | | | | | | 0.51 | | | | | | 0.41 | | | | | | 0.41 | | | | | | 1.08 | | | | | | 58,217 | | | | | | 40 | | |
| 12-31-16 | | | | | 12.62 | | | | | | 0.13 | | | | | | 0.66 | | | | | | 0.79 | | | | | | 0.18 | | | | | | 0.85 | | | | | | — | | | | | | 1.03 | | | | | | — | | | | | | 12.38 | | | | | | 6.44 | | | | | | 0.51 | | | | | | 0.44 | | | | | | 0.44 | | | | | | 1.16 | | | | | | 51,294 | | | | | | 58 | | |
| 12-31-15 | | | | | 14.37 | | | | | | 0.12• | | | | | | (0.17) | | | | | | (0.05) | | | | | | 0.36 | | | | | | 1.34 | | | | | | — | | | | | | 1.70 | | | | | | — | | | | | | 12.62 | | | | | | (0.87) | | | | | | 0.51 | | | | | | 0.45 | | | | | | 0.45 | | | | | | 0.86 | | | | | | 46,913 | | | | | | 41 | | |
| Class S2 | | | | | | | | | | | | | | | | | | | | | | | | | | | | | | | | | | | | | | | | | | | | | | | | | | | | | | | | | | | | | | | | | | | | | | | | | | | | | | | | | | | | | | | | | | | | | | | | | | | | | | | |
| 12-31-19 | | | | | 12.39 | | | | | | 0.18• | | | | | | 2.70 | | | | | | 2.88 | | | | | | 0.19 | | | | | | 1.16 | | | | | | — | | | | | | 1.35 | | | | | | — | | | | | | 13.92 | | | | | | 24.28 | | | | | | 0.67 | | | | | | 0.62 | | | | | | 0.62 | | | | | | 1.33 | | | | | | 2,876 | | | | | | 61 | | |
| 12-31-18 | | | | | 14.54 | | | | | | 0.15 | | | | | | (1.62) | | | | | | (1.47) | | | | | | 0.16 | | | | | | 0.52 | | | | | | — | | | | | | 0.68 | | | | | | — | | | | | | 12.39 | | | | | | (10.68) | | | | | | 0.66 | | | | | | 0.58 | | | | | | 0.58 | | | | | | 1.03 | | | | | | 2,720 | | | | | | 62 | | |
| 12-31-17 | | | | | 12.31 | | | | | | 0.12• | | | | | | 2.50 | | | | | | 2.62 | | | | | | 0.11 | | | | | | 0.28 | | | | | | — | | | | | | 0.39 | | | | | | — | | | | | | 14.54 | | | | | | 21.52 | | | | | | 0.66 | | | | | | 0.56 | | | | | | 0.56 | | | | | | 0.89 | | | | | | 3,250 | | | | | | 40 | | |
| 12-31-16 | | | | | 12.56 | | | | | | 0.11 | | | | | | 0.65 | | | | | | 0.76 | | | | | | 0.16 | | | | | | 0.85 | | | | | | — | | | | | | 1.01 | | | | | | — | | | | | | 12.31 | | | | | | 6.24 | | | | | | 0.69 | | | | | | 0.59 | | | | | | 0.59 | | | | | | 0.93 | | | | | | 2,996 | | | | | | 58 | | |
| 12-31-15 | | | | | 14.31 | | | | | | 0.10 | | | | | | (0.17) | | | | | | (0.07) | | | | | | 0.34 | | | | | | 1.34 | | | | | | — | | | | | | 1.68 | | | | | | — | | | | | | 12.56 | | | | | | (1.04) | | | | | | 0.76 | | | | | | 0.60 | | | | | | 0.60 | | | | | | 0.71 | | | | | | 3,014 | | | | | | 41 | | |
| Class T | | | | | | | | | | | | | | | | | | | | | | | | | | | | | | | | | | | | | | | | | | | | | | | | | | | | | | | | | | | | | | | | | | | | | | | | | | | | | | | | | | | | | | | | | | | | | | | | | | | | | | | |
| 12-31-19 | | | | | 12.58 | | | | | | 0.17• | | | | | | 2.73 | | | | | | 2.90 | | | | | | 0.10 | | | | | | 1.16 | | | | | | — | | | | | | 1.26 | | | | | | — | | | | | | 14.22 | | | | | | 23.93 | | | | | | 0.97 | | | | | | 0.92 | | | | | | 0.92 | | | | | | 1.27 | | | | | | 22 | | | | | | 61 | | |
| 12-31-18 | | | | | 14.73 | | | | | | 0.08• | | | | | | (1.61) | | | | | | (1.53) | | | | | | 0.10 | | | | | | 0.52 | | | | | | — | | | | | | 0.62 | | | | | | — | | | | | | 12.58 | | | | | | (10.91) | | | | | | 0.96 | | | | | | 0.88 | | | | | | 0.88 | | | | | | 0.58 | | | | | | 18 | | | | | | 62 | | |
| 12-31-17 | | | | | 12.50 | | | | | | 0.09• | | | | | | 2.52 | | | | | | 2.61 | | | | | | 0.10 | | | | | | 0.28 | | | | | | — | | | | | | 0.38 | | | | | | — | | | | | | 14.73 | | | | | | 21.08 | | | | | | 0.96 | | | | | | 0.86 | | | | | | 0.86 | | | | | | 0.67 | | | | | | 32 | | | | | | 40 | | |
| 12-31-16 | | | | | 12.78 | | | | | | 0.12• | | | | | | 0.62 | | | | | | 0.74 | | | | | | 0.17 | | | | | | 0.85 | | | | | | — | | | | | | 1.02 | | | | | | — | | | | | | 12.50 | | | | | | 5.96 | | | | | | 0.98 | | | | | | 0.89 | | | | | | 0.89 | | | | | | 0.96 | | | | | | 25 | | | | | | 58 | | |
| 12-31-15 | | | | | 14.25 | | | | | | 0.08• | | | | | | (0.21) | | | | | | (0.13) | | | | | | — | | | | | | 1.34 | | | | | | — | | | | | | 1.34 | | | | | | — | | | | | | 12.78 | | | | | | (1.36) | | | | | | 1.01 | | | | | | 0.90 | | | | | | 0.90 | | | | | | 0.56 | | | | | | 9 | | | | | | 41 | | |
| Voya Solution 2060 Portfolio | | | | | | | | | | | | | | | | | | | | | | | | | | | | | | | | | | | | | | | | | | | | | | | | | | | | | | | | | | | | | | | | | | | | | | | | | | | | | | | | | | | | | | | | | | | | | | | | | | | | | | | |
| Class ADV | | | | | | | | | | | | | | | | | | | | | | | | | | | | | | | | | | | | | | | | | | | | | | | | | | | | | | | | | | | | | | | | | | | | | | | | | | | | | | | | | | | | | | | | | | | | | | | | | | | | | | | |
| 12-31-19 | | | | | 10.45 | | | | | | 0.16• | | | | | | 2.28 | | | | | | 2.44 | | | | | | 0.15 | | | | | | 0.70 | | | | | | — | | | | | | 0.85 | | | | | | — | | | | | | 12.04 | | | | | | 24.12 | | | | | | 0.95 | | | | | | 0.74 | | | | | | 0.74 | | | | | | 1.39 | | | | | | 6,976 | | | | | | 89 | | |
| 12-31-18 | | | | | 12.39 | | | | | | 0.13• | | | | | | (1.38) | | | | | | (1.25) | | | | | | 0.11 | | | | | | 0.58 | | | | | | — | | | | | | 0.69 | | | | | | — | | | | | | 10.45 | | | | | | (10.76) | | | | | | 0.96 | | | | | | 0.69 | | | | | | 0.69 | | | | | | 1.12 | | | | | | 4,593 | | | | | | 84 | | |
| 12-31-17 | | | | | 10.42 | | | | | | 0.13• | | | | | | 2.08 | | | | | | 2.21 | | | | | | 0.04 | | | | | | 0.20 | | | | | | — | | | | | | 0.24 | | | | | | — | | | | | | 12.39 | | | | | | 21.42 | | | | | | 1.10 | | | | | | 0.67 | | | | | | 0.67 | | | | | | 1.11 | | | | | | 3,202 | | | | | | 65 | | |
| 12-31-16 | | | | | 9.89 | | | | | | 0.15• | | | | | | 0.48 | | | | | | 0.63 | | | | | | 0.04 | | | | | | 0.06 | | | | | | — | | | | | | 0.10 | | | | | | — | | | | | | 10.42 | | | | | | 6.34 | | | | | | 1.97 | | | | | | 0.69 | | | | | | 0.69 | | | | | | 1.50 | | | | | | 1,395 | | | | | | 82 | | |
| 02-09-15(5) - 12-31-15 | | | | | 10.00 | | | | | | 0.25• | | | | | | (0.36) | | | | | | (0.11) | | | | | | — | | | | | | — | | | | | | — | | | | | | — | | | | | | — | | | | | | 9.89 | | | | | | (1.10) | | | | | | 19.06 | | | | | | 0.70 | | | | | | 0.70 | | | | | | 2.85 | | | | | | 191 | | | | | | 78 | | |
| Class I | | | | | | | | | | | | | | | | | | | | | | | | | | | | | | | | | | | | | | | | | | | | | | | | | | | | | | | | | | | | | | | | | | | | | | | | | | | | | | | | | | | | | | | | | | | | | | | | | | | | | | | |
| 12-31-19 | | | | | 10.60 | | | | | | 0.25• | | | | | | 2.29 | | | | | | 2.54 | | | | | | 0.19 | | | | | | 0.70 | | | | | | — | | | | | | 0.89 | | | | | | — | | | | | | 12.25 | | | | | | 24.79 | | | | | | 0.45 | | | | | | 0.24 | | | | | | 0.24 | | | | | | 2.14 | | | | | | 5,184 | | | | | | 89 | | |
| 12-31-18 | | | | | 12.53 | | | | | | 0.19• | | | | | | (1.41) | | | | | | (1.22) | | | | | | 0.13 | | | | | | 0.58 | | | | | | — | | | | | | 0.71 | | | | | | — | | | | | | 10.60 | | | | | | (10.35) | | | | | | 0.46 | | | | | | 0.19 | | | | | | 0.19 | | | | | | 1.57 | | | | | | 2,570 | | | | | | 84 | | |
| 12-31-17 | | | | | 10.49 | | | | | | 0.20• | | | | | | 2.10 | | | | | | 2.30 | | | | | | 0.06 | | | | | | 0.20 | | | | | | — | | | | | | 0.26 | | | | | | — | | | | | | 12.53 | | | | | | 22.15 | | | | | | 0.60 | | | | | | 0.17 | | | | | | 0.17 | | | | | | 1.73 | | | | | | 2,160 | | | | | | 65 | | |
| 12-31-16 | | | | | 9.92 | | | | | | 0.16• | | | | | | 0.51 | | | | | | 0.67 | | | | | | 0.04 | | | | | | 0.06 | | | | | | — | | | | | | 0.10 | | | | | | — | | | | | | 10.49 | | | | | | 6.73 | | | | | | 1.47 | | | | | | 0.19 | | | | | | 0.19 | | | | | | 1.56 | | | | | | 606 | | | | | | 82 | | |
| 02-09-15(5) - 12-31-15 | | | | | 10.00 | | | | | | 0.27• | | | | | | (0.35) | | | | | | (0.08) | | | | | | — | | | | | | — | | | | | | — | | | | | | — | | | | | | — | | | | | | 9.92 | | | | | | (0.80) | | | | | | 18.56 | | | | | | 0.20 | | | | | | 0.20 | | | | | | 3.11 | | | | | | 317 | | | | | | 78 | | |
See Accompanying Notes to Financial Statements
Financial Highlights (continued)
| | | | | | | | | | Income
(loss) from
investment
operations | | | | | | | | | Less
Distributions | | | | | | | | | | | | | | | | | | | | | | | | | | | Ratios to average
net assets | | | Supplemental
Data | |
| | | | Net asset value, beginning of year
or period | | | Net investment income (loss) | | | Net realized and unrealized
gain (loss) | | | Total from investment operations | | | From net investment income | | | From net realized gains | | | From return of capital | | | Total distributions | | | Payment by affiliate | | | Net asset value, end of year
or period | | | Total Return(1) | | | Expenses before
reductions/additions(2)(3)(4) | | | Expenses net of fee waivers
and/or recoupments if any(2)(3)(4) | | | Expenses net of all
reductions/additions(2)(3)(4) | | | Net investment income (loss)(2)(3) | | | Net assets, end of year or period | | | Portfolio turnover rate | |
Year or
period ended | | | ($) | | | ($) | | | ($) | | | ($) | | | ($) | | | ($) | | | ($) | | | ($) | | | ($) | | | ($) | | | (%) | | | (%) | | | (%) | | | (%) | | | (%) | | | ($000’s) | | | (%) | |
| Voya Solution 2060 Portfolio (continued) | | | | | | | | | | | | | | | | | | | | | | | | | | | | | | | | | | | | | | | | | | | | | | | | | | | | | | | | | | | | | | | | | | | | | | | | | | | | | | | | | | | | | | | | | | | | | | | | | | | | | | | |
| Class S | | | | | | | | | | | | | | | | | | | | | | | | | | | | | | | | | | | | | | | | | | | | | | | | | | | | | | | | | | | | | | | | | | | | | | | | | | | | | | | | | | | | | | | | | | | | | | | | | | | | | | | |
| 12-31-19 | | | | | 10.47 | | | | | | 0.18• | | | | | | 2.30 | | | | | | 2.48 | | | | | | 0.17 | | | | | | 0.70 | | | | | | — | | | | | | 0.87 | | | | | | — | | | | | | 12.08 | | | | | | 24.45 | | | | | | 0.70 | | | | | | 0.49 | | | | | | 0.49 | | | | | | 1.56 | | | | | | 4,901 | | | | | | 89 | | |
| 12-31-18 | | | | | 12.40 | | | | | | 0.16• | | | | | | (1.39) | | | | | | (1.23) | | | | | | 0.12 | | | | | | 0.58 | | | | | | — | | | | | | 0.70 | | | | | | — | | | | | | 10.47 | | | | | | (10.60) | | | | | | 0.71 | | | | | | 0.44 | | | | | | 0.44 | | | | | | 1.30 | | | | | | 3,440 | | | | | | 84 | | |
| 12-31-17 | | | | | 10.41 | | | | | | 0.15• | | | | | | 2.10 | | | | | | 2.25 | | | | | | 0.06 | | | | | | 0.20 | | | | | | — | | | | | | 0.26 | | | | | | — | | | | | | 12.40 | | | | | | 21.81 | | | | | | 0.85 | | | | | | 0.42 | | | | | | 0.42 | | | | | | 1.30 | | | | | | 2,825 | | | | | | 65 | | |
| 12-31-16 | | | | | 9.86 | | | | | | 0.17• | | | | | | 0.48 | | | | | | 0.65 | | | | | | 0.04 | | | | | | 0.06 | | | | | | — | | | | | | 0.10 | | | | | | — | | | | | | 10.41 | | | | | | 6.56 | | | | | | 1.72 | | | | | | 0.44 | | | | | | 0.44 | | | | | | 1.68 | | | | | | 836 | | | | | | 82 | | |
| 02-09-15(5) - 12-31-15 | | | | | 10.00 | | | | | | 0.27• | | | | | | (0.41) | | | | | | (0.14) | | | | | | — | | | | | | — | | | | | | — | | | | | | — | | | | | | — | | | | | | 9.86 | | | | | | (1.40) | | | | | | 18.81 | | | | | | 0.45 | | | | | | 0.45 | | | | | | 3.06 | | | | | | 140 | | | | | | 78 | | |
| Class S2 | | | | | | | | | | | | | | | | | | | | | | | | | | | | | | | | | | | | | | | | | | | | | | | | | | | | | | | | | | | | | | | | | | | | | | | | | | | | | | | | | | | | | | | | | | | | | | | | | | | | | | | |
| 12-31-19 | | | | | 10.46 | | | | | | 0.18 | | | | | | 2.28 | | | | | | 2.46 | | | | | | 0.15 | | | | | | 0.70 | | | | | | — | | | | | | 0.85 | | | | | | — | | | | | | 12.07 | | | | | | 24.26 | | | | | | 0.85 | | | | | | 0.64 | | | | | | 0.64 | | | | | | 1.44 | | | | | | 269 | | | | | | 89 | | |
| 12-31-18 | | | | | 12.40 | | | | | | 0.15• | | | | | | (1.40) | | | | | | (1.25) | | | | | | 0.11 | | | | | | 0.58 | | | | | | — | | | | | | 0.69 | | | | | | — | | | | | | 10.46 | | | | | | (10.70) | | | | | | 0.86 | | | | | | 0.59 | | | | | | 0.59 | | | | | | 1.23 | | | | | | 247 | | | | | | 84 | | |
| 12-31-17 | | | | | 10.42 | | | | | | 0.17• | | | | | | 2.05 | | | | | | 2.22 | | | | | | 0.04 | | | | | | 0.20 | | | | | | — | | | | | | 0.24 | | | | | | — | | | | | | 12.40 | | | | | | 21.56 | | | | | | 1.00 | | | | | | 0.57 | | | | | | 0.57 | | | | | | 1.45 | | | | | | 180 | | | | | | 65 | | |
| 12-31-16 | | | | | 9.89 | | | | | | 0.09• | | | | | | 0.54 | | | | | | 0.63 | | | | | | 0.04 | | | | | | 0.06 | | | | | | — | | | | | | 0.10 | | | | | | — | | | | | | 10.42 | | | | | | 6.34 | | | | | | 1.90 | | | | | | 0.59 | | | | | | 0.59 | | | | | | 0.92 | | | | | | 32 | | | | | | 82 | | |
| 02-09-15(5) - 12-31-15 | | | | | 10.00 | | | | | | 0.24• | | | | | | (0.35) | | | | | | (0.11) | | | | | | — | | | | | | — | | | | | | — | | | | | | — | | | | | | — | | | | | | 9.89 | | | | | | (1.10) | | | | | | 19.06 | | | | | | 0.60 | | | | | | 0.60 | | | | | | 2.66 | | | | | | 26 | | | | | | 78 | | |
| Class T | | | | | | | | | | | | | | | | | | | | | | | | | | | | | | | | | | | | | | | | | | | | | | | | | | | | | | | | | | | | | | | | | | | | | | | | | | | | | | | | | | | | | | | | | | | | | | | | | | | | | | | |
| 12-31-19 | | | | | 10.40 | | | | | | 0.11 | | | | | | 2.30 | | | | | | 2.41 | | | | | | 0.10 | | | | | | 0.70 | | | | | | — | | | | | | 0.80 | | | | | | — | | | | | | 12.01 | | | | | | 23.96 | | | | | | 1.15 | | | | | | 0.94 | | | | | | 0.94 | | | | | | 1.07 | | | | | | 4 | | | | | | 89 | | |
| 12-31-18 | | | | | 12.33 | | | | | | 0.08 | | | | | | (1.37) | | | | | | (1.29) | | | | | | 0.06 | | | | | | 0.58 | | | | | | — | | | | | | 0.64 | | | | | | — | | | | | | 10.40 | | | | | | (11.08) | | | | | | 1.16 | | | | | | 0.89 | | | | | | 0.89 | | | | | | 0.73 | | | | | | 3 | | | | | | 84 | | |
| 12-31-17 | | | | | 10.35 | | | | | | 0.08• | | | | | | 2.10 | | | | | | 2.18 | | | | | | — | | | | | | 0.20 | | | | | | — | | | | | | 0.20 | | | | | | — | | | | | | 12.33 | | | | | | 21.24 | | | | | | 1.30 | | | | | | 0.87 | | | | | | 0.87 | | | | | | 0.69 | | | | | | 4 | | | | | | 65 | | |
| 12-31-16 | | | | | 9.86 | | | | | | 0.07 | | | | | | 0.51 | | | | | | 0.58 | | | | | | 0.03 | | | | | | 0.06 | | | | | | — | | | | | | 0.09 | | | | | | — | | | | | | 10.35 | | | | | | 5.91 | | | | | | 2.19 | | | | | | 0.89 | | | | | | 0.89 | | | | | | 0.67 | | | | | | 3 | | | | | | 82 | | |
| 02-09-15(5) - 12-31-15 | | | | | 10.00 | | | | | | 0.05 | | | | | | (0.19) | | | | | | (0.14) | | | | | | — | | | | | | — | | | | | | — | | | | | | — | | | | | | — | | | | | | 9.86 | | | | | | (1.40) | | | | | | 19.31 | | | | | | 0.90 | | | | | | 0.90 | | | | | | 0.58 | | | | | | 3 | | | | | | 78 | | |
(1)
Total return is calculated assuming reinvestment of all dividends, capital gain distributions and return of capital distributions, if any, at net asset value and does not reflect the effect of insurance contract charges. Total return for periods less than one year is not annualized.
(2)
Annualized for periods less than one year.
(3)
Ratios reflect operating expenses of a Portfolio. Expenses before reductions/additions do not reflect amounts reimbursed or recouped by the Investment Adviser and/or Distributor or reductions from brokerage service arrangements or other expense offset arrangements and do not represent the amount paid by a Portfolio during periods when reimbursements or reductions occur. Expenses net of fee waivers reflect expenses after reimbursement by the Investment Adviser and/or Distributor or recoupment of previously reimbursed fees by the Investment Adviser, but prior to reductions from brokerage service arrangements or other expense offset arrangements. Expenses net of all reductions/additions represent the net expenses paid by a Portfolio. Net investment income (loss) is net of all such additions or reductions.
(4)
Ratios do not include expenses of underlying funds and do not include fees and expenses charged under the variable annuity contract or variable life insurance policy.
(5)
Commencement of operations.
•
Calculated using average number of shares outstanding throughout the year or period.
*
Amount is less than $0.005 or 0.005% or more than $(0.005) or (0.005)%.
See Accompanying Notes to Financial Statements
NOTES TO FINANCIAL STATEMENTS as of December 31, 2019
NOTE 1 — ORGANIZATION
Voya Partners, Inc. (the “Company”) is an open-end management investment company registered under the Investment Company Act of 1940, as amended (the “1940 Act”). It was incorporated under the laws of Maryland on May 7, 1997. The Articles of Incorporation permit the Company to offer separate series, each of which has its own investment objective, policies and restrictions. The Company currently consists of thirty-seven active separate investment series. The fifteen series (each, a “Portfolio” and collectively, the “Portfolios”) included in this report are: Voya Solution Aggressive Portfolio (“Solution Aggressive”), Voya Solution Balanced Portfolio (“Solution Balanced”), Voya Solution Conservative Portfolio (“Solution Conservative”), Voya Solution Income Portfolio (“Solution Income”), Voya Solution Moderately Aggressive Portfolio (“Solution Moderately Aggressive”), Voya Solution Moderately Conservative Portfolio (“Solution Moderately Conservative”), Voya Solution 2020 Portfolio (“Solution 2020”), Voya Solution 2025 Portfolio (“Solution 2025”), Voya Solution 2030 Portfolio (“Solution 2030”), Voya Solution 2035 Portfolio (“Solution 2035”), Voya Solution 2040 Portfolio (“Solution 2040”), Voya Solution 2045 Portfolio (“Solution 2045”), Voya Solution 2050 Portfolio (“Solution 2050”), Voya Solution 2055 Portfolio (“Solution 2055”) and Voya Solution 2060 Portfolio (“Solution 2060”). Each Portfolio is a diversified series of the Company.
Solution 2020, Solution 2025, Solution 2030, Solution 2035, Solution 2040, Solution 2045, Solution 2050, Solution 2055 and Solution 2060 are structured and managed around a specific target retirement or financial goal date (“Target Date”). When these Portfolios reach their respective Target Date, they may be combined with Solution Income, without a vote of shareholders, if approved by the Portfolios’ Board of Directors (the “Board”).
The classes of shares included in this report are: Adviser (“Class ADV”), Initial (“Class I”), Class R6, Service (“Class S”), Service 2 (“Class S2”) and Class T; however, each Portfolio may not offer all share classes. Shares of the Portfolios may be offered to separate accounts (“Separate Accounts”) of insurance companies as investment options in connection with variable annuity contracts and variable life insurance policies (“Variable Contracts”) and to certain of the Portfolios’ investment advisers and their affiliates. In the future, shares may also be offered to qualified pension and retirement plans (“Qualified Plans”) outside the Separate Account context. With the exception of class specific matters, each class has equal voting rights as to voting privileges. For class specific proposals, only the applicable class would have voting privileges. The classes differ principally in the
applicable distribution and shareholder service fees. Generally, shareholders of each class also bear certain expenses that pertain to that particular class. All shareholders are allocated the common expenses of a portfolio and earn income and realized gains/losses from a portfolio pro rata based on the daily ending net assets of each class, without distinction between share classes. Expenses that are specific to a portfolio or a class are charged directly to that portfolio or class. Other operating expenses shared by several portfolios are generally allocated among those portfolios based on average net assets. Distributions are determined separately for each class based on income and expenses allocated to each class. Realized gain distributions are allocated to each class pro rata based on the shares outstanding of each class on the date of distribution. Differences in per share dividend rates generally result from differences in separate class expenses, including distribution and shareholder service fees, if applicable.
Voya Investments, LLC (“Voya Investments” or the “Investment Adviser”), an Arizona limited liability company, serves as the Investment Adviser to the Portfolios. Voya Investment Management Co. LLC (“Voya IM” or the “Sub-Adviser”), a Delaware limited liability company, serves as the Sub-Adviser to the Portfolios. Voya Investments Distributor, LLC (“VID” or the “Distributor”), a Delaware limited liability company, serves as the principal underwriter to the Portfolios.
Each Portfolio seeks to achieve its investment objective by investing in other investment companies (“Underlying Funds”) and uses asset allocation strategies to determine how much to invest in the Underlying Funds. The investment objective of the Portfolios is described in the respective Portfolio’s Prospectus.
NOTE 2 — SIGNIFICANT ACCOUNTING POLICIES
The following significant accounting policies are consistently followed by the Portfolios in the preparation of their financial statements. Each Portfolio is considered an investment company under U.S. generally accepted accounting principles (“GAAP”) and follows the accounting and reporting guidance applicable to investment companies.
A. Security Valuation. Each Portfolio is open for business every day the New York Stock Exchange (“NYSE”) opens for regular trading (each such day, a “Business Day”). The net asset value (“NAV”) per share for each class of each Portfolio is determined each Business Day as of the close of the regular trading session (“Market Close”), as determined by the Consolidated Tape Association (“CTA”), the central distributor of transaction prices for exchange-traded securities (normally 4:00 p.m. Eastern
NOTES TO FINANCIAL STATEMENTS as of December 31, 2019 (continued)
NOTE 2 — SIGNIFICANT ACCOUNTING POLICIES (continued)
time unless otherwise designated by the CTA). The data reflected on the consolidated tape provided by the CTA is generated by various market centers, including all securities exchanges, electronic communications networks, and third-market broker-dealers. The NAV per share of each class of each Portfolio is calculated by taking the value of the Portfolio’s assets attributable to that class, subtracting the Portfolio’s liabilities attributable to that class, and dividing by the number of shares of that class that are outstanding. On days when a Portfolio is closed for business, Portfolio shares will not be priced and a Portfolio does not transact purchase and redemption orders. To the extent a Portfolio’s assets are traded in other markets on days when a Portfolio does not price its shares, the value of a Portfolio’s assets will likely change and you will not be able to purchase or redeem shares of a Portfolio.
Assets for which market quotations are readily available are valued at market value. A security listed or traded on an exchange is valued at its last sales price or official closing price as of the close of the regular trading session on the exchange where the security is principally traded or, if such price is not available, at the last sale price as of the Market Close for such security provided by the CTA. Bank loans are valued at the average of the averages of the bid and ask prices provided to an independent loan pricing service by brokers. Futures contracts are valued at the final settlement price set by an exchange on which they are principally traded. Listed options are valued at the mean between the last bid and ask prices from the exchange on which they are principally traded. Investments in open-end registered investment companies that do not trade on an exchange are valued at the end of day NAV per share. Investments in registered investment companies that trade on an exchange are valued at the last sales price or official closing price as of the close of the regular trading session on the exchange where the security is principally traded.
When a market quotation is not readily available or is deemed unreliable, each Portfolio will determine a fair value for the relevant asset in accordance with procedures adopted by the Portfolios’ Board. Such procedures provide, for example, that: (a) Exchange-traded securities are valued at the mean of the closing bid and ask; (b) Debt obligations are valued using an evaluated price provided by an independent pricing service. Evaluated prices provided by the pricing service may be determined without exclusive reliance on quoted prices, and may reflect factors such as institution-size trading in similar groups of securities, developments related to specific securities, benchmark yield, quality, type of issue, coupon rate, maturity, individual trading characteristics and other market
data; (c) Securities traded in the over-the-counter (“OTC”) market are valued based on prices provided by independent pricing services or market makers; (d) Options not listed on an exchange are valued by an independent source using an industry accepted model, such as Black-Scholes; (e) Centrally cleared swap agreements are valued using a price provided by the central counterparty clearinghouse; (f) OTC swap agreements are valued using a price provided by an independent pricing service; (g) Forward foreign currency exchange contracts are valued utilizing current and forward rates obtained from an independent pricing service. Such prices from the third party pricing service are for specific settlement periods and each Portfolio’s forward foreign currency exchange contracts are valued at an interpolated rate between the closest preceding and subsequent period reported by the independent pricing service; and (h) Securities for which market prices are not provided by any of the above methods may be valued based upon quotes furnished by brokers.
The prospectuses of the open-end registered investment companies in which each Portfolio may invest explain the circumstances under which they will use fair value pricing and the effects of using fair value pricing.
Foreign securities’ (including forward foreign currency exchange contracts) prices are converted into U.S. dollar amounts using the applicable exchange rates as of Market Close. If market quotations are available and believed to be reliable for foreign exchange-traded equity securities, the securities will be valued at the market quotations. Because trading hours for certain foreign securities end before Market Close, closing market quotations may become unreliable. An independent pricing service determines the degree of certainty, based on historical data, that the closing price in the principal market where a foreign security trades is not the current value as of Market Close. Foreign securities’ prices meeting the approved degree of certainty that the price is not reflective of current value will be valued by the independent pricing service using pricing models designed to estimate likely changes in the values of those securities between the times in which the trading in those securities is substantially completed and Market Close. Multiple factors may be considered by the independent pricing service in determining the value of such securities and may include information relating to sector indices, American Depositary Receipts and domestic and foreign index futures.
All other assets for which market quotations are not readily available or became unreliable (or if the above fair valuation methods are unavailable or determined to be unreliable) are valued at fair value as determined in good faith by or under the supervision of the Board following
NOTES TO FINANCIAL STATEMENTS as of December 31, 2019 (continued)
NOTE 2 — SIGNIFICANT ACCOUNTING POLICIES (continued)
procedures approved by the Board. The Board has delegated to the Investment Adviser responsibility for overseeing the implementation of the Portfolios’ valuation procedures; a “Pricing Committee” comprised of employees of the Investment Adviser or its affiliates has responsibility for applying the fair valuation methods set forth in the procedures and, if a fair valuation cannot be determined pursuant to the fair valuation methods, determining the fair value of assets held by the Portfolios. Issuer specific events, transaction price, position size, nature and duration of restrictions on disposition of the security, market trends, bid/ask quotes of brokers and other market data may be reviewed in the course of making a good faith determination of a security’s fair value. Valuations change in response to many factors including the historical and prospective earnings of the issuer, the value of the issuer’s assets, general economic conditions, interest rates, investor perceptions and market liquidity. Because of the inherent uncertainties of fair valuation, the values used to determine each Portfolio’s NAV may materially differ from the value received upon actual sale of those investments. Thus, fair valuation may have an unintended dilutive or accretive effect on the value of shareholders’ investments in each Portfolio.
Each investment asset or liability of the Portfolios is assigned a level at measurement date based on the significance and source of the inputs to its valuation. Quoted prices in active markets for identical securities are classified as “Level 1,” inputs other than quoted prices for an asset or liability that are observable are classified as “Level 2” and significant unobservable inputs, including the Sub-Adviser’s or Pricing Committee’s judgment about the assumptions that a market participant would use in pricing an asset or liability are classified as “Level 3.” The inputs used for valuing securities are not necessarily an indication of the risks associated with investing in those securities. Short-term securities of sufficient credit quality are generally considered to be Level 2 securities under applicable accounting rules. The Portfolios classify each of their investments in the Underlying Funds as Level 1, without consideration as to the classification level of the specific investments held by the Underlying Funds. A table summarizing the Portfolios’ investments under these levels of classification is included within the Portfolio of Investments.
GAAP requires a reconciliation of the beginning to ending balances for reported fair values that presents changes attributable to total realized and unrealized gains or losses, purchases and sales, and transfers in or out of the Level 3 category during the period. A reconciliation of Level 3
investments within the Portfolio of Investments is presented only when a Portfolio has a significant amount of Level 3 investments.
B. Securities Transactions and Revenue Recognition. Securities transactions are accounted for on the trade date. Dividend income received from the Underlying Funds is recognized on the ex-dividend date and is recorded as income distributions in the Statements of Operations. Capital gain distributions received from the Underlying Funds are recognized on the ex-dividend date and are recorded on the Statements of Operations as such. Realized gains and losses are reported on the basis of identified cost of securities sold.
C. Distributions to Shareholders. The Portfolios record distributions to their shareholders on the ex-dividend date. Each Portfolio declares and pays dividends from net investment income and capital gain distributions, if any, annually. The Portfolios may make distributions on a more frequent basis to comply with the distribution requirements of the Internal Revenue Code. The characteristics of income and gains to be distributed are determined in accordance with income tax regulations, which may differ from GAAP for investment companies.
D. Federal Income Taxes. It is the policy of each Portfolio to comply with the requirements of subchapter M of the Internal Revenue Code that are applicable to regulated investment companies and to distribute substantially all of its net investment income and any net realized capital gains to its shareholders. Therefore, a federal income tax or excise tax provision is not required. Management has considered the sustainability of the Portfolios’ tax positions taken on federal income tax returns for all open tax years in making this determination. No capital gain distributions shall be made until the capital loss carryforwards have been fully utilized or expire.
The Portfolios may utilize equalization accounting for tax purposes, whereby a portion of redemption payments are treated as distributions of income or gain.
E. Use of Estimates. The preparation of financial statements in conformity with GAAP requires management to make estimates and assumptions that affect the reported amounts of assets and liabilities and disclosure of contingent assets and liabilities at the date of the financial statements and the reported amounts of increases and decreases in net assets from operations during the reporting period. Actual results could differ from those estimates.
F. Risk Exposures and the Use of Derivative Instruments. Each Portfolio’s investment strategies permit it to enter into various types of derivatives contracts,
NOTES TO FINANCIAL STATEMENTS as of December 31, 2019 (continued)
NOTE 2 — SIGNIFICANT ACCOUNTING POLICIES (continued)
including, but not limited to, futures contracts. In doing so, a Portfolio will employ strategies in differing combinations to permit it to increase or decrease the level of risk, or change the level or types of exposure to risk factors. This may allow a Portfolio to pursue its objectives more quickly and efficiently than if it were to make direct purchases or sales of securities capable of affecting a similar response to market or credit factors.
In pursuit of its investment objectives, a Portfolio may seek to increase or decrease its exposure to the following market or credit risk factors:
Equity Risk. Stock prices may be volatile or have reduced liquidity in response to real or perceived impacts of factors including, but not limited to, economic conditions, changes in market interest rates, and political events. Stock markets tend to be cyclical, with periods when stock prices generally rise and periods when stock prices generally decline. Any given stock market segment may remain out of favor with investors for a short or long period of time, and stocks as an asset class may underperform bonds or other asset classes during some periods. Additionally, legislative, regulatory or tax policies or developments in these areas may adversely impact the investment techniques available to a manager, add to costs and impair the ability of a Portfolio to achieve its investment objectives.
Risks of Investing in Derivatives. Each Portfolio’s use of derivatives can result in losses due to unanticipated changes in the market or credit risk factors and the overall market. In instances where a Portfolio is using derivatives to decrease, or hedge, exposures to market or credit risk factors for securities held by a Portfolio, there are also risks that those derivatives may not perform as expected resulting in losses for the combined or hedged positions.
Derivative instruments are subject to a number of risks, including the risk of changes in the market price of the underlying securities, credit risk with respect to the counterparty, risk of loss due to changes in market interest rates and liquidity and volatility risk. The amounts required to purchase certain derivatives may be small relative to the magnitude of exposure assumed by a Portfolio. Therefore, the purchase of certain derivatives may have an economic leveraging effect on a Portfolio and exaggerate any increase or decrease in the NAV. Derivatives may not perform as expected, so a Portfolio may not realize the intended benefits. When used for hedging purposes, the change in value of a derivative may not correlate as expected with the currency, security or other risk being hedged. When used as an alternative or substitute for direct cash investments, the return provided by the
derivative may not provide the same return as direct cash investment. In addition, given their complexity, derivatives expose a Portfolio to the risk of improper valuation.
Generally, derivatives are sophisticated financial instruments whose performance is derived, at least in part, from the performance of an underlying asset or assets. Derivatives include, among other things, swap agreements, options, forwards and futures. Investments in derivatives are generally negotiated OTC with a single counterparty and as a result are subject to credit risks related to the counterparty’s ability or willingness to perform its obligations; any deterioration in the counterparty’s creditworthiness could adversely affect the value of the derivative. In addition, derivatives and their underlying securities may experience periods of illiquidity which could cause a Portfolio to hold a security it might otherwise sell, or to sell a security it otherwise might hold at inopportune times or at an unanticipated price. A manager might imperfectly judge the direction of the market. For instance, if a derivative is used as a hedge to offset investment risk in another security, the hedge might not correlate to the market’s movements and may have unexpected or undesired results such as a loss or a reduction in gains.
G. Futures Contracts. Certain Portfolios may enter into futures contracts involving foreign currency, interest rates, securities and security indices. A futures contract is a commitment to buy or sell a specific amount of a financial instrument at a negotiated price on a stipulated future date. A Portfolio may buy and sell futures contracts. Futures contracts traded on a commodities or futures exchange will be valued at the final settlement price or official closing price on the principal exchange as reported by such principal exchange at its trading session ending at, or most recently prior to, the time when each Portfolio’s assets are valued.
Upon entering into a futures contract, a Portfolio is required to deposit either cash or securities (initial margin) in an amount equal to a certain percentage of the contract value. Subsequent payments (variation margin) are made or received by a Portfolio each day. The variation margin payments are equal to the daily changes in the contract value and are recorded as unrealized gains and losses. Open futures contracts are reported on a table following each Portfolio’s Portfolio of Investments. Securities held in collateralized accounts to cover initial margin requirements on open futures contracts, if any, are footnoted in the Portfolio of Investments. Cash collateral held by the broker to cover initial margin requirements on open futures contracts are noted in the Statements of Assets and Liabilities. The net change in unrealized appreciation and depreciation is reported in the Statements of Operations.
NOTES TO FINANCIAL STATEMENTS as of December 31, 2019 (continued)
NOTE 2 — SIGNIFICANT ACCOUNTING POLICIES (continued)
Realized gains (losses) are reported in the Statements of Operations at the closing or expiration of futures contracts.
Futures contracts are exposed to the market risk factor of the underlying financial instrument. During the year ended December 31, 2019, certain Portfolios used futures to enact tactical positions and to provide the Portfolios with greater liquidity. Certain Portfolios had purchased and sold futures contracts on various equity indices. Certain Portfolios also purchased and sold futures contracts on various U.S. Treasury Notes and Bonds. Futures contracts are purchased to provide immediate market exposure proportionate to the size of the Portfolio’s respective cash flows and residual cash balances in order to decrease potential tracking error if the cash remained uninvested in the market. Additional associated risks of entering into futures contracts include the possibility that there may be an illiquid market where the Portfolios are unable to liquidate the contract or enter into an offsetting position and, if used for hedging purposes, the risk that the price of the contract will correlate imperfectly with the prices of the Portfolios’ securities. With futures, there is minimal counterparty credit risk to the Portfolios since futures are exchange traded and the exchange’s clearinghouse, as counterparty to all exchange traded futures, guarantees the futures against default.
During the year ended December 31, 2019, the below Portfolios had average notional values on futures contracts purchased and sold as disclosed below. Please refer to the tables within each respective Portfolio of Investments for open futures contracts purchased and sold for Solution Income, Solution Moderately Aggressive, Solution 2025, Solution 2035, Solution 2045 and Solution 2055. There were no open futures contracts purchased or sold for the remaining Portfolios at December 31, 2019.
| | | | Purchased | | | Sold | |
| Solution Income | | | | $ | 12,371,039 | | | | | $ | 12,434,543 | | |
| Solution Moderately Aggressive | | | | | 27,309,353 | | | | | | 27,182,539 | | |
| Solution 2025 | | | | | 28,836,973 | | | | | | 28,960,856 | | |
| Solution 2035 | | | | | 30,112,180 | | | | | | 30,140,022 | | |
| Solution 2045 | | | | | 24,341,981 | | | | | | 24,217,899 | | |
| Solution 2055 | | | | | 7,979,346 | | | | | | 7,937,583 | | |
H. Indemnifications. In the normal course of business, the Company may enter into contracts that provide certain indemnifications. The Company’s maximum exposure under these arrangements is dependent on future claims that may be made against the Portfolios and, therefore, cannot be estimated; however, based on experience, management considers the risk of loss from such claims remote.
NOTE 3 — INVESTMENTS IN UNDERLYING FUNDS
For the year ended December 31, 2019, the cost of purchases and the proceeds from sales of the Underlying Funds were as follows:
| | | | Purchases | | | Sales | |
| Solution Aggressive | | | | $ | 19,254,996 | | | | | $ | 16,210,338 | | |
| Solution Balanced | | | | | 47,257,898 | | | | | | 49,309,162 | | |
| Solution Conservative | | | | | 13,946,856 | | | | | | 15,116,869 | | |
| Solution Income | | | | | 131,738,965 | | | | | | 186,404,171 | | |
| Solution Moderately Aggressive | | | | | 324,327,815 | | | | | | 395,625,831 | | |
| Solution Moderately Conservative | | | | | 35,177,281 | | | | | | 29,149,935 | | |
| Solution 2020 | | | | | 31,459,632 | | | | | | 33,234,656 | | |
| Solution 2025 | | | | | 356,456,836 | | | | | | 415,742,536 | | |
| Solution 2030 | | | | | 39,686,565 | | | | | | 30,249,685 | | |
| Solution 2035 | | | | | 428,148,518 | | | | | | 479,500,550 | | |
| Solution 2040 | | | | | 30,886,294 | | | | | | 25,298,315 | | |
| Solution 2045 | | | | | 414,539,161 | | | | | | 435,963,423 | | |
| Solution 2050 | | | | | 28,362,456 | | | | | | 22,061,086 | | |
| Solution 2055 | | | | | 146,116,696 | | | | | | 123,569,247 | | |
| Solution 2060 | | | | | 16,367,326 | | | | | | 12,639,813 | | |
NOTE 4 — INVESTMENT MANAGEMENT FEES
The Portfolios have entered into an investment management agreement (“Management Agreement”) with the Investment Adviser. The Investment Adviser has overall responsibility for the management of the Portfolios. The Investment Adviser oversees all investment management and portfolio management services for the Portfolios and assists in managing and supervising all aspects of the general day-to-day business activities and operations of the Portfolios, including custodial, transfer agency, dividend disbursing, accounting, auditing, compliance and related services. This Management Agreement compensates the Investment Adviser with a management fee, computed daily and payable monthly, based on the average daily net assets of each Portfolio, at the following annual rates: 0.20% of each Portfolio’s average daily nets assets invested in affiliated Underlying Funds and 0.40% of each Portfolio’s average daily net assets invested in unaffiliated Underlying Funds and/or other direct investments.
The Investment Adviser has entered into a sub-advisory agreement with Voya IM with respect to each Portfolio. Voya IM provides investment advice for the Portfolios and is paid by the Investment Adviser based on the average daily net assets of each respective Portfolio. Subject to such policies as the Board or the Investment Adviser may determine, Voya IM manages the Portfolios’ assets in accordance with the Portfolios’ investment objectives, policies, and limitations.
NOTES TO FINANCIAL STATEMENTS as of December 31, 2019 (continued)
NOTE 5 — DISTRIBUTION AND SERVICE FEES
Classes ADV, S2 and T of the respective Portfolios have a plan of distribution (each a “Plan” and collectively, the “Plans”), whereby the Distributor is reimbursed or compensated by the Portfolios for expenses incurred in the distribution of each Portfolio’s shares (“Distribution Fees”). The Distributor may pay, on behalf of each Portfolio, out of its distribution fee, compensation to certain financial institutions for providing distribution assistance pursuant to a Distribution Services Agreement. Under the Plans, each Portfolio makes payments to the Distributor at an annual rate of 0.25% of each Portfolio’s average daily net assets attributable to its Class ADV shares and each Portfolio makes payments to the Distributor at an annual rate of 0.15% and 0.45% of each Portfolio’s average daily net assets attributable to its Class S2 and Class T shares, respectively.
The Company has a shareholder servicing plan (“Service Plan”) for the Classes ADV, S, S2 and T shares of each respective Portfolio. The Service Plan allows the Distributor to enter into shareholder servicing agreements with insurance companies, broker dealers or other financial intermediaries that provide administrative services related to Classes ADV, S, S2 and T shares and their shareholders including Variable Contract owners or Qualified Plan participants with interests in the Portfolios. Under the Service Plan, each Portfolio makes payments to the Distributor which shall not exceed an annual rate of 0.25% of each applicable Portfolio’s average daily net assets attributable to its Classes ADV, S, S2 and T shares.
NOTE 6 — OTHER TRANSACTIONS WITH AFFILIATES AND RELATED PARTIES
At December 31, 2019, the following direct or indirect, wholly-owned subsidiaries of Voya Financial, Inc. owned more than 5% of the following Portfolios:
| Subsidiary | | | Portfolio | | | Percentage | |
| Voya Institutional Trust Company | | | Solution Aggressive | | | | | 5.33% | | |
| | | | Solution Balanced | | | | | 6.16 | | |
| | | | Solution Conservative | | | | | 5.39 | | |
| | | | Solution Income | | | | | 43.72 | | |
| | | | Solution 2020 | | | | | 19.46 | | |
| | | | Solution 2025 | | | | | 40.86 | | |
| | | | Solution 2030 | | | | | 18.98 | | |
| | | | Solution 2035 | | | | | 40.09 | | |
| | | | Solution 2040 | | | | | 11.29 | | |
| | | | Solution 2045 | | | | | 41.28 | | |
| | | | Solution 2050 | | | | | 13.15 | | |
| | | | Solution 2055 | | | | | 47.42 | | |
| | | | Solution 2060 | | | | | 14.09 | | |
| Subsidiary | | | Portfolio | | | Percentage | |
Voya Retierment Insurance and
Annuity Company | | |
Solution Aggressive | | | | | 94.67 | | |
| | | | Solution Balanced | | | | | 93.84 | | |
| | | | Solution Conservative | | | | | 94.61 | | |
| | | | Solution Income | | | | | 50.70 | | |
| | | | Solution Moderatory Aggressive | | | | | 6.04 | | |
| | | | Solution Moderatory Conservative | | | | | 99.26 | | |
| | | | Solution 2020 | | | | | 80.53 | | |
| | | | Solution 2025 | | | | | 58.46 | | |
| | | | Solution 2030 | | | | | 80.85 | | |
| | | | Solution 2035 | | | | | 57.81 | | |
| | | | Solution 2040 | | | | | 88.70 | | |
| | | | Solution 2045 | | | | | 57.92 | | |
| | | | Solution 2050 | | | | | 86.84 | | |
| | | | Solution 2055 | | | | | 52.58 | | |
| | | | Solution 2060 | | | | | 85.88 | | |
Under the 1940 Act, the direct or indirect beneficial owner of more than 25% of the voting securities of a company (including a fund) is presumed to control such company. Companies under common control (e.g., companies with a common owner of greater than 25% of their respective voting securities) are affiliates under the 1940 Act.
The Portfolios have adopted a deferred compensation plan (the “DC Plan”), which allows eligible independent directors, as described in the DC Plan, to defer the receipt of all or a portion of the directors’ fees that they are entitled to receive from the Portfolios. For purposes of determining the amount owed to the director under the DC Plan, the amounts deferred are invested in shares of the funds selected by the director (the “Notional Funds”). The Portfolios purchase shares of the Notional Funds, which are all advised by Voya Investments, in amounts equal to the directors’ deferred fees, resulting in a Portfolio asset equal to the deferred compensation liability. Such assets, if applicable, are included as a component of “Other assets” on the accompanying Statements of Assets and Liabilities. Deferral of directors’ fees under the DC Plan will not affect net assets of the Portfolio, and will not materially affect the Portfolios’ assets, liabilities or net investment income per share. Amounts will be deferred until distributed in accordance with the DC Plan.
NOTE 7 — EXPENSE LIMITATION AGREEMENT
The Investment Adviser has entered into a written expense limitation agreement (“Expense Limitation Agreement”) with each Portfolio whereby the Investment Adviser has agreed to limit expenses, excluding interest, taxes, investment-related costs, leverage expenses, and extraordinary expenses to the levels listed below:
NOTES TO FINANCIAL STATEMENTS as of December 31, 2019 (continued)
NOTE 7 — EXPENSE LIMITATION AGREEMENT (continued)
Portfolio(1) | | | Class
ADV | | | Class
I | | | Class
R6 | | | Class
S | | | Class
S2 | | | Class
T | |
| Solution Aggressive | | | | | 1.39% | | | | | | 0.89% | | | | | | 0.89% | | | | | | 1.14% | | | | | | 1.29% | | | | | | N/A | | |
| Solution Balanced | | | | | 1.30% | | | | | | 0.80% | | | | | | 0.80% | | | | | | 1.05% | | | | | | 1.20% | | | | | | N/A | | |
| Solution Conservative | | | | | 1.16% | | | | | | 0.66% | | | | | | 0.66% | | | | | | 0.91% | | | | | | 1.06% | | | | | | N/A | | |
| Solution Income | | | | | 1.18% | | | | | | 0.68% | | | | | | N/A | | | | | | 0.93% | | | | | | 1.08% | | | | | | 1.38% | | |
| Solution Moderately Aggressive | | | | | 1.38% | | | | | | 0.88% | | | | | | 0.88% | | | | | | 1.13% | | | | | | 1.28% | | | | | | N/A | | |
| Solution Moderately Conservative | | | | | 1.24% | | | | | | 0.74% | | | | | | 0.74% | | | | | | 0.99% | | | | | | 1.14% | | | | | | N/A | | |
| Solution 2020 | | | | | 1.22% | | | | | | 0.72% | | | | | | N/A | | | | | | 0.97% | | | | | | 1.12% | | | | | | 1.42% | | |
| Solution 2025 | | | | | 1.28% | | | | | | 0.78% | | | | | | N/A | | | | | | 1.03% | | | | | | 1.18% | | | | | | 1.48% | | |
| Solution 2030 | | | | | 1.29% | | | | | | 0.79% | | | | | | N/A | | | | | | 1.04% | | | | | | 1.19% | | | | | | 1.49% | | |
| Solution 2035 | | | | | 1.33% | | | | | | 0.83% | | | | | | N/A | | | | | | 1.08% | | | | | | 1.23% | | | | | | 1.53% | | |
| Solution 2040 | | | | | 1.33% | | | | | | 0.83% | | | | | | N/A | | | | | | 1.08% | | | | | | 1.23% | | | | | | 1.53% | | |
| Solution 2045 | | | | | 1.36% | | | | | | 0.86% | | | | | | N/A | | | | | | 1.11% | | | | | | 1.26% | | | | | | 1.56% | | |
| Solution 2050 | | | | | 1.36% | | | | | | 0.86% | | | | | | N/A | | | | | | 1.11% | | | | | | 1.26% | | | | | | 1.56% | | |
| Solution 2055 | | | | | 1.36% | | | | | | 0.86% | | | | | | N/A | | | | | | 1.11% | | | | | | 1.26% | | | | | | 1.56% | | |
| Solution 2060 | | | | | 1.37% | | | | | | 0.87% | | | | | | N/A | | | | | | 1.12% | | | | | | 1.27% | | | | | | 1.57% | | |
(1)
The operating expense limits take into account the operating expenses incurred at the Underlying Fund level. The amount of fees and expenses of an Underlying Fund borne by each Portfolio will vary based on each Portfolio’s allocation of assets to, and the net expenses of, a particular Underlying Fund.
The Investment Adviser may at a later date recoup from a Portfolio for fees waived and/or other expenses reimbursed by the Investment Adviser during the previous 36 months, but only if, after such recoupment, a Portfolio’s expense ratio does not exceed the percentage described above. Waived and reimbursed fees net of any recoupment by the Investment Adviser of such waived and reimbursed fees are reflected on the accompanying Statements of Operations. Amounts payable by the Investment Adviser are reflected on the accompanying Statements of Assets and Liabilities.
As of December 31, 2019 the amounts of waived and/or reimbursed fees that are subject to possible recoupment by the Investment Adviser and the related expiration dates are as follows:
| | | | December 31, | | | | | | | |
| | | | 2020 | | | 2021 | | | 2022 | | | Total | |
| Solution Aggressive | | | | $ | 25,978 | | | | | $ | 31,805 | | | | | $ | 32,432 | | | | | $ | 90,215 | | |
| Solution Balanced | | | | | 66,438 | | | | | | 61,303 | | | | | | 37,237 | | | | | | 164,978 | | |
| Solution Conservative | | | | | 38,432 | | | | | | 41,777 | | | | | | 46,641 | | | | | | 126,850 | | |
| Solution Income | | | | | 633,760 | | | | | | 521,785 | | | | | | 235,911 | | | | | | 1,391,456 | | |
| Solution Moderately Aggressive | | | | | 288,587 | | | | | | 271,676 | | | | | | — | | | | | | 560,263 | | |
| Solution Moderately Conservative | | | | | 58,784 | | | | | | 48,769 | | | | | | 48,667 | | | | | | 156,220 | | |
| Solution 2020 | | | | | 55,984 | | | | | | 53,907 | | | | | | 45,854 | | | | | | 155,745 | | |
| Solution 2025 | | | | | 742,094 | | | | | | 623,038 | | | | | | 293,763 | | | | | | 1,658,895 | | |
| | | | December 31, | | | | | | | |
| | | | 2020 | | | 2021 | | | 2022 | | | Total | |
| Solution 2030 | | | | | 43,272 | | | | | | 47,147 | | | | | | 46,580 | | | | | | 136,999 | | |
| Solution 2035 | | | | | 806,282 | | | | | | 569,497 | | | | | | 317,164 | | | | | | 1,692,943 | | |
| Solution 2040 | | | | | 44,017 | | | | | | 45,460 | | | | | | 36,444 | | | | | | 125,921 | | |
| Solution 2045 | | | | | 513,695 | | | | | | 363,010 | | | | | | 181,110 | | | | | | 1,057,815 | | |
| Solution 2050 | | | | | 34,275 | | | | | | 36,857 | | | | | | 32,675 | | | | | | 103,807 | | |
| Solution 2055 | | | | | 160,115 | | | | | | 143,560 | | | | | | 90,950 | | | | | | 394,625 | | |
| Solution 2060 | | | | | 24,261 | | | | | | 28,347 | | | | | | 30,284 | | | | | | 82,892 | | |
The Expense Limitation Agreement is contractual through May 1, 2020 for all Portfolios and shall renew automatically for one-year terms. Termination or modification of this obligation requires approval by the Board.
NOTE 8 — LINE OF CREDIT
Effective May 17, 2019, each Portfolio, in addition to certain other funds managed by the Investment Adviser, has entered into a 364-day unsecured committed revolving line of credit agreement (the “Credit Agreement”) with The Bank of New York Mellon (“BNY”) for an aggregate amount of $400,000,000 through May 15, 2020. The proceeds may be used only to finance temporarily: (1) the purchase or sale of investment securities; or (2) the repurchase or redemption of shares of a Portfolio or certain other funds managed by the Investment Adviser. The funds to which the line of credit is available pay a commitment fee equal to 0.15% per annum on the daily unused portion of the committed line amount payable quarterly in arrears. Prior to May 17, 2019, the predecessor line of credit was for an aggregate amount of $400,000,000 and paid a commitment fee equal to 0.15% per annum on the daily unused portion of the committed line amount through May 17, 2019.
Borrowings under the Credit Agreement accrue interest at the federal funds rate plus a specified margin. Repayments generally must be made within 60 days after the date of a revolving credit advance.
The following Portfolios utilized the line of credit during the year ended December 31, 2019:
| Portfolio | | | Days
Utilized | | | Approximate
Average
Daily
Balance For
Days Utilized | | | Approximate
Weighted
Average
Interest Rate
For Days
Utilized | |
| Solution Conservative | | | | | 1 | | | | | $ | 956,000 | | | | | | 3.40% | | |
| Solution Income | | | | | 3 | | | | | | 4,382,333 | | | | | | 3.42 | | |
| Solution Moderately Aggressive | | | | | 1 | | | | | | 2,078,000 | | | | | | 3.13 | | |
| Solution Moderately Conservative | | | | | 1 | | | | | | 1,203,000 | | | | | | 3.44 | | |
| Solution 2020 | | | | | 1 | | | | | | 1,685,000 | | | | | | 3.44 | | |
| Solution 2025 | | | | | 4 | | | | | | 1,064,500 | | | | | | 3.27 | | |
| Solution 2035 | | | | | 2 | | | | | | 2,008,500 | | | | | | 3.23 | | |
| Solution 2045 | | | | | 1 | | | | | | 716,000 | | | | | | 3.13 | | |
NOTES TO FINANCIAL STATEMENTS as of December 31, 2019 (continued)
NOTE 9 — CAPITAL SHARES
Transactions in capital shares and dollars were as follows:
| | | | Shares
sold | | | Shares
issued in
merger | | | Reinvestment
of
distributions | | | Shares
redeemed | | | Net increase
(decrease)
in shares
outstanding | | | Shares
sold | | | Proceeds
from shares
issued in
merger | | | Reinvestment
of
distributions | | | Shares
redeemed | | | Net increase
(decrease) | |
Year or
period ended | | | # | | | # | | | # | | | # | | | # | | | ($) | | | ($) | | | ($) | | | ($) | | | ($) | |
| Solution Aggressive | |
| Class ADV | | | | | | | | | | | | | | | | | | | | | | | | | | | | | | | | | | | | | | | | | | | | | | | | | | | | | | | | | | | | | |
| 12/31/2019 | | | | | 69,148 | | | | | | — | | | | | | 27,888 | | | | | | (84,904) | | | | | | 12,132 | | | | | | 871,395 | | | | | | — | | | | | | 334,099 | | | | | | (1,059,631) | | | | | | 145,863 | | |
| 12/31/2018 | | | | | 81,232 | | | | | | — | | | | | | 12,699 | | | | | | (74,248) | | | | | | 19,683 | | | | | | 1,088,541 | | | | | | — | | | | | | 167,121 | | | | | | (992,290) | | | | | | 263,372 | | |
| Class I | | | | | | | | | | | | | | | | | | | | | | | | | | | | | | | | | | | | | | | | | | | | | | | | | | | | | | | | | | | | | |
| 12/31/2019 | | | | | 15,551 | | | | | | — | | | | | | 3,267 | | | | | | (1,808) | | | | | | 17,010 | | | | | | 198,986 | | | | | | — | | | | | | 40,057 | | | | | | (23,819) | | | | | | 215,224 | | |
| 12/31/2018 | | | | | 10,715 | | | | | | — | | | | | | 1,787 | | | | | | (16,891) | | | | | | (4,389) | | | | | | 147,238 | | | | | | — | | | | | | 24,011 | | | | | | (223,860) | | | | | | (52,611) | | |
| Class R6 | | | | | | | | | | | | | | | | | | | | | | | | | | | | | | | | | | | | | | | | | | | | | | | | | | | | | | | | | | | | | |
| 12/31/2019 | | | | | 282,889 | | | | | | — | | | | | | 75,533 | | | | | | (102,407) | | | | | | 256,015 | | | | | | 3,647,980 | | | | | | — | | | | | | 926,037 | | | | | | (1,306,887) | | | | | | 3,267,130 | | |
| 12/31/2018 | | | | | 320,438 | | | | | | — | | | | | | 25,489 | | | | | | (96,689) | | | | | | 249,238 | | | | | | 4,284,185 | | | | | | — | | | | | | 342,563 | | | | | | (1,301,315) | | | | | | 3,325,433 | | |
| Class S | | | | | | | | | | | | | | | | | | | | | | | | | | | | | | | | | | | | | | | | | | | | | | | | | | | | | | | | | | | | | |
| 12/31/2019 | | | | | 167,485 | | | | | | — | | | | | | 26,467 | | | | | | (166,919) | | | | | | 27,033 | | | | | | 2,205,913 | | | | | | — | | | | | | 320,787 | | | | | | (2,208,033) | | | | | | 318,667 | | |
| 12/31/2018 | | | | | 69,210 | | | | | | — | | | | | | 16,798 | | | | | | (130,750) | | | | | | (44,742) | | | | | | 911,864 | | | | | | — | | | | | | 223,244 | | | | | | (1,709,087) | | | | | | (573,979) | | |
| Class S2 | | | | | | | | | | | | | | | | | | | | | | | | | | | | | | | | | | | | | | | | | | | | | | | | | | | | | | | | | | | | | |
| 12/31/2019 | | | | | 49,577 | | | | | | — | | | | | | 10,481 | | | | | | (11,748) | | | | | | 48,310 | | | | | | 639,540 | | | | | | — | | | | | | 124,823 | | | | | | (148,518) | | | | | | 615,845 | | |
| 12/31/2018 | | | | | 22,031 | | | | | | — | | | | | | 3,181 | | | | | | (5,646) | | | | | | 19,566 | | | | | | 292,062 | | | | | | — | | | | | | 41,710 | | | | | | (72,971) | | | | | | 260,801 | | |
| Solution Balanced | |
| Class ADV | | | | | | | | | | | | | | | | | | | | | | | | | | | | | | | | | | | | | | | | | | | | | | | | | | | | | | | | | | | | | |
| 12/31/2019 | | | | | 142,295 | | | | | | — | | | | | | 99,291 | | | | | | (469,017) | | | | | | (227,431) | | | | | | 1,349,166 | | | | | | — | | | | | | 907,520 | | | | | | (4,465,434) | | | | | | (2,208,748) | | |
| 12/31/2018 | | | | | 151,383 | | | | | | — | | | | | | 83,992 | | | | | | (775,450) | | | | | | (540,075) | | | | | | 1,486,757 | | | | | | — | | | | | | 812,200 | | | | | | (7,535,126) | | | | | | (5,236,169) | | |
| Class I | | | | | | | | | | | | | | | | | | | | | | | | | | | | | | | | | | | | | | | | | | | | | | | | | | | | | | | | | | | | | |
| 12/31/2019 | | | | | 80,986 | | | | | | — | | | | | | 31,635 | | | | | | (267,081) | | | | | | (154,460) | | | | | | 788,198 | | | | | | — | | | | | | 300,214 | | | | | | (2,645,160) | | | | | | (1,556,748) | | |
| 12/31/2018 | | | | | 42,395 | | | | | | — | | | | | | 22,572 | | | | | | (113,571) | | | | | | (48,604) | | | | | | 436,057 | | | | | | — | | | | | | 226,396 | | | | | | (1,179,430) | | | | | | (516,977) | | |
| Class R6 | | | | | | | | | | | | | | | | | | | | | | | | | | | | | | | | | | | | | | | | | | | | | | | | | | | | | | | | | | | | | |
| 12/31/2019 | | | | | 683,702 | | | | | | — | | | | | | 164,885 | | | | | | (344,046) | | | | | | 504,541 | | | | | | 6,761,895 | | | | | | — | | | | | | 1,564,757 | | | | | | (3,399,678) | | | | | | 4,926,974 | | |
| 12/31/2018 | | | | | 478,476 | | | | | | — | | | | | | 77,752 | | | | | | (326,685) | | | | | | 229,543 | | | | | | 4,906,793 | | | | | | — | | | | | | 779,855 | | | | | | (3,380,515) | | | | | | 2,306,133 | | |
| Class S | | | | | | | | | | | | | | | | | | | | | | | | | | | | | | | | | | | | | | | | | | | | | | | | | | | | | | | | | | | | | |
| 12/31/2019 | | | | | 429,927 | | | | | | — | | | | | | 177,026 | | | | | | (715,118) | | | | | | (108,165) | | | | | | 4,259,980 | | | | | | — | | | | | | 1,637,486 | | | | | | (7,075,660) | | | | | | (1,178,194) | | |
| 12/31/2018 | | | | | 221,864 | | | | | | — | | | | | | 120,812 | | | | | | (509,828) | | | | | | (167,152) | | | | | | 2,206,260 | | | | | | — | | | | | | 1,182,749 | | | | | | (5,135,648) | | | | | | (1,746,639) | | |
| Class S2 | | | | | | | | | | | | | | | | | | | | | | | | | | | | | | | | | | | | | | | | | | | | | | | | | | | | | | | | | | | | | |
| 12/31/2019 | | | | | 170,667 | | | | | | — | | | | | | 21,603 | | | | | | (28,271) | | | | | | 163,999 | | | | | | 1,686,540 | | | | | | — | | | | | | 199,400 | | | | | | (271,558) | | | | | | 1,614,382 | | |
| 12/31/2018 | | | | | 18,374 | | | | | | — | | | | | | 4,737 | | | | | | (125,138) | | | | | | (102,027) | | | | | | 184,193 | | | | | | — | | | | | | 46,374 | | | | | | (1,270,844) | | | | | | (1,040,277) | | |
| Solution Conservative | |
| Class ADV | | | | | | | | | | | | | | | | | | | | | | | | | | | | | | | | | | | | | | | | | | | | | | | | | | | | | | | | | | | | | |
| 12/31/2019 | | | | | 95,510 | | | | | | — | | | | | | 20,385 | | | | | | (135,417) | | | | | | (19,522) | | | | | | 1,042,654 | | | | | | — | | | | | | 222,397 | | | | | | (1,495,108) | | | | | | (230,057) | | |
| 12/31/2018 | | | | | 124,782 | | | | | | — | | | | | | 27,747 | | | | | | (158,745) | | | | | | (6,216) | | | | | | 1,362,764 | | | | | | — | | | | | | 296,058 | | | | | | (1,738,806) | | | | | | (79,984) | | |
| Class I | | | | | | | | | | | | | | | | | | | | | | | | | | | | | | | | | | | | | | | | | | | | | | | | | | | | | | | | | | | | | |
| 12/31/2019 | | | | | 31,539 | | | | | | — | | | | | | 1,608 | | | | | | (1,460) | | | | | | 31,687 | | | | | | 349,613 | | | | | | — | | | | | | 17,768 | | | | | | (16,230) | | | | | | 351,151 | | |
| 12/31/2018 | | | | | 24,978 | | | | | | — | | | | | | 479 | | | | | | (7,523) | | | | | | 17,934 | | | | | | 272,245 | | | | | | — | | | | | | 5,173 | | | | | | (81,591) | | | | | | 195,827 | | |
| Class R6 | | | | | | | | | | | | | | | | | | | | | | | | | | | | | | | | | | | | | | | | | | | | | | | | | | | | | | | | | | | | | |
| 12/31/2019 | | | | | 198,253 | | | | | | — | | | | | | 17,151 | | | | | | (224,691) | | | | | | (9,287) | | | | | | 2,184,939 | | | | | | — | | | | | | 189,519 | | | | | | (2,522,786) | | | | | | (148,328) | | |
| 12/31/2018 | | | | | 211,670 | | | | | | — | | | | | | 14,471 | | | | | | (53,275) | | | | | | 172,866 | | | | | | 2,278,829 | | | | | | — | | | | | | 156,288 | | | | | | (589,436) | | | | | | 1,845,681 | | |
| Class S | | | | | | | | | | | | | | | | | | | | | | | | | | | | | | | | | | | | | | | | | | | | | | | | | | | | | | | | | | | | | |
| 12/31/2019 | | | | | 82,870 | | | | | | — | | | | | | 8,267 | | | | | | (175,540) | | | | | | (84,403) | | | | | | 912,126 | | | | | | — | | | | | | 90,852 | | | | | | (1,952,313) | | | | | | (949,335) | | |
| 12/31/2018 | | | | | 139,393 | | | | | | — | | | | | | 12,446 | | | | | | (178,051) | | | | | | (26,212) | | | | | | 1,509,961 | | | | | | — | | | | | | 133,797 | | | | | | (1,938,484) | | | | | | (294,726) | | |
| Class S2 | | | | | | | | | | | | | | | | | | | | | | | | | | | | | | | | | | | | | | | | | | | | | | | | | | | | | | | | | | | | | |
| 12/31/2019 | | | | | 26,193 | | | | | | — | | | | | | 1,057 | | | | | | (34,482) | | | | | | (7,232) | | | | | | 285,706 | | | | | | — | | | | | | 11,531 | | | | | | (378,971) | | | | | | (81,734) | | |
| 12/31/2018 | | | | | 7,762 | | | | | | — | | | | | | 1,493 | | | | | | (24,575) | | | | | | (15,320) | | | | | | 84,834 | | | | | | — | | | | | | 15,913 | | | | | | (269,779) | | | | | | (169,032) | | |
| Solution Income | |
| Class ADV | | | | | | | | | | | | | | | | | | | | | | | | | | | | | | | | | | | | | | | | | | | | | | | | | | | | | | | | | | | | | |
| 12/31/2019 | | | | | 535,546 | | | | | | — | | | | | | 599,615 | | | | | | (2,571,116) | | | | | | (1,435,955) | | | | | | 6,175,990 | | | | | | — | | | | | | 6,817,626 | | | | | | (29,520,625) | | | | | | (16,527,009) | | |
| 12/31/2018 | | | | | 620,219 | | | | | | — | | | | | | 689,145 | | | | | | (3,130,290) | | | | | | (1,820,926) | | | | | | 7,156,568 | | | | | | — | | | | | | 7,801,121 | | | | | | (36,050,921) | | | | | | (21,093,232) | | |
| Class I | | | | | | | | | | | | | | | | | | | | | | | | | | | | | | | | | | | | | | | | | | | | | | | | | | | | | | | | | | | | | |
| 12/31/2019 | | | | | 591,471 | | | | | | — | | | | | | 338,569 | | | | | | (1,176,288) | | | | | | (246,248) | | | | | | 6,999,059 | | | | | | — | | | | | | 3,937,553 | | | | | | (13,817,473) | | | | | | (2,880,861) | | |
| 12/31/2018 | | | | | 1,156,766 | | | | | | — | | | | | | 356,452 | | | | | | (1,836,327) | | | | | | (323,109) | | | | | | 13,708,533 | | | | | | — | | | | | | 4,124,148 | | | | | | (21,808,112) | | | | | | (3,975,431) | | |
| Class S | | | | | | | | | | | | | | | | | | | | | | | | | | | | | | | | | | | | | | | | | | | | | | | | | | | | | | | | | | | | | |
| 12/31/2019 | | | | | 408,456 | | | | | | — | | | | | | 445,084 | | | | | | (2,899,306) | | | | | | (2,045,766) | | | | | | 4,786,652 | | | | | | — | | | | | | 5,140,721 | | | | | | (34,048,138) | | | | | | (24,120,765) | | |
| 12/31/2018 | | | | | 657,095 | | | | | | — | | | | | | 575,500 | | | | | | (3,450,672) | | | | | | (2,218,077) | | | | | | 7,693,447 | | | | | | — | | | | | | 6,606,738 | | | | | | (40,425,640) | | | | | | (26,125,455) | | |
| Class S2 | | | | | | | | | | | | | | | | | | | | | | | | | | | | | | | | | | | | | | | | | | | | | | | | | | | | | | | | | | | | | |
| 12/31/2019 | | | | | 27,485 | | | | | | — | | | | | | 24,342 | | | | | | (160,676) | | | | | | (108,849) | | | | | | 313,987 | | | | | | — | | | | | | 274,095 | | | | | | (1,838,151) | | | | | | (1,250,069) | | |
| 12/31/2018 | | | | | 76,258 | | | | | | — | | | | | | 26,408 | | | | | | (351,204) | | | | | | (248,538) | | | | | | 861,202 | | | | | | — | | | | | | 296,031 | | | | | | (4,066,367) | | | | | | (2,909,134) | | |
| Class T | | | | | | | | | | | | | | | | | | | | | | | | | | | | | | | | | | | | | | | | | | | | | | | | | | | | | | | | | | | | | |
| 12/31/2019 | | | | | 1,222 | | | | | | — | | | | | | 826 | | | | | | (110) | | | | | | 1,938 | | | | | | 14,982 | | | | | | — | | | | | | 10,043 | | | | | | (1,352) | | | | | | 23,673 | | |
| 12/31/2018 | | | | | 684 | | | | | | — | | | | | | 773 | | | | | | (371) | | | | | | 1,086 | | | | | | 8,261 | | | | | | — | | | | | | 9,336 | | | | | | (4,612) | | | | | | 12,985 | | |
| Solution Moderately Aggressive | |
| Class ADV | | | | | | | | | | | | | | | | | | | | | | | | | | | | | | | | | | | | | | | | | | | | | | | | | | | | | | | | | | | | | |
| 12/31/2019 | | | | | 170,708 | | | | | | — | | | | | | 201,063 | | | | | | (325,500) | | | | | | 46,271 | | | | | | 2,097,432 | | | | | | — | | | | | | 2,334,348 | | | | | | (3,994,541) | | | | | | 437,239 | | |
| 12/31/2018 | | | | | 280,298 | | | | | | — | | | | | | 118,240 | | | | | | (569,466) | | | | | | (170,928) | | | | | | 3,653,749 | | | | | | — | | | | | | 1,511,112 | | | | | | (7,409,666) | | | | | | (2,244,805) | | |
NOTES TO FINANCIAL STATEMENTS as of December 31, 2019 (continued)
NOTE 9 — CAPITAL SHARES (continued)
| | | | Shares
sold | | | Shares
issued in
merger | | | Reinvestment
of
distributions | | | Shares
redeemed | | | Net increase
(decrease)
in shares
outstanding | | | Shares
sold | | | Proceeds
from shares
issued in
merger | | | Reinvestment
of
distributions | | | Shares
redeemed | | | Net increase
(decrease) | |
Year or
period ended | | | # | | | # | | | # | | | # | | | # | | | ($) | | | ($) | | | ($) | | | ($) | | | ($) | |
| Solution Moderately Aggressive (continued) | |
| Class I | | | | | | | | | | | | | | | | | | | | | | | | | | | | | | | | | | | | | | | | | | | | | | | | | | | | | | | | | | | | | |
| 12/31/2019 | | | | | 53,673 | | | | | | — | | | | | | 38,073 | | | | | | (47,875) | | | | | | 43,871 | | | | | | 671,896 | | | | | | — | | | | | | 450,780 | | | | | | (601,565) | | | | | | 521,111 | | |
| 12/31/2018 | | | | | 49,024 | | | | | | — | | | | | | 21,277 | | | | | | (179,052) | | | | | | (108,751) | | | | | | 649,017 | | | | | | — | | | | | | 276,815 | | | | | | (2,447,432) | | | | | | (1,521,600) | | |
| Class R6 | | | | | | | | | | | | | | | | | | | | | | | | | | | | | | | | | | | | | | | | | | | | | | | | | | | | | | | | | | | | | |
| 12/31/2019 | | | | | 509,653 | | | | | | — | | | | | | 151,379 | | | | | | (308,389) | | | | | | 352,643 | | | | | | 6,416,863 | | | | | | — | | | | | | 1,790,820 | | | | | | (3,846,921) | | | | | | 4,360,762 | | |
| 12/31/2018 | | | | | 545,723 | | | | | | — | | | | | | 57,502 | | | | | | (165,004) | | | | | | 438,221 | | | | | | 7,157,515 | | | | | | — | | | | | | 747,524 | | | | | | (2,167,246) | | | | | | 5,737,793 | | |
| Class S | | | | | | | | | | | | | | | | | | | | | | | | | | | | | | | | | | | | | | | | | | | | | | | | | | | | | | | | | | | | | |
| 12/31/2019 | | | | | 104,176 | | | | | | — | | | | | | 4,747,896 | | | | | | (6,593,396) | | | | | | (1,741,324) | | | | | | 1,286,268 | | | | | | — | | | | | | 55,597,857 | | | | | | (81,802,488) | | | | | | (24,918,363) | | |
| 12/31/2018 | | | | | 299,970 | | | | | | — | | | | | | 3,043,427 | | | | | | (7,246,894) | | | | | | (3,903,497) | | | | | | 3,720,952 | | | | | | — | | | | | | 39,199,340 | | | | | | (95,120,221) | | | | | | (52,199,929) | | |
| Class S2 | | | | | | | | | | | | | | | | | | | | | | | | | | | | | | | | | | | | | | | | | | | | | | | | | | | | | | | | | | | | | |
| 12/31/2019 | | | | | 18,900 | | | | | | — | | | | | | 7,862 | | | | | | (21,143) | | | | | | 5,619 | | | | | | 235,459 | | | | | | — | | | | | | 92,304 | | | | | | (259,543) | | | | | | 68,220 | | |
| 12/31/2018 | | | | | 15,047 | | | | | | — | | | | | | 3,832 | | | | | | (81,024) | | | | | | (62,145) | | | | | | 197,507 | | | | | | — | | | | | | 49,430 | | | | | | (1,087,528) | | | | | | (840,591) | | |
| Solution Moderately Conservative | |
| Class ADV | | | | | | | | | | | | | | | | | | | | | | | | | | | | | | | | | | | | | | | | | | | | | | | | | | | | | | | | | | | | | |
| 12/31/2019 | | | | | 80,771 | | | | | | — | | | | | | 32,892 | | | | | | (359,384) | | | | | | (245,721) | | | | | | 788,643 | | | | | | — | | | | | | 317,739 | | | | | | (3,511,446) | | | | | | (2,405,064) | | |
| 12/31/2018 | | | | | 148,406 | | | | | | — | | | | | | 48,899 | | | | | | (322,063) | | | | | | (124,758) | | | | | | 1,453,700 | | | | | | — | | | | | | 470,405 | | | | | | (3,116,236) | | | | | | (1,192,131) | | |
| Class I | | | | | | | | | | | | | | | | | | | | | | | | | | | | | | | | | | | | | | | | | | | | | | | | | | | | | | | | | | | | | |
| 12/31/2019 | | | | | 3,671 | | | | | | — | | | | | | 138 | | | | | | (599) | | | | | | 3,210 | | | | | | 37,776 | | | | | | — | | | | | | 1,391 | | | | | | (5,952) | | | | | | 33,215 | | |
| 12/31/2018 | | | | | 860 | | | | | | — | | | | | | 133 | | | | | | (259) | | | | | | 734 | | | | | | 8,667 | | | | | | — | | | | | | 1,336 | | | | | | (2,521) | | | | | | 7,482 | | |
| Class R6 | | | | | | | | | | | | | | | | | | | | | | | | | | | | | | | | | | | | | | | | | | | | | | | | | | | | | | | | | | | | | |
| 12/31/2019 | | | | | 301,683 | | | | | | — | | | | | | 23,750 | | | | | | (148,755) | | | | | | 176,678 | | | | | | 3,015,536 | | | | | | — | | | | | | 239,164 | | | | | | (1,524,784) | | | | | | 1,729,916 | | |
| 12/31/2018 | | | | | 241,250 | | | | | | — | | | | | | 15,439 | | | | | | (67,888) | | | | | | 188,801 | | | | | | 2,464,868 | | | | | | — | | | | | | 154,704 | | | | | | (694,095) | | | | | | 1,925,477 | | |
| Class S | | | | | | | | | | | | | | | | | | | | | | | | | | | | | | | | | | | | | | | | | | | | | | | | | | | | | | | | | | | | | |
| 12/31/2019 | | | | | 573,667 | | | | | | — | | | | | | 71,906 | | | | | | (317,649) | | | | | | 327,924 | | | | | | 5,734,180 | | | | | | — | | | | | | 708,276 | | | | | | (3,172,991) | | | | | | 3,269,465 | | |
| 12/31/2018 | | | | | 148,788 | | | | | | — | | | | | | 69,056 | | | | | | (349,127) | | | | | | (131,283) | | | | | | 1,473,197 | | | | | | — | | | | | | 677,443 | | | | | | (3,524,044) | | | | | | (1,373,404) | | |
| Class S2 | | | | | | | | | | | | | | | | | | | | | | | | | | | | | | | | | | | | | | | | | | | | | | | | | | | | | | | | | | | | | |
| 12/31/2019 | | | | | 406,677 | | | | | | — | | | | | | 21,441 | | | | | | (8,046) | | | | | | 420,072 | | | | | | 4,022,354 | | | | | | — | | | | | | 207,982 | | | | | | (78,877) | | | | | | 4,151,459 | | |
| 12/31/2018 | | | | | 23,390 | | | | | | — | | | | | | 4,375 | | | | | | (12,631) | | | | | | 15,134 | | | | | | 228,524 | | | | | | — | | | | | | 42,435 | | | | | | (126,092) | | | | | | 144,867 | | |
| Solution 2020 | |
| Class ADV | | | | | | | | | | | | | | | | | | | | | | | | | | | | | | | | | | | | | | | | | | | | | | | | | | | | | | | | | | | | | |
| 12/31/2019 | | | | | 480,109 | | | | | | — | | | | | | 79,890 | | | | | | (483,350) | | | | | | 76,649 | | | | | | 6,012,974 | | | | | | — | | | | | | 973,056 | | | | | | (6,075,318) | | | | | | 910,712 | | |
| 12/31/2018 | | | | | 491,463 | | ��� | | | | — | | | | | | 74,480 | | | | | | (542,041) | | | | | | 23,902 | | | | | | 6,356,288 | | | | | | — | | | | | | 931,748 | | | | | | (7,006,362) | | | | | | 281,674 | | |
| Class I | | | | | | | | | | | | | | | | | | | | | | | | | | | | | | | | | | | | | | | | | | | | | | | | | | | | | | | | | | | | | |
| 12/31/2019 | | | | | 204,624 | | | | | | — | | | | | | 39,742 | | | | | | (275,695) | | | | | | (31,329) | | | | | | 2,623,074 | | | | | | — | | | | | | 494,795 | | | | | | (3,573,311) | | | | | | (455,442) | | |
| 12/31/2018 | | | | | 512,684 | | | | | | — | | | | | | 33,558 | | | | | | (510,217) | | | | | | 36,025 | | | | | | 6,635,113 | | | | | | — | | | | | | 428,868 | | | | | | (6,734,970) | | | | | | 329,011 | | |
| Class S | | | | | | | | | | | | | | | | | | | | | | | | | | | | | | | | | | | | | | | | | | | | | | | | | | | | | | | | | | | | | |
| 12/31/2019 | | | | | 260,945 | | | | | | — | | | | | | 65,903 | | | | | | (369,076) | | | | | | (42,228) | | | | | | 3,329,128 | | | | | | — | | | | | | 817,201 | | | | | | (4,722,258) | | | | | | (575,929) | | |
| 12/31/2018 | | | | | 529,256 | | | | | | — | | | | | | 60,565 | | | | | | (308,303) | | | | | | 281,518 | | | | | | 6,891,239 | | | | | | — | | | | | | 770,382 | | | | | | (3,973,399) | | | | | | 3,688,222 | | |
| Class S2 | | | | | | | | | | | | | | | | | | | | | | | | | | | | | | | | | | | | | | | | | | | | | | | | | | | | | | | | | | | | | |
| 12/31/2019 | | | | | 21,766 | | | | | | — | | | | | | 2,002 | | | | | | (20,599) | | | | | | 3,169 | | | | | | 274,078 | | | | | | — | | | | | | 24,597 | | | | | | (260,246) | | | | | | 38,429 | | |
| 12/31/2018 | | | | | 27,772 | | | | | | — | | | | | | 2,725 | | | | | | (39,438) | | | | | | (8,941) | | | | | | 367,833 | | | | | | — | | | | | | 34,283 | | | | | | (518,618) | | | | | | (116,502) | | |
| Class T | | | | | | | | | | | | | | | | | | | | | | | | | | | | | | | | | | | | | | | | | | | | | | | | | | | | | | | | | | | | | |
| 12/31/2019 | | | | | 325 | | | | | | — | | | | | | 57 | | | | | | (100) | | | | | | 282 | | | | | | 3,999 | | | | | | — | | | | | | 696 | | | | | | (1,216) | | | | | | 3,479 | | |
| 12/31/2018 | | | | | 220 | | | | | | — | | | | | | 40 | | | | | | (122) | | | | | | 138 | | | | | | 2,747 | | | | | | — | | | | | | 503 | | | | | | (1,525) | | | | | | 1,725 | | |
| Solution 2025 | |
| Class ADV | | | | | | | | | | | | | | | | | | | | | | | | | | | | | | | | | | | | | | | | | | | | | | | | | | | | | | | | | | | | | |
| 12/31/2019 | | | | | 1,468,738 | | | | | | — | | | | | | 1,862,090 | | | | | | (3,774,091) | | | | | | (443,263) | | | | | | 16,318,051 | | | | | | — | | | | | | 20,017,470 | | | | | | (42,137,612) | | | | | | (5,802,091) | | |
| 12/31/2018 | | | | | 1,817,104 | | | | | | — | | | | | | 1,229,575 | | | | | | (5,314,588) | | | | | | (2,267,909) | | | | | | 21,021,392 | | | | | | — | | | | | | 13,857,311 | | | | | | (60,689,080) | | | | | | (25,810,377) | | |
| Class I | | | | | | | | | | | | | | | | | | | | | | | | | | | | | | | | | | | | | | | | | | | | | | | | | | | | | | | | | | | | | |
| 12/31/2019 | | | | | 3,011,404 | | | | | | — | | | | | | 1,821,091 | | | | | | (2,968,363) | | | | | | 1,864,132 | | | | | | 34,626,479 | | | | | | — | | | | | | 20,123,050 | | | | | | (33,907,806) | | | | | | 20,841,723 | | |
| 12/31/2018 | | | | | 3,202,132 | | | | | | — | | | | | | 1,085,320 | | | | | | (4,077,675) | | | | | | 209,777 | | | | | | 38,146,295 | | | | | | — | | | | | | 12,546,303 | | | | | | (48,703,040) | | | | | | 1,989,558 | | |
| Class S | | | | | | | | | | | | | | | | | | | | | | | | | | | | | | | | | | | | | | | | | | | | | | | | | | | | | | | | | | | | | |
| 12/31/2019 | | | | | 1,585,098 | | | | | | — | | | | | | 2,153,547 | | | | | | (5,453,032) | | | | | | (1,714,387) | | | | | | 18,024,804 | | | | | | — | | | | | | 23,516,734 | | | | | | (62,267,087) | | | | | | (20,725,549) | | |
| 12/31/2018 | | | | | 1,799,836 | | | | | | — | | | | | | 1,466,438 | | | | | | (5,880,003) | | | | | | (2,613,729) | | | | | | 20,993,901 | | | | | | — | | | | | | 16,776,054 | | | | | | (68,488,208) | | | | | | (30,718,253) | | |
| Class S2 | | | | | | | | | | | | | | | | | | | | | | | | | | | | | | | | | | | | | | | | | | | | | | | | | | | | | | | | | | | | | |
| 12/31/2019 | | | | | 106,424 | | | | | | — | | | | | | 76,886 | | | | | | (358,352) | | | | | | (175,042) | | | | | | 1,174,211 | | | | | | — | | | | | | 815,755 | | | | | | (4,041,686) | | | | | | (2,051,720) | | |
| 12/31/2018 | | | | | 208,400 | | | | | | — | | | | | | 55,774 | | | | | | (595,263) | | | | | | (331,089) | | | | | | 2,322,159 | | | | | | — | | | | | | 620,761 | | | | | | (6,783,982) | | | | | | (3,841,062) | | |
| Class T | | | | | | | | | | | | | | | | | | | | | | | | | | | | | | | | | | | | | | | | | | | | | | | | | | | | | | | | | | | | | |
| 12/31/2019 | | | | | 1,081 | | | | | | — | | | | | | 2,997 | | | | | | (13,093) | | | | | | (9,015) | | | | | | 12,511 | | | | | | — | | | | | | 33,957 | | | | | | (154,366) | | | | | | (107,898) | | |
| 12/31/2018 | | | | | 1,670 | | | | | | — | | | | | | 3,044 | | | | | | (19,353) | | | | | | (14,639) | | | | | | 19,734 | | | | | | — | | | | | | 35,881 | | | | | | (223,720) | | | | | | (168,105) | | |
| Solution 2030 | |
| Class ADV | | | | | | | | | | | | | | | | | | | | | | | | | | | | | | | | | | | | | | | | | | | | | | | | | | | | | | | | | | | | | |
| 12/31/2019 | | | | | 510,062 | | | | | | — | | | | | | 85,450 | | | | | | (282,703) | | | | | | 312,809 | | | | | | 7,573,963 | | | | | | — | | | | | | 1,222,789 | | | | | | (4,188,478) | | | | | | 4,608,274 | | |
| 12/31/2018 | | | | | 458,897 | | | | | | — | | | | | | 56,878 | | | | | | (451,378) | | | | | | 64,397 | | | | | | 7,156,351 | | | | | | — | | | | | | 858,857 | | | | | | (7,112,168) | | | | | | 903,040 | | |
| Class I | | | | | | | | | | | | | | | | | | | | | | | | | | | | | | | | | | | | | | | | | | | | | | | | | | | | | | | | | | | | | |
| 12/31/2019 | | | | | 477,575 | | | | | | — | | | | | | 63,466 | | | | | | (184,511) | | | | | | 356,530 | | | | | | 7,456,635 | | | | | | — | | | | | | 934,211 | | | | | | (2,808,486) | | | | | | 5,582,360 | | |
| 12/31/2018 | | | | | 320,247 | | | | | | — | | | | | | 32,650 | | | | | | (362,870) | | | | | | (9,973) | | | | | | 5,117,378 | | | | | | — | | | | | | 505,749 | | | | | | (5,868,717) | | | | | | (245,590) | | |
| Class S | | | | | | | | | | | | | | | | | | | | | | | | | | | | | | | | | | | | | | | | | | | | | | | | | | | | | | | | | | | | | |
| 12/31/2019 | | | | | 325,502 | | | | | | — | | | | | | 61,027 | | | | | | (272,412) | | | | | | 114,117 | | | | | | 5,019,252 | | | | | | — | | | | | | 892,833 | | | | | | (4,199,019) | | | | | | 1,713,066 | | |
| 12/31/2018 | | | | | 350,352 | | | | | | — | | | | | | 46,877 | | | | | | (166,741) | | | | | | 230,488 | | | | | | 5,565,957 | | | | | | — | | | | | | 722,379 | | | | | | (2,608,485) | | | | | | 3,679,851 | | |
NOTES TO FINANCIAL STATEMENTS as of December 31, 2019 (continued)
NOTE 9 — CAPITAL SHARES (continued)
| | | | Shares
sold | | | Shares
issued in
merger | | | Reinvestment
of
distributions | | | Shares
redeemed | | | Net increase
(decrease)
in shares
outstanding | | | Shares
sold | | | Proceeds
from shares
issued in
merger | | | Reinvestment
of
distributions | | | Shares
redeemed | | | Net increase
(decrease) | |
Year or
period ended | | | # | | | # | | | # | | | # | | | # | | | ($) | | | ($) | | | ($) | | | ($) | | | ($) | |
| Solution 2030 (continued) | |
| Class S2 | | | | | | | | | | | | | | | | | | | | | | | | | | | | | | | | | | | | | | | | | | | | | | | | | | | | | | | | | | | | | |
| 12/31/2019 | | | | | 15,055 | | | | | | — | | | | | | 2,120 | | | | | | (19,705) | | | | | | (2,530) | | | | | | 226,909 | | | | | | — | | | | | | 30,665 | | | | | | (296,127) | | | | | | (38,553) | | |
| 12/31/2018 | | | | | 10,506 | | | | | | — | | | | | | 2,534 | | | | | | (17,985) | | | | | | (4,945) | | | | | | 162,865 | | | | | | — | | | | | | 38,574 | | | | | | (283,967) | | | | | | (82,528) | | |
| Class T | | | | | | | | | | | | | | | | | | | | | | | | | | | | | | | | | | | | | | | | | | | | | | | | | | | | | | | | | | | | | |
| 12/31/2019 | | | | | 552 | | | | | | — | | | | | | 122 | | | | | | (25) | | | | | | 649 | | | | | | 8,174 | | | | | | — | | | | | | 1,745 | | | | | | (375) | | | | | | 9,544 | | |
| 12/31/2018 | | | | | 490 | | | | | | — | | | | | | 65 | | | | | | (15) | | | | | | 540 | | | | | | 7,638 | | | | | | — | | | | | | 987 | | | | | | (236) | | | | | | 8,389 | | |
| Solution 2035 | |
| Class ADV | | | | | | | | | | | | | | | | | | | | | | | | | | | | | | | | | | | | | | | | | | | | | | | | | | | | | | | | | | | | | |
| 12/31/2019 | | | | | 968,128 | | | | | | — | | | | | | 1,967,162 | | | | | | (3,509,711) | | | | | | (574,421) | | | | | | 11,073,368 | | | | | | — | | | | | | 21,225,678 | | | | | | (40,011,867) | | | | | | (7,712,821) | | |
| 12/31/2018 | | | | | 1,379,031 | | | | | | — | | | | | | 1,197,346 | | | | | | (4,345,400) | | | | | | (1,769,023) | | | | | | 16,709,844 | | | | | | — | | | | | | 14,092,763 | | | | | | (51,797,452) | | | | | | (20,994,845) | | |
| Class I | | | | | | | | | | | | | | | | | | | | | | | | | | | | | | | | | | | | | | | | | | | | | | | | | | | | | | | | | | | | | |
| 12/31/2019 | | | | | 2,958,892 | | | | | | — | | | | | | 2,497,449 | | | | | | (2,789,054) | | | | | | 2,667,287 | | | | | | 34,859,624 | | | | | | — | | | | | | 27,696,711 | | | | | | (32,492,389) | | | | | | 30,063,946 | | |
| 12/31/2018 | | | | | 3,610,963 | | | | | | — | | | | | | 1,334,193 | | | | | | (4,054,133) | | | | | | 891,023 | | | | | | 44,520,078 | | | | | | — | | | | | | 16,103,710 | | | | | | (50,601,623) | | | | | | 10,022,165 | | |
| Class S | | | | | | | | | | | | | | | | | | | | | | | | | | | | | | | | | | | | | | | | | | | | | | | | | | | | | | | | | | | | | |
| 12/31/2019 | | | | | 1,623,321 | | | | | | — | | | | | | 2,763,246 | | | | | | (4,587,897) | | | | | | (201,330) | | | | | | 18,774,658 | | | | | | — | | | | | | 30,312,804 | | | | | | (53,589,463) | | | | | | (4,502,001) | | |
| 12/31/2018 | | | | | 1,869,794 | | | | | | — | | | | | | 1,633,358 | | | | | | (5,443,467) | | | | | | (1,940,315) | | | | | | 22,710,849 | | | | | | — | | | | | | 19,502,295 | | | | | | (66,273,628) | | | | | | (24,060,484) | | |
| Class S2 | | | | | | | | | | | | | | | | | | | | | | | | | | | | | | | | | | | | | | | | | | | | | | | | | | | | | | | | | | | | | |
| 12/31/2019 | | | | | 117,607 | | | | | | — | | | | | | 132,163 | | | | | | (364,755) | | | | | | (114,985) | | | | | | 1,314,156 | | | | | | — | | | | | | 1,390,350 | | | | | | (4,124,936) | | | | | | (1,420,430) | | |
| 12/31/2018 | | | | | 254,556 | | | | | | — | | | | | | 87,714 | | | | | | (535,473) | | | | | | (193,203) | | | | | | 2,981,117 | | | | | | — | | | | | | 1,008,708 | | | | | | (6,278,912) | | | | | | (2,289,087) | | |
| Class T | | | | | | | | | | | | | | | | | | | | | | | | | | | | | | | | | | | | | | | | | | | | | | | | | | | | | | | | | | | | | |
| 12/31/2019 | | | | | 2,316 | | | | | | — | | | | | | 3,031 | | | | | | (2,646) | | | | | | 2,701 | | | | | | 27,225 | | | | | | — | | | | | | 34,551 | | | | | | (30,509) | | | | | | 31,267 | | |
| 12/31/2018 | | | | | 3,048 | | | | | | — | | | | | | 2,950 | | | | | | (27,028) | | | | | | (21,030) | | | | | | 37,866 | | | | | | — | | | | | | 36,315 | | | | | | (317,312) | | | | | | (243,131) | | |
| Solution 2040 | |
| Class ADV | | | | | | | | | | | | | | | | | | | | | | | | | | | | | | | | | | | | | | | | | | | | | | | | | | | | | | | | | | | | | |
| 12/31/2019 | | | | | 353,002 | | | | | | — | | | | | | 65,642 | | | | | | (135,719) | | | | | | 282,925 | | | | | | 5,481,888 | | | | | | — | | | | | | 974,788 | | | | | | (2,106,393) | | | | | | 4,350,283 | | |
| 12/31/2018 | | | | | 304,877 | | | | | | — | | | | | | 48,857 | | | | | | (254,667) | | | | | | 99,067 | | | | | | 5,010,093 | | | | | | — | | | | | | 781,717 | | | | | | (4,144,987) | | | | | | 1,646,823 | | |
| Class I | | | | | | | | | | | | | | | | | | | | | | | | | | | | | | | | | | | | | | | | | | | | | | | | | | | | | | | | | | | | | |
| 12/31/2019 | | | | | 297,287 | | | | | | — | | | | | | 55,476 | | | | | | (126,847) | | | | | | 225,916 | | | | | | 4,820,584 | | | | | | — | | | | | | 847,678 | | | | | | (2,034,437) | | | | | | 3,633,825 | | |
| 12/31/2018 | | | | | 271,973 | | | | | | — | | | | | | 33,899 | | | | | | (261,598) | | | | | | 44,274 | | | | | | 4,606,311 | | | | | | — | | | | | | 556,292 | | | | | | (4,571,742) | | | | | | 590,861 | | |
| Class S | | | | | | | | | | | | | | | | | | | | | | | | | | | | | | | | | | | | | | | | | | | | | | | | | | | | | | | | | | | | | |
| 12/31/2019 | | | | | 191,537 | | | | | | — | | | | | | 47,626 | | | | | | (247,656) | | | | | | (8,493) | | | | | | 3,072,754 | | | | | | — | | | | | | 721,532 | | | | | | (3,949,460) | | | | | | (155,174) | | |
| 12/31/2018 | | | | | 222,660 | | | | | | — | | | | | | 39,803 | | | | | | (123,720) | | | | | | 138,743 | | | | | | 3,757,941 | | | | | | — | | | | | | 648,392 | | | | | | (2,057,828) | | | | | | 2,348,505 | | |
| Class S2 | | | | | | | | | | | | | | | | | | | | | | | | | | | | | | | | | | | | | | | | | | | | | | | | | | | | | | | | | | | | | |
| 12/31/2019 | | | | | 17,193 | | | | | | — | | | | | | 4,792 | | | | | | (27,417) | | | | | | (5,432) | | | | | | 268,338 | | | | | | — | | | | | | 71,446 | | | | | | (426,178) | | | | | | (86,394) | | |
| 12/31/2018 | | | | | 31,436 | | | | | | — | | | | | | 4,892 | | | | | | (12,690) | | | | | | 23,638 | | | | | | 527,989 | | | | | | — | | | | | | 78,518 | | | | | | (220,984) | | | | | | 385,523 | | |
| Class T | | | | | | | | | | | | | | | | | | | | | | | | | | | | | | | | | | | | | | | | | | | | | | | | | | | | | | | | | | | | | |
| 12/31/2019 | | | | | 979 | | | | | | — | | | | | | 76 | | | | | | (272) | | | | | | 783 | | | | | | 14,878 | | | | | | — | | | | | | 1,128 | | | | | | (4,475) | | | | | | 11,531 | | |
| 12/31/2018 | | | | | 581 | | | | | | — | | | | | | 85 | | | | | | (614) | | | | | | 52 | | | | | | 9,296 | | | | | | — | | | | | | 1,366 | | | | | | (9,596) | | | | | | 1,066 | | |
| Solution 2045 | |
| Class ADV | | | | | | | | | | | | | | | | | | | | | | | | | | | | | | | | | | | | | | | | | | | | | | | | | | | | | | | | | | | | | |
| 12/31/2019 | | | | | 938,695 | | | | | | — | | | | | | 1,496,034 | | | | | | (2,291,762) | | | | | | 142,967 | | | | | | 10,564,731 | | | | | | — | | | | | | 15,768,200 | | | | | | (25,544,144) | | | | | | 788,787 | | |
| 12/31/2018 | | | | | 1,092,978 | | | | | | — | | | | | | 865,338 | | | | | | (3,355,704) | | | | | | (1,397,388) | | | | | | 13,079,599 | | | | | | — | | | | | | 10,228,294 | | | | | | (39,780,511) | | | | | | (16,472,618) | | |
| Class I | | | | | | | | | | | | | | | | | | | | | | | | | | | | | | | | | | | | | | | | | | | | | | | | | | | | | | | | | | | | | |
| 12/31/2019 | | | | | 3,265,408 | | | | | | — | | | | | | 2,475,330 | | | | | | (2,711,632) | | | | | | 3,029,106 | | | | | | 38,118,589 | | | | | | — | | | | | | 26,882,084 | | | | | | (31,348,739) | | | | | | 33,651,934 | | |
| 12/31/2018 | | | | | 3,395,741 | | | | | | — | | | | | | 1,265,892 | | | | | | (3,372,017) | | | | | | 1,289,616 | | | | | | 42,392,725 | | | | | | — | | | | | | 15,367,932 | | | | | | (42,285,089) | | | | | | 15,475,568 | | |
| Class S | | | | | | | | | | | | | | | | | | | | | | | | | | | | | | | | | | | | | | | | | | | | | | | | | | | | | | | | | | | | | |
| 12/31/2019 | | | | | 1,329,165 | | | | | | — | | | | | | 2,335,253 | | | | | | (3,115,909) | | | | | | 548,509 | | | | | | 15,225,822 | | | | | | — | | | | | | 24,987,205 | | | | | | (35,629,265) | | | | | | 4,583,762 | | |
| 12/31/2018 | | | | | 1,558,711 | | | | | | — | | | | | | 1,272,721 | | | | | | (4,448,167) | | | | | | (1,616,735) | | | | | | 19,002,680 | | | | | | — | | | | | | 15,247,200 | | | | | | (54,821,878) | | | | | | (20,571,998) | | |
| Class S2 | | | | | | | | | | | | | | | | | | | | | | | | | | | | | | | | | | | | | | | | | | | | | | | | | | | | | | | | | | | | | |
| 12/31/2019 | | | | | 87,072 | | | | | | — | | | | | | 70,369 | | | | | | (247,661) | | | | | | (90,220) | | | | | | 970,310 | | | | | | — | | | | | | 732,541 | | | | | | (2,820,918) | | | | | | (1,118,067) | | |
| 12/31/2018 | | | | | 134,268 | | | | | | — | | | | | | 48,031 | | | | | | (262,214) | | | | | | (79,915) | | | | | | 1,586,988 | | | | | | — | | | | | | 561,006 | | | | | | (3,100,369) | | | | | | (952,375) | | |
| Class T | | | | | | | | | | | | | | | | | | | | | | | | | | | | | | | | | | | | | | | | | | | | | | | | | | | | | | | | | | | | | |
| 12/31/2019 | | | | | 3,447 | | | | | | — | | | | | | 2,193 | | | | | | (1,887) | | | | | | 3,753 | | | | | | 39,830 | | | | | | — | | | | | | 24,095 | | | | | | (22,265) | | | | | | 41,660 | | |
| 12/31/2018 | | | | | 3,217 | | | | | | — | | | | | | 2,534 | | | | | | (25,041) | | | | | | (19,290) | | | | | | 39,351 | | | | | | — | | | | | | 30,897 | | | | | | (285,333) | | | | | | (215,085) | | |
| Solution 2050 | |
| Class ADV | | | | | | | | | | | | | | | | | | | | | | | | | | | | | | | | | | | | | | | | | | | | | | | | | | | | | | | | | | | | | |
| 12/31/2019 | | | | | 262,849 | | | | | | — | | | | | | 58,525 | | | | | | (101,163) | | | | | | 220,211 | | | | | | 4,189,256 | | | | | | — | | | | | | 891,921 | | | | | | (1,592,246) | | | | | | 3,488,931 | | |
| 12/31/2018 | | | | | 304,671 | | | | | | — | | | | | | 29,494 | | | | | | (178,570) | | | | | | 155,595 | | | | | | 5,185,040 | | | | | | — | | | | | | 489,007 | | | | | | (2,999,258) | | | | | | 2,674,789 | | |
| Class I | | | | | | | | | | | | | | | | | | | | | | | | | | | | | | | | | | | | | | | | | | | | | | | | | | | | | | | | | | | | | |
| 12/31/2019 | | | | | 294,493 | | | | | | — | | | | | | 48,890 | | | | | | (129,943) | | | | | | 213,440 | | | | | | 4,946,241 | | | | | | — | | | | | | 770,026 | | | | | | (2,120,508) | | | | | | 3,595,759 | | |
| 12/31/2018 | | | | | 306,052 | | | | | | — | | | | | | 21,043 | | | | | | (227,231) | | | | | | 99,864 | | | | | | 5,338,713 | | | | | | — | | | | | | 359,200 | | | | | | (3,998,614) | | | | | | 1,699,299 | | |
| Class S | | | | | | | | | | | | | | | | | | | | | | | | | | | | | | | | | | | | | | | | | | | | | | | | | | | | | | | | | | | | | |
| 12/31/2019 | | | | | 185,890 | | | | | | — | | | | | | 34,205 | | | | | | (149,076) | | | | | | 71,019 | | | | | | 3,035,273 | | | | | | — | | | | | | 532,912 | | | | | | (2,444,125) | | | | | | 1,124,060 | | |
| 12/31/2018 | | | | | 209,421 | | | | | | — | | | | | | 17,993 | | | | | | (114,350) | | | | | | 113,064 | | | | | | 3,607,249 | | | | | | — | | | | | | 304,081 | | | | | | (1,955,852) | | | | | | 1,955,478 | | |
| Class S2 | | | | | | | | | | | | | | | | | | | | | | | | | | | | | | | | | | | | | | | | | | | | | | | | | | | | | | | | | | | | | |
| 12/31/2019 | | | | | 10,178 | | | | | | — | | | | | | 1,733 | | | | | | (15,793) | | | | | | (3,882) | | | | | | 163,774 | | | | | | — | | | | | | 26,656 | | | | | | (255,465) | | | | | | (65,035) | | |
| 12/31/2018 | | | | | 19,959 | | | | | | — | | | | | | 1,374 | | | | | | (10,248) | | | | | | 11,085 | | | | | | 341,505 | | | | | | — | | | | | | 22,915 | | | | | | (178,100) | | | | | | 186,320 | | |
| Class T | | | | | | | | | | | | | | | | | | | | | | | | | | | | | | | | | | | | | | | | | | | | | | | | | | | | | | | | | | | | | |
| 12/31/2019 | | | | | 383 | | | | | | — | | | | | | 100 | | | | | | (1,225) | | | | | | (742) | | | | | | 6,254 | | | | | | — | | | | | | 1,538 | | | | | | (18,967) | | | | | | (11,175) | | |
| 12/31/2018 | | | | | 764 | | | | | | — | | | | | | 43 | | | | | | (592) | | | | | | 215 | | | | | | 12,814 | | | | | | — | | | | | | 714 | | | | | | (10,312) | | | | | | 3,216 | | |
NOTES TO FINANCIAL STATEMENTS as of December 31, 2019 (continued)
NOTE 9 — CAPITAL SHARES (continued)
| | | | Shares
sold | | | Shares
issued in
merger | | | Reinvestment
of
distributions | | | Shares
redeemed | | | Net increase
(decrease)
in shares
outstanding | | | Shares
sold | | | Proceeds
from shares
issued in
merger | | | Reinvestment
of
distributions | | | Shares
redeemed | | | Net increase
(decrease) | |
Year or
period ended | | | # | | | # | | | # | | | # | | | # | | | ($) | | | ($) | | | ($) | | | ($) | | | ($) | |
| Solution 2055 | |
| Class ADV | | | | | | | | | | | | | | | | | | | | | | | | | | | | | | | | | | | | | | | | | | | | | | | | | | | | | | | | | | | | | |
| 12/31/2019 | | | | | 550,223 | | | | | | — | | | | | | 341,380 | | | | | | (540,179) | | | | | | 351,424 | | | | | | 7,383,141 | | | | | | — | | | | | | 4,328,696 | | | | | | (7,304,002) | | | | | | 4,407,835 | | |
| 12/31/2018 | | | | | 573,495 | | | | | | — | | | | | | 152,610 | | | | | | (785,590) | | | | | | (59,485) | | | | | | 8,107,105 | | | | | | — | | | | | | 2,141,118 | | | | | | (11,025,011) | | | | | | (776,788) | | |
| Class I | | | | | | | | | | | | | | | | | | | | | | | | | | | | | | | | | | | | | | | | | | | | | | | | | | | | | | | | | | | | | |
| 12/31/2019 | | | | | 2,307,889 | | | | | | — | | | | | | 786,624 | | | | | | (816,111) | | | | | | 2,278,402 | | | | | | 31,841,400 | | | | | | — | | | | | | 10,186,778 | | | | | | (11,038,263) | | | | | | 30,989,915 | | |
| 12/31/2018 | | | | | 1,988,921 | | | | | | — | | | | | | 286,227 | | | | | | (1,090,603) | | | | | | 1,184,545 | | | | | | 28,836,328 | | | | | | — | | | | | | 4,093,046 | | | | | | (15,958,578) | | | | | | 16,970,796 | | |
| Class S | | | | | | | | | | | | | | | | | | | | | | | | | | | | | | | | | | | | | | | | | | | | | | | | | | | | | | | | | | | | | |
| 12/31/2019 | | | | | 703,925 | | | | | | — | | | | | | 421,239 | | | | | | (780,117) | | | | | | 345,047 | | | | | | 9,542,879 | | | | | | — | | | | | | 5,387,644 | | | | | | (10,649,419) | | | | | | 4,281,104 | | |
| 12/31/2018 | | | | | 773,431 | | | | | | — | | | | | | 183,164 | | | | | | (1,000,675) | | | | | | (44,080) | | | | | | 11,027,413 | | | | | | — | | | | | | 2,589,944 | | | | | | (14,332,928) | | | | | | (715,571) | | |
| Class S2 | | | | | | | | | | | | | | | | | | | | | | | | | | | | | | | | | | | | | | | | | | | | | | | | | | | | | | | | | | | | | |
| 12/31/2019 | | | | | 67,327 | | | | | | — | | | | | | 18,357 | | | | | | (98,614) | | | | | | (12,930) | | | | | | 907,564 | | | | | | — | | | | | | 233,868 | | | | | | (1,359,900) | | | | | | (218,468) | | |
| 12/31/2018 | | | | | 68,323 | | | | | | — | | | | | | 10,816 | | | | | | (83,181) | | | | | | (4,042) | | | | | | 962,735 | | | | | | — | | | | | | 152,185 | | | | | | (1,167,461) | | | | | | (52,541) | | |
| Class T | | | | | | | | | | | | | | | | | | | | | | | | | | | | | | | | | | | | | | | | | | | | | | | | | | | | | | | | | | | | | |
| 12/31/2019 | | | | | 335 | | | | | | — | | | | | | 112 | | | | | | (335) | | | | | | 112 | | | | | | 4,456 | | | | | | — | | | | | | 1,456 | | | | | | (4,367) | | | | | | 1,545 | | |
| 12/31/2018 | | | | | 238 | | | | | | — | | | | | | 69 | | | | | | (1,024) | | | | | | (717) | | | | | | 3,371 | | | | | | — | | | | | | 983 | | | | | | (14,629) | | | | | | (10,275) | | |
| Solution 2060 | |
| Class ADV | | | | | | | | | | | | | | | | | | | | | | | | | | | | | | | | | | | | | | | | | | | | | | | | | | | | | | | | | | | | | |
| 12/31/2019 | | | | | 226,789 | | | | | | — | | | | | | 40,002 | | | | | | (127,076) | | | | | | 139,715 | | | | | | 2,608,449 | | | | | | — | | | | | | 440,825 | | | | | | (1,450,917) | | | | | | 1,598,357 | | |
| 12/31/2018 | | | | | 265,744 | | | | | | — | | | | | | 21,676 | | | | | | (106,138) | | | | | | 181,282 | | | | | | 3,209,446 | | | | | | — | | | | | | 257,511 | ��� | | | | | (1,288,854) | | | | | | 2,178,103 | | |
| Class I | | | | | | | | | | | | | | | | | | | | | | | | | | | | | | | | | | | | | | | | | | | | | | | | | | | | | | | | | | | | | |
| 12/31/2019 | | | | | 250,746 | | | | | | — | | | | | | 27,252 | | | | | | (97,199) | | | | | | 180,799 | | | | | | 2,951,604 | | | | | | — | | | | | | 304,947 | | | | | | (1,119,641) | | | | | | 2,136,910 | | |
| 12/31/2018 | | | | | 210,814 | | | | | | — | | | | | | 10,538 | | | | | | (151,215) | | | | | | 70,137 | | | | | | 2,548,696 | | | | | | — | | | | | | 126,662 | | | | | | (1,857,583) | | | | | | 817,775 | | |
| Class S | | | | | | | | | | | | | | | | | | | | | | | | | | | | | | | | | | | | | | | | | | | | | | | | | | | | | | | | | | | | | |
| 12/31/2019 | | | | | 186,195 | | | | | | — | | | | | | 28,432 | | | | | | (137,540) | | | | | | 77,087 | | | | | | 2,146,309 | | | | | | — | | | | | | 314,172 | | | | | | (1,590,280) | | | | | | 870,201 | | |
| 12/31/2018 | | | | | 190,206 | | | | | | — | | | | | | 17,250 | | | | | | (106,657) | | | | | | 100,799 | | | | | | 2,296,529 | | | | | | — | | | | | | 205,097 | | | | | | (1,256,273) | | | | | | 1,245,353 | | |
| Class S2 | | | | | | | | | | | | | | | | | | | | | | | | | | | | | | | | | | | | | | | | | | | | | | | | | | | | | | | | | | | | | |
| 12/31/2019 | | | | | 19,738 | | | | | | — | | | | | | 1,557 | | | | | | (22,587) | | | | | | (1,292) | | | | | | 224,025 | | | | | | — | | | | | | 17,202 | | | | | | (249,186) | | | | | | (7,959) | | |
| 12/31/2018 | | | | | 13,934 | | | | | | — | | | | | | 1,122 | | | | | | (5,977) | | | | | | 9,079 | | | | | | 166,640 | | | | | | — | | | | | | 13,337 | | | | | | (71,667) | | | | | | 108,310 | | |
| Class T | | | | | | | | | | | | | | | | | | | | | | | | | | | | | | | | | | | | | | | | | | | | | | | | | | | | | | | | | | | | | |
| 12/31/2019 | | | | | — | | | | | | — | | | | | | 24 | | | | | | — | | | | | | 24 | | | | | | — | | | | | | — | | | | | | 262 | | | | | | — | | | | | | 262 | | |
| 12/31/2018 | | | | | — | | | | | | — | | | | | | 17 | | | | | | — | | | | | | 17 | | | | | | — | | | | | | — | | | | | | 197 | | | | | | — | | | | | | 197 | | |
NOTE 10 — FEDERAL INCOME TAXES
The amount of distributions from net investment income and net realized capital gains are determined in accordance with federal income tax regulations, which may differ from GAAP for investment companies. These book/tax differences may be either temporary or permanent. Permanent differences are reclassified within the capital accounts based on their federal tax-basis treatment; temporary differences are not reclassified. Key differences include the treatment of short-term capital gains, foreign currency transactions, and wash sale deferrals. Distributions in excess of net investment income and/or net realized capital gains for tax purposes are reported as return of capital.
Dividends paid by the Portfolios from net investment income and distributions of net realized short-term capital gains are, for federal income tax purposes, taxable as ordinary income to shareholders.
The tax composition of dividends and distributions to shareholders was as follows:
| | | | Year Ended
December 31, 2019 | | | Year Ended
December 31, 2018 | |
| | | | Ordinary
Income | | | Long-term
Capital Gains | | | Ordinary
Income | | | Long-term
Capital Gains | |
| Solution Aggressive | | | | $ | 290,677 | | | | | $ | 1,455,126 | | | | | $ | 234,832 | | | | | $ | 563,817 | | |
| Solution Balanced | | | | | 1,264,865 | | | | | | 3,344,512 | | | | | | 1,352,172 | | | | | | 1,695,402 | | |
| Solution Conservative | | | | | 387,065 | | | | | | 145,002 | | | | | | 478,277 | | | | | | 128,952 | | |
| Solution Income | | | | | 10,228,302 | | | | | | 5,951,736 | | | | | | 13,581,676 | | | | | | 5,255,698 | | |
Solution Moderately
Aggressive | | | | | 13,618,660 | | | | | | 46,647,449 | | | | | | 15,280,521 | | | | | | 26,503,700 | | |
Solution Moderately
Conservative | | | | | 736,476 | | | | | | 738,076 | | | | | | 832,215 | | | | | | 514,108 | | |
| Solution 2020 | | | | | 816,056 | | | | | | 1,494,564 | | | | | | 1,035,295 | | | | | | 1,130,733 | | |
| Solution 2025 | | | | | 19,364,337 | | | | | | 45,142,629 | | | | | | 21,872,437 | | | | | | 21,963,873 | | |
| Solution 2030 | | | | | 760,490 | | | | | | 2,322,107 | | | | | | 1,020,513 | | | | | | 1,106,355 | | |
| Solution 2035 | | | | | 18,536,013 | | | | | | 62,124,081 | | | | | | 18,163,767 | | | | | | 32,580,024 | | |
| Solution 2040 | | | | | 557,785 | | | | | | 2,059,165 | | | | | | 831,150 | | | | | | 1,235,549 | | |
| Solution 2045 | | | | | 12,677,673 | | | | | | 55,716,452 | | | | | | 13,096,105 | | | | | | 28,339,224 | | |
| Solution 2050 | | | | | 401,860 | | | | | | 1,821,588 | | | | | | 457,960 | | | | | | 718,247 | | |
| Solution 2055 | | | | | 3,576,235 | | | | | | 16,562,207 | | | | | | 2,967,858 | | | | | | 6,009,418 | | |
| Solution 2060 | | | | | 224,632 | | | | | | 852,776 | | | | | | 286,753 | | | | | | 316,051 | | |
NOTES TO FINANCIAL STATEMENTS as of December 31, 2019 (continued)
NOTE 10 — FEDERAL INCOME TAXES (continued)
The tax-basis components of distributable earnings as of December 31, 2019 were:
| | | | Undistributed
Ordinary
Income | | | Undistributed
Long-term
Capital Gains | | | Unrealized
Appreciation/
(Depreciation) | |
| Solution Aggressive | | | | $ | 394,026 | | | | | $ | 1,365,142 | | | | | $ | (333,250) | | |
| Solution Balanced | | | | | 1,563,643 | | | | | | 2,131,869 | | | | | | 167,437 | | |
| Solution Conservative | | | | | 534,955 | | | | | | 187,821 | | | | | | 197,625 | | |
| Solution Income | | | | | 7,417,917 | | | | | | 558,514 | | | | | | 7,277,408 | | |
Solution Moderately
Aggressive | | | | | 10,675,677 | | | | | | 39,481,314 | | | | | | (507,706) | | |
Solution Moderately
Conservative | | | | | 1,030,963 | | | | | | 854,887 | | | | | | 325,665 | | |
| Solution 2020 | | | | | 802,106 | | | | | | 554,637 | | | | | | 623,916 | | |
| Solution 2025 | | | | | 17,406,172 | | | | | | 30,987,740 | | | | | | 12,034,307 | | |
| | | | | |
| Solution 2030 | | | | | 926,086 | | | | | | 1,718,901 | | | | | | 267,807 | | |
| Solution 2035 | | | | | 15,618,898 | | | | | | 53,484,702 | | | | | | 9,664,466 | | |
| Solution 2040 | | | | | 691,044 | | | | | | 1,723,585 | | | | | | 177,363 | | |
| Solution 2045 | | | | | 10,940,738 | | | | | | 40,041,137 | | | | | | 6,634,562 | | |
| Solution 2050 | | | | | 528,601 | | | | | | 1,510,836 | | | | | | (39,151) | | |
| Solution 2055 | | | | | 3,515,884 | | | | | | 13,132,624 | | | | | | 1,838,919 | | |
| Solution 2060 | | | | | 302,594 | | | | | | 817,211 | | | | | | 12,912 | | |
At December 31, 2019, the Portfolios did not have any capital loss carryovers for U.S. federal income tax purposes.
The Portfolios’ major tax jurisdictions are U.S. federal and Arizona state.
As of December 31, 2019, no provision for income tax is required in the Portfolios’ financial statements as a result of tax positions taken on federal and state income tax returns for open tax years. The Portfolios’ federal and state income and federal excise tax returns for tax years for which the applicable statutes of limitations have not expired are subject to examination by the Internal Revenue Service and state department of revenue. Generally, the earliest tax year that remains subject to examination by these jurisdictions is 2015.
NOTE 11 — OTHER ACCOUNTING PRONOUNCEMENTS
The Portfolios have made a change in accounting principle and adopted the provisions of Financial Accounting Standards Board (“FASB”) Accounting Standards Update 2017-08 (“ASU 2017-08”), Premium Amortization on Purchased Callable Debt Securities. ASU 2017-08 shortens the amortization period for certain callable debt securities held at a premium; specifically, requiring the premium to be amortized to the earliest call date. Prior to ASU 2017-08, premiums on callable debt securities were generally amortized to maturity date. ASU 2017-08 is
intended to more closely align the amortization period with the expectations incorporated into the market pricing on the underlying security. ASU 2017-08 does not require an accounting change for securities held at a discount; the discount continues to be amortized to maturity date. Upon evaluation, the Portfolios have concluded that the change in accounting principle does not materially impact the financial statement amounts.
Also, in August 2018, the FASB issued Accounting Standards Update 2018-13, Fair Value Measurement (Topic 820): Disclosure Framework — Changes to the Disclosure Requirements for Fair Value Measurement (“ASU 2018-13”). The update provides guidance that eliminates, adds and modifies certain disclosure requirements for fair value measurements. ASU 2018-13 will be effective for annual periods beginning after December 15, 2019 and interim periods within those annual periods. At this time, the Portfolios have elected to early adopt the amendments that allow for removal of disclosure requirements related to transfers between Level 1 and Level 2 of the fair value hierarchy and the timing of transfers between levels of the fair value hierarchy. These changes did not have a material impact on the Portfolios’ financial statements. The Portfolios plan to adopt the amendments that require additional fair value measurement disclosures for annual periods beginning after December 15, 2019, and interim periods within those annual periods. The Portfolios are currently evaluating the impact of these changes on the financial statements.
NOTE 12 — AUDITOR CHANGE (Unaudited)
On September 12, 2019, KPMG LLP (“KPMG”) was dismissed as the independent registered public accounting firm to the Company, on behalf of the Portfolios, upon completion of the audit for the fiscal year ended December 31, 2019. The decision to change independent registered public accounting firms was recommended by the Audit Committee of the Board and was approved by the Board.
KPMG’s reports on the Portfolios’ financial statements for the fiscal years ended December 31, 2019 and December 31, 2018 contained no adverse opinion or disclaimer of opinion nor were they qualified or modified as to uncertainty, audit scope or accounting principle.
During the fiscal years ended December 31, 2019 and December 31, 2018: (i) there were no disagreements with KPMG on any matter of accounting principles or practices, financial statement disclosure or auditing scope or procedure, which disagreements, if not resolved to the satisfaction of KPMG, would have caused KPMG to make reference to the subject matter of the disagreements in connection with its reports on the Portfolios’ financial
NOTES TO FINANCIAL STATEMENTS as of December 31, 2019 (continued)
NOTE 12 — AUDITOR CHANGE (Unaudited) (continued)
statements for such periods; and (ii) there were no “reportable events” of the kind described in Item 304(a)(1)(v) of Regulation S-K under the Securities Exchange Act of 1934, as amended.
On September 12, 2019, based on the recommendation of the Audit Committee of the Board, the Board approved the selection of Ernst & Young LLP (“EY”) as the Portfolios’ independent registered public accounting firm for the fiscal year ending December 31, 2020. During the Portfolios’ fiscal years ended December 31, 2019 and December 31, 2018, neither the Portfolios, nor anyone on their behalf, consulted with EY on items which: (i) concerned the application of accounting principles to a specified transaction, either completed or proposed, or the type of
audit opinion that might be rendered on the Portfolios’ financial statements; or (ii) concerned the subject of a disagreement (as described in paragraph (a)(1)(iv) of Item 304 of Regulation S-K) or reportable events (as described in paragraph (a)(1)(v) of said Item 304).
NOTE 13 — SUBSEQUENT EVENTS
Reorganization: The Board approved a proposal to reorganize Solution 2020 with and into Solution Income on or about August 7, 2020.
The Portfolios have evaluated events occurring after the Statements of Assets and Liabilities date (“subsequent events”), to determine whether any subsequent events necessitated adjustment to or disclosure in the financial statements. Other than above, no such subsequent events were identified.
PORTFOLIO OF INVESTMENTS
| Voya Solution Aggressive Portfolio | as of December 31, 2019 |
| Shares | | | Value | | | Percentage
of Net
Assets | |
| EXCHANGE-TRADED FUNDS: 18.8% | |
| 2,232 | | | iShares 20+ Year Treasury
Bond ETF | | | | $ | 302,391 | | | | | | 1.4 | | |
| 6,489 | | | iShares Core MSCI EAFE
ETF | | | | | 423,342 | | | | | | 2.0 | | |
| 2,545 | | | iShares Core S&P Small-Cap
ETF | | | | | 213,398 | | | | | | 1.0 | | |
| 3,450 | | | Vanguard Global ex-U.S. Real
Estate ETF | | | | | 203,861 | | | | | | 0.9 | | |
| 2,273 | | | Vanguard Real Estate ETF | | | | | 210,912 | | | | | | 1.0 | | |
| 7,744 | | | Vanguard Russell 1000
Growth ETF | | | | | 1,401,122 | | | | | | 6.6 | | |
| 10,651 | | | Vanguard Value ETF | | | | | 1,276,522 | | | | | | 5.9 | | |
| | | | Total Exchange-Traded Funds
(Cost $3,757,683) | | | | | 4,031,548 | | | | | | 18.8 | | |
| MUTUAL FUNDS: 81.0% | |
| | | | Affiliated Investment Companies: 81.0% | |
| 29,821 | | | Voya Index Plus LargeCap
Portfolio - Class I | | | | | 857,942 | | | | | | 4.0 | | |
| 11,148 | | | Voya Large-Cap Growth
Fund - Class R6 | | | | | 536,577 | | | | | | 2.5 | | |
| 38,008 | | | Voya MidCap Opportunities
Portfolio - Class I | | | | | 529,068 | | | | | | 2.5 | | |
| 101,683 | | | Voya Multi-Manager Emerging
Markets Equity Fund - Class I | | | | | 1,315,782 | | | | | | 6.1 | | |
| 181,727 | | | Voya Multi-Manager
International Equity Fund -
Class I | | | | | 2,166,187 | | | | | | 10.0 | | |
| 110,351 | | | Voya Multi-Manager
International Factors Fund -
Class I | | | | | 1,071,508 | | | | | | 5.0 | | |
| 140,973 | | | Voya Multi-Manager Mid Cap
Value Fund - Class I | | | | | 1,382,944 | | | | | | 6.4 | | |
| Shares | | | Value | | | Percentage
of Net
Assets | |
| MUTUAL FUNDS: (continued) | |
| | | | Affiliated Investment Companies (continued) | |
| 10,592 | | | Voya Short Term Bond Fund -
Class R6 | | | | $ | 104,438 | | | | | | 0.5 | | |
| 37,669 | | | Voya Small Company
Portfolio - Class I | | | | | 641,880 | | | | | | 3.0 | | |
| 67,681 | | | Voya U.S. High Dividend Low
Volatility Fund - Class R6 | | | | | 853,459 | | | | | | 4.0 | | |
| 101,414 | | | Voya U.S. Stock Index
Portfolio - Class I | | | | | 1,723,027 | | | | | | 8.0 | | |
| 94,001 | | | VY® Invesco Comstock
Portfolio - Class I | | | | | 1,615,870 | | | | | | 7.5 | | |
| 65,846 | | | VY® JPMorgan Small Cap
Core Equity Portfolio Class I | | | | | 1,067,363 | | | | | | 5.0 | | |
| 36,205 | | | VY® T. Rowe Price Capital
Appreciation Portfolio - Class I | | | | | 1,064,801 | | | | | | 5.0 | | |
| 68,053 | | | VY® T. Rowe Price Diversified
Mid Cap Growth Portfolio -
Class I | | | | | 850,660 | | | | | | 4.0 | | |
| 19,706 | | | VY® T. Rowe Price Growth
Equity Portfolio - Class I | | | | | 1,604,662 | | | | | | 7.5 | | |
| | | | Total Mutual Funds
(Cost $17,484,027) | | | | | 17,386,168 | | | | | | 81.0 | | |
| | | | Total Investments in
Securities
(Cost $21,241,710) | | | | $ | 21,417,716 | | | | | | 99.8 | | |
| | | | Assets in Excess of Other
Liabilities | | | | | 42,241 | | | | | | 0.2 | | |
| | | | Net Assets | | | | $ | 21,459,957 | | | | | | 100.0 | | |
| |
Fair Value Measurements^
The following is a summary of the fair valuations according to the inputs used as of December 31, 2019 in valuing the assets and liabilities:
| | | | Quoted Prices
in Active Markets
for Identical
Investments
(Level 1) | | | Significant
Other
Observable
Inputs
(Level 2) | | | Significant
Unobservable
Inputs
(Level 3) | | | Fair Value
at
December 31, 2019 | |
| Asset Table | | | | | | | | | | | | | | | | | | | | | | | | | |
| Investments, at fair value | | | | | | | | | | | | | | | | | | | | | | | | | |
| Exchange-Traded Funds | | | | $ | 4,031,548 | | | | | $ | — | | | | | $ | — | | | | | $ | 4,031,548 | | |
| Mutual Funds | | | | | 17,386,168 | | | | | | — | | | | | | — | | | | | | 17,386,168 | | |
| Total Investments, at fair value | | | | $ | 21,417,716 | | | | | $ | — | | | | | $ | — | | | | | $ | 21,417,716 | | |
^
See Note 2, “Significant Accounting Policies” in the Notes to Financial Statements for additional information.
See Accompanying Notes to Financial Statements
PORTFOLIO OF INVESTMENTS
| Voya Solution Aggressive Portfolio | as of December 31, 2019 (continued) |
Transactions with Affiliates
An investment of at least 5% of the voting securities of an issuer, or a company which is under common control results in that issuer becoming an affiliated person as defined by the 1940 Act.
The following table provides transactions during the year ended December 31, 2019, where the following issuers were considered an affiliate:
| Issuer | | | Beginning
Fair Value
at 12/31/18 | | | Purchases
at Cost | | | Sales
at Cost | | | Change in
Unrealized
Appreciation/
(Depreciation) | | | Ending
Fair Value
at 12/31/2019 | | | Investment
Income | | | Realized
Gains/
(Losses) | | | Net Capital
Gain
Distributions | |
| Voya Emerging Markets Index Portfolio - Class I | | | | $ | 144,370 | | | | | $ | 39,530 | | | | | $ | (185,858) | | | | | $ | 1,958 | | | | | $ | — | | | | | $ | — | | | | | $ | 15,743 | | | | | $ | — | | |
| Voya Index Plus LargeCap Portfolio - Class I | | | | | 1,092,846 | | | | | | 471,431 | | | | | | (908,318) | | | | | | 201,983 | | | | | | 857,942 | | | | | | 12,088 | | | | | | 4,900 | | | | | | 66,549 | | |
| Voya Intermediate Bond Fund - Class R6 | | | | | 146,293 | | | | | | 492,194 | | | | | | (638,773) | | | | | | 286 | | | | | | — | | | | | | 4,478 | | | | | | 7,849 | | | | | | — | | |
| Voya International Index Portfolio - Class I | | | | | 797,012 | | | | | | 218,303 | | | | | | (1,141,320) | | | | | | 126,005 | | | | | | — | | | | | | — | | | | | | (35,959) | | | | | | — | | |
| Voya Large Cap Value Fund - Class R6 | | | | | 365,899 | | | | | | 219,474 | | | | | | (646,981) | | | | | | 61,608 | | | | | | — | | | | | | 2,288 | | | | | | (8,849) | | | | | | — | | |
| Voya Large-Cap Growth Fund - Class R6 | | | | | 801,846 | | | | | | 479,668 | | | | | | (960,691) | | | | | | 215,754 | | | | | | 536,577 | | | | | | 3,245 | | | | | | (21,820) | | | | | | 19,292 | | |
| Voya MidCap Opportunities Portfolio - Class I | | | | | 657,178 | | | | | | 314,513 | | | | | | (542,680) | | | | | | 100,057 | | | | | | 529,068 | | | | | | 1,602 | | | | | | 13,998 | | | | | | 58,485 | | |
| Voya Multi-Manager Emerging Markets Equity Fund - Class I | | | | | 871,152 | | | | | | 787,468 | | | | | | (605,506) | | | | | | 262,668 | | | | | | 1,315,782 | | | | | | 21,369 | | | | | | (62,931) | | | | | | 6,605 | | |
| Voya Multi-Manager International Equity Fund - Class I | | | | | 1,306,114 | | | | | | 926,035 | | | | | | (386,607) | | | | | | 320,645 | | | | | | 2,166,187 | | | | | | 41,385 | | | | | | (1,521) | | | | | | — | | |
| Voya Multi-Manager International Factors Fund - Class I | | | | | 796,941 | | | | | | 428,176 | | | | | | (275,732) | | | | | | 122,123 | | | | | | 1,071,508 | | | | | | 32,935 | | | | | | (3,621) | | | | | | — | | |
| Voya Multi-Manager Mid Cap Value Fund - Class I | | | | | 1,018,729 | | | | | | 602,502 | | | | | | (470,555) | | | | | | 232,268 | | | | | | 1,382,944 | | | | | | 15,392 | | | | | | (62,305) | | | | | | 112,482 | | |
| Voya RussellTM Mid Cap Growth Index Portfolio - Class I | | | | | 364,843 | | | | | | 98,721 | | | | | | (494,268) | | | | | | 30,704 | | | | | | — | | | | | | — | | | | | | 62,499 | | | | | | — | | |
| Voya Short Term Bond Fund - Class R6 | | | | | — | | | | | | 758,925 | | | | | | (654,578) | | | | | | 91 | | | | | | 104,438 | | | | | | 4,147 | | | | | | 3,071 | | | | | | — | | |
| Voya Small Company Portfolio - Class I | | | | | 1,019,831 | | | | | | 451,245 | | | | | | (1,112,129) | | | | | | 282,933 | | | | | | 641,880 | | | | | | 2,397 | | | | | | (129,062) | | | | | | 80,639 | | |
| Voya U.S. Bond Index Portfolio - Class I | | | | | 289,975 | | | | | | 330,865 | | | | | | (615,944) | | | | | | (4,896) | | | | | | — | | | | | | 2,762 | | | | | | 12,042 | | | | | | — | | |
| Voya U.S. High Dividend Low Volatility Fund - Class I | | | | | 364,035 | | | | | | 694,525 | | | | | | (1,092,838) | | | | | | 34,278 | | | | | | — | | | | | | 8,320 | | | | | | 6,321 | | | | | | — | | |
| Voya U.S. High Dividend Low Volatility Fund - Class R6 | | | | | — | | | | | | 1,026,119 | | | | | | (226,088) | | | | | | 53,428 | | | | | | 853,459 | | | | | | 10,791 | | | | | | 20,655 | | | | | | 9,262 | | |
| Voya U.S. Stock Index Portfolio - Class I | | | | | 1,110,696 | | | | | | 2,043,746 | | | | | | (1,677,463) | | | | | | 246,048 | | | | | | 1,723,027 | | | | | | 27,430 | | | | | | 1,556 | | | | | | 123,797 | | |
| VY® Invesco Comstock Portfolio - Class I | | | | | 1,109,150 | | | | | | 1,010,875 | | | | | | (455,131) | | | | | | (49,024) | | | | | | 1,615,870 | | | | | | 38,997 | | | | | | 11,618 | | | | | | 307,261 | | |
VY® JPMorgan Small Cap Core Equity Portfolio - Class I | | | | | — | | | | | | 1,413,829 | | | | | | (175,973) | | | | | | (170,493) | | | | | | 1,067,363 | | | | | | 20,101 | | | | | | (36,626) | | | | | | 256,474 | | |
VY® T. Rowe Price Capital Appreciation Portfolio - Class I | | | | | — | | | | | | 1,217,969 | | | | | | (179,463) | | | | | | 26,295 | | | | | | 1,064,801 | | | | | | 17,338 | | | | | | (1,526) | | | | | | 51,407 | | |
VY® T. Rowe Price Diversified Mid Cap Growth Portfolio - Class I | | | | | — | | | | | | 980,505 | | | | | | (134,851) | | | | | | 5,006 | | | | | | 850,660 | | | | | | 2,280 | | | | | | (3,505) | | | | | | 78,620 | | |
| VY® T. Rowe Price Growth Equity Portfolio - Class I | | | | | 1,093,166 | | | | | | 812,512 | | | | | | (366,453) | | | | | | 65,437 | | | | | | 1,604,662 | | | | | | 2,773 | | | | | | (25,823) | | | | | | 320,303 | | |
| | | | | $ | 13,350,076 | | | | | $ | 15,819,130 | | | | | $ | (13,948,200) | | | | | $ | 2,165,162 | | | | | $ | 17,386,168 | | | | | $ | 272,118 | | | | | $ | (233,296) | | | | | $ | 1,491,176 | | |
The financial statements for the above mutual fund[s] can be found at www.sec.gov.
At December 31, 2019, the aggregate cost of securities and other investments and the composition of unrealized appreciation and depreciation of securities and other investments at year end were:
| | Cost for federal income tax purposes was $21,750,966. | | |
| | Net unrealized depreciation consisted of: | | |
| | Gross Unrealized Appreciation | | | | $ | 770,080 | | |
| | Gross Unrealized Depreciation | | | | | (1,103,330) | | |
| | Net Unrealized Depreciation | | | | $ | (333,250) | | |
See Accompanying Notes to Financial Statements
PORTFOLIO OF INVESTMENTS
| Voya Solution Balanced Portfolio | as of December 31, 2019 |
| Shares | | | Value | | | Percentage
of Net
Assets | |
| EXCHANGE-TRADED FUNDS: 19.6% | |
| 8,238 | | | iShares 20+ Year Treasury
Bond ETF | | | | $ | 1,116,084 | | | | | | 2.0 | | |
| 17,578 | | | iShares Core MSCI EAFE ETF | | | | | 1,146,789 | | | | | | 2.0 | | |
| 7,045 | | | iShares Core S&P Small-Cap
ETF | | | | | 590,723 | | | | | | 1.1 | | |
| 20,336 | | | Schwab U.S. TIPS ETF | | | | | 1,151,628 | | | | | | 2.0 | | |
| 9,550 | | | Vanguard Global ex-U.S. Real
Estate ETF | | | | | 564,310 | | | | | | 1.0 | | |
| 6,293 | | | Vanguard Real Estate ETF | | | | | 583,927 | | | | | | 1.0 | | |
| 12,581 | | | Vanguard Russell 1000 Growth
ETF | | | | | 2,276,280 | | | | | | 4.0 | | |
| 30,614 | | | Vanguard Value ETF | | | | | 3,669,088 | | | | | | 6.5 | | |
| | | | Total Exchange-Traded Funds
(Cost $10,444,404) | | | | | 11,098,829 | | | | | | 19.6 | | |
| MUTUAL FUNDS: 80.3% | |
| | | | Affiliated Investment Companies: 80.3% | |
| 178,316 | | | Voya Floating Rate Fund -
Class I | | | | | 1,693,999 | | | | | | 3.0 | | |
| 281,252 | | | Voya High Yield Bond Fund -
Class R6 | | | | | 2,264,077 | | | | | | 4.0 | | |
| 261,182 | | | Voya Intermediate Bond Fund -
Class R6 | | | | | 2,705,850 | | | | | | 4.8 | | |
| 134,351 | | | Voya Large Cap Value Fund -
Class R6 | | | | | 1,699,537 | | | | | | 3.0 | | |
| 56,423 | | | Voya Large-Cap Growth Fund -
Class R6 | | | | | 2,715,638 | | | | | | 4.8 | | |
| 80,577 | | | Voya MidCap Opportunities
Portfolio - Class I | | | | | 1,121,635 | | | | | | 2.0 | | |
| 179,755 | | | Voya Multi-Manager Emerging
Markets Equity Fund - Class I | | | | | 2,326,030 | | | | | | 4.1 | | |
| 178,516 | | | Voya Multi-Manager
International Equity Fund -
Class I | | | | | 2,127,916 | | | | | | 3.8 | | |
| Shares | | | Value | | | Percentage
of Net
Assets | |
| MUTUAL FUNDS: (continued) | |
| | | | Affiliated Investment Companies (continued) | |
| 216,811 | | | Voya Multi-Manager
International Factors Fund -
Class I | | | | $ | 2,105,232 | | | | | | 3.7 | | |
| 114,996 | | | Voya Multi-Manager Mid Cap
Value Fund - Class I | | | | | 1,128,106 | | | | | | 2.0 | | |
| 283,509 | | | Voya Short Term Bond Fund -
Class R6 | | | | | 2,795,398 | | | | | | 4.9 | | |
| 81,712 | | | Voya Small Company
Portfolio - Class I | | | | | 1,392,381 | | | | | | 2.5 | | |
| 216,605 | | | Voya Strategic Income
Opportunities Fund - Class R6 | | | | | 2,233,199 | | | | | | 4.0 | | |
| 244,609 | | | Voya U.S. High Dividend Low
Volatility Fund - Class R6 | | | | | 3,084,518 | | | | | | 5.5 | | |
| 151,247 | | | Voya U.S. Stock Index
Portfolio - Class I | | | | | 2,569,693 | | | | | | 4.5 | | |
| 265,109 | | | VY® BrandywineGLOBAL -
Bond Portfolio - Class I | | | | | 2,786,294 | | | | | | 4.9 | | |
| 124,688 | | | VY® Invesco Comstock
Portfolio - Class I | | | | | 2,143,393 | | | | | | 3.8 | | |
| 191,968 | | | VY® T. Rowe Price Capital
Appreciation Portfolio - Class I | | | | | 5,645,771 | | | | | | 10.0 | | |
| 34,809 | | | VY® T. Rowe Price Growth
Equity Portfolio - Class I | | | | | 2,834,533 | | | | | | 5.0 | | |
| | | | Total Mutual Funds
(Cost $44,504,760) | | | | | 45,373,200 | | | | | | 80.3 | | |
| | | | Total Investments in
Securities
(Cost $54,949,164) | | | | $ | 56,472,029 | | | | | | 99.9 | | |
| | | | Assets in Excess of Other
Liabilities | | | | | 44,209 | | | | | | 0.1 | | |
| | | | Net Assets | | | | $ | 56,516,238 | | | | | | 100.0 | | |
| |
Fair Value Measurements^
The following is a summary of the fair valuations according to the inputs used as of December 31, 2019 in valuing the assets and liabilities:
| | | | Quoted Prices
in Active Markets
for Identical
Investments
(Level 1) | | | Significant
Other
Observable
Inputs
(Level 2) | | | Significant
Unobservable
Inputs
(Level 3) | | | Fair Value
at
December 31, 2019 | |
| Asset Table | | | | | |
| Investments, at fair value | | | | | |
| Exchange-Traded Funds | | | | $ | 11,098,829 | | | | | $ | — | | | | | $ | — | | | | | $ | 11,098,829 | | |
| Mutual Funds | | | | | 45,373,200 | | | | | | — | | | | | | — | | | | | | 45,373,200 | | |
| Total Investments, at fair value | | | | $ | 56,472,029 | | | | | $ | — | | | | | $ | — | | | | | $ | 56,472,029 | | |
^
See Note 2, “Significant Accounting Policies” in the Notes to Financial Statements for additional information.
See Accompanying Notes to Financial Statements
PORTFOLIO OF INVESTMENTS
| Voya Solution Balanced Portfolio | as of December 31, 2019 (continued) |
Transactions with Affiliates
An investment of at least 5% of the voting securities of an issuer, or a company which is under common control results in that issuer becoming an affiliated person as defined by the 1940 Act.
The following table provides transactions during the year ended December 31, 2019, where the following issuers were considered an affiliate:
| Issuer | | | Beginning
Fair Value
at 12/31/18 | | | Purchases
at Cost | | | Sales
at Cost | | | Change in
Unrealized
Appreciation/
(Depreciation) | | | Ending
Fair Value
at 12/31/2019 | | | Investment
Income | | | Realized
Gains/
(Losses) | | | Net Capital
Gain
Distributions | |
| Voya Emerging Markets Index Portfolio - Class I | | | | $ | 501,500 | | | | | $ | 59,383 | | | | | $ | (567,621) | | | | | $ | 6,738 | | | | | $ | — | | | | | $ | — | | | | | $ | 53,949 | | | | | $ | — | | |
| Voya Floating Rate Fund - Class I | | | | | 2,479,223 | | | | | | 646,035 | | | | | | (1,509,454) | | | | | | 78,195 | | | | | | 1,693,999 | | | | | | 93,030 | | | | | | (45,468) | | | | | | — | | |
| Voya High Yield Bond Fund - Class R6 | | | | | — | | | | | | 2,708,453 | | | | | | (474,053) | | | | | | 29,677 | | | | | | 2,264,077 | | | | | | 87,998 | | | | | | 602 | | | | | | — | | |
| Voya Intermediate Bond Fund - Class R6 | | | | | 4,943,107 | | | | | | 4,065,143 | | | | | | (6,459,404) | | | | | | 157,004 | | | | | | 2,705,850 | | | | | | 148,332 | | | | | | 112,901 | | | | | | 2,172 | | |
| Voya International Index Portfolio - Class I | | | | | 987,233 | | | | | | 112,730 | | | | | | (1,212,599) | | | | | | 112,636 | | | | | | — | | | | | | — | | | | | | (32,614) | | | | | | — | | |
| Voya Large Cap Value Fund - Class R6 | | | | | 1,468,991 | | | | | | 1,479,818 | | | | | | (1,574,006) | | | | | | 324,734 | | | | | | 1,699,537 | | | | | | 33,585 | | | | | | (92,357) | | | | | | 106,066 | | |
| Voya Large-Cap Growth Fund - Class R6 | | | | | 1,744,257 | | | | | | 1,599,540 | | | | | | (1,185,326) | | | | | | 557,167 | | | | | | 2,715,638 | | | | | | 16,074 | | | | | | (38,269) | | | | | | 95,575 | | |
| Voya MidCap Opportunities Portfolio - Class I | | | | | 998,375 | | | | | | 369,415 | | | | | | (388,372) | | | | | | 142,217 | | | | | | 1,121,635 | | | | | | 2,976 | | | | | | 6,489 | | | | | | 129,650 | | |
| Voya Multi-Manager Emerging Markets Equity Fund - Class I | | | | | 1,481,767 | | | | | | 2,054,476 | | | | | | (1,654,589) | | | | | | 444,376 | | | | | | 2,326,030 | | | | | | 38,048 | | | | | | (119,979) | | | | | | 11,766 | | |
| Voya Multi-Manager International Equity Fund - Class I | | | | | 2,232,440 | | | | | | 740,056 | | | | | | (1,251,657) | | | | | | 407,077 | | | | | | 2,127,916 | | | | | | 40,826 | | | | | | 47,758 | | | | | | — | | |
| Voya Multi-Manager International Factors Fund - Class I | | | | | 1,981,328 | | | | | | 703,038 | | | | | | (890,269) | | | | | | 311,135 | | | | | | 2,105,232 | | | | | | 65,014 | | | | | | (32,666) | | | | | | — | | |
| Voya Multi-Manager Mid Cap Value Fund - Class I | | | | | 994,894 | | | | | | 414,191 | | | | | | (527,388) | | | | | | 246,409 | | | | | | 1,128,106 | | | | | | 12,654 | | | | | | (79,372) | | | | | | 92,474 | | |
| Voya Short Term Bond Fund - Class R6 | | | | | 972,495 | | | | | | 2,729,861 | | | | | | (948,011) | | | | | | 41,053 | | | | | | 2,795,398 | | | | | | 55,717 | | | | | | (348) | | | | | | — | | |
| Voya Small Company Portfolio - Class I | | | | | 1,992,070 | | | | | | 683,472 | | | | | | (1,866,147) | | | | | | 582,986 | | | | | | 1,392,381 | | | | | | 5,593 | | | | | | (317,056) | | | | | | 188,116 | | |
| Voya Strategic Income Opportunities Fund - Class R6 | | | | | — | | | | | | 2,707,798 | | | | | | (492,844) | | | | | | 18,245 | | | | | | 2,233,199 | | | | | | 69,811 | | | | | | 3,463 | | | | | | — | | |
| Voya U.S. Bond Index Portfolio - Class I | | | | | 3,717,329 | | | | | | 1,288,476 | | | | | | (5,030,276) | | | | | | 24,471 | | | | | | — | | | | | | 29,644 | | | | | | 53,246 | | | | | | — | | |
| Voya U.S. High Dividend Low Volatility Fund - Class I | | | | | 1,742,179 | | | | | | 1,659,790 | | | | | | (3,557,718) | | | | | | 155,749 | | | | | | — | | | | | | 27,605 | | | | | | 22,069 | | | | | | — | | |
| Voya U.S. High Dividend Low Volatility Fund - Class R6 | | | | | — | | | | | | 3,136,734 | | | | | | (283,976) | | | | | | 231,760 | | | | | | 3,084,518 | | | | | | 36,161 | | | | | | 29,781 | | | | | | 33,820 | | |
| Voya U.S. Stock Index Portfolio - Class I | | | | | 3,021,068 | | | | | | 3,866,564 | | | | | | (4,904,311) | | | | | | 586,372 | | | | | | 2,569,693 | | | | | | 43,275 | | | | | | (19,145) | | | | | | 234,000 | | |
| VY® Goldman Sachs Bond Portfolio - Class I | | | | | 2,223,660 | | | | | | 1,287,882 | | | | | | (917,606) | | | | | | 192,358 | | | | | | 2,786,294 | | | | | | 53,796 | | | | | | 7,499 | | | | | | — | | |
| VY® Invesco Comstock Portfolio - Class I | | | | | 3,033,155 | | | | | | 1,226,792 | | | | | | (2,157,004) | | | | | | 40,450 | | | | | | 2,143,393 | | | | | | 54,456 | | | | | | 131,577 | | | | | | 432,597 | | |
VY® T. Rowe Price Capital Appreciation Portfolio - Class I | | | | | 5,086,070 | | | | | | 1,571,707 | | | | | | (1,687,962) | | | | | | 675,956 | | | | | | 5,645,771 | | | | | | 92,606 | | | | | | 152,711 | | | | | | 285,026 | | |
| VY® T. Rowe Price Growth Equity Portfolio - Class I | | | | | 2,491,206 | | | | | | 1,235,076 | | | | | | (1,059,484) | | | | | | 167,735 | | | | | | 2,834,533 | | | | | | 5,198 | | | | | | (26,083) | | | | | | 594,441 | | |
| | | | | $ | 44,092,347 | | | | | $ | 36,346,430 | | | | | $ | (40,600,077) | | | | | $ | 5,534,500 | | | | | $ | 45,373,200 | | | | | $ | 1,012,399 | | | | | $ | (181,312) | | | | | $ | 2,205,703 | | |
The financial statements for the above mutual fund[s] can be found at www.sec.gov.
At December 31, 2019, the aggregate cost of securities and other investments and the composition of unrealized appreciation and depreciation of securities and other investments at year end were:
| | Cost for federal income tax purposes was $56,304,591. | | |
| | Net unrealized appreciation consisted of: | | |
| | Gross Unrealized Appreciation | | | | $ | 2,210,086 | | |
| | Gross Unrealized Depreciation | | | | | (2,042,649) | | |
| | Net Unrealized Appreciation | | | | $ | 167,437 | | |
See Accompanying Notes to Financial Statements
PORTFOLIO OF INVESTMENTS
| Voya Solution Conservative Portfolio | as of December 31, 2019 |
| Shares | | | Value | | | Percentage
of Net
Assets | |
| EXCHANGE-TRADED FUNDS: 12.7% | |
| 2,671 | | | iShares 20+ Year Treasury
Bond ETF | | | | $ | 361,867 | | | | | | 2.0 | | |
| 5,823 | | | iShares Core MSCI EAFE ETF | | | | | 379,892 | | | | | | 2.2 | | |
| 2,284 | | | iShares Core S&P Small-Cap
ETF | | | | | 191,513 | | | | | | 1.1 | | |
| 23,074 | | | Schwab U.S. TIPS ETF | | | | | 1,306,681 | | | | | | 7.4 | | |
| | | | Total Exchange-Traded Funds
(Cost $2,171,547) | | | | | 2,239,953 | | | | | | 12.7 | | |
| MUTUAL FUNDS: 87.2% | |
| | | | Affiliated Investment Companies: 87.2% | |
| 93,455 | | | Voya Floating Rate Fund -
Class I | | | | | 887,819 | | | | | | 5.1 | | |
| 91,244 | | | Voya Global Bond Fund -
Class R6 | | | | | 878,684 | | | | | | 5.0 | | |
| 132,685 | | | Voya High Yield Bond Fund -
Class R6 | | | | | 1,068,112 | | | | | | 6.1 | | |
| 164,328 | | | Voya Intermediate Bond Fund -
Class R6 | | | | | 1,702,438 | | | | | | 9.7 | | |
| 38,878 | | | Voya Large Cap Value Fund -
Class R6 | | | | | 491,805 | | | | | | 2.8 | | |
| 12,116 | | | Voya Large-Cap Growth Fund -
Class R6 | | | | | 583,158 | | | | | | 3.3 | | |
| 12,669 | | | Voya MidCap Opportunities
Portfolio - Class I | | | | | 176,358 | | | | | | 1.0 | | |
| 28,290 | | | Voya Multi-Manager Emerging
Markets Equity Fund - Class I | | | | | 366,069 | | | | | | 2.1 | | |
| 33,969 | | | Voya Multi-Manager
International Factors Fund -
Class I | | | | | 329,836 | | | | | | 1.9 | | |
| Shares | | | Value | | | Percentage
of Net
Assets | |
| MUTUAL FUNDS: (continued) | |
| | | | Affiliated Investment Companies (continued) | |
| 18,077 | | | Voya Multi-Manager Mid Cap
Value Fund - Class I | | | | $ | 177,335 | | | | | | 1.0 | | |
| 344,974 | | | Voya Short Term Bond Fund -
Class R6 | | | | | 3,401,447 | | | | | | 19.3 | | |
| 127,665 | | | Voya Strategic Income
Opportunities Fund - Class R6 | | | | | 1,316,230 | | | | | | 7.5 | | |
| 42,304 | | | Voya U.S. High Dividend Low
Volatility Fund - Class R6 | | | | | 533,457 | | | | | | 3.0 | | |
| 9,759 | | | Voya U.S. Stock Index
Portfolio - Class I | | | | | 165,813 | | | | | | 0.9 | | |
| 140,590 | | | VY® BrandywineGLOBAL -
Bond Portfolio - Class I | | | | | 1,477,599 | | | | | | 8.4 | | |
| 60,364 | | | VY® T. Rowe Price Capital
Appreciation Portfolio - Class I | | | | | 1,775,291 | | | | | | 10.1 | | |
| | | | Total Mutual Funds
(Cost $14,914,067) | | | | | 15,331,451 | | | | | | 87.2 | | |
| | | | Total Investments in
Securities
(Cost $17,085,614) | | | | $ | 17,571,404 | | | | | | 99.9 | | |
| | | | Assets in Excess of Other
Liabilities | | | | | 19,898 | | | | | | 0.1 | | |
| | | | Net Assets | | | | $ | 17,591,302 | | | | | | 100.0 | | |
| |
Fair Value Measurements^
The following is a summary of the fair valuations according to the inputs used as of December 31, 2019 in valuing the assets and liabilities:
| | | | Quoted Prices
in Active Markets
for Identical
Investments
(Level 1) | | | Significant
Other
Observable
Inputs
(Level 2) | | | Significant
Unobservable
Inputs
(Level 3) | | | Fair Value
at
December 31, 2019 | |
| Asset Table | | | | | |
| Investments, at fair value | | | | | |
| Exchange-Traded Funds | | | | $ | 2,239,953 | | | | | $ | — | | | | | $ | — | | | | | $ | 2,239,953 | | |
| Mutual Funds | | | | | 15,331,451 | | | | | | — | | | | | | — | | | | | | 15,331,451 | | |
| Total Investments, at fair value | | | | $ | 17,571,404 | | | | | $ | — | | | | | $ | — | | | | | $ | 17,571,404 | | |
^
See Note 2, “Significant Accounting Policies” in the Notes to Financial Statements for additional information.
See Accompanying Notes to Financial Statements
PORTFOLIO OF INVESTMENTS
| Voya Solution Conservative Portfolio | as of December 31, 2019 (continued) |
Transactions with Affiliates
An investment of at least 5% of the voting securities of an issuer, or a company which is under common control results in that issuer becoming an affiliated person as defined by the 1940 Act.
The following table provides transactions during the year ended December 31, 2019, where the following issuers were considered an affiliate:
| Issuer | | | Beginning
Fair Value
at 12/31/18 | | | Purchases
at Cost | | | Sales
at Cost | | | Change in
Unrealized
Appreciation/
(Depreciation) | | | Ending
Fair Value
at 12/31/2019 | | | Investment
Income | | | Realized
Gains/
(Losses) | | | Net Capital
Gain
Distributions | |
| Voya Floating Rate Fund - Class I | | | | $ | 1,200,592 | | | | | $ | 310,776 | | | | | | (656,020) | | | | | $ | 32,471 | | | | | $ | 887,819 | | | | | $ | 51,999 | | | | | $ | (18,513) | | | | | $ | — | | |
| Voya Global Bond Fund - Class R6 | | | | | 515,446 | | | | | | 609,014 | | | | | | (267,431) | | | | | | 21,655 | | | | | | 878,684 | | | | | | 34,252 | | | | | | 5,738 | | | | | | — | | |
| Voya High Yield Bond Fund - Class R6 | | | | | — | | | | | | 1,306,837 | | | | | | (252,894) | | | | | | 14,169 | | | | | | 1,068,112 | | | | | | 44,686 | | | | | | 1,438 | | | | | | — | | |
| Voya Intermediate Bond Fund - Class R6 | | | | | 2,143,245 | | | | | | 1,633,707 | | | | | | (2,151,979) | | | | | | 77,465 | | | | | | 1,702,438 | | | | | | 81,107 | | | | | | 66,205 | | | | | | 1,541 | | |
| Voya International Index Portfolio - Class I | | | | | 171,329 | | | | | | 3,587 | | | | | | (196,413) | | | | | | 21,497 | | | | | | — | | | | | | — | | | | | | (14,432) | | | | | | — | | |
| Voya Large Cap Value Fund - Class R6 | | | | | 603,247 | | | | | | 191,376 | | | | | | (416,978) | | | | | | 114,160 | | | | | | 491,805 | | | | | | 11,206 | | | | | | (26,846) | | | | | | 35,296 | | |
| Voya Large-Cap Growth Fund - Class R6 | | | | | 430,970 | | | | | | 274,125 | | | | | | (255,915) | | | | | | 133,978 | | | | | | 583,158 | | | | | | 3,775 | | | | | | (7,588) | | | | | | 22,444 | | |
| Voya MidCap Opportunities Portfolio - Class I | | | | | 172,651 | | | | | | 66,827 | | | | | | (90,426) | | | | | | 27,306 | | | | | | 176,358 | | | | | | 517 | | | | | | (1,480) | | | | | | 22,351 | | |
| Voya Multi-Manager Emerging Markets Equity Fund - Class I | | | | | 257,428 | | | | | | 386,377 | | | | | | (315,371) | | | | | | 37,635 | | | | | | 366,069 | | | | | | 6,301 | | | | | | 17,194 | | | | | | 1,949 | | |
| Voya Multi-Manager International Factors Fund - Class I | | | | | 342,753 | | | | | | 131,110 | | | | | | (217,653) | | | | | | 73,626 | | | | | | 329,836 | | | | | | 11,478 | | | | | | (23,928) | | | | | | — | | |
| Voya Multi-Manager Mid Cap Value Fund - Class I | | | | | 172,067 | | | | | | 76,451 | | | | | | (121,134) | | | | | | 49,951 | | | | | | 177,335 | | | | | | 2,097 | | | | | | (20,074) | | | | | | 15,327 | | |
| Voya Short Term Bond Fund - Class R6 | | | | | 3,431,310 | | | | | | 1,149,422 | | | | | | (1,262,678) | | | | | | 83,393 | | | | | | 3,401,447 | | | | | | 89,766 | | | | | | (3,606) | | | | | | — | | |
| Voya Strategic Income Opportunities Fund - Class R6 | | | | | — | | | | | | 1,629,178 | | | | | | (324,002) | | | | | | 11,054 | | | | | | 1,316,230 | | | | | | 44,317 | | | | | | 2,898 | | | | | | — | | |
| Voya U.S. Bond Index Portfolio - Class I | | | | | 1,972,431 | | | | | | 612,869 | | | | | | (2,610,391) | | | | | | 25,091 | | | | | | — | | | | | | 15,834 | | | | | | 16,815 | | | | | | — | | |
| Voya U.S. High Dividend Low Volatility Fund - Class I | | | | | — | | | | | | 636,374 | | | | | | (636,374) | | | | | | — | | | | | | — | | | | | | 3,740 | | | | | | 905 | | | | | | — | | |
| Voya U.S. High Dividend Low Volatility Fund - Class R6 | | | | | — | | | | | | 599,437 | | | | | | (96,233) | | | | | | 30,253 | | | | | | 533,457 | | | | | | 6,673 | | | | | | 5,113 | | | | | | 6,160 | | |
| Voya U.S. Stock Index Portfolio - Class I | | | | | 525,021 | | | | | | 1,127,320 | | | | | | (1,559,233) | | | | | | 72,705 | | | | | | 165,813 | | | | | | 4,337 | | | | | | 19,917 | | | | | | 42,074 | | |
| VY® Goldman Sachs Bond Portfolio - Class I | | | | | 1,624,256 | | | | | | 450,609 | | | | | | (710,258) | | | | | | 112,992 | | | | | | 1,477,599 | | | | | | 30,815 | | | | | | 17,514 | | | | | | — | | |
VY® T. Rowe Price Capital Appreciation Portfolio - Class I | | | | | 1,318,352 | | | | | | 925,364 | | | | | | (644,714) | | | | | | 176,289 | | | | | | 1,775,291 | | | | | | 30,637 | | | | | | 54,155 | | | | | | 96,070 | | |
| | | | | $ | 14,881,098 | | | | | $ | 12,120,760 | | | | | $ | (12,786,097) | | | | | $ | 1,115,690 | | | | | $ | 15,331,451 | | | | | $ | 473,537 | | | | | $ | 91,425 | | | | | $ | 243,212 | | |
The financial statements for the above mutual fund[s] can be found at www.sec.gov.
At December 31, 2019, the aggregate cost of securities and other investments and the composition of unrealized appreciation and depreciation of securities and other investments at year end were:
| | Cost for federal income tax purposes was $17,373,779. | | |
| | Net unrealized appreciation consisted of: | | |
| | Gross Unrealized Appreciation | | | | $ | 519,789 | | |
| | Gross Unrealized Depreciation | | | | | (322,164) | | |
| | Net Unrealized Appreciation | | | | $ | 197,625 | | |
See Accompanying Notes to Financial Statements
PORTFOLIO OF INVESTMENTS
| Voya Solution Income Portfolio | as of December 31, 2019 |
| Shares | | | Value | | | Percentage
of Net
Assets | |
| EXCHANGE-TRADED FUNDS: 8.3% | |
| 407,866 | | | Schwab U.S. TIPS ETF | | | | $ | 23,097,451 | | | | | | 7.0 | | |
| 45,077 | | | Vanguard Real Estate ETF | | | | | 4,182,695 | | | | | | 1.3 | | |
| | | | Total Exchange-Traded Funds
(Cost $25,567,556) | | | | | 27,280,146 | | | | | | 8.3 | | |
| MUTUAL FUNDS: 91.5% | |
| | | | Affiliated Investment Companies: 91.5% | |
| 1,051,104 | | | Voya Floating Rate Fund -
Class I | | | | | 9,985,490 | | | | | | 3.0 | | |
| 1,026,707 | | | Voya Global Bond Fund -
Class R6 | | | | | 9,887,192 | | | | | | 3.0 | | |
| 6,107,195 | | | Voya Intermediate Bond
Fund - Class R6 | | | | | 63,270,541 | | | | | | 19.1 | | |
| 794,901 | | | Voya Large Cap Value
Fund - Class R6 | | | | | 10,055,500 | | | | | | 3.0 | | |
| 401,707 | | | Voya Large-Cap Growth
Fund - Class R6 | | | | | 19,334,143 | | | | | | 5.8 | | |
| 529,651 | | | Voya Multi-Manager Emerging
Markets Equity Fund - Class I | | | | | 6,853,688 | | | | | | 2.1 | | |
| 2,420,745 | | | Voya Multi-Manager
International Factors
Fund - Class I | | | | | 23,505,434 | | | | | | 7.1 | | |
| 4,646,700 | | | Voya Short Term Bond
Fund - Class R6 | | | | | 45,816,462 | | | | | | 13.9 | | |
| 1,756,201 | | | Voya Strategic Income
Opportunities Fund -
Class R6 | | | | | 18,106,437 | | | | | | 5.5 | | |
| Shares | | | Value | | | Percentage
of Net
Assets | |
| MUTUAL FUNDS: (continued) | |
| | | | Affiliated Investment Companies (continued) | |
| 748,026 | | | Voya U.S. Bond Index
Portfolio - Class I | | | | $ | 8,153,488 | | | | | | 2.5 | | |
| 919,881 | | | Voya U.S. High Dividend Low
Volatility Fund - Class R6 | | | | | 11,599,694 | | | | | | 3.5 | | |
| 492,100 | | | Voya U.S. Stock Index
Portfolio - Class I | | | | | 8,360,787 | | | | | | 2.5 | | |
| 3,259,003 | | | VY® BrandywineGLOBAL -
Bond Portfolio - Class I | | | | | 34,252,124 | | | | | | 10.4 | | |
| 1,131,667 | | | VY® T. Rowe Price Capital
Appreciation Portfolio -
Class I | | | | | 33,282,338 | | | | | | 10.1 | | |
| | | | Total Mutual Funds
(Cost $291,659,501) | | | | | 302,463,318 | | | | | | 91.5 | | |
| | | | Total Investments in
Securities
(Cost $317,227,057) | | | | $ | 329,743,464 | | | | | | 99.8 | | |
| | | | Assets in Excess of
Other Liabilities | | | | | 625,859 | | | | | | 0.2 | | |
| | | | Net Assets | | | | $ | 330,369,323 | | | | | | 100.0 | | |
| |
Fair Value Measurements^
The following is a summary of the fair valuations according to the inputs used as of December 31, 2019 in valuing the assets and liabilities:
| | | | Quoted Prices
in Active Markets
for Identical
Investments
(Level 1) | | | Significant
Other
Observable
Inputs
(Level 2) | | | Significant
Unobservable
Inputs
(Level 3) | | | Fair Value
at
December 31, 2019 | |
| Asset Table | | | | | |
| Investments, at fair value | | | | | |
| Exchange-Traded Funds | | | | $ | 27,280,146 | | | | | $ | — | | | | | $ | — | | | | | $ | 27,280,146 | | |
| Mutual Funds | | | | | 302,463,318 | | | | | | — | | | | | | — | | | | | | 302,463,318 | | |
| Total Investments, at fair value | | | | $ | 329,743,464 | | | | | $ | — | | | | | $ | — | | | | | $ | 329,743,464 | | |
| Other Financial Instruments+ | | | | | |
| Futures | | | | | 118,217 | | | | | | — | | | | | | — | | | | | | 118,217 | | |
| Total Assets | | | | $ | 329,861,681 | | | | | $ | — | | | | | $ | — | | | | | $ | 329,861,681 | | |
| Liabilities Table | | | | | |
| Other Financial Instruments+ | | | | | |
| Futures | | | | $ | (202,410) | | | | | $ | — | | | | | $ | — | | | | | $ | (202,410) | | |
| Total Liabilities | | | | $ | (202,410) | | | | | $ | — | | | | | $ | — | | | | | $ | (202,410) | | |
^
See Note 2, “Significant Accounting Policies” in the Notes to Financial Statements for additional information.
+
Other Financial Instruments may include open forward foreign currency contracts, futures, centrally cleared swaps, OTC swaps and written options. Forward foreign currency contracts, futures and centrally cleared swaps are valued at the unrealized gain (loss) on the instrument. OTC swaps and written options are valued at the fair value of the instrument.
See Accompanying Notes to Financial Statements
PORTFOLIO OF INVESTMENTS
| Voya Solution Income Portfolio | as of December 31, 2019 (continued) |
At December 31, 2019, the following futures contracts were outstanding for Voya Solution Income Portfolio:
| Description | | | Number of
Contracts | | | Expiration
Date | | | Notional
Value | | | Unrealized
Appreciation/
(Depreciation) | |
| Long Contracts: | | | | | |
| E-mini Russell 2000® Index | | | | | 41 | | | | | | 03/20/20 | | | | | $ | 3,424,730 | | | | | $ | 53,427 | | |
| U.S. Treasury Ultra Long Bond | | | | | 35 | | | | | | 03/20/20 | | | | | | 6,357,969 | | | | | | (202,410) | | |
| | | | | | | | | | | | | | | | | $ | 9,782,699 | | | | | $ | (148,983) | | |
| Short Contracts: | | | | | |
| Mini MSCI EAFE Index | | | | | (33) | | | | | | 03/20/20 | | | | | | (3,360,225) | | | | | | 7,910 | | |
| U.S. Treasury 10-Year Note | | | | | (51) | | | | | | 03/20/20 | | | | | | (6,549,516) | | | | | | 56,880 | | |
| | | | | | | | | | | | | | | | | $ | (9,909,741) | | | | | $ | 64,790 | | |
Transactions with Affiliates
An investment of at least 5% of the voting securities of an issuer, or a company which is under common control results in that issuer becoming an affiliated person as defined by the 1940 Act.
The following table provides transactions during the year ended December 31, 2019, where the following issuers were considered an affiliate:
| Issuer | | | Beginning
Fair Value
at 12/31/18 | | | Purchases
at Cost | | | Sales
at Cost | | | Change in
Unrealized
Appreciation/
(Depreciation) | | | Ending
Fair Value
at 12/31/2019 | | | Investment
Income | | | Realized
Gains/
(Losses) | | | Net Capital
Gain
Distributions | |
| Voya Floating Rate Fund - Class I | | | | $ | 17,364,349 | | | | | $ | 1,393,117 | | | | | $ | (9,540,099) | | | | | $ | 768,123 | | | | | $ | 9,985,490 | | | | | $ | 580,436 | | | | | $ | (525,568) | | | | | $ | — | | |
| Voya Global Bond Fund - Class R6 | | | | | 10,436,997 | | | | | | 1,398,846 | | | | | | (2,179,053) | | | | | | 230,402 | | | | | | 9,887,192 | | | | | | 423,845 | | | | | | 88,216 | | | | | | 1 | | |
| Voya Intermediate Bond Fund - Class R6 | | | | | 41,653,488 | | | | | | 33,457,264 | | | | | | (14,802,951) | | | | | | 2,962,740 | | | | | | 63,270,541 | | | | | | 1,940,967 | | | | | | 208,860 | | | | | | 51,651 | | |
| Voya International Index Portfolio - Class I | | | | | 6,934,165 | | | | | | 15,487 | | | | | | (7,131,716) | | | | | | 182,064 | | | | | | — | | | | | | — | | | | | | 626,580 | | | | | | — | | |
| Voya Large Cap Value Fund - Class R6 | | | | | 13,956,462 | | | | | | 1,562,691 | | | | | | (7,724,190) | | | | | | 2,260,537 | | | | | | 10,055,500 | | | | | | 221,610 | | | | | | (372,370) | | | | | | 686,733 | | |
| Voya Large-Cap Growth Fund - Class R6 | | | | | 13,958,905 | | | | | | 6,904,054 | | | | | | (5,693,976) | | | | | | 4,165,160 | | | | | | 19,334,143 | | | | | | 119,100 | | | | | | (301,715) | | | | | | 708,171 | | |
| Voya MidCap Opportunities Portfolio - Class I | | | | | 3,495,513 | | | | | | 5,597 | | | | | | (3,617,546) | | | | | | 116,436 | | | | | | — | | | | | | 1,612 | | | | | | 406,745 | | | | | | — | | |
| Voya Multi-Manager Emerging Markets Equity Fund - Class I | | | | | 10,422,802 | | | | | | 1,204,387 | | | | | | (6,469,679) | | | | | | 1,696,178 | | | | | | 6,853,688 | | | | | | 112,412 | | | | | | 255,851 | | | | | | 34,768 | | |
| Voya Multi-Manager International Factors Fund - Class I | | | | | 17,346,411 | | | | | | 9,891,339 | | | | | | (6,107,524) | | | | | | 2,375,208 | | | | | | 23,505,434 | | | | | | 730,091 | | | | | | 210,055 | | | | | | — | | |
| Voya Multi-Manager Mid Cap Value Fund - Class I | | | | | 3,483,914 | | | | | | 3,985 | | | | | | (4,116,025) | | | | | | 628,126 | | | | | | — | | | | | | — | | | | | | (95,452) | | | | | | — | | |
| Voya Short Term Bond Fund - Class R6 | | | | | 34,725,373 | | | | | | 19,793,610 | | | | | | (9,748,120) | | | | | | 1,045,599 | | | | | | 45,816,462 | | | | | | 1,058,700 | | | | | | (171,682) | | | | | | — | | |
| Voya Strategic Income Opportunities Fund - Class R6 | | | | | — | | | | | | 27,652,908 | | | | | | (9,705,976) | | | | | | 159,505 | | | | | | 18,106,437 | | | | | | 773,309 | | | | | | 75,845 | | | | | | — | | |
| Voya U.S. Bond Index Portfolio - Class I | | | | | 50,293,766 | | | | | | 3,044,836 | | | | | | (46,700,108) | | | | | | 1,514,994 | | | | | | 8,153,488 | | | | | | 505,026 | | | | | | (254,018) | | | | | | — | | |
| Voya U.S. High Dividend Low Volatility Fund - Class I | | | | | 12,200,015 | | | | | | 961,586 | | | | | | (14,205,616) | | | | | | 1,044,015 | | | | | | — | | | | | | 126,569 | | | | | | 80,779 | | | | | | — | | |
| Voya U.S. High Dividend Low Volatility Fund - Class R6 | | | | | — | | | | | | 11,346,867 | | | | | | (929,375) | | | | | | 1,182,202 | | | | | | 11,599,694 | | | | | | 136,535 | | | | | | 88,122 | | | | | | 127,789 | | |
| Voya U.S. Stock Index Portfolio - Class I | | | | | 3,519,805 | | | | | | 7,815,548 | | | | | | (3,931,978) | | | | | | 957,412 | | | | | | 8,360,787 | | | | | | 126,297 | | | | | | 41,796 | | | | | | 464,250 | | |
| VY® Goldman Sachs Bond Portfolio - Class I | | | | | 36,341,907 | | | | | | 3,711,009 | | | | | | (8,458,429) | | | | | | 2,657,637 | | | | | | 34,252,124 | | | | | | 679,270 | | | | | | 141,022 | | | | | | — | | |
VY® T. Rowe Price Capital Appreciation Portfolio - Class I | | | | | 35,589,968 | | | | | | 3,199,936 | | | | | | (10,700,502) | | | | | | 5,192,936 | | | | | | 33,282,338 | | | | | | 548,945 | | | | | | 238,079 | | | | | | 1,714,124 | | |
| | | | | $ | 311,723,840 | | | | | $ | 133,363,067 | | | | | $ | (171,762,863) | | | | | $ | 29,139,274 | | | | | $ | 302,463,318 | | | | | $ | 8,084,724 | | | | | $ | 741,145 | | | | | $ | 3,787,487 | | |
The financial statements for the above mutual fund[s] can be found at www.sec.gov.
See Accompanying Notes to Financial Statements
PORTFOLIO OF INVESTMENTS
| Voya Solution Income Portfolio | as of December 31, 2019 (continued) |
A summary of derivative instruments by primary risk exposure is outlined in the following tables.
The fair value of derivative instruments as of December 31, 2019 was as follows:
| Derivatives not accounted for as hedging instruments | | | Location on Statement
of Assets and Liabilities | | | Fair Value | |
| Asset Derivatives | | | |
| Equity contracts | | | Net Assets — Unrealized appreciation* | | | | $ | 61,337 | | |
| Interest rate contracts | | | Net Assets — Unrealized appreciation* | | | | | 56,880 | | |
| Total Asset Derivatives | | | | | | | $ | 118,217 | | |
| Liability Derivatives | | | |
| Equity contracts | | | Net Assets — Unrealized depreciation* | | | | | | | |
| Interest rate contracts | | | Net Assets — Unrealized depreciation* | | | | | 202,410 | | |
| Total Liability Derivatives | | | | | | | $ | 202,410 | | |
*
Includes cumulative appreciation/depreciation of futures contracts as reported in the table within the Portfolio of Investments.
The effect of derivative instruments on the Portfolio’s Statement of Operations for the year ended December 31, 2019 was as follows:
| | | | Amount of Realized Gain or (Loss) on
Derivatives Recognized in Income | |
| Derivatives not accounted for as hedging instruments | | | Futures | |
| Equity contracts | | | | $ | (1,076,370) | | |
| Interest rate contracts | | | | | 173,786 | | |
| Total | | | | $ | (902,584) | | |
| |
| | | | Change in Unrealized Appreciation or (Depreciation)
on Derivatives Recognized in Income | |
| Derivatives not accounted for as hedging instruments | | | Futures | |
| Equity contracts | | | | $ | (6,907) | | |
| Interest rate contracts | | | | | (336,518) | | |
| Total | | | | $ | (343,425) | | |
At December 31, 2019, the aggregate cost of securities and other investments and the composition of unrealized appreciation and depreciation of securities and other investments at year end were:
| | Cost for federal income tax purposes was $322,381,862. | | |
| | Net unrealized appreciation consisted of: | | |
| | Gross Unrealized Appreciation | | | | $ | 12,934,239 | | |
| | Gross Unrealized Depreciation | | | | | (5,656,831) | | |
| | Net Unrealized Appreciation | | | | $ | 7,277,408 | | |
See Accompanying Notes to Financial Statements
| Voya Solution Moderately | PORTFOLIO OF INVESTMENTS |
| Aggressive Portfolio | as of December 31, 2019 |
| Shares | | | Value | | | Percentage
of Net
Assets | |
| EXCHANGE-TRADED FUNDS: 14.6% | |
| 98,924 | | | Vanguard Global ex-U.S. Real
Estate ETF | | | | $ | 5,845,419 | | | | | | 0.9 | | |
| 65,188 | | | Vanguard Real Estate ETF | | | | | 6,048,795 | | | | | | 1.0 | | |
| 136,655 | | | Vanguard Russell 1000
Growth ETF | | | | | 24,724,989 | | | | | | 4.1 | | |
| 432,651 | | | Vanguard Value ETF | | | | | 51,853,222 | | | | | | 8.6 | | |
| | | | Total Exchange-Traded Funds
(Cost $81,236,687) | | | | | 88,472,425 | | | | | | 14.6 | | |
| MUTUAL FUNDS: 85.1% | |
| | | | Affiliated Investment Companies: 85.1% | |
| 1,896,951 | | | Voya Floating Rate Fund -
Class I | | | | | 18,021,036 | | | | | | 3.0 | | |
| 1,495,986 | | | Voya High Yield Bond Fund -
Class R6 | | | | | 12,042,691 | | | | | | 2.0 | | |
| 420,588 | | | Voya Index Plus LargeCap
Portfolio - Class I | | | | | 12,100,319 | | | | | | 2.0 | | |
| 2,273,508 | | | Voya Intermediate Bond
Fund - Class R6 | | | | | 23,553,547 | | | | | | 3.9 | | |
| 369,318 | | | Voya Large-Cap Growth
Fund - Class R6 | | | | | 17,775,297 | | | | | | 2.9 | | |
| 857,502 | | | Voya MidCap Opportunities
Portfolio - Class I | | | | | 11,936,430 | | | | | | 2.0 | | |
| 2,390,564 | | | Voya Multi-Manager Emerging
Markets Equity Fund - Class I | | | | | 30,933,893 | | | | | | 5.1 | | |
| 4,088,649 | | | Voya Multi-Manager
International Equity Fund -
Class I | | | | | 48,736,696 | | | | | | 8.0 | | |
| 2,474,607 | | | Voya Multi-Manager
International Factors Fund -
Class I | | | | | 24,028,432 | | | | | | 4.0 | | |
| 2,446,895 | | | Voya Multi-Manager Mid Cap
Value Fund - Class I | | | | | 24,004,043 | | | | | | 4.0 | | |
| Shares | | | Value | | | Percentage
of Net
Assets | |
| MUTUAL FUNDS: (continued) | |
| | | | Affiliated Investment Companies (continued) | |
| 1,198,138 | | | Voya Short Term Bond Fund -
Class R6 | | | | $ | 11,813,640 | | | | | | 1.9 | | |
| 1,059,592 | | | Voya Small Company
Portfolio - Class I | | | | | 18,055,454 | | | | | | 3.0 | | |
| 1,152,362 | | | Voya Strategic Income
Opportunities Fund -
Class R6 | | | | | 11,880,857 | | | | | | 2.0 | | |
| 2,131,762 | | | Voya U.S. High Dividend Low
Volatility Fund - Class R6 | | | | | 26,881,515 | | | | | | 4.4 | | |
| 2,700,814 | | | Voya U.S. Stock Index
Portfolio - Class I | | | | | 45,886,836 | | | | | | 7.6 | | |
| 2,607,321 | | | VY® Invesco Comstock
Portfolio - Class I | | | | | 44,819,852 | | | | | | 7.4 | | |
| 1,111,241 | | | VY® JPMorgan Small Cap
Core Equity Portfolio Class I | | | | | 18,013,220 | | | | | | 3.0 | | |
| 2,042,511 | | | VY® T. Rowe Price Capital
Appreciation Portfolio - Class I | | | | | 60,070,238 | | | | | | 9.9 | | |
| 959,660 | | | VY® T. Rowe Price Diversified
Mid Cap Growth Portfolio -
Class I | | | | | 11,995,755 | | | | | | 2.0 | | |
| 518,718 | | | VY® T. Rowe Price Growth
Equity Portfolio - Class I | | | | | 42,239,232 | | | | | | 7.0 | | |
| | | | Total Mutual Funds
(Cost $512,110,424) | | | | | 514,788,983 | | | | | | 85.1 | | |
| | | | Total Investments in
Securities
(Cost $593,347,111) | | | | $ | 603,261,408 | | | | | | 99.7 | | |
| | | | Assets in Excess of Other
Liabilities | | | | | 1,785,822 | | | | | | 0.3 | | |
| | | | Net Assets | | | | $ | 605,047,230 | | | | | | 100.0 | | |
| |
Fair Value Measurements^
The following is a summary of the fair valuations according to the inputs used as of December 31, 2019 in valuing the assets and liabilities:
| | | | Quoted Prices
in Active Markets
for Identical
Investments
(Level 1) | | | Significant
Other
Observable
Inputs
(Level 2) | | | Significant
Unobservable
Inputs
(Level 3) | | | Fair Value
at
December 31, 2019 | |
| Asset Table | | | | | |
| Investments, at fair value | | | | | |
| Exchange-Traded Funds | | | | $ | 88,472,425 | | | | | $ | — | | | | | $ | — | | | | | $ | 88,472,425 | | |
| Mutual Funds | | | | | 514,788,983 | | | | | | — | | | | | | — | | | | | | 514,788,983 | | |
| Total Investments, at fair value | | | | $ | 603,261,408 | | | | | $ | — | | | | | $ | — | | | | | $ | 603,261,408 | | |
| Other Financial Instruments+ | | | | | |
| Futures | | | | | 199,458 | | | | | | — | | | | | | — | | | | | | 199,458 | | |
| Total Assets | | | | $ | 603,460,866 | | | | | $ | — | | | | | $ | — | | | | | $ | 603,460,866 | | |
| |
See Accompanying Notes to Financial Statements
| Voya Solution Moderately | PORTFOLIO OF INVESTMENTS |
| Aggressive Portfolio | as of December 31, 2019 (continued) |
| | | | Quoted Prices
in Active Markets
for Identical
Investments
(Level 1) | | | Significant
Other
Observable
Inputs
(Level 2) | | | Significant
Unobservable
Inputs
(Level 3) | | | Fair Value
at
December 31, 2019 | |
| Liabilities Table | | | | | |
| Other Financial Instruments+ | | | | | |
| Futures | | | | $ | (717,930) | | | | | $ | — | | | | | $ | — | | | | | $ | (717,930) | | |
| Total Liabilities | | | | $ | (717,930) | | | | | $ | — | | | | | $ | — | | | | | $ | (717,930) | | |
| |
^
See Note 2, “Significant Accounting Policies” in the Notes to Financial Statements for additional information.
+
Other Financial Instruments may include open forward foreign currency contracts, futures, centrally cleared swaps, OTC swaps and written options. Forward foreign currency contracts, futures and centrally cleared swaps are valued at the unrealized gain (loss) on the instrument. OTC swaps and written options are valued at the fair value of the instrument.
At December 31, 2019, the following futures contracts were outstanding for Voya Solution Moderately Aggressive Portfolio:
| Description | | | Number
of Contracts | | | Expiration
Date | | | Notional
Value | | | Unrealized
Appreciation/
(Depreciation) | |
| Long Contracts: | | | | | |
| E-mini Russell 2000® Index | | | | | 74 | | | | | | 03/20/20 | | | | | $ | 6,181,220 | | | | | $ | 96,430 | | |
| Mini MSCI EAFE Index | | | | | 121 | | | | | | 03/20/20 | | | | | | 12,320,825 | | | | | | (24,826) | | |
| U.S. Treasury Ultra Long Bond | | | | | 64 | | | | | | 03/20/20 | | | | | | 11,626,000 | | | | | | (372,898) | | |
| | | | | | | | | | | | | | | | | $ | 30,128,045 | | | | | $ | (301,294) | | |
| Short Contracts: | | | | | |
| S&P 500® E-Mini | | | | | (115) | | | | | | 03/20/20 | | | | | | (18,578,825) | | | | | | (320,206) | | |
| U.S. Treasury 10-Year Note | | | | | (92) | | | | | | 03/20/20 | | | | | | (11,814,813) | | | | | | 103,028 | | |
| | | | | | | | | | | | | | | | | $ | (30,393,638) | | | | | $ | (217,178) | | |
Transactions with Affiliates
An investment of at least 5% of the voting securities of an issuer, or a company which is under common control results in that issuer becoming an affiliated person as defined by the 1940 Act.
The following table provides transactions during the year ended December 31, 2019, where the following issuers were considered an affiliate:
| Issuer | | | Beginning Fair
Value at
12/31/18 | | | Purchases
at Cost | | | Sales
at Cost | | | Change in
Unrealized
Appreciation/
(Depreciation) | | | Ending
Fair Value
at 12/31/2019 | | | Investment
Income | | | Realized
Gains/
(Losses) | | | Net Capital
Gain
Distributions | |
| Voya Emerging Markets Index Portfolio - Class I | | | | $ | 16,701,089 | | | | | $ | 40,216 | | | | | $ | (17,397,045) | | | | | $ | 655,740 | | | | | $ | — | | | | | $ | — | | | | | $ | 1,355,952 | | | | | $ | — | | |
| Voya Floating Rate Fund - Class I | | | | | 27,880,641 | | | | | | 3,733,040 | | | | | | (14,395,165) | | | | | | 802,520 | | | | | | 18,021,036 | | | | | | 1,001,561 | | | | | | (415,830) | | | | | | — | | |
| Voya High Yield Bond Fund - Class R6 | | | | | — | | | | | | 13,676,563 | | | | | | (1,794,691) | | | | | | 160,819 | | | | | | 12,042,691 | | | | | | 465,355 | | | | | | (1,228) | | | | | | — | | |
| Voya Index Plus LargeCap Portfolio - Class I | | | | | 23,805,927 | | | | | | 1,442,950 | | | | | | (14,136,786) | | | | | | 988,228 | | | | | | 12,100,319 | | | | | | 184,313 | | | | | | 3,117,519 | | | | | | 1,014,710 | | |
| Voya Intermediate Bond Fund - Class R6 | | | | | 32,059,541 | | | ��� | | | 11,658,124 | | | | | | (21,931,680) | | | | | | 1,767,562 | | | | | | 23,553,547 | | | | | | 997,776 | | | | | | (40,800) | | | | | | 19,184 | | |
| Voya International Index Portfolio - Class I | | | | | 27,852,771 | | | | | | 398,730 | | | | | | (31,674,392) | | | | | | 3,422,891 | | | | | | — | | | | | | — | | | | | | (27,738) | | | | | | — | | |
| Voya Large Cap Value Fund - Class R6 | | | | | 16,877,417 | | | | | | 677,779 | | | | | | (20,716,060) | | | | | | 3,160,864 | | | | | | — | | | | | | 89,170 | | | | | | (1,005,829) | | | | | | — | | |
| Voya Large-Cap Growth Fund - Class R6 | | | | | 19,615,183 | | | | | | 2,471,124 | | | | | | (9,533,912) | | | | | | 5,222,902 | | | | | | 17,775,297 | | | | | | 110,811 | | | | | | (429,405) | | | | | | 658,885 | | |
| Voya MidCap Opportunities Portfolio - Class I | | | | | 25,262,930 | | | | | | 1,759,763 | | | | | | (17,124,260) | | | | | | 2,037,997 | | | | | | 11,936,430 | | | | | | 42,538 | | | | | | 2,044,176 | | | | | | 1,387,538 | | |
Voya Multi-Manager Emerging Markets Equity Fund -
Class I | | | | | 33,468,184 | | | | | | 3,247,597 | | | | | | (11,890,415) | | | | | | 6,108,527 | | | | | | 30,933,893 | | | | | | 507,698 | | | | | | 679,802 | | | | | | 157,019 | | |
| Voya Multi-Manager International Equity Fund - Class I | | | | | 39,052,256 | | | | | | 9,677,901 | | | | | | (8,529,446) | | | | | | 8,535,985 | | | | | | 48,736,696 | | | | | | 943,457 | | | | | | (157,822) | | | | | | — | | |
| Voya Multi-Manager International Factors Fund - Class I | | | | | 27,851,401 | | | | | | 2,383,756 | | | | | | (10,507,834) | | | | | | 4,301,109 | | | | | | 24,028,432 | | | | | | 749,967 | | | | | | (670,826) | | | | | | — | | |
| Voya Multi-Manager Mid Cap Value Fund - Class I | | | | | 25,175,944 | | | | | | 3,594,247 | | | | | | (9,719,517) | | | | | | 4,953,369 | | | | | | 24,004,043 | | | | | | 270,204 | | | | | | (972,564) | | | | | | 1,974,633 | | |
| Voya Short Term Bond Fund - Class R6 | | | | | — | | | | | | 13,595,075 | | | | | | (1,888,427) | | | | | | 106,992 | | | | | | 11,813,640 | | | | | | 203,728 | | | | | | 16,047 | | | | | | — | | |
| Voya Small Company Portfolio - Class I | | | | | 33,602,865 | | | | | | 3,383,585 | | | | | | (28,532,679) | | | | | | 9,601,683 | | | | | | 18,055,454 | | | | | | 72,803 | | | | | | (4,867,265) | | | | | | 2,449,510 | | |
| Voya Strategic Income Opportunities Fund - Class R6 | | | | | — | | | | | | 13,664,215 | | | | | | (1,886,898) | | | | | | 103,540 | | | | | | 11,880,857 | | | | | | 369,637 | | | | | | 13,950 | | | | | | — | | |
| Voya U.S. Bond Index Portfolio - Class I | | | | | 11,147,844 | | | | | | 934,303 | | | | | | (11,888,466) | | | | | | (193,681) | | | | | | — | | | | | | 84,443 | | | | | | 412,368 | | | | | | — | | |
| Voya U.S. High Dividend Low Volatility Fund - Class I | | | | | 11,195,298 | | | | | | 21,883,802 | | | | | | (34,066,490) | | | | | | 987,390 | | | | | | — | | | | | | 261,422 | | | | | | 125,154 | | | | | | — | | |
See Accompanying Notes to Financial Statements
| Voya Solution Moderately | PORTFOLIO OF INVESTMENTS |
| Aggressive Portfolio | as of December 31, 2019 (continued) |
| Issuer | | | Beginning Fair
Value at
12/31/18 | | | Purchases
at Cost | | | Sales
at Cost | | | Change in
Unrealized
Appreciation/
(Depreciation) | | | Ending
Fair Value
at 12/31/2019 | | | Investment
Income | | | Realized
Gains/
(Losses) | | | Net Capital
Gain
Distributions | |
| Voya U.S. High Dividend Low Volatility Fund - Class R6 | | | | | — | | | | | | 31,683,762 | | | | | | (6,512,921) | | | | | | 1,710,674 | | | | | | 26,881,515 | | | | | | 345,260 | | | | | | 688,632 | | | | | | 296,608 | | |
| Voya U.S. Stock Index Portfolio - Class I | | | | | 17,079,999 | | | | | | 37,374,041 | | | | | | (13,419,186) | | | | | | 4,851,982 | | | | | | 45,886,836 | | | | | | 689,482 | | | | | | (419,073) | | | | | | 2,485,482 | | |
| VY® Invesco Comstock Portfolio - Class I | | | | | 42,637,710 | | | | | | 14,851,453 | | | | | | (11,025,600) | | | | | | (1,643,711) | | | | | | 44,819,852 | | | | | | 1,136,172 | | | | | | 1,648,586 | | | | | | 9,067,213 | | |
VY® JPMorgan Small Cap Core Equity Portfolio Class I | | | | | — | | | | | | 23,982,913 | | | | | | (2,941,229) | | | | | | (3,028,464) | | | | | | 18,013,220 | | | | | | 349,640 | | | | | | (598,521) | | | | | | 4,474,257 | | |
VY® T. Rowe Price Capital Appreciation Portfolio - Class I | | | | | 45,745,861 | | | | | | 18,041,602 | | | | | | (10,776,250) | | | | | | 7,059,025 | | | | | | 60,070,238 | | | | | | 987,065 | | | | | | 470,717 | | | | | | 3,027,368 | | |
VY® T. Rowe Price Diversified Mid Cap Growth Portfolio - Class I | | | | | — | | | | | | 13,627,312 | | | | | | (1,673,728) | | | | | | 42,171 | | | | | | 11,995,755 | | | | | | 33,741 | | | | | | (56,014) | | | | | | 1,184,559 | | |
| VY® T. Rowe Price Growth Equity Portfolio - Class I | | | | | 36,419,761 | | | | | | 11,226,659 | | | | | | (6,437,030) | | | | | | 1,029,842 | | | | | | 42,239,232 | | | | | | 77,966 | | | | | | 762,029 | | | | | | 8,812,537 | | |
| | | | | $ | 513,432,622 | | | | | $ | 259,010,512 | | | | | $ | (320,400,107) | | | | | $ | 62,745,956 | | | | | $ | 514,788,983 | | | | | $ | 9,974,209 | | | | | $ | 1,672,017 | | | | | $ | 37,009,503 | | |
| |
The financial statements for the above mutual fund[s] can be found at www.sec.gov.
A summary of derivative instruments by primary risk exposure is outlined in the following tables.
The fair value of derivative instruments as of December 31, 2019 was as follows:
| Derivatives not accounted for as hedging instruments | | | Location on Statement
of Assets and Liabilities | | | Fair Value | |
| Asset Derivatives | | | |
| Equity contracts | | | Net Assets — Unrealized appreciation* | | | | $ | 96,430 | | |
| Interest rate contracts | | | Net Assets — Unrealized appreciation* | | | | | 103,028 | | |
| Total Asset Derivatives | | | | | | | $ | 199,458 | | |
| Liability Derivatives | | | |
| Equity contracts | | | Net Assets — Unrealized depreciation* | | | | $ | 345,032 | | |
| Interest rate contracts | | | Net Assets — Unrealized depreciation* | | | | | 372,898 | | |
| Total Liability Derivatives | | | | | | | $ | 717,930 | | |
*
Includes cumulative appreciation/depreciation of futures contracts as reported in the table within the Portfolio of Investments.
The effect of derivative instruments on the Portfolio’s Statement of Operations for the year ended December 31, 2019 was as follows:
| | | | Amount of Realized Gain or (Loss) on
Derivatives Recognized in Income | |
| Derivatives not accounted for as hedging instruments | | | Futures | |
| Equity contracts | | | | $ | (1,647,707) | | |
| Interest rate contracts | | | | | 268,160 | | |
| Total | | | | $ | (1,379,547) | | |
| |
| | | | Change in Unrealized Appreciation or (Depreciation)
on Derivatives Recognized in Income | |
| Derivatives not accounted for as hedging instruments | | | Futures | |
| Equity contracts | | | | $ | 97,972 | | |
| Interest rate contracts | | | | | (573,346) | | |
| Total | | | | $ | (475,374) | | |
See Accompanying Notes to Financial Statements
| Voya Solution Moderately | PORTFOLIO OF INVESTMENTS |
| Aggressive Portfolio | as of December 31, 2019 (continued) |
At December 31, 2019, the aggregate cost of securities and other investments and the composition of unrealized appreciation and depreciation of securities and other investments at year end were:
| | Cost for federal income tax purposes was $603,250,642. | | |
| | Net unrealized appreciation consisted of: | | |
| | Gross Unrealized Appreciation | | | | $ | 22,729,732 | | |
| | Gross Unrealized Depreciation | | | | | (23,237,438) | | |
| | Net Unrealized Appreciation | | | | $ | (507,706) | | |
See Accompanying Notes to Financial Statements
| Voya Solution Moderately | PORTFOLIO OF INVESTMENTS |
| Conservative Portfolio | as of December 31, 2019 |
| Shares | | | Value | | | Percentage
of Net
Assets | |
| EXCHANGE-TRADED FUNDS: 11.9% | |
| 5,461 | | | iShares 20+ Year Treasury
Bond ETF | | | | $ | 739,856 | | | | | | 1.9 | | |
| 11,907 | | | iShares Core MSCI EAFE
ETF | | | | | 776,813 | | | | | | 2.0 | | |
| 4,670 | | | iShares Core S&P Small-Cap
ETF | | | | | 391,579 | | | | | | 1.0 | | |
| 33,701 | | | Schwab U.S. TIPS ETF | | | | | 1,908,488 | | | | | | 5.0 | | |
| 6,330 | | | Vanguard Global ex-U.S. Real
Estate ETF | | | | | 374,040 | | | | | | 1.0 | | |
| 4,171 | | | Vanguard Real Estate ETF | | | | | 387,027 | | | | | | 1.0 | | |
| | | | Total Exchange-Traded Funds
(Cost $4,429,628) | | | | | 4,577,803 | | | | | | 11.9 | | |
| MUTUAL FUNDS: 88.0% | |
| | | | Affiliated Investment Companies: 88.0% | |
| 203,038 | | | Voya Floating Rate Fund -
Class I | | | | | 1,928,865 | | | | | | 5.0 | | |
| 158,657 | | | Voya Global Bond Fund -
Class R6 | | | | | 1,527,865 | | | | | | 4.0 | | |
| 288,220 | | | Voya High Yield Bond Fund -
Class R6 | | | | | 2,320,172 | | | | | | 6.0 | | |
| 324,869 | | | Voya Intermediate Bond
Fund - Class R6 | | | | | 3,365,647 | | | | | | 8.8 | | |
| 191,934 | | | Voya Large Cap Value Fund -
Class R6 | | | | | 2,427,965 | | | | | | 6.3 | | |
| 26,316 | | | Voya Large-Cap Growth
Fund - Class R6 | | | | | 1,266,572 | | | | | | 3.3 | | |
| 27,536 | | | Voya MidCap Opportunities
Portfolio - Class I | | | | | 383,303 | | | | | | 1.0 | | |
| 92,088 | | | Voya Multi-Manager Emerging
Markets Equity Fund - Class I | | | | | 1,191,619 | | | | | | 3.1 | | |
| 48,692 | | | Voya Multi-Manager
International Equity Fund -
Class I | | | | | 580,404 | | | | | | 1.5 | | |
| Shares | | | Value | | | Percentage
of Net
Assets | |
| MUTUAL FUNDS: (continued) | |
| | | | Affiliated Investment Companies (continued) | |
| 119,121 | | | Voya Multi-Manager
International Factors Fund -
Class I | | | | $ | 1,156,668 | | | | | | 3.0 | | |
| 39,281 | | | Voya Multi-Manager Mid Cap
Value Fund - Class I | | | | | 385,348 | | | | | | 1.0 | | |
| 269,286 | | | Voya Short Term Bond Fund -
Class R6 | | | | | 2,655,158 | | | | | | 6.9 | | |
| 45,173 | | | Voya Small Company
Portfolio - Class I | | | | | 769,739 | | | | | | 2.0 | | |
| 222,013 | | | Voya Strategic Income
Opportunities Fund -
Class R6 | | | | | 2,288,951 | | | | | | 6.0 | | |
| 191,059 | | | Voya U.S. High Dividend Low
Volatility Fund - Class R6 | | | | | 2,409,256 | | | | | | 6.3 | | |
| 68,893 | | | Voya U.S. Stock Index
Portfolio - Class I | | | | | 1,170,489 | | | | | | 3.1 | | |
| 287,795 | | | VY® BrandywineGLOBAL -
Bond Portfolio - Class I | | | | | 3,024,727 | | | | | | 7.9 | | |
| 131,163 | | | VY® T. Rowe Price Capital
Appreciation Portfolio - Class I | | | | | 3,857,498 | | | | | | 10.0 | | |
| 13,086 | | | VY® T. Rowe Price Growth
Equity Portfolio - Class I | | | | | 1,065,572 | | | | | | 2.8 | | |
| | | | Total Mutual Funds
(Cost $32,846,953) | | | | | 33,775,818 | | | | | | 88.0 | | |
| | | | Total Investments in
Securities
(Cost $37,276,581) | | | | $ | 38,353,621 | | | | | | 99.9 | | |
| | | | Assets in Excess of Other
Liabilities | | | | | 55,391 | | | | | | 0.1 | | |
| | | | Net Assets | | | | $ | 38,409,012 | | | | | | 100.0 | | |
| |
Fair Value Measurements^
The following is a summary of the fair valuations according to the inputs used as of December 31, 2019 in valuing the assets and liabilities:
| | | | Quoted Prices
in Active Markets
for Identical
Investments
(Level 1) | | | Significant
Other
Observable
Inputs
(Level 2) | | | Significant
Unobservable
Inputs
(Level 3) | | | Fair Value
at
December 31, 2019 | |
| Asset Table | | | | | | | | | | | | | | | | | | | | | | | | | |
| Investments, at fair value | | | | | | | | | | | | | | | | | | | | | | | | | |
| Exchange-Traded Funds | | | | $ | 4,577,803 | | | | | $ | — | | | | | $ | — | | | | | $ | 4,577,803 | | |
| Mutual Funds | | | | | 33,775,818 | | | | | | — | | | | | | — | | | | | | 33,775,818 | | |
| Total Investments, at fair value | | | | $ | 38,353,621 | | | | | $ | — | | | | | $ | — | | | | | $ | 38,353,621 | | |
^
See Note 2, “Significant Accounting Policies” in the Notes to Financial Statements for additional information.
See Accompanying Notes to Financial Statements
| Voya Solution Moderately | PORTFOLIO OF INVESTMENTS |
| Conservative Portfolio | as of December 31, 2019 (continued) |
Transactions with Affiliates
An investment of at least 5% of the voting securities of an issuer, or a company which is under common control results in that issuer becoming an affiliated person as defined by the 1940 Act.
The following table provides transactions during the year ended December 31, 2019, where the following issuers were considered an affiliate:
| Issuer | | | Beginning
Fair Value
at 12/31/18 | | | Purchases
at Cost | | | Sales
at Cost | | | Change in
Unrealized
Appreciation/
(Depreciation) | | | Ending
Fair Value
at 12/31/2019 | | | Investment
Income | | | Realized
Gains/
(Losses) | | | Net Capital
Gain
Distributions | |
| Voya Emerging Markets Index Portfolio - Class I | | | | $ | 284,681 | | | | | $ | 85,942 | | | | | $ | (374,328) | | | | | $ | 3,705 | | | | | $ | — | | | | | $ | — | | | | | $ | 29,835 | | | | | $ | — | | |
| Voya Floating Rate Fund - Class I | | | | | 1,979,535 | | | | | | 901,684 | | | | | | (997,740) | | | | | | 45,386 | | | | | | 1,928,865 | | | | | | 99,158 | | | | | | (27,522) | | | | | | — | | |
| Voya Global Bond Fund - Class R6 | | | | | 566,591 | | | | | | 1,223,228 | | | | | | (297,899) | | | | | | 35,945 | | | | | | 1,527,865 | | | | | | 51,969 | | | | | | 6,528 | | | | | | — | | |
| Voya High Yield Bond Fund - Class R6 | | | | | — | | | | | | 2,647,741 | | | | | | (358,411) | | | | | | 30,842 | | | | | | 2,320,172 | | | | | | 90,553 | | | | | | 854 | | | | | | — | | |
| Voya Intermediate Bond Fund - Class R6 | | | | | 3,104,506 | | | | | | 3,545,175 | | | | | | (3,431,613) | | | | | | 147,579 | | | | | | 3,365,647 | | | | | | 135,498 | | | | | | 89,245 | | | | | | 2,757 | | |
| Voya International Index Portfolio - Class I | | | | | 281,265 | | | | | | 17,034 | | | | | | (326,345) | | | | | | 28,046 | | | | | | — | | | | | | — | | | | | | (16,335) | | | | | | — | | |
| Voya Large Cap Value Fund - Class R6 | | | | | 852,421 | | | | | | 1,971,654 | | | | | | (581,015) | | | | | | 184,905 | | | | | | 2,427,965 | | | | | | 40,499 | | | | | | (39,900) | | | | | | 165,842 | | |
| Voya Large-Cap Growth Fund - Class R6 | | | | | 923,620 | | | | | | 500,364 | | | | | | (444,870) | | | | | | 287,458 | | | | | | 1,266,572 | | | | | | 7,803 | | | | | | (21,989) | | | | | | 46,396 | | |
| Voya MidCap Opportunities Portfolio - Class I | | | | | 284,632 | | | | | | 177,620 | | | | | | (117,224) | | | | | | 38,275 | | | | | | 383,303 | | | | | | 960 | | | | | | 2,519 | | | | | | 44,966 | | |
| Voya Multi-Manager Emerging Markets Equity Fund - Class I | | | | | 704,952 | | | | | | 1,044,947 | | | | | | (779,963) | | | | | | 221,683 | | | | | | 1,191,619 | | | | | | 19,548 | | | | | | (61,548) | | | | | | 6,045 | | |
| Voya Multi-Manager International Equity Fund - Class I | | | | | 565,856 | | | | | | 377,733 | | | | | | (461,139) | | | | | | 97,954 | | | | | | 580,404 | | | | | | 11,302 | | | | | | 19,379 | | | | | | — | | |
| Voya Multi-Manager International Factors Fund -Class I | | | | | 1,130,003 | | | | | | 649,149 | | | | | | (815,275) | | | | | | 192,791 | | | | | | 1,156,668 | | | | | | 36,116 | | | | | | (36,526) | | | | | | — | | |
| Voya Multi-Manager Mid Cap Value Fund - Class I | | | | | 283,648 | | | | | | 197,201 | | | | | | (170,448) | | | | | | 74,947 | | | | | | 385,348 | | | | | | 4,336 | | | | | | (27,360) | | | | | | 31,686 | | |
| Voya Short Term Bond Fund - Class R6 | | | | | 2,253,223 | | | | | | 1,886,585 | | | | | | (1,556,219) | | | | | | 71,569 | | | | | | 2,655,158 | | | | | | 63,874 | | | | | | (14,433) | | | | | | — | | |
| Voya Small Company Portfolio - Class I | | | | | 568,001 | | | | | | 435,752 | | | | | | (369,120) | | | | | | 135,106 | | | | | | 769,739 | | | | | | 3,098 | | | | | | (84,300) | | | | | | 104,204 | | |
| Voya Strategic Income Opportunities Fund - Class R6 | | | | | — | | | | | | 2,650,039 | | | | | | (380,647) | | | | | | 19,559 | | | | | | 2,288,951 | | | | | | 71,889 | | | | | | 3,173 | | | | | | — | | |
| Voya U.S. Bond Index Portfolio - Class I | | | | | 2,817,471 | | | | | | 2,079,263 | | | | | | (4,944,326) | | | | | | 47,592 | | | | | | — | | | | | | 23,193 | | | | | | 14,770 | | | | | | — | | |
| Voya U.S. High Dividend Low Volatility Fund - Class I | | | | | 567,719 | | | | | | 2,057,741 | | | | | | (2,675,893) | | | | | | 50,433 | | | | | | — | | | | | | 18,193 | | | | | | 14,732 | | | | | | — | | |
| Voya U.S. High Dividend Low Volatility Fund - Class R6 | | | | | — | | | | | | 2,473,955 | | | | | | (213,721) | | | | | | 149,022 | | | | | | 2,409,256 | | | | | | 28,166 | | | | | | 18,009 | | | | | | 26,506 | | |
| Voya U.S. Stock Index Portfolio - Class I | | | | | 1,147,188 | | | | | | 2,821,015 | | | | | | (3,040,062) | | | | | | 242,348 | | | | | | 1,170,489 | | | | | | 20,778 | | | | | | (37,810) | | | | | | 128,225 | | |
| VY® Goldman Sachs Bond Portfolio - Class I | | | | | 2,254,666 | | | | | | 1,320,851 | | | | | | (739,196) | | | | | | 188,406 | | | | | | 3,024,727 | | | | | | 58,939 | | | | | | 26,014 | | | | | | — | | |
| VY® Invesco Comstock Portfolio - Class I | | | | | 1,224,810 | | | | | | 424,046 | | | | | | (1,756,620) | | | | | | 107,764 | | | | | | — | | | | | | — | | | | | | 91,582 | | | | | | — | | |
| VY® T. Rowe Price Capital Appreciation Portfolio - Class I | | | | | 2,899,138 | | | | | | 1,525,037 | | | | | | (988,933) | | | | | | 422,256 | | | | | | 3,857,498 | | | | | | 63,279 | | | | | | 76,804 | | | | | | 195,207 | | |
| VY® T. Rowe Price Growth Equity Portfolio - Class I | | | | | — | | | | | | 1,408,806 | | | | | | (229,370) | | | | | | (113,864) | | | | | | 1,065,572 | | | | | | 1,966 | | | | | | (12,947) | | | | | | 221,848 | | |
| | | | | $ | 24,693,926 | | | | | $ | 32,422,562 | | | | | $ | (26,050,377) | | | | | $ | 2,709,707 | | | | | $ | 33,775,818 | | | | | $ | 851,117 | | | | | $ | 12,774 | | | | | $ | 973,682 | | |
The financial statements for the above mutual fund[s] can be found at www.sec.gov.
At December 31, 2019, the aggregate cost of securities and other investments and the composition of unrealized appreciation and depreciation of securities and other investments at year end were:
| | Cost for federal income tax purposes was $38,027,956. | | |
| | Net unrealized appreciation consisted of: | | |
| | Gross Unrealized Appreciation | | | | $ | 1,292,535 | | |
| | Gross Unrealized Depreciation | | | | | (966,870) | | |
| | Net Unrealized Appreciation | | | | $ | 325,665 | | |
See Accompanying Notes to Financial Statements
PORTFOLIO OF INVESTMENTS
| Voya Solution 2020 Portfolio | as of December 31, 2019 |
| Shares | | | Value | | | Percentage
of Net
Assets | |
| EXCHANGE-TRADED FUNDS: 12.1% | |
| 5,099 | | | iShares 20+ Year Treasury
Bond ETF | | | | $ | 690,813 | | | | | | 1.9 | | |
| 11,118 | | | iShares Core MSCI EAFE
ETF | | | | | 725,338 | | | | | | 2.0 | | |
| 4,360 | | | iShares Core S&P Small-Cap
ETF | | | | | 365,586 | | | | | | 1.0 | | |
| 37,761 | | | Schwab U.S. TIPS ETF | | | | | 2,138,405 | | | | | | 5.9 | | |
| 4,869 | | | Vanguard Real Estate ETF | | | | | 451,795 | | | | | | 1.3 | | |
| | | | Total Exchange-Traded Funds
(Cost $4,222,526) | | | | | 4,371,937 | | | | | | 12.1 | | |
| MUTUAL FUNDS: 87.8% | |
| | | | Affiliated Investment Companies: 87.8% | |
| 115,223 | | | Voya Floating Rate
Fund - Class I | | | | | 1,094,618 | | | | | | 3.0 | | |
| 112,555 | | | Voya Global Bond
Fund - Class R6 | | | | | 1,083,908 | | | | | | 3.0 | | |
| 560,637 | | | Voya Intermediate
Bond Fund - Class R6 | | | | | 5,808,197 | | | | | | 16.0 | | |
| 108,935 | | | Voya Large Cap Value
Fund - Class R6 | | | | | 1,378,022 | | | | | | 3.8 | | |
| 42,126 | | | Voya Large-Cap Growth
Fund - Class R6 | | | | | 2,027,525 | | | | | | 5.6 | | |
| 13,023 | | | Voya MidCap Opportunities
Portfolio - Class I | | | | | 181,286 | | | | | | 0.5 | | |
| 72,594 | | | Voya Multi-Manager Emerging
Markets Equity Fund - Class I | | | | | 939,361 | | | | | | 2.6 | | |
| 226,890 | | | Voya Multi-Manager
International Factors
Fund - Class I | | | | | 2,203,106 | | | | | | 6.1 | | |
| Shares | | | Value | | | Percentage
of Net
Assets | |
| MUTUAL FUNDS: (continued) | |
| | | | Affiliated Investment Companies (continued) | |
| 18,581 | | | Voya Multi-Manager Mid Cap
Value Fund - Class I | | | | $ | 182,277 | | | | | | 0.5 | | |
| 436,666 | | | Voya Short Term Bond Fund -
Class R6 | | | | | 4,305,531 | | | | | | 11.9 | | |
| 183,862 | | | Voya Strategic Income
Opportunities Fund -
Class R6 | | | | | 1,895,616 | | | | | | 5.2 | | |
| 73,808 | | | Voya U.S. Bond Index
Portfolio - Class I | | | | | 804,508 | | | | | | 2.2 | | |
| 115,895 | | | Voya U.S. High Dividend Low
Volatility Fund - Class R6 | | | | | 1,461,438 | | | | | | 4.0 | | |
| 59,718 | | | Voya U.S. Stock Index
Portfolio - Class I | | | | | 1,014,607 | | | | | | 2.8 | | |
| 297,764 | | | VY® BrandywineGLOBAL -
Bond Portfolio - Class I | | | | | 3,129,497 | | | | | | 8.7 | | |
| 124,069 | | | VY® T. Rowe Price Capital
Appreciation Portfolio - Class I | | | | | 3,648,884 | | | | | | 10.1 | | |
| 7,878 | | | VY® T. Rowe Price Growth
Equity Portfolio - Class I | | | | | 641,471 | | | | | | 1.8 | | |
| | | | Total Mutual Funds
(Cost $30,857,002) | | | | | 31,799,852 | | | | | | 87.8 | | |
| | | | Total Investments in
Securities
(Cost $35,079,528) | | | | $ | 36,171,789 | | | | | | 99.9 | | |
| | | | Assets in Excess of
Other Liabilities | | | | | 46,504 | | | | | | 0.1 | | |
| | | | Net Assets | | | | $ | 36,218,293 | | | | | | 100.0 | | |
| |
Fair Value Measurements^
The following is a summary of the fair valuations according to the inputs used as of December 31, 2019 in valuing the assets and liabilities:
| | | | Quoted Prices
in Active Markets
for Identical
Investments
(Level 1) | | | Significant
Other
Observable
Inputs
(Level 2) | | | Significant
Unobservable
Inputs
(Level 3) | | | Fair Value
at
December 31, 2019 | |
| Asset Table | | | | | | | | | | | | | | | | | | | | | | | | | |
| Investments, at fair value | | | | | | | | | | | | | | | | | | | | | | | | | |
| Exchange-Traded Funds | | | | $ | 4,371,937 | | | | | $ | — | | | | | $ | — | | | | | $ | 4,371,937 | | |
| Mutual Funds | | | | | 31,799,852 | | | | | | — | | | | | | — | | | | | | 31,799,852 | | |
| Total Investments, at fair value | | | | $ | 36,171,789 | | | | | $ | — | | | | | $ | — | | | | | $ | 36,171,789 | | |
^
See Note 2, “Significant Accounting Policies” in the Notes to Financial Statements for additional information.
See Accompanying Notes to Financial Statements
PORTFOLIO OF INVESTMENTS
| Voya Solution 2020 Portfolio | as of December 31, 2019 (continued) |
Transactions with Affiliates
An investment of at least 5% of the voting securities of an issuer, or a company which is under common control results in that issuer becoming an affiliated person as defined by the 1940 Act.
The following table provides transactions during the year ended December 31, 2019, where the following issuers were considered an affiliate:
| Issuer | | | Beginning
Fair Value
at 12/31/18 | | | Purchases
at Cost | | | Sales
at Cost | | | Change in
Unrealized
Appreciation/
(Depreciation) | | | Ending
Fair Value
at 12/31/2019 | | | Investment
Income | | | Realized
Gains/
(Losses) | | | Net Capital
Gain
Distributions | |
| Voya Floating Rate Fund - Class I | | | | $ | 1,687,515 | | | | | $ | 444,143 | | | | | $ | (1,093,012) | | | | | $ | 55,972 | | | | | $ | 1,094,618 | | | | | $ | 57,704 | | | | | $ | (31,551) | | | | | $ | — | | |
| Voya Global Bond Fund - Class R6 | | | | | 1,014,325 | | | | | | 434,608 | | | | | | (394,381) | | | | | | 29,356 | | | | | | 1,083,908 | | | | | | 42,399 | | | | | | (137) | | ��� | | | | — | | |
| Voya Intermediate Bond Fund - Class R6 | | | | | 3,032,956 | | | | | | 6,220,543 | | | | | | (3,599,826) | | | | | | 154,524 | | | | | | 5,808,197 | | | | | | 169,045 | | | | | | 101,778 | | | | | | 4,727 | | |
| Voya International Index Portfolio - Class I | | | | | 673,424 | | | | | | 43,261 | | | | | | (807,820) | | | | | | 91,135 | | | | | | — | | | | | | — | | | | | | (38,547) | | | | | | — | | |
| Voya Large Cap Value Fund - Class R6 | | | | | 1,356,555 | | | | | | 598,349 | | | | | | (817,521) | | | | | | 240,639 | | | | | | 1,378,022 | | | | | | 26,952 | | | | | | (55,517) | | | | | | 93,852 | | |
| Voya Large-Cap Growth Fund - Class R6 | | | | | 1,356,799 | | | | | | 1,069,844 | | | | | | (827,944) | | | | | | 428,826 | | | | | | 2,027,525 | | | | | | 12,455 | | | | | | (54,808) | | | | | | 74,059 | | |
| Voya MidCap Opportunities Portfolio - Class I | | | | | 169,844 | | | | | | 265,086 | | | | | | (275,918) | | | | | | 22,274 | | | | | | 181,286 | | | | | | 616 | | | | | | (5,654) | | | | | | 28,247 | | |
| Voya Multi-Manager Emerging Markets Equity Fund - Class I | | | | | 844,188 | | | | | | 862,837 | | | | | | (915,640) | | | | | | 147,976 | | | | | | 939,361 | | | | | | 15,369 | | | | | | 12,622 | | | | | | 4,752 | | |
| Voya Multi-Manager International Equity Fund - Class I | | | | | 1,013,081 | | | | | | 86,482 | | | | | | (1,279,454) | | | | | | 179,891 | | | | | | — | | | | | | — | | | | | | (34,854) | | | | | | — | | |
| Voya Multi-Manager International Factors Fund - Class I | | | | | 1,685,924 | | | | | | 1,961,878 | | | | | | (1,845,950) | | | | | | 401,254 | | | | | | 2,203,106 | | | | | | 68,428 | | | | | | (156,834) | | | | | | — | | |
| Voya Multi-Manager Mid Cap Value Fund - Class I | | | | | 169,241 | | | | | | 277,951 | | | | | | (301,279) | | | | | | 36,364 | | | | | | 182,277 | | | | | | 2,045 | | | | | | (12,092) | | | | | | 14,944 | | |
| Voya Short Term Bond Fund - Class R6 | | | | | 2,444,023 | | | | | | 3,209,177 | | | | | | (1,412,623) | | | | | | 64,954 | | | | | | 4,305,531 | | | | | | 83,080 | | | | | | (6,748) | | | | | | — | | |
| Voya Small Company Portfolio - Class I | | | | | 338,976 | | | | | | 28,827 | | | | | | (459,692) | | | | | | 91,889 | | | | | | — | | | | | | — | | | | | | (32,091) | | | | | | — | | |
| Voya Strategic Income Opportunities Fund - Class R6 | | | | | — | | | | | | 2,877,189 | | | | | | (992,476) | | | | | | 10,903 | | | | | | 1,895,616 | | | | | | 65,826 | | | | | | 7,186 | | | | | | — | | |
| Voya U.S. Bond Index Portfolio - Class I | | | | | 3,703,160 | | | | | | 1,444,435 | | | | | | (4,322,588) | | | | | | (20,499) | | | | | | 804,508 | | | | | | 36,335 | | | | | | 105,879 | | | | | | — | | |
| Voya U.S. High Dividend Low Volatility Fund - Class I | | | | | 1,355,218 | | | | | | 626,908 | | | | | | (2,111,447) | | | | | | 129,321 | | | | | | — | | | | | | 14,393 | | | | | | 18,967 | | | | | | — | | |
| Voya U.S. High Dividend Low Volatility Fund - Class R6 | | | | | — | | | | | | 1,537,082 | | | | | | (186,520) | | | | | | 110,876 | | | | | | 1,461,438 | | | | | | 17,316 | | | | | | 14,599 | | | | | | 16,036 | | |
| Voya U.S. Stock Index Portfolio - Class I | | | | | 1,372,708 | | | | | | 2,855,301 | | | | | | (3,457,486) | | | | | | 244,084 | | | | | | 1,014,607 | | | | | | 17,734 | | | | | | 48,769 | | | | | | 104,455 | | |
| VY® Goldman Sachs Bond Portfolio - Class I | | | | | 2,943,397 | | | | | | 1,639,197 | | | | | | (1,644,911) | | | | | | 191,814 | | | | | | 3,129,497 | | | | | | 50,094 | | | | | | 12,259 | | | | | | — | | |
| VY® Invesco Comstock Portfolio - Class I | | | | | 687,958 | | | | | | 57,654 | | | | | | (817,414) | | | | | | 71,802 | | | | | | — | | | | | | — | | | | | | 34,444 | | | | | | — | | |
| VY® T. Rowe Price Capital Appreciation Portfolio - Class I | | | | | 3,460,205 | | | | | | 1,217,203 | | | | | | (1,501,168) | | | | | | 472,644 | | | | | | 3,648,884 | | | | | | 58,698 | | | | | | 67,376 | | | | | | 165,911 | | |
| VY® T. Rowe Price Growth Equity Portfolio - Class I | | | | | 678,243 | | | | | | 936,409 | | | | | | (1,033,483) | | | | | | 60,302 | | | | | | 641,471 | | | | | | 1,665 | | | | | | (45,399) | | | | | | 161,221 | | |
| | | | | $ | 29,987,740 | | | | | $ | 28,694,364 | | | | | $ | (30,098,553) | | | | | $ | 3,216,301 | | | | | $ | 31,799,852 | | | | | $ | 740,154 | | | | | $ | (50,353) | | | | | $ | 668,204 | | |
The financial statements for the above mutual fund[s] can be found at www.sec.gov.
At December 31, 2019, the aggregate cost of securities and other investments and the composition of unrealized appreciation and depreciation of securities and other investments at year end were:
| | Cost for federal income tax purposes was $35,547,873. | | | | | | | |
| | Net unrealized appreciation consisted of: | | | | | | | |
| | Gross Unrealized Appreciation | | | | $ | 1,207,699 | | |
| | Gross Unrealized Depreciation | | | | | (583,783) | | |
| | Net Unrealized Appreciation | | | | $ | 623,916 | | |
See Accompanying Notes to Financial Statements
PORTFOLIO OF INVESTMENTS
| Voya Solution 2025 Portfolio | as of December 31, 2019 |
| Shares | | | Value | | | Percentage
of Net
Assets | |
| EXCHANGE-TRADED FUNDS: 5.4% | |
| 575,737 | | | Schwab U.S. TIPS ETF | | | | $ | 32,603,986 | | | | | | 3.9 | | |
| 133,622 | | | Vanguard Real Estate ETF | | | | | 12,398,786 | | | | | | 1.5 | | |
| | | | Total Exchange-Traded Funds
(Cost $42,583,784) | | | | | 45,002,772 | | | | | | 5.4 | | |
| MUTUAL FUNDS: 94.4% | |
| | | | Affiliated Investment Companies: 94.4% | |
| 2,627,523 | | | Voya Floating Rate Fund -
Class I | | | | | 24,961,467 | | | | | | 3.0 | | |
| 2,566,708 | | | Voya Global Bond Fund -
Class R6 | | | | | 24,717,402 | | | | | | 3.0 | | |
| 8,454,427 | | | Voya Intermediate Bond
Fund - Class R6 | | | | | 87,587,859 | | | | | | 10.5 | | |
| 3,146,259 | | | Voya Large Cap Value Fund -
Class R6 | | | | | 39,800,180 | | | | | | 4.8 | | |
| 916,834 | | | Voya Large-Cap Growth
Fund - Class R6 | | | | | 44,127,237 | | | | | | 5.3 | | |
| 742,438 | | | Voya MidCap Opportunities
Portfolio - Class I | | | | | 10,334,739 | | | | | | 1.2 | | |
| 2,317,336 | | | Voya Multi-Manager Emerging
Markets Equity Fund - Class I | | | | | 29,986,325 | | | | | | 3.6 | | |
| 2,841,864 | | | Voya Multi-Manager
International Equity Fund -
Class I | | | | | 33,875,015 | | | | | | 4.1 | | |
| 8,627,048 | | | Voya Multi-Manager
International Factors Fund -
Class I | | | | | 83,768,632 | | | | | | 10.1 | | |
| 1,059,170 | | | Voya Multi-Manager Mid Cap
Value Fund - Class I | | | | | 10,390,458 | | | | | | 1.2 | | |
| 2,697,002 | | | Voya Short Term Bond Fund -
Class R6 | | | | | 26,592,442 | | | | | | 3.2 | | |
| Shares | | | Value | | | Percentage
of Net
Assets | |
| MUTUAL FUNDS: (continued) | |
| | | | Affiliated Investment Companies (continued) | |
| 979,337 | | | Voya Small Company
Portfolio - Class I | | | | $ | 16,687,907 | | | | | | 2.0 | | |
| 3,192,679 | | | Voya Strategic Income
Opportunities Fund -
Class R6 | | | | | 32,916,523 | | | | | | 3.9 | | |
| 1,496,150 | | | Voya U.S. Bond Index
Portfolio - Class I | | | | | 16,308,033 | | | | | | 2.0 | | |
| 3,300,366 | | | Voya U.S. High Dividend Low
Volatility Fund - Class R6 | | | | | 41,617,611 | | | | | | 5.0 | | |
| 5,200,507 | | | Voya U.S. Stock Index
Portfolio - Class I | | | | | 88,356,621 | | | | | | 10.6 | | |
| 4,656,359 | | | VY® BrandywineGLOBAL -
Bond Portfolio - Class I | | | | | 48,938,331 | | | | | | 5.9 | | |
| 2,829,131 | | | VY® T. Rowe Price Capital
Appreciation Portfolio - Class I | | | | | 83,204,754 | | | | | | 10.0 | | |
| 513,208 | | | VY® T. Rowe Price Growth
Equity Portfolio - Class I | | | | | 41,790,517 | | | | | | 5.0 | | |
| | | | Total Mutual Funds
(Cost $761,871,248) | | | | | 785,962,053 | | | | | | 94.4 | | |
| | | | Total Investments in
Securities
(Cost $804,455,032) | | | | $ | 830,964,825 | | | | | | 99.8 | | |
| | | | Assets in Excess of Other
Liabilities | | | | | 1,413,293 | | | | | | 0.2 | | |
| | | | Net Assets | | | | $ | 832,378,118 | | | | | | 100.0 | | |
| |
Fair Value Measurements^
The following is a summary of the fair valuations according to the inputs used as of December 31, 2019 in valuing the assets and liabilities:
| | | | Quoted Prices
in Active Markets
for Identical
Investments
(Level 1) | | | Significant
Other
Observable
Inputs
(Level 2) | | | Significant
Unobservable
Inputs
(Level 3) | | | Fair Value
at
December 31, 2019 | |
| Asset Table | | | | | |
| Investments, at fair value | | | | | |
| Exchange-Traded Funds | | | | $ | 45,002,772 | | | | | $ | — | | | | | $ | — | | | | | $ | 45,002,772 | | |
| Mutual Funds | | | | | 785,962,053 | | | | | | — | | | | | | — | | | | | | 785,962,053 | | |
| Total Investments, at fair value | | | | $ | 830,964,825 | | | | | $ | — | | | | | $ | — | | | | | $ | 830,964,825 | | |
| Other Financial Instruments+ | | | | | |
| Futures | | | | | 292,637 | | | | | | — | | | | | | — | | | | | | 292,637 | | |
| Total Assets | | | | $ | 831,257,462 | | | | | $ | — | | | | | $ | — | | | | | $ | 831,257,462 | | |
| |
See Accompanying Notes to Financial Statements
PORTFOLIO OF INVESTMENTS
| Voya Solution 2025 Portfolio | as of December 31, 2019 (continued) |
| | | | Quoted Prices
in Active Markets
for Identical
Investments
(Level 1) | | | Significant
Other
Observable
Inputs
(Level 2) | | | Significant
Unobservable
Inputs
(Level 3) | | | Fair Value
at
December 31, 2019 | |
| Liabilities Table | | | | | |
| Other Financial Instruments+ | | | | | |
| Futures | | | | $ | (507,298) | | | | | $ | — | | | | | $ | — | | | | | $ | (507,298) | | |
| Total Liabilities | | | | $ | (507,298) | | | | | $ | — | | | | | $ | — | | | | | $ | (507,298) | | |
| |
^
See Note 2, “Significant Accounting Policies” in the Notes to Financial Statements for additional information.
+
Other Financial Instruments may include open forward foreign currency contracts, futures, centrally cleared swaps, OTC swaps and written options. Forward foreign currency contracts, futures and centrally cleared swaps are valued at the unrealized gain (loss) on the instrument. OTC swaps and written options are valued at the fair value of the instrument.
At December 31, 2019, the following futures contracts were outstanding for Voya Solution 2025 Portfolio:
| Description | | | Number
of Contracts | | | Expiration
Date | | | Notional
Value | | | Unrealized
Appreciation/
(Depreciation) | |
| Long Contracts: | | | | | |
| E-mini Russell 2000® Index | | | | | 101 | | | | | | 03/20/20 | | | | | $ | 8,436,530 | | | | | $ | 131,613 | | |
| U.S. Treasury Ultra Long Bond | | | | | 87 | | | | | | 03/20/20 | | | | | | 15,804,094 | | | | | | (507,298) | | |
| | | | | | | | | | | | | | | | | $ | 24,240,624 | | | | | $ | (375,685) | | |
| Short Contracts: | | | | | |
| Mini MSCI EAFE Index | | | | | (82) | | | | | | 03/20/20 | | | | | | (8,349,650) | | | | | | 19,654 | | |
| U.S. Treasury 10-Year Note | | | | | (126) | | | | | | 03/20/20 | | | | | | (16,181,157) | | | | | | 141,370 | | |
| | | | | | | | | | | | | | | | | $ | (24,530,807) | | | | | $ | 161,024 | | |
Transactions with Affiliates
An investment of at least 5% of the voting securities of an issuer, or a company which is under common control results in that issuer becoming an affiliated person as defined by the 1940 Act.
The following table provides transactions during the year ended December 31, 2019, where the following issuers were considered an affiliate:
| Issuer | | | Beginning
Fair Value
at 12/31/18 | | | Purchases
at Cost | | | Sales
at Cost | | | Change in
Unrealized
Appreciation/
(Depreciation) | | | Ending
Fair Value
at 12/31/2019 | | | Investment
Income | | | Realized
Gains/
(Losses) | | | Net Capital
Gain
Distributions | |
| Voya Emerging Markets Index Portfolio - Class I | | | | $ | 7,643,329 | | | | | $ | 90,314 | | | | | $ | (8,257,969) | | | | | $ | 524,326 | | | | | $ | — | | | | | $ | — | | | | | $ | 388,480 | | | | | $ | — | | |
| Voya Floating Rate Fund - Class I | | | | | 38,275,752 | | | | | | 4,916,609 | | | | | | (19,654,755) | | | | | | 1,423,861 | | | | | | 24,961,467 | | | | | | 1,358,533 | | | | | | (892,454) | | | | | | — | | |
| Voya Global Bond Fund - Class R6 | | | | | 23,006,749 | | | | | | 5,232,541 | | | | | | (4,017,469) | | | | | | 495,581 | | | | | | 24,717,402 | | | | | | 997,587 | | | | | | 232,775 | | | | | | — | | |
| Voya Intermediate Bond Fund - Class R6 | | | | | 76,512,538 | | | | | | 32,623,559 | | | | | | (26,121,261) | | | | | | 4,573,023 | | | | | | 87,587,859 | | | | | | 2,869,905 | | | | | | 164,131 | | | | | | 70,925 | | |
| Voya International Index Portfolio - Class I | | | | | 30,578,452 | | | | | | 640,915 | | | | | | (31,924,988) | | | | | | 705,621 | | | | | | — | | | | | | — | | | | | | 2,968,242 | | | | | | — | | |
| Voya Large Cap Value Fund - Class R6 | | | | | 30,747,560 | | | | | | 11,612,055 | | | | | | (6,926,187) | | | | | | 4,366,752 | | | | | | 39,800,180 | | | | | | 733,207 | | | | | | (23,621) | | | | | | 2,702,363 | | |
| Voya Large-Cap Growth Fund - Class R6 | | | | | 38,465,854 | | | | | | 4,473,939 | | | | | | (9,351,122) | | | | | | 10,538,566 | | | | | | 44,127,237 | | | | | | 270,254 | | | | | | (574,860) | | | | | | 1,606,933 | | |
| Voya MidCap Opportunities Portfolio - Class I | | | | | 13,485,804 | | | | | | 1,700,200 | | | | | | (6,146,155) | | | | | | 1,294,890 | | | | | | 10,334,739 | | | | | | 26,757 | | | | | | 571,399 | | | | | | 1,159,497 | | |
| Voya Multi-Manager Emerging Markets Equity Fund - Class I | | | | | 30,632,981 | | | | | | 4,893,743 | | | | | | (11,380,887) | | | | | | 5,840,488 | | | | | | 29,986,325 | | | | | | 489,140 | | | | | | 494,285 | | | | | | 151,253 | | |
| Voya Multi-Manager International Equity Fund - Class I | | | | | 34,464,882 | | | | | | 4,398,136 | | | | | | (11,731,027) | | | | | | 6,743,024 | | | | | | 33,875,015 | | | | | | 650,450 | | | | | | 181,114 | | | | | | — | | |
| Voya Multi-Manager International Factors Fund - Class I | | | | | 42,059,891 | | | | | | 47,936,395 | | | | | | (14,034,678) | | | | | | 7,807,024 | | | | | | 83,768,632 | | | | | | 2,589,422 | | | | | | (699,665) | | | | | | — | | |
| Voya Multi-Manager Mid Cap Value Fund - Class I | | | | | 13,440,213 | | | | | | 2,204,680 | | | | | | (7,461,614) | | | | | | 2,207,179 | | | | | | 10,390,458 | | | | | | 116,206 | | | | | | (155,155) | | | | | | 849,228 | | |
| Voya Short Term Bond Fund - Class R6 | | | | | 24,872,619 | | | | | | 6,530,177 | | | | | | (5,416,524) | | | | | | 606,170 | | | | | | 26,592,442 | | | | | | 633,201 | | | | | | (57,857) | | | | | | — | | |
| Voya Small Company Portfolio - Class I | | | | | 15,375,955 | | | | | | 4,198,300 | | | | | | (4,932,345) | | | | | | 2,045,997 | | | | | | 16,687,907 | | | | | | 64,092 | | | | | | (406,876) | | | | | | 2,155,825 | | |
| Voya Strategic Income Opportunities Fund - Class R6 | | | | | — | | | | | | 45,314,916 | | | | | | (12,677,544) | | | | | | 279,151 | | | | | | 32,916,523 | | | | | | 1,233,045 | | | | | | 96,163 | | | | | | — | | |
| Voya U.S. Bond Index Portfolio - Class I | | | | | 65,024,165 | | | | | | 6,529,736 | | | | | | (56,075,690) | | | | | | 829,822 | | | | | | 16,308,033 | | | | | | 760,490 | | | | | | 1,035,850 | | | | | | — | | |
| Voya U.S. High Dividend Low Volatility Fund - Class I | | | | | 30,736,651 | | | | | | 10,071,413 | | | | | | (43,495,319) | | | | | | 2,687,255 | | | | | | — | | | | | | 389,336 | | | | | | 157,758 | | | | | | — | | |
See Accompanying Notes to Financial Statements
PORTFOLIO OF INVESTMENTS
| Voya Solution 2025 Portfolio | as of December 31, 2019 (continued) |
| Issuer | | | Beginning
Fair Value
at 12/31/18 | | | Purchases
at Cost | | | Sales
at Cost | | | Change in
Unrealized
Appreciation/
(Depreciation) | | | Ending
Fair Value
at 12/31/2019 | | | Investment
Income | | | Realized
Gains/
(Losses) | | | Net Capital
Gain
Distributions | |
| Voya U.S. High Dividend Low Volatility Fund - Class R6 | | | | | — | | | | | | 39,484,159 | | | | | | (1,627,514) | | | | | | 3,760,966 | | | | | | 41,617,611 | | | | | | 477,568 | | | | | | 151,452 | | | | | | 454,793 | | |
| Voya U.S. Stock Index Portfolio - Class I | | | | | 23,383,469 | | | | | | 76,471,034 | | | | | | (19,329,873) | | | | | | 7,831,991 | | | | | | 88,356,621 | | | | | | 1,318,511 | | | | | | 134,828 | | | | | | 4,623,326 | | |
| VY® Goldman Sachs Bond Portfolio - Class I | | | | | 40,052,626 | | | | | | 14,962,637 | | | | | | (9,505,596) | | | | | | 3,428,664 | | | | | | 48,938,331 | | | | | | 912,887 | | | | | | 57,845 | | | | | | — | | |
| VY® Invesco Comstock Portfolio - Class I | | | | | 23,405,599 | | | | | | 270,941 | | | | | | (22,256,711) | | | | | | (1,419,829) | | | | | | — | | | | | | — | | | | | | 5,114,271 | | | | | | — | | |
VY® T. Rowe Price Capital Appreciation Portfolio -
Class I | | | | | 78,486,591 | | | | | | 9,012,723 | | | | | | (16,926,187) | | | | | | 12,631,627 | | | | | | 83,204,754 | | | | | | 1,353,377 | | | | | | (222,849) | | | | | | 4,031,228 | | |
VY® T. Rowe Price Growth Equity Portfolio - Class I | | | | | 30,765,610 | | | | | | 18,055,708 | | | | | | (7,271,275) | | | | | | 240,474 | | | | | | 41,790,517 | | | | | | 74,659 | | | | | | 684,675 | | | | | | 8,539,354 | | |
| | | | | $ | 711,417,290 | | | | | $ | 351,624,830 | | | | | $ | (356,522,690) | | | | | $ | 79,442,623 | | | | | $ | 785,962,053 | | | | | $ | 17,318,627 | | | | | $ | 9,399,931 | | | | | $ | 26,344,725 | | |
| |
The financial statements for the above mutual fund[s] can be found at www.sec.gov.
A summary of derivative instruments by primary risk exposure is outlined in the following tables.
The fair value of derivative instruments as of December 31, 2019 was as follows:
| Derivatives not accounted for as hedging instruments | | | Location on Statement
of Assets and Liabilities | | | Fair Value | |
| Asset Derivatives | | | |
| Equity contracts | | | Net Assets — Unrealized appreciation* | | | | $ | 151,267 | | |
| Interest rate contracts | | | Net Assets — Unrealized appreciation* | | | | | 141,370 | | |
| Total Asset Derivatives | | | | | | | $ | 292,637 | | |
| Liability Derivatives | | | |
| Interest rate contracts | | | Net Assets — Unrealized depreciation* | | | | $ | 507,298 | | |
| Total Liability Derivatives | | | | | | | $ | 507,298 | | |
*
Includes cumulative appreciation/depreciation of futures contracts as reported in the table within the Portfolio of Investments.
The effect of derivative instruments on the Portfolio’s Statement of Operations for the year ended December 31, 2019 was as follows:
| | | | Amount of Realized Gain or (Loss) on
Derivatives Recognized in Income | |
| Derivatives not accounted for as hedging instruments | | | Futures | |
| Equity contracts | | | | $ | (2,427,072) | | |
| Interest rate contracts | | | | | 380,779 | | |
| Total | | | | $ | (2,046,293) | | |
| |
| | | | Change in Unrealized Appreciation or (Depreciation)
on Derivatives Recognized in Income | |
| Derivatives not accounted for as hedging instruments | | | Futures | |
| Equity contracts | | | | $ | (3,338) | | |
| Interest rate contracts | | | | | (789,536) | | |
| Total | | | | $ | (792,874) | | |
At December 31, 2019, the aggregate cost of securities and other investments and the composition of unrealized appreciation and depreciation of securities and other investments at year end were:
| | Cost for federal income tax purposes was $818,715,856. | | |
| | Net unrealized appreciation consisted of: | | |
| | Gross Unrealized Appreciation | | | | $ | 34,424,264 | | |
| | Gross Unrealized Depreciation | | | | | (22,389,957) | | |
| | Net Unrealized Appreciation | | | | $ | 12,034,307 | | |
See Accompanying Notes to Financial Statements
PORTFOLIO OF INVESTMENTS
| Voya Solution 2030 Portfolio | as of December 31, 2019 |
| Shares | | | Value | | | Percentage
of Net
Assets | |
| EXCHANGE-TRADED FUNDS: 13.8% | |
| 6,156 | | | iShares 20+ Year Treasury
Bond ETF | | | | $ | 834,015 | | | | | | 1.8 | | |
| 13,423 | | | iShares Core MSCI EAFE
ETF | | | | | 875,717 | | | | | | 1.9 | | |
| 5,264 | | | iShares Core S&P Small-Cap
ETF | | | | | 441,386 | | | | | | 1.0 | | |
| 30,393 | | | Schwab U.S. TIPS ETF | | | | | 1,721,156 | | | | | | 3.7 | | |
| 8,229 | | | Vanguard Real Estate ETF | | | | | 763,569 | | | | | | 1.6 | | |
| 4,929 | | | Vanguard Russell 1000
Growth ETF | | | | | 891,804 | | | | | | 1.9 | | |
| 7,344 | | | Vanguard Value ETF | | | | | 880,178 | | | | | | 1.9 | | |
| | | | Total Exchange-Traded Funds
(Cost $6,173,336) | | | | | 6,407,825 | | | | | | 13.8 | | |
| MUTUAL FUNDS: 86.1% | |
| | | | Affiliated Investment Companies: 86.1% | |
| 97,894 | | | Voya Floating Rate Fund -
Class I | | | | | 929,995 | | | | | | 2.0 | | |
| 278,168 | | | Voya Intermediate Bond
Fund - Class R6 | | | | | 2,881,817 | | | | | | 6.2 | | |
| 129,567 | | | Voya Large Cap Value
Fund - Class R6 | | | | | 1,639,022 | | | | | | 3.5 | | |
| 47,374 | | | Voya Large-Cap Growth
Fund - Class R6 | | | | | 2,280,088 | | | | | | 4.9 | | |
| 49,817 | | | Voya MidCap Opportunities
Portfolio - Class I | | | | | 693,451 | | | | | | 1.5 | | |
| 184,959 | | | Voya Multi-Manager Emerging
Markets Equity Fund - Class I | | | | | 2,393,375 | | | | | | 5.1 | | |
| 279,820 | | | Voya Multi-Manager
International Equity Fund -
Class I | | | | | 3,335,450 | | | | | | 7.1 | | |
| 436,386 | | | Voya Multi-Manager
International Factors Fund -
Class I | | | | | 4,237,304 | | | | | | 9.1 | | |
| Shares | | | Value | | | Percentage
of Net
Assets | |
| MUTUAL FUNDS: (continued) | |
| | | | Affiliated Investment Companies (continued) | |
| 71,057 | | | Voya Multi-Manager Mid Cap
Value Fund - Class I | | | | $ | 697,070 | | | | | | 1.5 | | |
| 92,820 | | | Voya Short Term Bond
Fund - Class R6 | | | | | 915,207 | | | | | | 2.0 | | |
| 56,268 | | | Voya Small Company
Portfolio - Class I | | | | | 958,812 | | | | | | 2.0 | | |
| 133,954 | | | Voya Strategic Income
Opportunities Fund -
Class R6 | | | | | 1,381,068 | | | | | | 3.0 | | |
| 118,246 | | | Voya U.S. High Dividend Low
Volatility Fund - Class R6 | | | | | 1,491,082 | | | | | | 3.2 | | |
| 304,483 | | | Voya U.S. Stock Index
Portfolio - Class I | | | | | 5,173,167 | | | | | | 11.1 | | |
| 260,451 | | | VY® BrandywineGLOBAL -
Bond Portfolio - Class I | | | | | 2,737,344 | | | | | | 5.9 | | |
| 82,162 | | | VY® Invesco Comstock
Portfolio - Class I | | | | | 1,412,357 | | | | | | 3.0 | | |
| 158,147 | | | VY® T. Rowe Price Capital
Appreciation Portfolio - Class I | | | | | 4,651,089 | | | | | | 10.0 | | |
| 28,719 | | | VY® T. Rowe Price Growth
Equity Portfolio - Class I | | | | | 2,338,590 | | | | | | 5.0 | | |
| | | | Total Mutual Funds
(Cost $39,389,109) | | | | | 40,146,288 | | | | | | 86.1 | | |
| | | | Total Investments in
Securities
(Cost $45,562,445) | | | | $ | 46,554,113 | | | | | | 99.9 | | |
| | | | Assets in Excess of Other
Liabilities | | | | | 59,137 | | | | | | 0.1 | | |
| | | | Net Assets | | | | $ | 46,613,250 | | | | | | 100.0 | | |
| |
Fair Value Measurements^
The following is a summary of the fair valuations according to the inputs used as of December 31, 2019 in valuing the assets and liabilities:
| | | | Quoted Prices
in Active Markets
for Identical
Investments
(Level 1) | | | Significant
Other
Observable
Inputs
(Level 2) | | | Significant
Unobservable
Inputs
(Level 3) | | | Fair Value
at
December 31, 2019 | |
| Asset Table | | | | | |
| Investments, at fair value | | | | | |
| Exchange-Traded Funds | | | | $ | 6,407,825 | | | | | $ | — | | | | | $ | — | | | | | $ | 6,407,825 | | |
| Mutual Funds | | | | | 40,146,288 | | | | | | — | | | | | | — | | | | | | 40,146,288 | | |
| Total Investments, at fair value | | | | $ | 46,554,113 | | | | | $ | — | | | | | $ | — | | | | | $ | 46,554,113 | | |
^
See Note 2, “Significant Accounting Policies” in the Notes to Financial Statements for additional information.
See Accompanying Notes to Financial Statements
PORTFOLIO OF INVESTMENTS
| Voya Solution 2030 Portfolio | as of December 31, 2019 (continued) |
Transactions with Affiliates
An investment of at least 5% of the voting securities of an issuer, or a company which is under common control results in that issuer becoming an affiliated person as defined by the 1940 Act.
The following table provides transactions during the year ended December 31, 2019, where the following issuers were considered an affiliate:
| Issuer | | | Beginning
Fair Value
at 12/31/18 | | | Purchases
at Cost | | | Sales
at Cost | | | Change in
Unrealized
Appreciation/
(Depreciation) | | | Ending
Fair Value
at 12/31/2019 | | | Investment
Income | | | Realized
Gains/
(Losses) | | | Net Capital
Gain
Distributions | |
| Voya Emerging Markets Index Portfolio - Class I | | | | $ | 307,827 | | | | | $ | 40,581 | | | | | $ | (352,340) | | | | | $ | 3,932 | | | | | $ | — | | | | | $ | — | | | | | $ | 33,915 | | | | | $ | — | | |
| Voya Floating Rate Fund - Class I | | | | | 1,233,190 | | | | | | 506,740 | | | | | | (851,455) | | | | | | 41,520 | | | | | | 929,995 | | | | | | 43,412 | | | | | | (24,631) | | | | | | — | | |
| Voya Intermediate Bond Fund - Class R6 | | | | | 2,308,532 | | | | | | 4,007,562 | | | | | | (3,486,719) | | | | | | 52,442 | | | | | | 2,881,817 | | | | | | 93,720 | | | | | | 105,337 | | | | | | 2,210 | | |
| Voya International Index Portfolio - Class I | | | | | 1,231,054 | | | | | | 168,084 | | | | | | (1,595,861) | | | | | | 196,723 | | | | | | — | | | | | | — | | | | | | (68,972) | | | | | | — | | |
| Voya Large Cap Value Fund - Class R6 | | | | | 926,894 | | | | | | 1,031,311 | | | | | | (492,478) | | | | | | 173,295 | | | | | | 1,639,022 | | | | | | 26,306 | | | | | | (39,156) | | | | | | 108,183 | | |
| Voya Large-Cap Growth Fund - Class R6 | | | | | 1,549,275 | | | | | | 1,178,551 | | | | | | (923,621) | | | | | | 475,883 | | | | | | 2,280,088 | | | | | | 13,434 | | | | | | (50,684) | | | | | | 79,878 | | |
| Voya MidCap Opportunities Portfolio - Class I | | | | | 465,537 | | | | | | 325,192 | | | | | | (176,164) | | | | | | 78,886 | | | | | | 693,451 | | | | | | 1,555 | | | | | | (5,829) | | | | | | 64,983 | | |
| Voya Multi-Manager Emerging Markets Equity Fund - Class I | | | | | 1,233,760 | | | | | | 1,765,643 | | | | | | (1,008,261) | | | | | | 402,233 | | | | | | 2,393,375 | | | | | | 38,010 | | | | | | (96,076) | | | | | | 11,742 | | |
| Voya Multi-Manager International Equity Fund - Class I | | | | | 2,004,983 | | | | | | 1,587,550 | | | | | | (755,781) | | | | | | 498,698 | | | | | | 3,335,450 | | | | | | 62,068 | | | | | | (19,475) | | | | | | — | | |
| Voya Multi-Manager International Factors Fund - Class I | | | | | 2,309,903 | | | | | | 2,416,252 | | | | | | (946,301) | | | | | | 457,450 | | | | | | 4,237,304 | | | | | | 126,977 | | | | | | (84,692) | | | | | | — | | |
| Voya Multi-Manager Mid Cap Value Fund - Class I | | | | | 463,919 | | | | | | 356,332 | | | | | | (241,406) | | | | | | 118,225 | | | | | | 697,070 | | | | | | 7,577 | | | | | | (42,995) | | | | | | 55,373 | | |
| Voya Short Term Bond Fund - Class R6 | | | | | — | | | | | | 1,025,128 | | | | | | (116,483) | | | | | | 6,562 | | | | | | 915,207 | | | | | | 13,934 | | | | | | 1,000 | | | | | | — | | |
| Voya Small Company Portfolio - Class I | | | | | 619,288 | | | | | | 529,787 | | | | | | (341,080) | | | | | | 150,817 | | | | | | 958,812 | | | | | | 2,907 | | | | | | (75,920) | | | | | | 97,694 | | |
| Voya Strategic Income Opportunities Fund - Class R6 | | | | | — | | | | | | 2,041,966 | | | | | | (669,130) | | | | | | 8,232 | | | | | | 1,381,068 | | | | | | 48,710 | | | | | | 5,258 | | | | | | — | | |
| Voya U.S. Bond Index Portfolio - Class I | | | | | 2,002,301 | | | | | | 1,099,353 | | | | | | (3,082,713) | | | | | | (18,941) | | | | | | — | | | | | | 16,567 | | | | | | 60,829 | | | | | | — | | |
| Voya U.S. High Dividend Low Volatility Fund - Class I | | | | | 1,083,206 | | | | | | 1,250,956 | | | | | | (2,438,233) | | | | | | 104,071 | | | | | | — | | | | | | 16,839 | | | | | | 14,411 | | | | | | — | | |
| Voya U.S. High Dividend Low Volatility Fund - Class R6 | | | | | — | | | | | | 2,312,907 | | | | | | (886,840) | | | | | | 65,015 | | | | | | 1,491,082 | | | | | | 20,933 | | | | | | 93,399 | | | | | | 15,356 | | |
| Voya U.S. Stock Index Portfolio - Class I | | | | | 2,041,619 | | | | | | 6,180,889 | | | | | | (3,594,837) | | | | | | 545,496 | | | | | | 5,173,167 | | | | | | 78,791 | | | | | | (10,725) | | | | | | 307,549 | | |
| VY® Goldman Sachs Bond Portfolio - Class I | | | | | 1,536,270 | | | | | | 1,696,371 | | | | | | (639,900) | | | | | | 144,603 | | | | | | 2,737,344 | | | | | | 45,498 | | | | | | 7,763 | | | | | | — | | |
| VY® Invesco Comstock Portfolio - Class I | | | | | 1,571,334 | | | | | | 966,559 | | | | | | (1,188,982) | | | | | | 63,446 | | | | | | 1,412,357 | | | | | | 33,287 | | | | | | 6,767 | | | | | | 259,542 | | |
VY® T. Rowe Price Capital Appreciation Portfolio - Class I | | | | | 3,161,616 | | | | | | 2,019,404 | | | | | | (1,025,820) | | | | | | 495,889 | | | | | | 4,651,089 | | | | | | 73,709 | | | | | | 34,894 | | | | | | 200,768 | | |
| VY® T. Rowe Price Growth Equity Portfolio - Class I | | | | | 1,858,693 | | | | | | 1,379,956 | | | | | | (1,078,275) | | | | | | 178,216 | | | | | | 2,338,590 | | | | | | 3,742 | | | | | | (68,695) | | | | | | 443,817 | | |
| | | | | $ | 27,909,201 | | | | | $ | 33,887,074 | | | | | $ | (25,892,680) | | | | | $ | 4,242,693 | | | | | $ | 40,146,288 | | | | | $ | 767,976 | | | | | $ | (224,277) | | | | | $ | 1,647,095 | | |
The financial statements for the above mutual fund[s] can be found at www.sec.gov.
At December 31, 2019, the aggregate cost of securities and other investments and the composition of unrealized appreciation and depreciation of securities and other investments at year end were:
| | Cost for federal income tax purposes was $46,286,306. | | |
| | Net unrealized appreciation consisted of: | | |
| | Gross Unrealized Appreciation | | | | $ | 1,437,024 | | |
| | Gross Unrealized Depreciation | | | | | (1,169,217) | | |
| | Net Unrealized Appreciation | | | | $ | 267,807 | | |
See Accompanying Notes to Financial Statements
PORTFOLIO OF INVESTMENTS
| Voya Solution 2035 Portfolio | as of December 31, 2019 |
| Shares | | | Value | | | Percentage
of Net
Assets | |
| EXCHANGE-TRADED FUNDS: 10.0% | |
| 596,099 | | | Schwab U.S. TIPS ETF | | | | $ | 33,757,086 | | | | | | 3.9 | | |
| 139,963 | | | Vanguard Global ex-U.S.
Real Estate ETF | | | | | 8,270,414 | | | | | | 0.9 | | |
| 92,232 | | | Vanguard Real Estate ETF | | | | | 8,558,207 | | | | | | 1.0 | | |
| 108,758 | | | Vanguard Russell 1000
Growth ETF | | | | | 19,677,585 | | | | | | 2.2 | | |
| 144,033 | | | Vanguard Value ETF | | | | | 17,262,355 | | | | | | 2.0 | | |
| | | | Total Exchange-Traded
Funds
(Cost $83,227,110) | | | | | 87,525,647 | | | | | | 10.0 | | |
| MUTUAL FUNDS: 89.8% | |
| | | | Affiliated Investment Companies: 89.8% | |
| 1,820,813 | | | Voya Floating Rate Fund -
Class I | | | | | 17,297,721 | | | | | | 2.0 | | |
| 605,562 | | | Voya Index Plus LargeCap
Portfolio - Class I | | | | | 17,422,011 | | | | | | 2.0 | | |
| 4,911,277 | | | Voya Intermediate Bond
Fund - Class R6 | | | | | 50,880,831 | | | | | | 5.8 | | |
| 2,065,582 | | | Voya Large Cap Value Fund -
Class R6 | | | | | 26,129,609 | | | | | | 3.0 | | |
| 771,505 | | | Voya Large-Cap Growth
Fund - Class R6 | | | | | 37,132,522 | | | | | | 4.3 | | |
| 1,234,834 | | | Voya MidCap Opportunities
Portfolio - Class I | | | | | 17,188,895 | | | | | | 2.0 | | |
| 4,129,766 | | | Voya Multi-Manager Emerging
Markets Equity Fund - Class I | | | | | 53,439,166 | | | | | | 6.1 | | |
| 7,382,013 | | | Voya Multi-Manager
International Equity Fund -
Class I | | | | | 87,993,594 | | | | | | 10.1 | | |
| 8,966,116 | | | Voya Multi-Manager
International Factors Fund -
Class I | | | | | 87,060,990 | | | | | | 10.0 | | |
| Shares | | | Value | | | Percentage
of Net
Assets | |
| MUTUAL FUNDS: (continued) | |
| | | | Affiliated Investment Companies (continued) | |
| 1,761,638 | | | Voya Multi-Manager Mid Cap
Value Fund - Class I | | | | $ | 17,281,667 | | | | | | 2.0 | | |
| 1,725,338 | | | Voya Short Term Bond Fund -
Class R6 | | | | | 17,011,832 | | | | | | 2.0 | | |
| 1,020,158 | | | Voya Small Company
Portfolio - Class I | | | | | 17,383,499 | | | | | | 2.0 | | |
| 1,659,293 | | | Voya Strategic Income
Opportunities Fund -
Class R6 | | | | | 17,107,313 | | | | | | 2.0 | | |
| 2,065,447 | | | Voya U.S. High Dividend Low
Volatility Fund - Class R6 | | | | | 26,045,286 | | | | | | 3.0 | | |
| 5,920,776 | | | Voya U.S. Stock Index
Portfolio - Class I | | | | | 100,593,983 | | | | | | 11.6 | | |
| 2,546,929 | | | VY® Invesco Comstock
Portfolio - Class I | | | | | 43,781,711 | | | | | | 5.0 | | |
| 2,940,899 | | | VY® T. Rowe Price Capital
Appreciation Portfolio -
Class I | | | | | 86,491,854 | | | | | | 9.9 | | |
| 746,912 | | | VY® T. Rowe Price Growth
Equity Portfolio - Class I | | | | | 60,821,081 | | | | | | 7.0 | | |
| | | | Total Mutual Funds
(Cost $762,302,959) | | | | | 781,063,565 | | | | | | 89.8 | | |
| | | | Total Investments in
Securities
(Cost $845,530,069) | | | | $ | 868,589,212 | | | | | | 99.8 | | |
| | | | Assets in Excess of Other
Liabilities | | | | | 1,445,889 | | | | | | 0.2 | | |
| | | | Net Assets | | | | $ | 870,035,101 | | | | | | 100.0 | | |
| |
Fair Value Measurements^
The following is a summary of the fair valuations according to the inputs used as of December 31, 2019 in valuing the assets and liabilities:
| | | | Quoted Prices
in Active Markets
for Identical
Investments
(Level 1) | | | Significant
Other
Observable
Inputs
(Level 2) | | | Significant
Unobservable
Inputs
(Level 3) | | | Fair Value
at
December 31, 2019 | |
| Asset Table | | | | | |
| Investments, at fair value | | | | | |
| Exchange-Traded Funds | | | | $ | 87,525,647 | | | | | $ | — | | | | | $ | — | | | | | $ | 87,525,647 | | |
| Mutual Funds | | | | | 781,063,565 | | | | | | — | | | | | | — | | | | | | 781,063,565 | | |
| Total Investments, at fair value | | | | $ | 868,589,212 | | | | | $ | — | | | | | $ | — | | | | | $ | 868,589,212 | | |
| Other Financial Instruments+ | | | | | |
| Futures | | | | | 351,954 | | | | | | — | | | | | | — | | | | | | 351,954 | | |
| Total Assets | | | | $ | 868,941,166 | | | | | $ | — | | | | | $ | — | | | | | $ | 868,941,166 | | |
| |
See Accompanying Notes to Financial Statements
PORTFOLIO OF INVESTMENTS
| Voya Solution 2035 Portfolio | as of December 31, 2019 (continued) |
| | | | Quoted Prices
in Active Markets
for Identical
Investments
(Level 1) | | | Significant
Other
Observable
Inputs
(Level 2) | | | Significant
Unobservable
Inputs
(Level 3) | | | Fair Value
at
December 31, 2019 | |
| Liabilities Table | | | | | |
| Other Financial Instruments+ | | | | | |
| Futures | | | | $ | (752,960) | | | | | $ | — | | | | | $ | — | | | | | $ | (752,960) | | |
| Total Liabilities | | | | $ | (752,960) | | | | | $ | — | | | | | $ | — | | | | | $ | (752,960) | | |
| |
^
See Note 2, “Significant Accounting Policies” in the Notes to Financial Statements for additional information.
+
Other Financial Instruments may include open forward foreign currency contracts, futures, centrally cleared swaps, OTC swaps and written options. Forward foreign currency contracts, futures and centrally cleared swaps are valued at the unrealized gain (loss) on the instrument. OTC swaps and written options are valued at the fair value of the instrument.
At December 31, 2019, the following futures contracts were outstanding for Voya Solution 2035 Portfolio:
| Description | | | Number
of Contracts | | | Expiration
Date | | | Notional
Value | | | Unrealized
Appreciation/
(Depreciation) | |
| Long Contracts: | | | | | |
| E-mini Russell 2000® Index | | | | | 157 | | | | | | 03/20/20 | | | | | $ | 13,114,210 | | | | | $ | 204,586 | | |
| U.S. Treasury Ultra Long Bond | | | | | 90 | | | | | | 03/20/20 | | | | | | 16,349,063 | | | | | | (527,424) | | |
| | | | | | | | | | | | | | | | | $ | 29,463,273 | | | | | $ | (322,838) | | |
| Short Contracts: | | | | | |
| S&P 500® E-Mini | | | | | (81) | | | | | | 03/20/20 | | | | | | (13,085,955) | | | | | | (225,536) | | |
| U.S. Treasury 10-Year Note | | | | | (131) | | | | | | 03/20/20 | | | | | | (16,823,266) | | | | | | 147,368 | | |
| | | | | | | | | | | | | | | | | $ | (29,909,221) | | | | | $ | (78,168) | | |
Transactions with Affiliates
An investment of at least 5% of the voting securities of an issuer, or a company which is under common control results in that issuer becoming an affiliated person as defined by the 1940 Act.
The following table provides transactions during the year ended December 31, 2019, where the following issuers were considered an affiliate:
| Issuer | | | Beginning
Fair Value
at 12/31/18 | | | Purchases
at Cost | | | Sales
at Cost | | | Change in
Unrealized
Appreciation/
(Depreciation) | | | Ending
Fair Value
at 12/31/2019 | | | Investment
Income | | | Realized
Gains/
(Losses) | | | Net Capital
Gain
Distributions | |
| Voya Emerging Markets Index Portfolio - Class I | | | | $ | 22,916,283 | | | | | $ | 515,754 | | | | | $ | (24,003,230) | | | | | $ | 571,193 | | | | | $ | — | | | | | $ | — | | | | | $ | 2,184,415 | | | | | $ | — | | |
| Voya Floating Rate Fund - Class I | | | | | 30,603,880 | | | | | | 4,039,709 | | | | | | (18,327,527) | | | | | | 981,659 | | | | | | 17,297,721 | | | | | | 942,951 | | | | | | (534,134) | | | | | | — | | |
| Voya Index Plus LargeCap Portfolio - Class I | | | | | 36,506,441 | | | | | | 2,991,646 | | | | | | (24,732,682) | | | | | | 2,656,606 | | | | | | 17,422,011 | | | | | | 250,591 | | | | | | 3,656,031 | | | | | | 1,379,595 | | |
| Voya Intermediate Bond Fund - Class R6 | | | | | 66,910,557 | | | | | | 23,039,562 | | | | | | (42,320,798) | | | | | | 3,251,510 | | | | | | 50,880,831 | | | | | | 2,039,978 | | | | | | 241,544 | | | | | | 41,054 | | |
| Voya International Index Portfolio - Class I | | | | | 45,850,143 | | | | | | 1,164,905 | | | | | | (49,456,969) | | | | | | 2,441,921 | | | | | | — | | | | | | — | | | | | | 3,081,131 | | | | | | — | | |
| Voya Large Cap Value Fund - Class R6 | | | | | 23,067,015 | | | | | | 4,631,457 | | | | | | (4,683,511) | | | | | | 3,114,648 | | | | | | 26,129,609 | | | | | | 493,120 | | | | | | 53,586 | | | | | | 1,769,945 | | |
| Voya Large-Cap Growth Fund - Class R6 | | | | | 42,292,751 | | | | | | 4,890,548 | | | | | | (21,399,887) | | | | | | 11,349,110 | | | | | | 37,132,522 | | | | | | 226,806 | | | | | | (1,210,235) | | | | | | 1,348,594 | | |
| Voya MidCap Opportunities Portfolio - Class I | | | | | 19,256,918 | | | | | | 3,009,531 | | | | | | (7,492,278) | | | | | | 2,414,724 | | | | | | 17,188,895 | | | | | | 43,460 | | | | | | 286,028 | | | | | | 1,902,769 | | |
Voya Multi-Manager Emerging Markets Equity Fund -
Class I | | | | | 38,269,430 | | | | | | 15,446,853 | | | | | | (7,178,498) | | | | | | 6,901,381 | | | | | | 53,439,166 | | | | | | 869,729 | | | | | | 1,849,196 | | | | | | 268,920 | | |
| Voya Multi-Manager International Equity Fund - Class I | | | | | 57,411,116 | | | | | | 29,845,640 | | | | | | (12,317,102) | | | | | | 13,053,940 | | | | | | 87,993,594 | | | | | | 1,685,983 | | | | | | 45,117 | | | | | | — | | |
| Voya Multi-Manager International Factors Fund - Class I | | | | | 57,322,867 | | | | | | 32,600,582 | | | | | | (11,802,126) | | | | | | 8,939,667 | | | | | | 87,060,990 | | | | | | 2,684,995 | | | | | | (314,742) | | | | | | — | | |
| Voya Multi-Manager Mid Cap Value Fund - Class I | | | | | 19,190,898 | | | | | | 3,275,380 | | | | | | (8,494,580) | | | | | | 3,309,969 | | | | | | 17,281,667 | | | | | | 192,815 | | | | | | (362,867) | | | | | | 1,409,079 | | |
| Voya Short Term Bond Fund - Class R6 | | | | | — | | | | | | 18,938,025 | | | | | | (2,076,837) | | | | | | 150,644 | | | | | | 17,011,832 | | | | | | 284,014 | | | | | | 16,296 | | | | | | — | | |
| Voya Small Company Portfolio - Class I | | | | | 15,368,634 | | | | | | 4,012,809 | | | | | | (4,931,059) | | | | | | 2,933,115 | | | | | | 17,383,499 | | | | | | 66,090 | | | | | | (1,354,232) | | | | | | 2,223,284 | | |
| Voya Strategic Income Opportunities Fund - Class R6 | | | | | — | | | | | | 19,050,081 | | | | | | (2,088,982) | | | | | | 146,214 | | | | | | 17,107,313 | | | | | | 513,308 | | | | | | 14,635 | | | | | | — | | |
| Voya U.S. Bond Index Portfolio - Class I | | | | | 22,945,452 | | | | | | 2,417,184 | | | | | | (25,041,647) | | | | | | (320,989) | | | | | | — | | | | | | 172,791 | | | | | | 768,928 | | | | | | — | | |
| Voya U.S. High Dividend Low Volatility Fund - Class I | | | | | 15,360,895 | | | | | | 26,432,531 | | | | | | (43,153,184) | | | | | | 1,359,758 | | | | | | — | | | | | | 331,719 | | | | | | 144,097 | | | | | | — | | |
| Voya U.S. High Dividend Low Volatility Fund - Class R6 | | | | | — | | | | | | 40,729,557 | | | | | | (16,144,418) | | | | | | 1,460,147 | | | | | | 26,045,286 | | | | | | 392,213 | | | | | | 1,649,807 | | | | | | 283,623 | | |
| Voya U.S. Stock Index Portfolio - Class I | | | | | 35,103,721 | | | | | | 73,592,303 | | | | | | (17,634,685) | | | | | | 9,532,644 | | | | | | 100,593,983 | | | | | | 1,496,808 | | | | | | 662,094 | | | | | | 5,203,551 | | |
See Accompanying Notes to Financial Statements
PORTFOLIO OF INVESTMENTS
| Voya Solution 2035 Portfolio | as of December 31, 2019 (continued) |
| Issuer | | | Beginning
Fair Value
at 12/31/18 | | | Purchases
at Cost | | | Sales
at Cost | | | Change in
Unrealized
Appreciation/
(Depreciation) | | | Ending
Fair Value
at 12/31/2019 | | | Investment
Income | | | Realized
Gains/
(Losses) | | | Net Capital
Gain
Distributions | |
| VY® Invesco Comstock Portfolio - Class I | | | | | 50,697,935 | | | | | | 14,074,839 | | | | | | (18,205,769) | | | | | | (2,785,294) | | | | | | 43,781,711 | | | | | | 1,079,428 | | | | | | 4,497,633 | | | | | | 8,550,445 | | |
VY® T. Rowe Price Capital Appreciation Portfolio - Class I | | | | | 62,766,825 | | | | | | 27,537,012 | | | | | | (14,388,546) | | | | | | 10,576,563 | | | | | | 86,491,854 | | | | | | 1,401,947 | | | | | | (154,215) | | | | | | 4,137,916 | | |
| VY® T. Rowe Price Growth Equity Portfolio - Class I | | | | | 53,814,670 | | | | | | 15,850,239 | | | | | | (10,731,880) | | | | | | 1,888,052 | | | | | | 60,821,081 | | | | | | 107,207 | | | | | | 1,187,464 | | | | | | 12,326,815 | | |
| | | | | $ | 715,656,431 | | | | | $ | 368,086,147 | | | | | $ | (386,606,195) | | | | | $ | 83,927,182 | | | | | $ | 781,063,565 | | | | | $ | 15,275,953 | | | | | $ | 16,407,577 | | | | | $ | 40,845,590 | | |
| |
The financial statements for the above mutual fund[s] can be found at www.sec.gov.
A summary of derivative instruments by primary risk exposure is outlined in the following tables.
The fair value of derivative instruments as of December 31, 2019 was as follows:
| Derivatives not accounted for as hedging instruments | | | Location on Statement
of Assets and Liabilities | | | Fair Value | |
| Asset Derivatives | | | |
| Equity contracts | | | Net Assets — Unrealized appreciation* | | | | $ | 204,586 | | |
| Interest rate contracts | | | Net Assets — Unrealized appreciation* | | | | | 147,368 | | |
| Total Asset Derivatives | | | | | | | $ | 351,954 | | |
| Liability Derivatives | | | |
| Equity contracts | | | Net Assets — Unrealized depreciation* | | | | $ | 225,536 | | |
| Interest rate contracts | | | Net Assets — Unrealized depreciation* | | | | | 527,424 | | |
| Total Liability Derivatives | | | | | | | $ | 752,960 | | |
*
Includes cumulative appreciation/depreciation of futures contracts as reported in the table within the Portfolio of Investments.
The effect of derivative instruments on the Portfolio’s Statement of Operations for the year ended December 31, 2019 was as follows:
| | | | Amount of Realized Gain or (Loss) on
Derivatives Recognized in Income | |
| Derivatives not accounted for as hedging instruments | | | Futures | |
| Equity contracts | | | | $ | (2,381,110) | | |
| Interest rate contracts | | | | | 382,113 | | |
| Total | | | | $ | (1,998,997) | | |
| |
| | | | Change in Unrealized Appreciation or (Depreciation)
on Derivatives Recognized in Income | |
| Derivatives not accounted for as hedging instruments | | | Futures | |
| Equity contracts | | | | $ | 136,008 | | |
| Interest rate contracts | | | | | (798,648) | | |
| Total | | | | $ | (662,640) | | |
At December 31, 2019, the aggregate cost of securities and other investments and the composition of unrealized appreciation and depreciation of securities and other investments at year end were:
| | Cost for federal income tax purposes was $858,523,741. | | |
| | Net unrealized appreciation consisted of: | | |
| | Gross Unrealized Appreciation | | | | $ | 37,978,900 | | |
| | Gross Unrealized Depreciation | | | | | (28,314,434) | | |
| | Net Unrealized Appreciation | | | | $ | 9,664,466 | | |
See Accompanying Notes to Financial Statements
PORTFOLIO OF INVESTMENTS
| Voya Solution 2040 Portfolio | as of December 31, 2019 |
| Shares | | | Value | | | Percentage
of Net
Assets | |
| EXCHANGE-TRADED FUNDS: 13.8% | |
| 4,731 | | | iShares 20+ Year Treasury
Bond ETF | | | | $ | 640,956 | | | | | | 1.8 | | |
| 10,316 | | | iShares Core MSCI EAFE
ETF | | | | | 673,016 | | | | | | 1.9 | | |
| 6,069 | | | iShares Core S&P Small-Cap
ETF | | | | | 508,886 | | | | | | 1.4 | | |
| 5,485 | | | Vanguard Global ex-U.S. Real
Estate ETF | | | | | 324,109 | | | | | | 0.9 | | |
| 4,518 | | | Vanguard Real Estate ETF | | | | | 419,225 | | | | | | 1.2 | | |
| 4,735 | | | Vanguard Russell 1000
Growth ETF | | | | | 856,703 | | | | | | 2.4 | | |
| 12,699 | | | Vanguard Value ETF | | | | | 1,521,975 | | | | | | 4.2 | | |
| | | | Total Exchange-Traded Funds
(Cost $4,697,617) | | | | | 4,944,870 | | | | | | 13.8 | | |
| MUTUAL FUNDS: 86.0% | |
| | | | Affiliated Investment Companies: 86.0% | |
| 24,801 | | | Voya Index Plus LargeCap
Portfolio - Class I | | | | | 713,512 | | | | | | 2.0 | | |
| 137,065 | | | Voya Intermediate Bond
Fund - Class R6 | | | | | 1,419,991 | | | | | | 4.0 | | |
| 30,536 | | | Voya Large-Cap Growth
Fund - Class R6 | | | | | 1,469,708 | | | | | | 4.1 | | |
| 50,582 | | | Voya MidCap Opportunities
Portfolio - Class I | | | | | 704,108 | | | | | | 2.0 | | |
| 183,201 | | | Voya Multi-Manager Emerging
Markets Equity Fund - Class I | | | | | 2,370,621 | | | | | | 6.6 | | |
| 357,170 | | | Voya Multi-Manager
International Equity Fund -
Class I | | | | | 4,257,461 | | | | | | 11.9 | | |
| 305,321 | | | Voya Multi-Manager
International Factors Fund -
Class I | | | | | 2,964,668 | | | | | | 8.3 | | |
| Shares | | | Value | | | Percentage
of Net
Assets | |
| MUTUAL FUNDS: (continued) | |
| | | | Affiliated Investment Companies (continued) | |
| 72,159 | | | Voya Multi-Manager Mid Cap
Value Fund - Class I | | | | $ | 707,881 | | | | | | 2.0 | | |
| 70,688 | | | Voya Short Term Bond Fund -
Class R6 | | | | | 696,985 | | | | | | 2.0 | | |
| 64,015 | | | Voya Small Company
Portfolio - Class I | | | | | 1,090,823 | | | | | | 3.1 | | |
| 34,055 | | | Voya Strategic Income
Opportunities Fund -
Class R6 | | | | | 351,109 | | | | | | 1.0 | | |
| 88,538 | | | Voya U.S. High Dividend Low
Volatility Fund - Class R6 | | | | | 1,116,466 | | | | | | 3.1 | | |
| 253,045 | | | Voya U.S. Stock Index
Portfolio - Class I | | | | | 4,299,237 | | | | | | 12.1 | | |
| 132,664 | | | VY® Invesco Comstock
Portfolio - Class I | | | | | 2,280,494 | | | | | | 6.4 | | |
| 120,451 | | | VY® T. Rowe Price Capital
Appreciation Portfolio - Class I | | | | | 3,542,478 | | | | | | 9.9 | | |
| 32,782 | | | VY® T. Rowe Price Growth
Equity Portfolio - Class I | | | | | 2,669,461 | | | | | | 7.5 | | |
| | | | Total Mutual Funds
(Cost $30,294,078) | | | | | 30,655,003 | | | | | | 86.0 | | |
| | | | Total Investments in
Securities
(Cost $34,991,695) | | | | $ | 35,599,873 | | | | | | 99.8 | | |
| | | | Assets in Excess of Other
Liabilities | | | | | 53,875 | | | | | | 0.2 | | |
| | | | Net Assets | | | | $ | 35,653,748 | | | | | | 100.0 | | |
| |
Fair Value Measurements^
The following is a summary of the fair valuations according to the inputs used as of December 31, 2019 in valuing the assets and liabilities:
| | | | Quoted Prices
in Active Markets
for Identical
Investments
(Level 1) | | | Significant
Other
Observable
Inputs
(Level 2) | | | Significant
Unobservable
Inputs
(Level 3) | | | Fair Value
at
December 31, 2019 | |
| Asset Table | | | | | | | | | | | | | | | | | | | | | | | | | |
| Investments, at fair value | | | | | | | | | | | | | | | | | | | | | | | | | |
| Exchange-Traded Funds | | | | $ | 4,944,870 | | | | | $ | — | | | | | $ | — | | | | | $ | 4,944,870 | | |
| Mutual Funds | | | | | 30,655,003 | | | | | | — | | | | | | — | | | | | | 30,655,003 | | |
| Total Investments, at fair value | | | | $ | 35,599,873 | | | | | $ | — | | | | | $ | — | | | | | $ | 35,599,873 | | |
^
See Note 2, “Significant Accounting Policies” in the Notes to Financial Statements for additional information.
See Accompanying Notes to Financial Statements
PORTFOLIO OF INVESTMENTS
| Voya Solution 2040 Portfolio | as of December 31, 2019 (continued) |
Transactions with Affiliates
An investment of at least 5% of the voting securities of an issuer, or a company which is under common control results in that issuer becoming an affiliated person as defined by the 1940 Act.
The following table provides transactions during the year ended December 31, 2019, where the following issuers were considered an affiliate:
| Issuer | | | Beginning
Fair Value
at 12/31/18 | | | Purchases
at Cost | | | Sales
at Cost | | | Change in
Unrealized
Appreciation/
(Depreciation) | | | Ending
Fair Value
at 12/31/2019 | | | Investment
Income | | | Realized
Gains/
(Losses) | | | Net Capital
Gain
Distributions | |
| Voya Emerging Markets Index Portfolio - Class I | | | | $ | 239,972 | | | | | $ | 34,187 | | | | | $ | (277,350) | | | | | $ | 3,191 | | | | | $ | — | | | | | $ | — | | | | | $ | 26,587 | | | | | $ | — | | |
| Voya Floating Rate Fund - Class I | | | | | 727,431 | | | | | | 63,429 | | | | | | (825,441) | | | | | | 34,581 | | | | | | — | | | | | | 6,865 | | | | | | (17,695) | | | | | | — | | |
| Voya Index Plus LargeCap Portfolio - Class I | | | | | 1,278,805 | | | | | | 416,130 | | | | | | (1,196,075) | | | | | | 214,652 | | | | | | 713,512 | | | | | | 8,977 | | | | | | 26,146 | | | | | | 49,421 | | |
| Voya Intermediate Bond Fund - Class R6 | | | | | 917,430 | | | | | | 2,249,645 | | | | | | (1,764,996) | | | | | | 17,912 | | | | | | 1,419,991 | | | | | | 54,677 | | | | | | 75,826 | | | | | | 1,120 | | |
| Voya International Index Portfolio - Class I | | | | | 1,696,945 | | | | | | 267,314 | | | | | | (2,246,096) | | | | | | 281,837 | | | | | | — | | | | | | — | | | | | | (86,769) | | | | | | — | | |
| Voya Large Cap Value Fund - Class R6 | | | | | 859,227 | | | | | | 248,590 | | | | | | (1,264,596) | | | | | | 156,779 | | | | | | — | | | | | | 5,224 | | | | | | (38,581) | | | | | | — | | |
| Voya Large-Cap Growth Fund - Class R6 | | | | | 1,340,399 | | | | | | 805,608 | | | | | | (1,072,026) | | | | | | 395,727 | | | | | | 1,469,708 | | | | | | 8,764 | | | | | | (47,836) | | | | | | 52,114 | | |
| Voya MidCap Opportunities Portfolio - Class I | | | | | 610,287 | | | | | | 338,220 | | | | | | (343,682) | | | | | | 99,283 | | | | | | 704,108 | | | | | | 1,811 | | | | | | (307) | | | | | | 71,814 | | |
Voya Multi-Manager Emerging Markets Equity Fund -
Class I | | | | | 1,336,421 | | | | | | 1,531,339 | | | | | | (880,503) | | | | | | 383,364 | | | | | | 2,370,621 | | | | | | 38,034 | | | | | | (49,085) | | | | | | 11,754 | | |
| Voya Multi-Manager International Equity Fund - Class I | | | | | 1,940,888 | | | | | | 2,611,460 | | | | | | (795,079) | | | | | | 500,192 | | | | | | 4,257,461 | | | | | | 80,207 | | | | | | 28,662 | | | | | | — | | |
| Voya Multi-Manager International Factors Fund - Class I | | | | | 1,695,681 | | | | | | 1,583,845 | | | | | | (618,185) | | | | | | 303,327 | | | | | | 2,964,668 | | | | | | 89,813 | | | | | | (28,394) | | | | | | — | | |
| Voya Multi-Manager Mid Cap Value Fund - Class I | | | | | 608,181 | | | | | | 341,805 | | | | | | (412,038) | | | | | | 169,933 | | | | | | 707,881 | | | | | | 7,778 | | | | | | (65,450) | | | | | | 56,845 | | |
| Voya Short Term Bond Fund - Class R6 | | | | | — | | | | | | 818,363 | | | | | | (126,429) | | | | | | 5,051 | | | | | | 696,985 | | | | | | 11,053 | | | | | | 1,153 | | | | | | — | | |
| Voya Small Company Portfolio - Class I | | | | | 730,631 | | | | | | 551,273 | | | | | | (345,522) | | | | | | 154,441 | | | | | | 1,090,823 | | | | | | 3,556 | | | | | | (71,635) | | | | | | 119,535 | | |
| Voya Strategic Income Opportunities Fund - Class R6 | | | | | — | | | | | | 812,376 | | | | | | (462,858) | | | | | | 1,591 | | | | | | 351,109 | | | | | | 19,014 | | | | | | 3,628 | | | | | | — | | |
| Voya U.S. Bond Index Portfolio - Class I | | | | | 484,779 | | | | | | 502,702 | | | | | | (979,222) | | | | | | (8,259) | | | | | | — | | | | | | 4,530 | | | | | | 19,670 | | | | | | — | | |
| Voya U.S. High Dividend Low Volatility Fund - Class I | | | | | 486,840 | | | | | | 1,295,431 | | | | | | (1,829,581) | | | | | | 47,310 | | | | | | — | | | | | | 12,328 | | | | | | 10,701 | | | | | | — | | |
| Voya U.S. High Dividend Low Volatility Fund - Class R6 | | | | | — | | | | | | 1,798,241 | | | | | | (733,945) | | | | | | 52,170 | | | | | | 1,116,466 | | | | | | 16,199 | | | | | | 57,497 | | | | | | 11,794 | | |
| Voya U.S. Stock Index Portfolio - Class I | | | | | 1,611,832 | | | | | | 5,223,268 | | | | | | (2,966,136) | | | | | | 430,273 | | | | | | 4,299,237 | | | | | | 65,369 | | | | | | (8,977) | | | | | | 259,103 | | |
| VY® Invesco Comstock Portfolio - Class I | | | | | 1,606,586 | | | | | | 1,451,381 | | | | | | (720,549) | | | | | | (56,924) | | | | | | 2,280,494 | | | | | | 54,466 | | | | | | 9,920 | | | | | | 429,412 | | |
VY® T. Rowe Price Capital Appreciation Portfolio - Class I | | | | | 1,989,201 | | | | | | 1,984,251 | | | | | | (754,644) | | | | | | 323,670 | | | | | | 3,542,478 | | | | | | 56,618 | | | | | | 30,423 | | | | | | 163,294 | | |
VY® T. Rowe Price Growth Equity Portfolio - Class I | | | | | 1,827,390 | | | | | | 1,401,101 | | | | | | (686,942) | | | | | | 127,912 | | | | | | 2,669,461 | | | | | | 4,510 | | | | | | (65,938) | | | | | | 524,199 | | |
| | | | | $ | 21,988,926 | | | | | $ | 26,329,959 | | | | | $ | (21,301,895) | | | | | $ | 3,638,013 | | | | | $ | 30,655,003 | | | | | $ | 549,793 | | | | | $ | (190,454) | | | | | $ | 1,750,405 | | |
The financial statements for the above mutual fund[s] can be found at www.sec.gov.
At December 31, 2019, the aggregate cost of securities and other investments and the composition of unrealized appreciation and depreciation of securities and other investments at year end were:
| | Cost for federal income tax purposes was $35,422,510. | | | | | | | |
| | Net unrealized appreciation consisted of: | | | | | | | |
| | Gross Unrealized Appreciation | | | | $ | 1,219,556 | | |
| | Gross Unrealized Depreciation | | | | | (1,042,193) | | |
| | Net Unrealized Appreciation | | | | $ | 177,363 | | |
See Accompanying Notes to Financial Statements
PORTFOLIO OF INVESTMENTS
| Voya Solution 2045 Portfolio | as of December 31, 2019 |
| Shares | | | Value | | | Percentage
of Net
Assets | |
| EXCHANGE-TRADED FUNDS: 8.9% | |
| 106,221 | | | Vanguard Global ex-U.S. Real
Estate ETF | | | | $ | 6,276,599 | | | | | | 1.0 | | |
| 87,496 | | | Vanguard Real Estate ETF | | | | | 8,118,754 | | | | | | 1.2 | | |
| 110,052 | | | Vanguard Russell 1000 Growth
ETF | | | | | 19,911,708 | | | | | | 3.0 | | |
| 204,955 | | | Vanguard Value ETF | | | | | 24,563,857 | | | | | | 3.7 | | |
| | | | Total Exchange-Traded Funds
(Cost $54,228,120) | | | | | 58,870,918 | | | | | | 8.9 | | |
| MUTUAL FUNDS: 90.8% | |
| | | | Affiliated Investment Companies: 90.8% | |
| 460,297 | | | Voya Index Plus LargeCap
Portfolio - Class I | | | | | 13,242,750 | | | | | | 2.0 | | |
| 1,401,245 | | | Voya Intermediate Bond Fund -
Class R6 | | | | | 14,516,900 | | | | | | 2.2 | | |
| 483,578 | | | Voya Large-Cap Growth Fund -
Class R6 | | | | | 23,274,619 | | | | | | 3.5 | | |
| 1,055,902 | | | Voya MidCap Opportunities
Portfolio - Class I | | | | | 14,698,160 | | | | | | 2.2 | | |
| 3,662,337 | | | Voya Multi-Manager Emerging
Markets Equity Fund - Class I | | | | | 47,390,641 | | | | | | 7.1 | | |
| 7,856,803 | | | Voya Multi-Manager
International Equity Fund -
Class I | | | | | 93,653,097 | | | | | | 14.1 | | |
| 6,134,937 | | | Voya Multi-Manager
International Factors Fund -
Class I | | | | | 59,570,238 | | | | | | 9.0 | | |
| 1,506,442 | | | Voya Multi-Manager Mid Cap
Value Fund - Class I | | | | | 14,778,193 | | | | | | 2.2 | | |
| Shares | | | Value | | | Percentage
of Net
Assets | |
| MUTUAL FUNDS: (continued) | |
| | | | Affiliated Investment Companies (continued) | |
| 1,147,584 | | | Voya Short Term Bond Fund -
Class R6 | | | | $ | 11,315,179 | | | | | | 1.7 | | |
| 630,433 | | | Voya Strategic Income
Opportunities Fund - Class R6 | | | | | 6,499,767 | | | | | | 1.0 | | |
| 1,309,055 | | | Voya U.S. High Dividend Low
Volatility Fund - Class R6 | | | | | 16,507,189 | | | | | | 2.5 | | |
| 6,064,891 | | | Voya U.S. Stock Index
Portfolio - Class I | | | | | 103,042,503 | | | | | | 15.5 | | |
| 2,905,929 | | | VY® Invesco Comstock
Portfolio - Class I | | | | | 49,952,927 | | | | | | 7.5 | | |
| 1,220,802 | | | VY® JPMorgan Small Cap
Core Equity Portfolio Class I | | | | | 19,789,207 | | | | | | 3.0 | | |
| 2,235,438 | | | VY® T. Rowe Price Capital
Appreciation Portfolio - Class I | | | | | 65,744,231 | | | | | | 9.9 | | |
| 608,297 | | | VY® T. Rowe Price Growth
Equity Portfolio - Class I | | | | | 49,533,612 | | | | | | 7.4 | | |
| | | | Total Mutual Funds
(Cost $593,760,944) | | | | | 603,509,213 | | | | | | 90.8 | | |
| | | | Total Investments in
Securities
(Cost $647,989,064) | | | | $ | 662,380,131 | | | | | | 99.7 | | |
| | | | Assets in Excess of Other
Liabilities | | | | | 2,315,137 | | | | | | 0.3 | | |
| | | | Net Assets | | | | $ | 664,695,268 | | | | | | 100.0 | | |
| |
Fair Value Measurements^
The following is a summary of the fair valuations according to the inputs used as of December 31, 2019 in valuing the assets and liabilities:
| | | | Quoted Prices
in Active Markets
for Identical
Investments
(Level 1) | | | Significant
Other
Observable
Inputs
(Level 2) | | | Significant
Unobservable
Inputs
(Level 3) | | | Fair Value
at
December 31, 2019 | |
| Asset Table | | | | | | | | | | | | | | | | | | | | | | | | | |
| Investments, at fair value | | | | | | | | | | | | | | | | | | | | | | | | | |
| Exchange-Traded Funds | | | | $ | 58,870,918 | | | | | $ | — | | | | | $ | — | | | | | $ | 58,870,918 | | |
| Mutual Funds | | | | | 603,509,213 | | | | | | — | | | | | | — | | | | | | 603,509,213 | | |
| Total Investments, at fair value | | | | $ | 662,380,131 | | | | | $ | — | | | | | $ | — | | | | | $ | 662,380,131 | | |
| Other Financial Instruments+ | | | | | | | | | | | | | | | | | | | | | | | | | |
| Futures | | | | | 296,925 | | | | | | — | | | | | | — | | | | | | 296,925 | | |
| Total Assets | | | | $ | 662,677,056 | | | | | $ | — | | | | | $ | — | | | | | $ | 662,677,056 | | |
| Liabilities Table | | | | | | | | | | | | | | | | | | | | | | | | | |
| Other Financial Instruments+ | | | | | | | | | | | | | | | | | | | | | | | | | |
| Futures | | | | $ | (590,559) | | | | | $ | — | | | | | $ | — | | | | | $ | (590,559) | | |
| Total Liabilities | | | | $ | (590,559) | | | | | $ | — | | | | | $ | — | | | | | $ | (590,559) | | |
^
See Note 2, “Significant Accounting Policies” in the Notes to Financial Statements for additional information.
See Accompanying Notes to Financial Statements
PORTFOLIO OF INVESTMENTS
| Voya Solution 2045 Portfolio | as of December 31, 2019 (continued) |
+
Other Financial Instruments may include open forward foreign currency contracts, futures, centrally cleared swaps, OTC swaps and written options. Forward foreign currency contracts, futures and centrally cleared swaps are valued at the unrealized gain (loss) on the instrument. OTC swaps and written options are valued at the fair value of the instrument.
At December 31, 2019, the following futures contracts were outstanding for Voya Solution 2045 Portfolio:
| Description | | | Number of
Contracts | | | Expiration
Date | | | Notional
Value | | | Unrealized
Appreciation/
(Depreciation) | |
| Long Contracts: | | | | | | | | | | | | | | | | | | | |
| E-mini Russell 2000® Index | | | 119 | | | 03/20/20 | | | | $ | 9,940,070 | | | | | $ | 155,069 | | |
| Mini MSCI EAFE Index | | | 65 | | | 03/20/20 | | | | | 6,618,625 | | | | | | (13,336) | | |
| U.S. Treasury Ultra Long Bond | | | 69 | | | 03/20/20 | | | | | 12,534,281 | | | | | | (404,590) | | |
| | | | | | | | | | | $ | 29,092,976 | | | | | $ | (262,857) | | |
| Short Contracts: | | | | | | | | | | | | | | | | | | | |
| S&P 500® E-Mini | | | (62) | | | 03/20/20 | | | | | (10,016,410) | | | | | | (172,633) | | |
| U.S. Treasury 10-Year Note | | | (149) | | | 03/20/20 | | | | | (19,134,859) | | | | | | 141,856 | | |
| | | | | | | | | | | $ | (29,151,269) | | | | | $ | (30,777) | | |
Transactions with Affiliates
An investment of at least 5% of the voting securities of an issuer, or a company which is under common control results in that issuer becoming an affiliated person as defined by the 1940 Act.
The following table provides transactions during the year ended December 31, 2019, where the following issuers were considered an affiliate:
| Issuer | | | Beginning
Fair Value
at 12/31/18 | | | Purchases
at Cost | | | Sales
at Cost | | | Change in
Unrealized
Appreciation/
(Depreciation) | | | Ending
Fair Value
at 12/31/2019 | | | Investment
Income | | | Realized
Gains/
(Losses) | | | Net Capital
Gain
Distributions | |
| Voya Emerging Markets Index Portfolio - Class I | | | | $ | 16,728,572 | | | | | $ | 393,876 | | | | | $ | (17,653,656) | | | | | $ | 531,208 | | | | | $ | — | | | | | $ | — | | | | | $ | 1,481,462 | | | | | $ | — | | |
| Voya Floating Rate Fund - Class I | | | | | 9,774,415 | | | | | | 95,216 | | | | | | (10,359,550) | | | | | | 489,919 | | | | | | — | | | | | | 38,387 | | | | | | (309,697) | | | | | | — | | |
| Voya Index Plus LargeCap Portfolio - Class I | | | | | 42,080,982 | | | | | | 2,933,260 | | | | | | (37,297,549) | | | | | | 5,526,057 | | | | | | 13,242,750 | | | | | | 187,052 | | | | | | 1,776,926 | | | | | | 1,029,791 | | |
| Voya Intermediate Bond Fund - Class R6 | | | | | 23,724,672 | | | | | | 16,585,850 | | | | | | (26,762,509) | | | | | | 968,887 | | | | | | 14,516,900 | | | | | | 526,912 | | | | | | (66,008) | | | | | | 11,717 | | |
| Voya International Index Portfolio - Class I | | | | | 44,623,675 | | | | | | 1,740,921 | | | | | | (49,711,179) | | | | | | 3,346,583 | | | | | | — | | | | | | — | | | | | | 2,077,628 | | | | | | — | | |
| Voya Large Cap Value Fund - Class R6 | | | | | 22,434,204 | | | | | | 1,756,766 | | | | | | (27,392,858) | | | | | | 3,201,888 | | | | | | — | | | | | | 122,239 | | | | | | (302,648) | | | | | | — | | |
| Voya Large-Cap Growth Fund - Class R6 | | | | | 42,103,213 | | | | | | 4,693,983 | | | | | | (34,595,214) | | | | | | 11,072,637 | | | | | | 23,274,619 | | | | | | 141,822 | | | | | | (1,832,811) | | | | | | 843,274 | | |
| Voya MidCap Opportunities Portfolio - Class I | | | | | 19,682,117 | | | | | | 3,140,413 | | | | | | (10,009,249) | | | | | | 1,884,879 | | | | | | 14,698,160 | | | | | | 40,812 | | | | | | 1,093,341 | | | | | | 1,606,559 | | |
| Voya Multi-Manager Emerging Markets Equity Fund - Class I | | | | | 39,110,566 | | | | | | 7,033,784 | | | | | | (5,436,469) | | | | | | 6,682,760 | | | | | | 47,390,641 | | | | | | 770,400 | | | | | | 1,844,622 | | | | | | 238,202 | | |
| Voya Multi-Manager International Equity Fund - Class I | | | | | 50,293,499 | | | | | | 41,557,405 | | | | | | (10,535,050) | | | | | | 12,337,243 | | | | | | 93,653,097 | | | | | | 1,792,102 | | | | | | (62,689) | | | | | | — | | |
Voya Multi-Manager International Factors Fund -
Class I | | | | | 39,056,534 | | | | | | 21,685,422 | | | | | | (6,864,419) | | | | | | 5,692,701 | | | | | | 59,570,238 | | | | | | 1,834,643 | | | | | | 135,034 | | | | | | — | | |
| Voya Multi-Manager Mid Cap Value Fund - Class I | | | | | 19,614,055 | | | | | | 3,016,146 | | | | | | (11,317,944) | | | | | | 3,465,936 | | | | | | 14,778,193 | | | | | | 164,683 | | | | | | (308,588) | | | | | | 1,203,498 | | |
| Voya Short Term Bond Fund - Class R6 | | | | | — | | | | | | 12,639,880 | | | | | | (1,422,702) | | | | | | 98,001 | | | | | | 11,315,179 | | | | | | 187,062 | | | | | | 11,886 | | | | | | — | | |
| Voya Small Company Portfolio - Class I | | | | | 16,829,602 | | | | | | 393,876 | | | | | | (22,506,948) | | | | | | 5,283,470 | | | | | | — | | | | | | — | | | | | | (2,211,158) | | | | | | — | | |
| Voya Strategic Income Opportunities Fund - Class R6 | | | | | — | | | | | | 14,489,184 | | | | | | (8,035,625) | | | | | | 46,208 | | | | | | 6,499,767 | | | | | | 370,125 | | | | | | 61,711 | | | | | | — | | |
| Voya U.S. Bond Index Portfolio - Class I | | | | | 11,166,307 | | | | | | 1,293,367 | | | | | | (12,265,735) | | | | | | (193,939) | | | | | | — | | | | | | 84,178 | | | | | | 417,682 | | | | | | — | | |
| Voya U.S. High Dividend Low Volatility Fund - Class I | | | | | 11,214,062 | | | | | | 10,706,996 | | | | | | (22,928,390) | | | | | | 1,007,332 | | | | | | — | | | | | | 188,348 | | | | | | 75,334 | | | | | | — | | |
| Voya U.S. High Dividend Low Volatility Fund - Class R6 | | | | | — | | | | | | 21,506,478 | | | | | | (6,133,102) | | | | | | 1,133,813 | | | | | | 16,507,189 | | | | | | 222,296 | | | | | | 653,715 | | | | | | 179,357 | | |
| Voya U.S. Stock Index Portfolio - Class I | | | | | 31,315,115 | | | | | | 79,106,088 | | | | | | (16,747,541) | | | | | | 9,368,841 | | | | | | 103,042,503 | | | | | | 1,531,633 | | | | | | 34,188 | | | | | | 5,296,231 | | |
| VY® Invesco Comstock Portfolio - Class I | | | | | 42,710,314 | | | | | | 17,204,740 | | | | | | (8,541,035) | | | | | | (1,421,092) | | | | | | 49,952,927 | | | | | | 1,229,224 | | | | | | 986,425 | | | | | | 9,736,539 | | |
VY® JPMorgan Small Cap Core Equity Portfolio -
Class I | | | | | — | | | | | | 25,448,196 | | | | | | (2,385,518) | | | | | | (3,273,471) | | | | | | 19,789,207 | | | | | | 373,635 | | | | | | (565,860) | | | | | | 4,749,494 | | |
VY® T. Rowe Price Capital Appreciation Portfolio - Class I | | | | | — | | | | | | 71,633,131 | | | | | | (7,566,542) | | | | | | 1,677,642 | | | | | | 65,744,231 | | | | | | 1,064,057 | | | | | | (61,860) | | | | | | 3,121,709 | | |
VY® T. Rowe Price Growth Equity Portfolio - Class I | | | | | 42,093,423 | | | | | | 13,636,089 | | | | | | (8,082,923) | | | | | | 1,887,023 | | | | | | 49,533,612 | | | | | | 87,113 | | | | | | 296,233 | | | | | | 10,021,153 | | |
| | | | | $ | 524,555,327 | | | | | $ | 372,691,067 | | | | | $ | (364,551,707) | | | | | $ | 70,814,526 | | | | | $ | 603,509,213 | | | | | $ | 10,956,723 | | | | | $ | 5,224,868 | | | | | $ | 38,037,524 | | |
| |
See Accompanying Notes to Financial Statements
PORTFOLIO OF INVESTMENTS
| Voya Solution 2045 Portfolio | as of December 31, 2019 (continued) |
The financial statements for the above mutual fund[s] can be found at www.sec.gov.
A summary of derivative instruments by primary risk exposure is outlined in the following tables.
The fair value of derivative instruments as of December 31, 2019 was as follows:
| Derivatives not accounted for as hedging instruments | | | Location on Statement
of Assets and Liabilities | | | Fair Value | |
| Asset Derivatives | | | | | | | | | | |
| Equity contracts | | | Net Assets — Unrealized appreciation* | | | | $ | 155,069 | | |
| Interest rate contracts | | | Net Assets — Unrealized appreciation* | | | | | 141,856 | | |
| Total Asset Derivatives | | | | | | | $ | 296,925 | | |
| Liability Derivatives | | | | | | | | | | |
| Equity contracts | | | Net Assets — Unrealized depreciation* | | | | $ | 185,969 | | |
| Interest rate contracts | | | Net Assets — Unrealized depreciation* | | | | | 404,590 | | |
| Total Liability Derivatives | | | | | | | $ | 590,559 | | |
*
Includes cumulative appreciation/depreciation of futures contracts as reported in the table within the Portfolio of Investments.
The effect of derivative instruments on the Portfolio’s Statement of Operations for the year ended December 31, 2019 was as follows:
| | | | Amount of Realized Gain or (Loss) on
Derivatives Recognized in Income | |
| Derivatives not accounted for as hedging instruments | | | Futures | |
| Equity contracts | | | | $ | (1,610,052) | | |
| Interest rate contracts | | | | | 278,705 | | |
| Total | | | | $ | (1,331,347) | | |
| |
| | | | Change in Unrealized Appreciation or (Depreciation)
on Derivatives Recognized in Income | |
| Derivatives not accounted for as hedging instruments | | | Futures | |
| Equity contracts | | | | $ | 315,754 | | |
| Interest rate contracts | | | | | (574,722) | | |
| Total | | | | $ | (258,968) | | |
At December 31, 2019, the aggregate cost of securities and other investments and the composition of unrealized appreciation and depreciation of securities and other investments at year end were:
| | Cost for federal income tax purposes was $655,451,935. | | | | | | | |
| | Net unrealized appreciation consisted of: | | | | | | | |
| | Gross Unrealized Appreciation | | | | $ | 27,207,791 | | |
| | Gross Unrealized Depreciation | | | | | (20,573,229) | | |
| | Net Unrealized Appreciation | | | | $ | 6,634,562 | | |
See Accompanying Notes to Financial Statements
PORTFOLIO OF INVESTMENTS
| Voya Solution 2050 Portfolio | as of December 31, 2019 |
| Shares | | | Value | | | Percentage
of Net
Assets | |
| EXCHANGE-TRADED FUNDS: 13.6% | |
| 3,736 | | | iShares 20+ Year
Treasury Bond ETF | | | | $ | 506,153 | | | | | | 1.6 | | |
| 9,309 | | | iShares Core MSCI
EAFE ETF | | | | | 607,319 | | | | | | 1.9 | | |
| 5,476 | | | iShares Core S&P
Small-Cap ETF | | | | | 459,163 | | | | | | 1.5 | | |
| 4,949 | | | Vanguard Global ex-U.S.
Real Estate ETF | | | | | 292,436 | | | | | | 0.9 | | |
| 4,077 | | | Vanguard Real Estate
ETF | | | | | 378,305 | | | | | | 1.2 | | |
| 5,128 | | | Vanguard Russell 1000
Growth ETF | | | | | 927,809 | | | | | | 2.9 | | |
| 9,549 | | | Vanguard Value ETF | | | | | 1,144,448 | | | | | | 3.6 | | |
| | | | Total Exchange-Traded
Funds
(Cost $4,064,665) | | | | | 4,315,633 | | | | | | 13.6 | | |
| MUTUAL FUNDS: 86.2% | |
| | | | Affiliated Investment Companies: 86.2% | |
| 43,979 | | | Voya Index Plus
LargeCap Portfolio -
Class I | | | | | 1,265,271 | | | | | | 4.0 | | |
| 30,672 | | | Voya Intermediate Bond
Fund - Class R6 | | | | | 317,763 | | | | | | 1.0 | | |
| 20,293 | | | Voya Large-Cap Growth
Fund - Class R6 | | | | | 976,685 | | | | | | 3.1 | | |
| 174,932 | | | Voya Multi-Manager
Emerging Markets Equity
Fund - Class I | | | | | 2,263,617 | | | | | | 7.2 | | |
| 389,703 | | | Voya Multi-Manager
International Equity
Fund - Class I | | | | | 4,645,264 | | | | | | 14.7 | | |
| 278,024 | | | Voya Multi-Manager
International Factors
Fund - Class I | | | | | 2,699,613 | | | | | | 8.5 | | |
| Shares | | | Value | | | Percentage
of Net
Assets | |
| MUTUAL FUNDS: (continued) | |
| | | | Affiliated Investment Companies (continued) | |
| 71,972 | | | Voya Multi-Manager Mid
Cap Value Fund - Class I | | | | $ | 706,042 | | | | | | 2.2 | | |
| 51,083 | | | Voya U.S. High Dividend
Low Volatility Fund -
Class R6 | | | | | 644,152 | | | | | | 2.0 | | |
| 285,129 | | | Voya U.S. Stock Index
Portfolio - Class I | | | | | 4,844,342 | | | | | | 15.3 | | |
| 140,326 | | | VY® Invesco Comstock
Portfolio - Class I | | | | | 2,412,212 | | | | | | 7.6 | | |
| 59,043 | | | VY® JPMorgan Small
Cap Core Equity
Portfolio Class I | | | | | 957,081 | | | | | | 3.0 | | |
| 85,436 | | | VY® T. Rowe Price
Capital Appreciation
Portfolio - Class I | | | | | 2,512,678 | | | | | | 7.9 | | |
| 56,593 | | | VY® T. Rowe Price
Diversified Mid Cap
Growth Portfolio - Class I | | | | | 707,417 | | | | | | 2.2 | | |
| 29,114 | | | VY® T. Rowe Price
Growth Equity Portfolio -
Class I | | | | | 2,370,745 | | | | | | 7.5 | | |
| | | | Total Mutual Funds
(Cost $27,133,528) | | | | | 27,322,882 | | | | | | 86.2 | | |
| | | | Total Investments in
Securities
(Cost $31,198,193) | | | | $ | 31,638,515 | | | | | | 99.8 | | |
| | | | Assets in Excess of
Other Liabilities | | | | | 50,721 | | | | | | 0.2 | | |
| | | | Net Assets | | | | $ | 31,689,236 | | | | | | 100.0 | | |
| |
Fair Value Measurements^
The following is a summary of the fair valuations according to the inputs used as of December 31, 2019 in valuing the assets and liabilities:
| | | | Quoted Prices
in Active Markets
for Identical
Investments
(Level 1) | | | Significant
Other
Observable
Inputs
(Level 2) | | | Significant
Unobservable
Inputs
(Level 3) | | | Fair Value
at
December 31, 2019 | |
| Asset Table | | | | | | | | | | | | | | | | | | | | | | | | | |
| Investments, at fair value | | | | | | | | | | | | | | | | | | | | | | | | | |
| Exchange-Traded Funds | | | | $ | 4,315,633 | | | | | $ | — | | | | | $ | — | | | | | $ | 4,315,633 | | |
| Mutual Funds | | | | | 27,322,882 | | | | | | — | | | | | | — | | | | | | 27,322,882 | | |
| Total Investments, at fair value | | | | $ | 31,638,515 | | | | | $ | — | | | | | $ | — | | | | | $ | 31,638,515 | | |
^
See Note 2, “Significant Accounting Policies” in the Notes to Financial Statements for additional information.
See Accompanying Notes to Financial Statements
PORTFOLIO OF INVESTMENTS
| Voya Solution 2050 Portfolio | as of December 31, 2019 (continued) |
Transactions with Affiliates
An investment of at least 5% of the voting securities of an issuer, or a company which is under common control results in that issuer becoming an affiliated person as defined by the 1940 Act.
The following table provides transactions during the year ended December 31, 2019, where the following issuers were considered an affiliate:
| Issuer | | | Beginning
Fair Value
at 12/31/18 | | | Purchases
at Cost | | | Sales
at Cost | | | Change in
Unrealized
Appreciation/
(Depreciation) | | | Ending
Fair Value
at 12/31/2019 | | | Investment
Income | | | Realized
Gains/
(Losses) | | | Net Capital
Gain
Distributions | |
| Voya Emerging Markets Index Portfolio - Class I | | | | $ | 201,852 | | | | | $ | 25,640 | | | | | $ | (230,063) | | | | | $ | 2,571 | | | | | $ | — | | | | | $ | — | | | | | $ | 22,392 | | | | | $ | — | | |
| Voya Index Plus LargeCap Portfolio - Class I | | | | | 1,523,289 | | | | | | 598,628 | | | | | | (1,159,937) | | | | | | 303,291 | | | | | | 1,265,271 | | | | | | 15,126 | | | | | | (11,234) | | | | | | 83,273 | | |
| Voya Intermediate Bond Fund - Class R6 | | | | | 599,535 | | | | | | 1,503,738 | | | | | | (1,790,067) | | | | | | 4,557 | | | | | | 317,763 | | | | | | 17,339 | | | | | | 28,116 | | | | | | 248 | | |
| Voya International Index Portfolio - Class I | | | | | 1,411,776 | | | | | | 194,094 | | | | | | (1,840,335) | | | | | | 234,465 | | | | | | — | | | | | | — | | | | | | (74,256) | | | | | | — | | |
| Voya Large Cap Value Fund - Class R6 | | | | | 805,045 | | | | | | 215,611 | | | | | | (1,167,131) | | | | | | 146,475 | | | | | | — | | | | | | 4,918 | | | | | | (35,691) | | | | | | — | | |
| Voya Large-Cap Growth Fund - Class R6 | | | | | 1,524,098 | | | | | | 713,030 | | | | | | (1,685,264) | | | | | | 424,821 | | | | | | 976,685 | | | | | | 5,826 | | | | | | (75,788) | | | | | | 34,644 | | |
| Voya MidCap Opportunities Portfolio - Class I | | | | | 610,684 | | | | | | 77,587 | | | | | | (794,410) | | | | | | 106,139 | | | | | | — | | | | | | 667 | | | | | | 13,527 | | | | | | — | | |
Voya Multi-Manager Emerging Markets Equity Fund -
Class I | | | | | 1,314,710 | | | | | | 1,386,885 | | | | | | (851,901) | | | | | | 413,923 | | | | | | 2,263,617 | | | | | | 36,425 | | | | | | (100,221) | | | | | | 11,258 | | |
| Voya Multi-Manager International Equity Fund - Class I | | | | | 2,022,770 | | | | | | 2,716,080 | | | | | | (655,369) | | | | | | 561,783 | | | | | | 4,645,264 | | | | | | 87,850 | | | | | | (6,154) | | | | | | — | | |
| Voya Multi-Manager International Factors Fund - Class I | | | | | 1,413,721 | | | | | | 1,447,439 | | | | | | (436,079) | | | | | | 274,532 | | | | | | 2,699,613 | | | | | | 82,093 | | | | | | (44,206) | | | | | | — | | |
| Voya Multi-Manager Mid Cap Value Fund - Class I | | | | | 608,534 | | | | | | 332,789 | | | | | | (405,355) | | | | | | 170,074 | | | | | | 706,042 | | | | | | 7,783 | | | | | | (67,747) | | | | | | 56,878 | | |
| Voya Small Company Portfolio - Class I | | | | | 609,220 | | | | | | 76,919 | | | | | | (860,218) | | | | | | 174,079 | | | | | | — | | | | | | — | | | | | | (60,255) | | | | | | — | | |
| Voya Strategic Income Opportunities Fund - Class R6 | | | | | — | | | | | | 735,324 | | | | | | (735,324) | | | | | | — | | | | | | — | | | | | | 15,519 | | | | | | 3,660 | | | | | | — | | |
| Voya U.S. Bond Index Portfolio - Class I | | | | | 404,169 | | | | | | 385,839 | | | | | | (783,134) | | | | | | (6,874) | | | | | | — | | | | | | 3,539 | | | | | | 16,218 | | | | | | — | | |
| Voya U.S. High Dividend Low Volatility Fund - Class I | | | | | 405,933 | | | | | | 397,988 | | | | | | (844,357) | | | | | | 40,436 | | | | | | — | | | | | | 5,979 | | | | | | 6,774 | | | | | | — | | |
| Voya U.S. High Dividend Low Volatility Fund - Class I | | | | | — | | | | | | 768,118 | | | | | | (160,511) | | | | | | 36,545 | | | | | | 644,152 | | | | | | 7,889 | | | | | | 16,214 | | | | | | 6,862 | | |
| Voya U.S. Stock Index Portfolio - Class I | | | | | 1,851,341 | | | | | | 5,187,990 | | | | | | (2,695,882) | | | | | | 500,893 | | | | | | 4,844,342 | | | | | | 72,417 | | | | | | (1,085) | | | | | | 263,470 | | |
| VY® Invesco Comstock Portfolio - Class I | | | | | 1,546,237 | | | | | | 1,541,658 | | | | | | (613,533) | | | | | | (62,150) | | | | | | 2,412,212 | | | | | | 57,704 | | | | | | (18,360) | | | | | | 453,147 | | |
VY® JPMorgan Small Cap Core Equity Portfolio Class I | | | | | — | | | | | | 1,261,523 | | | | | | (163,475) | | | | | | (140,967) | | | | | | 957,081 | | | | | | 17,296 | | | | | | (31,110) | | | | | | 217,362 | | |
VY® T. Rowe Price Capital Appreciation Portfolio - Class I | | | | | — | | | | | | 2,827,450 | | | | | | (374,834) | | | | | | 60,062 | | | | | | 2,512,678 | | | | | | 39,745 | | | | | | (2,513) | | | | | | 108,539 | | |
VY® T. Rowe Price Diversified Mid Cap Growth Portfolio Class I | | | | | — | | | | | | 802,760 | | | | | | (100,418) | | | | | | 5,075 | | | | | | 707,417 | | | | | | 1,809 | | | | | | (4,262) | | | | | | 61,398 | | |
VY® T. Rowe Price Growth Equity Portfolio - Class I | | | | | 1,523,729 | | | | | | 1,254,221 | | | | | | (496,500) | | | | | | 89,295 | | | | | | 2,370,745 | | | | | | 3,848 | | | | | | (53,048) | | | | | | 456,891 | | |
| | | | | $ | 18,376,643 | | | | | $ | 24,451,311 | | | | | $ | (18,844,097) | | | | | $ | 3,339,025 | | | | | $ | 27,322,882 | | | | | $ | 483,772 | | | | | $ | (479,029) | | | | | $ | 1,753,970 | | |
The financial statements for the above mutual fund[s] can be found at www.sec.gov.
At December 31, 2019, the aggregate cost of securities and other investments and the composition of unrealized appreciation and depreciation of securities and other investments at year end were:
| | Cost for federal income tax purposes was $31,677,666. | | | | | | | |
| | Net unrealized depreciation consisted of: | | | | | | | |
| | Gross Unrealized Appreciation | | | | $ | 1,140,967 | | |
| | Gross Unrealized Depreciation | | | | | (1,180,118) | | |
| | Net Unrealized Depreciation | | | | $ | (39,151) | | |
See Accompanying Notes to Financial Statements
PORTFOLIO OF INVESTMENTS
| Voya Solution 2055 Portfolio | as of December 31, 2019 |
| Shares | | | Value | | | Percentage
of Net
Assets | |
| EXCHANGE-TRADED FUNDS: 9.2% | |
| 36,579 | | | Vanguard Global ex-U.S.
Real Estate ETF | | | | $ | 2,161,453 | | | | | | 0.9 | | |
| 30,130 | | | Vanguard Real Estate
ETF | | | | | 2,795,763 | | | | | | 1.2 | | |
| 44,214 | | | Vanguard Russell 1000
Growth ETF | | | | | 7,999,639 | | | | | | 3.5 | | |
| 70,579 | | | Vanguard Value ETF | | | | | 8,458,893 | | | | | | 3.6 | | |
| | | | Total Exchange-Traded
Funds
(Cost $19,591,717) | | | | | 21,415,748 | | | | | | 9.2 | | |
| MUTUAL FUNDS: 90.6% | |
| | | | Affiliated Investment Companies: 90.6% | |
| 321,452 | | | Voya Index Plus
LargeCap Portfolio -
Class I | | | | | 9,248,174 | | | | | | 4.0 | | |
| 595,290 | | | Voya Intermediate Bond
Fund - Class R6 | | | | | 6,167,200 | | | | | | 2.7 | | |
| 147,143 | | | Voya Large-Cap Growth
Fund - Class R6 | | | | | 7,081,974 | | | | | | 3.0 | | |
| 1,370,126 | | | Voya Multi-Manager
Emerging Markets Equity
Fund - Class I | | | | | 17,729,431 | | | | | | 7.6 | | |
| 2,941,914 | | | Voya Multi-Manager
International Equity
Fund - Class I | | | | | 35,067,618 | | | | | | 15.1 | | |
| 2,145,437 | | | Voya Multi-Manager
International Factors
Fund - Class I | | | | | 20,832,195 | | | | | | 9.0 | | |
| 584,486 | | | Voya Multi-Manager Mid
Cap Value Fund - Class I | | | | | 5,733,808 | | | | | | 2.5 | | |
| Shares | | | Value | | | Percentage
of Net
Assets | |
| MUTUAL FUNDS: (continued) | |
| | | | Affiliated Investment Companies (continued) | |
| 368,211 | | | Voya U.S. High Dividend
Low Volatility Fund -
Class R6 | | | | $ | 4,643,146 | | | | | | 2.0 | | |
| 2,216,600 | | | Voya U.S. Stock Index
Portfolio - Class I | | | | | 37,660,040 | | | | | | 16.2 | | |
| 1,021,924 | | | VY® Invesco Comstock
Portfolio - Class I | | | | | 17,566,874 | | | | | | 7.6 | | |
| 429,242 | | | VY® JPMorgan Small
Cap Core Equity
Portfolio Class I | | | | | 6,958,005 | | | | | | 3.0 | | |
| 624,473 | | | VY® T. Rowe Price
Capital Appreciation
Portfolio - Class I | | | | | 18,365,752 | | | | | | 7.9 | | |
| 458,483 | | | VY® T. Rowe Price
Diversified Mid Cap
Growth Portfolio - Class I | | | | | 5,731,038 | | | | | | 2.5 | | |
| 212,419 | | | VY® T. Rowe Price
Growth Equity
Portfolio - Class I | | | | | 17,297,266 | | | | | | 7.5 | | |
| | | | Total Mutual Funds
(Cost $207,471,807) | | | | | 210,082,521 | | | | | | 90.6 | | |
| | | | Total Investments in
Securities
(Cost $227,063,524) | | | | $ | 231,498,269 | | | | | | 99.8 | | |
| | | | Assets in Excess of
Other Liabilities | | | | | 551,734 | | | | | | 0.2 | | |
| | | | Net Assets | | | | $ | 232,050,003 | | | | | | 100.0 | | |
| |
Fair Value Measurements^
The following is a summary of the fair valuations according to the inputs used as of December 31, 2019 in valuing the assets and liabilities:
| | | | Quoted Prices
in Active Markets
for Identical
Investments
(Level 1) | | | Significant
Other
Observable
Inputs
(Level 2) | | | Significant
Unobservable
Inputs
(Level 3) | | | Fair Value
at
December 31, 2019 | |
| Asset Table | | | | | | | | | | | | | | | | | | | | | | | | | |
| Investments, at fair value | | | | | | | | | | | | | | | | | | | | | | | | | |
| Exchange-Traded Funds | | | | $ | 21,415,748 | | | | | $ | — | | | | | $ | — | | | | | $ | 21,415,748 | | |
| Mutual Funds | | | | | 210,082,521 | | | | | | — | | | | | | — | | | | | | 210,082,521 | | |
| Total Investments, at fair value | | | | $ | 231,498,269 | | | | | $ | — | | | | | $ | — | | | | | $ | 231,498,269 | | |
| Other Financial Instruments+ | | | | | | | | | | | | | | | | | | | | | | | | | |
| Futures | | | | | 102,383 | | | | | | — | | | | | | — | | | | | | 102,383 | | |
| Total Assets | | | | $ | 231,600,652 | | | | | $ | — | | | | | $ | — | | | | | $ | 231,600,652 | | |
| |
PORTFOLIO OF INVESTMENTS
| Voya Solution 2055 Portfolio | as of December 31, 2019 (continued) |
| | | | Quoted Prices
in Active Markets
for Identical
Investments
(Level 1) | | | Significant
Other
Observable
Inputs
(Level 2) | | | Significant
Unobservable
Inputs
(Level 3) | | | Fair Value
at
December 31, 2019 | |
| Liabilities Table | | | | | | | | | | | | | | | | | | | | | | | | | |
| Other Financial Instruments+ | | | | | | | | | | | | | | | | | | | | | | | | | |
| Futures | | | | $ | (205,946) | | | | | $ | — | | | | | $ | — | | | | | $ | (205,946) | | |
| Total Liabilities | | | | $ | (205,946) | | | | | $ | — | | | | | $ | — | | | | | $ | (205,946) | | |
| |
^
See Note 2, “Significant Accounting Policies” in the Notes to Financial Statements for additional information.
+
Other Financial Instruments may include open forward foreign currency contracts, futures, centrally cleared swaps, OTC swaps and written options. Forward foreign currency contracts, futures and centrally cleared swaps are valued at the unrealized gain (loss) on the instrument. OTC swaps and written options are valued at the fair value of the instrument.
At December 31, 2019, the following futures contracts were outstanding for Voya Solution 2055 Portfolio:
| Description | | | Number of
Contracts | | | Expiration
Date | | | Notional
Value | | | Unrealized
Appreciation/
(Depreciation) | |
| Long Contracts: | | | | | | | | | | | | | | | | | | | |
| E-mini Russell 2000® Index | | | 41 | | | 03/20/20 | | | | $ | 3,424,730 | | | | | $ | 53,427 | | |
| Mini MSCI EAFE Index | | | 22 | | | 03/20/20 | | | | | 2,240,150 | | | | | | (4,514) | | |
| U.S. Treasury Ultra Long Bond | | | 24 | | | 03/20/20 | | | | | 4,359,750 | | | | | | (142,960) | | |
| | | | | | | | | | | $ | 10,024,630 | | | | | $ | (94,047) | | |
| Short Contracts: | | | | | | | | | | | | | | | | | | | |
| S&P 500® E-Mini | | | (21) | | | 03/20/20 | | | | | (3,392,655) | | | | | | (58,472) | | |
| U.S. Treasury 10-Year Note | | | (51) | | | 03/20/20 | | | | | (6,549,516) | | | | | | 48,956 | | |
| | | | | | | | | | | $ | (9,942,171) | | | | | $ | (9,516) | | |
Transactions with Affiliates
An investment of at least 5% of the voting securities of an issuer, or a company which is under common control results in that issuer becoming an affiliated person as defined by the 1940 Act.
The following table provides transactions during the year ended December 31, 2019, where the following issuers were considered an affiliate:
| Issuer | | | Beginning
Fair Value
at 12/31/18 | | | Purchases
at Cost | | | Sales
at Cost | | | Change in
Unrealized
Appreciation/
(Depreciation) | | | Ending
Fair Value
at 12/31/2019 | | | Investment
Income | | | Realized
Gains/
(Losses) | | | Net Capital
Gain
Distributions | |
| Voya Emerging Markets Index Portfolio - Class I | | | | $ | 5,024,582 | | | | | $ | 356,505 | | | | | $ | (5,665,057) | | | | | $ | 283,970 | | | | | $ | — | | | | | $ | — | | | | | $ | 335,810 | | | | | $ | — | | |
| Voya Index Plus LargeCap Portfolio - Class I | | | | | 12,639,490 | | | | | | 2,812,388 | | | | | | (8,248,510) | | | | | | 2,044,806 | | | | | | 9,248,174 | | | | | | 122,515 | | | | | | 280,481 | | | | | | 674,492 | | |
| Voya Intermediate Bond Fund - Class R6 | | | | | 6,706,562 | | | | | | 4,463,460 | | | | | | (5,403,122) | | | | | | 400,300 | | | | | | 6,167,200 | | | | | | 235,252 | | | | | | (7,964) | | | | | | 4,962 | | |
| Voya International Index Portfolio - Class I | | | | | 13,400,794 | | | | | | 1,190,413 | | | | | | (15,711,901) | | | | | | 1,120,694 | | | | | | — | | | | | | — | | | | | | 555,848 | | | | | | — | | |
| Voya Large Cap Value Fund - Class R6 | | | | | 6,728,894 | | | | | | 988,841 | | | | | | (8,923,485) | | | | | | 1,205,750 | | | | | | — | | | | | | 40,071 | | | | | | (295,507) | | | | | | — | | |
| Voya Large-Cap Growth Fund - Class R6 | | | | | 12,646,171 | | | | | | 3,013,668 | | | | | | (12,017,289) | | | | | | 3,439,424 | | | | | | 7,081,974 | | | | | | 42,757 | | | | | | (605,350) | | | | | | 254,231 | | |
| Voya MidCap Opportunities Portfolio - Class I | | | | | 5,911,749 | | | | | | 385,991 | | | | | | (6,836,288) | | | | | | 538,548 | | | | | | — | | | | | | 5,371 | | | | | | 550,613 | | | | | | — | | |
| Voya Multi-Manager Emerging Markets Equity Fund - Class I | | | | | 12,586,417 | | | | | | 4,255,493 | | | | | | (1,658,293) | | | | | | 2,545,814 | | | | | | 17,729,431 | | | | | | 287,108 | | | | | | 389,314 | | | | | | 88,756 | | |
| Voya Multi-Manager International Equity Fund - Class I | | | | | 16,784,520 | | | | | | 17,191,226 | | | | | | (3,039,117) | | | | | | 4,130,989 | | | | | | 35,067,618 | | | | | | 668,143 | | | | | | 231,781 | | | | | | — | | |
Voya Multi-Manager International Factors Fund -
Class I | | | | | 11,730,913 | | | | | | 9,266,311 | | | | | | (1,947,093) | | | | | | 1,782,064 | | | | | | 20,832,195 | | | | | | 638,674 | | | | | | 73,493 | | | | | | — | | |
| Voya Multi-Manager Mid Cap Value Fund - Class I | | | | | 5,891,291 | | | | | | 1,778,956 | | | | | | (3,255,934) | | | | | | 1,319,495 | | | | | | 5,733,808 | | | | | | 63,631 | | | | | | (376,998) | | | | | | 465,014 | | |
| Voya Small Company Portfolio - Class I | | | | | 5,054,979 | | | | | | 356,505 | | | | | | (6,895,199) | | | | | | 1,483,715 | | | | | | — | | | | | | — | | | | | | (538,203) | | | | | | — | | |
| Voya U.S. Bond Index Portfolio - Class I | | | | | 3,353,811 | | | | | | 483,305 | | | | | | (3,779,199) | | | | | | (57,917) | | | | | | — | | | | | | 23,566 | | | | | | 127,586 | | | | | | — | | |
| Voya U.S. High Dividend Low Volatility Fund - Class I | | | | | 3,368,256 | | | | | | 823,783 | | | | | | (4,501,998) | | | | | | 309,959 | | | | | | — | | | | | | 41,869 | | | | | | 25,079 | | | | | | — | | |
| Voya U.S. High Dividend Low Volatility Fund - Class R6 | | | | | — | | | | | | 4,339,694 | | | | | | (94,381) | | | | | | 397,833 | | | | | | 4,643,146 | | | | | | 50,969 | | | | | | 7,757 | | | | | | 50,140 | | |
| Voya U.S. Stock Index Portfolio - Class I | | | | | 10,256,862 | | | | | | 29,485,415 | | | | | | (5,541,895) | | | | | | 3,459,658 | | | | | | 37,660,040 | | | | | | 554,566 | | | | | | (144,243) | | | | | | 1,830,581 | | |
PORTFOLIO OF INVESTMENTS
| Voya Solution 2055 Portfolio | as of December 31, 2019 (continued) |
| Issuer | | | Beginning
Fair Value
at 12/31/18 | | | Purchases
at Cost | | | Sales
at Cost | | | Change in
Unrealized
Appreciation/
(Depreciation) | | | Ending
Fair Value
at 12/31/2019 | | | Investment
Income | | | Realized
Gains/
(Losses) | | | Net Capital
Gain
Distributions | |
| VY® Invesco Comstock Portfolio - Class I | | | | | 12,828,423 | | | | | | 8,167,598 | | | | | | (2,474,473) | | | | | | (954,674) | | | | | | 17,566,874 | | | | | | 423,504 | | | | | | 596,896 | | | | | | 3,317,297 | | |
VY® JPMorgan Small Cap Core Equity Portfolio
Class I | | | | | — | | | | | | 8,932,091 | | | | | | (880,189) | | | | | | (1,093,897) | | | | | | 6,958,005 | | | | | | 128,065 | | | | | | (199,954) | | | | | | 1,616,414 | | |
VY® T. Rowe Price Capital Appreciation Portfolio - Class I | | | | | — | | | | | | 20,066,199 | | | | | | (2,171,257) | | | | | | 470,810 | | | | | | 18,365,752 | | | | | | 293,836 | | | | | | (19,424) | | | | | | 823,197 | | |
VY® T. Rowe Price Diversified Mid Cap Growth Portfolio Class I | | | | | — | | | | | | 6,321,736 | | | | | | (624,937) | | | | | | 34,239 | | | | | | 5,731,038 | | | | | | 14,970 | | | | | | (22,203) | | | | | | 511,462 | | |
VY® T. Rowe Price Growth Equity Portfolio - Class I | | | | | 12,643,172 | | | | | | 6,569,797 | | | | | | (2,494,579) | | | | | | 578,876 | | | | | | 17,297,266 | | | | | | 28,855 | | | | | | (49,403) | | | | | | 3,394,139 | | |
| | | | | $ | 157,556,886 | | | | | $ | 131,249,375 | | | | | $ | (102,164,196) | | | | | $ | 23,440,456 | | | | | $ | 210,082,521 | | | | | $ | 3,663,722 | | | | | $ | 915,409 | | | | | $ | 13,030,685 | | |
| |
The financial statements for the above mutual fund[s] can be found at www.sec.gov.
A summary of derivative instruments by primary risk exposure is outlined in the following tables.
The fair value of derivative instruments as of December 31, 2019 was as follows:
| Derivatives not accounted for as hedging instruments | | | Location on Statement
of Assets and Liabilities | | | Fair Value | |
| Asset Derivatives | | | | | | | | | | |
| Equity contracts | | | Net Assets — Unrealized appreciation* | | | | $ | 53,427 | | |
| Interest rate contracts | | | Net Assets — Unrealized appreciation* | | | | | 48,956 | | |
| Total Asset Derivatives | | | | | | | $ | 102,383 | | |
| Liability Derivatives | | | | | | | | | | |
| Equity contracts | | | Net Assets — Unrealized appreciation* | | | | $ | 62,986 | | |
| Interest rate contracts | | | Net Assets — Unrealized appreciation* | | | | | 142,960 | | |
| Total Liability Derivatives | | | | | | | $ | 205,946 | | |
*
Includes cumulative appreciation/depreciation of futures contracts as reported in the table within the Portfolio of Investments.
The effect of derivative instruments on the Portfolio’s Statement of Operations for the year ended December 31, 2019 was as follows:
| | | | Amount of Realized Gain or (Loss) on
Derivatives Recognized in Income | |
| Derivatives not accounted for as hedging instruments | | | Futures | |
| Equity contracts | | | | $ | (515,951) | | |
| Interest rate contracts | | | | | 84,161 | | |
| Total | | | | $ | (431,790) | | |
| |
| | | | Change in Unrealized Appreciation or (Depreciation)
on Derivatives Recognized in Income | |
| Derivatives not accounted for as hedging instruments | | | Futures | |
| Equity contracts | | | | $ | 88,168 | | |
| Interest rate contracts | | | | | (187,751) | | |
| Total | | | | $ | (99,583) | | |
At December 31, 2019, the aggregate cost of securities and other investments and the composition of unrealized appreciation and depreciation of securities and other investments at year end were:
| | Cost for federal income tax purposes was $229,555,787. | | | | | | | |
| | Net unrealized appreciation consisted of: | | | | | | | |
| | Gross Unrealized Appreciation | | | | $ | 9,282,650 | | |
| | Gross Unrealized Depreciation | | | | | (7,443,731) | | |
| | Net Unrealized Appreciation | | | | $ | 1,838,919 | | |
PORTFOLIO OF INVESTMENTS
| Voya Solution 2060 Portfolio | as of December 31, 2019 |
| Shares | | | Value | | | Percentage
of Net
Assets | |
| EXCHANGE-TRADED FUNDS: 13.9% | |
| 1,416 | | | iShares 20+ Year
Treasury Bond ETF | | | | $ | 191,840 | | | | | | 1.1 | | |
| 5,029 | | | iShares Core MSCI
EAFE ETF | | | | | 328,092 | | | | | | 1.9 | | |
| 2,958 | | | iShares Core S&P
Small-Cap ETF | | | | | 248,028 | | | | | | 1.4 | | |
| 3,342 | | | Vanguard Global ex-U.S.
Real Estate ETF | | | | | 197,479 | | | | | | 1.1 | | |
| 2,643 | | | Vanguard Real Estate
ETF | | | | | 245,244 | | | | | | 1.4 | | |
| 3,232 | | | Vanguard Russell 1000
Growth ETF | | | | | 584,766 | | | | | | 3.4 | | |
| 5,159 | | | Vanguard Value ETF | | | | | 618,306 | | | | | | 3.6 | | |
| | | | Total Exchange-Traded
Funds
(Cost $2,257,831) | | | | | 2,413,755 | | | | | | 13.9 | | |
| MUTUAL FUNDS: 85.9% | |
| | | | Affiliated Investment Companies: 85.9% | |
| 24,044 | | | Voya Index Plus
LargeCap Portfolio -
Class I | | | | | 691,750 | | | | | | 4.0 | | |
| 11,287 | | | Voya Large-Cap Growth
Fund - Class R6 | | | | | 543,221 | | | | | | 3.1 | | |
| 102,451 | | | Voya Multi-Manager
Emerging Markets Equity
Fund - Class I | | | | | 1,325,711 | | | | | | 7.6 | | |
| 213,439 | | | Voya Multi-Manager
International Equity
Fund - Class I | | | | | 2,544,191 | | | | | | 14.7 | | |
| 152,311 | | | Voya Multi-Manager
International Factors
Fund - Class I | | | | | 1,478,939 | | | | | | 8.5 | | |
| Shares | | | Value | | | Percentage
of Net
Assets | |
| MUTUAL FUNDS: (continued) | |
| | | | Affiliated Investment Companies (continued) | |
| 43,723 | | | Voya Multi-Manager Mid
Cap Value Fund - Class I | | | | $ | 428,922 | | | | | | 2.5 | | |
| 28,054 | | | Voya U.S. High Dividend
Low Volatility
Fund - Class R6 | | | | | 353,766 | | | | | | 2.0 | | |
| 150,768 | | | Voya U.S. Stock Index
Portfolio - Class I | | | | | 2,561,546 | | | | | | 14.8 | | |
| 77,290 | | | VY® Invesco Comstock
Portfolio - Class I | | | | | 1,328,618 | | | | | | 7.7 | | |
| 32,463 | | | VY® JPMorgan Small
Cap Core Equity
Portfolio Class I | | | | | 526,225 | | | | | | 3.0 | | |
| 46,906 | | | VY® T. Rowe Price
Capital Appreciation
Portfolio - Class I | | | | | 1,379,506 | | | | | | 8.0 | | |
| 34,298 | | | VY® T. Rowe Price
Diversified Mid Cap
Growth Portfolio - Class I | | | | | 428,727 | | | | | | 2.5 | | |
| 15,936 | | | VY® T. Rowe Price
Growth Equity
Portfolio - Class I | | | | | 1,297,631 | | | | | | 7.5 | | |
| | | | Total Mutual Funds
(Cost $14,708,912) | | | | | 14,888,753 | | | | | | 85.9 | | |
| | | | Total Investments in
Securities
(Cost $16,966,743) | | | | $ | 17,302,508 | | | | | | 99.8 | | |
| | | | Assets in Excess of
Other Liabilities | | | | | 32,097 | | | | | | 0.2 | | |
| | | | Net Assets | | | | $ | 17,334,605 | | | | | | 100.0 | | |
| |
Fair Value Measurements^
The following is a summary of the fair valuations according to the inputs used as of December 31, 2019 in valuing the assets and liabilities:
| | | | Quoted Prices
in Active Markets
for Identical
Investments
(Level 1) | | | Significant
Other
Observable
Inputs
(Level 2) | | | Significant
Unobservable
Inputs
(Level 3) | | | Fair Value
at
December 31, 2019 | |
| Asset Table | | | | | | | | | | | | | | | | | | | | | | | | | |
| Investments, at fair value | | | | | | | | | | | | | | | | | | | | | | | | | |
| Exchange-Traded Funds | | | | $ | 2,413,755 | | | | | $ | — | | | | | $ | — | | | | | $ | 2,413,755 | | |
| Mutual Funds | | | | | 14,888,753 | | | | | | — | | | | | | — | | | | | | 14,888,753 | | |
| Total Investments, at fair value | | | | $ | 17,302,508 | | | | | $ | — | | | | | $ | — | | | | | $ | 17,302,508 | | |
^
See Note 2, “Significant Accounting Policies” in the Notes to Financial Statements for additional information.
See Accompanying Notes to Financial Statements
PORTFOLIO OF INVESTMENTS
| Voya Solution 2060 Portfolio | as of December 31, 2019 (continued) |
Transactions with Affiliates
An investment of at least 5% of the voting securities of an issuer, or a company which is under common control results in that issuer becoming an affiliated person as defined by the 1940 Act.
The following table provides transactions during the year ended December 31, 2019, where the following issuers were considered an affiliate:
| Issuer | | | Beginning
Fair Value
at 12/31/18 | | | Purchases
at Cost | | | Sales
at Cost | | | Change in
Unrealized
Appreciation/
(Depreciation) | | | Ending
Fair Value
at 12/31/2019 | | | Investment
Income | | | Realized
Gains/
(Losses) | | | Net Capital
Gain
Distributions | |
| Voya Emerging Markets Index Portfolio - Class I | | | | $ | 108,397 | | | | | $ | 12,096 | | | | | $ | (121,951) | | | | | $ | 1,458 | | | | | $ | — | | | | | $ | — | | | | | $ | 12,001 | | | | | $ | — | | |
| Voya Index Plus LargeCap Portfolio - Class I | | | | | 813,355 | | | | | | 374,274 | | | | | | (654,793) | | | | | | 158,914 | | | | | | 691,750 | | | | | | 8,174 | | | | | | (1,635) | | | | | | 45,000 | | |
| Voya Intermediate Bond Fund - Class R6 | | | | | 321,781 | | | | | | 751,453 | | | | | | (1,075,527) | | | | | | 2,293 | | | | | | — | | | | | | 10,235 | | | | | | 18,791 | | | | | | — | | |
| Voya International Index Portfolio - Class I | | | | | 754,253 | | | | | | 124,928 | | | | | | (997,274) | | | | | | 118,093 | | | | | | — | | | | | | — | | | | | | (31,971) | | | | | | — | | |
| Voya Large Cap Value Fund - Class R6 | | | | | 431,940 | | | | | | 131,529 | | | | | | (636,443) | | | | | | 72,974 | | | | | | — | | | | | | 2,676 | | | | | | (13,578) | | | | | | — | | |
| Voya Large-Cap Growth Fund - Class R6 | | | | | 813,785 | | | | | | 479,957 | | | | | | (963,757) | | | | | | 213,236 | | | | | | 543,221 | | | | | | 3,193 | | | | | | (26,460) | | | | | | 18,985 | | |
| Voya MidCap Opportunities Portfolio - Class I | | | | | 326,068 | | | | | | 49,399 | | | | | | (430,897) | | | | | | 55,430 | | | | | | — | | | | | | 356 | | | | | | 8,789 | | | | | | — | | |
| Voya Multi-Manager Emerging Markets Equity Fund - Class I | | | | | 701,384 | | | | | | 994,371 | | | | | | (598,005) | | | | | | 227,961 | | | | | | 1,325,711 | | | | | | 21,208 | | | | | | (55,544) | | | | | | 6,553 | | |
| Voya Multi-Manager International Equity Fund - Class I | | | | | 1,080,065 | | | | | | 1,631,676 | | | | | | (489,852) | | | | | | 322,302 | | | | | | 2,544,191 | | | | | | 47,770 | | | | | | (20,815) | | | | | | — | | |
| Voya Multi-Manager International Factors Fund - Class I | | | | | 754,866 | | | | | | 880,262 | | | | | | (318,399) | | | | | | 162,210 | | | | | | 1,478,939 | | | | | | 44,643 | | | | | | (36,250) | | | | | | — | | |
| Voya Multi-Manager Mid Cap Value Fund - Class I | | | | | 324,927 | | | | | | 224,197 | | | | | | (207,962) | | | | | | 87,760 | | | | | | 428,922 | | | | | | 4,698 | | | | | | (33,484) | | | | | | 34,335 | | |
| Voya Small Company Portfolio - Class I | | | | | 325,292 | | | | | | 49,044 | | | | | | (464,625) | | | | | | 90,289 | | | | | | — | | | | | | — | | | | | | (29,211) | | | | | | — | | |
| Voya U.S. Bond Index Portfolio - Class I | | | | | 215,804 | | | | | | 216,647 | | | | | | (428,840) | | | | | | (3,611) | | | | | | — | | | | | | 2,000 | | | | | | 8,582 | | | | | | — | | |
| Voya U.S. High Dividend Low Volatility Fund - Class I | | | | | 216,747 | | | | | | 151,159 | | | | | | (389,322) | | | | | | 21,416 | | | | | | — | | | | | | 2,827 | | | | | | 2,841 | | | | | | — | | |
| Voya U.S. High Dividend Low Volatility Fund - Class R6 | | | | | — | | | | | | 380,576 | | | | | | (48,068) | | | | | | 21,258 | | | | | | 353,766 | | | | | | 3,922 | | | | | | 3,984 | | | | | | 3,734 | | |
| Voya U.S. Stock Index Portfolio - Class I | | | | | 989,978 | | | | | | 3,003,975 | | | | | | (1,696,863) | | | | | | 264,456 | | | | | | 2,561,546 | | | | | | 38,076 | | | | | | (1,427) | | | | | | 138,160 | | |
| VY® Invesco Comstock Portfolio - Class I | | | | | 825,563 | | | | | | 954,981 | | | | | | (429,329) | | | | | | (22,597) | | | | | | 1,328,618 | | | | | | 31,279 | | | | | | (21,759) | | | | | | 245,472 | | |
VY® JPMorgan Small Cap Core Equity Portfolio Class I | | | | | — | | | | | | 714,208 | | | | | | (115,346) | | | | | | (72,637) | | | | | | 526,225 | | | | | | 9,363 | | | | | | (20,288) | | | | | | 117,596 | | |
VY® T. Rowe Price Capital Appreciation Portfolio - Class I | | | | | — | | | | | | 1,593,687 | | | | | | (247,559) | | | | | | 33,378 | | | | | | 1,379,506 | | | | | | 21,630 | | | | | | (1,618) | | | | | | 58,550 | | |
VY® T. Rowe Price Diversified Mid Cap Growth Portfolio
Class I | | | | | — | | | | | | 500,121 | | | | | | (75,699) | | | | | | 4,305 | | | | | | 428,727 | | | | | | 1,091 | | | | | | (3,740) | | | | | | 37,047 | | |
| VY® T. Rowe Price Growth Equity Portfolio - Class I | | | | | 813,583 | | | | | | 757,040 | | | | | | (328,921) | | | | | | 55,929 | | | | | | 1,297,631 | | | | | | 2,090 | | | | | | (38,072) | | | | | | 247,725 | | |
| | | | | $ | 9,817,788 | | | | | $ | 13,975,580 | | | | | $ | (10,719,432) | | | | | $ | 1,814,817 | | | | | $ | 14,888,753 | | | | | $ | 255,231 | | | | | $ | (280,864) | | | | | $ | 953,157 | | |
The financial statements for the above mutual fund[s] can be found at www.sec.gov.
At December 31, 2019, the aggregate cost of securities and other investments and the composition of unrealized appreciation and depreciation of securities and other investments at year end were:
| | Cost for federal income tax purposes was $17,289,596. | | | | | | | |
| | Net unrealized appreciation consisted of: | | |
| | Gross Unrealized Appreciation | | | | $ | 670,588 | | |
| | Gross Unrealized Depreciation | | | | | (657,676) | | |
| | Net Unrealized Appreciation | | | | $ | 12,912 | | |
See Accompanying Notes to Financial Statements
TAX INFORMATION (Unaudited)
Dividends and distributions paid during the year ended December 31, 2019 were as follows:
| Portfolio Name | | | Type | | | Per Share Amount | |
| Voya Solution Aggressive Portfolio | |
| Class ADV | | | NII | | | | $ | 0.1590 | | |
| Class I | | | NII | | | | $ | 0.2181 | | |
| Class R6 | | | NII | | | | $ | 0.2183 | | |
| Class S | | | NII | | | | $ | 0.1793 | | |
| Class S2 | | | NII | | | | $ | 0.1879 | | |
| All Classes | | | LTCG | | | | $ | 0.9867 | | |
| Voya Solution Balanced Portfolio | |
| Class ADV | | | NII | | | | $ | 0.1881 | | |
| Class I | | | NII | | | | $ | 0.2557 | | |
| Class R6 | | | NII | | | | $ | 0.2558 | | |
| Class S | | | NII | | | | $ | 0.2277 | | |
| Class S2 | | | NII | | | | $ | 0.2344 | | |
| All Classes | | | LTCG | | | | $ | 0.6103 | | |
| Voya Solution Conservative Portfolio | |
| Class ADV | | | NII | | | | $ | 0.2074 | | |
| Class I | | | NII | | | | $ | 0.2608 | | |
| Class R6 | | | NII | | | | $ | 0.2608 | | |
| Class S | | | NII | | | | $ | 0.2289 | | |
| Class S2 | | | NII | | | | $ | 0.2096 | | |
| All Classes | | | LTCG | | | | $ | 0.0862 | | |
| Voya Solution Income Portfolio | |
| Class ADV | | | NII | | | | $ | 0.3052 | | |
| Class I | | | NII | | | | $ | 0.3728 | | |
| Class S | | | NII | | | | $ | 0.3341 | | |
| Class S2 | | | NII | | | | $ | 0.3114 | | |
| Class T | | | NII | | | | $ | 0.2910 | | |
| All Classes | | | STCG | | | | $ | 0.0317 | | |
| All Classes | | | LTCG | | | | $ | 0.2103 | | |
| Voya Solution Moderately Aggressive Portfolio | |
| Class ADV | | | NII | | | | $ | 0.2625 | | |
| Class I | | | NII | | | | $ | 0.3315 | | |
| Class R6 | | | NII | | | | $ | 0.3316 | | |
| Class S | | | NII | | | | $ | 0.2946 | | |
| Class S2 | | | NII | | | | $ | 0.2651 | | |
| All Classes | | | STCG | | | | $ | 0.0039 | | |
| All Classes | | | LTCG | | | | $ | 1.0225 | | |
| Voya Solution Moderately Conservative Portfolio | |
| Class ADV | | | NII | | | | $ | 0.1616 | | |
| Class I | | | NII | | | | $ | 0.2212 | | |
| Class R6 | | | NII | | | | $ | 0.2212 | | |
| Class S | | | NII | | | | $ | 0.1996 | | |
| Class S2 | | | NII | | | | $ | 0.2132 | | |
| All Classes | | | LTCG | | | | $ | 0.1962 | | |
| Voya Solution 2020 Portfolio | |
| Class ADV | | | NII | | | | $ | 0.3074 | | |
| Class I | | | NII | | | | $ | 0.3764 | | |
| Class S | | | NII | | | | $ | 0.3406 | | |
| Class S2 | | | NII | | | | $ | 0.2796 | | |
| Class T | | | NII | | | | $ | 0.2985 | | |
| All Classes | | | LTCG | | | | $ | 0.6096 | | |
| Voya Solution 2025 Portfolio | |
| Class ADV | | | NII | | | | $ | 0.2459 | | |
| Class I | | | NII | | | | $ | 0.3112 | | |
| Class S | | | NII | | | | $ | 0.2773 | | |
| Class S2 | | | NII | | | | $ | 0.2454 | | |
| Class T | | | NII | | | | $ | 0.1752 | | |
| Portfolio Name | | | Type | | | Per Share Amount | |
| Voya Solution 2025 Portfolio (continued) | |
| All Classes | | | STCG | | | | $ | 0.0089 | | |
| All Classes | | | LTCG | | | | $ | 0.6664 | | |
| Voya Solution 2030 Portfolio | |
| Class ADV | | | NII | | | | $ | 0.2533 | | |
| Class I | | | NII | | | | $ | 0.3174 | | |
| Class S | | | NII | | | | $ | 0.2821 | | |
| Class S2 | | | NII | | | | $ | 0.2408 | | |
| Class T | | | NII | | | | $ | 0.2437 | | |
| All Classes | | | STCG | | | | $ | 0.0185 | | |
| All Classes | | | LTCG | | | | $ | 0.9125 | | |
| Voya Solution 2035 Portfolio | |
| Class ADV | | | NII | | | | $ | 0.2360 | | |
| Class I | | | NII | | | | $ | 0.3049 | | |
| Class S | | | NII | | | | $ | 0.2710 | | |
| Class S2 | | | NII | | | | $ | 0.2442 | | |
| Class T | | | NII | | | | $ | 0.1566 | | |
| All Classes | | | STCG | | | | $ | 0.0030 | | |
| All Classes | | | LTCG | | | | $ | 0.9227 | | |
| Voya Solution 2040 Portfolio | |
| Class ADV | | | NII | | | | $ | 0.2586 | | |
| Class I | | | NII | | | | $ | 0.3215 | | |
| Class S | | | NII | | | | $ | 0.2858 | | |
| Class S2 | | | NII | | | | $ | 0.2558 | | |
| Class T | | | NII | | | | $ | 0.1999 | | |
| All Classes | | | LTCG | | | | $ | 1.0552 | | |
| Voya Solution 2045 Portfolio | |
| Class ADV | | | NII | | | | $ | 0.1989 | | |
| Class I | | | NII | | | | $ | 0.2671 | | |
| Class S | | | NII | | | | $ | 0.2341 | | |
| Class S2 | | | NII | | | | $ | 0.2005 | | |
| Class T | | | NII | | | | $ | 0.0944 | | |
| All Classes | | | STCG | | | | $ | 0.0091 | | |
| All Classes | | | LTCG | | | | $ | 1.0860 | | |
| Voya Solution 2050 Portfolio | |
| Class ADV | | | NII | | | | $ | 0.2195 | | |
| Class I | | | NII | | | | $ | 0.2838 | | |
| Class S | | | NII | | | | $ | 0.2502 | | |
| Class S2 | | | NII | | | | $ | 0.2015 | | |
| Class T | | | NII | | | | $ | 0.1803 | | |
| All Classes | | | LTCG | | | | $ | 1.1255 | | |
| Voya Solution 2055 Portfolio | |
| Class ADV | | | NII | | | | $ | 0.1966 | | |
| Class I | | | NII | | | | $ | 0.2692 | | |
| Class S | | | NII | | | | $ | 0.2333 | | |
| Class S2 | | | NII | | | | $ | 0.1949 | | |
| Class T | | | NII | | | | $ | 0.0973 | | |
| All Classes | | | STCG | | | | $ | 0.0063 | | |
| All Classes | | | LTCG | | | | $ | 1.1522 | | |
| Voya Solution 2060 Portfolio | |
| Class ADV | | | NII | | | | $ | 0.1473 | | |
| Class I | | | NII | | | | $ | 0.1890 | | |
| Class S | | | NII | | | | $ | 0.1653 | | |
| Class S2 | | | NII | | | | $ | 0.1450 | | |
| Class T | | | NII | | | | $ | 0.1036 | | |
| All Classes | | | STCG | | | | $ | 0.0170 | | |
| All Classes | | | LTCG | | | | $ | 0.6870 | | |
NII – Net investment income
STCG – Short-term capital gain
LTCG – Long-term capital gain
TAX INFORMATION (Unaudited) (continued)
Of the ordinary distributions made during the year ended December 31, 2019, the following percentages qualify for the dividends received deduction (DRD) available to corporate shareholders:
| | Voya Solution Aggressive Portfolio | | | | | 44.54% | | |
| | Voya Solution Balanced Portfolio | | | | | 35.09% | | |
| | Voya Solution Conservative Portfolio | | | | | 15.61% | | |
| | Voya Solution Income Portfolio | | | | | 18.61% | | |
| | Voya Solution Moderately Aggressive Portfolio | | | | | 40.32% | | |
| | Voya Solution Moderately Conservative Portfolio | | | | | 23.78% | | |
| | Voya Solution 2020 Portfolio | | | | | 25.87% | | |
| | Voya Solution 2025 Portfolio | | | | | 29.84% | | |
| | Voya Solution 2030 Portfolio | | | | | 32.76% | | |
| | Voya Solution 2035 Portfolio | | | | | 36.31% | | |
| | Voya Solution 2040 Portfolio | | | | | 39.70% | | |
| | Voya Solution 2045 Portfolio | | | | | 39.49% | | |
| | Voya Solution 2050 Portfolio | | | | | 43.45% | | |
| | Voya Solution 2055 Portfolio | | | | | 40.44% | | |
| | Voya Solution 2060 Portfolio | | | | | 39.68% | | |
The Portfolios designate the following amounts of long-term capital gain distributions as 20% rate long-term capital gain dividends under Internal Revenue Code Section 852(b)(3)(C):
| | Voya Solution Aggressive Portfolio | | | | $ | 1,455,126 | | |
| | Voya Solution Balanced Portfolio | | | | | 3,344,512 | | |
| | Voya Solution Conservative Portfolio | | | | | 145,002 | | |
| | Voya Solution Income Portfolio | | | | | 5,951,736 | | |
| | Voya Solution Moderately Aggressive Portfolio | | | | | 46,647,449 | | |
| | Voya Solution Moderately Conservative Portfolio | | | | | 738,076 | | |
| | Voya Solution 2020 Portfolio | | | | | 1,494,564 | | |
| | Voya Solution 2025 Portfolio | | | | | 45,142,629 | | |
| | Voya Solution 2030 Portfolio | | | | | 2,322,107 | | |
| | Voya Solution 2035 Portfolio | | | | | 62,124,081 | | |
| | Voya Solution 2040 Portfolio | | | | | 2,059,165 | | |
| | Voya Solution 2045 Portfolio | | | | | 55,716,452 | | |
| | Voya Solution 2050 Portfolio | | | | | 1,821,588 | | |
| | Voya Solution 2055 Portfolio | | | | | 16,562,207 | | |
| | Voya Solution 2060 Portfolio | | | | | 852,776 | | |
The Regulated Investment Company Modernization Act of 2010 allows qualified fund-of-funds to elect to pass through the ability to take foreign tax credits (or deductions) to the extent that foreign taxes are passed through from underlying funds. A qualified fund-of-funds is a regulated investment company that has at least 50% of the value of its total assets invested in other regulated investment companies at the end of each quarter of the taxable year. Pursuant to Section 853 of the Internal Revenue Code, the Portfolios designate the following amounts as foreign taxes paid for the year ended December 31, 2019:
TAX INFORMATION (Unaudited) (continued)
| | | | Creditable
Foreign Taxes
Paid | | | Per Share
Amount | | | Portion of Ordinary Income
Distribution Derived from
Foreign Sourced Income* | |
| Voya Solution Aggressive Portfolio | | | | $ | 8,179 | | | | | $ | 0.0050 | | | | | | 19.73% | | |
| Voya Solution Balanced Portfolio | | | | | 12,190 | | | | | | 0.0021 | | | | | | 7.76% | | |
| Voya Solution Conservative Portfolio | | | | | 1,491 | | | | | | 0.0009 | | | | | | 2.79% | | |
| Voya Solution Income Portfolio | | | | | 61,088 | | | | | | 0.0022 | | | | | | 8.50% | | |
| Voya Solution Moderately Aggressive Portfolio | | | | | 188,824 | | | | | | 0.0039 | | | | | | 15.75% | | |
| Voya Solution Moderately Conservative Portfolio | | | | | 5,619 | | | | | | 0.0015 | | | | | | 5.41% | | |
| Voya Solution 2020 Portfolio | | | | | 6,291 | | | | | | 0.0022 | | | | | | 7.97% | | |
| Voya Solution 2025 Portfolio | | | | | 282,509 | | | | | | 0.0039 | | | | | | 16.42% | | |
| Voya Solution 2030 Portfolio | | | | | 18,054 | | | | | | 0.0060 | | | | | | 19.31% | | |
| Voya Solution 2035 Portfolio | | | | | 421,305 | | | | | | 0.0057 | | | | | | 25.76% | | |
| Voya Solution 2040 Portfolio | | | | | 17,160 | | | | | | 0.0079 | | | | | | 23.73% | | |
| Voya Solution 2045 Portfolio | | | | | 362,871 | | | | | | 0.0064 | | | | | | 30.85% | | |
| Voya Solution 2050 Portfolio | | | | | 17,115 | | | | | | 0.0092 | | | | | | 29.96% | | |
| Voya Solution 2055 Portfolio | | | | | 132,292 | | | | | | 0.0080 | | | | | | 35.11% | | |
| Voya Solution 2060 Portfolio | | | | | 9,470 | | | | | | 0.0066 | | | | | | 28.81% | | |
*
None of the Portfolios listed above derived any income from ineligible foreign sources as defined under Section 901(j) of the Internal Revenue Code.
Foreign taxes paid or withheld must be included in taxable income with an offsetting deduction from gross income or as a credit for taxes paid to foreign governments. Shareholders are strongly advised to consult their own tax advisors regarding the appropriate treatment of foreign taxes paid.
Above figures may differ from those cited elsewhere in this report due to differences in the calculation of income and gains under U.S. generally accepted accounting principles (book) purposes and Internal Revenue Service (tax) purposes.
Shareholders are strongly advised to consult their own tax advisers with respect to the tax consequences of their investments in the Portfolios. In January, shareholders, excluding corporate shareholders, receive an IRS 1099-DIV regarding the federal tax status of the dividends and distributions they received in the calendar year.
DIRECTOR AND OFFICER INFORMATION (Unaudited)
The business and affairs of the Company are managed under the direction of the Board. A Director, who is not an interested person of the Company, as defined in the 1940 Act, is an independent director (“Independent Director”). The Directors and Officers of the Company are listed below. The Statement of Additional Information includes additional information about Directors of the Company and is available, without charge, upon request at (800) 262-3862.
| Name, Address and Age | | | Position(s)
Held with the
Company | | | Term of Office and
Length of Time
Served(1) | | | Principal
Occupation(s) –
During the Past 5 Years | | | Number of
funds
in Fund
Complex
Overseen by
Director(2) | | | Other Board Positions
Held by Director | |
| Independent Directors*: | |
Colleen D. Baldwin
7337 East Doubletree Ranch Rd.
Suite 100
Scottsdale, Arizona 85258
Age: 59 | | | Director
Chairperson | | | November 2007 –
Present
January 2020 –
Present | | | President, Glantuam Partners, LLC, a business consulting firm (January 2009 – Present). | | | 146 | | | Dentaquest (February 2014 – Present); RSR Partners, Inc. (2016 – Present). | |
John V. Boyer
7337 East Doubletree Ranch Rd.
Suite 100
Scottsdale, Arizona 85258
Age: 66 | | | Director | | | November 1997 –
Present | | | Retired. Formerly, President and Chief Executive Officer, Bechtler Arts Foundation, an arts and education foundation (January 2008 – December 2019). | | | 146 | | | None. | |
Patricia W. Chadwick
7337 East Doubletree Ranch Rd.
Suite 100
Scottsdale, Arizona 85258
Age: 71 | | | Director | | | January 2006 –
Present | | | Consultant and President, Ravengate Partners LLC, a consulting firm that provides advice regarding financial markets and the global economy (January 2000 – Present). | | | 146 | | | Wisconsin Energy Corporation (June 2006 – Present); The Royce Fund (22 funds) (December 2009 – Present); and AMICA Mutual Insurance Company (1992 – Present). | |
Martin J. Gavin
7337 East Doubletree Ranch Rd. Suite 100
Scottsdale, AZ 85258
Age: 69 | | | Director | | | August 2015 –
Present | | | Retired. Formerly, President and Chief Executive Officer, Connecticut Children’s Medical Center (May 2006 – November 2015). | | | 146 | | | None. | |
Joseph E. Obermeyer
7337 East Doubletree Ranch Rd.
Suite 100
Scottsdale, Arizona 85258
Age: 62 | | | Director | | | May 2013 – Present | | | President, Obermeyer & Associates, Inc., a provider of financial and economic consulting services (November 1999 – Present). | | | 146 | | | None. | |
Sheryl K. Pressler
7337 East Doubletree Ranch Rd.
Suite 100
Scottsdale, Arizona 85258
Age: 69 | | | Director | | | January 2006 –
Present | | | Consultant (May 2001 – Present). | | | 146 | | | None. | |
Christopher P. Sullivan
7337 East Doubletree Ranch Rd.
Suite 100
Scottsdale, Arizona 85258
Age: 66 | | | Director | | | October 2015 –
Present | | | Retired. | | | 146 | | | None. | |
DIRECTOR AND OFFICER INFORMATION (Unaudited) (continued)
| Name, Address and Age | | | Position(s)
Held with the
Company | | | Term of Office and
Length of Time
Served(1) | | | Principal
Occupation(s) –
During the Past 5 Years | | | Number of
funds
in Fund
Complex
Overseen by
Director(2) | | | Other Board Positions
Held by Director | |
| Director who is an “interested person”: | | | | | |
Dina Santoro
230 Park Avenue
New York, New York 10169
Age: 46 | | | Director | | | July 2018 – Present | | | President, Voya Investments, LLC and Voya Capital, LLC (March 2018 – Present); Senior Vice President, Voya Investments Distributor, LLC (April 2018 – Present); Senior Managing Director, Head of Product and Marketing Strategy, Voya Investment Management (September 2017 – Present). Formerly, Managing Director, Quantitative Management Associates, LLC (January 2004 – August 2017). | | | 146 | | | Voya Investments, LLC, Voya Capital, LLC, and Voya Funds Services, LLC (March 2018 – Present); Voya Investments Distributor, LLC (April 2018 – Present). | |
(1)
Directors serve until their successors are duly elected and qualified. The tenure of each Director who is not an “interested person” as defined in the 1940 Act, of each Portfolio (“Independent Director”) is subject to the Board’s retirement policy which states that each duly elected or appointed Independent Director shall retire from and cease to be a member of the Board of Directors at the close of business on December 31 of the calendar year in which the Independent Director attains the age of 75. A majority vote of the Board’s other Independent Directors may extend the retirement date of an Independent Director if the retirement would trigger a requirement to hold a meeting of shareholders of the Company under applicable law, whether for the purposes of appointing a successor to the Independent Director or otherwise comply under applicable law, in which case the extension would apply until such time as the shareholder meeting can be held or is no longer required (as determined by a vote of a majority of the other Independent Directors).
(2)
For the purposes of this table, “Fund Complex” means the Voya family of funds including the following investment companies: Voya Asia Pacific High Dividend Equity Income Fund; Voya Balanced Portfolio, Inc.; Voya Emerging Markets High Dividend Equity Fund; Voya Equity Trust; Voya Funds Trust; Voya Global Advantage and Premium Opportunity Fund; Voya Global Equity Dividend and Premium Opportunity Fund; Voya Government Money Market Portfolio; Voya Infrastructure, Industrials and Materials Fund; Voya Intermediate Bond Portfolio; Voya International High Dividend Equity Income Fund; Voya Investors Trust; Voya Mutual Funds; Voya Natural Resources Equity Income Fund; Voya Partners, Inc.; Voya Prime Rate Trust; Voya Senior Income Fund; Voya Separate Portfolios Trust; Voya Strategic Allocation Portfolios, Inc.; Voya Variable Funds; Voya Variable Insurance Trust; Voya Variable Portfolios, Inc.; and Voya Variable Products Trust. The number of funds in the Fund Complex is as of January 31, 2020.
*
Effective December 31, 2019, Russell H. Jones and Roger B. Vincent each retired as a Director of the Board.
DIRECTOR AND OFFICER INFORMATION (Unaudited) (continued)
| Name, Address and Age | | | Position(s) Held
With the Company | | | Term of Office and
Length of Time
Served(1) | | | Principal Occupation(s) – During the Past 5 Years | |
Michael Bell
One Orange Way
Windsor, Connecticut 06095
Age: 51 | | | Chief Executive Officer | | | March 2018 – Present | | | Chief Executive Officer and Director, Voya Investments, LLC, Voya Capital, LLC, and Voya Funds Services, LLC (March 2018 – Present); Senior Vice President and Chief Financial Officer, Voya Investments Distributor, LLC (September 2019 – Present); Chief Financial Officer, Voya Investment Management (September 2014 – Present). Formerly, Senior Vice President, Chief Financial Officer and Treasurer, Voya Investments, LLC (November 2015 – March 2018). | |
Dina Santoro
230 Park Avenue
New York, New York 10169
Age: 46 | | | President | | | March 2018 – Present | | | President and Director, Voya Investments, LLC and Voya Capital, LLC (March 2018-Present); Director, Voya Funds Services, LLC (March 2018-Present); Director and Senior Vice President, Voya Investments Distributor, LLC (April 2018 – Present); Senior Managing Director, Head of Product and Marketing Strategy, Voya Investment Management (September 2017 – Present). Formerly, Managing Director, Quantitative Management Associates, LLC (January 2004 – August 2017). | |
Stanley D. Vyner
230 Park Avenue
New York, New York 10169
Age: 69 | | | Executive Vice President
Chief Investment Risk Officer | | | January 2005 – Present
September 2009 – Present | | | Executive Vice President, Voya Investments, LLC (July 2000 – Present) and Chief Investment Risk Officer, Voya Investments, LLC (January 2003 – Present). | |
James M. Fink
5780 Powers Ferry Road NW
Atlanta, Georgia 30327
Age: 61 | | | Executive Vice President | | | March 2018 – Present | | | Managing Director, Voya Investments, LLC, Voya Capital, LLC, and Voya Funds Services, LLC (March 2018 – Present); Senior Vice President, Voya Investments Distributor, LLC (April 2018 – Present); Chief Administrative Officer, Voya Investment Management (September 2017 – Present). Formerly, Managing Director, Operations, Voya Investment Management (March 1999 – September 2017). | |
Kevin M. Gleason
7337 East Doubletree Ranch Rd.
Suite 100
Scottsdale, Arizona 85258
Age: 53 | | | Chief Compliance Officer | | | February 2012 – Present | | | Senior Vice President, Voya Investment Management and Chief Compliance Officer, Voya Family of Funds (February 2012 – Present). | |
Todd Modic
7337 East Doubletree Ranch Rd.
Suite 100
Scottsdale, Arizona 85258
Age:52 | | | Senior Vice President, Chief/Principal Financial Officer and Assistant Secretary | | | March 2005 – Present | | | President, Voya Funds Services, LLC (March 2018 – Present) and Senior Vice President, Voya Investments, LLC (April 2005 – Present). | |
Kimberly A. Anderson
7337 East Doubletree Ranch Rd.
Suite 100
Scottsdale, Arizona 85258
Age: 55 | | | Senior Vice President | | | January 2005 – Present | | | Senior Vice President, Voya Investments, LLC (September 2003 – Present). | |
Robert Terris
5780 Powers Ferry Road NW
Atlanta, Georgia 30327
Age: 49 | | | Senior Vice President | | | May 2006 – Present | | | Senior Vice President, Voya Investments Distributor, LLC (April 2018 – Present); Senior Vice President, Head of Division Operations, Voya Investments, LLC (October 2015 – Present) and Voya Funds Services, LLC (March 2006 – Present). | |
Fred Bedoya
7337 East Doubletree Ranch Rd.
Suite 100
Scottsdale, Arizona 85258
Age: 47 | | | Vice President and Treasurer | | | September 2012 – Present | | | Vice President, Voya Investments, LLC (October 2015 – Present) and Voya Funds Services, LLC (July 2012 – Present). | |
Maria M. Anderson
7337 East Doubletree Ranch Rd.
Suite 100
Scottsdale, Arizona 85258
Age: 61 | | | Vice President | | | January 2005 – Present | | | Vice President, Voya Investments, LLC (October 2015 – Present) and Voya Funds Services, LLC (September 2004 – Present). | |
DIRECTOR AND OFFICER INFORMATION (Unaudited) (continued)
| Name, Address and Age | | | Position(s) Held
With the Company | | | Term of Office and
Length of Time
Served(1) | | | Principal Occupation(s) – During the Past 5 Years | |
Sara M. Donaldson
7337 East Doubletree Ranch Rd.
Suite 100
Scottsdale, Arizona 85258
Age: 60 | | | Vice President | | | September 2014 – Present | | | Vice President, Voya Investments, LLC (October 2015 – Present). Formerly, Vice President, Voya Funds Services, LLC (April 2014 – October 2015). | |
Micheline S. Faver
7337 East Doubletree Ranch Rd.
Suite 100
Scottsdale, Arizona 85258
Age: 42 | | | Vice President | | | September 2016 – Present | | | Vice President, Head of Fund Compliance and Chief Compliance Officer, Voya Investments, LLC (June 2016 – Present). Formerly, Vice President, Mutual Fund Compliance (March 2014 – June 2016). | |
Robyn L. Ichilov
7337 East Doubletree Ranch Rd.
Suite 100
Scottsdale, Arizona 85258
Age: 52 | | | Vice President | | | January 2005 – Present | | | Vice President, Voya Funds Services, LLC (November 1995 – Present) and Voya Investments, LLC (August 1997 – Present). | |
Jason Kadavy
7337 East Doubletree Ranch Rd.
Suite 100
Scottsdale, Arizona 85258
Age: 43 | | | Vice President | | | September 2012 – Present | | | Vice President, Voya Investments, LLC (October 2015 – Present) and Voya Funds Services, LLC (July 2007 – Present). | |
Andrew K. Schlueter
7337 East Doubletree Ranch Rd.
Suite 100
Scottsdale, Arizona 85258
Age: 43 | | | Vice President | | | March 2018 – Present | | | Vice President, Voya Investments Distributor, LLC (April 2018 – Present); Vice President, Voya Investments, LLC and Voya Funds Services, LLC (March 2018 – Present); Vice President, Head of Mutual Fund Operations, Voya Investment Management (February 2018 – Present). Formerly, Vice President, Voya Investment Management (March 2014 – February 2018). | |
Craig Wheeler
7337 East Doubletree Ranch Rd.
Suite 100
Scottsdale, Arizona 85258
Age: 50 | | | Vice President | | | May 2013 – Present | | | Vice President – Director of Tax, Voya Investments, LLC (October 2015 – Present). Formerly, Vice President – Director of Tax, Voya Funds Services, LLC (March 2013 – October 2015). | |
Monia Piacenti
One Orange Way
Windsor, Connecticut 06095
Age: 43 | | | Anti-Money Laundering Officer | | | June 2018 – Present | | | Anti-Money Laundering Officer, Voya Investments Distributor, LLC, Voya Investment Management and Voya Investment Management Trust Co. (June 2018 – Present); Compliance Consultant, Voya Financial, Inc. (January 2019 – Present). Formerly, Senior Compliance Officer, Voya Investment Management (December 2009 – December 2018). | |
Theresa K. Kelety
7337 East Doubletree Ranch Rd.
Suite 100
Scottsdale, Arizona 85258
Age: 57 | | | Secretary | | | January 2020 – Present | | | Vice President and Senior Counsel, Voya Investment Management – Mutual Fund Legal Department (March 2010 – Present). | |
Paul A. Caldarelli
7337 East Doubletree Ranch Rd.
Suite 100
Scottsdale, Arizona 85258
Age: 68 | | | Assistant Secretary | | | June 2010 – Present | | | Vice President and Senior Counsel, Voya Investment Management – Mutual Fund Legal Department (March 2010 – Present). | |
Joanne F. Osberg
7337 East Doubletree Ranch Rd.
Suite 100
Scottsdale, Arizona 85258
Age: 38 | | | Assistant Secretary | | | January 2020 – Present | | | Vice President and Counsel, Voya Investment Management – Mutual Fund Legal Department (January 2013 – Present). | |
(1)
The Officers hold office until the next annual meeting of the Board of Directors and until their successors shall have been elected and qualified.
ADVISORY AND SUB-ADVISORY CONTRACT APPROVAL DISCUSSION (Unaudited)
BOARD CONSIDERATION AND APPROVAL OF INVESTMENT MANAGEMENT CONTRACTS AND SUB-ADVISORY CONTRACTS
At a meeting held on November 21, 2019, the Board of Directors (“Board”) of Voya Partners, Inc. (the “Company”), including a majority of the Independent Directors, considered and approved the renewal of the investment management contracts (the “Management Contracts”) between Voya Investments, LLC (the “Manager”) and the Company, on behalf of Voya Solution Aggressive Portfolio, Voya Solution Balanced Portfolio, Voya Solution Conservative Portfolio, Voya Solution Income Portfolio, Voya Solution Moderately Aggressive Portfolio, Voya Solution Moderately Conservative Portfolio, Voya Solution 2020 Portfolio, Voya Solution 2025 Portfolio, Voya Solution 2030 Portfolio, Voya Solution 2035 Portfolio, Voya Solution 2040 Portfolio, Voya Solution 2045 Portfolio, Voya Solution 2050 Portfolio, Voya Solution 2055 Portfolio, and Voya Solution 2060 Portfolio, each a series of the Company (the “Portfolios”), and the sub-advisory contracts (the “Sub-Advisory Contracts,” and together with the Management Contracts, the “Contracts”) with Voya Investment Management Co. LLC, the sub-adviser to each Portfolio (the “Sub-Adviser”) for an additional one year period ending November 30, 2020. In determining to renew such contracts, the Board considered information furnished to it throughout the year at meetings of the Board and its committees, including information regarding performance, expenses, and other matters.
In addition to the Board meeting on November 21, 2019, the Independent Directors also held meetings outside the presence of personnel representing the Manager or Sub-Adviser (collectively, such persons are referred to herein as “management”) on October 9, 2019, and November 19, 2019, specifically to review and consider materials related to the proposed continuance of the Contracts that they believed to be relevant to the renewal of the Contracts in light of their own business judgment and the legal advice furnished to them by K&L Gates LLP, their independent legal counsel. Subsequent references herein to factors considered and determinations made by the Independent Directors and/or the Board include, as applicable, factors considered and determinations made at those meetings by the Independent Directors. While the Board considered the renewal of the management contracts and sub-advisory contracts for all of the applicable investment companies in the Voya family of funds at the same meetings, the Board considered each Voya fund’s investment management and sub-advisory relationships separately.
The Board follows a process pursuant to which it seeks and considers relevant information when it evaluates whether to renew existing investment management and
sub-advisory contracts for the Voya funds. The Board has established a Contracts Committee and Investment Review Committees (the “IRCs”), each of which includes only Independent Directors as members. The Contracts Committee meets several times throughout the year to provide oversight with respect to the management and sub-advisory contracts approval and renewal process, among other functions, and each IRC meets several times throughout the year to provide oversight regarding the investment performance of the sub-advisers, as well as the Manager’s role in monitoring the sub-advisers, with respect to each Voya fund that is assigned to that IRC.
The Contracts Committee oversees, and annually recommends Board approval of updates to, a methodology guide for the Voya funds (“Methodology Guide”) related to the investment management and sub-advisory contract renewal process. The Methodology Guide sets out a framework pursuant to which the Independent Directors request, and management provides, certain information that the Independent Directors deem to be important or potentially relevant. The Independent Directors retain the services of an independent consultant with experience in the mutual fund industry to assist the Contracts Committee in developing and recommending to the Board: (1) a selected peer group of investment companies for each Portfolio (“Selected Peer Group”) based on that Portfolio’s particular attributes, such as fund type and size, fund category (as determined by Morningstar, Inc., an independent provider of mutual fund data (“Morningstar”)), sales channels and structure and the Portfolio share class being compared to the Selected Peer Group; and (2) updates to the Methodology Guide with respect to the content and format of various data including, but not limited to, investment performance, fee structure, and expense information prepared in connection with the renewal process. In addition, the Independent Directors periodically have retained, including most recently in 2018, an independent firm to test and verify the accuracy of certain information presented to the Board for a representative sample of the Voya funds.
Provided below is an overview of certain material factors that the Board considered at its meetings regarding the renewal of the Contracts and the compensation to be paid thereunder. The Board members did not identify any particular information or factor that was overarching, and each Board member may have accorded different weight to the various factors in reaching his or her conclusions with respect to each Portfolio’s investment management and sub-advisory arrangements.
Nature, Extent and Quality of Services
The Manager oversees, subject to the authority of the Board, and is responsible for the provision of all investment
ADVISORY AND SUB-ADVISORY CONTRACT APPROVAL DISCUSSION (Unaudited) (continued)
advisory and portfolio management services for the Portfolios, but may delegate certain of these responsibilities to one or more sub-advisers. In addition, the Manager provides administrative services reasonably necessary for the operation of the Portfolios as set forth in the Management Contracts, including oversight of the Portfolios’ operations and risk management and the oversight of their various other service providers.
The Board considered the “manager-of-managers” platform of the Voya funds that has been developed by the Manager pursuant to which the Manager selects, subject to the Board’s approval, sub-advisers to provide day-to-day management services to all or a portion of each Voya fund. The Board recognized that the Manager is responsible for monitoring the investment program, performance, developments, ongoing operations, and compliance with applicable regulations and investment policies and restrictions of the Sub-Adviser with respect to the Portfolios under this manager-of-managers arrangement. The Board also considered the techniques and resources that the Manager has developed to provide this ongoing oversight and due diligence with respect to the sub-advisers and to advocate or recommend, when it believes appropriate, changes in investment strategies or investment sub-advisers designed to assist in improving a Voya fund’s performance. The Board was advised that, in connection with the Manager’s performance of these duties, the Manager has developed an oversight process formulated by its Manager Research & Selection Group which reviews, among other matters, performance data, the Sub-Adviser’s management team, portfolio data and attribution analysis related to the Sub-Adviser through various means, including, but not limited to, in-person meetings, on-site visits, and telephonic meetings with the Sub-Adviser.
Further, the Board considered periodic compliance reports it receives from the Company’s Chief Compliance Officer evaluating whether the regulatory compliance systems and procedures of the Manager and the Sub-Adviser are reasonably designed to ensure compliance with the federal securities laws and whether the investment policies and restrictions for each Portfolio are consistently complied with, and other periodic reports covering related matters.
The Board considered the portfolio management team assigned by the Sub-Adviser to the Portfolios and the level of resources committed to the Portfolios (and other relevant funds in the Voya funds) by the Manager and the Sub-Adviser, and whether those resources are sufficient to provide high-quality services to the Portfolios.
Based on their deliberations and the materials presented to them, the Board concluded that the nature, extent and quality of the overall services provided by the Manager and the Sub-Adviser under the Contracts were appropriate.
Portfolio Performance
In assessing the investment management and sub-advisory relationships, the Board placed emphasis on the investment returns of each Portfolio, including its investment performance over certain time periods compared to the Portfolio’s Morningstar category and primary benchmark, a broad-based securities market index that appears in the Portfolio’s prospectus. The Board also considered information from the Manager Research & Selection Group and received reports summarizing a separate analysis of each Portfolio’s performance and risk, including risk-adjusted investment return information, from the Company’s Chief Investment Risk Officer.
Economies of Scale
When evaluating the reasonableness of the management fee schedules, the Board considered whether economies of scale have been or likely will be realized by the Manager and the Sub-Adviser as a Portfolio grows larger and the extent to which any such economies are shared with the Portfolio. The Board considered that, while the Portfolios do not have management fee breakpoints, they have fee waiver and expense reimbursement arrangements. The Board considered the extent to which economies of scale realized by the Manager could be shared with each Portfolio through such fee waivers, expense reimbursements or other expense reductions. In evaluating these matters, the Independent Directors also considered periodic management reports, Selected Peer Group comparisons, and industry information regarding economies of scale.
Information Regarding Services, Performance, and Fee Schedules Offered to Other Clients
The Board considered comparative information regarding the nature of services, performance, and fee schedules offered by the Manager and the Sub-Adviser to other clients with similar investment objectives, if applicable, including other registered investment companies and relevant institutional accounts. When the fee schedules offered to or the performance of such other clients differed materially from a Portfolio, the Board took into account the underlying rationale provided by the Manager or the Sub-Adviser, as applicable, for these differences.
Fee Schedules, Profitability, and Fall-out Benefits
The Board reviewed and considered the contractual management fee schedule and net management fee rate payable by each Portfolio to the Manager compared to the Portfolio’s Selected Peer Group. In addition, the Board considered certain Portfolio’s contractual management fee schedule compared to other third-party sub-advised funds,
ADVISORY AND SUB-ADVISORY CONTRACT APPROVAL DISCUSSION (Unaudited) (continued)
other funds the Sub-Adviser manages and/or their proprietary funds (if applicable) identified by the Manager. The Board also considered the compensation payable by the Manager to the Sub-Adviser for sub-advisory services for each Portfolio, including the portion of the contractual and net management fee rates that are paid to the Sub-Adviser, as compared to the compensation paid to the Manager. In addition, the Board considered the fee waivers, expense limitations, and recoupment arrangements that apply to the fees payable by the Portfolios, including whether the Manager intends to propose any changes thereto. For each Portfolio, the Board separately determined that the fees payable to the Manager and the fee schedule payable to the Sub-Adviser are reasonable for the services that each performs, which were considered in light of the nature, extent and quality of the services that each has performed and is expected to perform.
For each Portfolio, the Board considered information on revenues, costs and profits or losses realized by the Manager and the Voya-affiliated Sub-Adviser related to their services to the Portfolio. In analyzing the profitability of the Manager and its affiliated service providers in connection with services they render to a Portfolio, the Board took into account the sub-advisory fee rate payable by the Manager to the Sub-Adviser. The Board also considered the profitability of the Manager and its affiliated Sub-Adviser attributable to servicing each Portfolio both with and without taking into account the profitability of the distributor of the Portfolios and any revenue sharing payments made by the Manager and both before and after giving effect to any expenses incurred by the Manager or the affiliated Sub-Adviser in making payments to affiliated insurance companies.
Although the Methodology Guide establishes a framework for profit calculation, the Board recognized that there is no uniform methodology within the asset management industry for determining profitability for this purpose. The Board also recognized that the use of different reasonable methodologies can give rise to dramatically different reported profit and loss results with respect to the Manager and the Voya-affiliated Sub-Adviser, as well as other industry participants with whom the profits of the Manager and its affiliated Sub-Adviser could be compared. In addition, the Board recognized that management’s calculations regarding its costs incurred in establishing the infrastructure necessary for the Portfolios’ operations may not be fully reflected in the expenses allocated to each Portfolio in determining profitability, and that the information presented may not portray all of the costs borne by the Manager or reflect all risks, including
entrepreneurial, regulatory, legal and operational risks, associated with offering and managing a mutual fund complex in the current regulatory and market environment.
The Board also considered that the Manager is entitled to earn a reasonable level of profits for the services that it provides to the Portfolios. The Board also considered information regarding the potential fall-out benefits to the Manager and Sub-Adviser and their respective affiliates from their association with the Portfolios, including their ability to engage in soft-dollar transactions on behalf of the Portfolios. Following its reviews, the Board determined that the Manager’s and the Voya-affiliated Sub-Adviser’s profitability with respect to their services to the Portfolios and the Manager’s and Sub-Adviser’s potential fall-out benefits were not unreasonable.
Portfolio-by-Portfolio Analysis
Set forth below are certain of the specific factors that the Board considered at its October 9, 2019, November 19, 2019, and/or November 21, 2019 meetings in relation to approving each Portfolio’s Contracts and the conclusions reached by the Board. These specific factors are in addition to those considerations discussed above. In each case, the Portfolio’s performance was compared to its Morningstar category, as well as its primary benchmark. The performance data provided to the Board primarily was for various periods ended March 31, 2019. In addition, the Board also considered at its October 9, 2019, November 19, 2019, and November 21, 2019 meetings certain additional data regarding each Portfolio’s more recent performance, asset levels and asset flows. Each Portfolio’s management fee rate and expense ratio were compared to the management fee rates and expense ratios of the funds in its Selected Peer Group. With respect to the quintile rankings noted below, the first quintile represents the range of funds with the highest performance or the lowest management fee rate or expense ratio, as applicable, and the fifth quintile represents the range of funds with the lowest performance or the highest management fee rate or expense ratio, as applicable.
Voya Solution Aggressive Portfolio
In considering whether to approve the renewal of the Contracts for Voya Solution Aggressive Portfolio, the Board considered that, based on performance data for the periods ended March 31, 2019: (1) the Portfolio is ranked in the third quintile of its Morningstar category for the year-to-date, three-year and five-year periods, and the fourth quintile for the one-year period; and (2) the Portfolio outperformed its primary benchmark for all periods
ADVISORY AND SUB-ADVISORY CONTRACT APPROVAL DISCUSSION (Unaudited) (continued)
presented, with the exception of the one-year period, during which it underperformed.
In considering the fees payable under the Contracts for the Portfolio, the Board took into account the factors described above and also considered: (1) the fairness of the compensation under a Management Contract with a level fee rate that does not include breakpoints; and (2) the pricing structure (including the net expense ratio to be borne by shareholders) of the Portfolio, as compared to its Selected Peer Group, including that: (a) the net management fee rate for the Portfolio is ranked in the first quintile of net management fee rates of the funds in its Selected Peer Group; (b) the contractual management fee rate for the Portfolio is ranked in the third quintile of contractual management fee rates of the funds in its Selected Peer Group; and (c) the all-in net expense ratio for the Portfolio, inclusive of Acquired Fund Fees and Expenses (“AFFE”), is ranked in the second quintile of all-in net expense ratios of the funds in its Selected Peer Group, and the net expense ratio for the Portfolio, not inclusive of AFFE, is below the median of net expense ratios of the funds in its Selected Peer Group. In analyzing this fee data, the Board took into account that the Portfolio indirectly bears the fees payable by the underlying funds in which the Portfolio invests.
After its deliberation, the Board reached the following conclusions: (1) the Portfolio’s management fee rate is reasonable in the context of all factors considered by the Board; (2) the Portfolio’s net expense ratio is reasonable in the context of all factors considered by the Board; (3) the Portfolio’s performance is reasonable in the context of all factors considered by the Board; and (4) the sub-advisory fee rate payable by the Manager to the Sub-Adviser is reasonable in the context of all factors considered by the Board. Based on these conclusions and other factors, the Board voted to renew the Contracts for the Portfolio for the year ending November 30, 2020. During this renewal process, different Board members may have given different weight to different individual factors and related conclusions.
Voya Solution Balanced Portfolio
In considering whether to approve the renewal of the Contracts for Voya Solution Balanced Portfolio, the Board considered that, based on performance data for the periods ended March 31, 2019: (1) the Portfolio is ranked in the second quintile of its Morningstar category for the five-year and ten-year periods, the third quintile for the year-to-date and three-year periods, and the fourth quintile for the one-year period; and (2) the Portfolio outperformed its primary benchmark for the year-to-date, three-year and ten-year periods, and underperformed for the one-year and five-year periods.
In considering the fees payable under the Contracts for the Portfolio, the Board took into account the factors described above and also considered: (1) the fairness of the compensation under a Management Contract with a level fee rate that does not include breakpoints; and (2) the pricing structure (including the net expense ratio to be borne by shareholders) of the Portfolio, as compared to its Selected Peer Group, including that: (a) the net management fee rate for the Portfolio is ranked in the second quintile of net management fee rates of the funds in its Selected Peer Group; (b) the contractual management fee rate for the Portfolio is ranked in the fourth quintile of contractual management fee rates of the funds in its Selected Peer Group; and (c) the all-in net expense ratio for the Portfolio, inclusive of Acquired Fund Fees and Expenses (“AFFE”), is ranked in the second quintile of all-in net expense ratios of the funds in its Selected Peer Group, and the net expense ratio for the Portfolio, not inclusive of AFFE, is above the median of net expense ratios of the funds in its Selected Peer Group. In analyzing this fee data, the Board took into account that the Portfolio indirectly bears the fees payable by the underlying funds in which the Portfolio invests.
After its deliberation, the Board reached the following conclusions: (1) the Portfolio’s management fee rate is reasonable in the context of all factors considered by the Board; (2) the Portfolio’s net expense ratio is reasonable in the context of all factors considered by the Board; (3) the Portfolio’s performance is reasonable in the context of all factors considered by the Board; and (4) the sub-advisory fee rate payable by the Manager to the Sub-Adviser is reasonable in the context of all factors considered by the Board. Based on these conclusions and other factors, the Board voted to renew the Contracts for the Portfolio for the year ending November 30, 2020. During this renewal process, different Board members may have given different weight to different individual factors and related conclusions.
Voya Solution Conservative Portfolio
In considering whether to approve the renewal of the Contracts for Voya Solution Conservative Portfolio, the Board considered that, based on performance data for the periods ended March 31, 2019: (1) the Portfolio is ranked in the first quintile of its Morningstar category for the five-year period, the second quintile for the one-year and three-year periods, and the third quintile for the year-to-date period; and (2) the Portfolio underperformed its primary benchmark for all periods presented.
In considering the fees payable under the Contracts for the Portfolio, the Board took into account the factors described above and also considered: (1) the fairness of the
ADVISORY AND SUB-ADVISORY CONTRACT APPROVAL DISCUSSION (Unaudited) (continued)
compensation under a Management Contract with a level fee rate that does not include breakpoints; and (2) the pricing structure (including the net expense ratio to be borne by shareholders) of the Portfolio, as compared to its Selected Peer Group, including that: (a) the net management fee rate for the Portfolio is ranked in the first quintile of net management fee rates of the funds in its Selected Peer Group; (b) the contractual management fee rate for the Portfolio is ranked in the second quintile of contractual management fee rates of the funds in its Selected Peer Group; and (c) the all-in net expense ratio for the Portfolio, inclusive of Acquired Fund Fees and Expenses (“AFFE”), is ranked in the first quintile of all-in net expense ratios of the funds in its Selected Peer Group, and the net expense ratio for the Portfolio, not inclusive of AFFE, is below the median of net expense ratios of the funds in its Selected Peer Group. In analyzing this fee data, the Board took into account that the Portfolio indirectly bears the fees payable by the underlying funds in which the Portfolio invests.
After its deliberation, the Board reached the following conclusions: (1) the Portfolio’s management fee rate is reasonable in the context of all factors considered by the Board; (2) the Portfolio’s net expense ratio is reasonable in the context of all factors considered by the Board; (3) the Portfolio’s performance is reasonable in the context of all factors considered by the Board; and (4) the sub-advisory fee rate payable by the Manager to the Sub-Adviser is reasonable in the context of all factors considered by the Board. Based on these conclusions and other factors, the Board voted to renew the Contracts for the Portfolio for the year ending November 30, 2020. During this renewal process, different Board members may have given different weight to different individual factors and related conclusions.
Voya Solution Income Portfolio
In considering whether to approve the renewal of the Contracts for Voya Solution Income Portfolio, the Board considered that, based on performance data for the periods ended March 31, 2019: (1) the Portfolio is ranked in the first quintile of its Morningstar category for the five-year period, the second quintile for the one-year, three-year and ten-year periods, and the third quintile for the year-to-date period; and (2) the Portfolio outperformed its primary benchmark for all periods presented, with the exception of the one-year period, during which it underperformed.
In considering the fees payable under the Contracts for the Portfolio, the Board took into account the factors described above and also considered: (1) the fairness of the compensation under a Management Contract with a level
fee rate that does not include breakpoints; and (2) the pricing structure (including the net expense ratio to be borne by shareholders) of the Portfolio, as compared to its Selected Peer Group, including that: (a) the net management fee rate for the Portfolio is ranked in the fifth quintile of net management fee rates of the funds in its Selected Peer Group; (b) the contractual management fee rate for the Portfolio is ranked in the fourth quintile of contractual management fee rates of the funds in its Selected Peer Group; and (c) the all-in net expense ratio for the Portfolio, inclusive of the Acquired Fund Fees and Expenses (“AFFE”), is ranked in the fourth quintile of all-in net expense ratios of the funds in its Selected Peer Group, and the net expense ratio for the Portfolio, not inclusive of AFFE, is above the median of net expense ratios of the funds in its Selected Peer Group. In analyzing this fee data, the Board took into account: (1) that the Portfolio indirectly bears the fees payable by the underlying funds in which the Portfolio invests; and (2) management’s representations regarding tits belief that the Portfolio’s pricing is competitive and the competitiveness of the Solution Portfolios’ expense ratios when compared to peers identified by management.
After its deliberation, the Board reached the following conclusions: (1) the Portfolio’s management fee rate is reasonable in the context of all factors considered by the Board; (2) the Portfolio’s net expense ratio is reasonable in the context of all factors considered by the Board; (3) the Portfolio’s performance is reasonable in the context of all factors considered by the Board; and (4) the sub-advisory fee rate payable by the Manager to the Sub-Adviser is reasonable in the context of all factors considered by the Board. Based on these conclusions and other factors, the Board voted to renew the Contracts for the Portfolio for the year ending November 30, 2020. During this renewal process, different Board members may have given different weight to different individual factors and related conclusions.
Voya Solution Moderately Aggressive Portfolio
In considering whether to approve the renewal of the Contracts for Voya Solution Moderately Aggressive Portfolio, the Board considered that, based on performance data for the periods ended March 31, 2019: (1) the Portfolio is ranked in the third quintile of its Morningstar category for the year-to-date, three-year and five-year periods, and the fourth quintile for the one-year period; and (2) the Portfolio underperformed its primary benchmark for all periods presented, with the exception of the year-to-date period, during which it outperformed.
In considering the fees payable under the Management and Sub-Advisory Contracts for the Portfolio, the Board
ADVISORY AND SUB-ADVISORY CONTRACT APPROVAL DISCUSSION (Unaudited) (continued)
took into account the factors described above and also considered: (1) the fairness of the compensation under a Management Contract with a level fee rate that does not include breakpoints; and (2) the pricing structure (including the net expense ratio to be borne by shareholders) of the Portfolio, as compared to its Selected Peer Group, including that: (a) the net management fee rate for the Portfolio is ranked in the fourth quintile of net management fee rates of the funds in its Selected Peer Group; (b) the contractual management fee rate for the Portfolio is ranked in the third quintile of contractual management fee rates of the funds in its Selected Peer Group; and (c) the all-in net expense ratio for the Portfolio, inclusive of Acquired Fund Fees and Expenses (“AFFE”), is ranked in the second quintile of all-in net expense ratios of the funds in its Selected Peer Group, and the net expense ratio for the Portfolio, not inclusive of AFFE, is above the median of expense ratios of the funds in its Selected Peer Group. In analyzing this fee data, the Board took into account: (1) that the Portfolio indirectly bears the fees payable by the underlying funds in which the Portfolio invests; and (2) management’s representations regarding its belief that the Portfolio’s pricing is competitive.
After its deliberation, the Board reached the following conclusions: (1) the Portfolio’s management fee rate is reasonable in the context of all factors considered by the Board; (2) the Portfolio’s net expense ratio is reasonable in the context of all factors considered by the Board; (3) the Portfolio’s performance is reasonable in the context of all factors considered by the Board; and (4) the sub-advisory fee rate payable by the Manager to the Sub-Adviser is reasonable in the context of all factors considered by the Board. Based on these conclusions and other factors, the Board voted to renew the Contracts for the Portfolio for the year ending November 30, 2020. During this renewal process, different Board members may have given different weight to different individual factors and related conclusions.
Voya Solution Moderately Conservative Portfolio
In considering whether to approve the renewal of the Contracts for Voya Solution Moderately Conservative Portfolio, the Board considered that, based on performance data for the periods ended March 31, 2019: (1) the Portfolio is ranked in the first quintile of its Morningstar category for the five-year period, the second quintile for the three-year and ten-year periods, the third quintile for the one-year period, and the fourth quintile for the year-to-date period; and (2) the Portfolio outperformed its primary benchmark for the five-year and ten-year periods, underperformed for the one-year and three-year periods, and its performance was equal to the performance of its primary benchmark for the year-to-date period.
In considering the fees payable under the Contracts for the Portfolio, the Board took into account the factors described above and also considered: (1) the fairness of the compensation under a Management Contract with a level fee rate that does not include breakpoints; and (2) the pricing structure (including the net expense ratio to be borne by shareholders) of the Portfolio, as compared to its Selected Peer Group, including that: (a) the net management fee rate for the Portfolio is ranked in the second quintile of net management fee rates of the funds in its Selected Peer Group; (b) the contractual management fee rate for the Portfolio is ranked in the third quintile of contractual management fee rates of the funds in its Selected Peer Group; and (c) the all-in net expense ratio for the Portfolio, inclusive of Acquired Fund Fees and Expenses (“AFFE”), is ranked in the second quintile of all-in net expense ratios of the funds in its Selected Peer Group, and the net expense ratio for the Portfolio, not inclusive of AFFE, is above the median of net expense ratios of the funds in its Selected Peer Group. In analyzing this fee data, the Board took into account that the Portfolio indirectly bears the fees payable by the underlying funds in which the Portfolio invests.
After its deliberation, the Board reached the following conclusions: (1) the Portfolio’s management fee rate is reasonable in the context of all factors considered by the Board; (2) the Portfolio’s net expense ratio is reasonable in the context of all factors considered by the Board; (3) the Portfolio’s performance is reasonable in the context of all factors considered by the Board; and (4) the sub-advisory fee rate payable by the Manager to the Sub-Adviser is reasonable in the context of all factors considered by the Board. Based on these conclusions and other factors, the Board voted to renew the Contracts for the Portfolio for the year ending November 30, 2020. During this renewal process, different Board members may have given different weight to different individual factors and related conclusions.
Voya Solution 2020 Portfolio
In considering whether to approve the renewal of the Contracts for Voya Solution 2020 Portfolio, the Board considered that, based on performance data for the periods ended March 31, 2019: (1) the Portfolio is ranked in the first quintile of its Morningstar category for the five-year period, the second quintile for the one-year period, the third quintile for the three-year period, and the fourth quintile for the year-to-date period; and (2) the Portfolio underperformed its primary benchmark for all periods presented, with the exception of the five-year period, during which it outperformed. In analyzing this performance data, the Board took into account
ADVISORY AND SUB-ADVISORY CONTRACT APPROVAL DISCUSSION (Unaudited) (continued)
Management’s representations regarding the competitiveness of the Portfolio’s performance during certain periods.
In considering the fees payable under the Contracts for the Portfolio, the Board took into account the factors described above and also considered: (1) the fairness of the compensation under a Management Contract with a level fee rate that does not include breakpoints; and (2) the pricing structure (including the net expense ratio to be borne by shareholders) of the Portfolio, as compared to its Selected Peer Group, including that: (a) the net management fee rate for the Portfolio is ranked in the fifth quintile of net management fee rates of the funds in its Selected Peer Group; (b) the contractual management fee rate for the Portfolio is ranked in the fourth quintile of contractual management fee rates of the funds in its Selected Peer Group; and (c) the net expense ratio for the Portfolio, inclusive of the Acquired Fund Fees and Expenses (“AFFE”), is ranked in the fifth quintile of all-in net expense ratios of the funds in its Selected Peer Group, and the net expense ratio for the Portfolio, not inclusive of AFFE, is above the median of net expense ratios of the funds in its Selected Peer Group. In analyzing this fee data, the Board took into account: (1) that the Portfolio indirectly bears the fees payable by the underlying funds in which the Portfolio invests; and (2) management’s representations regarding its belief that the Portfolio’s pricing is competitive and the competitiveness of the Solution Portfolios’ expense ratios when compared to peers identified by management.
After its deliberation, the Board reached the following conclusions: (1) the Portfolio’s management fee rate is reasonable in the context of all factors considered by the Board; (2) the Portfolio’s net expense ratio is reasonable in the context of all factors considered by the Board; (3) the Portfolio’s performance is reasonable in the context of all factors considered by the Board; and (4) the sub-advisory fee rate payable by the Manager to the Sub-Adviser is reasonable in the context of all factors considered by the Board. Based on these conclusions and other factors, the Board voted to renew the Contracts for the Portfolio for the year ending November 30, 2020. During this renewal process, different Board members may have given different weight to different individual factors and related conclusions.
Voya Solution 2025 Portfolio
In considering whether to approve the renewal of the Contracts for Voya Solution 2025 Portfolio, the Board considered that, based on performance data for the periods ended March 31, 2019: (1) the Portfolio is ranked in the second quintile of its Morningstar category for the
five-year period, and the third quintile for the year-to-date, one-year, three-year and ten-year periods; and (2) the Portfolio underperformed its primary benchmark for all periods presented, with the exception of the ten-year period, during which it outperformed.
In considering the fees payable under the Contracts for the Portfolio, the Board took into account the factors described above and also considered: (1) the fairness of the compensation under a Management Contract with a level fee rate that does not include breakpoints; and (2) the pricing structure (including the net expense ratio to be borne by shareholders) of the Portfolio, as compared to its Selected Peer Group, including that: (a) the net management fee rate for the Portfolio is ranked in the fifth quintile of net management fee rates of the funds in its Selected Peer Group; (b) the contractual management fee rate for the Portfolio is ranked in the third quintile of contractual management fee rates of the funds in its Selected Peer Group; and (c) the all-in net expense ratio for the Portfolio, inclusive of the Acquired Fund Fees and Expenses (“AFFE”), is ranked in the fifth quintile all-in net expense ratios of the funds in its Selected Peer Group, and the net expense ratio for the Portfolio, not inclusive of AFFE, is above the median of net expense ratios of the funds in its Selected Peer Group. In analyzing this fee data, the Board took into account: (1) that the Portfolio indirectly bears the fees payable by the underlying funds in which the Portfolio invests; and (2) management’s representations regarding its belief that that the Portfolio’s pricing is competitive and the competitiveness of the Solution Portfolios’ expense ratios when compared to peers identified by management.
After its deliberation, the Board reached the following conclusions: (1) the Portfolio’s management fee rate is reasonable in the context of all factors considered by the Board; (2) the Portfolio’s net expense ratio is reasonable in the context of all factors considered by the Board; (3) the Portfolio’s performance is reasonable in the context of all factors considered by the Board; and (4) the sub-advisory fee rate payable by the Manager to the Sub-Adviser is reasonable in the context of all factors considered by the Board. Based on these conclusions and other factors, the Board voted to renew the Contracts for the Portfolio for the year ending November 30, 2020. During this renewal process, different Board members may have given different weight to different individual factors and related conclusions.
Voya Solution 2030 Portfolio
In considering whether to approve the renewal of the Contracts for Voya Solution 2030 Portfolio, the Board considered that, based on performance data for the
ADVISORY AND SUB-ADVISORY CONTRACT APPROVAL DISCUSSION (Unaudited) (continued)
periods ended March 31, 2019: (1) the Portfolio is ranked in the first quintile of its Morningstar category for the five-year period, the second quintile for the year-to-date period, the third quintile for the three-year period, and the fourth quintile for the one-year period; and (2) the Portfolio outperformed its primary benchmark for all periods presented, with the exception of the one-year period, during which it underperformed.
In considering the fees payable under the Contracts for the Portfolio, the Board took into account the factors described above and also considered: (1) the fairness of the compensation under a Management Contract with a level fee rate that does not include breakpoints; and (2) the pricing structure (including the net expense ratio to be borne by shareholders) of the Portfolio, as compared to its Selected Peer Group, including that: (a) the net management fee rate for the Portfolio is ranked in the fifth quintile of net management fee rates of the funds in its Selected Peer Group; (b) the contractual management fee rate for the Portfolio is ranked in the fourth quintile of contractual management fee rates of the funds in its Selected Peer Group; and (c) the all-in net expense ratio for the Portfolio, inclusive of the Acquired Fund Fees and Expenses (“AFFE”), is ranked in the fifth quintile of all-in net expense ratios of the funds in its Selected Peer Group, and the net expense ratio for the Portfolio, not inclusive of AFFE, is above the median of net expense ratios of the funds in its Selected Peer Group. In analyzing this fee data, the Board took into account: (1) that the Portfolio indirectly bears the fees payable by the underlying funds in which the Portfolio invests; and (2) management’s representations regarding its belief that the Portfolio’s pricing is competitive and the competitiveness of the Solution Portfolios’ expense ratios when compared to peers identified by management.
After its deliberation, the Board reached the following conclusions: (1) the Portfolio’s management fee rate is reasonable in the context of all factors considered by the Board; (2) the Portfolio’s net expense ratio is reasonable in the context of all factors considered by the Board; (3) the Portfolio’s performance is reasonable in the context of all factors considered by the Board; and (4) the sub-advisory fee rate payable by the Manager to the Sub-Adviser is reasonable in the context of all factors considered by the Board. Based on these conclusions and other factors, the Board voted to renew the Contracts for the Portfolio for the year ending November 30, 2020. During this renewal process, different Board members may have given different weight to different individual factors and related conclusions.
Voya Solution 2035 Portfolio
In considering whether to approve the renewal of the Contracts for Voya Solution 2035 Portfolio, the Board considered that, based on performance data for the periods ended March 31, 2019: (1) the Portfolio is ranked in the second quintile of its Morningstar category for the year-to-date and five-year periods, the third quintile for the three-year and ten-year periods, and the fifth quintile for the one-year period; and (2) the Portfolio underperformed its primary benchmark for the one-year, five-year and ten-year periods and outperformed for the year-to-date and three-year periods.
In considering the fees payable under the Contracts for the Portfolio, the Board took into account the factors described above and also considered: (1) the fairness of the compensation under a Management Contract with a level fee rate that does not include breakpoints; and (2) the pricing structure (including the net expense ratio to be borne by shareholders) of the Portfolio, as compared to its Selected Peer Group, including that: (a) the net management fee rate for the Portfolio is ranked in the fifth quintile of net management fee rates of the funds in its Selected Peer Group; (b) the contractual management fee rate for the Portfolio is ranked in the fourth quintile of contractual management fee rates of the funds in its Selected Peer Group; and (c) the all-in net expense ratio for the Portfolio, inclusive of the Acquired Fund Fees and Expenses (“AFFE), is ranked in the fifth quintile of all-in net expense ratios of the funds in its Selected Peer Group, and the net expense ratio for the Portfolio, not inclusive of AFFE, is above the median of net expense ratios of the funds in its Selected Peer Group. In analyzing this fee data, the Board took into account: (1) that the Portfolio indirectly bears the fees payable by the underlying funds in which the Portfolio invests; and (2) management’s representations regarding its belief that the Portfolio’s pricing is competitive and the competitiveness of the Solution Portfolios’ expense ratios when compared to peers identified by management.
After its deliberation, the Board reached the following conclusions: (1) the Portfolio’s management fee rate is reasonable in the context of all factors considered by the Board; (2) the Portfolio’s net expense ratio is reasonable in the context of all factors considered by the Board; (3) the Portfolio’s performance is reasonable in the context of all factors considered by the Board; and (4) the sub-advisory fee rate payable by the Manager to the Sub-Adviser is reasonable in the context of all factors considered by the Board. Based on these conclusions and other factors, the Board voted to renew the Contracts for the Portfolio for the year ending November 30, 2020. During this renewal
ADVISORY AND SUB-ADVISORY CONTRACT APPROVAL DISCUSSION (Unaudited) (continued)
process, different Board members may have given different weight to different individual factors and related conclusions.
Voya Solution 2040 Portfolio
In considering whether to approve the renewal of the Contracts for Voya Solution 2040 Portfolio, the Board considered that, based on performance data for the periods ended March 31, 2019: (1) the Portfolio is ranked in the second quintile of its Morningstar category for the five-year period, the third quintile for the year-to-date and three-year periods, and the fifth quintile for the one-year period; and (2) the Portfolio outperformed its primary benchmark for the year-to-date and five-year periods, and underperformed for the one-year and three-year periods.
In considering the fees payable under the Contracts for the Portfolio, the Board took into account the factors described above and also considered: (1) the fairness of the compensation under a Management Contract with a level fee rate that does not include breakpoints; and (2) the pricing structure (including the net expense ratio to be borne by shareholders) of the Portfolio, as compared to its Selected Peer Group, including that: (a) the net management fee rate for the Portfolio is ranked in the fourth quintile of net management fee rates of the funds in its Selected Peer Group; (b) the contractual management fee rate for the Portfolio is ranked in the fourth quintile of contractual management fee rates of the funds in its Selected Peer Group; and (c) the all-in net expense ratio for the Portfolio, inclusive of the Acquired Fund Fees and Expenses (“AFFE”), is ranked in the fifth quintile of all-in net expense ratios of the funds in it Selected Peer Group, and the net expense ratio for the Portfolio, not inclusive of AFFE, is above the median of net expense ratios of the funds in its Selected Peer Group. In analyzing this fee data, the Board took into account: (1) that the Portfolio indirectly bears the fees payable by the underlying funds in which the Portfolio invests; and (2) management’s representations regarding its belief that the Portfolio’s pricing is competitive and the competitiveness of the Solution Portfolios’ expense ratios when compared to peers identified by management.
After its deliberation, the Board reached the following conclusions: (1) the Portfolio’s management fee rate is reasonable in the context of all factors considered by the Board; (2) the Portfolio’s net expense ratio is reasonable in the context of all factors considered by the Board; (3) the Portfolio’s performance is reasonable in the context of all factors considered by the Board; and (4) the sub-advisory fee rate payable by the Manager to the Sub-Adviser is reasonable in the context of all factors considered by the Board. Based on these conclusions and other factors, the
Board voted to renew the Contracts for the Portfolio for the year ending November 30, 2020. During this renewal process, different Board members may have given different weight to different individual factors and related conclusions.
Voya Solution 2045 Portfolio
In considering whether to approve the renewal of the Contracts for Voya Solution 2045 Portfolio, the Board considered that, based on performance data for the periods ended March 31, 2019: (1) the Portfolio is ranked in the third quintile of its Morningstar category for the year-to-date, five-year and ten-year periods, and the fifth quintile for the one-year and three-year periods; and (2) the Portfolio underperformed its primary benchmark for all periods presented, with the exception of the year-to-date period, during which it outperformed. In analyzing this performance data, the Board took into account management’s representations regarding: (1) the competitiveness of the Portfolio’s performance during certain periods; (2) the impact of asset allocation positioning on the Portfolio’s performance; (3) its belief that the Sub-Adviser can improve the Portfolio’s long-term performance; and (4) ongoing periodic monitoring of the Portfolio’s performance by management and the Board or its Investment Review Committee.
In considering the fees payable under the Contracts for the Portfolio, the Board took into account the factors described above and also considered: (1) the fairness of the compensation under a Management Contract with a level fee rate that does not include breakpoints; and (2) the pricing structure (including the net expense ratio to be borne by shareholders) of the Portfolio, as compared to its Selected Peer Group, including that: (a) the net management fee rate for the Portfolio is ranked in the fourth quintile of net management fee rates of the funds in its Selected Peer Group; (b) the contractual management fee rate for the Portfolio is ranked in the fourth quintile of contractual management fee rates of the funds in its Selected Peer Group; and (c) the all-in net expense ratio for the Portfolio, inclusive of the Acquired Fund Fees and Expenses (“AFFE”), is ranked in the fifth quintile of all-in net expense ratios of the funds in its Selected Peer Group, and the net expense ratio for the Portfolio, not inclusive of AFFE, is above the median of net expense ratios of the funds in its Selected Peer Group. In analyzing this fee data, the Board took into account: (1) that the Portfolio indirectly bears the fees payable by the underlying funds in which the Portfolio invests; and (2) Management’s representations regarding the competitiveness of the Portfolio’s management fee rate and the competitiveness of the Solution Portfolios’ expense ratios when compared to peers identified by management.
ADVISORY AND SUB-ADVISORY CONTRACT APPROVAL DISCUSSION (Unaudited) (continued)
After its deliberation, the Board reached the following conclusions: (1) the Portfolio’s management fee rate is reasonable in the context of all factors considered by the Board; (2) the Portfolio’s net expense ratio is reasonable in the context of all factors considered by the Board; (3) the Portfolio’s performance is reasonable in the context of all factors considered by the Board; and (4) the sub-advisory fee rate payable by the Manager to the Sub-Adviser is reasonable in the context of all factors considered by the Board. Based on these conclusions and other factors, the Board voted to renew the Contracts for the Portfolio for the year ending November 30, 2020. During this renewal process, different Board members may have given different weight to different individual factors and related conclusions.
Voya Solution 2050 Portfolio
In considering whether to approve the renewal of the Contracts for Voya Solution 2050 Portfolio, the Board considered that, based on performance data for the periods ended March 31, 2019: (1) the Portfolio is ranked in the second quintile of its Morningstar category for the five-year period, the third quintile for the year-to-date period, the fourth quintile for the three-year period, and the fifth quintile for the one-year period; and (2) the Portfolio underperformed its primary benchmark for all periods presented, with the exception of the year-to-date period, during which it outperformed. In analyzing this performance data, the Board took into account management’s representations regarding: (1) the competitiveness of the Portfolio’s performance during certain periods; (2) the impact of asset allocation positioning on the Portfolio’s performance; (3) its belief that the Sub-Adviser can improve the Portfolio’s long-term performance; and (4) ongoing periodic monitoring of the Portfolio’s performance by management and the Board or its Investment Review Committee.
In considering the fees payable under the Contracts for the Portfolio, the Board took into account the factors described above and also considered: (1) the fairness of the compensation under a Management Contract with a level fee rate that does not include breakpoints; and (2) the pricing structure (including the net expense ratio to be borne by shareholders) of the Portfolio, as compared to its Selected Peer Group, including that: (a) the net management fee rate for the Portfolio is ranked in the fourth quintile of net management fee rates of the funds in its Selected Peer Group; (b) the contractual management fee rate for the Portfolio is ranked in the fourth quintile of contractual management fee rates of the funds in its Selected Peer Group; and (c) the all-in net expense ratio for the Portfolio, inclusive of the Acquired Fund Fees and Expenses (“AFFE”), is ranked in the fifth quintile of all-in
net expense ratios of the funds in its Selected Peer Group, and the net expense ratio for the Portfolio, not inclusive of the AFFE, is above the median of net expense ratios of the funds in its Selected Peer Group. In analyzing this fee data, the Board took into account: (1) that the Portfolio indirectly bears the fees payable by the underlying funds in which the Portfolio invests; and (2) management’s representations regarding its belief that the Portfolio’s pricing is competitive and the competitiveness of the Solution Portfolios’ expense ratios when compared to peers identified by management.
After its deliberation, the Board reached the following conclusions: (1) the Portfolio’s management fee rate is reasonable in the context of all factors considered by the Board; (2) the Portfolio’s net expense ratio is reasonable in the context of all factors considered by the Board; (3) the Portfolio’s performance is reasonable in the context of all factors considered by the Board; and (4) the sub-advisory fee rate payable by the Manager to the Sub-Adviser is reasonable in the context of all factors considered by the Board. Based on these conclusions and other factors, the Board voted to renew the Contracts for the Portfolio for the year ending November 30, 2020. During this renewal process, different Board members may have given different weight to different individual factors and related conclusions.
Voya Solution 2055 Portfolio
In considering whether to approve the renewal of the Contracts for Voya Solution 2055 Portfolio, the Board considered that, based on performance data for the periods ended March 31, 2019: (1) the Portfolio is ranked in the third quintile of its Morningstar category for the year-to-date and five-year periods, and the fifth quintile for the one-year and three-year periods; and (2) the Portfolio underperformed its primary benchmark for all periods presented, with the exception of the year-to-date period, during which it outperformed. In analyzing this performance data, the Board took into account management’s representations regarding: (1) the competitiveness of the Portfolio’s performance during certain periods; (2) the impact of asset allocation positioning on the Portfolio’s performance; (3) its belief that the Sub-Adviser can improve the Portfolio’s long-term performance; and (4) ongoing periodic monitoring of the Portfolio’s performance by management and the Board or its Investment Review Committee.
In considering the fees payable under the Contracts for the Portfolio, the Board took into account the factors described above and also considered: (1) the fairness of the compensation under a Management Contract with a level fee rate that does not include breakpoints; and (2) the
ADVISORY AND SUB-ADVISORY CONTRACT APPROVAL DISCUSSION (Unaudited) (continued)
pricing structure (including the net expense ratio to be borne by shareholders) of the Portfolio, as compared to its Selected Peer Group, including that: (a) the net management fee rate for the Portfolio is ranked in the fourth quintile of net management fee rates of the funds in its Selected Peer Group; (b) the contractual management fee rate for the Portfolio is ranked in the third quintile of contractual management fee rates of the funds in its Selected Peer Group; and (c) the all-in net expense ratio for the Portfolio, inclusive of the Acquired Fund Fees and Expenses (“AFFE”), is ranked in the fifth quintile of all-in net expense ratios of the funds in its Selected Peer Group, and the net expense ratio for the Portfolio, not inclusive of the AFFE, is above the median of net expense ratios of the funds in its Selected Peer Group. In analyzing this fee data, the Board took into account: (1) that the Portfolio indirectly bears the fees payable by the underlying funds in which the Portfolio invests; and (2) management’s representations regarding its belief that the Portfolio’s pricing is competitive and the competitiveness of the Solution Portfolios’ expense ratios when compared to peers identified by management.
After its deliberation, the Board reached the following conclusions: (1) the Portfolio’s management fee rate is reasonable in the context of all factors considered by the Board; (2) the Portfolio’s net expense ratio is reasonable in the context of all factors considered by the Board; (3) the Portfolio’s performance is reasonable in the context of all factors considered by the Board; and (4) the sub-advisory fee rate payable by the Manager to the Sub-Adviser is reasonable in the context of all factors considered by the Board. Based on these conclusions and other factors, the Board voted to renew the Contracts for the Portfolio for the year ending November 30, 2020. During this renewal process, different Board members may have given different weight to different individual factors and related conclusions.
Voya Solution 2060 Portfolio
In considering whether to approve the renewal of the Contracts for Voya Solution 2060 Portfolio, the Board considered that, based on performance data for the periods ended March 31, 2019: (1) the Portfolio is ranked in the fourth quintile of its Morningstar category for the year-to-date period, and the fifth quintile for the one-year and three-year periods; and (2) the Portfolio outperformed its primary benchmark for the year-to-date period and underperformed for the one-year and three-year periods. In analyzing this performance data, the Board took into
account management’s representations regarding: (1) the impact of asset allocation positioning on the Portfolio’s performance; (2) its belief that the Sub-Adviser can improve the Portfolio’s long-term performance; and (3) ongoing periodic monitoring of the Portfolio’s performance by management and the Board or its Investment Review Committee.
In considering the fees payable under the Contracts for the Portfolio, the Board took into account the factors described above and also considered: (1) the fairness of the compensation under a Management Contract with a level fee rate that does not include breakpoints; and (2) the pricing structure (including the net expense ratio to be borne by shareholders) of the Portfolio, as compared to its Selected Peer Group, including that: (a) the net management fee rate for the Portfolio is ranked in the fourth quintile of net management fee rates of the funds in its Selected Peer Group; (b) the contractual management fee rate for the Portfolio is ranked in the third quintile of contractual management fee rates of the funds in its Selected Peer Group; and (c) the all-in net expense ratio for the Portfolio, inclusive of the Acquired Fund Fees and Expenses (“AFFE”), is ranked in the fifth quintile of all-in net expense ratios of the funds in its Selected Peer Group, and the net expense ratio for the Portfolio, not inclusive of the AFFE, is above the median of net expense ratios of the funds in its Selected Peer Group. In analyzing this fee data, the Board took into account: (1) that the Portfolio indirectly bears the fees payable by the underlying funds in which the Portfolio invests; and (2) management’s representations regarding its belief that the Portfolio’s pricing is competitive and the competitiveness of the Solution Portfolios’ expense ratios when compared to peers identified by management.
After its deliberation, the Board reached the following conclusions: (1) the Portfolio’s management fee rate is reasonable in the context of all factors considered by the Board; (2) the Portfolio’s net expense ratio is reasonable in the context of all factors considered by the Board; (3) the Portfolio’s performance is reasonable in the context of all factors considered by the Board; and (4) the sub-advisory fee rate payable by the Manager to the Sub-Adviser is reasonable in the context of all factors considered by the Board. Based on these conclusions and other factors, the Board voted to renew the Contracts for the Portfolio for the year ending November 30, 2020. During this renewal process, different Board members may have given different weight to different individual factors and related conclusions.
Investment Adviser
Voya Investments, LLC
7337 East Doubletree Ranch Road, Suite 100
Scottsdale, Arizona 85258
Distributor
Voya Investments Distributor, LLC
7337 East Doubletree Ranch Road, Suite 100
Scottsdale, Arizona 85258
Transfer Agent
BNY Mellon Investment Servicing (U.S.) Inc.
301 Bellevue Parkway
Wilmington, Delaware 19809
Independent Registered Public Accounting Firm
KPMG LLP
Two Financial Center
60 South Street
Boston, Massachusetts 02111
Custodian
The Bank of New York Mellon
225 Liberty Street
New York, New York 10286
Legal Counsel
Ropes & Gray LLP
Prudential Tower
800 Boylston Street
Boston, Massachusetts 02199
Before investing, carefully consider the investment objectives, risks, charges and expenses of the variable annuity contract or variable life insurance policy and the underlying variable investment options. This and other information is contained in the prospectus for the variable annuity contract or variable life insurance policy and the underlying variable investment options. Obtain these prospectuses from your agent/registered representative and read them carefully before investing.
RETIREMENT | INVESTMENTS | INSURANCE
voyainvestments.com
Annual Report
December 31, 2019
Classes ADV, I, S, S2 and Z
Voya Partners, Inc.
| | ■
Voya Index Solution Income Portfolio | | | ■
Voya Index Solution 2040 Portfolio | |
| | ■
Voya Index Solution 2020 Portfolio | | | ■
Voya Index Solution 2045 Portfolio | |
| | ■
Voya Index Solution 2025 Portfolio | | | ■
Voya Index Solution 2050 Portfolio | |
| | ■
Voya Index Solution 2030 Portfolio | | | ■
Voya Index Solution 2055 Portfolio | |
| | ■
Voya Index Solution 2035 Portfolio | | | ■
Voya Index Solution 2060 Portfolio | |
| | | Beginning on January 1, 2021, as permitted by regulations adopted by the U.S. Securities and Exchange Commission, paper copies of each Portfolio’s annual and semi-annual shareholder reports, like this annual report, will no longer be sent by mail, unless you specifically request paper copies of the reports. Instead, the reports will be made available on a website and you will be notified by mail each time a report is posted and provided with a website link to access the report. | | |
| | | If you already elected to receive shareholder reports electronically, you will not be affected by this change and you need not take any action. You may elect to receive shareholder reports and other communications from your insurance carrier electronically by contacting them directly. | | |
| | | You may elect to receive all future reports in paper free of charge. If you received this document in the mail, please follow the instructions provided to elect to continue receiving paper copies of your shareholder reports. You can inform us that you wish to continue receiving paper copies by calling 1-800-283-3427. Your election to receive reports in paper will apply to all the funds in which you invest. | | |
| | | This report is submitted for general information to shareholders of the Voya mutual funds. It is not authorized for distribution to prospective shareholders unless accompanied or preceded by a prospectus which includes details regarding the funds’ investment objectives, risks, charges, expenses and other information. This information should be read carefully. | | |
PROXY VOTING INFORMATION
A description of the policies and procedures that the Portfolios use to determine how to vote proxies related to portfolio securities is available: (1) without charge, upon request, by calling Shareholder Services toll-free at (800) 992-0180; (2) on the Portfolios’ website at www.voyainvestments.com; and (3) on the U.S. Securities and Exchange Commission’s (“SEC’s”) website at www.sec.gov. Information regarding how the Portfolios voted proxies related to portfolio securities during the most recent 12-month period ended June 30 is available without charge on the Portfolios’ website at www.voyainvestments.com and on the SEC’s website at www.sec.gov.
QUARTERLY PORTFOLIO HOLDINGS
The Portfolios file their complete schedule of portfolio holdings with the SEC for the first and third quarters of each fiscal year on Form N-Q or Form N-PORT, available for filings after March 31, 2019. The Portfolios’ Form N-Q or Form N-PORT is available on the SEC’s website at www.sec.gov. The Portfolios’ complete schedule of portfolio holdings, as filed on Form N-Q or Form N-PORT, are available: on www.voyainvestments.com and without charge upon request from the Portfolio by calling Shareholder Services toll-free at (800) 992-0180.
New season, last year’s plot
Dear Shareholder,
The financial markets delivered strong performance in 2019, and at this juncture, in our view, the outlook for 2020 seems upbeat. Thanks to supportive central bank policies around the world, global economic growth is reaccelerating; manufacturing activity, a key metric for setting market expectations, appears to be strengthening. Recent progress in the trade negotiations between China and the U.S. also helps brighten the outlook as 2020 gets underway.
So expect smooth sailing, right? Maybe. Barely into the first week of the new year, the world faced the prospect of escalating conflict in the Middle East, though tensions appear to have eased since then. Markets initially pulled back in response to heightened uncertainty but regrouped quickly. Follow-on events, if they occur, may not impact markets that much: during 2019, investors generally did well by downplaying geopolitical concerns, and we could see the same behavior in 2020.
Still, we believe that turbulence seems to be the world’s modus operandi: economic and market uncertainty are still with us, trade issues remain unresolved and the upcoming U.S. presidential election adds another dimension of political uncertainty. Even though market participants have become more comfortable accepting risk, we have observed persistent preferences for higher-quality, lower-volatility assets. This tells us that investors perceive significant risks they wish to avoid, and points to the potential for volatile reactions to adverse news.
With potential surprises from anywhere, we believe investors should continue to diversify their portfolios as broadly as practicable, and not attempt to time the markets. At the start of 2019, in our opinion, many investors did not believe U.S. equities offered attractive return potential — acting on that belief would have resulted in missed opportunities. Remember that your portfolio is structured to meet your long-term objectives; changing it in response to short-term market conditions may put your long-term goals at risk. If your goals have changed, please discuss them thoroughly with your investment advisor before making any changes to your portfolio.
Voya seeks to remain a reliable partner committed to reliable investing, helping you and your investment advisor achieve your goals. We appreciate your continued confidence in us, and we look forward to serving your investment needs in the future.
Sincerely,
Dina Santoro
President
Voya Family of Funds
January 21, 2020
The views expressed in the President’s Letter reflect those of the President as of the date of the letter. Any such views are subject to change at any time based upon market or other conditions and the Voya mutual funds disclaim any responsibility to update such views. These views may not be relied on as investment advice and because investment decisions for a Voya mutual fund are based on numerous factors, may not be relied on as an indication of investment intent on behalf of any Voya mutual fund. Reference to specific company securities should not be construed as recommendations or investment advice.
International investing poses special risks including currency fluctuation, economic and political risks not found in investments that are solely domestic.
Market Perspective: Year Ended December 31, 2019
In our semi-annual report, we described how global equities, in the form of the MSCI World IndexSM (the “Index”) measured in local currencies, including net reinvested dividends, rose 16.69% for the half-year after a nervous start.
A trade war between the U.S. and China had been ongoing for more than a year, with U.S. tariffs on some $250 billion of Chinese goods in place together with Chinese tariffs on $110 billion of U.S. goods. The war was being waged against a backdrop of slowing global growth, in part the result of uncertainties caused by the trade war itself.
Fears on both fronts: the trade war and slowing global growth, would ebb and flow in the second half; yet the Index rose five months out of six, ending the year up 27.34%, just below the record set a few days earlier. (The Index returned 27.67% for the year ended December 31, 2019, measured in U.S. dollars.)
Entering May, trade talks had appeared to be going reasonably well and the path of least resistance for the Index still seemed upwards. This all changed when the President tweeted his intention to raise the existing 10% tariff on $200 billion of the $250 billion to 25% of Chinese goods. Trade negotiations had evidently broken down. Later he unexpectedly threatened tariffs on Mexican goods for reasons unrelated to trade.
On perceived slowing global growth, there was still plenty to worry about.
In Europe, manufacturing was in contraction. The euro zone’s annual growth in gross domestic product (“GDP”) in the second and third quarters of 2019 was just 1.2%. In the U.K., chronic disagreement about whether and how to leave the European Union (“Brexit”) culminated in a general election called for December.
Japan, with manufacturing also in contraction, managed GDP growth of 2.0% annualized in the second quarter, slipping to 1.8% in the third. Exports and imports were both falling and core inflation languished at 0.8%, with a demand-dampening sales tax increase effective on October 1.
China’s GDP grew at 6.0% in the third quarter, the smallest advance in 27 years. Industrial production was expanding near the slowest pace in 17 years, retail sales in 16 years.
In the U.S., manufacturing fell into contraction in September. Corporate profits were flat to falling year-over-year. While annualized first quarter growth had surprised to the upside at 3.1%, it fell to 2.0% and 2.1% in the second and third quarters, respectively. Growth was heavily dependent on consumer spending, supported by the lowest unemployment rate since 1969.
Back in the markets, after May’s slump, central banks came to the rescue in June. On June 19 the Federal Open Market Committee (“FOMC”) left rates unchanged, but markets heard Chairman Powell signal a cut in July. The European Central Bank announced its willingness to cut its already negative deposit rate and resume bond purchases. The Japanese government also promised increased stimulus. Plans for tariffs on Mexican imports were “indefinitely suspended”, and investors were finally left to cheer a truce in the U.S.-China trade conflict, agreed on June 29.
July was a comparatively quiet month. The FOMC duly cut the federal funds rate by 25 basis points (0.25%), but disappointed some, including the President, by referring to it as only a “mid-cycle adjustment”. And it was back to trade-war angst in
August, as first the President announced 10% tariffs on the approximately $300 billion of Chinese imports as yet unaffected, and then increased existing and planned tariffs by 5% when China retaliated.
The market rollercoaster lurched back up in September and October, when high-level trade talks between the U.S. and China resumed. Both sides expressed confidence that “Phase 1” of a deal was possible by year-end. The FOMC cut rates again in both months.
And as year-end approached, a more positive narrative was increasingly heard. Markets were rising despite trade tensions, sluggish global growth, declining profits and political uncertainties in the U.S. and elsewhere. Perhaps, some commentators ventured, this was a signal that the worst was over. The Phase 1 trade deal was announced, amid some skepticism on the details, as was agreement on USMCA, the replacement for NAFTA. The U.K. government’s emphatic election victory might offer more clarity on Brexit. Central banks were all supportive and some of the economic data were starting to improve.
In U.S. fixed income markets, the Treasury yield curve fell. For the year, the Bloomberg Barclays U.S. Aggregate Bond Index rose 8.72%. The Bloomberg Barclays Long-Term U.S. Treasury sub-index returned 14.83%, the 30-year yield briefly dipping below 2% in August. The 10-year yield on Japanese and some euro zone government bonds ended below zero.
U.S. equities, represented by the S&P 500® Index, including dividends, surged 31.49%. Technology was by far the top performer, up 50.29%, led by Apple and Microsoft. Energy, exposed to slowing global economic activity, was the weakest, but still rose 11.81%.
In currencies, the dollar rose 2.04% against the euro, but lost 3.80% against the pound and 0.97% against the yen. On a trade-weighted basis, according to Reuters, the dollar had the smallest annual move ever in 2019.
In international markets, the MSCI Japan® Index ended up 18.48% for the year, supported by the Bank of Japan’s purchases of exchange-traded funds, but pressured by Japan’s own vulnerability to a trade war. The MSCI Europe ex U.K.® Index advanced 26.43%, powered by capital goods and pharmaceuticals companies. The MSCI U.K.® Index rose 16.37%, dampened by Brexit concerns, but also affected by the company-specific fortunes of MSCI U.K.’s market heavyweights. Among the largest contributors were pharmaceuticals, AstraZeneca and GlaxoSmithKline; the biggest detractors were miner Glencore and HSBC.
All indices are unmanaged and investors cannot invest directly in an index. Past performance does not guarantee future results. The performance quoted represents past performance.
Investment return and principal value of an investment will fluctuate, and shares, when redeemed, may be worth more or less than their original cost. Each Portfolio’s performance is subject to change since the period’s end and may be lower or higher than the performance data shown. Please call (800) 262-3862 or log on to www.voyainvestments.com to obtain performance data current to the most recent month end.
Market Perspective reflects the views of Voya Investment Management’s Chief Investment Risk Officer only through the end of the period, and is subject to change based on market and other conditions.
| | | Index | | | | Description | | |
| | | Bloomberg Barclays U.S. Aggregate Bond Index | | | | An index of publicly issued investment grade U.S. government, mortgage-backed, asset-backed and corporate debt securities. | | |
| | | Bloomberg Barclays Long-Term U.S.
Treasury Index | | | | This index measures the performance of U.S. Treasury bills with long-term maturity. The credit level for this index is investment grade. The rebalance scheme is monthly. | | |
| | | MSCI Europe ex UK® Index | | | | A free float-adjusted market capitalization index that is designed to measure developed market equity performance in Europe, excluding the UK. | | |
| | | MSCI Japan® Index | | | | A free float-adjusted market capitalization index that is designed to measure developed market equity performance in Japan. | | |
| | | MSCI U.K.® Index | | | | A free float-adjusted market capitalization index that is designed to measure developed market equity performance in the UK. | | |
| | | MSCI World IndexSM | | | | An index that measures the performance of over 1,600 securities listed on exchanges in the U.S., Europe, Canada, Australia, New Zealand and the Far East. | | |
| | | S&P 500® Index | | | | An index that measures the performance of securities of approximately 500 large-capitalization companies whose securities are traded on major U.S. stock markets. | | |
| | | S&P Target Date Retirement Income Index | | | | Seeks to represent asset allocations which target an immediate retirement horizon. | | |
| | | S&P Target Date 2020 Index,
S&P Target Date 2025 Index,
S&P Target Date 2030 Index,
S&P Target Date 2035 Index,
S&P Target Date 2040 Index,
S&P Target Date 2045 Index,
S&P Target Date 2050 Index,
S&P Target Date 2055 Index and
S&P Target Date 2060+ Index | | | | Each index seeks to represent the market consensus for asset allocations which target an approximate 2020, 2025, 2030, 2035, 2040, 2045, 2050, 2055, 2060 and beyond the 2060 retirement horizon, respectively. | | |
| Voya Index Solution Portfolios | Portfolio Managers’ Report |
The Voya Index Solution Portfolios consist of Voya Index Solution Income Portfolio, Voya Index Solution 2020 Portfolio*, Voya Index Solution 2025 Portfolio, Voya Index Solution 2030 Portfolio, Voya Index Solution 2035 Portfolio, Voya Index Solution 2040 Portfolio, Voya Index Solution 2045 Portfolio, Voya Index Solution 2050 Portfolio, Voya Index Solution 2055 Portfolio, and Voya Index Solution 2060 Portfolio (each a “Portfolio” or collectively, the “Portfolios”). Each Portfolio seeks to achieve its investment objective by investing in a combination of underlying funds which are passively managed funds (index funds)(1). Each Portfolio uses an asset allocation strategy (“Target Asset Allocation”) designed for investors expecting to retire around the year applicable to that Portfolio. These Target Asset Allocations as of December 31, 2019 are set out in the table below. The Portfolios are managed by Halvard Kvaale, CIMA, Paul Zemsky, CFA and Chief Investment Officer, and Barbara Reinhard, CFA, Portfolio Managers** of Voya Investment Management Co. LLC (“Voya IM”) — the Sub-Adviser.
Performance: Each Portfolio’s performance against its respective benchmark can be found on page 6.
Portfolio Specifics: The Portfolio managers attempt to enhance investment returns by tactically deviating from Target Asset Allocations to take advantage of opportunities or reduce risk. The following tactics were among those employed in 2019.
All of the Portfolios started the 12-month reporting period with overweight positions in domestic large blend, short duration bonds and long government bonds. These positions were funded by underweight positions in domestic mid-cap, international equities, real estate investment trusts (“REITs”), core U.S. fixed income and high-yield bonds. Three trades were placed in January across the Portfolios. In early January 2019, the Portfolios initiated an underweight to senior loans, lowering their overall credit exposure and realizing gains earned from the solid recovery in the loan market post-December 2018 selloff. In addition, with the U.S. Federal Open Market Committee (“FOMC”) having moved closer to concluding its tightening cycle, in our opinion, the need for a floating rate component was minimized. Proceeds from the sale were moved into short-term bonds. In mid-January, the Portfolios reduced their equity exposure by selling international developed equities for short-term bonds following a meaningful bounce off the December 2018 lows. At the end of January 2019, the Portfolios unwound a portion of their underweight to REITs, funded by selling domestic large cap equities.
In early February, we shortened duration across the Portfolios by swapping long-term Treasuries for core fixed income. The trade was primarily the result of our 10-year bond fair value model signaling over-valuation and a slightly more optimistic economic growth outlook. At the end of March, the Portfolios’ allocation to commodities was eliminated, as their betas became increasingly leveraged to emerging markets, giving them less of a diversifying property than in the past. Proceeds from the sale were used to purchase domestic large-cap equities.
As part of their annual review process, the Portfolios glided down at the end of April and also made adjustments to their strategic asset allocation targets. This was done to reflect revised long-term capital market expectations for a range of asset classes. This resulted in an overall decrease in equities across the 2045 – 2020 Portfolios and changes in the strategic sub-asset allocations. The most notable changes included increased allocations to U.S. large-cap, core fixed income and Treasury Inflation-Protected Securities. These adjustments were funded by decreased allocations to U.S. mid-cap, developed international and emerging market equities and senior loans. During the review, we also removed commodities as a strategic asset class from the Portfolios.
At the end of May, the Portfolios purchased long-maturity Treasury bonds, funded by selling intermediate bonds. At the time of the trade, the potential impacts of trade war actions, combined with recent weakness in U.S. capital investment and retail sales, were suggesting a lower trajectory for economic growth. We reversed this position in June as fears of a slowdown abated.
In June, we lowered equity exposure within the 2020 vintage, as the first of a four-part equity glide down to eventually merge the 2020 vintage into the Income vintage on August 7, 2020.
In early August, the Portfolios reduced their allocation to emerging markets equity in favor of domestic large-cap equity. At the time of the trade, FOMC policy indicated less supportive policy action than expected, supporting a stronger U.S. dollar — a historical headwind to emerging markets equities. In the middle of August, the Portfolios reduced their overall equity exposure by selling domestic large-cap in favor of core U.S. fixed income, reflective of expectations for soft industrial data and a lack of support from sentiment measures. This trade was unwound at the beginning of September after having reached its stop-loss range.
In September, the Portfolios increased their exposure to domestic small-cap equity, after being underweight to the asset class over the course of two years. At the time of the trade, underperformance of small-cap equities had reached historical extremes and valuations had become what we believed to be attractive, indicating potential performance reversal. In addition, we felt lower interest rates driven by FOMC policy should be supportive of growth, which is tracked closely by small-cap stocks. The final trade in the third quarter extended duration across the suite as a defensive measure in a volatile market punctuated by oil shocks.
| Portfolio Managers’ Report | Voya Index Solution Portfolios |
Three trades were enacted across the Portfolios in October. The first trade reduced the existing duration underweight of the Portfolios through the purchase of long government bonds, funded by intermediate bonds. This positioning reflected our belief that U.S. employment will likely weaken from its current pace, leading to continued easing by the FOMC. The second and third trades of the month sought to diversify the Portfolios’ existing equity overweight, rotating a portion from domestic into both developed international and emerging market equities. At the time of the trades, recent foreign data, such as global Purchasing Manager Indices (“PMIs”), supported the idea that the global economy had stopped slumping and was stabilizing.
During the year, tactical moves relative to our strategic benchmarks had a negative impact across the suite.
During the year, the Portfolios utilized various futures to enact tactical positions. Futures were utilized to avoid significant manager disruption and provide the Portfolios with greater liquidity. The impact of the derivatives was in line with expectations of the tactical asset allocation positions.
Current Strategy and Outlook: After several months of easing in monetary policy from global central banks, the effects are beginning to trickle through to the real economy. For example, in our view, the manufacturing sector is showing signs of life, while consumer demand remains strong. We believe relaxed financial conditions and a robust labor market are likely to keep the marginal improvement trend in place. We view the likelihood of a U.S. recession over the next 12 months as low. We believe that central banks appear willing to provide sufficient liquidity to prolong the cycle, inflation is tame and there are no materially worrisome signs of financial excess.
What’s more, in our opinion, the probability of an exogenous shock has declined as U.S. and Chinese officials appear to be making progress on trade. Assuring us of this opinion are strong non-farm payrolls, contained high yield spreads and decent consumer confidence, which is corroborated by strong auto sales. Furthermore, although we have discounted the yield curve as a leading indicator of recession given the distortions arising from unconventional central bank asset buying and negative term premiums, the areas of the curve most closely correlated with future recessions have reverted to a more normal shape.
As a result, we retain our modest overweight to stocks. Third quarter U.S. corporate earnings reports are coming in better than expected, as 75% of S&P 500® Index companies have reported positive earnings per share surprises and 60% have beaten revenue estimates. With profit margins for U.S. large-cap companies well above their long-term average, further gains in S&P 500® Index stocks, we believe, will most likely need to come from revenue growth, or earnings multiple expansion. We are reticent to rely much on top-line growth, given what we see as the lackluster, albeit improving, economic backdrop; yet we see scope for further tightening of the equity risk premium and higher valuations.
That said, the relative advantage U.S. large-caps have held over smaller-cap and foreign stocks is lessening. In our view, multiple financial indicators suggest economic activity is gaining momentum, such as a move-up in global PMIs, strong performance from global semiconductor stocks and high copper prices. Following a long bout of underperformance, non-U.S. stocks are under-owned and relatively cheap, in our opinion. Therefore, we have increased non-U.S. equity beta by rotating our Europe Australasia Far East positioning back to neutral, funded by reducing our U.S. equity overweight. Additionally, supportive Chinese money and credit growth, easy global monetary policy and a range-bound U.S. dollar make us comfortable continuing our emerging market equity exposure.
(1)
The investment objective of each Portfolio is described in the Portfolios’ prospectuses, each dated May 1, 2019.
*
On November 21, 2019, the Board of Directors of Voya Partners, Inc. (the “Board”) approved a proposal to reorganize Voya Index Solution 2020 Portfolio and into Voya Index Solution Income Portfolio on or about August 7, 2020.
**
Effective September 30, 2019, Barbara Reinhard was added as a portfolio manager to the Portfolios.
The views expressed in this commentary are informed opinions. They should not be considered promises or advice. The views expressed reflect those of the portfolio managers, only through the end of the period as stated on the cover. The portfolio managers’ views are subject to change at any time based on market and other conditions.
Portfolio holdings and characteristics are subject to change and may not be representative of current holdings and characteristics. Portfolio holdings are subject to change daily. The outlook for this Portfolio may differ from that presented for other Voya mutual funds. This report contains statements that may be “forward-looking” statements. Actual results may differ materially from those projected in the “forward-looking” statements. The Portfolio’s performance returns shown reflect applicable fee waivers and/or expense limits in effect during this period. Absent such fee waivers/expense limitations, if any, performance would have been lower. Performance for the different classes of shares will vary based on differences in fees associated with each class. An index has no cash in its portfolio and imposes no sales charges. An investor cannot invest directly in an index.
| Voya Index Solution Portfolios | Portfolio Managers’ Report |
| | | Total Returns for the Period Ended December 31, 2019 | | |
| | | | | | 1 Year | | |
| | | Voya Index Solution Income Portfolio, Class S | | | 12.88% | | |
| | | S&P Target Date Retirement Income Index | | | 13.33% | | |
| | | Voya Index Solution 2020 Portfolio, Class S | | | 14.93% | | |
| | | S&P Target Date 2020 Index | | | 16.52% | | |
| | | Voya Index Solution 2025 Portfolio, Class S | | | 18.46% | | |
| | | S&P Target Date 2025 Index | | | 18.38% | | |
| | | Voya Index Solution 2030 Portfolio, Class S | | | 20.67% | | |
| | | S&P Target Date 2030 Index | | | 20.38% | | |
| | | Voya Index Solution 2035 Portfolio, Class S | | | 22.36% | | |
| | | S&P Target Date 2035 Index | | | 22.18% | | |
| | | Voya Index Solution 2040 Portfolio, Class S | | | 23.53% | | |
| | | S&P Target Date 2040 Index | | | 23.37% | | |
| | | Voya Index Solution 2045 Portfolio, Class S | | | 24.55% | | |
| | | S&P Target Date 2045 Index | | | 24.02% | | |
| | | Voya Index Solution 2050 Portfolio, Class S | | | 24.94% | | |
| | | S&P Target Date 2050 Index | | | 24.35% | | |
| | | Voya Index Solution 2055 Portfolio, Class S | | | 24.94% | | |
| | | S&P Target Date 2055 Index | | | 24.48% | | |
| | | Voya Index Solution 2060 Portfolio, Class S | | | 24.87% | | |
| | | S&P Target Date 2060+ Index | | | 24.73% | | |
| | | | | | | | |
| | | Annual Target Asset Allocation as of December 31, 2019(1) | | |
| | | Sub Asset Class | | | 2060 | | | 2055 | | | 2050 | | | 2045 | | | 2040 | | | 2035 | | | 2030 | | | 2025 | | | 2020 | | | Income | | |
| | | U.S. Large Blend | | | | | 50.75% | | | | | | 50.75% | | | | | | 50.75% | | | | | | 49.75% | | | | | | 47.75% | | | | | | 44.50% | | | | | | 40.25% | | | | | | 36.50% | | | | | | 23.75% | | | | | | 20.75% | | | |
| | | U.S. Mid Cap Blend | | | | | 5.00% | | | | | | 5.00% | | | | | | 4.50% | | | | | | 4.50% | | | | | | 4.00% | | | | | | 4.00% | | | | | | 3.00% | | | | | | 2.50% | | | | | | 1.00% | | | | | | 0.00% | | | |
| | | U.S. Small Cap | | | | | 4.50% | | | | | | 4.50% | | | | | | 4.50% | | | | | | 4.50% | | | | | | 4.50% | | | | | | 3.50% | | | | | | 3.00% | | | | | | 3.00% | | | | | | 1.00% | | | | | | 1.00% | | | |
| | | International | | | | | 25.00% | | | | | | 25.00% | | | | | | 25.00% | | | | | | 24.00% | | | | | | 22.00% | | | | | | 20.00% | | | | | | 18.00% | | | | | | 13.00% | | | | | | 8.00% | | | | | | 6.00% | | | |
| | | Emerging Markets | | | | | 7.50% | | | | | | 7.50% | | | | | | 7.00% | | | | | | 7.00% | | | | | | 6.50% | | | | | | 6.00% | | | | | | 5.00% | | | | | | 3.50% | | | | | | 2.50% | | | | | | 2.00% | | | |
| | | Global Real Estate | | | | | 2.75% | | | | | | 2.25% | | | | | | 2.25% | | | | | | 2.25% | | | | | | 2.25% | | | | | | 2.00% | | | | | | 1.75% | | | | | | 1.50% | | | | | | 1.25% | | | | | | 1.25% | | | |
| | | Core Fixed Income | | | | | 2.50% | | | | | | 3.00% | | | | | | 4.00% | | | | | | 4.25% | | | | | | 9.00% | | | | | | 10.00% | | | | | | 19.00% | | | | | | 27.75% | | | | | | 39.50% | | | | | | 43.00% | | | |
| | | Senior Debt | | | | | 0.00% | | | | | | 0.00% | | | | | | 0.00% | | | | | | 0.00% | | | | | | 0.00% | | | | | | 2.00% | | | | | | 2.00% | | | | | | 3.00% | | | | | | 3.00% | | | | | | 3.00% | | | |
| | | TIPS | | | | | 0.00% | | | | | | 0.00% | | | | | | 0.00% | | | | | | 0.00% | | | | | | 0.00% | | | | | | 4.00% | | | | | | 4.00% | | | | | | 4.00% | | | | | | 6.00% | | | | | | 7.00% | | | |
| | | Short Duration | | | | | 0.00% | | | | | | 0.00% | | | | | | 0.00% | | | | | | 1.75% | | | | | | 2.00% | | | | | | 2.00% | | | | | | 2.00% | | | | | | 3.25% | | | | | | 12.00% | | | | | | 14.00% | | | |
| | | Long Government Bonds | | | | | 2.00% | | | | | | 2.00% | | | | | | 2.00% | | | | | | 2.00% | | | | | | 2.00% | | | | | | 2.00% | | | | | | 2.00% | | | | | | 2.00% | | | | | | 2.00% | | | | | | 2.00% | | | |
| | | Total Equity | | | | | 95.50% | | | | | | 95.00% | | | | | | 94.00% | | | | | | 92.00% | | | | | | 87.00% | | | | | | 80.00% | | | | | | 71.00% | | | | | | 60.00% | | | | | | 37.50% | | | | | | 31.00% | | | |
| | | Total Fixed Income | | | | | 4.50% | | | | | | 5.00% | | | | | | 6.00% | | | | | | 8.00% | | | | | | 13.00% | | | | | | 20.00% | | | | | | 29.00% | | | | | | 40.00% | | | | | | 62.50% | | | | | | 69.00% | | | |
| | | | | | | | 100.00% | | | | | | 100.00% | | | | | | 100.00% | | | | | | 100.00% | | | | | | 100.00% | | | | | | 100.00% | | | | | | 100.00% | | | | | | 100.00% | | | | | | 100.00% | | | | | | 100.00% | | | |
| | | | | | | | | | | | | | | | | | | |
(1)
As these are target allocations, the actual allocations of each Portfolio’s assets may be deviate from the percentages shown. Although the Portfolios expect to be fully invested at all times, they may maintain liquidity reserves to meet redemption requests.
Portfolio holdings are subject to change daily.
| Portfolio Managers’ Report | Voya Index Solution Income Portfolio |
| | | Average Annual Total Returns for the Periods Ended December 31, 2019 | | |
| | | | | | 1 Year | | | 5 Year | | | 10 Year | | |
| | | Class ADV | | | | | 12.62% | | | | | | 4.06% | | | | | | 5.14% | | | |
| | | Class I | | | | | 13.16% | | | | | | 4.58% | | | | | | 5.68% | | | |
| | | Class S | | | | | 12.88% | | | | | | 4.33% | | | | | | 5.40% | | | |
| | | Class S2 | | | | | 12.70% | | | | | | 4.17% | | | | | | 5.26% | | | |
| | | Class Z(1) | | | | | 13.47% | | | | | | 4.78% | | | | | | 5.78% | | | |
| | | S&P Target Date Retirement Income Index | | | | | 13.33% | | | | | | 4.67% | | | | | | 5.50% | | | |
| | | | | |
Based on a $10,000 initial investment, the graph and table above illustrate the total return of Voya Index Solution Income Portfolio against the index indicated. The index is unmanaged and has no cash in its portfolio and imposes no sales charges. An investor cannot invest directly in an index.
The Portfolio’s performance is shown without the imposition of any expenses or charges which are, or may be, imposed under your variable annuity contract or variable life insurance policy. Total returns would have been lower if such expenses or charges were included.
The performance graph and table do not reflect the deduction of taxes that a shareholder will pay on Portfolio distributions or the redemption of Portfolio shares.
The performance shown may include the effect of fee waivers and/or expense reimbursements by the Investment Adviser and/or other service providers, which have the effect of increasing total return. Had all fees and expenses been considered, the total returns would have been lower.
The performance update illustrates performance for a variable investment option available through a variable annuity contract or a variable life insurance policy. The performance shown indicates past performance and is not a projection or prediction of future results. Actual investment returns and principal value will fluctuate so that shares and/or units, at redemption, may be worth more or less than their original cost. Please log on to www.voyainvestments.com or call (800) 262-3862 to get performance through the most recent month end.
Portfolio holdings are subject to change daily.
(1)
Class Z incepted on May 1, 2015. The Class Z shares performance shown for the period prior to their inception date is the performance of Class I shares without adjustment for any differences in the expenses between the two classes. If adjusted for such differences, returns would be different.
| Voya Index Solution 2020 Portfolio | Portfolio Managers’ Report |
| | | Average Annual Total Returns for the Periods Ended December 31, 2019 | | |
| | | | | | 1 Year | | | 5 Year | | | Since Inception
of Classes ADV, I, S, and S2
October 3, 2011 | | |
| | | Class ADV | | | | | 14.69% | | | | | | 5.35% | | | | | | 7.78% | | | |
| | | Class I | | | | | 15.25% | | | | | | 5.79% | | | | | | 8.26% | | | |
| | | Class S | | | | | 14.93% | | | | | | 5.56% | | | | | | 7.99% | | | |
| | | Class S2 | | | | | 14.78% | | | | | | 5.41% | | | | | | 7.87% | | | |
| | | Class Z(1) | | | | | 15.46% | | | | | | 5.97% | | | | | | 8.37% | | | |
| | | S&P Target Date 2020 Index | | | | | 16.52% | | | | | | 6.16% | | | | | | 8.71% | | | |
| | | | | |
Based on a $10,000 initial investment, the graph and table above illustrate the total return of Voya Index Solution 2020 Portfolio against the index indicated. The index is unmanaged and has no cash in its portfolio and imposes no sales charges. An investor cannot invest directly in an index.
The Portfolio’s performance is shown without the imposition of any expenses or charges which are, or may be, imposed under your variable annuity contract or variable life insurance policy. Total returns would have been lower if such expenses or charges were included.
The performance graph and table do not reflect the deduction of taxes that a shareholder will pay on Portfolio distributions or the redemption of Portfolio shares.
The performance shown may include the effect of fee waivers and/or expense reimbursements by the Investment Adviser and/or other service providers, which have the effect of increasing total return. Had all fees and expenses been considered, the total returns would have been lower.
The performance update illustrates performance for a variable investment option available through a variable annuity contract or a variable life insurance policy. The performance shown indicates past performance and is not a projection or prediction of future results. Actual investment returns and principal value will fluctuate so that shares and/or units, at redemption, may be worth more or less than their original cost. Please log on to www.voyainvestments.com or call (800) 262-3862 to get performance through the most recent month end.
Portfolio holdings are subject to change daily.
(1)
Class Z incepted on May 1, 2015. The Class Z shares performance shown for the period prior to their inception date is the performance of Class I shares without adjustment for any differences in the expenses between the two classes. If adjusted for such differences, returns would be different.
| Portfolio Managers’ Report | Voya Index Solution 2025 Portfolio |
| | | Average Annual Total Returns for the Periods Ended December 31, 2019 | | |
| | | | | | 1 Year | | | 5 Year | | | 10 Year | | |
| | | Class ADV | | | | | 18.15% | | | | | | 6.00% | | | | | | 7.35% | | | |
| | | Class I | | | | | 18.78% | | | | | | 6.53% | | | | | | 7.89% | | | |
| | | Class S | | | | | 18.46% | | | | | | 6.27% | | | | | | 7.62% | | | |
| | | Class S2 | | | | | 18.23% | | | | | | 6.10% | | | | | | 7.47% | | | |
| | | Class Z(1) | | | | | 19.04% | | | | | | 6.71% | | | | | | 7.98% | | | |
| | | S&P Target Date 2025 Index | | | | | 18.38% | | | | | | 6.73% | | | | | | 8.13% | | | |
| | | | | |
Based on a $10,000 initial investment, the graph and table above illustrate the total return of Voya Index Solution 2025 Portfolio against the index indicated. The index is unmanaged and has no cash in its portfolio and imposes no sales charges. An investor cannot invest directly in an index.
The Portfolio’s performance is shown without the imposition of any expenses or charges which are, or may be, imposed under your variable annuity contract or variable life insurance policy. Total returns would have been lower if such expenses or charges were included.
The performance graph and table do not reflect the deduction of taxes that a shareholder will pay on Portfolio distributions or the redemption of Portfolio shares.
The performance shown may include the effect of fee waivers and/or expense reimbursements by the Investment Adviser and/or other service providers, which have the effect of increasing total return. Had all fees and expenses been considered, the total returns would have been lower.
The performance update illustrates performance for a variable investment option available through a variable annuity contract or a variable life insurance policy. The performance shown indicates past performance and is not a projection or prediction of future results. Actual investment returns and principal value will fluctuate so that shares and/or units, at redemption, may be worth more or less than their original cost. Please log on to www.voyainvestments.com or call (800) 262-3862 to get performance through the most recent month end.
Portfolio holdings are subject to change daily.
(1)
Class Z incepted on May 1, 2015. The Class Z shares performance shown for the period prior to their inception date is the performance of Class I shares without adjustment for any differences in the expenses between the two classes. If adjusted for such differences, returns would be different.
| Voya Index Solution 2030 Portfolio | Portfolio Managers’ Report |
| | | Average Annual Total Returns for the Periods Ended December 31, 2019 | | |
| | | | | | 1 Year | | | 5 Year | | | Since Inception
of Classes ADV, I, S, and S2
October 3, 2011 | | |
| | | Class ADV | | | | | 20.35% | | | | | | 6.87% | | | | | | 9.91% | | | |
| | | Class I | | | | | 21.02% | | | | | | 7.38% | | | | | | 10.44% | | | |
| | | Class S | | | | | 20.67% | | | | | | 7.12% | | | | | | 10.14% | | | |
| | | Class S2 | | | | | 20.50% | | | | | | 6.93% | | | | | | 9.98% | | | |
| | | Class Z(1) | | | | | 21.20% | | | | | | 7.52% | | | | | | 10.53% | | | |
| | | S&P Target Date 2030 Index | | | | | 20.38% | | | | | | 7.27% | | | | | | 10.36% | | | |
| | | | | |
Based on a $10,000 initial investment, the graph and table above illustrate the total return of Voya Index Solution 2030 Portfolio against the index indicated. The index is unmanaged and has no cash in its portfolio and imposes no sales charges. An investor cannot invest directly in an index.
The Portfolio’s performance is shown without the imposition of any expenses or charges which are, or may be, imposed under your variable annuity contract or variable life insurance policy. Total returns would have been lower if such expenses or charges were included.
The performance graph and table do not reflect the deduction of taxes that a shareholder will pay on Portfolio distributions or the redemption of Portfolio shares.
The performance shown may include the effect of fee waivers and/or expense reimbursements by the Investment Adviser and/or other service providers, which have the effect of increasing total return. Had all fees and expenses been considered, the total returns would have been lower.
The performance update illustrates performance for a variable investment option available through a variable annuity contract or a variable life insurance policy. The performance shown indicates past performance and is not a projection or prediction of future results. Actual investment returns and principal value will fluctuate so that shares and/or units, at redemption, may be worth more or less than their original cost. Please log on to www.voyainvestments.com or call (800) 262-3862 to get performance through the most recent month end.
Portfolio holdings are subject to change daily.
(1)
Class Z incepted on May 1, 2015. The Class Z shares performance shown for the period prior to their inception date is the performance of Class I shares without adjustment for any differences in the expenses between the two classes. If adjusted for such differences, returns would be different.
| Portfolio Managers’ Report | Voya Index Solution 2035 Portfolio |
| | | Average Annual Total Returns for the Periods Ended December 31, 2019 | | |
| | | | | | 1 Year | | | 5 Year | | | 10 Year | | |
| | | Class ADV | | | | | 21.91% | | | | | | 7.08% | | | | | | 8.49% | | | |
| | | Class I | | | | | 22.58% | | | | | | 7.61% | | | | | | 9.02% | | | |
| | | Class S | | | | | 22.36% | | | | | | 7.36% | | | | | | 8.77% | | | |
| | | Class S2 | | | | | 22.09% | | | | | | 7.21% | | | | | | 8.61% | | | |
| | | Class Z(1) | | | | | 22.88% | | | | | | 7.83% | | | | | | 9.13% | | | |
| | | S&P Target Date 2035 Index | | | | | 22.18% | | | | | | 7.77% | | | | | | 9.13% | | | |
| | | | | |
Based on a $10,000 initial investment, the graph and table above illustrate the total return of Voya Index Solution 2035 Portfolio against the index indicated. The index is unmanaged and has no cash in its portfolio and imposes no sales charges. An investor cannot invest directly in an index.
The Portfolio’s performance is shown without the imposition of any expenses or charges which are, or may be, imposed under your variable annuity contract or variable life insurance policy. Total returns would have been lower if such expenses or charges were included.
The performance graph and table do not reflect the deduction of taxes that a shareholder will pay on Portfolio distributions or the redemption of Portfolio shares.
The performance shown may include the effect of fee waivers and/or expense reimbursements by the Investment Adviser and/or other service providers, which have the effect of increasing total return. Had all fees and expenses been considered, the total returns would have been lower.
The performance update illustrates performance for a variable investment option available through a variable annuity contract or a variable life insurance policy. The performance shown indicates past performance and is not a projection or prediction of future results. Actual investment returns and principal value will fluctuate so that shares and/or units, at redemption, may be worth more or less than their original cost. Please log on to www.voyainvestments.com or call (800) 262-3862 to get performance through the most recent month end.
Portfolio holdings are subject to change daily.
(1)
Class Z incepted on May 1, 2015. The Class Z shares performance shown for the period prior to their inception date is the performance of Class I shares without adjustment for any differences in the expenses between the two classes. If adjusted for such differences, returns would be different.
| Voya Index Solution 2040 Portfolio | Portfolio Managers’ Report |
| | | Average Annual Total Returns for the Periods Ended December 31, 2019 | | |
| | | | | | 1 Year | | | 5 Year | | | Since Inception
of Classes ADV, I, S, and S2
October 3, 2011 | | |
| | | Class ADV | | | | | 23.19% | | | | | | 7.38% | | | | | | 11.16% | | | |
| | | Class I | | | | | 23.82% | | | | | | 7.88% | | | | | | 11.69% | | | |
| | | Class S | | | | | 23.53% | | | | | | 7.62% | | | | | | 11.41% | | | |
| | | Class S2 | | | | | 23.36% | | | | | | 7.46% | | | | | | 11.25% | | | |
| | | Class Z(1) | | | | | 24.08% | | | | | | 8.05% | | | | | | 11.80% | | | |
| | | S&P Target Date 2040 Index | | | | | 23.37% | | | | | | 8.11% | | | | | | 11.51% | | | |
| | | | | |
Based on a $10,000 initial investment, the graph and table above illustrate the total return of Voya Index Solution 2040 Portfolio against the index indicated. The index is unmanaged and has no cash in its portfolio and imposes no sales charges. An investor cannot invest directly in an index.
The Portfolio’s performance is shown without the imposition of any expenses or charges which are, or may be, imposed under your variable annuity contract or variable life insurance policy. Total returns would have been lower if such expenses or charges were included.
The performance graph and table do not reflect the deduction of taxes that a shareholder will pay on Portfolio distributions or the redemption of Portfolio shares.
The performance shown may include the effect of fee waivers and/or expense reimbursements by the Investment Adviser and/or other service providers, which have the effect of increasing total return. Had all fees and expenses been considered, the total returns would have been lower.
The performance update illustrates performance for a variable investment option available through a variable annuity contract or a variable life insurance policy. The performance shown indicates past performance and is not a projection or prediction of future results. Actual investment returns and principal value will fluctuate so that shares and/or units, at redemption, may be worth more or less than their original cost. Please log on to www.voyainvestments.com or call (800) 262-3862 to get performance through the most recent month end.
Portfolio holdings are subject to change daily.
(1)
Class Z incepted on May 1, 2015. The Class Z shares performance shown for the period prior to their inception date is the performance of Class I shares without adjustment for any differences in the expenses between the two classes. If adjusted for such differences, returns would be different.
| Portfolio Managers’ Report | Voya Index Solution 2045 Portfolio |
| | | Average Annual Total Returns for the Periods Ended December 31, 2019 | | |
| | | | | | 1 Year | | | 5 Year | | | 10 Year | | |
| | | Class ADV | | | | | 24.29% | | | | | | 7.50% | | | | | | 8.97% | | | |
| | | Class I | | | | | 24.89% | | | | | | 8.04% | | | | | | 9.52% | | | |
| | | Class S | | | | | 24.55% | | | | | | 7.77% | | | | | | 9.24% | | | |
| | | Class S2 | | | | | 24.34% | | | | | | 7.61% | | | | | | 9.08% | | | |
| | | Class Z(1) | | | | | 25.17% | | | | | | 8.24% | | | | | | 9.62% | | | |
| | | S&P Target Date 2045 Index | | | | | 24.02% | | | | | | 8.32% | | | | | | 9.67% | | | |
| | | | | |
Based on a $10,000 initial investment, the graph and table above illustrate the total return of Voya Index Solution 2045 Portfolio against the index indicated. The index is unmanaged and has no cash in its portfolio and imposes no sales charges. An investor cannot invest directly in an index.
The Portfolio’s performance is shown without the imposition of any expenses or charges which are, or may be, imposed under your variable annuity contract or variable life insurance policy. Total returns would have been lower if such expenses or charges were included.
The performance graph and table do not reflect the deduction of taxes that a shareholder will pay on Portfolio distributions or the redemption of Portfolio shares.
The performance shown may include the effect of fee waivers and/or expense reimbursements by the Investment Adviser and/or other service providers, which have the effect of increasing total return. Had all fees and expenses been considered, the total returns would have been lower.
The performance update illustrates performance for a variable investment option available through a variable annuity contract or a variable life insurance policy. The performance shown indicates past performance and is not a projection or prediction of future results. Actual investment returns and principal value will fluctuate so that shares and/or units, at redemption, may be worth more or less than their original cost. Please log on to www.voyainvestments.com or call (800) 262-3862 to get performance through the most recent month end.
Portfolio holdings are subject to change daily.
(1)
Class Z incepted on May 1, 2015. The Class Z shares performance shown for the period prior to their inception date is the performance of Class I shares without adjustment for any differences in the expenses between the two classes. If adjusted for such differences, returns would be different.
| Voya Index Solution 2050 Portfolio | Portfolio Managers’ Report |
| | | Average Annual Total Returns for the Periods Ended December 31, 2019 | | |
| | | | | | 1 Year | | | 5 Year | | | Since Inception
of Classes ADV, I, S, and S2
October 3, 2011 | | | |
| | | Class ADV | | | | | 24.60% | | | | | | 7.60% | | | | | | 11.36% | | | | |
| | | Class I | | | | | 25.21% | | | | | | 8.15% | | | | | | 11.93% | | | | |
| | | Class S | | | | | 24.94% | | | | | | 7.91% | | | | | | 11.66% | | | | |
| | | Class S2 | | | | | 24.69% | | | | | | 7.71% | | | | | | 11.48% | | | | |
| | | Class Z(1) | | | | | 25.56% | | | | | | 8.33% | | | | | | 12.04% | | | | |
| | | S&P Target Date 2050 Index | | | | | 24.35% | | | | | | 8.49% | | | | | | 12.11% | | | | |
| | | | | |
Based on a $10,000 initial investment, the graph and table above illustrate the total return of Voya Index Solution 2050 Portfolio against the index indicated. The index is unmanaged and has no cash in its portfolio and imposes no sales charges. An investor cannot invest directly in an index.
The Portfolio’s performance is shown without the imposition of any expenses or charges which are, or may be, imposed under your variable annuity contract or variable life insurance policy. Total returns would have been lower if such expenses or charges were included.
The performance graph and table do not reflect the deduction of taxes that a shareholder will pay on Portfolio distributions or the redemption of Portfolio shares.
The performance shown may include the effect of fee waivers and/or expense reimbursements by the Investment Adviser and/or other service providers, which have the effect of increasing total return. Had all fees and expenses been considered, the total returns would have been lower.
The performance update illustrates performance for a variable investment option available through a variable annuity contract or a variable life insurance policy. The performance shown indicates past performance and is not a projection or prediction of future results. Actual investment returns and principal value will fluctuate so that shares and/or units, at redemption, may be worth more or less than their original cost. Please log on to www.voyainvestments.com or call (800) 262-3862 to get performance through the most recent month end.
Portfolio holdings are subject to change daily.
(1)
Class Z incepted on May 1, 2015. The Class Z shares performance shown for the period prior to their inception date is the performance of Class I shares without adjustment for any differences in the expenses between the two classes. If adjusted for such differences, returns would be different.
| Portfolio Managers’ Report | Voya Index Solution 2055 Portfolio |
| | | Average Annual Total Returns for the Periods Ended December 31, 2019 | | |
| | | | | | 1 Year | | | 5 Year | | | Since Inception
of Classes ADV, I, S, and S2
March 8, 2010 | | |
| | | Class ADV | | | | | 24.52% | | | | | | 7.54% | | | | | | 9.02% | | | |
| | | Class I | | | | | 25.22% | | | | | | 8.08% | | | | | | 9.57% | | | |
| | | Class S | | | | | 24.94% | | | | | | 7.81% | | | | | | 9.31% | | | |
| | | Class S2 | | | | | 24.68% | | | | | | 7.66% | | | | | | 9.14% | | | |
| | | Class Z(1) | | | | | 25.54% | | | | | | 8.29% | | | | | | 9.68% | | | |
| | | S&P Target Date 2055 Index | | | | | 24.48% | | | | | | 8.58% | | | | | | 9.91% | | | |
| | | | | |
Based on a $10,000 initial investment, the graph and table above illustrate the total return of Voya Index Solution 2055 Portfolio against the index indicated. The index is unmanaged and has no cash in its portfolio and imposes no sales charges. An investor cannot invest directly in an index.
The Portfolio’s performance is shown without the imposition of any expenses or charges which are, or may be, imposed under your variable annuity contract or variable life insurance policy. Total returns would have been lower if such expenses or charges were included.
The performance graph and table do not reflect the deduction of taxes that a shareholder will pay on Portfolio distributions or the redemption of Portfolio shares.
The performance shown may include the effect of fee waivers and/or expense reimbursements by the Investment Adviser and/or other service providers, which have the effect of increasing total return. Had all fees and expenses been considered, the total returns would have been lower.
The performance update illustrates performance for a variable investment option available through a variable annuity contract or a variable life insurance policy. The performance shown indicates past performance and is not a projection or prediction of future results. Actual investment returns and principal value will fluctuate so that shares and/or units, at redemption, may be worth more or less than their original cost. Please log on to www.voyainvestments.com or call (800) 262-3862 to get performance through the most recent month end.
Portfolio holdings are subject to change daily.
(1)
Class Z incepted on May 1, 2015. The Class Z shares performance shown for the period prior to their inception date is the performance of Class I shares without adjustment for any differences in the expenses between the two classes. If adjusted for such differences, returns would be different.
| Voya Index Solution 2060 Portfolio | Portfolio Managers’ Report |
| | | Average Annual Total Returns for the Periods Ended December 31, 2019 | | |
| | | | | | 1 Year | | | Since Inception
of Classes ADV, I, and S
February 9, 2015 | | |
| | | Class ADV | | | | | 24.62% | | | | | | 7.76% | | | |
| | | Class I | | | | | 25.32% | | | | | | 8.30% | | | |
| | | Class S | | | | | 24.87% | | | | | | 8.00% | | | |
| | | Class S2 | | | | | 24.76% | | | | | | 7.85% | | | |
| | | Class Z(1) | | | | | 25.61% | | | | | | 8.49% | | | |
| | | S&P Target Date 2060+ Index | | | | | 24.73% | | | | | | 8.72% | | | |
| | | | | |
Based on a $10,000 initial investment, the graph and table above illustrate the total return of Voya Index Solution 2060 Portfolio against the index indicated. The index is unmanaged and has no cash in its portfolio and imposes no sales charges. An investor cannot invest directly in an index.
The Portfolio’s performance is shown without the imposition of any expenses or charges which are, or may be, imposed under your variable annuity contract or variable life insurance policy. Total returns would have been lower if such expenses or charges were included.
The performance graph and table do not reflect the deduction of taxes that a shareholder will pay on Portfolio distributions or the redemption of Portfolio shares.
The performance shown may include the effect of fee waivers and/or expense reimbursements by the Investment Adviser and/or other service providers, which have the effect of increasing total return. Had all fees and expenses been considered, the total returns would have been lower.
The performance update illustrates performance for a variable investment option available through a variable annuity contract or a variable life insurance policy. The performance shown indicates past performance and is not a projection or prediction of future results. Actual investment returns and principal value will fluctuate so that shares and/or units, at redemption, may be worth more or less than their original cost. Please log on to www.voyainvestments.com or call (800) 262-3862 to get performance through the most recent month end.
Portfolio holdings are subject to change daily.
(1)
Class Z incepted on May 1, 2015. The Class Z shares performance shown for the period prior to their inception date is the performance of Class I shares without adjustment for any differences in the expenses between the two classes. If adjusted for such differences, returns would be different.
SHAREHOLDER EXPENSE EXAMPLES (Unaudited)
As a shareholder of a Portfolio, you incur two types of costs: (1) transaction costs, including redemption fees and exchange fees; and (2) ongoing costs including management fees, distribution and/or service (12b-1) fees, and other Portfolio expenses. These Examples are intended to help you understand your ongoing costs (in dollars) of investing in a Portfolio and to compare these costs with the ongoing costs of investing in other mutual funds.
The Examples are based on an investment of $1,000 invested at the beginning of the period and held for the entire period from July 1, 2019 to December 31, 2019. The Portfolios’ expenses are shown without the imposition of any charges which are, or may be, imposed under your variable annuity contract, variable life insurance policy, qualified pension or retirement plan. Expenses would have been higher if such charges were included.
Actual Expenses
The left section of the table shown below, “Actual Portfolio Return,” provides information about actual account values and actual expenses. You may use the information in this section, together with the amount you invested, to estimate the expenses that you paid over the period. Simply divide your account value by $1,000 (for example, an $8,600 account value divided by $1,000 = 8.6), then multiply the result by the number in the first section under the heading entitled “Expenses Paid During the Period” to estimate the expenses you paid on your account during this period.
Hypothetical Example for Comparison Purposes
The right section of the table shown below, “Hypothetical (5% return before expenses),” provides information about hypothetical account values and hypothetical expenses based on a Portfolio’s actual expense ratio and an assumed rate of return of 5% per year before expenses, which is not a Portfolio’s actual return. The hypothetical account values and expenses may not be used to estimate the actual ending account balance or expenses you paid for the period. You may use this information to compare the ongoing costs of investing in a Portfolio and other mutual funds. To do so, compare this 5% hypothetical example with the 5% hypothetical examples that appear in the shareholder reports of the other mutual funds.
Please note that the expenses shown in the table are meant to highlight your ongoing costs only and do not reflect any transactional costs, such as redemption fees or exchange fees. Therefore, the hypothetical section of the table is useful in comparing ongoing costs only, and will not help you determine the relative total costs of owning different mutual funds. In addition, if these transactional costs were included, your costs would have been higher.
| | | | Actual Portfolio Return | | | Hypothetical (5% return before expenses) | |
| | | | Beginning
Account
Value
July 1,
2019 | | | Ending
Account
Value
December 31,
2019 | | | Annualized
Expense
Ratio* | | | Expenses Paid
During the
Period Ended
December 31,
2019** | | | Beginning
Account
Value
July 1,
2019 | | | Ending
Account
Value
December 31,
2019 | | | Annualized
Expense
Ratio* | | | Expenses Paid
During the
Period Ended
December 31,
2019** | |
| Voya Index Solution Income Portfolio | |
| Class ADV | | | | $ | 1,000.00 | | | | | $ | 1,039.00 | | | | | | 0.74% | | | | | $ | 3.80 | | | | | $ | 1,000.00 | | | | | $ | 1,021.48 | | | | | | 0.74% | | | | | $ | 3.77 | | |
| Class I | | | | | 1,000.00 | | | | | | 1,042.30 | | | | | | 0.24 | | | | | | 1.24 | | | | | | 1,000.00 | | | | | | 1,024.00 | | | | | | 0.24 | | | | | | 1.22 | | |
| Class S | | | | | 1,000.00 | | | | | | 1,040.80 | | | | | | 0.49 | | | | | | 2.52 | | | | | | 1,000.00 | | | | | | 1,022.74 | | | | | | 0.49 | | | | | | 2.50 | | |
| Class S2 | | | | | 1,000.00 | | | | | | 1,040.40 | | | | | | 0.64 | | | | | | 3.29 | | | | | | 1,000.00 | | | | | | 1,021.98 | | | | | | 0.64 | | | | | | 3.26 | | |
| Class Z | | | | | 1,000.00 | | | | | | 1,043.80 | | | | | | 0.00 | | | | | | 0.00 | | | | | | 1,000.00 | | | | | | 1,025.21 | | | | | | 0.00 | | | | | | 0.00 | | |
| Voya Index Solution 2020 Portfolio | |
| Class ADV | | | | $ | 1,000.00 | | | | | $ | 1,043.60 | | | | | | 0.73% | | | | | $ | 3.76 | | | | | $ | 1,000.00 | | | | | $ | 1,021.53 | | | | | | 0.73% | | | | | $ | 3.72 | | |
| Class I | | | | | 1,000.00 | | | | | | 1,045.80 | | | | | | 0.23 | | | | | | 1.19 | | | | | | 1,000.00 | | | | | | 1,024.05 | | | | | | 0.23 | | | | | | 1.17 | | |
| Class S | | | | | 1,000.00 | | | | | | 1,044.80 | | | | | | 0.48 | | | | | | 2.47 | | | | | | 1,000.00 | | | | | | 1,022.79 | | | | | | 0.48 | | | | | | 2.45 | | |
| Class S2 | | | | | 1,000.00 | | | | | | 1,043.70 | | | | | | 0.63 | | | | | | 3.25 | | | | | | 1,000.00 | | | | | | 1,022.03 | | | | | | 0.63 | | | | | | 3.21 | | |
| Class Z | | | | | 1,000.00 | | | | | | 1,046.90 | | | | | | 0.00 | | | | | | 0.00 | | | | | | 1,000.00 | | | | | | 1,025.21 | | | | | | 0.00 | | | | | | 0.00 | | |
| Voya Index Solution 2025 Portfolio | |
| Class ADV | | | | $ | 1,000.00 | | | | | $ | 1,061.50 | | | | | | 0.72% | | | | | $ | 3.74 | | | | | $ | 1,000.00 | | | | | $ | 1,021.58 | | | | | | 0.72% | | | | | $ | 3.67 | | |
| Class I | | | | | 1,000.00 | | | | | | 1,064.10 | | | | | | 0.22 | | | | | | 1.14 | | | | | | 1,000.00 | | | | | | 1,024.10 | | | | | | 0.22 | | | | | | 1.12 | | |
| Class S | | | | | 1,000.00 | | | | | | 1,062.00 | | | | | | 0.47 | | | | | | 2.44 | | | | | | 1,000.00 | | | | | | 1,022.84 | | | | | | 0.47 | | | | | | 2.40 | | |
| Class S2 | | | | | 1,000.00 | | | | | | 1,061.80 | | | | | | 0.62 | | | | | | 3.22 | | | | | | 1,000.00 | | | | | | 1,022.08 | | | | | | 0.62 | | | | | | 3.16 | | |
| Class Z | | | | | 1,000.00 | | | | | | 1,064.40 | | | | | | 0.00 | | | | | | 0.00 | | | | | | 1,000.00 | | | | | | 1,025.21 | | | | | | 0.00 | | | | | | 0.00 | | |
SHAREHOLDER EXPENSE EXAMPLES (Unaudited) (continued)
| | | | Actual Portfolio Return | | | Hypothetical (5% return before expenses) | |
| | | | Beginning
Account
Value
July 1,
2019 | | | Ending
Account
Value
December 31,
2019 | | | Annualized
Expense
Ratio* | | | Expenses Paid
During the
Period Ended
December 31,
2019** | | | Beginning
Account
Value
July 1,
2019 | | | Ending
Account
Value
December 31,
2019 | | | Annualized
Expense
Ratio* | | | Expenses Paid
During the
Period Ended
December 31,
2019** | |
| Voya Index Solution 2030 Portfolio | |
| Class ADV | | | | $ | 1,000.00 | | | | | $ | 1,067.40 | | | | | | 0.73% | | | | | $ | 3.80 | | | | | $ | 1,000.00 | | | | | $ | 1,021.53 | | | | | | 0.73% | | | | | $ | 3.72 | | |
| Class I | | | | | 1,000.00 | | | | | | 1,070.70 | | | | | | 0.23 | | | | | | 1.20 | | | | | | 1,000.00 | | | | | | 1,024.05 | | | | | | 0.23 | | | | | | 1.17 | | |
| Class S | | | | | 1,000.00 | | | | | | 1,068.70 | | | | | | 0.48 | | | | | | 2.50 | | | | | | 1,000.00 | | | | | | 1,022.79 | | | | | | 0.48 | | | | | | 2.45 | | |
| Class S2 | | | | | 1,000.00 | | | | | | 1,067.90 | | | | | | 0.63 | | | | | | 3.28 | | | | | | 1,000.00 | | | | | | 1,022.03 | | | | | | 0.63 | | | | | | 3.21 | | |
| Class Z | | | | | 1,000.00 | | | | | | 1,071.50 | | | | | | 0.00 | | | | | | 0.00 | | | | | | 1,000.00 | | | | | | 1,025.21 | | | | | | 0.00 | | | | | | 0.00 | | |
| Voya Index Solution 2035 Portfolio | |
| Class ADV | | | | $ | 1,000.00 | | | | | $ | 1,073.00 | | | | | | 0.73% | | | | | $ | 3.81 | | | | | $ | 1,000.00 | | | | | $ | 1,021.53 | | | | | | 0.73% | | | | | $ | 3.72 | | |
| Class I | | | | | 1,000.00 | | | | | | 1,075.20 | | | | | | 0.23 | | | | | | 1.20 | | | | | | 1,000.00 | | | | | | 1,024.05 | | | | | | 0.23 | | | | | | 1.17 | | |
| Class S | | | | | 1,000.00 | | | | | | 1,074.30 | | | | | | 0.48 | | | | | | 2.51 | | | | | | 1,000.00 | | | | | | 1,022.79 | | | | | | 0.48 | | | | | | 2.45 | | |
| Class S2 | | | | | 1,000.00 | | | | | | 1,073.60 | | | | | | 0.63 | | | | | | 3.29 | | | | | | 1,000.00 | | | | | | 1,022.03 | | | | | | 0.63 | | | | | | 3.21 | | |
| Class Z | | | | | 1,000.00 | | | | | | 1,077.10 | | | | | | 0.00 | | | | | | 0.00 | | | | | | 1,000.00 | | | | | | 1,025.21 | | | | | | 0.00 | | | | | | 0.00 | | |
| Voya Index Solution 2040 Portfolio | |
| Class ADV | | | | $ | 1,000.00 | | | | | $ | 1,077.40 | | | | | | 0.73% | | | | | $ | 3.82 | | | | | $ | 1,000.00 | | | | | $ | 1,021.53 | | | | | | 0.73% | | | | | $ | 3.72 | | |
| Class I | | | | | 1,000.00 | | | | | | 1,080.40 | | | | | | 0.23 | | | | | | 1.21 | | | | | | 1,000.00 | | | | | | 1,024.05 | | | | | | 0.23 | | | | | | 1.17 | | |
| Class S | | | | | 1,000.00 | | | | | | 1,078.80 | | | | | | 0.48 | | | | | | 2.52 | | | | | | 1,000.00 | | | | | | 1,022.79 | | | | | | 0.48 | | | | | | 2.45 | | |
| Class S2 | | | | | 1,000.00 | | | | | | 1,078.10 | | | | | | 0.63 | | | | | | 3.30 | | | | | | 1,000.00 | | | | | | 1,022.03 | | | | | | 0.63 | | | | | | 3.21 | | |
| Class Z | | | | | 1,000.00 | | | | | | 1,081.00 | | | | | | 0.00 | | | | | | 0.00 | | | | | | 1,000.00 | | | | | | 1,025.21 | | | | | | 0.00 | | | | | | 0.00 | | |
| Voya Index Solution 2045 Portfolio | |
| Class ADV | | | | $ | 1,000.00 | | | | | $ | 1,080.50 | | | | | | 0.73% | | | | | $ | 3.83 | | | | | $ | 1,000.00 | | | | | $ | 1,021.53 | | | | | | 0.73% | | | | | $ | 3.72 | | |
| Class I | | | | | 1,000.00 | | | | | | 1,083.40 | | | | | | 0.23 | | | | | | 1.21 | | | | | | 1,000.00 | | | | | | 1,024.05 | | | | | | 0.23 | | | | | | 1.17 | | |
| Class S | | | | | 1,000.00 | | | | | | 1,081.90 | | | | | | 0.48 | | | | | | 2.52 | | | | | | 1,000.00 | | | | | | 1,022.79 | | | | | | 0.48 | | | | | | 2.45 | | |
| Class S2 | | | | | 1,000.00 | | | | | | 1,081.40 | | | | | | 0.63 | | | | | | 3.31 | | | | | | 1,000.00 | | | | | | 1,022.03 | | | | | | 0.63 | | | | | | 3.21 | | |
| Class Z | | | | | 1,000.00 | | | | | | 1,084.40 | | | | | | 0.00 | | | | | | 0.00 | | | | | | 1,000.00 | | | | | | 1,025.21 | | | | | | 0.00 | | | | | | 0.00 | | |
| Voya Index Solution 2050 Portfolio | |
| Class ADV | | | | $ | 1,000.00 | | | | | $ | 1,081.40 | | | | | | 0.74% | | | | | $ | 3.88 | | | | | $ | 1,000.00 | | | | | $ | 1,021.48 | | | | | | 0.74% | | | | | $ | 3.77 | | |
| Class I | | | | | 1,000.00 | | | | | | 1,083.90 | | | | | | 0.24 | | | | | | 1.26 | | | | | | 1,000.00 | | | | | | 1,024.00 | | | | | | 0.24 | | | | | | 1.22 | | |
| Class S | | | | | 1,000.00 | | | | | | 1,083.00 | | | | | | 0.49 | | | | | | 2.57 | | | | | | 1,000.00 | | | | | | 1,022.74 | | | | | | 0.49 | | | | | | 2.50 | | |
| Class S2 | | | | | 1,000.00 | | | | | | 1,081.50 | | | | | | 0.64 | | | | | | 3.36 | | | | | | 1,000.00 | | | | | | 1,021.98 | | | | | | 0.64 | | | | | | 3.26 | | |
| Class Z | | | | | 1,000.00 | | | | | | 1,085.80 | | | | | | 0.00 | | | | | | 0.00 | | | | | | 1,000.00 | | | | | | 1,025.21 | | | | | | 0.00 | | | | | | 0.00 | | |
| Voya Index Solution 2055 Portfolio | |
| Class ADV | | | | $ | 1,000.00 | | | | | $ | 1,081.50 | | | | | | 0.74% | | | | | $ | 3.88 | | | | | $ | 1,000.00 | | | | | $ | 1,021.48 | | | | | | 0.74% | | | | | $ | 3.77 | | |
| Class I | | | | | 1,000.00 | | | | | | 1,084.30 | | | | | | 0.24 | | | | | | 1.26 | | | | | | 1,000.00 | | | | | | 1,024.00 | | | | | | 0.24 | | | | | | 1.22 | | |
| Class S | | | | | 1,000.00 | | | | | | 1,083.60 | | | | | | 0.49 | | | | | | 2.57 | | | | | | 1,000.00 | | | | | | 1,022.74 | | | | | | 0.49 | | | | | | 2.50 | | |
| Class S2 | | | | | 1,000.00 | | | | | | 1,082.30 | | | | | | 0.64 | | | | | | 3.36 | | | | | | 1,000.00 | | | | | | 1,021.98 | | | | | | 0.64 | | | | | | 3.26 | | |
| Class Z | | | | | 1,000.00 | | | | | | 1,086.10 | | | | | | 0.00 | | | | | | 0.00 | | | | | | 1,000.00 | | | | | | 1,025.21 | | | | | | 0.00 | | | | | | 0.00 | | |
| Voya Index Solution 2060 Portfolio | |
| Class ADV | | | | $ | 1,000.00 | | | | | $ | 1,082.20 | | | | | | 0.74% | | | | | $ | 3.88 | | | | | $ | 1,000.00 | | | | | $ | 1,021.48 | | | | | | 0.74% | | | | | $ | 3.77 | | |
| Class I | | | | | 1,000.00 | | | | | | 1,084.50 | | | | | | 0.24 | | | | | | 1.26 | | | | | | 1,000.00 | | | | | | 1,024.00 | | | | | | 0.24 | | | | | | 1.22 | | |
| Class S | | | | | 1,000.00 | | | | | | 1,082.90 | | | | | | 0.49 | | | | | | 2.57 | | | | | | 1,000.00 | | | | | | 1,022.74 | | | | | | 0.49 | | | | | | 2.50 | | |
| Class S2 | | | | | 1,000.00 | | | | | | 1,083.20 | | | | | | 0.64 | | | | | | 3.36 | | | | | | 1,000.00 | | | | | | 1,021.98 | | | | | | 0.64 | | | | | | 3.26 | | |
| Class Z | | | | | 1,000.00 | | | | | | 1,086.30 | | | | | | 0.00 | | | | | | 0.00 | | | | | | 1,000.00 | | | | | | 1,025.21 | | | | | | 0.00 | | | | | | 0.00 | | |
*
The annualized expense ratios do not include expenses of underlying funds.
**
Expenses are equal to each Portfolio’s respective annualized expense ratios multiplied by the average account value over the period, multiplied by 184/365 to reflect the most recent fiscal half-year.
REPORT OF INDEPENDENT REGISTERED PUBLIC ACCOUNTING FIRM
To the Shareholders of the Funds and Board of Directors
Voya Partners, Inc.:
Opinion on the Financial Statements
We have audited the accompanying statements of assets and liabilities of Voya Index Solution Income Portfolio, Voya Index Solution 2020 Portfolio, Voya Index Solution 2025 Portfolio, Voya Index Solution 2030 Portfolio, Voya Index Solution 2035 Portfolio, Voya Index Solution 2040 Portfolio, Voya Index Solution 2045 Portfolio, Voya Index Solution 2050 Portfolio, Voya Index Solution 2055 Portfolio, and Voya Index Solution 2060 Portfolio (the Funds), each a series of Voya Partners, Inc., including the portfolios of investments, as of December 31, 2019, the related statements of operations for the year then ended, the statements of changes in net assets for each of the years in the two-year period then ended, and the related notes (collectively, the financial statements) and the financial highlights for each of the years or periods in the five-year period then ended. In our opinion, the financial statements and financial highlights present fairly, in all material respects, the financial position of the Funds as of December 31, 2019, the results of their operations for the year then ended, the changes in their net assets for each of the years in the two-year period then ended, and the financial highlights for each of the years or periods in the five-year period then ended, in conformity with U.S. generally accepted accounting principles.
Basis for Opinion
These financial statements and financial highlights are the responsibility of the Funds’ management. Our responsibility is to express an opinion on these financial statements and financial highlights based on our audits. We are a public accounting firm registered with the Public Company Accounting Oversight Board (United States) (PCAOB) and are required to be independent with respect to the Funds in accordance with the U.S. federal securities laws and the applicable rules and regulations of the Securities and Exchange Commission and the PCAOB.
We conducted our audits in accordance with the standards of the PCAOB. Those standards require that we plan and perform the audit to obtain reasonable assurance about whether the financial statements and financial highlights are free of material misstatement, whether due to error or fraud. Our audits included performing procedures to assess the risks of material misstatement of the financial statements and financial highlights, whether due to error or fraud, and performing procedures that respond to those risks. Such procedures included examining, on a test basis, evidence regarding the amounts and disclosures in the financial statements and financial highlights. Such procedures also included confirmation of securities owned as of December 31, 2019, by correspondence with the custodian, transfer agent and brokers or by other appropriate auditing procedures when replies from brokers were not received. Our audits also included evaluating the accounting principles used and significant estimates made by management, as well as evaluating the overall presentation of the financial statements and financial highlights. We believe that our audits provide a reasonable basis for our opinion.
We have served as the auditor of one or more Voya investment companies since 1975.
Boston, Massachusetts
February 26, 2020
STATEMENTS OF ASSETS AND LIABILITIES as of December 31, 2019
| | | | Voya Index
Solution Income
Portfolio | | | Voya Index
Solution 2020
Portfolio | | | Voya Index
Solution 2025
Portfolio | | | Voya Index
Solution 2030
Portfolio | |
| ASSETS: | | | | | | | | | | | | | | | | | | | | | | | | | |
| Investments in affiliated underlying funds at fair value* | | | | $ | 388,491,423 | | | | | $ | 339,525,438 | | | | | $ | 975,785,965 | | | | | $ | 564,339,376 | | |
| Investments in unaffiliated underlying funds at fair value** | | | | | 53,313,156 | | | | | | 57,078,206 | | | | | | 126,850,759 | | | | | | 58,572,677 | | |
| Short-term investments at fair value*** | | | | | 32,715,384 | | | | | | 16,840,314 | | | | | | — | | | | | | — | | |
| Cash | | | | | — | | | | | | — | | | | | | 1,866,151 | | | | | | 798,898 | | |
| Cash collateral for futures | | | | | 637,879 | | | | | | 420,169 | | | | | | 1,219,395 | | | | | | 260,206 | | |
| Receivables: | | | | | | | | | | | | | | | | | | | | | | | | | |
| Investments in affiliated underlying funds sold | | | | | — | | | | | | — | | | | | | 4,534 | | | | | | — | | |
| Fund shares sold | | | | | 887,685 | | | | | | 1,567,140 | | | | | | 833,485 | | | | | | 1,167,173 | | |
| Dividends | | | | | 41,186 | | | | | | 21,405 | | | | | | 183 | | | | | | 62 | | |
| Interest | | | | | — | | | | | | — | | | | | | 143 | | | | | | 599 | | |
| Prepaid expenses | | | | | 3,288 | | | | | | 2,364 | | | | | | 6,603 | | | | | | 3,192 | | |
| Reimbursement due from manager | | | | | 59,137 | | | | | | 91,702 | | | | | | 147,362 | | | | | | 120,807 | | |
| Other assets | | | | | 14,261 | | | | | | 4,490 | | | | | | 21,184 | | | | | | 5,799 | | |
| Total assets | | | | | 476,163,399 | | | | | | 415,551,228 | | | | | | 1,106,735,764 | | | | | | 625,268,789 | | |
| LIABILITIES: | | | | | | | | | | | | | | | | | | | | | | | | | |
| Payable for investments in affiliated underlying funds purchased | | | | | 280,282 | | | | | | 994,105 | | | | | | — | | | | | | 1,166,989 | | |
| Payable for fund shares redeemed | | | | | 607,402 | | | | | | 573,035 | | | | | | 838,019 | | | | | | 184 | | |
| Payable for investment management fees | | | | | 95,833 | | | | | | 82,061 | | | | | | 208,188 | | | | | | 114,327 | | |
| Payable for distribution and shareholder service fees | | | | | 66,994 | | | | | | 16,441 | | | | | | 121,124 | | | | | | 20,104 | | |
| Payable for directors fees | | | | | 2,320 | | | | | | 1,820 | | | | | | 4,975 | | | | | | 2,586 | | |
| Payable to directors under the deferred compensation plan (Note 6) | | | | | 14,261 | | | | | | 4,490 | | | | | | 21,184 | | | | | | 5,799 | | |
| Other accrued expenses and liabilities | | | | | 71,066 | | | | | | 28,369 | | | | | | 89,963 | | | | | | 24,684 | | |
| Total liabilities | | | | | 1,138,158 | | | | | | 1,700,321 | | | | | | 1,283,453 | | | | | | 1,334,673 | | |
| NET ASSETS | | | | $ | 475,025,241 | | | | | $ | 413,850,907 | | | | | $ | 1,105,452,311 | | | | | $ | 623,934,116 | | |
| NET ASSETS WERE COMPRISED OF: | | | | | | | | | | | | | | | | | | | | | | | | | |
| Paid-in capital | | | | $ | 443,532,009 | | | | | $ | 381,636,105 | | | | | $ | 992,523,797 | | | | | $ | 560,039,231 | | |
| Total distributable earnings | | | | | 31,493,232 | | | | | | 32,214,802 | | | | | | 112,928,514 | | | | | | 63,894,885 | | |
| NET ASSETS | | | | $ | 475,025,241 | | | | | $ | 413,850,907 | | | | | $ | 1,105,452,311 | | | | | $ | 623,934,116 | | |
*
Cost of investments in affiliated underlying funds | | | | $ | 368,015,429 | | | | | $ | 321,932,825 | | | | | $ | 907,734,201 | | | | | $ | 529,948,802 | | |
**
Cost of investments in unaffiliated underlying funds | | | | $ | 51,826,468 | | | | | $ | 55,933,343 | | | | | $ | 124,161,729 | | | | | $ | 57,071,293 | | |
***
Cost of short-term investments | | | | $ | 32,715,384 | | | | | $ | 16,840,314 | | | | | $ | — | | | | | $ | — | | |
See Accompanying Notes to Financial Statements
STATEMENTS OF ASSETS AND LIABILITIES as of December 31, 2019 (continued)
| | | | Voya Index
Solution Income
Portfolio | | | Voya Index
Solution 2020
Portfolio | | | Voya Index
Solution 2025
Portfolio | | | Voya Index
Solution 2030
Portfolio | |
| Class ADV | | | | | | | | | | | | | | | | | | | | | | | | | |
| Net assets | | | | $ | 81,026,574 | | | | | $ | 29,015,437 | | | | | $ | 193,477,115 | | | | | $ | 36,621,375 | | |
| Shares authorized | | | | | 100,000,000 | | | | | | 100,000,000 | | | | | | 100,000,000 | | | | | | 100,000,000 | | |
| Par value | | | | $ | 0.001 | | | | | $ | 0.001 | | | | | $ | 0.001 | | | | | $ | 0.001 | | |
| Shares outstanding | | | | | 7,685,997 | | | | | | 2,152,175 | | | | | | 17,246,294 | | | | | | 2,303,997 | | |
| Net asset value and redemption price per share | | | | $ | 10.54 | | | | | $ | 13.48 | | | | | $ | 11.22 | | | | | $ | 15.89 | | |
| Class I | | | | | | | | | | | | | | | | | | | | | | | | | |
| Net assets | | | | $ | 18,652,928 | | | | | $ | 7,052,398 | | | | | $ | 60,503,628 | | | | | $ | 8,674,129 | | |
| Shares authorized | | | | | 100,000,000 | | | | | | 100,000,000 | | | | | | 100,000,000 | | | | | | 100,000,000 | | |
| Par value | | | | $ | 0.001 | | | | | $ | 0.001 | | | | | $ | 0.001 | | | | | $ | 0.001 | | |
| Shares outstanding | | | | | 1,723,763 | | | | | | 509,092 | | | | | | 5,257,744 | | | | | | 530,008 | | |
| Net asset value and redemption price per share | | | | $ | 10.82 | | | | | $ | 13.85 | | | | | $ | 11.51 | | | | | $ | 16.37 | | |
| Class S | | | | | | | | | | | | | | | | | | | | | | | | | |
| Net assets | | | | $ | 136,384,555 | | | | | $ | 8,103,073 | | | | | $ | 133,118,194 | | | | | $ | 14,569,510 | | |
| Shares authorized | | | | | 100,000,000 | | | | | | 100,000,000 | | | | | | 100,000,000 | | | | | | 100,000,000 | | |
| Par value | | | | $ | 0.001 | | | | | $ | 0.001 | | | | | $ | 0.001 | | | | | $ | 0.001 | | |
| Shares outstanding | | | | | 12,731,519 | | | | | | 586,395 | | | | | | 11,698,107 | | | | | | 896,903 | | |
| Net asset value and redemption price per share | | | | $ | 10.71 | | | | | $ | 13.82 | | | | | $ | 11.38 | | | | | $ | 16.24 | | |
| Class S2 | | | | | | | | | | | | | | | | | | | | | | | | | |
| Net assets | | | | $ | 8,386,901 | | | | | $ | 8,696,091 | | | | | $ | 32,858,694 | | | | | $ | 5,688,220 | | |
| Shares authorized | | | | | 100,000,000 | | | | | | 100,000,000 | | | | | | 100,000,000 | | | | | | 100,000,000 | | |
| Par value | | | | $ | 0.001 | | | | | $ | 0.001 | | | | | $ | 0.001 | | | | | $ | 0.001 | | |
| Shares outstanding | | | | | 800,482 | | | | | | 634,802 | | | | | | 2,941,212 | | | | | | 355,093 | | |
| Net asset value and redemption price per share | | | | $ | 10.48 | | | | | $ | 13.70 | | | | | $ | 11.17 | | | | | $ | 16.02 | | |
| Class Z | | | | | | | | | | | | | | | | | | | | | | | | | |
| Net assets | | | | $ | 230,574,283 | | | | | $ | 360,983,908 | | | | | $ | 685,494,680 | | | | | $ | 558,380,882 | | |
| Shares authorized | | | | | 100,000,000 | | | | | | 100,000,000 | | | | | | 300,000,000 | | | | | | 100,000,000 | | |
| Par value | | | | $ | 0.001 | | | | | $ | 0.001 | | | | | $ | 0.001 | | | | | $ | 0.001 | | |
| Shares outstanding | | | | | 21,097,742 | | | | | | 25,813,379 | | | | | | 58,992,306 | | | | | | 33,874,235 | | |
| Net asset value and redemption price per share | | | | $ | 10.93 | | | | | $ | 13.98 | | | | | $ | 11.62 | | | | | $ | 16.48 | | |
See Accompanying Notes to Financial Statements
STATEMENTS OF ASSETS AND LIABILITIES as of December 31, 2019
| | | | Voya Index
Solution 2035
Portfolio | | | Voya Index
Solution 2040
Portfolio | | | Voya Index
Solution 2045
Portfolio | | | Voya Index
Solution 2050
Portfolio | |
| ASSETS: | | | | | | | | | | | | | | | | | | | | | | | | | |
| Investments in affiliated underlying funds at fair value* | | | | $ | 977,381,756 | | | | | $ | 450,562,888 | | | | | $ | 716,061,807 | | | | | $ | 316,837,295 | | |
| Investments in unaffiliated underlying funds at fair value** | | | | | 104,060,100 | | | | | | 19,009,629 | | | | | | 28,715,253 | | | | | | 6,860,200 | | |
| Cash | | | | | 1,865,599 | | | | | | 702,954 | | | | | | 1,857,570 | | | | | | 749,299 | | |
| Cash collateral for futures | | | | | 545,919 | | | | | | 316,578 | | | | | | 733,710 | | | | | | 309,576 | | |
| Receivables: | | | | | | | | | | | | | | | | | | | | | | | | | |
| Investments in affiliated underlying funds sold | | | | | 274,035 | | | | | | — | | | | | | 1,550,937 | | | | | | — | | |
| Fund shares sold | | | | | 1,326,070 | | | | | | 607,015 | | | | | | 282,998 | | | | | | 329,314 | | |
| Dividends | | | | | 139 | | | | | | 46 | | | | | | 53 | | | | | | 23 | | |
| Interest | | | | | 1,078 | | | | | | 385 | | | | | | 1,068 | | | | | | 420 | | |
| Prepaid expenses | | | | | 6,097 | | | | | | 2,280 | | | | | | 4,158 | | | | | | 1,492 | | |
| Reimbursement due from manager | | | | | 140,576 | | | | | | 91,228 | | | | | | 88,583 | | | | | | 53,632 | | |
| Other assets | | | | | 18,645 | | | | | | 3,985 | | | | | | 12,281 | | | | | | 2,554 | | |
| Total assets | | | | | 1,085,620,014 | | | | | | 471,296,988 | | | | | | 749,308,418 | | | | | | 325,143,805 | | |
| LIABILITIES: | | | | | | | | | | | | | | | | | | | | | | | | | |
| Payable for investments in affiliated underlying funds purchased | | | | | — | | | | | | 607,015 | | | | | | — | | | | | | 139,911 | | |
| Payable for fund shares redeemed | | | | | 1,600,105 | | | | | | — | | | | | | 1,833,935 | | | | | | 189,402 | | |
| Payable for investment management fees | | | | | 199,319 | | | | | | 81,058 | | | | | | 129,967 | | | | | | 54,794 | | |
| Payable for distribution and shareholder service fees | | | | | 114,269 | | | | | | 13,498 | | | | | | 79,852 | | | | | | 10,691 | | |
| Payable for directors fees | | | | | 4,697 | | | | | | 1,896 | | | | | | 3,229 | | | | | | 1,272 | | |
| Payable to directors under the deferred compensation plan (Note 6) | | | | | 18,645 | | | | | | 3,985 | | | | | | 12,281 | | | | | | 2,554 | | |
| Other accrued expenses and liabilities | | | | | 71,221 | | | | | | 31,257 | | | | | | 45,415 | | | | | | 26,276 | | |
| Total liabilities | | | | | 2,008,256 | | | | | | 738,709 | | | | | | 2,104,679 | | | | | | 424,900 | | |
| NET ASSETS | | | | $ | 1,083,611,758 | | | | | $ | 470,558,279 | | | | | $ | 747,203,739 | | | | | $ | 324,718,905 | | |
| NET ASSETS WERE COMPRISED OF: | | | | | | | | | | | | | | | | | | | | | | | | | |
| Paid-in capital | | | | $ | 949,774,992 | | | | | $ | 418,822,207 | | | | | $ | 649,923,675 | | | | | $ | 288,776,555 | | |
| Total distributable earnings | | | | | 133,836,766 | | | | | | 51,736,072 | | | | | | 97,280,064 | | | | | | 35,942,350 | | |
| NET ASSETS | | | | $ | 1,083,611,758 | | | | | $ | 470,558,279 | | | | | $ | 747,203,739 | | | | | $ | 324,718,905 | | |
*
Cost of investments in affiliated underlying funds | | | | $ | 896,310,934 | | | | | $ | 422,441,013 | | | | | $ | 657,308,295 | | | | | $ | 296,724,044 | | |
**
Cost of investments in unaffiliated underlying funds | | | | $ | 101,874,492 | | | | | $ | 18,332,105 | | | | | $ | 27,651,007 | | | | | $ | 6,440,853 | | |
See Accompanying Notes to Financial Statements
STATEMENTS OF ASSETS AND LIABILITIES as of December 31, 2019 (continued)
| | | | Voya Index
Solution 2035
Portfolio | | | Voya Index
Solution 2040
Portfolio | | | Voya Index
Solution 2045
Portfolio | | | Voya Index
Solution 2050
Portfolio | |
| Class ADV | | | | | | | | | | | | | | | | | | | | | | | | | |
| Net assets | | | | $ | 186,454,629 | | | | | $ | 24,422,080 | | | | | $ | 134,330,774 | | | | | $ | 17,450,271 | | |
| Shares authorized | | | | | 100,000,000 | | | | | | 100,000,000 | | | | | | 100,000,000 | | | | | | 100,000,000 | | |
| Par value | | | | $ | 0.001 | | | | | $ | 0.001 | | | | | $ | 0.001 | | | | | $ | 0.001 | | |
| Shares outstanding | | | | | 15,902,786 | | | | | | 1,453,226 | | | | | | 11,039,369 | | | | | | 1,015,588 | | |
| Net asset value and redemption price per share | | | | $ | 11.72 | | | | | $ | 16.81 | | | | | $ | 12.17 | | | | | $ | 17.18 | | |
| Class I | | | | | | | | | | | | | | | | | | | | | | | | | |
| Net assets | | | | $ | 64,433,464 | | | | | $ | 5,831,769 | | | | | $ | 53,784,265 | | | | | $ | 6,366,948 | | |
| Shares authorized | | | | | 100,000,000 | | | | | | 100,000,000 | | | | | | 100,000,000 | | | | | | 100,000,000 | | |
| Par value | | | | $ | 0.001 | | | | | $ | 0.001 | | | | | $ | 0.001 | | | | | $ | 0.001 | | |
| Shares outstanding | | | | | 5,341,081 | | | | | | 337,543 | | | | | | 4,266,637 | | | | | | 362,089 | | |
| Net asset value and redemption price per share | | | | $ | 12.06 | | | | | $ | 17.28 | | | | | $ | 12.61 | | | | | $ | 17.58 | | |
| Class S | | | | | | | | | | | | | | | | | | | | | | | | | |
| Net assets | | | | $ | 110,305,032 | | | | | $ | 11,372,327 | | | | | $ | 74,022,317 | | | | | $ | 10,884,533 | | |
| Shares authorized | | | | | 100,000,000 | | | | | | 100,000,000 | | | | | | 100,000,000 | | | | | | 100,000,000 | | |
| Par value | | | | $ | 0.001 | | | | | $ | 0.001 | | | | | $ | 0.001 | | | | | $ | 0.001 | | |
| Shares outstanding | | | | | 9,261,878 | | | | | | 659,773 | | | | | | 5,965,420 | | | | | | 620,940 | | |
| Net asset value and redemption price per share | | | | $ | 11.91 | | | | | $ | 17.24 | | | | | $ | 12.41 | | | | | $ | 17.53 | | |
| Class S2 | | | | | | | | | | | | | | | | | | | | | | | | | |
| Net assets | | | | $ | 33,876,689 | | | | | $ | 2,895,514 | | | | | $ | 20,383,859 | | | | | $ | 3,072,098 | | |
| Shares authorized | | | | | 100,000,000 | | | | | | 100,000,000 | | | | | | 100,000,000 | | | | | | 100,000,000 | | |
| Par value | | | | $ | 0.001 | | | | | $ | 0.001 | | | | | $ | 0.001 | | | | | $ | 0.001 | | |
| Shares outstanding | | | | | 2,893,580 | | | | | | 170,548 | | | | | | 1,672,800 | | | | | | 177,954 | | |
| Net asset value and redemption price per share | | | | $ | 11.71 | | | | | $ | 16.98 | | | | | $ | 12.19 | | | | | $ | 17.26 | | |
| Class Z | | | | | �� | | | | | | | | | | | | | | | | | | | | |
| Net assets | | | | $ | 688,541,944 | | | | | $ | 426,036,589 | | | | | $ | 464,682,524 | | | | | $ | 286,945,055 | | |
| Shares authorized | | | | | 300,000,000 | | | | | | 100,000,000 | | | | | | 100,000,000 | | | | | | 100,000,000 | | |
| Par value | | | | $ | 0.001 | | | | | $ | 0.001 | | | | | $ | 0.001 | | | | | $ | 0.001 | | |
| Shares outstanding | | | | | 56,456,147 | | | | | | 24,439,391 | | | | | | 36,476,701 | | | | | | 16,187,924 | | |
| Net asset value and redemption price per share | | | | $ | 12.20 | | | | | $ | 17.43 | | | | | $ | 12.74 | | | | | $ | 17.73 | | |
See Accompanying Notes to Financial Statements
STATEMENTS OF ASSETS AND LIABILITIES as of December 31, 2019
| | | | Voya Index
Solution 2055
Portfolio | | | Voya Index
Solution 2060
Portfolio | |
| ASSETS: | | | | | | | | | | | | | |
| Investments in affiliated underlying funds at fair value* | | | | $ | 341,340,559 | | | | | $ | 102,804,400 | | |
| Investments in unaffiliated underlying funds at fair value** | | | | | 7,491,688 | | | | | | 6,288,154 | | |
| Cash | | | | | 935,072 | | | | | | 177,968 | | |
| Cash collateral for futures | | | | | 341,046 | | | | | | — | | |
| Receivables: | | | | | | | | | | | | | |
| Investments in affiliated underlying funds sold | | | | | 220,878 | | | | | | — | | |
| Fund shares sold | | | | | 579,542 | | | | | | 343,958 | | |
| Dividends | | | | | 17 | | | | | | 10 | | |
| Interest | | | | | 550 | | | | | | 91 | | |
| Prepaid expenses | | | | | 1,742 | | | | | | 399 | | |
| Reimbursement due from manager | | | | | 40,679 | | | | | | 14,047 | | |
| Other assets | | | | | 4,257 | | | | | | 673 | | |
| Total assets | | | | | 350,956,030 | | | | | | 109,629,700 | | |
| LIABILITIES: | | | | | | | | | | | | | |
| Payable for investments in affiliated underlying funds purchased | | | | | — | | | | | | 75,163 | | |
| Payable for fund shares redeemed | | | | | 800,420 | | | | | | 268,795 | | |
| Payable for investment management fees | | | | | 59,613 | | | | | | 23,487 | | |
| Payable for distribution and shareholder service fees | | | | | 34,704 | | | | | | 5,723 | | |
| Payable for directors fees | | | | | 1,431 | | | | | | 386 | | |
| Payable to directors under the deferred compensation plan (Note 6) | | | | | 4,257 | | | | | | 673 | | |
| Other accrued expenses and liabilities | | | | | 28,028 | | | | | | 12,707 | | |
| Total liabilities | | | | | 928,453 | | | | | | 386,934 | | |
| NET ASSETS | | | | $ | 350,027,577 | | | | | $ | 109,242,766 | | |
| NET ASSETS WERE COMPRISED OF: | | | | | | | | | | | | | |
| Paid-in capital | | | | $ | 307,653,020 | | | | | $ | 98,295,078 | | |
| Total distributable earnings | | | | | 42,374,557 | | | | | | 10,947,688 | | |
| NET ASSETS | | | | $ | 350,027,577 | | | | | $ | 109,242,766 | | |
*
Cost of investments in affiliated underlying funds | | | | $ | 315,698,451 | | | | | $ | 96,653,594 | | |
**
Cost of investments in unaffiliated underlying funds | | | | $ | 7,037,686 | | | | | $ | 6,165,431 | | |
See Accompanying Notes to Financial Statements
STATEMENTS OF ASSETS AND LIABILITIES as of December 31, 2019 (continued)
| | | | Voya Index
Solution 2055
Portfolio | | | Voya Index
Solution 2060
Portfolio | |
| Class ADV | | | | | | | | | | | | | |
| Net assets | | | | $ | 54,377,994 | | | | | $ | 9,575,908 | | |
| Shares authorized | | | | | 100,000,000 | | | | | | 100,000,000 | | |
| Par value | | | | $ | 0.001 | | | | | $ | 0.001 | | |
| Shares outstanding | | | | | 3,416,871 | | | | | | 719,458 | | |
| Net asset value and redemption price per share | | | | $ | 15.91 | | | | | $ | 13.31 | | |
| Class I | | | | | | | | | | | | | |
| Net assets | | | | $ | 31,202,351 | | | | | $ | 7,603,318 | | |
| Shares authorized | | | | | 100,000,000 | | | | | | 100,000,000 | | |
| Par value | | | | $ | 0.001 | | | | | $ | 0.001 | | |
| Shares outstanding | | | | | 1,910,360 | | | | | | 561,150 | | |
| Net asset value and redemption price per share | | | | $ | 16.33 | | | | | $ | 13.55 | | |
| Class S | | | | | | | | | | | | | |
| Net assets | | | | $ | 35,423,117 | | | | | $ | 5,692,639 | | |
| Shares authorized | | | | | 100,000,000 | | | | | | 100,000,000 | | |
| Par value | | | | $ | 0.001 | | | | | $ | 0.001 | | |
| Shares outstanding | | | | | 2,196,339 | | | | | | 424,414 | | |
| Net asset value and redemption price per share | | | | $ | 16.13 | | | | | $ | 13.41 | | |
| Class S2 | | | | | | | | | | | | | |
| Net assets | | | | $ | 11,439,471 | | | | | $ | 1,545,013 | | |
| Shares authorized | | | | | 100,000,000 | | | | | | 100,000,000 | | |
| Par value | | | | $ | 0.001 | | | | | $ | 0.001 | | |
| Shares outstanding | | | | | 715,486 | | | | | | 115,601 | | |
| Net asset value and redemption price per share | | | | $ | 15.99 | | | | ��� | $ | 13.37 | | |
| Class Z | | | | | | | | | | | | | |
| Net assets | | | | $ | 217,584,644 | | | | | $ | 84,825,888 | | |
| Shares authorized | | | | | 100,000,000 | | | | | | 100,000,000 | | |
| Par value | | | | $ | 0.001 | | | | | $ | 0.001 | | |
| Shares outstanding | | | | | 13,181,729 | | | | | | 6,206,418 | | |
| Net asset value and redemption price per share | | | | $ | 16.51 | | | | | $ | 13.67 | | |
See Accompanying Notes to Financial Statements
STATEMENTS OF OPERATIONS for the year ended December 31, 2019
| | | | Voya Index
Solution Income
Portfolio | | | Voya Index
Solution 2020
Portfolio | | | Voya Index
Solution 2025
Portfolio | | | Voya Index
Solution 2030
Portfolio | |
| INVESTMENT INCOME: | | | | | | | | | | | | | | | | | | | | | | | | | |
| Dividends from affiliated underlying funds | | | | $ | 8,531,100 | | | | | $ | 6,700,784 | | | | | $ | 19,414,064 | | | | | $ | 10,389,490 | | |
| Dividends from unaffiliated underlying funds | | | | | 2,065,096 | | | | | | 1,661,144 | | | | | | 3,652,492 | | | | | | 1,497,496 | | |
| Interest | | | | | 23,553 | | | | | | 8,059 | | | | | | 47,514 | | | | | | 21,476 | | |
| Total investment income | | | | | 10,619,749 | | | | | | 8,369,987 | | | | | | 23,114,070 | | | | | | 11,908,462 | | |
| EXPENSES: | | | | | | | | | | | | | | | | | | | | | | | | | |
| Investment management fees | | | | | 1,098,385 | | | | | | 854,258 | | | | | | 2,230,943 | | | | | | 1,126,757 | | |
| Distribution and shareholder service fees: | | | | | | | | | | | | | | | | | | | | | | | | | |
| Class ADV | | | | | 425,352 | | | | | | 135,353 | | | | | | 981,709 | | | | | | 155,744 | | |
| Class S | | | | | 356,760 | | | | | | 23,903 | | | | | | 324,518 | | | | | | 33,773 | | |
| Class S2 | | | | | 39,206 | | | | | | 25,393 | | | | | | 118,117 | | | | | | 17,134 | | |
| Transfer agent fees | | | | | 1,084 | | | | | | 777 | | | | | | 1,278 | | | | | | 1,070 | | |
| Shareholder reporting expense | | | | | 16,790 | | | | | | 17,358 | | | | | | 21,500 | | | | | | 17,755 | | |
| Registration fees | | | | | — | | | | | | 3,319 | | | | | | 4,105 | | | | | | 5,899 | | |
| Professional fees | | | | | 38,040 | | | | | | 42,241 | | | | | | 80,458 | | | | | | 43,394 | | |
| Custody and accounting expense | | | | | 26,190 | | | | | | 21,874 | | | | | | 58,080 | | | | | | 28,296 | | |
| Directors fees | | | | | 18,557 | | | | | | 14,557 | | | | | | 39,798 | | | | | | 20,686 | | |
| Miscellaneous expense | | | | | 24,091 | | | | | | 16,581 | | | | | | 31,476 | | | | | | 18,107 | | |
| Interest expense | | | | | 279 | | | | | | 204 | | | | | | 468 | | | | | | 53 | | |
| Total expenses | | | | | 2,044,734 | | | | | | 1,155,818 | | | | | | 3,892,450 | | | | | | 1,468,668 | | |
| Waived and reimbursed fees | | | | | (596,210) | | | | | | (849,232) | | | | | | (1,540,459) | | | | | | (1,120,962) | | |
| Net expenses | | | | | 1,448,524 | | | | | | 306,586 | | | | | | 2,351,991 | | | | | | 347,706 | | |
| Net investment income | | | | | 9,171,225 | | | | | | 8,063,401 | | | | | | 20,762,079 | | | | | | 11,560,756 | | |
| REALIZED AND UNREALIZED GAIN (LOSS): | | | | | | | | | | | | | | | | | | | | | | | | | |
| Net realized gain (loss) on: | | | | | | | | | | | | | | | | | | | | | | | | | |
| Sale of affiliated underlying funds | | | | | 5,009,536 | | | | | | 2,127,550 | | | | | | 10,389,197 | | | | | | 4,387,670 | | |
| Sale of unaffiliated underlying funds | | | | | (1,057,058) | | | | | | (124,016) | | | | | | (1,815,472) | | | | | | (493,422) | | |
| Capital gain distributions from affiliated underlying funds | | | | | 5,309,506 | | | | | | 6,726,668 | | | | | | 26,210,571 | | | | | | 15,477,515 | | |
| Futures | | | | | (741,486) | | | | | | (915,699) | | | | | | (2,634,693) | | | | | | (1,341,349) | | |
| Net realized gain | | | | | 8,520,498 | | | | | | 7,814,503 | | | | | | 32,149,603 | | | | | | 18,030,414 | | |
| Net change in unrealized appreciation (depreciation) on: | | | | | | | | | | | | | | | | | | | | | | | | | |
| Affiliated underlying funds | | | | | 34,159,938 | | | | | | 31,947,253 | | | | | | 106,193,701 | | | | | | 62,870,501 | | |
| Unaffiliated underlying funds | | | | | 5,794,743 | | | | | | 3,214,184 | | | | | | 8,896,473 | | | | | | 3,643,388 | | |
| Futures | | | | | (759,711) | | | | | | (602,545) | | | | | | (931,417) | | | | | | (441,929) | | |
| Net change in unrealized appreciation (depreciation) | | | | | 39,194,970 | | | | | | 34,558,892 | | | | | | 114,158,757 | | | | | | 66,071,960 | | |
| Net realized and unrealized gain | | | | | 47,715,468 | | | | | | 42,373,395 | | | | | | 146,308,360 | | | | | | 84,102,374 | | |
| Increase in net assets resulting from operations | | | | $ | 56,886,693 | | | | | $ | 50,436,796 | | | | | $ | 167,070,439 | | | | | $ | 95,663,130 | | |
See Accompanying Notes to Financial Statements
STATEMENTS OF OPERATIONS for the year ended December 31, 2019
| | | | Voya Index
Solution 2035
Portfolio | | | Voya Index
Solution 2040
Portfolio | | | Voya Index
Solution 2045
Portfolio | | | Voya Index
Solution 2050
Portfolio | |
| INVESTMENT INCOME: | | | | | | | | | | | | | | | | | | | | | | | | | |
| Dividends from affiliated underlying funds | | | | $ | 18,120,333 | | | | | $ | 7,766,947 | | | | | $ | 12,904,298 | | | | | $ | 5,314,200 | | |
| Dividends from unaffiliated underlying funds | | | | | 3,290,115 | | | | | | 750,061 | | | | | | 1,104,091 | | | | | | 353,448 | | |
| Interest | | | | | 40,236 | | | | | | 15,422 | | | | | | 27,395 | | | | | | 9,685 | | |
| Total investment income | | | | | 21,450,684 | | | | | | 8,532,430 | | | | | | 14,035,784 | | | | | | 5,677,333 | | |
| EXPENSES: | | | | | | | | | | | | | | | | | | | | | | | | | |
| Investment management fees | | | | | 2,052,430 | | | | | | 794,959 | | | | | | 1,345,672 | | | | | | 521,598 | | |
| Distribution and shareholder service fees: | | | | | | | | | | | | | | | | | | | | | | | | | |
| Class ADV | | | | | 925,117 | | | | | | 101,633 | | | | | | 656,836 | | | | | | 73,899 | | |
| Class S | | | | | 270,321 | | | | | | 25,622 | | | | | | 181,856 | | | | | | 24,311 | | |
| Class S2 | | | | | 124,730 | | | | | | 9,869 | | | | | | 74,175 | | | | | | 10,340 | | |
| Transfer agent fees | | | | | 1,437 | | | | | | 933 | | | | | | 1,227 | | | | | | 664 | | |
| Shareholder reporting expense | | | | | 17,811 | | | | | | 14,775 | | | | | | 13,870 | | | | | | 15,318 | | |
| Registration fees | | | | | 4,429 | | | | | | 5,057 | | | | | | 3,596 | | | | | | 3,897 | | |
| Professional fees | | | | | 73,124 | | | | | | 38,270 | | | | | | 54,750 | | | | | | 22,808 | | |
| Custody and accounting expense | | | | | 59,955 | | | | | | 29,044 | | | | | | 45,785 | | | | | | 20,387 | | |
| Directors fees | | | | | 37,577 | | | | | | 15,164 | | | | | | 25,832 | | | | | | 10,181 | | |
| Miscellaneous expense | | | | | 29,060 | | | | | | 15,434 | | | | | | 19,054 | | | | | | 10,691 | | |
| Interest expense | | | | | 387 | | | | | | — | | | | | | — | | | | | | — | | |
| Total expenses | | | | | 3,596,378 | | | | | | 1,050,760 | | | | | | 2,422,653 | | | | | | 714,094 | | |
| Waived and reimbursed fees | | | | | (1,376,072) | | | | | | (818,307) | | | | | | (872,448) | | | | | | (526,114) | | |
| Net expenses | | | | | 2,220,306 | | | | | | 232,453 | | | | | | 1,550,205 | | | | | | 187,980 | | |
| Net investment income | | | | | 19,230,378 | | | | | | 8,299,977 | | | | | | 12,485,579 | | | | | | 5,489,353 | | |
| REALIZED AND UNREALIZED GAIN (LOSS): | | | | | | | | | | | | | | | | | | | | | | | | | |
| Net realized gain (loss) on: | | | | | | | | | | | | | | | | | | | | | | | | | |
| Sale of affiliated underlying funds | | | | | 10,812,612 | | | | | | 2,624,076 | | | | | | 6,698,556 | | | | | | 886,132 | | |
| Sale of unaffiliated underlying funds | | | | | (1,392,172) | | | | | | (312,351) | | | | | | (986,556) | | | | | | (114,925) | | |
| Capital gain distributions from affiliated underlying funds | | | | | 32,060,786 | | | | | | 13,831,114 | | | | | | 25,199,282 | | | | | | 10,052,015 | | |
| Futures | | | | | (2,590,995) | | | | | | (870,287) | | | | | | (1,709,002) | | | | | | (615,291) | | |
| Net realized gain | | | | | 38,890,231 | | | | | | 15,272,552 | | | | | | 29,202,280 | | | | | | 10,207,931 | | |
| Net change in unrealized appreciation (depreciation) on: | | | | | | | | | | | | | | | | | | | | | | | | | |
| Affiliated underlying funds | | | | | 121,924,589 | | | | | | 52,810,958 | | | | | | 94,111,640 | | | | | | 38,615,796 | | |
| Unaffiliated underlying funds | | | | | 7,037,371 | | | | | | 1,972,161 | | | | | | 3,709,085 | | | | | | 949,027 | | |
| Futures | | | | | (788,059) | | | | | | (223,249) | | | | | | (318,184) | | | | | | (151,713) | | |
| Net change in unrealized appreciation (depreciation) | | | | | 128,173,901 | | | | | | 54,559,870 | | | | | | 97,502,541 | | | | | | 39,413,110 | | |
| Net realized and unrealized gain | | | | | 167,064,132 | | | | | | 69,832,422 | | | | | | 126,704,821 | | | | | | 49,621,041 | | |
| Increase in net assets resulting from operations | | | | $ | 186,294,510 | | | | | $ | 78,132,399 | | | | | $ | 139,190,400 | | | | | $ | 55,110,394 | | |
See Accompanying Notes to Financial Statements
STATEMENTS OF OPERATIONS for the year ended December 31, 2019
| | | | Voya Index
Solution 2055
Portfolio | | | Voya Index
Solution 2060
Portfolio | |
| INVESTMENT INCOME: | | | | | | | | | | | | | |
| Dividends from affiliated underlying funds | | | | $ | 5,893,326 | | | | | $ | 1,597,827 | | |
| Dividends from unaffiliated underlying funds | | | | | 391,717 | | | | | | 173,597 | | |
| Interest | | | | | 11,424 | | | | | | 223 | | |
| Total investment income | | | | | 6,296,467 | | | | | | 1,771,647 | | |
| EXPENSES: | | | | | | | | | | | | | |
| Investment management fees | | | | | 586,560 | | | | | | 161,410 | | |
| Distribution and shareholder service fees: | | | | | | | | | | | | | |
| Class ADV | | | | | 260,697 | | | | | | 38,554 | | |
| Class S | | | | | 80,930 | | | | | | 11,071 | | |
| Class S2 | | | | | 39,538 | | | | | | 4,919 | | |
| Transfer agent fees | | | | | 929 | | | | | | 592 | | |
| Shareholder reporting expense | | | | | 12,775 | | | | | | 12,837 | | |
| Registration fees | | | | | 2,868 | | | | | | 1,262 | | |
| Professional fees | | | | | 25,553 | | | | | | 10,075 | | |
| Custody and accounting expense | | | | | 22,889 | | | | | | 11,553 | | |
| Directors fees | | | | | 11,445 | | | | | | 3,085 | | |
| Miscellaneous expense | | | | | 11,042 | | | | | | 8,850 | | |
| Total expenses | | | | | 1,055,226 | | | | | | 264,208 | | |
| Waived and reimbursed fees | | | | | (390,422) | | | | | | (164,735) | | |
| Net expenses | | | | | 664,804 | | | | | | 99,473 | | |
| Net investment income | | | | | 5,631,663 | | | | | | 1,672,174 | | |
| REALIZED AND UNREALIZED GAIN (LOSS): | | | | | | | | | | | | | |
| Net realized gain (loss) on: | | | | | | | | | | | | | |
| Sale of affiliated underlying funds | | | | | 2,143,354 | | | | | | 35,544 | | |
| Sale of unaffiliated underlying funds | | | | | (230,880) | | | | | | 30,982 | | |
| Capital gain distributions from affiliated underlying funds | | | | | 11,531,437 | | | | | | 3,134,262 | | |
| Futures | | | | | (765,487) | | | | | | — | | |
| Net realized gain | | | | | 12,678,424 | | | | | | 3,200,788 | | |
| Net change in unrealized appreciation (depreciation) on: | | | | | | | | | | | | | |
| Affiliated underlying funds | | | | | 42,616,316 | | | | | | 11,314,884 | | |
| Unaffiliated underlying funds | | | | | 1,213,256 | | | | | | 215,567 | | |
| Futures | | | | | (147,327) | | | | | | — | | |
| Net change in unrealized appreciation (depreciation) | | | | | 43,682,245 | | | | | | 11,530,451 | | |
| Net realized and unrealized gain | | | | | 56,360,669 | | | | | | 14,731,239 | | |
| Increase in net assets resulting from operations | | | | $ | 61,992,332 | | | | | $ | 16,403,413 | | |
See Accompanying Notes to Financial Statements
STATEMENTS OF CHANGES IN NET ASSETS
| | | | Voya Index Solution Income Portfolio | | | Voya Index Solution 2020 Portfolio | |
| | | | Year Ended
December 31,
2019 | | | Year Ended
December 31,
2018 | | | Year Ended
December 31,
2019 | | | Year Ended
December 31,
2018 | |
| FROM OPERATIONS: | | | | | | | | | | | | | | | | | | | | | | | | | |
| Net investment income | | | | $ | 9,171,225 | | | | | $ | 9,319,936 | | | | | $ | 8,063,401 | | | | | $ | 6,285,465 | | |
| Net realized gain | | | | | 8,520,498 | | | | | | 6,528,525 | | | | | | 7,814,503 | | | | | | 7,209,202 | | |
| Net change in unrealized appreciation (depreciation) | | | | | 39,194,970 | | | | | | (30,357,701) | | | | | | 34,558,892 | | | | | | (25,265,774) | | |
| Increase (decrease) in net assets resulting from operations | | | | | 56,886,693 | | | | | | (14,509,240) | | | | | | 50,436,796 | | | | | | (11,771,107) | | |
| FROM DISTRIBUTIONS TO SHAREHOLDERS: | | | | | | | | | | | | | | | | | | | | | | | | ��� | |
| Total distributions (excluding return of capital): | | | | | | | | | | | | | | | | | | | | | | | | | |
| Class ADV | | | | | (2,575,512) | | | | | | (3,141,436) | | | | | | (1,033,955) | | | | | | (956,903) | | |
| Class I | | | | | (711,876) | | | | | | (800,450) | | | | | | (285,814) | | | | | | (286,342) | | |
| Class S | | | | | (4,823,540) | | | | | | (5,392,426) | | | | | | (287,380) | | | | | | (423,433) | | |
| Class S2 | | | | | (293,428) | | | | | | (383,617) | | | | | | (244,252) | | | | | | (122,211) | | |
| Class Z | | | | | (7,575,291) | | | | | | (6,821,212) | | | | | | (13,430,758) | | | | | | (9,630,042) | | |
| Total distributions | | | | | (15,979,647) | | | | | | (16,539,141) | | | | | | (15,282,159) | | | | | | (11,418,931) | | |
| FROM CAPITAL SHARE TRANSACTIONS: | | | | | | | | | | | | | | | | | | | | | | | | | |
| Net proceeds from sale of shares | | | | | 71,484,449 | | | | | | 75,068,904 | | | | | | 119,152,070 | | | | | | 110,461,933 | | |
| Reinvestment of distributions | | | | | 15,979,647 | | | | | | 16,539,141 | | | | | | 15,282,159 | | | | | | 11,418,931 | | |
| | | | | | 87,464,096 | | | | | | 91,608,045 | | | | | | 134,434,229 | | | | | | 121,880,864 | | |
| Cost of shares redeemed | | | | | (97,832,372) | | | | | | (100,347,966) | | | | | | (56,184,080) | | | | | | (44,434,515) | | |
Net increase (decrease) in net assets resulting from capital share
transactions | | | | | (10,368,276) | | | | | | (8,739,921) | | | | | | 78,250,149 | | | | | | 77,446,349 | | |
| Net increase (decrease) in net assets | | | | | 30,538,770 | | | | | | (39,788,302) | | | | | | 113,404,786 | | | | | | 54,256,311 | | |
| NET ASSETS: | | | | | | | | | | | | | | | | | | | | | | | | | |
| Beginning of year or period | | | | | 444,486,471 | | | | | | 484,274,773 | | | | | | 300,446,121 | | | | | | 246,189,810 | | |
| End of year or period | | | | $ | 475,025,241 | | | | | $ | 444,486,471 | | | | | $ | 413,850,907 | | | | | $ | 300,446,121 | | |
See Accompanying Notes to Financial Statements
STATEMENTS OF CHANGES IN NET ASSETS
| | | | Voya Index Solution 2025 Portfolio | | | Voya Index Solution 2030 Portfolio | |
| | | | Year Ended
December 31,
2019 | | | Year Ended
December 31,
2018 | | | Year Ended
December 31,
2019 | | | Year Ended
December 31,
2018 | |
| FROM OPERATIONS: | | | | | | | | | | | | | | | | | | | | | | | | | |
| Net investment income | | | | $ | 20,762,079 | | | | | $ | 17,418,491 | | | | | $ | 11,560,756 | | | | | $ | 8,276,283 | | |
| Net realized gain | | | | | 32,149,603 | | | | | | 32,119,663 | | | | | | 18,030,414 | | | | | | 15,118,642 | | |
| Net change in unrealized appreciation (depreciation) | | | | | 114,158,757 | | | | | | (94,219,458) | | | | | | 66,071,960 | | | | | | (48,739,583) | | |
| Increase (decrease) in net assets resulting from operations | | | | | 167,070,439 | | | | | | (44,681,304) | | | | | | 95,663,130 | | | | | | (25,344,658) | | |
| FROM DISTRIBUTIONS TO SHAREHOLDERS: | | | | | | | | | | | | | | | | | | | | | | | | | |
| Total distributions (excluding return of capital): | | | | | | | | | | | | | | | | | | | | | | | | | |
| Class ADV | | | | | (9,444,733) | | | | | | (7,866,273) | | | | | | (1,389,077) | | | | | | (919,660) | | |
| Class I | | | | | (3,130,351) | | | | | | (2,326,597) | | | | | | (357,097) | | | | | | (221,300) | | |
| Class S | | | | | (6,676,575) | | | | | | (5,065,217) | | | | | | (596,130) | | | | | | (396,823) | | |
| Class S2 | | | | | (1,517,211) | | | | | | (971,219) | | | | | | (238,292) | | | | | | (48,650) | | |
| Class Z | | | | | (32,027,968) | | | | | | (17,452,190) | | | | | | (21,967,828) | | | | | | (11,687,273) | | |
| Total distributions | | | | | (52,796,838) | | | | | | (33,681,496) | | | | | | (24,548,424) | | | | | | (13,273,706) | | |
| FROM CAPITAL SHARE TRANSACTIONS: | | | | | | | | | | | | | | | | | | | | | | | | | |
| Net proceeds from sale of shares | | | | | 215,596,514 | | | | | | 185,108,981 | | | | | | 172,683,194 | | | | | | 147,534,189 | | |
| Reinvestment of distributions | | | | | 52,796,838 | | | | | | 33,681,496 | | | | | | 24,548,424 | | | | | | 13,273,706 | | |
| | | | | | 268,393,352 | | | | | | 218,790,477 | | | | | | 197,231,618 | | | | | | 160,807,895 | | |
| Cost of shares redeemed | | | | | (129,159,106) | | | | | | (137,799,543) | | | | | | (39,594,711) | | | | | | (34,347,759) | | |
| Net increase in net assets resulting from capital share transactions | | | | | 139,234,246 | | | | | | 80,990,934 | | | | | | 157,636,907 | | | | | | 126,460,136 | | |
| Net increase in net assets | | | | | 253,507,847 | | | | | | 2,628,134 | | | | | | 228,751,613 | | | | | | 87,841,772 | | |
| NET ASSETS: | | | | | | | | | | | | | | | | | | | | | | | | | |
| Beginning of year or period | | | | | 851,944,464 | | | | | | 849,316,330 | | | | | | 395,182,503 | | | | | | 307,340,731 | | |
| End of year or period | | | | $ | 1,105,452,311 | | | | | $ | 851,944,464 | | | | | $ | 623,934,116 | | | | | $ | 395,182,503 | | |
See Accompanying Notes to Financial Statements
STATEMENTS OF CHANGES IN NET ASSETS
| | | | Voya Index Solution 2035 Portfolio | | | Voya Index Solution 2040 Portfolio | | | | | | | |
| | | | Year Ended
December 31,
2019 | | | Year Ended
December 31,
2018 | | | Year Ended
December 31,
2019 | | | Year Ended
December 31,
2018 | | | |
| FROM OPERATIONS: | | | | | | | | | | | | | | | | | | | | | | | | | | | |
| Net investment income | | | | $ | 19,230,378 | | | | | $ | 15,332,188 | | | | | $ | 8,299,977 | | | | | $ | 5,349,528 | | | | |
| Net realized gain | | | | | 38,890,231 | | | | | | 34,990,839 | | | | | | 15,272,552 | | | | | | 12,298,412 | | | | |
| Net change in unrealized appreciation (depreciation) | | | | | 128,173,901 | | | | | | (107,446,205) | | | | | | 54,559,870 | | | | | | (39,751,923) | | | | |
| Increase (decrease) in net assets resulting from operations | | | | | 186,294,510 | | | | | | (57,123,178) | | | | | | 78,132,399 | | | | | | (22,103,983) | | | | |
| FROM DISTRIBUTIONS TO SHAREHOLDERS: | | | | | | | | | | | | | | | | | | | | | | | | | | | |
| Total distributions (excluding return of capital): | | | | | | | | | | | | | | | | | | | | | | | | | | | |
| Class ADV | | | | | (9,351,556) | | | | | | (7,461,570) | | | | | | (944,613) | | | | | | (505,650) | | | | |
| Class I | | | | | (3,201,072) | | | | | | (2,310,284) | | | | | | (214,734) | | | | | | (116,176) | | | | |
| Class S | | | | | (5,875,369) | | | | | | (4,099,685) | | | | | | (462,330) | | | | | | (271,036) | | | | |
| Class S2 | | | | | (1,545,029) | | | | | | (1,112,359) | | | | | | (118,389) | | | | | | (56,322) | | | | |
| Class Z | | | | | (32,118,650) | | | | | | (16,743,315) | | | | | | (16,464,473) | | | | | | (7,459,687) | | | | |
| Total distributions | | | | | (52,091,676) | | | | | | (31,727,213) | | | | | | (18,204,539) | | | | | | (8,408,871) | | | | |
| FROM CAPITAL SHARE TRANSACTIONS: | | | | | | | | | | | | | | | | | | | | | | | | | | | |
| Net proceeds from sale of shares | | | | | 237,452,242 | | | | | | 190,382,506 | | | | | | 144,976,166 | | | | | | 122,526,046 | | | | |
| Reinvestment of distributions | | | | | 52,091,676 | | | | | | 31,727,213 | | | | | | 18,204,539 | | | | | | 8,408,871 | | | | |
| | | | | | 289,543,918 | | | | | | 222,109,719 | | | | | | 163,180,705 | | | | | | 130,934,917 | | | | |
| Cost of shares redeemed | | | | | (110,295,595) | | | | | | (122,752,480) | | | | | | (25,057,448) | | | | | | (21,228,147) | | | | |
| Net increase in net assets resulting from capital share transactions | | | | | 179,248,323 | | | �� | | | 99,357,239 | | | | | | 138,123,257 | | | | | | 109,706,770 | | | | |
| Net increase in net assets | | | | | 313,451,157 | | | | | | 10,506,848 | | | | | | 198,051,117 | | | | | | 79,193,916 | | | | |
| NET ASSETS: | | | | | | | | | | | | | | | | | | | | | | | | | | | |
| Beginning of year or period | | | | | 770,160,601 | | | | | | 759,653,753 | | | | | | 272,507,162 | | | | | | 193,313,246 | | | | |
| End of year or period | | | | $ | 1,083,611,758 | | | | | $ | 770,160,601 | | | | | $ | 470,558,279 | | | | | $ | 272,507,162 | | | | |
See Accompanying Notes to Financial Statements
STATEMENTS OF CHANGES IN NET ASSETS
| | | | Voya Index Solution 2045 Portfolio | | | Voya Index Solution 2050 Portfolio | | | | | | | |
| | | | Year Ended
December 31,
2019 | | | Year Ended
December 31,
2018 | | | Year Ended
December 31,
2019 | | | Year Ended
December 31,
2018 | | | |
| FROM OPERATIONS: | | | | | | | | | | | | | | | | | | | | | | | | | | | |
| Net investment income | | | | $ | 12,485,579 | | | | | $ | 9,652,843 | | | | | $ | 5,489,353 | | | | | $ | 3,232,124 | | | | |
| Net realized gain | | | | | 29,202,280 | | | | | | 28,215,966 | | | | | | 10,207,931 | | | | | | 8,017,108 | | | | |
| Net change in unrealized appreciation (depreciation) | | | | | 97,502,541 | | | | | | (84,469,881) | | | | | | 39,413,110 | | | | | | (27,506,955) | | | | |
| Increase (decrease) in net assets resulting from operations | | | | | 139,190,400 | | | | | | (46,601,072) | | | | | | 55,110,394 | | | | | | (16,257,723) | | | | |
| FROM DISTRIBUTIONS TO SHAREHOLDERS: | | | | | | | | | | | | | | | | | | | | | | | | | | | |
| Total distributions (excluding return of capital): | | | | | | | | | | | | | | | | | | | | | | | | | | | |
| Class ADV | | | | | (7,369,585) | | | | | | (5,250,526) | | | | | | (639,345) | | | | | | (337,544) | | | | |
| Class I | | | | | (2,733,025) | | | | | | (1,842,140) | | | | | | (206,350) | | | | | | (115,790) | | | | |
| Class S | | | | | (4,239,765) | | | | | | (2,853,544) | | | | | | (410,826) | | | | | | (243,786) | | | | |
| Class S2 | | | | | (1,070,837) | | | | | | (582,513) | | | | | | (113,385) | | | | | | (56,506) | | | | |
| Class Z | | | | | (22,826,868) | | | | | | (10,755,975) | | | | | | (10,045,779) | | | | | | (4,286,340) | | | | |
| Total distributions | | | | | (38,240,080) | | | | | | (21,284,698) | | | | | | (11,415,685) | | | | | | (5,039,966) | | | | |
| FROM CAPITAL SHARE TRANSACTIONS: | | | | | | | | | | �� | | | | | | | | | | | | | | | | | |
| Net proceeds from sale of shares | | | | | 161,741,859 | | | | | | 140,674,726 | | | | | | 106,664,469 | | | | | | 87,393,326 | | | | |
| Reinvestment of distributions | | | | | 38,240,080 | | | | | | 21,284,698 | | | | | | 11,415,685 | | | | | | 5,039,966 | | | | |
| | | | | | 199,981,939 | | | | | | 161,959,424 | | | | | | 118,080,154 | | | | | | 92,433,292 | | | | |
| Cost of shares redeemed | | | | | (74,762,682) | | | | | | (84,342,501) | | | | | | (15,101,324) | | | | | | (11,291,117) | | | | |
| Net increase in net assets resulting from capital share transactions | | | | | 125,219,257 | | | | | | 77,616,923 | | | | | | 102,978,830 | | | | | | 81,142,175 | | | | |
| Net increase in net assets | | | | | 226,169,577 | | | | | | 9,731,153 | | | | | | 146,673,539 | | | | | | 59,844,486 | | | | |
| NET ASSETS: | | | | | | | | | | | | | | | | | | | | | | | | | | | |
| Beginning of year or period | | | | | 521,034,162 | | | | | | 511,303,009 | | | | | | 178,045,366 | | | | | | 118,200,880 | | | | |
| End of year or period | | | | $ | 747,203,739 | | | | | $ | 521,034,162 | | | | | $ | 324,718,905 | | | | | $ | 178,045,366 | | | | |
See Accompanying Notes to Financial Statements
STATEMENTS OF CHANGES IN NET ASSETS
| | | | Voya Index Solution 2055 Portfolio | | | Voya Index Solution 2060 Portfolio | | | | | | | |
| | | | Year Ended
December 31,
2019 | | | Year Ended
December 31,
2018 | | | Year Ended
December 31,
2019 | | | Year Ended
December 31,
2018 | | | |
| FROM OPERATIONS: | | | | | | | | | | | | | | | | | | | | | | | | | | | |
| Net investment income | | | | $ | 5,631,663 | | | | | $ | 3,680,264 | | | | | $ | 1,672,174 | | | | | $ | 759,636 | | | | |
| Net realized gain | | | | | 12,678,424 | | | | | | 11,566,623 | | | | | | 3,200,788 | | | | | | 1,719,184 | | | | |
| Net change in unrealized appreciation (depreciation) | | | | | 43,682,245 | | | | | | (35,206,061) | | | | | | 11,530,451 | | | | | | (6,713,250) | | | | |
| Increase (decrease) in net assets resulting from operations | | | | | 61,992,332 | | | | | | (19,959,174) | | | | | | 16,403,413 | | | | | | (4,234,430) | | | | |
| FROM DISTRIBUTIONS TO SHAREHOLDERS: | | | | | | | | | | | | | | | | | | | | | | | | | | | |
| Total distributions (excluding return of capital): | | | | | | | | | | | | | | | | | | | | | | | | | | | |
| Class ADV | | | | | (2,502,162) | | | | | | (1,669,989) | | | | | | (242,830) | | | | | | (193,157) | | | | |
| Class I | | | | | (1,263,096) | | | | | | (712,946) | | | | | | (159,806) | | | | | | (80,758) | | | | |
| Class S | | | | | (1,646,898) | | | | | | (943,356) | | | | | | (147,396) | | | | | | (96,290) | | | | |
| Class S2 | | | | | (499,112) | | | | | | (237,947) | | | | | | (41,350) | | | | | | (19,991) | | | | |
| Class Z | | | | | (8,817,712) | | | | | | (3,421,598) | | | | | | (2,083,235) | | | | | | (916,901) | | | | |
| Total distributions | | | | | (14,728,980) | | | | | | (6,985,836) | | | | | | (2,674,617) | | | | | | (1,307,097) | | | | |
| FROM CAPITAL SHARE TRANSACTIONS: | | | | | | | | | | | | | | | | | | | | | | | | | | | |
| Net proceeds from sale of shares | | | | | 104,869,051 | | | | | | 84,132,987 | | | | | | 53,468,952 | | | | | | 31,183,132 | | | | |
| Reinvestment of distributions | | | | | 14,728,980 | | | | | | 6,985,836 | | | | | | 2,674,617 | | | | | | 1,307,097 | | | | |
| | | | | | 119,598,031 | | | | | | 91,118,823 | | | | | | 56,143,569 | | | | | | 32,490,229 | | | | |
| Cost of shares redeemed | | | | | (31,452,413) | | | | | | (30,010,200) | | | | | | (6,457,877) | | | | | | (5,603,938) | | | | |
| Net increase in net assets resulting from capital share transactions | | | | | 88,145,618 | | | | | | 61,108,623 | | | | | | 49,685,692 | | | | | | 26,886,291 | | | | |
| Net increase in net assets | | | | | 135,408,970 | | | | | | 34,163,613 | | | | | | 63,414,488 | | | | | | 21,344,764 | | | | |
| NET ASSETS: | | | | | | | | | | | | | | | | | | | | | | | | | | | |
| Beginning of year or period | | | | | 214,618,607 | | | | | | 180,454,994 | | | | | | 45,828,278 | | | | | | 24,483,514 | | | | |
| End of year or period | | | | $ | 350,027,577 | | | | | $ | 214,618,607 | | | | | $ | 109,242,766 | | | | | $ | 45,828,278 | | | | |
See Accompanying Notes to Financial Statements
Selected data for a share of beneficial interest outstanding throughout each year or period.
| | | | | | | | | | Income (loss)
from
investment
operations | | | | | | | | | Less Distributions | | | | | | Ratios to average net assets | | | Supplemental
Data | |
| | | | Net asset value, beginning of year
or period | | | Net investment income (loss) | | | Net realized and unrealized
gain (loss) | | | Total from investment operations | | | From net investment income | | | From net realized gains | | | From return of capital | | | Total distributions | | | Payment by affiliate | | | Net asset value, end of year
or period | | | Total Return(1) | | | Expenses before
reductions/additions(2)(3)(4) | | | Expenses net of fee waivers
and/or recoupments if any(2)(3)(4) | | | Expenses net of all
reductions/additions(2)(3)(4) | | | Net investment income (loss)(2)(3) | | | Net assets, end of year or period | | | Portfolio turnover rate | |
Year or
period ended | | | ($) | | | ($) | | | ($) | | | ($) | | | ($) | | | ($) | | | ($) | | | ($) | | | ($) | | | ($) | | | (%) | | | (%) | | | (%) | | | (%) | | | (%) | | | ($000’s) | | | (%) | |
| Voya Index Solution Income Portfolio | | | | | | | | | | | | | | | | | | | | | | | | | | | | | | | | | | | | | | | | | | | | | | | | | | | | | | | | | | | | | | | | | | | | | | | | | | | | | | | | | | | | | | | | | | | | | | | | | | | | | | | |
| Class ADV | | | | | | | | | | | | | | | | | | | | | | | | | | | | | | | | | | | | | | | | | | | | | | | | | | | | | | | | | | | | | | | | | | | | | | | | | | | | | | | | | | | | | | | | | | | | | | | | | | | | | | | |
| 12-31-19 | | | | | 9.66 | | | | | | 0.16• | | | | | | 1.05 | | | | | | 1.21 | | | | | | 0.18 | | | | | | 0.15 | | | | | | — | | | | | | 0.33 | | | | | | — | | | | | | 10.54 | | | | | | 12.62 | | | | | | 0.76 | | | | | | 0.74 | | | | | | 0.74 | | | | | | 1.52 | | | | | | 81,027 | | | | | | 38 | | |
| 12-31-18 | | | | | 10.34 | | | | | | 0.16• | | | | | | (0.51) | | | | | | (0.35) | | | | | | 0.17 | | | | | | 0.16 | | | | | | — | | | | | | 0.33 | | | | | | — | | | | | | 9.66 | | | | | | (3.50) | | | | | | 0.77 | | | | | | 0.71 | | | | | | 0.71 | | | | | | 1.59 | | | | | | 87,697 | | | | | | 38 | | |
| 12-31-17 | | | | | 9.71 | | | | | | 0.16• | | | | | | 0.68 | | | | | | 0.84 | | | | | | 0.16 | | | | | | 0.05 | | | | | | — | | | | | | 0.21 | | | | | | — | | | | | | 10.34 | | | | | | 8.69 | | | | | | 0.76 | | | | | | 0.68 | | | | | | 0.68 | | | | | | 1.64 | | | | | | 110,507 | | | | | | 32 | | |
| 12-31-16 | | | | | 9.55 | | | | | | 0.18• | | | | | | 0.27 | | | | | | 0.45 | | | | | | 0.15 | | | | | | 0.14 | | | | | | — | | | | | | 0.29 | | | | | | — | | | | | | 9.71 | | | | | | 4.71 | | | | | | 0.77 | | | | | | 0.62 | | | | | | 0.62 | | | | | | 1.82 | | | | | | 119,455 | | | | | | 45 | | |
| 12-31-15 | | | | | 10.53 | | | | | | 0.21• | | | | | | (0.33) | | | | | | (0.12) | | | | | | 0.19 | | | | | | 0.67 | | | | | | — | | | | | | 0.86 | | | | | | — | | | | | | 9.55 | | | | | | (1.37) | | | | | | 0.77 | | | | | | 0.62 | | | | | | 0.62 | | | | | | 2.17 | | | | | | 134,515 | | | | | | 34 | | |
| Class I | | | | | | | | | | | | | | | | | | | | | | | | | | | | | | | | | | | | | | | | | | | | | | | | | | | | | | | | | | | | | | | | | | | | | | | | | | | | | | | | | | | | | | | | | | | | | | | | | | | | | | | |
| 12-31-19 | | | | | 9.92 | | | | | | 0.21• | | | | | | 1.08 | | | | | | 1.29 | | | | | | 0.24 | | | | | | 0.15 | | | | | | — | | | | | | 0.39 | | | | | | — | | | | | | 10.82 | | | | | | 13.16 | | | | | | 0.26 | | | | | | 0.24 | | | | | | 0.24 | | | | | | 2.02 | | | | | | 18,653 | | | | | | 38 | | |
| 12-31-18 | | | | | 10.62 | | | | | | 0.23 | | | | | | (0.54) | | | | | | (0.31) | | | | | | 0.23 | | | | | | 0.16 | | | | | | — | | | | | | 0.39 | | | | | | — | | | | | | 9.92 | | | | | | (3.04) | | | | | | 0.27 | | | | | | 0.21 | | | | | | 0.21 | | | | | | 2.11 | | | | | | 21,140 | | | | | | 38 | | |
| 12-31-17 | | | | | 9.96 | | | | | | 0.22• | | | | | | 0.71 | | | | | | 0.93 | | | | | | 0.22 | | | | | | 0.05 | | | | | | — | | | | | | 0.27 | | | | | | — | | | | | | 10.62 | | | | | | 9.36 | | | | | | 0.26 | | | | | | 0.18 | | | | | | 0.18 | | | | | | 2.11 | | | | | | 22,916 | | | | | | 32 | | |
| 12-31-16 | | | | | 9.77 | | | | | | 0.23• | | | | | | 0.28 | | | | | | 0.51 | | | | | | 0.18 | | | | | | 0.14 | | | | | | — | | | | | | 0.32 | | | | | | — | | | | | | 9.96 | | | | | | 5.23 | | | | | | 0.27 | | | | | | 0.12 | | | | | | 0.12 | | | | | | 2.33 | | | | | | 29,545 | | | | | | 45 | | |
| 12-31-15 | | | | | 10.76 | | | | | | 0.28• | | | | | | (0.36) | | | | | | (0.08) | | | | | | 0.24 | | | | | | 0.67 | | | | | | — | | | | | | 0.91 | | | | | | — | | | | | | 9.77 | | | | | | (0.91) | | | | | | 0.27 | | | | | | 0.12 | | | | | | 0.12 | | | | | | 2.84 | | | | | | 30,873 | | | | | | 34 | | |
| Class S | | | | | | | | | | | | | | | | | | | | | | | | | | | | | | | | | | | | | | | | | | | | | | | | | | | | | | | | | | | | | | | | | | | | | | | | | | | | | | | | | | | | | | | | | | | | | | | | | | | | | | | |
| 12-31-19 | | | | | 9.82 | | | | | | 0.19• | | | | | | 1.06 | | | | | | 1.25 | | | | | | 0.21 | | | | | | 0.15 | | | | | | — | | | | | | 0.36 | | | | | | — | | | | | | 10.71 | | | | | | 12.88 | | | | | | 0.51 | | | | | | 0.49 | | | | | | 0.49 | | | | | | 1.78 | | | | | | 136,385 | | | | | | 38 | | |
| 12-31-18 | | | | | 10.51 | | | | | | 0.19• | | | | | | (0.52) | | | | | | (0.33) | | | | | | 0.20 | | | | | | 0.16 | | | | | | — | | | | | | 0.36 | | | | | | — | | | | | | 9.82 | | | | | | (3.25) | | | | | | 0.52 | | | | | | 0.46 | | | | | | 0.46 | | | | | | 1.84 | | | | | | 140,647 | | | | | | 38 | | |
| 12-31-17 | | | | | 9.86 | | | | | | 0.19• | | | | | | 0.70 | | | | | | 0.89 | | | | | | 0.19 | | | | | | 0.05 | | | | | | — | | | | | | 0.24 | | | | | | — | | | | | | 10.51 | | | | | | 9.06 | | | | | | 0.51 | | | | | | 0.43 | | | | | | 0.43 | | | | | | 1.89 | | | | | | 168,730 | | | | | | 32 | | |
| 12-31-16 | | | | | 9.68 | | | | | | 0.20• | | | | | | 0.28 | | | | | | 0.48 | | | | | | 0.16 | | | | | | 0.14 | | | | | | — | | | | | | 0.30 | | | | | | — | | | | | | 9.86 | | | | | | 4.95 | | | | | | 0.52 | | | | | | 0.37 | | | | | | 0.37 | | | | | | 2.05 | | | | | | 174,891 | | | | | | 45 | | |
| 12-31-15 | | | | | 10.66 | | | | | | 0.23• | | | | | | (0.33) | | | | | | (0.10) | | | | | | 0.21 | | | | | | 0.67 | | | | | | — | | | | | | 0.88 | | | | | | — | | | | | | 9.68 | | | | | | (1.11) | | | | | | 0.52 | | | | | | 0.37 | | | | | | 0.37 | | | | | | 2.24 | | | | | | 199,999 | | | | | | 34 | | |
| Class S2 | | | | | | | | | | | | | | | | | | | | | | | | | | | | | | | | | | | | | | | | | | | | | | | | | | | | | | | | | | | | | | | | | | | | | | | | | | | | | | | | | | | | | | | | | | | | | | | | | | | | | | | |
| 12-31-19 | | | | | 9.61 | | | | | | 0.16• | | | | | | 1.05 | | | | | | 1.21 | | | | | | 0.19 | | | | | | 0.15 | | | | | | — | | | | | | 0.34 | | | | | | — | | | | | | 10.48 | | | | | | 12.70 | | | | | | 0.66 | | | | | | 0.64 | | | | | | 0.64 | | | | | | 1.55 | | | | | | 8,387 | | | | | | 38 | | |
| 12-31-18 | | | | | 10.29 | | | | | | 0.19• | | | | | | (0.52) | | | | | | (0.33) | | | | | | 0.19 | | | | | | 0.16 | | | | | | — | | | | | | 0.35 | | | | | | — | | | | | | 9.61 | | | | | | (3.39) | | | | | | 0.67 | | | | | | 0.61 | | | | | | 0.61 | | | | | | 1.85 | | | | | | 16,240 | | | | | | 38 | | |
| 12-31-17 | | | | | 9.66 | | | | | | 0.18• | | | | | | 0.68 | | | | | | 0.86 | | | | | | 0.18 | | | | | | 0.05 | | | | | | — | | | | | | 0.23 | | | | | | — | | | | | | 10.29 | | | | | | 8.89 | | | | | | 0.66 | | | | | | 0.58 | | | | | | 0.58 | | | | | | 1.75 | | | | | | 12,928 | | | | | | 32 | | |
| 12-31-16 | | | | | 9.50 | | | | | | 0.19• | | | | | | 0.27 | | | | | | 0.46 | | | | | | 0.16 | | | | | | 0.14 | | | | | | — | | | | | | 0.30 | | | | | | — | | | | | | 9.66 | | | | | | 4.79 | | | | | | 0.70 | | | | | | 0.52 | | | | | | 0.52 | | | | | | 1.98 | | | | | | 13,809 | | | | | | 45 | | |
| 12-31-15 | | | | | 10.46 | | | | | | 0.22• | | | | | | (0.33) | | | | | | (0.11) | | | | | | 0.18 | | | | | | 0.67 | | | | | | — | | | | | | 0.85 | | | | | | — | | | | | | 9.50 | | | | | | (1.25) | | | | | | 0.77 | | | | | | 0.52 | | | | | | 0.52 | | | | | | 2.28 | | | | | | 14,859 | | | | | | 34 | | |
| Class Z | | | | | | | | | | | | | | | | | | | | | | | | | | | | | | | | | | | | | | | | | | | | | | | | | | | | | | | | | | | | | | | | | | | | | | | | | | | | | | | | | | | | | | | | | | | | | | | | | | | | | | | |
| 12-31-19 | | | | | 9.99 | | | | | | 0.25• | | | | | | 1.08 | | | | | | 1.33 | | | | | | 0.24 | | | | | | 0.15 | | | | | | — | | | | | | 0.39 | | | | | | — | | | | | | 10.93 | | | | | | 13.47 | | | | | | 0.26 | | | | | | 0.00* | | | | | | 0.00* | | | | | | 2.32 | | | | | | 230,574 | | | | | | 38 | | |
| 12-31-18 | | | | | 10.67 | | | | | | 0.24• | | | | | | (0.53) | | | | | | (0.29) | | | | | | 0.23 | | | | | | 0.16 | | | | | | — | | | | | | 0.39 | | | | | | — | | | | | | 9.99 | | | | | | (2.83) | | | | | | 0.27 | | | | | | 0.00* | | | | | | 0.00* | | | | | | 2.33 | | | | | | 178,763 | | | | | | 38 | | |
| 12-31-17 | | | | | 9.99 | | | | | | 0.25• | | | | | | 0.70 | | | | | | 0.95 | | | | | | 0.22 | | | | | | 0.05 | | | | | | — | | | | | | 0.27 | | | | | | — | | | | | | 10.67 | | | | | | 9.54 | | | | | | 0.26 | | | | | | 0.00* | | | | | | 0.00* | | | | | | 2.45 | | | | | | 169,194 | | | | | | 32 | | |
| 12-31-16 | | | | | 9.79 | | | | | | 0.32• | | | | | | 0.20 | | | | | | 0.52 | | | | | | 0.18 | | | | | | 0.14 | | | | | | — | | | | | | 0.32 | | | | | | — | | | | | | 9.99 | | | | | | 5.32 | | | | | | 0.27 | | | | | | 0.00* | | | | | | 0.00* | | | | | | 3.20 | | | | | | 70,857 | | | | | | 45 | | |
| 05-01-15(5) - | | | | | | | | | | | | | | | | | | | | | | | | | | | | | | | | | | | | | | | | | | | | | | | | | | | | | | | | | | | | | | | | | | | | | | | | | | | | | | | | | | | | | | | | | | | | | | | | | | | | | | | |
| 12-31-15 | | | | | 11.02 | | | | | | 0.58• | | | | | | (0.90) | | | | | | (0.32) | | | | | | 0.24 | | | | | | 0.67 | | | | | | — | | | | | | 0.91 | | | | | | — | | | | | | 9.79 | | | | | | (3.06) | | | | | | 0.28 | | | | | | 0.00* | | | | | | 0.00* | | | | | | 9.14 | | | | | | 1,635 | | | | | | 34 | | |
| Voya Index Solution 2020 Portfolio | | | | | | | | | | | | | | | | | | | | | | | | | | | | | | | | | | | | | | | | | | | | | | | | | | | | | | | | | | | | | | | | | | | | | | | | | | | | | | | | | | | | | | | | | | | | | | | | | | | | | | | |
| Class ADV | | | | | | | | | | | | | | | | | | | | | | | | | | | | | | | | | | | | | | | | | | | | | | | | | | | | | | | | | | | | | | | | | | | | | | | | | | | | | | | | | | | | | | | | | | | | | | | | | | | | | | | |
| 12-31-19 | | | | | 12.22 | | | | | | 0.19 | | | | | | 1.58 | | | | | | 1.77 | | | | | | 0.18 | | | | | | 0.33 | | | | | | — | | | | | | 0.51 | | | | | | — | | | | | | 13.48 | | | | | | 14.69 | | | | | | 0.77 | | | | | | 0.73 | | | | | | 0.73 | | | | | | 1.55 | | | | | | 29,015 | | | | | | 44 | | |
| 12-31-18 | | | | | 13.27 | | | | | | 0.21• | | | | | | (0.77) | | | | | | (0.56) | | | | | | 0.15 | | | | | | 0.34 | | | | | | — | | | | | | 0.49 | | | | | | — | | | | | | 12.22 | | | | | | (4.42) | | | | | | 0.77 | | | | | | 0.71 | | | | | | 0.71 | | | | | | 1.59 | | | | | | 24,850 | | | | | | 44 | | |
| 12-31-17 | | | | | 12.02 | | | | | | 0.20• | | | | | | 1.21 | | | | | | 1.41 | | | | | | 0.06 | | | | | | 0.10 | | | | | | — | | | | | | 0.16 | | | | | | — | | | | | | 13.27 | | | | | | 11.78 | | | | | | 0.77 | | | | | | 0.68 | | | | | | 0.68 | | | | | | 1.58 | | | | | | 21,918 | | | | | | 42 | | |
| 12-31-16 | | | | | 11.37 | | | | | | 0.24• | | | | | | 0.43 | | | | | | 0.67 | | | | | | 0.01 | | | | | | 0.01 | | | | | | — | | | | | | 0.02 | | | | | | — | | | | | | 12.02 | | | | | | 5.90 | | | | | | 0.82 | | | | | | 0.63 | | | | | | 0.63 | | | | | | 2.07 | | | | | | 13,619 | | | | | | 75 | | |
| 12-31-15 | | | | | 11.82 | | | | | | 0.46• | | | | | | (0.46) | | | | | | 0.00* | | | | | | 0.15 | | | | | | 0.30 | | | | | | — | | | | | | 0.45 | | | | | | — | | | | | | 11.37 | | | | | | 0.00 | | | | | | 2.22 | | | | | | 0.63 | | | | | | 0.63 | | | | | | 4.05 | | | | | | 4,703 | | | | | | 108 | | |
See Accompanying Notes to Financial Statements
Financial Highlights (continued)
| | | | | | | | | | Income (loss)
from
investment
operations | | | | | | | | | Less Distributions | | | | | | Ratios to average net assets | | | Supplemental
Data | |
| | | | Net asset value, beginning of year
or period | | | Net investment income (loss) | | | Net realized and unrealized
gain (loss) | | | Total from investment operations | | | From net investment income | | | From net realized gains | | | From return of capital | | | Total distributions | | | Payment by affiliate | | | Net asset value, end of year
or period | | | Total Return(1) | | | Expenses before
reductions/additions(2)(3)(4) | | | Expenses net of fee waivers
and/or recoupments if any(2)(3)(4) | | | Expenses net of all
reductions/additions(2)(3)(4) | | | Net investment income (loss)(2)(3) | | | Net assets, end of year or period | | | Portfolio turnover rate | |
Year or
period ended | | | ($) | | | ($) | | | ($) | | | ($) | | | ($) | | | ($) | | | ($) | | | ($) | | | ($) | | | ($) | | | (%) | | | (%) | | | (%) | | | (%) | | | (%) | | | ($000’s) | | | (%) | |
| Voya Index Solution 2020 Portfolio (continued) | | | | | | | | | | | | | | | | | | | | | | | | | | | | | | | | | | | | | | | | | | | | | | | | | | | | | | | | | | | | | | | | | | | | | | | | | | | | | | | | | | | | | | | | | | | | | | | | | | | | | | | |
| Class I | | | | | | | | | | | | | | | | | | | | | | | | | | | | | | | | | | | | | | | | | | | | | | | | | | | | | | | | | | | | | | | | | | | | | | | | | | | | | | | | | | | | | | | | | | | | | | | | | | | | | | | |
| 12-31-19 | | | | | 12.54 | | | | | | 0.27• | | | | | | 1.62 | | | | | | 1.89 | | | | | | 0.25 | | | | | | 0.33 | | | | | | — | | | | | | 0.58 | | | | | | — | | | | | | 13.85 | | | | | | 15.25 | | | | | | 0.27 | | | | | | 0.23 | | | | | | 0.23 | | | | | | 2.02 | | | | | | 7,052 | | | | | | 44 | | |
| 12-31-18 | | | | | 13.59 | | | | | | 0.28• | | | | | | (0.79) | | | | | | (0.51) | | | | | | 0.20 | | | | | | 0.34 | | | | | | — | | | | | | 0.54 | | | | | | — | | | | | | 12.54 | | | | | | (3.98) | | | | | | 0.27 | | | | | | 0.21 | | | | | | 0.21 | | | | | | 2.10 | | | | | | 7,471 | | | | | | 44 | | |
| 12-31-17 | | | | | 12.27 | | | | | | 0.28• | | | | | | 1.23 | | | | | | 1.51 | | | | | | 0.09 | | | | | | 0.10 | | | | | | — | | | | | | 0.19 | | | | | | — | | | | | | 13.59 | | | | | | 12.42 | | | | | | 0.27 | | | | | | 0.18 | | | | | | 0.18 | | | | | | 2.12 | | | | | | 5,360 | | | | | | 42 | | |
| 12-31-16 | | | | | 11.55 | | | | | | 0.37• | | | | | | 0.38 | | | | | | 0.75 | | | | | | 0.02 | | | | | | 0.01 | | | | | | — | | | | | | 0.03 | | | | | | — | | | | | | 12.27 | | | | | | 6.45 | | | | | | 0.32 | | | | | | 0.13 | | | | | | 0.13 | | | | | | 3.05 | | | | | | 3,539 | | | | | | 75 | | |
| 12-31-15 | | | | | 11.91 | | | | | | 0.34• | | | | | | (0.33) | | | | | | 0.01 | | | | | | 0.07 | | | | | | 0.30 | | | | | | — | | | | | | 0.37 | | | | | | — | | | | | | 11.55 | | | | | | 0.04 | | | | | | 1.72 | | | | | | 0.13 | | | | | | 0.13 | | | | | | 2.98 | | | | | | 311 | | | | | | 108 | | |
| Class S | | | | | | | | | | | | | | | | | | | | | | | | | | | | | | | | | | | | | | | | | | | | | | | | | | | | | | | | | | | | | | | | | | | | | | | | | | | | | | | | | | | | | | | | | | | | | | | | | | | | | | | |
| 12-31-19 | | | | | 12.50 | | | | | | 0.22• | | | | | | 1.62 | | | | | | 1.84 | | | | | | 0.19 | | | | | | 0.33 | | | | | | — | | | | | | 0.52 | | | | | | — | | | | | | 13.82 | | | | | | 14.93 | | | | | | 0.52 | | | | | | 0.48 | | | | | | 0.48 | | | | | | 1.68 | | | | | | 8,103 | | | | | | 44 | | |
| 12-31-18 | | | | | 13.54 | | | | | | 0.24 | | | | | | (0.77) | | | | | | (0.53) | | | | | | 0.17 | | | | | | 0.34 | | | | | | — | | | | | | 0.51 | | | | | | — | | | | | | 12.50 | | | | | | (4.13) | | | | | | 0.52 | | | | | | 0.46 | | | | | | 0.46 | | | | | | 1.83 | | | | | | 11,578 | | | | | | 44 | | |
| 12-31-17 | | | | | 12.25 | | | | | | 0.23• | | | | | | 1.24 | | | | | | 1.47 | | | | | | 0.08 | | | | | | 0.10 | | | | | | — | | | | | | 0.18 | | | | | | — | | | | | | 13.54 | | | | | | 12.06 | | | | | | 0.52 | | | | | | 0.43 | | | | | | 0.43 | | | | | | 1.80 | | | | | | 12,049 | | | | | | 42 | | |
| 12-31-16 | | | | | 11.55 | | | | | | 0.30• | | | | | | 0.43 | | | | | | 0.73 | | | | | | 0.02 | | | | | | 0.01 | | | | | | — | | | | | | 0.03 | | | | | | — | | | | | | 12.25 | | | | | | 6.26 | | | | | | 0.57 | | | | | | 0.38 | | | | | | 0.38 | | | | | | 2.53 | | | | | | 8,811 | | | | | | 75 | | |
| 12-31-15 | | | | | 11.91 | | | | | | 0.58• | | | | | | (0.59) | | | | | | (0.01) | | | | | | 0.05 | | | | | | 0.30 | | | | | | — | | | | | | 0.35 | | | | | | — | | | | | | 11.55 | | | | | | (0.08) | | | | | | 1.97 | | | | | | 0.38 | | | | | | 0.38 | | | | | | 5.10 | | | | | | 1,084 | | | | | | 108 | | |
| Class S2 | | | | | | | | | | | | | | | | | | | | | | | | | | | | | | | | | | | | | | | | | | | | | | | | | | | | | | | | | | | | | | | | | | | | | | | | | | | | | | | | | | | | | | | | | | | | | | | | | | | | | | | |
| 12-31-19 | | | | | 12.43 | | | | | | 0.23• | | | | | | 1.58 | | | | | | 1.81 | | | | | | 0.21 | | | | | | 0.33 | | | | | | — | | | | | | 0.54 | | | | | | — | | | | | | 13.70 | | | | | | 14.78 | | | | | | 0.67 | | | | | | 0.63 | | | | | | 0.63 | | | | | | 1.73 | | | | | | 8,696 | | | | | | 44 | | |
| 12-31-18 | | | | | 13.46 | | | | | | 0.25• | | | | | | (0.80) | | | | | | (0.55) | | | | | | 0.14 | | | | | | 0.34 | | | | | | — | | | | | | 0.48 | | | | | | — | | | | | | 12.43 | | | | | | (4.29) | | | | | | 0.67 | | | | | | 0.61 | | | | | | 0.61 | | | | | | 1.88 | | | | | | 5,488 | | | | | | 44 | | |
| 12-31-17 | | | | | 12.19 | | | | | | 0.20 | | | | | | 1.24 | | | | | | 1.44 | | | | | | 0.07 | | | | | | 0.10 | | | | | | — | | | | | | 0.17 | | | | | | — | | | | | | 13.46 | | | | | | 11.92 | | | | | | 0.67 | | | | | | 0.58 | | | | | | 0.58 | | | | | | 1.59 | | | | | | 3,783 | | | | | | 42 | | |
| 12-31-16 | | | | | 11.52 | | | | | | 0.30• | | | | | | 0.39 | | | | | | 0.69 | | | | | | 0.01 | | | | | | 0.01 | | | | | | — | | | | | | 0.02 | | | | | | — | | | | | | 12.19 | | | | | | 6.00 | | | | | | 0.75 | | | | | | 0.53 | | | | | | 0.53 | | | | | | 2.54 | | | | | | 3,328 | | | | | | 75 | | |
| 12-31-15 | | | | | 11.84 | | | | | | 0.46• | | | | | | (0.48) | | | | | | (0.02) | | | | | | 0.00* | | | | | | 0.30 | | | | | | — | | | | | | 0.30 | | | | | | — | | | | | | 11.52 | | | | | | (0.16) | | | | | | 2.22 | | | | | | 0.53 | | | | | | 0.53 | | | | | | 3.99 | | | | | | 367 | | | | | | 108 | | |
| Class Z | | | | | | | | | | | | | | | | | | | | | | | | | | | | | | | | | | | | | | | | | | | | | | | | | | | | | | | | | | | | | | | | | | | | | | | | | | | | | | | | | | | | | | | | | | | | | | | | | | | | | | | |
| 12-31-19 | | | | | 12.63 | | | | | | 0.31• | | | | | | 1.62 | | | | | | 1.93 | | | | | | 0.25 | | | | | | 0.33 | | | | | | — | | | | | | 0.58 | | | | | | — | | | | | | 13.98 | | | | | | 15.46 | | | | | | 0.27 | | | | | | 0.00* | | | | | | 0.00* | | | | | | 2.30 | | | | | | 360,984 | | | | | | 44 | | |
| 12-31-18 | | | | | 13.65 | | | | | | 0.31• | | | | | | (0.79) | | | | | | (0.48) | | | | | | 0.20 | | | | | | 0.34 | | | | | | — | | | | | | 0.54 | | | | | | — | | | | | | 12.63 | | | | | | (3.74) | | | | | | 0.27 | | | | | | 0.00* | | | | | | 0.00* | | | | | | 2.31 | | | | | | 251,060 | | | | | | 44 | | |
| 12-31-17 | | | | | 12.30 | | | | | | 0.31• | | | | | | 1.23 | | | | | | 1.54 | | | | | | 0.09 | | | | | | 0.10 | | | | | | — | | | | | | 0.19 | | | | | | — | | | | | | 13.65 | | | | | | 12.63 | | | | | | 0.27 | | | | | | 0.00* | | | | | | 0.00* | | | | | | 2.35 | | | | | | 203,080 | | | | | | 42 | | |
| 12-31-16 | | | | | 11.57 | | | | | | 0.41• | | | | | | 0.35 | | | | | | 0.76 | | | | | | 0.02 | | | | | | 0.01 | | | | | | — | | | | | | 0.03 | | | | | | — | | | | | | 12.30 | | | | | | 6.52 | | | | | | 0.32 | | | | | | 0.00* | | | | | | 0.00* | | | | | | 3.44 | | | | | | 73,350 | | | | | | 75 | | |
| 05-01-15(5) - | | | | | | | | | | | | | | | | | | | | | | | | | | | | | | | | | | | | | | | | | | | | | | | | | | | | | | | | | | | | | | | | | | | | | | | | | | | | | | | | | | | | | | | | | | | | | | | | | | | | | | | |
| 12-31-15 | | | | | 12.30 | | | | | | 0.38• | | | | | | (0.74) | | | | | | (0.36) | | | | | | 0.07 | | | | | | 0.30 | | | | | | — | | | | | | 0.37 | | | | | | — | | | | | | 11.57 | | | | | | (2.97) | | | | | | 1.70 | | | | | | 0.00* | | | | | | 0.00* | | | | | | 4.91 | | | | | | 2,030 | | | | | | 108 | | |
| Voya Index Solution 2025 Portfolio | | | | | | | | | | | | | | | | | | | | | | | | | | | | | | | | | | | | | | | | | | | | | | | | | | | | | | | | | | | | | | | | | | | | | | | | | | | | | | | | | | | | | | | | | | | | | | | | | | | | | | | |
| Class ADV | | | | | | | | | | | | | | | | | | | | | | | | | | | | | | | | | | | | | | | | | | | | | | | | | | | | | | | | | | | | | | | | | | | | | | | | | | | | | | | | | | | | | | | | | | | | | | | | | | | | | | | |
| 12-31-19 | | | | | 9.99 | | | | | | 0.17• | | | | | | 1.61 | | | | | | 1.78 | | | | | | 0.16 | | | | | | 0.39 | | | | | | — | | | | | | 0.55 | | | | | | — | | | | | | 11.22 | | | | | | 18.15 | | | | | | 0.75 | | | | | | 0.72 | | | | | | 0.72 | | | | | | 1.55 | | | | | | 193,477 | | | | | | 28 | | |
| 12-31-18 | | ��� | | | 10.94 | | | | | | 0.17• | | | | | | (0.73) | | | | | | (0.56) | | | | | | 0.14 | | | | | | 0.25 | | | | | | — | | | | | | 0.39 | | | | | | — | | | | | | 9.99 | | | | | | (5.37) | | | | | | 0.76 | | | | | | 0.70 | | | | | | 0.70 | | | | | | 1.53 | | | | | | 196,102 | | | | | | 35 | | |
| 12-31-17 | | | | | 9.89 | | | | | | 0.15• | | | | | | 1.25 | | | | | | 1.40 | | | | | | 0.14 | | | | | | 0.21 | | | | | | — | | | | | | 0.35 | | | | | | — | | | | | | 10.94 | | | | | | 14.32 | | | | | | 0.76 | | | | | | 0.68 | | | | | | 0.68 | | | | | | 1.44 | | | | | | 232,790 | | | | | | 32 | | |
| 12-31-16 | | | | | 10.19 | | | | | | 0.19 | | | | | | 0.47 | | | | | | 0.66 | | | | | | 0.21 | | | | | | 0.75 | | | | | | — | | | | | | 0.96 | | | | | | — | | | | | | 9.89 | | | | | | 6.61 | | | | | | 0.77 | | | | | | 0.63 | | | | | | 0.63 | | | | | | 1.86 | | | | | | 228,234 | | | | | | 44 | | |
| 12-31-15 | | | | | 11.49 | | | | | | 0.19 | | | | | | (0.36) | | | | | | (0.17) | | | | | | 0.16 | | | | | | 0.97 | | | | | | — | | | | | | 1.13 | | | | | | — | | | | | | 10.19 | | | | | | (1.80) | | | | | | 0.77 | | | | | | 0.63 | | | | | | 0.63 | | | | | | 1.75 | | | | | | 228,081 | | | | | | 40 | | |
| Class I | | | | | | | | | | | | | | | | | | | | | | | | | | | | | | | | | | | | | | | | | | | | | | | | | | | | | | | | | | | | | | | | | | | | | | | | | | | | | | | | | | | | | | | | | | | | | | | | | | | | | | | |
| 12-31-19 | | | | | 10.24 | | | | | | 0.23• | | | | | | 1.65 | | | | | | 1.88 | | | | | | 0.22 | | | | | | 0.39 | | | | | | — | | | | | | 0.61 | | | | | | — | | | | | | 11.51 | | | | | | 18.78 | | | | | | 0.25 | | | | | | 0.22 | | | | | | 0.22 | | | | | | 2.07 | | | | | | 60,504 | | | | | | 28 | | |
| 12-31-18 | | | | | 11.21 | | | | | | 0.23 | | | | | | (0.76) | | | | | | (0.53) | | | | | | 0.19 | | | | | | 0.25 | | | | | | — | | | | | | 0.44 | | | | | | — | | | | | | 10.24 | | | | | | (4.94) | | | | | | 0.26 | | | | | | 0.20 | | | | | | 0.20 | | | | | | 2.06 | | | | | | 56,645 | | | | | | 35 | | |
| 12-31-17 | | | | | 10.13 | | | | | | 0.21• | | | | | | 1.27 | | | | | | 1.48 | | | | | | 0.19 | | | | | | 0.21 | | | | | | — | | | | | | 0.40 | | | | | | — | | | | | | 11.21 | | | | | | 14.84 | | | | | | 0.26 | | | | | | 0.18 | | | | | | 0.18 | | | | | | 1.94 | | | | | | 60,664 | | | | | | 32 | | |
| 12-31-16 | | | | | 10.42 | | | | | | 0.25• | | | | | | 0.48 | | | | | | 0.73 | | | | | | 0.27 | | | | | | 0.75 | | | | | | — | | | | | | 1.02 | | | | | | — | | | | | | 10.13 | | | | | | 7.14 | | | | | | 0.27 | | | | | | 0.13 | | | | | | 0.13 | | | | | | 2.39 | | | | | | 56,555 | | | | | | 44 | | |
| 12-31-15 | | | | | 11.72 | | | | | | 0.26• | | | | | | (0.37) | | | | | | (0.11) | | | | | | 0.22 | | | | | | 0.97 | | | | | | — | | | | | | 1.19 | | | | | | — | | | | | | 10.42 | | | | | | (1.25) | | | | | | 0.27 | | | | | | 0.13 | | | | | | 0.13 | | | | | | 2.29 | | | | | | 49,275 | | | | | | 40 | | |
See Accompanying Notes to Financial Statements
Financial Highlights (continued)
| | | | | | | | | | Income (loss)
from
investment
operations | | | | | | | | | Less Distributions | | | | | | Ratios to average net assets | | | Supplemental
Data | |
| | | | Net asset value, beginning of year
or period | | | Net investment income (loss) | | | Net realized and unrealized
gain (loss) | | | Total from investment operations | | | From net investment income | | | From net realized gains | | | From return of capital | | | Total distributions | | | Payment by affiliate | | | Net asset value, end of year
or period | | | Total Return(1) | | | Expenses before
reductions/additions(2)(3)(4) | | | Expenses net of fee waivers
and/or recoupments if any(2)(3)(4) | | | Expenses net of all
reductions/additions(2)(3)(4) | | | Net investment income (loss)(2)(3) | | | Net assets, end of year or period | | | Portfolio turnover rate | |
Year or
period ended | | | ($) | | | ($) | | | ($) | | | ($) | | | ($) | | | ($) | | | ($) | | | ($) | | | ($) | | | ($) | | | (%) | | | (%) | | | (%) | | | (%) | | | (%) | | | ($000’s) | | | (%) | |
| Voya Index Solution 2025 Portfolio (continued) | | | | | | | | | | | | | | | | | | | | | | | | | | | | | | | | | | | | | | | | | | | | | | | | | | | | | | | | | | | | | | | | | | | | | | | | | | | | | | | | | | | | | | | | | | | | | | | | | | | | | | | |
| Class S | | | | | | | | | | | | | | | | | | | | | | | | | | | | | | | | | | | | | | | | | | | | | | | | | | | | | | | | | | | | | | | | | | | | | | | | | | | | | | | | | | | | | | | | | | | | | | | | | | | | | | | |
| 12-31-19 | | | | | 10.13 | | | | | | 0.21 | | | | | | 1.62 | | | | | | 1.83 | | | | | | 0.19 | | | | | | 0.39 | | | | | | — | | | | | | 0.58 | | | | | | — | | | | | | 11.38 | | | | | | 18.46 | | | | | | 0.50 | | | | | | 0.47 | | | | | | 0.47 | | | | | | 1.82 | | | | | | 133,118 | | | | | | 28 | | |
| 12-31-18 | | | | | 11.09 | | | | | | 0.19• | | | | | | (0.74) | | | | | | (0.55) | | | | | | 0.16 | | | | | | 0.25 | | | | | | — | | | | | | 0.41 | | | | | | — | | | | | | 10.13 | | | | | | (5.17) | | | | | | 0.51 | | | | | | 0.45 | | | | | | 0.45 | | | | | | 1.78 | | | | | | 120,905 | | | | | | 35 | | |
| 12-31-17 | | | | | 10.02 | | | | | | 0.18• | | | | | | 1.26 | | | | | | 1.44 | | | | | | 0.16 | | | | | | 0.21 | | | | | | — | | | | | | 0.37 | | | | | | — | | | | | | 11.09 | | | | | | 14.62 | | | | | | 0.51 | | | | | | 0.43 | | | | | | 0.43 | | | | | | 1.69 | | | | | | 149,827 | | | | | | 32 | | |
| 12-31-16 | | | | | 10.31 | | | | | | 0.21• | | | | | | 0.48 | | | | | | 0.69 | | | | | | 0.23 | | | | | | 0.75 | | | | | | — | | | | | | 0.98 | | | | | | — | | | | | | 10.02 | | | | | | 6.85 | | | | | | 0.52 | | | | | | 0.38 | | | | | | 0.38 | | | | | | 2.07 | | | | | | 150,126 | | | | | | 44 | | |
| 12-31-15 | | | | | 11.61 | | | | | | 0.23 | | | | | | (0.36) | | | | | | (0.13) | | | | | | 0.20 | | | | | | 0.97 | | | | | | — | | | | | | 1.17 | | | | | | — | | | | | | 10.31 | | | | | | (1.50) | | | | | | 0.52 | | | | | | 0.38 | | | | | | 0.38 | | | | | | 1.99 | | | | | | 166,420 | | | | | | 40 | | |
| Class S2 | | | | | | | | | | | | | | | | | | | | | | | | | | | | | | | | | | | | | | | | | | | | | | | | | | | | | | | | | | | | | | | | | | | | | | | | | | | | | | | | | | | | | | | | | | | | | | | | | | | | | | | |
| 12-31-19 | | | | | 9.96 | | | | | | 0.18• | | | | | | 1.60 | | | | | | 1.78 | | | | | | 0.18 | | | | | | 0.39 | | | | | | — | | | | | | 0.57 | | | | | | — | | | | | | 11.17 | | | | | | 18.23 | | | | | | 0.65 | | | | | | 0.62 | | | | | | 0.62 | | | | | | 1.70 | | | | | | 32,859 | | | | | | 28 | | |
| 12-31-18 | | | | | 10.90 | | | | | | 0.17• | | | | | | (0.72) | | | | | | (0.55) | | | | | | 0.14 | | | | | | 0.25 | | | | | | — | | | | | | 0.39 | | | | | | — | | | | | | 9.96 | | | | | | (5.29) | | | | | | 0.66 | | | | | | 0.60 | | | | | | 0.60 | | | | | | 1.61 | | | | | | 26,038 | | | | | | 35 | | |
| 12-31-17 | | | | | 9.86 | | | | | | 0.16• | | | | | | 1.24 | | | | | | 1.40 | | | | | | 0.15 | | | | | | 0.21 | | | | | | — | | | | | | 0.36 | | | | | | — | | | | | | 10.90 | | | | | | 14.41 | | | | | | 0.66 | | | | | | 0.58 | | | | | | 0.58 | | | | | | 1.55 | | | | | | 34,197 | | | | | | 32 | | |
| 12-31-16 | | | | | 10.16 | | | | | | 0.20• | | | | | | 0.47 | | | | | | 0.67 | | | | | | 0.22 | | | | | | 0.75 | | | | | | — | | | | | | 0.97 | | | | | | — | | | | | ��� | 9.86 | | | | | | 6.72 | | | | | | 0.70 | | | | | | 0.53 | | | | | | 0.53 | | | | | | 2.04 | | | | | | 34,034 | | | | | | 44 | | |
| 12-31-15 | | | | | 11.44 | | | | | | 0.20• | | | | | | (0.35) | | | | | | (0.15) | | | | | | 0.16 | | | | | | 0.97 | | | | | | — | | | | | | 1.13 | | | | | | — | | | | | | 10.16 | | | | | | (1.63) | | | | | | 0.77 | | | | | | 0.53 | | | | | | 0.53 | | | | | | 1.83 | | | | | | 34,934 | | | | | | 40 | | |
| Class Z | | | | | | | | | | | | | | | | | | | | | | | | | | | | | | | | | | | | | | | | | | | | | | | | | | | | | | | | | | | | | | | | | | | | | | | | | | | | | | | | | | | | | | | | | | | | | | | | | | | | | | | |
| 12-31-19 | | | | | 10.31 | | | | | | 0.26• | | | | | | 1.66 | | | | | | 1.92 | | | | | | 0.22 | | | | | | 0.39 | | | | | | — | | | | | | 0.61 | | | | | | — | | | | | | 11.62 | | | | | | 19.04 | | | | | | 0.25 | | | | | | 0.00* | | | | | | 0.00* | | | | | | 2.35 | | | | | | 685,495 | | | | | | 28 | | |
| 12-31-18 | | | | | 11.26 | | | | | | 0.26• | | | | | | (0.77) | | | | | | (0.51) | | | | | | 0.19 | | | | | | 0.25 | | | | | | — | | | | | | 0.44 | | | | | | — | | | | | | 10.31 | | | | | | (4.74) | | | | | | 0.26 | | | | | | 0.00* | | | | | | 0.00* | | | | | | 2.31 | | | | | | 452,255 | | | | | | 35 | | |
| 12-31-17 | | | | | 10.16 | | | | | | 0.25• | | | | | | 1.25 | | | | | | 1.50 | | | | | | 0.19 | | | | | | 0.21 | | | | | | — | | | | | | 0.40 | | | | | | — | | | | | | 11.26 | | | | | | 15.00 | | | | | | 0.26 | | | | | | 0.00* | | | | | | 0.00* | | | | | | 2.31 | | | | | | 371,838 | | | | | | 32 | | |
| 12-31-16 | | | | | 10.43 | | | | | | 0.32• | | | | | | 0.43 | | | | | | 0.75 | | | | | | 0.27 | | | | | | 0.75 | | �� | | | | — | | | | | | 1.02 | | | | | | — | | | | | | 10.16 | | | | | | 7.33 | | | | | | 0.27 | | | | | | 0.00* | | | | | | 0.00* | | | | | | 3.13 | | | | | | 118,855 | | | | | | 44 | | |
| 05-01-15(5) - | | | | | | | | | | | | | | | | | | | | | | | | | | | | | | | | | | | | | | | | | | | | | | | | | | | | | | | | | | | | | | | | | | | | | | | | | | | | | | | | | | | | | | | | | | | | | | | | | | | | | | | |
| 12-31-15 | | | | | 12.17 | | | | | | 0.41• | | | | | | (0.96) | | | | | | (0.55) | | | | | | 0.22 | | | | | | 0.97 | | | | | | — | | | | | | 1.19 | | | | | | — | | | | | | 10.43 | | | | | | (4.81) | | | | | | 0.28 | | | | | | 0.00* | | | | | | 0.00* | | | | | | 5.95 | | | | | | 2,310 | | | | | | 40 | | |
| Voya Index Solution 2030 Portfolio | | | | | | | | | | | | | | | | | | | | | | | | | | | | | | | | | | | | | | | | | | | | | | | | | | | | | | | | | | | | | | | | | | | | | | | | | | | | | | | | | | | | | | | | | | | | | | | | | | | | | | | |
| Class ADV | | | | | | | | | | | | | | | | | | | | | | | | | | | | | | | | | | | | | | | | | | | | | | | | | | | | | | | | | | | | | | | | | | | | | | | | | | | | | | | | | | | | | | | | | | | | | | | | | | | | | | | |
| 12-31-19 | | | | | 13.81 | | | | | | 0.23• | | | | | | 2.53 | | | | | | 2.76 | | | | | | 0.20 | | | | | | 0.48 | | | | | | — | | | | | | 0.68 | | | | | | — | | | | | | 15.89 | | | | | | 20.35 | | | | | | 0.74 | | | | | | 0.73 | | | | | | 0.73 | | | | | | 1.55 | | | | | | 36,621 | | | | | | 29 | | |
| 12-31-18 | | | | | 15.28 | | | | | | 0.24• | | | | | | (1.21) | | | | | | (0.97) | | | | | | 0.15 | | | | | | 0.35 | | | | | | — | | | | | | 0.50 | | | | | | — | | | | | | 13.81 | | | | | | (6.60) | | | | | | 0.75 | | | | | | 0.70 | | | | | | 0.70 | | | | | | 1.61 | | | | | | 27,143 | | | | | | 33 | | |
| 12-31-17 | | | | | 13.22 | | | | | | 0.21• | | | | | | 1.98 | | | | | | 2.19 | | | | | | 0.05 | | | | | | 0.08 | | | | | | — | | | | | | 0.13 | | | | | | — | | | | | | 15.28 | | | | | | 16.62 | | | | | | 0.76 | | | | | | 0.69 | | | | | | 0.69 | | | | | | 1.48 | | | | | | 20,939 | | | | | | 32 | | |
| 12-31-16 | | | | | 12.39 | | | | | | 0.27• | | | | | | 0.58 | | | | | | 0.85 | | | | | | 0.01 | | | | | | 0.01 | | | | | | — | | | | | | 0.02 | | | | | | — | | | | | | 13.22 | | | | | | 6.84 | | | | | | 0.83 | | | | | | 0.63 | | | | | | 0.63 | | | | | | 2.13 | | | | | | 10,732 | | | | | | 64 | | |
| 12-31-15 | | | | | 12.70 | | | | | | 0.48• | | | | | | (0.53) | | | | | | (0.05) | | | | | | 0.07 | | | | | | 0.19 | | | | | | — | | | | | | 0.26 | | | | | | — | | | | | | 12.39 | | | | | | (0.48) | | | | | | 3.36 | | | | | | 0.63 | | | | | | 0.63 | | | | | | 3.93 | | | | | | 2,598 | | | | | | 136 | | |
| Class I | | | | | | | | | | | | | | | | | | | | | | | | | | | | | | | | | | | | | | | | | | | | | | | | | | | | | | | | | | | | | | | | | | | | | | | | | | | | | | | | | | | | | | | | | | | | | | | | | | | | | | | |
| 12-31-19 | | | | | 14.19 | | | | | | 0.31• | | | | | | 2.61 | | | | | | 2.92 | | | | | | 0.26 | | | | | | 0.48 | | | | | | — | | | | | | 0.74 | | | | | | — | | | | | | 16.37 | | | | | | 21.02 | | | | | | 0.24 | | | | | | 0.23 | | | | | | 0.23 | | | | | | 2.01 | | | | | | 8,674 | | | | | | 29 | | |
| 12-31-18 | | | | | 15.65 | | | | | | 0.31• | | | | | | (1.23) | | | | | | (0.92) | | | | | | 0.19 | | | | | | 0.35 | | | | | | — | | | | | | 0.54 | | | | | | — | | | | | | 14.19 | | | | | | (6.11) | | | | | | 0.25 | | | | | | 0.20 | | | | | | 0.20 | | | | | | 2.03 | | | | | | 6,304 | | | | | | 33 | | |
| 12-31-17 | | | | | 13.50 | | | | | | 0.31• | | | | | | 1.99 | | | | | | 2.30 | | | | | | 0.07 | | | | | | 0.08 | | | | | | — | | | | | | 0.15 | | | | | | — | | | | | | 15.65 | | | | | | 17.14 | | | | | | 0.26 | | | | | | 0.19 | | | | | | 0.19 | | | | | | 2.10 | | | | | | 4,953 | | | | | | 32 | | |
| 12-31-16 | | | | | 12.60 | | | | | | 0.31• | | | | | | 0.61 | | | | | | 0.92 | | | | | | 0.01 | | | | | | 0.01 | | | | | | — | | | | | | 0.02 | | | | | | — | | | | | | 13.50 | | | | | | 7.31 | | | | | | 0.33 | | | | | | 0.13 | | | | | | 0.13 | | | | | | 2.36 | | | | | | 2,173 | | | | | | 64 | | |
| 12-31-15 | | | | | 12.79 | | | | | | 0.99• | | | | | | (0.99) | | | | | | 0.00* | | | | | | — | | | | | | 0.19 | | | | | | — | | | | | | 0.19 | | | | | | — | | | | | | 12.60 | | | | | | (0.03) | | | | | | 2.86 | | | | | | 0.13 | | | | | | 0.13 | | | | | | 8.08 | | | | | | 779 | | | | | | 136 | | |
| Class S | | | | | | | | | | | | | | | | | | | | | | | | | | | | | | | | | | | | | | | | | | | | | | | | | | | | | | | | | | | | | | | | | | | | | | | | | | | | | | | | | | | | | | | | | | | | | | | | | | | | | | | |
| 12-31-19 | | | | | 14.09 | | | | | | 0.28• | | | | | | 2.58 | | | | | | 2.86 | | | | | | 0.23 | | | | | | 0.48 | | | | | | — | | | | | | 0.71 | | | | | | — | | | | | | 16.24 | | | | | | 20.67 | | | | | | 0.49 | | | | | | 0.48 | | | | | | 0.48 | | | | | | 1.79 | | | | | | 14,570 | | | | | | 29 | | |
| 12-31-18 | | | | | 15.56 | | | | | | 0.28 | | | | | | (1.24) | | | | | | (0.96) | | | | | | 0.16 | | | | | | 0.35 | | | | | | — | | | | | | 0.51 | | | | | | — | | | | | | 14.09 | | | | | | (6.40) | | | | | | 0.50 | | | | | | 0.45 | | | | | | 0.45 | | | | | | 1.77 | | | | | | 11,224 | | | | | | 33 | | |
| 12-31-17 | | | | | 13.44 | | | | | | 0.27• | | | | | | 1.99 | | | | | | 2.26 | | | | | | 0.06 | | | | | | 0.08 | | | | | | — | | | | | | 0.14 | | | | | | — | | | | | | 15.56 | | | | | | 16.91 | | | | | | 0.51 | | | | | | 0.44 | | | | | | 0.44 | | | | | | 1.82 | | | | | | 12,320 | | | | | | 32 | | |
| 12-31-16 | | | | | 12.57 | | | | | | 0.37• | | | | | | 0.52 | | | | | | 0.89 | | | | | | 0.01 | | | | | | 0.01 | | | | | | — | | | | | | 0.02 | | | | | | — | | | | | | 13.44 | | | | | | 7.08 | | | | | | 0.58 | | | | | | 0.38 | | | | | | 0.38 | | | | | | 2.83 | | | | | | 6,607 | | | | | | 64 | | |
| 12-31-15 | | | | | 12.79 | | | | | | 0.43• | | | | | | (0.46) | | | | | | (0.03) | | | | | | — | | | | | | 0.19 | | | | | | — | | | | | | 0.19 | | | | | | — | | | | | | 12.57 | | | | | | (0.27) | | | | | | 3.11 | | | | | | 0.38 | | | | | | 0.38 | | | | | | 3.45 | | | | | | 521 | | | | | | 136 | | |
See Accompanying Notes to Financial Statements
Financial Highlights (continued)
| | | | | | | | | | Income (loss)
from
investment
operations | | | | | | | | | Less Distributions | | | | | | Ratios to average net assets | | | Supplemental
Data | |
| | | | Net asset value, beginning of year
or period | | | Net investment income (loss) | | | Net realized and unrealized
gain (loss) | | | Total from investment operations | | | From net investment income | | | From net realized gains | | | From return of capital | | | Total distributions | | | Payment by affiliate | | | Net asset value, end of year
or period | | | Total Return(1) | | | Expenses before
reductions/additions(2)(3)(4) | | | Expenses net of fee waivers
and/or recoupments if any(2)(3)(4) | | | Expenses net of all
reductions/additions(2)(3)(4) | | | Net investment income (loss)(2)(3) | | | Net assets, end of year or period | | | Portfolio turnover rate | |
Year or
period ended | | | ($) | | | ($) | | | ($) | | | ($) | | | ($) | | | ($) | | | ($) | | | ($) | | | ($) | | | ($) | | | (%) | | | (%) | | | (%) | | | (%) | | | (%) | | | ($000’s) | | | (%) | |
| Voya Index Solution 2030 Portfolio (continued) | | | | | | | | | | | | | | | | | | | | | | | | | | | | | | | | | | | | | | | | | | | | | | | | | | | | | | | | | | | | | | | | | | | | | | | | | | | | | | | | | | | | | | | | | | | | | | | | | | | | | | | |
| Class S2 | | | | | | | | | | | | | | | | | | | | | | | | | | | | | | | | | | | | | | | | | | | | | | | | | | | | | | | | | | | | | | | | | | | | | | | | | | | | | | | | | | | | | | | | | | | | | | | | | | | | | | | |
| 12-31-19 | | | | | 13.94 | | | | | | 0.27• | | | | | | 2.53 | | | | | | 2.80 | | | | | | 0.24 | | | | | | 0.48 | | | | | | — | | | | | | 0.72 | | | | | | — | | | | | | 16.02 | | | | | | 20.50 | | | | | | 0.64 | | | | | | 0.63 | | | | | | 0.63 | | | | | | 1.77 | | | | | | 5,688 | | | | | | 29 | | |
| 12-31-18 | | | | | 15.37 | | | | | | 0.26• | | | | | | (1.22) | | | | | | (0.96) | | | | | | 0.12 | | | | | | 0.35 | | | | | | — | | | | | | 0.47 | | | | | | — | | | | | | 13.94 | | | | | | (6.47) | | | | | | 0.65 | | | | | | 0.60 | | | | | | 0.60 | | | | | | 1.74 | | | | | | 2,239 | | | | | | 33 | | |
| 12-31-17 | | | | | 13.29 | | | | | | 0.22• | | | | | | 1.99 | | | | | | 2.21 | | | | | | 0.05 | | | | | | 0.08 | | | | | | — | | | | | | 0.13 | | | | | | — | | | | | | 15.37 | | | | | | 16.69 | | | | | | 0.66 | | | | | | 0.59 | | | | | | 0.59 | | | | | | 1.54 | | | | | | 1,800 | | | | | | 32 | | |
| 12-31-16 | | | | | 12.45 | | | | | | 0.33• | | | | | | 0.53 | | | | | | 0.86 | | | | | | 0.01 | | | | | | 0.01 | | | | | | — | | | | | | 0.02 | | | | | | — | | | | | | 13.29 | | | | | | 6.92 | | | | | | 0.76 | | | | | | 0.53 | | | | | | 0.53 | | | | | | 2.54 | | | | | | 1,735 | | | | | | 64 | | |
| 12-31-15 | | | | | 12.71 | | | | | | 0.48• | | | | | | (0.55) | | | | | | (0.07) | | | | | | — | | | | | | 0.19 | | | | | | — | | | | | | 0.19 | | | | | | — | | | | | | 12.45 | | | | | | (0.58) | | | | | | 3.36 | | | | | | 0.53 | | | | | | 0.53 | | | | | | 3.87 | | | | | | 47 | | | | | | 136 | | |
| Class Z | | | | | | | | | | | | | | | | | | | | | | | | | | | | | | | | | | | | | | | | | | | | | | | | | | | | | | | | | | | | | | | | | | | | | | | | | | | | | | | | | | | | | | | | | | | | | | | | | | | | | | | |
| 12-31-19 | | | | | 14.26 | | | | | | 0.36• | | | | | | 2.60 | | | | | | 2.96 | | | | | | 0.26 | | | | | | 0.48 | | | | | | — | | | | | | 0.74 | | | | | | — | | | | | | 16.48 | | | | | | 21.20 | | | | | | 0.24 | | | | | | 0.00* | | | | | | 0.00* | | | | | | 2.30 | | | | | | 558,381 | | | | | | 29 | | |
| 12-31-18 | | | | | 15.69 | | | | | | 0.36• | | | | | | (1.25) | | | | | | (0.89) | | | | | | 0.19 | | | | | | 0.35 | | | | | | — | | | | | | 0.54 | | | | | | — | | | | | | 14.26 | | | | | | (5.90) | | | | | | 0.25 | | | | | | 0.00* | | | | | | 0.00* | | | | | | 2.29 | | | | | | 348,273 | | | | | | 33 | | |
| 12-31-17 | | | | | 13.51 | | | | | | 0.35• | | | | | | 1.98 | | | | | | 2.33 | | | | | | 0.07 | | | | | | 0.08 | | | | | | — | | | | | | 0.15 | | | | | | — | | | | | | 15.69 | | | | | | 17.35 | | | | | | 0.26 | | | | | | 0.00* | | | | | | 0.00* | | | | | | 2.36 | | | | | | 267,328 | | | | | | 32 | | |
| 12-31-16 | | | | | 12.59 | | | | | | 0.46• | | | | | | 0.48 | | | | | | 0.94 | | | | | | 0.01 | | | | | | 0.01 | | | | | | — | | | | | | 0.02 | | | | | | — | | | | | | 13.51 | | | | | | 7.48 | | | | | | 0.33 | | | | | | 0.00* | | | | | | 0.00* | | | | | | 3.53 | | | | | | 72,347 | | | | | | 64 | | |
| 05-01-15(5) - | | | | | | | | | | | | | | | | | | | | | | | | | | | | | | | | | | | | | | | | | | | | | | | | | | | | | | | | | | | | | | | | | | | | | | | | | | | | | | | | | | | | | | | | | | | | | | | | | | | | | | | |
| 12-31-15 | | | | | 13.34 | | | | | | 0.36• | | | | | | (0.92) | | | | | | (0.56) | | | | | | — | | | | | | 0.19 | | | | | | — | | | | | | 0.19 | | | | | | — | | | | | | 12.59 | | | | | | (4.23) | | | | | | 2.82 | | | | | | 0.00* | | | | | | 0.00* | | | | | | 4.30 | | | | | | 1,196 | | | | | | 136 | | |
| Voya Index Solution 2035 Portfolio | | | | | | | | | | | | | | | | | | | | | | | | | | | | | | | | | | | | | | | | | | | | | | | | | | | | | | | | | | | | | | | | | | | | | | | | | | | | | | | | | | | | | | | | | | | | | | | | | | | | | | | |
| Class ADV | | | | | | | | | | | | | | | | | | | | | | | | | | | | | | | | | | | | | | | | | | | | | | | | | | | | | | | | | | | | | | | | | | | | | | | | | | | | | | | | | | | | | | | | | | | | | | | | | | | | | | | |
| 12-31-19 | | | | | 10.14 | | | | | | 0.17• | | | | | | 2.00 | | | | | | 2.17 | | | | | | 0.15 | | | | | | 0.44 | | | | | | — | | | | | | 0.59 | | | | | | — | | | | | | 11.72 | | | | | | 21.91 | | | | | | 0.74 | | | | | | 0.73 | | | | | | 0.73 | | | | | | 1.51 | | | | | | 186,455 | | | | | | 28 | | |
| 12-31-18 | | | | | 11.34 | | | | | | 0.16• | | | | | | (0.94) | | | | | | (0.78) | | | | | | 0.13 | | | | | | 0.29 | | | | | | — | | | | | | 0.42 | | | | | | — | | | | | | 10.14 | | | | | | (7.26) | | | | | | 0.75 | | | | | | 0.70 | | | | | | 0.70 | | | | | | 1.45 | | | | | | 176,145 | | | | | | 33 | | |
| 12-31-17 | | | | | 9.98 | | | | | | 0.15• | | | | | | 1.61 | | | | | | 1.76 | | | | | | 0.13 | | | | | | 0.27 | | | | | | — | | | | | | 0.40 | | | | | | — | | | | | | 11.34 | | | | | | 17.95 | | | | | | 0.76 | | | | | | 0.68 | | | | | | 0.68 | | | | | | 1.37 | | | | | | 215,074 | | | | | | 25 | | |
| 12-31-16 | | | | | 10.34 | | | | | | 0.19 | | | | | | 0.57 | | | | | | 0.76 | | | | | | 0.19 | | | | | | 0.93 | | | | | | — | | | | | | 1.12 | | | | | | — | | | | | | 9.98 | | | | | | 7.63 | | | | | | 0.76 | | | | | | 0.63 | | | | | | 0.63 | | | | | | 1.86 | | | | | | 203,566 | | | | | | 41 | | |
| 12-31-15 | | | | | 11.86 | | | | | | 0.18 | | | | | | (0.35) | | | | | | (0.17) | | | | | | 0.15 | | | | | | 1.20 | | | | | | — | | | | | | 1.35 | | | | | | — | | | | | | 10.34 | | | | | | (1.91) | | | | | | 0.77 | | | | | | 0.64 | | | | | | 0.64 | | | | | | 1.62 | | | | | | 199,097 | | | | | | 38 | | |
| Class I | | | | | | | | | | | | | | | | | | | | | | | | | | | | | | | | | | | | | | | | | | | | | | | | | | | | | | | | | | | | | | | | | | | | | | | | | | | | | | | | | | | | | | | | | | | | | | | | | | | | | | | |
| 12-31-19 | | | | | 10.42 | | | | | | 0.24 | | | | | | 2.05 | | | | | | 2.29 | | | | | | 0.21 | | | | | | 0.44 | | | | | | — | | | | | | 0.65 | | | | | | — | | | | | | 12.06 | | | | | | 22.58 | | | | | | 0.24 | | | | | | 0.23 | | | | | | 0.23 | | | | | | 2.00 | | | | | | 64,433 | | | | | | 28 | | |
| 12-31-18 | | | | | 11.65 | | | | | | 0.22 | | | | | | (0.98) | | | | | | (0.76) | | | | | | 0.18 | | | | | | 0.29 | | | | | | — | | | | | | 0.47 | | | | | | — | | | | | | 10.42 | | | | | | (6.86) | | | | | | 0.25 | | | | | | 0.20 | | | | | | 0.20 | | | | | | 1.99 | | | | | | 55,982 | | | | | | 33 | | |
| 12-31-17 | | | | | 10.23 | | | | | | 0.20 | | | | | | 1.68 | | | | | | 1.88 | | | | | | 0.19 | | | | | | 0.27 | | | | | | — | | | | | | 0.46 | | | | | | — | | | | | | 11.65 | | | | | | 18.65 | | | | | | 0.26 | | | | | | 0.18 | | | | | | 0.18 | | | | | | 1.89 | | | | | | 58,021 | | | | | | 25 | | |
| 12-31-16 | | | | | 10.58 | | | | | | 0.25• | | | | | | 0.58 | | | | | | 0.83 | | | | | | 0.25 | | | | | | 0.93 | | | | | | — | | | | | | 1.18 | | | | | | — | | | | | | 10.23 | | | | | | 8.12 | | | | | | 0.26 | | | | | | 0.13 | | | | | | 0.13 | | | | | | 2.40 | | | | | | 47,484 | | | | | | 41 | | |
| 12-31-15 | | | | | 12.11 | | | | | | 0.25• | | | | | | (0.37) | | | | | | (0.12) | | | | | | 0.21 | | | | | | 1.20 | | | | | | — | | | | | | 1.41 | | | | | | — | | | | | | 10.58 | | | | | | (1.47) | | | | | | 0.27 | | | | | | 0.14 | | | | | | 0.14 | | | | | | 2.18 | | | | | | 37,272 | | | | | | 38 | | |
| Class S | | | | | | | | | | | | | | | | | | | | | | | | | | | | | | | | | | | | | | | | | | | | | | | | | | | | | | | | | | | | | | | | | | | | | | | | | | | | | | | | | | | | | | | | | | | | | | | | | | | | | | | |
| 12-31-19 | | | | | 10.29 | | | | | | 0.21 | | | | | | 2.03 | | | | | | 2.24 | | | | | | 0.18 | | | | | | 0.44 | | | | | | — | | | | | | 0.62 | | | | | | — | | | | | | 11.91 | | | | | | 22.36 | | | | | | 0.49 | | | | | | 0.48 | | | | | | 0.48 | | | | | | 1.76 | | | | | | 110,305 | | | | | | 28 | | |
| 12-31-18 | | | | | 11.51 | | | | | | 0.19• | | | | | | (0.97) | | | | | | (0.78) | | | | | | 0.15 | | | | | | 0.29 | | | | | | — | | | | | | 0.44 | | | | | | — | | | | | | 10.29 | | | | | | (7.12) | | | | | | 0.50 | | | | | | 0.45 | | | | | | 0.45 | | | | | | 1.70 | | | | | | 96,259 | | | | | | 33 | | |
| 12-31-17 | | | | | 10.11 | | | | | | 0.17• | | | | | | 1.66 | | | | | | 1.83 | | | | | | 0.16 | | | | | | 0.27 | | | | | | — | | | | | | 0.43 | | | | | | — | | | | | | 11.51 | | | | | | 18.39 | | | | | | 0.51 | | | | | | 0.43 | | | | | | 0.43 | | | | | | 1.61 | | | | | | 121,702 | | | | | | 25 | | |
| 12-31-16 | | | | | 10.47 | | | | | | 0.21• | | | | | | 0.58 | | | | | | 0.79 | | | | | | 0.22 | | | | | | 0.93 | | | | | | — | | | | | | 1.15 | | | | | | — | | | | | | 10.11 | | | | | | 7.77 | | | | | | 0.51 | | | | | | 0.38 | | | | | | 0.38 | | | | | | 2.06 | | | | | | 118,463 | | | | | | 41 | | |
| 12-31-15 | | | | | 11.99 | | | | | | 0.22 | | | | | | (0.36) | | | | | | (0.14) | | | | | | 0.18 | | | | | | 1.20 | | | | | | — | | | | | | 1.38 | | | | | | — | | | | | | 10.47 | | | | | | (1.63) | | | | | | 0.52 | | | | | | 0.39 | | | | | | 0.39 | | | | | | 1.87 | | | | | | 129,764 | | | | | | 38 | | |
| Class S2 | | | | | | | | | | | | | | | | | | | | | | | | | | | | | | | | | | | | | | | | | | | | | | | | | | | | | | | | | | | | | | | | | | | | | | | | | | | | | | | | | | | | | | | | | | | | | | | | | | | | | | | |
| 12-31-19 | | | | | 10.13 | | | | | | 0.18• | | | | | | 2.00 | | | | | | 2.18 | | | | | | 0.16 | | | | | | 0.44 | | | | | | — | | | | | | 0.60 | | | | | | — | | | | | | 11.71 | | | | | | 22.09 | | | | | | 0.64 | | | | | | 0.63 | | | | | | 0.63 | | | | | | 1.62 | | | | | | 33,877 | | | | | | 28 | | |
| 12-31-18 | | | | | 11.32 | | | | | | 0.17• | | | | | | (0.94) | | | | | | (0.77) | | | | | | 0.13 | | | | | | 0.29 | | | | | | — | | | | | | 0.42 | | | | | | — | | | | | | 10.13 | | | | | | (7.14) | | | | | | 0.65 | | | | | | 0.60 | | | | | | 0.60 | | | | | | 1.52 | | | | | | 29,751 | | | | | | 33 | | |
| 12-31-17 | | | | | 9.96 | | | | | | 0.16 | | | | | | 1.62 | | | | | | 1.78 | | | | | | 0.15 | | | | | | 0.27 | | | | | | — | | | | | | 0.42 | | | | | | — | | | | | | 11.32 | | | | | | 18.14 | | | | | | 0.66 | | | | | | 0.58 | | | | | | 0.58 | | | | | | 1.50 | | | | | | 37,316 | | | | | | 25 | | |
| 12-31-16 | | | | | 10.33 | | | | | | 0.20 | | | | | | 0.56 | | | | | | 0.76 | | | | | | 0.20 | | | | | | 0.93 | | | | | | — | | | | | | 1.13 | | | | | | — | | | | | | 9.96 | | | | | | 7.65 | | | | | | 0.69 | | | | | | 0.53 | | | | | | 0.53 | | | | | | 2.01 | | | | | | 32,558 | | | | | | 41 | | |
| 12-31-15 | | | | | 11.83 | | | | | | 0.19• | | | | | | (0.34) | | | | | | (0.15) | | | | | | 0.15 | | | | | | 1.20 | | | | | | — | | | | | | 1.35 | | | | | | — | | | | | | 10.33 | | | | | | (1.78) | | | | | | 0.77 | | | | | | 0.54 | | | | | | 0.54 | | | | | | 1.71 | | | | | | 31,067 | | | | | | 38 | | |
See Accompanying Notes to Financial Statements
Financial Highlights (continued)
| | | | | | | | | | Income (loss)
from
investment
operations | | | | | | | | | Less Distributions | | | | | | Ratios to average net assets | | | Supplemental
Data | |
| | | | Net asset value, beginning of year
or period | | | Net investment income (loss) | | | Net realized and unrealized
gain (loss) | | | Total from investment operations | | | From net investment income | | | From net realized gains | | | From return of capital | | | Total distributions | | | Payment by affiliate | | | Net asset value, end of year
or period | | | Total Return(1) | | | Expenses before
reductions/additions(2)(3)(4) | | | Expenses net of fee waivers
and/or recoupments if any(2)(3)(4) | | | Expenses net of all
reductions/additions(2)(3)(4) | | | Net investment income (loss)(2)(3) | | | Net assets, end of year or period | | | Portfolio turnover rate | |
Year or
period ended | | | ($) | | | ($) | | | ($) | | | ($) | | | ($) | | | ($) | | | ($) | | | ($) | | | ($) | | | ($) | | | (%) | | | (%) | | | (%) | | | (%) | | | (%) | | | ($000’s) | | | (%) | |
| Voya Index Solution 2035 Portfolio (continued) | | | | | | | | | | | | | | | | | | | | | | | | | | | | | | | | | | | | | | | | | | | | | | | | | | | | | | | | | | | | | | | | | | | | | | | | | | | | | | | | | | | | | | | | | | | | | | | | | | | | | | | |
| Class Z | | | | | | | | | | | | | | | | | | | | | | | | | | | | | | | | | | | | | | | | | | | | | | | | | | | | | | | | | | | | | | | | | | | | | | | | | | | | | | | | | | | | | | | | | | | | | | | | | | | | | | | |
| 12-31-19 | | | | | 10.51 | | | | | | 0.27• | | | | | | 2.07 | | | | | | 2.34 | | | | | | 0.21 | | | | | | 0.44 | | | | | | — | | | | | | 0.65 | | | | | | — | | | | | | 12.20 | | | | | | 22.88 | | | | | | 0.24 | | | | | | 0.00* | | | | | | 0.00* | | | | | | 2.31 | | | | | | 688,542 | | | | | | 28 | | |
| 12-31-18 | | | | | 11.72 | | | | | | 0.26• | | | | | | (1.00) | | | | | | (0.74) | | | | | | 0.18 | | | | | | 0.29 | | | | | | — | | | | | | 0.47 | | | | | | — | | | | | | 10.51 | | | | | | (6.64) | | | | | | 0.25 | | | | | | 0.00* | | | | | | 0.00* | | | | | | 2.24 | | | | | | 412,024 | | | | | | 33 | | |
| 12-31-17 | | | | | 10.27 | | | | | | 0.25• | | | | | | 1.66 | | | | | | 1.91 | | | | | | 0.19 | | | | | | 0.27 | | | | | | — | | | | | | 0.46 | | | | | | — | | | | | | 11.72 | | | | | | 18.88 | | | | | | 0.26 | | | | | | 0.00* | | | | | | 0.00* | | | | | | 2.26 | | | | | | 327,540 | | | | | | 25 | | |
| 12-31-16 | | | | | 10.61 | | | | | | 0.34• | | | | | | 0.50 | | | | | | 0.84 | | | | | | 0.25 | | | | | | 0.93 | | | | | | — | | | | | | 1.18 | | | | | | — | | | | | | 10.27 | | | | | | 8.21 | | | | | | 0.26 | | | | | | 0.00* | | | | | | 0.00* | | | | | | 3.31 | | | | | | 101,022 | | | | | | 41 | | |
| 05-01-15(5) - | | | | | | | | | | | | | | | | | | | | | | | | | | | | | | | | | | | | | | | | | | | | | | | | | | | | | | | | | | | | | | | | | | | | | | | | | | | | | | | | | | | | | | | | | | | | | | | | | | | | | | | |
| 12-31-15 | | | | | 12.66 | | | | | | 0.43• | | | | | | (1.07) | | | | | | (0.64) | | | | | | 0.21 | | | | | | 1.20 | | | | | | — | | | | | | 1.41 | | | | | | — | | | | | | 10.61 | | | | | | (5.49) | | | | | | 0.28 | | | | | | 0.00* | | | | | | 0.00* | | | | | | 6.12 | | | | | | 2,456 | | | | | | 38 | | |
| Voya Index Solution 2040 Portfolio | | | | | | | | | | | | | | | | | | | | | | | | | | | | | | | | | | | | | | | | | | | | | | | | | | | | | | | | | | | | | | | | | | | | | | | | | | | | | | | | | | | | | | | | | | | | | | | | | | | | | | | |
| Class ADV | | | | | | | | | | | | | | | | | | | | | | | | | | | | | | | | | | | | | | | | | | | | | | | | | | | | | | | | | | | | | | | | | | | | | | | | | | | | | | | | | | | | | | | | | | | | | | | | | | | | | | | |
| 12-31-19 | | | | | 14.29 | | | | | | 0.24• | | | | | | 3.01 | | | | | | 3.25 | | | | | | 0.19 | | | | | | 0.54 | | | | | | — | | | | | | 0.73 | | | | | | — | | | | | | 16.81 | | | | | | 23.19 | | | | | | 0.74 | | | | | | 0.73 | | | | | | 0.73 | | | | | | 1.48 | | | | | | 24,422 | | | | | | 23 | | |
| 12-31-18 | | | | | 16.00 | | | | | | 0.23• | | | | | | (1.45) | | | | | | (1.22) | | | | | | 0.13 | | | | | | 0.36 | | | | | | — | | | | | | 0.49 | | | | | | — | | | | | | 14.29 | | | | | | (7.94) | | | | | | 0.75 | | | | | | 0.71 | | | | | | 0.71 | | | | | | 1.48 | | | | | | 15,441 | | | | | | 30 | | |
| 12-31-17 | | | | | 13.57 | | | | | | 0.21• | | | | | | 2.36 | | | | | | 2.57 | | | | | | 0.05 | | | | | | 0.09 | | | | | | — | | | | | | 0.14 | | | | | | — | | | | | | 16.00 | | | | | | 19.05 | | | | | | 0.77 | | | | | | 0.68 | | | | | | 0.68 | | | | | | 1.44 | | | | | | 11,117 | | | | | | 29 | | |
| 12-31-16 | | | | | 12.62 | | | | | | 0.29• | | | | | | 0.68 | | | | | | 0.97 | | | | | | 0.01 | | | | | | 0.01 | | | | | | — | | | | | | 0.02 | | | | | | — | | | | | | 13.57 | | | | | | 7.67 | | | | | | 0.90 | | | | | | 0.62 | | | | | | 0.62 | | | | | | 2.27 | | | | | | 5,222 | | | | | | 52 | | |
| 12-31-15 | | | | | 13.60 | | | | | | 0.52• | | | | | | (0.73) | | | | | | (0.21) | | | | | | 0.13 | | | | | | 0.64 | | | | | | — | | | | | | 0.77 | | | | | | — | | | | | | 12.62 | | | | | | (1.78) | | | | | | 5.76 | | | | | | 0.63 | | | | | | 0.63 | | | | | | 4.17 | | | | | | 1,252 | | | | | | 106 | | |
| Class I | | | | | | | | | | | | | | | | | | | | | | | | | | | | | | | | | | | | | | | | | | | | | | | | | | | | | | | | | | | | | | | | | | | | | | | | | | | | | | | | | | | | | | | | | | | | | | | | | | | | | | | |
| 12-31-19 | | | | | 14.65 | | | | | | 0.32• | | | | | | 3.09 | | | | | | 3.41 | | | | | | 0.24 | | | | | | 0.54 | | | | | | — | | | | | | 0.78 | | | | | | — | | | | | | 17.28 | | | | | | 23.82 | | | | | | 0.24 | | | | | | 0.23 | | | | | | 0.23 | | | | | | 1.95 | | | | | | 5,832 | | | | | | 23 | | |
| 12-31-18 | | | | | 16.36 | | | | | | 0.32• | | | | | | (1.50) | | | | | | (1.18) | | | | | | 0.17 | | | | | | 0.36 | | | | | | — | | | | | | 0.53 | | | | | | — | | | | | | 14.65 | | | | | | (7.53) | | | | | | 0.25 | | | | | | 0.21 | | | | | | 0.21 | | | | | | 1.97 | | | | | | 3,952 | | | | | | 30 | | |
| 12-31-17 | | | | | 13.82 | | | | | | 0.32• | | | | | | 2.38 | | | | | | 2.70 | | | | | | 0.07 | | | | | | 0.09 | | | | | | — | | | | | | 0.16 | | | | | | — | | | | | | 16.36 | | | | | | 19.68 | | | | | | 0.27 | | | | | | 0.18 | | | | | | 0.18 | | | | | | 2.12 | | | | | | 2,612 | | | | | | 29 | | |
| 12-31-16 | | | | | 12.79 | | | | | | 0.32• | | | | | | 0.73 | | | | | | 1.05 | | | | | | 0.01 | | | | | | 0.01 | | | | | | — | | | | | | 0.02 | | | | | | — | | | | | | 13.82 | | | | | | 8.24 | | | | | | 0.40 | | | | | | 0.12 | | | | | | 0.12 | | | | | | 2.43 | | | | | | 659 | | | | | | 52 | | |
| 12-31-15 | | | | | 13.71 | | | | | | 1.29• | | | | | | (1.47) | | | | | | (0.18) | | | | | | 0.10 | | | | | | 0.64 | | | | | | — | | | | | | 0.74 | | | | | | — | | | | | | 12.79 | | | | | | (1.50) | | | | | | 5.26 | | | | | | 0.13 | | | | | | 0.13 | | | | | | 10.20 | | | | | | 165 | | | | | | 106 | | |
| Class S | | | | | | | | | | | | | | | | | | | | | | | | | | | | | | | | | | | | | | | | | | | | | | | | | | | | | | | | | | | | | | | | | | | | | | | | | | | | | | | | | | | | | | | | | | | | | | | | | | | | | | | |
| 12-31-19 | | | | | 14.62 | | | | | | 0.28• | | | | | | 3.09 | | | | | | 3.37 | | | | | | 0.21 | | | | | | 0.54 | | | | | | — | | | | | | 0.75 | | | | | | — | | | | | | 17.24 | | | | | | 23.53 | | | | | | 0.49 | | | | | | 0.48 | | | | | | 0.48 | | | | | | 1.71 | | | | | | 11,372 | | | | | | 23 | | |
| 12-31-18 | | | | | 16.33 | | | | | | 0.26 | | | | | | (1.47) | | | | | | (1.21) | | | | | | 0.14 | | | | | | 0.36 | | | | | | — | | | | | | 0.50 | | | | | | — | | | | | | 14.62 | | | | | | (7.73) | | | | | | 0.50 | | | | | | 0.46 | | | | | | 0.46 | | | | | | 1.64 | | | | | | 7,981 | | | | | | 30 | | |
| 12-31-17 | | | | | 13.82 | | | | | | 0.25• | | | | | | 2.41 | | | | | | 2.66 | | | | | | 0.06 | | | | | | 0.09 | | | | | | — | | | | | | 0.15 | | | | | | — | | | | | | 16.33 | | | | | | 19.39 | | | | | | 0.52 | | | | | | 0.43 | | | | | | 0.43 | | | | | | 1.64 | | | | | | 8,832 | | | | | | 29 | | |
| 12-31-16 | | | | | 12.83 | | | | | | 0.38• | | | | | | 0.63 | | | | | | 1.01 | | | | | | 0.01 | | | | | | 0.01 | | | | | | — | | | | | | 0.02 | | | | | | — | | | | | | 13.82 | | | | | | 7.89 | | | | | | 0.65 | | | | | | 0.37 | | | | | | 0.37 | | | | | | 2.85 | | | | | | 5,044 | | | | | | 52 | | |
| 12-31-15 | | | | | 13.72 | | | | | | 0.51• | | | | | | (0.71) | | | | | | (0.20) | | | | | | 0.05 | | | | | | 0.64 | | | | | | — | | | | | | 0.69 | | | | | | — | | | | | | 12.83 | | | | | | (1.65) | | | | | | 5.51 | | | | | | 0.38 | | | | | | 0.38 | | | | | | 3.95 | | | | | | 401 | | | | | | 106 | | |
| Class S2 | | | | | | | | | | | | | | | | | | | | | | | | | | | | | | | | | | | | | | | | | | | | | | | | | | | | | | | | | | | | | | | | | | | | | | | | | | | | | | | | | | | | | | | | | | | | | | | | | | | | | | | |
| 12-31-19 | | | | | 14.42 | | | | | | 0.24• | | | | | | 3.06 | | | | | | 3.30 | | | | | | 0.20 | | | | | | 0.54 | | | | | | — | | | | | | 0.74 | | | | | | — | | | | | | 16.98 | | | | | | 23.36 | | | | | | 0.64 | | | | | | 0.63 | | | | | | 0.63 | | | | | | 1.51 | | | | | | 2,896 | | | | | | 23 | | |
| 12-31-18 | | | | | 16.13 | | | | | | 0.23• | | | | | | (1.46) | | | | | | (1.23) | | | | | | 0.12 | | | | | | 0.36 | | | | | | — | | | | | | 0.48 | | | | | | — | | | | | | 14.42 | | | | | | (7.90) | | | | | | 0.65 | | | | | | 0.61 | | | | | | 0.61 | | | | | | 1.47 | | | | | | 1,905 | | | | | | 30 | | |
| 12-31-17 | | | | | 13.67 | | | | | | 0.23• | | | | | | 2.38 | | | | | | 2.61 | | | | | | 0.06 | | | | | | 0.09 | | | | | | — | | | | | | 0.15 | | | | | | — | | | | | | 16.13 | | | | | | 19.21 | | | | | | 0.67 | | | | | | 0.58 | | | | | | 0.58 | | | | | | 1.50 | | | | | | 1,688 | | | | | | 29 | | |
| 12-31-16 | | | | | 12.70 | | | | | | 0.34• | | | | | | 0.65 | | | | | | 0.99 | | | | | | 0.01 | | | | | | 0.01 | | | | | | — | | | | | | 0.02 | | | | | | — | | | | | | 13.67 | | | | | | 7.82 | | | | | | 0.83 | | | | | | 0.52 | | | | | | 0.52 | | | | | | 2.60 | | | | | | 651 | | | | | | 52 | | |
| 12-31-15 | | | | | 13.62 | | | | | | 0.38• | | | | | | (0.61) | | | | | | (0.23) | | | | | | 0.05 | | | | | | 0.64 | | | | | | — | | | | | | 0.69 | | | | | | — | | | | | | 12.70 | | | | | | (1.88) | | | | | | 5.76 | | | | | | 0.53 | | | | | | 0.53 | | | | | | 2.84 | | | | | | 14 | | | | | | 106 | | |
| Class Z | | | | | | | | | | | | | | | | | | | | | | | | | | | | | | | | | | | | | | | | | | | | | | | | | | | | | | | | | | | | | | | | | | | | | | | | | | | | | | | | | | | | | | | | | | | | | | | | | | | | | | | |
| 12-31-19 | | | | | 14.74 | | | | | | 0.37• | | | | | | 3.10 | | | | | | 3.47 | | | | | | 0.24 | | | | | | 0.54 | | | | | | — | | | | | | 0.78 | | | | | | — | | | | | | 17.43 | | | | | | 24.08 | | | | | | 0.24 | | | | | | 0.00* | | | | | | 0.00* | | | | | | 2.25 | | | | | | 426,037 | | | | | | 23 | | |
| 12-31-18 | | | | | 16.42 | | | | | | 0.36• | | | | | | (1.51) | | | | | | (1.15) | | | | | | 0.17 | | | | | | 0.36 | | | | | | — | | | | | | 0.53 | | | | | | — | | | | | | 14.74 | | | | | | (7.32) | | | | | | 0.25 | | | | | | 0.00* | | | | | | 0.00* | | | | | | 2.22 | | | | | | 243,229 | | | | | | 30 | | |
| 12-31-17 | | | | | 13.85 | | | | | | 0.34• | | | | | | 2.39 | | | | | | 2.73 | | | | | | 0.07 | | | | | | 0.09 | | | | | | — | | | | | | 0.16 | | | | | | — | | | | | | 16.42 | | | | | | 19.86 | | | | | | 0.27 | | | | | | 0.00* | | | | | | 0.00* | | | | | | 2.21 | | | | | | 169,065 | | | | | | 29 | | |
| 12-31-16 | | | | | 12.80 | | | | | | 0.47• | | | | | | 0.61 | | | | | | 1.08 | | | | | | 0.02 | | | | | | 0.01 | | | | | | — | | | | | | 0.03 | | | | | | — | | | | | | 13.85 | | | | | | 8.40 | | | | | | 0.40 | | | | | | 0.00* | | | | | | 0.00* | | | | | | 3.51 | | | | | | 48,146 | | | | | | 52 | | |
| 05-01-15(5) - | | | | | | | | | | | | | | | | | | | | | | | | | | | | | | | | | | | | | | | | | | | | | | | | | | | | | | | | | | | | | | | | | | | | | | | | | | | | | | | | | | | | | | | | | | | | | | | | | | | | | | | |
| 12-31-15 | | | | | 14.34 | | | | | | 0.57• | | | | | | (1.37) | | | | | | (0.80) | | | | | | 0.10 | | | | | | 0.64 | | | | | | — | | | | | | 0.74 | | | | | | — | | | | | | 12.80 | | | | | | (5.75) | | | | | | 5.12 | | | | | | 0.00* | | | | | | 0.00* | | | | | | 6.74 | | | | | | 1,086 | | | | | | 106 | | |
See Accompanying Notes to Financial Statements
Financial Highlights (continued)
| | | | | | | | | | Income (loss)
from
investment
operations | | | | | | | | | Less Distributions | | | | | | Ratios to average net assets | | | Supplemental
Data | |
| | | | Net asset value, beginning of year
or period | | | Net investment income (loss) | | | Net realized and unrealized
gain (loss) | | | Total from investment operations | | | From net investment income | | | From net realized gains | | | From return of capital | | | Total distributions | | | Payment by affiliate | | | Net asset value, end of year
or period | | | Total Return(1) | | | Expenses before
reductions/additions(2)(3)(4) | | | Expenses net of fee waivers
and/or recoupments if any(2)(3)(4) | | | Expenses net of all
reductions/additions(2)(3)(4) | | | Net investment income (loss)(2)(3) | | | Net assets, end of year or period | | | Portfolio turnover rate | |
Year or
period ended | | | ($) | | | ($) | | | ($) | | | ($) | | | ($) | | | ($) | | | ($) | | | ($) | | | ($) | | | ($) | | | (%) | | | (%) | | | (%) | | | (%) | | | (%) | | | ($000’s) | | | (%) | |
| Voya Index Solution 2045 Portfolio | | | | | | | | | | | | | | | | | | | | | | | | | | | | | | | | | | | | | | | | | | | | | | | | | | | | | | | | | | | | | | | | | | | | | | | | | | | | | | | | | | | | | | | | | | | | | | | | | | | | | | | |
| Class ADV | | | | | | | | | | | | | | | | | | | | | | | | | | | | | | | | | | | | | | | | | | | | | | | | | | | | | | | | | | | | | | | | | | | | | | | | | | | | | | | | | | | | | | | | | | | | | | | | | | | | | | | |
| 12-31-19 | | | | | 10.38 | | | | | | 0.16• | | | | | | 2.29 | | | | | | 2.45 | | | | | | 0.14 | | | | | | 0.52 | | | | | | — | | | | | | 0.66 | | | | | | — | | | | | | 12.17 | | | | | | 24.29 | | | | | | 0.73 | | | | | | 0.73 | | | | | | 0.73 | | | | | | 1.39 | | | | | | 134,331 | | | | | | 24 | | |
| 12-31-18 | | | | | 11.79 | | | | | | 0.15• | | | | | | (1.13) | | | | | | (0.98) | | | | | | 0.11 | | | | | | 0.32 | | | | | | — | | | | | | 0.43 | | | | | | — | | | | | | 10.38 | | | | | | (8.70) | | | | | | 0.74 | | | | | | 0.72 | | | | | | 0.72 | | | | | | 1.31 | | | | | | 122,905 | | | | | | 31 | | |
| 12-31-17 | | | | | 10.22 | | | | | | 0.13• | | | | | | 1.88 | | | | | | 2.01 | | | | | | 0.12 | | | | | | 0.32 | | | | | | — | | | | | | 0.44 | | | | | | — | | | | | | 11.79 | | | | | | 19.96 | | | | | | 0.75 | | | | | | 0.69 | | | | | | 0.69 | | | | | | 1.20 | | | | | | 148,205 | | | | | | 25 | | |
| 12-31-16 | | | | | 10.55 | | | | | | 0.17 | | | | | | 0.61 | | | | | | 0.78 | | | | | | 0.17 | | | | | | 0.94 | | | | | | — | | | | | | 1.11 | | | | | | — | | | | | | 10.22 | | | | | | 7.67 | | | | | | 0.76 | | | | | | 0.64 | | | | | | 0.64 | | | | | | 1.70 | | | | | | 139,777 | | | | | | 41 | | |
| 12-31-15 | | | | | 12.16 | | | | | | 0.16 | | | | | | (0.34) | | | | | | (0.18) | | | | | | 0.12 | | | | | | 1.31 | | | | | | — | | | | | | 1.43 | | | | | | — | | | | | | 10.55 | | | | | | (2.05) | | | | | | 0.76 | | | | | | 0.64 | | | | | | 0.64 | | | | | | 1.44 | | | | | | 133,884 | | | | | | 36 | | |
| Class I | | | | | | | | | | | | | | | | | | | | | | | | | | | | | | | | | | | | | | | | | | | | | | | | | | | | | | | | | | | | | | | | | | | | | | | | | | | | | | | | | | | | | | | | | | | | | | | | | | | | | | | |
| 12-31-19 | | | | | 10.74 | | | | | | 0.22 | | | | | | 2.38 | | | | | | 2.60 | | | | | | 0.21 | | | | | | 0.52 | | | | | | — | | | | | | 0.73 | | | | | | — | | | | | | 12.61 | | | | | | 24.89 | | | | | | 0.23 | | | | | | 0.23 | | | | | | 0.23 | | | | | | 1.89 | | | | | | 53,784 | | | | | | 24 | | |
| 12-31-18 | | | | | 12.17 | | | | | | 0.22 | | | | | | (1.16) | | | | | | (0.94) | | | | | | 0.17 | | | | | | 0.32 | | | | | | — | | | | | | 0.49 | | | | | | — | | | | | | 10.74 | | | | | | (8.16) | | | | | | 0.24 | | | | | | 0.22 | | | | | | 0.22 | | | | | | 1.84 | | | | | | 43,658 | | | | | | 31 | | |
| 12-31-17 | | | | | 10.54 | | | | | | 0.20• | | | | | | 1.93 | | | | | | 2.13 | | | | | | 0.18 | | | | | | 0.32 | | | | | | — | | | | | | 0.50 | | | | | | — | | | | | | 12.17 | | | | | | 20.48 | | | | | | 0.25 | | | | | | 0.19 | | | | | | 0.19 | | | | | | 1.76 | | | | | | 48,317 | | | | | | 25 | | |
| 12-31-16 | | | | | 10.84 | | | | | | 0.24• | | | | | | 0.63 | | | | | | 0.87 | | | | | | 0.23 | | | | | | 0.94 | | | | | | — | | | | | | 1.17 | | | | | | — | | | | | | 10.54 | | | | | | 8.29 | | | | | | 0.26 | | | | | | 0.14 | | | | | | 0.14 | | | | | | 2.24 | | | | | | 35,877 | | | | | | 41 | | |
| 12-31-15 | | | | | 12.46 | | | | | | 0.25• | | | | | | (0.38) | | | | | | (0.13) | | | | | | 0.18 | | | | | | 1.31 | | | | | | — | | | | | | 1.49 | | | | | | — | | | | | | 10.84 | | | | | | (1.61) | | | | | | 0.26 | | | | | | 0.14 | | | | | | 0.14 | | | | | | 2.09 | | | | | | 27,900 | | | | | | 36 | | |
| Class S | | | | | | | | | | | | | | | | | | | | | | | | | | | | | | | | | | | | | | | | | | | | | | | | | | | | | | | | | | | | | | | | | | | | | | | | | | | | | | | | | | | | | | | | | | | | | | | | | | | | | | | |
| 12-31-19 | | | | | 10.58 | | | | | | 0.20 | | | | | | 2.33 | | | | | | 2.53 | | | | | | 0.18 | | | | | | 0.52 | | | | | | — | | | | | | 0.70 | | | | | | — | | | | | | 12.41 | | | | | | 24.55 | | | | | | 0.48 | | | | | | 0.48 | | | | | | 0.48 | | | | | | 1.64 | | | | | | 74,022 | | | | | | 24 | | |
| 12-31-18 | | | | | 12.00 | | | | | | 0.18• | | | | | | (1.14) | | | | | | (0.96) | | | | | | 0.14 | | | | | | 0.32 | | | | | | — | | | | | | 0.46 | | | | | | — | | | | | | 10.58 | | | | | | (8.44) | | | | | | 0.49 | | | | | | 0.47 | | | | | | 0.47 | | | | | | 1.53 | | | | | | 65,002 | | | | | | 31 | | |
| 12-31-17 | | | | | 10.40 | | | | | | 0.17 | | | | | | 1.90 | | | | | | 2.07 | | | | | | 0.15 | | | | | | 0.32 | | | | | | — | | | | | | 0.47 | | | | | | — | | | | | | 12.00 | | | | | | 20.21 | | | | | | 0.50 | | | | | | 0.44 | | | | | | 0.44 | | | | | | 1.46 | | | | | | 87,386 | | | | | | 25 | | |
| 12-31-16 | | | | | 10.70 | | | | | | 0.21 | | | | | | 0.62 | | | | | | 0.83 | | | | | | 0.19 | | | | | | 0.94 | | | | | | — | | | | | | 1.13 | | | | | | — | | | | | | 10.40 | | | | | | 8.05 | | | | | | 0.51 | | | | | | 0.39 | | | | | | 0.39 | | | | | | 1.91 | | | | | | 76,656 | | | | | | 41 | | |
| 12-31-15 | | | | | 12.32 | | | | | | 0.20 | | | | | | (0.36) | | | | | | (0.16) | | | | | | 0.15 | | | | | | 1.31 | | | | | | — | | | | | | 1.46 | | | | | | — | | | | | | 10.70 | | | | | | (1.86) | | | | | | 0.51 | | | | | | 0.39 | | | | | | 0.39 | | | | | | 1.66 | | | | | | 80,586 | | | | | | 36 | | |
| Class S2 | | | | | | | | | | | | | | | | | | | | | | | | | | | | | | | | | | | | | | | | | | | | | | | | | | | | | | | | | | | | | | | | | | | | | | | | | | | | | | | | | | | | | | | | | | | | | | | | | | | | | | | |
| 12-31-19 | | | | | 10.41 | | | | | | 0.16 | | | | | | 2.30 | | | | | | 2.46 | | | | | | 0.16 | | | | | | 0.52 | | | | | | — | | | | | | 0.68 | | | | | | — | | | | | | 12.19 | | | | | | 24.34 | | | | | | 0.63 | | | | | | 0.63 | | | | | | 0.63 | | | | | | 1.50 | | | | | | 20,384 | | | | | | 24 | | |
| 12-31-18 | | | | | 11.80 | | | | | | 0.16• | | | | | | (1.12) | | | | | | (0.96) | | | | | | 0.11 | | | | | | 0.32 | | | | | | — | | | | | | 0.43 | | | | | | — | | | | | | 10.41 | | | | | | (8.52) | | | | | | 0.64 | | | | | | 0.62 | | | | | | 0.62 | | | | | | 1.40 | | | | | | 16,121 | | | | | | 31 | | |
| 12-31-17 | | | | | 10.24 | | | | | | 0.14• | | | | | | 1.88 | | | | | | 2.02 | | | ��� | | | 0.14 | | | | | | 0.32 | | | | | | — | | | | | | 0.46 | | | | | | — | | | | | | 11.80 | | | | | | 19.97 | | | | | | 0.65 | | | | | | 0.59 | | | | | | 0.59 | | | | | | 1.26 | | | | | | 19,206 | | | | | | 25 | | |
| 12-31-16 | | | | | 10.56 | | | | | | 0.20• | | | | | | 0.60 | | | | | | 0.80 | | | | | | 0.18 | | | | | | 0.94 | | | | | | — | | | | | | 1.12 | | | | | | — | | | | | | 10.24 | | | | | | 7.88 | | | | | | 0.69 | | | | | | 0.54 | | | | | | 0.54 | | | | | | 1.93 | | | | | | 18,507 | | | | | | 41 | | |
| 12-31-15 | | | | | 12.16 | | | | | | 0.18• | | | | | | (0.35) | | | | | | (0.17) | | | | | | 0.12 | | | | | | 1.31 | | | | | | — | | | | | | 1.43 | | | | | | — | | | | | | 10.56 | | | | | | (1.99) | | | | | | 0.76 | | | | | | 0.54 | | | | | | 0.54 | | | | | | 1.54 | | | | | | 16,368 | | | | | | 36 | | |
| Class Z | | | | | | | | | | | | | | | | | | | | | | | | | | | | | | | | | | | | | | | | | | | | | | | | | | | | | | | | | | | | | | | | | | | | | | | | | | | | | | | | | | | | | | | | | | | | | | | | | | | | | | | |
| 12-31-19 | | | | | 10.82 | | | | | | 0.27• | | | | | | 2.38 | | | | | | 2.65 | | | | | | 0.21 | | | | | | 0.52 | | | | | | — | | | | | | 0.73 | | | | | | — | | | | | | 12.74 | | | | | | 25.17 | | | | | | 0.23 | | | | | | 0.00* | | | | | | 0.00* | | | | | | 2.21 | | | | | | 464,683 | | | | | | 24 | | |
| 12-31-18 | | | | | 12.24 | | | | | | 0.26• | | | | | | (1.19) | | | | | | (0.93) | | | | | | 0.17 | | | | | | 0.32 | | | | | | — | | | | | | 0.49 | | | | | | — | | | | | | 10.82 | | | | | | (8.03) | | | | | | 0.24 | | | | | | 0.00* | | | | | | 0.00* | | | | | | 2.14 | | | | | | 273,348 | | | | | | 31 | | |
| 12-31-17 | | | | | 10.57 | | | | | | 0.24• | | | | | | 1.93 | | | | | | 2.17 | | | | | | 0.18 | | | | | | 0.32 | | | | | | — | | | | | | 0.50 | | | | | | — | | | | | | 12.24 | | | | | | 20.81 | | | | | | 0.25 | | | | | | 0.00* | | | | | | 0.00* | | | | | | 2.12 | | | | | | 208,189 | | | | | | 25 | | |
| 12-31-16 | | | | | 10.85 | | | | | | 0.34• | | | | | | 0.55 | | | | | | 0.89 | | | | | | 0.23 | | | | | | 0.94 | | | | | | — | | | | | | 1.17 | | | | | | — | | | | | | 10.57 | | | | | | 8.47 | | | | | | 0.26 | | | | | | 0.00* | | | | | | 0.00* | | | | | | 3.21 | | | | | | 58,923 | | | | | | 41 | | |
| 05-01-15(5) - | | | | | | | | | | | | | | | | | | | | | | | | | | | | | | | | | | | | | | | | | | | | | | | | | | | | | | | | | | | | | | | | | | | | | | | | | | | | | | | | | | | | | | | | | | | | | | | | | | | | | | | |
| 12-31-15 | | | | | 13.09 | | | | | | 0.59• | | | | | | (1.34) | | | | | | (0.75) | | | | | | 0.18 | | | | | | 1.31 | | | | | | — | | | | | | 1.49 | | | | | | — | | | | | | 10.85 | | | | | | (6.26) | | | | | | 0.32 | | | | | | 0.00* | | | | | | 0.00* | | | | | | 8.27 | | | | | | 544 | | | | | | 36 | | |
| Voya Index Solution 2050 Portfolio | | | | | | | | | | | | | | | | | | | | | | | | | | | | | | | | | | | | | | | | | | | | | | | | | | | | | | | | | | | | | | | | | | | | | | | | | | | | | | | | | | | | | | | | | | | | | | | | | | | | | | | |
| Class ADV | | | | | | | | | | | | | | | | | | | | | | | | | | | | | | | | | | | | | | | | | | | | | | | | | | | | | | | | | | | | | | | | | | | | | | | | | | | | | | | | | | | | | | | | | | | | | | | | | | | | | | | |
| 12-31-19 | | | | | 14.39 | | | | | | 0.24• | | | | | | 3.24 | | | | | | 3.48 | | | | | | 0.17 | | | | | | 0.52 | | | | | | — | | | | | | 0.69 | | | | | | — | | | | | | 17.18 | | | | | | 24.60 | | | | | | 0.74 | | | | | | 0.74 | | | | | | 0.74 | | | | | | 1.47 | | | | | | 17,450 | | | | | | 22 | | |
| 12-31-18 | | | | | 16.26 | | | | | | 0.22• | | | | | | (1.62) | | | | | | (1.40) | | | | | | 0.11 | | | | | | 0.36 | | | | | | — | | | | | | 0.47 | | | | | | — | | | | | | 14.39 | | | | | | (8.92) | | | | | | 0.75 | | | | | | 0.73 | | | | | | 0.73 | | | | | | 1.39 | | | | | | 11,155 | | | | | | 28 | | |
| 12-31-17 | | | | | 13.65 | | | | | | 0.20• | | | | | | 2.53 | | | | | | 2.73 | | | | | | 0.04 | | | | | | 0.08 | | | | | | — | | | | | | 0.12 | | | | | | — | | | | | | 16.26 | | | | | | 20.12 | | | | | | 0.78 | | | | | | 0.70 | | | | | | 0.70 | | | | | | 1.31 | | | | | | 7,817 | | | | | | 26 | | |
| 12-31-16 | | | | | 12.69 | | | | | | 0.27• | | | | | | 0.73 | | | | | | 1.00 | | | | | | 0.01 | | | | | | 0.03 | | | | | | — | | | | | | 0.04 | | | | | | — | | | | | | 13.65 | | | | | | 7.94 | | | | | | 1.03 | | | | | | 0.64 | | | | | | 0.64 | | | | | | 2.05 | | | | | | 3,296 | | | | | | 49 | | |
| 12-31-15 | | | | | 13.68 | | | | | | 0.44• | | | | | | (0.68) | | | | | | (0.24) | | | | | | 0.04 | | | | | | 0.71 | | | | | | — | | | | | | 0.75 | | | | | | — | | | | | | 12.69 | | | | | | (1.97) | | | | | | 7.70 | | | | | | 0.64 | | | | | | 0.64 | | | | | | 3.52 | | | | | | 666 | | | | | | 195 | | |
See Accompanying Notes to Financial Statements
Financial Highlights (continued)
| | | | | | | | | | Income (loss)
from
investment
operations | | | | | | | | | Less Distributions | | | | | | Ratios to average net assets | | | Supplemental
Data | |
| | | | Net asset value, beginning of year
or period | | | Net investment income (loss) | | | Net realized and unrealized
gain (loss) | | | Total from investment operations | | | From net investment income | | | From net realized gains | | | From return of capital | | | Total distributions | | | Payment by affiliate | | | Net asset value, end of year
or period | | | Total Return(1) | | | Expenses before
reductions/additions(2)(3)(4) | | | Expenses net of fee waivers
and/or recoupments if any(2)(3)(4) | | | Expenses net of all
reductions/additions(2)(3)(4) | | | Net investment income (loss)(2)(3) | | | Net assets, end of year or period | | | Portfolio turnover rate | |
Year or
period ended | | | ($) | | | ($) | | | ($) | | | ($) | | | ($) | | | ($) | | | ($) | | | ($) | | | ($) | | | ($) | | | (%) | | | (%) | | | (%) | | | (%) | | | (%) | | | ($000’s) | | | (%) | |
| Voya Index Solution 2050 Portfolio (continued) | | | | | | | | | | | | | | | | | | | | | | | | | | | | | | | | | | | | | | | | | | | | | | | | | | | | | | | | | | | | | | | | | | | | | | | | | | | | | | | | | | | | | | | | | | | | | | | | | | | | | | | |
| Class I | | | | | | | | | | | | | | | | | | | | | | | | | | | | | | | | | | | | | | | | | | | | | | | | | | | | | | | | | | | | | | | | | | | | | | | | | | | | | | | | | | | | | | | | | | | | | | | | | | | | | | | |
| 12-31-19 | | | | | 14.69 | | | | | | 0.32• | | | | | | 3.31 | | | | | | 3.63 | | | | | | 0.22 | | | | | | 0.52 | | | | | | — | | | | | | 0.74 | | | | | | — | | | | | | 17.58 | | | | | | 25.21 | | | | | | 0.24 | | | | | | 0.24 | | | | | | 0.24 | | | | | | 1.97 | | | | | | 6,367 | | | | | | 22 | | |
| 12-31-18 | | | | | 16.55 | | | | | | 0.30• | | | | | | (1.65) | | | | | | (1.35) | | | | | | 0.15 | | | | | | 0.36 | | | | | | — | | | | | | 0.51 | | | | | | — | | | | | | 14.69 | | | | | | (8.49) | | | | | | 0.25 | | | | | | 0.23 | | | | | | 0.23 | | | | | | 1.82 | | | | | | 3,851 | | | | | | 28 | | |
| 12-31-17 | | | | | 13.84 | | | | | | 0.31• | | | | | | 2.55 | | | | | | 2.86 | | | | | | 0.07 | | | | | | 0.08 | | | | | | — | | | | | | 0.15 | | | | | | — | | | | | | 16.55 | | | | | | 20.75 | | | | | | 0.28 | | | | | | 0.20 | | | | | | 0.20 | | | | | | 2.00 | | | | | | 3,195 | | | | | | 26 | | |
| 12-31-16 | | | | | 12.80 | | | | | | 0.33• | | | | | | 0.76 | | | | | | 1.09 | | | | | | 0.02 | | | | | | 0.03 | | | | | | — | | | | | | 0.05 | | | | | | — | | | | | | 13.84 | | | | | | 8.52 | | | | | | 0.53 | | | | | | 0.14 | | | | | | 0.14 | | | | | | 2.52 | | | | | | 950 | | | | | | 49 | | |
| 12-31-15 | | | | | 13.79 | | | | | | 0.44• | | | | | | (0.61) | | | | | | (0.17) | | | | | | 0.11 | | | | | | 0.71 | | | | | | — | | | | | | 0.82 | | | | | | — | | | | | | 12.80 | | | | | | (1.45) | | | | | | 7.20 | | | | | | 0.14 | | | | | | 0.14 | | | | | | 3.47 | | | | | | 295 | | | | | | 195 | | |
| Class S | | | | | | | | | | | | | | | | | | | | | | | | | | | | | | | | | | | | | | | | | | | | | | | | | | | | | | | | | | | | | | | | | | | | | | | | | | | | | | | | | | | | | | | | | | | | | | | | | | | | | | | |
| 12-31-19 | | | | | 14.65 | | | | | | 0.28• | | | | | | 3.31 | | | | | | 3.59 | | | | | | 0.19 | | | | | | 0.52 | | | | | | — | | | | | | 0.71 | | | | | | — | | | | | | 17.53 | | | | | | 24.94 | | | | | | 0.49 | | | | | | 0.49 | | | | | | 0.49 | | | | | | 1.70 | | | | | | 10,885 | | | | | | 22 | | |
| 12-31-18 | | | | | 16.51 | | | | | | 0.25 | | | | | | (1.63) | | | | | | (1.38) | | | | | | 0.12 | | | | | | 0.36 | | | | | | — | | | | | | 0.48 | | | | | | — | | | | | | 14.65 | | | | | | (8.68) | | | | | | 0.50 | | | | | | 0.48 | | | | | | 0.48 | | | | | | 1.53 | | | | | | 7,477 | | | | | | 28 | | |
| 12-31-17 | | | | | 13.83 | | | | | | 0.24• | | | | | | 2.58 | | | | | | 2.82 | | | | | | 0.06 | | | | | | 0.08 | | | | | | — | | | | | | 0.14 | | | | | | �� | | | | | | 16.51 | | | | | | 20.47 | | | | | | 0.53 | | | | | | 0.45 | | | | | | 0.45 | | | | | | 1.56 | | | | | | 8,090 | | | | | | 26 | | |
| 12-31-16 | | | | | 12.83 | | | | | | 0.37• | | | | | | 0.68 | | | | | | 1.05 | | | | | | 0.02 | | | | | | 0.03 | | | | | | — | | | | | | 0.05 | | | | | | — | | | | | | 13.83 | | | | | | 8.20 | | | | | | 0.78 | | | | | | 0.39 | | | | | | 0.39 | | | | | | 2.76 | | | | | | 3,987 | | | | | | 49 | | |
| 12-31-15 | | | | | 13.80 | | | | | | 0.55• | | | | | | (0.74) | | | | | | (0.19) | | | | | | 0.07 | | | | | | 0.71 | | | | | | — | | | | | | 0.78 | | | | | | — | | | | | | 12.83 | | | | | | (1.60) | | | | | | 7.45 | | | | | | 0.39 | | | | | | 0.39 | | | | | | 4.31 | | | | | | 254 | | | | | | 195 | | |
| Class S2 | | | | | | | | | | | | | | | | | | | | | | | | | | | | | | | | | | | | | | | | | | | | | | | | | | | | | | | | | | | | | | | | | | | | | | | | | | | | | | | | | | | | | | | | | | | | | | | | | | | | | | | |
| 12-31-19 | | | | | 14.45 | | | | | | 0.25• | | | | | | 3.25 | | | | | | 3.50 | | | | | | 0.17 | | | | | | 0.52 | | | | | | — | | | | | | 0.69 | | | | | | — | | | | | | 17.26 | | | | | | 24.69 | | | | | | 0.64 | | | | | | 0.64 | | | | | | 0.64 | | | | | | 1.53 | | | | | | 3,072 | | | | | | 22 | | |
| 12-31-18 | | | | | 16.30 | | | | | | 0.22• | | | | | | (1.60) | | | | | | (1.38) | | | | | | 0.11 | | | | | | 0.36 | | | | | | — | | | | | | 0.47 | | | | | | — | | | | | | 14.45 | | | | | | (8.80) | | | | | | 0.65 | | | | | | 0.63 | | | | | | 0.63 | | | | | | 1.36 | | | | | | 2,023 | | | | | | 28 | | |
| 12-31-17 | | | | | 13.68 | | | | | | 0.23• | | | | | | 2.52 | | | | | | 2.75 | | | | | | 0.05 | | | | | | 0.08 | | | | | | — | | | | | | 0.13 | | | | | | — | | | | | | 16.30 | | | | | | 20.21 | | | | | | 0.68 | | | | | | 0.60 | | | | | | 0.60 | | | | | | 1.50 | | | | | | 1,973 | | | | | | 26 | | |
| 12-31-16 | | | | | 12.71 | | | | | | 0.35• | | | | | | 0.67 | | | | | | 1.02 | | | | | | 0.02 | | | | | | 0.03 | | | | | | — | | | | | | 0.05 | | | | | | — | | | | | | 13.68 | | | | | | 8.04 | | | | | | 0.96 | | | | | | 0.54 | | | | | | 0.54 | | | | | | 2.66 | | | | | | 766 | | | | | | 49 | | |
| 12-31-15 | | | | | 13.70 | | | | | | 0.32• | | | | | | (0.54) | | | | | | (0.22) | | | | | | 0.06 | | | | | | 0.71 | | | | | | — | | | | | | 0.77 | | | | | | — | | | | | | 12.71 | | | | | | (1.83) | | | | | | 7.70 | | | | | | 0.54 | | | | | | 0.54 | | | | | | 2.43 | | | | | | 14 | | | | | | 195 | | |
| Class Z | | | | | | | | | | | | | | | | | | | | | | | | | | | | | | | | | | | | | | | | | | | | | | | | | | | | | | | | | | | | | | | | | | | | | | | | | | | | | | | | | | | | | | | | | | | | | | | | | | | | | | | |
| 12-31-19 | | | | | 14.77 | | | | | | 0.37• | | | | | | 3.33 | | | | | | 3.70 | | | | | | 0.22 | | | | | | 0.52 | | | | | | — | | | | | | 0.74 | | | | | | — | | | | | | 17.73 | | | | | | 25.56 | | | | | | 0.24 | | | | | | 0.00* | | | | | | 0.00* | | | | | | 2.23 | | | | | | 286,945 | | | | | | 22 | | |
| 12-31-18 | | | | | 16.60 | | | | | | 0.35• | | | | | | (1.67) | | | | | | (1.32) | | | | | | 0.15 | | | | | | 0.36 | | | | | | — | | | | | | 0.51 | | | | | | — | | | | | | 14.77 | | | | | | (8.28) | | | | | | 0.25 | | | | | | 0.00* | | | | | | 0.00* | | | | | | 2.15 | | | | | | 153,539 | | | | | | 28 | | |
| 12-31-17 | | | | | 13.85 | | | | | | 0.33• | | | | | | 2.57 | | | | | | 2.90 | | | | | | 0.07 | | | | | | 0.08 | | | | | | — | | | | | | 0.15 | | | | | | — | | | | | | 16.60 | | | | | | 21.03 | | | | | | 0.28 | | | | | | 0.00* | | | | | | 0.00* | | | | | | 2.13 | | | | | | 97,126 | | | | | | 26 | | |
| 12-31-16 | | | | | 12.80 | | | | | | 0.49• | | | | | | 0.61 | | | | | | 1.10 | | | | | | 0.02 | | | | | | 0.03 | | | | | | — | | | | | | 0.05 | | | | | | — | | | | | | 13.85 | | | | | | 8.62 | | | | | | 0.53 | | | | | | 0.00* | | | | | | 0.00* | | | | | | 3.63 | | | | | | 21,080 | | | | | | 49 | | |
| 05-01-15(5) - | | | | | | | | | | | | | | | | | | | | | | | | | | | | | | | | | | | | | | | | | | | | | | | | | | | | | | | | | | | | | | | | | | | | | | | | | | | | | | | | | | | | | | | | | | | | | | | | | | | | | | | |
| 12-31-15 | | | | | 14.46 | | | | | | 0.61• | | | | | | (1.45) | | | | | | (0.84) | | | | | | 0.11 | | | | | | 0.71 | | | | | | — | | | | | | 0.82 | | | | | | — | | | | | | 12.80 | | | | | | (6.02) | | | | | | 7.05 | | | | | | 0.00* | | | | | | 0.00* | | | | | | 7.16 | | | | | | 576 | | | | | | 195 | | |
| Voya Index Solution 2055 Portfolio | | | | | | | | | | | | | | | | | | | | | | | | | | | | | | | | | | | | | | | | | | | | | | | | | | | | | | | | | | | | | | | | | | | | | | | | | | | | | | | | | | | | | | | | | | | | | | | | | | | | | | | |
| Class ADV | | | | | | | | | | | | | | | | | | | | | | | | | | | | | | | | | | | | | | | | | | | | | | | | | | | | | | | | | | | | | | | | | | | | | | | | | | | | | | | | | | | | | | | | | | | | | | | | | | | | | | | |
| 12-31-19 | | | | | 13.42 | | | | | | 0.22 | | | | | | 3.00 | | | | | | 3.22 | | | | | | 0.15 | | | | | | 0.58 | | | | | | — | | | | | | 0.73 | | | | | | — | | | | | | 15.91 | | | | | | 24.52 | | | | | | 0.74 | | | | | | 0.74 | | | | | | 0.74 | | | | | | 1.40 | | | | | | 54,378 | | | | | | 20 | | |
| 12-31-18 | | | | | 15.18 | | | | | | 0.19 | | | | | | (1.49) | | | | | | (1.30) | | | | | | 0.12 | | | | | | 0.34 | | | | | | — | | | | | | 0.46 | | | | | | — | | | | | | 13.42 | | | | | | (8.87) | | | | | | 0.75 | | | | | | 0.73 | | | | | | 0.73 | | | | | | 1.27 | | | | | | 46,688 | | | | | | 29 | | |
| 12-31-17 | | | | | 13.01 | | | | | | 0.16 | | | | | | 2.46 | | | | | | 2.62 | | | | | | 0.14 | | | | | | 0.31 | | | | | | — | | | | | | 0.45 | | | | | | — | | | | | | 15.18 | | | | | | 20.37 | | | | | | 0.76 | | | | | | 0.70 | | | | | | 0.70 | | | | | | 1.19 | | | | | | 52,886 | | | | | | 25 | | |
| 12-31-16 | | | | | 13.12 | | | | | | 0.22• | | | | | | 0.75 | | | | | | 0.97 | | | | | | 0.18 | | | | | | 0.90 | | | | | | — | | | | | | 1.08 | | | | | | — | | | | | | 13.01 | | | | | | 7.61 | | | | | | 0.78 | | | | | | 0.64 | | | | | | 0.64 | | | | | | 1.68 | | | | | | 43,002 | | | | | | 42 | | |
| 12-31-15 | | | | | 14.69 | | | | | | 0.20• | | | | | | (0.45) | | | | | | (0.25) | | | | | | 0.12 | | | | | | 1.20 | | | | | | — | | | | | | 1.32 | | | | | | — | | | | | | 13.12 | | | | | | (2.15) | | | | | | 0.78 | | | | | | 0.65 | | | | | | 0.65 | | | | | | 1.42 | | | | | | 37,162 | | | | | | 39 | | |
| Class I | | | | | | | | | | | | | | | | | | | | | | | | | | | | | | | | | | | | | | | | | | | | | | | | | | | | | | | | | | | | | | | | | | | | | | | | | | | | | | | | | | | | | | | | | | | | | | | | | | | | | | | |
| 12-31-19 | | | | | 13.75 | | | | | | 0.30• | | | | | | 3.09 | | | | | | 3.39 | | | | | | 0.23 | | | | | | 0.58 | | | | | | — | | | | | | 0.81 | | | | | | — | | | | | | 16.33 | | | | | | 25.22 | | | | | | 0.24 | | | | | | 0.24 | | | | | | 0.24 | | | | | | 1.95 | | | | | | 31,202 | | | | | | 20 | | |
| 12-31-18 | | | | | 15.54 | | | | | | 0.28• | | | | | | (1.54) | | | | | | (1.26) | | | | | | 0.19 | | | | | | 0.34 | | | | | | — | | | | | | 0.53 | | | | | | — | | | | | | 13.75 | | | | | | (8.48) | | | | | | 0.25 | | | | | | 0.23 | | | | | | 0.23 | | | | | | 1.82 | | | | | | 21,247 | | | | | | 29 | | |
| 12-31-17 | | | | | 13.29 | | | | | | 0.27• | | | | | | 2.49 | | | | | | 2.76 | | | | | | 0.20 | | | | | | 0.31 | | | | | | — | | | | | | 0.51 | | | | | | — | | | | | | 15.54 | | | | | | 21.03 | | | | | | 0.26 | | | | | | 0.20 | | | | | | 0.20 | | | | | | 1.87 | | | | | | 19,100 | | | | | | 25 | | |
| 12-31-16 | | | | | 13.38 | | | | | | 0.30• | | | | | | 0.75 | | | | | | 1.05 | | | | | | 0.24 | | | | | | 0.90 | | | | | | — | | | | | | 1.14 | | | | | | — | | | | | | 13.29 | | | | | | 8.10 | | | | | | 0.28 | | | | | | 0.14 | | | | | | 0.14 | | | | | | 2.24 | | | | | | 10,595 | | | | | | 42 | | |
| 12-31-15 | | | | | 14.94 | | | | | | 0.32• | | | | | | (0.50) | | | | | | (0.18) | | | | | | 0.18 | | | | | | 1.20 | | | | | | — | | | | | | 1.38 | | | | | | — | | | | | | 13.38 | | | | | | (1.66) | | | | | | 0.28 | | | | | | 0.15 | | | | | | 0.15 | | | | | | 2.23 | | | | | | 8,113 | | | | | | 39 | | |
See Accompanying Notes to Financial Statements
Financial Highlights (continued)
| | | | | | | | | | Income (loss)
from
investment
operations | | | | | | | | | Less Distributions | | | | | | Ratios to average net assets | | | Supplemental
Data | |
| | | | Net asset value, beginning of year
or period | | | Net investment income (loss) | | | Net realized and unrealized
gain (loss) | | | Total from investment operations | | | From net investment income | | | From net realized gains | | | From return of capital | | | Total distributions | | | Payment by affiliate | | | Net asset value, end of year
or period | | | Total Return(1) | | | Expenses before
reductions/additions(2)(3)(4) | | | Expenses net of fee waivers
and/or recoupments if any(2)(3)(4) | | | Expenses net of all
reductions/additions(2)(3)(4) | | | Net investment income (loss)(2)(3) | | | Net assets, end of year or period | | | Portfolio turnover rate | |
Year or
period ended | | | ($) | | | ($) | | | ($) | | | ($) | | | ($) | | | ($) | | | ($) | | | ($) | | | ($) | | | ($) | | | (%) | | | (%) | | | (%) | | | (%) | | | (%) | | | ($000’s) | | | (%) | |
| Voya Index Solution 2055 Portfolio (continued) | | | | | | | | | | | | | | | | | | | | | | | | | | | | | | | | | | | | | | | | | | | | | | | | | | | | | | | | | | | | | | | | | | | | | | | | | | | | | | | | | | | | | | | | | | | | | | | | | | | | | | | |
| Class S | | | | | | | | | | | | | | | | | | | | | | | | | | | | | | | | | | | | | | | | | | | | | | | | | | | | | | | | | | | | | | | | | | | | | | | | | | | | | | | | | | | | | | | | | | | | | | | | | | | | | | | |
| 12-31-19 | | | | | 13.59 | | | | | | 0.25• | | | | | | 3.06 | | | | | | 3.31 | | | | | | 0.19 | | | | | | 0.58 | | | | | | — | | | | | | 0.77 | | | | | | — | | | | | | 16.13 | | | | | | 24.94 | | | | | | 0.49 | | | | | | 0.49 | | | | | | 0.49 | | | | | | 1.66 | | | | | | 35,423 | | | | | | 20 | | |
| 12-31-18 | | | | | 15.36 | | | | | | 0.23 | | | | | | (1.51) | | | | | | (1.28) | | | | | | 0.15 | | | | | | 0.34 | | | | | | — | | | | | | 0.49 | | | | | | — | | | | | | 13.59 | | | | | | (8.66) | | | | | | 0.50 | | | | | | 0.48 | | | | | | 0.48 | | | | | | 1.55 | | | | | | 26,744 | | | | | | 29 | | |
| 12-31-17 | | | | | 13.16 | | | | | | 0.20• | | | | | | 2.48 | | | | | | 2.68 | | | | | | 0.17 | | | | | | 0.31 | | | | | | — | | | | | | 0.48 | | | | | | — | | | | | | 15.36 | | | | | | 20.63 | | | | �� | | 0.51 | | | | | | 0.45 | | | | | | 0.45 | | | | | | 1.40 | | | | | | 29,602 | | | | | | 25 | | |
| 12-31-16 | | | | | 13.25 | | | | | | 0.25• | | | | | | 0.76 | | | | | | 1.01 | | | | | | 0.20 | | | | | | 0.90 | | | | | | — | | | | | | 1.10 | | | | | | — | | | | | | 13.16 | | | | | | 7.89 | | | | | | 0.53 | | | | | | 0.39 | | | | | | 0.39 | | | | | | 1.92 | | | | | | 23,832 | | | | | | 42 | | |
| 12-31-15 | | | | | 14.82 | | | | | | 0.21 | | | | | | (0.43) | | | | | | (0.22) | | | | | | 0.15 | | | | | | 1.20 | | | | | | — | | | | | | 1.35 | | | | | | — | | | | | | 13.25 | | | | | | (1.93) | | | | | | 0.53 | | | | | | 0.40 | | | | | | 0.40 | | | | | | 1.55 | | | | | | 20,530 | | | | | | 39 | | |
| Class S2 | | | | | | | | | | | | | | | | | | | | | | | | | | | | | | | | | | | | | | | | | | | | | | | | | | | | | | | | | | | | | | | | | | | | | | | | | | | | | | | | | | | | | | | | | | | | | | | | | | | | | | | |
| 12-31-19 | | | | | 13.49 | | | | | | 0.23• | | | | | | 3.03 | | | | | | 3.26 | | | | | | 0.18 | | | | | | 0.58 | | | | | | — | | | | | | 0.76 | | | | | | — | | | | | | 15.99 | | | | | | 24.68 | | | | | | 0.64 | | | | | | 0.64 | | | | | | 0.64 | | | | | | 1.53 | | | | | | 11,439 | | | | | | 20 | | |
| 12-31-18 | | | | | 15.24 | | | | | | 0.20• | | | | | | (1.49) | | | | | | (1.29) | | | | | | 0.12 | | | | | | 0.34 | | | | | | — | | | | | | 0.46 | | | | | | — | | | | | | 13.49 | | | | | | (8.77) | | | | | | 0.65 | | | | | | 0.63 | | | | | | 0.63 | | | | | | 1.30 | | | | | | 7,943 | | | | | | 29 | | |
| 12-31-17 | | | | | 13.06 | | | | | | 0.19• | | | | | | 2.45 | | | | | | 2.64 | | | | | | 0.15 | | | | | | 0.31 | | | | | | — | | | | | | 0.46 | | | | | | — | | | | | | 15.24 | | | | | | 20.50 | | | | | | 0.66 | | | | | | 0.60 | | | | | | 0.60 | | | | | | 1.35 | | | | | | 10,327 | | | | | | 25 | | |
| 12-31-16 | | | | | 13.17 | | | | | | 0.24• | | | | | | 0.74 | | | | | | 0.98 | | | | | | 0.19 | | | | | | 0.90 | | | | | | — | | | | | | 1.09 | | | | | | — | | | | | | 13.06 | | | | | | 7.71 | | | | | | 0.71 | | | | | | 0.54 | | | | | | 0.54 | | | | | | 1.87 | | | | | | 6,752 | | | | | | 42 | | |
| 12-31-15 | | | | | 14.72 | | | | | | 0.21• | | | | | | (0.45) | | | | | | (0.24) | | | | | | 0.11 | | | | | | 1.20 | | | | | | — | | | | | | 1.31 | | | | | | — | | | | | | 13.17 | | | | | | (2.04) | | | | | | 0.78 | | | | | | 0.55 | | | | | | 0.55 | | | | | | 1.50 | | | | | | 5,816 | | | | | | 39 | | |
| Class Z | | | | | | | | | | | | | | | | | | | | | | | | | | | | | | | | | | | | | | | | | | | | | | | | | | | | | | | | | | | | | | | | | | | | | | | | | | | | | | | | | | | | | | | | | | | | | | | | | | | | | | | |
| 12-31-19 | | | | | 13.86 | | | | | | 0.35• | | | | | | 3.11 | | | | | | 3.46 | | | | | | 0.23 | | | | | | 0.58 | | | | | | — | | | | | | 0.81 | | | | | | — | | | | | | 16.51 | | | | | | 25.54 | | | | | | 0.24 | | | | | | 0.00* | | | | | | 0.00* | | | | | | 2.23 | | | | | | 217,585 | | | | | | 20 | | |
| 12-31-18 | | | | | 15.62 | | | | | | 0.33• | | | | | | (1.56) | | | | | | (1.23) | | | | | | 0.19 | | | | | | 0.34 | | | | | | — | | | | | | 0.53 | | | | | | — | | | | | | 13.86 | | | | | | (8.24) | | | | | | 0.25 | | | | | | 0.00* | | | | | | 0.00* | | | | | | 2.15 | | | | | | 111,996 | | | | | | 29 | | |
| 12-31-17 | | | | | 13.33 | | | | | | 0.30• | | | | | | 2.50 | | | | | | 2.80 | | | | | | 0.20 | | | | | | 0.31 | | | | | | — | | | | | | 0.51 | | | | | | — | | | | | | 15.62 | | | | | | 21.27 | | | | | | 0.26 | | | | | | 0.00* | | | | | | 0.00* | | | | | | 2.07 | | | | | | 68,540 | | | | | | 25 | | |
| 12-31-16 | | | | | 13.40 | | | | | | 0.40• | | | | | | 0.67 | | | | | | 1.07 | | | | | | 0.24 | | | | | | 0.90 | | | | | | — | | | | | | 1.14 | | | | | | — | | | | | | 13.33 | | | | | | 8.24 | | | | | | 0.28 | | | | | | 0.00* | | | | | | 0.00* | | | | | | 3.06 | | | | | | 17,543 | | | | | | 42 | | |
| 05-01-15(5) - | | | | | | | | | | | | | | | | | | | | | | | | | | | | | | | | | | | | | | | | | | | | | | | | | | | | | | | | | | | | | | | | | | | | | | | | | | | | | | | | | | | | | | | | | | | | | | | | | | | | | | | |
| 12-31-15 | | | | | 15.69 | | | | | | 0.28• | | | | | | (1.19) | | | | | | (0.91) | | | | | | 0.18 | | | | | | 1.20 | | | | | | — | | | | | | 1.38 | | | | | | — | | | | | | 13.40 | | | | | | (6.22) | | | | | | 0.30 | | | | | | 0.00* | | | | | | 0.00* | | | | | | 3.14 | | | | | | 446 | | | | | | 39 | | |
| Voya Index Solution 2060 Portfolio | | | | | | | | | | | | | | | | | | | | | | | | | | | | | | | | | | | | | | | | | | | | | | | | | | | | | | | | | | | | | | | | | | | | | | | | | | | | | | | | | | | | | | | | | | | | | | | | | | | | | | | |
| Class ADV | | | | | | | | | | | | | | | | | | | | | | | | | | | | | | | | | | | | | | | | | | | | | | | | | | | | | | | | | | | | | | | | | | | | | | | | | | | | | | | | | | | | | | | | | | | | | | | | | | | | | | | |
| 12-31-19 | | | | | 11.02 | | | | | | 0.18• | | | | | | 2.50 | | | | | | 2.68 | | | | | | 0.09 | | | | | | 0.30 | | | | | | — | | | | | | 0.39 | | | | | | — | | | | | | 13.31 | | | | | | 24.62 | | | | | | 0.77 | | | | | | 0.74 | | | | | | 0.74 | | | | | | 1.45 | | | | | | 9,576 | | | | | | 36 | | |
| 12-31-18 | | | | | 12.49 | | | | | | 0.17• | | | | | | (1.23) | | | | | | (1.06) | | | | | | 0.07 | | | | | | 0.34 | | | | | | — | | | | | | 0.41 | | | | | | — | | | | | | 11.02 | | | | | | (8.88) | | | | | | 0.81 | | | | | | 0.72 | | | | | | 0.72 | | | | | | 1.42 | | | | | | 6,029 | | | | | | 40 | | |
| 12-31-17 | | | | | 10.48 | | | | | | 0.16• | | | | | | 1.97 | | | | | | 2.13 | | | | | | 0.03 | | | | | | 0.09 | | | | | | — | | | | | | 0.12 | | | | | | — | | | | | | 12.49 | | | | | | 20.44 | | | | | | 0.90 | | | | | | 0.70 | | | | | | 0.70 | | | | | | 1.40 | | | | | | 4,579 | | | | | | 51 | | |
| 12-31-16 | | | | | 9.77 | | | | | | 0.21• | | | | | | 0.56 | | | | | | 0.77 | | | | | | 0.02 | | | | | | 0.04 | | | | | | — | | | | | | 0.06 | | | | | | — | | | | | | 10.48 | | | | | | 7.87 | | | | | | 1.91 | | | | | | 0.64 | | | | | | 0.64 | | | | | | 2.06 | | | | | | 1,690 | | | | | | 63 | | |
| 02-09-15(5) - | | | | | | | | | | | | | | | | | | | | | | | | | | | | | | | | | | | | | | | | | | | | | | | | | | | | | | | | | | | | | | | | | | | | | | | | | | | | | | | | | | | | | | | | | | | | | | | | | | | | | | | |
| 12-31-15 | | | | | 10.00 | | | | | | 0.20• | | | | | | (0.43) | | | | | | (0.23) | | | | | | — | | | | | | — | | | | | | — | | | | | | — | | | | | | — | | | | | | 9.77 | | | | | | (2.30) | | | | | | 36.51 | | | | | | 0.65 | | | | | | 0.65 | | | | | | 2.29 | | | | | | 87 | | | | | | 208 | | |
| Class I | | | | | | | | | | | | | | | | | | | | | | | | | | | | | | | | | | | | | | | | | | | | | | | | | | | | | | | | | | | | | | | | | | | | | | | | | | | | | | | | | | | | | | | | | | | | | | | | | | | | | | | |
| 12-31-19 | | | | | 11.19 | | | | | | 0.27• | | | | | | 2.52 | | | | | | 2.79 | | | | | | 0.13 | | | | | | 0.30 | | | | | | — | | | | | | 0.43 | | | | | | — | | | | | | 13.55 | | | | | | 25.32 | | | | | | 0.27 | | | | | | 0.24 | | | | | | 0.24 | | | | | | 2.18 | | | | | | 7,603 | | | | | | 36 | | |
| 12-31-18 | | | | | 12.65 | | | | | | 0.25• | | | | | | (1.27) | | | | | | (1.02) | | | | | | 0.10 | | | | | | 0.34 | | | | | | — | | | | | | 0.44 | | | | | | — | | | | | | 11.19 | | | | | | (8.46) | | | | | | 0.31 | | | | | | 0.22 | | | | | | 0.22 | | | | | | 2.05 | | | | | | 3,020 | | | | | | 40 | | |
| 12-31-17 | | | | | 10.57 | | | | | | 0.31• | | | | | | 1.91 | | | | | | 2.22 | | | | | | 0.05 | | | | | | 0.09 | | | | | | — | | | | | | 0.14 | | | | | | — | | | | | | 12.65 | | | | | | 21.11 | | | | | | 0.40 | | | | | | 0.20 | | | | | | 0.20 | | | | | | 2.60 | | | | | | 1,563 | | | | | | 51 | | |
| 12-31-16 | | | | | 9.82 | | | | | | 0.26• | | | | | | 0.54 | | | | | | 0.80 | | | | | | 0.01 | | | | | | 0.04 | | | | | | — | | | | | | 0.05 | | | | | | — | | | | | | 10.57 | | | | | | 8.24 | | | | | | 1.41 | | | | | | 0.14 | | | | | | 0.14 | | | | | | 2.52 | | | | | | 146 | | | | | | 63 | | |
| 02-09-15(5) - | | | | | | | | | | | | | | | | | | | | | | | | | | | | | | | | | | | | | | | | | | | | | | | | | | | | | | | | | | | | | | | | | | | | | | | | | | | | | | | | | | | | | | | | | | | | | | | | | | | | | | | |
| 12-31-15 | | | | | 10.00 | | | | | | 0.51• | | | | | | (0.69) | | | | | | (0.18) | | | | | | — | | | | | | — | | | | | | — | | | | | | — | | | | | | — | | | | | | 9.82 | | | | | | (1.80) | | | | | | 36.01 | | | | | | 0.15 | | | | | | 0.15 | | | | | | 5.86 | | | | | | 32 | | | | | | 208 | | |
| Class S | | | | | | | | | | | | | | | | | | | | | | | | | | | | | | | | | | | | | | | | | | | | | | | | | | | | | | | | | | | | | | | | | | | | | | | | | | | | | | | | | | | | | | | | | | | | | | | | | | | | | | | |
| 12-31-19 | | | | | 11.10 | | | | | | 0.22• | | | | | | 2.50 | | | | | | 2.72 | | | | | | 0.11 | | | | | | 0.30 | | | | | | — | | | | | | 0.41 | | | | | | — | | | | | | 13.41 | | | | | | 24.87 | | | | | | 0.52 | | | | | | 0.49 | | | | | | 0.49 | | | | | | 1.74 | | | | | | 5,693 | | | | | | 36 | | |
| 12-31-18 | | | | | 12.56 | | | | | | 0.21• | | | | | | (1.25) | | | | | | (1.04) | | | | | | 0.08 | | | | | | 0.34 | | | | | | — | | | | | | 0.42 | | | | | | — | | | | | | 11.10 | | | | | | (8.66) | | | | | | 0.56 | | | | | | 0.47 | | | | | | 0.47 | | | | | | 1.70 | | | | | | 3,057 | | | | | | 40 | | |
| 12-31-17 | | | | | 10.52 | | | | | | 0.18• | | | | | | 1.99 | | | | | | 2.17 | | | | | | 0.04 | | | | | | 0.09 | | | | | | — | | | | | | 0.13 | | | | | | — | | | | | | 12.56 | | | | | | 20.76 | | | | | | 0.65 | | | | | | 0.45 | | | | | | 0.45 | | | | | | 1.51 | | | | | | 2,294 | | | | | | 51 | | |
| 12-31-16 | | | | | 9.79 | | | | | | 0.25• | | | | | | 0.54 | | | | | | 0.79 | | | | | | 0.02 | | | | | | 0.04 | | | | | | — | | | | | | 0.06 | | | | | | — | | | | | | 10.52 | | | | | | 8.06 | | | | | | 1.66 | | | | | | 0.39 | | | | | | 0.39 | | | | | | 2.46 | | | | | | 863 | | | | | | 63 | | |
| 02-09-15(5) - | | | | | | | | | | | | | | | | | | | | | | | | | | | | | | | | | | | | | | | | | | | | | | | | | | | | | | | | | | | | | | | | | | | | | | | | | | | | | | | | | | | | | | | | | | | | | | | | | | | | | | | |
| 12-31-15 | | | | | 10.00 | | | | | | 0.58• | | | | | | (0.79) | | | | | | (0.21) | | | | | | — | | | | | | — | | | | | | — | | | | | | — | | | | | | — | | | | | | 9.79 | | | | | | (2.10) | | | | | | 36.26 | | | | | | 0.40 | | | | | | 0.40 | | | | | | 6.61 | | | | | | 131 | | | | | | 208 | | |
See Accompanying Notes to Financial Statements
Financial Highlights (continued)
| | | | | | | | | | Income (loss)
from
investment
operations | | | | | | | | | Less Distributions | | | | | | Ratios to average net assets | | | Supplemental
Data | |
| | | | Net asset value, beginning of year
or period | | | Net investment income (loss) | | | Net realized and unrealized
gain (loss) | | | Total from investment operations | | | From net investment income | | | From net realized gains | | | From return of capital | | | Total distributions | | | Payment by affiliate | | | Net asset value, end of year
or period | | | Total Return(1) | | | Expenses before
reductions/additions(2)(3)(4) | | | Expenses net of fee waivers
and/or recoupments if any(2)(3)(4) | | | Expenses net of all
reductions/additions(2)(3)(4) | | | Net investment income (loss)(2)(3) | | | Net assets, end of year or period | | | Portfolio turnover rate | |
Year or
period ended | | | ($) | | | ($) | | | ($) | | | ($) | | | ($) | | | ($) | | | ($) | | | ($) | | | ($) | | | ($) | | | (%) | | | (%) | | | (%) | | | (%) | | | (%) | | | ($000’s) | | | (%) | |
| Voya Index Solution 2060 Portfolio (continued) | | | | | | | | | | | | | | | | | | | | | | | | | | | | | | | | | | | | | | | | | | | | | | | | | | | | | | | | | | | | | | | | | | | | | | | | | | | | | | | | | | | | | | | | | | | | | | | | | | | | | | | |
| Class S2 | | | | | | | | | | | | | | | | | | | | | | | | | | | | | | | | | | | | | | | | | | | | | | | | | | | | | | | | | | | | | | | | | | | | | | | | | | | | | | | | | | | | | | | | | | | | | | | | | | | | | | | |
| 12-31-19 | | | | | 11.07 | | | | | | 0.19• | | | | | | 2.51 | | | | | | 2.70 | | | | | | 0.10 | | | | | | 0.30 | | | | | | — | | | | | | 0.40 | | | | | | — | | | | | | 13.37 | | | | | | 24.76 | | | | | | 0.67 | | | | | | 0.64 | | | | | | 0.64 | | | | | | 1.56 | | | | | | 1,545 | | | | | | 36 | | |
| 12-31-18 | | | | | 12.51 | | | | | | 0.15• | | | | | | (1.20) | | | | | | (1.05) | | | | | | 0.05 | | | | | | 0.34 | | | | | | — | | | | | | 0.39 | | | | | | — | | | | | | 11.07 | | | | | | (8.75) | | | | | | 0.71 | | | | | | 0.62 | | | | | | 0.62 | | | | | | 1.18 | | | | | | 751 | | | | | | 40 | | |
| 12-31-17 | | | | | 10.50 | | | | | | 0.20• | | | | | | 1.95 | | | | | | 2.15 | | | | | | 0.05 | | | | | | 0.09 | | | | | | — | | | | | | 0.14 | | | | | | — | | | | | | 12.51 | | | | | | 20.54 | | | | | | 0.80 | | | | | | 0.60 | | | | | | 0.60 | | | | | | 1.68 | | | | | | 993 | | | | | | 51 | | |
| 12-31-16 | | | | | 9.77 | | | | | | 0.26• | | | | | | 0.51 | | | | | | 0.77 | | | | | | — | | | | | | 0.04 | | | | | | — | | | | | | 0.04 | | | | | | — | | | | | | 10.50 | | | | | | 7.92 | | | | | | 1.84 | | | | | | 0.54 | | | | | | 0.54 | | | | | | 2.61 | | | | | | 139 | | | | | | 63 | | |
| 02-09-15(5) - | | | | | | | | | | | | | | | | | | | | | | | | | | | | | | | | | | | | | | | | | | | | | | | | | | | | | | | | | | | | | | | | | | | | | | | | | | | | | | | | | | | | | | | | | | | | | | | | | | | | | | | |
| 12-31-15 | | | | | 10.00 | | | | | | 0.06• | | | | | | (0.29) | | | | | | (0.23) | | | | | | — | | | | | | — | | | | | | — | | | | | | — | | | | | | — | | | | | | 9.77 | | | | | | (2.30) | | | | | | 36.51 | | | | | | 0.55 | | | | | | 0.55 | | | | | | 0.73 | | | | | | 4 | | | | | | 208 | | |
| Class Z | | | | | | | | | | | | | | | | | | | | | | | | | | | | | | | | | | | | | | | | | | | | | | | | | | | | | | | | | | | | | | | | | | | | | | | | | | | | | | | | | | | | | | | | | | | | | | | | | | | | | | | |
| 12-31-19 | | | | | 11.26 | | | | | | 0.29• | | | | | | 2.55 | | | | | | 2.84 | | | | | | 0.13 | | | | | | 0.30 | | | | | | — | | | | | | 0.43 | | | | | | — | | | | | | 13.67 | | | | | | 25.61 | | | | | | 0.27 | | | | | | 0.00* | | | | | | 0.00* | | | | | | 2.31 | | | | | | 84,826 | | | | | | 36 | | |
| 12-31-18 | | | | | 12.70 | | | | | | 0.29• | | | | | | (1.29) | | | | | | (1.00) | | | | | | 0.10 | | | | | | 0.34 | | | | | | — | | | | | | 0.44 | | | | | | — | | | | | | 11.26 | | | | | | (8.27) | | | | | | 0.31 | | | | | | 0.00* | | | | | | 0.00* | | | | | | 2.29 | | | | | | 32,971 | | | | | | 40 | | |
| 12-31-17 | | | | | 10.60 | | | | | | 0.26• | | | | | | 1.98 | | | | | | 2.24 | | | | | | 0.05 | | | | | | 0.09 | | | | | | — | | | | | | 0.14 | | | | | | — | | | | | | 12.70 | | | | | | 21.24 | | | | | | 0.40 | | | | | | 0.00* | | | | | | 0.00* | | | | | | 2.16 | | | | | | 15,056 | | | | | | 51 | | |
| 12-31-16 | | | | | 9.82 | | | | | | 0.50• | | | | | | 0.34 | | | | | | 0.84 | | | | | | 0.02 | | | | | | 0.04 | | | | | | — | | | | | | 0.06 | | | | | | — | | | | | | 10.60 | | | | | | 8.58 | | | | | | 1.41 | | | | | | 0.00* | | | | | | 0.00* | | | | | | 4.95 | | | | | | 3,068 | | | | | | 63 | | |
| 05-01-15(5) - | | | | | | | | | | | | | | | | | | | | | | | | | | | | | | | | | | | | | | | | | | | | | | | | | | | | | | | | | | | | | | | | | | | | | | | | | | | | | | | | | | | | | | | | | | | | | | | | | | | | | | | |
| 12-31-15 | | | | | 10.46 | | | | | | 0.03• | | | | | | (0.67) | | | | | | (0.64) | | | | | | — | | | | | | — | | | | | | — | | | | | | — | | | | | | — | | | | | | 9.82 | | | | | | (6.12) | | | | | | 35.54 | | | | | | 0.00* | | | | | | 0.00* | | | | | | 0.52 | | | | | | 143 | | | | | | 208 | | |
(1)
Total return is calculated assuming reinvestment of all dividends, capital gain distributions and return of capital distributions, if any, at net asset value and does not reflect the effect of insurance contract charges. Total return for periods less than one year is not annualized.
(2)
Annualized for periods less than one year.
(3)
Ratios reflect operating expenses of a Portfolio. Expenses before reductions/additions do not reflect amounts reimbursed or recouped by the Investment Adviser and/or Distributor or reductions from brokerage service arrangements or other expense offset arrangements and do not represent the amount paid by a Portfolio during periods when reimbursements or reductions occur. Expenses net of fee waivers reflect expenses after reimbursement by the Investment Adviser and/or Distributor or recoupment of previously reimbursed fees by the Investment Adviser, but prior to reductions from brokerage service arrangements or other expense offset arrangements. Expenses net of all reductions/additions represent the net expenses paid by a Portfolio. Net investment income (loss) is net of all such additions or reductions.
(4)
Ratios do not include expenses of underlying funds and do not include fees and expenses charged under the variable annuity contract or variable life insurance policy.
(5)
Commencement of operations.
•
Calculated using average number of shares outstanding throughout the year or period.
*
Amount is less than $0.005 or 0.005% or more than $(0.005) or (0.005)%.
See Accompanying Notes to Financial Statements
NOTES TO FINANCIAL STATEMENTS as of December 31, 2019
NOTE 1 — ORGANIZATION
Voya Partners, Inc. (the “Company”) is an open-end management investment company registered under the Investment Company Act of 1940, as amended (the “1940 Act”). It was incorporated under the laws of Maryland on May 7, 1997. The Articles of Incorporation permit the Company to offer separate series, each of which has its own investment objective, policies and restrictions. The Company currently consists of thirty-seven active separate investment series. The ten series (each, a “Portfolio” and collectively, the “Portfolios”) included in this report are: Voya Index Solution Income Portfolio (“Index Solution Income”), Voya Index Solution 2020 Portfolio (“Index Solution 2020”), Voya Index Solution 2025 Portfolio (“Index Solution 2025”), Voya Index Solution 2030 Portfolio (“Index Solution 2030”), Voya Index Solution 2035 Portfolio (“Index Solution 2035”), Voya Index Solution 2040 Portfolio (“Index Solution 2040”), Voya Index Solution 2045 Portfolio (“Index Solution 2045”), Voya Index Solution 2050 Portfolio (“Index Solution 2050”), Voya Index Solution 2055 Portfolio (“Index Solution 2055”) and Voya Index Solution 2060 Portfolio (“Index Solution 2060”), each a diversified series of the Company.
Index Solution 2020, Index Solution 2025, Index Solution 2030, Index Solution 2035, Index Solution 2040, Index Solution 2045, Index Solution 2050, Index Solution 2055 and Index Solution 2060 are structured and managed around a specific target retirement or financial goal date (“Target Date”). When these Portfolios reach their respective Target Date, they may be combined with Index Solution Income, without a vote of shareholders, if approved by the Board of Directors (the “Board”).
The classes of shares included in this report are: Adviser (“Class ADV”), Initial (“Class I”), Service (“Class S”), Service 2 (“Class S2”) and Class Z. Shares of the Portfolios may be offered to separate accounts (“Separate Accounts”) of insurance companies as investment options in connection with variable annuity contracts and variable life insurance policies (“Variable Contracts”) and to certain of the Portfolios’ investment advisers and their affiliates. In the future, shares may also be offered to qualified pension and retirement plans (“Qualified Plans”) outside the Separate Account context. With the exception of class specific matters, each class has equal voting rights as to voting privileges. For class specific proposals, only the applicable class would have voting privileges. The classes differ principally in the applicable distribution and shareholder service fees. Generally, shareholders of each class also bear certain expenses that pertain to that particular class. All shareholders are allocated the common expenses of a portfolio and earn income and realized gains/losses from a portfolio pro rata based on the
daily ending net assets of each class, without distinction between share classes. Expenses that are specific to a portfolio or a class are charged directly to that portfolio or class. Other operating expenses shared by several portfolios are generally allocated among those portfolios based on average net assets. Distributions are determined separately for each class based on income and expenses allocated to each class. Realized gain distributions are allocated to each class pro rata based on the shares outstanding of each class on the date of distribution. Differences in per share dividend rates generally result from differences in separate class expenses, including distribution and shareholder service fees, if applicable.
Voya Investments, LLC (“Voya Investments” or the “Investment Adviser”), an Arizona limited liability company serves as the Investment Adviser to the Portfolios. Voya Investment Management Co. LLC (“Voya IM” or the “Sub-Adviser”), a Delaware limited liability company, serves as the Sub-Adviser to the Portfolios. Voya Investments Distributor, LLC (“VID” or the “Distributor”), a Delaware limited liability company, serves as the principal underwriter to the Portfolios.
Each Portfolio seeks to achieve its investment objective by investing in other investment companies (“Underlying Funds”) and uses asset allocation strategies to determine how much to invest in the Underlying Funds. The investment objective of the Portfolios is described in the respective Portfolio’s Prospectus.
NOTE 2 — SIGNIFICANT ACCOUNTING POLICIES
The following significant accounting policies are consistently followed by the Portfolios in the preparation of their financial statements. Each Portfolio is considered an investment company under U.S. generally accepted accounting principles (“GAAP”) and follows the accounting and reporting guidance applicable to investment companies.
A. Security Valuation. Each Portfolio is open for business every day the New York Stock Exchange (“NYSE”) opens for regular trading (each such day, a “Business Day”). The net asset value (“NAV”) per share for each class of each Portfolio is determined each Business Day as of the close of the regular trading session (“Market Close”), as determined by the Consolidated Tape Association (“CTA”), the central distributor of transaction prices for exchange-traded securities (normally 4:00 p.m. Eastern time unless otherwise designated by the CTA). The data reflected on the consolidated tape provided by the CTA is generated by various market centers, including all securities exchanges, electronic communications networks, and third-market broker-dealers. The NAV per share of each class of each Portfolio is calculated by
NOTES TO FINANCIAL STATEMENTS as of December 31, 2019 (continued)
NOTE 2 — SIGNIFICANT ACCOUNTING POLICIES (continued)
taking the value of the Portfolio’s assets attributable to that class, subtracting the Portfolio’s liabilities attributable to that class, and dividing by the number of shares of that class that are outstanding. On days when a Portfolio is closed for business, Portfolio shares will not be priced and a Portfolio does not transact purchase and redemption orders. To the extent a Portfolio’s assets are traded in other markets on days when a Portfolio does not price its shares, the value of a Portfolio’s assets will likely change and you will not be able to purchase or redeem shares of a Portfolio.
Assets for which market quotations are readily available are valued at market value. A security listed or traded on an exchange is valued at its last sales price or official closing price as of the close of the regular trading session on the exchange where the security is principally traded or, if such price is not available, at the last sale price as of the Market Close for such security provided by the CTA. Bank loans are valued at the average of the averages of the bid and ask prices provided to an independent loan pricing service by brokers. Futures contracts are valued at the final settlement price set by an exchange on which they are principally traded. Listed options are valued at the mean between the last bid and ask prices from the exchange on which they are principally traded. Investments in open-end registered investment companies that do not trade on an exchange are valued at the end of day NAV per share. Investments in registered investment companies that trade on an exchange are valued at the last sales price or official closing price as of the close of the regular trading session on the exchange where the security is principally traded.
When a market quotation is not readily available or is deemed unreliable, each Portfolio will determine a fair value for the relevant asset in accordance with procedures adopted by the Portfolios’ Board. Such procedures provide, for example, that: (a) Exchange-traded securities are valued at the mean of the closing bid and ask; (b) Debt obligations are valued using an evaluated price provided by an independent pricing service. Evaluated prices provided by the pricing service may be determined without exclusive reliance on quoted prices, and may reflect factors such as institution-size trading in similar groups of securities, developments related to specific securities, benchmark yield, quality, type of issue, coupon rate, maturity, individual trading characteristics and other market data; (c) Securities traded in the over-the-counter (“OTC”) market are valued based on prices provided by independent pricing services or market makers; (d) Options not listed on an exchange are valued by an independent source using an industry accepted model, such as Black-Scholes; (e) Centrally cleared swap
agreements are valued using a price provided by the central counterparty clearinghouse; (f) OTC swap agreements are valued using a price provided by an independent pricing service; (g) Forward foreign currency exchange contracts are valued utilizing current and forward rates obtained from an independent pricing service. Such prices from the third party pricing service are for specific settlement periods and each Portfolio’s forward foreign currency exchange contracts are valued at an interpolated rate between the closest preceding and subsequent period reported by the independent pricing service; and (h) Securities for which market prices are not provided by any of the above methods may be valued based upon quotes furnished by brokers.
The prospectuses of the open-end registered investment companies in which each Portfolio may invest explain the circumstances under which they will use fair value pricing and the effects of using fair value pricing.
Foreign securities’ (including forward foreign currency exchange contracts) prices are converted into U.S. dollar amounts using the applicable exchange rates as of Market Close. If market quotations are available and believed to be reliable for foreign exchange-traded equity securities, the securities will be valued at the market quotations. Because trading hours for certain foreign securities end before Market Close, closing market quotations may become unreliable. An independent pricing service determines the degree of certainty, based on historical data, that the closing price in the principal market where a foreign security trades is not the current value as of Market Close. Foreign securities’ prices meeting the approved degree of certainty that the price is not reflective of current value will be valued by the independent pricing service using pricing models designed to estimate likely changes in the values of those securities between the times in which the trading in those securities is substantially completed and Market Close. Multiple factors may be considered by the independent pricing service in determining the value of such securities and may include information relating to sector indices, American Depositary Receipts and domestic and foreign index futures.
All other assets for which market quotations are not readily available or became unreliable (or if the above fair valuation methods are unavailable or determined to be unreliable) are valued at fair value as determined in good faith by or under the supervision of the Board following procedures approved by the Board. The Board has delegated to the Investment Adviser responsibility for overseeing the implementation of the Portfolios’ valuation procedures; a “Pricing Committee” comprised of employees of the Investment Adviser or its affiliates has responsibility for applying the fair valuation methods set
NOTES TO FINANCIAL STATEMENTS as of December 31, 2019 (continued)
NOTE 2 — SIGNIFICANT ACCOUNTING POLICIES (continued)
forth in the procedures and, if a fair valuation cannot be determined pursuant to the fair valuation methods, determining the fair value of assets held by the Portfolios. Issuer specific events, transaction price, position size, nature and duration of restrictions on disposition of the security, market trends, bid/ask quotes of brokers and other market data may be reviewed in the course of making a good faith determination of a security’s fair value. Valuations change in response to many factors including the historical and prospective earnings of the issuer, the value of the issuer’s assets, general economic conditions, interest rates, investor perceptions and market liquidity. Because of the inherent uncertainties of fair valuation, the values used to determine each Portfolio’s NAV may materially differ from the value received upon actual sale of those investments. Thus, fair valuation may have an unintended dilutive or accretive effect on the value of shareholders’ investments in each Portfolio.
Each investment asset or liability of the Portfolios is assigned a level at measurement date based on the significance and source of the inputs to its valuation. Quoted prices in active markets for identical securities are classified as “Level 1,” inputs other than quoted prices for an asset or liability that are observable are classified as “Level 2” and significant unobservable inputs, including the Sub-Adviser’s or Pricing Committee’s judgment about the assumptions that a market participant would use in pricing an asset or liability are classified as “Level 3.” The inputs used for valuing securities are not necessarily an indication of the risks associated with investing in those securities. Short-term securities of sufficient credit quality are generally considered to be Level 2 securities under applicable accounting rules. The Portfolios classify each of their investments in the Underlying Funds as Level 1, without consideration as to the classification level of the specific investments held by the Underlying Funds. A table summarizing the Portfolios’ investments under these levels of classification is included within the Portfolio of Investments.
GAAP requires a reconciliation of the beginning to ending balances for reported fair values that presents changes attributable to total realized and unrealized gains or losses, purchases and sales, and transfers in or out of the Level 3 category during the period. A reconciliation of Level 3 investments within the Portfolio of Investments is presented only when a Portfolio has a significant amount of Level 3 investments.
B. Securities Transactions and Revenue Recognition. Security transactions are accounted for on the trade date. Dividend income received from the Underlying Funds is
recognized on the ex-dividend date and is recorded as income distributions in the Statements of Operations. Capital gain distributions received from the Underlying Funds are recognized on the ex-dividend date and are recorded on the Statements of Operations as such. Realized gains and losses are reported on the basis of identified cost of securities sold.
C. Distributions to Shareholders. The Portfolios record distributions to their shareholders on the ex-dividend date. Dividends from net investment income and capital gain distributions, if any, are declared and paid annually. The Portfolios may make distributions on a more frequent basis to comply with the distribution requirements of the Internal Revenue Code. The characteristics of income and gains to be distributed are determined in accordance with income tax regulations, which may differ from GAAP for investment companies.
D. Federal Income Taxes. It is the policy of each Portfolio to comply with the requirements of subchapter M of the Internal Revenue Code that are applicable to regulated investment companies and to distribute substantially all of its net investment income and any net realized capital gains to its shareholders. Therefore, a federal income tax or excise tax provision is not required. Management has considered the sustainability of the Portfolios’ tax positions taken on federal income tax returns for all open tax years in making this determination. No capital gain distributions shall be made until the capital loss carryforwards have been fully utilized or expire.
The Portfolios may utilize equalization accounting for tax purposes, whereby a portion of redemption payments are treated as distributions of income or gain.
E. Use of Estimates. The preparation of financial statements in conformity with GAAP requires management to make estimates and assumptions that affect the reported amounts of assets and liabilities and disclosure of contingent assets and liabilities at the date of the financial statements and the reported amounts of increases and decreases in net assets from operations during the reporting period. Actual results could differ from those estimates.
F. Risk Exposures and the Use of Derivative Instruments. Each Portfolio’s investment strategies permit it to enter into various types of derivatives contracts, including, but not limited to, futures contracts. In doing so, a Portfolio will employ strategies in differing combinations to permit it to increase or decrease the level of risk, or change the level or types of exposure to risk factors. This may allow a Portfolio to pursue its objectives more quickly and efficiently than if it were to make direct purchases or sales of securities capable of affecting a similar response to market or credit factors.
NOTES TO FINANCIAL STATEMENTS as of December 31, 2019 (continued)
NOTE 2 — SIGNIFICANT ACCOUNTING POLICIES (continued)
In pursuit of its investment objectives, a Portfolio may seek to increase or decrease its exposure to the following market or credit risk factors:
Equity Risk. Stock prices may be volatile or have reduced liquidity in response to real or perceived impacts of factors including, but not limited to, economic conditions, changes in market interest rates, and political events. Stock markets tend to be cyclical, with periods when stock prices generally rise and periods when stock prices generally decline. Any given stock market segment may remain out of favor with investors for a short or long period of time, and stocks as an asset class may underperform bonds or other asset classes during some periods. Additionally, legislative, regulatory or tax policies or developments in these areas may adversely impact the investment techniques available to a manager, add to costs and impair the ability of a Portfolio to achieve its investment objectives.
Risks of Investing in Derivatives. Each Portfolio’s use of derivatives can result in losses due to unanticipated changes in the market or credit risk factors and the overall market. In instances where a Portfolio is using derivatives to decrease, or hedge, exposures to market or credit risk factors for securities held by a Portfolio, there are also risks that those derivatives may not perform as expected resulting in losses for the combined or hedged positions.
Derivative instruments are subject to a number of risks, including the risk of changes in the market price of the underlying securities, credit risk with respect to the counterparty, risk of loss due to changes in market interest rates and liquidity and volatility risk. The amounts required to purchase certain derivatives may be small relative to the magnitude of exposure assumed by a Portfolio. Therefore, the purchase of certain derivatives may have an economic leveraging effect on a Portfolio and exaggerate any increase or decrease in the NAV. Derivatives may not perform as expected, so a Portfolio may not realize the intended benefits. When used for hedging purposes, the change in value of a derivative may not correlate as expected with the currency, security or other risk being hedged. When used as an alternative or substitute for direct cash investments, the return provided by the derivative may not provide the same return as direct cash investment. In addition, given their complexity, derivatives expose a Portfolio to the risk of improper valuation.
Generally, derivatives are sophisticated financial instruments whose performance is derived, at least in part, from the performance of an underlying asset or assets. Derivatives include, among other things, swap agreements, options, forwards and futures. Investments in
derivatives are generally negotiated OTC with a single counterparty and as a result are subject to credit risks related to the counterparty’s ability or willingness to perform its obligations; any deterioration in the counterparty’s creditworthiness could adversely affect the value of the derivative. In addition, derivatives and their underlying securities may experience periods of illiquidity which could cause a Portfolio to hold a security it might otherwise sell, or to sell a security it otherwise might hold at inopportune times or at an unanticipated price. A manager might imperfectly judge the direction of the market. For instance, if a derivative is used as a hedge to offset investment risk in another security, the hedge might not correlate to the market’s movements and may have unexpected or undesired results such as a loss or a reduction in gains.
G. Futures Contracts. Certain Portfolios may enter into futures contracts involving foreign currency, interest rates, securities and security indices. A futures contract is a commitment to buy or sell a specific amount of a financial instrument at a negotiated price on a stipulated future date. A Portfolio may buy and sell futures contracts. Futures contracts traded on a commodities or futures exchange will be valued at the final settlement price or official closing price on the principal exchange as reported by such principal exchange at its trading session ending at, or most recently prior to, the time when each Portfolio’s assets are valued.
Upon entering into a futures contract, a Portfolio is required to deposit either cash or securities (initial margin) in an amount equal to a certain percentage of the contract value. Subsequent payments (variation margin) are made or received by a Portfolio each day. The variation margin payments are equal to the daily changes in the contract value and are recorded as unrealized gains and losses. Open futures contracts are reported on a table following each Portfolio’s Portfolio of Investments. Securities held in collateralized accounts to cover initial margin requirements on open futures contracts, if any, are footnoted in the Portfolio of Investments. Cash collateral held by the broker to cover initial margin requirements on open futures contracts are noted in the Statements of Assets and Liabilities. The net change in unrealized appreciation and depreciation is reported in the Statements of Operations. Realized gains (losses) are reported in the Statements of Operations at the closing or expiration of futures contracts.
Futures contracts are exposed to the market risk factor of the underlying financial instrument. During the year ended December 31, 2019, each Portfolio, with the exception of Index Solution 2060, used futures to enact tactical positions and to provide the Portfolios with greater liquidity. With the exception of Index Solution 2060, each Portfolio
NOTES TO FINANCIAL STATEMENTS as of December 31, 2019 (continued)
NOTE 2 — SIGNIFICANT ACCOUNTING POLICIES (continued)
had purchased and sold futures contracts on various equity indices and various U.S. Treasury Notes and Bonds. Futures contracts are purchased to provide immediate market exposure proportionate to the size of the Portfolio’s respective cash flows and residual cash balances in order to decrease potential tracking error if the cash remained uninvested in the market. Additional associated risks of entering into futures contracts include the possibility that there may be an illiquid market where the Portfolios are unable to liquidate the contract or enter into an offsetting position and, if used for hedging purposes, the risk that the price of the contract will correlate imperfectly with the prices of the Portfolios’ securities. With futures, there is minimal counterparty credit risk to the Portfolios since futures are exchange traded and the exchange’s clearinghouse, as counterparty to all exchange traded futures, guarantees the futures against default.
During the year ended December 31, 2019, the following Portfolios had average notional values on futures contracts purchased and sold as disclosed below. Please refer to the tables within each respective Portfolio of Investments for open futures contracts purchased and sold for Index Solution Income, Index Solution 2020, Index Solution 2025, Index Solution 2030, Index Solution 2035, Index Solution 2040, Index Solution 2045, index Solution 2050 and Index Solution 2055. There were no open futures contracts purchased or sold for Index Solution 2060 during the year ended December 31, 2019.
| | | | Purchased | | | Sold | |
| Index Solution Income | | | | $ | 54,383,478 | | | | | $ | 15,881,556 | | |
| Index Solution 2020 | | | | | 25,963,132 | | | | | | 9,216,501 | | |
| Index Solution 2025 | | | | | 33,177,451 | | | | | | 33,383,571 | | |
| Index Solution 2030 | | | | | 15,652,286 | | | | | | 15,783,335 | | |
| Index Solution 2035 | | | | | 29,878,069 | | | | | | 30,013,893 | | |
| Index Solution 2040 | | | | | 11,812,293 | | | | | | 11,873,697 | | |
| Index Solution 2045 | | | | | 20,972,952 | | | | | | 21,034,127 | | |
| Index Solution 2050 | | | | | 8,081,844 | | | | | | 8,131,589 | | |
| Index Solution 2055 | | | | | 9,546,030 | | | | | | 9,563,003 | | |
H. Indemnifications. In the normal course of business, the Company may enter into contracts that provide certain indemnifications. The Company’s maximum exposure under these arrangements is dependent on future claims that may be made against the Portfolios and, therefore, cannot be estimated; however, based on experience, management considers the risk of loss from such claims remote.
NOTE 3 — INVESTMENTS IN UNDERLYING FUNDS
For the year ended December 31, 2019, the cost of purchases and the proceeds from sales of the Underlying Funds were as follows:
| | | | Purchases | | | Sales | |
| Index Solution Income | | | | $ | 162,194,627 | | | | | $ | 169,926,927 | | |
| Index Solution 2020 | | | | | 227,985,065 | | | | | | 154,138,959 | | |
| Index Solution 2025 | | | | | 379,646,382 | | | | | | 275,529,982 | | |
| Index Solution 2030 | | | | | 293,412,883 | | | | | | 149,691,997 | | |
| Index Solution 2035 | | | | | 408,587,365 | | | | | | 264,157,937 | | |
| Index Solution 2040 | | | | | 214,415,675 | | | | | | 86,989,358 | | |
| Index Solution 2045 | | | | | 254,072,868 | | | | | | 156,148,147 | | |
| Index Solution 2050 | | | | | 152,188,051 | | | | | | 55,947,221 | | |
| Index Solution 2055 | | | | | 135,350,953 | | | | | | 57,221,707 | | |
| Index Solution 2060 | | | | | 76,476,969 | | | | | | 27,925,340 | | |
NOTE 4 — INVESTMENT MANAGEMENT FEES
The Portfolios have entered into an investment management agreement (“Management Agreement”) with the Investment Adviser. The Investment Adviser has overall responsibility for the management of the Portfolios. The Investment Adviser oversees all investment management and portfolio management services for the Portfolios and assists in managing and supervising all aspects of the general day-to-day business activities and operations of the Portfolios, including custodial, transfer agency, dividend disbursing, accounting, auditing, compliance and related services. This Management Agreement compensates the Investment Adviser with a management fee, computed daily and payable monthly, based on the average daily net assets of each Portfolio, at the following annual rates: 0.20% of each Portfolio’s average daily nets assets invested in affiliated Underlying Funds and 0.40% of each Portfolio’s average daily net assets invested in unaffiliated Underlying Funds and/or other direct investments.
The Investment Adviser has entered into a sub-advisory agreement with Voya IM with respect to each Portfolio. Voya IM provides investment advice for the Portfolios and is paid by the Investment Adviser based on the average daily net assets of each respective Portfolio. Subject to such policies as the Board or the Investment Adviser may determine, Voya IM manages the Portfolios’ assets in accordance with the Portfolios’ investment objectives, policies, and limitations.
NOTE 5 — DISTRIBUTION AND SERVICE FEES
Classes ADV and S2 of the Portfolios have a plan of distribution (the “Plans”), whereby the Distributor is
NOTES TO FINANCIAL STATEMENTS as of December 31, 2019 (continued)
NOTE 5 — DISTRIBUTION AND SERVICE FEES (continued)
reimbursed or compensated by the Portfolios for expenses incurred in the distribution of each respective Portfolio’s shares (“Distribution Fees”). The Distributor may pay, on behalf of each Portfolio, out of its distribution fee, compensation to certain financial institutions for providing distribution assistance pursuant to a Distribution Services Agreement. Under the Plans each Portfolio makes payments to the Distributor at an annual rate of 0.25% of each Portfolio’s average daily net assets attributable to its Class ADV shares and each Portfolio makes payments to the Distributor at an annual rate of 0.15% of each Portfolio’s average daily net assets attributable to its Class S2 shares.
The Company has a shareholder servicing plan (“Service Plan”) for the Classes ADV, S and S2 shares of each respective Portfolio. The Service Plan allows the Distributor to enter into shareholder servicing agreements with insurance companies, broker dealers or other financial intermediaries that provide administrative services related to Classes ADV, S and S2 shares and their shareholders including Variable Contract owners or Qualified Plan participants with interests in the Portfolios. Under the Service Plan, each Portfolio makes payments to the Distributor which shall not exceed an annual rate of 0.25% of each Portfolio’s average daily net assets attributable to its Classes ADV, S and S2 shares.
NOTE 6 — OTHER TRANSACTIONS WITH AFFILIATES AND RELATED PARTIES
At December 31, 2019, the following direct or indirect, wholly-owned subsidiaries of Voya Financial, Inc. owned more than 5% of the following Portfolios:
| Subsidiary | | | Portfolio | | | Percentage | |
| Voya Institutional Trust Company | | | Index Solution Income | | | | | 36.44% | | |
| | | | Index Solution 2020 | | | | | 10.02 | | |
| | | | Index Solution 2025 | | | | | 15.72 | | |
| | | | Index Solution 2030 | | | | | 8.23 | | |
| | | | Index Solution 2035 | | | | | 13.28 | | |
| | | | Index Solution 2040 | | | | | 7.61 | | |
| | | | Index Solution 2045 | | | | | 12.09 | | |
| | | | Index Solution 2050 | | | | | 7.51 | | |
| | | | Index Solution 2055 | | | | | 9.28 | | |
| | | | Index Solution 2060 | | | | | 8.97 | | |
| Voya Retirement Insurance and Annuity Company | | | Index Solution Income | | | | | 63.52 | | |
| | | | Index Solution 2020 | | | | | 89.98 | | |
| | | | Index Solution 2025 | | | | | 84.28 | | |
| | | | Index Solution 2030 | | | | | 91.77 | | |
| | | | Index Solution 2035 | | | | | 86.69 | | |
| | | | Index Solution 2040 | | | | | 92.39 | | |
| | | | Index Solution 2045 | | | | | 87.91 | | |
| | | | Index Solution 2050 | | | | | 92.49 | | |
| | | | Index Solution 2055 | | | | | 90.72 | | |
| | | | Index Solution 2060 | | | | | 91.03 | | |
Under the 1940 Act, the direct or indirect beneficial owner of more than 25% of the voting securities of a company (including a fund) is presumed to control such company. Companies under common control (e.g., companies with a common owner of greater than 25% of their respective voting securities) are affiliates under the 1940 Act.
The Portfolios have adopted a deferred compensation plan (the “DC Plan”), which allows eligible independent directors, as described in the DC Plan, to defer the receipt of all or a portion of the directors’ fees that they are entitled to receive from the Portfolios. For purposes of determining the amount owed to the director under the DC Plan, the amounts deferred are invested in shares of the funds selected by the director (the “Notional Funds”). The Portfolios purchase shares of the Notional Funds, which are all advised by Voya Investments, in amounts equal to the directors’ deferred fees, resulting in a Portfolio asset equal to the deferred compensation liability. Such assets, if applicable, are included as a component of “Other assets” on the accompanying Statements of Assets and Liabilities. Deferral of directors’ fees under the DC Plan will not affect net assets of the Portfolio, and will not materially affect the Portfolios’ assets, liabilities or net investment income per share. Amounts will be deferred until distributed in accordance with the DC Plan.
NOTE 7 — EXPENSE LIMITATION AGREEMENTS
The Investment Adviser has entered into a written expense limitation agreement (“Expense Limitation Agreement”) with each Portfolio whereby the Investment Adviser has agreed to limit expenses, excluding, except for Class Z, interest, taxes, investment-related costs, leverage expenses, and extraordinary expenses to the levels listed in the table below.
| Portfolio | | | Class
ADV(1)(2) | | | Class
I(1)(2) | | | Class
S(1)(2) | | | Class
S2(1)(2) | | | Class
Z(3)(4) | |
| Index Solution Income | | | | | 0.89% | | | | | | 0.39% | | | | | | 0.64% | | | | | | 0.79% | | | | | | 0.00% | | |
| Index Solution 2020 | | | | | 0.89% | | | | | | 0.39% | | | | | | 0.64% | | | | | | 0.79% | | | | | | 0.00% | | |
| Index Solution 2025 | | | | | 0.89% | | | | | | 0.39% | | | | | | 0.64% | | | | | | 0.79% | | | | | | 0.00% | | |
| Index Solution 2030 | | | | | 0.89% | | | | | | 0.39% | | | | | | 0.64% | | | | | | 0.79% | | | | | | 0.00% | | |
| Index Solution 2035 | | | | | 0.89% | | | | | | 0.39% | | | | | | 0.64% | | | | | | 0.79% | | | | | | 0.00% | | |
| Index Solution 2040 | | | | | 0.89% | | | | | | 0.39% | | | | | | 0.64% | | | | | | 0.79% | | | | | | 0.00% | | |
| Index Solution 2045 | | | | | 0.89% | | | | | | 0.39% | | | | | | 0.64% | | | | | | 0.79% | | | | | | 0.00% | | |
| Index Solution 2050 | | | | | 0.89% | | | | | | 0.39% | | | | | | 0.64% | | | | | | 0.79% | | | | | | 0.00% | | |
| Index Solution 2055 | | | | | 0.89% | | | | | | 0.39% | | | | | | 0.64% | | | | | | 0.79% | | | | | | 0.00% | | |
| Index Solution 2060 | | | | | 0.89% | | | | | | 0.39% | | | | | | 0.64% | | | | | | 0.79% | | | | | | 0.00% | | |
(1)
The operating expense limits take into account the operating expenses incurred at the Underlying Fund level. The amount of fees and expenses of an Underlying Fund borne by each Portfolio will vary based on each Portfolio’s allocation of assets to, and the net expenses of, a particular Underlying Fund.
(2)
Any fees waived pursuant to the Expense Limitation Agreement shall not be eligible for recoupment.
NOTES TO FINANCIAL STATEMENTS as of December 31, 2019 (continued)
NOTE 7 — EXPENSE LIMITATION AGREEMENTS (continued)
(3)
Pursuant to a side letter agreement, through May 1, 2020, the Investment Adviser has agreed to waive all or a portion of the management fee so that the direct expense limits are 0.00% for all Portfolios. Any fees waived pursuant to the side letter agreement shall not be eligible for recoupment. Termination or modification of this obligation requires approval by the Board.
(4)
The operating expense limits shown apply only at each Portfolio level and do not include the fees payable by the Underlying Funds in which each Portfolio invests, investment-related costs and extraordinary expenses, such as litigation and other expenses not incurred in the ordinary course of each Portfolio’s business.
The Expense Limitation Agreement is contractual through May 1, 2020 and shall renew automatically for one-year terms. Termination or modification of this obligation requires approval by the Board.
NOTE 8 — LINE OF CREDIT
Effective May 17, 2019, each Portfolio, in addition to certain other funds managed by the Investment Adviser, has entered into a 364-day unsecured committed revolving line of credit agreement (the “Credit Agreement”) with The Bank of New York Mellon (“BNY”) for an aggregate amount of $400,000,000 through May 15, 2020. The proceeds may be used only to finance temporarily: (1) the purchase or sale of investment securities; or (2) the repurchase or redemption of shares of a Portfolio or certain other funds managed by the Investment Adviser. The funds to which
the line of credit is available pay a commitment fee equal to 0.15% per annum on the daily unused portion of the committed line amount payable quarterly in arrears. Prior to May 17, 2019, the predecessor line of credit was for an aggregate amount of $400,000,000 and paid a commitment fee equal to 0.15% per annum on the daily unused portion of the committed line amount through May 17, 2019.
Borrowings under the Credit Agreement accrue interest at the federal funds rate plus a specified margin. Repayments generally must be made within 60 days after the date of a revolving credit advance.
The following Portfolios utilized the line of credit during the year ended December 31, 2019:
| Portfolio | | | Days
Utilized | | | Approximate
Average
Daily
Balance For
Days
Utilized | | | Approximate
Weighted
Average
Interest Rate
For Days
Utilized | |
| Index Solution Income | | | | | 1 | | | | | $ | 3,252,000 | | | | | | 3.13% | | |
| Index Solution 2020 | | | | | 2 | | | | | | 1,161,000 | | | | | | 3.21 | | |
| Index Solution 2025 | | | | | 5 | | | | | | 1,055,000 | | | | | | 3.24 | | |
| Index Solution 2030 | | | | | 1 | | | | | | 577,000 | | | | | | 3.38 | | |
| Index Solution 2035 | | | | | 5 | | | | | | 875,600 | | | | | | 3.23 | | |
NOTE 9 — CAPITAL SHARES
Transactions in capital shares and dollars were as follows:
| | | | Shares
sold | | | Shares
issued in
merger | | | Reinvestment
of
distributions | | | Shares
redeemed | | | Net increase
(decrease)
in shares
outstanding | | | Shares
sold | | | Proceeds
from shares
issued in
merger | | | Reinvestment
of
distributions | | | Shares
redeemed | | | Net increase
(decrease) | |
| Year or period ended | | | # | | | # | | | # | | | # | | | # | | | ($) | | | ($) | | | ($) | | | ($) | | | ($) | |
| Index Solution Income | |
| Class ADV | | | | | | | | | | | | | | | | | | | | | | | | | | | | | | | | | | | | | | | | | | | | | | | | | | | | | | | | | | | | | |
| 12/31/2019 | | | | | 429,206 | | | | | | — | | | | | | 253,246 | | | | | | (2,074,088) | | | | | | (1,391,636) | | | | | | 4,386,134 | | | | | | — | | | | | | 2,575,512 | | | | | | (21,252,132) | | | | | | (14,290,486) | | |
| 12/31/2018 | | | | | 646,418 | | | | | | — | | | | | | 313,830 | | | | | | (2,564,995) | | | | | | (1,604,747) | | | | | | 6,566,562 | | | | | | — | | | | | | 3,141,436 | | | | | | (25,972,388) | | | | | | (16,264,390) | | |
| Class I | | | | | | | | | | | | | | | | | | | | | | | | | | | | | | | | | | | | | | | | | | | | | | | | | | | | | | | | | | | | | |
| 12/31/2019 | | | | | 276,159 | | | | | | — | | | | | | 68,384 | | | | | | (752,288) | | | | | | (407,745) | | | | | | 2,910,332 | | | | | | — | | | | | | 711,876 | | | | | | (7,869,411) | | | | | | (4,247,203) | | |
| 12/31/2018 | | | | | 249,741 | | | | | | — | | | | | | 78,017 | | | | | | (354,127) | | | | | | (26,369) | | | | | | 2,599,791 | | | | | | — | | | | | | 800,450 | | | | | | (3,706,148) | | | | | | (305,907) | | |
| Class S | | | | | | | | | | | | | | | | | | | | | | | | | | | | | | | | | | | | | | | | | | | | | | | | | | | | | | | | | | | | | |
| 12/31/2019 | | | | | 344,355 | | | | | | — | | | | | | 467,397 | | | | | | (2,404,332) | | | | | | (1,592,580) | | | | | | 3,569,721 | | | | | | — | | | | | | 4,823,540 | | | | | | (25,166,525) | | | | | | (16,773,264) | | |
| 12/31/2018 | | | | | 413,680 | | | | | | — | | | | | | 530,229 | | | | | | (2,667,750) | | | | | | (1,723,841) | | | | | | 4,279,638 | | | | | | — | | | | | | 5,392,426 | | | | | | (27,335,509) | | | | | | (17,663,445) | | |
| Class S2 | | | | | | | | | | | | | | | | | | | | | | | | | | | | | | | | | | | | | | | | | | | | | | | | | | | | | | | | | | | | | |
| 12/31/2019 | | | | | 598,934 | | | | | | — | | | | | | 29,052 | | | | | | (1,518,193) | | | | | | (890,207) | | | | | | 6,080,050 | | | | | | — | | | | | | 293,428 | | | | | | (15,276,480) | | | | | | (8,903,002) | | |
| 12/31/2018 | | | | | 970,860 | | | | | | — | | | | | | 38,554 | | | | | | (575,130) | | | | | | 434,284 | | | | | | 9,407,825 | | | | | | — | | | | | | 383,617 | | | | | | (5,801,646) | | | | | | 3,989,796 | | |
| Class Z | | | | | | | | | | | | | | | | | | | | | | | | | | | | | | | | | | | | | | | | | | | | | | | | | | | | | | | | | | | | | |
| 12/31/2019 | | | | | 5,140,709 | | | | | | — | | | | | | 720,770 | | | | | | (2,659,126) | | | | | | 3,202,353 | | | | | | 54,538,212 | | | | | | — | | | | | | 7,575,291 | | | | | | (28,267,824) | | | | | | 33,845,679 | | |
| 12/31/2018 | | | | | 4,984,923 | | | | | | — | | | | | | 660,970 | | | | | | (3,605,443) | | | | | | 2,040,450 | | | | | | 52,215,088 | | | | | | — | | | | | | 6,821,212 | | | | | | (37,532,275) | | | | | | 21,504,025 | | |
| Index Solution 2020 | |
| Class ADV | | | | | | | | | | | | | | | | | | | | | | | | | | | | | | | | | | | | | | | | | | | | | | | | | | | | | | | | | | | | | |
| 12/31/2019 | | | | | 552,124 | | | | | | — | | | | | | 79,966 | | | | | | (512,630) | | | | | | 119,460 | | | | | | 7,229,032 | | | | | | — | | | | | | 1,033,955 | | | | | | (6,692,240) | | | | | | 1,570,747 | | |
| 12/31/2018 | | | | | 917,597 | | | | | | — | | | | | | 74,293 | | | | | | (610,242) | | | | | | 381,648 | | | | | | 11,974,728 | | | | | | — | | | | | | 956,903 | | | | | | (7,888,365) | | | | | | 5,043,266 | | |
NOTES TO FINANCIAL STATEMENTS as of December 31, 2019 (continued)
NOTE 9 — CAPITAL SHARES (continued)
| | | | Shares
sold | | | Shares
issued in
merger | | | Reinvestment
of
distributions | | | Shares
redeemed | | | Net increase
(decrease)
in shares
outstanding | | | Shares
sold | | | Proceeds
from shares
issued in
merger | | | Reinvestment
of
distributions | | | Shares
redeemed | | | Net increase
(decrease) | |
| Year or period ended | | | # | | | # | | | # | | | # | | | # | | | ($) | | | ($) | | | ($) | | | ($) | | | ($) | |
| Index Solution 2020 (continued) | |
| Class I | | | | | | | | | | | | | | | | | | | | | | | | | | | | | | | | | | | | | | | | | | | | | | | | | | | | | | | | | | | | | |
| 12/31/2019 | | | | | 242,324 | | | | | | — | | | | | | 21,555 | | | | | | (350,324) | | | | | | (86,445) | | | | | | 3,227,918 | | | | | | — | | | | | | 285,814 | | | | | | (4,653,181) | | | | | | (1,139,449) | | |
| 12/31/2018 | | | | | 219,724 | | | | | | — | | | | | | 21,709 | | | | | | (40,316) | | | | | | 201,117 | | | | | | 2,954,136 | | | | | | — | | | | | | 286,342 | | | | | | (535,987) | | | | | | 2,704,491 | | |
| Class S | | | | | | | | | | | | | | | | | | | | | | | | | | | | | | | | | | | | | | | | | | | | | | | | | | | | | | | | | | | | | |
| 12/31/2019 | | | | | 259,455 | | | | | | — | | | | | | 21,705 | | | | | | (621,284) | | | | | | (340,124) | | | | | | 3,464,997 | | | | | | — | | | | | | 287,380 | | | | | | (8,375,220) | | | | | | (4,622,843) | | |
| 12/31/2018 | | | | | 364,926 | | | | | | — | | | | | | 32,200 | | | | | | (360,293) | | | | | | 36,833 | | | | | | 4,854,248 | | | | | | — | | | | | | 423,433 | | | | | | (4,831,340) | | | | | | 446,341 | | |
| Class S2 | | | | | | | | | | | | | | | | | | | | | | | | | | | | | | | | | | | | | | | | | | | | | | | | | | | | | | | | | | | | | |
| 12/31/2019 | | | | | 539,783 | | | | | | — | | | | | | 18,603 | | | | | | (365,198) | | | | | | 193,188 | | | | | | 7,159,978 | | | | | | — | | | | | | 244,252 | | | | | | (4,793,498) | | | | | | 2,610,732 | | |
| 12/31/2018 | | | | | 244,016 | | | | | | — | | | | | | 9,336 | | | | | | (92,766) | | | | | | 160,586 | | | | | | 3,080,944 | | | | | | — | | | | | | 122,211 | | | | | | (1,233,752) | | | | | | 1,969,403 | | |
| Class Z | | | | | | | | | | | | | | | | | | | | | | | | | | | | | | | | | | | | | | | | | | | | | | | | | | | | | | | | | | | | | |
| 12/31/2019 | | | | | 7,258,308 | | | | | | — | | | | | | 1,004,544 | | | | | | (2,328,078) | | | | | | 5,934,774 | | | | | | 98,070,145 | | | | | | — | | | | | | 13,430,758 | | | | | | (31,669,941) | | | | | | 79,830,962 | | |
| 12/31/2018 | | | | | 6,508,892 | | | | | | — | | | | | | 725,700 | | | | | | (2,234,378) | | | | | | 5,000,214 | | | | | | 87,597,877 | | | | | | — | | | | | | 9,630,042 | | | | | | (29,945,071) | | | | | | 67,282,848 | | |
| Index Solution 2025 | |
| Class ADV | | | | | | | | | | | | | | | | | | | | | | | | | | | | | | | | | | | | | | | | | | | | | | | | | | | | | | | | | | | | | |
| 12/31/2019 | | | | | 1,306,445 | | | | | | — | | | | | | 896,085 | | | | | | (4,586,291) | | | | | | (2,383,761) | | | | | | 14,084,744 | | | | | | — | | | | | | 9,444,733 | | | | | | (49,592,340) | | | | | | (26,062,863) | | |
| 12/31/2018 | | | | | 1,574,538 | | | | | | — | | | | | | 734,479 | | | | | | (3,954,518) | | | | | | (1,645,501) | | | | | | 17,068,237 | | | | | | — | | | | | | 7,866,273 | | | | | | (42,487,852) | | | | | | (17,553,342) | | |
| Class I | | | | | | | | | | | | | | | | | | | | | | | | | | | | | | | | | | | | | | | | | | | | | | | | | | | | | | | | | | | | | |
| 12/31/2019 | | | | | 853,962 | | | | | | — | | | | | | 290,116 | | | | | | (1,416,613) | | | | | | (272,535) | | | | | | 9,439,730 | | | | | | — | | | | | | 3,130,351 | | | | | | (15,537,805) | | | | | | (2,967,724) | | |
| 12/31/2018 | | | | | 790,888 | | | | | | — | | | | | | 212,475 | | | | | | (884,820) | | | | | | 118,543 | | | | | | 8,739,612 | | | | | | — | | | | | | 2,326,597 | | | | | | (9,829,167) | | | | | | 1,237,042 | | |
| Class S | | | | | | | | | | | | | | | | | | | | | | | | | | | | | | | | | | | | | | | | | | | | | | | | | | | | | | | | | | | | | |
| 12/31/2019 | | | | | 1,091,410 | | | | | | — | | | | | | 625,147 | | | | | | (1,951,305) | | | | | | (234,748) | | | | | | 11,938,477 | | | | | | — | | | | | | 6,676,575 | | | | | | (21,485,005) | | | | | | (2,869,953) | | |
| 12/31/2018 | | | | | 1,087,070 | | | | | | — | | | | | | 466,840 | | | | | | (3,130,442) | | | | | | (1,576,532) | | | | | | 11,943,091 | | | | | | — | | | | | | 5,065,217 | | | | | | (34,400,022) | | | | | | (17,391,714) | | |
| Class S2 | | | | | | | | | | | | | | | | | | | | | | | | | | | | | | | | | | | | | | | | | | | | | | | | | | | | | | | | | | | | | |
| 12/31/2019 | | | | | 1,196,949 | | | | | | — | | | | | | 144,634 | | | | | | (1,014,888) | | | | | | 326,695 | | | | | | 12,827,457 | | | | | | — | | | | | | 1,517,211 | | | | | | (10,877,777) | | | | | | 3,466,891 | | |
| 12/31/2018 | | | | | 905,536 | | | | | | — | | | | | | 91,023 | | | | | | (1,519,829) | | | | | | (523,270) | | | | | | 9,791,867 | | | | | | — | | | | | | 971,219 | | | | | | (16,460,233) | | | | | | (5,697,147) | | |
| Class Z | | | | | | | | | | | | | | | | | | | | | | | | | | | | | | | | | | | | | | | | | | | | | | | | | | | | | | | | | | | | | |
| 12/31/2019 | | | | | 15,034,022 | | | | | | — | | | | | | 2,941,044 | | | | | | (2,829,426) | | | | | | 15,145,640 | | | | | | 167,306,106 | | | | | | — | | | | | | 32,027,968 | | | | | | (31,666,179) | | | | | | 167,667,895 | | |
| 12/31/2018 | | | | | 12,372,507 | | | | | | — | | | | | | 1,583,684 | | | | | | (3,123,954) | | | | | | 10,832,237 | | | | | | 137,566,174 | | | | | | — | | | | | | 17,452,190 | | | | | | (34,622,269) | | | | | | 120,396,095 | | |
| Index Solution 2030 | |
| Class ADV | | | | | | | | | | | | | | | | | | | | | | | | | | | | | | | | | | | | | | | | | | | | | | | | | | | | | | | | | | | | | |
| 12/31/2019 | | | | | 779,706 | | | | | | — | | | | | | 93,857 | | | | | | (534,788) | | | | | | 338,775 | | | | | | 11,843,916 | | | | | | — | | | | | | 1,389,077 | | | | | | (8,052,836) | | | | | | 5,180,157 | | |
| 12/31/2018 | | | | | 898,458 | | | | | | — | | | | | | 61,107 | | | | | | (364,897) | | | | | | 594,668 | | | | | | 13,594,463 | | | | | | — | | | | | | 919,660 | | | | | | (5,502,144) | | | | | | 9,011,979 | | |
| Class I | | | | | | | | | | | | | | | | | | | | | | | | | | | | | | | | | | | | | | | | | | | | | | | | | | | | | | | | | | | | | |
| 12/31/2019 | | | | | 184,888 | | | | | | — | | | | | | 23,493 | | | | | | (122,570) | | | | | | 85,811 | | | | | | 2,862,886 | | | | | | — | | | | | | 357,097 | | | | | | (1,912,146) | | | | | | 1,307,837 | | |
| 12/31/2018 | | | | | 242,079 | | | | | | — | | | | | | 14,342 | | | | | | (128,679) | | | | | | 127,742 | | | | | | 3,769,376 | | | | | | — | | | | | | 221,300 | | | | | | (1,949,972) | | | | | | 2,040,704 | | |
| Class S | | | | | | | | | | | | | | | | | | | | | | | | | | | | | | | | | | | | | | | | | | | | | | | | | | | | | | | | | | | | | |
| 12/31/2019 | | | | | 337,511 | | | | | | — | | | | | | 39,452 | | | | | | (276,422) | | | | | | 100,541 | | | | | | 5,151,445 | | | | | | — | | | | | | 596,130 | | | | | | (4,284,296) | | | | | | 1,463,279 | | |
| 12/31/2018 | | | | | 334,909 | | | | | | — | | | | | | 25,868 | | | | | | (356,431) | | | | | | 4,346 | | | | | | 5,199,413 | | | | | | — | | | | | | 396,823 | | | | | | (5,531,063) | | | | | | 65,173 | | |
| Class S2 | | | | | | | | | | | | | | | | | | | | | | | | | | | | | | | | | | | | | | | | | | | | | | | | | | | | | | | | | | | | | |
| 12/31/2019 | | | | | 328,496 | | | | | | — | | | | | | 15,982 | | | | | | (149,994) | | | | | | 194,484 | | | | | | 5,025,721 | | | | | | — | | | | | | 238,292 | | | | | | (2,266,159) | | | | | | 2,997,854 | | |
| 12/31/2018 | | | | | 163,235 | | | | | | — | | | | | | 3,205 | | | | | | (122,928) | | | | | | 43,512 | | | | | | 2,462,246 | | | | | | — | | | | | | 48,650 | | | | | | (1,869,413) | | | | | | 641,483 | | |
| Class Z | | | | | | | | | | | | | | | | | | | | | | | | | | | | | | | | | | | | | | | | | | | | | | | | | | | | | | | | | | | | | |
| 12/31/2019 | | | | | 9,483,023 | | | | | | — | | | | | | 1,435,806 | | | | | | (1,471,224) | | | | | | 9,447,605 | | | | | | 147,799,226 | | | | | | — | | | | | | 21,967,828 | | | | | | (23,079,274) | | | | | | 146,687,780 | | |
| 12/31/2018 | | | | | 7,888,028 | | | | | | — | | | | | | 754,504 | | | | | | (1,252,311) | | | | | | 7,390,221 | | | | | | 122,508,691 | | | | | | — | | | | | | 11,687,273 | | | | | | (19,495,167) | | | | | | 114,700,797 | | |
| Index Solution 2035 | |
| Class ADV | | | | | | | | | | | | | | | | | | | | | | | | | | | | | | | | | | | | | | | | | | | | | | | | | | | | | | | | | | | | | |
| 12/31/2019 | | | | | 1,315,919 | | | | | | — | | | | | | 863,486 | | | | | | (3,653,364) | | | | | | (1,473,959) | | | | | | 14,661,352 | | | | | | — | | | | | | 9,351,556 | | | | | | (40,954,360) | | | | | | (16,941,452) | | |
| 12/31/2018 | | | | | 1,633,874 | | | | | | — | | | | | | 667,403 | | | | | | (3,884,915) | | | | | | (1,583,638) | | | | | | 18,404,417 | | | | | | — | | | | | | 7,461,570 | | | | | | (43,541,953) | | | | | | (17,675,966) | | |
| Class I | | | | | | | | | | | | | | | | | | | | | | | | | | | | | | | | | | | | | | | | | | | | | | | | | | | | | | | | | | | | | |
| 12/31/2019 | | | | | 947,979 | | | | | | — | | | | | | 287,866 | | | | | | (1,266,807) | | | | | | (30,962) | | | | | | 10,999,071 | | | | | | — | | | | | | 3,201,072 | | | | | | (14,478,364) | | | | | | (278,221) | | |
| 12/31/2018 | | | | | 836,090 | | | | | | — | | | | | | 201,420 | | | | | | (645,974) | | | | | | 391,536 | | | | | | 9,597,012 | | | | | | — | | | | | | 2,310,284 | | | | | | (7,496,219) | | | | | | 4,411,077 | | |
| Class S | | | | | | | | | | | | | | | | | | | | | | | | | | | | | | | | | | | | | | | | | | | | | | | | | | | | | | | | | | | | | |
| 12/31/2019 | | | | | 1,106,775 | | | | | | — | | | | | | 534,610 | | | | | | (1,730,144) | | | | | | (88,759) | | | | | | 12,473,584 | | | | | | — | | | | | | 5,875,369 | | | | | | (19,830,618) | | | | | | (1,481,665) | | |
| 12/31/2018 | | | | | 1,134,978 | | | | | | — | | | | | | 361,206 | | | | | | (2,719,219) | | | | | | (1,223,035) | | | | | | 13,011,612 | | | | | | — | | | | | | 4,099,685 | | | | | | (31,371,572) | | | | | | (14,260,275) | | |
NOTES TO FINANCIAL STATEMENTS as of December 31, 2019 (continued)
NOTE 9 — CAPITAL SHARES (continued)
| | | | Shares
sold | | | Shares
issued in
merger | | | Reinvestment
of
distributions | | | Shares
redeemed | | | Net increase
(decrease)
in shares
outstanding | | | Shares
sold | | | Proceeds
from shares
issued in
merger | | | Reinvestment
of
distributions | | | Shares
redeemed | | | Net increase
(decrease) | |
| Year or period ended | | | # | | | # | | | # | | | # | | | # | | | ($) | | | ($) | | | ($) | | | ($) | | | ($) | |
| Index Solution 2035 (continued) | |
| Class S2 | | | | | | | | | | | | | | | | | | | | | | | | | | | | | | | | | | | | | | | | | | | | | | | | | | | | | | | | | | | | | |
| 12/31/2019 | | | | | 914,074 | | | | | | — | | | | | | 142,926 | | | | | | (1,101,673) | | | | | | (44,673) | | | | | | 10,113,557 | | | | | | — | | | | | | 1,545,029 | | | | | | (12,270,996) | | | | | | (612,410) | | |
| 12/31/2018 | | | | | 803,649 | | | | | | — | | | | | | 99,584 | | | | | | (1,260,153) | | | | | | (356,920) | | | | | | 8,960,826 | | | | | | — | | | | | | 1,112,359 | | | | | | (14,237,920) | | | | | | (4,164,735) | | |
| Class Z | | | | | | | | | | | | | | | | | | | | | | | | | | | | | | | | | | | | | | | | | | | | | | | | | | | | | | | | | | | | | |
| 12/31/2019 | | | | | 16,366,911 | | | | | | — | | | | | | 2,860,076 | | | | | | (1,990,688) | | | | | | 17,236,299 | | | | | | 189,204,678 | | | | | | — | | | | | | 32,118,650 | | | | | | (22,761,257) | | | | | | 198,562,071 | | |
| 12/31/2018 | | | | | 12,072,843 | | | | | | — | | | | | | 1,448,384 | | | | | | (2,255,782) | | | | | | 11,265,445 | | | | | | 140,408,639 | | | | | | — | | | | | | 16,743,315 | | | | | | (26,104,816) | | | | | | 131,047,138 | | |
| Index Solution 2040 | |
| Class ADV | | | | | | | | | | | | | | | | | | | | | | | | | | | | | | | | | | | | | | | | | | | | | | | | | | | | | | | | | | | | | |
| 12/31/2019 | | | | | 552,733 | | | | | | — | | | | | | 61,180 | | | | | | (241,519) | | | | | | 372,394 | | | | | | 8,729,051 | | | | | | — | | | | | | 944,613 | | | | | | (3,842,615) | | | | | | 5,831,049 | | |
| 12/31/2018 | | | | | 573,094 | | | | | | — | | | | | | 31,802 | | | | | | (218,826) | | | | | | 386,070 | | | | | | 9,108,294 | | | | | | — | | | | | | 505,650 | | | | | | (3,412,458) | | | | | | 6,201,486 | | |
| Class I | | | | | | | | | | | | | | | | | | | | | | | | | | | | | | | | | | | | | | | | | | | | | | | | | | | | | | | | | | | | | |
| 12/31/2019 | | | | | 145,117 | | | | | | — | | | | | | 13,556 | | | | | | (90,899) | | | | | | 67,774 | | | | | | 2,366,891 | | | | | | — | | | | | | 214,734 | | | | | | (1,488,574) | | | | | | 1,093,051 | | |
| 12/31/2018 | | | | | 140,969 | | | | | | — | | | | | | 7,141 | | | | | | (38,031) | | | | | | 110,079 | | | | | | 2,307,181 | | | | | | — | | | | | | 116,176 | | | | | | (618,585) | | | | | | 1,804,772 | | |
| Class S | | | | | | | | | | | | | | | | | | | | | | | | | | | | | | | | | | | | | | | | | | | | | | | | | | | | | | | | | | | | | |
| 12/31/2019 | | | | | 244,414 | | | | | | — | | | | | | 29,224 | | | | | | (159,715) | | | | | | 113,923 | | | | | | 3,925,638 | | | | | | — | | | | | | 462,330 | | | | | | (2,634,249) | | | | | | 1,753,719 | | |
| 12/31/2018 | | | | | 270,370 | | | | | | — | | | | | | 16,669 | | | | | | (281,941) | | | | | | 5,098 | | | | | | 4,374,460 | | | | | | — | | | | | | 271,036 | | | | | | (4,584,355) | | | | | | 61,141 | | |
| Class S2 | | | | | | | | | | | | | | | | | | | | | | | | | | | | | | | | | | | | | | | | | | | | | | | | | | | | | | | | | | | | | |
| 12/31/2019 | | | | | 77,278 | | | | | | — | | | | | | 7,594 | | | | | | (46,375) | | | | | | 38,497 | | | | | | 1,232,685 | | | | | | — | | | | | | 118,389 | | | | | | (741,409) | | | | | | 609,665 | | |
| 12/31/2018 | | | | | 88,961 | | | | | | — | | | | | | 3,509 | | | | | | (65,060) | | | | | | 27,410 | | | | | | 1,419,428 | | | | | | — | | | | | | 56,322 | | | | | | (1,035,113) | | | | | | 440,637 | | |
| Class Z | | | | | | | | | | | | | | | | | | | | | | | | | | | | | | | | | | | | | | | | | | | | | | | | | | | | | | | | | | | | | |
| 12/31/2019 | | | | | 7,890,571 | | | | | | — | | | | | | 1,030,963 | | | | | | (981,712) | | | | | | 7,939,822 | | | | | | 128,721,901 | | | | | | — | | | | | | 16,464,473 | | | | | | (16,350,601) | | | | | | 128,835,773 | | |
| 12/31/2018 | | | | | 6,451,257 | | | | | | — | | | | | | 455,971 | | | | | | (703,682) | | | | | | 6,203,546 | | | | | | 105,316,683 | | | | | | — | | | | | | 7,459,687 | | | | | | (11,577,636) | | | | | | 101,198,734 | | |
| Index Solution 2045 | |
| Class ADV | | | | | | | | | | | | | | | | | | | | | | | | | | | | | | | | | | | | | | | | | | | | | | | | | | | | | | | | | | | | | |
| 12/31/2019 | | | | | 1,000,157 | | | | | | — | | | | | | 662,137 | | | | | | (2,459,840) | | | | | | (797,546) | | | | | | 11,532,760 | | | | | | — | | | | | | 7,369,585 | | | | | | (28,281,090) | | | | | | (9,378,745) | | |
| 12/31/2018 | | | | | 1,366,385 | | | | | | — | | | | | | 450,302 | | | | | | (2,552,318) | | | | | | (735,631) | | | | | | 15,933,626 | | | | | | — | | | | | | 5,250,526 | | | | | | (29,675,869) | | | | | | (8,491,717) | | |
| Class I | | | | | | | | | | | | | | | | | | | | | | | | | | | | | | | | | | | | | | | | | | | | | | | | | | | | | | | | | | | | | |
| 12/31/2019 | | | | | 862,366 | | | | | | — | | | | | | 237,448 | | | | | | (898,357) | | | | | | 201,457 | | | | | | 10,387,389 | | | | | | — | | | | | | 2,733,025 | | | | | | (10,640,649) | | | | | | 2,479,765 | | |
| 12/31/2018 | | | | | 607,911 | | | | | | — | | | | | | 153,129 | | | | | | (664,458) | | | | | | 96,582 | | | | | | 7,278,406 | | | | | | — | | | | | | 1,842,140 | | | | | | (8,102,621) | | | | | | 1,017,925 | | |
| Class S | | | | | | | | | | | | | | | | | | | | | | | | | | | | | | | | | | | | | | | | | | | | | | | | | | | | | | | | | | | | | |
| 12/31/2019 | | | | | 808,784 | | | | | | — | | | | | | 373,877 | | | | | | (1,361,178) | | | | | | (178,517) | | | | | | 9,435,178 | | | | | | — | | | | | | 4,239,765 | | | | | | (16,086,808) | | | | | | (2,411,865) | | |
| 12/31/2018 | | | | | 938,875 | | | | | | — | | | | | | 240,602 | | | | | | (2,319,027) | | | | | | (1,139,550) | | | | | | 11,167,516 | | | | | | — | | | | | | 2,853,544 | | | | | | (27,873,850) | | | | | | (13,852,790) | | |
| Class S2 | | | | | | | | | | | | | | | | | | | | | | | | | | | | | | | | | | | | | | | | | | | | | | | | | | | | | | | | | | | | | |
| 12/31/2019 | | | | | 538,466 | | | | | | — | | | | | | 96,125 | | | | | | (511,082) | | | | | | 123,509 | | | | | | 6,197,030 | | | | | | — | | | | | | 1,070,837 | | | | | | (5,925,703) | | | | | | 1,342,164 | | |
| 12/31/2018 | | | | | 513,445 | | | | | | — | | | | | | 49,873 | | | | | | (641,433) | | | | | | (78,115) | | | | | | 5,955,261 | | | | | | — | | | | | | 582,513 | | | | | | (7,514,758) | | | | | | (976,984) | | |
| Class Z | | | | | | | | | | | | | | | | | | | | | | | | | | | | | | | | | | | | | | | | | | | | | | | | | | | | | | | | | | | | | |
| 12/31/2019 | | | | | 10,392,563 | | | | | | — | | | | | | 1,964,446 | | | | | | (1,138,487) | | | | | | 11,218,522 | | | | | | 124,189,502 | | | | | | — | | | | | | 22,826,868 | | | | | | (13,828,432) | | | | | | 133,187,938 | | |
| 12/31/2018 | | | | | 8,277,089 | �� | | | | | — | | | | | | 888,190 | | | | | | (918,262) | | | | | | 8,247,017 | | | | | | 100,339,917 | | | | | | — | | | | | | 10,755,975 | | | | | | (11,175,403) | | | | | | 99,920,489 | | |
| Index Solution 2050 | |
| Class ADV | | | | | | | | | | | | | | | | | | | | | | | | | | | | | | | | | | | | | | | | | | | | | | | | | | | | | | | | | | | | | |
| 12/31/2019 | | | | | 371,643 | | | | | | — | | | | | | 40,749 | | | | | | (172,005) | | | | | | 240,387 | | | | | | 5,955,644 | | | | | | — | | | | | | 639,345 | | | | | | (2,765,757) | | | | | | 3,829,232 | | |
| 12/31/2018 | | | | | 396,050 | | | | | | — | | | | | | 20,849 | | | | | | (122,425) | | | | | | 294,474 | | | | | | 6,356,813 | | | | | | — | | | | | | 337,544 | | | | | | (1,966,948) | | | | | | 4,727,409 | | |
| Class I | | | | | | | | | | | | | | | | | | | | | | | | | | | | | | | | | | | | | | | | | | | | | | | | | | | | | | | | | | | | | |
| 12/31/2019 | | | | | 152,475 | | | | | | — | | | | | | 12,873 | | | | | | (65,377) | | | | | | 99,971 | | | | | | 2,524,060 | | | | | | — | | | | | | 206,350 | | | | | | (1,073,358) | | | | | | 1,657,052 | | |
| 12/31/2018 | | | | | 113,349 | | | | | | — | | | | | | 7,022 | | | | | | (51,364) | | | | | | 69,007 | | | | | | 1,872,004 | | | | | | — | | | | | | 115,790 | | | | | | (840,145) | | | | | | 1,147,649 | | |
| Class S | | | | | | | | | | | | | | | | | | | | | | | | | | | | | | | | | | | | | | | | | | | | | | | | | | | | | | | | | | | | | |
| 12/31/2019 | | | | | 238,456 | | | | | | — | | | | | | 25,693 | | | | | | (153,567) | | | | | | 110,582 | | | | | | 3,887,844 | | | | | | — | | | | | | 410,826 | | | | | | (2,559,815) | | | | | | 1,738,855 | | |
| 12/31/2018 | | | | | 257,385 | | | | | | — | | | | | | 14,811 | | | | | | (251,708) | | | | | | 20,488 | | | | | | 4,224,161 | | | | | | — | | | | | | 243,786 | | | | | | (4,099,274) | | | | | | 368,673 | | |
| Class S2 | | | | | | | | | | | | | | | | | | | | | | | | | | | | | | | | | | | | | | | | | | | | | | | | | | | | | | | | | | | | | |
| 12/31/2019 | | | | | 65,496 | | | | | | — | | | | | | 7,195 | | | | | | (34,778) | | | | | | 37,913 | | | | | | 1,052,508 | | | | | | — | | | | | | 113,385 | | | | | | (560,443) | | | | | | 605,450 | | |
| 12/31/2018 | | | | | 84,930 | | | | | | — | | | | | | 3,479 | | | | | | (69,384) | | | | | | 19,025 | | | | | | 1,376,109 | | | | | | — | | | | | | 56,506 | | | | | | (1,129,775) | | | | | | 302,840 | | |
| Class Z | | | | | | | | | | | | | | | | | | | | | | | | | | | | | | | | | | | | | | | | | | | | | | | | | | | | | | | | | | | | | |
| 12/31/2019 | | | | | 5,671,663 | | | | | | — | | | | | | 622,415 | | | | | | (501,311) | | | | | | 5,792,767 | | | | | | 93,244,413 | | | | | | — | | | | | | 10,045,779 | | | | | | (8,141,951) | | | | | | 95,148,241 | | |
| 12/31/2018 | | | | | 4,483,173 | | | | | | — | | | | | | 258,837 | | | | | | (199,481) | | | | | | 4,542,529 | | | | | | 73,564,239 | | | | | | — | | | | | | 4,286,340 | | | | | | (3,254,975) | | | | | | 74,595,604 | | |
NOTES TO FINANCIAL STATEMENTS as of December 31, 2019 (continued)
NOTE 9 — CAPITAL SHARES (continued)
| | | | Shares
sold | | | Shares
issued in
merger | | | Reinvestment
of
distributions | | | Shares
redeemed | | | Net increase
(decrease)
in shares
outstanding | | | Shares
sold | | | Proceeds
from shares
issued in
merger | | | Reinvestment
of
distributions | | | Shares
redeemed | | | Net increase
(decrease) | |
| Year or period ended | | | # | | | # | | | # | | | # | | | # | | | ($) | | | ($) | | | ($) | | | ($) | | | ($) | |
| Index Solution 2055 | |
| Class ADV | | | | | | | | | | | | | | | | | | | | | | | | | | | | | | | | | | | | | | | | | | | | | | | | | | | | | | | | | | | | | |
| 12/31/2019 | | | | | 652,853 | | | | | | — | | | | | | 172,207 | | | | | | (888,098) | | | | | | (63,038) | | | | | | 9,717,453 | | | | | | — | | | | | | 2,502,162 | | | | | | (13,297,717) | | | | | | (1,078,102) | | |
| 12/31/2018 | | | | | 610,126 | | | | | | — | | | | | | 110,669 | | | | | | (725,320) | | | | | | (4,525) | | | | | | 9,211,224 | | | | | | — | | | | | | 1,669,989 | | | | | | (10,760,076) | | | | | | 121,137 | | |
| Class I | | | | | | | | | | | | | | | | | | | | | | | | | | | | | | | | | | | | | | | | | | | | | | | | | | | | | | | | | | | | | |
| 12/31/2019 | | | | | 650,507 | | | | | | — | | | | | | 84,885 | | | | | | (369,735) | | | | | | 365,657 | | | | | | 10,030,676 | | | | | | — | | | | | | 1,263,096 | | | | | | (5,591,839) | | | | | | 5,701,933 | | |
| 12/31/2018 | | | | | 481,167 | | | | | | — | | | | | | 46,175 | | | | | | (211,966) | | | | | | 315,376 | | | | | | 7,406,714 | | | | | | — | | | | | | 712,946 | | | | | | (3,270,972) | | | | | | 4,848,688 | | |
| Class S | | | | | | | | | | | | | | | | | | | | | | | | | | | | | | | | | | | | | | | | | | | | | | | | | | | | | | | | | | | | | |
| 12/31/2019 | | | | | 546,907 | | | | | | — | | | | | | 111,958 | | | | | | (429,858) | | | | | | 229,007 | | | | | | 8,259,023 | | | | | | — | | | | | | 1,646,898 | | | | | | (6,612,048) | | | | | | 3,293,873 | | |
| 12/31/2018 | | | | | 581,849 | | | | | | — | | | | | | 61,738 | | | | | | (603,022) | | | | | | 40,565 | | | | | | 8,912,178 | | | | | | — | | | | | | 943,356 | | | | | | (9,303,908) | | | | | | 551,626 | | |
| Class S2 | | | | | | | | | | | | | | | | | | | | | | | | | | | | | | | | | | | | | | | | | | | | | | | | | | | | | | | | | | | | | |
| 12/31/2019 | | | | | 205,630 | | | | | | — | | | | | | 34,209 | | | | | | (113,342) | | | | | | 126,497 | | | | | | 3,077,638 | | | | | | — | | | | | | 499,112 | | | | | | (1,704,745) | | | | | | 1,872,005 | | |
| 12/31/2018 | | | | | 228,669 | | | | | | — | | | | | | 15,696 | | | | | | (333,062) | | | | | | (88,697) | | | | | | 3,434,189 | | | | | | — | | | | | | 237,947 | | | | | | (5,102,069) | | | | | | (1,429,933) | | |
| Class Z | | | | | | | | | | | | | | | | | | | | | | | | | | | | | | | | | | | | | | | | | | | | | | | | | | | | | | | | | | | | | |
| 12/31/2019 | | | | | 4,793,751 | | | | | | — | | | | | | 587,065 | | | | | | (278,473) | | | | | | 5,102,343 | | | | | | 73,784,261 | | | | | | — | | | | | | 8,817,712 | | | | | | (4,246,064) | | | | | | 78,355,909 | | |
| 12/31/2018 | | | | | 3,572,627 | | | | | | — | | | | | | 220,039 | | | | | | (101,772) | | | | | | 3,690,894 | | | | | | 55,168,682 | | | | | | — | | | | | | 3,421,598 | | | | | | (1,573,175) | | | | | | 57,017,105 | | |
| Index Solution 2060 | |
| Class ADV | | | | | | | | | | | | | | | | | | | | | | | | | | | | | | | | | | | | | | | | | | | | | | | | | | | | | | | | | | | | | |
| 12/31/2019 | | | | | 317,214 | | | | | | — | | | | | | 20,003 | | | | | | (164,963) | | | | | | 172,254 | | | | | | 3,909,266 | | | | | | — | | | | | | 242,830 | | | | | | (2,020,412) | | | | | | 2,131,684 | | |
| 12/31/2018 | | | | | 273,165 | | | | | | — | | | | | | 15,577 | | | | | | (108,121) | | | | | | 180,621 | | | | | | 3,376,349 | | | | | | — | | | | | | 193,157 | | | | | | (1,334,225) | | | | | | 2,235,281 | | |
| Class I | | | | | | | | | | | | | | | | | | | | | | | | | | | | | | | | | | | | | | | | | | | | | | | | | | | | | | | | | | | | | |
| 12/31/2019 | | | | | 353,320 | | | | | | — | | | | | | 12,950 | | | | | | (74,873) | | | | | | 291,397 | | | | | | 4,463,917 | | | | | | — | | | | | | 159,806 | | | | | | (953,982) | | | | | | 3,669,741 | | |
| 12/31/2018 | | | | | 185,704 | | | | | | — | | | | | | 6,425 | | | | | | (45,913) | | | | | | 146,216 | | | | | | 2,309,386 | | | | | | — | | | | | | 80,758 | | | | | | (567,904) | | | | | | 1,822,240 | | |
| Class S | | | | | | | | | | | | | | | | | | | | | | | | | | | | | | | | | | | | | | | | | | | | | | | | | | | | | | | | | | | | | |
| 12/31/2019 | | | | | 254,537 | | | | | | — | | | | | | 12,052 | | | | | | (117,649) | | | | | | 148,940 | | | | | | 3,168,198 | | | | | | — | | | | | | 147,396 | | | | | | (1,481,343) | | | | | | 1,834,251 | | |
| 12/31/2018 | | | | | 203,589 | | | | | | — | | | | | | 7,722 | | | | | | (118,501) | | | | | | 92,810 | | | | | | 2,520,120 | | | | | | — | | | | | | 96,290 | | | | | | (1,466,279) | | | | | | 1,150,131 | | |
| Class S2 | | | | | | | | | | | | | | | | | | | | | | | | | | | | | | | | | | | | | | | | | | | | | | | | | | | | | | | | | | | | | |
| 12/31/2019 | | | | | 69,509 | | | | | | — | | | | | | 3,392 | | | | | | (25,200) | | | | | | 47,701 | | | | | | 856,258 | | | | | | — | | | | | | 41,350 | | | | | | (320,606) | | | | | | 577,002 | | |
| 12/31/2018 | | | | | 52,646 | | | | | | — | | | | | | 1,607 | | | | | | (65,675) | | | | | | (11,422) | | | | | | 648,889 | | | | | | — | | | | | | 19,991 | | | | | | (829,725) | | | | | | (160,845) | | |
| Class Z | | | | | | | | | | | | | | | | | | | | | | | | | | | | | | | | | | | | | | | | | | | | | | | | | | | | | | | | | | | | | |
| 12/31/2019 | | | | | 3,244,883 | | | | | | — | | | | | | 167,597 | | | | | | (133,470) | | | | | | 3,279,010 | | | | | | 41,071,313 | | | | | | — | | | | | | 2,083,235 | | | | | | (1,681,534) | | | | | | 41,473,014 | | |
| 12/31/2018 | | | | | 1,778,803 | | | | | | — | | | | | | 72,597 | | | | | | (109,524) | | | | | | 1,741,876 | | | | | | 22,328,388 | | | | | | — | | | | | | 916,901 | | | | | | (1,405,805) | | | | | | 21,839,484 | | |
NOTE 10 — FEDERAL INCOME TAXES
The amount of distributions from net investment income and net realized capital gains are determined in accordance with federal income tax regulations, which may differ from GAAP for investment companies. These book/tax differences may be either temporary or permanent. Permanent differences are reclassified within the capital accounts based on their federal tax-basis treatment; temporary differences are not reclassified. Key differences include the treatment of short-term capital gains, foreign currency transactions, and wash sale deferrals. Distributions in excess of net investment income and/or net realized capital gains for tax purposes are reported as return of capital.
Dividends paid by the Portfolios from net investment income and distributions of net realized short-term capital gains are, for federal income tax purposes, taxable as ordinary income to shareholders.
The tax composition of dividends and distributions to shareholders was as follows:
| | | | Year Ended
December 31, 2019 | | | Year Ended
December 31, 2018 | |
| | | | Ordinary
Income | | | Long-term
Capital
Gains | | | Ordinary
Income | | | Long-term
Capital
Gains | |
| Index Solution Income | | | | $ | 10,295,056 | | | | | $ | 5,684,591 | | | | | $ | 11,267,338 | | | | | $ | 5,271,803 | | |
| Index Solution 2020 | | | | | 6,700,852 | | | | | | 8,581,307 | | | | | | 7,762,271 | | | | | | 3,656,660 | | |
| Index Solution 2025 | | | | | 18,244,079 | | | | | | 34,552,759 | | | | | | 16,420,643 | | | | | | 17,260,853 | | |
| Index Solution 2030 | | | | | 8,520,783 | | | | | | 16,027,641 | | | | | | 7,286,508 | | | | | | 5,987,198 | | |
| Index Solution 2035 | | | | | 16,878,390 | | | | | | 35,213,286 | | | | | | 13,230,213 | | | | | | 18,497,000 | | |
| Index Solution 2040 | | | | | 5,662,718 | | | | | | 12,541,821 | | | | | | 4,272,668 | | | | | | 4,136,203 | | |
| Index Solution 2045 | | | | | 11,097,465 | | | | | | 27,142,615 | | | | | | 7,788,467 | | | | | | 13,496,231 | | |
| Index Solution 2050 | | | | | 3,484,421 | | | | | | 7,931,264 | | | | | | 2,378,676 | | | | | | 2,661,290 | | |
| Index Solution 2055 | | | | | 4,152,226 | | | | | | 10,576,754 | | | | | | 2,528,304 | | | | | | 4,457,532 | | |
| Index Solution 2060 | | | | | 846,182 | | | | | | 1,828,435 | | | | | | 842,040 | | | | | | 465,057 | | |
NOTES TO FINANCIAL STATEMENTS as of December 31, 2019 (continued)
NOTE 10 — FEDERAL INCOME TAXES (continued)
The tax-basis components of distributable earnings as of December 31, 2019 were:
| | | | Undistributed
Ordinary
Income | | | Undistributed
Long-term
Capital Gains | | | Unrealized
Appreciation/
(Depreciation) | |
| Index Solution Income | | | | $ | 9,798,093 | | | | | $ | 8,291,781 | | | | | $ | 13,412,952 | | |
| Index Solution 2020 | | | | | 8,084,244 | | | | | | 8,184,505 | | | | | | 15,948,963 | | |
| Index Solution 2025 | | | | | 21,041,211 | | | | | | 31,348,438 | | | | | | 60,552,784 | | |
| Index Solution 2030 | | | | | 11,710,686 | | | | | | 18,867,824 | | | | | | 33,320,163 | | |
| Index Solution 2035 | | | | | 19,545,411 | | | | | | 38,648,904 | | | | | | 75,654,668 | | |
| Index Solution 2040 | | | | | 8,468,164 | | | | | | 15,754,046 | | | | | | 27,516,478 | | |
| Index Solution 2045 | | | | | 12,787,691 | | | | | | 29,316,408 | | | | | | 55,183,993 | | |
| Index Solution 2050 | | | | | 5,635,290 | | | | | | 11,097,094 | | | | | | 19,211,650 | | |
| Index Solution 2055 | | | | | 5,772,195 | | | | | | 12,919,001 | | | | | | 23,686,123 | | |
| Index Solution 2060 | | | | | 2,017,949 | | | | | | 3,178,024 | | | | | | 5,752,165 | | |
At December 31, 2019, the Portfolios did not have any capital loss carryovers for U.S. federal income tax purposes.
The Portfolios’ major tax jurisdictions are U.S. federal and Arizona state.
As of December 31, 2019, no provision for income tax is required in the Portfolios’ financial statements as a result of tax positions taken on federal and state income tax returns for open tax years. The Portfolios’ federal and state income and federal excise tax returns for tax years for which the applicable statutes of limitations have not expired are subject to examination by the Internal Revenue Service and state department of revenue. Generally, the earliest tax year that remains subject to examination by these jurisdictions is 2015.
NOTE 11 — OTHER ACCOUNTING PRONOUNCEMENTS
The Portfolios have made a change in accounting principle and adopted the provisions of Financial Accounting Standards Board (“FASB”) Accounting Standards Update 2017-08 (“ASU 2017-08”), Premium Amortization on Purchased Callable Debt Securities. ASU 2017-08 shortens the amortization period for certain callable debt securities held at a premium; specifically, requiring the premium to be amortized to the earliest call date. Prior to ASU 2017-08, premiums on callable debt securities were generally amortized to maturity date. ASU 2017-08 is intended to more closely align the amortization period with the expectations incorporated into the market pricing on the underlying security. ASU 2017-08 does not require an accounting change for securities held at a discount; the discount continues to be amortized to maturity date. Upon evaluation, the Portfolios have concluded that the change
in accounting principle does not materially impact the financial statement amounts.
Also, in August 2018, the FASB issued Accounting Standards Update 2018-13, Fair Value Measurement (Topic 820): Disclosure Framework — Changes to the Disclosure Requirements for Fair Value Measurement (“ASU 2018-13”). The update provides guidance that eliminates, adds and modifies certain disclosure requirements for fair value measurements. ASU 2018-13 will be effective for annual periods beginning after December 15, 2019 and interim periods within those annual periods. At this time, the Portfolios have elected to early adopt the amendments that allow for removal of disclosure requirements related to transfers between Level 1 and Level 2 of the fair value hierarchy and the timing of transfers between levels of the fair value hierarchy. These changes did not have a material impact on the Portfolios’ financial statements. The Portfolios plan to adopt the amendments that require additional fair value measurement disclosures for annual periods beginning after December 15, 2019, and interim periods within those annual periods. The Portfolios are currently evaluating the impact of these changes on the financial statements.
NOTE 12 — AUDITOR CHANGE (Unaudited)
On September 12, 2019, KPMG LLP (“KPMG”) was dismissed as the independent registered public accounting firm to the Company, on behalf of the Portfolios, upon completion of the audit for the fiscal year ended December 31, 2019. The decision to change independent registered public accounting firms was recommended by the Audit Committee of the Board and was approved by the Board.
KPMG’s reports on the Portfolios’ financial statements for the fiscal years ended December 31, 2019 and December 31, 2018 contained no adverse opinion or disclaimer of opinion nor were they qualified or modified as to uncertainty, audit scope or accounting principle.
During the fiscal years ended December 31, 2019 and December 31, 2018: (i) there were no disagreements with KPMG on any matter of accounting principles or practices, financial statement disclosure or auditing scope or procedure, which disagreements, if not resolved to the satisfaction of KPMG, would have caused KPMG to make reference to the subject matter of the disagreements in connection with its reports on the Portfolios’ financial statements for such periods; and (ii) there were no “reportable events” of the kind described in Item 304(a)(1)(v) of Regulation S-K under the Securities Exchange Act of 1934, as amended.
On September 12, 2019, based on the recommendation of the Audit Committee of the Board, the Board approved the
NOTES TO FINANCIAL STATEMENTS as of December 31, 2019 (continued)
NOTE 12 — AUDITOR CHANGE (Unaudited) (continued)
selection of Ernst & Young LLP (“EY”) as the Portfolios’ independent registered public accounting firm for the fiscal year ending December 31, 2020. During the Portfolios’ fiscal years ended December 31, 2019 and December 31, 2018, neither the Portfolios, nor anyone on their behalf, consulted with EY on items which: (i) concerned the application of accounting principles to a specified transaction, either completed or proposed, or the type of audit opinion that might be rendered on the Portfolios’ financial statements; or (ii) concerned the subject of a disagreement (as described in paragraph (a)(1)(iv) of Item 304 of Regulation S-K) or reportable events (as described in paragraph (a)(1)(v) of said Item 304).
NOTE 13 — SUBSEQUENT EVENTS
Reorganization: The Board approved a proposal to reorganize Index Solution 2020 with and into Index Solution Income on or about August 7, 2020.
The Portfolios have evaluated events occurring after the Statements of Assets and Liabilities date (“subsequent events”), to determine whether any subsequent events necessitated adjustment to or disclosure in the financial statements. Other than the above, no such subsequent events were identified.
PORTFOLIO OF INVESTMENTS
| Voya Index Solution Income Portfolio | as of December 31, 2019 |
| Shares | | | Value | | | Percentage
of Net
Assets | |
| EXCHANGE-TRADED FUNDS: 11.2% | |
| 630,808 | | | Invesco Senior Loan ETF | | | | $ | 14,395,038 | | | | | | 3.0 | | |
| 581,866 | | | Schwab U.S. TIPS ETF | | | | | 32,951,072 | | | | | | 6.9 | | |
| 64,307 | | | Vanguard Real Estate
ETF | | | | | 5,967,046 | | | | | | 1.3 | | |
| | | | Total Exchange-Traded
Funds
(Cost $51,826,468) | | | | | 53,313,156 | | | | | | 11.2 | | |
| MUTUAL FUNDS: 81.8% | |
| | | | Affiliated Investment Companies: 81.8% | |
| 803,005 | | | Voya Emerging Markets
Index Portfolio - Class P2 | | | | | 9,949,232 | | | | | | 2.1 | | |
| 3,156,269 | | | Voya International Index
Portfolio - Class P2 | | | | | 33,772,074 | | | | | | 7.1 | | |
| 3,351,340 | | | Voya Short Term Bond
Fund - Class P2 | | | | | 33,044,213 | | | | | | 7.0 | | |
| 19,361,916 | | | Voya U.S. Bond Index
Portfolio - Class P2 | | | | | 211,044,886 | | | | | | 44.4 | | |
| 5,905,045 | | | Voya U.S. Stock Index
Portfolio - Class P2 | | | | | 100,681,018 | | | | | | 21.2 | | |
| | | | Total Mutual Funds
(Cost $368,015,429) | | | | | 388,491,423 | | | | | | 81.8 | | |
| |
| Shares | | | Value | | | Percentage
of Net
Assets | |
| | | | Total Long-Term
Investments
(Cost $419,841,897) | | | | $ | 441,804,579 | | | | | | 93.0 | | |
| SHORT-TERM INVESTMENTS: 6.9% | |
| | | | Mutual Funds: 6.9% | |
| 32,715,384 (1) | | | BlackRock Liquidity
Funds, FedFund,
Institutional Class,
1.520%
(Cost $32,715,384) | | | | | 32,715,384 | | | | | | 6.9 | | |
| | | | Total Short-Term
Investments
(Cost $32,715,384) | | | | | 32,715,384 | | | | | | 6.9 | | |
| | | | Total Investments in
Securities
(Cost $452,557,281) | | | | $ | 474,519,963 | | | | | | 99.9 | | |
| | | | Assets in Excess of
Other Liabilities | | | | | 505,278 | | | | | | 0.1 | | |
| | | | Net Assets | | | | $ | 475,025,241 | | | | | | 100.0 | | |
| |
(1)
Rate shown is the 7-day yield as of December 31, 2019.
Fair Value Measurements^
The following is a summary of the fair valuations according to the inputs used as of December 31, 2019 in valuing the assets and liabilities:
| | | | Quoted Prices
in Active Markets
for Identical
Investments
(Level 1) | | | Significant
Other
Observable
Inputs
(Level 2) | | | Significant
Unobservable
Inputs
(Level 3) | | | Fair Value
at
December 31, 2019 | |
| Asset Table | | | | | | | | | | | | | | | | | | | | | | | | | |
| Investments, at fair value | | | | | | | | | | | | | | | | | | | | | | | | | |
| Exchange-Traded Funds | | | | $ | 53,313,156 | | | | | $ | — | | | | | $ | — | | | | | $ | 53,313,156 | | |
| Mutual Funds | | | | | 388,491,423 | | | | | | — | | | | | | — | | | | | | 388,491,423 | | |
| Short-Term Investments | | | | | 32,715,384 | | | | | | — | | | | | | — | | | | | | 32,715,384 | | |
| Total Investments, at fair value | | | | $ | 474,519,963 | | | | | $ | — | | | | | $ | — | | | | | $ | 474,519,963 | | |
| Other Financial Instruments+ | | | | | | | | | | | | | | | | | | | | | | | | | |
| Futures | | | | | 168,923 | | | | | | — | | | | | | — | | | | | | 168,923 | | |
| Total Assets | | | | $ | 474,688,886 | | | | | $ | — | | | | | $ | — | | | | | $ | 474,688,886 | | |
| Liabilities Table | | | | | | | | | | | | | | | | | | | | | | | | | |
| Other Financial Instruments+ | | | | | | | | | | | | | | | | | | | | | | | | | |
| Futures | | | | $ | (311,101) | | | | | $ | — | | | | | $ | — | | | | | $ | (311,101) | | |
| Total Liabilities | | | | $ | (311,101) | | | | | $ | — | | | | | $ | — | | | | | $ | (311,101) | | |
^
See Note 2, “Significant Accounting Policies” in the Notes to Financial Statements for additional information.
+
Other Financial Instruments may include open forward foreign currency contracts, futures, centrally cleared swaps, OTC swaps and written options. Forward foreign currency contracts, futures and centrally cleared swaps are valued at the unrealized gain (loss) on the instrument. OTC swaps and written options are valued at the fair value of the instrument.
See Accompanying Notes to Financial Statements
PORTFOLIO OF INVESTMENTS
| Voya Index Solution Income Portfolio | as of December 31, 2019 (continued) |
Transactions with Affiliates
An investment of at least 5% of the voting securities of an issuer, or a company which is under common control results in that issuer becoming an affiliated person as defined by the 1940 Act.
The following table provides transactions during the period ended December 31, 2019, where the following issuers were considered an affiliate:
| Issuer | | | Beginning
Fair
Value at
12/31/2018 | | | Purchases
at Cost | | | Sales
at Cost | | | Change in
Unrealized
Appreciation/
(Depreciation) | | | Ending
Fair
Value at
12/31/2019 | | | Investment
Income | | | Realized
Gains/
(Losses) | | | Net
Capital
Gain
Distributions | |
| Voya Emerging Markets Index Portfolio - Class P2 | | | | $ | 13,284,845 | | | | | $ | 2,647,914 | | | | | $ | (7,436,618) | | | | | $ | 1,453,091 | | | | | $ | 9,949,232 | | | | | $ | 209,147 | | | | | $ | 400,470 | | | | | $ | — | | |
| Voya International Index Portfolio - Class P2 | | | | | 31,040,572 | | | | | | 6,127,449 | | | | | | (7,744,836) | | | | | | 4,348,889 | | | | | | 33,772,074 | | | | | | 965,998 | | | | | | 1,296,530 | | | | | | — | | |
| Voya Russell Mid Cap Index Portfolio - Class P2 | | | | | 8,907,703 | | | | | | 159,870 | | | | | | (10,253,051) | | | | | | 1,185,478 | | | | | | — | | | | | | — | | | | | | 226,172 | | | | | | — | | |
| Voya Short Term Bond - Class P2 | | | | | — | | | | | | 34,184,029 | | | | | | (1,104,830) | | | | | | (34,986) | | | | | | 33,044,213 | | | | | | 207,861 | | | | | | 304 | | | | | | — | | |
| Voya Short Term Bond - Class R6 | | | | | — | | | | | | 33,207,198 | | | | | | (33,207,198) | | | | | | — | | | | | | — | | | | | | 144,340 | | | | | | (88) | | | | | | — | | |
| Voya U.S. Bond Index Portfolio - Class P2 | | | | | 195,093,126 | | | | | | 55,000,999 | | | | | | (51,161,077) | | | | | | 12,111,838 | | | | | | 211,044,886 | | | | | | 5,512,426 | | | | | | (731,667) | | | | | | — | | |
| Voya U.S. Stock Index Portfolio - Class P2 | | | | | 83,621,893 | | | | | | 33,609,029 | | | | | | (31,645,532) | | | | | | 15,095,628 | | | | | | 100,681,018 | | | | | | 1,491,328 | | | | | | 3,817,815 | | | | | | 5,309,506 | | |
| | | | | $ | 331,948,139 | | | | | $ | 164,936,488 | | | | | $ | (142,553,142) | | | | | $ | 34,159,938 | | | | | $ | 388,491,423 | | | | | $ | 8,531,100 | | | | | $ | 5,009,536 | | | | | $ | 5,309,506 | | |
The financial statements for the above mutual fund[s] can be found at www.sec.gov.
At December 31, 2019, the following futures contracts were outstanding for Voya Index Solution Income Portfolio:
| Description | | | Number
of Contracts | | | Expiration
Date | | | Notional
Value | | | Unrealized
Appreciation/
(Depreciation) | |
| Long Contracts: | | | | | | | | | | | | | | | | | | | |
| E-mini Russell 2000® Index | | | 58 | | | 03/20/20 | | | | $ | 4,844,740 | | | | | $ | 75,580 | | |
| U.S. Treasury 2-Year Note | | | 153 | | | 03/31/20 | | | | | 32,971,500 | | | | | | (20,555) | | |
| U.S. Treasury Ultra Long Bond | | | 50 | | | 03/20/20 | | | | | 9,082,813 | | | | | | (290,546) | | |
| | | | | | | | | | | $ | 46,899,053 | | | | | $ | (235,521) | | |
| Short Contracts: | | | | | | | | | | | | | | | | | | | |
| Mini MSCI EAFE Index | | | (48) | | | 03/20/20 | | | | | (4,887,600) | | | | | | 11,505 | | |
| U.S. Treasury 10-Year Note | | | (73) | | | 03/20/20 | | | | | (9,374,797) | | | | | | 81,838 | | |
| | | | | | | | | | | $ | (14,262,397) | | | | | $ | 93,343 | | |
A summary of derivative instruments by primary risk exposure is outlined in the following tables.
The fair value of derivative instruments as of December 31, 2019 was as follows:
| Derivatives not accounted for as hedging instruments | | | Location on Statement
of Assets and Liabilities | | | Fair Value | |
| Asset Derivatives | | | | | | | | | | |
| Equity contracts | | | Net Assets — Unrealized appreciation* | | | | $ | 87,085 | | |
| Interest rate contracts | | | Net Assets — Unrealized appreciation* | | | | | 81,838 | | |
| Total Asset Derivatives | | | | | | | $ | 168,923 | | |
| Liability Derivatives | | | | | | | | | | |
| Interest rate contracts | | | Net Assets — Unrealized depreciation* | | | | $ | 311,101 | | |
| Total Liability Derivatives | | | | | | | $ | 311,101 | | |
*
Includes cumulative appreciation/depreciation of futures contracts as reported in the table within the Portfolio of Investments.
See Accompanying Notes to Financial Statements
PORTFOLIO OF INVESTMENTS
| Voya Index Solution Income Portfolio | as of December 31, 2019 (continued) |
The effect of derivative instruments on the Portfolio’s Statement of Operations for the year ended December 31, 2019 was as follows:
| | | | Amount of Realized Gain or (Loss) on
Derivatives Recognized in Income | |
| Derivatives not accounted for as hedging instruments | | | Futures | |
| Equity contracts | | | | $ | (1,542,085) | | |
| Interest rate contracts | | | | | 800,599 | | |
| Total | | | | $ | (741,486) | | |
| |
| | | | Change in Unrealized Appreciation or (Depreciation)
on Derivatives Recognized in Income | |
| Derivatives not accounted for as hedging instruments | | | Futures | |
| Equity contracts | | | | $ | (3,128) | | |
| Interest rate contracts | | | | | (756,583) | | |
| Total | | | | $ | (759,711) | | |
At December 31, 2019, the aggregate cost of securities and other investments and the composition of unrealized appreciation and depreciation of securities and other investments at year end were:
| | Cost for federal income tax purposes was $460,964,832. | | | | | | | |
| | Net unrealized appreciation consisted of: | | | | | | | |
| | Gross Unrealized Appreciation | | | | $ | 21,357,501 | | |
| | Gross Unrealized Depreciation | | | | | (7,944,549) | | |
| | Net Unrealized Appreciation | | | | $ | 13,412,952 | | |
See Accompanying Notes to Financial Statements
PORTFOLIO OF INVESTMENTS
| Voya Index Solution 2020 Portfolio | as of December 31, 2019 |
| Shares | | | Value | | | Percentage
of Net
Assets | |
| EXCHANGE-TRADED FUNDS: 13.8% | |
| 533,586 | | | Invesco Senior Loan ETF | | | | $ | 12,176,432 | | | | | | 2.9 | | |
| 188,628 | | | iShares 1-3 Year Treasury
Bond ETF | | | | | 15,963,588 | | | | | | 3.9 | | |
| 421,875 | | | Schwab U.S. TIPS ETF | | | | | 23,890,781 | | | | | | 5.8 | | |
| 54,396 | | | Vanguard Real Estate ETF | | | | | 5,047,405 | | | | | | 1.2 | | |
| | | | Total Exchange-Traded
Funds
(Cost $55,933,343) | | | | | 57,078,206 | | | | | | 13.8 | | |
| MUTUAL FUNDS: 82.0% | |
| | | | Affiliated Investment Companies: 82.0% | |
| 871,942 | | | Voya Emerging Markets
Index Portfolio - Class P2 | | | | | 10,803,361 | | | | | | 2.6 | | |
| 2,940,478 | | | Voya International Index
Portfolio - Class P2 | | | | | 31,463,111 | | | | | | 7.6 | | |
| 304,110 | | | Voya Russell Mid Cap Index
Portfolio - Class P2 | | | | | 4,187,602 | | | | | | 1.0 | | |
| 1,635,045 | | | Voya Short Term Bond
Fund - Class P2 | | | | | 16,121,545 | | | | | | 3.9 | | |
| 15,629,826 | | | Voya U.S. Bond Index
Portfolio - Class P2 | | | | | 170,365,098 | | | | | | 41.2 | | |
| 6,251,303 | | | Voya U.S. Stock Index
Portfolio - Class P2 | | | | | 106,584,721 | | | | | | 25.7 | | |
| Shares | | | Value | | | Percentage
of Net
Assets | |
| MUTUAL FUNDS: (continued) | |
| | | | Affiliated Investment Companies (continued) | |
| | | | Total Mutual Funds
(Cost $321,932,825) | | | | $ | 339,525,438 | | | | | | 82.0 | | |
| | | | Total Long-Term
Investments
(Cost $377,866,168) | | | | | 396,603,644 | | | | | | 95.8 | | |
| SHORT-TERM INVESTMENTS: 4.1% | |
| | | | Mutual Funds: 4.1% | |
| 16,840,314 (1) | | | BlackRock Liquidity Funds,
FedFund, Institutional
Class, 1.520%
(Cost $16,840,314) | | | | | 16,840,314 | | | | | | 4.1 | | |
| | | | Total Short-Term
Investments
(Cost $16,840,314) | | | | | 16,840,314 | | | | | | 4.1 | | |
| | | | Total Investments in
Securities
(Cost $394,706,482) | | | | $ | 413,443,958 | | | | | | 99.9 | | |
| | | | Assets in Excess of
Other Liabilities | | | | | 406,949 | | | | | | 0.1 | | |
| | | | Net Assets | | | | $ | 413,850,907 | | | | | | 100.0 | | |
| |
(1)
Rate shown is the 7-day yield as of December 31, 2019.
Fair Value Measurements^
The following is a summary of the fair valuations according to the inputs used as of December 31, 2019 in valuing the assets and liabilities:
| | | | Quoted Prices
in Active Markets
for Identical
Investments
(Level 1) | | | Significant
Other
Observable
Inputs
(Level 2) | | | Significant
Unobservable
Inputs
(Level 3) | | | Fair Value
at
December 31, 2019 | |
| Asset Table | | | | | | | | | | | | | | | | | | | | | | | | | |
| Investments, at fair value | | | | | | | | | | | | | | | | | | | | | | | | | |
| Exchange-Traded Funds | | | | $ | 57,078,206 | | | | | $ | — | | | | | $ | — | | | | | $ | 57,078,206 | | |
| Mutual Funds | | | | | 339,525,438 | | | | | | — | | | | | | — | | | | | | 339,525,438 | | |
| Short-Term Investments | | | | | 16,840,314 | | | | | | — | | | | | | — | | | | | | 16,840,314 | | |
| Total Investments, at fair value | | | | $ | 413,443,958 | | | | | $ | — | | | | | $ | — | | | | | $ | 413,443,958 | | |
| Other Financial Instruments+ | | | | | | | | | | | | | | | | | | | | | | | | | |
| Futures | | | | | 133,633 | | | | | | — | | | | | | — | | | | | | 133,633 | | |
| Total Assets | | | | $ | 413,577,591 | | | | | $ | — | | | | | $ | — | | | | | $ | 413,577,591 | | |
| Liabilities Table | | | | | | | | | | | | | | | | | | | | | | | | | |
| Other Financial Instruments+ | | | | | | | | | | | | | | | | | | | | | | | | | |
| Futures | | | | $ | (372,143) | | | | | $ | — | | | | | $ | — | | | | | $ | (372,143) | | |
| Total Liabilities | | | | $ | (372,143) | | | | | $ | — | | | | | $ | — | | | | | $ | (372,143) | | |
^
See Note 2, “Significant Accounting Policies” in the Notes to Financial Statements for additional information.
+
Other Financial Instruments may include open forward foreign currency contracts, futures, centrally cleared swaps, OTC swaps and written options. Forward foreign currency contracts, futures and centrally cleared swaps are valued at the unrealized gain (loss) on the instrument. OTC swaps and written options are valued at the fair value of the instrument.
See Accompanying Notes to Financial Statements
PORTFOLIO OF INVESTMENTS
| Voya Index Solution 2020 Portfolio | as of December 31, 2019 (continued) |
Transactions with Affiliates
An investment of at least 5% of the voting securities of an issuer, or a company which is under common control results in that issuer becoming an affiliated person as defined by the 1940 Act.
The following table provides transactions during the period ended December 31, 2019, where the following issuers were considered an affiliate:
| Issuer | | | Beginning
Fair Value
at 12/31/2018 | | | Purchases
at Cost | | | Sales
at Cost | | | Change in
Unrealized
Appreciation/
(Depreciation) | | | Ending
Fair Value
at 12/31/2019 | | | Investment
Income | | | Realized
Gains/
(Losses) | | | Net Capital
Gain
Distributions | |
| Voya Emerging Markets Index Portfolio - Class P2 | | | | $ | 10,460,987 | | | | | $ | 6,328,244 | | | | | $ | (7,765,447) | | | | | $ | 1,779,577 | | | | | $ | 10,803,361 | | | | | $ | 243,138 | | | | | $ | (213,229) | | | | | $ | — | | |
| Voya International Index Portfolio - Class P2 | | | | | 32,923,512 | | | | | | 12,133,227 | | | | | | (18,434,776) | | | | | | 4,841,148 | | | | | | 31,463,111 | | | | | | 845,642 | | | | | | 1,060,462 | | | | | | — | | |
| Voya Russell Mid Cap Index Portfolio - Class P2 | | | | | 6,012,581 | | | | | | 6,368,965 | | | | | | (9,209,580) | | | | | | 1,015,636 | | | | | | 4,187,602 | | | | | | 104,804 | | | | | | (978,307) | | | | | | 1,173,796 | | |
| Voya Russell Small Cap Index Portfolio - Class P2 | | | | | 3,001,069 | | | | | | 367,736 | | | | | | (3,886,393) | | | | | | 517,588 | | | | | | — | | | | | | — | | | | | | 35,453 | | | | | | — | | |
| Voya Short Term Bond Fund - Class P2 | | | | | — | | | | | | 17,388,706 | | | | | | (1,230,249) | | | | | | (36,912) | | | | | | 16,121,545 | | | | | | 96,399 | | | | | | 209 | | | | | | — | | |
| Voya Short Term Bond Fund - Class R6 | | | | | — | | | | | | 14,665,506 | | | | | | (14,665,506) | | | | | | — | | | | | | — | | | | | | 39,317 | | | | | | 137 | | | | | | — | | |
| Voya U.S. Bond Index Portfolio - Class P2 | | | | | 109,989,214 | | | | | | 83,102,163 | | | | | | (29,824,608) | | | | | | 7,098,329 | | | | | | 170,365,098 | | | | | | 3,795,925 | | | | | | 232,456 | | | | | | — | | |
| Voya U.S. Stock Index Portfolio - Class P2 | | | | | 76,292,563 | | | | | | 53,147,824 | | | | | | (39,587,553) | | | | | | 16,731,887 | | | | | | 106,584,721 | | | | | | 1,575,559 | | | | | | 1,990,369 | | | | | | 5,552,872 | | |
| | | | | $ | 238,679,926 | | | | | $ | 193,502,371 | | | | | $ | (124,604,112) | | | | | $ | 31,947,253 | | | | | $ | 339,525,438 | | | | | $ | 6,700,784 | | | | | $ | 2,127,550 | | | | | $ | 6,726,668 | | |
The financial statements for the above mutual fund[s] can be found at www.sec.gov.
At December 31, 2019, the following futures contracts were outstanding for Voya Index Solution 2020 Portfolio:
| Description | | | Number
of Contracts | | | Expiration
Date | | | Notional
Value | | | Unrealized
Appreciation/
(Depreciation) | |
| Long Contracts: | | | | | | | | | | | | | | | | | | | | | | | | | |
| E-mini Russell 2000® Index | | | | | 49 | | | | | | 03/20/20 | | | | | $ | 4,092,970 | | | | | $ | 63,852 | | |
| Mini MSCI EAFE Index | | | | | 20 | | | | | | 03/20/20 | | | | | | 2,036,500 | | | | | | (4,104) | | |
| U.S. Treasury 2-Year Note | | | | | 79 | | | | | | 03/31/20 | | | | | | 17,024,500 | | | | | | (10,780) | | |
| U.S. Treasury Ultra Long Bond | | | | | 43 | | | | | | 03/20/20 | | | | | | 7,811,219 | | | | | | (251,452) | | |
| | | | | | | | | | | | | | | | | $ | 30,965,189 | | | | | $ | (202,484) | | |
| Short Contracts: | | | | | | | | | | | | | | | | | | | | | | | | | |
| S&P 500® E-Mini | | | | | (38) | | | | | | 03/20/20 | | | | | | (6,139,090) | | | | | | (105,807) | | |
| U.S. Treasury 10-Year Note | | | | | (62) | | | | | | 03/20/20 | | | | | | (7,962,156) | | | | | | 69,781 | | |
| | | | | | | | | | | | | | | | | $ | (14,101,246) | | | | | $ | (36,026) | | |
A summary of derivative instruments by primary risk exposure is outlined in the following tables.
The fair value of derivative instruments as of December 31, 2019 was as follows:
| Derivatives not accounted for as hedging instruments | | | Location on Statement
of Assets and Liabilities | | | Fair Value | |
| Asset Derivatives | | | |
| Equity contracts | | | Net Assets — Unrealized appreciation* | | | | $ | 63,852 | | |
| Interest rate contracts | | | Net Assets — Unrealized appreciation* | | | | | 69,781 | | |
| Total Asset Derivatives | | | | | | | $ | 133,633 | | |
| Liability Derivatives | | | |
| Equity contracts | | | Net Assets — Unrealized depreciation* | | | | $ | 109,911 | | |
| Interest rate contracts | | | Net Assets — Unrealized depreciation* | | | | | 262,232 | | |
| Total Liability Derivatives | | | | | | | $ | 372,143 | | |
*
Includes cumulative appreciation/depreciation of futures contracts as reported in the table within the Portfolio of Investments.
See Accompanying Notes to Financial Statements
PORTFOLIO OF INVESTMENTS
| Voya Index Solution 2020 Portfolio | as of December 31, 2019 (continued) |
The effect of derivative instruments on the Portfolio’s Statement of Operations for the year ended December 31, 2019 was as follows:
| | | | Amount of Realized Gain or (Loss) on
Derivatives Recognized in Income | |
| Derivatives not accounted for as hedging instruments | | | Futures | |
| Equity contracts | | | | $ | (1,138,347) | | |
| Interest rate contracts | | | | | 222,648 | | |
| Total | | | | $ | (915,699) | | |
| |
| | | | Change in Unrealized Appreciation or (Depreciation)
on Derivatives Recognized in Income | |
| Derivatives not accounted for as hedging instruments | | | Futures | |
| Equity contracts | | | | $ | (108,653) | | |
| Interest rate contracts | | | | | (493,892) | | |
| Total | | | | $ | (602,545) | | |
At December 31, 2019, the aggregate cost of securities and other investments and the composition of unrealized appreciation and depreciation of securities and other investments at year end were:
| | Cost for federal income tax purposes was $397,256,486. | | | | | | | |
| | Net unrealized appreciation consisted of: | | | | | | | |
| | Gross Unrealized Appreciation | | | | $ | 18,689,441 | | |
| | Gross Unrealized Depreciation | | | | | (2,740,478) | | |
| | Net Unrealized Appreciation | | | | $ | 15,948,963 | | |
See Accompanying Notes to Financial Statements
PORTFOLIO OF INVESTMENTS
| Voya Index Solution 2025 Portfolio | as of December 31, 2019 |
| Shares | | | Value | | | Percentage
of Net
Assets | |
| EXCHANGE-TRADED FUNDS: 11.5% | |
| 1,436,124 | | | Invesco Senior Loan ETF | | | | $ | 32,772,350 | | | | | | 3.0 | | |
| 412,494 | | | iShares 1-3 Year Treasury
Bond ETF | | | | | 34,909,367 | | | | | | 3.1 | | |
| 756,972 | | | Schwab U.S. TIPS ETF | | | | | 42,867,324 | | | | | | 3.9 | | |
| 175,684 | | | Vanguard Real Estate ETF | | | | | 16,301,718 | | | | | | 1.5 | | |
| | | | Total Exchange-Traded
Funds
(Cost $124,161,729) | | | | | 126,850,759 | | | | | | 11.5 | | |
| MUTUAL FUNDS: 88.2% | |
| | | | Affiliated Investment Companies: 88.2% | |
| 3,234,412 | | | Voya Emerging Markets
Index Portfolio - Class P2 | | | | | 40,074,360 | | | | | | 3.6 | | |
| 14,511,480 | | | Voya International Index
Portfolio - Class P2 | | | | | 155,272,833 | | | | | | 14.0 | | |
| 2,013,435 | | | Voya Russell Mid Cap Index
Portfolio - Class P2 | | | | | 27,725,001 | | | | | | 2.5 | | |
| Shares | | | Value | | | Percentage
of Net
Assets | |
| MUTUAL FUNDS: (continued) | |
| | | | Affiliated Investment Companies (continued) | |
| 1,547,094 | | | Voya Russell Small Cap
Index Portfolio - Class P2 | | | | $ | 22,340,041 | | | | | | 2.0 | | |
| 29,583,578 | | | Voya U.S. Bond Index
Portfolio - Class P2 | | | | | 322,460,999 | | | | | | 29.2 | | |
| 23,924,500 | | | Voya U.S. Stock Index
Portfolio - Class P2 | | | | | 407,912,731 | | | | | | 36.9 | | |
| | | | Total Mutual Funds
(Cost $907,734,201) | | | | | 975,785,965 | | | | | | 88.2 | | |
| | | | Total Investments in
Securities
(Cost $1,031,895,930) | | | | $ | 1,102,636,724 | | | | | | 99.7 | | |
| | | | Assets in Excess of
Other Liabilities | | | | | 2,815,587 | | | | | | 0.3 | | |
| | | | Net Assets | | | | $ | 1,105,452,311 | | | | | | 100.0 | | |
| |
Fair Value Measurements^
The following is a summary of the fair valuations according to the inputs used as of December 31, 2019 in valuing the assets and liabilities:
| | | | Quoted Prices
in Active Markets
for Identical
Investments
(Level 1) | | | Significant
Other
Observable
Inputs
(Level 2) | | | Significant
Unobservable
Inputs
(Level 3) | | | Fair Value
at
December 31, 2019 | |
| Asset Table | | | | | | | | | | | | | | | | | | | | | | | | | |
| Investments, at fair value | | | | | |
| Exchange-Traded Funds | | | | $ | 126,850,759 | | | | | $ | — | | | | | $ | — | | | | | $ | 126,850,759 | | |
| Mutual Funds | | | | | 975,785,965 | | | | | | — | | | | | | — | | | | | | 975,785,965 | | |
| Total Investments, at fair value | | | | $ | 1,102,636,724 | | | | | $ | — | | | | | $ | — | | | | | $ | 1,102,636,724 | | |
| Other Financial Instruments+ | | | | | | | | | | | | | | | | | | | | | | | | | |
| Futures | | | | | 386,235 | | | | | | — | | | | | | — | | | | | | 386,235 | | |
| Total Assets | | | | $ | 1,103,022,959 | | | | | $ | — | | | | | $ | — | | | | | $ | 1,103,022,959 | | |
| Liabilities Table | | | | | | | | | | | | | | | | | | | | | | | | | |
| Other Financial Instruments+ | | | | | | | | | | | | | | | | | | | | | | | | | |
| Futures | | | | $ | (673,391) | | | | | $ | — | | | | | $ | — | | | | | $ | (673,391) | | |
| Total Liabilities | | | | $ | (673,391) | | | | | $ | — | | | | | $ | — | | | | | $ | (673,391) | | |
^
See Note 2, “Significant Accounting Policies” in the Notes to Financial Statements for additional information.
+
Other Financial Instruments may include open forward foreign currency contracts, futures, centrally cleared swaps, OTC swaps and written options. Forward foreign currency contracts, futures and centrally cleared swaps are valued at the unrealized gain (loss) on the instrument. OTC swaps and written options are valued at the fair value of the instrument.
See Accompanying Notes to Financial Statements
PORTFOLIO OF INVESTMENTS
| Voya Index Solution 2025 Portfolio | as of December 31, 2019 (continued) |
Transactions with Affiliates
An investment of at least 5% of the voting securities of an issuer, or a company which is under common control results in that issuer becoming an affiliated person as defined by the 1940 Act.
The following table provides transactions during the period ended December 31, 2019, where the following issuers were considered an affiliate:
| Issuer | | | Beginning
Fair Value
at 12/31/2018 | | | Purchases
at Cost | | | Sales
at Cost | | | Change in
Unrealized
Appreciation/
(Depreciation) | | | Ending
Fair Value
at 12/31/2019 | | | Investment
Income | | | Realized
Gains/
(Losses) | | | Net Capital
Gain
Distributions | |
| Voya Emerging Markets Index Portfolio - Class P2 | | | | $ | 42,142,033 | | | | | $ | 11,183,358 | | | | | $ | (17,813,625) | | | | | $ | 4,562,594 | | | | | $ | 40,074,360 | | | | | $ | 778,684 | | | | | $ | 1,999,642 | | | | | $ | — | | |
| Voya International Index Portfolio - Class P2 | | | | | 118,158,788 | | | | | | 32,318,604 | | | | | | (18,212,423) | | | | | | 23,007,864 | | | | | | 155,272,833 | | | | | | 4,099,022 | | | | | | 246,431 | | | | | | — | | |
| Voya Russell Mid Cap Index Portfolio - Class P2 | | | | | 29,673,653 | | | | | | 9,158,862 | | | | | | (14,752,945) | | | | | | 3,645,431 | | | | | | 27,725,001 | | | | | | 363,355 | | | | | | (555,592) | | | | | | 4,062,375 | | |
| Voya Russell Small Cap Index Portfolio - Class P2 | | | | | 16,926,455 | | | | | | 7,313,546 | | | | | | (4,128,601) | | | | | | 2,228,641 | | | | | | 22,340,041 | | | | | | 211,513 | | | | | | 43,519 | | | | | | 2,014,760 | | |
| Voya U.S. Bond Index Portfolio - Class P2 | | | | | 259,396,057 | | | | | | 104,757,039 | | | | | | (58,279,448) | | | | | | 16,587,351 | | | | | | 322,460,999 | | | | | | 7,971,891 | | | | | | (349,053) | | | | | | — | | |
| Voya U.S. Stock Index Portfolio - Class P2 | | | | | 266,800,205 | | | | | | 141,397,762 | | | | | | (56,447,056) | | | | | | 56,161,820 | | | | | | 407,912,731 | | | | | | 5,989,599 | | | | | | 9,004,250 | | | | | | 20,133,436 | | |
| | | | | $ | 733,097,191 | | | | | $ | 306,129,171 | | | | | $ | (169,634,098) | | | | | $ | 106,193,701 | | | | | $ | 975,785,965 | | | | | $ | 19,414,064 | | | | | $ | 10,389,197 | | | | | $ | 26,210,571 | | |
The financial statements for the above mutual fund[s] can be found at www.sec.gov.
At December 31, 2019, the following futures contracts were outstanding for Voya Index Solution 2025 Portfolio:
| Description | | | Number
of Contracts | | | Expiration
Date | | | Notional
Value | | | Unrealized
Appreciation/
(Depreciation) | |
| Long Contracts: | | | | | | | | | | | | | | | | | | | | | | | | | |
| E-mini Russell 2000® Index | | | | | 133 | | | | | | 03/20/20 | | | | | $ | 11,109,490 | | | | | $ | 173,313 | | |
| U.S. Treasury Ultra Long Bond | | | | | 115 | | | | | | 03/20/20 | | | | | | 20,890,469 | | | | | | (673,391) | | |
| | | | | | | | | | | | | | | | | $ | 31,999,959 | | | | | $ | (500,078) | | |
| Short Contracts: | | | | | | | | | | | | | | | | | | | | | | | | | |
| Mini MSCI EAFE Index | | | | | (108) | | | | | | 03/20/20 | | | | | | (10,997,100) | | | | | | 25,886 | | |
| U.S. Treasury 10-Year Note | | | | | (166) | | | | | | 03/20/20 | | | | | | (21,318,032) | | | | | | 187,036 | | |
| | | | | | | | | | | | | | | | | $ | (32,315,132) | | | | | $ | 212,922 | | |
A summary of derivative instruments by primary risk exposure is outlined in the following tables.
The fair value of derivative instruments as of December 31, 2019 was as follows:
| Derivatives not accounted for as hedging instruments | | | Location on Statement
of Assets and Liabilities | | | Fair Value | |
| Asset Derivatives | | | | | | | | | | |
| Equity contracts | | | Net Assets — Unrealized appreciation* | | | | $ | 199,199 | | |
| Interest rate contracts | | | Net Assets — Unrealized appreciation* | | | | | 187,036 | | |
| Total Asset Derivatives | | | | | | | $ | 386,235 | | |
| Liability Derivatives | | | | | | | | | | |
| Equity contracts | | | Net Assets — Unrealized depreciation* | | | | | | | |
| Interest rate contracts | | | Net Assets — Unrealized depreciation* | | | | $ | 673,391 | | |
| Total Liability Derivatives | | | | | | | $ | 673,391 | | |
*
Includes cumulative appreciation/depreciation of futures contracts as reported in the table within the Portfolio of Investments.
See Accompanying Notes to Financial Statements
PORTFOLIO OF INVESTMENTS
| Voya Index Solution 2025 Portfolio | as of December 31, 2019 (continued) |
The effect of derivative instruments on the Portfolio’s Statement of Operations for the year ended December 31, 2019 was as follows:
| | | | Amount of Realized Gain or (Loss) on
Derivatives Recognized in Income | |
| Derivatives not accounted for as hedging instruments | | | Futures | |
| Equity contracts | | | | $ | (3,042,108) | | |
| Interest rate contracts | | | | | 407,415 | | |
| Total | | | | $ | (2,634,693) | | |
| |
| | | | Change in Unrealized Appreciation or (Depreciation)
on Derivatives Recognized in Income | |
| Derivatives not accounted for as hedging instruments | | | Futures | |
| Equity contracts | | | | $ | 26,300 | | |
| Interest rate contracts | | | | | (957,717) | | |
| Total | | | | $ | (931,417) | | |
At December 31, 2019, the aggregate cost of securities and other investments and the composition of unrealized appreciation and depreciation of securities and other investments at year end were:
| | Cost for federal income tax purposes was $1,041,796,784. | | | | | | | |
| | Net unrealized appreciation consisted of: | | | | | | | |
| | Gross Unrealized Appreciation | | | | $ | 70,847,712 | | |
| | Gross Unrealized Depreciation | | | | | (10,294,928) | | |
| | Net Unrealized Appreciation | | | | $ | 60,552,784 | | |
See Accompanying Notes to Financial Statements
PORTFOLIO OF INVESTMENTS
| Voya Index Solution 2030 Portfolio | as of December 31, 2019 |
| Shares | | | Value | | | Percentage
of Net
Assets | |
| EXCHANGE-TRADED FUNDS: 9.4% | |
| 532,979 | | | Invesco Senior Loan ETF | | | | $ | 12,162,581 | | | | | | 2.0 | | |
| 141,310 | | | iShares 1-3 Year Treasury
Bond ETF | | | | | 11,959,065 | | | | | | 1.9 | | |
| 421,395 | | | Schwab U.S. TIPS ETF | | | | | 23,863,599 | | | | | | 3.8 | | |
| 114,101 | | | Vanguard Real Estate ETF | | | | | 10,587,432 | | | | | | 1.7 | | |
| | | | Total Exchange-Traded
Funds
(Cost $57,071,293) | | | | | 58,572,677 | | | | | | 9.4 | | |
| MUTUAL FUNDS: 90.4% | |
| | | | Affiliated Investment Companies: 90.4% | |
| 2,600,971 | | | Voya Emerging Markets
Index Portfolio - Class P2 | | | | | 32,226,031 | | | | | | 5.2 | | |
| 10,508,232 | | | Voya International Index
Portfolio - Class P2 | | | | | 112,438,084 | | | | | | 18.0 | | |
| 1,360,251 | | | Voya Russell Mid Cap Index
Portfolio - Class P2 | | | | | 18,730,661 | | | | | | 3.0 | | |
| Shares | | | Value | | | Percentage
of Net
Assets | |
| MUTUAL FUNDS: (continued) | |
| | | | Affiliated Investment Companies (continued) | |
| 875,782 | | | Voya Russell Small Cap
Index Portfolio - Class P2 | | | | $ | 12,646,292 | | | | | | 2.0 | | |
| 11,812,405 | | | Voya U.S. Bond Index
Portfolio - Class P2 | | | | | 128,755,210 | | | | | | 20.6 | | |
| 15,222,469 | | | Voya U.S. Stock Index
Portfolio - Class P2 | | | | | 259,543,098 | | | | | | 41.6 | | |
| | | | Total Mutual Funds
(Cost $529,948,802) | | | | | 564,339,376 | | | | | | 90.4 | | |
| | | | Total Investments in
Securities
(Cost $587,020,095) | | | | $ | 622,912,053 | | | | | | 99.8 | | |
| | | | Assets in Excess of Other
Liabilities | | | | | 1,022,063 | | | | | | 0.2 | | |
| | | | Net Assets | | | | $ | 623,934,116 | | | | | | 100.0 | | |
| |
Fair Value Measurements^
The following is a summary of the fair valuations according to the inputs used as of December 31, 2019 in valuing the assets and liabilities:
| | | | Quoted Prices
in Active Markets
for Identical
Investments
(Level 1) | | | Significant
Other
Observable
Inputs
(Level 2) | | | Significant
Unobservable
Inputs
(Level 3) | | | Fair Value
at
December 31, 2019 | |
| Asset Table | | | | | | | | | | | | | | | | | | | | | | | | | |
| Investments, at fair value | | | | | | | | | | | | | | | | | | | | | | | | | |
| Exchange-Traded Funds | | | | $ | 58,572,677 | | | | | $ | — | | | | | $ | — | | | | | $ | 58,572,677 | | |
| Mutual Funds | | | | | 564,339,376 | | | | | | — | | | | | | — | | | | | | 564,339,376 | | |
| Total Investments, at fair value | | | | $ | 622,912,053 | | | | | $ | — | | | | | $ | — | | | | | $ | 622,912,053 | | |
| Other Financial Instruments+ | | | | | | | | | | | | | | | | | | | | | | | | | |
| Futures | | | | | 200,513 | | | | | | — | | | | | | — | | | | | | 200,513 | | |
| Total Assets | | | | $ | 623,112,566 | | | | | $ | — | | | | | $ | — | | | | | $ | 623,112,566 | | |
| Liabilities Table | | | | | | | | | | | | | | | | | | | | | | | | | |
| Other Financial Instruments+ | | | | | | | | | | | | | | | | | | | | | | | | | |
| Futures | | | | $ | (484,257) | | | | | $ | — | | | | | $ | — | | | | | $ | (484,257) | | |
| Total Liabilities | | | | $ | (484,257) | | | | | $ | — | | | | | $ | — | | | | | $ | (484,257) | | |
^
See Note 2, “Significant Accounting Policies” in the Notes to Financial Statements for additional information.
+
Other Financial Instruments may include open forward foreign currency contracts, futures, centrally cleared swaps, OTC swaps and written options. Forward foreign currency contracts, futures and centrally cleared swaps are valued at the unrealized gain (loss) on the instrument. OTC swaps and written options are valued at the fair value of the instrument.
See Accompanying Notes to Financial Statements
PORTFOLIO OF INVESTMENTS
| Voya Index Solution 2030 Portfolio | as of December 31, 2019 (continued) |
Transactions with Affiliates
An investment of at least 5% of the voting securities of an issuer, or a company which is under common control results in that issuer becoming an affiliated person as defined by the 1940 Act.
The following table provides transactions during the period ended December 31, 2019, where the following issuers were considered an affiliate:
| Issuer | | | Beginning
Fair Value
at 12/31/2018 | | | Purchases
at Cost | | | Sales
at Cost | | | Change in
Unrealized
Appreciation/
(Depreciation) | | | Ending
Fair Value
at 12/31/2019 | | | Investment
Income | | | Realized
Gains/
(Losses) | | | Net Capital
Gain
Distributions | |
| Voya Emerging Markets Index Portfolio - Class P2 | | | | $ | 27,306,369 | | | | | $ | 12,710,528 | | | | | $ | (12,151,868) | | | | | $ | 4,361,002 | | | | | $ | 32,226,031 | | | | | $ | 571,061 | | | | | $ | 249,990 | | | | | $ | — | | |
| Voya International Index Portfolio - Class P2 | | | | | 74,232,389 | | | | | | 35,445,495 | | | | | | (11,368,338) | | | | | | 14,128,538 | | | | | | 112,438,084 | | | | | | 2,697,038 | | | | | | 1,583,302 | | | | | | — | | |
| Voya Russell Mid Cap Index Portfolio - Class P2 | | | | | 15,696,720 | | | | | | 7,861,473 | | | | | | (6,800,975) | | | | | | 1,973,443 | | | | | | 18,730,661 | | | | | | 223,520 | | | | | | (313,117) | | | | | | 2,498,092 | | |
| Voya Russell Small Cap Index Portfolio - Class P2 | | | | | 7,834,469 | | | | | | 5,308,957 | | | | | | (1,657,212) | | | | | | 1,160,078 | | | | | | 12,646,292 | | | | | | 108,473 | | | | | | (26,139) | | | | | | 1,032,626 | | |
| Voya U.S. Bond Index Portfolio - Class P2 | | | | | 93,800,772 | | | | | | 62,323,904 | | | | | | (33,173,900) | | | | | | 5,804,434 | | | | | | 128,755,210 | | | | | | 3,028,818 | | | | | | 237,535 | | | | | | — | | |
| Voya U.S. Stock Index Portfolio - Class P2 | | | | | 143,466,463 | | | | | | 112,645,508 | | | | | | (32,011,879) | | | | | | 35,443,006 | | | | | | 259,543,098 | | | | | | 3,760,580 | | | | | | 2,656,099 | | | | | | 11,946,797 | | |
| | | | | $ | 362,337,182 | | | | | $ | 236,295,865 | | | | | $ | (97,164,172) | | | | | $ | 62,870,501 | | | | | $ | 564,339,376 | | | | | $ | 10,389,490 | | | | | $ | 4,387,670 | | | | | $ | 15,477,515 | | |
The financial statements for the above mutual fund[s] can be found at www.sec.gov.
At December 31, 2019, the following futures contracts were outstanding for Voya Index Solution 2030 Portfolio:
| Description | | | Number
of Contracts | | | Expiration
Date | | | Notional
Value | | | Unrealized
Appreciation/
(Depreciation) | |
| Long Contracts: | | | | | | | | | | | | | | | | | | | | | | | | | |
| E-mini Russell 2000® Index | | | | | 74 | | | | | | 03/20/20 | | | | | $ | 6,181,220 | | | | | $ | 96,430 | | |
| U.S. Treasury Ultra Long Bond | | | | | 64 | | | | | | 03/20/20 | | | | | | 11,626,000 | | | | | | (378,450) | | |
| | | | | | | | | | | | | | | | | $ | 17,807,220 | | | | | $ | (282,020) | | |
| Short Contracts: | | | | | | | | | | | | | | | | | | | | | | | | | |
| S&P 500® E-Mini | | | | | (38) | | | | | | 03/20/20 | | | | | | (6,139,090) | | | | | | (105,807) | | |
| U.S. Treasury 10-Year Note | | | | | (92) | | | | | | 03/20/20 | | | | | | (11,814,813) | | | | | | 104,083 | | |
| | | | | | | | | | | | | | | | | $ | (17,953,903) | | | | | $ | (1,724) | | |
A summary of derivative instruments by primary risk exposure is outlined in the following tables.
The fair value of derivative instruments as of December 31, 2019 was as follows:
| Derivatives not accounted for as hedging instruments | | | Location on Statement
of Assets and Liabilities | | | Fair Value | |
| Asset Derivatives | | | | | | | | | | |
| Equity contracts | | | Net Assets — Unrealized appreciation* | | | | $ | 96,430 | | |
| Interest rate contracts | | | Net Assets — Unrealized appreciation* | | | | | 104,083 | | |
| Total Asset Derivatives | | | | | | | $ | 200,513 | | |
| Liability Derivatives | | | | | | | | | | |
| Equity contracts | | | Net Assets — Unrealized depreciation* | | | | $ | 105,807 | | |
| Interest rate contracts | | | Net Assets — Unrealized depreciation* | | | | | 378,450 | | |
| Total Liability Derivatives | | | | | | | $ | 484,257 | | |
*
Includes cumulative appreciation/depreciation of futures contracts as reported in the table within the Portfolio of Investments.
See Accompanying Notes to Financial Statements
PORTFOLIO OF INVESTMENTS
| Voya Index Solution 2030 Portfolio | as of December 31, 2019 (continued) |
The effect of derivative instruments on the Portfolio’s Statement of Operations for the year ended December 31, 2019 was as follows:
| | | | Amount of Realized Gain or (Loss) on
Derivatives Recognized in Income | |
| Derivatives not accounted for as hedging instruments | | | Futures | |
| Equity contracts | | | | $ | (1,524,357) | | |
| Interest rate contracts | | | | | 183,008 | | |
| Total | | | | $ | (1,341,349) | | |
| |
| | | | Change in Unrealized Appreciation or (Depreciation)
on Derivatives Recognized in Income | |
| Derivatives not accounted for as hedging instruments | | | Futures | |
| Equity contracts | | | | $ | 47,185 | | |
| Interest rate contracts | | | | | (489,114) | | |
| Total | | | | $ | (441,929) | | |
At December 31, 2019, the aggregate cost of securities and other investments and the composition of unrealized appreciation and depreciation of securities and other investments at year end were:
| | Cost for federal income tax purposes was $589,308,145. | | | | | | | |
| | Net unrealized appreciation consisted of: | | | | | | | |
| | Gross Unrealized Appreciation | | | | $ | 36,173,380 | | |
| | Gross Unrealized Depreciation | | | | | (2,853,217) | | |
| | Net Unrealized Appreciation | | | | $ | 33,320,163 | | |
See Accompanying Notes to Financial Statements
PORTFOLIO OF INVESTMENTS
| Voya Index Solution 2035 Portfolio | as of December 31, 2019 |
| Shares | | | Value | | | Percentage
of Net
Assets | |
| EXCHANGE-TRADED FUNDS: 9.6% | |
| 926,190 | | | Invesco Senior Loan ETF | | | | $ | 21,135,656 | | | | | | 2.0 | | |
| 245,563 | | | iShares 1-3 Year Treasury
Bond ETF | | | | | 20,781,997 | | | | | | 1.9 | | |
| 732,283 | | | Schwab U.S. TIPS ETF | | | | | 41,469,186 | | | | | | 3.8 | | |
| 171,939 | | | Vanguard Global ex-U.S.
Real Estate ETF | | | | | 10,159,876 | | | | | | 0.9 | | |
| 113,303 | | | Vanguard Real Estate ETF | | | | | 10,513,385 | | | | | | 1.0 | | |
| | | | Total Exchange-Traded
Funds
(Cost $101,874,492) | | | | | 104,060,100 | | | | | | 9.6 | | |
| MUTUAL FUNDS: 90.2% | |
| | | | Affiliated Investment Companies: 90.2% | |
| 5,406,101 | | | Voya Emerging Markets
Index Portfolio - Class P2 | | | | | 66,981,587 | | | | | | 6.2 | | |
| 20,233,591 | | | Voya International Index
Portfolio - Class P2 | | | | | 216,499,419 | | | | | | 20.0 | | |
| 3,140,771 | | | Voya Russell Mid Cap Index
Portfolio - Class P2 | | | | | 43,248,421 | | | | | | 4.0 | | |
| Shares | | | Value | | | Percentage
of Net
Assets | |
| MUTUAL FUNDS: (continued) | |
| | | | Affiliated Investment Companies (continued) | |
| 1,519,086 | | | Voya Russell Small Cap
Index Portfolio - Class P2 | | | | $ | 21,935,604 | | | | | | 2.0 | | |
| 11,716,312 | | | Voya U.S. Bond Index
Portfolio - Class P2 | | | | | 127,707,799 | | | | | | 11.8 | | |
| 29,384,688 | | | Voya U.S. Stock Index
Portfolio - Class P2 | | | | | 501,008,926 | | | | | | 46.2 | | |
| | | | Total Mutual Funds
(Cost $896,310,934) | | | | | 977,381,756 | | | | | | 90.2 | | |
| | | | Total Investments in
Securities
(Cost $998,185,426) | | | | $ | 1,081,441,856 | | | | | | 99.8 | | |
| | | | Assets in Excess of
Other Liabilities | | | | | 2,169,902 | | | | | | 0.2 | | |
| | | | Net Assets | | | | $ | 1,083,611,758 | | | | | | 100.0 | | |
| |
Fair Value Measurements^
The following is a summary of the fair valuations according to the inputs used as of December 31, 2019 in valuing the assets and liabilities:
| | | | Quoted Prices
in Active Markets
for Identical
Investments
(Level 1) | | | Significant
Other
Observable
Inputs
(Level 2) | | | Significant
Unobservable
Inputs
(Level 3) | | | Fair Value
at
December 31, 2019 | |
| Asset Table | | | | | | | | | | | | | | | | | | | | | | | | | |
| Investments, at fair value | | | | | | | | | | | | | | | | | | | | | | | | | |
| Exchange-Traded Funds | | | | $ | 104,060,100 | | | | | $ | — | | | | | $ | — | | | | | $ | 104,060,100 | | |
| Mutual Funds | | | | | 977,381,756 | | | | | | — | | | | | | — | | | | | | 977,381,756 | | |
| Total Investments, at fair value | | | | $ | 1,081,441,856 | | | | | $ | — | | | | | $ | — | | | | | $ | 1,081,441,856 | | |
| Other Financial Instruments+ | | | | | | | | | | | | | | | | | | | | | | | | | |
| Futures | | | | | 432,287 | | | | | | — | | | | | | — | | | | | | 432,287 | | |
| Total Assets | | | | $ | 1,081,874,143 | | | | | $ | — | | | | | $ | — | | | | | $ | 1,081,874,143 | | |
| Liabilities Table | | | | | | | | | | | | | | | | | | | | | | | | | |
| Other Financial Instruments+ | | | | | | | | | | | | | | | | | | | | | | | | | |
| Futures | | | | $ | (931,474) | | | | | $ | — | | | | | $ | — | | | | | $ | (931,474) | | |
| Total Liabilities | | | | $ | (931,474) | | | | | $ | — | | | | | $ | — | | | | | $ | (931,474) | | |
^
See Note 2, “Significant Accounting Policies” in the Notes to Financial Statements for additional information.
+
Other Financial Instruments may include open forward foreign currency contracts, futures, centrally cleared swaps, OTC swaps and written options. Forward foreign currency contracts, futures and centrally cleared swaps are valued at the unrealized gain (loss) on the instrument. OTC swaps and written options are valued at the fair value of the instrument.
See Accompanying Notes to Financial Statements
PORTFOLIO OF INVESTMENTS
| Voya Index Solution 2035 Portfolio | as of December 31, 2019 (continued) |
Transactions with Affiliates
An investment of at least 5% of the voting securities of an issuer, or a company which is under common control results in that issuer becoming an affiliated person as defined by the 1940 Act.
The following table provides transactions during the period ended December 31, 2019, where the following issuers were considered an affiliate:
| Issuer | | | Beginning
Fair Value
at 12/31/2018 | | | Purchases
at Cost | | | Sales
at Cost | | | Change in
Unrealized
Appreciation/
(Depreciation) | | | Ending
Fair Value
at 12/31/2019 | | | Investment
Income | | | Realized
Gains/
(Losses) | | | Net Capital
Gain
Distributions | |
| Voya Emerging Markets Index Portfolio - Class P2 | | | | $ | 60,756,882 | | | | | $ | 20,607,722 | | | | | $ | (22,156,966) | | | | | $ | 7,773,949 | | | | | $ | 66,981,587 | | | | | $ | 1,264,854 | | | | | $ | 2,039,998 | | | | | $ | — | | |
| Voya International Index Portfolio - Class P2 | | | | | 159,717,275 | | | | | | 48,654,350 | | | | | | (23,414,763) | | | | | | 31,542,557 | | | | | | 216,499,419 | | | | | | 5,531,820 | | | | | | 202,831 | | | | | | — | | |
| Voya Russell Mid Cap Index Portfolio - Class P2 | | | | | 38,202,531 | | | | | | 14,197,109 | | | | | | (13,388,132) | | | | | | 4,236,913 | | | | | | 43,248,421 | | | | | | 549,842 | | | | | | (418,980) | | | | | | 6,147,324 | | |
| Voya Russell Small Cap Index Portfolio - Class P2 | | | | | 15,253,590 | | | | | | 7,139,891 | | | | | | (2,673,059) | | | | | | 2,215,182 | | | | | | 21,935,604 | | | | | | 200,066 | | | | | | (144,073) | | | | | | 1,905,643 | | |
| Voya U.S. Bond Index Portfolio - Class P2 | | | | | 114,047,195 | | | | | | 60,956,261 | | | | | | (53,362,650) | | | | | | 6,066,993 | | | | | | 127,707,799 | | | | | | 3,250,907 | | | | | | 593,075 | | | | | | — | | |
| Voya U.S. Stock Index Portfolio - Class P2 | | | | | 318,106,836 | | | | | | 162,848,170 | | | | | | (50,035,075) | | | | | | 70,088,995 | | | | | | 501,008,926 | | | | | | 7,322,844 | | | | | | 8,539,761 | | | | | | 24,007,819 | | |
| | | | | $ | 706,084,309 | | | | | $ | 314,403,504 | | | | | $ | (165,030,646) | | | | | $ | 121,924,589 | | | | | $ | 977,381,756 | | | | | $ | 18,120,333 | | | | | $ | 10,812,612 | | | | | $ | 32,060,786 | | |
The financial statements for the above mutual fund[s] can be found at www.sec.gov.
At December 31, 2019, the following futures contracts were outstanding for Voya Index Solution 2035 Portfolio:
| Description | | | Number
of Contracts | | | Expiration
Date | | | Notional
Value | | | Unrealized
Appreciation/
(Depreciation) | |
| Long Contracts: | | | | | | | | | | | | | | | | | | | | | | | | | |
| E-mini Russell 2000® Index | | | | | 192 | | | | | | 03/20/20 | | | | | $ | 16,037,760 | | | | | $ | 250,195 | | |
| U.S. Treasury Ultra Long Bond | | | | | 111 | | | | | | 03/20/20 | | | | | | 20,163,844 | | | | | | (653,034) | | |
| | | | | | | | | | | | | | | | | $ | 36,201,604 | | | | | $ | (402,839) | | |
| Short Contracts: | | | | | | | | | | | | | | | | | | | | | | | | | |
| S&P 500® E-Mini | | | | | (100) | | | | | | 03/20/20 | | | | | | (16,155,500) | | | | | | (278,440) | | |
| U.S. Treasury 10-Year Note | | | | | (161) | | | | | | 03/20/20 | | | | | | (20,675,922) | | | | | | 182,092 | | |
| | | | | | | | | | | | | | | | | $ | (36,831,422) | | | | | $ | (96,348) | | |
A summary of derivative instruments by primary risk exposure is outlined in the following tables.
The fair value of derivative instruments as of December 31, 2019 was as follows:
| Derivatives not accounted for as hedging instruments | | | Location on Statement
of Assets and Liabilities | | | Fair Value | |
| Asset Derivatives | | | | | | | | | | |
| Equity contracts | | | Net Assets — Unrealized appreciation* | | | | $ | 250,195 | | |
| Interest rate contracts | | | Net Assets — Unrealized appreciation* | | | | | 182,092 | | |
| Total Asset Derivatives | | | | | | | $ | 432,287 | | |
| Liability Derivatives | | | | | | | | | | |
| Equity contracts | | | Net Assets — Unrealized depreciation* | | | | $ | 278,440 | | |
| Interest rate contracts | | | Net Assets — Unrealized depreciation* | | | | | 653,034 | | |
| Total Liability Derivatives | | | | | | | $ | 931,474 | | |
*
Includes cumulative appreciation/depreciation of futures contracts as reported in the table within the Portfolio of Investments.
See Accompanying Notes to Financial Statements
PORTFOLIO OF INVESTMENTS
| Voya Index Solution 2035 Portfolio | as of December 31, 2019 (continued) |
The effect of derivative instruments on the Portfolio’s Statement of Operations for the year ended December 31, 2019 was as follows:
| | | | Amount of Realized Gain or (Loss) on
Derivatives Recognized in Income | |
| Derivatives not accounted for as hedging instruments | | | Futures | |
| Equity contracts | | | | $ | (2,958,632) | | |
| Interest rate contracts | | | | | 367,637 | | |
| Total | | | | $ | (2,590,995) | | |
| |
| | | | Change in Unrealized Appreciation or (Depreciation)
on Derivatives Recognized in Income | |
| Derivatives not accounted for as hedging instruments | | | Futures | |
| Equity contracts | | | | $ | 109,120 | | |
| Interest rate contracts | | | | | (897,179) | | |
| Total | | | | $ | (788,059) | | |
At December 31, 2019, the aggregate cost of securities and other investments and the composition of unrealized appreciation and depreciation of securities and other investments at year end were:
| | Cost for federal income tax purposes was $1,005,288,001. | | | | | | | |
| | Net unrealized appreciation consisted of: | | | | | | | |
| | Gross Unrealized Appreciation | | | | $ | 83,449,146 | | |
| | Gross Unrealized Depreciation | | | | | (7,794,478) | | |
| | Net Unrealized Appreciation | | | | $ | 75,654,668 | | |
See Accompanying Notes to Financial Statements
PORTFOLIO OF INVESTMENTS
| Voya Index Solution 2040 Portfolio | as of December 31, 2019 |
| Shares | | | | | | Value | | | Percentage
of Net
Assets | |
| EXCHANGE-TRADED FUNDS: 4.0% | |
| 105,891 | | | iShares 1-3 Year Treasury
Bond ETF | | | | $ | 8,961,555 | | | | | | 1.9 | | |
| 74,143 | | | Vanguard Global ex-U.S.
Real Estate ETF | | | | | 4,381,110 | | | | | | 0.9 | | |
| 61,073 | | | Vanguard Real Estate ETF | | | | | 5,666,964 | | | | | | 1.2 | | |
| | | | Total Exchange-Traded
Funds
(Cost $18,332,105) | | | | | 19,009,629 | | | | | | 4.0 | | |
| MUTUAL FUNDS: 95.8% | |
| | | | Affiliated Investment Companies: 95.8% | |
| 2,538,096 | | | Voya Emerging Markets Index
Portfolio - Class P2 | | | | | 31,447,013 | | | | | | 6.7 | | |
| 9,649,779 | | | Voya International Index
Portfolio - Class P2 | | | | | 103,252,631 | | | | | | 22.0 | | |
| 1,361,588 | | | Voya Russell Mid Cap Index
Portfolio - Class P2 | | | | | 18,749,061 | | | | | | 4.0 | | |
| Shares | | | | | | Value | | | Percentage
of Net
Assets | |
| MUTUAL FUNDS: (continued) | |
| | | | Affiliated Investment Companies (continued) | |
| 987,073 | | | Voya Russell Small Cap
Index Portfolio - Class P2 | | | | $ | 14,253,332 | | | | | | 3.0 | | |
| 5,041,653 | | | Voya U.S. Bond Index
Portfolio - Class P2 | | | | | 54,954,018 | | | | | | 11.7 | | |
| 13,366,970 | | | Voya U.S. Stock Index
Portfolio - Class P2 | | | | | 227,906,833 | | | | | | 48.4 | | |
| | | | Total Mutual Funds
(Cost $422,441,013) | | | | | 450,562,888 | | | | | | 95.8 | | |
| | | | Total Investments in
Securities
(Cost $440,773,118) | | | | $ | 469,572,517 | | | | | | 99.8 | | |
| | | | Assets in Excess of Other
Liabilities | | | | | 985,762 | | | | | | 0.2 | | |
| | | | Net Assets | | | | $ | 470,558,279 | | | | | | 100.0 | | |
| |
Fair Value Measurements^
The following is a summary of the fair valuations according to the inputs used as of December 31, 2019 in valuing the assets and liabilities:
| | | | Quoted Prices
in Active Markets
for Identical
Investments
(Level 1) | | | Significant
Other
Observable
Inputs
(Level 2) | | | Significant
Unobservable
Inputs
(Level 3) | | | Fair Value
at
December 31, 2019 | |
| Asset Table | | | | | | | | | | | | | | | | | | | | | | | | | |
| Investments, at fair value | | | | | | | | | | | | | | | | | | | | | | | | | |
| Exchange-Traded Funds | | | | $ | 19,009,629 | | | | | $ | — | | | | | $ | — | | | | | $ | 19,009,629 | | |
| Mutual Funds | | | | | 450,562,888 | | | | | | — | | | | | | — | | | | | | 450,562,888 | | |
| Total Investments, at fair value | | | | $ | 469,572,517 | | | | | $ | — | | | | | $ | — | | | | | $ | 469,572,517 | | |
| Other Financial Instruments+ | | | | | | | | | | | | | | | | | | | | | | | | | |
| Futures | | | | | 207,797 | | | | | | — | | | | | | — | | | | | | 207,797 | | |
| Total Assets | | | | $ | 469,780,314 | | | | | $ | — | | | | | $ | — | | | | | $ | 469,780,314 | | |
| Liabilities Table | | | | | | | | | | | | | | | | | | | | | | | | | |
| Other Financial Instruments+ | | | | | | | | | | | | | | | | | | | | | | | | | |
| Futures | | | | $ | (323,513) | | | | | $ | — | | | | | $ | — | | | | | $ | (323,513) | | |
| Total Liabilities | | | | $ | (323,513) | | | | | $ | — | | | | | $ | — | | | | | $ | (323,513) | | |
^
See Note 2, “Significant Accounting Policies” in the Notes to Financial Statements for additional information.
+
Other Financial Instruments may include open forward foreign currency contracts, futures, centrally cleared swaps, OTC swaps and written options. Forward foreign currency contracts, futures and centrally cleared swaps are valued at the unrealized gain (loss) on the instrument. OTC swaps and written options are valued at the fair value of the instrument.
See Accompanying Notes to Financial Statements
PORTFOLIO OF INVESTMENTS
| Voya Index Solution 2040 Portfolio | as of December 31, 2019 (continued) |
Transactions with Affiliates
An investment of at least 5% of the voting securities of an issuer, or a company which is under common control results in that issuer becoming an affiliated person as defined by the 1940 Act.
The following table provides transactions during the period ended December 31, 2019, where the following issuers were considered an affiliate:
| Issuer | | | Beginning
Fair Value
at 12/31/2018 | | | Purchases
at Cost | | | Sales
at Cost | | | Change in
Unrealized
Appreciation/
(Depreciation) | | | Ending
Fair Value
at 12/31/2019 | | | Investment
Income | | | Realized
Gains/
(Losses) | | | Net Capital
Gain
Distributions | |
| Voya Emerging Markets Index Portfolio - Class P2 | | | | $ | 22,829,012 | | | | | $ | 13,292,633 | | | | | $ | (8,628,784) | | | | | $ | 3,954,152 | | | | | $ | 31,447,013 | | | | | $ | 546,146 | | | | | $ | 217,603 | | | | | $ | — | | |
| Voya International Index Portfolio - Class P2 | | | | | 61,869,390 | | | | | | 35,182,443 | | | | | | (6,466,108) | | | | | | 12,666,906 | | | | | | 103,252,631 | | | | | | 2,424,399 | | | | | | 1,090,175 | | | | | | — | | |
| Voya Russell Mid Cap Index Portfolio - Class P2 | | | | | 16,212,166 | | | | | | 8,793,238 | | | | | | (8,393,560) | | | | | | 2,137,217 | | | | | | 18,749,061 | | | | | | 219,237 | | | | | | (150,337) | | | | | | 2,450,250 | | |
| Voya Russell Small Cap Index Portfolio - Class P2 | | | | | 8,091,573 | | | | | | 6,384,911 | | | | | | (1,432,340) | | | | | | 1,209,188 | | | | | | 14,253,332 | | | | | | 119,655 | | | | | | (23,077) | | | | | | 1,139,093 | | |
| Voya U.S. Bond Index Portfolio - Class P2 | | | | | 26,922,761 | | | | | | 32,590,956 | | | | | | (6,649,244) | | | | | | 2,089,545 | | | | | | 54,954,018 | | | | | | 1,177,035 | | | | | | 224,563 | | | | | | — | | |
| Voya U.S. Stock Index Portfolio - Class P2 | | | | | 116,640,661 | | | | | | 96,738,829 | | | | | | (16,226,607) | | | | | | 30,753,950 | | | | | | 227,906,833 | | | | | | 3,280,475 | | | | | | 1,265,149 | | | | | | 10,241,771 | | |
| | | | | $ | 252,565,563 | | | | | $ | 192,983,010 | | | | | $ | (47,796,643) | | | | | $ | 52,810,958 | | | | | $ | 450,562,888 | | | | | $ | 7,766,947 | | | | | $ | 2,624,076 | | | | | $ | 13,831,114 | | |
The financial statements for the above mutual fund[s] can be found at www.sec.gov.
At December 31, 2019, the following futures contracts were outstanding for Voya Index Solution 2040 Portfolio:
| Description | | | Number
of Contracts | | | Expiration
Date | | | Notional
Value | | | Unrealized
Appreciation/
(Depreciation) | |
| Long Contracts: | | | | | | | | | | | | | | | | | | | | | | | | | |
| E-mini Russell 2000® Index | | | | | 83 | | | | | | 03/20/20 | | | | | $ | 6,932,990 | | | | | $ | 108,158 | | |
| U.S. Treasury Ultra Long Bond | | | | | 48 | | | | | | 03/20/20 | | | | | | 8,719,500 | | | | | | (284,532) | | |
| | | | | | | | | | | | | | | | | $ | 15,652,490 | | | | | $ | (176,374) | | |
| Short Contracts: | | | | | | | | | | | | | | | | | | | | | | | | | |
| S&P 500® E-Mini | | | | | (14) | | | | | | 03/20/20 | | | | | | (2,261,770) | | | | | | (38,981) | | |
| U.S. Treasury 10-Year Note | | | | | (104) | | | | | | 03/20/20 | | | | | | (13,355,875) | | | | | | 99,639 | | |
| | | | | | | | | | | | | | | | | $ | (15,617,645) | | | | | $ | 60,658 | | |
A summary of derivative instruments by primary risk exposure is outlined in the following tables.
The fair value of derivative instruments as of December 31, 2019 was as follows:
| Derivatives not accounted for as hedging instruments | | | Location on Statement
of Assets and Liabilities | | | Fair Value | |
| Asset Derivatives | | | | | | | | | | |
| Equity contracts | | | Net Assets — Unrealized appreciation* | | | | $ | 108,158 | | |
| Interest rate contracts | | | Net Assets — Unrealized appreciation* | | | | | 99,639 | | |
| Total Asset Derivatives | | | | | | | $ | 207,797 | | |
| Liability Derivatives | | | | | | | | | | |
| Equity contracts | | | Net Assets — Unrealized depreciation* | | | | $ | 38,981 | | |
| Interest rate contracts | | | Net Assets — Unrealized depreciation* | | | | | 284,532 | | |
| Total Liability Derivatives | | | | | | | $ | 323,513 | | |
*
Includes cumulative appreciation/depreciation of futures contracts as reported in the table within the Portfolio of Investments.
See Accompanying Notes to Financial Statements
PORTFOLIO OF INVESTMENTS
| Voya Index Solution 2040 Portfolio | as of December 31, 2019 (continued) |
The effect of derivative instruments on the Portfolio’s Statement of Operations for the year ended December 31, 2019 was as follows:
| | | | Amount of Realized Gain or (Loss) on
Derivatives Recognized in Income | |
| Derivatives not accounted for as hedging instruments | | | Futures | |
| Equity contracts | | | | $ | (985,395) | | |
| Interest rate contracts | | | | | 115,108 | | |
| Total | | | | $ | (870,287) | | |
| |
| | | | Change in Unrealized Appreciation or (Depreciation)
on Derivatives Recognized in Income | |
| Derivatives not accounted for as hedging instruments | | | Futures | |
| Equity contracts | | | | $ | 105,751 | | |
| Interest rate contracts | | | | | (329,000) | | |
| Total | | | | $ | (223,249) | | |
At December 31, 2019, the aggregate cost of securities and other investments and the composition of unrealized appreciation and depreciation of securities and other investments at year end were:
| | Cost for federal income tax purposes was $441,940,322. | | | | | | | |
| | Net unrealized appreciation consisted of: | | | | | | | |
| | Gross Unrealized Appreciation | | | | $ | 29,241,606 | | |
| | Gross Unrealized Depreciation | | | | | (1,725,128) | | |
| | Net Unrealized Appreciation | | | | $ | 27,516,478 | | |
See Accompanying Notes to Financial Statements
PORTFOLIO OF INVESTMENTS
| Voya Index Solution 2045 Portfolio | as of December 31, 2019 |
| Shares | | | | | | Value | | | Percentage
of Net
Assets | |
| EXCHANGE-TRADED FUNDS: 3.9% | |
| 148,725 | | | iShares 1-3 Year Treasury
Bond ETF | | | | $ | 12,586,597 | | | | | | 1.7 | | |
| 119,011 | | | Vanguard Global ex-U.S.
Real Estate ETF | | | | | 7,032,360 | | | | | | 1.0 | | |
| 98,031 | | | Vanguard Real Estate ETF | | | | | 9,096,296 | | | | | | 1.2 | | |
| | | | Total Exchange-Traded
Funds
(Cost $27,651,007) | | | | | 28,715,253 | | | | | | 3.9 | | |
| MUTUAL FUNDS: 95.8% | |
| | | | Affiliated Investment Companies: 95.8% | |
| 4,329,775 | | | Voya Emerging Markets Index
Portfolio - Class P2 | | | | | 53,645,915 | | | | | | 7.2 | | |
| 15,968,538 | | | Voya International Index
Portfolio - Class P2 | | | | | 170,863,362 | | | | | | 22.8 | | |
| 2,425,410 | | | Voya Russell Mid Cap Index
Portfolio - Class P2 | | | | | 33,397,890 | | | | | | 4.5 | | |
| Shares | | | | | | Value | | | Percentage
of Net
Assets | |
| MUTUAL FUNDS: (continued) | |
| | | | Affiliated Investment Companies (continued) | |
| 1,552,726 | | | Voya Russell Small Cap
Index Portfolio - Class P2 | | | | $ | 22,421,371 | | | | | | 3.0 | | |
| 4,817,177 | | | Voya U.S. Bond Index
Portfolio - Class P2 | | | | | 52,507,230 | | | | | | 7.0 | | |
| 22,476,601 | | | Voya U.S. Stock Index
Portfolio - Class P2 | | | | | 383,226,039 | | | | | | 51.3 | | |
| | | | Total Mutual Funds
(Cost $657,308,295) | | | | | 716,061,807 | | | | | | 95.8 | | |
| | | | Total Investments in
Securities
(Cost $684,959,302) | | | | $ | 744,777,060 | | | | | | 99.7 | | |
| | | | Assets in Excess of
Other Liabilities | | | | | 2,426,679 | | | | | | 0.3 | | |
| | | | Net Assets | | | | $ | 747,203,739 | | | | | | 100.0 | | |
| |
Fair Value Measurements^
The following is a summary of the fair valuations according to the inputs used as of December 31, 2019 in valuing the assets and liabilities:
| | | | Quoted Prices
in Active Markets
for Identical
Investments
(Level 1) | | | Significant
Other
Observable
Inputs
(Level 2) | | | Significant
Unobservable
Inputs
(Level 3) | | | Fair Value
at
December 31, 2019 | |
| Asset Table | | | | | | | | | | | | | | | | | | | | | | | | | |
| Investments, at fair value | | | | | | | | | | | | | | | | | | | | | | | | | |
| Exchange-Traded Funds | | | | $ | 28,715,253 | | | | | $ | — | | | | | $ | — | | | | | $ | 28,715,253 | | |
| Mutual Funds | | | | | 716,061,807 | | | | | | — | | | | | | — | | | | | | 716,061,807 | | |
| Total Investments, at fair value | | | | $ | 744,777,060 | | | | | $ | — | | | | | $ | — | | | | | $ | 744,777,060 | | |
| Other Financial Instruments+ | | | | | | | | | | | | | | | | | | | | | | | | | |
| Futures | | | | | 333,067 | | | | | | — | | | | | | — | | | | | | 333,067 | | |
| Total Assets | | | | $ | 745,110,127 | | | | | $ | — | | | | | $ | — | | | | | $ | 745,110,127 | | |
| Liabilities Table | | | | | | | | | | | | | | | | | | | | | | | | | |
| Other Financial Instruments+ | | | | | | | | | | | | | | | | | | | | | | | | | |
| Futures | | | | $ | (660,732) | | | | | $ | — | | | | | $ | — | | | | | $ | (660,732) | | |
| Total Liabilities | | | | $ | (660,732) | | | | | $ | — | | | | | $ | — | | | | | $ | (660,732) | | |
^
See Note 2, “Significant Accounting Policies” in the Notes to Financial Statements for additional information.
+
Other Financial Instruments may include open forward foreign currency contracts, futures, centrally cleared swaps, OTC swaps and written options. Forward foreign currency contracts, futures and centrally cleared swaps are valued at the unrealized gain (loss) on the instrument. OTC swaps and written options are valued at the fair value of the instrument.
See Accompanying Notes to Financial Statements
PORTFOLIO OF INVESTMENTS
| Voya Index Solution 2045 Portfolio | as of December 31, 2019 (continued) |
Transactions with Affiliates
An investment of at least 5% of the voting securities of an issuer, or a company which is under common control results in that issuer becoming an affiliated person as defined by the 1940 Act.
The following table provides transactions during the period ended December 31, 2019, where the following issuers were considered an affiliate:
| Issuer | | | Beginning
Fair Value
at 12/31/2018 | | | Purchases
at Cost | | | Sales
at Cost | | | Change in
Unrealized
Appreciation/
(Depreciation) | | | Ending
Fair Value
at 12/31/2019 | | | Investment
Income | | | Realized
Gains/
(Losses) | | | Net Capital
Gain
Distributions | |
| Voya Emerging Markets Index Portfolio - Class P2 | | | | $ | 51,272,059 | | | | | $ | 16,235,946 | | | | | $ | (19,870,704) | | | | | $ | 6,008,614 | | | | | $ | 53,645,915 | | | | | $ | 1,021,779 | | | | | $ | 2,050,788 | | | | | $ | — | | |
| Voya International Index Portfolio - Class P2 | | | | | 123,237,857 | | | | | | 36,539,520 | | | | | | (13,549,204) | | | | | | 24,635,189 | | | | | | 170,863,362 | | | | | | 4,407,106 | | | | | | 95,117 | | | | | | — | | |
| Voya Russell Mid Cap Index Portfolio - Class P2 | | | | | 36,109,754 | | | | | | 11,546,199 | | | | | | (18,633,918) | | | | | | 4,375,855 | | | | | | 33,397,890 | | | | | | 428,442 | | | | | | 7,122 | | | | | | 4,790,314 | | |
| Voya Russell Small Cap Index Portfolio - Class P2 | | | | | 15,447,643 | | | | | | 6,978,429 | | | | | | (2,252,806) | | | | | | 2,248,105 | | | | | | 22,421,371 | | | | | | 208,034 | | | | | | (191,640) | | | | | | 1,981,746 | | |
| Voya U.S. Bond Index Portfolio - Class P2 | | | | | 32,090,802 | | | | | | 27,407,650 | | | | | | (9,358,006) | | | | | | 2,366,784 | | | | | | 52,507,230 | | | | | | 1,222,524 | | | | | | 99,042 | | | | | | — | | |
| Voya U.S. Stock Index Portfolio - Class P2 | | | | | 235,762,965 | | | | | | 120,769,893 | | | | | | (27,783,912) | | | | | | 54,477,093 | | | | | | 383,226,039 | | | | | | 5,616,413 | | | | | | 4,638,127 | | | | | | 18,427,222 | | |
| | | | | $ | 493,921,080 | | | | | $ | 219,477,638 | | | | | $ | (91,448,551) | | | | | $ | 94,111,640 | | | | | $ | 716,061,807 | | | | | $ | 12,904,298 | | | | | $ | 6,698,556 | | | | | $ | 25,199,282 | | |
The financial statements for the above mutual fund[s] can be found at www.sec.gov.
At December 31, 2019, the following futures contracts were outstanding for Voya Index Solution 2045 Portfolio:
| Description | | | Number
of Contracts | | | Expiration
Date | | | Notional
Value | | | Unrealized
Appreciation/
(Depreciation) | |
| Long Contracts: | | | | | | | | | | | | | | | | | | | | | | | | | |
| E-mini Russell 2000® Index | | | | | 133 | | | | | | 03/20/20 | | | | | $ | 11,109,490 | | | | | $ | 173,312 | | |
| Mini MSCI EAFE Index | | | | | 73 | | | | | | 03/20/20 | | | | | | 7,433,225 | | | | | | (14,977) | | |
| U.S. Treasury Ultra Long Bond | | | | | 77 | | | | | | 03/20/20 | | | | | | 13,987,531 | | | | | | (453,631) | | |
| | | | | | | | | | | | | | | | | $ | 32,530,246 | | | | | $ | (295,296) | | |
| Short Contracts: | | | | | | | | | | | | | | | | | | | | | | | | | |
| S&P 500® E-Mini | | | | | (69) | | | | | | 03/20/20 | | | | | | (11,147,295) | | | | | | (192,124) | | |
| U.S. Treasury 10-Year Note | | | | | (167) | | | | | | 03/20/20 | | | | | | (21,446,453) | | | | | | 159,755 | | |
| | | | | | | | | | | | | | | | | $ | (32,593,748) | | | | | $ | (32,369) | | |
A summary of derivative instruments by primary risk exposure is outlined in the following tables.
The fair value of derivative instruments as of December 31, 2019 was as follows:
| Derivatives not accounted for as hedging instruments | | | Location on Statement
of Assets and Liabilities | | | Fair Value | |
| Asset Derivatives | | | | | | | | | | |
| Equity contracts | | | Net Assets — Unrealized appreciation* | | | | $ | 173,312 | | |
| Interest rate contracts | | | Net Assets — Unrealized appreciation* | | | | | 159,755 | | |
| Total Asset Derivatives | | | | | | | $ | 333,067 | | |
| Liability Derivatives | | | | | | | | | | |
| Equity contracts | | | Net Assets — Unrealized depreciation* | | | | $ | 207,101 | | |
| Interest rate contracts | | | Net Assets — Unrealized depreciation* | | | | | 453,631 | | |
| Total Liability Derivatives | | | | | | | $ | 660,732 | | |
*
Includes cumulative appreciation/depreciation of futures contracts as reported in the table within the Portfolio of Investments.
See Accompanying Notes to Financial Statements
PORTFOLIO OF INVESTMENTS
| Voya Index Solution 2045 Portfolio | as of December 31, 2019 (continued) |
The effect of derivative instruments on the Portfolio’s Statement of Operations for the year ended December 31, 2019 was as follows:
| | | | Amount of Realized Gain or (Loss) on
Derivatives Recognized in Income | |
| Derivatives not accounted for as hedging instruments | | | Futures | |
| Equity contracts | | | | $ | (1,952,061) | | |
| Interest rate contracts | | | | | 243,059 | | |
| Total | | | | $ | (1,709,002) | | |
| |
| | | | Change in Unrealized Appreciation or (Depreciation)
on Derivatives Recognized in Income | |
| Derivatives not accounted for as hedging instruments | | | Futures | |
| Equity contracts | | | | $ | 260,428 | | |
| Interest rate contracts | | | | | (578,612) | | |
| Total | | | | $ | (318,184) | | |
At December 31, 2019, the aggregate cost of securities and other investments and the composition of unrealized appreciation and depreciation of securities and other investments at year end were:
| | Cost for federal income tax purposes was $689,265,401. | | | | | | | |
| | Net unrealized appreciation consisted of: | | | | | | | |
| | Gross Unrealized Appreciation | | | | $ | 59,891,560 | | |
| | Gross Unrealized Depreciation | | | | | (4,707,567) | | |
| | Net Unrealized Appreciation | | | | $ | 55,183,993 | | |
See Accompanying Notes to Financial Statements
PORTFOLIO OF INVESTMENTS
| Voya Index Solution 2050 Portfolio | as of December 31, 2019 |
| Shares | | | | | | Value | | | Percentage
of Net
Assets | |
| EXCHANGE-TRADED FUNDS: 2.1% | |
| 50,620 | | | Vanguard Global ex-U.S. Real
Estate ETF | | | | $ | 2,991,136 | | | | | | 0.9 | | |
| 41,697 | | | Vanguard Real Estate ETF | | | | | 3,869,064 | | | | | | 1.2 | | |
| | | | Total Exchange-Traded Funds
(Cost $6,440,853) | | | | | 6,860,200 | | | | | | 2.1 | | |
| MUTUAL FUNDS: 97.6% | |
| | | | Affiliated Investment Companies: 97.6% | |
| 1,880,301 | | | Voya Emerging Markets Index
Portfolio - Class P2 | | | | | 23,296,925 | | | | | | 7.2 | | |
| 7,250,509 | | | Voya International Index
Portfolio - Class P2 | | | | | 77,580,444 | | | | | | 23.9 | | |
| 1,053,546 | | | Voya Russell Mid Cap Index
Portfolio - Class P2 | | | | | 14,507,330 | | | | | | 4.5 | | |
| 681,322 | | | Voya Russell Small Cap Index
Portfolio - Class P2 | | | | | 9,838,286 | | | | | | 3.0 | | |
| Shares | | | | | | Value | | | Percentage
of Net
Assets | |
| MUTUAL FUNDS: (continued) | |
| | | | Affiliated Investment Companies (continued) | |
| 2,013,356 | | | Voya U.S. Bond Index
Portfolio - Class P2 | | | | $ | 21,945,576 | | | | | | 6.8 | | |
| 9,951,245 | | | Voya U.S. Stock Index
Portfolio - Class P2 | | | | | 169,668,734 | | | | | | 52.2 | | |
| | | | Total Mutual Funds
(Cost $296,724,044) | | | | | 316,837,295 | | | | | | 97.6 | | |
| | | | Total Investments in
Securities
(Cost $303,164,897) | | | | $ | 323,697,495 | | | | | | 99.7 | | |
| | | | Assets in Excess of Other
Liabilities | | | | | 1,021,410 | | | | | | 0.3 | | |
| | | | Net Assets | | | | $ | 324,718,905 | | | | | | 100.0 | | |
| |
Fair Value Measurements^
The following is a summary of the fair valuations according to the inputs used as of December 31, 2019 in valuing the assets and liabilities:
| | | | Quoted Prices
in Active Markets
for Identical
Investments
(Level 1) | | | Significant
Other
Observable
Inputs
(Level 2) | | | Significant
Unobservable
Inputs
(Level 3) | | | Fair Value
at
December 31, 2019 | |
| Asset Table | | | | | | | | | | | | | | | | | | | | | | | | | |
| Investments, at fair value | | | | | | | | | | | | | | | | | | | | | | | | | |
| Exchange-Traded Funds | | | | $ | 6,860,200 | | | | | $ | — | | | | | $ | — | | | | | $ | 6,860,200 | | |
| Mutual Funds | | | | | 316,837,295 | | | | | | — | | | | | | — | | | | | | 316,837,295 | | |
| Total Investments, at fair value | | | | $ | 323,697,495 | | | | | $ | — | | | | | $ | — | | | | | $ | 323,697,495 | | |
| Other Financial Instruments+ | | | | | | | | | | | | | | | | | | | | | | | | | |
| Futures | | | | | 142,226 | | | | | | — | | | | | | — | | | | | | 142,226 | | |
| Total Assets | | | | $ | 323,839,721 | | | | | $ | — | | | | | $ | — | | | | | $ | 323,839,721 | | |
| Liabilities Table | | | | | | | | | | | | | | | | | | | | | | | | | |
| Other Financial Instruments+ | | | | | | | | | | | | | | | | | | | | | | | | | |
| Futures | | | | $ | (283,504) | | | | | $ | — | | | | | $ | — | | | | | $ | (283,504) | | |
| Total Liabilities | | | | $ | (283,504) | | | | | $ | — | | | | | $ | — | | | | | $ | (283,504) | | |
^
See Note 2, “Significant Accounting Policies” in the Notes to Financial Statements for additional information.
+
Other Financial Instruments may include open forward foreign currency contracts, futures, centrally cleared swaps, OTC swaps and written options. Forward foreign currency contracts, futures and centrally cleared swaps are valued at the unrealized gain (loss) on the instrument. OTC swaps and written options are valued at the fair value of the instrument.
See Accompanying Notes to Financial Statements
PORTFOLIO OF INVESTMENTS
| Voya Index Solution 2050 Portfolio | as of December 31, 2019 (continued) |
Transactions with Affiliates
An investment of at least 5% of the voting securities of an issuer, or a company which is under common control results in that issuer becoming an affiliated person as defined by the 1940 Act.
The following table provides transactions during the period ended December 31, 2019, where the following issuers were considered an affiliate:
| Issuer | | | Beginning
Fair Value
at 12/31/2018 | | | Purchases
at Cost | | | Sales
at Cost | | | Change in
Unrealized
Appreciation/
(Depreciation) | | | Ending
Fair Value
at 12/31/2019 | | | Investment
Income | | | Realized
Gains/
(Losses) | | | Net Capital
Gain
Distributions | |
| Voya Emerging Markets Index Portfolio - Class P2 | | | | $ | 18,395,359 | | | | | $ | 10,260,079 | | | | | $ | (8,859,198) | | | | | $ | 3,500,685 | | | | | $ | 23,296,925 | | | | | $ | 393,574 | | | | | $ | (257,515) | | | | | $ | — | | |
| Voya International Index Portfolio - Class P2 | | | | | 43,870,476 | | | | | | 28,218,609 | | | | | | (3,942,227) | | | | | | 9,433,586 | | | | | | 77,580,444 | | | | | | 1,772,315 | | | | | | 565,618 | | | | | | — | | |
| Voya Russell Mid Cap Index Portfolio - Class P2 | | | | | 12,338,150 | | | | | | 7,229,956 | | | | | | (6,871,268) | | | | | | 1,810,492 | | | | | | 14,507,330 | | | | | | 165,200 | | | | | | (236,030) | | | | | | 1,846,082 | | |
| Voya Russell Small Cap Index Portfolio - Class P2 | | | | | 5,278,303 | | | | | | 4,564,093 | | | | | | (801,476) | | | | | | 797,366 | | | | | | 9,838,286 | | | | | | 80,388 | | | | | | (13,151) | | | | | | 765,158 | | |
| Voya U.S. Bond Index Portfolio - Class P2 | | | | | 10,526,026 | | | | | | 19,746,538 | | | | | | (9,029,180) | | | | | | 702,192 | | | | | | 21,945,576 | | | | | | 459,859 | | | | | | 200,430 | | | | | | — | | |
| Voya U.S. Stock Index Portfolio - Class P2 | | | | | 81,467,984 | | | | | | 77,103,963 | | | | | | (11,274,688) | | | | | | 22,371,475 | | | | | | 169,668,734 | | | | | | 2,442,864 | | | | | | 626,780 | | | | | | 7,440,775 | | |
| | | | | $ | 171,876,298 | | | | | $ | 147,123,239 | | | | | $ | (40,778,038) | | | | | $ | 38,615,796 | | | | | $ | 316,837,295 | | | | | $ | 5,314,200 | | | | | $ | 886,132 | | | | | $ | 10,052,015 | | |
The financial statements for the above mutual fund[s] can be found at www.sec.gov.
At December 31, 2019, the following futures contracts were outstanding for Voya Index Solution 2050 Portfolio:
| Description | | | Number
of Contracts | | | Expiration
Date | | | Notional
Value | | | Unrealized
Appreciation/
(Depreciation) | |
| Long Contracts: | | | | | | | | | | | | | | | | | | | | | | | | | |
| E-mini Russell 2000® Index | | | | | 57 | | | | | | 03/20/20 | | | | | $ | 4,761,210 | | | | | $ | 74,277 | | |
| Mini MSCI EAFE Index | | | | | 31 | | | | | | 03/20/20 | | | | | | 3,156,575 | | | | | | (6,360) | | |
| U.S. Treasury Ultra Long Bond | | | | | 33 | | | | | | 03/20/20 | | | | | | 5,994,656 | | | | | | (196,396) | | |
| | | | | | | | | | | | | | | | | $ | 13,912,441 | | | | | $ | (128,479) | | |
| Short Contracts: | | | | | | | | | | | | | | | | | | | | | | | | | |
| S&P 500® E-Mini | | | | | (29) | | | | | | 03/20/20 | | | | | | (4,685,095) | | | | | | (80,748) | | |
| U.S. Treasury 10-Year Note | | | | | (71) | | | | | | 03/20/20 | | | | | | (9,117,953) | | | | | | 67,949 | | |
| | | | | | | | | | | | | | | | | $ | (13,803,048) | | | | | $ | (12,799) | | |
A summary of derivative instruments by primary risk exposure is outlined in the following tables.
The fair value of derivative instruments as of December 31, 2019 was as follows:
| Derivatives not accounted for as hedging instruments | | | Location on Statement
of Assets and Liabilities | | | Fair Value | |
| Asset Derivatives | | | | | | | | | | |
| Equity contracts | | | Net Assets — Unrealized appreciation* | | | | $ | 74,277 | | |
| Interest rate contracts | | | Net Assets — Unrealized appreciation* | | | | | 67,949 | | |
| Total Asset Derivatives | | | | | | | $ | 142,226 | | |
| Liability Derivatives | | | | | | | | | | |
| Equity contracts | | | Net Assets — Unrealized depreciation* | | | | $ | 87,108 | | |
| Interest rate contracts | | | Net Assets — Unrealized depreciation* | | | | | 196,396 | | |
| Total Liability Derivatives | | | | | | | $ | 283,504 | | |
*
Includes cumulative appreciation/depreciation of futures contracts as reported in the table within the Portfolio of Investments.
See Accompanying Notes to Financial Statements
PORTFOLIO OF INVESTMENTS
| Voya Index Solution 2050 Portfolio | as of December 31, 2019 (continued) |
The effect of derivative instruments on the Portfolio’s Statement of Operations for the year ended December 31, 2019 was as follows:
| | | | Amount of Realized Gain or (Loss) on
Derivatives Recognized in Income | |
| Derivatives not accounted for as hedging instruments | | | Futures | |
| Equity contracts | | | | $ | (700,291) | | |
| Interest rate contracts | | | | | 85,000 | | |
| Total | | | | $ | (615,291) | | |
| |
| | | | Change in Unrealized Appreciation or (Depreciation)
on Derivatives Recognized in Income | |
| Derivatives not accounted for as hedging instruments | | | Futures | |
| Equity contracts | | | | $ | 78,993 | | |
| Interest rate contracts | | | | | (230,706) | | |
| Total | | | | $ | (151,713) | | |
At December 31, 2019, the aggregate cost of securities and other investments and the composition of unrealized appreciation and depreciation of securities and other investments at year end were:
| | Cost for federal income tax purposes was $304,344,567. | | | | | | | |
| | Net unrealized appreciation consisted of: | | | | | | | |
| | Gross Unrealized Appreciation | | | | $ | 20,471,727 | | |
| | Gross Unrealized Depreciation | | | | | (1,260,077) | | |
| | Net Unrealized Appreciation | | | | $ | 19,211,650 | | |
See Accompanying Notes to Financial Statements
PORTFOLIO OF INVESTMENTS
| Voya Index Solution 2055 Portfolio | as of December 31, 2019 |
| Shares | | | | | | Value | | | Percentage
of Net
Assets | |
| EXCHANGE-TRADED FUNDS: 2.2% | |
| 55,280 | | | Vanguard Global ex-U.S. Real
Estate ETF | | | | $ | 3,266,495 | | | | | | 1.0 | | |
| 45,535 | | | Vanguard Real Estate ETF | | | | | 4,225,193 | | | | | | 1.2 | | |
| | | | Total Exchange-Traded Funds
(Cost $7,037,686) | | | | | 7,491,688 | | | | | | 2.2 | | |
| MUTUAL FUNDS: 97.5% | |
| | | | Affiliated Investment Companies: 97.5% | |
| 2,170,687 | | | Voya Emerging Markets Index
Portfolio - Class P2 | | | | | 26,894,812 | | | | | | 7.7 | | |
| 7,801,247 | | | Voya International Index
Portfolio - Class P2 | | | | | 83,473,347 | | | | | | 23.8 | | |
| 1,260,940 | | | Voya Russell Mid Cap Index
Portfolio - Class P2 | | | | | 17,363,145 | | | | | | 5.0 | | |
| 729,131 | | | Voya Russell Small Cap Index
Portfolio - Class P2 | | | | | 10,528,646 | | | | | | 3.0 | | |
| Shares | | | | | | Value | | | Percentage
of Net
Assets | |
| MUTUAL FUNDS: (continued) | |
| | | | Affiliated Investment Companies (continued) | |
| 1,861,495 | | | Voya U.S. Bond Index
Portfolio - Class P2 | | | | $ | 20,290,299 | | | | | | 5.8 | | |
| 10,720,839 | | | Voya U.S. Stock Index
Portfolio - Class P2 | | | | | 182,790,310 | | | | | | 52.2 | | |
| | | | Total Mutual Funds
(Cost $315,698,451) | | | | | 341,340,559 | | | | | | 97.5 | | |
| | | | Total Investments in
Securities
(Cost $322,736,137) | | | | $ | 348,832,247 | | | | | | 99.7 | | |
| | | | Assets in Excess of Other
Liabilities | | | | | 1,195,330 | | | | | | 0.3 | | |
| | | | Net Assets | | | | $ | 350,027,577 | | | | | | 100.0 | | |
| |
Fair Value Measurements^
The following is a summary of the fair valuations according to the inputs used as of December 31, 2019 in valuing the assets and liabilities:
| | | | Quoted Prices
in Active Markets
for Identical
Investments
(Level 1) | | | Significant
Other
Observable
Inputs
(Level 2) | | | Significant
Unobservable
Inputs
(Level 3) | | | Fair Value
at
December 31, 2019 | |
| Asset Table | | | | | | | | | | | | | | | | | | | | | | | | | |
| Investments, at fair value | | | | | | | | | | | | | | | | | | | | | | | | | |
| Exchange-Traded Funds | | | | $ | 7,491,688 | | | | | $ | — | | | | | $ | — | | | | | $ | 7,491,688 | | |
| Mutual Funds | | | | | 341,340,559 | | | | | | — | | | | | | — | | | | | | 341,340,559 | | |
| Total Investments, at fair value | | | | $ | 348,832,247 | | | | | $ | — | | | | | $ | — | | | | | $ | 348,832,247 | | |
| Other Financial Instruments+ | | | | | | | | | | | | | | | | | | | | | | | | | |
| Futures | | | | | 155,753 | | | | | | — | | | | | | — | | | | | | 155,753 | | |
| Total Assets | | | | $ | 348,988,000 | | | | | $ | — | | | | | $ | — | | | | | $ | 348,988,000 | | |
| Liabilities Table | | | | | | | | | | | | | | | | | | | | | | | | | |
| Other Financial Instruments+ | | | | | | | | | | | | | | | | | | | | | | | | | |
| Futures | | | | $ | (308,434) | | | | | $ | — | | | | | $ | — | | | | | $ | (308,434) | | |
| Total Liabilities | | | | $ | (308,434) | | | | | $ | — | | | | | $ | — | | | | | $ | (308,434) | | |
^
See Note 2, “Significant Accounting Policies” in the Notes to Financial Statements for additional information.
+
Other Financial Instruments may include open forward foreign currency contracts, futures, centrally cleared swaps, OTC swaps and written options. Forward foreign currency contracts, futures and centrally cleared swaps are valued at the unrealized gain (loss) on the instrument. OTC swaps and written options are valued at the fair value of the instrument.
See Accompanying Notes to Financial Statements
PORTFOLIO OF INVESTMENTS
| Voya Index Solution 2055 Portfolio | as of December 31, 2019 (continued) |
Transactions with Affiliates
An investment of at least 5% of the voting securities of an issuer, or a company which is under common control results in that issuer becoming an affiliated person as defined by the 1940 Act.
The following table provides transactions during the period ended December 31, 2019, where the following issuers were considered an affiliate:
| Issuer | | | Beginning
Fair Value
at 12/31/2018 | | | Purchases
at Cost | | | Sales
at Cost | | | Change in
Unrealized
Appreciation/
(Depreciation) | | | Ending
Fair Value
at 12/31/2019 | | | Investment
Income | | | Realized
Gains/
(Losses) | | | Net Capital
Gain
Distributions | |
| Voya Emerging Markets Index Portfolio - Class P2 | | | | $ | 22,172,027 | | | | | $ | 9,961,572 | | | | | $ | (8,335,111) | | | | | $ | 3,096,324 | | | | | $ | 26,894,812 | | | | | $ | 476,692 | | | | | $ | 662,403 | | | | | $ | — | | |
| Voya International Index Portfolio - Class P2 | | | | | 52,872,713 | | | | | | 24,496,324 | | | | | | (4,997,498) | | | | | | 11,101,808 | | | | | | 83,473,347 | | | | | | 2,002,185 | | | | | | 218,273 | | | | | | — | | |
| Voya Russell Mid Cap Index Portfolio - Class P2 | | | | | 14,871,873 | | | | | | 7,112,137 | | | | | | (6,451,609) | | | | | | 1,830,744 | | | | | | 17,363,145 | | | | | | 207,316 | | | | | | (102,754) | | | | | | 2,317,103 | | |
| Voya Russell Small Cap Index Portfolio - Class P2 | | | | | 6,362,160 | | | | | | 4,106,841 | | | | | | (905,419) | | | | | | 965,064 | | | | | | 10,528,646 | | | | | | 90,798 | | | | | | (64,002) | | | | | | 864,463 | | |
| Voya U.S. Bond Index Portfolio - Class P2 | | | | | 12,687,324 | | | | | | 14,308,860 | | | | | | (7,568,954) | | | | | | 863,069 | | | | | | 20,290,299 | | | | | | 462,382 | | | | | | 62,337 | | | | | | — | | |
| Voya U.S. Stock Index Portfolio - Class P2 | | | | | 98,184,009 | | | | | | 69,951,179 | | | | | | (10,104,185) | | | | | | 24,759,307 | | | | | | 182,790,310 | | | | | | 2,653,953 | | | | | | 1,367,097 | | | | | | 8,349,871 | | |
| | | | | $ | 207,150,106 | | | | | $ | 129,936,912 | | | | | $ | (38,362,775) | | | | | $ | 42,616,316 | | | | | $ | 341,340,559 | | | | | $ | 5,893,326 | | | | | $ | 2,143,354 | | | | | $ | 11,531,437 | | |
The financial statements for the above mutual fund[s] can be found at www.sec.gov.
At December 31, 2019, the following futures contracts were outstanding for Voya Index Solution 2055 Portfolio:
| Description | | | Number
of Contracts | | | Expiration
Date | | | Notional
Value | | | Unrealized
Appreciation/
(Depreciation) | |
| Long Contracts: | | | | | | | | | | | | | | | | | | | | | | | | | |
| E-mini Russell 2000® Index | | | | | 62 | | | | | | 03/20/20 | | | | | $ | 5,178,860 | | | | | $ | 80,792 | | |
| Mini MSCI EAFE Index | | | | | 34 | | | | | | 03/20/20 | | | | | | 3,462,050 | | | | | | (6,976) | | |
| U.S. Treasury Ultra Long Bond | | | | | 36 | | | | | | 03/20/20 | | | | | | 6,539,625 | | | | | | (212,357) | | |
| | | | | | | | | | | | | | | | | $ | 15,180,535 | | | | | $ | (138,541) | | |
| Short Contracts: | | | | | | | | | | | | | | | | | | | | | | | | | |
| S&P 500® E-Mini | | | | | (32) | | | | | | 03/20/20 | | | | | | (5,169,760) | | | | | | (89,101) | | |
| U.S. Treasury 10-Year Note | | | | | (78) | | | | | | 03/20/20 | | | | | | (10,016,906) | | | | | | 74,961 | | |
| | | | | | | | | | | | | | | | | $ | (15,186,666) | | | | | $ | (14,140) | | |
A summary of derivative instruments by primary risk exposure is outlined in the following tables.
The fair value of derivative instruments as of December 31, 2019 was as follows:
| Derivatives not accounted for as hedging instruments | | | Location on Statement
of Assets and Liabilities | | | Fair Value | |
| Asset Derivatives | | | | | | | | | | |
| Equity contracts | | | Net Assets — Unrealized appreciation* | | | | $ | 80,792 | | |
| Interest rate contracts | | | Net Assets — Unrealized appreciation* | | | | | 74,961 | | |
| Total Asset Derivatives | | | | | | | $ | 155,753 | | |
| Liability Derivatives | | | | | | | | | | |
| Equity contracts | | | Net Assets — Unrealized depreciation* | | | | $ | 96,077 | | |
| Interest rate contracts | | | Net Assets — Unrealized depreciation* | | | | | 212,357 | | |
| Total Liability Derivatives | | | | | | | $ | 308,434 | | |
*
Includes cumulative appreciation/depreciation of futures contracts as reported in the table within the Portfolio of Investments.
See Accompanying Notes to Financial Statements
PORTFOLIO OF INVESTMENTS
| Voya Index Solution 2055 Portfolio | as of December 31, 2019 (continued) |
The effect of derivative instruments on the Portfolio’s Statement of Operations for the year ended December 31, 2019 was as follows:
| | | | Amount of Realized Gain or (Loss) on
Derivatives Recognized in Income | |
| Derivatives not accounted for as hedging instruments | | | Futures | |
| Equity contracts | | | | $ | (855,344) | | |
| Interest rate contracts | | | | | 89,857 | | |
| Total | | | | $ | (765,487) | | |
| |
| | | | Change in Unrealized Appreciation or (Depreciation)
on Derivatives Recognized in Income | |
| Derivatives not accounted for as hedging instruments | | | Futures | |
| Equity contracts | | | | $ | 105,185 | | |
| Interest rate contracts | | | | | (252,512) | | |
| Total | | | | $ | (147,327) | | |
At December 31, 2019, the aggregate cost of securities and other investments and the composition of unrealized appreciation and depreciation of securities and other investments at year end were:
| | Cost for federal income tax purposes was $324,993,443. | | | | | | | |
| | Net unrealized appreciation consisted of: | | | | | | | |
| | Gross Unrealized Appreciation | | | | $ | 26,178,497 | | |
| | Gross Unrealized Depreciation | | | | | (2,492,374) | | |
| | Net Unrealized Appreciation | | | | $ | 23,686,123 | | |
See Accompanying Notes to Financial Statements
PORTFOLIO OF INVESTMENTS
| Voya Index Solution 2060 Portfolio | as of December 31, 2019 |
| Shares | | | Value | | | Percentage
of Net
Assets | |
| EXCHANGE-TRADED FUNDS: 5.8% | |
| 14,456 | | | iShares 20+ Year Treasury
Bond ETF | | | | $ | 1,958,499 | | | | | | 1.8 | | |
| 18,543 | | | iShares Core S&P Small-Cap
ETF | | | | | 1,554,831 | | | | | | 1.4 | | |
| 20,947 | | | Vanguard Global ex-U.S. Real
Estate ETF | | | | | 1,237,758 | | | | | | 1.2 | | |
| 16,565 | | | Vanguard Real Estate ETF | | | | | 1,537,066 | | | | | | 1.4 | | |
| | | | Total Exchange-Traded Funds
(Cost $6,165,431) | | | | | 6,288,154 | | | | | | 5.8 | | |
| MUTUAL FUNDS: 94.1% | |
| | | | Affiliated Investment Companies: 94.1% | |
| 679,090 | | | Voya Emerging Markets Index
Portfolio - Class P2 | | | | | 8,413,928 | | | | | | 7.7 | | |
| 2,545,863 | | | Voya International Index
Portfolio - Class P2 | | | | | 27,240,738 | | | | | | 24.9 | | |
| 394,603 | | | Voya Russell Mid Cap Index
Portfolio - Class P2 | | | | | 5,433,682 | | | | | | 5.0 | | |
| Shares | | | Value | | | Percentage
of Net
Assets | |
| MUTUAL FUNDS: (continued) | |
| | | | Affiliated Investment Companies (continued) | |
| 231,642 | | | Voya Russell Small Cap
Index Portfolio - Class P2 | | | | $ | 3,344,918 | | | | | | 3.1 | | |
| 251,343 | | | Voya U.S. Bond Index
Portfolio - Class P2 | | | | | 2,739,633 | | | | | | 2.5 | | |
| 3,262,845 | | | Voya U.S. Stock Index
Portfolio - Class P2 | | | | | 55,631,501 | | | | | | 50.9 | | |
| | | | Total Mutual Funds
(Cost $96,653,594) | | | | | 102,804,400 | | | | | | 94.1 | | |
| | | | Total Investments in
Securities
(Cost $102,819,025) | | | | $ | 109,092,554 | | | | | | 99.9 | | |
| | | | Assets in Excess of Other
Liabilities | | | | | 150,212 | | | | | | 0.1 | | |
| | | | Net Assets | | | | $ | 109,242,766 | | | | | | 100.0 | | |
| |
Fair Value Measurements^
The following is a summary of the fair valuations according to the inputs used as of December 31, 2019 in valuing the assets and liabilities:
| | | | Quoted Prices
in Active Markets
for Identical
Investments
(Level 1) | | | Significant
Other
Observable
Inputs
(Level 2) | | | Significant
Unobservable
Inputs
(Level 3) | | | Fair Value
at
December 31, 2019 | |
| Asset Table | | | | | | | | | | | | | | | | | | | | | | | | | |
| Investments, at fair value | | | | | | | | | | | | | | | | | | | | | | | | | |
| Exchange-Traded Funds | | | | $ | 6,288,154 | | | | | $ | — | | | | | $ | — | | | | | $ | 6,288,154 | | |
| Mutual Funds | | | | | 102,804,400 | | | | | | — | | | | | | — | | | | | | 102,804,400 | | |
| Total Investments, at fair value | | | | $ | 109,092,554 | | | | | $ | — | | | | | $ | — | | | | | $ | 109,092,554 | | |
^
See Note 2, “Significant Accounting Policies” in the Notes to Financial Statements for additional information.
Transactions with Affiliates
An investment of at least 5% of the voting securities of an issuer, or a company which is under common control results in that issuer becoming an affiliated person as defined by the 1940 Act.
The following table provides transactions during the period ended December 31, 2019, where the following issuers were considered an affiliate:
| Issuer | | | Beginning
Fair Value
at 12/31/2018 | | | Purchases
at Cost | | | Sales
at Cost | | | Change in
Unrealized
Appreciation/
(Depreciation) | | | Ending
Fair Value
at 12/31/2019 | | | Investment
Income | | | Realized
Gains/
(Losses) | | | Net Capital
Gain
Distributions | |
| Voya Emerging Markets Index Portfolio - Class P2 | | | | $ | 3,397,583 | | | | | $ | 6,099,805 | | | | | $ | (2,190,240) | | | | | $ | 1,106,780 | | | | | $ | 8,413,928 | | | | | $ | 123,906 | | | | | $ | (299,637) | | | | | $ | — | | |
| Voya International Index Portfolio - Class P2 | | | | | 10,889,850 | | | | | | 14,668,739 | | | | | | (1,292,068) | | | | | | 2,974,217 | | | | | | 27,240,738 | | | | | | 499,456 | | | | | | (13,754) | | | | | | — | | |
| Voya Russell Mid Cap Index Portfolio - Class P2 | | | | | 2,734,377 | | | | | | 3,265,724 | | | | | | (979,127) | | | | | | 412,708 | | | | | | 5,433,682 | | | | | | 53,925 | | | | | | (60,351) | | | | | | 602,194 | | |
| Voya Russell Small Cap Index Portfolio - Class P2 | | | | | 1,364,796 | | | | | | 2,076,918 | | | | | | (358,440) | | | | | | 261,644 | | | | | | 3,344,918 | | | | | | 23,626 | | | | | | (22,350) | | | | | | 224,629 | | |
| Voya U.S. Bond Index Portfolio - Class P2 | | | | | 2,274,908 | | | | | | 6,832,341 | | | | | | (6,341,032) | | | | | | (26,584) | | | | | | 2,739,633 | | | | | | 100,724 | | | | | | 242,729 | | | | | | — | | |
| Voya U.S. Stock Index Portfolio - Class P2 | | | | | 22,453,240 | | | | | | 35,428,926 | | | | | | (8,836,784) | | | | | | 6,586,119 | | | | | | 55,631,501 | | | | | | 796,190 | | | | | | 188,907 | | | | | | 2,307,439 | | |
| | | | | $ | 43,114,754 | | | | | $ | 68,372,454 | | | | | $ | (19,997,692) | | | | | $ | 11,314,884 | | | | | $ | 102,804,400 | | | | | $ | 1,597,827 | | | | | $ | 35,544 | | | | | $ | 3,134,262 | | |
| |
See Accompanying Notes to Financial Statements
PORTFOLIO OF INVESTMENTS
| Voya Index Solution 2060 Portfolio | as of December 31, 2019 (continued) |
The financial statements for the above mutual fund[s] can be found at www.sec.gov.
At December 31, 2019, the aggregate cost of securities and other investments and the composition of unrealized appreciation and depreciation of securities and other investments at year end were:
| | Cost for federal income tax purposes was $103,340,389. | | | | | | | |
| | Net unrealized appreciation consisted of: | | | | | | | |
| | Gross Unrealized Appreciation | | | | $ | 6,447,082 | | |
| | Gross Unrealized Depreciation | | | | | (694,917) | | |
| | Net Unrealized Appreciation | | | | $ | 5,752,165 | | |
See Accompanying Notes to Financial Statements
TAX INFORMATION (Unaudited)
Dividends and distributions paid during the year ended December 31, 2019 were as follows:
| Portfolio Name | | | Type | | | Per Share
Amount | |
| Voya Index Solution Income Portfolio | |
| Class ADV | | | NII | | | | $ | 0.1762 | | |
| Class I | | | NII | | | | $ | 0.2394 | | |
| Class S | | | NII | | | | $ | 0.2101 | | |
| Class S2 | | | NII | | | | $ | 0.1868 | | |
| Class Z | | | NII | | | | $ | 0.2394 | | |
| All Classes | | | STCG | | | | $ | 0.0196 | | |
| All Classes | | | LTCG | | | | $ | 0.1311 | | |
| Voya Index Solution 2020 Portfolio | |
| Class ADV | | | NII | | | | $ | 0.1820 | | |
| Class I | | | NII | | | | $ | 0.2451 | | |
| Class S | | | NII | | | | $ | 0.1917 | | |
| Class S2 | | | NII | | | | $ | 0.2115 | | |
| Class Z | | | NII | | | | $ | 0.2451 | | |
| All Classes | | | STCG | | | | $ | 0.0114 | | |
| All Classes | | | LTCG | | | | $ | 0.3203 | | |
| Voya Index Solution 2025 Portfolio | |
| Class ADV | | | NII | | | | $ | 0.1555 | | |
| Class I | | | NII | | | | $ | 0.2195 | | |
| Class S | | | NII | | | | $ | 0.1897 | | |
| Class S2 | | | NII | | | | $ | 0.1763 | | |
| Class Z | | | NII | | | | $ | 0.2195 | | |
| All Classes | | | STCG | | | | $ | 0.0035 | | |
| All Classes | | | LTCG | | | | $ | 0.3890 | | |
| Voya Index Solution 2030 Portfolio | |
| Class ADV | | | NII | | | | $ | 0.1964 | | |
| Class I | | | NII | | | | $ | 0.2623 | | |
| Class S | | | NII | | | | $ | 0.2260 | | |
| Class S2 | | | NII | | | | $ | 0.2400 | | |
| Class Z | | | NII | | | | $ | 0.2623 | | |
| All Classes | | | LTCG | | | | $ | 0.4836 | | |
| Voya Index Solution 2035 Portfolio | |
| Class ADV | | | NII | | | | $ | 0.1485 | | |
| Class I | | | NII | | | | $ | 0.2132 | | |
| Class S | | | NII | | | | $ | 0.1839 | | |
| Class S2 | | | NII | | | | $ | 0.1630 | | |
| Class Z | | | NII | | | | $ | 0.2132 | | |
| All Classes | | | STCG | | | | $ | 0.0117 | | |
| All Classes | | | LTCG | | | | $ | 0.4326 | | |
| Portfolio Name | | | Type | | | Per Share
Amount | |
| Voya Index Solution 2040 Portfolio | |
| Class ADV | | | NII | | | | $ | 0.1859 | | |
| Class I | | | NII | | | | $ | 0.2441 | | |
| Class S | | | NII | | | | $ | 0.2084 | | |
| Class S2 | | | NII | | | | $ | 0.1987 | | |
| Class Z | | | NII | | | | $ | 0.2442 | | |
| All Classes | | | STCG | | | | $ | 0.0039 | | |
| All Classes | | | LTCG | | | | $ | 0.5396 | | |
| Voya Index Solution 2045 Portfolio | |
| Class ADV | | | NII | | | | $ | 0.1437 | | |
| Class I | | | NII | | | | $ | 0.2084 | | |
| Class S | | | NII | | | | $ | 0.1767 | | |
| Class S2 | | | NII | | | | $ | 0.1647 | | |
| Class Z | | | NII | | | | $ | 0.2084 | | |
| All Classes | | | STCG | | | | $ | 0.0172 | | |
| All Classes | | | LTCG | | | | $ | 0.5074 | | |
| Voya Index Solution 2050 Portfolio | |
| Class ADV | | | NII | | | | $ | 0.1664 | | |
| Class I | | | NII | | | | $ | 0.2237 | | |
| Class S | | | NII | | | | $ | 0.1874 | | |
| Class S2 | | | NII | | | | $ | 0.1741 | | |
| Class Z | | | NII | | | | $ | 0.2237 | | |
| All Classes | | | STCG | | | | $ | 0.0065 | | |
| All Classes | | | LTCG | | | | $ | 0.5119 | | |
| Voya Index Solution 2055 Portfolio | |
| Class ADV | | | NII | | | | $ | 0.1493 | | |
| Class I | | | NII | | | | $ | 0.2281 | | |
| Class S | | | NII | | | | $ | 0.1938 | | |
| Class S2 | | | NII | | | | $ | 0.1760 | | |
| Class Z | | | NII | | | | $ | 0.2281 | | |
| All Classes | | | STCG | | | | $ | 0.0146 | | |
| All Classes | | | LTCG | | | | $ | 0.5667 | | |
| Voya Index Solution 2060 Portfolio | |
| Class ADV | | | NII | | | | $ | 0.0871 | | |
| Class I | | | NII | | | | $ | 0.1323 | | |
| Class S | | | NII | | | | $ | 0.1128 | | |
| Class S2 | | | NII | | | | $ | 0.1036 | | |
| Class Z | | | NII | | | | $ | 0.1323 | | |
| All Classes | | | STCG | | | | $ | 0.0081 | | |
| All Classes | | | LTCG | | | | $ | 0.2902 | | |
NII – Net investment income
STCG – Short-term capital gain
LTCG – Long-term capital gain
TAX INFORMATION (Unaudited) (continued)
Of the ordinary distributions made during the year ended December 31, 2019, the following percentages qualify for the dividends received deduction (DRD) available to corporate shareholders:
| | Voya Index Solution Income Portfolio | | | | | 16.57% | | �� |
| | Voya Index Solution 2020 Portfolio | | | | | 22.27% | | |
| | Voya Index Solution 2025 Portfolio | | | | | 30.51% | | |
| | Voya Index Solution 2030 Portfolio | | | | | 33.38% | | |
| | Voya Index Solution 2035 Portfolio | | | | | 39.21% | | |
| | Voya Index Solution 2040 Portfolio | | | | | 41.09% | | |
| | Voya Index Solution 2045 Portfolio | | | | | 45.15% | | |
| | Voya Index Solution 2050 Portfolio | | | | | 45.85% | | |
| | Voya Index Solution 2055 Portfolio | | | | | 48.39% | | |
| | Voya Index Solution 2060 Portfolio | | | | | 48.19% | | |
The Portfolios designate the following amounts of long-term capital gain distributions as 20% rate long-term capital gain dividends under Internal Revenue Code Section 852(b)(3)(C):
| | Voya Index Solution Income Portfolio | | | | $ | 5,684,591 | | |
| | Voya Index Solution 2020 Portfolio | | | | | 8,581,307 | | |
| | Voya Index Solution 2025 Portfolio | | | | | 34,552,759 | | |
| | Voya Index Solution 2030 Portfolio | | | | | 16,027,641 | | |
| | Voya Index Solution 2035 Portfolio | | | | | 35,213,286 | | |
| | Voya Index Solution 2040 Portfolio | | | | | 12,541,821 | | |
| | Voya Index Solution 2045 Portfolio | | | | | 27,142,615 | | |
| | Voya Index Solution 2050 Portfolio | | | | | 7,931,264 | | |
| | Voya Index Solution 2055 Portfolio | | | | | 10,576,754 | | |
| | Voya Index Solution 2060 Portfolio | | | | | 1,828,435 | | |
The Regulated Investment Company Modernization Act of 2010 allows qualified fund-of-funds to elect to pass through the ability to take foreign tax credits (or deductions) to the extent that foreign taxes are passed through from underlying funds. A qualified fund-of-funds is a regulated investment company that has at least 50% of the value of its total assets invested in other regulated investment companies at the end of each quarter of the taxable year. Pursuant to Section 853 of the Internal Revenue Code, the Portfolios designate the following amounts as foreign taxes paid for the year ended December 31, 2019:
| | | | Creditable
Foreign Taxes
Paid | | | Per Share
Amount | | | Portion of Ordinary Income
Distribution Derived from
Foreign Sourced Income* | |
| Voya Index Solution Income Portfolio | | | | $ | 51,238 | | | | | $ | 0.0012 | | | | | | 9.14% | | |
| Voya Index Solution 2020 Portfolio | | | | | 51,635 | | | | | | 0.0017 | | | | | | 11.47% | | |
| Voya Index Solution 2025 Portfolio | | | | | 220,927 | | | | | | 0.0023 | | | | | | 18.13% | | |
| Voya Index Solution 2030 Portfolio | | | | | 168,029 | | | | | | 0.0044 | | | | | | 23.68% | | |
| Voya Index Solution 2035 Portfolio | | | | | 337,072 | | | | | | 0.0038 | | | | | | 27.24% | | |
| Voya Index Solution 2040 Portfolio | | | | | 159,210 | | | | | | 0.0059 | | | | | | 29.81% | | |
| Voya Index Solution 2045 Portfolio | | | | | 268,568 | | | | | | 0.0045 | | | | | | 32.94% | | |
| Voya Index Solution 2050 Portfolio | | | | | 118,865 | | | | | | 0.0065 | | | | | | 32.44% | | |
| Voya Index Solution 2055 Portfolio | | | | | 132,802 | | | | | | 0.0062 | | | | | | 33.60% | | |
| Voya Index Solution 2060 Portfolio | | | | | 42,335 | | | | | | 0.0053 | | | | | | 26.07% | | |
*
None of the Portfolios listed above derived any income from ineligible foreign sources as defined under Section 901(j) of the Internal Revenue Code.
TAX INFORMATION (Unaudited) (continued)
Foreign taxes paid or withheld must be included in taxable income with an offsetting deduction from gross income or as a credit for taxes paid to foreign governments. Shareholders are strongly advised to consult their own tax advisors regarding the appropriate treatment of foreign taxes paid.
Above figures may differ from those cited elsewhere in this report due to differences in the calculation of income and gains under U.S. generally accepted accounting principles (book) purposes and Internal Revenue Service (tax) purposes.
Shareholders are strongly advised to consult their own tax advisers with respect to the tax consequences of their investments in the Portfolios. In January, shareholders, excluding corporate shareholders, receive an IRS 1099-DIV regarding the federal tax status of the dividends and distributions they received in the calendar year.
DIRECTOR AND OFFICER INFORMATION (Unaudited)
The business and affairs of the Company are managed under the direction of the Board. A Director, who is not an interested person of the Company, as defined in the 1940 Act, is an independent director (“Independent Director”). The Directors and Officers of the Company are listed below. The Statement of Additional Information includes additional information about Directors of the Company and is available, without charge, upon request at (800) 262-3862.
| | Name, Address and Age | | | Position(s)
Held with the
Company | | | Term of Office and
Length of Time
Served(1) | | | Principal
Occupation(s) –
During the Past 5 Years | | | Number of
funds
in Fund
Complex
Overseen
by Director(2) | | | Other Board Positions
Held by Director | |
| | Independent Directors*: | |
| | Colleen D. Baldwin
7337 East Doubletree Ranch Rd.
Suite 100
Scottsdale, Arizona 85258
Age: 59 | | | Director
Chairperson | | | November 2007 –
Present
January 2020 –
Present | | | President, Glantuam Partners, LLC, a business consulting firm (January 2009 – Present). | | | 146 | | | Dentaquest (February 2014 – Present); RSR Partners, Inc. (2016 – Present). | |
| | John V. Boyer
7337 East Doubletree Ranch Rd.
Suite 100
Scottsdale, Arizona 85258
Age: 66 | | | Director | | | November 1997 –
Present | | | Retired. Formerly, President and Chief Executive Officer, Bechtler Arts Foundation, an arts and education foundation (January 2008 – December 2019). | | | 146 | | | None. | |
| | Patricia W. Chadwick
7337 East Doubletree Ranch Rd.
Suite 100
Scottsdale, Arizona 85258
Age: 71 | | | Director | | | January 2006 –
Present | | | Consultant and President, Ravengate Partners LLC, a consulting firm that provides advice regarding financial markets and the global economy (January 2000 – Present). | | | 146 | | | Wisconsin Energy Corporation (June 2006 – Present); The Royce Fund (22 funds) (December 2009 – Present); and AMICA Mutual Insurance Company (1992 – Present). | |
| | Martin J. Gavin
7337 East Doubletree Ranch Rd.
Suite 100
Scottsdale, AZ 85258
Age: 69 | | | Director | | | August 2015 –
Present | | | Retired. Formerly, President and Chief Executive Officer, Connecticut Children’s Medical Center (May 2006 – November 2015). | | | 146 | | | None. | |
| | Joseph E. Obermeyer
7337 East Doubletree Ranch Rd.
Suite 100
Scottsdale, Arizona 85258
Age: 62 | | | Director | | | May 2013 – Present | | | President, Obermeyer & Associates, Inc., a provider of financial and economic consulting services (November 1999 – Present). | | | 146 | | | None. | |
| | Sheryl K. Pressler
7337 East Doubletree Ranch Rd.
Suite 100
Scottsdale, Arizona 85258
Age: 69 | | | Director | | | January 2006 –
Present | | | Consultant (May 2001 – Present). | | | 146 | | | None. | |
| | Christopher P. Sullivan
7337 East Doubletree Ranch Rd.
Suite 100
Scottsdale, Arizona 85258
Age: 66 | | | Director | | | October 2015 – Present | | | Retired. | | | 146 | | | None. | |
DIRECTOR AND OFFICER INFORMATION (Unaudited) (continued)
| | Name, Address and Age | | | Position(s)
Held with the
Company | | | Term of Office and
Length of Time
Served(1) | | | Principal
Occupation(s) –
During the Past 5 Years | | | Number of
funds
in Fund
Complex
Overseen
by Director(2) | | | Other Board Positions
Held by Director | |
| | Director who is an “interested person”: | |
| | Dina Santoro
230 Park Avenue
New York, New York 10169
Age: 46 | | | Director | | | July 2018 – Present | | | President, Voya Investments, LLC and Voya Capital, LLC (March 2018 – Present); Senior Vice President, Voya Investments Distributor, LLC (April 2018 – Present); Senior Managing Director, Head of Product and Marketing Strategy, Voya Investment Management (September 2017 – Present). Formerly, Managing Director, Quantitative Management Associates, LLC (January 2004 – August 2017). | | | 146 | | | Voya Investments, LLC, Voya Capital, LLC, and Voya Funds Services, LLC (March 2018 – Present); Voya Investments Distributor, LLC (April 2018 – Present). | |
(1)
Directors serve until their successors are duly elected and qualified. The tenure of each Director who is not an “interested person” as defined in the 1940 Act, of each Portfolio (“Independent Director”) is subject to the Board’s retirement policy which states that each duly elected or appointed Independent Director shall retire from and cease to be a member of the Board of Directors at the close of business on December 31 of the calendar year in which the Independent Director attains the age of 75. A majority vote of the Board’s other Independent Directors may extend the retirement date of an Independent Director if the retirement would trigger a requirement to hold a meeting of shareholders of the Company under applicable law, whether for the purposes of appointing a successor to the Independent Director or otherwise comply under applicable law, in which case the extension would apply until such time as the shareholder meeting can be held or is no longer required (as determined by a vote of a majority of the other Independent Directors).
(2)
For the purposes of this table, “Fund Complex” means the Voya family of funds including the following investment companies: Voya Asia Pacific High Dividend Equity Income Fund; Voya Balanced Portfolio, Inc.; Voya Emerging Markets High Dividend Equity Fund; Voya Equity Trust; Voya Funds Trust; Voya Global Advantage and Premium Opportunity Fund; Voya Global Equity Dividend and Premium Opportunity Fund; Voya Government Money Market Portfolio; Voya Infrastructure, Industrials and Materials Fund; Voya Intermediate Bond Portfolio; Voya International High Dividend Equity Income Fund; Voya Investors Trust; Voya Mutual Funds; Voya Natural Resources Equity Income Fund; Voya Partners, Inc.; Voya Prime Rate Trust; Voya Senior Income Fund; Voya Separate Portfolios Trust; Voya Strategic Allocation Portfolios, Inc.; Voya Variable Funds; Voya Variable Insurance Trust; Voya Variable Portfolios, Inc.; and Voya Variable Products Trust. The number of funds in the Fund Complex is as of January 31, 2020.
*
Effective December 31, 2019, Russell H. Jones and Roger B. Vincent each retired as a Director of the Board.
DIRECTOR AND OFFICER INFORMATION (Unaudited) (continued)
| | Name, Address and Age | | | Position(s) Held
With the Company | | | Term of Office and
Length of Time Served(1) | | | Principal Occupation(s) –
During the Past 5 Years | |
| | Michael Bell
One Orange Way
Windsor, Connecticut 06095
Age: 51 | | | Chief Executive Officer | | | March 2018 – Present | | | Chief Executive Officer and Director, Voya Investments, LLC, Voya Capital, LLC, and Voya Funds Services, LLC (March 2018 – Present); Senior Vice President and Chief Financial Officer, Voya Investments Distributor, LLC (September 2019 – Present); Chief Financial Officer, Voya Investment Management (September 2014 – Present). Formerly, Senior Vice President, Chief Financial Officer and Treasurer, Voya Investments, LLC (November 2015 – March 2018). | |
| | Dina Santoro
230 Park Avenue
New York, New York 10169
Age: 46 | | | President | | | March 2018 – Present | | | President and Director, Voya Investments, LLC and Voya Capital, LLC (March 2018 – Present); Director, Voya Funds Services, LLC (March 2018 – Present); Director and Senior Vice President, Voya Investments Distributor, LLC (April 2018 – Present); Senior Managing Director, Head of Product and Marketing Strategy, Voya Investment Management (September 2017 – Present). Formerly, Managing Director, Quantitative Management Associates, LLC (January 2004 – August 2017). | |
| | Stanley D. Vyner
230 Park Avenue
New York, New York 10169
Age: 69 | | | Executive Vice President
Chief Investment Risk Officer | | | January 2005 – Present
September 2009 – Present | | | Executive Vice President, Voya Investments, LLC (July 2000 – Present) and Chief Investment Risk Officer, Voya Investments, LLC (January 2003 – Present). | |
| | James M. Fink
5780 Powers Ferry Road NW
Atlanta, Georgia 30327
Age: 61 | | | Executive Vice President | | | March 2018 – Present | | | Managing Director, Voya Investments, LLC, Voya Capital, LLC, and Voya Funds Services, LLC (March 2018 – Present); Senior Vice President, Voya Investments Distributor, LLC (April 2018 – Present); Chief Administrative Officer, Voya Investment Management (September 2017 – Present). Formerly, Managing Director, Operations, Voya Investment Management (March 1999 – September 2017). | |
| | Kevin M. Gleason
7337 East Doubletree Ranch Rd.
Suite 100
Scottsdale, Arizona 85258
Age: 53 | | | Chief Compliance Officer | | | February 2012 – Present | | | Senior Vice President, Voya Investment Management and Chief Compliance Officer, Voya Family of Funds (February 2012 – Present). | |
| | Todd Modic
7337 East Doubletree Ranch Rd.
Suite 100
Scottsdale, Arizona 85258
Age:52 | | | Senior Vice President, Chief/Principal Financial Officer and Assistant Secretary | | | March 2005 – Present | | | President, Voya Funds Services, LLC (March 2018 – Present) and Senior Vice President, Voya Investments, LLC (April 2005 – Present). | |
| | Kimberly A. Anderson
7337 East Doubletree Ranch Rd.
Suite 100
Scottsdale, Arizona 85258
Age: 55 | | | Senior Vice President | | | January 2005 – Present | | | Senior Vice President, Voya Investments, LLC (September 2003 – Present). | |
| | Robert Terris
5780 Powers Ferry Road NW
Atlanta, Georgia 30327
Age: 49 | | | Senior Vice President | | | May 2006 – Present | | | Senior Vice President, Voya Investments Distributor, LLC (April 2018 – Present); Senior Vice President, Head of Division Operations, Voya Investments, LLC (October 2015 – Present) and Voya Funds Services, LLC (March 2006 – Present). | |
| | Fred Bedoya
7337 East Doubletree Ranch Rd.
Suite 100
Scottsdale, Arizona 85258
Age: 47 | | | Vice President and Treasurer | | | September 2012 – Present | | | Vice President, Voya Investments, LLC (October 2015 – Present) and Voya Funds Services, LLC (July 2012 – Present). | |
| | Maria M. Anderson
7337 East Doubletree Ranch Rd.
Suite 100
Scottsdale, Arizona 85258
Age: 61 | | | Vice President | | | January 2005 – Present | | | Vice President, Voya Investments, LLC (October 2015 – Present) and Voya Funds Services, LLC (September 2004 – Present). | |
DIRECTOR AND OFFICER INFORMATION (Unaudited) (continued)
| | Name, Address and Age | | | Position(s) Held
With the Company | | | Term of Office and
Length of Time Served(1) | | | Principal Occupation(s) –
During the Past 5 Years | |
| | Sara M. Donaldson
7337 East Doubletree Ranch Rd.
Suite 100
Scottsdale, Arizona 85258
Age: 60 | | | Vice President | | | September 2014 – Present | | | Vice President, Voya Investments, LLC (October 2015 – Present). Formerly, Vice President, Voya Funds Services, LLC (April 2014 – October 2015). | |
| | Micheline S. Faver
7337 East Doubletree Ranch Rd.
Suite 100
Scottsdale, Arizona 85258
Age: 42 | | | Vice President | | | September 2016 – Present | | | Vice President, Head of Fund Compliance and Chief Compliance Officer, Voya Investments, LLC (June 2016 – Present). Formerly, Vice President, Mutual Fund Compliance (March 2014 – June 2016). | |
| | Robyn L. Ichilov
7337 East Doubletree Ranch Rd.
Suite 100
Scottsdale, Arizona 85258
Age: 52 | | | Vice President | | | January 2005 – Present | | | Vice President, Voya Funds Services, LLC (November 1995 – Present) and Voya Investments, LLC (August 1997 – Present). | |
| | Jason Kadavy
7337 East Doubletree Ranch Rd.
Suite 100
Scottsdale, Arizona 85258
Age: 43 | | | Vice President | | | September 2012 – Present | | | Vice President, Voya Investments, LLC (October 2015 – Present) and Voya Funds Services, LLC (July 2007 – Present). | |
| | Andrew K. Schlueter
7337 East Doubletree Ranch Rd.
Suite 100
Scottsdale, Arizona 85258
Age: 43 | | | Vice President | | | March 2018 – Present | | | Vice President, Voya Investments Distributor, LLC (April 2018 – Present); Vice President, Voya Investments, LLC and Voya Funds Services, LLC (March 2018 – Present); Vice President, Head of Mutual Fund Operations, Voya Investment Management (February 2018 – Present). Formerly, Vice President, Voya Investment Management (March 2014 – February 2018). | |
| | Craig Wheeler
7337 East Doubletree Ranch Rd.
Suite 100
Scottsdale, Arizona 85258
Age: 50 | | | Vice President | | | May 2013 – Present | | | Vice President – Director of Tax, Voya Investments, LLC (October 2015 – Present). Formerly, Vice President – Director of Tax, Voya Funds Services, LLC (March 2013 – October 2015). | |
| | Monia Piacenti
One Orange Way
Windsor, Connecticut 06095
Age: 43 | | | Anti-Money Laundering Officer | | | June 2018 – Present | | | Anti-Money Laundering Officer, Voya Investments Distributor, LLC, Voya Investment Management and Voya Investment Management Trust Co. (June 2018 – Present); Compliance Consultant, Voya Financial, Inc. (January 2019 – Present). Formerly, Senior Compliance Officer, Voya Investment Management (December 2009 – December 2018). | |
| | Theresa K. Kelety
7337 East Doubletree Ranch Rd.
Suite 100
Scottsdale, Arizona 85258
Age: 57 | | | Secretary | | | January 2020 – Present | | | Vice President and Senior Counsel, Voya Investment Management – Mutual Fund Legal Department (March 2010 – Present). | |
| | Paul A. Caldarelli
7337 East Doubletree Ranch Rd.
Suite 100
Scottsdale, Arizona 85258
Age: 68 | | | Assistant Secretary | | | June 2010 – Present | | | Vice President and Senior Counsel, Voya Investment Management – Mutual Fund Legal Department (March 2010 – Present). | |
| | Joanne F. Osberg
7337 East Doubletree Ranch Rd.
Suite 100
Scottsdale, Arizona 85258
Age: 38 | | | Assistant Secretary | | | January 2020 – Present | | | Vice President and Counsel, Voya Investment Management – Mutual Fund Legal Department (January 2013 – Present). | |
(1)
The Officers hold office until the next annual meeting of the Board of Directors and until their successors shall have been elected and qualified.
ADVISORY AND SUB-ADVISORY CONTRACT APPROVAL DISCUSSION (Unaudited)
BOARD CONSIDERATION AND APPROVAL OF INVESTMENT MANAGEMENT CONTRACTS AND
SUB-ADVISORY CONTRACTS
At a meeting held on November 21, 2019, the Board of Directors (“Board”) of Voya Partners, Inc. (the “Company”), including a majority of the Independent Directors, considered and approved the renewal of the investment management contracts (the “Management Contracts”) between Voya Investments, LLC (the “Manager”) and the Company, on behalf of Voya Index Solution Income Portfolio, Voya Index Solution 2020 Portfolio, Voya Index Solution 2025 Portfolio, Voya Index Solution 2030 Portfolio, Voya Index Solution 2035 Portfolio, Voya Index Solution 2040 Portfolio, Voya Index Solution 2045 Portfolio, Voya Index Solution 2050 Portfolio, Voya Index Solution 2055 Portfolio, and Voya Index Solution 2060 Portfolio, each a series of the Company (the “Portfolios”), and the sub-advisory contracts (the “Sub-Advisory Contracts,” and together with the Management Contracts, the “Contracts”) with Voya Investment Management Co. LLC, the sub-adviser to each Portfolio (the “Sub-Adviser”) for an additional one year period ending November 30, 2020. In determining to renew such contracts, the Board considered information furnished to it throughout the year at meetings of the Board and its committees, including information regarding performance, expenses, and other matters.
In addition to the Board meeting on November 21, 2019, the Independent Directors also held meetings outside the presence of personnel representing the Manager or Sub-Adviser (collectively, such persons are referred to herein as “management”) on October 9, 2019, and November 19, 2019, specifically to review and consider materials related to the proposed continuance of the Contracts that they believed to be relevant to the renewal of the Contracts in light of their own business judgment and the legal advice furnished to them by K&L Gates LLP, their independent legal counsel. Subsequent references herein to factors considered and determinations made by the Independent Directors and/or the Board include, as applicable, factors considered and determinations made at those meetings by the Independent Directors. While the Board considered the renewal of the management contracts and sub-advisory contracts for all of the applicable investment companies in the Voya family of funds at the same meetings, the Board considered each Voya fund’s investment management and sub-advisory relationships separately.
The Board follows a process pursuant to which it seeks and considers relevant information when it evaluates whether to renew existing investment management and sub-advisory contracts for the Voya funds. The Board has established a Contracts Committee and Investment Review Committees (the “IRCs”), each of which includes only Independent Directors as members. The Contracts
Committee meets several times throughout the year to provide oversight with respect to the management and sub-advisory contracts approval and renewal process, among other functions, and each IRC meets several times throughout the year to provide oversight regarding the investment performance of the sub-advisers, as well as the Manager’s role in monitoring the sub-advisers, with respect to each Voya fund that is assigned to that IRC.
The Contracts Committee oversees, and annually recommends Board approval of updates to, a methodology guide for the Voya funds (“Methodology Guide”) related to the investment management and sub-advisory contract renewal process. The Methodology Guide sets out a framework pursuant to which the Independent Directors request, and management provides, certain information that the Independent Directors deem to be important or potentially relevant. The Independent Directors retain the services of an independent consultant with experience in the mutual fund industry to assist the Contracts Committee in developing and recommending to the Board: (1) a selected peer group of investment companies for each Portfolio (“Selected Peer Group”) based on that Portfolio’s particular attributes, such as fund type and size, fund category (as determined by Morningstar, Inc., an independent provider of mutual fund data (“Morningstar”)), sales channels and structure and the Portfolio share class being compared to the Selected Peer Group; and (2) updates to the Methodology Guide with respect to the content and format of various data including, but not limited to, investment performance, fee structure, and expense information prepared in connection with the renewal process. In addition, the Independent Directors periodically have retained, including most recently in 2018, an independent firm to test and verify the accuracy of certain information presented to the Board for a representative sample of the Voya funds.
Provided below is an overview of certain material factors that the Board considered at its meetings regarding the renewal of the Contracts and the compensation to be paid thereunder. The Board members did not identify any particular information or factor that was overarching, and each Board member may have accorded different weight to the various factors in reaching his or her conclusions with respect to each Portfolio’s investment management and sub-advisory arrangements.
Nature, Extent and Quality of Services
The Manager oversees, subject to the authority of the Board, and is responsible for the provision of all investment advisory and portfolio management services for the Portfolios, but may delegate certain of these responsibilities to one or more sub-advisers. In addition, the Manager provides administrative services reasonably necessary for the operation of the Portfolios as set forth in
ADVISORY AND SUB-ADVISORY CONTRACT APPROVAL DISCUSSION (Unaudited) (continued)
the Management Contracts, including oversight of the Portfolios’ operations and risk management and the oversight of their various other service providers.
The Board considered the “manager-of-managers” platform of the Voya funds that has been developed by the Manager pursuant to which the Manager selects, subject to the Board’s approval, sub-advisers to provide day-to-day management services to all or a portion of each Voya fund. The Board recognized that the Manager is responsible for monitoring the investment program, performance, developments, ongoing operations, and compliance with applicable regulations and investment policies and restrictions of the Sub-Adviser with respect to the Portfolios under this manager-of-managers arrangement. The Board also considered the techniques and resources that the Manager has developed to provide this ongoing oversight and due diligence with respect to the sub-advisers and to advocate or recommend, when it believes appropriate, changes in investment strategies or investment sub-advisers designed to assist in improving a Voya fund’s performance. The Board was advised that, in connection with the Manager’s performance of these duties, the Manager has developed an oversight process formulated by its Manager Research & Selection Group which reviews, among other matters, performance data, the Sub-Adviser’s management team, portfolio data and attribution analysis related to the Sub-Adviser through various means, including, but not limited to, in-person meetings, on-site visits, and telephonic meetings with the Sub-Adviser.
Further, the Board considered periodic compliance reports it receives from the Company’s Chief Compliance Officer evaluating whether the regulatory compliance systems and procedures of the Manager and the Sub-Adviser are reasonably designed to ensure compliance with the federal securities laws and whether the investment policies and restrictions for each Portfolio are consistently complied with, and other periodic reports covering related matters.
The Board considered the portfolio management team assigned by the Sub-Adviser to the Portfolios and the level of resources committed to the Portfolios (and other relevant funds in the Voya funds) by the Manager and the Sub-Adviser, and whether those resources are sufficient to provide high-quality services to the Portfolios.
Based on their deliberations and the materials presented to them, the Board concluded that the nature, extent and quality of the overall services provided by the Manager and the Sub-Adviser under the Contracts were appropriate.
Portfolio Performance
In assessing the investment management and sub-advisory relationships, the Board placed emphasis on the investment returns of each Portfolio, including its
investment performance over certain time periods compared to the Portfolio’s Morningstar category and primary benchmark, a broad-based securities market index that appears in the Portfolio’s prospectus. The Board also considered information from the Manager Research & Selection Group and received reports summarizing a separate analysis of each Portfolio’s performance and risk, including risk-adjusted investment return information, from the Company’s Chief Investment Risk Officer.
Economies of Scale
When evaluating the reasonableness of the management fee schedules, the Board considered whether economies of scale have been or likely will be realized by the Manager and the Sub-Adviser as a Portfolio grows larger and the extent to which any such economies are shared with the Portfolio. The Board considered that, while the Portfolios do not have management fee breakpoints, they have fee waiver and expense reimbursement arrangements. The Board considered the extent to which economies of scale realized by the Manager could be shared with each Portfolio through such fee waivers, expense reimbursements or other expense reductions. In evaluating these matters, the Independent Directors also considered periodic management reports, Selected Peer Group comparisons, and industry information regarding economies of scale.
Information Regarding Services, Performance, and Fee Schedules Offered to Other Clients
The Board considered comparative information regarding the nature of services, performance, and fee schedules offered by the Manager and the Sub-Adviser to other clients with similar investment objectives, if applicable, including other registered investment companies and relevant institutional accounts. When the fee schedules offered to or the performance of such other clients differed materially from a Portfolio, the Board took into account the underlying rationale provided by the Manager or the Sub-Adviser, as applicable, for these differences.
Fee Schedules, Profitability, and Fall-out Benefits
The Board reviewed and considered the contractual management fee schedule and net management fee rate payable by each Portfolio to the Manager compared to the Portfolio’s Selected Peer Group. In addition, the Board considered each Portfolio’s contractual management fee schedule compared to other third-party sub-advised funds and other funds the Sub-Adviser manages identified by the Manager. The Board also considered the compensation payable by the Manager to the Sub-Adviser for sub-advisory services for each Portfolio, including the portion of the contractual and net management fee rates that are paid to the Sub-Adviser, as compared to the
ADVISORY AND SUB-ADVISORY CONTRACT APPROVAL DISCUSSION (Unaudited) (continued)
compensation paid to the Manager. In addition, the Board considered the fee waivers, expense limitations, and/or recoupment arrangements that apply to the fees payable by the Portfolios, including whether the Manager intends to propose any changes thereto. For each Portfolio, the Board separately determined that the fees payable to the Manager and the fee schedule payable to the Sub-Adviser are reasonable for the services that each performs, which were considered in light of the nature, extent and quality of the services that each has performed and is expected to perform.
For each Portfolio, the Board considered information on revenues, costs and profits or losses realized by the Manager and the Voya-affiliated Sub-Adviser related to their services to the Portfolio. In analyzing the profitability of the Manager and its affiliated service providers in connection with services they render to a Portfolio, the Board took into account the sub-advisory fee rate payable by the Manager to the Sub-Adviser. The Board also considered the profitability of the Manager and its affiliated Sub-Adviser attributable to servicing each Portfolio both with and without taking into account the profitability of the distributor of the Portfolios and any revenue sharing payments made by the Manager and both before and after giving effect to any expenses incurred by the Manager or the affiliated Sub-Adviser in making payments to affiliated insurance companies.
Although the Methodology Guide establishes a framework for profit calculation, the Board recognized that there is no uniform methodology within the asset management industry for determining profitability for this purpose. The Board also recognized that the use of different reasonable methodologies can give rise to dramatically different reported profit and loss results with respect to the Manager and the Voya-affiliated Sub-Adviser, as well as other industry participants with whom the profits of the Manager and its affiliated Sub-Adviser could be compared. In addition, the Board recognized that management’s calculations regarding its costs incurred in establishing the infrastructure necessary for the Portfolios’ operations may not be fully reflected in the expenses allocated to each Portfolio in determining profitability, and that the information presented may not portray all of the costs borne by the Manager or reflect all risks, including entrepreneurial, regulatory, legal and operational risks, associated with offering and managing a mutual fund complex in the current regulatory and market environment.
The Board also considered that the Manager is entitled to earn a reasonable level of profits for the services that it provides to the Portfolios. The Board also considered information regarding the potential fall-out benefits to the Manager and Sub-Adviser and their respective affiliates from their association with the Portfolios, including their ability to engage in soft-dollar transactions on behalf of the
Portfolios. Following its reviews, the Board determined that the Manager’s and the Voya-affiliated Sub-Adviser’s profitability with respect to their services to the Portfolios and the Manager and Sub-Adviser’s potential fall-out benefits were not unreasonable.
Portfolio-by-Portfolio Analysis
Set forth below are certain of the specific factors that the Board considered at its October 9, 2019, November 19, 2019, and/or November 21, 2019 meetings in relation to approving each Portfolio’s Contracts and the conclusions reached by the Board. These specific factors are in addition to those considerations discussed above. In each case, the Portfolio’s performance was compared to its Morningstar category, as well as its primary benchmark. The performance data provided to the Board primarily was for various periods ended March 31, 2019. In addition, the Board also considered at its October 9, 2019, November 19, 2019, and November 21, 2019 meetings certain additional data regarding each Portfolio’s more recent performance, asset levels and asset flows. Each Portfolio’s management fee rate and expense ratio were compared to the management fee rates and expense ratios of the funds in its Selected Peer Group. With respect to the quintile rankings noted below, the first quintile represents the range of funds with the highest performance or the lowest management fee rate or expense ratio, as applicable, and the fifth quintile represents the range of funds with the lowest performance or the highest management fee rate or expense ratio, as applicable.
Voya Index Solution Income Portfolio
In considering whether to approve the renewal of the Contracts for Voya Index Solution Income Portfolio, the Board considered that, based on performance data for the periods ended March 31, 2019: (1) the Portfolio is ranked in the second quintile of its Morningstar category for the five-year period, and the third quintile for the year-to-date, one-year, three-year and ten-year periods; and (2) the Portfolio outperformed its primary benchmark for the three-year, five-year and ten-year periods and underperformed for the year-to-date and one-year periods.
In considering the fees payable under the Contracts for the Portfolio, the Board took into account the factors described above and also considered: (1) the fairness of the compensation under a Management Contract with a level fee rate that does not include breakpoints; and (2) the pricing structure (including the net expense ratio to be borne by shareholders) of the Portfolio, as compared to its Selected Peer Group, including that: (a) the net management fee rate for the Portfolio is ranked in the fifth quintile of net management fee rates of the funds in its Selected Peer Group; (b) the contractual management fee
ADVISORY AND SUB-ADVISORY CONTRACT APPROVAL DISCUSSION (Unaudited) (continued)
rate for the Portfolio is ranked in the fourth quintile of contractual management fee rates of the funds in its Selected Peer Group; and (c) the all-in net expense ratio for the Portfolio, inclusive of the Acquired Fund Fees and Expenses (“AFFE”), is ranked in the third quintile of all-in net expense ratios of the funds in its Selected Peer Group, and the net expense ratio for the Portfolio, not inclusive of AFFE, is above the median of net expense ratios of the funds in its Selected Peer Group. In analyzing this fee data, the Board took into account: (1) that the Portfolio indirectly bears the fees payable by the underlying funds in which the Portfolio invests; and (2) management’s representations regarding its belief that the Portfolio’s pricing is competitive and the competitiveness of the Voya Index Solution Portfolios’ expense ratios when compared to peers identified by management.
After its deliberation, the Board reached the following conclusions: (1) the Portfolio’s management fee rate is reasonable in the context of all factors considered by the Board; (2) the Portfolio’s net expense ratio is reasonable in the context of all factors considered by the Board; (3) the Portfolio’s performance is reasonable in the context of all factors considered by the Board; and (4) the sub-advisory fee rate payable by the Manager to the Sub-Adviser is reasonable in the context of all factors considered by the Board. Based on these conclusions and other factors, the Board voted to renew the Contracts for the Portfolio for the year ending November 30, 2020. During this renewal process, different Board members may have given different weight to different individual factors and related conclusions.
Voya Index Solution 2020 Portfolio
In considering whether to approve the renewal of the Contracts for Voya Index Solution 2020 Portfolio, the Board considered that, based on performance data for the periods ended March 31, 2019: (1) the Portfolio is ranked in the second quintile of its Morningstar category for the one-year and five-year periods, the third quintile for the three-year period, and the fourth quintile for the year-to-date period; and (2) the Portfolio underperformed its primary benchmark for all periods presented.
In considering the fees payable under the Contracts for the Portfolio, the Board took into account the factors described above and also considered: (1) the fairness of the compensation under a Management Contract with a level fee rate that does not include breakpoints; and (2) the pricing structure (including the net expense ratio to be borne by shareholders) of the Portfolio, as compared to its Selected Peer Group, including that: (a) the net management fee rate for the Portfolio is ranked in the fourth quintile of net management fee rates of the funds in its Selected Peer Group; (b) the contractual management fee rate for the Portfolio is ranked in the fourth quintile of
contractual management fee rates of the funds in its Selected Peer Group; and (c) the all-in net expense ratio for the Portfolio, inclusive of the Acquired Fund Fees and Expenses (“AFFE”), is ranked in the third quintile of all-in net expense ratios of the funds in its Selected Peer Group, and the net expense ratio for the Portfolio, not inclusive of AFFE, is above the median of net expense ratios of the funds in its Selected Peer Group. In analyzing this fee data, the Board took into account: (1) that the Portfolio indirectly bears the fees payable by the underlying funds in which the Portfolio invests; and (2) management’s representations regarding its belief that the Portfolio’s pricing is competitive and the competitiveness of the Voya Index Solution Portfolios’ expense ratios when compared to peers identified by management.
After its deliberation, the Board reached the following conclusions: (1) the Portfolio’s management fee rate is reasonable in the context of all factors considered by the Board; (2) the Portfolio’s net expense ratio is reasonable in the context of all factors considered by the Board; (3) the Portfolio’s performance is reasonable in the context of all factors considered by the Board; and (4) the sub-advisory fee rate payable by the Manager to the Sub-Adviser is reasonable in the context of all factors considered by the Board. Based on these conclusions and other factors, the Board voted to renew the Contracts for the Portfolio for the year ending November 30, 2020. During this renewal process, different Board members may have given different weight to different individual factors and related conclusions.
Voya Index Solution 2025 Portfolio
In considering whether to approve the renewal of the Contracts for Voya Index Solution 2025 Portfolio, the Board considered that, based on performance data for the periods ended March 31, 2019: (1) the Portfolio is ranked in the second quintile of its Morningstar category for the one-year and five-year periods, the third quintile for the three-year period, and the fourth quintile for the year-to-date and ten-year periods; and (2) the Portfolio underperformed its primary benchmark for all periods presented, with the exception of the three-year period, during which it outperformed.
In considering the fees payable under the Contracts for the Portfolio, the Board took into account the factors described above and also considered: (1) the fairness of the compensation under a Management Contract with a level fee rate that does not include breakpoints; and (2) the pricing structure (including the net expense ratio to be borne by shareholders) of the Portfolio, as compared to its Selected Peer Group, including that: (a) the net management fee rate for the Portfolio is ranked in the fifth quintile of net management fee rates of the funds in its Selected Peer Group; (b) the contractual management fee
ADVISORY AND SUB-ADVISORY CONTRACT APPROVAL DISCUSSION (Unaudited) (continued)
rate for the Portfolio is ranked in the fourth quintile of contractual management fee rates of the funds in its Selected Peer Group; and (c) the all-in net expense ratio for the Portfolio, inclusive of the Acquired Fund Fees and Expenses (“AFFE”), is ranked in the third quintile of all-in next expense ratios of the funds in its Selected Peer Group, and the net expense ratio for the Portfolio, not inclusive of AFFE, is above the median of net expense ratios of the funds in its Selected Peer Group. In analyzing this fee data, the Board took into account: (1) that the Portfolio indirectly bears the fees payable by the underlying funds in which the Portfolio invests; and (2) management’s representations regarding its belief that the Portfolio’s pricing is competitive and the competitiveness of the Voya Index Solution Portfolios’ expense ratios when compared to peers identified by management.
After its deliberation, the Board reached the following conclusions: (1) the Portfolio’s management fee rate is reasonable in the context of all factors considered by the Board; (2) the Portfolio’s net expense ratio is reasonable in the context of all factors considered by the Board; (3) the Portfolio’s performance is reasonable in the context of all factors considered by the Board; and (4) the sub-advisory fee rate payable by the Manager to the Sub-Adviser is reasonable in the context of all factors considered by the Board. Based on these conclusions and other factors, the Board voted to renew the Contracts for the Portfolio for the year ending November 30, 2020. During this renewal process, different Board members may have given different weight to different individual factors and related conclusions.
Voya Index Solution 2030 Portfolio
In considering whether to approve the renewal of the Contracts for Voya Index Solution 2030 Portfolio, the Board considered that, based on performance data for the periods ended March 31, 2019: (1) the Portfolio is ranked in the second quintile of its Morningstar category for the one-year and five-year periods, the third quintile for the three-year period, and the fourth quintile for the year-to-date period; and (2) the Portfolio underperformed its primary benchmark for all periods presented, with the exception of the three-year period, during which it outperformed.
In considering the fees payable under the Contracts for the Portfolio, the Board took into account the factors described above and also considered: (1) the fairness of the compensation under a Management Contract with a level fee rate that does not include breakpoints; and (2) the pricing structure (including the net expense ratio to be borne by shareholders) of the Portfolio, as compared to its Selected Peer Group, including that: (a) the net management fee rate for the Portfolio is ranked in the fourth quintile of net management fee rates of the funds in
its Selected Peer Group; (b) the contractual management fee rate for the Portfolio is ranked in the fourth quintile of contractual management fee rates of the funds in its Selected Peer Group; and (c) the all-in net expense ratio for the Portfolio, inclusive of the Acquired Fund Fees and Expenses (“AFFE”), is ranked in the fourth quintile of all-in net expense ratios of the funds in its Selected Peer Group, and the net expense ratio for the Portfolio, not inclusive of AFFE, is above the median of net expense ratios of the funds in its Selected Peer Group. In analyzing this fee data, the Board took into account: (1) that the Portfolio indirectly bears the fees payable by the underlying funds in which the Portfolio invests; and (2) management’s representations regarding of its belief that the Portfolio’s pricing is competitive and the competitiveness of the Voya Index Solution Portfolios’ expense ratios when compared to peers identified by management.
After its deliberation, the Board reached the following conclusions: (1) the Portfolio’s management fee rate is reasonable in the context of all factors considered by the Board; (2) the Portfolio’s net expense ratio is reasonable in the context of all factors considered by the Board; (3) the Portfolio’s performance is reasonable in the context of all factors considered by the Board; and (4) the sub-advisory fee rate payable by the Manager to the Sub-Adviser is reasonable in the context of all factors considered by the Board. Based on these conclusions and other factors, the Board voted to renew the Contracts for the Portfolio for the year ending November 30, 2020. During this renewal process, different Board members may have given different weight to different individual factors and related conclusions.
Voya Index Solution 2035 Portfolio
In considering whether to approve the renewal of the Contracts for Voya Index Solution 2035 Portfolio, the Board considered that, based on performance data for the periods ended March 31, 2019: (1) the Portfolio is ranked in the second quintile of its Morningstar category for the one-year, three-year and five-year periods, the third quintile for the ten-year period, and the fourth quintile for the year-to-date period; and (2) the Portfolio underperformed its primary benchmark for all periods presented, with the exception of the three-year period, during which it outperformed.
In considering the fees payable under the Contracts for the Portfolio, the Board took into account the factors described above and also considered: (1) the fairness of the compensation under a Management Contract with a level fee rate that does not include breakpoints; and (2) the pricing structure (including the net expense ratio to be borne by shareholders) of the Portfolio, as compared to its Selected Peer Group, including that: (a) the net management fee rate for the Portfolio is ranked in the fifth
ADVISORY AND SUB-ADVISORY CONTRACT APPROVAL DISCUSSION (Unaudited) (continued)
quintile of net management fee rates of the funds in its Selected Peer Group; (b) the contractual management fee rate for the Portfolio is ranked in the fourth quintile of contractual management fee rates of the funds in its Selected Peer Group; and (c) the all-in net expense ratio for the Portfolio, inclusive of the Acquired Fund Fees and Expenses (“AFFE”) is ranked in the fourth quintile of all-in expense ratios of the funds in its Selected Peer Group, and the net expense ratio for the Portfolio, not inclusive of AFFE, is above the median of net expense ratios of the funds in its Selected Peer Group. In analyzing this fee data, the Board took into account: (1) that the Portfolio indirectly bears the fees payable by the underlying funds in which the Portfolio invests; and (2) management’s representations regarding its belief that the Portfolio’s pricing is competitive and the competitiveness of the Voya Index Solution Portfolios’ expense ratios when compared to peers identified by management.
After its deliberation, the Board reached the following conclusions: (1) the Portfolio’s management fee rate is reasonable in the context of all factors considered by the Board; (2) the Portfolio’s net expense ratio is reasonable in the context of all factors considered by the Board; (3) the Portfolio’s performance is reasonable in the context of all factors considered by the Board; and (4) the sub-advisory fee rate payable by the Manager to the Sub-Adviser is reasonable in the context of all factors considered by the Board. Based on these conclusions and other factors, the Board voted to renew the Contracts for the Portfolio for the year ending November 30, 2020. During this renewal process, different Board members may have given different weight to different individual factors and related conclusions.
Voya Index Solution 2040 Portfolio
In considering whether to approve the renewal of the Contracts for Voya Index Solution 2040 Portfolio, the Board considered that, based on performance data for the periods ended March 31, 2019: (1) the Portfolio is ranked in the second quintile of its Morningstar category for the five-year period, the third quintile for the one-year and three-year periods, and the fourth quintile for the year-to-date period; and (2) the Portfolio underperformed its primary benchmark for all periods presented, with the exception of the three-year period, during which it outperformed.
In considering the fees payable under the Contracts for the Portfolio, the Board took into account the factors described above and also considered: (1) the fairness of the compensation under a Management Contract with a level fee rate that does not include breakpoints; and (2) the pricing structure (including the net expense ratio to be borne by shareholders) of the Portfolio, as compared to its Selected Peer Group, including that: (a) the net
management fee rate for the Portfolio is ranked in the fourth quintile of net management fee rates of the funds in its Selected Peer Group; (b) the contractual management fee rate for the Portfolio is ranked in the fourth quintile of contractual management fee rates of the funds in its Selected Peer Group; and (c) the all-in net expense ratio for the Portfolio, inclusive of the Acquired Fund Fees and Expenses (“AFFE”), is ranked in the fourth quintile of all-in net expense ratios of the funds in its Selected Peer Group, and the net expense ratio for the Portfolio, not inclusive of AFFE, is above the median of net expense ratios of the funds in its Selected Peer Group. In analyzing this fee data, the Board took into account: (1) that the Portfolio indirectly bears the fees payable by the underlying funds in which the Portfolio invests; and (2) management’s representations regarding its belief that the Portfolio’s pricing is competitive and the competitiveness of the Voya Index Solution Portfolios’ expense ratios when compared to peers identified by management.
After its deliberation, the Board reached the following conclusions: (1) the Portfolio’s management fee rate is reasonable in the context of all factors considered by the Board; (2) the Portfolio’s net expense ratio is reasonable in the context of all factors considered by the Board; (3) the Portfolio’s performance is reasonable in the context of all factors considered by the Board; and (4) the sub-advisory fee rate payable by the Manager to the Sub-Adviser is reasonable in the context of all factors considered by the Board. Based on these conclusions and other factors, the Board voted to renew the Contracts for the Portfolio for the year ending November 30, 2020. During this renewal process, different Board members may have given different weight to different individual factors and related conclusions.
Voya Index Solution 2045 Portfolio
In considering whether to approve the renewal of the Contracts for Voya Index Solution 2045 Portfolio, the Board considered that, based on performance data for the periods ended March 31, 2019: (1) the Portfolio is ranked in the second quintile of its Morningstar category for the five-year and ten-year periods, and the third quintile for the year-to-date, one-year and three-year periods; and (2) the Portfolio underperformed its primary benchmark for the one-year, five-year and ten-year periods, and outperformed for the year-to-date and three-year periods.
In considering the fees payable under the Contracts for the Portfolio, the Board took into account the factors described above and also considered: (1) the fairness of the compensation under a Management Contract with a level fee rate that does not include breakpoints; and (2) the pricing structure (including the net expense ratio to be borne by shareholders) of the Portfolio, as compared to its Selected Peer Group, including that: (a) the net
ADVISORY AND SUB-ADVISORY CONTRACT APPROVAL DISCUSSION (Unaudited) (continued)
management fee rate for the Portfolio is ranked in the fifth quintile of net management fee rates of the funds in its Selected Peer Group; (b) the contractual management fee rate for the Portfolio is ranked in the fourth quintile of contractual management fee rates of the funds in its Selected Peer Group; and (c) the all-in net expense ratio for the Portfolio, inclusive of the Acquired Fund Fees and Expenses (“AFFE”), is ranked in the fourth quintile of all-in net expense ratios of the funds in its Selected Peer Group, and the net expense ratio for the Portfolio, not inclusive of AFFE, is above the median of net expense ratios of the funds in its Selected Peer Group. In analyzing this fee data, the Board took into account: (1) that the Portfolio indirectly bears the fees payable by the underlying funds in which the Portfolio invests; and (2) management’s representations regarding its belief that the Portfolio’s pricing is competitive and the competitiveness of the Voya Index Solution Portfolios’ expense ratios when compared to peers identified by management.
After its deliberation, the Board reached the following conclusions: (1) the Portfolio’s management fee rate is reasonable in the context of all factors considered by the Board; (2) the Portfolio’s net expense ratio is reasonable in the context of all factors considered by the Board; (3) the Portfolio’s performance is reasonable in the context of all factors considered by the Board; and (4) the sub-advisory fee rate payable by the Manager to the Sub-Adviser is reasonable in the context of all factors considered by the Board. Based on these conclusions and other factors, the Board voted to renew the Contracts for the Portfolio for the year ending November 30, 2020. During this renewal process, different Board members may have given different weight to different individual factors and related conclusions.
Voya Index Solution 2050 Portfolio
In considering whether to approve the renewal of the Contracts for Voya Index Solution 2050 Portfolio, the Board considered that, based on performance data for the periods ended March 31, 2019: (1) the Portfolio is ranked in the second quintile of its Morningstar category for the five-year period, and the third quintile for the year-to-date, one-year and three-year periods; and (2) the Portfolio underperformed its primary benchmark for all periods presented, with the exception of the year-to-date period, during which it outperformed.
In considering the fees payable under the Contracts for the Portfolio, the Board took into account the factors described above and also considered: (1) the fairness of the compensation under a Management Contract with a level fee rate that does not include breakpoints; and (2) the pricing structure (including the net expense ratio to be borne by shareholders) of the Portfolio, as compared to its Selected Peer Group, including that: (a) the net
management fee rate for the Portfolio is ranked in the fifth quintile of net management fee rates of the funds in its Selected Peer Group; (b) the contractual management fee rate for the Portfolio is ranked in the fourth quintile of contractual management fee rates of the funds in its Selected Peer Group; and (c) the all-in net expense ratio for the Portfolio, inclusive of the Acquired Fund Fees and Expenses (“AFFE”), is ranked in the fourth quintile of all-in net expense ratios of the funds in its Selected Peer Group, and the net expense ratio for the Portfolio, not inclusive of AFFE, is above the median of net expense ratios of the funds in its Selected Peer Group. In analyzing this fee data, the Board took into account: (1) that the Portfolio indirectly bears the fees payable by the underlying funds in which the Portfolio invests; (2) management’s representations regarding its belief that the Portfolio’s pricing is competitive and the competitiveness of the Voya Index Solution Portfolios’ expense ratios when compared to peers identified by management.
After its deliberation, the Board reached the following conclusions: (1) the Portfolio’s management fee rate is reasonable in the context of all factors considered by the Board; (2) the Portfolio’s net expense ratio is reasonable in the context of all factors considered by the Board; (3) the Portfolio’s performance is reasonable in the context of all factors considered by the Board; and (4) the sub-advisory fee rate payable by the Manager to the Sub-Adviser is reasonable in the context of all factors considered by the Board. Based on these conclusions and other factors, the Board voted to renew the Contracts for the Portfolio for the year ending November 30, 2020. During this renewal process, different Board members may have given different weight to different individual factors and related conclusions.
Voya Index Solution 2055 Portfolio
In considering whether to approve the renewal of the Contracts for Voya Index Solution 2055 Portfolio, the Board considered that, based on performance data for the periods ended March 31, 2019: (1) the Portfolio is ranked in the third quintile of its Morningstar category for all periods presented; and (2) the Portfolio underperformed its primary benchmark for all periods presented, with the exception of the year-to-date period, during which it outperformed.
In considering the fees payable under the Contracts for the Portfolio, the Board took into account the factors described above and also considered: (1) the fairness of the compensation under a Management Contract with a level fee rate that does not include breakpoints; and (2) the pricing structure (including the net expense ratio to be borne by shareholders) of the Portfolio, as compared to its Selected Peer Group, including that: (a) the net management fee rate for the Portfolio is ranked in the fifth
ADVISORY AND SUB-ADVISORY CONTRACT APPROVAL DISCUSSION (Unaudited) (continued)
quintile of net management fee rates of the funds in its Selected Peer Group; (b) the contractual management fee rate for the Portfolio is ranked in the fourth quintile of contractual management fee rates of the funds in its Selected Peer Group; and (c) the all-in net expense ratio for the Portfolio, inclusive of the Acquired Fund Fees and Expenses (“AFFE”), is ranked in the fourth quintile of all-in net expense ratios of the funds in its Selected Peer Group, and the net expense ratio for the Portfolio, not inclusive of AFFE, is above the median of net expense ratios of the funds in its Selected Peer Group. In analyzing this fee data, the Board took into account: (1) that the Portfolio indirectly bears the fees payable by the underlying funds in which the Portfolio invests; and (2) management’s representations regarding its belief that the Portfolio’s pricing is competitive and the competitiveness of the Voya Index Solution Portfolios’ expense ratios when compared to peers identified by management.
After its deliberation, the Board reached the following conclusions: (1) the Portfolio’s management fee rate is reasonable in the context of all factors considered by the Board; (2) the Portfolio’s net expense ratio is reasonable in the context of all factors considered by the Board; (3) the Portfolio’s performance is reasonable in the context of all factors considered by the Board; and (4) the sub-advisory fee rate payable by the Manager to the Sub-Adviser is reasonable in the context of all factors considered by the Board. Based on these conclusions and other factors, the Board voted to renew the Contracts for the Portfolio for the year ending November 30, 2020. During this renewal process, different Board members may have given different weight to different individual factors and related conclusions.
Voya Index Solution 2060 Portfolio
In considering whether to approve the renewal of the Contracts for Voya Index Solution 2060 Portfolio, the Board considered that, based on performance data for the periods ended March 31, 2019: (1) the Portfolio is ranked in the third quintile of its Morningstar category for the one-year period, and the fourth quintile for the year-to-date and three-year periods; and (2) the Portfolio outperformed its primary benchmark for the year-to-date period and underperformed for the one-year and three-year periods. In analyzing this performance data, the Board took into account management’s representations regarding: (1) the impact of asset allocation positioning on the Portfolio’s
performance; (2) its belief that the Sub-Adviser can improve the Portfolio’ long-term performance; and (3) ongoing periodic monitoring of the Portfolio’s performance by management and the Board or its Investment Review Committee.
In considering the fees payable under the Contracts for the Portfolio, the Board took into account the factors described above and also considered: (1) the fairness of the compensation under a Management Contract with a level fee rate that does not include breakpoints; and (2) the pricing structure (including the net expense ratio to be borne by shareholders) of the Portfolio, as compared to its Selected Peer Group, including that: (a) the net management fee rate for the Portfolio is ranked in the fifth quintile of net management fee rates of the funds in its Selected Peer Group; (b) the contractual management fee rate for the Portfolio is ranked in the fifth quintile of contractual management fee rates of the funds in its Selected Peer Group; and (c) the all-in net expense ratio for the Portfolio, inclusive of the Acquired Fund Fees and Expenses (“AFFE”), is ranked in the fourth quintile of all-in net expense ratios of the funds in its Selected Peer Group, and the net expense ratio for the Portfolio, not inclusive of AFFE, is above the median of net expense ratios of the funds in its Selected Peer Group. In analyzing this fee data, the Board took into account: (1) that the Portfolio indirectly bears the fees payable by the underlying funds in which the Portfolio invests; (2) management’s representations regarding its belief that the Portfolio’s pricing is competitive and the competitiveness of the Voya Index Solution Portfolios’ expense ratios when compared to peers identified by management.
After its deliberation, the Board reached the following conclusions: (1) the Portfolio’s management fee rate is reasonable in the context of all factors considered by the Board; (2) the Portfolio’s net expense ratio is reasonable in the context of all factors considered by the Board; (3) the Portfolio’s performance is reasonable in the context of all factors considered by the Board; and (4) the sub-advisory fee rate payable by the Manager to the Sub-Adviser is reasonable in the context of all factors considered by the Board. Based on these conclusions and other factors, the Board voted to renew the Contracts for the Portfolio for the year ending November 30, 2020. During this renewal process, different Board members may have given different weight to different individual factors and related conclusions.
Investment Adviser
Voya Investments, LLC
7337 East Doubletree Ranch Road, Suite 100
Scottsdale, Arizona 85258
Distributor
Voya Investments Distributor, LLC
7337 East Doubletree Ranch Road, Suite 100
Scottsdale, Arizona 85258
Transfer Agent
BNY Mellon Investment Servicing (U.S.) Inc.
301 Bellevue Parkway
Wilmington, Delaware 19809
Independent Registered Public Accounting Firm
KPMG LLP
Two Financial Center
60 South Street
Boston, Massachusetts 02111
Custodian
The Bank of New York Mellon
225 Liberty Street
New York, New York 10286
Legal Counsel
Ropes & Gray LLP
Prudential Tower
800 Boylston Street
Boston, Massachusetts 02199
Before investing, carefully consider the investment objectives, risks, charges and expenses of the variable annuity contract or variable life insurance policy and the underlying variable investment options. This and other information is contained in the prospectus for the variable annuity contract or variable life insurance policy and the underlying variable investment options. Obtain these prospectuses from your agent/registered representative and read them carefully before investing.
RETIREMENT | INVESTMENTS | INSURANCE
voyainvestments.com
VPAR-VINDSOL (1219-021420)
Item 2. Code of Ethics.
As of the end of the period covered by this report, Registrant had adopted a code of ethics, as defined in Item 2 of Form N-CSR, that applies to the Registrant’s principal executive officer and principal financial officer. There were no amendments to the Code during the period covered by the report. The Registrant did not grant any waivers, including implicit waivers, from any provisions of the Code during the period covered by this report. The code of ethics is filed herewith pursuant to Item 10(a)(1), Ex-99.CODE ETH.
Item 3. Audit Committee Financial Expert.
The Board of Directors has determined that Colleen D. Baldwin, Martin J. Gavin, and Joseph E. Obermeyer are audit committee financial experts, as defined in Item 3 of Form N-CSR. Ms. Baldwin, Mr. Gavin, and Mr. Obermeyer are “independent” for purposes of Item 3 of Form N-CSR.
Item 4. Principal Accountant Fees and Services.
| (a) | Audit Fees: The aggregate fees billed for each of the last two fiscal years for professional services rendered by KPMG LLP (“KPMG”), the principal accountant for the audit of the registrant’s annual financial statements or services that are normally provided by the accountant in connection with statutory and regulatory filings or engagements for those fiscal years were $866,080 for the year ended December 31, 2019 and $891,345 for the year ended December 31, 2018. |
| (b) | Audit-Related Fees: The aggregate fees billed in each of the last two fiscal years for assurance and related services by KPMG that are reasonably related to the performance of the audit of the registrant’s financial statements and are not reported under paragraph (a) of this Item were $0 for the year ended December 31, 2019 and $102,600 for the year ended December 31, 2018. |
| (c) | Tax Fees: The aggregate fees billed in each of the last two fiscal years for professional services rendered by KPMG for tax compliance, tax advice, and tax planning were $208,039 for the year ended December 31, 2019 and $232,281 for the year ended December 31, 2018. Such services included review of excise distribution calculations (if applicable), preparation of the Funds’ federal, state, and excise tax returns, tax services related to mergers and routine consulting. |
| (d) | All Other Fees: The aggregate fees billed in each of the last two fiscal years for products and services provided by KPMG, other than the services reported in paragraphs (a) through (c) of this Item were $6,152 for the year ended December 31, 2019 and $0 for the year ended December 31, 2018. |
| (e)(1) | Audit Committee Pre-Approval Policies and Procedures |
AUDIT AND NON-AUDIT SERVICES
PRE-APPROVAL POLICY
| I. | Statement of Principles |
Under the Sarbanes-Oxley Act of 2002 (the “Act”), the Audit Committee of the Board of Directors or Trustees (the “Committee”) of the Voya funds (each a “Fund,” collectively, the “Funds”) set out onExhibit A to this Audit and Non-Audit Services Pre-Approval Policy (“Policy”) is responsible for the oversight of the work of the Funds’ independent auditors. As part of its responsibilities, the Committee must pre-approve the audit and non-audit services performed by the auditors in order to assure that the provision of these services does not impair the auditors’ independence from the Funds. The Committee has adopted, and the Board has ratified, this Policy, which sets out the procedures and conditions under which the services of the independent auditors may be pre-approved.
Under Securities and Exchange Commission (“SEC”) rules promulgated in accordance with the Act, the Funds may establish two different approaches to pre-approving audit and non-audit services. The Committee may approve services without consideration of specific case-by-case services (“general pre-approval”) or it may pre-approve specific services (“specific pre-approval”). The Committee believes that the combination of these approaches contemplated in this Policy results in an effective and efficient method for pre-approving audit and non-audit services to be performed by the Funds’ independent auditors. Under this Policy, services that are not of a type that may receive general pre-approval require specific pre-approval by the Committee. Any proposed services that exceed pre-approved cost levels or budgeted amounts will also require the Committee’s specific pre-approval.
For both types of approval, the Committee considers whether the subject services are consistent with the SEC’s rules on auditor independence and that such services are compatible with maintaining the auditors independence. The Committee also considers whether a particular audit firm is in the best position to provide effective and efficient services to the Funds. Reasons that the auditors are in the best position include the auditors’ familiarity with the Funds’ business, personnel, culture, accounting systems, risk profile, and other factors, and whether the services will enhance the Funds’ ability to manage and control risk or improve audit quality. Such factors will be considered as a whole, with no one factor being determinative.
The appendices attached to this Policy describe the audit, audit-related, tax-related, and other services that have the Committee’s general pre-approval. For any service that has been approved through general pre-approval, the general pre-approval will remain in place for a period 12 months from the date of pre-approval, unless the Committee determines that a different period is appropriate. The Committee will annually review and pre-approve the services that may be provided by the independent auditors without specific pre-approval. The Committee will revise the list of services subject to general pre-approval as appropriate. This Policy does not serve as a delegation to Fund management of the Committee’s duty to pre-approve services performed by the Funds’ independent auditors.
The annual audit services engagement terms and fees are subject to the Committee’s specific pre-approval. Audit services are those services that are normally provided by auditors in connection with statutory and regulatory filings or engagements or those that generally only independent auditors can reasonably provide. They include the Funds’ annual financial statement audit and procedures that the independent auditors must perform in order to form an opinion on the Funds’ financial statements (e.g., information systems and procedural reviews and testing). The Committee will monitor the audit services engagement and approve any changes in terms, conditions or fees deemed by the Committee to be necessary or appropriate.
The Committee may grant general pre-approval to other audit services, such as statutory audits and services associated with SEC registration statements, periodic reports and other documents filed with the SEC or issued in connection with securities offerings.
The Committee has pre-approved the audit services listed on Appendix A. The Committee must specifically approve all audit services not listed on Appendix A.
| III. | Audit-related Services |
Audit-related services are assurance and related services that are reasonably related to the performance of the audit or the review of the Funds’ financial statements or are traditionally performed by the independent auditors. The Committee believes that the provision of audit-related services will not impair the independent auditors’ independence, and therefore may grant pre-approval to audit-related services. Audit-related services include accounting consultations related to accounting, financial reporting or disclosure matters not classified as “audit services;” assistance with understanding and implementing new accounting and financial reporting guidance from rulemaking authorities; agreed-upon or expanded audit procedures relating to accounting and/or billing records required to respond to or comply with financial, accounting or regulatory reporting matters; and assistance with internal control reporting requirements under Form N-SAR or Form N-CSR.
The Committee has pre-approved the audit-related services listed on Appendix B. The Committee must specifically approve all audit-related services not listed on Appendix B.
The Committee believes the independent auditors can provide tax services to the Funds, including tax compliance, tax planning, and tax advice, without compromising the auditors’ independence. Therefore, the Committee may grant general pre-approval with respect to tax services historically provided by the Funds’ independent auditors that do not, in the Committee’s view, impair auditor independence and that are consistent with the SEC’s rules on auditor independence.
The Committee will not grant pre-approval if the independent auditors initially recommends a transaction the sole business purpose of which is tax avoidance and the tax treatment of which may not be supported in the Internal Revenue Code and related regulations. The Committee may consult
outside counsel to determine that tax planning and reporting positions are consistent with this Policy.
The Committee has pre-approved the tax-related services listed on Appendix C. The Committee must specifically approve all tax-related services not listed on Appendix C.
The Committee believes it may grant approval of non-audit services that are permissible services for independent auditors to a Fund. The Committee has determined to grant general pre-approval to other services that it believes are routine and recurring, do not impair auditor independence, and are consistent with SEC rules on auditor independence.
The Committee has pre-approved the non-audit services listed on Appendix D. The Committee must specifically approve all non-audit services not listed on Appendix D.
A list of the SEC’s prohibited non-audit services is attached to this Policy as Appendix E. The SEC’s rules and relevant guidance should be consulted to determine the precise definitions of these impermissible services and the applicability of exceptions to certain of the SEC’s prohibitions.
| VI. | Pre-approval of Fee levels and Budgeted Amounts |
The Committee will annually establish pre-approval fee levels or budgeted amounts for audit, audit-related, tax and non-audit services to be provided to the Funds by the independent auditors. Any proposed services exceeding these levels or amounts require the Committee’s specific pre-approval. The Committee considers fees for audit and non-audit services when deciding whether to pre-approve services. The Committee may determine, for a pre-approval period of 12 months, the appropriate ratio between the total amount of fees for the Fund’s audit, audit-related, and tax services (including fees for services provided to Fund affiliates that are subject to pre-approval), and the total amount of fees for certain permissible non-audit services for the Fund classified as other services (including any such services provided to Fund affiliates that are subject to pre-approval).
Requests or applications for services to be provided by the independent auditors will be submitted to management. If management determines that the services do not fall within those services generally pre-approved by the Committee and set out in the appendices to these procedures, management will submit the services to the Committee or its delagee. Any such submission will include a detailed description of the services to be rendered. Notwithstanding this paragraph, the Committee will, on a quarterly basis, receive from the independent auditors a list of services provided for the previous calendar quarter on a cumulative basis by the auditors during the Pre-Approval Period.
The Committee may delegate pre-approval authority to one or more of the Committee’s members. Any member or members to whom such pre-approval authority is delegated must report any pre-approval decisions, including any pre-approved services, to the Committee at its next scheduled meeting. The Committee will identify any member to whom pre-approval authority is delegated in writing. The member will retain such authority for a period of 12 months from the date of pre-approval unless the Committee determines that a different period is appropriate. The period of delegated authority may be terminated by the Committee or at the option of the member.
| IX. | Additional Requirements |
The Committee will take any measures the Committee deems necessary or appropriate to oversee the work of the independent auditors and to assure the auditors’ independence from the Funds. This may include reviewing a formal written statement from the independent auditors delineating all relationships between the auditors and the Funds, consistent with Independence Standards Board No. 1, and discussing with the auditors their methods and procedures for ensuring independence.
Part of KPMG’s performance of an audit in accordance with standards of the Public Company Accounting Oversight Board (US) includes their responsibility to maintain and monitor auditor independence with respect to the Voya funds. Using a proprietary system called Sentinel, the audit team is able to identify and manage potential conflicts of interest across the member firms of the KPMG International Network and prevent the provision of prohibited services to the Voya entities that would impair KPMG independence with the respect to the Voya funds. KPMG requests pre-approval from the Voya funds Audit Committee for services provided to the Voya funds and for services to affiliated entities that relate to the financial reporting or nature of operations of the Voya Funds. Additionally, KPMG provides an annual summary of the fees for services that have commenced for Voya funds and Affiliates.
Last Approved: November 16, 2018
Appendix A
Pre-Approved Audit Services for the Pre-Approval Period January 1, 2019 through December 31, 2019
| Service | The Fund(s) | Fee Range |
| | | |
| Statutory audits or financial audits (including tax services associated with audit services) | √ | As presented to Audit Committee1 |
| | | |
| Services associated with SEC registration statements, periodic reports and other documents filed with the SEC or other documents issued in connection with securities offerings (e.g., consents), and assistance in responding to SEC comment letters. | √ | Not to exceed $9,750 per filing |
| | | |
| Consultations by Fund management with respect to accounting or disclosure treatment of transactions or events and/or the actual or potential effect of final or proposed rules, standards or interpretations by the SEC, Financial Accounting Standards Board, or other regulatory or standard setting bodies. | √ | Not to exceed $8,000 during the Pre- Approval Period |
| | | |
| Seed capital audit and related review and issuance of consent on the N-2 registration statement | √ | Not to exceed $14,750 per audit |
| | | |
| Audit of summary portfolio of investments | √ | Not to exceed $565 per fund |
| 1 | For new Funds launched during the Pre-Approval Period, the fee ranges pre-approved will be the same as those for existing Funds, pro-rated in accordance with inception dates as provided in the auditors’ Proposal or any Engagement Letter covering the period at issue. Fees in the Engagement Letter will be controlling. |
Appendix B
Pre-Approved Audit-Related Services for the Pre-Approval Period January 1, 2019 through December 31, 2019
| Service | The Fund(s) | Fund Affiliates | Fee Range |
| | | | |
| Services related to Fund mergers (Excludes tax services - See Appendix C for tax services associated with Fund mergers) | √ | √ | Not to exceed $10,000 per merger |
| | | | |
| Consultations by Fund management with respect to accounting or disclosure treatment of transactions or events and/or the actual or potential effect of final or proposed rules, standards or interpretations by the SEC, Financial Accounting Standards Board, or other regulatory or standard setting bodies. [Note: Under SEC rules some consultations may be “audit” services and others may be “audit-related” services.] | √ | | Not to exceed $5,000 per occurrence during the Pre-Approval Period |
| | | | |
| Review of the Funds’ semi-annual and quarterly financial statements | √ | | Not to exceed $2,700 per set of financial statements per fund |
| | | | |
| Reports to regulatory or government agencies related to the annual engagement | √ | | Up to $5,000 per occurrence during the Pre-Approval Period |
| | | | |
| Regulatory compliance assistance | √ | √ | Not to exceed $5,000 per quarter |
| | | | |
| Training courses | | √ | Not to exceed |
| | | | $5,000 per course |
| | | | |
| For Prime Rate Trust, agreed upon procedures for quarterly reports to rating agencies | √ | | Not to exceed $9,450 per quarter |
Appendix C
Pre-Approved Tax Services for the Pre-Approval Period January 1, 2019 through December 31, 2019
| Service | The Fund(s) | Fund Affiliates | Fee Range |
| | | | |
| Preparation of federal and state income tax returns and federal excise tax returns for the Funds including assistance and review with excise tax distributions | √ | | As presented to Audit Committee2 |
| | | | |
| Review of IRC Sections 851(b) and 817(h) diversification testing on a real-time basis | √ | | As presented to Audit Committee2 |
| | | | |
| Tax assistance and advice regarding statutory, regulatory or administrative developments | √ | √ | Not to exceed $5,000 for the Funds or for the Funds’ investment adviser during the Pre- Approval Period |
| 2 | For new Funds launched during the Pre-Approval Period, the fee ranges pre-approved will be the same as those for existing Funds, pro-rated in accordance with inception dates as provided in the auditors’ Proposal or any Engagement Letter covering the period at issue. Fees in the Engagement Letter will be controlling. |
Appendix C,continued
Pre-Approved Tax Services for the Pre-Approval Period January 1, 2019 through December 31, 2019
| Service | The Fund(s) | Fund Affiliates | Fee Range |
| | | | |
| Tax and technology training sessions | | √ | Not to exceed $5,000 per course during the Pre- Approval Period |
| | | | |
| Tax services associated with Fund mergers | √ | √ | Not to exceed $4,000 per fund per merger during the Pre- Approval Period |
| | | | |
| Other tax-related assistance and consultation, including, without limitation, assistance in evaluating derivative financial instruments and international tax issues, qualification and distribution issues, year- end reporting for 1099’s and similar routine tax consultations as requested. | √ | | Not to exceed $120,000 during the Pre- Approval Period |
Appendix D
Pre-Approved Other Services for the Pre-Approval Period January 1, 2019 through December 31, 2019
| Service | The Fund(s) | Fund Affiliates | Fee Range |
| | | | |
| Agreed-upon procedures for Class B share 12b-1 programs | | √ | Not to exceed $60,000 during the Pre- Approval Period |
| | | | |
| Security counts performed pursuant to Rule 17f-2 of the 1940 Act (i.e., counts for Funds holding securities with affiliated sub-custodians) | √ | √ | Not to exceed $5,700 per Fund during the Pre- |
| | | | Approval |
| Cost to be borne 50% by the Funds and 50% by Voya Investments, LLC. | | | Period |
| | | | |
| Agreed upon procedures for 15 (c) FACT Books | √ | | Not to exceed $50,000 during the Pre- Approval Period |
Appendix E
Prohibited Non-Audit Services
Dated: January 1, 2019 to December 31, 2019
| · | Bookkeeping or other services related to the accounting records or financial statements of the Funds |
| · | Financial information systems design and implementation |
| · | Appraisal or valuation services, fairness opinions, or contribution-in-kind reports |
| · | Internal audit outsourcing services |
| · | Broker-dealer, investment adviser, or investment banking services |
| · | Expert services unrelated to the audit |
| · | Any other service that the Public Company Accounting Oversight Board determines, by regulation, is impermissible |
EXHIBIT A
VOYA ASIA PACIFIC HIGH DIVIDEND EQUITY INCOME FUND
VOYA BALANCED PORTFOLIO, INC.
VOYA EMERGING MARKETS HIGH DIVIDEND EQUITY FUND
VOYA EQUITY TRUST
VOYA FUNDS TRUST
VOYA GLOBAL ADVANTAGE AND PREMIUM OPPORTUNITY FUND
VOYA GLOBAL EQUITY DIVIDEND AND PREMIUM OPPORTUNITY FUND
VOYA INFRASTRUCTURE, INDUSTRIALS AND MATERIALS FUND
VOYA INTERMEDIATE BOND PORTFOLIO
VOYA INTERNATIONAL HIGH DIVIDEND EQUITY INCOME FUND
VOYA INVESTORS TRUST
VOYA GOVERNMENT MONEY MARKET PORTFOLIO
VOYA MUTUAL FUNDS
VOYA PARTNERS, INC.
VOYA PRIME RATE TRUST
VOYA NATURAL RESOURCES EQUITY INCOME FUND
VOYA SENIOR INCOME FUND
VOYA SEPARATE PORTFOLIOS TRUST
VOYA SERIES FUND, INC.
VOYA STRATEGIC ALLOCATIONS PORTFOLIOS, INC.
VOYA VARIABLE FUNDS
VOYA VARIABLE INSURANCE TRUST
VOYA VARIABLE PORTFOLIOS, INC.
VOYA VARIABLE PRODUCTS TRUST
| (e)(2) | Percentage of services referred to in 4(b) – (4)(d) that were approved by the audit committee |
| 100% of the services were approved by the audit committee. |
| (f) | Percentage of hours expended attributable to work performed by other than full time employees of KPMG if greater than 50% |
| (g) | Non-Audit Fees: The following table presents (i) the aggregate non-audit fees (i.e., fees for audit-related, tax, and other services) billed to each Registrant by the independent registered public accounting firm for each Registrant’s fiscal years ended December 31, 2019 and December 31, 2018; and (ii) the aggregate non-audit fees billed to the investment adviser, or any of its affiliates that provide ongoing services to the registrant, by the independent registered public accounting firm for the same time periods. |
| Registrant/Investment Adviser | 2019 | 2018 |
| Voya Partners, Inc. | $214,191 | $334,881 |
| Voya Investments, LLC(1) | $107,750 | $38,950 |
(1) Each Registrant’s investment adviser and any of its affiliates, which are subsidiaries of Voya Financial, Inc.
| (h) | Principal Accountants Independence: The Registrant’s Audit committee has considered whether the provision of non-audit services that were rendered to the registrant’s investment adviser and any entity controlling, controlled by, or under common control with the investment adviser that provides ongoing services to the registrant that were not pre-approved pursuant to Rule 2-01(c)(7)(ii) of Regulation S-X is compatible with maintaining KPMG’s independence. |
Item 5. Audit Committee of Listed Registrants.
Not applicable.
Item 6. Schedule of Investments.
Complete schedule of investments, as applicable, in included as part of the report to shareholders filed under Item 1 of this Form and filed herein, as applicable.
Report of Independent Registered Public Accounting Firm
To the Shareholders of the Funds and Board of Directors
Voya Partners, Inc.:
Opinion on the Financial Statements
We have audited the accompanying statements of assets and liabilities of Voya Global Bond Portfolio, Voya International High Dividend Low Volatility Portfolio (formerly Voya Templeton Foreign Equity Portfolio), VY® American Century Small-Mid Cap Value Portfolio, VY® Baron Growth Portfolio, VY® Columbia Contrarian Core Portfolio, VY® Columbia Small Cap Value II Portfolio, VY® Invesco Comstock Portfolio, VY® Invesco Equity and Income Portfolio, VY® Invesco Oppenheimer Global Portfolio (formerly VY® Oppenheimer Global Portfolio), VY® JPMorgan Mid Cap Value Portfolio, VY® T. Rowe Price Diversified Mid Cap Growth Portfolio, and VY® T. Rowe Price Growth Equity Portfolio (the “Funds”), each a series of Voya Partners, Inc., including the summary portfolios of investments, as of December 31, 2019, the related statements of operations for the year then ended, the statements of changes in net assets for each of the years in the two-year period then ended and the related notes (collectively, the "financial statements") the financial highlights for each of the years or periods in the five-year period then ended (the financial statements and financial highlights are included in Item 1 of this Form N-CSR), and the portfolios of investments as of December 31, 2019 (included in Item 6 of this Form N-CSR). In our opinion, the financial statements, financial highlights, and portfolios of investments present fairly, in all material respects, the financial position of the Funds as of December 31, 2019, the results of their operations for the year then ended, the changes in their net assets for each of the years in the two-year period then ended, and the financial highlights for each of the years or periods in the five-year period then ended, in conformity with U.S. generally accepted accounting principles.
Basis for Opinion
These financial statements, financial highlights, and portfolios of investments are the responsibility of the Funds’ management. Our responsibility is to express an opinion on these financial statements, financial highlights, and portfolios of investments based on our audits. We are a public accounting firm registered with the Public Company Accounting Oversight Board (United States) (“PCAOB”) and are required to be independent with respect to the Funds in accordance with the U.S. federal securities laws and the applicable rules and regulations of the Securities and Exchange Commission and the PCAOB.
We conducted our audits in accordance with the standards of the PCAOB. Those standards require that we plan and perform the audit to obtain reasonable assurance about whether the financial statements, financial highlights, and portfolios of investments are free of material misstatement, whether due to error or fraud. Our audits included performing procedures to assess the risks of material misstatement of the financial statements, financial highlights, and portfolios of investments, whether due to error or fraud, and performing procedures that respond to those risks. Such procedures included examining, on a test basis, evidence regarding the amounts and disclosures in the financial statements, financial highlights, and portfolios of investments. Such procedures also included confirmation of securities owned as of December 31, 2019, by correspondence with the custodian, transfer agent, and brokers, or by other appropriate auditing procedures when replies from brokers were not received. Our audits also included evaluating the accounting principles used and significant estimates made by management, as well as evaluating the overall financial statement presentation. We believe that our audits provide a reasonable basis for our opinion.

We have served as the auditor of one or more Voya investment companies since 1975.
Boston, Massachusetts
February 26, 2020
| Voya Global Bond Portfolio | PORTFOLIO OF INVESTMENTS
as ofDecember 31, 2019 |
Principal
Amount† | | | | Value | | | Percentage
of Net
Assets | |
| CORPORATE BONDS/NOTES: 21.1% | | | |
| | | Canada: 0.2% |
| 191,000 | | Cenovus Energy, Inc., 4.250%, 04/15/2027 | | $ | 202,305 | | | | 0.1 | |
| 186,000 | | Fortis, Inc./Canada, 3.055%, 10/04/2026 | | | 189,937 | | | | 0.1 | |
| | | | | | 392,242 | | | | 0.2 | |
| | | | | | | | | | | |
| | | China: 0.3% | | | | | | | | |
| 601,000 | | Alibaba Group Holding Ltd., 3.600%, 11/28/2024 | | | 632,889 | | | | 0.3 | |
| | | | | | | | | | | |
| | | France: 0.7% | | | | | | | | |
| 572,000 (1) | | BNP Paribas SA, 3.500%, 03/01/2023 | | | 591,935 | | | | 0.3 | |
| 265,000 (1) | | BPCE SA, 2.700%, 10/01/2029 | | | 262,807 | | | | 0.1 | |
| 287,000 (1) | | BPCE SA, 5.150%, 07/21/2024 | | | 314,958 | | | | 0.2 | |
| 226,000 (1) | | Electricite de France SA, 2.350%, 10/13/2020 | | | 226,457 | | | | 0.1 | |
| | | | | | 1,396,157 | | | | 0.7 | |
| | | | | | | | | | | |
| | | Guernsey: 0.4% | | | | | | | | |
| 716,000 | | Credit Suisse Group Funding Guernsey Ltd., 2.750%, 03/26/2020 | | | 716,937 | | | | 0.4 | |
| | | | | | | | | | | |
| | | Ireland: 0.2% | | | | | | | | |
| 370,000 | | Shire Acquisitions Investments Ireland DAC, 3.200%, 09/23/2026 | | | 381,224 | | | | 0.2 | |
| | | | | | | | | | | |
| | | Japan: 0.9% | | | | | | | | |
| 200,000 (1) | | Mizuho Bank Ltd., 3.200%, 03/26/2025 | | | 207,680 | | | | 0.1 | |
| 790,000 (1) | | MUFG Bank Ltd., 2.300%, 03/05/2020 | | | 790,474 | | | | 0.4 | |
| 200,000 | | Sumitomo Mitsui Financial Group, Inc., 2.448%, 09/27/2024 | | | 200,463 | | | | 0.1 | |
| 639,000 | | Sumitomo Mitsui Financial Group, Inc., 3.784%, 03/09/2026 | | | 683,081 | | | | 0.3 | |
| | | | | | 1,881,698 | | | | 0.9 | |
| | | | | | | | | | | |
| | | Mexico: 0.0% | | | | | | | | |
| MXN 1,007,437 (2),(3) | | Banco Invex SA / Hipotecaria Credito y Casa SA de CV, 6.450%, 03/13/2034 | | | – | | | | – | |
| MXN 59,796 (2) | | JP Morgan / Hipotecaria su Casita, 6.100%, 09/25/2035 | | | 3,108 | | | | 0.0 | |
| | | | | | 3,108 | | | | 0.0 | |
| | | | | | | | | | | |
| | | Netherlands: 0.8% | | | | | | | | |
| 270,000 | | Cooperatieve Rabobank UA/NY, 2.500%, 01/19/2021 | | | 271,629 | | | | 0.1 | |
| 690,000 | | Shell International Finance BV, 3.250%, 05/11/2025 | | | 730,184 | | | | 0.4 | |
| 361,000 | | Shell International Finance BV, 4.000%, 05/10/2046 | | | 411,366 | | | | 0.2 | |
| 300,000 (1) | | Siemens Financieringsmaatschappij NV, 2.350%, 10/15/2026 | | | 298,341 | | | | 0.1 | |
| | | | | | 1,711,520 | | | | 0.8 | |
| | | | | | | | | | | |
| | | Norway: 0.2% | | | | | | | | |
| 380,000 | | Equinor ASA, 2.450%, 01/17/2023 | | | 385,977 | | | | 0.2 | |
| | | | | | | | | | | |
| | | South Africa: 0.0% | | | | | | | | |
| ZAR 1,000,000 | | Transnet SOC Ltd., 10.800%, 11/06/2023 | | | 76,502 | | | | 0.0 | |
| | | | | | | | | | | |
| | | Switzerland: 0.4% | | | | | | | | |
| 400,000 (1) | | Credit Suisse AG, 6.500%, 08/08/2023 | | | 446,970 | | | | 0.2 | |
| 250,000 | | UBS AG/Stamford CT, 7.625%, 08/17/2022 | | | 281,926 | | | | 0.2 | |
| | | | | | 728,896 | | | | 0.4 | |
| | | | | | | | | | | |
| | | United Kingdom: 1.1% | | | | | | | | |
| 283,000 | | Aon PLC, 2.800%, 03/15/2021 | | | 285,918 | | | | 0.2 | |
| 405,000 (4) | | HSBC Holdings PLC, 3.973%, 05/22/2030 | | | 436,469 | | | | 0.2 | |
| 200,000 (1) | | Reckitt Benckiser Treasury Services PLC, 3.000%, 06/26/2027 | | | 204,906 | | | | 0.1 | |
| 1,002,000 | | Santander UK PLC, 2.375%, 03/16/2020 | | | 1,002,593 | | | | 0.5 | |
| 230,000 (1) | | Standard Chartered PLC, 5.300%, 01/09/2043 | | | 277,349 | | | | 0.1 | |
| | | | | | 2,207,235 | | | | 1.1 | |
| | | | | | | | | | | |
| | | United States: 15.9% | | | | | | | | |
| 185,000 (1) | | AbbVie, Inc., 3.200%, 11/21/2029 | | | 188,318 | | | | 0.1 | |
| 150,000 | | AbbVie, Inc., 3.600%, 05/14/2025 | | | 158,316 | | | | 0.1 | |
| 321,000 | | AbbVie, Inc., 4.300%, 05/14/2036 | | | 355,302 | | | | 0.2 | |
| 53,000 | | Aetna, Inc., 2.800%, 06/15/2023 | | | 53,858 | | | | 0.0 | |
| 175,000 | | Altria Group, Inc., 4.500%, 05/02/2043 | | | 178,779 | | | | 0.1 | |
| 180,000 | | Altria Group, Inc., 4.800%, 02/14/2029 | | | 200,540 | | | | 0.1 | |
| 9,199 | | American Airlines 2016-1 Class B Pass Through Trust, 5.250%, 07/15/2025 | | | 9,748 | | | | 0.0 | |
| 197,576 | | American Airlines 2016-3 Class B Pass Through Trust, 3.750%, 04/15/2027 | | | 199,884 | | | | 0.1 | |
| 55,090 | | American Airlines 2017-1 Class B Pass Through Trust, 4.950%, 08/15/2026 | | | 58,240 | | | | 0.0 | |
| 459,000 | | American International Group, Inc., 4.500%, 07/16/2044 | | | 528,755 | | | | 0.3 | |
| 450,000 | | American Tower Corp., 2.750%, 01/15/2027 | | | 449,715 | | | | 0.2 | |
| 300,000 | | Amgen, Inc., 3.200%, 11/02/2027 | | | 315,840 | | | | 0.2 | |
| 88,000 | | Amgen, Inc., 4.563%, 06/15/2048 | | | 102,171 | | | | 0.1 | |
| 170,000 | | Anheuser-Busch Cos LLC / Anheuser-Busch InBev Worldwide, Inc., 4.900%, 02/01/2046 | | | 201,360 | | | | 0.1 | |
See Accompanying Notes to Financial Statements
| Voya Global Bond Portfolio | PORTFOLIO OF INVESTMENTS
as ofDecember 31, 2019 (CONTINUED) |
| 130,000 | | Anheuser-Busch InBev Worldwide, Inc., 4.000%, 04/13/2028 | | | 143,009 | | | | 0.1 | |
| 201,000 | | Anthem, Inc., 3.700%, 09/15/2049 | | | 200,913 | | | | 0.1 | |
| 301,000 | | AT&T, Inc., 4.300%, 02/15/2030 | | | 334,687 | | | | 0.2 | |
| 299,000 | | AT&T, Inc., 5.150%, 03/15/2042 | | | 349,120 | | | | 0.2 | |
| 433,000 | | AT&T, Inc., 5.450%, 03/01/2047 | | | 537,137 | | | | 0.3 | |
| 368,000 | | Bank of America Corp., 3.300%, 01/11/2023 | | | 380,596 | | | | 0.2 | |
| 616,000 (4) | | Bank of America Corp., 3.419%, 12/20/2028 | | | 646,512 | | | | 0.3 | |
| 458,000 | | Bank of America Corp., 4.100%, 07/24/2023 | | | 488,783 | | | | 0.2 | |
| 258,000 (4) | | Bank of America Corp., 4.330%, 03/15/2050 | | | 309,312 | | | | 0.2 | |
| 412,000 | | Bank of New York Mellon Corp., 2.050%, 05/03/2021 | | | 413,324 | | | | 0.2 | |
| 530,000 | | BP Capital Markets America, Inc., 3.216%, 11/28/2023 | | | 552,149 | | | | 0.3 | |
| 266,000 (1) | | Bristol-Myers Squibb Co., 3.875%, 08/15/2025 | | | 287,760 | | | | 0.1 | |
| 135,000 | | Broadridge Financial Solutions, Inc., 2.900%, 12/01/2029 | | | 135,009 | | | | 0.1 | |
| 140,000 | | Burlington Northern Santa Fe LLC, 3.900%, 08/01/2046 | | | 153,501 | | | | 0.1 | |
| 395,000 | | CBRE Services, Inc., 5.250%, 03/15/2025 | | | 444,401 | | | | 0.2 | |
| 216,000 | | ViacomCBS, Inc., 3.700%, 08/15/2024 | | | 228,641 | | | | 0.1 | |
| 474,000 | | Charter Communications Operating LLC / Charter Communications Operating Capital, 4.464%, 07/23/2022 | | | 498,173 | | | | 0.2 | |
| 50,000 | | Charter Communications Operating LLC / Charter Communications Operating Capital, 4.800%, 03/01/2050 | | | 52,631 | | | | 0.0 | |
| 265,000 | | Citigroup, Inc., 4.125%, 07/25/2028 | | | 289,093 | | | | 0.1 | |
| 579,000 | | Citigroup, Inc., 4.000%, 08/05/2024 | | | 620,007 | | | | 0.3 | |
| 469,000 | | Citigroup, Inc., 5.500%, 09/13/2025 | | | 536,143 | | | | 0.3 | |
| 278,000 (1) | | Cleveland Electric Illuminating Co/The, 3.500%, 04/01/2028 | | | 289,436 | | | | 0.1 | |
| 165,000 | | Comcast Corp., 2.350%, 01/15/2027 | | | 164,818 | | | | 0.1 | |
| 310,000 | | Comcast Corp., 4.150%, 10/15/2028 | | | 348,994 | | | | 0.2 | |
| 110,000 | | Comcast Corp., 4.250%, 01/15/2033 | | | 127,313 | | | | 0.1 | |
| 80,000 | | Comcast Corp., 5.650%, 06/15/2035 | | | 105,176 | | | | 0.1 | |
| 72,000 | | Consumers Energy Co., 3.100%, 08/15/2050 | | | 71,819 | | | | 0.0 | |
| 1,184,000 | | CVS Health Corp., 2.800%, 07/20/2020 | | | 1,187,466 | | | | 0.6 | |
| 510,000 | | CVS Health Corp., 4.300%, 03/25/2028 | | | 556,984 | | | | 0.3 | |
| 313,000 (1) | | Dell International LLC / EMC Corp., 6.020%, 06/15/2026 | | | 360,253 | | | | 0.2 | |
| 187,006 | | Delta Air Lines 2015-1 Class B Pass Through Trust, 4.250%, 01/30/2025 | | | 195,052 | | | | 0.1 | |
| 442,000 | | Discover Bank, 7.000%, 04/15/2020 | | | 447,953 | | | | 0.2 | |
| 120,000 (4) | | Dominion Energy, Inc., 4.650%, 12/31/2199 | | | 122,570 | | | | 0.1 | |
| 125,000 | | Duke Energy Carolinas LLC, 3.200%, 08/15/2049 | | | 124,495 | | | | 0.1 | |
| 85,000 | | Duke Energy Indiana LLC, 3.250%, 10/01/2049 | | | 84,948 | | | | 0.0 | |
| 1,026,000 | | Energy Transfer Operating L.P., 4.900%, 02/01/2024 | | | 1,100,882 | | | | 0.5 | |
| 280,000 | | Energy Transfer Partners L.P. / Regency Energy Finance Corp., 4.500%, 11/01/2023 | | | 296,625 | | | | 0.1 | |
| 558,000 | | Entergy Corp., 5.125%, 09/15/2020 | | | 565,663 | | | | 0.3 | |
| 200,000 | | Entergy Louisiana LLC, 4.200%, 04/01/2050 | | | 235,978 | | | | 0.1 | |
| 111,000 | | Evergy Kansas Central, Inc., 3.250%, 09/01/2049 | | | 109,284 | | | | 0.1 | |
| 57,000 | | Exxon Mobil Corp., 2.995%, 08/16/2039 | | | 57,123 | | | | 0.0 | |
| 57,000 | | Exxon Mobil Corp., 3.095%, 08/16/2049 | | | 56,868 | | | | 0.0 | |
| 281,000 (1) | | Fairfax US, Inc., 4.875%, 08/13/2024 | | | 300,346 | | | | 0.1 | |
| 202,000 | | FedEx Corp., 4.050%, 02/15/2048 | | | 194,910 | | | | 0.1 | |
| 318,000 | | Fifth Third Bancorp, 8.250%, 03/01/2038 | | | 485,440 | | | | 0.2 | |
| 532,000 | | FirstEnergy Corp., 4.250%, 03/15/2023 | | | 560,875 | | | | 0.3 | |
| 569,000 | | Ford Motor Credit Co. LLC, 3.200%, 01/15/2021 | | | 572,216 | | | | 0.3 | |
| 205,000 | | General Electric Co., 6.750%, 03/15/2032 | | | 263,150 | | | | 0.1 | |
| 224,000 | | General Motors Financial Co., Inc., 4.300%, 07/13/2025 | | | 239,442 | | | | 0.1 | |
| 240,000 | | Goldman Sachs Group, Inc./The, 2.625%, 04/25/2021 | | | 242,103 | | | | 0.1 | |
| 945,000 | | Goldman Sachs Group, Inc./The, 3.000%, 04/26/2022 | | | 956,802 | | | | 0.5 | |
| 130,000 | | Healthpeak Properties, Inc., 3.000%, 01/15/2030 | | | 130,482 | | | | 0.1 | |
| 140,000 | | Intel Corp., 3.250%, 11/15/2049 | | | 141,035 | | | | 0.1 | |
| 90,000 | | Johnson & Johnson, 2.900%, 01/15/2028 | | | 94,049 | | | | 0.0 | |
| 150,000 | | Johnson & Johnson, 3.400%, 01/15/2038 | | | 160,742 | | | | 0.1 | |
| 50,000 | | Johnson & Johnson, 4.375%, 12/05/2033 | | | 59,229 | | | | 0.0 | |
| 117,000 | | JPMorgan Chase & Co., 2.550%, 03/01/2021 | | | 117,908 | | | | 0.1 | |
| 478,000 (4) | | JPMorgan Chase & Co., 6.000%, 12/31/2199 | | | 513,594 | | | | 0.3 | |
| 250,000 (4) | | JPMorgan Chase Bank NA, 2.604%, 02/01/2021 | | | 250,133 | | | | 0.1 | |
| 110,000 | | Kimco Realty Corp., 3.700%, 10/01/2049 | | | 107,025 | | | | 0.1 | |
See Accompanying Notes to Financial Statements
| Voya Global Bond Portfolio | PORTFOLIO OF INVESTMENTS
as ofDecember 31, 2019 (CONTINUED) |
| 222,000 | | Kinder Morgan Energy Partners L.P., 4.250%, 09/01/2024 | | | 237,861 | | | | 0.1 | |
| 194,000 | | Kinder Morgan, Inc./DE, 5.550%, 06/01/2045 | | | 232,243 | | | | 0.1 | |
| 165,000 | | Kraft Heinz Foods Co., 3.000%, 06/01/2026 | | | 165,006 | | | | 0.1 | |
| 135,000 (1) | | Kraft Heinz Foods Co., 4.875%, 10/01/2049 | | | 142,293 | | | | 0.1 | |
| 103,000 | | Kroger Co/The, 4.650%, 01/15/2048 | | | 112,699 | | | | 0.1 | |
| 148,000 | | Medtronic, Inc., 3.150%, 03/15/2022 | | | 152,202 | | | | 0.1 | |
| 380,000 (1) | | Metropolitan Edison Co., 4.000%, 04/15/2025 | | | 404,610 | | | | 0.2 | |
| 190,000 | | Mississippi Power Co., 4.250%, 03/15/2042 | | | 204,128 | | | | 0.1 | |
| 372,000 | | Morgan Stanley, 3.750%, 02/25/2023 | | | 389,699 | | | | 0.2 | |
| 618,000 | | Morgan Stanley, 4.100%, 05/22/2023 | | | 652,792 | | | | 0.3 | |
| 70,000 (1) | | MPLX L.P., 5.250%, 01/15/2025 | | | 73,479 | | | | 0.0 | |
| 280,000 | | National Rural Utilities Cooperative Finance Corp., 3.900%, 11/01/2028 | | | 308,094 | | | | 0.2 | |
| 324,000 | | Newmont Corp., 3.700%, 03/15/2023 | | | 338,844 | | | | 0.2 | |
| 123,000 | | Occidental Petroleum Corp., 4.625%, 06/15/2045 | | | 127,093 | | | | 0.1 | |
| 349,000 | | Oracle Corp., 2.950%, 05/15/2025 | | | 363,265 | | | | 0.2 | |
| 48,000 | | O'Reilly Automotive, Inc., 3.600%, 09/01/2027 | | | 51,218 | | | | 0.0 | |
| 95,000 | | O'Reilly Automotive, Inc., 4.350%, 06/01/2028 | | | 106,025 | | | | 0.1 | |
| 140,000 | | PayPal Holdings, Inc., 2.850%, 10/01/2029 | | | 140,994 | | | | 0.1 | |
| 235,000 | | Pfizer, Inc., 2.750%, 06/03/2026 | | | 243,080 | | | | 0.1 | |
| 460,000 | | Philip Morris International, Inc., 3.875%, 08/21/2042 | | | 479,045 | | | | 0.2 | |
| 45,000 | | Puget Sound Energy, Inc., 3.250%, 09/15/2049 | | | 44,810 | | | | 0.0 | |
| 249,000 | | Qualcomm, Inc., 3.250%, 05/20/2027 | | | 262,005 | | | | 0.1 | |
| 272,000 | | Reynolds American, Inc., 6.150%, 09/15/2043 | | | 319,267 | | | | 0.2 | |
| 225,000 | | Southern Co., 2.750%, 06/15/2020 | | | 225,550 | | | | 0.1 | |
| 185,000 | | Southwest Airlines Co., 3.450%, 11/16/2027 | | | 194,531 | | | | 0.1 | |
| 104,000 | | Sunoco Logistics Partners Operations L.P., 4.250%, 04/01/2024 | | | 109,353 | | | | 0.1 | |
| 272,000 | | Time Warner Cable LLC, 5.875%, 11/15/2040 | | | 312,046 | | | | 0.2 | |
| 255,000 | | Union Electric Co., 3.250%, 10/01/2049 | | | 253,079 | | | | 0.1 | |
| 73,017 | | United Airlines 2013-1 Class B Pass Through Trust, 5.375%, 02/15/2023 | | | 75,887 | | | | 0.0 | |
| 72,062 | | United Airlines 2014-2 Class B Pass Through Trust, 4.625%, 03/03/2024 | | | 74,359 | | | | 0.0 | |
| 52,292 | | United Airlines 2016-1 Class B Pass Through Trust, 3.650%, 07/07/2027 | | | 53,150 | | | | 0.0 | |
| 74,583 | | United Airlines 2016-2 Class B Pass Through Trust, 3.650%, 04/07/2027 | | | 75,299 | | | | 0.0 | |
| 90,000 | | United Parcel Service, Inc., 3.400%, 09/01/2049 | | | 91,130 | | | | 0.0 | |
| 230,000 | | Verizon Communications, Inc., 4.125%, 03/16/2027 | | | 255,278 | | | | 0.1 | |
| 331,000 | | Verizon Communications, Inc., 4.522%, 09/15/2048 | | | 396,513 | | | | 0.2 | |
| 252,000 | | ViacomCBS, Inc., 4.375%, 03/15/2043 | | | 267,077 | | | | 0.1 | |
| 245,000 | | Walmart, Inc., 3.700%, 06/26/2028 | | | 270,166 | | | | 0.1 | |
| 300,000 | | Walt Disney Co/The, 5.400%, 10/01/2043 | | | 408,229 | | | | 0.2 | |
| 240,000 (4) | | Wells Fargo & Co., 2.406%, 10/30/2025 | | | 240,163 | | | | 0.1 | |
| 430,000 | | Wells Fargo & Co., 4.100%, 06/03/2026 | | | 463,678 | | | | 0.2 | |
| | | | | | 31,917,148 | | | | 15.9 | |
| | | | | | | | | | | |
| | Total Corporate Bonds/Notes | | | | | | | | |
| | (Cost $40,439,972) | | | 42,431,533 | | | | 21.1 | |
| | | | | | | | | | | |
| COLLATERALIZED MORTGAGE OBLIGATIONS: 15.4% | | | | | | | | |
| | | United States: 15.4% | | | | | | | | |
| 249,153 (4) | | Adjustable Rate Mortgage Trust 2006-2 1A1, 4.595%, 05/25/2036 | | | 246,678 | | | | 0.1 | |
| 230,576 | | Alternative Loan Trust 2005-51 3A2A, 3.530%, (12MTA + 1.290%), 11/20/2035 | | | 225,603 | | | | 0.1 | |
| 77,763 | | Alternative Loan Trust 2006-13T1 A9, 6.000%, 05/25/2036 | | | 59,379 | | | | 0.0 | |
| 470,839 | | Banc of America Funding 2005-1 Trust 1A1, 5.500%, 02/25/2035 | | | 480,578 | | | | 0.2 | |
| 52,556 | | CHL Mortgage Pass-Through Trust 2005-17 1A8, 5.500%, 09/25/2035 | | | 52,669 | | | | 0.0 | |
| 51,083 | | CHL Mortgage Pass-Through Trust 2005-J4 A7, 5.500%, 11/25/2035 | | | 50,918 | | | | 0.0 | |
| 288,552 | | CHL Mortgage Pass-Through Trust 2007-7 A7, 5.750%, 06/25/2037 | | | 238,998 | | | | 0.1 | |
| 69,096 (4) | | Citigroup Mortgage Loan Trust, Inc. 2005-2 1A3, 4.759%, 05/25/2035 | | | 70,571 | | | | 0.0 | |
| 297,106 | | CitiMortgage Alternative Loan Trust Series 2006-A3 1A7, 6.000%, 07/25/2036 | | | 292,876 | | | | 0.2 | |
| 49,090 | | Countrywide Alternative Loan Trust 2005-53T2 2A6, 2.292%, (US0001M + 0.500%), 11/25/2035 | | | 27,626 | | | | 0.0 | |
| 246,233 | | Countrywide Asset-Backed Certificates 2005-IM1 M1, 2.512%, (US0001M + 0.720%), 11/25/2035 | | | 245,204 | | | | 0.1 | |
| 266,654 (1),(4) | | CSMC Trust 2015-3 B1, 3.934%, 03/25/2045 | | | 277,726 | | | | 0.1 | |
| 4,228 (1) | | Deutsche ALT-A Securities, Inc. ALT2007-RS1 A2, 2.200%, (US0001M + 0.500%), 01/27/2037 | | | 7,213 | | | | 0.0 | |
See Accompanying Notes to Financial Statements
| Voya Global Bond Portfolio | PORTFOLIO OF INVESTMENTS
as ofDecember 31, 2019 (CONTINUED) |
| 666,673 | | Fannie Mae Connecticut Avenue Securities 2016-C05 2M2, 6.242%, (US0001M + 4.450%), 01/25/2029 | | | 704,866 | | | | 0.4 | |
| 754,862 | | Fannie Mae Connecticut Avenue Securities 2016-C07 2M2, 6.142%, (US0001M + 4.350%), 05/25/2029 | | | 796,643 | | | | 0.4 | |
| 400,000 | | Fannie Mae Connecticut Avenue Securities 2017-C02 2M2, 5.442%, (US0001M + 3.650%), 09/25/2029 | | | 421,709 | | | | 0.2 | |
| 500,000 | | Fannie Mae Connecticut Avenue Securities 2017-C03 1M2, 4.792%, (US0001M + 3.000%), 10/25/2029 | | | 522,793 | | | | 0.3 | |
| 500,000 | | Fannie Mae Connecticut Avenue Securities 2017-C05 1M2, 3.992%, (US0001M + 2.200%), 01/25/2030 | | | 509,006 | | | | 0.3 | |
| 300,000 | | Fannie Mae Connecticut Avenue Securities 2017-C07 1M2, 4.192%, (US0001M + 2.400%), 05/28/2030 | | | 305,833 | | | | 0.2 | |
| 596,142 | | Fannie Mae Connecticut Avenue Securities 2017-C07 2M2, 4.292%, (US0001M + 2.500%), 05/25/2030 | | | 605,760 | | | | 0.3 | |
| 600,000 | | Fannie Mae Connecticut Avenue Securities 2018-C04 2M2, 4.342%, (US0001M + 2.550%), 12/25/2030 | | | 611,193 | | | | 0.3 | |
| 379,617 | | Fannie Mae Connecticut Avenue Securities 2018-C06 1M2, 3.792%, (US0001M + 2.000%), 03/25/2031 | | | 381,512 | | | | 0.2 | |
| 400,000 (1) | | Fannie Mae Connecticut Avenue Securities 2019-R02 1M2, 4.092%, (US0001M + 2.300%), 08/25/2031 | | | 404,043 | | | | 0.2 | |
| 659,170 (1) | | Fannie Mae Connecticut Avenue Securities Trust 2018-R07 1M2, 4.192%, (US0001M + 2.400%), 04/25/2031 | | | 667,360 | | | | 0.3 | |
| 87,872 (5) | | Fannie Mae Interest Strip Series 254 2, 7.500%, 01/25/2024 | | | 9,445 | | | | 0.0 | |
| 17,663 (5) | | Fannie Mae Interest Strip Series 294 2, 7.000%, 02/25/2028 | | | 3,474 | | | | 0.0 | |
| 153,515 (5) | | Fannie Mae Interest Strip Series 319 2, 6.500%, 02/25/2032 | | | 31,991 | | | | 0.0 | |
| 55,562 (5) | | Fannie Mae Interest Strip Series 328 2, 6.000%, 12/25/2032 | | | 12,369 | | | | 0.0 | |
| 24,337 (5) | | Fannie Mae Interest Strip Series 331 5, 6.000%, 02/25/2033 | | | 4,840 | | | | 0.0 | |
| 29,789 (5) | | Fannie Mae Interest Strip Series 332 2, 6.000%, 03/25/2033 | | | 6,810 | | | | 0.0 | |
| 23,911 (5) | | Fannie Mae Interest Strip Series 334 12, 6.000%, 03/25/2033 | | | 5,181 | | | | 0.0 | |
| 29,617 (5) | | Fannie Mae Interest Strip Series 338 2, 5.500%, 07/25/2033 | | | 6,016 | | | | 0.0 | |
| 12,567 (5) | | Fannie Mae Interest Strip Series 356 10, 5.500%, 06/25/2035 | | | 2,441 | | | | 0.0 | |
| 13,526 (5) | | Fannie Mae Interest Strip Series 364 15, 6.000%, 09/25/2035 | | | 2,684 | | | | 0.0 | |
| 438,967 (5) | | Fannie Mae Interest Strip Series 418 5, 3.500%, 08/25/2043 | | | 69,805 | | | | 0.0 | |
| 641,856 (4),(5) | | Fannie Mae Interest Strip Series 418 80, 3.500%, 08/25/2033 | | | 82,704 | | | | 0.1 | |
| 8,294 | | Fannie Mae REMIC Trust 1999-14 MB, 6.500%, 04/25/2029 | | | 9,060 | | | | 0.0 | |
| 11,906 | | Fannie Mae REMIC Trust 2001-80 ZB, 6.000%, 01/25/2032 | | | 13,259 | | | | 0.0 | |
| 57,177 (5) | | Fannie Mae REMIC Trust 2002-12 SB, 5.958%, (-1.000*US0001M + 7.750%), 07/25/2031 | | | 12,024 | | | | 0.0 | |
| 34,236 (5) | | Fannie Mae REMIC Trust 2002-2 SW, 5.958%, (-1.000*US0001M + 7.750%), 02/25/2032 | | | 7,438 | | | | 0.0 | |
| 14,619 | | Fannie Mae REMIC Trust 2002-21 PE, 6.500%, 04/25/2032 | | | 16,595 | | | | 0.0 | |
| 6,036 | | Fannie Mae REMIC Trust 2002-29 F, 2.792%, (US0001M + 1.000%), 04/25/2032 | | | 6,164 | | | | 0.0 | |
| 18,671 (5) | | Fannie Mae REMIC Trust 2002-41 S, 6.158%, (-1.000*US0001M + 7.950%), 07/25/2032 | | | 3,442 | | | | 0.0 | |
| 1,858 | | Fannie Mae REMIC Trust 2002-64 FJ, 2.792%, (US0001M + 1.000%), 04/25/2032 | | | 1,897 | | | | 0.0 | |
| 3,924 | | Fannie Mae REMIC Trust 2002-68 FH, 2.245%, (US0001M + 0.500%), 10/18/2032 | | | 3,930 | | | | 0.0 | |
| 672,454 (5) | | Fannie Mae REMIC Trust 2002-77 JS, 6.255%, (-1.000*US0001M + 8.000%), 12/18/2032 | | | 141,055 | | | | 0.1 | |
| 16,951 | | Fannie Mae REMIC Trust 2002-84 FB, 2.792%, (US0001M + 1.000%), 12/25/2032 | | | 17,312 | | | | 0.0 | |
| 16,948 | | Fannie Mae REMIC Trust 2003-11 FA, 2.792%, (US0001M + 1.000%), 09/25/2032 | | | 17,310 | | | | 0.0 | |
| 3,631 | | Fannie Mae REMIC Trust 2003-116 FA, 2.192%, (US0001M + 0.400%), 11/25/2033 | | | 3,626 | | | | 0.0 | |
See Accompanying Notes to Financial Statements
| Voya Global Bond Portfolio | PORTFOLIO OF INVESTMENTS
as ofDecember 31, 2019 (CONTINUED) |
| 23,374 (5) | | Fannie Mae REMIC Trust 2003-13 IO, 7.000%, 03/25/2033 | | | 5,996 | | | | 0.0 | |
| 17,089 (5) | | Fannie Mae REMIC Trust 2003-26 IK, 7.000%, 04/25/2033 | | | 3,926 | | | | 0.0 | |
| 7,831 (5) | | Fannie Mae REMIC Trust 2003-52 NS, 5.308%, (-1.000*US0001M + 7.100%), 06/25/2023 | | | 360 | | | | 0.0 | |
| 414,072 (5) | | Fannie Mae REMIC Trust 2004-56 SE, 5.758%, (-1.000*US0001M + 7.550%), 10/25/2033 | | | 79,646 | | | | 0.0 | |
| 24,925 | | Fannie Mae REMIC Trust 2005-25 PS, 20.275%, (-4.400*US0001M + 28.160%), 04/25/2035 | | | 42,015 | | | | 0.0 | |
| 11,926 (5) | | Fannie Mae REMIC Trust 2005-40 SB, 4.958%, (-1.000*US0001M + 6.750%), 05/25/2035 | | | 1,713 | | | | 0.0 | |
| 38,286 | | Fannie Mae REMIC Trust 2005-71 DB, 4.500%, 08/25/2025 | | | 39,131 | | | | 0.0 | |
| 112,127 | | Fannie Mae REMIC Trust 2005-74 DK, 16.832%, (-4.000*US0001M + 24.000%), 07/25/2035 | | | 175,273 | | | | 0.1 | |
| 301,887 | | Fannie Mae REMIC Trust 2005-87 SB, 17.263%, (-3.667*US0001M + 23.833%), 10/25/2035 | | | 471,514 | | | | 0.2 | |
| 185,880 | | Fannie Mae REMIC Trust 2006-104 ES, 24.490%, (-5.000*US0001M + 33.450%), 11/25/2036 | | | 335,063 | | | | 0.2 | |
| 13,536 | | Fannie Mae REMIC Trust 2006-11 PS, 17.996%, (-3.667*US0001M + 24.567%), 03/25/2036 | | | 22,028 | | | | 0.0 | |
| 34,665 | | Fannie Mae REMIC Trust 2006-46 SW, 17.629%, (-3.667*US0001M + 24.199%), 06/25/2036 | | | 52,111 | | | | 0.0 | |
| 7,455,744 (5) | | Fannie Mae REMIC Trust 2006-51 SA, 4.778%, (-1.000*US0001M + 6.570%), 06/25/2036 | | | 1,397,595 | | | | 0.7 | |
| 62,422 (5) | | Fannie Mae REMIC Trust 2006-90 SX, 5.438%, (-1.000*US0001M + 7.230%), 09/25/2036 | | | 11,581 | | | | 0.0 | |
| 7,426,407 (5) | | Fannie Mae REMIC Trust 2007-116 DI, 4.148%, (-1.000*US0001M + 5.940%), 01/25/2038 | | | 1,396,825 | | | | 0.7 | |
| 53,125 (5) | | Fannie Mae REMIC Trust 2007-88 XI, 4.748%, (-1.000*US0001M + 6.540%), 06/25/2037 | | | 11,046 | | | | 0.0 | |
| 683,108 (5) | | Fannie Mae REMIC Trust 2007-89 SB, 4.758%, (-1.000*US0001M + 6.550%), 09/25/2037 | | | 109,218 | | | | 0.1 | |
| 1,449,472 (5) | | Fannie Mae REMIC Trust 2007-94 SG, 4.658%, (-1.000*US0001M + 6.450%), 10/25/2037 | | | 290,474 | | | | 0.2 | |
| 248,774 | | Fannie Mae REMIC Trust 2010-109 SN, 16.544%, (-5.000*US0001M + 25.000%), 10/25/2040 | | | 634,878 | | | | 0.3 | |
| 93,347 | | Fannie Mae REMIC Trust 2010-155 PL, 5.000%, 07/25/2040 | | | 99,746 | | | | 0.1 | |
| 2,808,115 (5) | | Fannie Mae REMIC Trust 2011-55 SK, 4.768%, (-1.000*US0001M + 6.560%), 06/25/2041 | | | 572,205 | | | | 0.3 | |
| 2,235,555 (5) | | Fannie Mae REMIC Trust 2011-86 NS, 4.158%, (-1.000*US0001M + 5.950%), 09/25/2041 | | | 356,487 | | | | 0.2 | |
| 1,441,018 (5) | | Fannie Mae REMIC Trust 2012-10 US, 4.658%, (-1.000*US0001M + 6.450%), 02/25/2042 | | | 186,471 | | | | 0.1 | |
| 1,168,695 (5) | | Fannie Mae REMIC Trust 2012-110 JI, 4.000%, 06/25/2042 | | | 156,123 | | | | 0.1 | |
| 3,843,466 (5) | | Fannie Mae REMIC Trust 2012-133 PS, 4.408%, (-1.000*US0001M + 6.200%), 03/25/2042 | | | 373,538 | | | | 0.2 | |
| 1,919,059 (5) | | Fannie Mae REMIC Trust 2012-144 SB, 4.308%, (-1.000*US0001M + 6.100%), 01/25/2043 | | | 427,387 | | | | 0.2 | |
| 1,988,279 (5) | | Fannie Mae REMIC Trust 2012-27 SB, 4.188%, (-1.000*US0001M + 5.980%), 11/25/2041 | | | 272,676 | | | | 0.1 | |
| 23,601 | | Fannie Mae REMIC Trust 2013-130 ST, 8.000%, (-16.000*US0001M + 64.000%), 05/25/2043 | | | 26,437 | | | | 0.0 | |
| 1,267,031 (5) | | Fannie Mae REMIC Trust 2013-64 LI, 3.000%, 06/25/2033 | | | 145,748 | | | | 0.1 | |
| 7,393,218 (5) | | Fannie Mae REMICS 2012-138 DI, 3.000%, 12/25/2027 | | | 482,820 | | | | 0.2 | |
| 6,700,497 (5) | | Freddie Mac 3502 DL, 4.260%, (-1.000*US0001M + 6.000%), 01/15/2039 | | | 1,234,061 | | | | 0.6 | |
| 24,568 | | Freddie Mac REMIC Trust 1360 PZ, 7.500%, 09/15/2022 | | | 25,782 | | | | 0.0 | |
| 16,301 | | Freddie Mac REMIC Trust 1674 Z, 6.750%, 02/15/2024 | | | 17,279 | | | | 0.0 | |
| 32,553 | | Freddie Mac REMIC Trust 1897 K, 7.000%, 09/15/2026 | | | 35,695 | | | | 0.0 | |
| 7,245 (5) | | Freddie Mac REMIC Trust 2035 PE, 7.000%, 03/15/2028 | | | 1,408 | | | | 0.0 | |
| 37,761 (5) | | Freddie Mac REMIC Trust 2049 PL, 7.000%, 04/15/2028 | | | 7,077 | | | | 0.0 | |
| 19,762 | | Freddie Mac REMIC Trust 2122 F, 2.190%, (US0001M + 0.450%), 02/15/2029 | | | 19,435 | | | | 0.0 | |
| 59,403 (5) | | Freddie Mac REMIC Trust 2134 SB, 5.960%, (-1.000*US0001M + 7.700%), 03/15/2029 | | | 8,681 | | | | 0.0 | |
See Accompanying Notes to Financial Statements
| Voya Global Bond Portfolio | PORTFOLIO OF INVESTMENTS
as ofDecember 31, 2019 (CONTINUED) |
| 63,313 (5) | | Freddie Mac REMIC Trust 2136 SG, 5.910%, (-1.000*US0001M + 7.650%), 03/15/2029 | | | 10,515 | | | | 0.0 | |
| 85,181 (5) | | Freddie Mac REMIC Trust 2177 SB, 7.210%, (-1.000*US0001M + 8.950%), 08/15/2029 | | | 16,202 | | | | 0.0 | |
| 10,107 | | Freddie Mac REMIC Trust 2344 FP, 2.690%, (US0001M + 0.950%), 08/15/2031 | | | 10,299 | | | | 0.0 | |
| 4,357 | | Freddie Mac REMIC Trust 2412 GF, 2.690%, (US0001M + 0.950%), 02/15/2032 | | | 4,441 | | | | 0.0 | |
| 35,904 | | Freddie Mac REMIC Trust 2415 ZA, 6.500%, 02/15/2032 | | | 41,583 | | | | 0.0 | |
| 5,554 | | Freddie Mac REMIC Trust 2464 FI, 2.740%, (US0001M + 1.000%), 02/15/2032 | | | 5,671 | | | | 0.0 | |
| 5,697 | | Freddie Mac REMIC Trust 2470 LF, 2.740%, (US0001M + 1.000%), 02/15/2032 | | | 5,817 | | | | 0.0 | |
| 8,091 | | Freddie Mac REMIC Trust 2471 FD, 2.740%, (US0001M + 1.000%), 03/15/2032 | | | 8,261 | | | | 0.0 | |
| 6,578 | | Freddie Mac REMIC Trust 2504 FP, 2.240%, (US0001M + 0.500%), 03/15/2032 | | | 6,588 | | | | 0.0 | |
| 23,605 | | Freddie Mac REMIC Trust 2551 LF, 2.240%, (US0001M + 0.500%), 01/15/2033 | | | 23,663 | | | | 0.0 | |
| 46,649 | | Freddie Mac REMIC Trust 2676 KY, 5.000%, 09/15/2023 | | | 48,434 | | | | 0.0 | |
| 315,473 | | Freddie Mac REMIC Trust 2750 XG, 5.000%, 02/15/2034 | | | 350,388 | | | | 0.2 | |
| 260,755 | | Freddie Mac REMIC Trust 2890 PE, 5.000%, 11/15/2034 | | | 286,676 | | | | 0.2 | |
| 51,461 | | Freddie Mac REMIC Trust 3001 HT, 8.000%, (-6.667*US0001M + 44.667%), 05/15/2035 | | | 58,169 | | | | 0.0 | |
| 52,483 (5) | | Freddie Mac REMIC Trust 3004 SB, 4.410%, (-1.000*US0001M + 6.150%), 07/15/2035 | | | 6,428 | | | | 0.0 | |
| 11,984 | | Freddie Mac REMIC Trust 3025 SJ, 18.371%, (-3.667*US0001M + 24.750%), 08/15/2035 | | | 19,365 | | | | 0.0 | |
| 660,387 (5) | | Freddie Mac REMIC Trust 3223 S, 4.210%, (-1.000*US0001M + 5.950%), 10/15/2036 | | | 97,387 | | | | 0.1 | |
| 1,961,439 (5) | | Freddie Mac REMIC Trust 3505 SA, 4.260%, (-1.000*US0001M + 6.000%), 01/15/2039 | | | 384,188 | | | | 0.2 | |
| 2,231,095 (5) | | Freddie Mac REMIC Trust 3702 S, 2.710%, (-1.000*US0001M + 4.450%), 05/15/2036 | | | 242,467 | | | | 0.1 | |
| 489,567 (5) | | Freddie Mac REMIC Trust 3710 SL, 4.260%, (-1.000*US0001M + 6.000%), 05/15/2036 | | | 5,859 | | | | 0.0 | |
| 2,205,813 (5) | | Freddie Mac REMIC Trust 3925 SD, 4.310%, (-1.000*US0001M + 6.050%), 07/15/2040 | | | 220,366 | | | | 0.1 | |
| 1,098,907 (5) | | Freddie Mac REMIC Trust 4136 SW, 4.510%, (-1.000*US0001M + 6.250%), 11/15/2032 | | | 150,606 | | | | 0.1 | |
| 543,096 (5) | | Freddie Mac REMIC Trust 4161 CI, 4.000%, 02/15/2043 | | | 92,378 | | | | 0.1 | |
| 8,197,353 (5) | | Freddie Mac REMIC Trust 4194 GI, 4.000%, 04/15/2043 | | | 1,186,749 | | | | 0.6 | |
| 991,102 (5) | | Freddie Mac Series 4120 IK, 3.000%, 10/15/2032 | | | 107,039 | | | | 0.1 | |
| 250,000 | | Freddie Mac Structured Agency Credit Risk Debt Notes 2015-DNA2 M3, 5.692%, (US0001M + 3.900%), 12/25/2027 | | | 258,724 | | | | 0.1 | |
| 100,000 | | Freddie Mac Structured Agency Credit Risk Debt Notes 2015-DNA3 M3, 6.492%, (US0001M + 4.700%), 04/25/2028 | | | 110,882 | | | | 0.1 | |
| 168,807 | | Freddie Mac Structured Agency Credit Risk Debt Notes 2015-HQ1 M3, 5.592%, (US0001M + 3.800%), 03/25/2025 | | | 173,232 | | | | 0.1 | |
| 500,000 | | Freddie Mac Structured Agency Credit Risk Debt Notes 2017-DNA2 M2, 5.242%, (US0001M + 3.450%), 10/25/2029 | | | 533,114 | | | | 0.3 | |
| 400,000 | | Freddie Mac Structured Agency Credit Risk Debt Notes 2017-DNA3 M2, 4.292%, (US0001M + 2.500%), 03/25/2030 | | | 409,771 | | | | 0.2 | |
| 600,000 | | Freddie Mac Structured Agency Credit Risk Debt Notes 2017-HQA2 M2, 4.442%, (US0001M + 2.650%), 12/25/2029 | | | 617,068 | | | | 0.3 | |
| 55,496 (4) | | Freddie Mac Whole Loan Securities Trust 2016-SC02 M1, 3.601%, 10/25/2046 | | | 55,848 | | | | 0.0 | |
| 346,044 | | Ginnie Mae Series 2007-8 SP, 16.327%, (-3.242*US0001M + 22.049%), 03/20/2037 | | | 541,406 | | | | 0.3 | |
| 214,589 (5) | | Ginnie Mae Series 2010-165 IP, 4.000%, 04/20/2038 | | | 708 | | | | 0.0 | |
| 1,791,448 (5) | | Ginnie Mae Series 2010-68 MS, 4.085%, (-1.000*US0001M + 5.850%), 06/20/2040 | | | 305,039 | | | | 0.2 | |
| 1,260,408 (5) | | Ginnie Mae Series 2012-97 SC, 4.960%, (-1.000*US0001M + 6.700%), 07/16/2041 | | | 219,507 | | | | 0.1 | |
| 215,339 | | GreenPoint Mortgage Funding Trust 2006-AR3 4A1, 2.002%, (US0001M + 0.210%), 04/25/2036 | | | 207,738 | | | | 0.1 | |
See Accompanying Notes to Financial Statements
| Voya Global Bond Portfolio | PORTFOLIO OF INVESTMENTS
as ofDecember 31, 2019 (CONTINUED) |
| 220,041 (1),(4) | | GS Mortgage-Backed Securities Corp. Trust 2019-PJ2 A1, 4.000%, 11/25/2049 | | | 223,449 | | | | 0.1 | |
| 191,044 (1),(4) | | GS Mortgage-Backed Securities Corp. Trust 2019-PJ3 A1, 3.500%, 03/25/2050 | | | 193,947 | | | | 0.1 | |
| 26,565 (4) | | GSR Mortgage Loan Trust 2005-AR6 1A4, 4.704%, 09/25/2035 | | | 26,995 | | | | 0.0 | |
| 559,317 | | IndyMac INDX Mortgage Loan Trust 2006-AR2 1A1B, 2.002%, (US0001M + 0.210%), 04/25/2046 | | | 531,263 | | | | 0.3 | |
| 200,000 (1),(4) | | JP Morgan Mortgage Trust 2019-INV3 A15, 3.500%, 05/25/2050 | | | 203,094 | | | | 0.1 | |
| 400,000 (1),(4) | | JP Morgan Mortgage Trust 2019-INV3 A3, 3.500%, 05/25/2050 | | | 407,688 | | | | 0.2 | |
| 288,631 (1),(4) | | JP Morgan Mortgage Trust 2019-LTV3 A15, 3.500%, 12/31/2049 | | | 292,336 | | | | 0.2 | |
| 615,843 (4) | | JP Morgan Mortgage Trust 2005-A4 B1, 4.329%, 07/25/2035 | | | 625,906 | | | | 0.3 | |
| 63,388 (4) | | JP Morgan Mortgage Trust 2007-A1 7A1, 4.459%, 07/25/2035 | | | 64,316 | | | | 0.0 | |
| 253,002 (1),(4) | | JP Morgan Mortgage Trust 2017-3 1A13, 3.500%, 08/25/2047 | | | 254,432 | | | | 0.1 | |
| 282,766 (1),(4) | | JP Morgan Mortgage Trust 2017-3 B1, 3.845%, 08/25/2047 | | | 295,115 | | | | 0.2 | |
| 257,765 (1),(4) | | JP Morgan Mortgage Trust 2019-LTV2 A18, 4.000%, 12/25/2049 | | | 264,572 | | | | 0.1 | |
| 138,105 | | Lehman XS Trust Series 2005-5N 1A2, 2.152%, (US0001M + 0.360%), 11/25/2035 | | | 127,853 | | | | 0.1 | |
| 64,152 (4) | | MASTR Adjustable Rate Mortgages Trust 2006-2 1A1, 4.733%, 04/25/2036 | | | 65,355 | | | | 0.0 | |
| 2,177,059 (4) | | RALI Series Trust 2006-QO1 X2, 2.723%, 02/25/2046 | | | 240,259 | | | | 0.1 | |
| 59,020 (1),(4) | | Sequoia Mortgage Trust 2018-CH1 A19, 4.000%, 02/25/2048 | | | 59,894 | | | | 0.0 | |
| 657,258 (4) | | TBW Mortgage-Backed Trust 2007-2 A1A, 5.965%, 07/25/2037 | | | 336,978 | | | | 0.2 | |
| 5,993,590 (4),(5) | | WaMu Mortgage Pass-Through Certificates Series 2005-AR11 X, 1.276%, 08/25/2045 | | | 216,834 | | | | 0.1 | |
| 37,808 (4) | | WaMu Mortgage Pass-Through Certificates Series 2006-AR12 1A1, 3.693%, 10/25/2036 | | | 37,237 | | | | 0.0 | |
| 709,490 (4) | | WaMu Mortgage Pass-Through Certificates Series 2006-AR16 3A1, 3.522%, 12/25/2036 | | | 684,874 | | | | 0.3 | |
| 130,284 (4) | | WaMu Mortgage Pass-Through Certificates Series 2006-AR8 1A4, 3.875%, 08/25/2046 | | | 126,517 | | | | 0.1 | |
| 290,352 (4) | | WaMu Mortgage Pass-Through Certificates Series 2007-HY2 1A1, 3.804%, 12/25/2036 | | | 290,949 | | | | 0.2 | |
| 79,955 (4) | | WaMu Mortgage Pass-Through Certificates Series 2007-HY4 1A1, 3.501%, 04/25/2037 | | | 73,757 | | | | 0.0 | |
| 96,763 | | Wells Fargo Alternative Loan 2007-PA2 2A1, 2.222%, (US0001M + 0.430%), 06/25/2037 | | | 80,386 | | | | 0.0 | |
| 181,417 (1),(4) | | WinWater Mortgage Loan Trust 2015-5 B4, 3.777%, 08/20/2045 | | | 181,041 | | | | 0.1 | |
| | | | | | | | | | | |
| | Total Collateralized Mortgage Obligations | | | | | | | | |
| | (Cost $28,696,758) | | | 30,954,701 | | | | 15.4 | |
| | | | | | | | | | | |
| SOVEREIGN BONDS: 10.9% | | | | | | | | |
| | | Brazil: 1.0% | | | | | | | | |
| BRL 7,000,000 | | Brazil Notas do Tesouro Nacional Serie F, 10.000%, 01/01/2027 | | | 1,956,881 | | | | 1.0 | |
| | | | | | | | | | | |
| | | Chile: 0.1% | | | | | | | | |
| CLP 155,000,000 | | Bonos de la Tesoreria de la Republica en pesos, 5.100%, 07/15/2050 | | | 249,832 | | | | 0.1 | |
| | | | | | | | | | | |
| | | Germany: 4.8% | | | | | | | | |
| EUR 1,010,000 (6) | | Bundesobligation, 0.000%, 10/08/2021 | | | 1,145,550 | | | | 0.6 | |
| EUR 30,000 | | Bundesrepublik Deutschland Bundesanleihe, 0.500%, 02/15/2028 | | | 35,872 | | | | 0.0 | |
| EUR 200,000 | | Bundesrepublik Deutschland Bundesanleihe, 1.250%, 08/15/2048 | | | 281,820 | | | | 0.1 | |
| EUR 10,000 | | Bundesrepublik Deutschland Bundesanleihe, 2.000%, 08/15/2023 | | | 12,267 | | | | 0.0 | |
| EUR 660,000 | | Bundesrepublik Deutschland Bundesanleihe, 2.500%, 08/15/2046 | | | 1,160,886 | | | | 0.6 | |
| EUR 120,000 | | Bundesrepublik Deutschland Bundesanleihe, 0.000%, 08/15/2026 | | | 138,088 | | | | 0.1 | |
| EUR 5,770,000 | | Bundesrepublik Deutschland, 0.500%, 02/15/2025 | | | 6,798,348 | | | | 3.4 | |
| EUR 10,000 | | Bundesschatzanweisungen, 0.000%, 03/13/2020 | | | 11,231 | | | | 0.0 | |
| | | | | | 9,584,062 | | | | 4.8 | |
| | | | | | | | | | | |
| | | Indonesia: 0.2% | | | | | | | | |
| IDR 6,452,000,000 | | Indonesia Treasury Bond, 8.375%, 04/15/2039 | | | 498,453 | | | | 0.2 | |
See Accompanying Notes to Financial Statements
| Voya Global Bond Portfolio | PORTFOLIO OF INVESTMENTS
as ofDecember 31, 2019 (CONTINUED) |
| | | Italy: 0.7% | | | | | | | | |
| EUR 438,000 (1) | | Italy Buoni Poliennali Del Tesoro, 3.850%, 09/01/2049 | | | 636,608 | | | | 0.3 | |
| EUR 438,000 (1) | | Italy Buoni Poliennali Del Tesoro, 5.000%, 08/01/2034 | | | 690,841 | | | | 0.4 | |
| | | | | | 1,327,449 | | | | 0.7 | |
| | | | | | | | | | | |
| | | Mexico: 0.5% | | | | | | | | |
| MXN 18,580,000 | | Mexican Bonos, 7.750%, 11/13/2042 | | | 1,043,104 | | | | 0.5 | |
| | | | | | | | | | | |
| | | Peru: 1.0% | | | | | | | | |
| PEN 5,649,000 (1) | | Peru Government Bond, 6.150%, 08/12/2032 | | | 1,933,840 | | | | 1.0 | |
| | | | | | | | | | | |
| | | Portugal: 0.7% | | | | | | | | |
| EUR 1,135,000 (1) | | Portugal Obrigacoes do Tesouro OT, 2.250%, 04/18/2034 | | | 1,523,141 | | | | 0.7 | |
| | | | | | | | | | | |
| | | Russia: 0.7% | | | | | | | | |
| RUB 76,937,000 | | Russian Federal Bond - OFZ, 7.250%, 05/10/2034 | | | 1,336,903 | | | | 0.7 | |
| | | | | | | | | | | |
| | | Spain: 1.2% | | | | | | | | |
| EUR 870,000 (1) | | Spain Government Bond, 1.450%, 04/30/2029 | | | 1,067,001 | | | | 0.5 | |
| EUR 908,000 (1) | | Spain Government Bond, 2.700%, 10/31/2048 | | | 1,354,718 | | | | 0.7 | |
| | | | | | 2,421,719 | | | | 1.2 | |
| | | | | | | | | | | |
| | Total Sovereign Bonds | | | | | | | | |
| | (Cost $21,625,099) | | | 21,875,384 | | | | 10.9 | |
| | | | | | | | | | | |
| U.S. TREASURY OBLIGATIONS: 11.4% | | | | | | | | |
| | | Treasury Inflation Indexed Protected Securities: 3.1% | | | | | | | | |
| 6,199,403 | | 0.250%,07/15/2029 | | | 6,261,830 | | | | 3.1 | |
| | | | | | | | | | | |
| | | U.S. Treasury Bonds: 1.8% | | | | | | | | |
| 3,505,000 | | 2.250%,08/15/2049 | | | 3,397,174 | | | | 1.7 | |
| 250,000 | | 3.500%,02/15/2039 | | | 299,401 | | | | 0.1 | |
| | | | | | 3,696,575 | | | | 1.8 | |
| | | | | | | | | | | |
| | | U.S. Treasury Notes: 6.5% | | | | | | | | |
| 10,000 | | 1.500%,10/31/2024 | | | 9,909 | | | | 0.0 | |
| 2,399,600 | | 1.625%,12/31/2021 | | | 2,402,021 | | | | 1.2 | |
| 1,691,000 | | 1.625%,12/15/2022 | | | 1,691,803 | | | | 0.8 | |
| 1,927,500 | | 1.750%,12/31/2024 | | | 1,931,873 | | | | 1.0 | |
| 2,730,000 | | 1.750%,12/31/2026 | | | 2,714,213 | | | | 1.4 | |
| 4,152,000 (7) | | 1.750%,11/15/2029 | | | 4,086,637 | | | | 2.0 | |
| 268,000 | | 2.125%,01/31/2021 | | | 269,404 | | | | 0.1 | |
| | | | | | 13,105,860 | | | | 6.5 | |
| | | | | | | | | | | |
| | Total U.S. Treasury Obligations | | | | | | | | |
| | (Cost $23,086,125) | | | 23,064,265 | | | | 11.4 | |
| | | | | | | | | | | |
| U.S. GOVERNMENT AGENCY OBLIGATIONS: 7.6% | | | | | | | | |
| | | Federal Home Loan Mortgage Corporation: 0.4%(8) | | | | | | | | |
| 219,489 | | 4.000%,09/01/2045 | | | 232,765 | | | | 0.1 | |
| 130,634 | | 4.000%,09/01/2045 | | | 136,902 | | | | 0.1 | |
| 123,948 | | 4.000%,09/01/2045 | | | 131,447 | | | | 0.1 | |
| 97,219 | | 4.000%,09/01/2045 | | | 103,102 | | | | 0.0 | |
| 173,527 | | 4.000%,05/01/2046 | | | 183,590 | | | | 0.1 | |
| 12 | | 5.000%,01/01/2020 | | | 13 | | | | 0.0 | |
| 226 | | 5.000%,02/01/2020 | | | 234 | | | | 0.0 | |
| 9,253 | | 5.000%,12/01/2034 | | | 10,107 | | | | 0.0 | |
| 33,811 | | 6.000%,02/01/2034 | | | 38,805 | | | | 0.0 | |
| 2,565 | | 6.500%,02/01/2022 | | | 2,683 | | | | 0.0 | |
| 3,215 | | 6.500%,09/01/2022 | | | 3,340 | | | | 0.0 | |
| 2,286 | | 6.500%,08/01/2032 | | | 2,564 | | | | 0.0 | |
| 6,031 | | 6.500%,07/01/2034 | | | 6,703 | | | | 0.0 | |
| 4,544 | | 6.500%,07/01/2034 | | | 5,050 | | | | 0.0 | |
| | | | | | 857,305 | | | | 0.4 | |
| | | | | | | | | | | |
| | | Federal National Mortgage Association: 0.1%(8) | | | | | | | | |
| 88,597 | | 4.521%, (US0012M + 1.777%),10/01/2036 | | | 93,426 | | | | 0.1 | |
| | | | | | | | | | | |
| | | Government National Mortgage Association: 2.1% | | | | | | | | |
| 4,100,000 (9) | | 3.000%,01/20/2050 | | | 4,209,047 | | | | 2.1 | |
| 32,046 | | 5.000%,04/15/2034 | | | 35,524 | | | | 0.0 | |
| 14,578 | | 6.500%,02/20/2035 | | | 16,717 | | | | 0.0 | |
| | | | | | 4,261,288 | | | | 2.1 | |
| | | | | | | | | | | |
| | | Uniform Mortgage-Backed Securities: 5.0% | | | | | | | | |
| 4,173,683 | | 3.500%,08/01/2049 | | | 4,290,799 | | | | 2.1 | |
| 72,381 | | 2.500%,06/01/2030 | | | 73,326 | | | | 0.1 | |
| 51,228 | | 2.500%,06/01/2030 | | | 51,897 | | | | 0.0 | |
| 29,412 | | 2.500%,07/01/2030 | | | 29,796 | | | | 0.0 | |
| 2,312,985 | | 3.500%,09/01/2049 | | | 2,378,652 | | | | 1.2 | |
| 132,725 | | 4.000%,05/01/2045 | | | 140,573 | | | | 0.1 | |
| 2,531,980 | | 4.000%,06/01/2049 | | | 2,632,414 | | | | 1.3 | |
| 58,995 | | 5.000%,06/01/2041 | | | 64,967 | | | | 0.0 | |
| 14,103 | | 5.500%,09/01/2024 | | | 15,173 | | | | 0.0 | |
| 852 | | 6.000%,05/01/2021 | | | 863 | | | | 0.0 | |
| 64,712 | | 6.000%,11/01/2034 | | | 74,258 | | | | 0.1 | |
| 105,798 | | 6.000%,04/01/2035 | | | 121,432 | | | | 0.1 | |
| 46,277 | | 6.500%,12/01/2029 | | | 51,410 | | | | 0.0 | |
| 19,525 | | 6.500%,01/01/2034 | | | 21,725 | | | | 0.0 | |
| 262 | | 7.000%,04/01/2033 | | | 292 | | | | 0.0 | |
| 17,413 | | 7.500%,09/01/2032 | | | 20,612 | | | | 0.0 | |
| 37,089 | | 7.500%,01/01/2033 | | | 43,144 | | | | 0.0 | |
| | | | | | 10,011,333 | | | | 5.0 | |
| | | | | | | | | | | |
| | | | | | | | | | | |
| | Total U.S. Government Agency Obligations | | | | | | | | |
| | (Cost $15,142,874) | | | 15,223,352 | | | | 7.6 | |
| | | | | | | | | | | |
| COMMERCIAL MORTGAGE-BACKED SECURITIES: 9.1% | | | | | | | | |
| | | United States: 9.1% | | | | | | | | |
| 6,909,108 (4),(5) | | BANK 2017-BNK5 XA, 1.082%, 06/15/2060 | | | 391,581 | | | | 0.2 | |
| 900,000 (1),(4) | | BANK 2017-BNK6 E, 2.653%, 07/15/2060 | | | 654,448 | | | | 0.3 | |
| 1,948,000 (1),(4),(5) | | BANK 2017-BNK6 XE, 1.500%, 07/15/2060 | | | 184,765 | | | | 0.1 | |
| 995,608 (4),(5) | | BANK 2019-BNK16 XA, 0.967%, 02/15/2052 | | | 69,766 | | | | 0.0 | |
| 8,020,000 (1),(4),(5) | | BBCCRE Trust 2015-GTP XA, 0.597%, 08/10/2033 | | | 265,846 | | | | 0.1 | |
| 210,000 (1) | | Benchmark 2019-B9 D Mortgage Trust, 3.000%, 03/15/2052 | | | 187,755 | | | | 0.1 | |
| 1,197,424 (4),(5) | | Benchmark 2019-B9 XA Mortgage Trust, 1.047%, 03/15/2052 | | | 94,564 | | | | 0.0 | |
| 690,000 (1) | | BX Commercial Mortgage Trust 2019-XL J, 4.390%, (US0001M + 2.650%), 10/15/2036 | | | 692,611 | | | | 0.3 | |
| 270,000 (1) | | BX Trust 2019-OC11 E, 4.076%, 12/09/2041 | | | 262,206 | | | | 0.1 | |
See Accompanying Notes to Financial Statements
| Voya Global Bond Portfolio | PORTFOLIO OF INVESTMENTS
as ofDecember 31, 2019 (CONTINUED) |
| 1,834,338 (4),(5) | | CD 2016-CD1 Mortgage Trust XA, 1.409%, 08/10/2049 | | | 130,551 | | | | 0.1 | |
| 7,900,000 (4),(5) | | Citigroup Commercial Mortgage Trust 2016-C2 XB, 0.846%, 08/10/2049 | | | 406,043 | | | | 0.2 | |
| 3,208,075 (4),(5) | | Citigroup Commercial Mortgage Trust 2017-C4 XA, 1.109%, 10/12/2050 | | | 203,994 | | | | 0.1 | |
| 3,244,376 (4),(5) | | COMM 2012-CR1 XA, 1.856%, 05/15/2045 | | | 119,811 | | | | 0.1 | |
| 9,501,587 (1),(4),(5) | | COMM 2012-LTRT XA, 0.930%, 10/05/2030 | | | 184,180 | | | | 0.1 | |
| 11,181,226 (4),(5) | | COMM 2014-CR16 XA, 0.978%, 04/10/2047 | | | 398,668 | | | | 0.2 | |
| 570,000 (1),(4) | | COMM 2014-LC15 D Mortgage Trust, 4.984%, 04/10/2047 | | | 579,591 | | | | 0.3 | |
| 570,000 (4) | | COMM 2016-COR1 C, 4.383%, 10/10/2049 | | | 591,346 | | | | 0.3 | |
| 4,398,398 (4),(5) | | COMM 2016-CR28 XA, 0.687%, 02/10/2049 | | | 137,855 | | | | 0.1 | |
| 1,000,000 (4) | | COMM 2017-COR2 C, 4.562%, 09/10/2050 | | | 1,061,871 | | | | 0.5 | |
| 200,000 (4) | | CSAIL 2015-C2 C Commercial Mortgage Trust, 4.192%, 06/15/2057 | | | 194,247 | | | | 0.1 | |
| 290,000 (1),(4) | | DBJPM 16-C3 Mortgage Trust, 3.491%, 08/10/2049 | | | 279,017 | | | | 0.1 | |
| 1,269,940 (1),(4),(5) | | DBUBS 2011-LC1A XA, 0.700%, 11/10/2046 | | | 4,891 | | | | 0.0 | |
| 270,000 (1) | | Fontainebleau Miami Beach Trust 2019-FBLU F, 4.095%, 12/10/2036 | | | 265,241 | | | | 0.1 | |
| 3,840,000 (4),(5) | | Freddie Mac Multifamily Structured Pass Through Certificates K013 X3, 2.815%, 01/25/2043 | | | 109,266 | | | | 0.1 | |
| 7,000,000 (4),(5) | | Freddie Mac Multifamily Structured Pass Through Certificates K035 X3, 1.791%, 12/25/2041 | | | 426,569 | | | | 0.2 | |
| 36,859,883 (1),(5) | | FREMF Mortgage Trust 2012-K17 X2A, 0.100%, 12/25/2044 | | | 54,844 | | | | 0.0 | |
| 255,000 (1) | | GPT 2018-GPP D Mortgage Trust, 3.590%, (US0001M + 1.850%), 06/15/2035 | | | 252,931 | | | | 0.1 | |
| 450,000 (1),(4) | | GRACE 2014-GRCE F Mortgage Trust, 3.590%, 06/10/2028 | | | 451,670 | | | | 0.2 | |
| 100,000 (1),(4) | | GS Mortgage Securities Trust 2010-C2 F, 4.548%, 12/10/2043 | | | 98,860 | | | | 0.0 | |
| 1,934,226 (4),(5) | | GS Mortgage Securities Trust 2012-GCJ7 XA, 2.161%, 05/10/2045 | | | 54,077 | | | | 0.0 | |
| 180,000 (1) | | GS Mortgage Securities Trust 2013-GC16 G, 3.500%, 11/10/2046 | | | 156,717 | | | | 0.1 | |
| 3,952,071 (4),(5) | | GS Mortgage Securities Trust 2013-GC16 XA, 1.035%, 11/10/2046 | | | 135,135 | | | | 0.1 | |
| 690,000 (1),(4) | | GS Mortgage Securities Trust 2016-GS4 E, 3.800%, 11/10/2049 | | | 553,680 | | | | 0.3 | |
| 2,313,067 (4),(5) | | GS Mortgage Securities Trust 2017-GS6 XA, 1.042%, 05/10/2050 | | | 150,576 | | | | 0.1 | |
| 410,000 (1),(4) | | GS Mortgage Securities Trust 2019-GC40 DBD, 3.550%, 07/10/2052 | | | 408,858 | | | | 0.2 | |
| 310,000 (1),(4) | | GS Mortgage Securities Trust 2019-GC40 DBE, 3.550%, 07/10/2052 | | | 302,346 | | | | 0.2 | |
| 360,000 (1),(4) | | Jackson Park Trust 2019-LIC F, 3.242%, 10/14/2039 | | | 310,809 | | | | 0.2 | |
| 1,740,000 (1),(4) | | JP Morgan Chase Commercial Mortgage Securities Trust 2011-C5 E, 4.000%, 08/15/2046 | | | 1,707,112 | | | | 0.8 | |
| 5,715,174 (4),(5) | | JP Morgan Chase Commercial Mortgage Securities Trust 2012-CIBX XA, 1.478%, 06/15/2045 | | | 126,374 | | | | 0.1 | |
| 660,000 (4) | | JPMBB Commercial Mortgage Securities Trust 2014-C18 AS, 4.439%, 02/15/2047 | | | 703,060 | | | | 0.4 | |
| 334,698 (4) | | LB-UBS Commercial Mortgage Trust 2005-C3 F, 5.013%, 07/15/2040 | | | 334,837 | | | | 0.2 | |
| 3,024,022 (1),(4),(5) | | LSTAR Commercial Mortgage Trust 2017-5 X, 1.084%, 03/10/2050 | | | 119,413 | | | | 0.1 | |
| 1,090,000 (1),(4) | | Morgan Stanley Bank of America Merrill Lynch Trust 2012-C6 E, 4.608%, 11/15/2045 | | | 1,100,551 | | | | 0.5 | |
| 18,750,000 (1),(4),(5) | | Morgan Stanley Bank of America Merrill Lynch Trust 2014 C19 XB, 0.455%, 12/15/2047 | | | 410,893 | | | | 0.2 | |
| 440,000 (1),(4) | | Morgan Stanley Bank of America Merrill Lynch Trust 2014-C15 D, 4.910%, 04/15/2047 | | | 461,706 | | | | 0.2 | |
| 570,000 (1),(4) | | Morgan Stanley Capital I Trust 2011-C1 D, 5.375%, 09/15/2047 | | | 584,265 | | | | 0.3 | |
| 170,000 (1) | | MRCD 2019-PARK E Mortgage Trust, 2.718%, 12/15/2036 | | | 160,911 | | | | 0.1 | |
| 320,000 (1) | | MRCD 2019-PARK F Mortgage Trust, 2.718%, 12/15/2036 | | | 297,747 | | | | 0.1 | |
| 220,000 (1) | | Wells Fargo Commercial Mortgage Trust 2010-C1 F, 4.000%, 11/15/2043 | | | 217,836 | | | | 0.1 | |
| 3,123,618 (1),(4),(5) | | WFRBS Commercial Mortgage Trust 2012-C8 XA, 1.811%, 08/15/2045 | | | 112,769 | | | | 0.1 | |
| 550,000 (1),(4) | | WFRBS Commercial Mortgage Trust 2013-C11 F, 4.261%, 03/15/2045 | | | 531,150 | | | | 0.3 | |
| 330,000 (1),(4) | | WFRBS Commercial Mortgage Trust 2013-C14 D, 3.977%, 06/15/2046 | | | 314,981 | | | | 0.2 | |
| 9,269,806 (4),(5) | | WFRBS Commercial Mortgage Trust 2014-C19 XA, 1.032%, 03/15/2047 | | | 293,335 | | | | 0.1 | |
| | | | | | | | | | | |
| | Total Commercial Mortgage-Backed Securities | | | | | | | | |
| | (Cost $17,838,337) | | | 18,304,126 | | | | 9.1 | |
See Accompanying Notes to Financial Statements
| Voya Global Bond Portfolio | PORTFOLIO OF INVESTMENTS
as ofDecember 31, 2019 (CONTINUED) |
| ASSET-BACKED SECURITIES: 4.3% | | | | | | | | |
| | | Cayman Islands: 1.1% | | | | | | | | |
| 500,000 (1) | | Barings Clo Ltd. 2019-4A C, 4.703%, (US0003M + 2.800%), 01/15/2033 | | | 499,980 | | | | 0.3 | |
| 400,000 (1) | | Clear Creek CLO 2015-1A CR, 3.916%, (US0003M + 1.950%), 10/20/2030 | | | 386,419 | | | | 0.2 | |
| 400,000 (1) | | Galaxy XXI CLO Ltd. 2015-21A CR, 3.716%, (US0003M + 1.750%), 04/20/2031 | | | 380,219 | | | | 0.2 | |
| 500,000 (1) | | Jay Park CLO Ltd. 2016-1A BR, 3.966%, (US0003M + 2.000%), 10/20/2027 | | | 487,852 | | | | 0.2 | |
| 400,000 (1) | | Shackleton CLO Ltd. 2019-15A C, 4.703%, (US0003M + 2.800%), 01/15/2030 | | | 399,984 | | | | 0.2 | |
| | | | | | 2,154,454 | | | | 1.1 | |
| | | | | | | | | | | |
| | | United States: 3.2% | | | | | | | | |
| 500,000 (1) | | AMMC CLO 16 Ltd. 2015-16A CR, 4.351%, (US0003M + 2.350%), 04/14/2029 | | | 497,478 | | | | 0.3 | |
| 412,500 (1) | | BlueMountain CLO 2013-2A CR, 3.903%, (US0003M + 1.950%), 10/22/2030 | | | 395,011 | | | | 0.2 | |
| 400,000 (1) | | CIFC Funding 2013-IA BR Ltd., 4.401%, (US0003M + 2.400%), 07/16/2030 | | | 390,420 | | | | 0.2 | |
| 281,072 (4) | | Citigroup Mortgage Loan Trust 2006-WF1 A2E, 4.866%, 03/25/2036 | | | 194,696 | | | | 0.1 | |
| 1,040,000 (1) | | Invitation Homes 2018-SFR1 D Trust, 3.187%, (US0001M + 1.450%), 03/17/2037 | | | 1,039,471 | | | | 0.5 | |
| 500,000 (1) | | LCM XXIV Ltd. 24A C, 4.216%, (US0003M + 2.250%), 03/20/2030 | | | 482,812 | | | | 0.2 | |
| 250,000 (1) | | Madison Park Funding XXVII Ltd. 2018-27A B, 3.766%, (US0003M + 1.800%), 04/20/2030 | | | 240,910 | | | | 0.1 | |
| 400,000 (1) | | Madison Park Funding XXXI Ltd. 2018-31A C, 4.084%, (US0003M + 2.150%), 01/23/2031 | | | 397,132 | | | | 0.2 | |
| 200,000 (1),(4) | | Mill City Mortgage Loan Trust 2017-2 M2, 3.250%, 07/25/2059 | | | 204,365 | | | | 0.1 | |
| 575,000 (1) | | Palmer Square Loan Funding 2017-1A D Ltd., 6.851%, (US0003M + 4.850%), 10/15/2025 | | | 571,651 | | | | 0.3 | |
| 250,000 (1) | | Palmer Square Loan Funding 2018-1A C Ltd., 3.851%, (US0003M + 1.850%), 04/15/2026 | | | 242,378 | | | | 0.1 | |
| 1,060,000 (1) | | Progress Residential 2018-SFR2 E Trust, 4.656%, 08/17/2035 | | | 1,084,110 | | | | 0.5 | |
| 250,000 (1) | | THL Credit Wind River 2013-2A CR CLO Ltd., 4.003%, (US0003M + 2.000%), 10/18/2030 | | | 234,943 | | | | 0.1 | |
| 560,000 (1) | | THL Credit Wind River 2017-3A C CLO Ltd., 4.201%, (US0003M + 2.200%), 10/15/2030 | | | 551,369 | | | | 0.3 | |
| | | | | | 6,526,746 | | | | 3.2 | |
| | | | | | | | | | | |
| | Total Asset-Backed Securities | | | | | | | | |
| | (Cost $8,741,366) | | | 8,681,200 | | | | 4.3 | |
| | | | | | | | | | | |
| | | | | | | | | | | |
| STRUCTURED NOTES: 0.0% | | | |
| | | Russia: 0.0% |
| RUB 3,958,045 (2) | | Morgan Stanley & Co. International PLC - EM Whole Loan SA /Russian Federation Total Return Linked Bonds, Series 007, Cl. VR, 5.000%, 08/22/2034 | | | 10,692 | | | | 0.0 | |
| | | | | | | | | | | |
| | Total Structured Notes | | | | | | | | |
| | (Cost $141,849) | | | 10,692 | | | | 0.0 | |
| | | | | | | | | |
| Shares | | | | Value | | | Percentage
of Net
Assets | |
| COMMON STOCK: 0.0% |
| | | United States: 0.0% | | | | | | | | |
| 43,083 (2),(7),(10) | | American Media, Inc. | | | – | | | | – | |
| 18 (10) | | Ingevity Corp. | | | 1,573 | | | | 0.0 | |
| 4,988 (10) | | Resolute Forest Products, Inc. | | | 20,950 | | | | 0.0 | |
| 120 | | WestRock Co. | | | 5,149 | | | | 0.0 | |
| | | | | | | | | | | |
| | Total Common Stock | | | | | | | | |
| | (Cost $1,305,734) | | | 27,672 | | | | 0.0 | |
| | | | | | | | | | | |
| MUTUAL FUNDS: 19.2% |
| | | United States: 19.2% | | | | | | | | |
| 643,128 | | Voya Emerging Markets Corporate Debt Fund - Class P | | | 6,534,186 | | | | 3.2 | |
| 1,127,507 | | Voya Emerging Markets Hard Currency Debt Fund - Class P | | | 11,083,391 | | | | 5.5 | |
| 1,853,229 | | Voya Emerging Markets Local Currency Debt Fund - Class P | | | 13,806,553 | | | | 6.9 | |
| 905,054 | | Voya High Yield Bond Fund - Class P | | | 7,285,686 | | | | 3.6 | |
| | | | | | | | | | | |
| | Total Mutual Funds | | | | | | | | |
| | (Cost $40,499,130) | | | 38,709,816 | | | | 19.2 | |
| | | | | | | | | | | |
| | | | | | Value | | | | Percentage
of Net
Assets | |
| PURCHASED OPTIONS (11): 0.0% |
| | Total Purchased Options | | | | | | | | |
| | (Cost $72,275) | | | 42,509 | | | | 0.0 | |
| | | | | | | | | | | |
| | Total Long-Term Investments | | | | | | | | |
| | (Cost $197,589,519) | | | 199,325,250 | | | | 99.0 | |
See Accompanying Notes to Financial Statements
| Voya Global Bond Portfolio | PORTFOLIO OF INVESTMENTS
as ofDecember 31, 2019 (CONTINUED) |
Principal
Amount† | | | | | Value | | | | Percentage
of Net
Assets | |
| SHORT-TERM INVESTMENTS: 3.0% |
| | | Repurchase Agreements: 2.1% | | | | | | | | |
| 1,000,000 (12) | | Bank of Montreal, Repurchase Agreement dated 12/31/19, 1.57%, due 01/02/20 (Repurchase Amount $1,000,086, collateralized by various U.S. Government Agency Obligations, 2.500%-5.000%, Market Value plus accrued interest $1,020,000, due 04/20/49-12/01/49) | | | 1,000,000 | | | | 0.5 | |
| 1,000,000 (12) | | Bank of Nova Scotia, Repurchase Agreement dated 12/31/19, 1.57%, due 01/02/20 (Repurchase Amount $1,000,086, collateralized by various U.S. Government Agency Obligations, 2.500%-6.500%, Market Value plus accrued interest $1,020,089, due 09/01/24-11/01/49) | | | 1,000,000 | | | | 0.5 | |
| 199,320 (12) | | Citadel Securities LLC, Repurchase Agreement dated 12/31/19, 1.60%, due 01/02/20 (Repurchase Amount $199,337, collateralized by various U.S. Government Securities, 0.000%-8.500%, Market Value plus accrued interest $203,324, due 01/15/20-11/15/48) | | | 199,320 | | | | 0.1 | |
| 1,000,000 (12) | | Citigroup, Inc., Repurchase Agreement dated 12/31/19, 1.57%, due 01/02/20 (Repurchase Amount $1,000,086, collateralized by various U.S. Government/U.S. Government Agency Obligations, 0.000%-9.000%, Market Value plus accrued interest $1,020,000, due 02/13/20-09/20/69) | | | 1,000,000 | | | | 0.5 | |
| 1,000,000 (12) | | Morgan Stanley, Repurchase Agreement dated 12/31/19, 1.57%, due 01/02/20 (Repurchase Amount $1,000,086, collateralized by various U.S. Government Agency Obligations, 2.000%-6.500%, Market Value plus accrued interest $1,020,000, due 07/01/27-01/01/50) | | | 1,000,000 | | | | 0.5 | |
| | | | | | | | | | | |
| | Total Repurchase Agreements | | | | | | | | |
| | (Cost $4,199,320) | | | 4,199,320 | | | | 2.1 | |
| | | | | | | | | | | |
| Shares | | | | Value | | | Percentage
of Net
Assets | |
| | | Mutual Funds: 0.9% | | | | | | | | |
| 1,917,000 (13) | | Goldman Sachs Financial Square Government Fund - Institutional Shares, 1.500% | | | | | | | | |
| | | (Cost $1,917,000) | | | 1,917,000 | | | | 0.9 | |
| | | | | | | | | | | |
| | Total Short-Term Investments | | | | | | | | |
| | (Cost $6,116,320) | | | 6,116,320 | | | | 3.0 | |
| | | | | | | | | | | |
| | Total Investments in Securities
(Cost $203,705,839) | | $ | 205,441,570 | | | | 102.0 | |
| | Liabilities in Excess of Other Assets | | | (4,103,028 | ) | | | (2.0 | ) |
| | Net Assets | | $ | 201,338,542 | | | | 100.0 | |
| † | Unless otherwise indicated, principal amount is shown in USD. |
| (1) | Securities with purchases pursuant to Rule 144A or section 4(a)(2), under the Securities Act of 1933 and may not be resold subject to that rule except to qualified institutional buyers. |
| (2) | For fair value measurement disclosure purposes, security is categorized as Level 3, whose value was determined using significant unobservable inputs. |
| (3) | Defaulted security |
| (4) | Variable rate security. Rate shown is the rate in effect as of December 31, 2019. |
| (5) | Interest only securities represent the right to receive the monthly interest payments on an underlying pool of mortgage loans. Principal amount shown represents the notional amount on which current interest is calculated. Payments of principal on the pool reduce the value of the interest only security. |
| (6) | Represents a zero coupon bond. Rate shown reflects the effective yield as of December 31, 2019. |
| (7) | Security, or a portion of the security, is on loan. |
| (8) | The Federal Housing Finance Agency (“FHFA”) placed the Federal Home Loan Mortgage Corporation and Federal National Mortgage Association into conservatorship with FHFA as the conservator. As such, the FHFA oversees the continuing affairs of these companies. |
| (9) | Settlement is on a when-issued or delayed-delivery basis. |
| (10) | Non-income producing security. |
| (11) | The tables within the Portfolio of Investments detail open purchased options which are non-income producing securities. |
| (12) | All or a portion of the security represents securities purchased with cash collateral received for securities on loan. |
| (13) | Rate shown is the 7-day yield as of December 31, 2019. |
| Currency Abbreviations: |
| BRL | Brazilian Real |
| CLP | Chilean Peso |
| EUR | EU Euro |
| IDR | Indonesian Rupiah |
| MXN | Mexican Peso |
| PEN | Peruvian Nuevo Sol |
| RUB | Russian Ruble |
| ZAR | South African Rand |
| Reference Rate Abbreviations: |
| 12MTA | 12-month Treasury Average |
| US0001M | 1-month LIBOR |
| US0003M | 3-month LIBOR |
| US0012M | 12-month LIBOR |
See Accompanying Notes to Financial Statements
| Voya International High Dividend Low Volatility Portfolio | PORTFOLIO OF INVESTMENTS
as of December 31, 2019 |
| Shares | | | | Value | | | Percentage
of Net
Assets | |
| COMMON STOCK: 98.7% |
| | | Australia: 7.8% |
| 197,147 | | AGL Energy Ltd. | | $ | 2,837,650 | | | | 0.6 | |
| 1,048,839 | | Alumina Ltd. | | | 1,694,091 | | | | 0.3 | |
| 750,555 | | Aurizon Holdings Ltd. | | | 2,754,480 | | | | 0.6 | |
| 675,447 | | AusNet Services | | | 805,461 | | | | 0.2 | |
| 99,974 | | Australia & New Zealand Banking Group Ltd. | | | 1,724,149 | | | | 0.4 | |
| 57,981 | | BHP Group Ltd. | | | 1,587,652 | | | | 0.3 | |
| 589,543 | | Boral Ltd. | | | 1,854,750 | | | | 0.4 | |
| 234,833 | | Coca-Cola Amatil Ltd. | | | 1,823,631 | | | | 0.4 | |
| 197,137 | | Crown Resorts Ltd. | | | 1,662,101 | | | | 0.3 | |
| 262,223 | | Harvey Norman Holdings Ltd. | | | 748,936 | | | | 0.2 | |
| 20,987 | | Macquarie Group Ltd. | | | 2,032,470 | | | | 0.4 | |
| 82,357 | | Rio Tinto Ltd. | | | 5,826,757 | | | | 1.2 | |
| 1,010,201 | | Scentre Group | | | 2,718,708 | | | | 0.6 | |
| 94,580 | | Sonic Healthcare Ltd. | | | 1,907,009 | | | | 0.4 | |
| 392,836 | | Stockland | | | 1,274,581 | | | | 0.3 | |
| 515,758 | | Sydney Airport | | | 3,133,600 | | | | 0.6 | |
| 870,030 | | Vicinity Centres | | | 1,521,735 | | | | 0.3 | |
| 62,515 | | Woolworths Group Ltd. | | | 1,585,596 | | | | 0.3 | |
| | | | | | 37,493,357 | | | | 7.8 | |
| | | | | | | | | | | |
| | | Belgium: 0.3% | | | | | | | | |
| 29,195 | | Colruyt S.A. | | | 1,522,135 | | | | 0.3 | |
| | | | | | | | | | | |
| | | China: 0.4% | | | | | | | | |
| 516,500 | | BOC Hong Kong Holdings Ltd. | | | 1,792,992 | | | | 0.4 | |
| | | | | | | | | | | |
| | | Denmark: 3.5% | | | | | | | | |
| 20,380 | | Carlsberg A/S | | | 3,041,429 | | | | 0.6 | |
| 24,466 | | Coloplast A/S | | | 3,035,278 | | | | 0.6 | |
| 45,484 | | H Lundbeck A/S | | | 1,738,877 | | | | 0.4 | |
| 104,830 | | Novo Nordisk A/S | | | 6,074,776 | | | | 1.3 | |
| 60,942 | | Pandora A/S | | | 2,651,064 | | | | 0.6 | |
| | | | | | 16,541,424 | | | | 3.5 | |
| | | | | | | | | | | |
| | | Finland: 3.1% | | | | | | | | |
| 35,493 | | Elisa OYJ | | | 1,960,774 | | | | 0.4 | |
| 87,180 | | Neste OYJ | | | 3,033,453 | | | | 0.6 | |
| 70,878 | | Nokian Renkaat OYJ | | | 2,038,595 | | | | 0.4 | |
| 37,314 | | Orion Oyj | | | 1,728,081 | | | | 0.4 | |
| 72,966 | | Sampo OYJ | | | 3,185,938 | | | | 0.7 | |
| 83,697 | | UPM-Kymmene OYJ | | | 2,903,839 | | | | 0.6 | |
| | | | | | 14,850,680 | | | | 3.1 | |
| | | | | | | | | | | |
| | | France: 8.3% | | | | | | | | |
| 67,011 | | Bouygues SA | | | 2,856,488 | | | | 0.6 | |
| 4,335 | | Covivio | | | 492,328 | | | | 0.1 | |
| 40,044 | | Danone | | | 3,325,507 | | | | 0.7 | |
| 13,253 | | Edenred | | | 686,833 | | | | 0.1 | |
| 28,761 | | Eiffage SA | | | 3,299,674 | | | | 0.7 | |
| 196,047 | | Engie SA | | | 3,175,648 | | | | 0.7 | |
| 97,072 | | Eutelsat Communications | | | 1,577,760 | | | | 0.3 | |
| 123,361 | | Getlink SE | | | 2,150,794 | | | | 0.4 | |
| 36,232 | | Klepierre SA | | | 1,378,414 | | | | 0.3 | |
| 420,155 | | Natixis SA | | | 1,871,596 | | | | 0.4 | |
| 85,719 (1) | | Orange SA | | | 1,259,750 | | | | 0.3 | |
| 23,422 | | Peugeot S.A. | | | 563,938 | | | | 0.1 | |
| 49,577 | | Renault S.A. | | | 2,354,296 | | | | 0.5 | |
| 66,466 | | Sanofi | | | 6,675,041 | | | | 1.4 | |
| 74,805 | | Societe Generale | | | 2,610,555 | | | | 0.5 | |
| 25,815 | | Sodexo SA | | | 3,059,288 | | | | 0.7 | |
| 29,221 | | Total SA | | | 1,621,496 | | | | 0.3 | |
| 6,526 | | Vinci SA | | | 726,828 | | | | 0.2 | |
| | | | | | 39,686,234 | | | | 8.3 | |
| | | | | | | | | | | |
| | | Germany: 5.6% | | | | | | | | |
| 3,055 | | Adidas AG | | | 993,089 | | | | 0.2 | |
| 1,913 | | Allianz SE | | | 468,740 | | | | 0.1 | |
| 51,073 | | BASF SE | | | 3,847,685 | | | | 0.8 | |
| 6,392 | | Beiersdorf AG | | | 764,674 | | | | 0.2 | |
| 24,435 | | Deutsche Boerse AG | | | 3,831,734 | | | | 0.8 | |
| 69,411 | | Deutsche Lufthansa AG | | | 1,277,661 | | | | 0.3 | |
| 107,825 | | Deutsche Post AG | | | 4,099,976 | | | | 0.8 | |
| 182,295 | | Deutsche Telekom AG | | | 2,979,112 | | | | 0.6 | |
| 12,449 | | Hannover Rueck SE | | | 2,400,361 | | | | 0.5 | |
| 7,729 | | Muenchener Rueckversicherungs-Gesellschaft AG | | | 2,280,784 | | | | 0.5 | |
| 16,936 | | Siemens AG | | | 2,211,708 | | | | 0.5 | |
| 539,575 (1) | | Telefonica Deutschland Holding AG | | | 1,563,951 | | | | 0.3 | |
| | | | | | 26,719,475 | | | | 5.6 | |
| | | | | | | | | | | |
| | | Hong Kong: 2.7% | | | | | | | | |
| 184,000 | | CK Hutchison Holdings Ltd. | | | 1,754,530 | | | | 0.4 | |
| 274,500 | | CLP Holdings Ltd. | | | 2,881,543 | | | | 0.6 | |
| 138,000 | | Hang Seng Bank Ltd. | | | 2,852,457 | | | | 0.6 | |
| 739,000 | | HKT Trust / HKT Ltd. | | | 1,041,463 | | | | 0.2 | |
| 19,700 | | Jardine Matheson Holdings Ltd. | | | 1,096,260 | | | | 0.2 | |
| 1,400,000 | | PCCW Ltd. | | | 828,375 | | | | 0.2 | |
| 271,000 | | Power Assets Holdings Ltd. | | | 1,982,533 | | | | 0.4 | |
| 221,500 | | Yue Yuen Industrial Holdings | | | 653,711 | | | | 0.1 | |
| | | | | | 13,090,872 | | | | 2.7 | |
| | | | | | | | | | | |
| | | Israel: 1.2% | | | | | | | | |
| 376,036 | | Bank Leumi Le-Israel BM | | | 2,742,407 | | | | 0.6 | |
| 183,305 | | Israel Chemicals Ltd. | | | 865,661 | | | | 0.2 | |
| 236,358 | | Israel Discount Bank Ltd. | | | 1,097,697 | | | | 0.2 | |
| 36,604 | | Mizrahi Tefahot Bank Ltd. | | | 976,394 | | | | 0.2 | |
| | | | | | 5,682,159 | | | | 1.2 | |
| | | | | | | | | | | |
| | | Italy: 4.1% | | | | | | | | |
| 144,429 | | Assicurazioni Generali S.p.A. | | | 2,981,721 | | | | 0.6 | |
| 63,945 | | Enel S.p.A. | | | 507,970 | | | | 0.1 | |
| 250,895 | | ENI S.p.A. | | | 3,896,726 | | | | 0.8 | |
| 1,498,008 | | Intesa Sanpaolo SpA | | | 3,946,056 | | | | 0.8 | |
| 275,041 | | Mediobanca Banca di Credito Finanziario SpA | | | 3,028,364 | | | | 0.7 | |
| 43,238 | | Recordati S.p.A. | | | 1,822,694 | | | | 0.4 | |
| 564,816 | | Snam SpA | | | 2,969,704 | | | | 0.6 | |
| 85,949 | | Terna Rete Elettrica Nazionale SpA | | | 574,822 | | | | 0.1 | |
| | | | | | 19,728,057 | | | | 4.1 | |
| | | | | | | | | | | |
| | | Japan: 25.2% | | | | | | | | |
| 15,200 | | ABC-Mart, Inc. | | | 1,037,573 | | | | 0.2 | |
| 158,700 | | Ajinomoto Co., Inc. | | | 2,641,928 | | | | 0.6 | |
| 78,800 | | ANA Holdings, Inc. | | | 2,630,623 | | | | 0.6 | |
See Accompanying Notes to Financial Statements
| Voya International High Dividend Low Volatility Portfolio | PORTFOLIO OF INVESTMENTS
as of December 31, 2019 (CONTINUED) |
| 40,500 | | Benesse Holdings, Inc. | | | 1,064,532 | | | | 0.2 | |
| 31,400 | | Calbee, Inc. | | | 1,023,053 | | | | 0.2 | |
| 123,100 (2) | | Canon, Inc. | | | 3,369,060 | | | | 0.7 | |
| 527 | | Daiwa House REIT Investment Corp. | | | 1,378,018 | | | | 0.3 | |
| 167,400 | | Pan Pacific International Holdings Corp. | | | 2,777,380 | | | | 0.6 | |
| 12,000 | | East Japan Railway Co. | | | 1,083,144 | | | | 0.2 | |
| 69,100 | | Fuji Film Holdings Corp. | | | 3,299,933 | | | | 0.7 | |
| 34,500 | | Hamamatsu Photonics KK | | | 1,413,826 | | | | 0.3 | |
| 24,800 | | Hitachi Ltd. | | | 1,046,455 | | | | 0.2 | |
| 6,900 | | Hoya Corp. | | | 658,688 | | | | 0.1 | |
| 153,900 | | Itochu Corp. | | | 3,566,892 | | | | 0.7 | |
| 83,700 | | Japan Airlines Co. Ltd. | | | 2,606,073 | | | | 0.5 | |
| 324 | | Japan Prime Realty Investment Corp. | | | 1,424,589 | | | | 0.3 | |
| 931 | | Japan Retail Fund Investment Corp. | | | 2,003,425 | | | | 0.4 | |
| 103,300 | | Kakaku.com, Inc. | | | 2,637,570 | | | | 0.6 | |
| 36,900 | | Kamigumi Co., Ltd. | | | 811,131 | | | | 0.2 | |
| 59,100 | | Konami Holdings Corp. | | | 2,428,568 | | | | 0.5 | |
| 9,800 | | Kyocera Corp. | | | 667,926 | | | | 0.1 | |
| 59,000 | | Kyushu Railway Co. | | | 1,975,179 | | | | 0.4 | |
| 26,200 | | Lawson, Inc. | | | 1,487,181 | | | | 0.3 | |
| 153,200 | | LIXIL Group Corp. | | | 2,643,751 | | | | 0.6 | |
| 24,600 | | Maruichi Steel Tube Ltd. | | | 691,321 | | | | 0.1 | |
| 23,100 | | McDonald's Holdings Co. Japan Ltd. | | | 1,112,930 | | | | 0.2 | |
| 80,000 | | Medipal Holdings Corp. | | | 1,765,630 | | | | 0.4 | |
| 34,500 | | MEIJI Holdings Co., Ltd. | | | 2,331,517 | | | | 0.5 | |
| 233,600 | | Mitsubishi Chemical Holdings Corp. | | | 1,740,597 | | | | 0.4 | |
| 129,300 | | Mitsubishi Corp. | | | 3,425,334 | | | | 0.7 | |
| 74,200 | | Mitsubishi Heavy Industries Ltd. | | | 2,877,243 | | | | 0.6 | |
| 209,200 | | Mitsui & Co., Ltd. | | | 3,718,640 | | | | 0.8 | |
| 93,600 | | MS&AD Insurance Group Holdings, Inc. | | | 3,089,614 | | | | 0.6 | |
| 74,000 | | NEC Corp. | | | 3,062,450 | | | | 0.6 | |
| 839 | | Nippon Prologis REIT, Inc. | | | 2,136,857 | | | | 0.5 | |
| 397 | | Nippon Building Fund, Inc. | | | 2,910,110 | | | | 0.6 | |
| 6,400 | | Nippon Shinyaku Co., Ltd. | | | 554,199 | | | | 0.1 | |
| 133,000 | | Nissan Motor Co., Ltd. | | | 770,700 | | | | 0.2 | |
| 137,800 | | NTT DoCoMo, Inc. | | | 3,838,576 | | | | 0.8 | |
| 32,200 | | Olympus Corp. | | | 496,289 | | | | 0.1 | |
| 9,800 | | Oracle Corp. Japan | | | 889,436 | | | | 0.2 | |
| 39,500 | | ORIX Corp. | | | 654,569 | | | | 0.1 | |
| 29,500 | | Otsuka Corp. | | | 1,178,081 | | | | 0.2 | |
| 231,100 | | Ricoh Co., Ltd. | | | 2,514,716 | | | | 0.5 | |
| 29,500 | | Sankyo Co., Ltd. | | | 979,777 | | | | 0.2 | |
| 25,400 | | Secom Co., Ltd. | | | 2,266,766 | | | | 0.5 | |
| 174,100 | | Seiko Epson Corp. | | | 2,628,712 | | | | 0.6 | |
| 147,600 | | Sekisui House Ltd. | | | 3,151,977 | | | | 0.7 | |
| 79,200 | | Seven & I Holdings Co., Ltd. | | | 2,903,111 | | | | 0.6 | |
| 211,600 | | Softbank Corp. | | | 2,837,488 | | | | 0.6 | |
| 210,900 | | Sumitomo Corp. | | | 3,132,570 | | | | 0.7 | |
| 111,700 | | Sumitomo Mitsui Financial Group, Inc. | | | 4,125,681 | | | | 0.9 | |
| 39,400 | | Sundrug Co., Ltd. | | | 1,425,570 | | | | 0.3 | |
| 19,700 | | Suzuken Co., Ltd. | | | 802,931 | | | | 0.2 | |
| 103,000 | | Teijin Ltd. | | | 1,924,261 | | | | 0.4 | |
| 24,800 | | Toyo Suisan Kaisha Ltd. | | | 1,053,152 | | | | 0.2 | |
| 52,700 (1) | | Trend Micro, Inc. | | | 2,696,650 | | | | 0.6 | |
| 1,059 | | United Urban Investment Corp. | | | 1,988,863 | | | | 0.4 | |
| 34,500 | | West Japan Railway Co. | | | 2,984,028 | | | | 0.6 | |
| | | | | | 120,336,844 | | | | 25.2 | |
| | | | | | | | | | | |
| | | Netherlands: 6.1% | | | | | | | | |
| 156,930 (3) | | ABN AMRO Bank NV | | | 2,860,272 | | | | 0.6 | |
| 189,536 | | ING Groep NV | | | 2,278,690 | | | | 0.5 | |
| 449,512 | | Koninklijke KPN NV | | | 1,330,281 | | | | 0.3 | |
| 78,074 | | NN Group NV | | | 2,968,605 | | | | 0.6 | |
| 20,971 | | Randstad NV | | | 1,285,007 | | | | 0.3 | |
| 341,728 | | Royal Dutch Shell PLC - Class A | | | 10,120,077 | | | | 2.1 | |
| 88,706 | | Unilever NV | | | 5,090,924 | | | | 1.0 | |
| 47,823 | | Wolters Kluwer NV | | | 3,491,837 | | | | 0.7 | |
| | | | | | 29,425,693 | | | | 6.1 | |
| | | | | | | | | | | |
| | | New Zealand: 0.1% | | | | | | | | |
| 241,256 | | Spark New Zealand Ltd. | | | 703,507 | | | | 0.1 | |
| | | | | | | | | | | |
| | | Norway: 0.4% | | | | | | | | |
| 204,489 | | Orkla ASA | | | 2,073,686 | | | | 0.4 | |
| | | | | | | | | | | |
| | | Singapore: 2.6% | | | | | | | | |
| 1,099,500 | | CapitaLand Mall Trust | | | 2,012,705 | | | | 0.4 | |
| 886,900 | | ComfortDelgro Corp., Ltd. | | | 1,569,288 | | | | 0.3 | |
| 1,696,200 | | Genting Singapore Ltd. | | | 1,161,539 | | | | 0.2 | |
| 128,100 | | SATS Ltd. | | | 482,184 | | | | 0.1 | |
| 143,900 | | Singapore Airlines Ltd. | | | 967,483 | | | | 0.2 | |
| 324,900 | | Singapore Exchange Ltd. | | | 2,139,835 | | | | 0.5 | |
| 1,053,400 | | Singapore Telecommunications Ltd. | | | 2,640,999 | | | | 0.6 | |
| 432,200 | | Singapore Technologies Engineering Ltd. | | | 1,265,759 | | | | 0.3 | |
| | | | | | 12,239,792 | | | | 2.6 | |
| | | | | | | | | | | |
| | | Spain: 3.1% | | | | | | | | |
| 16,132 (3) | | Aena SME SA | | | 3,092,808 | | | | 0.7 | |
| 11,380 | | Amadeus IT Group SA | | | 931,990 | | | | 0.2 | |
| 91,445 | | Enagas | | | 2,332,540 | | | | 0.5 | |
| 112,075 | | Endesa S.A. | | | 2,992,946 | | | | 0.6 | |
| 113,155 | | Ferrovial SA - FERE | | | 3,428,289 | | | | 0.7 | |
| 62,048 | | Red Electrica Corp. SA | | | 1,250,258 | | | | 0.3 | |
| 44,072 | | Repsol SA | | | 692,381 | | | | 0.1 | |
| | | | | | 14,721,212 | | | | 3.1 | |
| | | | | | | | | | | |
| | | Sweden: 1.4% | | | | | | | | |
| 254,203 | | Skandinaviska Enskilda Banken AB | | | 2,390,493 | | | | 0.5 | |
| 216,196 | | Swedbank AB | | | 3,213,966 | | | | 0.7 | |
| 21,086 | | Swedish Match AB | | | 1,086,282 | | | | 0.2 | |
| | | | | | 6,690,741 | | | | 1.4 | |
| | | | | | | | | | | |
| | | Switzerland: 9.3% | | | | | | | | |
| 11,480 | | Adecco Group AG | | | 725,791 | | | | 0.1 | |
| 154 | | Chocoladefabriken Lindt & Sprungli AG - PC - LISP | | | 1,195,815 | | | | 0.3 | |
| 837 | | Givaudan | | | 2,622,317 | | | | 0.5 | |
| 155,365 | | Glencore PLC | | | 483,766 | | | | 0.1 | |
| 59,403 | | LafargeHolcim Ltd.-CHF | | | 3,295,529 | | | | 0.7 | |
| 5,059 | | Kuehne & Nagel International AG | | | 853,285 | | | | 0.2 | |
| 117,244 | | Nestle SA | | | 12,693,453 | | | | 2.7 | |
| 81,982 | | Novartis AG | | | 7,762,843 | | | | 1.6 | |
| 30,774 | | Roche Holding AG | | | 10,001,637 | | | | 2.1 | |
See Accompanying Notes to Financial Statements
| Voya International High Dividend Low Volatility Portfolio | PORTFOLIO OF INVESTMENTS
as of December 31, 2019 (CONTINUED) |
| 11,322 | | Zurich Insurance Group AG | | | 4,644,280 | | | | 1.0 | |
| | | | | | 44,278,716 | | | | 9.3 | |
| | | | | | | | | | | |
| | | United Kingdom: 13.5% | | | | | | | | |
| 70,219 | | Admiral Group PLC | | | 2,145,793 | | | | 0.5 | |
| 374,486 (3) | | Auto Trader Group PLC | | | 2,957,392 | | | | 0.6 | |
| 613,784 | | Aviva PLC | | | 3,406,860 | | | | 0.7 | |
| 449,332 | | BAE Systems PLC | | | 3,364,314 | | | | 0.7 | |
| 1,065,415 | | BP PLC | | | 6,702,364 | | | | 1.4 | |
| 1,279,613 | | BT Group PLC | | | 3,260,720 | | | | 0.7 | |
| 57,850 | | Coca-Cola European Partners PLC | | | 2,943,408 | | | | 0.6 | |
| 150,497 | | Compass Group PLC | | | 3,771,747 | | | | 0.8 | |
| 16,836 | | Diageo PLC | | | 709,418 | | | | 0.2 | |
| 630,075 | | Direct Line Insurance Group PLC | | | 2,606,984 | | | | 0.5 | |
| 374,312 | | Evraz PLC | | | 2,004,386 | | | | 0.4 | |
| 288,393 | | GlaxoSmithKline PLC | | | 6,776,427 | | | | 1.4 | |
| 821,775 | | Legal & General Group PLC | | | 3,301,139 | | | | 0.7 | |
| 35,397 | | Next PLC | | | 3,298,411 | | | | 0.7 | |
| 78,653 | | Persimmon PLC | | | 2,809,433 | | | | 0.6 | |
| 89,854 | | Relx PLC (GBP Exchange) | | | 2,268,231 | | | | 0.5 | |
| 1,049,984 | | Royal Bank of Scotland Group PLC | | | 3,368,312 | | | | 0.7 | |
| 189,572 | | Sage Group PLC/The | | | 1,880,698 | | | | 0.4 | |
| 76,304 | | Unilever PLC | | | 4,367,873 | | | | 0.9 | |
| 923,810 | | WM Morrison Supermarkets PLC | | | 2,444,926 | | | | 0.5 | |
| | | | | | 64,388,836 | | | | 13.5 | |
| | | | | | | | | | | |
| | Total Common Stock | | | | | | | | |
| | (Cost $443,488,322) | | | 471,966,412 | | | | 98.7 | |
| | | | | | | | | | | |
| EXCHANGE-TRADED FUNDS: 0.2% |
| 10,419 | | iShares MSCI EAFE ETF | | | 723,495 | | | | 0.2 | |
| | | | | | | | | | | |
| | Total Exchange-Traded Funds | | | | | | | | |
| | (Cost $710,725) | | | 723,495 | | | | 0.2 | |
| | | | | | | | | | | |
| RIGHTS: 0.0% |
| | | Spain: 0.0% | | | | | | | | |
| 28,748 (1) | | Repsol SA | | | 13,640 | | | | 0.0 | |
| | | | | | | | | | | |
| | Total Rights | | | | | | | | |
| | (Cost $13,586) | | | 13,640 | | | | 0.0 | |
| | | | | | | | | | | |
| | Total Long-Term Investments | | | | | | | | |
| | (Cost $444,212,633) | | | 472,703,547 | | | | 98.9 | |
Principal
Amount† | | | | | Value | | | | Percentage
of Net
Assets | |
| SHORT-TERM INVESTMENTS: 0.7% |
| | | Repurchase Agreements: 0.7% | | | | | | | | |
| 1,000,000 (4) | | Bethesda Securities LLC, Repurchase Agreement dated 12/31/19, 1.65%, due 01/02/20 (Repurchase Amount $1,000,090, collateralized by various U.S. Government Agency Obligations, 3.000%-4.500%, Market Value plus accrued interest $1,020,000, due 11/01/32-01/01/49) | | | 1,000,000 | | | | 0.2 | |
| 1,000,000 (4) | | Cantor Fitzgerald Securities, Repurchase Agreement dated 12/31/19, 1.58%, due 01/02/20 (Repurchase Amount $1,000,087, collateralized by various U.S. Government/U.S. Government Agency Obligations, 0.000%-8.500%, Market Value plus accrued interest $1,020,000, due 01/25/20-10/15/60) | | | 1,000,000 | | | | 0.2 | |
| 1,000,000 (4) | | Millennium Fixed Income Ltd., Repurchase Agreement dated 12/31/19, 1.75%, due 01/02/20 (Repurchase Amount $1,000,096, collateralized by various U.S. Government Securities, 0.125%-2.250%, Market Value plus accrued interest $1,020,000, due 04/15/20-03/31/21) | | | 1,000,000 | | | | 0.2 | |
| 512,449 (4) | | RBC Dominion Securities Inc., Repurchase Agreement dated 12/31/19, 1.57%, due 01/02/20 (Repurchase Amount $512,493, collateralized by various U.S. Government/U.S. Government Agency Obligations, 0.000%-6.500%, Market Value plus accrued interest $522,698, due 06/30/21-12/01/49) | | | 512,449 | | | | 0.1 | |
| | | | | | | | | | | |
| | Total Repurchase Agreements | | | | | | | | |
| | | | | | | | | | | |
| | Total Short-Term Investments | | | | | | | | |
| | (Cost $3,512,449) | | | 3,512,449 | | | | 0.7 | |
See Accompanying Notes to Financial Statements
| Voya International High Dividend Low Volatility Portfolio | PORTFOLIO OF INVESTMENTS
as of December 31, 2019 (CONTINUED) |
| | | | | | | | | | | |
| | Total Investments in Securities
(Cost $447,725,082) | | $ | 476,215,996 | | | | 99.6 | |
| | Assets in Excess of Other Liabilities | | | 2,066,478 | | | | 0.4 | |
| | Net Assets | | $ | 478,282,474 | | | | 100.0 | |
|
| † | Unless otherwise indicated, principal amount is shown in USD. |
| (1) | Non-income producing security. |
| (2) | Security, or a portion of the security, is on loan. |
| (3) | Securities with purchases pursuant to Rule 144A or section 4(a)(2), under the Securities Act of 1933 and may not be resold subject to that rule except to qualified institutional buyers. |
| (4) | All or a portion of the security represents securities purchased with cash collateral received for securities on loan. |
See Accompanying Notes to Financial Statements
VY®American Century Small-Mid Cap Value Portfolio | |
| PORTFOLIO OF INVESTMENTS |
| AS OF December 31, 2019 |
| Shares | | | | Value | | | Percentage
of Net
Assets | |
| COMMON STOCK: 96.6% |
| | | Communication Services: 0.8% | | | | | | | | |
| 406,024 | | Entravision Communications Corp. | | $ | 1,063,783 | | | | 0.3 | |
| 35,156 | | Rogers Communications, Inc. | | | 1,745,685 | | | | 0.4 | |
| 35,197 | | Townsquare Media, Inc. | | | 350,914 | | | | 0.1 | |
| | | | | | 3,160,382 | | | | 0.8 | |
| | | | | | | | | | | |
| | | Consumer Discretionary: 7.5% | | | | | | | | |
| 74,410 (1),(2) | | Accel Entertainment, Inc. | | | 930,125 | | | | 0.2 | |
| 22,542 | | Advance Auto Parts, Inc. | | | 3,610,327 | | | | 0.9 | |
| 13,077 | | Aptiv PLC | | | 1,241,923 | | | | 0.3 | |
| 50,799 | | BorgWarner, Inc. | | | 2,203,661 | | | | 0.6 | |
| 24,572 (1) | | Camping World Holdings, Inc. | | | 362,191 | | | | 0.1 | |
| 50,923 | | Carnival Corp. | | | 2,588,416 | | | | 0.7 | |
| 15,600 (2) | | Everi Holdings, Inc. | | | 209,508 | | | | 0.1 | |
| 29,574 | | Genuine Parts Co. | | | 3,141,646 | | | | 0.8 | |
| 87,344 | | Honda Motor Co., Ltd. ADR | | | 2,472,709 | | | | 0.7 | |
| 36,073 (2) | | MarineMax, Inc. | | | 602,058 | | | | 0.2 | |
| 35,347 | | Penske Auto Group, Inc. | | | 1,775,126 | | | | 0.5 | |
| 55,600 | | Pulte Group, Inc. | | | 2,157,280 | | | | 0.6 | |
| 36,859 (2) | | Red Robin Gourmet Burgers, Inc. | | | 1,217,084 | | | | 0.3 | |
| 20,241 | | Sodexo SA | | | 2,398,723 | | | | 0.6 | |
| 15,381 | | Target Corp. | | | 1,971,998 | | | | 0.5 | |
| 22,677 | | Thor Industries, Inc. | | | 1,684,674 | | | | 0.4 | |
| | | | | | 28,567,449 | | | | 7.5 | |
| | | | | | | | | | | |
| | | Consumer Staples: 5.8% | | | | | | | | |
| 87,189 | | Conagra Brands, Inc. | | | 2,985,351 | | | | 0.8 | |
| 41,090 (2) | | Hain Celestial Group, Inc. | | | 1,066,491 | | | | 0.3 | |
| 17,437 | | JM Smucker Co. | | | 1,815,715 | | | | 0.5 | |
| 21,704 | | Kellogg Co. | | | 1,501,049 | | | | 0.4 | |
| 17,039 | | Kimberly-Clark Corp. | | | 2,343,714 | | | | 0.6 | |
| 111,638 | | Koninklijke Ahold Delhaize NV | | | 2,799,045 | | | | 0.7 | |
| 26,426 | | Mondelez International, Inc. | | | 1,455,544 | | | | 0.4 | |
| 273,799 | | Orkla ASA | | | 2,776,545 | | | | 0.7 | |
| 39,910 | | Spectrum Brands Holdings, Inc. | | | 2,565,814 | | | | 0.6 | |
| 26,377 | | Sysco Corp. | | | 2,256,289 | | | | 0.6 | |
| 17,619 (1) | | Weis Markets, Inc. | | | 713,393 | | | | 0.2 | |
| | | | | | 22,278,950 | | | | 5.8 | |
| | | | | | | | | | | |
| | | Energy: 4.5% | | | | | | | | |
| 104,087 | | Baker Hughes Co. | | | 2,667,750 | | | | 0.7 | |
| 17,381 | | Cactus, Inc. | | | 596,516 | | | | 0.2 | |
| 84,670 (2) | | Callon Petroleum Co. | | | 408,956 | | | | 0.1 | |
| 40,743 (2) | | Centennial Resource Development, Inc./DE | | | 188,233 | | | | 0.1 | |
| 56,706 | | ConocoPhillips | | | 3,687,591 | | | | 1.0 | |
| 54,934 (2) | | Earthstone Energy, Inc. | | | 347,732 | | | | 0.1 | |
| 55,832 | | Imperial Oil Ltd. | | | 1,476,901 | | | | 0.4 | |
| 11,400 | | Liberty Oilfield Services, Inc. | | | 126,768 | | | | 0.0 | |
| 78,414 (2) | | Magnolia Oil & Gas Corp. | | | 986,448 | | | | 0.3 | |
| 136,985 (1),(2) | | NCS Multistage Holdings, Inc. | | | 287,669 | | | | 0.1 | |
| 26,012 (2) | | NexTier Oilfield Solutions, Inc. | | | 174,280 | | | | 0.0 | |
| 93,981 | | Noble Energy, Inc. | | | 2,334,488 | | | | 0.6 | |
| 27,085 | | Parsley Energy, Inc. | | | 512,177 | | | | 0.1 | |
| 65,956 | | Schlumberger Ltd. | | | 2,651,431 | | | | 0.7 | |
| 38,165 (2) | | WPX Energy, Inc. | | | 524,387 | | | | 0.1 | |
| | | | | | 16,971,327 | | | | 4.5 | |
| | | | | | | | | | | |
| | | Financials: 26.4% | | | | | | | | |
| 40,414 | | Aflac, Inc. | | | 2,137,901 | | | | 0.6 | |
| 24,472 | | Ameriprise Financial, Inc. | | | 4,076,546 | | | | 1.1 | |
| 12,000 | | Ameris Bancorp. | | | 510,480 | | | | 0.1 | |
| 14,446 | | Amerisafe, Inc. | | | 953,869 | | | | 0.2 | |
| 39,676 | | Ares Management Corp. | | | 1,416,036 | | | | 0.4 | |
| 7,735 | | Arthur J. Gallagher & Co. | | | 736,604 | | | | 0.2 | |
| 46,671 | | Axis Capital Holdings Ltd. | | | 2,774,124 | | | | 0.7 | |
| 3,343 | | Bank OZK | | | 101,978 | | | | 0.0 | |
| 85,310 | | BankUnited, Inc. | | | 3,118,934 | | | | 0.8 | |
| 31,348 | | Brown & Brown, Inc. | | | 1,237,619 | | | | 0.3 | |
| 161,466 | | Capitol Federal Financial, Inc. | | | 2,216,928 | | | | 0.6 | |
| 25,848 | | Chubb Ltd. | | | 4,023,500 | | | | 1.1 | |
| 57,588 | | Comerica, Inc. | | | 4,131,939 | | | | 1.1 | |
| 46,384 (1) | | Commerce Bancshares, Inc. | | | 3,151,329 | | | | 0.8 | |
| 132,895 (1),(3) | | Compass Diversified Holdings | | | 3,303,770 | | | | 0.9 | |
| 68,215 (2) | | CrossFirst Bankshares, Inc. | | | 983,660 | | | | 0.3 | |
| 153,208 (2) | | Donnelley Financial Solutions, Inc. | | | 1,604,088 | | | | 0.4 | |
| 201,577 | | First Hawaiian, Inc. | | | 5,815,497 | | | | 1.5 | |
| 10,113 | | Globe Life, Inc. | | | 1,064,393 | | | | 0.3 | |
| 4,860 | | Hanover Insurance Group, Inc. | | | 664,216 | | | | 0.2 | |
| 31,209 | | Hilltop Holdings, Inc. | | | 778,040 | | | | 0.2 | |
| 157,696 | | Home Bancshares, Inc./Conway AR | | | 3,100,303 | | | | 0.8 | |
| 26,306 | | Independent Bank Group, Inc. | | | 1,458,405 | | | | 0.4 | |
| 44,272 | | James River Group Holdings Ltd. | | | 1,824,449 | | | | 0.5 | |
| 19,356 | | M&T Bank Corp. | | | 3,285,681 | | | | 0.9 | |
| 60,610 | | Northern Trust Corp. | | | 6,439,206 | | | | 1.7 | |
| 41,561 | | Origin Bancorp, Inc. | | | 1,572,668 | | | | 0.4 | |
| 30,117 | | Pacific Premier Bancorp, Inc. | | | 981,965 | | | | 0.3 | |
| 145,211 | | ProAssurance Corp. | | | 5,247,926 | | | | 1.4 | |
| 33,560 (2) | | ProSight Global, Inc. | | | 541,323 | | | | 0.1 | |
| 27,470 (1) | | Prosperity Bancshares, Inc. | | | 1,974,818 | | | | 0.5 | |
| 19,667 | | Reinsurance Group of America, Inc. | | | 3,206,901 | | | | 0.8 | |
| 3,891 | | RenaissanceRe Holdings Ltd. | | | 762,714 | | | | 0.2 | |
| 17,394 | | Signature Bank | | | 2,376,194 | | | | 0.6 | |
| 3,988 | | South State Corp. | | | 345,959 | | | | 0.1 | |
| 34,000 | | State Street Corp. | | | 2,689,400 | | | | 0.7 | |
| 38,755 (2) | | Texas Capital Bancshares, Inc. | | | 2,200,121 | | | | 0.6 | |
| 25,764 | | TowneBank/Portsmouth VA | | | 716,755 | | | | 0.2 | |
| 6,456 | | Travelers Cos, Inc. | | | 884,149 | | | | 0.2 | |
| 115,635 | | Truist Financial Corp. | | | 6,512,563 | | | | 1.7 | |
| 55,904 | | UMB Financial Corp. | | | 3,837,251 | | | | 1.0 | |
| 266,702 | | Valley National Bancorp | | | 3,053,738 | | | | 0.8 | |
| 23,022 | | Westamerica Bancorp. | | | 1,560,201 | | | | 0.4 | |
See Accompanying Notes to Financial Statements
VY®American Century Small-Mid Cap Value Portfolio | |
| PORTFOLIO OF INVESTMENTS |
| AS OF December 31, 2019 (CONTINUED) |
| 1,161 | | White Mountains Insurance Group Ltd. | | | 1,295,107 | | | | 0.3 | |
| | | | | | 100,669,248 | | | | 26.4 | |
| | | | | | | | | | | |
| | | Health Care: 9.0% | | | | | | | | |
| 63,394 | | Cardinal Health, Inc. | | | 3,206,469 | | | | 0.8 | |
| 39,629 | | Cerner Corp. | | | 2,908,372 | | | | 0.7 | |
| 34,356 (2) | | Henry Schein, Inc. | | | 2,292,232 | | | | 0.6 | |
| 41,635 (2) | | Hologic, Inc. | | | 2,173,763 | | | | 0.6 | |
| 21,079 | | McKesson Corp. | | | 2,915,647 | | | | 0.8 | |
| 49,375 | | Patterson Cos., Inc. | | | 1,011,200 | | | | 0.3 | |
| 44,101 (2) | | Premier, Inc. | | | 1,670,546 | | | | 0.4 | |
| 31,995 (2) | | Providence Service Corp. | | | 1,893,464 | | | | 0.5 | |
| 38,172 | | Quest Diagnostics, Inc. | | | 4,076,388 | | | | 1.1 | |
| 37,263 (4) | | Siemens Healthineers AG | | | 1,786,286 | | | | 0.5 | |
| 18,975 | | Universal Health Services, Inc. | | | 2,722,154 | | | | 0.7 | |
| 50,911 | | Zimmer Biomet Holdings, Inc. | | | 7,620,359 | | | | 2.0 | |
| | | | | | 34,276,880 | | | | 9.0 | |
| | | | | | | | | | | |
| | | Industrials: 15.7% | | | | | | | | |
| 270,774 | | BAE Systems PLC | | | 2,027,385 | | | | 0.5 | |
| 19,021 | | Brink's Co. | | | 1,724,824 | | | | 0.5 | |
| 78,580 (2) | | Ceco Environmental Corp. | | | 601,923 | | | | 0.2 | |
| 158,132 (2) | | Charah Solutions, Inc. | | | 385,842 | | | | 0.1 | |
| 30,851 (2) | | Colfax Corp. | | | 1,122,359 | | | | 0.3 | |
| 15,698 | | Cummins, Inc. | | | 2,809,314 | | | | 0.7 | |
| 23,542 | | Deluxe Corp. | | | 1,175,217 | | | | 0.3 | |
| 13,482 (2) | | DXP Enterprises, Inc. | | | 536,718 | | | | 0.1 | |
| 19,236 (2) | | Dycom Industries, Inc. | | | 906,977 | | | | 0.2 | |
| 21,222 | | Eaton Corp. PLC | | | 2,010,148 | | | | 0.5 | |
| 63,929 | | Emerson Electric Co. | | | 4,875,226 | | | | 1.3 | |
| 19,513 | | EnPro Industries, Inc. | | | 1,305,030 | | | | 0.3 | |
| 24,829 (2) | | Foundation Building Materials, Inc. | | | 480,441 | | | | 0.1 | |
| 13,377 (2) | | GMS, Inc. | | | 362,249 | | | | 0.1 | |
| 17,088 | | Graham Corp. | | | 373,885 | | | | 0.1 | |
| 37,346 (1) | | Healthcare Services Group, Inc. | | | 908,255 | | | | 0.2 | |
| 119,004 | | Heartland Express, Inc. | | | 2,505,034 | | | | 0.7 | |
| 29,148 | | Hubbell, Inc. | | | 4,308,657 | | | | 1.1 | |
| 15,310 | | Hurco Cos, Inc. | | | 587,292 | | | | 0.2 | |
| 160,146 | | IMI PLC | | | 2,502,612 | | | | 0.7 | |
| 173,567 (2) | | Innerworkings, Inc. | | | 956,354 | | | | 0.3 | |
| 93,182 | | Johnson Controls International plc | | | 3,793,439 | | | | 1.0 | |
| 27,503 | | Korn Ferry | | | 1,166,127 | | | | 0.3 | |
| 36,108 | | MSC Industrial Direct Co. | | | 2,833,395 | | | | 0.8 | |
| 14,982 | | Mueller Water Products, Inc. | | | 179,484 | | | | 0.1 | |
| 152,527 | | nVent Electric PLC | | | 3,901,641 | | | | 1.0 | |
| 30,727 | | Paccar, Inc. | | | 2,430,506 | | | | 0.6 | |
| 24,727 | | Republic Services, Inc. | | | 2,216,281 | | | | 0.6 | |
| 14,068 | | Schneider Electric SE | | | 1,445,349 | | | | 0.4 | |
| 73,563 | | Southwest Airlines Co. | | | 3,970,931 | | | | 1.0 | |
| 43,790 | | Textron, Inc. | | | 1,953,034 | | | | 0.5 | |
| 32,082 | | Timken Co. | | | 1,806,537 | | | | 0.5 | |
| 5,868 | | Unifirst Corp. | | | 1,185,219 | | | | 0.3 | |
| 2,929 | | Valmont Industries, Inc. | | | 438,706 | | | | 0.1 | |
| | | | | | 59,786,391 | | | | 15.7 | |
| | | | | | | | | | | |
| | | Information Technology: 8.0% | | | | | | | | |
| 6,156 (2) | | Advanced Energy Industries, Inc. | | | 438,307 | | | | 0.1 | |
| 58,076 | | Applied Materials, Inc. | | | 3,544,959 | | | | 0.9 | |
| 24,100 | | Avnet, Inc. | | | 1,022,804 | | | | 0.3 | |
| 13,764 | | Belden, Inc. | | | 757,020 | | | | 0.2 | |
| 22,491 (1),(2) | | Casa Systems, Inc. | | | 91,988 | | | | 0.0 | |
| 6,126 | | Cass Information Systems, Inc. | | | 353,715 | | | | 0.1 | |
| 11,819 (2) | | Coherent, Inc. | | | 1,966,091 | | | | 0.5 | |
| 34,103 | | Cypress Semiconductor Corp. | | | 795,623 | | | | 0.2 | |
| 54,641 | | EVERTEC, Inc. | | | 1,859,980 | | | | 0.5 | |
| 97,293 | | HP, Inc. | | | 1,999,371 | | | | 0.5 | |
| 36,472 (2) | | II-VI, Inc. | | | 1,228,012 | | | | 0.3 | |
| 57,188 | | Kulicke & Soffa Industries, Inc. | | | 1,555,514 | | | | 0.4 | |
| 27,778 | | LogMeIn, Inc. | | | 2,381,686 | | | | 0.6 | |
| 55,356 | | Maxim Integrated Products | | | 3,404,947 | | | | 0.9 | |
| 22,283 (1) | | Microchip Technology, Inc. | | | 2,333,476 | | | | 0.6 | |
| 11,344 | | Sapiens International Corp. NV | | | 260,912 | | | | 0.1 | |
| 27,550 | | TE Connectivity Ltd. | | | 2,640,392 | | | | 0.7 | |
| 4,715 (2) | | Tech Data Corp. | | | 677,074 | | | | 0.2 | |
| 96,849 (2) | | Teradata Corp. | | | 2,592,648 | | | | 0.7 | |
| 16,649 | | TTEC Holdings, Inc. | | | 659,633 | | | | 0.2 | |
| | | | | | 30,564,152 | | | | 8.0 | |
| | | | | | | | | | | |
| | | Materials: 4.9% | | | | | | | | |
| 252,311 | | Graphic Packaging Holding Co. | | | 4,200,978 | | | | 1.1 | |
| 40,922 | | Innophos Holdings, Inc. | | | 1,308,686 | | | | 0.3 | |
| 36,098 | | Minerals Technologies, Inc. | | | 2,080,328 | | | | 0.6 | |
| 112,953 | | Mondi PLC | | | 2,648,675 | | | | 0.7 | |
| 1,629 | | Neenah, Inc. | | | 114,730 | | | | 0.0 | |
| 18,696 | | Packaging Corp. of America | | | 2,093,765 | | | | 0.6 | |
| 64,935 | | Silgan Holdings, Inc. | | | 2,018,180 | | | | 0.5 | |
| 30,064 | | Sonoco Products Co. | | | 1,855,550 | | | | 0.5 | |
| 94,351 (1) | | Tecnoglass, Inc. | | | 778,396 | | | | 0.2 | |
| 33,680 | | WestRock Co. | | | 1,445,209 | | | | 0.4 | |
| | | | | | 18,544,497 | | | | 4.9 | |
| | | | | | | | | | | |
| | | Real Estate: 7.1% | | | | | | | | |
| 118,086 | | Brandywine Realty Trust | | | 1,859,855 | | | | 0.5 | |
| 22,786 | | CareTrust REIT, Inc. | | | 470,075 | | | | 0.1 | |
| 28,367 | | Cousins Properties, Inc. | | | 1,168,721 | | | | 0.3 | |
| 127,271 | | Empire State Realty Trust, Inc. | | | 1,776,703 | | | | 0.5 | |
| 13,060 | | Four Corners Property Trust, Inc. | | | 368,161 | | | | 0.1 | |
| 9,904 | | Highwoods Properties, Inc. | | | 484,405 | | | | 0.1 | |
| 89,259 | | Kite Realty Group Trust | | | 1,743,228 | | | | 0.5 | |
| 46,679 | | Lexington Realty Trust | | | 495,731 | | | | 0.1 | |
| 93,009 | | MGM Growth Properties LLC | | | 2,880,489 | | | | 0.8 | |
| 8,945 | | National Health Investors, Inc. | | | 728,839 | | | | 0.2 | |
| 1 | | Omega Healthcare Investors, Inc. | | | 42 | | | | 0.0 | |
| 55,529 | | Physicians Realty Trust | | | 1,051,719 | | | | 0.3 | |
| 107,926 | | Piedmont Office Realty Trust, Inc. | | | 2,400,274 | | | | 0.6 | |
| 33,292 | | RLJ Lodging Trust | | | 589,934 | | | | 0.2 | |
| 25,296 | | Sabra Healthcare REIT, Inc. | | | 539,817 | | | | 0.1 | |
| 58,444 | | Summit Hotel Properties, Inc. | | | 721,199 | | | | 0.2 | |
| 6,935 | | Urstadt Biddle Properties, Inc. | | | 172,265 | | | | 0.0 | |
See Accompanying Notes to Financial Statements
VY®American Century Small-Mid Cap Value Portfolio | |
| PORTFOLIO OF INVESTMENTS |
| AS OF December 31, 2019 (CONTINUED) |
| 37,821 | | Weingarten Realty Investors | | | 1,181,528 | | | | 0.3 | |
| 40,859 | | Welltower, Inc. | | | 3,341,449 | | | | 0.9 | |
| 162,419 | | Weyerhaeuser Co. | | | 4,905,054 | | | | 1.3 | |
| | | | | | 26,879,488 | | | | 7.1 | |
| | | | | | | | | | | |
| | | Utilities: 6.9% | | | | | | | | |
| 33,549 | | Ameren Corp. | | | 2,576,563 | | | | 0.7 | |
| 21,097 | | Atmos Energy Corp. | | | 2,359,910 | | | | 0.6 | |
| 49,173 | | Edison International | | | 3,708,136 | | | | 1.0 | |
| 24,174 | | Eversource Energy | | | 2,056,482 | | | | 0.5 | |
| 39,373 | | NorthWestern Corp. | | | 2,821,863 | | | | 0.7 | |
| 37,725 | | Pinnacle West Capital Corp. | | | 3,392,609 | | | | 0.9 | |
| 32,224 | | Spire, Inc. | | | 2,684,582 | | | | 0.7 | |
| 16,704 | | WEC Energy Group, Inc. | | | 1,540,610 | | | | 0.4 | |
| 80,844 | | Xcel Energy, Inc. | | | 5,132,786 | | | | 1.4 | |
| | | | | | 26,273,541 | | | | 6.9 | |
| | | | | | | | | | | |
| | Total Common Stock | | | | | | | | |
| | (Cost $329,270,067) | | | 367,972,305 | | | | 96.6 | |
| | | | | | | | | | | |
| EXCHANGE-TRADED FUNDS: 2.1% |
| 85,888 | | iShares Russell Mid-Cap Value ETF | | | 8,139,606 | | | | 2.1 | |
| | | | | | | | | | | |
| | Total Exchange-Traded Funds | | | | | | | | |
| | (Cost $7,511,640) | | | 8,139,606 | | | | 2.1 | |
| | | | | | | | | | | |
| | Total Long-Term Investments | | | | | | | | |
| | (Cost $336,781,707) | | | 376,111,911 | | | | 98.7 | |
| | | | | | | | | | | |
Principal
Amount† | | | | | Value | | | | Percentage
of Net
Assets | |
| SHORT-TERM INVESTMENTS: 3.2% |
| | | Repurchase Agreements: 1.8% | | | | | | | | |
| 1,585,058 (5) | | Bank of Nova Scotia, Repurchase Agreement dated 12/31/19, 1.57%, due 01/02/20 (Repurchase Amount $1,585,194, collateralized by various U.S. Government Agency Obligations, 2.500%-6.500%, Market Value plus accrued interest $1,616,900, due 09/01/24-11/01/49) | | | 1,585,058 | | | | 0.4 | |
| 469,500 (5) | | Citadel Securities LLC, Repurchase Agreement dated 12/31/19, 1.60%, due 01/02/20 (Repurchase Amount $469,541, collateralized by various U.S. Government Securities, 0.000%-8.500%, Market Value plus accrued interest $478,933, due 01/15/20-11/15/48) | | | 469,500 | | | | 0.2 | |
| 1,585,058 (5) | | Citigroup, Inc., Repurchase Agreement dated 12/31/19, 1.57%, due 01/02/20 (Repurchase Amount $1,585,194, collateralized by various U.S. Government/U.S. Government Agency Obligations, 0.000%-9.000%, Market Value plus accrued interest $1,616,759, due 02/13/20-09/20/69) | | | 1,585,058 | | | | 0.4 | |
| 1,585,058 (5) | | Jefferies LLC, Repurchase Agreement dated 12/31/19, 1.58%, due 01/02/20 (Repurchase Amount $1,585,195, collateralized by various U.S. Government Securities, 0.000%-2.875%, Market Value plus accrued interest $1,616,759, due 01/28/20-05/15/27) | | | 1,585,058 | | | | 0.4 | |
| 1,585,058 (5) | | RBC Dominion Securities Inc., Repurchase Agreement dated 12/31/19, 1.57%, due 01/02/20 (Repurchase Amount $1,585,194, collateralized by various U.S. Government/U.S. Government Agency Obligations, 0.000%-6.500%, Market Value plus accrued interest $1,616,759, due 06/30/21-12/01/49) | | | 1,585,058 | | | | 0.4 | |
| | | | | | | | | | | |
| | Total Repurchase Agreements | | | | | | | | |
| | (Cost $6,809,732) | | | 6,809,732 | | | | 1.8 | |
| | | | | | | | | | | |
| Shares | | | | | Value | | | | Percentage
of Net
Assets | |
| | | Mutual Funds: 1.4% | | | | | | | | |
| 5,193,548 (6) | | BlackRock Liquidity Funds, FedFund, Institutional Class, 1.520% | | | | | | | | |
| | | (Cost $5,193,548) | | | 5,193,548 | | | | 1.4 | |
| | | | | | | | | | | |
| | Total Short-Term Investments | | | | | | | | |
| | (Cost $12,003,280) | | | 12,003,280 | | | | 3.2 | |
| | | | | | | | | | | |
| | Total Investments in Securities
(Cost $348,784,987) | | $ | 388,115,191 | | | | 101.9 | |
| | Liabilities in Excess of Other Assets | | | (7,237,575 | ) | | | (1.9 | ) |
| | Net Assets | | $ | 380,877,616 | | | | 100.0 | |
| † | Unless otherwise indicated, principal amount is shown in USD. |
| ADR | American Depositary Receipt |
| (1) | Security, or a portion of the security, is on loan. |
| (2) | Non-income producing security. |
See Accompanying Notes to Financial Statements
VY®American Century Small-Mid Cap Value Portfolio | |
| PORTFOLIO OF INVESTMENTS |
| AS OF December 31, 2019 (CONTINUED) |
| (3) | Security is a Master Limited Partnership. |
| (4) | Securities with purchases pursuant to Rule 144A or section 4(a)(2), under the Securities Act of 1933 and may not be resold subject to that rule except to qualified institutional buyers. |
| (5) | All or a portion of the security represents securities purchased with cash collateral received for securities on loan. |
| (6) | Rate shown is the 7-day yield as of December 31, 2019. |
See Accompanying Notes to Financial Statements
| VY®Baron Growth Portfolio | PORTFOLIO OF INVESTMENTS as ofDecember 31, 2019 |
| Shares | | | | Value | | | Percentage
of Net
Assets | |
| COMMON STOCK: 99.6% |
| | | Communication Services: 3.9% | | | | | | | | |
| 640,834 (1) | | Iridium Communications, Inc. | | $ | 15,790,150 | | | | 3.1 | |
| 215,250 | | Manchester United PLC - Class A | | | 4,289,932 | | | | 0.8 | |
| | | | | | 20,080,082 | | | | 3.9 | |
| | | | | | | | | | | |
| | | Consumer Discretionary: 23.6% | | | | | | | | |
| 125,000 (1) | | Bright Horizons Family Solutions, Inc. | | | 18,786,250 | | | | 3.6 | |
| 327,290 | | Choice Hotels International, Inc. | | | 33,851,605 | | | | 6.6 | |
| 105,300 | | Marriott Vacations Worldwide Corp. | | | 13,558,428 | | | | 2.6 | |
| 21,650 (1) | | Ollie's Bargain Outlet Holdings, Inc. | | | 1,413,961 | | | | 0.3 | |
| 408,482 (1) | | Penn National Gaming, Inc. | | | 10,440,800 | | | | 2.0 | |
| 155,450 | | Red Rock Resorts, Inc. | | | 3,723,028 | | | | 0.7 | |
| 167,500 | | Vail Resorts, Inc. | | | 40,171,525 | | | | 7.8 | |
| | | | | | 121,945,597 | | | | 23.6 | |
| | | | | | | | | | | |
| | | Consumer Staples: 0.7% | | | | | | | | |
| 70,150 (1) | | Performance Food Group Co. | | | 3,611,322 | | | | 0.7 | |
| | | | | | | | | | | |
| | | Financials: 26.1% | | | | | | | | |
| 427,881 (1) | | Arch Capital Group Ltd. | | | 18,351,816 | | | | 3.5 | |
| 90,635 (1) | | BRP Group, Inc. | | | 1,454,692 | | | | 0.3 | |
| 162,500 (2) | | Carlyle Group L.P. | | | 5,213,000 | | | | 1.0 | |
| 179,000 | | Cohen & Steers, Inc. | | | 11,234,040 | | | | 2.2 | |
| 40,050 | | Essent Group Ltd. | | | 2,082,199 | | | | 0.4 | |
| 82,000 | | Factset Research Systems, Inc. | | | 22,000,600 | | | | 4.3 | |
| 33,125 | | Houlihan Lokey, Inc. | | | 1,618,819 | | | | 0.3 | |
| 76,618 | | Kinsale Capital Group, Inc. | | | 7,788,986 | | | | 1.5 | |
| 7,950 (1) | | LendingTree, Inc. | | | 2,412,348 | | | | 0.5 | |
| 52,025 | | Moelis & Co. | | | 1,660,638 | | | | 0.3 | |
| 74,407 | | Morningstar, Inc. | | | 11,258,523 | | | | 2.2 | |
| 128,875 | | MSCI, Inc. - Class A | | | 33,272,947 | | | | 6.4 | |
| 127,969 | | Primerica, Inc. | | | 16,707,633 | | | | 3.2 | |
| | | | | | 135,056,241 | | | | 26.1 | |
| | | | | | | | | | | |
| | | Health Care: 10.2% | | | | | | | | |
| 28,043 (1) | | Adaptive Biotechnologies Corp. | | | 839,047 | | | | 0.1 | |
| 31,454 (1) | | Alector, Inc. | | | 541,952 | | | | 0.1 | |
| 51,523 | | Bio-Techne Corp. | | | 11,309,814 | | | | 2.2 | |
| 117,300 | | Dechra Pharmaceuticals PLC | | | 4,510,217 | | | | 0.9 | |
| 49,295 (1) | | Denali Therapeutics, Inc. | | | 858,719 | | | | 0.2 | |
| 75,500 (1) | | Idexx Laboratories, Inc. | | | 19,715,315 | | | | 3.8 | |
| 7,800 (1) | | Mettler Toledo International, Inc. | | | 6,187,584 | | | | 1.2 | |
| 41,550 (1) | | Neogen Corp. | | | 2,711,553 | | | | 0.5 | |
| 40,000 | | West Pharmaceutical Services, Inc. | | | 6,013,200 | | | | 1.2 | |
| | | | | | 52,687,401 | | | | 10.2 | |
| | | | | | | | | | | |
| | | Industrials: 9.4% | | | | | | | | |
| 29,727 | | Air Lease Corp. | | | 1,412,627 | | | | 0.3 | |
| 7,000 | | Albany International Corp. | | | 531,440 | | | | 0.1 | |
| 35,427 (1) | | BrightView Holdings, Inc. | | | 597,653 | | | | 0.1 | |
| 57,547 (1) | | CoStar Group, Inc. | | | 34,430,370 | | | | 6.6 | |
| 501,725 (1),(3) | | Marel HF | | | 2,560,683 | | | | 0.5 | |
| 103,150 (1) | | Trex Co., Inc. | | | 9,271,122 | | | | 1.8 | |
| | | | | | 48,803,895 | | | | 9.4 | |
| | | | | | | | | | | |
| | | Information Technology: 17.1% | | | | | | | | |
| 53,870 (1) | | Altair Engineering, Inc. | | | 1,934,472 | | | | 0.4 | |
| 100,305 (1) | | ANSYS, Inc. | | | 25,819,510 | | | | 5.0 | |
| 155,550 (1) | | Benefitfocus, Inc. | | | 3,412,767 | | | | 0.7 | |
| 157,400 (1) | | Gartner, Inc. | | | 24,255,340 | | | | 4.7 | |
| 122,318 (1) | | Guidewire Software, Inc. | | | 13,426,847 | | | | 2.6 | |
| 8,950 | | Littelfuse, Inc. | | | 1,712,135 | | | | 0.3 | |
| 236,422 | | SS&C Technologies Holdings, Inc. | | | 14,516,311 | | | | 2.8 | |
| 25,936 (1) | | Wix.com Ltd. | | | 3,174,047 | | | | 0.6 | |
| | | | | | 88,251,429 | | | | 17.1 | |
| | | | | | | | | | | |
| | | Real Estate: 8.6% | | | | | | | | |
| 3,878 | | Alexander's, Inc. | | | 1,281,097 | | | | 0.2 | |
| 65,954 | | Alexandria Real Estate Equities, Inc. | | | 10,656,848 | | | | 2.0 | |
| 45,750 | | American Assets Trust, Inc. | | | 2,099,925 | | | | 0.4 | |
| 313,837 | | Douglas Emmett, Inc. | | | 13,777,444 | | | | 2.7 | |
| 49,855 (1) | | Forestar Group, Inc. | | | 1,039,477 | | | | 0.2 | |
| 370,266 | | Gaming and Leisure Properties, Inc. | | | 15,939,951 | | | | 3.1 | |
| | | | | | 44,794,742 | | | | 8.6 | |
| | | | | | | | | | | |
| | Total Common Stock | | | | | | | | |
| | (Cost $143,789,138) | | | 515,230,709 | | | | 99.6 | |
| | | | | | | | | | | |
| SHORT-TERM INVESTMENTS: 0.4% |
| | | Mutual Funds: 0.4% | | | | | | | | |
| 1,869,679 (4) | | BlackRock Liquidity Funds, FedFund, Institutional Class, 1.520% | | | | | | | | |
| | | (Cost $1,869,679) | | | 1,869,679 | | | | 0.4 | |
| | | | | | | | | | | |
| | Total Short-Term Investments | | | | | | | | |
| | (Cost $1,869,679) | | | 1,869,679 | | | | 0.4 | |
| | | | | | | | | | | |
| | Total Investments in Securities
(Cost $145,658,817) | | $ | 517,100,388 | | | | 100.0 | |
| | Liabilities in Excess of Other Assets | | | (182,316 | ) | | | – | |
| | Net Assets | | $ | 516,918,072 | | | | 100.0 | |
| (1) | Non-income producing security. |
| (2) | Security is a Master Limited Partnership. |
| (3) | Securities with purchases pursuant to Rule 144A or section 4(a)(2), under the Securities Act of 1933 and may not be resold subject to that rule except to qualified institutional buyers. |
| (4) | Rate shown is the 7-day yield as of December 31, 2019. |
See Accompanying Notes to Financial Statements
| VY®Columbia Contrarian Core Portfolio | PORTFOLIO OF INVESTMENTS as ofDecember 31, 2019 |
| Shares | | | | Value | | | Percentage
of Net
Assets | |
| COMMON STOCK: 97.5% |
| | | Communication Services: 14.2% | | | | | | | | |
| 11,260 | | Activision Blizzard, Inc. | | $ | 669,069 | | | | 1.3 | |
| 663 (1) | | Alphabet, Inc. - Class A | | | 888,016 | | | | 1.7 | |
| 829 (1) | | Alphabet, Inc. - Class C | | | 1,108,390 | | | | 2.2 | |
| 17,140 | | AT&T, Inc. | | | 669,831 | | | | 1.3 | |
| 27,999 | | Comcast Corp. – Class A | | | 1,259,115 | | | | 2.5 | |
| 4,240 (1) | | Electronic Arts, Inc. | | | 455,842 | | | | 0.9 | |
| 6,065 (1) | | Facebook, Inc. - Class A | | | 1,244,841 | | | | 2.5 | |
| 3,275 (1) | | T-Mobile US, Inc. | | | 256,825 | | | | 0.5 | |
| 6,582 | | Verizon Communications, Inc. | | | 404,135 | | | | 0.8 | |
| 6,050 | | ViacomCBS, Inc. | | | 253,919 | | | | 0.5 | |
| | | | | | 7,209,983 | | | | 14.2 | |
| | | | | | | | | | | |
| | | Consumer Discretionary: 7.7% | | | | | | | | |
| 805 (1) | | Amazon.com, Inc. | | | 1,487,511 | | | | 2.9 | |
| 6,376 | | Aramark | | | 276,718 | | | | 0.6 | |
| 4,525 (1) | | Capri Holdings Ltd. | | | 172,629 | | | | 0.3 | |
| 2,920 | | D.R. Horton, Inc. | | | 154,030 | | | | 0.3 | |
| 17,395 | | eBay, Inc. | | | 628,133 | | | | 1.2 | |
| 7,779 | | Lowe's Cos, Inc. | | | 931,613 | | | | 1.8 | |
| 516 | | McDonald's Corp. | | | 101,967 | | | | 0.2 | |
| 1,375 (1) | | Mohawk Industries, Inc. | | | 187,523 | | | | 0.4 | |
| | | | | | 3,940,124 | | | | 7.7 | |
| | | | | | | | | | | |
| | | Consumer Staples: 4.5% | | | | | | | | |
| 3,410 | | Colgate-Palmolive Co. | | | 234,745 | | | | 0.5 | |
| 8,216 | | Conagra Brands, Inc. | | | 281,316 | | | | 0.6 | |
| 9,140 | | Mondelez International, Inc. | | | 503,431 | | | | 1.0 | |
| 12,245 | | Philip Morris International, Inc. | | | 1,041,927 | | | | 2.0 | |
| 2,439 | | Sysco Corp. | | | 208,632 | | | | 0.4 | |
| | | | | | 2,270,051 | | | | 4.5 | |
| | | | | | | | | | | |
| | | Energy: 5.5% | | | | | | | | |
| 13,493 | | Canadian Natural Resources Ltd. | | | 436,499 | | | | 0.9 | |
| 9,281 | | Chevron Corp. | | | 1,118,453 | | | | 2.2 | |
| 7,354 | | EOG Resources, Inc. | | | 615,971 | | | | 1.2 | |
| 3,210 | | Marathon Petroleum Corp. | | | 193,402 | | | | 0.4 | |
| 7,865 | | Schlumberger Ltd. | | | 316,173 | | | | 0.6 | |
| 1,260 | | Valero Energy Corp. | | | 117,999 | | | | 0.2 | |
| | | | | | 2,798,497 | | | | 5.5 | |
| | | | | | | | | | | |
| | | Financials: 14.9% | | | | | | | | |
| 1,960 | | Aon PLC | | | 408,249 | | | | 0.8 | |
| 8,978 (1) | | Berkshire Hathaway, Inc. – Class B | | | 2,033,517 | | | | 4.0 | |
| 1,461 | | BlackRock, Inc. | | | 734,445 | | | | 1.4 | |
| 18,807 | | Citigroup, Inc. | | | 1,502,491 | | | | 3.0 | |
| 11,913 | | JPMorgan Chase & Co. | | | 1,660,672 | | | | 3.3 | |
| 17,210 | | Morgan Stanley | | | 879,775 | | | | 1.7 | |
| 7,080 | | Wells Fargo & Co. | | | 380,904 | | | | 0.7 | |
| | | | | | 7,600,053 | | | | 14.9 | |
| | | | | | | | | | | |
| | | Health Care: 12.3% | | | | | | | | |
| 4,628 | | Abbott Laboratories | | | 401,988 | | | | 0.8 | |
| 2,885 (1) | | Alexion Pharmaceuticals, Inc. | | | 312,013 | | | | 0.6 | |
| 2,250 | | Allergan plc | | | 430,133 | | | | 0.8 | |
| 1,462 | | Anthem, Inc. | | | 441,568 | | | | 0.9 | |
| 2,290 | | Becton Dickinson & Co. | | | 622,811 | | | | 1.2 | |
| 2,658 | | Cigna Corp. | | | 543,534 | | | | 1.1 | |
| 8,630 | | Dentsply Sirona, Inc. | | | 488,372 | | | | 1.0 | |
| 6,862 | | Johnson & Johnson | | | 1,000,960 | | | | 2.0 | |
| 12,843 | | Medtronic PLC | | | 1,457,038 | | | | 2.9 | |
| 13,676 | | Pfizer, Inc. | | | 535,826 | | | | 1.0 | |
| | | | | | 6,234,243 | | | | 12.3 | |
| | | | | | | | | | | |
| | | Industrials: 7.5% | | | | | | | | |
| 847 | | 3M Co. | | | 149,428 | | | | 0.3 | |
| 3,360 | | Caterpillar, Inc. | | | 496,205 | | | | 1.0 | |
| 9,000 | | Emerson Electric Co. | | | 686,340 | | | | 1.3 | |
| 5,722 | | Honeywell International, Inc. | | | 1,012,794 | | | | 2.0 | |
| 1,175 | | L3Harris Technologies, Inc. | | | 232,497 | | | | 0.5 | |
| 4,682 (1) | | Lyft, Inc. | | | 201,420 | | | | 0.4 | |
| 2,200 | | Northrop Grumman Corp. | | | 756,734 | | | | 1.5 | |
| 2,404 | | Spirit Aerosystems Holdings, Inc. | | | 175,203 | | | | 0.3 | |
| 3,350 (1) | | Uber Technologies, Inc. | | | 99,629 | | | | 0.2 | |
| | | | | | 3,810,250 | | | | 7.5 | |
| | | | | | | | | | | |
| | | Information Technology: 25.8% | | | | | | | | |
| 1,930 (1) | | Adobe, Inc. | | | 636,533 | | | | 1.3 | |
| 8,536 | | Apple, Inc. | | | 2,506,596 | | | | 4.9 | |
| 1,275 (1) | | Autodesk, Inc. | | | 233,912 | | | | 0.5 | |
| 4,245 | | CDK Global, Inc. | | | 232,117 | | | | 0.5 | |
| 8,990 | | Cisco Systems, Inc. | | | 431,160 | | | | 0.9 | |
| 15,315 | | Corning, Inc. | | | 445,820 | | | | 0.9 | |
| 5,977 | | DXC Technology Co. | | | 224,675 | | | | 0.4 | |
| 6,890 | | Fidelity National Information Services, Inc. | | | 958,330 | | | | 1.9 | |
| 5,837 (1) | | Fiserv, Inc. | | | 674,932 | | | | 1.3 | |
| 5,455 | | Intel Corp. | | | 326,482 | | | | 0.6 | |
| 2,765 | | International Business Machines Corp. | | | 370,621 | | | | 0.7 | |
| 1,845 | | Lam Research Corp. | | | 539,478 | | | | 1.1 | |
| 8,405 | | Marvell Technology Group Ltd. | | | 223,237 | | | | 0.4 | |
| 3,956 | | Mastercard, Inc. - Class A | | | 1,181,222 | | | | 2.3 | |
| 18,350 | | Microsoft Corp. | | | 2,893,795 | | | | 5.7 | |
| 1,310 | | Nvidia Corp. | | | 308,243 | | | | 0.6 | |
| 4,400 | | NXP Semiconductor NV - NXPI - US | | | 559,944 | | | | 1.1 | |
| 1,495 (1) | | Palo Alto Networks, Inc. | | | 345,719 | | | | 0.7 | |
| | | | | | 13,092,816 | | | | 25.8 | |
| | | | | | | | | | | |
| | | Materials: 3.2% | | | | | | | | |
| 870 | | Air Products & Chemicals, Inc. | | | 204,441 | | | | 0.4 | |
| 11,193 | | Corteva, Inc. | | | 330,865 | | | | 0.7 | |
| 3,688 | | DowDuPont, Inc. | | | 236,770 | | | | 0.5 | |
| 12,195 | | Newmont Goldcorp Corp. | | | 529,873 | | | | 1.0 | |
| 528 | | Sherwin-Williams Co. | | | 308,109 | | | | 0.6 | |
| | | | | | 1,610,058 | | | | 3.2 | |
| | | | | | | | | | | |
| | | Real Estate: 1.1% | | | | | | | | |
| 2,475 | | American Tower Corp. | | | 568,804 | | | | 1.1 | |
See Accompanying Notes to Financial Statements
| VY®Columbia Contrarian Core Portfolio | PORTFOLIO OF INVESTMENTS as ofDecember 31, 2019 (CONTINUED) |
| | | Utilities: 0.8% | | | | | | | | |
| 4,295 | | American Electric Power Co., Inc. | | | 405,920 | | | | 0.8 | |
| | | | | | | | | | | |
| | Total Common Stock | | | | | | | | |
| | (Cost $39,859,994) | | | 49,540,799 | | | | 97.5 | |
| | | | | | | | | | | |
| OTHER(2): –% |
| | | Materials: –% | | | | | | | | |
| 649,000 (3),(4) | | SINO Forest Corp. (Escrow) | | | – | | | | – | |
| | | | | | | | | | | |
| | Total Other | | | | | | | | |
| | (Cost $–) | | | – | | | | – | |
| | | | | | | | | | |
| | Total Long-Term Investments | | | | | | | | |
| | (Cost $39,859,994) | | | 49,540,799 | | | | 97.5 | |
| | | | | | | | | | | |
| SHORT-TERM INVESTMENTS: 2.4% |
| | | Mutual Funds: 2.4% | | | | | | | | |
| 1,198,041 (5) | | BlackRock Liquidity Funds, FedFund, Institutional Class, 1.520% | | | | | | | | |
| | | (Cost $1,198,041) | | | 1,198,041 | | | | 2.4 | |
| | | | | | | | | | | |
| | Total Short-Term Investments | | | | | | | | |
| (Cost $1,198,041) | | | 1,198,041 | | | | 2.4 | |
| | | | | | | | | | |
| | Total Investments in Securities
(Cost $41,058,035) | | $ | 50,738,840 | | | | 99.9 | |
| | Assets in Excess of Other Liabilities | | | 43,995 | | | | 0.1 | |
| | Net Assets | | $ | 50,782,835 | | | | 100.0 | |
| (1) | Non-income producing security. |
| (2) | Represents an escrow position for future entitlements, if any, on the defaulted bond. The escrow position was received in exchange for the defaulted bond as part of the bankruptcy reorganization of the bond issuer.These holdings are non-income producing. |
| (3) | For fair value measurement disclosure purposes, security is categorized as Level 3, whose value was determined using significant unobservable inputs. |
| (4) | Restricted security as to resale, excluding Rule 144A securities. As of December 31, 2019, the Portfolio held restricted securities with a fair value of $– or 0.0% of net assets. Please refer to the table below for additional details. |
| (5) | Rate shown is the 7-day yield as of December 31, 2019. |
See Accompanying Notes to Financial Statements
| VY®Columbia Small Cap Value II Portfolio | PORTFOLIO OF INVESTMENTS as ofDecember 31, 2019 |
| Shares | | | | Value | | | Percentage
of Net
Assets | |
| COMMON STOCK: 98.2% |
| | | Communication Services: 2.2% | | | | | | | | |
| 20,200 | | Nexstar Media Group, Inc. | | $ | 2,368,450 | | | | 1.5 | |
| 145,000 (1) | | Vonage Holdings Corp. | | | 1,074,450 | | | | 0.7 | |
| | | | | | 3,442,900 | | | | 2.2 | |
| | | | | | | | | | | |
| | | Consumer Discretionary: 8.6% | | | | | | | | |
| 23,000 | | Aarons, Inc. | | | 1,313,530 | | | | 0.8 | |
| 52,200 | | American Eagle Outfitters, Inc. | | | 767,340 | | | | 0.5 | |
| 27,500 | | Bed Bath & Beyond, Inc. | | | 475,750 | | | | 0.3 | |
| 33,000 | | Brinker International, Inc. | | | 1,386,000 | | | | 0.9 | |
| 12,000 | | Childrens Place, Inc./The | | | 750,240 | | | | 0.5 | |
| 15,500 | | Dine Brands Global, Inc. | | | 1,294,560 | | | | 0.8 | |
| 24,000 (1) | | Genesco, Inc. | | | 1,150,080 | | | | 0.7 | |
| 41,000 | | KB Home | | | 1,405,070 | | | | 0.9 | |
| 28,000 (1) | | Penn National Gaming, Inc. | | | 715,680 | | | | 0.4 | |
| 56,000 (1) | | PlayAGS, Inc. | | | 679,280 | | | | 0.4 | |
| 44,500 (1) | | Sally Beauty Holdings, Inc. | | | 812,125 | | | | 0.5 | |
| 15,600 (1) | | TopBuild Corp. | | | 1,608,048 | | | | 1.0 | |
| 17,000 (1) | | Visteon Corp. | | | 1,472,030 | | | | 0.9 | |
| | | | | | 13,829,733 | | | | 8.6 | |
| | | | | | | | | | | |
| | | Consumer Staples: 2.9% | | | | | | | | |
| 73,500 (1) | | BellRing Brands, Inc. | | | 1,564,815 | | | | 1.0 | |
| 65,000 (1) | | BJ's Wholesale Club Holdings, Inc. | | | 1,478,100 | | | | 0.9 | |
| 34,000 (1) | | TreeHouse Foods, Inc. | | | 1,649,000 | | | | 1.0 | |
| | | | | | 4,691,915 | | | | 2.9 | |
| | | | | | | | | | | |
| | | Energy: 4.8% | | | | | | | | |
| 15,500 | | Arch Coal, Inc. | | | 1,111,970 | | | | 0.7 | |
| 200,000 (1) | | Callon Petroleum Co. | | | 966,000 | | | | 0.6 | |
| 40,500 | | Delek US Holdings, Inc. | | | 1,357,965 | | | | 0.8 | |
| 228,000 (1) | | Oasis Petroleum, Inc. | | | 743,280 | | | | 0.5 | |
| 111,000 | | Patterson-UTI Energy, Inc. | | | 1,165,500 | | | | 0.7 | |
| 40,500 | | Scorpio Tankers, Inc. | | | 1,593,270 | | | | 1.0 | |
| 65,600 | | SM Energy Co. | | | 737,344 | | | | 0.5 | |
| | | | | | 7,675,329 | | | | 4.8 | |
| | | | | | | | | | | |
| | | Financials: 28.1% | | | | | | | | |
| 30,000 | | American Equity Investment Life Holding Co. | | | 897,900 | | | | 0.6 | |
| 44,500 | | Ameris Bancorp. | | | 1,893,030 | | | | 1.2 | |
| 26,500 | | Amerisafe, Inc. | | | 1,749,795 | | | | 1.1 | |
| 28,500 | | Argo Group International Holdings Ltd. | | | 1,873,875 | | | | 1.2 | |
| 68,500 | | Atlantic Union Bankshares Corp. | | | 2,572,175 | | | | 1.6 | |
| 48,000 (1) | | Axos Financial, Inc. | | | 1,453,440 | | | | 0.9 | |
| 51,000 (1) | | Bancorp, Inc. | | | 661,470 | | | | 0.4 | |
| 43,500 | | Blackstone Mortgage Trust, Inc. | | | 1,619,070 | | | | 1.0 | |
| 53,000 | | Cathay General Bancorp. | | | 2,016,650 | | | | 1.3 | |
| 38,500 | | Community Bank System, Inc. | | | 2,731,190 | | | | 1.7 | |
| 47,000 | | Hancock Whitney Corp. | | | 2,062,360 | | | | 1.3 | |
| 69,100 | | Heritage Commerce Corp. | | | 886,553 | | | | 0.6 | |
| 47,000 | | Heritage Financial Corp. | | | 1,330,100 | | | | 0.8 | |
| 39,000 | | Houlihan Lokey, Inc. | | | 1,905,930 | | | | 1.2 | |
| 29,000 | | Independent Bank Corp. | | | 2,414,250 | | | | 1.5 | |
| 39,000 | | Invesco Mortgage Capital, Inc. | | | 649,350 | | | | 0.4 | |
| 82,000 (1) | | MBIA, Inc. | | | 762,600 | | | | 0.5 | |
| 157,000 | | MGIC Investment Corp. | | | 2,224,690 | | | | 1.4 | |
| 44,000 | | OceanFirst Financial Corp. | | | 1,123,760 | | | | 0.7 | |
| 54,500 | | Pacific Premier Bancorp, Inc. | | | 1,776,972 | | | | 1.1 | |
| 58,000 | | Renasant Corp. | | | 2,054,360 | | | | 1.3 | |
| 57,000 | | Sandy Spring Bancorp, Inc. | | | 2,159,160 | | | | 1.3 | |
| 95,000 | | SLM Corp. | | | 846,450 | | | | 0.5 | |
| 58,500 | | TCF Financial Corp. | | | 2,737,800 | | | | 1.7 | |
| 29,500 | | UMB Financial Corp. | | | 2,024,880 | | | | 1.3 | |
| 34,000 | | Virtu Financial, Inc. | | | 543,660 | | | | 0.3 | |
| 45,500 | | WSFS Financial Corp. | | | 2,001,545 | | | | 1.2 | |
| | | | | | 44,973,015 | | | | 28.1 | |
| | | | | | | | | | | |
| | | Health Care: 5.1% | | | | | | | | |
| 48,000 (1) | | Horizon Therapeutics Plc | | | 1,737,600 | | | | 1.1 | |
| 41,000 (1) | | Immunomedics, Inc. | | | 867,560 | | | | 0.5 | |
| 15,500 (1) | | LHC Group, Inc. | | | 2,135,280 | | | | 1.3 | |
| 23,000 (1) | | Merit Medical Systems, Inc. | | | 718,060 | | | | 0.5 | |
| 118,000 (1) | | R1 RCM, Inc. | | | 1,531,640 | | | | 1.0 | |
| 19,000 (1) | | Syneos Health, Inc. | | | 1,130,025 | | | | 0.7 | |
| | | | | | 8,120,165 | | | | 5.1 | |
| | | | | | | | | | | |
| | | Industrials: 13.5% | | | | | | | | |
| 72,700 (1) | | Bloom Energy Corp. | | | 543,069 | | | | 0.4 | |
| 80,500 (1) | | Covenant Transportation Group, Inc. | | | 1,040,463 | | | | 0.7 | |
| 92,000 (1) | | Evoqua Water Technologies Corp. | | | 1,743,400 | | | | 1.1 | |
| 85,000 (1) | | Hertz Global Holdings, Inc. | | | 1,338,750 | | | | 0.8 | |
| 23,000 | | ICF International, Inc. | | | 2,107,260 | | | | 1.3 | |
| 32,800 | | Kennametal, Inc. | | | 1,209,992 | | | | 0.8 | |
| 40,500 | | Kforce, Inc. | | | 1,607,850 | | | | 1.0 | |
| 23,800 | | Korn Ferry | | | 1,009,120 | | | | 0.6 | |
| 11,900 (1) | | Masonite International Corp. | | | 859,299 | | | | 0.5 | |
| 27,500 (1) | | Mastec, Inc. | | | 1,764,400 | | | | 1.1 | |
| 44,000 (1) | | Navistar International Corp. | | | 1,273,360 | | | | 0.8 | |
| 90,000 (1) | | NOW, Inc. | | | 1,011,600 | | | | 0.6 | |
| 32,000 | | Skywest, Inc. | | | 2,068,160 | | | | 1.3 | |
| 26,000 (1) | | Spirit Airlines, Inc. | | | 1,048,060 | | | | 0.7 | |
| 108,000 (1) | | Sunrun, Inc. | | | 1,491,480 | | | | 0.9 | |
| 35,500 | | Triton International Ltd./Bermuda | | | 1,427,100 | | | | 0.9 | |
| | | | | | 21,543,363 | | | | 13.5 | |
| | | | | | | | | | | |
| | | Information Technology: 14.0% | | | | | | | | |
| 107,000 (1) | | Avaya Holdings Corp. | | | 1,444,500 | | | | 0.9 | |
| 34,000 (1) | | Ciena Corp. | | | 1,451,460 | | | | 0.9 | |
| 78,000 | | Cohu, Inc. | | | 1,782,300 | | | | 1.1 | |
| 17,400 (1) | | Diodes, Inc. | | | 980,838 | | | | 0.6 | |
| 28,200 | | Entegris, Inc. | | | 1,412,538 | | | | 0.9 | |
| 59,000 | | KBR, Inc. | | | 1,799,500 | | | | 1.1 | |
See Accompanying Notes to Financial Statements
| VY®Columbia Small Cap Value II Portfolio | PORTFOLIO OF INVESTMENTS as ofDecember 31, 2019(CONTINUED) |
| 47,000 | | Kulicke & Soffa Industries, Inc. | | | 1,278,400 | | | | 0.8 | |
| 21,300 (1) | | Lumentum Holdings, Inc. | | | 1,689,090 | | | | 1.1 | |
| 45,000 (1) | | MACOM Technology Solutions Holdings, Inc. | | | 1,197,000 | | | | 0.8 | |
| 75,300 (1) | | Photronics, Inc. | | | 1,186,728 | | | | 0.8 | |
| 19,000 | | Science Applications International Corp. | | | 1,653,380 | | | | 1.0 | |
| 17,800 | | SYNNEX Corp. | | | 2,292,640 | | | | 1.4 | |
| 46,000 (1) | | Ultra Clean Holdings, Inc. | | | 1,079,620 | | | | 0.7 | |
| 25,500 (1) | | Verint Systems, Inc. | | | 1,411,680 | | | | 0.9 | |
| 111,000 (1) | | Viavi Solutions, Inc. | | | 1,665,000 | | | | 1.0 | |
| | | | | | 22,324,674 | | | | 14.0 | |
| | | | | | | | | | | |
| | | Materials: 5.6% | | | | | | | | |
| 29,000 | | Boise Cascade Co. | | | 1,059,370 | | | | 0.7 | |
| 33,522 | | Carpenter Technology Corp. | | | 1,668,725 | | | | 1.0 | |
| 128,200 | | Cleveland-Cliffs, Inc. | | | 1,076,880 | | | | 0.7 | |
| 82,000 (1) | | Livent Corp. | | | 701,100 | | | | 0.4 | |
| 25,500 | | Materion Corp. | | | 1,515,975 | | | | 0.9 | |
| 72,000 | | Orion Engineered Carbons SA | | | 1,389,600 | | | | 0.9 | |
| 66,000 (1) | | Summit Materials, Inc. | | | 1,577,400 | | | | 1.0 | |
| | | | | | 8,989,050 | | | | 5.6 | |
| | | | | | | | | | | |
| | | Real Estate: 8.2% | | | | | | | | |
| 33,500 | | American Assets Trust, Inc. | | | 1,537,650 | | | | 1.0 | |
| 63,000 | | First Industrial Realty Trust, Inc. | | | 2,615,130 | | | | 1.6 | |
| 26,200 | | Hannon Armstrong Sustainable Infrastructure Capital, Inc. | | | 843,116 | | | | 0.5 | |
| 32,300 | | Hudson Pacific Properties, Inc. | | | 1,216,095 | | | | 0.8 | |
| 10,400 | | Investors Real Estate Trust | | | 754,000 | �� | | | 0.5 | |
| 77,000 | | Mack-Cali Realty Corp. | | | 1,781,010 | | | | 1.1 | |
| 12,000 | | PS Business Parks, Inc. | | | 1,978,440 | | | | 1.2 | |
| 33,000 | | Sabra Healthcare REIT, Inc. | | | 704,220 | | | | 0.4 | |
| 120,000 | | Sunstone Hotel Investors, Inc. | | | 1,670,400 | | | | 1.1 | |
| | | | | | 13,100,061 | | | | 8.2 | |
| | | | | | | | | | | |
| | | Utilities: 5.2% | | | | | | | | |
| 32,500 | | New Jersey Resources Corp. | | | 1,448,525 | | | | 0.9 | |
| 17,500 | | ONE Gas, Inc. | | | 1,637,475 | | | | 1.0 | |
| 30,000 | | PNM Resources, Inc. | | | 1,521,300 | | | | 1.0 | |
| 29,000 | | Portland General Electric Co. | | | 1,617,910 | | | | 1.0 | |
| 40,000 | | South Jersey Industries, Inc. | | | 1,319,200 | | | | 0.8 | |
| 10,500 | | Southwest Gas Holdings, Inc. | | | 797,685 | | | | 0.5 | |
| | | | | | 8,342,095 | | | | 5.2 | |
| | | | | | | | | | | |
| | Total Common Stock | | | | | | | | |
| | (Cost $132,960,402) | | | 157,032,300 | | | | 98.2 | |
| | | | | | | | | | | |
| | | | | | | | | | | |
| SHORT-TERM INVESTMENTS: 1.9% |
| | | Mutual Funds: 1.9% | | | | | | | | |
| 3,086,638 (2) | | BlackRock Liquidity Funds, FedFund, Institutional Class, 1.520% | | | | | | | | |
| | | (Cost $3,086,638) | | | 3,086,638 | | | | 1.9 | |
| | | | | | | | | | | |
| | Total Short-Term Investments | | | | | | | | |
| | (Cost $3,086,638) | | | 3,086,638 | | | | 1.9 | |
| | | | | | | | | | | |
| | Total Investments in Securities
(Cost $136,047,040) | | $ | 160,118,938 | | | | 100.1 | |
| | Liabilities in Excess of Other Assets | | | (228,744 | ) | | | (0.1 | ) |
| | Net Assets | | $ | 159,890,194 | | | | 100.0 | |
| (1) | Non-income producing security. |
| (2) | Rate shown is the 7-day yield as of December 31, 2019. |
See Accompanying Notes to Financial Statements
| VY®Invesco Comstock Portfolio | PORTFOLIO OF INVESTMENTS as ofDecember 31, 2019 |
| Shares | | | | Value | | | Percentage
of Net
Assets | |
| COMMON STOCK: 95.7% |
| | | Communication Services: 5.5% | | | | | | | | |
| 130,680 | | AT&T, Inc. | | $ | 5,106,975 | | | | 1.6 | |
| 9,538 (1) | | Charter Communications, Inc. | | | 4,626,693 | | | | 1.5 | |
| 80,622 | | Comcast Corp. – Class A | | | 3,625,571 | | | | 1.2 | |
| 46,528 | | ViacomCBS, Inc. | | | 1,952,780 | | | | 0.6 | |
| 920,104 | | Vodafone Group PLC | | | 1,786,278 | | | | 0.6 | |
| | | | | | 17,098,297 | | | | 5.5 | |
| | | | | | | | | | | |
| | | Consumer Discretionary: 5.9% | | | | | | | | |
| 5,821 | | Advance Auto Parts, Inc. | | | 932,291 | | | | 0.3 | |
| 115,848 | | Carnival Corp. | | | 5,888,554 | | | | 1.9 | |
| 104,453 | | eBay, Inc. | | | 3,771,798 | | | | 1.2 | |
| 75,327 (2) | | Gap, Inc. | | | 1,331,781 | | | | 0.5 | |
| 167,083 | | General Motors Co. | | | 6,115,238 | | | | 2.0 | |
| | | | | | 18,039,662 | | | | 5.9 | |
| | | | | | | | | | | |
| | | Consumer Staples: 6.8% | | | | | | | | |
| 49,047 | | Altria Group, Inc. | | | 2,447,936 | | | | 0.8 | |
| 91,819 | | Archer-Daniels-Midland Co. | | | 4,255,811 | | | | 1.4 | |
| 22,797 | | Kimberly-Clark Corp. | | | 3,135,727 | | | | 1.0 | |
| 97,436 | | Philip Morris International, Inc. | | | 8,290,829 | | | | 2.7 | |
| 33,638 | | Reckitt Benckiser Group PLC | | | 2,732,382 | | | | 0.9 | |
| | | | | | 20,862,685 | | | | 6.8 | |
| | | | | | | | | | | |
| | | Energy: 15.8% | | | | | | | | |
| 166,185 | | BP PLC ADR | | | 6,271,822 | | | | 2.0 | |
| 103,488 | | Canadian Natural Resources Ltd. | | | 3,347,192 | | | | 1.1 | |
| 55,184 | | Chevron Corp. | | | 6,650,224 | | | | 2.2 | |
| 150,672 | | Devon Energy Corp. | | | 3,912,952 | | | | 1.3 | |
| 462,256 (2) | | EnCana Corp. | | | 2,167,981 | | | | 0.7 | |
| 10,330 | | Exxon Mobil Corp. | | | 720,827 | | | | 0.2 | |
| 66,646 | | Hess Corp. | | | 4,452,619 | | | | 1.4 | |
| 360,914 | | Marathon Oil Corp. | | | 4,901,212 | | | | 1.6 | |
| 131,632 | | Noble Energy, Inc. | | | 3,269,739 | | | | 1.1 | |
| 6,915 | | Pioneer Natural Resources Co. | | | 1,046,723 | | | | 0.3 | |
| 91,749 | | Royal Dutch Shell PLC - Class A ADR | | | 5,411,356 | | | | 1.8 | |
| 200,425 | | Suncor Energy, Inc. | | | 6,573,940 | | | | 2.1 | |
| | | | | | 48,726,587 | | | | 15.8 | |
| | | | | | | | | | | |
| | | Financials: 30.2% | | | | | | | | |
| 31,521 | | Allstate Corp. | | | 3,544,537 | | | | 1.2 | |
| 63,820 | | Ally Financial, Inc. | | | 1,950,339 | | | | 0.6 | |
| 115,850 | | American International Group, Inc. | | | 5,946,581 | | | | 1.9 | |
| 442,348 | | Bank of America Corp. | | | 15,579,497 | | | | 5.1 | |
| 84,271 | | Bank of New York Mellon Corp. | | | 4,241,359 | | | | 1.4 | |
| 204,077 | | Citigroup, Inc. | | | 16,303,712 | | | | 5.3 | |
| 102,116 | | Citizens Financial Group, Inc. | | | 4,146,931 | | | | 1.3 | |
| 140,750 | | Fifth Third Bancorp | | | 4,326,655 | | | | 1.4 | |
| 18,340 | | Goldman Sachs Group, Inc. | | | 4,216,916 | | | | 1.4 | |
| 78,148 | | JPMorgan Chase & Co. | | | 10,893,831 | | | | 3.5 | |
| 61,252 | | Metlife, Inc. | | | 3,122,014 | | | | 1.0 | |
| 123,370 | | Morgan Stanley | | | 6,306,674 | | | | 2.0 | |
| 19,304 | | PNC Financial Services Group, Inc. | | | 3,081,498 | | | | 1.0 | |
| 57,542 | | State Street Corp. | | | 4,551,572 | | | | 1.5 | |
| 91,973 | | Wells Fargo & Co. | | | 4,948,147 | | | | 1.6 | |
| | | | | | 93,160,263 | | | | 30.2 | |
| | | | | | | | | | | |
| | | Health Care: 11.2% | | | | | | | | |
| 19,507 | | Allergan plc | | | 3,729,153 | | | | 1.2 | |
| 21,104 | | Anthem, Inc. | | | 6,374,041 | | | | 2.1 | |
| 70,149 | | Bristol-Myers Squibb Co. | | | 4,502,864 | | | | 1.5 | |
| 48,054 | | Cardinal Health, Inc. | | | 2,430,571 | | | | 0.8 | |
| 40,805 | | CVS Health Corp. | | | 3,031,404 | | | | 1.0 | |
| 53,179 | | Gilead Sciences, Inc. | | | 3,455,572 | | | | 1.1 | |
| 18,330 | | McKesson Corp. | | | 2,535,406 | | | | 0.8 | |
| 91,974 (1) | | Mylan NV | | | 1,848,677 | | | | 0.6 | |
| 14,769 | | Novartis AG | | | 1,398,471 | | | | 0.4 | |
| 106,497 (2) | | Sanofi ADR | | | 5,346,149 | | | | 1.7 | |
| | | | | | 34,652,308 | | | | 11.2 | |
| | | | | | | | | | | |
| | | Industrials: 8.5% | | | | | | | | |
| 19,695 | | Caterpillar, Inc. | | | 2,908,558 | | | | 0.9 | |
| 53,288 | | Eaton Corp. PLC | | | 5,047,439 | | | | 1.6 | |
| 57,794 | | Emerson Electric Co. | | | 4,407,370 | | | | 1.4 | |
| 289,453 | | General Electric Co. | | | 3,230,296 | | | | 1.1 | |
| 20,546 | | Ingersoll-Rand PLC - Class A | | | 2,730,974 | | | | 0.9 | |
| 111,060 | | Johnson Controls International plc | | | 4,521,253 | | | | 1.5 | |
| 77,130 | | Textron, Inc. | | | 3,439,998 | | | | 1.1 | |
| | | | | | 26,285,888 | | | | 8.5 | |
| | | | | | | | | | | |
| | | Information Technology: 8.1% | | | | | | | | |
| 101,896 | | Cisco Systems, Inc. | | | 4,886,932 | | | | 1.6 | |
| 47,151 | | Cognizant Technology Solutions Corp. | | | 2,924,305 | | | | 1.0 | |
| 94,983 | | Intel Corp. | | | 5,684,733 | | | | 1.8 | |
| 31,978 | | Microsoft Corp. | | | 5,042,931 | | | | 1.6 | |
| 11,718 | | NXP Semiconductor NV - NXPI - US | | | 1,491,233 | | | | 0.5 | |
| 56,645 | | Qualcomm, Inc. | | | 4,997,788 | | | | 1.6 | |
| | | | | | 25,027,922 | | | | 8.1 | |
| | | | | | | | | | | |
| | | Materials: 3.2% | | | | | | | | |
| 49,535 | | CF Industries Holdings, Inc. | | | 2,364,801 | | | | 0.8 | |
| 129,772 | | Corteva, Inc. | | | 3,836,060 | | | | 1.2 | |
| 79,781 | | International Paper Co. | | | 3,673,915 | | | | 1.2 | |
| | | | | | 9,874,776 | | | | 3.2 | |
| | | | | | | | | | | |
| | | Utilities: 0.5% | | | | | | | | |
| 63,000 | | Vistra Energy Corp. | | | 1,448,370 | | | | 0.5 | |
| | | | | | | | | | | |
| | Total Common Stock | | | | | | | | |
| | (Cost $251,735,557) | | | 295,176,758 | | | | 95.7 | |
See Accompanying Notes to Financial Statements
| VY®Invesco Comstock Portfolio | PORTFOLIO OF INVESTMENTS as ofDecember 31, 2019 (CONTINUED) |
Principal
Amount† | | | | | Value | | | | Percentage
of Net
Assets | |
| SHORT-TERM INVESTMENTS: 5.2% |
| | | Repurchase Agreements: 1.8% | | | | | | | | |
| 1,305,021 (3) | | Bank of Montreal, Repurchase Agreement dated 12/31/19, 1.57%, due 01/02/20 (Repurchase Amount $1,305,133, collateralized by various U.S. Government Agency Obligations, 2.500%-5.000%, Market Value plus accrued interest $1,331,121, due 04/20/49-12/01/49) | | | 1,305,021 | | | | 0.4 | |
| 386,635 (3) | | Citadel Securities LLC, Repurchase Agreement dated 12/31/19, 1.60%, due 01/02/20 (Repurchase Amount $386,669, collateralized by various U.S. Government Securities, 0.000%-8.500%, Market Value plus accrued interest $394,403, due 01/15/20-11/15/48) | | | 386,635 | | | | 0.2 | |
| 1,305,021 (3) | | Citigroup, Inc., Repurchase Agreement dated 12/31/19, 1.57%, due 01/02/20 (Repurchase Amount $1,305,133, collateralized by various U.S. Government/U.S. Government Agency Obligations, 0.000%-9.000%, Market Value plus accrued interest $1,331,121, due 02/13/20-09/20/69) | | | 1,305,021 | | | | 0.4 | |
| 1,305,021 (3) | | HSBC Securities USA, Repurchase Agreement dated 12/31/19, 1.57%, due 01/02/20 (Repurchase Amount $1,305,133, collateralized by various U.S. Government Agency Obligations, 3.000%-4.000%, Market Value plus accrued interest $1,331,121, due 07/20/47-06/20/48) | | | 1,305,021 | | | | 0.4 | |
| 1,305,021 (3) | | Jefferies LLC, Repurchase Agreement dated 12/31/19, 1.58%, due 01/02/20 (Repurchase Amount $1,305,134, collateralized by various U.S. Government Securities, 0.000%-2.875%, Market Value plus accrued interest $1,331,122, due 01/28/20-05/15/27) | | | 1,305,021 | | | | 0.4 | |
| | | | | | | | | | | |
| | Total Repurchase Agreements | | | | | | | | |
| | (Cost $5,606,719) | | | 5,606,719 | | | | 1.8 | |
| | | | | | | | | | | |
| Shares | | | | | Value | | | | Percentage
of Net
Assets | |
| | | Mutual Funds: 3.4% | | | | | | | | |
| 10,531,178 (4) | | BlackRock Liquidity Funds, FedFund, Institutional Class, 1.520% | | | | | | | | |
| | | (Cost $10,531,178) | | | 10,531,178 | | | | 3.4 | |
| | | | | | | | | | | |
| | Total Short-Term Investments | | | | | | | | |
| | (Cost $16,137,897) | | | 16,137,897 | | | | 5.2 | |
| | | | | | | | | | | |
| | Total Investments in Securities
(Cost $267,873,454) | | $ | 311,314,655 | | | | 100.9 | |
| | Liabilities in Excess of Other Assets | | | (2,927,662 | ) | | | (0.9 | ) |
| | Net Assets | | $ | 308,386,993 | | | | 100.0 | |
| † | Unless otherwise indicated, principal amount is shown in USD. |
| ADR | American Depositary Receipt |
| (1) | Non-income producing security. |
| (2) | Security, or a portion of the security, is on loan. |
| (3) | All or a portion of the security represents securities purchased with cash collateral received for securities on loan. |
| (4) | Rate shown is the 7-day yield as of December 31, 2019. |
See Accompanying Notes to Financial Statements
| VY®Invesco Equity and Income Portfolio | PORTFOLIO OF INVESTMENTS as ofDecember 31, 2019 |
| Shares | | | | Value | | | Percentage
of Net
Assets | |
| COMMON STOCK: 60.3% |
| | | Communication Services: 2.5% | | | | | | | | |
| 26,174 (1) | | Charter Communications, Inc. | | $ | 12,696,484 | | | | 1.0 | |
| 223,027 | | Comcast Corp. – Class A | | | 10,029,524 | | | | 0.7 | |
| 5,400,655 | | Vodafone Group PLC | | | 10,484,764 | | | | 0.8 | |
| | | | | | 33,210,772 | | | | 2.5 | |
| | | | | | | | | | | |
| | | Consumer Discretionary: 5.4% | | | | | | | | |
| 408,853 (1),(2) | | Capri Holdings Ltd. | | | 15,597,742 | | | | 1.2 | |
| 336,594 (2) | | Carnival Corp. | | | 17,109,073 | | | | 1.3 | |
| 294,584 | | eBay, Inc. | | | 10,637,428 | | | | 0.8 | |
| 590,944 | | General Motors Co. | | | 21,628,551 | | | | 1.6 | |
| 2,352,216 | | Kingfisher PLC | | | 6,771,437 | | | | 0.5 | |
| | | | | | 71,744,231 | | | | 5.4 | |
| | | | | | | | | | | |
| | | Consumer Staples: 4.9% | | | | | | | | |
| 126,968 (2) | | Kellogg Co. | | | 8,781,107 | | | | 0.7 | |
| 286,638 | | Mondelez International, Inc. | | | 15,788,021 | | | | 1.2 | |
| 312,052 | | Philip Morris International, Inc. | | | 26,552,505 | | | | 2.0 | |
| 335,509 (1) | | US Foods Holding Corp. | | | 14,054,472 | | | | 1.0 | |
| | | | | | 65,176,105 | | | | 4.9 | |
| | | | | | | | | | | |
| | | Energy: 6.4% | | | | | | | | |
| 2,132,672 | | BP PLC | | | 13,416,316 | | | | 1.0 | |
| 288,748 | | Canadian Natural Resources Ltd. | | | 9,339,198 | | | | 0.7 | |
| 104,964 | | Chevron Corp. | | | 12,649,212 | | | | 0.9 | |
| 463,047 | | Devon Energy Corp. | | | 12,025,330 | | | | 0.9 | |
| 801,609 | | Marathon Oil Corp. | | | 10,885,850 | | | | 0.8 | |
| 559,562 | | Royal Dutch Shell PLC - Class A | | | 16,571,104 | | | | 1.3 | |
| 478,947 | | TechnipFMC PLC | | | 10,268,624 | | | | 0.8 | |
| | | | | | 85,155,634 | | | | 6.4 | |
| | | | | | | | | | | |
| | | Financials: 16.1% | | | | | | | | |
| 474,667 | | American International Group, Inc. | | | 24,364,657 | | | | 1.8 | |
| 300,786 | | AXA Equitable Holdings, Inc. | | | 7,453,477 | | | | 0.6 | |
| 810,644 | | Bank of America Corp. | | | 28,550,882 | | | | 2.1 | |
| 318,455 | | Citigroup, Inc. | | | 25,441,370 | | | | 1.9 | |
| 409,444 | | Citizens Financial Group, Inc. | | | 16,627,521 | | | | 1.3 | |
| 73,943 | | Goldman Sachs Group, Inc. | | | 17,001,714 | | | | 1.3 | |
| 101,424 | | JPMorgan Chase & Co. | | | 14,138,505 | | | | 1.1 | |
| 432,104 | | Morgan Stanley | | | 22,089,156 | | | | 1.7 | |
| 131,808 | | PNC Financial Services Group, Inc. | | | 21,040,511 | | | | 1.6 | |
| 265,549 | | Truist Financial Corp. | | | 14,955,720 | | | | 1.1 | |
| 178,894 | | Wells Fargo & Co. | | | 9,624,497 | | | | 0.7 | |
| 61,404 | | Willis Towers Watson PLC | | | 12,399,924 | | | | 0.9 | |
| | | | | | 213,687,934 | | | | 16.1 | |
| | | | | | | | | | | |
| | | Health Care: 10.3% | | | | | | | | |
| 101,637 (1) | | Alcon, Inc. | | | 5,756,884 | | | | 0.4 | |
| 34,883 | | Anthem, Inc. | | | 10,535,713 | | | | 0.8 | |
| 272,476 | | Bristol-Myers Squibb Co. | | | 17,490,234 | | | | 1.3 | |
| 179,337 | | CVS Health Corp. | | | 13,322,946 | | | | 1.0 | |
| 262,616 | | GlaxoSmithKline PLC | | | 6,170,740 | | | | 0.5 | |
| 209,151 | | Johnson & Johnson | | | 30,508,856 | | | | 2.3 | |
| 83,890 | | McKesson Corp. | | | 11,603,665 | | | | 0.9 | |
| 95,722 | | Medtronic PLC | | | 10,859,661 | | | | 0.8 | |
| 193,711 | | Pfizer, Inc. | | | 7,589,597 | | | | 0.5 | |
| 119,948 | | Sanofi | | | 12,046,127 | | | | 0.9 | |
| 77,988 | | Zimmer Biomet Holdings, Inc. | | | 11,673,244 | | | | 0.9 | |
| | | | | | 137,557,667 | | | | 10.3 | |
| | | | | | | | | | | |
| | | Industrials: 4.2% | | | | | | | | |
| 176,617 | | CSX Corp. | | | 12,780,006 | | | | 1.0 | |
| 103,249 | | General Dynamics Corp. | | | 18,207,961 | | | | 1.4 | |
| 96,990 | | Ingersoll-Rand PLC - Class A | | | 12,891,911 | | | | 1.0 | |
| 280,143 | | Johnson Controls International plc | | | 11,404,621 | | | | 0.8 | |
| | | | | | 55,284,499 | | | | 4.2 | |
| | | | | | | | | | | |
| | | Information Technology: 6.6% | | | | | | | | |
| 48,130 | | Apple, Inc. | | | 14,133,374 | | | | 1.1 | |
| 181,126 | | Cisco Systems, Inc. | | | 8,686,803 | | | | 0.6 | |
| 210,927 | | Cognizant Technology Solutions Corp. | | | 13,081,693 | | | | 1.0 | |
| 256,022 | | Intel Corp. | | | 15,322,917 | | | | 1.1 | |
| 70,047 | | NXP Semiconductor NV - NXPI - US | | | 8,914,181 | | | | 0.7 | |
| 290,749 | | Oracle Corp. | | | 15,403,882 | | | | 1.2 | |
| 143,050 | | Qualcomm, Inc. | | | 12,621,301 | | | | 0.9 | |
| | | | | | 88,164,151 | | | | 6.6 | |
| | | | | | | | | | | |
| | | Materials: 2.6% | | | | | | | | |
| 460,146 | | Corteva, Inc. | | | 13,601,916 | | | | 1.0 | |
| 146,544 | | Dow, Inc. | | | 8,020,353 | | | | 0.6 | |
| 108,125 | | DowDuPont, Inc. | | | 6,941,625 | | | | 0.5 | |
| 129,080 (2) | | Nutrien Ltd. | | | 6,184,223 | | | | 0.5 | |
| | | | | | 34,748,117 | | | | 2.6 | |
| | | | | | | | | | | |
| | | Utilities: 1.3% | | | | | | | | |
| 50,681 | | Duke Energy Corp. | | | 4,622,614 | | | | 0.3 | |
| 140,574 | | Exelon Corp. | | | 6,408,769 | | | | 0.5 | |
| 138,792 | | FirstEnergy Corp. | | | 6,745,291 | | | | 0.5 | |
| | | | | | 17,776,674 | | | | 1.3 | |
| | | | | | | | | | | |
| | Total Common Stock | | | | | | | |
| | (Cost $676,192,717) | | 802,505,784 | | | | 60.3 | |
| | | | | | | | | | | |
| PREFERRED STOCK: 0.8% | | | | | | | | |
| | | Energy: 0.5% | | | | | | | | |
| 140,612 (1),(3) | | El Paso Energy Capital Trust I | | | 7,235,893 | | | | 0.5 | |
| | | | | | | | | | | |
| | | Financials: 0.3% | | | | | | | | |
| 75,900 (1) | | AMG Capital Trust II | | | 3,681,150 | | | | 0.3 | |
| 4,000 (1),(2),(3),(4) | Wells Fargo & Co. | | | 109,560 | | | | 0.0 | |
| | | | | | 3,790,710 | | | | 0.3 | |
| | | | | | | | | | | |
| | Total Preferred Stock | | | | | | | | |
| | (Cost $10,847,296) | | | 11,026,603 | | | | 0.8 | |
See Accompanying Notes to Financial Statements
| VY®Invesco Equity and Income Portfolio | PORTFOLIO OF INVESTMENTS as ofDecember 31, 2019 (CONTINUED) |
Principal
Amount† | | | | | Value | | | | Percentage
of Net
Assets | |
| CORPORATE BONDS/NOTES: 13.9% | | | | | | | | |
| | | Basic Materials: 0.1% | | | | | | | | |
| 770,000 (5) | | LYB Finance Co. BV, 8.100%, 03/15/2027 | | | 984,813 | | | | 0.1 | |
| 195,000 | | International Paper Co., 6.000%, 11/15/2041 | | | 243,205 | | | | 0.0 | |
| 150,000 | | Rio Tinto Finance USA Ltd., 7.125%, 07/15/2028 | | | 201,041 | | | | 0.0 | |
| 211,000 | | Sherwin-Williams Co/The, 4.500%, 06/01/2047 | | | 239,402 | | | | 0.0 | |
| | | | | | 1,668,461 | | | | 0.1 | |
| | | | | | | | | | | |
| | | Communications: 1.6% | | | | | | | | |
| 455,000 (2) | | America Movil SAB de CV, 4.375%, 07/16/2042 | | | 513,351 | | | | 0.0 | |
| 837,000 | | AT&T, Inc., 3.000%, 06/30/2022 | | | 855,446 | | | | 0.1 | |
| 466,000 | | AT&T, Inc., 3.400%, 05/15/2025 | | | 488,468 | | | | 0.0 | |
| 533,000 | | AT&T, Inc., 4.300%, 02/15/2030 | | | 592,652 | | | | 0.1 | |
| 747,000 | | AT&T, Inc., 4.500%, 05/15/2035 | | | 831,961 | | | | 0.1 | |
| 1,300,000 | | AT&T, Inc., 4.800%, 06/15/2044 | | | 1,481,444 | | | | 0.1 | |
| 2,960,000 | | AT&T, Inc., 5.150%, 03/15/2042 | | | 3,456,176 | | | | 0.3 | |
| 271,000 | | AT&T, Inc., 5.150%, 11/15/2046 | | | 324,091 | | | | 0.0 | |
| 101,000 | | AT&T, Inc., 5.350%, 09/01/2040 | | | 121,818 | | | | 0.0 | |
| 1,635,000 | | Charter Communications Operating LLC / Charter Communications Operating Capital, 4.464%, 07/23/2022 | | | 1,718,381 | | | | 0.1 | |
| 910,000 | | Comcast Corp., 3.900%, 03/01/2038 | | | 1,007,374 | | | | 0.1 | |
| 1,055,000 (2) | | Comcast Corp., 4.150%, 10/15/2028 | | | 1,187,704 | | | | 0.1 | |
| 430,000 | | Comcast Corp., 4.600%, 10/15/2038 | | | 512,315 | | | | 0.0 | |
| 135,000 | | Comcast Corp., 6.450%, 03/15/2037 | | | 190,884 | | | | 0.0 | |
| 3,225,000 | | Discovery Communications LLC, 2.800%, 06/15/2020 | | | 3,233,583 | | | | 0.2 | |
| 210,000 | | NBCUniversal Media LLC, 5.950%, 04/01/2041 | | | 288,806 | | | | 0.0 | |
| 910,000 | | Rogers Communications, Inc., 4.300%, 02/15/2048 | | | 1,012,246 | | | | 0.1 | |
| 415,000 | | Rogers Communications, Inc., 4.500%, 03/15/2043 | | | 463,076 | | | | 0.0 | |
| 390,000 | | Telefonica Emisiones SAU, 4.665%, 03/06/2038 | | | 433,114 | | | | 0.0 | |
| 860,000 (2) | | Telefonica Emisiones SAU, 5.213%, 03/08/2047 | | | 1,019,417 | | | | 0.1 | |
| 370,000 | | Telefonica Emisiones SAU, 7.045%, 06/20/2036 | | | 517,544 | | | | 0.0 | |
| 535,000 | | Verizon Communications, Inc., 4.400%, 11/01/2034 | | | 619,910 | | | | 0.1 | |
| 833,000 | | Verizon Communications, Inc., 4.812%, 03/15/2039 | | | 1,004,799 | | | | 0.1 | |
| | | | | | 21,874,560 | | | | 1.6 | |
| | | | | | | | | | | |
| | | Consumer, Cyclical: 1.2% | | | | | | | | |
| 2,650,000 | | Advance Auto Parts, Inc., 4.500%, 12/01/2023 | | | 2,840,115 | | | | 0.2 | |
| 548,530 | | American Airlines 2014-1 Class A Pass Through Trust, 3.700%, 10/01/2026 | | | 578,070 | | | | 0.0 | |
| 124,998 | | Continental Airlines 2010-1 Class A Pass Through Trust, 4.750%, 07/12/2022 | | | 127,697 | | | | 0.0 | |
| 272,031 | | Continental Airlines 2012-1 Class A Pass Through Trust, 4.150%, 10/11/2025 | | | 286,178 | | | | 0.0 | |
| 1,290,000 (5) | | Daimler Finance North America LLC, 2.250%, 03/02/2020 | | | 1,290,351 | | | | 0.1 | |
| 595,000 (2) | | Dollar General Corp., 3.250%, 04/15/2023 | | | 614,552 | | | | 0.0 | |
| 368,000 | | Ford Motor Credit Co. LLC, 3.096%, 05/04/2023 | | | 367,727 | | | | 0.0 | |
| 569,000 | | Ford Motor Credit Co. LLC, 3.810%, 01/09/2024 | | | 577,624 | | | | 0.0 | |
| 1,056,000 | | Ford Motor Credit Co. LLC, 4.134%, 08/04/2025 | | | 1,070,625 | | | | 0.1 | |
| 563,000 | | General Motors Co., 6.600%, 04/01/2036 | | | 664,215 | | | | 0.0 | |
| 713,000 | | General Motors Financial Co., Inc., 5.250%, 03/01/2026 | | | 791,831 | | | | 0.1 | |
| 896,000 | | Home Depot, Inc., 2.000%, 04/01/2021 | | | 897,950 | | | | 0.1 | |
| 310,000 | | Lowe's Cos, Inc., 4.550%, 04/05/2049 | | | 365,430 | | | | 0.0 | |
| 725,000 | | MDC Holdings, Inc., 6.000%, 01/15/2043 | | | 755,287 | | | | 0.1 | |
| 1,460,000 | | QVC, Inc., 5.450%, 08/15/2034 | | | 1,401,469 | | | | 0.1 | |
| 740,000 | | Starbucks Corp., 3.550%, 08/15/2029 | | | 802,310 | | | | 0.1 | |
| 684,637 | | United Airlines 2014-2 Class A Pass Through Trust, 3.750%, 03/03/2028 | | | 722,844 | | | | 0.1 | |
| 574,686 | | United Airlines 2018-1 Class AA Pass Through Trust, 3.500%, 09/01/2031 | | | 592,626 | | | | 0.0 | |
| 1,000,000 | | Walgreens Boots Alliance, Inc., 3.300%, 11/18/2021 | | | 1,018,968 | | | | 0.1 | |
See Accompanying Notes to Financial Statements
| VY®Invesco Equity and Income Portfolio | PORTFOLIO OF INVESTMENTS as ofDecember 31, 2019 (CONTINUED) |
| 737,000 | | Walgreens Boots Alliance, Inc., 4.500%, 11/18/2034 | | | 768,612 | | | | 0.1 | |
| | | | | | 16,534,481 | | | | 1.2 | |
| | | | | | | | | | | |
| | | Consumer, Non-cyclical: 2.4% | | | | | | | | |
| 1,299,000 (5) | | AbbVie, Inc., 4.050%, 11/21/2039 | | | 1,377,454 | | | | 0.1 | |
| 1,137,000 (2) | | AbbVie, Inc., 4.500%, 05/14/2035 | | | 1,288,787 | | | | 0.1 | |
| 985,000 | | Allergan Funding SCS, 4.850%, 06/15/2044 | | | 1,072,246 | | | | 0.1 | |
| 1,273,000 | | Altria Group, Inc., 5.800%, 02/14/2039 | | | 1,497,114 | | | | 0.1 | |
| 1,475,000 | | Anheuser-Busch Cos LLC / Anheuser-Busch InBev Worldwide, Inc., 4.700%, 02/01/2036 | | | 1,703,806 | | | | 0.1 | |
| 1,646,000 | | Anheuser-Busch Cos LLC / Anheuser-Busch InBev Worldwide, Inc., 4.900%, 02/01/2046 | | | 1,949,635 | | | | 0.2 | |
| 498,000 (5) | | Bayer US Finance II LLC, 4.375%, 12/15/2028 | | | 543,360 | | | | 0.0 | |
| 981,000 (5) | | Bayer US Finance LLC, 3.000%, 10/08/2021 | | | 993,587 | | | | 0.1 | |
| 218,000 | | Becton Dickinson & Co., 4.875%, 05/15/2044 | | | 252,234 | | | | 0.0 | |
| 654,000 (5) | | Bristol-Myers Squibb Co., 4.125%, 06/15/2039 | | | 754,333 | | | | 0.1 | |
| 325,000 (5) | | Bristol-Myers Squibb Co., 4.000%, 08/15/2023 | | | 346,252 | | | | 0.0 | |
| 1,445,000 (5) | | Bristol-Myers Squibb Co., 4.625%, 05/15/2044 | | | 1,750,888 | | | | 0.1 | |
| 107,000 | | Cigna Corp., 4.800%, 08/15/2038 | | | 124,904 | | | | 0.0 | |
| 620,000 | | CVS Health Corp., 3.375%, 08/12/2024 | | | 645,263 | | | | 0.1 | |
| 495,000 | | CVS Health Corp., 4.100%, 03/25/2025 | | | 531,286 | | | | 0.0 | |
| 480,932 | | CVS Pass-Through Trust, 6.036%, 12/10/2028 | | | 537,083 | | | | 0.0 | |
| 1,910,000 | | Gilead Sciences, Inc., 2.550%, 09/01/2020 | | | 1,918,332 | | | | 0.2 | |
| 755,000 | | Gilead Sciences, Inc., 4.400%, 12/01/2021 | | | 787,819 | | | | 0.1 | |
| 80,000 | | GlaxoSmithKline Capital, Inc., 6.375%, 05/15/2038 | | | 114,753 | | | | 0.0 | |
| 1,232,000 (5) | | Heineken NV, 3.500%, 01/29/2028 | | | 1,305,281 | | | | 0.1 | |
| 240,000 | | Ingredion, Inc., 6.625%, 04/15/2037 | | | 305,012 | | | | 0.0 | |
| 2,795,000 | | JM Smucker Co/The, 2.500%, 03/15/2020 | | | 2,797,412 | | | | 0.2 | |
| 150,000 (5) | | Kraft Heinz Foods Co., 4.625%, 10/01/2039 | | | 156,214 | | | | 0.0 | |
| 963,000 | | Laboratory Corp. of America Holdings, 3.200%, 02/01/2022 | | | 984,899 | | | | 0.1 | |
| 423,000 | | Laboratory Corp. of America Holdings, 4.700%, 02/01/2045 | | | 475,660 | | | | 0.0 | |
| 92,000 | | Mead Johnson Nutrition Co., 4.125%, 11/15/2025 | | | 100,534 | | | | 0.0 | |
| 681,000 | | Medtronic, Inc., 3.150%, 03/15/2022 | | | 700,336 | | | | 0.1 | |
| 413,000 | | Medtronic, Inc., 4.375%, 03/15/2035 | | | 489,029 | | | | 0.0 | |
| 513,000 (2) | | Molson Coors Brewing Co., 4.200%, 07/15/2046 | | | 511,416 | | | | 0.0 | |
| 574,000 | | Mylan NV, 3.150%, 06/15/2021 | | | 581,557 | | | | 0.1 | |
| 3,220,000 (2),(5) | | Nestle Holdings, Inc., 3.100%, 09/24/2021 | | | 3,292,177 | | | | 0.3 | |
| 275,000 | | Philip Morris International, Inc., 3.600%, 11/15/2023 | | | 290,081 | | | | 0.0 | |
| 820,000 | | Philip Morris International, Inc., 4.875%, 11/15/2043 | | | 979,475 | | | | 0.1 | |
| 155,000 (2) | | UnitedHealth Group, Inc., 3.500%, 08/15/2039 | | | 162,692 | | | | 0.0 | |
| 79,000 | | Zoetis, Inc., 4.700%, 02/01/2043 | | | 94,036 | | | | 0.0 | |
| | | | | | 31,414,947 | | | | 2.4 | |
| | | | | | | | | | | |
| | | Energy: 1.1% | | | | | | | | |
| 612,000 (2),(5) | | Cameron LNG LLC, 3.701%, 01/15/2039 | | | 625,048 | | | | 0.1 | |
| 392,000 | | ConocoPhillips Co., 4.150%, 11/15/2034 | | | 440,063 | | | | 0.0 | |
| 182,000 | | Energy Transfer Operating L.P., 4.200%, 09/15/2023 | | | 191,097 | | | | 0.0 | |
| 570,000 | | Energy Transfer Operating L.P., 4.900%, 03/15/2035 | | | 598,572 | | | | 0.0 | |
| 2,695,000 | | Energy Transfer Operating L.P., 7.500%, 10/15/2020 | | | 2,801,129 | | | | 0.2 | |
| 833,000 | | Enterprise Products Operating LLC, 4.250%, 02/15/2048 | | | 893,698 | | | | 0.1 | |
| 175,000 | | Enterprise Products Operating LLC, 5.250%, 01/31/2020 | | | 175,400 | | | | 0.0 | |
| 250,000 | | Husky Energy, Inc., 3.950%, 04/15/2022 | | | 258,584 | | | | 0.0 | |
| 700,000 (2) | | Kinder Morgan, Inc./DE, 5.300%, 12/01/2034 | | | 824,313 | | | | 0.1 | |
| 2,340,000 | | MPLX L.P., 4.500%, 07/15/2023 | | | 2,486,648 | | | | 0.2 | |
| 973,000 | | MPLX L.P., 4.500%, 04/15/2038 | | | 989,457 | | | | 0.1 | |
| 570,000 | | Noble Energy, Inc., 5.250%, 11/15/2043 | | | 641,514 | | | | 0.1 | |
| 236,000 | | Occidental Petroleum Corp., 3.200%, 08/15/2026 | | | 238,993 | | | | 0.0 | |
| 505,000 | | Occidental Petroleum Corp., 3.400%, 04/15/2026 | | | 518,436 | | | | 0.0 | |
| 295,000 (2) | | Plains All American Pipeline L.P. / PAA Finance Corp., 3.650%, 06/01/2022 | | | 302,688 | | | | 0.0 | |
See Accompanying Notes to Financial Statements
| VY®Invesco Equity and Income Portfolio | PORTFOLIO OF INVESTMENTS as ofDecember 31, 2019 (CONTINUED) |
| 858,000 | | Spectra Energy Partners L.P., 4.500%, 03/15/2045 | | | 945,448 | | | | 0.1 | |
| 544,000 | | Suncor Energy, Inc., 3.600%, 12/01/2024 | | | 577,204 | | | | 0.0 | |
| 835,000 | | Sunoco Logistics Partners Operations L.P., 5.300%, 04/01/2044 | | | 887,875 | | | | 0.1 | |
| 550,000 | | Sunoco Logistics Partners Operations L.P., 5.500%, 02/15/2020 | | | 551,814 | | | | 0.0 | |
| 215,000 | | Texas Eastern Transmission L.P., 7.000%, 07/15/2032 | | | 288,314 | | | | 0.0 | |
| | | | | | 15,236,295 | | | | 1.1 | |
| | | | | | | | | | | |
| | | Financial: 5.1% | | | | | | | | |
| 1,140,000 | | American International Group, Inc., 4.375%, 01/15/2055 | | | 1,249,635 | | | | 0.1 | |
| 231,000 | | Air Lease Corp., 3.000%, 09/15/2023 | | | 236,590 | | | | 0.0 | |
| 1,870,000 | | Air Lease Corp., 4.250%, 09/15/2024 | | | 2,002,826 | | | | 0.2 | |
| 885,000 (2) | | Aircastle Ltd., 4.400%, 09/25/2023 | | | 935,669 | | | | 0.1 | |
| 410,000 | | Allstate Corp., 3.280%, 12/15/2026 | | | 433,055 | | | | 0.0 | |
| 543,000 | | American Express Co., 3.625%, 12/05/2024 | | | 573,933 | | | | 0.0 | |
| 615,000 | | American Financial Group, Inc./OH, 4.500%, 06/15/2047 | | | 664,662 | | | | 0.1 | |
| 455,000 (5) | | ANZ New Zealand Int'l Ltd./London, 2.875%, 01/25/2022 | | | 462,430 | | | | 0.0 | |
| 440,000 (5) | | Apollo Management Holdings L.P., 4.000%, 05/30/2024 | | | 465,990 | | | | 0.0 | |
| 285,000 (5) | | Athene Global Funding, 2.750%, 06/25/2024 | | | 287,830 | | | | 0.0 | |
| 1,555,000 (5) | | Athene Global Funding, 4.000%, 01/25/2022 | | | 1,606,245 | | | | 0.1 | |
| 948,000 | | Australia & New Zealand Banking Group Ltd./New York NY, 2.300%, 06/01/2021 | | | 953,152 | | | | 0.1 | |
| 3,120,000 | | Australia & New Zealand Banking Group Ltd./New York NY, 2.700%, 11/16/2020 | | | 3,143,146 | | | | 0.2 | |
| 720,000 | | Bank of America Corp., 3.248%, 10/21/2027 | | | 750,326 | | | | 0.1 | |
| 725,000 (5) | | BBVA Bancomer SA/Texas, 4.375%, 04/10/2024 | | | 773,339 | | | | 0.1 | |
| 765,000 | | Brookfield Asset Management, Inc., 4.000%, 01/15/2025 | | | 822,673 | | | | 0.1 | |
| 1,140,000 | | Capital One Financial Corp., 3.200%, 01/30/2023 | | | 1,172,118 | | | | 0.1 | |
| 130,000 (5) | | Carlyle Holdings Finance LLC, 3.875%, 02/01/2023 | | | 134,348 | | | | 0.0 | |
| 630,000 (4) | | Citigroup, Inc., 3.668%, 07/24/2028 | | | 671,364 | | | | 0.1 | |
| 1,930,000 | | Citigroup, Inc., 4.000%, 08/05/2024 | | | 2,066,691 | | | | 0.2 | |
| 520,000 | | Citigroup, Inc., 4.750%, 05/18/2046 | | | 624,047 | | | | 0.0 | |
| 260,000 | | Citigroup, Inc., 5.300%, 05/06/2044 | | | 331,863 | | | | 0.0 | |
| 560,000 | | Citigroup, Inc., 6.675%, 09/13/2043 | | | 819,247 | | | | 0.1 | |
| 595,000 | | Citizens Financial Group, Inc., 2.375%, 07/28/2021 | | | 597,923 | | | | 0.0 | |
| 1,335,000 (5) | | Commonwealth Bank of Australia, 2.250%, 03/10/2020 | | | 1,335,788 | | | | 0.1 | |
| 472,000 (5) | | Credit Suisse AG, 6.500%, 08/08/2023 | | | 527,424 | | | | 0.0 | |
| 60,000 | | Crown Castle International Corp., 4.750%, 05/15/2047 | | | 68,815 | | | | 0.0 | |
| 620,000 | | Discover Bank, 3.350%, 02/06/2023 | | | 639,946 | | | | 0.0 | |
| 2,275,000 | | EPR Properties, 4.750%, 12/15/2026 | | | 2,486,115 | | | | 0.2 | |
| 820,000 | | Goldman Sachs Group, Inc., 4.250%, 10/21/2025 | | | 890,390 | | | | 0.1 | |
| 355,000 | | Goldman Sachs Group, Inc., 5.250%, 07/27/2021 | | | 372,572 | | | | 0.0 | |
| 835,000 | | Office Properties Income Trust, 4.000%, 07/15/2022 | | | 854,639 | | | | 0.1 | |
| 755,000 (5) | | Guardian Life Global Funding, 2.900%, 05/06/2024 | | | 775,905 | | | | 0.1 | |
| 840,000 | | Healthpeak Properties, Inc., 3.875%, 08/15/2024 | | | 893,464 | | | | 0.1 | |
| 320,000 | | Healthpeak Properties, Inc., 4.200%, 03/01/2024 | | | 342,132 | | | | 0.0 | |
| 240,000 (2) | | Service Properties Trust, 5.000%, 08/15/2022 | | | 252,447 | | | | 0.0 | |
| 1,790,000 (4) | | HSBC Holdings PLC, 2.633%, 11/07/2025 | | | 1,796,669 | | | | 0.1 | |
| 670,000 (5) | | Jackson National Life Global Funding, 2.100%, 10/25/2021 | | | 671,645 | | | | 0.1 | |
| 620,000 (5) | | Jackson National Life Global Funding, 3.250%, 01/30/2024 | | | 643,195 | | | | 0.1 | |
| 550,000 | | JPMorgan Chase & Co., 3.200%, 06/15/2026 | | | 574,514 | | | | 0.0 | |
| 1,270,000 (2),(4) | | JPMorgan Chase & Co., 3.509%, 01/23/2029 | | | 1,349,222 | | | | 0.1 | |
| 1,270,000 (2),(4) | | JPMorgan Chase & Co., 3.897%, 01/23/2049 | | | 1,426,909 | | | | 0.1 | |
| 675,000 (4) | | JPMorgan Chase & Co., 4.260%, 02/22/2048 | | | 800,097 | | | | 0.1 | |
| 665,000 (4) | | JPMorgan Chase & Co., 5.229%, 12/31/2199 | | | 670,819 | | | | 0.1 | |
| 443,000 (5) | | KKR Group Finance Co. III LLC, 5.125%, 06/01/2044 | | | 524,023 | | | | 0.0 | |
| 2,335,000 (5) | | Liberty Mutual Group, Inc., 4.850%, 08/01/2044 | | | 2,677,648 | | | | 0.2 | |
| 587,000 | | Lifestorage L.P./CA, 3.500%, 07/01/2026 | | | 603,164 | | | | 0.0 | |
See Accompanying Notes to Financial Statements
| VY®Invesco Equity and Income Portfolio | PORTFOLIO OF INVESTMENTS as ofDecember 31, 2019 (CONTINUED) |
| 285,000 | | Markel Corp., 5.000%, 03/30/2043 | | | 309,308 | | | | 0.0 | |
| 525,000 | | Markel Corp., 5.000%, 05/20/2049 | | | 617,745 | | | | 0.0 | |
| 1,300,000 (5) | | MassMutual Global Funding II, 2.000%, 04/15/2021 | | | 1,302,130 | | | | 0.1 | |
| 670,000 (5) | | Metropolitan Life Global Funding I, 2.050%, 06/12/2020 | | | 670,446 | | | | 0.1 | |
| 2,360,000 (5) | | Mizuho Financial Group Cayman 3 Ltd., 4.600%, 03/27/2024 | | | 2,521,516 | | | | 0.2 | |
| 1,040,000 | | Morgan Stanley, 4.000%, 07/23/2025 | | | 1,125,366 | | | | 0.1 | |
| 1,230,000 | | National Australia Bank Ltd./New York, 1.875%, 07/12/2021 | | | 1,229,556 | | | | 0.1 | |
| 1,000,000 (5) | | Nationwide Financial Services, Inc., 5.300%, 11/18/2044 | | | 1,139,612 | | | | 0.1 | |
| 1,105,000 | | PartnerRe Finance B LLC, 3.700%, 07/02/2029 | | | 1,149,332 | | | | 0.1 | |
| 755,000 | | PNC Financial Services Group, Inc./The, 3.450%, 04/23/2029 | | | 805,419 | | | | 0.1 | |
| 333,000 | | Prudential Financial, Inc., 3.935%, 12/07/2049 | | | 362,927 | | | | 0.0 | |
| 200,000 | | Regency Centers L.P., 2.950%, 09/15/2029 | | | 199,839 | | | | 0.0 | |
| 300,000 | | Regency Centers L.P., 4.650%, 03/15/2049 | | | 352,556 | | | | 0.0 | |
| 259,000 | | Reinsurance Group of America, Inc., 4.700%, 09/15/2023 | | | 280,945 | | | | 0.0 | |
| 690,000 (5) | | Reliance Standard Life Global Funding II, 3.050%, 01/20/2021 | | | 697,456 | | | | 0.1 | |
| 1,360,000 (5) | | Societe Generale SA, 2.625%, 09/16/2020 | | | 1,366,010 | | | | 0.1 | |
| 805,000 (5) | | Societe Generale SA, 5.000%, 01/17/2024 | | | 868,083 | | | | 0.1 | |
| 985,000 (5) | | Standard Chartered PLC, 3.050%, 01/15/2021 | | | 993,255 | | | | 0.1 | |
| 1,100,000 | | Sumitomo Mitsui Banking Corp., 2.650%, 07/23/2020 | | | 1,104,343 | | | | 0.1 | |
| 670,000 | | Synchrony Financial, 3.950%, 12/01/2027 | | | 703,993 | | | | 0.1 | |
| 610,000 (2) | | Toronto-Dominion Bank/The, 2.650%, 06/12/2024 | | | 624,728 | | | | 0.0 | |
| 445,000 | | Travelers Cos, Inc., 4.600%, 08/01/2043 | | | 538,825 | | | | 0.0 | |
| 585,000 (5) | | UBS Group AG, 4.125%, 04/15/2026 | | | 636,109 | | | | 0.0 | |
| 410,000 | | US Bancorp, 3.100%, 04/27/2026 | | | 426,735 | | | | 0.0 | |
| 145,000 | | Ventas Realty L.P., 5.700%, 09/30/2043 | | | 180,273 | | | | 0.0 | |
| 965,000 | | Wells Fargo & Co., 3.550%, 09/29/2025 | | | 1,021,904 | | | | 0.1 | |
| 470,000 | | Wells Fargo & Co., 4.100%, 06/03/2026 | | | 506,811 | | | | 0.0 | |
| 2,000,000 | | Wells Fargo & Co., 4.650%, 11/04/2044 | | | 2,348,880 | | | | 0.2 | |
| 315,000 | | Willis North America, Inc., 3.600%, 05/15/2024 | | | 329,060 | | | | 0.0 | |
| 350,000 | | WR Berkley Corp., 4.625%, 03/15/2022 | | | 369,082 | | | | 0.0 | |
| | | | | | 67,738,888 | | | | 5.1 | |
| | | | | | | | | | | |
| | | Industrial: 1.1% | | | | | | | | |
| 305,000 (5) | | Aviation Capital Group LLC, 2.875%, 01/20/2022 | | | 307,170 | | | | 0.0 | |
| 1,095,000 (5) | | Aviation Capital Group LLC, 4.875%, 10/01/2025 | | | 1,179,485 | | | | 0.1 | |
| 970,000 | | Avnet, Inc., 4.625%, 04/15/2026 | | | 1,026,314 | | | | 0.1 | |
| 435,000 (5) | | BAE Systems Holdings, Inc., 2.850%, 12/15/2020 | | | 437,997 | | | | 0.0 | |
| 224,000 | | Burlington Northern Santa Fe LLC, 5.150%, 09/01/2043 | | | 285,496 | | | | 0.0 | |
| 330,000 | | CSX Corp., 5.500%, 04/15/2041 | | | 418,131 | | | | 0.0 | |
| 1,015,000 | | Deere & Co., 2.600%, 06/08/2022 | | | 1,033,949 | | | | 0.1 | |
| 295,000 | | FedEx Corp., 4.900%, 01/15/2034 | | | 336,734 | | | | 0.0 | |
| 605,000 | | FedEx Corp., 5.100%, 01/15/2044 | | | 663,260 | | | | 0.1 | |
| 100,000 | | General Dynamics Corp., 2.875%, 05/11/2020 | | | 100,353 | | | | 0.0 | |
| 459,000 | | Norfolk Southern Corp., 3.400%, 11/01/2049 | | | 456,547 | | | | 0.1 | |
| 1,294,000 | | Northrop Grumman Corp., 2.080%, 10/15/2020 | | | 1,295,541 | | | | 0.1 | |
| 703,000 | | Packaging Corp. of America, 4.500%, 11/01/2023 | | | 755,271 | | | | 0.1 | |
| 285,000 | | Precision Castparts Corp., 2.500%, 01/15/2023 | | | 290,155 | | | | 0.0 | |
| 2,395,000 | | Raytheon Co., 3.125%, 10/15/2020 | | | 2,418,224 | | | | 0.2 | |
| 410,000 (5) | | SMBC Aviation Capital Finance DAC, 2.650%, 07/15/2021 | | | 412,886 | | | | 0.0 | |
| 157,000 | | Union Pacific Corp., 3.646%, 02/15/2024 | | | 166,002 | | | | 0.0 | |
| 375,000 (5) | | Union Pacific Corp., 3.839%, 03/20/2060 | | | 380,969 | | | | 0.0 | |
| 730,000 | | Union Pacific Corp., 4.150%, 01/15/2045 | | | 800,014 | | | | 0.1 | |
| 330,000 | | United Parcel Service, Inc., 3.400%, 11/15/2046 | | | 329,208 | | | | 0.0 | |
| 345,000 | | United Technologies Corp., 4.450%, 11/16/2038 | | | 408,221 | | | | 0.0 | |
| 752,000 | | Waste Management, Inc., 3.900%, 03/01/2035 | | | 828,522 | | | | 0.1 | |
| | | | | | 14,330,449 | | | | 1.1 | |
| | | | | | | | | | | |
| | | Technology: 0.8% | | | | | | | | |
| 1,146,000 | | Apple, Inc., 2.150%, 02/09/2022 | | | 1,155,617 | | | | 0.1 | |
See Accompanying Notes to Financial Statements
| VY®Invesco Equity and Income Portfolio | PORTFOLIO OF INVESTMENTS as ofDecember 31, 2019 (CONTINUED) |
| 435,000 | | Apple, Inc., 3.350%, 02/09/2027 | | | 463,219 | | | | 0.0 | |
| 2,315,000 | | Applied Materials, Inc., 2.625%, 10/01/2020 | | | 2,327,838 | | | | 0.2 | |
| 1,030,000 | | Broadcom Corp. / Broadcom Cayman Finance Ltd., 3.625%, 01/15/2024 | | | 1,067,372 | | | | 0.1 | |
| 910,000 (5) | | Dell International LLC / EMC Corp., 5.450%, 06/15/2023 | | | 987,045 | | | | 0.1 | |
| 35,000 (5) | | Dell International LLC / EMC Corp., 8.350%, 07/15/2046 | | | 48,177 | | | | 0.0 | |
| 340,000 | | DXC Technology Co., 4.450%, 09/18/2022 | | | 356,986 | | | | 0.0 | |
| 1,630,000 | | Fiserv, Inc., 3.800%, 10/01/2023 | | | 1,721,652 | | | | 0.1 | |
| 75,000 | | Micron Technology, Inc., 4.185%, 02/15/2027 | | | 80,292 | | | | 0.0 | |
| 649,000 | | Microsoft Corp., 3.500%, 02/12/2035 | | | 714,552 | | | | 0.1 | |
| 795,000 (5) | | NXP BV / NXP Funding LLC, 5.350%, 03/01/2026 | | | 896,470 | | | | 0.1 | |
| 285,000 | | Texas Instruments, Inc., 2.625%, 05/15/2024 | | | 292,549 | | | | 0.0 | |
| | | | | | 10,111,769 | | | | 0.8 | |
| | | | | | | | | | | |
| | | Utilities: 0.5% | | | | | | | | |
| 150,000 (5) | | Electricite de France SA, 4.600%, 01/27/2020 | | | 150,253 | | | | 0.0 | |
| 620,000 (5) | | Electricite de France SA, 4.875%, 01/22/2044 | | | 710,881 | | | | 0.1 | |
| 350,000 (4),(5) | | Electricite de France SA, 5.625%, 12/31/2199 | | | 371,250 | | | | 0.0 | |
| 2,135,000 | | Georgia Power Co., 2.000%, 03/30/2020 | | | 2,134,760 | | | | 0.2 | |
| 703,000 (2) | | NextEra Energy Capital Holdings, Inc., 3.550%, 05/01/2027 | | | 746,710 | | | | 0.1 | |
| 760,000 | | NiSource, Inc., 4.375%, 05/15/2047 | | | 841,852 | | | | 0.1 | |
| 605,000 | | Oglethorpe Power Corp., 4.550%, 06/01/2044 | | | 634,618 | | | | 0.0 | |
| 667,000 | | Sempra Energy, 3.800%, 02/01/2038 | | | 696,267 | | | | 0.0 | |
| 274,000 (2) | | Xcel Energy, Inc., 3.500%, 12/01/2049 | | | 278,894 | | | | 0.0 | |
| | | | | | 6,565,485 | | | | 0.5 | |
| | | | | | | | | | | |
| | Total Corporate Bonds/Notes | | | | | | | | |
| | (Cost $173,661,895) | | | 185,475,335 | | | | 13.9 | |
| | | | | | | | | | | |
| MUNICIPAL BONDS: 0.0% | | | | | | | | |
| | | Georgia: 0.0% | | | | | | | | |
| 323,000 | | Municipal Electric Authority of Georgia, 6.655%, 04/01/2057 | | | 445,517 | | | | 0.0 | |
| | | | | | | | | | | |
| | | Total Municipal Bonds | | | | | | | | |
| | | (Cost $323,000) | | | 445,517 | | | | 0.0 | |
| | | | | | | | | | | |
| U.S. TREASURY OBLIGATIONS: 10.3% | | | | | | | | |
| | | U.S. Treasury Bonds: 0.7% | | | | | | | | |
| 9,555,800 | | 2.250%,08/15/2049 | | | 9,261,831 | | | | 0.7 | |
| 425,000 | | 4.500%,02/15/2036 | | | 563,145 | | | | 0.0 | |
| | | | | | 9,824,976 | | | | 0.7 | |
| | | | | | | | | | | |
| | | U.S. Treasury Notes: 9.6% | | | | | | | | |
| 180,000 | | 2.625%,11/15/2020 | | | 181,517 | | | | 0.0 | |
| 41,470,000 | | 1.625%,12/31/2021 | | | 41,511,844 | | | | 3.1 | |
| 50,770,000 | | 1.625%,12/15/2022 | | | 50,794,109 | | | | 3.8 | |
| 30,846,700 | | 1.750%,12/31/2024 | | | 30,916,678 | | | | 2.4 | |
| 3,842,900 (2) | | 1.750%,11/15/2029 | | | 3,782,403 | | | | 0.3 | |
| | | | | | 127,186,551 | | | | 9.6 | |
| | | | | | | | | | | |
| | Total U.S. Treasury Obligations | | | | | | | | |
| | (Cost $136,771,605) | | | 137,011,527 | | | | 10.3 | |
| | | | | | | | | | | |
| CONVERTIBLE BONDS/NOTES: 8.7% | | | | | | | | |
| | | Communications: 3.9% | | | | | | | | |
| 3,989,000 | | Trip.com Group Ltd., 1.250%, 09/15/2022 | | | 3,983,611 | | | | 0.3 | |
| 7,840,000 | | DISH Network Corp., 3.375%, 08/15/2026 | | | 7,560,896 | | | | 0.6 | |
| 1,319,000 | | Finisar Corp., 0.500%, 12/15/2036 | | | 1,317,681 | | | | 0.1 | |
| 2,501,000 | | FireEye, Inc., 1.000%, 06/01/2035 | | | 2,493,519 | | | | 0.2 | |
| 2,535,000 | | FireEye, Inc., 1.625%, 06/01/2035 | | | 2,459,501 | | | | 0.2 | |
| 2,954,000 (5) | | GCI Liberty, Inc., 1.750%, 09/30/2046 | | | 4,080,951 | | | | 0.3 | |
| 3,355,000 (5) | | IAC Financeco 3, Inc., 2.000%, 01/15/2030 | | | 3,927,363 | | | | 0.3 | |
| 2,512,000 (5) | | JOYY, Inc., 1.375%, 06/15/2026 | | | 2,272,561 | | | | 0.2 | |
| 2,665,000 (5) | | Liberty Latin America Ltd., 2.000%, 07/15/2024 | | | 2,861,544 | | | | 0.2 | |
| 9,559,000 | | Liberty Media Corp., 1.375%, 10/15/2023 | | | 12,886,488 | | | | 1.0 | |
| 1,933,000 | | Liberty Media Corp., 2.250%, 09/30/2046 | | | 1,122,090 | | | | 0.1 | |
| 673,000 (2) | | Liberty Media Corp.-Liberty Formula One, 1.000%, 01/30/2023 | | | 896,909 | | | | 0.0 | |
| 2,327,000 | | Viavi Solutions, Inc., 1.000%, 03/01/2024 | | | 3,007,632 | | | | 0.2 | |
| 2,258,000 (2) | | Viavi Solutions, Inc., 1.750%, 06/01/2023 | | | 2,844,961 | | | | 0.2 | |
| | | | | | 51,715,707 | | | | 3.9 | |
| | | | | | | | | | | |
| | | Consumer, Cyclical: 0.2% | | | | | | | | |
| 2,264,000 | | Live Nation Entertainment, Inc., 2.500%, 03/15/2023 | | | 2,766,382 | | | | 0.2 | |
| | | | | | | | | | | |
| | | Consumer, Non-cyclical: 2.3% | | | | | | | | |
| 3,952,000 | | BioMarin Pharmaceutical, Inc., 1.500%, 10/15/2020 | | | 4,302,963 | | | | 0.3 | |
| 1,069,000 (2) | | DexCom, Inc., 0.750%, 05/15/2022 | | | 2,379,757 | | | | 0.2 | |
| 3,140,000 | | DexCom, Inc., 0.750%, 12/01/2023 | | | 4,658,809 | | | | 0.4 | |
| 617,000 (2),(5) | | Euronet Worldwide, Inc., 0.750%, 03/15/2049 | | | 737,491 | | | | 0.1 | |
| 2,410,000 | | Jazz Investments I Ltd., 1.875%, 08/15/2021 | | | 2,487,419 | | | | 0.2 | |
See Accompanying Notes to Financial Statements
| VY®Invesco Equity and Income Portfolio | PORTFOLIO OF INVESTMENTS as ofDecember 31, 2019 (CONTINUED) |
| 2,104,000 | | Neurocrine Biosciences, Inc., 2.250%, 05/15/2024 | | | 3,232,348 | | | | 0.2 | |
| 2,762,000 | | NuVasive, Inc., 2.250%, 03/15/2021 | | | 3,686,751 | | | | 0.3 | |
| 1,385,000 (2) | | Pacira BioSciences, Inc., 2.375%, 04/01/2022 | | | 1,443,188 | | | | 0.1 | |
| 1,212,000 | | Supernus Pharmaceuticals, Inc., 0.625%, 04/01/2023 | | | 1,103,127 | | | | 0.1 | |
| 1,309,000 (2) | | Wright Medical Group NV, 2.250%, 11/15/2021 | | | 1,900,734 | | | | 0.1 | |
| 3,694,000 | | Wright Medical Group, Inc., 1.625%, 06/15/2023 | | | 3,911,145 | | | | 0.3 | |
| | | | | | 29,843,732 | | | | 2.3 | |
| | | | | | | | | | | |
| | | Energy: 0.2% | | | | | | | | |
| 1,359,000 | | Helix Energy Solutions Group, Inc., 4.250%, 05/01/2022 | | | 1,455,897 | | | | 0.1 | |
| 1,677,000 | | Oil States International, Inc., 1.500%, 02/15/2023 | | | 1,513,660 | | | | 0.1 | |
| | | | | | 2,969,557 | | | | 0.2 | |
| | | | | | | | | | | |
| | | Technology: 2.1% | | | | | | | | |
| 3,560,000 | | Cree, Inc., 0.875%, 09/01/2023 | | | 3,782,936 | | | | 0.3 | |
| 2,544,000 | | Microchip Technology, Inc., 1.625%, 02/15/2027 | | | 3,631,560 | | | | 0.3 | |
| 4,003,000 | | Nuance Communications, Inc., 1.000%, 12/15/2035 | | | 4,040,524 | | | | 0.3 | |
| 1,819,000 | | Nuance Communications, Inc., 1.250%, 04/01/2025 | | | 2,029,645 | | | | 0.1 | |
| 2,479,000 (2) | | ON Semiconductor Corp., 1.000%, 12/01/2020 | | | 3,375,140 | | | | 0.2 | |
| 790,000 | | RealPage, Inc., 1.500%, 11/15/2022 | | | 1,103,037 | | | | 0.1 | |
| 3,899,000 | | SanDisk LLC, 0.500%, 10/15/2020 | | | 3,551,716 | | | | 0.3 | |
| 726,000 | | Silicon Laboratories, Inc., 1.375%, 03/01/2022 | | | 966,720 | | | | 0.1 | |
| 2,238,000 | | Western Digital Corp., 1.500%, 02/01/2024 | | | 2,203,031 | | | | 0.2 | |
| 2,643,000 | | Workday, Inc., 0.250%, 10/01/2022 | | | 3,389,461 | | | | 0.2 | |
| | | | | | 28,073,770 | | | | 2.1 | |
| | | | | | | | | | | |
| | Total Convertible Bonds/Notes | | | | | | | | |
| | (Cost $99,771,141) | | | 115,369,148 | | | | 8.7 | |
| | | | | | | | | | | |
| EQUITY-LINKED NOTES: 1.2% | | | | | | | | |
| | | Financial: 1.2% | | | | | | | | |
| 9,000,000 (5) | | Credit Suisse AG, Convertible Basket (Basket of 5 Common Stocks), 0.500%, 06/24/2024 | | | 8,631,000 | | | | 0.7 | |
| 6,746,000 | | GS Finance Corp (Guarantor: The Goldman Sachs Group, Inc.), Exchangeable Basket (Basket of 5 Common Stocks), 0.250%, 07/08/2024 | | | 6,934,888 | | | | 0.5 | |
| | | | | | | | | | | |
| | Total Equity-Linked Notes | | | | | | | | |
| | (Cost $15,746,000) | | | 15,565,888 | | | | 1.2 | |
| | | | | | | | | | | |
| STRUCTURED NOTES: 1.9% | | | | | | | | |
| | | Diversified Finan Serv: 1.0% | | | | | | | | |
| 6,016,000 | | Wells Fargo Bank N.A., Convertible Trust - Energy Series 2019-1 (Linked to a basket of 4 Stocks), 0.330%, 09/19/2024 | | | 6,230,771 | | | | 0.5 | |
| 5,968,000 | | Wells Fargo Bank N.A., Convertible Trust - Media Series 2019-1 (Linked to a basked of 3 Stocks), 0.250%, 12/04/2024 | | | 6,619,109 | | | | 0.5 | |
| | | | | | 12,849,880 | | | | 1.0 | |
| | | | | | | | | | | |
| | | Financial: 0.9% | | | | | | | | |
| 5,915,000 | | Wells Fargo Bank N.A., Convertible Trust - Consumer Series 2018-1 (Linked to a basket of 5 Bonds), 0.250%, 01/17/2024 | | | 6,095,999 | | | | 0.4 | |
| 6,139,000 | | Wells Fargo Bank N.A., Convertible Trust - Healthcare Series 2018-1 (Linked to a basket of 4 Bonds), 0.250%, 02/05/2024 | | | 6,685,371 | | | | 0.5 | |
| | | | | | 12,781,370 | | | | 0.9 | |
| | | | | | | | | | | |
| | Total Structured Notes | | | | | | | | |
| | (Cost $24,651,651) | | | 25,631,250 | | | | 1.9 | |
| | | | | | | | | | | |
| U.S. GOVERNMENT AGENCY OBLIGATIONS: 0.1% | | | | | | | | |
| | | Federal National Mortgage Association: 0.1%(6) | | | | | | | | |
| 915,000 | | 6.625%,11/15/2030 | | | 1,303,536 | | | | 0.1 | |
| | | | | | | | | | | |
| | Total U.S. Government Agency Obligations | | | | | | | | |
| | (Cost $1,015,842) | | | 1,303,536 | | | | 0.1 | |
| | | | | | | | | | | |
| | Total Long-Term Investments | | | | | | | | |
| | (Cost $1,138,981,147) | | | 1,294,334,588 | | | | 97.2 | |
| | | | | | | | | | | |
| SHORT-TERM INVESTMENTS: 5.0% | | | | | | | | |
| | | Commercial Paper: 0.3% | | | | | | | | |
| 990,000 (7) | | DBS Bank Ltd., 1.710%, 01/07/2020 | | | 989,688 | | | | 0.1 | |
| 990,000 (7) | | Le Mouvement Des Caisses Desjardins, 1.750%, 01/09/2020 | | | 989,609 | | | | 0.1 | |
| 990,000 (7) | | LMA Americas LLC, 1.800%, 01/27/2020 | | | 988,548 | | | | 0.1 | |
| 450,000 (7) | | Matchpoint Finance PLC, 1.850%, 02/03/2020 | | | 449,237 | | | | 0.0 | |
See Accompanying Notes to Financial Statements
| VY®Invesco Equity and Income Portfolio | PORTFOLIO OF INVESTMENTS as ofDecember 31, 2019 (CONTINUED) |
| 325,000 (7) | | Sheffield Receivables Company LLC, 1.950%, 02/27/2020 | | | 324,033 | | | | 0.0 | |
| 400,000 (7) | | Sheffield Receivables Company LLC, 2.000%, 03/16/2020 | | | 398,434 | | | | 0.0 | |
| | | | | | | | | | | |
| | Total Commercial Paper | | | | | | | | |
| | (Cost $4,139,549) | | | 4,139,549 | | | | 0.3 | |
| | | | | | | | | | | |
| | | Floating Rate Notes: 0.3% | | | | | | | | |
| 900,000 (7) | | Bank of Nova Scotia, 1.940%, 05/08/2020 | | | 899,933 | | | | 0.0 | |
| 900,000 (7) | | Bedford Row Funding, 1.920%, 03/13/2020 | | | 900,079 | | | | 0.1 | |
| 990,000 (7) | | Commonwealth Bank of Australia, 1.940%, 06/10/2020 | | | 989,998 | | | | 0.1 | |
| 625,000 (7) | | Crédit Industriel et Commercial, 1.990%, 04/24/2020 | | | 625,048 | | | | 0.0 | |
| 990,000 (7) | | Mitsubishi UFJ Financial Group, Inc., 1.960%, 05/22/2020 | | | 990,074 | | | | 0.1 | |
| | | | | | | | | | | |
| | Total Floating Rate Notes | | | | | | | | |
| | (Cost $4,405,132) | | | 4,405,132 | | | | 0.3 | |
| | | | | | | | | | | |
| | | Repurchase Agreements: 1.5% | | | | | | | | |
| 2,324,956 (7) | | Citadel Securities LLC, Repurchase Agreement dated 12/31/19, 1.60%, due 01/02/20 (Repurchase Amount $2,325,160, collateralized by various U.S. Government Securities, 0.000%-8.500%, Market Value plus accrued interest $2,371,666, due 01/15/20-11/15/48) | | | 2,324,956 | | | | 0.1 | |
| 7,703,092(7) | | Citigroup, Inc., Repurchase Agreement dated 12/31/19, 1.57%, due 01/02/20 (Repurchase Amount $7,703,755, collateralized by various U.S. Government/U.S. Government Agency Obligations, 0.000%-9.000%, Market Value plus accrued interest $7,857,154, due 02/13/20-09/20/69) | | | 7,703,092 | | | | 0.6 | |
| 7,703,092(7) | | Daiwa Capital Markets, Repurchase Agreement dated 12/31/19, 1.58%, due 01/02/20 (Repurchase Amount $7,703,759, collateralized by various U.S. Government/U.S. Government Agency Obligations, 0.000%-6.030%, Market Value plus accrued interest $7,857,154, due 01/14/20-12/20/49) | | | 7,703,092 | | | | 0.6 | |
| 2,612,029 (7) | | State of Wisconsin Investment Board, Repurchase Agreement dated 12/31/19, 1.75%, due 01/02/20 (Repurchase Amount $2,612,279, collateralized by various U.S. Government Securities, 0.125%-3.875%, Market Value plus accrued interest $2,664,341, due 04/15/21-02/15/47) | | | 2,612,029 | | | | 0.2 | |
| | | | | | | | | | | |
| | Total Repurchase Agreements | | | | | | | | |
| | (Cost $20,343,169) | | | 20,343,169 | | | | 1.5 | |
| | | | | | | | | | | |
| | | Certificates of Deposit: 0.2% | | | | | | | | |
| 990,000 (7) | | Dz Bank Ag Deutsche Zentral-Genossenschaftsbank, 1.870%, 03/12/2020 | | | 989,914 | | | | 0.1 | |
| 900,000 (7) | | Toronto-Dominion Bank, 1.850%, 03/18/2020 | | | 900,136 | | | | 0.1 | |
| | | | | | | | | | | |
| | Total Certificates of Deposit | | | | | | | | |
| | (Cost $1,890,050) | | | 1,890,050 | | | | 0.2 | |
| | | | | | | | | | | |
| Shares | | | | | Value | | | | Percentage
of Net
Assets | |
| | | Mutual Funds: 2.7% | | | | | | | | |
| 33,529,166 (8) | | BlackRock Liquidity Funds, FedFund, Institutional Class, 1.520% | | | 33,529,166 | | | | 2.5 | |
| 1,250,000 (7),(8) | | Goldman Sachs Financial Square Government Fund - Institutional Shares, 1.500% | | | 1,250,000 | | | | 0.1 | |
| 1,030,000 (7),(8) | | Morgan Stanley Institutional Liquidity Funds - Government Portfolio (Institutional Share Class), 1.510% | | | 1,030,000 | | | | 0.1 | |
| | | | | | | | | | | |
| | Total Mutual Funds | | | | | | | | |
| | (Cost $35,809,166) | | | 35,809,166 | | | | 2.7 | |
| | | | | | | | | | | |
| | Total Short-Term Investments | | | | | | | | |
| | (Cost $66,587,066) | | | 66,587,066 | | | | 5.0 | |
| | | | | | | | | | | |
| | Total Investments in Securities
(Cost $1,205,568,213) | | $ | 1,360,921,654 | | | | 102.2 | |
| | Liabilities in Excess of Other Assets | | | (28,977,124 | ) | | | (2.2 | ) |
| | Net Assets | | $ | 1,331,944,530 | | | | 100.0 | |
See Accompanying Notes to Financial Statements
| VY®Invesco Equity and Income Portfolio | PORTFOLIO OF INVESTMENTS as ofDecember 31, 2019 (CONTINUED) |
| † | Unless otherwise indicated, principal amount is shown in USD. |
| (1) | Non-income producing security. |
| (2) | Security, or a portion of the security, is on loan. |
| (3) | Preferred Stock may be called prior to convertible date. |
| (4) | Variable rate security. Rate shown is the rate in effect as of December 31, 2019. |
| (5) | Securities with purchases pursuant to Rule 144A or section 4(a)(2), under the Securities Act of 1933 and may not be resold subject to that rule except to qualified institutional buyers. |
| (6) | The Federal Housing Finance Agency (“FHFA”) placed the Federal Home Loan Mortgage Corporation and Federal National Mortgage Association into conservatorship with FHFA as the conservator. As such, the FHFA oversees the continuing affairs of these companies. |
| (7) | All or a portion of the security represents securities purchased with cash collateral received for securities on loan. |
| (8) | Rate shown is the 7-day yield as of December 31, 2019. |
See Accompanying Notes to Financial Statements
| VY®Invesco Oppenheimer Global Portfolio | PORTFOLIO OF INVESTMENTS |
| AS OF December 31, 2019 |
| Shares | | | | Value | | | Percentage
of Net
Assets | |
| COMMON STOCK: 97.5% |
| | | Brazil: 0.6% |
| 220,850 (1),(2) | | StoneCo Ltd. | | $ | 8,809,706 | | | | 0.6 | |
| | | | | | | | | | | |
| | | China: 1.9% | | | | | | | | |
| 830,559 (2) | | JD.com, Inc. ADR | | | 29,260,594 | | | | 1.9 | |
| | | | | | | | | | | |
| | | France: 7.8% | | | | | | | | |
| 61,950 | | Kering SA | | | 40,819,975 | | | | 2.7 | |
| 141,738 | | LVMH Moet Hennessy Louis Vuitton SE | | | 66,043,671 | | | | 4.3 | |
| 369,290 | | Societe Generale | | | 12,887,534 | | | | 0.8 | |
| | | | | | 119,751,180 | | | | 7.8 | |
| | | | | | | | | | | |
| | | Germany: 5.7% | | | | | | | | |
| 123,030 | | Allianz SE | | | 30,145,903 | | | | 2.0 | |
| 153,584 | | Bayer AG | | | 12,485,920 | | | | 0.8 | |
| 327,572 | | SAP SE | | | 44,090,817 | | | | 2.9 | |
| | | | | | 86,722,640 | | | | 5.7 | |
| | | | | | | | | | | |
| | | India: 4.5% | | | | | | | | |
| 12,243,558 | | DLF Ltd. | | | 39,613,906 | | | | 2.6 | |
| 1,986,682 (1) | | ICICI Bank Ltd. ADR | | | 29,979,031 | | | | 1.9 | |
| | | | | | 69,592,937 | | | | 4.5 | |
| | | | | | | | | | | |
| | | Italy: 0.2% | | | | | | | | |
| 104,433 | | Brunello Cucinelli SpA | | | 3,699,753 | | | | 0.2 | |
| | | | | | | | | | | |
| | | Japan: 14.2% | | | | | | | | |
| 385,900 | | Capcom Co., Ltd. | | | 10,681,720 | | | | 0.7 | |
| 80,900 | | Fanuc Ltd. | | | 14,939,392 | | | | 1.0 | |
| 88,604 | | Keyence Corp. | | | 31,112,283 | | | | 2.0 | |
| 324,100 | | Minebea Mitsumi, Inc. | | | 6,694,658 | | | | 0.4 | |
| 585,000 | | Murata Manufacturing Co., Ltd. | | | 36,005,933 | | | | 2.4 | |
| 258,000 | | Nidec Corp. | | | 35,238,622 | | | | 2.3 | |
| 38,700 | | Nintendo Co., Ltd. | | | 15,478,458 | | | | 1.0 | |
| 303,400 | | Omron Corp. | | | 17,684,636 | | | | 1.2 | |
| 353,841 | | Takeda Pharmaceutical Co., Ltd. | | | 13,995,198 | | | | 0.9 | |
| 315,700 | | TDK Corp. | | | 35,478,095 | | | | 2.3 | |
| | | | | | 217,308,995 | | | | 14.2 | |
| | | | | | | | | | | |
| | | Netherlands: 4.1% | | | | | | | | |
| 426,403 | | Airbus SE | | | 62,581,424 | | | | 4.1 | |
| | | | | | | | | | | |
| | | Spain: 1.7% | | | | | | | | |
| 750,211 | | Industria de Diseno Textil SA | | | 26,512,954 | | | | 1.7 | |
| | | | | | | | | | | |
| | | Sweden: 2.4% | | | | | | | | |
| 864,725 | | Assa Abloy AB | | | 20,213,344 | | | | 1.3 | |
| 420,598 | | Atlas Copco AB - A Shares | | | 16,788,451 | | | | 1.1 | |
| | | | | | 37,001,795 | | | | 2.4 | |
| | | | | | | | | | | |
| | | Switzerland: 1.4% | | | | | | | | |
| 1,391,246 | | Credit Suisse Group AG | | | 18,806,414 | | | | 1.2 | |
| 224,374 | | UBS Group AG | | | 2,831,463 | | | | 0.2 | |
| | | | | | 21,637,877 | | | | 1.4 | |
| | | | | | | | | | | |
| | | United Kingdom: 3.8% | | | | | | | | |
| 423,220 (1),(2) | | Farfetch Ltd. - Class A | | | 4,380,327 | | | | 0.3 | |
| 459,677 (1) | | International Game Technology PLC | | | 6,881,365 | | | | 0.4 | |
| 1,154,386 | | Prudential PLC | | | 22,118,914 | | | | 1.5 | |
| 428,068 | | Unilever PLC | | | 24,503,912 | | | | 1.6 | |
| | | | | | 57,884,518 | | | | 3.8 | |
| | | | | | | | | | | |
| | | United States: 49.2% | | | | | | | | |
| 25,051 | | 3M Co. | | | 4,419,497 | | | | 0.3 | |
| 82,540 (1),(2) | | Acadia Pharmaceuticals, Inc. | | | 3,531,061 | | | | 0.2 | |
| 165,563 (2) | | Adobe, Inc. | | | 54,604,333 | | | | 3.6 | |
| 250,800 | | Agilent Technologies, Inc. | | | 21,395,748 | | | | 1.4 | |
| 83,080 (2) | | Alphabet, Inc. - Class A | | | 111,276,521 | | | | 7.2 | |
| 7,191 (2) | | Amazon.com, Inc. | | | 13,287,818 | | | | 0.9 | |
| 140,480 | | Anthem, Inc. | | | 42,429,174 | | | | 2.8 | |
| 514,362 (2) | | Avantor, Inc. | | | 9,335,670 | | | | 0.6 | |
| 109,530 (1),(2) | | Blueprint Medicines Corp. | | | 8,774,448 | | | | 0.6 | |
| 233,220 (2) | | Centene Corp. | | | 14,662,541 | | | | 1.0 | |
| 504,660 | | Citigroup, Inc. | | | 40,317,287 | | | | 2.6 | |
| 330,999 | | Colgate-Palmolive Co. | | | 22,785,971 | | | | 1.5 | |
| 106,844 (2) | | Electronic Arts, Inc. | | | 11,486,799 | | | | 0.7 | |
| 143,475 | | Equifax, Inc. | | | 20,103,717 | | | | 1.3 | |
| 258,520 (2) | | Facebook, Inc. - Class A | | | 53,061,230 | | | | 3.5 | |
| 64,029 | | Fidelity National Information Services, Inc. | | | 8,905,794 | | | | 0.6 | |
| 345,610 (1),(2) | | GlycoMimetics, Inc. | | | 1,828,277 | | | | 0.1 | |
| 18,850 | | Goldman Sachs Group, Inc. | | | 4,334,181 | | | | 0.3 | |
| 126,130 (2) | | Incyte Corp., Ltd. | | | 11,013,672 | | | | 0.7 | |
| 187,070 | | Intuit, Inc. | | | 48,999,245 | | | | 3.2 | |
| 168,050 (2) | | Ionis Pharmaceuticals, Inc. | | | 10,151,901 | | | | 0.7 | |
| 324,440 (2) | | MacroGenics, Inc. | | | 3,529,907 | | | | 0.2 | |
| 570,100 | | Maxim Integrated Products | | | 35,066,851 | | | | 2.3 | |
| 77,409 | | Microsoft Corp. | | | 12,207,399 | | | | 0.8 | |
| 274,643 (2) | | PayPal Holdings, Inc. | | | 29,708,133 | | | | 1.9 | |
| 151,606 (1),(2) | | Phathom Pharmaceuticals, Inc. | | | 4,721,011 | | | | 0.3 | |
| 205,270 | | S&P Global, Inc. | | | 56,048,974 | | | | 3.7 | |
| 94,026 (1),(2) | | Sage Therapeutics, Inc. | | | 6,787,737 | | | | 0.4 | |
| 70,797 (1),(2) | | Sarepta Therapeutics, Inc. | | | 9,135,645 | | | | 0.6 | |
| 140,302 (2) | | Uniqure B.V. | | | 10,054,041 | | | | 0.7 | |
| 170,630 | | United Parcel Service, Inc. - Class B | | | 19,973,948 | | | | 1.3 | |
| 177,070 (2) | | Veracyte, Inc. | | | 4,943,794 | | | | 0.3 | |
| 195,520 | | Walt Disney Co. | | | 28,278,058 | | | | 1.8 | |
| 116,777 | | Zimmer Biomet Holdings, Inc. | | | 17,479,181 | | | | 1.1 | |
| | | | | | 754,639,564 | | | | 49.2 | |
| | | | | | | | | | | |
| | Total Common Stock | | | | | | | | |
| | (Cost $732,588,694) | | | 1,495,403,937 | | | | 97.5 | |
| | | | | | | | | | | |
| PREFERRED STOCK: 0.3% | | | | | | | | |
| | | Germany: 0.3% | | | | | | | | |
| 81,382 | | Bayerische Motoren Werke AG | | | 5,010,064 | | | | 0.3 | |
See Accompanying Notes to Financial Statements
| VY®Invesco Oppenheimer Global Portfolio | PORTFOLIO OF INVESTMENTS |
| AS OF December 31, 2019(Continued) |
| | | India: 0.0% | | | | | | | | |
| 2,598,630 (2) | | Zee Entertainment Enterprises Ltd. | | | 200,236 | | | | 0.0 | |
| | | | | | | | | | | |
| | Total Preferred Stock | | | | | | | |
| | (Cost $5,223,617) | | 5,210,300 | | | | 0.3 | |
| | | | | | | | | | | |
| | Total Long-Term Investments | | | | | | | |
| | (Cost $737,812,311) | | 1,500,614,237 | | | | 97.8 | |
| | | | | | | | | | | |
Principal
Amount† | | | | | Value | | | | Percentage
of Net
Assets | |
| SHORT-TERM INVESTMENTS: 5.4% | | | | | | | | |
| | | Commercial Paper: 0.4% | | | | | | | | |
| 900,000 (3) | | Banco Santander S.A., 1.950%, 02/05/2020 | | | 898,382 | | | | 0.1 | |
| 600,000 (3) | | Flex Co. LLC, 1.910%, 01/31/2020 | | | 599,070 | | | | 0.0 | |
| 850,000 (3) | | Le Mouvement Des Caisses Desjardins, 1.860%, 02/14/2020 | | | 848,162 | | | | 0.1 | |
| 900,000 (3) | | LMA Americas LLC, 2.000%, 01/31/2020 | | | 898,529 | | | | 0.1 | |
| 150,000 (3) | | Mitsubishi UFJ Trust and Banking Corp., 1.910%, 02/04/2020 | | | 149,723 | | | | 0.0 | |
| 850,000 (3) | | Nederlandse Waterschapsbank, 1.870%, 02/12/2020 | | | 848,247 | | | | 0.1 | |
| 500,000 (3) | | Oversea-Chinese Banking Corp., Ltd., 1.900%, 02/11/2020 | | | 498,922 | | | | 0.0 | |
| 823,000 (3) | | Societe Generale, 1.970%, 01/09/2020 | | | 822,630 | | | | 0.0 | |
| 725,000 (3) | | United Overseas Bnk Group, 1.900%, 01/24/2020 | | | 724,219 | | | | 0.0 | |
| | | | | | | | | | | |
| | Total Commercial Paper | | | | | | | |
| | (Cost $6,287,884) | | 6,287,884 | | | | 0.4 | |
| | | | | | | | | | | |
| | | Floating Rate Notes: 0.5% | | | | | | | | |
| 825,000 (3) | | Australia & New Zealand Banking Group Ltd., 1.920%, 04/09/2020 | | | 825,239 | | | | 0.1 | |
| 575,000 (3) | | Commonwealth Bank of Australia, 1.920%, 03/16/2020 | | | 575,008 | | | | 0.0 | |
| 800,000 (3) | | Coöperatieve Rabobank U.A., 1.980%, 04/20/2020 | | | 800,224 | | | | 0.1 | |
| 725,000 (3) | | Crédit Industriel et Commercial, 1.950%, 04/09/2020 | | | 725,122 | | | | 0.0 | |
| 700,000 (3) | | Credit Suisse Group AG, 1.890%, 04/17/2020 | | | 700,313 | | | | 0.0 | |
| 800,000 (3) | | Mitsubishi UFJ Financial Group, Inc., 1.930%, 01/16/2020 | | | 800,094 | | | | 0.1 | |
| 825,000 (3) | | Mizuho Financial Group Inc., 1.960%, 05/05/2020 | | | 825,035 | | | | 0.1 | |
| 700,000 (3) | | The Norinchukin Bank, 2.050%, 04/24/2020 | | | 700,252 | | | | 0.0 | |
| 825,000 (3) | | The Sumitomo Mitsui Financial Group, 1.960%, 05/06/2020 | | | 824,936 | | | | 0.1 | |
| 450,000 (3) | | Toronto-Dominion Bank, 1.980%, 04/16/2020 | | | 450,136 | | | | 0.0 | |
| | | | | | | | | | | |
| | Total Floating Rate Notes | | | | | | | |
| | (Cost $7,226,359) | | 7,226,359 | | | | 0.5 | |
| | | | | | | | | | | |
| | | Repurchase Agreements: 2.1% | | | | | | | | |
| 4,549,628 (3) | | Citadel Securities LLC, Repurchase Agreement dated 12/31/19, 1.60%, due 01/02/20 (Repurchase Amount $4,550,027, collateralized by various U.S. Government Securities, 0.000%-8.500%, Market Value plus accrued interest $4,641,033, due 01/15/20-11/15/48) | | | 4,549,628 | | | | 0.3 | |
| 11,562,348 (3) | | Citigroup, Inc., Repurchase Agreement dated 12/31/19, 1.57%, due 01/02/20 (Repurchase Amount $11,563,343, collateralized by various U.S. Government/U.S. Government Agency Obligations, 0.000%-9.000%, Market Value plus accrued interest $11,793,595, due 02/13/20-09/20/69) | | | 11,562,348 | | | | 0.7 | |
| 11,562,348 (3) | | RBC Dominion Securities Inc., Repurchase Agreement dated 12/31/19, 1.57%, due 01/02/20 (Repurchase Amount $11,563,343, collateralized by various U.S. Government/U.S. Government Agency Obligations, 0.000%-6.500%, Market Value plus accrued interest $11,793,595, due 06/30/21-12/01/49) | | | 11,562,348 | | | | 0.8 | |
| 4,079,834 (3) | | State of Wisconsin Investment Board, Repurchase Agreement dated 12/31/19, 1.75%, due 01/02/20 (Repurchase Amount $4,080,225, collateralized by various U.S. Government Securities, 0.125%-3.875%, Market Value plus accrued interest $4,161,543, due 04/15/21-02/15/47) | | | 4,079,834 | | | | 0.3 | |
See Accompanying Notes to Financial Statements
| VY®Invesco Oppenheimer Global Portfolio | PORTFOLIO OF INVESTMENTS |
| AS OF December 31, 2019(Continued) |
| | Total Repurchase Agreements | | | | | | | |
| | (Cost $31,754,158) | | 31,754,158 | | | | 2.1 | |
| | | | | | | | | | | |
| | | Certificates of Deposit: 0.0% | | | | | | | | |
| 450,000 (3) | | Toronto-Dominion Bank, 1.850%, 03/18/2020 | | | | | | | | |
| | | (Cost $450,068) | | | 450,068 | | | | 0.0 | |
| | | | | | | | | | | |
| Shares | | | | | Value | | | | Percentage
of Net
Assets | |
| | | Mutual Funds: 2.4% | | | | | | | | |
| 33,374,580 (4) | | BlackRock Liquidity Funds, FedFund, Institutional Class, 1.520% | | | 33,374,580 | | | | 2.2 | |
| 2,040,000 (3),(4) | | Invesco Short-Term Investments Trust Government & Agency Portfolio - Institutional Class, 1.510% | | | 2,040,000 | | | | 0.1 | |
| 1,910,000 (3),(4) | | Morgan Stanley Institutional Liquidity Funds - Government Portfolio (Institutional Share Class), 1.510% | | | 1,910,000 | | | | 0.1 | |
| | Total Mutual Funds | | | | | | | |
| | (Cost $37,324,580) | | 37,324,580 | | | | 2.4 | |
| | | | | | | | | | | |
| | Total Short-Term Investments | | | | | | | |
| | (Cost $83,043,049) | | 83,043,049 | | | | 5.4 | |
| | | | | | | | | | | |
| | Total Investments in Securities
(Cost $820,855,360) | $ | 1,583,657,286 | | | | 103.2 | |
| | Liabilities in Excess of Other Assets | | (49,337,504 | ) | | | (3.2 | ) |
| | Net Assets | $ | 1,534,319,782 | | | | 100.0 | |
| † | Unless otherwise indicated, principal amount is shown in USD. |
| ADR | American Depositary Receipt |
| (1) | Security, or a portion of the security, is on loan. |
| (2) | Non-income producing security. |
| (3) | All or a portion of the security represents securities purchased with cash collateral received for securities on loan. |
| (4) | Rate shown is the 7-day yield as of December 31, 2019. |
See Accompanying Notes to Financial Statements
| VY®JPMorgan Mid Cap Value Portfolio | PORTFOLIO OF INVESTMENTS |
| AS OF December 31, 2019 |
| Shares | | | | Value | | | Percentage
of Net
Assets | |
| COMMON STOCK: 97.9% |
| | | Communication Services: 2.9% | | | | | | | | |
| 79,680 (1) | | Dish Network Corp. - Class A | | $ | 2,826,250 | | | | 0.6 | |
| 23,570 (1) | | Liberty Broadband Corp. - Series C | | | 2,963,927 | | | | 0.7 | |
| 98,050 (1) | | Liberty Media Corp. - SiriusXM C | | | 4,720,127 | | | | 1.1 | |
| 51,072 | | ViacomCBS, Inc. | | | 2,143,492 | | | | 0.5 | |
| | | | | | 12,653,796 | | | | 2.9 | |
| | | | | | | | | | | |
| | | Consumer Discretionary: 12.0% | | | | | | | | |
| 5,670 (1) | | Autozone, Inc. | | | 6,754,728 | | | | 1.5 | |
| 56,420 | | Best Buy Co., Inc. | | | 4,953,676 | | | | 1.1 | |
| 80,280 | | BorgWarner, Inc. | | | 3,482,546 | | | | 0.8 | |
| 42,960 | | Expedia Group, Inc. | | | 4,645,694 | | | | 1.1 | |
| 134,860 | | Gap, Inc. | | | 2,384,325 | | | | 0.5 | |
| 27,330 | | Genuine Parts Co. | | | 2,903,266 | | | | 0.7 | |
| 33,810 | | Hilton Worldwide Holdings, Inc. | | | 3,749,867 | | | | 0.9 | |
| 57,551 | | Kohl's Corp. | | | 2,932,223 | | | | 0.7 | |
| 31,750 (1) | | Mohawk Industries, Inc. | | | 4,330,065 | | | | 1.0 | |
| 146,806 | | Newell Brands, Inc. | | | 2,821,611 | | | | 0.6 | |
| 46,990 (2) | | Nordstrom, Inc. | | | 1,923,301 | | | | 0.4 | |
| 33,350 | | PVH Corp. | | | 3,506,753 | | | | 0.8 | |
| 35,590 | | Ralph Lauren Corp. | | | 4,171,860 | | | | 0.9 | |
| 33,510 | | Tiffany & Co. | | | 4,478,612 | | | | 1.0 | |
| | | | | | 53,038,527 | | | | 12.0 | |
| | | | | | | | | | | |
| | | Consumer Staples: 3.9% | | | | | | | | |
| 19,460 | | Constellation Brands, Inc. | | | 3,692,535 | | | | 0.8 | |
| 117,862 | | Coty, Inc - Class A | | | 1,325,947 | | | | 0.3 | |
| 65,763 (2) | | Energizer Holdings, Inc. | | | 3,302,618 | | | | 0.8 | |
| 67,260 | | Keurig Dr Pepper, Inc. | | | 1,947,177 | | | | 0.4 | |
| 102,140 | | Kroger Co. | | | 2,961,039 | | | | 0.7 | |
| 36,030 (1) | | Post Holdings, Inc. | | | 3,930,873 | | | | 0.9 | |
| | | | | | 17,160,189 | | | | 3.9 | |
| | | | | | | | | | | |
| | | Energy: 5.4% | | | | | | | | |
| 199,500 | | Cabot Oil & Gas Corp. | | | 3,473,295 | | | | 0.8 | |
| 82,034 | | Diamondback Energy, Inc. | | | 7,617,677 | | | | 1.7 | |
| 119,660 | | EQT Corp. | | | 1,304,294 | | | | 0.3 | |
| 110,324 | | Equitrans Midstream Corp. | | | 1,473,929 | | | | 0.3 | |
| 93,030 | | PBF Energy, Inc. | | | 2,918,351 | | | | 0.7 | |
| 301,760 | | Williams Cos., Inc. | | | 7,157,747 | | | | 1.6 | |
| | | | | | 23,945,293 | | | | 5.4 | |
| | | | | | | | | | | |
| | | Financials: 21.8% | | | | | | | | |
| 4,253 (1) | | Alleghany Corp. | | | 3,400,571 | | | | 0.8 | |
| 20,960 | | Ally Financial, Inc. | | | 640,537 | | | | 0.1 | |
| 32,990 | | Ameriprise Financial, Inc. | | | 5,495,474 | | | | 1.2 | |
| 122,470 | | Citizens Financial Group, Inc. | | | 4,973,507 | | | | 1.1 | |
| 22,820 | | Comerica, Inc. | | | 1,637,335 | | | | 0.4 | |
| 214,520 | | Fifth Third Bancorp | | | 6,594,345 | | | | 1.5 | |
| 41,230 | | First Republic Bank | | | 4,842,463 | | | | 1.1 | |
| 96,570 | | Hartford Financial Services Group, Inc. | | | 5,868,559 | | | | 1.3 | |
| 240,370 | | Huntington Bancshares, Inc. | | | 3,624,779 | | | | 0.8 | |
| 56,380 | | Lincoln National Corp. | | | 3,326,984 | | | | 0.7 | |
| 160,840 | | Loews Corp. | | | 8,442,492 | | | | 1.9 | |
| 49,433 | | M&T Bank Corp. | | | 8,391,252 | | | | 1.9 | |
| 39,030 | | Marsh & McLennan Cos., Inc. | | | 4,348,332 | | | | 1.0 | |
| 48,290 | | Northern Trust Corp. | | | 5,130,330 | | | | 1.2 | |
| 18,710 | | Principal Financial Group, Inc. | | | 1,029,050 | | | | 0.2 | |
| 47,720 | | Progressive Corp. | | | 3,454,451 | | | | 0.8 | |
| 54,050 | | Raymond James Financial, Inc. | | | 4,835,313 | | | | 1.1 | |
| 57,620 | | T. Rowe Price Group, Inc. | | | 7,020,421 | | | | 1.6 | |
| 33,690 | | TCF Financial Corp. | | | 1,576,692 | | | | 0.4 | |
| 117,027 | | Truist Financial Corp. | | | 6,590,961 | | | | 1.5 | |
| 21,990 | | Unum Group | | | 641,228 | | | | 0.1 | |
| 42,005 | | WR Berkley Corp. | | | 2,902,545 | | | | 0.7 | |
| 35,830 | | Zions Bancorp NA | | | 1,860,294 | | | | 0.4 | |
| | | | | | 96,627,915 | | | | 21.8 | |
| | | | | | | | | | | |
| | | Health Care: 6.6% | | | | | | | | |
| 51,100 | | AmerisourceBergen Corp. | | | 4,344,522 | | | | 1.0 | |
| 18,550 | | Cigna Corp. | | | 3,793,290 | | | | 0.9 | |
| 48,290 (1) | | Henry Schein, Inc. | | | 3,221,909 | | | | 0.7 | |
| 6,460 | | Humana, Inc. | | | 2,367,719 | | | | 0.5 | |
| 28,810 (1) | | Laboratory Corp. of America Holdings | | | 4,873,788 | | | | 1.1 | |
| 30,640 | | Universal Health Services, Inc. | | | 4,395,614 | | | | 1.0 | |
| 41,480 | | Zimmer Biomet Holdings, Inc. | | | 6,208,726 | | | | 1.4 | |
| | | | | | 29,205,568 | | | | 6.6 | |
| | | | | | | | | | | |
| | | Industrials: 8.8% | | | | | | | | |
| 30,230 | | Acuity Brands, Inc. | | | 4,171,740 | | | | 0.9 | |
| 50,320 | | Ametek, Inc. | | | 5,018,917 | | | | 1.1 | |
| 19,000 | | Carlisle Cos., Inc. | | | 3,074,960 | | | | 0.7 | |
| 60,030 | | Fortune Brands Home & Security, Inc. | | | 3,922,360 | | | | 0.9 | |
| 19,380 | | Hubbell, Inc. | | | 2,864,752 | | | | 0.7 | |
| 24,160 | | IDEX Corp. | | | 4,155,520 | | | | 0.9 | |
| 34,800 | | ITT, Inc. | | | 2,572,068 | | | | 0.6 | |
| 27,620 | | Lincoln Electric Holdings, Inc. | | | 2,671,683 | | | | 0.6 | |
| 34,120 (1) | | Middleby Corp. | | | 3,736,822 | | | | 0.8 | |
| 26,900 | | MSC Industrial Direct Co. | | | 2,110,843 | | | | 0.5 | |
| 28,031 | | Snap-On, Inc. | | | 4,748,451 | | | | 1.1 | |
| | | | | | 39,048,116 | | | | 8.8 | |
| | | | | | | | | | | |
| | | Information Technology: 6.7% | | | | | | | | |
| 40,680 | | Amphenol Corp. | | | 4,402,796 | | | | 1.0 | |
| 17,370 | | Analog Devices, Inc. | | | 2,064,251 | | | | 0.5 | |
| 42,780 (1) | | Arrow Electronics, Inc. | | | 3,625,177 | | | | 0.8 | |
| 33,540 | | CDW Corp. | | | 4,790,854 | | | | 1.1 | |
| 79,712 (1) | | CommScope Holding Co., Inc. | | | 1,131,113 | | | | 0.2 | |
| 27,306 | | Jack Henry & Associates, Inc. | | | 3,977,665 | | | | 0.9 | |
| 26,729 (1) | | Keysight Technologies, Inc. | | | 2,743,197 | | | | 0.6 | |
| 23,920 | | SYNNEX Corp. | | | 3,080,896 | | | | 0.7 | |
| 27,690 (1) | | Synopsys, Inc. | | | 3,854,448 | | | | 0.9 | |
| | | | | | 29,670,397 | | | | 6.7 | |
See Accompanying Notes to Financial Statements
| VY®JPMorgan Mid Cap Value Portfolio | PORTFOLIO OF INVESTMENTS |
| AS OF December 31, 2019(Continued) |
| | | Materials: 4.8% | | | | | | | | |
| 51,750 | | Ball Corp. | | | 3,346,673 | | | | 0.8 | |
| 16,080 | | Martin Marietta Materials, Inc. | | | 4,496,611 | | | | 1.0 | |
| 8,950 | | Sherwin-Williams Co. | | | 5,222,683 | | | | 1.2 | |
| 145,850 | | Silgan Holdings, Inc. | | | 4,533,018 | | | | 1.0 | |
| 83,010 | | WestRock Co. | | | 3,561,959 | | | | 0.8 | |
| | | | | | 21,160,944 | | | | 4.8 | |
| | | | | | | | | | | |
| | | Real Estate: 14.1% | | | | | | | | |
| 52,160 | | American Campus Communities, Inc. | | | 2,453,085 | | | | 0.6 | |
| 108,000 | | American Homes 4 Rent | | | 2,830,680 | | | | 0.6 | |
| 28,500 | | AvalonBay Communities, Inc. | | | 5,976,450 | | | | 1.4 | |
| 42,250 | | Boston Properties, Inc. | | | 5,824,585 | | | | 1.3 | |
| 174,390 | | Brixmor Property Group, Inc. | | | 3,768,568 | | | | 0.9 | |
| 97,490 (1) | | CBRE Group, Inc. | | | 5,975,162 | | | | 1.3 | |
| 84,240 (1) | | Cushman & Wakefield PLC | | | 1,721,866 | | | | 0.4 | |
| 11,830 | | Essex Property Trust, Inc. | | | 3,559,174 | | | | 0.8 | |
| 34,880 | | Federal Realty Investment Trust | | | 4,490,102 | | | | 1.0 | |
| 46,233 | | JBG SMITH Properties | | | 1,844,234 | | | | 0.4 | |
| 154,570 | | Kimco Realty Corp. | | | 3,201,145 | | | | 0.7 | |
| 111,862 | | Outfront Media, Inc. | | | 3,000,139 | | | | 0.7 | |
| 107,800 | | Rayonier, Inc. | | | 3,531,528 | | | | 0.8 | |
| 39,570 | | Regency Centers Corp. | | | 2,496,471 | | | | 0.6 | |
| 33,590 | | Ventas, Inc. | | | 1,939,487 | | | | 0.4 | |
| 65,646 | | Vornado Realty Trust | | | 4,365,459 | | | | 1.0 | |
| 96,550 | | Weyerhaeuser Co. | | | 2,915,810 | | | | 0.7 | |
| 28,630 | | WP Carey, Inc. | | | 2,291,545 | | | | 0.5 | |
| | | | | | 62,185,490 | | | | 14.1 | |
| | | | | | | | | | | |
| | | Utilities: 10.9% | | | | | | | | |
| 145,010 | | CMS Energy Corp. | | | 9,112,429 | | | | 2.0 | |
| 69,000 | | Edison International | | | 5,203,290 | | | | 1.2 | |
| 37,470 | | Entergy Corp. | | | 4,488,906 | | | | 1.0 | |
| 79,410 | | National Fuel Gas Co. | | | 3,695,741 | | | | 0.8 | |
| 46,180 | | Sempra Energy | | | 6,995,346 | | | | 1.6 | |
| 101,240 | | WEC Energy Group, Inc. | | | 9,337,365 | | | | 2.1 | |
| 151,230 | | Xcel Energy, Inc. | | | 9,601,593 | | | | 2.2 | |
| | | | | | 48,434,670 | | | | 10.9 | |
| | | | | | | | | | | |
| | Total Common Stock | | | | | | | | |
| | (Cost $315,650,941) | | | 433,130,905 | | | | 97.9 | |
| | | | | | | | | | | |
Principal
Amount† | | | | | Value | | | | Percentage
of Net
Assets | |
| SHORT-TERM INVESTMENTS: 2.4% |
| | | Repurchase Agreements: 0.5% | | | | | | | | |
| 1,000,000 (3) | | Cantor Fitzgerald Securities, Repurchase Agreement dated 12/31/19, 1.58%, due 01/02/20 (Repurchase Amount $1,000,087, collateralized by various U.S. Government/U.S. Government Agency Obligations, 0.000%-8.500%, Market Value plus accrued interest $1,020,000, due 01/25/20-10/15/60) | | | 1,000,000 | | | | 0.2 | |
| 266,832 (3) | | Citadel Securities LLC, Repurchase Agreement dated 12/31/19, 1.60%, due 01/02/20 (Repurchase Amount $266,855, collateralized by various U.S. Government Securities, 0.000%-8.500%, Market Value plus accrued interest $272,193, due 01/15/20-11/15/48) | | | 266,832 | | | | 0.1 | |
| 1,000,000 (3) | | RBC Dominion Securities Inc., Repurchase Agreement dated 12/31/19, 1.57%, due 01/02/20 (Repurchase Amount $1,000,086, collateralized by various U.S. Government/U.S. Government Agency Obligations, 0.000%-6.500%, Market Value plus accrued interest $1,020,000, due 06/30/21-12/01/49) | | | 1,000,000 | | | | 0.2 | |
| | | | | | | | | | | |
| | Total Repurchase Agreements | | | | | | | | |
| | (Cost $2,266,832) | | | 2,266,832 | | | | 0.5 | |
| | | | | | | | | | | |
| Shares | | | | | Value | | | | Percentage
of Net
Assets | |
| | | Mutual Funds: 1.9% | | | | | | | | |
| 8,506,831 (4) | | BlackRock Liquidity Funds, FedFund, Institutional Class, 1.520% | | | | | | | | |
| | | (Cost $8,506,831) | | | 8,506,831 | | | | 1.9 | |
| | | | | | | | | | | |
| | Total Short-Term Investments | | | | | | | | |
| | (Cost $10,773,663) | | | 10,773,663 | | | | 2.4 | |
| | | | | | | | | | | |
| | Total Investments in Securities
(Cost $326,424,604) | | $ | 443,904,568 | | | | 100.3 | |
| | Liabilities in Excess of Other Assets | | | (1,316,355 | ) | | | (0.3 | ) |
| | Net Assets | | $ | 442,588,213 | | | | 100.0 | |
| † | Unless otherwise indicated, principal amount is shown in USD. |
| (1) | Non-income producing security. |
| (2) | Security, or a portion of the security, is on loan. |
| (3) | All or a portion of the security represents securities purchased with cash collateral received for securities on loan. |
| (4) | Rate shown is the 7-day yield as of December 31, 2019. |
See Accompanying Notes to Financial Statements
VY®T. Rowe Price Diversified Mid Cap Growth Portfolio | |
| PORTFOLIO OF INVESTMENTS |
as ofDecember 31, 2019 |
| Shares | | | | Value | | | Percentage
of Net
Assets | |
| COMMON STOCK: 99.0% |
| | | Communication Services: 2.2% | | | | | | | | |
| 69,694 (1) | | Altice USA, Inc. | | $ | 1,905,434 | | | | 0.2 | |
| 29,500 (1) | | Electronic Arts, Inc. | | | 3,171,545 | | | | 0.3 | |
| 21,100 (1) | | IAC/InterActiveCorp | | | 5,256,221 | | | | 0.4 | |
| 38,400 | | Interpublic Group of Cos., Inc. | | | 887,040 | | | | 0.1 | |
| 41,900 (1) | | Live Nation Entertainment, Inc. | | | 2,994,593 | | | | 0.3 | |
| 47,300 (1),(2) | | Match Group, Inc. | | | 3,883,803 | | | | 0.3 | |
| 15,600 (2) | | Omnicom Group | | | 1,263,912 | | | | 0.1 | |
| 27,500 (1) | | Take-Two Interactive Software, Inc. | | | 3,366,825 | | | | 0.3 | |
| 26,800 (1),(2) | | Zillow Group, Inc. - Class A | | | 1,225,832 | | | | 0.1 | |
| 236,500 (1) | | Zynga, Inc. - Class A | | | 1,447,380 | | | | 0.1 | |
| | | | | | 25,402,585 | | | | 2.2 | |
| | | | | | | | | | | |
| | | Consumer Discretionary: 14.8% | | | | | | | | |
| 90,200 | | Aptiv PLC | | | 8,566,294 | | | | 0.7 | |
| 28,700 | | Aramark | | | 1,245,580 | | | | 0.1 | |
| 2,100 (1) | | Autozone, Inc. | | | 2,501,751 | | | | 0.2 | |
| 17,700 (1) | | Bright Horizons Family Solutions, Inc. | | | 2,660,133 | | | | 0.2 | |
| 54,800 (1) | | Burlington Stores, Inc. | | | 12,496,044 | | | | 1.1 | |
| 50,800 (1),(2) | | Carmax, Inc. | | | 4,453,636 | | | | 0.4 | |
| 37,619 (1),(2) | | Chewy, Inc. | | | 1,090,951 | | | | 0.1 | |
| 27,400 (2) | | Choice Hotels International, Inc. | | | 2,833,982 | | | | 0.2 | |
| 75,100 | | Dollar General Corp. | | | 11,714,098 | | | | 1.0 | |
| 73,200 (1) | | Dollar Tree, Inc. | | | 6,884,460 | | | | 0.6 | |
| 21,400 | | Domino's Pizza, Inc. | | | 6,286,892 | | | | 0.5 | |
| 70,800 | | Dunkin Brands Group, Inc. | | | 5,348,232 | | | | 0.5 | |
| 98,900 | | Extended Stay America, Inc. | | | 1,469,654 | | | | 0.1 | |
| 41,915 (1),(2) | | Farfetch Ltd. - Class A | | | 433,820 | | | | 0.0 | |
| 15,200 (2) | | Ferrari NV | | | 2,516,208 | | | | 0.2 | |
| 13,400 (1) | | Five Below, Inc. | | | 1,713,324 | | | | 0.2 | |
| 23,700 (1),(2) | | Grand Canyon Education, Inc. | | | 2,270,223 | | | | 0.2 | |
| 8,400 (1),(2) | | GrubHub, Inc. | | | 408,576 | | | | 0.0 | |
| 98,333 | | Hilton Worldwide Holdings, Inc. | | | 10,906,113 | | | | 0.9 | |
| 29,900 (1) | | Lululemon Athletica, Inc. | | | 6,926,933 | | | | 0.6 | |
| 3,900 (1) | | MercadoLibre, Inc. | | | 2,230,566 | | | | 0.2 | |
| 109,700 | | MGM Resorts International | | | 3,649,719 | | | | 0.3 | |
| 48,500 (1),(2) | | Michaels Cos, Inc. | | | 392,365 | | | | 0.0 | |
| 8,697 (1) | | Mohawk Industries, Inc. | | | 1,186,097 | | | | 0.1 | |
| 49,800 (1) | | Norwegian Cruise Line Holdings Ltd. | | | 2,908,818 | | | | 0.3 | |
| 1,360 (1) | | NVR, Inc. | | | 5,179,438 | | | | 0.5 | |
| 19,000 (1),(2) | | Ollie's Bargain Outlet Holdings, Inc. | | | 1,240,890 | | | | 0.1 | |
| 21,600 (1) | | O'Reilly Automotive, Inc. | | | 9,466,416 | | | | 0.8 | |
| 25,900 (2) | | Papa Johns International, Inc. | | | 1,635,585 | | | | 0.1 | |
| 19,300 | | Pool Corp. | | | 4,098,934 | | | | 0.4 | |
| 14,100 | | PVH Corp. | | | 1,482,615 | | | | 0.1 | |
| 51,581 | | Restaurant Brands International, Inc. | | | 3,289,320 | | | | 0.3 | |
| 45,300 | | Ross Stores, Inc. | | | 5,273,826 | | | | 0.5 | |
| 25,300 | | Royal Caribbean Cruises Ltd. | | | 3,377,803 | | | | 0.3 | |
| 99,700 | | Service Corp. International | | | 4,589,191 | | | | 0.4 | |
| 96,000 | | Tapestry, Inc. | | | 2,589,120 | | | | 0.2 | |
| 38,000 | | Toll Brothers, Inc. | | | 1,501,380 | | | | 0.1 | |
| 39,100 | | Tractor Supply Co. | | | 3,653,504 | | | | 0.3 | |
| 45,000 (1) | | Trip.com Group Ltd. ADR | | | 1,509,300 | | | | 0.1 | |
| 26,021 (1) | | Ulta Beauty, Inc. | | | 6,586,956 | | | | 0.6 | |
| 9,720 (1),(2) | | Wayfair, Inc. | | | 878,396 | | | | 0.1 | |
| 23,600 (2) | | Williams-Sonoma, Inc. | | | 1,733,184 | | | | 0.2 | |
| 38,100 | | Wynn Resorts Ltd. | | | 5,290,947 | | | | 0.5 | |
| 66,200 | | Yum China Holdings, Inc. | | | 3,178,262 | | | | 0.3 | |
| 17,100 | | Yum! Brands, Inc. | | | 1,722,483 | | | | 0.2 | |
| | | | | | 171,372,019 | | | | 14.8 | |
| | | | | | | | | | | |
| | | Consumer Staples: 3.1% | | | | | | | | |
| 69,975 (2) | | Brown-Forman Corp. - Class B | | | 4,730,310 | | | | 0.4 | |
| 15,000 | | Casey's General Stores, Inc. | | | 2,384,850 | | | | 0.2 | |
| 75,800 | | Church & Dwight Co., Inc. | | | 5,331,772 | | | | 0.5 | |
| 36,000 | | Clorox Co. | | | 5,527,440 | | | | 0.5 | |
| 57,600 | | Conagra Brands, Inc. | | | 1,972,224 | | | | 0.2 | |
| 34,600 | | Hershey Co. | | | 5,085,508 | | | | 0.4 | |
| 26,500 (2) | | Hormel Foods Corp. | | | 1,195,415 | | | | 0.1 | |
| 31,600 | | McCormick & Co., Inc. | | | 5,363,468 | | | | 0.5 | |
| 42,789 | | Tyson Foods, Inc. | | | 3,895,511 | | | | 0.3 | |
| | | | | | 35,486,498 | | | | 3.1 | |
| | | | | | | | | | | |
| | | Energy: 1.4% | | | | | | | | |
| 157,300 | | Cabot Oil & Gas Corp. | | | 2,738,593 | | | | 0.2 | |
| 26,752 | | Concho Resources, Inc./Midland TX | | | 2,342,673 | | | | 0.2 | |
| 28,000 | | Continental Resources, Inc. | | | 960,400 | | | | 0.1 | |
| 20,800 | | Diamondback Energy, Inc. | | | 1,931,488 | | | | 0.2 | |
| 50,400 | | HollyFrontier Corp. | | | 2,555,784 | | | | 0.2 | |
| 250,800 (1),(2) | | Jagged Peak Energy, Inc. | | | 2,129,292 | | | | 0.2 | |
| 44 (1),(3),(4) | | Venture Global LNG, Inc. - Series B | | | 228,800 | | | | 0.0 | |
| 560 (1),(3),(4) | | Venture Global LNG, Inc. - Series C | | | 2,912,000 | | | | 0.3 | |
| | | | | | 15,799,030 | | | | 1.4 | |
| | | | | | | | | | | |
| | | Financials: 7.3% | | | | | | | | |
| 39,600 | | Assurant, Inc. | | | 5,190,768 | | | | 0.4 | |
| 46,400 | | Axis Capital Holdings Ltd. | | | 2,758,016 | | | | 0.2 | |
| 33,800 | | BankUnited, Inc. | | | 1,235,728 | | | | 0.1 | |
| 83,433 | | Cboe Global Markets, Inc. | | | 10,011,960 | | | | 0.9 | |
| 41,900 | | Discover Financial Services | | | 3,553,958 | | | | 0.3 | |
| 48,400 | | E*Trade Financial Corp. | | | 2,195,908 | | | | 0.2 | |
| 7,100 (2) | | Factset Research Systems, Inc. | | | 1,904,930 | | | | 0.2 | |
| 103,200 | | Fidelity National Financial, Inc. | | | 4,680,120 | | | | 0.4 | |
| 57,200 | | Fifth Third Bancorp | | | 1,758,328 | | | | 0.1 | |
| 54,500 | | First Republic Bank | | | 6,401,025 | | | | 0.6 | |
| 18,900 (1) | | Green Dot Corp. | | | 440,370 | | | | 0.0 | |
| 87,000 (2) | | Lazard Ltd. | | | 3,476,520 | | | | 0.3 | |
See Accompanying Notes to Financial Statements
VY®T. Rowe Price Diversified
Mid Cap Growth Portfolio | |
| PORTFOLIO OF INVESTMENTS |
| as ofDecember 31, 2019(CONTINUED) |
| 9,500 | | MarketAxess Holdings, Inc. | | | 3,601,545 | | | | 0.3 | |
| 12,300 | | Moody's Corp. | | | 2,920,143 | | | | 0.3 | |
| 16,700 | | MSCI, Inc. - Class A | | | 4,311,606 | | | | 0.4 | |
| 26,400 | | Nasdaq, Inc. | | | 2,827,440 | | | | 0.2 | |
| 20,500 | | Northern Trust Corp. | | | 2,177,920 | | | | 0.2 | |
| 21,800 | | Pinnacle Financial Partners, Inc. | | | 1,395,200 | | | | 0.1 | |
| 15,600 | | Signature Bank | | | 2,131,116 | | | | 0.2 | |
| 14,900 (1) | | SVB Financial Group | | | 3,740,496 | | | | 0.3 | |
| 89,200 | | TD Ameritrade Holding Corp. | | | 4,433,240 | | | | 0.4 | |
| 57,716 | | Tradeweb Markets, Inc. | | | 2,675,136 | | | | 0.2 | |
| 73,230 | | Webster Financial Corp. | | | 3,907,553 | | | | 0.3 | |
| 37,500 | | Willis Towers Watson PLC | | | 7,572,750 | | | | 0.7 | |
| | | | | | 85,301,776 | | | | 7.3 | |
| | | | | | | | | | | |
| | | Health Care: 14.5% | | | | | | | | |
| 13,700 (1) | | Abiomed, Inc. | | | 2,337,083 | | | | 0.2 | |
| 57,199 (1),(2) | | Acadia Healthcare Co., Inc. | | | 1,900,151 | | | | 0.2 | |
| 24,800 (1),(2) | | Acadia Pharmaceuticals, Inc. | | | 1,060,944 | | | | 0.1 | |
| 74,000 | | Agilent Technologies, Inc. | | | 6,312,940 | | | | 0.5 | |
| 43,200 (1),(2) | | Agios Pharmaceuticals, Inc. | | | 2,062,800 | | | | 0.2 | |
| 17,200 (1) | | Alexion Pharmaceuticals, Inc. | | | 1,860,180 | | | | 0.2 | |
| 22,100 (1) | | Align Technology, Inc. | | | 6,166,784 | | | | 0.5 | |
| 48,500 (1) | | Alkermes PLC | | | 989,400 | | | | 0.1 | |
| 28,300 (1),(2) | | Alnylam Pharmaceuticals, Inc. | | | 3,259,311 | | | | 0.3 | |
| 64,600 (1),(2) | | Amarin Corp. PLC ADR | | | 1,385,024 | | | | 0.1 | |
| 12,500 (1) | | Amedisys, Inc. | | | 2,086,500 | | | | 0.2 | |
| 7,592 (1),(2) | | Argenx SE ADR | | | 1,218,668 | | | | 0.1 | |
| 8,000 (1) | | Ascendis Pharma A/S ADR | | | 1,112,960 | | | | 0.1 | |
| 243,043 (1) | | Avantor, Inc. | | | 4,411,230 | | | | 0.4 | |
| 61,300 (1) | | BioMarin Pharmaceutical, Inc. | | | 5,182,915 | | | | 0.4 | |
| 5,600 (1),(2) | | Bluebird Bio, Inc. | | | 491,400 | | | | 0.0 | |
| 11,100 (1),(2) | | Blueprint Medicines Corp. | | | 889,221 | | | | 0.1 | |
| 29,600 | | Bruker Corp. | | | 1,508,712 | | | | 0.1 | |
| 46,484 (1) | | Catalent, Inc. | | | 2,617,049 | | | | 0.2 | |
| 157,000 (1) | | Centene Corp. | | | 9,870,590 | | | | 0.9 | |
| 33,912 | | Cerner Corp. | | | 2,488,802 | | | | 0.2 | |
| 25,600 | | Cooper Cos., Inc. | | | 8,225,024 | | | | 0.7 | |
| 27,800 (1),(2) | | DaVita, Inc. | | | 2,085,834 | | | | 0.2 | |
| 19,600 (1) | | DexCom, Inc. | | | 4,287,304 | | | | 0.4 | |
| 96,910 (1) | | Elanco Animal Health, Inc. | | | 2,854,000 | | | | 0.2 | |
| 38,400 (1) | | Exact Sciences Corp. | | | 3,551,232 | | | | 0.3 | |
| 79,000 (1) | | Exelixis, Inc. | | | 1,391,980 | | | | 0.1 | |
| 20,200 (1),(2) | | FibroGen, Inc. | | | 866,378 | | | | 0.1 | |
| 5,700 (1),(2) | | GW Pharmaceuticals PLC ADR | | | 595,992 | | | | 0.0 | |
| 22,000 (1) | | Henry Schein, Inc. | | | 1,467,840 | | | | 0.1 | |
| 113,700 (1) | | Hologic, Inc. | | | 5,936,277 | | | | 0.5 | |
| 7,875 (1) | | ICU Medical, Inc. | | | 1,473,570 | | | | 0.1 | |
| 26,500 (1) | | Idexx Laboratories, Inc. | | | 6,919,945 | | | | 0.6 | |
| 45,800 (1) | | Immunomedics, Inc. | | | 969,128 | | | | 0.1 | |
| 50,300 (1) | | Incyte Corp., Ltd. | | | 4,392,196 | | | | 0.4 | |
| 20,200 (1) | | IQVIA Holdings, Inc. | | | 3,121,102 | | | | 0.3 | |
| 17,800 (1) | | Jazz Pharmaceuticals PLC | | | 2,657,184 | | | | 0.2 | |
| 6,700 (1) | | Mettler Toledo International, Inc. | | | 5,314,976 | | | | 0.5 | |
| 39,200 (1) | | Molina Healthcare, Inc. | | | 5,319,048 | | | | 0.5 | |
| 31,279 (1) | | Neurocrine Biosciences, Inc. | | | 3,362,180 | | | | 0.3 | |
| 14,800 (1) | | Novocure Ltd. | | | 1,247,196 | | | | 0.1 | |
| 8,900 (1),(2) | | Penumbra, Inc. | | | 1,462,003 | | | | 0.1 | |
| 41,900 (2) | | Perrigo Co. PLC | | | 2,164,554 | | | | 0.2 | |
| 20,700 (1) | | PRA Health Sciences, Inc. | | | 2,300,805 | | | | 0.2 | |
| 68,300 (1) | | QIAGEN NV | | | 2,308,540 | | | | 0.2 | |
| 16,942 (1),(2) | | Sage Therapeutics, Inc. | | | 1,223,043 | | | | 0.1 | |
| 15,900 (1),(2) | | Sarepta Therapeutics, Inc. | | | 2,051,736 | | | | 0.2 | |
| 39,980 (1) | | Seattle Genetics, Inc. | | | 4,568,115 | | | | 0.4 | |
| 14,500 | | STERIS Public Ltd. Co. | | | 2,210,090 | | | | 0.2 | |
| 20,000 | | Teleflex, Inc. | | | 7,528,800 | | | | 0.6 | |
| 14,092 (1),(2) | | Ultragenyx Pharmaceutical, Inc. | | | 601,869 | | | | 0.1 | |
| 18,000 | | Universal Health Services, Inc. | | | 2,582,280 | | | | 0.2 | |
| 45,000 (1) | | Veeva Systems, Inc. | | | 6,329,700 | | | | 0.5 | |
| 17,464 (1) | | WellCare Health Plans, Inc. | | | 5,766,787 | | | | 0.5 | |
| 15,100 | | West Pharmaceutical Services, Inc. | | | 2,269,983 | | | | 0.2 | |
| | | | | | 168,619,355 | | | | 14.5 | |
| | | | | | | | | | | |
| | | Industrials: 17.8% | | | | | | | | |
| 140,700 (2) | | ADT, Inc. | | | 1,115,751 | | | | 0.1 | |
| 59,200 | | Alaska Air Group, Inc. | | | 4,010,800 | | | | 0.3 | |
| 35,800 | | Allegion Public Ltd. | | | 4,458,532 | | | | 0.4 | |
| 32,200 (2) | | American Airlines Group, Inc. | | | 923,496 | | | | 0.1 | |
| 28,762 | | Ametek, Inc. | | | 2,868,722 | | | | 0.2 | |
| 48,500 (2) | | AO Smith Corp. | | | 2,310,540 | | | | 0.2 | |
| 51,200 | | BWX Technologies, Inc. | | | 3,178,496 | | | | 0.3 | |
| 22,600 (2) | | CH Robinson Worldwide, Inc. | | | 1,767,320 | | | | 0.1 | |
| 31,200 | | Cintas Corp. | | | 8,395,296 | | | | 0.7 | |
| 13,800 | | Copa Holdings S.A.- Class A | | | 1,491,504 | | | | 0.1 | |
| 62,000 (1) | | Copart, Inc. | | | 5,638,280 | | | | 0.5 | |
| 16,800 (1) | | CoStar Group, Inc. | | | 10,051,440 | | | | 0.9 | |
| 15,900 | | Donaldson Co., Inc. | | | 916,158 | | | | 0.1 | |
| 39,487 | | Equifax, Inc. | | | 5,532,918 | | | | 0.5 | |
| 25,200 | | Expeditors International Washington, Inc. | | | 1,966,104 | | | | 0.2 | |
| 31,600 | | Fastenal Co. | | | 1,167,620 | | | | 0.1 | |
| 29,300 | | Flowserve Corp. | | | 1,458,261 | | | | 0.1 | |
| 56,038 | | Fortive Corp. | | | 4,280,743 | | | | 0.4 | |
| 51,975 | | Fortune Brands Home & Security, Inc. | | | 3,396,046 | | | | 0.3 | |
| 21,400 (1) | | Generac Holdings, Inc. | | | 2,152,626 | | | | 0.2 | |
| 51,600 | | Graco, Inc. | | | 2,683,200 | | | | 0.2 | |
| 112,000 (1) | | HD Supply Holdings, Inc. | | | 4,504,640 | | | | 0.4 | |
| 41,700 | | Hexcel Corp. | | | 3,057,027 | | | | 0.3 | |
| 31,000 | | Hubbell, Inc. | | | 4,582,420 | | | | 0.4 | |
| 14,300 | | Huntington Ingalls Industries, Inc. | | | 3,587,584 | | | | 0.3 | |
| 72,600 (1) | | IAA, Inc. | | | 3,416,556 | | | | 0.3 | |
| 17,500 | | IDEX Corp. | | | 3,010,000 | | | | 0.3 | |
| 72,153 (1) | | IHS Markit Ltd. | | | 5,436,729 | | | | 0.5 | |
| 36,400 | | JB Hunt Transport Services, Inc. | | | 4,250,792 | | | | 0.4 | |
| 31,600 | | Kansas City Southern | | | 4,839,856 | | | | 0.4 | |
| 69,200 (2) | | KAR Auction Services, Inc. | | | 1,507,868 | | | | 0.1 | |
| 12,700 (1) | | Kirby Corp. | | | 1,137,031 | | | | 0.1 | |
| 51,610 | | L3Harris Technologies, Inc. | | | 10,212,071 | | | | 0.9 | |
See Accompanying Notes to Financial Statements
VY®T. Rowe Price Diversified
Mid Cap Growth Portfolio | |
| PORTFOLIO OF INVESTMENTS |
| as ofDecember 31, 2019(CONTINUED) |
| 11,300 | | Landstar System, Inc. | | | 1,286,731 | | | | 0.1 | |
| 10,400 | | Manpowergroup, Inc. | | | 1,009,840 | | | | 0.1 | |
| 20,500 (1),(2) | | Middleby Corp. | | | 2,245,160 | | | | 0.2 | |
| 126,400 | | Nielsen Holdings PLC | | | 2,565,920 | | | | 0.2 | |
| 17,700 (2) | | Nordson Corp. | | | 2,882,268 | | | | 0.2 | |
| 18,000 | | Old Dominion Freight Line | | | 3,416,040 | | | | 0.3 | |
| 28,300 | | Paccar, Inc. | | | 2,238,530 | | | | 0.2 | |
| 44,100 | | Ritchie Bros Auctioneers, Inc. | | | 1,894,095 | | | | 0.2 | |
| 30,700 | | Robert Half International, Inc. | | | 1,938,705 | | | | 0.2 | |
| 22,400 | | Rockwell Automation, Inc. | | | 4,539,808 | | | | 0.4 | |
| 73,761 | | Rollins, Inc. | | | 2,445,915 | | | | 0.2 | |
| 3,100 | | Roper Technologies, Inc. | | | 1,098,113 | | | | 0.1 | |
| 60,024 | | Schneider National, Inc. | | | 1,309,724 | | | | 0.1 | |
| 71,100 (1) | | Sensata Technologies Holding PLC | | | 3,830,157 | | | | 0.3 | |
| 12,400 | | Snap-On, Inc. | | | 2,100,560 | | | | 0.2 | |
| 49,600 | | Textron, Inc. | | | 2,212,160 | | | | 0.2 | |
| 40,700 | | Toro Co. | | | 3,242,569 | | | | 0.3 | |
| 15,200 | | TransDigm Group, Inc. | | | 8,512,000 | | | | 0.7 | |
| 116,100 | | TransUnion | | | 9,939,321 | | | | 0.9 | |
| 41,741 (1) | | United Airlines Holdings, Inc. | | | 3,676,965 | | | | 0.3 | |
| 10,200 | | Valmont Industries, Inc. | | | 1,527,756 | | | | 0.1 | |
| 49,556 | | Verisk Analytics, Inc. | | | 7,400,693 | | | | 0.6 | |
| 42,520 | | Westinghouse Air Brake Technologies Corp. | | | 3,308,056 | | | | 0.3 | |
| 56,050 | | Waste Connections, Inc. | | | 5,088,779 | | | | 0.4 | |
| 12,700 (2) | | Watsco, Inc. | | | 2,287,905 | | | | 0.2 | |
| 24,300 | | Woodward, Inc. | | | 2,878,092 | | | | 0.2 | |
| 26,300 | | Xylem, Inc. | | | 2,072,177 | | | | 0.2 | |
| | | | | | 206,254,466 | | | | 17.8 | |
| | | | | | | | | | | |
| | | Information Technology: 32.0% | | | | | | | | |
| 97,500 | | Amphenol Corp. | | | 10,552,425 | | | | 0.9 | |
| 20,000 (1) | | Anaplan, Inc. | | | 1,048,000 | | | | 0.1 | |
| 9,600 (1) | | ANSYS, Inc. | | | 2,471,136 | | | | 0.2 | |
| 69,379 (1) | | Atlassian Corp. PLC | | | 8,349,069 | | | | 0.7 | |
| 22,300 (1) | | Autodesk, Inc. | | | 4,091,158 | | | | 0.4 | |
| 13,200 (1) | | Avalara, Inc. | | | 966,900 | | | | 0.1 | |
| 99,470 (1) | | Black Knight, Inc. | | | 6,413,826 | | | | 0.6 | |
| 94,664 | | Booz Allen Hamilton Holding Corp. | | | 6,733,450 | | | | 0.6 | |
| 95,800 (1) | | Cadence Design Systems, Inc. | | | 6,644,688 | | | | 0.6 | |
| 39,200 | | CDK Global, Inc. | | | 2,143,456 | | | | 0.2 | |
| 59,100 | | CDW Corp. | | | 8,441,844 | | | | 0.7 | |
| 62,303 (1),(2) | | Ceridian HCM Holding, Inc. | | | 4,229,128 | | | | 0.4 | |
| 40,000 | | Cognex Corp. | | | 2,241,600 | | | | 0.2 | |
| 15,720 (1),(2) | | Coherent, Inc. | | | 2,615,022 | | | | 0.2 | |
| 63,400 (1) | | CoreLogic, Inc. | | | 2,771,214 | | | | 0.2 | |
| 122,200 | | Corning, Inc. | | | 3,557,242 | | | | 0.3 | |
| 20,200 (1),(2) | | Coupa Software, Inc. | | | 2,954,250 | | | | 0.3 | |
| 19,597 (1),(2) | | Crowdstrike Holdings, Inc. | | | 977,302 | | | | 0.1 | |
| 22,973 (1),(2) | | Datadog, Inc. | | | 867,920 | | | | 0.1 | |
| 15,473 (1),(4) | | Datadog, Inc. - Lockup Shares | | | 578,724 | | | | 0.1 | |
| 67,053 (1) | | DocuSign, Inc. | | | 4,969,298 | | | | 0.4 | |
| 51,726 (1) | | Dropbox, Inc. | | | 926,413 | | | | 0.1 | |
| 69,237 (1) | | Dynatrace, Inc. | | | 1,751,696 | | | | 0.1 | |
| 119,600 | | Entegris, Inc. | | | 5,990,764 | | | | 0.5 | |
| 13,200 (1) | | EPAM Systems, Inc. | | | 2,800,512 | | | | 0.2 | |
| 31,600 (1) | | Euronet Worldwide, Inc. | | | 4,978,896 | | | | 0.4 | |
| 43,930 | | Fidelity National Information Services, Inc. | | | 6,110,224 | | | | 0.5 | |
| 109,500 (1) | | Fiserv, Inc. | | | 12,661,485 | | | | 1.1 | |
| 33,400 (1) | | FleetCor Technologies, Inc. | | | 9,609,848 | | | | 0.8 | |
| 17,200 | | Flir Systems, Inc. | | | 895,604 | | | | 0.1 | |
| 54,800 (1) | | Fortinet, Inc. | | | 5,850,448 | | | | 0.5 | |
| 45,100 (1) | | Gartner, Inc. | | | 6,949,910 | | | | 0.6 | |
| 48,500 | | Genpact Ltd. | | | 2,045,245 | | | | 0.2 | |
| 107,127 | | Global Payments, Inc. | | | 19,557,105 | | | | 1.7 | |
| 70,000 (1) | | GoDaddy, Inc. | | | 4,754,400 | | | | 0.4 | |
| 40,900 (1),(2) | | Guidewire Software, Inc. | | | 4,489,593 | | | | 0.4 | |
| 11,300 (1),(2) | | IPG Photonics Corp. | | | 1,637,596 | | | | 0.1 | |
| 69,850 (1) | | Keysight Technologies, Inc. | | | 7,168,705 | | | | 0.6 | |
| 58,500 | | KLA Corp. | | | 10,422,945 | | | | 0.9 | |
| 34,755 | | Lam Research Corp. | | | 10,162,362 | | | | 0.9 | |
| 55,700 | | Leidos Holdings, Inc. | | | 5,452,473 | | | | 0.5 | |
| 11,000 | | Littelfuse, Inc. | | | 2,104,300 | | | | 0.2 | |
| 255,948 | | Marvell Technology Group Ltd. | | | 6,797,979 | | | | 0.6 | |
| 153,600 | | Maxim Integrated Products | | | 9,447,936 | | | | 0.8 | |
| 107,700 (2) | | Microchip Technology, Inc. | | | 11,278,344 | | | | 1.0 | |
| 24,000 | | Monolithic Power Systems, Inc. | | | 4,272,480 | | | | 0.4 | |
| 47,700 | | Motorola Solutions, Inc. | | | 7,686,378 | | | | 0.7 | |
| 18,300 (1) | | New Relic, Inc. | | | 1,202,493 | | | | 0.1 | |
| 129,200 | | NortonLifeLock, Inc. | | | 3,297,184 | | | | 0.3 | |
| 27,900 (1) | | Okta, Inc. | | | 3,218,823 | | | | 0.3 | |
| 34,100 (1) | | Palo Alto Networks, Inc. | | | 7,885,625 | | | | 0.7 | |
| 32,100 | | Paychex, Inc. | | | 2,730,426 | | | | 0.2 | |
| 14,700 (1) | | Paycom Software, Inc. | | | 3,891,972 | | | | 0.3 | |
| 34,186 (1),(2) | | Pluralsight, Inc. | | | 588,341 | | | | 0.0 | |
| 34,700 (1) | | Proofpoint, Inc. | | | 3,982,866 | | | | 0.3 | |
| 171,369 (1) | | Pure Storage, Inc. - Class A | | | 2,932,124 | | | | 0.3 | |
| 81,867 (1) | | RealPage, Inc. | | | 4,400,351 | | | | 0.4 | |
| 110,200 | | Sabre Corp. | | | 2,472,888 | | | | 0.2 | |
| 20,800 (1) | | ServiceNow, Inc. | | | 5,872,256 | | | | 0.5 | |
| 12,400 (1) | | Shopify, Inc. | | | 4,929,992 | | | | 0.4 | |
| 79,200 | | Skyworks Solutions, Inc. | | | 9,573,696 | | | | 0.8 | |
| 58,160 (1),(2) | | Slack Technologies, Inc. | | | 1,307,437 | | | | 0.1 | |
| 66,500 (1) | | Splunk, Inc. | | | 9,959,705 | | | | 0.9 | |
| 107,635 | | SS&C Technologies Holdings, Inc. | | | 6,608,789 | | | | 0.6 | |
| 34,597 (1),(2) | | StoneCo Ltd. | | | 1,380,074 | | | | 0.1 | |
| 39,200 (1) | | Synopsys, Inc. | | | 5,456,640 | | | | 0.5 | |
| 44,800 (1),(2) | | Twilio, Inc. | | | 4,402,944 | | | | 0.4 | |
| 16,700 (1) | | Tyler Technologies, Inc. | | | 5,010,334 | | | | 0.4 | |
| 25,500 (1) | | VeriSign, Inc. | | | 4,913,340 | | | | 0.4 | |
| 24,399 (1) | | WEX, Inc. | | | 5,110,615 | | | | 0.4 | |
| 31,047 (1) | | Workday, Inc. | | | 5,105,679 | | | | 0.4 | |
| 79,700 | | Xilinx, Inc. | | | 7,792,269 | | | | 0.7 | |
| 10,800 (1) | | Zebra Technologies Corp. | | | 2,758,752 | | | | 0.2 | |
| 54,600 (1) | | Zendesk, Inc. | | | 4,183,998 | | | | 0.4 | |
| 2,760 (1),(2) | | Zoom Video Communications, Inc. | | | 187,790 | | | | 0.0 | |
| | | | | | 370,578,696 | | | | 32.0 | |
| | | | | | | | | | | |
| | | Materials: 3.6% | | | | | | | | |
| 36,500 | | Avery Dennison Corp. | | | 4,774,930 | | | | 0.4 | |
| 55,500 (1) | | Axalta Coating Systems Ltd. | | | 1,687,200 | | | | 0.1 | |
| 98,380 | | Ball Corp. | | | 6,362,234 | | | | 0.6 | |
| 25,100 | | Celanese Corp. - Series A | | | 3,090,312 | | | | 0.3 | |
See Accompanying Notes to Financial Statements
VY®T. Rowe Price Diversified
Mid Cap Growth Portfolio | |
| PORTFOLIO OF INVESTMENTS |
| as ofDecember 31, 2019(CONTINUED) |
| 42,800 | | CF Industries Holdings, Inc. | | | 2,043,272 | | | | 0.2 | |
| 18,500 (2) | | Eagle Materials, Inc. | | | 1,677,210 | | | | 0.1 | |
| 36,500 | | International Paper Co. | | | 1,680,825 | | | | 0.1 | |
| 43,900 (2) | | Kirkland Lake Gold Ltd. | | | 1,934,673 | | | | 0.2 | |
| 22,500 | | PPG Industries, Inc. | | | 3,003,525 | | | | 0.3 | |
| 58,300 | | RPM International, Inc. | | | 4,475,108 | | | | 0.4 | |
| 67,300 | | Sealed Air Corp. | | | 2,680,559 | | | | 0.2 | |
| 51,429 | | Valvoline, Inc. | | | 1,101,095 | | | | 0.1 | |
| 48,700 | | Vulcan Materials Co. | | | 7,012,313 | | | | 0.6 | |
| | | | | | 41,523,256 | | | | 3.6 | |
| | | | | | | | | | | |
| | | Real Estate: 1.7% | | | | | | | | |
| 26,995 | | American Campus Communities, Inc. | | | 1,269,575 | | | | 0.1 | |
| 38,900 | | CubeSmart | | | 1,224,572 | | | | 0.1 | |
| 6,300 | | Federal Realty Investment Trust | | | 810,999 | | | | 0.1 | |
| 48,400 (2) | | Iron Mountain, Inc. | | | 1,542,508 | | | | 0.1 | |
| 14,000 | | Jones Lang LaSalle, Inc. | | | 2,437,260 | | | | 0.2 | |
| 75,100 (2) | | MGM Growth Properties LLC | | | 2,325,847 | | | | 0.2 | |
| 32,250 | | SBA Communications Corp. | | | 7,771,927 | | | | 0.7 | |
| 12,700 | | SL Green Realty Corp. | | | 1,166,876 | | | | 0.1 | |
| 117,915 | | VEREIT, Inc. | | | 1,089,535 | | | | 0.1 | |
| 6,575 (1),(3),(4) | | WeWork Companies, Inc. - Class A | | | 92,576 | | | | 0.0 | |
| | | | | | 19,731,675 | | | | 1.7 | |
| | | | | | | | | | | |
| | | Utilities: 0.6% | | | | | | | | |
| 24,026 | | American Water Works Co., Inc. | | | 2,951,594 | | | | 0.2 | |
| 29,400 | | Atmos Energy Corp. | | | 3,288,684 | | | | 0.3 | |
| 50,200 | | NiSource, Inc. | | | 1,397,568 | | | | 0.1 | |
| | | | | | 7,637,846 | | | | 0.6 | |
| | | | | | | | | | | |
| | Total Common Stock | | | | | | | | |
| | (Cost $761,302,503) | | | 1,147,707,202 | | | | 99.0 | |
| | | | | | | | | | | |
| PREFERRED STOCK: 0.9% |
| | | Communication Services: 0.4% | | | | | | | | |
| 32,391 (1),(3),(4) | | AirBNB, Inc. - Series D | | | 3,854,529 | | | | 0.3 | |
| 3,719 (1),(3),(4) | | AirBNB, Inc. - Series E | | | 442,561 | | | | 0.1 | |
| | | | | | 4,297,090 | | | | 0.4 | |
| | | | | | | | | | | |
| | | Information Technology: 0.4% | | | | | | | | |
| 24,459 (1),(3),(4) | | Databricks, Inc., Series F | | | 1,050,475 | | | | 0.1 | |
| 353,970 (1),(3),(4) | | Tanium, Inc. - Series G | | | 3,009,241 | | | | 0.2 | |
| 23,311 (1),(3),(4) | | UiPath Inc., Series D-1 | | | 917,327 | | | | 0.1 | |
| 3,914 (1),(3),(4) | | UiPath Inc., Series D-2 | | | 154,023 | | | | 0.0 | |
| | | | | | 5,131,066 | | | | 0.4 | |
| | | | | | | | | | | |
| | | Real Estate: 0.1% | | | | | | | | |
| 44,396 (1),(3),(4) | | WeWork Companies, Inc. - Series D-1 | | | 625,096 | | | | 0.1 | |
| 34,882 (1),(3),(4) | | WeWork Companies, Inc. - Series D-2 | | | 491,138 | | | | 0.0 | |
| 24,709 (1),(3),(4) | | WeWork Companies, Inc. - Series E | | | 347,903 | | | | 0.0 | |
| | | | | | 1,464,137 | | | | 0.1 | |
| | | | | | | | | | | |
| | Total Preferred Stock | | | | | | | | |
| | (Cost $7,676,732) | | | 10,892,293 | | | | 0.9 | |
| | | | | | | | | | | |
| | Total Long-Term Investments | | | | | | | | |
| | (Cost $768,979,235) | | | 1,158,599,495 | | | | 99.9 | |
| | | | | | | | | | | |
Principal
Amount† | | | | | Value | | | | Percentage
of Net
Assets | |
| SHORT-TERM INVESTMENTS: 8.4% |
| | | Commercial Paper: 0.8% | | | | | | | | |
| 975,000 (5) | | Banco Santander S.A., 1.950%, 02/05/2020 | | | 973,247 | | | | 0.1 | |
| 950,000 (5) | | DBS Bank Ltd., 1.820%, 02/18/2020 | | | 947,688 | | | | 0.1 | |
| 700,000 (5) | | Flex Co. LLC, 1.910%, 01/31/2020 | | | 698,915 | | | | 0.0 | |
| 975,000 (5) | | Le Mouvement Des Caisses Desjardins, 1.860%, 02/14/2020 | | | 972,892 | | | | 0.1 | |
| 900,000 (5) | | LMA Americas LLC, 2.000%, 01/31/2020 | | | 898,529 | | | | 0.1 | |
| 725,000 (5) | | Mitsubishi UFJ Trust and Banking Corp., 1.920%, 01/31/2020 | | | 723,814 | | | | 0.0 | |
| 950,000 (5) | | Nederlandse Waterschapsbank, 1.870%, 02/12/2020 | | | 948,041 | | | | 0.1 | |
| 850,000 (5) | | Sheffield Receivables Company LLC, 2.000%, 03/16/2020 | | | 846,671 | | | | 0.1 | |
| 987,000 (5) | | Societe Generale, 1.970%, 01/09/2020 | | | 986,556 | | | | 0.1 | |
| 975,000 (5) | | Starbird Funding Corp., 1.910%, 02/20/2020 | | | 972,445 | | | | 0.1 | |
| 775,000 (5) | | United Overseas Bnk Group, 1.900%, 01/24/2020 | | | 774,165 | | | | 0.0 | |
| | | | | | | | | | | |
| | Total Commercial Paper | | | | | | | | |
| | (Cost $9,742,963) | | | 9,742,963 | | | | 0.8 | |
| | | | | | | | | | | |
| | | Floating Rate Notes: 1.4% | | | | | | | | |
| 950,000 (5) | | Australia & New Zealand Banking Group Ltd., 1.920%, 04/09/2020 | | | 950,275 | | | | 0.1 | |
| 950,000 (5) | | Bank of America Corp., 1.910%, 05/07/2020 | | | 950,000 | | | | 0.1 | |
| 900,000 (5) | | Bank of Nova Scotia, 1.940%, 05/08/2020 | | | 899,933 | | | | 0.1 | |
| 650,000 (5) | | Bedford Row Funding, 1.960%, 05/18/2020 | | | 650,110 | | | | 0.0 | |
| 990,000 (5) | | Commonwealth Bank of Australia, 1.940%, 06/10/2020 | | | 989,998 | | | | 0.1 | |
| 800,000 (5) | | Coöperatieve Rabobank U.A., 1.980%, 04/20/2020 | | | 800,224 | | | | 0.1 | |
| 625,000 (5) | | Crédit Industriel et Commercial, 1.990%, 04/24/2020 | | | 625,048 | | | | 0.0 | |
| 925,000 (5) | | Credit Suisse Group AG, 1.890%, 04/17/2020 | | | 925,414 | | | | 0.1 | |
| 1,000,000 (5) | | DNB ASA, 1.930%, 02/14/2020 | | | 1,000,143 | | | | 0.1 | |
| 975,000 (5) | | HSBC Bank PLC, 1.970%, 06/03/2020 | | | 974,997 | | | | 0.1 | |
| 250,000 (5) | | Mitsubishi UFJ Financial Group, Inc., 2.050%, 02/25/2020 | | | 250,086 | | | | 0.0 | |
| 925,000 (5) | | Mizuho Financial Group Inc., 1.960%, 05/05/2020 | | | 925,039 | | | | 0.1 | |
See Accompanying Notes to Financial Statements
VY®T. Rowe Price Diversified
Mid Cap Growth Portfolio | |
| PORTFOLIO OF INVESTMENTS |
| as ofDecember 31, 2019(CONTINUED) |
| 350,000 (5) | | National Australia Bank Ltd., 1.890%, 02/10/2020 | | | 350,008 | | | | 0.0 | |
| 875,000 (5) | | National Bank Of Canada, 1.990%, 05/01/2020 | | | 875,113 | | | | 0.1 | |
| 325,000 (5) | | Royal Bank Of Canada, 1.860%, 04/29/2020 | | | 325,020 | | | | 0.0 | |
| 975,000 (5) | | Skandinaviska Enskilda Banken AB, 1.950%, 05/11/2020 | | | 975,031 | | | | 0.1 | |
| 975,000 (5) | | The Norinchukin Bank, 2.050%, 04/24/2020 | | | 975,351 | | | | 0.1 | |
| 275,000 (5) | | The Sumitomo Mitsui Financial Group, 1.960%, 05/06/2020 | | | 274,979 | | | | 0.0 | |
| 675,000 (5) | | The Sumitomo Mitsui Financial Group, 2.010%, 05/01/2020 | | | 675,819 | | | | 0.1 | |
| 800,000 (5) | | Toronto-Dominion Bank, 2.000%, 04/30/2020 | | | 800,051 | | | | 0.1 | |
| 625,000 (5) | | Westpac Banking Corp, 1.830%, 02/10/2020 | | | 625,050 | | | | 0.0 | |
| 300,000 (5) | | Westpac Banking Corp, 1.970%, 06/03/2020 | | | 300,012 | | | | 0.0 | |
| | | | | | | | | | | |
| | Total Floating Rate Notes | | | | | | | | |
| | (Cost $16,117,701) | | | 16,117,701 | | | | 1.4 | |
| | | | | | | | | | | |
| | | Repurchase Agreements: 5.0% | | | | | | | | |
| 22,543,635 (5) | | Bank of Nova Scotia, Repurchase Agreement dated 12/31/19, 1.57%, due 01/02/20 (Repurchase Amount $22,545,574, collateralized by various U.S. Government Agency Obligations, 2.500%-6.500%, Market Value plus accrued interest $22,996,513, due 09/01/24-11/01/49) | | | 22,543,635 | | | | 2.0 | |
| 5,133,490 (5) | | Citadel Securities LLC, Repurchase Agreement dated 12/31/19, 1.60%, due 01/02/20 (Repurchase Amount $5,133,940, collateralized by various U.S. Government Securities, 0.000%-8.500%, Market Value plus accrued interest $5,236,625, due 01/15/20-11/15/48) | | | 5,133,490 | | | | 0.4 | |
| 22,543,635 (5) | | Citigroup, Inc., Repurchase Agreement dated 12/31/19, 1.57%, due 01/02/20 (Repurchase Amount $22,545,574, collateralized by various U.S. Government/U.S. Government Agency Obligations, 0.000%-9.000%, Market Value plus accrued interest $22,994,508, due 02/13/20-09/20/69) | | | 22,543,635 | | | | 2.0 | |
| 7,393,850 (5) | | State of Wisconsin Investment Board, Repurchase Agreement dated 12/31/19, 1.75%, due 01/02/20 (Repurchase Amount $7,394,559, collateralized by various U.S. Government Securities, 0.125%-3.875%, Market Value plus accrued interest $7,541,930, due 04/15/21-02/15/47) | | | 7,393,850 | | | | 0.6 | |
| | | | | | | | | | | |
| | Total Repurchase Agreements | | | | | | | | |
| | (Cost $57,614,610) | | | 57,614,610 | | | | 5.0 | |
| | | | | | | | | | | |
| | | Certificates of Deposit: 0.3% | | | | | | | | |
| 950,000 (5) | | Deutscher Sparkassen- und Giroverband, 1.860%, 02/13/2020 | | | 950,269 | | | | 0.1 | |
| 950,000 (5) | | Dz Bank Ag Deutsche Zentral-Genossenschaftsbank, 1.830%, 02/13/2020 | | | 949,923 | | | | 0.0 | |
| 950,000 (5) | | Landesbank Baden-Wurttemberg, 1.830%, 01/16/2020 | | | 950,033 | | | | 0.1 | |
| 950,000 (5) | | Sumitomo Mitsui Trust Holdings, Inc., 1.950%, 01/27/2020 | | | 950,138 | | | | 0.1 | |
| | | | | | | | | | | |
| | Total Certificates of Deposit | | | | | | | | |
| | (Cost $3,800,363) | | | 3,800,363 | | | | 0.3 | |
| | | | | | | | | | | |
| Shares | | | | | Value | | | | Percentage
of Net
Assets | |
| | | Mutual Funds: 0.9% | | | | | | | | |
| 2,140,000 (5),(6) | | BlackRock Liquidity Funds, FedFund, Institutional Class, 1.520% | | | 2,140,000 | | | | 0.2 | |
| 890,000 (5) | | Fidelity Investments Money Market Government Portfolio - Institutional Class, 1.520% | | | 890,000 | | | | 0.1 | |
| 2,722,000 (5),(6) | | Goldman Sachs Financial Square Government Fund - Institutional Shares, 1.500% | | | 2,722,000 | | | | 0.2 | |
| 3,794,000 (5),(6) | | Morgan Stanley Institutional Liquidity Funds - Government Portfolio (Institutional Share Class), 1.510% | | | 3,794,000 | | | | 0.3 | |
| 509,341 (6) | | T. Rowe Price Government Reserve Fund, 1.590% | | | 509,341 | | | | 0.1 | |
| | Total Mutual Funds | | | | | | | | |
| | (Cost $10,055,341) | | | 10,055,341 | | | | 0.9 | |
| | | | | | | | | | | |
| | Total Short-Term Investments | | | | | | | | |
| | (Cost $97,330,978) | | | 97,330,978 | | | | 8.4 | |
See Accompanying Notes to Financial Statements
VY®T. Rowe Price Diversified
Mid Cap Growth Portfolio | |
| PORTFOLIO OF INVESTMENTS |
| as ofDecember 31, 2019(CONTINUED) |
| | | | | | | | | | | |
| | Total Investments in Securities
(Cost $866,310,213) | | $ | 1,255,930,473 | | | | 108.3 | |
| | Liabilities in Excess of Other Assets | | | (96,743,789 | ) | | | (8.3 | ) |
| | Net Assets | | $ | 1,159,186,684 | | | | 100.0 | |
| † | Unless otherwise indicated, principal amount is shown in USD. |
| ADR | American Depositary Receipt |
| (1) | Non-income producing security. |
| (2) | Security, or a portion of the security, is on loan. |
| (3) | For fair value measurement disclosure purposes, security is categorized as Level 3, whose value was determined using significant unobservable inputs. |
| (4) | Restricted security as to resale, excluding Rule 144A securities. As of December 31, 2019, the Portfolio held restricted securities with a fair value of $14,704,393 or 1.3% of net assets. Please refer to the table below for additional details. |
| (5) | All or a portion of the security represents securities purchased with cash collateral received for securities on loan. |
| (6) | Rate shown is the 7-day yield as of December 31, 2019. |
See Accompanying Notes to Financial Statements
| VY®T. Rowe Price Growth Equity Portfolio | PORTFOLIO OF INVESTMENTS
as ofDecember 31, 2019 |
| Shares | | | | Value | | | Percentage
of Net
Assets | |
| COMMON STOCK: 97.9% | | | | | | | | |
| | | Communication Services: 18.7% | | | | | | | | |
| 39,440 (1) | | Alphabet, Inc. - Class A | | $ | 52,825,542 | | | | 3.2 | |
| 38,466 (1) | | Alphabet, Inc. - Class C | | | 51,429,811 | | | | 3.1 | |
| 465,916 (1) | | Facebook, Inc. - Class A | | | 95,629,259 | | | | 5.7 | |
| 45,447 (1) | | IAC/InterActiveCorp | | | 11,321,302 | | | | 0.7 | |
| 63,491 (1),(2) | | Match Group, Inc. | | | 5,213,246 | | | | 0.3 | |
| 110,344 (1) | | Netflix, Inc. | | | 35,704,008 | | | | 2.1 | |
| 51,366 (1) | | Spotify Technology SA | | | 7,681,785 | | | | 0.5 | |
| 567,600 | | Tencent Holdings Ltd. | | | 27,344,787 | | | | 1.6 | |
| 566,847 (1),(2) | | Tencent Music Entertainment Group ADR | | | 6,654,784 | | | | 0.4 | |
| 126,593 | | Walt Disney Co. | | | 18,309,146 | | | | 1.1 | |
| | | | | | 312,113,670 | | | | 18.7 | |
| | | | | | | | | | | |
| | | Consumer Discretionary: 18.9% | | | | | | | | |
| 231,876 (1) | | Alibaba Group Holding Ltd. ADR | | | 49,180,900 | | | | 2.9 | |
| 58,038 (1) | | Amazon.com, Inc. | | | 107,244,938 | | | | 6.4 | |
| 164,099 | | Aptiv PLC | | | 15,584,482 | | | | 0.9 | |
| 7,537 (1) | | Booking Holdings, Inc. | | | 15,478,963 | | | | 0.9 | |
| 38,604 | | Dollar General Corp. | | | 6,021,452 | | | | 0.4 | |
| 118,372 (1) | | Dollar Tree, Inc. | | | 11,132,887 | | | | 0.7 | |
| 365,044 | | Dollarama, Inc. | | | 12,546,235 | | | | 0.7 | |
| 89,212 (2) | | Ferrari NV | | | 14,768,155 | | | | 0.9 | |
| 155,974 | | Las Vegas Sands Corp. | | | 10,768,445 | | | | 0.6 | |
| 42,881 (1) | | Lululemon Athletica, Inc. | | | 9,934,241 | | | | 0.6 | |
| 7,597 (1) | | MercadoLibre, Inc. | | | 4,345,028 | | | | 0.3 | |
| 232,591 | | MGM Resorts International | | | 7,738,303 | | | | 0.5 | |
| 138,253 | | Nike, Inc. | | | 14,006,411 | | | | 0.8 | |
| 835 (1) | | NVR, Inc. | | | 3,180,022 | | | | 0.2 | |
| 53,149 | | Restaurant Brands International, Inc. | | | 3,389,312 | | | | 0.2 | |
| 23,200 (1),(2) | | Tesla, Inc. | | | 9,705,256 | | | | 0.6 | |
| 17,003 (1) | | Ulta Beauty, Inc. | | | 4,304,139 | | | | 0.3 | |
| 117,517 | | Wynn Resorts Ltd. | | | 16,319,586 | | | | 1.0 | |
| | | | | | 315,648,755 | | | | 18.9 | |
| | | | | | | | | | | |
| | | Consumer Staples: 0.5% | | | | | | | | |
| 105,914 | | Philip Morris International, Inc. | | | 9,012,222 | | | | 0.5 | |
| | | | | | | | | | | |
| | | Energy: 0.7% | | | | | | | | |
| 51,325 | | Concho Resources, Inc./Midland TX | | | 4,494,530 | | | | 0.3 | |
| 44,438 | | Pioneer Natural Resources Co. | | | 6,726,580 | | | | 0.4 | |
| | | | | | 11,221,110 | | | | 0.7 | |
| | | | | | | | | | | |
| | | Financials: 2.2% | | | | | | | | |
| 1,134,411 (1),(3),(4) | | Ant International Co., Limited- Class C | | | 7,294,263 | | | | 0.4 | |
| 69,022 | | Chubb Ltd. | | | 10,743,965 | | | | 0.7 | |
| 76,575 | | Intercontinental Exchange, Inc. | | | 7,087,016 | | | | 0.4 | |
| 185,742 | | TD Ameritrade Holding Corp. | | | 9,231,377 | | | | 0.6 | |
| 54,839 (1) | | XP, Inc. | | | 2,112,398 | | | | 0.1 | |
| | | | | | 36,469,019 | | | | 2.2 | |
| | | | | | | | | | | |
| | | Health Care: 12.2% | | | | | | | | |
| 139,441 (1) | | Alcon, Inc. | | | 7,898,163 | | | | 0.5 | |
| 46,690 (1) | | Alexion Pharmaceuticals, Inc. | | | 5,049,524 | | | | 0.3 | |
| 51,813 | | Anthem, Inc. | | | 15,649,080 | | | | 0.9 | |
| 74,635 | | Becton Dickinson & Co. | | | 20,298,481 | | | | 1.2 | |
| 252,424 (1) | | Centene Corp. | | | 15,869,897 | | | | 1.0 | |
| 69,991 | | Cigna Corp. | | | 14,312,460 | | | | 0.9 | |
| 97,316 | | HCA Healthcare, Inc. | | | 14,384,278 | | | | 0.9 | |
| 41,789 (1) | | Intuitive Surgical, Inc. | | | 24,703,567 | | | | 1.5 | |
| 120,221 | | Stryker Corp. | | | 25,239,197 | | | | 1.5 | |
| 103,378 | | UnitedHealth Group, Inc. | | | 30,391,064 | | | | 1.8 | |
| 109,491 (1) | | Vertex Pharmaceuticals, Inc. | | | 23,973,054 | | | | 1.4 | |
| 15,989 (1) | | WellCare Health Plans, Inc. | | | 5,279,728 | | | | 0.3 | |
| | | | | | 203,048,493 | | | | 12.2 | |
| | | | | | | | | | | |
| | | Industrials: 8.5% | | | | | | | | |
| 137,524 | | Boeing Co. | | | 44,799,818 | | | | 2.7 | |
| 50,306 | | Equifax, Inc. | | | 7,048,877 | | | | 0.4 | |
| 180,592 | | Fortive Corp. | | | 13,795,423 | | | | 0.8 | |
| 376,000 | | General Electric Co. | | | 4,196,160 | | | | 0.3 | |
| 20,394 | | Honeywell International, Inc. | | | 3,609,738 | | | | 0.2 | |
| 75,651 | | JB Hunt Transport Services, Inc. | | | 8,834,524 | | | | 0.5 | |
| 55,009 | | Roper Technologies, Inc. | | | 19,485,838 | | | | 1.2 | |
| 191,747 | | TransUnion | | | 16,415,461 | | | | 1.0 | |
| 58,257 (1) | | Uber Technologies, Inc. | | | 1,732,563 | | | | 0.1 | |
| 43,283 | | Union Pacific Corp. | | | 7,825,133 | | | | 0.5 | |
| 182,419 (2) | | Westinghouse Air Brake Technologies Corp. | | | 14,192,198 | | | | 0.8 | |
| | | | | | 141,935,733 | | | | 8.5 | |
| | | | | | | | | | | |
| | | Information Technology: 34.2% | | | | | | | | |
| 201,513 (1) | | Advanced Micro Devices, Inc. | | | 9,241,386 | | | | 0.6 | |
| 264,099 | | Apple, Inc. | | | 77,552,671 | | | | 4.6 | |
| 60,440 (2) | | ASML Holding NV-NY REG | | | 17,886,614 | | | | 1.1 | |
| 32,139 (1) | | Atlassian Corp. PLC | | | 3,867,607 | | | | 0.2 | |
| 244,315 | | Fidelity National Information Services, Inc. | | | 33,981,773 | | | | 2.0 | |
| 185,204 (1) | | Fiserv, Inc. | | | 21,415,138 | | | | 1.3 | |
| 80,532 | | Global Payments, Inc. | | | 14,701,922 | | | | 0.9 | |
| 143,008 | | Hexagon AB - B Shares | | | 8,015,786 | | | | 0.5 | |
| 85,658 | | Intuit, Inc. | | | 22,436,400 | | | | 1.3 | |
| 528,551 | | Marvell Technology Group Ltd. | | | 14,038,315 | | | | 0.8 | |
| 190,687 | | Mastercard, Inc. - Class A | | | 56,937,231 | | | | 3.4 | |
| 641,783 | | Microsoft Corp. | | | 101,209,179 | | | | 6.1 | |
| 22,746 (1) | | Paycom Software, Inc. | | | 6,022,231 | | | | 0.4 | |
| 139,463 (1) | | PayPal Holdings, Inc. | | | 15,085,713 | | | | 0.9 | |
| 179,743 (1) | | Salesforce.com, Inc. | | | 29,233,402 | | | | 1.8 | |
| 68,839 (1) | | ServiceNow, Inc. | | | 19,434,626 | | | | 1.2 | |
| 261,716 (1),(2) | | Slack Technologies, Inc. | | | 5,883,376 | | | | 0.3 | |
| 120,638 (1) | | Splunk, Inc. | | | 18,067,953 | | | | 1.1 | |
| 51,440 (1),(3),(4) | | Stripe, Inc. - Class B | | | 807,094 | | | | 0.0 | |
| 55,891 | | Temenos AG | | | 8,841,360 | | | | 0.5 | |
| 338,067 | | Visa, Inc. - Class A | | | 63,522,789 | | | | 3.8 | |
| 85,873 (1),(2) | | VMware, Inc. | | | 13,034,663 | | | | 0.8 | |
| 57,044 (1) | | Workday, Inc. | | | 9,380,886 | | | | 0.6 | |
| 2,045 (1),(2) | | Zoom Video Communications, Inc. | | | 139,142 | | | | 0.0 | |
| | | | | | 570,737,257 | | | | 34.2 | |
See Accompanying Notes to Financial Statements
| VY®T. Rowe Price Growth Equity Portfolio | PORTFOLIO OF INVESTMENTS
as ofDecember 31, 2019(continued) |
| | | Materials: 0.6% | | | | | | | | |
| 43,952 | | Linde Public Ltd. | | | 9,357,381 | | | | 0.6 | |
| | | | | | | | | | | |
| | | Utilities: 1.4% | | | | | | | | |
| 42,121 | | NextEra Energy, Inc. | | | 10,200,022 | | | | 0.6 | |
| 89,338 | | Sempra Energy | | | 13,532,920 | | | | 0.8 | |
| | | | | | 23,732,942 | | | | 1.4 | |
| | | | | | | | | | | |
| | Total Common Stock | | | | | | | | |
| | (Cost $1,172,614,947) | | | 1,633,276,582 | | | | 97.9 | |
| | | | | | | | | | | |
| PREFERRED STOCK: 1.9% |
| | | Communication Services: 0.8% | | | | | | | | |
| 59,241 (1),(3),(4) | | AirBNB, Inc. - Series D | | | 7,049,679 | | | | 0.5 | |
| 16,058 (1),(3),(4) | | AirBNB, Inc. - Series E | | | 1,910,902 | | | | 0.1 | |
| 68,026 (1),(3),(4) | | Xiaoju Kuaizhi, Inc., Series A-17 (DiDi Chuxing, Inc.) | | | 3,464,707 | | | | 0.2 | |
| | | | | | 12,425,288 | | | | 0.8 | |
| | | | | | | | | | | |
| | | Consumer Discretionary: 0.5% | | | | | | | | |
| 163,010 (1),(3),(4) | | Aurora Innovation, Inc., - Series B | | | 1,506,261 | | | | 0.1 | |
| 8,132 (1),(3),(4) | | DoorDash, Inc. - Series G | | | 1,542,617 | | | | 0.1 | |
| 549,762 (1),(3),(4) | | Rivian Automotive, Inc. - Series D | | | 5,906,643 | | | | 0.3 | |
| | | | | | 8,955,521 | | | | 0.5 | |
| | | | | | | | | | | |
| | | Industrials: 0.2% | | | | | | | | |
| 159,700 (1),(3),(4) | | GM Cruise Holdings, LLC - Class F | | | 2,914,525 | | | | 0.2 | |
| | | | | | | | | | | |
| | | Information Technology: 0.4% | | | | | | | | |
| 93,459 (1),(3),(4) | | Magic Leap, Inc. - Series C | | | 2,271,053 | | | | 0.2 | |
| 61,969 (1),(3),(4) | | Magic Leap, Inc. - Series D | | | 1,505,847 | | | | 0.1 | |
| 57,073 (1),(3),(4) | | UiPath Inc., Series D-1 | | | 2,245,920 | | | | 0.1 | |
| 9,584 (1),(3),(4) | | UiPath Inc., Series D-2 | | | 377,147 | | | | 0.0 | |
| | | | | | 6,399,967 | | | | 0.4 | |
| | | | | | | | | | | |
| | | Real Estate: 0.0% | | | | | | | | |
| 42,822 (1),(3),(4) | | WeWork Companies, Inc. - Series E | | | 602,934 | | | | 0.0 | |
| | | | | | | | | | | |
| | Total Preferred Stock | | | | | | | | |
| | (Cost $25,499,799) | | | 31,298,235 | | | | 1.9 | |
| | | | | | | | | | | |
| | Total Long-Term Investments | | | | | | | | |
| | (Cost $1,198,114,746) | | | 1,664,574,817 | | | | 99.8 | |
| | | | | | | | | | | |
Principal
Amount† | | | | | Value | | | | Percentage
of Net
Assets | |
| SHORT-TERM INVESTMENTS: 4.2% |
| | | Commercial Paper: 0.4% | | | | | | | | |
| 425,000 (5) | | Banco Santander S.A., 1.950%, 02/05/2020 | | | 424,236 | | | | 0.0 | |
| 300,000 (5) | | Banco Santander S.A., 1.950%, 02/06/2020 | | | 299,445 | | | | 0.0 | |
| 975,000 (5) | | DBS Bank Ltd., 1.820%, 02/18/2020 | | | 972,627 | | | | 0.1 | |
| 350,000 (5) | | Le Mouvement Des Caisses Desjardins, 1.850%, 02/10/2020 | | | 349,314 | | | | 0.0 | |
| 450,000 (5) | | Le Mouvement Des Caisses Desjardins, 1.860%, 02/14/2020 | | | 449,027 | | | | 0.0 | |
| 900,000 (5) | | LMA Americas LLC, 1.810%, 01/23/2020 | | | 898,832 | | | | 0.1 | |
| 625,000 (5) | | Matchpoint Finance PLC, 1.850%, 02/03/2020 | | | 623,941 | | | | 0.1 | |
| 650,000 (5) | | Mitsubishi UFJ Trust and Banking Corp., 1.910%, 02/04/2020 | | | 648,799 | | | | 0.1 | |
| 400,000 (5) | | Nederlandse Waterschapsbank, 1.870%, 02/12/2020 | | | 399,175 | | | | 0.0 | |
| 250,000 (5) | | Sheffield Receivables Company LLC, 1.950%, 02/27/2020 | | | 249,257 | | | | 0.0 | |
| 500,000 (5) | | Sheffield Receivables Company LLC, 2.000%, 03/16/2020 | | | 498,042 | | | | 0.0 | |
| | | | | | | | | | | |
| | Total Commercial Paper | | | | | | | | |
| | (Cost $5,812,695) | | | 5,812,695 | | | | 0.4 | |
| | | | | | | | | | | |
| | | Floating Rate Notes: 0.7% | | | | | | | | |
| 775,000 (5) | | Australia & New Zealand Banking Group Ltd., 1.920%, 04/09/2020 | | | 775,224 | | | | 0.1 | |
| 750,000 (5) | | Bank of America Corp., 1.910%, 05/07/2020 | | | 750,000 | | | | 0.1 | |
| 900,000 (5) | | Bank of Nova Scotia, 1.940%, 05/08/2020 | | | 899,933 | | | | 0.1 | |
| 425,000 (5) | | Commonwealth Bank of Australia, 1.920%, 01/24/2020 | | | 425,054 | | | | 0.0 | |
| 550,000 (5) | | Commonwealth Bank of Australia, 1.940%, 06/10/2020 | | | 549,999 | | | | 0.0 | |
| 300,000 (5) | | Coöperatieve Rabobank U.A., 1.980%, 04/20/2020 | | | 300,084 | | | | 0.0 | |
| 625,000 (5) | | Crédit Industriel et Commercial, 1.990%, 04/24/2020 | | | 625,048 | | | | 0.1 | |
| 600,000 (5) | | Credit Suisse Group AG, 1.720%, 01/16/2020 | | | 600,044 | | | | 0.0 | |
| 375,000 (5) | | Credit Suisse Group AG, 1.750%, 01/30/2020 | | | 375,040 | | | | 0.0 | |
| 300,000 (5) | | Lloyds Bank PLC, 1.880%, 01/15/2020 | | | 300,029 | | | | 0.0 | |
| 300,000 (5) | | Mitsubishi UFJ Financial Group, Inc., 2.070%, 02/28/2020 | | | 300,120 | | | | 0.0 | |
| 250,000 (5) | | Mizuho Financial Group Inc., 1.960%, 05/05/2020 | | | 250,010 | | | | 0.0 | |
| 600,000 (5) | | Mizuho Financial Group Inc., 2.020%, 05/26/2020 | | | 600,052 | | | | 0.1 | |
| 350,000 (5) | | National Australia Bank Ltd., 1.890%, 02/10/2020 | | | 350,008 | | | | 0.0 | |
| 575,000 (5) | | National Bank Of Canada, 1.990%, 05/01/2020 | | | 575,074 | | | | 0.0 | |
| 550,000 (5) | | Natixis S.A., 2.030%, 01/24/2020 | | | 550,033 | | | | 0.0 | |
| 875,000 (5) | | Skandinaviska Enskilda Banken AB, 1.950%, 05/11/2020 | | | 875,028 | | | | 0.1 | |
| 650,000 (5) | | Sumitomo Mitsui Trust Holdings, Inc., 1.980%, 05/07/2020 | | | 649,992 | | | | 0.1 | |
See Accompanying Notes to Financial Statements
| VY®T. Rowe Price Growth Equity Portfolio | PORTFOLIO OF INVESTMENTS
as ofDecember 31, 2019(continued) |
| 575,000 (5) | | The Norinchukin Bank, 2.050%, 04/24/2020 | | | 575,207 | | | | 0.0 | |
| 450,000 (5) | | The Sumitomo Mitsui Financial Group, 1.840%, 01/10/2020 | | | 450,033 | | | | 0.0 | |
| 500,000 (5) | | The Sumitomo Mitsui Financial Group, 1.960%, 05/06/2020 | | | 499,961 | | | | 0.0 | |
| 575,000 (5) | | Westpac Banking Corp, 1.830%, 02/10/2020 | | | 575,046 | | | | 0.0 | |
| | | | | | | | | | | |
| | Total Floating Rate Notes | | | | | | | | |
| | (Cost $11,851,019) | | | 11,851,019 | | | | 0.7 | |
| | | | | | | | | | | |
| | | Repurchase Agreements: 2.2% | | | | | | | | |
| 14,973,682 (5) | | Bank of Nova Scotia, Repurchase Agreement dated 12/31/19, 1.57%, due 01/02/20 (Repurchase Amount $14,974,970, collateralized by various U.S. Government Agency Obligations, 2.500%-6.500%, Market Value plus accrued interest $15,274,488, due 09/01/24-11/01/49) | | | 14,973,682 | | | | 0.9 | |
| 2,645,054 (5) | | Citadel Securities LLC, Repurchase Agreement dated 12/31/19, 1.60%, due 01/02/20 (Repurchase Amount $2,645,286, collateralized by various U.S. Government Securities, 0.000%-8.500%, Market Value plus accrued interest $2,698,195, due 01/15/20-11/15/48) | | | 2,645,054 | | | | 0.1 | |
| 14,973,682 (5) | | Citigroup, Inc., Repurchase Agreement dated 12/31/19, 1.57%, due 01/02/20 (Repurchase Amount $14,974,970, collateralized by various U.S. Government/U.S. Government Agency Obligations, 0.000%-9.000%, Market Value plus accrued interest $15,273,156, due 02/13/20-09/20/69) | | | 14,973,682 | | | | 0.9 | |
| 4,796,180 (5) | | State of Wisconsin Investment Board, Repurchase Agreement dated 12/31/19, 1.75%, due 01/02/20 (Repurchase Amount $4,796,640, collateralized by various U.S. Government Securities, 0.125%-3.875%, Market Value plus accrued interest $4,892,235, due 04/15/21-02/15/47) | | | 4,796,180 | | | | 0.3 | |
| | | | | | | | | | | |
| | Total Repurchase Agreements | | | | | | | | |
| | (Cost $37,388,598) | | | 37,388,598 | | | | 2.2 | |
| | | | | | | | | | | |
| | | Certificates of Deposit: 0.2% | | | | | | | | |
| 650,000 (5) | | Deutscher Sparkassen- und Giroverband, 1.860%, 02/13/2020 | | | 650,184 | | | | 0.0 | |
| 825,000 (5) | | Dz Bank Ag Deutsche Zentral-Genossenschaftsbank, 1.830%, 02/13/2020 | | | 824,933 | | | | 0.0 | |
| 850,000 (5) | | Landesbank Baden-Wurttemberg, 1.830%, 01/16/2020 | | | 850,030 | | | | 0.1 | |
| 325,000 (5) | | The Norinchukin Bank, 1.870%, 03/05/2020 | | | 325,011 | | | | 0.0 | |
| 900,000 (5) | | Toronto-Dominion Bank, 1.850%, 03/18/2020 | | | 900,136 | | | | 0.1 | |
| | | | | | | | | | | |
| | Total Certificates of Deposit | | | | | | | | |
| | (Cost $3,550,294) | | | 3,550,294 | | | | 0.2 | |
| | | | | | | | | | | |
| Shares | | | | | Value | | | | Percentage
of Net
Assets | |
| | | Mutual Funds: 0.7% | | | | | | | | |
| 530,000 (5) | | Fidelity Investments Money Market Government Portfolio - Institutional Class, 1.520% | | | 530,000 | | | | 0.1 | |
| 1,773,000 (5),(6) | | Goldman Sachs Financial Square Government Fund - Institutional Shares, 1.500% | | | 1,773,000 | | | | 0.1 | |
| 1,630,000 (5),(6) | | Invesco Short-Term Investments Trust Government & Agency Portfolio - Institutional Class, 1.510% | | | 1,630,000 | | | | 0.1 | |
| 1,773,000 (5),(6) | | Morgan Stanley Institutional Liquidity Funds - Government Portfolio (Institutional Share Class), 1.510% | | | 1,773,000 | | | | 0.1 | |
| 5,320,233 (6) | | T. Rowe Price Government Reserve Fund, 1.590% | | | 5,320,233 | | | | 0.3 | |
| | | | | | | | | | | |
| | Total Mutual Funds | | | | | | | | |
| | (Cost $11,026,233) | | | 11,026,233 | | | | 0.7 | |
| | | | | | | | | | | |
| | Total Short-Term Investments | | | | | | | | |
| | (Cost $69,628,839) | | | 69,628,839 | | | | 4.2 | |
| | | | | | | | | | | |
| | Total Investments in Securities
(Cost $1,267,743,585) | | $ | 1,734,203,656 | | | | 104.0 | |
| | Liabilities in Excess of Other Assets | | | (66,854,680 | ) | | | (4.0 | ) |
| | Net Assets | | $ | 1,667,348,976 | | | | 100.0 | |
| † | Unless otherwise indicated, principal amount is shown in USD. |
| ADR | American Depositary Receipt |
| (1) | Non-income producing security. |
| (2) | Security, or a portion of the security, is on loan. |
| (3) | For fair value measurement disclosure purposes, security is categorized as Level 3, whose value was determined using significant unobservable inputs. |
| (4) | Restricted security as to resale, excluding Rule 144A securities. As of December 31, 2019, the Portfolio held restricted securities with a fair value of $39,399,592 or 2.4% of net assets. Please refer to the table below for additional details. |
| (5) | All or a portion of the security represents securities purchased with cash collateral received for securities on loan. |
| (6) | Rate shown is the 7-day yield as of December 31, 2019. |
See Accompanying Notes to Financial Statements
Item 7. Disclosure of Proxy Voting Policies and Procedures for Closed-End Management Investment Companies.
Not applicable.
Item 8. Portfolio Managers of Closed-End Management Investment Companies.
Not applicable.
Item 9. Purchases of Equity Securities by Closed-End Management Investment Company and Affiliated Purchasers.
Not applicable.
Item 10. Submission of Matters to a Vote of Security Holders.
Not applicable.
Item 11. Controls and Procedures.
| (a) | Based on our evaluation conducted within 90 days of the filing date, hereof, the design and operation of the registrant’s disclosure controls and procedures are effective to ensure that material information relating to the registrant is made known to the certifying officers by others within the appropriate entities, particularly during the period in which Forms N-CSR are being prepared, and the registrant’s disclosure controls and procedures allow timely preparation and review of the information for the registrant’s Form N-CSR and the officer certifications of such Form N-CSR. |
| (b) | There were no significant changes in the registrant’s internal controls that occurred during the second fiscal quarter of the period covered by this report that has materially affected, or is reasonably likely to materially affect, the registrant’s internal control over financial reporting. |
Item 12. Disclosure of Securities Lending Activities for Closed-End Management Investment Companies.
Not applicable.
Item 13. Exhibits.
| (a)(1) | The Code of Ethics pursuant to Item 2 of Form N-CSR is filed and attached hereto as EX-99.CODE ETH. |
| (a)(3) | A separate certification for each principal executive officer and principal financial officer of the registrant as required by Rule 30a-2(a)underthe Act (17 CFR 270.30a-2(a)) is attached hereto as EX-99.CERT. |
| (b) | The officer certifications required by Section 906 of the Sarbanes-Oxley Act of 2002 are attached hereto as EX-99.906CERT. |
SIGNATURES
Pursuant to the requirements of the Securities Exchange Act of 1934 and the Investment Company Act of 1940, the registrant has duly caused this report to be signed on its behalf by the undersigned, thereunto duly authorized.
(Registrant): Voya Partners, Inc.
| By | /s/ Michael Bell | |
| | Michael Bell | |
| | Chief Executive Officer | |
Date: March 9, 2020
Pursuant to the requirements of the Securities Exchange Act of 1934 and the Investment Company Act of 1940, this report has been signed below by the following persons on behalf of the registrant and in the capacities and on the dates indicated.
| By | /s/ Michael Bell | |
| | Michael Bell | |
| | Chief Executive Officer | |
Date: March 9, 2020
| By | /s/ Todd Modic | |
| | Todd Modic | |
| | Senior Vice President and Chief Financial Officer | |
Date: March 9, 2020
![[MISSING IMAGE: ing_cov.jpg]](https://capedge.com/proxy/N-CSR/0001104659-20-030730/ing_cov.jpg)
![[MISSING IMAGE: voya_covinvmgt.jpg]](https://capedge.com/proxy/N-CSR/0001104659-20-030730/voya_covinvmgt.jpg)
![[MISSING IMAGE: ph_dina-santoro.jpg]](https://capedge.com/proxy/N-CSR/0001104659-20-030730/ph_dina-santoro.jpg)
![[MISSING IMAGE: tv536348_lc-aggressive.jpg]](https://capedge.com/proxy/N-CSR/0001104659-20-030730/tv536348_lc-aggressive.jpg)
![[MISSING IMAGE: tv536348_lc-balance.jpg]](https://capedge.com/proxy/N-CSR/0001104659-20-030730/tv536348_lc-balance.jpg)
![[MISSING IMAGE: tv536348_lc-conservative.jpg]](https://capedge.com/proxy/N-CSR/0001104659-20-030730/tv536348_lc-conservative.jpg)
![[MISSING IMAGE: tv536348_lc-income.jpg]](https://capedge.com/proxy/N-CSR/0001104659-20-030730/tv536348_lc-income.jpg)
![[MISSING IMAGE: tv536348_lc-moderate.jpg]](https://capedge.com/proxy/N-CSR/0001104659-20-030730/tv536348_lc-moderate.jpg)
![[MISSING IMAGE: tv536348_lc-moderatecon.jpg]](https://capedge.com/proxy/N-CSR/0001104659-20-030730/tv536348_lc-moderatecon.jpg)
![[MISSING IMAGE: tv536348_lc-index2020.jpg]](https://capedge.com/proxy/N-CSR/0001104659-20-030730/tv536348_lc-index2020.jpg)
![[MISSING IMAGE: tv536348_lc-index2025.jpg]](https://capedge.com/proxy/N-CSR/0001104659-20-030730/tv536348_lc-index2025.jpg)
![[MISSING IMAGE: tv536348_lc-index2030.jpg]](https://capedge.com/proxy/N-CSR/0001104659-20-030730/tv536348_lc-index2030.jpg)
![[MISSING IMAGE: tv536348_lc-index2035.jpg]](https://capedge.com/proxy/N-CSR/0001104659-20-030730/tv536348_lc-index2035.jpg)
![[MISSING IMAGE: tv536348_lc-index2040.jpg]](https://capedge.com/proxy/N-CSR/0001104659-20-030730/tv536348_lc-index2040.jpg)
![[MISSING IMAGE: tv536348_lc-index2045.jpg]](https://capedge.com/proxy/N-CSR/0001104659-20-030730/tv536348_lc-index2045.jpg)
![[MISSING IMAGE: tv536348_lc-index2050.jpg]](https://capedge.com/proxy/N-CSR/0001104659-20-030730/tv536348_lc-index2050.jpg)
![[MISSING IMAGE: tv536348_lc-index2055.jpg]](https://capedge.com/proxy/N-CSR/0001104659-20-030730/tv536348_lc-index2055.jpg)
![[MISSING IMAGE: tv536348_lc-index2060.jpg]](https://capedge.com/proxy/N-CSR/0001104659-20-030730/tv536348_lc-index2060.jpg)
![[MISSING IMAGE: tv536349_lc-solutionincome.jpg]](https://capedge.com/proxy/N-CSR/0001104659-20-030730/tv536349_lc-solutionincome.jpg)
![[MISSING IMAGE: tv536349_lc-index2020.jpg]](https://capedge.com/proxy/N-CSR/0001104659-20-030730/tv536349_lc-index2020.jpg)
![[MISSING IMAGE: tv536349_lc-index2025.jpg]](https://capedge.com/proxy/N-CSR/0001104659-20-030730/tv536349_lc-index2025.jpg)
![[MISSING IMAGE: tv536349_lc-index2030.jpg]](https://capedge.com/proxy/N-CSR/0001104659-20-030730/tv536349_lc-index2030.jpg)
![[MISSING IMAGE: tv536349_lc-index2035.jpg]](https://capedge.com/proxy/N-CSR/0001104659-20-030730/tv536349_lc-index2035.jpg)
![[MISSING IMAGE: tv536349_lc-index2040.jpg]](https://capedge.com/proxy/N-CSR/0001104659-20-030730/tv536349_lc-index2040.jpg)
![[MISSING IMAGE: tv536349_lc-index2045.jpg]](https://capedge.com/proxy/N-CSR/0001104659-20-030730/tv536349_lc-index2045.jpg)
![[MISSING IMAGE: tv536349_lc-index2050.jpg]](https://capedge.com/proxy/N-CSR/0001104659-20-030730/tv536349_lc-index2050.jpg)
![[MISSING IMAGE: tv536349_lc-index2055.jpg]](https://capedge.com/proxy/N-CSR/0001104659-20-030730/tv536349_lc-index2055.jpg)
![[MISSING IMAGE: tv536349_lc-index2060.jpg]](https://capedge.com/proxy/N-CSR/0001104659-20-030730/tv536349_lc-index2060.jpg)