UNITED STATES
SECURITIES AND EXCHANGE COMMISSION
Washington, D.C. 20549
Form N-CSR
CERTIFIED SHAREHOLDER REPORT OF
REGISTERED MANAGEMENT INVESTMENT COMPANIES
Investment Company Act file number: 811-08319
Voya Partners, Inc.
(Exact name of registrant as specified in charter)
| 7337 East Doubletree Ranch Road, Suite 100, Scottsdale, AZ | 85258 |
| (Address of principal executive offices) | (Zip code) |
The Corporation Trust Company, 1209 Orange Street, Wilmington, DE 19801
(Name and address of agent for service)
Registrant’s telephone number, including area code: 1-800-262-3862
Date of fiscal year end: December 31
Date of reporting period: December 31, 2017
Item 1. Reports to Stockholders.
The following is a copy of the report transmitted to stockholders pursuant to Rule 30e-1 under the Act (17 CFR 270.30e-1):


Voya Investment Management
Annual Report
December 31, 2017
Classes ADV, I, R6, S and S2
Voya Partners, Inc.
n Voya Global Bond Portfolio
n VY® American Century Small-Mid Cap Value Portfolio
n VY® Baron Growth Portfolio
n VY® Columbia Contrarian Core Portfolio
n VY® Columbia Small Cap Value II Portfolio
n VY® Invesco Comstock Portfolio
n VY® Invesco Equity and Income Portfolio
n VY® JPMorgan Mid Cap Value Portfolio
n VY® Oppenheimer Global Portfolio
n VY® Pioneer High Yield Portfolio
n VY® T. Rowe Price Diversified Mid Cap Growth Portfolio
n VY® T. Rowe Price Growth Equity Portfolio
n VY® Templeton Foreign Equity Portfolio
This report is submitted for general information to shareholders of the Voya mutual funds. It is not authorized for distribution to prospective shareholders unless accompanied or preceded by a prospectus which includes details regarding the funds' investment objectives, risks, charges, expenses and other information. This information should be read carefully.
INVESTMENT MANAGEMENT
voyainvestments.com

President's Letter | | | 2 | | |
Market Perspective | | | 3 | | |
Portfolio Managers' Reports | | | 6 | | |
Shareholder Expense Examples | | | 32 | | |
Report of Independent Registered Public Accounting Firm | | | 35 | | |
Statements of Assets and Liabilities | | | 36 | | |
Statements of Operations | | | 44 | | |
Statements of Changes in Net Assets | | | 48 | | |
Financial Highlights | | | 55 | | |
Notes to Financial Statements | | | 61 | | |
Summary Portfolios of Investments ("Portfolio of Investments") | | | 85 | | |
Tax Information | | | 162 | | |
Director and Officer Information | | | 164 | | |
Advisory and Sub-Advisory Contract Approval Discussion | | | 168 | | |
PROXY VOTING INFORMATION
A description of the policies and procedures that the Portfolios use to determine how to vote proxies related to portfolio securities is available: (1) without charge, upon request, by calling Shareholder Services toll-free at (800) 992-0180; (2) on the Portfolios' website at www.voyainvestments.com; and (3) on the U.S. Securities and Exchange Commission's ("SEC's") website at www.sec.gov. Information regarding how the Portfolios voted proxies related to portfolio securities during the most recent 12-month period ended June 30 is available without charge on the Portfolios' website at www.voyainvestments.com and on the SEC's website at www.sec.gov.
QUARTERLY PORTFOLIO HOLDINGS
The Portfolios file their complete schedule of portfolio holdings with the SEC for the first and third quarters of each fiscal year on Form N-Q. This report contains a summary portfolio of investments for the Portfolios. The Portfolios' Forms N-Q are available on the SEC's website at www.sec.gov. The Portfolios' Forms N-Q may be reviewed and copied at the SEC's Public Reference Room in Washington, D.C., and information on the operation of the Public Reference Room may be obtained by calling (800) SEC-0330. The Portfolios' Forms N-Q, as well as a complete portfolio of investments, are available without charge upon request from the Portfolios by calling Shareholder Services toll-free at (800) 992-0180.

After a Strong Year, Positive Expectations
Dear Shareholder,
The U.S. equity market proved resilient throughout 2017, posting a "perfect pitch" year with not one single month of negative returns. A lot of chatter in the markets has focused on the low levels of volatility that prevailed in 2017, and whether 2018 will be the year that volatility returns (witness early February markets). As usual there are also any number of geopolitical or other risks that could cause a sell-off, but we are heartened by the reality of macroeconomic fundamentals, which include strong and synchronous global growth; we believe these would likely be a governor on a rise in volatility.
We believe the United States, Europe and China will continue to dominate the world economy in 2018. Combined, the three account for about $48 trillion of GDP, more than 60% of the $79 trillion global GDP produced each year. And the rest of the world still has its own positive backdrop: The International Monetary Fund projects that 185 of 190 national economies will grow in 2018.
While economic growth may be synchronous across the globe, it is not likely to be uniform — thus, broad global diversification across continents and asset classes remains important for positioning your portfolio to benefit from potential opportunities. Regardless of where individual markets are in their business cycles, we believe investors are best served by following their asset allocation plan and avoiding the temptation to time entry or exit points.
If your goals have changed, thoroughly discuss them with your investment advisor before making any changes to your investment strategy. We seek to remain a reliable partner committed to reliable investing, helping you and your investment advisor achieve your goals. We appreciate your continued confidence in us, and we look forward to serving your investment needs in the future.
Sincerely,

Shaun Mathews
President and Chief Executive Officer
Voya Family of Funds
January 19, 2018
The views expressed in the President's Letter reflect those of the President as of the date of the letter. Any such views are subject to change at any time based upon market or other conditions and the Voya mutual funds disclaim any responsibility to update such views. These views may not be relied on as investment advice and because investment decisions for a Voya mutual fund are based on numerous factors, may not be relied on as an indication of investment intent on behalf of any Voya mutual fund. Reference to specific company securities should not be construed as recommendations or investment advice.
International investing poses special risks including currency fluctuation, economic and political risks not found in investments that are solely domestic.
2
MARKET PERSPECTIVE: YEAR ENDED DECEMBER 31, 2017
In our semi-annual report we described how global equities, in the form of the MSCI World IndexSM (the "Index"), measured in local currencies, including net reinvested dividends, rose 8.25%, carried higher in what seemed to be the path of least resistance. Investor sentiment was still trying to come to terms with the unexpected result of the U.S. presidential election. For this and perhaps more importantly, other reasons, the Index continued its advance, rising in every month, to end up 18.48% for the fiscal year. (The Index returned 22.40% for the year ended December 31, 2017, measured in U.S. dollars.)
By mid-year most commentators had largely discounted a reflation trade driven by U.S. legislative initiatives. But this did not mean that such initiatives were dead; just that the credibility of anything market friendly coming out of them had fallen very low. The President had said on February 9 that he would announce his pro-growth tax reform plan in the coming weeks. Nothing solid had emerged and by early July the Senate was still pre-occupied with the Affordable Care Act ("ACA"), desperately trying to pass any version of a repeal and replace bill. Such attempts finally foundered in the early hours of July 28.
But investors could still take comfort in a narrative of improving global growth and corporate earnings, with monetary conditions still historically easy, to underpin the prices of risk assets. The evidence was there to see. In August the Wall Street Journal observed that the prices of base metals had recently hit multi-year highs, inferring that investors were increasingly bullish on global growth, and later noted that every country tracked by the Organization for Economic Cooperation and Development was set to grow in 2017.
In the euro zone, unemployment ended November at 8.8%, the lowest since January 2009. Gross domestic product ("GDP") grew 2.5% year-over-year in the third quarter of 2017, slightly higher than the U.S. (2.3%). The European Central Bank finally confirmed that monthly bond purchases would be halved to €30 billion in 2018. The region's Economic Sentiment Indicator ended the period at the highest since 2000.
China's GDP growth in the second quarter of 2017 was a healthy 6.9% year-over-year and 6.8% in the third. Imports were continuing to grow at double-digit year-over-year rates, supporting global demand. Excessive debt remained a problem in financial markets, however. In November the authorities announced curbs on leverage in asset management products and promises of guaranteed returns.
Even Japan contributed some good news with GDP rising in the third quarter of 2017 for the seventh straight quarter.
In the U.S., the Federal Reserve ("Fed") added 25bp (0.25%) to the federal funds rate in March and did so again in June. But areas of sluggishness, like low core consumer price inflation and wage growth persisted into September, which started with devastating hurricanes and rising geo-political tensions with North Korea. Some commentators suggested that the Fed might be done for the year.
However, the hurricanes subsided, geo-political tensions cooled and yet another forlorn attempt to replace the ACA was shrugged off. The December employment report showed the unemployment rate barely above 4%, near the lowest since February 2001. Third quarter GDP growth was reported at 3.2% (annualized) after 3.1% in the second. The outline of a long-awaited pro-growth tax reform program was finally announced, although moving day by day to bring recalcitrant
senators on board. For investors, its key feature was a reduction in the corporate tax rate to 21%, which many believed would be used to increase share buy-backs and dividends. The Fed duly raised the federal funds rate by another 25bp (0.25%) in December and the tax bill was signed into law on December 22.
In U.S. fixed income markets, the Bloomberg Barclays U.S. Aggregate Bond Index ("Barclays Aggregate") added 3.54% in the fiscal year. The Treasury yield curve became flatter, with yields on maturities up to about nine years rising and those on longer maturities falling. Thus the Bloomberg Barclays U.S. Treasury Bond Index rose 2.31% while the Bloomberg Barclays Long-Term U.S. Treasury sub-index gained 8.53%. Indices of riskier classes generally outperformed Treasuries: the Bloomberg Barclays U.S. Corporate Investment Grade Bond Index climbed 6.42%, the Bloomberg Barclays High-Yield Bond — 2% Issuer Constrained Composite Index (not a part of the Barclays Aggregate) rose 7.50%.
U.S. equities, represented by the S&P 500® Index including dividends, surged 21.83% in 2017. The earnings per share of its constituent companies grew 6.4% year-over-year in the third quarter of 2017, after two quarters of double-digit gains. Technology was the leader, soaring 38.83%. Telecommunications and energy were the laggards, falling 1.25% and 1.01% respectively. Index companies thought to offer comparatively good earnings growth outperformed those considered to offer comparatively good value by more than 12%.
In currencies, the dollar fell 12.37% against the euro, 8.63% against the pound, reflecting some dissipation of the post-election reflation euphoria. In the meantime, the euro zone's prospects had improved, while some of the panic over Brexit had faded. The dollar slipped 3.65% against the yen, moving within a narrow trading range for most of the year.
In international markets, the MSCI Japan® Index jumped 19.75% over the year, in an environment of improving corporate governance and profitability, with little competition from fixed income investments. The MSCI Europe ex UK® Index rose 13.59%. Aside from the positive developments noted above, corporate earnings were improving and political fears were assuaged by the election of a centrist President in France. But gains were muted by the strengthening euro. The MSCI UK® Index rose 11.94%. GDP growth was down to 0.4% in each of the middle two quarters, Brexit negotiations were slow and inconclusive and we believe by year end it was abundantly clear that the UK's position was very weak.
All indices are unmanaged and investors cannot invest directly in an index. Past performance does not guarantee future results. The performance quoted represents past performance. Investment return and principal value of an investment will fluctuate, and shares, when redeemed, may be worth more or less than their original cost. The Portfolios' performance is subject to change since the period's end and may be lower or higher than the performance data shown. Please call (800) 262-3862 or log on to www.voyainvestments.com to obtain performance data current to the most recent month end.
Market Perspective reflects the views of Voya Investment Management's Chief Investment Risk Officer only through the end of the period, and is subject to change based on market and other conditions.
3
Index | | Description | |
Bloomberg Barclays High Yield Bond — 2% Issuer Constrained Composite Index | | An index that includes all fixed-income securities having a maximum quality rating of Ba1, a minimum amount outstanding of $150 million, and at least one year to maturity. | |
Bloomberg Barclays Global Aggregate Index | | Provides a broad-based measure of the global investment-grade fixed-rate debt markets. | |
Bloomberg Barclays U.S. Aggregate Bond Index | | An index of publicly issued investment grade U.S. Government, mortgage-backed, asset-backed and corporate debt securities. | |
Bloomberg Barclays U.S. Corporate Investment Grade Bond Index | | An index consisting of publicly issued, fixed rate, nonconvertible, investment grade debt securities. | |
Bloomberg Barclays U.S. Government/Credit Bond Index | | An index made up of the Barclays Government and Credit indices, including securities issued by the U.S. government and its agencies and publicly issued U.S. corporate and foreign debentures and secured notes that meet specified maturity, liquidity and quality requirements. | |
Bloomberg Barclays Long-Term U.S. Treasury Index | | This index measures the performance of U.S. Treasury bills with long-term maturity. The credit level for this index is investment grade. The rebalance scheme is monthly. | |
Bloomberg Barclays U.S. Treasury Bond Index | | A market capitalization-weighted index that measures the performance of public obligations of the U.S. Treasury that have a remaining maturity of one year or more. | |
ICE BofAML Speculative Grade U.S. Convertible Index | | An index that includes about 270 convertible securities and represents the non-investment-grade convertible market. | |
ICE BofAML U.S. High Yield Index | | A broad-based index consisting of all U.S. dollar-denominated high-yield bonds with a minimum outstanding amount of $100 million and with a maturity of greater than one year period. The quality rating is less than BBB by Standard & Poor's. | |
MSCI All Country World IndexSM | | A free-float adjusted market capitalization index that is designed to measure equity performance in the global developed and emerging markets. | |
MSCI All Country World ex-U.S. IndexSM | | A free float-adjusted market capitalization index that is designed to measure equity market performance in the global developed and emerging markets, excluding the U.S. It includes the reinvestment of dividends and distributions net of withholding taxes, but does not reflect fees, brokerage commissions or other expenses of investing. | |
MSCI Europe, Australasia and Far East® ("MSCI EAFE") Index | | An index that measures the performance of securities listed on exchanges in Europe, Australasia and the Far East. It includes the reinvestment of dividends net of withholding taxes, but does not reflect fees, brokerage commissions or other expenses of investing. | |
MSCI Europe ex UK® Index | | A free float-adjusted market capitalization index that is designed to measure developed market equity performance in Europe, excluding the UK. | |
MSCI Japan® Index | | A free float-adjusted market capitalization index that is designed to measure developed market equity performance in Japan. | |
MSCI UK® Index | | A free float-adjusted market capitalization index that is designed to measure developed market equity performance in the UK. | |
MSCI World IndexSM | | An index that measures the performance of over 1,400 securities listed on exchanges in the U.S., Europe, Canada, Australia, New Zealand and the Far East. | |
Russell 1000® Index | | A comprehensive large-cap index measuring the performance of the largest 1,000 U.S. incorporated companies. | |
Russell 1000® Growth Index | | Measures the performance of the 1,000 largest companies in the Russell 3000® Index with higher price-to-book ratios and higher forecasted growth. | |
Russell 1000® Value Index | | An index that measures the performance of those Russell 1000® securities with lower price-to-book ratios and lower forecasted growth values. | |
4
BENCHMARK DESCRIPTIONS (CONTINUED)
Index | | Description | |
Russell 2000® Growth Index | | An index that measures the performance of securities of smaller U.S. companies with greater than average growth orientation. | |
Russell 2000® Value Index | | An index that measures the performance of those Russell 2000® companies with lower price-to-book ratios and lower than forecasted growth values. | |
Russell 2500TM Growth Index | | Measures the performance of the small- to mid-cap growth segment of the U.S. equity universe. It includes those Russell 2500TM Index companies with higher price-to-book ratios and higher forecasted growth values. | |
Russell 2500TM Value Index | | Measures the performance of those Russell 2500 companies with lower price-to-book ratios and lower forecasted growth values. | |
Russell Midcap® Growth Index | | An index that measures the performance of those companies included in the Russell Midcap® Index with relatively higher price-to-book ratios and higher forecasted growth values. | |
Russell Midcap® Value Index | | Measures the performance of those Russell Midcap companies with lower price-to-book ratios and lower forecasted growth values. | |
S&P 500® Index | | An index that measures the performance of securities of approximately 500 large-capitalization companies whose securities are traded on major U.S. stock markets. | |
S&P MidCap 400 Index | | An index that measures the performance of the mid-size company segment of the U.S. market. | |
S&P Small Cap 600/Citigroup Value Index | | Measures the performance of those S&P 600 Index companies with lower price-to-book ratios. | |
5
VOYA GLOBAL BOND PORTFOLIO
PORTFOLIO MANAGERS' REPORT
Voya Global Bond Portfolio (the "Portfolio") seeks to maximize total return through a combination of current income and capital appreciation. The Portfolio is managed by Mustafa Chowdhury and Brian Timberlake, Ph.D., CFA, Portfolio Managers* of Voya Investment Management Co. LLC ("Voya IM") — the Sub-Adviser.
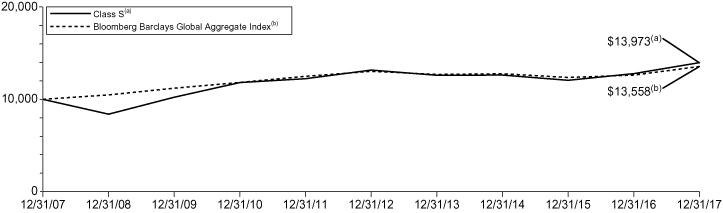
Performance: For the year ended December 31, 2017, the Portfolio's Class S shares provided a total return of 9.31% compared to the Bloomberg Barclays Global Aggregate Index, which returned 7.39% for the same period.
Portfolio Specifics: The Portfolio outperformed the Bloomberg Barclays Global Aggregate Index primarily due to favorable sector allocation, duration positioning and security selection. Currency positioning in both developed and emerging markets detracted from performance.
The U.S. Federal Reserve Board ("Fed") continued with their cautious pace of rate increases with three rate hikes over the course of 2017. The 2-year Treasury note tracked the moves in official short-term rates, as the yield rose from 1.20% to 1.89% in 2017. Meanwhile, 10-year yields were anchored by a lack of inflationary pressures and continued demand from foreign buyers. As a result, the 10-year U.S. Treasury was barely changed, as yields began the year at 2.41% and ended 2017 at 2.43%. While the Bank of England and Bank of Canada nudged their official rates higher, larger central banks including the European Central Bank ("ECB") and Bank of Japan left their official rates unchanged. Outside the U.S., German rates continued to grind higher in the first half with the 10-year German Bund touching 0.60% in the second quarter, then falling as the ECB remained firmly committed to their buying programs. Meanwhile, the Japanese government bond market remained in a narrow range, with the Bank of Japan committed to a zero yield target for their 10-year government bond. Currency performance diverged significantly over the period, reflecting different growth paths. The Euro rallied over 10% as economic data continued to highlight growing momentum across the Euro area. The Japanese Yen also strengthened, albeit at a more modest pace. Meanwhile, emerging market bonds and currencies performed well over the period, supported by the continued improvement in global growth and rebound in energy prices. The Portfolio's allocations to emerging markets was a positive source of return over the period.
Investment grade corporate bonds posted positive returns, with only modest disruptions over the year. The degree of outperformance went hand in hand with credit quality and maturity, as BBB-rated securities outperformed. While there were some episodes of 'disruption'; 1) the U.S. & N. Korea 'twitter spat'; 2) idiosyncratic M&A activity; 3) uncertainties around Brexit; and 4) jockeying over U.S. tax reform, all of it was short-lived. High yield corporates also posted positive results buoyed by strong fundamentals and solid economic growth. The portfolio benefited from our overweight in both investment grade and high yield corporate bonds. As high grade spreads continued to grind ever tighter we reduced positions in investment grade corporates in order to have dry powder. Securitized assets also posted excess returns for the year. Similar to the corporate bond markets, more credit sensitive sectors such as Non-Agency residential mortgage-backed securities ("RMBS") and credit risk transfer securities ("CRTs") as well as commercial mortgage-backed securities ("CMBS") posted some the most attractive returns. Lower beta sectors including asset-backed securities ("ABS") and collateralized loan obligations ("CLOs") outperformed Treasuries while trailing other credit sectors. Even Agency mortgage-backed securities ("MBS"), which flirted with multi-year tights during the year and the challenge of the Fed stepping away as a significant buyer, posted positive excess returns. We ranged from neutral to underweight in Agency MBS, reflecting our concerns on valuations. Meanwhile we tempered our allocations to Non-Agency RMBS and CRTs but continued to maintain a significant overweight to ABS, including CLOs, as we sought to maintain carry in sectors we believed would exhibit lower volatility. As a result, allocations and positioning in Non-Agency RMBS and CRTs, CMBS and ABS all added nicely to returns, while positioning in Agency MBS was a modest detractor.
The Portfolio used derivatives, including futures, swaps and currency forwards to hedge as well as to seek to efficiently implement portfolio strategies. For the twelve-month period ending December 31, 2017, the impact from derivatives was positive on the Portfolio's performance.
Current Strategy and Outlook: We believe the Fed continues to chart a course for modest increases in the Fed Funds rate and a well-defined path for slowly reducing the size of their balance sheet after aggressive quantitative easing measures were implemented after the financial crisis. Meanwhile, we believe the ECB and Bank of Japan will remain more accommodative than the Fed, as rate hikes remain further out on the horizon. While we believe rates in the U.S. are likely to drift higher, the sizeable yield advantage that U.S. Treasuries boast versus other developed markets, in our opinion, can temper the degree of increase. In non-government sectors, we believe fundamentals remain supportive for credit investing, but valuations leave little room for error. As a result, we continue to see what we believe are opportunities in non-government sectors, but we have trimmed the size of allocations.
* Effective April 3, 2017, Christine Hurtsellers no longer serves as a portfolio manager for the Portfolio.
Portfolio holdings and characteristics are subject to change and may not be representative of current holdings and characteristics. Portfolio holdings are subject to change daily. The outlook for this Portfolio may differ from that presented for other Voya mutual funds. The Portfolio's performance returns shown reflect applicable fee waivers and/or expense limits in effect during this period. Absent such fee waivers/expense limitations, if any, performance would have been lower. Performance for the different classes of shares will vary based on differences in fees associated with each class.
Geographic Diversification
as of December 31, 2017
(as a percentage of net assets)
United States(1) | | | 76.3 | % | |
Italy | | | 5.8 | % | |
Cayman Islands | | | 3.7 | % | |
United Kingdom | | | 1.4 | % | |
Netherlands | | | 1.0 | % | |
Germany | | | 0.9 | % | |
Brazil | | | 0.8 | % | |
Japan | | | 0.6 | % | |
Canada | | | 0.5 | % | |
Russia | | | 0.4 | % | |
Countries between 0.0% - 0.4%^ | | | 2.9 | % | |
Assets in Excess of Other Liabilities* | | | 5.7 | % | |
Net Assets | | | 100.0 | % | |
* Includes short-term investments and purchased options.
(1) Includes 23.7% total investment in Voya Emerging Markets Corporate Debt Fund, Voya Emerging Markets Hard Currency Debt Fund, Voya Emerging Markets Local Currency Debt Fund, and Voya High Yield Bond Fund.
^ Includes 13 countries, which each represents 0.0%-0.4% of net assets.
Portfolio holdings are subject to change daily.
Top Ten Holdings
as of December 31, 2017*
(as a percentage of net assets)
Voya Emerging Markets Local Currency Debt
Fund — Class P | | | 10.6 | % | |
Voya Emerging Markets Hard Currency
Debt Fund — Class P | | | 7.1 | % | |
Voya Emerging Markets Corporate
Debt Fund — Class P | | | 4.7 | % | |
United States Treasury Note, 2.250%, 11/15/27 | | | 4.2 | % | |
Italy Buoni Poliennali Del Tesoro, 4.500%, 03/01/26 | | | 3.1 | % | |
Italy Buoni Poliennali Del Tesoro, 2.200%, 06/01/27 | | | 2.6 | % | |
United States Treasury Note, 0.625%, 06/30/18 | | | 1.5 | % | |
Voya High Yield Bond Fund — Class P | | | 1.3 | % | |
United States Treasury Note, 1.875%, 12/15/20 | | | 1.2 | % | |
United States Treasury Bond, 2.750%, 08/15/47 | | | 1.0 | % | |
* Excludes short-term investments.
Portfolio holdings are subject to change daily.
6
PORTFOLIO MANAGERS' REPORT
VOYA GLOBAL BOND PORTFOLIO
Average Annual Total Returns for the Periods Ended December 31, 2017 | |
| | 1 Year | | 5 Year | | 10 Year | |
Class ADV | | | 9.05 | % | | | 0.94 | % | | | 3.14 | % | |
Class I | | | 9.67 | % | | | 1.47 | % | | | 3.66 | % | |
Class S | | | 9.31 | % | | | 1.19 | % | | | 3.40 | % | |
Blooomberg Barclays Global Aggregate Index | | | 7.39 | % | | | 0.79 | % | | | 3.09 | % | |
Based on a $10,000 initial investment, the graph and table above illustrate the total return of Voya Global Bond Portfolio against the index indicated. The index is unmanaged and has no cash in its portfolio and imposes no sales charges. An investor cannot invest directly in an index.
The Portfolio's performance is shown without the imposition of any expenses or charges which are, or may be, imposed under your variable annuity contract or variable life insurance policy. Total returns would have been lower if such expenses or charges were included.
The performance graph and table do not reflect the deduction of taxes that a shareholder will pay on Portfolio distributions or the redemption of Portfolio shares.
The performance shown may include the effect of fee waivers and/or expense reimbursements by the Investment Adviser and/or other service providers, which have the effect of increasing total return. Had all fees and expenses been considered, the total returns would have been lower.
The performance update illustrates performance for a variable investment option available through a variable
annuity contract or a variable life insurance policy. The performance shown indicates past performance and is not a projection or prediction of future results. Actual investment returns and principal value will fluctuate so that shares and/or units, at redemption, may be worth more or less than their original cost. Please log on to www.voyainvestments.com or call (800) 262-3862 to get performance through the most recent month end.
This report contains statements that may be "forward-looking" statements. Actual results may differ materially from those projected in the "forward-looking" statements.
The views expressed in this report reflect those of the portfolio managers, only through the end of the period as stated on the cover. The portfolio managers' views are subject to change at any time based on market and other conditions.
Portfolio holdings are subject to change daily.
Prior to January 21, 2011, the Portfolio was managed by a different sub-adviser.
7
VY® AMERICAN CENTURY SMALL-MID CAP VALUE PORTFOLIO
PORTFOLIO MANAGERS' REPORT
VY® American Century Small-Mid Cap Value Portfolio (the "Portfolio") seeks long-term capital growth. Income is a secondary objective. The Portfolio is managed by a team of portfolio managers comprised of Miles Lewis, CFA, and Jeff John, CFA, Vice President (responsible for the management of the Small Cap Value portion of the Portfolio) and Kevin Toney, CFA, Senior Vice President, Phillip N. Davidson, CFA, Chief Investment Officer — Value Equity and Senior Vice President, Michael Liss, CFA and Vice President, and Brian Woglom, CFA, Vice President (responsible for the Mid Cap Value portion of the Portfolio) (each a "Sleeve"), Portfolio Managers of American Century Investment Management, Inc. — the Sub-Adviser.
Performance: For the year ended December 31, 2017, the Portfolio's Class S shares provided a total return 11.12% compared to the Russell 2500TM Value Index and the S&P SmallCap 600®/Citigroup Value Index, which returned 10.36% and 11.51%, respectively, for the same period.
Portfolio Specifics: Major U.S. stock market benchmarks climbed to record highs during the year. At year-end, the S&P 500® Index delivered its ninth-consecutive quarterly gain, and the highest quarterly return in two years. Market gains were fueled by positive economic and earnings news, moderate inflation, and passage of the largest corporate tax cut in decades. The outperformance of growth versus value was pronounced in 2017. This created headwinds for our approach to value investing as quality and value factors are key determinants of our performance over time.
The Portfolio outperformed the Russell 2500 TM Value Index. Although the Russell 2500 TM Value Index is the overall portfolio benchmark, the Small Cap Value and Mid Cap Value sleeves are managed against the Russell 2000® Value and Russell Mid Cap Value® indices, respectively.
The Mid Cap Value sleeve underperformed its benchmark, the Russell Midcap® Value Index, for the year. Stock selection and an overweight allocation in the energy sector detracted from the sleeve's relative performance. Consumer discretionary holdings also detracted. An underweight allocation to the real estate sector, however, boosted relative performance.
The Small Cap Value sleeve, however, outperformed its benchmark, the Russell 2000 Value® Index. Stock selection in the industrials and information technology sectors contributed to relative performance. Stock selection in the consumer staples and health care sectors detracted from relative performance in the sleeve.
The overall Portfolio's performance for the year exceeded that of its benchmark, the Russell 2500 Value® Index. Information technology holdings drove relative outperformance. Semiconductor companies Applied Materials and Lam Research were among the top individual contributors. Applied Materials reported record revenues and earnings per share for its fiscal third quarter. It also announced that it expects continued growth in revenues and earnings over the next few years due to strong demand. Solid orders and backlog drove Lam Research's revenue and earnings forecasts higher as end demand remained strong. An underweight position in the real estate sector, which was pressured by rising interest rates, also contributed to performance.
On the other hand, stock selection in the consumer discretionary and utilities sectors detracted from relative returns. Among individual stocks, Advance Auto Parts was a significant detractor. The company's stock fell on reports that Amazon was increasing its focus on the aftermarket automotive parts sector. The company materially lowered its fiscal year 2017 guidance after missing both first- and second-quarter earnings estimates. The stock rebounded somewhat after beating third-quarter estimates, but we believe weak sales continue to be a concern. Baker Hughes, a General Electric company, also weighed on performance. The oil services company underperformed due to weaker-than-expected cash flow generation and due to its large exposure to the slower-growth markets outside of North America.
Current Strategy and Outlook: We follow a stock-specific, valuation-driven strategy. The Portfolio's sector allocation is a result of our bottom-up investment process.
Relative to the Russell 2500TM Value Index, the overall Portfolio is overweight in consumer staples. Many food company stocks declined earlier this year on concerns over increased competition from Amazon, and their valuations, in our opinion, became more compelling. The energy sector is another overweight. We believe energy valuations remain attractive after the sector declined in the face of falling oil prices and a rising service cost environment.
The Portfolio continues to be underweight in the real estate sector. Our valuation methodology shows that many real estate stocks remain overvalued, in our opinion.
Portfolio holdings and characteristics are subject to change and may not be representative of current holdings and characteristics. Portfolio holdings are subject to change daily. The outlook for this Portfolio may differ from that presented for other Voya mutual funds. The Portfolio's performance returns shown reflect applicable fee waivers and/or expense limits in effect during this period. Absent such fee waivers/expense limitations, if any, performance would have been lower. Performance for the different classes of shares will vary based on differences in fees associated with each class.
Sector Diversification
as of December 31, 2017
(as a percentage of net assets)
Financials | | | 24.2 | % | |
Industrials | | | 14.1 | % | |
Energy | | | 10.2 | % | |
Consumer Staples | | | 8.8 | % | |
Information Technology | | | 8.3 | % | |
Health Care | | | 7.5 | % | |
Materials | | | 6.9 | % | |
Real Estate | | | 6.0 | % | |
Consumer Discretionary | | | 5.2 | % | |
Utilities | | | 4.4 | % | |
Exchange-Traded Funds | | | 1.4 | % | |
Telecommunication Services | | | 0.2 | % | |
Assets in Excess of Other Liabilities* | | | 2.8 | % | |
Net Assets | | | 100.0 | % | |
* Includes short-term investments.
Portfolio holdings are subject to change daily.
Top Ten Holdings
as of December 31, 2017*
(as a percentage of net assets)
Johnson Controls International plc | | | 1.8 | % | |
Northern Trust Corp. | | | 1.8 | % | |
Zimmer Biomet Holdings, Inc. | | | 1.7 | % | |
Graphic Packaging Holding Co. | | | 1.6 | % | |
Weyerhaeuser Co. | | | 1.5 | % | |
iShares Russell Midcap Value Index Fund | | | 1.4 | % | |
Conagra Brands, Inc. | | | 1.2 | % | |
Invesco Ltd. | | | 1.2 | % | |
WestRock Co. | | | 1.2 | % | |
BB&T Corp. | | | 1.2 | % | |
* Excludes short-term investments.
Portfolio holdings are subject to change daily.
8
VY® AMERICAN CENTURY SMALL-MID CAP VALUE PORTFOLIO
PORTFOLIO MANAGERS' REPORT

Average Annual Total Returns for the Periods Ended December 31, 2017 | |
| | 1 Year | | 5 Year | | 10 Year | | Since Inception
of Class S2
February 27, 2009 | |
Class ADV | | | 10.90 | % | | | 14.61 | % | | | 10.34 | % | | | — | | |
Class I | | | 11.44 | % | | | 15.19 | % | | | 10.89 | % | | | — | | |
Class S | | | 11.12 | % | | | 14.88 | % | | | 10.61 | % | | | — | | |
Class S2 | | | 10.96 | % | | | 14.72 | % | | | — | | | | 18.74 | % | |
Russell 2500TM Value Index | | | 10.36 | % | | | 13.27 | % | | | 8.82 | % | | | 18.41 | % | |
S&P SmallCap 600®/Citigroup Value Index | | | 11.51 | % | | | 15.52 | % | | | 9.99 | % | | | 19.71 | % | |
Based on a $10,000 initial investment, the graph and table above illustrate the total return of VY® American Century Small-Mid Cap Value Portfolio against the indices indicated. An index is unmanaged and has no cash in its portfolio and imposes no sales charges. An investor cannot invest directly in an index.
The Portfolio's performance is shown without the imposition of any expenses or charges which are, or may be, imposed under your variable annuity contract or variable life insurance policy. Total returns would have been lower if such expenses or charges were included.
The performance graph and table do not reflect the deduction of taxes that a shareholder will pay on Portfolio distributions or the redemption of Portfolio shares.
The performance shown may include the effect of fee waivers and/or expense reimbursements by the Investment Adviser and/or other service providers, which have the effect of increasing total return. Had all fees and expenses been considered, the total returns would have been lower.
The performance update illustrates performance for a variable investment option available through a variable
annuity contract or a variable life insurance policy. The performance shown indicates past performance and is not a projection or prediction of future results. Actual investment returns and principal value will fluctuate so that shares and/or units, at redemption, may be worth more or less than their original cost. Please call (800) 262-3862 to get performance through the most recent month end.
This report contains statements that may be "forward-looking" statements. Actual results may differ materially from those projected in the "forward-looking" statements.
The views expressed in this report reflect those of the portfolio managers, only through the end of the period as stated on the cover. The portfolio managers' views are subject to change at any time based on market and other conditions.
Portfolio holdings are subject to change daily.
9
VY® BARON GROWTH PORTFOLIO
PORTFOLIO MANAGERS' REPORT
VY® Baron Growth Portfolio (the "Portfolio") seeks capital appreciation. The Portfolio is managed by Ronald Baron, Founder, Chief Executive Officer, Chief Investment Officer, Chairman, and Portfolio Manager and Neal Rosenberg, assistant Portfolio Manager* of BAMCO, Inc. — the Sub-Adviser.
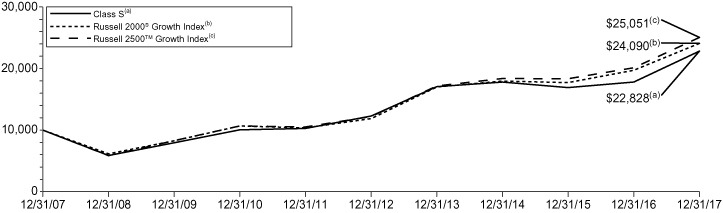
Performance: For the year ended December 31, 2017, the Portfolio's Class S shares provided a total return of 28.20% compared to the Russell 2000® Growth Index and the Russell 2500TM Growth Index, which returned 22.17% and 24.46%, respectively, for the same period.
Portfolio Specifics: U.S. equity indexes reached record highs several times in 2017, driven by strong corporate earnings results and economic growth. Although events like weather-related catastrophes, geopolitical tensions, and the U.S. Federal Reserve's three interest rate hikes could have posed challenges, the stock markets continued to inch higher. Volatility also remained relatively low throughout the year, hovering below 12 for the CBOE Volatility Index. The unemployment rate declined, while GDP expanded during the year. Later in 2017, prospects for U.S. tax law reform in Congress also helped boost the markets.
Absolute Performance
Consumer discretionary, information technology, and financials were the top performers in 2017. Strength in consumer discretionary came mainly from top contributor Vail Resorts, Inc., a ski resort operator. Second largest contributor CoStar Group, Inc., an information and marketing service provider to the commercial real estate industry, and ANSYS, Inc., a simulation software developer, drove performance of IT. Investment tools provider MSCI, Inc. and insurance and investment product provider Primerica, Inc. bolstered Financials, whose performance was also fueled by gains in 13 out of 14 holdings.
Consumer staples was a slight detractor during the year. Underperformance by private label foods company TreeHouse Foods, Inc. and value-oriented food retailer Smart & Final Stores, Inc. detracted from performance in the sector. TreeHouse was undergoing restructuring, making previously stated potential synergies from its 2016 acquisition of ConAgra's private label business unachievable, in our view. We exited our position in November.
Relative Performance
The Portfolio outperformed the Russell 2000 Growth® Index for the year due to stock selection.
Stock selection in consumer discretionary, information technology, and financials and lack of exposure to the energy sector, which was down more than 23% in the index, contributed the most to relative results. Strength in consumer discretionary was partly attributable to the outperformance of ski resort operator Vail Resorts, Inc., fast casual restaurant chain Panera Bread Co., and education services provider Nord Anglia Education, Inc. Additionally, outperformance of casinos & gaming and hotels, resorts & cruise lines holdings and higher exposure to these sub-industries added value. Regional casino operator Pinnacle Entertainment, Inc. and timeshare seller and operator Marriott Vacations Worldwide Corp. drove performance in these respective sub-industries. Within IT, outperformance of application software holdings, led by ANSYS, Inc. and SS&C Technologies Holdings, Inc., and greater exposure to this sub-industry lifted relative results. Additionally, lack of exposure to lagging communications equipment and semiconductor stocks and outperformance of CoStar Group, Inc. contributed to relative results. Financials investments outperformed after increasing 31.4% as a group, led by MSCI, Inc. and Primerica, Inc.
Meaningfully lower exposure to the top-performing health care sector weighed the most on relative performance. In particular, significantly lower exposure to biotechnology and pharmaceutical stocks, which were up 55.7% and 38.9%, respectively, in the index, detracted nearly 300 basis points (3.00%) from relative results.
Current Strategy and Outlook: As long-term, fundamental, bottom-up investors, we are continuing to position the Portfolio to benefit from what we believe to be strong, long-term growth opportunities. We believe the economic and market expansion from 2017 could continue into 2018, especially with potential for increased corporate profits from U.S. tax reforms. Economic prospects remain solid, in our view, and we think the Portfolio is well positioned to benefit.
* Effective January 27, 2017, Neal Rosenberg was added as an assistant Portfolio Manager to the Portfolio.
Portfolio holdings and characteristics are subject to change and may not be representative of current holdings and characteristics. Portfolio holdings are subject to change daily. The outlook for this Portfolio may differ from that presented for other Voya mutual funds. The Portfolio's performance returns shown reflect applicable fee waivers and/or expense limits in effect during this period. Absent such fee waivers/expense limitations, if any, performance would have been lower. Performance for the different classes of shares will vary based on differences in fees associated with each class.
Sector Diversification
as of December 31, 2017
(as a percentage of net assets)
Consumer Discretionary | | | 33.9 | % | |
Information Technology | | | 23.4 | % | |
Financials | | | 19.8 | % | |
Health Care | | | 8.7 | % | |
Real Estate | | | 8.5 | % | |
Industrials | | | 2.2 | % | |
Telecommunication Services | | | 1.4 | % | |
Consumer Staples | | | 1.4 | % | |
Assets in Excess of Other Liabilities | | | 0.7 | % | |
Net Assets | | | 100.0 | % | |
Portfolio holdings are subject to change daily.
Top Ten Holdings
as of December 31, 2017
(as a percentage of net assets)
Vail Resorts, Inc. | | | 12.8 | % | |
Choice Hotels International, Inc. | | | 5.6 | % | |
CoStar Group, Inc. | | | 5.2 | % | |
Gartner, Inc. | | | 4.8 | % | |
ANSYS, Inc. | | | 3.8 | % | |
IDEXX Laboratories, Inc. | | | 3.6 | % | |
Bright Horizons Family Solutions, Inc. | | | 3.6 | % | |
Gaming and Leisure Properties, Inc. | | | 3.4 | % | |
Primerica, Inc. | | | 3.4 | % | |
Marriott Vacations Worldwide Corp. | | | 3.3 | % | |
Portfolio holdings are subject to change daily.
10
PORTFOLIO MANAGERS' REPORT
VY® BARON GROWTH PORTFOLIO
Average Annual Total Returns for the Periods Ended December 31, 2017 | |
| | 1 Year | | 5 Year | | 10 Year | | Since Inception
of Class S2
February 27, 2009 | |
Class ADV | | | 27.86 | % | | | 12.90 | % | | | 8.33 | % | | | — | | |
Class I | | | 28.52 | % | | | 13.47 | % | | | 8.87 | % | | | — | | |
Class R6(1) | | | 28.51 | % | | | 13.47 | % | | | 8.87 | % | | | — | | |
Class S | | | 28.20 | % | | | 13.19 | % | | | 8.61 | % | | | — | | |
Class S2 | | | 28.02 | % | | | 13.02 | % | | | — | | | | 18.50 | % | |
Russell 2000® Growth Index | | | 22.17 | % | | | 15.21 | % | | | 9.19 | % | | | 19.24 | % | |
Russell 2500TM Growth Index | | | 24.46 | % | | | 15.47 | % | | | 9.62 | % | | | 19.95 | % | |
Based on a $10,000 initial investment, the graph and table above illustrate the total return of VY® Baron Growth Portfolio against the indices indicated. An index is unmanaged and has no cash in its portfolio and imposes no sales charges. An investor cannot invest directly in an index.
The Portfolio's performance is shown without the imposition of any expenses or charges which are, or may be, imposed under your variable annuity contract or variable life insurance policy. Total returns would have been lower if such expenses or charges were included.
The performance graph and table do not reflect the deduction of taxes that a shareholder will pay on Portfolio distributions or the redemption of Portfolio shares.
The performance shown may include the effect of fee waivers and/or expense reimbursements by the Investment Adviser and/or other service providers, which have the effect of increasing total return. Had all fees and expenses been considered, the total returns would have been lower.
The performance update illustrates performance for a variable investment option available through a variable annuity contract or a variable life insurance policy. The
performance shown indicates past performance and is not a projection or prediction of future results. Actual investment returns and principal value will fluctuate so that shares and/or units, at redemption, may be worth more or less than their original cost. Please call (800) 262-3862 to get performance through the most recent month end.
This report contains statements that may be "forward-looking" statements. Actual results may differ materially from those projected in the "forward-looking" statements.
The views expressed in this report reflect those of the portfolio manager, only through the end of the period as stated on the cover. The portfolio manager's views are subject to change at any time based on market and other conditions.
Portfolio holdings are subject to change daily.
(1) Class R6 incepted on May 3, 2016. The Class R6 shares performance shown for the period prior to their inception date is the performance of Class I shares without adjustment for any differences in the expenses between the two classes. If adjusted for such differences, returns would be different.
11
VY® COLUMBIA CONTRARIAN CORE PORTFOLIO
PORTFOLIO MANAGERS' REPORT
VY® Columbia Contrarian Core Portfolio (the "Portfolio") seeks total return consisting of long-term capital appreciation and current income. The Portfolio is managed by Guy W. Pope, CFA, Senior Portfolio Manager and Head of Contrarian Core Strategy with Columbia Management Investment Advisers, LLC ("CMIA") — the Sub-Adviser.
Performance: For the year ended December 31, 2017, the Portfolio's Class S shares provided a total return of 21.58% compared to the Russell 1000® Index, which returned 21.69% for the same period.
Portfolio Specifics: For the year, stock selection was the primary driver of performance before fees. Strong stock selection in the information technology, consumer discretionary and real estate sectors contributed most to Portfolio performance relative to the benchmark for the year. Stock selection was weakest in the industrials, consumer staples and health care sectors for the period. Sector allocation contributed to overall performance for the year. An overweight to the financials sector and an underweight to utilities were positives for the strategy during the year.
Top contributors included MasterCard ("MA"), Facebook ("FB"), and Electronic Arts Inc. ("EA"). In our opinion, MA is well positioned to benefit from the ongoing global secular shift away from traditional cash and checks and towards electronic payments. FB was another strong performer for the Portfolio, with profits and revenues up double digits. Advertisers continue to embrace the core Facebook platform as well as its subsidiary Instagram. EA generated record net sales and operating cash flow in fiscal 2017 (announced on 9 May for the fiscal year ended 31 March); the company continues to successfully navigate its ongoing transition to digital, as well as increasing success with live services.
Top detractors included Cardinal Health, Inc. ("CAH"), the Kroger Co. ("KR"), and Allergan PLC ("AGN"). Generic drug pricing deflation as well as company spending initiatives hurt CAH's growth outlook resulting in investor disappointment. KR, which operates retail food and drug stores across the U.S., reported a mediocre earnings report, mostly explained by grocery price deflation that has troubled the entire industry. Additionally, news broke that Walmart, one of KR's competitors, may be kicking off a price war in the space. AGN detracted from the Portfolio's performance despite reporting strong results in early August, including a 9% increase in revenues. Investor's remain concerned on the patent integrity of AGN's leading product, Restatis.
Current Strategy and Outlook:
The team has been anticipating that the Tax Cuts and Jobs Act would eventually be passed and has been working to reposition the Portfolio to take advantage of this dynamic for much of the past year. We expect the "tax trade" to continue to be a tailwind to performance in 2018 as we continue to adhere to our contrarian process, using pessimism as a starting point to select potential investment candidates where we see the ability for long-term value creation for the Portfolio.
Portfolio holdings and characteristics are subject to change and may not be representative of current holdings and characteristics. Portfolio holdings are subject to change daily. The outlook for this Portfolio may differ from that presented for other Voya mutual funds. The Portfolio's performance returns shown reflect applicable fee waivers and/or expense limits in effect during this period. Absent such fee waivers/expense limitations, if any, performance would have been lower. Performance for the different classes of shares will vary based on differences in fees associated with each class.
Sector Diversification
as of December 31, 2017
(as a percentage of net assets)
Information Technology | | | 24.0 | % | |
Financials | | | 17.2 | % | |
Health Care | | | 13.4 | % | |
Consumer Discretionary | | | 12.5 | % | |
Consumer Staples | | | 7.9 | % | |
Industrials | | | 7.3 | % | |
Energy | | | 7.3 | % | |
Materials | | | 3.2 | % | |
Telecommunication Services | | | 3.0 | % | |
Real Estate | | | 1.2 | % | |
Utilities | | | 0.7 | % | |
Assets in Excess of Other Liabilities* | | | 2.3 | % | |
Net Assets | | | 100.0 | % | |
* Includes short-term investments.
Portfolio holdings are subject to change daily.
Top Ten Holdings
as of December 31, 2017*
(as a percentage of net assets)
Apple, Inc. | | | 3.9 | % | |
JPMorgan Chase & Co. | | | 3.7 | % | |
Berkshire Hathaway, Inc. — Class B | | | 3.3 | % | |
Facebook, Inc. | | | 3.2 | % | |
Microsoft Corp. | | | 3.1 | % | |
Citigroup, Inc. | | | 3.0 | % | |
Alphabet, Inc. — Class C | | | 2.9 | % | |
Philip Morris International, Inc. | | | 2.9 | % | |
Wells Fargo & Co. | | | 2.7 | % | |
FedEx Corp. | | | 2.7 | % | |
* Excludes short-term investments.
Portfolio holdings are subject to change daily.
12
VY® COLUMBIA CONTRARIAN CORE PORTFOLIO
PORTFOLIO MANAGERS' REPORT

Average Annual Total Returns for the Periods Ended December 31, 2017 | |
| | 1 Year | | 5 Year | | 10 Year | |
Class ADV | | | 21.32 | % | | | 15.30 | % | | | 6.80 | % | |
Class I | | | 21.96 | % | | | 15.90 | % | | | 7.34 | % | |
Class S | | | 21.58 | % | | | 15.59 | % | | | 7.06 | % | |
Russell 1000® Index | | | 21.69 | % | | | 15.71 | % | | | 8.59 | % | |
Based on a $10,000 initial investment, the graph and table above illustrate the total return of VY® Columbia Contrarian Core Portfolio against the index indicated. The index is unmanaged and has no cash in its portfolio and imposes no sales charges. An investor cannot invest directly in an index.
The Portfolio's performance is shown without the imposition of any expenses or charges which are, or may be, imposed under your variable annuity contract or variable life insurance policy. Total returns would have been lower if such expenses or charges were included.
The performance graph and table do not reflect the deduction of taxes that a shareholder will pay on Portfolio distributions or the redemption of Portfolio shares.
The performance shown may include the effect of fee waivers and/or expense reimbursements by the Investment Adviser and/or other service providers, which have the effect of increasing total return. Had all fees and expenses been considered, the total returns would have been lower.
The performance update illustrates performance for a variable investment option available through a variable
annuity contract or a variable life insurance policy. The performance shown indicates past performance and is not a projection or prediction of future results. Actual investment returns and principal value will fluctuate so that shares and/or units, at redemption, may be worth more or less than their original cost. Please call (800) 262-3862 to get performance through the most recent month end.
This report contains statements that may be "forward-looking" statements. Actual results may differ materially from those projected in the "forward-looking" statements.
The views expressed in this report reflect those of the portfolio manager, only through the end of the period as stated on the cover. The portfolio manager's views are subject to change at any time based on market and other conditions.
Portfolio holdings are subject to change daily.
Prior to April 30, 2013, the Portfolio was managed by a different sub-adviser.
13
VY® COLUMBIA SMALL CAP VALUE II PORTFOLIO
PORTFOLIO MANAGERS' REPORT
VY® Columbia Small Cap Value II Portfolio (the "Portfolio") seeks long-term growth of capital. The Portfolio is managed by Christian K. Stadlinger, Ph.D., CFA, and Jarl Ginsberg, CFA, CAIA, Portfolio Managers, of Columbia Management Investment Advisors, LLC — the Sub-Adviser.
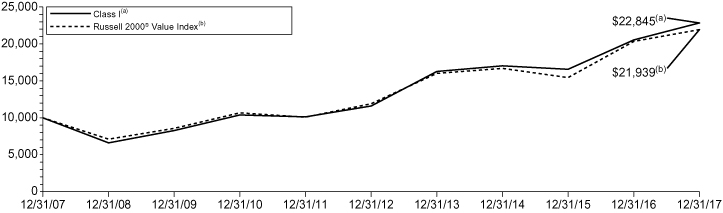
Performance: For the year ended December 31, 2017, the Portfolio's Class I shares provided a total return of 11.21% compared to the Russell 2000® Value Index, which returned 7.84% for the same period.
Portfolio Specifics: For the year, stocks were driven higher by a combination of accelerating economic growth, rising earnings, and the additional momentum from the prospect of tax reform. This led to sectors with the most sensitivity to economic growth generally outperforming. For the year, the Portfolio outperformed its benchmark, the Russell 2000® Value Index. Stock selection was the primary driver of outperformance. Strong stock selection in the industrials and information technology sectors contributed most to Portfolio outperformance relative to the benchmark. Stock selection was weakest in the energy and utilities sectors. The Portfolio was also aided by avoiding the underperforming telecommunication sector. Specific names that contributed to performance include:
Rogers Corporation, the technology company that designs and sells engineered materials and components, saw its shares rise steadily throughout the year as it plays a vital role in many advanced mobility and advanced connectivity applications such as Advanced Driver Assistance Systems, electric and hybrid electric vehicles and the latest generation of high performance wireless networks.
Merit Medical Systems, which designs and develops single-use medical products. The company reported strong first-quarter earnings, which propelled the stock higher. The company highlighted continued gross margin expansion as well as improving integration of recent acquisitions, which we believe should produce substantial upside going forward.
Children's Place, as the children's apparel and footwear company saw its shares rise after posting impressive third quarter results. It was equally impressive that these results came despite headwinds caused by three major hurricanes and record October heat.
One notable detractor for the Portfolio during the year was AK Steel Holding Corporation. The steelmaking company's shares fell throughout the year amid mounting pressure on the steel industry as well as pushback to President Trump's plan to curb steel imports. The company also posted a disappointing third quarter that led to shares selling off.
Current Strategy and Outlook: Our outlook as we enter into 2018 is similar to our thoughts at the end of the third quarter 2017. In our view, the global growth outlook appears to have improved recently as decent synchronized gross domestic product growth took hold in most parts of the world. In our opinion, this renewed growth will be good for earnings but not great as we enter the later stages of this economic cycle. We find that previous operating leverage has already improved margins back to very high levels. We believe a better growth outlook, coupled with the prospect of tax reform and normalizing interest rates, should benefit the small value space.
Our focus continues to be on companies with strong underlying earnings prospects and attractively priced shares. By identifying undervalued companies that we believe are exhibiting upward inflection points, we seek to be able to continue to avoid value traps and deliver strong returns.
Portfolio holdings and characteristics are subject to change and may not be representative of current holdings and characteristics. Portfolio holdings are subject to change daily. The outlook for this Portfolio may differ from that presented for other Voya mutual funds. The Portfolio's performance returns shown reflect applicable fee waivers and/or expense limits in effect during this period. Absent such fee waivers/expense limitations, if any, performance would have been lower. Performance for the different classes of shares will vary based on differences in fees associated with each class.
Sector Diversification
as of December 31, 2017
(as a percentage of net assets)
Financials | | | 31.9 | % | |
Industrials | | | 14.6 | % | |
Consumer Discretionary | | | 10.3 | % | |
Materials | | | 8.6 | % | |
Information Technology | | | 8.3 | % | |
Real Estate | | | 7.0 | % | |
Energy | | | 6.5 | % | |
Utilities | | | 5.4 | % | |
Health Care | | | 5.4 | % | |
Consumer Staples | | | 0.6 | % | |
Assets in Excess of Other Liabilities* | | | 1.4 | % | |
Net Assets | | | 100.0 | % | |
* Includes short-term investments.
Portfolio holdings are subject to change daily.
Top Ten Holdings
as of December 31, 2017*
(as a percentage of net assets)
Sterling Bancorp/DE | | | 1.6 | % | |
Skywest, Inc. | | | 1.5 | % | |
MGIC Investment Corp. | | | 1.4 | % | |
First Industrial Realty Trust, Inc. | | | 1.4 | % | |
Hancock Holding Co. | | | 1.4 | % | |
Kennametal, Inc. | | | 1.4 | % | |
Independent Bank Corp. | | | 1.3 | % | |
Childrens Place Retail Stores, Inc. | | | 1.3 | % | |
Union Bankshares Corp. | | | 1.3 | % | |
Carpenter Technology Corp. | | | 1.3 | % | |
* Excludes short-term investments.
Portfolio holdings are subject to change daily.
14
PORTFOLIO MANAGERS' REPORT
VY® COLUMBIA SMALL CAP VALUE II PORTFOLIO
Average Annual Total Returns for the Periods Ended December 31, 2017 | |
| | 1 Year | | 5 Year | | 10 Year | | Since Inception
of Class S2
February 27, 2009 | |
Class ADV | | | 10.65 | % | | | 13.95 | % | | | 8.06 | % | | | — | | |
Class I | | | 11.21 | % | | | 14.52 | % | | | 8.61 | % | | | — | | |
Class R6(1) | | | 11.20 | % | | | 14.51 | % | | | 8.61 | % | | | — | | |
Class S | | | 10.92 | % | | | 14.23 | % | | | 8.33 | % | | | — | | |
Class S2 | | | 10.77 | % | | | 14.06 | % | | | — | | | | 18.08 | % | |
Russell 2000® Value Index | | | 7.84 | % | | | 13.01 | % | | | 8.17 | % | | | 17.58 | % | |
Based on a $10,000 initial investment, the graph and table above illustrate the total return of VY® Columbia Small Cap Value II Portfolio against the index indicated. The index is unmanaged and has no cash in its portfolio and imposes no sales charges. An investor cannot invest directly in an index.
The Portfolio's performance is shown without the imposition of any expenses or charges which are, or may be, imposed under your variable annuity contract or variable life insurance policy. Total returns would have been lower if such expenses or charges were included.
The performance graph and table do not reflect the deduction of taxes that a shareholder will pay on Portfolio distributions or the redemption of Portfolio shares.
The performance shown may include the effect of fee waivers and/or expense reimbursements by the Investment Adviser and/or other service providers, which have the effect of increasing total return. Had all fees and expenses been considered, the total returns would have been lower.
The performance update illustrates performance for a variable investment option available through a variable annuity contract or a variable life insurance policy. The
performance shown indicates past performance and is not a projection or prediction of future results. Actual investment returns and principal value will fluctuate so that shares and/or units, at redemption, may be worth more or less than their original cost. Please call (800) 262-3862 to get performance through the most recent month end.
This report contains statements that may be "forward-looking" statements. Actual results may differ materially from those projected in the "forward-looking" statements.
The views expressed in this report reflect those of the portfolio managers, only through the end of the period as stated on the cover. The portfolio managers' views are subject to change at any time based on market and other conditions.
Portfolio holdings are subject to change daily.
(1) Class R6 incepted on May 3, 2016. The Class R6 shares performance shown for the period prior to their inception date is the performance of Class I shares without adjustment for any differences in the expenses between the two classes. If adjusted for such differences, returns would be different.
15
VY® INVESCO COMSTOCK PORTFOLIO
PORTFOLIO MANAGERS' REPORT
VY® Invesco Comstock Portfolio (the "Portfolio") seeks capital growth and income. The Portfolio is managed by Kevin Holt, Lead Portfolio Manager, and Devin Armstrong, James Warwick, and Charles DyReyes each a Portfolio Manager of Invesco Advisers, Inc. — the Sub-Adviser.
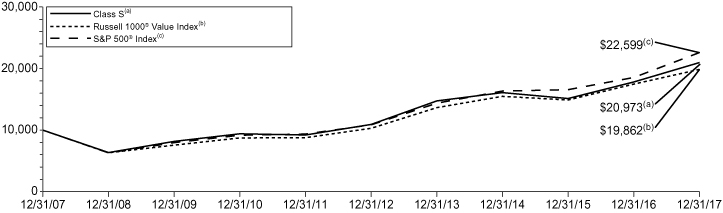
Performance: For the year ended December 31, 2017, the Portfolio's Class S shares, provided a total return of 17.68% compared to the Russell 1000® Value Index and the S&P 500® Index, which returned 13.66% and 21.83%, respectively, for the same period.
Portfolio Specifics: Stock selection in and an overweight exposure to the financials sector were the largest contributors to the Portfolio's relative performance. Notably, within banks, Citigroup and Bank of America performed well for the reporting period, outperforming the sector and the Russell 1000® Value Index. Within diversified financials, Ally Financial and Morgan Stanley were top performers.
Strong stock selection in and an overweight exposure to the information technology sector also boosted the Portfolio's relative performance for the reporting period. Within hardware and equipment, NetApp and Cisco Systems were large contributors to relative Portfolio performance. Software and services companies, eBay, PayPal and Microsoft, as well as semiconductors and equipment company Qualcomm, were also large contributors to the Portfolio's relative performance.
Stock selection in energy stocks was also a large driver of Portfolio performance, with Royal Dutch Shell being a top contributor to returns relative to the Russell 1000® Value Index. However, the largest drivers of relative Portfolio performance were having no exposure to Exxon Mobil and not owning Schlumberger.
Being materially underweight in the telecommunication services sector and having no exposure to the real estate sector also helped relative Portfolio performance. The team has kept the Portfolio underweight in these sectors based on the opinion that valuations are unattractive.
Stock selection within the industrials sector also contributed to Portfolio performance relative to the Russell 1000® Value Index. Notably, Caterpillar was the largest contributor with returns of 75% for the fiscal year. Caterpillar reported consecutive quarters of improving revenue and profits and analysts upgraded the stock on projected strong demand for construction equipment. Being underweight General Electric also aided relative Portfolio performance, as the stock posted double-digit negative returns for the reporting period.
The Portfolio utilizes currency forward contracts to hedge foreign currency exposure. These instruments detracted from performance as the U.S. dollar weakened relative to the foreign currencies of the Portfolio's non-U.S. holdings.
The Portfolio's cash position, while 3% on average, was the largest detractor from relative Portfolio performance given the strong equity market.
Stock selection within the consumer discretionary sector also detracted from Portfolio performance relative to the Russell 1000® Value Index. Strong gains in Carnival Cruise were offset by poor performance from Advance Auto Parts when the company's stock price fell after missing earnings expectations and management projecting a drop in same-store-sales due to industry headwinds.
Current Strategy and Outlook: At the close of the reporting period, the Portfolio's financials sector weighting was overweight to the Russell 1000® Value Index, as we have a favorable view of large banks within financials. We also maintain a constructive view on the long-term prospects for our energy holdings as we believe supply and demand for oil should balance over time. The Portfolio's exposure to each sector has a higher beta than the Russell 1000® Value Index. Therefore, we expect that the Portfolio should be more sensitive to broad moves within these sectors for the foreseeable future.
Portfolio holdings and characteristics are subject to change and may not be representative of current holdings and characteristics. Portfolio holdings are subject to change daily. The outlook for this Portfolio may differ from that presented for other Voya mutual funds. The Portfolio's performance returns shown reflect applicable fee waivers and/or expense limits in effect during this period. Absent such fee waivers/expense limitations, if any, performance would have been lower. Performance for the different classes of shares will vary based on differences in fees associated with each class.
Sector Diversification
as of December 31, 2017
(as a percentage of net assets)
Financials | | | 33.6 | % | |
Energy | | | 16.7 | % | |
Health Care | | | 12.5 | % | |
Information Technology | | | 11.4 | % | |
Industrials | | | 8.1 | % | |
Consumer Discretionary | | | 6.5 | % | |
Consumer Staples | | | 3.5 | % | |
Materials | | | 2.3 | % | |
Telecommunication Services | | | 0.8 | % | |
Utilities | | | 0.6 | % | |
Assets in Excess of Other Liabilities* | | | 4.0 | % | |
Net Assets | | | 100.0 | % | |
* Includes short-term investments.
Portfolio holdings are subject to change daily.
Top Ten Holdings
as of December 31, 2017*
(as a percentage of net assets)
Citigroup, Inc. | | | 5.8 | % | |
Bank of America Corp. | | | 4.8 | % | |
JPMorgan Chase & Co. | | | 3.7 | % | |
Cisco Systems, Inc. | | | 2.8 | % | |
Suncor Energy, Inc. | | | 2.3 | % | |
Royal Dutch Shell PLC — Class A ADR | | | 2.3 | % | |
PNC Financial Services Group, Inc. | | | 2.2 | % | |
Morgan Stanley | | | 2.1 | % | |
Chevron Corp. | | | 2.0 | % | |
General Motors Co. | | | 1.9 | % | |
* Excludes short-term investments.
Portfolio holdings are subject to change daily.
16
PORTFOLIO MANAGERS' REPORT
VY® INVESCO COMSTOCK PORTFOLIO
Average Annual Total Returns for the Periods Ended December 31, 2017 | |
| | 1 Year | | 5 Year | | 10 Year | |
Class ADV | | | 17.31 | % | | | 13.66 | % | | | 7.41 | % | |
Class I | | | 17.95 | % | | | 14.24 | % | | | 7.95 | % | |
Class S | | | 17.68 | % | | | 13.94 | % | | | 7.69 | % | |
Russell 1000® Value Index | | | 13.66 | % | | | 14.04 | % | | | 7.10 | % | |
S&P 500® Index | | | 21.83 | % | | | 15.79 | % | | | 8.50 | % | |
Based on a $10,000 initial investment, the graph and table above illustrate the total return of VY® Invesco Comstock Portfolio against the indices indicated. An index is unmanaged and has no cash in its portfolio and imposes no sales charges. An investor cannot invest directly in an index.
The Portfolio's performance is shown without the imposition of any expenses or charges which are, or may be, imposed under your variable annuity contract or variable life insurance policy. Total returns would have been lower if such expenses or charges were included.
The performance graph and table do not reflect the deduction of taxes that a shareholder will pay on Portfolio distributions or the redemption of Portfolio shares.
The performance shown may include the effect of fee waivers and/or expense reimbursements by the Investment Adviser and/or other service providers, which have the effect of increasing total return. Had all fees and expenses been considered, the total returns would have been lower.
The performance update illustrates performance for a variable investment option available through a variable annuity contract or a variable life insurance policy. The performance shown indicates past performance and is not a projection or prediction of future results. Actual investment returns and principal value will fluctuate so that shares and/or units, at redemption, may be worth more or less than their original cost. Please call (800) 262-3862 to get performance through the most recent month end.
This report contains statements that may be "forward-looking" statements. Actual results may differ materially from those projected in the "forward-looking" statements.
The views expressed in this report reflect those of the portfolio managers, only through the end of the period as stated on the cover. The portfolio managers' views are subject to change at any time based on market and other conditions.
Portfolio holdings are subject to change daily.
17
VY® INVESCO EQUITY AND INCOME PORTFOLIO
PORTFOLIO MANAGERS' REPORT
VY® Invesco Equity and Income Portfolio (the "Portfolio") seeks total return consisting of long-term capital appreciation and current income. The Portfolio is managed by Brian Jurkash, Thomas B. Bastian, CFA, Lead Portfolio Manager, Sergio Marcheli, Matthew Titus and Chuck Burge of Invesco Advisers, Inc. — the Sub-Adviser.*
Performance: For the year ended December 31, 2017, the Portfolio's Class S shares provided a total return of 10.62% compared to the Russell 1000® Value Index, Bloomberg Barclays U.S. Government/Credit Index and the 60% Russell 1000® Value Index/40% Bloomberg Barclays U.S. Government/Credit Index, which returned 13.66%, 4.00% and 9.75%, respectively, for the same period.
Portfolio Specifics: The financials sector was the largest contributor to the Portfolio's performance versus the Russell 1000® Value Index due to strong stock selection in and an overweight exposure to the sector. Specifically, Citigroup, Bank of America and Morgan Stanley were the Portfolio's top contributors. These companies benefited from investor optimism about future interest rates, an improving economy and lower corporate tax rates. Financials also benefited when the U.S. Federal Reserve Board's Comprehensive Capital Analysis and Review was better than expected, providing a favorable view of the financial strength of U.S. banks and their ability to return capital to their shareholders.
Stock selection in the telecommunication services sector, as well as underweight exposure relative to the Russell 1000® Value Index, contributed to relative portfolio performance. The Portfolio's lack of exposure to some of the weaker names in the sector, namely AT&T, helped on a relative basis as the sector posted negative returns for the year. Similarly, the Portfolio's lack of exposure to the real estate sector also contributed to relative returns. The Portfolio has remained materially underweight in these sectors because we believe they are overvalued, as investors have driven up stock prices in a quest for yield in a low-interest rate environment.
Stock selection in the consumer discretionary sector also benefited the Portfolio's performance relative to the Russell 1000® Value Index. Carnival was a key contributor in this sector. The stock performed well and posted returns of over 30% for the reporting period, leading the cruise operator to raise its outlook after reporting better pricing and strong forward-booking volumes for 2017. Michael Kors also contributed to the Portfolio's relative results. Mid-year, the company reported better-than-expected results and a better revenue outlook due to fewer promotions and increased sales within its high-end product lines.
Stock selection within the consumer staples sector was a large detractor from relative portfolio performance for the year. Specifically, Walgreen's Boots Alliance stock posted negative returns for the year after rumors emerged that Amazon (not a portfolio holding) may be entering the pharmacy space, driving investor concerns.
The Portfolio uses high grade bonds as a source of income and to dampen return volatility. Although the bond portion of the Portfolio posted positive returns for the reporting period, bonds generally underperformed equity markets and detracted from portfolio performance versus the Russell 1000® Value Index. Similarly, the Portfolio's allocation to convertible securities also posted positive returns on an absolute basis, but detracted from relative performance as convertibles underperformed the Russell 1000® Value Index. The Portfolio's cash position was a detractor in a strong equity market, as would be expected.
We used currency forward contracts for the purpose of hedging currency exposure of non-U.S.-based companies held in the Portfolio. Currency forward contracts were used solely for the purpose of hedging and not for speculative purposes or leverage. The use of currency forward contracts had a negative impact on the Portfolio's performance, largely due to the weakness of the U.S. dollar compared to the foreign currencies in which the Portfolio's non-U.S. holdings were denominated.
Current Strategy and Outlook: Equities finished 2017 with very strong gains, and many indexes reached record highs. We believe market volatility may return in 2018 given the possibility of slowing economic growth, higher interest rates and political gridlock leading up to the mid-term elections. As always, we seek to invest in companies with what we believe are attractive valuations and strong fundamentals, qualities that we believe will ultimately be reflected in those companies' stock prices.
At the end of the reporting period, the Portfolio's largest overweight exposures relative to the Russell 1000® Value Index were in the financials and energy sectors, while the largest underweight exposures were in the real estate and utilities sectors.
* Effective June 1, 2017, James O. Roeder retired and was removed as a portfolio manager of the Portfolio.
Portfolio holdings and characteristics are subject to change and may not be representative of current holdings and characteristics. Portfolio holdings are subject to change daily. The outlook for this Portfolio may differ from that presented for other Voya mutual funds. The Portfolio's performance returns shown reflect applicable fee waivers and/or expense limits in effect during this period. Absent such fee waivers/expense limitations, if any, performance would have been lower. Performance for the different classes of shares will vary based on differences in fees associated with each class.
Top Ten Holdings
as of December 31, 2017*
(as a percentage of net assets)
Citigroup, Inc. | | | 3.6 | % | |
United States Treasury Note, 1.875%, 12/15/20 | | | 3.4 | % | |
Bank of America Corp. | | | 3.0 | % | |
United States Treasury Note, 1.750%, 11/30/19 | | | 2.8 | % | |
JPMorgan Chase & Co. | | | 2.5 | % | |
United States Treasury Note, 2.000%, 11/30/22 | | | 2.5 | % | |
Morgan Stanley | | | 2.0 | % | |
Citizens Financial Group, Inc. | | | 1.7 | % | |
Royal Dutch Shell PLC — Class A | | | 1.6 | % | |
Occidental Petroleum Corp. | | | 1.5 | % | |
* Excludes short-term investments.
Portfolio holdings are subject to change daily.
Sector Diversification
as of December 31, 2017
(as a percentage of net assets)
Financials | | | 28.7 | % | |
Energy | | | 12.4 | % | |
U.S. Treasury Obligations | | | 10.6 | % | |
Health Care | | | 7.3 | % | |
Information Technology | | | 7.0 | % | |
Consumer Discretionary | | | 5.2 | % | |
Industrials | | | 4.3 | % | |
Consumer Staples | | | 4.2 | % | |
Communications | | | 4.0 | % | |
Consumer, Non-cyclical | | | 3.1 | % | |
Technology | | | 2.1 | % | |
Materials | | | 1.5 | % | |
Telecommunication Services | | | 1.2 | % | |
Consumer, Cyclical | | | 1.0 | % | |
Utilities | | | 0.6 | % | |
Basic Materials | | | 0.2 | % | |
Federal Home Loan Mortgage Corporation | | | 0.1 | % | |
Federal National Mortgage Association | | | 0.1 | % | |
Municipal | | | 0.1 | % | |
Assets in Excess of Other Liabilities* | | | 6.3 | % | |
Net Assets | | | 100.0 | % | |
* Includes short-term investments.
Portfolio holdings are subject to change daily.
18
VY® INVESCO EQUITY AND INCOME PORTFOLIO
PORTFOLIO MANAGERS' REPORT

Average Annual Total Returns for the Periods Ended December 31, 2017 | |
| | 1 Year | | 5 Year | | 10 Year | | Since Inception
of Class S2
February 27, 2009 | |
Class ADV | | | 10.32 | % | | | 10.70 | % | | | 6.68 | % | | | — | | |
Class I | | | 10.90 | % | | | 11.26 | % | | | 7.22 | % | | | — | | |
Class S | | | 10.62 | % | | | 10.98 | % | | | 6.95 | % | | | — | | |
Class S2 | | | 10.48 | % | | | 10.83 | % | | | — | | | | 12.82 | % | |
Russell 1000® Value Index | | | 13.66 | % | | | 14.04 | % | | | 7.10 | % | | | 17.33 | % | |
Bloomberg Barclays U.S. Government/Credit Index | | | 4.00 | % | | | 2.13 | % | | | 4.08 | % | | | 4.25 | % | |
60% Russell 1000® Value Index/40% Bloomberg Barclays U.S. Government/Credit Index | | | 9.75 | % | | | 9.28 | % | | | 6.23 | % | | | 12.18 | % | |
Based on a $10,000 initial investment, the graph and table above illustrate the total return of VY® Invesco Equity and Income Portfolio against the indices indicated. An index is unmanaged and has no cash in its portfolio and imposes no sales charges. An investor cannot invest directly in an index.
The Portfolio's performance is shown without the imposition of any expenses or charges which are, or may be, imposed under your variable annuity contract or variable life insurance policy. Total returns would have been lower if such expenses or charges were included.
The performance graph and table do not reflect the deduction of taxes that a shareholder will pay on Portfolio distributions or the redemption of Portfolio shares.
The performance shown may include the effect of fee waivers and/or expense reimbursements by the Investment Adviser and/or other service providers, which have the effect of increasing total return. Had all fees and expenses been considered, the total returns would have been lower.
The performance update illustrates performance for a variable investment option available through a variable
annuity contract or a variable life insurance policy. The performance shown indicates past performance and is not a projection or prediction of future results. Actual investment returns and principal value will fluctuate so that shares and/or units, at redemption, may be worth more or less than their original cost. Please call (800) 262-3862 to get performance through the most recent month end.
This report contains statements that may be "forward-looking" statements. Actual results may differ materially from those projected in the "forward-looking" statements.
The views expressed in this report reflect those of the portfolio managers, only through the end of the period as stated on the cover. The portfolio managers' views are subject to change at any time based on market and other conditions.
Portfolio holdings are subject to change daily.
19
VY® JPMORGAN MID CAP VALUE PORTFOLIO
PORTFOLIO MANAGERS' REPORT
VY® JPMorgan Mid Cap Value Portfolio (the "Portfolio") seeks growth from capital appreciation. The Portfolio is managed by Jonathan K.L. Simon, Lawrence Playford, CFA, and Gloria Fu, CFA, Managing Directors and Portfolio Managers of J.P. Morgan Investment Management Inc. — the Sub-Adviser.
Performance: For the year ended December 31, 2017, the Portfolio's Class S shares provided a total return of 13.72% compared to the Russell Midcap® Value Index (the "Index" or "Russell Midcap® Value"), which returned 13.34% for the same period.
Portfolio Specifics: The Portfolio outperformed the Index during the year. The combination of strong stock selection as well as our underweight position in the energy sector contributed most during the year. Stock selection in health-care and financials also proved helpful while weak stock selection in consumer staples and real estate detracted from results.
On a stock specific basis, Mohawk ("MHK") and Synopsys were top contributors. Investors responded positively to continued strong management execution at Mohawk, reflected in excellent operating results. Our favorable view of MHK is based on its leading market share position in flooring with its strong competitive advantage driven by, what we believe is, its best-in-class manufacturing and distribution. In our view, MHK's management team is high quality, consistently creating significant value for shareholders through mergers and acquisitions, further consolidating its leadership position, and capitalizing on the strong organic growth story in the global flooring industry. Technology has been the best-performing sector this year, which has caused Synopsys, a leader in electronic design automation software, to be a top contributor to performance. While our view of the company remains favorable, we trimmed the position given the magnitude of this year's outperformance, which has caused the valuation to be less compelling. That said, we maintain a position because Synopsys offers differentiated products and continues to deliver strong returns on invested capital. We continue to think that management will successfully execute and deliver growth amidst a consolidating chip industry.
Two stock-specific detractors from performance for the year were Newell Brands ("Newell") and Bed Bath & Beyond. Shares of Newell sold off after missing consensus expectations. While investors were disappointed to see higher spending, we actually view these investments positively. Newell has been proactive in growing its e-commerce channel (e-commerce now represents 10% of total sales). We continue to like the fact that Newell is a hybrid consumer staples/discretionary company and we still don't think potential cost savings from the recent Jarden merger are fully reflected in the valuation. We believe it is clear that the Bed Bath & Beyond business model remains in flux as digital strength is failing to offset brick-and-mortar weakness. Margins have been pressured by elevated expenses in direct to consumer shipping, coupons, advertising, payroll, and technology. Given additional downside risk, we exited our position. While the valuation is certainly inexpensive, we believe that the prospects of a turnaround will take longer than expected to materialize so we decided to exit the position.
Current Strategy and Outlook: In our opinion, we still see the best opportunities in financials given potential for rate normalization, regulatory easing and tax reform. Consequently, financials remain the largest sector position. Additionally, we find opportunities in high-quality shopping center REITs, which in our view should benefit from retailer bankruptcies, as they can re-lease at higher rates.
Alternatively, we have been trimming technology given outperformance, which makes valuations less compelling. As Amazon has changed consumer behavior within discretionary and staples, we prefer to own companies with differentiated brands, barriers to entry, and management capable of executing a successful omni-channel strategy. Finally, we have limited exposure to energy and industrials, given their cyclicality.
Portfolio holdings and characteristics are subject to change and may not be representative of current holdings and characteristics. Portfolio holdings are subject to change daily. The outlook for this Portfolio may differ from that presented for other Voya mutual funds. The Portfolio's performance returns shown reflect applicable fee waivers and/or expense limits in effect during this period. Absent such fee waivers/expense limitations, if any, performance would have been lower. Performance for the different classes of shares will vary based on differences in fees associated with each class.
Sector Diversification
as of December 31, 2017
(as a percentage of net assets)
Financials | | | 23.6 | % | |
Consumer Discretionary | | | 16.6 | % | |
Real Estate | | | 10.7 | % | |
Information Technology | | | 9.1 | % | |
Utilities | | | 8.4 | % | |
Industrials | | | 8.4 | % | |
Consumer Staples | | | 6.5 | % | |
Energy | | | 6.2 | % | |
Health Care | | | 6.2 | % | |
Materials | | | 4.6 | % | |
Liabilities in Excess of Other Assets* | | | (0.3 | )% | |
Net Assets | | | 100.0 | % | |
* Includes short-term investments.
Portfolio holdings are subject to change daily.
Top Ten Holdings
as of December 31, 2017
(as a percentage of net assets)
Energen Corp. | | | 2.1 | % | |
Mohawk Industries, Inc. | | | 2.1 | % | |
EQT Corp. | | | 1.9 | % | |
Loews Corp. | | | 1.8 | % | |
M&T Bank Corp. | | | 1.8 | % | |
Xcel Energy, Inc. | | | 1.6 | % | |
CMS Energy Corp. | | | 1.6 | % | |
Williams Cos., Inc. | | | 1.6 | % | |
T. Rowe Price Group, Inc. | | | 1.6 | % | |
WEC Energy Group, Inc. | | | 1.6 | % | |
Portfolio holdings are subject to change daily.
20
VY® JPMORGAN MID CAP VALUE PORTFOLIO
PORTFOLIO MANAGERS' REPORT
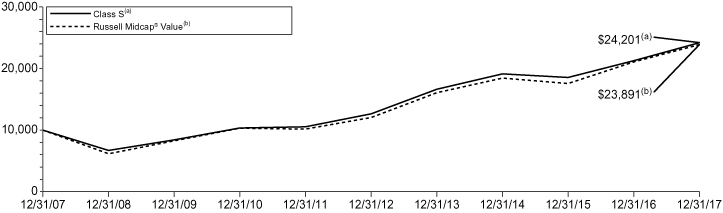
Average Annual Total Returns for the Periods Ended December 31, 2017 | |
| | 1 Year | | 5 Year | | 10 Year | | Since Inception
of Class S2
February 27, 2009 | |
Class ADV | | | 13.41 | % | | | 13.57 | % | | | 8.97 | % | | | — | | |
Class I | | | 14.04 | % | | | 14.14 | % | | | 9.51 | % | | | — | | |
Class S | | | 13.72 | % | | | 13.85 | % | | | 9.23 | % | | | — | | |
Class S2 | | | 13.52 | % | | | 13.68 | % | | | — | | | | 18.16 | % | |
Russell Midcap® Value | | | 13.34 | % | | | 14.68 | % | | | 9.10 | % | | | 19.84 | % | |
Based on a $10,000 initial investment, the graph and table above illustrate the total return of VY® JPMorgan Mid Cap Value Portfolio against the index indicated. The index is unmanaged and has no cash in its portfolio and imposes no sales charges. An investor cannot invest directly in an index.
The Portfolio's performance is shown without the imposition of any expenses or charges which are, or may be, imposed under your variable annuity contract or variable life insurance policy. Total returns would have been lower if such expenses or charges were included.
The performance graph and table do not reflect the deduction of taxes that a shareholder will pay on Portfolio distributions or the redemption of Portfolio shares.
The performance shown may include the effect of fee waivers and/or expense reimbursements by the Investment Adviser and/or other service providers, which have the effect of increasing total return. Had all fees and expenses been considered, the total returns would have been lower.
The performance update illustrates performance for a variable investment option available through a variable
annuity contract or a variable life insurance policy. The performance shown indicates past performance and is not a projection or prediction of future results. Actual investment returns and principal value will fluctuate so that shares and/or units, at redemption, may be worth more or less than their original cost. Please call (800) 262-3862 to get performance through the most recent month end.
This report contains statements that may be "forward-looking" statements. Actual results may differ materially from those projected in the "forward-looking" statements.
The views expressed in this report reflect those of the portfolio managers, only through the end of the period as stated on the cover. The portfolio managers' views are subject to change at any time based on market and other conditions.
Portfolio holdings are subject to change daily.
21
VY® OPPENHEIMER GLOBAL PORTFOLIO
PORTFOLIO MANAGERS' REPORT
VY® Oppenheimer Global Portfolio (the "Portfolio") seeks capital appreciation. The Portfolio is managed by Rajeev Bhaman, CFA, John Delano, CFA, Portfolio Managers* of OppenheimerFunds, Inc. — the Sub-Adviser.
Performance: For the year ended December 31, 2017, the Portfolio's Class S shares provided a total return of 36.13% compared to the MSCI All Country World IndexSM, which returned 23.97% for the same period.
Portfolio Specifics: The Portfolio outperformed in 10 out of 11 sectors of the MSCI All Country World IndexSM this reporting period, led by stock selection in the consumer discretionary, health care and real estate sectors. The Portfolio underperformed within the materials sector, where our typical underweight position detracted from performance. On a country basis, the U.S., France, and Japan, were the strongest outperformers, due to stock selection. Detractors included stock selection in Spain, an underweight position in China, and the Portfolio's lack of exposure to South Korea.
Top contributors to performance this period included DLF Limited ("DLF"), Alphabet, and Kering. DLF Limited is an Indian real estate entity that has been undergoing a lengthy restructuring. Of late, more steps have been taken to reduce leverage and sell off a significant inventory of unsold properties. In our opinion, though the Indian real estate markets remain soft, DLF's management is taking the right steps to right size the portfolio and fix the balance sheet. In our opinion, Alphabet performed well, reflecting its advantage in a number of fast growing verticals. We see those advantages holding, and there remains significant optionality for the company, which we do not believe is, as yet, represented in its share value. Kering is the world's third-largest luxury goods conglomerate. Its flagship brand, Gucci, continued to demonstrate booming growth. Gucci maintains its focus on luxury goods in the upper price range and enjoys broad-based growth across customer groups and regions. The rest of the business lines have been performing roughly in line with expectations and have overall been benefiting from a more confident Asian consumer.
The most significant detractors from performance this period included TechnipFMC, Earthport, and Shire.
TechnipFMC is the global leader in offshore oil infrastructure equipment and services. The firm's competitive position strengthened with the FMC combination earlier in the year. The company operates under three reporting segments: Subsea, Surface, and Onshore/Offshore. Share weakness was partially due to lower oil prices earlier in the year, which constrains oil producers' capital spending budget, which can lead to lower inbound orders for TechnipFMC. We see tangible evidence that its various business segments, particularly in Subsea, are attracting wide customer interest and we believe are poised to gain market share in the coming years.
Shire is a diversified, Ireland-based specialty drug firm with increasing exposure to biologics manufacturing and rare diseases. The company's performance has partially been a result of supply disruptions for its one drug, Cinryze, and faster than expected erosion of another drug, Lialda. That being said, several other drugs within the firm's franchise have been performing strongly. We believe that Shire's wide range of drugs to treat various diseases including ADHD, rare genetic diseases and ulcerative colitis, buffers the company from one-product risk. We are confident in the long-term outlook for this company. Earthport provides cross-border payment services to banks and businesses. The company experienced declines after announcing it expected revenue to come in below market expectations for the year.
Current Strategy and Outlook: In our view, a good starting point for investing in companies that have the capacity to grow at an above average rate for a long period of time is to be thinking carefully about what economic ecosystems are expanding structurally. From this thought process we can develop investment themes, some of which can be populated by multiple companies/beneficiaries. Some of these themes today include the human desire for status and happiness. Within this broad idea, we believe we own some of the world's best luxury goods companies. The use of technology to advance the treatment of illnesses for which there is no cure, or the deepening electronic content of automobiles and trucks are others. None are present to capitalize on a market regime or cycle; instead they play upon trends which we believe will unfold over the next decade or more.
The market that we see before us, in our opinion, continues to carry above average headline valuations, and this is something to be mindful of. However, the level of interest rates we see today matters a lot. We believe if there ever were an environment where high multiples were to be the norm, it would be now. Growth is picking up and inflation is not picking up much. Were that to materially shift, then valuations may make much less sense.
We try to assemble a portfolio that is adaptable to most environments by emphasizing the quality and sustainability of purpose for each company we invest in. We believe businesses that have these two traits can weather an uncertain future.
* Effective March 31, 2017, John Delano was added as a portfolio manager of the Portfolio.
Portfolio holdings and characteristics are subject to change and may not be representative of current holdings and characteristics. Portfolio holdings are subject to change daily. The outlook for this Portfolio may differ from that presented for other Voya mutual funds. The Portfolio's performance returns shown reflect applicable fee waivers and/or expense limits in effect during this period. Absent such fee waivers/expense limitations, if any, performance would have been lower. Performance for the different classes of shares will vary based on differences in fees associated with each class.
Geographic Diversification
as of December 31, 2017
(as a percentage of net assets)
United States | | | 44.9 | % | |
Japan | | | 14.2 | % | |
Germany | | | 9.2 | % | |
United Kingdom | | | 7.0 | % | |
France | | | 6.1 | % | |
India | | | 3.7 | % | |
Switzerland | | | 3.2 | % | |
Netherlands | | | 3.1 | % | |
China | | | 2.4 | % | |
Spain | | | 2.3 | % | |
Countries between 0.5%-1.2%^ | | | 2.4 | % | |
Assets in Excess of Other Liabilities* | | | 1.5 | % | |
Net Assets | | | 100.0 | % | |
* Includes short-term investments.
^ Includes 3 countries, which each represents 0.5%-1.2% of net assets.
Portfolio holdings are subject to change daily.
Top Ten Holdings
as of December 31, 2017
(as a percentage of net assets)
Airbus SE | | | 3.1 | % | |
Alphabet, Inc. — Class A | | | 3.0 | % | |
LVMH Moet Hennessy Louis Vuitton SE | | | 2.8 | % | |
Alphabet, Inc. — Class C | | | 2.8 | % | |
Aetna, Inc. | | | 2.7 | % | |
Nidec Corp. | | | 2.5 | % | |
Citigroup, Inc. | | | 2.5 | % | |
DLF Ltd. | | | 2.4 | % | |
S&P Global, Inc. | | | 2.4 | % | |
Facebook, Inc. | | | 2.4 | % | |
Portfolio holdings are subject to change daily.
22
PORTFOLIO MANAGERS' REPORT
VY® OPPENHEIMER GLOBAL PORTFOLIO

Average Annual Total Returns for the Periods Ended December 31, 2017 | |
| | 1 Year | | 5 Year | | 10 Year | | Since Inception
of Class S2
February 27, 2009 | |
Class ADV | | | 35.82 | % | | | 12.55 | % | | | 6.66 | % | | | — | | |
Class I | | | 36.49 | % | | | 13.13 | % | | | 7.19 | % | | | — | | |
Class S | | | 36.13 | % | | | 12.85 | % | | | 6.93 | % | | | — | | |
Class S2 | | | 35.92 | % | | | 12.68 | % | | | — | | | | 16.56 | % | |
MSCI All Country World IndexSM | | | 23.97 | % | | | 10.80 | % | | | 4.65 | % | | | 14.49 | % | |
Based on a $10,000 initial investment, the graph and table above illustrate the total return of VY® Oppenheimer Global Portfolio against the index indicated. The index is unmanaged and has no cash in its portfolio and imposes no sales charges. An investor cannot invest directly in an index.
The Portfolio's performance is shown without the imposition of any expenses or charges which are, or may be, imposed under your variable annuity contract or variable life insurance policy. Total returns would have been lower if such expenses or charges were included.
The performance graph and table do not reflect the deduction of taxes that a shareholder will pay on Portfolio distributions or the redemption of Portfolio shares.
The performance shown may include the effect of fee waivers and/or expense reimbursements by the Investment Adviser and/or other service providers, which have the effect of increasing total return. Had all fees and expenses been considered, the total returns would have been lower.
The performance update illustrates performance for a variable investment option available through a variable
annuity contract or a variable life insurance policy. The performance shown indicates past performance and is not a projection or prediction of future results. Actual investment returns and principal value will fluctuate so that shares and/or units, at redemption, may be worth more or less than their original cost. Please call (800) 262-3862 to get performance through the most recent month end.
This report contains statements that may be "forward-looking" statements. Actual results may differ materially from those projected in the "forward-looking" statements.
The views expressed in this report reflect those of the portfolio manager, only through the end of the period as stated on the cover. The portfolio manager's views are subject to change at any time based on market and other conditions.
Portfolio holdings are subject to change daily.
23
VY® PIONEER HIGH YIELD PORTFOLIO
PORTFOLIO MANAGERS' REPORT
VY® Pioneer High Yield Portfolio (the "Portfolio") seeks to maximize total return through income and capital appreciation. The Portfolio is managed by Tracy Wright, Senior Vice President, Lead Portfolio Manager, Matthew Shulkin, CFA, Vice President, Portfolio Manager*, and Andrew Feltus, Director of High Yield and Senior Vice President of Amundi Pioneer Asset Management, Inc. — the Sub-Adviser**.
Performance: For the year ended December 31, 2017, the Portfolio's Class I shares provided a total return of 7.36% compared to the ICE BofAML U.S. High Yield Index and the ICE BofAML Speculative Grade U.S. Convertible Index, which returned 7.48% and 14.29%, respectively, for the same period.
Portfolio Specifics: Sector allocation was the most significant contributor to the Portfolio's relative performance during the one-year period. The out-of-benchmark allocations to convertible bonds and equities outperformed corporate high yield, with the majority of that return coming from the healthcare sector. Healthcare was also the biggest supplier of absolute and relative performance within the corporate high yield allocation.
The Portfolio's underweight positioning in the lower-rated CCC and below, including distressed, quality tiers was a negative contributor to relative performance, as the more speculative rated credits significantly outperformed during the period. From a total return perspective, we utilize convertible bonds as a means to offset the underweight to CCC rated bonds, and to capture the upside in equities. Overall, the impact of the ratings mix was slightly positive, supported by the benefit from the "not-rated" securities (largely convertibles and equities).
Securities contributing to performance included the corporate bond positions in Valeant Pharmaceuticals and Scientific Games International. The decision to add exposure to Valeant Pharmaceuticals after a severe sell-off in the name aided performance, as the bond was supported by the company's efforts to sell assets and pay down debt. Our overweight position in gambling products company Scientific Games was a strong contributor to results as management restructuring initiatives led to significantly improved operating results. Within equities, the positions in Aetna and Emergent BioSolutions (a convertible bond recently converted to equity) were significant outperformers. Having underperformed for the great part of 2017, the healthcare and specialty pharma sectors rebounded in the fourth quarter.
Securities detracting from performance, during the year, included the corporate bond positions in PetSmart, Frontier Communications and Windstream, which is unsurprising given the secular challenges faced by both the retail and telecommunication sectors in 2017.
Current Strategy and Outlook: We continue to remain overweight the healthcare sector. We believe the sector may be poised to benefit from further capital appreciation in 2018. We had been overweight homebuilders, having recently reduced exposure as the sector had a strong year. We remain underweight retail which, in our view, continues to struggle, and historically is a sector that has exhibited low recovery rates. High yield experienced another strong year in 2017, following 2016's blockbuster year. We do not expect similar returns going into 2018, but believe fundamentals remain strong and returns will be more consistent. In our opinion, corporate health is good while defaults remain low. Spreads are tight, but we do not see any catalysts for spread widening. We will continue to invest in out-of-benchmark sectors such as bank loans and convertible bonds. Bank loans continue to benefit from higher coupons as a result of higher LIBOR rates. We believe that bank loans also have high credit quality and provide an additional diversification to the Portfolio. We expect that convertible bonds will continue to be utilized, although new issuance has been limited, to enhance the Portfolio's total return without the need to invest further down in the lower quality rating tiers.
* Effective October 1, 2017, Matthew Shulkin was added as a portfolio manager to the Portfolio.
** Pioneer Investment Management, Inc. was acquired by Amundi S.A. As a result, the name was changed to Amunid Pioneer Asset Management, Inc.
Portfolio holdings and characteristics are subject to change and may not be representative of current holdings and characteristics. Portfolio holdings are subject to change daily. The outlook for this Portfolio may differ from that presented for other Voya mutual funds. The Portfolio's performance returns shown reflect applicable fee waivers and/or expense limits in effect during this period. Absent such fee waivers/expense limitations, if any, performance would have been lower. Performance for the different classes of shares will vary based on differences in fees associated with each class.
Investment Type Allocation
as of December 31, 2017
(as a percentage of net assets)
Corporate Bonds/Notes | | | 73.9 | % | |
Convertible Bonds/Notes | | | 8.3 | % | |
Bank Loans | | | 3.8 | % | |
Common Stock | | | 3.2 | % | |
Preferred Stock | | | 1.6 | % | |
Warrants** | | | 0.0 | % | |
Foreign Government Bonds** | | | 0.0 | % | |
Assets in Excess of Other Liabilities* | | | 9.2 | % | |
Net Assets | | | 100.0 | % | |
* Includes short-term investments.
** Amount less than 0.05%.
Portfolio holdings are subject to change daily.
Top Ten Holdings
as of December 31, 2017*
(as a percentage of net assets)
Sprint Corp., 7.250%, 09/15/21 | | | 1.7 | % | |
Valeant Pharmaceuticals International, Inc.,
5.875%, 05/15/23 | | | 1.6 | % | |
Wells Fargo & Co. | | | 0.8 | % | |
HCA, Inc., 5.375%, 02/01/25 | | | 0.8 | % | |
Crown Cork & Seal Co., Inc., 7.375%, 12/15/26 | | | 0.7 | % | |
Royal Bank of Scotland Group PLC,
8.000%, 12/31/99 | | | 0.7 | % | |
Level 3 Financing, Inc., 5.250%, 03/15/26 | | | 0.7 | % | |
Forest City Realty Trust, Inc. | | | 0.7 | % | |
Scientific Games International, Inc.,
10.000%, 12/01/22 | | | 0.6 | % | |
Fly Leasing Ltd., 6.375%, 10/15/21 | | | 0.6 | % | |
* Excludes short-term investments.
Portfolio holdings are subject to change daily.
24
VY® PIONEER HIGH YIELD PORTFOLIO
PORTFOLIO MANAGERS' REPORT

Average Annual Total Returns for the Periods Ended December 31, 2017 | |
| | 1 Year | | 5 Year | | 10 Year | |
Class I | | | 7.36 | % | | | 5.70 | % | | | 7.89 | % | |
Class S | | | 7.19 | % | | | 5.45 | % | | | 7.62 | % | |
ICE BofAML U.S. High Yield Index | | | 7.48 | % | | | 5.80 | % | | | 7.89 | % | |
ICE BofAML Speculative Grade U.S. Convertible Index | | | 14.29 | % | | | 9.54 | % | | | 7.42 | % | |
Based on a $10,000 initial investment, the graph and table above illustrate the total return of VY® Pioneer High Yield Portfolio against the indices indicated. An index is unmanaged and has no cash in its portfolio and imposes no sales charges. An investor cannot invest directly in an index.
The Portfolio's performance is shown without the imposition of any expenses or charges which are, or may be, imposed under your variable annuity contract or variable life insurance policy. Total returns would have been lower if such expenses or charges were included.
The performance graph and table do not reflect the deduction of taxes that a shareholder will pay on Portfolio distributions or the redemption of Portfolio shares.
The performance shown may include the effect of fee waivers and/or expense reimbursements by the Investment Adviser and/or other service providers, which have the effect of increasing total return. Had all fees and expenses been considered, the total returns would have been lower.
The performance update illustrates performance for a variable investment option available through a variable
annuity contract or a variable life insurance policy. The performance shown indicates past performance and is not a projection or prediction of future results. Actual investment returns and principal value will fluctuate so that shares and/or units, at redemption, may be worth more or less than their original cost. Please call (800) 262-3862 to get performance through the most recent month end.
This report contains statements that may be "forward-looking" statements. Actual results may differ materially from those projected in the "forward-looking" statements.
The views expressed in this report reflect those of the portfolio managers, only through the end of the period as stated on the cover. The portfolio managers' views are subject to change at any time based on market and other conditions.
Portfolio holdings are subject to change daily.
25
VY® T. ROWE PRICE DIVERSIFIED MID CAP GROWTH PORTFOLIO
PORTFOLIO MANAGERS' REPORT
VY® T. Rowe Price Diversified Mid Cap Growth Portfolio (the "Portfolio") seeks long-term capital appreciation. The Portfolio is managed by Donald J. Peters, Vice President, and Donald J. Easley, CFA, Vice President, Portfolio Managers of T. Rowe Price Associates, Inc. — the Sub-Adviser.
Performance: For the year ended December 31, 2017, the Portfolio's Class S shares provided a total return of 24.46% compared to the S&P MidCap 400® Index and the Russell Midcap® Growth Index, which returned 16.24% and 25.27%, respectively, for the same period.
Portfolio Specifics: The Portfolio underperformed the Russell Midcap® Growth Index after fees and expenses but outperformed the Russell Midcap® Growth Index before the deduction of fees and expenses. Consumer staples benefited relative results, due to stock selection. Leading contributors within the sector included Tyson Foods, a producer and processor of chicken, beef, and pork. Shares traded higher after the company reported better-than-expected topline and bottom-line results, primarily driven by the sustained strength of the company's beef and pork segments. We continue to like Tyson Foods' focus on increasing its higher-margin prepared-food business, which we believe improves product diversity and could lead to stronger, less volatile earnings over the long term.
The consumer discretionary sector also contributed to relative results, due to stock selection and an underweight position. Within the sector, Wayfair, an online retailer offering home furnishing and décor across a variety of styles and price points, helped performance. Shares traded higher due to a confluence of positive events including strong North American sales driving topline growth momentum, a mix-shift in categories and geography driving margin expansion, and continued penetration of private-label offerings. Also in the sector, Ferrari performed well. The company manufactures high performance supercars and participates as a constructor team in Formula 1 racing. Shares climbed as the company exceeded expectations due to volume growth, a positive price mix, and growth in engine sales to Maserati. We have confidence in Chief Executive Officer Sergio Marchionne's ability to drive sustained growth through new model launches and a focus on margin expansion. Burlington Stores is the third-largest off-price retailer in the U.S., providing branded clothing, footwear, accessories, home goods, and coats. Growth in traffic, a high conversion rate, and higher average sales thanks to increases in units per transaction and average unit price drove higher-than-expected same-store sales, while decreased markdowns and higher initial markups contributed to expanded margins. We believe the company is on the right side of a secular trend and has the building blocks to execute and deliver consistent growth.
Conversely, the information technology sector hindered relative performance, due to security selection and an underweight position. Detractors in the sector include Sabre, which provides data-driven business intelligence, as well as mobile, distribution, and software-as-a-service solutions to the global travel and tourism industry. Shares retreated after disappointing results and lowered guidance for the airline and hospitality solutions business as revenue was lighter than expected and margins narrowed due to costs from a cybersecurity breach, increased investment, operating expenses, and lost revenue associated with halting the implementation of a reservation system, as well as lost bookings from the insolvency of a travel agency. Stock selection in the materials sector also detracted from relative results.
Current Strategy and Outlook: The stock market has continued to "melt up" in recent months, extending an already exceptional bull market, both in magnitude and duration. While a sense that the good times cannot continue forever might call for some caution, we are also moderately concerned about valuations, which in our opinion seem, if not in bubble territory, also not encouraging of further near-term gains. The market's steady advance has also made it more difficult to find entry points to add new positions to the Portfolio. This is true even of the industrials sector, long a favored hunting ground of ours because of an abundance of what we have believe are reasonably valued growth stocks.
Portfolio holdings and characteristics are subject to change and may not be representative of current holdings and characteristics. Portfolio holdings are subject to change daily. The outlook for this Portfolio may differ from that presented for other Voya mutual funds. The Portfolio's performance returns shown reflect applicable fee waivers and/or expense limits in effect during this period. Absent such fee waivers/expense limitations, if any, performance would have been lower. Performance for the different classes of shares will vary based on differences in fees associated with each class.
Sector Diversification
as of December 31, 2017
(as a percentage of net assets)
Information Technology | | | 27.2 | % | |
Industrials | | | 18.7 | % | |
Consumer Discretionary | | | 15.3 | % | |
Health Care | | | 13.8 | % | |
Financials | | | 8.0 | % | |
Consumer Staples | | | 5.8 | % | |
Materials | | | 5.2 | % | |
Real Estate | | | 3.3 | % | |
Energy | | | 1.7 | % | |
Utilities | | | 0.6 | % | |
Telecommunication Services | | | 0.3 | % | |
Assets in Excess of Other Liabilities* | | | 0.1 | % | |
Net Assets | | | 100.0 | % | |
* Includes short-term investments.
Portfolio holdings are subject to change daily.
Top Ten Holdings
as of December 31, 2017
(as a percentage of net assets)
Ross Stores, Inc. | | | 1.0 | % | |
Microchip Technology, Inc. | | | 0.9 | % | |
Progressive Corp. | | | 0.9 | % | |
Fiserv, Inc. | | | 0.9 | % | |
Fidelity National Information Services, Inc. | | | 0.9 | % | |
SBA Communications Corp. | | | 0.9 | % | |
Vantiv, Inc. | | | 0.9 | % | |
Dollar General Corp. | | | 0.8 | % | |
Vulcan Materials Co. | | | 0.8 | % | |
ServiceNow, Inc. | | | 0.8 | % | |
Portfolio holdings are subject to change daily.
26
PORTFOLIO MANAGERS' REPORT
VY® T. ROWE PRICE DIVERSIFIED MID CAP GROWTH PORTFOLIO

Average Annual Total Returns for the Periods Ended December 31, 2017 | |
| | 1 Year | | 5 Year | | 10 Year | | Since Inception
of Class S2
February 27, 2009 | |
Class ADV | | | 24.12 | % | | | 15.05 | % | | | 8.94 | % | | | — | | |
Class I | | | 24.81 | % | | | 15.63 | % | | | 9.48 | % | | | — | | |
Class R6(1) | | | 24.81 | % | | | 15.66 | % | | | 9.49 | % | | | — | | |
Class S | | | 24.46 | % | | | 15.34 | % | | | 9.20 | % | | | — | | |
Class S2 | | | 24.28 | % | | | 15.16 | % | | | — | | | | 19.19 | % | |
S&P MidCap 400® Index | | | 16.24 | % | | | 15.01 | % | | | 9.97 | % | | | 19.55 | % | |
Russell Midcap® Growth Index | | | 25.27 | % | | | 15.30 | % | | | 9.10 | % | | | 19.61 | % | |
Based on a $10,000 initial investment, the graph and table above illustrate the total return of VY® T. Rowe Price Diversified Mid Cap Growth Portfolio against the indices indicated. An index is unmanaged and has no cash in its portfolio and imposes no sales charges. An investor cannot invest directly in an index.
The Portfolio's performance is shown without the imposition of any expenses or charges which are, or may be, imposed under your variable annuity contract or variable life insurance policy. Total returns would have been lower if such expenses or charges were included.
The performance graph and table do not reflect the deduction of taxes that a shareholder will pay on Portfolio distributions or the redemption of Portfolio shares.
The performance shown may include the effect of fee waivers and/or expense reimbursements by the Investment Adviser and/or other service providers, which have the effect of increasing total return. Had all fees and expenses been considered, the total returns would have been lower.
The performance update illustrates performance for a variable investment option available through a variable annuity contract or a variable life insurance policy. The
performance shown indicates past performance and is not a projection or prediction of future results. Actual investment returns and principal value will fluctuate so that shares and/or units, at redemption, may be worth more or less than their original cost. Please call (800) 262-3862 to get performance through the most recent month end.
This report contains statements that may be "forward-looking" statements. Actual results may differ materially from those projected in the "forward-looking" statements.
The views expressed in this report reflect those of the portfolio managers, only through the end of the period as stated on the cover. The portfolio managers' views are subject to change at any time based on market and other conditions.
Portfolio holdings are subject to change daily.
(1) Class R6 incepted on May 3, 2016. The Class R6 shares performance shown for the period prior to their inception date is the performance of Class I shares without adjustment for any differences in the expenses between the two classes. If adjusted for such differences, returns would be different.
27
VY® T. ROWE PRICE GROWTH EQUITY PORTFOLIO
PORTFOLIO MANAGERS' REPORT
VY® T. Rowe Price Growth Equity Portfolio (the "Portfolio") seeks long-term growth through investments in stocks. The Portfolio is managed by Joseph B. Fath, Vice President and Portfolio Manager of T. Rowe Price Associates, Inc. — the Sub-Adviser.
Performance: For the year ended December 31, 2017, the Portfolio's Class I shares, provided a total return of 33.58% compared to the S&P 500® Index and the Russell 1000® Growth Index, which returned 21.83% and 30.21%, respectively, for the same period.
Portfolio Specifics: Stock selection was the main reason for relative outperformance by the Portfolio, but sector weighting was also notably positive. Information technology was the leading relative outperformer, due to stock selection and significant overweighting against the S&P 500® Index. The absence of energy stocks benefited performance as it was the weakest sector in the S&P 500® Index. Health care outperformed driven by stock selection. Financials was the largest detractor, due to stock selection and significant underweighting. The absence of materials stocks hurt results.
Information technology was the leading relative outperformer. Shares of PayPal, the leading pure-play digital wallet, rose over the past year as it delivered solid results across a broad range of metrics, including total payment volume and active accounts. Higher-than-expected revenue growth in its gaming and cloud-computing businesses helped drive shares of Tencent Holdings higher over the past year. We believe the company, which operates the dominant social media platform in China, is the best-positioned mobile Internet player in the region with its WeChat messaging service and portfolio of other promising assets. In our opinion, the company's large traffic base provides significant opportunities to monetize its efforts in online payments, Internet finance, cloud computing, and subscription-based content. Shares of Alibaba Group Holding rallied sharply over the past year, with results consistently exceeding expectations, driven by the strength in its core Chinese e-commerce business.
Health care outperformed. Vertex Pharmaceuticals demonstrated strong stock gains thanks in large part to successful results from its Phase III clinical trial for a new drug designed to treat patients with cystic fibrosis. The population served by its existing treatment did well in the trial, without the same tolerability issues. More importantly, the drug is now approved for a wider patient population, thereby raising the long-term potential of the company's cystic fibrosis franchise. Intuitive Surgical shares climbed on accelerated growth in the number of global procedures being performed by da Vinci, the company's robotic surgical system. Procedure growth — the engine of the business model — could get an additional boost as the company rolls out its new and more affordable system (da Vinci X), which should afford the opportunity for expansion into many more hospitals.
Financials was the largest relative detractor. Stock selection weighed on relative performance over the year.
Current Strategy and Outlook: U.S. stocks posted strong returns in 2017, buoyed by solid corporate earnings and economic growth. Throughout the year, hopes that President Trump's proposals for lower tax rates, reduced regulation, and increased infrastructure spending would be enacted supported the market. While the U.S. Federal Reserve Board raised its interest rate target three times in 2017, the central bank's moves were widely expected and did not disrupt equity markets. Most major stock indexes finished the year near record levels amid expectations that the new tax law would add to economic growth in 2018.
In our opinion, the current environment is almost an ideal one for equities, with elevated prices for a range of assets and high expectations for profit and economic growth encouraging investors to accept a higher level of risk. The strong earnings performance of 2017 will set a higher bar for year-over-year profit comparisons but investors are likely to look past some slowing in earnings growth if the overall economy remains healthy. Nevertheless, we believe market leadership is likely to narrow as the bull market ages even further. We are on the lookout for a regulatory attack on leading technology and Internet firms, which, in our opinion, could result in widespread disruption in the markets.
Portfolio holdings and characteristics are subject to change and may not be representative of current holdings and characteristics. Portfolio holdings are subject to change daily. The outlook for this Portfolio may differ from that presented for other Voya mutual funds. The Portfolio's performance returns shown reflect applicable fee waivers and/or expense limits in effect during this period. Absent such fee waivers/expense limitations, if any, performance would have been lower. Performance for the different classes of shares will vary based on differences in fees associated with each class.
Sector Diversification
as of December 31, 2017
(as a percentage of net assets)
Information Technology | | | 42.4 | % | |
Consumer Discretionary | | | 16.9 | % | |
Health Care | | | 15.3 | % | |
Industrials | | | 11.2 | % | |
Financials | | | 5.9 | % | |
Real Estate | | | 3.0 | % | |
Consumer Staples | | | 2.2 | % | |
Utilities | | | 1.7 | % | |
Telecommunication Services | | | 0.5 | % | |
Consumer, Cyclical | | | 0.3 | % | |
Assets in Excess of Other Liabilities* | | | 0.6 | % | |
Net Assets | | | 100.0 | % | |
* Includes short-term investments.
Portfolio holdings are subject to change daily.
Top Ten Holdings
as of December 31, 2017
(as a percentage of net assets)
Apple, Inc. | | | 6.2 | % | |
Amazon.com, Inc. | | | 6.1 | % | |
Microsoft Corp. | | | 4.3 | % | |
Facebook, Inc. | | | 4.0 | % | |
The Priceline Group, Inc. | | | 3.7 | % | |
Alphabet, Inc. — Class C | | | 2.8 | % | |
Alibaba Group Holding Ltd. ADR | | | 2.7 | % | |
Boeing Co. | | | 2.6 | % | |
Alphabet, Inc. — Class A | | | 2.5 | % | |
Visa, Inc. — Class A | | | 2.5 | % | |
Portfolio holdings are subject to change daily.
28
PORTFOLIO MANAGERS' REPORT
VY® T. ROWE PRICE GROWTH EQUITY PORTFOLIO

Average Annual Total Returns for the Periods Ended December 31, 2017 | |
| | 1 Year | | 5 Year | | 10 Year | | Since Inception
of Class S2
February 27, 2009 | |
Class ADV | | | 32.91 | % | | | 17.27 | % | | | 9.41 | % | | | — | | |
Class I | | | 33.58 | % | | | 17.86 | % | | | 9.95 | % | | | — | | |
Class S | | | 33.25 | % | | | 17.56 | % | | | 9.68 | % | | | — | | |
Class S2 | | | 33.06 | % | | | 17.39 | % | | | — | | | | 19.08 | % | |
S&P 500® Index | | | 21.83 | % | | | 15.79 | % | | | 8.50 | % | | | 18.22 | % | |
Russell 1000® Growth Index | | | 30.21 | % | | | 17.33 | % | | | 10.00 | % | | | 19.39 | % | |
Based on a $10,000 initial investment, the graph and table above illustrate the total return of VY® T. Rowe Price Growth Equity Portfolio against the indices indicated. An index is unmanaged and has no cash in its portfolio and imposes no sales charges. An investor cannot invest directly in an index.
The Portfolio's performance is shown without the imposition of any expenses or charges which are, or may be, imposed under your variable annuity contract or variable life insurance policy. Total returns would have been lower if such expenses or charges were included.
The performance graph and table do not reflect the deduction of taxes that a shareholder will pay on Portfolio distributions or the redemption of Portfolio shares.
The performance shown may include the effect of fee waivers and/or expense reimbursements by the Investment Adviser and/or other service providers, which have the effect of increasing total return. Had all fees and expenses been considered, the total returns would have been lower.
The performance update illustrates performance for a variable investment option available through a variable
annuity contract or a variable life insurance policy. The performance shown indicates past performance and is not a projection or prediction of future results. Actual investment returns and principal value will fluctuate so that shares and/or units, at redemption, may be worth more or less than their original cost. Please call (800) 262-3862 to get performance through the most recent month end.
This report contains statements that may be "forward-looking" statements. Actual results may differ materially from those projected in the "forward-looking" statements.
The views expressed in this report reflect those of the portfolio manager, only through the end of the period as stated on the cover. The portfolio manager's views are subject to change at any time based on market and other conditions.
Portfolio holdings are subject to change daily.
29
VY® TEMPLETON FOREIGN EQUITY PORTFOLIO
PORTFOLIO MANAGERS' REPORT
VY® Templeton Foreign Equity Portfolio (the "Portfolio") seeks long-term capital growth. The Portfolio is managed by Antonio T. Docal, CFA and Executive Vice President, Peter A. Nori, CFA and Executive Vice President, and Matthew R. Nagle, CFA and Vice President, Portfolio Managers of Templeton Investment Counsel, LLC — the Sub-Adviser*.
Performance: For the year ended December 31, 2017, the Portfolio's Class I shares provided a total return of 22.35% compared to the MSCI All Country World ex-U.S. IndexSM ("MSCI ACWI ex-U.S.") and the MSCI EAFE® Index, which returned 27.19% and 25.03%, respectively, for the same period.
Portfolio Specifics: International equities rallied in 2017 as investors looked beyond political turmoil and nascent monetary policy tightening and focused on global growth and fiscal stimulus that could potentially help earnings growth. The Portfolio delivered solid absolute gains, but trailed MSCI ACWI ex-U.S. as a still-challenging backdrop for value investors contributed to stock-specific setbacks.
Health care was the biggest sector detractor on a relative basis, pressured by stock selection and overweighting. Israeli generic drug-maker Teva Pharmaceutical Industries declined after reducing its guidance, leading to concerns about its debt profile. Our analysis indicates that Teva does not have a liquidity problem and should be able to deliver on a more conservative outlook. The health care sector remains subject to concerns about generic competition, regulatory scrutiny and a consolidating payor industry, all of which we believe are overstated and addressable.
Stock-specific weakness and an underweighting in consumer discretionary also hurt relative results. Shares of Luxembourg-based SES, a satellite and network services provider, declined after a string of disappointing results cast doubts on management's credibility. The stock was recently trading at replacement cost, in our view, for a business with very high barriers to entry and valuable orbital satellite slots that cannot be replicated. The addition of high single-digit dividend and free cash flow yields, as well as a contract backlog equivalent to four years of revenue, leads us to believe the stock remains undervalued.
Company-specific pressures also negatively impacted industrials holdings, with UK defense contractor BAE Systems finishing as that sector's biggest relative detractor. Shares underperformed due to concerns about potential weakness in UK defense spending amid Brexit uncertainty and recovering Labour party momentum. Such concerns look fully discounted in BAE's share price, in our view, though we see limited implications for the company, which sources 80% of revenues outside the UK. Continued progress addressing the firm's pension deficit could also support shares in the intermediate term.
Turning to relative contributors, stock selection drove the Portfolio's underweighted financials holdings to outperform, led by Asian and European lenders. Select European and Asian markets are benefiting from an economic upturn and the potential for incrementally tighter monetary policy, which we believe can improve the earnings prospects for the Portfolio's financials holdings. Stock selection and an underweighting in utilities also benefited relative performance.
Regionally, stock-specific weakness among underweighted Asian and overweighted European holdings detracted from relative results.
During the period, the U.S. dollar declined in value against most foreign currencies, which helped the Portfolio's performance because investments in securities with non-U.S. currency exposure appreciated as the dollar declined. However, one cannot expect the same result in future periods.
Current Strategy and Outlook: After outperforming growth in 2016, value lagged growth in 2017 by the most in two decades, marking the tenth year out of the past eleven that global value has underperformed global growth. We believe value's headwinds stem largely from unconventional monetary policy, which, since the global financial crisis, has depressed interest rates and sent investors out the risk curve in search of growth and yield. We believe these policies are unsustainable for three reasons. First, they increase social inequality, which has political consequences; second, they inflate asset prices, which creates stability risks; and third, rising inflationary pressures and falling unemployment give data-dependent central bankers cause to begin reversing such policies. As policies transition, we believe the mature cycle could eventually change, and with it the conditions hostile to value. We would not want to own the leaders of the last cycle during this transition: the growth stocks and bond proxies trading at valuations we consider expensive. However, the stocks left behind — those of companies whose long-term fundamentals have been overlooked and undervalued by a myopic market — appear to us well positioned over a long-term investment horizon we believe is likely to include an inflection point in this mature cycle.
* Effective December 31, 2017, Cindy Sweeting was removed as a portfolio manager of the Portfolio and Matthew R. Nagle was added as a portfolio manager of the Portfolio.
Portfolio holdings and characteristics are subject to change and may not be representative of current holdings and characteristics. Portfolio holdings are subject to change daily. The outlook for this Portfolio may differ from that presented for other Voya mutual funds. The Portfolio's performance returns shown reflect applicable fee waivers and/or expense limits in effect during this period. Absent such fee waivers/expense limitations, if any, performance would have been lower. Performance for the different classes of shares will vary based on differences in fees associated with each class.
Geographic Diversification
as of December 31, 2017
(as a percentage of net assets)
United Kingdom | | | 19.9 | % | |
Japan | | | 12.7 | % | |
Germany | | | 11.3 | % | |
France | | | 9.3 | % | |
China | | | 7.1 | % | |
South Korea | | | 5.9 | % | |
Switzerland | | | 5.2 | % | |
Netherlands | | | 5.0 | % | |
Hong Kong | | | 3.6 | % | |
Singapore | | | 3.3 | % | |
Countries between 0.1%-2.4%^ | | | 14.9 | % | |
Assets in Excess of Other Liabilities* | | | 1.8 | % | |
Net Assets | | | 100.0 | % | |
* Includes short-term investments.
^ Includes 12 countries, which each represents 0.1%-2.4% of net assets.
Portfolio holdings are subject to change daily.
Top Ten Holdings
as of December 31, 2017
(as a percentage of net assets)
Samsung Electronics Co., Ltd. GDR | | | 3.1 | % | |
| BP PLC | | | 2.9 | % | |
Royal Dutch Shell PLC — Class B | | | 2.7 | % | |
HSBC Holdings PLC (HKD) | | | 2.0 | % | |
Vodafone Group PLC | | | 1.8 | % | |
BNP Paribas | | | 1.8 | % | |
Standard Chartered PLC | | | 1.8 | % | |
Housing Development Finance Corp. | | | 1.8 | % | |
Roche Holding AG | | | 1.8 | % | |
BAE Systems PLC | | | 1.7 | % | |
Portfolio holdings are subject to change daily.
30
PORTFOLIO MANAGERS' REPORT
VY® TEMPLETON FOREIGN EQUITY PORTFOLIO

Average Annual Total Returns for the Periods Ended December 31, 2017 | |
| | 1 Year | | 5 Year | | 10 Year | | Since Inception
of Class S2
February 27, 2009 | |
Class ADV | | | 21.66 | % | | | 5.70 | % | | | 1.46 | % | | | — | | |
Class I | | | 22.35 | % | | | 6.24 | % | | | 1.95 | % | | | — | | |
Class S | | | 22.00 | % | | | 5.98 | % | | | 1.69 | % | | | — | | |
Class S2 | | | 21.90 | % | | | 5.82 | % | | | — | | | | 10.70 | % | |
MSCI ACWI ex-U.S. | | | 27.19 | % | | | 6.80 | % | | | 1.84 | % | | | 11.74 | % | |
MSCI EAFE® Index | | | 25.03 | % | | | 7.90 | % | | | 1.94 | % | | | 11.64 | % | |
Based on a $10,000 initial investment, the graph and table above illustrate the total return of VY® Templeton Foreign Equity Portfolio against the indices indicated. An index is unmanaged and has no cash in its portfolio and imposes no sales charges. An investor cannot invest directly in an index.
The Portfolio's performance is shown without the imposition of any expenses or charges which are, or may be, imposed under your variable annuity contract or variable life insurance policy. Total returns would have been lower if such expenses or charges were included.
The performance graph and table do not reflect the deduction of taxes that a shareholder will pay on Portfolio distributions or the redemption of Portfolio shares.
The performance shown may include the effect of fee waivers and/or expense reimbursements by the Investment Adviser and/or other service providers, which have the effect of increasing total return. Had all fees and expenses been considered, the total returns would have been lower.
The performance update illustrates performance for a variable investment option available through a variable
annuity contract or a variable life insurance policy. The performance shown indicates past performance and is not a projection or prediction of future results. Actual investment returns and principal value will fluctuate so that shares and/or units, at redemption, may be worth more or less than their original cost. Please log on to www.voyainvestments.com or call (800) 262-3862 to get performance through the most recent month end.
This report contains statements that may be "forward-looking" statements. Actual results may differ materially from those projected in the "forward-looking" statements.
The views expressed in this report reflect those of the portfolio managers, only through the end of the period as stated on the cover. The portfolio managers' views are subject to change at any time based on market and other conditions.
Portfolio holdings are subject to change daily.
31
SHAREHOLDER EXPENSE EXAMPLES (UNAUDITED)
As a shareholder of a Portfolio, you incur two types of costs: (1) transaction costs, including redemption fees and exchange fees; and (2) ongoing costs, including management fees, distribution and/or service (12b-1) fees, and other Portfolio expenses. These Examples are intended to help you understand your ongoing costs (in dollars) of investing in a Portfolio and to compare these costs with the ongoing costs of investing in other mutual funds.
The Examples are based on an investment of $1,000 invested at the beginning of the period and held for the entire period from July 1, 2017 to December 31, 2017. The Portfolios' expenses are shown without the imposition of any charges which are, or may be, imposed under your variable annuity contract, variable life insurance policy, qualified pension, or retirement plan. Expenses would have been higher if such charges were included.
Actual Expenses
The left section of the table shown below, "Actual Portfolio Return," provides information about actual account values and actual expenses. You may use the information in this section, together with the amount you invested, to estimate the expenses that you paid over the period. Simply divide your account value by $1,000 (for example, an $8,600 account value divided by $1,000 = 8.6), then multiply the result by the number in the first section under the heading entitled "Expenses Paid During the Period" to estimate the expenses you paid on your account during this period.
Hypothetical Example for Comparison Purposes
The right section of the table shown below, "Hypothetical (5% return before expenses)," provides information about hypothetical account values and hypothetical expenses based on a Portfolio's actual expense ratio and an assumed rate of return of 5% per year before expenses, which is not a Portfolio's actual return. The hypothetical account values and expenses may not be used to estimate the actual ending account balance or expenses you paid for the period. You may use this information to compare the ongoing costs of investing in a Portfolio and other mutual funds. To do so, compare this 5% hypothetical example with the 5% hypothetical examples that appear in the shareholder reports of the other mutual funds.
Please note that the expenses shown in the table are meant to highlight your ongoing costs only and do not reflect any transactional costs, such as redemption fees or exchange fees. Therefore, the hypothetical section of the table is useful in comparing ongoing costs only, and will not help you determine the relative total costs of owning different mutual funds. In addition, if these transactional costs were included, your costs would have been higher.
| | | Actual Portfolio Return | | Hypothetical (5% return before expenses) | |
Voya Global Bond Portfolio | | Beginning
Account
Value
July 1,
2017 | | Ending
Account
Value
December 31,
2017 | | Annualized
Expense
Ratio | | Expenses Paid
During the
Period Ended
December 31,
2017* | | Beginning
Account
Value
July 1,
2017 | | Ending
Account
Value
December 31,
2017 | | Annualized
Expense
Ratio | | Expenses Paid
During the
Period Ended
December 31,
2017* | |
Class ADV | | $ | 1,000.00 | | | $ | 1,034.00 | | | | 1.10 | % | | $ | 5.64 | | | $ | 1,000.00 | | | $ | 1,019.66 | | | | 1.10 | % | | $ | 5.60 | | |
Class I | | | 1,000.00 | | | | 1,037.10 | | | | 0.60 | | | | 3.08 | | | | 1,000.00 | | | | 1,022.18 | | | | 0.60 | | | | 3.06 | | |
Class S | | | 1,000.00 | | | | 1,035.80 | | | | 0.85 | | | | 4.36 | | | | 1,000.00 | | | | 1,020.92 | | | | 0.85 | | | | 4.33 | | |
VY® American Century Small-Mid Cap Value Portfolio | |
Class ADV | | $ | 1,000.00 | | | $ | 1,069.80 | | | | 1.36 | % | | $ | 7.10 | | | $ | 1,000.00 | | | $ | 1,018.35 | | | | 1.36 | % | | $ | 6.92 | | |
Class I | | | 1,000.00 | | | | 1,073.10 | | | | 0.86 | | | | 4.49 | | | | 1,000.00 | | | | 1,020.87 | | | | 0.86 | | | | 4.38 | | |
Class S | | | 1,000.00 | | | | 1,071.10 | | | | 1.11 | | | | 5.79 | | | | 1,000.00 | | | | 1,019.61 | | | | 1.11 | | | | 5.65 | | |
Class S2 | | | 1,000.00 | | | | 1,071.20 | | | | 1.26 | | | | 6.58 | | | | 1,000.00 | | | | 1,018.85 | | | | 1.26 | | | | 6.41 | | |
VY® Baron Growth Portfolio | |
Class ADV | | $ | 1,000.00 | | | $ | 1,087.20 | | | | 1.49 | % | | $ | 7.84 | | | $ | 1,000.00 | | | $ | 1,017.69 | | | | 1.49 | % | | $ | 7.58 | | |
Class I | | | 1,000.00 | | | | 1,090.10 | | | | 0.99 | | | | 5.22 | | | | 1,000.00 | | | | 1,020.21 | | | | 0.99 | | | | 5.04 | | |
Class R6 | | | 1,000.00 | | | | 1,090.00 | | | | 0.99 | | | | 5.22 | | | | 1,000.00 | | | | 1,020.21 | | | | 0.99 | | | | 5.04 | | |
Class S | | | 1,000.00 | | | | 1,088.90 | | | | 1.24 | | | | 6.53 | | | | 1,000.00 | | | | 1,018.95 | | | | 1.24 | | | | 6.31 | | |
Class S2 | | | 1,000.00 | | | | 1,088.00 | | | | 1.39 | | | | 7.32 | | | | 1,000.00 | | | | 1,018.20 | | | | 1.39 | | | | 7.07 | | |
32
SHAREHOLDER EXPENSE EXAMPLES (UNAUDITED) (CONTINUED)
| | | Actual Portfolio Return | | Hypothetical (5% return before expenses) | |
VY® Columbia Contrarian Core
Portfolio | | Beginning
Account
Value
July 1,
2017 | | Ending
Account
Value
December 31,
2017 | | Annualized
Expense
Ratio | | Expenses Paid
During the
Period Ended
December 31,
2017* | | Beginning
Account
Value
July 1,
2017 | | Ending
Account
Value
December 31,
2017 | | Annualized
Expense
Ratio | | Expenses Paid
During the
Period Ended
December 31,
2017* | |
Class ADV | | $ | 1,000.00 | | | $ | 1,095.50 | | | | 1.21 | % | | $ | 6.39 | | | $ | 1,000.00 | | | $ | 1,019.11 | | | | 1.21 | % | | $ | 6.16 | | |
Class I | | | 1,000.00 | | | | 1,098.60 | | | | 0.71 | | | | 3.76 | | | | 1,000.00 | | | | 1,021.63 | | | | 0.71 | | | | 3.62 | | |
Class S | | | 1,000.00 | | | | 1,096.90 | | | | 0.96 | | | | 5.07 | | | | 1,000.00 | | | | 1,020.37 | | | | 0.96 | | | | 4.89 | | |
VY® Columbia Small Cap Value II Portfolio | |
Class ADV | | $ | 1,000.00 | | | $ | 1,093.50 | | | | 1.37 | % | | $ | 7.23 | | | $ | 1,000.00 | | | $ | 1,018.30 | | | | 1.37 | % | | $ | 6.97 | | |
Class I | | | 1,000.00 | | | | 1,096.00 | | | | 0.87 | | | | 4.60 | | | | 1,000.00 | | | | 1,020.82 | | | | 0.87 | | | | 4.43 | | |
Class R6 | | | 1,000.00 | | | | 1,095.90 | | | | 0.87 | | | | 4.60 | | | | 1,000.00 | | | | 1,020.82 | | | | 0.87 | | | | 4.43 | | |
Class S | | | 1,000.00 | | | | 1,094.10 | | | | 1.12 | | | | 5.91 | | | | 1,000.00 | | | | 1,019.56 | | | | 1.12 | | | | 5.70 | | |
Class S2 | | | 1,000.00 | | | | 1,093.50 | | | | 1.27 | | | | 6.70 | | | | 1,000.00 | | | | 1,018.80 | | | | 1.27 | | | | 6.46 | | |
VY® Invesco Comstock Portfolio | |
Class ADV | | $ | 1,000.00 | | | $ | 1,137.10 | | | | 1.23 | % | | $ | 6.63 | | | $ | 1,000.00 | | | $ | 1,019.00 | | | | 1.23 | % | | $ | 6.26 | | |
Class I | | | 1,000.00 | | | | 1,139.70 | | | | 0.73 | | | | 3.94 | | | | 1,000.00 | | | | 1,021.53 | | | | 0.73 | | | | 3.72 | | |
Class S | | | 1,000.00 | | | | 1,138.30 | | | | 0.98 | | | | 5.28 | | | | 1,000.00 | | | | 1,020.27 | | | | 0.98 | | | | 4.99 | | |
VY® Invesco Equity and Income Portfolio | |
Class ADV | | $ | 1,000.00 | | | $ | 1,060.90 | | | | 1.14 | % | | $ | 5.92 | | | $ | 1,000.00 | | | $ | 1,019.46 | | | | 1.14 | % | | $ | 5.80 | | |
Class I | | | 1,000.00 | | | | 1,063.70 | | | | 0.64 | | | | 3.33 | | | | 1,000.00 | | | | 1,021.98 | | | | 0.64 | | | | 3.26 | | |
Class S | | | 1,000.00 | | | | 1,062.40 | | | | 0.89 | | | | 4.63 | | | | 1,000.00 | | | | 1,020.72 | | | | 0.89 | | | | 4.53 | | |
Class S2 | | | 1,000.00 | | | | 1,061.70 | | | | 1.02 | | | | 5.30 | | | | 1,000.00 | | | | 1,020.06 | | | | 1.02 | | | | 5.19 | | |
VY® JPMorgan Mid Cap Value Portfolio | |
Class ADV | | $ | 1,000.00 | | | $ | 1,068.30 | | | | 1.37 | % | | $ | 7.14 | | | $ | 1,000.00 | | | $ | 1,018.30 | | | | 1.37 | % | | $ | 6.97 | | |
Class I | | | 1,000.00 | | | | 1,071.00 | | | | 0.87 | | | | 4.54 | | | | 1,000.00 | | | | 1,020.82 | | | | 0.87 | | | | 4.43 | | |
Class S | | | 1,000.00 | | | | 1,069.60 | | | | 1.12 | | | | 5.84 | | | | 1,000.00 | | | | 1,019.56 | | | | 1.12 | | | | 5.70 | | |
Class S2 | | | 1,000.00 | | | | 1,068.60 | | | | 1.27 | | | | 6.62 | | | | 1,000.00 | | | | 1,018.80 | | | | 1.27 | | | | 6.46 | | |
VY® Oppenheimer Global Portfolio | |
Class ADV | | $ | 1,000.00 | | | $ | 1,134.80 | | | | 1.25 | % | | $ | 6.73 | | | $ | 1,000.00 | | | $ | 1,018.90 | | | | 1.25 | % | | $ | 6.36 | | |
Class I | | | 1,000.00 | | | | 1,138.10 | | | | 0.75 | | | | 4.04 | | | | 1,000.00 | | | | 1,021.42 | | | | 0.75 | | | | 3.82 | | |
Class S | | | 1,000.00 | | | | 1,136.60 | | | | 1.00 | | | | 5.39 | | | | 1,000.00 | | | | 1,020.16 | | | | 1.00 | | | | 5.09 | | |
Class S2 | | | 1,000.00 | | | | 1,135.40 | | | | 1.15 | | | | 6.19 | | | | 1,000.00 | | | | 1,019.41 | | | | 1.15 | | | | 5.85 | | |
VY® Pioneer High Yield Portfolio | |
Class I | | $ | 1,000.00 | | | $ | 1,025.50 | | | | 0.71 | % | | $ | 3.62 | | | $ | 1,000.00 | | | $ | 1,021.63 | | | | 0.71 | % | | $ | 3.62 | | |
Class S | | | 1,000.00 | | | | 1,024.20 | | | | 0.96 | | | | 4.90 | | | | 1,000.00 | | | | 1,020.37 | | | | 0.96 | | | | 4.89 | | |
VY® T. Rowe Price Diversified Mid Cap Growth Portfolio | |
Class ADV | | $ | 1,000.00 | | | $ | 1,104.20 | | | | 1.27 | % | | $ | 6.74 | | | $ | 1,000.00 | | | $ | 1,018.80 | | | | 1.27 | % | | $ | 6.46 | | |
Class I | | | 1,000.00 | | | | 1,106.80 | | | | 0.77 | | | | 4.09 | | | | 1,000.00 | | | | 1,021.32 | | | | 0.77 | | | | 3.92 | | |
Class R6 | | | 1,000.00 | | | | 1,105.90 | | | | 0.77 | | | | 4.09 | | | | 1,000.00 | | | | 1,021.32 | | | | 0.77 | | | | 3.92 | | |
Class S | | | 1,000.00 | | | | 1,104.60 | | | | 1.02 | | | | 5.41 | | | | 1,000.00 | | | | 1,020.06 | | | | 1.02 | | | | 5.19 | | |
Class S2 | | | 1,000.00 | | | | 1,103.90 | | | | 1.17 | | | | 6.20 | | | | 1,000.00 | | | | 1,019.31 | | | | 1.17 | | | | 5.96 | | |
33
SHAREHOLDER EXPENSE EXAMPLES (UNAUDITED) (CONTINUED)
| | | Actual Portfolio Return | | Hypothetical (5% return before expenses) | |
VY® T. Rowe Price Growth Equity
Portfolio | | Beginning
Account
Value
July 1,
2017 | | Ending
Account
Value
December 31,
2017 | | Annualized
Expense
Ratio | | Expenses Paid
During the
Period Ended
December 31,
2017* | | Beginning
Account
Value
July 1,
2017 | | Ending
Account
Value
December 31,
2017 | | Annualized
Expense
Ratio | | Expenses Paid
During the
Period Ended
December 31,
2017* | |
Class ADV | | $ | 1,000.00 | | | $ | 1,115.20 | | | | 1.23 | % | | $ | 6.56 | | | $ | 1,000.00 | | | $ | 1,019.00 | | | | 1.23 | % | | $ | 6.26 | | |
Class I | | | 1,000.00 | | | | 1,118.00 | | | | 0.73 | | | | 3.90 | | | | 1,000.00 | | | | 1,021.53 | | | | 0.73 | | | | 3.72 | | |
Class S | | | 1,000.00 | | | | 1,116.80 | | | | 0.98 | | | | 5.23 | | | | 1,000.00 | | | | 1,020.27 | | | | 0.98 | | | | 4.99 | | |
Class S2 | | | 1,000.00 | | | | 1,115.90 | | | | 1.13 | | | | 6.03 | | | | 1,000.00 | | | | 1,019.51 | | | | 1.13 | | | | 5.75 | | |
VY® Templeton Foreign Equity Portfolio | |
Class ADV | | $ | 1,000.00 | | | $ | 1,071.10 | | | | 1.40 | % | | $ | 7.31 | | | $ | 1,000.00 | | | $ | 1,018.15 | | | | 1.40 | % | | $ | 7.12 | | |
Class I | | | 1,000.00 | | | | 1,074.20 | | | | 0.90 | | | | 4.71 | | | | 1,000.00 | | | | 1,020.67 | | | | 0.90 | | | | 4.58 | | |
Class S | | | 1,000.00 | | | | 1,072.90 | | | | 1.15 | | | | 6.01 | | | | 1,000.00 | | | | 1,019.41 | | | | 1.15 | | | | 5.85 | | |
Class S2 | | | 1,000.00 | | | | 1,071.90 | | | | 1.30 | | | | 6.79 | | | | 1,000.00 | | | | 1,018.65 | | | | 1.30 | | | | 6.61 | | |
* Expenses are equal to each Portfolio's respective annualized expense ratios multiplied by the average account value over the period, multiplied by 184/365 to reflect the most recent fiscal half-year.
34
REPORT OF INDEPENDENT REGISTERED PUBLIC ACCOUNTING FIRM
To the Shareholders and Board of Directors
Voya Partners, Inc.:
Opinion on the Financial Statements
We have audited the accompanying statements of assets and liabilities of Voya Global Bond Portfolio, VY® American Century Small-Mid Cap Value Portfolio, VY® Baron Growth Portfolio, VY® Columbia Contrarian Core Portfolio, VY® Columbia Small Cap Value II Portfolio, VY® Invesco Comstock Portfolio, VY® Invesco Equity and Income Portfolio, VY® JPMorgan Mid Cap Value Portfolio, VY® Oppenheimer Global Portfolio, VY® Pioneer High Yield Portfolio, VY® T. Rowe Price Diversified Mid Cap Growth Portfolio, VY® T. Rowe Price Growth Equity Portfolio, and VY® Templeton Foreign Equity Portfolio (the "Funds"), each a series of Voya Partners, Inc., including the summary portfolios of investments, as of December 31, 2017, the related statements of operations for the year then ended, the statements of changes in net assets for each of the years in the two-year period then ended, and the related notes (collectively, the "financial statements") and the financial highlights for each of the years or periods in the five-year period then ended. In our opinion, the financial statements and financial highlights present fairly, in all material respects, the financial position of the Funds as of December 31, 2017, the results of their operations for the year then ended, the changes in their net assets for each of the years in the two-year period then ended, and the financial highlights for each of the years or periods in the five-year period then ended, in conformity with U.S. generally accepted accounting principles.
Basis for Opinion
These financial statements and financial highlights are the responsibility of the Funds' management. Our responsibility is to express an opinion on these financial statements and financial highlights based on our audits. We are a public accounting firm registered with the Public Company Accounting Oversight Board (United States) ("PCAOB") and are required to be independent with respect to the Funds in accordance with the U.S. federal securities laws and the applicable rules and regulations of the Securities and Exchange Commission and the PCAOB.
We conducted our audits in accordance with the standards of the PCAOB. Those standards require that we plan and perform the audit to obtain reasonable assurance about whether the financial statements and financial highlights are free of material misstatement, whether due to error or fraud. Our audits included performing procedures to assess the risks of material misstatement of the financial statements and financial highlights, whether due to error or fraud, and performing procedures that respond to those risks. Such procedures included examining, on a test basis, evidence regarding the amounts and disclosures in the financial statements and financial highlights. Such procedures also included confirmation of securities owned as of December 31, 2017, by correspondence with the custodian, transfer agent and brokers or by other appropriate auditing procedures when replies from brokers were not received. Our audits also included evaluating the accounting principles used and significant estimates made by management, as well as evaluating the overall presentation of the financial statements and financial highlights. We believe that our audits provide a reasonable basis for our opinion.

We have served as the auditor of one or more Voya investment companies since 1975.
Boston, Massachusetts
February 22, 2018
35
STATEMENTS OF ASSETS AND LIABILITIES AS OF DECEMBER 31, 2017
| | | Voya
Global Bond
Portfolio | | VY®
American Century
Small-Mid Cap Value
Portfolio | | VY®
Baron
Growth
Portfolio | | VY®
Columbia
Contrarian Core
Portfolio | |
ASSETS: | |
Investments in securities at fair value+* | | $ | 163,648,906 | | | $ | 366,664,833 | | | $ | 754,530,107 | | | $ | 317,222,394 | | |
Investments in affiliates at fair value** | | | 54,035,335 | | | | — | | | | — | | | | — | | |
Short-term investments at fair value*** | | | 14,287,528 | | | | 23,458,116 | | | | — | | | | 9,024,466 | | |
Cash | | | 159,246 | | | | 3,201 | | | | 338 | | | | — | | |
Cash collateral for futures | | | 1,320,113 | | | | — | | | | — | | | | — | | |
Cash pledged for centrally cleared swaps (Note 2) | | | 1,778,000 | | | | — | | | | — | | | | — | | |
Foreign currencies at value**** | | | 521,399 | | | | — | | | | — | | | | — | | |
Foreign cash collateral for futures***** | | | 11,357 | | | | — | | | | — | | | | — | | |
Receivables: | |
Investment securities sold | | | 878 | | | | 1,262,426 | | | | 7,598,059 | | | | 293,360 | | |
Fund shares sold | | | 163,009 | | | | 119,964 | | | | 144,975 | | | | 9,663 | | |
Dividends | | | 8,393 | | | | 694,077 | | | | 965,361 | | | | 290,291 | | |
Interest | | | 1,497,046 | | | | — | | | | — | | | | — | | |
Unrealized appreciation on forward foreign currency
contracts | | | 2,550,196 | | | | 3,224 | | | | — | | | | — | | |
Variation margin receivable on centrally cleared swaps | | | 15,055 | | | | — | | | | — | | | | — | | |
Prepaid expenses | | | 937 | | | | 1,491 | | | | 2,978 | | | | 1,351 | | |
Reimbursement due from manager | | | 12,360 | | | | 37,264 | | | | — | | | | 55,709 | | |
Other assets | | | 14,444 | | | | 9,721 | | | | 30,834 | | | | 14,057 | | |
Total assets | | | 240,024,202 | | | | 392,254,317 | | | | 763,272,652 | | | | 326,911,291 | | |
LIABILITIES: | |
Payable for investment securities purchased | | | 292,806 | | | | 964,119 | | | | — | | | | 1,694,357 | | |
Payable for fund shares redeemed | | | 224,014 | | | | 115,201 | | | | 602,641 | | | | 186,731 | | |
Payable upon receipt of securities loaned | | | 7,139,528 | | | | 13,124,344 | | | | — | | | | — | | |
Unrealized depreciation on forward foreign currency
contracts | | | 1,202,545 | | | | 135,692 | | | | — | | | | — | | |
Cash received as collateral for OTC derivatives (Note 2) | | | 630,000 | | | | — | | | | — | | | | — | | |
Payable for investment management fees | | | 116,224 | | | | 346,297 | | | | 619,430 | | | | 249,363 | | |
Payable for distribution and shareholder service fees | | | 19,396 | | | | 72,796 | | | | 148,637 | | | | 73,385 | | |
Payable to directors under the deferred compensation
plan (Note 6) | | | 14,444 | | | | 9,721 | | | | 30,834 | | | | 14,057 | | |
Payable for directors fees | | | 1,145 | | | | 1,817 | | | | 3,772 | | | | 1,633 | | |
Payable for borrowings against line of credit | | | — | | | | — | | | | 2,189,000 | | | | — | | |
Other accrued expenses and liabilities | | | 58,356 | | | | 66,490 | | | | 115,336 | | | | 53,081 | | |
Written options, at fair value^ | | | 1,903,395 | | | | — | | | | — | | | | — | | |
Total liabilities | | | 11,601,853 | | | | 14,836,477 | | | | 3,709,650 | | | | 2,272,607 | | |
NET ASSETS | | $ | 228,422,349 | | | $ | 377,417,840 | | | $ | 759,563,002 | | | $ | 324,638,684 | | |
NET ASSETS WERE COMPRISED OF: | |
Paid-in capital | | $ | 222,991,690 | | | $ | 295,212,737 | | | $ | 198,344,095 | | | $ | 220,831,911 | | |
Undistributed (distributions in excess of) net investment
income or accumulated net investment loss | | | 5,889,353 | | | | 4,223,160 | | | | (23,339 | ) | | | 2,602,940 | | |
Accumulated net realized gain (loss) | | | (1,644,142 | ) | | | 35,291,755 | | | | 69,973,526 | | | | 29,253,197 | | |
Net unrealized appreciation | | | 1,185,448 | | | | 42,690,188 | | | | 491,268,720 | | | | 71,950,636 | | |
NET ASSETS | | $ | 228,422,349 | | | $ | 377,417,840 | | | $ | 759,563,002 | | | $ | 324,638,684 | | |
| + Including securities loaned at value | | $ | 6,978,696 | | | $ | 12,815,847 | | | $ | — | | | $ | — | | |
| * Cost of investments in securities | | $ | 161,817,913 | | | $ | 323,842,547 | | | $ | 263,261,387 | | | $ | 245,271,757 | | |
| ** Cost of investments in affiliates | | $ | 59,523,505 | | | $ | — | | | $ | — | | | $ | — | | |
| *** Cost of short-term investments | | $ | 14,287,528 | | | $ | 23,458,116 | | | $ | — | | | $ | 9,024,466 | | |
| **** Cost of foreign currencies | | $ | 487,040 | | | $ | — | | | $ | — | | | $ | — | | |
| ***** Cost of foreign cash collateral for futures | | $ | 11,357 | | | $ | — | | | $ | — | | | $ | — | | |
| ^ Premiums received on written options | | $ | 2,503,559 | | | $ | — | | | $ | — | | | $ | — | | |
See Accompanying Notes to Financial Statements
36
STATEMENTS OF ASSETS AND LIABILITIES AS OF DECEMBER 31, 2017 (CONTINUED)
| | | Voya
Global Bond
Portfolio | | VY®
American Century
Small-Mid Cap Value
Portfolio | | VY®
Baron
Growth
Portfolio | | VY®
Columbia
Contrarian Core
Portfolio | |
Class ADV: | |
Net assets | | $ | 24,922,039 | | | $ | 115,235,218 | | | $ | 88,499,426 | | | $ | 29,514,693 | | |
Shares authorized | | | 100,000,000 | | | | 100,000,000 | | | | 100,000,000 | | | | 100,000,000 | | |
Par value | | $ | 0.001 | | | $ | 0.001 | | | $ | 0.001 | | | $ | 0.001 | | |
Shares outstanding | | | 2,277,440 | | | | 9,100,044 | | | | 3,173,769 | | | | 1,261,410 | | |
Net asset value and redemption price per share | | $ | 10.94 | | | $ | 12.66 | | | $ | 27.88 | | | $ | 23.40 | | |
Class I: | |
Net assets | | $ | 161,714,924 | | | $ | 151,054,465 | | | $ | 145,389,436 | | | $ | 10,098,658 | | |
Shares authorized | | | 100,000,000 | | | | 100,000,000 | | | | 100,000,000 | | | | 100,000,000 | | |
Par value | | $ | 0.001 | | | $ | 0.001 | | | $ | 0.001 | | | $ | 0.001 | | |
Shares outstanding | | | 14,521,767 | | | | 11,238,391 | | | | 4,754,352 | | | | 410,913 | | |
Net asset value and redemption price per share | | $ | 11.14 | | | $ | 13.44 | | | $ | 30.58 | | | $ | 24.58 | | |
Class R6: | |
Net assets | | | n/a | | | | n/a | | | $ | 11,441,606 | | | | n/a | | |
Shares authorized | | | n/a | | | | n/a | | | | 100,000,000 | | | | n/a | | |
Par value | | | n/a | | | | n/a | | | $ | 0.001 | | | | n/a | | |
Shares outstanding | | | n/a | | | | n/a | | | | 373,976 | | | | n/a | | |
Net asset value and redemption price per share | | | n/a | | | | n/a | | | $ | 30.59 | | | | n/a | | |
Class S: | |
Net assets | | $ | 41,785,386 | | | $ | 106,501,426 | | | $ | 512,397,129 | | | $ | 285,025,333 | | |
Shares authorized | | | 100,000,000 | | | | 100,000,000 | | | | 100,000,000 | | | | 100,000,000 | | |
Par value | | $ | 0.001 | | | $ | 0.001 | | | $ | 0.001 | | | $ | 0.001 | | |
Shares outstanding | | | 3,756,828 | | | | 8,035,058 | | | | 17,483,072 | | | | 11,835,691 | | |
Net asset value and redemption price per share | | $ | 11.12 | | | $ | 13.25 | | | $ | 29.31 | | | $ | 24.08 | | |
Class S2: | |
Net assets | | | n/a | | | $ | 4,626,731 | | | $ | 1,835,405 | | | | n/a | | |
Shares authorized | | | n/a | | | | 100,000,000 | | | | 100,000,000 | | | | n/a | | |
Par value | | | n/a | | | $ | 0.001 | | | $ | 0.001 | | | | n/a | | |
Shares outstanding | | | n/a | | | | 366,049 | | | | 65,319 | | | | n/a | | |
Net asset value and redemption price per share | | | n/a | | | $ | 12.64 | | | $ | 28.10 | | | | n/a | | |
See Accompanying Notes to Financial Statements
37
STATEMENTS OF ASSETS AND LIABILITIES AS OF DECEMBER 31, 2017
| | | VY®
Columbia Small
Cap Value II
Portfolio | | VY®
Invesco
Comstock
Portfolio | | VY®
Invesco
Equity and Income
Portfolio | | VY®
JPMorgan
Mid Cap Value
Portfolio | |
ASSETS: | |
Investments in securities at fair value+* | | $ | 210,828,588 | | | $ | 478,582,578 | | | $ | 1,570,538,947 | | | $ | 573,082,205 | | |
Short-term investments at fair value** | | | 3,147,071 | | | | 20,456,451 | | | | 200,215,306 | | | | 6,200,153 | | |
Cash | | | — | | | | — | | | | 11,250 | | | | — | | |
Foreign currencies at value*** | | | — | | | | 2,024 | | | | 1,449 | | | | — | | |
Receivables: | |
Investment securities sold | | | 357,065 | | | | 840,840 | | | | — | | | | 279,090 | | |
Fund shares sold | | | 211,720 | | | | 59,438 | | | | 199,478 | | | | 37,093 | | |
Dividends | | | 279,848 | | | | 481,673 | | | | 1,862,656 | | | | 889,022 | | |
Interest | | | — | | | | — | | | | 2,936,200 | | | | — | | |
Foreign tax reclaims | | | — | | | | 199,954 | | | | 386,901 | | | | — | | |
Unrealized appreciation on forward foreign currency
contracts | | | — | | | | — | | | | 33,679 | | | | — | | |
Prepaid expenses | | | 966 | | | | 2,172 | | | | 7,320 | | | | 2,502 | | |
Reimbursement due from manager | | | — | | | | — | | | | 34,699 | | | | — | | |
Other assets | | | 9,050 | | | | 23,386 | | | | 85,674 | | | | 19,002 | | |
Total assets | | | 214,834,308 | | | | 500,648,516 | | | | 1,776,313,559 | | | | 580,509,067 | | |
LIABILITIES: | |
Payable for investment securities purchased | | | — | | | | 95,202 | | | | — | | | | 31,010 | | |
Payable for fund shares redeemed | | | 882,208 | | | | 534,305 | | | | 983,108 | | | | 5,057,853 | | |
Payable upon receipt of securities loaned | | | — | | | | — | | | | 95,858,870 | | | | 3,776,640 | | |
Unrealized depreciation on forward foreign currency
contracts | | | — | | | | 810,493 | | | | 1,511,795 | | | | — | | |
Payable for investment management fees | | | 155,994 | | | | 296,902 | | | | 884,977 | | | | 410,676 | | |
Payable for distribution and shareholder service fees | | | 44,042 | | | | 74,021 | | | | 287,954 | | | | 99,320 | | |
Payable to directors under the deferred compensation
plan (Note 6) | | | 9,050 | | | | 23,386 | | | | 85,674 | | | | 19,002 | | |
Payable for directors fees | | | 1,099 | | | | 2,491 | | | | 8,636 | | | | 2,954 | | |
Other accrued expenses and liabilities | | | 37,711 | | | | 94,655 | | | | 245,969 | | | | 95,520 | | |
Total liabilities | | | 1,130,104 | | | | 1,931,455 | | | | 99,866,983 | | | | 9,492,975 | | |
NET ASSETS | | $ | 213,704,204 | | | $ | 498,717,061 | | | $ | 1,676,446,576 | | | $ | 571,016,092 | | |
NET ASSETS WERE COMPRISED OF: | |
Paid-in capital | | $ | 137,726,143 | | | $ | 382,415,348 | | | $ | 1,356,930,900 | | | $ | 363,785,475 | | |
Undistributed net investment income | | | 561,259 | | | | 791,452 | | | | 1,822,110 | | | | 406,606 | | |
Accumulated net realized gain (loss) | | | 20,858,037 | | | | (4,651,021 | ) | | | 85,585,919 | | | | 40,823,681 | | |
Net unrealized appreciation | | | 54,558,765 | | | | 120,161,282 | | | | 232,107,647 | | | | 166,000,330 | | |
NET ASSETS | | $ | 213,704,204 | | | $ | 498,717,061 | | | $ | 1,676,446,576 | | | $ | 571,016,092 | | |
| + Including securities loaned at value | | $ | — | | | $ | — | | | $ | 93,787,492 | | | $ | 3,691,726 | | |
| * Cost of investments in securities | | $ | 156,269,823 | | | $ | 357,608,762 | | | $ | 1,336,954,612 | | | $ | 407,081,875 | | |
| ** Cost of short-term investments | | $ | 3,147,071 | | | $ | 20,456,451 | | | $ | 200,215,306 | | | $ | 6,200,153 | | |
| *** Cost of foreign currencies | | $ | — | | | $ | 2,005 | | | $ | 1,433 | | | $ | — | | |
See Accompanying Notes to Financial Statements
38
STATEMENTS OF ASSETS AND LIABILITIES AS OF DECEMBER 31, 2017 (CONTINUED)
| | | VY®
Columbia Small
Cap Value II
Portfolio | | VY®
Invesco
Comstock
Portfolio | | VY®
Invesco
Equity and Income
Portfolio | | VY®
JPMorgan
Mid Cap Value
Portfolio | |
Class ADV: | |
Net assets | | $ | 37,003,886 | | | $ | 36,178,445 | | | $ | 54,582,549 | | | $ | 99,801,408 | | |
Shares authorized | | | 100,000,000 | | | | 100,000,000 | | | | 100,000,000 | | | | 100,000,000 | | |
Par value | | $ | 0.001 | | | $ | 0.001 | | | $ | 0.001 | | | $ | 0.001 | | |
Shares outstanding | | | 1,891,320 | | | | 1,796,009 | | | | 1,165,937 | | | | 5,045,526 | | |
Net asset value and redemption price per share | | $ | 19.57 | | | $ | 20.14 | | | $ | 46.81 | | | $ | 19.78 | | |
Class I: | |
Net assets | | $ | 43,896,851 | | | $ | 188,040,307 | | | $ | 594,833,902 | | | $ | 210,988,544 | | |
Shares authorized | | | 100,000,000 | | | | 100,000,000 | | | | 100,000,000 | | | | 100,000,000 | | |
Par value | | $ | 0.001 | | | $ | 0.001 | | | $ | 0.001 | | | $ | 0.001 | | |
Shares outstanding | | | 2,173,129 | | | | 9,255,068 | | | | 12,520,135 | | | | 10,395,112 | | |
Net asset value and redemption price per share | | $ | 20.20 | | | $ | 20.32 | | | $ | 47.51 | | | $ | 20.30 | | |
Class R6: | |
Net assets | | $ | 4,389,214 | | | | n/a | | | | n/a | | | | n/a | | |
Shares authorized | | | 100,000,000 | | | | n/a | | | | n/a | | | | n/a | | |
Par value | | $ | 0.001 | | | | n/a | | | | n/a | | | | n/a | | |
Shares outstanding | | | 217,188 | | | | n/a | | | | n/a | | | | n/a | | |
Net asset value and redemption price per share | | $ | 20.21 | | | | n/a | | | | n/a | | | | n/a | | |
Class S: | |
Net assets | | $ | 124,983,617 | | | $ | 274,498,309 | | | $ | 606,502,996 | | | $ | 256,844,559 | | |
Shares authorized | | | 100,000,000 | | | | 100,000,000 | | | | 100,000,000 | | | | 100,000,000 | | |
Par value | | $ | 0.001 | | | $ | 0.001 | | | $ | 0.001 | | | $ | 0.001 | | |
Shares outstanding | | | 6,217,559 | | | | 13,521,596 | | | | 12,844,645 | | | | 12,779,524 | | |
Net asset value and redemption price per share | | $ | 20.10 | | | $ | 20.30 | | | $ | 47.22 | | | $ | 20.10 | | |
Class S2: | |
Net assets | | $ | 3,430,636 | | | | n/a | | | $ | 420,527,129 | | | $ | 3,381,581 | | |
Shares authorized | | | 100,000,000 | | | | n/a | | | | 100,000,000 | | | | 100,000,000 | | |
Par value | | $ | 0.001 | | | | n/a | | | $ | 0.001 | | | $ | 0.001 | | |
Shares outstanding | | | 175,768 | | | | n/a | | | | 9,025,842 | | | | 171,443 | | |
Net asset value and redemption price per share | | $ | 19.52 | | | | n/a | | | $ | 46.59 | | | $ | 19.72 | | |
See Accompanying Notes to Financial Statements
39
STATEMENTS OF ASSETS AND LIABILITIES AS OF DECEMBER 31, 2017
| | | VY®
Oppenheimer
Global
Portfolio | | VY®
Pioneer
High Yield
Portfolio | | VY®
T. Rowe Price
Diversified Mid Cap
Growth
Portfolio | | VY®
T. Rowe Price
Growth Equity
Portfolio | |
ASSETS: | |
Investments in securities at fair value+* | | $ | 1,721,168,959 | | | $ | 92,325,996 | | | $ | 1,009,398,263 | | | $ | 1,728,267,830 | | |
Short-term investments at fair value** | | | 36,851,222 | | | | 7,664,143 | | | | 32,968,101 | | | | 66,934,511 | | |
Cash | | | — | | | | — | | | | 806,728 | | | | 7,879,042 | | |
Cash collateral for futures | | | — | | | | 156,215 | | | | — | | | | — | | |
Cash pledged for centrally cleared swaps (Note 2) | | | — | | | | 225,135 | | | | — | | | | — | | |
Receivables: | |
Investment securities sold | | | 1,137,735 | | | | 174,037 | | | | 406,032 | | | | 1,398,595 | | |
Fund shares sold | | | 11,221 | | | | 93,586 | | | | 197,332 | | | | 337,491 | | |
Dividends | | | 352,680 | | | | 16,273 | | | | 588,079 | | | | 781,651 | | |
Interest | | | — | | | | 1,165,719 | | | | — | | | | 27,245 | | |
Foreign tax reclaims | | | 1,836,894 | | | | — | | | | — | | | | 28,393 | | |
Variation margin receivable on centrally cleared swaps | | | — | | | | 776 | | | | — | | | | — | | |
Prepaid expenses | | | 5,860 | | | | 432 | | | | 3,670 | | | | 6,501 | | |
Reimbursement due from manager | | | — | | | | 6,414 | | | | — | | | | — | | |
Other assets | | | 72,577 | | | | 5,638 | | | | 37,016 | | | | 57,910 | | |
Total assets | | | 1,761,437,148 | | | | 101,834,364 | | | | 1,044,405,221 | | | | 1,805,719,169 | | |
LIABILITIES: | |
Payable for investment securities purchased | | | 32,514 | | | | — | | | | 224,157 | | | | — | | |
Payable for fund shares redeemed | | | 970,183 | | | | 19,681 | | | | 407,440 | | | | 1,195,302 | | |
Payable upon receipt of securities loaned | | | 11,605,125 | | | | — | | | | 32,605,100 | | | | 63,982,831 | | |
Unrealized depreciation on unfunded commitments | | | — | | | | 3,880 | | | | — | | | | — | | |
Payable for investment management fees | | | 1,034,244 | | | | 60,098 | | | | 633,989 | | | | 1,024,403 | | |
Payable for distribution and shareholder service fees | | | 101,940 | | | | 735 | | | | 39,122 | | | | 189,710 | | |
Payable to directors under the deferred compensation
plan (Note 6) | | | 72,577 | | | | 5,638 | | | | 37,016 | | | | 57,910 | | |
Payable for directors fees | | | 7,875 | | | | 523 | | | | 4,740 | | | | 8,329 | | |
Other accrued expenses and liabilities | | | 350,411 | | | | 31,960 | | | | 115,740 | | | | 185,355 | | |
Total liabilities | | | 14,174,869 | | | | 122,515 | | | | 34,067,304 | | | | 66,643,840 | | |
NET ASSETS | | $ | 1,747,262,279 | | | $ | 101,711,849 | | | $ | 1,010,337,917 | | | $ | 1,739,075,329 | | |
NET ASSETS WERE COMPRISED OF: | |
Paid-in capital | | $ | 740,139,849 | | | $ | 99,318,993 | | | $ | 610,292,409 | | | $ | 949,856,673 | | |
Undistributed net investment income | | | 26,293,131 | | | | 3,004,403 | | | | 1,555,502 | | | | 2,961,695 | | |
Accumulated net realized gain (loss) | | | 86,119,978 | | | | (3,592,823 | ) | | | 92,793,358 | | | | 302,352,235 | | |
Net unrealized appreciation | | | 894,709,321 | | | | 2,981,276 | | | | 305,696,648 | | | | 483,904,726 | | |
NET ASSETS | | $ | 1,747,262,279 | | | $ | 101,711,849 | | | $ | 1,010,337,917 | | | $ | 1,739,075,329 | | |
| + Including securities loaned at value | | $ | 10,464,803 | | | $ | — | | | $ | 31,867,905 | | | $ | 62,613,534 | | |
| * Cost of investments in securities | | $ | 826,520,942 | | | $ | 89,401,684 | | | $ | 703,701,615 | | | $ | 1,244,360,541 | | |
| ** Cost of short-term investments | | $ | 36,851,222 | | | $ | 7,663,925 | | | $ | 32,968,101 | | | $ | 66,934,511 | | |
See Accompanying Notes to Financial Statements
40
STATEMENTS OF ASSETS AND LIABILITIES AS OF DECEMBER 31, 2017 (CONTINUED)
| | | VY®
Oppenheimer
Global
Portfolio | | VY®
Pioneer
High Yield
Portfolio | | VY®
T. Rowe Price
Diversified Mid Cap
Growth
Portfolio | | VY®
T. Rowe Price
Growth Equity
Portfolio | |
Class ADV: | |
Net assets | | $ | 120,343,804 | | | | n/a | | | $ | 62,022,051 | | | $ | 248,624,410 | | |
Shares authorized | | | 100,000,000 | | | | n/a | | | | 100,000,000 | | | | 100,000,000 | | |
Par value | | $ | 0.001 | | | | n/a | | | $ | 0.001 | | | $ | 0.001 | | |
Shares outstanding | | | 5,618,134 | | | | n/a | | | | 5,907,912 | | | | 2,883,461 | | |
Net asset value and redemption price per share | | $ | 21.42 | | | | n/a | | | $ | 10.50 | | | $ | 86.22 | | |
Class I: | |
Net assets | | $ | 1,384,452,281 | | | $ | 98,202,210 | | | $ | 879,678,094 | | | $ | 1,101,964,578 | | |
Shares authorized | | | 250,000,000 | | | | 100,000,000 | | | | 250,000,000 | | | | 100,000,000 | | |
Par value | | $ | 0.001 | | | $ | 0.001 | | | $ | 0.001 | | | $ | 0.001 | | |
Shares outstanding | | | 62,005,028 | | | | 8,215,422 | | | | 76,107,161 | | | | 11,824,712 | | |
Net asset value and redemption price per share | | $ | 22.33 | | | $ | 11.95 | | | $ | 11.56 | | | $ | 93.19 | | |
Class R6: | |
Net assets | | | n/a | | | | n/a | | | $ | 9,313,150 | | | | n/a | | |
Shares authorized | | | n/a | | | | n/a | | | | 100,000,000 | | | | n/a | | |
Par value | | | n/a | | | | n/a | | | $ | 0.001 | | | | n/a | | |
Shares outstanding | | | n/a | | | | n/a | | | | 805,424 | | | | n/a | | |
Net asset value and redemption price per share | | | n/a | | | | n/a | | | $ | 11.56 | | | | n/a | | |
Class S: | |
Net assets | | $ | 238,436,241 | | | $ | 3,509,639 | | | $ | 55,221,768 | | | $ | 379,472,610 | | |
Shares authorized | | | 100,000,000 | | | | 100,000,000 | | | | 100,000,000 | | | | 100,000,000 | | |
Par value | | $ | 0.001 | | | $ | 0.001 | | | $ | 0.001 | | | $ | 0.001 | | |
Shares outstanding | | | 11,073,575 | | | | 293,946 | | | | 4,953,300 | | | | 4,230,875 | | |
Net asset value and redemption price per share | | $ | 21.53 | | | $ | 11.94 | | | $ | 11.15 | | | $ | 89.69 | | |
Class S2: | |
Net assets | | $ | 4,029,953 | | | | n/a | | | $ | 4,102,854 | | | $ | 9,013,731 | | |
Shares authorized | | | 100,000,000 | | | | n/a | | | | 100,000,000 | | | | 100,000,000 | | |
Par value | | $ | 0.001 | | | | n/a | | | $ | 0.001 | | | $ | 0.001 | | |
Shares outstanding | | | 192,162 | | | | n/a | | | | 389,272 | | | | 103,247 | | |
Net asset value and redemption price per share | | $ | 20.97 | | | | n/a | | | $ | 10.54 | | | $ | 87.30 | | |
See Accompanying Notes to Financial Statements
41
STATEMENTS OF ASSETS AND LIABILITIES AS OF DECEMBER 31, 2017
| | | VY®
Templeton
Foreign Equity
Portfolio | |
ASSETS: | |
Investments in securities at fair value+* | | $ | 616,163,198 | | |
Short-term investments at fair value** | | | 22,183,049 | | |
Foreign currencies at value*** | | | 74,721 | | |
Receivables: | |
Investment securities sold | | | 2,827,385 | | |
Fund shares sold | | | 79,206 | | |
Dividends | | | 901,491 | | |
Foreign tax reclaims | | | 1,405,925 | | |
Unrealized appreciation on forward foreign currency contracts | | | 362 | | |
Prepaid expenses | | | 2,652 | | |
Reimbursement due from manager | | | 21,905 | | |
Other assets | | | 59,050 | | |
Total assets | | | 643,718,944 | | |
LIABILITIES: | |
Payable for investment securities purchased | | | 3,063,417 | | |
Payable for fund shares redeemed | | | 719,442 | | |
Payable upon receipt of securities loaned | | | 11,521,061 | | |
Payable for investment management fees | | | 474,513 | | |
Payable for distribution and shareholder service fees | | | 102,541 | | |
Payable to directors under the deferred compensation plan (Note 6) | | | 59,050 | | |
Payable for directors fees | | | 3,240 | | |
Other accrued expenses and liabilities | | | 172,498 | | |
Total liabilities | | | 16,115,762 | | |
NET ASSETS | | $ | 627,603,182 | | |
NET ASSETS WERE COMPRISED OF: | |
Paid-in capital | | $ | 465,722,224 | | |
Undistributed net investment income | | | 13,941,969 | | |
Accumulated net realized loss | | | (5,474,911 | ) | |
Net unrealized appreciation | | | 153,413,900 | | |
NET ASSETS | | $ | 627,603,182 | | |
| + Including securities loaned at value | | $ | 11,021,391 | | |
| * Cost of investments in securities | | $ | 462,756,296 | | |
| ** Cost of short-term investments | | $ | 22,182,757 | | |
| *** Cost of foreign currencies | | $ | 74,721 | | |
See Accompanying Notes to Financial Statements
42
STATEMENTS OF ASSETS AND LIABILITIES AS OF DECEMBER 31, 2017 (CONTINUED)
| | | VY®
Templeton
Foreign Equity
Portfolio | |
Class ADV: | |
Net assets | | $ | 37,897,764 | | |
Shares authorized | | | 100,000,000 | | |
Par value | | $ | 0.001 | | |
Shares outstanding | | | 2,901,076 | | |
Net asset value and redemption price per share | | $ | 13.06 | | |
Class I: | |
Net assets | | $ | 183,905,386 | | |
Shares authorized | | | 100,000,000 | | |
Par value | | $ | 0.001 | | |
Shares outstanding | | | 13,925,016 | | |
Net asset value and redemption price per share | | $ | 13.21 | | |
Class S: | |
Net assets | | $ | 404,801,142 | | |
Shares authorized | | | 100,000,000 | | |
Par value | | $ | 0.001 | | |
Shares outstanding | | | 30,858,937 | | |
Net asset value and redemption price per share | | $ | 13.12 | | |
Class S2: | |
Net assets | | $ | 998,890 | | |
Shares authorized | | | 100,000,000 | | |
Par value | | $ | 0.001 | | |
Shares outstanding | | | 76,571 | | |
Net asset value and redemption price per share | | $ | 13.05 | | |
See Accompanying Notes to Financial Statements
43
STATEMENTS OF OPERATIONS FOR THE YEAR ENDED DECEMBER 31, 2017
| | | Voya
Global Bond
Portfolio | | VY®
American Century
Small-Mid Cap Value
Portfolio | | VY®
Baron
Growth
Portfolio | | VY®
Columbia
Contrarian Core
Portfolio | |
INVESTMENT INCOME: | |
Dividends, net of foreign taxes withheld* | | $ | 65,149 | | | $ | 8,267,157 | | | $ | 8,330,956 | | | $ | 5,813,285 | | |
Interest, net of foreign taxes withheld* | | | 5,862,569 | | | | — | | | | — | | | | — | | |
Dividends from affiliated underlying funds | | | 2,238,258 | | | | — | | | | — | | | | — | | |
Securities lending income, net | | | 26,870 | | | | 105,106 | | | | — | | | | — | | |
Total investment income | | | 8,192,846 | | | | 8,372,263 | | | | 8,330,956 | | | | 5,813,285 | | |
EXPENSES: | |
Investment management fees | | | 1,373,915 | | | | 3,941,379 | | | | 7,165,793 | | | | 2,938,578 | | |
Distribution and shareholder service fees: | |
Class ADV | | | 123,771 | | | | 539,343 | | | | 422,519 | | | | 138,542 | | |
Class S | | | 103,350 | | | | 252,680 | | | | 1,276,600 | | | | 721,882 | | |
Class S2 | | | — | | | | 17,622 | | | | 9,496 | | | | — | | |
Transfer agent fees | | | 365 | | | | 1,204 | | | | 1,232 | | | | 782 | | |
Shareholder reporting expense | | | 27,602 | | | | 37,198 | | | | 72,950 | | | | 33,551 | | |
Professional fees | | | 21,248 | | | | 35,289 | | | | 49,897 | | | | 27,866 | | |
Custody and accounting expense | | | 81,755 | | | | 110,861 | | | | 80,534 | | | | 42,937 | | |
Directors fees | | | 9,159 | | | | 14,538 | | | | 30,172 | | | | 13,060 | | |
Miscellaneous expense | | | 12,421 | | | | 23,473 | | | | 40,150 | | | | 20,258 | | |
Interest expense | | | 1,403 | | | | 406 | | | | 8,330 | | | | 5 | | |
Total expenses | | | 1,754,989 | | | | 4,973,993 | | | | 9,157,673 | | | | 3,937,461 | | |
Waived and reimbursed fees | | | (153,816 | ) | | | (1,044,572 | ) | | | — | | | | (746,501 | ) | |
Brokerage commission recapture | | | — | | | | — | | | | (1,282 | ) | | | (23,151 | ) | |
Net expenses | | | 1,601,173 | | | | 3,929,421 | | | | 9,156,391 | | | | 3,167,809 | | |
Net investment income (loss) | | | 6,591,673 | | | | 4,442,842 | | | | (825,435 | ) | | | 2,645,476 | | |
REALIZED AND UNREALIZED GAIN (LOSS): | |
Net realized gain (loss) on: | |
Investments | | | (4,223,223 | ) | | | 40,641,313 | | | | 77,004,152 | | | | 30,185,943 | | |
Forward foreign currency contracts | | | 1,183,259 | | | | (227,407 | ) | | | — | | | | — | | |
Foreign currency related transactions | | | 404,364 | | | | (65,438 | ) | | | (2,977 | ) | | | 10,346 | | |
Futures | | | 451,289 | | | | — | | | | — | | | | — | | |
Swaps | | | (9,523,900 | ) | | | — | | | | — | | | | — | | |
Written options | | | 12,881,449 | | | | — | | | | — | | | | — | | |
Net realized gain | | | 1,173,238 | | | | 40,348,468 | | | | 77,001,175 | | | | 30,196,289 | | |
Net change in unrealized appreciation (depreciation) on: | |
Investments | | | (1,397,910 | ) | | | (5,919,528 | ) | | | 109,813,877 | | | | 31,018,205 | | |
Affiliated underlying funds | | | 3,584,479 | | | | — | | | | — | | | | — | | |
Forward foreign currency contracts | | | 4,756,562 | | | | (94,004 | ) | | | — | | | | — | | |
Foreign currency related transactions | | | 88,623 | | | | 346 | | | | — | | | | 346 | | |
Futures | | | (408,241 | ) | | | — | | | | — | | | | — | | |
Swaps | | | 3,393,166 | | | | — | | | | — | | | | — | | |
Written options | | | 2,931,124 | | | | — | | | | — | | | | — | | |
Net change in unrealized appreciation (depreciation) | | | 12,947,803 | | | | (6,013,186 | ) | | | 109,813,877 | | | | 31,018,551 | | |
Net realized and unrealized gain | | | 14,121,041 | | | | 34,335,282 | | | | 186,815,052 | | | | 61,214,840 | | |
Increase in net assets resulting from operations | | $ | 20,712,714 | | | $ | 38,778,124 | | | $ | 185,989,617 | | | $ | 63,860,316 | | |
| * Foreign taxes withheld | | $ | 1,356 | | | $ | 54,604 | | | $ | — | | | $ | 13,813 | | |
See Accompanying Notes to Financial Statements
44
STATEMENTS OF OPERATIONS FOR THE YEAR ENDED DECEMBER 31, 2017
| | | VY®
Columbia Small
Cap Value II
Portfolio | | VY®
Invesco
Comstock
Portfolio | | VY®
Invesco
Equity and Income
Portfolio | | VY®
JPMorgan
Mid Cap Value
Portfolio | |
INVESTMENT INCOME: | |
Dividends, net of foreign taxes withheld* | | $ | 2,989,358 | | | $ | 10,992,133 | | | $ | 30,858,982 | | | $ | 10,134,615 | | |
Interest | | | — | | | | — | | | | 12,719,389 | | | | — | | |
Securities lending income, net | | | — | | | | 120,583 | | | | 695,911 | | | | 116,659 | | |
Total investment income | | | 2,989,358 | | | | 11,112,716 | | | | 44,274,282 | | | | 10,251,274 | | |
EXPENSES: | |
Investment management fees | | | 1,870,050 | | | | 3,487,267 | | | | 10,885,224 | | | | 4,931,065 | | |
Distribution and shareholder service fees: | |
Class ADV | | | 182,865 | | | | 172,775 | | | | 263,881 | | | | 495,168 | | |
Class S | | | 327,414 | | | | 699,298 | | | | 1,607,834 | | | | 681,469 | | |
Class S2 | | | 20,109 | | | | — | | | | 1,747,415 | | | | 14,815 | | |
Transfer agent fees | | | 935 | | | | 1,192 | | | | 2,767 | | | | 902 | | |
Shareholder reporting expense | | | 24,840 | | | | 53,552 | | | | 171,040 | | | | 51,948 | | |
Professional fees | | | 23,031 | | | | 42,759 | | | | 131,753 | | | | 39,549 | | |
Custody and accounting expense | | | 23,490 | | | | 88,930 | | | | 231,304 | | | | 63,754 | | |
Directors fees | | | 8,800 | | | | 19,927 | | | | 69,083 | | | | 23,632 | | |
Miscellaneous expense | | | 19,533 | | | | 30,843 | | | | 87,960 | | | | 25,217 | | |
Interest expense | | | 100 | | | | 162 | | | | 5 | | | | 80 | | |
Total expenses | | | 2,501,167 | | | | 4,596,705 | | | | 15,198,266 | | | | 6,327,599 | | |
Waived and reimbursed fees | | | (60,867 | ) | | | (92,521 | ) | | | (580,218 | ) | | | (1,870 | ) | |
Brokerage commission recapture | | | (18,782 | ) | | | (2,823 | ) | | | (21,083 | ) | | | (3,558 | ) | |
Net expenses | | | 2,421,518 | | | | 4,501,361 | | | | 14,596,965 | | | | 6,322,171 | | |
Net investment income | | | 567,840 | | | | 6,611,355 | | | | 29,677,317 | | | | 3,929,103 | | |
REALIZED AND UNREALIZED GAIN (LOSS): | |
Net realized gain (loss) on: | |
Investments | | | 21,065,398 | | | | 44,023,253 | | | | 92,774,464 | | | | 42,555,468 | | |
Forward foreign currency contracts | | | — | | | | (3,076,365 | ) | | | (2,875,698 | ) | | | — | | |
Foreign currency related transactions | | | — | | | | 675,626 | | | | (412,335 | ) | | | — | | |
Net realized gain | | | 21,065,398 | | | | 41,622,514 | | | | 89,486,431 | | | | 42,555,468 | | |
Net change in unrealized appreciation (depreciation) on: | |
Investments | | | 635,450 | | | | 33,989,890 | | | | 58,464,897 | | | | 29,569,358 | | |
Forward foreign currency contracts | | | — | | | | (1,631,619 | ) | | | (3,361,348 | ) | | | — | | |
Foreign currency related transactions | | | — | | | | 11,811 | | | | 19,642 | | | | — | | |
Net change in unrealized appreciation (depreciation) | | | 635,450 | | | | 32,370,082 | | | | 55,123,191 | | | | 29,569,358 | | |
Net realized and unrealized gain | | | 21,700,848 | | | | 73,992,596 | | | | 144,609,622 | | | | 72,124,826 | | |
Increase in net assets resulting from operations | | $ | 22,268,688 | | | $ | 80,603,951 | | | $ | 174,286,939 | | | $ | 76,053,929 | | |
| * Foreign taxes withheld | | $ | 9,114 | | | $ | 267,977 | | | $ | 626,708 | | | $ | — | | |
See Accompanying Notes to Financial Statements
45
STATEMENTS OF OPERATIONS FOR THE YEAR ENDED DECEMBER 31, 2017
| | | VY®
Oppenheimer
Global
Portfolio | | VY®
Pioneer
High Yield
Portfolio | | VY®
T. Rowe Price
Diversified Mid Cap
Growth
Portfolio | | VY®
T. Rowe Price
Growth Equity
Portfolio | |
INVESTMENT INCOME: | |
Dividends, net of foreign taxes withheld* | | $ | 21,992,852 | | | $ | 188,122 | | | $ | 8,724,528 | | | $ | 14,953,278 | | |
Interest | | | — | | | | 5,560,583 | | | | 337 | | | | 28,537 | | |
Securities lending income, net | | | 354,255 | | | | — | | | | 324,825 | | | | 666,700 | | |
Total investment income | | | 22,347,107 | | | | 5,748,705 | | | | 9,049,690 | | | | 15,648,515 | | |
EXPENSES: | |
Investment management fees | | | 11,026,079 | | | | 732,482 | | | | 7,014,016 | | | | 11,659,453 | | |
Distribution and shareholder service fees: | |
Class ADV | | | 525,532 | | | | — | | | | 274,559 | | | | 1,117,844 | | |
Class S | | | 517,157 | | | | 9,316 | | | | 129,957 | | | | 891,034 | | |
Class S2 | | | 16,592 | | | | — | | | | 18,252 | | | | 39,323 | | |
Transfer agent fees | | | 2,213 | | | | 402 | | | | 935 | | | | 2,762 | | |
Shareholder reporting expense | | | 124,732 | | | | 17,155 | | | | 76,980 | | | | 138,080 | | |
Professional fees | | | 106,388 | | | | 19,833 | | | | 68,765 | | | | 118,325 | | |
Custody and accounting expense | | | 364,140 | | | | 32,207 | | | | 101,030 | | | | 200,767 | | |
Directors fees | | | 63,006 | | | | 4,186 | | | | 37,914 | | | | 66,625 | | |
Miscellaneous expense | | | 60,345 | | | | 10,322 | | | | 38,283 | | | | 66,897 | | |
Interest expense | | | 1 | | | | 451 | | | | 720 | | | | 566 | | |
Total expenses | | | 12,806,185 | | | | 826,354 | | | | 7,761,411 | | | | 14,301,676 | | |
Waived and reimbursed fees | | | — | | | | (71,559 | ) | | | — | | | | (95,302 | ) | |
Brokerage commission recapture | | | — | | | | (7 | ) | | | (1,475 | ) | | | (8,674 | ) | |
Net expenses | | | 12,806,185 | | | | 754,788 | | | | 7,759,936 | | | | 14,197,700 | | |
Net investment income | | | 9,540,922 | | | | 4,993,917 | | | | 1,289,754 | | | | 1,450,815 | | |
REALIZED AND UNREALIZED GAIN (LOSS): | |
Net realized gain (loss) on: | |
Investments | | | 110,348,393 | | | | 1,845,688 | | | | 97,549,385 | | | | 307,848,115 | | |
Forward foreign currency contracts | | | (119,722 | ) | | | — | | | | — | | | | — | | |
Foreign currency related transactions | | | 211,299 | | | | 148 | | | | — | | | | 87,894 | | |
Futures | | | — | | | | (384,556 | ) | | | — | | | | — | | |
Swaps | | | — | �� | | | 115,390 | | | | — | | | | — | | |
Net realized gain | | | 110,439,970 | | | | 1,576,670 | | | | 97,549,385 | | | | 307,936,009 | | |
Net change in unrealized appreciation (depreciation) on: | |
| Investments (net of Indian capital gains tax accrued#) | | | 361,004,395 | | | | 954,470 | | | | 108,864,402 | | | | 162,301,164 | | |
Foreign currency related transactions | | | 149,143 | | | | 103 | | | | — | | | | 1,590 | | |
Futures | | | — | | | | (38,144 | ) | | | — | | | | — | | |
Swaps | | | — | | | | (33,666 | ) | | | — | | | | — | | |
Unfunded commitments | | | — | | | | (9,394 | ) | | | — | | | | — | | |
Net change in unrealized appreciation (depreciation) | | | 361,153,538 | | | | 873,369 | | | | 108,864,402 | | | | 162,302,754 | | |
Net realized and unrealized gain | | | 471,593,508 | | | | 2,450,039 | | | | 206,413,787 | | | | 470,238,763 | | |
Increase in net assets resulting from operations | | $ | 481,134,430 | | | $ | 7,443,956 | | | $ | 207,703,541 | | | $ | 471,689,578 | | |
| * Foreign taxes withheld | | $ | 1,798,328 | | | $ | — | | | $ | 16,482 | | | $ | 21,822 | | |
| # Foreign taxes accrued on Indian investments | | $ | 74,218 | | | $ | — | | | $ | — | | | $ | — | | |
See Accompanying Notes to Financial Statements
46
STATEMENTS OF OPERATIONS FOR THE YEAR ENDED DECEMBER 31, 2017
| | | VY®
Templeton
Foreign Equity
Portfolio | |
INVESTMENT INCOME: | |
Dividends, net of foreign taxes withheld* | | $ | 16,719,515 | | |
Interest | | | 85,904 | | |
Securities lending income, net | | | 247,159 | | |
Foreign withholding tax claims (Note 14) | | | 1,812,563 | | |
Total investment income | | | 18,865,141 | | |
EXPENSES: | |
Investment management fees | | | 5,757,277 | | |
Distribution and shareholder service fees: | |
Class ADV | | | 178,392 | | |
Class S | | | 1,074,593 | | |
Class S2 | | | 6,914 | | |
Transfer agent fees | | | 1,168 | | |
Shareholder reporting expense | | | 63,490 | | |
Professional fees | | | 50,081 | | |
Custody and accounting expense | | | 265,071 | | |
Directors fees | | | 25,917 | | |
Miscellaneous expense | | | 61,065 | | |
Interest expense | | | 62 | | |
Total expenses | | | 7,484,030 | | |
Waived and reimbursed fees | | | (349,518 | ) | |
Brokerage commission recapture | | | (11,567 | ) | |
Net expenses | | | 7,122,945 | | |
Net investment income | | | 11,742,196 | | |
REALIZED AND UNREALIZED GAIN (LOSS): | |
Net realized gain (loss) on: | |
Investments | | | 31,445,746 | | |
Forward foreign currency contracts | | | (3,912 | ) | |
Foreign currency related transactions | | | 273,616 | | |
Net realized gain | | | 31,715,450 | | |
Net change in unrealized appreciation (depreciation) on: | |
Investments | | | 85,264,843 | | |
Forward foreign currency contracts | | | 362 | | |
Foreign currency related transactions | | | 118,275 | | |
Net change in unrealized appreciation (depreciation) | | | 85,383,480 | | |
Net realized and unrealized gain | | | 117,098,930 | | |
Increase in net assets resulting from operations | | $ | 128,841,126 | | |
| * Foreign taxes withheld | | $ | 248,881 | | |
See Accompanying Notes to Financial Statements
47
STATEMENTS OF CHANGES IN NET ASSETS
| | | Voya Global Bond Portfolio | | VY® American Century Small-Mid
Cap Value Portfolio | |
| | | Year
Ended
December 31,
2017 | | Year
Ended
December 31,
2016 | | Year
Ended
December 31,
2017 | | Year
Ended
December 31,
2016 | |
FROM OPERATIONS: | |
Net investment income | | $ | 6,591,673 | | | $ | 6,482,623 | | | $ | 4,442,842 | | | $ | 3,191,292 | | |
Net realized gain | | | 1,173,238 | | | | 4,514,745 | | | | 40,348,468 | | | | 12,678,670 | | |
Net change in unrealized appreciation (depreciation) | | | 12,947,803 | | | | 3,677,694 | | | | (6,013,186 | ) | | | 50,815,235 | | |
Increase in net assets resulting from operations | | | 20,712,714 | | | | 14,675,062 | | | | 38,778,124 | | | | 66,685,197 | | |
FROM DISTRIBUTIONS TO SHAREHOLDERS: | |
Net investment income: | |
Class ADV | | | (511,317 | ) | | | (154,504 | ) | | | (1,009,008 | ) | | | (995,310 | ) | |
Class I | | | (4,176,794 | ) | | | (1,633,644 | ) | | | (1,888,408 | ) | | | (2,077,708 | ) | |
Class S | | | (957,957 | ) | | | (327,519 | ) | | | (1,080,278 | ) | | | (1,101,144 | ) | |
Class S2 | | | — | | | | — | | | | (40,449 | ) | | | (48,274 | ) | |
Net realized gains: | |
Class ADV | | | — | | | | — | | | | (4,431,604 | ) | | | (7,579,332 | ) | |
Class I | | | — | | | | — | | | | (5,837,409 | ) | | | (11,110,668 | ) | |
Class S | | | — | | | | — | | | | (3,971,230 | ) | | | (7,061,817 | ) | |
Class S2 | | | — | | | | — | | | | (171,694 | ) | | | (327,339 | ) | |
Return of capital: | |
Class ADV | | | — | | | | (200,037 | ) | | | — | | | | — | | |
Class I | | | — | | | | (1,312,446 | ) | | | — | | | | — | | |
Class S | | | — | | | | (322,210 | ) | | | — | | | | — | | |
Total distributions | | | (5,646,068 | ) | | | (3,950,360 | ) | | | (18,430,080 | ) | | | (30,301,592 | ) | |
FROM CAPITAL SHARE TRANSACTIONS: | |
Net proceeds from sale of shares | | | 14,082,098 | | | | 11,918,890 | | | | 60,979,747 | | | | 61,787,440 | | |
Reinvestment of distributions | | | 5,646,068 | | | | 3,950,360 | | | | 18,430,080 | | | | 30,301,592 | | |
| | | | 19,728,166 | | | | 15,869,250 | | | | 79,409,827 | | | | 92,089,032 | | |
Cost of shares redeemed | | | (34,769,551 | ) | | | (36,478,785 | ) | | | (84,915,294 | ) | | | (43,296,396 | ) | |
Net increase (decrease) in net assets resulting from capital
share transactions | | | (15,041,385 | ) | | | (20,609,535 | ) | | | (5,505,467 | ) | | | 48,792,636 | | |
Net increase (decrease) in net assets | | | 25,261 | | | | (9,884,833 | ) | | | 14,842,577 | | | | 85,176,241 | | |
NET ASSETS: | |
Beginning of year or period | | | 228,397,088 | | | | 238,281,921 | | | | 362,575,263 | | | | 277,399,022 | | |
End of year or period | | $ | 228,422,349 | | | $ | 228,397,088 | | | $ | 377,417,840 | | | $ | 362,575,263 | | |
Undistributed net investment income at end of year or period | | $ | 5,889,353 | | | $ | 2,763,579 | | | $ | 4,223,160 | | | $ | 4,001,439 | | |
See Accompanying Notes to Financial Statements
48
STATEMENTS OF CHANGES IN NET ASSETS
| | | VY® Baron Growth Portfolio | | VY® Columbia Contrarian
Core Portfolio | |
| | | Year
Ended
December 31,
2017 | | Year
Ended
December 31,
2016 | | Year
Ended
December 31,
2017 | | Year
Ended
December 31,
2016 | |
FROM OPERATIONS: | |
Net investment income (loss) | | $ | (825,435 | ) | | $ | (1,011,480 | ) | | $ | 2,645,476 | | | $ | 3,144,831 | | |
Net realized gain | | | 77,001,175 | | | | 85,923,156 | | | | 30,196,289 | | | | 18,523,482 | | |
Net change in unrealized appreciation (depreciation) | | | 109,813,877 | | | | (46,286,719 | ) | | | 31,018,551 | | | | 4,985,666 | | |
Increase in net assets resulting from operations | | | 185,989,617 | | | | 38,624,957 | | | | 63,860,316 | | | | 26,653,979 | | |
FROM DISTRIBUTIONS TO SHAREHOLDERS: | |
Net investment income: | |
Class ADV | | | (472,568 | ) | | | — | | | | (236,421 | ) | | | (818,094 | ) | |
Class I | | | (1,502,041 | ) | | | — | | | | (120,908 | ) | | | (372,081 | ) | |
Class R6 | | | (19,734 | ) | | | — | | | | — | | | | — | | |
Class S | | | (3,905,958 | ) | | | — | | | | (2,825,606 | ) | | | (9,970,524 | ) | |
Class S2 | | | (7,458 | ) | | | — | | | | — | | | | — | | |
Net realized gains: | |
Class ADV | | | (9,831,150 | ) | | | (9,413,716 | ) | | | (1,647,211 | ) | | | (2,225,263 | ) | |
Class I | | | (16,641,830 | ) | | | (17,990,751 | ) | | | (558,456 | ) | | | (901,673 | ) | |
Class R6 | | | (218,571 | ) | | | (324 | ) | | | — | | | | — | | |
Class S | | | (57,464,205 | ) | | | (56,573,883 | ) | | | (16,468,799 | ) | | | (26,093,897 | ) | |
Class S2 | | | (226,899 | ) | | | (318,426 | ) | | | — | | | | — | | |
Total distributions | | | (90,290,414 | ) | | | (84,297,100 | ) | | | (21,857,401 | ) | | | (40,381,532 | ) | |
FROM CAPITAL SHARE TRANSACTIONS: | |
Net proceeds from sale of shares | | | 59,780,402 | | | | 24,054,643 | | | | 5,706,660 | | | | 16,806,433 | | |
Reinvestment of distributions | | | 90,290,414 | | | | 84,297,100 | | | | 21,857,401 | | | | 40,381,532 | | |
| | | | 150,070,816 | | | | 108,351,743 | | | | 27,564,061 | | | | 57,187,965 | | |
Cost of shares redeemed | | | (196,041,680 | ) | | | (202,292,467 | ) | | | (70,852,925 | ) | | | (55,253,278 | ) | |
Net increase (decrease) in net assets resulting from capital
share transactions | | | (45,970,864 | ) | | | (93,940,724 | ) | | | (43,288,864 | ) | | | 1,934,687 | | |
Net increase (decrease) in net assets | | | 49,728,339 | | | | (139,612,867 | ) | | | (1,285,949 | ) | | | (11,792,866 | ) | |
NET ASSETS: | |
Beginning of year or period | | | 709,834,663 | | | | 849,447,530 | | | | 325,924,633 | | | | 337,717,499 | | |
End of year or period | | $ | 759,563,002 | | | $ | 709,834,663 | | | $ | 324,638,684 | | | $ | 325,924,633 | | |
Undistributed (distributions in excess of) net investment
income or accumulated net investment loss at
end of year or period | | $ | (23,339 | ) | | $ | 5,804,645 | | | $ | 2,602,940 | | | $ | 3,172,780 | | |
See Accompanying Notes to Financial Statements
49
STATEMENTS OF CHANGES IN NET ASSETS
| | | VY® Columbia Small Cap
Value II Portfolio | | VY® Invesco Comstock Portfolio | |
| | | Year
Ended
December 31,
2017 | | Year
Ended
December 31,
2016 | | Year
Ended
December 31,
2017 | | Year
Ended
December 31,
2016 | |
FROM OPERATIONS: | |
Net investment income | | $ | 567,840 | | | $ | 714,352 | | | $ | 6,611,355 | | | $ | 10,086,501 | | |
Net realized gain | | | 21,065,398 | | | | 8,854,041 | | | | 41,622,514 | | | | 27,700,248 | | |
Net change in unrealized appreciation (depreciation) | | | 635,450 | | | | 35,484,324 | | | | 32,370,082 | | | | 45,552,749 | | |
Increase in net assets resulting from operations | | | 22,268,688 | | | | 45,052,717 | | | | 80,603,951 | | | | 83,339,498 | | |
FROM DISTRIBUTIONS TO SHAREHOLDERS: | |
Net investment income: | |
Class ADV | | | (60,081 | ) | | | (15,674 | ) | | | (334,147 | ) | | | (738,151 | ) | |
Class I | | | (246,775 | ) | | | (230,012 | ) | | | (2,586,848 | ) | | | (5,061,532 | ) | |
Class R6 | | | (14,085 | ) | | | (17 | ) | | | — | | | | — | | |
Class S | | | (384,597 | ) | | | (349,701 | ) | | | (3,158,173 | ) | | | (6,796,359 | ) | |
Class S2 | | | (10,279 | ) | | | (8,597 | ) | | | — | | | | — | | |
Net realized gains: | |
Class ADV | | | (1,480,869 | ) | | | (1,236,527 | ) | | | — | | | | — | | |
Class I | | | (1,802,845 | ) | | | (1,752,923 | ) | | | — | | | | — | | |
Class R6 | | | (102,808 | ) | | | (131 | ) | | | — | | | | — | | |
Class S | | | (5,210,507 | ) | | | (5,529,745 | ) | | | — | | | | — | | |
Class S2 | | | (216,301 | ) | | | (214,304 | ) | | | — | | | | — | | |
Total distributions | | | (9,529,147 | ) | | | (9,337,631 | ) | | | (6,079,168 | ) | | | (12,596,042 | ) | |
FROM CAPITAL SHARE TRANSACTIONS: | |
Net proceeds from sale of shares | | | 28,505,309 | | | | 29,420,526 | | | | 40,687,773 | | | | 34,781,203 | | |
Reinvestment of distributions | | | 9,529,147 | | | | 9,337,631 | | | | 6,079,168 | | | | 12,596,042 | | |
| | | | 38,034,456 | | | | 38,758,157 | | | | 46,766,941 | | | | 47,377,245 | | |
Cost of shares redeemed | | | (75,064,802 | ) | | | (47,448,223 | ) | | | (142,775,740 | ) | | | (133,465,225 | ) | |
Net decrease in net assets resulting from capital
share transactions | | | (37,030,346 | ) | | | (8,690,066 | ) | | | (96,008,799 | ) | | | (86,087,980 | ) | |
Net increase (decrease) in net assets | | | (24,290,805 | ) | | | 27,025,020 | | | | (21,484,016 | ) | | | (15,344,524 | ) | |
NET ASSETS: | |
Beginning of year or period | | | 237,995,009 | | | | 210,969,989 | | | | 520,201,077 | | | | 535,545,601 | | |
End of year or period | | $ | 213,704,204 | | | $ | 237,995,009 | | | $ | 498,717,061 | | | $ | 520,201,077 | | |
Undistributed net investment income at end of year or period | | $ | 561,259 | | | $ | 709,236 | | | $ | 791,452 | | | $ | 1,270,256 | | |
See Accompanying Notes to Financial Statements
50
STATEMENTS OF CHANGES IN NET ASSETS
| | | VY® Invesco Equity and
Income Portfolio | | VY® JPMorgan Mid Cap
Value Portfolio | |
| | | Year
Ended
December 31,
2017 | | Year
Ended
December 31,
2016 | | Year
Ended
December 31,
2017 | | Year
Ended
December 31,
2016 | |
FROM OPERATIONS: | |
Net investment income | | $ | 29,677,317 | | | $ | 26,581,357 | | | $ | 3,929,103 | | | $ | 4,349,793 | | |
Net realized gain | | | 89,486,431 | | | | 45,060,679 | | | | 42,555,468 | | | | 54,144,082 | | |
Net change in unrealized appreciation (depreciation) | | | 55,123,191 | | | | 167,932,332 | | | | 29,569,358 | | | | 23,478,691 | | |
Increase in net assets resulting from operations | | | 174,286,939 | | | | 239,574,368 | | | | 76,053,929 | | | | 81,972,566 | | |
FROM DISTRIBUTIONS TO SHAREHOLDERS: | |
Net investment income: | |
Class ADV | | | (706,585 | ) | | | (750,644 | ) | | | (367,446 | ) | | | (421,565 | ) | |
Class I | | | (12,863,459 | ) | | | (11,647,011 | ) | | | (1,780,656 | ) | | | (1,897,621 | ) | |
Class S | | | (10,168,042 | ) | | | (11,792,935 | ) | | | (1,537,684 | ) | | | (1,880,544 | ) | |
Class S2 | | | (5,973,523 | ) | | | (7,227,173 | ) | | | (14,734 | ) | | | (21,210 | ) | |
Net realized gains: | |
Class ADV | | | (1,312,370 | ) | | | (2,032,873 | ) | | | (9,276,090 | ) | | | (8,688,677 | ) | |
Class I | | | (14,259,508 | ) | | | (24,684,765 | ) | | | (19,983,617 | ) | | | (19,904,144 | ) | |
Class S | | | (15,529,797 | ) | | | (29,280,225 | ) | | | (25,068,058 | ) | | | (26,505,473 | ) | |
Class S2 | | | (10,722,943 | ) | | | (18,543,168 | ) | | | (359,318 | ) | | | (391,432 | ) | |
Total distributions | | | (71,536,227 | ) | | | (105,958,794 | ) | | | (58,387,603 | ) | | | (59,710,666 | ) | |
FROM CAPITAL SHARE TRANSACTIONS: | |
Net proceeds from sale of shares | | | 35,752,953 | | | | 25,992,017 | | | | 37,140,515 | | | | 35,302,031 | | |
Reinvestment of distributions | | | 71,536,227 | | | | 105,958,794 | | | | 58,387,603 | | | | 59,710,666 | | |
| | | | 107,289,180 | | | | 131,950,811 | | | | 95,528,118 | | | | 95,012,697 | | |
Cost of shares redeemed | | | (307,139,472 | ) | | | (305,107,611 | ) | | | (151,607,906 | ) | | | (129,110,564 | ) | |
Net decrease in net assets resulting from capital
share transactions | | | (199,850,292 | ) | | | (173,156,800 | ) | | | (56,079,788 | ) | | | (34,097,867 | ) | |
Net decrease in net assets | | | (97,099,580 | ) | | | (39,541,226 | ) | | | (38,413,462 | ) | | | (11,835,967 | ) | |
NET ASSETS: | |
Beginning of year or period | | | 1,773,546,156 | | | | 1,813,087,382 | | | | 609,429,554 | | | | 621,265,521 | | |
End of year or period | | $ | 1,676,446,576 | | | $ | 1,773,546,156 | | | $ | 571,016,092 | | | $ | 609,429,554 | | |
Undistributed net investment income at end of year or period | | $ | 1,822,110 | | | $ | 4,391,247 | | | $ | 406,606 | | | $ | 178,023 | | |
See Accompanying Notes to Financial Statements
51
STATEMENTS OF CHANGES IN NET ASSETS
| | | VY® Oppenheimer Global Portfolio | | VY® Pioneer High Yield Portfolio | |
| | | Year
Ended
December 31,
2017 | | Year
Ended
December 31,
2016 | | Year
Ended
December 31,
2017 | | Year
Ended
December 31,
2016 | |
FROM OPERATIONS: | |
Net investment income | | $ | 9,540,922 | | | $ | 14,182,744 | | | $ | 4,993,917 | | | $ | 4,951,384 | | |
Net realized gain (loss) | | | 110,439,970 | | | | 8,980,566 | | | | 1,576,670 | | | | (3,167,476 | ) | |
Net change in unrealized appreciation (depreciation) | | | 361,153,538 | | | | (31,484,334 | ) | | | 873,369 | | | | 11,345,286 | | |
Increase (decrease) in net assets resulting from operations | | | 481,134,430 | | | | (8,321,024 | ) | | | 7,443,956 | | | | 13,129,194 | | |
FROM DISTRIBUTIONS TO SHAREHOLDERS: | |
Net investment income: | |
Class ADV | | | (718,720 | ) | | | (687,804 | ) | | | — | | | | — | | |
Class I | | | (13,712,818 | ) | | | (13,873,563 | ) | | | (4,964,852 | ) | | | (4,907,706 | ) | |
Class S | | | (1,874,426 | ) | | | (1,776,290 | ) | | | (174,026 | ) | | | (197,859 | ) | |
Class S2 | | | (36,515 | ) | | | (25,099 | ) | | | — | | | | — | | |
Net realized gains: | |
Class ADV | | | (172,448 | ) | | | (6,897,082 | ) | | | — | | | | — | | |
Class I | | | (1,960,781 | ) | | | (77,745,290 | ) | | | — | | | | — | | |
Class S | | | (335,880 | ) | | | (13,294,926 | ) | | | — | | | | — | | |
Class S2 | | | (7,228 | ) | | | (242,723 | ) | | | — | | | | — | | |
Total distributions | | | (18,818,816 | ) | | | (114,542,777 | ) | | | (5,138,878 | ) | | | (5,105,565 | ) | |
FROM CAPITAL SHARE TRANSACTIONS: | |
Net proceeds from sale of shares | | | 91,394,605 | | | | 24,311,860 | | | | 10,680,318 | | | | 18,508,506 | | |
Reinvestment of distributions | | | 18,818,816 | | | | 114,542,777 | | | | 5,138,878 | | | | 5,105,565 | | |
| | | | 110,213,421 | | | | 138,854,637 | | | | 15,819,196 | | | | 23,614,071 | | |
Cost of shares redeemed | | | (185,236,519 | ) | | | (256,622,666 | ) | | | (20,248,141 | ) | | | (23,137,395 | ) | |
Net increase (decrease) in net assets resulting from capital
share transactions | | | (75,023,098 | ) | | | (117,768,029 | ) | | | (4,428,945 | ) | | | 476,676 | | |
Net increase (decrease) in net assets | | | 387,292,516 | | | | (240,631,830 | ) | | | (2,123,867 | ) | | | 8,500,305 | | |
NET ASSETS: | |
Beginning of year or period | | | 1,359,969,763 | | | | 1,600,601,593 | | | | 103,835,716 | | | | 95,335,411 | | |
End of year or period | | $ | 1,747,262,279 | | | $ | 1,359,969,763 | | | $ | 101,711,849 | | | $ | 103,835,716 | | |
Undistributed net investment income at end of year or period | | $ | 26,293,131 | | | $ | 16,291,321 | | | $ | 3,004,403 | | | $ | 3,364,553 | | |
See Accompanying Notes to Financial Statements
52
STATEMENTS OF CHANGES IN NET ASSETS
| | | VY® T. Rowe Price Diversified
Mid Cap Growth Portfolio | | VY® T. Rowe Price Growth
Equity Portfolio | |
| | | Year
Ended
December 31,
2017 | | Year
Ended
December 31,
2016 | | Year
Ended
December 31,
2017 | | Year
Ended
December 31,
2016 | |
FROM OPERATIONS: | |
Net investment income | | $ | 1,289,754 | | | $ | 2,455,582 | | | $ | 1,450,815 | | | $ | 633,868 | | |
Net realized gain | | | 97,549,385 | | | | 67,926,268 | | | | 307,936,009 | | | | 171,333,387 | | |
Net change in unrealized appreciation (depreciation) | | | 108,864,402 | | | | (11,910,223 | ) | | | 162,302,754 | | | | (159,758,756 | ) | |
Increase in net assets resulting from operations | | | 207,703,541 | | | | 58,471,627 | | | | 471,689,578 | | | | 12,208,499 | | |
FROM DISTRIBUTIONS TO SHAREHOLDERS: | |
Net investment income: | |
Class ADV | | | (131,843 | ) | | | (13,696 | ) | | | — | | | | — | | |
Class I | | | (5,216,194 | ) | | | (2,294,727 | ) | | | (565,610 | ) | | | — | | |
Class R6 | | | (35,197 | ) | | | (9 | ) | | | — | | | | — | | |
Class S | | | (230,672 | ) | | | (27,759 | ) | | | — | | | | — | | |
Class S2 | | | (16,432 | ) | | | — | | | | — | | | | — | | |
Net realized gains: | |
Class ADV | | | (4,234,793 | ) | | | (6,387,707 | ) | | | (24,552,336 | ) | | | (23,966,449 | ) | |
Class I | | | (59,161,068 | ) | | | (88,659,304 | ) | | | (109,063,868 | ) | | | (119,705,351 | ) | |
Class R6 | | | (399,191 | ) | | | (366 | ) | | | — | | | | — | | |
Class S | | | (3,734,472 | ) | | | (3,940,284 | ) | | | (38,236,738 | ) | | | (39,520,831 | ) | |
Class S2 | | | (372,735 | ) | | | (541,416 | ) | | | (1,081,420 | ) | | | (1,051,248 | ) | |
Total distributions | | | (73,532,597 | ) | | | (101,865,268 | ) | | | (173,499,972 | ) | | | (184,243,879 | ) | |
FROM CAPITAL SHARE TRANSACTIONS: | |
Net proceeds from sale of shares | | | 79,057,061 | | | | 43,577,227 | | | | 123,553,995 | | | | 112,814,677 | | |
Proceeds from shares issued in merger (Note 15) | | | — | | | | 29,183,887 | | | | — | | | | — | | |
Reinvestment of distributions | | | 73,532,597 | | | | 101,865,268 | | | | 173,499,972 | | | | 184,243,879 | | |
| | | | 152,589,658 | | | | 174,626,382 | | | | 297,053,967 | | | | 297,058,556 | | |
Cost of shares redeemed | | | (125,008,164 | ) | | | (111,164,436 | ) | | | (383,947,327 | ) | | | (356,518,739 | ) | |
Net increase (decrease) in net assets resulting from capital
share transactions | | | 27,581,494 | | | | 63,461,946 | | | | (86,893,360 | ) | | | (59,460,183 | ) | |
Net increase (decrease) in net assets | | | 161,752,438 | | | | 20,068,305 | | | | 211,296,246 | | | | (231,495,563 | ) | |
NET ASSETS: | |
Beginning of year or period | | | 848,585,479 | | | | 828,517,174 | | | | 1,527,779,083 | | | | 1,759,274,646 | | |
End of year or period | | $ | 1,010,337,917 | | | $ | 848,585,479 | | | $ | 1,739,075,329 | | | $ | 1,527,779,083 | | |
Undistributed net investment income at end of
year or period | | $ | 1,555,502 | | | $ | 5,589,834 | | | $ | 2,961,695 | | | $ | 527,655 | | |
See Accompanying Notes to Financial Statements
53
STATEMENTS OF CHANGES IN NET ASSETS
| | | VY® Templeton Foreign
Equity Portfolio | |
| | | Year
Ended
December 31,
2017 | | Year
Ended
December 31,
2016 | |
FROM OPERATIONS: | |
Net investment income | | $ | 11,742,196 | | | $ | 14,066,735 | | |
Net realized gain (loss) | | | 31,715,450 | | | | (4,342,160 | ) | |
Net change in unrealized appreciation (depreciation) | | | 85,383,480 | | | | (1,862,442 | ) | |
Increase in net assets resulting from operations | | | 128,841,126 | | | | 7,862,133 | | |
FROM DISTRIBUTIONS TO SHAREHOLDERS: | |
Net investment income: | |
Class ADV | | | (555,843 | ) | | | (947,058 | ) | |
Class I | | | (3,578,275 | ) | | | (6,016,205 | ) | |
Class S | | | (7,476,254 | ) | | | (14,104,724 | ) | |
Class S2 | | | (24,956 | ) | | | (76,613 | ) | |
Total distributions | | | (11,635,328 | ) | | | (21,144,600 | ) | |
FROM CAPITAL SHARE TRANSACTIONS: | |
Net proceeds from sale of shares | | | 16,893,974 | | | | 26,656,215 | | |
Reinvestment of distributions | | | 11,635,328 | | | | 21,144,600 | | |
| | | | 28,529,302 | | | | 47,800,815 | | |
Cost of shares redeemed | | | (146,010,456 | ) | | | (129,326,350 | ) | |
Net decrease in net assets resulting from capital share transactions | | | (117,481,154 | ) | | | (81,525,535 | ) | |
Net decrease in net assets | | | (275,356 | ) | | | (94,808,002 | ) | |
NET ASSETS: | |
Beginning of year or period | | | 627,878,538 | | | | 722,686,540 | | |
End of year or period | | $ | 627,603,182 | | | $ | 627,878,538 | | |
Undistributed net investment income at end of year or period | | $ | 13,941,969 | | | $ | 11,585,457 | | |
See Accompanying Notes to Financial Statements
54
Selected data for a share of beneficial interest outstanding throughout each year or period.
| | | | | Income (loss)
from investment
operations | | | | Less distributions | |
| | | Net asset value, beginning of year or period | | Net investment income (loss) | | Net realized and unrealized gain (loss) | | Total from investment operations | | From net investment income | | From net realized gains | | From return of capital | |
Year or period ended | | ($) | | ($) | | ($) | | ($) | | ($) | | ($) | | ($) | |
Voya Global Bond Portfolio | | | |
Class ADV | | | |
12-31-17 | | | 10.24 | | | | 0.26 | • | | | 0.66 | | | | 0.92 | | | | 0.22 | | | | — | | | | — | | |
12-31-16 | | | 9.81 | | | | 0.24 | • | | | 0.33 | | | | 0.57 | | | | 0.06 | | | | — | | | | 0.08 | | |
12-31-15 | | | 10.31 | | | | 0.26 | • | | | (0.76 | ) | | | (0.50 | ) | | | — | | | | — | | | | — | | |
12-31-14 | | | 10.35 | | | | 0.37 | • | | | (0.37 | ) | | | 0.00 | * | | | 0.04 | | | | — | | | | — | | |
12-31-13 | | | 11.35 | | | | 0.33 | • | | | (0.85 | ) | | | (0.52 | ) | | | 0.19 | | | | 0.29 | | | | — | | |
Class I | | | |
12-31-17 | | | 10.42 | | | | 0.32 | • | | | 0.68 | | | | 1.00 | | | | 0.28 | | | | — | | | | — | | |
12-31-16 | | | 9.97 | | | | 0.30 | • | | | 0.33 | | | | 0.63 | | | | 0.10 | | | | — | | | | 0.08 | | |
12-31-15 | | | 10.42 | | | | 0.32 | • | | | (0.77 | ) | | | (0.45 | ) | | | — | | | | — | | | | — | | |
12-31-14 | | | 10.46 | | | | 0.43 | • | | | (0.38 | ) | | | 0.05 | | | | 0.09 | | | | — | | | | — | | |
12-31-13 | | | 11.46 | | | | 0.40 | • | | | (0.87 | ) | | | (0.47 | ) | | | 0.24 | | | | 0.29 | | | | — | | |
Class S | | | |
12-31-17 | | | 10.41 | | | | 0.30 | • | | | 0.66 | | | | 0.96 | | | | 0.25 | | | | — | | | | — | | |
12-31-16 | | | 9.97 | | | | 0.27 | | | | 0.33 | | | | 0.60 | | | | 0.08 | | | | — | | | | 0.08 | | |
12-31-15 | | | 10.44 | | | | 0.29 | • | | | (0.76 | ) | | | (0.47 | ) | | | — | | | | — | | | | — | | |
12-31-14 | | | 10.48 | | | | 0.40 | • | | | (0.38 | ) | | | 0.02 | | | | 0.06 | | | | — | | | | — | | |
12-31-13 | | | 11.48 | | | | 0.37 | • | | | (0.87 | ) | | | (0.50 | ) | | | 0.21 | | | | 0.29 | | | | — | | |
| VY® American Century Small-Mid Cap Value Portfolio | | | |
Class ADV | | | |
12-31-17 | | | 12.03 | | | | 0.11 | | | | 1.16 | | | | 1.27 | | | | 0.12 | | | | 0.52 | | | | — | | |
12-31-16 | | | 10.80 | | | | 0.08 | | | | 2.34 | | | | 2.42 | | | | 0.14 | | | | 1.05 | | | | — | | |
12-31-15 | | | 13.82 | | | | 0.08 | | | | (0.27 | ) | | | (0.19 | ) | | | 0.19 | | | | 2.64 | | | | — | | |
12-31-14 | | | 14.79 | | | | 0.12 | • | | | 1.49 | | | | 1.61 | | | | 0.18 | | | | 2.40 | | | | — | | |
12-31-13 | | | 11.76 | | | | 0.12 | • | | | 3.49 | | | | 3.61 | | | | 0.14 | | | | 0.44 | | | | — | | |
Class I | | | |
12-31-17 | | | 12.72 | | | | 0.19 | • | | | 1.22 | | | | 1.41 | | | | 0.17 | | | | 0.52 | | | | — | | |
12-31-16 | | | 11.35 | | | | 0.15 | • | | | 2.47 | | | | 2.62 | | | | 0.20 | | | | 1.05 | | | | — | | |
12-31-15 | | | 14.40 | | | | 0.16 | • | | | (0.31 | ) | | | (0.15 | ) | | | 0.26 | | | | 2.64 | | | | — | | |
12-31-14 | | | 15.30 | | | | 0.20 | • | | | 1.55 | | | | 1.75 | | | | 0.25 | | | | 2.40 | | | | — | | |
12-31-13 | | | 12.12 | | | | 0.19 | • | | | 3.61 | | | | 3.80 | | | | 0.18 | | | | 0.44 | | | | — | | |
Class S | | | |
12-31-17 | | | 12.56 | | | | 0.16 | | | | 1.19 | | | | 1.35 | | | | 0.14 | | | | 0.52 | | | | — | | |
12-31-16 | | | 11.22 | | | | 0.11 | | | | 2.44 | | | | 2.55 | | | | 0.16 | | | | 1.05 | | | | — | | |
12-31-15 | | | 14.25 | | | | 0.13 | • | | | (0.30 | ) | | | (0.17 | ) | | | 0.22 | | | | 2.64 | | | | — | | |
12-31-14 | | | 15.16 | | | | 0.16 | • | | | 1.54 | | | | 1.70 | | | | 0.21 | | | | 2.40 | | | | — | | |
12-31-13 | | | 12.03 | | | | 0.15 | • | | | 3.57 | | | | 3.72 | | | | 0.15 | | | | 0.44 | | | | — | | |
Class S2 | | | |
12-31-17 | | | 12.01 | | | | 0.12 | • | | | 1.15 | | | | 1.27 | | | | 0.12 | | | | 0.52 | | | | — | | |
12-31-16 | | | 10.78 | | | | 0.09 | | | | 2.35 | | | | 2.44 | | | | 0.16 | | | | 1.05 | | | | — | | |
12-31-15 | | | 13.79 | | | | 0.11 | • | | | (0.30 | ) | | | (0.19 | ) | | | 0.18 | | | | 2.64 | | | | — | | |
12-31-14 | | | 14.70 | | | | 0.13 | • | | | 1.49 | | | | 1.62 | | | | 0.13 | | | | 2.40 | | | | — | | |
12-31-13 | | | 11.70 | | | | 0.13 | • | | | 3.46 | | | | 3.59 | | | | 0.15 | | | | 0.44 | | | | — | | |
| VY® Baron Growth Portfolio | | | |
Class ADV | | | |
12-31-17 | | | 24.82 | | | | (0.10 | )• | | | 6.72 | | | | 6.62 | | | | 0.16 | | | | 3.40 | | | | — | | |
12-31-16 | | | 26.58 | | | | (0.11 | ) | | | 1.50 | | | | 1.39 | | | | — | | | | 3.15 | | | | — | | |
12-31-15 | | | 30.35 | | | | (0.16 | ) | | | (1.23 | ) | | | (1.39 | ) | | | 0.02 | | | | 2.36 | | | | — | | |
12-31-14 | | | 29.66 | | | | (0.01 | ) | | | 1.17 | | | | 1.16 | | | | — | | | | 0.47 | | | | — | | |
12-31-13 | | | 22.53 | | | | (0.04 | )• | | | 8.55 | | | | 8.51 | | | | 0.32 | | | | 1.06 | | | | — | | |
| | | | | Ratios to average net assets | | Supplemental
data | |
| | | Total distributions | | Payment by affiliate | | Net asset value, end of year or period | | Total Return(1) | | Expenses before reductions/additions(2)(3)(4) | | Expenses net of fee waivers and/or recoupments if any(2)(3)(4) | | Expense net of all reductions/additions(2)(3)(4) | | Net investment income (loss)(2)(3) | | Net assets, end of year or period | | Portfolio turnover rate | |
Year or period ended | | ($) | | ($) | | ($) | | (%) | | (%) | | (%) | | (%) | | (%) | | ($000's) | | (%) | |
Voya Global Bond Portfolio | |
Class ADV | |
12-31-17 | | | 0.22 | | | | — | | | | 10.94 | | | | 9.05 | | | | 1.17 | | | | 1.10 | | | | 1.10 | | | | 2.48 | | | | 24,922 | | | | 127 | | |
12-31-16 | | | 0.14 | | | | — | | | | 10.24 | | | | 5.82 | | | | 1.16 | | | | 1.10 | | | | 1.10 | | | | 2.27 | | | | 24,365 | | | | 214 | | |
12-31-15 | | | — | | | | — | | | | 9.81 | | | | (4.85 | ) | | | 1.15 | | | | 1.10 | | | | 1.10 | | | | 2.58 | | | | 26,374 | | | | 335 | | |
12-31-14 | | | 0.04 | | | | — | | | | 10.31 | | | | (0.06 | ) | | | 1.16 | | | | 1.10 | | | | 1.10 | | | | 3.49 | | | | 32,874 | | | | 296 | | |
12-31-13 | | | 0.48 | | | | — | | | | 10.35 | | | | (4.50 | ) | | | 1.19 | | | | 1.08 | | | | 1.08 | | | | 3.09 | | | | 34,155 | | | | 394 | | |
Class I | |
12-31-17 | | | 0.28 | | | | — | | | | 11.14 | | | | 9.67 | | | | 0.67 | | | | 0.60 | | | | 0.60 | | | | 2.98 | | | | 161,715 | | | | 127 | | |
12-31-16 | | | 0.18 | | | | — | | | | 10.42 | | | | 6.30 | | | | 0.66 | | | | 0.60 | | | | 0.60 | | | | 2.78 | | | | 163,397 | | | | 214 | | |
12-31-15 | | | — | | | | — | | | | 9.97 | | | | (4.32 | ) | | | 0.65 | | | | 0.60 | | | | 0.60 | | | | 3.08 | | | | 168,739 | | | | 335 | | |
12-31-14 | | | 0.09 | | | | — | | | | 10.42 | | | | 0.42 | | | | 0.66 | | | | 0.60 | | | | 0.60 | | | | 3.99 | | | | 208,023 | | | | 296 | | |
12-31-13 | | | 0.53 | | | | — | | | | 10.46 | | | | (4.00 | ) | | | 0.69 | | | | 0.58 | | | | 0.58 | | | | 3.65 | | | | 237,646 | | | | 394 | | |
Class S | |
12-31-17 | | | 0.25 | | | | — | | | | 11.12 | | | | 9.31 | | | | 0.92 | | | | 0.85 | | | | 0.85 | | | | 2.73 | | | | 41,785 | | | | 127 | | |
12-31-16 | | | 0.16 | | | | — | | | | 10.41 | | | | 6.03 | | | | 0.91 | | | | 0.85 | | | | 0.85 | | | | 2.53 | | | | 40,635 | | | | 214 | | |
12-31-15 | | | — | | | | — | | | | 9.97 | | | | (4.50 | ) | | | 0.90 | | | | 0.85 | | | | 0.85 | | | | 2.83 | | | | 43,169 | | | | 335 | | |
12-31-14 | | | 0.06 | | | | — | | | | 10.44 | | | | 0.15 | | | | 0.91 | | | | 0.85 | | | | 0.85 | | | | 3.74 | | | | 51,041 | | | | 296 | | |
12-31-13 | | | 0.50 | | | | — | | | | 10.48 | | | | (4.28 | ) | | | 0.94 | | | | 0.83 | | | | 0.83 | | | | 3.39 | | | | 54,246 | | | | 394 | | |
| VY® American Century Small-Mid Cap Value Portfolio | |
Class ADV | |
12-31-17 | | | 0.64 | | | | — | | | | 12.66 | | | | 10.90 | | | | 1.65 | | | | 1.36 | | | | 1.36 | | | | 0.95 | | | | 115,235 | | | | 57 | | |
12-31-16 | | | 1.19 | | | | — | | | | 12.03 | | | | 23.69 | | | | 1.65 | | | | 1.36 | | | | 1.36 | | | | 0.78 | | | | 101,948 | | | | 68 | | |
12-31-15 | | | 2.83 | | | | — | | | | 10.80 | | | | (1.97 | ) | | | 1.66 | | | | 1.36 | | | | 1.36 | | | | 0.72 | | | | 79,901 | | | | 71 | | |
12-31-14 | | | 2.58 | | | | — | | | | 13.82 | | | | 12.15 | | | | 1.65 | | | | 1.36 | | | | 1.36 | | | | 0.82 | | | | 86,335 | | | | 79 | | |
12-31-13 | | | 0.58 | | | | — | | | | 14.79 | | | | 31.12 | | | | 1.66 | | | | 1.42 | | | | 1.42 | | | | 0.88 | | | | 95,563 | | | | 84 | | |
Class I | |
12-31-17 | | | 0.69 | | | | — | | | | 13.44 | | | | 11.44 | | | | 1.15 | | | | 0.86 | | | | 0.86 | | | | 1.44 | | | | 151,054 | | | | 57 | | |
12-31-16 | | | 1.25 | | | | — | | | | 12.72 | | | | 24.38 | | | | 1.15 | | | | 0.86 | | | | 0.86 | | | | 1.28 | | | | 156,657 | | | | 68 | | |
12-31-15 | | | 2.90 | | | | — | | | | 11.35 | | | | (1.54 | ) | | | 1.16 | | | | 0.86 | | | | 0.86 | | | | 1.21 | | | | 115,279 | | | | 71 | | |
12-31-14 | | | 2.65 | | | | — | | | | 14.40 | | | | 12.76 | | | | 1.15 | | | | 0.86 | | | | 0.86 | | | | 1.31 | | | | 138,605 | | | | 79 | | |
12-31-13 | | | 0.62 | | | | — | | | | 15.30 | | | | 31.78 | | | | 1.16 | | | | 0.92 | | | | 0.92 | | | | 1.38 | | | | 171,086 | | | | 84 | | |
Class S | |
12-31-17 | | | 0.66 | | | | — | | | | 13.25 | | | | 11.12 | | | | 1.40 | | | | 1.11 | | | | 1.11 | | | | 1.20 | | | | 106,501 | | | | 57 | | |
12-31-16 | | | 1.21 | | | | — | | | | 12.56 | | | | 24.06 | | | | 1.40 | | | | 1.11 | | | | 1.11 | | | | 1.03 | | | | 99,089 | | | | 68 | | |
12-31-15 | | | 2.86 | | | | — | | | | 11.22 | | | | (1.74 | ) | | | 1.41 | | | | 1.11 | | | | 1.11 | | | | 0.96 | | | | 78,646 | | | | 71 | | |
12-31-14 | | | 2.61 | | | | — | | | | 14.25 | | | | 12.47 | | | | 1.40 | | | | 1.11 | | | | 1.11 | | | | 1.06 | | | | 94,268 | | | | 79 | | |
12-31-13 | | | 0.59 | | | | — | | | | 15.16 | | | | 31.36 | | | | 1.41 | | | | 1.17 | | | | 1.17 | | | | 1.12 | | | | 116,117 | | | | 84 | | |
Class S2 | |
12-31-17 | | | 0.64 | | | | — | | | | 12.64 | | | | 10.96 | | | | 1.55 | | | | 1.26 | | | | 1.26 | | | | 1.01 | | | | 4,627 | | | | 57 | | |
12-31-16 | | | 1.21 | | | | — | | | | 12.01 | | | | 23.92 | | | | 1.58 | | | | 1.26 | | | | 1.26 | | | | 0.90 | | | | 4,881 | | | | 68 | | |
12-31-15 | | | 2.82 | | | | — | | | | 10.78 | | | | (1.91 | ) | | | 1.66 | | | | 1.26 | | | | 1.26 | | | | 0.85 | | | | 3,573 | | | | 71 | | |
12-31-14 | | | 2.53 | | | | — | | | | 13.79 | | | | 12.33 | | | | 1.65 | | | | 1.26 | | | | 1.26 | | | | 0.89 | | | | 3,262 | | | | 79 | | |
12-31-13 | | | 0.59 | | | | — | | | | 14.70 | | | | 31.15 | | | | 1.66 | | | | 1.32 | | | | 1.32 | | | | 0.98 | | | | 6,560 | | | | 84 | | |
| VY® Baron Growth Portfolio | |
Class ADV | |
12-31-17 | | | 3.56 | | | | — | | | | 27.88 | | | | 27.86 | | | | 1.49 | | | | 1.49 | | | | 1.49 | | | | (0.38 | ) | | | 88,499 | | | | 3 | | |
12-31-16 | | | 3.15 | | | | — | | | | 24.82 | | | | 5.06 | | | | 1.48 | | | | 1.48 | | | | 1.48 | | | | (0.41 | ) | | | 77,655 | | | | 4 | | |
12-31-15 | | | 2.38 | | | | — | | | | 26.58 | | | | (5.27 | ) | | | 1.49 | | | | 1.49 | | | | 1.49 | | | | (0.54 | ) | | | 90,914 | | | | 5 | | |
12-31-14 | | | 0.47 | | | | — | | | | 30.35 | | | | 4.06 | | | | 1.48 | | | | 1.48 | | | | 1.48 | | | | (0.04 | ) | | | 111,145 | | | | 10 | | |
12-31-13 | | | 1.38 | | | | — | | | | 29.66 | | | | 38.50 | | | | 1.49 | | | | 1.49 | | | | 1.49 | | | | (0.15 | ) | | | 110,486 | | | | 8 | | |
See Accompanying Notes to Financial Statements
55
FINANCIAL HIGHLIGHTS (CONTINUED)
Selected data for a share of beneficial interest outstanding throughout each year or period.
| | | | | Income (loss)
from investment
operations | | | | Less distributions | |
| | | Net asset value, beginning of year or period | | Net investment income (loss) | | Net realized and unrealized gain (loss) | | Total from investment operations | | From net investment income | | From net realized gains | | From return of capital | |
Year or period ended | | ($) | | ($) | | ($) | | ($) | | ($) | | ($) | | ($) | |
| VY® Baron Growth Portfolio (continued) | | | |
Class I | | | |
12-31-17 | | | 26.92 | | | | 0.03 | • | | | 7.34 | | | | 7.37 | | | | 0.31 | | | | 3.40 | | | | — | | |
12-31-16 | | | 28.45 | | | | 0.04 | | | | 1.58 | | | | 1.62 | | | | — | | | | 3.15 | | | | — | | |
12-31-15 | | | 32.31 | | | | (0.01 | ) | | | (1.31 | ) | | | (1.32 | ) | | | 0.18 | | | | 2.36 | | | | — | | |
12-31-14 | | | 31.49 | | | | 0.14 | | | | 1.24 | | | | 1.38 | | | | 0.09 | | | | 0.47 | | | | — | | |
12-31-13 | | | 23.80 | | | | 0.10 | • | | | 9.06 | | | | 9.16 | | | | 0.41 | | | | 1.06 | | | | — | | |
Class R6 | | | |
12-31-17 | | | 26.93 | | | | 0.13 | • | | | 7.24 | | | | 7.37 | | | | 0.31 | | | | 3.40 | | | | — | | |
| 05-03-16(5)-12-31-16 | | | 28.86 | | | | 0.23 | • | | | 0.99 | | | | 1.22 | | | | — | | | | 3.15 | | | | — | | |
Class S | | | |
12-31-17 | | | 25.93 | | | | (0.04 | )• | | | 7.05 | | | | 7.01 | | | | 0.23 | | | | 3.40 | | | | — | | |
12-31-16 | | | 27.57 | | | | (0.05 | ) | | | 1.56 | | | | 1.51 | | | | — | | | | 3.15 | | | | — | | |
12-31-15 | | | 31.39 | | | | (0.08 | ) | | | (1.29 | ) | | | (1.37 | ) | | | 0.09 | | | | 2.36 | | | | — | | |
12-31-14 | | | 30.60 | | | | 0.09 | | | | 1.19 | | | | 1.28 | | | | 0.02 | | | | 0.47 | | | | — | | |
12-31-13 | | | 23.18 | | | | 0.01 | | | | 8.83 | | | | 8.84 | | | | 0.36 | | | | 1.06 | | | | — | | |
Class S2 | | | |
12-31-17 | | | 24.92 | | | | (0.09 | )• | | | 6.78 | | | | 6.69 | | | | 0.11 | | | | 3.40 | | | | — | | |
12-31-16 | | | 26.65 | | | | (0.10 | )• | | | 1.52 | | | | 1.42 | | | | — | | | | 3.15 | | | | — | | |
12-31-15 | | | 30.43 | | | | (0.13 | ) | | | (1.24 | ) | | | (1.37 | ) | | | 0.05 | | | | 2.36 | | | | — | | |
12-31-14 | | | 29.75 | | | | 0.02 | | | | 1.17 | | | | 1.19 | | | | 0.04 | | | | 0.47 | | | | — | | |
12-31-13 | | | 22.62 | | | | (0.03 | )• | | | 8.61 | | | | 8.58 | | | | 0.39 | | | | 1.06 | | | | — | | |
| VY® Columbia Contrarian Core Portfolio | | | |
Class ADV | | | |
12-31-17 | | | 20.66 | | | | 0.13 | | | | 4.17 | | | | 4.30 | | | | 0.20 | | | | 1.36 | | | | — | | |
12-31-16 | | | 21.73 | | | | 0.15 | • | | | 1.55 | | | | 1.70 | | | | 0.74 | | | | 2.03 | | | | — | | |
12-31-15 | | | 24.00 | | | | 0.12 | • | | | 0.58 | | | | 0.70 | | | | 0.18 | | | | 2.79 | | | | — | | |
12-31-14 | | | 24.56 | | | | 0.14 | • | | | 2.70 | | | | 2.84 | | | | 0.17 | | | | 3.23 | | | | — | | |
12-31-13 | | | 18.49 | | | | 0.11 | | | | 6.23 | | | | 6.34 | | | | 0.27 | | | | — | | | | — | | |
Class I | | | |
12-31-17 | | | 21.61 | | | | 0.25 | • | | | 4.37 | | | | 4.62 | | | | 0.29 | | | | 1.36 | | | | — | | |
12-31-16 | | | 22.59 | | | | 0.27 | • | | | 1.62 | | | | 1.89 | | | | 0.84 | | | | 2.03 | | | | — | | |
12-31-15 | | | 24.82 | | | | 0.24 | • | | | 0.60 | | | | 0.84 | | | | 0.28 | | | | 2.79 | | | | — | | |
12-31-14 | | | 25.24 | | | | 0.27 | | | | 2.79 | | | | 3.06 | | | | 0.25 | | | | 3.23 | | | | — | | |
12-31-13 | | | 18.96 | | | | 0.18 | • | | | 6.45 | | | | 6.63 | | | | 0.35 | | | | — | | | | — | | |
Class S | | | |
12-31-17 | | | 21.21 | | | | 0.19 | • | | | 4.27 | | | | 4.46 | | | | 0.23 | | | | 1.36 | | | | — | | |
12-31-16 | | | 22.21 | | | | 0.21 | • | | | 1.59 | | | | 1.80 | | | | 0.77 | | | | 2.03 | | | | — | | |
12-31-15 | | | 24.45 | | | | 0.18 | • | | | 0.58 | | | | 0.76 | | | | 0.21 | | | | 2.79 | | | | — | | |
12-31-14 | | | 24.93 | | | | 0.21 | | | | 2.75 | | | | 2.96 | | | | 0.21 | | | | 3.23 | | | | — | | |
12-31-13 | | | 18.75 | | | | 0.18 | • | | | 6.30 | | | | 6.48 | | | | 0.30 | | | | — | | | | — | | |
| VY® Columbia Small Cap Value II Portfolio | | | |
Class ADV | | | |
12-31-17 | | | 18.50 | | | | 0.00 | *• | | | 1.89 | | | | 1.89 | | | | 0.03 | | | | 0.79 | | | | — | | |
12-31-16 | | | 15.67 | | | | 0.01 | | | | 3.55 | | | | 3.56 | | | | 0.01 | | | | 0.72 | | | | — | | |
12-31-15 | | | 16.23 | | | | 0.00 | * | | | (0.52 | ) | | | (0.52 | ) | | | 0.04 | | | | — | | | | — | | |
12-31-14 | | | 15.63 | | | | 0.03 | • | | | 0.61 | | | | 0.64 | | | | 0.04 | | | | — | | | | — | | |
12-31-13 | | | 11.28 | | | | 0.01 | • | | | 4.44 | | | | 4.45 | | | | 0.10 | | | | — | | | | — | | |
Class I | | | |
12-31-17 | | | 19.05 | | | | 0.10 | • | | | 1.95 | | | | 2.05 | | | | 0.11 | | | | 0.79 | | | | — | | |
12-31-16 | | | 16.12 | | | | 0.10 | | | | 3.64 | | | | 3.74 | | | | 0.09 | | | | 0.72 | | | | — | | |
12-31-15 | | | 16.67 | | | | 0.09 | | | | (0.54 | ) | | | (0.45 | ) | | | 0.10 | | | | — | | | | — | | |
12-31-14 | | | 15.99 | | | | 0.11 | • | | | 0.63 | | | | 0.74 | | | | 0.06 | | | | — | | | | — | | |
12-31-13 | | | 11.51 | | | | 0.08 | • | | | 4.54 | | | | 4.62 | | | | 0.14 | | | | — | | | | — | | |
| | | | | Ratios to average net assets | | Supplemental
data | |
| | | Total distributions | | Payment by affiliate | | Net asset value, end of year or period | | Total Return(1) | | Expenses before reductions/additions(2)(3)(4) | | Expenses net of fee waivers and/or recoupments if any(2)(3)(4) | | Expense net of all reductions/additions(2)(3)(4) | | Net investment income (loss)(2)(3) | | Net assets, end of year or period | | Portfolio turnover rate | |
Year or period ended | | ($) | | ($) | | ($) | | (%) | | (%) | | (%) | | (%) | | (%) | | ($000's) | | (%) | |
| VY® Baron Growth Portfolio (continued) | |
Class I | |
12-31-17 | | | 3.71 | | | | — | | | | 30.58 | | | | 28.52 | | | | 0.99 | | | | 0.99 | | | | 0.99 | | | | 0.11 | | | | 145,389 | | | | 3 | | |
12-31-16 | | | 3.15 | | | | — | | | | 26.92 | | | | 5.57 | | | | 0.98 | | | | 0.98 | | | | 0.98 | | | | 0.12 | | | | 150,672 | | | | 4 | | |
12-31-15 | | | 2.54 | | | | — | | | | 28.45 | | | | (4.75 | ) | | | 0.99 | | | | 0.99 | | | | 0.99 | | | | (0.04 | ) | | | 193,601 | | | | 5 | | |
12-31-14 | | | 0.56 | | | | — | | | | 32.31 | | | | 4.55 | | | | 0.98 | | | | 0.98 | | | | 0.98 | | | | 0.45 | | | | 251,230 | | | | 10 | | |
12-31-13 | | | 1.47 | | | | — | | | | 31.49 | | | | 39.23 | | | | 0.99 | | | | 0.99 | | | | 0.99 | | | | 0.36 | | | | 270,788 | | | | 8 | | |
Class R6 | |
12-31-17 | | | 3.71 | | | | — | | | | 30.59 | | | | 28.51 | | | | 0.99 | | | | 0.99 | | | | 0.99 | | | | 0.43 | | | | 11,442 | | | | 3 | | |
| 05-03-16(5)-12-31-16 | | | 3.15 | | | | — | | | | 26.93 | | | | 4.10 | | | | 0.98 | | | | 0.98 | | | | 0.98 | | | | 1.39 | | | | 879 | | | | 4 | | |
Class S | |
12-31-17 | | | 3.63 | | | | — | | | | 29.31 | | | | 28.20 | | | | 1.24 | | | | 1.24 | | | | 1.24 | | | | (0.13 | ) | | | 512,397 | | | | 3 | | |
12-31-16 | | | 3.15 | | | | — | | | | 25.93 | | | | 5.33 | | | | 1.23 | | | | 1.23 | | | | 1.23 | | | | (0.17 | ) | | | 478,020 | | | | 4 | | |
12-31-15 | | | 2.45 | | | | — | | | | 27.57 | | | | (5.03 | ) | | | 1.24 | | | | 1.24 | | | | 1.24 | | | | (0.29 | ) | | | 559,237 | | | | 5 | | |
12-31-14 | | | 0.49 | | | | — | | | | 31.39 | | | | 4.34 | | | | 1.23 | | | | 1.23 | | | | 1.23 | | | | 0.26 | | | | 694,762 | | | | 10 | | |
12-31-13 | | | 1.42 | | | | — | | | | 30.60 | | | | 38.85 | | | | 1.24 | | | | 1.24 | | | | 1.24 | | | | 0.09 | | | | 798,221 | | | | 8 | | |
Class S2 | |
12-31-17 | | | 3.51 | | | | — | | | | 28.10 | | | | 28.02 | | | | 1.39 | | | | 1.39 | | | | 1.39 | | | | (0.32 | ) | | | 1,835 | | | | 3 | | |
12-31-16 | | | 3.15 | | | | — | | | | 24.92 | | | | 5.17 | | | | 1.42 | | | | 1.38 | | | | 1.38 | | | | (0.38 | ) | | | 2,609 | | | | 4 | | |
12-31-15 | | | 2.41 | | | | — | | | | 26.65 | | | | (5.17 | ) | | | 1.49 | | | | 1.39 | | | | 1.39 | | | | (0.44 | ) | | | 5,696 | | | | 5 | | |
12-31-14 | | | 0.51 | | | | — | | | | 30.43 | | | | 4.17 | | | | 1.48 | | | | 1.38 | | | | 1.38 | | | | 0.05 | | | | 6,874 | | | | 10 | | |
12-31-13 | | | 1.45 | | | | — | | | | 29.75 | | | | 38.68 | | | | 1.49 | | | | 1.39 | | | | 1.39 | | | | (0.11 | ) | | | 6,312 | | | | 8 | | |
| VY® Columbia Contrarian Core Portfolio | |
Class ADV | |
12-31-17 | | | 1.56 | | | | — | | | | 23.40 | | | | 21.32 | | | | 1.44 | | | | 1.21 | | | | 1.20 | | | | 0.58 | | | | 29,515 | | | | 45 | | |
12-31-16 | | | 2.77 | | | | — | | | | 20.66 | | | | 8.12 | | | | 1.44 | | | | 1.20 | | | | 1.19 | | | | 0.71 | | | | 25,432 | | | | 53 | | |
12-31-15 | | | 2.97 | | | | — | | | | 21.73 | | | | 2.75 | | | | 1.44 | | | | 1.18 | | | | 1.17 | | | | 0.51 | | | | 22,738 | | | | 65 | | |
12-31-14 | | | 3.40 | | | | — | | | | 24.00 | | | | 12.50 | | | | 1.44 | | | | 1.18 | | | | 1.17 | | | | 0.56 | | | | 17,942 | | | | 72 | | |
12-31-13 | | | 0.27 | | | | — | | | | 24.56 | | | | 34.42 | | | | 1.46 | | | | 1.24 | | | | 1.23 | | | | 0.55 | | | | 15,554 | | | | 128 | | |
Class I | |
12-31-17 | | | 1.65 | | | | — | | | | 24.58 | | | | 21.96 | | | | 0.94 | | | | 0.71 | | | | 0.70 | | | | 1.08 | | | | 10,099 | | | | 45 | | |
12-31-16 | | | 2.87 | | | | — | | | | 21.61 | | | | 8.64 | | | | 0.94 | | | | 0.70 | | | | 0.69 | | | | 1.21 | | | | 10,629 | | | | 53 | | |
12-31-15 | | | 3.07 | | | | — | | | | 22.59 | | | | 3.25 | | | | 0.94 | | | | 0.68 | | | | 0.67 | | | | 1.01 | | | | 10,628 | | | | 65 | | |
12-31-14 | | | 3.48 | | | | — | | | | 24.82 | | | | 13.09 | | | | 0.94 | | | | 0.68 | | | | 0.67 | | | | 1.07 | | | | 11,751 | | | | 72 | | |
12-31-13 | | | 0.35 | | | | — | | | | 25.24 | | | | 35.18 | | | | 0.96 | | | | 0.74 | | | | 0.72 | | | | 0.87 | | | | 10,991 | | | | 128 | | |
Class S | |
12-31-17 | | | 1.59 | | | | — | | | | 24.08 | | | | 21.58 | | | | 1.19 | | | | 0.96 | | | | 0.95 | | | | 0.83 | | | | 285,025 | | | | 45 | | |
12-31-16 | | | 2.80 | | | | — | | | | 21.21 | | | | 8.41 | | | | 1.19 | | | | 0.95 | | | | 0.94 | | | | 0.96 | | | | 289,864 | | | | 53 | | |
12-31-15 | | | 3.00 | | | | — | | | | 22.21 | | | | 2.98 | | | | 1.19 | | | | 0.93 | | | | 0.92 | | | | 0.76 | | | | 304,352 | | | | 65 | | |
12-31-14 | | | 3.44 | | | | — | | | | 24.45 | | | | 12.81 | | | | 1.19 | | | | 0.93 | | | | 0.92 | | | | 0.82 | | | | 331,659 | | | | 72 | | |
12-31-13 | | | 0.30 | | | | — | | | | 24.93 | | | | 34.74 | | | | 1.21 | | | | 0.99 | | | | 0.98 | | | | 0.80 | | | | 327,459 | | | | 128 | | |
| VY® Columbia Small Cap Value II Portfolio | |
Class ADV | |
12-31-17 | | | 0.82 | | | | — | | | | 19.57 | | | | 10.65 | | | | 1.40 | | | | 1.37 | | | | 1.36 | | | | 0.01 | | | | 37,004 | | | | 44 | | |
12-31-16 | | | 0.73 | | | | — | | | | 18.50 | | | | 23.41 | | | | 1.39 | | | | 1.36 | | | | 1.34 | | | | 0.10 | | | | 36,304 | | | | 61 | | |
12-31-15 | | | 0.04 | | | | — | | | | 15.67 | | | | (3.21 | ) | | | 1.39 | | | | 1.36 | | | | 1.35 | | | | 0.00 | * | | | 27,978 | | | | 53 | | |
12-31-14 | | | 0.04 | | | | — | | | | 16.23 | | | | 4.12 | | | | 1.39 | | | | 1.36 | | | | 1.35 | | | | 0.18 | | | | 30,927 | | | | 52 | | |
12-31-13 | | | 0.10 | | | | — | | | | 15.63 | | | | 39.58 | | | | 1.38 | | | | 1.36 | | | | 1.36 | | | | 0.10 | | | | 12,246 | | | | 39 | | |
Class I | |
12-31-17 | | | 0.90 | | | | — | | | | 20.20 | | | | 11.21 | | | | 0.90 | | | | 0.87 | | | | 0.86 | | | | 0.50 | | | | 43,897 | | | | 44 | | |
12-31-16 | | | 0.81 | | | | — | | | | 19.05 | | | | 24.00 | | | | 0.89 | | | | 0.86 | | | | 0.84 | | | | 0.59 | | | | 49,625 | | | | 61 | | |
12-31-15 | | | 0.10 | | | | — | | | | 16.12 | | | | (2.74 | ) | | | 0.89 | | | | 0.86 | | | | 0.85 | | | | 0.50 | | | | 42,845 | | | | 53 | | |
12-31-14 | | | 0.06 | | | | — | | | | 16.67 | | | | 4.68 | | | | 0.89 | | | | 0.86 | | | | 0.85 | | | | 0.67 | | | | 49,412 | | | | 52 | | |
12-31-13 | | | 0.14 | | | | — | | | | 15.99 | | | | 40.27 | | | | 0.88 | | | | 0.86 | | | | 0.86 | | | | 0.60 | | | | 23,620 | | | | 39 | | |
See Accompanying Notes to Financial Statements
56
FINANCIAL HIGHLIGHTS (CONTINUED)
Selected data for a share of beneficial interest outstanding throughout each year or period.
| | | | | Income (loss)
from investment
operations | | | | Less distributions | |
| | | Net asset value, beginning of year or period | | Net investment income (loss) | | Net realized and unrealized gain (loss) | | Total from investment operations | | From net investment income | | From net realized gains | | From return of capital | |
Year or period ended | | ($) | | ($) | | ($) | | ($) | | ($) | | ($) | | ($) | |
| VY® Columbia Small Cap Value II Portfolio (continued) | | | |
Class R6 | | | |
12-31-17 | | | 19.06 | | | | 0.13 | • | | | 1.92 | | | | 2.05 | | | | 0.11 | | | | 0.79 | | | | — | | |
| 05-03-16(5)-12-31-16 | | | 16.28 | | | | 0.19 | • | | | 3.40 | | | | 3.59 | | | | 0.09 | | | | 0.72 | | | | — | | |
Class S | | | |
12-31-17 | | | 18.96 | | | | 0.05 | • | | | 1.94 | | | | 1.99 | | | | 0.06 | | | | 0.79 | | | | — | | |
12-31-16 | | | 16.04 | | | | 0.06 | | | | 3.63 | | | | 3.69 | | | | 0.05 | | | | 0.72 | | | | — | | |
12-31-15 | | | 16.58 | | | | 0.05 | | | | (0.54 | ) | | | (0.49 | ) | | | 0.05 | | | | — | | | | — | | |
12-31-14 | | | 15.92 | | | | 0.06 | | | | 0.63 | | | | 0.69 | | | | 0.03 | | | | — | | | | — | | |
12-31-13 | | | 11.46 | | | | 0.05 | • | | | 4.52 | | | | 4.57 | | | | 0.11 | | | | — | | | | — | | |
Class S2 | | | |
12-31-17 | | | 18.44 | | | | 0.01 | • | | | 1.90 | | | | 1.91 | | | | 0.04 | | | | 0.79 | | | | — | | |
12-31-16 | | | 15.62 | | | | 0.03 | | | | 3.54 | | | | 3.57 | | | | 0.03 | | | | 0.72 | | | | — | | |
12-31-15 | | | 16.20 | | | | 0.02 | • | | | (0.53 | ) | | | (0.51 | ) | | | 0.07 | | | | — | | | | — | | |
12-31-14 | | | 15.59 | | | | 0.05 | • | | | 0.61 | | | | 0.66 | | | | 0.05 | | | | — | | | | — | | |
12-31-13 | | | 11.24 | | | | 0.02 | | | | 4.43 | | | | 4.45 | | | | 0.10 | | | | — | | | | — | | |
| VY® Invesco Comstock Portfolio | | | |
Class ADV | | | |
12-31-17 | | | 17.33 | | | | 0.19 | | | | 2.80 | | | | 2.99 | | | | 0.18 | | | | — | | | | — | | |
12-31-16 | | | 15.07 | | | | 0.28 | | | | 2.35 | | | | 2.63 | | | | 0.37 | | | | — | | | | — | | |
12-31-15 | | | 16.42 | | | | 0.17 | • | | | (1.18 | ) | | | (1.01 | ) | | | 0.34 | | | | — | | | | — | | |
12-31-14 | | | 15.34 | | | | 0.19 | | | | 1.17 | | | | 1.36 | | | | 0.28 | | | | — | | | | — | | |
12-31-13 | | | 11.44 | | | | 0.11 | | | | 3.87 | | | | 3.98 | | | | 0.08 | | | | — | | | | — | | |
Class I | | | |
12-31-17 | | | 17.47 | | | | 0.28 | • | | | 2.85 | | | | 3.13 | | | | 0.28 | | | | — | | | | — | | |
12-31-16 | | | 15.18 | | | | 0.34 | • | | | 2.41 | | | | 2.75 | | | | 0.46 | | | | — | | | | — | | |
12-31-15 | | | 16.55 | | | | 0.26 | • | | | (1.20 | ) | | | (0.94 | ) | | | 0.43 | | | | — | | | | — | | |
12-31-14 | | | 15.45 | | | | 0.28 | | | | 1.17 | | | | 1.45 | | | | 0.35 | | | | — | | | | — | | |
12-31-13 | | | 11.51 | | | | 0.19 | | | | 3.89 | | | | 4.08 | | | | 0.14 | | | | — | | | | — | | |
Class S | | | |
12-31-17 | | | 17.45 | | | | 0.23 | • | | | 2.85 | | | | 3.08 | | | | 0.23 | | | | — | | | | — | | |
12-31-16 | | | 15.17 | | | | 0.30 | • | | | 2.39 | | | | 2.69 | | | | 0.41 | | | | — | | | | — | | |
12-31-15 | | | 16.53 | | | | 0.22 | • | | | (1.20 | ) | | | (0.98 | ) | | | 0.38 | | | | — | | | | — | | |
12-31-14 | | | 15.43 | | | | 0.24 | | | | 1.17 | | | | 1.41 | | | | 0.31 | | | | — | | | | — | | |
12-31-13 | | | 11.51 | | | | 0.15 | | | | 3.88 | | | | 4.03 | | | | 0.11 | | | | — | | | | — | | |
| VY® Invesco Equity and Income Portfolio | | | |
Class ADV | | | |
12-31-17 | | | 44.06 | | | | 0.65 | | | | 3.84 | | | | 4.49 | | | | 0.61 | | | | 1.13 | | | | — | | |
12-31-16 | | | 40.80 | | | | 0.53 | | | | 5.28 | | | | 5.81 | | | | 0.68 | | | | 1.87 | | | | — | | |
12-31-15 | | | 46.25 | | | | 0.46 | | | | (1.47 | ) | | | (1.01 | ) | | | 0.79 | | | | 3.65 | | | | — | | |
12-31-14 | | | 44.34 | | | | 0.61 | • | | | 3.09 | | | | 3.70 | | | | 0.55 | | | | 1.24 | | | | — | | |
12-31-13 | | | 36.01 | | | | 0.49 | • | | | 8.27 | | | | 8.76 | | | | 0.43 | | | | — | | | | — | | |
Class I | | | |
12-31-17 | | | 44.86 | | | | 0.89 | • | | | 3.93 | | | | 4.82 | | | | 1.04 | | | | 1.13 | | | | — | | |
12-31-16 | | | 41.47 | | | | 0.74 | • | | | 5.41 | | | | 6.15 | | | | 0.89 | | | | 1.87 | | | | — | | |
12-31-15 | | | 46.93 | | | | 0.70 | • | | | (1.50 | ) | | | (0.80 | ) | | | 1.01 | | | | 3.65 | | | | — | | |
12-31-14 | | | 44.92 | | | | 0.87 | • | | | 3.11 | | | | 3.98 | | | | 0.73 | | | | 1.24 | | | | — | | |
12-31-13 | | | 36.43 | | | | 0.71 | • | | | 8.38 | | | | 9.09 | | | | 0.60 | | | | — | | | | — | | |
Class S | | | |
12-31-17 | | | 44.48 | | | | 0.77 | • | | | 3.89 | | | | 4.66 | | | | 0.79 | | | | 1.13 | | | | — | | |
12-31-16 | | | 41.14 | | | | 0.62 | • | | | 5.37 | | | | 5.99 | | | | 0.78 | | | | 1.87 | | | | — | | |
12-31-15 | | | 46.59 | | | | 0.58 | • | | | (1.49 | ) | | | (0.91 | ) | | | 0.89 | | | | 3.65 | | | | — | | |
12-31-14 | | | 44.65 | | | | 0.64 | • | | | 3.20 | | | | 3.84 | | | | 0.66 | | | | 1.24 | | | | — | | |
12-31-13 | | | 36.23 | | | | 0.60 | • | | | 8.32 | | | | 8.92 | | | | 0.50 | | | | — | | | | — | | |
| | | | | Ratios to average net assets | | Supplemental
data | |
| | | Total distributions | | Payment by affiliate | | Net asset value, end of year or period | | Total Return(1) | | Expenses before reductions/additions(2)(3)(4) | | Expenses net of fee waivers and/or recoupments if any(2)(3)(4) | | Expense net of all reductions/additions(2)(3)(4) | | Net investment income (loss)(2)(3) | | Net assets, end of year or period | | Portfolio turnover rate | |
Year or period ended | | ($) | | ($) | | ($) | | (%) | | (%) | | (%) | | (%) | | (%) | | ($000's) | | (%) | |
| VY® Columbia Small Cap Value II Portfolio (continued) | |
Class R6 | |
12-31-17 | | | 0.90 | | | | — | | | | 20.21 | | | | 11.20 | | | | 0.90 | | | | 0.87 | | | | 0.86 | | | | 0.69 | | | | 4,389 | | | | 44 | | |
| 05-03-16(5)-12-31-16 | | | 0.81 | | | | — | | | | 19.06 | | | | 22.85 | | | | 0.89 | | | | 0.86 | | | | 0.84 | | | | 1.57 | | | | 402 | | | | 61 | | |
Class S | |
12-31-17 | | | 0.85 | | | | — | | | | 20.10 | | | | 10.92 | | | | 1.15 | | | | 1.12 | | | | 1.11 | | | | 0.25 | | | | 124,984 | | | | 44 | | |
12-31-16 | | | 0.77 | | | | — | | | | 18.96 | | | | 23.70 | | | | 1.14 | | | | 1.11 | | | | 1.09 | | | | 0.33 | | | | 145,816 | | | | 61 | | |
12-31-15 | | | 0.05 | | | | — | | | | 16.04 | | | | (2.95 | ) | | | 1.14 | | | | 1.11 | | | | 1.10 | | | | 0.24 | | | | 135,313 | | | | 53 | | |
12-31-14 | | | 0.03 | | | | — | | | | 16.58 | | | | 4.33 | | | | 1.14 | | | | 1.11 | | | | 1.10 | | | | 0.36 | | | | 160,726 | | | | 52 | | |
12-31-13 | | | 0.11 | | | | — | | | | 15.92 | | | | 39.97 | | | | 1.13 | | | | 1.11 | | | | 1.11 | | | | 0.34 | | | | 161,750 | | | | 39 | | |
Class S2 | |
12-31-17 | | | 0.83 | | | | — | | | | 19.52 | | | | 10.77 | | | | 1.30 | | | | 1.27 | | | | 1.26 | | | | 0.06 | | | | 3,431 | | | | 44 | | |
12-31-16 | | | 0.75 | | | | — | | | | 18.44 | | | | 23.57 | | | | 1.32 | | | | 1.26 | | | | 1.24 | | | | 0.18 | | | | 5,849 | | | | 61 | | |
12-31-15 | | | 0.07 | | | | — | | | | 15.62 | | | | (3.19 | ) | | | 1.39 | | | | 1.26 | | | | 1.25 | | | | 0.12 | | | | 4,834 | | | | 53 | | |
12-31-14 | | | 0.05 | | | | — | | | | 16.20 | | | | 4.28 | | | | 1.39 | | | | 1.26 | | | | 1.25 | | | | 0.30 | | | | 3,967 | | | | 52 | | |
12-31-13 | | | 0.10 | | | | — | | | | 15.59 | | | | 39.68 | | | | 1.38 | | | | 1.26 | | | | 1.26 | | | | 0.19 | | | | 978 | | | | 39 | | |
| VY® Invesco Comstock Portfolio | |
Class ADV | |
12-31-17 | | | 0.18 | | | | — | | | | 20.14 | | | | 17.31 | | | | 1.25 | | | | 1.23 | | | | 1.23 | | | | 1.00 | | | | 36,178 | | | | 14 | | |
12-31-16 | | | 0.37 | | | | — | | | | 17.33 | | | | 17.51 | | | | 1.25 | | | | 1.23 | | | | 1.23 | | | | 1.66 | | | | 34,490 | | | | 18 | | |
12-31-15 | | | 0.34 | | | | — | | | | 15.07 | | | | (6.19 | ) | | | 1.24 | | | | 1.22 | | | | 1.22 | | | | 1.08 | | | | 34,395 | | | | 24 | | |
12-31-14 | | | 0.28 | | | | — | | | | 16.42 | | | | 8.82 | | | | 1.24 | | | | 1.22 | | | | 1.22 | | | | 1.20 | | | | 41,258 | | | | 26 | | |
12-31-13 | | | 0.08 | | | | — | | | | 15.34 | | | | 34.79 | | | | 1.24 | | | | 1.24 | | | | 1.24 | | | | 0.87 | | | | 36,783 | | | | 15 | | |
Class I | |
12-31-17 | | | 0.28 | | | | — | | | | 20.32 | | | | 17.95 | | | | 0.75 | | | | 0.73 | | | | 0.73 | | | | 1.50 | | | | 188,040 | | | | 14 | | |
12-31-16 | | | 0.46 | | | | — | | | | 17.47 | | | | 18.13 | | | | 0.75 | | | | 0.73 | | | | 0.73 | | | | 2.16 | | | | 194,504 | | | | 18 | | |
12-31-15 | | | 0.43 | | | | — | | | | 15.18 | | | | (5.76 | ) | | | 0.74 | | | | 0.72 | | | | 0.72 | | | | 1.62 | | | | 198,367 | | | | 24 | | |
12-31-14 | | | 0.35 | | | | — | | | | 16.55 | | | | 9.39 | | | | 0.74 | | | | 0.72 | | | | 0.72 | | | | 1.70 | | | | 143,633 | | | | 26 | | |
12-31-13 | | | 0.14 | | | | — | | | | 15.45 | | | | 35.47 | | | | 0.74 | | | | 0.74 | | | | 0.74 | | | | 1.38 | | | | 58,373 | | | | 15 | | |
Class S | |
12-31-17 | | | 0.23 | | | | — | | | | 20.30 | | | | 17.68 | | | | 1.00 | | | | 0.98 | | | | 0.98 | | | | 1.25 | | | | 274,498 | | | | 14 | | |
12-31-16 | | | 0.41 | | | | — | | | | 17.45 | | | | 17.79 | | | | 1.00 | | | | 0.98 | | | | 0.98 | | | | 1.91 | | | | 291,208 | | | | 18 | | |
12-31-15 | | | 0.38 | | | | — | | | | 15.17 | | | | (5.97 | ) | | | 0.99 | | | | 0.97 | | | | 0.97 | | | | 1.33 | | | | 302,784 | | | | 24 | | |
12-31-14 | | | 0.31 | | | | — | | | | 16.53 | | | | 9.13 | | | | 0.99 | | | | 0.97 | | | | 0.97 | | | | 1.44 | | | | 383,997 | | | | 26 | | |
12-31-13 | | | 0.11 | | | | — | | | | 15.43 | | | | 35.00 | | | | 0.99 | | | | 0.99 | | | | 0.99 | | | | 1.13 | | | | 367,659 | | | | 15 | | |
| VY® Invesco Equity and Income Portfolio | |
Class ADV | |
12-31-17 | | | 1.74 | | | | — | | | | 46.81 | | | | 10.32 | | | | 1.17 | | | | 1.14 | | | | 1.14 | | | | 1.43 | | | | 54,583 | | | | 134 | | |
12-31-16 | | | 2.55 | | | | — | | | | 44.06 | | | | 14.69 | | | | 1.17 | | | | 1.14 | | | | 1.14 | | | | 1.24 | | | | 49,628 | | | | 134 | | |
12-31-15 | | | 4.44 | | | | — | | | | 40.80 | | | | (2.55 | ) | | | 1.16 | | | | 1.14 | | | | 1.14 | | | | 1.04 | | | | 49,572 | | | | 140 | | |
12-31-14 | | | 1.79 | | | | — | | | | 46.25 | | | | 8.43 | | | | 1.16 | | | | 1.14 | | | | 1.14 | | | | 1.34 | | | | 52,407 | | | | 157 | | |
12-31-13 | | | 0.43 | | | | — | | | | 44.34 | | | | 24.33 | | | | 1.18 | | | | 1.15 | | | | 1.15 | | | | 1.19 | | | | 32,942 | | | | 37 | | |
Class I | |
12-31-17 | | | 2.17 | | | | — | | | | 47.51 | | | | 10.90 | | | | 0.67 | | | | 0.64 | | | | 0.64 | | | | 1.92 | | | | 594,834 | | | | 134 | | |
12-31-16 | | | 2.76 | | | | — | | | | 44.86 | | | | 15.28 | | | | 0.67 | | | | 0.64 | | | | 0.64 | | | | 1.74 | | | | 594,456 | | | | 134 | | |
12-31-15 | | | 4.66 | | | | — | | | | 41.47 | | | | (2.06 | ) | | | 0.66 | | | | 0.64 | | | | 0.64 | | | | 1.53 | | | | 600,309 | | | | 140 | | |
12-31-14 | | | 1.97 | | | | — | | | | 46.93 | | | | 8.96 | | | | 0.66 | | | | 0.64 | | | | 0.64 | | | | 1.87 | | | | 694,569 | | | | 157 | | |
12-31-13 | | | 0.60 | | | | — | | | | 44.92 | | | | 24.96 | | | | 0.68 | | | | 0.65 | | | | 0.65 | | | | 1.70 | | | | 561,393 | | | | 37 | | |
Class S | |
12-31-17 | | | 1.92 | | | | — | | | | 47.22 | | | | 10.62 | | | | 0.92 | | | | 0.89 | | | | 0.89 | | | | 1.67 | | | | 606,503 | | | | 134 | | |
12-31-16 | | | 2.65 | | | | — | | | | 44.48 | | | | 15.00 | | | | 0.92 | | | | 0.89 | | | | 0.89 | | | | 1.49 | | | | 682,465 | | | | 134 | | |
12-31-15 | | | 4.54 | | | | — | | | | 41.14 | | | | (2.31 | ) | | | 0.91 | | | | 0.89 | | | | 0.89 | | | | 1.28 | | | | 720,086 | | | | 140 | | |
12-31-14 | | | 1.90 | | | | — | | | | 46.59 | | | | 8.69 | | | | 0.91 | | | | 0.89 | | | | 0.89 | | | | 1.39 | | | | 889,726 | | | | 157 | | |
12-31-13 | | | 0.50 | | | | — | | | | 44.65 | | | | 24.64 | | | | 0.93 | | | | 0.90 | | | | 0.90 | | | | 1.45 | | | | 271,953 | | | | 37 | | |
See Accompanying Notes to Financial Statements
57
FINANCIAL HIGHLIGHTS (CONTINUED)
Selected data for a share of beneficial interest outstanding throughout each year or period.
| | | | | Income (loss)
from investment
operations | | | | Less distributions | |
| | | Net asset value, beginning of year or period | | Net investment income (loss) | | Net realized and unrealized gain (loss) | | Total from investment operations | | From net investment income | | From net realized gains | | From return of capital | |
Year or period ended | | ($) | | ($) | | ($) | | ($) | | ($) | | ($) | | ($) | |
| VY® Invesco Equity and Income Portfolio (continued) | | | |
Class S2 | | | |
12-31-17 | | | 43.85 | | | | 0.70 | • | | | 3.83 | | | | 4.53 | | | | 0.66 | | | | 1.13 | | | | — | | |
12-31-16 | | | 40.60 | | | | 0.56 | • | | | 5.28 | | | | 5.84 | | | | 0.72 | | | | 1.87 | | | | — | | |
12-31-15 | | | 46.03 | | | | 0.51 | • | | | (1.46 | ) | | | (0.95 | ) | | | 0.83 | | | | 3.65 | | | | — | | |
12-31-14 | | | 44.13 | | | | 0.43 | • | | | 3.29 | | | | 3.72 | | | | 0.58 | | | | 1.24 | | | | — | | |
12-31-13 | | | 35.87 | | | | 0.54 | • | | | 8.24 | | | | 8.78 | | | | 0.52 | | | | — | | | | — | | |
| VY® JPMorgan Mid Cap Value Portfolio | | | |
Class ADV | | | |
12-31-17 | | | 19.31 | | | | 0.07 | | | | 2.41 | | | | 2.48 | | | | 0.07 | | | | 1.94 | | | | — | | |
12-31-16 | | | 18.66 | | | | 0.08 | | | | 2.50 | | | | 2.58 | | | | 0.08 | | | | 1.85 | | | | — | | |
12-31-15 | | | 22.47 | | | | 0.06 | | | | (0.63 | ) | | | (0.57 | ) | | | 0.08 | | | | 3.16 | | | | — | | |
12-31-14 | | | 20.96 | | | | 0.11 | | | | 2.84 | | | | 2.95 | | | | 0.14 | | | | 1.30 | | | | — | | |
12-31-13 | | | 16.57 | | | | 0.06 | | | | 5.07 | | | | 5.13 | | | | 0.08 | | | | 0.66 | | | | — | | |
Class I | | | |
12-31-17 | | | 19.75 | | | | 0.18 | • | | | 2.48 | | | | 2.66 | | | | 0.17 | | | | 1.94 | | | | — | | |
12-31-16 | | | 19.04 | | | | 0.18 | | | | 2.56 | | | | 2.74 | | | | 0.18 | | | | 1.85 | | | | — | | |
12-31-15 | | | 22.85 | | | | 0.17 | | | | (0.64 | ) | | | (0.47 | ) | | | 0.18 | | | | 3.16 | | | | — | | |
12-31-14 | | | 21.27 | | | | 0.23 | | | | 2.89 | | | | 3.12 | | | | 0.24 | | | | 1.30 | | | | — | | |
12-31-13 | | | 16.79 | | | | 0.16 | | | | 5.14 | | | | 5.30 | | | | 0.16 | | | | 0.66 | | | | — | | |
Class S | | | |
12-31-17 | | | 19.58 | | | | 0.12 | • | | | 2.46 | | | | 2.58 | | | | 0.12 | | | | 1.94 | | | | — | | |
12-31-16 | | | 18.89 | | | | 0.13 | | | | 2.54 | | | | 2.67 | | | | 0.13 | | | | 1.85 | | | | — | | |
12-31-15 | | | 22.70 | | | | 0.12 | | | | (0.65 | ) | | | (0.53 | ) | | | 0.12 | | | | 3.16 | | | | — | | |
12-31-14 | | | 21.14 | | | | 0.18 | | | | 2.86 | | | | 3.04 | | | | 0.18 | | | | 1.30 | | | | — | | |
12-31-13 | | | 16.70 | | | | 0.11 | | | | 5.11 | | | | 5.22 | | | | 0.12 | | | | 0.66 | | | | — | | |
Class S2 | | | |
12-31-17 | | | 19.25 | | | | 0.09 | • | | | 2.41 | | | | 2.50 | | | | 0.09 | | | | 1.94 | | | | — | | |
12-31-16 | | | 18.60 | | | | 0.10 | | | | 2.50 | | | | 2.60 | | | | 0.10 | | | | 1.85 | | | | — | | |
12-31-15 | | | 22.40 | | | | 0.08 | • | | | (0.63 | ) | | | (0.55 | ) | | | 0.09 | | | | 3.16 | | | | — | | |
12-31-14 | | | 20.89 | | | | 0.13 | | | | 2.84 | | | | 2.97 | | | | 0.16 | | | | 1.30 | | | | — | | |
12-31-13 | | | 16.52 | | | | 0.10 | • | | | 5.03 | | | | 5.13 | | | | 0.10 | | | | 0.66 | | | | — | | |
| VY® Oppenheimer Global Portfolio | | | |
Class ADV | | | |
12-31-17 | | | 15.90 | | | | 0.04 | | | | 5.64 | | | | 5.68 | | | | 0.13 | | | | 0.03 | | | | — | | |
12-31-16 | | | 17.30 | | | | 0.09 | • | | | (0.17 | ) | | | (0.08 | ) | | | 0.12 | | | | 1.20 | | | | — | | |
12-31-15 | | | 18.21 | | | | 0.08 | | | | 0.69 | | | | 0.77 | | | | 0.19 | | | | 1.49 | | | | — | | |
12-31-14 | | | 18.28 | | | | 0.15 | | | | 0.19 | | | | 0.34 | | | | 0.15 | | | | 0.26 | | | | — | | |
12-31-13 | | | 14.60 | | | | 0.12 | • | | | 3.73 | | | | 3.85 | | | | 0.17 | | | | — | | | | — | | |
Class I | | | |
12-31-17 | | | 16.56 | | | | 0.15 | | | | 5.87 | | | | 6.02 | | | | 0.22 | | | | 0.03 | | | | — | | |
12-31-16 | | | 17.97 | | | | 0.20 | | | | (0.20 | ) | | | 0.00 | * | | | 0.21 | | | | 1.20 | | | | — | | |
12-31-15 | | | 18.84 | | | | 0.20 | • | | | 0.71 | | | | 0.91 | | | | 0.29 | | | | 1.49 | | | | — | | |
12-31-14 | | | 18.89 | | | | 0.25 | • | | | 0.19 | | | | 0.44 | | | | 0.23 | | | | 0.26 | | | | — | | |
12-31-13 | | | 15.06 | | | | 0.21 | • | | | 3.85 | | | | 4.06 | | | | 0.23 | | | | — | | | | — | | |
Class S | | | |
12-31-17 | | | 15.98 | | | | 0.08 | | | | 5.67 | | | | 5.75 | | | | 0.17 | | | | 0.03 | | | | — | | |
12-31-16 | | | 17.38 | | | | 0.13 | • | | | (0.17 | ) | | | (0.04 | ) | | | 0.16 | | | | 1.20 | | | | — | | |
12-31-15 | | | 18.28 | | | | 0.15 | • | | | 0.68 | | | | 0.83 | | | | 0.24 | | | | 1.49 | | | | — | | |
12-31-14 | | | 18.34 | | | | 0.20 | • | | | 0.18 | | | | 0.38 | | | | 0.18 | | | | 0.26 | | | | — | | |
12-31-13 | | | 14.63 | | | | 0.15 | | | | 3.76 | | | | 3.91 | | | | 0.20 | | | | — | | | | — | | |
| | | | | Ratios to average net assets | | Supplemental
data | |
| | | Total distributions | | Payment by affiliate | | Net asset value, end of year or period | | Total Return(1) | | Expenses before reductions/additions(2)(3)(4) | | Expenses net of fee waivers and/or recoupments if any(2)(3)(4) | | Expense net of all reductions/additions(2)(3)(4) | | Net investment income (loss)(2)(3) | | Net assets, end of year or period | | Portfolio turnover rate | |
Year or period ended | | ($) | | ($) | | ($) | | (%) | | (%) | | (%) | | (%) | | (%) | | ($000's) | | (%) | |
| VY® Invesco Equity and Income Portfolio (continued) | |
Class S2 | |
12-31-17 | | | 1.79 | | | | — | | | | 46.59 | | | | 10.48 | | | | 1.07 | | | | 1.02 | | | | 1.02 | | | | 1.54 | | | | 420,527 | | | | 134 | | |
12-31-16 | | | 2.59 | | | | — | | | | 43.85 | | | | 14.84 | | | | 1.10 | | | | 1.02 | | | | 1.02 | | | | 1.36 | | | | 446,998 | | | | 134 | | |
12-31-15 | | | 4.48 | | | | — | | | | 40.60 | | | | (2.44 | ) | | | 1.16 | | | | 1.02 | | | | 1.02 | | | | 1.15 | | | | 443,119 | | | | 140 | | |
12-31-14 | | | 1.82 | | | | — | | | | 46.03 | | | | 8.54 | | | | 1.16 | | | | 1.02 | | | | 1.02 | | | | 0.95 | | | | 522,608 | | | | 157 | | |
12-31-13 | | | 0.52 | | | | — | | | | 44.13 | | | | 24.47 | | | | 1.18 | | | | 1.05 | | | | 1.05 | | | | 1.31 | | | | 4,078 | | | | 37 | | |
| VY® JPMorgan Mid Cap Value Portfolio | |
Class ADV | |
12-31-17 | | | 2.01 | | | | — | | | | 19.78 | | | | 13.41 | | | | 1.37 | | | | 1.37 | | | | 1.37 | | | | 0.37 | | | | 99,801 | | | | 10 | | |
12-31-16 | | | 1.93 | | | | — | | | | 19.31 | | | | 14.42 | | | | 1.37 | | | | 1.37 | | | | 1.37 | | | | 0.42 | | | | 98,003 | | | | 19 | | |
12-31-15 | | | 3.24 | | | | — | | | | 18.66 | | | | (3.27 | ) | | | 1.36 | | | | 1.36 | | | | 1.36 | | | | 0.31 | | | | 90,818 | | | | 14 | | |
12-31-14 | | | 1.44 | | | | — | | | | 22.47 | | | | 14.66 | | | | 1.36 | | | | 1.36 | | | | 1.36 | | | | 0.54 | | | | 91,446 | | | | 22 | | |
12-31-13 | | | 0.74 | | | | — | | | | 20.96 | | | | 31.26 | | | | 1.36 | | | | 1.36 | | | | 1.36 | | | | 0.39 | | | | 78,395 | | | | 25 | | |
Class I | |
12-31-17 | | | 2.11 | | | | — | | | | 20.30 | | | | 14.04 | | | | 0.87 | | | | 0.87 | | | | 0.87 | | | | 0.87 | | | | 210,989 | | | | 10 | | |
12-31-16 | | | 2.03 | | | | — | | | | 19.75 | | | | 14.94 | | | | 0.87 | | | | 0.87 | | | | 0.87 | | | | 0.92 | | | | 215,892 | | | | 19 | | |
12-31-15 | | | 3.34 | | | | — | | | | 19.04 | | | | (2.77 | ) | | | 0.86 | | | | 0.86 | | | | 0.86 | | | | 0.80 | | | | 227,935 | | | | 14 | | |
12-31-14 | | | 1.54 | | | | — | | | | 22.85 | | | | 15.27 | | | | 0.86 | | | | 0.86 | | | | 0.86 | | | | 1.02 | | | | 272,496 | | | | 22 | | |
12-31-13 | | | 0.82 | | | | — | | | | 21.27 | | | | 31.89 | | | | 0.86 | | | | 0.86 | | | | 0.86 | | | | 0.88 | | | | 256,705 | | | | 25 | | |
Class S | |
12-31-17 | | | 2.06 | | | | — | | | | 20.10 | | | | 13.72 | | | | 1.12 | | | | 1.12 | | | | 1.12 | | | | 0.61 | | | | 256,845 | | | | 10 | | |
12-31-16 | | | 1.98 | | | | — | | | | 19.58 | | | | 14.69 | | | | 1.12 | | | | 1.12 | | | | 1.12 | | | | 0.67 | | | | 291,725 | | | | 19 | | |
12-31-15 | | | 3.28 | | | | — | | | | 18.89 | | | | (3.04 | ) | | | 1.11 | | | | 1.11 | | | | 1.11 | | | | 0.55 | | | | 298,607 | | | | 14 | | |
12-31-14 | | | 1.48 | | | | — | | | | 22.70 | | | | 14.99 | | | | 1.11 | | | | 1.11 | | | | 1.11 | | | | 0.75 | | | | 352,277 | | | | 22 | | |
12-31-13 | | | 0.78 | | | | — | | | | 21.14 | | | | 31.54 | | | | 1.11 | | | | 1.11 | | | | 1.11 | | | | 0.63 | | | | 380,688 | | | | 25 | | |
Class S2 | |
12-31-17 | | | 2.03 | | | | — | | | | 19.72 | | | | 13.52 | | | | 1.27 | | | | 1.27 | | | | 1.27 | | | | 0.45 | | | | 3,382 | | | | 10 | | |
12-31-16 | | | 1.95 | | | | — | | | | 19.25 | | | | 14.56 | | | | 1.30 | | | | 1.27 | | | | 1.27 | | | | 0.52 | | | | 3,810 | | | | 19 | | |
12-31-15 | | | 3.25 | | | | — | | | | 18.60 | | | | (3.20 | ) | | | 1.36 | | | | 1.26 | | | | 1.26 | | | | 0.40 | | | | 3,906 | | | | 14 | | |
12-31-14 | | | 1.46 | | | | — | | | | 22.40 | | | | 14.81 | | | | 1.36 | | | | 1.26 | | | | 1.26 | | | | 0.63 | | | | 5,643 | | | | 22 | | |
12-31-13 | | | 0.76 | | | | — | | | | 20.89 | | | | 31.37 | | | | 1.36 | | | | 1.26 | | | | 1.26 | | | | 0.50 | | | | 5,066 | | | | 25 | | |
| VY® Oppenheimer Global Portfolio | |
Class ADV | |
12-31-17 | | | 0.16 | | | | — | | | | 21.42 | | | | 35.82 | | | | 1.25 | | | | 1.25 | | | | 1.25 | | | | 0.17 | | | | 120,344 | | | | 9 | | |
12-31-16 | | | 1.32 | | | | — | | | | 15.90 | | | | (0.29 | ) | | | 1.25 | | | | 1.25 | | | | 1.25 | | | | 0.58 | | | | 90,660 | | | | 6 | | |
12-31-15 | | | 1.68 | | | | — | | | | 17.30 | | | | 3.56 | | | | 1.25 | | | | 1.25 | | | | 1.25 | | | | 0.51 | | | | 110,372 | | | | 12 | | |
12-31-14 | | | 0.41 | | | | — | | | | 18.21 | | | | 1.86 | | | | 1.25 | | | | 1.25 | | | | 1.25 | | | | 0.81 | | | | 101,077 | | | | 12 | | |
12-31-13 | | | 0.17 | | | | — | | | | 18.28 | | | | 26.46 | | | | 1.26 | | | | 1.26 | | | | 1.26 | | | | 0.70 | | | | 102,691 | | | | 11 | | |
Class I | |
12-31-17 | | | 0.25 | | | | — | | | | 22.33 | | | | 36.49 | | | | 0.75 | | | | 0.75 | | | | 0.75 | | | | 0.68 | | | | 1,384,452 | | | | 9 | | |
12-31-16 | | | 1.41 | | | | — | | | | 16.56 | | | | 0.22 | | | | 0.75 | | | | 0.75 | | | | 0.75 | | | | 1.07 | | | | 1,091,478 | | | | 6 | | |
12-31-15 | | | 1.78 | | | | — | | | | 17.97 | | | | 4.13 | | | | 0.75 | | | | 0.75 | | | | 0.75 | | | | 1.04 | | | | 1,254,238 | | | | 12 | | |
12-31-14 | | | 0.49 | | | | — | | | | 18.84 | | | | 2.32 | | | | 0.75 | | | | 0.75 | | | | 0.75 | | | | 1.32 | | | | 1,320,671 | | | | 12 | | |
12-31-13 | | | 0.23 | | | | — | | | | 18.89 | | | | 27.12 | | | | 0.76 | | | | 0.76 | | | | 0.76 | | | | 1.22 | | | | 1,481,760 | | | | 11 | | |
Class S | |
12-31-17 | | | 0.20 | | | | — | | | | 21.53 | | | | 36.13 | | | | 1.00 | | | | 1.00 | | | | 1.00 | | | | 0.41 | | | | 238,436 | | | | 9 | | |
12-31-16 | | | 1.36 | | | | — | | | | 15.98 | | | | (0.04 | ) | | | 1.00 | | | | 1.00 | | | | 1.00 | | | | 0.82 | | | | 174,417 | | | | 6 | | |
12-31-15 | | | 1.73 | | | | — | | | | 17.38 | | | | 3.84 | | | | 1.00 | | | | 1.00 | | | | 1.00 | | | | 0.77 | | | | 231,621 | | | | 12 | | |
12-31-14 | | | 0.44 | | | | — | | | | 18.28 | | | | 2.09 | | | | 1.00 | | | | 1.00 | | | | 1.00 | | | | 1.08 | | | | 215,383 | | | | 12 | | |
12-31-13 | | | 0.20 | | | | — | | | | 18.34 | | | | 26.85 | | | | 1.01 | | | | 1.01 | | | | 1.01 | | | | 0.96 | | | | 252,672 | | | | 11 | | |
See Accompanying Notes to Financial Statements
58
FINANCIAL HIGHLIGHTS (CONTINUED)
Selected data for a share of beneficial interest outstanding throughout each year or period.
| | | | | Income (loss)
from investment
operations | | | | Less distributions | |
| | | Net asset value, beginning of year or period | | Net investment income (loss) | | Net realized and unrealized gain (loss) | | Total from investment operations | | From net investment income | | From net realized gains | | From return of capital | |
Year or period ended | | ($) | | ($) | | ($) | | ($) | | ($) | | ($) | | ($) | |
| VY® Oppenheimer Global Portfolio (continued) | | | |
Class S2 | | | |
12-31-17 | | | 15.58 | | | | 0.05 | | | | 5.53 | | | | 5.58 | | | | 0.16 | | | | 0.03 | | | | — | | |
12-31-16 | | | 16.97 | | | | 0.10 | • | | | (0.17 | ) | | | (0.07 | ) | | | 0.12 | | | | 1.20 | | | | — | | |
12-31-15 | | | 17.88 | | | | 0.11 | • | | | 0.69 | | | | 0.80 | | | | 0.22 | | | | 1.49 | | | | — | | |
12-31-14 | | | 17.98 | | | | 0.16 | • | | | 0.18 | | | | 0.34 | | | | 0.18 | | | | 0.26 | | | | — | | |
12-31-13 | | | 14.37 | | | | 0.11 | • | | | 3.70 | | | | 3.81 | | | | 0.20 | | | | — | | | | — | | |
| VY® Pioneer High Yield Portfolio | | | |
Class I | | | |
12-31-17 | | | 11.69 | | | | 0.57 | • | | | 0.28 | | | | 0.85 | | | | 0.59 | | | | — | | | | — | | |
12-31-16 | | | 10.77 | | | | 0.56 | | | | 0.94 | | | | 1.50 | | | | 0.58 | | | | — | | | | — | | |
12-31-15 | | | 11.87 | | | | 0.59 | • | | | (1.10 | ) | | | (0.51 | ) | | | 0.59 | | | | — | | | | — | | |
12-31-14 | | | 12.41 | | | | 0.58 | | | | (0.53 | ) | | | 0.05 | | | | 0.59 | | | | — | | | | — | | |
12-31-13 | | | 11.60 | | | | 0.60 | • | | | 0.80 | | | | 1.40 | | | | 0.59 | | | | — | | | | — | | |
Class S | | | |
12-31-17 | | | 11.67 | | | | 0.54 | • | | | 0.29 | | | | 0.83 | | | | 0.56 | | | | — | | | | — | | |
12-31-16 | | | 10.76 | | | | 0.52 | | | | 0.94 | | | | 1.46 | | | | 0.55 | | | | — | | | | — | | |
12-31-15 | | | 11.86 | | | | 0.56 | • | | | (1.10 | ) | | | (0.54 | ) | | | 0.56 | | | | — | | | | — | | |
12-31-14 | | | 12.39 | | | | 0.56 | • | | | (0.53 | ) | | | 0.03 | | | | 0.56 | | | | — | | | | — | | |
12-31-13 | | | 11.58 | | | | 0.57 | • | | | 0.80 | | | | 1.37 | | | | 0.56 | | | | — | | | | — | | |
| VY® T. Rowe Price Diversified Mid Cap Growth Portfolio | | | |
Class ADV | | | |
12-31-17 | | | 9.19 | | | | (0.03 | ) | | | 2.17 | | | | 2.14 | | | | 0.03 | | | | 0.80 | | | | — | | |
12-31-16 | | | 9.83 | | | | (0.01 | )• | | | 0.68 | | | | 0.67 | | | | 0.00 | * | | | 1.31 | | | | — | | |
12-31-15 | | | 11.43 | | | | (0.04 | ) | | | 0.31 | | | | 0.27 | | | | — | | | | 1.87 | | | | — | | |
12-31-14 | | | 11.08 | | | | (0.03 | ) | | | 1.21 | | | | 1.18 | | | | 0.00 | * | | | 0.83 | | | | — | | |
12-31-13 | | | 8.35 | | | | (0.03 | ) | | | 2.90 | | | | 2.87 | | | | 0.02 | | | | 0.12 | | | | — | | |
Class I | | | |
12-31-17 | | | 10.03 | | | | 0.02 | | | | 2.38 | | | | 2.40 | | | | 0.07 | | | | 0.80 | | | | — | | |
12-31-16 | | | 10.60 | | | | 0.04 | | | | 0.73 | | | | 0.77 | | | | 0.03 | | | | 1.31 | | | | — | | |
12-31-15 | | | 12.13 | | | | 0.02 | | | | 0.32 | | | | 0.34 | | | | — | | | | 1.87 | | | | — | | |
12-31-14 | | | 11.68 | | | | 0.03 | | | | 1.28 | | | | 1.31 | | | | 0.03 | | | | 0.83 | | | | — | | |
12-31-13 | | | 8.76 | | | | 0.02 | | | | 3.05 | | | | 3.07 | | | | 0.03 | | | | 0.12 | | | | — | | |
Class R6 | | | |
12-31-17 | | | 10.03 | | | | 0.02 | • | | | 2.38 | | | | 2.40 | | | | 0.07 | | | | 0.80 | | | | — | | |
| 05-03-16(5)-12-31-16 | | | 10.58 | | | | 0.03 | • | | | 0.76 | | | | 0.79 | | | | 0.03 | | | | 1.31 | | | | — | | |
Class S | | | |
12-31-17 | | | 9.71 | | | | (0.01 | )• | | | 2.30 | | | | 2.29 | | | | 0.05 | | | | 0.80 | | | | — | | |
12-31-16 | | | 10.30 | | | | 0.01 | • | | | 0.72 | | | | 0.73 | | | | 0.01 | | | | 1.31 | | | | — | | |
12-31-15 | | | 11.87 | | | | (0.01 | ) | | | 0.31 | | | | 0.30 | | | | — | | | | 1.87 | | | | — | | |
12-31-14 | | | 11.44 | | | | (0.00 | )* | | | 1.26 | | | | 1.26 | | | | 0.00 | * | | | 0.83 | | | | — | | |
12-31-13 | | | 8.60 | | | | (0.00 | )* | | | 2.98 | | | | 2.98 | | | | 0.02 | | | | 0.12 | | | | — | | |
Class S2 | | | |
12-31-17 | | | 9.22 | | | | (0.02 | ) | | | 2.18 | | | | 2.16 | | | | 0.04 | | | | 0.80 | | | | — | | |
12-31-16 | | | 9.85 | | | | (0.01 | ) | | | 0.69 | | | | 0.68 | | | | — | | | | 1.31 | | | | — | | |
12-31-15 | | | 11.44 | | | | (0.02 | ) | | | 0.30 | | | | 0.28 | | | | — | | | | 1.87 | | | | — | | |
12-31-14 | | | 11.08 | | | | (0.01 | ) | | | 1.20 | | | | 1.19 | | | | 0.00 | * | | | 0.83 | | | | — | | |
12-31-13 | | | 8.34 | | | | (0.02 | ) | | | 2.90 | | | | 2.88 | | | | 0.02 | | | | 0.12 | | | | — | | |
| VY® T. Rowe Price Growth Equity Portfolio | | | |
Class ADV | | | |
12-31-17 | | | 72.53 | | | | (0.23 | ) | | | 23.41 | | | | 23.18 | | | | — | | | | 9.49 | | | | — | | |
12-31-16 | | | 81.69 | | | | (0.25 | ) | | | 0.93 | | | | 0.68 | | | | — | | | | 9.84 | | | | — | | |
12-31-15 | | | 86.54 | | | | (0.46 | )• | | | 9.58 | | | | 9.12 | | | | — | | | | 13.97 | | | | — | | |
12-31-14 | | | 86.20 | | | | (0.42 | ) | | | 7.08 | | | | 6.66 | | | | — | | | | 6.32 | | | | — | | |
12-31-13 | | | 62.23 | | | | (0.38 | )• | | | 24.36 | | | | 23.98 | | | | 0.01 | | | | — | | | | — | | |
| | | | | Ratios to average net assets | | Supplemental
data | |
| | | Total distributions | | Payment by affiliate | | Net asset value, end of year or period | | Total Return(1) | | Expenses before reductions/additions(2)(3)(4) | | Expenses net of fee waivers and/or recoupments if any(2)(3)(4) | | Expense net of all reductions/additions(2)(3)(4) | | Net investment income (loss)(2)(3) | | Net assets, end of year or period | | Portfolio turnover rate | |
Year or period ended | | ($) | | ($) | | ($) | | (%) | | (%) | | (%) | | (%) | | (%) | | ($000's) | | (%) | |
| VY® Oppenheimer Global Portfolio (continued) | |
Class S2 | |
12-31-17 | | | 0.19 | | | | — | | | | 20.97 | | | | 35.92 | | | | 1.15 | | | | 1.15 | | | | 1.15 | | | | 0.27 | | | | 4,030 | | | | 9 | | |
12-31-16 | | | 1.32 | | | | — | | | | 15.58 | | | | (0.20 | ) | | | 1.18 | | | | 1.15 | | | | 1.15 | | | | 0.66 | | | | 3,415 | | | | 6 | | |
12-31-15 | | | 1.71 | | | | — | | | | 16.97 | | | | 3.74 | | | | 1.25 | | | | 1.15 | | | | 1.15 | | | | 0.61 | | | | 4,371 | | | | 12 | | |
12-31-14 | | | 0.44 | | | | — | | | | 17.88 | | | | 1.91 | | | | 1.25 | | | | 1.15 | | | | 1.15 | | | | 0.91 | | | | 4,827 | | | | 12 | | |
12-31-13 | | | 0.20 | | | | — | | | | 17.98 | | | | 26.66 | | | | 1.26 | | | | 1.16 | | | | 1.16 | | | | 0.67 | | | | 4,287 | | | | 11 | | |
| VY® Pioneer High Yield Portfolio | |
Class I | |
12-31-17 | | | 0.59 | | | | — | | | | 11.95 | | | | 7.36 | | | | 0.78 | | | | 0.71 | | | | 0.71 | | | | 4.78 | | | | 98,202 | | | | 44 | | |
12-31-16 | | | 0.58 | | | | — | | | | 11.69 | | | | 14.29 | | | | 0.78 | | | | 0.71 | | | | 0.71 | | | | 5.01 | | | | 99,573 | | | | 51 | | |
12-31-15 | | | 0.59 | | | | — | | | | 10.77 | | | | (4.55 | ) | | | 0.76 | | | | 0.71 | | | | 0.71 | | | | 4.98 | | | | 91,560 | | | | 28 | | |
12-31-14 | | | 0.59 | | | | — | | | | 11.87 | | | | 0.27 | | | | 0.76 | | | | 0.71 | | | | 0.71 | | | | 4.73 | | | | 117,617 | | | | 35 | | |
12-31-13 | | | 0.59 | | | | — | | | | 12.41 | | | | 12.33 | | | | 0.73 | | | | 0.71 | | | | 0.71 | | | | 4.93 | | | | 119,042 | | | | 51 | | |
Class S | |
12-31-17 | | | 0.56 | | | | — | | | | 11.94 | | | | 7.19 | | | | 1.03 | | | | 0.96 | | | | 0.96 | | | | 4.53 | | | | 3,510 | | | | 44 | | |
12-31-16 | | | 0.55 | | | | — | | | | 11.67 | | | | 13.91 | | | | 1.03 | | | | 0.96 | | | | 0.96 | | | | 4.76 | | | | 4,263 | | | | 51 | | |
12-31-15 | | | 0.56 | | | | — | | | | 10.76 | | | | (4.79 | ) | | | 1.01 | | | | 0.96 | | | | 0.96 | | | | 4.73 | | | | 3,776 | | | | 28 | | |
12-31-14 | | | 0.56 | | | | — | | | | 11.86 | | | | 0.10 | | | | 1.01 | | | | 0.96 | | | | 0.96 | | | | 4.50 | | | | 4,412 | | | | 35 | | |
12-31-13 | | | 0.56 | | | | — | | | | 12.39 | | | | 12.07 | | | | 0.98 | | | | 0.96 | | | | 0.96 | | | | 4.67 | | | | 3,406 | | | | 51 | | |
| VY® T. Rowe Price Diversified Mid Cap Growth Portfolio | |
Class ADV | |
12-31-17 | | | 0.83 | | | | — | | | | 10.50 | | | | 24.12 | | | | 1.27 | | | | 1.27 | | | | 1.27 | | | | (0.32 | ) | | | 62,022 | | | | 28 | | |
12-31-16 | | | 1.31 | | | | — | | | | 9.19 | | | | 6.93 | | | | 1.27 | | | | 1.27 | | | | 1.27 | | | | (0.15 | ) | | | 49,418 | | | | 26 | | |
12-31-15 | | | 1.87 | | | | — | | | | 9.83 | | | | 1.51 | | | | 1.27 | | | | 1.27 | | | | 1.27 | | | | (0.34 | ) | | | 27,217 | | | | 26 | | |
12-31-14 | | | 0.83 | | | | — | | | | 11.43 | | | | 11.29 | | | | 1.28 | | | | 1.27 | | | | 1.27 | | | | (0.28 | ) | | | 29,356 | | | | 27 | | |
12-31-13 | | | 0.14 | | | | — | | | | 11.08 | | | | 34.46 | | | | 1.27 | | | | 1.25 | | | | 1.25 | | | | (0.32 | ) | | | 27,222 | | | | 20 | | |
Class I | |
12-31-17 | | | 0.87 | | | | — | | | | 11.56 | | | | 24.81 | | | | 0.77 | | | | 0.77 | | | | 0.77 | | | | 0.18 | | | | 879,678 | | | | 28 | | |
12-31-16 | | | 1.34 | | | | — | | | | 10.03 | | | | 7.41 | | | | 0.77 | | | | 0.77 | | | | 0.77 | | | | 0.34 | | | | 737,054 | | | | 26 | | |
12-31-15 | | | 1.87 | | | | — | | | | 10.60 | | | | 2.02 | | | | 0.77 | | | | 0.77 | | | | 0.77 | | | | 0.17 | | | | 766,591 | | | | 26 | | |
12-31-14 | | | 0.86 | | | | — | | | | 12.13 | | | | 11.82 | | | | 0.78 | | | | 0.77 | | | | 0.77 | | | | 0.22 | | | | 796,856 | | | | 27 | | |
12-31-13 | | | 0.15 | | | | — | | | | 11.68 | | | | 35.18 | | | | 0.77 | | | | 0.75 | | | | 0.75 | | | | 0.17 | | | | 804,053 | | | | 20 | | |
Class R6 | |
12-31-17 | | | 0.87 | | | | — | | | | 11.56 | | | | 24.81 | | | | 0.77 | | | | 0.77 | | | | 0.77 | | | | 0.18 | | | | 9,313 | | | | 28 | | |
| 05-03-16(5)-12-31-16 | | | 1.34 | | | | — | | | | 10.03 | | | | 7.62 | | | | 0.77 | | | | 0.77 | | | | 0.77 | | | | 0.53 | | | | 1,084 | | | | 26 | | |
Class S | |
12-31-17 | | | 0.85 | | | | — | | | | 11.15 | | | | 24.46 | | | | 1.02 | | | | 1.02 | | | | 1.02 | | | | (0.07 | ) | | | 55,222 | | | | 28 | | |
12-31-16 | | | 1.32 | | | | — | | | | 9.71 | | | | 7.19 | | | | 1.02 | | | | 1.02 | | | | 1.02 | | | | 0.12 | | | | 56,578 | | | | 26 | | |
12-31-15 | | | 1.87 | | | | — | | | | 10.30 | | | | 1.72 | | | | 1.02 | | | | 1.02 | | | | 1.02 | | | | (0.08 | ) | | | 30,614 | | | | 26 | | |
12-31-14 | | | 0.83 | | | | — | | | | 11.87 | | | | 11.65 | | | | 1.03 | | | | 1.02 | | | | 1.02 | | | | (0.02 | ) | | | 30,412 | | | | 27 | | |
12-31-13 | | | 0.14 | | | | — | | | | 11.44 | | | | 34.74 | | | | 1.02 | | | | 1.00 | | | | 1.00 | | | | (0.06 | ) | | | 29,284 | | | | 20 | | |
Class S2 | |
12-31-17 | | | 0.84 | | | | — | | | | 10.54 | | | | 24.28 | | | | 1.17 | | | | 1.17 | | | | 1.17 | | | | (0.21 | ) | | | 4,103 | | | | 28 | | |
12-31-16 | | | 1.31 | | | | — | | | | 9.22 | | | | 6.99 | | | | 1.20 | | | | 1.17 | | | | 1.17 | | | | (0.06 | ) | | | 4,451 | | | | 26 | | |
12-31-15 | | | 1.87 | | | | — | | | | 9.85 | | | | 1.60 | | | | 1.27 | | | | 1.17 | | | | 1.17 | | | | (0.23 | ) | | | 4,095 | | | | 26 | | |
12-31-14 | | | 0.83 | | | | — | | | | 11.44 | | | | 11.39 | | | | 1.28 | | | | 1.17 | | | | 1.17 | | | | (0.13 | ) | | | 3,893 | | | | 27 | | |
12-31-13 | | | 0.14 | | | | — | | | | 11.08 | | | | 34.62 | | | | 1.27 | | | | 1.15 | | | | 1.15 | | | | (0.23 | ) | | | 1,013 | | | | 20 | | |
| VY® T. Rowe Price Growth Equity Portfolio | |
Class ADV | |
12-31-17 | | | 9.49 | | | | — | | | | 86.22 | | | | 32.91 | | | | 1.24 | | | | 1.23 | | | | 1.23 | | | | (0.29 | ) | | | 248,624 | | | | 51 | | |
12-31-16 | | | 9.84 | | | | — | | | | 72.53 | | | | 1.01 | | | | 1.24 | | | | 1.23 | | | | 1.23 | | | | (0.34 | ) | | | 192,546 | | | | 40 | | |
12-31-15 | | | 13.97 | | | | — | | | | 81.69 | | | | 10.25 | | | | 1.24 | | | | 1.23 | | | | 1.23 | | | | (0.54 | ) | | | 202,307 | | | | 42 | | |
12-31-14 | | | 6.32 | | | | — | | | | 86.54 | | | | 8.16 | | | | 1.24 | | | | 1.23 | | | | 1.23 | | | | (0.50 | ) | | | 171,971 | | | | 35 | | |
12-31-13 | | | 0.01 | | | | — | | | | 86.20 | | | | 38.54 | | | | 1.24 | | | | 1.23 | | | | 1.23 | | | | (0.53 | ) | | | 164,865 | | | | 41 | | |
See Accompanying Notes to Financial Statements
59
FINANCIAL HIGHLIGHTS (CONTINUED)
Selected data for a share of beneficial interest outstanding throughout each year or period.
| | | | | Income (loss)
from investment
operations | | | | Less distributions | |
| | | Net asset value, beginning of year or period | | Net investment income (loss) | | Net realized and unrealized gain (loss) | | Total from investment operations | | From net investment income | | From net realized gains | | From return of capital | |
Year or period ended | | ($) | | ($) | | ($) | | ($) | | ($) | | ($) | | ($) | |
| VY® T. Rowe Price Growth Equity Portfolio (continued) | | | |
Class I | | | |
12-31-17 | | | 77.44 | | | | 0.19 | | | | 25.10 | | | | 25.29 | | | | 0.05 | | | | 9.49 | | | | — | | |
12-31-16 | | | 86.14 | | | | 0.13 | | | | 1.01 | | | | 1.14 | | | | — | | | | 9.84 | | | | — | | |
12-31-15 | | | 90.15 | | | | (0.03 | ) | | | 9.99 | | | | 9.96 | | | | — | | | | 13.97 | | | | — | | |
12-31-14 | | | 89.11 | | | | 0.00 | * | | | 7.36 | | | | 7.36 | | | | — | | | | 6.32 | | | | — | | |
12-31-13 | | | 64.01 | | | | (0.02 | ) | | | 25.13 | | | | 25.11 | | | | 0.01 | | | | — | | | | — | | |
Class S | | | |
12-31-17 | | | 74.96 | | | | (0.03 | ) | | | 24.25 | | | | 24.22 | | | | — | | | | 9.49 | | | | — | | |
12-31-16 | | | 83.90 | | | | (0.08 | ) | | | 0.98 | | | | 0.90 | | | | — | | | | 9.84 | | | | — | | |
12-31-15 | | | 88.33 | | | | (0.25 | )• | | | 9.79 | | | | 9.54 | | | | — | | | | 13.97 | | | | — | | |
12-31-14 | | | 87.65 | | | | (0.22 | ) | | | 7.22 | | | | 7.00 | | | | — | | | | 6.32 | | | | — | | |
12-31-13 | | | 63.12 | | | | (0.20 | )• | | | 24.74 | | | | 24.54 | | | | 0.01 | | | | — | | | | — | | |
Class S2 | | | |
12-31-17 | | | 73.27 | | | | (0.16 | )• | | | 23.68 | | | | 23.52 | | | | — | | | | 9.49 | | | | — | | |
12-31-16 | | | 82.35 | | | | (0.17 | )• | | | 0.93 | | | | 0.76 | | | | — | | | | 9.84 | | | | — | | |
12-31-15 | | | 87.05 | | | | (0.38 | )• | | | 9.65 | | | | 9.27 | | | | — | | | | 13.97 | | | | — | | |
12-31-14 | | | 86.59 | | | | (0.33 | )• | | | 7.11 | | | | 6.78 | | | | — | | | | 6.32 | | | | — | | |
12-31-13 | | | 62.45 | | | | (0.31 | )• | | | 24.46 | | | | 24.15 | | | | 0.01 | | | | — | | | | — | | |
| VY® Templeton Foreign Equity Portfolio | | | |
Class ADV | | | |
12-31-17 | | | 10.90 | | | | 0.19 | | | | 2.16 | | | | 2.35 | | | | 0.19 | | | | — | | | | — | | |
12-31-16 | | | 11.08 | | | | 0.20 | • | | | (0.07 | ) | | | 0.13 | | | | 0.31 | | | | — | | | | — | | |
12-31-15 | | | 11.91 | | | | 0.21 | • | | | (0.63 | ) | | | (0.42 | ) | | | 0.41 | | | | — | | | | — | | |
12-31-14 | | | 13.07 | | | | 0.36 | • | | | (1.26 | ) | | | (0.90 | ) | | | 0.26 | | | | — | | | | — | | |
12-31-13 | | | 11.05 | | | | 0.20 | • | | | 1.96 | | | | 2.16 | | | | 0.14 | | | | — | | | | — | | |
Class I | | | |
12-31-17 | | | 11.01 | | | | 0.25 | • | | | 2.20 | | | | 2.45 | | | | 0.25 | | | | — | | | | — | | |
12-31-16 | | | 11.20 | | | | 0.25 | • | | | (0.06 | ) | | | 0.19 | | | | 0.38 | | | | — | | | | — | | |
12-31-15 | | | 12.04 | | | | 0.28 | • | | | (0.64 | ) | | | (0.36 | ) | | | 0.48 | | | | — | | | | — | | |
12-31-14 | | | 13.21 | | | | 0.43 | • | | | (1.28 | ) | | | (0.85 | ) | | | 0.32 | | | | — | | | | — | | |
12-31-13 | | | 11.15 | | | | 0.29 | • | | | 1.95 | | | | 2.24 | | | | 0.18 | | | | — | | | | — | | |
Class S | | | |
12-31-17 | | | 10.94 | | | | 0.22 | • | | | 2.18 | | | | 2.40 | | | | 0.22 | | | | — | | | | — | | |
12-31-16 | | | 11.12 | | | | 0.22 | • | | | (0.05 | ) | | | 0.17 | | | | 0.35 | | | | — | | | | — | | |
12-31-15 | | | 11.95 | | | | 0.25 | • | | | (0.64 | ) | | | (0.39 | ) | | | 0.44 | | | | — | | | | — | | |
12-31-14 | | | 13.12 | | | | 0.40 | • | | | (1.28 | ) | | | (0.88 | ) | | | 0.29 | | | | — | | | | — | | |
12-31-13 | | | 11.08 | | | | 0.23 | • | | | 1.97 | | | | 2.20 | | | | 0.16 | | | | — | | | | — | | |
Class S2 | | | |
12-31-17 | | | 10.86 | | | | 0.19 | • | | | 2.18 | | | | 2.37 | | | | 0.18 | | | | — | | | | — | | |
12-31-16 | | | 11.06 | | | | 0.22 | | | | (0.08 | ) | | | 0.14 | | | | 0.34 | | | | — | | | | — | | |
12-31-15 | | | 11.90 | | | | 0.23 | • | | | (0.63 | ) | | | (0.40 | ) | | | 0.44 | | | | — | | | | — | | |
12-31-14 | | | 13.07 | | | | 0.34 | | | | (1.23 | ) | | | (0.89 | ) | | | 0.28 | | | | — | | | | — | | |
12-31-13 | | | 11.04 | | | | 0.21 | • | | | 1.97 | | | | 2.18 | | | | 0.15 | | | | — | | | | — | | |
| | | | | Ratios to average net assets | | Supplemental
data | |
| | | Total distributions | | Payment by affiliate | | Net asset value, end of year or period | | Total Return(1) | | Expenses before reductions/additions(2)(3)(4) | | Expenses net of fee waivers and/or recoupments if any(2)(3)(4) | | Expense net of all reductions/additions(2)(3)(4) | | Net investment income (loss)(2)(3) | | Net assets, end of year or period | | Portfolio turnover rate | |
Year or period ended | | ($) | | ($) | | ($) | | (%) | | (%) | | (%) | | (%) | | (%) | | ($000's) | | (%) | |
| VY® T. Rowe Price Growth Equity Portfolio (continued) | |
Class I | |
12-31-17 | | | 9.54 | | | | — | | | | 93.19 | | | | 33.58 | | | | 0.74 | | | | 0.73 | | | | 0.73 | | | | 0.21 | | | | 1,101,965 | | | | 51 | | |
12-31-16 | | | 9.84 | | | | — | | | | 77.44 | | | | 1.51 | | | | 0.74 | | | | 0.73 | | | | 0.73 | | | | 0.16 | | | | 989,826 | | | | 40 | | |
12-31-15 | | | 13.97 | | | | — | | | | 86.14 | | | | 10.81 | | | | 0.74 | | | | 0.73 | | | | 0.73 | | | | (0.04 | ) | | | 1,124,421 | | | | 42 | | |
12-31-14 | | | 6.32 | | | | — | | | | 90.15 | | | | 8.69 | | | | 0.74 | | | | 0.73 | | | | 0.73 | | | | 0.00 | * | | | 1,036,976 | | | | 35 | | |
12-31-13 | | | 0.01 | | | | — | | | | 89.11 | | | | 39.24 | | | | 0.74 | | | | 0.73 | | | | 0.73 | | | | (0.03 | ) | | | 1,069,544 | | | | 41 | | |
Class S | |
12-31-17 | | | 9.49 | | | | — | | | | 89.69 | | | | 33.25 | | | | 0.99 | | | | 0.98 | | | | 0.98 | | | | (0.04 | ) | | | 379,473 | | | | 51 | | |
12-31-16 | | | 9.84 | | | | — | | | | 74.96 | | | | 1.26 | | | | 0.99 | | | | 0.98 | | | | 0.98 | | | | (0.10 | ) | | | 336,810 | | | | 40 | | |
12-31-15 | | | 13.97 | | | | — | | | | 83.90 | | | | 10.54 | | | | 0.99 | | | | 0.98 | | | | 0.98 | | | | (0.29 | ) | | | 427,186 | | | | 42 | | |
12-31-14 | | | 6.32 | | | | — | | | | 88.33 | | | | 8.42 | | | | 0.99 | | | | 0.98 | | | | 0.98 | | | | (0.25 | ) | | | 360,966 | | | | 35 | | |
12-31-13 | | | 0.01 | | | | — | | | | 87.65 | | | | 38.89 | | | | 0.99 | | | | 0.98 | | | | 0.98 | | | | (0.28 | ) | | | 367,958 | | | | 41 | | |
Class S2 | |
12-31-17 | | | 9.49 | | | | — | | | | 87.30 | | | | 33.06 | | | | 1.14 | | | | 1.13 | | | | 1.13 | | | | (0.19 | ) | | | 9,014 | | | | 51 | | |
12-31-16 | | | 9.84 | | | | — | | | | 73.27 | | | | 1.10 | | | | 1.17 | | | | 1.13 | | | | 1.13 | | | | (0.23 | ) | | | 8,597 | | | | 40 | | |
12-31-15 | | | 13.97 | | | | — | | | | 82.35 | | | | 10.38 | | | | 1.24 | | | | 1.13 | | | | 1.13 | | | | (0.44 | ) | | | 5,361 | | | | 42 | | |
12-31-14 | | | 6.32 | | | | — | | | | 87.05 | | | | 8.26 | | | | 1.24 | | | | 1.13 | | | | 1.13 | | | | (0.38 | ) | | | 4,616 | | | | 35 | | |
12-31-13 | | | 0.01 | | | | — | | | | 86.59 | | | | 38.68 | | | | 1.24 | | | | 1.13 | | | | 1.13 | | | | (0.43 | ) | | | 2,482 | | | | 41 | | |
| VY® Templeton Foreign Equity Portfolio | |
Class ADV | |
12-31-17 | | | 0.19 | | | | — | | | | 13.06 | | | | 21.66 | (a) | | | 1.46 | | | | 1.40 | | | | 1.40 | | | | 1.50 | | | | 37,898 | | | | 14 | | |
12-31-16 | | | 0.31 | | | | — | | | | 10.90 | | | | 1.33 | | | | 1.46 | | | | 1.41 | | | | 1.41 | | | | 1.84 | | | | 31,937 | | | | 15 | | |
12-31-15 | | | 0.41 | | | | — | | | | 11.08 | | | | (3.83 | )(b) | | | 1.45 | | | | 1.43 | | | | 1.43 | | | | 1.76 | | | | 35,751 | | | | 10 | | |
12-31-14 | | | 0.26 | | | | — | | | | 11.91 | | | | (7.01 | ) | | | 1.44 | | | | 1.42 | | | | 1.42 | | | | 2.81 | | | | 40,973 | | | | 10 | | |
12-31-13 | | | 0.14 | | | | — | | | | 13.07 | | | | 19.68 | | | | 1.44 | | | | 1.42 | | | | 1.42 | | | | 1.64 | | | | 46,583 | | | | 12 | | |
Class I | |
12-31-17 | | | 0.25 | | | | — | | | | 13.21 | | | | 22.35 | (a) | | | 0.96 | | | | 0.90 | | | | 0.90 | | | | 2.00 | | | | 183,905 | | | | 14 | | |
12-31-16 | | | 0.38 | | | | — | | | | 11.01 | | | | 1.85 | | | | 0.96 | | | | 0.91 | | | | 0.91 | | | | 2.33 | | | | 170,231 | | | | 15 | | |
12-31-15 | | | 0.48 | | | | — | | | | 11.20 | | | | (3.34 | )(b) | | | 0.95 | | | | 0.93 | | | | 0.93 | | | | 2.29 | | | | 186,602 | | | | 10 | | |
12-31-14 | | | 0.32 | | | | — | | | | 12.04 | | | | (6.59 | ) | | | 0.94 | | | | 0.92 | | | | 0.92 | | | | 3.27 | | | | 215,838 | | | | 10 | | |
12-31-13 | | | 0.18 | | | | — | | | | 13.21 | | | | 20.28 | | | | 0.94 | | | | 0.92 | | | | 0.92 | | | | 2.47 | | | | 277,773 | | | | 12 | | |
Class S | |
12-31-17 | | | 0.22 | | | | — | | | | 13.12 | | | | 22.00 | (a) | | | 1.21 | | | | 1.15 | | | | 1.15 | | | | 1.76 | | | | 404,801 | | | | 14 | | |
12-31-16 | | | 0.35 | | | | — | | | | 10.94 | | | | 1.63 | | | | 1.21 | | | | 1.16 | | | | 1.16 | | | | 2.09 | | | | 423,390 | | | | 15 | | |
12-31-15 | | | 0.44 | | | | — | | | | 11.12 | | | | (3.57 | )(b) | | | 1.20 | | | | 1.18 | | | | 1.18 | | | | 2.03 | | | | 497,824 | | | | 10 | | |
12-31-14 | | | 0.29 | | | | — | | | | 11.95 | | | | (6.87 | ) | | | 1.19 | | | | 1.17 | | | | 1.17 | | | | 3.10 | | | | 584,346 | | | | 10 | | |
12-31-13 | | | 0.16 | | | | — | | | | 13.12 | | | | 20.05 | | | | 1.19 | | | | 1.17 | | | | 1.17 | | | | 1.91 | | | | 709,362 | | | | 12 | | |
Class S2 | |
12-31-17 | | | 0.18 | | | | — | | | | 13.05 | | | | 21.90 | (a) | | | 1.36 | | | | 1.30 | | | | 1.30 | | | | 1.57 | | | | 999 | | | | 14 | | |
12-31-16 | | | 0.34 | | | | — | | | | 10.86 | | | | 1.39 | | | | 1.39 | | | | 1.31 | | | | 1.31 | | | | 1.94 | | | | 2,321 | | | | 15 | | |
12-31-15 | | | 0.44 | | | | — | | | | 11.06 | | | | (3.72 | )(b) | | | 1.45 | | | | 1.33 | | | | 1.33 | | | | 1.88 | | | | 2,510 | | | | 10 | | |
12-31-14 | | | 0.28 | | | | — | | | | 11.90 | | | | (6.99 | ) | | | 1.44 | | | | 1.32 | | | | 1.32 | | | | 2.80 | | | | 2,065 | | | | 10 | | |
12-31-13 | | | 0.15 | | | | — | | | | 13.07 | | | | 19.88 | | | | 1.44 | | | | 1.32 | | | | 1.32 | | | | 1.80 | | | | 2,158 | | | | 12 | | |
(1) Total return is calculated assuming reinvestment of all dividends, capital gain distributions and return of capital distributions, if any, at net asset value and does not reflect the effect of insurance contract charges. Total return for periods less than one year is not annualized.
(2) Annualized for periods less than one year.
(3) Ratios reflect operating expenses of a Portfolio. Expenses before reductions/additions do not reflect amounts reimbursed by an Investment Adviser and/or Distributor or reductions from brokerage service arrangements or other expense offset arrangements and do not represent the amount paid by a Portfolio during periods when reimbursements or reductions occur. Expenses net of fee waivers reflect expenses after reimbursement by an Investment Adviser and/or Distributor but prior to reductions from brokerage service arrangements or other expense offset arrangements. Expenses net of all reductions/additions represent the net expenses paid by a Portfolio. Net investment income (loss) is net of all such additions or reductions.
(4) Ratios do not include fees and expenses charged under the variable annuity contract or variable life insurance policy.
(5) Commencement of operations.
(a) Excluding amounts from foreign withholding tax claims received in the year ended December 31, 2017, Templeton Foreign Equity's total return would have been 21.38%, 21.98%, 21.63%, and 21.53% for Classes ADV, I, S, and S2, respectively.
(b) Excluding amounts related to a foreign currency settlement recorded in the fiscal year ended December 31, 2015, Templeton Foreign Equity's total return would have been (4.09)%, (3.60)%, (3.83)% and (3.99)% for Classes ADV, I, S and S2, respectively.
• Calculated using average number of shares outstanding throughout the year or period.
* Amount is less than $0.005 or 0.005% or more than $(0.005) or (0.005)%.
See Accompanying Notes to Financial Statements
60
NOTES TO FINANCIAL STATEMENTS AS OF DECEMBER 31, 2017
Voya Partners, Inc. (the "Company") is an open-end management investment company registered under the Investment Company Act of 1940, as amended (the "1940 Act"). It was incorporated under the laws of Maryland on May 7, 1997. The Articles of Incorporation permit the Company to offer separate series, each of which has its own investment objective, policies and restrictions. The Company currently consists of thirty-eight active separate investment series. The thirteen series (each, a "Portfolio" and collectively, the "Portfolios") included in this report are: Voya Global Bond Portfolio ("Global Bond"),VY® American Century Small-Mid Cap Value Portfolio ("American Century Small-Mid Cap Value"), VY® Baron Growth Portfolio ("Baron Growth"), VY® Columbia Contrarian Core Portfolio ("Columbia Contrarian Core"), VY® Columbia Small Cap Value II Portfolio ("Columbia Small Cap Value II"), VY® Invesco Comstock Portfolio ("Invesco Comstock"), VY® Invesco Equity and Income Portfolio ("Invesco Equity and Income"), VY® JPMorgan Mid Cap Value Portfolio ("JPMorgan Mid Cap Value"), VY® Oppenheimer Global Portfolio ("Oppenheimer Global"), VY® Pioneer High Yield Portfolio ("Pioneer High Yield"), VY® T. Rowe Price Diversified Mid Cap Growth Portfolio ("T. Rowe Price Diversified Mid Cap Growth"), VY® T. Rowe Price Growth Equity Portfolio ("T. Rowe Price Growth Equity"), and VY® Templeton Foreign Equity Portfolio ("Templeton Foreign Equity"), each a diversified series of the Company. The investment objective of the Portfolios is described in the respective Portfolio's Prospectus.
The classes of shares included in this report are: Adviser ("Class ADV"), Initial ("Class I"), Class R6, Service ("Class S") and Service 2 ("Class S2"); however, each Portfolio may not offer all share classes. Shares of the Portfolios may be offered to separate accounts ("Separate Accounts") of insurance companies as investment options in connection with variable annuity contracts and variable life insurance policies ("Variable Contracts") and to certain of the Portfolios' investment advisers and their affiliates. In the future, shares may also be offered to qualified pension and retirement plans ("Qualified Plans") outside the Separate Account context. With the exception of class specific matters, each class has equal voting rights as to voting privileges. For class specific proposals, only the applicable class would have voting privileges. The classes differ principally in the applicable distribution and shareholder service fees. Generally, shareholders of each class also bear certain expenses that pertain to that particular class. All shareholders are allocated the common expenses of a portfolio and earn income and realized gains/losses from a portfolio pro rata based on the daily ending net assets
of each class, without distinction between share classes. Distributions are determined separately for each class based on income and expenses allocated to each class. Expenses that are specific to a portfolio or a class are charged directly to that portfolio or class. Other operating expenses shared by several portfolios are generally allocated among those portfolios based on average net assets. Realized gain distributions are allocated to each class pro rata based on the shares outstanding of each class on the date of distribution. Differences in per share dividend rates generally result from differences in separate class expenses, including distribution and shareholder service fees, if applicable.
Voya Investments, LLC ("Voya Investments" or the "Investment Adviser"), an Arizona limited liability company, serves as the Investment Adviser to the Portfolios. Prior to May 1, 2017, Directed Services LLC ("DSL"), a Delaware limited liability company, served as the investment adviser to the Portfolios. There were no changes to the services provided or the fees charged to the Portfolios upon the replacement of DSL with Voya Investments. Voya Investment Management Co. LLC ("Voya IM"), a Delaware limited liability company, serves as the sub-adviser to Global Bond. Voya Investments Distributor, LLC ("VID" or the "Distributor"), a Delaware limited liability company, serves as the principal underwriter to the Portfolios.
NOTE 2 — SIGNIFICANT ACCOUNTING POLICIES
The following significant accounting policies are consistently followed by the Portfolios in the preparation of their financial statements. Each Portfolio is considered an investment company under U.S. generally accepted accounting principles ("GAAP") and follows the accounting and reporting guidance applicable to investment companies.
A. Security Valuation. Each Portfolio is open for business every day the New York Stock Exchange ("NYSE") opens for regular trading (each such day, a "Business Day"). The net asset value ("NAV") per share for each class of each Portfolio is determined each Business Day as of the close of the regular trading session ("Market Close"), as determined by the Consolidated Tape Association ("CTA"), the central distributor of transaction prices for exchange-traded securities (normally 4:00 p.m. Eastern time unless otherwise designated by the CTA). The data reflected on the consolidated tape provided by the CTA is generated by various market centers, including all securities exchanges, electronic communications networks, and third-market broker-dealers. The NAV per share of each class of each Portfolio is calculated by taking the value of the Portfolio's assets attributable to that class,
61
NOTES TO FINANCIAL STATEMENTS AS OF DECEMBER 31, 2017 (CONTINUED)
NOTE 2 — SIGNIFICANT ACCOUNTING POLICIES (continued)
subtracting the Portfolio's liabilities attributable to that class, and dividing by the number of shares of that class that are outstanding. On days when a Portfolio is closed for business, Portfolio shares will not be priced and a Portfolio does not transact purchase and redemption orders. To the extent a Portfolio's assets are traded in other markets on days when a Portfolio does not price its shares, the value of a Portfolio's assets will likely change and you will not be able to purchase or redeem shares of a Portfolio.
Assets for which market quotations are readily available are valued at market value. A security listed or traded on an exchange is valued at its last sales price or official closing price as of the close of the regular trading session on the exchange where the security is principally traded or, if such price is not available, at the last sale price as of the Market Close for such security provided by the CTA. Bank loans are valued at the average of the averages of the bid and ask prices provided to an independent loan pricing service by brokers. Futures contracts are valued at the final settlement price set by an exchange on which they are principally traded. Listed options are valued at the mean between the last bid and ask prices from the exchange on which they are principally traded. Investments in open-end registered investment companies that do not trade on an exchange are valued at the end of day NAV per share. Investments in registered investment companies that trade on an exchange are valued at the last sales price or official closing price as of the close of the regular trading session on the exchange where the security is principally traded.
When a market quotation is not readily available or is deemed unreliable, each Portfolio will determine a fair value for the relevant asset in accordance with procedures adopted by the Portfolios' Board of Directors ("Board"). Such procedures provide, for example, that: (a) Exchange-traded securities are valued at the mean of the closing bid and ask; (b) Debt obligations are valued using an evaluated price provided by an independent pricing service. Evaluated prices provided by the pricing service may be determined without exclusive reliance on quoted prices, and may reflect factors such as institution-size trading in similar groups of securities, developments related to specific securities, benchmark yield, quality, type of issue, coupon rate, maturity, individual trading characteristics and other market data; (c) Securities traded in the over-the-counter ("OTC") market are valued based on prices provided by independent pricing services or market makers; (d) Options not listed on an exchange are valued by an independent source using an industry
accepted model, such as Black-Scholes; (e) Centrally cleared swap agreements are valued using a price provided by the central counterparty clearinghouse; (f) OTC swap agreements are valued using a price provided by an independent pricing service; (g) Forward foreign currency exchange contracts are valued utilizing current and forward rates obtained from an independent pricing service. Such prices from the third party pricing service are for specific settlement periods and each Portfolio's forward foreign currency exchange contracts are valued at an interpolated rate between the closest preceding and subsequent period reported by the independent pricing service; and (h) Securities for which market prices are not provided by any of the above methods may be valued based upon quotes furnished by brokers.
The prospectuses of the open-end registered investment companies in which each Portfolio may invest explain the circumstances under which they will use fair value pricing and the effects of using fair value pricing.
Foreign securities' (including forward foreign currency exchange contracts) prices are converted into U.S. dollar amounts using the applicable exchange rates as of Market Close. If market quotations are available and believed to be reliable for foreign exchange-traded equity securities, the securities will be valued at the market quotations. Because trading hours for certain foreign securities end before Market Close, closing market quotations may become unreliable. An independent pricing service determines the degree of certainty, based on historical data, that the closing price in the principal market where a foreign security trades is not the current value as of Market Close. Foreign securities' prices meeting the approved degree of certainty that the price is not reflective of current value will be valued by the independent pricing service using pricing models designed to estimate likely changes in the values of those securities between the times in which the trading in those securities is substantially completed and Market Close. Multiple factors may be considered by the independent pricing service in determining the value of such securities and may include information relating to sector indices, American Depositary Receipts and domestic and foreign index futures.
All other assets for which market quotations are not readily available or became unreliable (or if the above fair valuation methods are unavailable or determined to be unreliable) are valued at fair value as determined in good faith by or under the supervision of the Board following procedures approved by the Board. The Board has delegated to the Investment Adviser responsibility for overseeing the implementation of the Portfolios' valuation procedures; a "Pricing Committee" comprised of
62
NOTES TO FINANCIAL STATEMENTS AS OF DECEMBER 31, 2017 (CONTINUED)
NOTE 2 — SIGNIFICANT ACCOUNTING POLICIES (continued)
employees of the Investment Adviser or its affiliates has responsibility for applying the fair valuation methods set forth in the procedures and, if a fair valuation cannot be determined pursuant to the fair valuation methods, determining the fair value of assets held by the Portfolios. Issuer specific events, transaction price, position size, nature and duration of restrictions on disposition of the security, market trends, bid/ask quotes of brokers and other market data may be reviewed in the course of making a good faith determination of a security's fair value. Valuations change in response to many factors including the historical and prospective earnings of the issuer, the value of the issuer's assets, general economic conditions, interest rates, investor perceptions and market liquidity. Because of the inherent uncertainties of fair valuation, the values used to determine each Portfolio's NAV may materially differ from the value received upon actual sale of those investments. Thus, fair valuation may have an unintended dilutive or accretive effect on the value of shareholders' investments in each Portfolio.
Each investment asset or liability of the Portfolios is assigned a level at measurement date based on the significance and source of the inputs to its valuation. Quoted prices in active markets for identical securities are classified as "Level 1," inputs other than quoted prices for an asset or liability that are observable are classified as "Level 2" and significant unobservable inputs, including the sub-advisers' or Pricing Committee's judgment about the assumptions that a market participant would use in pricing an asset or liability are classified as "Level 3." The inputs used for valuing securities are not necessarily an indication of the risks associated with investing in those securities. Short-term securities of sufficient credit quality are generally considered to be Level 2 securities under applicable accounting rules. A table summarizing the Portfolios' investments under these levels of classification is included following the Portfolio of Investments.
GAAP requires a reconciliation of the beginning to ending balances for reported fair values that presents changes attributable to total realized and unrealized gains or losses, purchases and sales, and transfers in or out of the Level 3 category during the period. The beginning of period timing recognition is used for the transfers between levels of the Portfolio's assets and liabilities. A reconciliation of Level 3 investments is presented only when a Portfolio has a significant amount of Level 3 investments.
B. Securities Transactions and Revenue Recognition. Securities transactions are accounted for on the trade date. Realized gains and losses are reported on the basis of identified cost of securities sold. Interest income is recorded on an accrual basis. Dividend income is recorded on the ex-dividend date, or for certain foreign securities, when the information becomes available to the Portfolios. Premium amortization and discount accretion are determined by the effective yield method.
C. Foreign Currency Translation. The books and records of the Portfolios are maintained in U.S. dollars. Any foreign currency amounts are translated into U.S. dollars on the following basis:
(1) Market value of investment securities, other assets and liabilities — at the exchange rates prevailing at Market Close.
(2) Purchases and sales of investment securities, income and expenses — at the rates of exchange prevailing on the respective dates of such transactions.
Although the net assets and the market values are presented at the foreign exchange rates at Market Close, the Portfolios do not isolate the portion of the results of operations resulting from changes in foreign exchange rates on investments from the fluctuations arising from changes in market prices of securities held. Such fluctuations are included with the net realized and unrealized gains or losses from investments. For securities, which are subject to foreign withholding tax upon disposition, liabilities are recorded on the Statements of Assets and Liabilities for the estimated tax withholding based on the securities' current market value. Upon disposition, realized gains or losses on such securities are recorded net of foreign withholding tax.
Reported net realized foreign exchange gains or losses arise from sales of foreign currencies, currency gains or losses realized between the trade and settlement dates on securities transactions, the difference between the amounts of dividends, interest, and foreign withholding tax reclaims recorded on the Portfolios' books, and the U.S. dollar equivalent of the amounts actually received or paid. Net unrealized foreign exchange gains and losses arise from changes in the value of assets and liabilities other than investments in securities, resulting from changes in the exchange rate. Foreign security and currency transactions may involve certain considerations and risks not typically associated with investing in U.S. companies and U.S. government securities. These risks include, but are not limited to, revaluation of currencies and future adverse political and economic developments, which could cause securities and their markets to be less liquid and prices more volatile than those of comparable
63
NOTES TO FINANCIAL STATEMENTS AS OF DECEMBER 31, 2017 (CONTINUED)
NOTE 2 — SIGNIFICANT ACCOUNTING POLICIES (continued)
U.S. companies and U.S. government securities. The foregoing risks are even greater with respect to securities of issuers in emerging markets.
D. Distributions to Shareholders. The Portfolios record distributions to their shareholders on the ex-dividend date. All Portfolios (except Pioneer High Yield and Global Bond) declare and pay dividends annually. Pioneer High Yield and Global Bond declare dividends on a daily basis and pay dividends monthly. The Portfolios distribute capital gains distributions, if any, annually. The Portfolios may make distributions on a more frequent basis to comply with the distribution requirements of subchapter M of the Internal Revenue Code. The characteristics of income and gains to be distributed are determined in accordance with income tax regulations, which may differ from GAAP for investment companies.
E. Federal Income Taxes. It is the policy of each Portfolio to comply with the requirements of subchapter M of the Internal Revenue Code that are applicable to regulated investment companies and to distribute substantially all of its net investment income and any net realized capital gains to its shareholders. Therefore, a federal income tax or excise tax provision is not required. Management has considered the sustainability of the Portfolios' tax positions taken on federal income tax returns for all open tax years in making this determination. No capital gain distributions shall be made until the capital loss carryforwards have been fully utilized or expire.
The Portfolios may utilize equalization accounting for tax purposes, whereby a portion of redemption payments are treated as distributions of income or gain.
F. Use of Estimates. Management of the Portfolios has made certain estimates and assumptions relating to the reporting of assets, liabilities, income, and expenses to prepare these financial statements in conformity with GAAP for investment companies. Actual results could differ from these estimates.
G. Risk Exposures and the Use of Derivative Instruments. The Portfolios' investment strategies permit the Portfolios to enter into various types of derivatives contracts, including, but not limited to, futures contracts, forward foreign currency exchange contracts, credit default swaps, interest rate swaps, total return swaps, and purchased and written options. In doing so, a Portfolio will employ strategies in differing combinations to permit it to increase or decrease the level of risk, or change the level or types of exposure to risk factors. This may allow a Portfolio to pursue its objectives more
quickly, and efficiently than if it were to make direct purchases or sales of securities capable of affecting a similar response to market or credit factors.
In pursuit of its investment objectives, a Portfolio may seek to increase or decrease its exposure to the following market or credit risk factors:
Credit Risk. The price of a bond or other debt instrument is likely to fall if the issuer's actual or perceived financial health deteriorates, whether because of broad economic or issuer-specific reasons. In certain cases, the issuer could be late in paying interest or principal, or could fail to pay its financial obligations altogether.
Equity Risk. Stock prices may be volatile or have reduced liquidity in response to real or perceived impacts of factors including, but not limited to, economic conditions, changes in market interest rates, and political events. Stock markets tend to be cyclical, with periods when stock prices generally rise and periods when stock prices generally decline. Any given stock market segment may remain out of favor with investors for a short or long period of time, and stocks as an asset class may underperform bonds or other asset classes during some periods. Additionally, legislative, regulatory or tax policies or developments in these areas may adversely impact the investment techniques available to a manager, add to costs and impair the ability of a Portfolio to achieve its investment objectives.
Foreign Exchange Rate Risk. To the extent that a Portfolio invests directly in foreign (non-U.S.) currencies or in securities denominated in, or that trade in, foreign (non-U.S.) currencies, it is subject to the risk that those foreign (non-U.S.) currencies will decline in value relative to the U.S. dollar or, in the case of hedging positions, that the U.S. dollar will decline in value relative to the currency being hedged by a Portfolio through foreign currency exchange transactions.
Currency rates may fluctuate significantly over short periods of time. Currency rates may be affected by changes in market interest rates, intervention (or the failure to intervene) by U.S. or foreign governments, central banks or supranational entities such as the International Monetary Fund, by the imposition of currency controls, or other political or economic developments in the United States or abroad.
Interest Rate Risk. With bonds and other fixed rate debt instruments, a rise in market interest rates generally causes values to fall; conversely, values generally rise as market interest rates fall. The higher the credit quality of the instrument, and the longer its maturity or duration, the more sensitive it is likely to be to interest rate risk. In the case of inverse securities, the interest rate paid by the
64
NOTES TO FINANCIAL STATEMENTS AS OF DECEMBER 31, 2017 (CONTINUED)
NOTE 2 — SIGNIFICANT ACCOUNTING POLICIES (continued)
securities is a floating rate, which generally will decrease when the market rate of interest to which the inverse security is indexed increases and will increase when the market rate of interest to which the inverse security is indexed decreases. As of the date of this report, market interest rates in the United States are at or near historic lows, which may increase a Portfolio's exposure to risks associated with rising market interest rates. Rising market interest rates could have unpredictable effects on the markets and may expose fixed-income and related markets to heightened volatility. For a fund that invests in fixed-income securities, an increase in market interest rates may lead to increased redemptions and increased portfolio turnover, which could reduce liquidity for certain investments, adversely affect values, and increase costs. If dealer capacity in fixed-income markets is insufficient for market conditions, it may further inhibit liquidity and increase volatility in the fixed-income markets. Further, recent and potential changes in government policy may affect interest rates.
Risks of Investing in Derivatives. A Portfolio's use of derivatives can result in losses due to unanticipated changes in the market or credit risk factors and the overall market. In instances where a Portfolio is using derivatives to decrease, or hedge, exposures to market or credit risk factors for securities held by a Portfolio, there are also risks that those derivatives may not perform as expected resulting in losses for the combined or hedged positions.
Derivative instruments are subject to a number of risks, including the risk of changes in the market price of the underlying securities, credit risk with respect to the counterparty, risk of loss due to changes in market interest rates and liquidity and volatility risk. The amounts required to purchase certain derivatives may be small relative to the magnitude of exposure assumed by a Portfolio. Therefore, the purchase of certain derivatives may have an economic leveraging effect on a Portfolio and exaggerate any increase or decrease in the NAV. Derivatives may not perform as expected, so a Portfolio may not realize the intended benefits. When used for hedging purposes, the change in value of a derivative may not correlate as expected with the currency, security or other risk being hedged. When used as an alternative or substitute for direct cash investments, the return provided by the derivative may not provide the same return as direct cash investment. In addition, given their complexity, derivatives expose a Portfolio to the risk of improper valuation.
Generally, derivatives are sophisticated financial instruments whose performance is derived, at least in part, from the performance of an underlying asset or assets. Derivatives include, among other things, swap agreements, options, forwards and futures. Investments in derivatives are generally negotiated OTC with a single counterparty and as a result are subject to credit risks related to the counterparty's ability or willingness to perform its obligations; any deterioration in the counterparty's creditworthiness could adversely affect the value of the derivative. In addition, derivatives and their underlying securities may experience periods of illiquidity which could cause a Portfolio to hold a security it might otherwise sell, or to sell a security it otherwise might hold at inopportune times or at an unanticipated price. A manager might imperfectly judge the direction of the market. For instance, if a derivative is used as a hedge to offset investment risk in another security, the hedge might not correlate to the market's movements and may have unexpected or undesired results such as a loss or a reduction in gains.
The U.S. government has enacted legislation that provides for new regulation of the derivatives market, including clearing, margin, reporting, and registration requirements. The European Union is (and other countries outside of the European Union are) implementing similar requirements, which will affect a Portfolio when it enters into a derivatives transaction with a counterparty organized in that country or otherwise subject to that country's derivatives regulations. Because these requirements are new and evolving (and some of the rules are not yet final), their ultimate impact remains unclear. Central clearing is expected to reduce counterparty risk and increase liquidity, however, there is no assurance that it will achieve that result, and in the meantime, central clearing and related requirements expose a Portfolio to new kinds of costs and risks.
Counterparty Credit Risk and Credit Related Contingent Features. Certain derivative positions are subject to counterparty credit risk, which is the risk that the counterparty will not fulfill its obligation to a Portfolio. Each Portfolio's derivative counterparties are financial institutions who are subject to market conditions that may weaken their financial position. A Portfolio intends to enter into financial transactions with counterparties it believes to be creditworthy at the time of the transaction. To reduce this risk, a Portfolio has entered into master netting arrangements, established within each Portfolio's International Swap and Derivatives Association, Inc. ("ISDA") Master Agreements ("Master Agreements"). These Master Agreements are with select counterparties and they govern transactions, including certain OTC derivative and forward foreign currency contracts,
65
NOTES TO FINANCIAL STATEMENTS AS OF DECEMBER 31, 2017 (CONTINUED)
NOTE 2 — SIGNIFICANT ACCOUNTING POLICIES (continued)
entered into by a Portfolio and the counterparty. The Master Agreements maintain provisions for general obligations, representations, agreements, collateral, and events of default or termination. The occurrence of a specified event of termination may give a counterparty the right to terminate all of its contracts and affect settlement of all outstanding transactions under the applicable Master Agreement.
A Portfolio may also enter into collateral agreements with certain counterparties to further mitigate counterparty credit risk on OTC derivative and forward foreign currency contracts. Subject to established minimum levels, collateral is generally determined based on the net aggregate unrealized gain or loss on contracts with a certain counterparty. Collateral pledged to or from a Portfolio is held in a segregated account by a third-party agent and can be in the form of cash or debt securities issued by the U.S. government or related agencies.
As of December 31, 2017, the maximum amount of loss that Global Bond, Invesco Equity and Income and Templeton Foreign Equity would incur if the counterparties to its derivative transactions failed to perform would be $4,751,077, $33,679 and $362, respectively, which represents the gross payments to be received by the Portfolios on open forward foreign currency contracts and purchased options were they to be unwound as of December 31, 2017. To reduce the amount of potential loss to Global Bond, the Portfolio has received $630,000 in cash collateral for open OTC transactions at December 31, 2017.
Each Portfolio has credit related contingent features that if triggered would allow its derivative counterparties to close out and demand payment or additional collateral to cover their exposure from a Portfolio. Credit related contingent features are established between each Portfolio and their derivatives counterparties to reduce the risk that a Portfolio will not fulfill its payment obligations to its counterparties. These triggering features include, but are not limited to, a percentage decrease in a Portfolio's net assets and/or a percentage decrease in a Portfolio's NAV, which could cause a Portfolio to accelerate payment of any net liability owed to the counterparty. The contingent features are established within each Portfolio's Master Agreements.
As of December 31, 2017, Global Bond, Invesco Comstock and Invesco Equity and Income had a liability position of $3,105,940, $810,493 and $1,511,795 on open forward foreign currency contracts and OTC written options with credit related contingent features. If a
contingent feature would have been triggered as of December 31, 2017, the Portfolios could have been required to pay this amount in cash to its counterparties. There was no cash collateral pledged by any Portfolio as of December 31, 2017 for open OTC derivatives.
H. Forward Foreign Currency Contracts. Certain Portfolios may enter into forward foreign currency contracts primarily to hedge against foreign currency exchange rate risks on their non-U.S. dollar denominated investment securities. When entering into a forward currency contract, a Portfolio agrees to receive or deliver a fixed quantity of foreign currency for an agreed-upon price on an agreed future date. These contracts are valued daily and a Portfolio's net equity therein, representing unrealized gain or loss on the contracts as measured by the difference between the forward foreign exchange rates at the dates of entry into the contracts and the forward rates at the reporting date, is included in the Statement of Assets and Liabilities. Realized and unrealized gains and losses are included in the Statement of Operations. These instruments involve market and/or credit risk in excess of the amount recognized in the Statement of Assets and Liabilities. Risks arise from the possible inability of counterparties to meet the terms of their contracts and from movement in currency and securities values and interest rates. Open forward foreign currency contracts are presented following the Portfolio of Investments.
During the year ended December 31, 2017, the following Portfolios had average contract amounts on forward foreign currency contracts purchased and sold as disclosed below:
| | | Purchased | | Sold | |
Global Bond** | | $ | 199,197,433 | | | $ | 113,564,216 | | |
American Century Small-Mid Cap
Value* | | | 149,232 | | | | 7,595,079 | | |
Invesco Comstock* | | | 183,561 | | | | 49,213,279 | | |
Invesco Equity and Income* | | | 1,990,216 | | | | 85,249,250 | | |
Oppenheimer Global* | | | — | | | | 4,622,324 | | |
Templeton Foreign Equity* | | | — | | | | 125,620 | | |
* For the year ended December 31, 2017, the Portfolios used forward foreign currency contracts primarily to protect their non-U.S. dollar-denominated holdings from adverse currency movements. Please refer to the tables following each respective Portfolio of Investments for open forward foreign currency contracts at December 31, 2017.
** For the year ended December 31, 2017, the Portfolio used forward foreign currency contracts primarily to protect their non-U.S. dollar-denominated holdings from adverse currency movements and to gain exposure to currencies for the purposes of risk management or enhanced return. Please refer to the tables following each respective Portfolio of Investments for open forward foreign currency contracts at December 31, 2017.
I. Futures Contracts. Certain Portfolios may enter into futures contracts involving foreign currency, interest rates, securities and security indices. A futures contract is a commitment to buy or sell a specific amount of a financial
66
NOTES TO FINANCIAL STATEMENTS AS OF DECEMBER 31, 2017 (CONTINUED)
NOTE 2 — SIGNIFICANT ACCOUNTING POLICIES (continued)
instrument at a negotiated price on a stipulated future date. A Portfolio may buy and sell futures contracts. Futures contracts traded on a commodities or futures exchange will be valued at the final settlement price or official closing price on the principal exchange as reported by such principal exchange at its trading session ending at, or most recently prior to, the time when each Portfolio's assets are valued.
Upon entering into a futures contract, a Portfolio is required to deposit either cash or securities (initial margin) in an amount equal to a certain percentage of the contract value. Subsequent payments (variation margin) are made or received by a Portfolio each day. The variation margin payments are equal to the daily changes in the contract value and are recorded as unrealized gains and losses. Open futures contracts are reported on a table following each Portfolio's Portfolio of Investments. Securities held in collateralized accounts to cover initial margin requirements on open futures contracts are footnoted in the Portfolio of Investments. Cash collateral held by the broker to cover initial margin requirements on open futures contracts are noted in the Statements of Assets and Liabilities. The net change in unrealized appreciation and depreciation is reported in the Statements of Operations. Realized gains (losses) are reported in the Statements of Operations at the closing or expiration of futures contracts.
Futures contracts are exposed to the market risk factor of the underlying financial instrument. During the year ended December 31, 2017, Global Bond had purchased and sold futures contracts on various notes and bonds as part of their respective duration strategy. During the year ended December 31, 2017, Pioneer High Yield had sold futures contracts on equity indices to decrease exposure to equity risk. Additional associated risks of entering into futures contracts include the possibility that there may be an illiquid market where each Portfolio is unable to liquidate the contract or enter into an offsetting position and, if used for hedging purposes, the risk that the price of the contract will correlate imperfectly with the prices of each Portfolios' securities. With futures, there is minimal counterparty credit risk to the Portfolios since futures are exchange traded and the exchange's clearinghouse, as counterparty to all exchange traded futures, guarantees the futures against default.
During the year ended December 31, 2017, the following Portfolios had average notional values on futures contracts purchased and sold as disclosed below. Please refer to the tables following each respective Portfolio of
Investments for open futures contracts at December 31, 2017.
| | | Purchased | | Sold | |
Global Bond | | $ | 58,700,891 | | | $ | 38,764,837 | | |
Pioneer High Yield | | | — | | | | 2,319,596 | | |
J. Securities Lending. Each Portfolio may temporarily loan up to 331/3% of its total assets to brokers, dealers or other financial institutions in exchange for a negotiated lender's fee. Securities lending involves two primary risks: "investment risk" and "borrower default risk." When lending securities, the Portfolios will receive cash or U.S. government securities as collateral. Investment risk is the risk that the Portfolios will lose money from the investment of the cash collateral received from the borrower. Borrower default risk is the risk that the Portfolios will lose money due to the failure of a borrower to return a borrowed security. Loans are subject to termination at the option of the borrower or the Portfolios. Securities lending may result in leverage. The use of leverage may exaggerate any increase or decrease in the NAV, causing the Portfolios to be more volatile. The use of leverage may increase expenses and increase the impact of the Portfolios' other risks.
K. Restricted Securities. The Portfolios may invest in restricted securities which include those sold under Rule 144A of the Securities Act of 1933, as amended ("1933 Act") or securities offered pursuant to Section 4(a)(2) of the 1933 Act, and/or are subject to legal or contractual restrictions on resale and may not be publicly sold without registration under the 1933 Act. Restricted securities are fair valued using market quotations when readily available. In the absence of market quotations, the securities are valued based upon their fair value determined in good faith under procedures approved by the Board.
Securities that are not registered for sale to the public under the 1933 Act are referred to as "restricted securities." These securities may be sold in private placement transactions between issuers and their purchasers and may be neither listed on an exchange nor traded in other established markets. Many times these securities are subject to legal or contractual restrictions on resale. As a result of the absence of a public trading market, the prices of these securities may be more volatile, less liquid and more difficult to value than publicly traded securities. The price realized from the sale of these securities could be less than the amount originally paid or less than their fair value if they are resold in privately negotiated transactions. In addition, these securities may not be subject to disclosure and other investment protection requirements that are afforded to publicly traded securities. Certain investments may
67
NOTES TO FINANCIAL STATEMENTS AS OF DECEMBER 31, 2017 (CONTINUED)
NOTE 2 — SIGNIFICANT ACCOUNTING POLICIES (continued)
include investment in smaller, less seasoned issuers, which may involve greater risk.
L. Delayed-Delivery and When-Issued Transactions. Certain Portfolios may purchase or sell securities on a when-issued or forward commitment basis. The price of the underlying securities and date when the securities will be delivered and paid for are fixed at the time the transaction is negotiated. The fair value of such is identified in the Portfolios' Portfolio of Investments. Losses may arise due to changes in the fair value of the securities or from the inability of counterparties to meet the terms of the contract. In connection with such purchases, the Portfolios are required to hold liquid assets as collateral with the Portfolios' custodian sufficient to cover the purchase price.
To mitigate counterparty risk, certain Portfolios have entered into Master Securities Forward Transaction Agreements ("MSFTA") with their respective counterparties that provide for collateral and the right to offset amounts due to or from those counterparties under specified conditions. Subject to minimum transfer amounts, collateral requirements are determined and transfers made based on the net aggregate unrealized gain or loss on all the when-issued or delayed-delivery transactions with a particular counterparty. Cash collateral, if any, is presented on the Statement of Assets and Liabilities as an asset (Cash pledged as collateral for delayed-delivery or when-issued securities) and a liability (Cash received as collateral for delayed-delivery or when-issued securities). At December 31, 2017, there was no cash collateral pledged to or received by any Portfolio.
M. Mortgage Dollar Roll Transactions. Certain Portfolios may engage in dollar roll transactions with respect to mortgage-backed securities issued by Government National Mortgage Association, Federal National Mortgage Association and Federal Home Loan Mortgage Corp. In a dollar roll transaction, a Portfolio sells a mortgage-backed security to a financial institution, such as a bank or broker/dealer, and simultaneously agrees to repurchase a substantially similar (i.e., same type, coupon, and maturity) security from the institution on a delayed delivery basis at an agreed upon price. The mortgage-backed securities that are repurchased will bear the same interest rate as those sold, but generally will be collateralized by different pools of mortgages with different prepayment histories. The Portfolios account for dollar roll transactions as purchases and sales. For fee based dollar roll transactions, the fee is recorded as income.
N. Options Contracts. Certain Portfolios may purchase put and call options and may write (sell) put options and covered call options on futures, swaps ("swaptions"), securities, commodities or foreign currencies. The Portfolios may engage in option transactions as a hedge against adverse movements in the value of portfolio holdings or to increase market exposure. Option contracts are valued daily and unrealized gains or losses are recorded based upon the last sales price on the principal exchange on which the options are traded. An amount equal to the proceeds of the premium received by the Portfolios upon the writing of a put or call option is included in the Statements of Assets and Liabilities as an asset and equivalent liability which is subsequently marked-to-market until it is exercised or closed, or it expires. The Portfolios will realize a gain or loss upon the expiration or closing of the option contract. When an option is exercised, the proceeds on sales of the underlying security for a written call option, the purchase cost of the security for a written put option, or the cost of the security for a purchased put or call option is adjusted by the amount of premium received or paid. Realized and unrealized gains or losses on option contracts are reflected in the accompanying financial statements. The risk in writing a covered call option is that the Portfolios give up the opportunity for profit if the market price of the security increases and the option is exercised. The risk in writing a put option is that the Portfolios may incur a loss if the market price of the security decreases and the option is exercised. The risk in buying an option is that the Portfolios pay a premium whether or not the option is exercised. Risks may also arise from an illiquid secondary market or from the inability of counterparties to meet the terms of the contract.
During the year ended December 31, 2017, Global Bond had purchased credit default swaptions to increase exposure to credit risk. There were no open credit default swaptions at December 31, 2017.
During the year ended December 31, 2017, Global Bond had purchased foreign currency options to gain exposure to currencies. There were no open purchased foreign currency options at December 31, 2017.
During the year ended December 31, 2017, Global Bond had purchased and written interest rate swaptions to gain exposure to interest rates and to generate income. Please refer to the tables following the Portfolio of Investments for open purchased and written interest rate swaptions at December 31, 2017.
During the year ended December 31, 2017, Global Bond had purchased and written interest rate caps to gain exposure to interest rates and to generate income. Please refer to tables following the Portfolio of
68
NOTES TO FINANCIAL STATEMENTS AS OF DECEMBER 31, 2017 (CONTINUED)
NOTE 2 — SIGNIFICANT ACCOUNTING POLICIES (continued)
Investments for open purchased interest rate caps at December 31, 2017. There were no open written interest rate caps at December 31, 2017.
During the year ended December 31, 2017, Global Bond had purchased and written interest rate steepeners to gain exposure to interest rates and to generate income. Please refer to tables following the Portfolio of Investments for open purchased interest rate steepeners at December 31, 2017. There were no open written interest rate steepeners at December 31, 2017.
During the year ended December 31, 2017, Global Bond had written interest rate floors and flatteners to generate income. Please refer to tables following the Portfolio of Investments for open written interest rate floors and flatteners at December 31, 2017.
Please refer to Note 9 for the volume of both purchased and written option activity during the year ended December 31, 2017.
O. Swap Agreements. Certain Portfolios may enter into swap agreements. A swap is an agreement between two parties pursuant to which each party agrees to make one or more payments to the other at specified future intervals based on the return of an asset (such as a stock, bond or currency) or non-asset reference (such as an interest rate or index). Swap agreements are privately negotiated in the OTC market and may be executed in a multilateral or other trade facility platform, such as a registered commodities exchange ("centrally cleared swaps").
The swap agreement will specify the "notional" amount of the asset or non-asset reference to which the contract relates. Subsequent changes in fair value, if any, are calculated based upon changes in the performance of the asset or non-asset reference multiplied by the notional value of the contract. A Portfolio may enter into credit default, interest rate, total return and currency swaps to manage its exposure to credit, currency and interest rate risk. All outstanding swap agreements are reported following each Portfolio's Portfolio of Investments.
Swaps are marked to market daily using quotations primarily from third party pricing services, registered commodities exchange(s), counterparties or brokers. The fair value of an OTC swap contract is recorded on each Portfolio's Statements of Assets and Liabilities. Daily changes in the value of centrally cleared swaps, if any, are recorded as variation margin receivable or payable on the Statement of Assets and Liabilities. During the term of the swap, changes in the value of the swap, if
any, are recorded as unrealized gains or losses on the Statements of Operations. Upfront payments paid or received on OTC swaps by a Portfolio when entering into the agreements are reported on the Statements of Assets and Liabilities and as a component of the changes in unrealized gains or losses on the Statements of Operations. These upfront payments represent the amounts paid or received when initially entering into the swap agreement to compensate for differences between the stated terms of the swap agreement and the prevailing market conditions. The upfront payments are included as a component in the realized gains or losses on each Portfolio's Statement of Operations upon termination or maturity of the swap. A Portfolio also records net periodic payments paid or received on the swap contract as a realized gain or loss on the Statements of Operations.
In a centrally cleared swap, immediately following execution of the swap agreement, the swap agreement is novated to a central counterparty (the "CCP") and the Portfolio's counterparty on the swap agreement becomes the CCP. The Portfolios are required to interface with the CCP through a broker. Upon entering into a centrally cleared swap, the Portfolios are required to deposit initial margin with the broker in the form of cash or securities in an amount that varies depending on the size and risk profile of the particular swap. Securities deposited as initial margin are footnoted as pledged on the Portfolio of Investments and cash deposited is recorded on the Statements of Assets and Liabilities as cash pledged for centrally cleared swaps. The daily change in valuation of centrally cleared swaps is recorded as a receivable or payable for variation margin in the Statements of Assets and Liabilities. Payments received from (paid to) the counterparty, including at termination, are recorded as realized gain (loss) on the Statements of Operations.
Entering into swap agreements involves the risk that the maximum potential loss of an investment exceeds the current value of the investment as reported on each Portfolio's Statements of Assets and Liabilities. Other risks involve the possibility that the counterparty to the agreements may default on its obligation to perform, that there will be no liquid market for these investments and that unfavorable changes in the market will have a negative impact on the value of the index or securities underlying the respective swap agreement.
Credit Default Swap Contracts. A credit default swap is a bilateral agreement between counterparties in which the buyer of the protection agrees to make a stream of periodic payments to the seller of protection in exchange for the right to receive a specified return in the event of a default or other credit event for a referenced entity, obligation or index. As a seller of protection on credit
69
NOTES TO FINANCIAL STATEMENTS AS OF DECEMBER 31, 2017 (CONTINUED)
NOTE 2 — SIGNIFICANT ACCOUNTING POLICIES (continued)
default swaps, a Portfolio will generally receive from the buyer a fixed payment stream based on the notional amount of the swap contract. This fixed payment stream will continue until the swap contract expires or a defined credit event occurs.
A Portfolio is subject to credit risk in the normal course of pursuing its investment objectives. As a seller of protection in a credit default swap, a Portfolio may execute these contracts to manage its exposure to the market or certain sectors of the market. Certain Portfolios may also enter into credit default swaps to speculate on changes in an issuer's credit quality, to take advantage of perceived spread advantages, or to offset an existing short equivalent (i.e. buying protection on an equivalent reference entity).
Certain Portfolios may sell credit default swaps which expose these Portfolios to the risk of loss from credit risk- related events specified in the contract. Although contract specific, credit events are generally defined as bankruptcy, failure to pay, restructuring, obligation acceleration, obligation default or repudiation/moratorium. If a Portfolio is a seller of protection, and a credit event occurs, as defined under the terms of that particular swap agreement, a Portfolio will generally either (i) pay to the buyer an amount equal to the notional amount of the swap and take delivery of the referenced obligation, other deliverable obligations, or underlying securities comprising a referenced index or (ii) pay a net settlement amount in the form of cash or securities equal to the notional amount of the swap less the recovery value of the referenced obligation or underlying securities comprising a referenced index. If a Portfolio is a buyer of protection and a credit event occurs, as defined under the terms of that particular swap agreement, a Portfolio will either (i) receive from the seller of protection an amount equal to the notional amount of the swap and deliver the referenced obligation, other deliverable obligations or underlying securities comprising the referenced index or (ii) receive a net settlement amount in the form of cash or securities equal to the notional amount of the swap less the recovery value of the referenced obligation or underlying securities comprising the referenced index. Recovery values are assumed by market makers considering either industry standard recovery rates or entity specific factors and considerations until a credit event occurs. If a credit event has occurred, the recovery value is determined by a facilitated auction whereby a minimum number of allowable broker bids, together with a specified valuation method, are used to calculate the settlement value.
Implied credit spreads, represented in absolute terms, utilized in determining the fair value of credit default swap agreements on corporate issues or sovereign issues are disclosed in each Portfolio's Portfolio of Investments and serve as an indicator of the current status of the payment/performance risk and represent the likelihood or risk of default for the credit derivative. The implied credit spread of a particular referenced entity reflects the cost of buying/selling protection and may include upfront payments required to be made to enter into the agreement. For credit default swaps on asset-backed securities or credit indices, the quoted market prices and resulting fair values serve as the indicator of the current status of the payment/performance risk. Wider credit spreads and increasing fair values, in absolute terms when compared to the notional amount of the swap, represent a deterioration of the referenced entity's credit soundness and a greater likelihood or risk of default or other credit event occurring as defined under the terms of the agreement.
The maximum amount of future payments (undiscounted) that a Portfolio as seller of protection could be required to make under a credit default swap agreement would be an amount equal to the notional amount of the agreement. These potential amounts would be partially offset by any recovery values of the respective referenced obligations, upfront payments received upon entering into the agreements, or net amounts received from the settlement of buy protection credit default swap agreements entered into by a Portfolio for the same referenced entity or entities.
For the year ended December 31, 2017, Global Bond had purchased credit protection on various credit default swap indices to hedge the credit risk associated with certain sectors of the markets. For the year ended December 31, 2017, Global Bond and Pioneer High Yield had sold credit protection on various credit default swap indices to gain additional exposure to the market or certain sectors of the markets.
During the year ended December 31, 2017, Global Bond and Pioneer High Yield had an average notional amount on credit default swaps to buy and sell protection as disclosed below. Please refer to the tables following each respective Portfolio of Investments for open purchased and sold credit default swaps at December 31, 2017.
| | | Purchased | | Sold | |
Global Bond | | $ | 7,638,554 | | | $ | 10,725,333 | | |
Pioneer High Yield | | | — | | | | 3,114,020 | | |
At December 31, 2017, Pioneer High Yield had pledged $225,135 in cash collateral for open centrally cleared credit default swaps outstanding at December 31, 2017.
70
NOTES TO FINANCIAL STATEMENTS AS OF DECEMBER 31, 2017 (CONTINUED)
NOTE 2 — SIGNIFICANT ACCOUNTING POLICIES (continued)
Interest Rate Swap Contracts. An interest rate swap involves the agreement between counterparties to exchange periodic payments based on interest rates. One payment will be based on a floating rate of a specified interest rate while the other will be a fixed rate. Risks involve the future fluctuations of interest rates in which a Portfolio may make payments that are greater than what a Portfolio received from the counterparty. Other risks include credit, liquidity and market risk.
For the year ended December 31, 2017, Global Bond had entered into interest rate swaps in which it pays a floating interest rate and receives a fixed interest rate ("Long interest rate swap") in order to increase exposure to interest rate risk. Average notional amounts on long interest rate swaps was $327,843,732.
For the year ended December 31, 2017, Global Bond had entered into interest rate swaps in which it pays a fixed interest rate and receives a floating interest rate ("Short interest rate swap") in order to decrease exposure to interest rate risk. Average notional amounts on short interest rate swaps was $394,465,868.
Global Bond entered into interest rate swaps to adjust interest rate and yield curve exposures and to substitute for physical fixed-income securities. Please refer to the table following the Portfolio of Investments for Global Bond for open centrally cleared interest rate swaps at December 31, 2017.
At December 31, 2017, Global Bond had pledged $1,778,000 in cash collateral for open centrally cleared swaps outstanding at December 31, 2017.
P. Structured Products. Global Bond invests in structured products which are specially-designed investments whose principal payments or interest payments are linked to the performance of underlying foreign currencies, interest rate spreads, stock market indices, prices of individual securities, commodities or other financial instruments or the occurrence of other specific events. The terms and conditions of these products may be 'structured' by the purchaser (a Portfolio) and the borrower issuing the note. The market value of these products will increase or decrease based on the performance of the underlying asset or reference. A Portfolio records the net change in the market value of the structured product on the accompanying Statements of Operations as a change in unrealized appreciation or depreciation on investments. A Portfolio records a realized gain or loss on the Statements of Operations upon the sale or maturity of the structured product. Please refer to the
Portfolio of Investments for structured products held by Global Bond at December 31, 2017.
Q. Indemnifications. In the normal course of business, the Company may enter into contracts that provide certain indemnifications. The Company's maximum exposure under these arrangements is dependent on future claims that may be made against the Portfolios and, therefore, cannot be estimated; however, based on experience, management considers the risk of loss from such claims remote.
NOTE 3 — INVESTMENT TRANSACTIONS
For the year ended December 31, 2017, the cost of purchases and the proceeds from the sales of securities, excluding U.S. government and short-term securities, were as follows:
| | | Purchases | | Sales | |
Global Bond | | $ | 66,563,696 | | | $ | 91,335,826 | | |
American Century Small-Mid Cap
Value | | | 203,873,358 | | | | 224,356,097 | | |
Baron Growth | | | 24,805,640 | | | | 160,252,513 | | |
Columbia Contrarian Core | | | 145,376,475 | | | | 211,268,655 | | |
Columbia Small Cap Value II | | | 94,727,535 | | | | 138,380,767 | | |
Invesco Comstock | | | 65,839,373 | | | | 176,807,785 | | |
Invesco Equity and Income | | | 278,731,241 | | | | 554,631,021 | | |
JPMorgan Mid Cap Value | | | 59,967,685 | | | | 155,438,358 | | |
Oppenheimer Global | | | 139,547,580 | | | | 229,130,531 | | |
Pioneer High Yield | | | 44,630,134 | | | | 51,679,139 | | |
T. Rowe Price Diversified Mid Cap
Growth | | | 267,643,749 | | | | 313,438,250 | | |
T. Rowe Price Growth Equity | | | 830,947,745 | | | | 1,087,911,612 | | |
Templeton Foreign Equity | | | 86,127,068 | | | | 199,818,809 | | |
U.S. government securities not included above were as follows:
| | | Purchases | | Sales | |
Global Bond | | $ | 200,442,357 | | | $ | 201,117,256 | | |
Invesco Equity and Income | | | 1,919,348,897 | | | | 1,908,464,481 | | |
Pioneer High Yield | | | — | | | | 3,505,856 | | |
NOTE 4 — INVESTMENT MANAGEMENT FEES
The Portfolios have entered into an investment management agreement ("Management Agreement") with the Investment Adviser. The Investment Adviser has overall responsibility for the management of the Portfolios. The Investment Adviser oversees all investment management and portfolio management services for the Portfolios and assists in managing and supervising all aspects of the general day-to-day business activities and operations of the Portfolios, including custodial, transfer agency, dividend disbursing, accounting, auditing, compliance and related services. This Management Agreement compensates the Investment Adviser with a management fee, computed daily and payable monthly, based on the average daily
71
NOTES TO FINANCIAL STATEMENTS AS OF DECEMBER 31, 2017 (CONTINUED)
NOTE 4 — INVESTMENT MANAGEMENT FEES (continued)
net assets of each Portfolio, at the following annual rates:
Portfolio | | Fee | |
Global Bond | | 0.600% on the first $4 billion; | |
| | | 0.575% on the next $1 billion; | |
| | | 0.550% on the next $1 billion; | |
| | | 0.530% on assets over $6 billion | |
American Century Small-Mid
Cap Value | | 1.10% on the first $250 million; | |
| | | 1.05% on the next $250 million; | |
| | | 1.00% on assets over $500 million | |
Baron Growth | | 0.950% on the first $1 billion; | |
| | | 0.925% on the next $1 billion; | |
| | | 0.900% on assets over $2 billion | |
Columbia Contrarian Core | | 0.90% on the first $500 million; | |
| | | 0.85% on the next $500 million; | |
| | | 0.80% on assets over $1 billion | |
Columbia Small Cap Value II | | 0.85% | |
Invesco Comstock | | 0.70% | |
Invesco Equity and Income(1) | | 0.65% on the first $750 million; | |
| | | 0.63% on the next $250 million; | |
| | | 0.61% on assets over $1 billion | |
JPMorgan Mid Cap Value | | 0.85% on the first $500 million; | |
| | | 0.75% on the next $500 million; | |
| | | 0.70% on assets over $1 billion | |
Oppenheimer Global | | 0.70% on the first $3 billion; | |
| | | 0.68% on the next $1 billion; | |
| | | 0.67% on the next $4 billion; | |
| | | 0.66% on assets over $8 billion | |
Pioneer High Yield | | 0.70% on the first $2 billion; | |
| | | 0.60% on the next $1 billion; | |
| | | 0.50% on the next $1 billion; | |
| | | 0.40% on assets over $4 billion | |
T. Rowe Price Diversified
Mid Cap Growth | | 0.74% | |
T. Rowe Price Growth Equity | | 0.70% | |
Templeton Foreign Equity | | 0.90% on the first $500 million; | |
| | | 0.85% on assets over $500 million | |
(1) The Investment Adviser has contractually agreed to waive 0.01% of the management fee for Invesco Equity and Income. Any fees waived or reimbursed are not eligible for recoupment. Termination or modification of this obligation requires approval by the Board.
The Investment Adviser has contractually agreed to waive a portion of the management fee for Global Bond, American Century Small-Mid Cap Value, Columbia Contrarian Core, Columbia Small Cap Value II, Invesco Comstock, T. Rowe Price Growth Equity and Templeton Foreign Equity in connection with sub-advisory fee reductions for these Portfolios. The waiver is calculated as follows: Waiver = 50% x (former sub-advisory fee rate minus new sub-advisory fee rate) x average daily net assets as of the calculation date.
In addition, the Investment Adviser has agreed to further waive a portion of the advisory fee for T. Rowe Price Growth Equity. The waiver for T. Rowe Price Growth Equity is based on the total savings in excess of $500,000 as a result of the aggregated sub-advisory fee schedule of T. Rowe Price Growth Equity and VY® T. Rowe Price Equity Income Portfolio, which is not
included in this report. The aggregated amount of savings is allocated to the two Portfolios pro rata based on each Portfolio's contribution to the amount saved.
For the period ended April 30, 2017, DSL waived $1,890, $197,272, $31,264, $22,595, $31,057, $31,285 and $40,153 for Global Bond, American Century Small-Mid Cap Value, Columbia Contrarian Core, Columbia Small Cap Value II, Invesco Comstock, T. Rowe Price Growth Equity and Templeton Foreign Equity, respectively. From May 1, 2017 to December 31, 2017, Voya Investments waived $3,835, $398,515, $60,210, $38,272, $61,464, $64,017 and $81,531 for Global Bond, American Century Small-Mid Cap Value, Columbia Contrarian Core, Columbia Small Cap Value II, Invesco Comstock, T. Rowe Price Growth Equity and Templeton Foreign Equity, respectively. Termination or modification of these obligations requires approval by the Board.
At the July 13, 2017 Board meeting, the Board ratified and approved a sub-advisory fee waiver agreement for JPMorgan Mid Cap Value effective June 1, 2017. In connection with this sub-advisory fee waiver, the Board ratified and approved a management fee waiver whereby the management fee for JPMorgan Mid Cap Value is reduced by the same amount as the reduction in sub-advisory fees also effective June 1, 2017. For the year ended December 31, 2017, Voya Investments waived $1,871 in management fees for the Portfolio. Termination or modification of these obligations requires approval by the Board.
Templeton Foreign Equity may invest its assets in Templeton Institutional Funds-Foreign Smaller Companies Series ("Foreign Smaller Companies Series"). Templeton Foreign Equity's purchase of shares of Foreign Smaller Companies Series will result in Templeton Foreign Equity paying a proportionate share of the expenses of Foreign Smaller Companies Series. The Investment Adviser will waive its management fee in an amount equal to the advisory fee received by the adviser of the Foreign Smaller Companies Series resulting from the Templeton Foreign Equity's investment into the Foreign Smaller Companies Series. There were no such waivers for the year ended December 31, 2017.
The Investment Adviser has entered into a sub-advisory agreement with each respective sub-adviser. These sub-advisers provide investment advice for certain Portfolios and are paid by the Investment Adviser based on the average daily net assets of the respective Portfolios. Subject to such policies as the Board or the Investment Adviser may determine, the sub-advisers manage each respective Portfolio's assets in accordance with the Portfolio's investment objectives, policies, and limitations.
72
NOTES TO FINANCIAL STATEMENTS AS OF DECEMBER 31, 2017 (CONTINUED)
NOTE 4 — INVESTMENT MANAGEMENT FEES (continued)
The sub-advisers of the Portfolios are as follows (*denotes an affiliated sub-adviser):
Portfolio | | Sub-Adviser | |
Global Bond | | Voya Investment Management Co. LLC* | |
American Century Small-Mid Cap Value | | American Century Investment Management, Inc. | |
Baron Growth | | BAMCO, Inc. | |
Columbia Contrarian Core & Columbia Small Cap Value II | | Columbia Management Investment Advisers, LLC | |
Invesco Comstock & Invesco Equity and Income | | Invesco Advisers, Inc. | |
JPMorgan Mid Cap Value | | J.P. Morgan Investment Management Inc. | |
Oppenheimer Global | | OppenheimerFunds, Inc. | |
Pioneer High Yield(1) | | Amundi Pioneer Asset Management, Inc. | |
T. Rowe Price Diversified Mid Cap Growth & T. Rowe Price Growth Equity | | T. Rowe Price Associates, Inc. | |
Templeton Foreign Equity | | Templeton Investment Counsel, LLC | |
(1) Effective July 3, 2017, the Investment Adviser entered into a new sub-advisory agreement with Amundi Pioneer Asset Management, Inc. due to a change in control of Pioneer Investment Management, Inc.
NOTE 5 — DISTRIBUTION AND SERVICE FEES
Class ADV and Class S2 shares of each respective Portfolio have a plan of distribution (the "Plan"), whereby the Distributor is reimbursed or compensated by the Portfolios for expenses incurred in the distribution of each Portfolio's shares. The Distributor may pay, on behalf of each Portfolio, out of its distribution fee, compensation to certain financial institutions for providing distribution assistance. Under the Plan, a Portfolio makes payments at an annual rate of 0.25% of the Portfolio's average daily net assets attributable to its Class ADV shares and a Portfolio makes payments at an annual rate of 0.15% of the Portfolio's average daily net assets attributable to its Class S2 shares. The Distributor has contractually agreed to waive 0.02% of the distribution fee for Class S2 shares of Invesco Equity and Income. Termination or modification of this obligation requires approval by the Board.
Class ADV, Class S and Class S2 shares are further subject to a shareholder servicing fee payable to shareholder organizations pursuant to the shareholder servicing plan adopted for Class ADV, Class S and Class S2 shares which shall not exceed an annual rate of
0.25% of the average daily net assets of each class, respectively.
NOTE 6 — OTHER TRANSACTIONS WITH AFFILIATES AND RELATED PARTIES
At December 31, 2017, the following direct or indirect, wholly-owned subsidiaries of Voya Financial, Inc. or affiliated investment companies owned more than 5% of the following Portfolios:
Subsidiary/Affiliated
Investment Company | | Portfolio | | Percentage | |
ReliaStar Life Insurance
Company | | Oppenheimer Global | | | 5.78 | % | |
| | | Pioneer High Yield | | | 23.86 | | |
| | | T. Rowe Price Diversified
Mid Cap Growth | | | 12.10 | | |
Security Life of Denver
Insurance Company | | Global Bond | | | 7.34 | | |
| | | Columbia Small Cap Value II | | | 5.46 | | |
| | | Pioneer High Yield | | | 19.50 | | |
| | | T. Rowe Price Diversified
Mid Cap Growth | | | 5.35 | | |
Voya Institutional Trust
Company | | Global Bond | | | 21.14 | | |
| | | American Century Small-Mid
Cap Value | | | 40.61 | | |
| | | Baron Growth | | | 15.44 | | |
| | | Columbia Contrarian Core | | | 8.85 | | |
| | | Columbia Small Cap Value II | | | 12.86 | | |
| | | Invesco Comstock | | | 7.44 | | |
| | | JPMorgan Mid Cap Value | | | 25.50 | | |
| | | Oppenheimer Global | | | 11.53 | | |
| | | T. Rowe Price Diversified Mid
Cap Growth | | | 11.27 | | |
| | | T. Rowe Price Growth Equity | | | 21.55 | | |
| | | Templeton Foreign Equity | | | 5.62 | | |
Voya Insurance and Annuity
Company | | Baron Growth | | | 39.91 | | |
| | | Columbia Contrarian Core | | | 79.33 | | |
| | | Columbia Small Cap Value II | | | 43.33 | | |
| | | Invesco Comstock | | | 37.22 | | |
| | | Invesco Equity and Income | | | 58.31 | | |
| | | JPMorgan Mid Cap Value | | | 21.79 | | |
| | | Oppenheimer Global | | | 10.37 | | |
| | | T. Rowe Price Growth Equity | | | 16.50 | | |
| | | Templeton Foreign Equity | | | 61.03 | | |
Voya Retirement Insurance
and Annuity Company | | Global Bond | | | 64.90 | | |
| | | American Century Small-Mid
Cap Value | | | 56.77 | | |
| | | Baron Growth | | | 39.76 | | |
| | | Columbia Contrarian Core | | | 8.85 | | |
| | | Columbia Small Cap Value II | | | 33.36 | | |
| | | Invesco Comstock | | | 20.19 | | |
| | | Invesco Equity and Income | | | 34.85 | | |
| | | JPMorgan Mid Cap Value | | | 46.31 | | |
| | | Oppenheimer Global | | | 70.42 | | |
| | | Pioneer High Yield | | | 54.22 | | |
| | | T. Rowe Price Diversified Mid
Cap Growth | | | 69.97 | | |
| | | T. Rowe Price Growth Equity | | | 55.19 | | |
| | | Templeton Foreign Equity | | | 26.95 | | |
Voya Solution 2025 Portfolio | | Invesco Comstock | | | 5.63 | | |
Voya Solution 2035 Portfolio | | Invesco Comstock | | | 7.54 | | |
Voya Solution 2045 Portfolio | | Invesco Comstock | | | 7.00 | | |
Voya Solution Moderately
Aggressive Portfolio | | Invesco Comstock | | | 5.80 | | |
73
NOTES TO FINANCIAL STATEMENTS AS OF DECEMBER 31, 2017 (CONTINUED)
NOTE 6 — OTHER TRANSACTIONS WITH AFFILIATES AND RELATED PARTIES (continued)
Under the 1940 Act, the direct or indirect beneficial owner of more than 25% of the voting securities of a company (including a fund) is presumed to control such company. Companies under common control (e.g., companies with a common owner of greater than 25% of their respective voting securities) are affiliates under the 1940 Act.
The Investment Adviser may direct the Portfolios' sub-advisers to use their best efforts (subject to obtaining best execution of each transaction) to allocate a Portfolio's equity security transactions through certain designated broker-dealers. The designated broker-dealer, in turn, will reimburse a portion of the brokerage commissions to pay certain expenses of that Portfolio. Any amounts credited to the Portfolios are reflected as brokerage commission recapture on the accompanying Statements of Operations.
The Portfolios have adopted a deferred compensation plan (the "DC Plan"), which allows eligible independent directors, as described in the DC Plan, to defer the receipt of all or a portion of the directors' fees that they are entitled to receive from the Portfolios. For purposes of determining the amount owed to the director under the DC Plan, the amounts deferred are invested in shares of the funds selected by the director (the "Notional Funds"). The Portfolios purchase shares of the Notional Funds, which are all advised by Voya Investments, in amounts equal to the directors' deferred fees, resulting in a Portfolio asset equal to the deferred compensation liability. Such assets, if applicable, are included as a component of "Other assets" on the accompanying Statements of Assets and Liabilities. Deferral of directors' fees under the DC Plan will not affect net assets of the Portfolio, and will not materially affect the Portfolios' assets, liabilities or net investment income per share. Amounts will be deferred until distributed in accordance with the DC Plan.
The Portfolio(s) may engage in purchase and sale transactions with funds that have a common investment adviser (or affiliated investment advisers) and/or have a common sub-adviser. These interfund transactions are made pursuant to Rule 17a-7 of the Investment Company Act of 1940. For the year ended December 31, 2017, Pioneer High Yield engaged in such purchase and sales transactions totaling $1,869,965 and $104,407, respectively.
NOTE 7 — OTHER ACCRUED EXPENSES AND LIABILITIES
At December 31, 2017, Pioneer High Yield had the following payables included in Other Accrued Expenses
and Liabilities on the Statements of Assets and Liabilities that exceeded 5% of total liabilities:
Accrued Expenses | | Amount | |
Custody | | $ | 10,392 | | |
Postage | | | 14,079 | | |
NOTE 8 — EXPENSE LIMITATION AGREEMENTS
The Investment Adviser has entered into a written expense limitation agreement ("Expense Limitation Agreement") with the following Portfolios, whereby the Investment Adviser has agreed to limit expenses, excluding interest, taxes, investment-related costs, leverage expenses, extraordinary expenses, and acquired fund fees and expenses to the levels listed below:
Portfolio | | Class ADV | | Class I | | Class R6 | | Class S | | Class S2 | |
Global Bond | | | 1.10 | % | | | 0.60 | % | | | N/A | | | | 0.85 | % | | | N/A | | |
American Century
Small-Mid Cap
Value | | | 1.52 | % | | | 1.02 | % | | | N/A | | | | 1.27 | % | | | 1.42 | % | |
Baron Growth | | | 1.55 | % | | | 1.05 | % | | | 1.05 | % | | | 1.30 | % | | | 1.45 | % | |
Columbia Contrarian
Core(1) | | | N/A | | | | N/A | | | | N/A | | | | N/A | | | | N/A | | |
Columbia Small Cap
Value II | | | 1.65 | % | | | 1.15 | % | | | 1.15 | % | | | 1.40 | % | | | 1.55 | % | |
Invesco Comstock(2) | | | N/A | | | | N/A | | | | N/A | | | | N/A | | | | N/A | | |
Invesco Equity and
Income | | | 1.15 | % | | | 0.65 | % | | | N/A | | | | 0.90 | % | | | 1.05 | % | |
JPMorgan Mid Cap
Value | | | 1.50 | % | | | 1.00 | % | | | N/A | | | | 1.25 | % | | | 1.40 | % | |
Oppenheimer Global | | | 1.30 | % | | | 0.80 | % | | | N/A | | | | 1.05 | % | | | 1.20 | % | |
Pioneer High Yield | | | N/A | | | | 0.71 | % | | | N/A | | | | 0.96 | % | | | N/A | | |
T. Rowe Price
Diversified Mid
Cap Growth | | | 1.30 | % | | | 0.80 | % | | | 0.80 | % | | | 1.05 | % | | | 1.20 | % | |
T. Rowe Price Growth
Equity | | | 1.25 | % | | | 0.75 | % | | | N/A | | | | 1.00 | % | | | 1.15 | % | |
Templeton Foreign
Equity(3) | | | 1.48 | % | | | 0.98 | % | | | N/A | | | | 1.23 | % | | | 1.38 | % | |
(1) Pursuant to a side letter agreement, through May 1, 2018, the Investment Adviser has agreed to waive all or a portion of the management fee and/or reimburse expenses so that the expense limits are 1.24%, 0.74% and 0.99% for Class ADV, Class I and Class S, respectively. Termination or modification of this obligation requires approval by the Board. Any fees waived pursuant to the side letter agreement shall not be eligible for recoupment.
(2) Pursuant to a side letter agreement, through May 1, 2018, the Investment Adviser has agreed to waive all or a portion of the management fee and/or reimburse expenses so that the expense limits are 1.31%, 0.81% and 1.06% for Class ADV, Class I, and Class S, respectively. Termination or modification of this obligation requires approval by the Board. Any fees waived pursuant to the side letter agreement shall not be eligible for recoupment.
(3) Pursuant to a side letter agreement, through May 1, 2018, the Investment Adviser has agreed to waive all or a portion of the management fee and/or reimburse expenses so that the expense limits are 1.42%, 0.92%, 1.17% and 1.32% for Class ADV, Class I, Class S, and Class S2, respectively. Termination or modification of this obligation requires approval by the Board. Any fees waived pursuant to the side letter agreement shall not be eligible for recoupment.
74
NOTES TO FINANCIAL STATEMENTS AS OF DECEMBER 31, 2017 (CONTINUED)
NOTE 8 — EXPENSE LIMITATION AGREEMENTS (continued)
Unless otherwise specified above, the Investment Adviser may, at a later date, recoup from a Portfolio for fees waived and/or other expenses reimbursed by the Investment Adviser during the previous 36 months, but only if, after such recoupment, a Portfolio's expense ratio does not exceed the percentage described above. Waived and reimbursed fees net of any recoupment by the Investment Adviser of such waived and reimbursed fees are reflected on the accompanying Statements of Operations. Amounts payable by the Investment Adviser are reflected on the accompanying Statements of Assets and Liabilities.
At December 31, 2017, the amounts of waived and/or reimbursed fees that are subject to possible recoupment by the Investment Adviser, and the related expiration dates are as follows:
| | | December 31, | | | |
Portfolio | | 2018 | | 2019 | | 2020 | | Total | |
Global Bond | | $ | 135,581 | | | $ | 142,214 | | | $ | 148,091 | | | $ | 425,886 | | |
American Century
Small-Mid Cap Value | | | 430,902 | | | | 397,677 | | | | 448,785 | | | | 1,277,364 | | |
Invesco Equity and
Income | | | 207,075 | | | | 331,544 | | | | 320,129 | | | | 858,748 | | |
Pioneer High Yield | | | 55,577 | | | | 65,632 | | | | 71,559 | | | | 192,768 | | |
The Expense Limitation Agreement is contractual through May 1, 2018 and shall renew automatically for one-year terms. Termination or modification of this obligation requires approval by the Board.
NOTE 9 — PURCHASED AND WRITTEN OPTIONS
Transactions in purchased credit default swaptions for Global Bond during the year ended December 31, 2017 were as follows:
| | | USD
Notional | |
Cost | |
Balance at 12/31/2016 | | | — | | | $ | — | | |
Options Purchased | | | 22,500,000 | | | | 15,750 | | |
Options Expired | | | (22,500,000 | ) | | | (15,750 | ) | |
Balance at 12/31/2017 | | | — | | | $ | — | | |
Transactions in purchased foreign currency options for Global Bond during the year ended December 31, 2017 were as follows:
| | | USD
Notional | |
Cost | |
Balance at 12/31/2016 | | | 49,600,000 | | | $ | 630,019 | | |
Options Purchased | | | 23,700,000 | | | | 47,637 | | |
Options Expired | | | (73,300,000 | ) | | | (677,656 | ) | |
Balance at 12/31/2017 | | | — | | | $ | — | | |
Transactions in purchased interest rate swaptions for Global Bond during the year ended December 31, 2017 were as follows:
| | | EUR
Notional | | USD
Notional | |
Cost | |
Balance at
12/31/2016 | | | — | | | | 848,900,000 | | | $ | 16,806,367 | | |
Options Purchased | | | 129,500,000 | | | | 1,821,200,000 | | | | 38,009,969 | | |
Options Terminated
in Closing Sell
Transactions | | | (129,500,000 | ) | | | (1,987,300,000 | ) | | | (49,517,415 | ) | |
Options Expired | | | — | | | | (415,100,000 | ) | | | (2,665,784 | ) | |
Balance at
12/31/2017 | | | — | | | | 267,700,000 | | | $ | 2,633,137 | | |
Transactions in purchased interest rate caps for Global Bond during the year ended December 31, 2017 were as follows:
| | | USD
Notional | |
Cost | |
Balance at 12/31/2016 | | | — | | | $ | — | | |
Options Purchased | | | 236,800,000 | | | | 33,152 | | |
Balance at 12/31/2017 | | | 236,800,000 | | | $ | 33,152 | | |
Transactions in purchased option steepeners for Global Bond during the year ended December 31, 2017 were as follows:
| | | USD
Notional | |
Cost | |
Balance at 12/31/2016 | | | — | | | $ | — | | |
Options Purchased | | | 23,680 | | | | 2,368 | | |
Balance at 12/31/2017 | | | 23,680 | | | $ | 2,368 | | |
Transactions in written interest rate swaptions for Global Bond during the year ended December 31, 2017 were as follows:
| | | EUR
Notional | | USD
Notional | | Premiums
Received | |
Balance at
12/31/2016 | | | — | | | | 541,500,000 | | | $ | 17,710,908 | | |
Options Written | | | 1,212,500,000 | | | | 4,670,300,000 | | | | 41,599,040 | | |
Options Terminated
in Closing
Purchase
Transactions | | | (264,400,000 | ) | | | (3,149,200,000 | ) | | | (52,291,927 | ) | |
Options Expired | | | (948,100,000 | ) | | | (1,761,700,000 | ) | | | (4,549,982 | ) | |
Balance at
12/31/2017 | | | — | | | | 300,900,000 | | | $ | 2,468,039 | | |
Transactions in written interest rate caps for Global Bond for the year ended December 31, 2017 were as follows:
| | | EUR
Notional | | USD
Notional | | Premiums
Received | |
Balance at 12/31/2016 | | | — | | | | — | | | $ | — | | |
Options Written | | | 355,300,000 | | | | 470,200,000 | | | | 383,812 | | |
Options Terminated in
Closing Purchase
Transactions | | | (355,300,000 | ) | | | — | | | | (188,679 | ) | |
Options Expired | | | — | | | | (470,200,000 | ) | | | (195,133 | ) | |
Balance at 12/31/2017 | | | — | | | | — | | | $ | — | | |
75
NOTES TO FINANCIAL STATEMENTS AS OF DECEMBER 31, 2017 (CONTINUED)
NOTE 9 — PURCHASED AND WRITTEN OPTIONS (continued)
Transactions in written interest rate floors for Global Bond for the year ended December 31, 2017 were as follows:
| | | EUR
Notional | | USD
Notional | | Premiums
Received | |
Balance at 12/31/2016 | | | — | | | | — | | | $ | — | | |
Options Written | | | 355,300,000 | | | | 707,000,000 | | | | 419,332 | | |
Options Terminated in
Closing Purchase
Transactions | | | (355,300,000 | ) | | | (470,200,000 | ) | | | (383,812 | ) | |
Balance at 12/31/2017 | | | — | | | | 236,800,000 | | | $ | 35,520 | | |
Transactions in written interest rate steepeners for Global Bond for the year ended December 31, 2017 were as follows:
| | | USD
Notional | | Premiums
Received | |
Balance at 12/31/2016 | | | — | | | $ | — | | |
Options Written | | | 11,755 | | | | 49,371 | | |
Options Expired | | | (11,755 | ) | | | (49,371 | ) | |
Balance at 12/31/2017 | | | — | | | $ | — | | |
Transactions in written interest rate flatteners for Global Bond for the year ended December 31, 2017 were as follows:
| | | USD
Notional | | Premiums
Received | |
Balance at 12/31/2016 | | | — | | | $ | — | | |
Options Written | | | 35,435 | | | | 49,371 | | |
Options Terminated in Closing
Purchase Transactions | | | (11,755 | ) | | | (49,371 | ) | |
Balance at 12/31/2017 | | | 23,680 | | | $ | — | | |
NOTE 10 — LINE OF CREDIT
Effective May 19, 2017, each Portfolio, in addition to certain other funds managed by the Investment Adviser,
has entered into a 364-day unsecured committed revolving line of credit agreement (the "Credit Agreement") with The Bank of New York Mellon ("BNY") for an aggregate amount of $400,000,000 through May 18, 2018. The proceeds may be used only to finance temporarily: (1) the purchase or sale of investment securities; or (2) the repurchase or redemption of shares of a Portfolio or certain other funds managed by the Investment Adviser. The funds to which the line of credit is available pay a commitment fee equal to 0.15% per annum on the daily unused portion of the committed line amount payable quarterly in arrears.
Borrowings under the Credit Agreement accrue interest at the federal funds rate plus a specified margin. Repayments generally must be made within 60 days after the date of a revolving credit advance.
The below Portfolios utilized the line of credit during the year ended December 31, 2017 as follows:
Portfolio | | Days
Utilized | | Approximate
Average Daily
Balance For
Days Utilized | | Approximate
Weighted
Average
Interest Rate
For Days
Utilized | |
Global Bond | | | 20 | | | $ | 791,900 | | | | 1.97 | % | |
American Century
Small-Mid Cap Value | | | 7 | | | | 1,100,286 | | | | 1.66 | | |
Baron Growth(1) | | | 59 | | | | 2,741,017 | | | | 1.88 | | |
Columbia Small Cap Value II | | | 1 | | | | 923,000 | | | | 1.91 | | |
Invesco Comstock | | | 3 | | | | 1,029,000 | | | | 1.91 | | |
JPMorgan Mid Cap Value | | | 1 | | | | 1,564,000 | | | | 1.66 | | |
Pioneer High Yield | | | 2 | | | | 3,457,500 | | | | 2.16 | | |
T. Rowe Price Diversified
Mid Cap Growth | | | 6 | | | | 1,187,333 | | | | 1.98 | | |
T. Rowe Price Growth Equity | | | 1 | | | | 12,436,000 | | | | 1.66 | | |
(1) At December 31, 2017, Baron Growth had an outstanding balance of $2,189,000.
NOTE 11 — CAPITAL SHARES
Transactions in capital shares and dollars were as follows:
| | | Shares sold | | Shares
issued
in merger | | Reinvestment
of
distributions | | Shares
redeemed | | Net increase
(decrease)
in shares
outstanding | | Shares sold | | Proceeds
from shares
issued
in merger | | Reinvestment
of
distributions | | Shares
redeemed | | Net increase
(decrease) | |
Year or period ended | | # | | # | | # | | # | | # | | ($) | | ($) | | ($) | | ($) | | ($) | |
Global Bond | |
Class ADV | |
12/31/2017 | | | 128,282 | | | | — | | | | 47,648 | | | | (277,672 | ) | | | (101,742 | ) | | | 1,365,036 | | | | — | | | | 511,317 | | | | (2,961,339 | ) | | | (1,084,986 | ) | |
12/31/2016 | | | 107,392 | | | | — | | | | 33,630 | | | | (449,149 | ) | | | (308,127 | ) | | | 1,108,838 | | | | — | | | | 354,541 | | | | (4,679,862 | ) | | | (3,216,483 | ) | |
Class I | |
12/31/2017 | | | 680,805 | | | | — | | | | 382,622 | | | | (2,220,463 | ) | | | (1,157,036 | ) | | | 7,442,323 | | | | — | | | | 4,176,794 | | | | (24,015,554 | ) | | | (12,396,437 | ) | |
12/31/2016 | | | 653,116 | | | | — | | | | 274,656 | | | | (2,172,158 | ) | | | (1,244,386 | ) | | | 6,967,143 | | | | — | | | | 2,946,090 | | | | (22,923,095 | ) | | | (13,009,862 | ) | |
Class S | |
12/31/2017 | | | 485,526 | | | | — | | | | 87,843 | | | | (720,342 | ) | | | (146,973 | ) | | | 5,274,739 | | | | — | | | | 957,957 | | | | (7,792,658 | ) | | | (1,559,962 | ) | |
12/31/2016 | | | 360,024 | | | | — | | | | 60,641 | | | | (848,014 | ) | | | (427,349 | ) | | | 3,842,909 | | | | — | | | | 649,729 | | | | (8,875,828 | ) | | | (4,383,190 | ) | |
American Century Small-Mid Cap Value | |
Class ADV | |
12/31/2017 | | | 1,273,611 | | | | — | | | | 459,511 | | | | (1,104,163 | ) | | | 628,959 | | | | 15,480,756 | | | | — | | | | 5,440,612 | | | | (13,511,146 | ) | | | 7,410,222 | | |
12/31/2016 | | | 1,295,216 | | | | — | | | | 795,421 | | | | (1,020,127 | ) | | | 1,070,510 | | | | 14,704,948 | | | | — | | | | 8,574,642 | | | | (11,256,751 | ) | | | 12,022,839 | | |
76
NOTES TO FINANCIAL STATEMENTS AS OF DECEMBER 31, 2017 (CONTINUED)
NOTE 11 — CAPITAL SHARES (continued)
| | | Shares sold | | Shares
issued
in merger | | Reinvestment
of
distributions | | Shares
redeemed | | Net increase
(decrease)
in shares
outstanding | | Shares sold | | Proceeds
from shares
issued
in merger | | Reinvestment
of
distributions | | Shares
redeemed | | Net increase
(decrease) | |
Year or period ended | | # | | # | | # | | # | | # | | ($) | | ($) | | ($) | | ($) | | ($) | |
Class I | |
12/31/2017 | | | 2,316,647 | | | | — | | | | 616,094 | | | | (4,007,876 | ) | | | (1,075,135 | ) | | | 29,878,367 | | | | — | | | | 7,725,817 | | | | (51,684,822 | ) | | | (14,080,638 | ) | |
12/31/2016 | | | 2,512,202 | | | | — | | | | 1,159,927 | | | | (1,514,853 | ) | | | 2,157,276 | | | | 29,961,101 | | | | — | | | | 13,188,376 | | | | (17,722,536 | ) | | | 25,426,941 | | |
Class S | |
12/31/2017 | | | 1,140,010 | | | | — | | | | 408,038 | | | | (1,402,449 | ) | | | 145,599 | | | | 14,536,039 | | | | — | | | | 5,051,508 | | | | (17,912,614 | ) | | | 1,674,933 | | |
12/31/2016 | | | 1,323,919 | | | | — | | | | 726,242 | | | | (1,172,038 | ) | | | 878,123 | | | | 15,736,354 | | | | — | | | | 8,162,961 | | | | (13,410,822 | ) | | | 10,488,493 | | |
Class S2 | |
12/31/2017 | | | 88,532 | | | | — | | | | 17,963 | | | | (147,039 | ) | | | (40,544 | ) | | | 1,084,585 | | | | — | | | | 212,143 | | | | (1,806,712 | ) | | | (509,984 | ) | |
12/31/2016 | | | 124,442 | | | | — | | | | 34,941 | | | | (84,336 | ) | | | 75,047 | | | | 1,385,037 | | | | — | | | | 375,613 | | | | (906,287 | ) | | | 854,363 | | |
Baron Growth | |
Class ADV | |
12/31/2017 | | | 141,794 | | | | — | | | | 399,679 | | | | (496,797 | ) | | | 44,676 | | | | 3,876,341 | | | | — | | | | 10,303,718 | | | | (13,551,988 | ) | | | 628,071 | | |
12/31/2016 | | | 109,364 | | | | — | | | | 373,857 | | | | (773,995 | ) | | | (290,774 | ) | | | 2,797,559 | | | | — | | | | 9,413,716 | | | | (19,855,399 | ) | | | (7,644,124 | ) | |
Class I | |
12/31/2017 | | | 408,359 | | | | — | | | | 642,944 | | | | (1,894,705 | ) | | | (843,402 | ) | | | 12,294,387 | | | | — | | | | 18,143,871 | | | | (56,356,725 | ) | | | (25,918,467 | ) | |
12/31/2016 | | | 417,307 | | | | — | | | | 660,211 | | | | (2,285,812 | ) | | | (1,208,294 | ) | | | 11,410,135 | | | | — | | | | 17,990,751 | | | | (63,974,158 | ) | | | (34,573,272 | ) | |
Class R6 | |
12/31/2017 | | | 361,465 | | | | — | | | | 8,442 | | | | (28,559 | ) | | | 341,348 | | | | 11,011,062 | | | | — | | | | 238,305 | | | | (846,236 | ) | | | 10,403,131 | | |
5/3/2016(1)-12/31/2016 | | | 32,619 | | | | — | | | | 12 | | | | (3 | ) | | | 32,628 | | | | 891,979 | | | | — | | | | 324 | | | | (76 | ) | | | 892,227 | | |
Class S | |
12/31/2017 | | | 1,113,946 | | | | — | | | | 2,267,091 | | | | (4,336,445 | ) | | | (955,408 | ) | | | 32,227,401 | | | | — | | | | 61,370,163 | | | | (123,509,735 | ) | | | (29,912,171 | ) | |
12/31/2016 | | | 314,847 | | | | — | | | | 2,153,555 | | | | (4,311,981 | ) | | | (1,843,579 | ) | | | 8,589,723 | | | | — | | | | 56,573,883 | | | | (114,899,359 | ) | | | (49,735,753 | ) | |
Class S2 | |
12/31/2017 | | | 13,674 | | | | — | | | | 9,024 | | | | (62,094 | ) | | | (39,396 | ) | | | 371,211 | | | | — | | | | 234,357 | | | | (1,776,996 | ) | | | (1,171,428 | ) | |
12/31/2016 | | | 14,243 | | | | — | | | | 12,601 | | | | (135,840 | ) | | | (108,996 | ) | | | 365,247 | | | | — | | | | 318,426 | | | | (3,563,475 | ) | | | (2,879,802 | ) | |
Columbia Contrarian Core | |
Class ADV | |
12/31/2017 | | | 99,184 | | | | — | | | | 86,050 | | | | (154,736 | ) | | | 30,498 | | | | 2,213,239 | | | | — | | | | 1,883,632 | | | | (3,445,221 | ) | | | 651,650 | | |
12/31/2016 | | | 206,108 | | | | — | | | | 150,661 | | | | (172,206 | ) | | | 184,563 | | | | 4,342,604 | | | | — | | | | 3,043,357 | | | | (3,618,361 | ) | | | 3,767,600 | | |
Class I | |
12/31/2017 | | | 29,491 | | | | — | | | | 29,602 | | | | (139,937 | ) | | | (80,844 | ) | | | 689,950 | | | | — | | | | 679,364 | | | | (3,217,272 | ) | | | (1,847,958 | ) | |
12/31/2016 | | | 52,290 | | | | — | | | | 60,396 | | | | (91,369 | ) | | | 21,317 | | | | 1,150,383 | | | | — | | | | 1,273,754 | | | | (2,028,475 | ) | | | 395,662 | | |
Class S | |
12/31/2017 | | | 122,711 | | | | — | | | | 857,148 | | | | (2,813,079 | ) | | | (1,833,220 | ) | | | 2,803,471 | | | | — | | | | 19,294,405 | | | | (64,190,432 | ) | | | (42,092,556 | ) | |
12/31/2016 | | | 510,533 | | | | — | | | | 1,741,401 | | | | (2,286,414 | ) | | | (34,480 | ) | | | 11,313,446 | | | | — | | | | 36,064,421 | | | | (49,606,442 | ) | | | (2,228,575 | ) | |
Columbia Small Cap Value II | |
Class ADV | |
12/31/2017 | | | 380,508 | | | | — | | | | 86,086 | | | | (537,902 | ) | | | (71,308 | ) | | | 7,090,123 | | | | — | | | | 1,540,950 | | | | (10,025,990 | ) | | | (1,394,917 | ) | |
12/31/2016 | | | 450,766 | | | | — | | | | 78,116 | | | | (352,261 | ) | | | 176,621 | | | | 7,702,073 | | | | — | | | | 1,252,201 | | | | (5,575,925 | ) | | | 3,378,349 | | |
Class I | |
12/31/2017 | | | 598,665 | | | | — | | | | 111,151 | | | | (1,141,377 | ) | | | (431,561 | ) | | | 11,537,760 | | | | — | | | | 2,049,620 | | | | (21,880,016 | ) | | | (8,292,636 | ) | |
12/31/2016 | | | 733,228 | | | | — | | | | 120,397 | | | | (907,546 | ) | | | (53,921 | ) | | | 12,450,314 | | | | — | | | | 1,982,935 | | | | (14,937,217 | ) | | | (503,968 | ) | |
Class R6 | |
12/31/2017 | | | 213,365 | | | | — | | | | 6,336 | | | | (23,579 | ) | | | 196,122 | | | | 4,128,456 | | | | — | | | | 116,893 | | | | (458,426 | ) | | | 3,786,923 | | |
5/3/2016(1)-12/31/2016 | | | 21,304 | | | | — | | | | 9 | | | | (246 | ) | | | 21,067 | | | | 397,901 | | | | — | | | | 148 | | | | (4,790 | ) | | | 393,259 | | |
Class S | |
12/31/2017 | | | 262,690 | | | | — | | | | 304,578 | | | | (2,039,675 | ) | | | (1,472,407 | ) | | | 5,083,662 | | | | — | | | | 5,595,104 | | | | (39,135,759 | ) | | | (28,456,993 | ) | |
12/31/2016 | | | 411,446 | | | | — | | | | 358,284 | | | | (1,517,722 | ) | | | (747,992 | ) | | | 7,134,368 | | | | — | | | | 5,879,446 | | | | (25,165,493 | ) | | | (12,151,679 | ) | |
Class S2 | |
12/31/2017 | | | 35,765 | | | | — | | | | 12,693 | | | | (189,825 | ) | | | (141,367 | ) | | | 665,308 | | | | — | | | | 226,580 | | | | (3,564,611 | ) | | | (2,672,723 | ) | |
12/31/2016 | | | 105,603 | | | | — | | | | 13,958 | | | | (111,844 | ) | | | 7,717 | | | | 1,735,870 | | | | — | | | | 222,901 | | | | (1,764,798 | ) | | | 193,973 | | |
Invesco Comstock | |
Class ADV | |
12/31/2017 | | | 98,884 | | | | — | | | | 17,308 | | | | (310,862 | ) | | | (194,670 | ) | | | 1,801,457 | | | | — | | | | 334,147 | | | | (5,699,252 | ) | | | (3,563,648 | ) | |
12/31/2016 | | | 137,527 | | | | — | | | | 43,241 | | | | (472,936 | ) | | | (292,168 | ) | | | 2,173,379 | | | | — | | | | 738,151 | | | | (7,225,279 | ) | | | (4,313,749 | ) | |
Class I | |
12/31/2017 | | | 1,082,768 | | | | — | | | | 130,626 | | | | (3,093,588 | ) | | | (1,880,194 | ) | | | 19,788,295 | | | | — | | | | 2,586,848 | | | | (56,589,093 | ) | | | (34,213,950 | ) | |
12/31/2016 | | | 1,703,584 | | | | — | | | | 293,404 | | | | (3,927,834 | ) | | | (1,930,846 | ) | | | 25,537,401 | | | | — | | | | 5,061,532 | | | | (62,442,471 | ) | | | (31,843,538 | ) | |
(1) Commencement of operations.
77
NOTES TO FINANCIAL STATEMENTS AS OF DECEMBER 31, 2017 (CONTINUED)
NOTE 11 — CAPITAL SHARES (continued)
| | | Shares sold | | Shares
issued
in merger | | Reinvestment
of
distributions | | Shares
redeemed | | Net increase
(decrease)
in shares
outstanding | | Shares sold | | Proceeds
from shares
issued
in merger | | Reinvestment
of
distributions | | Shares
redeemed | | Net increase
(decrease) | |
Year or period ended | | # | | # | | # | | # | | # | | ($) | | ($) | | ($) | | ($) | | ($) | |
Class S | |
12/31/2017 | | | 1,061,639 | | | | — | | | | 161,017 | | | | (4,385,990 | ) | | | (3,163,334 | ) | | | 19,098,021 | | | | — | | | | 3,158,173 | | | | (80,487,395 | ) | | | (58,231,201 | ) | |
12/31/2016 | | | 441,908 | | | | — | | | | 394,851 | | | | (4,109,040 | ) | | | (3,272,281 | ) | | | 7,070,423 | | | | — | | | | 6,796,359 | | | | (63,797,475 | ) | | | (49,930,693 | ) | |
Invesco Equity and Income | |
Class ADV | |
12/31/2017 | | | 179,881 | | | | — | | | | 44,151 | | | | (184,517 | ) | | | 39,515 | | | | 8,148,670 | | | | — | | | | 2,018,955 | | | | (8,391,843 | ) | | | 1,775,782 | | |
12/31/2016 | | | 117,019 | | | | — | | | | 67,141 | | | | (272,844 | ) | | | (88,684 | ) | | | 4,917,985 | | | | — | | | | 2,783,517 | | | | (11,060,798 | ) | | | (3,359,296 | ) | |
Class I | |
12/31/2017 | | | 176,109 | | | | — | | | | 582,501 | | | | (1,489,600 | ) | | | (730,990 | ) | | | 8,118,081 | | | | — | | | | 27,122,967 | | | | (69,117,060 | ) | | | (33,876,012 | ) | |
12/31/2016 | | | 140,124 | | | | — | | | | 855,589 | | | | (2,219,141 | ) | | | (1,223,428 | ) | | | 6,100,181 | | | | — | | | | 36,331,776 | | | | (93,520,850 | ) | | | (51,088,893 | ) | |
Class S | |
12/31/2017 | | | 134,816 | | | | — | | | | 556,519 | | | | (3,190,895 | ) | | | (2,499,560 | ) | | | 6,169,361 | | | | — | | | | 25,697,839 | | | | (146,664,061 | ) | | | (114,796,861 | ) | |
12/31/2016 | | | 168,617 | | | | — | | | | 979,188 | | | | (3,305,136 | ) | | | (2,157,331 | ) | | | 7,220,022 | | | | — | | | | 41,073,160 | | | | (138,071,848 | ) | | | (89,778,666 | ) | |
Class S2 | |
12/31/2017 | | | 295,115 | | | | — | | | | 366,805 | | | | (1,829,528 | ) | | | (1,167,608 | ) | | | 13,316,841 | | | | — | | | | 16,696,466 | | | | (82,966,508 | ) | | | (52,953,201 | ) | |
12/31/2016 | | | 180,004 | | | | — | | | | 623,733 | | | | (1,523,860 | ) | | | (720,123 | ) | | | 7,753,829 | | | | — | | | | 25,770,341 | | | | (62,454,115 | ) | | | (28,929,945 | ) | |
JPMorgan Mid Cap Value | |
Class ADV | |
12/31/2017 | | | 294,850 | | | | — | | | | 511,206 | | | | (836,242 | ) | | | (30,186 | ) | | | 5,804,921 | | | | — | | | | 9,643,536 | | | | (16,464,711 | ) | | | (1,016,254 | ) | |
12/31/2016 | | | 379,036 | | | | — | | | | 496,562 | | | | (667,514 | ) | | | 208,084 | | | | 7,178,861 | | | | — | | | | 9,110,242 | | | | (12,514,259 | ) | | | 3,774,844 | | |
Class I | |
12/31/2017 | | | 1,197,570 | | | | — | | | | 1,119,189 | | | | (2,850,311 | ) | | | (533,552 | ) | | | 24,507,161 | | | | — | | | | 21,764,273 | | | | (57,612,445 | ) | | | (11,341,011 | ) | |
12/31/2016 | | | 851,179 | | | | — | | | | 1,156,229 | | | | (3,052,791 | ) | | | (1,045,383 | ) | | | 16,553,193 | | | | — | | | | 21,801,765 | | | | (58,125,339 | ) | | | (19,770,381 | ) | |
Class S | |
12/31/2017 | | | 300,409 | | | | — | | | | 1,385,434 | | | | (3,804,102 | ) | | | (2,118,259 | ) | | | 6,065,319 | | | | — | | | | 26,605,742 | | | | (75,880,829 | ) | | | (43,209,768 | ) | |
12/31/2016 | | | 567,728 | | | | — | | | | 1,522,331 | | | | (3,001,207 | ) | | | (911,148 | ) | | | 10,935,631 | | | | — | | | | 28,386,017 | | | | (57,184,186 | ) | | | (17,862,538 | ) | |
Class S2 | |
12/31/2017 | | | 38,685 | | | | — | | | | 19,880 | | | | (85,022 | ) | | | (26,457 | ) | | | 763,114 | | | | — | | | | 374,052 | | | | (1,649,921 | ) | | | (512,755 | ) | |
12/31/2016 | | | 33,702 | | | | — | | | | 22,547 | | | | (68,319 | ) | | | (12,070 | ) | | | 634,346 | | | | — | | | | 412,642 | | | | (1,286,780 | ) | | | (239,792 | ) | |
Oppenheimer Global | |
Class ADV | |
12/31/2017 | | | 625,755 | | | | — | | | | 45,631 | | | | (754,477 | ) | | | (83,091 | ) | | | 12,232,396 | | | | — | | | | 891,168 | | | | (14,075,962 | ) | | | (952,398 | ) | |
12/31/2016 | | | 323,960 | | | | — | | | | 489,979 | | | | (1,491,343 | ) | | | (677,404 | ) | | | 5,108,110 | | | | — | | | | 7,584,886 | | | | (23,882,388 | ) | | | (11,189,392 | ) | |
Class I | |
12/31/2017 | | | 1,917,311 | | | | — | | | | 771,338 | | | | (6,602,141 | ) | | | (3,913,492 | ) | | | 36,700,944 | | | | — | | | | 15,673,599 | | | | (129,425,679 | ) | | | (77,051,136 | ) | |
12/31/2016 | | | 763,650 | | | | — | | | | 5,694,149 | | | | (10,331,521 | ) | | | (3,873,722 | ) | | | 12,607,200 | | | | — | | | | 91,618,853 | | | | (171,064,377 | ) | | | (66,838,324 | ) | |
Class S | |
12/31/2017 | | | 2,199,107 | | | | — | | | | 112,713 | | | | (2,153,352 | ) | | | 158,468 | | | | 41,756,204 | | | | — | | | | 2,210,306 | | | | (40,391,200 | ) | | | 3,575,310 | | |
12/31/2016 | | | 387,945 | | | | — | | | | 969,834 | | | | (3,768,813 | ) | | | (2,411,034 | ) | | | 6,216,476 | | | | — | | | | 15,071,216 | | | | (60,422,277 | ) | | | (39,134,585 | ) | |
Class S2 | |
12/31/2017 | | | 37,268 | | | | — | | | | 2,289 | | | | (66,589 | ) | | | (27,032 | ) | | | 705,061 | | | | — | | | | 43,743 | | | | (1,343,678 | ) | | | (594,874 | ) | |
12/31/2016 | | | 24,256 | | | | — | | | | 17,666 | | | | (80,329 | ) | | | (38,407 | ) | | | 380,074 | | | | — | | | | 267,822 | | | | (1,253,624 | ) | | | (605,728 | ) | |
Pioneer High Yield | |
Class I | |
12/31/2017 | | | 841,543 | | | | — | | | | 415,844 | | | | (1,560,684 | ) | | | (303,297 | ) | | | 10,032,678 | | | | — | | | | 4,964,852 | | | | (18,587,981 | ) | | | (3,590,451 | ) | |
12/31/2016 | | | 1,586,910 | | | | — | | | | 437,270 | | | | (2,008,093 | ) | | | 16,087 | | | | 17,733,148 | | | | — | | | | 4,907,706 | | | | (22,326,804 | ) | | | 314,050 | | |
Class S | |
12/31/2017 | | | 54,382 | | | | — | | | | 14,597 | | | | (140,182 | ) | | | (71,203 | ) | | | 647,640 | | | | — | | | | 174,026 | | | | (1,660,160 | ) | | | (838,494 | ) | |
12/31/2016 | | | 69,562 | | | | — | | | | 17,639 | | | | (73,088 | ) | | | 14,113 | | | | 775,358 | | | | — | | | | 197,859 | | | | (810,591 | ) | | | 162,626 | | |
T. Rowe Price Diversified Mid Cap Growth | |
Class ADV | |
12/31/2017 | | | 550,952 | | | | — | | | | 455,332 | | | | (477,636 | ) | | | 528,648 | | | | 5,533,384 | | | | — | | | | 4,366,636 | | | | (4,738,144 | ) | | | 5,161,876 | | |
12/31/2016 | | | 2,584,781 | | | | 40,605 | | | | 703,451 | | | | (719,181 | ) | | | 2,609,656 | | | | 24,893,148 | | | | 370,917 | | | | 6,401,403 | | | | (6,749,217 | ) | | | 24,916,251 | | |
Class I | |
12/31/2017 | | | 5,573,549 | | | | — | | | | 6,107,900 | | | | (9,041,136 | ) | | | 2,640,313 | | | | 58,936,316 | | | | — | | | | 64,377,262 | | | | (98,883,389 | ) | | | 24,430,189 | | |
12/31/2016 | | | 1,137,024 | | | | — | | | | 9,178,005 | | | | (9,167,702 | ) | | | 1,147,327 | | | | 11,584,917 | | | | — | | | | 90,954,031 | | | | (93,257,764 | ) | | | 9,281,184 | | |
78
NOTES TO FINANCIAL STATEMENTS AS OF DECEMBER 31, 2017 (CONTINUED)
NOTE 11 — CAPITAL SHARES (continued)
| | | Shares sold | | Shares
issued
in merger | | Reinvestment
of
distributions | | Shares
redeemed | | Net increase
(decrease)
in shares
outstanding | | Shares sold | | Proceeds
from shares
issued
in merger | | Reinvestment
of
distributions | | Shares
redeemed | | Net increase
(decrease) | |
Year or period ended | | # | | # | | # | | # | | # | | ($) | | ($) | | ($) | | ($) | | ($) | |
Class R6 | |
12/31/2017 | | | 706,212 | | | | — | | | | 41,213 | | | | (49,984 | ) | | | 697,441 | | | | 7,790,739 | | | | — | | | | 434,388 | | | | (542,501 | ) | | | 7,682,626 | | |
5/3/2016(1)-12/31/2016 | | | 109,396 | | | | — | | | | 38 | | | | (1,451 | ) | | | 107,983 | | | | 1,094,354 | | | | — | | | | 375 | | | | (14,630 | ) | | | 1,080,099 | | |
Class S | |
12/31/2017 | | | 595,095 | | | | — | | | | 389,886 | | | | (1,859,261 | ) | | | (874,280 | ) | | | 6,343,254 | | | | — | | | | 3,965,144 | | | | (19,072,570 | ) | | | (8,764,172 | ) | |
12/31/2016 | | | 504,140 | | | | 2,987,146 | | | | 413,338 | | | | (1,049,203 | ) | | | 2,855,421 | | | | 4,984,404 | | | | 28,812,970 | | | | 3,968,043 | | | | (10,214,524 | ) | | | 27,550,893 | | |
Class S2 | |
12/31/2017 | | | 44,450 | | | | — | | | | 40,454 | | | | (178,357 | ) | | | (93,453 | ) | | | 453,368 | | | | — | | | | 389,167 | | | | (1,771,560 | ) | | | (929,025 | ) | |
12/31/2016 | | | 104,820 | | | | — | | | | 59,301 | | | | (97,200 | ) | | | 66,921 | | | | 1,020,404 | | | | — | | | | 541,416 | | | | (928,301 | ) | | | 633,519 | | |
T. Rowe Price Growth Equity | |
Class ADV | |
12/31/2017 | | | 218,115 | | | | — | | | | 305,644 | | | | (294,931 | ) | | | 228,828 | | | | 18,360,766 | | | | — | | | | 24,552,336 | | | | (23,990,510 | ) | | | 18,922,592 | | |
12/31/2016 | | | 200,051 | | | | — | | | | 335,148 | | | | (357,035 | ) | | | 178,164 | | | | 14,888,541 | | | | — | | | | 23,966,449 | | | | (26,585,574 | ) | | | 12,269,416 | | |
Class I | |
12/31/2017 | | | 662,676 | | | | — | | | | 1,265,199 | | | | (2,884,588 | ) | | | (956,713 | ) | | | 59,360,712 | | | | — | | | | 109,629,478 | | | | (254,338,020 | ) | | | (85,347,830 | ) | |
12/31/2016 | | | 735,960 | | | | — | | | | 1,570,936 | | | | (2,578,497 | ) | | | (271,601 | ) | | | 58,374,400 | | | | — | | | | 119,705,351 | | | | (205,091,631 | ) | | | (27,011,880 | ) | |
Class S | |
12/31/2017 | | | 513,742 | | | | — | | | | 458,035 | | | | (1,234,032 | ) | | | (262,255 | ) | | | 44,631,473 | | | | — | | | | 38,236,738 | | | | (102,055,398 | ) | | | (19,187,187 | ) | |
12/31/2016 | | | 460,280 | | | | — | | | | 535,295 | | | | (1,594,203 | ) | | | (598,628 | ) | | | 35,025,413 | | | | — | | | | 39,520,831 | | | | (123,258,488 | ) | | | (48,712,244 | ) | |
Class S2 | |
12/31/2017 | | | 14,303 | | | | — | | | | 13,302 | | | | (41,684 | ) | | | (14,079 | ) | | | 1,201,044 | | | | — | | | | 1,081,420 | | | | (3,563,399 | ) | | | (1,280,935 | ) | |
12/31/2016 | | | 58,653 | | | | — | | | | 14,558 | | | | (20,988 | ) | | | 52,223 | | | | 4,526,323 | | | | — | | | | 1,051,248 | | | | (1,583,046 | ) | | | 3,994,525 | | |
Templeton Foreign Equity | |
Class ADV | |
12/31/2017 | | | 330,072 | | | | — | | | | 44,396 | | | | (404,112 | ) | | | (29,644 | ) | | | 4,021,746 | | | | — | | | | 555,843 | | | | (4,921,306 | ) | | | (343,717 | ) | |
12/31/2016 | | | 182,603 | | | | — | | | | 90,541 | | | | (569,378 | ) | | | (296,234 | ) | | | 1,931,568 | | | | — | | | | 947,058 | | | | (6,081,216 | ) | | | (3,202,590 | ) | |
Class I | |
12/31/2017 | | | 575,493 | | | | — | | | | 283,091 | | | | (2,396,231 | ) | | | (1,537,647 | ) | | | 7,195,681 | | | | — | | | | 3,578,275 | | | | (29,617,070 | ) | | | (18,843,114 | ) | |
12/31/2016 | | | 1,373,628 | | | | — | | | | 570,798 | | | | (3,140,085 | ) | | | (1,195,659 | ) | | | 14,865,872 | | | | — | | | | 6,016,205 | | | | (34,019,056 | ) | | | (13,136,979 | ) | |
Class S | |
12/31/2017 | | | 463,022 | | | | — | | | | 595,243 | | | | (8,915,080 | ) | | | (7,856,815 | ) | | | 5,427,287 | | | | — | | | | 7,476,254 | | | | (109,538,094 | ) | | | (96,634,553 | ) | |
12/31/2016 | | | 893,873 | | | | — | | | | 1,345,871 | | | | (8,286,273 | ) | | | (6,046,529 | ) | | | 9,497,019 | | | | — | | | | 14,104,724 | | | | (88,637,951 | ) | | | (65,036,208 | ) | |
Class S2 | |
12/31/2017 | | | 20,466 | | | | — | | | | 1,997 | | | | (159,552 | ) | | | (137,089 | ) | | | 249,260 | | | | — | | | | 24,956 | | | | (1,933,986 | ) | | | (1,659,770 | ) | |
12/31/2016 | | | 34,034 | | | | — | | | | 7,353 | | | | (54,647 | ) | | | (13,260 | ) | | | 361,756 | | | | — | | | | 76,613 | | | | (588,127 | ) | | | (149,758 | ) | |
(1) Commencement of operations.
NOTE 12 — SECURITIES LENDING
Under a Master Securities Lending Agreement (the "Agreement") with BNY, the Portfolios can lend their securities to approved brokers, dealers and other financial institutions. Loans are collateralized by cash and U.S. government securities. The collateral is equal to at least 105% of the market value of non-U.S. securities loaned and 102% of the market value of U.S. securities loaned. The market value of the loaned securities is determined at Market Close of the Portfolios at their last sale price or official closing price on the principal exchange or system on which they are traded and any additional collateral is delivered to the Portfolios on the next business day. The cash collateral received is invested in approved investments as defined in the Agreement with BNY. The Portfolios bear the risk of loss
with respect to the investment of collateral with the following exception: BNY provides the Portfolios indemnification from loss with respect to the investment of collateral provided that the cash collateral is invested solely in overnight repurchase agreements.
The cash collateral is invested in overnight repurchase agreements that are collateralized at 102% with securities issued or fully guaranteed by the U.S. Treasury; U.S. government or any agency, instrumentality or authority of the U.S. government. The securities purchased with cash collateral received are reflected in the Portfolio of Investments under Securities Lending Collateral.
Generally, in the event of counterparty default, the Portfolios have the right to use the collateral to offset
79
NOTES TO FINANCIAL STATEMENTS AS OF DECEMBER 31, 2017 (CONTINUED)
NOTE 12 — SECURITIES LENDING (continued)
losses incurred. The Agreement contains certain guarantees by BNY in the event of counterparty default and/or a borrower's failure to return a loaned security; however, there would be a potential loss to the Portfolios in the event the Portfolios are delayed or prevented from exercising their right to dispose of the collateral. Engaging in securities lending could have a leveraging effect, which may intensify the credit, market and other risks associated with investing in a Portfolio.
The following is a summary of each respective Portfolio's securities lending agreements by counterparty which are subject to offset under the Agreement as of December 31, 2017:
Global Bond
Counterparty | | Securities
Loaned
at Value | | Cash
Collateral
Received(1) | | Net
Amount | |
Barclays Capital Inc. | | $ | 296,961 | | | $ | (296,961 | ) | | $ | — | | |
BNP Paribas Prime
Brokerage Intl Ltd | | | 193,475 | | | | (193,475 | ) | | | — | | |
Citigroup Global Markets Inc. | | | 1,959,175 | | | | (1,959,175 | ) | | | — | | |
Credit Suisse Securities
(USA) LLC | | | 1,062,168 | | | | (1,062,168 | ) | | | — | | |
Goldman, Sachs & Co. LLC | | | 894,279 | | | | (894,279 | ) | | | — | | |
J.P. Morgan Securities LLC | | | 180,096 | | | | (180,096 | ) | | | — | | |
Merrill Lynch, Pierce,
Fenner & Smith Inc. | | | 9,922 | | | | (9,922 | ) | | | — | | |
Morgan Stanley & Co. LLC | | | 79,374 | | | | (79,374 | ) | | | — | | |
RBC Capital Markets, LLC | | | 497,558 | | | | (497,558 | ) | | | — | | |
Societe Generale | | | 1,805,688 | | | | (1,805,688 | ) | | | — | | |
Total | | $ | 6,978,696 | | | $ | (6,978,696 | ) | | $ | — | | |
(1) Collateral with a fair value of $7,139,528 has been received in connection with the above securities lending transactions. Excess collateral received from the individual counterparty is not shown for financial reporting purposes.
American Century Small-Mid Cap Value
Counterparty | | Securities
Loaned
at Value | | Cash
Collateral
Received(1) | | Net
Amount | |
Barclays Capital Inc. | | $ | 3,701,991 | | | $ | (3,701,991 | ) | | $ | — | | |
Credit Suisse Securities
(USA) LLC | | | 777,039 | | | | (777,039 | ) | | | — | | |
Goldman, Sachs & Co. LLC | | | 1,113,840 | | | | (1,113,840 | ) | | | — | | |
Industrial And Commercial
Bank Of China | | | 978,505 | | | | (978,505 | ) | | | — | | |
J.P. Morgan Securities LLC | | | 729,036 | | | | (729,036 | ) | | | — | | |
Janney Montgomery Scott LLC | | | 12,230 | | | | (12,230 | ) | | | — | | |
Jefferies LLC | | | 146,764 | | | | (146,764 | ) | | | — | | |
Merrill Lynch, Pierce, Fenner &
Smith Inc. | | | 2,427 | | | | (2,427 | ) | | | — | | |
Morgan Stanley & Co. LLC | | | 172,059 | | | | (172,059 | ) | | | — | | |
NATIONAL BANK OF
CANADA FINANCIAL INC | | | 534,075 | | | | (534,075 | ) | | | — | | |
Natixis Securities America LLC | | | 110,225 | | | | (110,225 | ) | | | — | | |
Nomura Securities
International, Inc. | | | 4,871 | | | | (4,871 | ) | | | — | | |
RBC Dominion Securities Inc | | | 133,143 | | | | (133,143 | ) | | | — | | |
Scotia Capital (USA) INC | | | 31,869 | | | | (31,869 | ) | | | — | | |
SG Americas Securities, LLC | | | 209,267 | | | | (209,267 | ) | | | — | | |
UBS AG | | | 2,543,598 | | | | (2,543,598 | ) | | | — | | |
American Century Small-Mid Cap Value (continued)
Counterparty | | Securities
Loaned
at Value | | Cash
Collateral
Received(1) | | Net
Amount | |
UBS Securities LLC. | | $ | 417,423 | | | $ | (417,423 | ) | | $ | — | | |
Wells Fargo Securities LLC | | | 1,197,485 | | | | (1,197,485 | ) | | | — | | |
Total | | $ | 12,815,847 | | | $ | (12,815,847 | ) | | $ | — | | |
(1) Collateral with a fair value of $13,124,344 has been received in connection with the above securities lending transactions. Excess collateral received from the individual counterparty is not shown for financial reporting purposes.
Invesco Equity and Income
Counterparty | | Securities
Loaned
at Value | | Cash
Collateral
Received(1) | | Net
Amount | |
Citadel Clearing LLC | | $ | 1,578,418 | | | $ | (1,578,418 | ) | | $ | — | | |
Citigroup Global Markets Inc. | | | 6,217,175 | | | | (6,217,175 | ) | | | — | | |
Credit Suisse Securities
(USA) LLC | | | 40,881,762 | | | | (40,881,762 | ) | | | — | | |
J.P. Morgan Securities LLC | | | 1,817,123 | | | | (1,817,123 | ) | | | — | | |
Jefferies LLC | | | 109,485 | | | | (109,485 | ) | | | — | | |
Merrill Lynch, Pierce, Fenner &
Smith Inc. | | | 4,234,122 | | | | (4,234,122 | ) | | | — | | |
Morgan Stanley & Co. LLC | | | 228,070 | | | | (228,070 | ) | | | — | | |
Nomura Securities
International, Inc. | | | 2,578,576 | | | | (2,578,576 | ) | | | — | | |
UBS Securities LLC. | | | 3,934,415 | | | | (3,934,415 | ) | | | — | | |
Wells Fargo Securities LLC | | | 32,208,346 | | | | (32,208,346 | ) | | | — | | |
Total | | $ | 93,787,492 | | | $ | (93,787,492 | ) | | $ | — | | |
(1) Collateral with a fair value of $95,858,870 has been received in connection with the above securities lending transactions. Excess collateral received from the individual counterparty is not shown for financial reporting purposes.
JPMorgan Mid Cap Value
Counterparty | | Securities
Loaned
at Value | | Cash
Collateral
Received(1) | | Net
Amount | |
CIBC World Markets INC | | $ | 43,928 | | | $ | (43,928 | ) | | $ | — | | |
Goldman, Sachs & Co. LLC | | | 1,785,157 | | | | (1,785,157 | ) | | | — | | |
Jefferies LLC | | | 566,408 | | | | (566,408 | ) | | | — | | |
Morgan Stanley & Co. LLC | | | 163,752 | | | | (163,752 | ) | | | — | | |
Natixis Securities America LLC | | | 247,586 | | | | (247,586 | ) | | | — | | |
RBC Dominion Securities Inc | | | 856,651 | | | | (856,651 | ) | | | — | | |
Scotia Capital (USA) INC | | | 28,244 | | | | (28,244 | ) | | | — | | |
Total | | $ | 3,691,726 | | | $ | (3,691,726 | ) | | $ | — | | |
(1) Collateral with a fair value of $3,776,640 has been received in connection with the above securities lending transactions. Excess collateral received from the individual counterparty is not shown for financial reporting purposes.
Oppenheimer Global
Counterparty | | Securities
Loaned
at Value | | Cash
Collateral
Received(1) | | Net
Amount | |
CIBC World Markets INC | | $ | 1,707,153 | | | $ | (1,707,153 | ) | | $ | — | | |
Citadel Clearing LLC | | | 503,650 | | | | (503,650 | ) | | | — | | |
Citigroup Global Markets Inc. | | | 688,722 | | | | (688,722 | ) | | | — | | |
Citigroup Global Markets
Limited | | | 1,658,059 | | | | (1,658,059 | ) | | | — | | |
J.P. Morgan Securities LLC | | | 2,096,200 | | | | (2,096,200 | ) | | | — | | |
JP Morgan Securities, Plc. | | | 90,911 | | | | (90,911 | ) | | | — | | |
Morgan Stanley & Co. LLC | | | 858,724 | | | | (858,724 | ) | | | — | | |
Nomura International PLC | | | 6,182 | | | | (6,182 | ) | | | — | | |
80
NOTES TO FINANCIAL STATEMENTS AS OF DECEMBER 31, 2017 (CONTINUED)
NOTE 12 — SECURITIES LENDING (continued)
Oppenheimer Global (continued)
Counterparty | | Securities
Loaned
at Value | | Cash
Collateral
Received(1) | | Net
Amount | |
RBC Dominion Securities Inc | | $ | 1,733,754 | | | $ | (1,733,754 | ) | | $ | — | | |
Scotia Capital (USA) INC | | | 879,214 | | | | (879,214 | ) | | | — | | |
UBS AG | | | 242,234 | | | | (242,234 | ) | | | — | | |
Total | | $ | 10,464,803 | | | $ | (10,464,803 | ) | | $ | — | | |
(1) Collateral with a fair value of $11,605,125 has been received in connection with the above securities lending transactions. Excess collateral received from the individual counterparty is not shown for financial reporting purposes.
T. Rowe Price Diversified Mid Cap Growth
Counterparty | | Securities
Loaned
at Value | | Cash
Collateral
Received(1) | | Net
Amount | |
BMO Capital Markets Corp | | $ | 19,367 | | | $ | (19,367 | ) | | $ | — | | |
CIBC World Markets INC | | | 258,115 | | | | (258,115 | ) | | | — | | |
Citadel Clearing LLC | | | 267,977 | | | | (267,977 | ) | | | — | | |
Goldman, Sachs & Co. LLC | | | 3,210,585 | | | | (3,210,585 | ) | | | — | | |
J.P. Morgan Securities LLC | | | 5,367,670 | | | | (5,367,670 | ) | | | — | | |
Jefferies LLC | | | 114,212 | | | | (114,212 | ) | | | — | | |
Morgan Stanley & Co. LLC | | | 2,649,674 | | | | (2,649,674 | ) | | | — | | |
Natixis Securities America LLC | | | 5,717,821 | | | | (5,717,821 | ) | | | — | | |
RBC Capital Markets, LLC | | | 679,391 | | | | (679,391 | ) | | | — | | |
RBC Dominion Securities Inc | | | 3,434,888 | | | | (3,434,888 | ) | | | — | | |
Scotia Capital (USA) INC | | | 7,364,812 | | | | (7,364,812 | ) | | | — | | |
SG Americas Securities, LLC | | | 666,414 | | | | (666,414 | ) | | | — | | |
UBS AG | | | 2,116,979 | | | | (2,116,979 | ) | | | — | | |
Total | | $ | 31,867,905 | | | $ | (31,867,905 | ) | | $ | — | | |
(1) Collateral with a fair value of $32,605,100 has been received in connection with the above securities lending transactions. Excess collateral received from the individual counterparty is not shown for financial reporting purposes.
T. Rowe Price Growth Equity
Counterparty | | Securities
Loaned
at Value | | Cash
Collateral
Received(1) | | Net
Amount | |
BMO Capital Markets Corp | | $ | 83,711 | | | $ | (83,711 | ) | | $ | — | | |
CIBC World Markets INC | | | 4,882,636 | | | | (4,882,636 | ) | | | — | | |
Citigroup Global Markets Inc. | | | 4,770,135 | | | | (4,770,135 | ) | | | — | | |
Goldman, Sachs & Co. LLC | | | 4,092,029 | | | | (4,092,029 | ) | | | — | | |
J.P. Morgan Securities LLC | | | 556,385 | | | | (556,385 | ) | | | — | | |
Jefferies LLC | | | 663,310 | | | | (663,310 | ) | | | — | | |
Morgan Stanley & Co. LLC | | | 2,958,077 | | | | (2,958,077 | ) | | | — | | |
Natixis Securities America LLC | | | 12,403,883 | | | | (12,403,883 | ) | | | — | | |
Nomura Securities
International, Inc. | | | 93,953 | | | | (93,953 | ) | | | — | | |
RBC Capital Markets, LLC | | | 60,236 | | | | (60,236 | ) | | | — | | |
RBC Dominion Securities Inc | | | 5,483,422 | | | | (5,483,422 | ) | | | — | | |
Scotia Capital (USA) INC | | | 255,442 | | | | (255,442 | ) | | | — | | |
SG Americas Securities, LLC | | | 19,552 | | | | (19,552 | ) | | | — | | |
UBS AG | | | 1,647,756 | | | | (1,647,756 | ) | | | — | | |
UBS Securities LLC. | | | 9,655,229 | | | | (9,655,229 | ) | | | — | | |
Wells Fargo Securities LLC | | | 14,987,778 | | | | (14,987,778 | ) | | | — | | |
Total | | $ | 62,613,534 | | | $ | (62,613,534 | ) | | $ | — | | |
(1) Collateral with a fair value of $63,982,831 has been received in connection with the above securities lending transactions. Excess collateral received from the individual counterparty is not shown for financial reporting purposes.
Templeton Foreign Equity
Counterparty | | Securities
Loaned
at Value | | Cash
Collateral
Received(1) | | Net
Amount | |
Barclays Capital Inc. | | $ | 1,318,473 | | | $ | (1,318,473 | ) | | $ | — | | |
Credit Suisse Securities
(Europe) Limited | | | 2,974,354 | | | | (2,974,354 | ) | | | — | | |
HSBC Bank PLC | | | 28,842 | | | | (28,842 | ) | | | — | | |
J.P. Morgan Securities LLC | | | 6,392,721 | | | | (6,392,721 | ) | | | — | | |
Societe Generale | | | 307,001 | | | | (307,001 | ) | | | — | | |
Total | | $ | 11,021,391 | | | $ | (11,021,391 | ) | | $ | — | | |
(1) Collateral with a fair value of $11,521,061 has been received in connection with the above securities lending transactions. Excess collateral received from the individual counterparty is not shown for financial reporting purposes.
NOTE 13 — UNFUNDED LOAN COMMITMENTS
Certain Portfolios may enter in credit agreements, all or a portion of which may be unfunded. The Portfolios are obligated to fund these loan commitments at the borrower's discretion. Funded portions of the credit agreements are presented in the Portfolio of Investments. At December 31, 2017, Pioneer High Yield had the following unfunded loan commitments:
Loan | | Unfunded
Commitments | | Unrealized
Depreciation
at 12/31/17* | |
Centene Corp. Bridge Loan | | $ | 770,000 | | | $ | — | | |
Itron, Inc. Bridge Loan | | | 300,000 | | | | — | | |
Neiman Marcus Group, Inc. Term
Loan 1L | | | 250,000 | | | | (875 | ) | |
Revlon Consumer Products Corp.
Term Loan B 1L | | | 19,950 | | | | (3,005 | ) | |
| | | $ | 1,339,950 | | | $ | (3,880 | ) | |
* Unfunded loan commitments are marked to market daily and any unrealized appreciation or depreciation is included in the Portfolio's Statement of Assets and Liabilities and Statement of Operations.
NOTE 14 — FOREIGN WITHHOLDING CLAIMS
Templeton Foreign Equity had filed claims to recover taxes withheld by Poland and Spain on dividend income on the basis that Poland and Spain had purportedly violated certain provisions in the Treaty on the Functioning of the European Union. The claims were filed based on the premise that the imposition of a withholding tax by a European Union member state on dividends paid to a nonresident company, including the Portfolio, while exempting domestic funds from such taxes results in discriminatory tax withholding contrary to the free movement of capital.
In May 2017, the Portfolio received payment, including interest, of approximately $1,295,708 of taxes withheld in Poland from 2005-2008. In June 2017, the Portfolio received payment, including interest, of approximately $516,855 of taxes withheld in Spain from 2006-2010. Polish and Spanish withholding tax claims received are disclosed in the statement of operations.
81
NOTES TO FINANCIAL STATEMENTS AS OF DECEMBER 31, 2017 (CONTINUED)
NOTE 15 — REORGANIZATIONS
On August 26, 2016, T. Rowe Price Diversified Mid Cap Growth ("Acquiring Portfolio") acquired all of the assets of, and assumed all of the liabilities of VY® Fidelity® VIP Mid Cap Portfolio ("Acquired Portfolio"), an open-end investment company that is not included in this report, in a tax-free reorganization in exchange for shares of the Acquiring Portfolio, pursuant to a plan of reorganization approved by the shareholders of the Acquired Portfolio on August 9, 2016. For financial reporting purposes, assets received and shares issued by the Acquiring Portfolio were recorded at fair value.
Assuming the acquisition had been completed on January 1, 2016, the beginning of the annual reporting period of the Acquiring Portfolio, the Acquiring Portfolio's pro forma results of operations for the year ended December 31, 2016, are as follows:
Net investment income | | $ | 2,396,290 | | |
Net realized and unrealized gain on investments | | $ | 57,917,138 | | |
Net increase in net assets resulting from operations | | $ | 60,313,428 | | |
Because the combined investment portfolios have been managed as a single integrated portfolio since the acquisition was completed, it is not practicable to separate the amounts of revenue and earnings of the Acquired Portfolio that have been included in the Acquiring Portfolio's statement of operations since August 26, 2016. Net assets and unrealized appreciation or depreciation as of the reorganization date were as follows:
Total Net Assets of
Acquired Portfolio (000s) | | Total Net Assets of
Acquiring Portfolio (000s) | | Acquired Portfolio's
Capital Loss
Carryforwards (000s) | | Acquired Portfolio's
Unrealized
Appreciation (000s) | | Portfolios'
Conversion
Ratio | |
| $ | 29,184 | | | $ | 850,426 | | | $ | — | | | $ | — | | | | 1.3397 | | |
The net assets of the Acquiring Portfolio after the acquisition were $879,610,125.
NOTE 16 — FEDERAL INCOME TAXES
The amount of distributions from net investment income and net realized capital gains are determined in accordance with federal income tax regulations, which may differ from GAAP for investment companies. These book/tax differences may be either temporary or permanent. Permanent differences are reclassified within the capital accounts based on their federal tax-basis treatment; temporary differences are not reclassified. Key differences include the treatment of short-term capital gains, foreign currency transactions, paydowns, income from passive foreign investment companies (PFICs), wash sale deferrals and expiration of capital loss carryforwards. Distributions in excess of net investment income and/or net realized capital gains for tax purposes are reported as return of capital.
The following permanent tax differences have been reclassified as of December 31, 2017:
| | | Paid-in
Capital | | Undistributed
Net
Investment
Income | | Accumulated
Net Realized
Gains/
(Losses) | |
Global Bond | | $ | — | | | $ | 2,180,169 | | | $ | (2,180,169 | ) | |
American Century
Small-Mid Cap
Value | | | (112 | ) | | | (202,978 | ) | | | 203,090 | | |
Baron Growth | | | 519 | | | | 905,210 | | | | (905,729 | ) | |
Columbia Contrarian
Core | | | — | | | | (32,381 | ) | | | 32,381 | | |
Invesco Comstock | | | (43,780,189 | )(1) | | | (1,010,991 | ) | | | 44,791,180 | | |
Invesco Equity and
Income | | | — | | | | (2,534,845 | ) | | | 2,534,845 | | |
Oppenheimer Global | | | — | | | | 16,803,367 | | | | (16,803,367 | ) | |
Pioneer High Yield | | | (12,856,704 | )(1) | | | (215,189 | ) | | | 13,071,893 | | |
T. Rowe Price
Diversified Mid Cap
Growth | | | — | | | | 306,252 | | | | (306,252 | ) | |
T. Rowe Price Growth
Equity | | | — | | | | 1,548,835 | | | | (1,548,835 | ) | |
Templeton Foreign
Equity | | | (104,784,530 | )(1) | | | 2,249,644 | | | | 102,534,886 | | |
(1) Amount relates to the expiration of capital loss carryforwards.
82
NOTES TO FINANCIAL STATEMENTS AS OF DECEMBER 31, 2017 (CONTINUED)
NOTE 16 — FEDERAL INCOME TAXES (continued)
Dividends paid by the Portfolios from net investment income and distributions of net realized short-term capital gains are, for federal income tax purposes, taxable as ordinary income to shareholders.
The tax composition of dividends and distributions to shareholders was as follows:
| | | Year Ended December 31, 2017 | | Year Ended December 31, 2016 | |
| | | Ordinary
Income | | Long-term
Capital
Gains | | Ordinary
Income | | Long-term
Capital
Gains | | Return of
Capital | |
Global Bond | | $ | 5,646,068 | | | $ | — | | | $ | 2,115,667 | | | $ | — | | | $ | 1,834,693 | | |
American Century Small-Mid Cap Value | | | 9,472,022 | | | | 8,958,058 | | | | 11,518,051 | | | | 18,783,541 | | | | — | | |
Baron Growth | | | 5,906,024 | | | | 84,384,390 | | | | — | | | | 84,297,100 | | | | — | | |
Columbia Contrarian Core | | | 3,182,935 | | | | 18,674,466 | | | | 11,518,396 | | | | 28,863,136 | | | | — | | |
Columbia Small Cap Value II | | | 715,817 | | | | 8,813,330 | | | | 604,001 | | | | 8,733,630 | | | | — | | |
Invesco Comstock | | | 6,079,168 | | | | — | | | | 12,596,042 | | | | — | | | | — | | |
Invesco Equity and Income | | | 29,711,609 | | | | 41,824,618 | | | | 31,417,763 | | | | 74,541,031 | | | | — | | |
JPMorgan Mid Cap Value | | | 8,035,488 | | | | 50,352,115 | | | | 5,185,326 | | | | 54,525,340 | | | | — | | |
Oppenheimer Global | | | 16,342,479 | | | | 2,476,337 | | | | 19,489,360 | | | | 95,053,417 | | | | — | | |
Pioneer High Yield | | | 5,138,878 | | | | — | | | | 5,105,565 | | | | — | | | | — | | |
T. Rowe Price Diversified Mid Cap Growth | | | 9,291,817 | | | | 64,240,780 | | | | 7,800,802 | | | | 94,064,466 | | | | — | | |
T. Rowe Price Growth Equity | | | 565,610 | | | | 172,934,362 | | | | — | | | | 184,243,879 | | | | — | | |
Templeton Foreign Equity | | | 11,635,328 | | | | — | | | | 21,144,600 | | | | — | | | | — | | |
The tax-basis components of distributable earnings and the capital loss carryforwards which may be used to offset future realized capital gains for federal income tax purposes as of December 31, 2017 were:
| | | Undistributed | | Undistributed
Long-term | | Unrealized
Appreciation/ | | Capital Loss Carryforwards | |
| | | Ordinary Income | | Capital Gains | | (Depreciation) | | Amount | | Character | | Expiration | |
Global Bond | | $ | 7,797,033 | | | $ | — | | | $ | 153,435 | | | $ | (1,512,275 | ) | | Short-term | | | None | | |
| | | | | | | | | | (995,673 | ) | | Long-term | | | None | | |
| | | | | | | | | $ | (2,507,948 | ) | | | | | | | |
American Century Small-Mid Cap Value | | | 15,206,084 | | | | 27,945,128 | | | | 39,061,036 | | | | — | | | | — | | | | — | | |
Baron Growth | | | 3,109,336 | | | | 72,349,868 | | | | 485,783,042 | | | | — | | | | — | | | | — | | |
Columbia Contrarian Core | | | 4,326,967 | | | | 28,597,782 | | | | 70,892,537 | | | | — | | | | — | | | | — | | |
Columbia Small Cap Value II | | | 3,297,363 | | | | 18,116,492 | | | | 54,570,816 | | | | — | | | | — | | | | — | | |
Invesco Comstock | | | — | | | | — | | | | 116,320,754 | | | | — | | | | — | | | | — | | |
Invesco Equity and Income | | | 1,642,362 | | | | 93,943,730 | | | | 223,996,825 | | | | — | | | | — | | | | — | | |
JPMorgan Mid Cap Value | | | 2,037,788 | | | | 40,335,061 | | | | 164,871,786 | | | | — | | | | — | | | | — | | |
Oppenheimer Global | | | 31,125,370 | | | | 104,663,738 | | | | 871,391,710 | | | | — | | | | — | | | | — | | |
Pioneer High Yield | | | 3,077,331 | | | | — | | | | 2,692,428 | | | | (365,828 | ) | | Short-term | | | None | | |
| | | | | | | | | | (3,006,613 | ) | | Long-term | | | None | | |
| | | | | | | | | $ | (3,372,441 | ) | | | | | | | |
T. Rowe Price Diversified Mid Cap Growth | | | 7,484,167 | | | | 91,166,831 | | | | 301,423,643 | | | | — | | | | — | | | | — | | |
T. Rowe Price Growth Equity | | | 8,461,126 | | | | 299,822,433 | | | | 480,979,509 | | | | — | | | | — | | | | — | | |
Templeton Foreign Equity | | | 13,992,808 | | | | — | | | | 147,937,601 | | | | — | | | | — | | | | — | | |
The Portfolios' major tax jurisdictions are U.S. federal and Arizona state.
As of December 31, 2017, no provision for income tax is required in the Portfolios' financial statements as a result of tax positions taken on federal and state income tax returns for open tax years. The Portfolios' federal and state income and federal excise tax returns for tax years for which the applicable statutes of limitations have not expired are subject to examination by the Internal Revenue Service and state department of revenue. The earliest tax year that remains subject to examination by these jurisdictions is 2013.
83
NOTES TO FINANCIAL STATEMENTS AS OF DECEMBER 31, 2017 (CONTINUED)
NOTE 17 — SUBSEQUENT EVENTS
Subsequent to December 31, 2017, the following Portfolios paid dividends from net investment income of:
| | | Per Share
Amount | | Payable Date | | Record Date | |
Global Bond | |
Class ADV | | $ | 0.0222 | | | February 1, 2018 | | Daily | |
Class I | | $ | 0.0274 | | | February 1, 2018 | | Daily | |
Class S | | $ | 0.0250 | | | February 1, 2018 | | Daily | |
Pioneer High Yield | |
Class I | | $ | 0.0474 | | | February 1, 2018 | | Daily | |
Class S | | $ | 0.0448 | | | February 1, 2018 | | Daily | |
Expense Limitation Agreement: On January 11, 2018, the Board approved revised expense limits for each class
of Global Bond and Columbia Contrarian Core. Effective May 1, 2018 through May 1, 2019, the Investment Adviser has increased the expense limits for Global Bond to 1.17%, 0.67% and 0.92% for Class ADV, Class I and Class S, respectively and for Columbia Contrarian Core, the side-letter agreement increased the Portfolio's expense limit to 1.25%, 0.75% and 1.00% for Class ADV, Class I and Class S, respectively.
The Portfolios have evaluated events occurring after the Statements of Assets and Liabilities date ("subsequent events") to determine whether any subsequent events necessitated adjustment to or disclosure in the financial statements. Other than the above, no such subsequent events were identified.
84
SUMMARY PORTFOLIO OF INVESTMENTS
VOYA GLOBAL BOND PORTFOLIO AS OF DECEMBER 31, 2017
Principal
Amount† | |
| |
| | Value | | Percentage
of Net
Assets | |
CORPORATE BONDS/NOTES: 25.1% | | | |
| | | | | Brazil: 0.5% | |
| | 900,000 | | | | | | | Petrobras Global
Finance BV,
8.750%, 05/23/26 | | $ | 1,077,750 | | | | 0.5 | | |
| | | | | Canada: 0.5% | |
| | 235,000 | | | | (1 | ) | | 1011778 BC ULC/
New Red Finance,
Inc., 5.000%,
10/15/25 | | | 237,938 | | | | 0.1 | | |
| | 88,000 | | | | (1 | ) | | Air Canada 2017-1
Class AA Pass
Through Trust,
3.300%, 07/15/31 | | | 87,560 | | | | 0.0 | | |
| | 844,000 | | | | (2 | ) | | Other Securities | | | 901,500 | | | | 0.4 | | |
| | | | | | | | | | 1,226,998 | | | | 0.5 | | |
| | | | | China: 0.3% | |
| | 601,000 | | | | (3 | ) | | Alibaba Group
Holding Ltd.,
3.600%, 11/28/24 | | | 623,872 | | | | 0.3 | | |
| | | | | France: 0.4% | |
| | 287,000 | | | | (1 | ) | | BPCE SA, 5.150%,
07/21/24 | | | 311,566 | | | | 0.2 | | |
| | 226,000 | | | | (1 | ) | | Electricite de France
SA, 2.350%,
10/13/20 | | | 225,790 | | | | 0.1 | | |
| | 294,000 | | | | | | | Other Securities | | | 294,865 | | | | 0.1 | | |
| | | | | | | | | | 832,221 | | | | 0.4 | | |
| | | | | Guernsey: 0.3% | |
| | 716,000 | | | | | | | Credit Suisse Group
Funding Guernsey
Ltd., 2.750%,
03/26/20 | | | 719,137 | | | | 0.3 | | |
| | | | | Ireland: 0.3% | |
| | 652,000 | | | | | | | Other Securities | | | 667,908 | | | | 0.3 | | |
| | | | | Israel: 0.1% | |
| | 345,000 | | | | (2 | ) | | Other Securities | | | 285,296 | | | | 0.1 | | |
| | | | | Italy: 0.1% | |
| | 255,000 | | | | | | | Other Securities | | | 322,575 | | | | 0.1 | | |
| | | | | Japan: 0.6% | |
| | 790,000 | | | | (1 | ) | | Bank of
Tokyo-Mitsubishi
UFJ Ltd./The,
2.300%, 03/05/20 | | | 787,357 | | | | 0.4 | | |
| | 200,000 | | | | (1 | ) | | Mizuho Bank Ltd.,
3.200%, 03/26/25 | | | 201,539 | | | | 0.1 | | |
| | 300,000 | | | | | | | Other Securities | | | 310,469 | | | | 0.1 | | |
| | | | | | | | | | 1,299,365 | | | | 0.6 | | |
Principal
Amount† | |
| |
| | Value | | Percentage
of Net
Assets | |
| | | | | Luxembourg: 0.3% | |
| | 350,000 | | | | (1 | ) | | Altice Financing SA,
6.625%, 02/15/23 | | $ | 367,360 | | | | 0.2 | | |
| | 130,000 | | | | (1 | ) | | Dana Financing
Luxembourg Sarl,
5.750%, 04/15/25 | | | 137,313 | | | | 0.0 | | |
| | 185,000 | | | | (1 | ) | | Dana Financing
Luxembourg Sarl,
6.500%, 06/01/26 | | | 200,956 | | | | 0.1 | | |
| | | | | | | | | | 705,629 | | | | 0.3 | | |
| | | | | Mexico: 0.0% | |
MXN | 105,174 | | | | (4 | ) | | JPMorgan
Hipotecaria su
Casita, 6.100%,
09/25/35 | | | 5,331 | | | | 0.0 | | |
MXN | 1,007,437 | | | | (5 | ) | | Other Securities | | | — | | | | — | | |
| | | | | | | | | | 5,331 | | | | 0.0 | | |
| | | | | Netherlands: 1.0% | |
| | 300,000 | | | | (1 | ) | | Braskem Netherlands
Finance BV,
4.500%, 01/10/28 | | | 295,515 | | | | 0.1 | | |
| | 690,000 | | | | | | | Shell International
Finance BV, 3.250%,
05/11/25 | | | 709,628 | | | | 0.3 | | |
| | 361,000 | | | | | | | Shell International
Finance BV, 4.000%,
05/10/46 | | | 385,110 | | | | 0.2 | | |
| | 300,000 | | | | (1 | ) | | Siemens
Financieringsmaatschappij
NV, 2.350%,
10/15/26 | | | 283,619 | | | | 0.1 | | |
| | 539,000 | | | | | | | Other Securities | | | 630,673 | | | | 0.3 | | |
| | | | | | | | | | 2,304,545 | | | | 1.0 | | |
| | | | | Norway: 0.2% | |
| | 380,000 | | | | | Other Securities | | | 377,954 | | | | 0.2 | | |
| | | | | South Africa: 0.0% | |
ZAR | 1,000,000 | | | | | Other Securities | | | 85,662 | | | | 0.0 | | |
| | | | | Sweden: 0.1% | |
| | 298,000 | | | | (1 | ) | | Nordea Bank AB,
5.500%, 12/31/2199 | | | 306,568 | | | | 0.1 | | |
| | | | | Switzerland: 0.3% | |
| | 400,000 | | | | (1 | ) | | Credit Suisse AG,
6.500%, 08/08/23 | | | 448,550 | | | | 0.2 | | |
| | 250,000 | | | | | UBS AG/Stamford CT,
7.625%, 08/17/22 | | | 292,675 | | | | 0.1 | | |
| | | | | | | | | | 741,225 | | | | 0.3 | | |
See Accompanying Notes to Financial Statements
85
SUMMARY PORTFOLIO OF INVESTMENTS
VOYA GLOBAL BOND PORTFOLIO AS OF DECEMBER 31, 2017 (CONTINUED)
Principal
Amount† | |
| |
| | Value | | Percentage
of Net
Assets | |
| | | | | United Kingdom: 1.4% | |
| | 230,000 | | | | (1 | ) | | Anglo American
Capital PLC,
4.750%, 04/10/27 | | $ | 241,018 | | | | 0.1 | | |
| | 200,000 | | | | (1 | ) | | Reckitt Benckiser
Treasury Services
PLC,
3.000%, 06/26/27 | | | 195,507 | | | | 0.1 | | |
| | 239,000 | | | | (1 | ) | | Santander UK Group
Holdings PLC,
5.625%, 09/15/45 | | | 290,369 | | | | 0.1 | | |
| | 1,002,000 | | | | | | | Santander UK PLC,
2.375%, 03/16/20 | | | 1,002,514 | | | | 0.5 | | |
| | 400,000 | | | | (1 | ),(3) | | Standard Chartered
PLC, 4.300%,
02/19/27 | | | 408,317 | | | | 0.2 | | |
| | 200,000 | | | | (1 | ) | | Virgin Media Secured
Finance PLC,
5.250%, 01/15/26 | | | 202,750 | | | | 0.1 | | |
| | 813,000 | | | | | | | Other Securities | | | 825,889 | | | | 0.3 | | |
| | | | | | | | | | 3,166,364 | | | | 1.4 | | |
| | | | | United States: 18.7% | |
| | 724,000 | | | | | | | 21st Century Fox
America, Inc.,
4.500%-5.400%,
02/15/21-10/01/43 | | | 820,565 | | | | 0.4 | | |
| | 987,000 | | | | | | | Anheuser-Busch
InBev Finance, Inc.,
2.650%-3.650%,
02/01/21-02/01/26 | | | 1,008,018 | | | | 0.4 | | |
| | 301,000 | | | | (1 | ) | | AT&T, Inc., 4.300%,
02/15/30 | | | 301,354 | | | | 0.1 | | |
| | 729,000 | | | | | | | AT&T, Inc.,
5.150%-5.450%,
03/15/42-03/01/47 | | | 771,980 | | | | 0.4 | | |
| | 387,000 | | | | (1 | ) | | Bank of America
Corp., 3.419%,
12/20/28 | | | 387,451 | | | | 0.2 | | |
| | 993,000 | | | | | | | Bank of America
Corp.,
3.300%-4.100%,
01/11/23-04/01/24 | | | 1,039,985 | | | | 0.4 | | |
| | 105,000 | | | | (1 | ) | | Brink's Co/The,
4.625%, 10/15/27 | | | 103,162 | | | | 0.1 | | |
| | 300,000 | | | | (1 | ) | | Builders FirstSource,
Inc., 5.625%,
09/01/24 | | | 313,335 | | | | 0.1 | | |
| | 540,000 | | | | (1 | ) | | Calpine Corp.,
6.000%, 01/15/22 | | | 558,225 | | | | 0.3 | | |
| | 60,000 | | | | (1 | ) | | CCO Holdings LLC/
CCO Holdings
Capital Corp.,
5.125%, 05/01/27 | | | 59,250 | | | | 0.0 | | |
| | 1,048,000 | | | | | | | Citigroup, Inc.,
4.000%-5.500%,
08/05/24-09/13/25 | | | 1,133,641 | | | | 0.5 | | |
Principal
Amount† | |
| |
| | Value | | Percentage
of Net
Assets | |
| | 758,000 | | | | | | | Citizens Bank NA/
Providence RI,
2.450%, 12/04/19 | | $ | 758,762 | | | | 0.3 | | |
| | 185,000 | | | | (1 | ) | | CommScope
Technologies LLC,
5.000%, 03/15/27 | | | 185,462 | | | | 0.1 | | |
| | 255,000 | | | | (1 | ) | | Continental
Resources,
Inc./OK, 4.375%,
01/15/28 | | | 252,055 | | | | 0.1 | | |
| | 562,000 | | | | (1 | ) | | Cox Communications,
Inc., 2.950%,
06/30/23 | | | 554,620 | | | | 0.3 | | |
| | 335,000 | | | | (1 | ) | | CRC Escrow Issuer
LLC/CRC Finco, Inc.,
5.250%, 10/15/25 | | | 339,288 | | | | 0.2 | | |
| | 777,000 | | | | | | | CVS Health Corp.,
2.800%, 07/20/20 | | | 780,648 | | | | 0.3 | | |
| | 177,000 | | | | (1 | ) | | Dell International
LLC/EMC Corp.,
4.420%, 06/15/21 | | | 184,564 | | | | 0.1 | | |
| | 480,000 | | | | (1 | ) | | Dell International
LLC/EMC Corp.,
5.450%, 06/15/23 | | | 519,231 | | | | 0.2 | | |
| | 313,000 | | | | (1 | ) | | Dell International
LLC/EMC Corp.,
6.020%, 06/15/26 | | | 345,600 | | | | 0.2 | | |
| | 1,026,000 | | | | | | | Energy Transfer L.P.,
4.900%, 02/01/24 | | | 1,086,171 | | | | 0.5 | | |
| | 470,000 | | | | (1 | ) | | ESH Hospitality, Inc.,
5.250%, 05/01/25 | | | 475,875 | | | | 0.2 | | |
| | 310,000 | | | | (1 | ) | | First Data Corp.,
5.750%, 01/15/24 | | | 323,097 | | | | 0.1 | | |
| | 940,000 | | | | | | | Goldman Sachs
Group, Inc./The,
2.876%, 10/31/22 | | | 937,709 | | | | 0.4 | | |
| | 70,000 | | | | (1 | ) | | Hess Infrastructure
Partners L.P./Hess
Infrastructure
Partners Finance
Corp., 5.625%,
02/15/26 | | | 72,625 | | | | 0.0 | | |
| | 115,000 | | | | (1 | ) | | Hill-Rom Holdings,
Inc., 5.000%,
02/15/25 | | | 117,840 | | | | 0.1 | | |
| | 75,000 | | | | (1 | ) | | IHS Markit Ltd,
4.000%, 03/01/26 | | | 75,281 | | | | 0.0 | | |
| | 1,041,000 | | | | | | | Indiana Michigan
Power Co., 7.000%,
03/15/19 | | | 1,097,782 | | | | 0.5 | | |
| | 320,000 | | | | (1 | ) | | Iron Mountain, Inc.,
5.250%, 03/15/28 | | | 320,000 | | | | 0.1 | | |
| | 570,000 | | | | (1 | ) | | JBS USA LUX
SA/JBS USA
Finance, Inc.,
5.875%, 07/15/24 | | | 553,613 | | | | 0.2 | | |
See Accompanying Notes to Financial Statements
86
SUMMARY PORTFOLIO OF INVESTMENTS
VOYA GLOBAL BOND PORTFOLIO AS OF DECEMBER 31, 2017 (CONTINUED)
Principal
Amount† | |
| |
| | Value | | Percentage
of Net
Assets | |
| | | | | United States (continued) | |
| | 1,197,000 | | | | | | | JPMorgan
Chase & Co.,
1.625%-6.000%,
05/15/2018-
12/31/2199 | | $ | 1,234,165 | | | | 0.5 | | |
| | 291,000 | | | | (1 | ) | | Lennar Corp.,
4.750%, 11/29/27 | | | 301,127 | | | | 0.1 | | |
| | 380,000 | | | | (1 | ) | | Metropolitan Edison
Co.,
4.000%, 04/15/25 | | | 391,029 | | | | 0.2 | | |
| | 372,000 | | | | | Morgan Stanley,
3.750%, 02/25/23 | | | 385,741 | | | | 0.2 | | |
| | 618,000 | | | | | | | Morgan Stanley,
4.100%, 05/22/23 | | | 644,540 | | | | 0.3 | | |
| | 625,000 | | | | | | | Netflix, Inc.,
5.750%, 03/01/24 | | | 666,406 | | | | 0.3 | | |
| | 175,000 | | | | (1 | ) | | Nielsen Finance
LLC/Nielsen
Finance Co.,
5.000%, 04/15/22 | | | 180,469 | | | | 0.1 | | |
| | 315,000 | | | | (1 | ) | | Novelis Corp.,
5.875%, 09/30/26 | | | 322,088 | | | | 0.1 | | |
| | 140,000 | | | | (1 | ) | | Owens-Brockway
Glass Container,
Inc., 5.875%,
08/15/23 | | | 151,113 | | | | 0.1 | | |
| | 475,000 | | | | (1 | ) | | Post Holdings, Inc.,
5.000%, 08/15/26 | | | 468,469 | | | | 0.2 | | |
| | 245,000 | | | | (1 | ) | | Quicken Loans, Inc.,
5.250%, 01/15/28 | | | 242,477 | | | | 0.1 | | |
| | 135,000 | | | | (1 | ) | | Sirius XM Radio, Inc.,
5.000%, 08/01/27 | | | 136,013 | | | | 0.0 | | |
| | 175,000 | | | | (1 | ) | | Sirius XM Radio, Inc.,
5.375%, 04/15/25 | | | 182,656 | | | | 0.1 | | |
| | 95,000 | | | | (1 | ) | | Six Flags
Entertainment Corp.,
4.875%, 07/31/24 | | | 96,663 | | | | 0.0 | | |
| | 370,000 | | | | (1 | ) | | Six Flags
Entertainment Corp.,
5.500%, 04/15/27 | | | 383,875 | | | | 0.2 | | |
| | 235,000 | | | | (1 | ) | | Standard Industries,
Inc./NJ,
5.000%, 02/15/27 | | | 240,875 | | | | 0.1 | | |
| | 335,000 | | | | (1 | ) | | Tallgrass Energy
Partners L.P./
Tallgrass Energy
Finance Corp.,
5.500%, 01/15/28 | | | 339,506 | | | | 0.2 | | |
| | 272,000 | | | | | | | Time Warner Cable
LLC, 5.875%,
11/15/40 | | | 295,852 | | | | 0.1 | | |
| | 485,000 | | | | | | | Time Warner, Inc.,
6.500%, 11/15/36 | | | 609,262 | | | | 0.3 | | |
| | 480,000 | | | | (1 | ) | | Univision
Communications,
Inc.,
5.125%, 02/15/25 | | | 469,200 | | | | 0.2 | | |
Principal
Amount† | |
| |
| | Value | | Percentage
of Net
Assets | |
| | 505,000 | | | | (1 | ),(3) | | Valeant
Pharmaceuticals
International, Inc.,
7.250%, 07/15/22 | | $ | 512,575 | | | | 0.2 | | |
| | 599,000 | | | | | | | Wells Fargo & Co.,
4.100%, 06/03/26 | | | 628,631 | | | | 0.3 | | |
| | 250,000 | | | | (1 | ) | | Wynn Las Vegas
LLC/Wynn Las
Vegas Capital Corp.,
5.500%, 03/01/25 | | | 258,125 | | | | 0.1 | | |
| | 17,729,000 | | | | (2 | ),(6) | | Other Securities | | | 17,968,934 | | | | 7.9 | | |
| | | | | | | | | | 42,586,980 | | | | 18.7 | | |
| | | | | | | Total Corporate
Bonds/Notes
(Cost $55,957,743) | | | 57,335,380 | | | | 25.1 | | |
COLLATERALIZED MORTGAGE OBLIGATIONS: 13.0% | | | |
| | | | | United States: 13.0% | |
| | 311,594 | | | | | | | Alternative Loan Trust
2005-51 3A2A,
2.353%, (12MTA +
1.290%), 11/20/35 | | | 302,245 | | | | 0.1 | | |
| | 598,641 | | | | | | | Bank of America
Funding 2005-1
Trust 1A1, 5.500%,
02/25/35 | | | 600,715 | | | | 0.3 | | |
| | 126,493 | | | | | | | Citigroup Mortgage
Loan Trust, Inc.
2005-2 1A3,
3.489%, 05/25/35 | | | 127,327 | | | | 0.0 | | |
| | 388,990 | | | | | | | CitiMortgage
Alternative Loan
Trust Series
2006-A3 1A7,
6.000%, 07/25/36 | | | 375,572 | | | | 0.2 | | |
| | 66,991 | | | | | | | Countrywide
Alternative Loan
Trust 2005-53T2
2A6, 2.052%,
(US0001M +
0.500%), 11/25/35 | | | 40,886 | | | | 0.0 | | |
| | 300,000 | | | | | | | Countrywide
Asset-Backed
Certificates
2005-IM1 M1,
2.272%, (US0001M +
0.720%), 11/25/35 | | | 289,544 | | | | 0.1 | | |
| | 20,482 | | | | (1 | ) | | Deutsche ALT-A
Securities, Inc.
ALT2007-RS1 A2,
2.052%, (US0001M +
0.500%), 01/27/37 | | | 97,244 | | | | 0.0 | | |
| | 500,000 | | | | | | | Fannie Mae
Connecticut Avenue
Securities 2017-C03
1M2, 4.552%,
(US0001M +
3.000%), 10/25/29 | | | 526,264 | | | | 0.2 | | |
See Accompanying Notes to Financial Statements
87
SUMMARY PORTFOLIO OF INVESTMENTS
VOYA GLOBAL BOND PORTFOLIO AS OF DECEMBER 31, 2017 (CONTINUED)
Principal
Amount† | |
| |
| | Value | | Percentage
of Net
Assets | |
| | | | | United States (continued) | |
| | 500,000 | | | | | | | Fannie Mae
Connecticut
Avenue Securities
2017-C05 1M2,
3.752%, (US0001M +
2.200%), 01/25/30 | | $ | 505,655 | | | | 0.2 | | |
| | 300,000 | | | | | | | Fannie Mae
Connecticut Avenue
Securities
2017-C07 1M2,
3.952%,
(US0001M +
2.400%), 05/25/30 | | | 308,215 | | | | 0.1 | | |
| | 600,000 | | | | | | | Fannie Mae
Connecticut Avenue
Securities
2017-C07 2M2,
4.052%,
(US0001M +
2.500%), 05/25/30 | | | 618,469 | | | | 0.3 | | |
| | 81,856 | | | | (7 | ) | | Fannie Mae Interest
Strip Sereis 328
2, 6.000%, 12/25/32 | | | 19,344 | | | | 0.0 | | |
| | 42,068 | | | | (7 | ) | | Fannie Mae Interest
Strip Sereis 332 2,
6.000%, 03/25/33 | | | 10,028 | | | | 0.0 | | |
| | 167,202 | | | | (7 | ) | | Fannie Mae Interest
Strip Series 254 2,
7.500%, 01/25/24 | | | 27,725 | | | | 0.0 | | |
| | 26,735 | | | | (7 | ) | | Fannie Mae Interest
Strip Series 294 2,
7.000%, 02/25/28 | | | 6,066 | | | | 0.0 | | |
| | 219,228 | | | | (7 | ) | | Fannie Mae Interest
Strip Series 319 2,
6.500%, 02/25/32 | | | 47,802 | | | | 0.0 | | |
| | 35,720 | | | | (7 | ) | | Fannie Mae Interest
Strip Series 331 5,
6.000%, 02/25/33 | | | 7,438 | | | | 0.0 | | |
| | 34,598 | | | | (7 | ) | | Fannie Mae Interest
Strip Series 334 12,
6.000%, 03/25/33 | | | 8,111 | | | | 0.0 | | |
| | 42,689 | | | | (7 | ) | | Fannie Mae Interest
Strip Series 338 2,
5.500%, 07/25/33 | | | 9,438 | | | | 0.0 | | |
| | 18,205 | | | | (7 | ) | | Fannie Mae Interest
Strip Series 356 10,
5.500%, 06/25/35 | | | 3,708 | | | | 0.0 | | |
| | 19,493 | | | | (7 | ) | | Fannie Mae Interest
Strip Series 364 15,
6.000%, 09/25/35 | | | 4,136 | | | | 0.0 | | |
| | 572,883 | | | | (7 | ) | | Fannie Mae Interest
Strip Series 418 5,
3.500%, 08/25/43 | | | 98,082 | | | | 0.1 | | |
| | 878,417 | | | | (7 | ) | | Fannie Mae Interest
Strip Series 418 80,
3.500%, 08/25/33 | | | 122,452 | | | | 0.1 | | |
| | 13,928 | | | | | | | Fannie Mae REMIC
Trust 1999-14 MB,
6.500%, 04/25/29 | | | 15,447 | | | | 0.0 | | |
Principal
Amount† | |
| |
| | Value | | Percentage
of Net
Assets | |
| | 21,003 | | | | | | | Fannie Mae REMIC
Trust
1999-54 LH,
6.500%, 11/25/29 | | $ | 23,242 | | | | 0.0 | | |
| | 18,770 | | | | | | | Fannie Mae REMIC
Trust
2001-80 ZB,
6.000%, 01/25/32 | | | 20,871 | | | | 0.0 | | |
| | 84,784 | | | | (7 | ) | | Fannie Mae REMIC
Trust 2002-12 SB,
6.198%,
(-1.000*US0001M +
7.750%), 07/25/31 | | | 16,685 | | | | 0.0 | | |
| | 48,891 | | | | (7 | ) | | Fannie Mae REMIC
Trust 2002-2 SW,
6.198%,
(-1.000*US0001M +
7.750%), 02/25/32 | | | 9,911 | | | | 0.0 | | |
| | 22,358 | | | | | | | Fannie Mae REMIC
Trust 2002-21 PE,
6.500%, 04/25/32 | | | 25,132 | | | | 0.0 | | |
| | 8,848 | | | | | | | Fannie Mae REMIC
Trust 2002-29 F,
2.552%, (US0001M +
1.000%), 04/25/32 | | | 9,068 | | | | 0.0 | | |
| | 31,873 | | | | (7 | ) | | Fannie Mae REMIC
Trust 2002-41 S,
6.398%,
(-1.000*US0001M +
7.950%), 07/25/32 | | | 5,981 | | | | 0.0 | | |
| | 2,723 | | | | | | | Fannie Mae REMIC
Trust 2002-64 FJ,
2.552%, (US0001M +
1.000%), 04/25/32 | | | 2,791 | | | | 0.0 | | |
| | 5,805 | | | | | | | Fannie Mae REMIC
Trust 2002-68 FH,
1.991%, (US0001M +
0.500%), 10/18/32 | | | 5,832 | | | | 0.0 | | |
| | 968,615 | | | | (7 | ) | | Fannie Mae REMIC
Trust 2002-77 JS,
6.509%,
(-1.000*US0001M +
8.000%), 12/18/32 | | | 193,154 | | | | 0.1 | | |
| | 25,670 | | | | | | | Fannie Mae REMIC
Trust 2002-84 FB,
2.552%, (US0001M +
1.000%), 12/25/32 | | | 26,278 | | | | 0.0 | | |
| | 25,667 | | | | | | | Fannie Mae REMIC
Trust 2003-11 FA,
2.552%, (US0001M +
1.000%), 09/25/32 | | | 26,275 | | | | 0.0 | | |
| | 5,538 | | | | | | | Fannie Mae REMIC
Trust 2003-116 FA,
1.952%, (US0001M +
0.400%), 11/25/33 | | | 5,544 | | | | 0.0 | | |
| | 33,373 | | | | (7 | ) | | Fannie Mae REMIC
Trust 2003-13 IO,
7.000%, 03/25/33 | | | 8,378 | | | | 0.0 | | |
| | 25,332 | | | | (7 | ) | | Fannie Mae REMIC
Trust 2003-26 IK,
7.000%, 04/25/33 | | | 5,887 | | | | 0.0 | | |
See Accompanying Notes to Financial Statements
88
SUMMARY PORTFOLIO OF INVESTMENTS
VOYA GLOBAL BOND PORTFOLIO AS OF DECEMBER 31, 2017 (CONTINUED)
Principal
Amount† | |
| |
| | Value | | Percentage
of Net
Assets | |
| | | | | United States (continued) | |
| | 19,171 | | | | (7 | ) | | Fannie Mae REMIC
Trust
2003-52 NS, 5.548%,
(-1.000*US0001M +
7.100%), 06/25/23 | | $ | 1,540 | | | | 0.0 | | |
| | 134,473 | | | | (7 | ) | | Fannie Mae REMIC
Trust 2004-56 SE,
5.998%,
(-1.000*US0001M +
7.550%), 10/25/33 | | | 27,490 | | | | 0.0 | | |
| | 36,858 | | | | | | | Fannie Mae REMIC
Trust 2005-25 PS,
21.331%,
(-4.400*US0001M +
28.160%), 04/25/35 | | | 59,391 | | | | 0.0 | | |
| | 17,396 | | | | (7 | ) | | Fannie Mae REMIC
Trust 2005-40 SB,
5.198%,
(-1.000*US0001M +
6.750%), 05/25/35 | | | 2,561 | | | | 0.0 | | |
| | 81,999 | | | | | | | Fannie Mae REMIC
Trust
2005-71 DB,
4.500%, 08/25/25 | | | 84,780 | | | | 0.0 | | |
| | 112,127 | | | | | | | Fannie Mae REMIC
Trust 2005-74 DK,
17.792%,
(-4.000*US0001M +
24.000%), 07/25/35 | | | 174,986 | | | | 0.1 | | |
| | 365,995 | | | | | | | Fannie Mae REMIC
Trust 2005-87 SB,
18.142%,
(-3.667*US0001M +
23.830%), 10/25/35 | | | 551,450 | | | | 0.3 | | |
| | 291,183 | | | | | | | Fannie Mae REMIC
Trust
2006-104 ES,
25.689%,
(-5.000*US0001M +
33.450%), 11/25/36 | | | 506,037 | | | | 0.2 | | |
| | 18,335 | | | | | | | Fannie Mae REMIC
Trust
2006-11 PS,
18.876%,
(-3.667*US0001M +
24.570%), 03/25/36 | | | 28,518 | | | | 0.0 | | |
| | 48,397 | | | | | | | Fannie Mae REMIC
Trust 2006-46 SW,
18.508%,
(-3.667*US0001M +
24.200%), 06/25/36 | | | 73,668 | | | | 0.0 | | |
| | 277,561 | | | | (7 | ) | | Fannie Mae REMIC
Trust 2006-51 SA,
5.018%,
(-1.000*US0001M +
6.570%), 06/25/36 | | | 47,611 | | | | 0.0 | | |
| | 91,174 | | | | (7 | ) | | Fannie Mae REMIC
Trust 2006-90 SX,
5.678%,
(-1.000*US0001M +
7.230%), 09/25/36 | | | 16,773 | | | | 0.0 | | |
Principal
Amount† | |
| |
| | Value | | Percentage
of Net
Assets | |
| | 10,550,552 | | | | (7 | ) | | Fannie Mae REMIC
Trust
2007-116 DI, 4.388%,
(-1.000*US0001M +
5.940%), 01/25/38 | | $ | 1,722,535 | | | | 0.8 | | |
| | 80,008 | | | | (7 | ) | | Fannie Mae REMIC
Trust 2007-88 XI,
4.988%,
(-1.000*US0001M +
6.540%), 06/25/37 | | | 14,536 | | | | 0.0 | | |
| | 1,039,457 | | | | (7 | ) | | Fannie Mae REMIC
Trust
2007-89 SB,
4.998%,
(-1.000*US0001M +
6.550%), 09/25/37 | | | 179,912 | | | | 0.1 | | |
| | 2,244,578 | | | | (7 | ) | | Fannie Mae REMIC
Trust 2007-94 SG,
4.898%,
(-1.000*US0001M +
6.450%), 10/25/37 | | | 388,116 | | | | 0.2 | | |
| | 248,774 | | | | | | | Fannie Mae REMIC
Trust 2010-109 SN,
18.197%,
(-5.000*US0001M +
25.000%), 10/25/40 | | | 553,476 | | | | 0.3 | | |
| | 156,240 | | | | | | | Fannie Mae REMIC
Trust
2010-155 PL,
5.000%, 07/25/40 | | | 162,544 | | | | 0.1 | | |
| | 4,083,746 | | | | (7 | ) | | Fannie Mae REMIC
Trust
2011-55 SK,
5.008%,
(-1.000*US0001M +
6.560%), 06/25/41 | | | 754,047 | | | | 0.3 | | |
| | 11,803 | | | | (7 | ) | | Fannie Mae REMIC
Trust 2011-69 AI,
5.000%, 05/25/18 | | | 42 | | | | 0.0 | | |
| | 3,284,977 | | | | (7 | ) | | Fannie Mae REMIC
Trust 2011-86 NS,
4.398%,
(-1.000*US0001M +
5.950%), 09/25/41 | | | 470,330 | | | | 0.2 | | |
| | 2,250,271 | | | | (7 | ) | | Fannie Mae REMIC
Trust 2012-10 US,
4.898%,
(-1.000*US0001M +
6.450%), 02/25/42 | | | 309,160 | | | | 0.1 | | |
| | 1,676,564 | | | | (7 | ) | | Fannie Mae REMIC
Trust 2012-110 JI,
4.000%, 06/25/42 | | | 237,767 | | | | 0.1 | | |
| | 5,542,624 | | | | (7 | ) | | Fannie Mae REMIC
Trust 2012-133 PS,
4.648%,
(-1.000*US0001M +
6.200%), 03/25/42 | | | 690,883 | | | | 0.3 | | |
| | 2,655,685 | | | | (7 | ) | | Fannie Mae REMIC
Trust 2012-144 SB,
4.548%,
(-1.000*US0001M +
6.100%), 01/25/43 | | | 584,738 | | | | 0.3 | | |
See Accompanying Notes to Financial Statements
89
SUMMARY PORTFOLIO OF INVESTMENTS
VOYA GLOBAL BOND PORTFOLIO AS OF DECEMBER 31, 2017 (CONTINUED)
Principal
Amount† | |
| |
| | Value | | Percentage
of Net
Assets | |
| | | | | United States (continued) | |
| | 2,880,071 | | | | (7 | ) | | Fannie Mae REMIC
Trust 2012-27 SB,
4.428%,
(-1.000*US0001M +
5.980%),
11/25/41 | | $ | 364,102 | | | | 0.2 | | |
| | 23,601 | | | | | | | Fannie Mae REMIC
Trust 2013-130 ST,
8.000%,
(-16.000*US0001M +
64.000%), 05/25/43 | | | 27,982 | | | | 0.0 | | |
| | 1,761,960 | | | | (7 | ) | | Fannie Mae REMIC
Trust 2013-64 LI,
3.000%, 06/25/33 | | | 236,913 | | | | 0.1 | | |
| | 10,293,789 | | | | (7 | ) | | Freddie Mac 3502 DL,
4.523%,
(-1.000*US0001M +
6.000%), 01/15/39 | | | 1,614,111 | | | | 0.7 | | |
| | 51,315 | | | | | | | Freddie Mac REMIC
Trust 1360 PZ,
7.500%, 09/15/22 | | | 55,359 | | | | 0.0 | | |
| | 30,001 | | | | | | | Freddie Mac REMIC
Trust 1674 Z,
6.750%, 02/15/24 | | | 32,328 | | | | 0.0 | | |
| | 62,818 | | | | | | | Freddie Mac REMIC
Trust 1897 K,
7.000%, 09/15/26 | | | 69,530 | | | | 0.0 | | |
| | 10,972 | | | | (7 | ) | | Freddie Mac REMIC
Trust 2035 PE,
7.000%, 03/15/28 | | | 2,432 | | | | 0.0 | | |
| | 56,441 | | | | (7 | ) | | Freddie Mac REMIC
Trust 2049 PL,
7.000%, 04/15/28 | | | 11,765 | | | | 0.0 | | |
| | 26,901 | | | | | | | Freddie Mac REMIC
Trust 2122 F,
1.927%,
(US0001M +
0.450%), 02/15/29 | | | 27,034 | | | | 0.0 | | |
| | 93,923 | | | | (7 | ) | | Freddie Mac REMIC
Trust 2134 SB,
6.223%,
(-1.000*US0001M +
7.700%), 03/15/29 | | | 14,800 | | | | 0.0 | | |
| | 101,540 | | | | (7 | ) | | Freddie Mac REMIC
Trust 2136 SG,
6.173%,
(-1.000*US0001M +
7.650%), 03/15/29 | | | 17,094 | | | | 0.0 | | |
| | 130,999 | | | | (7 | ) | | Freddie Mac REMIC
Trust 2177 SB,
7.473%,
(-1.000*US0001M +
8.950%), 08/15/29 | | | 26,339 | | | | 0.0 | | |
| | 14,382 | | | | | | | Freddie Mac REMIC
Trust 2344 FP,
2.427%,
(US0001M +
0.950%), 08/15/31 | | | 14,780 | | | | 0.0 | | |
Principal
Amount† | |
| |
| | Value | | Percentage
of Net
Assets | |
| | 6,672 | | | | | | | Freddie Mac REMIC
Trust 2412 GF,
2.427%,
(US0001M +
0.950%), 02/15/32 | | $ | 6,860 | | | | 0.0 | | |
| | 51,026 | | | | | | | Freddie Mac REMIC
Trust 2415 ZA,
6.500%, 02/15/32 | | | 57,476 | | | | 0.0 | | |
| | 40,610 | | | | | | | Freddie Mac REMIC
Trust 2461 PZ,
6.500%, 06/15/32 | | | 44,904 | | | | 0.0 | | |
| | 7,799 | | | | | | | Freddie Mac REMIC
Trust 2464 FI,
2.477%,
(US0001M +
1.000%), 02/15/32 | | | 7,987 | | | | 0.0 | | |
| | 8,000 | | | | | | | Freddie Mac REMIC
Trust 2470 LF,
2.477%,
(US0001M +
1.000%), 02/15/32 | | | 8,192 | | | | 0.0 | | |
| | 10,838 | | | | | | | Freddie Mac REMIC
Trust 2471 FD,
2.477%,
(US0001M +
1.000%), 03/15/32 | | | 11,101 | | | | 0.0 | | |
| | 8,811 | | | | | | | Freddie Mac REMIC
Trust 2504 FP,
1.977%,
(US0001M +
0.500%), 03/15/32 | | | 8,857 | | | | 0.0 | | |
| | 35,091 | | | | | | | Freddie Mac REMIC
Trust 2551 LF,
1.977%,
(US0001M +
0.500%), 01/15/33 | | | 35,249 | | | | 0.0 | | |
| | 99,245 | | | | | | | Freddie Mac REMIC
Trust 2676 KY,
5.000%, 09/15/23 | | | 104,393 | | | | 0.0 | | |
| | 437,081 | | | | | | | Freddie Mac REMIC
Trust 2750 XG,
5.000%, 02/15/34 | | | 470,387 | | | | 0.2 | | |
| | 376,229 | | | | | | | Freddie Mac REMIC
Trust 2890 PE,
5.000%, 11/15/34 | | | 405,568 | | | | 0.2 | | |
| | 72,454 | | | | | | | Freddie Mac REMIC
Trust 3001 HT,
8.000%,
(-6.667*US0001M +
44.670%), 05/15/35 | | | 81,381 | | | | 0.0 | | |
| | 82,709 | | | | (7 | ) | | Freddie Mac REMIC
Trust 3004 SB,
4.673%,
(-1.000*US0001M +
6.150%), 07/15/35 | | | 9,938 | | | | 0.0 | | |
| | 16,630 | | | | | | | Freddie Mac REMIC
Trust 3025 SJ,
19.334%,
(-3.667*US0001M +
24.750%), 08/15/35 | | | 24,911 | | | | 0.0 | | |
See Accompanying Notes to Financial Statements
90
SUMMARY PORTFOLIO OF INVESTMENTS
VOYA GLOBAL BOND PORTFOLIO AS OF DECEMBER 31, 2017 (CONTINUED)
Principal
Amount† | |
| |
| | Value | | Percentage
of Net
Assets | |
| | | | | United States (continued) | |
| | 1,136,201 | | | | (7 | ) | | Freddie Mac REMIC
Trust 3223 S, 4.473%,
(-1.000*US0001M +
5.950%), 10/15/36 | | $ | 144,678 | | | | 0.1 | | |
| | 2,822,297 | | | | (7 | ) | | Freddie Mac REMIC
Trust 3505 SA,
4.523%,
(-1.000*US0001M +
6.000%), 01/15/39 | | | 456,316 | | | | 0.2 | | |
| | 3,136,751 | | | | (7 | ) | | Freddie Mac REMIC
Trust 3702 S,
2.973%,
(-1.000*US0001M +
4.450%), 05/15/36 | | | 277,368 | | | | 0.1 | | |
| | 2,681,136 | | | | (7 | ) | | Freddie Mac REMIC
Trust 3710 SL,
4.523%,
(-1.000*US0001M +
6.000%), 05/15/36 | | | 135,795 | | | | 0.1 | | |
| | 238,924 | | | | (7 | ) | | Freddie Mac REMIC
Trust 3803 SG,
5.123%,
(-1.000*US0001M +
6.600%), 08/15/28 | | | 5,087 | | | | 0.0 | | |
| | 3,207,262 | | | | (7 | ) | | Freddie Mac REMIC
Trust 3925 SD,
4.573%,
(-1.000*US0001M +
6.050%), 07/15/40 | | | 383,050 | | | | 0.2 | | |
| | 1,665,951 | | | | (7 | ) | | Freddie Mac REMIC
Trust 4136 SW,
4.773%,
(-1.000*US0001M +
6.250%), 11/15/32 | | | 266,990 | | | | 0.1 | | |
| | 741,631 | | | | (7 | ) | | Freddie Mac REMIC
Trust 4161 CI,
4.000%, 02/15/43 | | | 133,621 | | | | 0.1 | | |
| | 11,322,502 | | | | (7 | ) | | Freddie Mac
REMIC Trust 4194
GI, 4.000%,
04/15/43 | | | 1,939,913 | | | | 0.9 | | |
| | 1,333,323 | | | | (7 | ) | | Freddie Mac Series
4120 IK, 3.000%,
10/15/32 | | | 172,618 | | | | 0.1 | | |
| | 100,000 | | | | | | | Freddie Mac
Structured Agency
Credit Risk Debt
Notes 2015-DNA3
M3, 6.252%,
(US0001M +
4.700%), 04/25/28 | | | 118,239 | | | | 0.1 | | |
| | 400,000 | | | | | | | Freddie Mac
Structured Agency
Credit Risk Debt
Notes 2017-DNA3
M2, 4.052%,
(US0001M +
2.500%), 03/25/30 | | | 414,782 | | | | 0.2 | | |
Principal
Amount† | |
| |
| | Value | | Percentage
of Net
Assets | |
| | 600,000 | | | | | | | Freddie Mac
Structured Agency
Credit Risk Debt
Notes 2017-HQA2 M2,
4.202%, (US0001M +
2.650%), 12/25/29 | | $ | 621,195 | | | | 0.3 | | |
| | 476,634 | | | | | | | Ginnie Mae Series
2007-8 SP, 17.181%,
(-3.242*US0001M +
22.050%), 03/20/37 | | | 684,013 | | | | 0.3 | | |
| | 2,774,624 | | | | (7 | ) | | Ginnie Mae Series
2010-165 IP, 4.000%,
04/20/38 | | | 123,811 | | | | 0.1 | | |
| | 2,632,697 | | | | (7 | ) | | Ginnie Mae Series
2010-68 MS, 4.349%,
(-1.000*US0001M +
5.850%), 06/20/40 | | | 378,672 | | | | 0.2 | | |
| | 1,884,439 | | | | (7 | ) | | Ginnie Mae Series
2012-97 SC, 5.209%,
(-1.000*US0001M +
6.700%), 07/16/41 | | | 312,485 | | | | 0.1 | | |
| | 283,778 | | | | | | | GreenPoint Mortgage
Funding Trust
2006-AR3 4A1,
1.762%,
(US0001M +
0.210%), 04/25/36 | | | 262,614 | | | | 0.1 | | |
| | 723,895 | | | | | | | IndyMac INDX
Mortgage Loan Trust
2006-AR2 1A1B,
1.762%,
(US0001M +
0.210%), 04/25/46 | | | 671,882 | | | | 0.3 | | |
| | 692,665 | | | | | | | JP Morgan Mortgage
Trust 2005-A4 B1,
3.560%, 07/25/35 | | | 625,159 | | | | 0.3 | | |
| | 106,047 | | | | | | | JP Morgan Mortgage
Trust 2007-A1 7A1,
3.658%, 07/25/35 | | | 106,257 | | | | 0.0 | | |
| | 297,709 | | | | (1 | ) | | JP Morgan Mortgage
Trust 2017-3 B1,
3.882%, 08/25/47 | | | 299,814 | | | | 0.1 | | |
| | 153,186 | | | | | | | Lehman XS Trust
Series 2005-5N 1A2,
1.912%,
(US0001M +
0.360%), 11/25/35 | | | 136,600 | | | | 0.1 | | |
| | 8,855,466 | | | | (7 | ) | | WaMu Mortgage
Pass-Through
Certificates Series
2005-AR11 X,
1.121%, 08/25/45 | | | 287,537 | | | | 0.1 | | |
| | 56,867 | | | | | | | WaMu Mortgage
Pass-Through
Certificates Series
2006-AR12 1A1,
3.287%, 10/25/36 | | | 55,559 | | | | 0.0 | | |
See Accompanying Notes to Financial Statements
91
SUMMARY PORTFOLIO OF INVESTMENTS
VOYA GLOBAL BOND PORTFOLIO AS OF DECEMBER 31, 2017 (CONTINUED)
Principal
Amount† | |
| |
| | Value | | Percentage
of Net
Assets | |
| | | | | United States (continued) | |
| | 931,981 | | | | | | | WaMu Mortgage
Pass-Through
Certificates Series
2006-AR16 3A1,
2.992%, 12/25/36 | | $ | 910,400 | | | | 0.4 | | |
| | 210,460 | | | | | | | WaMu Mortgage
Pass-Through
Certificates Series
2006-AR8 1A4,
3.249%, 08/25/46 | | | 199,522 | | | | 0.1 | | |
| | 428,806 | | | | | | | WaMu Mortgage
Pass-Through
Certificates Series
2007-HY2 1A1,
3.163%, 12/25/36 | | | 413,495 | | | | 0.2 | | |
| | 121,547 | | | | | | | WaMu Mortgage
Pass-Through
Certificates Series
2007-HY4 1A1,
2.832%, 04/25/37 | | | 111,135 | | | | 0.1 | | |
| | 139,729 | | | | | | | Wells Fargo
Alternative Loan
2007-PA2 2A1,
1.982%,
(US0001M +
0.430%), 06/25/37 | | | 116,022 | | | | 0.1 | | |
| | 68,414 | | | | | | | Wells Fargo Mortgage
Backed Securities
2005-AR16 2A1,
3.543%, 02/25/34 | | | 70,314 | | | | 0.0 | | |
| | 174,795 | | | | | | | Wells Fargo Mortgage
Backed Securities
2006-8 A15,
6.000%, 07/25/36 | | | 176,474 | | | | 0.1 | | |
| | 219,417 | | | | | | | Wells Fargo Mortgage
Backed Securities
2006-AR17 A1,
3.631%, 10/25/36 | | | 215,052 | | | | 0.1 | | |
| | 47,325 | | | | | | | Wells Fargo Mortgage
Backed Securities
2006-AR17 A2,
3.631%, 10/25/36 | | | 46,384 | | | | 0.0 | | |
| | 278,153 | | | | | | | Wells Fargo Mortgage
Backed Securities
2006-AR7 2A1,
3.336%, 05/25/36 | | | 276,157 | | | | 0.1 | | |
| | 275,376 | | | | | | | Wells Fargo Mortgage
Backed Securities
2006-AR8 3A2,
3.612%, 04/25/36 | | | 273,069 | | | | 0.1 | | |
| | 4,641,581 | | | | | | | Other Securities | | | 1,947,746 | | | | 0.9 | | |
| | | | | | | Total Collateralized
Mortgage
Obligations
(Cost $28,576,107) | | | 29,761,431 | | | | 13.0 | | |
Principal
Amount† | |
| |
| | Value | | Percentage
of Net
Assets | |
STRUCTURED PRODUCTS: 0.0% | | | | | |
| | | | | Russia: 0.0% | |
RUB | 5,083,300 | | | | (4 | ) | | Morgan
Stanley & Co.
International
PLC - EM Whole
Loan SA /Russian
Federation Total
Return Linked
Bonds, Series 007,
Cl. VR, 5.000%,
8/22/34 | | $ | 38,901 | | | | 0.0 | | |
| | | | | | | Total Structured
Products
(Cost $181,592) | | | 38,901 | | | | 0.0 | | |
U.S. GOVERNMENT AGENCY OBLIGATIONS(8): 1.1% | | | | | |
| | | | | Federal Home Loan Mortgage
Corporation(8): 0.6% | |
| | 1,200,908 | | | | | | | 4.000%-6.500%,
01/01/18-05/01/46 | | | 1,261,753 | | | | 0.6 | | |
| | | | | Federal National Mortgage
Association(8): 0.5% | |
| | 1,144,968 | | | | | | | 2.500%-7.500%,
09/01/19-05/01/45 | | | 1,234,586 | | | | 0.5 | | |
| | | | | Government National Mortgage
Association: 0.0% | |
| | 65,865 | | | | | | | 5.000%-6.500%,
04/15/34-02/20/35 | | | 72,922 | | | | 0.0 | | |
| | | | | | | Total U.S.
Government
Agency Obligations
(Cost $2,529,342) | | | 2,569,261 | | | | 1.1 | | |
U.S. TREASURY OBLIGATIONS: 9.8% | | | | | |
| | | | | U.S. Treasury Bonds: 1.0% | |
| | 2,353,000 | | | | | | | 2.750%, 08/15/47 | | | 2,353,802 | | | | 1.0 | | |
| | | | | U.S. Treasury Notes: 8.8% | |
| | 2,744,000 | | | | | | | 1.875%, 12/15/20 | | | 2,736,124 | | | | 1.2 | | |
| | 1,071,000 | | | | (3 | ) | | 2.000%, 11/30/22 | | | 1,061,227 | | | | 0.5 | | |
| | 1,167,000 | | | | | | | 2.125%, 11/30/24 | | | 1,151,562 | | | | 0.5 | | |
| | 9,859,000 | | | | (3 | ) | | 2.250%, 11/15/27 | | | 9,718,371 | | | | 4.2 | | |
| | 3,420,000 | | | | | | | 0.625%, 06/30/18 | | | 3,405,974 | | | | 1.5 | | |
| | 1,773,000 | | | | (3 | ) | | 1.750%, 11/30/19 | | | 1,768,528 | | | | 0.8 | | |
| | 250,000 | | | | | | | 1.250%-1.625%,
10/31/21-10/31/23 | | | 241,450 | | | | 0.1 | | |
| | | | | | | | | | 20,083,236 | | | | 8.8 | | |
| | | | | | | Total U.S. Treasury
Obligations
(Cost $22,400,296) | | | 22,437,038 | | | | 9.8 | | |
See Accompanying Notes to Financial Statements
92
SUMMARY PORTFOLIO OF INVESTMENTS
VOYA GLOBAL BOND PORTFOLIO AS OF DECEMBER 31, 2017 (CONTINUED)
Principal
Amount† | |
| |
| | Value | | Percentage
of Net
Assets | |
ASSET-BACKED SECURITIES: 4.2% | | | |
| | | | | Cayman Islands: 3.7% | |
| | 350,000 | | | | (1 | ) | | ALM VII R-2 Ltd.
2013-7R2A A2R,
3.359%, (US0003M +
2.000%), 10/15/27 | | $ | 352,728 | | | | 0.2 | | |
| | 240,000 | | | | (1 | ) | | Apidos CLO
XI 2012-11A BR,
3.303%, (US0003M +
1.950%), 01/17/28 | | | 241,759 | | | | 0.1 | | |
| | 210,000 | | | | (1 | ) | | Apidos CLO XVII
2014-17A A2R,
3.203%, (US0003M +
1.850%), 04/17/26 | | | 210,377 | | | | 0.1 | | |
| | 370,000 | | | | (1 | ) | | Apidos CLO XVII
2014-17A BR,
3.853%, (US0003M +
2.500%), 04/17/26 | | | 370,939 | | | | 0.2 | | |
| | 250,000 | | | | (1 | ) | | ArrowMark Colorado
Holdings 2017-7A C,
3.504%, (US0003M +
1.900%), 07/15/30 | | | 250,487 | | | | 0.1 | | |
| | 250,000 | | | | (1 | ) | | Avery Point IV CLO
Ltd. 2014-1A CR,
3.717%, (US0003M +
2.350%), 04/25/26 | | | 250,843 | | | | 0.1 | | |
| | 250,000 | | | | (1 | ) | | Babson CLO Ltd.
2014-IA BR,
3.563%,
(US0003M + 2.200%),
07/20/25 | | | 250,552 | | | | 0.1 | | |
| | 510,000 | | | | (1 | ) | | BlueMountain CLO
2012-2A BR, 3.336%,
(US0003M + 1.900%),
11/20/28 | | | 513,628 | | | | 0.2 | | |
| | 330,000 | | | | (1 | ) | | BlueMountain CLO
2014-4A B1R,
3.318%, (US0003M +
1.850%), 11/30/26 | | | 331,812 | | | | 0.2 | | |
| | 300,000 | | | | (1 | ) | | BlueMountain CLO
2014-4A CR, 4.018%,
(US0003M +
2.550%), 11/30/26 | | | 302,052 | | | | 0.1 | | |
| | 640,000 | | | | (1 | ) | | Bristol Park CLO Ltd.
2016-1A B, 3.259%,
(US0003M +
1.900%), 04/15/29 | | | 644,853 | | | | 0.3 | | |
| | 290,000 | | | | (1 | ) | | Carlyle Global Market
Strategies CLO Ltd.
2012-4A BR,
3.263%, (US0003M +
1.900%), 01/20/29 | | | 293,014 | | | | 0.1 | | |
| | 250,000 | | | | (1 | ) | | Carlyle Global Market
Strategies CLO Ltd.
2014-3A BR,
3.525%,
(US0003M +
2.150%), 07/27/26 | | | 251,221 | | | | 0.1 | | |
Principal
Amount† | |
| |
| | Value | | Percentage
of Net
Assets | |
| | 250,000 | | | | (1 | ) | | Cedar Funding II CLO
Ltd. 2013-1A CR,
3.886%, (US0003M +
2.350%), 06/09/30 | | $ | 251,952 | | | | 0.1 | | |
| | 500,000 | | | | (1 | ) | | Cedar Funding IV
CLO Ltd. 2014-4A
CR, 3.613%,
(US0003M +
2.250%), 07/23/30 | | | 502,258 | | | | 0.2 | | |
| | 520,000 | | | | (1 | ) | | Dryden 33 Senior
Loan Fund 2014-33A
BR, 3.209%,
(US0003M +
1.850%), 10/15/28 | | | 524,994 | | | | 0.2 | | |
| | 250,000 | | | | (1 | ) | | Madison Park
Funding XI Ltd.
2013-11A CR,
3.563%,
(US0003M +
2.200%), 07/23/29 | | | 250,561 | | | | 0.1 | | |
| | 250,000 | | | | (1 | ) | | Octagon Investment
Partners XIX Ltd.
2014-1A CR,
3.459%,
(US0003M +
2.100%), 04/15/26 | | | 250,220 | | | | 0.1 | | |
| | 250,000 | | | | (1 | ) | | Palmer Square CLO
2015-2A BR Ltd.,
3.763%,
(US0003M +
2.400%), 07/20/30 | | | 252,486 | | | | 0.1 | | |
| | 575,000 | | | | (1 | ) | | Palmer Square Loan
Funding 2017-1A D
Ltd., 6.170%,
(US0003M +
4.850%), 10/15/25 | | | 573,511 | | | | 0.3 | | |
| | 266,000 | | | | (1 | ) | | Recette CLO Ltd.
2015-1A CR,
3.063%,
(US0003M +
1.700%), 10/20/27 | | | 266,704 | | | | 0.1 | | |
| | 250,000 | | | | (1 | ) | | Thacher Park CLO
Ltd. 2014-1A CR,
3.563%,
(US0003M +
2.200%), 10/20/26 | | | 250,806 | | | | 0.1 | | |
| | 250,000 | | | | (1 | ) | | THL Credit Wind
River 2013-2A CR
CLO Ltd., 3.354%,
(US0003M +
2.000%), 10/18/30 | | | 251,981 | | | | 0.1 | | |
| | 560,000 | | | | (1 | ) | | THL Credit Wind River
2017-3A C CLO Ltd.,
3.439%,
(US0003M +
2.200%), 10/15/30 | | | 565,889 | | | | 0.3 | | |
| | 250,000 | | | | (1 | ) | | THL Credit Wind River
2017-4A C CLO Ltd.,
3.256%,
(US0003M +
1.750%), 11/20/30 | | | 250,460 | | | | 0.1 | | |
| | | | | | | | | | 8,456,087 | | | | 3.7 | | |
See Accompanying Notes to Financial Statements
93
SUMMARY PORTFOLIO OF INVESTMENTS
VOYA GLOBAL BOND PORTFOLIO AS OF DECEMBER 31, 2017 (CONTINUED)
Principal
Amount† | |
| |
| | Value | | Percentage
of Net
Assets | |
| | | | | United States: 0.5% | |
| | 344,545 | | | | | | | Citigroup Mortgage
Loan Trust
2006-WF1 A2E,
4.985%, 03/25/36 | | $ | 253,271 | | | | 0.1 | | |
| | 200,000 | | | | (1 | ) | | Mill City Mortgage
Loan Trust 2017-2
M2, 3.250%,
07/25/59 | | | 200,500 | | | | 0.1 | | |
| | 640,000 | | | | (1 | ) | | OHA Loan Funding
Ltd. 2016-1A B1,
3.163%,
(US0003M +
1.800%), 01/20/28 | | | 643,381 | | | | 0.3 | | |
| | | | | | | | | | 1,097,152 | | | | 0.5 | | |
| | | | | | | Total Asset-Backed
Securities
(Cost $9,506,871) | | | 9,553,239 | | | | 4.2 | | |
FOREIGN GOVERNMENT BONDS: 7.9% | | | |
| | | | | Brazil: 0.3% | |
BRL | 705,000 | | | | | | | Brazil Notas do
Tesouro Nacional
Series F, 6.000%,
05/15/45 | | | 697,628 | | | | 0.3 | | |
| | | | | Germany: 0.9% | |
EUR | 680,000 | | | | | | | Bundesrepublik
Deutschland
Bundesanleihe,
2.500%, 08/15/46 | | | 1,071,561 | | | | 0.5 | | |
EUR | 60,000 | | | | | | | Bundesrepublik
Deutschland
Bundesanleihe,
0.290%-2.000%,
08/15/23-08/15/26 | | | 71,945 | | | | 0.0 | | |
EUR | 760,000 | | | | | | | Bundesschatzanweisungen,
-0.670%, 12/14/18 | | | 917,772 | | | | 0.4 | | |
| | | | | | | | | | 2,061,278 | | | | 0.9 | | |
| | | | | Hungary: 0.4% | |
EUR | 650,000 | | | | | | | Hungary Government
International Bond,
1.750%, 10/10/27 | | | 808,951 | | | | 0.4 | | |
| | | | | Indonesia: 0.2% | |
IDR | 5,665,000,000 | | | | | | | Other Securities | | | 442,713 | | | | 0.2 | | |
| | | | | Italy: 5.7% | |
EUR | 4,840,000 | | | | | | | Italy Buoni Poliennali
Del Tesoro, 2.200%,
06/01/27 | | | 5,935,353 | | | | 2.6 | | |
EUR | 4,900,000 | | | | | | | Italy Buoni Poliennali
Del Tesoro, 4.500%,
03/01/26 | | | 7,141,934 | | | | 3.1 | | |
| | | | | | | | | | 13,077,287 | | | | 5.7 | | |
Principal
Amount† | |
| |
| | Value | | Percentage
of Net
Assets | |
| | | | | Russia: 0.4% | |
RUB | 51,720,000 | | | | | | | Russian Federal
Bond - OFZ,
7.500%, 08/18/21 | | $ | 914,122 | | | | 0.4 | | |
| | | | | | | Total Foreign
Government Bonds
(Cost $17,114,648) | | | 18,001,979 | | | | 7.9 | | |
COMMERCIAL MORTGAGE-BACKED SECURITIES: 9.5% | | | |
| | | | | United States: 9.5% | |
| | 7,015,878 | | | | (7 | ) | | BANK 2017-BNK5 XA,
1.107%, 06/15/60 | | | 508,757 | | | | 0.2 | | |
| | 900,000 | | | | (1 | ) | | BANK 2017-BNK6 E,
2.656%, 07/15/60 | | | 534,300 | | | | 0.3 | | |
| | 141,110 | | | | | | | Bank of America
Commercial
Mortgage
Trust 2007-3 B,
5.697%, 06/10/49 | | | 142,602 | | | | 0.0 | | |
| | 390,000 | | | | | | | Bank of America
Commercial
Mortgage Trust
2007-3 C, 5.697%,
06/10/49 | | | 401,189 | | | | 0.2 | | |
| | 8,865,662 | | | | (7 | ) | | Bank of America
Commercial
Mortgage Trust
2017-BNK3 XA,
1.144%, 02/15/50 | | | 681,541 | | | | 0.3 | | |
| | 8,020,000 | | | | (1 | ),(7) | | BBCCRE Trust
2015-GTP XA,
0.597%, 08/10/33 | | | 348,584 | | | | 0.1 | | |
| | 2,069,115 | | | | (7 | ) | | Barclays Commercial
Mortgage Trust
2017-C1 XA,
1.524%, 02/15/50 | | | 215,022 | | | | 0.1 | | |
| | 440,000 | | | | (1 | ) | | Bear Stearns
Commercial
Mortgage Securities
Trust 2004-PWR6 E,
5.406%, 11/11/41 | | | 456,015 | | | | 0.2 | | |
| | 140,000 | | | | (1 | ) | | Bear Stearns
Commercial
Mortgage Securities
Trust 2006-TOP22 E,
5.720%, 04/12/38 | | | 146,824 | | | | 0.1 | | |
| | 396,062 | | | | (1 | ) | | Beckman Coulter, Inc.
2000-A A, 7.498%,
12/15/18 | | | 397,429 | | | | 0.2 | | |
| | 1,872,202 | | | | (7 | ) | | CD 2016-CD1
Mortgage Trust XA,
1.437%, 08/10/49 | | | 170,222 | | | | 0.1 | | |
| | 8,976,749 | | | | (7 | ) | | CFCRE Commercial
Mortgage Trust
2016-C7 XA,
0.789%, 12/10/54 | | | 490,113 | | | | 0.2 | | |
See Accompanying Notes to Financial Statements
94
SUMMARY PORTFOLIO OF INVESTMENTS
VOYA GLOBAL BOND PORTFOLIO AS OF DECEMBER 31, 2017 (CONTINUED)
Principal
Amount† | |
| |
| | Value | | Percentage
of Net
Assets | |
| | | | | United States (continued) | |
| | 3,247,322 | | | | (7 | ) | | Citigroup Commercial
Mortgage Trust
2017-C4 XA,
1.127%, 10/12/50 | | $ | 255,131 | | | | 0.1 | | |
| | 3,451,704 | | | | (7 | ) | | COMM 2012-CR1 XA,
1.878%, 05/15/45 | | | 228,320 | | | | 0.1 | | |
| | 10,168,445 | | | | (1 | ),(7) | | COMM 2012-LTRT
XA, 1.002%,
10/05/30 | | | 365,770 | | | | 0.2 | | |
| | 10,279,329 | | | | (7 | ) | | COMM 2013-CCRE13
XA, 0.915%,
11/12/46 | | | 341,048 | | | | 0.1 | | |
| | 14,268,124 | | | | (7 | ) | | COMM 2014-CR16
XA, 1.172%,
04/10/47 | | | 645,571 | | | | 0.3 | | |
| | 570,000 | | | | | | | COMM 2016-COR1 C,
4.394%, 10/10/49 | | | 572,018 | | | | 0.3 | | |
| | 4,468,682 | | | | (7 | ) | | COMM 2016-CR28
XA, 0.393%,
02/10/49 | | | 181,980 | | | | 0.1 | | |
| | 1,000,000 | | | | | | | COMM 2017-COR2 C,
4.563%, 09/10/50 | | | 1,009,201 | | | | 0.4 | | |
| | 13,544,333 | | | | (7 | ) | | CSAIL 2017-CX9 XA
Commercial
Mortgage Trust,
0.904%, 09/15/50 | | | 700,157 | | | | 0.3 | | |
| | 290,000 | | | | (1 | ) | | DBJPM 16-C3
Mortgage Trust,
3.494%, 09/10/49 | | | 240,562 | | | | 0.1 | | |
| | 2,030,059 | | | | (1 | ),(7) | | DBUBS 2011-LC1A
XA, 0.726%,
11/10/46 | | | 31,357 | | | | 0.0 | | |
| | 210,000 | | | | (1 | ) | | DBUBS 2011-LC2A
D, 5.542%, 07/10/44 | | | 219,145 | | | | 0.1 | | |
| | 3,560,000 | | | | (7 | ) | | Freddie Mac
Multifamily
Structured Pass
Through Certificates
K010 X3, 4.622%,
11/25/44 | | | 426,924 | | | | 0.2 | | |
| | 3,840,000 | | | | (7 | ) | | Freddie Mac
Multifamily
Structured Pass
Through Certificates
K013 X3, 2.814%,
01/25/43 | | | 309,496 | | | | 0.1 | | |
| | 8,385,405 | | | | (7 | ) | | Freddie Mac
Multifamily
Structured Pass
Through Certificates
K018 X1, 1.372%,
01/25/22 | | | 371,910 | | | | 0.2 | | |
| | 10,000,000 | | | | (7 | ) | | Freddie Mac
Multifamily
Structured Pass
Through Certificates
K035 X3, 1.791%,
12/25/41 | | | 873,577 | | | | 0.4 | | |
Principal
Amount† | |
| |
| | Value | | Percentage
of Net
Assets | |
| | 8,935,008 | | | | (7 | ) | | Freddie Mac
Multifamily
Structured Pass
Through Certificates
K704 X1, 1.964%,
08/25/18 | | $ | 57,502 | | | | 0.0 | | |
| | 28,507,666 | | | | (7 | ) | | Freddie Mac
Multifamily
Structured Pass
Through
Certificates
K710 X1, 1.733%,
05/25/19 | | | 529,946 | | | | 0.2 | | |
| | 4,423,190 | | | | (7 | ) | | Freddie Mac
Multifamily
Structured Pass
Through Certificates
K711 X3, 1.619%,
08/25/40 | | | 112,412 | | | | 0.0 | | |
| | 41,200,265 | | | | (1 | ),(7) | | FREMF Mortgage
Trust 2012-K17 X2A,
0.100%, 12/25/44 | | | 128,298 | | | | 0.1 | | |
| | 247,472 | | | | (1 | ) | | GCCFC Commercial
Mortgage Trust
2004-GG1 F,
6.382%, 06/10/36 | | | 246,658 | | | | 0.1 | | |
| | 100,000 | | | | (1 | ) | | GS Mortgage
Securities Trust
2010-C2 F, 4.548%,
12/10/43 | | | 89,955 | | | | 0.0 | | |
| | 2,327,717 | | | | (7 | ) | | GS Mortgage
Securities Trust
2012-GCJ7 XA,
2.228%, 05/10/45 | | | 145,108 | | | | 0.1 | | |
| | 5,630,612 | | | | (7 | ) | | GS Mortgage
Securities Trust
2013-GC16 XA,
1.398%, 11/10/46 | | | 231,025 | | | | 0.1 | | |
| | 3,973,377 | | | | (7 | ) | | GS Mortgage
Securities Trust
2013-GCJ14 XA,
0.727%, 08/10/46 | | | 115,713 | | | | 0.1 | | |
| | 1,350,000 | | | | (1 | ) | | GS Mortgage
Securities Trust
2016-GS4 E,
3.803%, 11/10/49 | | | 955,550 | | | | 0.4 | | |
| | 2,940,000 | | | | (1 | ),(7) | | JP Morgan
Chase Commercial
Mortgage Securities
Corp. 2012-LC9 XB,
0.328%, 12/15/47 | | | 44,909 | | | | 0.0 | | |
| | 270,000 | | | | | | | JP Morgan Chase
Commercial
Mortgage Securities
Trust 2004-CIBC9 E,
5.338%, 06/12/41 | | | 271,514 | | | | 0.1 | | |
| | 300,000 | | | | | | | JP Morgan Chase
Commercial
Mortgage Securities
Trust 2005-LDP2 F,
5.010%, 07/15/42 | | | 299,995 | | | | 0.1 | | |
See Accompanying Notes to Financial Statements
95
SUMMARY PORTFOLIO OF INVESTMENTS
VOYA GLOBAL BOND PORTFOLIO AS OF DECEMBER 31, 2017 (CONTINUED)
Principal
Amount† | |
| |
| | Value | | Percentage
of Net
Assets | |
| | | | | United States (continued) | |
| | 6,987,322 | | | | (7 | ) | | JP Morgan Chase
Commercial
Mortgage Securities
Trust 2012-CIBX XA,
1.653%, 06/15/45 | | $ | 317,575 | | | | 0.2 | | |
| | 250,000 | | | | | | | JP Morgan Chase
Commercial
Mortgage Securities
Trust 2013-C10 C,
4.142%, 12/15/47 | | | 249,970 | | | | 0.1 | | |
| | 660,000 | | | | | | | JPMBB Commercial
Mortgage Securities
Trust 2014-C18 AS,
4.439%, 02/15/47 | | | 703,047 | | | | 0.3 | | |
| | 731,507 | | | | (1 | ) | | JPMBB Commercial
Mortgage Securities
Trust 2014-C24 ESK,
9.989%, 11/15/47 | | | 729,293 | | | | 0.3 | | |
| | 13,484,179 | | | | (7 | ) | | JPMBB Commercial
Mortgage Securities
Trust 2014-C24 XA,
1.049%, 11/15/47 | | | 571,903 | | | | 0.3 | | |
| | 360,000 | | | | | | | LB-UBS Commercial
Mortgage Trust
2005-C3 F, 5.013%,
07/15/40 | | | 356,157 | | | | 0.2 | | |
| | 38,048 | | | | | | | LB-UBS Commercial
Mortgage Trust
2006-C4 C, 5.793%,
06/15/38 | | | 38,100 | | | | 0.0 | | |
| | 780,000 | | | | | | | LB-UBS Commercial
Mortgage Trust
2006-C4 D, 5.793%,
06/15/38 | | | 780,128 | | | | 0.3 | | |
| | 3,492,128 | | | | (1 | ),(7) | | LSTAR Commercial
Mortgage Trust
2017-5 X, 1.234%,
03/10/50 | | | 195,932 | | | | 0.1 | | |
| | 170,000 | | | | (1 | ) | | Morgan Stanley
Capital I Trust
2007-TOP27 B,
5.951%, 06/11/42 | | | 185,975 | | | | 0.1 | | |
| | 570,000 | | | | (1 | ) | | Morgan Stanley
Capital I Trust
2011-C1 D, 5.426%,
09/15/47 | | | 600,879 | | | | 0.2 | | |
| | 460,000 | | | | (1 | ) | | Morgan Stanley
Capital I Trust
2011-C1 E, 5.426%,
09/15/47 | | | 484,682 | | | | 0.2 | | |
| | 207,474 | | | | (1 | ) | | Morgan Stanley
Reremic Trust
2012-XA B, 0.250%,
07/27/49 | | | 203,498 | | | | 0.1 | | |
| | 5,360,976 | | | | (1 | ),(7) | | UBS-Barclays
Commercial
Mortgage
Trust 2012-C3 XA,
1.891%, 08/10/49 | | | 390,689 | | | | 0.2 | | |
Principal
Amount† | |
| |
| | Value | | Percentage
of Net
Assets | |
| | 7,151,704 | | | | (7 | ) | | Wells Fargo
Commercial
Mortgage Trust
2016-C37,
1.032%, 12/15/49 | | $ | 404,579 | | | | 0.2 | | |
| | 3,425,663 | | | | (1 | ),(7) | | WFRBS
Commercial
Mortgage Trust
2012-C8 XA,
1.851%, 08/15/45 | | | 228,967 | | | | 0.1 | | |
| | 1,223,564 | | | | (1 | ),(7) | | WFRBS
Commercial
Mortgage Trust
2013-C12 XA,
1.307%, 03/15/48 | | | 63,187 | | | | 0.0 | | |
| | 10,245,023 | | | | (7 | ) | | WFRBS
Commercial
Mortgage Trust
2014-C19 XA,
1.138%, 03/15/47 | | | 486,861 | | | | 0.2 | | |
| | 210,000 | | | | | | | Other Securities | | | 210,907 | | | | 0.1 | | |
| | | | | | | Total Commercial
Mortgage-Backed
Securities
(Cost $21,584,643) | | | 21,695,679 | | | | 9.5 | | |
Shares | |
| |
| | Value | | Percentage
of Net
Assets | |
COMMON STOCK: 0.0% | | | |
| | | | | United States: 0.0% | |
| | 48,071 | | | | (2 | ),(6),(9) | | Other Securities | | $ | 55,117 | | | | 0.0 | | |
| | | | | | | Total Common Stock
(Cost $1,298,014) | | | 55,117 | | | | 0.0 | | |
MUTUAL FUNDS: 23.7% | | | |
| | | | | United States: 23.7% | |
| | 1,066,705 | | | | | | | Voya Emerging
Markets Corporate
Debt Fund - Class P | | | 10,763,054 | | | | 4.7 | | |
| | 1,622,144 | | | | | | | Voya Emerging
Markets Hard
Currency Debt
Fund - Class P | | | 16,140,338 | | | | 7.1 | | |
| | 3,119,936 | | | | | | | Voya Emerging
Markets Local
Currency Debt
Fund - Class P | | | 24,241,904 | | | | 10.6 | | |
| | 357,236 | | | | | | | Voya High Yield Bond
Fund - Class P | | | 2,890,039 | | | | 1.3 | | |
| | | | | | | Total Mutual Funds
(Cost $59,523,505) | | | 54,035,335 | | | | 23.7 | | |
See Accompanying Notes to Financial Statements
96
SUMMARY PORTFOLIO OF INVESTMENTS
VOYA GLOBAL BOND PORTFOLIO AS OF DECEMBER 31, 2017 (CONTINUED)
| | |
| |
| | Value | | Percentage
of Net
Assets | |
PURCHASED OPTIONS(10): 1.0% | |
| | | | | Total Purchased
Options
(Cost $2,668,657) | | $ | 2,200,881 | | | | 1.0 | | |
| | | | | Total Long-Term
Investments
(Cost $221,341,418) | | | 217,684,241 | | | | 95.3 | | |
Principal
Amount† | |
| |
| | Value | | Percentage
of Net
Assets | |
SHORT-TERM INVESTMENTS: 6.3% | |
| | | | | Securities Lending Collateral(11): 3.1% | |
| | 1,695,812 | | | | | | | Cantor Fitzgerald,
Repurchase
Agreement dated
12/29/17, 1.41%,
due 01/02/18
(Repurchase
Amount $1,696,074,
collateralized
by various U.S.
Government\U.S.
Government Agency
Obligations,
0.000%-8.500%,
Market Value plus
accrued interest
$1,729,728, due
01/31/18-06/20/63) | | | 1,695,812 | | | | 0.7 | | |
| | 356,280 | | | | | | | Daiwa Capital
Markets,
Repurchase
Agreement
dated 12/29/17,
1.43%, due
01/02/18
(Repurchase
Amount $356,336,
collateralized by
various U.S.
Government and
U.S. Government
Agency Obligations,
0.000%-6.500%,
Market Value plus
accrued interest
$363,406, due
01/11/18-12/01/51) | | | 356,280 | | | | 0.2 | | |
Principal
Amount† | |
| |
| | Value | | Percentage
of Net
Assets | |
| | 1,695,812 | | | | | | | Millenium Fixed
Income Ltd.,
Repurchase
Agreement dated
12/29/17, 1.44%,
due 01/02/18
(Repurchase Amount
$1,696,080,
collateralized by
various U.S.
Government
Securities,
2.875%-3.625%,
Market Value
plus accrued
interest
$1,729,728, due
02/15/43-02/15/44) | | $ | 1,695,812 | | | | 0.7 | | |
| | 1,695,812 | | | | | | | NBC Global Finance
Ltd., Repurchase
Agreement dated
12/29/17, 1.50%,
due 01/02/18
(Repurchase
Amount $1,696,091,
collateralized by
various U.S.
Government
Securities,
0.750%-2.250%,
Market Value plus
accrued interest
$1,729,728, due
09/30/18-09/09/49) | | | 1,695,812 | | | | 0.7 | | |
| | 1,695,812 | | | | | | | State of Wisconsin
Investment Board,
Repurchase
Agreement dated
12/29/17, 1.63%,
due 01/02/18
(Repurchase
Amount $1,696,115,
collateralized by
various U.S.
Government
Securities,
0.125%-3.875%,
Market Value plus
accrued interest
$1,742,904, due
01/15/19-02/15/46) | | | 1,695,812 | | | | 0.8 | | |
| | | | | | | | | | 7,139,528 | | | | 3.1 | | |
See Accompanying Notes to Financial Statements
97
SUMMARY PORTFOLIO OF INVESTMENTS
VOYA GLOBAL BOND PORTFOLIO AS OF DECEMBER 31, 2017 (CONTINUED)
Shares | |
| |
| | Value | | Percentage
of Net
Assets | |
| | | | | Mutual Funds: 3.2% | |
| | 7,148,000 | | | | (12 | ) | | BlackRock Liquidity
Funds, FedFund,
Institutional Class,
1.170%
(Cost $7,148,000) | | $ | 7,148,000 | | | | 3.2 | | |
| | | | | Total Short-Term
Investments
(Cost $14,287,528) | | | 14,287,528 | | | | 6.3 | | |
| | | | | Total Investments in
Securities
(Cost
$235,628,946) | | $ | 231,971,769 | | | | 101.6 | | |
| | | | | Liabilities in Excess
of Other Assets | | | (3,549,420 | ) | | | (1.6 | ) | |
| | | | | Net Assets | | $ | 228,422,349 | | | | 100.0 | | |
"Other Securities" represents issues not identified as the top 50 holdings in terms of market value and issues or issuers not exceeding 1% of net assets individually or in aggregate respectively as of December 31, 2017.
The following footnotes apply to either the individual securities noted or one or more of the securities aggregated and listed as a single line item.
† Unless otherwise indicated, principal amount is shown in USD.
(1) Securities with purchases pursuant to Rule 144A or section 4(a)(2), under the Securities Act of 1933 and may not be resold subject to that rule except to qualified institutional buyers.
(2) The grouping contains securities on loan.
(3) Security, or a portion of the security, is on loan.
(4) For fair value measurement disclosure purposes, security is categorized as Level 3, whose value was determined using significant unobservable inputs.
(5) The grouping contains securities in default.
(6) The grouping contains Level 3 securities.
(7) Interest only securities represent the right to receive the monthly interest payments on an underlying pool of mortgage loans. Principal amount shown represents the notional amount on which current interest is calculated. Payments of principal on the pool reduce the value of the interest only security.
(8) The Federal Housing Finance Agency ("FHFA") placed the Federal Home Loan Mortgage Corporation and Federal National Mortgage Association into conservatorship with FHFA as the conservator. As such, the FHFA oversees the continuing affairs of these companies.
(9) The grouping contains non-income producing securities.
(10) The tables below the Portfolio of Investments detail open purchased options which are non-income producing securities.
(11) Represents securities purchased with cash collateral received for securities on loan.
(12) Rate shown is the 7-day yield as of December 31, 2017.
BRL Brazilian Real
EUR EU Euro
IDR Indonesian Rupiah
MXN Mexican Peso
RUB Russian Ruble
ZAR South African Rand
Reference Rate Abbreviations:
12MTA 12-month Treasury Average
US0001M 1-month LIBOR
US0003M 3-month LIBOR
US0012M 12-month LIBOR
Sector Diversification | | Percentage of
Net Assets | |
Affiliated Investment Companies | | | 23.7 | % | |
Collateralized Mortgage Obligations | | | 13.0 | | |
Commercial Mortgage-Backed Securities | | | 9.5 | | |
U.S. Government Agency Obligations | | | 9.3 | | |
Foreign Government Bonds | | | 7.9 | | |
Financial | | | 7.5 | | |
Communications | | | 4.6 | | |
Other Asset-Backed Securities | | | 4.2 | | |
Consumer, Non-cyclical | | | 4.2 | | |
Energy | | | 2.7 | | |
Consumer, Cyclical | | | 1.9 | | |
Utilities | | | 1.8 | | |
U.S. Treasury Obligations | | | 1.6 | | |
Purchased Options | | | 1.0 | | |
Basic Materials | | | 0.9 | | |
Technology | | | 0.9 | | |
Industrial | | | 0.6 | | |
Structured Products | | | 0.0 | | |
Consumer Discretionary | | | 0.0 | | |
Materials | | | 0.0 | | |
Short-Term Investments | | | 6.3 | | |
Liabilities in Excess of Other Assets | | | (1.6 | ) | |
Net Assets | | | 100.0 | % | |
See Accompanying Notes to Financial Statements
98
SUMMARY PORTFOLIO OF INVESTMENTS
VOYA GLOBAL BOND PORTFOLIO AS OF DECEMBER 31, 2017 (CONTINUED)
Fair Value Measurements^
The following is a summary of the fair valuations according to the inputs used as of December 31, 2017 in valuing the assets and liabilities:
| | | Quoted Prices
in Active Markets
for Identical Investments
(Level 1) | | Significant Other
Observable
Inputs
(Level 2) | | Significant
Unobservable
Inputs
(Level 3) | | Fair Value
at
December 31, 2017 | |
Asset Table | |
Investments, at fair value | |
Common Stock | |
United States | | $ | 55,117 | | | $ | — | | | $ | — | | | $ | 55,117 | | |
Total Common Stock | | | 55,117 | | | | — | | | | — | | | | 55,117 | | |
Mutual Funds | | | 54,035,335 | | | | — | | | | — | | | | 54,035,335 | | |
Purchased Options | | | — | | | | 2,200,881 | | | | — | | | | 2,200,881 | | |
Corporate Bonds/Notes | | | — | | | | 57,330,049 | | | | 5,331 | | | | 57,335,380 | | |
Collateralized Mortgage Obligations | | | — | | | | 29,761,431 | | | | — | | | | 29,761,431 | | |
Structured Products | | | — | | | | — | | | | 38,901 | | | | 38,901 | | |
Commercial Mortgage-Backed Securities | | | — | | | | 21,695,679 | | | | — | | | | 21,695,679 | | |
Asset-Backed Securities | | | — | | | | 9,553,239 | | | | — | | | | 9,553,239 | | |
Foreign Government Bonds | | | — | | | | 18,001,979 | | | | — | | | | 18,001,979 | | |
U.S. Treasury Obligations | | | — | | | | 22,437,038 | | | | — | | | | 22,437,038 | | |
U.S. Government Agency Obligations | | | — | | | | 2,569,261 | | | | — | | | | 2,569,261 | | |
Short-Term Investments | | | 7,148,000 | | | | 7,139,528 | | | | — | | | | 14,287,528 | | |
Total Investments, at fair value | | $ | 61,238,452 | | | $ | 170,689,085 | | | $ | 44,232 | | | $ | 231,971,769 | | |
Other Financial Instruments+ | |
Centrally Cleared Swaps | | | — | | | | 4,495,926 | | | | — | | | | 4,495,926 | | |
Forward Foreign Currency Contracts | | | — | | | | 2,550,196 | | | | — | | | | 2,550,196 | | |
Futures | | | 90,595 | | | | — | | | | — | | | | 90,595 | | |
Total Assets | | $ | 61,329,047 | | | $ | 177,735,207 | | | $ | 44,232 | | | $ | 239,108,486 | | |
Liabilities Table | |
Other Financial Instruments+ | |
Centrally Cleared Swaps | | $ | — | | | $ | (1,432,218 | ) | | $ | — | | | $ | (1,432,218 | ) | |
Forward Foreign Currency Contracts | | | — | | | | (1,202,545 | ) | | | — | | | | (1,202,545 | ) | |
Futures | | | (296,004 | ) | | | — | | | | — | | | | (296,004 | ) | |
Written Options | | | — | | | | (1,903,395 | ) | | | — | | | | (1,903,395 | ) | |
Total Liabilities | | $ | (296,004 | ) | | $ | (4,538,158 | ) | | $ | — | | | $ | (4,834,162 | ) | |
^ See Note 2, "Significant Accounting Policies" in the Notes to Financial Statements for additional information.
+ Other Financial Instruments are derivatives not reflected in the Portfolio of Investments and may include open forward foreign currency contracts, futures, centrally cleared swaps, OTC swaps and written options. Forward foreign currency contracts, futures and centrally cleared swaps are valued at the unrealized gain (loss) on the instrument. OTC swaps and written options are valued at the fair value of the instrument.
Transactions with Affiliates
An investment of at least 5% of the voting securities of an issuer, or a company which is under common control results in that issuer becoming an affiliated person as defined by the 1940 Act.
The following table provides transactions during the year ended December 31, 2017, where the following issuers were considered an affiliate:
Issuer | | Beginning
Fair
Value at
12/31/16 | | Purchases
at Cost | | Sales
at Cost | | Change in
Unrealized
Appreciation/
(Depreciation) | | Ending
Fair
Value at
12/31/17 | | Investment
Income | | Realized
Gains/
(Losses) | | Net Capital
Gain
Distributions | |
Voya Emerging Markets
Corporate Debt
Fund — Class P | | $ | 9,840,467 | | | $ | 502,609 | | | $ | — | | | $ | 419,978 | | | $ | 10,763,054 | | | $ | 502,609 | | | $ | — | | | $ | — | | |
Voya Emerging Markets
Hard Currency Debt
Fund — Class P | | | 14,492,650 | | | | 733,616 | | | | — | | | | 914,072 | | | | 16,140,338 | | | | 733,616 | | | | — | | | | — | | |
Voya Emerging Markets
Local Currency Debt
Fund — Class P | | | 21,177,722 | | | | 829,285 | | | | — | | | | 2,234,897 | | | | 24,241,904 | | | | 829,286 | | | | — | | | | — | | |
Voya High Yield Bond
Fund — Class P | | | 2,701,759 | | | | 172,748 | | | | — | | | | 15,532 | | | | 2,890,039 | | | | 172,747 | | | | — | | | | — | | |
| | | $ | 48,212,598 | | | $ | 2,238,258 | | | $ | — | | | $ | 3,584,479 | | | $ | 54,035,335 | | | $ | 2,238,258 | | | $ | — | | | $ | — | | |
The financial statements for the above mutual fund[s] can be found at www.sec.gov.
See Accompanying Notes to Financial Statements
99
SUMMARY PORTFOLIO OF INVESTMENTS
VOYA GLOBAL BOND PORTFOLIO AS OF DECEMBER 31, 2017 (CONTINUED)
At December 31, 2017, the following forward foreign currency contracts were outstanding for Voya Global Bond Portfolio:
Currency
Purchased | | Currency Sold | | Counterparty | | Settlement
Date | | Unrealized
Appreciation
(Depreciation) | |
CHF | 587,779 | | | USD | 596,000 | | | Barclays Bank PLC | | 01/12/18 | | $ | 7,638 | | |
AUD | 2,616,127 | | | USD | 2,008,000 | | | Barclays Bank PLC | | 01/12/18 | | | 33,250 | | |
RUB | 1,798,746 | | | USD | 30,462 | | | Barclays Bank PLC | | 01/12/18 | | | 686 | | |
EUR | 986,133 | | | USD | 1,169,000 | | | Barclays Bank PLC | | 01/12/18 | | | 14,957 | | |
USD | 946,000 | | | AUD | 1,251,760 | | | Barclays Bank PLC | | 01/12/18 | | | (30,694 | ) | |
USD | 604,000 | | | CAD | 756,136 | | | Barclays Bank PLC | | 01/12/18 | | | 2,365 | | |
USD | 1,059,381 | | | PLN | 3,857,323 | | | Barclays Bank PLC | | 01/12/18 | | | (48,754 | ) | |
NZD | 898,271 | | | USD | 635,000 | | | Barclays Bank PLC | | 01/12/18 | | | 1,519 | | |
USD | 3,463,000 | | | NOK | 28,329,070 | | | Barclays Bank PLC | | 01/12/18 | | | 11,620 | | |
USD | 2,291,000 | | | GBP | 1,700,957 | | | Barclays Bank PLC | | 01/12/18 | | | (6,360 | ) | |
USD | 702,675 | | | RON | 2,730,291 | | | Barclays Bank PLC | | 01/12/18 | | | 630 | | |
USD | 3,627,000 | | | CHF | 3,568,054 | | | Barclays Bank PLC | | 01/12/18 | | | (37,320 | ) | |
USD | 763,000 | | | EUR | 641,195 | | | Barclays Bank PLC | | 01/12/18 | | | (6,823 | ) | |
USD | 8,105,924 | | | JPY | 910,889,364 | | | Barclays Bank PLC | | 01/12/18 | | | 17,622 | | |
USD | 1,225,136 | | | HUF | 321,605,868 | | | Barclays Bank PLC | | 01/12/18 | | | (17,462 | ) | |
GBP | 906,437 | | | USD | 1,227,000 | | | Barclays Bank PLC | | 01/12/18 | | | (2,740 | ) | |
NZD | 1,814,895 | | | USD | 1,288,000 | | | Barclays Bank PLC | | 01/12/18 | | | (1,956 | ) | |
USD | 840,000 | | | CAD | 1,065,427 | | | Barclays Bank PLC | | 01/12/18 | | | (7,728 | ) | |
USD | 880,000 | | | CAD | 1,128,343 | | | Barclays Bank PLC | | 01/12/18 | | | (17,788 | ) | |
ZAR | 18,254,254 | | | USD | 1,274,000 | | | Barclays Bank PLC | | 01/12/18 | | | 198,932 | | |
NOK | 18,984,154 | | | USD | 2,278,832 | | | Barclays Bank PLC | | 01/12/18 | | | 34,041 | | |
USD | 611,000 | | | CAD | 776,883 | | | Barclays Bank PLC | | 01/12/18 | | | (7,142 | ) | |
USD | 815,000 | | | CAD | 1,034,229 | | | Barclays Bank PLC | | 01/12/18 | | | (7,905 | ) | |
BRL | 5,732,003 | | | USD | 1,726,091 | | | Barclays Bank PLC | | 02/09/18 | | | (5,820 | ) | |
USD | 639,434 | | | CLP | 405,426,840 | | | Barclays Bank PLC | | 02/09/18 | | | (19,296 | ) | |
MXN | 32,113,284 | | | USD | 1,709,390 | | | Barclays Bank PLC | | 02/09/18 | | | (88,255 | ) | |
USD | 1,709,390 | | | BRL | 5,613,996 | | | Barclays Bank PLC | | 02/09/18 | | | 24,535 | | |
USD | 1,233,527 | | | THB | 40,198,922 | | | Barclays Bank PLC | | 03/09/18 | | | (2,023 | ) | |
MYR | 2,181,955 | | | USD | 534,570 | | | Barclays Bank PLC | | 03/09/18 | | | 1,800 | | |
USD | 1,587,242 | | | IDR | 21,686,492,907 | | | Barclays Bank PLC | | 03/09/18 | | | (8,927 | ) | |
KRW | 3,175,658,700 | | | USD | 2,905,053 | | | Barclays Bank PLC | | 03/09/18 | | | 72,870 | | |
ILS | 1,035,992 | | | USD | 297,166 | | | Citibank N.A. | | 01/12/18 | | | 681 | | |
USD | 664,000 | | | NZD | 949,987 | | | Citibank N.A. | | 01/12/18 | | | (9,166 | ) | |
NZD | 1,819,269 | | | USD | 1,277,000 | | | Citibank N.A. | | 01/12/18 | | | 12,143 | | |
USD | 1,043,056 | | | RON | 4,044,763 | | | Citibank N.A. | | 01/12/18 | | | 3,019 | | |
USD | 527,981 | | | RON | 2,082,304 | | | Citibank N.A. | | 01/12/18 | | | (7,446 | ) | |
USD | 627,000 | | | NZD | 896,331 | | | Citibank N.A. | | 01/12/18 | | | (8,145 | ) | |
USD | 1,612,052 | | | ZAR | 22,393,079 | | | Citibank N.A. | | 01/12/18 | | | (194,842 | ) | |
JPY | 158,545,165 | | | USD | 1,408,000 | | | Citibank N.A. | | 01/12/18 | | | (188 | ) | |
USD | 566,000 | | | CHF | 551,001 | | | Citibank N.A. | | 01/12/18 | | | 133 | | |
USD | 1,807,319 | | | MXN | 35,163,115 | | | Citibank N.A. | | 02/09/18 | | | 32,224 | | |
USD | 3,366,967 | | | BRL | 11,188,767 | | | Citibank N.A. | | 02/09/18 | | | 9,028 | | |
USD | 1,214,000 | | | SEK | 9,927,644 | | | Deutsche Bank AG | | 01/12/18 | | | 2,986 | | |
CAD | 4,400,278 | | | USD | 3,437,000 | | | Deutsche Bank AG | | 01/12/18 | | | 64,167 | | |
USD | 637,000 | | | AUD | 819,203 | | | Deutsche Bank AG | | 01/12/18 | | | (2,188 | ) | |
USD | 3,972,000 | | | JPY | 449,707,457 | | | Deutsche Bank AG | | 01/12/18 | | | (21,207 | ) | |
NZD | 4,018,132 | | | USD | 2,825,000 | | | Deutsche Bank AG | | 01/12/18 | | | 22,269 | | |
USD | 539,000 | | | EUR | 457,817 | | | Deutsche Bank AG | | 01/12/18 | | | (10,658 | ) | |
AUD | 2,958,592 | | | USD | 2,240,000 | | | Deutsche Bank AG | | 01/12/18 | | | 68,460 | | |
USD | 1,312,000 | | | AUD | 1,700,066 | | | Deutsche Bank AG | | 01/12/18 | | | (14,487 | ) | |
USD | 1,534,000 | | | CAD | 1,973,029 | | | Deutsche Bank AG | | 01/12/18 | | | (35,879 | ) | |
EUR | 343,430 | | | USD | 406,000 | | | Goldman Sachs International | | 01/12/18 | | | 6,325 | | |
USD | 52,000 | | | JPY | 5,869,136 | | | Goldman Sachs International | | 01/12/18 | | | (115 | ) | |
CHF | 3,220,452 | | | USD | 3,257,297 | | | Goldman Sachs International | | 01/12/18 | | | 50,042 | | |
USD | 1,214,926 | | | ZAR | 16,404,982 | | | Goldman Sachs International | | 01/12/18 | | | (108,789 | ) | |
USD | 1,070,000 | | | RUB | 64,025,660 | | | Goldman Sachs International | | 01/12/18 | | | (38,686 | ) | |
USD | 111,012 | | | PHP | 5,648,082 | | | Goldman Sachs International | | 03/09/18 | | | (1,891 | ) | |
USD | 1,161,000 | | | TRY | 4,585,759 | | | HSBC Bank USA N.A. | | 01/12/18 | | | (45,079 | ) | |
HUF | 271,776,481 | | | USD | 1,043,056 | | | HSBC Bank USA N.A. | | 01/12/18 | | | 7,015 | | |
USD | 1,633,462 | | | TRY | 6,172,881 | | | HSBC Bank USA N.A. | | 01/12/18 | | | 9,961 | | |
TRY | 3,504,708 | | | USD | 938,624 | | | HSBC Bank USA N.A. | | 01/12/18 | | | (16,867 | ) | |
USD | 1,439,020 | | | MXN | 27,958,513 | | | HSBC Bank USA N.A. | | 02/09/18 | | | 27,625 | | |
SGD | 648,988 | | | USD | 480,043 | | | HSBC Bank USA N.A. | | 03/09/18 | | | 5,683 | | |
USD | 2,568,000 | | | NZD | 3,698,304 | | | JPMorgan Chase Bank N.A. | | 01/12/18 | | | (52,637 | ) | |
USD | 2,411,000 | | | GBP | 1,802,905 | | | JPMorgan Chase Bank N.A. | | 01/12/18 | | | (24,053 | ) | |
USD | 1,383,742 | | | RUB | 81,294,838 | | | JPMorgan Chase Bank N.A. | | 01/12/18 | | | (23,982 | ) | |
CAD | 2,895,738 | | | USD | 2,258,862 | | | JPMorgan Chase Bank N.A. | | 01/12/18 | | | 45,187 | | |
CAD | 3,651,172 | | | USD | 2,845,000 | | | JPMorgan Chase Bank N.A. | | 01/12/18 | | | 60,126 | | |
USD | 1,029,149 | | | AUD | 1,358,794 | | | JPMorgan Chase Bank N.A. | | 01/12/18 | | | (31,059 | ) | |
EUR | 44,642,018 | | | USD | 52,673,447 | | | JPMorgan Chase Bank N.A. | | 01/12/18 | | | 924,030 | | |
See Accompanying Notes to Financial Statements
100
SUMMARY PORTFOLIO OF INVESTMENTS
VOYA GLOBAL BOND PORTFOLIO AS OF DECEMBER 31, 2017 (CONTINUED)
Currency
Purchased | | Currency Sold | | Counterparty | | Settlement
Date | | Unrealized
Appreciation
(Depreciation) | |
GBP | 587,860 | | | USD | 784,000 | | | JPMorgan Chase Bank N.A. | | 01/12/18 | | $ | 9,980 | | |
GBP | 11,228,439 | | | USD | 15,028,140 | | | JPMorgan Chase Bank N.A. | | 01/12/18 | | | 137,302 | | |
USD | 791,971 | | | HUF | 209,475,839 | | | JPMorgan Chase Bank N.A. | | 01/12/18 | | | (17,387 | ) | |
PLN | 5,619,834 | | | USD | 1,563,635 | | | JPMorgan Chase Bank N.A. | | 01/12/18 | | | 50,836 | | |
USD | 1,864,000 | | | CHF | 1,830,055 | | | JPMorgan Chase Bank N.A. | | 01/12/18 | | | (15,429 | ) | |
EUR | 402,034 | | | USD | 474,000 | | | JPMorgan Chase Bank N.A. | | 01/12/18 | | | 8,684 | | |
USD | 1,409,880 | | | COP | 4,271,936,773 | | | JPMorgan Chase Bank N.A. | | 02/09/18 | | | (16,272 | ) | |
USD | 612,357 | | | PEN | 1,993,223 | | | JPMorgan Chase Bank N.A. | | 02/09/18 | | | (1,282 | ) | |
HKD | 762,813 | | | USD | 97,840 | | | JPMorgan Chase Bank N.A. | | 03/09/18 | | | (75 | ) | |
DKK | 6,741,468 | | | USD | 1,068,731 | | | Morgan Stanley | | 01/12/18 | | | 18,497 | | |
CHF | 741,392 | | | USD | 750,000 | | | Morgan Stanley | | 01/12/18 | | | 11,394 | | |
SEK | 8,397,214 | | | USD | 997,900 | | | Morgan Stanley | | 01/12/18 | | | 26,426 | | |
USD | 367,000 | | | CAD | 467,122 | | | Morgan Stanley | | 01/12/18 | | | (4,674 | ) | |
AUD | 2,898,422 | | | USD | 2,212,000 | | | Morgan Stanley | | 01/12/18 | | | 49,512 | | |
NZD | 5,236,082 | | | USD | 3,634,166 | | | Morgan Stanley | | 01/12/18 | | | 76,149 | | |
NOK | 14,742,435 | | | USD | 1,783,000 | | | Morgan Stanley | | 01/12/18 | | | 13,097 | | |
USD | 660,000 | | | PLN | 2,419,602 | | | Morgan Stanley | | 01/12/18 | | | (35,105 | ) | |
USD | 354,000 | | | NOK | 2,968,312 | | | Morgan Stanley | | 01/12/18 | | | (7,635 | ) | |
JPY | 3,782,652,926 | | | USD | 33,397,975 | | | Morgan Stanley | | 01/12/18 | | | 190,342 | | |
USD | 3,281,000 | | | NZD | 4,674,722 | | | Morgan Stanley | | 01/12/18 | | | (31,531 | ) | |
GBP | 441,086 | | | USD | 591,000 | | | Morgan Stanley | | 01/12/18 | | | 4,743 | | |
CZK | 24,385,357 | | | USD | 1,116,835 | | | Morgan Stanley | | 01/12/18 | | | 29,033 | | |
GBP | 644,153 | | | USD | 863,000 | | | Morgan Stanley | | 01/12/18 | | | 7,011 | | |
USD | 1,861,000 | | | NZD | 2,659,692 | | | Morgan Stanley | | 01/12/18 | | | (23,672 | ) | |
USD | 2,193,000 | | | AUD | 2,838,231 | | | Morgan Stanley | | 01/12/18 | | | (21,548 | ) | |
USD | 731,000 | | | AUD | 935,718 | | | Morgan Stanley | | 01/12/18 | | | 900 | | |
NZD | 2,142,174 | | | USD | 1,485,000 | | | Morgan Stanley | | 01/12/18 | | | 32,955 | | |
USD | 1,502,000 | | | CHF | 1,484,986 | | | Morgan Stanley | | 01/12/18 | | | (23,051 | ) | |
USD | 2,374,960 | | | NZD | 3,396,575 | | | Morgan Stanley | | 01/12/18 | | | (31,870 | ) | |
GBP | 810,291 | | | USD | 1,087,000 | | | Morgan Stanley | | 01/12/18 | | | 7,401 | | |
GBP | 611,575 | | | USD | 820,000 | | | Morgan Stanley | | 01/12/18 | | | 6,010 | | |
JPY | 34,000 | | | USD | 302 | | | Morgan Stanley & Co. International PLC | | 01/05/18 | | | — | | |
USD | 1,541,000 | | | GBP | 1,146,653 | | | The Bank of New York Mellon | | 01/12/18 | | | (7,702 | ) | |
EUR | 472,196 | | | USD | 557,000 | | | The Bank of New York Mellon | | 01/12/18 | | | 9,921 | | |
SEK | 23,907,130 | | | USD | 2,845,000 | | | The Bank of New York Mellon | | 01/12/18 | | | 71,289 | | |
USD | 734,000 | | | JPY | 82,112,506 | | | The Bank of New York Mellon | | 01/12/18 | | | 4,877 | | |
EUR | 586,594 | | | USD | 694,000 | | | The Bank of New York Mellon | | 01/12/18 | | | 10,268 | | |
USD | 53,528 | | | EUR | 45,380 | | | The Bank of New York Mellon | | 01/12/18 | | | (955 | ) | |
| | | | | | | $1,347,651 | |
At December 31, 2017, the following futures contracts were outstanding for Voya Global Bond Portfolio:
Contract Description | | Number
of Contracts | | Expiration Date | | Notional
Value | | Unrealized
Appreciation/
(Depreciation) | |
Long Contracts | |
Australia 10-Year Bond | | | 11 | | | 03/15/18 | | $ | 1,108,531 | | | $ | (9,022 | ) | |
Australia 3-Year Bond | | | 36 | | | 03/15/18 | | | 3,120,599 | | | | (17,096 | ) | |
Canada 10-Year Bond | | | 26 | | | 03/20/18 | | | 2,787,812 | | | | (40,712 | ) | |
Euro-Bobl 5-Year | | | 63 | | | 03/08/18 | | | 9,948,443 | | | | (51,559 | ) | |
Euro-Bund | | | 37 | | | 03/08/18 | | | 7,177,673 | | | | (53,750 | ) | |
Euro-Buxl® 30-year German Government Bond | | | 28 | | | 03/08/18 | | | 5,504,991 | | | | (86,982 | ) | |
Euro-Schatz | | | 110 | | | 03/08/18 | | | 14,778,808 | | | | (18,320 | ) | |
Japanese Government Bonds 10-Year Mini | | | 6 | | | 03/12/18 | | | 803,231 | | | | (180 | ) | |
Long Gilt | | | 35 | | | 03/27/18 | | | 5,914,455 | | | | 37,537 | | |
Short Gilt | | | 12 | | | 03/27/18 | | | 1,679,475 | | | | 306 | | |
U.S. Treasury Long Bond | | | 17 | | | 03/20/18 | | | 2,601,000 | | | | (4,282 | ) | |
U.S. Treasury Ultra Long Bond | | | 9 | | | 03/20/18 | | | 1,508,906 | | | | 6,661 | | |
| | | | | | | $ | 56,933,924 | | | $ | (237,399 | ) | |
Short Contracts | |
Japan 10-Year Bond (TSE) | | | (2 | ) | | 03/13/18 | | | (2,676,370 | ) | | | 1,234 | | |
U.S. Treasury 10-Year Note | | | (10 | ) | | 03/20/18 | | | (1,240,469 | ) | | | 6,621 | | |
U.S. Treasury 2-Year Note | | | (274 | ) | | 03/29/18 | | | (58,665,969 | ) | | | (14,101 | ) | |
U.S. Treasury 5-Year Note | | | (60 | ) | | 03/29/18 | | | (6,969,844 | ) | | | 32,698 | | |
U.S. Treasury Ultra 10-Year Note | | | (9 | ) | | 03/20/18 | | | (1,202,062 | ) | | | 5,538 | | |
| | | | | | | $ | (70,754,714 | ) | | $ | 31,990 | | |
See Accompanying Notes to Financial Statements
101
SUMMARY PORTFOLIO OF INVESTMENTS
VOYA GLOBAL BOND PORTFOLIO AS OF DECEMBER 31, 2017 (CONTINUED)
At December 31, 2017, the following centrally cleared credit default swaps were outstanding for Voya Global Bond Portfolio:
Centrally Cleared Credit Default Swaps on Credit Indices — Buy Protection(1)
Reference
Entity/Obligation | | Buy/Sell
Protection | | (Pay)/
Receive
Financing
Rate (%) | | Payment
Frequency | | Termination
Date | | Notional
Amount(2) | | Fair
Value(3) | | Unrealized
Appreciation/
(Depreciation) | |
iTraxx Europe Crossover Index,
Series 28, Version 1 | | Buy | | | (5.000 | ) | | Quarterly | | 12/20/22 | | EUR | 6,340,000 | | | $ | (927,182 | ) | | $ | (5,403 | ) | |
| | | | | | | $ | (927,182 | ) | | $ | (5,403 | ) | |
Centrally Cleared Credit Default Swaps on Credit Indices — Sell Protection(4)
Reference
Entity/Obligation | | Buy/Sell
Protection | | (Pay)/
Receive
Financing
Rate (%) | | Payment
Frequency | | Termination
Date | | Notional
Amount(2) | | Fair
Value(3) | | Unrealized
Appreciation/
(Depreciation) | |
CDX North American High Yield
Index, Series 29, Version 1 | | Sell | | | 5.000 | | | Quarterly | | 12/20/22 | | USD | 9,490,000 | | | $ | 786,199 | | | $ | 13,596 | | |
| | | | | | | $ | 786,199 | | | $ | 13,596 | | |
(1) If a Portfolio is a buyer of protection and a credit event occurs, as defined under the terms of that particular swap agreement, a Portfolio will either i) receive from the seller of protection an amount equal to the notional amount of the swap and deliver the referenced obligation, other deliverable obligations or underlying securities comprising the referenced index or ii) receive a net settlement amount in the form of cash or securities equal to the notional amount of the swap less the recovery value of the referenced obligation or underlying securities comprising the referenced index.
(2) The maximum amount of future payments (undiscounted) that a Portfolio as seller of protection could be required to make or receive as a buyer of credit protection under a credit default swap agreement would be an amount equal to the notional amount of the agreement.
(3) The fair values for credit default swap agreements serve as an indicator of the current status of the payment/performance risk and represent the likelihood or risk of default for the credit derivative. Increasing fair values, in absolute terms, when compared to the notional amount of the agreement, represent a deterioration of the referenced obligation's credit soundness and a greater likelihood or risk of default or other credit event occurring.
(4) If the Portfolio is a seller of protection and a credit event occurs, as defined under the terms of that particular swap agreement, the Portfolio will generally either i) Pay to the buyer an amount equal to the notional amount of the swap and take delivery of the referenced obligation, other deliverable obligations, or underlying securities comprising a referenced index or ii) Pay a net settlement amount in the form of cash or securities equal to the notional amount of the swap less the recovery value of the referenced obligation or underlying securities comprising a referenced index.
At December 31, 2017, the following centrally cleared interest rate swaps were outstanding for Voya Global Bond Portfolio:
Pay/Receive
Floating Rate | | Floating Rate Index | | Floating Rate
Index
Payment
Frequency | | Fixed Rate | | Fixed Rate
Payment
Frequency | | Maturity
Date | | Notional
Amount | | Fair
Value | | Unrealized
Appreciation/
(Depreciation) | |
Pay | | 3-month CAD-CDOR | | Semi-Annual | | | 2.960 | % | | Semi-Annual | | 11/21/44 | | CAD | 1,000,000 | | | $ | 63,990 | | | $ | 56,284 | | |
Pay | | 6-month EUR-EURIBOR | | Semi-Annual | | | 0.294 | | | Annual | | 02/10/23 | | EUR | 2,400,000 | | | | (4,436 | ) | | | (3,273 | ) | |
Pay | | 6-month EUR-EURIBOR | | Semi-Annual | | | 0.325 | | | Annual | | 02/16/23 | | EUR | 100,000 | | | | (5 | ) | | | 30 | | |
Pay | | 6-month GBP-LIBOR | | Semi-Annual | | | 2.899 | | | Semi-Annual | | 08/22/44 | | GBP | 2,000,000 | | | | 899,575 | | | | 1,005,941 | | |
Pay | | 6-month JPY-LIBOR | | Semi-Annual | | | (0.165 | ) | | Semi-Annual | | 07/14/18 | | JPY | 619,500,000 | | | | (5,417 | ) | | | (6,698 | ) | |
Pay | | 6-month JPY-LIBOR | | Semi-Annual | | | (0.105 | ) | | Semi-Annual | | 03/07/21 | | JPY | 750,000,000 | | | | (36,486 | ) | | | (38,126 | ) | |
Pay | | 6-month JPY-LIBOR | | Semi-Annual | | | (0.199 | ) | | Semi-Annual | | 07/14/21 | | JPY | 512,300,000 | | | | (44,068 | ) | | | (47,515 | ) | |
Pay | | 6-month JPY-LIBOR | | Semi-Annual | | | (0.020 | ) | | Semi-Annual | | 03/07/23 | | JPY | 750,000,000 | | | | (48,356 | ) | | | (48,440 | ) | |
Pay | | 6-month JPY-LIBOR | | Semi-Annual | | | 0.754 | | | Semi-Annual | | 05/21/24 | | JPY | 1,855,000,000 | | | | 625,533 | | | | 608,659 | | |
Pay | | 6-month JPY-LIBOR | | Semi-Annual | | | 0.558 | | | Semi-Annual | | 02/24/25 | | JPY | 1,084,559,370 | | | | 253,707 | | | | 230,112 | | |
Pay | | 6-month JPY-LIBOR | | Semi-Annual | | | (0.092 | ) | | Semi-Annual | | 07/14/26 | | JPY | 652,900,000 | | | | (167,674 | ) | | | (175,552 | ) | |
Pay | | 6-month JPY-LIBOR | | Semi-Annual | | | 0.387 | | | Semi-Annual | | 03/02/31 | | JPY | 7,700,000 | | | | (731 | ) | | | (650 | ) | |
Pay | | 6-month JPY-LIBOR | | Semi-Annual | | | 0.360 | | | Semi-Annual | | 03/03/31 | | JPY | 867,000,000 | | | | (109,455 | ) | | | (100,026 | ) | |
Pay | | 6-month JPY-LIBOR | | Semi-Annual | | | 0.623 | | | Semi-Annual | | 03/02/36 | | JPY | 6,200,000 | | | | (701 | ) | | | (626 | ) | |
Pay | | 6-month JPY-LIBOR | | Semi-Annual | | | 0.585 | | | Semi-Annual | | 03/03/36 | | JPY | 693,000,000 | | | | (119,360 | ) | | | (110,320 | ) | |
Pay | | 6-month JPY-LIBOR | | Semi-Annual | | | 1.289 | | | Semi-Annual | | 02/04/45 | | JPY | 1,015,000,000 | | | | 865,441 | | | | 822,920 | | |
Pay | | 1-month USD-LIBOR | | Monthly | | | 2.400 | | | Monthly | | 10/27/32 | | USD | 690,000 | | | | (931 | ) | | | (842 | ) | |
Pay | | 1-month USD-LIBOR | | Monthly | | | 2.488 | | | Monthly | | 10/27/47 | | USD | 800,000 | | | | 7,987 | | | | 8,098 | | |
Pay | | 3-month USD-LIBOR | | Quarterly | | | 2.532 | | | Semi-Annual | | 12/11/47 | | USD | 2,000,000 | | | | (3,415 | ) | | | (3,415 | ) | |
Pay | | 3-month USD-LIBOR | | Quarterly | | | 2.558 | | | Semi-Annual | | 12/15/47 | | USD | 5,300,000 | | | | 20,471 | | | | 20,471 | | |
Pay | | 3-month USD-LIBOR | | Quarterly | | | 2.494 | | | Semi-Annual | | 12/19/47 | | USD | 7,500,000 | | | | (77,803 | ) | | | (77,803 | ) | |
Pay | | 3-month USD-LIBOR | | Quarterly | | | 2.598 | | | Semi-Annual | | 12/21/47 | | USD | 3,200,000 | | | | 40,563 | | | | 40,563 | | |
Pay | | 3-month USD-LIBOR | | Quarterly | | | 2.628 | | | Semi-Annual | | 12/27/47 | | USD | 2,200,000 | | | | 41,861 | | | | 41,861 | | |
Pay | | 3-month USD-LIBOR | | Quarterly | | | 2.575 | | | Semi-Annual | | 12/28/47 | | USD | 2,000,000 | | | | 15,009 | | | | 15,009 | | |
Pay | | 3-month USD-LIBOR | | Quarterly | | | 2.591 | | | Semi-Annual | | 12/28/47 | | USD | 4,000,000 | | | | 43,505 | | | | 43,505 | | |
Pay | | 3-month USD-LIBOR | | Quarterly | | | 2.530 | | | Semi-Annual | | 12/29/47 | | USD | 2,000,000 | | | | (4,474 | ) | | | (4,474 | ) | |
Pay | | 3-month USD-LIBOR | | Quarterly | | | 2.551 | | | Semi-Annual | | 12/29/47 | | USD | 2,000,000 | | | | 4,566 | | | | 4,566 | | |
Receive | | 6-month EUR-EURIBOR | | Semi-Annual | | | (0.123 | ) | | Annual | | 02/11/19 | | EUR | 200,000 | | | | (335 | ) | | | (309 | ) | |
Receive | | 6-month EUR-EURIBOR | | Semi-Annual | | | (0.095 | ) | | Annual | | 02/16/19 | | EUR | 100,000 | | | | (207 | ) | | | (192 | ) | |
See Accompanying Notes to Financial Statements
102
SUMMARY PORTFOLIO OF INVESTMENTS
VOYA GLOBAL BOND PORTFOLIO AS OF DECEMBER 31, 2017 (CONTINUED)
Pay/Receive
Floating Rate | | Floating Rate Index | | Floating Rate
Index
Payment
Frequency | | Fixed Rate | | Fixed Rate
Payment
Frequency | | Maturity
Date | | Notional
Amount | | Fair
Value | | Unrealized
Appreciation/
(Depreciation) | |
Receive | | 6-month EUR-EURIBOR | | Semi-Annual | | | 0.056 | % | | Annual | | 02/10/21 | | EUR | 100,000 | | | $ | (127 | ) | | $ | (134 | ) | |
Receive | | 6-month EUR-EURIBOR | | Semi-Annual | | | 1.143 | | | Annual | | 02/04/46 | | EUR | 500,000 | | | | 50,080 | | | | 43,948 | | |
Receive | | 6-month JPY-LIBOR | | Semi-Annual | | | (0.030 | ) | | Semi-Annual | | 03/02/23 | | JPY | 15,400,000 | | | | 1,058 | | | | 1,060 | | |
Receive | | 6-month JPY-LIBOR | | Semi-Annual | | | (0.044 | ) | | Semi-Annual | | 03/03/23 | | JPY | 1,733,000,000 | | | | 130,167 | | | | 130,072 | | |
Receive | | 6-month JPY-LIBOR | | Semi-Annual | | | 0.119 | | | Semi-Annual | | 03/02/26 | | JPY | 10,900,000 | | | | 879 | | | | 831 | | |
Receive | | 6-month JPY-LIBOR | | Semi-Annual | | | 0.103 | | | Semi-Annual | | 03/03/26 | | JPY | 1,231,000,000 | | | | 113,464 | | | | 107,708 | | |
Receive | | 6-month JPY-LIBOR | | Semi-Annual | | | 0.373 | | | Semi-Annual | | 03/07/31 | | JPY | 350,000,000 | | | | 39,366 | | | | 35,601 | | |
Receive | | 6-month JPY-LIBOR | | Semi-Annual | | | 0.178 | | | Semi-Annual | | 07/14/36 | | JPY | 326,600,000 | | | | 278,348 | | | | 287,410 | | |
Receive | | 6-month JPY-LIBOR | | Semi-Annual | | | 1.443 | | | Semi-Annual | | 02/24/45 | | JPY | 468,636,765 | | | | (563,381 | ) | | | (535,865 | ) | |
Receive | | 6-month JPY-LIBOR | | Semi-Annual | | | 0.233 | | | Semi-Annual | | 07/14/46 | | JPY | 172,300,000 | | | | 286,845 | | | | 297,524 | | |
Receive | | 1-month USD-LIBOR | | Monthly | | | 1.578 | | | Monthly | | 10/27/18 | | USD | 35,780,000 | | | | 48,716 | | | | 47,372 | | |
Receive | | 1-month USD-LIBOR | | Monthly | | | 1.720 | | | Monthly | | 10/27/19 | | USD | 18,320,000 | | | | 75,113 | | | | 74,136 | | |
Receive | | 1-month USD-LIBOR | | Monthly | | | 1.079 | | | Monthly | | 04/04/21 | | USD | 7,500,000 | | | | 240,464 | | | | 240,464 | | |
Receive | | 1-month USD-LIBOR | | Monthly | | | 1.983 | | | Monthly | | 10/27/22 | | USD | 23,590,000 | | | | 181,953 | | | | 180,007 | | |
Receive | | 1-month USD-LIBOR | | Monthly | | | 2.210 | | | Monthly | | 10/27/26 | | USD | 3,590,000 | | | | 22,162 | | | | 21,775 | | |
Receive | | 1-month USD-LIBOR | | Monthly | | | 2.390 | | | Monthly | | 12/11/32 | | USD | 400,000 | | | | 1,132 | | | | 1,132 | | |
Receive | | 3-month USD-LIBOR | | Quarterly | | | 2.188 | | | Semi-Annual | | 04/04/46 | | USD | 900,000 | | | | 73,039 | | | | 73,039 | | |
Receive | | 3-month USD-LIBOR | | Quarterly | | | 2.589 | | | Semi-Annual | | 12/14/47 | | USD | 5,300,000 | | | | (56,809 | ) | | | (56,809 | ) | |
Receive | | 3-month USD-LIBOR | | Quarterly | | | 2.530 | | | Semi-Annual | | 12/18/47 | | USD | 3,200,000 | | | | 7,684 | | | | 7,684 | | |
Receive | | 3-month USD-LIBOR | | Quarterly | | | 2.516 | | | Semi-Annual | | 12/20/47 | | USD | 6,400,000 | | | | 34,548 | | | | 34,548 | | |
Receive | | 3-month USD-LIBOR | | Quarterly | | | 2.576 | | | Semi-Annual | | 12/21/47 | | USD | 5,400,000 | | | | (41,780 | ) | | | (41,780 | ) | |
Receive | | 3-month USD-LIBOR | | Quarterly | | | 2.632 | | | Semi-Annual | | 12/22/47 | | USD | 8,700,000 | | | | (173,967 | ) | | | (173,967 | ) | |
| | | | | | | | $ 3,007,308 | | $ 3,055,514 | |
At December 31, 2017, the following over-the-counter purchased interest rate swaptions were outstanding for Voya Global Bond Portfolio:
Description | | Counterparty | | Exercise
Rate | | Pay/
Receive
Exercise
Rate | | Floating
Rate
Index | | Expiration
Date | | Notional
Amount | | Cost | | Fair
Value | |
Call on 10-Year
Interest Rate
Swap | | Deutsche
Bank AG | | | 2.500 | % | | Receive | | 3-month
USD-LIBOR | | 06/07/18 | | USD | 37,900,000 | | | $ | 1,122,787 | | | $ | 1,031,538 | | |
Put on 10-Year
Interest Rate
Swap | | Barclays
Bank PLC | | | 2.665 | % | | Pay | | 3-month
USD-LIBOR | | 02/26/18 | | USD | 47,400,000 | | | | 85,320 | | | | 51,916 | | |
Put on 10-Year
Interest Rate
Swap | | Deutsche
Bank AG | | | 2.680 | % | | Pay | | 3-month
USD-LIBOR | | 02/12/18 | | USD | 47,400,000 | | | | 67,782 | | | | 22,646 | | |
Put on 10-Year
Interest Rate
Swap | | Goldman Sachs
International | | | 2.812 | % | | Pay | | 3-month
USD-LIBOR | | 01/25/18 | | USD | 97,100,000 | | | | 239,198 | | | | 1,075 | | |
Put on 30-Year
Interest Rate
Swap | | Deutsche
Bank AG | | | 2.600 | % | | Pay | | 3-month
USD-LIBOR | | 06/07/18 | | USD | 37,900,000 | | | | 1,118,050 | | | | 1,071,989 | | |
| | | | | | | | | | | | | | | $ | 2,633,137 | | | $ | 2,179,164 | | |
At December 31, 2017, the following over-the-counter written interest rate swaptions were outstanding for Voya Global Bond Portfolio:
Description | | Counterparty | | Exercise
Rate | | Pay/
Receive
Exercise
Rate | | Floating
Rate
Index | | Expiration
Date | | Notional
Amount | | Premiums
Received | | Fair
Value | |
Call on 10-Year
Interest Rate
Swap | | Barclays
Bank PLC | | | 2.165 | % | | Pay | | 3-month
USD-LIBOR | | 02/26/18 | | USD | 47,400,000 | | | $ | 85,320 | | | $ | (52,847 | ) | |
Call on 10-Year
Interest Rate
Swap | | Deutsche
Bank AG | | | 2.180 | % | | Pay | | 3-month
USD-LIBOR | | 02/12/18 | | USD | 47,400,000 | | | | 67,782 | | | | (34,616 | ) | |
Call on 10-Year
Interest Rate
Swap | | Goldman Sachs
International | | | 2.112 | % | | Pay | | 3-month
USD-LIBOR | | 01/25/18 | | USD | 97,100,000 | | | | 239,198 | | | | (7,145 | ) | |
Call on 30-Year
Interest Rate
Swap | | Deutsche
Bank AG | | | 2.500 | % | | Pay | | 3-month
USD-LIBOR | | 03/07/18 | | USD | 54,500,000 | | | | 1,090,000 | | | | (860,036 | ) | |
Put on 30-Year
Interest Rate
Swap | | Deutsche
Bank AG | | | 2.600 | % | | Receive | | 3-month
USD-LIBOR | | 03/07/18 | | USD | 54,500,000 | | | | 985,739 | | | | (825,794 | ) | |
| | | | | | | | | | | | | | | $ | 2,468,039 | | | $ | (1,780,438 | ) | |
See Accompanying Notes to Financial Statements
103
SUMMARY PORTFOLIO OF INVESTMENTS
VOYA GLOBAL BOND PORTFOLIO AS OF DECEMBER 31, 2017 (CONTINUED)
At December 31, 2017, the following over-the-counter purchased interest rate caps were outstanding for Voya Global Bond Portfolio:
Description | | Counterparty | | Exercise
Rate | | Pay/
Receive
Exercise
Rate | | Floating
Rate
Index | | Expiration
Date | | Notional
Amount | | Cost | | Fair
Value | |
Put Option-Max
[0, 10-Year Swap
Rate minus 2-Year
Swap Rate)-
Exercise Rate] | | Barclays Bank PLC | | | 0.440 | % | | Receive | | |
3-month
USD-LIBOR | | | 02/28/18 | | USD | 236,800,000 | | | $ | 33,152 | | | $ | 11,430 | | |
| | | | | | | | | | | | | | | $ | 33,152 | | | $ | 11,430 | | |
At December 31, 2017, the following over-the-counter written interest rate floors were outstanding for Voya Global Bond Portfolio:
Description | | Counterparty | | Exercise
Rate | | Pay/
Receive
Exercise
Rate | | Floating
Rate
Index | | Expiration
Date | | Notional
Amount | | Premiums
Received | | Fair
Value | |
Call Option-Max
[0, Exercise Rate
minus 10-Year Swap
Rate minus 2-Year
Swap Rate] | | Barclays Bank PLC | | | 0.240 | % | | Pay | | |
3-month
USD-LIBOR | | | 02/28/18 | | USD | 236,800,000 | | | $ | 35,520 | | | $ | (55,901 | ) | |
| | | | | | | | | | | | | | | $ | 35,520 | | | $ | (55,901 | ) | |
At December 31, 2017, the following over-the-counter purchased option steepeners were outstanding for Voya Global Bond Portfolio:
Description | | Counterparty | | Exercise
Rate | | Pay/
Receive
Exercise
Rate | | Floating
Rate
Index | | Expiration
Date | | Notional
Amount | | Cost | | Fair
Value | |
Put Option-Max [10-Year
Receiver Swap Value*
10-Year Multiplier minus
2-Year Receiver Swap
Value*2-Year Multiplier, 0] | | Morgan Stanley
Capital Services LLC | | | 0.435 | % | | Receive | | |
3-month
USD-LIBOR | | | 03/12/18 | | USD | 23,680 | | | $ | 2,368 | | | $ | 10,287 | | |
| | | | | | | | | | | | | | | $ | 2,368 | | | $ | 10,287 | | |
At December 31, 2017, the following over-the-counter written option flatteners were outstanding for Voya Global Bond Portfolio:
Description | | Counterparty | | Exercise
Rate | | Pay/
Receive
Exercise
Rate | | Floating
Rate
Index | | Expiration
Date | | Notional
Amount | | Premiums
Received | | Fair
Value | |
Call Option-Max[10-Year
Receiver Swap Value*
10-Year Multiplier minus
2-Year Receiver Swap
Value*2-Year Multiplier,0] | | Morgan Stanley
Capital Services LLC | | | 0.235 | % | | Pay | | |
3-month
USD-LIBOR | | | 03/12/18 | | USD | 23,680 | | | $ | — | | | $ | (67,056 | ) | |
| | | | | | | | | | | | | | | $ | — | | | $ | (67,056 | ) | |
Currency Abbreviations
AUD — Australian Dollar
BRL — Brazilian Real
CAD — Canadian Dollar
CHF — Swiss Franc
CLP — Chilean Peso
COP — Colombian Peso
CZK — Czech Koruna
DKK — Danish Krone
EUR — EU Euro
GBP — British Pound
HKD — Hong Kong Sar Dollar
HUF — Hungarian Forint
IDR — Indonesian Rupiah
ILS — Israeli New Shekel
JPY — Japanese Yen
KRW — South Korean Won
MXN — Mexican Peso
See Accompanying Notes to Financial Statements
104
SUMMARY PORTFOLIO OF INVESTMENTS
VOYA GLOBAL BOND PORTFOLIO AS OF DECEMBER 31, 2017 (CONTINUED)
MYR — Malaysian Ringgit
NOK — Norwegian Krone
NZD — New Zealand Dollar
PEN — Peruvian Nuevo Sol
PHP — Philippine Peso
PLN — Polish Zloty
RON — Romanian New Leu
RUB — Russian Ruble
SEK — Swedish Krona
SGD — Singapore Dollar
THB — Thai Baht
TRY — Turkish Lira
USD — United States Dollar
ZAR — South African Rand
A summary of derivative instruments by primary risk exposure is outlined in the following tables.
The fair value of derivative instruments as of December 31, 2017 was as follows:
Derivatives not accounted
for as hedging instruments | | Location on Statement of Assets and Liabilities | | Fair Value | |
Asset Derivatives | |
Interest rate contracts | | Investments in securities at value* | | $ | 2,200,881 | | |
Foreign exchange contracts | | Unrealized appreciation on forward foreign currency contracts | | | 2,550,196 | | |
Interest rate contracts | | Net Assets- Unrealized appreciation** | | | 90,595 | | |
Credit contracts | | Net Assets- Unrealized appreciation*** | | | 13,596 | | |
Interest rate contracts | | Net Assets- Unrealized appreciation*** | | | 4,482,330 | | |
Total Asset Derivatives | | | | $ | 9,337,598 | | |
Liability Derivatives | |
Foreign exchange contracts | | Unrealized depreciation on forward foreign currency contracts | | $ | 1,202,545 | | |
Interest rate contracts | | Net Assets- Unrealized depreciation** | | | 296,004 | | |
Credit contracts | | Net Assets- Unrealized appreciation*** | | | 5,403 | | |
Interest rate contracts | | Net Assets- Unrealized depreciation*** | | | 1,426,815 | | |
Interest rate contracts | | Written options, at fair value | | | 1,903,395 | | |
Total Liability Derivatives | | | | $ | 4,834,162 | | |
* Includes purchased options.
** Includes cumulative appreciation/depreciation of futures contracts as reported in the table following the Portfolio of Investments.
*** Includes cumulative appreciation/depreciation of centrally cleared swaps as reported in the table following the Portfolio of Investments. Only current day's variation margin receivable/payable is shown on the Statement of Assets and Liabiliites.
The effect of derivative instruments on the Portfolio's Statement of Operations for the year ended December 31, 2017 was as follows:
| | | Amount of Realized Gain or (Loss) on Derivatives Recognized in Income | |
Derivatives not
accounted for as
hedging instruments | | Investments* | | Forward foreign
currency contracts | | Futures | | Swaps | | Written
options | | Total | |
Equity contracts | | $ | — | | | $ | — | | | $ | 15,529 | | | $ | — | | | $ | — | | | $ | 15,529 | | |
Credit Contracts | | | (15,750 | ) | | | — | | | | — | | | | 667,405 | | | | — | | | | 651,655 | | |
Foreign exchange contracts | | | (677,656 | ) | | | 1,183,259 | | | | — | | | | — | | | | — | | | | 505,603 | | |
Interest rate contracts | | | (5,495,600 | ) | | | — | | | | 435,760 | | | | (10,191,305 | ) | | | 12,881,449 | | | | (2,369,696 | ) | |
Total | | $ | (6,189,006 | ) | | $ | 1,183,259 | | | $ | 451,289 | | | $ | (9,523,900 | ) | | $ | 12,881,449 | | | $ | (1,196,909 | ) | |
| | | Change in Unrealized Appreciation or (Depreciation) on Derivatives Recognized in Income | |
Derivatives not
accounted for as
hedging instruments | | Investments* | | Forward foreign
currency contracts | | Futures | | Swaps | | Written
options | | Total | |
Equity contracts | | $ | — | | | $ | — | | | $ | (70,032 | ) | | $ | — | | | $ | — | | | $ | (70,032 | ) | |
Credit contracts | | | — | | | | — | | | | — | | | | (146,938 | ) | | | — | | | | (146,938 | ) | |
Foreign exchange contracts | | | 71,430 | | | | 4,756,562 | | | | — | | | | — | | | | — | | | | 4,827,992 | | |
Interest rate contracts | | | (3,274,177 | ) | | | — | | | | (338,209 | ) | | | 3,540,104 | | | | 2,931,124 | | | | 2,858,842 | | |
Total | | $ | (3,202,747 | ) | | $ | 4,756,562 | | | $ | (408,241 | ) | | $ | 3,393,166 | | | $ | 2,931,124 | | | $ | 7,469,864 | | |
* Amounts recognized for purchased options are included in net realized gain (loss) on investments and net change in unrealized appreciation or depreciation on investments.
See Accompanying Notes to Financial Statements
105
SUMMARY PORTFOLIO OF INVESTMENTS
VOYA GLOBAL BOND PORTFOLIO AS OF DECEMBER 31, 2017 (CONTINUED)
The following is a summary by counterparty of the fair value of OTC derivative instruments subject to Master Netting Agreements and collateral pledged (received), if any, at December 31, 2017:
| | | Barclays
Bank
PLC | | Citibank
N.A. | | Deutsche
Bank AG | | Goldman
Sachs
International | | HSBC
Bank
USA
N.A. | | JPMorgan
Chase
Bank N.A. | | Morgan
Stanley | | Morgan
Stanley
Capital
Services
LLC | | The
Bank of
New York
Mellon | | Totals | |
Assets: | |
Purchased options | | $ | 63,346 | | | $ | — | | | $ | 2,126,173 | | | $ | 1,075 | | | $ | — | | | $ | — | | | $ | — | | | $ | 10,287 | | | $ | — | | | $ | 2,200,881 | | |
Forward foreign currency
contracts | | | 422,465 | | | | 57,228 | | | | 157,882 | | | | 56,367 | | | | 50,284 | | | | 1,236,145 | | | | 473,470 | | | | — | | | | 96,355 | | | | 2,550,196 | | |
Total Assets | | $ | 485,811 | | | $ | 57,228 | | | $ | 2,284,055 | | | $ | 57,442 | | | $ | 50,284 | | | $ | 1,236,145 | | | $ | 473,470 | | | $ | 10,287 | | | $ | 96,355 | | | $ | 4,751,077 | | |
Liabilities: | |
Forward foreign currency
contracts | | $ | 316,993 | | | $ | 219,787 | | | $ | 84,419 | | | $ | 149,481 | | | $ | 61,946 | | | $ | 182,176 | | | $ | 179,086 | | | $ | — | | | $ | 8,657 | | | $ | 1,202,545 | | |
Written options | | | 108,748 | | | | — | | | | 1,720,446 | | | | 7,145 | | | | — | | | | — | | | | — | | | | 67,056 | | | | — | | | | 1,903,395 | | |
Total Liabilities | | $ | 425,741 | | | $ | 219,787 | | | $ | 1,804,865 | | | $ | 156,626 | | | $ | 61,946 | | | $ | 182,176 | | | $ | 179,086 | | | $ | 67,056 | | | $ | 8,657 | | | $ | 3,105,940 | | |
Net OTC derivative
instruments by
counterparty, at fair
value | | $ | 60,070 | | | $ | (162,559 | ) | | $ | 479,190 | | | $ | (99,184 | ) | | $ | (11,662 | ) | | $ | 1,053,969 | | | $ | 294,384 | | | $ | (56,769 | ) | | $ | 87,698 | | | $ | 1,645,137 | | |
Total collateral pledged
by the Portfolio/
(Received from
counterparty) | | $ | (60,070 | ) | | $ | — | | | $ | — | | | $ | — | | | $ | — | | | $ | (560,000 | ) | | $ | — | | | $ | — | | | $ | — | | | $ | (620,070 | ) | |
Net Exposure(1)(2) | | $ | — | | | $ | (162,559 | ) | | $ | 479,190 | | | $ | (99,184 | ) | | $ | (11,662 | ) | | $ | 493,969 | | | $ | 294,384 | | | $ | (56,769 | ) | | $ | 87,698 | | | $ | 1,025,067 | | |
(1) Positive net exposure represents amounts due from each respective counterparty. Negative exposure represents amounts due from the Portfolio. Please refer to Note 2 for additional details regarding counterparty credit risk and credit related contingent features.
(2) At December 31, 2017, the Portfolio received $70,000 in cash collateral from Barclays Bank PLC. Excess cash collateral is not shown for financial reporting purposes.
At December 31, 2017, the aggregate cost of securities and other investments and the composition of unrealized appreciation and depreciation of securities and other investments at period end were:
Cost for federal income tax purposes was $234,527,691.
Net unrealized appreciation consisted of: | |
Gross Unrealized Appreciation | | $ | 11,912,325 | | |
Gross Unrealized Depreciation | | | (11,758,890 | ) | |
Net Unrealized Appreciation | | $ | 153,435 | | |
See Accompanying Notes to Financial Statements
106
VY® AMERICAN CENTURY SUMMARY PORTFOLIO OF INVESTMENTS
SMALL-MID CAP VALUE PORTFOLIO AS OF DECEMBER 31, 2017
Shares | |
| |
| | Value | | Percentage
of Net
Assets | |
COMMON STOCK: 95.6% | | | |
| | | | | Consumer Discretionary: 5.2% | |
| | 28,488 | | | | | | | Advance Auto Parts, Inc. | | $ | 2,839,969 | | | | 0.7 | | |
| | 76,686 | | | | (1 | ) | | Honda Motor Co., Ltd.
ADR | | | 2,613,459 | | | | 0.7 | | |
| | 546,053 | | | | (2 | ) | | Other Securities | | | 14,209,566 | | | | 3.8 | | |
| | | | | | | | | | 19,662,994 | | | | 5.2 | | |
| | | | | Consumer Staples: 8.8% | |
| | 125,714 | | | | | | | Conagra Brands, Inc. | | | 4,735,646 | | | | 1.2 | | |
| | 68,340 | | | | | | | General Mills, Inc. | | | 4,051,878 | | | | 1.1 | | |
| | 49,380 | | | | | | | Kellogg Co. | | | 3,356,852 | | | | 0.9 | | |
| | 96,526 | | | | | | | Mondelez International,
Inc. | | | 4,131,313 | | | | 1.1 | | |
| | 256,872 | | | | | | | Orkla ASA | | | 2,722,095 | | | | 0.7 | | |
| | 59,768 | | | | | | | Sysco Corp. | | | 3,629,711 | | | | 1.0 | | |
| | 155,283 | | | | (2 | ),(3) | | Other Securities | | | 10,539,505 | | | | 2.8 | | |
| | | | | | | | | | 33,167,000 | | | | 8.8 | | |
| | | | | Energy: 10.2% | |
| | 49,805 | | | | | | | Anadarko Petroleum
Corp. | | | 2,671,540 | | | | 0.7 | | |
| | 106,373 | | | | | | | Baker Hughes a GE Co. | | | 3,365,642 | | | | 0.9 | | |
| | 60,336 | | | | | | | EQT Corp. | | | 3,434,325 | | | | 0.9 | | |
| | 138,614 | | | | | | | Imperial Oil Ltd. | | | 4,326,036 | | | | 1.1 | | |
| | 95,335 | | | | | | | National Oilwell Varco,
Inc. | | | 3,433,967 | | | | 0.9 | | |
| | 120,459 | | | | | | | Noble Energy, Inc. | | | 3,510,175 | | | | 0.9 | | |
| | 50,241 | | | | | | | Occidental Petroleum
Corp. | | | 3,700,752 | | | | 1.0 | | |
| | 524,876 | | | | (2 | ),(3) | | Other Securities | | | 14,170,313 | | | | 3.8 | | |
| | | | | | | | | | 38,612,750 | | | | 10.2 | | |
| | | | | Financials: 24.2% | |
| | 21,316 | | | | | | | Ameriprise Financial, Inc. | | | 3,612,423 | | | | 1.0 | | |
| | 61,575 | | | | | | | Bank of the Ozarks, Inc. | | | 2,983,309 | | | | 0.8 | | |
| | 71,072 | | | | | | | BankUnited, Inc. | | | 2,894,052 | | | | 0.8 | | |
| | 89,160 | | | | | | | BB&T Corp. | | | 4,433,035 | | | | 1.2 | | |
| | 26,956 | | | | | | | Chubb Ltd. | | | 3,939,080 | | | | 1.0 | | |
| | 129,591 | | | | | | | Invesco Ltd. | | | 4,735,255 | | | | 1.2 | | |
| | 19,451 | | | | | | | M&T Bank Corp. | | | 3,325,926 | | | | 0.9 | | |
| | 66,876 | | | | | | | Northern Trust Corp. | | | 6,680,244 | | | | 1.8 | | |
| | 37,167 | | | | | | | UMB Financial Corp. | | | 2,673,051 | | | | 0.7 | | |
| | 236,062 | | | | | | | Valley National Bancorp | | | 2,648,616 | | | | 0.7 | | |
| | 43,646 | | | | (1 | ) | | Westamerica Bancorp. | | | 2,599,119 | | | | 0.7 | | |
| | 1,385,316 | | | | (2 | ),(3) | | Other Securities | | | 50,644,656 | | | | 13.4 | | |
| | | | | | | | | | 91,168,766 | | | | 24.2 | | |
| | | | | Health Care: 7.5% | |
| | 54,830 | | | | | | | Cardinal Health, Inc. | | | 3,359,434 | | | | 0.9 | | |
| | 31,842 | | | | (4 | ) | | HCA Healthcare, Inc. | | | 2,797,001 | | | | 0.7 | | |
| | 59,319 | | | | (4 | ) | | LifePoint Health, Inc. | | | 2,954,086 | | | | 0.8 | | |
Shares | |
| |
| | Value | | Percentage
of Net
Assets | |
| | 52,945 | | | | | | | Zimmer Biomet
Holdings, Inc. | | $ | 6,388,873 | | | | 1.7 | | |
| | 164,989 | | | | (2 | ) | | Other Securities | | | 12,877,342 | | | | 3.4 | | |
| | | | | | | | | | 28,376,736 | | | | 7.5 | | |
| | | | | Industrials: 13.9% | |
| | 53,026 | | | | | | | Emerson Electric Co. | | | 3,695,382 | | | | 1.0 | | |
| | 110,967 | | | | (1 | ) | | Heartland Express, Inc. | | | 2,589,970 | | | | 0.7 | | |
| | 29,948 | | | | | | | Hubbell, Inc. | | | 4,053,162 | | | | 1.0 | | |
| | 175,599 | | | | | | | Johnson Controls
International plc | | | 6,692,078 | | | | 1.8 | | |
| | 38,167 | | | | | | | MSC Industrial Direct Co. | | | 3,689,222 | | | | 1.0 | | |
| | 51,958 | | | | | | | Textron, Inc. | | | 2,940,303 | | | | 0.8 | | |
| | 715,977 | | | | (2 | ),(3) | | Other Securities | | | 28,829,644 | | | | 7.6 | | |
| | | | | | | | | | 52,489,761 | | | | 13.9 | | |
| | | | | Information Technology: 8.3% | |
| | 57,259 | | | | | | | Applied Materials, Inc. | | | 2,927,080 | | | | 0.8 | | |
| | 74,415 | | | | (4 | ) | | Keysight Technologies,
Inc. | | | 3,095,664 | | | | 0.8 | | |
| | 69,354 | | | | | | | Maxim Integrated
Products | | | 3,625,827 | | | | 0.9 | | |
| | 27,160 | | | | | | | TE Connectivity Ltd. | | | 2,581,287 | | | | 0.7 | | |
| | 60,600 | | | | | | | Teradyne, Inc. | | | 2,537,322 | | | | 0.7 | | |
| | 574,612 | | | | (2 | ),(3) | | Other Securities | | | 16,705,889 | | | | 4.4 | | |
| | | | | | | | | | 31,473,069 | | | | 8.3 | | |
| | | | | Materials: 6.9% | |
| | 68,632 | | | | | | | Bemis Co., Inc. | | | 3,279,923 | | | | 0.9 | | |
| | 398,569 | | | | | | | Graphic Packaging
Holding Co. | | | 6,157,891 | | | | 1.6 | | |
| | 97,573 | | | | | | | Silgan Holdings, Inc. | | | 2,867,671 | | | | 0.8 | | |
| | 48,527 | | | | | | | Sonoco Products Co. | | | 2,578,725 | | | | 0.7 | | |
| | 72,040 | | | | | | | WestRock Co. | | | 4,553,648 | | | | 1.2 | | |
| | 116,922 | | | | | | | Other Securities | | | 6,501,771 | | | | 1.7 | | |
| | | | | | | | | | 25,939,629 | | | | 6.9 | | |
| | | | | Real Estate: 6.0% | |
| | 161,999 | | | | | | | Weyerhaeuser Co. | | | 5,712,085 | | | | 1.5 | | |
| | 730,979 | | | | (3 | ) | | Other Securities | | | 16,821,799 | | | | 4.5 | | |
| | | | | | | | | | 22,533,884 | | | | 6.0 | | |
| | | | | Telecommunication Services: 0.2% | |
| | 37,248 | | | | | | | Other Securities | | | 621,297 | | | | 0.2 | | |
| | | | | Utilities: 4.4% | |
| | 43,166 | | | | | | | NorthWestern Corp. | | | 2,577,010 | | | | 0.7 | | |
| | 78,794 | | | | | | | Xcel Energy, Inc. | | | 3,790,780 | | | | 1.0 | | |
| | 151,234 | | | | | | | Other Securities | | | 10,379,559 | | | | 2.7 | | |
| | | | | | | | | | 16,747,349 | | | | 4.4 | | |
| | | | | | | Total Common Stock
(Cost $318,306,344) | | | 360,793,235 | | | | 95.6 | | |
See Accompanying Notes to Financial Statements
107
VY® AMERICAN CENTURY SUMMARY PORTFOLIO OF INVESTMENTS
SMALL-MID CAP VALUE PORTFOLIO AS OF DECEMBER 31, 2017 (CONTINUED)
Shares | |
| |
| | Value | | Percentage
of Net
Assets | |
EXCHANGE-TRADED FUNDS: 1.4% | | | |
| | 56,915 | | | | | | | iShares Russell Midcap
Value Index Fund | | $ | 5,073,972 | | | | 1.4 | | |
| | | | | | | | | Total Exchange-Traded
Funds
(Cost $4,842,350) | | | 5,073,972 | | | | 1.4 | | |
PREFERRED STOCK: 0.2% | | | |
| | | | | Industrials: 0.2% | |
| | 13,665 | | | | (2 | ),(3) | | Other Securities | | | 797,626 | | | | 0.2 | | |
| | | | | | | | | Total Preferred Stock
(Cost $693,853) | | | 797,626 | | | | 0.2 | | |
| | | | | | | | | Total Long-Term
Investments
(Cost $323,842,547) | | | 366,664,833 | | | | 97.2 | | |
Principal
Amount† | |
| |
| | Value | | Percentage
of Net
Assets | |
SHORT-TERM INVESTMENTS: 6.2% | | | |
| | | | | Securities Lending Collateral(5): 3.5% | |
| | 3,117,149 | | | | | | | Cantor Fitzgerald,
Repurchase Agreement
dated 12/29/17, 1.41%,
due 01/02/18
(Repurchase Amount
$3,117,631,
collateralized by
various U.S.
Government\U.S.
Government Agency
Obligations,
0.000%-8.500%,
Market Value plus
accrued interest
$3,179,492, due
01/31/18-06/20/63) | | $ | 3,117,149 | | | | 0.9 | | |
| | 655,748 | | | | | | | Daiwa Capital Markets,
Repurchase Agreement
dated 12/29/17, 1.43%,
due 01/02/18
(Repurchase Amount
$655,851, collateralized
by various U.S.
Government and U.S.
Government Agency
Obligations,
0.000%-6.500%,
Market Value plus
accrued interest
$668,863, due
01/11/18-12/01/51) | | | 655,748 | | | | 0.2 | | |
Principal
Amount† | |
| |
| | Value | | Percentage
of Net
Assets | |
| | 3,117,149 | | | | | | | Millenium Fixed Income
Ltd., Repurchase
Agreement dated
12/29/17, 1.44%,
due 01/02/18
(Repurchase Amount
$3,117,641,
collateralized by
various U.S.
Government Securities,
2.875%-3.625%,
Market Value plus
accrued interest
$3,179,492, due
02/15/43-02/15/44) | | $ | 3,117,149 | | | | 0.8 | | |
| | 3,117,149 | | | | | | | NBC Global Finance Ltd.,
Repurchase Agreement
dated 12/29/17, 1.50%,
due 01/02/18
(Repurchase Amount
$3,117,661,
collateralized by
various U.S.
Government Securities,
0.750%-2.250%,
Market Value plus
accrued interest
$3,179,492, due
09/30/18-09/09/49) | | | 3,117,149 | | | | 0.8 | | |
| | 3,117,149 | | | | | | | State of Wisconsin
Investment Board,
Repurchase Agreement
dated 12/29/17, 1.63%,
due 01/02/18
(Repurchase Amount
$3,117,706,
collateralized by
various U.S.
Government Securities,
0.125%-3.875%,
Market Value plus
accrued interest
$3,203,711, due
01/15/19-02/15/46) | | | 3,117,149 | | | | 0.8 | | |
| | | | | | | | | | 13,124,344 | | | | 3.5 | | |
See Accompanying Notes to Financial Statements
108
VY® AMERICAN CENTURY SUMMARY PORTFOLIO OF INVESTMENTS
SMALL-MID CAP VALUE PORTFOLIO AS OF DECEMBER 31, 2017 (CONTINUED)
Shares | |
| |
| | Value | | Percentage
of Net
Assets | |
| | | | | Mutual Funds: 2.7% | |
| | 10,333,772 | | | | (6 | ) | | BlackRock Liquidity
Funds, FedFund,
Institutional
Class, 1.170%
(Cost $10,333,772) | | $ | 10,333,772 | | | | 2.7 | | |
| | | | | | | Total Short-Term
Investments
(Cost $23,458,116) | | | 23,458,116 | | | | 6.2 | | |
| | | | | | | Total Investments in
Securities
(Cost $347,300,663) | | $ | 390,122,949 | | | | 103.4 | | |
| | | | | | | Liabilities in Excess of
Other Assets | | | (12,705,109 | ) | | | (3.4 | ) | |
| | | | | | | Net Assets | | $ | 377,417,840 | | | | 100.0 | | |
"Other Securities" represents issues not identified as the top 50 holdings in terms of market value and issues or issuers not exceeding 1% of net assets individually or in aggregate respectively as of December 31, 2017.
The following footnotes apply to either the individual securities noted or one or more of the securities aggregated and listed as a single line item.
† Unless otherwise indicated, principal amount is shown in USD.
ADR American Depositary Receipt
(1) Security, or a portion of the security, is on loan.
(2) The grouping contains non-income producing securities.
(3) The grouping contains securities on loan.
(4) Non-income producing security.
(5) Represents securities purchased with cash collateral received for securities on loan.
(6) Rate shown is the 7-day yield as of December 31, 2017.
Fair Value Measurements^
The following is a summary of the fair valuations according to the inputs used as of December 31, 2017 in valuing the assets and liabilities:
| | | Quoted Prices
in Active Markets
for Identical Investments
(Level 1) | | Significant Other
Observable
Inputs#
(Level 2) | | Significant
Unobservable
Inputs
(Level 3) | | Fair Value
at
December 31, 2017 | |
Asset Table | |
Investments, at fair value | |
Common Stock | |
Consumer Discretionary | | $ | 19,662,994 | | | $ | — | | | $ | — | | | $ | 19,662,994 | | |
Consumer Staples | | | 30,444,905 | | | | 2,722,095 | | | | — | | | | 33,167,000 | | |
Energy | | | 38,612,750 | | | | — | | | | — | | | | 38,612,750 | | |
Financials | | | 91,168,766 | | | | — | | | | — | | | | 91,168,766 | | |
Health Care | | | 27,917,969 | | | | 458,767 | | | | — | | | | 28,376,736 | | |
Industrials | | | 52,489,761 | | | | — | | | | — | | | | 52,489,761 | | |
Information Technology | | | 31,473,069 | | | | — | | | | — | | | | 31,473,069 | | |
Materials | | | 25,939,629 | | | | — | | | | — | | | | 25,939,629 | | |
Real Estate | | | 22,533,884 | | | | — | | | | — | | | | 22,533,884 | | |
Telecommunication Services | | | 621,297 | | | | — | | | | — | | | | 621,297 | | |
Utilities | | | 16,747,349 | | | | — | | | | — | | | | 16,747,349 | | |
Total Common Stock | | | 357,612,373 | | | | 3,180,862 | | | | — | | | | 360,793,235 | | |
Exchange-Traded Funds | | | 5,073,972 | | | | — | | | | — | | | | 5,073,972 | | |
Preferred Stock | | | 797,626 | | | | — | | | | — | | | | 797,626 | | |
Short-Term Investments | | | 10,333,772 | | | | 13,124,344 | | | | — | | | | 23,458,116 | | |
Total Investments, at fair value | | $ | 373,817,743 | | | $ | 16,305,206 | | | $ | — | | | $ | 390,122,949 | | |
Other Financial Instruments+ | |
Forward Foreign Currency Contracts | | | — | | | | 3,224 | | | | — | | | | 3,224 | | |
Total Assets | | $ | 373,817,743 | | | $ | 16,308,430 | | | $ | — | | | $ | 390,126,173 | | |
Liabilities Table | |
Other Financial Instruments+ | |
Forward Foreign Currency Contracts | | $ | — | | | $ | (135,692 | ) | | $ | — | | | $ | (135,692 | ) | |
Total Liabilities | | $ | — | | | $ | (135,692 | ) | | $ | — | | | $ | (135,692 | ) | |
^ See Note 2, "Significant Accounting Policies" in the Notes to Financial Statements for additional information.
+ Other Financial Instruments are derivatives not reflected in the Portfolio of Investments and may include open forward foreign currency contracts, futures, centrally cleared swaps, OTC swaps and written options. Forward foreign currency contracts, futures and centrally cleared swaps are valued at the unrealized gain (loss) on the instrument. OTC swaps and written options are valued at the fair value of the instrument.
# The earlier close of the foreign markets gives rise to the possibility that significant events, including broad market moves, may have occurred in the interim and may materially affect the value of those securities. To account for this, the Portfolio may frequently value many of its foreign equity securities using fair value prices based on third party vendor modeling tools to the extent available. Accordingly, a portion of the Portfolio's investments are categorized as Level 2 investments.
See Accompanying Notes to Financial Statements
109
VY® AMERICAN CENTURY SUMMARY PORTFOLIO OF INVESTMENTS
SMALL-MID CAP VALUE PORTFOLIO AS OF DECEMBER 31, 2017 (CONTINUED)
At December 31, 2017, the following forward foreign currency contracts were outstanding for VY® American Century Small-Mid Cap Value Portfolio:
Currency
Purchased | | Currency Sold | | Counterparty | | Settlement
Date | | Unrealized
Appreciation
(Depreciation) | |
USD | 1,577,269 | | | JPY | 176,543,765 | | | Credit Suisse AG | | 03/30/18 | | $ | 3,224 | | |
USD | 2,257,748 | | | NOK | 18,869,355 | | | JPMorgan Chase Bank N.A. | | 03/28/18 | | | (45,893 | ) | |
USD | 3,527,307 | | | CAD | 4,532,525 | | | Morgan Stanley | | 03/29/18 | | | (82,570 | ) | |
USD | 397,930 | | | EUR | 335,902 | | | UBS AG | | 03/29/18 | | | (7,229 | ) | |
| | | | | | | $(132,468) | |
Currency Abbreviations
CAD — Canadian Dollar
EUR — EU Euro
JPY — Japanese Yen
USD — United States Dollar
A summary of derivative instruments by primary risk exposure is outlined in the following tables.
The fair value of derivative instruments as of December 31, 2017 was as follows:
Derivatives not accounted
for as hedging instruments | | Location on Statement of Assets and Liabilities | | Fair Value | |
Asset Derivatives | |
Foreign exchange contracts | | Unrealized appreciation on forward foreign currency contracts | | $ | 3,224 | | |
Total Asset Derivatives | | | | $ | 3,224 | | |
Liability Derivatives | |
Foreign exchange contracts | | Unrealized depreciation on forward foreign currency contracts | | $ | 135,692 | | |
Total Liability Derivatives | | | | $ | 135,692 | | |
The effect of derivative instruments on the Portfolio's Statement of Operations for the year ended December 31, 2017 was as follows:
| | | Amount of Realized Gain or (Loss) on Derivatives Recognized in Income | |
Derivatives not accounted
for as hedging instruments | | Forward foreign currency contracts | |
Foreign exchange contracts | | $ | (227,407 | ) | |
Total | | $ | (227,407 | ) | |
| | | Change in Unrealized Appreciation or (Depreciation) on Derivatives Recognized in Income | |
Derivatives not accounted
for as hedging instruments | | Forward foreign currency contracts | |
Foreign exchange contracts | | $ | (94,004 | ) | |
Total | | $ | (94,004 | ) | |
At December 31, 2017, the aggregate cost of securities and other investments and the composition of unrealized appreciation and depreciation of securities and other investments at period end were:
Cost for federal income tax purposes was $350,929,815.
Net unrealized appreciation consisted of: | |
Gross Unrealized Appreciation | | $ | 50,918,754 | | |
Gross Unrealized Depreciation | | | (11,857,718 | ) | |
Net Unrealized Appreciation | | $ | 39,061,036 | | |
See Accompanying Notes to Financial Statements
110
SUMMARY PORTFOLIO OF INVESTMENTS
VY® BARON GROWTH PORTFOLIO AS OF DECEMBER 31, 2017
Shares | |
| |
| | Value | | Percentage
of Net
Assets | |
COMMON STOCK: 99.3% | | | |
| | | | | Consumer Discretionary: 33.9% | |
| | 291,000 | | | | (1 | ) | | Bright Horizons Family
Solutions, Inc. | | $ | 27,354,000 | | | | 3.6 | | |
| | 550,000 | | | | | | | Choice Hotels
International, Inc. | | | 42,680,000 | | | | 5.6 | | |
| | 728,364 | | | | | | | Manchester United PLC -
Class A | | | 14,421,607 | | | | 1.9 | | |
| | 188,200 | | | | | | | Marriott Vacations
Worldwide Corp. | | | 25,446,522 | | | | 3.3 | | |
| | 43,123 | | | | (1 | ) | | Ollie's Bargain Outlet
Holdings, Inc. | | | 2,296,300 | | | | 0.3 | | |
| | 472,571 | | | | (1 | ) | | Penn National
Gaming, Inc. | | | 14,805,650 | | | | 1.9 | | |
| | 593,691 | | | | (1 | ) | | Pinnacle
Entertainment, Inc. | | | 19,431,506 | | | | 2.6 | | |
| | 213,000 | | | | | | | Red Rock Resorts, Inc. | | | 7,186,620 | | | | 0.9 | | |
| | 241,200 | | | | (1 | ) | | Under Armour, Inc. -
Class A | | | 3,480,516 | | | | 0.5 | | |
| | 456,500 | | | | | | | Vail Resorts, Inc. | | | 96,992,555 | | | | 12.8 | | |
| | 102,000 | | | | | | | Other Securities | | | 3,475,140 | | | | 0.5 | | |
| | | | | | | | | | 257,570,416 | | | | 33.9 | | |
| | | | | Consumer Staples: 1.4% | |
| | 121,500 | | | | | | | Church & Dwight Co., Inc. | | | 6,095,655 | | | | 0.8 | | |
| | 135,000 | | | | (1 | ) | | Performance Food
Group Co. | | | 4,468,500 | | | | 0.6 | | |
| | | | | | | | | | 10,564,155 | | | | 1.4 | | |
| | | | | Financials: 19.8% | |
| | 191,100 | | | | (1 | ) | | Arch Capital Group Ltd. | | | 17,346,147 | | | | 2.3 | | |
| | 270,000 | | | | (2 | ) | | Carlyle Group L.P. | | | 6,183,000 | | | | 0.8 | | |
| | 330,000 | | | | | | | Cohen & Steers, Inc. | | | 15,605,700 | | | | 2.1 | | |
| | 65,500 | | | | (1 | ) | | Essent Group Ltd. | | | 2,844,010 | | | | 0.4 | | |
| | 82,000 | | | | | | | Factset Research
Systems, Inc. | | | 15,806,320 | | | | 2.1 | | |
| | 284,000 | | | | | | | Financial Engines, Inc. | | | 8,605,200 | | | | 1.1 | | |
| | 123,241 | | | | | | | Kinsale Capital Group, Inc. | | | 5,545,845 | | | | 0.7 | | |
| | 9,289 | | | | (1 | ) | | LendingTree, Inc. | | | 3,162,440 | | | | 0.4 | | |
| | 80,000 | | | | | | | Moelis & Co. | | | 3,880,000 | | | | 0.5 | | |
| | 149,000 | | | | | | | Morningstar, Inc. | | | 14,448,530 | | | | 1.9 | | |
| | 182,500 | | | | | | | MSCI, Inc. - Class A | | | 23,093,550 | | | | 3.0 | | |
| | 160,000 | | | | (2 | ) | | Oaktree Capital Group LLC | | | 6,736,000 | | | | 0.9 | | |
| | 253,500 | | | | | | | Primerica, Inc. | | | 25,742,925 | | | | 3.4 | | |
| | 35,065 | | | | | | | Other Securities | | | 1,593,003 | | | | 0.2 | | |
| | | | | | | | | | 150,592,670 | | | | 19.8 | | |
| | | | | Health Care: 8.7% | |
| | 100,400 | | | | | | | Bio-Techne Corp. | | | 13,006,820 | | | | 1.7 | | |
| | 175,000 | | | | (1 | ) | | IDEXX Laboratories, Inc. | | | 27,366,500 | | | | 3.6 | | |
| | 18,300 | | | | (1 | ) | | Mettler Toledo
International, Inc. | | | 11,337,216 | | | | 1.5 | | |
| | 47,008 | | | | (1 | ) | | Neogen Corp. | | | 3,864,528 | | | | 0.5 | | |
Shares | |
| |
| | Value | | Percentage
of Net
Assets | |
| | 96,500 | | | | | | | West Pharmaceutical
Services, Inc. | | $ | 9,521,655 | | | | 1.3 | | |
| | 50,000 | | | | (3 | ) | | Other Securities | | | 782,000 | | | | 0.1 | | |
| | | | | | | | | | 65,878,719 | | | | 8.7 | | |
| | | | | Industrials: 2.2% | |
| | 70,000 | | | | | | | Air Lease Corp. | | | 3,366,300 | | | | 0.4 | | |
| | 54,500 | | | | (1 | ) | | Middleby Corp. | | | 7,354,775 | | | | 1.0 | | |
| | 56,500 | | | | (1 | ) | | Trex Co., Inc. | | | 6,124,035 | | | | 0.8 | | |
| | | | | | | | | | 16,845,110 | | | | 2.2 | | |
| | | | | Information Technology: 23.4% | |
| | 89,734 | | | | (1 | ) | | 2U, Inc. | | | 5,788,740 | | | | 0.8 | | |
| | 91,000 | | | | (1 | ) | | Altair Engineering, Inc. | | | 2,176,720 | | | | 0.3 | | |
| | 195,900 | | | | (1 | ) | | ANSYS, Inc. | | | 28,912,881 | | | | 3.8 | | |
| | 283,700 | | | | (1 | ) | | Benefitfocus, Inc. | | | 7,659,900 | | | | 1.0 | | |
| | 133,800 | | | | (1 | ) | | CoStar Group, Inc. | | | 39,731,910 | | | | 5.2 | | |
| | 296,300 | | | | (1 | ) | | Gartner, Inc. | | | 36,489,345 | | | | 4.8 | | |
| | 164,000 | | | | (1 | ) | | Guidewire Software, Inc. | | | 12,178,640 | | | | 1.6 | | |
| | 15,000 | | | | | | | Littelfuse, Inc. | | | 2,967,300 | | | | 0.4 | | |
| | 244,000 | | | | | | | Maximus, Inc. | | | 17,465,520 | | | | 2.3 | | |
| | 515,050 | | | | | | | SS&C Technologies
Holdings, Inc. | | | 20,849,224 | | | | 2.7 | | |
| | 52,500 | | | | (1 | ) | | Wix.com Ltd. | | | 3,021,375 | | | | 0.4 | | |
| | 6,858 | | | | (3 | ) | | Other Securities | | | 613,105 | | | | 0.1 | | |
| | | | | | | | | | 177,854,660 | | | | 23.4 | | |
| | | | | Real Estate: 8.5% | |
| | | | | | 14,720 | | | Alexander's, Inc. | | | 5,826,912 | | | | 0.8 | | |
| | | | | | 82,000 | | | Alexandria Real Estate
Equities, Inc. | | | 10,708,380 | | | | 1.4 | | |
| | | | | | 68,838 | | | American Assets
Trust, Inc. | | | 2,632,365 | | | | 0.4 | | |
| | | | | | 470,000 | | | Douglas Emmett, Inc. | | | 19,298,200 | | | | 2.5 | | |
| | | | | | 699,650 | | | Gaming and Leisure
Properties, Inc. | | | 25,887,050 | | | | 3.4 | | |
| | | | | | | | | | 64,352,907 | | | | 8.5 | | |
| | | | | Telecommunication Services: 1.4% | |
| | 921,311 | | | | (1 | ) | | Iridium
Communications, Inc. | | | 10,871,470 | | | | 1.4 | | |
| | | | | | | Total Common Stock
(Cost $263,261,387) | | | 754,530,107 | | | | 99.3 | | |
| | | | | | | Assets in Excess of
Other Liabilities | | | 5,032,895 | | | | 0.7 | | |
| | | | | | | Net Assets | | $ | 759,563,002 | | | | 100.0 | | |
"Other Securities" represents issues not identified as the top 50 holdings in terms of market value and issues or issuers not exceeding 1% of net assets individually or in aggregate respectively as of December 31, 2017.
The following footnotes apply to either the individual securities noted or one or more of the securities aggregated and listed as a single line item.
See Accompanying Notes to Financial Statements
111
SUMMARY PORTFOLIO OF INVESTMENTS
VY® BARON GROWTH PORTFOLIO AS OF DECEMBER 31, 2017 (CONTINUED)
(1) Non-income producing security.
(2) Security is a Master Limited Partnership.
(3) The grouping contains non-income producing securities.
Fair Value Measurements^
The following is a summary of the fair valuations according to the inputs used as of December 31, 2017 in valuing the assets and liabilities:
| | | Quoted Prices
in Active Markets
for Identical Investments
(Level 1) | | Significant Other
Observable
Inputs
(Level 2) | | Significant
Unobservable
Inputs
(Level 3) | | Fair Value
at
December 31, 2017 | |
Asset Table | |
Investments, at fair value | |
Common Stock* | | $ | 754,530,107 | | | $ | — | | | $ | — | | | $ | 754,530,107 | | |
Total Investments, at fair value | | $ | 754,530,107 | | | $ | — | | | $ | — | | | $ | 754,530,107 | | |
^ See Note 2, "Significant Accounting Policies" in the Notes to Financial Statements for additional information.
* For further breakdown of Common Stock by sector, please refer to the Portfolio of Investments.
At December 31, 2017, the aggregate cost of securities and other investments and the composition of unrealized appreciation and depreciation of securities and other investments at period end were:
Cost for federal income tax purposes was $268,747,065.
Net unrealized appreciation consisted of: | |
Gross Unrealized Appreciation | | $ | 490,876,535 | | |
Gross Unrealized Depreciation | | | (5,093,493 | ) | |
Net Unrealized Appreciation | | $ | 485,783,042 | | |
See Accompanying Notes to Financial Statements
112
VY® COLUMBIA SUMMARY PORTFOLIO OF INVESTMENTS
CONTRARIAN CORE PORTFOLIO AS OF DECEMBER 31, 2017
Shares | |
| |
| | Value | | Percentage
of Net
Assets | |
COMMON STOCK: 97.7% | | | |
| | | | | Consumer Discretionary: 12.5% | |
| | 3,180 | | | | (1 | ) | | Amazon.com, Inc. | | $ | 3,718,915 | | | | 1.2 | | |
| | 207,454 | | | | | | | Comcast Corp. - Class A | | | 8,308,533 | | | | 2.6 | | |
| | 28,525 | | | | | | | Dollar General Corp. | | | 2,653,110 | | | | 0.8 | | |
| | 86,454 | | | | | | | Lowe's Cos, Inc. | | | 8,035,035 | | | | 2.5 | | |
| | 13,345 | | | | | | | McDonald's Corp. | | | 2,296,941 | | | | 0.7 | | |
| | 25,820 | | | | | | | PVH Corp. | | | 3,542,762 | | | | 1.1 | | |
| | 45,405 | | | | | | | Starbucks Corp. | | | 2,607,609 | | | | 0.8 | | |
| | 69,030 | | | | | | | Tapestry, Inc. | | | 3,053,197 | | | | 0.9 | | |
| | 36,964 | | | | (2 | ) | | Other Securities | | | 6,254,918 | | | | 1.9 | | |
| | | | | | | | | | 40,471,020 | | | | 12.5 | | |
| | | | | Consumer Staples: 7.9% | |
| | 33,289 | | | | | | | CVS Health Corp. | | | 2,413,453 | | | | 0.8 | | |
| | 71,015 | | | | | | | Mondelez International, Inc. | | | 3,039,442 | | | | 0.9 | | |
| | 38,984 | | | | | | | PepsiCo, Inc. | | | 4,674,961 | | | | 1.4 | | |
| | 87,590 | | | | | | | Philip Morris International, Inc. | | | 9,253,884 | | | | 2.9 | | |
| | 55,525 | | | | | | | Sysco Corp. | | | 3,372,033 | | | | 1.0 | | |
| | 46,465 | | | | | | | Other Securities | | | 2,916,411 | | | | 0.9 | | |
| | | | | | | | | | 25,670,184 | | | | 7.9 | | |
| | | | | Energy: 7.3% | |
| | 129,978 | | | | | | | Canadian Natural
Resources Ltd. | | | 4,642,814 | | | | 1.4 | | |
| | 44,431 | | | | | | | Chevron Corp. | | | 5,562,317 | | | | 1.7 | | |
| | 34,574 | | | | | | | EOG Resources, Inc. | | | 3,730,880 | | | | 1.1 | | |
| | 75,700 | | | | | | | Exxon Mobil Corp. | | | 6,331,548 | | | | 2.0 | | |
| | 72,441 | | | | | | | Halliburton Co. | | | 3,540,192 | | | | 1.1 | | |
| | | | | | | | | | 23,807,751 | | | | 7.3 | | |
| | | | | Financials: 17.2% | |
| | 84,971 | | | | | | | Bank of New York
Mellon Corp. | | | 4,576,538 | | | | 1.4 | | |
| | 53,247 | | | | (1 | ) | | Berkshire Hathaway, Inc. -
Class B | | | 10,554,621 | | | | 3.3 | | |
| | 128,832 | | | | | | | Citigroup, Inc. | | | 9,586,389 | | | | 3.0 | | |
| | 111,413 | | | | | | | JPMorgan Chase & Co. | | | 11,914,506 | | | | 3.7 | | |
| | 105,095 | | | | | | | Morgan Stanley | | | 5,514,335 | | | | 1.7 | | |
| | 147,145 | | | | | | | Wells Fargo & Co. | | | 8,927,287 | | | | 2.7 | | |
| | 40,396 | | | | | | | Other Securities | | | 4,673,120 | | | | 1.4 | | |
| | | | | | | | | | 55,746,796 | | | | 17.2 | | |
| | | | | Health Care: 13.4% | |
| | 53,313 | | | | | | | Abbott Laboratories | | | 3,042,573 | | | | 0.9 | | |
| | 24,075 | | | | | | | Allergan plc | | | 3,938,188 | | | | 1.2 | | |
| | 15,515 | | | | (1 | ) | | Biogen, Inc. | | | 4,942,614 | | | | 1.5 | | |
| | 32,499 | | | | (1 | ) | | Celgene Corp. | | | 3,391,596 | | | | 1.1 | | |
| | 19,738 | | | | | | | Cigna Corp. | | | 4,008,590 | | | | 1.2 | | |
| | 60,454 | | | | | | | Johnson & Johnson | | | 8,446,633 | | | | 2.6 | | |
| | 162,850 | | | | | | | Pfizer, Inc. | | | 5,898,427 | | | | 1.8 | | |
| | 95,259 | | | | (2 | ) | | Other Securities | | | 9,866,331 | | | | 3.1 | | |
| | | | | | | | | | 43,534,952 | | | | 13.4 | | |
Shares | |
| |
| | Value | | Percentage
of Net
Assets | |
| | | | | Industrials: 7.3% | |
| | 35,049 | | | | | | | FedEx Corp. | | $ | 8,746,127 | | | | 2.7 | | |
| | 50,797 | | | | | | | Honeywell International, Inc. | | | 7,790,228 | | | | 2.4 | | |
| | 69,973 | | | | | | | Johnson Controls
International plc | | | 2,666,671 | | | | 0.8 | | |
| | 150,462 | | | | | | | Other Securities | | | 4,634,476 | | | | 1.4 | | |
| | | | | | | | | | 23,837,502 | | | | 7.3 | | |
| | | | | Information Technology: 24.0% | |
| | 43,700 | | | | | | | Activision Blizzard, Inc. | | | 2,767,084 | | | | 0.9 | | |
| | 4,353 | | | | (1 | ) | | Alphabet, Inc. - Class A | | | 4,585,450 | | | | 1.4 | | |
| | 9,104 | | | | (1 | ) | | Alphabet, Inc. - Class C | | | 9,526,426 | | | | 2.9 | | |
| | 75,521 | | | | | | | Apple, Inc. | | | 12,780,419 | | | | 3.9 | | |
| | 23,586 | | | | | | | Broadcom Ltd. | | | 6,059,243 | | | | 1.9 | | |
| | 140,675 | | | | | | | Cisco Systems, Inc. | | | 5,387,853 | | | | 1.7 | | |
| | 58,495 | | | | (1 | ) | | Facebook, Inc. | | | 10,322,028 | | | | 3.2 | | |
| | 35,647 | | | | | | | Fidelity National Information
Services, Inc. | | | 3,354,026 | | | | 1.0 | | |
| | 38,931 | | | | | | | Mastercard, Inc. - Class A | | | 5,892,596 | | | | 1.8 | | |
| | 117,265 | | | | | | | Microsoft Corp. | | | 10,030,848 | | | | 3.1 | | |
| | 28,865 | | | | | | | Total System Services, Inc. | | | 2,282,933 | | | | 0.7 | | |
| | 71,812 | | | | (2 | ) | | Other Securities | | | 4,866,869 | | | | 1.5 | | |
| | | | | | | | | | 77,855,775 | | | | 24.0 | | |
| | | | | Materials: 3.2% | |
| | 45,270 | | | | | | | Nucor Corp. | | | 2,878,267 | | | | 0.9 | | |
| | 10,958 | | | | | | | Sherwin-Williams Co. | | | 4,493,218 | | | | 1.4 | | |
| | 84,345 | | | | | | | Other Securities | | | 2,948,313 | | | | 0.9 | | |
| | | | | | | | | | 10,319,798 | | | | 3.2 | | |
| | | | | Real Estate: 1.2% | |
| | 28,650 | | | | | | | American Tower Corp. | | | 4,087,495 | | | | 1.2 | | |
| | | | | Telecommunication Services: 3.0% | |
| | 148,090 | | | | | | | AT&T, Inc. | | | 5,757,739 | | | | 1.8 | | |
| | 73,602 | | | | | | | Verizon
Communications, Inc. | | | 3,895,754 | | | | 1.2 | | |
| | | | | | | | | | 9,653,493 | | | | 3.0 | | |
| | | | | Utilities: 0.7% | |
| | 46,530 | | | | | | | Southern Co. | | | 2,237,628 | | | | 0.7 | | |
| | | | | | | Total Common Stock
(Cost $245,271,757) | | | 317,222,394 | | | | 97.7 | | |
See Accompanying Notes to Financial Statements
113
VY® COLUMBIA SUMMARY PORTFOLIO OF INVESTMENTS
CONTRARIAN CORE PORTFOLIO AS OF DECEMBER 31, 2017 (CONTINUED)
Principal
Amount† | |
| |
| | Value | | Percentage
of Net
Assets | |
CORPORATE BONDS/NOTES: — % | |
| | | | | Materials: —% | |
| | 649,000 | | | | (3 | ) | | Other Securities | | $ | — | | | | — | | |
| | | | | Total Corporate
Bonds/Notes
(Cost $—) | | | — | | | | — | | |
| | | | | Total Long-Term
Investments
(Cost $245,271,757) | | | 317,222,394 | | | | 97.7 | | |
Shares | |
| |
| | Value | | Percentage
of Net
Assets | |
SHORT-TERM INVESTMENTS: 2.8% | |
| | | | | Mutual Funds: 2.8% | |
| | 9,024,466 | | | | (4 | ) | | BlackRock Liquidity
Funds, FedFund,
Institutional Class, 1.170%
(Cost $9,024,466) | | $ | 9,024,466 | | | | 2.8 | | |
| | | | | Total Short-Term
Investments
(Cost $9,024,466) | | | 9,024,466 | | | | 2.8 | | |
| | | | | Total Investments in
Securities
(Cost $254,296,223) | | $ | 326,246,860 | | | | 100.5 | | |
| | | | | Liabilities in Excess of
Other Assets | | | (1,608,176 | ) | | | (0.5 | ) | |
| | | | | Net Assets | | $ | 324,638,684 | | | | 100.0 | | |
"Other Securities" represents issues not identified as the top 50 holdings in terms of market value and issues or issuers not exceeding 1% of net assets individually or in aggregate respectively as of December 31, 2017.
The following footnotes apply to either the individual securities noted or one or more of the securities aggregated and listed as a single line item.
† Unless otherwise indicated, principal amount is shown in USD.
(1) Non-income producing security.
(2) The grouping contains non-income producing securities.
(3) The grouping contains Level 3 securities.
(4) Rate shown is the 7-day yield as of December 31, 2017.
Fair Value Measurements^
The following is a summary of the fair valuations according to the inputs used as of December 31, 2017 in valuing the assets and liabilities:
| | | Quoted Prices
in Active Markets
for Identical Investments
(Level 1) | | Significant Other
Observable
Inputs
(Level 2) | | Significant
Unobservable
Inputs
(Level 3) | | Fair Value
at
December 31, 2017 | |
Asset Table | |
Investments, at fair value | |
Common Stock* | | $ | 317,222,394 | | | $ | — | | | $ | — | | | $ | 317,222,394 | | |
Corporate Bonds/Notes | | | — | | | | — | | | | — | | | | — | | |
Short-Term Investments | | | 9,024,466 | | | | — | | | | — | | | | 9,024,466 | | |
Total Investments, at fair value | | $ | 326,246,860 | | | $ | — | | | $ | — | | | $ | 326,246,860 | | |
^ See Note 2, "Significant Accounting Policies" in the Notes to Financial Statements for additional information.
* For further breakdown of Common Stock by sector, please refer to the Portfolio of Investments.
At December 31, 2017, the aggregate cost of securities and other investments and the composition of unrealized appreciation and depreciation of securities and other investments at period end were:
Cost for federal income tax purposes was $255,354,322.
Net unrealized appreciation consisted of: | |
Gross Unrealized Appreciation | | $ | 74,394,227 | | |
Gross Unrealized Depreciation | | | (3,501,690 | ) | |
Net Unrealized Appreciation | | $ | 70,892,537 | | |
See Accompanying Notes to Financial Statements
114
VY® COLUMBIA SUMMARY PORTFOLIO OF INVESTMENTS
SMALL CAP VALUE II PORTFOLIO AS OF DECEMBER 31, 2017
Shares | |
| |
| | Value | | Percentage
of Net
Assets | |
COMMON STOCK: 98.6% | | | |
| | | | | Consumer Discretionary: 10.3% | |
| | 52,000 | | | | | | | Adtalem Global
Education, Inc. | | $ | 2,186,600 | | | | 1.0 | | |
| | 128,000 | | | | | | | American Eagle
Outfitters, Inc. | | | 2,406,400 | | | | 1.1 | | |
| | 19,700 | | | | | | | Childrens Place
Retail Stores, Inc. | | | 2,863,395 | | | | 1.3 | | |
| | 16,300 | | | | (1 | ) | | Cooper-Standard
Holdings, Inc. | | | 1,996,750 | | | | 1.0 | | |
| | 30,500 | | | | | | | Nexstar Media
Group, Inc. | | | 2,385,100 | | | | 1.1 | | |
| | 93,500 | | | | (1 | ) | | William Lyon Homes | | | 2,718,980 | | | | 1.3 | | |
| | 304,300 | | | | (2 | ) | | Other Securities | | | 7,505,017 | | | | 3.5 | | |
| | | | | | | | | | 22,062,242 | | | | 10.3 | | |
| | | | | Consumer Staples: 0.6% | |
| | 26,000 | | | | (2 | ) | | Other Securities | | | 1,281,020 | | | | 0.6 | | |
| | | | | Energy: 6.5% | |
| | 28,500 | | | | | | | Arch Coal, Inc. | | | 2,655,060 | | | | 1.2 | | |
| | 178,000 | | | | (1 | ) | | Callon Petroleum Co. | | | 2,162,700 | | | | 1.0 | | |
| | 109,000 | | | | | | | Patterson-UTI Energy, Inc. | | | 2,508,090 | | | | 1.2 | | |
| | 412,200 | | | | (2 | ) | | Other Securities | | | 6,598,990 | | | | 3.1 | | |
| | | | | | | | | | 13,924,840 | | | | 6.5 | | |
| | | | | Financials: 31.9% | |
| | 65,000 | | | | | | | American Equity Investment
Life Holding Co. | | | 1,997,450 | | | | 0.9 | | |
| | 54,000 | | | | | | | Ameris Bancorp. | | | 2,602,800 | | | | 1.2 | | |
| | 34,000 | | | | | | | Argo Group International
Holdings Ltd. | | | 2,096,100 | | | | 1.0 | | |
| | 66,000 | | | | (1 | ) | | BofI Holding, Inc. | | | 1,973,400 | | | | 0.9 | | |
| | 55,000 | | | | | | | Cathay General Bancorp. | | | 2,319,350 | | | | 1.1 | | |
| | 48,000 | | | | | | | Community Bank
System, Inc. | | | 2,580,000 | | | | 1.2 | | |
| | 48,000 | | | | (1 | ) | | Encore Capital
Group, Inc. | | | 2,020,800 | | | | 1.0 | | |
| | 60,500 | | | | | | | Hancock Holding Co. | | | 2,994,750 | | | | 1.4 | | |
| | 51,000 | | | | | | | Houlihan Lokey, Inc. | | | 2,316,930 | | | | 1.1 | | |
| | 41,000 | | | | | | | Independent Bank Corp. | | | 2,863,850 | | | | 1.3 | | |
| | 218,000 | | | | (1 | ) | | MGIC Investment Corp. | | | 3,075,980 | | | | 1.4 | | |
| | 43,921 | | | | | | | Moelis & Co. | | | 2,130,168 | | | | 1.0 | | |
| | 29,000 | | | | | | | Prosperity Bancshares, Inc. | | | 2,032,030 | | | | 1.0 | | |
| | 63,500 | | | | | | | Renasant Corp. | | | 2,596,515 | | | | 1.2 | | |
| | 68,000 | | | | | | | Sandy Spring Bancorp, Inc. | | | 2,653,360 | | | | 1.2 | | |
| | 193,000 | | | | (1 | ) | | SLM Corp. | | | 2,180,900 | | | | 1.0 | | |
| | 134,000 | | | | | | | Sterling Bancorp/DE | | | 3,296,400 | | | | 1.6 | | |
| | 33,200 | | | | | | | UMB Financial Corp. | | | 2,387,744 | | | | 1.1 | | |
| | 79,000 | | | | | | | Union Bankshares Corp. | | | 2,857,430 | | | | 1.3 | | |
| | 36,000 | | | | (1 | ) | | Western Alliance Bancorp. | | | 2,038,320 | | | | 1.0 | | |
| | 31,500 | | | | | | | Wintrust Financial Corp. | | | 2,594,655 | | | | 1.2 | | |
Shares | |
| |
| | Value | | Percentage
of Net
Assets | |
| | 51,000 | | | | | | | WSFS Financial Corp. | | $ | 2,440,350 | | | | 1.2 | | |
| | 629,145 | | | | (2 | ) | | Other Securities | | | 14,141,749 | | | | 6.6 | | |
| | | | | | | | | | 68,191,031 | | | | 31.9 | | |
| | | | | Health Care: 5.4% | |
| | 36,033 | | | | (1 | ) | | Almost Family, Inc. | | | 1,994,427 | | | | 0.9 | | |
| | 317,000 | | | | (2 | ) | | Other Securities | | | 9,481,190 | | | | 4.5 | | |
| | | | | | | | | | 11,475,617 | | | | 5.4 | | |
| | | | | Industrials: 14.6% | |
| | 41,000 | | | | | | | Barnes Group, Inc. | | | 2,594,070 | | | | 1.2 | | |
| | 31,500 | | | | | | | Deluxe Corp. | | | 2,420,460 | | | | 1.1 | | |
| | 26,000 | | | | | | | EMCOR Group, Inc. | | | 2,125,500 | | | | 1.0 | | |
| | 34,000 | | | | | | | Granite Construction, Inc. | | | 2,156,620 | | | | 1.0 | | |
| | 61,500 | | | | | | | Kennametal, Inc. | | | 2,977,215 | | | | 1.4 | | |
| | 43,500 | | | | (1 | ) | | Mastec, Inc. | | | 2,129,325 | | | | 1.0 | | |
| | 59,000 | | | | | | | Skywest, Inc. | | | 3,132,900 | | | | 1.5 | | |
| | 58,000 | | | | | | | Triton International Ltd./
Bermuda | | | 2,172,100 | | | | 1.0 | | |
| | 287,000 | | | | (2 | ) | | Other Securities | | | 11,556,980 | | | | 5.4 | | |
| | | | | | | | | | 31,265,170 | | | | 14.6 | | |
| | | | | Information Technology: 8.3% | |
| | 44,000 | | | | (1 | ) | | II-VI, Inc. | | | 2,065,800 | | | | 1.0 | | |
| | 14,500 | | | | | | | SYNNEX Corp. | | | 1,971,275 | | | | 0.9 | | |
| | 559,200 | | | | (2 | ) | | Other Securities | | | 13,577,134 | | | | 6.4 | | |
| | | | | | | | | | 17,614,209 | | | | 8.3 | | |
| | | | | Materials: 8.6% | |
| | 56,000 | | | | | | | Carpenter Technology Corp. | | | 2,855,440 | | | | 1.3 | | |
| | 25,500 | | | | | | | Neenah Paper, Inc. | | | 2,311,575 | | | | 1.1 | | |
| | 81,659 | | | | | | | Orion Engineered
Carbons SA | | | 2,090,470 | | | | 1.0 | | |
| | 659,000 | | | | (2 | ) | | Other Securities | | | 11,197,045 | | | | 5.2 | | |
| | | | | | | | | | 18,454,530 | | | | 8.6 | | |
| | | | | Real Estate: 7.0% | |
| | 97,000 | | | | | | | First Industrial Realty
Trust, Inc. | | | 3,052,590 | | | | 1.4 | | |
| | 16,000 | | | | | | | PS Business Parks, Inc. | | | 2,001,440 | | | | 1.0 | | |
| | 129,000 | | | | | | | Sunstone Hotel
Investors, Inc. | | | 2,132,370 | | | | 1.0 | | |
| | 280,000 | | | | | | | Other Securities | | | 7,759,880 | | | | 3.6 | | |
| | | | | | | | | | 14,946,280 | | | | 7.0 | | |
| | | | | Utilities: 5.4% | |
| | 66,000 | | | | | | | New Jersey Resources Corp. | | | 2,653,200 | | | | 1.2 | | |
| | 27,500 | | | | | | | ONE Gas, Inc. | | | 2,014,650 | | | | 0.9 | | |
| | 151,800 | | | | | | | Other Securities | | | 6,945,799 | | | | 3.3 | | |
| | | | | | | | | | 11,613,649 | | | | 5.4 | | |
| | | | | | | Total Common Stock
(Cost $156,269,823) | | | 210,828,588 | | | | 98.6 | | |
See Accompanying Notes to Financial Statements
115
VY® COLUMBIA SUMMARY PORTFOLIO OF INVESTMENTS
SMALL CAP VALUE II PORTFOLIO AS OF DECEMBER 31, 2017 (CONTINUED)
Shares | |
| |
| | Value | | Percentage
of Net
Assets | |
SHORT-TERM INVESTMENTS: 1.5% | |
| | | | | Mutual Funds: 1.5% | |
| | 3,147,071 | | | | (3 | ) | | BlackRock Liquidity
Funds, FedFund,
Institutional Class,
1.170%
(Cost $3,147,071) | | $ | 3,147,071 | | | | 1.5 | | |
| | | | | Total Short-Term
Investments
(Cost $3,147,071) | | | 3,147,071 | | | | 1.5 | | |
| | | | | Total Investments in
Securities
(Cost $159,416,894) | | $ | 213,975,659 | | | | 100.1 | | |
| | | | | Liabilities in Excess of
Other Assets | | | (271,455 | ) | | | (0.1 | ) | |
| | | | | Net Assets | | $ | 213,704,204 | | | | 100.0 | | |
"Other Securities" represents issues not identified as the top 50 holdings in terms of market value and issues or issuers not exceeding 1% of net assets individually or in aggregate respectively as of December 31, 2017.
The following footnotes apply to either the individual securities noted or one or more of the securities aggregated and listed as a single line item.
(1) Non-income producing security.
(2) The grouping contains non-income producing securities.
(3) Rate shown is the 7-day yield as of December 31, 2017.
Fair Value Measurements^
The following is a summary of the fair valuations according to the inputs used as of December 31, 2017 in valuing the assets and liabilities:
| | | Quoted Prices
in Active Markets
for Identical Investments
(Level 1) | | Significant Other
Observable
Inputs
(Level 2) | | Significant
Unobservable
Inputs
(Level 3) | | Fair Value
at
December 31, 2017 | |
Asset Table | |
Investments, at fair value | |
Common Stock* | | $ | 210,828,588 | | | $ | — | | | $ | — | | | $ | 210,828,588 | | |
Short-Term Investments | | | 3,147,071 | | | | — | | | | — | | | | 3,147,071 | | |
Total Investments, at fair value | | $ | 213,975,659 | | | $ | — | | | $ | — | | | $ | 213,975,659 | | |
^ See Note 2, "Significant Accounting Policies" in the Notes to Financial Statements for additional information.
* For further breakdown of Common Stock by sector, please refer to the Portfolio of Investments.
At December 31, 2017, the aggregate cost of securities and other investments and the composition of unrealized appreciation and depreciation of securities and other investments at period end were:
Cost for federal income tax purposes was $159,404,843.
Net unrealized appreciation consisted of: | |
Gross Unrealized Appreciation | | $ | 56,037,252 | | |
Gross Unrealized Depreciation | | | (1,466,436 | ) | |
Net Unrealized Appreciation | | $ | 54,570,816 | | |
See Accompanying Notes to Financial Statements
116
SUMMARY PORTFOLIO OF INVESTMENTS
VY® INVESCO COMSTOCK PORTFOLIO AS OF DECEMBER 31, 2017
Shares | |
| |
| | Value | | Percentage
of Net
Assets | |
COMMON STOCK: 95.5% | | | |
| | | | | Consumer Discretionary: 6.5% | |
| | 120,445 | | | | | | | Carnival Corp. | | $ | 7,993,934 | | | | 1.6 | | |
| | 232,592 | | | | | | | General Motors Co. | | | 9,533,946 | | | | 1.9 | | |
| | 269,655 | | | | (1 | ) | | Other Securities | | | 15,170,809 | | | | 3.0 | | |
| | | | | | | | | | 32,698,689 | | | | 6.5 | | |
| | | | | Consumer Staples: 3.5% | |
| | 72,377 | | | | | | | Danone | | | 6,064,517 | | | | 1.2 | | |
| | 59,445 | | | | | | | Wal-Mart Stores, Inc. | | | 5,870,194 | | | | 1.2 | | |
| | 71,102 | | | | | | | Other Securities | | | 5,612,888 | | | | 1.1 | | |
| | | | | | | | | | 17,547,599 | | | | 3.5 | | |
| | | | | Energy: 16.7% | |
| | 226,131 | | | | | | | BP PLC ADR | | | 9,504,286 | | | | 1.9 | | |
| | 154,456 | | | | | | | Canadian Natural
Resources Ltd. | | | 5,519,621 | | | | 1.1 | | |
| | 79,579 | | | | | | | Chevron Corp. | | | 9,962,495 | | | | 2.0 | | |
| | 187,801 | | | | | | | Devon Energy Corp. | | | 7,774,961 | | | | 1.6 | | |
| | 98,785 | | | | | | | Halliburton Co. | | | 4,827,623 | | | | 1.0 | | |
| | 117,302 | | | | | | | Hess Corp. | | | 5,568,326 | | | | 1.1 | | |
| | 488,262 | | | | | | | Marathon Oil Corp. | | | 8,266,276 | | | | 1.7 | | |
| | 61,695 | | | | | | | Occidental
Petroleum Corp. | | | 4,544,454 | | | | 0.9 | | |
| | 172,089 | | | | | | | Royal Dutch Shell PLC -
Class A ADR | | | 11,480,057 | | | | 2.3 | | |
| | 313,736 | | | | | | | Suncor Energy, Inc. | | | 11,520,386 | | | | 2.3 | | |
| | 268,441 | | | | (1 | ) | | Other Securities | | | 4,154,178 | | | | 0.8 | | |
| | | | | | | | | | 83,122,663 | | | | 16.7 | | |
| | | | | Financials: 33.6% | |
| | 108,821 | | | | | | | American International
Group, Inc. | | | 6,483,555 | | | | 1.3 | | |
| | 55,534 | | | | | | | Allstate Corp. | | | 5,814,965 | | | | 1.2 | | |
| | 217,667 | | | | | | | Ally Financial, Inc. | | | 6,347,170 | | | | 1.3 | | |
| | 814,707 | | | | | | | Bank of America Corp. | | | 24,050,151 | | | | 4.8 | | |
| | 133,358 | | | | | | | Bank of New York
Mellon Corp. | | | 7,182,662 | | | | 1.4 | | |
| | 391,142 | | | | | | | Citigroup, Inc. | | | 29,104,876 | | | | 5.8 | | |
| | 147,833 | | | | | | | Citizens Financial
Group, Inc. | | | 6,206,029 | | | | 1.2 | | |
| | 282,962 | | | | | | | Fifth Third Bancorp | | | 8,585,067 | | | | 1.7 | | |
| | 22,530 | | | | | | | Goldman Sachs
Group, Inc. | | | 5,739,743 | | | | 1.1 | | |
| | 170,876 | | | | | | | JPMorgan Chase & Co. | | | 18,273,480 | | | | 3.7 | | |
| | 153,631 | | | | | | | Metlife, Inc. | | | 7,767,583 | | | | 1.6 | | |
| | 196,883 | | | | | | | Morgan Stanley | | | 10,330,451 | | | | 2.1 | | |
| | 75,456 | | | | | | | PNC Financial Services
Group, Inc. | | | 10,887,546 | | | | 2.2 | | |
| | 65,904 | | | | | | | State Street Corp. | | | 6,432,889 | | | | 1.3 | | |
| | 146,773 | | | | | | | Wells Fargo & Co. | | | 8,904,718 | | | | 1.8 | | |
| | 147,990 | | | | | | | Other Securities | | | 5,583,573 | | | | 1.1 | | |
| | | | | | | | | | 167,694,458 | | | | 33.6 | | |
Shares | |
| |
| | Value | | Percentage
of Net
Assets | |
| | | | | Health Care: 12.5% | |
| | 33,677 | | | | | | | Anthem, Inc. | | $ | 7,577,662 | | | | 1.5 | | |
| | 14,933 | | | | (2 | ) | | Biogen, Inc. | | | 4,757,206 | | | | 1.0 | | |
| | 75,220 | | | | | | | Cardinal Health, Inc. | | | 4,608,729 | | | | 0.9 | | |
| | 28,687 | | | | | | | McKesson Corp. | | | 4,473,737 | | | | 0.9 | | |
| | 87,351 | | | | | | | Merck & Co., Inc. | | | 4,915,241 | | | | 1.0 | | |
| | 135,907 | | | | (2 | ) | | Mylan NV | | | 5,750,225 | | | | 1.1 | | |
| | 51,943 | | | | | | | Novartis AG | | | 4,371,134 | | | | 0.9 | | |
| | 262,553 | | | | | | | Pfizer, Inc. | | | 9,509,670 | | | | 1.9 | | |
| | 159,210 | | | | | | | Sanofi ADR | | | 6,846,030 | | | | 1.4 | | |
| | 141,897 | | | | | | | Other Securities | | | 9,553,430 | | | | 1.9 | | |
| | | | | | | | | | 62,363,064 | | | | 12.5 | | |
| | | | | Industrials: 8.1% | |
| | 147,276 | | | | | | | Arconic, Inc. | | | 4,013,271 | | | | 0.8 | | |
| | 36,588 | | | | | | | Caterpillar, Inc. | | | 5,765,537 | | | | 1.2 | | |
| | 99,518 | | | | | | | Eaton Corp. PLC | | | 7,862,917 | | | | 1.6 | | |
| | 195,913 | | | | | | | Johnson Controls
International plc | | | 7,466,244 | | | | 1.5 | | |
| | 100,755 | | | | | | | Textron, Inc. | | | 5,701,726 | | | | 1.1 | | |
| | 260,118 | | | | | | | Other Securities | | | 9,452,203 | | | | 1.9 | | |
| | | | | | | | | | 40,261,898 | | | | 8.1 | | |
| | | | | Information Technology: 10.9% | |
| | 365,059 | | | | | | | Cisco Systems, Inc. | | | 13,981,760 | | | | 2.8 | | |
| | 161,884 | | | | (2 | ) | | eBay, Inc. | | | 6,109,502 | | | | 1.2 | | |
| | 178,678 | | | | | | | Intel Corp. | | | 8,247,776 | | | | 1.7 | | |
| | 90,749 | | | | | | | Microsoft Corp. | | | 7,762,669 | | | | 1.6 | | |
| | 120,547 | | | | | | | Qualcomm, Inc. | | | 7,717,419 | | | | 1.5 | | |
| | 161,622 | | | | (1 | ) | | Other Securities | | | 10,600,625 | | | | 2.1 | | |
| | | | | | | | | | 54,419,751 | | | | 10.9 | | |
| | | | | Materials: 2.3% | |
| | 105,918 | | | | | | | CF Industries
Holdings, Inc. | | | 4,505,752 | | | | 0.9 | | |
| | 77,822 | | | | | | | International Paper Co. | | | 4,509,007 | | | | 0.9 | | |
| | 45,936 | | | | (1 | ) | | Other Securities | | | 2,474,572 | | | | 0.5 | | |
| | | | | | | | | | 11,489,331 | | | | 2.3 | | |
| | | | | Telecommunication Services: 0.8% | |
| | 1,222,098 | | | | | | | Other Securities | | | 3,863,038 | | | | 0.8 | | |
| | | | | Utilities: 0.6% | |
| | 91,952 | | | | | | | Other Securities | | | 2,815,570 | | | | 0.6 | | |
| | | | | | | Total Common Stock
(Cost $356,629,051) | | | 476,276,061 | | | | 95.5 | | |
CLOSED-END FUNDS: 0.5% | | | |
| | | | | Information Technology: 0.5% | |
| | 33,021 | | | | (1 | ) | | Other Securities | | | 2,306,517 | | | | 0.5 | | |
| | | | | | | Total Closed-End Funds
(Cost $979,711) | | | 2,306,517 | | | | 0.5 | | |
| | | | | | | Total Long-Term
Investments
(Cost $357,608,762) | | | 478,582,578 | | | | 96.0 | | |
See Accompanying Notes to Financial Statements
117
SUMMARY PORTFOLIO OF INVESTMENTS
VY® INVESCO COMSTOCK PORTFOLIO AS OF DECEMBER 31, 2017 (CONTINUED)
Shares | |
| |
| | Value | | Percentage
of Net
Assets | |
SHORT-TERM INVESTMENTS: 4.1% | | | |
| | | | | Mutual Funds: 4.1% | |
| | 20,456,451 | | | | (3 | ) | | BlackRock Liquidity
Funds, FedFund,
Institutional Class,
1.170%
(Cost $20,456,451) | | $ | 20,456,451 | | | | 4.1 | | |
| | | | | Total Short-Term
Investments
(Cost $20,456,451) | | | 20,456,451 | | | | 4.1 | | |
| | | | | Total Investments in
Securities
(Cost $378,065,213) | | $ | 499,039,029 | | | | 100.1 | | |
| | | | | Liabilities in Excess
of Other Assets | | | (321,968 | ) | | | (0.1 | ) | |
| | | | | Net Assets | | $ | 498,717,061 | | | | 100.0 | | |
"Other Securities" represents issues not identified as the top 50 holdings in terms of market value and issues or issuers not exceeding 1% of net assets individually or in aggregate respectively as of December 31, 2017.
The following footnotes apply to either the individual securities noted or one or more of the securities aggregated and listed as a single line item.
ADR American Depositary Receipt
(1) The grouping contains non-income producing securities.
(2) Non-income producing security.
(3) Rate shown is the 7-day yield as of December 31, 2017.
Fair Value Measurements^
The following is a summary of the fair valuations according to the inputs used as of December 31, 2017 in valuing the assets and liabilities:
| | | Quoted Prices
in Active Markets
for Identical Investments
(Level 1) | | Significant Other
Observable
Inputs#
(Level 2) | | Significant
Unobservable
Inputs
(Level 3) | | Fair Value
at
December 31, 2017 | |
Asset Table | |
Investments, at fair value | |
Common Stock | |
Consumer Discretionary | | $ | 32,698,689 | | | $ | — | | | $ | — | | | $ | 32,698,689 | | |
Consumer Staples | | | 9,428,204 | | | | 8,119,395 | | | | — | | | | 17,547,599 | | |
Energy | | | 83,122,663 | | | | — | | | | — | | | | 83,122,663 | | |
Financials | | | 167,694,458 | | | | — | | | | — | | | | 167,694,458 | | |
Health Care | | | 55,352,530 | | | | 7,010,534 | | | | — | | | | 62,363,064 | | |
Industrials | | | 40,261,898 | | | | — | | | | — | | | | 40,261,898 | | |
Information Technology | | | 54,419,751 | | | | — | | | | — | | | | 54,419,751 | | |
Materials | | | 11,489,331 | | | | — | | | | — | | | | 11,489,331 | | |
Telecommunication Services | | | — | | | | 3,863,038 | | | | — | | | | 3,863,038 | | |
Utilities | | | 2,815,570 | | | | — | | | | — | | | | 2,815,570 | | |
Total Common Stock | | | 457,283,094 | | | | 18,992,967 | | | | — | | | | 476,276,061 | | |
Closed-End Funds | | | 2,306,517 | | | | — | | | | — | | | | 2,306,517 | | |
Short-Term Investments | | | 20,456,451 | | | | — | | | | — | | | | 20,456,451 | | |
Total Investments, at fair value | | $ | 480,046,062 | | | $ | 18,992,967 | | | $ | — | | | $ | 499,039,029 | | |
Liabilities Table | |
Other Financial Instruments+ | |
Forward Foreign Currency Contracts | | $ | — | | | $ | (810,493 | ) | | $ | — | | | $ | (810,493 | ) | |
Total Liabilities | | $ | — | | | $ | (810,493 | ) | | $ | — | | | $ | (810,493 | ) | |
^ See Note 2, "Significant Accounting Policies" in the Notes to Financial Statements for additional information.
+ Other Financial Instruments are derivatives not reflected in the Portfolio of Investments and may include open forward foreign currency contracts, futures, centrally cleared swaps, OTC swaps and written options. Forward foreign currency contracts, futures and centrally cleared swaps are valued at the unrealized gain (loss) on the instrument. OTC swaps and written options are valued at the fair value of the instrument.
# The earlier close of the foreign markets gives rise to the possibility that significant events, including broad market moves, may have occurred in the interim and may materially affect the value of those securities. To account for this, the Portfolio may frequently value many of its foreign equity securities using fair value prices based on third party vendor modeling tools to the extent available. Accordingly, a portion of the Portfolio's investments are categorized as Level 2 investments.
See Accompanying Notes to Financial Statements
118
SUMMARY PORTFOLIO OF INVESTMENTS
VY® INVESCO COMSTOCK PORTFOLIO AS OF DECEMBER 31, 2017 (CONTINUED)
At December 31, 2017, the following forward foreign currency contracts were outstanding for VY® Invesco Comstock Portfolio:
Currency Purchased | | Currency Sold | | Counterparty | | Settlement
Date | | Unrealized
Appreciation
(Depreciation) | |
USD | 3,586,767 | | | GBP | 2,681,750 | | | Barclays Bank PLC | | 01/19/18 | | $ | (36,181 | ) | |
USD | 944,335 | | | CHF | 928,301 | | | Barclays Bank PLC | | 01/19/18 | | | (9,505 | ) | |
USD | 3,393,550 | | | CAD | 4,370,162 | | | Barclays Bank PLC | | 01/19/18 | | | (84,036 | ) | |
USD | 5,169,830 | | | EUR | 4,361,989 | | | CIBC World Markets Corp. | | 01/19/18 | | | (69,521 | ) | |
USD | 128,576 | | | GBP | 95,823 | | | Deutsche Bank AG | | 01/19/18 | | | (877 | ) | |
USD | 215,493 | | | GBP | 160,480 | | | Deutsche Bank AG | | 01/19/18 | | | (1,309 | ) | |
USD | 127,136 | | | GBP | 94,915 | | | Deutsche Bank AG | | 01/19/18 | | | (1,090 | ) | |
USD | 126,122 | | | GBP | 94,089 | | | Deutsche Bank AG | | 01/19/18 | | | (990 | ) | |
USD | 943,491 | | | CHF | 928,301 | | | Deutsche Bank AG | | 01/19/18 | | | (10,349 | ) | |
USD | 3,589,031 | | | GBP | 2,683,418 | | | Deutsche Bank AG | | 01/19/18 | | | (36,170 | ) | |
USD | 3,393,220 | | | CAD | 4,370,162 | | | Deutsche Bank AG | | 01/19/18 | | | (84,365 | ) | |
USD | 943,203 | | | CHF | 928,301 | | | Goldman Sachs International | | 01/19/18 | | | (10,637 | ) | |
USD | 5,167,692 | | | EUR | 4,361,989 | | | Goldman Sachs International | | 01/19/18 | | | (71,658 | ) | |
USD | 3,587,592 | | | GBP | 2,681,750 | | | Goldman Sachs International | | 01/19/18 | | | (35,356 | ) | |
USD | 3,392,904 | | | CAD | 4,370,162 | | | JPMorgan Chase Bank N.A. | | 01/19/18 | | | (84,682 | ) | |
USD | 942,868 | | | CHF | 928,244 | | | JPMorgan Chase Bank N.A. | | 01/19/18 | | | (10,914 | ) | |
USD | 5,169,620 | | | EUR | 4,362,917 | | | JPMorgan Chase Bank N.A. | | 01/19/18 | | | (70,844 | ) | |
USD | 5,168,194 | | | EUR | 4,361,989 | | | RBC Capital Markets Corp. | | 01/19/18 | | | (71,156 | ) | |
USD | 3,392,015 | | | CAD | 4,370,136 | | | RBC Capital Markets Corp. | | 01/19/18 | | | (85,550 | ) | |
USD | 3,587,645 | | | GBP | 2,681,750 | | | RBC Capital Markets Corp. | | 01/19/18 | | | (35,303 | ) | |
| | | | | | | | | | | $ | (810,493 | ) | |
Currency Abbreviations
CAD — Canadian Dollar
CHF — Swiss Franc
EUR — EU Euro
GBP — British Pound
USD — United States Dollar
A summary of derivative instruments by primary risk exposure is outlined in the following tables.
The fair value of derivative instruments as of December 31, 2017 was as follows:
Derivatives not accounted
for as hedging instruments | | Location on Statement of Assets and Liabilities | | Fair Value | |
Liability Derivatives | | | | | |
Foreign exchange contracts | | Unrealized depreciation on forward foreign currency contracts | | $ | 810,493 | | |
Total Liability Derivatives | | | | $ | 810,493 | | |
The effect of derivative instruments on the Portfolio's Statement of Operations for the year ended December 31, 2017 was as follows:
| | | Amount of Realized Gain or (Loss) on Derivatives Recognized in Income | |
Derivatives not accounted
for as hedging instruments | | Forward foreign currency contracts | |
Foreign exchange contracts | | $ | (3,076,365 | ) | |
Total | | $ | (3,076,365 | ) | |
| | | Change in Unrealized Appreciation or (Depreciation) on Derivatives Recognized in Income | |
Derivatives not accounted
for as hedging instruments | | Forward foreign currency contracts | |
Foreign exchange contracts | | $ | (1,631,619 | ) | |
Total | | $ | (1,631,619 | ) | |
See Accompanying Notes to Financial Statements
119
SUMMARY PORTFOLIO OF INVESTMENTS
VY® INVESCO COMSTOCK PORTFOLIO AS OF DECEMBER 31, 2017 (CONTINUED)
The following is a summary by counterparty of the fair value of OTC derivative instruments subject to Master Netting Agreements and collateral pledged (received), if any, at December 31, 2017:
Barclays
Bank PLC | | CIBC World
Markets Corp. | | Deutsche
Bank AG | | Goldman
Sachs
International | | JPMorgan
Chase Bank N.A. | | RBC Capital
Markets Corp. | | Totals | |
Liabilities: | |
| Forward foreign currency contracts $129,722 | | $ | 69,521 | | | $ | 135,150 | | | $ | 117,651 | | | $ | 166,440 | | | $ | 192,009 | | | $ | 810,493 | | |
| Total Liabilities $129,722 | | $ | 69,521 | | | $ | 135,150 | | | $ | 117,651 | | | $ | 166,440 | | | $ | 192,009 | | | $ | 810,493 | | |
Net OTC derivative instruments by
counterparty, at fair value $(129,722) | | $ | (69,521 | ) | | $ | (135,150 | ) | | $ | (117,651 | ) | | $ | (166,440 | ) | | $ | (192,009 | ) | | $ | (810,493 | ) | |
Total collateral pledged by the Portfolio/
(Received from counterparty) $— | | $ | — | | | $ | — | | | $ | — | | | $ | — | | | $ | — | | | $ | — | | |
| Net Exposure(1) $(129,722) | | $ | (69,521 | ) | | $ | (135,150 | ) | | $ | (117,651 | ) | | $ | (166,440 | ) | | $ | (192,009 | ) | | $ | (810,493 | ) | |
(1) Positive net exposure represents amounts due from each respective counterparty. Negative exposure represents amounts due from the Portfolio. Please refer to Note 2 for additional details regarding counterparty credit risk and credit related contingent features.
At December 31, 2017, the aggregate cost of securities and other investments and the composition of unrealized appreciation and depreciation of securities and other investments at period end were:
Cost for federal income tax purposes was $381,907,746.
Net unrealized appreciation consisted of: | |
Gross Unrealized Appreciation | | $ | 132,517,104 | | |
Gross Unrealized Depreciation | | | (16,196,350 | ) | |
Net Unrealized Appreciation | | $ | 116,320,754 | | |
See Accompanying Notes to Financial Statements
120
VY® INVESCO SUMMARY PORTFOLIO OF INVESTMENTS
EQUITY AND INCOME PORTFOLIO AS OF DECEMBER 31, 2017
Shares | |
| |
| | Value | | Percentage
of Net
Assets | |
COMMON STOCK: 62.3% | | | |
| | | | | Consumer Discretionary: 5.2% | |
| | 277,796 | | | | | | | Carnival Corp. | | $ | 18,437,321 | | | | 1.1 | | |
| | 348,530 | | | | | | | Comcast Corp. -
Class A | | | 13,958,626 | | | | 0.8 | | |
| | 521,229 | | | | | | | General Motors Co. | | | 21,365,177 | | | | 1.3 | | |
| | 3,045,474 | | | | | | | Kingfisher PLC | | | 13,885,677 | | | | 0.8 | | |
| | 202,521 | | | | (1 | ) | | Other Securities | | | 20,156,704 | | | | 1.2 | | |
| | | | | | | | | | 87,803,505 | | | | 5.2 | | |
| | | | | Consumer Staples: 4.2% | |
| | 276,383 | | | | | | | CVS Health Corp. | | | 20,037,768 | | | | 1.2 | | |
| | 314,140 | | | | | | | Mondelez
International, Inc. | | | 13,445,192 | | | | 0.8 | | |
| | 172,783 | | | | | | | Philip Morris
International, Inc. | | | 18,254,524 | | | | 1.1 | | |
| | 249,639 | | | | | | | Walgreens Boots
Alliance, Inc. | | | 18,128,784 | | | | 1.1 | | |
| | | | | | | | | | 69,866,268 | | | | 4.2 | | |
| | | | | Energy: 10.1% | |
| | 304,264 | | | | | | | Anadarko
Petroleum Corp. | | | 16,320,721 | | | | 1.0 | | |
| | 515,890 | | | | | | | Apache Corp. | | | 21,780,876 | | | | 1.3 | | |
| | 497,915 | | | | | | | Canadian Natural
Resources Ltd. | | | 17,793,430 | | | | 1.1 | | |
| | 540,371 | | | | | | | Devon Energy Corp. | | | 22,371,360 | | | | 1.3 | | |
| | 331,465 | | | | | | | Occidental
Petroleum Corp. | | | 24,415,712 | | | | 1.5 | | |
| | 786,450 | | | | | | | Royal Dutch Shell
PLC - Class A | | | 26,254,158 | | | | 1.6 | | |
| | 607,172 | | | | | | | TechnipFMC PLC | | | 19,010,555 | | | | 1.1 | | |
| | 229,614 | | | | | | | Total S.A. | | | 12,674,641 | | | | 0.7 | | |
| | 291,633 | | | | | | | Other Securities | | | 9,227,268 | | | | 0.5 | | |
| | | | | | | | | | 169,848,721 | | | | 10.1 | | |
| | | | | Financials: 22.0% | |
| | 285,609 | | | | | | | American
International
Group, Inc. | | | 17,016,584 | | | | 1.0 | | |
| | 96,357 | | | | | | | Aon PLC | | | 12,911,838 | | | | 0.8 | | |
| | 1,701,886 | | | | | | | Bank of
America Corp. | | | 50,239,675 | | | | 3.0 | | |
| | 223,447 | | | | | | | Charles
Schwab Corp. | | | 11,478,472 | | | | 0.7 | | |
| | 811,170 | | | | | | | Citigroup, Inc. | | | 60,359,160 | | | | 3.6 | | |
| | 663,209 | | | | | | | Citizens Financial
Group, Inc. | | | 27,841,514 | | | | 1.7 | | |
| | 607,843 | | | | | | | Fifth Third Bancorp | | | 18,441,957 | | | | 1.1 | | |
| | 54,708 | | | | | | | Goldman Sachs
Group, Inc. | | | 13,937,410 | | | | 0.8 | | |
| | 388,489 | | | | | | | JPMorgan
Chase & Co. | | | 41,545,014 | | | | 2.5 | | |
| | 632,854 | | | | | | | Morgan Stanley | | | 33,205,849 | | | | 2.0 | | |
| | 121,006 | | | | | | | Northern Trust Corp. | | | 12,087,289 | | | | 0.7 | | |
Shares | |
| |
| | Value | | Percentage
of Net
Assets | |
| | 133,345 | | | | | | | PNC Financial
Services
Group, Inc. | | $ | 19,240,350 | | | | 1.1 | | |
| | 165,771 | | | | | | | State Street Corp. | | | 16,180,907 | | | | 1.0 | | |
| | 692,135 | | | | | | | Other Securities | | | 34,142,179 | | | | 2.0 | | |
| | | | | | | | | | 368,628,198 | | | | 22.0 | | |
| | | | | Health Care: 7.3% | |
| | 49,942 | | | | | | | Anthem, Inc. | | | 11,237,449 | | | | 0.7 | | |
| | 92,717 | | | | | | | McKesson Corp. | | | 14,459,216 | | | | 0.9 | | |
| | 172,797 | | | | | | | Medtronic PLC | | | 13,953,358 | | | | 0.8 | | |
| | 238,425 | | | | | | | Merck & Co., Inc. | | | 13,416,175 | | | | 0.8 | | |
| | 158,632 | | | | | | | Novartis AG | | | 13,349,280 | | | | 0.8 | | |
| | 533,349 | | | | | | | Pfizer, Inc. | | | 19,317,901 | | | | 1.1 | | |
| | 470,645 | | | | | | | Other Securities | | | 37,263,095 | | | | 2.2 | | |
| | | | | | | | | | 122,996,474 | | | | 7.3 | | |
| | | | | Industrials: 3.5% | |
| | 318,444 | | | | | | | CSX Corp. | | | 17,517,604 | | | | 1.1 | | |
| | 83,204 | | | | | | | General
Dynamics Corp. | | | 16,927,854 | | | | 1.0 | | |
| | 144,955 | | | | | | | Ingersoll-Rand PLC -
Class A | | | 12,928,536 | | | | 0.8 | | |
| | 282,259 | | | | | | | Johnson Controls
International plc | | | 10,756,891 | | | | 0.6 | | |
| | | | | | | | | | 58,130,885 | | | | 3.5 | | |
| | | | | Information Technology: 7.0% | |
| | 508,376 | | | | | | | Cisco Systems, Inc. | | | 19,470,801 | | | | 1.2 | | |
| | 192,685 | | | | | | | Cognizant
Technology
Solutions Corp. | | | 13,684,489 | | | | 0.8 | | |
| | 390,088 | | | | (2 | ) | | eBay, Inc. | | | 14,721,921 | | | | 0.9 | | |
| | 308,514 | | | | | | | Intel Corp. | | | 14,241,006 | | | | 0.8 | | |
| | 498,296 | | | | | | | Oracle Corp. | | | 23,559,435 | | | | 1.4 | | |
| | 229,929 | | | | | | | Qualcomm, Inc. | | | 14,720,055 | | | | 0.9 | | |
| | 445,688 | | | | (1 | ) | | Other Securities | | | 16,719,502 | | | | 1.0 | | |
| | | | | | | | | | 117,117,209 | | | | 7.0 | | |
| | | | | Materials: 1.5% | |
| | 792,022 | | | | | | | Other Securities | | | 25,964,534 | | | | 1.5 | | |
| | | | | Telecommunication Services: 1.2% | |
| | 150,827 | | | | | | | Verizon
Communications, Inc. | | | 7,983,273 | | | | 0.5 | | |
| | 442,933 | | | | | | | Other Securities | | | 11,798,211 | | | | 0.7 | | |
| | | | | | | | | | 19,781,484 | | | | 1.2 | | |
| | | | | Utilities: 0.3% | |
| | 155,217 | | | | | | | Other Securities | | | 4,752,745 | | | | 0.3 | | |
| | | | | | | Total Common Stock
(Cost $828,544,276) | | | 1,044,890,023 | | | | 62.3 | | |
See Accompanying Notes to Financial Statements
121
VY® INVESCO SUMMARY PORTFOLIO OF INVESTMENTS
EQUITY AND INCOME PORTFOLIO AS OF DECEMBER 31, 2017 (CONTINUED)
Shares | |
| |
| | Value | | Percentage
of Net
Assets | |
PREFERRED STOCK: 0.7% | | | |
| | | | | Energy: 0.4% | |
| | 140,612 | | | | (1 | ) | | Other Securities | | $ | 6,859,222 | | | | 0.4 | | |
| | | | | Financials: 0.3% | |
| | 79,900 | | | | (1 | ) | | Other Securities | | | 4,922,906 | | | | 0.3 | | |
| | | | | | | Total Preferred Stock
(Cost $10,847,296) | | | 11,782,128 | | | | 0.7 | | |
Principal
Amount† | |
| | | | Value | | Percentage
of Net
Assets | |
CORPORATE BONDS/NOTES: 11.4% | | | |
| | | | | Basic Materials: 0.2% | |
| | 770,000 | | | | (3 | ) | | Basell Finance Co. BV,
8.100%, 03/15/27 | | $ | 1,023,421 | | | | 0.1 | | |
| | 2,191,000 | | | | | | | Other Securities | | | 2,317,534 | | | | 0.1 | | |
| | | | | | | | | | 3,340,955 | | | | 0.2 | | |
| | | | | Communications: 1.4% | |
| | 533,000 | | | | (3 | ) | | AT&T, Inc.,
4.300%, 02/15/30 | | | 533,626 | | | | 0.0 | | |
| | 271,000 | | | | (3 | ) | | AT&T, Inc.,
5.150%, 11/15/46 | | | 277,779 | | | | 0.0 | | |
| | 2,700,000 | | | | (3 | ) | | Crown Castle
Towers LLC,
4.883%, 08/15/40 | | | 2,825,570 | | | | 0.2 | | |
| | 435,000 | | | | (3 | ) | | Crown Castle
Towers LLC,
6.113%, 01/15/40 | | | 458,783 | | | | 0.0 | | |
| | 2,215,000 | | | | | | | eBay, Inc.,
2.500%, 03/09/18 | | | 2,217,164 | | | | 0.1 | | |
| | 3,029,000 | | | | | | | Verizon
Communications, Inc.,
4.125%-5.012%,
11/01/34-08/21/54 | | | 3,070,112 | | | | 0.2 | | |
| | 13,908,000 | | | | | | | Other Securities | | | 14,568,214 | | | | 0.9 | | |
| | | | | | | | | | 23,951,248 | | | | 1.4 | | |
| | | | | Consumer, Cyclical: 1.0% | |
| | 137,000 | | | | (3 | ) | | Alimentation
Couche-Tard, Inc.,
4.500%, 07/26/47 | | | 143,044 | | | | 0.0 | | |
| | 810,605 | | | | (3 | ) | | Virgin Australia
2013-1A Pass
Through Trust,
5.000%, 04/23/25 | | | 845,056 | | | | 0.1 | | |
| | 1,737,000 | | | | | | | Walgreens Boots
Alliance, Inc.,
3.300%-4.500%,
11/18/21-11/18/34 | | | 1,788,759 | | | | 0.1 | | |
| | 13,164,315 | | | | | | | Other Securities | | | 13,708,948 | | | | 0.8 | | |
| | | | | | | | | | 16,485,807 | | | | 1.0 | | |
Principal
Amount† | | | | | | Value | | Percentage
of Net
Assets | |
| | | | | Consumer, Non-cyclical: 1.6% | |
| | 1,200,000 | | | | (3 | ) | | Bayer US
Finance LLC,
2.375%, 10/08/19 | | $ | 1,200,843 | | | | 0.1 | | |
| | 981,000 | | | | (3 | ) | | Bayer US
Finance LLC,
3.000%, 10/08/21 | | | 991,489 | | | | 0.0 | | |
| | 965,000 | | | | (3 | ) | | ERAC USA
Finance LLC,
2.350%, 10/15/19 | | | 962,557 | | | | 0.0 | | |
| | 1,232,000 | | | | (3 | ) | | Heineken NV,
3.500%, 01/29/28 | | | 1,259,115 | | | | 0.1 | | |
| | 1,095,000 | | | | | | | Philip Morris
International, Inc.,
3.600%-4.875%,
11/15/23-11/15/43 | | | 1,222,739 | | | | 0.1 | | |
| | 19,916,000 | | | | | | | Other Securities | | | 21,132,216 | | | | 1.3 | | |
| | | | | | | | | | 26,768,959 | | | | 1.6 | | |
| | | | | Energy: 1.3% | |
| | 20,437,000 | | | | | | | Other Securities | | | 21,459,917 | | | | 1.3 | | |
| | | | | Financial: 4.3% | |
| | 395,000 | | | | | | | American
International
Group, Inc.,
2.300%, 07/16/19 | | | 394,814 | | | | 0.0 | | |
| | 455,000 | | | | (3 | ) | | ANZ New Zealand
Int'l Ltd. / London,
2.875%, 01/25/22 | | | 456,401 | | | | 0.0 | | |
| | 440,000 | | | | (3 | ) | | Apollo Management
Holdings L.P.,
4.000%, 05/30/24 | | | 450,741 | | | | 0.0 | | |
| | 927,000 | | | | (3 | ) | | Athene Global
Funding,
2.875%, 10/23/18 | | | 931,985 | | | | 0.1 | | |
| | 1,555,000 | | | | (3 | ) | | Athene Global
Funding,
4.000%, 01/25/22 | | | 1,605,324 | | | | 0.1 | | |
| | 725,000 | | | | (3 | ) | | BBVA Bancomer
SA/Texas,
4.375%, 04/10/24 | | | 757,625 | | | | 0.1 | | |
| | 485,000 | | | | (3 | ) | | Carlyle Holdings
Finance LLC,
3.875%, 02/01/23 | | | 496,915 | | | | 0.0 | | |
| | 595,000 | | | | | | | Citizens Financial
Group, Inc.,
2.375%, 07/28/21 | | | 587,649 | | | | 0.0 | | |
| | 1,335,000 | | | | (3 | ) | | Commonwealth
Bank of Australia,
2.250%, 03/10/20 | | | 1,331,236 | | | | 0.1 | | |
| | 472,000 | | | | (3 | ) | | Credit Suisse AG,
6.500%, 08/08/23 | | | 529,289 | | | | 0.0 | | |
| | 1,175,000 | | | | | | | Goldman Sachs
Group, Inc.,
4.250%-5.250%,
07/27/21-10/21/25 | | | 1,242,546 | | | | 0.1 | | |
See Accompanying Notes to Financial Statements
122
VY® INVESCO SUMMARY PORTFOLIO OF INVESTMENTS
EQUITY AND INCOME PORTFOLIO AS OF DECEMBER 31, 2017 (CONTINUED)
Principal
Amount† | | | | | | Value | | Percentage
of Net
Assets | |
| | | | | Financial (continued) | |
| | 465,000 | | | | (3 | ) | | HBOS PLC,
6.750%, 05/21/18 | | $ | 472,928 | | | | 0.0 | | |
| | 670,000 | | | | (3 | ) | | Jackson National Life
Global Funding,
2.100%, 10/25/21 | | | 657,665 | | | | 0.1 | | |
| | 620,000 | | | | (3 | ) | | Jackson National Life
Global Funding,
3.250%, 01/30/24 | | | 626,586 | | | | 0.0 | | |
| | 2,405,000 | | | | | | | JPMorgan
Chase & Co.,
3.200%-5.000%,
06/15/2026-
12/31/2199 | | | 2,507,638 | | | | 0.2 | | |
| | 443,000 | | | | (3 | ) | | KKR Group Finance
Co. III LLC,
5.125%, 06/01/44 | | | 491,757 | | | | 0.0 | | |
| | 2,335,000 | | | | (3 | ) | | Liberty Mutual
Group, Inc.,
4.850%, 08/01/44 | | | 2,602,915 | | | | 0.2 | | |
| | 3,250,000 | | | | (3 | ) | | MassMutual Global
Funding II,
2.100%, 08/02/18 | | | 3,254,513 | | | | 0.2 | | |
| | 1,300,000 | | | | (3 | ) | | MassMutual Global
Funding II,
2.000%, 04/15/21 | | | 1,280,240 | | | | 0.1 | | |
| | 670,000 | | | | (3 | ) | | Metropolitan Life
Global Funding I,
2.050%, 06/12/20 | | | 665,331 | | | | 0.0 | | |
| | 2,360,000 | | | | (3 | ) | | Mizuho Financial
Group Cayman
3 Ltd.,
4.600%, 03/27/24 | | | 2,498,401 | | | | 0.2 | | |
| | 4,015,000 | | | | | | | Morgan Stanley,
2.375%-4.000%,
07/23/19-07/23/25 | | | 4,068,924 | | | | 0.2 | | |
| | 1,350,000 | | | | (3 | ) | | National Australia
Bank Ltd.,
3.500%, 01/10/27 | | | 1,381,518 | | | | 0.1 | | |
| | 1,515,000 | | | | (3 | ) | | Nationwide Financial
Services, Inc.,
5.300%, 11/18/44 | | | 1,802,570 | | | | 0.1 | | |
| | 333,000 | | | | (3 | ) | | Prudential
Financial, Inc.,
3.935%, 12/07/49 | | | 340,942 | | | | 0.0 | | |
| | 690,000 | | | | (3 | ) | | Reliance Standard
Life Global
Funding II,
3.050%, 01/20/21 | | | 699,614 | | | | 0.0 | | |
| | 1,360,000 | | | | (3 | ) | | Societe Generale SA,
2.625%, 09/16/20 | | | 1,363,997 | | | | 0.1 | | |
| | 805,000 | | | | (3 | ) | | Societe Generale SA,
5.000%, 01/17/24 | | | 860,362 | | | | 0.0 | | |
| | 985,000 | | | | (3 | ) | | Standard
Chartered PLC,
3.050%, 01/15/21 | | | 994,180 | | | | 0.1 | | |
Principal
Amount† | | | | | | Value | | Percentage
of Net
Assets | |
| | 616,000 | | | | (3 | ) | | Teachers Insurance &
Annuity Association
of America,
4.270%, 05/15/47 | | $ | 652,483 | | | | 0.0 | | |
| | 585,000 | | | | (3 | ) | | UBS Group Funding
Switzerland AG,
4.125%, 04/15/26 | | | 614,319 | | | | 0.0 | | |
| | 34,888,000 | | | | | | | Other Securities | | | 36,232,192 | | | | 2.2 | | |
| | | | | | | | | | 72,853,600 | | | | 4.3 | | |
| | | | | Industrial: 0.8% | |
| | 1,105,000 | | | | (3 | ) | | Aviation Capital
Group LLC,
2.875%, 09/17/18 | | | 1,108,873 | | | | 0.1 | | |
| | 305,000 | | | | (3 | ) | | Aviation Capital
Group LLC,
2.875%, 01/20/22 | | | 305,004 | | | | 0.0 | | |
| | 1,095,000 | | | | (3 | ) | | Aviation Capital
Group LLC,
4.875%, 10/01/25 | | | 1,191,232 | | | | 0.1 | | |
| | 435,000 | | | | (3 | ) | | BAE Systems
Holdings, Inc.,
2.850%, 12/15/20 | | | 437,222 | | | | 0.0 | | |
| | 410,000 | | | | (3 | ) | | SMBC Aviation
Capital
Finance DAC,
2.650%, 07/15/21 | | | 403,517 | | | | 0.0 | | |
| | 9,751,000 | | | | | | | Other Securities | | | 10,275,506 | | | | 0.6 | | |
| | | | | | | | | | 13,721,354 | | | | 0.8 | | |
| | | | | Technology: 0.5% | |
| | 1,840,000 | | | | (3 | ) | | Broadcom Corp. /
Broadcom Cayman
Finance Ltd.,
3.625%, 01/15/24 | | | 1,831,751 | | | | 0.1 | | |
| | 910,000 | | | | (3 | ) | | Dell International
LLC / EMC Corp.,
5.450%, 06/15/23 | | | 984,375 | | | | 0.1 | | |
| | 35,000 | | | | (3 | ) | | Dell International
LLC / EMC Corp.,
8.350%, 07/15/46 | | | 45,210 | | | | 0.0 | | |
| | 5,399,000 | | | | (4 | ) | | Other Securities | | | 5,371,817 | | | | 0.3 | | |
| | | | | | | | | | 8,233,153 | | | | 0.5 | | |
| | | | | Utilities: 0.3% | |
| | 150,000 | | | | (3 | ) | | Electricite de
France SA,
4.600%, 01/27/20 | | | 157,043 | | | | 0.0 | | |
| | 620,000 | | | | (3 | ) | | Electricite de
France SA,
4.875%, 01/22/44 | | | 690,951 | | | | 0.1 | | |
| | 350,000 | | | | (3 | ) | | Electricite de
France SA,
5.625%, 12/31/2199 | | | 362,687 | | | | 0.0 | | |
| | 3,488,000 | | | | | | | Other Securities | | | 3,609,731 | | | | 0.2 | | |
| | | | | | | | | | 4,820,412 | | | | 0.3 | | |
| | | | | | | Total Corporate
Bonds/Notes
(Cost $184,234,055) | | | 191,635,405 | | | | 11.4 | | |
See Accompanying Notes to Financial Statements
123
VY® INVESCO SUMMARY PORTFOLIO OF INVESTMENTS
EQUITY AND INCOME PORTFOLIO AS OF DECEMBER 31, 2017 (CONTINUED)
Principal
Amount† | | | | | | Value | | Percentage
of Net
Assets | |
MUNICIPAL BONDS: 0.1% | | | |
| | | | | Georgia: 0.1% | |
| | 500,000 | | | | | | | Other Securities | | $ | 633,692 | | | | 0.1 | | |
| | | | | | | Total Municipal
Bonds
(Cost $503,936) | | | 633,692 | | | | 0.1 | | |
U.S. TREASURY OBLIGATIONS: 10.6% | | | |
| | | | | U.S. Treasury Bonds: 0.7% | |
| | 11,310,900 | | | | | | | 2.750%, 08/15/47 | | | 11,314,753 | | | | 0.7 | | |
| | 425,000 | | | | | | | 4.500%, 02/15/36 | | | 546,896 | | | | 0.0 | | |
| | | | | | | | | | 11,861,649 | | | | 0.7 | | |
| | | | | U.S. Treasury Notes: 9.9% | |
| | 57,650,000 | | | | | | | 1.875%, 12/15/20 | | | 57,484,530 | | | | 3.4 | | |
| | 41,221,700 | | | | (5 | ) | | 2.000%, 11/30/22 | | | 40,845,539 | | | | 2.5 | | |
| | 13,401,300 | | | | | | | 2.125%-2.250%,
11/30/24-11/15/27 | | | 13,217,701 | | | | 0.8 | | |
| | 47,470,000 | | | | (5 | ) | | 1.750%, 11/30/19 | | | 47,350,270 | | | | 2.8 | | |
| | 6,410,000 | | | | | | | 1.250%-2.625%,
01/31/19-11/15/20 | | | 6,374,725 | | | | 0.4 | | |
| | | | | | | | | | 165,272,765 | | | | 9.9 | | |
| | | | | | | Total U.S. Treasury
Obligations
(Cost $177,108,270) | | | 177,134,414 | | | | 10.6 | | |
U.S. GOVERNMENT AGENCY OBLIGATIONS(6): 0.2% | | | |
| | | | | Federal Home Loan Mortgage Corporation: 0.1% | |
| | 2,400,000 | | | | | | | Other Securities | | | 2,434,925 | | | | 0.1 | | |
| | | | | Federal National Mortgage Association: 0.1% | |
| | 915,000 | | | | | | | Other Securities | | | 1,288,143 | | | | 0.1 | | |
| | | | | | | Total U.S. Government
Agency Obligations
(Cost $3,442,820) | | | 3,723,068 | | | | 0.2 | | |
CONVERTIBLE BONDS/NOTES: 8.4% | | | |
| | | | | Communications: 2.6% | |
| | 1,807,000 | | | | (3 | ),(5) | | Liberty Expedia
Holdings, Inc.,
1.000%, 06/30/47 | | | 1,811,518 | | | | 0.1 | | |
| | 2,954,000 | | | | (3 | ) | | Liberty
Interactive LLC,
1.750%, 09/30/46 | | | 3,424,794 | | | | 0.2 | | |
| | 9,559,000 | | | | | | | Liberty Media Corp.,
1.375%, 10/15/23 | | | 11,047,336 | | | | 0.7 | | |
| | 1,933,000 | | | | | | | Liberty Media Corp.,
2.250%, 09/30/46 | | | 2,022,401 | | | | 0.1 | | |
| | 673,000 | | | | (3 | ) | | Liberty Media Corp.-
Liberty Formula
One,
1.000%, 01/30/23 | | | 754,601 | | | | 0.0 | | |
| | 2,327,000 | | | | (3 | ) | | Viavi Solutions, Inc.,
1.000%, 03/01/24 | | | 2,305,184 | | | | 0.1 | | |
| | 21,804,000 | | | | (4 | ) | | Other Securities | | | 22,971,638 | | | | 1.4 | | |
| | | | | | | | | | 44,337,472 | | | | 2.6 | | |
Principal
Amount† | | | | | | Value | | Percentage
of Net
Assets | |
| | | | | Consumer, Non-cyclical: 1.5% | |
| | 2,934,000 | | | | (3 | ) | | DexCom, Inc.,
0.750%, 05/15/22 | | $ | 2,770,797 | | | | 0.2 | | |
| | 514,000 | | | | (3 | ) | | Insulet Corp.,
1.375%, 11/15/24 | | | 522,031 | | | | 0.0 | | |
| | 2,104,000 | | | | (3 | ) | | Neurocrine
Biosciences, Inc.,
2.250%, 05/15/24 | | | 2,691,805 | | | | 0.2 | | |
| | 924,000 | | | | (3 | ) | | Pacira
Pharmaceuticals,
Inc./DE,
2.375%, 04/01/22 | | | 970,200 | | | | 0.0 | | |
| | 16,790,000 | | | | | | | Other Securities | | | 18,887,978 | | | | 1.1 | | |
| | | | | | | | | | 25,842,811 | | | | 1.5 | | |
| | | | | Energy: 0.6% | |
| | 1,298,000 | | | | (3 | ) | | Chesapeake
Energy Corp.,
5.500%, 09/15/26 | | | 1,188,481 | | | | 0.1 | | |
| | 1,360,000 | | | | (3 | ) | | Nabors
Industries, Inc.,
0.750%, 01/15/24 | | | 1,045,500 | | | | 0.0 | | |
| | 7,791,000 | | | | (4 | ) | | Other Securities | | | 7,861,624 | | | | 0.5 | | |
| | | | | | | | | | 10,095,605 | | | | 0.6 | | |
| | | | | Financial: 2.1% | |
| | 9,000,000 | | | | (3 | ) | | Credit Suisse AG
Convertible Basket,
0.500%, 06/24/24 | | | 8,880,300 | | | | 0.6 | | |
| | 4,179,000 | | | | (3 | ),(7) | | Goldman Sachs
Group, Inc.,
1.000%, 09/28/20 | | | 7,013,072 | | | | 0.4 | | |
| | 17,639,000 | | | | (4 | ) | | Other Securities | | | 18,526,338 | | | | 1.1 | | |
| | | | | | | | | | 34,419,710 | | | | 2.1 | | |
| | | | | Technology: 1.6% | |
| | 2,544,000 | | | | (3 | ) | | Microchip
Technology, Inc.,
1.625%, 02/15/27 | | | 2,993,970 | | | | 0.2 | | |
| | 790,000 | | | | (3 | ) | | RealPage, Inc.,
1.500%, 11/15/22 | | | 981,575 | | | | 0.1 | | |
| | 726,000 | | | | (3 | ) | | Silicon
Laboratories, Inc.,
1.375%, 03/01/22 | | | 838,984 | | | | 0.0 | | |
| | 2,643,000 | | | | (3 | ) | | Workday, Inc.,
0.250%, 10/01/22 | | | 2,619,874 | | | | 0.2 | | |
| | 16,210,000 | | | | | | | Other Securities | | | 18,610,216 | | | | 1.1 | | |
| | | | | | | | | | 26,044,619 | | | | 1.6 | | |
| | | | | | | Total Convertible
Bonds/Notes
(Cost $132,273,959) | | | 140,740,217 | | | | 8.4 | | |
| | | | | | | Total Long-Term
Investments
(Cost $1,336,954,612) | | | 1,570,538,947 | | | | 93.7 | | |
See Accompanying Notes to Financial Statements
124
VY® INVESCO SUMMARY PORTFOLIO OF INVESTMENTS
EQUITY AND INCOME PORTFOLIO AS OF DECEMBER 31, 2017 (CONTINUED)
Principal
Amount† | | | | | | Value | | Percentage
of Net
Assets | |
SHORT-TERM INVESTMENTS: 11.9% | | | |
| | | | | Securities Lending Collateral(8): 5.7% | |
| | 22,774,774 | | | | | | | BNP Paribas S.A.,
Repurchase
Agreement dated
12/29/17, 1.40%,
due 01/02/18
(Repurchase
Amount
$22,778,268,
collateralized by
various U.S.
Government\U.S.
Government
Agency Obligations,
0.000%-7.000%,
Market Value plus
accrued interest
$23,230,270, due
03/31/19-10/20/47) | | $ | 22,774,774 | | | | 1.3 | | |
| | 22,774,774 | | | | | | | Cantor Fitzgerald,
Repurchase
Agreement dated
12/29/17, 1.41%,
due 01/02/18
(Repurchase
Amount
$22,778,293,
collateralized by
various U.S.
Government\U.S.
Government
Agency Obligations,
0.000%-8.500%,
Market Value plus
accrued interest
$23,230,269, due
01/31/18-06/20/63) | | | 22,774,774 | | | | 1.4 | | |
| | 22,774,774 | | | | | | | Daiwa Capital
Markets,
Repurchase
Agreement dated
12/29/17, 1.43%,
due 01/02/18
(Repurchase
Amount
$22,778,343,
collateralized by
various U.S.
Government\U.S.
Government
Agency Obligations,
0.000%-6.500%,
Market Value plus
accrued interest
$23,230,270, due
01/11/18-12/01/51) | | | 22,774,774 | | | | 1.4 | | |
Principal
Amount† | | | | | | Value | | Percentage
of Net
Assets | |
| | 4,759,774 | | | | | | | Jefferies LLC,
Repurchase
Agreement dated
12/29/17, 1.50%,
due 01/02/18
(Repurchase
Amount
$4,760,556,
collateralized by
various U.S.
Government
Securities,
0.000%-1.750%,
Market Value plus
accrued interest
$4,854,971, due
09/13/18-04/30/22) | | $ | 4,759,774 | | | | 0.3 | | |
| | 22,774,774 | | | | | | | State of Wisconsin
Investment Board,
Repurchase
Agreement dated
12/29/17, 1.63%,
due 01/02/18
(Repurchase
Amount
$22,778,842,
collateralized by
various U.S.
Government
Securities,
0.125%-3.875%,
Market Value plus
accrued interest
$23,407,220, due
01/15/19-02/15/46) | | | 22,774,774 | | | | 1.3 | | |
| | | | | | | | | | 95,858,870 | | | | 5.7 | | |
Shares | |
| |
| | Value | | Percentage
of Net
Assets | |
| | | | | Mutual Funds: 6.2% | |
| | 104,356,436 | | | | (9 | ) | | BlackRock Liquidity
Funds, FedFund,
Institutional Class,
1.170%
(Cost $104,356,436) | | | 104,356,436 | | | | 6.2 | | |
| | | | | | | Total Short-Term
Investments
(Cost $200,215,306) | | | 200,215,306 | | | | 11.9 | | |
| | | | | | | Total Investments
in Securities
(Cost $1,537,169,918) | | $ | 1,770,754,253 | | | | 105.6 | | |
| | | | | | | Liabilities in Excess
of Other Assets | | | (94,307,677 | ) | | | (5.6 | ) | |
| | | | | | | Net Assets | | $ | 1,676,446,576 | | | | 100.0 | | |
See Accompanying Notes to Financial Statements
125
VY® INVESCO SUMMARY PORTFOLIO OF INVESTMENTS
EQUITY AND INCOME PORTFOLIO AS OF DECEMBER 31, 2017 (CONTINUED)
"Other Securities" represents issues not identified as the top 50 holdings in terms of market value and issues or issuers not exceeding 1% of net assets individually or in aggregate respectively as of December 31, 2017.
The following footnotes apply to either the individual securities noted or one or more of the securities aggregated and listed as a single line item.
† Unless otherwise indicated, principal amount is shown in USD.
(1) The grouping contains non-income producing securities.
(2) Non-income producing security.
(3) Securities with purchases pursuant to Rule 144A or section 4(a)(2), under the Securities Act of 1933 and may not be resold subject to that rule except to qualified institutional buyers.
(4) The grouping contains securities on loan.
(5) Security, or a portion of the security, is on loan.
(6) The Federal Housing Finance Agency ("FHFA") placed the Federal Home Loan Mortgage Corporation and Federal National Mortgage Association into conservatorship with FHFA as the conservator. As such, the FHFA oversees the continuing affairs of these companies.
(7) Exchangeable into a basket of 5 common shares.
(8) Represents securities purchased with cash collateral received for securities on loan.
(9) Rate shown is the 7-day yield as of December 31, 2017.
Fair Value Measurements^
The following is a summary of the fair valuations according to the inputs used as of December 31, 2017 in valuing the assets and liabilities:
| | | Quoted Prices
in Active Markets
for Identical Investments
(Level 1) | | Significant Other
Observable
Inputs#
(Level 2) | | Significant
Unobservable
Inputs
(Level 3) | | Fair Value
at
December 31, 2017 | |
Asset Table | |
Investments, at fair value | |
Common Stock | |
Consumer Discretionary | | $ | 87,803,505 | | | $ | — | | | $ | — | | | $ | 87,803,505 | | |
Consumer Staples | | | 69,866,268 | | | | — | | | | — | | | | 69,866,268 | | |
Energy | | | 130,919,922 | | | | 38,928,799 | | | | — | | | | 169,848,721 | | |
Financials | | | 368,628,198 | | | | — | | | | — | | | | 368,628,198 | | |
Health Care | | | 99,416,311 | | | | 23,580,163 | | | | — | | | | 122,996,474 | | |
Industrials | | | 58,130,885 | | | | — | | | | — | | | | 58,130,885 | | |
Information Technology | | | 117,117,209 | | | | — | | | | — | | | | 117,117,209 | | |
Materials | | | 17,151,193 | | | | 8,813,341 | | | | — | | | | 25,964,534 | | |
Telecommunication Services | | | 17,008,230 | | | | 2,773,254 | | | | — | | | | 19,781,484 | | |
Utilities | | | 4,752,745 | | | | — | | | | — | | | | 4,752,745 | | |
Total Common Stock | | | 970,794,466 | | | | 74,095,557 | | | | — | | | | 1,044,890,023 | | |
Preferred Stock | | | 108,000 | | | | 11,674,128 | | | | — | | | | 11,782,128 | | |
Corporate Bonds/Notes | | | — | | | | 191,635,405 | | | | — | | | | 191,635,405 | | |
Municipal Bonds | | | — | | | | 633,692 | | | | — | | | | 633,692 | | |
U.S. Treasury Obligations | | | — | | | | 177,134,414 | | | | — | | | | 177,134,414 | | |
Convertible Bonds/Notes | | | — | | | | 140,740,217 | | | | — | | | | 140,740,217 | | |
U.S. Government Agency Obligations | | | — | | | | 3,723,068 | | | | — | | | | 3,723,068 | | |
Short-Term Investments | | | 104,356,436 | | | | 95,858,870 | | | | — | | | | 200,215,306 | | |
Total Investments, at fair value | | $ | 1,075,258,902 | | | $ | 695,495,351 | | | $ | — | | | $ | 1,770,754,253 | | |
Other Financial Instruments+ | |
Forward Foreign Currency Contracts | | | — | | | | 33,679 | | | | — | | | | 33,679 | | |
Total Assets | | $ | 1,075,258,902 | | | $ | 695,529,030 | | | $ | — | | | $ | 1,770,787,932 | | |
Liabilities Table | |
Other Financial Instruments+ | |
Forward Foreign Currency Contracts | | $ | — | | | $ | (1,511,795 | ) | | $ | — | | | $ | (1,511,795 | ) | |
Total Liabilities | | $ | — | | | $ | (1,511,795 | ) | | $ | — | | | $ | (1,511,795 | ) | |
^ See Note 2, "Significant Accounting Policies" in the Notes to Financial Statements for additional information.
+ Other Financial Instruments are derivatives not reflected in the Portfolio of Investments and may include open forward foreign currency contracts, futures, centrally cleared swaps, OTC swaps and written options. Forward foreign currency contracts, futures and centrally cleared swaps are valued at the unrealized gain (loss) on the instrument. OTC swaps and written options are valued at the fair value of the instrument.
# The earlier close of the foreign markets gives rise to the possibility that significant events, including broad market moves, may have occurred in the interim and may materially affect the value of those securities. To account for this, the Portfolio may frequently value many of its foreign equity securities using fair value prices based on third party vendor modeling tools to the extent available. Accordingly, a portion of the Portfolio's investments are categorized as Level 2 investments.
See Accompanying Notes to Financial Statements
126
VY® INVESCO SUMMARY PORTFOLIO OF INVESTMENTS
EQUITY AND INCOME PORTFOLIO AS OF DECEMBER 31, 2017 (CONTINUED)
At December 31, 2017, the following forward foreign currency contracts were outstanding for VY® Invesco Equity and Income Portfolio:
Currency Purchased | | Currency Sold | | Counterparty | | Settlement
Date | | Unrealized
Appreciation
(Depreciation) | |
CHF | 246,782 | | | USD | 251,306 | | | State Street Bank and Trust Co. | | 01/19/18 | | $ | 2,266 | | |
AUD | 200,225 | | | USD | 153,631 | | | State Street Bank and Trust Co. | | 01/19/18 | | | 2,597 | | |
EUR | 402,033 | | | USD | 477,667 | | | State Street Bank and Trust Co. | | 01/19/18 | | | 5,230 | | |
AUD | 119,678 | | | USD | 91,734 | | | State Street Bank and Trust Co. | | 01/19/18 | | | 1,645 | | |
CAD | 238,628 | | | USD | 185,653 | | | State Street Bank and Trust Co. | | 01/19/18 | | | 4,237 | | |
GBP | 351,186 | | | USD | 471,039 | | | State Street Bank and Trust Co. | | 01/19/18 | | | 3,401 | | |
CAD | 401,498 | | | USD | 312,179 | | | State Street Bank and Trust Co. | | 01/19/18 | | | 7,316 | | |
CHF | 146,542 | | | USD | 149,370 | | | State Street Bank and Trust Co. | | 01/19/18 | | | 1,204 | | |
EUR | 242,110 | | | USD | 286,666 | | | State Street Bank and Trust Co. | | 01/19/18 | | | 4,141 | | |
GBP | 209,319 | | | USD | 281,141 | | | State Street Bank and Trust Co. | | 01/19/18 | | | 1,642 | | |
USD | 10,053,379 | | | EUR | 8,534,893 | | | State Street Bank and Trust Co. | | 01/19/18 | | | (198,204 | ) | |
USD | 6,713,138 | | | CAD | 8,637,661 | | | State Street Bank and Trust Co. | | 01/19/18 | | | (160,338 | ) | |
USD | 18,309,780 | | | GBP | 13,704,699 | | | State Street Bank and Trust Co. | | 01/19/18 | | | (204,777 | ) | |
USD | 3,124,823 | | | AUD | 4,134,556 | | | State Street Bank and Trust Co. | | 01/19/18 | | | (101,208 | ) | |
USD | 5,185,799 | | | CHF | 5,131,379 | | | State Street Bank and Trust Co. | | 01/19/18 | | | (86,754 | ) | |
USD | 5,185,856 | | | CHF | 5,131,404 | | | The Bank of New York Mellon | | 01/19/18 | | | (86,723 | ) | |
USD | 3,123,632 | | | AUD | 4,134,523 | | | The Bank of New York Mellon | | 01/19/18 | | | (102,373 | ) | |
USD | 18,308,471 | | | GBP | 13,704,612 | | | The Bank of New York Mellon | | 01/19/18 | | | (205,968 | ) | |
USD | 10,048,136 | | | EUR | 8,534,899 | | | The Bank of New York Mellon | | 01/19/18 | | | (203,453 | ) | |
USD | 6,711,045 | | | CAD | 8,637,115 | | | The Bank of New York Mellon | | 01/19/18 | | | (161,997 | ) | |
| | | | | | | | | | | $ | (1,478,116 | ) | |
Currency Abbreviations
AUD — Australian Dollar
CAD — Canadian Dollar
CHF — Swiss Franc
EUR — EU Euro
GBP — British Pound
USD — United States Dollar
A summary of derivative instruments by primary risk exposure is outlined in the following tables.
The fair value of derivative instruments as of December 31, 2017 was as follows:
Derivatives not accounted
for as hedging instruments | | Location on Statement of Assets and Liabilities | | Fair Value | |
Asset Derivatives | |
Foreign exchange contracts | | Unrealized appreciation on forward foreign currency contracts | | $ | 33,679 | | |
Total Asset Derivatives | | | | $ | 33,679 | | |
Liability Derivatives | |
Foreign exchange contracts | | Unrealized depreciation on forward foreign currency contracts | | $ | 1,511,795 | | |
Total Liability Derivatives | | | | $ | 1,511,795 | | |
The effect of derivative instruments on the Portfolio's Statement of Operations for the year ended December 31, 2017 was as follows:
| | | Amount of Realized Gain or (Loss) on Derivatives Recognized in Income | |
Derivatives not accounted
for as hedging instruments | | Forward foreign currency contracts | |
Foreign exchange contracts | | $ | (2,875,698 | ) | |
Total | | $ | (2,875,698 | ) | |
| | | Change in Unrealized Appreciation or (Depreciation) on Derivatives Recognized in Income | |
Derivatives not accounted
for as hedging instruments | | Forward foreign currency contracts | |
Foreign exchange contracts | | $ | (3,361,348 | ) | |
Total | | $ | (3,361,348 | ) | |
See Accompanying Notes to Financial Statements
127
VY® INVESCO SUMMARY PORTFOLIO OF INVESTMENTS
EQUITY AND INCOME PORTFOLIO AS OF DECEMBER 31, 2017 (CONTINUED)
The following is a summary by counterparty of the fair value of OTC derivative instruments subject to Master Netting Agreements and collateral pledged (received), if any, at December 31, 2017:
| | | State Street Bank
and Trust Co. | | The Bank of
New York Mellon | | Totals | |
Assets: | |
Forward foreign currency contracts | | $ | 33,679 | | | $ | — | | | $ | 33,679 | | |
Total Assets | | $ | 33,679 | | | $ | — | | | $ | 33,679 | | |
Liabilities: | |
Forward foreign currency contracts | | $ | 751,281 | | | $ | 760,514 | | | $ | 1,511,795 | | |
Total Liabilities | | $ | 751,281 | | | $ | 760,514 | | | $ | 1,511,795 | | |
Net OTC derivative instruments by counterparty, at fair value | | $ | (717,602 | ) | | $ | (760,514 | ) | | $ | (1,478,116 | ) | |
Total collateral pledged by the Portfolio/(Received from counterparty) | | $ | — | | | $ | — | | | $ | — | | |
Net Exposure(1) | | $ | (717,602 | ) | | $ | (760,514 | ) | | $ | (1,478,116 | ) | |
(1) Positive net exposure represents amounts due from each respective counterparty. Negative exposure represents amounts due from the Portfolio. Please refer to Note 2 for additional details regarding counterparty credit risk and credit related contingent features.
At December 31, 2017, the aggregate cost of securities and other investments and the composition of unrealized appreciation and depreciation of securities and other investments at period end were:
Cost for federal income tax purposes was $1,545,282,173.
Net unrealized appreciation consisted of: | |
Gross Unrealized Appreciation | | $ | 259,422,113 | | |
Gross Unrealized Depreciation | | | (35,425,288 | ) | |
Net Unrealized Appreciation | | $ | 223,996,825 | | |
See Accompanying Notes to Financial Statements
128
VY® JPMORGAN SUMMARY PORTFOLIO OF INVESTMENTS
MID CAP VALUE PORTFOLIO AS OF DECEMBER 31, 2017
Shares | |
| |
| | Value | | Percentage
of Net
Assets | |
COMMON STOCK: 100.3% | | | |
| | | | | Consumer Discretionary: 16.6% | |
| | 9,220 | | | | (1 | ) | | Autozone, Inc. | | $ | 6,558,832 | | | | 1.1 | | |
| | 82,070 | | | | | | | Best Buy Co., Inc. | | | 5,619,333 | | | | 1.0 | | |
| | 58,320 | | | | | | | Expedia, Inc. | | | 6,984,986 | | | | 1.2 | | |
| | 92,750 | | | | | | | Hilton Worldwide
Holdings, Inc. | | | 7,407,015 | | | | 1.3 | | |
| | 111,901 | | | | | | | Kohl's Corp. | | | 6,068,391 | | | | 1.1 | | |
| | 43,230 | | | | (1 | ) | | Mohawk Industries, Inc. | | | 11,927,157 | | | | 2.1 | | |
| | 49,790 | | | | | | | PVH Corp. | | | 6,831,686 | | | | 1.2 | | |
| | 803,464 | | | | (2 | ),(3) | | Other Securities | | | 43,404,692 | | | | 7.6 | | |
| | | | | | | | | | 94,802,092 | | | | 16.6 | | |
| | | | | Consumer Staples: 6.5% | |
| | 27,100 | | | | | | | Constellation
Brands, Inc. | | | 6,194,247 | | | | 1.1 | | |
| | 73,710 | | | | | | | Dr Pepper Snapple
Group, Inc. | | | 7,154,293 | | | | 1.3 | | |
| | 214,330 | | | | | | | Kroger Co. | | | 5,883,358 | | | | 1.0 | | |
| | 463,786 | | | | (3 | ) | | Other Securities | | | 17,925,783 | | | | 3.1 | | |
| | | | | | | | | | 37,157,681 | | | | 6.5 | | |
| | | | | Energy: 6.2% | |
| | 211,364 | | | | (1 | ) | | Energen Corp. | | | 12,168,226 | | | | 2.1 | | |
| | 186,020 | | | | | | | EQT Corp. | | | 10,588,258 | | | | 1.9 | | |
| | 293,700 | | | | | | | Williams Cos., Inc. | | | 8,954,913 | | | | 1.6 | | |
| | 104,480 | | | | | | | Other Securities | | | 3,703,816 | | | | 0.6 | | |
| | | | | | | | | | 35,415,213 | | | | 6.2 | | |
| | | | | Financials: 23.6% | |
| | 203,820 | | | | | | | Ally Financial, Inc. | | | 5,943,391 | | | | 1.0 | | |
| | 33,680 | | | | | | | Ameriprise Financial, Inc. | | | 5,707,750 | | | | 1.0 | | |
| | 166,060 | | | | | | | Citizens Financial
Group, Inc. | | | 6,971,199 | | | | 1.2 | | |
| | 288,910 | | | | | | | Fifth Third Bancorp | | | 8,765,530 | | | | 1.5 | | |
| | 148,330 | | | | | | | Hartford Financial
Services Group, Inc. | | | 8,348,012 | | | | 1.5 | | |
| | 168,590 | | | | | | | Invesco Ltd. | | | 6,160,279 | | | | 1.1 | | |
| | 206,540 | | | | | | | Loews Corp. | | | 10,333,196 | | | | 1.8 | | |
| | 59,673 | | | | | | | M&T Bank Corp. | | | 10,203,486 | | | | 1.8 | | |
| | 72,900 | | | | | | | Marsh & McLennan
Cos., Inc. | | | 5,933,331 | | | | 1.0 | | |
| | 65,760 | | | | | | | Northern Trust Corp. | | | 6,568,766 | | | | 1.2 | | |
| | 65,280 | | | | | | | Raymond James
Financial, Inc. | | | 5,829,504 | | | | 1.0 | | |
| | 135,480 | | | | | | | SunTrust Banks, Inc. | | | 8,750,653 | | | | 1.5 | | |
| | 85,230 | | | | | | | T. Rowe Price Group, Inc. | | | 8,943,184 | | | | 1.6 | | |
| | 168,370 | | | | | | | XL Group Ltd. | | | 5,919,889 | | | | 1.0 | | |
| | 664,930 | | | | (3 | ) | | Other Securities | | | 30,711,212 | | | | 5.4 | | |
| | | | | | | | | | 135,089,382 | | | | 23.6 | | |
Shares | |
| |
| | Value | | Percentage
of Net
Assets | |
| | | | | Health Care: 6.2% | |
| | 62,240 | | | | | | | AmerisourceBergen
Corp. | | $ | 5,714,877 | | | | 1.0 | | |
| | 35,340 | | | | | | | Cigna Corp. | | | 7,177,201 | | | | 1.3 | | |
| | 175,790 | | | | (3 | ) | | Other Securities | | | 22,318,516 | | | | 3.9 | | |
| | | | | | | | | | 35,210,594 | | | | 6.2 | | |
| | | | | Industrials: 8.4% | |
| | 73,660 | | | | | | | Ametek, Inc. | | | 5,338,140 | | | | 0.9 | | |
| | 51,260 | | | | | | | Carlisle Cos., Inc. | | | 5,825,699 | | | | 1.0 | | |
| | 87,830 | | | | | | | Fortune Brands Home &
Security, Inc. | | | 6,011,085 | | | | 1.1 | | |
| | 41,110 | | | | | | | Hubbell, Inc. | | | 5,563,828 | | | | 1.0 | | |
| | 44,800 | | | | | | | IDEX Corp. | | | 5,912,256 | | | | 1.1 | | |
| | 60,620 | | | | | | | MSC Industrial
Direct Co. | | | 5,859,529 | | | | 1.0 | | |
| | 46,561 | | | | | | | Snap-On, Inc. | | | 8,115,582 | | | | 1.4 | | |
| | 35,720 | | | | | | | Other Securities | | | 5,162,506 | | | | 0.9 | | |
| | | | | | | | | | 47,788,625 | | | | 8.4 | | |
| | | | | Information Technology: 9.1% | |
| | 81,980 | | | | | | | Amphenol Corp. | | | 7,197,844 | | | | 1.3 | | |
| | 87,290 | | | | (1 | ) | | Arrow Electronics, Inc. | | | 7,018,989 | | | | 1.2 | | |
| | 109,310 | | | | | | | CDW Corp. | | | 7,595,952 | | | | 1.3 | | |
| | 172,976 | | | | (1 | ) | | CommScope Holding
Co., Inc. | | | 6,543,682 | | | | 1.2 | | |
| | 151,839 | | | | (1 | ) | | Keysight
Technologies, Inc. | | | 6,316,502 | | | | 1.1 | | |
| | 240,796 | | | | (2 | ),(3) | | Other Securities | | | 17,336,548 | | | | 3.0 | | |
| | | | | | | | | | 52,009,517 | | | | 9.1 | | |
| | | | | Materials: 4.6% | |
| | 210,340 | | | | | | | Ball Corp. | | | 7,961,369 | | | | 1.4 | | |
| | 182,830 | | | | | | | Silgan Holdings, Inc. | | | 5,373,373 | | | | 1.0 | | |
| | 129,190 | | | | | | | WestRock Co. | | | 8,166,100 | | | | 1.4 | | |
| | 11,520 | | | | | | | Other Securities | | | 4,723,661 | | | | 0.8 | | |
| | | | | | | | | | 26,224,503 | | | | 4.6 | | |
| | | | | Real Estate: 10.7% | |
| | 1,540,772 | | | | (3 | ) | | Other Securities | | | 61,226,485 | | | | 10.7 | | |
| | | | | Utilities: 8.4% | |
| | 189,380 | | | | | | | CMS Energy Corp. | | | 8,957,674 | | | | 1.6 | | |
| | 84,750 | | | | | | | Edison International | | | 5,359,590 | | | | 0.9 | | |
| | 99,530 | | | | (4 | ) | | National Fuel Gas Co. | | | 5,465,192 | | | | 0.9 | | |
| | 63,680 | | | | | | | Sempra Energy | | | 6,808,666 | | | | 1.2 | | |
| | 134,430 | | | | | | | WEC Energy Group, Inc. | | | 8,930,185 | | | | 1.6 | | |
| | 189,900 | | | | | | | Xcel Energy, Inc. | | | 9,136,089 | | | | 1.6 | | |
| | 93,690 | | | | | | | Other Securities | | | 3,500,717 | | | | 0.6 | | |
| | | | | | | | | | 48,158,113 | | | | 8.4 | | |
| | | | | | | Total Common Stock
(Cost $407,081,875) | | | 573,082,205 | | | | 100.3 | | |
See Accompanying Notes to Financial Statements
129
VY® JPMORGAN SUMMARY PORTFOLIO OF INVESTMENTS
MID CAP VALUE PORTFOLIO AS OF DECEMBER 31, 2017 (CONTINUED)
Principal
Amount† | |
| |
| | Value | | Percentage
of Net
Assets | |
SHORT-TERM INVESTMENTS: 1.1% | | | |
| | | | | Securities Lending Collateral(5): 0.7% | |
| | 776,640 | | | | | | | Cantor Fitzgerald,
Repurchase
Agreement dated
12/29/17, 1.41%,
due 01/02/18
(Repurchase
Amount $776,760,
collateralized by
various U.S.
Government and
U.S. Government
Agency Obligations,
0.000%-8.500%,
Market Value plus
accrued interest
$792,173, due
01/31/18-06/20/63) | | $ | 776,640 | | | | 0.1 | | |
| | 1,000,000 | | | | | | | Millenium Fixed Income
Ltd., Repurchase
Agreement dated
12/29/17, 1.44%,
due 01/02/18
(Repurchase
Amount $1,000,158,
collateralized by
various U.S.
Government Securities,
2.875%-3.625%,
Market Value plus
accrued interest
$1,020,000, due
02/15/43-02/15/44) | | | 1,000,000 | | | | 0.2 | | |
| | 1,000,000 | | | | | | | NBC Global Finance
Ltd., Repurchase
Agreement dated
12/29/17, 1.50%,
due 01/02/18
(Repurchase Amount
$1,000,164,
collateralized by
various U.S.
Government Securities,
0.750%-2.250%,
Market Value plus
accrued interest
$1,020,000, due
09/30/18-09/09/49) | | | 1,000,000 | | | | 0.2 | | |
Principal
Amount† | |
| |
| | Value | | Percentage
of Net
Assets | |
| | 1,000,000 | | | | | | | State of Wisconsin
Investment Board,
Repurchase
Agreement dated
12/29/17, 1.63%,
due 01/02/18
(Repurchase
Amount $1,000,179,
collateralized by
various U.S.
Government Securities,
0.125%-3.875%,
Market Value plus
accrued interest
$1,027,770, due
01/15/19-02/15/46) | | $ | 1,000,000 | | | | 0.2 | | |
| | | | | | | | 3,776,640 | | | | 0.7 | | |
Shares | |
| |
| | Value | | Percentage
of Net
Assets | |
| | | | | Mutual Funds: 0.4% | |
| | 2,423,513 | | | | (6 | ) | | BlackRock Liquidity
Funds, FedFund,
Institutional Class,
1.170%
(Cost $2,423,513) | | $ | 2,423,513 | | | | 0.4 | | |
| | | | | Total Short-Term
Investments
(Cost $6,200,153) | | | 6,200,153 | | | | 1.1 | | |
| | | | | Total Investments in
Securities
(Cost $413,282,028) | | $ | 579,282,358 | | | | 101.4 | | |
| | | | | Liabilities in Excess of
Other Assets | | | (8,266,266 | ) | | | (1.4 | ) | |
| | | | | Net Assets | | $ | 571,016,092 | | | | 100.0 | | |
"Other Securities" represents issues not identified as the top 50 holdings in terms of market value and issues or issuers not exceeding 1% of net assets individually or in aggregate respectively as of December 31, 2017.
The following footnotes apply to either the individual securities noted or one or more of the securities aggregated and listed as a single line item.
† Unless otherwise indicated, principal amount is shown in USD.
(1) Non-income producing security.
(2) The grouping contains securities on loan.
(3) The grouping contains non-income producing securities.
(4) Security, or a portion of the security, is on loan.
(5) Represents securities purchased with cash collateral received for securities on loan.
(6) Rate shown is the 7-day yield as of December 31, 2017.
See Accompanying Notes to Financial Statements
130
VY® JPMORGAN SUMMARY PORTFOLIO OF INVESTMENTS
MID CAP VALUE PORTFOLIO AS OF DECEMBER 31, 2017 (CONTINUED)
Fair Value Measurements^
The following is a summary of the fair valuations according to the inputs used as of December 31, 2017 in valuing the assets and liabilities:
| | | Quoted Prices
in Active Markets
for Identical Investments
(Level 1) | | Significant Other
Observable
Inputs
(Level 2) | | Significant
Unobservable
Inputs
(Level 3) | | Fair Value
at
December 31, 2017 | |
Asset Table | |
Investments, at fair value | |
Common Stock* | | $ | 573,082,205 | | | $ | — | | | $ | — | | | $ | 573,082,205 | | |
Short-Term Investments | | | 2,423,513 | | | | 3,776,640 | | | | — | | | | 6,200,153 | | |
Total Investments, at fair value | | $ | 575,505,718 | | | $ | 3,776,640 | | | $ | — | | | $ | 579,282,358 | | |
^ See Note 2, "Significant Accounting Policies" in the Notes to Financial Statements for additional information.
* For further breakdown of Common Stock by sector, please refer to the Portfolio of Investments.
At December 31, 2017, the aggregate cost of securities and other investments and the composition of unrealized appreciation and depreciation of securities and other investments at period end were:
Cost for federal income tax purposes was $414,410,572.
Net unrealized appreciation consisted of: | |
Gross Unrealized Appreciation | | $ | 175,451,013 | | |
Gross Unrealized Depreciation | | | (10,579,227 | ) | |
Net Unrealized Appreciation | | $ | 164,871,786 | | |
See Accompanying Notes to Financial Statements
131
SUMMARY PORTFOLIO OF INVESTMENTS
VY® OPPENHEIMER GLOBAL PORTFOLIO AS OF DECEMBER 31, 2017
Shares | |
| |
| |
Value | | Percentage
of Net
Assets | |
COMMON STOCK: 96.8% | | | |
| | | | | China: 2.4% | |
| | 728,424 | | | | (1 | ) | | JD.com, Inc. ADR | | $ | 30,171,322 | | | | 1.7 | | |
| | 50,110 | | | | (2 | ) | | Other Securities | | | 11,736,263 | | | | 0.7 | | |
| | | | | | | | | | 41,907,585 | | | | 2.4 | | |
| | | | | Denmark: 0.5% | |
| | 163,676 | | | | | | | Other Securities | | | 9,520,066 | | | | 0.5 | | |
| | | | | France: 6.1% | |
| | 168,078 | | | | | | | LVMH Moet Hennessy
Louis Vuitton SE | | | 49,331,652 | | | | 2.8 | | |
| | 76,410 | | | | | | | Kering | | | 35,968,159 | | | | 2.1 | | |
| | 398,940 | | | | | | | Societe Generale | | | 20,567,504 | | | | 1.2 | | |
| | | | | | | | | | 105,867,315 | | | | 6.1 | | |
| | | | | Germany: 7.5% | |
| | 143,266 | | | | | | | Allianz SE | | | 32,786,024 | | | | 1.9 | | |
| | 164,205 | | | | | | | Bayer AG | | | 20,404,584 | | | | 1.2 | | |
| | 77,968 | | | | (1 | ) | | Linde AG | | | 18,209,435 | | | | 1.1 | | |
| | 334,404 | | | | | | | SAP SE | | | 37,411,460 | | | | 2.1 | | |
| | 153,884 | | | | | | | Siemens AG | | | 21,306,363 | | | | 1.2 | | |
| | | | | | | | | | 130,117,866 | | | | 7.5 | | |
| | | | | India: 3.7% | |
| | 10,564,970 | | | | | | | DLF Ltd. | | | 42,732,786 | | | | 2.4 | | |
| | 1,528,222 | | | | | | | ICICI Bank Ltd. ADR | | | 14,869,600 | | | | 0.9 | | |
| | 812,691 | | | | | | | Other Securities | | | 7,398,884 | | | | 0.4 | | |
| | | | | | | | | | 65,001,270 | | | | 3.7 | | |
| | | | | Italy: 0.7% | |
| | 277,680 | | | | | | | Other Securities | | | 11,781,348 | | | | 0.7 | | |
| | | | | Japan: 14.2% | |
| | 1,138,800 | | | | | | | Dai-ichi Life Holdings,
Inc. | | | 23,404,782 | | | | 1.3 | | |
| | 61,900 | | | | | | | Fanuc Ltd. | | | 14,849,590 | | | | 0.9 | | |
| | 72,302 | | | | | | | Keyence Corp. | | | 40,390,164 | | | | 2.3 | | |
| | 319,500 | | | | | | | Kyocera Corp. | | | 20,859,196 | | | | 1.2 | | |
| | 213,700 | | | | | | | Murata Manufacturing
Co., Ltd. | | | 28,611,888 | | | | 1.6 | | |
| | 311,600 | | | | | | | Nidec Corp. | | | 43,629,313 | | | | 2.5 | | |
| | 45,500 | | | | | | | Nintendo Co., Ltd. | | | 16,384,397 | | | | 0.9 | | |
| | 339,700 | | | | | | | Suzuki Motor Corp. | | | 19,663,077 | | | | 1.1 | | |
| | 233,700 | | | | | | | TDK Corp. | | | 18,572,334 | | | | 1.1 | | |
| | 1,022,600 | | | | (2 | ) | | Other Securities | | | 22,552,829 | | | | 1.3 | | |
| | | | | | | | | | 248,917,570 | | | | 14.2 | | |
| | | | | Netherlands: 3.1% | |
| | 549,333 | | | | | | | Airbus SE | | | 54,596,319 | | | | 3.1 | | |
Shares | |
| |
| |
Value | | Percentage
of Net
Assets | |
| | | | | Spain: 2.3% | |
| | 861,340 | | | | | | | Industria de Diseno
Textil SA | | $ | 29,950,241 | | | | 1.7 | | |
| | 1,158,732 | | | | | | | Other Securities | | | 9,847,124 | | | | 0.6 | | |
| | | | | | | | | | 39,797,365 | | | | 2.3 | | |
| | | | | Sweden: 1.2% | |
| | 1,006,130 | | | | | | | Assa Abloy AB | | | 20,858,547 | | | | 1.2 | | |
| | | | | Switzerland: 3.2% | |
| | 1,005,893 | | | | | | | Credit Suisse
Group AG | | | 17,940,830 | | | | 1.1 | | |
| | 1,531,780 | | | | | | | UBS Group AG | | | 28,143,023 | | | | 1.6 | | |
| | 35,852 | | | | | | | Other Securities | | | 9,065,371 | | | | 0.5 | | |
| | | | | | | | | | 55,149,224 | | | | 3.2 | | |
| | | | | United Kingdom: 7.0% | |
| | 1,798,250 | | | | | | | International
Consolidated Airlines
Group SA | | | 15,748,175 | | | | 0.9 | | |
| | 539,477 | | | | | | | International Game
Technology PLC | | | 14,301,535 | | | | 0.8 | | |
| | 1,254,846 | | | | | | | Prudential PLC | | | 32,136,937 | | | | 1.9 | | |
| | 522,544 | | | | | | | TechnipFMC PLC | | | 16,209,844 | | | | 0.9 | | |
| | 575,097 | | | | | | | Unilever PLC | | | 31,898,334 | | | | 1.8 | | |
| | 12,080,886 | | | | (2 | ),(3) | | Other Securities | | | 12,584,738 | | | | 0.7 | | |
| | | | | | | | | | 122,879,563 | | | | 7.0 | | |
| | | | | United States: 44.9% | |
| | 115,430 | | | | | | | 3M Co. | | | 27,168,759 | | | | 1.5 | | |
| | 223,213 | | | | (1 | ) | | Adobe Systems, Inc. | | | 39,115,846 | | | | 2.2 | | |
| | 259,270 | | | | | | | Aetna, Inc. | | | 46,769,715 | | | | 2.7 | | |
| | 49,170 | | | | (1 | ) | | Alphabet, Inc. -
Class A | | | 51,795,678 | | | | 3.0 | | |
| | 46,227 | | | | (1 | ) | | Alphabet, Inc. -
Class C | | | 48,371,933 | | | | 2.8 | | |
| | 163,730 | | | | | | | Anthem, Inc. | | | 36,840,887 | | | | 2.1 | | |
| | 53,690 | | | | (1 | ) | | Biogen, Inc. | | | 17,104,023 | | | | 1.0 | | |
| | 584,270 | | | | | | | Citigroup, Inc. | | | 43,475,531 | | | | 2.5 | | |
| | 498,040 | | | | | | | Colgate-Palmolive Co. | | | 37,577,118 | | | | 2.1 | | |
| | 235,950 | | | | (1 | ) | | Facebook, Inc. | | | 41,635,737 | | | | 2.4 | | |
| | 102,760 | | | | | | | Goldman Sachs
Group, Inc. | | | 26,179,138 | | | | 1.5 | | |
| | 223,270 | | | | | | | Intuit, Inc. | | | 35,227,541 | | | | 2.0 | | |
| | 665,010 | | | | | | | Maxim Integrated
Products | | | 34,766,723 | | | | 2.0 | | |
| | 300,020 | | | | (1 | ) | | PayPal Holdings, Inc. | | | 22,087,472 | | | | 1.3 | | |
| | 251,060 | | | | | | | S&P Global, Inc. | | | 42,529,564 | | | | 2.4 | | |
| | 114,390 | | | | (1 | ) | | Sage Therapeutics, Inc. | | | 18,841,177 | | | | 1.1 | | |
| | 216,200 | | | | | | | Tiffany & Co. | | | 22,473,990 | | | | 1.3 | | |
| | 148,390 | | | | | | | United Parcel
Service, Inc. -
Class B | | | 17,680,669 | | | | 1.0 | | |
See Accompanying Notes to Financial Statements
132
SUMMARY PORTFOLIO OF INVESTMENTS
VY® OPPENHEIMER GLOBAL PORTFOLIO AS OF DECEMBER 31, 2017 (CONTINUED)
Shares | |
| |
| |
Value | | Percentage
of Net
Assets | |
| | | | | United States (continued) | |
| | 228,600 | | | | | | | Walt Disney Co. | | $ | 24,576,786 | | | | 1.4 | | |
| | 153,690 | | | | | | | Zimmer Biomet
Holdings, Inc. | | | 18,545,772 | | | | 1.1 | | |
| | 2,338,790 | | | | (2 | ),(3) | | Other Securities | | | 131,627,713 | | | | 7.5 | | |
| | | | | | | | | | 784,391,772 | | | | 44.9 | | |
| | | | | | | Total Common Stock
(Cost $813,899,161) | | | 1,690,785,810 | | | | 96.8 | | |
PREFERRED STOCK: 1.7% | | | |
| | | | | Germany: 1.7% | |
| | 332,094 | | | | | | | Bayerische Motoren
Werke AG | | | 29,634,029 | | | | 1.7 | | |
| | | | | India: 0.0% | |
| | 4,781,446 | | | | (2 | ) | | Other Securities | | | 749,120 | | | | 0.0 | | |
| | | | | | | | | Total Preferred Stock
(Cost $12,621,781) | | | 30,383,149 | | | | 1.7 | | |
| | | | | | | | | Total Long-Term
Investments
(Cost $826,520,942) | | | 1,721,168,959 | | | | 98.5 | | |
Principal
Amount† | |
| |
| | Value | | Percentage
of Net
Assets | |
SHORT-TERM INVESTMENTS: 2.1% | | | |
| | | | | Securities Lending Collateral(4): 0.7% | |
| | 3,081,613 | | | | | | | Cantor Fitzgerald,
Repurchase
Agreement dated
12/29/17, 1.41%,
due 01/02/18
(Repurchase Amount
$3,082,089,
collateralized by
various U.S.
Government\U.S.
Government Agency
Obligations,
0.000%-8.500%,
Market Value plus
accrued interest
$3,143,245, due
01/31/18-06/20/63) | | $ | 3,081,613 | | | | 0.2 | | |
Principal
Amount† | |
| |
| |
Value | | Percentage
of Net
Assets | |
| | 2,360,286 | | | | | | | Daiwa Capital Markets,
Repurchase
Agreement dated
12/29/17, 1.43%,
due 01/02/18
(Repurchase Amount
$2,360,656,
collateralized by
various U.S.
Government\U.S.
Government Agency
Obligations,
0.000%-6.500%,
Market Value plus
accrued interest
$2,407,492, due
01/11/18-12/01/51) | | $ | 2,360,286 | | | | 0.1 | | |
| | 3,081,613 | | | | | | | Millenium Fixed
Income Ltd.,
Repurchase
Agreement dated
12/29/17, 1.44%,
due 01/02/18
(Repurchase Amount
$3,082,099,
collateralized by
various U.S.
Government
Securities,
2.875%-3.625%,
Market Value plus
accrued interest
$3,143,245, due
02/15/43-02/15/44) | | | 3,081,613 | | | | 0.2 | | |
| | 3,081,613 | | | | | | | State of Wisconsin
Investment Board,
Repurchase
Agreement dated
12/29/17, 1.63%,
due 01/02/18
(Repurchase Amount
$3,082,163,
collateralized by
various U.S.
Government
Securities,
0.125%-3.875%,
Market Value plus
accrued interest
$3,167,188, due
01/15/19-02/15/46) | | | 3,081,613 | | | | 0.2 | | |
| | | | | | | | | | 11,605,125 | | | | 0.7 | | |
See Accompanying Notes to Financial Statements
133
SUMMARY PORTFOLIO OF INVESTMENTS
VY® OPPENHEIMER GLOBAL PORTFOLIO AS OF DECEMBER 31, 2017 (CONTINUED)
Shares | |
| |
| |
Value | | Percentage
of Net
Assets | |
| | | | | Mutual Funds: 1.4% | |
| | 25,246,097 | | | | (5 | ) | | BlackRock Liquidity
Funds, FedFund,
Institutional
Class, 1.170%
(Cost $25,246,097) | | $ | 25,246,097 | | | | 1.4 | | |
| | | | | | | Total Short-Term
Investments
(Cost $36,851,222) | | | 36,851,222 | | | | 2.1 | | |
| | | | | | | Total Investments
in Securities
(Cost $863,372,164) | | $ | 1,758,020,181 | | | | 100.6 | | |
| | | | | | | Liabilities in Excess
of Other Assets | | | (10,757,902 | ) | | | (0.6 | ) | |
| | | | | | | Net Assets | | $ | 1,747,262,279 | | | | 100.0 | | |
"Other Securities" represents issues not identified as the top 50 holdings in terms of market value and issues or issuers not exceeding 1% of net assets individually or in aggregate respectively as of December 31, 2017.
The following footnotes apply to either the individual securities noted or one or more of the securities aggregated and listed as a single line item.
† Unless otherwise indicated, principal amount is shown in USD.
ADR American Depositary Receipt
(1) Non-income producing security.
(2) The grouping contains non-income producing securities.
(3) The grouping contains securities on loan.
(4) Represents securities purchased with cash collateral received for securities on loan.
(5) Rate shown is the 7-day yield as of December 31, 2017.
Sector Diversification | | Percentage of
Net Assets | |
Information Technology | | | 26.5 | % | |
Financials | | | 17.7 | | |
Consumer Discretionary | | | 16.1 | | |
Health Care | | | 16.1 | | |
Industrials | | | 13.8 | | |
Consumer Staples | | | 3.9 | | |
Real Estate | | | 2.4 | | |
Materials | | | 1.1 | | |
Energy | | | 0.9 | | |
Short-Term Investments | | | 2.1 | | |
Liabilities in Excess of Other Assets | | | (0.6 | ) | |
Net Assets | | | 100.0 | % | |
Fair Value Measurements^
The following is a summary of the fair valuations according to the inputs used as of December 31, 2017 in valuing the assets and liabilities:
| | | Quoted Prices
in Active Markets
for Identical Investments
(Level 1) | | Significant Other
Observable
Inputs#
(Level 2) | | Significant
Unobservable
Inputs
(Level 3) | | Fair Value
at
December 31, 2017 | |
Asset Table | |
Investments, at fair value | |
Common Stock | |
China | | $ | 41,907,585 | | | $ | — | | | $ | — | | | $ | 41,907,585 | | |
Denmark | | | — | | | | 9,520,066 | | | | — | | | | 9,520,066 | | |
France | | | — | | | | 105,867,315 | | | | — | | | | 105,867,315 | | |
Germany | | | 18,209,435 | | | | 111,908,431 | | | | — | | | | 130,117,866 | | |
India | | | 14,869,600 | | | | 50,131,670 | | | | — | | | | 65,001,270 | | |
Italy | | | 5,019,734 | | | | 6,761,614 | | | | — | | | | 11,781,348 | | |
Japan | | | — | | | | 248,917,570 | | | | — | | | | 248,917,570 | | |
Netherlands | | | — | | | | 54,596,319 | | | | — | | | | 54,596,319 | | |
Spain | | | — | | | | 39,797,365 | | | | — | | | | 39,797,365 | | |
Sweden | | | — | | | | 20,858,547 | | | | — | | | | 20,858,547 | | |
Switzerland | | | — | | | | 55,149,224 | | | | — | | | | 55,149,224 | | |
United Kingdom | | | 19,463,431 | | | | 103,416,132 | | | | — | | | | 122,879,563 | | |
United States | | | 784,391,772 | | | | — | | | | — | | | | 784,391,772 | | |
Total Common Stock | | | 883,861,557 | | | | 806,924,253 | | | | — | | | | 1,690,785,810 | | |
Preferred Stock | | | 749,120 | | | | 29,634,029 | | | | — | | | | 30,383,149 | | |
Short-Term Investments | | | 25,246,097 | | | | 11,605,125 | | | | — | | | | 36,851,222 | | |
Total Investments, at fair value | | $ | 909,856,774 | | | $ | 848,163,407 | | | $ | — | | | $ | 1,758,020,181 | | |
^ See Note 2, "Significant Accounting Policies" in the Notes to Financial Statements for additional information.
# The earlier close of the foreign markets gives rise to the possibility that significant events, including broad market moves, may have occurred in the interim and may materially affect the value of those securities. To account for this, the Portfolio may frequently value many of its foreign equity securities using fair value prices based on third party vendor modeling tools to the extent available. Accordingly, a portion of the Portfolio's investments are categorized as Level 2 investments.
See Accompanying Notes to Financial Statements
134
SUMMARY PORTFOLIO OF INVESTMENTS
VY® OPPENHEIMER GLOBAL PORTFOLIO AS OF DECEMBER 31, 2017 (CONTINUED)
The effect of derivative instruments on the Fund's Statement of Operations for the year ended December 31, 2017 was as follows:
| | | Amount of Realized Gain or (Loss) on Derivatives Recognized in Income | |
Derivatives not accounted
for as hedging instruments | | Forward foreign currency contracts | |
Foreign exchange contracts | | $ | (119,722 | ) | |
Total | | $ | (119,722 | ) | |
At December 31, 2017, the aggregate cost of securities and other investments and the composition of unrealized appreciation and depreciation of securities and other investments at period end were:
Cost for federal income tax purposes was $886,689,775.
Net unrealized appreciation consisted of: | |
Gross Unrealized Appreciation | | $ | 891,751,991 | | |
Gross Unrealized Depreciation | | | (20,360,281 | ) | |
Net Unrealized Appreciation | | $ | 871,391,710 | | |
See Accompanying Notes to Financial Statements
135
VY® PIONEER SUMMARY PORTFOLIO OF INVESTMENTS
HIGH YIELD PORTFOLIO AS OF DECEMBER 31, 2017
Principal
Amount† | |
| |
| | Value | | Percentage
of Net
Assets | |
CORPORATE BONDS/NOTES: 73.9% | | | |
| | | | | Basic Materials: 3.1% | |
| | 300,000 | | | | (1 | ) | | Ausdrill Finance Pty Ltd.,
6.875%, 11/01/19 | | $ | 305,250 | | | | 0.3 | | |
| | 250,000 | | | | (1 | ) | | Constellium NV,
5.875%, 02/15/26 | | | 255,312 | | | | 0.3 | | |
| | 75,000 | | | | (1 | ) | | Hudbay Minerals, Inc.,
7.250%, 01/15/23 | | | 79,875 | | | | 0.1 | | |
| | 100,000 | | | | (1 | ) | | Hudbay Minerals, Inc.,
7.625%, 01/15/25 | | | 110,000 | | | | 0.1 | | |
| | 190,000 | | | | (1 | ) | | Kinross Gold Corp.,
4.500%, 07/15/27 | | | 191,663 | | | | 0.2 | | |
| | 435,000 | | | | (1 | ) | | Kraton Polymers LLC /
Kraton Polymers
Capital Corp.,
7.000%, 04/15/25 | | | 467,625 | | | | 0.5 | | |
| | 450,000 | | | | (1 | ) | | NOVA Chemicals Corp.,
5.000%, 05/01/25 | | | 450,000 | | | | 0.4 | | |
| | 145,000 | | | | (1 | ) | | Tronox Finance LLC,
7.500%, 03/15/22 | | | 151,887 | | | | 0.1 | | |
| | 1,143,000 | | | | | | | Other Securities | | | 1,134,028 | | | | 1.1 | | |
| | | | | | | | | | 3,145,640 | | | | 3.1 | | |
| | | | | Communications: 12.8% | |
| | 200,000 | | | | (1 | ) | | Altice Financing SA,
6.625%, 02/15/23 | | | 209,920 | | | | 0.2 | | |
| | 200,000 | | | | (1 | ) | | Altice US Finance I Corp.,
5.375%, 07/15/23 | | | 205,500 | | | | 0.2 | | |
| | 200,000 | | | | (1 | ) | | CB Escrow Corp.,
8.000%, 10/15/25 | | | 204,000 | | | | 0.2 | | |
| | 210,000 | | | | (1 | ) | | CCO Holdings LLC /
CCO Holdings
Capital Corp.,
5.000%, 02/01/28 | | | 205,275 | | | | 0.2 | | |
| | 505,000 | | | | (1 | ) | | CCO Holdings LLC /
CCO Holdings
Capital Corp.,
5.500%, 05/01/26 | | | 518,888 | | | | 0.5 | | |
| | 310,000 | | | | (1 | ) | | CCO Holdings LLC /
CCO Holdings
Capital Corp., 5.750%,
02/15/26 | | | 322,787 | | | | 0.3 | | |
| | 155,000 | | | | (1 | ) | | CommScope
Technologies LLC,
5.000%, 03/15/27 | | | 155,387 | | | | 0.2 | | |
| | 120,000 | | | | (1 | ) | | CommScope, Inc.,
5.000%, 06/15/21 | | | 122,700 | | | | 0.1 | | |
| | 200,000 | | | | (1 | ) | | CSC Holdings LLC,
5.500%, 04/15/27 | | | 204,500 | | | | 0.2 | | |
| | 555,000 | | | | | | | Frontier Communications
Corp., 8.750%, 04/15/22 | | | 400,815 | | | | 0.4 | | |
| | 416,000 | | | | | | | Frontier Communications
Corp., 8.500%-10.500%,
04/15/20-09/15/22 | | | 321,983 | | | | 0.3 | | |
| | 250,000 | | | | (1 | ) | | Gray Television, Inc.,
5.125%, 10/15/24 | | | 250,000 | | | | 0.2 | | |
| | 280,000 | | | | (1 | ) | | Gray Television, Inc.,
5.875%, 07/15/26 | | | 287,700 | | | | 0.3 | | |
Principal
Amount† | |
| |
| | Value | | Percentage
of Net
Assets | |
| | 415,000 | | | | | | | Hughes Satellite
Systems Corp.,
5.250%, 08/01/26 | | $ | 424,856 | | | | 0.4 | | |
| | 690,000 | | | | | | | Level 3 Financing, Inc.,
5.250%, 03/15/26 | | | 678,995 | | | | 0.7 | | |
| | 195,000 | | | | (1 | ) | | MDC Partners, Inc.,
6.500%, 05/01/24 | | | 196,950 | | | | 0.2 | | |
| | 550,000 | | | | | | | Netflix, Inc.,
4.375%, 11/15/26 | | | 540,375 | | | | 0.5 | | |
| | 200,000 | | | | (1 | ) | | SFR Group SA,
6.000%, 05/15/22 | | | 202,750 | | | | 0.2 | | |
| | 251,000 | | | | (1 | ) | | Sinclair Television
Group, Inc.,
5.125%, 02/15/27 | | | 250,059 | | | | 0.3 | | |
| | 170,000 | | | | (1 | ) | | Sirius XM Radio, Inc.,
4.625%, 05/15/23 | | | 174,037 | | | | 0.2 | | |
| | 525,000 | | | | (1 | ) | | Sirius XM Radio, Inc.,
5.000%, 08/01/27 | | | 528,938 | | | | 0.5 | | |
| | 1,660,000 | | | | | | | Sprint Corp.,
7.250%, 09/15/21 | | | 1,761,675 | | | | 1.7 | | |
| | 425,000 | | | | | | | TEGNA, Inc.,
6.375%, 10/15/23 | | | 446,781 | | | | 0.5 | | |
| | 450,000 | | | | | | | T-Mobile USA, Inc.,
6.500%, 01/15/26 | | | 492,187 | | | | 0.5 | | |
| | 545,000 | | | | | | | T-Mobile USA, Inc.,
5.125%-6.500%,
03/01/23-04/15/25 | | | 575,354 | | | | 0.6 | | |
| | 24,000 | | | | (1 | ) | | Univision
Communications, Inc.,
5.125%, 02/15/25 | | | 23,460 | | | | 0.0 | | |
| | 440,000 | | | | (1 | ) | | Videotron Ltd.,
5.375%, 06/15/24 | | | 475,750 | | | | 0.5 | | |
| | 346,000 | | | | (1 | ) | | Wind Tre SpA,
5.000%, 01/20/26 | | | 330,776 | | | | 0.3 | | |
| | 335,000 | | | | (1 | ) | | Windstream Services
LLC / Windstream
Finance Corp.,
8.625%, 10/31/25 | | | 324,113 | | | | 0.3 | | |
| | 387,000 | | | | (1 | ) | | Windstream Services
LLC / Windstream
Finance Corp.,
8.750%, 12/15/24 | | | 272,351 | | | | 0.3 | | |
| | 3,805,000 | | | | (2 | ),(3) | | Other Securities | | | 1,866,188 | | | | 1.8 | | |
| | | | | | | | | | 12,975,050 | | | | 12.8 | | |
| | | | | Consumer, Cyclical: 11.8% | |
| | 75,000 | | | | (1 | ) | | Allison Transmission, Inc.,
4.750%, 10/01/27 | | | 75,656 | | | | 0.1 | | |
| | 225,000 | | | | (1 | ) | | Beazer Homes USA, Inc.,
5.875%, 10/15/27 | | | 227,250 | | | | 0.2 | | |
| | 570,000 | | | | | | | Beazer Homes USA, Inc.,
6.750%, 03/15/25 | | | 603,487 | | | | 0.6 | | |
| | 70,000 | | | | | | | Beazer Homes USA, Inc.,
8.750%, 03/15/22 | | | 77,343 | | | | 0.1 | | |
| | 230,000 | | | | (1 | ) | | Cooper-Standard
Automotive, Inc.,
5.625%, 11/15/26 | | | 238,050 | | | | 0.2 | | |
See Accompanying Notes to Financial Statements
136
VY® PIONEER SUMMARY PORTFOLIO OF INVESTMENTS
HIGH YIELD PORTFOLIO AS OF DECEMBER 31, 2017 (CONTINUED)
Principal
Amount† | |
| |
| | Value | | Percentage
of Net
Assets | |
| | | | | Consumer, Cyclical (continued) | |
| | 125,000 | | | | (1 | ) | | Dana Financing
Luxembourg Sarl,
5.750%, 04/15/25 | | $ | 132,031 | | | | 0.1 | | |
| | 250,000 | | | | (1 | ) | | Golden Nugget, Inc.,
6.750%, 10/15/24 | | | 255,000 | | | | 0.3 | | |
| | 230,000 | | | | (1 | ) | | Golden Nugget, Inc.,
8.750%, 10/01/25 | | | 242,075 | | | | 0.2 | | |
| | 236,000 | | | | (1 | ) | | H&E Equipment
Services, Inc.,
5.625%, 09/01/25 | | | 247,210 | | | | 0.3 | | |
| | 165,000 | | | | (1 | ) | | Hilton Grand Vacations
Borrower LLC/Hilton
Grand Vacations
Borrower, Inc.,
6.125%, 12/01/24 | | | 180,881 | | | | 0.2 | | |
| | 185,000 | | | | (1 | ) | | International Automotive
Components Group SA,
9.125%, 06/01/18 | | | 183,266 | | | | 0.2 | | |
| | 300,000 | | | | (1 | ) | | International Game
Technology PLC,
6.500%, 02/15/25 | | | 336,750 | | | | 0.3 | | |
| | 186,000 | | | | (1 | ) | | Intrepid Aviation Group
Holdings LLC / Intrepid
Finance Co.,
6.875%, 02/15/19 | | | 185,535 | | | | 0.2 | | |
| | 248,000 | | | | (1 | ) | | JB Poindexter & Co., Inc.,
9.000%, 04/01/22 | | | 257,920 | | | | 0.3 | | |
| | 400,000 | | | | | | | KB Home,
7.000%, 12/15/21 | | | 446,000 | | | | 0.4 | | |
| | 245,000 | | | | | | | KB Home,
7.500%, 09/15/22 | | | 279,913 | | | | 0.3 | | |
| | 205,000 | | | | (1 | ) | | KFC Holding Co/Pizza
Hut Holdings LLC/Taco
Bell of America LLC,
5.000%, 06/01/24 | | | 211,919 | | | | 0.2 | | |
| | 205,000 | | | | (1 | ) | | KFC Holding Co/Pizza
Hut Holdings LLC/Taco
Bell of America LLC,
5.250%, 06/01/26 | | | 216,275 | | | | 0.2 | | |
| | 250,000 | | | | | | | Lennar Corp.,
4.500%, 06/15/19 | | | 256,562 | | | | 0.2 | | |
| | 465,000 | | | | | | | Lennar Corp.,
4.750%, 11/15/22 | | | 489,994 | | | | 0.5 | | |
| | 200,000 | | | | (1 | ) | | Nexteer Automotive
Group Ltd.,
5.875%, 11/15/21 | | | 209,500 | | | | 0.2 | | |
| | 466,000 | | | | (1 | ) | | PetSmart, Inc.,
7.125%, 03/15/23 | | | 278,435 | | | | 0.3 | | |
| | 200,000 | | | | (1 | ) | | Scientific Games
International, Inc.,
5.000%, 10/15/25 | | | 201,000 | | | | 0.2 | | |
| | 595,000 | | | | | | | Scientific Games
International, Inc.,
10.000%, 12/01/22 | | | 655,244 | | | | 0.6 | | |
Principal
Amount† | |
| |
| | Value | | Percentage
of Net
Assets | |
| | 365,000 | | | | (1 | ) | | Taylor Morrison
Communities, Inc. /
Taylor Morrison
Holdings II, Inc.,
5.625%, 03/01/24 | | $ | 383,706 | | | | 0.4 | | |
| | 400,000 | | | | | | | Tempur Sealy
International, Inc.,
5.500%, 06/15/26 | | | 411,080 | | | | 0.4 | | |
| | 169,000 | | | | (1 | ) | | TI Group Automotive
Systems LLC,
8.750%, 07/15/23 | | | 182,098 | | | | 0.2 | | |
| | 255,000 | | | | (1 | ) | | Titan International, Inc.,
6.500%, 11/30/23 | | | 260,100 | | | | 0.3 | | |
| | 228,000 | | | | (1 | ) | | Viking Cruises Ltd.,
5.875%, 09/15/27 | | | 232,560 | | | | 0.2 | | |
| | 305,000 | | | | (1 | ) | | Viking Cruises Ltd,
6.250%, 05/15/25 | | | 315,675 | | | | 0.3 | | |
| | 3,548,000 | | | | | | | Other Securities | | | 3,687,740 | | | | 3.6 | | |
| | | | | | | | | | 11,960,255 | | | | 11.8 | | |
| | | | | Consumer, Non-cyclical: 10.8% | |
| | 80,000 | | | | (1 | ) | | Alliance One
International, Inc.,
8.500%, 04/15/21 | | | 84,000 | | | | 0.1 | | |
| | 200,000 | | | | (1 | ) | | Ashtead Capital, Inc.,
4.125%, 08/15/25 | | | 202,250 | | | | 0.2 | | |
| | 94,000 | | | | (1 | ) | | Avantor, Inc.,
6.000%, 10/01/24 | | | 93,882 | | | | 0.1 | | |
| | 260,000 | | | | (1 | ) | | Brink's Co/The,
4.625%, 10/15/27 | | | 255,450 | | | | 0.2 | | |
| | 215,000 | | | | (1 | ) | | C&S Group Enterprises
LLC, 5.375%, 07/15/22 | | | 203,712 | | | | 0.2 | | |
| | 20,000 | | | | (1 | ) | | Cardtronics, Inc. /
Cardtronics USA, Inc.,
5.500%, 05/01/25 | | | 18,150 | | | | 0.0 | | |
| | 375,000 | | | | (1 | ) | | Cimpress NV,
7.000%, 04/01/22 | | | 388,125 | | | | 0.4 | | |
| | 250,000 | | | | (1 | ) | | APTIM Corp.,
7.750%, 06/15/25 | | | 240,000 | | | | 0.2 | | |
| | 270,000 | | | | (1 | ) | | Endo Finance LLC,
5.750%, 01/15/22 | | | 226,125 | | | | 0.2 | | |
| | 200,000 | | | | (1 | ) | | Endo Ltd. / Endo
Finance LLC / Endo
Finco, Inc.,
6.000%, 02/01/25 | | | 156,000 | | | | 0.2 | | |
| | 750,000 | | | | | | | HCA, Inc.,
5.375%, 02/01/25 | | | 778,125 | | | | 0.8 | | |
| | 35,000 | | | | (1 | ) | | Horizon Pharma, Inc. /
Horizon Pharma USA,
Inc., 8.750%, 11/01/24 | | | 37,144 | | | | 0.0 | | |
| | 450,000 | | | | | | | Kindred Healthcare, Inc.,
6.375%, 04/15/22 | | | 459,000 | | | | 0.4 | | |
| | 240,000 | | | | | | | Kindred Healthcare, Inc.,
8.000%, 01/15/20 | | | 261,228 | | | | 0.3 | | |
| | 80,000 | | | | (1 | ) | | Lamb Weston Holdings,
Inc., 4.625%, 11/01/24 | | | 82,800 | | | | 0.1 | | |
| | 80,000 | | | | (1 | ) | | Lamb Weston Holdings,
Inc., 4.875%, 11/01/26 | | | 83,800 | | | | 0.1 | | |
See Accompanying Notes to Financial Statements
137
VY® PIONEER SUMMARY PORTFOLIO OF INVESTMENTS
HIGH YIELD PORTFOLIO AS OF DECEMBER 31, 2017 (CONTINUED)
Principal
Amount† | |
| |
| | Value | | Percentage
of Net
Assets | |
| | | | | Consumer, Non-cyclical (continued) | |
| | 424,000 | | | | (1 | ) | | Pilgrim's Pride Corp.,
5.875%, 09/30/27 | | $ | 437,780 | | | | 0.4 | | |
| | 500,000 | | | | (1 | ) | | Post Holdings, Inc.,
5.625%, 01/15/28 | | | 502,500 | | | | 0.5 | | |
| | 510,000 | | | | (1 | ) | | RegionalCare Hospital
Partners Holdings, Inc.,
8.250%, 05/01/23 | | | 540,600 | | | | 0.5 | | |
| | 235,000 | | | | (1 | ) | | Team Health Holdings,
Inc., 6.375%, 02/01/25 | | | 210,912 | | | | 0.2 | | |
| | 85,000 | | | | (1 | ) | | Tenet Healthcare Corp.,
7.500%, 01/01/22 | | | 89,569 | | | | 0.1 | | |
| | 525,000 | | | | | | | United Rentals North
America, Inc.,
5.750%, 11/15/24 | | | 554,531 | | | | 0.6 | | |
| | 120,000 | | | | | | | United Rentals North
America, Inc.,
4.625%-4.875%,
10/15/25-01/15/28 | | | 121,050 | | | | 0.1 | | |
| | 200,000 | | | | (1 | ) | | Valeant Pharmaceuticals
International, Inc.,
5.500%, 11/01/25 | | | 204,500 | | | | 0.2 | | |
| | 1,709,000 | | | | (1 | ) | | Valeant Pharmaceuticals
International, Inc.,
5.875%, 05/15/23 | | | 1,587,234 | | | | 1.6 | | |
| | 95,000 | | | | (1 | ) | | Valeant Pharmaceuticals
International, Inc.,
6.500%, 03/15/22 | | | 99,987 | | | | 0.1 | | |
| | 125,000 | | | | (1 | ) | | Valeant Pharmaceuticals
International, Inc.,
7.000%, 03/15/24 | | | 134,063 | | | | 0.1 | | |
| | 525,000 | | | | | | | WellCare Health Plans,
Inc., 5.250%, 04/01/25 | | | 555,188 | | | | 0.5 | | |
| | 2,550,000 | | | | | | | Other Securities | | | 2,417,024 | | | | 2.4 | | |
| | | | | | | | | | 11,024,729 | | | | 10.8 | | |
| | | | | Energy: 15.3% | |
| | 525,000 | | | | | | | Archrock Partners L.P. /
Archrock Partners
Finance Corp.,
6.000%, 04/01/21 | | | 527,625 | | | | 0.5 | | |
| | 50,000 | | | | | | | Archrock Partners L.P. /
Archrock Partners
Finance Corp.,
6.000%, 10/01/22 | | | 50,250 | | | | 0.1 | | |
| | 355,000 | | | | (1 | ) | | Blue Racer Midstream
LLC / Blue Racer
Finance Corp.,
6.125%, 11/15/22 | | | 370,975 | | | | 0.4 | | |
| | 525,000 | | | | | | | Calumet Specialty
Products Partners L.P. /
Calumet Finance Corp.,
6.500%-7.750%,
04/15/21-04/15/23 | | | 526,750 | | | | 0.5 | | |
| | 518,000 | | | | | | | Cheniere Corpus Christi
Holdings LLC,
5.125%, 06/30/27 | | | 537,114 | | | | 0.5 | | |
| | 100,000 | | | | | | | Cheniere Corpus Christi
Holdings LLC,
5.875%, 03/31/25 | | | 108,563 | | | | 0.1 | | |
Principal
Amount† | |
| |
| | Value | | Percentage
of Net
Assets | |
| | 104,000 | | | | (1 | ) | | Chesapeake Energy
Corp., 8.000%, 12/15/22 | | $ | 112,580 | | | | 0.1 | | |
| | 249,000 | | | | (1 | ) | | Covey Park Energy LLC /
Covey Park Finance
Corp., 7.500%, 05/15/25 | | | 260,130 | | | | 0.3 | | |
| | | | | | 535,000 | | | DCP Midstream Operating
L.P., 2.700%-5.600%,
04/01/19-04/01/44 | | | 533,925 | | | | 0.5 | | |
| | 285,000 | | | | (1 | ) | | Delek Logistics Partners
L.P., 6.750%, 05/15/25 | | | 289,275 | | | | 0.3 | | |
| | 110,000 | | | | (1 | ) | | Endeavor Energy
Resources L.P. / EER
Finance, Inc.,
5.500%, 01/30/26 | | | 112,200 | | | | 0.1 | | |
| | 115,000 | | | | (1 | ) | | Endeavor Energy
Resources L.P. / EER
Finance, Inc.,
5.750%, 01/30/28 | | | 118,536 | | | | 0.1 | | |
| | 495,000 | | | | | | | Energy Transfer Equity
L.P., 4.250%-5.875%,
03/15/23-01/15/24 | | | 510,225 | | | | 0.5 | | |
| | 150,000 | | | | (1 | ) | | Exterran Energy
Solutions L.P. / EES
Finance Corp.,
8.125%, 05/01/25 | | | 161,625 | | | | 0.2 | | |
| | 205,000 | | | | (1 | ) | | Extraction Oil & Gas
Holdings LLC /
Extraction Finance
Corp., 7.875%, 07/15/21 | | | 217,812 | | | | 0.2 | | |
| | 543,000 | | | | | | | Genesis Energy L.P. /
Genesis Energy
Finance Corp.,
6.250%-6.750%,
08/01/22-05/15/26 | | | 551,648 | | | | 0.5 | | |
| | 245,000 | | | | (1 | ) | | Great Western Petroleum
LLC / Great Western
Finance Corp.,
9.000%, 09/30/21 | | | 256,025 | | | | 0.2 | | |
| | 520,000 | | | | | | | Gulfport Energy Corp.,
6.000%-6.625%,
05/01/23-05/15/25 | | | 523,750 | | | | 0.5 | | |
| | 36,000 | | | | (1 | ) | | Halcon Resources Corp.,
6.750%, 02/15/25 | | | 37,620 | | | | 0.0 | | |
| | 285,000 | | | | (1 | ) | | Hess Infrastructure
Partners L.P. / Hess
Infrastructure Partners
Finance Corp.,
5.625%, 02/15/26 | | | 295,688 | | | | 0.3 | | |
| | 255,000 | | | | (1 | ) | | Hilcorp Energy I L.P. /
Hilcorp Finance Co.,
5.750%, 10/01/25 | | | 262,013 | | | | 0.3 | | |
| | 100,000 | | | | (1 | ) | | MEG Energy Corp.,
6.500%, 01/15/25 | | | 99,125 | | | | 0.1 | | |
| | 220,000 | | | | (1 | ) | | MEG Energy Corp.,
7.000%, 03/31/24 | | | 186,725 | | | | 0.2 | | |
| | 162,000 | | | | (1 | ) | | NGPL PipeCo LLC,
4.375%, 08/15/22 | | | 165,341 | | | | 0.2 | | |
| | 230,000 | | | | (1 | ) | | Parsley Energy LLC /
Parsley Finance Corp.,
5.375%, 01/15/25 | | | 233,450 | | | | 0.2 | | |
See Accompanying Notes to Financial Statements
138
VY® PIONEER SUMMARY PORTFOLIO OF INVESTMENTS
HIGH YIELD PORTFOLIO AS OF DECEMBER 31, 2017 (CONTINUED)
Principal
Amount† | |
| |
| | Value | | Percentage
of Net
Assets | |
| | | | | Energy (continued) | |
| | 200,000 | | | | (1 | ) | | Parsley Energy LLC /
Parsley Finance Corp.,
5.625%, 10/15/27 | | $ | 205,000 | | | | 0.2 | | |
| | 210,000 | | | | (1 | ) | | Parsley Energy LLC /
Parsley Finance Corp.,
6.250%, 06/01/24 | | | 222,075 | | | | 0.2 | | |
| | 400,000 | | | | (1 | ) | | PBF Logistics L.P. / PBF
Logistics Finance Corp.,
6.875%, 05/15/23 | | | 414,000 | | | | 0.4 | | |
| | 225,000 | | | | (1 | ) | | Precision Drilling Corp.,
7.125%, 01/15/26 | | | 230,063 | | | | 0.2 | | |
| | 470,000 | | | | | | | Sabine Pass Liquefaction
LLC, 5.000%-5.875%,
02/01/21-03/15/27 | | | 517,091 | | | | 0.5 | | |
| | 85,000 | | | | (1 | ) | | SESI LLC,
7.750%, 09/15/24 | | | 90,525 | | | | 0.1 | | |
| | 84,000 | | | | (1 | ) | | Targa Resources
Partners L.P. / Targa
Resources Partners
Finance Corp.,
5.000%, 01/15/28 | | | 84,105 | | | | 0.1 | | |
| | 550,000 | | | | | | | Targa Resources Partners
L.P. / Targa Resources
Partners Finance Corp.,
4.250%-5.250%,
05/01/23-11/15/23 | | | 552,863 | | | | 0.5 | | |
| | 300,000 | | | | (1 | ) | | TerraForm Power
Operating LLC,
4.250%, 01/31/23 | | | 298,125 | | | | 0.3 | | |
| | 300,000 | | | | (1 | ) | | TerraForm Power
Operating LLC,
5.000%, 01/31/28 | | | 297,375 | | | | 0.3 | | |
| | 75,000 | | | | (1 | ) | | Transocean, Inc.,
7.500%, 01/15/26 | | | 76,991 | | | | 0.1 | | |
| | 270,000 | | | | (1 | ) | | Trinidad Drilling Ltd,
6.625%, 02/15/25 | | | 257,850 | | | | 0.3 | | |
| | 125,000 | | | | (1 | ) | | Whiting Petroleum Corp.,
6.625%, 01/15/26 | | | 127,656 | | | | 0.1 | | |
| | 480,000 | | | | | | | Williams Cos, Inc./The,
4.550%-5.750%,
06/24/24-06/24/44 | | | 509,400 | | | | 0.5 | | |
| | 4,639,000 | | | | (2 | ) | | Other Securities | | | 4,673,737 | | | | 4.6 | | |
| | | | | | | | | | 15,605,826 | | | | 15.3 | | |
| | | | | Financial: 8.3% | |
| | 500,000 | | | | (1 | ) | | Alliance Data Systems
Corp., 5.875%, 11/01/21 | | | 513,750 | | | | 0.5 | | |
| | 708,000 | | | | | | | Ally Financial, Inc.,
4.625%-5.750%,
05/19/22-11/20/25 | | | 750,725 | | | | 0.7 | | |
| | 50,000 | | | | (1 | ) | | CyrusOne L.P. / CyrusOne
Finance Corp.,
5.000%, 03/15/24 | | | 52,000 | | | | 0.1 | | |
| | 140,000 | | | | (1 | ) | | CyrusOne L.P. / CyrusOne
Finance Corp.,
5.000%, 03/15/24 | | | 145,600 | | | | 0.1 | | |
| | 40,000 | | | | (1 | ) | | CyrusOne L.P. / CyrusOne
Finance Corp.,
5.375%, 03/15/27 | | | 42,100 | | | | 0.0 | | |
Principal
Amount† | |
| |
| | Value | | Percentage
of Net
Assets | |
| | 600,000 | | | | | | | Fly Leasing Ltd.,
6.375%, 10/15/21 | | $ | 627,000 | | | | 0.6 | | |
| | 345,000 | | | | (1 | ) | | Freedom Mortgage Corp.,
8.125%, 11/15/24 | | | 352,331 | | | | 0.4 | | |
| | 115,000 | | | | (1 | ) | | Greystar Real Estate
Partners LLC,
5.750%, 12/01/25 | | | 118,737 | | | | 0.1 | | |
| | 260,000 | | | | (1 | ) | | Iron Mountain US
Holdings, Inc.,
5.375%, 06/01/26 | | | 268,450 | | | | 0.3 | | |
| | 300,000 | | | | | | | Iron Mountain, Inc.,
5.750%, 08/15/24 | | | 305,250 | | | | 0.3 | | |
| | 250,000 | | | | (1 | ) | | Kilimanjaro Re Ltd.
(Cat Bond), 5.876%,
(T-BILL 3MO + 4.500%),
04/30/18 | | | 246,100 | | | | 0.3 | | |
| | 250,000 | | | | (1 | ) | | Kilimanjaro Re Ltd.
(Cat Bond), 10.626%,
(T-BILL 3MO + 9.250%),
12/06/19 | | | 244,175 | | | | 0.2 | | |
| | 575,000 | | | | | | | Nationstar Mortgage LLC /
Nationstar Capital Corp.,
6.500%, 07/01/21 | | | 584,703 | | | | 0.6 | | |
| | 225,000 | | | | | | | Nationstar Mortgage LLC /
Nationstar Capital Corp.,
6.500%,
08/01/18-06/01/22 | | | 227,108 | | | | 0.2 | | |
| | 295,000 | | | | (1 | ) | | Oxford Finance LLC /
Oxford Finance
Co-Issuer II, Inc.,
6.375%, 12/15/22 | | | 305,325 | | | | 0.3 | | |
| | 308,000 | | | | (1 | ) | | Provident Funding
Associates L.P. / PFG
Finance Corp.,
6.375%, 06/15/25 | | | 324,170 | | | | 0.3 | | |
| | 120,000 | | | | (1 | ) | | Quicken Loans, Inc.,
5.750%, 05/01/25 | | | 124,801 | | | | 0.1 | | |
| | 225,000 | | | | (1 | ) | | Rialto Holdings LLC /
Rialto Corp.,
7.000%, 12/01/18 | | | 226,688 | | | | 0.2 | | |
| | 600,000 | | | | | | | Royal Bank of Scotland
Group PLC,
8.000%, 12/31/2199 | | | 687,750 | | | | 0.7 | | |
| | 200,000 | | | | (1 | ) | | Societe Generale SA,
7.375%, 12/31/2199 | | | 217,260 | | | | 0.2 | | |
| | 250,000 | | | | (1 | ),(4) | | Tailwind Re Ltd.
2017-1, 8.626%,
(T-BILL 3MO + 7.250%),
01/08/25 | | | 250,000 | | | | 0.2 | | |
| | 335,000 | | | | (1 | ) | | Uniti Group L.P. / Uniti
Group Finance, Inc. /
CSL Capital LLC,
6.000%, 04/15/23 | | | 329,975 | | | | 0.3 | | |
| | 250,000 | | | | (1 | ) | | Ursa Re Ltd 2017-2 D
(Cat Bond), 5.250%,
12/10/20 | | | 250,750 | | | | 0.3 | | |
| | 1,230,000 | | | | | | | Other Securities | | | 1,300,350 | | | | 1.3 | | |
| | | | | | | | | | 8,495,098 | | | | 8.3 | | |
See Accompanying Notes to Financial Statements
139
VY® PIONEER SUMMARY PORTFOLIO OF INVESTMENTS
HIGH YIELD PORTFOLIO AS OF DECEMBER 31, 2017 (CONTINUED)
Principal
Amount† | |
| |
| | Value | | Percentage
of Net
Assets | |
| | | | | Industrial: 5.8% | |
| | 405,000 | | | | | | | AECOM, 5.875%,
10/15/24 | | $ | 440,721 | | | | 0.4 | | |
| | 250,000 | | | | (1 | ) | | Amsted Industries, Inc.,
5.000%, 03/15/22 | | | 256,562 | | | | 0.2 | | |
| | 250,000 | | | | (1 | ) | | Amsted Industries, Inc.,
5.375%, 09/15/24 | | | 261,250 | | | | 0.3 | | |
| | 220,000 | | | | (1 | ) | | Apex Tool Group LLC,
7.000%, 02/01/21 | | | 212,850 | | | | 0.2 | | |
| | 80,000 | | | | (1 | ) | | Ardagh Packaging
Finance PLC / Ardagh
Holdings USA, Inc.,
4.625%, 05/15/23 | | | 81,900 | | | | 0.1 | | |
| | 220,000 | | | | (1 | ) | | Ardagh Packaging
Finance PLC / Ardagh
Holdings USA, Inc.,
6.000%, 02/15/25 | | | 232,100 | | | | 0.2 | | |
| | 90,000 | | | | (1 | ) | | Ardagh Packaging
Finance PLC / Ardagh
Holdings USA, Inc.,
7.250%, 05/15/24 | | | 98,325 | | | | 0.1 | | |
| | 500,000 | | | | | | | Ball Corp., 5.250%,
07/01/25 | | | 545,625 | | | | 0.5 | | |
| | 85,000 | | | | (1 | ) | | Belden, Inc., 5.250%,
07/15/24 | | | 87,975 | | | | 0.1 | | |
| | 140,000 | | | | (1 | ) | | Builders FirstSource, Inc.,
5.625%, 09/01/24 | | | 146,223 | | | | 0.2 | | |
| | 205,000 | | | | (1 | ) | | Coveris Holdings SA,
7.875%, 11/01/19 | | | 204,487 | | | | 0.2 | | |
| | 640,000 | | | | | | | Crown Cork & Seal Co.,
Inc., 7.375%, 12/15/26 | | | 748,800 | | | | 0.7 | | |
| | 110,000 | | | | (1 | ) | | DAE Funding LLC,
4.500%, 08/01/22 | | | 108,350 | | | | 0.1 | | |
| | 160,000 | | | | (1 | ) | | Itron, Inc., 5.000%,
01/15/26 | | | 161,000 | | | | 0.2 | | |
| | 180,000 | | | | (1 | ) | | Kratos Defense &
Security Solutions, Inc.,
6.500%, 11/30/25 | | | 187,425 | | | | 0.2 | | |
| | 125,000 | | | | (1 | ) | | Plastipak Holdings, Inc.,
6.250%, 10/15/25 | | | 129,063 | | | | 0.1 | | |
| | 120,000 | | | | (1 | ) | | RBS Global, Inc. /
Rexnord LLC,
4.875%, 12/15/25 | | | 121,500 | | | | 0.1 | | |
| | 200,000 | | | | (1 | ) | | syncreon Group BV /
syncreon Global
Finance US, Inc.,
8.625%, 11/01/21 | | | 163,000 | | | | 0.2 | | |
| | 75,000 | | | | (1 | ) | | TTM Technologies, Inc.,
5.625%, 10/01/25 | | | 77,063 | | | | 0.1 | | |
| | 230,000 | | | | (1 | ) | | Tutor Perini Corp.,
6.875%, 05/01/25 | | | 247,825 | | | | 0.2 | | |
| | 185,000 | | | | (1 | ) | | USG Corp., 4.875%,
06/01/27 | | | 192,224 | | | | 0.2 | | |
| | 1,166,911 | | | | | | | Other Securities | | | 1,239,368 | | | | 1.2 | | |
| | | | | | | | | | 5,943,636 | | | | 5.8 | | |
Principal
Amount† | |
| |
| | Value | | Percentage
of Net
Assets | |
| | | | | Technology: 3.5% | |
| | 310,000 | | | | (1 | ) | | Change Healthcare
Holdings LLC / Change
Healthcare Finance, Inc.,
5.750%, 03/01/25 | | $ | 311,162 | | | | 0.3 | | |
| | 145,000 | | | | (1 | ) | | Dell International LLC /
EMC Corp.,
5.875%, 06/15/21 | | | 150,800 | | | | 0.2 | | |
| | 435,000 | | | | | | | Diebold Nixdorf, Inc.,
8.500%, 04/15/24 | | | 463,819 | | | | 0.5 | | |
| | 80,000 | | | | (1 | ) | | Entegris, Inc.,
4.625%, 02/10/26 | | | 81,600 | | | | 0.1 | | |
| | 570,000 | | | | (1 | ) | | First Data Corp.,
5.750%, 01/15/24 | | | 594,082 | | | | 0.6 | | |
| | 155,000 | | | | (1 | ) | | First Data Corp.,
7.000%, 12/01/23 | | | 164,300 | | | | 0.1 | | |
| | 70,000 | | | | (1 | ) | | j2 Cloud Services LLC / j2
Global Co-Obligor, Inc.,
6.000%, 07/15/25 | | | 74,025 | | | | 0.1 | | |
| | 160,000 | | | | (1 | ) | | MSCI, Inc., 4.750%,
08/01/26 | | | 168,400 | | | | 0.2 | | |
| | 200,000 | | | | (1 | ) | | Open Text Corp.,
5.875%, 06/01/26 | | | 216,000 | | | | 0.2 | | |
| | 200,000 | | | | (1 | ) | | Quintiles IMS, Inc.,
5.000%, 10/15/26 | | | 205,750 | | | | 0.2 | | |
| | 400,000 | | | | (1 | ) | | Rackspace Hosting, Inc.,
8.625%, 11/15/24 | | | 428,000 | | | | 0.4 | | |
| | 835,000 | | | | (2 | ),(3) | | Other Securities | | | 654,738 | | | | 0.6 | | |
| | | | | | | | | | 3,512,676 | | | | 3.5 | | |
| | | | | Utilities: 2.5% | |
| | 200,000 | | | | (1 | ) | | Calpine Corp.,
5.250%, 06/01/26 | | | 196,752 | | | | 0.2 | | |
| | 580,000 | | | | | | | Calpine Corp.,
5.750%, 01/15/25 | | | 553,175 | | | | 0.5 | | |
| | 361,000 | | | | (1 | ) | | Dynegy, Inc., 8.000%,
01/15/25 | | | 392,587 | | | | 0.4 | | |
| | 65,000 | | | | (1 | ) | | NextEra Energy
Operating Partners L.P.,
4.250%, 09/15/24 | | | 66,300 | | | | 0.1 | | |
| | 395,000 | | | | | | | NRG Energy, Inc.,
6.625%, 01/15/27 | | | 419,687 | | | | 0.4 | | |
| | 184,505 | | | | (1 | ) | | NSG Holdings LLC /
NSG Holdings, Inc.,
7.750%, 12/15/25 | | | 203,416 | | | | 0.2 | | |
| | 250,000 | | | | (1 | ) | | Terraform Global
Operating LLC,
9.750%, 08/15/22 | | | 277,813 | | | | 0.3 | | |
| | 377,000 | | | | | | | Other Securities | | | 388,543 | | | | 0.4 | | |
| | | | | | | | | | 2,498,273 | | | | 2.5 | | |
| | | | | | | Total Corporate
Bonds/Notes
(Cost $73,504,125) | | | 75,161,183 | | | | 73.9 | | |
See Accompanying Notes to Financial Statements
140
VY® PIONEER SUMMARY PORTFOLIO OF INVESTMENTS
HIGH YIELD PORTFOLIO AS OF DECEMBER 31, 2017 (CONTINUED)
Principal
Amount† | |
| |
| | Value | | Percentage
of Net
Assets | |
FOREIGN GOVERNMENT BONDS: —% | | | |
| | 15,388 | | | | (3 | ) | | Other Securities | | $ | — | | | | — | | |
| | | | | | | Total Foreign
Government Bonds
(Cost $2,288) | | | — | | | | — | | |
BANK LOANS: 3.8% | | | |
| | | | | Auto Parts & Equipment: 0.6% | |
| | 128,050 | | | | | | | American Axle &
Manufacturing
Holdings, Inc. - Term
Loan A, 3.810%,
(US0003M + 2.000%),
04/06/24 | | | 128,498 | | | | 0.1 | | |
| | 99,599 | | | | | | | Federal-Mogul Holdings
Corporation New Term
Loan C, 5.230%,
(US0003M + 3.750%),
04/15/21 | | | 100,460 | | | | 0.1 | | |
| | 367,972 | | | | | | | Tower Automotive
Holdings Term Loan B1,
4.188%, (US0003M +
2.750%), 03/07/24 | | | 369,869 | | | | 0.4 | | |
| | | | | | | | | | 598,827 | | | | 0.6 | | |
| | | | | Building Materials: 0.2% | |
| | 206,861 | | | | | | | Builders FirstSource, Inc.,
4.693%, (US0003M +
3.000%), 02/29/24 | | | 207,960 | | | | 0.2 | | |
| | | | | Cable & Satellite Television: 0.3% | |
| | 269,328 | | | | | | | Virgin Media Bristol LLC
2017 USD Term Loan,
3.977%, (US0003M +
2.500%), 01/15/26 | | | 269,665 | | | | 0.3 | | |
| | | | | Computers: 0.2% | |
| | 175,782 | | | | | | | DynCorp International,
Inc. Term Loan B2 1L,
7.750%, (US0003M +
600.000%), 07/07/20 | | | 176,661 | | | | 0.2 | | |
| | | | | Cosmetics/Personal Care: 0.3% | |
| | 388,000 | | | | | | | Revlon Consumer
Products Corp. TL B 1L,
5.069%, (US0003M +
3.500%), 09/07/23 | | | 276,728 | | | | 0.3 | | |
| | | | | Food: 0.2% | |
| | 430,000 | | | | | | | Del Monte Foods, Inc.
2nd Lien Term Loan,
9.064%, (US0003M +
7.250%), 08/18/21 | | | 207,475 | | | | 0.2 | | |
Principal
Amount† | |
| |
| | Value | | Percentage
of Net
Assets | |
| | | | | Forest Products & Paper: 0.2% | |
| | 263,013 | | | | | | | Caraustar Industries,
Inc. - TL 1L, 7.193%,
(US0003M + 5.500%),
03/14/22 | | $ | 263,999 | | | | 0.2 | | |
| | | | | Insurance: 0.4% | |
| | 70,857 | | | | | | | Alliant Holdings I, Inc.
2015 Term Loan B,
4.802%, (US0003M +
3.250%), 08/12/22 | | | 71,308 | | | | 0.1 | | |
| | 312,399 | | | | | | | Confie Seguros
Holding II - TL B 1L,
6.729%, (US0003M +
4.750%), 04/19/22 | | | 311,345 | | | | 0.3 | | |
| | | | | | | | | | 382,653 | | | | 0.4 | | |
| | | | | Lodging: 0.0% | |
| | 59,875 | | | | | | | Golden Nugget,
Inc. - TL 1L, 6.750%,
(US0003M + 3.250%),
10/04/23 | | | 60,394 | | | | 0.0 | | |
| | | | | Media: 0.5% | |
| | 444,375 | | | | | | | McGraw-Hill Global
Education Holdings,
LLC, 5.350%,
(US0003M + 4.000%),
05/04/22 | | | 444,097 | | | | 0.4 | | |
| | 57,055 | | | | | | | Univision
Communications Inc.
Term Loan C5, 4.319%,
(US0003M + 2.750%),
03/15/24 | | | 56,952 | | | | 0.1 | | |
| | | | | | | | | | 501,049 | | | | 0.5 | | |
| | | | | Metal Fabricate/Hardware: 0.3% | |
| | 310,291 | | | | | | | Zekelman Industries, Inc.
Term Loan B, 4.073%,
(US0003M + 3.500%),
06/14/21 | | | 312,540 | | | | 0.3 | | |
| | | | | Oil & Gas: 0.3% | |
| | 325,000 | | | | | | | Gavilan Resources
LLC - TL 2L, 7.460%,
(US0003M + 6.000%),
03/01/24 | | | 322,969 | | | | 0.3 | | |
| | | | | Retail: 0.2% | |
| | 220,402 | | | | | | | Camping World TL B 1L,
4.569%, (US0003M +
3.750%), 11/08/23 | | | 222,124 | | | | 0.2 | | |
See Accompanying Notes to Financial Statements
141
VY® PIONEER SUMMARY PORTFOLIO OF INVESTMENTS
HIGH YIELD PORTFOLIO AS OF DECEMBER 31, 2017 (CONTINUED)
Principal
Amount† | |
| |
| | Value | | Percentage
of Net
Assets | |
| | | | | Telecommunications: 0.1% | |
| | 107,759 | | | | | | | West Corp. - TL 1L,
5.350%, (US0003M +
4.000%), 10/10/24 | | $ | 108,290 | | | | 0.1 | | |
| | | | | | | Total Bank Loans
(Cost $4,176,344) | | | 3,911,334 | | | | 3.8 | | |
CONVERTIBLE BONDS/NOTES: 8.3% | | | |
| | | | | Communications: 1.2% | |
| | 319,000 | | | | (1 | ) | | DISH Network Corp.,
2.375%, 03/15/24 | | | 307,237 | | | | 0.3 | | |
| | 858,000 | | | | | | | Other Securities | | | 870,244 | | | | 0.9 | | |
| | | | | | | | | | 1,177,481 | | | | 1.2 | | |
| | | | | Consumer, Cyclical: 0.4% | |
| | 310,000 | | | | | | | KB Home, 1.375%, 02/01/19 | | | 380,912 | | | | 0.4 | | |
| | 58,000 | | | | (1 | ) | | Marriott Vacations
Worldwide Corp.,
1.500%, 09/15/22 | | | 65,069 | | | | 0.0 | | |
| | | | | | | | | | 445,981 | | | | 0.4 | | |
| | | | | Consumer, Non-cyclical: 3.6% | |
| | 246,000 | | | | | | | Emergent BioSolutions,
Inc., 2.875%, 01/15/21 | | | 397,905 | | | | 0.4 | | |
| | 400,000 | | | | | | | Jazz Investments I Ltd.,
1.875%, 08/15/21 | | | 402,250 | | | | 0.4 | | |
| | 470,000 | | | | | | | Wright Medical Group, Inc.,
2.000%, 02/15/20 | | | 484,394 | | | | 0.5 | | |
| | 2,315,000 | | | | | | | Other Securities | | | 2,357,087 | | | | 2.3 | | |
| | | | | | | | | | 3,641,636 | | | | 3.6 | | |
| | | | | Energy: 0.4% | |
| | 390,000 | | | | | | | Other Securities | | | 363,919 | | | | 0.4 | | |
| | | | | Industrial: 0.9% | |
| | 68,000 | | | | (1 | ) | | Air Transport Services
Group, Inc., 1.125%,
10/15/24 | | | 70,380 | | | | 0.1 | | |
| | 410,000 | | | | | | | Dycom Industries, Inc.,
0.750%, 09/15/21 | | | 536,587 | | | | 0.5 | | |
| | 332,000 | | | | | | | Other Securities | | | 351,713 | | | | 0.3 | | |
| | | | | | | | | | 958,680 | | | | 0.9 | | |
| | | | | Technology: 1.8% | |
| | 175,000 | | | | (1 | ) | | Microchip Technology, Inc.,
1.625%, 02/15/27 | | | 205,953 | | | | 0.2 | | |
| | 90,000 | | | | (1 | ) | | Nice Systems, Inc.,
1.250%, 01/15/24 | | | 111,319 | | | | 0.1 | | |
| | 190,000 | | | | | | | ON Semiconductor Corp.,
1.000%, 12/01/20 | | | 243,438 | | | | 0.3 | | |
| | 250,000 | | | | (1 | ) | | ON Semiconductor Corp.,
1.625%, 10/15/23 | | | 309,219 | | | | 0.3 | | |
| | 90,000 | | | | (1 | ) | | Silicon Laboratories, Inc.,
1.375%, 03/01/22 | | | 104,006 | | | | 0.1 | | |
Principal
Amount† | |
| |
| | Value | | Percentage
of Net
Assets | |
| | 110,000 | | | | (1 | ) | | Synaptics, Inc.,
0.500%, 06/15/22 | | $ | 101,750 | | | | 0.1 | | |
| | 736,000 | | | | | | | Other Securities | | | 752,211 | | | | 0.7 | | |
| | | | | | | | | | 1,827,896 | | | | 1.8 | | |
| | | | | | | Total Convertible
Bonds/Notes
(Cost $7,811,380) | | | 8,415,593 | | | | 8.3 | | |
Shares | |
| |
| | Value | | Percentage
of Net
Assets | |
COMMON STOCK: 3.2% | | | |
| | | | | Consumer Discretionary: 0.5% | |
| | 1,476 | | | | (1 | ),(4),(5) | | Perseus Holding Corp. | | | — | | | | — | | |
| | 28,153 | | | | | | | Other Securities | | | 537,638 | | | | 0.5 | | |
| | | | | | | | | | 537,638 | | | | 0.5 | | |
| | | | | Energy: 0.0% | |
| | 424,562 | | | | (3 | ),(6) | | Other Securities | | | 7,494 | | | | 0.0 | | |
| | | | | Financials: 0.2% | |
| | 2,372 | | | | | | | Other Securities | | | 238,331 | | | | 0.2 | | |
| | | | | Health Care: 0.9% | |
| | 2,581 | | | | | | | Aetna, Inc. | | | 465,586 | | | | 0.5 | | |
| | 19,599 | | | | (6 | ) | | Other Securities | | | 460,012 | | | | 0.4 | | |
| | | | | | | | | | 925,598 | | | | 0.9 | | |
| | | | | Industrials: 0.2% | |
| | 7,898 | | | | (3 | ),(6) | | Other Securities | | | 138,979 | | | | 0.2 | | |
| | | | | Information Technology: 0.4% | |
| | 15,090 | | | | (6 | ) | | Other Securities | | | 380,879 | | | | 0.4 | | |
| | | | | Materials: 0.2% | |
| | 1,808 | | | | | | | Other Securities | | | 199,458 | | | | 0.2 | | |
| | | | | Real Estate: 0.8% | |
| | 27,816 | | | | | | | Forest City Realty Trust, Inc. | | | 670,366 | | | | 0.7 | | |
| | 5,760 | | | | (6 | ) | | Other Securities | | | 102,470 | | | | 0.1 | | |
| | | | | | | | | | 772,836 | | | | 0.8 | | |
| | | | | | | Total Common Stock
(Cost $2,285,981) | | | 3,201,213 | | | | 3.2 | | |
PREFERRED STOCK: 1.6% | | | |
| | | | | Consumer Discretionary: —% | |
| | 775 | | | | (1 | ),(4),(5) | | Perseus Holding Corp. | | | — | | | | — | | |
| | | | | Financials: 1.5% | |
| | 470 | | | | (5 | ) | | Bank of America Corp. | | | 619,930 | | | | 0.6 | | |
| | 602 | | | | (5 | ) | | Wells Fargo & Co. | | | 788,614 | | | | 0.8 | | |
| | 3,542 | | | | (6 | ) | | Other Securities | | | 91,915 | | | | 0.1 | | |
| | | | | | | | | | 1,500,459 | | | | 1.5 | | |
See Accompanying Notes to Financial Statements
142
VY® PIONEER SUMMARY PORTFOLIO OF INVESTMENTS
HIGH YIELD PORTFOLIO AS OF DECEMBER 31, 2017 (CONTINUED)
Shares | |
| |
| | Value | | Percentage
of Net
Assets | |
| | | | | Health Care: 0.1% | |
| | 269 | | | | (3 | ),(6) | | Other Securities | | $ | 136,214 | | | | 0.1 | | |
| | | | | | | Total Preferred Stock
(Cost $1,621,566) | | | 1,636,673 | | | | 1.6 | | |
WARRANTS: —% | | | |
| | | | | Energy: —% | |
| | 644 | | | | (3 | ),(6) | | Other Securities | | | — | | | | — | | |
| | | | | Health Care: —% | |
| | 252 | | | | (3 | ),(6) | | Other Securities | | | — | | | | — | | |
| | | | | | | Total Warrants
(Cost $—) | | | — | | | | — | | |
| | | | | | | Total Long-Term
Investments
(Cost $89,401,684) | | | 92,325,996 | | | | 90.8 | | |
Principal
Amount† | |
| |
| | Value | | Percentage
of Net
Assets | |
SHORT-TERM INVESTMENTS: 7.5% | | | |
| | | | | U.S. Treasury Bills: 6.8% | |
| | 4,450,000 | | | | | | | United States Treasury
Bill, 0.570%, 01/04/18 | | | 4,449,721 | | | | 4.4 | | |
| | 2,500,000 | | | | | | | United States Treasury
Bill, 0.980%, 01/11/18 | | | 2,499,267 | | | | 2.4 | | |
| | | | | | | | | | 6,948,988 | | | | 6.8 | | |
Shares | |
| |
| | Value | | Percentage
of Net
Assets | |
| | | | | Mutual Funds: 0.7% | |
| | 715,155 | | | | (7 | ) | | BlackRock Liquidity
Funds, FedFund,
Institutional Class,
1.170%
(Cost $715,155) | | $ | 715,155 | | | | 0.7 | | |
| | | | | Total Short-Term
Investments
(Cost $7,663,925) | | | 7,664,143 | | | | 7.5 | | |
| | | | | Total Investments in
Securities
(Cost $97,065,609) | | $ | 99,990,139 | | | | 98.3 | | |
| | | | | Assets in Excess of
Other Liabilities | | | 1,721,710 | | | | 1.7 | | |
| | | | | Net Assets | | $ | 101,711,849 | | | | 100.0 | | |
"Other Securities" represents issues not identified as the top 50 holdings in terms of market value and issues or issuers not exceeding 1% of net assets individually or in aggregate respectively as of December 31, 2017.
The following footnotes apply to either the individual securities noted or one or more of the securities aggregated and listed as a single line item.
† Unless otherwise indicated, principal amount is shown in USD.
(1) Securities with purchases pursuant to Rule 144A or section 4(a)(2), under the Securities Act of 1933 and may not be resold subject to that rule except to qualified institutional buyers.
(2) The grouping contains securities in default.
(3) The grouping contains Level 3 securities.
(4) For fair value measurement disclosure purposes, security is categorized as Level 3, whose value was determined using significant unobservable inputs.
(5) Non-income producing security.
(6) The grouping contains non-income producing securities.
(7) Rate shown is the 7-day yield as of December 31, 2017.
EUR EU Euro
Reference Rate Abbreviations:
T-BILL 3MO 3-month U.S. Treasury Bill
US0003M 3-month LIBOR
See Accompanying Notes to Financial Statements
143
VY® PIONEER SUMMARY PORTFOLIO OF INVESTMENTS
HIGH YIELD PORTFOLIO AS OF DECEMBER 31, 2017 (CONTINUED)
Fair Value Measurements^
The following is a summary of the fair valuations according to the inputs used as of December 31, 2017 in valuing the assets and liabilities:
| | | Quoted Prices
in Active Markets
for Identical Investments
(Level 1) | | Significant Other
Observable
Inputs
(Level 2) | | Significant
Unobservable
Inputs
(Level 3) | | Fair Value
at
December 31, 2017 | |
Asset Table | |
Investments, at fair value | |
Common Stock | |
Consumer Discretionary | | $ | 537,638 | | | $ | — | | | $ | — | | | $ | 537,638 | | |
Energy | | | 2,401 | | | | — | | | | 5,093 | | | | 7,494 | | |
Financials | | | 238,331 | | | | — | | | | — | | | | 238,331 | | |
Health Care | | | 925,598 | | | | — | | | | — | | | | 925,598 | | |
Industrials | | | 138,979 | | | | — | | | | — | | | | 138,979 | | |
Information Technology | | | 380,879 | | | | — | | | | — | | | | 380,879 | | |
Materials | | | 199,458 | | | | — | | | | — | | | | 199,458 | | |
Real Estate | | | 772,836 | | | | — | | | | — | | | | 772,836 | | |
Total Common Stock | | | 3,196,120 | | | | — | | | | 5,093 | | | | 3,201,213 | | |
Preferred Stock | | | 920,520 | | | | 711,845 | | | | 4,308 | | | | 1,636,673 | | |
Warrants | | | — | | | | — | | | | — | | | | — | | |
Corporate Bonds/Notes | | | — | | | | 74,911,183 | | | | 250,000 | | | | 75,161,183 | | |
Bank Loans | | | — | | | | 3,911,334 | | | | — | | | | 3,911,334 | | |
Foreign Government Bonds | | | — | | | | — | | | | — | | | | — | | |
Convertible Bonds/Notes | | | — | | | | 8,415,593 | | | | — | | | | 8,415,593 | | |
Short-Term Investments | | | 715,155 | | | | 6,948,988 | | | | — | | | | 7,664,143 | | |
Total Investments, at fair value | | $ | 4,831,795 | | | $ | 94,898,943 | | | $ | 259,401 | | | $ | 99,990,139 | | |
Other Financial Instruments+ | |
Centrally Cleared Swaps | | | — | | | | 79,050 | | | | — | | | | 79,050 | | |
Total Assets | | $ | 4,831,795 | | | $ | 94,977,993 | | | $ | 259,401 | | | $ | 100,069,189 | | |
Liabilities Table | |
Other Financial Instruments+ | |
Centrally Cleared Swaps | | $ | — | | | $ | (10,583 | ) | | $ | — | | | $ | (10,583 | ) | |
Futures | | | (7,882 | ) | | | — | | | | — | | | | (7,882 | ) | |
Total Liabilities | | $ | (7,882 | ) | | $ | (10,583 | ) | | $ | — | | | $ | (18,465 | ) | |
^ See Note 2, "Significant Accounting Policies" in the Notes to Financial Statements for additional information.
+ Other Financial Instruments are derivatives not reflected in the Portfolio of Investments and may include open forward foreign currency contracts, futures, centrally cleared swaps, OTC swaps and written options. Forward foreign currency contracts, futures and centrally cleared swaps are valued at the unrealized gain (loss) on the instrument. OTC swaps and written options are valued at the fair value of the instrument.
At December 31, 2017, the following futures contracts were outstanding for VY® Pioneer High Yield Portfolio:
Contract Description | | Number
of Contracts | | Expiration Date | | Notional
Value | | Unrealized
Appreciation/
(Depreciation) | |
Short Contracts | |
S&P 500 E-Mini | | | (19 | ) | | 03/16/18 | | $ | (2,542,200 | ) | | $ | (7,882 | ) | |
| | | | | | | $ | (2,542,200 | ) | | $ | (7,882 | ) | |
See Accompanying Notes to Financial Statements
144
VY® PIONEER SUMMARY PORTFOLIO OF INVESTMENTS
HIGH YIELD PORTFOLIO AS OF DECEMBER 31, 2017 (CONTINUED)
At December 31, 2017, the following centrally cleared credit default swaps were outstanding for VY® Pioneer High Yield Portfolio:
Centrally Cleared Credit Default Swaps on Credit Indices — Sell Protection(1)
Reference
Entity/Obligation | | Buy/Sell
Protection | | (Pay)/
Receive
Financing
Rate (%) | | Payment
Frequency | | Termination
Date | | Notional
Amount(2) | | Fair
Value(3) | | Unrealized
Appreciation/
(Depreciation) | |
CDX North American High Yield Index
Series 23, Version 1 | | Sell | | | 5.000 | | | Quarterly | | 12/20/19 | | USD | 1,078,963 | | | $ | 58,470 | | | $ | (10,583 | ) | |
CDX North American High Yield Index
Series 25, Version 1 | | Sell | | | 5.000 | | | Quarterly | | 12/20/20 | | USD | 2,003,050 | | | | 133,189 | | | | 79,050 | | |
| | | | | $ | 191,659 | | | $ | 68,467 | | |
(1) If the Portfolio is a seller of protection and a credit event occurs, as defined under the terms of that particular swap agreement, the Portfolio will generally either i) Pay to the buyer an amount equal to the notional amount of the swap and take delivery of the referenced obligation, other deliverable obligations, or underlying securities comprising a referenced index or ii) Pay a net settlement amount in the form of cash or securities equal to the notional amount of the swap less the recovery value of the referenced obligation or underlying securities comprising a referenced index.
(2) The maximum amount of future payments (undiscounted) that a Portfolio as seller of protection could be required to make or receive as a buyer of credit protection under a credit default swap agreement would be an amount equal to the notional amount of the agreement.
(3) The fair values for credit default swap agreements serve as an indicator of the current status of the payment/performance risk and represent the likelihood or risk of default for the credit derivative. Increasing fair values, in absolute terms, when compared to the notional amount of the agreement, represent a deterioration of the referenced obligation's credit soundness and a greater likelihood or risk of default or other credit event occurring.
Currency Abbreviations
USD — United States Dollar
A summary of derivative instruments by primary risk exposure is outlined in the following tables.
The fair value of derivative instruments as of December 31, 2017 was as follows:
Derivatives not accounted
for as hedging instruments | | Location on Statement of Assets and Liabilities | | Fair Value | |
Asset Derivatives | |
Credit contracts | | Net Assets — Unrealized appreciation* | | $ | 79,050 | | |
Total Asset Derivatives | | | | $ | 79,050 | | |
Liability Derivatives | |
Credit contracts | | Net Assets — Unrealized depreciation* | | $ | 10,583 | | |
Equity contracts | | Net Assets — Unrealized depreciation** | | | 7,882 | | |
Total Liability Derivatives | | | | $ | 18,465 | | |
* Includes cumulative appreciation/depreciation of centrally cleared swaps as reported in the table following the Portfolio of Investments. Only current day's variation margin receivable/payable is shown on the Statement of Assets and Liabiliites.
** Includes cumulative appreciation/depreciation of futures contracts as reported in the table following the Portfolio of Investments.
The effect of derivative instruments on the Portfolio's Statement of Operations for the year ended December 31, 2017 was as follows:
| | | Amount of Realized Gain or (Loss) on Derivatives Recognized in Income | |
Derivatives not accounted
for as hedging instruments | | Futures | | Swaps | | Total | |
Credit Contract | | $ | — | | | $ | 115,390 | | | $ | 115,390 | | |
Equity contracts | | | (384,556 | ) | | | — | | | | (384,556 | ) | |
Total | | $ | (384,556 | ) | | $ | 115,390 | | | $ | (269,166 | ) | |
| | | Change in Unrealized Appreciation or (Depreciation) on Derivatives Recognized in Income | |
Derivatives not accounted
for as hedging instruments | | Futures | | Swaps | | Total | |
Credit contracts | | $ | — | | | $ | (33,666 | ) | | $ | (33,666 | ) | |
Equity contracts | | | (38,144 | ) | | | — | | | | (38,144 | ) | |
Total | | $ | (38,144 | ) | | $ | (33,666 | ) | | $ | (71,810 | ) | |
* Amounts recognized for purchased options are included in net realized gain (loss) on investments and net change in unrealized appreciation or depreciation on investments.
See Accompanying Notes to Financial Statements
145
VY® PIONEER SUMMARY PORTFOLIO OF INVESTMENTS
HIGH YIELD PORTFOLIO AS OF DECEMBER 31, 2017 (CONTINUED)
At December 31, 2017, the aggregate cost of securities and other investments and the composition of unrealized appreciation and depreciation of securities and other investments at period end were:
Cost for federal income tax purposes was $97,477,650.
Net unrealized appreciation consisted of: | |
Gross Unrealized Appreciation | | $ | 4,691,221 | | |
Gross Unrealized Depreciation | | | (1,998,793 | ) | |
Net Unrealized Appreciation | | $ | 2,692,428 | | |
See Accompanying Notes to Financial Statements
146
VY® T. ROWE PRICE DIVERSIFIED SUMMARY PORTFOLIO OF INVESTMENTS
MID CAP GROWTH PORTFOLIO AS OF DECEMBER 31, 2017
Shares | |
| |
| | Value | | Percentage
of Net
Assets | |
COMMON STOCK: 98.6% | | | |
| | | | | Consumer Discretionary: 15.2% | |
| | 7,500 | | | | (1 | ) | | Autozone, Inc. | | $ | 5,335,275 | | | | 0.5 | | |
| | 51,300 | | | | (1 | ) | | Burlington Stores, Inc. | | | 6,311,439 | | | | 0.6 | | |
| | 89,900 | | | | | | | Dollar General Corp. | | | 8,361,599 | | | | 0.8 | | |
| | 64,100 | | | | (1 | ) | | Dollar Tree, Inc. | | | 6,878,571 | | | | 0.7 | | |
| | 87,400 | | | | | | | Dunkin' Brands
Group, Inc. | | | 5,634,678 | | | | 0.6 | | |
| | 25,400 | | | | (1 | ) | | O'Reilly Automotive, Inc. | | | 6,109,716 | | | | 0.6 | | |
| | 124,200 | | | | | | | Ross Stores, Inc. | | | 9,967,050 | | | | 1.0 | | |
| | 1,780,440 | | | | (2 | ),(3) | | Other Securities | | | 105,312,907 | | | | 10.4 | | |
| | | | | | | | | | 153,911,235 | | | | 15.2 | | |
| | | | | Consumer Staples: 5.8% | |
| | 122,800 | | | | | | | Church & Dwight
Co., Inc. | | | 6,160,876 | | | | 0.6 | | |
| | 40,400 | | | | | | | Clorox Co. | | | 6,009,096 | | | | 0.6 | | |
| | 58,000 | | | | | | | Dr Pepper Snapple
Group, Inc. | | | 5,629,480 | | | | 0.6 | | |
| | 56,900 | | | | | | | Hershey Co. | | | 6,458,719 | | | | 0.7 | | |
| | 52,800 | | | | | | | McCormick & Co., Inc. | | | 5,380,848 | | | | 0.5 | | |
| | 556,300 | | | | (3 | ) | | Other Securities | | | 28,485,603 | | | | 2.8 | | |
| | | | | | | | | | 58,124,622 | | | | 5.8 | | |
| | | | | Energy: 1.7% | |
| | 408,360 | | | | (2 | ),(3),(4) | | Other Securities | | | 17,279,525 | | | | 1.7 | | |
| | | | | Financials: 8.0% | |
| | 53,933 | | | | | | | Cboe Global
Markets, Inc. | | | 6,719,512 | | | | 0.7 | | |
| | 73,100 | | | | | | | First Republic Bank | | | 6,333,384 | | | | 0.6 | | |
| | 36,700 | | | | | | | Moody's Corp. | | | 5,417,287 | | | | 0.5 | | |
| | 162,800 | | | | | | | Progressive Corp. | | | 9,168,896 | | | | 0.9 | | |
| | 861,271 | | | | (3 | ) | | Other Securities | | | 53,135,835 | | | | 5.3 | | |
| | | | | | | | | | 80,774,914 | | | | 8.0 | | |
| | | | | Health Care: 13.8% | |
| | 63,700 | | | | (1 | ) | | BioMarin
Pharmaceutical, Inc. | | | 5,680,129 | | | | 0.6 | | |
| | 54,000 | | | | (1 | ) | | Centene Corp. | | | 5,447,520 | | | | 0.5 | | |
| | 33,200 | | | | | | | Cooper Cos., Inc. | | | 7,233,616 | | | | 0.7 | | |
| | 147,600 | | | | (1 | ) | | Hologic, Inc. | | | 6,309,900 | | | | 0.6 | | |
| | 35,300 | | | | (1 | ) | | Idexx Laboratories, Inc. | | | 5,520,214 | | | | 0.5 | | |
| | 28,600 | | | | (1 | ) | | Illumina, Inc. | | | 6,248,814 | | | | 0.6 | | |
| | 60,200 | | | | (1 | ) | | Incyte Corp., Ltd. | | | 5,701,542 | | | | 0.6 | | |
| | 107,850 | | | | | | | Zoetis, Inc. | | | 7,769,514 | | | | 0.8 | | |
| | 1,334,111 | | | | (2 | ),(3) | | Other Securities | | | 89,823,592 | | | | 8.9 | | |
| | | | | | | | | | 139,734,841 | | | | 13.8 | | |
| | | | | Industrials: 18.7% | |
| | 45,987 | | | | | | | Equifax, Inc. | | | 5,422,787 | | | | 0.5 | | |
| | 54,700 | | | | | | | Harris Corp. | | | 7,748,255 | | | | 0.8 | | |
Shares | |
| |
| | Value | | Percentage
of Net
Assets | |
| | 60,500 | | | | (1 | ) | | Verisk Analytics, Inc. | | $ | 5,808,000 | | | | 0.6 | | |
| | 2,402,615 | | | | (2 | ),(3) | | Other Securities | | | 170,137,683 | | | | 16.8 | | |
| | | | | | | | | | 189,116,725 | | | | 18.7 | | |
| | | | | Information Technology: 26.5% | |
| | 86,000 | | | | | | | Amphenol Corp. | | | 7,550,800 | | | | 0.7 | | |
| | 134,179 | | | | (1 | ) | | Atlassian Corp. PLC | | | 6,107,828 | | | | 0.6 | | |
| | 75,200 | | | | | | | CDK Global, Inc. | | | 5,360,256 | | | | 0.5 | | |
| | 20,100 | | | | (1 | ) | | CoStar Group, Inc. | | | 5,968,695 | | | | 0.6 | | |
| | 93,800 | | | | | | | Fidelity National
Information
Services, Inc. | | | 8,825,642 | | | | 0.9 | | |
| | 69,500 | | | | (1 | ) | | Fiserv, Inc. | | | 9,113,535 | | | | 0.9 | | |
| | 28,700 | | | | (1 | ) | | FleetCor Technologies,
Inc. | | | 5,522,741 | | | | 0.5 | | |
| | 60,300 | | | | | | | Global Payments, Inc. | | | 6,044,472 | | | | 0.6 | | |
| | 58,800 | | | | | | | KLA-Tencor Corp. | | | 6,178,116 | | | | 0.6 | | |
| | 255,948 | | | | | | | Marvell Technology
Group Ltd. | | | 5,495,203 | | | | 0.5 | | |
| | 106,900 | | | | | | | Microchip Technology,
Inc. | | | 9,394,372 | | | | 0.9 | | |
| | 105,500 | | | | (1 | ) | | Microsemi Corp. | | | 5,449,075 | | | | 0.5 | | |
| | 56,900 | | | | (1 | ) | | Red Hat, Inc. | | | 6,833,690 | | | | 0.7 | | |
| | 61,900 | | | | (1 | ) | | ServiceNow, Inc. | | | 8,071,141 | | | | 0.8 | | |
| | 69,000 | | | | | | | Skyworks Solutions, Inc. | | | 6,551,550 | | | | 0.7 | | |
| | 239,000 | | | | | | | Symantec Corp. | | | 6,706,340 | | | | 0.7 | | |
| | 118,000 | | | | (1 | ),(5) | | Vantiv, Inc. | | | 8,678,900 | | | | 0.9 | | |
| | 54,100 | | | | (1 | ),(5) | | VeriSign, Inc. | | | 6,191,204 | | | | 0.6 | | |
| | 57,847 | | | | (1 | ) | | Workday, Inc. | | | 5,885,354 | | | | 0.6 | | |
| | 79,000 | | | | | | | Xilinx, Inc. | | | 5,326,180 | | | | 0.5 | | |
| | 2,408,308 | | | | (2 | ),(3),(4) | | Other Securities | | | 132,875,911 | | | | 13.2 | | |
| | | | | | | | | | 268,131,005 | | | | 26.5 | | |
| | | | | Materials: 5.2% | |
| | 174,800 | | | | | | | Ball Corp. | | | 6,616,180 | | | | 0.6 | | |
| | 64,900 | | | | | | | Vulcan Materials Co. | | | 8,331,213 | | | | 0.8 | | |
| | 699,329 | | | | (2 | ),(3) | | Other Securities | | | 37,945,312 | | | | 3.8 | | |
| | | | | | | | | | 52,892,705 | | | | 5.2 | | |
| | | | | Real Estate: 2.8% | |
| | 53,650 | | | | (1 | ) | | SBA Communications
Corp. | | | 8,764,264 | | | | 0.9 | | |
| | 552,601 | | | | (2 | ),(3),(4) | | Other Securities | | | 19,256,312 | | | | 1.9 | | |
| | | | | | | | | | 28,020,576 | | | | 2.8 | | |
| | | | | Telecommunication Services: 0.3% | |
| | 65,600 | | | | (3 | ) | | Other Securities | | | 2,414,080 | | | | 0.3 | | |
| | | | | Utilities: 0.6% | |
| | 123,300 | | | | | | | Other Securities | | | 5,796,725 | | | | 0.6 | | |
| | | | | | | Total Common Stock
(Cost $695,963,491) | | | 996,196,953 | | | | 98.6 | | |
See Accompanying Notes to Financial Statements
147
VY® T. ROWE PRICE DIVERSIFIED SUMMARY PORTFOLIO OF INVESTMENTS
MID CAP GROWTH PORTFOLIO AS OF DECEMBER 31, 2017 (CONTINUED)
Shares | |
| |
| | Value | | Percentage
of Net
Assets | |
PREFERRED STOCK: 1.3% | | | |
| | | | | Consumer Discretionary: 0.1% | |
| | 7,415 | | | | (3 | ),(4) | | Other Securities | | $ | 877,739 | | | | 0.1 | | |
| | | | | Information Technology: 0.7% | |
| | 533,210 | | | | (3 | ),(4) | | Other Securities | | | 7,555,767 | | | | 0.7 | | |
| | | | | Real Estate: 0.5% | |
| | 103,987 | | | | (3 | ),(4) | | Other Securities | | | 4,767,804 | | | | 0.5 | | |
| | | | | | | Total Preferred Stock
(Cost $7,738,124) | | | 13,201,310 | | | | 1.3 | | |
| | | | | | | Total Long-Term
Investments
(Cost $703,701,615) | | | 1,009,398,263 | | | | 99.9 | | |
Principal
Amount† | |
| |
| | Value | | Percentage
of Net
Assets | |
SHORT-TERM INVESTMENTS: 3.3% | | | |
| | | | | Securities Lending Collateral(6): 3.2% | |
| | 7,744,016 | | | | | | | Cantor Fitzgerald,
Repurchase
Agreement dated
12/29/17, 1.41%,
due 01/02/18
(Repurchase Amount
$7,745,213,
collateralized by
various U.S.
Government\U.S.
Government Agency
Obligations,
0.000%-8.500%,
Market Value plus
accrued interest
$7,898,896, due
01/31/18-06/20/63) | | $ | 7,744,016 | | | | 0.8 | | |
| | 1,629,036 | | | | | | | Daiwa Capital Markets,
Repurchase
Agreement dated
12/29/17, 1.43%,
due 01/02/18
(Repurchase Amount
$1,629,291,
collateralized by
various U.S.
Government\U.S.
Government Agency
Obligations,
0.000%-6.500%,
Market Value plus
accrued interest
$1,661,617, due
01/11/18-12/01/51) | | | 1,629,036 | | | | 0.1 | | |
Principal
Amount† | |
| |
| | Value | | Percentage
of Net
Assets | |
| | 7,744,016 | | | | | | | Millenium Fixed
Income Ltd.,
Repurchase
Agreement dated
12/29/17, 1.44%,
due 01/02/18
(Repurchase Amount
$7,745,238,
collateralized by
various U.S.
Government
Securities,
2.875%-3.625%,
Market Value plus
accrued interest
$7,898,897, due
02/15/43-02/15/44) | | $ | 7,744,016 | | | | 0.8 | | |
| | 7,744,016 | | | | | | | NBC Global Finance
Ltd., Repurchase
Agreement dated
12/29/17, 1.50%,
due 01/02/18
(Repurchase Amount
$7,745,289,
collateralized by
various U.S.
Government
Securities,
0.750%-2.250%,
Market Value plus
accrued interest
$7,898,897, due
09/30/18-09/09/49) | | | 7,744,016 | | | | 0.8 | | |
| | 7,744,016 | | | | | | | State of Wisconsin
Investment Board,
Repurchase
Agreement dated
12/29/17, 1.63%,
due 01/02/18
(Repurchase Amount
$7,745,399,
collateralized by
various U.S.
Government
Securities,
0.125%-3.875%,
Market Value plus
accrued interest
$7,959,064, due
01/15/19-02/15/46) | | | 7,744,016 | | | | 0.7 | | |
| | | | | | | | | | 32,605,100 | | | | 3.2 | | |
See Accompanying Notes to Financial Statements
148
VY® T. ROWE PRICE DIVERSIFIED SUMMARY PORTFOLIO OF INVESTMENTS
MID CAP GROWTH PORTFOLIO AS OF DECEMBER 31, 2017 (CONTINUED)
Shares | |
| |
| | Value | | Percentage
of Net
Assets | |
| | | | | Mutual Funds: 0.1% | |
| | 363,001 | | | | (7 | ) | | T. Rowe Price Reserve
Investment
Fund, 1.247%
(Cost $363,001) | | $ | 363,001 | | | | 0.1 | | |
| | | | | Total Short-Term
Investments
(Cost $32,968,101) | | | 32,968,101 | | | | 3.3 | | |
| | | | | Total Investments in
Securities
(Cost $736,669,716) | | $ | 1,042,366,364 | | | | 103.2 | | |
| | | | | Liabilities in Excess of
Other Assets | | | (32,028,447 | ) | | | (3.2 | ) | |
| | | | | Net Assets | | $ | 1,010,337,917 | | | | 100.0 | | |
"Other Securities" represents issues not identified as the top 50 holdings in terms of market value and issues or issuers not exceeding 1% of net assets individually or in aggregate respectively as of December 31, 2017.
The following footnotes apply to either the individual securities noted or one or more of the securities aggregated and listed as a single line item.
† Unless otherwise indicated, principal amount is shown in USD.
(1) Non-income producing security.
(2) The grouping contains securities on loan.
(3) The grouping contains non-income producing securities.
(4) The grouping contains Level 3 securities.
(5) Security, or a portion of the security, is on loan.
(6) Represents securities purchased with cash collateral received for securities on loan.
(7) Rate shown is the 7-day yield as of December 31, 2017.
Fair Value Measurements^
The following is a summary of the fair valuations according to the inputs used as of December 31, 2017 in valuing the assets and liabilities:
| | | Quoted Prices
in Active Markets
for Identical Investments
(Level 1) | | Significant Other
Observable
Inputs
(Level 2) | | Significant
Unobservable
Inputs
(Level 3) | | Fair Value
at
December 31, 2017 | |
Asset Table | |
Investments, at fair value | |
Common Stock | |
Consumer Discretionary | | $ | 153,911,235 | | | $ | — | | | $ | — | | | $ | 153,911,235 | | |
Consumer Staples | | | 58,124,622 | | | | — | | | | — | | | | 58,124,622 | | |
Energy | | | 15,307,292 | | | | — | | | | 1,972,233 | | | | 17,279,525 | | |
Financials | | | 80,774,914 | | | | — | | | | — | | | | 80,774,914 | | |
Health Care | | | 139,734,841 | | | | — | | | | — | | | | 139,734,841 | | |
Industrials | | | 189,116,725 | | | | — | | | | — | | | | 189,116,725 | | |
Information Technology | | | 267,384,493 | | | | — | | | | 746,512 | | | | 268,131,005 | | |
Materials | | | 52,892,705 | | | | — | | | | — | | | | 52,892,705 | | |
Real Estate | | | 27,182,621 | | | | — | | | | 837,955 | | | | 28,020,576 | | |
Telecommunication Services | | | 2,414,080 | | | | — | | | | — | | | | 2,414,080 | | |
Utilities | | | 5,796,725 | | | | — | | | | — | | | | 5,796,725 | | |
Total Common Stock | | | 992,640,253 | | | | — | | | | 3,556,700 | | | | 996,196,953 | | |
Preferred Stock | | | — | | | | — | | | | 13,201,310 | | | | 13,201,310 | | |
Short-Term Investments | | | 363,001 | | | | 32,605,100 | | | | — | | | | 32,968,101 | | |
Total Investments, at fair value | | $ | 993,003,254 | | | $ | 32,605,100 | | | $ | 16,758,010 | | | $ | 1,042,366,364 | | |
^ See Note 2, "Significant Accounting Policies" in the Notes to Financial Statements for additional information.
The following table presents additional information about valuation techniques and inputs used for investments that are measured at fair value and categorized within Level 3 at December 31, 2017.
Investments, at fair value | | Fair Value at
December 31,
2017 | | Valuation
Technique(s) | | Unobservable
Inputs | | Range | | Impact to Valuation
from an Increase
in Input** | |
Common Stock | |
Dropbox, Inc. - Class A | | $ | 518,226 | | | Recent Comparable
Transaction Price/
Market Comparable | |
Discount Factor* | | | — | | | n/a | |
| | | | | | | Enterprise Value to
Sales Multiple | | | 5.1 | x-6.3x | | Increase | |
| | | | | | | Discount for Lack of
Marketability | | | 10 | % | | Decrease | |
| | | | | | | Enterprise Value to
Gross Profit | | | 6.6 | x | | Increase | |
| | | | | | | Sales Growth Rate | | | 30 | %-40% | | Increase | |
| | | | | | | Gross Profit Growth
Rate | | | 30 | %-40% | | Increase | |
See Accompanying Notes to Financial Statements
149
VY® T. ROWE PRICE DIVERSIFIED SUMMARY PORTFOLIO OF INVESTMENTS
MID CAP GROWTH PORTFOLIO AS OF DECEMBER 31, 2017 (CONTINUED)
Investments, at fair value | | Fair Value at
December 31,
2017 | | Valuation
Technique(s) | | Unobservable
Inputs | | Range | | Impact to Valuation
from an Increase
in Input** | |
Dropbox, Inc. - Class B | | $ | 228,286 | | | Recent Comparable
Transaction Price/
Market Comparable | |
Discount Factor* | | | — | | | n/a | |
| | | | | | | Enterprise Value to
Sales Multiple | | | 5.1 | x-6.3x | | Increase | |
| | | | | | | Discount for Lack of
Marketability | | | 10 | % | | Decrease | |
| | | | | | | Enterprise Value to
Gross Profit | | | 6.6 | x | | Increase | |
| | | | | | | Sales Growth Rate | | | 30 | %-40% | | Increase | |
| | | | | | | Gross Profit Growth
Rate | | | 30 | %-40% | | Increase | |
Venture Global LNG, Inc., Series C | | | 1,972,233 | | | Recent Comparable
Transaction Price | | Transaction price | | | — | | | n/a | |
WeWork Companies, Inc., Class A | | | 837,955 | | | Recent Comparable
Transaction Price | | Discount Factor* | | | — | | | n/a | |
Total Common Stock | | $ | 3,556,700 | | | | | | | | | | |
Preferred Stock | |
AirBNB, Inc. - Series D | | $ | 3,791,366 | | | Recent Comparable
Transaction Price/
Market Comparable | |
Discount Factor* | | | — | | | n/a | |
| | | | | | | Enterprise Value to
Sales Multiple | | | 5.3 | x | | Increase | |
| | | | | | | Discount for Lack of
Marketability | | | 10 | % | | Decrease | |
| | | | | | | Enterprise Value to
Gross Profit | | | 7.3 | x | | Increase | |
| | | | | | | Sales Growth Rate | | | 40 | % | | Increase | |
| | | | | | | Gross Profit Growth
Rate | | | 40 | % | | Increase | |
AirBNB, Inc. - Series E | | | 435,309 | | | Recent Comparable
Transaction Price/
Market Comparable | | Discount Factor* | | | — | | | n/a | |
| | | | | | | Enterprise Value to
Sales Multiple | | | 5.3 | x | | Increase | |
| | | | | | | Discount for Lack of
Marketability | | | 10 | % | | Decrease | |
| | | | | | | Enterprise Value to
Gross Profit | | | 7.3 | x | | Increase | |
| | | | | | | Sales Growth Rate | | | 40 | % | | Increase | |
| | | | | | | Gross Profit Growth
Rate | | | 40 | % | | Increase | |
Dropbox, Inc. - Series A | | | 283,487 | | | Recent Comparable
Transaction Price/
Market Comparable | | Discount Factor* | | | — | | | n/a | |
| | | | | | | Enterprise Value to
Sales Multiple | | | 5.1 | x-6.3x | | Increase | |
| | | | | | | Discount for Lack of
Marketability | | | 10 | % | | Decrease | |
| | | | | | | Enterprise Value to
Gross Profit | | | 6.6 | x | | Increase | |
| | | | | | | Sales Growth Rate | | | 30 | %-40% | | Increase | |
| | | | | | | Gross Profit Growth
Rate | | | 30 | %-40% | | Increase | |
See Accompanying Notes to Financial Statements
150
VY® T. ROWE PRICE DIVERSIFIED SUMMARY PORTFOLIO OF INVESTMENTS
MID CAP GROWTH PORTFOLIO AS OF DECEMBER 31, 2017 (CONTINUED)
Investments, at fair value | | Fair Value at
December 31,
2017 | | Valuation
Technique(s) | | Unobservable
Inputs | | Range | | Impact to Valuation
from an Increase
in Input** | |
Dropbox, Inc. - Series A-1 | | $ | 1,392,565 | | | Recent Comparable
Transaction Price/
Market Comparable | |
Discount Factor* | | | — | | | n/a | |
| | | | | | | Enterprise Value to
Sales Multiple | | | 5.1 | x-6.3x | | Increase | |
| | | | | | | Discount for Lack of
Marketability | | | 10 | % | | Decrease | |
| | | | | | | Enterprise Value to
Gross Profit | | | 6.6 | x | | Increase | |
| | | | | | | Sales Growth Rate | | | 30 | %-40% | | Increase | |
| | | | | | | Gross Profit Growth
Rate | | | 30 | %-40% | | Increase | |
Flipkart Online Services Pvt. Ltd., -
Series G | | | 877,739 | | | Recent Comparable
Transaction Price | | Discount Factor* | | | — | | | n/a | |
Tanium, Inc.- Series G | | | 1,653,040 | | | Recent Comparable
Transaction Price/
Market Comparable | | Discount Factor* | | | — | | | n/a | |
| | | | | | | Sales Growth Rate | | | 60 | % | | Increase | |
| | | | | | | Enterprise Value to
Sales Multiple | | | 5.3 | x | | Increase | |
| | | | | | | Discount for Lack of
Marketability | | | 10 | % | | Decrease | |
WeWork Companies, Inc. - Series D-1 | | | 2,035,556 | | | Recent Comparable
Transaction Price | | Discount Factor* | | | — | | | n/a | |
WeWork Companies, Inc. - Series D-2 | | | 1,599,340 | | | Recent Comparable
Transaction Price | | Discount Factor* | | | — | | | n/a | |
WeWork Companies, Inc. - Series E | | | 1,132,908 | | | Recent Comparable
Transaction Price | | Discount Factor* | | | — | | | n/a | |
Total Preferred Stock | | $ | 13,201,310 | | | | | | | | | | |
* No quantitative unobservable inputs were significant to the fair valuation determination at December 31, 2017.
** Represents the directional change in the fair value of the Level 3 investment(s) that would result from an increase in the corresponding input. A decrease in the unobservable input would have the opposite effect. Significant increases and decreases in these inputs in isolation could result in significantly higher or lower fair value measurements.
The following is a reconciliation of the fair valuations using significant unobservable inputs (Level 3) for the Portfolio's assets and liabilities during the year ended December 31, 2017:
| | | Beginning
Balance
12/31/16 | | Purchases | | Sales | | Accrued
Discounts/
(Premiums) | | Total
Realized
Gain/(Loss) | | Net Change
in Unrealized
Appreciation/
(Depreciation)* | | Transfers
Into
Level 3 | | Transfers
Out of
Level 3 | | Ending
Balance
12/31/17 | |
Asset Table | |
Investments,
at fair value
Common Stock | | $ | 1,477,047 | | | $ | 1,972,233 | | | $ | (436,396 | ) | | $ | — | | | $ | 296,144 | | | $ | 247,672 | | | $ | — | | | $ | — | | | $ | 3,556,700 | | |
Preferred Stock | | | 11,044,890 | | | | — | | | | (167,412 | ) | | | — | | | | (5,522 | ) | | | 2,329,354 | | | | — | | | | — | | | | 13,201,310 | | |
Total Investments,
at value | | $ | 12,521,937 | | | $ | 1,972,233 | | | $ | (603,808 | ) | | $ | — | | | $ | 290,622 | | | $ | 2,577,026 | | | $ | — | | | $ | — | | | $ | 16,758,010 | | |
* As of December 31, 2017, total change in unrealized gain (loss) on Level 3 securities still held at period end and included in the change in net assets was $4,236,075.
At December 31, 2017, the aggregate cost of securities and other investments and the composition of unrealized appreciation and depreciation of securities and other investments at period end were:
Cost for federal income tax purposes was $740,942,721.
Net unrealized appreciation consisted of: | |
Gross Unrealized Appreciation | | $ | 315,279,715 | | |
Gross Unrealized Depreciation | | | (13,856,072 | ) | |
Net Unrealized Appreciation | | $ | 301,423,643 | | |
See Accompanying Notes to Financial Statements
151
VY® T. ROWE PRICE SUMMARY PORTFOLIO OF INVESTMENTS
GROWTH EQUITY PORTFOLIO AS OF DECEMBER 31, 2017
Shares | |
| |
| | Value | | Percentage
of Net
Assets | |
COMMON STOCK: 97.7% | | | |
| | | | | Consumer Discretionary: 16.7% | |
| | 90,569 | | | | (1 | ) | | Amazon.com, Inc. | | $ | 105,917,728 | | | | 6.1 | | |
| | 784,769 | | | | (1 | ) | | Caesars
Entertainment
Corp. | | | 9,927,328 | | | | 0.6 | | |
| | 78,700 | | | | (1 | ) | | Netflix, Inc. | | | 15,107,252 | | | | 0.9 | | |
| | 37,559 | | | | (1 | ) | | The Priceline
Group, Inc. | | | 65,267,777 | | | | 3.7 | | |
| | 69,189 | | | | (1 | ),(2) | | Tesla, Inc. | | | 21,541,995 | | | | 1.2 | | |
| | 163,100 | | | | | | | Yum! Brands, Inc. | | | 13,310,591 | | | | 0.8 | | |
| | 736,920 | | | | (3 | ),(4),(5) | | Other Securities | | | 58,656,672 | | | | 3.4 | | |
| | | | | | | | | | 289,729,343 | | | | 16.7 | | |
| | | | | Consumer Staples: 2.2% | |
| | 222,063 | | | | | | | Philip Morris
International, Inc. | | | 23,460,956 | | | | 1.4 | | |
| | 205,891 | | | | | | | Other Securities | | | 14,546,940 | | | | 0.8 | | |
| | | | | | | | | | 38,007,896 | | | | 2.2 | | |
| | | | | Financials: 5.9% | |
| | 94,100 | | | | | | | Chubb Ltd. | | | 13,750,833 | | | | 0.8 | | |
| | 215,200 | | | | | | | Intercontinental
Exchange, Inc. | | | 15,184,512 | | | | 0.9 | | |
| | 173,900 | | | | | | | JPMorgan
Chase & Co. | | | 18,596,866 | | | | 1.0 | | |
| | 429,900 | | | | | | | Morgan Stanley | | | 22,556,853 | | | | 1.3 | | |
| | 364,876 | | | | | | | TD Ameritrade
Holding Corp. | | | 18,656,110 | | | | 1.1 | | |
| | 149,190 | | | | | | | Other Securities | | | 13,852,786 | | | | 0.8 | | |
| | | | | | | | | | 102,597,960 | | | | 5.9 | | |
| | | | | Health Care: 15.3% | |
| | 154,994 | | | | (1 | ) | | Alexion
Pharmaceuticals,
Inc. | | | 18,535,733 | | | | 1.1 | | |
| | 83,200 | | | | | | | Anthem, Inc. | | | 18,720,832 | | | | 1.1 | | |
| | 134,967 | | | | | | | Becton Dickinson &
Co. | | | 28,891,036 | | | | 1.6 | | |
| | 88,095 | | | | | | | Cigna Corp. | | | 17,891,214 | | | | 1.0 | | |
| | 65,100 | | | | (1 | ) | | Intuitive Surgical,
Inc. | | | 23,757,594 | | | | 1.4 | | |
| | 167,800 | | | | | | | Stryker Corp. | | | 25,982,152 | | | | 1.5 | | |
| | 180,000 | | | | | | | UnitedHealth
Group, Inc. | | | 39,682,800 | | | | 2.3 | | |
| | 166,533 | | | | (1 | ) | | Vertex
Pharmaceuticals,
Inc. | | | 24,956,635 | | | | 1.4 | | |
| | 578,196 | | | | (4 | ) | | Other Securities | | | 68,099,277 | | | | 3.9 | | |
| | | | | | | | | | 266,517,273 | | | | 15.3 | | |
Shares | |
| |
| | Value | | Percentage
of Net
Assets | |
| | | | | Industrials: 11.2% | |
| | 91,269 | | | | | | | Acuity Brands, Inc. | | $ | 16,063,344 | | | | 0.9 | | |
| | 438,500 | | | | | | | American Airlines
Group, Inc. | | | 22,815,155 | | | | 1.3 | | |
| | 154,142 | | | | | | | Boeing Co. | | | 45,458,017 | | | | 2.6 | | |
| | 116,628 | | | | | | | Equifax, Inc. | | | 13,752,774 | | | | 0.8 | | |
| | 181,721 | | | | | | | Fortive Corp. | | | 13,147,514 | | | | 0.8 | | |
| | 123,200 | | | | | | | Honeywell
International, Inc. | | | 18,893,952 | | | | 1.1 | | |
| | 78,400 | | | | | | | Illinois Tool Works,
Inc. | | | 13,081,040 | | | | 0.8 | | |
| | 61,132 | | | | | | | Roper Technologies,
Inc. | | | 15,833,188 | | | | 0.9 | | |
| | 540,911 | | | | (3 | ),(4) | | Other Securities | | | 34,898,688 | | | | 2.0 | | |
| | | | | | | | | | 193,943,672 | | | | 11.2 | | |
| | | | | Information Technology: 41.3% | |
| | 273,664 | | | | (1 | ) | | Alibaba Group
Holding Ltd. ADR | | | 47,187,883 | | | | 2.7 | | |
| | 41,350 | | | | (1 | ) | | Alphabet, Inc. -
Class A | | | 43,558,090 | | | | 2.5 | | |
| | 46,671 | | | | (1 | ) | | Alphabet, Inc. -
Class C | | | 48,836,534 | | | | 2.8 | | |
| | 633,578 | | | | | | | Apple, Inc. | | | 107,220,405 | | | | 6.2 | | |
| | 143,600 | | | | (1 | ) | | Electronic Arts, Inc. | | | 15,086,616 | | | | 0.9 | | |
| | 400,469 | | | | (1 | ) | | Facebook, Inc. | | | 70,666,760 | | | | 4.0 | | |
| | 103,028 | | | | (1 | ) | | Fiserv, Inc. | | | 13,510,062 | | | | 0.8 | | |
| | 150,700 | | | | | | | Intuit, Inc. | | | 23,777,446 | | | | 1.4 | | |
| | 220,900 | | | | | | | Mastercard, Inc. -
Class A | | | 33,435,424 | | | | 1.9 | | |
| | 869,100 | | | | | | | Microsoft Corp. | | | 74,342,814 | | | | 4.3 | | |
| | 368,414 | | | | (1 | ) | | PayPal Holdings,
Inc. | | | 27,122,639 | | | | 1.5 | | |
| | 211,464 | | | | (1 | ) | | Salesforce.com, Inc. | | | 21,617,965 | | | | 1.2 | | |
| | 108,595 | | | | (1 | ) | | ServiceNow, Inc. | | | 14,159,702 | | | | 0.8 | | |
| | 785,212 | | | | | | | Symantec Corp. | | | 22,033,049 | | | | 1.3 | | |
| | 425,300 | | | | | | | Tencent Holdings
Ltd. | | | 22,012,658 | | | | 1.3 | | |
| | 229,400 | | | | (1 | ),(2) | | Vantiv, Inc. | | | 16,872,370 | | | | 1.0 | | |
| | 382,000 | | | | | | | Visa, Inc. - Class A | | | 43,555,640 | | | | 2.5 | | |
| | 158,380 | | | | (1 | ),(2) | | VMware, Inc. | | | 19,848,181 | | | | 1.1 | | |
| | 124,340 | | | | (1 | ) | | Workday, Inc. | | | 12,650,352 | | | | 0.7 | | |
| | 230,657 | | | | | | | Xilinx, Inc. | | | 15,550,895 | | | | 0.9 | | |
| | 361,543 | | | | (3 | ),(4),(5) | | Other Securities | | | 25,953,285 | | | | 1.5 | | |
| | | | | | | | | | 718,998,770 | | | | 41.3 | | |
See Accompanying Notes to Financial Statements
152
VY® T. ROWE PRICE SUMMARY PORTFOLIO OF INVESTMENTS
GROWTH EQUITY PORTFOLIO AS OF DECEMBER 31, 2017 (CONTINUED)
Shares | |
| |
| | Value | | Percentage
of Net
Assets | |
| | | | | Real Estate: 2.9% | |
| | 101,700 | | | | | | | American Tower
Corp. | | $ | 14,509,539 | | | | 0.8 | | |
| | 296,030 | | | | | | | Crown Castle
International Corp. | | | 32,862,290 | | | | 1.9 | | |
| | 8,538 | | | | (4 | ),(5) | | Other Securities | | | 3,136,327 | | | | 0.2 | | |
| | | | | | | | | | 50,508,156 | | | | 2.9 | | |
| | | | | Telecommunication Services: 0.5% | |
| | 139,400 | | | | (4 | ) | | Other Securities | | | 8,853,294 | | | | 0.5 | | |
| | | | | Utilities: 1.7% | |
| | 81,300 | | | | | | | NextEra Energy,
Inc. | | | 12,698,247 | | | | 0.7 | | |
| | 174,929 | | | | | | | Other Securities | | | 17,180,468 | | | | 1.0 | | |
| | | | | | | | | | 29,878,715 | | | | 1.7 | | |
| | | | | | | Total Common Stock
(Cost
$1,221,542,099) | | | 1,699,035,079 | | | | 97.7 | | |
PREFERRED STOCK: 1.4% | | | |
| | | | | Consumer Discretionary: 0.2% | |
| | 30,940 | | | | (4 | ),(5) | | Other Securities | | | 3,756,394 | | | | 0.2 | | |
| | | | | Information Technology: 1.1% | |
| | 372,138 | | | | (4 | ),(5) | | Other Securities | | | 19,005,135 | | | | 1.1 | | |
| | | | | Real Estate: 0.1% | |
| | 45,554 | | | | (4 | ),(5) | | Other Securities | | | 2,088,651 | | | | 0.1 | | |
| | | | | | | Total Preferred Stock
(Cost $18,614,291) | | | 24,850,180 | | | | 1.4 | | |
Principal
Amount† | |
| |
| | Value | | Percentage
of Net
Assets | |
CONVERTIBLE BONDS/NOTES: 0.3% | | | |
| | | | | Consumer, Cyclical: 0.3% | |
| | 2,259,785 | | | | | | | Caesars
Entertainment
Corp., 5.000%,
10/01/24 | | $ | 4,382,571 | | | | 0.3 | | |
| | | | | | | Total Convertible
Bonds/Notes
(Cost $4,204,151) | | | 4,382,571 | | | | 0.3 | | |
| | | | | | | Total Long-Term
Investments
(Cost
$1,244,360,541) | | | 1,728,267,830 | | | | 99.4 | | |
Principal
Amount† | |
| |
| | Value | | Percentage
of Net
Assets | |
SHORT-TERM INVESTMENTS: 3.8% | | | |
| | | | | Securities Lending Collateral(6): 3.7% | |
| | 12,071,162 | | | | | | | Bank of Nova
Scotia/New York,
Repurchase
Agreement dated
12/29/17, 1.36%,
due 01/02/18
(Repurchase
Amount
$12,072,961,
collateralized by
various U.S.
Government
Securities,
0.125%-3.625%,
Market Value plus
accrued interest
$12,314,447, due
01/31/19-
09/09/49) | | $ | 12,071,162 | | | | 0.7 | | |
| | 15,196,497 | | | | | | | Cantor Fitzgerald,
Repurchase
Agreement dated
12/29/17, 1.41%,
due 01/02/18
(Repurchase
Amount
$15,198,845,
collateralized by
various U.S.
Government\U.S.
Government
Agency
Obligations,
0.000%-8.500%,
Market Value plus
accrued interest
$15,500,427, due
01/31/18-06/20/63) | | | 15,196,497 | | | | 0.9 | | |
| | 15,196,497 | | | | | | | Daiwa Capital
Markets,
Repurchase
Agreement dated
12/29/17, 1.43%,
due 01/02/18
(Repurchase
Amount
$15,198,878,
collateralized by
various U.S.
Government\U.S.
Government
Agency
Obligations,
0.000%-6.500%,
Market Value plus
accrued interest
$15,500,427, due
01/11/18-12/01/51) | | | 15,196,497 | | | | 0.9 | | |
See Accompanying Notes to Financial Statements
153
VY® T. ROWE PRICE SUMMARY PORTFOLIO OF INVESTMENTS
GROWTH EQUITY PORTFOLIO AS OF DECEMBER 31, 2017 (CONTINUED)
Principal
Amount† | |
| |
| | Value | | Percentage
of Net
Assets | |
| | | | | Securities Lending Collateral(6) (continued) | |
| | 6,322,178 | | | | | | | Millenium Fixed
Income Ltd.,
Repurchase
Agreement dated
12/29/17, 1.44%,
due 01/02/18
(Repurchase
Amount
$6,323,176,
collateralized by
various U.S.
Government
Securities,
2.875%-3.625%,
Market Value plus
accrued interest
$6,448,622, due
02/15/43-
02/15/44) | | $ | 6,322,178 | | | | 0.3 | | |
| | 15,196,497 | | | | | | | State of Wisconsin
Investment Board,
Repurchase
Agreement dated
12/29/17, 1.63%,
due 01/02/18
(Repurchase
Amount
$15,199,212,
collateralized by
various U.S.
Government
Securities,
0.125%-3.875%,
Market Value plus
accrued interest
$15,618,497, due
01/15/19-02/15/46) | | | 15,196,497 | | | | 0.9 | | |
| | | | | | | | 63,982,831 | | | | 3.7 | | |
Shares | |
| |
| | Value | | Percentage
of Net
Assets | |
| | | | | Mutual Funds: 0.1% | |
| | 2,951,680 | | | | (7 | ) | | T. Rowe Price
Reserve
Investment Fund,
1.247%
(Cost $2,951,680) | | $ | 2,951,680 | | | | 0.1 | | |
| | | | | Total Short-Term
Investments
(Cost $66,934,511) | | | 66,934,511 | | | | 3.8 | | |
| | | | | Total Investments
in Securities
(Cost
$1,311,295,052) | | $ | 1,795,202,341 | | | | 103.2 | | |
| | | | | Liabilities in
Excess of Other
Assets | | | (56,127,012 | ) | | | (3.2 | ) | |
| | | | | Net Assets | | $ | 1,739,075,329 | | | | 100.0 | | |
"Other Securities" represents issues not identified as the top 50 holdings in terms of market value and issues or issuers not exceeding 1% of net assets individually or in aggregate respectively as of December 31, 2017.
The following footnotes apply to either the individual securities noted or one or more of the securities aggregated and listed as a single line item.
† Unless otherwise indicated, principal amount is shown in USD.
ADR American Depositary Receipt
(1) Non-income producing security.
(2) Security, or a portion of the security, is on loan.
(3) The grouping contains securities on loan.
(4) The grouping contains non-income producing securities.
(5) The grouping contains Level 3 securities.
(6) Represents securities purchased with cash collateral received for securities on loan.
(7) Rate shown is the 7-day yield as of December 31, 2017.
Fair Value Measurements^
The following is a summary of the fair valuations according to the inputs used as of December 31, 2017 in valuing the assets and liabilities:
| | | Quoted Prices
in Active Markets
for Identical Investments
(Level 1) | | Significant Other
Observable
Inputs#
(Level 2) | | Significant
Unobservable
Inputs
(Level 3) | | Fair Value
at
December 31, 2017 | |
Asset Table | |
Investments, at fair value | |
Common Stock | |
Consumer Discretionary | | $ | 289,504,207 | | | $ | — | | | $ | 225,136 | | | $ | 289,729,343 | | |
Consumer Staples | | | 28,274,300 | | | | 9,733,596 | | | | — | | | | 38,007,896 | | |
Financials | | | 102,597,960 | | | | — | | | | — | | | | 102,597,960 | | |
Health Care | | | 266,517,273 | | | | — | | | | — | | | | 266,517,273 | | |
Industrials | | | 193,943,672 | | | | — | | | | — | | | | 193,943,672 | | |
Information Technology | | | 695,307,566 | | | | 22,012,658 | | | | 1,678,546 | | | | 718,998,770 | | |
Real Estate | | | 50,425,626 | | | | — | | | | 82,530 | | | | 50,508,156 | | |
Telecommunication Services | | | 8,853,294 | | | | — | | | | — | | | | 8,853,294 | | |
Utilities | | | 29,878,715 | | | | — | | | | — | | | | 29,878,715 | | |
Total Common Stock | | | 1,665,302,613 | | | | 31,746,254 | | | | 1,986,212 | | | | 1,699,035,079 | | |
See Accompanying Notes to Financial Statements
154
VY® T. ROWE PRICE SUMMARY PORTFOLIO OF INVESTMENTS
GROWTH EQUITY PORTFOLIO AS OF DECEMBER 31, 2017 (CONTINUED)
| | | Quoted Prices
in Active Markets
for Identical Investments
(Level 1) | | Significant Other
Observable
Inputs#
(Level 2) | | Significant
Unobservable
Inputs
(Level 3) | | Fair Value
at
December 31, 2017 | |
Preferred Stock | | $ | — | | | $ | — | | | $ | 24,850,180 | | | $ | 24,850,180 | | |
Convertible Bonds/Notes | | | — | | | | 4,382,571 | | | | — | | | | 4,382,571 | | |
Short-Term Investments | | | 2,951,680 | | | | 63,982,831 | | | | — | | | | 66,934,511 | | |
Total Investments, at fair value | | $ | 1,668,254,293 | | | $ | 100,111,656 | | | $ | 26,836,392 | | | $ | 1,795,202,341 | | |
^ See Note 2, "Significant Accounting Policies" in the Notes to Financial Statements for additional information.
# The earlier close of the foreign markets gives rise to the possibility that significant events, including broad market moves, may have occurred in the interim and may materially affect the value of those securities. To account for this, the Portfolio may frequently value many of its foreign equity securities using fair value prices based on third party vendor modeling tools to the extent available. Accordingly, a portion of the Portfolio's investments are categorized as Level 2 investments.
The following table presents additional information about valuation techniques and inputs used for investments that are measured at fair value and categorized within Level 3 at December 31, 2017:
Investments, at fair value | | Fair Value at
December 31,
2017 | | Valuation
Technique(s) | | Unobservable
Inputs | | Range | | Impact to Valuation
from an Increase
in Input** | |
Common Stock | |
Dropbox, Inc. - Class A | | $ | 1,678,546 | | | Recent Comparable
Transaction Price/
Market Comparable | |
Discount Factor* | | |
— | | |
n/a | |
| | | | | | | Enterprise Value to
Sales Multiple | | | 5.1 | x-6.3x | | Increase | |
| | | | | | | Discount for Lack of
Marketability | | | 10 | % | | Decrease | |
| | | | | | | Enterprise Value to
Gross Profit | | | 6.6 | x | | Increase | |
| | | | | | | Sales Growth Rate | | | 30 | %-40% | | Increase | |
| | | | | | | Gross Profit Growth
Rate | | | 30 | %-40% | | Increase | |
Flipkart Online Services Pvt. Ltd. | | | 225,136 | | | Recent Comparable
Transaction Price | | Discount Factor* | | | — | | | n/a | |
WeWork Companies, Inc., - Class A | | | 82,530 | | | Recent Comparable
Transaction Price | | Discount Factor* | | | — | | | n/a | |
Total Common Stock | | $ | 1,986,212 | | | | | | | | | | |
Preferred Stock | |
AirBNB, Inc. - Series D | | | 6,934,159 | | | Recent Comparable
Transaction Price/
Market Comparable | | Discount Factor* | | | — | | | n/a | |
| | | | | | | Enterprise Value to
Sales Multiple | | | 5.3 | x | | Increase | |
| | | | | | | Discount for Lack of
Marketability | | | 10 | % | | Decrease | |
| | | | | | | Enterprise Value to
Gross Profit | | | 7.3 | x | | Increase | |
| | | | | | | Sales Growth Rate | | | 40 | % | | Increase | |
| | | | | | | Gross Profit Growth
Rate | | | 40 | % | | Increase | |
AirBNB, Inc. - Series E | | | 1,879,589 | | | Recent Comparable
Transaction Price/
Market Comparable | | Discount Factor* | | | — | | | n/a | |
| | | | | | | Enterprise Value to
Sales Multiple | | | 5.3 | x | | Increase | |
| | | | | | | Discount for Lack of
Marketability | | | 10 | % | | Decrease | |
| | | | | | | Enterprise Value to
Gross Profit | | | 7.3 | x | | Increase | |
| | | | | | | Sales Growth Rate | | | 40 | % | | Increase | |
| | | | | | | Gross Profit Growth
Rate | | | 40 | % | | Increase | |
Flipkart Online Services Pvt. Ltd., -
Series A | | | 76,816 | | | Recent Comparable
Transaction Price | | Discount Factor* | | | — | | | n/a | |
See Accompanying Notes to Financial Statements
155
VY® T. ROWE PRICE SUMMARY PORTFOLIO OF INVESTMENTS
GROWTH EQUITY PORTFOLIO AS OF DECEMBER 31, 2017 (CONTINUED)
Investments, at fair value | | Fair Value at
December 31,
2017 | | Valuation
Technique(s) | | Unobservable
Inputs | | Range | | Impact to Valuation
from an Increase
in Input** | |
Flipkart Online Services Pvt. Ltd., -
Series C $135,778 | | Recent Comparable | | Transaction Price | | Discount Factor* | | | — | | | n/a | |
Flipkart Online Services Pvt. Ltd., -
Series E | | | 252,396 | | | Recent Comparable
Transaction Price | | Discount Factor* | | | — | | | n/a | |
Flipkart Online Services Pvt. Ltd., -
Series G | | | 1,640,419 | | | Recent Comparable
Transaction Price | | Discount Factor* | | | — | | | n/a | |
Flipkart Online Services Pvt. Ltd., -
Series H | | | 1,650,985 | | | Recent Comparable
Transaction Price | | Discount Factor* | | | — | | | n/a | |
Magic Leap, Inc., Series C | | | 2,523,393 | | | Recent Comparable
Transaction Price | | Discount Factor* | | | — | | | n/a | |
Magic Leap, Inc., Series D | | | 1,673,163 | | | Recent Comparable
Transaction Price | | Discount Factor* | | | — | | | n/a | |
Uber Technologies, Inc. - Series G | | | 2,530,124 | | | Recent Comparable
Transaction Price | | Discount Factor* | | | — | | | n/a | |
WeWork Companies, Inc. - Series E | | | 2,088,651 | | | Recent Comparable
Transaction Price | | Discount Factor* | | | — | | | n/a | |
Xiaoju Kuaizhi, Inc., Series A-17 | | | 3,464,707 | | | Recent Comparable
Transaction Price | | Discount Factor* | | | — | | | n/a | |
Total Preferred Stock | | $ | 24,850,180 | | | | | | | | | | |
* No quantitative unobservable inputs were significant to the fair valuation determination at December 31, 2017.
** Represents the directional change in the fair value of the Level 3 investment(s) that would result from an increase in the corresponding input. A decrease in the unobservable input would have the opposite effect. Significant increases and decreases in these inputs in isolation could result in significantly higher or lower fair value measurements.
The following is a reconciliation of the fair valuations using significant unobservable inputs (Level 3) for the Portfolio's assets and liabilities during the year ended December 31, 2017:
| | | Beginning
Balance
12/31/16 | | Purchases | | Sales | | Accrued
Discounts/
(Premiums) | | Total
Realized
Gain/(Loss) | | Net Change
in Unrealized
Appreciation/
(Depreciation)* | | Transfers
Into
Level 3 | | Transfers
Out of
Level 3 | | Ending
Balance
12/31/17 | |
Asset Table | |
Investments,
at fair value
Common Stock | | $ | 1,827,749 | | | $ | — | | | $ | (42,906 | ) | | $ | — | | | $ | (14,438 | ) | | $ | 215,807 | | | $ | — | | | $ | — | | | $ | 1,986,212 | | |
Preferred Stock | | | 23,579,639 | | | | 1,673,163 | | | | (2,474,703 | ) | | | — | | | | (713,981 | ) | | | 2,786,062 | | | | — | | | | — | | | | 24,850,180 | | |
Total Investments,
at value | | $ | 25,407,388 | | | $ | 1,673,163 | | | $ | (2,517,609 | ) | | $ | — | | | $ | (728,419 | ) | | $ | 3,001,869 | | | $ | — | | | $ | — | | | $ | 26,836,392 | | |
* As of December 31, 2017, total change in unrealized gain (loss) on Level 3 securities still held at period end and included in the change in net assets was $3,850,970.
At December 31, 2017, the aggregate cost of securities and other investments and the composition of unrealized appreciation and depreciation of securities and other investments at period end were:
Cost for federal income tax purposes was $1,314,220,269.
Net unrealized appreciation consisted of: | |
Gross Unrealized Appreciation | | $ | 494,776,065 | | |
Gross Unrealized Depreciation | | | (13,796,556 | ) | |
Net Unrealized Appreciation | | $ | 480,979,509 | | |
See Accompanying Notes to Financial Statements
156
VY® TEMPLETON SUMMARY PORTFOLIO OF INVESTMENTS
FOREIGN EQUITY PORTFOLIO AS OF DECEMBER 31, 2017
Shares | |
| |
| | Value | | Percentage
of Net
Assets | |
COMMON STOCK: 98.2% | | | |
| | | | | Canada: 2.2% | |
| | 460,200 | | | | (1 | ) | | Husky Energy, Inc. | | $ | 6,498,449 | | | | 1.1 | | |
| | 676,810 | | | | | | | Other Securities | | | 7,018,730 | | | | 1.1 | | |
| | | | | | | | | | 13,517,179 | | | | 2.2 | | |
| | | | | China: 7.1% | |
| | 36,110 | | | | (1 | ) | | Baidu, Inc. ADR | | | 8,457,323 | | | | 1.3 | | |
| | 2,585,000 | | | | | | | China Life Insurance
Co., Ltd. | | | 8,061,357 | | | | 1.3 | | |
| | 729,000 | | | | | | | China Mobile Ltd. | | | 7,371,680 | | | | 1.2 | | |
| | 21,246,000 | | | | | | | China Telecom Corp.,
Ltd. | | | 10,077,196 | | | | 1.6 | | |
| | 3,856,800 | | | | | | | Other Securities | | | 10,590,843 | | | | 1.7 | | |
| | | | | | | | | | 44,558,399 | | | | 7.1 | | |
| | | | | France: 9.3% | |
| | 306,996 | | | | | | | AXA S.A. | | | 9,097,259 | | | | 1.4 | | |
| | 155,207 | | | | | | | BNP Paribas | | | 11,545,601 | | | | 1.8 | | |
| | 121,133 | | | | | | | Cie de Saint-Gobain | | | 6,666,687 | | | | 1.1 | | |
| | 47,171 | | | | | | | Cie Generale des
Etablissements
Michelin | | | 6,748,041 | | | | 1.1 | | |
| | 108,732 | | | | | | | Sanofi | | | 9,360,926 | | | | 1.5 | | |
| | 284,240 | | | | | | | Veolia Environnement | | | 7,247,865 | | | | 1.2 | | |
| | 273,851 | | | | | | | Other Securities | | | 7,773,226 | | | | 1.2 | | |
| | | | | | | | | | 58,439,605 | | | | 9.3 | | |
| | | | | Germany: 11.3% | |
| | 87,212 | | | | | | | Bayer AG | | | 10,837,213 | | | | 1.7 | | |
| | 73,732 | | | | | | | HeidelbergCement AG | | | 7,950,161 | | | | 1.3 | | |
| | 391,745 | | | | (1 | ) | | Infineon
Technologies AG | | | 10,668,836 | | | | 1.7 | | |
| | 187,470 | | | | (2 | ) | | Innogy SE | | | 7,336,939 | | | | 1.2 | | |
| | 111,924 | | | | | | | Lanxess | | | 8,872,120 | | | | 1.4 | | |
| | 83,268 | | | | | | | Merck KGaA | | | 8,937,697 | | | | 1.4 | | |
| | 69,071 | | | | | | | Siemens AG | | | 9,563,384 | | | | 1.5 | | |
| | 65,992 | | | | (3 | ),(4) | | Other Securities | | | 6,660,522 | | | | 1.1 | | |
| | | | | | | | | | 70,826,872 | | | | 11.3 | | |
| | | | | Hong Kong: 3.6% | |
| | 973,900 | | | | | | | AIA Group Ltd. | | | 8,283,650 | | | | 1.3 | | |
| | 228,400 | | | | | | | CK Hutchison Holdings
Ltd. ADR | | | 2,867,562 | | | | 0.5 | | |
| | 485,640 | | | | | | | CK Hutchison Holdings
Ltd. | | | 6,085,216 | | | | 1.0 | | |
| | 583,140 | | | | | | | Other Securities | | | 5,083,330 | | | | 0.8 | | |
| | | | | | | | | | 22,319,758 | | | | 3.6 | | |
| | | | | India: 1.8% | |
| | 413,798 | | | | | | | Housing Development
Finance Corp. | | | 11,080,951 | | | | 1.8 | | |
Shares | |
| |
| | Value | | Percentage
of Net
Assets | |
| | | | | Ireland: 0.3% | |
| | 227,200 | | | | (4 | ) | | Other Securities | | $ | 1,934,133 | | | | 0.3 | | |
| | | | | Israel: 1.0% | |
| | 339,858 | | | | (5 | ) | | Teva Pharmaceutical
Industries Ltd. ADR | | | 6,440,309 | | | | 1.0 | | |
| | | | | Italy: 1.5% | |
| | 571,066 | | | | | | | ENI S.p.A. | | | 9,449,942 | | | | 1.5 | | |
| | | | | Japan: 12.7% | |
| | 522,200 | | | | | | | Inpex Corp. | | | 6,499,312 | | | | 1.0 | | |
| | 277,700 | | | | | | | Mitsui Fudosan Co., Ltd. | | | 6,210,893 | | | | 1.0 | | |
| | 133,800 | | | | | | | Omron Corp. | | | 7,958,284 | | | | 1.3 | | |
| | 646,600 | | | | | | | Panasonic Corp. | | | 9,436,427 | | | | 1.5 | | |
| | 24,300 | | | | | | | Ryohin Keikaku Co., Ltd. | | | 7,564,325 | | | | 1.2 | | |
| | 135,100 | | | | | | | SoftBank Group Corp. | | | 10,695,945 | | | | 1.7 | | |
| | 192,800 | | | | | | | Sumitomo Metal Mining
Co., Ltd. | | | 8,820,655 | | | | 1.4 | | |
| | 240,400 | | | | | | | Suntory Beverage &
Food Ltd. | | | 10,690,557 | | | | 1.7 | | |
| | 598,400 | | | | (3 | ) | | Other Securities | | | 11,874,479 | | | | 1.9 | | |
| | | | | | | | | | 79,750,877 | | | | 12.7 | | |
| | | | | Luxembourg: 1.0% | |
| | 392,554 | | | | (1 | ) | | SES S.A. - Luxembourg | | | 6,127,769 | | | | 1.0 | | |
| | | | | Netherlands: 5.0% | |
| | 510,931 | | | | | | | Royal Dutch Shell PLC -
Class B | | | 17,205,071 | | | | 2.7 | | |
| | 374,301 | | | | | | | SBM Offshore NV | | | 6,588,352 | | | | 1.1 | | |
| | 180,836 | | | | (4 | ) | | Other Securities | | | 7,649,281 | | | | 1.2 | | |
| | | | | | | | | | 31,442,704 | | | | 5.0 | | |
| | | | | Norway: 2.4% | |
| | 475,788 | | | | | | | Telenor ASA | | | 10,185,097 | | | | 1.6 | | |
| | 109,447 | | | | | | | Other Securities | | | 5,025,188 | | | | 0.8 | | |
| | | | | | | | | | 15,210,285 | | | | 2.4 | | |
| | | | | Portugal: 1.0% | |
| | 338,807 | | | | | | | Galp Energia SGPS SA | | | 6,224,800 | | | | 1.0 | | |
| | | | | Singapore: 3.3% | |
| | 334,182 | | | | | | | DBS Group Holdings
Ltd. | | | 6,181,124 | | | | 1.0 | | |
| | 3,347,000 | | | | | | | Singapore
Telecommunications
Ltd. | | | 8,923,526 | | | | 1.4 | | |
| | 282,900 | | | | | | | Other Securities | | | 5,576,813 | | | | 0.9 | | |
| | | | | | | | | | 20,681,463 | | | | 3.3 | | |
See Accompanying Notes to Financial Statements
157
VY® TEMPLETON SUMMARY PORTFOLIO OF INVESTMENTS
FOREIGN EQUITY PORTFOLIO AS OF DECEMBER 31, 2017 (CONTINUED)
Shares | |
| |
| | Value | | Percentage
of Net
Assets | |
| | | | | South Korea: 5.9% | |
| | 171,216 | | | | | | | Hana Financial Group,
Inc. | | $ | 7,958,368 | | | | 1.3 | | |
| | 114,480 | | | | | | | KB Financial Group, Inc.
ADR | | | 6,698,225 | | | | 1.0 | | |
| | 16,291 | | | | | | | Samsung Electronics
Co., Ltd. GDR | | | 19,291,875 | | | | 3.1 | | |
| | 13,043 | | | | | | | Other Securities | | | 3,204,249 | | | | 0.5 | | |
| | | | | | | | | | 37,152,717 | | | | 5.9 | | |
| | | | | Sweden: 0.9% | |
| | 645,988 | | | | (3 | ),(4) | | Other Securities | | | 5,605,407 | | | | 0.9 | | |
| | | | | Switzerland: 5.2% | |
| | 74,580 | | | | | | | Novartis AG | | | 6,276,094 | | | | 1.0 | | |
| | 43,811 | | | | | | | Roche Holding AG | | | 11,077,846 | | | | 1.8 | | |
| | 547,076 | | | | | | | UBS Group AG | | | 10,051,295 | | | | 1.6 | | |
| | 61,380 | | | | (4 | ) | | Other Securities | | | 5,366,242 | | | | 0.8 | | |
| | | | | | | | | | 32,771,477 | | | | 5.2 | | |
| | | | | Taiwan: 1.3% | |
| | 1,099,251 | | | | | | | Taiwan Semiconductor
Manufacturing Co.,
Ltd. | | | 8,417,047 | | | | 1.3 | | |
| | | | | Thailand: 1.4% | |
| | 1,298,000 | | | | | | | Bangkok Bank PCL -
Foreign Reg | | | 8,722,369 | | | | 1.4 | | |
| | | | | United Kingdom: 19.9% | |
| | 1,403,493 | | | | | | | BAE Systems PLC | | | 10,843,823 | | | | 1.7 | | |
| | 3,841,860 | | | | | | | Barclays PLC | | | 10,516,574 | | | | 1.7 | | |
| | 2,584,939 | | | | | | | BP PLC | | | 18,134,049 | | | | 2.9 | | |
| | 217,734 | | | | | | | CRH PLC - London | | | 7,814,456 | | | | 1.3 | | |
| | 1,214,000 | | | | | | | HSBC Holdings PLC
(HKD) | | | 12,481,519 | | | | 2.0 | | |
| | 164,170 | | | | | | | Johnson Matthey PLC | | | 6,802,923 | | | | 1.1 | | |
| | 1,514,234 | | | | | | | Kingfisher PLC | | | 6,904,070 | | | | 1.1 | | |
| | 127,185 | | | | | | | Shire PLC | | | 6,590,856 | | | | 1.1 | | |
| | 1,090,602 | | | | (1 | ) | | Standard Chartered
PLC | | | 11,453,026 | | | | 1.8 | | |
| | 3,653,591 | | | | | | | Vodafone Group PLC | | | 11,548,960 | | | | 1.8 | | |
| | 3,614,253 | | | | (4 | ) | | Other Securities | | | 21,547,246 | | | | 3.4 | | |
| | | | | | | | | | 124,637,502 | | | | 19.9 | | |
| | | | | United States: 0.1% | |
| | 173,400 | | | | | | | Other Securities | | | 831,823 | | | | 0.1 | | |
| | | | | | | Total Common Stock
(Cost $462,737,000) | | | 616,143,388 | | | | 98.2 | | |
Shares | |
| |
| | Value | | Percentage
of Net
Assets | |
PREFERRED STOCK: 0.0% | | | |
| | | | | United Kingdom: 0.0% | |
| | 14,672,160 | | | | (4 | ) | | Other Securities | | | 19,810 | | | | 0.0 | | |
| | | | | | | Total Preferred Stock
(Cost $19,296) | | | 19,810 | | | | 0.0 | | |
| | | | | | | Total Long-Term
Investments
(Cost $462,756,296) | | | 616,163,198 | | | | 98.2 | | |
Principal
Amount† | |
| |
| | Value | | Percentage
of Net
Assets | |
SHORT-TERM INVESTMENTS: 3.5% | | | |
| | | | | U.S. Government Agency Obligations: 1.6% | |
| | 10,000,000 | | | | | | | Federal Home Loan
Bank Discount Notes,
01/02/18
(Cost $9,999,708) | | $ | 10,000,000 | | | | 1.6 | | |
| | | | | Securities Lending Collateral(6): 1.8% | |
| | 2,736,364 | | | | | | | Cantor Fitzgerald,
Repurchase
Agreement dated
12/29/17, 1.41%,
due 01/02/18
(Repurchase
Amount $2,736,787,
collateralized by
various U.S.
Government\U.S.
Government Agency
Obligations,
0.000%-8.500%,
Market Value plus
accrued interest
$2,791,091, due
01/31/18-06/20/63) | | | 2,736,364 | | | | 0.4 | | |
| | 2,736,364 | | | | | | | Daiwa Capital Markets,
Repurchase
Agreement dated
12/29/17, 1.43%,
due 01/02/18
(Repurchase
Amount $2,736,793,
collateralized by
various U.S.
Government\U.S.
Government Agency
Obligations,
0.000%-6.500%,
Market Value plus
accrued interest
$2,791,091, due
01/11/18-12/01/51) | | | 2,736,364 | | | | 0.5 | | |
See Accompanying Notes to Financial Statements
158
VY® TEMPLETON SUMMARY PORTFOLIO OF INVESTMENTS
FOREIGN EQUITY PORTFOLIO AS OF DECEMBER 31, 2017 (CONTINUED)
Principal
Amount† | |
| |
| | Value | | Percentage
of Net
Assets | |
| | | | | Securities Lending Collateral(6) (continued) | |
| | 2,736,364 | | | | | | | Millenium Fixed Income
Ltd., Repurchase
Agreement dated
12/29/17, 1.44%,
due 01/02/18
(Repurchase
Amount $2,736,796,
collateralized
by various
U.S. Government
Securities,
2.875%-3.625%,
Market Value plus
accrued interest
$2,791,091, due
02/15/43-02/15/44) | | $ | 2,736,364 | | | | 0.4 | | |
| | 575,605 | | | | | | | RBC Dominion
Securities Inc.,
Repurchase
Agreement dated
12/29/17, 1.40%,
due 01/02/18
(Repurchase
Amount $575,693,
collateralized by
various U.S.
Government and U.S.
Government Agency
Obligations,
1.875%-8.875%,
Market Value plus
accrued interest
$587,117, due
02/15/19-12/20/47) | | | 575,605 | | | | 0.1 | | |
| | 2,736,364 | | | | | | | State of Wisconsin
Investment Board,
Repurchase
Agreement dated
12/29/17, 1.63%,
due 01/02/18
(Repurchase
Amount $2,736,853,
collateralized by
various U.S.
Government
Securities,
0.125%-3.875%,
Market Value plus
accrued interest
$2,812,352, due
01/15/19-02/15/46) | | | 2,736,364 | | | | 0.4 | | |
| | | | | | | | | | 11,521,061 | | | | 1.8 | | |
Shares | |
| |
| | Value | | Percentage
of Net
Assets | |
| | | | | Mutual Funds: 0.1% | |
| | 661,988 | | | | (7 | ) | | BlackRock Liquidity
Funds, FedFund,
Institutional
Class, 1.170%
(Cost $661,988) | | $ | 661,988 | | | | 0.1 | | |
| | | | | Total Short-Term
Investments
(Cost $22,182,757) | | | 22,183,049 | | | | 3.5 | | |
| | | | | Total Investments
in Securities
(Cost $484,939,053) | | $ | 638,346,247 | | | | 101.7 | | |
| | | | | Liabilities in Excess
of Other Assets | | | (10,743,065 | ) | | | (1.7 | ) | |
| | | | | Net Assets | | $ | 627,603,182 | | | | 100.0 | | |
"Other Securities" represents issues not identified as the top 50 holdings in terms of market value and issues or issuers not exceeding 1% of net assets individually or in aggregate respectively as of December 31, 2017.
The following footnotes apply to either the individual securities noted or one or more of the securities aggregated and listed as a single line item.
† Unless otherwise indicated, principal amount is shown in USD.
ADR American Depositary Receipt
GDR Global Depositary Receipt
(1) Non-income producing security.
(2) Securities with purchases pursuant to Rule 144A or section 4(a)(2), under the Securities Act of 1933 and may not be resold subject to that rule except to qualified institutional buyers.
(3) The grouping contains securities on loan.
(4) The grouping contains non-income producing securities.
(5) Security, or a portion of the security, is on loan.
(6) Represents securities purchased with cash collateral received for securities on loan.
(7) Rate shown is the 7-day yield as of December 31, 2017.
Sector Diversification | | Percentage of
Net Assets | |
Financials | | | 21.6 | % | |
Health Care | | | 14.0 | | |
Energy | | | 12.5 | | |
Information Technology | | | 10.3 | | |
Telecommunication Services | | | 9.3 | | |
Materials | | | 9.0 | | |
Industrials | | | 8.6 | | |
Consumer Discretionary | | | 7.0 | | |
Utilities | | | 2.4 | | |
Real Estate | | | 1.8 | | |
Consumer Staples | | | 1.7 | | |
Short-Term Investments | | | 3.5 | | |
Liabilities in Excess of Other Assets | | | (1.7 | ) | |
Net Assets | | | 100.0 | % | |
See Accompanying Notes to Financial Statements
159
VY® TEMPLETON SUMMARY PORTFOLIO OF INVESTMENTS
FOREIGN EQUITY PORTFOLIO AS OF DECEMBER 31, 2017 (CONTINUED)
Fair Value Measurements^
The following is a summary of the fair valuations according to the inputs used as of December 31, 2017 in valuing the assets and liabilities:(1)
| | | Quoted Prices
in Active Markets
for Identical Investments
(Level 1) | | Significant Other
Observable
Inputs#
(Level 2) | | Significant
Unobservable
Inputs
(Level 3) | | Fair Value
at
December 31, 2017 | |
Asset Table | |
Investments, at fair value | |
Common Stock | |
Canada | | $ | 13,517,179 | | | $ | — | | | $ | — | | | $ | 13,517,179 | | |
China | | | 12,598,163 | | | | 31,960,236 | | | | — | | | | 44,558,399 | | |
France | | | — | | | | 58,439,605 | | | | — | | | | 58,439,605 | | |
Germany | | | — | | | | 70,826,872 | | | | — | | | | 70,826,872 | | |
Hong Kong | | | 2,867,562 | | | | 19,452,196 | | | | — | | | | 22,319,758 | | |
India | | | — | | | | 11,080,951 | | | | — | | | | 11,080,951 | | |
Ireland | | | 1,934,133 | | | | — | | | | — | | | | 1,934,133 | | |
Israel | | | 6,440,309 | | | | — | | | | — | | | | 6,440,309 | | |
Italy | | | — | | | | 9,449,942 | | | | — | | | | 9,449,942 | | |
Japan | | | — | | | | 79,750,877 | | | | — | | | | 79,750,877 | | |
Luxembourg | | | 6,127,769 | | | | — | | | | — | | | | 6,127,769 | | |
Netherlands | | | 6,588,352 | | | | 24,854,352 | | | | — | | | | 31,442,704 | | |
Norway | | | — | | | | 15,210,285 | | | | — | | | | 15,210,285 | | |
Portugal | | | — | | | | 6,224,800 | | | | — | | | | 6,224,800 | | |
Singapore | | | — | | | | 20,681,463 | | | | — | | | | 20,681,463 | | |
South Korea | | | 9,902,474 | | | | 27,250,243 | | | | — | | | | 37,152,717 | | |
Sweden | | | 921,760 | | | | 4,683,647 | | | | — | | | | 5,605,407 | | |
Switzerland | | | — | | | | 32,771,477 | | | | — | | | | 32,771,477 | | |
Taiwan | | | — | | | | 8,417,047 | | | | — | | | | 8,417,047 | | |
Thailand | | | 8,722,369 | | | | — | | | | — | | | | 8,722,369 | | |
United Kingdom | | | 21,538,841 | | | | 103,098,661 | | | | — | | | | 124,637,502 | | |
United States | | | 831,823 | | | | — | | | | — | | | | 831,823 | | |
Total Common Stock | | | 91,990,734 | | | | 524,152,654 | | | | — | | | | 616,143,388 | | |
Preferred Stock | | | — | | | | 19,810 | | | | — | | | | 19,810 | | |
Short-Term Investments | | | 661,988 | | | | 21,521,061 | | | | — | | | | 22,183,049 | | |
Total Investments, at fair value | | $ | 92,652,722 | | | $ | 545,693,525 | | | $ | — | | | $ | 638,346,247 | | |
Other Financial Instruments+ | |
Forward Foreign Currency Contracts | | | — | | | | 362 | | | | — | | | | 362 | | |
Total Assets | | $ | 92,652,722 | | | $ | 545,693,887 | | | $ | — | | | $ | 638,346,609 | | |
(1) For the year ended December 31, 2017, as a result of the fair value pricing procedures for international equities (Note 2) utilized by the Portfolio certain securities have transferred in and out of Level 1 and Level 2 measurements during the year. The Portfolio's policy is to recognize transfers between levels at the beginning of the reporting period. At December 31, 2017, securities valued at $5,478,038 and $25,266,307 were transferred from Level 1 to Level 2 and from Level 2 to Level 1, respectively, within the fair value hierarchy.
^ See Note 2, "Significant Accounting Policies" in the Notes to Financial Statements for additional information.
+ Other Financial Instruments are derivatives not reflected in the Portfolio of Investments and may include open forward foreign currency contracts, futures, centrally cleared swaps, OTC swaps and written options. Forward foreign currency contracts, futures and centrally cleared swaps are valued at the unrealized gain (loss) on the instrument. OTC swaps and written options are valued at the fair value of the instrument.
# The earlier close of the foreign markets gives rise to the possibility that significant events, including broad market moves, may have occurred in the interim and may materially affect the value of those securities. To account for this, the Portfolio may frequently value many of its foreign equity securities using fair value prices based on third party vendor modeling tools to the extent available. Accordingly, a portion of the Portfolio's investments are categorized as Level 2 investments.
At December 31, 2017, the following forward foreign currency contracts were outstanding for VY® Templeton Foreign Equity Portfolio:
Currency Purchased | | Currency Sold | | Counterparty | | Settlement
Date | | Unrealized
Appreciation
(Depreciation) | |
CHF | 38,526 | | | USD | 39,536 | | | Bank of America N.A. | | 01/04/18 | | $ | 6 | | |
CHF | 84,225 | | | USD | 86,084 | | | Goldman Sachs & Co. | | 01/03/18 | | | 356 | | |
| | | | | | | | | $ | 362 | | |
Currency Abbreviations
CHF — Swiss Franc
USD — United States Dollar
See Accompanying Notes to Financial Statements
160
VY® TEMPLETON SUMMARY PORTFOLIO OF INVESTMENTS
FOREIGN EQUITY PORTFOLIO AS OF DECEMBER 31, 2017 (CONTINUED)
A summary of derivative instruments by primary risk exposure is outlined in the following tables.
The fair value of derivative instruments as of December 31, 2017 was as follows:
Derivatives not accounted
for as hedging instruments | | Location on Statement of Assets and Liabilities | | Fair Value | |
Asset Derivatives | |
Foreign exchange contracts | | Unrealized appreciation on forward foreign currency contracts | | $ | 362 | | |
Total Asset Derivatives | | | | $ | 362 | | |
The effect of derivative instruments on the Portfolio's Statement of Operations for the year ended December 31, 2017 was as follows:
| | | Amount of Realized Gain or (Loss) on Derivatives Recognized in Income | |
Derivatives not accounted
for as hedging instruments | | Forward foreign currency contracts | |
Foreign exchange contracts | | $ | (3,912 | ) | |
Total | | $ | (3,912 | ) | |
| | | Change in Unrealized Appreciation or (Depreciation) on Derivatives Recognized in Income | |
Derivatives not accounted
for as hedging instruments | | Forward foreign currency contracts | |
Foreign exchange contracts | | $ | 362 | | |
Total | | $ | 362 | | |
The following is a summary by counterparty of the fair value of OTC derivative instruments subject to Master Netting Agreements and collateral pledged (received), if any, at December 31, 2017:
| | | Bank of
America N.A. | | Goldman
Sachs & Co. | | Totals | |
Assets: | |
Forward foreign currency contracts | | $ | 6 | | | $ | 356 | | | $ | 362 | | |
Total Assets | | $ | 6 | | | $ | 356 | | | $ | 362 | | |
Net OTC derivative instruments by counterparty, at fair value | | $ | 6 | | | $ | 356 | | | $ | 362 | | |
Total collateral pledged by the Portfolio/(Received from counterparty) | | $ | — | | | $ | — | | | $ | — | | |
Net Exposure(1) | | $ | 6 | | | $ | 356 | | | $ | 362 | | |
(1) Positive net exposure represents amounts due from each respective counterparty. Negative exposure represents amounts due from the Portfolio. Please refer to Note 2 for additional details regarding counterparty credit risk and credit related contingent features.
At December 31, 2017, the aggregate cost of securities and other investments and the composition of unrealized appreciation and depreciation of securities and other investments at period end were:
Cost for federal income tax purposes was $490,490,073.
Net unrealized appreciation consisted of: | |
Gross Unrealized Appreciation | | $ | 176,556,177 | | |
Gross Unrealized Depreciation | | | (28,618,576 | ) | |
Net Unrealized Appreciation | | $ | 147,937,601 | | |
See Accompanying Notes to Financial Statements
161
TAX INFORMATION (UNAUDITED)
Dividends and distributions paid during the year ended December 31, 2017 were as follows:
Portfolio Name | | Type | | Per Share Amount | |
Voya Global Bond Portfolio | |
Class ADV | | NII | | $ | 0.2208 | | |
Class I | | NII | | $ | 0.2790 | | |
Class S | | NII | | $ | 0.2515 | | |
VY® American Century Small-Mid Cap Value Portfolio | |
Class ADV | | NII | | $ | 0.1182 | | |
Class I | | NII | | $ | 0.1679 | | |
Class S | | NII | | $ | 0.1412 | | |
Class S2 | | NII | | $ | 0.1223 | | |
All Classes | | STCG | | $ | 0.1962 | | |
All Classes | | LTCG | | $ | 0.3224 | | |
VY® Baron Growth Portfolio | |
Class ADV | | NII | | $ | 0.1634 | | |
Class I | | NII | | $ | 0.3069 | | |
Class R6 | | NII | | $ | 0.3070 | | |
Class S | | NII | | $ | 0.2311 | | |
Class S2 | | NII | | $ | 0.1117 | | |
All Classes | | LTCG | | $ | 3.4015 | | |
VY® Columbia Contrarian Core Portfolio | |
Class ADV | | NII | | $ | 0.1955 | | |
Class I | | NII | | $ | 0.2949 | | |
Class S | | NII | | $ | 0.2337 | | |
All Classes | | LTCG | | $ | 1.3621 | | |
VY® Columbia Small Cap Value II Portfolio | |
Class ADV | | NII | | $ | 0.0321 | | |
Class I | | NII | | $ | 0.1083 | | |
Class R6 | | NII | | $ | 0.1084 | | |
Class S | | NII | | $ | 0.0584 | | |
Class S2 | | NII | | $ | 0.0376 | | |
All Classes | | LTCG | | $ | 0.7912 | | |
VY® Invesco Comstock Portfolio | |
Class ADV | | NII | | $ | 0.1825 | | |
Class I | | NII | | $ | 0.2787 | | |
Class S | | NII | | $ | 0.2266 | | |
VY® Invesco Equity and Income Portfolio | |
Class ADV | | NII | | $ | 0.6109 | | |
Class I | | NII | | $ | 1.0380 | | |
Class S | | NII | | $ | 0.7875 | | |
Class S2 | | NII | | $ | 0.6623 | | |
All Classes | | LTCG | | $ | 1.1345 | | |
Portfolio Name | | Type | | Per Share Amount | |
VY® JPMorgan Mid Cap Value Portfolio | |
Class ADV | | NII | | $ | 0.0733 | | |
Class I | | NII | | $ | 0.1716 | | |
Class S | | NII | | $ | 0.1189 | | |
Class S2 | | NII | | $ | 0.0852 | | |
All Classes | | STCG | | $ | 0.1539 | | |
All Classes | | LTCG | | $ | 1.7876 | | |
VY® Oppenheimer Global Portfolio | |
Class ADV | | NII | | $ | 0.1292 | | |
Class I | | NII | | $ | 0.2168 | | |
Class S | | NII | | $ | 0.1730 | | |
Class S2 | | NII | | $ | 0.1566 | | |
All Classes | | LTCG | | $ | 0.0310 | | |
VY® Pioneer High Yield Portfolio | |
Class I | | NII | | $ | 0.5864 | | |
Class S | | NII | | $ | 0.5560 | | |
VY® T. Rowe Price Diversified Mid Cap Growth Portfolio | |
Class ADV | | NII | | $ | 0.0250 | | |
Class I | | NII | | $ | 0.0708 | | |
Class R6 | | NII | | $ | 0.0708 | | |
Class S | | NII | | $ | 0.0496 | | |
Class S2 | | NII | | $ | 0.0354 | | |
All Classes | | STCG | | $ | 0.0433 | | |
All Classes | | LTCG | | $ | 0.7597 | | |
VY® T. Rowe Price Growth Equity Portfolio | |
Class ADV | | NII | | $ | — | | |
Class I | | NII | | $ | 0.0492 | | |
Class S | | NII | | $ | — | | |
Class S2 | | NII | | $ | — | | |
All Classes | | LTCG | | $ | 9.4870 | | |
VY® Templeton Foreign Equity Portfolio | |
Class ADV | | NII | | $ | 0.1923 | | |
Class I | | NII | | $ | 0.2492 | | |
Class S | | NII | | $ | 0.2168 | | |
Class S2 | | NII | | $ | 0.1803 | | |
NII — Net investment income
STCG — Short-term capital gain
LTCG — Long-term capital gain
Of the ordinary distributions made during the year ended December 31, 2017, the following percentages qualify for the dividends received deduction (DRD) available to corporate shareholders:
VY® American Century Small-Mid Cap Value Portfolio | | | 48.45 | % | |
VY® Baron Growth Portfolio | | | 99.55 | % | |
VY® Columbia Contrarian Core Portfolio | | | 100.00 | % | |
VY® Columbia Small Cap Value II Portfolio | | | 99.96 | % | |
VY® Invesco Comstock Portfolio | | | 95.40 | % | |
VY® Invesco Equity and Income Portfolio | | | 91.00 | % | |
VY® JPMorgan Mid Cap Value Portfolio | | | 100.00 | % | |
VY® Oppenheimer Global Portfolio | | | 41.98 | % | |
VY® Pioneer High Yield Portfolio | | | 3.05 | % | |
VY® T. Rowe Price Diversified Mid Cap Growth Portfolio | | | 78.48 | % | |
VY® T. Rowe Price Growth Equity Portfolio | | | 100.00 | % | |
The Portfolios designate the following amounts of long-term capital gain distributions as 20% rate long-term capital gain dividends under Internal Revenue Code Section 852(b)(3)(C):
VY® American Century Small-Mid Cap Value Portfolio | | $ | 8,958,058 | | |
VY® Baron Growth Portfolio | | $ | 84,384,390 | | |
VY® Columbia Contrarian Core Portfolio | | $ | 18,674,466 | | |
VY® Columbia Small Cap Value II Portfolio | | $ | 8,813,330 | | |
VY® Invesco Equity and Income Portfolio | | $ | 41,824,618 | | |
VY® JPMorgan Mid Cap Value Portfolio | | $ | 50,352,115 | | |
VY® Oppenheimer Global Portfolio | | $ | 2,476,337 | | |
VY® T. Rowe Price Diversified Mid Cap Growth Portfolio | | $ | 64,240,780 | | |
VY® T. Rowe Price Growth Equity Portfolio | | $ | 172,934,362 | | |
162
TAX INFORMATION (UNAUDITED) (CONTINUED)
Pursuant to Section 853 of the Internal Revenue Code, the Portfolios designate the following amounts as foreign taxes paid for the year ended December 31, 2017. Foreign taxes paid for purposes of Section 853 may be less than actual foreign taxes paid for financial statement purposes.
| | | Creditable
Foreign
Taxes Paid | | Per Share
Amount | | Portion of Ordinary
Income Distribution
Derived from Foreign
Sourced Income* | |
VY® Oppenheimer Global Portfolio | | $ | 1,175,441 | | | $ | 0.0149 | | | | 36.32 | % | |
VY® Templeton Foreign Equity Portfolio | | $ | 867,089 | | | $ | 0.0181 | | | | 71.84 | % | |
*None of the Portfolios listed above derived any income from ineligible foreign sources as defined under Section 901(j) of the Internal Revenue Code.
Foreign taxes paid or withheld must be included in taxable income with an offsetting deduction from gross income or as a credit for taxes paid to foreign governments. Shareholders are strongly advised to consult their own tax advisors regarding the appropriate treatment of foreign taxes paid.
Above figures may differ from those cited elsewhere in this report due to differences in the calculation of income and gains under U.S. generally accepted accounting principles (book) purposes and Internal Revenue Service (tax) purposes.
Shareholders are strongly advised to consult their own tax advisers with respect to the tax consequences of their investments in the Portfolios. In January, shareholders, excluding corporate shareholders, receive an IRS 1099-DIV regarding the federal tax status of the dividends and distributions they received in the calendar year.
163
DIRECTOR AND OFFICER INFORMATION (UNAUDITED)
The business and affairs of the Company are managed under the direction of the Board. A Director, who is not an interested person of the Company, as defined in the 1940 Act, is an independent director ("Independent Director"). The Directors and Officers of the Company are listed below. The Statement of Additional Information includes additional information about directors of the Company and is available, without charge, upon request at (800) 262-3862.
Name, Address
and Age | | Position(s)
held with the
Company | | Term of
Office and
Length of
Time
Served(1) | | Principal
Occupation(s) -
during the
Past 5 Years | | Number of
funds in
Fund Complex
Overseen
by Director(2) | | Other Board
Positions
held by
Director | |
Independent Directors*: | |
Colleen D. Baldwin
7337 East Doubletree Ranch Rd.
Suite 100
Scottsdale, Arizona 85258
Age: 57 | | Director | | November 2007 - Present | | President, Glantuam Partners, LLC, a business consulting firm (January 2009 - Present). | | | 151 | | | DSM/Dentaquest, Boston, MA (February 2014 - Present). | |
John V. Boyer
7337 East Doubletree Ranch Rd.
Suite 100
Scottsdale, Arizona 85258
Age: 64 | | Chairperson
Director | | January 2014 - Present
November 1997 - Present | | President and Chief Executive Officer, Bechtler Arts Foundation, an arts and education foundation (January 2008 - Present). | | | 151 | | | None. | |
Patricia W. Chadwick
7337 East Doubletree Ranch Rd.
Suite 100
Scottsdale, Arizona 85258
Age: 69 | | Director | | January 2006 - Present | | Consultant and President, Ravengate Partners LLC, a consulting firm that provides advice regarding financial markets and the global economy (January 2000 - Present). | | | 151 | | | Wisconsin Energy Corporation (June 2006 - Present); The Royce Funds (23 funds) (December 2009 - Present); and AMICA Mutual Insurance Company (1992 - Present). | |
Martin J. Gavin
7337 East Doubletree Ranch Rd. Suite 100
Scottsdale, AZ 85258
Age: 67 | | Director | | August 2015 - Present | | Retired. Formerly, President and Chief Executive Officer, Connecticut Children's Medical Center (May 2006 - November 2015). | | | 151 | | | None. | |
Russell H. Jones
7337 East Doubletree Ranch Rd.
Suite 100
Scottsdale, Arizona 85258
Age: 73 | | Director | | May 2013 - Present | | Retired. | | | 151 | | | None. | |
Patrick W. Kenny
7337 East Doubletree Ranch Rd.
Suite 100
Scottsdale, Arizona 85258
Age: 75 | | Director | | March 2002 - Present | | Retired. | | | 151 | | | Assured Guaranty Ltd. (April 2004 - Present). | |
Joseph E. Obermeyer
7337 East Doubletree Ranch Rd.
Suite 100
Scottsdale, Arizona 85258
Age: 60 | | Director | | May 2013 - Present | | President, Obermeyer & Associates, Inc., a provider of financial and economic consulting services (November 1999 - Present). | | | 151 | | | None. | |
Sheryl K. Pressler
7337 East Doubletree Ranch Rd.
Suite 100
Scottsdale, Arizona 85258
Age: 67 | | Director | | January 2006 - Present | | Consultant (May 2001 - Present). | | | 151 | | | None. | |
Christopher P. Sullivan
7337 East Doubletree Ranch Rd.
Suite 100
Scottsdale, Arizona 85258
Age: 64 | | Director | | October 2015 - Present | | Retired. Formerly, President, Bond Division, Fidelity Management and Research (June 2009 - September 2012). | | | 151 | | | None. | |
Roger B. Vincent
7337 East Doubletree Ranch Rd.
Suite 100
Scottsdale, Arizona 85258
Age: 72 | | Director | | January 2005 - Present | | Retired. | | | 151 | | | None. | |
164
DIRECTOR AND OFFICER INFORMATION (UNAUDITED) (CONTINUED)
Name, Address
and Age | | Position(s)
held with the
Company | | Term of
Office and
Length of
Time
Served(1) | | Principal
Occupation(s) -
during the
Past 5 Years | | Number of
funds in
Fund Complex
Overseen
by Director(2) | | Other Board
Positions
held by
Director | |
Director who is an "interested person": | |
Shaun P. Mathews(3)
7337 East Doubletree Ranch Rd.
Suite 100
Scottsdale, Arizona 85258
Age: 62 | | Director | | November 2007 - Present | | President and Chief Executive Officer, Voya Investments, LLC (December 2006 - Present). | | | 151 | | | Voya Capital Corporation, LLC and Voya Investments Distributor, LLC (December 2005 - Present); Voya Funds Services, LLC, Voya Investments, LLC and Voya Investment Management (March 2006 - Present); and Voya Investment Trust Co. (April 2009 - Present). | |
(1) Directors serve until their successors are duly elected and qualified. The tenure of each Director who is not an "interested person" as defined in the 1940 Act, of each Portfolio ("Independent Director") is subject to the Board's retirement policy which states that each duly elected or appointed Independent Director shall retire from and cease to be a member of the Board of Directors at the close of business on December 31 of the calendar year in which the Independent Director attains the age of 75. A majority vote of the Board's other Independent Directors may extend the retirement date of an Independent Director if the retirement would trigger a requirement to hold a meeting of shareholders of the Company under applicable law, whether for the purposes of appointing a successor to the Independent Director or otherwise comply under applicable law, in which case the extension would apply until such time as the shareholder meeting can be held or is no longer required (as determined by a vote of a majority of the other Independent Directors).
(2) For the purposes of this table, "Fund Complex" means the Voya family of funds including the following investment companies: Voya Asia Pacific High Dividend Equity Income Fund; Voya Balanced Portfolio, Inc.; Voya Emerging Markets High Dividend Equity Fund; Voya Equity Trust; Voya Funds Trust; Voya Global Advantage and Premium Opportunity Fund; Voya Global Equity Dividend and Premium Opportunity Fund; Voya Government Money Market Portfolio; Voya Infrastructure, Industrials and Materials Fund; Voya Intermediate Bond Portfolio; Voya International High Dividend Equity Income Fund; Voya Investors Trust; Voya Mutual Funds; Voya Natural Resources Equity Income Fund; Voya Partners, Inc.; Voya Prime Rate Trust; Voya Senior Income Fund; Voya Separate Portfolios Trust; Voya Series Fund, Inc.; Voya Strategic Allocation Portfolios, Inc.; Voya Variable Funds; Voya Variable Insurance Trust; Voya Variable Portfolios, Inc.; and Voya Variable Products Trust. The number of funds in the Fund Complex is as of January 31, 2018.
(3) Mr. Mathews is deemed to be an "interested person" of the Company as defined in the 1940 Act, because of his current affiliation with the Voya funds, Voya Financial, Inc., or Voya Financial, Inc.'s affiliates.
* Effective December 31, 2017, Peter S. Drotch retired as a Director of the Board.
165
DIRECTOR AND OFFICER INFORMATION (UNAUDITED) (CONTINUED)
Name, Address
and Age | | Position(s)
Held with the Company | | Term of Office and
Length of Time Served(1) | | Principal Occupation(s) - during the
Past 5 Years | |
Shaun P. Mathews
7337 East Doubletree Ranch Rd.
Suite 100
Scottsdale, Arizona 85258
Age: 62 | | President and Chief Executive Officer | | November 2006 - Present | | President and Chief Executive Officer, Voya Investments, LLC (December 2006 - Present). | |
Michael J. Roland
7337 East Doubletree Ranch Rd.
Suite 100
Scottsdale, Arizona 85258
Age: 59 | | Executive Vice President | | January 2005 - Present | | Managing Director and Chief Operating Officer, Voya Investments, LLC and Voya Funds Services, LLC (March 2012 - Present). Formerly, Chief Compliance Officer, Directed Services LLC and Voya Investments, LLC (March 2011 - December 2013). | |
Stanley D. Vyner
230 Park Avenue
New York, New York 10169
Age: 67 | | Executive Vice President
Chief Investment Risk Officer | | January 2005 - Present
September 2009 - Present | | Executive Vice President, Voya Investments, LLC (July 2000 - Present) and Chief Investment Risk Officer, Voya Investments, LLC (January 2003 - Present). | |
Kevin M. Gleason
7337 East Doubletree Ranch Rd.
Suite 100
Scottsdale, Arizona 85258
Age: 51 | | Chief Compliance Officer | | February 2012 - Present | | Senior Vice President, Voya Investment Management and Chief Compliance Officer, Voya Family of Funds (February 2012 - Present). | |
Todd Modic
7337 East Doubletree Ranch Rd.
Suite 100
Scottsdale, Arizona 85258
Age: 50 | | Senior Vice President, Chief/Principal Financial Officer and Assistant Secretary | | March 2005 - Present | | Senior Vice President, Voya Investments, LLC and Voya Funds Services, LLC (April 2005 - Present). | |
Kimberly A. Anderson
7337 East Doubletree Ranch Rd.
Suite 100
Scottsdale, Arizona 85258
Age: 53 | | Senior Vice President | | January 2005 - Present | | Senior Vice President, Voya Investments, LLC (September 2003 - Present). | |
Robert Terris
7337 East Doubletree Ranch Rd.
Suite 100
Scottsdale, Arizona 85258
Age: 47 | | Senior Vice President | | May 2006 - Present | | Senior Vice President, Head of Division Operations, Voya Investments, LLC (October 2015 - Present) and Voya Funds Services, LLC (March 2006 - Present). | |
Fred Bedoya
7337 East Doubletree Ranch Rd.
Suite 100
Scottsdale, Arizona 85258
Age: 45 | | Vice President and Treasurer | | September 2012 - Present | | Vice President, Voya Investments, LLC (October 2015 - Present) and Voya Funds Services, LLC (July 2012 - Present). | |
Maria M. Anderson
7337 East Doubletree Ranch Rd.
Suite 100
Scottsdale, Arizona 85258
Age: 59 | | Vice President | | January 2005 - Present | | Vice President, Voya Investments, LLC (October 2015 - Present) and Voya Funds Services, LLC (September 2004 - Present). | |
Lauren D. Bensinger
7337 East Doubletree Ranch Rd.
Suite 100
Scottsdale, Arizona 85258
Age: 64 | | Vice President | | January 2005 - Present | | Vice President, Voya Funds Services, LLC (February 1996 - Present) and Voya Investments, LLC (October 2004 - Present); Vice President and Anti-Money Laundering Officer, Voya Investments Distributor, LLC (April 2010 - Present). Anti-Money Laundering Officer, Voya Financial, Inc. (January 2013 - Present); and Anti-Money Laundering Officer, Voya Investment Management Trust Co. (October 2012 - Present). | |
Sara M. Donaldson
7337 East Doubletree Ranch Rd.
Suite 100
Scottsdale, Arizona 85258
Age: 58 | | Vice President | | September 2014 - Present | | Vice President, Voya Investments, LLC (October 2015 - Present). Formerly, Vice President, Voya Funds Services, LLC (April 2014 - October 2015). Formerly, Director, Compliance, AXA Rosenberg Global Services, LLC (September 1997 - March 2014). | |
166
DIRECTOR AND OFFICER INFORMATION (UNAUDITED) (CONTINUED)
Name, Address
and Age | | Position(s)
Held with the Company | | Term of Office and
Length of Time Served(1) | | Principal Occupation(s) - during the
Past 5 Years | |
Micheline S. Favor
7337 East Doubletree Ranch Rd.
Suite 100
Scottsdale, Arizona 85258
Age: 40 | | Vice President | | September 2016 - Present | | Vice President, Head of Fund Compliance, Voya Investments LLC, and Chief Compliance Officer for Voya Investments, LLC and Directed Services, LLC (June 2016 - Present). Formerly, Vice President, Mutual Fund Compliance (March 2014 - June 2016); Assistant Vice President, Mutual Fund Compliance (May 2013 - March 2014); Assistant Vice President, Senior Project Manager (May 2008 - May 2013). | |
Robyn L. Ichilov
7337 East Doubletree Ranch Rd.
Suite 100
Scottsdale, Arizona 85258
Age: 50 | | Vice President | | January 2005 - Present | | Vice President, Voya Funds Services, LLC (November 1995 - Present) and Voya Investments, LLC (August 1997 - Present). | |
Jason Kadavy
7337 East Doubletree Ranch Rd.
Suite 100
Scottsdale, Arizona 85258
Age: 41 | | Vice President | | September 2012 - Present | | Vice President, Voya Investments, LLC (October 2015 - Present) and Voya Funds Services, LLC (July 2007 - Present). | |
Kimberly K. Springer
7337 East Doubletree Ranch Rd.
Suite 100
Scottsdale, Arizona 85258
Age: 60 | | Vice President | | March 2006 - Present | | Vice President - Mutual Fund Product Development, Voya Investments, LLC (July 2012 - Present); Vice President, Voya Family of Funds (March 2010 - Present) and Vice President, Voya Funds Services, LLC (March 2006 - Present). | |
Craig Wheeler
7337 East Doubletree Ranch Rd.
Suite 100
Scottsdale, Arizona 85258
Age: 48 | | Vice President | | May 2013 - Present | | Vice President - Director of Tax, Voya Investments, LLC (October 2015 - Present). Formerly, Vice President - Director of Tax, Voya Funds Services, LLC (March 2013 - October 2015). Formerly, Assistant Vice President - Director of Tax, Voya Funds Services, LLC (March 2008 - February 2013). | |
Huey P. Falgout, Jr.
7337 East Doubletree Ranch Rd.
Suite 100
Scottsdale, Arizona 85258
Age: 54 | | Secretary | | August 2003 - Present | | Senior Vice President and Chief Counsel, Voya Investment Management - Mutual Fund Legal Department (March 2010 - Present). | |
Paul A. Caldarelli
7337 East Doubletree Ranch Rd.
Suite 100
Scottsdale, Arizona 85258
Age: 66 | | Assistant Secretary | | June 2010 - Present | | Vice President and Senior Counsel, Voya Investment Management - Mutual Fund Legal Department (March 2010 - Present). | |
Theresa K. Kelety
7337 East Doubletree Ranch Rd.
Suite 100
Scottsdale, Arizona 85258
Age: 55 | | Assistant Secretary | | August 2003 - Present | | Vice President and Senior Counsel, Voya Investment Management - Mutual Fund Legal Department (March 2010 - Present). | |
(1) The Officers hold office until the next annual meeting of the Board of Directors and until their successors shall have been elected and qualified.
167
ADVISORY AND SUB-ADVISORY CONTRACT APPROVAL DISCUSSION (UNAUDITED)
BOARD CONSIDERATION AND APPROVAL OF INVESTMENT MANAGEMENT CONTRACTS AND SUB-ADVISORY CONTRACTS
At a meeting held on November 16, 2017, the Board, including a majority of the Independent Directors, considered and approved the renewal of the investment management contracts (the "Management Contracts") between Voya Investments, LLC (the "Manager") and Voya Partners, Inc. (the "Company"), on behalf of Voya Global Bond Portfolio, VY® American Century Small-Mid Cap Value Portfolio, VY® Baron Growth Portfolio, VY® Columbia Contrarian Core Portfolio, VY® Columbia Small Cap Value II Portfolio, VY® Invesco Comstock Portfolio, VY® Invesco Equity and Income Portfolio, VY® JPMorgan Mid Cap Value Portfolio, VY® Oppenheimer Global Portfolio, VY® Pioneer High Yield Portfolio, VY® T. Rowe Price Diversified Mid Cap Growth Portfolio, VY® T. Rowe Price Growth Equity Portfolio, and VY® Templeton Foreign Equity Portfolio, each a series of the Company (the "Portfolios"), and the sub-advisory contracts (the "Sub-Advisory Contracts") with the respective sub-adviser to each Portfolio (the "Sub-Advisers"), for an additional one year period ending November 30, 2018. In determining to renew such contracts, the Board took into account information furnished to it throughout the year at meetings of the Board and its committees, including regarding performance, expenses, and other matters.
In addition to the Board meeting on November 16, 2017, the Independent Directors also held meetings outside the presence of personnel representing the Manager or Sub-Advisers (collectively, such persons are referred to herein as "Management") on October 12, 2017, and November 14, 2017, specifically to review and consider materials related to the proposed continuance of each Management Contract and Sub-Advisory Contract that they believed to be relevant to the renewal of the Management Contracts and Sub-Advisory Contracts in light of the legal advice furnished to them by K&L Gates LLP, their independent legal counsel, and their own business judgment. Subsequent references herein to factors considered and determinations made by the Independent Directors and/or the Board include, as applicable, factors considered and determinations made at those meetings by the Independent Directors. While the Board considered the renewal of the management contracts and sub-advisory contracts for all of the applicable investment companies in the Voya family of funds at the same meetings, the Board considered each Voya fund's investment management and sub-advisory relationships separately.
The Board follows a structured process pursuant to which it seeks and considers relevant information when it
evaluates whether to renew existing investment management and sub-advisory contracts for the Voya funds. The Board has established a Contracts Committee and three Investment Review Committees (the "IRCs"), each of which includes only Independent Directors as members. The Contracts Committee provides oversight with respect to the management and sub-advisory contracts approval and renewal process, and each IRC provides oversight throughout the year regarding the investment performance of the sub-advisers, as well as the Manager's role in monitoring the sub-advisers, with respect to each Voya fund that is assigned to that IRC.
The Contracts Committee oversees, and annually recommends Board approval of updates to, a methodology guide for the Voya funds ("Methodology Guide"). The Methodology Guide sets out a framework pursuant to which the Independent Directors request, and Management provides, certain information that the Independent Directors deem to be important or potentially relevant. The Independent Directors retain the services of an independent consultant with experience in the mutual fund industry to assist the Contracts Committee in developing and recommending to the Board: (1) a selected peer group of investment companies for each Portfolio ("Selected Peer Group") based on that Portfolio's particular attributes, such as fund type and size, fund category (as determined by Morningstar, Inc., an independent provider of mutual fund data ("Morningstar")), sales channels and structure and the Portfolio share class being compared to the Selected Peer Group, and (2) updates to the Methodology Guide with respect to the content and format of various data including, but not limited to, investment performance, fee structure, and expense information prepared in connection with the renewal process.
Provided below is an overview of certain material factors that the Board considered at its meetings regarding the renewal of the Management Contracts and Sub-Advisory Contracts and the compensation to be paid thereunder. Board members did not identify any particular information or factor that was overarching, and each Board member may have accorded different weight to the various factors in reaching his or her conclusions with respect to each Portfolio's investment management and sub-advisory arrangements.
Nature, Extent and Quality of Services
The Manager oversees, subject to the authority of the Board, the provision of all investment advisory and portfolio management services for the Portfolios, but may delegate certain of these responsibilities to one or more sub-advisers. In addition, the Manager provides administrative services reasonably necessary for the
168
ADVISORY AND SUB-ADVISORY CONTRACT APPROVAL DISCUSSION (UNAUDITED) (CONTINUED)
operation of the Portfolios as set forth in the Management Contracts, including oversight of the Portfolios' operations and risk management and the oversight of their various other service providers.
The Board considered the "manager-of-managers" platform of the Voya funds that has been developed by the Manager pursuant to which the Manager selects, subject to the Board's approval, experienced sub-advisers to provide day-to-day management services to all or a portion of each Voya fund. The Board recognized that the Manager is responsible for monitoring the investment program, performance, developments, ongoing operations, and regulatory compliance of the Sub-Advisers with respect to the Portfolios under this manager-of-managers arrangement. The Board also considered the techniques and resources that the Manager has developed to provide this ongoing oversight and due diligence with respect to the sub-advisers and to advocate or recommend, when it believes appropriate, changes in investment strategies or investment sub-advisers designed to assist in improving a Voya fund's performance. The Board was advised that, in connection with the Manager's performance of these duties, the Manager has developed an oversight process formulated by its Manager Research & Selection Group which reviews, among other matters, performance data, each Sub-Adviser's management team, portfolio data and attribution analysis related to each Sub-Adviser through various means, including, but not limited to, in-person meetings, on-site visits, and telephonic meetings with the Sub-Adviser.
Further, the Board considered periodic compliance reports it receives from the Company's Chief Compliance Officer evaluating whether the regulatory compliance systems and procedures of the Manager and the Sub-Advisers are reasonably designed to ensure compliance with the federal securities laws and whether the investment policies and restrictions for each Portfolio are consistently complied with, and other periodic reports covering related matters.
The Board considered the portfolio management team assigned by the Sub-Advisers to the Portfolios and the level of resources committed to the Portfolios (and other relevant funds in the Voya funds) by the Manager and the Sub-Advisers, and whether those resources are sufficient to provide high-quality services to the Portfolios.
Based on their deliberations and the materials presented to them, the Board concluded that the nature, extent and quality of the overall services provided by the Manager and each Sub-Adviser under the Management Contracts and Sub-Advisory Contracts were appropriate.
Portfolio Performance
In assessing investment management and sub-advisory relationships, the Board placed emphasis on the investment returns of each Portfolio, including its investment performance over certain time periods compared to the Portfolio's Morningstar category, Selected Peer Group and primary benchmark. In addition, the Board considered Voya Global Bond Portfolio's investment performance compared to an additional performance peer group that is approved by the Portfolio's IRC due to the unique investment structure or strategy of that Portfolio. The Board also considered information from the Manager Research & Selection Group and received reports summarizing a separate analysis of each Portfolio's performance and risk, including risk-adjusted investment return information, by the Company's Chief Investment Risk Officer.
Economies of Scale
When evaluating the reasonableness of management fee schedules, the Board considered whether economies of scale have been or likely will be realized by the Manager and the Sub-Advisers as a Portfolio grows larger and the extent to which any such economies are reflected in contractual fee schedules. In this regard, the Board noted any breakpoints in management fee schedules that will result in a lower management fee rate when a Portfolio achieves sufficient asset levels to receive a breakpoint discount. The Board also considered that, while some of the Portfolios do not have management fee breakpoints, they may have fee waiver and/or expense reimbursement arrangements. The Board considered the extent to which economies of scale realized by the Manager or the Sub-Advisers could be shared with each Portfolio through such fee waivers, expense reimbursements or other expense reductions. In evaluating these matters, the Independent Directors also considered periodic management reports, Selected Peer Group comparisons, and industry information regarding economies of scale. In the case of sub-advisory fee rates, the Board considered that breakpoints would inure to the benefit of the Manager.
Information Regarding Services to Other Clients
The Board considered information regarding the nature of services, performance, and fee schedules offered by the Manager and the Sub-Advisers to other clients with similar investment objectives, if applicable, including other registered investment companies and relevant institutional accounts. When the fee schedules offered to or the performance of other clients differed materially from a Portfolio, the Board took into account the underlying rationale provided by
169
ADVISORY AND SUB-ADVISORY CONTRACT APPROVAL DISCUSSION (UNAUDITED) (CONTINUED)
the Manager or the Sub-Adviser, as applicable, for these differences. For the non-Voya-affiliated Sub-Advisers, the Board viewed the information related to any material differences in the fee schedules as not being a key factor in its deliberations because of the arm's-length nature of negotiations between the Manager and non-Voya-affiliated Sub-Advisers with respect to sub-advisory fee schedules. The Board also considered that the fee schedules charged to the Portfolios and other institutional clients of the Manager or the Sub-Advisers (including other investment companies) and the performance of the Portfolios and the other accounts, as applicable, may differ materially due to, among other reasons: differences in services; different regulatory requirements associated with registered investment companies; market differences in fee schedules that existed when a Portfolio first was organized; differences in the original sponsors; investment capacity constraints that existed when certain contracts were first agreed upon or that might exist at present; and different pricing structures that are necessary to be competitive in different marketing channels.
Fee Schedules, Profitability, and Fall-out Benefits
The Board reviewed and considered the contractual management fee schedule payable by each Portfolio to the Manager compared to the Portfolio's Selected Peer Group. In addition, the Board considered VY® Baron Growth Portfolio's contractual management fee schedule compared to an additional peer group of proprietary funds identified by the Manager. The Board also considered the contractual sub-advisory fee schedule payable by the Manager to each Sub-Adviser for sub-advisory services for each Portfolio, including the portion of the contractual management fee rates that are paid to each Sub-Adviser, as compared to the portion retained by the Manager. In addition, the Board considered any fee waivers, expense limitations, and/or recoupment arrangements that apply to the fees payable by the Portfolios, including whether the Manager intends to propose any changes thereto. For each Portfolio, the Board separately determined that the fees payable to the Manager and the fee schedule payable to each Sub-Adviser are reasonable for the services that each performs, which were considered in light of the nature, extent and quality of the services that each has performed and is expected to perform.
For each Portfolio, the Board considered information on revenues, costs and profits or losses realized by the Manager and the Voya-affiliated Sub-Adviser. In analyzing the profitability of the Manager and its affiliated service providers in connection with services they render to a Portfolio, the Board took into account the sub-advisory fee
rate payable by the Manager to each Sub-Adviser. The Board also considered the profitability of the Manager and its affiliated Sub-Adviser attributable to servicing each Portfolio both with and without taking into account the profitability of the distributor of the Portfolios and both before and after giving effect to any expenses incurred by the Manager or the affiliated Sub-Adviser in making payments to affiliated insurance companies. The Board did not request profitability data from the Sub-Advisers that were not affiliated with the Manager because the Board did not view this data as being a key factor to its deliberations given the arm's-length nature of the relationship between the Manager and these non-Voya-affiliated Sub-Advisers with respect to the negotiation of sub-advisory fee schedules. In addition, the Board noted that non-Voya-affiliated sub-advisers may not account for their profits on an account-by-account basis and those that do typically employ different methodologies in connection with these calculations.
Although the Methodology Guide establishes a framework for profit calculation, the Board recognized that there is no uniform methodology within the asset management industry for determining profitability for this purpose. The Board also recognized that the use of different reasonable methodologies can give rise to dramatically different reported profit and loss results with respect to the Manager and the Voya-affiliated Sub-Adviser, as well as other industry participants with whom the profits of the Manager and its affiliated Sub-Adviser could be compared. In addition, the Board recognized that Management's calculations regarding its costs incurred in establishing the infrastructure necessary for the Portfolios' operations may not be fully reflected in the expenses allocated to each Portfolio in determining profitability, and that the information presented may not portray all of the costs borne by the Manager or reflect all risks, including entrepreneurial, regulatory, legal and operational risks, associated with offering and managing a mutual fund complex in the current regulatory and market environment.
The Board also considered that the Manager is entitled to earn a reasonable level of profits for the services that it provides to the Portfolios. The Board also received information regarding the potential fall-out benefits to the Manager and Sub-Advisers and their respective affiliates from their association with the Portfolios, including their ability to engage in soft-dollar transactions on behalf of the Portfolios. Following its reviews, the Board determined that the Manager's and the Voya-affiliated Sub-Adviser's profitability with respect to their services to the Portfolios and the Manager and Sub-Advisers' potential fall-out benefits were not unreasonable.
170
ADVISORY AND SUB-ADVISORY CONTRACT APPROVAL DISCUSSION (UNAUDITED) (CONTINUED)
Portfolio-by-Portfolio Analysis
Set forth below are certain of the specific factors that the Board considered, and the conclusions reached, at its October 12, 2017, November 14, 2017, and/or November 16, 2017 meetings in relation to approving each Portfolio's Management Contracts and Sub-Advisory Contracts. These specific factors are in addition to those considerations discussed above. In each case, each Portfolio's performance was compared to its Morningstar category, as well as its primary benchmark, a broad-based securities market index that appears in the Portfolio's prospectus. With respect to Morningstar quintile rankings, the first quintile represents the highest (best) performance and the fifth quintile represents the lowest performance. The performance data provided to the Board primarily was for various periods ended March 31, 2017. In addition, the Board also considered at its October 12, 2017, November 14, 2017, and November 16, 2017 meetings certain additional data regarding performance and Portfolio asset levels and flows as of August 31, 2017, and September 30, 2017. Each Portfolio's management fee rate and expense ratio were compared to the fees and expense ratios of the funds in its Selected Peer Group.
Voya Global Bond Portfolio
In considering whether to approve the renewal of the Management and Sub-Advisory Contracts for Voya Global Bond Portfolio, the Board considered that, based on performance data for the periods ended March 31, 2017: (1) the Portfolio underperformed its Morningstar category average for all periods presented, with the exception of the one-year and three-year periods, during which it outperformed; (2) the Portfolio outperformed its primary benchmark for all periods presented; and (3) the Portfolio is ranked in the second quintile of its Morningstar category for the one-year period, and the third quintile for the year-to-date, three-year, five-year and ten-year periods.
In considering the fees payable under the Management and Sub-Advisory Contracts for the Portfolio, the Board took into account the factors described above and also considered: (1) the fairness of the compensation under a Management Contract with a breakpoint fee schedule where the asset level necessary to achieve a breakpoint discount had not been reached by the Portfolio; and (2) the pricing structure (including the net expense ratio to be borne by shareholders) of the Portfolio, as compared to its Selected Peer Group, including that: (a) the contractual management fee rate for the Portfolio is below the median and the average management fee rates of the funds in its Selected Peer Group; and (b) the net expense ratio for the Portfolio is below the median
and the average net expense ratios of the funds in its Selected Peer Group.
After its deliberation, the Board reached the following conclusions: (1) the Portfolio's management fee rate is reasonable in the context of all factors considered by the Board; (2) the Portfolio's net expense ratio is reasonable in the context of all factors considered by the Board; (3) the Portfolio's performance is reasonable in the context of all factors considered by the Board; and (4) the sub-advisory fee rate payable by the Manager to the Sub-Adviser is reasonable in the context of all factors considered by the Board. Based on these conclusions and other factors, the Board voted to renew the Management and Sub-Advisory Contracts for the Portfolio for the year ending November 30, 2018. During this renewal process, different Board members may have given different weight to different individual factors and related conclusions.
VY® American Century Small-Mid Cap Value Portfolio
In considering whether to approve the renewal of the Management and Sub-Advisory Contracts for VY® American Century Small-Mid Cap Value Portfolio, the Board considered that, based on performance data for the periods ended March 31, 2017: (1) the Portfolio outperformed its Morningstar category average for all periods presented, with the exception of the year-to-date period, during which it underperformed; (2) the Portfolio outperformed its primary benchmark for all periods presented; and (3) the Portfolio is ranked in the first (highest) quintile of its Morningstar category for the one-year, three-year, five-year and ten-year periods, and the third quintile for the year-to-date period.
In considering the fees payable under the Management and Sub-Advisory Contracts for the Portfolio, the Board took into account the factors described above and also considered: (1) the economies of scale benefits to the Portfolio and its shareholders from breakpoint discounts applicable to the Portfolio's management fee rate, which result in lower fees at higher asset levels; and (2) the pricing structure (including the net expense ratio to be borne by shareholders) of the Portfolio, as compared to its Selected Peer Group, including that: (a) the contractual management fee rate for the Portfolio is above the median and the average management fee rates of the funds in its Selected Peer Group; and (b) the net expense ratio for the Portfolio is equal to the median and below the average net expense ratios of the funds in its Selected Peer Group. To assist the Board in its deliberations regarding this fee data, the Board was provided with information regarding the effect of waivers and/or reimbursements on the Portfolio's net expense ratio.
171
ADVISORY AND SUB-ADVISORY CONTRACT APPROVAL DISCUSSION (UNAUDITED) (CONTINUED)
After its deliberation, the Board reached the following conclusions: (1) the Portfolio's management fee rate is reasonable in the context of all factors considered by the Board; (2) the Portfolio's net expense ratio is reasonable in the context of all factors considered by the Board; (3) the Portfolio's performance is reasonable in the context of all factors considered by the Board; and (4) the sub-advisory fee rate payable by the Manager to the Sub-Adviser is reasonable in the context of all factors considered by the Board. Based on these conclusions and other factors, the Board voted to renew the Management and Sub-Advisory Contracts for the Portfolio for the year ending November 30, 2018. During this renewal process, different Board members may have given different weight to different individual factors and related conclusions.
VY® Baron Growth Portfolio
In considering whether to approve the renewal of the Management and Sub-Advisory Contracts for VY® Baron Growth Portfolio, the Board considered that, based on performance data for the periods ended March 31, 2017: (1) the Portfolio outperformed its Morningstar category average for all periods presented, with the exception of the three-year period, during which it underperformed; (2) the Portfolio underperformed its primary benchmark for all periods presented, with the exception of the year-to-date and five-year periods, during which it outperformed; and (3) the Portfolio is ranked in the first (highest) quintile of its Morningstar category for the year-to-date period, the second quintile for the one-year, five-year and ten-year periods, and the fourth quintile for the three-year period.
In analyzing this performance data, the Board took into account: (1) Management's representations regarding the Portfolio's favorable performance during certain periods; (2) Management's discussion regarding the differences between the investment exposure of the Portfolio and the Morningstar category funds; and (3) Management's confidence in the Sub-Adviser's ability to execute the Portfolio's investment strategy.
In considering the fees payable under the Management and Sub-Advisory Contracts for the Portfolio, the Board took into account the factors described above and also considered: (1) the fairness of the compensation under a Management Contract with a breakpoint fee schedule where the asset level necessary to achieve a breakpoint discount had not been reached by the Portfolio; and (2) the pricing structure (including the net expense ratio to be borne by shareholders) of the Portfolio, as compared to its Selected Peer Group, including that: (a) the contractual management fee rate for the Portfolio is above the median and the average management fee rates of the funds in its Selected Peer Group; and (b) the net expense ratio for the Portfolio is above the median
and the average net expense ratios of the funds in its Selected Peer Group.
In analyzing this fee data, the Board took into account Management's representations regarding the competitiveness of the Portfolio's management fee rate and expense ratio when compared to peers identified by Management.
After its deliberation, the Board reached the following conclusions: (1) the Portfolio's management fee rate is reasonable in the context of all factors considered by the Board; (2) the Portfolio's net expense ratio is reasonable in the context of all factors considered by the Board; (3) the Portfolio's performance is reasonable in the context of all factors considered by the Board; and (4) the sub-advisory fee rate payable by the Manager to the Sub-Adviser is reasonable in the context of all factors considered by the Board. Based on these conclusions and other factors, the Board voted to renew the Management and Sub-Advisory Contracts for the Portfolio for the year ending November 30, 2018. During this renewal process, different Board members may have given different weight to different individual factors and related conclusions.
VY® Columbia Contrarian Core Portfolio
In considering whether to approve the renewal of the Management and Sub-Advisory Contracts for VY® Columbia Contrarian Core Portfolio, the Board considered that, based on performance data for the periods ended March 31, 2017: (1) the Portfolio outperformed its Morningstar category average for all periods presented, with the exception of the one-year and ten-year periods, during which it underperformed; (2) the Portfolio underperformed its primary benchmark for all periods presented, with the exception of the year-to-date and three-year periods, during which it outperformed; and (3) the Portfolio is ranked in the first (highest) quintile of its Morningstar category for the year-to-date, three-year and five-year periods, and the third quintile for the one-year and ten-year periods.
In considering the fees payable under the Management and Sub-Advisory Contracts for the Portfolio, the Board took into account the factors described above and also considered: (1) the fairness of the compensation under a Management Contract with a breakpoint fee schedule where the asset level necessary to achieve a breakpoint discount had not been reached by the Portfolio; and (2) the pricing structure (including the net expense ratio to be borne by shareholders) of the Portfolio, as compared to its Selected Peer Group, including that: (a) the contractual management fee rate for the Portfolio is above the median and the average management fee
172
ADVISORY AND SUB-ADVISORY CONTRACT APPROVAL DISCUSSION (UNAUDITED) (CONTINUED)
rates of the funds in its Selected Peer Group; and (b) the net expense ratio for the Portfolio is below the median and above the average net expense ratios of the funds in its Selected Peer Group. To assist the Board in its deliberations regarding this fee data, the Board was provided with information regarding the effect of waivers and/or reimbursements on the Portfolio's net expense ratio.
After its deliberation, the Board reached the following conclusions: (1) the Portfolio's management fee rate is reasonable in the context of all factors considered by the Board; (2) the Portfolio's net expense ratio is reasonable in the context of all factors considered by the Board; (3) the Portfolio's performance is reasonable in the context of all factors considered by the Board; and (4) the sub-advisory fee rate payable by the Manager to the Sub-Adviser is reasonable in the context of all factors considered by the Board. Based on these conclusions and other factors, the Board voted to renew the Management and Sub-Advisory Contracts for the Portfolio for the year ending November 30, 2018. During this renewal process, different Board members may have given different weight to different individual factors and related conclusions.
VY® Columbia Small Cap Value II Portfolio
In considering whether to approve the renewal of the Management and Sub-Advisory Contracts for VY® Columbia Small Cap Value II Portfolio, the Board considered that, based on performance data for the periods ended March 31, 2017: (1) the Portfolio outperformed its Morningstar category average for all periods presented; (2) the Portfolio outperformed its primary benchmark for all periods presented, with the exception of the one-year and three-year periods, during which it underperformed; and (3) the Portfolio is ranked in the second quintile of its Morningstar category for all periods presented.
In considering the fees payable under the Management and Sub-Advisory Contracts for the Portfolio, the Board took into account the factors described above and also considered: (1) the fairness of the compensation under a Management Contract with a level fee rate that does not include breakpoints; and (2) the pricing structure (including the net expense ratio to be borne by shareholders) of the Portfolio, as compared to its Selected Peer Group, including that: (a) the contractual management fee rate for the Portfolio is below the median and above the average management fee rates of the funds in its Selected Peer Group; and (b) the net expense ratio for the Portfolio is below the median and the average net expense ratios of the funds in its Selected Peer Group.
After its deliberation, the Board reached the following conclusions: (1) the Portfolio's management fee rate is reasonable in the context of all factors considered by the Board; (2) the Portfolio's net expense ratio is reasonable in the context of all factors considered by the Board; (3) the Portfolio's performance is reasonable in the context of all factors considered by the Board; and (4) the sub-advisory fee rate payable by the Manager to the Sub-Adviser is reasonable in the context of all factors considered by the Board. Based on these conclusions and other factors, the Board voted to renew the Management and Sub-Advisory Contracts for the Portfolio for the year ending November 30, 2018. During this renewal process, different Board members may have given different weight to different individual factors and related conclusions.
VY® Invesco Comstock Portfolio
In considering whether to approve the renewal of the Management and Sub-Advisory Contracts for VY® Invesco Comstock Portfolio, the Board considered that, based on performance data for the periods ended March 31, 2017: (1) the Portfolio outperformed its Morningstar category average for all periods presented, with the exception of the year-to-date and three-year periods, during which it underperformed; (2) the Portfolio underperformed its primary benchmark for all periods presented, with the exception of the one-year and ten-year periods, during which it outperformed; and (3) the Portfolio is ranked in the first (highest) quintile of its Morningstar category for the one-year period, the second quintile for the five-year and ten-year periods, the fourth quintile for the three-year period, and the fifth (lowest) quintile for the year-to-date period.
In analyzing this performance data, the Board took into account: (1) Management's discussion of the impact of security selection and sector allocation on the Portfolio's relative performance; (2) Management's representations regarding the investment philosophy pursued by the Sub-Adviser on behalf of the Portfolio, which it believes has the potential to outperform over a full market cycle; (3) Management's confidence in the Sub-Adviser's ability to execute the Portfolio's investment objective; and (4) Management's representations regarding the Portfolio's favorable performance during certain periods.
In considering the fees payable under the Management and Sub-Advisory Contracts for the Portfolio, the Board took into account the factors described above and also considered: (1) the fairness of the compensation under a Management Contract with a level fee rate that does not include breakpoints; and (2) the pricing structure (including the net expense ratio to be borne by shareholders) of the Portfolio, as compared to its Selected Peer Group, including that: (a) the contractual
173
ADVISORY AND SUB-ADVISORY CONTRACT APPROVAL DISCUSSION (UNAUDITED) (CONTINUED)
management fee rate for the Portfolio is above the median and the average management fee rates of the funds in its Selected Peer Group; and (b) the net expense ratio for the Portfolio is below the median and the average net expense ratios of the funds in its Selected Peer Group.
In analyzing this fee data, the Board took into account: (1) Management's discussion of fee waivers and/or reimbursements, which lower the Portfolio's net effective management fee rate; and (2) Management's representations regarding the competitiveness of the Portfolio's net expense ratio.
After its deliberation, the Board reached the following conclusions: (1) the Portfolio's management fee rate is reasonable in the context of all factors considered by the Board; (2) the Portfolio's net expense ratio is reasonable in the context of all factors considered by the Board; (3) the Portfolio's performance is reasonable in the context of all factors considered by the Board; and (4) the sub-advisory fee rate payable by the Manager to the Sub-Adviser is reasonable in the context of all factors considered by the Board. Based on these conclusions and other factors, the Board voted to renew the Management and Sub-Advisory Contracts for the Portfolio for the year ending November 30, 2018. During this renewal process, different Board members may have given different weight to different individual factors and related conclusions.
VY® Invesco Equity and Income Portfolio
In considering whether to approve the renewal of the Management and Sub-Advisory Contracts for VY® Invesco Equity and Income Portfolio, the Board considered that, based on performance data for the periods ended March 31, 2017: (1) the Portfolio outperformed its Morningstar category average for all periods presented, with the exception of the year-to-date period, during which it underperformed; (2) the Portfolio underperformed its primary benchmark for all periods presented, with the exception of the ten-year period, during which it outperformed; and (3) the Portfolio is ranked in the first (highest) quintile of its Morningstar category for the one-year, three-year, five-year and ten-year periods, and the fifth (lowest) quintile for the year-to-date period.
In considering the fees payable under the Management and Sub-Advisory Contracts for the Portfolio, the Board took into account the factors described above and also considered: (1) the economies of scale benefits to the Portfolio and its shareholders from breakpoint discounts applicable to the Portfolio's management fee rate, which result in lower fees at higher asset levels; and (2) the pricing structure (including the net expense ratio to be
borne by shareholders) of the Portfolio, as compared to its Selected Peer Group, including that: (a) the contractual management fee rate for the Portfolio is below the median and equal to the average management fee rates of the funds in its Selected Peer Group; and (b) the net expense ratio for the Portfolio is below the median and the average net expense ratios of the funds in its Selected Peer Group.
After its deliberation, the Board reached the following conclusions: (1) the Portfolio's management fee rate is reasonable in the context of all factors considered by the Board; (2) the Portfolio's net expense ratio is reasonable in the context of all factors considered by the Board; (3) the Portfolio's performance is reasonable in the context of all factors considered by the Board; and (4) the sub-advisory fee rate payable by the Manager to the Sub-Adviser is reasonable in the context of all factors considered by the Board. Based on these conclusions and other factors, the Board voted to renew the Management and Sub-Advisory Contracts for the Portfolio for the year ending November 30, 2018. During this renewal process, different Board members may have given different weight to different individual factors and related conclusions.
VY® JPMorgan Mid Cap Value Portfolio
In considering whether to approve the renewal of the Management and Sub-Advisory Contracts for VY® JPMorgan Mid Cap Value Portfolio, the Board considered that, based on performance data for the periods ended March 31, 2017: (1) the Portfolio outperformed its Morningstar category average for all periods presented, with the exception of the year-to-date and one-year periods, during which it underperformed; (2) the Portfolio outperformed its primary benchmark for all periods presented, with the exception of the one-year and five-year periods, during which it underperformed; and (3) the Portfolio is ranked in the first (highest) quintile of its Morningstar category for the three-year, five-year, and ten-year periods, the third quintile for the year-to-date period, and the fourth quintile for the one-year period.
In analyzing this performance data, the Board took into account Management's representations regarding the Portfolio's favorable performance during certain periods.
In considering the fees payable under the Management and Sub-Advisory Contracts for the Portfolio, the Board took into account the factors described above and also considered: (1) the economies of scale benefits to the Portfolio and its shareholders from breakpoint discounts applicable to the Portfolio's management fee rate, which result in lower fees at higher asset levels; (2) the pricing structure (including the net expense ratio to be borne by shareholders) of the Portfolio, as compared to its
174
ADVISORY AND SUB-ADVISORY CONTRACT APPROVAL DISCUSSION (UNAUDITED) (CONTINUED)
Selected Peer Group, including that: (a) the contractual management fee rate for the Portfolio is above the median and the average management fee rates of the funds in its Selected Peer Group; and (b) the net expense ratio for the Portfolio is above the median and the average net expense ratios of the funds in its Selected Peer Group.
In analyzing this fee data, the Board took into account Management's representations regarding the competitiveness of the Portfolio's management fee rate and net expense ratio.
After its deliberation, the Board reached the following conclusions: (1) the Portfolio's management fee rate is reasonable in the context of all factors considered by the Board; (2) the Portfolio's expense ratio is reasonable in the context of all factors considered by the Board; (3) the Portfolio's performance is reasonable in the context of all factors considered by the Board; and (4) the sub-advisory fee rate payable by the Manager to the Sub-Adviser is reasonable in the context of all factors considered by the Board. Based on these conclusions and other factors, the Board voted to renew the Management and Sub-Advisory Contracts for the Portfolio for the year ending November 30, 2018. During this renewal process, different Board members may have given different weight to different individual factors and related conclusions.
VY® Oppenheimer Global Portfolio
In considering whether to approve the renewal of the Management and Sub-Advisory Contracts for VY® Oppenheimer Global Portfolio, the Board considered that, based on performance data for the periods ended March 31, 2017: (1) the Portfolio outperformed its Morningstar category average for all periods presented; (2) the Portfolio outperformed its primary benchmark all periods presented; and (3) the Portfolio is ranked in the first (highest) quintile of its Morningstar category for the year-to-date, one-year, five-year and ten-year periods, and the second quintile for the three-year period.
In considering the fees payable under the Management and Sub-Advisory Contracts for the Portfolio, the Board took into account the factors described above and also considered: (1) the fairness of the compensation under a Management Contract with a breakpoint fee schedule where the asset level necessary to achieve a breakpoint discount had not been reached by the Portfolio; and (2) the pricing structure (including the net expense ratio to be borne by shareholders) of the Portfolio, as compared to its Selected Peer Group, including that: (a) the contractual management fee rate for the Portfolio is below the median and the average management fee rates of the funds in its Selected Peer Group; and (b) the
net expense ratio for the Portfolio is below the median and the average net expense ratios of the funds in its Selected Peer Group.
After its deliberation, the Board reached the following conclusions: (1) the Portfolio's management fee rate is reasonable in the context of all factors considered by the Board; (2) the Portfolio's net expense ratio is reasonable in the context of all factors considered by the Board; (3) the Portfolio's performance is reasonable in the context of all factors considered by the Board; and (4) the sub-advisory fee rate payable by the Manager to the Sub-Adviser is reasonable in the context of all factors considered by the Board. Based on these conclusions and other factors, the Board voted to renew the Management and Sub-Advisory Contracts for the Portfolio for the year ending November 30, 2018. During this renewal process, different Board members may have given different weight to different individual factors and related conclusions.
VY® Pioneer High Yield Portfolio
In considering whether to approve the renewal of the Management and Sub-Advisory Contracts for VY® Pioneer High Yield Portfolio, the Board considered that, based on performance data for the periods ended March 31, 2017: (1) the Portfolio outperformed its Morningstar category average for all periods presented, with the exception of the three-year period, during which it underperformed; (2) the Portfolio underperformed its primary benchmark for all periods presented, with the exception of the year-to-date and ten-year periods, during which it outperformed; and (3) the Portfolio is ranked in the first (highest) quintile of its Morningstar category for the ten-year period, the second quintile for the year-to-date, one-year and five-year periods, and the third quintile for the three-year period.
In analyzing this performance data, the Board took into account Management's representations regarding the competitiveness of the Portfolio's performance during certain periods.
In considering the fees payable under the Management and Sub-Advisory Contracts for the Portfolio, the Board took into account the factors described above and also considered: (1) the fairness of the compensation under a Management Contract with a breakpoint fee schedule where the asset level necessary to achieve a breakpoint discount had not been reached by the Portfolio; and (2) the pricing structure (including the net expense ratio to be borne by shareholders) of the Portfolio, as compared to its Selected Peer Group, including that: (a) the contractual management fee rate for the Portfolio is above the median and the average management fee
175
ADVISORY AND SUB-ADVISORY CONTRACT APPROVAL DISCUSSION (UNAUDITED) (CONTINUED)
rates of the funds in its Selected Peer Group; and (b) the net expense ratio for the Portfolio is below the median and the average net expense ratios of the funds in its Selected Peer Group.
In analyzing this fee data, the Board took into account Management's discussion of fee waivers and/or reimbursements, which lower the Portfolio's net effective management fee rate.
After its deliberation, the Board reached the following conclusions: (1) the Portfolio's management fee rate is reasonable in the context of all factors considered by the Board; (2) the Portfolio's net expense ratio is reasonable in the context of all factors considered by the Board; (3) the Portfolio's performance is reasonable in the context of all factors considered by the Board; and (4) the sub-advisory fee rate payable by the Manager to the Sub-Adviser is reasonable in the context of all factors considered by the Board. Based on these conclusions and other factors, the Board voted to renew the Management and Sub-Advisory Contracts for the Portfolio for the year ending November 30, 2018. During this renewal process, different Board members may have given different weight to different individual factors and related conclusions.
VY® T. Rowe Price Diversified Mid Cap Growth Portfolio
In considering whether to approve the renewal of the Management and Sub-Advisory Contracts for VY® T. Rowe Price Diversified Mid Cap Growth Portfolio, the Board considered that, based on performance data for the periods ended March 31, 2017: (1) the Portfolio outperformed its Morningstar category average for all periods presented; (2) the Portfolio underperformed its primary benchmark all periods presented, with the exception of the year-to-date period, during which it outperformed; and (3) the Portfolio is ranked in the first (highest) quintile of its Morningstar category for the three-year, five-year and ten-year periods, the second quintile for the year-to-date period, and the third quintile for the one-year period.
In considering the fees payable under the Management and Sub-Advisory Contracts for the Portfolio, the Board took into account the factors described above and also considered: (1) the fairness of the compensation under a Management Contract with a level fee rate that does not include breakpoints; and (2) the pricing structure (including the net expense ratio to be borne by shareholders) of the Portfolio, as compared to its Selected Peer Group, including that: (a) the contractual management fee rate for the Portfolio is below the median and the average management fee rates of the
funds in its Selected Peer Group; and (b) the net expense ratio for the Portfolio is below the median and the average net expense ratios of the funds in its Selected Peer Group.
After its deliberation, the Board reached the following conclusions: (1) the Portfolio's management fee rate is reasonable in the context of all factors considered by the Board; (2) the Portfolio's net expense ratio is reasonable in the context of all factors considered by the Board; (3) the Portfolio's performance is reasonable in the context of all factors considered by the Board; and (4) the sub-advisory fee rate payable by the Manager to the Sub-Adviser is reasonable in the context of all factors considered by the Board. Based on these conclusions and other factors, the Board voted to renew the Management and Sub-Advisory Contracts for the Portfolio for the year ending November 30, 2018. During this renewal process, different Board members may have given different weight to different individual factors and related conclusions.
VY® T. Rowe Price Growth Equity Portfolio
In considering whether to approve the renewal of the Management and Sub-Advisory Contracts for VY® T. Rowe Price Growth Equity Portfolio, the Board considered that, based on performance data for the periods ended March 31, 2017: (1) the Portfolio outperformed its Morningstar category average for all periods presented; (2) the Portfolio outperformed its primary benchmark for all periods presented; and (3) the Portfolio is ranked in the first (highest) quintile of its Morningstar category for all periods presented.
In considering the fees payable under the Management and Sub-Advisory Contracts for the Portfolio, the Board took into account the factors described above and also considered: (1) the fairness of the compensation under a Management Contract with a level fee rate that does not include breakpoints; and (2) the pricing structure (including the net expense ratio to be borne by shareholders) of the Portfolio, as compared to its Selected Peer Group, including that: (a) the contractual management fee rate for the Portfolio is above the median and the average management fee rates of the funds in its Selected Peer Group; and (b) the net expense ratio for the Portfolio is above the median and the average net expense ratios of the funds in its Selected Peer Group.
In analyzing this fee data, the Board took into account Management's representations regarding the competitiveness of the Portfolio's net expense ratio.
After its deliberation, the Board reached the following conclusions: (1) the Portfolio's management fee rate is
176
ADVISORY AND SUB-ADVISORY CONTRACT APPROVAL DISCUSSION (UNAUDITED) (CONTINUED)
reasonable in the context of all factors considered by the Board; (2) the Portfolio's net expense ratio is reasonable in the context of all factors considered by the Board; (3) the Portfolio's performance is reasonable in the context of all factors considered by the Board; and (4) the sub-advisory fee rate payable by the Manager to the Sub-Adviser is reasonable in the context of all factors considered by the Board. Based on these conclusions and other factors, the Board voted to renew the Management and Sub-Advisory Contracts for the Portfolio for the year ending November 30, 2018. During this renewal process, different Board members may have given different weight to different individual factors and related conclusions.
VY® Templeton Foreign Equity Portfolio
In considering whether to approve the renewal of the Management and Sub-Advisory Contracts for VY® Templeton Foreign Equity Portfolio, the Board considered that, based on performance data for the periods ended March 31, 2017: (1) the Portfolio outperformed its Morningstar category average for all periods presented, with the exception of the three-year period, during which it underperformed; (2) the Portfolio outperformed its primary benchmark for all periods presented, with the exception of the year-to-date and three-year periods, during which underperformed; and (3) the Portfolio is ranked in the first (highest) quintile of its Morningstar category for the ten-year period, the second quintile for the year-to-date period, and the third quintile for the one-year, three-year and five-year periods.
In analyzing this performance data, the Board took into account Management's representations regarding the Portfolio's favorable performance during certain periods.
In considering the fees payable under the Management and Sub-Advisory Contracts for the Portfolio, the Board
took into account the factors described above and also considered: (1) the economies of scale benefits to the Portfolio and its shareholders from breakpoint discounts applicable to the Portfolio's management fee rate, which result in lower fees at higher asset levels; and (2) the pricing structure (including the net expense ratio to be borne by shareholders) of the Portfolio, as compared to its Selected Peer Group, including that: (a) the contractual management fee rate for the Portfolio is above the median and the average management fee rates of the funds in its Selected Peer Group; and (b) the net expense ratio for the Portfolio is above the median and the average net expense ratios of the funds in its Selected Peer Group.
In analyzing this fee data, the Board took into account: (1) Management's discussion of fee waivers and/or reimbursements, which lower the Portfolio's net effective management fee rate; and (2) Management's representations regarding the competitiveness of the Portfolio's net expense ratio.
After its deliberation, the Board reached the following conclusions: (1) the Portfolio's management fee rate is reasonable in the context of all factors considered by the Board; (2) the Portfolio's net expense ratio is reasonable in the context of all factors considered by the Board; (3) the Portfolio's performance is reasonable in the context of all factors considered by the Board; and (4) the sub-advisory fee rate payable by the Manager to the Sub-Adviser is reasonable in the context of all factors considered by the Board. Based on these conclusions and other factors, the Board voted to renew the Management and Sub-Advisory Contracts for the Portfolio for the year ending November 30, 2018. During this renewal process, different Board members may have given different weight to different individual factors and related conclusions.
177
Investment Adviser
Voya Investments, LLC
7337 East Doubletree Ranch Road, Suite 100
Scottsdale, Arizona 85258
Distributor
Voya Investments Distributor, LLC
7337 East Doubletree Ranch Road, Suite 100
Scottsdale, Arizona 85258
Transfer Agent
BNY Mellon Investment Servicing (U.S.) Inc.
301 Bellevue Parkway
Wilmington, Delaware 19809
Independent Registered Public Accounting Firm
KPMG LLP
Two Financial Center
60 South Street
Boston, Massachusetts 02111
Custodian
The Bank of New York Mellon
225 Liberty Street
New York, New York 10286
Legal Counsel
Ropes & Gray LLP
Prudential Tower
800 Boylston Street
Boston, Massachusetts 02199
Before investing, carefully consider the investment objectives, risks, charges and expenses of the variable annuity contract or variable life insurance policy and the underlying variable investment options. This and other information is contained in the prospectus for the variable annuity contract or variable life insurance policy and the underlying variable investment options. Obtain these prospectuses from your agent/registered representative and read them carefully before investing.
RETIREMENT | INVESTMENTS | INSURANCE
voyainvestments.com

Annual Report
December 31, 2017
Classes ADV, I, R6, S, S2 and T
Voya Partners, Inc.
| | ■
Voya Solution Aggressive Portfolio | | | ■
Voya Solution 2030 Portfolio | |
| | ■
Voya Solution Balanced Portfolio | | | ■
Voya Solution 2035 Portfolio | |
| | ■
Voya Solution Conservative Portfolio | | | ■
Voya Solution 2040 Portfolio | |
| | ■
Voya Solution Income Portfolio | | | ■
Voya Solution 2045 Portfolio | |
| | ■
Voya Solution Moderately Aggressive Portfolio | | | ■
Voya Solution 2050 Portfolio | |
| | ■
Voya Solution Moderately Conservative Portfolio | | | ■
Voya Solution 2055 Portfolio | |
| | ■
Voya Solution 2020 Portfolio | | | ■
Voya Solution 2060 Portfolio | |
| | ■
Voya Solution 2025 Portfolio | | |
| | | This report is submitted for general information to shareholders of the Voya mutual funds. It is not authorized for distribution to prospective shareholders unless accompanied or preceded by a prospectus which includes details regarding the funds’ investment objectives, risks, charges, expenses and other information. This information should be read carefully. | | |
PROXY VOTING INFORMATION
A description of the policies and procedures that the Portfolios use to determine how to vote proxies related to portfolio securities is available: (1) without charge, upon request, by calling Shareholder Services toll-free at (800) 992-0180; (2) on the Portfolios’ website at www.voyainvestments.com; and (3) on the U.S. Securities and Exchange Commission’s (“SEC’s”) website at www.sec.gov. Information regarding how the Portfolios voted proxies related to portfolio securities during the most recent 12-month period ended June 30 is available without charge on the Portfolios’ website at www.voyainvestments.com and on the SEC’s website at www.sec.gov.
QUARTERLY PORTFOLIO HOLDINGS
The Portfolios file their complete schedule of portfolio holdings with the SEC for the first and third quarters of each fiscal year on Form N-Q. The Portfolios’ Forms N-Q are available on the SEC’s website at www.sec.gov. The Portfolios’ Forms N-Q may be reviewed and copied at the SEC’s Public Reference Room in Washington, D.C., and information on the operation of the Public Reference Room may be obtained by calling (800) SEC-0330. The Portfolios’ Forms N-Q, as well as a complete portfolio of investments, are available without charge upon request from the Portfolios by calling Shareholder Services toll-free at (800) 992-0180.
After a Strong Year, Positive Expectations
Dear Shareholder,
The U.S. equity market proved resilient throughout 2017, posting a “perfect pitch” year with not one single month of negative returns. A lot of chatter in the markets has focused on the low levels of volatility that prevailed in 2017, and whether 2018 will be the year that volatility returns (witness early February markets). As usual there are also any number of geopolitical or other risks that could cause a sell-off, but we are heartened by the reality of macroeconomic fundamentals, which include strong and synchronous global growth; we believe these would likely be a governor on a rise in volatility.
We believe the United States, Europe and China will continue to dominate the world economy in 2018. Combined, the three account for about $48 trillion of GDP, more than 60% of the $79 trillion global GDP produced each year. And the rest of the world still has its own positive backdrop: The International Monetary Fund projects that 185 of 190 national economies will grow in 2018.
While economic growth may be synchronous across the globe, it is not likely to be uniform — thus, broad global diversification across continents and asset classes remains important for positioning your portfolio to benefit from potential opportunities. Regardless of where individual markets are in their business cycles, we believe investors are best served by following their asset allocation plan and avoiding the temptation to time entry or exit points.
If your goals have changed, thoroughly discuss them with your investment advisor before making any changes to your investment strategy. We seek to remain a reliable partner committed to reliable investing, helping you and your investment advisor achieve your goals. We appreciate your continued confidence in us, and we look forward to serving your investment needs in the future.
Sincerely,
Shaun Mathews
President and Chief Executive Officer
Voya Family of Funds
January 19, 2018
The views expressed in the President’s Letter reflect those of the President as of the date of the letter. Any such views are subject to change at any time based upon market or other conditions and the Voya mutual funds disclaim any responsibility to update such views. These views may not be relied on as investment advice and because investment decisions for a Voya mutual fund are based on numerous factors, may not be relied on as an indication of investment intent on behalf of any Voya mutual fund. Reference to specific company securities should not be construed as recommendations or investment advice.
International investing poses special risks including currency fluctuation, economic and political risks not found in investments that are solely domestic.
Market Perspective: Year Ended December 31, 2017
In our semi-annual report we described how global equities, in the form of the MSCI World IndexSM (the “Index”), measured in local currencies, including net reinvested dividends, rose 8.25%, carried higher in what seemed to be the path of least resistance. Investor sentiment was still trying to come to terms with the unexpected result of the U.S. presidential election. For this and perhaps more importantly, other reasons, the Index continued its advance, rising in every month, to end up 18.48% for the fiscal year. (The Index returned 22.40% for the year ended December 31, 2017, measured in U.S. dollars.)
By mid-year most commentators had largely discounted a reflation trade driven by U.S. legislative initiatives. But this did not mean that such initiatives were dead; just that the credibility of anything market friendly coming out of them had fallen very low. The President had said on February 9 that he would announce his pro-growth tax reform plan in the coming weeks. Nothing solid had emerged and by early July the Senate was still pre-occupied with the Affordable Care Act (“ACA”), desperately trying to pass any version of a repeal and replace bill. Such attempts finally foundered in the early hours of July 28.
But investors could still take comfort in a narrative of improving global growth and corporate earnings, with monetary conditions still historically easy, to underpin the prices of risk assets. The evidence was there to see. In August the Wall Street Journal observed that the prices of base metals had recently hit multi-year highs, inferring that investors were increasingly bullish on global growth, and later noted that every country tracked by the Organization for Economic Cooperation and Development was set to grow in 2017.
In the euro zone, unemployment ended November at 8.8%, the lowest since January 2009. Gross domestic product (“GDP”) grew 2.5% year-over-year in the third quarter of 2017, slightly higher than the U.S. (2.3%). The European Central Bank finally confirmed that monthly bond purchases would be halved to €30 billion in 2018. The region’s Economic Sentiment Indicator ended the period at the highest since 2000.
China’s GDP growth in the second quarter of 2017 was a healthy 6.9% year-over-year and 6.8% in the third. Imports were continuing to grow at double-digit year-over-year rates, supporting global demand. Excessive debt remained a problem in financial markets, however. In November the authorities announced curbs on leverage in asset management products and promises of guaranteed returns.
Even Japan contributed some good news with GDP rising in the third quarter of 2017 for the seventh straight quarter.
In the U.S., the Federal Reserve (“Fed”) added 25bp (0.25%) to the federal funds rate in March and did so again in June. But areas of sluggishness, like low core consumer price inflation and wage growth persisted into September, which started with devastating hurricanes and rising geo-political tensions with North Korea. Some commentators suggested that the Fed might be done for the year.
However, the hurricanes subsided, geo-political tensions cooled and yet another forlorn attempt to replace the ACA was shrugged off. The December employment report showed the unemployment rate barely above 4%, near the lowest since February 2001. Third quarter GDP growth was reported at 3.2% (annualized) after 3.1% in the second. The outline of a long-awaited pro-growth tax reform program was finally announced, although moving day by day to bring recalcitrant
senators on board. For investors, its key feature was a reduction in the corporate tax rate to 21%, which many believed would be used to increase share buy-backs and dividends. The Fed duly raised the federal funds rate by another 25bp (0.25%) in December and the tax bill was signed into law on December 22.
In U.S. fixed income markets, the Bloomberg Barclays U.S. Aggregate Bond Index (“Barclays Aggregate”) added 3.54% in the fiscal year. The Treasury yield curve became flatter, with yields on maturities up to about nine years rising and those on longer maturities falling. Thus the Bloomberg Barclays U.S. Treasury Bond Index rose 2.31% while the Bloomberg Barclays Long-Term U.S. Treasury sub-index gained 8.53%. Indices of riskier classes generally outperformed Treasuries: the Bloomberg Barclays U.S. Corporate Investment Grade Bond Index climbed 6.42%, the Bloomberg Barclays High-Yield Bond — 2% Issuer Constrained Composite Index (not a part of the Barclays Aggregate) rose 7.50%.
U.S. equities, represented by the S&P 500® Index including dividends, surged 21.83% in 2017. The earnings per share of its constituent companies grew 6.4% year-over-year in the third quarter of 2017, after two quarters of double-digit gains. Technology was the leader, soaring 38.83%. Telecommunications and energy were the laggards, falling 1.25% and 1.01% respectively. Index companies thought to offer comparatively good earnings growth outperformed those considered to offer comparatively good value by more than 12%.
In currencies, the dollar fell 12.37% against the euro, 8.63% against the pound, reflecting some dissipation of the post-election reflation euphoria. In the meantime, the euro zone’s prospects had improved, while some of the panic over Brexit had faded. The dollar slipped 3.65% against the yen, moving within a narrow trading range for most of the year.
In international markets, the MSCI Japan® Index jumped 19.75% over the year, in an environment of improving corporate governance and profitability, with little competition from fixed income investments. The MSCI Europe ex UK® Index rose 13.59%. Aside from the positive developments noted above, corporate earnings were improving and political fears were assuaged by the election of a centrist President in France. But gains were muted by the strengthening euro. The MSCI UK® Index rose 11.94%. GDP growth was down to 0.4% in each of the middle two quarters, Brexit negotiations were slow and inconclusive and we believe by year end it was abundantly clear that the UK’s position was very weak.
All indices are unmanaged and investors cannot invest directly in an index. Past performance does not guarantee future results. The performance quoted represents past performance. Investment return and principal value of an investment will fluctuate, and shares, when redeemed, may be worth more or less than their original cost. The Portfolios’ performance is subject to change since the period’s end and may be lower or higher than the performance data shown. Please call (800) 262-3862 or log on to www.voyainvestments.com to obtain performance data current to the most recent month end.
Market Perspective reflects the views of Voya Investment Management’s Chief Investment Risk Officer only through the end of the period, and is subject to change based on market and other conditions.
| | | Index | | | | Description | | |
| | | Bloomberg Barclays High Yield Bond — 2% Issuer Constrained Composite Index | | | | An index that includes all fixed-income securities having a maximum quality rating of Ba1, a minimum amount outstanding of $150 million, and at least one year to maturity. | | |
| | | Bloomberg Barclays U.S. Aggregate Bond Index | | | | An index of publicly issued investment grade U.S. Government, mortgage-backed, asset-backed and corporate debt securities. | | |
| | | Bloomberg Barclays U.S. Corporate Investment Grade Bond Index | | | | An index consisting of publicly issued, fixed rate, nonconvertible, investment grade debt securities. | | |
| | | Bloomberg Barclays Long-Term U.S. Treasury Index | | | | This index measures the performance of U.S. Treasury bills with long-term maturity. The credit level for this index is investment grade. The rebalance scheme is monthly. | | |
| | | Bloomberg Barclays U.S. Treasury Bond Index | | | | A market capitalization-weighted index that measures the performance of public obligations of the U.S. Treasury that have a remaining maturity of one year or more. | | |
| | | MSCI Europe, Australasia and Far East® (“MSCI EAFE”) Index | | | | An index that measures the performance of securities listed on exchanges in Europe, Australasia and the Far East. It includes the reinvestment of dividends net of withholding taxes, but does not reflect fees, brokerage commissions or other expenses of investing. | | |
| | | MSCI Europe ex UK® Index | | | | A free float-adjusted market capitalization index that is designed to measure developed market equity performance in Europe, excluding the UK. | | |
| | | MSCI Japan® Index | | | | A free float-adjusted market capitalization index that is designed to measure developed market equity performance in Japan. | | |
| | | MSCI UK® Index | | | | A free float-adjusted market capitalization index that is designed to measure developed market equity performance in the UK. | | |
| | | MSCI World IndexSM | | | | An index that measures the performance of over 1,400 securities listed on exchanges in the U.S., Europe, Canada, Australia, New Zealand and the Far East. | | |
| | | Russell 3000® Index | | | | An index that measures the performance of the largest 3000 U.S. companies representing approximately 98% of the investable U.S. equity market. | | |
| | | S&P 500® Index | | | | An index that measures the performance of securities of approximately 500 large-capitalization companies whose securities are traded on major U.S. stock markets. | | |
| | | S&P Target Date Retirement Income Index | | | | Seeks to represent asset allocations which target an immediate retirement horizon. | | |
| | | S&P Target Risk Aggressive Index | | | | Seeks to emphasize exposure to equity securities, maximizing opportunities for long-term capital accumulation. It may include small allocations in fixed-income securities to enhance portfolio efficiency. | | |
| | | S&P Target Risk Conservative Index | | | | Seeks to emphasize exposure to fixed income securities in order to produce a current income stream and avoid excessive volatility of returns. Equity securities are included to protect long-term purchasing power. | | |
| | | S&P Target Risk Growth Index | | | | Seeks to measure the performance of an asset allocation strategy targeted to a growth focused risk profile. | | |
| | | S&P Target Risk Moderate Index | | | | Seeks to measure the performance of an asset allocation strategy targeted to a moderate risk profile. | | |
| | | S&P Target Date 2020 Index,
S&P Target Date 2025 Index,
S&P Target Date 2030 Index,
S&P Target Date 2035 Index,
S&P Target Date 2040 Index,
S&P Target Date 2045 Index,
S&P Target Date 2050 Index,
S&P Target Date 2055 Index and
S&P Target Date 2060+ Index | | | | Each index seeks to represent the market consensus for asset allocations which target an approximate 2020, 2025, 2030, 2035, 2040, 2045, 2050, 2055, 2060 and beyond the 2060 retirement horizon, respectively. | | |
| | | Tokyo Stock Price Index (“TOPIX Index®”) | | | | A composite index for the Tokyo Stock Exchange tracking all domestic stocks from the first section of the exchange. | | |
| Voya Solution Portfolios | Portfolio Managers’ Report |
The Voya Solution Portfolios consist of Voya Solution Aggressive Portfolio, Voya Solution Balanced Portfolio, Voya Solution Conservative Portfolio, Voya Solution Income Portfolio, Voya Solution Moderately Aggressive Portfolio, Voya Solution Moderately Conservative Portfolio, Voya Solution 2020 Portfolio, Voya Solution 2025 Portfolio, Voya Solution 2030 Portfolio, Voya Solution 2035 Portfolio, Voya Solution 2040 Portfolio, Voya Solution 2045 Portfolio, Voya Solution 2050 Portfolio, Voya Solution 2055 Portfolio, and Voya Solution 2060 Portfolio (each a “Portfolio” or collectively, the “Portfolios” or the “Solution Portfolios”). Each Portfolio seeks to achieve its investment objective by investing in a combination of underlying funds which are actively managed funds or passively managed funds (index funds)(1). Each Portfolio uses an asset allocation strategy (“Strategic Asset Allocation”) designed for investors expecting to retire around the year or have the risk profile applicable to that Portfolio. These Target Asset Allocations as of December 31, 2017 are set out in the table below. The Portfolios are managed by Halvard Kvaale, CIMA, Paul Zemsky, CFA and Chief Investment Officer, and Jody Hrazanek, Portfolio Managers of Voya Investment Management Co. LLC (“Voya IM”) the Sub-Adviser (“Sub-Adviser”).
Performance: Each Portfolio’s performance against its respective benchmarks can be found on page 7. Each Portfolio, except Solution Balanced, Solution Conservative, Solution Moderately Aggressive and Solution Moderately Conservative, outperformed its respective S&P Target Index.
Portfolio Specifics: The Portfolio managers attempt to enhance investment returns by tactically deviating from Strategic Asset Allocations to take advantage of opportunities or reduce risk. The following tactics were among those employed in 2017.
All Portfolios started the year with an overweight to U.S. large-cap equities, funded by underweight positions in core U.S. fixed income, high yield and short duration.
In January, the Portfolios purchased Japanese equities, funded by selling a portion of their U.S. large-cap equity position. At the time of the trade, we believed Japan to be one of the markets most likely to benefit from an acceleration in global growth. Therefore, we positioned the Portfolios to benefit from continued qualitative and quantitative easing by the Bank of Japan. This trade maintained the Portfolios’ global equity overweight, rotating equity from the United States towards more cyclical regions of the world. This position was unwound at the end of February, given the growing realization that the Bank of Japan’s easing was ineffective in its attempt to reaccelerate the Japanese economy. The proceeds of the sale were used to purchase U.S. large-cap equities.
At the end of March, the Portfolios enacted two new positions, selling their U.S. large-cap equity overweight in favor of euro zone and emerging market equities. We believe both trades were supported by attractive valuations and strong fundamentals underpinned by easing financial conditions and global reacceleration.
At the close of April, adjustments were made to the strategic asset allocation targets to reflect the portfolio management team’s revised long-term capital market expectations for a range of asset classes. This resulted in modest changes in the Portfolios’ sub-asset allocations in varying degrees. Primary adjustments across all Portfolios included a shift from growth to value within U.S. large-cap equities, increased allocations to small-cap equities and reduced global fixed income exposure in favor of core U.S. fixed income. In addition, long government bonds were removed as a strategic asset class but the Portfolios maintained a small tactical allocation to them for duration management purposes. Finally, to maintain equity weights through the annual glide down process, a tactical overweight to equities was enacted for the 2020-2035 Portfolios.
In June, the Portfolios tactically rotated a portion of their U.S. large-cap equity allocations towards growth to offset the value bias in their strategic allocations. The rationale supporting a growth-tilted market was based on the U.S. Federal Reserve Board’s (“Fed”) firm resolve for gradual interest-rate increases, two straight disappointing inflation readings and continual problems besetting the Trump administration’s agenda.
At the close of August, the Portfolios converted their existing euro zone equity exposure from a currency hedged position to an unhedged position. In August, the long euro and short U.S. dollar positioning had come off of extremes, providing an opportunity to scale into non-U.S. dollar exposure for the trade. In addition, fundamental indicators — such as gross domestic product (GDP) and purchasing managers index differentials between the two economies — were in our opinion showing support for a stronger euro versus the U.S. dollar.
At the end of September, the Portfolios opened a position in Japanese equities by selling international developed equities. At the time of the trade, Japan was on course to deliver the strongest earnings growth of any major region in 2017, but was the only major region to have been de-rated in forward price-to-earnings (“P/E”) terms. What’s more, at trade time, the TOPIX Index® was inexpensive, trading at a forward P/E relative to the MSCI World IndexSM at the lower end of its 12-year
| Portfolio Managers’ Report | Voya Solution Portfolios |
historical range. In October, the Portfolios further increased their Japanese equity exposure, funded by a reduced allocation to U.S. large blend equities. Also in mid-October, the 2020 and 2025 Portfolios sold U.S. large cap equities and purchased core U.S. fixed income to reduce an equity overweight position that was initiated in 2016. While the team remains positive on risk assets for 2018, we believe reducing equity exposures to be prudent in the event of an equity market sell-off for these near-dated Portfolios.
During the year, tactical moves had a positive impact across all Portfolios.
During the year, the Portfolios utilized various futures to enact tactical positions. Futures were utilized to avoid significant manager disruption and provide the Portfolios with greater liquidity. The impact of the derivatives was in line with expectations of the tactical asset allocation positions.
The Portfolio managers also attempt to add value by selecting underlying funds that are expected to perform well against the various asset class benchmarks from which the Strategic Asset Allocations are constructed. Individual contributors to benchmark-relative performance included VY® T. Rowe Price Growth Equity Portfolio, Voya Multi-Manager Emerging Markets Equity Fund and VY® Invesco Comstock Portfolio. Individual detractors from relative performance included Voya Small Company Portfolio, Voya Floating Rate Fund and Voya High Yield Bond Fund.
Current Strategy and Outlook: A lot of chatter in the markets is focusing on the low levels of volatility that prevailed in 2017 and whether 2018 will be the year that it returns. As usual, there are any number of geopolitical or other risks that could cause a temporary sell-off. That being said, we are heartened by the reality of macroeconomic fundamentals, which in our opinion include strong and synchronous global growth. We believe this would put a cap on any weakness in risk assets or rises in volatility.
Equities had a strong run in 2017, driven equally by multiple expansion and earnings growth. Investors will likely find that earnings will have to do most of the heavy lifting in 2018, as equities have become more expensive at 19 times forward earnings. We believe it’s not a bad thing to have an earnings-driven year for equities. Based on our models, we believe the S&P 500® Index should be able to deliver 10% earnings growth. While tax cuts can add more fuel to the earnings fire, they are largely already incorporated into equity prices.
We favored equities in 2017 and continue to do so going into 2018. The emerging markets were the darlings of last year, gaining over 30%. Even with a modest setback, lagging U.S. equities in the fourth quarter, in our view they are the ultimate beneficiaries of stronger than expected global growth and in our view offer good valuations. Japan has been among our strongest views in the latter part of 2017. The continued support from “Abenomics” and the central bank anchoring bond yields have produced solid growth and modest inflation.
In the United States, tax reform legislation has cleared the legislative hurdles to become law. We estimate the new policy will boost U.S. GDP growth by 0.3% in 2018 and 2019. The financial markets will have to digest some short- and longer-term consequences. We believe Fed spending will likely grow more quickly in 2018 than it has for the last three years. But with more fiscal stimulus comes larger deficits. Consensus expectations are for the U.S. budget deficit to reach 3.7% in 2018 and 5.0% in 2019. We also expect the Fed to respond to faster growth to maintain its mandate for a stable labor market. Therefore, we think the Fed will have to raise interest rates four times in 2018. Raising short-term interest rates will likely continue to flatten the yield curve (the difference between the yields on two-year and ten-year Treasuries), but the flattening is unlikely to match the magnitude that occurred in 2017. The longer end of the yield curve is unlikely to be as firmly anchored as it was in 2017, as one-off effects of softer inflation and an increase in the global supply of bonds impact the market.
In our opinion, the Portfolios remains positioned for a positive global growth outlook. Our long held constructive view on the emerging markets remains in place, even in light of some temporary relative weakness. We think economic data are still a positive and not too much of a good thing. While mindful that the cycle may be late in calendar years, we see our economic activity models and earnings projections telling us equities can remain well supported.
(1)
The investment objective of each Portfolio is described in the Portfolios’ prospectuses, each dated May 1, 2017.
Portfolio holdings and characteristics are subject to change and may not be representative of current holdings and characteristics. Portfolio holdings are subject to change daily. The outlook for this Portfolio may differ from that presented for other Voya mutual funds. The Portfolio’s performance returns shown reflect applicable fee waivers and/or expense limits in effect during this period. Absent such fee waivers/expense limitations, if any, performance would have been lower. Performance for the different classes of shares will vary based on differences in fees associated with each class.
| Voya Solution Portfolios | Portfolio Managers’ Report |
Target Allocations as of December 31, 2017
| | | Sub Asset Class | | | 2060 | | | 2055 | | | 2050 | | | 2045 | | | 2040 | | | 2035 | | | 2030 | | | 2025 | | | 2020 | | | Income | | |
| | | US Large Blend | | | | | 17.0% | | | | | | 17.0% | | | | | | 17.0% | | | | | | 17.0% | | | | | | 20.6% | | | | | | 22.0% | | | | | | 21.0% | | | | | | 16.0% | | | | | | 12.5% | | | | | | 9.1% | | | |
| | | US Large Growth | | | | | 13.0% | | | | | | 13.0% | | | | | | 13.0% | | | | | | 13.5% | | | | | | 11.5% | | | | | | 10.0% | | | | | | 9.0% | | | | | | 7.8% | | | | | | 6.5% | | | | | | 5.5% | | | |
| | | US Large Value | | | | | 13.0% | | | | | | 13.0% | | | | | | 13.0% | | | | | | 13.0% | | | | | | 11.0% | | | | | | 9.5% | | | | | | 8.5% | | | | | | 7.3% | | | | | | 6.0% | | | | | | 4.0% | | | |
| | | US Mid Cap Blend | | | | | 11.0% | | | | | | 11.0% | | | | | | 11.0% | | | | | | 10.0% | | | | | | 8.0% | | | | | | 7.0% | | | | | | 5.0% | | | | | | 4.5% | | | | | | 3.0% | | | | | | 3.0% | | | |
| | | US Small Cap | | | | | 5.0% | | | | | | 5.0% | | | | | | 5.0% | | | | | | 5.0% | | | | | | 5.0% | | | | | | 4.0% | | | | | | 4.0% | | | | | | 3.0% | | | | | | 3.0% | | | | | | — | | | |
| | | International | | | | | 21.0% | | | | | | 21.0% | | | | | | 21.0% | | | | | | 20.0% | | | | | | 19.0% | | | | | | 18.0% | | | | | | 16.0% | | | | | | 13.0% | | | | | | 10.0% | | | | | | 6.0% | | | |
| | | Japan Equity | | | | | 3.0% | | | | | | 3.0% | | | | | | 3.0% | | | | | | 3.0% | | | | | | 3.0% | | | | | | 3.0% | | | | | | 3.0% | | | | | | 3.0% | | | | | | 3.0% | | | | | | 3.0% | | | |
| | | Emerging Markets | | | | | 8.5% | | | | | | 8.5% | | | | | | 8.5% | | | | | | 8.0% | | | | | | 7.5% | | | | | | 7.0% | | | | | | 6.0% | | | | | | 5.0% | | | | | | 3.5% | | | | | | 3.0% | | | |
| | | US Real Estate | | | | | 1.5% | | | | | | 1.5% | | | | | | 1.5% | | | | | | 1.5% | | | | | | 1.5% | | | | | | 1.5% | | | | | | 1.5% | | | | | | 1.0% | | | | | | 1.0% | | | | | | 1.0% | | | |
| | | Global Real Estate | | | | | 1.5% | | | | | | 1.5% | | | | | | 1.5% | | | | | | 1.5% | | | | | | 1.5% | | | | | | 1.5% | | | | | | 1.5% | | | | | | 1.0% | | | | | | 1.0% | | | | | | 1.0% | | | |
| | | Commodities | | | | | 1.5% | | | | | | 1.5% | | | | | | 1.5% | | | | | | 1.5% | | | | | | 1.5% | | | | | | 1.5% | | | | | | 1.5% | | | | | | 1.5% | | | | | | 1.5% | | | | | | 1.5% | | | |
| | | Core Fixed Income | | | | | 4.0% | | | | | | 4.0% | | | | | | 4.0% | | | | | | 4.3% | | | | | | 5.0% | | | | | | 8.0% | | | | | | 15.0% | | | | | | 22.8% | | | | | | 26.8% | | | | | | 35.9% | | | |
| | | High Yield | | | | | — | | | | | | — | | | | | | — | | | | | | — | | | | | | 2.0% | | | | | | 2.0% | | | | | | 2.0% | | | | | | 2.0% | | | | | | 2.0% | | | | | | 2.0% | | | |
| | | Senior Debt | | | | | — | | | | | | — | | | | | | — | | | | | | 1.8% | | | | | | 3.0% | | | | | | 5.0% | | | | | | 5.0% | | | | | | 5.0% | | | | | | 5.0% | | | | | | 5.0% | | | |
| | | International Bonds | | | | | — | | | | | | — | | | | | | — | | | | | | — | | | | | | — | | | | | | — | | | | | | — | | | | | | 3.0% | | | | | | 3.0% | | | | | | 3.0% | | | |
| | | TIPS | | | | | — | | | | | | — | | | | | | — | | | | | | — | | | | | | — | | | | | | — | | | | | | — | | | | | | — | | | | | | 5.0% | | | | | | 7.0% | | | |
| | | Short Duration | | | | | — | | | | | | — | | | | | | — | | | | | | — | | | | | | — | | | | | | — | | | | | | — | | | | | | 3.3% | | | | | | 7.3% | | | | | | 10.0% | | | |
| | | Long Govt Bonds | | | | | — | | | | | | — | | | | | | — | | | | | | — | | | | | | — | | | | | | — | | | | | | 1.0% | | | | | | 1.0% | | | | | | — | | | | | | — | | | |
| | | Total Equity | | | | | 96.0% | | | | | | 96.0% | | | | | | 96.0% | | | | | | 94.0% | | | | | | 90.1% | | | | | | 85.0% | | | | | | 77.0% | | | | | | 63.0% | | | | | | 51.0% | | | | | | 37.1% | | | |
| | | Total Fixed Income | | | | | 4.0% | | | | | | 4.0% | | | | | | 4.0% | | | | | | 6.0% | | | | | | 10.0% | | | | | | 15.0% | | | | | | 23.0% | | | | | | 37.0% | | | | | | 49.0% | | | | | | 62.9% | | | |
| | | | | | | | 100.0% | | | | | | 100.0% | | | | | | 100.0% | | | | | | 100.0% | | | | | | 100.0% | | | | | | 100.0% | | | | | | 100.0% | | | | | | 100.0% | | | | | | 100.0% | | | | | | 100.0% | | | |
Target Allocations as of December 31, 2017
| | | Sub Asset Class | | | Aggressive | | | Balanced | | | Conservative | | | Moderately
Aggressive | | | Moderately
Conservative | | |
| | | US Large Blend | | | | | 15.5% | | | | | | 13.0% | | | | | | 8.5% | | | | | | 13.0% | | | | | | 9.5% | | | |
| | | US Large Growth | | | | | 13.0% | | | | | | 7.5% | | | | | | 2.0% | | | | | | 9.0% | | | | | | 3.5% | | | |
| | | US Large Value | | | | | 13.0% | | | | | | 12.0% | | | | | | 3.0% | | | | | | 14.5% | | | | | | 7.5% | | | |
| | | US Mid Cap Blend | | | | | 15.0% | | | | | | 8.0% | | | | | | 4.0% | | | | | | 12.0% | | | | | | 5.0% | | | |
| | | US Small Cap | | | | | 7.0% | | | | | | 4.0% | | | | | | — | | | | | | 6.0% | | | | | | 3.0% | | | |
| | | International | | | | | 21.0% | | | | | | 10.5% | | | | | | 2.0% | | | | | | 16.0% | | | | | | 6.0% | | | |
| | | Japan Equity | | | | | 3.0% | | | | | | 3.0% | | | | | | 3.0% | | | | | | 3.0% | | | | | | 3.0% | | | |
| | | Emerging Markets | | | | | 7.5% | | | | | | 4.5% | | | | | | 2.5% | | | | | | 6.0% | | | | | | 3.5% | | | |
| | | US Real Estate | | | | | 1.0% | | | | | | 1.0% | | | | | | — | | | | | | 1.0% | | | | | | 1.0% | | | |
| | | Global Real Estate | | | | | 1.0% | | | | | | 1.0% | | | | | | — | | | | | | 1.0% | | | | | | 1.0% | | | |
| | | Commodities | | | | | 1.0% | | | | | | 1.5% | | | | | | 2.0% | | | | | | 1.5% | | | | | | 2.0% | | | |
| | | Core Fixed Income | | | | | 2.0% | | | | | | 23.0% | | | | | | 31.0% | | | | | | 10.0% | | | | | | 28.0% | | | |
| | | High Yield | | | | | — | | | | | | 4.0% | | | | | | 7.0% | | | | | | 2.0% | | | | | | 6.0% | | | |
| | | Senior Debt | | | | | — | | | | | | 5.0% | | | | | | 7.0% | | | | | | 5.0% | | | | | | 7.0% | | | |
| | | International Bonds | | | | | — | | | | | | — | | | | | | 3.0% | | | | | | — | | | | | | 2.0% | | | |
| | | TIPS | | | | | — | | | | | | — | | | | | | 5.0% | | | | | | — | | | | | | 4.0% | | | |
| | | Short Duration | | | | | — | | | | | | 2.0% | | | | | | 20.0% | | | | | | — | | | | | | 8.0% | | | |
| | | Long Govt Bonds | | | | | — | | | | | | — | | | | | | — | | | | | | — | | | | | | — | | | |
| | | Total Equity | | | | | 98.0% | | | | | | 66.0% | | | | | | 27.0% | | | | | | 83.0% | | | | | | 45.0% | | | |
| | | Total Fixed Income | | | | | 2.0% | | | | | | 34.0% | | | | | | 73.0% | | | | | | 17.0% | | | | | | 55.0% | | | |
| | | | | | | | 100.0% | | | | | | 100.0% | | | | | | 100.0% | | | | | | 100.0% | | | | | | 100.0% | | | |
As these are target allocations, the actual allocations of each Portfolio’s assets may deviate from the percentages shown. Although the Portfolios expect to be fully invested at all times, they may maintain liquidity reserves to meet redemption requests.
Portfolio holdings are subject to change daily.
| Portfolio Managers’ Report | Voya Solution Portfolios |
| | | Total Returns for the Period Ended December 31, 2017 | | |
| | | | | | 1 Year | | |
| | | Voya Solution Aggressive Portfolio, Class S | | | 21.92% | | |
| | | S&P Target Risk Aggressive® Index | | | 20.36% | | |
| | | Voya Solution Balanced Portfolio, Class S | | | 14.75% | | |
| | | S&P Target Risk® Growth Index | | | 16.22% | | |
| | | Voya Solution Conservative Portfolio, Class S | | | 7.31% | | |
| | | S&P Target Risk® Conservative Index | | | 9.97% | | |
| | | Voya Solution Income Portfolio, Class S | | | 9.41% | | |
| | | S&P Target Date Retirement Income Index | | | 8.54% | | |
| | | Russell 3000® Index | | | 21.13% | | |
| | | MSCI EAFE® Index | | | 25.03% | | |
| | | Bloomberg Barclays U.S. Aggregate Bond (“BCAB”) Index | | | 3.54% | | |
| | | Voya Solution Moderately Aggressive Portfolio, Class S | | | 18.22% | | |
| | | S&P Target Risk Aggressive® Index | | | 20.36% | | |
| | | Voya Solution Moderately Conservative Portfolio, Class S | | | 10.40% | | |
| | | S&P Target Risk® Moderate Index | | | 12.06% | | |
| | | Voya Solution 2020 Portfolio, Class S | | | 12.78% | | |
| | | S&P Target Date 2020 Index | | | 12.80% | | |
| | | Voya Solution 2025 Portfolio, Class S | | | 15.29% | | |
| | | S&P Target Date 2025 Index | | | 14.55% | | |
| | | Russell 3000® Index | | | 21.13% | | |
| | | MSCI EAFE® Index | | | 25.03% | | |
| | | BCAB Index | | | 3.54% | | |
| | | Voya Solution 2030 Portfolio, Class S | | | 17.59% | | |
| | | S&P Target Date 2030 Index | | | 16.19% | | |
| | | Voya Solution 2035 Portfolio, Class S | | | 19.44% | | |
| | | S&P Target Date 2035 Index | | | 17.78% | | |
| | | Russell 3000® Index | | | 21.13% | | |
| | | MSCI EAFE® Index | | | 25.03% | | |
| | | BCAB Index | | | 3.54% | | |
| | | Voya Solution 2040 Portfolio, Class S | | | 20.53% | | |
| | | S&P Target Date 2040 Index | | | 18.87% | | |
| | | Voya Solution 2045 Portfolio, Class S | | | 21.25% | | |
| | | S&P Target Date 2045 Index | | | 19.56% | | |
| | | Russell 3000® Index | | | 21.13% | | |
| | | MSCI EAFE® Index | | | 25.03% | | |
| | | BCAB Index | | | 3.54% | | |
| | | Voya Solution 2050 Portfolio, Class S | | | 21.63% | | |
| | | S&P Target Date 2050 Index | | | 20.18% | | |
| | | Voya Solution 2055 Portfolio, Class S | | | 21.66% | | |
| | | S&P Target Date 2055 Index | | | 20.48% | | |
| | | Voya Solution 2060 Portfolio, Class S | | | 21.81% | | |
| | | S&P Target Date 2060+ Index | | | 20.75% | | |
| | | | | | | | |
| Voya Solution Aggressive Portfolio | Portfolio Managers’ Report |
| | | Average Annual Total Returns for the Periods Ended December 31, 2017 | | |
| | | | | | 1 Year | | | Since Inception
of Classes ADV, I, S, and S2
May 1, 2013 | | | Since Inception
of Class R6
May 2, 2016 | | |
| | | Class ADV | | | | | 21.71% | | | | | | 10.10% | | | | | | — | | | |
| | | Class I | | | | | 22.28% | | | | | | 10.75% | | | | | | — | | | |
| | | Class R6(1) | | | | | 22.28% | | | | | | — | | | | | | 10.75% | | | |
| | | Class S | | | | | 21.92% | | | | | | 10.46% | | | | | | — | | | |
| | | Class S2 | | | | | 21.71% | | | | | | 10.17% | | | | | | — | | | |
| | | S&P Target Risk Aggressive® Index | | | | | 20.36% | | | | | | 9.94% | | | | | | 9.94% | | | |
| | | | | |
Based on a $10,000 initial investment, the graph and table above illustrate the total return of Voya Solution Aggressive Portfolio against the index indicated. The index is unmanaged, has no cash in its portfolio and imposes no sales charges. An investor cannot invest directly in an index.
The Portfolio’s performance is shown without the imposition of any expenses or charges which are, or may be, imposed under your variable annuity contract or variable life insurance policy. Total returns would have been lower if such expenses or charges were included.
The performance graph and table do not reflect the deduction of taxes that a shareholder will pay on Portfolio distributions or the redemption of Portfolio shares.
The performance shown may include the effect of fee waivers and/or expense reimbursements by the Investment Adviser and/or other service providers, which have the effect of increasing total return. Had all fees and expenses been considered, the total returns would have been lower.
The performance update illustrates performance for a variable investment option available through a variable annuity contract or a variable life insurance policy. The
performance shown indicates past performance and is not a projection or prediction of future results. Actual investment returns and principal value will fluctuate so that shares and/or units, at redemption, may be worth more or less than their original cost. Please log on to www.voyainvestments.com or call (800) 262-3862 to get performance through the most recent month end.
This report contains statements that may be “forward-looking”statements. Actual results may differ materially from those projected in the “forward-looking” statements.
The views expressed in this report reflect those of the portfolio managers, only through the end of the period as stated on the cover. The portfolio managers’ views are subject to change at any time based on market and other conditions.
Portfolio holdings are subject to change daily.
(1)
The Class R6 shares performance shown for the period prior to their inception date is the performance of Class I shares without adjustment for any differences in the expenses between the two classes. If adjusted for such differences, returns would be different.
| Portfolio Managers’ Report | Voya Solution Balanced Portfolio |
| | | Average Annual Total Returns for the Periods Ended December 31, 2017 | | |
| | | | | | 1 Year | | | 5 Year | | | 10 Year | | | Since Inception
of Class S2
April 30, 2010 | | |
| | | Class ADV | | | | | 14.46% | | | | | | 8.10% | | | | | | 4.41% | | | | | | — | | | |
| | | Class I | | | | | 14.89% | | | | | | 8.63% | | | | | | 4.98% | | | | | | — | | | |
| | | Class R6(1) | | | | | 15.01% | | | | | | 8.63% | | | | | | 4.98% | | | | | | — | | | |
| | | Class S | | | | | 14.75% | | | | | | 8.35% | | | | | | 4.72% | | | | | | — | | | |
| | | Class S2 | | | | | 14.63% | | | | | | 8.21% | | | | | | — | | | | | | 7.64% | | | |
| | | S&P Target Risk® Growth Index | | | | | 16.22% | | | | | | 8.90% | | | | | | 5.50% | | | | | | 8.40% | | | |
| | | | | |
Based on a $10,000 initial investment, the graph and table above illustrate the total return of Voya Solution Balanced Portfolio against the index indicated. The index is unmanaged and has no cash in its portfolio and imposes no sales charges. An investor cannot invest directly in an index.
The Portfolio’s performance is shown without the imposition of any expenses or charges which are, or may be, imposed under your variable annuity contract or variable life insurance policy. Total returns would have been lower if such expenses or charges were included.
The performance graph and table do not reflect the deduction of taxes that a shareholder will pay on Portfolio distributions or the redemption of Portfolio shares.
The performance shown may include the effect of fee waivers and/or expense reimbursements by the Investment Adviser and/or other service providers, which have the effect of increasing total return. Had all fees and expenses been considered, the total returns would have been lower.
The performance update illustrates performance for a variable investment option available through a variable annuity contract or a variable life insurance policy. The
performance shown indicates past performance and is not a projection or prediction of future results. Actual investment returns and principal value will fluctuate so that shares and/or units, at redemption, may be worth more or less than their original cost. Please log on to www.voyainvestments.com or call (800) 262-3862 to get performance through the most recent month end.
This report contains statements that may be “forward-looking” statements. Actual results may differ materially from those projected in the “forward-looking” statements.
The views expressed in this report reflect those of the portfolio managers, only through the end of the period as stated on the cover. The portfolio managers’ views are subject to change at any time based on market and other conditions.
Portfolio holdings are subject to change daily.
(1)
Class R6 incepted on May 2, 2016. The Class R6 shares performance shown for the period prior to their inception date is the performance of Class I shares without adjustment for any differences in the expenses between the two classes. If adjusted for such differences, returns would be different.
| Voya Solution Conservative Portfolio | Portfolio Managers’ Report |
| | | Average Annual Total Returns for the Periods Ended December 31, 2017 | | |
| | | | | | 1 Year | | | 5 Year | | | Since Inception
of Classes ADV, I, S, and S2
April 30, 2010 | | | Since Inception
of Class R6
May 2, 2016 | | |
| | | Class ADV | | | | | 7.06% | | | | | | 4.30% | | | | | | 4.77% | | | | | | — | | | |
| | | Class I | | | | | 7.60% | | | | | | 4.82% | | | | | | 5.29% | | | | | | — | | | |
| | | Class R6(1) | | | | | 7.60% | | | | | | 4.82% | | | | | | — | | | | | | 5.29% | | | |
| | | Class S | | | | | 7.31% | | | | | | 4.57% | | | | | | 5.03% | | | | | | — | | | |
| | | Class S2 | | | | | 7.20% | | | | | | 4.42% | | | | | | 4.88% | | | | | | — | | | |
| | | S&P Target Risk® Conservative Index | | | | | 9.97% | | | | | | 5.11% | | | | | | 5.38% | | | | | | 5.38% | | | |
| | | | | |
Based on a $10,000 initial investment, the graph and table above illustrate the total return of Voya Solution Conservative Portfolio against the index indicated. The index is unmanaged and has no cash in its portfolio and imposes no sales charges. An investor cannot invest directly in an index.
The Portfolio’s performance is shown without the imposition of any expenses or charges which are, or may be, imposed under your variable annuity contract or variable life insurance policy. Total returns would have been lower if such expenses or charges were included.
The performance graph and table do not reflect the deduction of taxes that a shareholder will pay on Portfolio distributions or the redemption of Portfolio shares.
The performance shown may include the effect of fee waivers and/or expense reimbursements by the Investment Adviser and/or other service providers, which have the effect of increasing total return. Had all fees and expenses been considered, the total returns would have been lower.
The performance update illustrates performance for a variable investment option available through a variable annuity contract or a variable life insurance policy. The
performance shown indicates past performance and is not a projection or prediction of future results. Actual investment returns and principal value will fluctuate so that shares and/or units, at redemption, may be worth more or less than their original cost. Please log on to www.voyainvestments.com or call (800) 262-3862 to get performance through the most recent month end.
This report contains statements that may be “forward-looking” statements. Actual results may differ materially from those projected in the “forward-looking” statements.
The views expressed in this report reflect those of the portfolio managers, only through the end of the period as stated on the cover. The portfolio managers’ views are subject to change at any time based on market and other conditions.
Portfolio holdings are subject to change daily.
(1)
The Class R6 shares performance shown for the period prior to their inception date is the performance of Class I shares without adjustment for any differences in the expenses between the two classes. If adjusted for such differences, returns would be different.
| Portfolio Managers’ Report | Voya Solution Income Portfolio |
| | | Average Annual Total Returns for the Periods Ended December 31, 2017 | | |
| | | | | | 1 Year | | | 5 Year | | | 10 Year | | | Since Inception
of Class S2
May 28, 2009 | | |
| | | Class ADV | | | | | 9.15% | | | | | | 5.02% | | | | | | 4.06% | | | | | | — | | | |
| | | Class I | | | | | 9.66% | | | | | | 5.54% | | | | | | 4.58% | | | | | | — | | | |
| | | Class S | | | | | 9.41% | | | | | | 5.30% | | | | | | 4.32% | | | | | | — | | | |
| | | Class S2 | | | | | 9.23% | | | | | | 5.12% | | | | | | — | | | | | | 6.72% | | | |
| | | Class T | | | | | 8.84% | | | | | | 4.82% | | | | | | 3.85% | | | | | | — | | | |
| | | S&P Target Date Retirement Income Index | | | | | 8.54% | | | | | | 4.86% | | | | | | 4.12% | | | | | | 6.51% | | | |
| | | Russell 3000® Index | | | | | 21.13% | | | | | | 15.58% | | | | | | 8.60% | | | | | | 15.91% | | | |
| | | MSCI EAFE® Index | | | | | 25.03% | | | | | | 7.90% | | | | | | 1.94% | | | | | | 11.64% | | | |
| | | BCAB Index | | | | | 3.54% | | | | | | 2.10% | | | | | | 4.01% | | | | | | 4.09% | | | |
| | | | | |
Based on a $10,000 initial investment, the graph and table above illustrate the total return of Voya Solution Income Portfolio against the indices indicated. An index is unmanaged and has no cash in its portfolio and imposes no sales charges. An investor cannot invest directly in an index. On June 1, 2017, S&P Dow Jones Indices, a third-party index provider, made construction and methodology changes to the index used by the Portfolio. Performance for the index for periods prior to June 1, 2017 has been recalculated by the index provider based on the new construction and methodology.
The Portfolio’s performance is shown without the imposition of any expenses or charges which are, or may be, imposed under your variable annuity contract or variable life insurance policy. Total returns would have been lower if such expenses or charges were included.
The performance graph and table do not reflect the deduction of taxes that a shareholder will pay on Portfolio distributions or the redemption of Portfolio shares.
The performance shown may include the effect of fee waivers and/or expense reimbursements by the Investment Adviser and/orother service providers, which have the effect of increasing total
return. Had all fees and expenses been considered, the total returns would have been lower.
The performance update illustrates performance for a variable investment option available through a variable annuity contract or a variable life insurance policy. The performance shown indicates past performance and is not a projection or prediction of future results. Actual investment returns and principal value will fluctuate so that shares and/or units, at redemption, may be worth more or less than their original cost. Please log on to www.voyainvestments.com or call (800) 262-3862 to get performance through the most recent month end.
This report contains statements that may be “forward-looking”statements. Actual results may differ materially from those projected in the “forward-looking” statements.
The views expressed in this report reflect those of the portfolio managers, only through the end of the period as stated on the cover. The portfolio managers’ views are subject to change at any time based on market and other conditions.
Portfolio holdings are subject to change daily.
| Voya Solution Moderately Aggressive Portfolio | Portfolio Managers’ Report |
| | | Average Annual Total Returns for the Periods Ended December 31, 2017 | | |
| | | | | | 1 Year | | | 5 Year | | | Since Inception
of Classes ADV, I, S, and S2
April 30, 2010 | | | Since Inception
of Class R6
May 2, 2016 | | |
| | | Class ADV | | | | | 17.89% | | | | | | 9.49% | | | | | | 8.49% | | | | | | — | | | |
| | | Class I | | | | | 18.50% | | | | | | 10.05% | | | | | | 9.05% | | | | | | — | | | |
| | | Class R6(1) | | | | | 18.51% | | | | | | 10.03% | | | | | | — | | | | | | 9.04% | | | |
| | | Class S | | | | | 18.22% | | | | | | 9.77% | | | | | | 8.77% | | | | | | — | | | |
| | | Class S2 | | | | | 18.05% | | | | | | 9.60% | | | | | | 8.62% | | | | | | — | | | |
| | | S&P Target Risk Aggressive® Index | | | | | 20.36% | | | | | | 11.05% | | | | | | 10.24% | | | | | | 10.24% | | | |
| | | | | |
Based on a $10,000 initial investment, the graph and table above illustrate the total return of Voya Solution Moderately Aggressive Portfolio against the index indicated. The index is unmanaged and has no cash in its portfolio and imposes no sales charges. An investor cannot invest directly in an index.
The Portfolio’s performance is shown without the imposition of any expenses or charges which are, or may be, imposed under your variable annuity contract or variable life insurance policy. Total returns would have been lower if such expenses or charges were included.
The performance graph and table do not reflect the deduction of taxes that a shareholder will pay on Portfolio distributions or the redemption of Portfolio shares.
The performance shown may include the effect of fee waivers and/or expense reimbursements by the Investment Adviser and/or other service providers, which have the effect of increasing total return. Had all fees and expenses been considered, the total returns would have been lower.
The performance update illustrates performance for a variable investment option available through a variable annuity contract or a variable life insurance policy. The
performance shown indicates past performance and is not a projection or prediction of future results. Actual investment returns and principal value will fluctuate so that shares and/or units, at redemption, may be worth more or less than their original cost. Please log on to www.voyainvestments.com or call (800) 262-3862 to get performance through the most recent month end.
This report contains statements that may be “forward-looking” statements. Actual results may differ materially from those projected in the “forward-looking” statements.
The views expressed in this report reflect those of the portfolio managers, only through the end of the period as stated on the cover. The portfolio managers’ views are subject to change at any time based on market and other conditions.
Portfolio holdings are subject to change daily.
(1)
The Class R6 shares performance shown for the period prior to their inception date is the performance of Class I shares without adjustment for any differences in the expenses between the two classes. If adjusted for such differences, returns would be different.
| Portfolio Managers’ Report | Voya Solution Moderately Conservative Portfolio |
| | | Average Annual Total Returns for the Periods Ended December 31, 2017 | | |
| | | | | | 1 Year | | | 5 Year | | | 10 Year | | | Since Inception
of Class S2
April 30, 2010 | | |
| | | Class ADV | | | | | 10.09% | | | | | | 5.85% | | | | | | 3.99% | | | | | | — | | | |
| | | Class I | | | | | 10.73% | | | | | | 6.37% | | | | | | 4.63% | | | | | | — | | | |
| | | Class R6(1) | | | | | 10.68% | | | | | | 6.34% | | | | | | 4.61% | | | | | | — | | | |
| | | Class S | | | | | 10.40% | | | | | | 6.13% | | | | | | 4.34% | | | | | | — | | | |
| | | Class S2 | | | | | 10.33% | | | | | | 5.97% | | | | | | — | | | | | | 6.11% | | | |
| | | S&P Target Risk® Moderate Index | | | | | 12.06% | | | | | | 6.46% | | | | | | 4.55% | | | | | | 6.38% | | | |
| | | | | |
Based on a $10,000 initial investment, the graph and table above illustrate the total return of Voya Solution Moderately Conservative Portfolio against the index indicated. The index is unmanaged and has no cash in its portfolio and imposes no sales charges. An investor cannot invest directly in an index.
The Portfolio’s performance is shown without the imposition of any expenses or charges which are, or may be, imposed under your variable annuity contract or variable life insurance policy. Total returns would have been lower if such expenses or charges were included.
The performance graph and table do not reflect the deduction of taxes that a shareholder will pay on Portfolio distributions or the redemption of Portfolio shares.
The performance shown may include the effect of fee waivers and/or expense reimbursements by the Investment Adviser and/or other service providers, which have the effect of increasing total return. Had all fees and expenses been considered, the total returns would have been lower.
The performance update illustrates performance for a variable investment option available through a variable annuity contract or a variable life insurance policy. The
performance shown indicates past performance and is not a projection or prediction of future results. Actual investment returns and principal value will fluctuate so that shares and/or units, at redemption, may be worth more or less than their original cost. Please log on to www.voyainvestments.com or call (800) 262-3862 to get performance through the most recent month end.
This report contains statements that may be “forward-looking” statements. Actual results may differ materially from those projected in the “forward-looking” statements.
The views expressed in this report reflect those of the portfolio managers, only through the end of the period as stated on the cover. The portfolio managers’ views are subject to change at any time based on market and other conditions.
Portfolio holdings are subject to change daily.
(1)
Class R6 incepted on May 2, 2016. The Class R6 shares performance shown for the period prior to their inception date is the performance of Class I shares without adjustment for any differences in the expenses between the two classes. If adjusted for such differences, returns would be different.
| Voya Solution 2020 Portfolio | Portfolio Managers’ Report |
| | | Average Annual Total Returns for the Periods Ended December 31, 2017 | | |
| | | | | | 1 Year | | | 5 Year | | | Since Inception
of Classes ADV, I, S, S2 and T
October 3, 2011 | | |
| | | Class ADV | | | | | 12.43% | | | | | | 7.40% | | | | | | 9.21% | | | |
| | | Class I | | | | | 13.01% | | | | | | 7.97% | | | | | | 9.76% | | | |
| | | Class S | | | | | 12.78% | | | | | | 7.70% | | | | | | 9.47% | | | |
| | | Class S2 | | | | | 12.54% | | | | | | 7.54% | | | | | | 9.34% | | | |
| | | Class T | | | | | 12.22% | | | | | | 7.28% | | | | | | 9.06% | | | |
| | | S&P Target Date 2020 Index | | | | | 12.80% | | | | | | 7.92% | | | | | | 9.70% | | | |
| | | | | |
Based on a $10,000 initial investment, the graph and table above illustrate the total return of Voya Solution 2020 Portfolio against the index indicated. The index is unmanaged and has no cash in its portfolio and imposes no sales charges. An investor cannot invest directly in an index. On June 1, 2017, S&P Dow Jones Indices, a third-party index provider, made construction and methodology changes to the index used by the Portfolio. Performance for the index for periods prior to June 1, 2017 has been recalculated by the index provider based on the new construction and methodology.
The Portfolio’s performance is shown without the imposition of any expenses or charges which are, or may be, imposed under your variable annuity contract or variable life insurance policy. Total returns would have been lower if such expenses or charges were included.
The performance graph and table do not reflect the deduction of taxes that a shareholder will pay on Portfolio distributions or the redemption of Portfolio shares.
The performance shown may include the effect of fee waivers and/or expense reimbursements by the Investment Adviser and/or other service providers, which have the effect of
increasing total return. Had all fees and expenses been considered, the total returns would have been lower.
The performance update illustrates performance for a variable investment option available through a variable annuity contract or a variable life insurance policy. The performance shown indicates past performance and is not a projection or prediction of future results. Actual investment returns and principal value will fluctuate so that shares and/or units, at redemption, may be worth more or less than their original cost. Please log on to www.voyainvestments.com or call (800) 262-3862 to get performance through the most recent month end.
This report contains statements that may be “forward-looking”statements. Actual results may differ materially from those projected in the “forward-looking” statements.
The views expressed in this report reflect those of the portfolio managers, only through the end of the period as stated on the cover. The portfolio managers’ views are subject to change at any time based on market and other conditions.
Portfolio holdings are subject to change daily.
| Portfolio Managers’ Report | Voya Solution 2025 Portfolio |
| | | Average Annual Total Returns for the Periods Ended December 31, 2017 | | |
| | | | | | 1 Year | | | 5 Year | | | 10 Year | | | Since Inception
of Class S2
May 28, 2009 | | |
| | | Class ADV | | | | | 15.02% | | | | | | 8.14% | | | | | | 4.28% | | | | | | — | | | |
| | | Class I | | | | | 15.62% | | | | | | 8.68% | | | | | | 4.80% | | | | | | — | | | |
| | | Class S | | | | | 15.29% | | | | | | 8.42% | | | | | | 4.54% | | | | | | — | | | |
| | | Class S2 | | | | | 15.07% | | | | | | 8.23% | | | | | | — | | | | | | 9.75% | | | |
| | | Class T | | | | | 14.78% | | | | | | 7.93% | | | | | | 4.07% | | | | | | — | | | |
| | | S&P Target Date 2025 Index | | | | | 14.55% | | | | | | 8.76% | | | | | | 5.53% | | | | | | 10.37% | | | |
| | | Russell 3000® Index | | | | | 21.13% | | | | | | 15.58% | | | | | | 8.60% | | | | | | 15.91% | | | |
| | | MSCI EAFE® Index | | | | | 25.03% | | | | | | 7.90% | | | | | | 1.94% | | | | | | 11.64% | | | |
| | | BCAB Index | | | | | 3.54% | | | | | | 2.10% | | | | | | 4.01% | | | | | | 4.09% | | | |
| | | | | |
Based on a $10,000 initial investment, the graph and table above illustrate the total return of Voya Solution 2025 Portfolio against the indices indicated. An index is unmanaged and has no cash in its portfolio and imposes no sales charges. An investor cannot invest directly in an index. On June 1, 2017, S&P Dow Jones Indices, a third-party index provider, made construction and methodology changes to the index used by the Portfolio. Performance for the index for periods prior to June 1, 2017 has been recalculated by the index provider based on the new construction and methodology.
The Portfolio’s performance is shown without the imposition of any expenses or charges which are, or may be, imposed under your variable annuity contract or variable life insurance policy. Total returns would have been lower if such expenses or charges were included.
The performance graph and table do not reflect the deduction of taxes that a shareholder will pay on Portfolio distributions or the redemption of Portfolio shares.
The performance shown may include the effect of fee waivers and/or expense reimbursements by the Investment Adviser and/or other service providers, which have the effect of
increasing total return. Had all fees and expenses been considered, the total returns would have been lower.
The performance update illustrates performance for a variable investment option available through a variable annuity contract or a variable life insurance policy. The performance shown indicates past performance and is not a projection or prediction of future results. Actual investment returns and principal value will fluctuate so that shares and/or units, at redemption, may be worth more or less than their original cost. Please log on to www.voyainvestments.com or call (800) 262-3862 to get performance through the most recent month end.
This report contains statements that may be “forward-looking”statements. Actual results may differ materially from those projected in the “forward-looking” statements.
The views expressed in this report reflect those of the portfolio managers, only through the end of the period as stated on the cover. The portfolio managers’ views are subject to change at any time based on market and other conditions.
Portfolio holdings are subject to change daily.
| Voya Solution 2030 Portfolio | Portfolio Managers’ Report |
| | | Average Annual Total Returns for the Periods Ended December 31, 2017 | | |
| | | | | | 1 Year | | | 5 Year | | | Since Inception
of Classes ADV, I, S, S2 and T
October 3, 2011 | | |
| | | Class ADV | | | | | 17.22% | | | | | | 9.46% | | | | | | 11.49% | | | |
| | | Class I | | | | | 17.86% | | | | | | 10.05% | | | | | | 12.06% | | | |
| | | Class S | | | | | 17.59% | | | | | | 9.72% | | | | | | 11.73% | | | |
| | | Class S2 | | | | | 17.38% | | | | | | 9.52% | | | | | | 11.56% | | | |
| | | Class T | | | | | 17.05% | | | | | | 9.30% | | | | | | 11.31% | | | |
| | | S&P Target Date 2030 Index | | | | | 16.19% | | | | | | 9.57% | | | | | | 11.67% | | | |
| | | | | |
Based on a $10,000 initial investment, the graph and table above illustrate the total return of Voya Solution 2030 Portfolio against the index indicated. The index is unmanaged, has no cash in its portfolio and imposes no sales charges. An investor cannot invest directly in an index. On June 1, 2017, S&P Dow Jones Indices, a third-party index provider, made construction and methodology changes to the index used by the Portfolio. Performance for the index for periods prior to June 1, 2017 has been recalculated by the index provider based on the new construction and methodology.
The Portfolio’s performance is shown without the imposition of any expenses or charges which are, or may be, imposed under your variable annuity contract or variable life insurance policy. Total returns would have been lower if such expenses or charges were included.
The performance graph and table do not reflect the deduction of taxes that a shareholder will pay on Portfolio distributions or the redemption of Portfolio shares.
The performance shown may include the effect of fee waivers and/or expense reimbursements by the Investment Adviser and/or other service providers, which have the effect of increasing total return. Had all fees and expenses been considered, the total returns would have been lower.
The performance update illustrates performance for a variable investment option available through a variable contract or a variable life insurance policy. The performance shown indicates past performance and is not a projection or prediction of future results. Actual investment returns and principal value will fluctuate so that shares and/or units, at redemption, may be worth more or less than their original cost. Please call (800) 262-3862 to get performance through the most recent month end.
It is important to note that the Portfolio has a limited operating history. Performance over a longer period of time may be more meaningful than short-term performance.
This report contains statements that may be “forward-looking”statements. Actual results may differ materially from those projected in the “forward-looking” statements.
The views expressed in this report reflect those of the portfolio managers, only through the end of the period as stated on the cover. The portfolio managers’ views are subject to change at any time based on market and other conditions.
Portfolio holdings are subject to change daily.
| Portfolio Managers’ Report | Voya Solution 2035 Portfolio |
| | | Average Annual Total Returns for the Periods Ended December 31, 2017 | | |
| | | | | | 1 Year | | | 5 Year | | | 10 Year | | | Since Inception
of Class S2
May 28, 2009 | | |
| | | Class ADV | | | | | 19.22% | | | | | | 9.68% | | | | | | 4.77% | | | | | | — | | | |
| | | Class I | | | | | 19.82% | | | | | | 10.22% | | | | | | 5.28% | | | | | | — | | | |
| | | Class S | | | | | 19.44% | | | | | | 9.94% | | | | | | 5.03% | | | | | | — | | | |
| | | Class S2 | | | | | 19.28% | | | | | | 9.78% | | | | | | — | | | | | | 10.91% | | | |
| | | Class T | | | | | 19.03% | | | | | | 9.46% | | | | | | 4.56% | | | | | | — | | | |
| | | S&P Target Date 2035 Index | | | | | 17.78% | | | | | | 10.29% | | | | | | 5.90% | | | | | | 11.63% | | | |
| | | Russell 3000® Index | | | | | 21.13% | | | | | | 15.58% | | | | | | 8.60% | | | | | | 15.91% | | | |
| | | MSCI EAFE® Index | | | | | 25.03% | | | | | | 7.90% | | | | | | 1.94% | | | | | | 11.64% | | | |
| | | BCAB Index | | | | | 3.54% | | | | | | 2.10% | | | | | | 4.01% | | | | | | 4.09% | | | |
| | | | | |
Based on a $10,000 initial investment, the graph and table above illustrate the total return of Voya Solution 2035 Portfolio against the indices indicated. An index is unmanaged, has no cash in its portfolio and imposes no sales charges. An investor cannot invest directly in an index. On June 1, 2017, S&P Dow Jones Indices, a third-party index provider, made construction and methodology changes to the index used by the Portfolio. Performance for the index for periods prior to June 1, 2017 has been recalculated by the index provider based on the new construction and methodology.
The Portfolio’s performance is shown without the imposition of any expenses or charges which are, or may be, imposed under your variable annuity contract or variable life insurance policy. Total returns would have been lower if such expenses or charges were included.
The performance graph and table do not reflect the deduction of taxes that a shareholder will pay on Portfolio distributions or the redemption of Portfolio shares.
The performance shown may include the effect of fee waivers and/or expense reimbursements by the Investment Adviser and/or other service providers, which have the effect of increasing total return. Had all fees and expenses been considered, the total returns would have been lower.
The performance update illustrates performance for a variable investment option available through a variable contract or a variable life insurance policy. The performance shown indicates past performance and is not a projection or prediction of future results. Actual investment returns and principal value will fluctuate so that shares and/or units, at redemption, may be worth more or less than their original cost. Please call (800) 262-3862 to get performance through the most recent month end.
It is important to note that the Portfolio has a limited operating history. Performance over a longer period of time may be more meaningful than short-term performance.
This report contains statements that may be “forward-looking”statements. Actual results may differ materially from those projected in the “forward-looking” statements.
The views expressed in this report reflect those of the portfolio managers, only through the end of the period as stated on the cover. The portfolio managers’ views are subject to change at any time based on market and other conditions.
Portfolio holdings are subject to change daily.
| Voya Solution 2040 Portfolio | Portfolio Managers’ Report |
| | | Average Annual Total Returns for the Periods Ended December 31, 2017 | | |
| | | | | | 1 Year | | | 5 Year | | | Since Inception
of Classes ADV, I, S, S2 and T
October 3, 2011 | | |
| | | Class ADV | | | | | 20.23% | | | | | | 10.70% | | | | | | 12.97% | | | |
| | | Class I | | | | | 20.85% | | | | | | 11.29% | | | | | | 13.57% | | | |
| | | Class S | | | | | 20.53% | | | | | | 10.95% | | | | | | 13.23% | | | |
| | | Class S2 | | | | | 20.31% | | | | | | 10.78% | | | | | | 13.07% | | | |
| | | Class T | | | | | 20.05% | | | | | | 10.48% | | | | | | 12.76% | | | |
| | | S&P Target Date 2040 Index | | | | | 18.87% | | | | | | 10.78% | | | | | | 13.03% | | | |
| | | | | |
Based on a $10,000 initial investment, the graph and table above illustrate the total return of Voya Solution 2040 Portfolio against the index indicated. The index is unmanaged and has no cash in its portfolio and imposes no sales charges. An investor cannot invest directly in an index. On June 1, 2017, S&P Dow Jones Indices, a third-party index provider, made construction and methodology changes to the index used by the Portfolio. Performance for the index for periods prior to June 1, 2017 has been recalculated by the index provider based on the new construction and methodology.
The Portfolio’s performance is shown without the imposition of any expenses or charges which are, or may be, imposed under your variable annuity contract or variable life insurance policy. Total returns would have been lower if such expenses or charges were included.
The performance graph and table do not reflect the deduction of taxes that a shareholder will pay on Portfolio distributions or the redemption of Portfolio shares.
The performance shown may include the effect of fee waivers and/or expense reimbursements by the Investment Adviser and/or other service providers, which have the effect of
increasing total return. Had all fees and expenses been considered, the total returns would have been lower.
The performance update illustrates performance for a variable investment option available through a variable annuity contract or a variable life insurance policy. The performance shown indicates past performance and is not a projection or prediction of future results. Actual investment returns and principal value will fluctuate so that shares and/or units, at redemption, may be worth more or less than their original cost. Please log on to www.voyainvestments.com or call (800) 262-3862 to get performance through the most recent month end.
This report contains statements that may be “forward-looking”statements. Actual results may differ materially from those projected in the “forward-looking” statements.
The views expressed in this report reflect those of the portfolio managers, only through the end of the period as stated on the cover. The portfolio managers’ views are subject to change at any time based on market and other conditions.
Portfolio holdings are subject to change daily.
| Portfolio Managers’ Report | Voya Solution 2045 Portfolio |
| | | Average Annual Total Returns for the Periods Ended December 31, 2017 | | |
| | | | | | 1 Year | | | 5 Year | | | 10 Year | | | Since Inception
of Class S2
May 28, 2009 | | |
| | | Class ADV | | | | | 20.92% | | | | | | 10.58% | | | | | | 4.87% | | | | | | — | | | |
| | | Class I | | | | | 21.53% | | | | | | 11.13% | | | | | | 5.39% | | | | | | — | | | |
| | | Class S | | | | | 21.25% | | | | | | 10.85% | | | | | | 5.12% | | | | | | — | | | |
| | | Class S2 | | | | | 21.02% | | | | | | 10.68% | | | | | | — | | | | | | 11.55% | | | |
| | | Class T | | | | | 20.69% | | | | | | 10.36% | | | | | | 4.66% | | | | | | — | | | |
| | | S&P Target Date 2045 Index | | | | | 19.56% | | | | | | 11.15% | | | | | | 6.06% | | | | | | 12.29% | | | |
| | | Russell 3000® Index | | | | | 21.13% | | | | | | 15.58% | | | | | | 8.60% | | | | | | 15.91% | | | |
| | | MSCI EAFE® Index | | | | | 25.03% | | | | | | 7.90% | | | | | | 1.94% | | | | | | 11.64% | | | |
| | | BCAB Index | | | | | 3.54% | | | | | | 2.10% | | | | | | 4.01% | | | | | | 4.09% | | | |
| | | | | |
Based on a $10,000 initial investment, the graph and table above illustrate the total return of Voya Solution 2045 Portfolio against the indices indicated. An index is unmanaged and has no cash in its portfolio and imposes no sales charges. An investor cannot invest directly in an index. On June 1, 2017, S&P Dow Jones Indices, a third-party index provider, made construction and methodology changes to the index used by the Portfolio. Performance for the index for periods prior to June 1, 2017 has been recalculated by the index provider based on the new construction and methodology.
The Portfolio’s performance is shown without the imposition of any expenses or charges which are, or may be, imposed under your variable annuity contract or variable life insurance policy. Total returns would have been lower if such expenses or charges were included.
The performance graph and table do not reflect the deduction of taxes that a shareholder will pay on Portfolio distributions or the redemption of Portfolio shares.
The performance shown may include the effect of fee waivers and/or expense reimbursements by the Investment Adviser and/or other service providers, which have the effect of
increasing total return. Had all fees and expenses been considered, the total returns would have been lower.
The performance update illustrates performance for a variable investment option available through a variable annuity contract or a variable life insurance policy. The performance shown indicates past performance and is not a projection or prediction of future results. Actual investment returns and principal value will fluctuate so that shares and/or units, at redemption, may be worth more or less than their original cost. Please log on to www.voyainvestments.com or call (800) 262-3862 to get performance through the most recent month end.
This report contains statements that may be “forward-looking”statements. Actual results may differ materially from those projected in the “forward-looking” statements.
The views expressed in this report reflect those of the portfolio managers, only through the end of the period as stated on the cover. The portfolio managers’ views are subject to change at any time based on market and other conditions.
Portfolio holdings are subject to change daily.
| Voya Solution 2050 Portfolio | Portfolio Managers’ Report |
| | | Average Annual Total Returns for the Periods Ended December 31, 2017 | | |
| | | | | | 1 Year | | | 5 Year | | | Since Inception
of Classes ADV, I, S, S2 and T
October 3, 2011 | | |
| | | Class ADV | | | | | 21.30% | | | | | | 11.00% | | | | | | 13.23% | | | |
| | | Class I | | | | | 21.99% | | | | | | 11.62% | | | | | | 13.86% | | | |
| | | Class S | | | | | 21.63% | | | | | | 11.27% | | | | | | 13.49% | | | |
| | | Class S2 | | | | | 21.47% | | | | | | 11.09% | | | | | | 13.32% | | | |
| | | Class T | | | | | 21.15% | | | | | | 10.84% | | | | | | 13.07% | | | |
| | | S&P Target Date 2050 Index | | | | | 20.18% | | | | | | 11.48% | | | | | | 13.80% | | | |
| | | | | |
Based on a $10,000 initial investment, the graph and table above illustrate the total return of Voya Solution 2050 Portfolio against the index indicated. The index is unmanaged and has no cash in its portfolio and imposes no sales charges. An investor cannot invest directly in an index. On June 1, 2017, S&P Dow Jones Indices, a third-party index provider, made construction and methodology changes to the index used by the Portfolio. Performance for the index for periods prior to June 1, 2017 has been recalculated by the index provider based on the new construction and methodology.
The Portfolio’s performance is shown without the imposition of any expenses or charges which are, or may be, imposed under your variable annuity contract or variable life insurance policy. Total returns would have been lower if such expenses or charges were included.
The performance graph and table do not reflect the deduction of taxes that a shareholder will pay on Portfolio distributions or the redemption of Portfolio shares.
The performance shown may include the effect of fee waivers and/or expense reimbursements by the Investment Adviser and/or other service providers, which have the effect of
increasing total return. Had all fees and expenses been considered, the total returns would have been lower.
The performance update illustrates performance for a variable investment option available through a variable annuity contract or a variable life insurance policy. The performance shown indicates past performance and is not a projection or prediction of future results. Actual investment returns and principal value will fluctuate so that shares and/or units, at redemption, may be worth more or less than their original cost. Please log on to www.voyainvestments.com or call (800) 262-3862 to get performance through the most recent month end.
This report contains statements that may be “forward-looking”statements. Actual results may differ materially from those projected in the “forward-looking” statements.
The views expressed in this report reflect those of the portfolio managers, only through the end of the period as stated on the cover. The portfolio managers’ views are subject to change at any time based on market and other conditions.
Portfolio holdings are subject to change daily.
| Portfolio Managers’ Report | Voya Solution 2055 Portfolio |
| | | Average Annual Total Returns for the Periods Ended December 31, 2017 | | |
| | | | | | 1 Year | | | 5 Year | | | Since Inception
of Classes ADV, I, S, S2 and T
March 8, 2010 | | |
| | | Class ADV | | | | | 21.40% | | | | | | 10.72% | | | | | | 9.64% | | | |
| | | Class I | | | | | 21.94% | | | | | | 11.28% | | | | | | 10.18% | | | |
| | | Class S | | | | | 21.66% | | | | | | 11.00% | | | | | | 9.91% | | | |
| | | Class S2 | | | | | 21.52% | | | | | | 10.84% | | | | | | 9.75% | | | |
| | | Class T | | | | | 21.08% | | | | | | 10.53% | | | | | | 9.43% | | | |
| | | S&P Target Date 2055 Index | | | | | 20.48% | | | | | | 11.70% | | | | | | 10.66% | | | |
| | | | | |
Based on a $10,000 initial investment, the graph and table above illustrate the total return of Voya Solution 2055 Portfolio against the index indicated. The index is unmanaged and has no cash in its portfolio and imposes no sales charges. An investor cannot invest directly in an index. On June 1, 2017, S&P Dow Jones Indices, a third-party index provider, made construction and methodology changes to the index used by the Portfolio. Performance for the index for periods prior to June 1, 2017 has been recalculated by the index provider based on the new construction and methodology.
The Portfolio’s performance is shown without the imposition of any expenses or charges which are, or may be, imposed under your variable annuity contract or variable life insurance policy. Total returns would have been lower if such expenses or charges were included.
The performance graph and table do not reflect the deduction of taxes that a shareholder will pay on Portfolio distributions or the redemption of Portfolio shares.
The performance shown may include the effect of fee waivers and/or expense reimbursements by the Investment Adviser and/or other service providers, which have the effect of
increasing total return. Had all fees and expenses been considered, the total returns would have been lower.
The performance update illustrates performance for a variable investment option available through a variable annuity contract or a variable life insurance policy. The performance shown indicates past performance and is not a projection or prediction of future results. Actual investment returns and principal value will fluctuate so that shares and/or units, at redemption, may be worth more or less than their original cost. Please log on to www.voyainvestments.com or call (800) 262-3862 to get performance through the most recent month end.
This report contains statements that may be “forward-looking”statements. Actual results may differ materially from those projected in the “forward-looking” statements.
The views expressed in this report reflect those of the portfolio managers, only through the end of the period as stated on the cover. The portfolio managers’ views are subject to change at any time based on market and other conditions.
Portfolio holdings are subject to change daily.
| Voya Solution 2060 Portfolio | Portfolio Managers’ Report |
| | | Average Annual Total Returns for the Periods Ended December 31, 2017 | | |
| | | | | | 1 Year | | | Since Inception
of Classes ADV, I, S, S2 and T
February 9, 2015 | | |
| | | Class ADV | | | | | 21.42% | | | | | | 8.83% | | | |
| | | Class I | | | | | 22.15% | | | | | | 9.31% | | | |
| | | Class S | | | | | 21.81% | | | | | | 8.91% | | | |
| | | Class S2 | | | | | 21.56% | | | | | | 8.87% | | | |
| | | Class T | | | | | 21.24% | | | | | | 8.51% | | | |
| | | S&P Target Date 2060+ Index | | | | | 20.75% | | | | | | 9.82% | | | |
| | | | | |
Based on a $10,000 initial investment, the graph and table above illustrate the total return of Voya Solution 2060 Portfolio against the index indicated. The index is unmanaged and has no cash in its portfolio and imposes no sales charges. An investor cannot invest directly in an index. On June 1, 2017, S&P Dow Jones Indices, a third-party index provider, made construction and methodology changes to the index used by the Portfolio. Performance for the index for periods prior to June 1, 2017 has been recalculated by the index provider based on the new construction and methodology.
The Portfolio’s performance is shown without the imposition of any expenses or charges which are, or may be, imposed under your variable annuity contract or variable life insurance policy. Total returns would have been lower if such expenses or charges were included.
The performance graph and table do not reflect the deduction of taxes that a shareholder will pay on Portfolio distributions or the redemption of Portfolio shares.
The performance shown may include the effect of fee waivers and/or expense reimbursements by the Investment Adviser and/or other service providers, which have the effect of increasing total return. Had all fees and expenses been considered, the total returns would have been lower.
The performance update illustrates performance for a variable investment option available through a variable annuity contract or a variable life insurance policy. The performance shown indicates past performance and is not a projection or prediction of future results. Actual investment returns and principal value will fluctuate so that shares and/or units, at redemption, may be worth more or less than their original cost. Please log on to www.voyainvestments.com or call (800) 262-3862 to get performance through the most recent month end.
It is important to note that the Portfolio has a limited operating history. Performance over a longer period of time may be more meaningful than short-term performance.
This report contains statements that may be “forward-looking”statements. Actual results may differ materially from those projected in the “forward-looking” statements.
The views expressed in this report reflect those of the portfolio managers, only through the end of the period as stated on the cover. The portfolio managers’ views are subject to change at any time based on market and other conditions.
Portfolio holdings are subject to change daily.
SHAREHOLDER EXPENSE EXAMPLES (Unaudited)
As a shareholder of a Portfolio, you incur two types of costs: (1) transaction costs, including redemption fees and exchange fees; and (2) ongoing costs including management fees, distribution and/or service (12b-1) fees, and other Portfolio expenses. These Examples are intended to help you understand your ongoing costs (in dollars) of investing in a Portfolio and to compare these costs with the ongoing costs of investing in other mutual funds.
The Examples are based on an investment of $1,000 invested at the beginning of the period and held for the entire period from July 1, 2017 to December 31, 2017. The Portfolios’ expenses are shown without the imposition of any charges which are, or may be, imposed under your variable annuity contract, variable life insurance policy, qualified pension or retirement plan. Expenses would have been higher if such charges were included.
Actual Expenses
The left section of the table shown below, “Actual Portfolio Return,” provides information about actual account values and actual expenses. You may use the information in this section, together with the amount you invested, to estimate the expenses that you paid over the period. Simply divide your account value by $1,000 (for example, an $8,600 account value divided by $1,000 = 8.6), then multiply the result by the number in the first section under the heading entitled “Expenses Paid During the Period” to estimate the expenses you paid on your account during this period.
Hypothetical Example for Comparison Purposes
The right section of the table shown below, “Hypothetical (5% return before expenses),” provides information about hypothetical account values and hypothetical expenses based on a Portfolio’s actual expense ratio and an assumed rate of return of 5% per year before expenses, which is not a Portfolio’s actual return. The hypothetical account values and expenses may not be used to estimate the actual ending account balance or expenses you paid for the period. You may use this information to compare the ongoing costs of investing in a Portfolio and other mutual funds. To do so, compare this 5% hypothetical example with the 5% hypothetical examples that appear in the shareholder reports of the other mutual funds.
Please note that the expenses shown in the table are meant to highlight your ongoing costs only and do not reflect any transactional costs, such as redemption fees or exchange fees. Therefore, the hypothetical section of the table is useful in comparing ongoing costs only, and will not help you determine the relative total costs of owning different mutual funds. In addition, if these transactional costs were included, your costs would have been higher.
| | | | Actual Portfolio Return | | | Hypothetical (5% return before expenses) | |
| | | | Beginning
Account
Value
July 1,
2017 | | | Ending
Account
Value
December 31,
2017 | | | Annualized
Expense
Ratio* | | | Expenses Paid
During the
Period Ended
December 31,
2017** | | | Beginning
Account
Value
July 1,
2017 | | | Ending
Account
Value
December 31,
2017 | | | Annualized
Expense
Ratio* | | | Expenses Paid
During the
Period Ended
December 31,
2017** | |
| Voya Solution Aggressive Portfolio | |
| Class ADV | | | | $ | 1,000.00 | | | | | $ | 1,105.00 | | | | | | 0.66% | | | | | $ | 3.50 | | | | | $ | 1,000.00 | | | | | $ | 1,021.88 | | | | | | 0.66% | | | | | $ | 3.36 | | |
| Class I | | | | | 1,000.00 | | | | | | 1,107.80 | | | | | | 0.16 | | | | | | 0.85 | | | | | | 1,000.00 | | | | | | 1,024.40 | | | | | | 0.16 | | | | | | 0.82 | | |
| Class R6 | | | | | 1,000.00 | | | | | | 1,107.80 | | | | | | 0.16 | | | | | | 0.85 | | | | | | 1,000.00 | | | | | | 1,024.40 | | | | | | 0.16 | | | | | | 0.82 | | |
| Class S | | | | | 1,000.00 | | | | | | 1,105.20 | | | | | | 0.41 | | | | | | 2.18 | | | | | | 1,000.00 | | | | | | 1,023.14 | | | | | | 0.41 | | | | | | 2.09 | | |
| Class S2 | | | | | 1,000.00 | | | | | | 1,104.90 | | | | | | 0.56 | | | | | | 2.97 | | | | | | 1,000.00 | | | | | | 1,022.38 | | | | | | 0.56 | | | | | | 2.85 | | |
| Voya Solution Balanced Portfolio | |
| Class ADV | | | | $ | 1,000.00 | | | | | $ | 1,070.10 | | | | | | 0.66% | | | | | $ | 3.44 | | | | | $ | 1,000.00 | | | | | $ | 1,021.88 | | | | | | 0.66% | | | | | $ | 3.36 | | |
| Class I | | | | | 1,000.00 | | | | | | 1,071.40 | | | | | | 0.16 | | | | | | 0.84 | | | | | | 1,000.00 | | | | | | 1,024.40 | | | | | | 0.16 | | | | | | 0.82 | | |
| Class R6 | | | | | 1,000.00 | | | | | | 1,071.40 | | | | | | 0.16 | | | | | | 0.84 | | | | | | 1,000.00 | | | | | | 1,024.40 | | | | | | 0.16 | | | | | | 0.82 | | |
| Class S | | | | | 1,000.00 | | | | | | 1,070.50 | | | | | | 0.41 | | | | | | 2.14 | | | | | | 1,000.00 | | | | | | 1,023.14 | | | | | | 0.41 | | | | | | 2.09 | | |
| Class S2 | | | | | 1,000.00 | | | | | | 1,070.40 | | | | | | 0.56 | | | | | | 2.92 | | | | | | 1,000.00 | | | | | | 1,022.38 | | | | | | 0.56 | | | | | | 2.85 | | |
| Voya Solution Conservative Portfolio | |
| Class ADV | | | | $ | 1,000.00 | | | | | $ | 1,032.70 | | | | | | 0.62% | | | | | $ | 3.18 | | | | | $ | 1,000.00 | | | | | $ | 1,022.08 | | | | | | 0.62% | | | | | $ | 3.16 | | |
| Class I | | | | | 1,000.00 | | | | | | 1,035.50 | | | | | | 0.12 | | | | | | 0.62 | | | | | | 1,000.00 | | | | | | 1,024.60 | | | | | | 0.12 | | | | | | 0.61 | | |
| Class R6 | | | | | 1,000.00 | | | | | | 1,035.50 | | | | | | 0.12 | | | | | | 0.62 | | | | | | 1,000.00 | | | | | | 1,024.60 | | | | | | 0.12 | | | | | | 0.61 | | |
| Class S | | | | | 1,000.00 | | | | | | 1,034.30 | | | | | | 0.37 | | | | | | 1.90 | | | | | | 1,000.00 | | | | | | 1,023.34 | | | | | | 0.37 | | | | | | 1.89 | | |
| Class S2 | | | | | 1,000.00 | | | | | | 1,033.90 | | | | | | 0.52 | | | | | | 2.67 | | | | | | 1,000.00 | | | | | | 1,022.58 | | | | | | 0.52 | | | | | | 2.65 | | |
SHAREHOLDER EXPENSE EXAMPLES (Unaudited) (continued)
| | | | Actual Portfolio Return | | | Hypothetical (5% return before expenses) | |
| | | | Beginning
Account
Value
July 1,
2017 | | | Ending
Account
Value
December 31,
2017 | | | Annualized
Expense
Ratio* | | | Expenses Paid
During the
Period Ended
December 31,
2017** | | | Beginning
Account
Value
July 1,
2017 | | | Ending
Account
Value
December 31,
2017 | | | Annualized
Expense
Ratio* | | | Expenses Paid
During the
Period Ended
December 31,
2017** | |
| Voya Solution Income Portfolio | |
| Class ADV | | | | $ | 1,000.00 | | | | | $ | 1,043.60 | | | | | | 0.61% | | | | | $ | 3.14 | | | | | $ | 1,000.00 | | | | | $ | 1,022.13 | | | | | | 0.61% | | | | | $ | 3.11 | | |
| Class I | | | | | 1,000.00 | | | | | | 1,045.20 | | | | | | 0.11 | | | | | | 0.57 | | | | | | 1,000.00 | | | | | | 1,024.65 | | | | | | 0.11 | | | | | | 0.56 | | |
| Class S | | | | | 1,000.00 | | | | | | 1,045.00 | | | | | | 0.36 | | | | | | 1.86 | | | | | | 1,000.00 | | | | | | 1,023.39 | | | | | | 0.36 | | | | | | 1.84 | | |
| Class S2 | | | | | 1,000.00 | | | | | | 1,043.80 | | | | | | 0.51 | | | | | | 2.63 | | | | | | 1,000.00 | | | | | | 1,022.63 | | | | | | 0.51 | | | | | | 2.60 | | |
| Class T | | | | | 1,000.00 | | | | | | 1,041.40 | | | | | | 0.81 | | | | | | 4.17 | | | | | | 1,000.00 | | | | | | 1,021.12 | | | | | | 0.81 | | | | | | 4.13 | | |
| Voya Solution Moderately Aggressive Portfolio | |
| Class ADV | | | | $ | 1,000.00 | | | | | $ | 1,086.30 | | | | | | 0.71% | | | | | $ | 3.73 | | | | | $ | 1,000.00 | | | | | $ | 1,021.63 | | | | | | 0.71% | | | | | $ | 3.62 | | |
| Class I | | | | | 1,000.00 | | | | | | 1,089.20 | | | | | | 0.21 | | | | | | 1.11 | | | | | | 1,000.00 | | | | | | 1,024.15 | | | | | | 0.21 | | | | | | 1.07 | | |
| Class R6 | | | | | 1,000.00 | | | | | | 1,089.30 | | | | | | 0.21 | | | | | | 1.11 | | | | | | 1,000.00 | | | | | | 1,024.15 | | | | | | 0.21 | | | | | | 1.07 | | |
| Class S | | | | | 1,000.00 | | | | | | 1,087.50 | | | | | | 0.46 | | | | | | 2.42 | | | | | | 1,000.00 | | | | | | 1,022.89 | | | | | | 0.46 | | | | | | 2.35 | | |
| Class S2 | | | | | 1,000.00 | | | | | | 1,086.70 | | | | | | 0.61 | | | | | | 3.21 | | | | | | 1,000.00 | | | | | | 1,022.13 | | | | | | 0.61 | | | | | | 3.11 | | |
| Voya Solution Moderately Conservative Portfolio | |
| Class ADV | | | | $ | 1,000.00 | | | | | $ | 1,048.70 | | | | | | 0.65% | | | | | $ | 3.36 | | | | | $ | 1,000.00 | | | | | $ | 1,021.93 | | | | | | 0.65% | | | | | $ | 3.31 | | |
| Class I | | | | | 1,000.00 | | | | | | 1,051.70 | | | | | | 0.15 | | | | | | 0.78 | | | | | | 1,000.00 | | | | | | 1,024.45 | | | | | | 0.15 | | | | | | 0.77 | | |
| Class R6 | | | | | 1,000.00 | | | | | | 1,052.20 | | | | | | 0.15 | | | | | | 0.78 | | | | | | 1,000.00 | | | | | | 1,024.45 | | | | | | 0.15 | | | | | | 0.77 | | |
| Class S | | | | | 1,000.00 | | | | | | 1,050.60 | | | | | | 0.40 | | | | | | 2.07 | | | | | | 1,000.00 | | | | | | 1,023.19 | | | | | | 0.40 | | | | | | 2.04 | | |
| Class S2 | | | | | 1,000.00 | | | | | | 1,050.40 | | | | | | 0.55 | | | | | | 2.84 | | | | | | 1,000.00 | | | | | | 1,022.43 | | | | | | 0.55 | | | | | | 2.80 | | |
| Voya Solution 2020 Portfolio | |
| Class ADV | | | | $ | 1,000.00 | | | | | $ | 1,058.20 | | | | | | 0.61% | | | | | $ | 3.16 | | | | | $ | 1,000.00 | | | | | $ | 1,022.13 | | | | | | 0.61% | | | | | $ | 3.11 | | |
| Class I | | | | | 1,000.00 | | | | | | 1,060.70 | | | | | | 0.11 | | | | | | 0.57 | | | | | | 1,000.00 | | | | | | 1,024.65 | | | | | | 0.11 | | | | | | 0.56 | | |
| Class S | | | | | 1,000.00 | | | | | | 1,059.80 | | | | | | 0.36 | | | | | | 1.87 | | | | | | 1,000.00 | | | | | | 1,023.39 | | | | | | 0.36 | | | | | | 1.84 | | |
| Class S2 | | | | | 1,000.00 | | | | | | 1,058.70 | | | | | | 0.51 | | | | | | 2.65 | | | | | | 1,000.00 | | | | | | 1,022.63 | | | | | | 0.51 | | | | | | 2.60 | | |
| Class T | | | | | 1,000.00 | | | | | | 1,057.00 | | | | | | 0.81 | | | | | | 4.20 | | | | | | 1,000.00 | | | | | | 1,021.12 | | | | | | 0.81 | | | | | | 4.13 | | |
| Voya Solution 2025 Portfolio | |
| Class ADV | | | | $ | 1,000.00 | | | | | $ | 1,069.90 | | | | | | 0.66% | | | | | $ | 3.44 | | | | | $ | 1,000.00 | | | | | $ | 1,021.88 | | | | | | 0.66% | | | | | $ | 3.36 | | |
| Class I | | | | | 1,000.00 | | | | | | 1,072.90 | | | | | | 0.16 | | | | | | 0.84 | | | | | | 1,000.00 | | | | | | 1,024.40 | | | | | | 0.16 | | | | | | 0.82 | | |
| Class S | | | | | 1,000.00 | | | | | | 1,071.70 | | | | | | 0.41 | | | | | | 2.14 | | | | | | 1,000.00 | | | | | | 1,023.14 | | | | | | 0.41 | | | | | | 2.09 | | |
| Class S2 | | | | | 1,000.00 | | | | | | 1,070.30 | | | | | | 0.56 | | | | | | 2.92 | | | | | | 1,000.00 | | | | | | 1,022.38 | | | | | | 0.56 | | | | | | 2.85 | | |
| Class T | | | | | 1,000.00 | | | | | | 1,068.80 | | | | | | 0.86 | | | | | | 4.48 | | | | | | 1,000.00 | | | | | | 1,020.87 | | | | | | 0.86 | | | | | | 4.38 | | |
| Voya Solution 2030 Portfolio | |
| Class ADV | | | | $ | 1,000.00 | | | | | $ | 1,082.10 | | | | | | 0.64% | | | | | $ | 3.36 | | | | | $ | 1,000.00 | | | | | $ | 1,021.98 | | | | | | 0.64% | | | | | $ | 3.26 | | |
| Class I | | | | | 1,000.00 | | | | | | 1,084.80 | | | | | | 0.14 | | | | | | 0.74 | | | | | | 1,000.00 | | | | | | 1,024.50 | | | | | | 0.14 | | | | | | 0.71 | | |
| Class S | | | | | 1,000.00 | | | | | | 1,083.40 | | | | | | 0.39 | | | | | | 2.05 | | | | | | 1,000.00 | | | | | | 1,023.24 | | | | | | 0.39 | | | | | | 1.99 | | |
| Class S2 | | | | | 1,000.00 | | | | | | 1,082.60 | | | | | | 0.54 | | | | | | 2.83 | | | | | | 1,000.00 | | | | | | 1,022.48 | | | | | | 0.54 | | | | | | 2.75 | | |
| Class T | | | | | 1,000.00 | | | | | | 1,081.50 | | | | | | 0.84 | | | | | | 4.41 | | | | | | 1,000.00 | | | | | | 1,020.97 | | | | | | 0.84 | | | | | | 4.28 | | |
| Voya Solution 2035 Portfolio | |
| Class ADV | | | | $ | 1,000.00 | | | | | $ | 1,091.30 | | | | | | 0.65% | | | | | $ | 3.43 | | | | | $ | 1,000.00 | | | | | $ | 1,021.93 | | | | | | 0.65% | | | | | $ | 3.31 | | |
| Class I | | | | | 1,000.00 | | | | | | 1,093.60 | | | | | | 0.15 | | | | | | 0.79 | | | | | | 1,000.00 | | | | | | 1,024.45 | | | | | | 0.15 | | | | | | 0.77 | | |
| Class S | | | | | 1,000.00 | | | | | | 1,092.80 | | | | | | 0.40 | | | | | | 2.11 | | | | | | 1,000.00 | | | | | | 1,023.19 | | | | | | 0.40 | | | | | | 2.04 | | |
| Class S2 | | | | | 1,000.00 | | | | | | 1,091.80 | | | | | | 0.55 | | | | | | 2.90 | | | | | | 1,000.00 | | | | | | 1,022.43 | | | | | | 0.55 | | | | | | 2.80 | | |
| Class T | | | | | 1,000.00 | | | | | | 1,090.40 | | | | | | 0.85 | | | | | | 4.48 | | | | | | 1,000.00 | | | | | | 1,020.92 | | | | | | 0.85 | | | | | | 4.33 | | |
SHAREHOLDER EXPENSE EXAMPLES (Unaudited) (continued)
| | | | Actual Portfolio Return | | | Hypothetical (5% return before expenses) | |
| | | | Beginning
Account
Value
July 1,
2017 | | | Ending
Account
Value
December 31,
2017 | | | Annualized
Expense
Ratio* | | | Expenses Paid
During the
Period Ended
December 31,
2017** | | | Beginning
Account
Value
July 1,
2017 | | | Ending
Account
Value
December 31,
2017 | | | Annualized
Expense
Ratio* | | | Expenses Paid
During the
Period Ended
December 31,
2017** | |
| Voya Solution 2040 Portfolio | |
| Class ADV | | | | $ | 1,000.00 | | | | | $ | 1,096.10 | | | | | | 0.63% | | | | | $ | 3.33 | | | | | $ | 1,000.00 | | | | | $ | 1,022.03 | | | | | | 0.63% | | | | | $ | 3.21 | | |
| Class I | | | | | 1,000.00 | | | | | | 1,099.00 | | | | | | 0.13 | | | | | | 0.69 | | | | | | 1,000.00 | | | | | | 1,024.55 | | | | | | 0.13 | | | | | | 0.66 | | |
| Class S | | | | | 1,000.00 | | | | | | 1,097.60 | | | | | | 0.38 | | | | | | 2.01 | | | | | | 1,000.00 | | | | | | 1,023.29 | | | | | | 0.38 | | | | | | 1.94 | | |
| Class S2 | | | | | 1,000.00 | | | | | | 1,096.60 | | | | | | 0.53 | | | | | | 2.80 | | | | | | 1,000.00 | | | | | | 1,022.53 | | | | | | 0.53 | | | | | | 2.70 | | |
| Class T | | | | | 1,000.00 | | | | | | 1,095.00 | | | | | | 0.83 | | | | | | 4.38 | | | | | | 1,000.00 | | | | | | 1,021.02 | | | | | | 0.83 | | | | | | 4.23 | | |
| Voya Solution 2045 Portfolio | |
| Class ADV | | | | $ | 1,000.00 | | | | | $ | 1,101.40 | | | | | | 0.67% | | | | | $ | 3.55 | | | | | $ | 1,000.00 | | | | | $ | 1,021.83 | | | | | | 0.67% | | | | | $ | 3.41 | | |
| Class I | | | | | 1,000.00 | | | | | | 1,104.10 | | | | | | 0.17 | | | | | | 0.90 | | | | | | 1,000.00 | | | | | | 1,024.35 | | | | | | 0.17 | | | | | | 0.87 | | |
| Class S | | | | | 1,000.00 | | | | | | 1,102.00 | | | | | | 0.42 | | | | | | 2.23 | | | | | | 1,000.00 | | | | | | 1,023.09 | | | | | | 0.42 | | | | | | 2.14 | | |
| Class S2 | | | | | 1,000.00 | | | | | | 1,101.20 | | | | | | 0.57 | | | | | | 3.02 | | | | | | 1,000.00 | | | | | | 1,022.33 | | | | | | 0.57 | | | | | | 2.91 | | |
| Class T | | | | | 1,000.00 | | | | | | 1,100.40 | | | | | | 0.87 | | | | | | 4.61 | | | | | | 1,000.00 | | | | | | 1,020.82 | | | | | | 0.87 | | | | | | 4.43 | | |
| Voya Solution 2050 Portfolio | |
| Class ADV | | | | $ | 1,000.00 | | | | | $ | 1,103.20 | | | | | | 0.65% | | | | | $ | 3.45 | | | | | $ | 1,000.00 | | | | | $ | 1,021.93 | | | | | | 0.65% | | | | | $ | 3.31 | | |
| Class I | | | | | 1,000.00 | | | | | | 1,106.40 | | | | | | 0.15 | | | | | | 0.80 | | | | | | 1,000.00 | | | | | | 1,024.45 | | | | | | 0.15 | | | | | | 0.77 | | |
| Class S | | | | | 1,000.00 | | | | | | 1,104.50 | | | | | | 0.40 | | | | | | 2.12 | | | | | | 1,000.00 | | | | | | 1,023.19 | | | | | | 0.40 | | | | | | 2.04 | | |
| Class S2 | | | | | 1,000.00 | | | | | | 1,103.90 | | | | | | 0.55 | | | | | | 2.92 | | | | | | 1,000.00 | | | | | | 1,022.43 | | | | | | 0.55 | | | | | | 2.80 | | |
| Class T | | | | | 1,000.00 | | | | | | 1,102.10 | | | | | | 0.85 | | | | | | 4.50 | | | | | | 1,000.00 | | | | | | 1,020.92 | | | | | | 0.85 | | | | | | 4.33 | | |
| Voya Solution 2055 Portfolio | |
| Class ADV | | | | $ | 1,000.00 | | | | | $ | 1,102.60 | | | | | | 0.66% | | | | | $ | 3.50 | | | | | $ | 1,000.00 | | | | | $ | 1,021.88 | | | | | | 0.66% | | | | | $ | 3.36 | | |
| Class I | | | | | 1,000.00 | | | | | | 1,106.20 | | | | | | 0.16 | | | | | | 0.85 | | | | | | 1,000.00 | | | | | | 1,024.40 | | | | | | 0.16 | | | | | | 0.82 | | |
| Class S | | | | | 1,000.00 | | | | | | 1,105.00 | | | | | | 0.41 | | | | | | 2.18 | | | | | | 1,000.00 | | | | | | 1,023.14 | | | | | | 0.41 | | | | | | 2.09 | | |
| Class S2 | | | | | 1,000.00 | | | | | | 1,104.00 | | | | | | 0.56 | | | | | | 2.97 | | | | | | 1,000.00 | | | | | | 1,022.38 | | | | | | 0.56 | | | | | | 2.85 | | |
| Class T | | | | | 1,000.00 | | | | | | 1,101.50 | | | | | | 0.86 | | | | | | 4.56 | | | | | | 1,000.00 | | | | | | 1,020.87 | | | | | | 0.86 | | | | | | 4.38 | | |
| Voya Solution 2060 Portfolio | |
| Class ADV | | | | $ | 1,000.00 | | | | | $ | 1,103.10 | | | | | | 0.67% | | | | | $ | 3.55 | | | | | $ | 1,000.00 | | | | | $ | 1,021.83 | | | | | | 0.67% | | | | | $ | 3.41 | | |
| Class I | | | | | 1,000.00 | | | | | | 1,106.50 | | | | | | 0.17 | | | | | | 0.90 | | | | | | 1,000.00 | | | | | | 1,024.35 | | | | | | 0.17 | | | | | | 0.87 | | |
| Class S | | | | | 1,000.00 | | | | | | 1,104.60 | | | | | | 0.42 | | | | | | 2.23 | | | | | | 1,000.00 | | | | | | 1,023.09 | | | | | | 0.42 | | | | | | 2.14 | | |
| Class S2 | | | | | 1,000.00 | | | | | | 1,103.30 | | | | | | 0.57 | | | | | | 3.02 | | | | | | 1,000.00 | | | | | | 1,022.33 | | | | | | 0.57 | | | | | | 2.91 | | |
| Class T | | | | | 1,000.00 | | | | | | 1,101.70 | | | | | | 0.87 | | | | | | 4.61 | | | | | | 1,000.00 | | | | | | 1,020.82 | | | | | | 0.87 | | | | | | 4.43 | | |
*
The annualized expense ratios do not include expenses of the underlying funds.
**
Expenses are equal to each Portfolio’s respective annualized expense ratios multiplied by the average account value over the period, multiplied by 184/365 to reflect the most recent fiscal half-year.
Report of Independent Registered Public Accounting Firm
To the Shareholders and Board of Directors
Voya Partners, Inc.:
Opinion on the Financial Statements
We have audited the accompanying statements of assets and liabilities of Voya Solution Aggressive Portfolio, Voya Solution Balanced Portfolio, Voya Solution Conservative Portfolio, Voya Solution Income Portfolio, Voya Solution Moderately Aggressive Portfolio, Voya Solution Moderately Conservative Portfolio, Voya Solution 2020 Portfolio, Voya Solution 2025 Portfolio, Voya Solution 2030 Portfolio, Voya Solution 2035 Portfolio, Voya Solution 2040 Portfolio, Voya Solution 2045 Portfolio, Voya Solution 2050 Portfolio, Voya Solution 2055 Portfolio, and Voya Solution 2060 Portfolio, (the “Funds”), each a series of Voya Partners, Inc., including the portfolios of investments, as of December 31, 2017, the related statements of operations for the year then ended, the statements of changes in net assets for each of the years in the two-year period then ended, and the related notes (collectively, the “financial statements”) and the financial highlights for each of the years or periods in the five-year period then ended. In our opinion, the financial statements and financial highlights present fairly, in all material respects, the financial position of the Funds as of December 31, 2017, the results of their operations for the year then ended, the changes in their net assets for each of the years in the two-year period then ended, and the financial highlights for each of the years or periods in the five-year period then ended, in conformity with U.S. generally accepted accounting principles.
Basis for Opinion
These financial statements and financial highlights are the responsibility of the Funds’ management. Our responsibility is to express an opinion on these financial statements and financial highlights based on our audits. We are a public accounting firm registered with the Public Company Accounting Oversight Board (United States) (“PCAOB”) and are required to be independent with respect to the Funds in accordance with the U.S. federal securities laws and the applicable rules and regulations of the Securities and Exchange Commission and the PCAOB.
We conducted our audits in accordance with the standards of the PCAOB. Those standards require that we plan and perform the audit to obtain reasonable assurance about whether the financial statements and financial highlights are free of material misstatement, whether due to error or fraud. Our audits included performing procedures to assess the risks of material misstatement of the financial statements and financial highlights, whether due to error or fraud, and performing procedures that respond to those risks. Such procedures included examining, on a test basis, evidence regarding the amounts and disclosures in the financial statements and financial highlights. Such procedures also included confirmation of securities owned as of December 31, 2017, by correspondence with the custodian, transfer agent and brokers or by other appropriate auditing procedures when replies from brokers were not received. Our audits also included evaluating the accounting principles used and significant estimates made by management, as well as evaluating the overall presentation of the financial statements and financial highlights. We believe that our audits provide a reasonable basis for our opinion.
![[MISSING IMAGE: sg_kpmg.jpg]](https://capedge.com/proxy/N-CSR/0001144204-18-013810/sg_kpmg.jpg)
We have served as the auditor of one or more Voya investment companies since 1975.
Boston, Massachusetts
February 22, 2018
STATEMENTS OF ASSETS AND LIABILITIES as of December 31, 2017
| | | | Voya Solution
Aggressive
Portfolio | | | Voya Solution
Balanced
Portfolio | | | Voya Solution
Conservative
Portfolio | | | Voya Solution
Income
Portfolio | |
| ASSETS: | | | | | |
| Investments in affiliated underlying funds at fair value* | | | | $ | 12,868,166 | | | | | $ | 58,967,972 | | | | | $ | 15,590,594 | | | | | $ | 419,627,503 | | |
| Investments in unaffiliated underlying funds at fair value** | | | | | 1,013,489 | | | | | | 3,637,305 | | | | | | 1,049,425 | | | | | | 12,984,798 | | |
| Cash | | | | | 25,594 | | | | | | 44,867 | | | | | | 29,374 | | | | | | 288,175 | | |
| Cash collateral for futures | | | | | — | | | | | | 92,361 | | | | | | — | | | | | | 649,320 | | |
| Foreign cash collateral for futures*** | | | | | — | | | | | | 22,258 | | | | | | — | | | | | | 166,302 | | |
| Receivables: | | | | | |
| Investments in affiliated underlying funds sold | | | | | — | | | | | | 122,643 | | | | | | 25,311 | | | | | | — | | |
| Investments in unaffiliated underlying funds sold | | | | | 137,539 | | | | | | — | | | | | | 162,316 | | | | | | — | | |
| Fund shares sold | | | | | 32,211 | | | | | | 16,872 | | | | | | 6,778 | | | | | | 166,412 | | |
| Dividends | | | | | 3,656 | | | | | | 24,711 | | | | | | 8,789 | | | | | | 178,079 | | |
| Prepaid expenses | | | | | 32 | | | | | | 205 | | | | | | 65 | | | | | | 1,970 | | |
| Reimbursement due from manager | | | | | 3,512 | | | | | | 6,068 | | | | | | 3,373 | | | | | | 49,258 | | |
| Other assets | | | | | 135 | | | | | | 1,270 | | | | | | 399 | | | | | | 27,431 | | |
| Total assets | | | | | 14,084,334 | | | | | | 62,936,532 | | | | | | 16,876,424 | | | | | | 434,139,248 | | |
| LIABILITIES: | | | | | |
| Payable for investments in affiliated underlying funds purchased | | | | | 142,510 | | | | | | — | | | | | | 164,429 | | | | | | 130,493 | | |
| Payable for fund shares redeemed | | | | | 28,531 | | | | | | 139,515 | | | | | | 32,088 | | | | | | 35,940 | | |
| Payable for investment management fees | | | | | 2,511 | | | | | | 11,105 | | | | | | 2,985 | | | | | | 75,953 | | |
| Payable for distribution and shareholder service fees | | | | | 2,575 | | | | | | 13,725 | | | | | | 4,653 | | | | | | 113,791 | | |
| Payable for directors fees | | | | | 53 | | | | | | 276 | | | | | | 81 | | | | | | 2,301 | | |
| Payable to directors under the deferred compensation plan (Note 6) | | | | | 135 | | | | | | 1,270 | | | | | | 399 | | | | | | 27,431 | | |
| Other accrued expenses and liabilities | | | | | 565 | | | | | | 12,762 | | | | | | 2,561 | | | | | | 95,801 | | |
| Total liabilities | | | | | 176,880 | | | | | | 178,653 | | | | | | 207,196 | | | | | | 481,710 | | |
| NET ASSETS | | | | $ | 13,907,454 | | | | | $ | 62,757,879 | | | | | $ | 16,669,228 | | | | | $ | 433,657,538 | | |
| NET ASSETS WERE COMPRISED OF: | | | | | |
| Paid-in capital | | | | $ | 12,248,479 | | | | | $ | 57,290,618 | | | | | $ | 16,231,778 | | | | | $ | 413,978,703 | | |
| Undistributed net investment income | | | | | 167,780 | | | | | | 1,033,518 | | | | | | 332,597 | | | | | | 9,117,000 | | |
| Accumulated net realized gain (loss) | | | | | 311,456 | | | | | | 854,674 | | | | | | (138,493) | | | | | | (965,643) | | |
| Net unrealized appreciation | | | | | 1,179,739 | | | | | | 3,579,069 | | | | | | 243,346 | | | | | | 11,527,478 | | |
| NET ASSETS | | | | $ | 13,907,454 | | | | | $ | 62,757,879 | | | | | $ | 16,669,228 | | | | | $ | 433,657,538 | | |
*
Cost of investments in affiliated underlying funds | | | | $ | 11,742,369 | | | | | $ | 55,517,699 | | | | | $ | 15,371,323 | | | | | $ | 407,936,967 | | |
**
Cost of investments in unaffiliated underlying funds | | | | $ | 959,548 | | | | | $ | 3,504,144 | | | | | $ | 1,025,350 | | | | | $ | 13,131,772 | | |
***
Cost of foreign cash collateral for futures | | | | $ | — | | | | | $ | 22,172 | | | | | $ | — | | | | | $ | 165,659 | | |
See Accompanying Notes to Financial Statements
STATEMENTS OF ASSETS AND LIABILITIES as of December 31, 2017 (continued)
| | | | Voya Solution
Aggressive
Portfolio | | | Voya Solution
Balanced
Portfolio | | | Voya Solution
Conservative
Portfolio | | | Voya Solution
Income
Portfolio | |
| Class ADV | | | | | |
| Net assets | | | | $ | 3,466,947 | | | | | $ | 19,019,625 | | | | | $ | 8,485,637 | | | | | $ | 182,911,987 | | |
| Shares authorized | | | | | 100,000,000 | | | | | | 100,000,000 | | | | | | 100,000,000 | | | | | | 100,000,000 | | |
| Par value | | | | $ | 0.001 | | | | | $ | 0.001 | | | | | $ | 0.001 | | | | | $ | 0.001 | | |
| Shares outstanding | | | | | 255,704 | | | | | | 1,887,774 | | | | | | 767,101 | | | | | | 15,438,542 | | |
| Net asset value and redemption price per share | | | | $ | 13.56 | | | | | $ | 10.08 | | | | | $ | 11.06 | | | | | $ | 11.85 | | |
| Class I | | | | | |
| Net assets | | | | $ | 444,458 | | | | | $ | 4,682,754 | | | | | $ | 90,179 | | | | | $ | 85,890,657 | | |
| Shares authorized | | | | | 100,000,000 | | | | | | 100,000,000 | | | | | | 100,000,000 | | | | | | 100,000,000 | | |
| Par value | | | | $ | 0.001 | | | | | $ | 0.001 | | | | | $ | 0.001 | | | | | $ | 0.001 | | |
| Shares outstanding | | | | | 32,099 | | | | | | 447,904 | | | | | | 8,043 | | | | | | 7,079,403 | | |
| Net asset value and redemption price per share | | | | $ | 13.85 | | | | | $ | 10.45 | | | | | $ | 11.21 | | | | | $ | 12.13 | | |
| Class R6 | | | | | |
| Net assets | | | | $ | 5,014,781 | | | | | $ | 13,145,462 | | | | | $ | 3,438,881 | | | | | | n/a | | |
| Shares authorized | | | | | 100,000,000 | | | | | | 100,000,000 | | | | | | 100,000,000 | | | | | | n/a | | |
| Par value | | | | $ | 0.001 | | | | | $ | 0.001 | | | | | $ | 0.001 | | | | | | n/a | | |
| Shares outstanding | | | | | 362,196 | | | | | | 1,257,456 | | | | | | 306,842 | | | | | | n/a | | |
| Net asset value and redemption price per share | | | | $ | 13.85 | | | | | $ | 10.45 | | | | | $ | 11.21 | | | | | | n/a | | |
| Class S | | | | | |
| Net assets | | | | $ | 4,300,021 | | | | | $ | 23,906,410 | | | | | $ | 4,019,778 | | | | | $ | 155,099,595 | | |
| Shares authorized | | | | | 100,000,000 | | | | | | 100,000,000 | | | | | | 100,000,000 | | | | | | 100,000,000 | | |
| Par value | | | | $ | 0.001 | | | | | $ | 0.001 | | | | | $ | 0.001 | | | | | $ | 0.001 | | |
| Shares outstanding | | | | | 314,002 | | | | | | 2,341,449 | | | | | | 361,014 | | | | | | 12,895,622 | | |
| Net asset value and redemption price per share | | | | $ | 13.69 | | | | | $ | 10.21 | | | | | $ | 11.13 | | | | | $ | 12.03 | | |
| Class S2 | | | | | |
| Net assets | | | | $ | 681,247 | | | | | $ | 2,003,628 | | | | | $ | 634,753 | | | | | $ | 9,533,343 | | |
| Shares authorized | | | | | 100,000,000 | | | | | | 100,000,000 | | | | | | 100,000,000 | | | | | | 100,000,000 | | |
| Par value | | | | $ | 0.001 | | | | | $ | 0.001 | | | | | $ | 0.001 | | | | | $ | 0.001 | | |
| Shares outstanding | | | | | 50,374 | | | | | | 197,086 | | | | | | 57,514 | | | | | | 813,289 | | |
| Net asset value and redemption price per share | | | | $ | 13.52 | | | | | $ | 10.17 | | | | | $ | 11.04 | | | | | $ | 11.72 | | |
| Class T | | | | | |
| Net assets | | | | | n/a | | | | | | n/a | | | | | | n/a | | | | | $ | 221,956 | | |
| Shares authorized | | | | | n/a | | | | | | n/a | | | | | | n/a | | | | | | 100,000,000 | | |
| Par value | | | | | n/a | | | | | | n/a | | | | | | n/a | | | | | $ | 0.001 | | |
| Shares outstanding | | | | | n/a | | | | | | n/a | | | | | | n/a | | | | | | 17,609 | | |
| Net asset value and redemption price per share | | | | | n/a | | | | | | n/a | | | | | | n/a | | | | | $ | 12.60 | | |
See Accompanying Notes to Financial Statements
STATEMENTS OF ASSETS AND LIABILITIES as of December 31, 2017
| | | | Voya Solution
Moderately
Aggressive
Portfolio | | | Voya Solution
Moderately
Conservative
Portfolio | | | Voya Solution
2020 Portfolio | | | Voya Solution
2025 Portfolio | |
| ASSETS: | | | | | |
| Investments in affiliated underlying funds at fair value* | | | | $ | 658,051,314 | | | | | $ | 29,847,473 | | | | | $ | 31,219,657 | | | | | $ | 875,006,637 | | |
| Investments in unaffiliated underlying funds at fair value** | | | | | 53,905,477 | | | | | | 1,566,873 | | | | | | 2,027,718 | | | | | | 43,825,536 | | |
| Cash | | | | | 516,752 | | | | | | 20,349 | | | | | | 40,310 | | | | | | 563,758 | | |
| Cash collateral for futures | | | | | 1,066,915 | | | | | | 44,107 | | | | | | — | | | | | | 1,379,053 | | |
| Foreign cash collateral for futures*** | | | | | 268,271 | | | | | | 12,454 | | | | | | — | | | | | | 346,124 | | |
| Receivables: | | | | | |
| Investments in affiliated underlying funds sold | | | | | 228,848 | | | | | | — | | | | | | 10,683 | | | | | | 1,068,304 | | |
| Investments in unaffiliated underlying funds sold | | | | | — | | | | | | — | | | | | | 318,414 | | | | | | — | | |
| Fund shares sold | | | | | 33,916 | | | | | | 16,965 | | | | | | 31,672 | | | | | | 466,451 | | |
| Dividends | | | | | 292,290 | | | | | | 17,095 | | | | | | 12,750 | | | | | | 377,429 | | |
| Interest | | | | | — | | | | | | — | | | | | | — | | | | | | 22 | | |
| Prepaid expenses | | | | ��� | 2,893 | | | | | | 142 | | | | | | 102 | | | | | | 3,703 | | |
| Reimbursement due from manager | | | | | 23,330 | | | | | | 4,845 | | | | | | 53,230 | | | | | | 174 | | |
| Other assets | | | | | 28,790 | | | | | | 1,008 | | | | | | 291 | | | | | | 38,683 | | |
| Total assets | | | | | 714,418,796 | | | | | | 31,531,311 | | | | | | 33,714,827 | | | | | | 923,075,874 | | |
| LIABILITIES: | | | | | |
| Payable for investments in affiliated underlying funds purchased | | | | | 33 | | | | | | 4,457 | | | | | | 331,522 | | | | | | — | | |
| Payable for fund shares redeemed | | | | | 262,764 | | | | | | 12,508 | | | | | | 42,356 | | | | | | 1,534,755 | | |
| Payable for investment management fees | | | | | 130,327 | | | | | | 5,609 | | | | | | 13,344 | | | | | | 169,602 | | |
| Payable for distribution and shareholder service fees | | | | | 154,436 | | | | | | 8,729 | | | | | | 8,413 | | | | | | 210,513 | | |
| Payable for directors fees | | | | | 3,537 | | | | | | 167 | | | | | | 139 | | | | | | 4,561 | | |
| Payable to directors under the deferred compensation plan (Note 6) | | | | | 28,790 | | | | | | 1,008 | | | | | | 291 | | | | | | 38,683 | | |
| Other accrued expenses and liabilities | | | | | 77,368 | | | | | | 19,127 | | | | | | 3,485 | | | | | | 116,050 | | |
| Total liabilities | | | | | 657,255 | | | | | | 51,605 | | | | | | 399,550 | | | | | | 2,074,164 | | |
| NET ASSETS | | | | $ | 713,761,541 | | | | | $ | 31,479,706 | | | | | $ | 33,315,277 | | | | | $ | 921,001,710 | | |
| NET ASSETS WERE COMPRISED OF: | | | | | |
| Paid-in capital | | | | $ | 626,018,032 | | | | | $ | 29,906,989 | | | | | $ | 30,132,636 | | | | | $ | 838,461,317 | | |
| Undistributed net investment income | | | | | 11,497,005 | | | | | | 635,900 | | | | | | 575,661 | | | | | | 17,027,322 | | |
| Accumulated net realized gain (loss) | | | | | 19,307,322 | | | | | | (331,214) | | | | | | 1,470,172 | | | | | | 9,423,927 | | |
| Net unrealized appreciation | | | | | 56,939,182 | | | | | | 1,268,031 | | | | | | 1,136,808 | | | | | | 56,089,144 | | |
| NET ASSETS | | | | $ | 713,761,541 | | | | | $ | 31,479,706 | | | | | $ | 33,315,277 | | | | | $ | 921,001,710 | | |
*
Cost of investments in affiliated underlying funds | | | | $ | 604,995,130 | | | | | $ | 28,633,133 | | | | | $ | 30,188,288 | | | | | $ | 819,402,918 | | |
**
Cost of investments in unaffiliated underlying funds | | | | $ | 49,995,094 | | | | | $ | 1,513,516 | | | | | $ | 1,922,279 | | | | | $ | 43,304,206 | | |
***
Cost of foreign cash collateral for futures | | | | $ | 267,218 | | | | | $ | 12,407 | | | | | $ | — | | | | | $ | 344,764 | | |
See Accompanying Notes to Financial Statements
STATEMENTS OF ASSETS AND LIABILITIES as of December 31, 2017 (continued)
| | | | Voya Solution
Moderately
Aggressive
Portfolio | | | Voya Solution
Moderately
Conservative
Portfolio | | | Voya Solution
2020 Portfolio | | | Voya Solution
2025 Portfolio | |
| Class ADV | | | | | |
| Net assets | | | | $ | 27,467,997 | | | | | $ | 11,134,244 | | | | | $ | 14,590,123 | | | | | $ | 300,452,871 | | |
| Shares authorized | | | | | 100,000,000 | | | | | | 100,000,000 | | | | | | 100,000,000 | | | | | | 100,000,000 | | |
| Par value | | | | $ | 0.001 | | | | | $ | 0.001 | | | | | $ | 0.001 | | | | | $ | 0.001 | | |
| Shares outstanding | | | | | 2,051,824 | | | | | | 1,114,154 | | | | | | 1,102,446 | | | | | | 25,632,029 | | |
| Net asset value and redemption price per share | | | | $ | 13.39 | | | | | $ | 9.99 | | | | | $ | 13.23 | | | | | $ | 11.72 | | |
| Class I | | | | | |
| Net assets | | | | $ | 6,062,307 | | | | | $ | 26,635 | | | | | $ | 7,487,473 | | | | | $ | 243,052,808 | | |
| Shares authorized | | | | | 100,000,000 | | | | | | 100,000,000 | | | | | | 100,000,000 | | | | | | 100,000,000 | | |
| Par value | | | | $ | 0.001 | | | | | $ | 0.001 | | | | | $ | 0.001 | | | | | $ | 0.001 | | |
| Shares outstanding | | | | | 444,358 | | | | | | 2,557 | | | | | | 554,142 | | | | | | 20,187,351 | | |
| Net asset value and redemption price per share | | | | $ | 13.64 | | | | | $ | 10.42 | | | | | $ | 13.51 | | | | | $ | 12.04 | | |
| Class R6 | | | | | |
| Net assets | | | | $ | 8,217,125 | | | | | $ | 2,164,183 | | | | | | n/a | | | | | | n/a | | |
| Shares authorized | | | | | 100,000,000 | | | | | | 100,000,000 | | | | | | n/a | | | | | | n/a | | |
| Par value | | | | $ | 0.001 | | | | | $ | 0.001 | | | | | | n/a | | | | | | n/a | | |
| Shares outstanding | | | | | 602,886 | | | | | | 207,968 | | | | | | n/a | | | | | | n/a | | |
| Net asset value and redemption price per share | | | | $ | 13.63 | | | | | $ | 10.41 | | | | | | n/a | | | | | | n/a | | |
| Class S | | | | | |
| Net assets | | | | $ | 670,319,061 | | | | | $ | 17,133,967 | | | | | $ | 10,565,476 | | | | | $ | 359,763,593 | | |
| Shares authorized | | | | | 200,000,000 | | | | | | 100,000,000 | | | | | | 100,000,000 | | | | | | 100,000,000 | | |
| Par value | | | | $ | 0.001 | | | | | $ | 0.001 | | | | | $ | 0.001 | | | | | $ | 0.001 | | |
| Shares outstanding | | | | | 49,655,688 | | | | | | 1,681,473 | | | | | | 785,089 | | | | | | 30,234,474 | | |
| Net asset value and redemption price per share | | | | $ | 13.50 | | | | | $ | 10.19 | | | | | $ | 13.46 | | | | | $ | 11.90 | | |
| Class S2 | | | | | |
| Net assets | | | | $ | 1,695,051 | | | | | $ | 1,020,677 | | | | | $ | 660,424 | | | | | $ | 16,911,172 | | |
| Shares authorized | | | | | 100,000,000 | | | | | | 100,000,000 | | | | | | 100,000,000 | | | | | | 100,000,000 | | |
| Par value | | | | $ | 0.001 | | | | | $ | 0.001 | | | | | $ | 0.001 | | | | | $ | 0.001 | | |
| Shares outstanding | | | | | 125,843 | | | | | | 101,303 | | | | | | 49,578 | | | | | | 1,462,562 | | |
| Net asset value and redemption price per share | | | | $ | 13.47 | | | | | $ | 10.08 | | | | | $ | 13.32 | | | | | $ | 11.56 | | |
| Class T | | | | | |
| Net assets | | | | | n/a | | | | | | n/a | | | | | $ | 11,781 | | | | | $ | 821,266 | | |
| Shares authorized | | | | | n/a | | | | | | n/a | | | | | | 100,000,000 | | | | | | 100,000,000 | | |
| Par value | | | | | n/a | | | | | | n/a | | | | | $ | 0.001 | | | | | $ | 0.001 | | |
| Shares outstanding | | | | | n/a | | | | | | n/a | | | | | | 890 | | | | | | 67,157 | | |
| Net asset value and redemption price per share | | | | | n/a | | | | | | n/a | | | | | $ | 13.24 | | | | | $ | 12.23 | | |
See Accompanying Notes to Financial Statements
STATEMENTS OF ASSETS AND LIABILITIES as of December 31, 2017
| | | | Voya Solution
2030 Portfolio | | | Voya Solution
2035 Portfolio | | | Voya Solution
2040 Portfolio | | | Voya Solution
2045 Portfolio | |
| ASSETS: | | | | | |
| Investments in affiliated underlying funds at fair value* | | | | $ | 28,463,047 | | | | | $ | 881,878,650 | | | | | $ | 21,874,034 | | | | | $ | 645,994,535 | | |
| Investments in unaffiliated underlying funds at fair value** | | | | | 2,772,871 | | | | | | 46,371,352 | | | | | | 1,992,397 | | | | | | 44,968,357 | | |
| Cash | | | | | 42,009 | | | | | | 538,406 | | | | | | 31,158 | | | | | | 447,845 | | |
| Cash collateral for futures | | | | | — | | | | | | 1,386,132 | | | | | | — | | | | | | 1,029,434 | | |
| Foreign cash collateral for futures*** | | | | | — | | | | | | 346,021 | | | | | | — | | | | | | 256,402 | | |
| Receivables: | | | | | |
| Investments in affiliated underlying funds sold | | | | | 86,012 | | | | | | — | | | | | | — | | | | | | — | | |
| Investments in unaffiliated underlying funds sold | | | | | 313,951 | | | | | | — | | | | | | 238,798 | | | | | | — | | |
| Fund shares sold | | | | | 24,485 | | | | | | 778,604 | | | | | | 81,451 | | | | | | 1,139,534 | | |
| Dividends | | | | | 12,528 | | | | | | 378,747 | | | | | | 9,525 | | | | | | 281,757 | | |
| Interest | | | | | — | | | | | | — | | | | | | — | | | | | | 15 | | |
| Prepaid expenses | | | | | 69 | | | | | | 3,550 | | | | | | 62 | | | | | | 2,587 | | |
| Reimbursement due from manager | | | | | 33,766 | | | | | | 80,015 | | | | | | 35,456 | | | | | | 42,929 | | |
| Other assets | | | | | 211 | | | | | | 34,071 | | | | | | 174 | | | | | | 22,737 | | |
| Total assets | | | | | 31,748,949 | | | | | | 931,795,548 | | | | | | 24,263,055 | | | | | | 694,186,132 | | |
| LIABILITIES: | | | | | |
| Payable for investments in affiliated underlying funds purchased | | | | | 312,688 | | | | | | 238,650 | | | | | | 319,400 | | | | | | 553,000 | | |
| Payable for fund shares redeemed | | | | | 110,497 | | | | | | 539,954 | | | | | | — | | | | | | 586,534 | | |
| Payable for investment management fees | | | | | 13,062 | | | | | | 165,465 | | | | | | 11,765 | | | | | | 124,765 | | |
| Payable for distribution and shareholder service fees | | | | | 7,734 | | | | | | 198,080 | | | | | | 5,308 | | | | | | 136,121 | | |
| Payable for directors fees | | | | | 117 | | | | | | 4,453 | | | | | | 98 | | | | | | 3,277 | | |
| Payable to directors under the deferred compensation plan (Note 6) | | | | | 211 | | | | | | 34,071 | | | | | | 174 | | | | | | 22,737 | | |
| Other accrued expenses and liabilities | | | | | 3,001 | | | | | | 86,679 | | | | | | 5,616 | | | | | | 83,023 | | |
| Total liabilities | | | | | 447,310 | | | | | | 1,267,352 | | | | | | 342,361 | | | | | | 1,509,457 | | |
| NET ASSETS | | | | $ | 31,301,639 | | | | | $ | 930,528,196 | | | | | $ | 23,920,694 | | | | | $ | 692,676,675 | | |
| NET ASSETS WERE COMPRISED OF: | | | | | |
| Paid-in capital | | | | $ | 27,562,950 | | | | | $ | 812,397,494 | | | | | $ | 20,335,187 | | | | | $ | 591,884,318 | | |
| Undistributed net investment income | | | | | 494,550 | | | | | | 15,371,266 | | | | | | 357,401 | | | | | | 9,601,286 | | |
| Accumulated net realized gain | | | | | 1,552,503 | | | | | | 21,290,654 | | | | | | 1,640,188 | | | | | | 21,783,657 | | |
| Net unrealized appreciation | | | | | 1,691,636 | | | | | | 81,468,782 | | | | | | 1,587,918 | | | | | | 69,407,414 | | |
| NET ASSETS | | | | $ | 31,301,639 | | | | | $ | 930,528,196 | | | | | $ | 23,920,694 | | | | | $ | 692,676,675 | | |
*
Cost of investments in affiliated underlying funds | | | | $ | 26,915,549 | | | | | $ | 801,455,052 | | | | | $ | 20,402,495 | | | | | $ | 579,663,919 | | |
**
Cost of investments in unaffiliated underlying funds | | | | $ | 2,628,733 | | | | | $ | 45,291,057 | | | | | $ | 1,876,018 | | | | | $ | 41,864,636 | | |
***
Cost of foreign cash collateral for futures | | | | $ | — | | | | | $ | 344,651 | | | | | $ | — | | | | | $ | 255,386 | | |
See Accompanying Notes to Financial Statements
STATEMENTS OF ASSETS AND LIABILITIES as of December 31, 2017 (continued)
| | | | Voya Solution
2030 Portfolio | | | Voya Solution
2035 Portfolio | | | Voya Solution
2040 Portfolio | | | Voya Solution
2045 Portfolio | |
| Class ADV | | | | | |
| Net assets | | | | $ | 13,589,402 | | | | | $ | 267,228,594 | | | | | $ | 8,695,784 | | | | | $ | 177,624,079 | | |
| Shares authorized | | | | | 100,000,000 | | | | | | 100,000,000 | | | | | | 100,000,000 | | | | | | 100,000,000 | | |
| Par value | | | | $ | 0.001 | | | | | $ | 0.001 | | | | | $ | 0.001 | | | | | $ | 0.001 | | |
| Shares outstanding | | | | | 851,330 | | | | | | 21,784,767 | | | | | | 508,193 | | | | | | 14,327,649 | | |
| Net asset value and redemption price per share | | | | $ | 15.96 | | | | | $ | 12.27 | | | | | $ | 17.11 | | | | | $ | 12.40 | | |
| Class I | | | | | |
| Net assets | | | | $ | 8,625,446 | | | | | $ | 274,899,811 | | | | | $ | 7,752,523 | | | | | $ | 235,121,505 | | |
| Shares authorized | | | | | 100,000,000 | | | | | | 100,000,000 | | | | | | 100,000,000 | | | | | | 100,000,000 | | |
| Par value | | | | $ | 0.001 | | | | | $ | 0.001 | | | | | $ | 0.001 | | | | | $ | 0.001 | | |
| Shares outstanding | | | | | 527,218 | | | | | | 21,830,179 | | | | | | 442,303 | | | | | | 18,443,608 | | |
| Net asset value and redemption price per share | | | | $ | 16.36 | | | | | $ | 12.59 | | | | | $ | 17.53 | | | | | $ | 12.75 | | |
| Class S | | | | | |
| Net assets | | | | $ | 8,484,220 | | | | | $ | 368,554,134 | | | | | $ | 6,731,720 | | | | | $ | 269,521,273 | | |
| Shares authorized | | | | | 100,000,000 | | | | | | 100,000,000 | | | | | | 100,000,000 | | | | | | 100,000,000 | | |
| Par value | | | | $ | 0.001 | | | | | $ | 0.001 | | | | | $ | 0.001 | | | | | $ | 0.001 | | |
| Shares outstanding | | | | | 521,263 | | | | | | 29,598,457 | | | | | | 386,837 | | | | | | 21,437,578 | | |
| Net asset value and redemption price per share | | | | $ | 16.28 | | | | | $ | 12.45 | | | | | $ | 17.40 | | | | | $ | 12.57 | | |
| Class S2 | | | | | |
| Net assets | | | | $ | 587,663 | | | | | $ | 19,145,970 | | | | | $ | 720,957 | | | | | $ | 9,901,623 | | |
| Shares authorized | | | | | 100,000,000 | | | | | | 100,000,000 | | | | | | 100,000,000 | | | | | | 100,000,000 | | |
| Par value | | | | $ | 0.001 | | | | | $ | 0.001 | | | | | $ | 0.001 | | | | | $ | 0.001 | | |
| Shares outstanding | | | | | 36,547 | | | | | | 1,595,328 | | | | | | 41,962 | | | | | | 808,105 | | |
| Net asset value and redemption price per share | | | | $ | 16.08 | | | | | $ | 12.00 | | | | | $ | 17.18 | | | | | $ | 12.25 | | |
| Class T | | | | | |
| Net assets | | | | $ | 14,908 | | | | | $ | 699,687 | | | | | $ | 19,710 | | | | | $ | 508,195 | | |
| Shares authorized | | | | | 100,000,000 | | | | | | 100,000,000 | | | | | | 100,000,000 | | | | | | 100,000,000 | | |
| Par value | | | | $ | 0.001 | | | | | $ | 0.001 | | | | | $ | 0.001 | | | | | $ | 0.001 | | |
| Shares outstanding | | | | | 931 | | | | | | 54,717 | | | | | | 1,154 | | | | | | 39,810 | | |
| Net asset value and redemption price per share | | | | $ | 16.02 | | | | | $ | 12.79 | | | | | $ | 17.08 | | | | | $ | 12.77 | | |
See Accompanying Notes to Financial Statements
STATEMENTS OF ASSETS AND LIABILITIES as of December 31, 2017
| | | | Voya Solution
2050 Portfolio | | | Voya Solution
2055 Portfolio | | | Voya Solution
2060 Portfolio | |
| ASSETS: | | | | |
| Investments in affiliated underlying funds at fair value* | | | | $ | 15,811,630 | | | | | $ | 170,530,538 | | | | | $ | 7,607,945 | | |
| Investments in unaffiliated underlying funds at fair value** | | | | | 1,594,666 | | | | | | 11,736,433 | | | | | | 754,438 | | |
| Cash | | | | | 27,670 | | | | | | 145,115 | | | | | | 10,535 | | |
| Cash collateral for futures | | | | | — | | | | | | 274,721 | | | | | | — | | |
| Foreign cash collateral for futures*** | | | | | — | | | | | | 66,672 | | | | | | — | | |
| Receivables: | | | | |
| Investments in unaffiliated underlying funds sold | | | | | 170,893 | | | | | | — | | | | | | 80,863 | | |
| Fund shares sold | | | | | 98,388 | | | | | | 516,577 | | | | | | 79,725 | | |
| Dividends | | | | | 6,819 | | | | | | 73,563 | | | | | | 3,227 | | |
| Prepaid expenses | | | | | 33 | | | | | | 594 | | | | | | 14 | | |
| Reimbursement due from manager | | | | | 23,682 | | | | | | 17,652 | | | | | | 12,560 | | |
| Other assets | | | | | 108 | | | | | | 3,007 | | | | | | — | | |
| Total assets | | | | | 17,733,889 | | | | | | 183,364,872 | | | | | | 8,549,307 | | |
| LIABILITIES: | | | | |
| Payable for investments in affiliated underlying funds purchased | | | | | 245,960 | | | | | | 151,905 | | | | | | 162,425 | | |
| Payable for fund shares redeemed | | | | | 26,474 | | | | | | 364,672 | | | | | | — | | |
| Payable for investment management fees | | | | | 10,519 | | | | | | 32,761 | | | | | | 8,992 | | |
| Payable for distribution and shareholder service fees | | | | | 3,934 | | | | | | 33,518 | | | | | | 1,933 | | |
| Payable for directors fees | | | | | 61 | | | | | | 808 | | | | | | 28 | | |
| Payable to directors under the deferred compensation plan (Note 6) | | | | | 108 | | | | | | 3,007 | | | | | | — | | |
| Other accrued expenses and liabilities | | | | | 5,073 | | | | | | 18,656 | | | | | | 5,228 | | |
| Total liabilities | | | | | 292,129 | | | | | | 605,327 | | | | | | 178,606 | | |
| NET ASSETS | | | | $ | 17,441,760 | | | | | $ | 182,759,545 | | | | | $ | 8,370,701 | | |
| NET ASSETS WERE COMPRISED OF: | | | | |
| Paid-in capital | | | | $ | 15,037,522 | | | | | $ | 158,687,939 | | | | | $ | 7,254,488 | | |
| Undistributed net investment income | | | | | 213,656 | | | | | | 2,375,258 | | | | | | 99,095 | | |
| Accumulated net realized gain | | | | | 902,985 | | | | | | 2,108,284 | | | | | | 490,809 | | |
| Net unrealized appreciation | | | | | 1,287,597 | | | | | | 19,588,064 | | | | | | 526,309 | | |
| NET ASSETS | | | | $ | 17,441,760 | | | | | $ | 182,759,545 | | | | | $ | 8,370,701 | | |
*
Cost of investments in affiliated underlying funds | | | | $ | 14,614,883 | | | | | $ | 151,718,444 | | | | | $ | 7,122,153 | | |
**
Cost of investments in unaffiliated underlying funds | | | | $ | 1,503,816 | | | | | $ | 10,952,402 | | | | | $ | 713,922 | | |
***
Cost of foreign cash collateral for futures | | | | $ | — | | | | | $ | 66,404 | | | | | $ | — | | |
See Accompanying Notes to Financial Statements
STATEMENTS OF ASSETS AND LIABILITIES as of December 31, 2017 (continued)
| | | | Voya Solution
2050 Portfolio | | | Voya Solution
2055 Portfolio | | | Voya Solution
2060 Portfolio | |
| Class ADV | | | | |
| Net assets | | | | $ | 6,982,927 | | | | | $ | 47,367,358 | | | | | $ | 3,202,131 | | |
| Shares authorized | | | | | 100,000,000 | | | | | | 100,000,000 | | | | | | 100,000,000 | | |
| Par value | | | | $ | 0.001 | | | | | $ | 0.001 | | | | | $ | 0.001 | | |
| Shares outstanding | | | | | 402,972 | | | | | | 3,268,873 | | | | | | 258,378 | | |
| Net asset value and redemption price per share | | | | $ | 17.33 | | | | | $ | 14.49 | | | | | $ | 12.39 | | |
| Class I | | | | |
| Net assets | | | | $ | 5,705,024 | | | | | $ | 73,893,844 | | | | | $ | 2,159,933 | | |
| Shares authorized | | | | | 100,000,000 | | | | | | 100,000,000 | | | | | | 100,000,000 | | |
| Par value | | | | $ | 0.001 | | | | | $ | 0.001 | | | | | $ | 0.001 | | |
| Shares outstanding | | | | | 320,394 | | | | | | 4,999,790 | | | | | | 172,420 | | |
| Net asset value and redemption price per share | | | | $ | 17.81 | | | | | $ | 14.78 | | | | | $ | 12.53 | | |
| Class S | | | | |
| Net assets | | | | $ | 4,424,193 | | | | | $ | 58,216,522 | | | | | $ | 2,824,531 | | |
| Shares authorized | | | | | 100,000,000 | | | | | | 100,000,000 | | | | | | 100,000,000 | | |
| Par value | | | | $ | 0.001 | | | | | $ | 0.001 | | | | | $ | 0.001 | | |
| Shares outstanding | | | | | 250,703 | | | | | | 3,983,037 | | | | | | 227,817 | | |
| Net asset value and redemption price per share | | | | $ | 17.65 | | | | | $ | 14.62 | | | | | $ | 12.40 | | |
| Class S2 | | | | |
| Net assets | | | | $ | 309,192 | | | | | $ | 3,250,184 | | | | | $ | 180,308 | | |
| Shares authorized | | | | | 100,000,000 | | | | | | 100,000,000 | | | | | | 100,000,000 | | |
| Par value | | | | $ | 0.001 | | | | | $ | 0.001 | | | | | $ | 0.001 | | |
| Shares outstanding | | | | | 17,742 | | | | | | 223,588 | | | | | | 14,538 | | |
| Net asset value and redemption price per share | | | | $ | 17.43 | | | | | $ | 14.54 | | | | | $ | 12.40 | | |
| Class T | | | | |
| Net assets | | | | $ | 20,424 | | | | | $ | 31,637 | | | | | $ | 3,798 | | |
| Shares authorized | | | | | 100,000,000 | | | | | | 100,000,000 | | | | | | 100,000,000 | | |
| Par value | | | | $ | 0.001 | | | | | $ | 0.001 | | | | | $ | 0.001 | | |
| Shares outstanding | | | | | 1,175 | | | | | | 2,147 | | | | | | 308 | | |
| Net asset value and redemption price per share | | | | $ | 17.39 | | | | | $ | 14.73 | | | | | $ | 12.33 | | |
See Accompanying Notes to Financial Statements
STATEMENTS OF OPERATIONS for the year ended December 31, 2017
| | | | Voya Solution
Aggressive
Portfolio | | | Voya Solution
Balanced
Portfolio | | | Voya Solution
Conservative
Portfolio | | | Voya Solution
Income
Portfolio | |
| INVESTMENT INCOME: | | | | | |
| Dividends from affiliated underlying funds | | | | $ | 149,785 | | | | | $ | 1,052,724 | | | | | $ | 374,776 | | | | | $ | 9,766,973 | | |
| Dividends from unaffiliated underlying funds | | | | | 19,229 | | | | | | 71,948 | | | | | | 27,232 | | | | | | 349,794 | | |
| Total investment income | | | | | 169,014 | | | | | | 1,124,672 | | | | | | 402,008 | | | | | | 10,116,767 | | |
| EXPENSES: | | | | | |
| Investment management fees | | | | | 22,762 | | | | | | 116,893 | | | | | | 34,790 | | | | | | 959,306 | | |
| Distribution and shareholder service fees: | | | | | | | | | | | | | | | | | | | | | | | | | |
| Class ADV | | | | | 14,531 | | | | | | 92,328 | | | | | | 42,091 | | | | | | 962,200 | | |
| Class S | | | | | 10,674 | | | | | | 60,377 | | | | | | 13,091 | | | | | | 427,141 | | |
| Class S2 | | | | | 2,174 | | | | | | 7,180 | | | | | | 2,431 | | | | | | 42,276 | | |
| Class T | | | | | — | | | | | | — | | | | | | — | | | | | | 1,489 | | |
| Transfer agent fees | | | | | 132 | | | | | | 207 | | | | | | 270 | | | | | | 5,237 | | |
| Shareholder reporting expense | | | | | 1,618 | | | | | | 7,300 | | | | | | 1,825 | | | | | | 35,290 | | |
| Professional fees | | | | | 8,201 | | | | | | 12,775 | | | | | | 9,796 | | | | | | 64,316 | | |
| Custody and accounting expense | | | | | 796 | | | | | | 4,380 | | | | | | 1,425 | | | | | | 36,455 | | |
| Directors fees | | | | | 426 | | | | | | 2,209 | | | | | | 654 | | | | | | 18,409 | | |
| Miscellaneous expense | | | | | 9,157 | | | | | | 12,301 | | | | | | 9,667 | | | | | | 31,321 | | |
| Interest expense | | | | | — | | | | | | 3 | | | | | | — | | | | | | 72 | | |
| Total expenses | | | | | 70,471 | | | | | | 315,953 | | | | | | 116,040 | | | | | | 2,583,512 | | |
| Waived and reimbursed fees | | | | | (25,978) | | | | | | (66,438) | | | | | | (38,432) | | | | | | (633,760) | | |
| Net expenses | | | | | 44,493 | | | | | | 249,515 | | | | | | 77,608 | | | | | | 1,949,752 | | |
| Net investment income | | | | | 124,521 | | | | | | 875,157 | | | | | | 324,400 | | | | | | 8,167,015 | | |
| REALIZED AND UNREALIZED GAIN (LOSS): | | | | | |
| Net realized gain (loss) on: | | | | | |
| Sale of affiliated underlying funds | | | | | 198,516 | | | | | | 221,129 | | | | | | 99,635 | | | | | | 2,056,278 | | |
| Sale of unaffiliated underlying funds | | | | | 59,907 | | | | | | 133,943 | | | | | | 73,422 | | | | | | 1,274,943 | | |
| Capital gain distributions from affiliated underlying funds | | | | | 456,794 | | | | | | 1,747,347 | | | | | | 207,517 | | | | | | 7,769,188 | | |
| Foreign currency related transactions | | | | | — | | | | | | 1,041 | | | | | | — | | | | | | 9,949 | | |
| Futures | | | | | — | | | | | | (478) | | | | | | — | | | | | | (87,048) | | |
| Net realized gain | | | | | 715,217 | | | | | | 2,102,982 | | | | | | 380,574 | | | | | | 11,023,310 | | |
| Net change in unrealized appreciation (depreciation) on: | | | | | |
| Affiliated underlying funds | | | | | 1,221,772 | | | | | | 4,375,082 | | | | | | 413,686 | | | | | | 21,570,092 | | |
| Unaffiliated underlying funds | | | | | 28,549 | | | | | | 189,545 | | | | | | 21,840 | | | | | | 482,751 | | |
| Foreign currency related transactions | | | | | — | | | | | | 86 | | | | | | — | | | | | | 642 | | |
| Futures | | | | | — | | | | | | (4,451) | | | | | | — | | | | | | (16,727) | | |
| Net change in unrealized appreciation (depreciation) | | | | | 1,250,321 | | | | | | 4,560,262 | | | | | | 435,526 | | | | | | 22,036,758 | | |
| Net realized and unrealized gain | | | | | 1,965,538 | | | | | | 6,663,244 | | | | | | 816,100 | | | | | | 33,060,068 | | |
| Increase in net assets resulting from operations | | | | $ | 2,090,059 | | | | | $ | 7,538,401 | | | | | $ | 1,140,500 | | | | | $ | 41,227,083 | | |
| |
See Accompanying Notes to Financial Statements
STATEMENTS OF OPERATIONS for the year ended December 31, 2017
| | | | Voya Solution
Moderately
Aggressive
Portfolio | | | Voya Solution
Moderately
Conservative
Portfolio | | | Voya Solution
2020 Portfolio | | | Voya Solution
2025 Portfolio | |
| INVESTMENT INCOME: | | | | | |
| Dividends from affiliated underlying funds | | | | $ | 11,102,100 | | | | | $ | 704,858 | | | | | $ | 569,211 | | | | | $ | 17,473,481 | | |
| Dividends from unaffiliated underlying funds | | | | | 1,270,577 | | | | | | 35,530 | | | | | | 43,344 | | | | | | 1,042,703 | | |
| Total investment income | | | | | 12,372,677 | | | | | | 740,388 | | | | | | 612,555 | | | | | | 18,516,184 | | |
| EXPENSES: | | | | | |
| Investment management fees | | | | | 1,540,166 | | | | | | 70,170 | | | | | | 58,961 | | | | | | 1,925,608 | | |
| Distribution and shareholder service fees: | | | | | | | | | | | | | | | | | | | | | | | | | |
| Class ADV | | | | | 130,553 | | | | | | 56,910 | | | | | | 60,353 | | | | | | 1,508,611 | | |
| Class S | | | | | 1,675,419 | | | | | | 49,500 | | | | | | 19,799 | | | | | | 919,258 | | |
| Class S2 | | | | | 5,763 | | | | | | 3,784 | | | | | | 1,215 | | | | | | 80,444 | | |
| Class T | | | | | — | | | | | | — | | | | | | 66 | | | | | | 5,541 | | |
| Transfer agent fees | | | | | 6,789 | | | | | | 135 | | | | | | 270 | | | | | | 1,176 | | |
| Shareholder reporting expense | | | | | 36,990 | | | | | | 6,935 | | | | | | 3,508 | | | | | | 47,450 | | |
| Professional fees | | | | | 91,978 | | | | | | 12,045 | | | | | | 12,323 | | | | | | 103,295 | | |
| Custody and accounting expense | | | | | 50,855 | | | | | | 3,650 | | | | | | 2,400 | | | | | | 65,700 | | |
| Directors fees | | | | | 28,295 | | | | | | 1,333 | | | | | | 1,112 | | | | | | 36,490 | | |
| Miscellaneous expense | | | | | 32,913 | | | | | | 15,394 | | | | | | 8,460 | | | | | | 41,051 | | |
| Interest expense | | | | | 80 | | | | | | — | | | | | | — | | | | | | 202 | | |
| Total expenses | | | | | 3,599,801 | | | | | | 219,856 | | | | | | 168,467 | | | | | | 4,734,826 | | |
| Waived and reimbursed fees | | | | | (288,587) | | | | | | (58,784) | | | | | | (55,984) | | | | | | (742,094) | | |
| Net expenses | | | | | 3,311,214 | | | | | | 161,072 | | | | | | 112,483 | | | | | | 3,992,732 | | |
| Net investment income | | | | | 9,061,463 | | | | | | 579,316 | | | | | | 500,072 | | | | | | 14,523,452 | | |
| REALIZED AND UNREALIZED GAIN (LOSS): | | | | | |
| Net realized gain (loss) on: | | | | | |
| Sale of affiliated underlying funds | | | | | 2,856,623 | | | | | | 368,615 | | | | | | 1,013,442 | | | | | | 3,628,076 | | |
| Sale of unaffiliated underlying funds | | | | | 5,130,386 | | | | | | 117,133 | | | | | | 88,303 | | | | | | 2,320,566 | | |
| Capital gain distributions from affiliated underlying funds | | | | | 24,604,023 | | | | | | 636,982 | | | | | | 668,085 | | | | | | 25,585,267 | | |
| Foreign currency related transactions | | | | | 14,780 | | | | | | 691 | | | | | | — | | | | | | 19,259 | | |
| Futures | | | | | (84,968) | | | | | | (2,584) | | | | | | — | | | | | | (109,819) | | |
| Net realized gain | | | | | 32,520,844 | | | | | | 1,120,837 | | | | | | 1,769,830 | | | | | | 31,443,349 | | |
| Net change in unrealized appreciation (depreciation) on: | | | | | |
| Affiliated underlying funds | | | | | 75,091,078 | | | | | | 1,548,854 | | | | | | 906,687 | | | | | | 81,767,544 | | |
| Unaffiliated underlying funds | | | | | 1,462,494 | | | | | | 37,576 | | | | | | 92,233 | | | | | | 2,097,086 | | |
| Foreign currency related transactions | | | | | 1,053 | | | | | | 47 | | | | | | — | | | | | | 1,360 | | |
| Futures | | | | | (28,438) | | | | | | 286 | | | | | | — | | | | | | (37,265) | | |
| Net change in unrealized appreciation (depreciation) | | | | | 76,526,187 | | | | | | 1,586,763 | | | | | | 998,920 | | | | | | 83,828,725 | | |
| Net realized and unrealized gain | | | | | 109,047,031 | | | | | | 2,707,600 | | | | | | 2,768,750 | | | | | | 115,272,074 | | |
| Increase in net assets resulting from operations | | | | $ | 118,108,494 | | | | | $ | 3,286,916 | | | | | $ | 3,268,822 | | | | | $ | 129,795,526 | | |
| |
See Accompanying Notes to Financial Statements
STATEMENTS OF OPERATIONS for the year ended December 31, 2017
| | | | Voya Solution
2030 Portfolio | | | Voya Solution
2035 Portfolio | | | Voya Solution
2040 Portfolio | | | Voya Solution
2045 Portfolio | |
| INVESTMENT INCOME: | | | | | |
| Dividends from affiliated underlying funds | | | | $ | 450,876 | | | | | $ | 14,899,237 | | | | | $ | 317,405 | | | | | $ | 9,062,890 | | |
| Dividends from unaffiliated underlying funds | | | | | 52,493 | | | | | | 1,084,199 | | | | | | 41,110 | | | | | | 1,043,703 | | |
| Total investment income | | | | | 503,369 | | | | | | 15,983,436 | | | | | | 358,515 | | | | | | 10,106,593 | | |
| EXPENSES: | | | | | |
| Investment management fees | | | | | 50,613 | | | | | | 1,888,003 | | | | | | 42,019 | | | | | | 1,411,861 | | |
| Distribution and shareholder service fees: | | | | | | | | | | | | | | | | | | | | | | | | | |
| Class ADV | | | | | 51,454 | | | | | | 1,321,813 | | | | | | 36,056 | | | | | | 887,121 | | |
| Class S | | | | | 16,838 | | | | | | 898,973 | | | | | | 14,684 | | | | | | 650,660 | | |
| Class S2 | | | | | 1,810 | | | | | | 81,001 | | | | | | 1,646 | | | | | | 50,666 | | |
| Class T | | | | | 86 | | | | | | 4,882 | | | | | | 104 | | | | | | 3,327 | | |
| Transfer agent fees | | | | | 271 | | | | | | 1,344 | | | | | | 237 | | | | | | 930 | | |
| Shareholder reporting expense | | | | | 3,520 | | | | | | 45,625 | | | | | | 3,309 | | | | | | 38,325 | | |
| Professional fees | | | | | 10,371 | | | | | | 96,725 | | | | | | 10,532 | | | | | | 80,826 | | |
| Custody and accounting expense | | | | | 2,033 | | | | | | 51,100 | | | | | | 1,579 | | | | | | 44,035 | | |
| Directors fees | | | | | 937 | | | | | | 35,620 | | | | | | 778 | | | | | | 26,215 | | |
| Miscellaneous expense | | | | | 8,713 | | | | | | 44,332 | | | | | | 11,175 | | | | | | 38,234 | | |
| Interest expense | | | | | 16 | | | | | | 74 | | | | | | — | | | | | | 95 | | |
| Total expenses | | | | | 146,662 | | | | | | 4,469,492 | | | | | | 122,119 | | | | | | 3,232,295 | | |
| Waived and reimbursed fees | | | | | (43,272) | | | | | | (806,283) | | | | | | (44,017) | | | | | | (513,695) | | |
| Net expenses | | | | | 103,390 | | | | | | 3,663,209 | | | | | | 78,102 | | | | | | 2,718,600 | | |
| Net investment income | | | | | 399,979 | | | | | | 12,320,227 | | | | | | 280,413 | | | | | | 7,387,993 | | |
| REALIZED AND UNREALIZED GAIN (LOSS): | | | | | |
| Net realized gain (loss) on: | | | | | |
| Sale of affiliated underlying funds | | | | | 952,088 | | | | | | 4,229,907 | | | | | | 996,622 | | | | | | 4,800,104 | | |
| Sale of unaffiliated underlying funds | | | | | 58,643 | | | | | | 4,582,990 | | | | | | 111,477 | | | | | | 4,284,697 | | |
| Capital gain distributions from affiliated underlying funds | | | | | 760,547 | | | | | | 30,164,250 | | | | | | 746,690 | | | | | | 24,256,408 | | |
| Foreign currency related transactions | | | | | — | | | | | | 18,615 | | | | | | — | | | | | | 13,535 | | |
| Futures | | | | | — | | | | | | (76,753) | | | | | | — | | | | | | (46,273) | | |
| Net realized gain | | | | | 1,771,278 | | | | | | 38,919,009 | | | | | | 1,854,789 | | | | | | 33,308,471 | | |
| Net change in unrealized appreciation (depreciation) on: | | | | | |
| Affiliated underlying funds | | | | | 1,386,914 | | | | | | 106,722,880 | | | | | | 1,353,251 | | | | | | 84,782,243 | | |
| Unaffiliated underlying funds | | | | | 148,746 | | | | | | 474,923 | | | | | | 59,315 | | | | | | 567,817 | | |
| Foreign currency related transactions | | | | | — | | | | | | 1,370 | | | | | | — | | | | | | 1,016 | | |
| Futures | | | | | — | | | | | | (36,482) | | | | | | — | | | | | | (27,940) | | |
| Net change in unrealized appreciation (depreciation) | | | | | 1,535,660 | | | | | | 107,162,691 | | | | | | 1,412,566 | | | | | | 85,323,136 | | |
| Net realized and unrealized gain | | | | | 3,306,938 | | | | | | 146,081,700 | | | | | | 3,267,355 | | | | | | 118,631,607 | | |
| Increase in net assets resulting from operations | | | | $ | 3,706,917 | | | | | $ | 158,401,927 | | | | | $ | 3,547,768 | | | | | $ | 126,019,600 | | |
| |
See Accompanying Notes to Financial Statements
STATEMENTS OF OPERATIONS for the year ended December 31, 2017
| | | | Voya Solution
2050 Portfolio | | | Voya Solution
2055 Portfolio | | | Voya Solution
2060 Portfolio | |
| INVESTMENT INCOME: | | | | |
| Dividends from affiliated underlying funds | | | | $ | 188,377 | | | | | $ | 2,214,851 | | | | | $ | 87,901 | | |
| Dividends from unaffiliated underlying funds | | | | | 30,033 | | | | | | 244,228 | | | | | | 14,048 | | |
| Total investment income | | | | | 218,410 | | | | | | 2,459,079 | | | | | | 101,949 | | |
| EXPENSES: | | | | |
| Investment management fees | | | | | 26,674 | | | | | | 344,831 | | | | | | 12,377 | | |
| Distribution and shareholder service fees: | | | | | | | | | | | | | | | | | | | |
| Class ADV | | | | | 25,434 | | | | | | 226,467 | | | | | | 10,420 | | |
| Class S | | | | | 8,028 | | | | | | 134,496 | | | | | | 5,319 | | |
| Class S2 | | | | | 881 | | | | | | 13,090 | | | | | | 401 | | |
| Class T | | | | | 88 | | | | | | 189 | | | | | | 23 | | |
| Transfer agent fees | | | | | 169 | | | | | | 1,333 | | | | | | 198 | | |
| Shareholder reporting expense | | | | | 3,127 | | | | | | 14,730 | | | | | | 2,562 | | |
| Professional fees | | | | | 9,763 | | | | | | 26,153 | | | | | | 8,349 | | |
| Custody and accounting expense | | | | | 1,067 | | | | | | 10,835 | | | | | | 643 | | |
| Directors fees | | | | | 490 | | | | | | 6,456 | | | | | | 228 | | |
| Miscellaneous expense | | | | | 11,471 | | | | | | 16,248 | | | | | | 9,502 | | |
| Interest expense | | | | | — | | | | | | 20 | | | | | | — | | |
| Total expenses | | | | | 87,192 | | | | | | 794,848 | | | | | | 50,022 | | |
| Waived and reimbursed fees | | | | | (34,275) | | | | | | (160,115) | | | | | | (24,261) | | |
| Net expenses | | | | | 52,917 | | | | | | 634,733 | | | | | | 25,761 | | |
| Net investment income | | | | | 165,493 | | | | | | 1,824,346 | | | | | | 76,188 | | |
| REALIZED AND UNREALIZED GAIN (LOSS): | | | | |
| Net realized gain (loss) on: | | | | |
| Sale of affiliated underlying funds | | | | | 485,040 | | | | | | (24,423) | | | | | | 283,305 | | |
| Sale of unaffiliated underlying funds | | | | | 61,664 | | | | | | 744,997 | | | | | | 28,584 | | |
| Capital gain distributions from affiliated underlying funds | | | | | 489,717 | | | | | | 6,091,950 | | | | | | 227,284 | | |
| Foreign currency related transactions | | | | | — | | | | | | 3,203 | | | | | | — | | |
| Futures | | | | | — | | | | | | (1,905) | | | | | | — | | |
| Net realized gain | | | | | 1,036,421 | | | | | | 6,813,822 | | | | | | 539,173 | | |
| Net change in unrealized appreciation (depreciation) on: | | | | |
| Affiliated underlying funds | | | | | 1,088,775 | | | | | | 22,651,119 | | | | | | 443,410 | | |
| Unaffiliated underlying funds | | | | | 62,123 | | | | | | 223,201 | | | | | | 27,504 | | |
| Foreign currency related transactions | | | | | — | | | | | | 269 | | | | | | — | | |
| Futures | | | | | — | | | | | | (8,330) | | | | | | — | | |
| Net change in unrealized appreciation (depreciation) | | | | | 1,150,898 | | | | | | 22,866,259 | | | | | | 470,914 | | |
| Net realized and unrealized gain | | | | | 2,187,319 | | | | | | 29,680,081 | | | | | | 1,010,087 | | |
| Increase in net assets resulting from operations | | | | $ | 2,352,812 | | | | | $ | 31,504,427 | | | | | $ | 1,086,275 | | |
| |
See Accompanying Notes to Financial Statements
STATEMENTS OF CHANGES IN NET ASSETS
| | | | Voya Solution Aggressive Portfolio | | | Voya Solution Balanced Portfolio | |
| | | | Year Ended
December 31,
2017 | | | Year Ended
December 31,
2016 | | | Year Ended
December 31,
2017 | | | Year Ended
December 31,
2016 | |
| FROM OPERATIONS: | | | | | |
| Net investment income | | | | $ | 124,521 | | | | | $ | 64,695 | | | | | $ | 875,157 | | | | | $ | 694,394 | | |
| Net realized gain (loss) | | | | | 715,217 | | | | | | (8,314) | | | | | | 2,102,982 | | | | | | 403,647 | | |
| Net change in unrealized appreciation (depreciation) | | | | | 1,250,321 | | | | | | 389,968 | | | | | | 4,560,262 | | | | | | 1,634,780 | | |
| Increase in net assets resulting from operations | | | | | 2,090,059 | | | | | | 446,349 | | | | | | 7,538,401 | | | | | | 2,732,821 | | |
| FROM DISTRIBUTIONS TO SHAREHOLDERS: | | | | | | | | | | | | | | | | | | | | | | | | | |
| Net investment income: | | | | | | | | | | | | | | | | | | | | | | | | | |
| Class ADV | | | | | (10,735) | | | | | | (23,934) | | | | | | (215,300) | | | | | | (410,012) | | |
| Class I | | | | | (2,617) | | | | | | (2,335) | | | | | | (74,182) | | | | | | (2,354) | | |
| Class R6 | | | | | (25,471) | | | | | | (957) | | | | | | (143,410) | | | | | | (20,744) | | |
| Class S | | | | | (24,175) | | | | | | (48,921) | | | | | | (350,819) | | | | | | (525,795) | | |
| Class S2 | | | | | (3,194) | | | | | | (3,605) | | | | | | (27,779) | | | | | | (11,571) | | |
| Net realized gains: | | | | | | | | | | | | | | | | | | | | | | | | | |
| Class ADV | | | | | (38,660) | | | | | | (123,049) | | | | | | (308,304) | | | | | | (1,429,535) | | |
| Class I | | | | | (4,496) | | | | | | (7,887) | | | | | | (70,860) | | | | | | (6,154) | | |
| Class R6 | | | | | (43,697) | | | | | | (3,226) | | | | | | (136,987) | | | | | | (54,237) | | |
| Class S | | | | | (56,340) | | | | | | (182,612) | | | | | | (389,772) | | | | | | (1,528,071) | | |
| Class S2 | | | | | (7,443) | | | | | | (14,026) | | | | | | (29,665) | | | | | | (36,902) | | |
| Total distributions | | | | | (216,828) | | | | | | (410,552) | | | | | | (1,747,078) | | | | | | (4,025,375) | | |
| FROM CAPITAL SHARE TRANSACTIONS: | | | | | |
| Net proceeds from sale of shares | | | | | 7,019,835 | | | | | | 3,630,137 | | | | | | 18,408,524 | | | | | | 14,742,333 | | |
| Reinvestment of distributions | | | | | 216,828 | | | | | | 410,552 | | | | | | 1,747,078 | | | | | | 4,025,375 | | |
| | | | | | 7,236,663 | | | | | | 4,040,689 | | | | | | 20,155,602 | | | | | | 18,767,708 | | |
| Cost of shares redeemed | | | | | (3,015,037) | | | | | | (1,371,169) | | | | | | (12,907,802) | | | | | | (16,023,486) | | |
| Net increase in net assets resulting from capital share transactions | | | | | 4,221,626 | | | | | | 2,669,520 | | | | | | 7,247,800 | | | | | | 2,744,222 | | |
| Net increase in net assets | | | | | 6,094,857 | | | | | | 2,705,317 | | | | | | 13,039,123 | | | | | | 1,451,668 | | |
| NET ASSETS: | | | | | |
| Beginning of year or period | | | | | 7,812,597 | | | | | | 5,107,280 | | | | | | 49,718,756 | | | | | | 48,267,088 | | |
| End of year or period | | | | $ | 13,907,454 | | | | | $ | 7,812,597 | | | | | $ | 62,757,879 | | | | | $ | 49,718,756 | | |
| Undistributed net investment income at end of year or period | | | | $ | 167,780 | | | | | $ | 65,132 | | | | | $ | 1,033,518 | | | | | $ | 809,692 | | |
| |
See Accompanying Notes to Financial Statements
STATEMENTS OF CHANGES IN NET ASSETS
| | | | Voya Solution Conservative Portfolio | | | Voya Solution Income Portfolio | |
| | | | Year Ended
December 31,
2017 | | | Year Ended
December 31,
2016 | | | Year Ended
December 31,
2017 | | | Year Ended
December 31,
2016 | |
| FROM OPERATIONS: | | | | | |
| Net investment income | | | | $ | 324,400 | | | | | $ | 299,116 | | | | | $ | 8,167,015 | | | | | $ | 8,636,813 | | |
| Net realized gain (loss) | | | | | 380,574 | | | | | | (66,340) | | | | | | 11,023,310 | | | | | | (200,701) | | |
| Net change in unrealized appreciation (depreciation) | | | | | 435,526 | | | | | | 651,291 | | | | | | 22,036,758 | | | | | | 15,021,804 | | |
| Increase in net assets resulting from operations | | | | | 1,140,500 | | | | | | 884,067 | | | | | | 41,227,083 | | | | | | 23,457,916 | | |
| FROM DISTRIBUTIONS TO SHAREHOLDERS: | | | | | | | | | | | | | | | | | | | | | | | | | |
| Net investment income: | | | | | | | | | | | | | | | | | | | | | | | | | |
| Class ADV | | | | | (169,438) | | | | | | (150,115) | | | | | | (3,761,189) | | | | | | (2,150,558) | | |
| Class I | | | | | (1,908) | | | | | | (628) | | | | | | (2,203,622) | | | | | | (1,212,513) | | |
| Class R6 | | | | | (52,764) | | | | | | (8,166) | | | | | | — | | | | | | — | | |
| Class S | | | | | (103,928) | | | | | | (136,481) | | | | | | (3,708,171) | | | | | | (2,220,269) | | |
| Class S2 | | | | | (13,314) | | | | | | (9,380) | | | | | | (211,040) | | | | | | (138,417) | | |
| Class T | | | | | — | | | | | | — | | | | | | (2,177) | | | | | | — | | |
| Net realized gains: | | | | | | | | | | | | | | | | | | | | | | | | | |
| Class ADV | | | | | (51,575) | | | | | | (206,616) | | | | | | (591,484) | | | | | | (2,591,594) | | |
| Class I | | | | | (463) | | | | | | (635) | | | | | | (266,332) | | | | | | (1,083,900) | | |
| Class R6 | | | | | (12,783) | | | | | | (8,257) | | | | | | — | | | | | | — | | |
| Class S | | | | | (29,058) | | | | | | (153,138) | | | | | | (509,978) | | | | | | (2,268,074) | | |
| Class S2 | | | | | (3,660) | | | | | | (10,919) | | | | | | (32,163) | | | | | | (155,401) | | |
| Class T | | | | | — | | | | | | — | | | | | | (631) | | | | | | (2,132) | | |
| Total distributions | | | | | (438,891) | | | | | | (684,335) | | | | | | (11,286,787) | | | | | | (11,822,858) | | |
| FROM CAPITAL SHARE TRANSACTIONS: | | | | | |
| Net proceeds from sale of shares | | | | | 5,302,856 | | | | | | 4,259,688 | | | | | | 25,934,613 | | | | | | 32,380,433 | | |
| Reinvestment of distributions | | | | | 438,891 | | | | | | 684,168 | | | | | | 11,286,787 | | | | | | 11,822,858 | | |
| | | | | | 5,741,747 | | | | | | 4,943,856 | | | | | | 37,221,400 | | | | | | 44,203,291 | | |
| Cost of shares redeemed | | | | | (6,143,731) | | | | | | (3,277,607) | | | | | | (119,171,815) | | | | | | (158,926,207) | | |
| Net increase (decrease) in net assets resulting from capital share transactions | | | | | (401,984) | | | | | | 1,666,249 | | | | | | (81,950,415) | | | | | | (114,722,916) | | |
| Net increase (decrease) in net assets | | | | | 299,625 | | | | | | 1,865,981 | | | | | | (52,010,119) | | | | | | (103,087,858) | | |
| NET ASSETS: | | | | | |
| Beginning of year or period | | | | | 16,369,603 | | | | | | 14,503,622 | | | | | | 485,667,657 | | | | | | 588,755,515 | | |
| End of year or period | | | | $ | 16,669,228 | | | | | $ | 16,369,603 | | | | | $ | 433,657,538 | | | | | $ | 485,667,657 | | |
| Undistributed net investment income at end of year or period | | | | $ | 332,597 | | | | | $ | 341,095 | | | | | $ | 9,117,000 | | | | | $ | 9,866,359 | | |
| |
See Accompanying Notes to Financial Statements
STATEMENTS OF CHANGES IN NET ASSETS
| | | | Voya Solution Moderately
Aggressive Portfolio | | | Voya Solution Moderately
Conservative Portfolio | |
| | | | Year Ended
December 31,
2017 | | | Year Ended
December 31,
2016 | | | Year Ended
December 31,
2017 | | | Year Ended
December 31,
2016 | |
| FROM OPERATIONS: | | | | | |
| Net investment income | | | | $ | 9,061,463 | | | | | $ | 8,801,998 | | | | | $ | 579,316 | | | | | $ | 597,138 | | |
| Net realized gain (loss) | | | | | 32,520,844 | | | | | | 1,174,345 | | | | | | 1,120,837 | | | | | | (678,541) | | |
| Net change in unrealized appreciation (depreciation) | | | | | 76,526,187 | | | | | | 31,015,331 | | | | | | 1,586,763 | | | | | | 2,172,416 | | |
| Increase in net assets resulting from operations | | | | | 118,108,494 | | | | | | 40,991,674 | | | | | | 3,286,916 | | | | | | 2,091,013 | | |
| FROM DISTRIBUTIONS TO SHAREHOLDERS: | | | | | | | | | | | | | | | | | | | | | | | | | |
| Net investment income: | | | | | | | | | | | | | | | | | | | | | | | | | |
| Class ADV | | | | | (301,993) | | | | | | (212,822) | | | | | | (196,049) | | | | | | (274,375) | | |
| Class I | | | | | (83,485) | | | | | | (53,499) | | | | | | (636) | | | | | | (1,055) | | |
| Class R6 | | | | | (73,824) | | | | | | (1,403) | | | | | | (30,444) | | | | | | (203) | | |
| Class S | | | | | (9,267,927) | | | | | | (8,226,554) | | | | | | (445,570) | | | | | | (513,040) | | |
| Class S2 | | | | | (21,190) | | | | | | (8,934) | | | | | | (20,307) | | | | | | (18,457) | | |
| Net realized gains: | | | | | | | | | | | | | | | | | | | | | | | | | |
| Class ADV | | | | | (296,003) | | | | | | (395,963) | | | | | | — | | | | | | (828,646) | | |
| Class I | | �� | | | (56,591) | | | | | | (62,404) | | | | | | — | | | | | | (2,273) | | |
| Class R6 | | | | | (50,019) | | | | | | (1,637) | | | | | | — | | | | | | (437) | | |
| Class S | | | | | (7,427,819) | | | | | | (10,441,172) | | | | | | — | | | | | | (1,219,917) | | |
| Class S2 | | | | | (17,137) | | | | | | (14,815) | | | | | | — | | | | | | (47,298) | | |
| Total distributions | | | | | (17,595,988) | | | | | | (19,419,203) | | | | | | (693,006) | | | | | | (2,905,701) | | |
| FROM CAPITAL SHARE TRANSACTIONS: | | | | | |
| Net proceeds from sale of shares | | | | | 17,669,067 | | | | | | 11,405,648 | | | | | | 6,018,372 | | | | | | 6,036,432 | | |
| Reinvestment of distributions | | | | | 17,595,988 | | | | | | 19,419,203 | | | | | | 693,006 | | | | | | 2,905,701 | | |
| | | | | | 35,265,055 | | | | | | 30,824,851 | | | | | | 6,711,378 | | | | | | 8,942,133 | | |
| Cost of shares redeemed | | | | | (115,212,536) | | | | | | (115,010,937) | | | | | | (13,360,522) | | | | | | (15,464,819) | | |
| Net decrease in net assets resulting from capital share transactions | | | | | (79,947,481) | | | | | | (84,186,086) | | | | | | (6,649,144) | | | | | | (6,522,686) | | |
| Net increase (decrease) in net assets | | | | | 20,565,025 | | | | | | (62,613,615) | | | | | | (4,055,234) | | | | | | (7,337,374) | | |
| NET ASSETS: | | | | | |
| Beginning of year or period | | | | | 693,196,516 | | | | | | 755,810,131 | | | | | | 35,534,940 | | | | | | 42,872,314 | | |
| End of year or period | | | | $ | 713,761,541 | | | | | $ | 693,196,516 | | | | | $ | 31,479,706 | | | | | $ | 35,534,940 | | |
| Undistributed net investment income at end of year or period | | | | $ | 11,497,005 | | | | | $ | 9,726,651 | | | | | $ | 635,900 | | | | | $ | 692,402 | | |
| |
See Accompanying Notes to Financial Statements
STATEMENTS OF CHANGES IN NET ASSETS
| | | | Voya Solution 2020 Portfolio | | | Voya Solution 2025 Portfolio | |
| | | | Year Ended
December 31,
2017 | | | Year Ended
December 31,
2016 | | | Year Ended
December 31,
2017 | | | Year Ended
December 31,
2016 | |
| FROM OPERATIONS: | | | | | |
| Net investment income | | | | $ | 500,072 | | | | | $ | 269,152 | | | | | $ | 14,523,452 | | | | | $ | 14,650,804 | | |
| Net realized gain | | | | | 1,769,830 | | | | | | 452,890 | | | | | | 31,443,349 | | | | | | 16,710,885 | | |
| Net change in unrealized appreciation (depreciation) | | | | | 998,920 | | | | | | 264,926 | | | | | | 83,828,725 | | | | | | 21,008,317 | | |
| Increase in net assets resulting from operations | | | | | 3,268,822 | | | | | | 986,968 | | | | | | 129,795,526 | | | | | | 52,370,006 | | |
| FROM DISTRIBUTIONS TO SHAREHOLDERS: | | | | | | | | | | | | | | | | | | | | | | | | | |
| Net investment income: | | | | | | | | | | | | | | | | | | | | | | | | | |
| Class ADV | | | | | (130,093) | | | | | | (30,050) | | | | | | (5,009,214) | | | | | | (5,850,591) | | |
| Class I | | | | | (96,738) | | | | | | (17,525) | | | | | | (4,924,333) | | | | | | (5,020,661) | | |
| Class S | | | | | (86,715) | | | | | | (23,360) | | | | | | (6,930,538) | | | | | | (8,047,201) | | |
| Class S2 | | | | | (2,729) | | | | | | (683) | | | | | | (337,961) | | | | | | (504,984) | | |
| Class T | | | | | (80) | | | | | | — | | | | | | (10,442) | | | | | | (12,925) | | |
| Net realized gains: | | | | | | | | | | | | | | | | | | | | | | | | | |
| Class ADV | | | | | (266,322) | | | | | | (39,585) | | | | | | (8,261,983) | | | | | | (25,793,205) | | |
| Class I | | | | | (156,426) | | | | | | (19,182) | | | | | | (6,125,343) | | | | | | (16,534,468) | | |
| Class S | | | | | (161,782) | | | | | | (26,838) | | | | | | (9,833,333) | | | | | | (30,295,541) | | |
| Class S2 | | | | | (5,526) | | | | | | (970) | | | | | | (546,738) | | | | | | (2,072,239) | | |
| Class T | | | | | (197) | | | | | | (28) | | | | | | (20,229) | | | | | | (62,642) | | |
| Total distributions | | | | | (906,608) | | | | | | (158,221) | | | | | | (42,000,114) | | | | | | (94,194,457) | | |
| FROM CAPITAL SHARE TRANSACTIONS: | | | | | |
| Net proceeds from sale of shares | | | | | 17,793,238 | | | | | | 21,178,235 | | | | | | 82,645,520 | | | | | | 77,865,505 | | |
| Reinvestment of distributions | | | | | 906,491 | | | | | | 158,203 | | | | | | 42,000,114 | | | | | | 94,194,456 | | |
| | | | | | 18,699,729 | | | | | | 21,336,438 | | | | | | 124,645,634 | | | | | | 172,059,961 | | |
| Cost of shares redeemed | | | | | (9,923,346) | | | | | | (9,430,029) | | | | | | (187,468,620) | | | | | | (243,406,338) | | |
| Net increase (decrease) in net assets resulting from capital share transactions | | | | | 8,776,383 | | | | | | 11,906,409 | | | | | | (62,822,986) | | | | | | (71,346,377) | | |
| Net increase (decrease) in net assets | | | | | 11,138,597 | | | | | | 12,735,156 | | | | | | 24,972,426 | | | | | | (113,170,828) | | |
| NET ASSETS: | | | | | |
| Beginning of year or period | | | | | 22,176,680 | | | | | | 9,441,524 | | | | | | 896,029,284 | | | | | | 1,009,200,112 | | |
| End of year or period | | | | $ | 33,315,277 | | | | | $ | 22,176,680 | | | | | $ | 921,001,710 | | | | | $ | 896,029,284 | | |
| Undistributed net investment income at end of year or period | | | | $ | 575,661 | | | | | $ | 315,292 | | | | | $ | 17,027,322 | | | | | $ | 17,184,274 | | |
| |
See Accompanying Notes to Financial Statements
STATEMENTS OF CHANGES IN NET ASSETS
| | | | Voya Solution 2030 Portfolio | | | Voya Solution 2035 Portfolio | |
| | | | Year Ended
December 31,
2017 | | | Year Ended
December 31,
2016 | | | Year Ended
December 31,
2017 | | | Year Ended
December 31,
2016 | |
| FROM OPERATIONS: | | | | | |
| Net investment income | | | | $ | 399,979 | | | | | $ | 174,309 | | | | | $ | 12,320,227 | | | | | $ | 12,146,510 | | |
| Net realized gain | | | | | 1,771,278 | | | | | | 311,127 | | | | | | 38,919,009 | | | | | | 17,868,373 | | |
| Net change in unrealized appreciation (depreciation) | | | | | 1,535,660 | | | | | | 227,521 | | | | | | 107,162,691 | | | | | | 22,191,160 | | |
| Increase in net assets resulting from operations | | | | | 3,706,917 | | | | | | 712,957 | | | | | | 158,401,927 | | | | | | 52,206,043 | | |
| FROM DISTRIBUTIONS TO SHAREHOLDERS: | | | | | | | | | | | | | | | | | | | | | | | | | |
| Net investment income: | | | | | | | | | | | | | | | | | | | | | | | | | |
| Class ADV | | | | | (84,233) | | | | | | (16,483) | | | | | | (3,456,441) | | | | | | (5,125,743) | | |
| Class I | | | | | (58,032) | | | | | | (5,762) | | | | | | (4,515,290) | | | | | | (5,348,117) | | |
| Class S | | | | | (55,605) | | | | | | (11,238) | | | | | | (5,536,220) | | | | | | (7,573,427) | | |
| Class S2 | | | | | (2,095) | | | | | | (1,455) | | | | | | (294,989) | | | | | | (448,201) | | |
| Class T | | | | | (62) | | | | | | — | | | | | | (7,417) | | | | | | (7,825) | | |
| Net realized gains: | | | | | | | | | | | | | | | | | | | | | | | | | |
| Class ADV | | | | | (178,355) | | | | | | (22,721) | | | | | | (6,886,293) | | | | | | (24,216,893) | | |
| Class I | | | | | (98,063) | | | | | | (7,039) | | | | | | (6,405,075) | | | | | | (19,033,957) | | |
| Class S | | | | | (105,944) | | | | | | (14,220) | | | | | | (9,133,000) | | | | | | (30,708,986) | | |
| Class S2 | | | | | (5,093) | | | | | | (1,785) | | | | | | (541,219) | | | | | | (1,959,015) | | |
| Class T | | | | | (187) | | | | | | (26) | | | | | | (17,775) | | | | | | (50,073) | | |
| Total distributions | | | | | (587,669) | | | | | | (80,729) | | | | | | (36,793,719) | | | | | | (94,472,237) | | |
| FROM CAPITAL SHARE TRANSACTIONS: | | | | | |
| Net proceeds from sale of shares | | | | | 20,544,004 | | | | | | 14,162,825 | | | | | | 79,749,603 | | | | | | 84,881,033 | | |
| Reinvestment of distributions | | | | | 587,571 | | | | | | 80,678 | | | | | | 36,793,719 | | | | | | 94,472,237 | | |
| | | | | | 21,131,575 | | | | | | 14,243,503 | | | | | | 116,543,322 | | | | | | 179,353,270 | | |
| Cost of shares redeemed | | | | | (7,855,628) | | | | | | (3,898,412) | | | | | | (161,532,032) | | | | | | (210,855,745) | | |
| Net increase (decrease) in net assets resulting from capital share transactions | | | | | 13,275,947 | | | | | | 10,345,091 | | | | | | (44,988,710) | | | | | | (31,502,475) | | |
| Net increase (decrease) in net assets | | | | | 16,395,195 | | | | | | 10,977,319 | | | | | | 76,619,498 | | | | | | (73,768,669) | | |
| NET ASSETS: | | | | | |
| Beginning of year or period | | | | | 14,906,444 | | | | | | 3,929,125 | | | | | | 853,908,698 | | | | | | 927,677,367 | | |
| End of year or period | | | | $ | 31,301,639 | | | | | $ | 14,906,444 | | | | | $ | 930,528,196 | | | | | $ | 853,908,698 | | |
| Undistributed net investment income at end of year or period | | | | $ | 494,550 | | | | | $ | 199,946 | | | | | $ | 15,371,266 | | | | | $ | 13,786,106 | | |
| |
See Accompanying Notes to Financial Statements
STATEMENTS OF CHANGES IN NET ASSETS
| | | | Voya Solution 2040 Portfolio | | | Voya Solution 2045 Portfolio | |
| | | | Year Ended
December 31,
2017 | | | Year Ended
December 31,
2016 | | | Year Ended
December 31,
2017 | | | Year Ended
December 31,
2016 | |
| FROM OPERATIONS: | | | | | |
| Net investment income | | | | $ | 280,413 | | | | | $ | 117,916 | | | | | $ | 7,387,993 | | | | | $ | 7,089,678 | | |
| Net realized gain | | | | | 1,854,789 | | | | | | 283,783 | | | | | | 33,308,471 | | | | | | 13,497,107 | | |
| Net change in unrealized appreciation (depreciation) | | | | | 1,412,566 | | | | | | 251,996 | | | | | | 85,323,136 | | | | | | 18,136,807 | | |
| Increase in net assets resulting from operations | | | | | 3,547,768 | | | | | | 653,695 | | | | | | 126,019,600 | | | | | | 38,723,592 | | |
| FROM DISTRIBUTIONS TO SHAREHOLDERS: | | | | | | | | | | | | | | | | | | | | | | | | | |
| Net investment income: | | | | | | | | | | | | | | | | | | | | | | | | | |
| Class ADV | | | | | (39,286) | | | | | | (16,429) | | | | | | (1,463,320) | | | | | | (2,509,631) | | |
| Class I | | | | | (46,566) | | | | | | (7,933) | | | | | | (2,774,509) | | | | | | (3,442,244) | | |
| Class S | | | | | (41,477) | | | | | | (11,673) | | | | | | (2,779,697) | | | | | | (4,215,034) | | |
| Class S2 | | | | | (3,488) | | | | | | (846) | | | | | | (124,295) | | | | | | (205,558) | | |
| Class T | | | | | (58) | | | | | | (9) | | | | | | (3,603) | | | | | | (4,674) | | |
| Net realized gains: | | | | | | | | | | | | | | | | | | | | | | | | | |
| Class ADV | | | | | (130,761) | | | | | | (36,813) | | | | | | (4,780,180) | | | | | | (16,558,058) | | |
| Class I | | | | | (104,170) | | | | | | (13,678) | | | | | | (5,566,229) | | | | | | (15,825,344) | | |
| Class S | | | | | (103,261) | | | | | | (20,636) | | | | | | (6,862,244) | | | | | | (22,768,310) | | |
| Class S2 | | | | | (8,983) | | | | | | (1,485) | | | | | | (354,473) | | | | | | (1,227,821) | | |
| Class T | | | | | (251) | | | | | | (65) | | | | | | (12,746) | | | | | | (34,121) | | |
| Total distributions | | | | | (478,301) | | | | | | (109,567) | | | | | | (24,721,296) | | | | | | (66,790,795) | | |
| FROM CAPITAL SHARE TRANSACTIONS: | | | | | |
| Net proceeds from sale of shares | | | | | 17,122,504 | | | | | | 10,328,998 | | | | | | 72,557,426 | | | | | | 74,260,683 | | |
| Reinvestment of distributions | | | | | 478,199 | | | | | | 109,464 | | | | | | 24,721,296 | | | | | | 66,790,795 | | |
| | | | | | 17,600,703 | | | | | | 10,438,462 | | | | | | 97,278,722 | | | | | | 141,051,478 | | |
| Cost of shares redeemed | | | | | (7,945,866) | | | | | | (3,126,569) | | | | | | (123,812,716) | | | | | | (145,774,446) | | |
| Net increase (decrease) in net assets resulting from capital share transactions | | | | | 9,654,837 | | | | | | 7,311,893 | | | | | | (26,533,994) | | | | | | (4,722,968) | | |
| Net increase (decrease) in net assets | | | | | 12,724,304 | | | | | | 7,856,021 | | | | | | 74,764,310 | | | | | | (32,790,171) | | |
| NET ASSETS: | | | | | |
| Beginning of year or period | | | | | 11,196,390 | | | | | | 3,340,369 | | | | | | 617,912,365 | | | | | | 650,702,536 | | |
| End of year or period | | | | $ | 23,920,694 | | | | | $ | 11,196,390 | | | | | $ | 692,676,675 | | | | | $ | 617,912,365 | | |
| Undistributed net investment income at end of year or period | | | | $ | 357,401 | | | | | $ | 130,837 | | | | | $ | 9,601,286 | | | | | $ | 7,128,010 | | |
| |
See Accompanying Notes to Financial Statements
STATEMENTS OF CHANGES IN NET ASSETS
| | | | Voya Solution 2050 Portfolio | | | Voya Solution 2055 Portfolio | |
| | | | Year Ended
December 31,
2017 | | | Year Ended
December 31,
2016 | | | Year Ended
December 31,
2017 | | | Year Ended
December 31,
2016 | |
| FROM OPERATIONS: | | | | | |
| Net investment income | | | | $ | 165,493 | | | | | $ | 64,799 | | | | | $ | 1,824,346 | | | | | $ | 1,543,944 | | |
| Net realized gain | | | | | 1,036,421 | | | | | | 143,579 | | | | | | 6,813,822 | | | | | | 254,313 | | |
| Net change in unrealized appreciation (depreciation) | | | | | 1,150,898 | | | | �� | | 181,827 | | | | | | 22,866,259 | | | | | | 6,974,759 | | |
| Increase in net assets resulting from operations | | | | | 2,352,812 | | | | | | 390,205 | | | | | | 31,504,427 | | | | | | 8,773,016 | | |
| FROM DISTRIBUTIONS TO SHAREHOLDERS: | | | | | | | | | | | | | | | | | | | | | | | | | |
| Net investment income: | | | | | | | | | | | | | | | | | | | | | | | | | |
| Class ADV | | | | | (21,251) | | | | | | (7,610) | | | | | | (323,990) | | | | | | (475,842) | | |
| Class I | | | | | (24,994) | | | | | | (3,867) | | | | | | (710,484) | | | | | | (700,799) | | |
| Class S | | | | | (16,722) | | | | | | (5,038) | | | | | | (501,577) | | | | | | (671,361) | | |
| Class S2 | | | | | (1,116) | | | | | | (380) | | | | | | (26,141) | | | | | | (39,938) | | |
| Class T | | | | | (15) | | | | | | — | | | | | | (181) | | | | | | (203) | | |
| Net realized gains: | | | | | | | | | | | | | | | | | | | | | | | | | |
| Class ADV | | | | | (83,562) | | | | | | (20,068) | | | | | | (922,482) | | | | | | (2,731,652) | | |
| Class I | | | | | (65,655) | | | | | | (7,612) | | | | | | (1,235,395) | | | | | | (2,812,511) | | |
| Class S | | | | | (51,460) | | | | | | (10,258) | | | | | | (1,079,609) | | | | | | (3,164,455) | | |
| Class S2 | | | | | (3,844) | | | | | | (798) | | | | | | (66,565) | | | | | | (207,570) | | |
| Class T | | | | | (167) | | | | | | (49) | | | | | | (521) | | | | | | (1,005) | | |
| Total distributions | | | | | (268,786) | | | | | | (55,680) | | | | | | (4,866,945) | | | | | | (10,805,336) | | |
| FROM CAPITAL SHARE TRANSACTIONS: | | | | | |
| Net proceeds from sale of shares | | | | | 11,743,400 | | | | | | 6,583,275 | | | | | | 44,087,327 | | | | | | 41,346,741 | | |
| Reinvestment of distributions | | | | | 268,702 | | | | | | 55,596 | | | | | | 4,866,945 | | | | | | 10,805,337 | | |
| | | | | | 12,012,102 | | | | | | 6,638,871 | | | | | | 48,954,272 | | | | | | 52,152,078 | | |
| Cost of shares redeemed | | | | | (3,438,140) | | | | | | (1,867,857) | | | | | | (34,458,608) | | | | | | (36,891,031) | | |
| Net increase in net assets resulting from capital share transactions | ��� | | | | 8,573,962 | | | | | | 4,771,014 | | | | | | 14,495,664 | | | | | | 15,261,047 | | |
| Net increase in net assets | | | | | 10,657,988 | | | | | | 5,105,539 | | �� | | | | 41,133,146 | | | | | | 13,228,727 | | |
| NET ASSETS: | | | | | |
| Beginning of year or period | | | | | 6,783,772 | | | | | | 1,678,233 | | | | | | 141,626,399 | | | | | | 128,397,672 | | |
| End of year or period | | | | $ | 17,441,760 | | | | | $ | 6,783,772 | | | | | $ | 182,759,545 | | | | | $ | 141,626,399 | | |
| Undistributed net investment income at end of year or period | | | | $ | 213,656 | | | | | $ | 64,080 | | | | | $ | 2,375,258 | | | | | $ | 1,560,825 | | |
| |
See Accompanying Notes to Financial Statements
STATEMENTS OF CHANGES IN NET ASSETS
| | | | Voya Solution 2060 Portfolio | |
| | | | Year Ended
December 31,
2017 | | | Year Ended
December 31,
2016 | |
| FROM OPERATIONS: | | | |
| Net investment income | | | | $ | 76,188 | | | | | $ | 27,562 | | |
| Net realized gain | | | | | 539,173 | | | | | | 82,665 | | |
| Net change in unrealized appreciation (depreciation) | | | | | 470,914 | | | | | | 65,448 | | |
| Increase in net assets resulting from operations | | | | | 1,086,275 | | | | | | 175,675 | | |
| FROM DISTRIBUTIONS TO SHAREHOLDERS: | | | | | | | | | | | | | |
| Net investment income: | | | | | | | | | | | | | |
| Class ADV | | | | | (7,401) | | | | | | (3,173) | | |
| Class I | | | | | (7,285) | | | | | | (2,369) | | |
| Class S | | | | | (11,691) | | | | | | (1,737) | | |
| Class S2 | | | | | (373) | | | | | | (167) | | |
| Class T | | | | | — | | | | | | (9) | | |
| Net realized gains: | | | | | | | | | | | | | |
| Class ADV | | | | | (37,209) | | | | | | (5,282) | | |
| Class I | | | | | (25,098) | | | | | | (3,922) | | |
| Class S | | | | | (41,979) | | | | | | (2,891) | | |
| Class S2 | | | | | (1,720) | | | | | | (282) | | |
| Class T | | | | | (62) | | | | | | (18) | | |
| Total distributions | | | | | (132,818) | | | | | | (19,850) | | |
| FROM CAPITAL SHARE TRANSACTIONS: | | | |
| Net proceeds from sale of shares | | | | | 6,667,962 | | | | | | 3,046,992 | | |
| Reinvestment of distributions | | | | | 132,818 | | | | | | 19,850 | | |
| | | | | | 6,800,780 | | | | | | 3,066,842 | | |
| Cost of shares redeemed | | | | | (2,255,044) | | | | | | (1,027,327) | | |
| Net increase in net assets resulting from capital share transactions | | | | | 4,545,736 | | | | | | 2,039,515 | | |
| Net increase in net assets | | | | | 5,499,193 | | | | | | 2,195,340 | | |
| NET ASSETS: | | | |
| Beginning of year or period | | | | | 2,871,508 | | | | | | 676,168 | | |
| End of year or period | | | | $ | 8,370,701 | | | | | $ | 2,871,508 | | |
| Undistributed net investment income at end of year or period | | | | $ | 99,095 | | | | | $ | 26,736 | | |
| |
See Accompanying Notes to Financial Statements
Selected data for a share of beneficial interest outstanding throughout each year or period.
| | | | | | | | | | Income
(loss) from
investment
operations | | | | | | | | | Less
Distributions | | | | | | | | | | | | | | | | | | | | | | | | | | | Ratios to average
net assets | | | Supplemental
Data | |
| | | | Net asset value, beginning of year
or period | | | Net investment income (loss) | | | Net realized and unrealized
gain (loss) | | | Total from investment operations | | | From net investment income | | | From net realized gains | | | From return of capital | | | Total distributions | | | Payment by affiliate | | | Net asset value, end of year
or period | | | Total Return(1) | | | Expenses before
reductions/additions(2)(3)(4) | | | Expenses net of fee waivers
and/or recoupments if any(2)(3)(4) | | | Expenses net of all
reductions/additions(2)(3)(4) | | | Net investment income (loss)(2)(3) | | | Net assets, end of year or period | | | Portfolio turnover rate | |
Year or
period ended | | | ($) | | | ($) | | | ($) | | | ($) | | | ($) | | | ($) | | | ($) | | | ($) | | | ($) | | | ($) | | | (%) | | | (%) | | | (%) | | | (%) | | | (%) | | | ($000’s) | | | (%) | |
| Voya Solution Aggressive Portfolio | | | | | | | | | | | | | | | | | | | | | | | | | | | | | | | | | | | | | | | | | | | | | | | | | | | | | | | | | | | | | | | | | | | | | | | | | | | | | | | | | | | | | | | | | | | | | | | | | | | | | | | |
| Class ADV | | | | | | | | | | | | | | | | | | | | | | | | | | | | | | | | | | | | | | | | | | | | | | | | | | | | | | | | | | | | | | | | | | | | | | | | | | | | | | | | | | | | | | | | | | | | | | | | | | | | | | | |
| 12-31-17 | | | | | 11.33 | | | | | | 0.11• | | | | | | 2.34 | | | | | | 2.45 | | | | | | 0.05 | | | | | | 0.17 | | | | | | — | | | | | | 0.22 | | | | | | — | | | | | | 13.56 | | | | | | 21.71 | | | | | | 0.91 | | | | | | 0.66 | | | | | | 0.66 | | | | | | 0.85 | | | | | | 3,467 | | | | | | 52 | | |
| 12-31-16 | | | | | 11.35 | | | | | | 0.08 | | | | | | 0.63 | | | | | | 0.71 | | | | | | 0.12 | | | | | | 0.61 | | | | | | — | | | | | | 0.73 | | | | | | — | | | | | | 11.33 | | | | | | 6.41 | | | | | | 1.04 | | | | | | 0.68 | | | | | | 0.68 | | | | | | 0.77 | | | | | | 2,520 | | | | | | 61 | | |
| 12-31-15 | | | | | 12.13 | | | | | | 0.06• | | | | | | (0.19) | | | | | | (0.13) | | | | | | 0.21 | | | | | | 0.44 | | | | | | — | | | | | | 0.65 | | | | | | — | | | | | | 11.35 | | | | | | (1.32) | | | | | | 0.94 | | | | | | 0.68 | | | | | | 0.68 | | | | | | 0.53 | | | | | | 2,383 | | | | | | 78 | | |
| 12-31-14 | | | | | 11.55 | | | | | | 0.13• | | | | | | 0.57 | | | | | | 0.70 | | | | | | 0.06 | | | | | | 0.06 | | | | | | — | | | | | | 0.12 | | | | | | — | | | | | | 12.13 | | | | | | 6.10 | | | | | | 1.26 | | | | | | 0.65 | | | | | | 0.65 | | | | | | 1.12 | | | | | | 2,180 | | | | | | 70 | | |
05-01-13(5) -
12-31-13 | | | | | 10.00 | | | | | | 0.19• | | | | | | 1.36 | | | | | | 1.55 | | | | | | — | | | | | | — | | | | | | — | | | | | | — | | | | | | — | | | | | | 11.55 | | | | | | 15.50 | | | | | | 12.00 | | | | | | 0.56 | | | | | | 0.56 | | | | | | 2.55 | | | | | | 496 | | | | | | 35 | | |
| Class I | | | | | | | | | | | | | | | | | | | | | | | | | | | | | | | | | | | | | | | | | | | | | | | | | | | | | | | | | | | | | | | | | | | | | | | | | | | | | | | | | | | | | | | | | | | | | | | | | | | | | | | |
| 12-31-17 | | | | | 11.56 | | | | | | 0.18• | | | | | | 2.38 | | | | | | 2.56 | | | | | | 0.10 | | | | | | 0.17 | | | | | | — | | | | | | 0.27 | | | | | | — | | | | | | 13.85 | | | | | | 22.28 | | | | | | 0.41 | | | | | | 0.16 | | | | | | 0.16 | | | | | | 1.41 | | | | | | 444 | | | | | | 52 | | |
| 12-31-16 | | | | | 11.57 | | | | | | 0.17• | | | | | | 0.61 | | | | | | 0.78 | | | | | | 0.18 | | | | | | 0.61 | | | | | | — | | | | | | 0.79 | | | | | | — | | | | | | 11.56 | | | | | | 6.93 | | | | | | 0.54 | | | | | | 0.18 | | | | | | 0.18 | | | | | | 1.53 | | | | | | 258 | | | | | | 61 | | |
| 12-31-15 | | | | | 12.32 | | | | | | 0.19• | | | | | | (0.26) | | | | | | (0.07) | | | | | | 0.24 | | | | | | 0.44 | | | | | | — | | | | | | 0.68 | | | | | | — | | | | | | 11.57 | | | | | | (0.83) | | | | | | 0.44 | | | | | | 0.18 | | | | | | 0.18 | | | | | | 1.56 | | | | | | 138 | | | | | | 78 | | |
| 12-31-14 | | | | | 11.65 | | | | | | 0.24• | | | | | | 0.52 | | | | | | 0.76 | | | | | | 0.03 | | | | | | 0.06 | | | | | | — | | | | | | 0.09 | | | | | | — | | | | | | 12.32 | | | | | | 6.56 | | | | | | 0.76 | | | | | | 0.15 | | | | | | 0.15 | | | | | | 2.01 | | | | | | 12 | | | | | | 70 | | |
05-01-13(5) -
12-31-13 | | | | | 10.00 | | | | | | 0.29• | | | | | | 1.36 | | | | | | 1.65 | | | | | | — | | | | | | — | | | | | | — | | | | | | — | | | | | | — | | | | | | 11.65 | | | | | | 16.50 | | | | | | 11.50 | | | | | | 0.06 | | | | | | 0.06 | | | | | | 3.99 | | | | | | 4 | | | | | | 35 | | |
| Class R6 | | | | | | | | | | | | | | | | | | | | | | | | | | | | | | | | | | | | | | | | | | | | | | | | | | | | | | | | | | | | | | | | | | | | | | | | | | | | | | | | | | | | | | | | | | | | | | | | | | | | | | | |
| 12-31-17 | | | | | 11.56 | | | | | | 0.24• | | | | | | 2.32 | | | | | | 2.56 | | | | | | 0.10 | | | | | | 0.17 | | | | | | — | | | | | | 0.27 | | | | | | — | | | | | | 13.85 | | | | | | 22.28 | | | | | | 0.41 | | | | | | 0.16 | | | | | | 0.16 | | | | | | 1.82 | | | | | | 5,015 | | | | | | 52 | | |
05-02-16(5) -
12-31-16 | | | | | 11.66 | | | | | | 0.44• | | | | | | 0.25 | | | | | | 0.69 | | | | | | 0.18 | | | | | | 0.61 | | | | | | — | | | | | | 0.79 | | | | | | — | | | | | | 11.56 | | | | | | 6.11 | | | | | | 0.54 | | | | | | 0.18 | | | | | | 0.18 | | | | | | 5.93 | | | | | | 659 | | | | | | 61 | | |
| Class S | | | | | | | | | | | | | | | | | | | | | | | | | | | | | | | | | | | | | | | | | ��� | | | | | | | | | | | | | | | | | | | | | | | | | | | | | | | | | | | | | | | | | | | | | | | | | | | | | | | | | | | | | | |
| 12-31-17 | | | | | 11.44 | | | | | | 0.12• | | | | | | 2.37 | | | | | | 2.49 | | | | | | 0.07 | | | | | | 0.17 | | | | | | — | | | | | | 0.24 | | | | | | — | | | | | | 13.69 | | | | | | 21.92 | | | | | | 0.66 | | | | | | 0.41 | | | | | | 0.41 | | | | | | 0.99 | | | | | | 4,300 | | | | | | 52 | | |
| 12-31-16 | | | | | 11.46 | | | | | | 0.12• | | | | | | 0.63 | | | | | | 0.75 | | | | | | 0.16 | | | | | | 0.61 | | | | | | — | | | | | | 0.77 | | | | | | — | | | | | | 11.44 | | | | | | 6.75 | | | | | | 0.79 | | | | | | 0.43 | | | | | | 0.43 | | | | | | 1.08 | | | | | | 3,954 | | | | | | 61 | | |
| 12-31-15 | | | | | 12.23 | | | | | | 0.13• | | | | | | (0.23) | | | | | | (0.10) | | | | | | 0.23 | | | | | | 0.44 | | | | | | — | | | | | | 0.67 | | | | | | — | | | | | | 11.46 | | | | | | (1.12) | | | | | | 0.69 | | | | | | 0.43 | | | | | | 0.43 | | | | | | 1.04 | | | | | | 2,417 | | | | | | 78 | | |
| 12-31-14 | | | | | 11.63 | | | | | | 0.11• | | | | | | 0.61 | | | | | | 0.72 | | | | | | 0.06 | | | | | | 0.06 | | | | | | — | | | | | | 0.12 | | | | | | — | | | | | | 12.23 | | | | | | 6.25 | | | | | | 1.01 | | | | | | 0.40 | | | | | | 0.40 | | | | | | 0.92 | | | | | | 1,395 | | | | | | 70 | | |
05-01-13(5) -
12-31-13 | | | | | 10.00 | | | | | | 0.28• | | | | | | 1.35 | | | | | | 1.63 | | | | | | — | | | | | | — | | | | | | — | | | | | | — | | | | | | — | | | | | | 11.63 | | | | | | 16.30 | | | | | | 11.75 | | | | | | 0.31 | | | | | | 0.31 | | | | | | 3.73 | | | | | | 591 | | | | | | 35 | | |
| Class S2 | | | | | | | | | | | | | | | | | | | | | | | | | | | | | | | | | | | | | | | | | | | | | | | | | | | | | | | | | | | | | | | | | | | | | | | | | | | | | | | | | | | | | | | | | | | | | | | | | | | | | | | |
| 12-31-17 | | | | | 11.32 | | | | | | 0.12• | | | | | | 2.32 | | | | | | 2.44 | | | | | | 0.07 | | | | | | 0.17 | | | | | | — | | | | | | 0.24 | | | | | | — | | | | | | 13.52 | | | | | | 21.71 | | | | | | 0.81 | | | | | | 0.56 | | | | | | 0.56 | | | | | | 0.99 | | | | | | 681 | | | | | | 52 | | |
| 12-31-16 | | | | | 11.36 | | | | | | 0.13• | | | | | | 0.60 | | | | | | 0.73 | | | | | | 0.16 | | | | | | 0.61 | | | | | | — | | | | | | 0.77 | | | | | | — | | | | | | 11.32 | | | | | | 6.57 | | | | | | 0.97 | | | | | | 0.58 | | | | | | 0.58 | | | | | | 1.15 | | | | | | 422 | | | | | | 61 | | |
| 12-31-15 | | | | | 12.14 | | | | | | 0.11• | | | | | | (0.22) | | | | | | (0.11) | | | | | | 0.23 | | | | | | 0.44 | | | | | | — | | | | | | 0.67 | | | | | | — | | | | | | 11.36 | | | | | | (1.20) | | | | | | 0.94 | | | | | | 0.58 | | | | | | 0.58 | | | | | | 0.93 | | | | | | 169 | | | | | | 78 | | |
| 12-31-14 | | | | | 11.56 | | | | | | 0.18• | | | | | | 0.51 | | | | | | 0.69 | | | | | | 0.05 | | | | | | 0.06 | | | | | | — | | | | | | 0.11 | | | | | | — | | | | | | 12.14 | | | | | | 6.04 | | | | | | 1.26 | | | | | | 0.55 | | | | | | 0.55 | | | | | | 1.54 | | | | | | 78 | | | | | | 70 | | |
05-01-13(5) -
12-31-13 | | | | | 10.00 | | | | | | 0.23• | | | | | | 1.33 | | | | | | 1.56 | | | | | | — | | | | | | — | | | | | | — | | | | | | — | | | | | | — | | | | | | 11.56 | | | | | | 15.60 | | | | | | 12.00 | | | | | | 0.46 | | | | | | 0.46 | | | | | | 3.12 | | | | | | 38 | | | | | | 35 | | |
| Voya Solution Balanced Portfolio | | | | | | | | | | | | | | | | | | | | | | | | | | | | | | | | | | | | | | | | | | | | | | | | | | | | | | | | | | | | | | | | | | | | | | | | | | | | | | | | | | | | | | | | | | | | | | | | | | | | | | | |
| Class ADV | | | | | | | | | | | | | | | | | | | | | | | | | | | | | | | | | | | | | | | | | | | | | | | | | | | | | | | | | | | | | | | | | | | | | | | | | | | | | | | | | | | | | | | | | | | | | | | | | | | | | | | |
| 12-31-17 | | | | | 9.06 | | | | | | 0.13• | | | | | | 1.16 | | | | | | 1.29 | | | | | | 0.11 | | | | | | 0.16 | | | | | | — | | | | | | 0.27 | | | | | | — | | | | | | 10.08 | | | | | | 14.46 | | | | | | 0.78 | | | | | | 0.66 | | | | | | 0.66 | | | | | | 1.32 | | | | | | 19,020 | | | | | | 48 | | |
| 12-31-16 | | | | | 9.39 | | | | | | 0.12• | | | | | | 0.44 | | | | | | 0.56 | | | | | | 0.20 | | | | | | 0.69 | | | | | | — | | | | | | 0.89 | | | | | | — | | | | | | 9.06 | | | | | | 6.08 | | | | | | 0.78 | | | | | | 0.64 | | | | | | 0.64 | | | | | | 1.25 | | | | | | 18,215 | | | | | | 78 | | |
| 12-31-15 | | | | | 10.57 | | | | | | 0.10• | | | | | | (0.14) | | | | | | (0.04) | | | | | | 0.28 | | | | | | 0.86 | | | | | | — | | | | | | 1.14 | | | | | | — | | | | | | 9.39 | | | | | | (0.72) | | | | | | 0.78 | | | | | | 0.65 | | | | | | 0.65 | | | | | | 0.97 | | | | | | 25,079 | | | | | | 49 | | |
| 12-31-14 | | | | | 10.88 | | | | | | 0.12 | | | | | | 0.52 | | | | | | 0.64 | | | | | | 0.20 | | | | | | 0.75 | | | | | | — | | | | | | 0.95 | | | | | | — | | | | | | 10.57 | | | | | | 6.14 | | | | | | 0.78 | | | | | | 0.64 | | | | | | 0.64 | | | | | | 1.09 | | | | | | 28,237 | | | | | | 61 | | |
| 12-31-13 | | | | | 9.84 | | | | | | 0.10• | | | | | | 1.38 | | | | | | 1.48 | | | | | | 0.20 | | | | | | 0.24 | | | | | | — | | | | | | 0.44 | | | | | | — | | | | | | 10.88 | | | | | | 15.39 | | | | | | 0.78 | | | | | | 0.63 | | | | | | 0.63 | | | | | | 0.97 | | | | | | 27,369 | | | | | | 78 | | |
See Accompanying Notes to Financial Statements
Financial Highlights (continued)
| | | | | | | | | | Income
(loss) from
investment
operations | | | | | | | | | Less
Distributions | | | | | | | | | | | | | | | | | | | | | | | | | | | Ratios to average
net assets | | | Supplemental
Data | |
| | | | Net asset value, beginning of year
or period | | | Net investment income (loss) | | | Net realized and unrealized
gain (loss) | | | Total from investment operations | | | From net investment income | | | From net realized gains | | | From return of capital | | | Total distributions | | | Payment by affiliate | | | Net asset value, end of year
or period | | | Total Return(1) | | | Expenses before
reductions/additions(2)(3)(4) | | | Expenses net of fee waivers
and/or recoupments if any(2)(3)(4) | | | Expenses net of all
reductions/additions(2)(3)(4) | | | Net investment income (loss)(2)(3) | | | Net assets, end of year or period | | | Portfolio turnover rate | |
Year or
period ended | | | ($) | | | ($) | | | ($) | | | ($) | | | ($) | | | ($) | | | ($) | | | ($) | | | ($) | | | ($) | | | (%) | | | (%) | | | (%) | | | (%) | | | (%) | | | ($000’s) | | | (%) | |
| Voya Solution Balanced Portfolio (continued) | | | | | | | | | | | | | | | | | | | | | | | | | | | | | | | | | | | | | | | | | | | | | | | | | | | | | | | | | | | | | | | | | | | | | | | | | | | | | | | | | | | | | | | | | | | | | | | | | | | | | | | |
| Class I | | | | | | | | | | | | | | | | | | | | | | | | | | | | | | | | | | | | | | | | | | | | | | | | | | | | | | | | | | | | | | | | | | | | | | | | | | | | | | | | | | | | | | | | | | | | | | | | | | | | | | | |
| 12-31-17 | | | | | 9.40 | | | | | | 0.21• | | | | | | 1.17 | | | | | | 1.38 | | | | | | 0.17 | | | | | | 0.16 | | | | | | — | | | | | | 0.33 | | | | | | — | | | | | | 10.45 | | | | | | 14.89 | | | | | | 0.28 | | | | | | 0.16 | | | | | | 0.16 | | | | | | 2.06 | | | | | | 4,683 | | | | | | 48 | | |
| 12-31-16 | | | | | 9.72 | | | | | | 0.28• | | | | | | 0.35 | | | | | | 0.63 | | | | | | 0.26 | | | | | | 0.69 | | | | | | — | | | | | | 0.95 | | | | | | — | | | | | | 9.40 | | | | | | 6.69 | | | | | | 0.28 | | | | | | 0.14 | | | | | | 0.14 | | | | | | 3.03 | | | | | | 2,092 | | | | | | 78 | | |
| 12-31-15 | | | | | 10.90 | | | | | | 0.18• | | | | | | (0.16) | | | | | | 0.02 | | | | | | 0.34 | | | | | | 0.86 | | | | | | — | | | | | | 1.20 | | | | | | — | | | | | | 9.72 | | | | | | (0.19) | | | | | | 0.28 | | | | | | 0.15 | | | | | | 0.15 | | | | | | 1.72 | | | | | | 59 | | | | | | 49 | | |
| 12-31-14 | | | | | 11.19 | | | | | | 0.27• | | | | | | 0.45 | | | | | | 0.72 | | | | | | 0.26 | | | | | | 0.75 | | | | | | — | | | | | | 1.01 | | | | | | — | | | | | | 10.90 | | | | | | 6.66 | | | | | | 0.28 | | | | | | 0.14 | | | | | | 0.14 | | | | | | 2.53 | | | | | | 23 | | | | | | 61 | | |
| 12-31-13 | | | | | 10.10 | | | | | | 0.16 | | | | | | 1.42 | | | | | | 1.58 | | | | | | 0.25 | | | | | | 0.24 | | | | | | — | | | | | | 0.49 | | | | | | — | | | | | | 11.19 | | | | | | 15.93 | | | | | | 0.28 | | | | | | 0.13 | | | | | | 0.13 | | | | | | 1.49 | | | | | | 1 | | | | | | 78 | | |
| Class R6 | | | | | | | | | | | | | | | | | | | | | | | | | | | | | | | | | | | | | | | | | | | | | | | | | | | | | | | | | | | | | | | | | | | | | | | | | | | | | | | | | | | | | | | | | | | | | | | | | | | | | | | |
| 12-31-17 | | | | | 9.39 | | | | | | 0.22• | | | | | | 1.17 | | | | | | 1.39 | | | | | | 0.17 | | | | | | 0.16 | | | | | | — | | | | | | 0.33 | | | | | | — | | | | | | 10.45 | | | | | | 15.01 | | | | | | 0.28 | | | | | | 0.16 | | | | | | 0.16 | | | | | | 2.20 | | | | | | 13,145 | | | | | | 48 | | |
05-02-16(5) -
12-31-16 | | | | | 9.89 | | | | | | 0.23• | | | | | | 0.22 | | | | | | 0.45 | | | | | | 0.26 | | | | | | 0.69 | | | | | | — | | | | | | 0.95 | | | | | | — | | | | | | 9.39 | | | | | | 4.75 | | | | | | 0.28 | | | | | | 0.14 | | | | | | 0.14 | | | | | | 3.74 | | | | | | 2,412 | | | | | | 78 | | |
| Class S | | | | | | | | | | | | | | | | | | | | | | | | | | | | | | | | | | | | | | | | | | | | | | | | | | | | | | | | | | | | | | | | | | | | | | | | | | | | | | | | | | | | | | | | | | | | | | | | | | | | | | | |
| 12-31-17 | | | | | 9.18 | | | | | | 0.15• | | | | | | 1.19 | | | | | | 1.34 | | | | | | 0.15 | | | | | | 0.16 | | | | | | — | | | | | | 0.31 | | | | | | — | | | | | | 10.21 | | | | | | 14.75 | | | | | | 0.53 | | | | | | 0.41 | | | | | | 0.41 | | | | | | 1.54 | | | | | | 23,906 | | | | | | 48 | | |
| 12-31-16 | | | | | 9.52 | | | | | | 0.16 | | | | | | 0.43 | | | | | | 0.59 | | | | | | 0.24 | | | | | | 0.69 | | | | | | — | | | | | | 0.93 | | | | | | — | | | | | | 9.18 | | | | | | 6.32 | | | | | | 0.53 | | | | | | 0.39 | | | | | | 0.39 | | | | | | 1.63 | | | | | | 25,331 | | | | | | 78 | | |
| 12-31-15 | | | | | 10.70 | | | | | | 0.13 | | | | | | (0.14) | | | | | | (0.01) | | | | | | 0.31 | | | | | | 0.86 | | | | | | — | | | | | | 1.17 | | | | | | — | | | | | | 9.52 | | | | | | (0.46) | | | | | | 0.53 | | | | | | 0.40 | | | | | | 0.40 | | | | | | 1.28 | | | | | | 22,552 | | | | | | 49 | | |
| 12-31-14 | | | | | 11.01 | | | | | | 0.16 | | | | | | 0.51 | | | | | | 0.67 | | | | | | 0.23 | | | | | | 0.75 | | | | | | — | | | | | | 0.98 | | | | | | — | | | | | | 10.70 | | | | | | 6.34 | | | | | | 0.53 | | | | | | 0.39 | | | | | | 0.39 | | | | | | 1.35 | | | | | | 23,128 | | | | | | 61 | | |
| 12-31-13 | | | | | 9.95 | | | | | | 0.13• | | | | | | 1.39 | | | | | | 1.52 | | | | | | 0.22 | | | | | | 0.24 | | | | | | — | | | | | | 0.46 | | | | | | — | | | | | | 11.01 | | | | | | 15.65 | | | | | | 0.53 | | | | | | 0.38 | | | | | | 0.38 | | | | | | 1.24 | | | | | | 23,012 | | | | | | 78 | | |
| Class S2 | | | | | | | | | | | | | | | | | | | | | | | | | | | | | | | | | | | | | | | | | | | | | | | | | | | | | | | | | | | | | | | | | | | | | | | | | | | | | | | | | | | | | | | | | | | | | | | | | | | | | | | |
| 12-31-17 | | | | | 9.16 | | | | | | 0.14• | | | | | | 1.18 | | | | | | 1.32 | | | | | | 0.15 | | | | | | 0.16 | | | | | | — | | | | | | 0.31 | | | | | | — | | | | | | 10.17 | | | | | | 14.63 | | | | | | 0.68 | | | | | | 0.56 | | | | | | 0.56 | | | | | | 1.43 | | | | | | 2,004 | | | | | | 48 | | |
| 12-31-16 | | | | | 9.50 | | | | | | 0.18• | | | | | | 0.39 | | | | | | 0.57 | | | | | | 0.22 | | | | | | 0.69 | | | | | | — | | | | | | 0.91 | | | | | | — | | | | | | 9.16 | | | | | | 6.10 | | | | | | 0.71 | | | | | | 0.54 | | | | | | 0.54 | | | | | | 1.96 | | | | | | 1,668 | | | | | | 78 | | |
| 12-31-15 | | | | | 10.67 | | | | | | 0.11• | | | | | | (0.13) | | | | | | (0.02) | | | | | | 0.29 | | | | | | 0.86 | | | | | | — | | | | | | 1.15 | | | | | | — | | | | | | 9.50 | | | | | | (0.60) | | | | | | 0.78 | | | | | | 0.55 | | | | | | 0.55 | | | | | | 1.06 | | | | | | 578 | | | | | | 49 | | |
| 12-31-14 | | | | | 10.95 | | | | | | 0.12• | | | | | | 0.54 | | | | | | 0.66 | | | | | | 0.19 | | | | | | 0.75 | | | | | | — | | | | | | 0.94 | | | | | | — | | | | | | 10.67 | | | | | | 6.22 | | | | | | 0.78 | | | | | | 0.54 | | | | | | 0.54 | | | | | | 1.06 | | | | | | 671 | | | | | | 61 | | |
| 12-31-13 | | | | | 9.90 | | | | | | 0.11• | | | | | | 1.39 | | | | | | 1.50 | | | | | | 0.21 | | | | | | 0.24 | | | | | | — | | | | | | 0.45 | | | | | | — | | | | | | 10.95 | | | | | | 15.51 | | | | | | 0.78 | | | | | | 0.53 | | | | | | 0.53 | | | | | | 1.06 | | | | | | 1,103 | | | | | | 78 | | |
| Voya Solution Conservative Portfolio | | | | | | | | | | | | | | | | | | | | | | | | | | | | | | | | | | | | | | | | | | | | | | | | | | | | | | | | | | | | | | | | | | | | | | | | | | | | | | | | | | | | | | | | | | | | | | | | | | | | | | | |
| Class ADV | | | | | | | | | | | | | | | | | | | | | | | | | | | | | | | | | | | | | | | | | | | | | | | | | | | | | | | | | | | | | | | | | | | | | | | | | | | | | | | | | | | | | | | | | | | | | | | | | | | | | | | |
| 12-31-17 | | | | | 10.60 | | | | | | 0.20• | | | | | | 0.55 | | | | | | 0.75 | | | | | | 0.22 | | | | | | 0.07 | | | | | | — | | | | | | 0.29 | | | | | | — | | | | | | 11.06 | | | | | | 7.06 | | | | | | 0.86 | | | | | | 0.62 | | | | | | 0.62 | | | | | | 1.84 | | | | | | 8,486 | | | | | | 63 | | |
| 12-31-16 | | | | | 10.45 | | | | | | 0.20 | | | | | | 0.40 | | | | | | 0.60 | | | | | | 0.19 | | | | | | 0.26 | | | | | | — | | | | | | 0.45 | | | | | | — | | | | | | 10.60 | | | | | | 5.76 | | | | | | 0.85 | | | | | | 0.62 | | | | | | 0.62 | | | | | | 1.79 | | | | | | 8,524 | | | | | | 58 | | |
| 12-31-15 | | | | | 11.15 | | | | | | 0.14• | | | | | | (0.22) | | | | | | (0.08) | | | | | | 0.27 | | | | | | 0.35 | | | | | | — | | | | | | 0.62 | | | | | | — | | | | | | 10.45 | | | | | | (0.76) | | | | | | 0.83 | | | | | | 0.61 | | | | | | 0.61 | | | | | | 1.29 | | | | | | 8,595 | | | | | | 51 | | |
| 12-31-14 | | | | | 11.42 | | | | | | 0.17 | | | | | | 0.30 | | | | | | 0.47 | | | | | | 0.27 | | | | | | 0.47 | | | | | | — | | | | | | 0.74 | | | | | | — | | | | | | 11.15 | | | | | | 4.20 | | | | | | 0.81 | | | | | | 0.58 | | | | | | 0.58 | | | | | | 1.62 | | | | | | 11,527 | | | | | | 54 | | |
| 12-31-13 | | | | | 11.22 | | | | | | 0.17• | | | | | | 0.43 | | | | | | 0.60 | | | | | | 0.29 | | | | | | 0.11 | | | | | | — | | | | | | 0.40 | | | | | | — | | | | | | 11.42 | | | | | | 5.40 | | | | | | 0.85 | | | | | | 0.60 | | | | | | 0.60 | | | | | | 1.50 | | | | | | 10,870 | | | | | | 72 | | |
| Class I | | | | | | | | | | | | | | | | | | | | | | | | | | | | | | | | | | | | | | | | | | | | | | | | | | | | | | | | | | | | | | | | | | | | | | | | | | | | | | | | | | | | | | | | | | | | | | | | | | | | | | | |
| 12-31-17 | | | | | 10.74 | | | | | | 0.25• | | | | | | 0.56 | | | | | | 0.81 | | | | | | 0.27 | | | | | | 0.07 | | | | | | — | | | | | | 0.34 | | | | | | — | | | | | | 11.21 | | | | | | 7.60 | | | | | | 0.36 | | | | | | 0.12 | | | | | | 0.12 | | | | | | 2.31 | | | | | | 90 | | | | | | 63 | | |
| 12-31-16 | | | | | 10.60 | | | | | | 0.29• | | | | | | 0.37 | | | | | | 0.66 | | | | | | 0.26 | | | | | | 0.26 | | | | | | — | | | | | | 0.52 | | | | | | — | | | | | | 10.74 | | | | | | 6.24 | | | | | | 0.35 | | | | | | 0.12 | | | | | | 0.12 | | | | | | 2.67 | | | | | | 109 | | | | | | 58 | | |
| 12-31-15 | | | | | 11.30 | | | | | | 0.21• | | | | | | (0.23) | | | | | | (0.02) | | | | | | 0.33 | | | | | | 0.35 | | | | | | — | | | | | | 0.68 | | | | | | — | | | | | | 10.60 | | | | | | (0.23) | | | | | | 0.33 | | | | | | 0.11 | | | | | | 0.11 | | | | | | 1.86 | | | | | | 13 | | | | | | 51 | | |
| 12-31-14 | | | | | 11.57 | | | | | | 0.25• | | | | | | 0.27 | | | | | | 0.52 | | | | | | 0.32 | | | | | | 0.47 | | | | | | — | | | | | | 0.79 | | | | | | — | | | | | | 11.30 | | | | | | 4.63 | | | | | | 0.31 | | | | | | 0.08 | | | | | | 0.08 | | | | | | 2.19 | | | | | | 10 | | | | | | 54 | | |
| 12-31-13 | | | | | 11.34 | | | | | | 0.23 | | | | | | 0.44 | | | | | | 0.67 | | | | | | 0.33 | | | | | | 0.11 | | | | | | — | | | | | | 0.44 | | | | | | — | | | | | | 11.57 | | | | | | 6.02 | | | | | | 0.35 | | | | | | 0.10 | | | | | | 0.10 | | | | | | 1.99 | | | | | | 3 | | | | | | 72 | | |
| Class R6 | | | | | | | | | | | | | | | | | | | | | | | | | | | | | | | | | | | | | | | | | | | | | | | | | | | | | | | | | | | | | | | | | | | | | | | | | | | | | | | | | | | | | | | | | | | | | | | | | | | | | | | |
| 12-31-17 | | | | | 10.74 | | | | | | 0.27• | | | | | | 0.54 | | | | | | 0.81 | | | | | | 0.27 | | | | | | 0.07 | | | | | | — | | | | | | 0.34 | | | | | | — | | | | | | 11.21 | | | | | | 7.60 | | | | | | 0.36 | | | | | | 0.12 | | | | | | 0.12 | | | | | | 2.42 | | | | | | 3,439 | | | | | | 63 | | |
05-02-16(5) -
12-31-16 | | | | | 10.98 | | | | | | 0.20• | | | | | | 0.08 | | | | | | 0.28 | | | | | | 0.26 | | | | | | 0.26 | | | | | | — | | | | | | 0.52 | | | | | | — | | | | | | 10.74 | | | | | | 2.57 | | | | | | 0.35 | | | | | | 0.12 | | | | | | 0.12 | | | | | | 2.81 | | | | | | 718 | | | | | | 58 | | |
See Accompanying Notes to Financial Statements
Financial Highlights (continued)
| | | | | | | | | | Income
(loss) from
investment
operations | | | | | | | | | Less
Distributions | | | | | | | | | | | | | | | | | | | | | | | | | | | Ratios to average
net assets | | | Supplemental
Data | |
| | | | Net asset value, beginning of year
or period | | | Net investment income (loss) | | | Net realized and unrealized
gain (loss) | | | Total from investment operations | | | From net investment income | | | From net realized gains | | | From return of capital | | | Total distributions | | | Payment by affiliate | | | Net asset value, end of year
or period | | | Total Return(1) | | | Expenses before
reductions/additions(2)(3)(4) | | | Expenses net of fee waivers
and/or recoupments if any(2)(3)(4) | | | Expenses net of all
reductions/additions(2)(3)(4) | | | Net investment income (loss)(2)(3) | | | Net assets, end of year or period | | | Portfolio turnover rate | |
Year or
period ended | | | ($) | | | ($) | | | ($) | | | ($) | | | ($) | | | ($) | | | ($) | | | ($) | | | ($) | | | ($) | | | (%) | | | (%) | | | (%) | | | (%) | | | (%) | | | ($000’s) | | | (%) | |
| Voya Solution Conservative Portfolio (continued) | | | | | | | | | | | | | | | | | | | | | | | | | | | | | | | | | | | | | | | | | | | | | | | | | | | | | | | | | | | | | | | | | | | | | | | | | | | | | | | | | | | | | | | | | | | | | | | | | | | | | | | |
| Class S | | | | | | | | | | | | | | | | | | | | | | | | | | | | | | | | | | | | | | | | | | | | | | | | | | | | | | | | | | | | | | | | | | | | | | | | | | | | | | | | | | | | | | | | | | | | | | | | | | | | | | | |
| 12-31-17 | | | | | 10.66 | | | | | | 0.22• | | | | | | 0.56 | | | | | | 0.78 | | | | | | 0.24 | | | | | | 0.07 | | | | | | — | | | | | | 0.31 | | | | | | — | | | | | | 11.13 | | | | | | 7.31 | | | | | | 0.61 | | | | | | 0.37 | | | | | | 0.37 | | | | | | 2.04 | | | | | | 4,020 | | | | | | 63 | | |
| 12-31-16 | | | | | 10.52 | | | | | | 0.22• | | | | | | 0.41 | | | | | | 0.63 | | | | | | 0.23 | | | | | | 0.26 | | | | | | — | | | | | | 0.49 | | | | | | — | | | | | | 10.66 | | | | | | 6.04 | | | | | | 0.60 | | | | | | 0.37 | | | | | | 0.37 | | | | | | 2.02 | | | | | | 6,513 | | | | | | 58 | | |
| 12-31-15 | | | | | 11.22 | | | | | | 0.17 | | | | | | (0.21) | | | | | | (0.04) | | | | | | 0.31 | | | | | | 0.35 | | | | | | — | | | | | | 0.66 | | | | | | — | | | | | | 10.52 | | | | | | (0.48) | | | | | | 0.58 | | | | | | 0.36 | | | | | | 0.36 | | | | | | 1.61 | | | | | | 5,539 | | | | | | 51 | | |
| 12-31-14 | | | | | 11.49 | | | | | | 0.21• | | | | | | 0.29 | | | | | | 0.50 | | | | | | 0.30 | | | | | | 0.47 | | | | | | — | | | | | | 0.77 | | | | | | — | | | | | | 11.22 | | | | | | 4.40 | | | | | | 0.56 | | | | | | 0.33 | | | | | | 0.33 | | | | | | 1.86 | | | | | | 5,867 | | | | | | 54 | | |
| 12-31-13 | | | | | 11.27 | | | | | | 0.20• | | | | | | 0.44 | | | | | | 0.64 | | | | | | 0.31 | | | | | | 0.11 | | | | | | — | | | | | | 0.42 | | | | | | — | | | | | | 11.49 | | | | | | 5.77 | | | | | | 0.60 | | | | | | 0.35 | | | | | | 0.35 | | | | | | 1.74 | | | | | | 6,168 | | | | | | 72 | | |
| Class S2 | | | | | | | | | | | | | | | | | | | | | | | | | | | | | | | | | | | | | | | | | | | | | | | | | | | | | | | | | | | | | | | | | | | | | | | | | | | | | | | | | | | | | | | | | | | | | | | | | | | | | | | |
| 12-31-17 | | | | | 10.59 | | | | | | 0.21• | | | | | | 0.55 | | | | | | 0.76 | | | | | | 0.24 | | | | | | 0.07 | | | | | | — | | | | | | 0.31 | | | | | | — | | | | | | 11.04 | | | | | | 7.20 | | | | | | 0.76 | | | | | | 0.52 | | | | | | 0.52 | | | | | | 1.92 | | | | | | 635 | | | | | | 63 | | |
| 12-31-16 | | | | | 10.46 | | | | | | 0.21• | | | | | | 0.40 | | | | | | 0.61 | | | | | | 0.22 | | | | | | 0.26 | | | | | | — | | | | | | 0.48 | | | | | | — | | | | | | 10.59 | | | | | | 5.90 | | | | | | 0.78 | | | | | | 0.52 | | | | | | 0.52 | | | | | | 1.94 | | | | | | 506 | | | | | | 58 | | |
| 12-31-15 | | | | | 11.17 | | | | | | 0.16• | | | | | | (0.22) | | | | | | (0.06) | | | | | | 0.30 | | | | | | 0.35 | | | | | | — | | | | | | 0.65 | | | | | | — | | | | | | 10.46 | | | | | | (0.67) | | | | | | 0.83 | | | | | | 0.51 | | | | | | 0.51 | | | | | | 1.43 | | | | | | 357 | | | | | | 51 | | |
| 12-31-14 | | | | | 11.44 | | | | | | 0.18 | | | | | | 0.30 | | | | | | 0.48 | | | | | | 0.28 | | | | | | 0.47 | | | | | | — | | | | | | 0.75 | | | | | | — | | | | | | 11.17 | | | | | | 4.28 | | | | | | 0.81 | | | | | | 0.48 | | | | | | 0.48 | | | | | | 1.70 | | | | | | 312 | | | | | | 54 | | |
| 12-31-13 | | | | | 11.23 | | | | | | 0.18• | | | | | | 0.44 | | | | | | 0.62 | | | | | | 0.30 | | | | | | 0.11 | | | | | | — | | | | | | 0.41 | | | | | | — | | | | | | 11.44 | | | | | | 5.59 | | | | | | 0.85 | | | | | | 0.50 | | | | | | 0.50 | | | | | | 1.60 | | | | | | 298 | | | | | | 72 | | |
| Voya Solution Income Portfolio | | | | | | | | | | | | | | | | | | | | | | | | | | | | | | | | | | | | | | | | | | | | | | | | | | | | | | | | | | | | | | | | | | | | | | | | | | | | | | | | | | | | | | | | | | | | | | | | | | | | | | | |
| Class ADV | | | | | | | | | | | | | | | | | | | | | | | | | | | | | | | | | | | | | | | | | | | | | | | | | | | | | | | | | | | | | | | | | | | | | | | | | | | | | | | | | | | | | | | | | | | | | | | | | | | | | | | |
| 12-31-17 | | | | | 11.11 | | | | | | 0.18• | | | | | | 0.83 | | | | | | 1.01 | | | | | | 0.23 | | | | | | 0.04 | | | | | | — | | | | | | 0.27 | | | | | | — | | | | | | 11.85 | | | | | | 9.15 | | | | | | 0.75 | | | | | | 0.61 | | | | | | 0.61 | | | | | | 1.59 | | | | | | 182,912 | | | | | | 36 | | |
| 12-31-16 | | | | | 10.88 | | | | | | 0.16• | | | | | | 0.31 | | | | | | 0.47 | | | | | | 0.11 | | | | | | 0.13 | | | | | | — | | | | | | 0.24 | | | | | | — | | | | | | 11.11 | | | | | | 4.26 | | | | | | 0.75 | | | | | | 0.62 | | | | | | 0.62 | | | | | | 1.41 | | | | | | 205,103 | | | | | | 46 | | |
| 12-31-15 | | | | | 11.61 | | | | | | 0.13• | | | | | | (0.15) | | | | | | (0.02) | | | | | | 0.29 | | | | | | 0.42 | | | | | | — | | | | | | 0.71 | | | | | | — | | | | | | 10.88 | | | | | | (0.30) | | | | | | 0.73 | | | | | | 0.63 | | | | | | 0.63 | | | | | | 1.16 | | | | | | 248,968 | | | | | | 31 | | |
| 12-31-14 | | | | | 11.26 | | | | | | 0.15• | | | | | | 0.47 | | | | | | 0.62 | | | | | | 0.27 | | | | | | — | | | | | | — | | | | | | 0.27 | | | | | | — | | | | | | 11.61 | | | | | | 5.53 | | | | | | 0.75 | | | | | | 0.62 | | | | | | 0.62 | | | | | | 1.33 | | | | | | 84,286 | | | | | | 47 | | |
| 12-31-13 | | | | | 10.89 | | | | | | 0.13• | | | | | | 0.59 | | | | | | 0.72 | | | | | | 0.35 | | | | | | — | | | | | | — | | | | | | 0.35 | | | | | | — | | | | | | 11.26 | | | | | | 6.68 | | | | | | 0.74 | | | | | | 0.63 | | | | | | 0.63 | | | | | | 1.19 | | | | | | 94,068 | | | | | | 70 | | |
| Class I | | | | | | | | | | | | | | | | | | | | | | | | | | | | | | | | | | | | | | | | | | | | | | | | | | | | | | | | | | | | | | | | | | | | | | | | | | | | | | | | | | | | | | | | | | | | | | | | | | | | | | | |
| 12-31-17 | | | | | 11.38 | | | | | | 0.25 | | | | | | 0.84 | | | | | | 1.09 | | | | | | 0.30 | | | | | | 0.04 | | | | | | — | | | | | | 0.34 | | | | | | — | | | | | | 12.13 | | | | | | 9.66 | | | | | | 0.25 | | | | | | 0.11 | | | | | | 0.11 | | | | | | 2.09 | | | | | | 85,891 | | | | | | 36 | | |
| 12-31-16 | | | | | 11.12 | | | | | | 0.22• | | | | | | 0.31 | | | | | | 0.53 | | | | | | 0.14 | | | | | | 0.13 | | | | | | — | | | | | | 0.27 | | | | | | — | | | | | | 11.38 | | | | | | 4.78 | | | | | | 0.25 | | | | | | 0.12 | | | | | | 0.12 | | | | | | 1.91 | | | | | | 82,426 | | | | | | 46 | | |
| 12-31-15 | | | | | 11.86 | | | | | | 0.19• | | | | | | (0.15) | | | | | | 0.04 | | | | | | 0.36 | | | | | | 0.42 | | | | | | — | | | | | | 0.78 | | | | | | — | | | | | | 11.12 | | | | | | 0.20 | | | | | | 0.23 | | | | | | 0.13 | | | | | | 0.13 | | | | | | 1.72 | | | | | | 98,321 | | | | | | 31 | | |
| 12-31-14 | | | | | 11.51 | | | | | | 0.22• | | | | | | 0.47 | | | | | | 0.69 | | | | | | 0.34 | | | | | | — | | | | | | — | | | | | | 0.34 | | | | | | — | | | | | | 11.86 | | | | | | 6.02 | | | | | | 0.25 | | | | | | 0.12 | | | | | | 0.12 | | | | | | 1.85 | | | | | | 23,178 | | | | | | 47 | | |
| 12-31-13 | | | | | 11.12 | | | | | | 0.19• | | | | | | 0.61 | | | | | | 0.80 | | | | | | 0.41 | | | | | | — | | | | | | — | | | | | | 0.41 | | | | | | — | | | | | | 11.51 | | | | | | 7.30 | | | | | | 0.24 | | | | | | 0.13 | | | | | | 0.13 | | | | | | 1.70 | | | | | | 24,937 | | | | | | 70 | | |
| Class S | | | | | | | | | | | | | | | | | | | | | | | | | | | | | | | | | | | | | | | | | | | | | | | | | | | | | | | | | | | | | | | | | | | | | | | | | | | | | | | | | | | | | | | | | | | | | | | | | | | | | | | |
| 12-31-17 | | | | | 11.28 | | | | | | 0.21• | | | | | | 0.85 | | | | | | 1.06 | | | | | | 0.27 | | | | | | 0.04 | | | | | | — | | | | | | 0.31 | | | | | | — | | | | | | 12.03 | | | | | | 9.41 | | | | | | 0.50 | | | | | | 0.36 | | | | | | 0.36 | | | | | | 1.83 | | | | | | 155,100 | | | | | | 36 | | |
| 12-31-16 | | | | | 11.04 | | | | | | 0.19• | | | | | | 0.31 | | | | | | 0.50 | | | | | | 0.13 | | | | | | 0.13 | | | | | | — | | | | | | 0.26 | | | | | | — | | | | | | 11.28 | | | | | | 4.47 | | | | | | 0.50 | | | | | | 0.37 | | | | | | 0.37 | | | | | | 1.66 | | | | | | 186,264 | | | | | | 46 | | |
| 12-31-15 | | | | | 11.76 | | | | | | 0.16• | | | | | | (0.14) | | | | | | 0.02 | | | | | | 0.32 | | | | | | 0.42 | | | | | | — | | | | | | 0.74 | | | | | | — | | | | | | 11.04 | | | | | | 0.10 | | | | | | 0.48 | | | | | | 0.38 | | | | | | 0.38 | | | | | | 1.43 | | | | | | 225,274 | | | | | | 31 | | |
| 12-31-14 | | | | | 11.41 | | | | | | 0.19• | | | | | | 0.46 | | | | | | 0.65 | | | | | | 0.30 | | | | | | — | | | | | | — | | | | | | 0.30 | | | | | | — | | | | | | 11.76 | | | | | | 5.76 | | | | | | 0.50 | | | | | | 0.37 | | | | | | 0.37 | | | | | | 1.59 | | | | | | 56,602 | | | | | | 47 | | |
| 12-31-13 | | | | | 11.03 | | | | | | 0.16• | | | | | | 0.60 | | | | | | 0.76 | | | | | | 0.38 | | | | | | — | | | | | | — | | | | | | 0.38 | | | | | | — | | | | | | 11.41 | | | | | | 6.97 | | | | | | 0.49 | | | | | | 0.38 | | | | | | 0.38 | | | | | | 1.46 | | | | | | 62,431 | | | | | | 70 | | |
| Class S2 | | | | | | | | | | | | | | | | | | | | | | | | | | | | | | | | | | | | | | | | | | | | | | | | | | | | | | | | | | | | | | | | | | | | | | | | | | | | | | | | | | | | | | | | | | | | | | | | | | | | | | | |
| 12-31-17 | | | | | 10.99 | | | | | | 0.19• | | | | | | 0.82 | | | | | | 1.01 | | | | | | 0.24 | | | | | | 0.04 | | | | | | — | | | | | | 0.28 | | | | | | — | | | | | | 11.72 | | | | | | 9.23 | | | | | | 0.65 | | | | | | 0.51 | | | | | | 0.51 | | | | | | 1.67 | | | | | | 9,533 | | | | | | 36 | | |
| 12-31-16 | | | | | 10.77 | | | | | | 0.16• | | | | | | 0.30 | | | | | | 0.46 | | | | | | 0.11 | | | | | | 0.13 | | | | | | — | | | | | | 0.24 | | | | | | — | | | | | | 10.99 | | | | | | 4.28 | | | | | | 0.68 | | | | | | 0.52 | | | | | | 0.52 | | | | | | 1.49 | | | | | | 11,670 | | | | | | 46 | | |
| 12-31-15 | | | | | 11.50 | | | | | | 0.14• | | | | | | (0.14) | | | | | | 0.00* | | | | | | 0.31 | | | | | | 0.42 | | | | | | — | | | | | | 0.73 | | | | | | — | | | | | | 10.77 | | | | | | (0.13) | | | | | | 0.73 | | | | | | 0.53 | | | | | | 0.53 | | | | | | 1.27 | | | | | | 15,377 | | | | | | 31 | | |
| 12-31-14 | | | | | 11.15 | | | | | | 0.16• | | | | | | 0.46 | | | | | | 0.62 | | | | | | 0.27 | | | | | | — | | | | | | — | | | | | | 0.27 | | | | | | — | | | | | | 11.50 | | | | | | 5.61 | | | | | | 0.75 | | | | | | 0.52 | | | | | | 0.52 | | | | | | 1.42 | | | | | | 4,281 | | | | | | 47 | | |
| 12-31-13 | | | | | 10.79 | | | | | | 0.14• | | | | | | 0.59 | | | | | | 0.73 | | | | | | 0.37 | | | | | | — | | | | | | — | | | | | | 0.37 | | | | | | — | | | | | | 11.15 | | | | | | 6.85 | | | | | | 0.74 | | | | | | 0.53 | | | | | | 0.53 | | | | | | 1.28 | | | | | | 5,274 | | | | | | 70 | | |
See Accompanying Notes to Financial Statements
Financial Highlights (continued)
| | | | | | | | | | Income
(loss) from
investment
operations | | | | | | | | | Less
Distributions | | | | | | | | | | | | | | | | | | | | | | | | | | | Ratios to average
net assets | | | Supplemental
Data | |
| | | | Net asset value, beginning of year
or period | | | Net investment income (loss) | | | Net realized and unrealized
gain (loss) | | | Total from investment operations | | | From net investment income | | | From net realized gains | | | From return of capital | | | Total distributions | | | Payment by affiliate | | | Net asset value, end of year
or period | | | Total Return(1) | | | Expenses before
reductions/additions(2)(3)(4) | | | Expenses net of fee waivers
and/or recoupments if any(2)(3)(4) | | | Expenses net of all
reductions/additions(2)(3)(4) | | | Net investment income (loss)(2)(3) | | | Net assets, end of year or period | | | Portfolio turnover rate | |
Year or
period ended | | | ($) | | | ($) | | | ($) | | | ($) | | | ($) | | | ($) | | | ($) | | | ($) | | | ($) | | | ($) | | | (%) | | | (%) | | | (%) | | | (%) | | | (%) | | | ($000’s) | | | (%) | |
| Voya Solution Income Portfolio (continued) | | | | | | | | | | | | | | | | | | | | | | | | | | | | | | | | | | | | | | | | | | | | | | | | | | | | | | | | | | | | | | | | | | | | | | | | | | | | | | | | | | | | | | | | | | | | | | | | | | | | | | | |
| Class T | | | | | | | | | | | | | | | | | | | | | | | | | | | | | | | | | | | | | | | | | | | | | | | | | | | | | | | | | | | | | | | | | | | | | | | | | | | | | | | | | | | | | | | | | | | | | | | | | | | | | | | |
| 12-31-17 | | | | | 11.73 | | | | | | 0.17 | | | | | | 0.87 | | | | | | 1.04 | | | | | | 0.13 | | | | | | 0.04 | | | | | | — | | | | | | 0.17 | | | | | | — | | | | | | 12.60 | | | | | | 8.84 | | | | | | 0.95 | | | | | | 0.81 | | | | | | 0.81 | | | | | | 1.40 | | | | | | 222 | | | | | | 36 | | |
| 12-31-16 | | | | | 11.39 | | | | | | 0.11• | | | | | | 0.36 | | | | | | 0.47 | | | | | | — | | | | | | 0.13 | | | | | | — | | | | | | 0.13 | | | | | | — | | | | | | 11.73 | | | | | | 4.11 | | | | | | 0.97 | | | | | | 0.82 | | | | | | 0.82 | | | | | | 0.92 | | | | | | 205 | | | | | | 46 | | |
| 12-31-15 | | | | | 12.07 | | | | | | 0.13• | | | | | | (0.17) | | | | | | (0.04) | | | | | | 0.22 | | | | | | 0.42 | | | | | | — | | | | | | 0.64 | | | | | | — | | | | | | 11.39 | | | | | | (0.40) | | | | | | 0.98 | | | | | | 0.83 | | | | | | 0.83 | | | | | | 1.09 | | | | | | 815 | | | | | | 31 | | |
| 12-31-14 | | | | | 11.67 | | | | | | 0.13• | | | | | | 0.48 | | | | | | 0.61 | | | | | | 0.21 | | | | | | — | | | | | | — | | | | | | 0.21 | | | | | | — | | | | | | 12.07 | | | | | | 5.22 | | | | | | 1.00 | | | | | | 0.82 | | | | | | 0.82 | | | | | | 1.05 | | | | | | 91 | | | | | | 47 | | |
| 12-31-13 | | | | | 11.29 | | | | | | 0.12• | | | | | | 0.61 | | | | | | 0.73 | | | | | | 0.35 | | | | | | — | | | | | | — | | | | | | 0.35 | | | | | | — | | | | | | 11.67 | | | | | | 6.55 | | | | | | 0.99 | | | | | | 0.83 | | | | | | 0.83 | | | | | | 1.00 | | | | | | 193 | | | | | | 70 | | |
| Voya Solution Moderately Aggressive Portfolio | | | | | | | | | | | | | | | | | | | | | | | | | | | | | | | | | | | | | | | | | | | | | | | | | | | | | | | | | | | | | | | | | | | | | | | | | | | | | | | | | | | | | | | | | | | | | | | | | | | | | | | |
| Class ADV | | | | | | | | | | | | | | | | | | | | | | | | | | | | | | | | | | | | | | | | | | | | | | | | | | | | | | | | | | | | | | | | | | | | | | | | | | | | | | | | | | | | | | | | | | | | | | | | | | | | | | | |
| 12-31-17 | | | | | 11.62 | | | | | | 0.13• | | | | | | 1.93 | | | | | | 2.06 | | | | | | 0.15 | | | | | | 0.14 | | | | | | — | | | | | | 0.29 | | | | | | — | | | | | | 13.39 | | | | | | 17.89 | | | | | | 0.75 | | | | | | 0.71 | | | | | | 0.71 | | | | | | 1.04 | | | | | | 27,468 | | | | | | 31 | | |
| 12-31-16 | | | | | 11.23 | | | | | | 0.11• | | | | | | 0.56 | | | | | | 0.67 | | | | | | 0.10 | | | | | | 0.18 | | | | | | — | | | | | | 0.28 | | | | | | — | | | | | | 11.62 | | | | | | 6.00 | | | | | | 0.75 | | | | | | 0.70 | | | | | | 0.70 | | | | | | 0.95 | | | | | | 24,645 | | | | | | 52 | | |
| 12-31-15 | | | | | 13.03 | | | | | | 0.11• | | | | | | (0.22) | | | | | | (0.11) | | | | | | 0.37 | | | | | | 1.32 | | | | | | — | | | | | | 1.69 | | | | | | — | | | | | | 11.23 | | | | | | (1.42) | | | | | | 0.74 | | | | | | 0.69 | | | | | | 0.69 | | | | | | 0.94 | | | | | | 31,416 | | | | | | 26 | | |
| 12-31-14 | | | | | 13.38 | | | | | | 0.12• | | | | | | 0.67 | | | | | | 0.79 | | | | | | 0.20 | | | | | | 0.94 | | | | | | — | | | | | | 1.14 | | | | | | — | | | | | | 13.03 | | | | | | 6.09 | | | | | | 0.78 | | | | | | 0.67 | | | | | | 0.67 | | | | | | 0.89 | | | | | | 20,020 | | | | | | 71 | | |
| 12-31-13 | | | | | 11.61 | | | | | | 0.10• | | | | | | 2.23 | | | | | | 2.33 | | | | | | 0.21 | | | | | | 0.35 | | | | | | — | | | | | | 0.56 | | | | | | — | | | | | | 13.38 | | | | | | 20.42 | | | | | | 0.80 | | | | | | 0.63 | | | | | | 0.63 | | | | | | 0.78 | | | | | | 16,945 | | | | | | 79 | | |
| Class I | | | | | | | | | | | | | | | | | | | | | | | | | | | | | | | | | | | | | | | | | | | | | | | | | | | | | | | | | | | | | | | | | | | | | | | | | | | | | | | | | | | | | | | | | | | | | | | | | | | | | | | |
| 12-31-17 | | | | | 11.83 | | | | | | 0.21• | | | | | | 1.95 | | | | | | 2.16 | | | | | | 0.21 | | | | | | 0.14 | | | | | | — | | | | | | 0.35 | | | | | | — | | | | | | 13.64 | | | | | | 18.50 | | | | | | 0.25 | | | | | | 0.21 | | | | | | 0.21 | | | | | | 1.62 | | | | | | 6,062 | | | | | | 31 | | |
| 12-31-16 | | | | | 11.44 | | | | | | 0.17 | | | | | | 0.55 | | | | | | 0.72 | | | | | | 0.15 | | | | | | 0.18 | | | | | | — | | | | | | 0.33 | | | | | | — | | | | | | 11.83 | | | | | | 6.40 | | | | | | 0.25 | | | | | | 0.20 | | | | | | 0.20 | | | | | | 1.55 | | | | | | 4,334 | | | | | | 52 | | |
| 12-31-15 | | | | | 13.23 | | | | | | 0.23• | | | | | | (0.27) | | | | | | (0.04) | | | | | | 0.43 | | | | | | 1.32 | | | | | | — | | | | | | 1.75 | | | | | | — | | | | | | 11.44 | | | | | | (0.85) | | | | | | 0.24 | | | | | | 0.19 | | | | | | 0.19 | | | | | | 2.00 | | | | | | 4,035 | | | | | | 26 | | |
| 12-31-14 | | | | | 13.56 | | | | | | 0.31• | | | | | | 0.56 | | | | | | 0.87 | | | | | | 0.26 | | | | | | 0.94 | | | | | | — | | | | | | 1.20 | | | | | | — | | | | | | 13.23 | | | | | | 6.60 | | | | | | 0.28 | | | | | | 0.17 | | | | | | 0.17 | | | | | | 2.39 | | | | | | 56 | | | | | | 71 | | |
| 12-31-13 | | | | | 11.74 | | | | | | 0.15 | | | | | | 2.28 | | | | | | 2.43 | | | | | | 0.26 | | | | | | 0.35 | | | | | | — | | | | | | 0.61 | | | | | | — | | | | | | 13.56 | | | | | | 21.10 | | | | | | 0.30 | | | | | | 0.13 | | | | | | 0.13 | | | | | | 1.19 | | | | | | 4 | | | | | | 79 | | |
| Class R6 | | | | | | | | | | | | | | | | | | | | | | | | | | | | | | | | | | | | | | | | | | | | | | | | | | | | | | | | | | | | | | | | | | | | | | | | | | | | | | | | | | | | | | | | | | | | | | | | | | | | | | | |
| 12-31-17 | | | | | 11.82 | | | | | | 0.25• | | | | | | 1.91 | | | | | | 2.16 | | | | | | 0.21 | | | | | | 0.14 | | | | | | — | | | | | | 0.35 | | | | | | — | | | | | | 13.63 | | | | | | 18.51 | | | | | | 0.25 | | | | | | 0.21 | | | | | | 0.21 | | | | | | 1.95 | | | | | | 8,217 | | | | | | 31 | | |
05-02-16(5) -
12-31-16 | | | | | 11.56 | | | | | | 0.39• | | | | | | 0.20 | | | | | | 0.59 | | | | | | 0.15 | | | | | | 0.18 | | | | | | — | | | | | | 0.33 | | | | | | — | | | | | | 11.82 | | | | | | 5.21 | | | | | | 0.25 | | | | | | 0.20 | | | | | | 0.20 | | | | | | 5.04 | | | | | | 1,287 | | | | | | 52 | | |
| Class S | | | | | | | | | | | | | | | | | | | | | | | | �� | | | | | | | | | | | | | | | | | | | | | | | | | | | | | | | | | | | | | | | | | | | | | | | | | | | | | | | | | | | | | | | | | | | | | | | | | | | | | | | |
| 12-31-17 | | | | | 11.71 | | | | | | 0.16• | | | | | | 1.95 | | | | | | 2.11 | | | | | | 0.18 | | | | | | 0.14 | | | | | | — | | | | | | 0.32 | | | | | | — | | | | | | 13.50 | | | | | | 18.22 | | | | | | 0.50 | | | | | | 0.46 | | | | | | 0.46 | | | | | | 1.28 | | | | | | 670,319 | | | | | | 31 | | |
| 12-31-16 | | | | | 11.34 | | | | | | 0.14• | | | | | | 0.55 | | | | | | 0.69 | | | | | | 0.14 | | | | | | 0.18 | | | | | | — | | | | | | 0.32 | | | | | | — | | | | | | 11.71 | | | | | | 6.17 | | | | | | 0.50 | | | | | | 0.45 | | | | | | 0.45 | | | | | | 1.25 | | | | | | 661,798 | | | | | | 52 | | |
| 12-31-15 | | | | | 13.13 | | | | | | 0.21• | | | | | | (0.29) | | | | | | (0.08) | | | | | | 0.39 | | | | | | 1.32 | | | | | | — | | | | | | 1.71 | | | | | | — | | | | | | 11.34 | | | | | | (1.15) | | | | | | 0.49 | | | | | | 0.44 | | | | | | 0.44 | | | | | | 1.81 | | | | | | 719,319 | | | | | | 26 | | |
| 12-31-14 | | | | | 13.47 | | | | | | 0.15 | | | | | | 0.68 | | | | | | 0.83 | | | | | | 0.23 | | | | | | 0.94 | | | | | | — | | | | | | 1.17 | | | | | | — | | | | | | 13.13 | | | | | | 6.33 | | | | | | 0.53 | | | | | | 0.42 | | | | | | 0.42 | | | | | | 1.04 | | | | | | 11,315 | | | | | | 71 | | |
| 12-31-13 | | | | | 11.67 | | | | | | 0.12• | | | | | | 2.27 | | | | | | 2.39 | | | | | | 0.24 | | | | | | 0.35 | | | | | | — | | | | | | 0.59 | | | | | | — | | | | | | 13.47 | | | | | | 20.84 | | | | | | 0.55 | | | | | | 0.38 | | | | | | 0.38 | | | | | | 0.96 | | | | | | 11,871 | | | | | | 79 | | |
| Class S2 | | | | | | | | | | | | | | | | | | | | | | | | | | | | | | | | | | | | | | | | | | | | | | | | | | | | | | | | | | | | | | | | | | | | | | | | | | | | | | | | | | | | | | | | | | | | | | | | | | | | | | | |
| 12-31-17 | | | | | 11.70 | | | | | | 0.15• | | | | | | 1.94 | | | | | | 2.09 | | | | | | 0.18 | | | | | | 0.14 | | | | | | — | | | | | | 0.32 | | | | | | — | | | | | | 13.47 | | | | | | 18.05 | | | | | | 0.65 | | | | | | 0.61 | | | | | | 0.61 | | | | | | 1.20 | | | | | | 1,695 | | | | | | 31 | | |
| 12-31-16 | | | | | 11.32 | | | | | | 0.13 | | | | | | 0.54 | | | | | | 0.67 | | | | | | 0.11 | | | | | | 0.18 | | | | | | — | | | | | | 0.29 | | | | | | — | | | | | | 11.70 | | | | | | 5.97 | | | | | | 0.68 | | | | | | 0.60 | | | | | | 0.60 | | | | | | 1.14 | | | | | | 1,132 | | | | | | 52 | | |
| 12-31-15 | | | | | 13.12 | | | | | | 0.12• | | | | | | (0.21) | | | | | | (0.09) | | | | | | 0.39 | | | | | | 1.32 | | | | | | — | | | | | | 1.71 | | | | | | — | | | | | | 11.32 | | | | | | (1.21) | | | | | | 0.74 | | | | | | 0.59 | | | | | | 0.59 | | | | | | 0.98 | | | | | | 1,040 | | | | | | 26 | | |
| 12-31-14 | | | | | 13.50 | | | | | | 0.14• | | | | | | 0.67 | | | | | | 0.81 | | | | | | 0.25 | | | | | | 0.94 | | | | | | — | | | | | | 1.19 | | | | | | — | | | | | | 13.12 | | | | | | 6.17 | | | | | | 0.78 | | | | | | 0.57 | | | | | | 0.57 | | | | | | 1.08 | | | | | | 806 | | | | | | 71 | | |
| 12-31-13 | | | | | 11.72 | | | | | | 0.17• | | | | | | 2.19 | | | | | | 2.36 | | | | | | 0.23 | | | | | | 0.35 | | | | | | — | | | | | | 0.58 | | | | | | — | | | | | | 13.50 | | | | | | 20.56 | | | | | | 0.80 | | | | | | 0.53 | | | | | | 0.53 | | | | | | 1.34 | | | | | | 284 | | | | | | 79 | | |
See Accompanying Notes to Financial Statements
Financial Highlights (continued)
| | | | | | | | | | Income
(loss) from
investment
operations | | | | | | | | | Less
Distributions | | | | | | | | | | | | | | | | | | | | | | | | | | | Ratios to average
net assets | | | Supplemental
Data | |
| | | | Net asset value, beginning of year
or period | | | Net investment income (loss) | | | Net realized and unrealized
gain (loss) | | | Total from investment operations | | | From net investment income | | | From net realized gains | | | From return of capital | | | Total distributions | | | Payment by affiliate | | | Net asset value, end of year
or period | | | Total Return(1) | | | Expenses before
reductions/additions(2)(3)(4) | | | Expenses net of fee waivers
and/or recoupments if any(2)(3)(4) | | | Expenses net of all
reductions/additions(2)(3)(4) | | | Net investment income (loss)(2)(3) | | | Net assets, end of year or period | | | Portfolio turnover rate | |
Year or
period ended | | | ($) | | | ($) | | | ($) | | | ($) | | | ($) | | | ($) | | | ($) | | | ($) | | | ($) | | | ($) | | | (%) | | | (%) | | | (%) | | | (%) | | | (%) | | | ($000’s) | | | (%) | |
| Voya Solution Moderately Conservative Portfolio | | | | | | | | | | | | | | | | | | | | | | | | | | | | | | | | | | | | | | | | | | | | | | | | | | | | | | | | | | | | | | | | | | | | | | | | | | | | | | | | | | | | | | | | | | | | | | | | | | | | | | | |
| Class ADV | | | | | | | | | | | | | | | | | | | | | | | | | | | | | | | | | | | | | | | | | | | | | | | | | | | | | | | | | | | | | | | | | | | | | | | | | | | | | | | | | | | | | | | | | | | | | | | | | | | | | | | |
| 12-31-17 | | | | | 9.24 | | | | | | 0.15• | | | | | | 0.78 | | | | | | 0.93 | | | | | | 0.18 | | | | | | — | | | | | | — | | | | | | 0.18 | | | | | | — | | | | | | 9.99 | | | | | | 10.09 | | | | | | 0.83 | | | | | | 0.65 | | | | | | 0.65 | | | | | | 1.57 | | | | | | 11,134 | | | | | | 47 | | |
| 12-31-16 | | | | | 9.51 | | | | | | 0.13• | | | | | | 0.40 | | | | | | 0.53 | | | | | | 0.20 | | | | | | 0.60 | | | | | | — | | | | | | 0.80 | | | | | | — | | | | | | 9.24 | | | | | | 5.64 | | | | | | 0.80 | | | | | | 0.64 | | | | | | 0.64 | | | | | | 1.35 | | | | | | 13,487 | | | | | | 65 | | |
| 12-31-15 | | | | | 10.45 | | | | | | 0.10 | | | | | | (0.14) | | | | | | (0.04) | | | | | | 0.28 | | | | | | 0.62 | | | | | | — | | | | | | 0.90 | | | | | | — | | | | | | 9.51 | | | | | | (0.60) | | | | | | 0.78 | | | | | | 0.66 | | | | | | 0.66 | | | | | | 1.09 | | | | | | 22,005 | | | | | | 58 | | |
| 12-31-14 | | | | | 10.80 | | | | | | 0.15 | | | | | | 0.39 | | | | | | 0.54 | | | | | | 0.23 | | | | | | 0.66 | | | | | | — | | | | | | 0.89 | | | | | | — | | | | | | 10.45 | | | | | | 5.20 | | | | | | 0.78 | | | | | | 0.65 | | | | | | 0.65 | | | | | | 1.30 | | | | | | 21,659 | | | | | | 66 | | |
| 12-31-13 | | | | | 10.42 | | | | | | 0.13• | | | | | | 0.81 | | | | | | 0.94 | | | | | | 0.27 | | | | | | 0.29 | | | | | | — | | | | | | 0.56 | | | | | | — | | | | | | 10.80 | | | | | | 9.27 | | | | | | 0.79 | | | | | | 0.62 | | | | | | 0.62 | | | | | | 1.23 | | | | | | 21,918 | | | | | | 85 | | |
| Class I | | | | | | | | | | | | | | | | | | | | | | | | | | | | | | | | | | | | | | | | | | | | | | | | | | | | | | | | | | | | | | | | | | | | | | | | | | | | | | | | | | | | | | | | | | | | | | | | | | | | | | | |
| 12-31-17 | | | | | 9.65 | | | | | | 0.21• | | | | | | 0.82 | | | | | | 1.03 | | | | | | 0.26 | | | | | | — | | | | | | — | | | | | | 0.26 | | | | | | — | | | | | | 10.42 | | | | | | 10.73 | | | | | | 0.33 | | | | | | 0.15 | | | | | | 0.15 | | | | | | 2.06 | | | | | | 27 | | | | | | 47 | | |
| 12-31-16 | | | | | 9.93 | | | | | | 0.19 | | | | | | 0.41 | | | | | | 0.60 | | | | | | 0.28 | | | | | | 0.60 | | | | | | — | | | | | | 0.88 | | | | | | — | | | | | | 9.65 | | | | | | 6.12 | | | | | | 0.30 | | | | | | 0.14 | | | | | | 0.14 | | | | | | 1.93 | | | | | | 33 | | | | | | 65 | | |
| 12-31-15 | | | | | 10.87 | | | | | | 0.16 | | | | | | (0.15) | | | | | | 0.01 | | | | | | 0.33 | | | | | | 0.62 | | | | | | — | | | | | | 0.95 | | | | | | — | | | | | | 9.93 | | | | | | (0.09) | | | | | | 0.28 | | | | | | 0.16 | | | | | | 0.16 | | | | | | 1.58 | | | | | | 36 | | | | | | 58 | | |
| 12-31-14 | | | | | 11.20 | | | | | | 0.23• | | | | | | 0.39 | | | | | | 0.62 | | | | | | 0.29 | | | | | | 0.66 | | | | | | — | | | | | | 0.95 | | | | | | — | | | | | | 10.87 | | | | | | 5.74 | | | | | | 0.28 | | | | | | 0.15 | | | | | | 0.15 | | | | | | 2.19 | | | | | | 37 | | | | | | 66 | | |
| 12-31-13 | | | | | 10.79 | | | | | | 0.18 | | | | | | 0.84 | | | | | | 1.02 | | | | | | 0.32 | | | | | | 0.29 | | | | | | — | | | | | | 0.61 | | | | | | — | | | | | | 11.20 | | | | | | 9.70 | | | | | | 0.29 | | | | | | 0.12 | | | | | | 0.12 | | | | | | 1.66 | | | | | | 1 | | | | | | 85 | | |
| Class R6 | | | | | | | | | | | | | | | | | | | | | | | | | | | | | | | | | | | | | | | | | | | | | | | | | | | | | | | | | | | | | | | | | | | | | | | | | | | | | | | | | | | | | | | | | | | | | | | | | | | | | | | |
| 12-31-17 | | | | | 9.64 | | | | | | 0.24• | | | | | | 0.78 | | | | | | 1.02 | | | | | | 0.25 | | | | | | — | | | | | | — | | | | | | 0.25 | | | | | | — | | | | | | 10.41 | | | | | | 10.68 | | | | | | 0.33 | | | | | | 0.15 | | | | | | 0.15 | | | | | | 2.37 | | | | | | 2,164 | | | | | | 47 | | |
05-02-16(5) -
12-31-16 | | | | | 10.17 | | | | | | 0.36• | | | | | | (0.01) | | | | | | 0.35 | | | | | | 0.28 | | | | | | 0.60 | | | | | | — | | | | | | 0.88 | | | | | | — | | | | | | 9.64 | | | | | | 3.52 | | | | | | 0.30 | | | | | | 0.14 | | | | | | 0.14 | | | | | | 5.68 | | | | | | 287 | | | | | | 65 | | |
| Class S | | | | | | | | | | | | | | | | | | | | | | | | | | | | | | | | | | | | | | | | | | | | | | | | | | | | | | | | | | | | | | | | | | | | | | | | | | | | | | | | | | | | | | | | | | | | | | | | | | | | | | | |
| 12-31-17 | | | | | 9.44 | | | | | | 0.18• | | | | | | 0.79 | | | | | | 0.97 | | | | | | 0.22 | | | | | | — | | | | | | — | | | | | | 0.22 | | | | | | — | | | | | | 10.19 | | | | | | 10.40 | | | | | | 0.58 | | | | | | 0.40 | | | | | | 0.40 | | | | | | 1.80 | | | | | | 17,134 | | | | | | 47 | | |
| 12-31-16 | | | | | 9.73 | | | | | | 0.17 | | | | | | 0.39 | | | | | | 0.56 | | | | | | 0.25 | | | | | | 0.60 | | | | | | — | | | | | | 0.85 | | | | | | — | | | | | | 9.44 | | | | | | 5.87 | | | | | | 0.55 | | | | | | 0.39 | | | | | | 0.39 | | | | | | 1.74 | | | | | | 20,883 | | | | | | 65 | | |
| 12-31-15 | | | | | 10.67 | | | | | | 0.14• | | | | | | (0.16) | | | | | | (0.02) | | | | | | 0.30 | | | | | | 0.62 | | | | | | — | | | | | | 0.92 | | | | | | — | | | | | | 9.73 | | | | | | (0.38) | | | | | | 0.53 | | | | | | 0.41 | | | | | | 0.41 | | | | | | 1.33 | | | | | | 20,081 | | | | | | 58 | | |
| 12-31-14 | | | | | 11.00 | | | | | | 0.17• | | | | | | 0.42 | | | | | | 0.59 | | | | | | 0.26 | | | | | | 0.66 | | | | | | — | | | | | | 0.92 | | | | | | — | | | | | | 10.67 | | | | | | 5.58 | | | | | | 0.53 | | | | | | 0.40 | | | | | | 0.40 | | | | | | 1.53 | | | | | | 22,346 | | | | | | 66 | | |
| 12-31-13 | | | | | 10.60 | | | | | | 0.16 | | | | | | 0.82 | | | | | | 0.98 | | | | | | 0.29 | | | | | | 0.29 | | | | | | — | | | | | | 0.58 | | | | | | — | | | | | | 11.00 | | | | | | 9.54 | | | | | | 0.54 | | | | | | 0.37 | | | | | | 0.37 | | | | | | 1.43 | | | | | | 24,016 | | | | | | 85 | | |
| Class S2 | | | | | | | | | | | | | | | | | | | | | | | | | | | | | | | | | | | | | | | | | | | | | | | | | | | | | | | | | | | | | | | | | | | | | | | | | | | | | | | | | | | | | | | | | | | | | | | | | | | | | | | |
| 12-31-17 | | | | | 9.34 | | | | | | 0.17• | | | | | | 0.79 | | | | | | 0.96 | | | | | | 0.22 | | | | | | — | | | | | | — | | | | | | 0.22 | | | | | | — | | | | | | 10.08 | | | | | | 10.33 | | | | | | 0.73 | | | | | | 0.55 | | | | | | 0.55 | | | | | | 1.71 | | | | | | 1,021 | | | | | | 47 | | |
| 12-31-16 | | | | | 9.64 | | | | | | 0.14 | | | | | | 0.39 | | | | | | 0.53 | | | | | | 0.23 | | | | | | 0.60 | | | | | | — | | | | | | 0.83 | | | | | | — | | | | | | 9.34 | | | | | | 5.62 | | | | | | 0.73 | | | | | | 0.54 | | | | | | 0.54 | | | | | | 1.61 | | | | | | 845 | | | | | | 65 | | |
| 12-31-15 | | | | | 10.59 | | | | | | 0.10 | | | | | | (0.13) | | | | | | (0.03) | | | | | | 0.30 | | | | | | 0.62 | | | | | | — | | | | | | 0.92 | | | | | | — | | | | | | 9.64 | | | | | | (0.50) | | | | | | 0.78 | | | | | | 0.56 | | | | | | 0.56 | | | | | | 1.14 | | | | | | 751 | | | | | | 58 | | |
| 12-31-14 | | | | | 10.93 | | | | | | 0.16• | | | | | | 0.41 | | | | | | 0.57 | | | | | | 0.25 | | | | | | 0.66 | | | | | | — | | | | | | 0.91 | | | | | | — | | | | | | 10.59 | | | | | | 5.40 | | | | | | 0.78 | | | | | | 0.55 | | | | | | 0.55 | | | | | | 1.43 | | | | | | 848 | | | | | | 66 | | |
| 12-31-13 | | | | | 10.55 | | | | | | 0.14• | | | | | | 0.82 | | | | | | 0.96 | | | | | | 0.29 | | | | | | 0.29 | | | | | | — | | | | | | 0.58 | | | | | | — | | | | | | 10.93 | | | | | | 9.36 | | | | | | 0.79 | | | | | | 0.52 | | | | | | 0.52 | | | | | | 1.26 | | | | | | 669 | | | | | | 85 | | |
| Voya Solution 2020 Portfolio | | | | | | | | | | | | | | | | | | | | | | | | | | | | | | | | | | | | | | | | | | | | | | | | | | | | | | | | | | | | | | | | | | | | | | | | | | | | | | | | | | | | | | | | | | | | | | | | | | | | | | | |
| Class ADV | | | | | | | | | | | | | | | | | | | | | | | | | | | | | | | | | | | | | | | | | | | | | | | | | | | | | | | | | | | | | | | | | | | | | | | | | | | | | | | | | | | | | | | | | | | | | | | | | | | | | | | |
| 12-31-17 | | | | | 12.15 | | | | | | 0.20• | | | | | | 1.30 | | | | | | 1.50 | | | | | | 0.14 | | | | | | 0.28 | | | | | | — | | | | | | 0.42 | | | | | | — | | | | | | 13.23 | | | | | | 12.43 | | | | | | 0.81 | | | | | | 0.61 | | | | | | 0.61 | | | | | | 1.59 | | | | | | 14,590 | | | | | | 72 | | |
| 12-31-16 | | | | | 11.65 | | | | | | 0.18• | | | | | | 0.43 | | | | | | 0.61 | | | | | | 0.05 | | | | | | 0.06 | | | | | | — | | | | | | 0.11 | | | | | | — | | | | | | 12.15 | | | | | | 5.21 | | | | | | 0.86 | | | | | | 0.64 | | | | | | 0.64 | | | | | | 1.53 | | | | | | 9,167 | | | | | | 84 | | |
| 12-31-15 | | | | | 12.87 | | | | | | 0.19• | | | | | | (0.05) | | | | | | 0.14 | | | | | | 0.57 | | | | | | 0.79 | | | | | | — | | | | | | 1.36 | | | | | | — | | | | | | 11.65 | | | | | | 0.88 | | | | | | 1.49 | | | | | | 0.63 | | | | | | 0.63 | | | | | | 1.60 | | | | | | 2,853 | | | | | | 86 | | |
| 12-31-14 | | | | | 12.19 | | | | | | 0.20• | | | | | | 0.53 | | | | | | 0.73 | | | | | | 0.01 | | | | | | 0.04 | | | | | | — | | | | | | 0.05 | | | | | | — | | | | | | 12.87 | | | | | | 5.97 | | | | | | 4.32 | | | | | | 0.63 | | | | | | 0.63 | | | | | | 1.55 | | | | | | 631 | | | | | | 32 | | |
| 12-31-13 | | | | | 11.80 | | | | | | 0.11• | | | | | | 1.36 | | | | | | 1.47 | | | | | | 0.29 | | | | | | 0.80 | | | | | | — | | | | | | 1.09 | | | | | | 0.01 | | | | | | 12.19 | | | | | | 13.01(a) | | | | | | 89.79 | | | | | | 0.63 | | | | | | 0.63 | | | | | | 0.87 | | | | | | 4 | | | | | | 68 | | |
| Class I | | | | | | | | | | | | | | | | | | | | | | | | | | | | | | | | | | | | | | | | | | | | | | | | | | | | | | | | | | | | | | | | | | | | | | | | | | | | | | | | | | | | | | | | | | | | | | | | | | | | | | | |
| 12-31-17 | | | | | 12.37 | | | | | | 0.26 | | | | | | 1.33 | | | | | | 1.59 | | | | | | 0.17 | | | | | | 0.28 | | | | | | — | | | | | | 0.45 | | | | | | — | | | | | | 13.51 | | | | | | 13.01 | | | | | | 0.31 | | | | | | 0.11 | | | | | | 0.11 | | | | | | 2.00 | | | | | | 7,487 | | | | | | 72 | | |
| 12-31-16 | | | | | 11.81 | | | | | | 0.26• | | | | | | 0.42 | | | | | | 0.68 | | | | | | 0.06 | | | | | | 0.06 | | | | | | — | | | | | | 0.12 | | | | | | — | | | | | | 12.37 | | | | | | 5.73 | | | | | | 0.36 | | | | | | 0.14 | | | | | | 0.14 | | | | | | 2.13 | | | | | | 6,377 | | | | | | 84 | | |
| 12-31-15 | | | | | 13.04 | | | | | | 0.32• | | | | | | (0.11) | | | | | | 0.21 | | | | | | 0.65 | | | | | | 0.79 | | | | | | — | | | | | | 1.44 | | | | | | — | | | | | | 11.81 | | | | | | 1.38 | | | | | | 0.99 | | | | | | 0.13 | | | | | | 0.13 | | | | | | 2.76 | | | | | | 2,157 | | | | | | 86 | | |
| 12-31-14 | | | | | 12.29 | | | | | | 0.19 | | | | | | 0.60 | | | | | | 0.79 | | | | | | — | | | | | | 0.04 | | | | | | — | | | | | | 0.04 | | | | | | — | | | | | | 13.04 | | | | | | 6.41 | | | | | | 3.82 | | | | | | 0.13 | | | | | | 0.13 | | | | | | 1.52 | | | | | | 4 | | | | | | 32 | | |
| 12-31-13 | | | | | 11.85 | | | | | | 0.17 | | | | | | 1.40 | | | | | | 1.57 | | | | | | 0.34 | | | | | | 0.80 | | | | | | — | | | | | | 1.14 | | | | | | 0.01 | | | | | | 12.29 | | | | | | 13.85(a) | | | | | | 89.29 | | | | | | 0.13 | | | | | | 0.13 | | | | | | 1.38 | | | | | | 4 | | | | | | 68 | | |
See Accompanying Notes to Financial Statements
Financial Highlights (continued)
| | | | | | | | | | Income
(loss) from
investment
operations | | | | | | | | | Less
Distributions | | | | | | | | | | | | | | | | | | | | | | | | | | | Ratios to average
net assets | | | Supplemental
Data | |
| | | | Net asset value, beginning of year
or period | | | Net investment income (loss) | | | Net realized and unrealized
gain (loss) | | | Total from investment operations | | | From net investment income | | | From net realized gains | | | From return of capital | | | Total distributions | | | Payment by affiliate | | | Net asset value, end of year
or period | | | Total Return(1) | | | Expenses before
reductions/additions(2)(3)(4) | | | Expenses net of fee waivers
and/or recoupments if any(2)(3)(4) | | | Expenses net of all
reductions/additions(2)(3)(4) | | | Net investment income (loss)(2)(3) | | | Net assets, end of year or period | | | Portfolio turnover rate | |
Year or
period ended | | | ($) | | | ($) | | | ($) | | | ($) | | | ($) | | | ($) | | | ($) | | | ($) | | | ($) | | | ($) | | | (%) | | | (%) | | | (%) | | | (%) | | | (%) | | | ($000’s) | | | (%) | |
| Voya Solution 2020 Portfolio (continued) | | | | | | | | | | | | | | | | | | | | | | | | | | | | | | | | | | | | | | | | | | | | | | | | | | | | | | | | | | | | | | | | | | | | | | | | | | | | | | | | | | | | | | | | | | | | | | | | | | | | | | | |
| Class S | | | | | | | | | | | | | | | | | | | | | | | | | | | | | | | | | | | | | | | | | | | | | | | | | | | | | | | | | | | | | | | | | | | | | | | | | | | | | | | | | | | | | | | | | | | | | | | | | | | | | | | |
| 12-31-17 | | | | | 12.33 | | | | | | 0.25• | | | | | | 1.31 | | | | | | 1.56 | | | | | | 0.15 | | | | | | 0.28 | | | | | | — | | | | | | 0.43 | | | | | | — | | | | | | 13.46 | | | | | | 12.78 | | | | | | 0.56 | | | | | | 0.36 | | | | | | 0.36 | | | | | | 1.91 | | | | | | 10,565 | | | | | | 72 | | |
| 12-31-16 | | | | | 11.80 | | | | | | 0.20• | | | | | | 0.44 | | | | | | 0.64 | | | | | | 0.05 | | | | | | 0.06 | | | | | | — | | | | | | 0.11 | | | | | | — | | | | | | 12.33 | | | | | | 5.46 | | | | | | 0.61 | | | | | | 0.39 | | | | | | 0.39 | | | | | | 1.65 | | | | | | 6,477 | | | | | | 84 | | |
| 12-31-15 | | | | | 13.01 | | | | | | 0.53• | | | | | | (0.34) | | | | | | 0.19 | | | | | | 0.61 | | | | | | 0.79 | | | | | | — | | | | | | 1.40 | | | | | | — | | | | | | 11.80 | | | | | | 1.23 | | | | | | 1.24 | | | | | | 0.38 | | | | | | 0.38 | | | | | | 4.58 | | | | | | 4,145 | | | | | | 86 | | |
| 12-31-14 | | | | | 12.30 | | | | | | 0.16 | | | | | | 0.59 | | | | | | 0.75 | | | | | | — | | | | | | 0.04 | | | | | | — | | | | | | 0.04 | | | | | | — | | | | | | 13.01 | | | | | | 6.08 | | | | | | 4.07 | | | | | | 0.38 | | | | | | 0.38 | | | | | | 1.27 | | | | | | 4 | | | | | | 32 | | |
| 12-31-13 | | | | | 11.81 | | | | | | 0.14 | | | | | | 1.39 | | | | | | 1.53 | | | | | | 0.25 | | | | | | 0.80 | | | | | | — | | | | | | 1.05 | | | | | | 0.01 | | | | | | 12.30 | | | | | | 13.47(a) | | | | | | 89.54 | | | | | | 0.38 | | | | | | 0.38 | | | | | | 1.14 | | | | | | 4 | | | | | | 68 | | |
| Class S2 | | | | | | | | | | | | | | | | | | | | | | | | | | | | | | | | | | | | | | | | | | | | | �� | | | | | | | | | | | | | | | | | | | | | | | | | | | | | | | | | | | | | | | | | | | | | | | | | | | | | | | | | | |
| 12-31-17 | | | | | 12.22 | | | | | | 0.26• | | | | | | 1.26 | | | | | | 1.52 | | | | | | 0.14 | | | | | | 0.28 | | | | | | — | | | | | | 0.42 | | | | | | — | | | | | | 13.32 | | | | | | 12.54 | | | | | | 0.71 | | | | | | 0.51 | | | | | | 0.51 | | | | | | 2.05 | | | | | | 660 | | | | | | 72 | | |
| 12-31-16 | | | | | 11.70 | | | | | | 0.14• | | | | | | 0.48 | | | | | | 0.62 | | | | | | 0.04 | | | | | | 0.06 | | | | | | — | | | | | | 0.10 | | | | | | — | | | | | | 12.22 | | | | | | 5.33 | | | | | | 0.79 | | | | | | 0.54 | | | | | | 0.54 | | | | | | 1.18 | | | | | | 148 | | | | | | 84 | | |
| 12-31-15 | | | | | 12.91 | | | | | | 0.36• | | | | | | (0.20) | | | | | | 0.16 | | | | | | 0.58 | | | | | | 0.79 | | | | | | — | | | | | | 1.37 | | | | | | — | | | | | | 11.70 | | | | | | 1.08 | | | | | | 1.49 | | | | | | 0.53 | | | | | | 0.53 | | | | | | 3.08 | | | | | | 283 | | | | | | 86 | | |
| 12-31-14 | | | | | 12.23 | | | | | | 0.14 | | | | | | 0.58 | | | | | | 0.72 | | | | | | — | | | | | | 0.04 | | | | | | — | | | | | | 0.04 | | | | | | — | | | | | | 12.91 | | | | | | 5.87 | | | | | | 4.32 | | | | | | 0.53 | | | | | | 0.53 | | | | | | 1.12 | | | | | | 4 | | | | | | 32 | | |
| 12-31-13 | | | | | 11.81 | | | | | | 0.12 | | | | | | 1.40 | | | | | | 1.52 | | | | | | 0.31 | | | | | | 0.80 | | | | | | — | | | | | | 1.11 | | | | | | 0.01 | | | | | | 12.23 | | | | | | 13.39(a) | | | | | | 89.79 | | | | | | 0.53 | | | | | | 0.53 | | | | | | 0.97 | | | | | | 4 | | | | | | 68 | | |
| Class T | | | | | | | | | | | | | | | | | | | | | | | | | | | | | | | | | | | | | | | | | | | | | | | | | | | | | | | | | | | | | | | | | | | | | | | | | | | | | | | | | | | | | | | | | | | | | | | | | | | | | | | |
| 12-31-17 | | | | | 12.16 | | | | | | 0.18• | | | | | | 1.29 | | | | | | 1.47 | | | | | | 0.11 | | | | | | 0.28 | | | | | | — | | | | | | 0.39 | | | | | | — | | | | | | 13.24 | | | | | | 12.22 | | | | | | 1.01 | | | | | | 0.81 | | | | | | 0.81 | | | | | | 1.42 | | | | | | 12 | | | | | | 72 | | |
| 12-31-16 | | | | | 11.64 | | | | | | 0.15• | | | | | | 0.43 | | | | | | 0.58 | | | | | | — | | | | | | 0.06 | | | | | | — | | | | | | 0.06 | | | | | | — | | | | | | 12.16 | | | | | | 4.99 | | | | | | 1.08 | | | | | | 0.84 | | | | | | 0.84 | | | | | | 1.29 | | | | | | 8 | | | | | | 84 | | |
| 12-31-15 | | | | | 12.87 | | | | | | 0.11• | | | | | | 0.01 | | | | | | 0.12 | | | | | | 0.56 | | | | | | 0.79 | | | | | | — | | | | | | 1.35 | | | | | | — | | | | | | 11.64 | | | | | | 0.72 | | | | | | 1.74 | | | | | | 0.83 | | | | | | 0.83 | | | | | | 0.91 | | | | | | 4 | | | | | | 86 | | |
| 12-31-14 | | | | | 12.21 | | | | | | 0.10 | | | | | | 0.60 | | | | | | 0.70 | | | | | | — | | | | | | 0.04 | | | | | | — | | | | | | 0.04 | | | | | | — | | | | | | 12.87 | | | | | | 5.72 | | | | | | 4.57 | | | | | | 0.83 | | | | | | 0.83 | | | | | | 0.81 | | | | | | 4 | | | | | | 32 | | |
| 12-31-13 | | | | | 11.77 | | | | | | 0.08 | | | | | | 1.42 | | | | | | 1.50 | | | | | | 0.27 | | | | | | 0.80 | | | | | | — | | | | | | 1.07 | | | | | | 0.01 | | | | | | 12.21 | | | | | | 13.28(a) | | | | | | 90.04 | | | | | | 0.83 | | | | | | 0.83 | | | | | | 0.67 | | | | | | 4 | | | | | | 68 | | |
| Voya Solution 2025 Portfolio | | | | | | | | | | | | | | | | | | | | | | | | | | | | | | | | | | | | | | | | | | | | | | | | | | | | | | | | | | | | | | | | | | | | | | | | | | | | | | | | | | | | | | | | | | | | | | | | | | | | | | | |
| Class ADV | | | | | | | | | | | | | | | | | | | | | | | | | | | | | | | | | | | | | | | | | | | | | | | | | | | | | | | | | | | | | | | | | | | | | | | | | | | | | | | | | | | | | | | | | | | | | | | | | | | | | | | |
| 12-31-17 | | | | | 10.66 | | | | | | 0.15• | | | | | | 1.42 | | | | | | 1.57 | | | | | | 0.19 | | | | | | 0.32 | | | | | | — | | | | | | 0.51 | | | | | | — | | | | | | 11.72 | | | | | | 15.02 | | | | | | 0.74 | | | | | | 0.66 | | | | | | 0.66 | | | | | | 1.36 | | | | | | 300,453 | | | | | | 46 | | |
| 12-31-16 | | | | | 11.17 | | | | | | 0.14• | | | | | | 0.47 | | | | | | 0.61 | | | | | | 0.21 | | | | | | 0.91 | | | | | | — | | | | | | 1.12 | | | | | | — | | | | | | 10.66 | | | | | | 5.53 | | | | | | 0.74 | | | | | | 0.64 | | | | | | 0.64 | | | | | | 1.31 | | | | | | 302,670 | | | | | | 43 | | |
| 12-31-15 | | | | | 12.83 | | | | | | 0.11• | | | | | | (0.09) | | | | | | 0.02 | | | | | | 0.37 | | | | | | 1.31 | | | | | | — | | | | | | 1.68 | | | | | | — | | | | | | 11.17 | | | | | | (0.26) | | | | | | 0.74 | | | | | | 0.65 | | | | | | 0.65 | | | | | | 0.89 | | | | | | 357,443 | | | | | | 42 | | |
| 12-31-14 | | | | | 13.06 | | | | | | 0.12• | | | | | | 0.54 | | | | | | 0.66 | | | | | | 0.23 | | | | | | 0.66 | | | | | | — | | | | | | 0.89 | | | | | | — | | | | | | 12.83 | | | | | | 5.26 | | | | | | 0.74 | | | | | | 0.63 | | | | | | 0.63 | | | | | | 0.94 | | | | | | 435,280 | | | | | | 46 | | |
| 12-31-13 | | | | | 11.48 | | | | | | 0.10• | | | | | | 1.73 | | | | | | 1.83 | | | | | | 0.25 | | | | | | — | | | | | | — | | | | | | 0.25 | | | | | | — | | | | | | 13.06 | | | | | | 16.05 | | | | | | 0.74 | | | | | | 0.62 | | | | | | 0.62 | | | | | | 0.85 | | | | | | 500,390 | | | | | | 72 | | |
| Class I | | | | | | | | | | | | | | | | | | | | | | | | | | | | | | | | | | | | | | | | | | | | | | | | | | | | | | | | | | | | | | | | | | | | | | | | | | | | | | | | | | | | | | | | | | | | | | | | | | | | | | | |
| 12-31-17 | | | | | 10.94 | | | | | | 0.22• | | | | | | 1.46 | | | | | | 1.68 | | | | | | 0.26 | | | | | | 0.32 | | | | | | — | | | | | | 0.58 | | | | | | — | | | | | | 12.04 | | | | | | 15.62 | | | | | | 0.24 | | | | | | 0.16 | | | | | | 0.16 | | | | | | 1.92 | | | | | | 243,053 | | | | | | 46 | | |
| 12-31-16 | | | | | 11.44 | | | | | | 0.21 | | | | | | 0.48 | | | | | | 0.69 | | | | | | 0.28 | | | | | | 0.91 | | | | | | — | | | | | | 1.19 | | | | | | — | | | | | | 10.94 | | | | | | 6.13 | | | | | | 0.24 | | | | | | 0.14 | | | | | | 0.14 | | | | | | 1.84 | | | | | | 193,795 | | | | | | 43 | | |
| 12-31-15 | | | | | 13.12 | | | | | | 0.18• | | | | | | (0.10) | | | | | | 0.08 | | | | | | 0.45 | | | | | | 1.31 | | | | | | — | | | | | | 1.76 | | | | | | — | | | | | | 11.44 | | | | | | 0.19 | | | | | | 0.24 | | | | | | 0.15 | | | | | | 0.15 | | | | | | 1.44 | | | | | | 204,693 | | | | | | 42 | | |
| 12-31-14 | | | | | 13.34 | | | | | | 0.20• | | | | | | 0.55 | | | | | | 0.75 | | | | | | 0.31 | | | | | | 0.66 | | | | | | — | | | | | | 0.97 | | | | | | — | | | | | | 13.12 | | | | | | 5.82 | | | | | | 0.24 | | | | | | 0.13 | | | | | | 0.13 | | | | | | 1.47 | | | | | | 197,457 | | | | | | 46 | | |
| 12-31-13 | | | | | 11.73 | | | | | | 0.17• | | | | | | 1.75 | | | | | | 1.92 | | | | | | 0.31 | | | | | | — | | | | | | — | | | | | | 0.31 | | | | | | — | | | | | | 13.34 | | | | | | 16.54 | | | | | | 0.24 | | | | | | 0.12 | | | | | | 0.12 | | | | | | 1.39 | | | | | | 225,551 | | | | | | 72 | | |
| Class S | | | | | | | | | | | | | | | | | | | | | | | | | | | | | | | | | | | | | | | | | | | | | | | | | | | | | | | | | | | | | | | | | | | | | | | | | | | | | | | | | | | | | | | | | | | | | | | | | | | | | | | |
| 12-31-17 | | | | | 10.82 | | | | | | 0.18• | | | | | | 1.45 | | | | | | 1.63 | | | | | | 0.23 | | | | | | 0.32 | | | | | | — | | | | | | 0.55 | | | | | | — | | | | | | 11.90 | | | | | | 15.29 | | | | | | 0.49 | | | | | | 0.41 | | | | | | 0.41 | | | | | | 1.60 | | | | | | 359,764 | | | | | | 46 | | |
| 12-31-16 | | | | | 11.32 | | | | | | 0.17• | | | | | | 0.48 | | | | | | 0.65 | | | | | | 0.24 | | | | | | 0.91 | | | | | | — | | | | | | 1.15 | | | | | | — | | | | | | 10.82 | | | | | | 5.88 | | | | | | 0.49 | | | | | | 0.39 | | | | | | 0.39 | | | | | | 1.58 | | | | | | 376,403 | | | | | | 43 | | |
| 12-31-15 | | | | | 13.00 | | | | | | 0.14• | | | | | | (0.10) | | | | | | 0.04 | | | | | | 0.41 | | | | | | 1.31 | | | | | | — | | | | | | 1.72 | | | | | | — | | | | | | 11.32 | | | | | | (0.09) | | | | | | 0.49 | | | | | | 0.40 | | | | | | 0.40 | | | | | | 1.14 | | | | | | 418,555 | | | | | | 42 | | |
| 12-31-14 | | | | | 13.22 | | | | | | 0.16• | | | | | | 0.55 | | | | | | 0.71 | | | | | | 0.27 | | | | | | 0.66 | | | | | | — | | | | | | 0.93 | | | | | | — | | | | | | 13.00 | | | | | | 5.58 | | | | | | 0.49 | | | | | | 0.38 | | | | | | 0.38 | | | | | | 1.21 | | | | | | 486,302 | | | | | | 46 | | |
| 12-31-13 | | | | | 11.62 | | | | | | 0.14• | | | | | | 1.74 | | | | | | 1.88 | | | | | | 0.28 | | | | | | — | | | | | | — | | | | | | 0.28 | | | | | | — | | | | | | 13.22 | | | | | | 16.33 | | | | | | 0.49 | | | | | | 0.37 | | | | | | 0.37 | | | | | | 1.11 | | | | | | 530,013 | | | | | | 72 | | |
See Accompanying Notes to Financial Statements
Financial Highlights (continued)
| | | | | | | | | | Income
(loss) from
investment
operations | | | | | | | | | Less
Distributions | | | | | | | | | | | | | | | | | | | | | | | | | | | Ratios to average
net assets | | | Supplemental
Data | |
| | | | Net asset value, beginning of year
or period | | | Net investment income (loss) | | | Net realized and unrealized
gain (loss) | | | Total from investment operations | | | From net investment income | | | From net realized gains | | | From return of capital | | | Total distributions | | | Payment by affiliate | | | Net asset value, end of year
or period | | | Total Return(1) | | | Expenses before
reductions/additions(2)(3)(4) | | | Expenses net of fee waivers
and/or recoupments if any(2)(3)(4) | | | Expenses net of all
reductions/additions(2)(3)(4) | | | Net investment income (loss)(2)(3) | | | Net assets, end of year or period | | | Portfolio turnover rate | |
Year or
period ended | | | ($) | | | ($) | | | ($) | | | ($) | | | ($) | | | ($) | | | ($) | | | ($) | | | ($) | | | ($) | | | (%) | | | (%) | | | (%) | | | (%) | | | (%) | | | ($000’s) | | | (%) | |
| Voya Solution 2025 Portfolio (continued) | | | | | | | | | | | | | | | | | | | | | | | | | | | | | | | | | | | | | | | | | | | | | | | | | | | | | | | | | | | | | | | | | | | | | | | | | | | | | | | | | | | | | | | | | | | | | | | | | | | | | | | |
| Class S2 | | | | | | | | | | | | | | | | | | | | | | | | | | | | | | | | | | | | | | | | | | | | | | | | | | | | | | | | | | | | | | | | | | | | | | | | | | | | | | | | | | | | | | | | | | | | | | | | | | | | | | | |
| 12-31-17 | | | | | 10.52 | | | | | | 0.16• | | | | | | 1.40 | | | | | | 1.56 | | | | | | 0.20 | | | | | | 0.32 | | | | | | — | | | | | | 0.52 | | | | | | — | | | | | | 11.56 | | | | | | 15.07 | | | | | | 0.64 | | | | | | 0.56 | | | | | | 0.56 | | | | | | 1.40 | | | | | | 16,911 | | | | | | 46 | | |
| 12-31-16 | | | | | 11.03 | | | | | | 0.15• | | | | | | 0.47 | | | | | | 0.62 | | | | | | 0.22 | | | | | | 0.91 | | | | | | — | | | | | | 1.13 | | | | | | — | | | | | | 10.52 | | | | | | 5.75 | | | | | | 0.67 | | | | | | 0.54 | | | | | | 0.54 | | | | | | 1.39 | | | | | | 22,356 | | | | | | 43 | | |
| 12-31-15 | | | | | 12.70 | | | | | | 0.12• | | | | | | (0.10) | | | | | | 0.02 | | | | | | 0.38 | | | | | | 1.31 | | | | | | — | | | | | | 1.69 | | | | | | — | | | | | | 11.03 | | | | | | (0.23) | | | | | | 0.74 | | | | | | 0.55 | | | | | | 0.55 | | | | | | 0.98 | | | | | | 27,673 | | | | | | 42 | | |
| 12-31-14 | | | | | 12.93 | | | | | | 0.13• | | | | | | 0.55 | | | | | | 0.68 | | | | | | 0.25 | | | | | | 0.66 | | | | | | — | | | | | | 0.91 | | | | | | — | | | | | | 12.70 | | | | | | 5.40 | | | | | | 0.74 | | | | | | 0.53 | | | | | | 0.53 | | | | | | 1.03 | | | | | | 35,050 | | | | | | 46 | | |
| 12-31-13 | | | | | 11.38 | | | | | | 0.11• | | | | | | 1.70 | | | | | | 1.81 | | | | | | 0.26 | | | | | | — | | | | | | — | | | | | | 0.26 | | | | | | — | | | | | | 12.93 | | | | | | 16.08 | | | | | | 0.74 | | | | | | 0.52 | | | | | | 0.52 | | | | | | 0.93 | | | | | | 41,255 | | | | | | 72 | | |
| Class T | | | | | | | | | | | | | | | | | | | | | | | | | | | | | | | | | | | | | | | | | | | | | | | | | | | | | | | | | | | | | | | | | | | | | | | | | | | | | | | | | | | | | | | | | | | | | | | | | | | | | | | |
| 12-31-17 | | | | | 11.10 | | | | | | 0.14• | | | | | | 1.48 | | | | | | 1.62 | | | | | | 0.17 | | | | | | 0.32 | | | | | | — | | | | | | 0.49 | | | | | | — | | | | | | 12.23 | | | | | | 14.78 | | | | | | 0.94 | | | | | | 0.86 | | | | | | 0.86 | | | | | | 1.18 | | | | | | 821 | | | | | | 46 | | |
| 12-31-16 | | | | | 11.58 | | | | | | 0.14 | | | | | | 0.48 | | | | | | 0.62 | | | | | | 0.19 | | | | | | 0.91 | | | | | | — | | | | | | 1.10 | | | | | | — | | | | | | 11.10 | | | | | | 5.43 | | | | | | 0.96 | | | | | | 0.84 | | | | | | 0.84 | | | | | | 1.14 | | | | | | 806 | | | | | | 43 | | |
| 12-31-15 | | | | | 13.07 | | | | | | 0.09• | | | | | | (0.12) | | | | | | (0.03) | | | | | | 0.15 | | | | | | 1.31 | | | | | | — | | | | | | 1.46 | | | | | | — | | | | | | 11.58 | | | | | | (0.56) | | | | | | 0.99 | | | | | | 0.85 | | | | | | 0.85 | | | | | | 0.70 | | | | | | 837 | | | | | | 42 | | |
| 12-31-14 | | | | | 13.29 | | | | | | 0.06• | | | | | | 0.60 | | | | | | 0.66 | | | | | | 0.22 | | | | | | 0.66 | | | | | | — | | | | | | 0.88 | | | | | | — | | | | | | 13.07 | | | | | | 5.14 | | | | | | 0.99 | | | | | | 0.83 | | | | | | 0.83 | | | | | | 0.45 | | | | | | 869 | | | | | | 46 | | |
| 12-31-13 | | | | | 11.68 | | | | | | 0.08• | | | | | | 1.75 | | | | | | 1.83 | | | | | | 0.22 | | | | | | — | | | | | | — | | | | | | 0.22 | | | | | | — | | | | | | 13.29 | | | | | | 15.75 | | | | | | 0.99 | | | | | | 0.82 | | | | | | 0.82 | | | | | | 0.66 | | | | | | 2,992 | | | | | | 72 | | |
| Voya Solution 2030 Portfolio | | | | | | | | | | | | | | | | | | | | | | | | | | | | | | | | | | | | | | | | | | | | | | | | | | | | | | | | | | | | | | | | | | | | | | | | | | | | | | | | | | | | | | | | | | | | | | | | | | | | | | | |
| Class ADV | | | | | | | | | | | | | | | | | | | | | | | | | | | | | | | | | | | | | | | | | | | | | | | | | | | | | | | | | | | | | | | | | | | | | | | | | | | | | | | | | | | | | | | | | | | | | | | | | | | | | | | |
| 12-31-17 | | | | | 13.94 | | | | | | 0.23• | | | | | | 2.15 | | | | | | 2.38 | | | | | | 0.12 | | | | | | 0.24 | | | | | | — | | | | | | 0.36 | | | | | | — | | | | | | 15.96 | | | | | | 17.22 | | | | | | 0.83 | | | | | | 0.64 | | | | | | 0.64 | | | | | | 1.50 | | | | | | 13,589 | | | | | | 63 | | |
| 12-31-16 | | | | | 13.24 | | | | | | 0.23• | | | | | | 0.57 | | | | | | 0.80 | | | | | | 0.04 | | | | | | 0.06 | | | | | | — | | | | | | 0.10 | | | | | | — | | | | | | 13.94 | | | | | | 6.09 | | | | | | 0.95 | | | | | | 0.66 | | | | | | 0.66 | | | | | | 1.71 | | | | | | 6,623 | | | | | | 67 | | |
| 12-31-15 | | | | | 13.94 | | | | | | 0.36• | | | | | | (0.31) | | | | | | 0.05 | | | | | | 0.19 | | | | | | 0.56 | | | | | | — | | | | | | 0.75 | | | | | | — | | | | | | 13.24 | | | | | | 0.18 | | | | | | 2.57 | | | | | | 0.66 | | | | | | 0.66 | | | | | | 2.65 | | | | | | 1,569 | | | | | | 69 | | |
| 12-31-14 | | | | | 13.23 | | | | | | 0.14• | | | | | | 0.69 | | | | | | 0.83 | | | | | | 0.02 | | | | | | 0.10 | | | | | | — | | | | | | 0.12 | | | | | | — | | | | | | 13.94 | | | | | | 6.30 | | | | | | 8.42 | | | | | | 0.66 | | | | | | 0.66 | | | | | | 0.98 | | | | | | 157 | | | | | | 136 | | |
| 12-31-13 | | | | | 12.12 | | | | | | 0.11 | | | | | | 2.06 | | | | | | 2.17 | | | | | | 0.24 | | | | | | 0.84 | | | | | | — | | | | | | 1.08 | | | | | | 0.02 | | | | | | 13.23 | | | | | | 18.66(b) | | | | | | 85.63 | | | | | | 0.64 | | | | | | 0.64 | | | | | | 0.86 | | | | | | 4 | | | | | | 73 | | |
| Class I | | | | | | | | | | | | | | | | | | | | | | | | | | | | | | | | | | | | | | | | | | | | | | | | | | | | | | | | | | | | | | | | | | | | | | | | | | | | | | | | | | | | | | | | | | | | | | | | | | | | | | | |
| 12-31-17 | | | | | 14.23 | | | | | | 0.32• | | | | | | 2.19 | | | | | | 2.51 | | | | | | 0.14 | | | | | | 0.24 | | | | | | — | | | | | | 0.38 | | | | | | — | | | | | | 16.36 | | | | | | 17.86 | | | | | | 0.33 | | | | | | 0.14 | | | | | | 0.14 | | | | | | 2.07 | | | | | | 8,625 | | | | | | 63 | | |
| 12-31-16 | | | | | 13.46 | | | | | | 0.35• | | | | | | 0.53 | | | | | | 0.88 | | | | | | 0.05 | | | | | | 0.06 | | | | | | — | | | | | | 0.11 | | | | | | — | | | | | | 14.23 | | | | | | 6.55 | | | | | | 0.45 | | | | | | 0.16 | | | | | | 0.16 | | | | | | 2.54 | | | | | | 3,247 | | | | | | 67 | | |
| 12-31-15 | | | | | 14.14 | | | | | | 0.39• | | | | | | (0.27) | | | | | | 0.12 | | | | | | 0.24 | | | | | | 0.56 | | | | | | — | | | | | | 0.80 | | | | | | — | | | | | | 13.46 | | | | | | 0.66 | | | | | | 2.07 | | | | | | 0.16 | | | | | | 0.16 | | | | | | 2.90 | | | | | | 861 | | | | | | 69 | | |
| 12-31-14 | | | | | 13.32 | | | | | | 0.20 | | | | | | 0.72 | | | | | | 0.92 | | | | | | — | | | | | | 0.10 | | | | | | — | | | | | | 0.10 | | | | | | — | | | | | | 14.14 | | | | | | 6.94 | | | | | | 7.92 | | | | | | 0.16 | | | | | | 0.16 | | | | | | 1.50 | | | | | | 4 | | | | | | 136 | | |
| 12-31-13 | | | | | 12.17 | | | | | | 0.18 | | | | | | 2.08 | | | | | | 2.26 | | | | | | 0.29 | | | | | | 0.84 | | | | | | — | | | | | | 1.13 | | | | | | 0.02 | | | | | | 13.32 | | | | | | 19.38(b) | | | | | | 85.13 | | | | | | 0.14 | | | | | | 0.14 | | | | | | 1.36 | | | | | | 4 | | | | | | 73 | | |
| Class S | | | | | | | | | | | | | | | | | | | | | | | | | | | | | | | | | | | | | | | | | | | | | | | | | | | | | | | | | | | | | | | | | | | | | | | | | | | | | | | | | | | | | | | | | | | | | | | | | | | | | | | |
| 12-31-17 | | | | | 14.18 | | | | | | 0.26• | | | | | | 2.21 | | | | | | 2.47 | | | | | | 0.13 | | | | | | 0.24 | | | | | | — | | | | | | 0.37 | | | | | | — | | | | | | 16.28 | | | | | | 17.59 | | | | | | 0.58 | | | | | | 0.39 | | | | | | 0.39 | | | | | | 1.72 | | | | | | 8,484 | | | | | | 63 | | |
| 12-31-16 | | | | | 13.44 | | | | | | 0.27• | | | | | | 0.58 | | | | | | 0.85 | | | | | | 0.05 | | | | | | 0.06 | | | | | | — | | | | | | 0.11 | | | | | | — | | | | | | 14.18 | | | | | | 6.32 | | | | | | 0.70 | | | | | | 0.41 | | | | | | 0.41 | | | | | | 2.00 | | | | | | 4,770 | | | | | | 67 | | |
| 12-31-15 | | | | | 14.07 | | | | | | 0.49• | | | | | | (0.39) | | | | | | 0.10 | | | | | | 0.17 | | | | | | 0.56 | | | | | | — | | | | | | 0.73 | | | | | | — | | | | | | 13.44 | | | | | | 0.52 | | | | | | 2.32 | | | | | | 0.41 | | | | | | 0.41 | | | | | | 3.69 | | | | | | 1,454 | | | | | | 69 | | |
| 12-31-14 | | | | | 13.32 | | | | | | 0.17 | | | | | | 0.68 | | | | | | 0.85 | | | | | | — | | | | | | 0.10 | | | | | | — | | | | | | 0.10 | | | | | | — | | | | | | 14.07 | | | | | | 6.41 | | | | | | 8.17 | | | | | | 0.41 | | | | | | 0.41 | | | | | | 1.25 | | | | | | 4 | | | | | | 136 | | |
| 12-31-13 | | | | | 12.13 | | | | | | 0.14 | | | | | | 2.06 | | | | | | 2.20 | | | | | | 0.19 | | | | | | 0.84 | | | | | | — | | | | | | 1.03 | | | | | | 0.02 | | | | | | 13.32 | | | | | | 18.92(b) | | | | | | 85.38 | | | | | | 0.39 | | | | | | 0.39 | | | | | | 1.09 | | | | | | 4 | | | | | | 73 | | |
| Class S2 | | | | | | | | | | | | | | | | | | | | | | | | | | | | | | | | | | | | | | | | | | | | | | | | | | | | | | | | | | | | | | | | | | | | | | | | | | | | | | | | | | | | | | | | | | | | | | | | | | | | | | | |
| 12-31-17 | | | | | 14.01 | | | | | | 0.21• | | | | | | 2.20 | | | | | | 2.41 | | | | | | 0.10 | | | | | | 0.24 | | | | | | — | | | | | | 0.34 | | | | | | — | | | | | | 16.08 | | | | | | 17.38 | | | | | | 0.73 | | | | | | 0.54 | | | | | | 0.54 | | | | | | 1.42 | | | | | | 588 | | | | | | 63 | | |
| 12-31-16 | | | | | 13.30 | | | | | | 0.18• | | | | | | 0.64 | | | | | | 0.82 | | | | | | 0.05 | | | | | | 0.06 | | | | | | — | | | | | | 0.11 | | | | | | — | | | | | | 14.01 | | | | | | 6.17 | | | | | | 0.88 | | | | | | 0.56 | | | | | | 0.56 | | | | | | 1.30 | | | | | | 255 | | | | | | 67 | | |
| 12-31-15 | | | | | 13.96 | | | | | | 0.28• | | | | | | (0.22) | | | | | | 0.06 | | | | | | 0.16 | | | | | | 0.56 | | | | | | — | | | | | | 0.72 | | | | | | — | | | | | | 13.30 | | | | | | 0.23 | | | | | | 2.57 | | | | | | 0.56 | | | | | | 0.56 | | | | | | 2.01 | | | | | | 41 | | | | | | 69 | | |
| 12-31-14 | | | | | 13.22 | | | | | | 0.15 | | | | | | 0.69 | | | | | | 0.84 | | | | | | — | | | | | | 0.10 | | | | | | — | | | | | | 0.10 | | | | | | — | | | | | | 13.96 | | | | | | 6.38 | | | | | | 8.42 | | | | | | 0.56 | | | | | | 0.56 | | | | | | 1.10 | | | | | | 4 | | | | | | 136 | | |
| 12-31-13 | | | | | 12.13 | | | | | | 0.12 | | | | | | 2.04 | | | | | | 2.16 | | | | | | 0.25 | | | | | | 0.84 | | | | | | — | | | | | | 1.09 | | | | | | 0.02 | | | | | | 13.22 | | | | | | 18.57(b) | | | | | | 85.63 | | | | | | 0.54 | | | | | | 0.54 | | | | | | 0.96 | | | | | | 4 | | | | | | 73 | | |
See Accompanying Notes to Financial Statements
Financial Highlights (continued)
| | | | | | | | | | Income
(loss) from
investment
operations | | | | | | | | | Less
Distributions | | | | | | | | | | | | | | | | | | | | | | | | | | | Ratios to average
net assets | | | Supplemental
Data | |
| | | | Net asset value, beginning of year
or period | | | Net investment income (loss) | | | Net realized and unrealized
gain (loss) | | | Total from investment operations | | | From net investment income | | | From net realized gains | | | From return of capital | | | Total distributions | | | Payment by affiliate | | | Net asset value, end of year
or period | | | Total Return(1) | | | Expenses before
reductions/additions(2)(3)(4) | | | Expenses net of fee waivers
and/or recoupments if any(2)(3)(4) | | | Expenses net of all
reductions/additions(2)(3)(4) | | | Net investment income (loss)(2)(3) | | | Net assets, end of year or period | | | Portfolio turnover rate | |
Year or
period ended | | | ($) | | | ($) | | | ($) | | | ($) | | | ($) | | | ($) | | | ($) | | | ($) | | | ($) | | | ($) | | | (%) | | | (%) | | | (%) | | | (%) | | | (%) | | | ($000’s) | | | (%) | |
| Voya Solution 2030 Portfolio (continued) | | | | | | | | | | | | | | | | | | | | | | | | | | | | | | | | | | | | | | | | | | | | | | | | | | | | | | | | | | | | | | | | | | | | | | | | | | | | | | | | | | | | | | | | | | | | | | | | | | | | | | | |
| Class T | | | | | | | | | | | | | | | | | | | | | | | | | | | | | | | | | | | | | | | | | | | | | | | | | | | | | | | | | | | | | | | | | | | | | | | | | | | | | | | | | | | | | | | | | | | | | | | | | | | | | | | |
| 12-31-17 | | | | | 13.98 | | | | | | 0.19• | | | | | | 2.17 | | | | | | 2.36 | | | | | | 0.08 | | | | | | 0.24 | | | | | | — | | | | | | 0.32 | | | | | | — | | | | | | 16.02 | | | | | | 17.05 | | | | | | 1.03 | | | | | | 0.84 | | | | | | 0.84 | | | | | | 1.23 | | | | | | 15 | | | | | | 63 | | |
| 12-31-16 | | | | | 13.27 | | | | | | 0.19• | | | | | | 0.58 | | | | | | 0.77 | | | | | | — | | | | | | 0.06 | | | | | | — | | | | | | 0.06 | | | | | | — | | | | | | 13.98 | | | | | | 5.81 | | | | | | 1.17 | | | | | | 0.86 | | | | | | 0.86 | | | | | | 1.43 | | | | | | 11 | | | | | | 67 | | |
| 12-31-15 | | | | | 13.97 | | | | | | 0.13 | | | | | | (0.14) | | | | | | (0.01) | | | | | | 0.13 | | | | | | 0.56 | | | | | | — | | | | | | 0.69 | | | | | | — | | | | | | 13.27 | | | | | | (0.26) | | | | | | 2.82 | | | | | | 0.86 | | | | | | 0.86 | | | | | | 0.92 | | | | | | 4 | | | | | | 69 | | |
| 12-31-14 | | | | | 13.25 | | | | | | 0.11 | | | | | | 0.71 | | | | | | 0.82 | | | | | | — | | | | | | 0.10 | | | | | | — | | | | | | 0.10 | | | | | | — | | | | | | 13.97 | | | | | | 6.22 | | | | | | 8.67 | | | | | | 0.86 | | | | | | 0.86 | | | | | | 0.80 | | | | | | 4 | | | | | | 136 | | |
| 12-31-13 | | | | | 12.09 | | | | | | 0.08 | | | | | | 2.11 | | | | | | 2.19 | | | | | | 0.21 | | | | | | 0.84 | | | | | | — | | | | | | 1.05 | | | | | | 0.02 | | | | | | 13.25 | | | | | | 18.89(b) | | | | | | 85.88 | | | | | | 0.84 | | | | | | 0.84 | | | | | | 0.66 | | | | | | 4 | | | | | | 73 | | |
| Voya Solution 2035 Portfolio | | | | | | | | | | | | | | | | | | | | | | | | | | | | | | | | | | | | | | | | | | | | | | | | | | | | | | | | | | | | | | | | | | | | | | | | | | | | | | | | | | | | | | | | | | | | | | | | | | | | | | | |
| Class ADV | | | | | | | | | | | | | | | | | | | | | | | | | | | | | | | | | | | | | | | | | | | | | | | | | | | | | | | | | | | | | | | | | | | | | | | | | | | | | | | | | | | | | | | | | | | | | | | | | | | | | | | |
| 12-31-17 | | | | | 10.71 | | | | | | 0.13• | | | | | | 1.90 | | | | | | 2.03 | | | | | | 0.16 | | | | | | 0.31 | | | | | | — | | | | | | 0.47 | | | | | | — | | | | | | 12.27 | | | | | | 19.22 | | | | | | 0.74 | | | | | | 0.65 | | | | | | 0.65 | | | | | | 1.12 | | | | | | 267,229 | | | | | | 36 | | |
| 12-31-16 | | | | | 11.27 | | | | | | 0.12• | | | | | | 0.53 | | | | | | 0.65 | | | | | | 0.21 | | | | | | 1.00 | | | | | | — | | | | | | 1.21 | | | | | | — | | | | | | 10.71 | | | | | | 6.00 | | | | | | 0.74 | | | | | | 0.66 | | | | | | 0.66 | | | | | | 1.11 | | | | | | 262,148 | | | | | | 44 | | |
| 12-31-15 | | | | | 13.22 | | | | | | 0.11• | | | | | | (0.13) | | | | | | (0.02) | | | | | | 0.38 | | | | | | 1.55 | | | | | | — | | | | | | 1.93 | | | | | | — | | | | | | 11.27 | | | | | | (0.77) | | | | | | 0.74 | | | | | | 0.67 | | | | | | 0.67 | | | | | | 0.84 | | | | | | 303,218 | | | | | | 46 | | |
| 12-31-14 | | | | | 13.97 | | | | | | 0.12• | | | | | | 0.61 | | | | | | 0.73 | | | | | | 0.26 | | | | | | 1.22 | | | | | | — | | | | | | 1.48 | | | | | | — | | | | | | 13.22 | | | | | | 5.38 | | | | | | 0.75 | | | | | | 0.66 | | | | | | 0.66 | | | | | | 0.84 | | | | | | 361,683 | | | | | | 59 | | |
| 12-31-13 | | | | | 11.82 | | | | | | 0.11• | | | | | | 2.25 | | | | | | 2.36 | | | | | | 0.21 | | | | | | — | | | | | | — | | | | | | 0.21 | | | | | | — | | | | | | 13.97 | | | | | | 20.09 | | | | | | 0.74 | | | | | | 0.63 | | | | | | 0.63 | | | | | | 0.82 | | | | | | 425,221 | | | | | | 74 | | |
| Class I | | | | | | | | | | | | | | | | | | | | | | | | | | | | | | | | | | | | | | | | | | | | | | | | | | | | | | | | | | | | | | | | | | | | | | | | | | | | | | | | | | | | | | | | | | | | | | | | | | | | | | | |
| 12-31-17 | | | | | 10.98 | | | | | | 0.20• | | | | | | 1.94 | | | | | | 2.14 | | | | | | 0.22 | | | | | | 0.31 | | | | | | — | | | | | | 0.53 | | | | | | — | | | | | | 12.59 | | | | | | 19.82 | | | | | | 0.24 | | | | | | 0.15 | | | | | | 0.15 | | | | | | 1.69 | | | | | | 274,900 | | | | | | 36 | | |
| 12-31-16 | | | | | 11.54 | | | | | | 0.19 | | | | | | 0.53 | | | | | | 0.72 | | | | | | 0.28 | | | | | | 1.00 | | | | | | — | | | | | | 1.28 | | | | | | — | | | | | | 10.98 | | | | | | 6.49 | | | | | | 0.24 | | | | | | 0.16 | | | | | | 0.16 | | | | | | 1.67 | | | | | | 210,863 | | | | | | 44 | | |
| 12-31-15 | | | | | 13.51 | | | | | | 0.18• | | | | | | (0.14) | | | | | | 0.04 | | | | | | 0.46 | | | | | | 1.55 | | | | | | — | | | | | | 2.01 | | | | | | — | | | | | | 11.54 | | | | | | (0.30) | | | | | | 0.24 | | | | | | 0.17 | | | | | | 0.17 | | | | | | 1.39 | | | | | | 218,051 | | | | | | 46 | | |
| 12-31-14 | | | | | 14.25 | | | | | | 0.20 | | | | | | 0.61 | | | | | | 0.81 | | | | | | 0.33 | | | | | | 1.22 | | | | | | — | | | | | | 1.55 | | | | | | — | | | | | | 13.51 | | | | | | 5.93 | | | | | | 0.25 | | | | | | 0.16 | | | | | | 0.16 | | | | | | 1.40 | | | | | | 214,675 | | | | | | 59 | | |
| 12-31-13 | | | | | 12.05 | | | | | | 0.18• | | | | | | 2.30 | | | | | | 2.48 | | | | | | 0.28 | | | | | | — | | | | | | — | | | | | | 0.28 | | | | | | — | | | | | | 14.25 | | | | | | 20.72 | | | | | | 0.24 | | | | | | 0.13 | | | | | | 0.13 | | | | | | 1.39 | | | | | | 208,709 | | | | | | 74 | | |
| Class S | | | | | | | | | | | | | | | | | | | | | | | | | | | | | | | | | | | | | | | | | | | | | | | | | | | | | | | | | | | | | | | | | | | | | | | | | | | | | | | | | | | | | | | | | | | | | | | | | | | | | | | |
| 12-31-17 | | | | | 10.87 | | | | | | 0.16• | | | | | | 1.92 | | | | | | 2.08 | | | | | | 0.19 | | | | | | 0.31 | | | | | | — | | | | | | 0.50 | | | | | | — | | | | | | 12.45 | | | | | | 19.44 | | | | | | 0.49 | | | | | | 0.40 | | | | | | 0.40 | | | | | | 1.38 | | | | | | 368,554 | | | | | | 36 | | |
| 12-31-16 | | | | | 11.43 | | | | | | 0.16• | | | | | | 0.53 | | | | | | 0.69 | | | | | | 0.25 | | | | | | 1.00 | | | | | | — | | | | | | 1.25 | | | | | | — | | | | | | 10.87 | | | | | | 6.23 | | | | | | 0.49 | | | | | | 0.41 | | | | | | 0.41 | | | | | | 1.41 | | | | | | 359,464 | | | | | | 44 | | |
| 12-31-15 | | | | | 13.39 | | | | | | 0.14• | | | | | | (0.13) | | | | | | 0.01 | | | | | | 0.42 | | | | | | 1.55 | | | | | | — | | | | | | 1.97 | | | | | | — | | | | | | 11.43 | | | | | | (0.48) | | | | | | 0.49 | | | | | | 0.42 | | | | | | 0.42 | | | | | | 1.10 | | | | | | 383,233 | | | | | | 46 | | |
| 12-31-14 | | | | | 14.13 | | | | | | 0.16• | | | | | | 0.61 | | | | | | 0.77 | | | | | | 0.29 | | | | | | 1.22 | | | | | | — | | | | | | 1.51 | | | | | | — | | | | | | 13.39 | | | | | | 5.68 | | | | | | 0.50 | | | | | | 0.41 | | | | | | 0.41 | | | | | | 1.14 | | | | | | 432,573 | | | | | | 59 | | |
| 12-31-13 | | | | | 11.96 | | | | | | 0.14• | | | | | | 2.28 | | | | | | 2.42 | | | | | | 0.25 | | | | | | — | | | | | | — | | | | | | 0.25 | | | | | | — | | | | | | 14.13 | | | | | | 20.35 | | | | | | 0.49 | | | | | | 0.38 | | | | | | 0.38 | | | | | | 1.08 | | | | | | 485,103 | | | | | | 74 | | |
| Class S2 | | | | | | | | | | | | | | | | | | | | | | | | | | | | | | | | | | | | | | | | | | | | | | | | | | | | | | | | | | | | | | | | | | | | | | | | | | | | | | | | | | | | | | | | | | | | | | | | | | | | | | | |
| 12-31-17 | | | | | 10.49 | | | | | | 0.14• | | | | | | 1.85 | | | | | | 1.99 | | | | | | 0.17 | | | | | | 0.31 | | | | | | — | | | | | | 0.48 | | | | | | — | | | | | | 12.00 | | | | | | 19.28 | | | | | | 0.64 | | | | | | 0.55 | | | | | | 0.55 | | | | | | 1.22 | | | | | | 19,146 | | | | | | 36 | | |
| 12-31-16 | | | | | 11.07 | | | | | | 0.14 | | | | | | 0.51 | | | | | | 0.65 | | | | | | 0.23 | | | | | | 1.00 | | | | | | — | | | | | | 1.23 | | | | | | — | | | | | | 10.49 | | | | | | 6.09 | | | | | | 0.67 | | | | | | 0.56 | | | | | | 0.56 | | | | | | 1.24 | | | | | | 20,809 | | | | | | 44 | | |
| 12-31-15 | | | | | 13.01 | | | | | | 0.11• | | | | | | (0.11) | | | | | | 0.00* | | | | | | 0.39 | | | | | | 1.55 | | | | | | — | | | | | | 1.94 | | | | | | — | | | | | | 11.07 | | | | | | (0.62) | | | | | | 0.74 | | | | | | 0.57 | | | | | | 0.57 | | | | | | 0.90 | | | | | | 22,289 | | | | | | 46 | | |
| 12-31-14 | | | | | 13.77 | | | | | | 0.13• | | | | | | 0.60 | | | | | | 0.73 | | | | | | 0.27 | | | | | | 1.22 | | | | | | — | | | | | | 1.49 | | | | | | — | | | | | | 13.01 | | | | | | 5.50 | | | | | | 0.75 | | | | | | 0.56 | | | | | | 0.56 | | | | | | 0.95 | | | | | | 31,331 | | | | | | 59 | | |
| 12-31-13 | | | | | 11.66 | | | | | | 0.11• | | | | | | 2.22 | | | | | | 2.33 | | | | | | 0.22 | | | | | | — | | | | | | — | | | | | | 0.22 | | | | | | — | | | | | | 13.77 | | | | | | 20.17 | | | | | | 0.74 | | | | | | 0.53 | | | | | | 0.53 | | | | | | 0.88 | | | | | | 34,588 | | | | | | 74 | | |
| Class T | | | | | | | | | | | | | | | | | | | | | | | | | | | | | | | | | | | | | | | | | | | | | | | | | | | | | | | | | | | | | | | | | | | | | | | | | | | | | | | | | | | | | | | | | | | | | | | | | | | | | | | |
| 12-31-17 | | | | | 11.14 | | | | | | 0.11• | | | | | | 1.98 | | | | | | 2.09 | | | | | | 0.13 | | | | | | 0.31 | | | | | | — | | | | | | 0.44 | | | | | | — | | | | | | 12.79 | | | | | | 19.03 | | | | | | 0.94 | | | | | | 0.85 | | | | | | 0.85 | | | | | | 0.95 | | | | | | 700 | | | | | | 36 | | |
| 12-31-16 | | | | | 11.65 | | | | | | 0.09• | | | | | | 0.56 | | | | | | 0.65 | | | | | | 0.16 | | | | | | 1.00 | | | | | | — | | | | | | 1.16 | | | | | | — | | | | | | 11.14 | | | | | | 5.73 | | | | | | 0.96 | | | | | | 0.86 | | | | | | 0.86 | | | | | | 0.83 | | | | | | 624 | | | | | | 44 | | |
| 12-31-15 | | | | | 13.50 | | | | | | 0.09• | | | | | | (0.15) | | | | | | (0.06) | | | | | | 0.24 | | | | | | 1.55 | | | | | | — | | | | | | 1.79 | | | | | | — | | | | | | 11.65 | | | | | | (1.00) | | | | | | 0.99 | | | | | | 0.87 | | | | | | 0.87 | | | | | | 0.69 | | | | | | 887 | | | | | | 46 | | |
| 12-31-14 | | | | | 14.22 | | | | | | 0.05• | | | | | | 0.67 | | | | | | 0.72 | | | | | | 0.22 | | | | | | 1.22 | | | | | | — | | | | | | 1.44 | | | | | | — | | | | | | 13.50 | | | | | | 5.26 | | | | | | 1.00 | | | | | | 0.86 | | | | | | 0.86 | | | | | | 0.32 | | | | | | 864 | | | | | | 59 | | |
| 12-31-13 | | | | | 12.02 | | | | | | 0.06• | | | | | | 2.31 | | | | | | 2.37 | | | | | | 0.17 | | | | | | — | | | | | | — | | | | | | 0.17 | | | | | | — | | | | | | 14.22 | | | | | | 19.85 | | | | | | 0.99 | | | | | | 0.83 | | | | | | 0.83 | | | | | | 0.48 | | | | | | 1,898 | | | | | | 74 | | |
See Accompanying Notes to Financial Statements
Financial Highlights (continued)
| | | | | | | | | | Income
(loss) from
investment
operations | | | | | | | | | Less
Distributions | | | | | | | | | | | | | | | | | | | | | | | | | | | Ratios to average
net assets | | | Supplemental
Data | |
| | | | Net asset value, beginning of year
or period | | | Net investment income (loss) | | | Net realized and unrealized
gain (loss) | | | Total from investment operations | | | From net investment income | | | From net realized gains | | | From return of capital | | | Total distributions | | | Payment by affiliate | | | Net asset value, end of year
or period | | | Total Return(1) | | | Expenses before
reductions/additions(2)(3)(4) | | | Expenses net of fee waivers
and/or recoupments if any(2)(3)(4) | | | Expenses net of all
reductions/additions(2)(3)(4) | | | Net investment income (loss)(2)(3) | | | Net assets, end of year or period | | | Portfolio turnover rate | |
Year or
period ended | | | ($) | | | ($) | | | ($) | | | ($) | | | ($) | | | ($) | | | ($) | | | ($) | | | ($) | | | ($) | | | (%) | | | (%) | | | (%) | | | (%) | | | (%) | | | ($000’s) | | | (%) | |
| Voya Solution 2040 Portfolio | | | | | | | | | | | | | | | | | | | | | | | | | | | | | | | | | | | | | | | | | | | | | | | | | | | | | | | | | | | | | | | | | | | | | | | | | | | | | | | | | | | | | | | | | | | | | | | | | | | | | | | |
| Class ADV | | | | | | | | | | | | | | | | | | | | | | | | | | | | | | | | | | | | | | | | | | | | | | | | | | | | | | | | | | | | | | | | | | | | | | | | | | | | | | | | | | | | | | | | | | | | | | | | | | | | | | | |
| 12-31-17 | | | | | 14.55 | | | | | | 0.19• | | | | | | 2.73 | | | | | | 2.92 | | | | | | 0.08 | | | | | | 0.28 | | | | | | — | | | | | | 0.36 | | | | | | — | | | | | | 17.11 | | | | | | 20.23 | | | | | | 0.86 | | | | | | 0.63 | | | | | | 0.63 | | | | | | 1.17 | | | | | | 8,696 | | | | | | 68 | | |
| 12-31-16 | | | | | 13.84 | | | | | | 0.19• | | | | | | 0.71 | | | | | | 0.90 | | | | | | 0.06 | | | | | | 0.13 | | | | | | — | | | | | | 0.19 | | | | | | — | | | | | | 14.55 | | | | | | 6.48 | | | | | | 1.03 | | | | | | 0.66 | | | | | | 0.66 | | | | | | 1.34 | | | | | | 4,897 | | | | | | 72 | | |
| 12-31-15 | | | | | 14.89 | | | | | | 0.25• | | | | | | (0.26) | | | | | | (0.01) | | | | | | 0.35 | | | | | | 0.69 | | | | | | — | | | | | | 1.04 | | | | | | — | | | | | | 13.84 | | | | | | (0.33) | | | | | | 2.07 | | | | | | 0.67 | | | | | | 0.67 | | | | | | 1.72 | | | | | | 2,229 | | | | | | 108 | | |
| 12-31-14 | | | | | 14.04 | | | | | | 0.18• | | | | | | 0.73 | | | | | | 0.91 | | | | | | 0.01 | | | | | | 0.05 | | | | | | — | | | | | | 0.06 | | | | | | — | | | | | | 14.89 | | | | | | 6.51 | | | | | | 3.66 | | | | | | 0.67 | | | | | | 0.67 | | | | | | 1.23 | | | | | | 701 | | | | | | 80 | | |
| 12-31-13 | | | | | 12.45 | | | | | | 0.08 | | | | | | 2.58 | | | | | | 2.66 | | | | | | 0.21 | | | | | | 0.89 | | | | | | — | | | | | | 1.10 | | | | | | 0.03 | | | | | | 14.04 | | | | | | 22.31(c) | | | | | | 84.89 | | | | | | 0.64 | | | | | | 0.64 | | | | | | 0.63 | | | | | | 4 | | | | | | 67 | | |
| Class I | | | | | | | | | | | | | | | | | | | | | | | | | | | | | | | | | | | | | | | | | | | | | | | | | | | | | | | | | | | | | | | | | | | | | | | | | | | | | | | | | | | | | | | | | | | | | | | | | | | | | | | |
| 12-31-17 | | | | | 14.86 | | | | | | 0.29• | | | | | | 2.78 | | | | | | 3.07 | | | | | | 0.12 | | | | | | 0.28 | | | | | | — | | | | | | 0.40 | | | | | | — | | | | | | 17.53 | | | | | | 20.85 | | | | | | 0.36 | | | | | | 0.13 | | | | | | 0.13 | | | | | | 1.76 | | | | | | 7,753 | | | | | | 68 | | |
| 12-31-16 | | | | | 14.07 | | | | | | 0.31• | | | | | | 0.68 | | | | | | 0.99 | | | | | | 0.07 | | | | | | 0.13 | | | | | | — | | | | | | 0.20 | | | | | | — | | | | | | 14.86 | | | | | | 7.06 | | | | | | 0.53 | | | | | | 0.16 | | | | | | 0.16 | | | | | | 2.14 | | | | | | 2,887 | | | | | | 72 | | |
| 12-31-15 | | | | | 15.08 | | | | | | 0.43• | | | | | | (0.36) | | | | | | 0.07 | | | | | | 0.39 | | | | | | 0.69 | | | | | | — | | | | | | 1.08 | | | | | | — | | | | | | 14.07 | | | | | | 0.22 | | | | | | 1.57 | | | | | | 0.17 | | | | | | 0.17 | | | | | | 3.06 | | | | | | 487 | | | | | | 108 | | |
| 12-31-14 | | | | | 14.14 | | | | | | 0.17 | | | | | | 0.82 | | | | | | 0.99 | | | | | | — | | | | | | 0.05 | | | | | | — | | | | | | 0.05 | | | | | | — | | | | | | 15.08 | | | | | | 7.04 | | | | | | 3.16 | | | | | | 0.17 | | | | | | 0.17 | | | | | | 1.14 | | | | | | 5 | | | | | | 80 | | |
| 12-31-13 | | | | | 12.52 | | | | | | 0.15 | | | | | | 2.60 | | | | | | 2.75 | | | | | | 0.27 | | | | | | 0.89 | | | | | | — | | | | | | 1.16 | | | | | | 0.03 | | | | | | 14.14 | | | | | | 22.99(c) | | | | | | 84.39 | | | | | | 0.14 | | | | | | 0.14 | | | | | | 1.11 | | | | | | 4 | | | | | | 67 | | |
| Class S | | | | | | | | | | | | | | | | | | | | | | | | | | | | | | | | | | | | | | | | | | | | | | | | | | | | | | | | | | | | | | | | | | | | | | | | | | | | | | | | | | | | | | | | | | | | | | | | | | | | | | | |
| 12-31-17 | | | | | 14.78 | | | | | | 0.23• | | | | | | 2.78 | | | | | | 3.01 | | | | | | 0.11 | | | | | | 0.28 | | | | | | — | | | | | | 0.39 | | | | | | — | | | | | | 17.40 | | | | | | 20.53 | | | | | | 0.61 | | | | | | 0.38 | | | | | | 0.38 | | | | | | 1.45 | | | | | | 6,732 | | | | | | 68 | | |
| 12-31-16 | | | | | 14.03 | | | | | | 0.25• | | | | | | 0.70 | | | | | | 0.95 | | | | | | 0.07 | | | | | | 0.13 | | | | | | — | | | | | | 0.20 | | | | | | — | | | | | | 14.78 | | | | | | 6.79 | | | | | | 0.78 | | | | | | 0.41 | | | | | | 0.41 | | | | | | 1.75 | | | | | | 3,217 | | | | | | 72 | | |
| 12-31-15 | | | | | 15.02 | | | | | | 0.49• | | | | | | (0.45) | | | | | | 0.04 | | | | | | 0.34 | | | | | | 0.69 | | | | | | — | | | | | | 1.03 | | | | | | — | | | | | | 14.03 | | | | | | 0.03 | | | | | | 1.82 | | | | | | 0.42 | | | | | | 0.42 | | | | | | 3.50 | | | | | | 610 | | | | | | 108 | | |
| 12-31-14 | | | | | 14.15 | | | | | | 0.13 | | | | | | 0.79 | | | | | | 0.92 | | | | | | — | | | | | | 0.05 | | | | | | — | | | | | | 0.05 | | | | | | — | | | | | | 15.02 | | | | | | 6.54 | | | | | | 3.41 | | | | | | 0.42 | | | | | | 0.42 | | | | | | 0.90 | | | | | | 5 | | | | | | 80 | | |
| 12-31-13 | | | | | 12.48 | | | | | | 0.11 | | | | | | 2.59 | | | | | | 2.70 | | | | | | 0.17 | | | | | | 0.89 | | | | | | — | | | | | | 1.06 | | | | | | 0.03 | | | | | | 14.15 | | | | | | 22.57(c) | | | | | | 84.64 | | | | | | 0.39 | | | | | | 0.39 | | | | | | 0.84 | | | | | | 4 | | | | | | 67 | | |
| Class S2 | | | | | | | | | | | | | | | | | | | | | | | | | | | | | | | | | | | | | | | | | | | | | | | | | | | | | | | | | | | | | | | | | | | | | | | | | | | | | | | | | | | | | | | | | | | | | | | | | | | | | | | |
| 12-31-17 | | | | | 14.62 | | | | | | 0.26• | | | | | | 2.69 | | | | | | 2.95 | | | | | | 0.11 | | | | | | 0.28 | | | | | | — | | | | | | 0.39 | | | | | | — | | | | | | 17.18 | | | | | | 20.31 | | | | | | 0.76 | | | | | | 0.53 | | | | | | 0.53 | | | | | | 1.61 | | | | | | 721 | | | | | | 68 | | |
| 12-31-16 | | | | | 13.90 | | | | | | 0.20• | | | | | | 0.72 | | | | | | 0.92 | | | | | | 0.07 | | | | | | 0.13 | | | | | | — | | | | | | 0.20 | | | | | | — | | | | | | 14.62 | | | | | | 6.64 | | | | | | 0.96 | | | | | | 0.56 | | | | | | 0.56 | | | | | | 1.41 | | | | | | 183 | | | | | | 72 | | |
| 12-31-15 | | | | | 14.93 | | | | | | 0.22• | | | | | | (0.23) | | | | | | (0.01) | | | | | | 0.33 | | | | | | 0.69 | | | | | | — | | | | | | 1.02 | | | | | | — | | | | | | 13.90 | | | | | | (0.33) | | | | | | 2.07 | | | | | | 0.57 | | | | | | 0.57 | | | | | | 1.46 | | | | | | 9 | | | | | | 108 | | |
| 12-31-14 | | | | | 14.05 | | | | | | 0.11 | | | | | | 0.82 | | | | | | 0.93 | | | | | | — | | | | | | 0.05 | | | | | | — | | | | | | 0.05 | | | | | | — | | | | | | 14.93 | | | | | | 6.66 | | | | | | 3.66 | | | | | | 0.57 | | | | | | 0.57 | | | | | | 0.76 | | | | | | 5 | | | | | | 80 | | |
| 12-31-13 | | | | | 12.47 | | | | | | 0.10 | | | | | | 2.56 | | | | | | 2.66 | | | | | | 0.22 | | | | | | 0.89 | | | | | | — | | | | | | 1.11 | | | | | | 0.03 | | | | | | 14.05 | | | | | | 22.30(c) | | | | | | 84.89 | | | | | | 0.54 | | | | | | 0.54 | | | | | | 0.71 | | | | | | 4 | | | | | | 67 | | |
| Class T | | | | | | | | | | | | | | | | | | | | | | | | | | | | | | | | | | | | | | | | | | | | | | | | | | | | | | | | | | | | | | | | | | | | | | | | | | | | | | | | | | | | | | | | | | | | | | | | | | | | | | | |
| 12-31-17 | | | | | 14.53 | | | | | | 0.17• | | | | | | 2.72 | | | | | | 2.89 | | | | | | 0.06 | | | | | | 0.28 | | | | | | — | | | | | | 0.34 | | | | | | — | | | | | | 17.08 | | | | | | 20.05 | | | | | | 1.06 | | | | | | 0.83 | | | | | | 0.83 | | | | | | 1.08 | | | | | | 20 | | | | | | 68 | | |
| 12-31-16 | | | | | 13.81 | | | | | | 0.17• | | | | | | 0.70 | | | | | | 0.87 | | | | | | 0.02 | | | | | | 0.13 | | | | | | — | | | | | | 0.15 | | | | | | — | | | | | | 14.53 | | | | | | 6.27 | | | | | | 1.25 | | | | | | 0.86 | | | | | | 0.86 | | | | | | 1.19 | | | | | | 12 | | | | | | 72 | | |
| 12-31-15 | | | | | 14.85 | | | | | | 0.10• | | | | | | (0.16) | | | | | | (0.06) | | | | | | 0.29 | | | | | | 0.69 | | | | | | — | | | | | | 0.98 | | | | | | — | | | | | | 13.81 | | | | | | (0.66) | | | | | | 2.32 | | | | | | 0.87 | | | | | | 0.87 | | | | | | 0.67 | | | | | | 4 | | | | | | 108 | | |
| 12-31-14 | | | | | 14.01 | | | | | | 0.06 | | | | | | 0.83 | | | | | | 0.89 | | | | | | — | | | | | | 0.05 | | | | | | — | | | | | | 0.05 | | | | | | — | | | | | | 14.85 | | | | | | 6.40 | | | | | | 3.91 | | | | | | 0.87 | | | | | | 0.87 | | | | | | 0.45 | | | | | | 4 | | | | | | 80 | | |
| 12-31-13 | | | | | 12.43 | | | | | | 0.06 | | | | | | 2.56 | | | | | | 2.62 | | | | | | 0.18 | | | | | | 0.89 | | | | | | — | | | | | | 1.07 | | | | | | 0.03 | | | | | | 14.01 | | | | | | 22.06(c) | | | | | | 85.14 | | | | | | 0.84 | | | | | | 0.84 | | | | | | 0.41 | | | | | | 4 | | | | | | 67 | | |
| Voya Solution 2045 Portfolio | | | | | | | | | | | | | | | | | | | | | | | | | | | | | | | | | | | | | | | | | | | | | | | | | | | | | | | | | | | | | | | | | | | | | | | | | | | | | | | | | | | | | | | | | | | | | | | | | | | | | | | |
| Class ADV | | | | | | | | | | | | | | | | | | | | | | | | | | | | | | | | | | | | | | | | | | | | | | | | | | | | | | | | | | | | | | | | | | | | | | | | | | | | | | | | | | | | | | | | | | | | | | | | | | | | | | | |
| 12-31-17 | | | | | 10.63 | | | | | | 0.10• | | | | | | 2.09 | | | | | | 2.19 | | | | | | 0.10 | | | | | | 0.32 | | | | | | — | | | | | | 0.42 | | | | | | — | | | | | | 12.40 | | | | | | 20.92 | | | | | | 0.75 | | | | | | 0.67 | | | | | | 0.67 | | | | | | 0.84 | | | | | | 177,624 | | | | | | 37 | | |
| 12-31-16 | | | | | 11.15 | | | | | | 0.09• | | | | | | 0.56 | | | | | | 0.65 | | | | | | 0.15 | | | | | | 1.02 | | | | | | — | | | | | | 1.17 | | | | | | — | | | | | | 10.63 | | | | | | 6.16 | | | | | | 0.75 | | | | | | 0.68 | | | | | | 0.68 | | | | | | 0.86 | | | | | | 176,397 | | | | | | 45 | | |
| 12-31-15 | | | | | 13.60 | | | | | | 0.07• | | | | | | (0.11) | | | | | | (0.04) | | | | | | 0.38 | | | | | | 2.03 | | | | | | — | | | | | | 2.41 | | | | | | — | | | | | | 11.15 | | | | | | (1.15) | | | | | | 0.75 | | | | | | 0.69 | | | | | | 0.69 | | | | | | 0.58 | | | | | | 197,360 | | | | | | 41 | | |
| 12-31-14 | | | | | 14.55 | | | | | | 0.08• | | | | | | 0.73 | | | | | | 0.81 | | | | | | 0.22 | | | | | | 1.54 | | | | | | — | | | | | | 1.76 | | | | | | — | | | | | | 13.60 | | | | | | 5.84 | | | | | | 0.74 | | | | | | 0.68 | | | | | | 0.68 | | | | | | 0.55 | | | | | | 237,641 | | | | | | 58 | | |
| 12-31-13 | | | | | 11.98 | | | | | | 0.06• | | | | | | 2.69 | | | | | | 2.75 | | | | | | 0.18 | | | | | | — | | | | | | — | | | | | | 0.18 | | | | | | — | | | | | | 14.55 | | | | | | 23.09 | | | | | | 0.74 | | | | | | 0.63 | | | | | | 0.63 | | | | | | 0.49 | | | | | | 266,469 | | | | | | 72 | | |
See Accompanying Notes to Financial Statements
Financial Highlights (continued)
| | | | | | | | | | Income
(loss) from
investment
operations | | | | | | | | | Less
Distributions | | | | | | | | | | | | | | | | | | | | | | | | | | | Ratios to average
net assets | | | Supplemental
Data | |
| | | | Net asset value, beginning of year
or period | | | Net investment income (loss) | | | Net realized and unrealized
gain (loss) | | | Total from investment operations | | | From net investment income | | | From net realized gains | | | From return of capital | | | Total distributions | | | Payment by affiliate | | | Net asset value, end of year
or period | | | Total Return(1) | | | Expenses before
reductions/additions(2)(3)(4) | | | Expenses net of fee waivers
and/or recoupments if any(2)(3)(4) | | | Expenses net of all
reductions/additions(2)(3)(4) | | | Net investment income (loss)(2)(3) | | | Net assets, end of year or period | | | Portfolio turnover rate | |
Year or
period ended | | | ($) | | | ($) | | | ($) | | | ($) | | | ($) | | | ($) | | | ($) | | | ($) | | | ($) | | | ($) | | | (%) | | | (%) | | | (%) | | | (%) | | | (%) | | | ($000’s) | | | (%) | |
| Voya Solution 2045 Portfolio (continued) | | | | | | | | | | | | | | | | | | | | | | | | | | | | | | | | | | | | | | | | | | | | | | | | | | | | | | | | | | | | | | | | | | | | | | | | | | | | | | | | | | | | | | | | | | | | | | | | | | | | | | | |
| Class I | | | | | | | | | | | | | | | | | | | | | | | | | | | | | | | | | | | | | | | | | | | | | | | | | | | | | | | | | | | | | | | | | | | | | | | | | | | | | | | | | | | | | | | | | | | | | | | | | | | | | | | |
| 12-31-17 | | | | | 10.92 | | | | | | 0.17• | | | | | | 2.14 | | | | | | 2.31 | | | | | | 0.16 | | | | | | 0.32 | | | | | | — | | | | | | 0.48 | | | | | | — | | | | | | 12.75 | | | | | | 21.53 | | | | | | 0.25 | | | | | | 0.17 | | | | | | 0.17 | | | | | | 1.42 | | | | | | 235,122 | | | | | | 37 | | |
| 12-31-16 | | | | | 11.44 | | | | | | 0.15 | | | | | | 0.57 | | | | | | 0.72 | | | | | | 0.22 | | | | | | 1.02 | | | | | | — | | | | | | 1.24 | | | | | | — | | | | | | 10.92 | | | | | | 6.63 | | | | | | 0.25 | | | | | | 0.18 | | | | | | 0.18 | | | | | | 1.41 | | | | | | 171,475 | | | | | | 45 | | |
| 12-31-15 | | | | | 13.90 | | | | | | 0.15• | | | | | | (0.12) | | | | | | 0.03 | | | | | | 0.46 | | | | | | 2.03 | | | | | | — | | | | | | 2.49 | | | | | | — | | | | | | 11.44 | | | | | | (0.59) | | | | | | 0.25 | | | | | | 0.19 | | | | | | 0.19 | | | | | | 1.15 | | | | | | 169,325 | | | | | | 41 | | |
| 12-31-14 | | | | | 14.84 | | | | | | 0.15 | | | | | | 0.75 | | | | | | 0.90 | | | | | | 0.30 | | | | | | 1.54 | | | | | | — | | | | | | 1.84 | | | | | | — | | | | | | 13.90 | | | | | | 6.34 | | | | | | 0.24 | | | | | | 0.18 | | | | | | 0.18 | | | | | | 1.04 | | | | | | 161,654 | | | | | | 58 | | |
| 12-31-13 | | | | | 12.21 | | | | | | 0.14• | | | | | | 2.74 | | | | | | 2.88 | | | | | | 0.25 | | | | | | — | | | | | | — | | | | | | 0.25 | | | | | | — | | | | | | 14.84 | | | | | | 23.74 | | | | | | 0.24 | | | | | | 0.13 | | | | | | 0.13 | | | | | | 1.07 | | | | | | 158,048 | | | | | | 72 | | |
| Class S | | | | | | | | | | | | | | | | | | | | | | | | | | | | | | | | | | | | | | | | | | | | | | | | | | | | | | | | | | | | | | | | | | | | | | | | | | | | | | | | | | | | | | | | | | | | | | | | | | | | | | | |
| 12-31-17 | | | | | 10.77 | | | | | | 0.13• | | | | | | 2.12 | | | | | | 2.25 | | | | | | 0.13 | | | | | | 0.32 | | | | | | — | | | | | | 0.45 | | | | | | — | | | | | | 12.57 | | | | | | 21.25 | | | | | | 0.50 | | | | | | 0.42 | | | | | | 0.42 | | | | | | 1.11 | | | | | | 269,521 | | | | | | 37 | | |
| 12-31-16 | | | | | 11.29 | | | | | | 0.14 | | | | | | 0.55 | | | | | | 0.69 | | | | | | 0.19 | | | | | | 1.02 | | | | | | — | | | | | | 1.21 | | | | | | — | | | | | | 10.77 | | | | | | 6.40 | | | | | | 0.50 | | | | | | 0.43 | | | | | | 0.43 | | | | | | 1.14 | | | | | | 256,935 | | | | | | 45 | | |
| 12-31-15 | | | | | 13.76 | | | | | | 0.12 | | | | | | (0.14) | | | | | | (0.02) | | | | | | 0.42 | | | | | | 2.03 | | | | | | — | | | | | | 2.45 | | | | | | — | | | | | | 11.29 | | | | | | (0.95) | | | | | | 0.50 | | | | | | 0.44 | | | | | | 0.44 | | | | | | 0.85 | | | | | | 270,222 | | | | | | 41 | | |
| 12-31-14 | | | | | 14.70 | | | | | | 0.12• | | | | | | 0.73 | | | | | | 0.85 | | | | | | 0.25 | | | | | | 1.54 | | | | | | — | | | | | | 1.79 | | | | | | — | | | | | | 13.76 | | | | | | 6.10 | | | | | | 0.49 | | | | | | 0.43 | | | | | | 0.43 | | | | | | 0.83 | | | | | | 301,617 | | | | | | 58 | | |
| 12-31-13 | | | | | 12.10 | | | | | | 0.10• | | | | | | 2.72 | | | | | | 2.82 | | | | | | 0.22 | | | | | | — | | | | | | — | | | | | | 0.22 | | | | | | — | | | | | | 14.70 | | | | | | 23.45 | | | | | | 0.49 | | | | | | 0.38 | | | | | | 0.38 | | | | | | 0.74 | | | | | | 350,686 | | | | | | 72 | | |
| Class S2 | | | | | | | | | | | | | | | | | | | | | | | | | | | | | | | | | | | | | | | | | | | | | | | | | | | | | | | | | | | | | | | | | | | | | | | | | | | | | | | | | | | | | | | | | | | | | | | | | | | | | | | |
| 12-31-17 | | | | | 10.51 | | | | | | 0.09• | | | | | | 2.08 | | | | | | 2.17 | | | | | | 0.11 | | | | | | 0.32 | | | | | | — | | | | | | 0.43 | | | | | | — | | | | | | 12.25 | | | | | | 21.02 | | | | | | 0.65 | | | | | | 0.57 | | | | | | 0.57 | | | | | | 0.82 | | | | | | 9,902 | | | | | | 37 | | |
| 12-31-16 | | | | | 11.04 | | | | | | 0.11 | | | | | | 0.55 | | | | | | 0.66 | | | | | | 0.17 | | | | | | 1.02 | | | | | | — | | | | | | 1.19 | | | | | | — | | | | | | 10.51 | | | | | | 6.28 | | | | | | 0.68 | | | | | | 0.58 | | | | | | 0.58 | | | | | | 0.96 | | | | | | 12,687 | | | | | | 45 | | |
| 12-31-15 | | | | | 13.49 | | | | | | 0.08• | | | | | | (0.11) | | | | | | (0.03) | | | | | | 0.39 | | | | | | 2.03 | | | | | | — | | | | | | 2.42 | | | | | | — | | | | | | 11.04 | | | | | | (1.07) | | | | | | 0.75 | | | | | | 0.59 | | | | | | 0.59 | | | | | | 0.65 | | | | | | 13,402 | | | | | | 41 | | |
| 12-31-14 | | | | | 14.45 | | | | | | 0.09• | | | | | | 0.72 | | | | | | 0.81 | | | | | | 0.23 | | | | | | 1.54 | | | | | | — | | | | | | 1.77 | | | | | | — | | | | | | 13.49 | | | | | | 5.87 | | | | | | 0.74 | | | | | | 0.58 | | | | | | 0.58 | | | | | | 0.67 | | | | | | 19,353 | | | | | | 58 | | |
| 12-31-13 | | | | | 11.89 | | | | | | 0.07• | | | | | | 2.68 | | | | | | 2.75 | | | | | | 0.19 | | | | | | — | | | | | | — | | | | | | 0.19 | | | | | | — | | | | | | 14.45 | | | | | | 23.26 | | | | | | 0.74 | | | | | | 0.53 | | | | | | 0.53 | | | | | | 0.52 | | | | | | 19,968 | | | | | | 72 | | |
| Class T | | | | | | | | | | | | | | | | | | | | | | | | | | | | | | | | | | | | | | | | | | | | | | | | | | | | | | | | | | | | | | | | | | | | | | | | | | | | | | | | | | | | | | | | | | | | | | | | | | | | | | | |
| 12-31-17 | | | | | 10.95 | | | | | | 0.08 | | | | | | 2.15 | | | | | | 2.23 | | | | | | 0.09 | | | | | | 0.32 | | | | | | — | | | | | | 0.41 | | | | | | — | | | | | | 12.77 | | | | | | 20.69 | | | | | | 0.95 | | | | | | 0.87 | | | | | | 0.87 | | | | | | 0.70 | | | | | | 508 | | | | | | 37 | | |
| 12-31-16 | | | | | 11.46 | | | | | | 0.07 | | | | | | 0.58 | | | | | | 0.65 | | | | | | 0.14 | | | | | | 1.02 | | | | | | — | | | | | | 1.16 | | | | | | — | | | | | | 10.95 | | | | | | 5.94 | | | | | | 0.97 | | | | | | 0.88 | | | | | | 0.88 | | | | | | 0.70 | | | | | | 418 | | | | | | 45 | | |
| 12-31-15 | | | | | 13.77 | | | | | | 0.06• | | | | | | (0.13) | | | | | | (0.07) | | | | | | 0.21 | | | | | | 2.03 | | | | | | — | | | | | | 2.24 | | | | | | — | | | | | | 11.46 | | | | | | (1.31) | | | | | | 1.00 | | | | | | 0.89 | | | | | | 0.89 | | | | | | 0.44 | | | | | | 393 | | | | | | 41 | | |
| 12-31-14 | | | | | 14.73 | | | | | | (0.00)*• | | | | | | 0.78 | | | | | | 0.78 | | | | | | 0.20 | | | | | | 1.54 | | | | | | — | | | | | | 1.74 | | | | | | — | | | | | | 13.77 | | | | | | 5.53 | | | | | | 0.99 | | | | | | 0.88 | | | | | | 0.88 | | | | | | (0.00)* | | | | | | 376 | | | | | | 58 | | |
| 12-31-13 | | | | | 12.10 | | | | | | 0.04• | | | | | | 2.72 | | | | | | 2.76 | | | | | | 0.13 | | | | | | — | | | | | | — | | | | | | 0.13 | | | | | | — | | | | | | 14.73 | | | | | | 22.93 | | | | | | 0.99 | | | | | | 0.83 | | | | | | 0.83 | | | | | | 0.27 | | | | | | 1,068 | | | | | | 72 | | |
| Voya Solution 2050 Portfolio | | | | | | | | | | | | | | | | | | | | | | | | | | | | | | | | | | | | | | | | | | | | | | | | | | | | | | | | | | | | | | | | | | | | | | | | | | | | | | | | | | | | | | | | | | | | | | | | | | | | | | | |
| Class ADV | | | | | | | | | | | | | | | | | | | | | | | | | | | | | | | | | | | | | | | | | | | | | | | | | | | | | | | | | | | | | | | | | | | | | | | | | | | | | | | | | | | | | | | | | | | | | | | | | | | | | | | |
| 12-31-17 | | | | | 14.57 | | | | | | 0.18• | | | | | | 2.89 | | | | | | 3.07 | | | | | | 0.06 | | | | | | 0.25 | | | | | | — | | | | | | 0.31 | | | | | | — | | | | | | 17.33 | | | | | | 21.30 | | | | | | 0.93 | | | | | | 0.65 | | | | | | 0.65 | | | | | | 1.11 | | | | | | 6,983 | | | | | | 52 | | |
| 12-31-16 | | | | | 13.86 | | | | | | 0.18• | | | | | | 0.68 | | | | | | 0.86 | | | | | | 0.04 | | | | | | 0.11 | | | | | | — | | | | | | 0.15 | | | | | | — | | | | | | 14.57 | | | | | | 6.27 | | | | | | 1.22 | | | | | | 0.68 | | | | | | 0.68 | | | | | | 1.26 | | | | | | 3,184 | | | | | | 70 | | |
| 12-31-15 | | | | | 14.95 | | | | | | 0.18• | | | | | | (0.19) | | | | | | (0.01) | | | | | | 0.35 | | | | | | 0.73 | | | | | | — | | | | | | 1.08 | | | | | | — | | | | | | 13.86 | | | | | | (0.33) | | | | | | 3.24 | | | | | | 0.69 | | | | | | 0.69 | | | | | | 1.22 | | | | | | 960 | | | | | | 67 | | |
| 12-31-14 | | | | | 14.16 | | | | | | 0.17• | | | | | | 0.74 | | | | | | 0.91 | | | | | | 0.01 | | | | | | 0.11 | | | | | | — | | | | | | 0.12 | | | | | | — | | | | | | 14.95 | | | | | | 6.49 | | | | | | 6.49 | | | | | | 0.68 | | | | | | 0.68 | | | | | | 1.15 | | | | | | 355 | | | | | | 51 | | |
| 12-31-13 | | | | | 12.44 | | | | | | 0.06 | | | | | | 2.70 | | | | | | 2.76 | | | | | | 0.19 | | | | | | 0.88 | | | | | | — | | | | | | 1.07 | | | | | | 0.03 | | | | | | 14.16 | | | | | | 23.18(d) | | | | | | 84.37 | | | | | | 0.64 | | | | | | 0.64 | | | | | | 0.48 | | | | | | 4 | | | | | | 65 | | |
| Class I | | | | | | | | | | | | | | | | | | | | | | | | | | | | | | | | | | | | | | | | | | | | | | | | | | | | | | | | | | | | | | | | | | | | | | | | | | | | | | | | | | | | | | | | | | | | | | | | | | | | | | | |
| 12-31-17 | | | | | 14.91 | | | | | | 0.28• | | | | | | 2.97 | | | | | | 3.25 | | | | | | 0.10 | | | | | | 0.25 | | | | | | — | | | | | | 0.35 | | | | | | — | | | | | | 17.81 | | | | | | 21.99 | | | | | | 0.43 | | | | | | 0.15 | | | | | | 0.15 | | | | | | 1.70 | | | | | | 5,705 | | | | | | 52 | | |
| 12-31-16 | | | | | 14.13 | | | | | | 0.28• | | | | | | 0.67 | | | | | | 0.95 | | | | | | 0.06 | | | | | | 0.11 | | | | | | — | | | | | | 0.17 | | | | | | — | | | | | | 14.91 | | | | | | 6.75 | | | | | | 0.72 | | | | | | 0.18 | | | | | | 0.18 | | | | | | 1.92 | | | | | | 1,452 | | | | | | 70 | | |
| 12-31-15 | | | | | 15.15 | | | | | | 0.53• | | | | | | (0.43) | | | | | | 0.10 | | | | | | 0.39 | | | | | | 0.73 | | | | | | — | | | | | | 1.12 | | | | | | — | | | | | | 14.13 | | | | | | 0.38 | | | | | | 2.74 | | | | | | 0.19 | | | | | | 0.19 | | | | | | 3.80 | | | | | | 387 | | | | | | 67 | | |
| 12-31-14 | | | | | 14.26 | | | | | | 0.14 | | | | | | 0.86 | | | | | | 1.00 | | | | | | — | | | | | | 0.11 | | | | | | — | | | | | | 0.11 | | | | | | — | | | | | | 15.15 | | | | | | 7.04 | | | | | | 5.99 | | | | | | 0.18 | | | | | | 0.18 | | | | | | 0.97 | | | | | | 5 | | | | | | 51 | | |
| 12-31-13 | | | | | 12.51 | | | | | | 0.13 | | | | | | 2.73 | | | | | | 2.86 | | | | | | 0.26 | | | | | | 0.88 | | | | | | — | | | | | | 1.14 | | | | | | 0.03 | | | | | | 14.26 | | | | | | 23.84(d) | | | | | | 84.87 | | | | | | 0.14 | | | | | | 0.14 | | | | | | 0.98 | | | | | | 4 | | | | | | 65 | | |
See Accompanying Notes to Financial Statements
Financial Highlights (continued)
| | | | | | | | | | Income
(loss) from
investment
operations | | | | | | | | | Less
Distributions | | | | | | | | | | | | | | | | | | | | | | | | | | | Ratios to average
net assets | | | Supplemental
Data | |
| | | | Net asset value, beginning of year
or period | | | Net investment income (loss) | | | Net realized and unrealized
gain (loss) | | | Total from investment operations | | | From net investment income | | | From net realized gains | | | From return of capital | | | Total distributions | | | Payment by affiliate | | | Net asset value, end of year
or period | | | Total Return(1) | | | Expenses before
reductions/additions(2)(3)(4) | | | Expenses net of fee waivers
and/or recoupments if any(2)(3)(4) | | | Expenses net of all
reductions/additions(2)(3)(4) | | | Net investment income (loss)(2)(3) | | | Net assets, end of year or period | | | Portfolio turnover rate | |
Year or
period ended | | | ($) | | | ($) | | | ($) | | | ($) | | | ($) | | | ($) | | | ($) | | | ($) | | | ($) | | | ($) | | | (%) | | | (%) | | | (%) | | | (%) | | | (%) | | | ($000’s) | | | (%) | |
| Voya Solution 2050 Portfolio (continued) | | | | | | | | | | | | | | | | | | | | | | | | | | | | | | | | | | | | | | | | | | | | | | | | | | | | | | | | | | | | | | | | | | | | | | | | | | | | | | | | | | | | | | | | | | | | | | | | | | | | | | | |
| Class S | | | | | | | | | | | | | | | | | | | | | | | | | | | | | | | | | | | | | | | | | | | | | | | | | | | | | | | | | | | | | | | | | | | | | | | | | | | | | | | | | | | | | | | | | | | | | | | | | | | | | | | |
| 12-31-17 | | | | | 14.81 | | | | | | 0.22• | | | | | | 2.95 | | | | | | 3.17 | | | | | | 0.08 | | | | | | 0.25 | | | | | | — | | | | | | 0.33 | | | | | | — | | | | | | 17.65 | | | | | | 21.63 | | | | | | 0.68 | | | | | | 0.40 | | | | | | 0.40 | | | | | | 1.33 | | | | | | 4,424 | | | | | | 52 | | |
| 12-31-16 | | | | | 14.06 | | | | | | 0.24• | | | | | | 0.68 | | | | | | 0.92 | | | | | | 0.06 | | | | | | 0.11 | | | | | | — | | | | | | 0.17 | | | | | | — | | | | | | 14.81 | | | | | | 6.56 | | | | | | 0.97 | | | | | | 0.43 | | | | | | 0.43 | | | | | | 1.71 | | | | | | 1,996 | | | | | | 70 | | |
| 12-31-15 | | | | | 15.09 | | | | | | 0.38• | | | | | | (0.34) | | | | | | 0.04 | | | | | | 0.34 | | | | | | 0.73 | | | | | | — | | | | | | 1.07 | | | | | | — | | | | | | 14.06 | | | | | | 0.00 | | | | | | 2.99 | | | | | | 0.44 | | | | | | 0.44 | | | | | | 2.70 | | | | | | 317 | | | | | | 67 | | |
| 12-31-14 | | | | | 14.25 | | | | | | 0.13 | | | | | | 0.82 | | | | | | 0.95 | | | | | | — | | | | | | 0.11 | | | | | | — | | | | | | 0.11 | | | | | | — | | | | | | 15.09 | | | | | | 6.69 | | | | | | 6.24 | | | | | | 0.43 | | | | | | 0.43 | | | | | | 0.87 | | | | | | 5 | | | | | | 51 | | |
| 12-31-13 | | | | | 12.46 | | | | | | 0.09 | | | | | | 2.71 | | | | | | 2.80 | | | | | | 0.16 | | | | | | 0.88 | | | | | | — | | | | | | 1.04 | | | | | | 0.03 | | | | | | 14.25 | | | | | | 23.37(d) | | | | | | 84.12 | | | | | | 0.39 | | | | | | 0.39 | | | | | | 0.66 | | | | | | 4 | | | | | | 65 | | |
| Class S2 | | | | | | | | | | | | | | | | | | | | | | | | | | | | | | | | | | | | | | | | | | | | | | | | | | | | | | | | | | | | | | | | | | | | | | | | | | | | | | | | | | | | | | | | | | | | | | | | | | | | | | | |
| 12-31-17 | | | | | 14.64 | | | | | | 0.20• | | | | | | 2.91 | | | | | | 3.11 | | | | | | 0.07 | | | | | | 0.25 | | | | | | — | | | | | | 0.32 | | | | | | — | | | | | | 17.43 | | | | | | 21.47 | | | | | | 0.83 | | | | | | 0.55 | | | | | | 0.55 | | | | | | 1.21 | | | | | | 309 | | | | | | 52 | | |
| 12-31-16 | | | | | 13.93 | | | | | | 0.20• | | | | | | 0.67 | | | | | | 0.87 | | | | | | 0.05 | | | | | | 0.11 | | | | | | — | | | | | | 0.16 | | | | | | — | | | | | | 14.64 | | | | | | 6.32 | | | | | | 1.15 | | | | | | 0.58 | | | | | | 0.58 | | | | | | 1.44 | | | | | | 142 | | | | | | 70 | | |
| 12-31-15 | | | | | 14.97 | | | | | | 0.13• | | | | | | (0.11) | | | | | | 0.02 | | | | | | 0.33 | | | | | | 0.73 | | | | | | — | | | | | | 1.06 | | | | | | — | | | | | | 13.93 | | | | | | (0.17) | | | | | | 3.24 | | | | | | 0.59 | | | | | | 0.59 | | | | | | 0.89 | | | | | | 9 | | | | | | 67 | | |
| 12-31-14 | | | | | 14.15 | | | | | | 0.08 | | | | | | 0.85 | | | | | | 0.93 | | | | | | — | | | | | | 0.11 | | | | | | — | | | | | | 0.11 | | | | | | — | | | | | | 14.97 | | | | | | 6.59 | | | | | | 6.49 | | | | | | 0.58 | | | | | | 0.58 | | | | | | 0.58 | | | | | | 5 | | | | | | 51 | | |
| 12-31-13 | | | | | 12.45 | | | | | | 0.08 | | | | | | 2.68 | | | | | | 2.76 | | | | | | 0.21 | | | | | | 0.88 | | | | | | — | | | | | | 1.09 | | | | | | 0.03 | | | | | | 14.15 | | | | | | 23.09(d) | | | | | | 84.37 | | | | | | 0.54 | | | | | | 0.54 | | | | | | 0.58 | | | | | | 4 | | | | | | 65 | | |
| Class T | | | | | | | | | | | | | | | | | | | | | | | | | | | | | | | | | | | | | | | | | | | | | | | | | | | | | | | | | | | | | | | | | | | | | | | | | | | | | | | | | | | | | | | | | | | | | | | | | | | | | | | |
| 12-31-17 | | | | | 14.60 | | | | | | 0.17• | | | | | | 2.89 | | | | | | 3.06 | | | | | | 0.02 | | | | | | 0.25 | | | | | | — | | | | | | 0.27 | | | | | | — | | | | | | 17.39 | | | | | | 21.15 | | | | | | 1.13 | | | | | | 0.85 | | | | | | 0.85 | | | | | | 1.05 | | | | | | 20 | | | | | | 52 | | |
| 12-31-16 | | | | | 13.88 | | | | | | 0.13• | | | | | | 0.70 | | | | | | 0.83 | | | | | | — | | | | | | 0.11 | | | | | | — | | | | | | 0.11 | | | | | | — | | | | | | 14.60 | | | | | | 6.02 | | | | | | 1.44 | | | | | | 0.88 | | | | | | 0.88 | | | | | | 0.96 | | | | | | 10 | | | | | | 70 | | |
| 12-31-15 | | | | | 14.95 | | | | | | 0.08 | | | | | | (0.13) | | | | | | (0.05) | | | | | | 0.29 | | | | | | 0.73 | | | | | | — | | | | | | 1.02 | | | | | | — | | | | | | 13.88 | | | | | | (0.60) | | | | | | 3.49 | | | | | | 0.89 | | | | | | 0.89 | | | | | | 0.51 | | | | | | 4 | | | | | | 67 | | |
| 12-31-14 | | | | | 14.17 | | | | | | 0.04 | | | | | | 0.85 | | | | | | 0.89 | | | | | | — | | | | | | 0.11 | | | | | | — | | | | | | 0.11 | | | | | | — | | | | | | 14.95 | | | | | | 6.30 | | | | | | 6.74 | | | | | | 0.88 | | | | | | 0.88 | | | | | | 0.28 | | | | | | 5 | | | | | | 51 | | |
| 12-31-13 | | | | | 12.42 | | | | | | 0.04 | | | | | | 2.73 | | | | | | 2.77 | | | | | | 0.17 | | | | | | 0.88 | | | | | | — | | | | | | 1.05 | | | | | | 0.03 | | | | | | 14.17 | | | | | | 23.28(d) | | | | | | 84.62 | | | | | | 0.84 | | | | | | 0.84 | | | | | | 0.26 | | | | | | 4 | | | | | | 65 | | |
| Voya Solution 2055 Portfolio | | | | | | | | | | | | | | | | | | | | | | | | | | | | | | | | | | | | | | | | | | | | | | | | | | | | | | | | | | | | | | | | | | | | | | | | | | | | | | | | | | | | | | | | | | | | | | | | | | | | | | | |
| Class ADV | | | | | | | | | | | | | | | | | | | | | | | | | | | | | | | | | | | | | | | | | | | | | | | | | | | | | | | | | | | | | | | | | | | | | | | | | | | | | | | | | | | | | | | | | | | | | | | | | | | | | | | |
| 12-31-17 | | | | | 12.27 | | | | | | 0.11• | | | | | | 2.49 | | | | | | 2.60 | | | | | | 0.10 | | | | | | 0.28 | | | | | | — | | | | | | 0.38 | | | | | | — | | | | | | 14.49 | | | | | | 21.40 | | | | | | 0.76 | | | | | | 0.66 | | | | | | 0.66 | | | | | | 0.82 | | | | | | 47,367 | | | | | | 40 | | |
| 12-31-16 | | | | | 12.52 | | | | | | 0.11 | | | | | | 0.64 | | | | | | 0.75 | | | | | | 0.15 | | | | | | 0.85 | | | | | | — | | | | | | 1.00 | | | | | | — | | | | | | 12.27 | | | | | | 6.13 | | | | | | 0.76 | | | | | | 0.69 | | | | | | 0.69 | | | | | | 0.88 | | | | | | 42,793 | | | | | | 58 | | |
| 12-31-15 | | | | | 14.27 | | | | | | 0.08• | | | | | | (0.17) | | | | | | (0.09) | | | | | | 0.32 | | | | | | 1.34 | | | | | | — | | | | | | 1.66 | | | | | | — | | | | | | 12.52 | | | | | | (1.15) | | | | | | 0.76 | | | | | | 0.70 | | | | | | 0.70 | | | | | | 0.61 | | | | | | 41,770 | | | | | | 41 | | |
| 12-31-14 | | | | | 14.46 | | | | | | 0.09• | | | | | | 0.76 | | | | | | 0.85 | | | | | | 0.18 | | | | | | 0.86 | | | | | | — | | | | | | 1.04 | | | | | | — | | | | | | 14.27 | | | | | | 6.03 | | | | | | 0.77 | | | | | | 0.68 | | | | | | 0.68 | | | | | | 0.60 | | | | | | 38,558 | | | | | | 72 | | |
| 12-31-13 | | | | | 12.05 | | | | | | 0.08• | | | | | | 2.69 | | | | | | 2.77 | | | | | | 0.14 | | | | | | 0.22 | | | | | | — | | | | | | 0.36 | | | | | | — | | | | | | 14.46 | | | | | | 23.19 | | | | | | 0.76 | | | | | | 0.63 | | | | | | 0.63 | | | | | | 0.61 | | | | | | 34,195 | | | | | | 73 | | |
| Class I | | | | | | | | | | | | | | | | | | | | | | | | | | | | | | | | | | | | | | | | | | | | | | | | | | | | | | | | | | | | | | | | | | | | | | | | | | | | | | | | | | | | | | | | | | | | | | | | | | | | | | | |
| 12-31-17 | | | | | 12.51 | | | | | | 0.20• | | | | | | 2.51 | | | | | | 2.71 | | | | | | 0.16 | | | | | | 0.28 | | | | | | — | | | | | | 0.44 | | | | | | — | | | | | | 14.78 | | | | | | 21.94 | | | | | | 0.26 | | | | | | 0.16 | | | | | | 0.16 | | | | | | 1.42 | | | | | | 73,894 | | | | | | 40 | | |
| 12-31-16 | | | | | 12.74 | | | | | | 0.18• | | | | | | 0.65 | | | | | | 0.83 | | | | | | 0.21 | | | | | | 0.85 | | | | | | — | | | | | | 1.06 | | | | | | — | | | | | | 12.51 | | | | | | 6.72 | | | | | | 0.26 | | | | | | 0.19 | | | | | | 0.19 | | | | | | 1.46 | | | | | | 44,519 | | | | | | 58 | | |
| 12-31-15 | | | | | 14.49 | | | | | | 0.17• | | | | | | (0.19) | | | | | | (0.02) | | | | | | 0.39 | | | | | | 1.34 | | | | | | — | | | | | | 1.73 | | | | | | — | | | | | | 12.74 | | | | | | (0.67) | | | | | | 0.26 | | | | | | 0.20 | | | | | | 0.20 | | | | | | 1.22 | | | | | | 36,692 | | | | | | 41 | | |
| 12-31-14 | | | | | 14.65 | | | | | | 0.17• | | | | | | 0.76 | | | | | | 0.93 | | | | | | 0.23 | | | | | | 0.86 | | | | | | — | | | | | | 1.09 | | | | | | — | | | | | | 14.49 | | | | | | 6.56 | | | | | | 0.27 | | | | | | 0.18 | | | | | | 0.18 | | | | | | 1.15 | | | | | | 24,787 | | | | | | 72 | | |
| 12-31-13 | | | | | 12.17 | | | | | | 0.17• | | | | | | 2.71 | | | | | | 2.88 | | | | | | 0.18 | | | | | | 0.22 | | | | | | — | | | | | | 0.40 | | | | | | — | | | | | | 14.65 | | | | | | 23.89 | | | | | | 0.26 | | | | | | 0.13 | | | | | | 0.13 | | | | | | 1.24 | | | | | | 16,948 | | | | | | 73 | | |
| Class S | | | | | | | | | | | | | | | | | | | | | | | | | | | | | | | | | | | | | | | | | | | | | | | | | | | | | | | | | | | | | | | | | | | | | | | | | | | | | | | | | | | | | | | | | | | | | | | | | | | | | | | |
| 12-31-17 | | | | | 12.38 | | | | | | 0.15• | | | | | | 2.50 | | | | | | 2.65 | | | | | | 0.13 | | | | | | 0.28 | | | | | | — | | | | | | 0.41 | | | | | | — | | | | | | 14.62 | | | | | | 21.66 | | | | | | 0.51 | | | | | | 0.41 | | | | | | 0.41 | | | | | | 1.08 | | | | | | 58,217 | | | | | | 40 | | |
| 12-31-16 | | | | | 12.62 | | | | | | 0.13 | | | | | | 0.66 | | | | | | 0.79 | | | | | | 0.18 | | | | | | 0.85 | | | | | | — | | | | | | 1.03 | | | | | | — | | | | | | 12.38 | | | | | | 6.44 | | | | | | 0.51 | | | | | | 0.44 | | | | | | 0.44 | | | | | | 1.16 | | | | | | 51,294 | | | | | | 58 | | |
| 12-31-15 | | | | | 14.37 | | | | | | 0.12• | | | | | | (0.17) | | | | | | (0.05) | | | | | | 0.36 | | | | | | 1.34 | | | | | | — | | | | | | 1.70 | | | | | | — | | | | | | 12.62 | | | | | | (0.87) | | | | | | 0.51 | | | | | | 0.45 | | | | | | 0.45 | | | | | | 0.86 | | | | | | 46,913 | | | | | | 41 | | |
| 12-31-14 | | | | | 14.55 | | | | | | 0.14• | | | | | | 0.74 | | | | | | 0.88 | | | | | | 0.20 | | | | | | 0.86 | | | | | | — | | | | | | 1.06 | | | | | | — | | | | | | 14.37 | | | | | | 6.25 | | | | | | 0.52 | | | | | | 0.43 | | | | | | 0.43 | | | | | | 0.93 | | | | | | 43,206 | | | | | | 72 | | |
| 12-31-13 | | | | | 12.11 | | | | | | 0.12• | | | | | | 2.70 | | | | | | 2.82 | | | | | | 0.16 | | | | | | 0.22 | | | | | | — | | | | | | 0.38 | | | | | | — | | | | | | 14.55 | | | | | | 23.52 | | | | | | 0.51 | | | | | | 0.38 | | | | | | 0.38 | | | | | | 0.90 | | | | | | 37,658 | | | | | | 73 | | |
See Accompanying Notes to Financial Statements
Financial Highlights (continued)
| | | | | | | | | | Income
(loss) from
investment
operations | | | | | | | | | Less
Distributions | | | | | | | | | | | | | | | | | | | | | | | | | | | Ratios to average
net assets | | | Supplemental
Data | |
| | | | Net asset value, beginning of year
or period | | | Net investment income (loss) | | | Net realized and unrealized
gain (loss) | | | Total from investment operations | | | From net investment income | | | From net realized gains | | | From return of capital | | | Total distributions | | | Payment by affiliate | | | Net asset value, end of year
or period | | | Total Return(1) | | | Expenses before
reductions/additions(2)(3)(4) | | | Expenses net of fee waivers
and/or recoupments if any(2)(3)(4) | | | Expenses net of all
reductions/additions(2)(3)(4) | | | Net investment income (loss)(2)(3) | | | Net assets, end of year or period | | | Portfolio turnover rate | |
Year or
period ended | | | ($) | | | ($) | | | ($) | | | ($) | | | ($) | | | ($) | | | ($) | | | ($) | | | ($) | | | ($) | | | (%) | | | (%) | | | (%) | | | (%) | | | (%) | | | ($000’s) | | | (%) | |
| Voya Solution 2055 Portfolio (continued) | | | | | | | | | | | | | | | | | | | | | | | | | | | | | | | | | | | | | | | | | | | | | | | | | | | | | | | | | | | | | | | | | | | | | | | | | | | | | | | | | | | | | | | | | | | | | | | | | | | | | | | |
| Class S2 | | | | | | | | | | | | | | | | | | | | | | | | | | | | | | | | | | | | | | | | | | | | | | | | | | | | | | | | | | | | | | | | | | | | | | | | | | | | | | | | | | | | | | | | | | | | | | | | | | | | | | | |
| 12-31-17 | | | | | 12.31 | | | | | | 0.12• | | | | | | 2.50 | | | | | | 2.62 | | | | | | 0.11 | | | | | | 0.28 | | | | | | — | | | | | | 0.39 | | | | | | — | | | | | | 14.54 | | | | | | 21.52 | | | | | | 0.66 | | | | | | 0.56 | | | | | | 0.56 | | | | | | 0.89 | | | | | | 3,250 | | | | | | 40 | | |
| 12-31-16 | | | | | 12.56 | | | | | | 0.11 | | | | | | 0.65 | | | | | | 0.76 | | | | | | 0.16 | | | | | | 0.85 | | | | | | — | | | | | | 1.01 | | | | | | — | | | | | | 12.31 | | | | | | 6.24 | | | | | | 0.69 | | | | | | 0.59 | | | | | | 0.59 | | | | | | 0.93 | | | | | | 2,996 | | | | | | 58 | | |
| 12-31-15 | | | | | 14.31 | | | | | | 0.10 | | | | | | (0.17) | | | | | | (0.07) | | | | | | 0.34 | | | | | | 1.34 | | | | | | — | | | | | | 1.68 | | | | | | — | | | | | | 12.56 | | | | | | (1.04) | | | | | | 0.76 | | | | | | 0.60 | | | | | | 0.60 | | | | | | 0.71 | | | | | | 3,014 | | | | | | 41 | | |
| 12-31-14 | | | | | 14.50 | | | | | | 0.11• | | | | | | 0.75 | | | | | | 0.86 | | | | | | 0.19 | | | | | | 0.86 | | | | | | — | | | | | | 1.05 | | | | | | — | | | | | | 14.31 | | | | | | 6.12 | | | | | | 0.77 | | | | | | 0.58 | | | | | | 0.58 | | | | | | 0.78 | | | | | | 3,071 | | | | | | 72 | | |
| 12-31-13 | | | | | 12.07 | | | | | | 0.10• | | | | | | 2.69 | | | | | | 2.79 | | | | | | 0.14 | | | | | | 0.22 | | | | | | — | | | | | | 0.36 | | | | | | — | | | | | | 14.50 | | | | | | 23.36 | | | | | | 0.76 | | | | | | 0.53 | | | | | | 0.53 | | | | | | 0.72 | | | | | | 2,250 | | | | | | 73 | | |
| Class T | | | | | | | | | | | | | | | | | | | | | | | | | | | | | | | | | | | | | | | | | | | | | | | | | | | | | | | | | | | | | | | | | | | | | | | | | | | | | | | | | | | | | | | | | | | | | | | | | | | | | | | |
| 12-31-17 | | | | | 12.50 | | | | | | 0.09• | | | | | | 2.52 | | | | | | 2.61 | | | | | | 0.10 | | | | | | 0.28 | | | | | | — | | | | | | 0.38 | | | | | | — | | | | | | 14.73 | | | | | | 21.08 | | | | | | 0.96 | | | | | | 0.86 | | | | | | 0.86 | | | | | | 0.67 | | | | | | 32 | | | | | | 40 | | |
| 12-31-16 | | | | | 12.78 | | | | | | 0.12• | | | | | | 0.62 | | | | | | 0.74 | | | | | | 0.17 | | | | | | 0.85 | | | | | | — | | | | | | 1.02 | | | | | | — | | | | | | 12.50 | | | | | | 5.96 | | | | | | 0.98 | | | | | | 0.89 | | | | | | 0.89 | | | | | | 0.96 | | | | | | 25 | | | | | | 58 | | |
| 12-31-15 | | | | | 14.25 | | | | | | 0.08• | | | | | | (0.21) | | | | | | (0.13) | | | | | | — | | | | | | 1.34 | | | | | | — | | | | | | 1.34 | | | | | | — | | | | | | 12.78 | | | | | | (1.36) | | | | | | 1.01 | | | | | | 0.90 | | | | | | 0.90 | | | | | | 0.56 | | | | | | 9 | | | | | | 41 | | |
| 12-31-14 | | | | | 14.44 | | | | | | (0.06)• | | | | | | 0.90 | | | | | | 0.84 | | | | | | 0.17 | | | | | | 0.86 | | | | | | — | | | | | | 1.03 | | | | | | — | | | | | | 14.25 | | | | | | 6.00 | | | | | | 1.02 | | | | | | 0.88 | | | | | | 0.88 | | | | | | (0.40) | | | | | | 5 | | | | | | 72 | | |
| 12-31-13 | | | | | 12.06 | | | | | | 0.14• | | | | | | 2.61 | | | | | | 2.75 | | | | | | 0.15 | | | | | | 0.22 | | | | | | — | | | | | | 0.37 | | | | | | — | | | | | | 14.44 | | | | | | 23.00 | | | | | | 1.01 | | | | | | 0.83 | | | | | | 0.83 | | | | | | 1.02 | | | | | | 68 | | | | | | 73 | | |
| Voya Solution 2060 Portfolio | | | | | | | | | | | | | | | | | | | | | | | | | | | | | | | | | | | | | | | | | | | | | | | | | | | | | | | | | | | | | | | | | | | | | | | | | | | | | | | | | | | | | | | | | | | | | | | | | | | | | | | |
| Class ADV | | | | | | | | | | | | | | | | | | | | | | | | | | | | | | | | | | | | | | | | | | | | | | | | | | | | | | | | | | | | | | | | | | | | | | | | | | | | | | | | | | | | | | | | | | | | | | | | | | | | | | | |
| 12-31-17 | | | | | 10.42 | | | | | | 0.13• | | | | | | 2.08 | | | | | | 2.21 | | | | | | 0.04 | | | | | | 0.20 | | | | | | — | | | | | | 0.24 | | | | | | — | | | | | | 12.39 | | | | | | 21.42 | | | | | | 1.10 | | | | | | 0.67 | | | | | | 0.67 | | | | | | 1.11 | | | | | | 3,202 | | | | | | 65 | | |
| 12-31-16 | | | | | 9.89 | | | | | | 0.15• | | | | | | 0.48 | | | | | | 0.63 | | | | | | 0.04 | | | | | | 0.06 | | | | | | — | | | | | | 0.10 | | | | | | — | | | | | | 10.42 | | | | | | 6.34 | | | | | | 1.97 | | | | | | 0.69 | | | | | | 0.69 | | | | | | 1.50 | | | | | | 1,395 | | | | | | 82 | | |
02-09-15(5) -
12-31-15 | | | | | 10.00 | | | | | | 0.25• | | | | | | (0.36) | | | | | | (0.11) | | | | | | — | | | | | | — | | | | | | — | | | | | | — | | | | | | — | | | | | | 9.89 | | | | | | (1.10) | | | | | | 19.06 | | | | | | 0.70 | | | | | | 0.70 | | | | | | 2.85 | | | | | | 191 | | | | | | 78 | | |
| Class I | | | | | | | | | | | | | | | | | | | | | | | | | | | | | | | | | | | | | | | | | | | | | | | | | | | | | | | | | | | | | | | | | | | | | | | | | | | | | | | | | | | | | | | | | | | | | | | | | | | | | | | |
| 12-31-17 | | | | | 10.49 | | | | | | 0.20• | | | | | | 2.10 | | | | | | 2.30 | | | | | | 0.06 | | | | | | 0.20 | | | | | | — | | | | | | 0.26 | | | | | | — | | | | | | 12.53 | | | | | | 22.15 | | | | | | 0.60 | | | | | | 0.17 | | | | | | 0.17 | | | | | | 1.73 | | | | | | 2,160 | | | | | | 65 | | |
| 12-31-16 | | | | | 9.92 | | | | | | 0.16• | | | | | | 0.51 | | | | | | 0.67 | | | | | | 0.04 | | | | | | 0.06 | | | | | | — | | | | | | 0.10 | | | | | | — | | | | | | 10.49 | | | | | | 6.73 | | | | | | 1.47 | | | | | | 0.19 | | | | | | 0.19 | | | | | | 1.56 | | | | | | 606 | | | | | | 82 | | |
02-09-15(5) -
12-31-15 | | | | | 10.00 | | | | | | 0.27• | | | | | | (0.35) | | | | | | (0.08) | | | | | | — | | | | | | — | | | | | | — | | | | | | — | | | | | | — | | | | | | 9.92 | | | | | | (0.80) | | | | | | 18.56 | | | | | | 0.20 | | | | | | 0.20 | | | | | | 3.11 | | | | | | 317 | | | | | | 78 | | |
| Class S | | | | | | | | | | | | | | | | | | | | | | | | | | | | | | | | | | | | | | | | | | | | | | | | | | | | | | | | | | | | | | | | | | | | | | | | | | | | | | | | | | | | | | | | | | | | | | | | | | | | | | | |
| 12-31-17 | | | | | 10.41 | | | | | | 0.15• | | | | | | 2.10 | | | | | | 2.25 | | | | | | 0.06 | | | | | | 0.20 | | | | | | — | | | | | | 0.26 | | | | | | — | | | | | | 12.40 | | | | | | 21.81 | | | | | | 0.85 | | | | | | 0.42 | | | | | | 0.42 | | | | | | 1.30 | | | | | | 2,825 | | | | | | 65 | | |
| 12-31-16 | | | | | 9.86 | | | | | | 0.17• | | | | | | 0.48 | | | | | | 0.65 | | | | | | 0.04 | | | | | | 0.06 | | | | | | — | | | | | | 0.10 | | | | | | — | | | | | | 10.41 | | | | | | 6.56 | | | | | | 1.72 | | | | | | 0.44 | | | | | | 0.44 | | | | | | 1.68 | | | | | | 836 | | | | | | 82 | | |
02-09-15(5) -
12-31-15 | | | | | 10.00 | | | | | | 0.27• | | | | | | (0.41) | | | | | | (0.14) | | | | | | — | | | | | | — | | | | | | — | | | | | | — | | | | | | — | | | | | | 9.86 | | | | | | (1.40) | | | | | | 18.81 | | | | | | 0.45 | | | | | | 0.45 | | | | | | 3.06 | | | | | | 140 | | | | | | 78 | | |
| Class S2 | | | | | | | | | | | | | | | | | | | | | | | | | | | | | | | | | | | | | | | | | | | | | | | | | | | | | | | | | | | | | | | | | | | | | | | | | | | | | | | | | | | | | | | | | | | | | | | | | | | | | | | |
| 12-31-17 | | | | | 10.42 | | | | | | 0.17• | | | | | | 2.05 | | | | | | 2.22 | | | | | | 0.04 | | | | | | 0.20 | | | | | | — | | | | | | 0.24 | | | | | | — | | | | | | 12.40 | | | | | | 21.56 | | | | | | 1.00 | | | | | | 0.57 | | | | | | 0.57 | | | | | | 1.45 | | | | | | 180 | | | | | | 65 | | |
| 12-31-16 | | | | | 9.89 | | | | | | 0.09• | | | | | | 0.54 | | | | | | 0.63 | | | | | | 0.04 | | | | | | 0.06 | | | | | | — | | | | | | 0.10 | | | | | | — | | | | | | 10.42 | | | | | | 6.34 | | | | | | 1.90 | | | | | | 0.59 | | | | | | 0.59 | | | | | | 0.92 | | | | | | 32 | | | | | | 82 | | |
02-09-15(5) -
12-31-15 | | | | | 10.00 | | | | | | 0.24• | | | | | | (0.35) | | | | | | (0.11) | | | | | | — | | | | | | — | | | | | | — | | | | | | — | | | | | | — | | | | | | 9.89 | | | | | | (1.10) | | | | | | 19.06 | | | | | | 0.60 | | | | | | 0.60 | | | | | | 2.66 | | | | | | 26 | | | | | | 78 | | |
| Class T | | | | | | | | | | | | | | | | | | | | | | | | | | | | | | | | | | | | | | | | | | | | | | | | | | | | | | | | | | | | | | | | | | | | | | | | | | | | | | | | | | | | | | | | | | | | | | | | | | | | | | | |
| 12-31-17 | | | | | 10.35 | | | | | | 0.08• | | | | | | 2.10 | | | | | | 2.18 | | | | | | — | | | | | | 0.20 | | | | | | — | | | | | | 0.20 | | | | | | — | | | | | | 12.33 | | | | | | 21.24 | | | | | | 1.30 | | | | | | 0.87 | | | | | | 0.87 | | | | | | 0.69 | | | | | | 4 | | | | | | 65 | | |
| 12-31-16 | | | | | 9.86 | | | | | | 0.07 | | | | | | 0.51 | | | | | | 0.58 | | | | | | 0.03 | | | | | | 0.06 | | | | | | — | | | | | | 0.09 | | | | | | — | | | | | | 10.35 | | | | | | 5.91 | | | | | | 2.19 | | | | | | 0.89 | | | | | | 0.89 | | | | | | 0.67 | | | | | | 3 | | | | | | 82 | | |
02-09-15(5) -
12-31-15 | | | | | 10.00 | | | | | | 0.05 | | | | | | (0.19) | | | | | | (0.14) | | | | | | — | | | | | | — | | | | | | — | | | | | | — | | | | | | — | | | | | | 9.86 | | | | | | (1.40) | | | | | | 19.31 | | | | | | 0.90 | | | | | | 0.90 | | | | | | 0.58 | | | | | | 3 | | | | | | 78 | | |
(1)
Total return is calculated assuming reinvestment of all dividends, capital gain distributions and return of capital distributions, if any, at net asset value and does not reflect the effect of insurance contract charges. Total return for periods less than one year is not annualized.
(2)
Annualized for periods less than one year.
See Accompanying Notes to Financial Statements
Financial Highlights (continued)
(3)
Ratios reflect operating expenses of a Portfolio. Expenses before reductions/additions do not reflect amounts reimbursed by an Investment Adviser and/or Distributor or reductions from brokerage service arrangements or other expense offset arrangements and do not represent the amount paid by a Portfolio during periods when reimbursements or reductions occur. Expenses net of fee waivers reflect expenses after reimbursement by an Investment Adviser and/or Distributor but prior to reductions from brokerage service arrangements or other expense offset arrangements. Expenses net of all reductions/additions represent the net expenses paid by a Portfolio. Net investment income (loss) is net of all such additions or reductions.
(4)
Ratios do not include expenses of underlying funds and do not include fees and expenses charged under the variable annuity contract or variable life insurance policy.
(5)
Commencement of operations.
(a)
During the year ended December 31, 2013, Voya Investments, LLC voluntarily reimbursed Voya Solution 2020 Portfolio $22 for the foregone investment opportunities attributable to uninvested cash. Excluding this payment by affiliate, total return would have been 12.88%, 13.71%, 13.33%, 13.25% and 13.15% on Classes ADV, I, S, S2 and T, respectively.
(b)
During the year ended December 31, 2013, Voya Investments, LLC voluntarily reimbursed Voya Solution 2030 Portfolio $33 for the foregone investment opportunities attributable to uninvested cash. Excluding this payment by affiliate, total return would have been 18.46%, 19,19%, 18.72%, 18.37% and 18.69% on Classes ADV, I, S, S2 and T, respectively.
(c)
During the year ended December 31, 2013, Voya Investments, LLC voluntarily reimbursed Voya Solution 2040 Portfolio $39 for the foregone investment opportunities attributable to uninvested cash. Excluding this payment by affiliate, total return would have been 22.09%, 22.76%, 22.35%, 22.07% and 21.84% on Classes ADV, I, S, S2 and T, respectively.
(d)
During the year ended December 31, 2013, Voya Investments, LLC voluntarily reimbursed Voya Solution 2050 Portfolio $40 for the foregone investment opportunities attributable to uninvested cash. Excluding this payment by affiliate, total return would have been 22.95%, 23.61%, 23.14%, 22.86% and 23.05% on Classes ADV, I, S, S2 and T, respectively.
•
Calculated using average number of shares outstanding throughout the year or period.
*
Amount is less than $0.005 or 0.005% or more than $(0.005) or (0.005)%.
See Accompanying Notes to Financial Statements
NOTES TO FINANCIAL STATEMENTS as of December 31, 2017
NOTE 1 — ORGANIZATION
Voya Partners, Inc. (the “Company”) is an open-end management investment company registered under the Investment Company Act of 1940, as amended (the “1940 Act”). It was incorporated under the laws of Maryland on May 7, 1997. The Articles of Incorporation permit the Company to offer separate series, each of which has its own investment objective, policies and restrictions. The Company currently consists of thirty-eight active separate investment series. The fifteen series (each, a “Portfolio” and collectively, the “Portfolios”) included in this report are: Voya Solution Aggressive Portfolio (“Solution Aggressive”), Voya Solution Balanced Portfolio (“Solution Balanced”), Voya Solution Conservative Portfolio (“Solution Conservative”), Voya Solution Income Portfolio (“Solution Income”), Voya Solution Moderately Aggressive Portfolio (“Solution Moderately Aggressive”), Voya Solution Moderately Conservative Portfolio (“Solution Moderately Conservative”), Voya Solution 2020 Portfolio (“Solution 2020”), Voya Solution 2025 Portfolio (“Solution 2025”), Voya Solution 2030 Portfolio (“Solution 2030”), Voya Solution 2035 Portfolio (“Solution 2035”), Voya Solution 2040 Portfolio (“Solution 2040”), Voya Solution 2045 Portfolio (“Solution 2045”), Voya Solution 2050 Portfolio (“Solution 2050”), Voya Solution 2055 Portfolio (“Solution 2055”) and Voya Solution 2060 Portfolio (“Solution 2060”). Each Portfolio is a diversified series of the Company.
Solution 2020, Solution 2025, Solution 2030, Solution 2035, Solution 2040, Solution 2045, Solution 2050, Solution 2055 and Solution 2060 are structured and managed around a specific target retirement or financial goal date (“Target Date”). When these Portfolios reach their respective Target Date, they may be combined with Solution Income, without a vote of shareholders, if approved by the Portfolios’ Board of Directors (the “Board”).
The classes of shares included in this report are: Adviser (“Class ADV”), Initial (“Class I”), Class R6, Service (“Class S”), Service 2 (“Class S2”) and Class T; however, each Portfolio may not offer all share classes. Shares of the Portfolios may be offered to separate accounts (“Separate Accounts”) of insurance companies as investment options in connection with variable annuity contracts and variable life insurance policies (“Variable Contracts”) and to certain of the Portfolios’ investment advisers and their affiliates. In the future, shares may also be offered to qualified pension and retirement plans (“Qualified Plans”) outside the Separate Account context. With the exception of class specific matters, each class has equal voting rights as to voting privileges. For class specific proposals, only the applicable class would have voting privileges. The classes differ principally in the
applicable distribution and shareholder service fees. Generally, shareholders of each class also bear certain expenses that pertain to that particular class. All shareholders are allocated the common expenses of a portfolio and earn income and realized gains/losses from a portfolio pro rata based on the daily ending net assets of each class, without distinction between share classes. Expenses that are specific to a portfolio or a class are charged directly to that portfolio or class. Other operating expenses shared by several portfolios are generally allocated among those portfolios based on average net assets. Distributions are determined separately for each class based on income and expenses allocated to each class. Realized gain distributions are allocated to each class pro rata based on the shares outstanding of each class on the date of distribution. Differences in per share dividend rates generally result from differences in separate class expenses, including distribution and shareholder service fees, if applicable.
Voya Investments, LLC (“Voya Investments” or the “Investment Adviser”), an Arizona limited liability company, serves as the Investment Adviser to the Portfolios. Prior to May 1, 2017, Directed Services LLC, a Delaware limited liability company, served as the investment adviser to the Portfolios. There were no changes to the services provided or the fees charged to the Portfolios upon the replacement of Directed Services LLC with Voya Investments. Voya Investment Management Co. LLC (“Voya IM” or the “Sub-Adviser”), a Delaware limited liability company, serves as the Sub-Adviser to the Portfolios. Voya Investments Distributor, LLC (“VID” or the “Distributor”), a Delaware limited liability company, serves as the principal underwriter to the Portfolios.
Each Portfolio seeks to achieve its investment objective by investing in other investment companies (“Underlying Funds”) and uses asset allocation strategies to determine how much to invest in the Underlying Funds. The investment objective of the Portfolios is described in the respective Portfolio’s Prospectus.
NOTE 2 — SIGNIFICANT ACCOUNTING POLICIES
The following significant accounting policies are consistently followed by the Portfolios in the preparation of their financial statements. Each Portfolio is considered an investment company under U.S. generally accepted accounting principles (“GAAP”) and follows the accounting and reporting guidance applicable to investment companies.
A. Security Valuation. Each Portfolio is open for business every day the New York Stock Exchange (“NYSE”) opens for regular trading (each such day, a “Business Day”). The net asset value (“NAV”) per share for each class of each
NOTES TO FINANCIAL STATEMENTS as of December 31, 2017 (continued)
NOTE 2 — SIGNIFICANT ACCOUNTING POLICIES (continued)
Portfolio is determined each Business Day as of the close of the regular trading session (“Market Close”), as determined by the Consolidated Tape Association (“CTA”), the central distributor of transaction prices for exchange-traded securities (normally 4:00 p.m. Eastern time unless otherwise designated by the CTA). The data reflected on the consolidated tape provided by the CTA is generated by various market centers, including all securities exchanges, electronic communications networks, and third-market broker-dealers. The NAV per share of each class of each Portfolio is calculated by taking the value of the Portfolio’s assets attributable to that class, subtracting the Portfolio’s liabilities attributable to that class, and dividing by the number of shares of that class that are outstanding. On days when a Portfolio is closed for business, Portfolio shares will not be priced and a Portfolio does not transact purchase and redemption orders. To the extent a Portfolio’s assets are traded in other markets on days when a Portfolio does not price its shares, the value of a Portfolio’s assets will likely change and you will not be able to purchase or redeem shares of a Portfolio.
Assets for which market quotations are readily available are valued at market value. A security listed or traded on an exchange is valued at its last sales price or official closing price as of the close of the regular trading session on the exchange where the security is principally traded or, if such price is not available, at the last sale price as of the Market Close for such security provided by the CTA. Bank loans are valued at the average of the averages of the bid and ask prices provided to an independent loan pricing service by brokers. Futures contracts are valued at the final settlement price set by an exchange on which they are principally traded. Listed options are valued at the mean between the last bid and ask prices from the exchange on which they are principally traded. Investments in open-end registered investment companies that do not trade on an exchange are valued at the end of day NAV per share. Investments in registered investment companies that trade on an exchange are valued at the last sales price or official closing price as of the close of the regular trading session on the exchange where the security is principally traded.
When a market quotation is not readily available or is deemed unreliable, each Portfolio will determine a fair value for the relevant asset in accordance with procedures adopted by the Portfolios’ Board. Such procedures provide, for example, that: (a) Exchange-traded securities are valued at the mean of the closing bid and ask; (b) Debt obligations are valued using an evaluated price provided by an independent pricing service. Evaluated prices provided by the pricing service may be determined without exclusive reliance on quoted prices, and may reflect factors
such as institution-size trading in similar groups of securities, developments related to specific securities, benchmark yield, quality, type of issue, coupon rate, maturity, individual trading characteristics and other market data; (c) Securities traded in the over-the-counter (“OTC”) market are valued based on prices provided by independent pricing services or market makers; (d) Options not listed on an exchange are valued by an independent source using an industry accepted model, such as Black-Scholes; (e) Centrally cleared swap agreements are valued using a price provided by the central counterparty clearinghouse; (f) OTC swap agreements are valued using a price provided by an independent pricing service; (g) Forward foreign currency exchange contracts are valued utilizing current and forward rates obtained from an independent pricing service. Such prices from the third party pricing service are for specific settlement periods and each Portfolio’s forward foreign currency exchange contracts are valued at an interpolated rate between the closest preceding and subsequent period reported by the independent pricing service; and (h) Securities for which market prices are not provided by any of the above methods may be valued based upon quotes furnished by brokers.
The prospectuses of the open-end registered investment companies in which each Portfolio may invest explain the circumstances under which they will use fair value pricing and the effects of using fair value pricing.
Foreign securities’ (including forward foreign currency exchange contracts) prices are converted into U.S. dollar amounts using the applicable exchange rates as of Market Close. If market quotations are available and believed to be reliable for foreign exchange-traded equity securities, the securities will be valued at the market quotations. Because trading hours for certain foreign securities end before Market Close, closing market quotations may become unreliable. An independent pricing service determines the degree of certainty, based on historical data, that the closing price in the principal market where a foreign security trades is not the current value as of Market Close. Foreign securities’ prices meeting the approved degree of certainty that the price is not reflective of current value will be valued by the independent pricing service using pricing models designed to estimate likely changes in the values of those securities between the times in which the trading in those securities is substantially completed and Market Close. Multiple factors may be considered by the independent pricing service in determining the value of such securities and may include information relating to sector indices, American Depositary Receipts and domestic and foreign index futures.
All other assets for which market quotations are not readily available or became unreliable (or if the above fair
NOTES TO FINANCIAL STATEMENTS as of December 31, 2017 (continued)
NOTE 2 — SIGNIFICANT ACCOUNTING POLICIES (continued)
valuation methods are unavailable or determined to be unreliable) are valued at fair value as determined in good faith by or under the supervision of the Board following procedures approved by the Board. The Board has delegated to the Investment Adviser responsibility for overseeing the implementation of the Portfolios’ valuation procedures; a “Pricing Committee” comprised of employees of the Investment Adviser or its affiliates has responsibility for applying the fair valuation methods set forth in the procedures and, if a fair valuation cannot be determined pursuant to the fair valuation methods, determining the fair value of assets held by the Portfolios. Issuer specific events, transaction price, position size, nature and duration of restrictions on disposition of the security, market trends, bid/ask quotes of brokers and other market data may be reviewed in the course of making a good faith determination of a security’s fair value. Valuations change in response to many factors including the historical and prospective earnings of the issuer, the value of the issuer’s assets, general economic conditions, interest rates, investor perceptions and market liquidity. Because of the inherent uncertainties of fair valuation, the values used to determine each Portfolio’s NAV may materially differ from the value received upon actual sale of those investments. Thus, fair valuation may have an unintended dilutive or accretive effect on the value of shareholders’ investments in each Portfolio.
Each investment asset or liability of the Portfolios is assigned a level at measurement date based on the significance and source of the inputs to its valuation. Quoted prices in active markets for identical securities are classified as “Level 1,” inputs other than quoted prices for an asset or liability that are observable are classified as “Level 2” and significant unobservable inputs, including the Sub-Adviser’s or Pricing Committee’s judgment about the assumptions that a market participant would use in pricing an asset or liability are classified as “Level 3.” The inputs used for valuing securities are not necessarily an indication of the risks associated with investing in those securities. Short-term securities of sufficient credit quality are generally considered to be Level 2 securities under applicable accounting rules. The Portfolios classify each of their investments in the Underlying Funds as Level 1, without consideration as to the classification level of the specific investments held by the Underlying Funds. A table summarizing each Portfolio’s investments under these levels of classification is included following the Portfolio of Investments.
GAAP requires a reconciliation of the beginning to ending balances for reported fair values that presents changes attributable to total realized and unrealized gains or losses,
purchases and sales, and transfers in or out of the Level 3 category during the period. The beginning of period timing recognition is used for the transfers between levels of a Portfolio’s assets and liabilities. A reconciliation of Level 3 investments is presented only when a Portfolio has a significant amount of Level 3 investments.
B. Securities Transactions and Revenue Recognition. Securities transactions are accounted for on the trade date. Dividend income received from the Underlying Funds is recognized on the ex-dividend date and is recorded as income distributions in the Statements of Operations. Capital gain distributions received from the Underlying Funds are recognized on the ex-dividend date and are recorded on the Statements of Operations as such. Realized gains and losses are reported on the basis of identified cost of securities sold.
C. Distributions to Shareholders. The Portfolios record distributions to their shareholders on the ex-dividend date. Each Portfolio declares and pays dividends from net investment income and capital gain distributions, if any, annually. The Portfolios may make distributions on a more frequent basis to comply with the distribution requirements of the Internal Revenue Code. The characteristics of income and gains to be distributed are determined in accordance with income tax regulations, which may differ from GAAP for investment companies.
D. Federal Income Taxes. It is the policy of each Portfolio to comply with the requirements of subchapter M of the Internal Revenue Code that are applicable to regulated investment companies and to distribute substantially all of its net investment income and any net realized capital gains to its shareholders. Therefore, a federal income tax or excise tax provision is not required. Management has considered the sustainability of the Portfolios’ tax positions taken on federal income tax returns for all open tax years in making this determination. No capital gain distributions shall be made until the capital loss carryforwards have been fully utilized or expire.
The Portfolios may utilize equalization accounting for tax purposes, whereby a portion of redemption payments are treated as distributions of income or gain.
E. Use of Estimates. The preparation of financial statements in conformity with GAAP requires management to make estimates and assumptions that affect the reported amounts of assets and liabilities and disclosure of contingent assets and liabilities at the date of the financial statements and the reported amounts of increases and decreases in net assets from operations during the reporting period. Actual results could differ from those estimates.
NOTES TO FINANCIAL STATEMENTS as of December 31, 2017 (continued)
NOTE 2 — SIGNIFICANT ACCOUNTING POLICIES (continued)
F. Risk Exposures and the Use of Derivative Instruments. Each Portfolio’s investment strategies permit it to enter into various types of derivatives contracts, including, but not limited to, futures contracts. In doing so, a Portfolio will employ strategies in differing combinations to permit it to increase or decrease the level of risk, or change the level or types of exposure to risk factors. This may allow a Portfolio to pursue its objectives more quickly and efficiently than if it were to make direct purchases or sales of securities capable of affecting a similar response to market or credit factors.
In pursuit of its investment objectives, a Portfolio may seek to increase or decrease its exposure to the following market or credit risk factors:
Equity Risk. Stock prices may be volatile or have reduced liquidity in response to real or perceived impacts of factors including, but not limited to, economic conditions, changes in market interest rates, and political events. Stock markets tend to be cyclical, with periods when stock prices generally rise and periods when stock prices generally decline. Any given stock market segment may remain out of favor with investors for a short or long period of time, and stocks as an asset class may underperform bonds or other asset classes during some periods. Additionally, legislative, regulatory or tax policies or developments in these areas may adversely impact the investment techniques available to a manager, add to costs and impair the ability of a Portfolio to achieve its investment objectives.
Risks of Investing in Derivatives. Each Portfolio’s use of derivatives can result in losses due to unanticipated changes in the market or credit risk factors and the overall market. In instances where a Portfolio is using derivatives to decrease, or hedge, exposures to market or credit risk factors for securities held by a Portfolio, there are also risks that those derivatives may not perform as expected resulting in losses for the combined or hedged positions.
Derivative instruments are subject to a number of risks, including the risk of changes in the market price of the underlying securities, credit risk with respect to the counterparty, risk of loss due to changes in market interest rates and liquidity and volatility risk. The amounts required to purchase certain derivatives may be small relative to the magnitude of exposure assumed by a Portfolio. Therefore, the purchase of certain derivatives may have an economic leveraging effect on a Portfolio and exaggerate any increase or decrease in the NAV. Derivatives may not perform as expected, so a Portfolio may not realize the intended benefits. When used for hedging purposes, the
change in value of a derivative may not correlate as expected with the currency, security or other risk being hedged. When used as an alternative or substitute for direct cash investments, the return provided by the derivative may not provide the same return as direct cash investment. In addition, given their complexity, derivatives expose a Portfolio to the risk of improper valuation.
Generally, derivatives are sophisticated financial instruments whose performance is derived, at least in part, from the performance of an underlying asset or assets. Derivatives include, among other things, swap agreements, options, forwards and futures. Investments in derivatives are generally negotiated OTC with a single counterparty and as a result are subject to credit risks related to the counterparty’s ability or willingness to perform its obligations; any deterioration in the counterparty’s creditworthiness could adversely affect the value of the derivative. In addition, derivatives and their underlying securities may experience periods of illiquidity which could cause a Portfolio to hold a security it might otherwise sell, or to sell a security it otherwise might hold at inopportune times or at an unanticipated price. A manager might imperfectly judge the direction of the market. For instance, if a derivative is used as a hedge to offset investment risk in another security, the hedge might not correlate to the market’s movements and may have unexpected or undesired results such as a loss or a reduction in gains.
The U.S. government has enacted legislation that provides for new regulation of the derivatives market, including clearing, margin, reporting, and registration requirements. The European Union is (and other countries outside of the European Union are) implementing similar requirements, which will affect a Portfolio when it enters into a derivatives transaction with a counterparty organized in that country or otherwise subject to that country’s derivatives regulations. Because these requirements are new and evolving (and some of the rules are not yet final), their ultimate impact remains unclear. Central clearing is expected to reduce counterparty risk and increase liquidity, however, there is no assurance that it will achieve that result, and in the meantime, central clearing and related requirements expose a Portfolio to new kinds of costs and risks.
G. Futures Contracts. Certain Portfolios may enter into futures contracts involving foreign currency, interest rates, securities and security indices. A futures contract is a commitment to buy or sell a specific amount of a financial instrument at a negotiated price on a stipulated future date. A Portfolio may buy and sell futures contracts. Futures contracts traded on a commodities or futures exchange will be valued at the final settlement price or official closing
NOTES TO FINANCIAL STATEMENTS as of December 31, 2017 (continued)
NOTE 2 — SIGNIFICANT ACCOUNTING POLICIES (continued)
price on the principal exchange as reported by such principal exchange at its trading session ending at, or most recently prior to, the time when each Portfolio’s assets are valued.
Upon entering into a futures contract, a Portfolio is required to deposit either cash or securities (initial margin) in an amount equal to a certain percentage of the contract value. Subsequent payments (variation margin) are made or received by a Portfolio each day. The variation margin payments are equal to the daily changes in the contract value and are recorded as unrealized gains and losses. Open futures contracts are reported on a table following each Portfolio’s Portfolio of Investments. Securities held in collateralized accounts to cover initial margin requirements on open futures contracts, if any, are footnoted in the Portfolio of Investments. Cash collateral held by the broker to cover initial margin requirements on open futures contracts are noted in the Statements of Assets and Liabilities. The net change in unrealized appreciation and depreciation is reported in the Statements of Operations. Realized gains (losses) are reported in the Statements of Operations at the closing or expiration of futures contracts.
Futures contracts are exposed to the market risk factor of the underlying financial instrument. During the year ended December 31, 2017, certain Portfolios had purchased futures contracts on various equity indices to “equitize” cash. Futures contracts are purchased to provide immediate market exposure proportionate to the size of the Portfolio’s respective cash flows and residual cash balances in order to decrease potential tracking error if the cash remained uninvested in the market. Certain Portfolios also purchased and sold futures contracts on equity indices as part of their tactical asset allocation strategy. Additional associated risks of entering into futures contracts include the possibility that there may be an illiquid market where the Portfolios are unable to liquidate the contract or enter into an offsetting position and, if used for hedging purposes, the risk that the price of the contract will correlate imperfectly with the prices of the Portfolios’ securities. With futures, there is minimal counterparty credit risk to the Portfolios since futures are exchange traded and the exchange’s clearinghouse, as counterparty to all exchange traded futures, guarantees the futures against default.
During the year ended December 31, 2017, the following Portfolios had average notional values on futures contracts purchased and sold as of December 31, 2017. Please refer to the tables following each respective Portfolio of Investments for open futures contracts purchased and sold for Solution Balanced, Solution Income, Solution
Moderately Aggressive, Solution Moderately Conservative, Solution 2025, Solution 2035, Solution 2045 and Solution 2055. There were no open futures contracts purchased or sold for the remaining Portfolios during the year ended December 31, 2017.
| | | | Purchased | | | Sold | |
| Solution Balanced | | | | $ | 1,116,631 | | | | | $ | 1,158,061 | | |
| Solution Income | | | | | 9,125,286 | | | | | | 9,182,594 | | |
| Solution Moderately Aggressive | | | | | 14,262,888 | | | | | | 14,297,599 | | |
| Solution Moderately Conservative | | | | | 682,489 | | | | | | 601,395 | | |
| Solution 2025 | | | | | 18,414,787 | | | | | | 18,556,381 | | |
| Solution 2035 | | | | | 18,185,174 | | | | | | 18,240,036 | | |
| Solution 2045 | | | | | 13,401,332 | | | | | | 13,458,809 | | |
| Solution 2055 | | | | | 3,375,469 | | | | | | 3,414,461 | | |
H. Indemnifications. In the normal course of business, the Company may enter into contracts that provide certain indemnifications. The Company’s maximum exposure under these arrangements is dependent on future claims that may be made against the Portfolios and, therefore, cannot be estimated; however, based on experience, management considers the risk of loss from such claims remote.
NOTE 3 — INVESTMENTS IN UNDERLYING FUNDS
For the year ended December 31, 2017, the cost of purchases and the proceeds from sales of the Underlying Funds were as follows:
| | | | Purchases | | | Sales | |
| Solution Aggressive | | | | $ | 9,739,455 | | | | | $ | 5,618,322 | | |
| Solution Balanced | | | | | 32,578,425 | | | | | | 26,296,557 | | |
| Solution Conservative | | | | | 10,412,259 | | | | | | 10,931,155 | | |
| Solution Income | | | | | 165,563,552 | | | | | | 251,177,861 | | |
| Solution Moderately Aggressive | | | | | 219,654,894 | | | | | | 308,991,332 | | |
| Solution Moderately Conservative | | | | | 15,607,042 | | | | | | 22,391,968 | | |
| Solution 2020 | | | | | 28,443,322 | | | | | | 20,102,526 | | |
| Solution 2025 | | | | | 422,882,061 | | | | | | 514,660,897 | | |
| Solution 2030 | | | | | 27,664,330 | | | | | | 14,623,093 | | |
| Solution 2035 | | | | | 316,600,784 | | | | | | 387,703,485 | | |
| Solution 2040 | | | | | 22,597,714 | | | | | | 13,176,165 | | |
| Solution 2045 | | | | | 243,936,786 | | | | | | 288,564,176 | | |
| Solution 2050 | | | | | 14,824,477 | | | | | | 6,378,480 | | |
| Solution 2055 | | | | | 75,101,138 | | | | | | 63,952,768 | | |
| Solution 2060 | | | | | 8,169,630 | | | | | | 3,689,169 | | |
NOTE 4 — INVESTMENT MANAGEMENT FEES
The Portfolios have entered into an investment management agreement (“Management Agreement”) with the Investment Adviser. The Investment Adviser has overall responsibility for the management of the Portfolios. The Investment Adviser oversees all investment management and portfolio management services for the Portfolios and assists in managing and supervising all aspects of the general day-to-day business activities and operations of
NOTES TO FINANCIAL STATEMENTS as of December 31, 2017 (continued)
NOTE 4 — INVESTMENT MANAGEMENT FEES (continued)
the Portfolios, including custodial, transfer agency, dividend disbursing, accounting, auditing, compliance and related services. This Management Agreement compensates the Investment Adviser with a management fee, computed daily and payable monthly, based on the average daily net assets of each Portfolio, at the following annual rates: 0.20% of each Portfolio’s average daily nets assets invested in affiliated Underlying Funds and 0.40% of each Portfolio’s average daily net assets invested in unaffiliated Underlying Funds and/or other direct investments.
The Investment Adviser has entered into a sub-advisory agreement with Voya IM. Voya IM provides investment advice for the Portfolios and is paid by the Investment Adviser based on the average daily net assets of each respective Portfolio. Subject to such policies as the Board or the Investment Adviser may determine, Voya IM manages the Portfolios’ assets in accordance with the Portfolios’ investment objectives, policies, and limitations.
NOTE 5 — DISTRIBUTION AND SERVICE FEES
Classes ADV, S2 and T of the respective Portfolios have a plan of distribution (each a “Plan” and collectively, the “Plans”), whereby the Distributor is reimbursed or compensated by the Portfolios for expenses incurred in the distribution of each Portfolio’s shares (“Distribution Fees”). The Distributor may pay, on behalf of each Portfolio, out of its distribution fee, compensation to certain financial institutions for providing distribution assistance pursuant to a Distribution Services Agreement. Under the Plans, each Portfolio makes payments to the Distributor at an annual rate of 0.25% of each Portfolio’s average daily net assets attributable to its Class ADV shares and each Portfolio makes payments to the Distributor at an annual rate of 0.15% and 0.45% of each Portfolio’s average daily net assets attributable to its Class S2 and Class T shares, respectively.
The Company has a shareholder servicing plan (“Service Plan”) for the Classes ADV, S, S2 and T shares of each respective Portfolio. The Service Plan allows the Distributor to enter into shareholder servicing agreements with insurance companies, broker dealers or other financial intermediaries that provide administrative services related to Classes ADV, S, S2 and T shares and their shareholders including Variable Contract owners or Qualified Plan participants with interests in the Portfolios. Under the Service Plan, each Portfolio makes payments to the Distributor which shall not exceed an annual rate of 0.25% of each applicable Portfolio’s average daily net assets attributable to its Classes ADV, S, S2 and T shares.
NOTE 6 — OTHER TRANSACTIONS WITH AFFILIATES AND RELATED PARTIES
At December 31, 2017, the following direct or indirect, wholly-owned subsidiaries of Voya Financial, Inc. owned more than 5% of the following Portfolios:
| Subsidiary | | | Portfolio | | | Percentage | |
| Voya Institutional Trust Company | | | Solution Aggressive | | | | | 5.25% | | |
| | | | Solution Balanced | | | | | 7.91 | | |
| | | | Solution Income | | | | | 38.58 | | |
| | | | Solution 2020 | | | | | 19.34 | | |
| | | | Solution 2025 | | | | | 34.76 | | |
| | | | Solution 2030 | | | | | 22.03 | | |
| | | | Solution 2035 | | | | | 34.17 | | |
| | | | Solution 2040 | | | | | 18.29 | | |
| | | | Solution 2045 | | | | | 33.20 | | |
| | | | Solution 2050 | | | | | 18.73 | | |
| | | | Solution 2055 | | | | | 36.43 | | |
| | | | Solution 2060 | | | | | 16.69 | | |
| Voya Insurance and Annuity Company | | | Solution Moderately Aggressive | | | | | 91.02 | | |
| Voya Retirement Insurance and Annuity Company | | | Solution Aggressive | | | | | 94.68 | | |
| | | | Solution Balanced | | | | | 92.09 | | |
| | | | Solution Conservative | | | | | 95.61 | | |
| | | | Solution Income | | | | | 55.86 | | |
| | | | Solution Moderately Conservative | | | | | 99.81 | | |
| | | | Solution 2020 | | | | | 80.64 | | |
| | | | Solution 2025 | | | | | 62.36 | | |
| | | | Solution 2030 | | | | | 77.68 | | |
| | | | Solution 2035 | | | | | 63.93 | | |
| | | | Solution 2040 | | | | | 81.68 | | |
| | | | Solution 2045 | | | | | 65.26 | | |
| | | | Solution 2050 | | | | | 81.24 | | |
| | | | Solution 2055 | | | | | 63.51 | | |
| | | | Solution 2060 | | | | | 83.26 | | |
Under the 1940 Act, the direct or indirect beneficial owner of more than 25% of the voting securities of a company (including a fund) is presumed to control such company. Companies under common control (e.g., companies with a common owner of greater than 25% of their respective voting securities) are affiliates under the 1940 Act.
The Portfolios have adopted a deferred compensation plan (the “DC Plan”), which allows eligible independent directors, as described in the DC Plan, to defer the receipt of all or a portion of the directors’ fees that they are entitled to receive from the Portfolios. For purposes of determining the amount owed to the director under the DC Plan, the amounts deferred are invested in shares of the funds selected by the director (the “Notional Funds”). The Portfolios purchase shares of the Notional Funds, which are all advised by Voya Investments, in amounts equal to the directors’ deferred fees, resulting in a Portfolio asset equal to the deferred compensation liability. Such assets, if applicable, are included as a component of
NOTES TO FINANCIAL STATEMENTS as of December 31, 2017 (continued)
NOTE 6 — OTHER TRANSACTIONS WITH AFFILIATES AND RELATED PARTIES (continued)
“Other assets” on the accompanying Statements of Assets and Liabilities. Deferral of directors’ fees under the DC Plan will not affect net assets of the Portfolio, and will not materially affect the Portfolios’ assets, liabilities or net investment income per share. Amounts will be deferred until distributed in accordance with the DC Plan.
NOTE 7 — OTHER ACCRUED EXPENSES AND LIABILITIES
At December 31, 2017, the following Portfolio has the below payable included in Other Accrued Expenses and Liabilities on the Statements of Assets and Liabilities that exceeded 5% of total liabilities:
| Portfolio | | | Accrued Expenses | | | Amount | |
| Solution Moderately Conservative | | | Custody | | | | $ | 2,856 | | |
| | | | Postage | | | | | 6,968 | | |
| | | | Miscellaneous | | | | | 4,398 | | |
NOTE 8 — EXPENSE LIMITATION AGREEMENT
The Investment Adviser has entered into a written expense limitation agreement (“Expense Limitation Agreement”) with each Portfolio whereby the Investment Adviser has agreed to limit expenses, excluding interest, taxes, investment-related costs, leverage expenses, and extraordinary expenses to the levels listed below:
Portfolio(1) | | | Class
ADV | | | Class
I | | | Class
R6 | | | Class
S | | | Class
S2 | | | Class
T | |
| Solution Aggressive | | | | | 1.39% | | | | | | 0.89% | | | | | | 0.89% | | | | | | 1.14% | | | | | | 1.29% | | | | | | N/A | | |
| Solution Balanced | | | | | 1.30% | | | | | | 0.80% | | | | | | 0.80% | | | | | | 1.05% | | | | | | 1.20% | | | | | | N/A | | |
| Solution Conservative | | | | | 1.16% | | | | | | 0.66% | | | | | | 0.66% | | | | | | 0.91% | | | | | | 1.06% | | | | | | N/A | | |
| Solution Income | | | | | 1.18% | | | | | | 0.68% | | | | | | N/A | | | | | | 0.93% | | | | | | 1.08% | | | | | | 1.38% | | |
| Solution Moderately Aggressive | | | | | 1.38% | | | | | | 0.88% | | | | | | 0.88% | | | | | | 1.13% | | | | | | 1.28% | | | | | | N/A | | |
| Solution Moderately Conservative | | | | | 1.24% | | | | | | 0.74% | | | | | | 0.74% | | | | | | 0.99% | | | | | | 1.14% | | | | | | N/A | | |
| Solution 2020 | | | | | 1.22% | | | | | | 0.72% | | | | | | N/A | | | | | | 0.97% | | | | | | 1.12% | | | | | | 1.42% | | |
| Solution 2025 | | | | | 1.28% | | | | | | 0.78% | | | | | | N/A | | | | | | 1.03% | | | | | | 1.18% | | | | | | 1.48% | | |
| Solution 2030 | | | | | 1.29% | | | | | | 0.79% | | | | | | N/A | | | | | | 1.04% | | | | | | 1.19% | | | | | | 1.49% | | |
| Solution 2035 | | | | | 1.33% | | | | | | 0.83% | | | | | | N/A | | | | | | 1.08% | | | | | | 1.23% | | | | | | 1.53% | | |
| Solution 2040 | | | | | 1.33% | | | | | | 0.83% | | | | | | N/A | | | | | | 1.08% | | | | | | 1.23% | | | | | | 1.53% | | |
| Solution 2045 | | | | | 1.36% | | | | | | 0.86% | | | | | | N/A | | | | | | 1.11% | | | | | | 1.26% | | | | | | 1.56% | | |
| Solution 2050 | | | | | 1.36% | | | | | | 0.86% | | | | | | N/A | | | | | | 1.11% | | | | | | 1.26% | | | | | | 1.56% | | |
| Solution 2055 | | | | | 1.36% | | | | | | 0.86% | | | | | | N/A | | | | | | 1.11% | | | | | | 1.26% | | | | | | 1.56% | | |
| Solution 2060 | | | | | 1.37% | | | | | | 0.87% | | | | | | N/A | | | | | | 1.12% | | | | | | 1.27% | | | | | | 1.57% | | |
(1)
The operating expense limits take into account the operating expenses incurred at the Underlying Fund level. The amount of fees and expenses of an Underlying Fund borne by each Portfolio will vary based on each Portfolio’s allocation of assets to, and the net expenses of, a particular Underlying Fund.
The Investment Adviser may at a later date recoup from a Portfolio for fees waived and/or other expenses reimbursed by the Investment Adviser during the previous 36 months, but only if, after such recoupment, a Portfolio’s expense ratio does not exceed the percentage described above. Waived and reimbursed fees net of any recoupment by the Investment Adviser of such waived and reimbursed fees are reflected on the accompanying Statements of Operations. Amounts payable by the Investment Adviser are reflected on the accompanying Statements of Assets and Liabilities.
As of December 31, 2017 the amounts of waived and/or reimbursed fees that are subject to possible recoupment by the Investment Adviser and the related expiration dates are as follows:
| | | �� | December 31, | | | | | | | |
| | | | 2018 | | | 2019 | | | 2020 | | | Total | |
| Solution Aggressive | | | | $ | 12,690 | | | | | $ | 22,989 | | | | | $ | 25,978 | | | | | $ | 61,657 | | |
| Solution Balanced | | | | | 63,484 | | | | | | 66,469 | | | | | | 66,438 | | | | | | 196,391 | | |
| Solution Conservative | | | | | 37,813 | | | | | | 36,857 | | | | | | 38,432 | | | | | | 113,102 | | |
| Solution Income | | | | | 340,447 | | | | | | 677,513 | | | | | | 633,760 | | | | | | 1,651,720 | | |
| Solution Moderately Aggressive | | | | | 141,031 | | | | | | 349,713 | | | | | | 288,587 | | | | | | 779,331 | | |
| Solution Moderately Conservative | | | | | 51,944 | | | | | | 59,855 | | | | | | 58,784 | | | | | | 170,583 | | |
| Solution 2020 | | | | | 19,318 | | | | | | 34,629 | | | | | | 55,984 | | | | | | 109,931 | | |
| Solution 2025 | | | | | 967,252 | | | | | | 935,785 | | | | | | 742,094 | | | | | | 2,645,131 | | |
| Solution 2030 | | | | | 17,601 | | | | | | 26,854 | | | | | | 43,272 | | | | | | 87,727 | | |
| Solution 2035 | | | | | 727,201 | | | | | | 721,028 | | | | | | 806,282 | | | | | | 2,254,511 | | |
| Solution 2040 | | | | | 16,747 | | | | | | 26,861 | | | | | | 44,017 | | | | | | 87,625 | | |
| Solution 2045 | | | | | 378,863 | | | | | | 412,613 | | | | | | 513,695 | | | | | | 1,305,171 | | |
| Solution 2050 | | | | | 16,251 | | | | | | 23,295 | | | | | | 34,275 | | | | | | 73,821 | | |
| Solution 2055 | | | | | 72,976 | | | | | | 92,164 | | | | | | 160,115 | | | | | | 325,255 | | |
| Solution 2060 | | | | | 29,374 | | | | | | 22,828 | | | | | | 24,261 | | | | | | 76,463 | | |
The Expense Limitation Agreement is contractual through May 1, 2018 for all Portfolios and shall renew automatically for one-year terms. Termination or modification of this obligation requires approval by the Board.
NOTE 9 — LINE OF CREDIT
Effective May 19, 2017, each Portfolio, in addition to certain other funds managed by the Investment Adviser, has entered into a 364-day unsecured committed revolving line of credit agreement (the “Credit Agreement”) with The Bank of New York Mellon (“BNY”) for an aggregate amount of $400,000,000 through May 18, 2018. The proceeds may be used only to finance temporarily: (1) the purchase or sale of investment securities; or (2) the repurchase or redemption of shares of a Portfolio or certain other funds managed by the Investment Adviser. The funds to which the line of credit is available pay a commitment fee equal to
NOTES TO FINANCIAL STATEMENTS as of December 31, 2017 (continued)
0.15% per annum on the daily unused portion of the committed line amount payable quarterly in arrears.
Borrowings under the Credit Agreement accrue interest at the federal funds rate plus a specified margin. Repayments generally must be made within 60 days after the date of a revolving credit advance.
The following Portfolios utilized the line of credit during the year ended December 31, 2017:
| Portfolio | | | Days
Utilized | | | Approximate
Average
Daily
Balance For
Days Utilized | | | Approximate
Weighted
Average
Interest Rate
For Days
Utilized | |
| Solution 2025 | | | | | 2 | | | | | $ | 551,000 | | | | | | 1.91% | | |
| Solution 2035 | | | | | 2 | | | | | | 488,000 | | | | | | 1.91 | | |
| Solution 2045 | | | | | 1 | | | | | | 500,000 | | | | | | 2.16 | | |
NOTE 10 — CAPITAL SHARES
Transactions in capital shares and dollars were as follows:
| | | | Shares
sold | | | Shares
issued in
merger | | | Reinvestment
of
distributions | | | Shares
redeemed | | | Net increase
(decrease)
in shares
outstanding | | | Shares
sold | | | Proceeds
from shares
issued in
merger | | | Reinvestment
of
distributions | | | Shares
redeemed | | | Net increase
(decrease) | |
Year or
period ended | | | # | | | # | | | # | | | # | | | # | | | ($) | | | ($) | | | ($) | | | ($) | | | ($) | |
| Solution Aggressive | |
| Class ADV | | | | | | | | | | | |
| 12/31/2017 | | | | | 70,549 | | | | | | — | | | | | | 3,927 | | | | | | (41,100) | | | | | | 33,376 | | | | | | 882,139 | | | | | | — | | | | | | 49,395 | | | | | | (501,964) | | | | | | 429,570 | | |
| 12/31/2016 | | | | | 71,088 | | | | | | — | | | | | | 13,350 | | | | | | (72,164) | | | | | | 12,274 | | | | | | 790,135 | | | | | | — | | | | | | 146,983 | | | | | | (806,792) | | | | | | 130,326 | | |
| Class I | | | | | | | | | | | |
| 12/31/2017 | | | | | 36,932 | | | | | | — | | | | | | 555 | | | | | | (27,707) | | | | | | 9,780 | | | | | | 493,068 | | | | | | — | | | | | | 7,113 | | | | | | (375,556) | | | | | | 124,625 | | |
| 12/31/2016 | | | | | 10,057 | | | | | | — | | | | | | 912 | | | | | | (547) | | | | | | 10,422 | | | | | | 113,995 | | | | | | — | | | | | | 10,222 | | | | | | (6,309) | | | | | | 117,908 | | |
| Class R6 | | | | | | | | | | | |
| 12/31/2017 | | | | | 311,284 | | | | | | — | | | | | | 5,395 | | | | | | (11,459) | | | | | | 305,220 | | | | | | 3,996,774 | | | | | | — | | | | | | 69,168 | | | | | | (144,648) | | | | | | 3,921,294 | | |
5/2/2016(1) -
12/31/2016 | | | | | 58,522 | | | | | | — | | | | | | 373 | | | | | | (1,919) | | | | | | 56,976 | | | | | | 678,814 | | | | | | — | | | | | | 4,183 | | | | | | (21,908) | | | | | | 661,089 | | |
| Class S | | | | | | | | | | | |
| 12/31/2017 | | | | | 113,053 | | | | | | — | | | | | | 6,345 | | | | | | (151,055) | | | | | | (31,657) | | | | | | 1,396,502 | | | | | | — | | | | | | 80,515 | | | | | | (1,894,241) | | | | | | (417,224) | | |
| 12/31/2016 | | | | | 157,521 | | | | | | — | | | | | | 20,859 | | | | | | (43,665) | | | | | | 134,715 | | | | | | 1,772,910 | | | | | | — | | | | | | 231,533 | | | | | | (492,326) | | | | | | 1,512,117 | | |
| Class S2 | | | | | | | | | | | |
| 12/31/2017 | | | | | 20,260 | | | | | | — | | | | | | 848 | | | | | | (8,046) | | | | | | 13,062 | | �� | | | | 251,352 | | | | | | — | | | | | | 10,637 | | | | | | (98,628) | | | | | | 163,361 | | |
| 12/31/2016 | | | | | 24,769 | | | | | | — | | | | | | 1,605 | | | | | | (3,928) | | | | | | 22,446 | | | | | | 274,283 | | | | | | — | | | | | | 17,631 | | | | | | (43,834) | | | | | | 248,080 | | |
| Solution Balanced | |
| Class ADV | | | | | | | | | | | |
| 12/31/2017 | | | | | 213,164 | | | | | | — | | | | | | 54,656 | | | | | | (391,211) | | | | | | (123,391) | | | | | | 2,056,748 | | | | | | — | | | | | | 523,604 | | | | | | (3,737,707) | | | | | | (1,157,355) | | |
| 12/31/2016 | | | | | 191,318 | | | | | | — | | | | | | 206,691 | | | | | | (1,058,045) | | | | | | (660,036) | | | | | | 1,755,767 | | | | | | — | | | | | | 1,839,547 | | | | | | (9,847,737) | | | | | | (6,252,423) | | |
| Class I | | | | | | | | | | | |
| 12/31/2017 | | | | | 260,084 | | | | | | — | | | | | | 14,621 | | | | | | (49,453) | | | | | | 225,252 | | | | | | 2,625,214 | | | | | | — | | | | | | 145,042 | | | | | | (501,667) | | | | | | 2,268,589 | | |
| 12/31/2016 | | | | | 217,306 | | | | | | — | | | | | | 924 | | | | | | (1,608) | | | | | | 216,622 | | | | | | 2,020,929 | | | | | | — | | | | | | 8,507 | | | | | | (15,058) | | | | | | 2,014,378 | | |
| Class R6 | | | | | | | | | | | |
| 12/31/2017 | | | | | 1,048,618 | | | | | | — | | | | | | 28,266 | | | | | | (76,203) | | | | | | 1,000,681 | | | | | | 10,487,577 | | | | | | — | | | | | | 280,397 | | | | | | (769,000) | | | | | | 9,998,974 | | |
5/2/2016(1) -
12/31/2016 | | | | | 258,700 | | | | | | — | | | | | | 8,141 | | | | | | (10,066) | | | | | | 256,775 | | | | | | 2,459,665 | | | | | | — | | | | | | 74,982 | | | | | | (92,951) | | | | | | 2,441,696 | | |
| Class S | | | | | | | | | | | |
| 12/31/2017 | | | | | 283,709 | | | | | | — | | | | | | 76,350 | | | | | | (777,289) | | | | | | (417,230) | | | | | | 2,761,287 | | | | | | — | | | | | | 740,591 | | | | | | (7,515,852) | | | | | | (4,013,974) | | |
| 12/31/2016 | | | | | 784,782 | | | | | | — | | | | | | 227,954 | | | | | | (622,570) | | | | | | 390,166 | | | | | | 7,217,170 | | | | | | — | | | | | | 2,053,866 | | | | | | (5,826,050) | | | | | | 3,444,986 | | |
| Class S2 | | | | | | | | | | | |
| 12/31/2017 | | | | | 49,066 | | | | | | — | | | | | | 5,946 | | | | | | (39,912) | | | | | | 15,100 | | | | | | 477,698 | | | | | | — | | | | | | 57,444 | | | | | | (383,576) | | | | | | 151,566 | | |
| 12/31/2016 | | | | | 141,831 | | | | | | — | | | | | | 5,386 | | | | | | (26,090) | | | | | | 121,127 | | | | | | 1,288,802 | | | | | | — | | | | | | 48,473 | | | | | | (241,690) | | | | | | 1,095,585 | | |
| Solution Conservative | |
| Class ADV | | | | | | | | | | | |
| 12/31/2017 | | | | | 131,986 | | | | | | — | | | | | | 20,445 | | | | | | (189,309) | | | | | | (36,878) | | | | | | 1,436,079 | | | | | | — | | | | | | 221,013 | | | | | | (2,049,592) | | | | | | (392,500) | | |
| 12/31/2016 | | | | | 110,109 | | | | | | — | | | | | | 33,749 | | | | | | (162,455) | | | | | | (18,597) | | | | | | 1,177,944 | | | | | | — | | | | | | 356,731 | | | | | | (1,740,892) | | | | | | (206,217) | | |
| Class I | | | | | | | | | | | |
| 12/31/2017 | | | | | 12,492 | | | | | | — | | | | | | 217 | | | | | | (14,794) | | | | | | (2,085) | | | | | | 138,943 | | | | | | — | | | | | | 2,371 | | | | | | (164,720) | | | | | | (23,406) | | |
| 12/31/2016 | | | | | 9,326 | | | | | | — | | | | | | 103 | | | | | | (519) | | | | | | 8,910 | | | | | | 100,105 | | | | | | — | | | | | | 1,096 | | | | | | (5,592) | | | | | | 95,609 | | |
| Class R6 | | | | | | | | | | | |
| 12/31/2017 | | | | | 243,826 | | | | | | — | | | | | | 5,991 | | | | | | (9,826) | | | | | | 239,991 | | | | | | 2,691,034 | | | | | | — | | | | | | 65,547 | | | | | | (108,214) | | | | | | 2,648,367 | | |
5/2/2016(1) -
12/31/2016 | | | | | 65,603 | | | | | | — | | | | | | 1,537 | | | | | | (289) | | | | | | 66,851 | | | | | | 718,269 | | | | | | — | | | | | | 16,423 | | | | | | (3,103) | | | | | | 731,589 | | |
NOTES TO FINANCIAL STATEMENTS as of December 31, 2017 (continued)
NOTE 10 — CAPITAL SHARES (continued)
| | | | Shares
sold | | | Shares
issued in
merger | | | Reinvestment
of
distributions | | | Shares
redeemed | | | Net increase
(decrease)
in shares
outstanding | | | Shares
sold | | | Proceeds
from shares
issued in
merger | | | Reinvestment
of
distributions | | | Shares
redeemed | | | Net increase
(decrease) | |
Year or
period ended | | | # | | | # | | | # | | | # | | | # | | | ($) | | | ($) | | | ($) | | | ($) | | | ($) | |
| Solution Conservative (continued) | |
| Class S | | | | | | | | | | | |
| 12/31/2017 | | | | | 74,983 | | | | | | — | | | | | | 12,234 | | | | | | (337,198) | | | | | | (249,981) | | | | | | 817,743 | | | | | | — | | | | | | 132,986 | | | | | | (3,689,749) | | | | | | (2,739,020) | | |
| 12/31/2016 | | | | | 191,001 | | | | | | — | | | | | | 27,271 | | | | | | (133,859) | | | | | | 84,413 | | | | | | 2,045,268 | | | | | | — | | | | | | 289,618 | | | | | | (1,435,029) | | | | | | 899,857 | | |
| Class S2 | | | | | | | | | | | |
| 12/31/2017 | | | | | 20,239 | | | | | | — | | | | | | 1,573 | | | | | | (12,058) | | | | | | 9,754 | | | | | | 219,057 | | | | | | — | | | | | | 16,974 | | | | | | (131,456) | | | | | | 104,575 | | |
| 12/31/2016 | | | | | 20,580 | | | | | | — | | | | | | 1,923 | | | | | | (8,826) | | | | | | 13,677 | | | | | | 218,102 | | | | | | — | | | | | | 20,300 | | | | | | (92,991) | | | | | | 145,411 | | |
| Solution Income | |
| Class ADV | | | | | | | | | | | |
| 12/31/2017 | | | | | 684,874 | | | | | | — | | | | | | 378,493 | | | | | | (4,082,575) | | | | | | (3,019,208) | | | | | | 7,890,664 | | | | | | — | | | | | | 4,352,673 | | | | | | (46,973,035) | | | | | | (34,729,698) | | |
| 12/31/2016 | | | | | 838,417 | | | | | | — | | | | | | 425,305 | | | | | | (5,679,960) | | | | | | (4,416,238) | | | | | | 9,245,175 | | | | | | — | | | | | | 4,742,151 | | | | | | (62,563,950) | | | | | | (48,576,624) | | |
| Class I | | | | | | | | | | | |
| 12/31/2017 | | | | | 972,564 | | | | | | — | | | | | | 210,030 | | | | | | (1,344,676) | | | | | | (162,082) | | | | | | 11,483,747 | | | | | | — | | | | | | 2,469,954 | | | | | | (15,929,389) | | | | | | (1,975,688) | | |
| 12/31/2016 | | | | | 1,339,227 | | | | | | — | | | | | | 201,617 | | | | | | (3,137,728) | | | | | | (1,596,884) | | | | | | 15,151,519 | | | | | | — | | | | | | 2,296,413 | | | | | | (35,447,069) | | | | | | (17,999,137) | | |
| Class S | | | | | | | | | | | |
| 12/31/2017 | | | | | 476,825 | | | | | | — | | | | | | 361,452 | | | | | | (4,456,256) | | | | | | (3,617,979) | | | | | | 5,587,254 | | | | | | — | | | | | | 4,218,149 | | | | | | (52,216,060) | | | | | | (42,410,657) | | |
| 12/31/2016 | | | | | 553,161 | | | | | | — | | | | | | 397,199 | | | | | | (4,849,656) | | | | | | (3,899,296) | | | | | | 6,191,680 | | | | | | — | | | | | | 4,488,343 | | | | | | (54,175,988) | | | | | | (43,495,965) | | |
| Class S2 | | | | | | | | | | | |
| 12/31/2017 | | | | | 84,331 | | | | | | — | | | | | | 21,371 | | | | | | (353,977) | | | | | | (248,275) | | | | | | 964,888 | | | | | | — | | | | | | 243,203 | | | | | | (4,044,357) | | | | | | (2,836,266) | | |
| 12/31/2016 | | | | | 155,769 | | | | | | — | | | | | | 26,662 | | | | | | (549,167) | | | | | | (366,736) | | | | | | 1,700,861 | | | | | | — | | | | | | 293,819 | | | | | | (6,019,372) | | | | | | (4,024,692) | | |
| Class T | | | | | | | | | | | |
| 12/31/2017 | | | | | 654 | | | | | | — | | | | | | 229 | | | | | | (734) | | | | | | 149 | | | | | | 8,060 | | | | | | — | | | | | | 2,808 | | | | | | (8,974) | | | | | | 1,894 | | |
| 12/31/2016 | | | | | 7,841 | | | | | | — | | | | | | 181 | | | | | | (62,146) | | | | | | (54,124) | | | | | | 91,198 | | | | | | — | | | | | | 2,132 | | | | | | (719,828) | | | | | | (626,498) | | |
| Solution Moderately Aggressive | |
| Class ADV | | | | | | | | | | | |
| 12/31/2017 | | | | | 291,030 | | | | | ��� | — | | | | | | 47,573 | | | | | | (408,252) | | | | | | (69,649) | | | | | | 3,643,839 | | | | | | — | | | | | | 597,996 | | | | | | (5,109,635) | | | | | | (867,800) | | |
| 12/31/2016 | | | | | 313,018 | | | | | | — | | | | | | 53,590 | | | | | | (1,041,492) | | | | | | (674,884) | | | | | | 3,517,103 | | | | | | — | | | | | | 608,784 | | | | | | (11,697,103) | | | | | | (7,571,216) | | |
| Class I | | | | | | | | | | | |
| 12/31/2017 | | | | | 121,084 | | | | | | — | | | | | | 10,952 | | | | | | (53,924) | | | | | | 78,112 | | | | | | 1,581,007 | | | | | | — | | | | | | 140,076 | | | | | | (711,450) | | | | | | 1,009,633 | | |
| 12/31/2016 | | | | | 56,764 | | | | | | — | | | | | | 10,035 | | | | | | (53,317) | | | | | | 13,482 | | | | | | 650,676 | | | | | | — | | | | | | 115,903 | | | | | | (607,100) | | | | | | 159,479 | | |
| Class R6 | | | | | | | | | | | |
| 12/31/2017 | | | | | 524,385 | | | | | | — | | | | | | 9,690 | | | | | | (40,049) | | | | | | 494,026 | | | | | | 6,672,950 | | | | | | — | | | | | | 123,843 | | | | | | (511,598) | | | | | | 6,285,195 | | |
5/2/2016(1) -
12/31/2016 | | | | | 111,329 | | | | | | — | | | | | | 263 | | | | | | (2,731) | | | | | | 108,861 | | | | | | 1,306,234 | | | | | | — | | | | | | 3,040 | | | | | | (31,825) | | | | | | 1,277,449 | | |
| Class S | | | | | | | | | | | |
| 12/31/2017 | | | | | 426,945 | | | | | | — | | | | | | 1,318,779 | | | | | | (8,595,557) | | | | | | (6,849,833) | | | | | | 5,365,781 | | | | | | — | | | | | | 16,695,746 | | | | | | (108,801,058) | | | | | | (86,739,531) | | |
| 12/31/2016 | | | | | 496,010 | | | | | | — | | | | | | 1,631,794 | | | | | | (9,052,219) | | | | | | (6,924,415) | | | | | | 5,592,080 | | | | | | — | | | | | | 18,667,727 | | | | | | (102,367,614) | | | | | | (78,107,807) | | |
| Class S2 | | | | | | | | | | | |
| 12/31/2017 | | | | | 32,201 | | | | | | — | | | | | | 3,032 | | | | | | (6,133) | | | | | | 29,100 | | | | | | 405,490 | | | | | | — | | | | | | 38,327 | | | | | | (78,795) | | | | | | 365,022 | | |
| 12/31/2016 | | | | | 30,115 | | | | | | — | | | | | | 2,076 | | | | | | (27,362) | | | | | | 4,829 | | | | | | 339,555 | | | | | | — | | | | | | 23,749 | | | | | | (307,295) | | | | | | 56,009 | | |
| Solution Moderately Conservative | |
| Class ADV | | | | | | | | | | | |
| 12/31/2017 | | | | | 162,327 | | | | | | — | | | | | | 20,316 | | | | | | (528,478) | | | | | | (345,835) | | | | | | 1,566,854 | | | | | | — | | | | | | 196,049 | | | | | | (5,031,935) | | | | | | (3,269,032) | | |
| 12/31/2016 | | | | | 314,962 | | | | | | — | | | | | | 120,417 | | | | | | (1,288,116) | | | | | | (852,737) | | | | | | 2,958,639 | | | | | | — | | | | | | 1,103,021 | | | | | | (12,347,311) | | | | | | (8,285,651) | | |
| Class I | | | | | | | | | | | |
| 12/31/2017 | | | | | 2,567 | | | | | | — | | | | | | 63 | | | | | | (3,474) | | | | | | (844) | | | | | | 26,570 | | | | | | — | | | | | | 636 | | | | | | (35,731) | | | | | | (8,525) | | |
| 12/31/2016 | | | | | 270 | | | | | | — | | | | | | 348 | | | | | | (798) | | | | | | (180) | | | | | | 2,671 | | | | | | — | | | | | | 3,328 | | | | | | (7,713) | | | | | | (1,714) | | |
| Class R6 | | | | | | | | | | | |
| 12/31/2017 | | | | | 182,228 | | | | | | — | | | | | | 3,035 | | | | | | (7,090) | | | | | | 178,173 | | | | | | 1,833,857 | | | | | | — | | | | | | 30,444 | | | | | | (71,677) | | | | | | 1,792,624 | | |
5/2/2016(1) -
12/31/2016 | | | | | 29,923 | | | | | | — | | | | | | 67 | | | | | | (195) | | | | | | 29,795 | | | | | | 287,964 | | | | | | — | | | | | | 640 | | | | | | (1,877) | | | | | | 286,727 | | |
| Class S | | | | | | | | | | | |
| 12/31/2017 | | | | | 244,517 | | | | | | — | | | | | | 45,328 | | | | | | (821,170) | | | | | | (531,325) | | | | | | 2,407,463 | | | | | | — | | | | | | 445,570 | | | | | | (8,121,600) | | | | | | (5,268,567) | | |
| 12/31/2016 | | | | | 267,868 | | | | | | — | | | | | | 185,343 | | | | | | (303,784) | | | | | | 149,427 | | | | | | 2,577,222 | | | | | | — | | | | | | 1,732,956 | | | | | | (2,950,942) | | | | | | 1,359,236 | | |
| Class S2 | | | | | | | | | | | |
| 12/31/2017 | | | | | 18,817 | | | | | | — | | | | | | 2,089 | | | | | | (10,029) | | | | | | 10,877 | | | | | | 183,628 | | | | | | — | | | | | | 20,307 | | | | | | (99,579) | | | | | | 104,356 | | |
| 12/31/2016 | | | | | 21,737 | | | | | | — | | | | | | 7,101 | | | | | | (16,349) | | | | | | 12,489 | | | | | | 209,936 | | | | | | — | | | | | | 65,756 | | | | | | (156,976) | | | | | | 118,716 | | |
| Solution 2020 | |
| Class ADV | | | | | | | | | | | |
| 12/31/2017 | | | | | 639,343 | | | | | | — | | | | | | 31,214 | | | | | | (322,318) | | | | | | 348,239 | | | | | | 8,161,610 | | | | | | — | | | | | | 396,415 | | | | | | (4,125,782) | | | | | | 4,432,243 | | |
| 12/31/2016 | | | | | 801,007 | | | | | | — | | | | | | 5,784 | | | | | | (297,458) | | | | | | 509,333 | | | | | | 9,402,802 | | | | | | — | | | | | | 69,636 | | | | | | (3,551,098) | | | | | | 5,921,340 | | |
| Class I | | | | | | | | | | | |
| 12/31/2017 | | | | | 259,146 | | | | | | — | | | | | | 19,564 | | | | | | (239,902) | | | | | | 38,808 | | | | | | 3,330,586 | | | | | | — | | | | | | 253,164 | | | | | | (3,128,692) | | | | | | 455,058 | | |
| 12/31/2016 | | | | | 572,827 | | | | | | — | | | | | | 2,999 | | | | | | (243,036) | | | | | | 332,790 | | | | | | 6,912,370 | | | | | | — | | | | | | 36,706 | | | | | | (2,901,732) | | | | | | 4,047,344 | | |
NOTES TO FINANCIAL STATEMENTS as of December 31, 2017 (continued)
NOTE 10 — CAPITAL SHARES (continued)
| | | | Shares
sold | | | Shares
issued in
merger | | | Reinvestment
of
distributions | | | Shares
redeemed | | | Net increase
(decrease)
in shares
outstanding | | | Shares
sold | | | Proceeds
from shares
issued in
merger | | | Reinvestment
of
distributions | | | Shares
redeemed | | | Net increase
(decrease) | |
Year or
period ended | | | # | | | # | | | # | | | # | | | # | | | ($) | | | ($) | | | ($) | | | ($) | | | ($) | |
| Solution 2020 (continued) | |
| Class S | | | | | | | | | | | |
| 12/31/2017 | | | | | 432,943 | | | | | | — | | | | | | 19,263 | | | | | | (192,256) | | | | | | 259,950 | | | | | | 5,637,344 | | | | | | — | | | | | | 248,497 | | | | | | (2,485,606) | | | | | | 3,400,235 | | |
| 12/31/2016 | | | | | 368,264 | | | | | | — | | | | | | 4,111 | | | | | | (198,513) | | | | | | 173,862 | | | | | | 4,408,326 | | | | | | — | | | | | | 50,198 | | | | | | (2,389,852) | | | | | | 2,068,672 | | |
| Class S2 | | | | | | | | | | | |
| 12/31/2017 | | | | | 50,917 | | | | | | — | | | | | | 646 | | | | | | (14,084) | | | | | | 37,479 | | | | | | 660,922 | | | | | | — | | | | | | 8,255 | | | | | | (183,206) | | | | | | 485,971 | | |
| 12/31/2016 | | | | | 37,380 | | | | | | — | | | | | | 137 | | | | | | (49,568) | | | | | | (12,051) | | | | | | 451,006 | | | | | | — | | | | | | 1,653 | | | | | | (587,326) | | | | | | (134,667) | | |
| Class T | | | | | | | | | | | |
| 12/31/2017 | | | | | 215 | | | | | | — | | | | | | 13 | | | | | | (5) | | | | | | 223 | | | | | | 2,776 | | | | | | — | | | | | | 160 | | | | | | (60) | | | | | | 2,876 | | |
| 12/31/2016 | | | | | 317 | | | | | | — | | | | | | 1 | | | | | | (2) | | | | | | 316 | | | | | | 3,731 | | | | | | — | | | | | | 10 | | | | | | (21) | | | | | | 3,720 | | |
| Solution 2025 | |
| Class ADV | | | | | | | | | | | |
| 12/31/2017 | | | | | 1,776,381 | | | | | | — | | | | | | 1,189,175 | | | | | | (5,727,557) | | | | | | (2,762,001) | | | | | | 19,975,178 | | | | | | — | | | | | | 13,271,197 | | | | | | (64,495,016) | | | | | | (31,248,641) | | |
| 12/31/2016 | | | | | 1,472,139 | | | | | | — | | | | | | 3,007,965 | | | | | | (8,095,747) | | | | | | (3,615,643) | | | | | | 16,021,320 | | | | | | — | | | | | | 31,643,796 | | | | | | (87,844,343) | | | | | | (40,179,227) | | |
| Class I | | | | | | | | | | | |
| 12/31/2017 | | | | | 3,825,273 | | | | | | — | | | | | | 965,881 | | | | | | (2,317,907) | | | | | | 2,473,247 | | | | | | 44,273,044 | | | | | | — | | | | | | 11,049,676 | | | | | | (26,891,127) | | | | | | 28,431,593 | | |
| 12/31/2016 | | | | | 3,616,536 | | | | | | — | | | | | | 2,001,405 | | | | | | (5,789,001) | | | | | | (171,060) | | | | | | 40,352,865 | | | | | | — | | | | | | 21,555,129 | | | | | | (63,717,960) | | | | | | (1,809,966) | | |
| Class S | | | | | | | | | | | |
| 12/31/2017 | | | | | 1,419,950 | | | | | | — | | | | | | 1,480,907 | | | | | | (7,466,931) | | | | | | (4,566,074) | | | | | | 16,260,819 | | | | | | — | | | | | | 16,763,871 | | | | | | (85,534,946) | | | | | | (52,510,256) | | |
| 12/31/2016 | | | | | 1,675,948 | | | | | | — | | | | | | 3,596,880 | | | | | | (7,440,994) | | | | | | (2,168,166) | | | | | | 18,501,186 | | | | | | — | | | | | | 38,342,742 | | | | | | (82,053,585) | | | | | | (25,209,657) | | |
| Class S2 | | | | | | | | | | | |
| 12/31/2017 | | | | | 187,371 | | | | | | — | | | | | | 80,427 | | | | | | (931,312) | | | | | | (663,514) | | | | | | 2,085,637 | | | | | | — | | | | | | 884,699 | | | | | | (10,402,544) | | | | | | (7,432,208) | | |
| 12/31/2016 | | | | | 274,563 | | | | | | — | | | | | | 248,527 | | | | | | (904,887) | | | | | | (381,797) | | | | | | 2,959,702 | | | | | | — | | | | | | 2,577,222 | | | | | | (9,685,304) | | | | | | (4,148,380) | | |
| Class T | | | | | | | | | | | |
| 12/31/2017 | | | | | 4,239 | | | | | | — | | | | | | 2,633 | | | | | | (12,325) | | | | | | (5,453) | | | | | | 50,842 | | | | | | — | | | | | | 30,671 | | | | | | (144,987) | | | | | | (63,474) | | |
| 12/31/2016 | | | | | 2,735 | | | | | | — | | | | | | 6,895 | | | | | | (9,228) | | | | | | 402 | | | | | | 30,432 | | | | | | — | | | | | | 75,567 | | | | | | (105,146) | | | | | | 853 | | |
| Solution 2030 | |
| Class ADV | | | | | | | | | | | |
| 12/31/2017 | | | | | 577,415 | | | | | | — | | | | | | 17,436 | | | | | | (218,741) | | | | | | 376,110 | | | | | | 8,654,852 | | | | | | — | | | | | | 262,588 | | | | | | (3,278,742) | | | | | | 5,638,698 | | |
| 12/31/2016 | | | | | 442,625 | | | | | | — | | | | | | 2,868 | | | | | | (88,794) | | | | | | 356,699 | | | | | | 5,898,535 | | | | | | — | | | | | | 39,204 | | | | | | (1,206,550) | | | | | | 4,731,189 | | |
| Class I | | | | | | | | | | | |
| 12/31/2017 | | | | | 353,934 | | | | | | — | | | | | | 10,136 | | | | | | (64,992) | | | | | | 299,078 | | | | | | 5,417,548 | | | | | | — | | | | | | 156,095 | | | | | | (996,430) | | | | | | 4,577,213 | | |
| 12/31/2016 | | | | | 263,076 | | | | | | — | | | | | | 918 | | | | | | (99,835) | | | | | | 164,159 | | | | | | 3,633,035 | | | | | | — | | | | | | 12,801 | | | | | | (1,361,694) | | | | | | 2,284,142 | | |
| Class S | | | | | | | | | | | |
| 12/31/2017 | | | | | 365,883 | | | | | | — | | | | | | 10,531 | | | | | | (191,459) | | | | | | 184,955 | | | | | | 5,597,191 | | | | | | — | | | | | | 161,549 | | | | | | (2,974,531) | | | | | | 2,784,209 | | |
| 12/31/2016 | | | | | 301,171 | | | | | | — | | | | | | 1,831 | | | | | | (74,932) | | | | | | 228,070 | | | | | | 4,131,153 | | | | | | — | | | | | | 25,458 | | | | | | (1,036,181) | | | | | | 3,120,430 | | |
| Class S2 | | | | | | | | | | | |
| 12/31/2017 | | | | | 58,446 | | | | | | — | | | | | | 474 | | | | | | (40,580) | | | | | | 18,340 | | | | | | 871,998 | | | | | | — | | | | | | 7,188 | | | | | | (605,778) | | | | | | 273,408 | | |
| 12/31/2016 | | | | | 36,147 | | | | | | — | | | | | | 234 | | | | | | (21,246) | | | | | | 15,135 | | | | | | 493,775 | | | | | | — | | | | | | 3,207 | | | | | | (293,936) | | | | | | 203,046 | | |
| Class T | | | | | | | | | | | |
| 12/31/2017 | | | | | 156 | | | | | | — | | | | | | 10 | | | | | | (10) | | | | | | 156 | | | | | | 2,415 | | | | | | — | | | | | | 151 | | | | | | (147) | | | | | | 2,419 | | |
| 12/31/2016 | | | | | 475 | | | | | | — | | | | | | —* | | | | | | (4) | | | | | | 471 | | | | | | 6,327 | | | | | | — | | | | | | 8 | | | | | | (51) | | | | | | 6,284 | | |
| Solution 2035 | |
| Class ADV | | | | | ��� | | | | | | |
| 12/31/2017 | | | | | 1,318,385 | | | | | | — | | | | | | 899,368 | | | | | | (4,916,043) | | | | | | (2,698,290) | | | | | | 15,196,026 | | | | | | — | | | | | | 10,342,734 | | | | | | (56,561,388) | | | | | | (31,022,628) | | |
| 12/31/2016 | | | | | 1,664,992 | | | | | | — | | | | | | 2,799,870 | | | | | | (6,879,600) | | | | | | (2,414,738) | | | | | | 18,108,474 | | | | | | — | | | | | | 29,342,636 | | | | | | (74,747,008) | | | | | | (27,295,898) | | |
| Class I | | | | | | | | | | | |
| 12/31/2017 | | | | | 3,453,853 | | | | | | — | | | | | | 927,026 | | | | | | (1,749,649) | | | | | | 2,631,230 | | | | | | 40,906,412 | | | | | | — | | | | | | 10,920,365 | | | | | | (20,889,385) | | | | | | 30,937,392 | | |
| 12/31/2016 | | | | | 3,627,460 | | | | | | — | | | | | | 2,272,327 | | | | | | (5,588,967) | | | | | | 310,820 | | | | | | 40,334,615 | | | | | | — | | | | | | 24,382,074 | | | | | | (61,733,997) | | | | | | 2,982,692 | | |
| Class S | | | | | | | | | | | |
| 12/31/2017 | | | | | 1,780,894 | | | | | | — | | | | | | 1,258,081 | | | | | | (6,525,031) | | | | | | (3,486,056) | | | | | | 20,884,733 | | | | | | — | | | | | | 14,669,220 | | | | | | (76,020,373) | | | | | | (40,466,420) | | |
| 12/31/2016 | | | | | 2,135,744 | | | | | | — | | | | | | 3,601,356 | | | | | | (6,188,718) | | | | | | (451,618) | | | | | | 23,469,030 | | | | | | — | | | | | | 38,282,413 | | | | | | (68,348,830) | | | | | | (6,597,387) | | |
| Class S2 | | | | | | | | | | | |
| 12/31/2017 | | | | | 239,075 | | | | | | — | | | | | | 74,330 | | | | | | (702,456) | | | | | | (389,051) | | | | | | 2,718,615 | | | | | | — | | | | | | 836,208 | | | | | | (7,971,707) | | | | | | (4,416,884) | | |
| 12/31/2016 | | | | | 274,981 | | | | | | — | | | | | | 234,621 | | | | | | (538,586) | | | | | | (28,984) | | | | | | 2,929,101 | | | | | | — | | | | | | 2,407,216 | | | | | | (5,690,669) | | | | | | (354,352) | | |
| Class T | | | | | | | | | | | |
| 12/31/2017 | | | | | 3,605 | | | | | | — | | | | | | 2,100 | | | | | | (7,030) | | | | | | (1,325) | | | | | | 43,817 | | | | | | — | | | | | | 25,192 | | | | | | (89,179) | | | | | | (20,170) | | |
| 12/31/2016 | | | | | 3,580 | | | | | | — | | | | | | 5,302 | | | | | | (28,951) | | | | | | (20,069) | | | | | | 39,813 | | | | | | — | | | | | | 57,898 | | | | | | (335,241) | | | | | | (237,530) | | |
| Solution 2040 | |
| Class ADV | | | | | | | | | | | |
| 12/31/2017 | | | | | 336,474 | | | | | | — | | | | | | 10,641 | | | | | | (175,506) | | | | | | 171,609 | | | | | | 5,328,978 | | | | | | — | | | | | | 170,047 | | | | | | (2,829,354) | | | | | | 2,669,671 | | |
| 12/31/2016 | | | | | 312,727 | | | | | | — | | | | | | 3,752 | | | | | | (141,023) | | | | | | 175,456 | | | | | | 4,342,825 | | | | | | — | | | | | | 53,242 | | | | | | (1,982,272) | | | | | | 2,413,795 | | |
NOTES TO FINANCIAL STATEMENTS as of December 31, 2017 (continued)
NOTE 10 — CAPITAL SHARES (continued)
| | | | Shares
sold | | | Shares
issued in
merger | | | Reinvestment
of
distributions | | | Shares
redeemed | | | Net increase
(decrease)
in shares
outstanding | | | Shares
sold | | | Proceeds
from shares
issued in
merger | | | Reinvestment
of
distributions | | | Shares
redeemed | | | Net increase
(decrease) | |
Year or
period ended | | | # | | | # | | | # | | | # | | | # | | | ($) | | | ($) | | | ($) | | | ($) | | | ($) | |
| Solution 2040 (continued) | |
| Class I | | | | | | | | | | | |
| 12/31/2017 | | | | | 347,672 | | | | | | — | | | | | | 9,225 | | | | | | (108,903) | | | | | | 247,994 | | | | | | 5,520,587 | | | | | | — | | | | | | 150,736 | | | | | | (1,752,433) | | | | | | 3,918,890 | | |
| 12/31/2016 | | | | | 183,107 | | | | | | — | | | | | | 1,494 | | | | | | (24,919) | | | | | | 159,682 | | | | | | 2,608,905 | | | | | | — | | | | | | 21,611 | | | | | | (363,209) | | | | | | 2,267,307 | | |
| Class S | | | | | | | | | | | |
| 12/31/2017 | | | | | 361,532 | | | | | | — | | | | | | 8,912 | | | | | | (201,286) | | | | | | 169,158 | | | | | | 5,704,597 | | | | | | — | | | | | | 144,738 | | | | | | (3,264,564) | | | | | | 2,584,771 | | |
| 12/31/2016 | | | | | 213,730 | | | | | | — | | | | | | 2,244 | | | | | | (41,758) | | | | | | 174,216 | | | | | | 3,024,568 | | | | | | — | | | | | | 32,309 | | | | | | (592,676) | | | | | | 2,464,201 | | |
| Class S2 | | | | | | | | | | | |
| 12/31/2017 | | | | | 34,887 | | | | | | — | | | | | | 778 | | | | | | (6,193) | | | | | | 29,472 | | | | | | 562,954 | | | | | | — | | | | | | 12,471 | | | | | | (99,361) | | | | | | 476,064 | | |
| 12/31/2016 | | | | | 24,827 | | | | | | — | | | | | | 159 | | | | | | (13,178) | | | | | | 11,808 | | | | | | 345,812 | | | | | | — | | | | | | 2,272 | | | | | | (188,319) | | | | | | 159,765 | | |
| Class T | | | | | | | | | | | |
| 12/31/2017 | | | | | 331 | | | | | | — | | | | | | 13 | | | | | | (9) | | | | | | 335 | | | | | | 5,388 | | | | | | — | | | | | | 207 | | | | | | (154) | | | | | | 5,441 | | |
| 12/31/2016 | | | | | 498 | | | | | | — | | | | | | 2 | | | | | | (6) | | | | | | 494 | | | | | | 6,888 | | | | | | — | | | | | | 30 | | | | | | (93) | | | | | | 6,825 | | |
| Solution 2045 | |
| Class ADV | | | | | | | | | | | |
| 12/31/2017 | | | | | 1,148,545 | | | | | | — | | | | | | 541,031 | | | | | | (3,962,418) | | | | | | (2,272,842) | | | | | | 13,187,351 | | | | | | — | | | | | | 6,243,500 | | | | | | (45,636,936) | | | | | | (26,206,085) | | |
| 12/31/2016 | | | | | 1,279,189 | | | | | | — | | | | | | 1,838,736 | | | | | | (4,217,207) | | | | | | (1,099,282) | | | | | | 13,744,459 | | | | | | — | | | | | | 19,067,689 | | | | | | (45,138,333) | | | | | | (12,326,185) | | |
| Class I | | | | | | | | | | | |
| 12/31/2017 | | | | | 3,343,846 | | | | | | — | | | | | | 703,860 | | | | | | (1,311,150) | | | | | | 2,736,556 | | | | | | 39,726,370 | | | | | | — | | | | | | 8,340,738 | | | | | | (15,678,311) | | | | | | 32,388,797 | | |
| 12/31/2016 | | | | | 3,458,160 | | | | | | — | | | | | | 1,812,567 | | | | | | (4,371,118) | | | | | | 899,609 | | | | | | 37,965,364 | | | | | | — | | | | | | 19,267,588 | | | | | | (47,840,957) | | | | | | 9,391,995 | | |
| Class S | | | | | | | | | �� | | |
| 12/31/2017 | | | | | 1,531,641 | | | | | | — | | | | | | 824,098 | | | | | | (4,770,307) | | | | | | (2,414,568) | | | | | | 17,937,145 | | | | | | — | | | | | | 9,641,941 | | | | | | (55,598,747) | | | | | | (28,019,661) | | |
| 12/31/2016 | | | | | 1,842,368 | | | | | | — | | | | | | 2,569,842 | | | | | | (4,486,162) | | | | | | (73,952) | | | | | | 19,982,189 | | | | | | — | | | | | | 26,983,344 | | | | | | (48,706,800) | | | | | | (1,741,267) | | |
| Class S2 | | | | | | | | | | | |
| 12/31/2017 | | | | | 146,757 | | | | | | — | | | | | | 41,997 | | | | | | (587,995) | | | | | | (399,241) | | | | | | 1,670,246 | | | | | | — | | | | | | 478,768 | | | | | | (6,863,864) | | | | | | (4,714,850) | | |
| 12/31/2016 | | | | | 237,021 | | | | | | — | | | | | | 139,842 | | | | | | (383,030) | | | | | | (6,167) | | | | | | 2,524,988 | | | | | | — | | | | | | 1,433,379 | | | | | | (4,045,609) | | | | | | (87,242) | | |
| Class T | | | | | | | | | | | |
| 12/31/2017 | | | | | 3,030 | | | | | | — | | | | | | 1,374 | | | | | | (2,766) | | | | | | 1,638 | | | | | | 36,314 | | | | | | — | | | | | | 16,349 | | | | | | (34,858) | | | | | | 17,805 | | |
| 12/31/2016 | | | | | 4,049 | | | | | | — | | | | | | 3,629 | | | | | | (3,827) | | | | | | 3,851 | | | | | | 43,683 | | | | | | — | | | | | | 38,795 | | | | | | (42,747) | | | | | | 39,731 | | |
| Solution 2050 | |
| Class ADV | | | | | | | | | | | |
| 12/31/2017 | | | | | 264,981 | | | | | | — | | | | | | 6,506 | | | | | | (87,124) | | | | | | 184,363 | | | | | | 4,224,246 | | | | | | — | | | | | | 104,813 | | | | | | (1,397,537) | | | | | | 2,931,522 | | |
| 12/31/2016 | | | | | 195,180 | | | | | | — | | | | | | 1,949 | | | | | | (47,816) | | | | | | 149,313 | | | | | | 2,707,059 | | | | | | — | | | | | | 27,679 | | | | | | (664,751) | | | | | | 2,069,987 | | |
| Class I | | | | | | | | | | | |
| 12/31/2017 | | | | | 258,937 | | | | | | — | | | | | | 5,487 | | | | | | (41,352) | | | | | | 223,072 | | | | | | 4,231,596 | | | | | | — | | | | | | 90,649 | | | | | | (691,523) | | | | | | 3,630,722 | | |
| 12/31/2016 | | | | | 112,886 | | | | | | — | | | | | | 791 | | | | | | (43,767) | | | | | | 69,910 | | | | | | 1,609,179 | | | | | | — | | | | | | 11,478 | | | | | | (627,537) | | | | | | 993,120 | | |
| Class S | | | | | | | | | | | |
| 12/31/2017 | | | | | 188,908 | | | | | | — | | | | | | 4,160 | | | | | | (77,130) | | | | | | 115,938 | | | | | | 3,080,202 | | | | | | — | | | | | | 68,182 | | | | | | (1,274,572) | | | | | | 1,873,812 | | |
| 12/31/2016 | | | | | 148,122 | | | | | | — | | | | | | 1,060 | | | | | | (36,987) | | | | | | 112,195 | | | | | | 2,095,615 | | | | | | — | | | | | | 15,296 | | | | | | (530,087) | | | | | | 1,580,824 | | |
| Class S2 | | | | | | | | | | | |
| 12/31/2017 | | | | | 12,224 | | | | | | — | | | | | | 306 | | | | | | (4,519) | | | | | | 8,011 | | | | | | 198,794 | | | | | | — | | | | | | 4,960 | | | | | | (74,353) | | | | | | 129,401 | | |
| 12/31/2016 | | | | | 12,196 | | | | | | — | | | | | | 79 | | | | | | (3,206) | | | | | | 9,069 | | | | | | 166,511 | | | | | | — | | | | | | 1,128 | | | | | | (45,435) | | | | | | 122,204 | | |
| Class T | | | | | | | | | | | |
| 12/31/2017 | | | | | 518 | | | | | | — | | | | | | 6 | | | | | | (10) | | | | | | 514 | | | | | | 8,562 | | | | | | — | | | | | | 98 | | | | | | (155) | | | | | | 8,505 | | |
| 12/31/2016 | | | | | 359 | | | | | | — | | | | | | 1 | | | | | | (3) | | | | | | 357 | | | | | | 4,911 | | | | | | — | | | | | | 15 | | | | | | (47) | | | | | | 4,879 | | |
| Solution 2055 | |
| Class ADV | | | | | | | | | | | |
| 12/31/2017 | | | | | 655,026 | | | | | | — | | | | | | 92,468 | | | | | | (965,030) | | | | | | (217,536) | | | | | | 8,716,067 | | | | | | — | | | | | | 1,246,472 | | | | | | (12,864,981) | | | | | | (2,902,442) | | |
| 12/31/2016 | | | | | 780,954 | | | | | | — | | | | | | 267,961 | | | | | | (897,478) | | | | | | 151,437 | | | | | | 9,513,310 | | | | | | — | | | | | | 3,207,494 | | | | | | (11,004,737) | | | | | | 1,716,067 | | |
| Class I | | | | | | | | | | | |
| 12/31/2017 | | | | | 1,701,510 | | | | | | — | | | | | | 141,828 | | | | | | (403,399) | | | | | | 1,439,939 | | | | | | 23,353,725 | | | | | | — | | | | | | 1,945,879 | | | | | | (5,572,271) | | | | | | 19,727,333 | | |
| 12/31/2016 | | | | | 1,528,510 | | | | | | — | | | | | | 288,686 | | | | | | (1,136,841) | | | | | | 680,355 | | | | | | 18,921,397 | | | | | | — | | | | | | 3,513,311 | | | | | | (14,137,682) | | | | | | 8,297,026 | | |
| Class S | | | | | | | | | | | |
| 12/31/2017 | | | | | 797,872 | | | | | | — | | | | | | 116,435 | | | | | | (1,076,062) | | | | | | (161,755) | | | | | | 10,767,683 | | | | | | — | | | | | | 1,581,186 | | | | | | (14,390,753) | | | | | | (2,041,884) | | |
| 12/31/2016 | | | | | 955,451 | | | | | | — | | | | | | 318,325 | | | | | | (845,974) | | | | | | 427,802 | | | | | | 11,722,491 | | | | | | — | | | | | | 3,835,816 | | | | | | (10,363,508) | | | | | | 5,194,799 | | |
| Class S2 | | | | | | | | | | | |
| 12/31/2017 | | | | | 92,134 | | | | | | — | | | | | | 6,862 | | | | | | (118,763) | | | | | | (19,767) | | | | | | 1,245,259 | | | | | | — | | | | | | 92,706 | | | | | | (1,627,487) | | | | | | (289,522) | | |
| 12/31/2016 | | | | | 96,308 | | | | | | — | | | | | | 20,626 | | | | | | (113,535) | | | | | | 3,399 | | | | | | 1,175,038 | | | | | | — | | | | | | 247,508 | | | | | | (1,384,825) | | | | | | 37,721 | | |
| Class T | | | | | | | | | | | |
| 12/31/2017 | | | | | 328 | | | | | | — | | | | | | 51 | | | | | | (230) | | | | | | 149 | | | | | | 4,593 | | | | | | — | | | | | | 702 | | | | | | (3,116) | | | | | | 2,179 | | |
| 12/31/2016 | | | | | 1,200 | | | | | | — | | | | | | 99 | | | | | | (23) | | | | | | 1,276 | | | | | | 14,505 | | | | | | — | | | | | | 1,208 | | | | | | (279) | | | | | | 15,434 | | |
NOTES TO FINANCIAL STATEMENTS as of December 31, 2017 (continued)
NOTE 10 — CAPITAL SHARES (continued)
| | | | Shares
sold | | | Shares
issued in
merger | | | Reinvestment
of
distributions | | | Shares
redeemed | | | Net increase
(decrease)
in shares
outstanding | | | Shares
sold | | | Proceeds
from shares
issued in
merger | | | Reinvestment
of
distributions | | | Shares
redeemed | | | Net increase
(decrease) | |
Year or
period ended | | | # | | | # | | | # | | | # | | | # | | | ($) | | | ($) | | | ($) | | | ($) | | | ($) | |
| Solution 2060 | |
| Class ADV | | | | | | | | | | | |
| 12/31/2017 | | | | | 202,745 | | | | | | — | | | | | | 3,872 | | | | | | (82,080) | | | | | | 124,537 | | | | | | 2,333,115 | | | | | | — | | | | | | 44,610 | | | | | | (927,573) | | | | | | 1,450,152 | | |
| 12/31/2016 | | | | | 134,992 | | | | | | — | | | | | | 833 | | | | | | (21,262) | | | | | | 114,563 | | | | | | 1,351,166 | | | | | | — | | | | | | 8,455 | | | | | | (215,748) | | | | | | 1,143,873 | | |
| Class I | | | | | | | | | | | |
| 12/31/2017 | | | | | 142,758 | | | | | | — | | | | | | 2,787 | | | | | | (30,905) | | | | | | 114,640 | | | | | | 1,643,865 | | | | | | — | | | | | | 32,383 | | | | | | (356,198) | | | | | | 1,320,050 | | |
| 12/31/2016 | | | | | 86,877 | | | | | | — | | | | | | 617 | | | | | | (61,632) | | | | | | 25,862 | | | | | | 857,791 | | | | | | — | | | | | | 6,292 | | | | | | (629,232) | | | | | | 234,851 | | |
| Class S | | | | | | | | | | | |
| 12/31/2017 | | | | | 220,422 | | | | | | — | | | | | | 4,659 | | | | | | (77,534) | | | | | | 147,547 | | | | | | 2,498,807 | | | | | | — | | | | | | 53,670 | | | | | | (908,917) | | | | | | 1,643,560 | | |
| 12/31/2016 | | | | | 79,155 | | | | | | — | | | | | | 456 | | | | | | (13,566) | | | | | | 66,045 | | | | | | 788,824 | | | | | | — | | | | | | 4,628 | | | | | | (136,276) | | | | | | 657,176 | | |
| Class S2 | | | | | | | | | | | |
| 12/31/2017 | | | | | 16,697 | | | | | | — | | | | | | 181 | | | | | | (5,390) | | | | | | 11,488 | | | | | | 192,176 | | | | | | — | | | | | | 2,093 | | | | | | (62,345) | | | | | | 131,924 | | |
| 12/31/2016 | | | | | 4,970 | | | | | | — | | | | | | 44 | | | | | | (4,560) | | | | | | 454 | | | | | | 49,211 | | | | | | — | | | | | | 448 | | | | | | (46,071) | | | | | | 3,588 | | |
| Class T | | | | | | | | | | | |
| 12/31/2017 | | | | | — | | | | | | — | | | | | | 5 | | | | | | (1) | | | | | | 4 | | | | | | (1) | | | | | | — | | | | | | 62 | | | | | | (11) | | | | | | 50 | | |
| 12/31/2016 | | | | | — | | | | | | — | | | | | | 3 | | | | | | — | | | | | | 3 | | | | | | — | | | | | | — | | | | | | 27 | | | | | | — | | | | | | 27 | | |
(1)
Commencement of operations
*
Share amount is less than 0.500 per share or $0.50.
NOTE 11 — FEDERAL INCOME TAXES
The amount of distributions from net investment income and net realized capital gains are determined in accordance with federal income tax regulations, which may differ from GAAP for investment companies. These book/tax differences may be either temporary or permanent. Permanent differences are reclassified within the capital accounts based on their federal tax-basis treatment; temporary differences are not reclassified. Key differences include the treatment of short-term capital gains, foreign currency transactions, and wash sale deferrals. Distributions in excess of net investment income and/or net realized capital gains for tax purposes are reported as return of capital.
The following permanent tax differences have been reclassified as of December 31, 2017:
| | | | Undistributed Net
Investment Income | | | Accumulated
Net Realized
Gains/(Losses) | |
| Solution Aggressive | | | | $ | 44,319 | | | | | $ | (44,319) | | |
| Solution Balanced | | | | | 160,159 | | | | | | (160,159) | | |
| Solution Conservative | | | | | 8,454 | | | | | | (8,454) | | |
| Solution Income | | | | | 969,825 | | | | | | (969,825) | | |
| Solution Moderately Aggressive | | | | | 2,457,310 | | | | | | (2,457,310) | | |
| Solution Moderately Conservative | | | | | 57,188 | | | | | | (57,188) | | |
| Solution 2020 | | | | | 76,652 | | | | | | (76,652) | | |
| Solution 2025 | | | | | 2,532,084 | | | | | | (2,532,084) | | |
| Solution 2030 | | | | | 94,652 | | | | | | (94,652) | | |
| Solution 2035 | | | | | 3,075,290 | | | | | | (3,075,290) | | |
| Solution 2040 | | | | | 77,026 | | | | | | (77,026) | | |
| | | | Undistributed Net
Investment Income | | | Accumulated
Net Realized
Gains/(Losses) | |
| Solution 2045 | | | | | 2,230,707 | | | | | | (2,230,707) | | |
| Solution 2050 | | | | | 48,181 | | | | | | (48,181) | | |
| Solution 2055 | | | | | 552,460 | | | | | | (552,460) | | |
| Solution 2060 | | | | | 22,921 | | | | | | (22,921) | | |
Dividends paid by the Portfolios from net investment income and distributions of net realized short-term capital gains are, for federal income tax purposes, taxable as ordinary income to shareholders.
The tax composition of dividends and distributions to shareholders was as follows:
| | | | Year Ended
December 31, 2017 | | | Year Ended
December 31, 2016 | |
| | | | Ordinary
Income | | | Long-term
Capital Gains | | | Ordinary
Income | | | Long-term
Capital Gains | |
| Solution Aggressive | | | | $ | 66,192 | | | | | $ | 150,636 | | | | | $ | 79,752 | | | | | $ | 330,801 | | |
| Solution Balanced | | | | | 811,490 | | | | | | 935,588 | | | | | | 970,476 | | | | | | 3,054,899 | | |
| Solution Conservative | | | | | 341,352 | | | | | | 97,539 | | | | | | 304,770 | | | | | | 379,565 | | |
| Solution Income | | | | | 9,886,199 | | | | | | 1,400,588 | | | | | | 5,721,757 | | | | | | 6,101,101 | | |
| Solution Moderately Aggressive | | | | | 9,748,419 | | | | | | 7,847,569 | | | | | | 8,503,212 | | | | | | 10,915,991 | | |
| Solution Moderately Conservative | | | | | 693,006 | | | | | | — | | | | | | 808,032 | | | | | | 2,097,669 | | |
| Solution 2020 | | | | | 482,935 | | | | | | 423,673 | | | | | | 81,257 | | | | | | 76,964 | | |
| Solution 2025 | | | | | 17,212,488 | | | | | | 24,787,626 | | | | | | 19,436,362 | | | | | | 74,758,095 | | |
| Solution 2030 | | | | | 281,217 | | | | | | 306,452 | | | | | | 39,434 | | | | | | 41,295 | | |
| Solution 2035 | | | | | 13,810,357 | | | | | | 22,983,362 | | | | | | 18,503,313 | | | | | | 75,968,924 | | |
| Solution 2040 | | | | | 199,452 | | | | | | 278,849 | | | | | | 39,261 | | | | | | 70,306 | | |
| Solution 2045 | | | | | 7,145,424 | | | | | | 17,575,872 | | | | | | 10,377,141 | | | | | | 56,413,654 | | |
| Solution 2050 | | | | | 109,808 | | | | | | 158,978 | | | | | | 19,203 | | | | | | 36,477 | | |
| Solution 2055 | | | | | 1,562,373 | | | | | | 3,304,572 | | | | | | 1,888,143 | | | | | | 8,917,193 | | |
| Solution 2060 | | | | | 62,957 | | | | | | 69,861 | | | | | | 11,188 | | | | | | 8,662 | | |
NOTES TO FINANCIAL STATEMENTS as of December 31, 2017 (continued)
NOTE 11 — FEDERAL INCOME TAXES (continued)
The tax-basis components of distributable earnings as of December 31, 2017 were:
| | | | Undistributed
Ordinary
Income | | | Undistributed
Long-term
Capital Gains | | | Unrealized
Appreciation/
(Depreciation) | |
| Solution Aggressive | | | | $ | 232,781 | | | | | $ | 563,780 | | | | | $ | 862,503 | | |
| Solution Balanced | | | | | 1,351,294 | | | | | | 1,695,380 | | | | | | 2,421,477 | | |
| Solution Conservative | | | | | 476,385 | | | | | | 128,015 | | | | | | (166,663) | | |
| Solution Income | | | | | 13,577,150 | | | | | | 5,253,969 | | | | | | 868,551 | | |
| Solution Moderately Aggressive | | | | | 15,279,431 | | | | | | 26,499,346 | | | | | | 45,985,408 | | |
| Solution Moderately Conservative | | | | | 832,143 | | | | | | 513,211 | | | | | | 228,078 | | |
| Solution 2020 | | | | | 1,034,363 | | | | | | 1,129,773 | | | | | | 1,018,693 | | |
| Solution 2025 | | | | | 21,870,596 | | | | | | 21,957,992 | | | | | | 38,740,692 | | |
| Solution 2030 | | | | | 1,019,540 | | | | | | 1,105,437 | | | | | | 1,613,850 | | |
| Solution 2035 | | | | | 18,155,622 | | | | | | 32,577,350 | | | | | | 67,423,013 | | |
| Solution 2040 | | | | | 831,111 | | | | | | 1,234,567 | | | | | | 1,519,943 | | |
| Solution 2045 | | | | | 13,092,109 | | | | | | 28,338,008 | | | | | | 59,378,951 | | |
| Solution 2050 | | | | | 455,928 | | | | | | 718,190 | | | | | | 1,230,191 | | |
| Solution 2055 | | | | | 2,967,614 | | | | | | 6,008,509 | | | | | | 15,097,536 | | |
| Solution 2060 | | | | | 285,724 | | | | | | 316,029 | | | | | | 514,493 | | |
At December 31, 2017, the Portfolios did not have any capital loss carryovers for U.S. federal income tax purposes.
The Portfolios’ major tax jurisdictions are U.S. federal and Arizona state.
As of December 31, 2017, no provision for income tax is required in the Portfolios' financial statements as a result of tax positions taken on federal and state income tax returns for open tax years. The Portfolios' federal and state income and federal excise tax returns for tax years for which the applicable statutes of limitations have not expired are subject to examination by the Internal Revenue Service and state department of revenue. The earliest tax year that remains subject to examination by these jurisdictions is 2013.
NOTE 12 — SUBSEQUENT EVENTS
The Portfolios have evaluated events occurring after the Statements of Assets and Liabilities date (“subsequent events”), to determine whether any subsequent events necessitated adjustment to or disclosure in the financial statements. No such subsequent events were identified.
PORTFOLIO OF INVESTMENTS
| Voya Solution Aggressive Portfolio | as of December 31, 2017 |
| Shares | | | Value | | | Percentage
of Net
Assets | |
| EXCHANGE-TRADED FUNDS: 6.3% | |
| | | 3,062 | | | | iShares MSCI EMU Index
Fund | | | | $ | 132,830 | | | | | | 1.0 | | |
| | | 2,731 | | | | iShares Russell 1000 Value
Index Fund | | | | | 339,573 | | | | | | 2.4 | | |
| | | 6,885 | | | | WisdomTree Japan Hedged
Equity Fund | | | | | 408,486 | | | | | | 2.9 | | |
| | | | | | | Total Exchange-Traded Funds
(Cost $824,793) | | | | | 880,889 | | | | | | 6.3 | | |
| MUTUAL FUNDS: 93.5% | |
| | | | | | | Affiliated Investment Companies: 92.5% | |
| | | 32,455 | | | | Voya Emerging Markets Index
Portfolio - Class I | | | | | 417,044 | | | | | | 3.0 | | |
| | | 14,429 | | | | Voya Index Plus LargeCap
Portfolio - Class I | | | | | 420,037 | | | | | | 3.0 | | |
| | | 27,159 | | | | Voya Intermediate Bond
Fund - Class R6 | | | | | 274,577 | | | | | | 2.0 | | |
| | | 26,554 | | | | Voya International Index
Portfolio - Class I | | | | | 285,186 | | | | | | 2.1 | | |
| | | 67,227 | | | | Voya Large Cap Growth
Portfolio - Class I | | | | | 1,398,332 | | | | | | 10.0 | | |
| | | 58,055 | | | | Voya Large Cap Value
Fund - Class R6 | | | | | 773,295 | | | | | | 5.6 | | |
| | | 47,838 | | | | Voya MidCap Opportunities
Portfolio - Class I | | | | | 696,517 | | | | | | 5.0 | | |
| | | 46,916 | | | | Voya Multi-Manager Emerging
Markets Equity Fund - Class I | | | | | 627,741 | | | | | | 4.5 | | |
| | | 140,034 | | | | Voya Multi-Manager
International Equity Fund -
Class I | | | | | 1,728,023 | | | | | | 12.3 | | |
| | | 71,933 | | | | Voya Multi-Manager
International Factors
Fund - Class I | | | | | 763,207 | | | | | | 5.5 | | |
| | | 75,121 | | | | Voya Multi-Manager Large
Cap Core Portfolio - Class I | | | | | 1,268,052 | | | | | | 9.1 | | |
| Shares | | | Value | | | Percentage
of Net
Assets | |
| MUTUAL FUNDS: (continued) | |
| | | | | | | Affiliated Investment Companies (continued) | |
| | | 86,629 | | | | Voya Multi-Manager Mid Cap
Value Fund - Class I | | | | $ | 1,031,753 | | | | | | 7.4 | | |
| | | 9,822 | | | | Voya Russell™ Mid Cap
Growth Index Portfolio -
Class I | | | | | 345,836 | | | | | | 2.5 | | |
| | | 43,499 | | | | Voya Small Company
Portfolio - Class I | | | | | 957,412 | | | | | | 6.9 | | |
| | | 31,210 | | | | Voya U.S. Stock Index
Portfolio - Class I | | | | | 489,683 | | | | | | 3.5 | | |
| | | 11,181 | | | | VY® Clarion Global Real
Estate Portfolio - Class I | | | | | 139,646 | | | | | | 1.0 | | |
| | | 3,625 | | | | VY® Clarion Real Estate
Portfolio - Class I | | | | | 136,892 | | | | | | 1.0 | | |
| | | 34,592 | | | | VY® Invesco Comstock
Portfolio - Class I | | | | | 702,918 | | | | | | 5.1 | | |
| | | 4,421 | | | | VY® T. Rowe Price Growth
Equity Portfolio - Class I | | | | | 412,015 | | | | | | 3.0 | | |
| | | | | | | | | | | | 12,868,166 | | | | | | 92.5 | | |
| | | | | | | Unaffiliated Investment Companies: 1.0% | |
| | | 26,414 | | | | Credit Suisse Commodity
Return Strategy Fund -
Class I | | | | | 132,600 | | | | | | 1.0 | | |
| | | | | | | Total Mutual Funds
(Cost $11,877,124) | | | | | 13,000,766 | | | | | | 93.5 | | |
| | | | | | | Total Investments in
Securities
(Cost $12,701,917) | | | | $ | 13,881,655 | | | | | | 99.8 | | |
| | | | | | | Assets in Excess of Other
Liabilities | | | | | 25,799 | | | | | | 0.2 | | |
| | | | | | | Net Assets | | | | $ | 13,907,454 | | | | | | 100.0 | | |
| |
Fair Value Measurements^
The following is a summary of the fair valuations according to the inputs used as of December 31, 2017 in valuing the assets and liabilities:
| | | | Quoted Prices
in Active Markets
for Identical
Investments
(Level 1) | | | Significant
Other
Observable
Inputs
(Level 2) | | | Significant
Unobservable
Inputs
(Level 3) | | | Fair Value
at
December 31, 2017 | |
| Asset Table | | | | | |
| Investments, at fair value | | | | | |
| Exchange-Traded Funds | | | | $ | 880,889 | | | | | $ | — | | | | | $ | — | | | | | $ | 880,889 | | |
| Mutual Funds | | | | | 13,000,766 | | | | | | — | | | | | | — | | | | | | 13,000,766 | | |
| Total Investments, at fair value | | | | $ | 13,881,655 | | | | | $ | — | | | | | $ | — | | | | | $ | 13,881,655 | | |
| |
^
See Note 2, “Significant Accounting Policies” in the Notes to Financial Statements for additional information.
See Accompanying Notes to Financial Statements
PORTFOLIO OF INVESTMENTS
| Voya Solution Aggressive Portfolio | as of December 31, 2017 (continued) |
Transactions with Affiliates
An investment of at least 5% of the voting securities of an issuer, or a company which is under common control results in that issuer becoming an affiliated person as defined by the 1940 Act.
The following table provides transactions during the year ended December 31, 2017, where the following issuers were considered an affiliate:
| Issuer | | | Beginning
Fair Value
at 12/31/16 | | | Purchases
at Cost | | | Sales
at Cost | | | Change in
Unrealized
Appreciation/
(Depreciation) | | | Ending
Fair Value
at 12/31/17 | | | Investment
Income | | | Realized
Gains/
(Losses) | | | Net Capital
Gain
Distributions | |
| Voya Emerging Markets Index Portfolio - Class I | | | | $ | 154,390 | | | | | $ | 265,588 | | | | | $ | (57,012) | | | | | $ | 54,078 | | | | | $ | 417,044 | | | | | $ | 3,113 | | | | | $ | 6,728 | | | | | $ | — | | |
| Voya Index Plus LargeCap Portfolio - Class I | | | | | 233,563 | | | | | | 188,037 | | | | | | (54,101) | | | | | | 52,538 | | | | | | 420,037 | | | | | | 4,598 | | | | | | 8,715 | | | | | | 5,268 | | |
| Voya Intermediate Bond Fund - Class R6 | | | | | 154,647 | | | | | | 156,687 | | | | | | (39,766) | | | | | | 3,009 | | | | | | 274,577 | | | | | | 6,743 | | | | | | (455) | | | | | | — | | |
| Voya International Index Portfolio - Class I | | | | | 157,616 | | | | | | 435,418 | | | | | | (332,503) | | | | | | 24,655 | | | | | | 285,186 | | | | | | 9,259 | | | | | | 28,859 | | | | | | — | | |
| Voya Large Cap Growth Portfolio - Class I | | | | | 652,651 | | | | | | 1,050,809 | | | | | | (483,396) | | | | | | 178,268 | | | | | | 1,398,332 | | | | | | 5,168 | | | | | | (8,680) | | | | | | 56,737 | | |
| Voya Large Cap Value Fund - Class R6 | | | | | 449,784 | | | | | | 566,958 | | | | | | (216,200) | | | | | | (27,247) | | | | | | 773,295 | | | | | | 11,670 | | | | | | 31,833 | | | | | | 60,360 | | |
| Voya MidCap Opportunities Portfolio - Class I | | | | | 421,480 | | | | | | 345,771 | | | | | | (172,543) | | | | | | 101,809 | | | | | | 696,517 | | | | | | 698 | | | | | | (11,365) | | | | | | 29,547 | | |
| Voya Multi-Manager Emerging Markets Equity Fund - Class I | | | | | 230,418 | | | | | | 422,513 | | | | | | (123,761) | | | | | | 98,571 | | | | | | 627,741 | | | | | | 8,457 | | | | | | 44,304 | | | | | | — | | |
| Voya Multi-Manager International Equity Fund - Class I | | | | | 741,845 | | | | | | 1,012,228 | | | | | | (247,238) | | | | | | 221,188 | | | | | | 1,728,023 | | | | | | 28,734 | | | | | | 5,691 | | | | | | 8,933 | | |
| Voya Multi-Manager Large Cap Core Portfolio - Class I | | | | | 730,705 | | | | | | 725,640 | | | | | | (306,025) | | | | | | 117,732 | | | | | | 1,268,052 | | | | | | 12,550 | | | | | | 3,066 | | | | | | 58,212 | | |
| Voya Multi-Manager Mid Cap Value Fund - Class I | | | | | 625,132 | | | | | | 553,456 | | | | | | (207,581) | | | | | | 60,746 | | | | | | 1,031,753 | | | | | | 7,526 | | | | | | (7,360) | | | | | | 59,892 | | |
| Voya Multi-Manager International Factors Fund - Class I | | | | | 671,275 | | | | | | 432,551 | | | | | | (425,565) | | | | | | 84,946 | | | | | | 763,207 | | | | | | 22,349 | | | | | | 23,729 | | | | | | 21,487 | | |
| Voya Russell™ Mid Cap Growth Index Portfolio - Class I | | | | | 191,617 | | | | | | 152,798 | | | | | | (47,026) | | | | | | 48,447 | | | | | | 345,836 | | | | | | 2,226 | | | | | | 7,949 | | | | | | — | | |
| Voya Small Company Portfolio - Class I | | | | | 315,274 | | | | | | 779,125 | | | | | | (139,588) | | | | | | 2,601 | | | | | | 957,412 | | | | | | 2,204 | | | | | | 6,108 | | | | | | 67,801 | | |
| Voya U.S. Stock Index Portfolio - Class I | | | | | 313,001 | | | | | | 340,506 | | | | | | (195,692) | | | | | | 31,868 | | | | | | 489,683 | | | | | | 8,198 | | | | | | 20,972 | | | | | | 23,334 | | |
| VY® Clarion Global Real Estate Portfolio - Class I | | | | | 78,791 | | | | | | 73,352 | | | | | | (20,064) | | | | | | 7,567 | | | | | | 139,646 | | | | | | 4,095 | | | | | | (410) | | | | | | — | | |
| VY® Clarion Real Estate Portfolio - Class I | | | | | 79,339 | | | | | | 73,845 | | | | | | (18,239) | | | | | | 1,947 | | | | | | 136,892 | | | | | | 2,563 | | | | | | 1,415 | | | | | | — | | |
| VY® Invesco Comstock Portfolio - Class I | | | | | 398,261 | | | | | | 332,025 | | | | | | (106,974) | | | | | | 79,606 | | | | | | 702,918 | | | | | | 9,297 | | | | | | 10,268 | | | | | | — | | |
| VY® T. Rowe Price Growth Equity Portfolio - Class I | | | | | 650,125 | | | | | | 416,869 | | | | | | (734,422) | | | | | | 79,443 | | | | | | 412,015 | | | | | | 337 | | | | | | 27,149 | | | | | | 65,223 | | |
| | | | | $ | 7,249,914 | | | | | $ | 8,324,176 | | | | | $ | (3,927,696) | | | | | $ | 1,221,772 | | | | | $ | 12,868,166 | | | | | $ | 149,785 | | | | | $ | 198,516 | | | | | $ | 456,794 | | |
| |
The financial statements for the above mutual fund[s] can be found at www.sec.gov.
At December 31, 2017, the aggregate cost of securities and other investments and the composition of unrealized appreciation and depreciation of securities and other investments at period end were:
| | Cost for federal income tax purposes was $13,019,153. | | |
| | Net unrealized appreciation consisted of: | | |
| | Gross Unrealized Appreciation | | | | $ | 1,181,965 | | |
| | Gross Unrealized Depreciation | | | | | (319,462) | | |
| | Net Unrealized Appreciation | | | | $ | 862,503 | | |
| |
See Accompanying Notes to Financial Statements
PORTFOLIO OF INVESTMENTS
| Voya Solution Balanced Portfolio | as of December 31, 2017 |
| Shares | | | Value | | | Percentage
of Net
Assets | |
| EXCHANGE-TRADED FUNDS: 4.4% | |
| | | 13,800 | | | | iShares MSCI EMU Index
Fund | | | | $ | 598,644 | | | | | | 1.0 | | |
| | | 17,232 | | | | iShares Russell 1000 Value
Index Fund | | | | | 2,142,627 | | | | | | 3.4 | | |
| | | | | | | Total Exchange-Traded Funds
(Cost $2,558,023) | | | | | 2,741,271 | | | | | | 4.4 | | |
| MUTUAL FUNDS: 95.4% | |
| | | | | | | Affiliated Investment Companies: 94.0% | |
| | | 122,726 | | | | Voya Emerging Markets Index
Portfolio - Class I | | | | | 1,577,026 | | | | | | 2.5 | | |
| | | 316,655 | | | | Voya Floating Rate Fund -
Class I | | | | | 3,112,722 | | | | | | 5.0 | | |
| | | 308,698 | | | | Voya High Yield Bond Fund -
Class R6 | | | | | 2,497,363 | | | | | | 4.0 | | |
| | | 615,806 | | | | Voya Intermediate Bond
Fund - Class R6 | | | | | 6,225,802 | | | | | | 9.9 | | |
| | | 175,131 | | | | Voya International Index
Portfolio - Class I | | | | | 1,880,909 | | | | | | 3.0 | | |
| | | 152,446 | | | | Voya Large Cap Growth
Portfolio - Class I | | | | | 3,170,880 | | | | | | 5.0 | | |
| | | 241,464 | | | | Voya Large Cap Value Fund -
Class R6 | | | | | 3,216,298 | | | | | | 5.1 | | |
| | | 173,588 | | | | Voya MidCap Opportunities
Portfolio - Class I | | | | | 2,527,447 | | | | | | 4.0 | | |
| | | 94,110 | | | | Voya Multi-Manager Emerging
Markets Equity Fund - Class I | | | | | 1,259,190 | | | | | | 2.0 | | |
| | | 177,813 | | | | Voya Multi-Manager
International Equity Fund -
Class I | | | | | 2,194,211 | | | | | | 3.5 | | |
| | | 296,579 | | | | Voya Multi-Manager
International Factors Fund -
Class I | | | | | 3,146,700 | | | | | | 5.0 | | |
| | | 227,151 | | | | Voya Multi-Manager Large Cap
Core Portfolio - Class I | | | | | 3,834,317 | | | | | | 6.1 | | |
| | | 209,528 | | | | Voya Multi-Manager Mid Cap
Value Fund - Class I | | | | | 2,495,475 | | | | | | 4.0 | | |
| Shares | | | Value | | | Percentage
of Net
Assets | |
| MUTUAL FUNDS: (continued) | |
| | | | | | | Affiliated Investment Companies (continued) | |
| | | 126,551 | | | | Voya Short Term Bond Fund -
Class R6 | | | | $ | 1,240,195 | | | | | | 2.0 | | |
| | | 112,735 | | | | Voya Small Company
Portfolio - Class I | | | | | 2,481,298 | | | | | | 4.0 | | |
| | | 264,194 | | | | Voya U.S. Bond Index
Portfolio - Class I | | | | | 2,797,813 | | | | | | 4.5 | | |
| | | 81,467 | | | | Voya U.S. Stock Index
Portfolio - Class I | | | | | 1,278,223 | | | | | | 2.0 | | |
| | | 50,704 | | | | VY® Clarion Global Real
Estate Portfolio - Class I | | | | | 633,299 | | | | | | 1.0 | | |
| | | 16,439 | | | | VY® Clarion Real Estate
Portfolio - Class I | | | | | 620,753 | | | | | | 1.0 | | |
| | | 275,999 | | | | VY® Goldman Sachs Bond
Portfolio - Class I | | | | | 2,793,114 | | | | | | 4.4 | | |
| | | 109,803 | | | | VY® Invesco Comstock
Portfolio - Class I | | | | | 2,231,187 | | | | | | 3.6 | | |
| | | 224,182 | | | | VY® T. Rowe Price Capital
Appreciation Portfolio - Class I | | | | | 6,196,389 | | | | | | 9.9 | | |
| | | 16,712 | | | | VY® T. Rowe Price Growth
Equity Portfolio - Class I | | | | | 1,557,361 | | | | | | 2.5 | | |
| | | | | | | | | | | | 58,967,972 | | | | | | 94.0 | | |
| | | | | | | Unaffiliated Investment Companies: 1.4% | |
| | | 178,493 | | | | Credit Suisse Commodity
Return Strategy Fund - Class I | | | | | 896,034 | | | | | | 1.4 | | |
| | | | | | | Total Mutual Funds
(Cost $56,463,820) | | | | | 59,864,006 | | | | | | 95.4 | | |
| | | | | | | Total Investments in
Securities
(Cost $59,021,843) | | | | $ | 62,605,277 | | | | | | 99.8 | | |
| | | | | | | Assets in Excess of Other
Liabilities | | | | | 152,602 | | | | | | 0.2 | | |
| | | | | | | Net Assets | | | | $ | 62,757,879 | | | | | | 100.0 | | |
| |
Fair Value Measurements^
The following is a summary of the fair valuations according to the inputs used as of December 31, 2017 in valuing the assets and liabilities:
| | | | Quoted Prices
in Active Markets
for Identical
Investments
(Level 1) | | | Significant
Other
Observable
Inputs
(Level 2) | | | Significant
Unobservable
Inputs
(Level 3) | | | Fair Value
at
December 31, 2017 | |
| Asset Table | | | | | |
| Investments, at fair value | | | | | |
| Exchange-Traded Funds | | | | $ | 2,741,271 | | | | | $ | — | | | | | $ | — | | | | | $ | 2,741,271 | | |
| Mutual Funds | | | | | 59,864,006 | | | | | | — | | | | | | — | | | | | | 59,864,006 | | |
| Total Investments, at fair value | | | | $ | 62,605,277 | | | | | $ | — | | | | | $ | — | | | | | $ | 62,605,277 | | |
| |
See Accompanying Notes to Financial Statements
PORTFOLIO OF INVESTMENTS
| Voya Solution Balanced Portfolio | as of December 31, 2017 (continued) |
| | | | Quoted Prices
in Active Markets
for Identical
Investments
(Level 1) | | | Significant
Other
Observable
Inputs
(Level 2) | | | Significant
Unobservable
Inputs
(Level 3) | | | Fair Value
at
December 31, 2017 | |
| Other Financial Instruments+ | | | | | |
| Futures | | | | | 30,975 | | | | | | — | | | | | | — | | | | | | 30,975 | | |
| Total Assets | | | | $ | 62,636,252 | | | | | $ | — | | | | | $ | — | | | | | $ | 62,636,252 | | |
| Liabilities Table | | | | | |
| Other Financial Instruments+ | | | | | |
| Futures | | | | $ | (35,426) | | | | | $ | — | | | | | $ | — | | | | | $ | (35,426) | | |
| Total Liabilities | | | | $ | (35,426) | | | | | $ | — | | | | | $ | — | | | | | $ | (35,426) | | |
| |
^
See Note 2, “Significant Accounting Policies” in the Notes to Financial Statements for additional information.
+
Other Financial Instruments are derivatives not reflected in the Portfolio of Investments and may include open forward foreign currency contracts, futures, centrally cleared swaps, OTC swaps and written options. Forward foreign currency contracts, futures and centrally cleared swaps are valued at the unrealized gain (loss) on the instrument. OTC swaps and written options are valued at the fair value of the instrument.
At December 31, 2017, the following futures contracts were outstanding for Voya Solution Balanced Portfolio:
| Contract Description | | | Number
of Contracts | | | Expiration
Date | | | Notional
Value | | | Unrealized
Appreciation/
(Depreciation) | |
| Long Contracts | | | | | |
| Tokyo Price Index (TOPIX) | | | | | 11 | | | | | | 03/08/18 | | | | | $ | 1,773,863 | | | | | $ | 30,975 | | |
| | | | | | | | | | | | | | | | | $ | 1,773,863 | | | | | $ | 30,975 | | |
| Short Contracts | | | | | |
| Mini MSCI EAFE Index | | | | | (12) | | | | | | 03/16/18 | | | | | | (1,227,300) | | | | | | (24,389) | | |
| S&P 500 E-Mini | | | | | (5) | | | | | | 03/16/18 | | | | | | (669,000) | | | | | | (11,037) | | |
| | | | | | | | | | | | | | | | | $ | (1,896,300) | | | | | $ | (35,426) | | |
| |
Transactions with Affiliates
An investment of at least 5% of the voting securities of an issuer, or a company which is under common control results in that issuer becoming an affiliated person as defined by the 1940 Act.
The following table provides transactions during the year ended December 31, 2017, where the following issuers were considered an affiliate:
| Issuer | | | Beginning
Fair Value
at 12/31/16 | | | Purchases
at Cost | | | Sales
at Cost | | | Change in
Unrealized
Appreciation/
(Depreciation) | | | Ending
Fair Value
at 12/31/17 | | | Investment
Income | | | Realized
Gains/
(Losses) | | | Net Capital
Gain
Distributions | |
| Voya Emerging Markets Index Portfolio - Class I | | | | $ | — | | | | | $ | 1,610,876 | | | | | $ | (239,736) | | | | | $ | 205,886 | | | | | $ | 1,577,026 | | | | | $ | 12,626 | | | | | $ | 26,126 | | | | | $ | — | | |
| Voya Floating Rate Fund - Class I | | | | | 2,487,620 | | | | | | 1,195,247 | | | | | | (551,690) | | | | | | (18,455) | | | | | | 3,112,722 | | | | | | 109,857 | | | | | | (15,612) | | | | | | — | | |
| Voya Global Bond Fund - Class R6 | | | | | 979,234 | | | | | | 119,184 | | | | | | (1,106,610) | | | | | | 8,192 | | | | | | — | | | | | | 17,112 | | | | | | 9,896 | | | | | | — | | |
| Voya High Yield Bond Fund - Class R6 | | | | | 2,011,630 | | | | | | 904,910 | | | | | | (442,168) | | | | | | 22,991 | | | | | | 2,497,363 | | | | | | 120,765 | | | | | | (13,305) | | | | | | — | | |
| Voya Intermediate Bond Fund - Class R6 | | | | | 2,711,353 | | | | | | 4,322,703 | | | | | | (858,855) | | | | | | 50,601 | | | | | | 6,225,802 | | | | | | 151,989 | | | | | | (1,204) | | | | | | — | | |
| Voya International Index Portfolio - Class I | | | | | 1,006,367 | | | | | | 952,805 | | | | | | (358,916) | | | | | | 280,653 | | | | | | 1,880,909 | | | | | | 37,444 | | | | | | (4,328) | | | | | | — | | |
| Voya Large Cap Growth Portfolio - Class I | | | | | 2,449,365 | | | | | | 2,057,297 | | | | | | (1,812,880) | | | | | | 477,098 | | | | | | 3,170,880 | | | | | | 18,084 | | | | | | (21,374) | | | | | | 198,527 | | |
| Voya Large Cap Value Fund - Class R6 | | | | | 2,529,908 | | | | | | 1,660,007 | | | | | | (968,733) | | | | | | (4,884) | | | | | | 3,216,298 | | | | | | 53,692 | | | | | | 58,140 | | | | | | 254,677 | | |
| Voya MidCap Opportunities Portfolio - Class I | | | | | 2,199,737 | | | | | | 827,877 | | | | | | (970,582) | | | | | | 470,415 | | | | | | 2,527,447 | | | | | | 3,224 | | | | | | (78,912) | | | | | | 126,226 | | |
| Voya Multi-Manager Emerging Markets Equity Fund - Class I | | | | | 979,401 | | | | | | 338,703 | | | | | | (418,095) | | | | | | 359,181 | | | | | | 1,259,190 | | | | | | 17,189 | | | | | | 34,592 | | | | | | — | | |
| Voya Multi-Manager International Equity Fund - Class I | | | | | 1,744,024 | | | | | | 610,979 | | | | | | (547,118) | | | | | | 386,326 | | | | | | 2,194,211 | | | | | | 36,867 | | | | | | (3,413) | | | | | | 11,462 | | |
| Voya Multi-Manager International Factors Fund - Class I | | | | | 1,765,168 | | | | | | 1,667,353 | | | | | | (633,339) | | | | | | 347,518 | | | | | | 3,146,700 | | | | | | 93,104 | | | | | | 15,987 | | | | | | 89,513 | | |
| Voya Multi-Manager Large Cap Core Portfolio - Class I | | | | | 2,782,448 | | | | | | 1,853,127 | | | | | | (1,143,196) | | | | | | 341,938 | | | | | | 3,834,317 | | | | | | 39,354 | | | | | | 55,048 | | | | | | 207,894 | | |
| Voya Multi-Manager Mid Cap Value Fund - Class I | | | | | 2,246,040 | | | | | | 912,561 | | | | | | (890,736) | | | | | | 227,610 | | | | | | 2,495,475 | | | | | | 18,394 | | | | | | (60,314) | | | | | | 146,374 | | |
| Voya Short Term Bond Fund - Class R6 | | | | | 1,599,515 | | | | | | 540,380 | | | | | | (900,716) | | | | | | 1,016 | | | | | | 1,240,195 | | | | | | 23,931 | | | | | | (3,912) | | | | | | — | | |
| Voya Small Company Portfolio - Class I | | | | | 1,007,181 | | | | | | 1,975,280 | | | | | | (488,210) | | | | | | (12,953) | | | | | | 2,481,298 | | | | | | 6,805 | | | | | | 10,566 | | | | | | 209,356 | | |
| Voya U.S. Bond Index Portfolio - Class I | | | | | 2,459,175 | | | | | | 1,100,223 | | | | | | (785,504) | | | | | | 23,919 | | | | | | 2,797,813 | | | | | | 58,540 | | | | | | (11,478) | | | | | | 6,693 | | |
| Voya U.S. Stock Index Portfolio - Class I | | | | | 1,499,278 | | | | | | 1,129,477 | | | | | | (1,435,036) | | | | | | 84,504 | | | | | | 1,278,223 | | | | | | 22,598 | | | | | | 92,271 | | | | | | 82,147 | | |
| VY® Clarion Global Real Estate Portfolio - Class I | | | | | 502,401 | | | | | | 204,482 | | | | | | (111,533) | | | | | | 37,949 | | | | | | 633,299 | | | | | | 21,505 | | | | | | (2,662) | | | | | | — | | |
| VY® Clarion Real Estate Portfolio - Class I | | | | | 506,095 | | | | | | 213,177 | | | | | | (108,888) | | | | | | 10,369 | | | | | | 620,753 | | | | | | 13,490 | | | | | | 5,848 | | | | | | — | | |
See Accompanying Notes to Financial Statements
PORTFOLIO OF INVESTMENTS
| Voya Solution Balanced Portfolio | as of December 31, 2017 (continued) |
| Issuer | | | Beginning
Fair Value
at 12/31/16 | | | Purchases
at Cost | | | Sales
at Cost | | | Change in
Unrealized
Appreciation/
(Depreciation) | | | Ending
Fair Value
at 12/31/17 | | | Investment
Income | | | Realized
Gains/
(Losses) | | | Net Capital
Gain
Distributions | |
| VY® Goldman Sachs Bond Portfolio - Class I | | | | | 2,212,708 | | | | | | 1,053,274 | | | | | | (479,674) | | | | | | 6,806 | | | | | | 2,793,114 | | | | | | 57,723 | | | | | | 2,797 | | | | | | — | | |
| VY® Invesco Comstock Portfolio - Class I | | | | | 1,783,289 | | | | | | 673,847 | | | | | | (463,215) | | | | | | 237,266 | | | | | | 2,231,187 | | | | | | 30,424 | | | | | | 74,049 | | | | | | — | | |
| VY® T. Rowe Price Capital Appreciation Portfolio - Class I | | | | | 4,928,596 | | | | | | 1,992,306 | | | | | | (1,190,265) | | | | | | 465,752 | | | | | | 6,196,389 | | | | | | 87,243 | | | | | | (48,826) | | | | | | 267,121 | | |
| VY® T. Rowe Price Equity Income Portfolio - Class I | | | | | 2,006,312 | | | | | | 145,573 | | | | | | (2,126,343) | | | | | | (25,542) | | | | | | — | | | | | | — | | | | | | 99,342 | | | | | | — | | |
| VY® T. Rowe Price Growth Equity Portfolio - Class I | | | | | 2,195,083 | | | | | | 627,276 | | | | | | (1,655,924) | | | | | | 390,926 | | | | | | 1,557,361 | | | | | | 764 | | | | | | 1,807 | | | | | | 147,357 | | |
| | | | | $ | 46,591,928 | | | | | $ | 28,688,924 | | | | | $ | (20,687,962) | | | | | $ | 4,375,082 | | | | | $ | 58,967,972 | | | | | $ | 1,052,724 | | | | | $ | 221,129 | | | | | $ | 1,747,347 | | |
| |
The financial statements for the above mutual fund[s] can be found at www.sec.gov.
A summary of derivative instruments by primary risk exposure is outlined in the following tables.
The fair value of derivative instruments as of December 31, 2017 was as follows:
| Derivatives not accounted for as hedging instruments | | | Location on Statement
of Assets and Liabilities | | | Fair Value | |
| Asset Derivatives | | | |
| Equity contracts | | | Net Assets — Unrealized appreciation* | | | | $ | 30,975 | | |
| Total Asset Derivatives | | | | | | | $ | 30,975 | | |
| Liability Derivatives | | | |
| Equity contracts | | | Net Assets — Unrealized depreciation* | | | | $ | 35,426 | | |
| Total Liability Derivatives | | | | | | | $ | 35,426 | | |
| |
*
Includes cumulative appreciation/depreciation of futures contracts as reported in the table following the Portfolio of Investments.
The effect of derivative instruments on the Portfolio’s Statement of Operations for the year ended December 31, 2017 was as follows:
| | | | Amount of Realized Gain or (Loss) on
Derivatives Recognized in Income | |
| Derivatives not accounted for as hedging instruments | | | Futures | |
| Equity contracts | | | | $ | (478) | | |
| Total | | | | $ | (478) | | |
| |
| | | | Change in Unrealized Appreciation or (Depreciation)
on Derivatives Recognized in Income | |
| Derivatives not accounted for as hedging instruments | | | Futures | |
| Equity contracts | | | | $ | (4,451) | | |
| Total | | | | $ | (4,451) | | |
| |
At December 31, 2017, the aggregate cost of securities and other investments and the composition of unrealized appreciation and depreciation of securities and other investments at period end were:
| | Cost for federal income tax purposes was $60,201,607. | | |
| | Net unrealized appreciation consisted of: | | |
| | Gross Unrealized Appreciation | | | | $ | 3,767,218 | | |
| | Gross Unrealized Depreciation | | | | | (1,345,741) | | |
| | Net Unrealized Appreciation | | | | $ | 2,421,477 | | |
| |
See Accompanying Notes to Financial Statements
PORTFOLIO OF INVESTMENTS
| Voya Solution Conservative Portfolio | as of December 31, 2017 |
| Shares | | | Value | | | Percentage
of Net
Assets | |
| EXCHANGE-TRADED FUNDS: 4.4% | |
| | | 3,682 | | | | iShares MSCI EMU Index
Fund | | | | $ | 159,725 | | | | | | 1.0 | | |
| | | 2,174 | | | | SPDR Bloomberg Barclays
High Yield Bond ETF | | | | | 79,829 | | | | | | 0.5 | | |
| | | 8,280 | | | | WisdomTree Japan Hedged
Equity Fund | | | | | 491,253 | | | | | | 2.9 | | |
| | | | | | | Total Exchange-Traded Funds
(Cost $692,734) | | | | | 730,807 | | | | | | 4.4 | | |
| MUTUAL FUNDS: 95.4% | |
| | | | | | | Affiliated Investment Companies: 93.5% | |
| | | 32,993 | | | | Voya Emerging Markets Index
Portfolio - Class I | | | | | 423,959 | | | | | | 2.5 | | |
| | | 118,396 | | | | Voya Floating Rate Fund -
Class I | | | | | 1,163,831 | | | | | | 7.0 | | |
| | | 50,089 | | | | Voya Global Bond Fund -
Class R6 | | | | | 501,888 | | | | | | 3.0 | | |
| | | 134,126 | | | | Voya High Yield Bond Fund -
Class R6 | | | | | 1,085,080 | | | | | | 6.5 | | |
| | | 164,637 | | | | Voya Intermediate Bond Fund -
Class R6 | | | | | 1,664,476 | | | | | | 10.0 | | |
| | | 16,544 | | | | Voya International Index
Portfolio - Class I | | | | | 177,682 | | | | | | 1.1 | | |
| | | 16,142 | | | | Voya Large Cap Growth
Portfolio - Class I | | | | | 335,744 | | | | | | 2.0 | | |
| | | 37,663 | | | | Voya Large Cap Value Fund -
Class R6 | | | | | 501,666 | | | | | | 3.0 | | |
| | | 23,155 | | | | Voya MidCap Opportunities
Portfolio - Class I | | | | | 337,136 | | | | | | 2.0 | | |
| | | 28,022 | | | | Voya Multi-Manager Mid Cap
Value Fund - Class I | | | | | 333,740 | | | | | | 2.0 | | |
| Shares | | | Value | | | Percentage
of Net
Assets | |
| MUTUAL FUNDS: (continued) | |
| | | | | | | Affiliated Investment Companies (continued) | |
| | | 338,862 | | | | Voya Short Term Bond Fund -
Class R6 | | | | $ | 3,320,845 | | | | | | 19.9 | | |
| | | 141,330 | | | | Voya U.S. Bond Index
Portfolio - Class I | | | | | 1,496,686 | | | | | | 9.0 | | |
| | | 27,229 | | | | Voya U.S. Stock Index
Portfolio - Class I | | | | | 427,222 | | | | | | 2.6 | | |
| | | 86,296 | | | | VY® BlackRock Inflation
Protected Bond Portfolio -
Class I | | | | | 833,616 | | | | | | 5.0 | | |
| | | 131,412 | | | | VY® Goldman Sachs Bond
Portfolio - Class I | | | | | 1,329,885 | | | | | | 8.0 | | |
| | | 59,954 | | | | VY® T. Rowe Price Capital
Appreciation Portfolio - Class I | | | | | 1,657,138 | | | | | | 9.9 | | |
| | | | | | | | | | | | 15,590,594 | | | | | | 93.5 | | |
| | | | | | | Unaffiliated Investment Companies: 1.9% | |
| | | 63,470 | | | | Credit Suisse Commodity
Return Strategy Fund -
Class I | | | | | 318,618 | | | | | | 1.9 | | |
| | | | | | | Total Mutual Funds
(Cost $15,703,939) | | | | | 15,909,212 | | | | | | 95.4 | | |
| | | | | | | Total Investments in
Securities
(Cost $16,396,673) | | | | $ | 16,640,019 | | | | | | 99.8 | | |
| | | | | | | Assets in Excess of Other
Liabilities | | | | | 29,209 | | | | | | 0.2 | | |
| | | | | | | Net Assets | | | | $ | 16,669,228 | | | | | | 100.0 | | |
| |
Fair Value Measurements^
The following is a summary of the fair valuations according to the inputs used as of December 31, 2017 in valuing the assets and liabilities:
| | | | Quoted Prices
in Active Markets
for Identical
Investments
(Level 1) | | | Significant
Other
Observable
Inputs
(Level 2) | | | Significant
Unobservable
Inputs
(Level 3) | | | Fair Value
at
December 31, 2017 | |
| Asset Table | | | | | |
| Investments, at fair value | | | | | |
| Exchange-Traded Funds | | | | $ | 730,807 | | | | | $ | — | | | | | $ | — | | | | | $ | 730,807 | | |
| Mutual Funds | | | | | 15,909,212 | | | | | | — | | | | | | — | | | | | | 15,909,212 | | |
| Total Investments, at fair value | | | | $ | 16,640,019 | | | | | $ | — | | | | | $ | — | | | | | $ | 16,640,019 | | |
| |
^
See Note 2, “Significant Accounting Policies” in the Notes to Financial Statements for additional information.
See Accompanying Notes to Financial Statements
PORTFOLIO OF INVESTMENTS
| Voya Solution Conservative Portfolio | as of December 31, 2017 (continued) |
Transactions with Affiliates
An investment of at least 5% of the voting securities of an issuer, or a company which is under common control results in that issuer becoming an affiliated person as defined by the 1940 Act.
The following table provides transactions during the year ended December 31, 2017, where the following issuers were considered an affiliate:
| Issuer | | | Beginning
Fair Value
at 12/31/16 | | | Purchases
at Cost | | | Sales
at Cost | | | Change in
Unrealized
Appreciation/
(Depreciation) | | | Ending
Fair Value
at 12/31/17 | | | Investment
Income | | | Realized
Gains/
(Losses) | | | Net Capital
Gain
Distributions | |
| Voya Emerging Markets Index Portfolio - Class I | | | | $ | — | | | | | $ | 487,889 | | | | | $ | (97,457) | | | | | $ | 33,527 | | | | | $ | 423,959 | | | | | $ | 3,662 | | | | | $ | 7,306 | | | | | $ | — | | |
| Voya Floating Rate Fund - Class I | | | | | 1,150,426 | | | | | | 385,426 | | | | | | (368,262) | | | | | | (3,759) | | | | | | 1,163,831 | | | | | | 45,968 | | | | | | (10,697) | | | | | | — | | |
| Voya Global Bond Fund - Class R6 | | | | | 1,131,841 | | | | | | 242,018 | | | | | | (903,635) | | | | | | 31,664 | | | | | | 501,888 | | | | | | 36,875 | | | | | | 2,941 | | | | | | — | | |
| Voya High Yield Bond Fund - Class R6 | | | | | 1,245,650 | | | | | | 388,707 | | | | | | (555,610) | | | | | | 6,333 | | | | | | 1,085,080 | | | | | | 61,353 | | | | | | 3,442 | | | | | | — | | |
| Voya Intermediate Bond Fund - Class R6 | | | | | 723,641 | | | | | | 1,356,622 | | | | | | (429,914) | | | | | | 14,127 | | | | | | 1,664,476 | | | | | | 42,817 | | | | | | 64 | | | | | | — | | |
| Voya International Index Portfolio - Class I | | | | | 498,558 | | | | | | 174,691 | | | | | | (531,398) | | | | | | 35,831 | | | | | | 177,682 | | | | | | 11,176 | | | | | | 49,556 | | | | | | — | | |
| Voya Large Cap Growth Portfolio - Class I | | | | | — | | | | | | 390,162 | | | | | | (65,069) | | | | | | 10,651 | | | | | | 335,744 | | | | | | 2,050 | | | | | | (1,411) | | | | | | 22,503 | | |
| Voya Large Cap Value Fund - Class R6 | | | | | 167,146 | | | | | | 514,205 | | | | | | (152,585) | | | | | | (27,100) | | | | | | 501,666 | | | | | | 7,302 | | | | | | 29,216 | | | | | | 39,326 | | |
| Voya MidCap Opportunities Portfolio - Class I | | | | | 322,725 | �� | | | | | 103,637 | | | | | | (154,035) | | | | | | 64,809 | | | | | | 337,136 | | | | | | 468 | | | | | | (8,933) | | | | | | 18,141 | | |
| Voya Multi-Manager Mid Cap Value Fund - Class I | | | | | 329,673 | | | | | | 117,263 | | | | | | (142,284) | | | | | | 29,088 | | | | | | 333,740 | | | | | | 2,432 | | | | | | (4,015) | | | | | | 19,350 | | |
| Voya Short Term Bond Fund - Class R6 | | | | | 2,275,721 | | | | | | 1,980,283 | | | | | | (932,616) | | | | | | (2,543) | | | | | | 3,320,845 | | | | | | 54,514 | | | | | | (9,364) | | | | | | — | | |
| Voya U.S. Bond Index Portfolio - Class I | | | | | 1,377,434 | | | | | | 561,686 | | | | | | (460,058) | | | | | | 17,624 | | | | | | 1,496,686 | | | | | | 33,232 | | | | | | (10,216) | | | | | | 3,843 | | |
| Voya U.S. Stock Index Portfolio - Class I | | | | | 495,132 | | | | | | 313,703 | | | | | | (406,263) | | | | | | 24,650 | | | | | | 427,222 | | | | | | 7,377 | | | | | | 39,751 | | | | | | 26,886 | | |
| VY® BlackRock Inflation Protected Bond Portfolio - Class I | | | | | 1,297,662 | | | | | | 329,180 | | | | | | (811,095) | | | | | | 17,869 | | | | | | 833,616 | | | | | | 12,448 | | | | | | (4,519) | | | | | | — | | |
| VY® Goldman Sachs Bond Portfolio - Class I | | | | | 1,878,318 | | | | | | 478,847 | | | | | | (1,034,319) | | | | | | 7,039 | | | | | | 1,329,885 | | | | | | 29,644 | | | | | | 8,639 | | | | | | — | | |
| VY® T. Rowe Price Capital Appreciation Portfolio - Class I | | | | | 1,627,353 | | | | | | 516,742 | | | | | | (648,786) | | | | | | 161,829 | | | | | | 1,657,138 | | | | | | 23,458 | | | | | | (27,083) | | | | | | 77,468 | | |
| VY® T. Rowe Price Equity Income Portfolio - Class I | | | | | 740,266 | | | | | | 169,170 | | | | | | (901,483) | | | | | | (7,953) | | | | | | — | | | | | | — | | | | | | 34,958 | | | | | | — | | |
| | | | | $ | 15,261,546 | | | | | $ | 8,510,231 | | | | | $ | (8,594,869) | | | | | $ | 413,686 | | | | | $ | 15,590,594 | | | | | $ | 374,776 | | | | | $ | 99,635 | | | | | $ | 207,517 | | |
| |
The financial statements for the above mutual fund[s] can be found at www.sec.gov.
At December 31, 2017, the aggregate cost of securities and other investments and the composition of unrealized appreciation and depreciation of securities and other investments at period end were:
| | Cost for federal income tax purposes was $16,806,682. | | |
| | Net unrealized depreciation consisted of: | | |
| | Gross Unrealized Appreciation | | | | $ | 309,288 | | |
| | Gross Unrealized Depreciation | | | | | (475,951) | | |
| | Net Unrealized Depreciation | | | | $ | (166,663) | | |
| |
See Accompanying Notes to Financial Statements
PORTFOLIO OF INVESTMENTS
| Voya Solution Income Portfolio | as of December 31, 2017 |
| | Shares | | | Value | | | Percentage
of Net
Assets | |
| | EXCHANGE-TRADED FUNDS: 1.5% | |
| | | | 99,537 | | | | iShares MSCI EMU Index
Fund | | | | $ | 4,317,915 | | | | | | 1.0 | | |
| | | | 17,755 | | | | iShares Russell 1000
Value Index Fund | | | | | 2,207,657 | | | | | | 0.5 | | |
| | | | | | | | Total Exchange-Traded Funds
(Cost $6,188,777) | | | | | 6,525,572 | | | | | | 1.5 | | |
| | MUTUAL FUNDS: 98.3% | |
| | | | | | | | Affiliated Investment Companies: 96.8% | |
| | | | 340,029 | | | | Voya Emerging Markets Index
Portfolio - Class I | | | | | 4,369,369 | | | | | | 1.0 | | |
| | | | 2,196,032 | | | | Voya Floating Rate Fund -
Class I | | | | | 21,586,996 | | | | | | 5.0 | | |
| | | | 1,295,307 | | | | Voya Global Bond Fund -
Class R6 | | | | | 12,978,976 | | | | | | 3.0 | | |
| | | | 1,070,486 | | | | Voya High Yield Bond Fund -
Class R6 | | | | | 8,660,236 | | | | | | 2.0 | | |
| | | | 4,697,280 | | | | Voya Intermediate Bond
Fund - Class R6 | | | | | 47,489,503 | | | | | | 11.0 | | |
| | | | 809,416 | | | | Voya International Index
Portfolio - Class I | | | | | 8,693,125 | | | | | | 2.0 | | |
| | | | 1,153,779 | | | | Voya Large Cap Growth
Portfolio - Class I | | | | | 23,998,593 | | | | | | 5.6 | | |
| | | | 1,149,077 | | | | Voya Large Cap Value Fund -
Class R6 | | | | | 15,305,707 | | | | | | 3.5 | | |
| | | | 451,538 | | | | Voya MidCap Opportunities
Portfolio - Class I | | | | | 6,574,390 | | | | | | 1.5 | | |
| | | | 651,979 | | | | Voya Multi-Manager Emerging
Markets Equity Fund - Class I | | | | | 8,723,481 | | | | | | 2.0 | | |
| | | | 2,056,005 | | | | Voya Multi-Manager
International Factors Fund -
Class I | | | | | 21,814,211 | | | | | | 5.0 | | |
| | | | 650,215 | | | | Voya Multi-Manager Large
Cap Core Portfolio - Class I | | | | | 10,975,633 | | | | | | 2.5 | | |
| | | | 544,808 | | | | Voya Multi-Manager Mid Cap
Value Fund - Class I | | | | | 6,488,658 | | | | | | 1.5 | | |
| | Shares | | | Value | | | Percentage
of Net
Assets | |
| | MUTUAL FUNDS: (continued) | |
| | | | | | | | Affiliated Investment Companies (continued) | |
| | | | 4,387,233 | | | | Voya Short Term Bond
Fund - Class R6 | | | | $ | 42,994,885 | | | | | | 9.9 | | |
| | | | 4,274,407 | | | | Voya U.S. Bond Index
Portfolio - Class I | | | | | 45,265,975 | | | | | | 10.5 | | |
| | | | 693,770 | | | | Voya U.S. Stock Index
Portfolio - Class I | | | | | 10,885,254 | | | | | | 2.5 | | |
| | | | 3,134,709 | | | | VY® BlackRock Inflation
Protected Bond Portfolio -
Class I | | | | | 30,281,288 | | | | | | 7.0 | | |
| | | | 351,671 | | | | VY® Clarion Global Real
Estate Portfolio - Class I | | | | | 4,392,367 | | | | | | 1.0 | | |
| | | | 113,970 | | | | VY® Clarion Real Estate
Portfolio - Class I | | | | | 4,303,500 | | | | | | 1.0 | | |
| | | | 4,677,106 | | | | VY® Goldman Sachs Bond
Portfolio - Class I | | | | | 47,332,314 | | | | | | 10.9 | | |
| | | | 1,321,022 | | | | VY® T. Rowe Price Capital
Appreciation Portfolio -
Class I | | | | | 36,513,042 | | | | | | 8.4 | | |
| | | | | | | | | | | | | 419,627,503 | | | | | | 96.8 | | |
| | | | | | | | Unaffiliated Investment Companies: 1.5% | |
| | | | 1,286,698 | | | | Credit Suisse Commodity
Return Strategy Fund -
Class I | | | | | 6,459,226 | | | | | | 1.5 | | |
| | | | | | | | Total Mutual Funds
(Cost $414,879,962) | | | | | 426,086,729 | | | | | | 98.3 | | |
| | | | | | | | Total Investments in
Securities
(Cost $421,068,739) | | | | $ | 432,612,301 | | | | | | 99.8 | | |
| | | | | | | | Assets in Excess of
Other Liabilities | | | | | 1,045,237 | | | | | | 0.2 | | |
| | | | | | | | Net Assets | | | | $ | 433,657,538 | | | | | | 100.0 | | |
| |
Fair Value Measurements^
The following is a summary of the fair valuations according to the inputs used as of December 31, 2017 in valuing the assets and liabilities:
| | | | Quoted Prices
in Active Markets
for Identical
Investments
(Level 1) | | | Significant
Other
Observable
Inputs
(Level 2) | | | Significant
Unobservable
Inputs
(Level 3) | | | Fair Value
at
December 31, 2017 | |
| Asset Table | | | | | |
| Investments, at fair value | | | | | |
| Exchange-Traded Funds | | | | $ | 6,525,572 | | | | | $ | — | | | | | $ | — | | | | | $ | 6,525,572 | | |
| Mutual Funds | | | | | 426,086,729 | | | | | | — | | | | | | — | | | | | | 426,086,729 | | |
| Total Investments, at fair value | | | | $ | 432,612,301 | | | | | $ | — | | | | | $ | — | | | | | $ | 432,612,301 | | |
| |
See Accompanying Notes to Financial Statements
PORTFOLIO OF INVESTMENTS
| Voya Solution Income Portfolio | as of December 31, 2017 (continued) |
| | | | Quoted Prices
in Active Markets
for Identical
Investments
(Level 1) | | | Significant
Other
Observable
Inputs
(Level 2) | | | Significant
Unobservable
Inputs
(Level 3) | | | Fair Value
at
December 31, 2017 | |
| Other Financial Instruments+ | | | | | |
| Futures | | | | | 230,902 | | | | | | — | | | | | | — | | | | | | 230,902 | | |
| Total Assets | | | | $ | 432,843,203 | | | | | $ | — | | | | | $ | — | | | | | $ | 432,843,203 | | |
| Liabilities Table | | | | | |
| Other Financial Instruments+ | | | | | |
| Futures | | | | $ | (247,629) | | | | | $ | — | | | | | $ | — | | | | | $ | (247,629) | | |
| Total Liabilities | | | | $ | (247,629) | | | | | $ | — | | | | | $ | — | | | | | $ | (247,629) | | |
| |
^
See Note 2, “Significant Accounting Policies” in the Notes to Financial Statements for additional information.
+
Other Financial Instruments are derivatives not reflected in the Portfolio of Investments and may include open forward foreign currency contracts, futures, centrally cleared swaps, OTC swaps and written options. Forward foreign currency contracts, futures and centrally cleared swaps are valued at the unrealized gain (loss) on the instrument. OTC swaps and written options are valued at the fair value of the instrument.
At December 31, 2017, the following futures contracts were outstanding for Voya Solution Income Portfolio:
| Contract Description | | | Number
of Contracts | | | Expiration
Date | | | Notional
Value | | | Unrealized
Appreciation/
(Depreciation) | |
| Long Contracts | | | | | |
| Tokyo Price Index (TOPIX) | | | | | 82 | | | | 03/08/18 | | | | $ | 13,223,341 | | | | | $ | 230,902 | | |
| | | | | | | | | | | | | | $ | 13,223,341 | | | | | $ | 230,902 | | |
| Short Contracts | | | | | |
| Mini MSCI EAFE Index | | | | | (86) | | | | 03/16/18 | | | | | (8,795,650) | | | | | | (174,787) | | |
| S&P 500 E-Mini | | | | | (33) | | | | 03/16/18 | | | | | (4,415,400) | | | | | | (72,842) | | |
| | | | | | | | | | | | | | $ | (13,211,050) | | | | | $ | (247,629) | | |
| |
Transactions with Affiliates
An investment of at least 5% of the voting securities of an issuer, or a company which is under common control results in that issuer becoming an affiliated person as defined by the 1940 Act.
The following table provides transactions during the year ended December 31, 2017, where the following issuers were considered an affiliate:
| Issuer | | | Beginning
Fair Value
at 12/31/16 | | | Purchases
at Cost | | | Sales
at Cost | | | Change in
Unrealized
Appreciation/
(Depreciation) | | | Ending
Fair Value
at 12/31/17 | | | Investment
Income | | | Realized
Gains/
(Losses) | | | Net Capital
Gain
Distributions | |
| Voya Emerging Markets Index Portfolio - Class I | | | | $ | — | | | | | $ | 4,654,714 | | | | | $ | (861,374) | | | | | $ | 576,029 | | | | | $ | 4,369,369 | | | | | $ | — | | | | | $ | 74,141 | | | | | $ | — | | |
| Voya Floating Rate Fund - Class I | | | | | 24,412,085 | | | | | | 2,571,079 | | | | | | (5,255,530) | | | | | | (140,638) | | | | | | 21,586,996 | | | | | | 921,369 | | | | | | (151,179) | | | | | | — | | |
| Voya Global Bond Fund - Class R6 | | | | | 28,805,185 | | | | | | 1,935,744 | | | | | | (19,019,257) | | | | | | 1,257,304 | | | | | | 12,978,976 | | | | | | 867,127 | | | | | | (341,576) | | | | | | — | | |
| Voya High Yield Bond Fund - Class R6 | | | | | 9,874,208 | | | | | | 860,867 | | | | | | (2,195,874) | | | | | | 121,035 | | | | | | 8,660,236 | | | | | | 505,176 | | | | | | (51,928) | | | | | | — | | |
| Voya Intermediate Bond Fund - Class R6 | | | | | 23,806,889 | | | | | | 32,336,156 | | | | | | (9,106,614) | | | | | | 453,072 | | | | | | 47,489,503 | | | | | | 1,312,092 | | | | | | 17,413 | | | | | | — | | |
| Voya International Index Portfolio - Class I | | | | | 9,876,036 | | | | | | 351,074 | | | | | | (3,503,137) | | | | | | 1,969,152 | | | | | | 8,693,125 | | | | | | 227,707 | | | | | | (90,494) | | | | | | — | | |
| Voya Large Cap Growth Portfolio - Class I | | | | | 9,605,205 | | | | | | 18,207,103 | | | | | | (6,154,429) | | | | | | 2,340,714 | | | | | | 23,998,593 | | | | | | 160,509 | | | | | | 78,602 | | | | | | 1,762,071 | | |
| Voya Large Cap Value Fund - Class R6 | | | | | 9,938,244 | | | | | | 9,549,920 | | | | | | (4,102,911) | | | | | | (79,546) | | | | | | 15,305,707 | | | | | | 253,348 | | | | | | 373,519 | | | | | | 1,220,782 | | |
| Voya MidCap Opportunities Portfolio - Class I | | | | | 7,189,262 | | | | | | 566,996 | | | | | | (2,429,516) | | | | | | 1,247,648 | | | | | | 6,574,390 | | | | | | 10,192 | | | | | | (62,775) | | | | | | 382,842 | | |
| Voya Multi-Manager Emerging Markets Equity Fund - Class I | | | | | — | | | | | | 9,586,849 | | | | | | (2,369,892) | | | | | | 1,506,524 | | | | | | 8,723,481 | | | | | | 119,727 | | | | | | 335,276 | | | | | | — | | |
| Voya Multi-Manager Large Cap Core Portfolio - Class I | | | | | 28,697,976 | | | | | | 2,355,914 | | | | | | (20,858,814) | | | | | | 780,557 | | | | | | 10,975,633 | | | | | | 115,194 | | | | | | 1,812,927 | | | | | | 665,899 | | |
| Voya Multi-Manager Mid Cap Value Fund - Class I | | | | | 7,347,244 | | | | | | 836,563 | | | | | | (2,296,017) | | | | | | 600,868 | | | | | | 6,488,658 | | | | | | 48,084 | | | | | | (57,755) | | | | | | 382,630 | | |
Voya Multi-Manager International Factors Fund -
Class I | | | | | 14,849,746 | | | | | | 10,568,580 | | | | | | (6,568,580) | | | | | | 2,964,465 | | | | | | 21,814,211 | | | | | | 648,883 | | | | | | 154,234 | | | | | | 623,859 | | |
| Voya Short Term Bond Fund - Class R6 | | | | | 33,789,395 | | | | | | 18,514,073 | | | | | | (9,297,159) | | | | | | (11,424) | | | | | | 42,994,885 | | | | | | 759,459 | | | | | | (141,229) | | | | | | — | | |
| Voya U.S. Bond Index Portfolio - Class I | | | | | 50,356,648 | | | | | | 5,685,903 | | | | | | (11,313,297) | | | | | | 536,721 | | | | | | 45,265,975 | | | | | | 1,105,920 | | | | | | (243,235) | | | | | | 125,223 | | |
See Accompanying Notes to Financial Statements
PORTFOLIO OF INVESTMENTS
| Voya Solution Income Portfolio | as of December 31, 2017 (continued) |
| Issuer | | | Beginning
Fair Value
at 12/31/16 | | | Purchases
at Cost | | | Sales
at Cost | | | Change in
Unrealized
Appreciation/
(Depreciation) | | | Ending
Fair Value
at 12/31/17 | | | Investment
Income | | | Realized
Gains/
(Losses) | | | Net Capital
Gain
Distributions | |
| Voya U.S. Stock Index Portfolio - Class I | | | | | 4,904,726 | | | | | | 17,565,746 | | | | | | (12,210,629) | | | | | | 625,411 | | | | | | 10,885,254 | | | | | | 195,648 | | | | | | 430,522 | | | | | | 772,414 | | |
VY® BlackRock Inflation Protected Bond
Portfolio - Class I | | | | | 43,336,196 | | | | | | 3,623,979 | | | | | | (18,637,978) | | | | | | 1,959,091 | | | | | | 30,281,288 | | | | | | 570,575 | | | | | | (1,526,526) | | | | | | — | | |
VY® Clarion Global Real Estate Portfolio - Class I | | | | | 4,930,084 | | | | | | 343,492 | | | | | | (1,193,400) | | | | | | 312,191 | | | | | | 4,392,367 | | | | | | 174,448 | | | | | | (17,147) | | | | | | — | | |
| VY® Clarion Real Estate Portfolio - Class I | | | | | 4,968,998 | | | | | | 388,462 | | | | | | (977,529) | | | | | | (76,431) | | | | | | 4,303,500 | | | | | | 108,362 | | | | | | 214,969 | | | | | | — | | |
| VY® Goldman Sachs Bond Portfolio - Class I | | | | | 66,488,713 | | | | | | 4,838,547 | | | | | | (24,104,746) | | | | | | 109,800 | | | | | | 47,332,314 | | | | | | 1,134,772 | | | | | | 419,050 | | | | | | — | | |
VY® T. Rowe Price Capital Appreciation Portfolio -
Class I | | | | | 39,875,740 | | | | | | 3,718,635 | | | | | | (10,704,770) | | | | | | 3,623,437 | | | | | | 36,513,042 | | | | | | 528,381 | | | | | | (383,623) | | | | | | 1,833,468 | | |
VY® T. Rowe Price Equity Income Portfolio - Class I | | | | | 19,696,222 | | | | | | 96,940 | | | | | | (19,717,521) | | | | | | (75,641) | | | | | | — | | | | | | — | | | | | | 793,458 | | | | | | — | | |
VY® T. Rowe Price Growth Equity Portfolio - Class I | | | | | 9,561,638 | | | | | | 48,470 | | | | | | (10,579,861) | | | | | | 969,753 | | | | | | — | | | | | | — | | | | | | 419,634 | | | | | | — | | |
| | | | | $ | 452,310,440 | | | | | $ | 149,205,806 | | | | | $ | (203,458,835) | | | | | $ | 21,570,092 | | | | | $ | 419,627,503 | | | | | $ | 9,766,973 | | | | | $ | 2,056,278 | | | | | $ | 7,769,188 | | |
| |
The financial statements for the above mutual fund[s] can be found at www.sec.gov.
A summary of derivative instruments by primary risk exposure is outlined in the following tables.
The fair value of derivative instruments as of December 31, 2017 was as follows:
| Derivatives not accounted for as hedging instruments | | | Location on Statement
of Assets and Liabilities | | | Fair Value | |
| Asset Derivatives | | | |
| Equity contracts | | | Net Assets — Unrealized appreciation* | | | | $ | 230,902 | | |
| Total Asset Derivatives | | | | | | | $ | 230,902 | | |
| Liability Derivatives | | | |
| Equity contracts | | | Net Assets — Unrealized depreciation* | | | | $ | 247,629 | | |
| Total Liability Derivatives | | | | | | | $ | 247,629 | | |
| |
*
Includes cumulative appreciation/depreciation of futures contracts as reported in the table following the Portfolio of Investments.
The effect of derivative instruments on the Portfolio’s Statement of Operations for the year ended December 31, 2017 was as follows:
| | | | Amount of Realized Gain or (Loss) on
Derivatives Recognized in Income | |
| Derivatives not accounted for as hedging instruments | | | Futures | |
| Equity contracts | | | | $ | (87,048) | | |
| Total | | | | $ | (87,048) | | |
| |
| | | | Change in Unrealized Appreciation or (Depreciation)
on Derivatives Recognized in Income | |
| Derivatives not accounted for as hedging instruments | | | Futures | |
| Equity contracts | | | | $ | (16,727) | | |
| Total | | | | $ | (16,727) | | |
| |
At December 31, 2017, the aggregate cost of securities and other investments and the composition of unrealized appreciation and depreciation of securities and other investments at period end were:
| | Cost for federal income tax purposes was $431,893,324. | | |
| | Net unrealized appreciation consisted of: | | |
| | Gross Unrealized Appreciation | | | | $ | 13,756,365 | | |
| | Gross Unrealized Depreciation | | | | | (12,887,814) | | |
| | Net Unrealized Appreciation | | | | $ | 868,551 | | |
| |
See Accompanying Notes to Financial Statements
| Voya Solution Moderately | PORTFOLIO OF INVESTMENTS |
| Aggressive Portfolio | as of December 31, 2017 |
| | Shares | | | Value | | | Percentage
of Net
Assets | |
| | EXCHANGE-TRADED FUNDS: 6.0% | |
| | | | 163,301 | | | | iShares MSCI EMU Index
Fund | | | | $ | 7,083,998 | | | | | | 1.0 | | |
| | | | 291,295 | | | | iShares Russell 1000 Value
Index Fund | | | | | 36,219,620 | | | | | | 5.0 | | |
| | | | | | | | Total Exchange-Traded Funds
(Cost $39,174,463) | | | | | 43,303,618 | | | | | | 6.0 | | |
| | MUTUAL FUNDS: 93.7% | |
| | | | | | | | Affiliated Investment Companies: 92.2% | |
| | | | 2,235,230 | | | | Voya Emerging Markets Index
Portfolio - Class I | | | | | 28,722,711 | | | | | | 4.0 | | |
| | | | 3,593,827 | | | | Voya Floating Rate Fund -
Class I | | | | | 35,327,319 | | | | | | 4.9 | | |
| | | | 1,751,761 | | | | Voya High Yield Bond Fund -
Class R6 | | | | | 14,171,746 | | | | | | 2.0 | | |
| | | | 743,033 | | | | Voya Index Plus LargeCap
Portfolio - Class I | | | | | 21,629,704 | | | | | | 3.0 | | |
| | | | 4,892,183 | | | | Voya Intermediate Bond
Fund - Class R6 | | | | | 49,459,974 | | | | | | 6.9 | | |
| | | | 1,987,117 | | | | Voya International Index
Portfolio - Class I | | | | | 21,341,642 | | | | | | 3.0 | | |
| | | | 2,065,961 | | | | Voya Large Cap Growth
Portfolio - Class I | | | | | 42,971,988 | | | | | | 6.0 | | |
| | | | 2,920,467 | | | | Voya Large Cap Value Fund -
Class R6 | | | | | 38,900,620 | | | | | | 5.5 | | |
| | | | 2,945,491 | | | | Voya MidCap Opportunities
Portfolio - Class I | | | | | 42,886,354 | | | | | | 6.0 | | |
| | | | 1,067,579 | | | | Voya Multi-Manager Emerging
Markets Equity Fund - Class I | | | | | 14,284,209 | | | | | | 2.0 | | |
| | | | 4,323,269 | | | | Voya Multi-Manager
International Equity Fund -
Class I | | | | | 53,349,145 | | | | | | 7.5 | | |
| | | | 4,374,542 | | | | Voya Multi-Manager
International Factors Fund -
Class I | | | | | 46,413,888 | | | | | | 6.5 | | |
| | | | 2,134,747 | | | | Voya Multi-Manager Large
Cap Core Portfolio - Class I | | | | | 36,034,537 | | | | | | 5.0 | | |
| | Shares | | | Value | | | Percentage
of Net
Assets | |
| | MUTUAL FUNDS: (continued) | |
| | | | | | | | Affiliated Investment Companies (continued) | |
| | | | 3,566,529 | | | | Voya Multi-Manager Mid Cap
Value Fund - Class I | | | | $ | 42,477,357 | | | | | | 6.0 | | |
| | | | 1,918,386 | | | | Voya Small Company
Portfolio - Class I | | | | | 42,223,673 | | | | | | 5.9 | | |
| | | | 666,271 | | | | Voya U.S. Bond Index
Portfolio - Class I | | | | | 7,055,811 | | | | | | 1.0 | | |
| | | | 1,355,516 | | | | Voya U.S. Stock Index
Portfolio - Class I | | | | | 21,268,052 | | | | | | 3.0 | | |
| | | | 575,470 | | | | VY® Clarion Global Real
Estate Portfolio - Class I | | | | | 7,187,624 | | | | | | 1.0 | | |
| | | | 186,516 | | | | VY® Clarion Real Estate
Portfolio - Class I | | | | | 7,042,853 | | | | | | 1.0 | | |
| | | | 1,424,935 | | | | VY® Invesco Comstock
Portfolio - Class I | | | | | 28,954,683 | | | | | | 4.1 | | |
| | | | 1,275,112 | | | | VY® T. Rowe Price Capital
Appreciation Portfolio -
Class I | | | | | 35,244,100 | | | | | | 4.9 | | |
| | | | 226,455 | | | | VY® T. Rowe Price Growth
Equity Portfolio - Class I | | | | | 21,103,324 | | | | | | 3.0 | | |
| | | | | | | | | | | | | 658,051,314 | | | | | | 92.2 | | |
| | | | | | | | Unaffiliated Investment Companies: 1.5% | |
| | | | 2,111,924 | | | | Credit Suisse Commodity
Return Strategy Fund -
Class I | | | | | 10,601,859 | | | | | | 1.5 | | |
| | | | | | | | Total Mutual Funds
(Cost $615,815,761) | | | | | 668,653,173 | | | | | | 93.7 | | |
| | | | | | | | Total Investments in
Securities
(Cost $654,990,224) | | | | $ | 711,956,791 | | | | | | 99.7 | | |
| | | | | | | | Assets in Excess of Other
Liabilities | | | | | 1,804,750 | | | | | | 0.3 | | |
| | | | | | | | Net Assets | | | | $ | 713,761,541 | | | | | | 100.0 | | |
| |
Fair Value Measurements^
The following is a summary of the fair valuations according to the inputs used as of December 31, 2017 in valuing the assets and liabilities:
| | | | Quoted Prices
in Active Markets
for Identical
Investments
(Level 1) | | | Significant
Other
Observable
Inputs
(Level 2) | | | Significant
Unobservable
Inputs
(Level 3) | | | Fair Value
at
December 31, 2017 | |
| Asset Table | | | | | |
| Investments, at fair value | | | | | |
| Exchange-Traded Funds | | | | $ | 43,303,618 | | | | | $ | — | | | | | $ | — | | | | | $ | 43,303,618 | | |
| Mutual Funds | | | | | 668,653,173 | | | | | | — | | | | | | — | | | | | | 668,653,173 | | |
| Total Investments, at fair value | | | | $ | 711,956,791 | | | | | $ | — | | | | | $ | — | | | | | $ | 711,956,791 | | |
| |
See Accompanying Notes to Financial Statements
| Voya Solution Moderately | PORTFOLIO OF INVESTMENTS |
| Aggressive Portfolio | as of December 31, 2017 (continued) |
| | | | Quoted Prices
in Active Markets
for Identical
Investments
(Level 1) | | | Significant
Other
Observable
Inputs
(Level 2) | | | Significant
Unobservable
Inputs
(Level 3) | | | Fair Value
at
December 31, 2017 | |
| Other Financial Instruments+ | | | | | |
| Futures | | | | | 377,328 | | | | | | — | | | | | | — | | | | | | 377,328 | | |
| Total Assets | | | | $ | 712,334,119 | | | | | $ | — | | | | | $ | — | | | | | $ | 712,334,119 | | |
| Liabilities Table | | | | | |
| Other Financial Instruments+ | | | | | |
| Futures | | | | $ | (405,766) | | | | | $ | — | | | | | $ | — | | | | | $ | (405,766) | | |
| Total Liabilities | | | | $ | (405,766) | | | | | $ | — | | | | | $ | — | | | | | $ | (405,766) | | |
| |
^
See Note 2, “Significant Accounting Policies” in the Notes to Financial Statements for additional information.
+
Other Financial Instruments are derivatives not reflected in the Portfolio of Investments and may include open forward foreign currency contracts, futures, centrally cleared swaps, OTC swaps and written options. Forward foreign currency contracts, futures and centrally cleared swaps are valued at the unrealized gain (loss) on the instrument. OTC swaps and written options are valued at the fair value of the instrument.
At December 31, 2017, the following futures contracts were outstanding for Voya Solution Moderately Aggressive Portfolio:
| Contract Description | | | Number
of Contracts | | | Expiration
Date | | | Notional
Value | | | Unrealized
Appreciation/
(Depreciation) | |
| Long Contracts | | | | | |
| Tokyo Price Index (TOPIX) | | | | | 134 | | | | 03/08/18 | | | | $ | 21,608,875 | | | | | $ | 377,328 | | |
| | | | | | | | | | | | | | $ | 21,608,875 | | | | | $ | 377,328 | | |
| Short Contracts | | | | | |
| Mini MSCI EAFE Index | | | | | (141) | | | | 03/16/18 | | | | | (14,420,775) | | | | | | (286,570) | | |
| S&P 500 E-Mini | | | | | (54) | | | | 03/16/18 | | | | | (7,225,200) | | | | | | (119,196) | | |
| | | | | | | | | | | | | | $ | (21,645,975) | | | | | $ | (405,766) | | |
| |
Transactions with Affiliates
An investment of at least 5% of the voting securities of an issuer, or a company which is under common control results in that issuer becoming an affiliated person as defined by the 1940 Act.
The following table provides transactions during the year ended December 31, 2017, where the following issuers were considered an affiliate:
| Issuer | | | Beginning Fair
Value at
12/31/16 | | | Purchases
at Cost | | | Sales
at Cost | | | Change in
Unrealized
Appreciation/
(Depreciation) | | | Ending
Fair Value
at 12/31/17 | | | Investment
Income | | | Realized
Gains/
(Losses) | | | Net Capital
Gain
Distributions |
| Voya Emerging Markets Index Portfolio - Class I | | | | $ | 13,697,941 | | | | | $ | 14,350,576 | | | | | $ | (4,993,159) | | | | | $ | 5,667,353 | | | | | $ | 28,722,711 | | | | | $ | 345,456 | | | | | $ | 804,438 | | | | | $ | — |
| Voya Floating Rate Fund - Class I | | | | | 20,781,804 | | | | | | 19,467,973 | | | | | | (4,614,751) | | | | | | (307,707) | | | | | | 35,327,319 | | | | | | 1,217,042 | | | | | | (70,900) | | | | | | — |
| Voya Global Bond Fund - Class R6 | | | | | 13,630,379 | | | | | | 814,164 | | | | | | (14,366,849) | | | | | | (77,694) | | | | | | — | | | | | | 240,083 | | | | | | 330,630 | | | | | | — |
| Voya High Yield Bond Fund - Class R6 | | | | | 14,006,352 | | | | | | 2,198,433 | | | | | | (2,069,931) | | | | | | 36,892 | | | | | | 14,171,746 | | | | | | 769,113 | | | | | | 48,819 | | | | | | — |
| Voya Index Plus LargeCap Portfolio - Class I | | | | | 20,761,240 | | | | | | 966,774 | | | | | | (3,446,135) | | | | | | 3,347,825 | | | | | | 21,629,704 | | | | | | 340,014 | | | | | | 614,775 | | | | | | 389,574 |
| Voya Intermediate Bond Fund - Class R6 | | | | | 35,984,089 | | | | | | 19,922,867 | | | | | | (6,985,102) | | | | | | 538,120 | | | | | | 49,459,974 | | | | | | 1,443,390 | | | | | | 54,012 | | | | | | — |
| Voya International Index Portfolio - Class I | | | | | 14,011,692 | | | | | | 7,230,064 | | | | | | (3,368,644) | | | | | | 3,468,530 | | | | | | 21,341,642 | | | | | | 512,582 | | | | | | 65,154 | | | | | | — |
| Voya Large Cap Growth Portfolio - Class I | | | | | 37,494,815 | | | | | | 20,974,159 | | | | | | (22,198,705) | | | | | | 6,701,719 | | | | | | 42,971,988 | | | | | | 245,672 | | | | | | 198,520 | | | | | | 2,697,006 |
| Voya Large Cap Value Fund - Class R6 | | | | | 31,491,888 | | | | | | 16,919,645 | | | | | | (9,531,995) | | | | | | 21,082 | | | | | | 38,900,620 | | | | | | 666,889 | | | | | | 825,779 | | | | | | 3,126,191 |
| Voya MidCap Opportunities Portfolio - Class I | | | | | 47,615,502 | | | | | | 3,559,074 | | | | | | (18,834,314) | | | | | | 10,546,092 | | | | | | 42,886,354 | | | | | | 70,407 | | | | | | (2,725,076) | | | | | | 2,320,519 |
Voya Multi-Manager Emerging Markets Equity
Fund - Class I | | | | | 13,628,443 | | | | | | 385,993 | | | | | | (3,988,058) | | | | | | 4,257,831 | | | | | | 14,284,209 | | | | | | 196,587 | | | | | | 878,977 | | | | | | — |
| Voya Multi-Manager International Equity Fund - Class I | | | | | 55,494,611 | | | | | | 2,320,985 | | | | | | (15,930,099) | | | | | | 11,463,648 | | | | | | 53,349,145 | | | | | | 903,642 | | | | | | (275,760) | | | | | | 280,954 |
| Voya Multi-Manager Large Cap Core Portfolio - Class I | | | | | 34,226,903 | | | | | | 6,530,252 | | | | | | (8,591,647) | | | | | | 3,869,029 | | | | | | 36,034,537 | | | | | | 374,150 | | | | | | 553,371 | | | | | | 2,078,636 |
| Voya Multi-Manager Mid Cap Value Fund - Class I | | | | | 48,640,205 | | | | | | 4,890,224 | | | | | | (15,830,481) | | | | | | 4,777,409 | | | | | | 42,477,357 | | | | | | 315,637 | | | | | | (1,381,398) | | | | | | 2,511,711 |
| Voya Multi-Manager International Factors Fund - Class I | | | | | 42,131,464 | | | | | | 5,999,005 | | | | | | (9,056,543) | | | | | | 7,339,962 | | | | | | 46,413,888 | | | | | | 1,384,407 | | | | | | 69,571 | | | | | | 1,331,017 |
| Voya Small Company Portfolio - Class I | | | | | 21,034,727 | | | | | | 29,206,928 | | | | | | (7,187,317) | | | | | | (830,665) | | | | | | 42,223,673 | | | | | | 139,727 | | | | | | 223,562 | | | | | | 4,298,123 |
| Voya U.S. Bond Index Portfolio - Class I | | | | | 13,661,568 | | | | | | 1,589,387 | | | | | | (8,461,170) | | | | | | 266,026 | | | | | | 7,055,811 | | | | | | 212,774 | | | | | | (175,112) | | | | | | 18,278 |
See Accompanying Notes to Financial Statements
| Voya Solution Moderately | PORTFOLIO OF INVESTMENTS |
| Aggressive Portfolio | as of December 31, 2017 (continued) |
| Issuer | | | Beginning Fair
Value at
12/31/16 | | | Purchases
at Cost | | | Sales
at Cost | | | Change in
Unrealized
Appreciation/
(Depreciation) | | | Ending
Fair Value
at 12/31/17 | | | Investment
Income | | | Realized
Gains/
(Losses) | | | Net Capital
Gain
Distributions | |
| Voya U.S. Stock Index Portfolio - Class I | | | | | 17,394,306 | | | | | | 20,080,646 | | | | | | (17,115,596) | | | | | | 908,696 | | | | | | 21,268,052 | | | | | | 374,142 | | | | | | 1,625,399 | | | | | | 1,345,827 | | |
| VY® Clarion Global Real Estate Portfolio - Class I | | | | | 6,994,370 | | | | | | 803,238 | | | | | | (1,075,900) | | | | | | 465,916 | | | | | | 7,187,624 | | | | | | 264,696 | | | | | | (16,524) | | | | | | — | | |
| VY® Clarion Real Estate Portfolio - Class I | | | | | 7,046,351 | | | | | | 883,627 | | | | | | (1,013,817) | | | | | | 126,692 | | | | | | 7,042,853 | | | | | | 166,092 | | | | | | 79,065 | | | | | | — | | |
| VY® Invesco Comstock Portfolio - Class I | | | | | 28,386,120 | | | | | | 2,049,168 | | | | | | (5,209,893) | | | | | | 3,729,288 | | | | | | 28,954,683 | | | | | | 403,071 | | | | | | 618,401 | | | | | | — | | |
VY® T. Rowe Price Capital Appreciation Portfolio - Class I | | | | | 34,303,039 | | | | | | 3,541,447 | | | | | | (5,436,738) | | | | | | 2,836,352 | | | | | | 35,244,100 | | | | | | 503,278 | | | | | | 22,786 | | | | | | 1,651,477 | | |
VY® T. Rowe Price Growth Equity Portfolio - Class I | | | | | 37,335,214 | | | | | | 2,833,462 | | | | | | (25,004,034) | | | | | | 5,938,682 | | | | | | 21,103,324 | | | | | | 13,249 | | | | | | 488,134 | | | | | | 2,554,710 | | |
| | | | | $ | 609,753,023 | | | | | $ | 187,518,091 | | | | | $ | (214,310,878) | | | | | $ | 75,091,078 | | | | | $ | 658,051,314 | | | | | $ | 11,102,100 | | | | | $ | 2,856,623 | | | | | $ | 24,604,023 | | |
| |
The financial statements for the above mutual fund[s] can be found at www.sec.gov.
A summary of derivative instruments by primary risk exposure is outlined in the following tables.
The fair value of derivative instruments as of December 31, 2017 was as follows:
| Derivatives not accounted for as hedging instruments | | | Location on Statement
of Assets and Liabilities | | | Fair Value | |
| Asset Derivatives | | | |
| Equity contracts | | | Net Assets-Unrealized appreciation* | | | | $ | 377,328 | | |
| Total Asset Derivatives | | | | | | | $ | 377,328 | | |
| Liability Derivatives | | | |
| Equity contracts | | | Net Assets-Unrealized depreciation* | | | | $ | 405,766 | | |
| Total Liability Derivatives | | | | | | | $ | 405,766 | | |
| |
*
Includes cumulative appreciation/depreciation of futures contracts as reported in the table following the Portfolio of Investments.
The effect of derivative instruments on the Portfolio’s Statement of Operations for the year ended December 31, 2017 was as follows:
| | | | Amount of Realized Gain or (Loss) on
Derivatives Recognized in Income | |
| Derivatives not accounted for as hedging instruments | | | Futures | |
| Equity contracts | | | | $ | (84,968) | | |
| Total | | | | $ | (84,968) | | |
| |
| | | | Change in Unrealized Appreciation or (Depreciation)
on Derivatives Recognized in Income | |
| Derivatives not accounted for as hedging instruments | | | Futures | |
| Equity contracts | | | | $ | (28,438) | | |
| Total | | | | $ | (28,438) | | |
| |
At December 31, 2017, the aggregate cost of securities and other investments and the composition of unrealized appreciation and depreciation of securities and other investments at period end were:
| | Cost for federal income tax purposes was $666,211,216. | | |
| | Net unrealized appreciation consisted of: | | |
| | Gross Unrealized Appreciation | | | | $ | 58,028,808 | | |
| | Gross Unrealized Depreciation | | | | | (12,043,400) | | |
| | Net Unrealized Appreciation | | | | $ | 45,985,408 | | |
| |
See Accompanying Notes to Financial Statements
| Voya Solution Moderately | PORTFOLIO OF INVESTMENTS |
| Conservative Portfolio | as of December 31, 2017 |
| Shares | | | Value | | | Percentage
of Net
Assets | |
| EXCHANGE-TRADED FUNDS: 3.0% | |
| | | 7,168 | | | | iShares MSCI EMU Index
Fund | | | | $ | 310,948 | | | | | | 1.0 | | |
| | | 5,114 | | | | iShares Russell 1000 Value
Index Fund | | | | | 635,875 | | | | | | 2.0 | | |
| | | | | | | Total Exchange-Traded Funds
(Cost $886,239) | | | | | 946,823 | | | | | | 3.0 | | |
| MUTUAL FUNDS: 96.8% | |
| | | | | | | Affiliated Investment Companies: 94.8% | |
| | | 86,334 | | | | Voya Emerging Markets Index
Portfolio - Class I | | | | | 1,109,388 | | | | | | 3.5 | | |
| | | 222,993 | | | | Voya Floating Rate Fund -
Class I | | | | | 2,192,022 | | | | | | 7.0 | | |
| | | 62,630 | | | | Voya Global Bond Fund -
Class R6 | | | | | 627,553 | | | | | | 2.0 | | |
| | | 232,927 | | | | Voya High Yield Bond Fund -
Class R6 | | | | | 1,884,377 | | | | | | 6.0 | | |
| | | 311,206 | | | | Voya Intermediate Bond
Fund - Class R6 | | | | | 3,146,288 | | | | | | 10.0 | | |
| | | 58,714 | | | | Voya International Index
Portfolio - Class I | | | | | 630,584 | | | | | | 2.0 | | |
| | | 53,583 | | | | Voya Large Cap Growth
Portfolio - Class I | | | | | 1,114,519 | | | | | | 3.5 | | |
| | | 83,230 | | | | Voya Large Cap Value Fund -
Class R6 | | | | | 1,108,630 | | | | | | 3.5 | | |
| | | 54,570 | | | | Voya MidCap Opportunities
Portfolio - Class I | | | | | 794,543 | | | | | | 2.5 | | |
| | | 63,867 | | | | Voya Multi-Manager
International Equity Fund -
Class I | | | | | 788,114 | | | | | | 2.5 | | |
| | | 74,567 | | | | Voya Multi-Manager
International Factors Fund -
Class I | | | | | 791,160 | | | | | | 2.5 | | |
| | | 65,860 | | | | Voya Multi-Manager Mid Cap
Value Fund - Class I | | | | | 784,388 | | | | | | 2.5 | | |
| | | 254,569 | | | | Voya Short Term Bond Fund -
Class R6 | | | | | 2,494,772 | | | | | | 7.9 | | |
| Shares | | | Value | | | Percentage
of Net
Assets | |
| MUTUAL FUNDS: (continued) | |
| | | | | | | Affiliated Investment Companies (continued) | |
| | | 42,511 | | | | Voya Small Company
Portfolio - Class I | | | | $ | 935,658 | | | | | | 3.0 | | |
| | | 221,442 | | | | Voya U.S. Bond Index
Portfolio - Class I | | | | | 2,345,068 | | | | | | 7.5 | | |
| | | 90,514 | | | | Voya U.S. Stock Index
Portfolio - Class I | | | | | 1,420,170 | | | | | | 4.5 | | |
| | | 129,920 | | | | VY® BlackRock Inflation
Protected Bond Portfolio -
Class I | | | | | 1,255,030 | | | | | | 4.0 | | |
| | | 25,506 | | | | VY® Clarion Global Real
Estate Portfolio - Class I | | | | | 318,564 | | | | | | 1.0 | | |
| | | 8,266 | | | | VY® Clarion Real Estate
Portfolio - Class I | | | | | 312,132 | | | | | | 1.0 | | |
| | | 200,459 | | | | VY® Goldman Sachs Bond
Portfolio - Class I | | | | | 2,028,646 | | | | | | 6.5 | | |
| | | 31,579 | | | | VY® Invesco Comstock
Portfolio - Class I | | | | | 641,678 | | | | | | 2.0 | | |
| | | 113,031 | | | | VY® T. Rowe Price Capital
Appreciation Portfolio - Class I | | | | | 3,124,189 | | | | | | 9.9 | | |
| | | | | | | | | | | | 29,847,473 | | | | | | 94.8 | | |
| | | | | | | Unaffiliated Investment Companies: 2.0% | |
| | | 123,516 | | | | Credit Suisse Commodity
Return Strategy Fund -
Class I | | | | | 620,050 | | | | | | 2.0 | | |
| | | | | | | Total Mutual Funds
(Cost $29,260,410) | | | | | 30,467,523 | | | | | | 96.8 | | |
| | | | | | | Total Investments in
Securities
(Cost $30,146,649) | | | | $ | 31,414,346 | | | | | | 99.8 | | |
| | | | | | | Assets in Excess of
Other Liabilities | | | | | 65,360 | | | | | | 0.2 | | |
| | | | | | | Net Assets | | | | $ | 31,479,706 | | | | | | 100.0 | | |
| |
Fair Value Measurements^
The following is a summary of the fair valuations according to the inputs used as of December 31, 2017 in valuing the assets and liabilities:
| | | | Quoted Prices
in Active Markets
for Identical
Investments
(Level 1) | | | Significant
Other
Observable
Inputs
(Level 2) | | | Significant
Unobservable
Inputs
(Level 3) | | | Fair Value
at
December 31, 2017 | |
| Asset Table | | | | | |
| Investments, at fair value | | | | | |
| Exchange-Traded Funds | | | | $ | 946,823 | | | | | $ | — | | | | | $ | — | | | | | $ | 946,823 | | |
| Mutual Funds | | | | | 30,467,523 | | | | | | — | | | | | | — | | | | | | 30,467,523 | | |
| Total Investments, at fair value | | | | $ | 31,414,346 | | | | | $ | — | | | | | $ | — | | | | | $ | 31,414,346 | | |
| |
See Accompanying Notes to Financial Statements
| Voya Solution Moderately | PORTFOLIO OF INVESTMENTS |
| Conservative Portfolio | as of December 31, 2017 (continued) |
| | | | Quoted Prices
in Active Markets
for Identical
Investments
(Level 1) | | | Significant
Other
Observable
Inputs
(Level 2) | | | Significant
Unobservable
Inputs
(Level 3) | | | Fair Value
at
December 31, 2017 | |
| Other Financial Instruments+ | | | | | |
| Futures | | | | | 16,895 | | | | | | — | | | | | | — | | | | | | 16,895 | | |
| Total Assets | | | | $ | 31,431,241 | | | | | $ | — | | | | | $ | — | | | | | $ | 31,431,241 | | |
| Liabilities Table | | | | | |
| Other Financial Instruments+ | | | | | |
| Futures | | | | $ | (16,609) | | | | | $ | — | | | | | $ | — | | | | | $ | (16,609) | | |
| Total Liabilities | | | | $ | (16,609) | | | | | $ | — | | | | | $ | — | | | | | $ | (16,609) | | |
| |
^
See Note 2, “Significant Accounting Policies” in the Notes to Financial Statements for additional information.
+
Other Financial Instruments are derivatives not reflected in the Portfolio of Investments and may include open forward foreign currency contracts, futures, centrally cleared swaps, OTC swaps and written options. Forward foreign currency contracts, futures and centrally cleared swaps are valued at the unrealized gain (loss) on the instrument. OTC swaps and written options are valued at the fair value of the instrument.
At December 31, 2017, the following futures contracts were outstanding for Voya Solution Moderately Conservative Portfolio:
| Contract Description | | | Number
of Contracts | | | Expiration
Date | | | Notional
Value | | | Unrealized
Appreciation/
(Depreciation) | |
| Long Contracts | | | | | |
| Tokyo Price Index (TOPIX) | | | | | 6 | | | | | | 03/08/18 | | | | | $ | 967,562 | | | | | $ | 16,895 | | |
| | | | | | | | | | | | | | | | | $ | 967,562 | | | | | $ | 16,895 | | |
| Short Contracts | | | | | |
| Mini MSCI EAFE Index | | | | | (6) | | | | | | 03/16/18 | | | | | | (613,650) | | | | | | (12,194) | | |
| S&P 500 E-Mini | | | | | (2) | | | | | | 03/16/18 | | | | | | (267,600) | | | | | | (4,415) | | |
| | | | | | | | | | | | | | | | | $ | (881,250) | | | | | $ | (16,609) | | |
| |
Transactions with Affiliates
An investment of at least 5% of the voting securities of an issuer, or a company which is under common control results in that issuer becoming an affiliated person as defined by the 1940 Act.
The following table provides transactions during the year ended December 31, 2017, where the following issuers were considered an affiliate:
| Issuer | | | Beginning
Fair Value
at 12/31/16 | | | Purchases
at Cost | | | Sales
at Cost | | | Change in
Unrealized
Appreciation/
(Depreciation) | | | Ending
Fair Value
at 12/31/17 | | | Investment
Income | | | Realized
Gains/
(Losses) | | | Net Capital
Gain
Distributions | |
| Voya Emerging Markets Index Portfolio - Class I | | | | $ | 704,605 | | | | | $ | 630,173 | | | | | $ | (443,903) | | | | | $ | 218,513 | | | | | $ | 1,109,388 | | | | | $ | 13,307 | | | | | $ | 61,974 | | | | | $ | — | | |
| Voya Floating Rate Fund - Class I | | | | | 2,137,490 | | | | | | 892,821 | | | | | | (830,341) | | | | | | (7,948) | | | | | | 2,192,022 | | | | | | 88,741 | | | | | | (19,535) | | | | | | — | | |
| Voya Global Bond Fund - Class R6 | | | | | 1,752,536 | | | | | | 250,649 | | | | | | (1,425,334) | | | | | | 49,702 | | | | | | 627,553 | | | | | | 47,727 | | | | | | (1,336) | | | | | | — | | |
| Voya High Yield Bond Fund - Class R6 | | | | | 2,160,759 | | | | | | 464,691 | | | | | | (748,036) | | | | | | 6,963 | | | | | | 1,884,377 | | | | | | 109,521 | | | | | | 6,341 | | | | | | — | | |
| Voya Intermediate Bond Fund - Class R6 | | | | | 1,032,437 | | | | | | 2,909,868 | | | | | | (815,849) | | | | | | 19,832 | | | | | | 3,146,288 | | | | | | 80,961 | | | | | | 3,255 | | | | | | — | | |
| Voya International Index Portfolio - Class I | | | | | 720,428 | | | | | | 113,358 | | | | | | (339,094) | | | | | | 135,892 | | | | | | 630,584 | | | | | | 15,792 | | | | | | (1,053) | | | | | | — | | |
| Voya Large Cap Growth Portfolio - Class I | | | | | 525,813 | | | | | | 880,411 | | | | | | (384,525) | | | | | | 92,820 | | | | | | 1,114,519 | | | | | | 7,326 | | | | | | 19,258 | | | | | | 80,423 | | |
| Voya Large Cap Value Fund - Class R6 | | | | | 362,284 | | | | | | 1,176,917 | | | | | | (371,847) | | | | | | (58,724) | | | | | | 1,108,630 | | | | | | 16,843 | | | | | | 64,795 | | | | | | 88,516 | | |
| Voya MidCap Opportunities Portfolio - Class I | | | | | 1,311,645 | | | | | | 202,092 | | | | | | (940,123) | | | | | | 220,929 | | | | | | 794,543 | | | | | | 1,726 | | | | | | (34,649) | | | | | | 45,292 | | |
| Voya Multi-Manager International Equity Fund - Class I | | | | | 891,764 | | | | | | 139,407 | | | | | | (379,728) | | | | | | 136,671 | | | | | | 788,114 | | | | | | 13,311 | | | | | | 35,706 | | | | | | 4,138 | | |
| Voya Multi-Manager Mid Cap Value Fund - Class I | | | | | 1,339,779 | | | | | | 223,545 | | | | | | (854,410) | | | | | | 75,474 | | | | | | 784,388 | | | | | | 5,812 | | | | | | 7,537 | | | | | | 46,247 | | |
| Voya Multi-Manager International Factors Fund - Class I | | | | | 902,606 | | | | | | 168,111 | | | | | | (395,064) | | | | | | 115,507 | | | | | | 791,160 | | | | | | 23,530 | | | | | | 30,382 | | | | | | 22,623 | | |
| Voya Short Term Bond Fund - Class R6 | | | | | 3,171,325 | | | | | | 678,986 | | | | | | (1,364,716) | | | | | | 9,177 | | | | | | 2,494,772 | | | | | | 50,878 | | | | | | (16,395) | | | | | | — | | |
| Voya Small Company Portfolio - Class I | | | | | 720,942 | | | | | | 635,772 | | | | | | (398,970) | | | | | | (22,086) | | | | | | 935,658 | | | | | | 3,112 | | | | | | 18,500 | | | | | | 98,509 | | |
| Voya U.S. Bond Index Portfolio - Class I | | | | | 2,634,775 | | | | | | 623,251 | | | | | | (927,678) | | | | | | 14,720 | | | | | | 2,345,068 | | | | | | 57,226 | | | | | | (1,969) | | | | | | 6,471 | | |
| Voya U.S. Stock Index Portfolio - Class I | | | | | 895,000 | | | | | | 1,850,773 | | | | | | (1,409,281) | | | | | | 83,678 | | | | | | 1,420,170 | | | | | | 24,845 | | | | | | 68,053 | | | | | | 88,403 | | |
| VY® BlackRock Inflation Protected Bond Portfolio - Class I | | | | | 1,406,582 | | | | | | 335,685 | | | | | | (504,309) | | | | | | 17,072 | | | | | | 1,255,030 | | | | | | 20,686 | | | | | | (3,458) | | | | | | — | | |
| VY® Clarion Global Real Estate Portfolio - Class I | | | | | 359,616 | | | | | | 69,300 | | | | | | (133,707) | | | | | | 23,355 | | | | | | 318,564 | | | | | | 12,660 | | | | | | (2,730) | | | | | | — | | |
| VY® Clarion Real Estate Portfolio - Class I | | | | | 362,244 | | | | | | 73,679 | | | | | | (127,320) | | | | | | 3,529 | | | | | | 312,132 | | | | | | 7,882 | | | | | | 6,224 | | | | | | — | | |
See Accompanying Notes to Financial Statements
| Voya Solution Moderately | PORTFOLIO OF INVESTMENTS |
| Conservative Portfolio | as of December 31, 2017 (continued) |
| Issuer | | | Beginning
Fair Value
at 12/31/16 | | | Purchases
at Cost | | | Sales
at Cost | | | Change in
Unrealized
Appreciation/
(Depreciation) | | | Ending
Fair Value
at 12/31/17 | | | Investment
Income | | | Realized
Gains/
(Losses) | | | Net Capital
Gain
Distributions | |
| VY® Goldman Sachs Bond Portfolio - Class I | | | | | 3,726,858 | | | | | | 589,263 | | | | | | (2,295,065) | | | | | | 7,590 | | | | | | 2,028,646 | | | | | | 48,730 | | | | | | 23,475 | | | | | | — | | |
| VY® Invesco Comstock Portfolio - Class I | | | | | 729,813 | | | | | | 130,519 | | | | | | (266,433) | | | | | | 47,779 | | | | | | 641,678 | | | | | | 9,106 | | | | | | 55,998 | | | | | | — | | |
| VY® T. Rowe Price Capital Appreciation Portfolio - Class I | | | | | 3,527,976 | | | | | | 689,327 | | | | | | (1,441,669) | | | | | | 348,555 | | | | | | 3,124,189 | | | | | | 45,136 | | | | | | (66,975) | | | | | | 156,360 | | |
| VY® T. Rowe Price Equity Income Portfolio - Class I | | | | | 1,437,718 | | | | | | 169,355 | | | | | | (1,596,541) | | | | | | (10,532) | | | | | | — | | | | | | — | | | | | | 61,133 | | | | | | — | | |
| VY® T. Rowe Price Growth Equity Portfolio - Class I | | | | | 523,599 | | | | | | 21,788 | | | | | | (565,773) | | | | | | 20,386 | | | | | | — | | | | | | — | | | | | | 54,084 | | | | | | — | | |
| | | | | $ | 33,338,594 | | | | | $ | 13,919,741 | | | | | $ | (18,959,716) | | | | | $ | 1,548,854 | | | | | $ | 29,847,473 | | | | | $ | 704,858 | | | | | $ | 368,615 | | | | | $ | 636,982 | | |
| |
The financial statements for the above mutual fund[s] can be found at www.sec.gov.
A summary of derivative instruments by primary risk exposure is outlined in the following tables.
The fair value of derivative instruments as of December 31, 2017 was as follows:
| Derivatives not accounted for as hedging instruments | | | Location on Statement
of Assets and Liabilities | | | Fair Value | |
| Asset Derivatives | | | |
| Equity contracts | | | Net Assets — Unrealized appreciation* | | | | $ | 16,895 | | |
| Total Asset Derivatives | | | | | | | $ | 16,895 | | |
| Liability Derivatives | | | |
| Equity contracts | | | Net Assets — Unrealized depreciation* | | | | $ | 16,609 | | |
| Total Liability Derivatives | | | | | | | $ | 16,609 | | |
| |
*
Includes cumulative appreciation/depreciation of futures contracts as reported in the table following the Portfolio of Investments.
The effect of derivative instruments on the Portfolio’s Statement of Operations for the year ended December 31, 2017 was as follows:
| | | | Amount of Realized Gain or (Loss) on
Derivatives Recognized in Income | |
| Derivatives not accounted for as hedging instruments | | | Futures | |
| Equity contracts | | | | $ | (2,584) | | |
| Total | | | | $ | (2,584) | | |
| |
| | | | Change in Unrealized Appreciation or (Depreciation)
on Derivatives Recognized in Income | |
| Derivatives not accounted for as hedging instruments | | | Futures | |
| Equity contracts | | | | $ | 286 | | |
| Total | | | | $ | 286 | | |
| |
At December 31, 2017, the aggregate cost of securities and other investments and the composition of unrealized appreciation and depreciation of securities and other investments at period end were:
| | Cost for federal income tax purposes was $31,199,009. | | |
| | Net unrealized appreciation consisted of: | | |
| | Gross Unrealized Appreciation | | | | $ | 1,362,144 | | |
| | Gross Unrealized Depreciation | | | | | (1,134,066) | | |
| | Net Unrealized Appreciation | | | | $ | 228,078 | | |
| |
See Accompanying Notes to Financial Statements
PORTFOLIO OF INVESTMENTS
| Voya Solution 2020 Portfolio | as of December 31, 2017 |
| | Shares | | | Value | | | Percentage
of Net
Assets | |
| | EXCHANGE-TRADED FUNDS: 4.7% | |
| | | | 7,087 | | | | iShares MSCI EMU Index
Fund | | | | $ | 307,434 | | | | | | 0.9 | | |
| | | | 2,528 | | | | iShares Russell 1000 Value
Index Fund | | | | | 314,331 | | | | | | 1.0 | | |
| | | | 15,938 | | | | WisdomTree Japan Hedged
Equity Fund | | | | | 945,602 | | | | | | 2.8 | | |
| | | | | | | | Total Exchange-Traded Funds
(Cost $1,468,131) | | | | | 1,567,367 | | | | | | 4.7 | | |
| | MUTUAL FUNDS: 95.1% | |
| | | | | | | | Affiliated Investment Companies: 93.7% | |
| | | | 25,799 | | | | Voya Emerging Markets Index
Portfolio - Class I | | | | | 331,522 | | | | | | 1.0 | | |
| | | | 168,315 | | | | Voya Floating Rate Fund -
Class I | | | | | 1,654,532 | | | | | | 5.0 | | |
| | | | 99,277 | | | | Voya Global Bond Fund -
Class R6 | | | | | 994,754 | | | | | | 3.0 | | |
| | | | 82,039 | | | | Voya High Yield Bond Fund -
Class R6 | | | | | 663,699 | | | | | | 2.0 | | |
| | | | 327,290 | | | | Voya Intermediate Bond
Fund - Class R6 | | | | | 3,308,898 | | | | | | 9.9 | | |
| | | | 36,621 | | | | Voya International Index
Portfolio - Class I | | | | | 393,312 | | | | | | 1.2 | | |
| | | | 81,023 | | | | Voya Large Cap Growth
Portfolio - Class I | | | | | 1,685,287 | | | | | | 5.0 | | |
| | | | 64,500 | | | | Voya Large Cap Value Fund -
Class R6 | | | | | 859,144 | | | | | | 2.6 | | |
| | | | 34,599 | | | | Voya MidCap Opportunities
Portfolio - Class I | | | | | 503,761 | | | | | | 1.5 | | |
| | | | 64,091 | | | | Voya Multi-Manager Emerging
Markets Equity Fund - Class I | | | | | 857,536 | | | | | | 2.6 | | |
| | | | 81,033 | | | | Voya Multi-Manager
International Equity Fund -
Class I | | | | | 999,946 | | | | | | 3.0 | | |
| | | | 157,668 | | | | Voya Multi-Manager
International Factors Fund -
Class I | | | | | 1,672,856 | | | | | | 5.0 | | |
| | | | 50,175 | | | | Voya Multi-Manager Large
Cap Core Portfolio - Class I | | | | | 846,952 | | | | | | 2.5 | | |
| | | | 41,766 | | | | Voya Multi-Manager Mid Cap
Value Fund - Class I | | | | | 497,436 | | | | | | 1.5 | | |
| | Shares | | | Value | | | Percentage
of Net
Assets | |
| | MUTUAL FUNDS: (continued) | |
| | | | | | | | Affiliated Investment Companies (continued) | |
| | | | 243,853 | | | | Voya Short Term Bond Fund -
Class R6 | | | | $ | 2,389,757 | | | | | | 7.2 | | |
| | | | 44,940 | | | | Voya Small Company
Portfolio - Class I | | | | | 989,132 | | | | | | 3.0 | | |
| | | | 184,108 | | | | Voya U.S. Bond Index
Portfolio - Class I | | | | | 1,949,708 | | | | | | 5.8 | | |
| | | | 88,660 | | | | Voya U.S. Stock Index
Portfolio - Class I | | | | | 1,391,069 | | | | | | 4.2 | | |
| | | | 171,648 | | | | VY® BlackRock Inflation
Protected Bond Portfolio -
Class I | | | | | 1,658,118 | | | | | | 5.0 | | |
| | | | 26,948 | | | | VY® Clarion Global Real
Estate Portfolio - Class I | | | | | 336,581 | | | | | | 1.0 | | |
| | | | 8,738 | | | | VY® Clarion Real Estate
Portfolio - Class I | | | | | 329,957 | | | | | | 1.0 | | |
| | | | 223,326 | | | | VY® Goldman Sachs Bond
Portfolio - Class I | | | | | 2,260,057 | | | | | | 6.8 | | |
| | | | 41,685 | | | | VY® Invesco Comstock
Portfolio - Class I | | | | | 847,032 | | | | | | 2.5 | | |
| | | | 119,457 | | | | VY® T. Rowe Price Capital
Appreciation Portfolio - Class I | | | | | 3,301,787 | | | | | | 9.9 | | |
| | | | 5,331 | | | | VY® T. Rowe Price Growth
Equity Portfolio - Class I | | | | | 496,824 | | | | | | 1.5 | | |
| | | | | | | | | | | | | 31,219,657 | | | | | | 93.7 | | |
| | | | | | | | Unaffiliated Investment Companies: 1.4% | |
| | | | 91,703 | | | | Credit Suisse Commodity
Return Strategy
Fund - Class I | | | | | 460,351 | | | | | | 1.4 | | |
| | | | | | | | Total Mutual Funds
(Cost $30,642,436) | | | | | 31,680,008 | | | | | | 95.1 | | |
| | | | | | | | Total Investments in
Securities
(Cost $32,110,567) | | | | $ | 33,247,375 | | | | | | 99.8 | | |
| | | | | | | | Assets in Excess of
Other Liabilities | | | | | 67,902 | | | | | | 0.2 | | |
| | | | | | | | Net Assets | | | | $ | 33,315,277 | | | | | | 100.0 | | |
| |
See Accompanying Notes to Financial Statements
PORTFOLIO OF INVESTMENTS
| Voya Solution 2020 Portfolio | as of December 31, 2017 (continued) |
Fair Value Measurements^
The following is a summary of the fair valuations according to the inputs used as of December 31, 2017 in valuing the assets and liabilities:
| | | | Quoted Prices
in Active Markets
for Identical
Investments
(Level 1) | | | Significant
Other
Observable
Inputs
(Level 2) | | | Significant
Unobservable
Inputs
(Level 3) | | | Fair Value
at
December 31, 2017 | |
| Asset Table | | | | | |
| Investments, at fair value | | | | | |
| Exchange-Traded Funds | | | | $ | 1,567,367 | | | | | $ | — | | | | | $ | — | | | | | $ | 1,567,367 | | |
| Mutual Funds | | | | | 31,680,008 | | | | | | — | | | | | | — | | | | | | 31,680,008 | | |
| Total Investments, at fair value | | | | $ | 33,247,375 | | | | | $ | — | | | | | $ | — | | | | | $ | 33,247,375 | | |
| |
^
See Note 2, “Significant Accounting Policies” in the Notes to Financial Statements for additional information.
Transactions with Affiliates
An investment of at least 5% of the voting securities of an issuer, or a company which is under common control results in that issuer becoming an affiliated person as defined by the 1940 Act.
The following table provides transactions during the year ended December 31, 2017, where the following issuers were considered an affiliate:
| Issuer | | | Beginning
Fair Value
at 12/31/16 | | | Purchases
at Cost | | | Sales
at Cost | | | Change in
Unrealized
Appreciation/
(Depreciation) | | | Ending
Fair Value
at 12/31/17 | | | Investment
Income | | | Realized
Gains/
(Losses) | | | Net Capital
Gain
Distributions | |
| Voya Emerging Markets Index Portfolio - Class I | | | | $ | — | | | | | $ | 331,522 | | | | | $ | — | | | | | $ | — | | | | | $ | 331,522 | | | | | $ | — | | | | | $ | — | | | | | $ | — | | |
| Voya Floating Rate Fund - Class I | | | | | 1,110,510 | | | | | | 935,081 | | | | | | (363,373) | | | | | | (27,686) | | | | | | 1,654,532 | | | | | | 55,530 | | | | | | 9,884 | | | | | | — | | |
| Voya Global Bond Fund - Class R6 | | | | | 1,312,994 | | | | | | 752,160 | | | | | | (1,120,727) | | | | | | 50,327 | | | | | | 994,754 | | | | | | 50,033 | | | | | | 804 | | | | | | — | | |
| Voya High Yield Bond Fund - Class R6 | | | | | 448,744 | | | | | | 362,223 | | | | | | (139,071) | | | | | | (8,197) | | | | | | 663,699 | | | | | | 30,510 | | | | | | 10,232 | | | | | | — | | |
| Voya Intermediate Bond Fund - Class R6 | | | | | 991,201 | | | | | | 2,943,056 | | | | | | (650,582) | | | | | | 25,223 | | | | | | 3,308,898 | | | | | | 73,749 | | | | | | (2,868) | | | | | | — | | |
| Voya International Index Portfolio - Class I | | | | | 448,823 | | | | | | 793,322 | | | | | | (855,990) | | | | | | 7,157 | | | | | | 393,312 | | | | | | 20,243 | | | | | | 127,378 | | | | | | — | | |
| Voya Large Cap Growth Portfolio - Class I | | | | | 765,781 | | | | | | 1,313,495 | | | | | | (543,004) | | | | | | 149,015 | | | | | | 1,685,287 | | | | | | 8,663 | | | | | | 39,209 | | | | | | 95,094 | | |
| Voya Large Cap Value Fund - Class R6 | | | | | 450,982 | | | | | | 710,448 | | | | | | (258,825) | | | | | | (43,461) | | | | | | 859,144 | | | | | | 12,670 | | | | | | 49,713 | | | | | | 66,559 | | |
| Voya MidCap Opportunities Portfolio - Class I | | | | | 545,865 | | | | | | 321,404 | | | | | | (424,892) | | | | | | 61,384 | | | | | | 503,761 | | | | | | 983 | | | | | | 33,050 | | | | | | 22,388 | | |
| Voya Multi-Manager Emerging Markets Equity Fund - Class I | | | | | — | | | | | | 1,025,296 | | | | | | (275,227) | | | | | | 107,467 | | | | | | 857,536 | | | | | | 11,431 | | | | | | 34,836 | | | | | | — | | |
| Voya Multi-Manager International Equity Fund - Class I | | | | | 667,223 | | | | | | 672,437 | | | | | | (441,289) | | | | | | 101,575 | | | | | | 999,946 | | | | | | 16,524 | | | | | | 44,103 | | | | | | 5,137 | | |
| Voya Multi-Manager Large Cap Core Portfolio - Class I | | | | | 1,333,324 | | | | | | 644,710 | | | | | | (1,164,373) | | | | | | 33,291 | | | | | | 846,952 | | | | | | 8,452 | | | | | | 114,499 | | | | | | 40,493 | | |
| Voya Multi-Manager Mid Cap Value Fund - Class I | | | | | 556,412 | | | | | | 339,181 | | | | | | (386,620) | | | | | | (11,537) | | | | | | 497,436 | | | | | | 3,606 | | | | | | 47,764 | | | | | | 28,698 | | |
| Voya Multi-Manager International Factors Fund - Class I | | | | | 1,349,208 | | | | | | 921,410 | | | | | | (724,895) | | | | | | 127,133 | | | | | | 1,672,856 | | | | | | 48,685 | | | | | | 115,094 | | | | | | 46,806 | | |
| Voya Short Term Bond Fund - Class R6 | | | | | 934,435 | | | | | | 1,951,883 | | | | | | (489,383) | | | | | | (7,178) | | | | | | 2,389,757 | | | | | | 32,542 | | | | | | (2,051) | | | | | | — | | |
| Voya Small Company Portfolio - Class I | | | | | 448,939 | | | | | | 827,715 | | | | | | (251,718) | | | | | | (35,804) | | | | | | 989,132 | | | | | | 2,755 | | | | | | 33,454 | | | | | | 84,762 | | |
| Voya U.S. Bond Index Portfolio - Class I | | | | | 1,331,484 | | | | | | 1,778,991 | | | | | | (1,195,150) | | | | | | 34,383 | | | | | | 1,949,708 | | | | | | 28,966 | | | | | | (27,526) | | | | | | 2,051 | | |
| Voya U.S. Stock Index Portfolio - Class I | | | | | 1,006,181 | | | | | | 2,491,598 | | | | | | (2,165,280) | | | | | | 58,570 | | | | | | 1,391,069 | | | | | | 25,255 | | | | | | 127,752 | | | | | | 104,037 | | |
| VY® BlackRock Inflation Protected Bond Portfolio - Class I | | | | | 1,536,704 | | | | | | 1,044,141 | | | | | | (926,287) | | | | | | 3,560 | | | | | | 1,658,118 | | | | | | 22,864 | | | | | | 17,846 | | | | | | — | | |
| VY® Clarion Global Real Estate Portfolio - Class I | | | | | 224,349 | | | | | | 170,665 | | | | | | (78,348) | | | | | | 19,915 | | | | | | 336,581 | | | | | | 10,289 | | | | | | (1,033) | | | | | | — | | |
| VY® Clarion Real Estate Portfolio - Class I | | | | | 225,928 | | | | | | 175,754 | | | | | | (76,222) | | | | | | 4,497 | | | | | | 329,957 | | | | | | 6,444 | | | | | | 3,813 | | | | | | — | | |
| VY® Goldman Sachs Bond Portfolio - Class I | | | | | 1,098,811 | | | | | | 1,635,316 | | | | | | (480,546) | | | | | | 6,476 | | | | | | 2,260,057 | | | | | | 42,013 | | | | | | (2,418) | | | | | | — | | |
| VY® Invesco Comstock Portfolio - Class I | | | | | 680,809 | | | | | | 434,448 | | | | | | (300,966) | | | | | | 32,741 | | | | | | 847,032 | | | | | | 11,246 | | | | | | 79,697 | | | | | | — | | |
| VY® T. Rowe Price Capital Appreciation Portfolio - Class I | | | | | 2,201,074 | | | | | | 1,703,745 | | | | | | (773,327) | | | | | | 170,295 | | | | | | 3,301,787 | | | | | | 45,531 | | | | | | 43,174 | | | | | | 128,242 | | |
| VY® T. Rowe Price Equity Income Portfolio - Class I | | | | | 447,275 | | | | | | 121,870 | | | | | | (562,475) | | | | | | (6,670) | | | | | | — | | | | | | — | | | | | | 24,665 | | | | | | — | | |
| VY® T. Rowe Price Growth Equity Portfolio - Class I | | | | | 762,713 | | | | | | 395,410 | | | | | | (715,510) | | | | | | 54,211 | | | | | | 496,824 | | | | | | 227 | | | | | | 92,371 | | | | | | 43,818 | | |
| | | | | $ | 20,879,769 | | | | | $ | 24,797,281 | | | | | $ | (15,364,080) | | | | | $ | 906,687 | | | | | $ | 31,219,657 | | | | | $ | 569,211 | | | | | $ | 1,013,442 | | | | | $ | 668,085 | | |
| |
The financial statements for the above mutual fund[s] can be found at www.sec.gov.
See Accompanying Notes to Financial Statements
PORTFOLIO OF INVESTMENTS
| Voya Solution 2020 Portfolio | as of December 31, 2017 (continued) |
At December 31, 2017, the aggregate cost of securities and other investments and the composition of unrealized appreciation and depreciation of securities and other investments at period end were:
| | Cost for federal income tax purposes was $32,228,683. | | |
| | Net unrealized appreciation consisted of: | | |
| | Gross Unrealized Appreciation | | | | $ | 1,174,450 | | |
| | Gross Unrealized Depreciation | | | | | (155,757) | | |
| | Net Unrealized Appreciation | | | | $ | 1,018,693 | | |
| |
See Accompanying Notes to Financial Statements
PORTFOLIO OF INVESTMENTS
| Voya Solution 2025 Portfolio | as of December 31, 2017 |
| Shares | | | Value | | | Percentage
of Net
Assets | |
| EXCHANGE-TRADED FUNDS: 3.3% | |
| | | 73,289 | | | | iShares Barclays 20+ Year
Treasury Bond Fund | | | | $ | 9,297,442 | | | | | | 1.0 | | |
| | | 210,857 | | | | iShares MSCI EMU Index
Fund | | | | | 9,146,977 | | | | | | 1.0 | | |
| | | 94,031 | | | | iShares Russell 1000 Value
Index Fund | | | | | 11,691,815 | | | | | | 1.3 | | |
| | | | | | | Total Exchange-Traded Funds
(Cost $28,521,838) | | | | | 30,136,234 | | | | | | 3.3 | | |
| MUTUAL FUNDS: 96.5% | |
| | | | | | | Affiliated Investment Companies: 95.0% | |
| | | 2,161,278 | | | | Voya Emerging Markets Index
Portfolio - Class I | | | | | 27,772,416 | | | | | | 3.0 | | |
| | | 4,650,824 | | | | Voya Floating Rate Fund -
Class I | | | | | 45,717,600 | | | | | | 5.0 | | |
| | | 2,743,222 | | | | Voya Global Bond Fund -
Class R6 | | | | | 27,487,089 | | | | | | 3.0 | | |
| | | 2,267,062 | | | | Voya High Yield Bond
Fund - Class R6 | | | | | 18,340,529 | | | | | | 2.0 | | |
| | | 8,806,468 | | | | Voya Intermediate Bond
Fund - Class R6 | | | | | 89,033,389 | | | | | | 9.7 | | |
| | | 3,428,781 | | | | Voya International Index
Portfolio - Class I | | | | | 36,825,106 | | | | | | 4.0 | | |
| | | 2,673,387 | | | | Voya Large Cap Growth
Portfolio - Class I | | | | | 55,606,446 | | | | | | 6.0 | | |
| | | 2,078,821 | | | | Voya Large Cap Value
Fund - Class R6 | | | | | 27,689,894 | | | | | | 3.0 | | |
| | | 1,434,317 | | | | Voya MidCap Opportunities
Portfolio - Class I | | | | | 20,883,650 | | | | | | 2.3 | | |
| | | 1,381,350 | | | | Voya Multi-Manager
Emerging Markets Equity
Fund - Class I | | | | | 18,482,458 | | | | | | 2.0 | | |
| | | 3,356,867 | | | | Voya Multi-Manager
International Equity Fund -
Class I | | | | | 41,423,736 | | | | | | 4.5 | | |
| | | 4,790,276 | | | | Voya Multi-Manager
International Factors Fund -
Class I | | | | | 50,824,833 | | | | | | 5.5 | | |
| | | 2,203,681 | | | | Voya Multi-Manager Large
Cap Core Portfolio - Class I | | | | | 37,198,139 | | | | | | 4.0 | | |
| Shares | | | Value | | | Percentage
of Net
Assets | |
| MUTUAL FUNDS: (continued) | |
| | | | | | | Affiliated Investment Companies (continued) | |
| | | 1,730,857 | | | | Voya Multi-Manager Mid Cap
Value Fund - Class I | | | | $ | 20,614,504 | | | | | | 2.2 | | |
| | | 3,019,854 | | | | Voya Short Term Bond
Fund - Class R6 | | | | | 29,594,566 | | | | | | 3.2 | | |
| | | 1,241,256 | | | | Voya Small Company
Portfolio - Class I | | | | | 27,320,054 | | | | | | 3.0 | | |
| | | 2,586,590 | | | | Voya U.S. Bond Index
Portfolio - Class I | | | | | 27,391,992 | | | | | | 3.0 | | |
| | | 4,108,261 | | | | Voya U.S. Stock Index
Portfolio - Class I | | | | | 64,458,621 | | | | | | 7.0 | | |
| | | 744,775 | | | | VY® Clarion Global Real
Estate Portfolio - Class I | | | | | 9,302,237 | | | | | | 1.0 | | |
| | | 241,373 | | | | VY® Clarion Real Estate
Portfolio - Class I | | | | | 9,114,241 | | | | | | 1.0 | | |
| | | 5,403,701 | | | | VY® Goldman Sachs Bond
Portfolio - Class I | | | | | 54,685,451 | | | | | | 5.9 | | |
| | | 1,383,084 | | | | VY® Invesco Comstock
Portfolio - Class I | | | | | 28,104,268 | | | | | | 3.1 | | |
| | | 3,296,764 | | | | VY® T. Rowe Price Capital
Appreciation Portfolio - Class I | | | | | 91,122,569 | | | | | | 9.9 | | |
| | | 171,830 | | | | VY® T. Rowe Price Growth
Equity Portfolio - Class I | | | | | 16,012,849 | | | | | | 1.7 | | |
| | | | | | | | | | | | 875,006,637 | | | | | | 95.0 | | |
| | | | | | | Unaffiliated Investment Companies: 1.5% | |
| | | 2,726,953 | | | | Credit Suisse Commodity
Return Strategy Fund -
Class I | | | | | 13,689,302 | | | | | | 1.5 | | |
| | | | | | | Total Mutual Funds
(Cost $834,185,286) | | | | | 888,695,939 | | | | | | 96.5 | | |
| | | | | | | Total Investments in
Securities
(Cost $862,707,124) | | | | $ | 918,832,173 | | | | | | 99.8 | | |
| | | | | | | Assets in Excess of
Other Liabilities | | | | | 2,169,537 | | | | | | 0.2 | | |
| | | | | | | Net Assets | | | | $ | 921,001,710 | | | | | | 100.0 | | |
| |
See Accompanying Notes to Financial Statements
PORTFOLIO OF INVESTMENTS
| Voya Solution 2025 Portfolio | as of December 31, 2017 (continued) |
Fair Value Measurements^
The following is a summary of the fair valuations according to the inputs used as of December 31, 2017 in valuing the assets and liabilities:
| | | | Quoted Prices
in Active Markets
for Identical
Investments
(Level 1) | | | Significant
Other
Observable
Inputs
(Level 2) | | | Significant
Unobservable
Inputs
(Level 3) | | | Fair Value
at
December 31, 2017 | |
| Asset Table | | | | | |
| Investments, at fair value | | | | | |
| Exchange-Traded Funds | | | | $ | 30,136,234 | | | | | $ | — | | | | | $ | — | | | | | $ | 30,136,234 | | |
| Mutual Funds | | | | | 888,695,939 | | | | | | — | | | | | | — | | | | | | 888,695,939 | | |
| Total Investments, at fair value | | | | $ | 918,832,173 | | | | | $ | — | | | | | $ | — | | | | | $ | 918,832,173 | | |
| Other Financial Instruments+ | | | | | |
| Futures | | | | | 487,148 | | | | | | — | | | | | | — | | | | | | 487,148 | | |
| Total Assets | | | | $ | 919,319,321 | | | | | $ | — | | | | | $ | — | | | | | $ | 919,319,321 | | |
| Liabilities Table | | | | | |
| Other Financial Instruments+ | | | | | |
| Futures | | | | $ | (524,413) | | | | | $ | — | | | | | $ | — | | | | | $ | (524,413) | | |
| Total Liabilities | | | | $ | (524,413) | | | | | $ | — | | | | | $ | — | | | | | $ | (524,413) | | |
| |
^
See Note 2, “Significant Accounting Policies” in the Notes to Financial Statements for additional information.
+
Other Financial Instruments are derivatives not reflected in the Portfolio of Investments and may include open forward foreign currency contracts, futures, centrally cleared swaps, OTC swaps and written options. Forward foreign currency contracts, futures and centrally cleared swaps are valued at the unrealized gain (loss) on the instrument. OTC swaps and written options are valued at the fair value of the instrument.
At December 31, 2017, the following futures contracts were outstanding for Voya Solution 2025 Portfolio:
| Contract Description | | | Number
of Contracts | | | Expiration
Date | | | Notional
Value | | | Unrealized
Appreciation/
(Depreciation) | |
| Long Contracts | | | | | |
| Tokyo Price Index (TOPIX) | | | | | 173 | | | | | | 03/08/18 | | | | | $ | 27,898,025 | | | | | $ | 487,148 | | |
| | | | | | | | | | | | | | | | | $ | 27,898,025 | | | | | $ | 487,148 | | |
| Short Contracts | | | | | |
| Mini MSCI EAFE Index | | | | | (182) | | | | | | 03/16/18 | | | | | | (18,614,050) | | | | | | (369,899) | | |
| S&P 500 E-Mini | | | | | (70) | | | | | | 03/16/18 | | | | | | (9,366,000) | | | | | | (154,514) | | |
| | | | | | | | | | | | | | | | | $ | (27,980,050) | | | | | $ | (524,413) | | |
| |
Transactions with Affiliates
An investment of at least 5% of the voting securities of an issuer, or a company which is under common control results in that issuer becoming an affiliated person as defined by the 1940 Act.
The following table provides transactions during the year ended December 31, 2017, where the following issuers were considered an affiliate:
| Issuer | | | Beginning
Fair Value
at 12/31/16 | | | Purchases
at Cost | | | Sales
at Cost | | | Change in
Unrealized
Appreciation/
(Depreciation) | | | Ending
Fair Value
at 12/31/17 | | | Investment
Income | | | Realized
Gains/
(Losses) | | | Net Capital
Gain
Distributions |
| Voya Emerging Markets Index Portfolio - Class I | | | | $ | 17,744,852 | | | | | $ | 10,454,384 | | | | | $ | (6,413,202) | | | | | $ | 5,986,382 | | | | | $ | 27,772,416 | | | | | $ | 301,950 | | | | | $ | 809,092 | | | | | $ | — |
| Voya Floating Rate Fund - Class I | | | | | 44,882,064 | | | | | | 8,827,724 | | | | | | (7,639,740) | | | | | | (352,448) | | | | | | 45,717,600 | | | | | | 1,814,327 | | | | | | (221,318) | | | | | | — |
| Voya Global Bond Fund - Class R6 | | | | | 52,960,688 | | | | | | 6,288,363 | | | | | | (34,045,694) | | | | | | 2,283,732 | | | | | | 27,487,089 | | | | | | 1,682,658 | | | | | | (536,472) | | | | | | — |
| Voya High Yield Bond Fund - Class R6 | | | | | 18,153,839 | | | | | | 3,039,512 | | | | | | (3,101,531) | | | | | | 248,709 | | | | | | 18,340,529 | | | | | | 995,537 | | | | | | (134,162) | | | | | | — |
| Voya Intermediate Bond Fund - Class R6 | | | | | 39,997,229 | | | | | | 61,506,912 | | | | | | (13,309,413) | | | | | | 838,661 | | | | | | 89,033,389 | | | | | | 2,321,539 | | | | | | (34,010) | | | | | | — |
| Voya International Index Portfolio - Class I | | | | | 18,158,620 | | | | | | 25,054,792 | | | | | | (14,076,492) | | | | | | 7,688,186 | | | | | | 36,825,106 | | | | | | 895,907 | | | | | | (269,874) | | | | | | — |
| Voya Large Cap Growth Portfolio - Class I | | | | | 35,320,276 | | | | | | 24,418,962 | | | | | | (10,886,640) | | | | | | 6,753,848 | | | | | | 55,606,446 | | | | | | 344,443 | | | | | | 530,089 | | | | | | 3,781,317 |
| Voya Large Cap Value Fund - Class R6 | | | | | 18,272,247 | | | | | | 15,459,362 | | | | | | (6,168,894) | | | | | | 127,179 | | | | | | 27,689,894 | | | | | | 450,254 | | | | | | 340,531 | | | | | | 2,218,223 |
| Voya MidCap Opportunities Portfolio - Class I | | | | | 30,842,492 | | | | | | 2,753,831 | | | | | | (18,178,223) | | | | | | 5,465,550 | | | | | | 20,883,650 | | | | | | 45,720 | | | | | | (876,990) | | | | | | 1,131,233 |
See Accompanying Notes to Financial Statements
PORTFOLIO OF INVESTMENTS
| Voya Solution 2025 Portfolio | as of December 31, 2017 (continued) |
| Issuer | | | Beginning
Fair Value
at 12/31/16 | | | Purchases
at Cost | | | Sales
at Cost | | | Change in
Unrealized
Appreciation/
(Depreciation) | | | Ending
Fair Value
at 12/31/17 | | | Investment
Income | | | Realized
Gains/
(Losses) | | | Net Capital
Gain
Distributions | |
Voya Multi-Manager Emerging Markets Equity
Fund - Class I | | | | | 8,825,764 | | | | | | 9,626,624 | | | | | | (4,612,989) | | | | | | 4,643,059 | | | | | | 18,482,458 | | | | | | 254,305 | | | | | | 501,253 | | | | | | — | | |
| Voya Multi-Manager International Equity Fund - Class I | | | | | 53,927,891 | | | | | | 2,752,850 | | | | | | (23,884,698) | | | | | | 8,627,693 | | | | | | 41,423,736 | | | | | | 701,486 | | | | | | 208,440 | | | | | | 218,101 | | |
| Voya Multi-Manager Large Cap Core Portfolio - Class I | | | | | 61,037,724 | | | | | | 8,463,260 | | | | | | (35,447,228) | | | | | | 3,144,383 | | | | | | 37,198,139 | | | | | | 384,933 | | | | | | 3,268,757 | | | | | | 2,107,725 | | |
| Voya Multi-Manager Mid Cap Value Fund - Class I | | | | | 31,519,136 | | | | | | 3,383,818 | | | | | | (17,843,610) | | | | | | 3,555,160 | | | | | | 20,614,504 | | | | | | 153,149 | | | | | | (1,607,802) | | | | | | 1,218,694 | | |
| Voya Multi-Manager International Factors Fund - Class I | | | | | 54,607,258 | | | | | | 10,758,366 | | | | | | (24,829,470) | | | | | | 10,288,679 | | | | | | 50,824,833 | | | | | | 1,515,627 | | | | | | (2,297,144) | | | | | | 1,457,177 | | |
| Voya Short Term Bond Fund - Class R6 | | | | | 19,974,891 | | | | | | 14,122,681 | | | | | | (4,472,395) | | | | | | (30,611) | | | | | | 29,594,566 | | | | | | 487,942 | | | | | | (78,292) | | | | | | — | | |
| Voya Small Company Portfolio - Class I | | | | | 27,265,755 | | | | | | 6,670,315 | | | | | | (6,804,371) | | | | | | 188,355 | | | | | | 27,320,054 | | | | | | 91,285 | | | | | | (58,448) | | | | | | 2,807,959 | | |
| Voya U.S. Bond Index Portfolio - Class I | | | | | 34,778,247 | | | | | | 32,199,674 | | | | | | (40,207,662) | | | | | | 621,733 | | | | | | 27,391,992 | | | | | | 397,081 | | | | | | (460,897) | | | | | | — | | |
| Voya U.S. Stock Index Portfolio - Class I | | | | | 27,051,477 | | | | | | 91,937,883 | | | | | | (58,623,239) | | | | | | 4,092,500 | | | | | | 64,458,621 | | | | | | 1,169,166 | | | | | | 2,693,028 | | | | | | 4,758,213 | | |
VY® Clarion Global Real Estate Portfolio - Class I | | | | | 9,064,818 | | | | | | 1,170,076 | | | | | | (1,541,581) | | | | | | 608,924 | | | | | | 9,302,237 | | | | | | 339,323 | | | | | | (21,132) | | | | | | — | | |
| VY® Clarion Real Estate Portfolio - Class I | | | | | 9,136,679 | | | | | | 1,340,334 | | | | | | (1,274,346) | | | | | | (88,426) | | | | | | 9,114,241 | | | | | | 212,786 | | | | | | 357,019 | | | | | | — | | |
| VY® Goldman Sachs Bond Portfolio - Class I | | | | | 35,454,120 | | | | | | 27,172,198 | | | | | | (7,917,857) | | | | | | (23,010) | | | | | | 54,685,451 | | | | | | 1,215,395 | | | | | | 128,504 | | | | | | — | | |
| VY® Invesco Comstock Portfolio - Class I | | | | | 36,833,252 | | | | | | 2,319,458 | | | | | | (13,623,348) | | | | | | 2,574,906 | | | | | | 28,104,268 | | | | | | 390,439 | | | | | | 1,839,097 | | | | | | — | | |
VY® T. Rowe Price Capital Appreciation Portfolio -
Class I | | | | | 88,866,305 | | | | | | 10,167,197 | | | | | | (15,441,850) | | | | | | 7,530,917 | | | | | | 91,122,569 | | | | | | 1,299,666 | | | | | | (83,635) | | | | | | 4,235,509 | | |
VY® T. Rowe Price Equity Income Portfolio - Class I | | | | | 18,106,023 | | | | | | 334,121 | | | | | | (18,367,276) | | | | | | (72,868) | | | | | | — | | | | | | — | | | | | | 738,934 | | | | | | — | | |
VY® T. Rowe Price Growth Equity Portfolio - Class I | | | | | 35,159,519 | | | | | | 2,732,259 | | | | | | (28,945,280) | | | | | | 7,066,351 | | | | | | 16,012,849 | | | | | | 8,563 | | | | | | (1,106,492) | | | | | | 1,651,116 | | |
| | | | | $ | 827,941,166 | | | | | $ | 382,954,956 | | | | | $ | (417,657,029) | | | | | $ | 81,767,544 | | | | | $ | 875,006,637 | | | | | $ | 17,473,481 | | | | | $ | 3,628,076 | | | | | $ | 25,585,267 | | |
| |
The financial statements for the above mutual fund[s] can be found at www.sec.gov.
A summary of derivative instruments by primary risk exposure is outlined in the following tables.
The fair value of derivative instruments as of December 31, 2017 was as follows:
| Derivatives not accounted for as hedging instruments | | | Location on Statement
of Assets and Liabilities | | | Fair Value | |
| Asset Derivatives | | | |
| Equity contracts | | | Net Assets — Unrealized appreciation* | | | | $ | 487,148 | | |
| Total Asset Derivatives | | | | | | | $ | 487,148 | | |
| Liability Derivatives | | | |
| Equity contracts | | | Net Assets — Unrealized depreciation* | | | | $ | 524,413 | | |
| Total Liability Derivatives | | | | | | | $ | 524,413 | | |
| |
*
Includes cumulative appreciation/depreciation of futures contracts as reported in the table following the Portfolio of Investments.
The effect of derivative instruments on the Portfolio’s Statement of Operations for the year ended December 31, 2017 was as follows:
| | | | Amount of Realized Gain or (Loss) on
Derivatives Recognized in Income | |
| Derivatives not accounted for as hedging instruments | | | Futures | |
| Equity contracts | | | | $ | (109,819) | | |
| Total | | | | $ | (109,819) | | |
| |
| | | | Change in Unrealized Appreciation or (Depreciation)
on Derivatives Recognized in Income | |
| Derivatives not accounted for as hedging instruments | | | Futures | |
| Equity contracts | | | | $ | (37,265) | | |
| Total | | | | $ | (37,265) | | |
| |
See Accompanying Notes to Financial Statements
PORTFOLIO OF INVESTMENTS
| Voya Solution 2025 Portfolio | as of December 31, 2017 (continued) |
At December 31, 2017, the aggregate cost of securities and other investments and the composition of unrealized appreciation and depreciation of securities and other investments at period end were:
| | Cost for federal income tax purposes was $880,400,340. | | |
| | Net unrealized appreciation consisted of: | | |
| | Gross Unrealized Appreciation | | | | $ | 59,200,989 | | |
| | Gross Unrealized Depreciation | | | | | (20,460,297) | | |
| | Net Unrealized Appreciation | | | | $ | 38,740,692 | | |
| |
See Accompanying Notes to Financial Statements
PORTFOLIO OF INVESTMENTS
| Voya Solution 2030 Portfolio | as of December 31, 2017 |
| Shares | | | Value | | | Percentage
of Net
Assets | |
| EXCHANGE-TRADED FUNDS: 7.4% | |
| | | 2,429 | | | | iShares Barclays 20+ Year
Treasury Bond Fund | | | | $ | 308,143 | | | | | | 1.0 | | |
| | | 6,988 | | | | iShares MSCI EMU Index
Fund | | | | | 303,140 | | | | | | 0.9 | | |
| | | 6,233 | | | | iShares Russell 1000 Value
Index Fund | | | | | 775,011 | | | | | | 2.5 | | |
| | | 15,716 | | | | WisdomTree Japan Hedged
Equity Fund | | | | | 932,430 | | | | | | 3.0 | | |
| | | | | | | Total Exchange-Traded Funds
(Cost $2,181,681) | | | | | 2,318,724 | | | | | | 7.4 | | |
| MUTUAL FUNDS: 92.4% | |
| | | | | | | Affiliated Investment Companies: 90.9% | |
| | | 73,210 | | | | Voya Emerging Markets Index
Portfolio - Class I | | | | | 940,753 | | | | | | 3.0 | | |
| | | 157,672 | | | | Voya Floating Rate Fund -
Class I | | | | | 1,549,912 | | | | | | 4.9 | | |
| | | 76,853 | | | | Voya High Yield Bond Fund -
Class R6 | | | | | 621,744 | | | | | | 2.0 | | |
| | | 32,590 | | | | Voya Index Plus LargeCap
Portfolio - Class I | | | | | 948,705 | | | | | | 3.0 | | |
| | | 207,287 | | | | Voya Intermediate Bond
Fund - Class R6 | | | | | 2,095,676 | | | | | | 6.7 | | |
| | | 59,031 | | | | Voya International Index
Portfolio - Class I | | | | | 633,988 | | | | | | 2.0 | | |
| | | 91,101 | | | | Voya Large Cap Growth
Portfolio - Class I | | | | | 1,894,894 | | | | | | 6.1 | | |
| | | 71,462 | | | | Voya Large Cap Value Fund -
Class R6 | | | | | 951,870 | | | | | | 3.0 | | |
| | | 54,021 | | | | Voya MidCap Opportunities
Portfolio - Class I | | | | | 786,539 | | | | | | 2.5 | | |
| | | 70,503 | | | | Voya Multi-Manager Emerging
Markets Equity Fund - Class I | | | | | 943,326 | | | | | | 3.0 | | |
| | | 151,770 | | | | Voya Multi-Manager
International Equity Fund -
Class I | | | | | 1,872,839 | | | | | | 6.0 | | |
| | | 206,726 | | | | Voya Multi-Manager
International Factors Fund -
Class I | | | | | 2,193,367 | | | | | | 7.0 | | |
| Shares | | | Value | | | Percentage
of Net
Assets | |
| MUTUAL FUNDS: (continued) | |
| | | | | | | Affiliated Investment Companies (continued) | |
| | | 75,236 | | | | Voya Multi-Manager Large
Cap Core Portfolio - Class I | | | | $ | 1,269,987 | | | | | | 4.1 | | |
| | | 65,203 | | | | Voya Multi-Manager Mid Cap
Value Fund - Class I | | | | | 776,569 | | | | | | 2.5 | | |
| | | 56,120 | | | | Voya Small Company
Portfolio - Class I | | | | | 1,235,204 | | | | | | 3.9 | | |
| | | 160,710 | | | | Voya U.S. Stock Index
Portfolio - Class I | | | | | 2,521,545 | | | | | | 8.1 | | |
| | | 37,874 | | | | VY® Clarion Global Real
Estate Portfolio - Class I | | | | | 473,041 | | | | | | 1.5 | | |
| | | 12,278 | | | | VY® Clarion Real Estate
Portfolio - Class I | | | | | 463,620 | | | | | | 1.5 | | |
| | | 129,794 | | | | VY® Goldman Sachs Bond
Portfolio - Class I | | | | | 1,313,518 | | | | | | 4.2 | | |
| | | 46,877 | | | | VY® Invesco Comstock
Portfolio - Class I | | | | | 952,545 | | | | | | 3.0 | | |
| | | 111,897 | | | | VY® T. Rowe Price Capital
Appreciation Portfolio - Class I | | | | | 3,092,836 | | | | | | 9.9 | | |
| | | 9,986 | | | | VY® T. Rowe Price Growth
Equity Portfolio - Class I | | | | | 930,569 | | | | | | 3.0 | | |
| | | | | | | | | | | | 28,463,047 | | | | | | 90.9 | | |
| | | | | | | Unaffiliated Investment Companies: 1.5% | |
| | | 90,468 | | | | Credit Suisse Commodity
Return Strategy Fund -
Class I | | | | | 454,147 | | | | | | 1.5 | | |
| | | | | | | Total Mutual Funds
(Cost $27,362,601) | | | | | 28,917,194 | | | | | | 92.4 | | |
| | | | | | | Total Investments in
Securities
(Cost $29,544,282) | | | | $ | 31,235,918 | | | | | | 99.8 | | |
| | | | | | | Assets in Excess of
Other Liabilities | | | | | 65,721 | | | | | | 0.2 | | |
| | | | | | | Net Assets | | | | $ | 31,301,639 | | | | | | 100.0 | | |
| |
See Accompanying Notes to Financial Statements
PORTFOLIO OF INVESTMENTS
| Voya Solution 2030 Portfolio | as of December 31, 2017 (continued) |
Fair Value Measurements^
The following is a summary of the fair valuations according to the inputs used as of December 31, 2017 in valuing the assets and liabilities:
| | | | Quoted Prices
in Active Markets
for Identical
Investments
(Level 1) | | | Significant
Other
Observable
Inputs
(Level 2) | | | Significant
Unobservable
Inputs
(Level 3) | | | Fair Value
at
December 31, 2017 | |
| Asset Table | | | | | |
| Investments, at fair value | | | | | |
| Exchange-Traded Funds | | | | $ | 2,318,724 | | | | | $ | — | | | | | $ | — | | | | | $ | 2,318,724 | | |
| Mutual Funds | | | | | 28,917,194 | | | | | | — | | | | | | — | | | | | | 28,917,194 | | |
| Total Investments, at fair value | | | | $ | 31,235,918 | | | | | $ | — | | | | | $ | — | | | | | $ | 31,235,918 | | |
| |
^
See Note 2, “Significant Accounting Policies” in the Notes to Financial Statements for additional information.
Transactions with Affiliates
An investment of at least 5% of the voting securities of an issuer, or a company which is under common control results in that issuer becoming an affiliated person as defined by the 1940 Act.
The following table provides transactions during the year ended December 31, 2017, where the following issuers were considered an affiliate:
| Issuer | | | Beginning
Fair Value
at 12/31/16 | | | Purchases
at Cost | | | Sales
at Cost | | | Change in
Unrealized
Appreciation/
(Depreciation) | | | Ending
Fair Value
at 12/31/17 | | | Investment
Income | | | Realized
Gains/
(Losses) | | | Net Capital
Gain
Distributions | |
| Voya Emerging Markets Index Portfolio - Class I | | | | $ | 295,424 | | | | | $ | 674,234 | | | | | $ | (142,180) | | | | | $ | 113,275 | | | | | $ | 940,753 | | | | | $ | 6,731 | | | | | $ | 19,430 | | | | | $ | — | | |
| Voya Floating Rate Fund - Class I | | | | | 745,459 | | | | | | 1,070,938 | | | | | | (245,544) | | | | | | (20,941) | | | | | | 1,549,912 | | | | | | 46,755 | | | | | | 6,243 | | | | | | — | | |
| Voya High Yield Bond Fund - Class R6 | | | | | 301,238 | | | | | | 420,771 | | | | | | (94,966) | | | | | | (5,299) | | | | | | 621,744 | | | | | | 25,613 | | | | | | 5,749 | | | | | | — | | |
| Voya Index Plus LargeCap Portfolio - Class I | | | | | 446,418 | | | | | | 551,297 | | | | | | (157,090) | | | | | | 108,080 | | | | | | 948,705 | | | | | | 9,942 | | | | | | 28,935 | | | | | | 11,391 | | |
| Voya Intermediate Bond Fund - Class R6 | | | | | 554,508 | | | | | | 1,887,125 | | | | | | (360,469) | | | | | | 14,512 | | | | | | 2,095,676 | | | | | | 44,679 | | | | | | (1,768) | | | | | | — | | |
| Voya International Index Portfolio - Class I | | | | | 301,304 | | | | | | 1,350,467 | | | | | | (1,048,890) | | | | | | 31,107 | | | | | | 633,988 | | | | | | 20,089 | | | | | | 133,372 | | | | | | — | | |
| Voya Large Cap Growth Portfolio - Class I | | | | | 660,430 | | | | | | 1,467,755 | | | | | | (407,427) | | | | | | 174,136 | | | | | | 1,894,894 | | | | | | 8,953 | | | | | | 25,645 | | | | | | 98,286 | | |
| Voya Large Cap Value Fund - Class R6 | | | | | 302,679 | | | | | | 1,102,336 | | | | | | (406,625) | | | | | | (46,520) | | | | | | 951,870 | | | | | | 13,012 | | | | | | 46,704 | | | | | | 74,877 | | |
| Voya MidCap Opportunities Portfolio - Class I | | | | | 512,733 | | | | | | 543,494 | | | | | | (358,096) | | | | | | 88,408 | | | | | | 786,539 | | | | | | 1,007 | | | | | | 26,306 | | | | | | 31,099 | | |
| Voya Multi-Manager Emerging Markets Equity Fund - Class I | | | | | 293,891 | | | | | | 781,207 | | | | | | (254,498) | | | | | | 122,726 | | | | | | 943,326 | | | | | | 12,807 | | | | | | 87,422 | | | | | | — | | |
| Voya Multi-Manager International Equity Fund - Class I | | | | | 970,469 | | | | | | 1,204,634 | | | | | | (505,505) | | | | | | 203,241 | | | | | | 1,872,839 | | | | | | 31,358 | | | | | | 46,137 | | | | | | 9,750 | | |
| Voya Multi-Manager Large Cap Core Portfolio - Class I | | | | | 1,192,901 | | | | | | 1,006,342 | | | | | | (991,137) | | | | | | 61,881 | | | | | | 1,269,987 | | | | | | 12,501 | | | | | | 104,496 | | | | | | 55,693 | | |
| Voya Multi-Manager Mid Cap Value Fund - Class I | | | | | 522,688 | | | | | | 573,084 | | | | | | (320,854) | | | | | | 1,651 | | | | | | 776,569 | | | | | | 5,704 | | | | | | 42,171 | | | | | | 45,393 | | |
| Voya Multi-Manager International Factors Fund - Class I | | | | | 981,298 | | | | | | 1,620,600 | | | | | | (539,309) | | | | | | 130,778 | | | | | | 2,193,367 | | | | | | 64,673 | | | | | | 64,325 | | | | | | 62,179 | | |
| Voya Short Term Bond Fund - Class R6 | | | | | 184,582 | | | | | | 83,845 | | | | | | (269,473) | | | | | | 1,046 | | | | | | — | | | | | | 1,347 | | | | | | (582) | | | | | | — | | |
| Voya Small Company Portfolio - Class I | | | | | 451,949 | | | | | | 1,013,861 | | | | | | (218,809) | | | | | | (11,797) | | | | | | 1,235,204 | | | | | | 2,719 | | | | | | 33,061 | | | | | | 83,660 | | |
| Voya U.S. Bond Index Portfolio - Class I | | | | | 290,509 | | | | | | 263,629 | | | | | | (559,571) | | | | | | 5,433 | | | | | | — | | | | | | 2,531 | | | | | | (2,614) | | | | | | — | | |
| Voya U.S. Stock Index Portfolio - Class I | | | | | 812,727 | | | | | | 2,796,445 | | | | | | (1,215,763) | | | | | | 128,136 | | | | | | 2,521,545 | | | | | | 41,428 | | | | | | 88,338 | | | | | | 102,019 | | |
| VY® Clarion Global Real Estate Portfolio - Class I | | | | | 226,033 | | | | | | 297,879 | | | | | | (73,352) | | | | | | 22,481 | | | | | | 473,041 | | | | | | 13,308 | | | | | | 2,184 | | | | | | — | | |
| VY® Clarion Real Estate Portfolio - Class I | | | | | 227,661 | | | | | | 302,537 | | | | | | (74,641) | | | | | | 8,063 | | | | | | 463,620 | | | | | | 8,320 | | | | | | 3,374 | | | | | | — | | |
| VY® Goldman Sachs Bond Portfolio - Class I | | | | | 295,098 | | | | | | 1,194,563 | | | | | | (175,917) | | | | | | (226) | | | | | | 1,313,518 | | | | | | 22,411 | | | | | | (2,515) | | | | | | — | | |
| VY® Invesco Comstock Portfolio - Class I | | | | | 761,426 | | | | | | 671,919 | | | | | | (508,891) | | | | | | 28,091 | | | | | | 952,545 | | | | | | 12,442 | | | | | | 98,017 | | | | | | — | | |
| VY® T. Rowe Price Capital Appreciation Portfolio - Class I | | | | | 1,477,146 | | | | | | 1,968,333 | | | | | | (495,621) | | | | | | 142,978 | | | | | | 3,092,836 | | | | | | 42,151 | | | | | | 19,407 | | | | | | 110,114 | | |
| VY® T. Rowe Price Equity Income Portfolio - Class I | | | | | 300,141 | | | | | | 115,970 | | | | | | (412,053) | | | | | | (4,058) | | | | | | — | | | | | | — | | | | | | 16,807 | | | | | | — | | |
| VY® T. Rowe Price Growth Equity Portfolio - Class I | | | | | 657,787 | | | | | | 690,631 | | | | | | (507,581) | | | | | | 89,732 | | | | | | 930,569 | | | | | | 395 | | | | | | 61,444 | | | | | | 76,086 | | |
| | | | | $ | 13,766,499 | | | | | $ | 23,653,896 | | | | | $ | (10,344,262) | | | | | $ | 1,386,914 | | | | | $ | 28,463,047 | | | | | $ | 450,876 | | | | | $ | 952,088 | | | | | $ | 760,547 | | |
| |
The financial statements for the above mutual fund[s] can be found at www.sec.gov.
See Accompanying Notes to Financial Statements
PORTFOLIO OF INVESTMENTS
| Voya Solution 2030 Portfolio | as of December 31, 2017 (continued) |
At December 31, 2017, the aggregate cost of securities and other investments and the composition of unrealized appreciation and depreciation of securities and other investments at period end were:
| | Cost for federal income tax purposes was $29,622,068. | | |
| | Net unrealized appreciation consisted of: | | |
| | Gross Unrealized Appreciation | | | | $ | 1,729,413 | | |
| | Gross Unrealized Depreciation | | | | | (115,563) | | |
| | Net Unrealized Appreciation | | | | $ | 1,613,850 | | |
| |
See Accompanying Notes to Financial Statements
PORTFOLIO OF INVESTMENTS
| Voya Solution 2035 Portfolio | as of December 31, 2017 |
| | Shares | | | Value | | | Percentage
of Net
Assets | |
| | EXCHANGE-TRADED FUNDS: 3.5% | |
| | | | 211,536 | | | | iShares MSCI EMU Index
Fund | | | | $ | 9,176,431 | | | | | | 1.0 | | |
| | | | 188,667 | | | | iShares Russell 1000 Value
Index Fund | | | | | 23,458,855 | | | | | | 2.5 | | |
| | | | | | | | Total Exchange-Traded Funds
(Cost $30,474,295) | | | | | 32,635,286 | | | | | | 3.5 | | |
| | MUTUAL FUNDS: 96.3% | |
| | | | | | | | Affiliated Investment Companies: 94.8% | |
| | | | 2,176,182 | | | | Voya Emerging Markets Index
Portfolio - Class I | | | | | 27,963,942 | | | | | | 3.0 | | |
| | | | 4,681,679 | | | | Voya Floating Rate Fund -
Class I | | | | | 46,020,909 | | | | | | 4.9 | | |
| | | | 2,282,008 | | | | Voya High Yield Bond Fund -
Class R6 | | | | | 18,461,448 | | | | | | 2.0 | | |
| | | | 967,893 | | | | Voya Index Plus LargeCap
Portfolio - Class I | | | | | 28,175,352 | | | | | | 3.0 | | |
| | | | 4,734,144 | | | | Voya Intermediate Bond
Fund - Class R6 | | | | | 47,862,192 | | | | | | 5.1 | | |
| | | | 4,314,573 | | | | Voya International Index
Portfolio - Class I | | | | | 46,338,518 | | | | | | 5.0 | | |
| | | | 3,143,020 | | | | Voya Large Cap Growth
Portfolio - Class I | | | | | 65,374,808 | | | | | | 7.0 | | |
| | | | 2,087,516 | | | | Voya Large Cap Value Fund -
Class R6 | | | | | 27,805,710 | | | | | | 3.0 | | |
| | | | 2,245,721 | | | | Voya MidCap Opportunities
Portfolio - Class I | | | | | 32,697,693 | | | | | | 3.5 | | |
| | | | 2,781,733 | | | | Voya Multi-Manager Emerging
Markets Equity Fund - Class I | | | | | 37,219,584 | | | | | | 4.0 | | |
| | | | 5,256,733 | | | | Voya Multi-Manager
International Equity Fund -
Class I | | | | | 64,868,082 | | | | | | 7.0 | | |
| | | | 6,137,370 | | | | Voya Multi-Manager
International Factors Fund -
Class I | | | | | 65,117,493 | | | | | | 7.0 | | |
| | Shares | | | Value | | | Percentage
of Net
Assets | |
| | MUTUAL FUNDS: (continued) | |
| | | | | | | | Affiliated Investment Companies (continued) | |
| | | | 4,343,922 | | | | Voya Multi-Manager Large
Cap Core Portfolio - Class I | | | | $ | 73,325,404 | | | | | | 7.9 | | |
| | | | 2,710,313 | | | | Voya Multi-Manager Mid Cap
Value Fund - Class I | | | | | 32,279,828 | | | | | | 3.5 | | |
| | | | 1,666,113 | | | | Voya Small Company
Portfolio - Class I | | | | | 36,671,155 | | | | | | 3.9 | | |
| | | | 4,733,279 | | | | Voya U.S. Stock Index
Portfolio - Class I | | | | | 74,265,145 | | | | | | 8.0 | | |
| | | | 1,124,497 | | | | VY® Clarion Global Real
Estate Portfolio - Class I | | | | | 14,044,966 | | | | | | 1.5 | | |
| | | | 364,477 | | | | VY® Clarion Real Estate
Portfolio - Class I | | | | | 13,762,642 | | | | | | 1.5 | | |
| | | | 1,856,177 | | | | VY® Invesco Comstock
Portfolio - Class I | | | | | 37,717,518 | | | | | | 4.1 | | |
| | | | 2,325,553 | | | | VY® T. Rowe Price Capital
Appreciation Portfolio -
Class I | | | | | 64,278,276 | | | | | | 6.9 | | |
| | | | 296,469 | | | | VY® T. Rowe Price Growth
Equity Portfolio - Class I | | | | | 27,627,985 | | | | | | 3.0 | | |
| | | | | | | | | | | | | 881,878,650 | | | | | | 94.8 | | |
| | | | | | | | Unaffiliated Investment Companies: 1.5% | |
| | | | 2,736,268 | | | | Credit Suisse Commodity
Return Strategy Fund -
Class I | | | | | 13,736,066 | | | | | | 1.5 | | |
| | | | | | | | Total Mutual Funds
(Cost $816,271,814) | | | | | 895,614,716 | | | | | | 96.3 | | |
| | | | | | | | Total Investments in
Securities
(Cost $846,746,109) | | | | $ | 928,250,002 | | | | | | 99.8 | | |
| | | | | | | | Assets in Excess of
Other Liabilities | | | | | 2,278,194 | | | | | | 0.2 | | |
| | | | | | | | Net Assets | | | | $ | 930,528,196 | | | | | | 100.0 | | |
| |
Fair Value Measurements^
The following is a summary of the fair valuations according to the inputs used as of December 31, 2017 in valuing the assets and liabilities:
| | | | Quoted Prices
in Active Markets
for Identical
Investments
(Level 1) | | | Significant
Other
Observable
Inputs
(Level 2) | | | Significant
Unobservable
Inputs
(Level 3) | | | Fair Value
at
December 31, 2017 | |
| Asset Table | | | | | |
| Investments, at fair value | | | | | |
| Exchange-Traded Funds | | | | $ | 32,635,286 | | | | | $ | — | | | | | $ | — | | | | | $ | 32,635,286 | | |
| Mutual Funds | | | | | 895,614,716 | | | | | | — | | | | | | — | | | | | | 895,614,716 | | |
| Total Investments, at fair value | | | | $ | 928,250,002 | | | | | $ | — | | | | | $ | — | | | | | $ | 928,250,002 | | |
| |
See Accompanying Notes to Financial Statements
PORTFOLIO OF INVESTMENTS
| Voya Solution 2035 Portfolio | as of December 31, 2017 (continued) |
| | | | Quoted Prices
in Active Markets
for Identical
Investments
(Level 1) | | | Significant
Other
Observable
Inputs
(Level 2) | | | Significant
Unobservable
Inputs
(Level 3) | | | Fair Value
at
December 31, 2017 | |
| Other Financial Instruments+ | | | | | |
| Futures | | | | | 489,964 | | | | | | — | | | | | | — | | | | | | 489,964 | | |
| Total Assets | | | | $ | 928,739,966 | | | | | $ | — | | | | | $ | — | | | | | $ | 928,739,966 | | |
| Liabilities Table | | | | | |
| Other Financial Instruments+ | | | | | |
| Futures | | | | $ | (526,446) | | | | | $ | — | | | | | $ | — | | | | | $ | (526,446) | | |
| Total Liabilities | | | | $ | (526,446) | | | | | $ | — | | | | | $ | — | | | | | $ | (526,446) | | |
| |
^
See Note 2, “Significant Accounting Policies” in the Notes to Financial Statements for additional information.
+
Other Financial Instruments are derivatives not reflected in the Portfolio of Investments and may include open forward foreign currency contracts, futures, centrally cleared swaps, OTC swaps and written options. Forward foreign currency contracts, futures and centrally cleared swaps are valued at the unrealized gain (loss) on the instrument. OTC swaps and written options are valued at the fair value of the instrument.
At December 31, 2017, the following futures contracts were outstanding for Voya Solution 2035 Portfolio:
| Contract Description | | | Number
of Contracts | | | Expiration
Date | | | Notional
Value | | | Unrealized
Appreciation/
(Depreciation) | |
| Long Contracts | | | | | |
| Tokyo Price Index (TOPIX) | | | | | 174 | | | | 03/08/18 | | | | $ | 28,059,286 | | | | | $ | 489,964 | | |
| | | | | | | | | | | | | | $ | 28,059,286 | | | | | $ | 489,964 | | |
| Short Contracts | | | | | |
| Mini MSCI EAFE Index | | | | | (183) | | | | 03/16/18 | | | | | (18,716,325) | | | | | | (371,932) | | |
| S&P 500 E-Mini | | | | | (70) | | | | 03/16/18 | | | | | (9,366,000) | | | | | | (154,514) | | |
| | | | | | | | | | | | | | $ | (28,082,325) | | | | | $ | (526,446) | | |
| |
Transactions with Affiliates
An investment of at least 5% of the voting securities of an issuer, or a company which is under common control results in that issuer becoming an affiliated person as defined by the 1940 Act.
The following table provides transactions during the year ended December 31, 2017, where the following issuers were considered an affiliate:
| Issuer | | | Beginning
Fair Value
at 12/31/16 | | | Purchases
at Cost | | | Sales
at Cost | | | Change in
Unrealized
Appreciation/
(Depreciation) | | | Ending
Fair Value
at 12/31/17 | | | Investment
Income | | | Realized
Gains/
(Losses) | | | Net Capital
Gain
Distributions |
| Voya Emerging Markets Index Portfolio - Class I | | | | $ | 16,866,148 | | | | | $ | 10,455,201 | | | | | $ | (5,292,486) | | | | | $ | 5,935,079 | | | | | $ | 27,963,942 | | | | | $ | 291,680 | | | | | $ | 664,683 | | | | | $ | — |
| Voya Floating Rate Fund - Class I | | | | | 42,658,867 | | | | | | 10,118,301 | | | | | | (6,367,955) | | | | | | (388,304) | | | | | | 46,020,909 | | | | | | 1,778,845 | | | | | | (182,207) | | | | | | — |
| Voya High Yield Bond Fund - Class R6 | | | | | 17,254,641 | | | | | | 3,578,871 | | | | | | (2,427,501) | | | | | | 55,437 | | | | | | 18,461,448 | | | | | | 967,057 | | | | | | 46,799 | | | | | | — |
| Voya Index Plus LargeCap Portfolio - Class I | | | | | 25,570,146 | | | | | | 2,268,831 | | | | | | (4,474,792) | | | | | | 4,317,612 | | | | | | 28,175,352 | | | | | | 430,767 | | | | | | 171,180 | | | | | | 493,555 |
| Voya Intermediate Bond Fund - Class R6 | | | | | 24,922,276 | | | | | | 28,002,201 | | | | | | (5,525,107) | | | | | | 462,822 | | | | | | 47,862,192 | | | | | | 1,259,733 | | | | | | (5,782) | | | | | | — |
| Voya International Index Portfolio - Class I | | | | | 17,260,051 | | | | | | 37,669,367 | | | | | | (17,729,477) | | | | | | 9,138,577 | | | | | | 46,338,518 | | | | | | 1,081,717 | | | | | | 63,610 | | | | | | — |
| Voya Large Cap Growth Portfolio - Class I | | | | | 50,356,044 | | | | | | 33,021,753 | | | | | | (24,968,617) | | | | | | 6,965,628 | | | | | | 65,374,808 | | | | | | 334,329 | | | | | | 2,957,122 | | | | | | 3,670,284 |
| Voya Large Cap Value Fund - Class R6 | | | | | 25,385,505 | | | | | | 8,904,152 | | | | | | (7,131,837) | | | | | | 647,890 | | | | | | 27,805,710 | | | | | | 486,625 | | | | | | 11,972 | | | | | | 2,221,476 |
| Voya MidCap Opportunities Portfolio - Class I | | | | | 29,314,584 | | | | | | 3,817,657 | | | | | | (6,352,028) | | | | | | 5,917,480 | | | | | | 32,697,693 | | | | | | 44,000 | | | | | | (682,196) | | | | | | 1,700,184 |
Voya Multi-Manager Emerging Markets Equity
Fund - Class I | | | | | 33,554,846 | | | | | | 2,214,280 | | | | | | (10,471,867) | | | | | | 11,922,325 | | | | | | 37,219,584 | | | | | | 510,706 | | | | | | 885,514 | | | | | | — |
| Voya Multi-Manager International Equity Fund - Class I | | | | | 81,160,453 | | | | | | 4,998,761 | | | | | | (37,119,692) | | | | | | 15,828,560 | | | | | | 64,868,082 | | | | | | 1,095,490 | | | | | | (2,464,059) | | | | | | 340,601 |
| Voya Multi-Manager Large Cap Core Portfolio - Class I | | | | | 73,362,446 | | | | | | 12,531,513 | | | | | | (21,816,400) | | | | | | 9,247,845 | | | | | | 73,325,404 | | | | | | 753,069 | | | | | | 87,050 | | | | | | 4,028,350 |
| Voya Multi-Manager Mid Cap Value Fund - Class I | | | | | 29,956,636 | | | | | | 5,608,119 | | | | | | (6,590,208) | | | | | | 3,305,281 | | | | | | 32,279,828 | | | | | | 239,153 | | | | | | (1,045,636) | | | | | | 1,903,081 |
| Voya Multi-Manager International Factors Fund - Class I | | | | | 64,880,186 | | | | | | 18,803,837 | | | | | | (31,267,309) | | | | | | 12,700,779 | | | | | | 65,117,493 | | | | | | 1,936,533 | | | | | | (3,382,796) | | | | | | 1,861,851 |
| Voya Small Company Portfolio - Class I | | | | | 25,915,169 | | | | | | 17,420,007 | | | | | | (6,027,578) | | | | | | (142,888) | | | | | | 36,671,155 | | | | | | 117,801 | | | | | | 490,083 | | | | | | 3,623,656 |
| Voya U.S. Bond Index Portfolio - Class I | | | | | 8,158,275 | | | | | | 1,243,054 | | | | | | (9,603,808) | | | | | | 202,479 | | | | | | — | | | | | | 62,681 | | | | | | (140,629) | | | | | | — |
| Voya U.S. Stock Index Portfolio - Class I | | | | | 34,280,199 | | | | | | 61,759,752 | | | | | | (26,937,525) | | | | | | 5,162,719 | | | | | | 74,265,145 | | | | | | 1,257,721 | | | | | | 1,810,008 | | | | | | 3,774,674 |
See Accompanying Notes to Financial Statements
PORTFOLIO OF INVESTMENTS
| Voya Solution 2035 Portfolio | as of December 31, 2017 (continued) |
| Issuer | | | Beginning
Fair Value
at 12/31/16 | | | Purchases
at Cost | | | Sales
at Cost | | | Change in
Unrealized
Appreciation/
(Depreciation) | | | Ending
Fair Value
at 12/31/17 | | | Investment
Income | | | Realized
Gains/
(Losses) | | | Net Capital
Gain
Distributions | |
| VY® Clarion Global Real Estate Portfolio - Class I | | | | | 12,925,541 | | | | | | 2,112,742 | | | | | | (1,841,460) | | | | | | 848,143 | | | | | | 14,044,966 | | | | | | 494,080 | | | | | | 14,265 | | | | | | — | | |
| VY® Clarion Real Estate Portfolio - Class I | | | | | 13,028,119 | | | | | | 2,250,193 | | | | | | (1,384,247) | | | | | | (131,423) | | | | | | 13,762,642 | | | | | | 309,705 | | | | | | 525,875 | | | | | | — | | |
| VY® Invesco Comstock Portfolio - Class I | | | | | 43,755,087 | | | | | | 3,067,127 | | | | | | (13,310,963) | | | | | | 4,206,267 | | | | | | 37,717,518 | | | | | | 518,891 | | | | | | 1,481,354 | | | | | | — | | |
VY® T. Rowe Price Capital Appreciation Portfolio - Class I | | | | | 59,125,635 | | | | | | 8,820,837 | | | | | | (8,997,890) | | | | | | 5,329,694 | | | | | | 64,278,276 | | | | | | 909,624 | | | | | | (337,843) | | | | | | 2,876,845 | | |
| VY® T. Rowe Price Growth Equity Portfolio - Class I | | | | | 50,126,572 | | | | | | 5,471,287 | | | | | | (33,160,752) | | | | | | 5,190,878 | | | | | | 27,627,985 | | | | | | 19,030 | | | | | | 3,261,540 | | | | | | 3,669,693 | | |
| | | | | $ | 779,817,426 | | | | | $ | 284,137,843 | | | | | $ | (288,799,499) | | | | | $ | 106,722,880 | | | | | $ | 881,878,650 | | | | | $ | 14,899,237 | | | | | $ | 4,229,907 | | | | | $ | 30,164,250 | | |
| |
The financial statements for the above mutual fund[s] can be found at www.sec.gov.
A summary of derivative instruments by primary risk exposure is outlined in the following tables.
The fair value of derivative instruments as of December 31, 2017 was as follows:
| Derivatives not accounted for as hedging instruments | | | Location on Statement
of Assets and Liabilities | | | Fair Value | |
| Asset Derivatives | | | |
| Equity contracts | | | Net Assets — Unrealized appreciation* | | | | $ | 489,964 | | |
| Total Asset Derivatives | | | | | | | $ | 489,964 | | |
| Liability Derivatives | | | |
| Equity contracts | | | Net Assets — Unrealized depreciation* | | | | $ | 526,446 | | |
| Total Liability Derivatives | | | | | | | $ | 526,446 | | |
| |
*
Includes cumulative appreciation/depreciation of futures contracts as reported in the table following the Portfolio of Investments.
The effect of derivative instruments on the Portfolio’s Statement of Operations for the year ended December 31, 2017 was as follows:
| | | | Amount of Realized Gain or (Loss) on
Derivatives Recognized in Income | |
| Derivatives not accounted for as hedging instruments | | | Futures | |
| Equity contracts | | | | $ | (76,753) | | |
| Total | | | | $ | (76,753) | | |
| |
| | | | Change in Unrealized Appreciation or (Depreciation)
on Derivatives Recognized in Income | |
| Derivatives not accounted for as hedging instruments | | | Futures | |
| Equity contracts | | | | $ | (36,482) | | |
| Total | | | | $ | (36,482) | | |
| |
At December 31, 2017, the aggregate cost of securities and other investments and the composition of unrealized appreciation and depreciation of securities and other investments at period end were:
| | Cost for federal income tax purposes was $861,136,529. | | |
| | Net unrealized appreciation consisted of: | | |
| | Gross Unrealized Appreciation | | | | $ | 83,852,548 | | |
| | Gross Unrealized Depreciation | | | | | (16,429,535) | | |
| | Net Unrealized Appreciation | | | | $ | 67,423,013 | | |
| |
See Accompanying Notes to Financial Statements
PORTFOLIO OF INVESTMENTS
| Voya Solution 2040 Portfolio | as of December 31, 2017 |
| Shares | | | Value | | | Percentage
of Net
Assets | |
| EXCHANGE-TRADED FUNDS: 6.9% | | | |
| | | 5,315 | | | | iShares MSCI EMU Index
Fund | | | | $ | 230,565 | | | | | | 1.0 | | |
| | | 5,689 | | | | iShares Russell 1000 Value
Index Fund | | | | | 707,370 | | | | | | 2.9 | | |
| | | 11,953 | | | | WisdomTree Japan Hedged
Equity Fund | | | | | 709,171 | | | | | | 3.0 | | |
| | | | | | | Total Exchange-Traded Funds
(Cost $1,532,661) | | | | | 1,647,106 | | | | | | 6.9 | | |
| MUTUAL FUNDS: 92.9% | | | |
| | | | | | | Affiliated Investment Companies: 91.5% | |
| | | 55,769 | | | | Voya Emerging Markets Index
Portfolio - Class I | | | | | 716,631 | | | | | | 3.0 | | |
| | | 72,129 | | | | Voya Floating Rate Fund -
Class I | | | | | 709,033 | | | | | | 3.0 | | |
| | | 58,598 | | | | Voya High Yield Bond Fund -
Class R6 | | | | | 474,061 | | | | | | 2.0 | | |
| | | 24,841 | | | | Voya Index Plus LargeCap
Portfolio - Class I | | | | | 723,119 | | | | | | 3.0 | | |
| | | 52,602 | | | | Voya Intermediate Bond
Fund - Class R6 | | | | | 531,804 | | | | | | 2.2 | | |
| | | 67,298 | | | | Voya International Index
Portfolio - Class I | | | | | 722,786 | | | | | | 3.0 | | |
| | | 98,366 | | | | Voya Large Cap Growth
Portfolio - Class I | | | | | 2,046,017 | | | | | | 8.6 | | |
| | | 63,685 | | | | Voya Large Cap Value Fund -
Class R6 | | | | | 848,290 | | | | | | 3.5 | | |
| | | 65,872 | | | | Voya MidCap Opportunities
Portfolio - Class I | | | | | 959,098 | | | | | | 4.0 | | |
| | | 80,574 | | | | Voya Multi-Manager Emerging
Markets Equity Fund - Class I | | | | | 1,078,082 | | | | | | 4.5 | | |
| | | 154,254 | | | | Voya Multi-Manager
International Equity Fund -
Class I | | | | | 1,903,492 | | | | | | 8.0 | | |
| Shares | | | Value | | | Percentage
of Net
Assets | |
| MUTUAL FUNDS: (continued) | | | |
| | | | | | | Affiliated Investment Companies (continued) | |
| | | 157,565 | | | | Voya Multi-Manager
International Factors Fund -
Class I | | | | $ | 1,671,763 | | | | | | 7.0 | | |
| | | 122,130 | | | | Voya Multi-Manager Large
Cap Core Portfolio - Class I | | | | | 2,061,552 | | | | | | 8.6 | | |
| | | 79,528 | | | | Voya Multi-Manager Mid Cap
Value Fund - Class I | | | | | 947,181 | | | | | | 4.0 | | |
| | | 53,467 | | | | Voya Small Company
Portfolio - Class I | | | | | 1,176,801 | | | | | | 4.9 | | |
| | | 76,497 | | | | Voya U.S. Stock Index
Portfolio - Class I | | | | | 1,200,241 | | | | | | 5.0 | | |
| | | 28,869 | | | | VY® Clarion Global Real
Estate Portfolio - Class I | | | | | 360,576 | | | | | | 1.5 | | |
| | | 9,362 | | | | VY® Clarion Real Estate
Portfolio - Class I | | | | | 353,513 | | | | | | 1.5 | | |
| | | 53,595 | | | | VY® Invesco Comstock
Portfolio - Class I | | | | | 1,089,042 | | | | | | 4.5 | | |
| | | 57,587 | | | | VY® T. Rowe Price Capital
Appreciation Portfolio - Class I | | | | | 1,591,703 | | | | | | 6.7 | | |
| | | 7,611 | | | | VY® T. Rowe Price Growth
Equity Portfolio - Class I | | | | | 709,249 | | | | | | 3.0 | | |
| | | | | | | | | | | | 21,874,034 | | | | | | 91.5 | | |
| | | | | | | Unaffiliated Investment Companies: 1.4% | |
| | | 68,783 | | | | Credit Suisse Commodity
Return Strategy Fund -
Class I | | | | | 345,291 | | | | | | 1.4 | | |
| | | | | | | Total Mutual Funds
(Cost $20,745,852) | | | | | 22,219,325 | | | | | | 92.9 | | |
| | | | | | | Total Investments
in Securities
(Cost $22,278,513) | | | | $ | 23,866,431 | | | | | | 99.8 | | |
| | | | | | | Assets in Excess of Other
Liabilities | | | | | 54,263 | | | | | | 0.2 | | |
| | | | | | | Net Assets | | | | $ | 23,920,694 | | | | | | 100.0 | | |
| |
Fair Value Measurements^
The following is a summary of the fair valuations according to the inputs used as of December 31, 2017 in valuing the assets and liabilities:
| | | | Quoted Prices
in Active Markets
for Identical
Investments
(Level 1) | | | Significant
Other
Observable
Inputs
(Level 2) | | | Significant
Unobservable
Inputs
(Level 3) | | | Fair Value
at
December 31, 2017 | |
| Asset Table | | | | | |
| Investments, at fair value | | | | | |
| Exchange-Traded Funds | | | | $ | 1,647,106 | | | | | $ | — | | | | | $ | — | | | | | $ | 1,647,106 | | |
| Mutual Funds | | | | | 22,219,325 | | | | | | — | | | | | | — | | | | | | 22,219,325 | | |
| Total Investments, at fair value | | | | $ | 23,866,431 | | | | | $ | — | | | | | $ | — | | | | | $ | 23,866,431 | | |
| |
^
See Note 2, “Significant Accounting Policies” in the Notes to Financial Statements for additional information.
See Accompanying Notes to Financial Statements
PORTFOLIO OF INVESTMENTS
| Voya Solution 2040 Portfolio | as of December 31, 2017 (continued) |
Transactions with Affiliates
An investment of at least 5% of the voting securities of an issuer, or a company which is under common control results in that issuer becoming an affiliated person as defined by the 1940 Act.
The following table provides transactions during the year ended December 31, 2017, where the following issuers were considered an affiliate:
| Issuer | | | Beginning
Fair Value
at 12/31/16 | | | Purchases
at Cost | | | Sales
at Cost | | | Change in
Unrealized
Appreciation/
(Depreciation) | | | Ending
Fair Value
at 12/31/17 | | | Investment
Income | | | Realized
Gains/
(Losses) | | | Net Capital
Gain
Distributions | |
| Voya Emerging Markets Index Portfolio - Class I | | | | $ | 221,519 | | | | | $ | 555,587 | | | | | $ | (149,544) | | | | | $ | 89,069 | | | | | $ | 716,631 | | | | | $ | 6,386 | | | | | $ | 20,496 | | | | | $ | — | | |
| Voya Floating Rate Fund - Class I | | | | | 223,466 | | | | | | 664,161 | | | | | | (169,522) | | | | | | (9,072) | | | | | | 709,033 | | | | | | 21,073 | | | | | | 2,523 | | | | | | — | | |
| Voya High Yield Bond Fund - Class R6 | | | | | 225,811 | | | | | | 370,235 | | | | | | (115,840) | | | | | | (6,145) | | | | | | 474,061 | | | | | | 21,177 | | | | | | 6,955 | | | | | | — | | |
| Voya Index Plus LargeCap Portfolio - Class I | | | | | 223,215 | | | | | | 591,669 | | | | | | (160,437) | | | | | | 68,672 | | | | | | 723,119 | | | | | | 9,444 | | | | | | 28,385 | | | | | | 10,820 | | |
| Voya Intermediate Bond Fund - Class R6 | | | | | 310,200 | | | | | | 456,173 | | | | | | (244,692) | | | | | | 10,123 | | | | | | 531,804 | | | | | | 14,793 | | | | | | (3,437) | | | | | | — | | |
| Voya International Index Portfolio - Class I | | | | | 226,038 | | | | | | 1,393,751 | | | | | | (949,172) | | | | | | 52,169 | | | | | | 722,786 | | | | | | 23,860 | | | | | | 122,717 | | | | | | — | | |
| Voya Large Cap Growth Portfolio - Class I | | | | | 715,185 | | | | | | 1,995,791 | | | | | | (839,851) | | | | | | 174,892 | | | | | | 2,046,017 | | | | | | 7,601 | | | | | | 71,266 | | | | | | 83,446 | | |
| Voya Large Cap Value Fund - Class R6 | | | | | 310,586 | | | | | | 1,259,939 | | | | | | (687,378) | | | | | | (34,857) | | | | | | 848,290 | | | | | | 12,483 | | | | | | 41,789 | | | | | | 63,534 | | |
| Voya MidCap Opportunities Portfolio - Class I | | | | | 549,225 | | | | | | 750,018 | | | | | | (447,132) | | | | | | 106,987 | | | | | | 959,098 | | | | | | 1,290 | | | | | | 32,458 | | | | | | 43,143 | | |
| Voya Multi-Manager Emerging Markets Equity Fund - Class I | | | | | 440,717 | | | | | | 800,034 | | | | | | (336,948) | | | | | | 174,279 | | | | | | 1,078,082 | | | | | | 14,177 | | | | | | 112,566 | | | | | | — | | |
| Voya Multi-Manager International Equity Fund - Class I | | | | | 1,063,770 | | | | | | 1,292,952 | | | | | | (679,146) | | | | | | 225,916 | | | | | | 1,903,492 | | | | | | 31,037 | | | | | | 72,836 | | | | | | 9,650 | | |
| Voya Multi-Manager Large Cap Core Portfolio - Class I | | | | | 1,037,212 | | | | | | 1,984,687 | | | | | | (1,089,096) | | | | | | 128,749 | | | | | | 2,061,552 | | | | | | 20,628 | | | | | | 83,178 | | | | | | 101,190 | | |
| Voya Multi-Manager Mid Cap Value Fund - Class I | | | | | 560,142 | | | | | | 782,493 | | | | | | (393,879) | | | | | | (1,575) | | | | | | 947,181 | | | | | | 6,776 | | | | | | 58,625 | | | | | | 53,918 | | |
| Voya Multi-Manager International Factors Fund - Class I | | | | | 849,580 | | | | | | 1,320,527 | | | | | | (607,638) | | | | | | 109,294 | | | | | | 1,671,763 | | | | | | 48,007 | | | | | | 74,313 | | | | | | 46,156 | | |
| Voya Small Company Portfolio - Class I | | | | | 451,996 | | | | | | 1,070,909 | | | | | | (313,408) | | | | | | (32,696) | | | | | | 1,176,801 | | | | | | 3,224 | | | | | | 34,995 | | | | | | 99,175 | | |
| Voya U.S. Stock Index Portfolio - Class I | | | | | 448,696 | | | | | | 1,226,648 | | | | | | (541,293) | | | | | | 66,190 | | | | | | 1,200,241 | | | | | | 20,058 | | | | | | 50,381 | | | | | | 57,170 | | |
| VY® Clarion Global Real Estate Portfolio - Class I | | | | | 169,529 | | | | | | 263,815 | | | | | | (90,580) | | | | | | 17,812 | | | | | | 360,576 | | | | | | 11,249 | | | | | | 1,516 | | | | | | — | | |
| VY® Clarion Real Estate Portfolio - Class I | | | | | 170,768 | | | | | | 266,799 | | | | | | (90,442) | | | | | | 6,388 | | | | | | 353,513 | | | | | | 7,037 | | | | | | 1,695 | | | | | | — | | |
| VY® Invesco Comstock Portfolio - Class I | | | | | 514,188 | | | | | | 753,120 | | | | | | (253,768) | | | | | | 75,502 | | | | | | 1,089,042 | | | | | | 14,531 | | | | | | 66,253 | | | | | | — | | |
| VY® T. Rowe Price Capital Appreciation Portfolio - Class I | | | | | 747,382 | | | | | | 1,166,392 | | | | | | (401,545) | | | | | | 79,474 | | | | | | 1,591,703 | | | | | | 21,977 | | | | | | 12,888 | | | | | | 63,045 | | |
| VY® T. Rowe Price Growth Equity Portfolio - Class I | | | | | 712,200 | | | | | | 977,112 | | | | | | (1,032,143) | | | | | | 52,080 | | | | | | 709,249 | | | | | | 597 | | | | | | 104,224 | | | | | | 115,443 | | |
| | | | | $ | 10,171,425 | | | | | $ | 19,942,812 | | | | | $ | (9,593,454) | | | | | $ | 1,353,251 | | | | | $ | 21,874,034 | | | | | $ | 317,405 | | | | | $ | 996,622 | | | | | $ | 746,690 | | |
| |
The financial statements for the above mutual fund[s] can be found at www.sec.gov.
At December 31, 2017, the aggregate cost of securities and other investments and the composition of unrealized appreciation and depreciation of securities and other investments at period end were:
| | Cost for federal income tax purposes was $22,346,488. | | |
| | Net unrealized appreciation consisted of: | | |
| | Gross Unrealized Appreciation | | | | $ | 1,610,758 | | |
| | Gross Unrealized Depreciation | | | | | (90,815) | | |
| | Net Unrealized Appreciation | | | | $ | 1,519,943 | | |
| |
See Accompanying Notes to Financial Statements
PORTFOLIO OF INVESTMENTS
| Voya Solution 2045 Portfolio | as of December 31, 2017 |
| | Shares | | | Value | | | Percentage
of Net
Assets | |
| | EXCHANGE-TRADED FUNDS: 5.0% | |
| | | | 157,366 | | | | iShares MSCI EMU Index
Fund | | | | $ | 6,826,537 | | | | | | 1.0 | | |
| | | | 224,566 | | | | iShares Russell 1000 Value
Index Fund | | | | | 27,922,536 | | | | | | 4.0 | | |
| | | | | | | | Total Exchange-Traded Funds
(Cost $30,902,349) | | | | | 34,749,073 | | | | | | 5.0 | | |
| | MUTUAL FUNDS: 94.8% | |
| | | | | | | | Affiliated Investment Companies: 93.3% | |
| | | | 1,616,890 | | | | Voya Emerging Markets Index
Portfolio - Class I | | | | | 20,777,032 | | | | | | 3.0 | | |
| | | | 1,217,454 | | | | Voya Floating Rate Fund -
Class I | | | | | 11,967,575 | | | | | | 1.7 | | |
| | | | 719,133 | | | | Voya Index Plus LargeCap
Portfolio - Class I | | | | | 20,933,949 | | | | | | 3.0 | | |
| | | | 2,874,973 | | | | Voya Intermediate Bond
Fund - Class R6 | | | | | 29,065,981 | | | | | | 4.2 | | |
| | | | 3,846,847 | | | | Voya International Index
Portfolio - Class I | | | | | 41,315,142 | | | | | | 6.0 | | |
| | | | 3,503,165 | | | | Voya Large Cap Growth
Portfolio - Class I | | | | | 72,865,831 | | | | | | 10.5 | | |
| | | | 2,062,437 | | | | Voya Large Cap Value Fund -
Class R6 | | | | | 27,471,662 | | | | | | 4.0 | | |
| | | | 2,383,525 | | | | Voya MidCap Opportunities
Portfolio - Class I | | | | | 34,704,127 | | | | | | 5.0 | | |
| | | | 2,583,556 | | | | Voya Multi-Manager
Emerging Markets Equity
Fund - Class I | | | | | 34,567,986 | | | | | | 5.0 | | |
| | | | 5,021,645 | | | | Voya Multi-Manager
International Equity Fund -
Class I | | | | | 61,967,101 | | | | | | 8.9 | | |
| | | | 3,908,548 | | | | Voya Multi-Manager
International Factors Fund -
Class I | | | | | 41,469,698 | | | | | | 6.0 | | |
| | Shares | | | Value | | | Percentage
of Net
Assets | |
| | MUTUAL FUNDS: (continued) | |
| | | | | | | | Affiliated Investment Companies (continued) | |
| | | | 4,139,901 | | | | Voya Multi-Manager Large
Cap Core Portfolio - Class I | | | | $ | 69,881,536 | | | | | | 10.1 | | |
| | | | 2,876,728 | | | | Voya Multi-Manager Mid Cap
Value Fund - Class I | | | | | 34,261,826 | | | | | | 4.9 | | |
| | | | 1,547,316 | | | | Voya Small Company
Portfolio - Class I | | | | | 34,056,436 | | | | | | 4.9 | | |
| | | | 2,197,300 | | | | Voya U.S. Stock Index
Portfolio - Class I | | | | | 34,475,635 | | | | | | 5.0 | | |
| | | | 835,499 | | | | VY® Clarion Global Real
Estate Portfolio - Class I | | | | | 10,435,378 | | | | | | 1.5 | | |
| | | | 270,814 | | | | VY® Clarion Real Estate
Portfolio - Class I | | | | | 10,225,929 | | | | | | 1.5 | | |
| | | | 1,723,834 | | | | VY® Invesco Comstock
Portfolio - Class I | | | | | 35,028,298 | | | | | | 5.1 | | |
| | | | 220,232 | | | | VY® T. Rowe Price Growth
Equity Portfolio - Class I | | | | | 20,523,413 | | | | | | 3.0 | | |
| | | | | | | | | | | | | 645,994,535 | | | | | | 93.3 | | |
| | | | | | | | Unaffiliated Investment Companies: 1.5% | |
| | | | 2,035,714 | | | | Credit Suisse Commodity
Return Strategy Fund -
Class I | | | | | 10,219,284 | | | | | | 1.5 | | |
| | | | | | | | Total Mutual Funds
(Cost $590,626,206) | | | | | 656,213,819 | | | | | | 94.8 | | |
| | | | | | | | Total Investments in
Securities
(Cost $621,528,555) | | | | $ | 690,962,892 | | | | | | 99.8 | | |
| | | | | | | | Assets in Excess of
Other Liabilities | | | | | 1,713,783 | | | | | | 0.2 | | |
| | | | | | | | Net Assets | | | | $ | 692,676,675 | | | | | | 100.0 | | |
| |
Fair Value Measurements^
The following is a summary of the fair valuations according to the inputs used as of December 31, 2017 in valuing the assets and liabilities:
| | | | Quoted Prices
in Active Markets
for Identical
Investments
(Level 1) | | | Significant
Other
Observable
Inputs
(Level 2) | | | Significant
Unobservable
Inputs
(Level 3) | | | Fair Value
at
December 31, 2017 | |
| Asset Table | | | | | |
| Investments, at fair value | | | | | |
| Exchange-Traded Funds | | | | $ | 34,749,073 | | | | | $ | — | | | | | $ | — | | | | | $ | 34,749,073 | | |
| Mutual Funds | | | | | 656,213,819 | | | | | | — | | | | | | — | | | | | | 656,213,819 | | |
| Total Investments, at fair value | | | | $ | 690,962,892 | | | | | $ | — | | | | | $ | — | | | | | $ | 690,962,892 | | |
| Other Financial Instruments+ | | | | | |
| Futures | | | | | 363,249 | | | | | | — | | | | | | — | | | | | | 363,249 | | |
| Total Assets | | | | $ | 691,326,141 | | | | | $ | — | | | | | $ | — | | | | | $ | 691,326,141 | | |
| |
See Accompanying Notes to Financial Statements
PORTFOLIO OF INVESTMENTS
| Voya Solution 2045 Portfolio | as of December 31, 2017 (continued) |
| | | | Quoted Prices
in Active Markets
for Identical
Investments
(Level 1) | | | Significant
Other
Observable
Inputs
(Level 2) | | | Significant
Unobservable
Inputs
(Level 3) | | | Fair Value
at
December 31, 2017 | |
| Liabilities Table | | | | | |
| Other Financial Instruments+ | | | | | |
| Futures | | | | $ | (391,189) | | | | | $ | — | | | | | $ | — | | | | | $ | (391,189) | | |
| Total Liabilities | | | | $ | (391,189) | | | | | $ | — | | | | | $ | — | | | | | $ | (391,189) | | |
| |
^
See Note 2, “Significant Accounting Policies” in the Notes to Financial Statements for additional information.
+
Other Financial Instruments are derivatives not reflected in the Portfolio of Investments and may include open forward foreign currency contracts, futures, centrally cleared swaps, OTC swaps and written options. Forward foreign currency contracts, futures and centrally cleared swaps are valued at the unrealized gain (loss) on the instrument. OTC swaps and written options are valued at the fair value of the instrument.
At December 31, 2017, the following futures contracts were outstanding for Voya Solution 2045 Portfolio:
| Contract Description | | | Number
of Contracts | | | Expiration
Date | | | Notional
Value | | | Unrealized
Appreciation/
(Depreciation) | |
| Long Contracts | | | | | |
| Tokyo Price Index (TOPIX) | | | | | 129 | | | | | | 03/08/18 | | | | | $ | 20,802,574 | | | | | $ | 363,249 | | |
| | | | | | | | | | | | | | | | | $ | 20,802,574 | | | | | $ | 363,249 | | |
| Short Contracts | | | | | |
| Mini MSCI EAFE Index | | | | | (136) | | | | | | 03/16/18 | | | | | | (13,909,400) | | | | | | (276,407) | | |
| S&P 500 E-Mini | | | | | (52) | | | | | | 03/16/18 | | | | | | (6,957,600) | | | | | | (114,782) | | |
| | | | | | | | | | | | | | | | | $ | (20,867,000) | | | | | $ | (391,189) | | |
| |
Transactions with Affiliates
An investment of at least 5% of the voting securities of an issuer, or a company which is under common control results in that issuer becoming an affiliated person as defined by the 1940 Act.
The following table provides transactions during the year ended December 31, 2017, where the following issuers were considered an affiliate:
| Issuer | | | Beginning
Fair Value
at 12/31/16 | | | Purchases
at Cost | | | Sales
at Cost | | | Change in
Unrealized
Appreciation/
(Depreciation) | | | Ending
Fair Value
at 12/31/17 | | | Investment
Income | | | Realized
Gains/
(Losses) | | | Net Capital
Gain
Distributions | |
| Voya Emerging Markets Index Portfolio - Class I | | | | $ | 12,191,320 | | | | | $ | 8,182,391 | | | | | $ | (3,926,817) | | | | | $ | 4,330,138 | | | | | $ | 20,777,032 | | | | | $ | 213,884 | | | | | $ | 514,725 | | | | | $ | — | | |
| Voya Floating Rate Fund - Class I | | | | | 10,791,393 | | | | | | 2,988,363 | | | | | | (1,715,273) | | | | | | (96,908) | | | | | | 11,967,575 | | | | | | 456,802 | | | | | | (49,615) | | | | | | — | | |
| Voya Index Plus LargeCap Portfolio - Class I | | | | | 18,482,193 | | | | | | 2,126,983 | | | | | | (2,876,256) | | | | | | 3,177,848 | | | | | | 20,933,949 | | | | | | 315,877 | | | | | | 460,168 | | | | | | 361,920 | | |
| Voya Intermediate Bond Fund - Class R6 | | | | | 16,592,861 | | | | | | 16,079,769 | | | | | | (3,909,760) | | | | | | 303,111 | | | | | | 29,065,981 | | | | | | 780,594 | | | | | | (11,690) | | | | | | — | | |
| Voya International Index Portfolio - Class I | | | | | 21,831,955 | | | | | | 29,116,948 | | | | | | (18,451,785) | | | | | | 8,818,024 | | | | | | 41,315,142 | | | | | | 951,787 | | | | | | (443,252) | | | | | | — | | |
| Voya Large Cap Growth Portfolio - Class I | | | | | 45,501,803 | | | | | | 40,165,271 | | | | | | (20,273,668) | | | | | | 7,472,425 | | | | | | 72,865,831 | | | | | | 308,118 | | | | | | 2,820,677 | | | | | | 3,382,535 | | |
| Voya Large Cap Value Fund - Class R6 | | | | | 24,300,952 | | | | | | 10,491,008 | | | | | | (7,762,678) | | | | | | 442,380 | | | | | | 27,471,662 | | | | | | 480,513 | | | | | | 196,768 | | | | | | 2,183,949 | | |
| Voya MidCap Opportunities Portfolio - Class I | | | | | 33,300,071 | | | | | | 4,909,438 | | | | | | (10,244,991) | | | | | | 6,739,609 | | | | | | 34,704,127 | | | | | | 50,698 | | | | | | (949,679) | | | | | | 1,782,328 | | |
| Voya Multi-Manager Emerging Markets Equity Fund - Class I | | | | | 24,254,360 | | | | | | 8,124,161 | | | | | | (7,661,369) | | | | | | 9,850,834 | | | | | | 34,567,986 | | | | | | 473,033 | | | | | | 851,513 | | | | | | — | | |
| Voya Multi-Manager International Equity Fund - Class I | | | | | 61,751,601 | | | | | | 11,225,842 | | | | | | (22,820,042) | | | | | | 11,809,700 | | | | | | 61,967,101 | | | | | | 1,043,657 | | | | | | (271,767) | | | | | | 324,486 | | |
| Voya Multi-Manager Large Cap Core Portfolio - Class I | | | | | 61,745,716 | | | | | | 10,216,374 | | | | | | (9,059,010) | | | | | | 6,978,456 | | | | | | 69,881,536 | | | | | | 716,736 | | | | | | 1,373,403 | | | | | | 3,830,838 | | |
| Voya Multi-Manager Mid Cap Value Fund - Class I | | | | | 34,023,643 | | | | | | 6,127,466 | | | | | | (9,540,181) | | | | | | 3,650,898 | | | | | | 34,261,826 | | | | | | 253,149 | | | | | | (1,179,502) | | | | | | 2,014,457 | | |
| Voya Multi-Manager International Factors Fund - Class I | | | | | 46,893,089 | | | | | | 7,704,736 | | | | | | (22,184,321) | | | | | | 9,056,194 | | | | | | 41,469,698 | | | | | | 1,229,936 | | | | | | (2,705,343) | | | | | | 1,182,502 | | |
| Voya Small Company Portfolio - Class I | | | | | 24,974,157 | | | | | | 15,125,896 | | | | | | (6,028,954) | | | | | | 8,518 | | | | | | 34,056,436 | | | | | | 107,940 | | | | | | (41,374) | | | | | | 3,320,367 | | |
| Voya U.S. Stock Index Portfolio - Class I | | | | | 17,489,407 | | | | | | 34,397,682 | | | | | | (19,444,229) | | | | | | 2,032,775 | | | | | | 34,475,635 | | | | | | 587,532 | | | | | | 1,302,945 | | | | | | 1,836,711 | | |
| VY® Clarion Global Real Estate Portfolio - Class I | | | | | 9,343,586 | | | | | | 1,884,592 | | | | | | (1,414,981) | | | | | | 622,181 | | | | | | 10,435,378 | | | | | | 363,729 | | | | | | 12,726 | | | | | | — | | |
| VY® Clarion Real Estate Portfolio - Class I | | | | | 9,417,718 | | | | | | 1,948,629 | | | | | | (1,047,092) | | | | | | (93,326) | | | | | | 10,225,929 | | | | | | 228,010 | | | | | | 380,614 | | | | | | — | | |
| VY® Invesco Comstock Portfolio - Class I | | | | | 31,618,719 | | | | | | 4,643,606 | | | | | | (5,406,960) | | | | | | 4,172,933 | | | | | | 35,028,298 | | | | | | 479,962 | | | | | | 912,351 | | | | | | — | | |
VY® T. Rowe Price Growth Equity Portfolio - Class I | | | | | 45,295,086 | | | | | | 7,051,540 | | | | | | (37,329,666) | | | | | | 5,506,453 | | | | | | 20,523,413 | | | | | | 20,933 | | | | | | 1,626,436 | | | | | | 4,036,315 | | |
| | | | | $ | 549,799,630 | | | | | $ | 222,510,695 | | | | | $ | (211,098,033) | | | | | $ | 84,782,243 | | | | | $ | 645,994,535 | | | | | $ | 9,062,890 | | | | | $ | 4,800,104 | | | | | $ | 24,256,408 | | |
| |
The financial statements for the above mutual fund[s] can be found at www.sec.gov.
See Accompanying Notes to Financial Statements
PORTFOLIO OF INVESTMENTS
| Voya Solution 2045 Portfolio | as of December 31, 2017 (continued) |
A summary of derivative instruments by primary risk exposure is outlined in the following tables.
The fair value of derivative instruments as of December 31, 2017 was as follows:
| Derivatives not accounted for as hedging instruments | | | Location on Statement
of Assets and Liabilities | | | Fair Value | |
| Asset Derivatives | | | |
| Equity contracts | | | Net Assets — Unrealized appreciation* | | | | $ | 363,249 | | |
| Total Asset Derivatives | | | | | | | $ | 363,249 | | |
| Liability Derivatives | | | |
| Equity contracts | | | Net Assets — Unrealized depreciation* | | | | $ | 391,189 | | |
| Total Liability Derivatives | | | | | | | $ | 391,189 | | |
| |
*
Includes cumulative appreciation/depreciation of futures contracts as reported in the table following the Portfolio of Investments.
The effect of derivative instruments on the Portfolio’s Statement of Operations for the year ended December 31, 2017 was as follows:
| | | | Amount of Realized Gain or (Loss) on
Derivatives Recognized in Income | |
| Derivatives not accounted for as hedging instruments | | | Futures | |
| Equity contracts | | | | $ | (46,273) | | |
| Total | | | | $ | (46,273) | | |
| |
| | | | Change in Unrealized Appreciation or (Depreciation)
on Derivatives Recognized in Income | |
| Derivatives not accounted for as hedging instruments | | | Futures | |
| Equity contracts | | | | $ | (27,940) | | |
| Total | | | | $ | (27,940) | | |
| |
At December 31, 2017, the aggregate cost of securities and other investments and the composition of unrealized appreciation and depreciation of securities and other investments at period end were:
| | Cost for federal income tax purposes was $631,812,404. | | |
| | Net unrealized appreciation consisted of: | | |
| | Gross Unrealized Appreciation | | | | $ | 70,724,603 | | |
| | Gross Unrealized Depreciation | | | | | (11,345,652) | | |
| | Net Unrealized Appreciation | | | | $ | 59,378,951 | | |
| |
See Accompanying Notes to Financial Statements
PORTFOLIO OF INVESTMENTS
| Voya Solution 2050 Portfolio | as of December 31, 2017 |
| Shares | | | Value | | | Percentage
of Net
Assets | |
| EXCHANGE-TRADED FUNDS: 7.7% | |
| | | 3,804 | | | | iShares MSCI EMU Index Fund | | | | $ | 165,017 | | | | | | 0.9 | | |
| | | 5,428 | | | | iShares Russell 1000 Value
Index Fund | | | | | 674,918 | | | | | | 3.9 | | |
| | | 8,554 | | | | WisdomTree Japan Hedged
Equity Fund | | | | | 507,509 | | | | | | 2.9 | | |
| | | | | | | Total Exchange-Traded Funds
(Cost $1,259,756) | | | | | 1,347,444 | | | | | | 7.7 | | |
| MUTUAL FUNDS: 92.1% | |
| | | | | | | Affiliated Investment Companies: 90.7% | |
| | | 40,683 | | | | Voya Emerging Markets Index
Portfolio - Class I | | | | | 522,773 | | | | | | 3.0 | | |
| | | 18,085 | | | | Voya Index Plus LargeCap
Portfolio - Class I | | | | | 526,443 | | | | | | 3.0 | | |
| | | 68,090 | | | | Voya Intermediate Bond Fund -
Class R6 | | | | | 688,393 | | | | | | 4.0 | | |
| | | 74,044 | | | | Voya International Index
Portfolio - Class I | | | | | 795,233 | | | | | | 4.6 | | |
| | | 84,257 | | | | Voya Large Cap Growth
Portfolio - Class I | | | | | 1,752,542 | | | | | | 10.1 | | |
| | | 53,983 | | | | Voya Large Cap Value Fund -
Class R6 | | | | | 719,055 | | | | | | 4.1 | | |
| | | 65,958 | | | | Voya MidCap Opportunities
Portfolio - Class I | | | | | 960,355 | | | | | | 5.5 | | |
| | | 71,921 | | | | Voya Multi-Manager Emerging
Markets Equity Fund - Class I | | | | | 962,309 | | | | | | 5.5 | | |
| | | 140,425 | | | | Voya Multi-Manager
International Equity Fund -
Class I | | | | | 1,732,844 | | | | | | 9.9 | | |
| | | 90,164 | | | | Voya Multi-Manager
International Factors Fund -
Class I | | | | | 956,636 | | | | | | 5.5 | | |
| Shares | | | Value | | | Percentage
of Net
Assets | |
| MUTUAL FUNDS: (continued) | |
| | | | | | | Affiliated Investment Companies (continued) | |
| | | 104,829 | | | | Voya Multi-Manager Large Cap
Core Portfolio - Class I | | | | $ | 1,769,516 | | | | | | 10.1 | | |
| | | 79,635 | | | | Voya Multi-Manager Mid Cap
Value Fund - Class I | | | | | 948,448 | | | | | | 5.4 | | |
| | | 38,947 | | | | Voya Small Company
Portfolio - Class I | | | | | 857,232 | | | | | | 4.9 | | |
| | | 44,772 | | | | Voya U.S. Stock Index
Portfolio - Class I | | | | | 702,479 | | | | | | 4.0 | | |
| | | 21,021 | | | | VY® Clarion Global Real
Estate Portfolio - Class I | | | | | 262,548 | | | | | | 1.5 | | |
| | | 6,818 | | | | VY® Clarion Real Estate
Portfolio - Class I | | | | | 257,431 | | | | | | 1.5 | | |
| | | 43,354 | | | | VY® Invesco Comstock
Portfolio - Class I | | | | | 880,949 | | | | | | 5.1 | | |
| | | 5,542 | | | | VY® T. Rowe Price Growth
Equity Portfolio - Class I | | | | | 516,444 | | | | | | 3.0 | | |
| | | | | | | | | | | | 15,811,630 | | | | | | 90.7 | | |
| | | | | | | Unaffiliated Investment Companies: 1.4% | |
| | | 49,247 | | | | Credit Suisse Commodity
Return Strategy Fund - Class I | | | | | 247,222 | | | | | | 1.4 | | |
| | | | | | | Total Mutual Funds
(Cost $14,858,943) | | | | | 16,058,852 | | | | | | 92.1 | | |
| | | | | | | Total Investments in
Securities
(Cost $16,118,699) | | | | $ | 17,406,296 | | | | | | 99.8 | | |
| | | | | | | Assets in Excess of Other
Liabilities | | | | | 35,464 | | | | | | 0.2 | | |
| | | | | | | Net Assets | | | | $ | 17,441,760 | | | | | | 100.0 | | |
| |
Fair Value Measurements^
The following is a summary of the fair valuations according to the inputs used as of December 31, 2017 in valuing the assets and liabilities:
| | | | Quoted Prices
in Active Markets
for Identical
Investments
(Level 1) | | | Significant
Other
Observable
Inputs
(Level 2) | | | Significant
Unobservable
Inputs
(Level 3) | | | Fair Value
at
December 31, 2017 | |
| Asset Table | | | | | |
| Investments, at fair value | | | | | |
| Exchange-Traded Funds | | | | $ | 1,347,444 | | | | | $ | — | | | | | $ | — | | | | | $ | 1,347,444 | | |
| Mutual Funds | | | | | 16,058,852 | | | | | | — | | | | | | — | | | | | | 16,058,852 | | |
| Total Investments, at fair value | | | | $ | 17,406,296 | | | | | $ | — | | | | | $ | — | | | | | $ | 17,406,296 | | |
| |
^
See Note 2, “Significant Accounting Policies” in the Notes to Financial Statements for additional information.
See Accompanying Notes to Financial Statements
PORTFOLIO OF INVESTMENTS
| Voya Solution 2050 Portfolio | as of December 31, 2017 (continued) |
Transactions with Affiliates
An investment of at least 5% of the voting securities of an issuer, or a company which is under common control results in that issuer becoming an affiliated person as defined by the 1940 Act.
The following table provides transactions during the year ended December 31, 2017, where the following issuers were considered an affiliate:
| Issuer | | | Beginning
Fair Value
at 12/31/16 | | | Purchases
at Cost | | | Sales
at Cost | | | Change in
Unrealized
Appreciation/
(Depreciation) | | | Ending
Fair Value
at 12/31/17 | | | Investment
Income | | | Realized
Gains/
(Losses) | | | Net Capital
Gain
Distributions | |
| Voya Emerging Markets Index Portfolio - Class I | | | | $ | 133,962 | | | | | $ | 382,889 | | | | | $ | (54,128) | | | | | $ | 60,050 | | | | | $ | 522,773 | | | | | $ | 3,512 | | | | | $ | 7,954 | | | | | $ | — | | |
| Voya Floating Rate Fund - Class I | | | | | 118,500 | | | | | | 66,973 | | | | | | (183,394) | | | | | | (2,079) | | | | | | — | | | | | | 2,069 | | | | | | 1,272 | | | | | | — | | |
| Voya Index Plus LargeCap Portfolio - Class I | | | | | 202,920 | | | | | | 313,843 | | | | | | (52,064) | | | | | | 61,744 | | | | | | 526,443 | | | | | | 5,187 | | | | | | 9,547 | | | | | | 5,943 | | |
| Voya Intermediate Bond Fund - Class R6 | | | | | 186,205 | | | | | | 578,825 | | | | | | (82,285) | | | | | | 5,648 | | | | | | 688,393 | | | | | | 14,386 | | | | | | (1,580) | | | | | | — | | |
| Voya International Index Portfolio - Class I | | | | | 239,638 | | | | | | 1,042,558 | | | | | | (547,118) | | | | | | 60,155 | | | | | | 795,233 | | | | | | 16,984 | | | | | | 79,690 | | | | | | — | | |
| Voya Large Cap Growth Portfolio - Class I | | | | | 499,922 | | | | | | 1,499,767 | | | | | | (401,221) | | | | | | 154,074 | | | | | | 1,752,542 | | | | | | 5,596 | | | | | | 31,564 | | | | | | 61,427 | | |
| Voya Large Cap Value Fund - Class R6 | | | | | 282,360 | | | | | | 879,912 | | | | | | (408,738) | | | | | | (34,479) | | | | | | 719,055 | | | | | | 10,232 | | | | | | 37,505 | | | | | | 54,257 | | |
| Voya MidCap Opportunities Portfolio - Class I | | | | | 365,814 | | | | | | 604,457 | | | | | | (113,407) | | | | | | 103,491 | | | | | | 960,355 | | | | | | 774 | | | | | | 5,675 | | | | | | 36,949 | | |
| Voya Multi-Manager Emerging Markets Equity Fund - Class I | | | | | 266,542 | | | | | | 717,628 | | | | | | (160,891) | | | | | | 139,030 | | | | | | 962,309 | | | | | | 12,757 | | | | | | 62,938 | | | | | | — | | |
| Voya Multi-Manager International Equity Fund - Class I | | | | | 678,115 | | | | | | 1,174,605 | | | | | | (299,489) | | | | | | 179,613 | | | | | | 1,732,844 | | | | | | 28,412 | | | | | | 30,512 | | | | | | 8,834 | | |
| Voya Multi-Manager Large Cap Core Portfolio - Class I | | | | | 687,068 | | | | | | 1,373,644 | | | | | | (404,780) | | | | | | 113,584 | | | | | | 1,769,516 | | | | | | 17,290 | | | | | | 40,455 | | | | | | 75,521 | | |
| Voya Multi-Manager Mid Cap Value Fund - Class I | | | | | 373,341 | | | | | | 653,927 | | | | | | (100,604) | | | | | | 21,784 | | | | | | 948,448 | | | | | | 6,822 | | | | | | 19,996 | | | | | | 54,290 | | |
| Voya Multi-Manager International Facotrs Fund - Class I | | | | | 514,629 | | | | | | 617,916 | | | | | | (241,459) | | | | | | 65,550 | | | | | | 956,636 | | | | | | 27,624 | | | | | | 25,237 | | | | | | 26,558 | | |
| Voya Small Company Portfolio - Class I | | | | | 274,008 | | | | | | 684,806 | | | | | | (102,689) | | | | | | 1,107 | | | | | | 857,232 | | | | | | 1,772 | | | | | | 14,411 | | | | | | 54,543 | | |
| Voya U.S. Stock Index Portfolio - Class I | | | | | 204,028 | | | | | | 690,409 | | | | | | (227,642) | | | | | | 35,684 | | | | | | 702,479 | | | | | | 11,586 | | | | | | 23,567 | | | | | | 30,051 | | |
| VY® Clarion Global Real Estate Portfolio - Class I | | | | | 102,638 | | | | | | 173,301 | | | | | | (24,724) | | | | | | 11,333 | | | | | | 262,548 | | | | | | 7,121 | | | | | | 1,405 | | | | | | — | | |
| VY® Clarion Real Estate Portfolio - Class I | | | | | 103,429 | | | | | | 174,507 | | | | | | (24,647) | | | | | | 4,142 | | | | | | 257,431 | | | | | | 4,449 | | | | | | 1,599 | | | | | | — | | |
| VY® Invesco Comstock Portfolio - Class I | | | | | 346,564 | | | | | | 545,041 | | | | | | (89,566) | | | | | | 78,910 | | | | | | 880,949 | | | | | | 11,383 | | | | | | 27,902 | | | | | | — | | |
| VY® T. Rowe Price Growth Equity Portfolio - Class I | | | | | 497,773 | | | | | | 680,513 | | | | | | (691,276) | | | | | | 29,434 | | | | | | 516,444 | | | | | | 421 | | | | | | 65,391 | | | | | | 81,344 | | |
| | | | | $ | 6,077,456 | | | | | $ | 12,855,521 | | | | | $ | (4,210,122) | | | | | $ | 1,088,775 | | | | | $ | 15,811,630 | | | | | $ | 188,377 | | | | | $ | 485,040 | | | | | $ | 489,717 | | |
| |
The financial statements for the above mutual fund[s] can be found at www.sec.gov.
At December 31, 2017, the aggregate cost of securities and other investments and the composition of unrealized appreciation and depreciation of securities and other investments at period end were:
| | Cost for federal income tax purposes was $16,176,105. | | |
| | Net unrealized appreciation consisted of: | | |
| | Gross Unrealized Appreciation | | | | $ | 1,305,830 | | |
| | Gross Unrealized Depreciation | | | | | (75,639) | | |
| | Net Unrealized Appreciation | | | | $ | 1,230,191 | | |
| |
See Accompanying Notes to Financial Statements
PORTFOLIO OF INVESTMENTS
| Voya Solution 2055 Portfolio | as of December 31, 2017 |
| | Shares | | | Value | | | Percentage
of Net
Assets | |
| | EXCHANGE-TRADED FUNDS: 4.9% | |
| | | | 41,069 | | | | iShares MSCI EMU Index
Fund | | | | $ | 1,781,573 | | | | | | 0.9 | | |
| | | | 58,607 | | | | iShares Russell 1000 Value
Index Fund | | | | | 7,287,195 | | | | | | 4.0 | | |
| | | | | | | | Total Exchange-Traded Funds
(Cost $8,139,542) | | | | | 9,068,768 | | | | | | 4.9 | | |
| | MUTUAL FUNDS: 94.8% | |
| | | | | | | | Affiliated Investment Companies: 93.3% | |
| | | | 426,084 | | | | Voya Emerging Markets Index
Portfolio - Class I | | | | | 5,475,181 | | | | | | 3.0 | | |
| | | | 189,445 | | | | Voya Index Plus LargeCap
Portfolio - Class I | | | | | 5,514,741 | | | | | | 3.0 | | |
| | | | 712,930 | | | | Voya Intermediate Bond
Fund - Class R6 | | | | | 7,207,720 | | | | | | 3.9 | | |
| | | | 1,098,062 | | | | Voya International Index
Portfolio - Class I | | | | | 11,793,184 | | | | | | 6.5 | | |
| | | | 882,606 | | | | Voya Large Cap Growth
Portfolio - Class I | | | | | 18,358,198 | | | | | | 10.0 | | |
| | | | 548,642 | | | | Voya Large Cap Value Fund -
Class R6 | | | | | 7,307,918 | | | | | | 4.0 | | |
| | | | 690,761 | | | | Voya MidCap Opportunities
Portfolio - Class I | | | | | 10,057,476 | | | | | | 5.5 | | |
| | | | 748,901 | | | | Voya Multi-Manager
Emerging Markets Equity
Fund - Class I | | | | | 10,020,297 | | | | | | 5.5 | | |
| | | | 1,475,883 | | | | Voya Multi-Manager
International Equity Fund -
Class I | | | | | 18,212,399 | | | | | | 10.0 | | |
| | | | 944,032 | | | | Voya Multi-Manager
International Factors Fund -
Class I | | | | | 10,016,175 | | | | | | 5.5 | | |
| | Shares | | | Value | | | Percentage
of Net
Assets | |
| | MUTUAL FUNDS: (continued) | |
| | | | | | | | Affiliated Investment Companies (continued) | |
| | | | 1,093,461 | | | | Voya Multi-Manager Large
Cap Core Portfolio - Class I | | | | $ | 18,457,614 | | | | | | 10.1 | | |
| | | | 833,757 | | | | Voya Multi-Manager Mid Cap
Value Fund - Class I | | | | | 9,930,042 | | | | | | 5.4 | | |
| | | | 407,703 | | | | Voya Small Company
Portfolio - Class I | | | | | 8,973,535 | | | | | | 4.9 | | |
| | | | 581,696 | | | | Voya U.S. Stock Index
Portfolio - Class I | | | | | 9,126,805 | | | | | | 5.0 | | |
| | | | 220,123 | | | | VY® Clarion Global Real
Estate Portfolio - Class I | | | | | 2,749,338 | | | | | | 1.5 | | |
| | | | 71,357 | | | | VY® Clarion Real Estate
Portfolio - Class I | | | | | 2,694,436 | | | | | | 1.5 | | |
| | | | 454,146 | | | | VY® Invesco Comstock
Portfolio - Class I | | | | | 9,228,238 | | | | | | 5.0 | | |
| | | | 58,024 | | | | VY® T. Rowe Price Growth
Equity Portfolio - Class I | | | | | 5,407,241 | | | | | | 3.0 | | |
| | | | | | | | | | | | | 170,530,538 | | | | | | 93.3 | | |
| | | | | | | | Unaffiliated Investment Companies: 1.5% | |
| | | | 531,407 | | | | Credit Suisse Commodity
Return Strategy Fund -
Class I | | | | | 2,667,665 | | | | | | 1.5 | | |
| | | | | | | | Total Mutual Funds
(Cost $154,531,304) | | | | | 173,198,203 | | | | | | 94.8 | | |
| | | | | | | | Total Investments in
Securities
(Cost $162,670,846) | | | | $ | 182,266,971 | | | | | | 99.7 | | |
| | | | | | | | Assets in Excess of Other
Liabilities | | | | | 492,574 | | | | | | 0.3 | | |
| | | | | | | | Net Assets | | | | $ | 182,759,545 | | | | | | 100.0 | | |
| |
Fair Value Measurements^
The following is a summary of the fair valuations according to the inputs used as of December 31, 2017 in valuing the assets and liabilities:
| | | | Quoted Prices
in Active Markets
for Identical
Investments
(Level 1) | | | Significant
Other
Observable
Inputs
(Level 2) | | | Significant
Unobservable
Inputs
(Level 3) | | | Fair Value
at
December 31, 2017 | |
| Asset Table | | | | | |
| Investments, at fair value | | | | | |
| Exchange-Traded Funds | | | | $ | 9,068,768 | | | | | $ | — | | | | | $ | — | | | | | $ | 9,068,768 | | |
| Mutual Funds | | | | | 173,198,203 | | | | | | — | | | | | | — | | | | | | 173,198,203 | | |
| Total Investments, at fair value | | | | $ | 182,266,971 | | | | | $ | — | | | | | $ | — | | | | | $ | 182,266,971 | | |
| Other Financial Instruments+ | | | | | |
| Futures | | | | | 95,740 | | | | | | — | | | | | | — | | | | | | 95,740 | | |
| Total Assets | | | | $ | 182,362,711 | | | | | $ | — | | | | | $ | — | | | | | $ | 182,362,711 | | |
| |
See Accompanying Notes to Financial Statements
PORTFOLIO OF INVESTMENTS
| Voya Solution 2055 Portfolio | as of December 31, 2017 (continued) |
| | | | Quoted Prices
in Active Markets
for Identical
Investments
(Level 1) | | | Significant
Other
Observable
Inputs
(Level 2) | | | Significant
Unobservable
Inputs
(Level 3) | | | Fair Value
at
December 31, 2017 | |
| Liabilities Table | | | | | |
| Other Financial Instruments+ | | | | | |
| Futures | | | | $ | (104,070) | | | | | $ | — | | | | | $ | — | | | | | $ | (104,070) | | |
| Total Liabilities | | | | $ | (104,070) | | | | | $ | — | | | | | $ | — | | | | | $ | (104,070) | | |
| |
^
See Note 2, “Significant Accounting Policies” in the Notes to Financial Statements for additional information.
+
Other Financial Instruments are derivatives not reflected in the Portfolio of Investments and may include open forward foreign currency contracts, futures, centrally cleared swaps, OTC swaps and written options. Forward foreign currency contracts, futures and centrally cleared swaps are valued at the unrealized gain (loss) on the instrument. OTC swaps and written options are valued at the fair value of the instrument.
Transactions with Affiliates
An investment of at least 5% of the voting securities of an issuer, or a company which is under common control results in that issuer becoming an affiliated person as defined by the 1940 Act.
The following table provides transactions during the year ended December 31, 2017, where the following issuers were considered an affiliate:
| Issuer | | | Beginning
Fair Value
at 12/31/16 | | | Purchases
at Cost | | | Sales
at Cost | | | Change in
Unrealized
Appreciation/
(Depreciation) | | | Ending
Fair Value
at 12/31/17 | | | Investment
Income | | | Realized
Gains/
(Losses) | | | Net Capital
Gain
Distributions | |
| Voya Emerging Markets Index Portfolio - Class I | | | | $ | 2,794,820 | | | | | $ | 2,538,591 | | | | | $ | (927,614) | | | | | $ | 1,069,384 | | | | | $ | 5,475,181 | | | | | $ | 51,239 | | | | | $ | 117,588 | | | | | $ | — | | |
| Voya Index Plus LargeCap Portfolio - Class I | | | | | 4,235,905 | | | | | | 1,147,678 | | | | | | (753,142) | | | | | | 797,596 | | | | | | 5,514,741 | | | | | | 75,674 | | | | | | 24,239 | | | | | | 86,704 | | |
| Voya Intermediate Bond Fund - Class R6 | | | | | 3,827,221 | | | | | | 4,160,935 | | | | | | (848,493) | | | | | | 68,057 | | | | | | 7,207,720 | | | | | | 185,030 | | | | | | (744) | | | | | | — | | |
| Voya International Index Portfolio - Class I | | | | | 5,003,550 | | | | | | 8,223,501 | | | | | | (3,382,716) | | | | | | 1,948,849 | | | | | | 11,793,184 | | | | | | 247,044 | | | | | | 165,756 | | | | | | — | | |
| Voya Large Cap Growth Portfolio - Class I | | | | | 10,430,145 | | | | | | 11,560,399 | | | | | | (6,153,145) | | | | | | 2,520,799 | | | | | | 18,358,198 | | | | | | 71,094 | | | | | | (51,343) | | | | | | 780,472 | | |
| Voya Large Cap Value Fund - Class R6 | | | | | 5,632,760 | | | | | | 3,436,748 | | | | | | (1,764,991) | | | | | | 3,401 | | | | | | 7,307,918 | | | | | | 121,940 | | | | | | 127,649 | | | | | | 573,630 | | |
| Voya MidCap Opportunities Portfolio - Class I | | | | | 7,633,349 | | | | | | 2,456,986 | | | | | | (1,696,251) | | | | | | 1,663,392 | | | | | | 10,057,476 | | | | | | 11,991 | | | | | | (190,058) | | | | | | 482,464 | | |
| Voya Multi-Manager Emerging Markets Equity Fund - Class I | | | | | 5,560,357 | | | | | | 3,852,096 | | | | | | (2,016,299) | | | | | | 2,624,143 | | | | | | 10,020,297 | | | | | | 136,236 | | | | | | 138,338 | | | | | | — | | |
| Voya Multi-Manager International Equity Fund - Class I | | | | | 14,154,056 | | | | | | 6,490,726 | | | | | | (5,880,590) | | | | | | 3,448,207 | | | | | | 18,212,399 | | | | | | 303,595 | | | | | | (485,634) | | | | | | 94,392 | | |
| Voya Multi-Manager Large Cap Core Portfolio - Class I | | | | | 14,151,297 | | | | | | 4,659,007 | | | | | | (2,320,619) | | | | | | 1,967,929 | | | | | | 18,457,614 | | | | | | 186,726 | | | | | | 83,259 | | | | | | 947,433 | | |
| Voya Multi-Manager Mid Cap Value Fund - Class I | | | | | 7,797,265 | | | | | | 3,014,840 | | | | | | (1,747,806) | | | | | | 865,743 | | | | | | 9,930,042 | | | | | | 72,901 | | | | | | (245,986) | | | | | | 580,119 | | |
| Voya Multi-Manager International Factors Fund - Class I | | | | | 10,746,843 | | | | | | 2,457,523 | | | | | | (5,163,339) | | | | | | 1,975,148 | | | | | | 10,016,175 | | | | | | 295,171 | | | | | | (531,716) | | | | | | 283,787 | | |
| Voya Small Company Portfolio - Class I | | | | | 5,723,080 | | | | | | 4,618,682 | | | | | | (1,333,599) | | | | | | 52,076 | | | | | | 8,973,535 | | | | | | 25,859 | | | | | | 64,894 | | | | | | 795,490 | | |
| Voya U.S. Stock Index Portfolio - Class I | | | | | 9,833,036 | | | | | | 3,406,913 | | | | | | (4,886,927) | | | | | | 773,783 | | | | | | 9,126,805 | | | | | | 154,006 | | | | | | 462,076 | | | | | | 457,489 | | |
| VY® Clarion Global Real Estate Portfolio - Class I | | | | | 2,141,682 | | | | | | 782,293 | | | | | | (332,368) | | | | | | 157,731 | | | | | | 2,749,338 | | | | | | 90,062 | | | | | | 1,627 | | | | | | — | | |
| VY® Clarion Real Estate Portfolio - Class I | | | | | 2,158,379 | | | | | | 796,674 | | | | | | (298,483) | | | | | | 37,866 | | | | | | 2,694,436 | | | | | | 56,427 | | | | | | 35,511 | | | | | | — | | |
| VY® Invesco Comstock Portfolio - Class I | | | | | 7,244,202 | | | | | | 2,185,672 | | | | | | (1,328,603) | | | | | | 1,126,967 | | | | | | 9,228,238 | | | | | | 124,618 | | | | | | 155,609 | | | | | | — | | |
VY® T. Rowe Price Growth Equity Portfolio - Class I | | | | | 10,383,318 | | | | | | 2,978,868 | | | | | | (9,504,993) | | | | | | 1,550,048 | | | | | | 5,407,241 | | | | | | 5,238 | | | | | | 104,512 | | | | | | 1,009,970 | | |
| | | | | $ | 129,451,265 | | | | | $ | 68,768,132 | | | | | $ | (50,339,978) | | | | | $ | 22,651,119 | | | | | $ | 170,530,538 | | | | | $ | 2,214,851 | | | | | $ | (24,423) | | | | | $ | 6,091,950 | | |
| |
The financial statements for the above mutual fund[s] can be found at www.sec.gov.
At December 31, 2017, the following futures contracts were outstanding for Voya Solution 2055 Portfolio:
| Contract Description | | | Number
of Contracts | | | Expiration
Date | | | Notional
Value | | | Unrealized
Appreciation/
(Depreciation) | |
| Long Contracts | | | | | |
| Tokyo Price Index (TOPIX) | | | | | 34 | | | | | | 03/08/18 | | | | | $ | 5,482,849 | | | | | $ | 95,740 | | |
| | | | | | | | | | | | | | | | | $ | 5,482,849 | | | | | $ | 95,740 | | |
| Short Contracts | | | | | |
| Mini MSCI EAFE Index | | | | | (36) | | | | | | 03/16/18 | | | | | | (3,681,900) | | | | | | (73,167) | | |
| S&P 500 E-Mini | | | | | (14) | | | | | | 03/16/18 | | | | | | (1,873,200) | | | | | | (30,903) | | |
| | | | | | | | | | | | | | | | | $ | (5,555,100) | | | | | $ | (104,070) | | |
| |
See Accompanying Notes to Financial Statements
PORTFOLIO OF INVESTMENTS
| Voya Solution 2055 Portfolio | as of December 31, 2017 (continued) |
A summary of derivative instruments by primary risk exposure is outlined in the following tables.
The fair value of derivative instruments as of December 31, 2017 was as follows:
| Derivatives not accounted for as hedging instruments | | | Location on Statement
of Assets and Liabilities | | | Fair Value | |
| Asset Derivatives | | | |
| Equity contracts | | | Net Assets — Unrealized appreciation* | | | | $ | 95,740 | | |
| Total Asset Derivatives | | | | | | | $ | 95,740 | | |
| Liability Derivatives | | | |
| Equity contracts | | | Net Assets — Unrealized depreciation* | | | | $ | 104,070 | | |
| Total Liability Derivatives | | | | | | | $ | 104,070 | | |
| |
*
Includes cumulative appreciation/depreciation of futures contracts as reported in the table following the Portfolio of Investments.
The effect of derivative instruments on the Portfolio’s Statement of Operations for the year ended December 31, 2017 was as follows:
| | | | Amount of Realized Gain or (Loss) on
Derivatives Recognized in Income | |
| Derivatives not accounted for as hedging instruments | | | Futures | |
| Equity contracts | | | | $ | (1,905) | | |
| Total | | | | $ | (1,905) | | |
| |
| | | | Change in Unrealized Appreciation or (Depreciation)
on Derivatives Recognized in Income | |
| Derivatives not accounted for as hedging instruments | | | Futures | |
| Equity contracts | | | | $ | (8,330) | | |
| Total | | | | $ | (8,330) | | |
| |
At December 31, 2017, the aggregate cost of securities and other investments and the composition of unrealized appreciation and depreciation of securities and other investments at period end were:
| | Cost for federal income tax purposes was $167,227,778. | | |
| | Net unrealized appreciation consisted of: | | |
| | Gross Unrealized Appreciation | | | | $ | 19,837,329 | | |
| | Gross Unrealized Depreciation | | | | | (4,739,793) | | |
| | Net Unrealized Appreciation | | | | $ | 15,097,536 | | |
| |
See Accompanying Notes to Financial Statements
PORTFOLIO OF INVESTMENTS
| Voya Solution 2060 Portfolio | as of December 31, 2017 |
| | Shares | | | Value | | | Percentage
of Net
Assets | |
| | EXCHANGE-TRADED FUNDS: 7.6% | |
| | | | 1,799 | | | | iShares MSCI EMU Index
Fund | | | | $ | 78,041 | | | | | | 0.9 | | |
| | | | 2,568 | | | | iShares Russell 1000 Value
Index Fund | | | | | 319,305 | | | | | | 3.8 | | |
| | | | 4,047 | | | | WisdomTree Japan Hedged
Equity Fund | | | | | 240,108 | | | | | | 2.9 | | |
| | | | | | | | Total Exchange-Traded Funds
(Cost $598,252) | | | | | 637,454 | | | | | | 7.6 | | |
| | MUTUAL FUNDS: 92.3% | |
| | | | | | | | Affiliated Investment Companies: 90.9% | |
| | | | 19,475 | | | | Voya Emerging Markets Index
Portfolio - Class I | | | | | 250,250 | | | | | | 3.0 | | |
| | | | 8,687 | | | | Voya Index Plus LargeCap
Portfolio - Class I | | | | | 252,872 | | | | | | 3.0 | | |
| | | | 32,710 | | | | Voya Intermediate Bond
Fund - Class R6 | | | | | 330,694 | | | | | | 4.0 | | |
| | | | 35,922 | | | | Voya International Index
Portfolio - Class I | | | | | 385,797 | | | | | | 4.6 | | |
| | | | 40,477 | | | | Voya Large Cap Growth
Portfolio - Class I | | | | | 841,927 | | | | | | 10.1 | | |
| | | | 26,299 | | | | Voya Large Cap Value Fund -
Class R6 | | | | | 350,302 | | | | | | 4.2 | | |
| | | | 31,687 | | | | Voya MidCap Opportunities
Portfolio - Class I | | | | | 461,369 | | | | | | 5.5 | | |
| | | | 34,647 | | | | Voya Multi-Manager
Emerging Markets Equity
Fund - Class I | | | | | 463,578 | | | | | | 5.5 | | |
| | | | 67,467 | | | | Voya Multi-Manager
International Equity Fund -
Class I | | | | | 832,548 | | | | | | 9.9 | | |
| | | | 43,319 | | | | Voya Multi-Manager
International Factors Fund -
Class I | | | | | 459,616 | | | | | | 5.5 | | |
| | Shares | | | Value | | | Percentage
of Net
Assets | |
| | MUTUAL FUNDS: (continued) | |
| | | | | | | | Affiliated Investment Companies (continued) | |
| | | | 50,463 | | | | Voya Multi-Manager Large
Cap Core Portfolio - Class I | | | | $ | 851,812 | | | | | | 10.2 | | |
| | | | 38,255 | | | | Voya Multi-Manager Mid Cap
Value Fund - Class I | | | | | 455,611 | | | | | | 5.4 | | |
| | | | 18,712 | | | | Voya Small Company
Portfolio - Class I | | | | | 411,844 | | | | | | 4.9 | | |
| | | | 21,589 | | | | Voya U.S. Stock Index
Portfolio - Class I | | | | | 338,728 | | | | | | 4.0 | | |
| | | | 10,098 | | | | VY® Clarion Global Real
Estate Portfolio - Class I | | | | | 126,120 | | | | | | 1.5 | | |
| | | | 3,275 | | | | VY® Clarion Real Estate
Portfolio - Class I | | | | | 123,669 | | | | | | 1.5 | | |
| | | | 20,820 | | | | VY® Invesco Comstock
Portfolio - Class I | | | | | 423,059 | | | | | | 5.1 | | |
| | | | 2,663 | | | | VY® T. Rowe Price Growth
Equity Portfolio - Class I | | | | | 248,149 | | | | | | 3.0 | | |
| | | | | | | | | | | | | 7,607,945 | | | | | | 90.9 | | |
| | | | | | | | Unaffiliated Investment Companies: 1.4% | |
| | | | 23,304 | | | | Credit Suisse Commodity
Return Strategy Fund -
Class I | | | | | 116,984 | | | | | | 1.4 | | |
| | | | | | | | Total Mutual Funds
(Cost $7,237,823) | | | | | 7,724,929 | | | | | | 92.3 | | |
| | | | | | | | Total Investments in
Securities
(Cost $7,836,075) | | | | $ | 8,362,383 | | | | | | 99.9 | | |
| | | | | | | | Assets in Excess of Other
Liabilities | | | | | 8,318 | | | | | | 0.1 | | |
| | | | | | | | Net Assets | | | | $ | 8,370,701 | | | | | | 100.0 | | |
| |
Fair Value Measurements^
The following is a summary of the fair valuations according to the inputs used as of December 31, 2017 in valuing the assets and liabilities:
| | | | Quoted Prices
in Active Markets
for Identical
Investments
(Level 1) | | | Significant
Other
Observable
Inputs
(Level 2) | | | Significant
Unobservable
Inputs
(Level 3) | | | Fair Value
at
December 31, 2017 | |
| Asset Table | | | | | |
| Investments, at fair value | | | | | |
| Exchange-Traded Funds | | | | $ | 637,454 | | | | | $ | — | | | | | $ | — | | | | | $ | 637,454 | | |
| Mutual Funds | | | | | 7,724,929 | | | | | | — | | | | | | — | | | | | | 7,724,929 | | |
| Total Investments, at fair value | | | | $ | 8,362,383 | | | | | $ | — | | | | | $ | — | | | | | $ | 8,362,383 | | |
| |
^
See Note 2, “Significant Accounting Policies” in the Notes to Financial Statements for additional information.
See Accompanying Notes to Financial Statements
PORTFOLIO OF INVESTMENTS
| Voya Solution 2060 Portfolio | as of December 31, 2017 (continued) |
Transactions with Affiliates
An investment of at least 5% of the voting securities of an issuer, or a company which is under common control results in that issuer becoming an affiliated person as defined by the 1940 Act.
The following table provides transactions during the year ended December 31, 2017, where the following issuers were considered an affiliate:
| Issuer | | | Beginning
Fair Value
at 12/31/16 | | | Purchases
at Cost | | | Sales
at Cost | | | Change in
Unrealized
Appreciation/
(Depreciation) | | | Ending
Fair Value
at 12/31/17 | | | Investment
Income | | | Realized
Gains/
(Losses) | | | Net Capital
Gain
Distributions | |
| Voya Emerging Markets Index Portfolio - Class I | | | | $ | 56,763 | | | | | $ | 206,216 | | | | | $ | (38,596) | | | | | $ | 25,867 | | | | | $ | 250,250 | | | | | $ | 1,618 | | | | | $ | 5,293 | | | | | $ | — | | |
| Voya Index Plus LargeCap Portfolio - Class I | | | | | 86,035 | | | | | | 186,440 | | | | | | (44,297) | | | | | | 24,694 | | | | | | 252,872 | | | | | | 2,390 | | | | | | 8,193 | | | | | | 2,739 | | |
| Voya Intermediate Bond Fund - Class R6 | | | | | 78,150 | | | | | | 317,015 | | | | | | (67,521) | | | | | | 3,050 | | | | | | 330,694 | | | | | | 6,679 | | | | | | (1,057) | | | | | | — | | |
| Voya International Index Portfolio - Class I | | | | | 101,611 | | | | | | 575,069 | | | | | | (315,232) | | | | | | 24,349 | | | | | | 385,797 | | | | | | 7,822 | | | | | | 40,749 | | | | | | — | | |
| Voya Large Cap Growth Portfolio - Class I | | | | | 211,893 | | | | | | 815,406 | | | | | | (249,171) | | | | | | 63,799 | | | | | | 841,927 | | | | | | 2,553 | | | | | | 22,358 | | | | | | 28,024 | | |
| Voya Large Cap Value Fund - Class R6 | | | | | 116,812 | | | | | | 518,691 | | | | | | (269,402) | | | | | | (15,799) | | | | | | 350,302 | | | | | | 4,875 | | | | | | 15,779 | | | | | | 26,397 | | |
| Voya MidCap Opportunities Portfolio - Class I | | | | | 155,055 | | | | | | 354,474 | | | | | | (92,955) | | | | | | 44,795 | | | | | | 461,369 | | | | | | 384 | | | | | | 6,181 | | | | | | 16,545 | | |
| Voya Multi-Manager Emerging Markets Equity Fund - Class I | | | | | 112,946 | | | | | | 401,854 | | | | | | (108,982) | | | | | | 57,760 | | | | | | 463,578 | | | | | | 6,139 | | | | | | 34,988 | | | | | | — | | |
| Voya Multi-Manager International Equity Fund - Class I | | | | | 287,474 | | | | | | 662,548 | | | | | | (193,518) | | | | | | 76,044 | | | | | | 832,548 | | | | | | 13,636 | | | | | | 20,651 | | | | | | 4,240 | | |
| Voya Multi-Manager Large Cap Core Portfolio - Class I | | | | | 287,252 | | | | | | 823,949 | | | | | | (304,895) | | | | | | 45,506 | | | | | | 851,812 | | | | | | 8,158 | | | | | | 25,671 | | | | | | 34,334 | | |
| Voya Multi-Manager Mid Cap Value Fund - Class I | | | | | 158,325 | | | | | | 379,790 | | | | | | (86,341) | | | | | | 3,837 | | | | | | 455,611 | | | | | | 3,274 | | | | | | 13,596 | | | | | | 26,051 | | |
| Voya Multi-Manager International Factors Fund - Class I | | | | | 218,234 | | | | | | 360,716 | | | | | | (143,656) | | | | | | 24,322 | | | | | | 459,616 | | | | | | 13,259 | | | | | | 16,626 | | | | | | 12,747 | | |
| Voya Small Company Portfolio - Class I | | | | | 116,202 | | | | | | 377,795 | | | | | | (78,851) | | | | | | (3,302) | | | | | | 411,844 | | | | | | 817 | | | | | | 10,330 | | | | | | 25,139 | | |
| Voya U.S. Stock Index Portfolio - Class I | | | | | 144,152 | | | | | | 323,365 | | | | | | (145,971) | | | | | | 17,182 | | | | | | 338,728 | | | | | | 5,478 | | | | | | 15,232 | | | | | | 13,646 | | |
| VY® Clarion Global Real Estate Portfolio - Class I | | | | | 43,495 | | | | | | 100,212 | | | | | | (23,534) | | | | | | 5,947 | | | | | | 126,120 | | | | | | 3,239 | | | | | | 73 | | | | | | — | | |
| VY® Clarion Real Estate Portfolio - Class I | | | | | 43,843 | | | | | | 100,852 | | | | | | (23,611) | | | | | | 2,585 | | | | | | 123,669 | | | | | | 2,023 | | | | | | 110 | | | | | | — | | |
| VY® Invesco Comstock Portfolio - Class I | | | | | 147,028 | | | | | | 321,746 | | | | | | (75,410) | | | | | | 29,695 | | | | | | 423,059 | | | | | | 5,363 | | | | | | 18,471 | | | | | | — | | |
| VY® T. Rowe Price Growth Equity Portfolio - Class I | | | | | 210,945 | | | | | | 389,016 | | | | | | (364,891) | | | | | | 13,079 | | | | | | 248,149 | | | | | | 194 | | | | | | 30,061 | | | | | | 37,422 | | |
| | | | | $ | 2,576,215 | | | | | $ | 7,215,154 | | | | | $ | (2,626,834) | | | | | $ | 443,410 | | | | | $ | 7,607,945 | | | | | $ | 87,901 | | | | | $ | 283,305 | | | | | $ | 227,284 | | |
| |
The financial statements for the above mutual fund[s] can be found at www.sec.gov.
At December 31, 2017, the aggregate cost of securities and other investments and the composition of unrealized appreciation and depreciation of securities and other investments at period end were:
| | Cost for federal income tax purposes was $7,847,891. | | |
| | Net unrealized appreciation consisted of: | | |
| | Gross Unrealized Appreciation | | | | $ | 536,297 | | |
| | Gross Unrealized Depreciation | | | | | (21,804) | | |
| | Net Unrealized Appreciation | | | | $ | 514,493 | | |
| |
See Accompanying Notes to Financial Statements
TAX INFORMATION (Unaudited)
Dividends and distributions paid during the year ended December 31, 2017 were as follows:
| Portfolio Name | | | Type | | | Per Share Amount | |
| Voya Solution Aggressive Portfolio | |
| Class ADV | | | NII | | | | $ | 0.0464 | | |
| Class I | | | NII | | | | $ | 0.0973 | | |
| Class R6 | | | NII | | | | $ | 0.0974 | | |
| Class S | | | NII | | | | $ | 0.0717 | | |
| Class S2 | | | NII | | | | $ | 0.0717 | | |
| All Classes | | | LTCG | | | | $ | 0.1671 | | |
| Voya Solution Balanced Portfolio | |
| Class ADV | | | NII | | | | $ | 0.1132 | | |
| Class I | | | NII | | | | $ | 0.1697 | | |
| Class R6 | | | NII | | | | $ | 0.1697 | | |
| Class S | | | NII | | | | $ | 0.1459 | | |
| Class S2 | | | NII | | | | $ | 0.1518 | | |
| All Classes | | | LTCG | | | | $ | 0.1621 | | |
| Voya Solution Conservative Portfolio | |
| Class ADV | | | NII | | | | $ | 0.2165 | | |
| Class I | | | NII | | | | $ | 0.2720 | | |
| Class R6 | | | NII | | | | $ | 0.2720 | | |
| Class S | | | NII | | | | $ | 0.2357 | | |
| Class S2 | | | NII | | | | $ | 0.2397 | | |
| All Classes | | | LTCG | | | | $ | 0.0659 | | |
| Voya Solution Income Portfolio | |
| Class ADV | | | NII | | | | $ | 0.2321 | | |
| Class I | | | NII | | | | $ | 0.3020 | | |
| Class S | | | NII | | | | $ | 0.2654 | | |
| Class S2 | | | NII | | | | $ | 0.2395 | | |
| Class T | | | NII | | | | $ | 0.1259 | | |
| All Classes | | | LTCG | | | | $ | 0.0365 | | |
| Voya Solution Moderately Aggressive Portfolio | |
| Class ADV | | | NII | | | | $ | 0.1462 | | |
| Class I | | | NII | | | | $ | 0.2114 | | |
| Class R6 | | | NII | | | | $ | 0.2115 | | |
| Class S | | | NII | | | | $ | 0.1788 | | |
| Class S2 | | | NII | | | | $ | 0.1772 | | |
| All Classes | | | LTCG | | | | $ | 0.1433 | | |
| Voya Solution Moderately Conservative Portfolio | |
| Class ADV | | | NII | | | | $ | 0.1759 | | |
| Class I | | | NII | | | | $ | 0.2554 | | |
| Class R6 | | | NII | | | | $ | 0.2499 | | |
| Class S | | | NII | | | | $ | 0.2239 | | |
| Class S2 | | | NII | | | | $ | 0.2167 | | |
| Voya Solution 2020 Portfolio | |
| Class ADV | | | NII | | | | $ | 0.1357 | | |
| Class I | | | NII | | | | $ | 0.1718 | | |
| Class S | | | NII | | | | $ | 0.1489 | | |
| Class S2 | | | NII | | | | $ | 0.1372 | | |
| Class T | | | NII | | | | $ | 0.1127 | | |
| All Classes | | | STCG | | | | $ | 0.0784 | | |
| All Classes | | | LTCG | | | | $ | 0.1994 | | |
| Voya Solution 2025 Portfolio | |
| Class ADV | | | NII | | | | $ | 0.1945 | | |
| Class I | | | NII | | | | $ | 0.2579 | | |
| Class S | | | NII | | | | $ | 0.2261 | | |
| Class S2 | | | NII | | | | $ | 0.1983 | | |
| Portfolio Name | | | Type | | | Per Share Amount | |
| Voya Solution 2025 Portfolio (continued) | |
| Class T | | | NII | | | | $ | 0.1656 | | |
| All Classes | | | LTCG | | | | $ | 0.3208 | | |
| Voya Solution 2030 Portfolio | |
| Class ADV | | | NII | | | | $ | 0.1150 | | |
| Class I | | | NII | | | | $ | 0.1441 | | |
| Class S | | | NII | | | | $ | 0.1278 | | |
| Class S2 | | | NII | | | | $ | 0.1002 | | |
| Class T | | | NII | | | | $ | 0.0808 | | |
| All Classes | | | STCG | | | | $ | 0.0510 | | |
| All Classes | | | LTCG | | | | $ | 0.1925 | | |
| Voya Solution 2035 Portfolio | |
| Class ADV | | | NII | | | | $ | 0.1560 | | |
| Class I | | | NII | | | | $ | 0.2191 | | |
| Class S | | | NII | | | | $ | 0.1884 | | |
| Class S2 | | | NII | | | | $ | 0.1694 | | |
| Class T | | | NII | | | | $ | 0.1297 | | |
| All Classes | | | LTCG | | | | $ | 0.3108 | | |
| Voya Solution 2040 Portfolio | |
| Class ADV | | | NII | | | | $ | 0.0828 | | |
| Class I | | | NII | | | | $ | 0.1232 | | |
| Class S | | | NII | | | | $ | 0.1107 | | |
| Class S2 | | | NII | | | | $ | 0.1070 | | |
| Class T | | | NII | | | | $ | 0.0638 | | |
| All Classes | | | STCG | | | | $ | 0.0544 | | |
| All Classes | | | LTCG | | | | $ | 0.2212 | | |
| Voya Solution 2045 Portfolio | |
| Class ADV | | | NII | | | | $ | 0.0990 | | |
| Class I | | | NII | | | | $ | 0.1612 | | |
| Class S | | | NII | | | | $ | 0.1310 | | |
| Class S2 | | | NII | | | | $ | 0.1134 | | |
| Class T | | | NII | | | | $ | 0.0914 | | |
| All Classes | | | LTCG | | | | $ | 0.3234 | | |
| Voya Solution 2050 Portfolio | |
| Class ADV | | | NII | | | | $ | 0.0648 | | |
| Class I | | | NII | | | | $ | 0.0970 | | |
| Class S | | | NII | | | | $ | 0.0828 | | |
| Class S2 | | | NII | | | | $ | 0.0740 | | |
| Class T | | | NII | | | | $ | 0.0227 | | |
| All Classes | | | STCG | | | | $ | 0.0569 | | |
| All Classes | | | LTCG | | | | $ | 0.1979 | | |
| Voya Solution 2055 Portfolio | |
| Class ADV | | | NII | | | | $ | 0.0982 | | |
| Class I | | | NII | | | | $ | 0.1608 | | |
| Class S | | | NII | | | | $ | 0.1299 | | |
| Class S2 | | | NII | | | | $ | 0.1098 | | |
| Class T | | | NII | | | | $ | 0.0973 | | |
| All Classes | | | LTCG | | | | $ | 0.2796 | | |
| Voya Solution 2060 Portfolio | |
| Class ADV | | | NII | | | | $ | 0.0405 | | |
| Class I | | | NII | | | | $ | 0.0591 | | |
| Class S | | | NII | | | | $ | 0.0567 | | |
| Class S2 | | | NII | | | | $ | 0.0441 | | |
| Class T | | | NII | | | | $ | — | | |
| All Classes | | | STCG | | | | $ | 0.0695 | | |
| All Classes | | | LTCG | | | | $ | 0.1341 | | |
NII – Net investment income
STCG – Short-term capital gain
LTCG – Long-term capital gain
TAX INFORMATION (Unaudited) (continued)
Of the ordinary distributions made during the year ended December 31, 2017, the following percentages qualify for the dividends received deduction (DRD) available to corporate shareholders:
| | Voya Solution Aggressive Portfolio | | | | | 72.31% | | |
| | Voya Solution Balanced Portfolio | | | | | 39.58% | | |
| | Voya Solution Conservative Portfolio | | | | | 18.66% | | |
| | Voya Solution Income Portfolio | | | | | 23.41% | | |
| | Voya Solution Moderately Aggressive Portfolio | | | | | 49.85% | | |
| | Voya Solution Moderately Conservative Portfolio | | | | | 22.99% | | |
| | Voya Solution 2020 Portfolio | | | | | 23.17% | | |
| | Voya Solution 2025 Portfolio | | | | | 32.43% | | |
| | Voya Solution 2030 Portfolio | | | | | 31.48% | | |
| | Voya Solution 2035 Portfolio | | | | | 44.12% | | |
| | Voya Solution 2040 Portfolio | | | | | 32.60% | | |
| | Voya Solution 2045 Portfolio | | | | | 58.43% | | |
| | Voya Solution 2050 Portfolio | | | | | 32.21% | | |
| | Voya Solution 2055 Portfolio | | | | | 62.87% | | |
| | Voya Solution 2060 Portfolio | | | | | 24.43% | | |
The Portfolios designate the following amounts of long-term capital gain distributions as 20% rate long-term capital gain dividends under Internal Revenue Code Section 852(b)(3)(C):
| | Voya Solution Aggressive Portfolio | | | | $ | 150,636 | | |
| | Voya Solution Balanced Portfolio | | | | $ | 935,588 | | |
| | Voya Solution Conservative Portfolio | | | | $ | 97,539 | | |
| | Voya Solution Income Portfolio | | | | $ | 1,400,588 | | |
| | Voya Solution Moderately Aggressive Portfolio | | | | $ | 7,847,569 | | |
| | Voya Solution 2020 Portfolio | | | | $ | 423,673 | | |
| | Voya Solution 2025 Portfolio | | | | $ | 24,787,626 | | |
| | Voya Solution 2030 Portfolio | | | | $ | 306,452 | | |
| | Voya Solution 2035 Portfolio | | | | $ | 22,983,362 | | |
| | Voya Solution 2040 Portfolio | | | | $ | 278,849 | | |
| | Voya Solution 2045 Portfolio | | | | $ | 17,575,872 | | |
| | Voya Solution 2050 Portfolio | | | | $ | 158,978 | | |
| | Voya Solution 2055 Portfolio | | | | $ | 3,304,572 | | |
| | Voya Solution 2060 Portfolio | | | | $ | 69,861 | | |
The Regulated Investment Company Modernization Act of 2010 allows qualified fund-of-funds to elect to pass through the ability to take foreign tax credits (or deductions) to the extent that foreign taxes are passed through from underlying funds. A qualified fund-of-funds is a regulated investment company that has at least 50% of the value of its total assets invested in other regulated investment companies at the end of each quarter of the taxable year. Pursuant to Section 853 of the Internal Revenue Code, the Portfolios designate the following amounts as foreign taxes paid for the year ended December 31, 2017:
TAX INFORMATION (Unaudited) (continued)
| | | | Creditable
Foreign Taxes
Paid | | | Per Share
Amount | | | Portion of Ordinary Income
Distribution Derived from
Foreign Sourced Income* | |
| Voya Solution Aggressive Portfolio | | | | $ | 6,977 | | | | | $ | 0.0069 | | | | | | 24.91% | | |
| Voya Solution Balanced Portfolio | | | | $ | 18,877 | | | | | $ | 0.0031 | | | | | | 11.80% | | |
| Voya Solution Conservative Portfolio | | | | $ | 772 | | | | | $ | 0.0005 | | | | | | 2.42% | | |
| Voya Solution Income Portfolio | | | | $ | 73,750 | | | | | $ | 0.0020 | | | | | | 5.99% | | |
| Voya Solution Moderately Aggressive Portfolio | | | | $ | 312,423 | | | | | $ | 0.0059 | | | | | | 17.21% | | |
| Voya Solution Moderately Conservative Portfolio | | | | $ | 6,273 | | | | | $ | 0.0020 | | | | | | 6.36% | | |
| Voya Solution 2020 Portfolio | | | | $ | 7,541 | | | | | $ | 0.0030 | | | | | | 8.00% | | |
| Voya Solution 2025 Portfolio | | | | $ | 325,219 | | | | | $ | 0.0042 | | | | | | 13.49% | | |
| Voya Solution 2030 Portfolio | | | | $ | 12,095 | | | | | $ | 0.0062 | | | | | | 11.56% | | |
| Voya Solution 2035 Portfolio | | | | $ | 446,762 | | | | | $ | 0.0060 | | | | | | 21.37% | | |
| Voya Solution 2040 Portfolio | | | | $ | 11,019 | | | | | $ | 0.0080 | | | | | | 12.99% | | |
| Voya Solution 2045 Portfolio | | | | $ | 364,543 | | | | | $ | 0.0066 | | | | | | 23.53% | | |
| Voya Solution 2050 Portfolio | | | | $ | 8,783 | | | | | $ | 0.0089 | | | | | | 16.90% | | |
| Voya Solution 2055 Portfolio | | | | $ | 100,503 | | | | | $ | 0.0081 | | | | | | 27.30% | | |
| Voya Solution 2060 Portfolio | | | | $ | 4,201 | | | | | $ | 0.0063 | | | | | | 13.18% | | |
*
None of the Portfolios listed above derived any income from ineligible foreign sources as defined under Section 901(j) of the Internal Revenue Code.
Foreign taxes paid or withheld must be included in taxable income with an offsetting deduction from gross income or as a credit for taxes paid to foreign governments. Shareholders are strongly advised to consult their own tax advisors regarding the appropriate treatment of foreign taxes paid.
Above figures may differ from those cited elsewhere in this report due to differences in the calculation of income and gains under U.S. generally accepted accounting principles (book) purposes and Internal Revenue Service (tax) purposes.
Shareholders are strongly advised to consult their own tax advisers with respect to the tax consequences of their investments in the Portfolios. In January, shareholders, excluding corporate shareholders, receive an IRS 1099-DIV regarding the federal tax status of the dividends and distributions they received in the calendar year.
DIRECTOR AND OFFICER INFORMATION (Unaudited)
The business and affairs of the Company are managed under the direction of the Board. A Director, who is not an interested person of the Company, as defined in the 1940 Act, is an independent director (“Independent Director”). The Directors and Officers of the Company are listed below. The Statement of Additional Information includes additional information about directors of the Company and is available, without charge, upon request at (800) 262-3862.
| Name, Address and Age | | | Position(s)
Held with the
Company | | | Term of Office and
Length of Time
Served(1) | | | Principal
Occupation(s) –
During the Past 5 Years | | | Number of
funds
in Fund
Complex
Overseen by
Director(2) | | | Other Board Positions
Held by Director | |
| Independent Directors*: | |
Colleen D. Baldwin
7337 East Doubletree Ranch Rd.
Suite 100
Scottsdale, Arizona 85258
Age: 57 | | | Director | | | November 2007 – Present | | | President, Glantuam Partners, LLC, a business consulting firm (January 2009 – Present). | | | 151 | | | DSM/Dentaquest, Boston, MA (February 2014 – Present). | |
John V. Boyer
7337 East Doubletree Ranch Rd.
Suite 100
Scottsdale, Arizona 85258
Age: 64 | | | Chairperson
Director | | | January 2014 – Present November 1997 – Present | | | President and Chief Executive Officer, Bechtler Arts Foundation, an arts and education foundation (January 2008 – Present). | | | 151 | | | None. | |
Patricia W. Chadwick
7337 East Doubletree Ranch Rd.
Suite 100
Scottsdale, Arizona 85258
Age: 69 | | | Director | | | January 2006 – Present | | | Consultant and President, Ravengate Partners LLC, a consulting firm that provides advice regarding financial markets and the global economy (January 2000 – Present). | | | 151 | | | Wisconsin Energy Corporation (June 2006 – Present); The Royce Funds (23 funds) (December 2009 – Present); and AMICA Mutual Insurance Company (1992 – Present). | ��� |
Martin J. Gavin
7337 East Doubletree Ranch Rd.
Suite 100
Scottsdale, AZ 85258
Age: 67 | | | Director | | | August 2015 – Present | | | Retired. Formerly, President and Chief Executive Officer, Connecticut Children’s Medical Center (May
2006 – November 2015). | | | 151 | | | None. | |
Russell H. Jones
7337 East Doubletree Ranch Rd.
Suite 100
Scottsdale, Arizona 85258
Age: 73 | | | Director | | | May 2013 – Present | | | Retired. | | | 151 | | | None. | |
Patrick W. Kenny
7337 East Doubletree Ranch Rd.
Suite 100
Scottsdale, Arizona 85258
Age: 75 | | | Director | | | March 2002 – Present | | | Retired. | | | 151 | | | Assured Guaranty Ltd. (April 2004 – Present). | |
Joseph E. Obermeyer
7337 East Doubletree Ranch Rd.
Suite 100
Scottsdale, Arizona 85258
Age: 60 | | | Director | | | May 2013 – Present | | | President, Obermeyer & Associates, Inc., a provider of financial and economic consulting services (November 1999 – Present). | | | 151 | | | None. | |
Sheryl K. Pressler
7337 East Doubletree Ranch Rd.
Suite 100
Scottsdale, Arizona 85258
Age: 67 | | | Director | | | January 2006 – Present | | | Consultant (May 2001 – Present). | | | 151 | | | None. | |
DIRECTOR AND OFFICER INFORMATION (Unaudited) (continued)
| Name, Address and Age | | | Position(s)
Held with the
Company | | | Term of Office and
Length of Time
Served(1) | | | Principal
Occupation(s) –
During the Past 5 Years | | | Number of
funds
in Fund
Complex
Overseen by
Director(2) | | | Other Board Positions
Held by Director | |
Christopher P. Sullivan
7337 East Doubletree Ranch Rd.
Suite 100
Scottsdale, Arizona 85258
Age: 64 | | | Director | | | October 2015 – Present | | | Retired. Formerly, President, Bond Division, Fidelity Management and Research (June 2009 – September 2012). | | | 151 | | | None. | |
Roger B. Vincent
7337 East Doubletree Ranch Rd.
Suite 100
Scottsdale, Arizona 85258
Age: 72 | | | Director | | | January 2005 – Present | | | Retired. | | | 151 | | | None. | |
| Director who is an “interested person”: | | | | | |
Shaun P. Mathews(3)
7337 East Doubletree Ranch Rd.
Suite 100
Scottsdale, Arizona 85258
Age: 62 | | | Director | | | November 2007 – Present | | | President and Chief Executive Officer, Voya Investments, LLC (December 2006 – Present). | | | 151 | | | Voya Capital Corporation, LLC and Voya Investments Distributor, LLC (December 2005 – Present); Voya Funds Services, LLC, Voya Investments, LLC and Voya Investment Management (March 2006 – Present); and Voya Investment Trust Co. (April 2009 – Present). | |
(1)
Directors serve until their successors are duly elected and qualified. The tenure of each Director who is not an “interested person” as defined in the 1940 Act, of each Portfolio (“Independent Director”) is subject to the Board’s retirement policy which states that each duly elected or appointed Independent Director shall retire from and cease to be a member of the Board of Directors at the close of business on December 31 of the calendar year in which the Independent Director attains the age of 75. A majority vote of the Board’s other Independent Directors may extend the retirement date of an Independent Director if the retirement would trigger a requirement to hold a meeting of shareholders of the Company under applicable law, whether for the purposes of appointing a successor to the Independent Director or otherwise comply under applicable law, in which case the extension would apply until such time as the shareholder meeting can be held or is no longer required (as determined by a vote of a majority of the other Independent Directors).
(2)
For the purposes of this table, “Fund Complex” means the Voya family of funds including the following investment companies: Voya Asia Pacific High Dividend Equity Income Fund; Voya Balanced Portfolio, Inc.; Voya Emerging Markets High Dividend Equity Fund; Voya Equity Trust; Voya Funds Trust; Voya Global Advantage and Premium Opportunity Fund; Voya Global Equity Dividend and Premium Opportunity Fund; Voya Government Money Market Portfolio; Voya Infrastructure, Industrials and Materials Fund; Voya Intermediate Bond Portfolio; Voya International High Dividend Equity Income Fund; Voya Investors Trust; Voya Mutual Funds; Voya Natural Resources Equity Income Fund; Voya Partners, Inc.; Voya Prime Rate Trust; Voya Senior Income Fund; Voya Separate Portfolios Trust; Voya Series Fund, Inc.; Voya Strategic Allocation Portfolios, Inc.; Voya Variable Funds; Voya Variable Insurance Trust; Voya Variable Portfolios, Inc.; and Voya Variable Products Trust. The number of funds in the Fund Complex is as of January 31, 2018.
(3)
Mr. Mathews is deemed to be an “interested person” of the Company as defined in the 1940 Act, because of his current affiliation with the Voya funds, Voya Financial, Inc., or Voya Financial, Inc.’s affiliates.
*
Effective December 31, 2017, Peter S. Drotch retired as a Director of the Board.
DIRECTOR AND OFFICER INFORMATION (Unaudited) (continued)
| Name, Address and Age | | | Position(s) Held
With the Company | | | Term of Office and
Length of Time
Served(1) | | | Principal Occupation(s) – During the Past 5 Years | |
Shaun P. Mathews
7337 East Doubletree Ranch Rd.
Suite 100
Scottsdale, Arizona 85258
Age: 62 | | | President and Chief Executive Officer | | | November 2006 – Present | | | President and Chief Executive Officer, Voya Investments, LLC (December 2006 – Present). | |
Michael J. Roland
7337 East Doubletree Ranch Rd.
Suite 100
Scottsdale, Arizona 85258
Age: 59 | | | Executive Vice President | | | January 2005 – Present | | | Managing Director and Chief Operating Officer, Voya Investments, LLC and Voya Funds Services, LLC (March 2012 – Present). Formerly, Chief Compliance Officer, Directed Services LLC and Voya Investments, LLC (March 2011 – December 2013). | |
Stanley D. Vyner
230 Park Avenue
New York, New York 10169
Age: 67 | | | Executive Vice President
Chief Investment Risk Officer | | | January 2005 – Present
September 2009 – Present | | | Executive Vice President, Voya Investments, LLC (July 2000 – Present) and Chief Investment Risk Officer, Voya Investments, LLC (January 2003 – Present). | |
Kevin M. Gleason
7337 East Doubletree Ranch Rd.
Suite 100
Scottsdale, Arizona 85258
Age: 51 | | | Chief Compliance Officer | | | February 2012 – Present | | | Senior Vice President, Voya Investment Management and Chief Compliance Officer, Voya Family of Funds (February 2012 – Present). | |
Todd Modic
7337 East Doubletree Ranch Rd.
Suite 100
Scottsdale, Arizona 85258
Age: 50 | | | Senior Vice President, Chief/Principal Financial Officer and Assistant Secretary | | | March 2005 – Present | | | Senior Vice President, Voya Investments, LLC and Voya Funds Services, LLC (April 2005 – Present). | |
Kimberly A. Anderson
7337 East Doubletree Ranch Rd.
Suite 100
Scottsdale, Arizona 85258
Age: 53 | | | Senior Vice President | | | January 2005 – Present | | | Senior Vice President, Voya Investments, LLC (September
2003 – Present). | |
Robert Terris
7337 East Doubletree Ranch Rd.
Suite 100
Scottsdale, Arizona 85258
Age: 47 | | | Senior Vice President | | | May 2006 – Present | | | Senior Vice President, Head of Division Operations, Voya Investments, LLC (October 2015 – Present) and Voya Funds Services, LLC (March 2006 – Present). | |
Fred Bedoya
7337 East Doubletree Ranch Rd.
Suite 100
Scottsdale, Arizona 85258
Age: 45 | | | Vice President and Treasurer | | | September 2012 – Present | | | Vice President, Voya Investments, LLC (October 2015 – Present) and Voya Funds Services, LLC (July 2012 – Present). | |
Maria M. Anderson
7337 East Doubletree Ranch Rd.
Suite 100
Scottsdale, Arizona 85258
Age: 59 | | | Vice President | | | January 2005 – Present | | | Vice President, Voya Investments, LLC (October 2015 – Present) and Voya Funds Services, LLC (September 2004 – Present). | |
Lauren D. Bensinger
7337 East Doubletree Ranch Rd.
Suite 100
Scottsdale, Arizona 85258
Age: 64 | | | Vice President | | | January 2005 – Present | | | Vice President, Voya Funds Services, LLC (February 1996 – Present) and Voya Investments, LLC (October 2004 – Present); Vice President and Anti-Money Laundering Officer, Voya Investments Distributor, LLC (April 2010 – Present). Anti-Money Laundering Officer, Voya Financial, Inc. (January 2013 – Present); and Anti-Money Laundering Officer, Voya Investment Management Trust Co. (October 2012 – Present). | |
DIRECTOR AND OFFICER INFORMATION (Unaudited) (continued)
| Name, Address and Age | | | Position(s) Held
With the Company | | | Term of Office and
Length of Time
Served(1) | | | Principal Occupation(s) – During the Past 5 Years | |
Sara M. Donaldson
7337 East Doubletree Ranch Rd.
Suite 100
Scottsdale, Arizona 85258
Age: 58 | | | Vice President | | | September 2014 – Present | | | Vice President, Voya Investments, LLC (October 2015 – Present). Formerly, Vice President, Voya Funds Services, LLC (April 2014 – October 2015). Formerly, Director, Compliance, AXA Rosenberg Global Services, LLC (September 1997 – March 2014). | |
Micheline S. Favor
7337 East Doubletree Ranch Rd.
Suite 100
Scottsdale, Arizona 85258
Age: 40 | | | Vice President | | | September 2016 – Present | | | Vice President, Head of Fund Compliance, Voya Investments LLC, and Chief Compliance Officer for Voya Investments, LLC and Directed Services, LLC (June 2016 – Present). Formerly, Vice President, Mutual Fund Compliance (March 2014 – June 2016); Assistant Vice President, Mutual Fund Compliance (May 2013 – March 2014); Assistant Vice President, Senior Project Manager (May 2008 – May 2013). | |
Robyn L. Ichilov
7337 East Doubletree Ranch Rd.
Suite 100
Scottsdale, Arizona 85258
Age: 50 | | | Vice President | | | January 2005 – Present | | | Vice President, Voya Funds Services, LLC (November 1995 – Present) and Voya Investments, LLC (August 1997 – Present). | |
Jason Kadavy
7337 East Doubletree Ranch Rd.
Suite 100
Scottsdale, Arizona 85258
Age: 41 | | | Vice President | | | September 2012 – Present | | | Vice President, Voya Investments, LLC (October 2015 – Present) and Voya Funds Services, LLC (July 2007 – Present). | |
Kimberly K. Springer
7337 East Doubletree Ranch Rd.
Suite 100
Scottsdale, Arizona 85258
Age: 60 | | | Vice President | | | March 2006 – Present | | | Vice President – Mutual Fund Product Development, Voya Investments, LLC (July 2012 – Present); Vice President, Voya Family of Funds (March 2010 – Present) and Vice President, Voya Funds Services, LLC (March 2006 – Present). | |
Craig Wheeler
7337 East Doubletree Ranch Rd.
Suite 100
Scottsdale, Arizona 85258
Age: 48 | | | Vice President | | | May 2013 – Present | | | Vice President – Director of Tax, Voya Investments, LLC (October 2015 – Present). Formerly, Vice President – Director of Tax, Voya Funds Services, LLC (March 2013 – October 2015). Formerly, Assistant Vice President – Director of Tax, Voya Funds Services, LLC (March 2008 – February 2013). | |
Huey P. Falgout, Jr.
7337 East Doubletree Ranch Rd.
Suite 100
Scottsdale, Arizona 85258
Age: 54 | | | Secretary | | | August 2003 – Present | | | Senior Vice President and Chief Counsel, Voya Investment Management – Mutual Fund Legal Department (March 2010 – Present). | |
Paul A. Caldarelli
7337 East Doubletree Ranch Rd.
Suite 100
Scottsdale, Arizona 85258
Age: 66 | | | Assistant Secretary | | | June 2010 – Present | | | Vice President and Senior Counsel, Voya Investment Management – Mutual Fund Legal Department (March 2010 – Present). | |
Theresa K. Kelety
7337 East Doubletree Ranch Rd.
Suite 100
Scottsdale, Arizona 85258
Age: 55 | | | Assistant Secretary | | | August 2003 – Present | | | Vice President and Senior Counsel, Voya Investment Management – Mutual Fund Legal Department (March 2010 – Present). | |
(1)
The Officers hold office until the next annual meeting of the Board of Directors and until their successors shall have been elected and qualified.
ADVISORY AND SUB-ADVISORY CONTRACT APPROVAL DISCUSSION (Unaudited)
BOARD CONSIDERATION AND APPROVAL OF INVESTMENT Management Contracts AND SUB-ADVISORY CONTRACTS
At a meeting held on November 16, 2017, the Board, including a majority of the Independent Directors, considered and approved the renewal of the investment management contracts (the “Management Contracts”) between Voya Investments, LLC (the “Manager”) and Voya Partners, Inc. (the “Company”), on behalf of Voya Solution 2020 Portfolio, Voya Solution 2025 Portfolio, Voya Solution 2030 Portfolio, Voya Solution 2035 Portfolio, Voya Solution 2040 Portfolio, Voya Solution 2045 Portfolio, Voya Solution 2050 Portfolio, Voya Solution 2055 Portfolio, Voya Solution 2060 Portfolio, Voya Solution Aggressive Portfolio, Voya Solution Balanced Portfolio, Voya Solution Conservative Portfolio, Voya Solution Income Portfolio, Voya Solution Moderately Aggressive Portfolio, and Voya Solution Moderately Conservative Portfolio, each a series of the Company (“the Portfolios”), and the sub-advisory contracts (the “Sub-Advisory Contracts”) with Voya Investment Management Co. LLC, the sub-adviser to each Portfolio (the “Sub-Adviser”), for an additional one year period ending November 30, 2018. In determining to renew such contracts, the Board took into account information furnished to it throughout the year at meetings of the Board and its committees, including regarding performance, expenses, and other matters.
In addition to the Board meeting on November 16, 2017, the Independent Directors also held meetings outside the presence of personnel representing the Manager or Sub-Adviser (collectively, such persons are referred to herein as “Management”) on October 12, 2017, and November 14, 2017, specifically to review and consider materials related to the proposed continuance of each Management Contract and Sub-Advisory Contract that they believed to be relevant to the renewal of the Management Contracts and Sub-Advisory Contracts in light of the legal advice furnished to them by K&L Gates LLP, their independent legal counsel, and their own business judgment. Subsequent references herein to factors considered and determinations made by the Independent Directors and/or the Board include, as applicable, factors considered and determinations made at those meetings by the Independent Directors. While the Board considered the renewal of the management contracts and sub-advisory contracts for all of the applicable investment companies in the Voya family of funds at the same meetings, the Board considered each Voya fund’s investment management and sub-advisory relationships separately.
The Board follows a structured process pursuant to which it seeks and considers relevant information when it evaluates whether to renew existing investment
management and sub-advisory contracts for the Voya funds. The Board has established a Contracts Committee and three Investment Review Committees (the “IRCs”), each of which includes only Independent Directors as members. The Contracts Committee provides oversight with respect to the management and sub-advisory contracts approval and renewal process, and each IRC provides oversight throughout the year regarding the investment performance of the sub-advisers, as well as the Manager’s role in monitoring the sub-advisers, with respect to each Voya fund that is assigned to that IRC.
The Contracts Committee oversees, and annually recommends Board approval of updates to, a methodology guide for the Voya funds (“Methodology Guide”). The Methodology Guide sets out a framework pursuant to which the Independent Directors request, and Management provides, certain information that the Independent Directors deem to be important or potentially relevant. The Independent Directors retain the services of an independent consultant with experience in the mutual fund industry to assist the Contracts Committee in developing and recommending to the Board: (1) a selected peer group of investment companies for each Portfolio (“Selected Peer Group”) based on that Portfolio’s particular attributes, such as fund type and size, fund category (as determined by Morningstar, Inc., an independent provider of mutual fund data (“Morningstar”)), sales channels and structure and the Portfolio share class being compared to the Selected Peer Group, and (2) updates to the Methodology Guide with respect to the content and format of various data including, but not limited to, investment performance, fee structure, and expense information prepared in connection with the renewal process.
Provided below is an overview of certain material factors that the Board considered at its meetings regarding the renewal of the Management Contracts and Sub-Advisory Contracts and the compensation to be paid thereunder. Board members did not identify any particular information or factor that was overarching, and each Board member may have accorded different weight to the various factors in reaching his or her conclusions with respect to each Portfolio’s investment management and sub-advisory arrangements.
Nature, Extent and Quality of Services
The Manager oversees, subject to the authority of the Board, the provision of all investment advisory and portfolio management services for the Portfolios, but may delegate certain of these responsibilities to one or more sub-advisers. In addition, the Manager provides administrative services reasonably necessary for the operation of the Portfolios as set forth in the Management
ADVISORY AND SUB-ADVISORY CONTRACT APPROVAL DISCUSSION (Unaudited) (continued)
Contracts, including oversight of the Portfolios’ operations and risk management and the oversight of their various other service providers.
The Board considered the “manager-of-managers” platform of the Voya funds that has been developed by the Manager pursuant to which the Manager selects, subject to the Board’s approval, experienced sub-advisers to provide day-to-day management services to all or a portion of each Voya fund. The Board recognized that the Manager is responsible for monitoring the investment program, performance, developments, ongoing operations, and regulatory compliance of the Sub-Adviser with respect to the Portfolios under this manager-of-managers arrangement. The Board also considered the techniques and resources that the Manager has developed to provide this ongoing oversight and due diligence with respect to the sub-advisers and to advocate or recommend, when it believes appropriate, changes in investment strategies or investment sub-advisers designed to assist in improving a Voya fund’s performance. The Board was advised that, in connection with the Manager’s performance of these duties, the Manager has developed an oversight process formulated by its Manager Research & Selection Group which reviews, among other matters, performance data, the Sub-Adviser’s management team, portfolio data and attribution analysis related to the Sub-Adviser through various means, including, but not limited to, in-person meetings, on-site visits, and telephonic meetings with the Sub-Adviser.
Further, the Board considered periodic compliance reports it receives from the Company’s Chief Compliance Officer evaluating whether the regulatory compliance systems and procedures of the Manager and the Sub-Adviser are reasonably designed to ensure compliance with the federal securities laws and whether the investment policies and restrictions for each Portfolio are consistently complied with, and other periodic reports covering related matters.
The Board considered the portfolio management team assigned by the Sub-Adviser to the Portfolios and the level of resources committed to the Portfolios (and other relevant funds in the Voya funds) by the Manager and the Sub-Adviser, and whether those resources are sufficient to provide high-quality services to the Portfolios.
Based on their deliberations and the materials presented to them, the Board concluded that the nature, extent and quality of the overall services provided by the Manager and the Sub-Adviser under the Management Contracts and Sub-Advisory Contracts were appropriate.
Portfolio Performance
In assessing investment management and sub-advisory relationships, the Board placed emphasis on the
investment returns of each Portfolio, including its investment performance over certain time periods compared to the Portfolio’s Morningstar category, Selected Peer Group and primary benchmark. The Board also considered information from the Manager Research & Selection Group and received reports summarizing a separate analysis of each Portfolio’s performance and risk, including risk-adjusted investment return information, by the Company’s Chief Investment Risk Officer.
Economies of Scale
When evaluating the reasonableness of management fee schedules, the Board considered whether economies of scale have been or likely will be realized by the Manager and the Sub-Adviser as a Portfolio grows larger and the extent to which any such economies are reflected in contractual fee schedules. In this regard, the Board considered that, while the Portfolios do not have management fee breakpoints, they have fee waiver and expense reimbursement arrangements. The Board considered the extent to which economies of scale realized by the Manager or the Sub-Adviser could be shared with each Portfolio through such fee waivers, expense reimbursements or other expense reductions. In evaluating these matters, the Independent Directors also considered periodic management reports, Selected Peer Group comparisons, and industry information regarding economies of scale.
Information Regarding Services to Other Clients
The Board considered information regarding the nature of services, performance, and fee schedules offered by the Manager and the Sub-Adviser to other clients with similar investment objectives, if applicable, including other registered investment companies and relevant institutional accounts. When the fee schedules offered to or the performance of other clients differed materially from a Portfolio, the Board took into account the underlying rationale provided by the Manager or the Sub-Adviser, as applicable, for these differences. The Board also considered that the fee schedules charged to the Portfolios and other institutional clients of the Manager or the Sub-Adviser (including other investment companies) and the performance of the Portfolios and the other accounts, as applicable, may differ materially due to, among other reasons: differences in services; different regulatory requirements associated with registered investment companies; market differences in fee schedules that existed when a Portfolio first was organized; differences in the original sponsors; investment capacity constraints that existed when certain contracts were first agreed upon or that might exist at present; and different pricing structures that are necessary to be competitive in different marketing channels.
ADVISORY AND SUB-ADVISORY CONTRACT APPROVAL DISCUSSION (Unaudited) (continued)
Fee Schedules, Profitability, and Fall-out Benefits
The Board reviewed and considered the contractual management fee schedule payable by each Portfolio to the Manager compared to the Portfolio’s Selected Peer Group. In addition, the Board considered certain Portfolio’s contractual management fee schedule compared to, for a retail fund, an additional peer group of funds that a business channel has identified as direct competitors or, in the case of an insurance dedicated third-party sub-advised fund, other funds the sub-adviser manages and/or their proprietary fund (if applicable) identified by the Manager. The Board also considered the contractual sub-advisory fee schedule payable by the Manager to the Sub-Adviser for sub-advisory services for each Portfolio, including the portion of the contractual management fee rates that are paid to the Sub-Adviser, as compared to the portion retained by the Manager. In addition, the Board considered any fee waivers, expense limitations, and/or recoupment arrangements that apply to the fees payable by the Portfolios, including whether the Manager intends to propose any changes thereto. For each Portfolio, the Board separately determined that the fees payable to the Manager and the fee schedule payable to the Sub-Adviser are reasonable for the services that each performs, which were considered in light of the nature, extent and quality of the services that each has performed and is expected to perform.
For each Portfolio, the Board considered information on revenues, costs and profits or losses realized by the Manager and the Voya-affiliated Sub-Adviser. In analyzing the profitability of the Manager and its affiliated service providers in connection with services they render to a Portfolio, the Board took into account the sub-advisory fee rate payable by the Manager to the Sub-Adviser. The Board also considered the profitability of the Manager and its affiliated Sub-Adviser attributable to servicing each Portfolio both with and without taking into account the profitability of the distributor of the Portfolios and both before and after giving effect to any expenses incurred by the Manager or the affiliated Sub-Adviser in making payments to affiliated insurance companies.
Although the Methodology Guide establishes a framework for profit calculation, the Board recognized that there is no uniform methodology within the asset management industry for determining profitability for this purpose. The Board also recognized that the use of different reasonable methodologies can give rise to dramatically different reported profit and loss results with respect to the Manager and the Voya-affiliated Sub-Adviser, as well as other industry participants with whom the profits of the Manager and its affiliated Sub-Adviser could be compared. In addition, the Board recognized that Management’s
calculations regarding its costs incurred in establishing the infrastructure necessary for the Portfolios’ operations may not be fully reflected in the expenses allocated to each Portfolio in determining profitability, and that the information presented may not portray all of the costs borne by the Manager or reflect all risks, including entrepreneurial, regulatory, legal and operational risks, associated with offering and managing a mutual fund complex in the current regulatory and market environment.
The Board also considered that the Manager is entitled to earn a reasonable level of profits for the services that it provides to the Portfolios. The Board also received information regarding the potential fall-out benefits to the Manager and Sub-Adviser and their respective affiliates from their association with the Portfolios, including their ability to engage in soft-dollar transactions on behalf of the Portfolios. Following its reviews, the Board determined that the Manager’s and the Voya-affiliated Sub-Adviser’s profitability with respect to their services to the Portfolios and the Manager and Sub-Adviser’s potential fall-out benefits were not unreasonable.
Portfolio-by-Portfolio Analysis
Set forth below are certain of the specific factors that the Board considered, and the conclusions reached, at its October 12, 2017, November 14, 2017, and/or November 16, 2017 meetings in relation to approving each Portfolio’s Management Contracts and Sub-Advisory Contracts. These specific factors are in addition to those considerations discussed above. In each case, the Portfolio’s performance was compared to its Morningstar category average, as well as its primary benchmark, a broad-based securities market index that appears in the Portfolio’s prospectus. With respect to Morningstar quintile rankings, the first quintile represents the highest (best) performance and the fifth quintile represents the lowest performance. The performance data provided to the Board primarily was for various periods ended March 31, 2017. In addition, the Board also considered at its October 12, 2017, November 14, 2017, and November 16, 2017 meetings certain additional data regarding performance and Portfolio asset levels and flows as of August 31, 2017, and September 30, 2017. Each Portfolio’s management fee rate and expense ratio were compared to the fees and expense ratios of the funds in its Selected Peer Group.
Voya Solution 2020 Portfolio
In considering whether to approve the renewal of the Management and Sub-Advisory Contracts for Voya Solution 2020 Portfolio, the Board considered that, based on performance data for the periods ended March 31, 2017: (1) the Portfolio outperformed its Morningstar category average for all periods presented; (2) the Portfolio
ADVISORY AND SUB-ADVISORY CONTRACT APPROVAL DISCUSSION (Unaudited) (continued)
outperformed its primary benchmark for the year-to-date and three-year periods and underperformed for the one-year and five-year periods; and (3) the Portfolio is ranked in the first (highest) quintile of its Morningstar category for the three-year and five-year periods, the second quintile for the year-to-date period, and the third quintile for the one-year period.
In considering the fees payable under the Management and Sub-Advisory Contracts for the Portfolio, the Board took into account the factors described above and also considered: (1) the fairness of the compensation under a Management Contract with a level fee rate that does not include breakpoints; and (2) the pricing structure (including the net expense ratio to be borne by shareholders) of the Portfolio, as compared to its Selected Peer Group, including that: (a) the contractual management fee rate for the Portfolio is above the median and the average management fee rates of the funds in its Selected Peer Group; and (b) the all-in net expense ratio for the Portfolio, inclusive of the Acquired Fund Fees and Expenses (“AFFE”), is above the median and the average all-in net expense ratios of the funds in its Selected Peer Group, and the net expense ratio for the Portfolio, not inclusive of AFFE, is above the median and the average net expense ratios of the funds in its Selected Peer Group.
In analyzing this fee data, the Board took into account: (1) Management’s discussion of fee waivers and/or expense reimbursements, which lower the Portfolio’s net effective management fee rate; (2) that the Portfolio indirectly bears the fees payable by the underlying funds in which the Portfolio invests; (3) that, as directed by the Board during the 2016 annual contract renewal cycle, lower expense limits were implemented for the Portfolio, effective January 1, 2017; and (4) Management’s representations regarding the competitiveness of the Portfolio’s net expense ratio when compared to peers identified by Management.
After its deliberation, the Board reached the following conclusions: (1) the Portfolio’s management fee rate is reasonable in the context of all factors considered by the Board; (2) the Portfolio’s net expense ratio is reasonable in the context of all factors considered by the Board; (3) the Portfolio’s performance is reasonable in the context of all factors considered by the Board; and (4) the sub-advisory fee rate payable by the Manager to the Sub-Adviser is reasonable in the context of all factors considered by the Board. Based on these conclusions and other factors, the Board voted to renew the Management and Sub-Advisory Contracts for the Portfolio for the year ending November 30, 2018. During this renewal process, different Board members may have given different weight to different individual factors and related conclusions.
Voya Solution 2025 Portfolio
In considering whether to approve the renewal of the Management and Sub-Advisory Contracts for Voya Solution 2025 Portfolio, the Board considered that, based on performance data for the periods ended March 31, 2017: (1) the Portfolio outperformed its Morningstar category average for all periods presented, with the exception of the ten-year period, during which it underperformed; (2) the Portfolio underperformed its primary benchmark for all periods presented, with the exceptions of the year-to-date period, during which it outperformed; and (3) the Portfolio is ranked in the second quintile of its Morningstar category for the year-to-date, three-year and five-year periods, the third quintile for the one-year period, and the fourth quintile for the ten-year period.
In considering the fees payable under the Management and Sub-Advisory Contracts for the Portfolio, the Board took into account the factors described above and also considered: (1) the fairness of the compensation under a Management Contract with a level fee rate that does not include breakpoints; and (2) the pricing structure (including the net expense ratio to be borne by shareholders) of the Portfolio, as compared to its Selected Peer Group, including that: (a) the contractual management fee rate for the Portfolio is above the median and the average management fee rates of the funds in its Selected Peer Group; and (b) the all-in net expense ratio for the Portfolio, inclusive of the Acquired Fund Fees and Expenses (“AFFE”), is above the median and the average all-in net expense ratios of the funds in its Selected Peer Group, and the net expense ratio for the Portfolio, not inclusive of AFFE, is above the median and the average net expense ratios of the funds in its Selected Peer Group.
In analyzing this fee data, the Board took into account: (1) that the Portfolio indirectly bears the fees payable by the underlying funds in which the Portfolio invests; (2) that, as directed by the Board during the 2016 annual contract renewal cycle, lower expense limits were implemented for the Portfolio, effective January 1, 2017; and (3) Management’s representations regarding the competitiveness of the Portfolio’s management fee rate and net expense ratio when compared to peers identified by Management.
After its deliberation, the Board reached the following conclusions: (1) the Portfolio’s management fee ratio is reasonable in the context of all factors considered by the Board; (2) the Portfolio’s net expense ratio is reasonable in the context of all factors considered by the Board; (3) the Portfolio’s performance is reasonable in the context of all factors considered by the Board; and (4) the sub-advisory fee rate payable by the Manager to the Sub-Adviser is
ADVISORY AND SUB-ADVISORY CONTRACT APPROVAL DISCUSSION (Unaudited) (continued)
reasonable in the context of all factors considered by the Board. Based on these conclusions and other factors, the Board voted to renew the Management and Sub-Advisory Contracts for the Portfolio for the year ending November 30, 2018. During this renewal process, different Board members may have given different weight to different individual factors and related conclusions.
Voya Solution 2030 Portfolio
In considering whether to approve the renewal of the Management and Sub-Advisory Contracts for Voya Solution 2030 Portfolio, the Board considered that, based on performance data for the periods ended March 31, 2017: (1) the Portfolio outperformed its Morningstar category average for all periods presented; (2) the Portfolio outperformed its primary benchmark for all periods presented, with the exception of the five-year period, during which it underperformed; and (3) the Portfolio is ranked in the first (highest) quintile of its Morningstar category for the three-year period, and the second quintile for the year-to-date, one-year and five-year periods.
In considering the fees payable under the Management and Sub-Advisory Contracts for the Portfolio, the Board took into account the factors described above and also considered: (1) the fairness of the compensation under a Management Contract with a level fee rate that does not include breakpoints; and (2) the pricing structure (including the net expense ratio to be borne by shareholders) of the Portfolio, as compared to its Selected Peer Group, including that: (a) the contractual management fee rate for the Portfolio is above the median and the average management fee rates of the funds in its Selected Peer Group; and (b) the all-in net expense ratio for the Portfolio, inclusive of the Acquired Fund Fees and Expenses (“AFFE”), is above the median and the average all-in net expense ratios of the funds in its Selected Peer Group, and the net expense ratio for the Portfolio, not inclusive of AFFE, is above the median and the average net expense ratios of the funds in its Selected Peer Group.
In analyzing this fee data, the Board took into account: (1) Management’s discussion of fee waivers and/or expense reimbursements, which lower the Portfolio’s net effective management fee rate; (2) that the Portfolio indirectly bears the fees payable by the underlying funds in which the Portfolio invests; (3) that, as directed by the Board during the 2016 annual contract renewal cycle, lower expense limits were implemented for the Portfolio, effective January 1, 2017; and (4) Management’s representations regarding the competitiveness of the Portfolio’s net expense ratio when compared to peers identified by Management.
After its deliberation, the Board reached the following conclusions: (1) the Portfolio’s management fee rate is reasonable in the context of all factors considered by the Board; (2) the Portfolio’s net expense ratio is reasonable in the context of all factors considered by the Board; (3) the Portfolio’s performance is reasonable in the context of all factors considered by the Board; and (4) the sub-advisory fee rate payable by the Manager to the Sub-Adviser is reasonable in the context of all factors considered by the Board. Based on these conclusions and other factors, the Board voted to renew the Management and Sub-Advisory Contracts for the Portfolio for the year ending November 30, 2018. During this renewal process, different Board members may have given different weight to different individual factors and related conclusions.
Voya Solution 2035 Portfolio
In considering whether to approve the renewal of the Management and Sub-Advisory Contracts for Voya Solution 2035 Portfolio, the Board considered that, based on performance data for the periods ended March 31, 2017: (1) the Portfolio outperformed its Morningstar category average for all periods presented, with the exception of the ten-year period, during which it underperformed; (2) the Portfolio underperformed its primary benchmark for all periods presented, with the exception of the year-to-date and one-year periods, during which it outperformed; and (3) the Portfolio is ranked in the second quintile of its Morningstar category for the year-to-date and three-year periods, the third quintile for the one-year and five-year periods, and the fourth quintile for the ten-year period.
In considering the fees payable under the Management and Sub-Advisory Contracts for the Portfolio, the Board took into account the factors described above and also considered: (1) the fairness of the compensation under a Management Contract with a level fee rate that does not include breakpoints; and (2) the pricing structure (including the net expense ratio to be borne by shareholders) of the Portfolio, as compared to its Selected Peer Group, including that: (a) the contractual management fee rate for the Portfolio is above the median and the average management fee rates of the funds in its Selected Peer Group; and (b) the “all-in” net expense ratio for the Portfolio, inclusive of the Acquired Fund Fees and Expenses (“AFFE”), is above the median and the average all-in net expense ratios of the funds in its Selected Peer Group, and the net expense ratio for the Portfolio, not inclusive of AFFE, is above the median and the average net expense ratios of the funds in its Selected Peer Group.
In analyzing this fee data, the Board took into account: (1) that the Portfolio indirectly bears the fees payable by
ADVISORY AND SUB-ADVISORY CONTRACT APPROVAL DISCUSSION (Unaudited) (continued)
the underlying funds in which the Portfolio invests; (2) that, as directed by the Board during the 2016 annual contract renewal cycle, lower expense limits were implemented for the Portfolio, effective January 1, 2017; and (3) Management’s representations regarding the competitiveness of the Portfolio’s management fee rate and net expense ratio when compared to peers identified by Management.
After its deliberation, the Board reached the following conclusions: (1) the Portfolio’s management fee rate is reasonable in the context of all factors considered by the Board; (2) the Portfolio’s net expense ratio is reasonable in the context of all factors considered by the Board; (3) the Portfolio’s performance is reasonable in the context of all factors considered by the Board; and (4) the sub-advisory fee rate payable by the Manager to the Sub-Adviser is reasonable in the context of all factors considered by the Board. Based on these conclusions and other factors, the Board voted to renew the Management and Sub-Advisory Contracts for the Portfolio for the year ending November 30, 2018. During this renewal process, different Board members may have given different weight to different individual factors and related conclusions.
Voya Solution 2040 Portfolio
In considering whether to approve the renewal of the Management and Sub-Advisory Contracts for Voya Solution 2040 Portfolio, the Board considered that, based on performance data for the periods ended March 31, 2017: (1) the Portfolio outperformed its Morningstar category average for all periods presented; (2) the Portfolio outperformed its primary benchmark for all periods presented, with the exception of the five-year period, during which it underperformed; and (3) the Portfolio is ranked in the first (highest) quintile of its Morningstar category for the three-year period, and the second quintile for the year-to-date, one-year and five-year periods.
In considering the fees payable under the Management and Sub-Advisory Contracts for the Portfolio, the Board took into account the factors described above and also considered: (1) the fairness of the compensation under a Management Contract with a level fee rate that does not include breakpoints; and (2) the pricing structure (including the net expense ratio to be borne by shareholders) of the Portfolio, as compared to its Selected Peer Group, including that: (a) the contractual management fee rate for the Portfolio is above the median and the average management fee rates of the funds in its Selected Peer Group; and (b) the all-in net expense ratio for the Portfolio, inclusive of the Acquired Fund Fees and Expenses (“AFFE”), is above the median and the average all-in net expense ratios of the funds in its Selected Peer Group, and
the net expense ratio for the Portfolio, not inclusive of AFFE, is above the median and the average net expense ratios of the funds in its Selected Peer Group.
In analyzing this fee data, the Board took into account: (1) that the Portfolio indirectly bears the fees payable by the underlying funds in which the Portfolio invests; (2) that, as directed by the Board during the 2016 annual contract renewal cycle, lower expense limits were implemented for the Portfolio, effective January 1, 2017; and (3) Management’s representations regarding the competitiveness of the Portfolio’s management fee rate and net expense ratio when compared to peers identified by Management.
After its deliberation, the Board reached the following conclusions: (1) the Portfolio’s management fee rate is reasonable in the context of all factors considered by the Board; (2) the Portfolio’s net expense ratio is reasonable in the context of all factors considered by the Board; (3) the Portfolio’s performance is reasonable in the context of all factors considered by the Board; and (4) the sub-advisory fee rate payable by the Manager to the Sub-Adviser is reasonable in the context of all factors considered by the Board. Based on these conclusions and other factors, the Board voted to renew the Management and Sub-Advisory Contracts for the Portfolio for the year ending November 30, 2018. During this renewal process, different Board members may have given different weight to different individual factors and related conclusions.
Voya Solution 2045 Portfolio
In considering whether to approve the renewal of the Management and Sub-Advisory Contracts for Voya Solution 2045 Portfolio, the Board considered that, based on performance data for the periods ended March 31, 2017: (1) the Portfolio outperformed its Morningstar category average for all periods presented, with the exception of the one-year period, during which it was equal to the performance of this Morningstar category average, and the ten-year period, during which it underperformed; (2) the Portfolio underperformed its primary benchmark for all periods presented, with the exception of the year-to-date period, during which it outperformed; and (3) the Portfolio is ranked in the second quintile of its Morningstar category for the year-to-date, three-year and five-year periods, the third quintile for the one-year period, and the fourth quintile for the ten-year period.
In considering the fees payable under the Management and Sub-Advisory Contracts for the Portfolio, the Board took into account the factors described above and also considered: (1) the fairness of the compensation under a Management Contract with a level fee rate that does not include breakpoints; and (2) the pricing structure (including
ADVISORY AND SUB-ADVISORY CONTRACT APPROVAL DISCUSSION (Unaudited) (continued)
the net expense ratio to be borne by shareholders) of the Portfolio, as compared to its Selected Peer Group, including that: (a) the contractual management fee rate for the Portfolio is above the median and the average management fee rates of the funds in its Selected Peer Group; and (b) the all-in net expense ratio for the Portfolio, inclusive of the Acquired Fund Fees and Expenses (“AFFE”), is above the median and the average all-in net expense ratios of the funds in its Selected Peer Group, and the net expense ratio for the Portfolio, not inclusive of AFFE, is above the median and the average net expense ratios of the funds in its Selected Peer Group.
In analyzing this fee data, the Board took into account: (1) that the Portfolio indirectly bears the fees payable by the underlying funds in which the Portfolio invests; (2) that, as directed by the Board during the 2016 annual contract renewal cycle, lower expense limits were implemented for the Portfolio, effective January 1, 2017; and (3) Management’s representations regarding the competitiveness of the Portfolio’s management fee rate and net expense ratio when compared to peers identified by Management.
After its deliberation, the Board reached the following conclusions: (1) the Portfolio’s management fee rate is reasonable in the context of all factors considered by the Board; (2) the Portfolio’s net expense ratio is reasonable in the context of all factors considered by the Board; (3) the Portfolio’s performance is reasonable in the context of all factors considered by the Board; and (4) the sub-advisory fee rate payable by the Manager to the Sub-Adviser is reasonable in the context of all factors considered by the Board. Based on these conclusions and other factors, the Board voted to renew the Management and Sub-Advisory Contracts for the Portfolio for the year ending November 30, 2018. During this renewal process, different Board members may have given different weight to different individual factors and related conclusions.
Voya Solution 2050 Portfolio
In considering whether to approve the renewal of the Management and Sub-Advisory Contracts for Voya Solution 2050 Portfolio, the Board considered that, based on performance data for the periods ended March 31, 2017: (1) the Portfolio outperformed its Morningstar category average for all periods presented, with the exception of the one-year period, during which it underperformed; (2) the Portfolio underperformed its primary benchmark for all periods presented, with the exception of the year-to-date period, during which it outperformed; and (3) the Portfolio is ranked in the first (highest) quintile of its Morningstar category for the
three-year period, the second quintile for the year-to-date and five-year periods, and the third quintile for the one-year period.
In considering the fees payable under the Management and Sub-Advisory Contracts for the Portfolio, the Board took into account the factors described above and also considered: (1) the fairness of the compensation under a Management Contract with a level fee rate that does not include breakpoints; and (2) the pricing structure (including the net expense ratio to be borne by shareholders) of the Portfolio, as compared to its Selected Peer Group, including that: (a) the contractual management fee rate for the Portfolio is above the median and the average management fee rates of the funds in its Selected Peer Group; and (b) the all-in net expense ratio for the Portfolio, inclusive of the Acquired Fund Fees and Expenses (“AFFE”), is above the median and the average all-in net expense ratios of the funds in its Selected Peer Group, and the net expense ratio for the Portfolio, not inclusive of AFFE, is above the median and the average net expense ratios of the funds in its Selected Peer Group.
In analyzing this fee data, the Board took into account: (1) Management’s discussion of fee waivers and/or expense reimbursements, which lower the Portfolio’s net effective management fee rate; (2) that the Portfolio indirectly bears the fees payable by the underlying funds in which the Portfolio invests; (3) that, as directed by the Board during the 2016 annual contract renewal cycle, lower expense limits were implemented for the Portfolio, effective January 1, 2017; and (4) Management’s representations regarding the competitiveness of the Portfolio’s management fee rate and net expense ratio.
After its deliberation, the Board reached the following conclusions: (1) the Portfolio’s management fee rate is reasonable in the context of all factors considered by the Board; (2) the Portfolio’s net expense ratio is reasonable in the context of all factors considered by the Board; (3) the Portfolio’s performance is reasonable in the context of all factors considered by the Board; and (4) the sub-advisory fee rate payable by the Manager to the Sub-Adviser is reasonable in the context of all factors considered by the Board. Based on these conclusions and other factors, the Board voted to renew the Management and Sub-Advisory Contracts for the Portfolio for the year ending November 30, 2018. During this renewal process, different Board members may have given different weight to different individual factors and related conclusions.
Voya Solution 2055 Portfolio
In considering whether to approve the renewal of the Management and Sub-Advisory Contracts for Voya
ADVISORY AND SUB-ADVISORY CONTRACT APPROVAL DISCUSSION (Unaudited) (continued)
Solution 2055 Portfolio, the Board considered that, based on performance data for the periods ended March 31, 2017: (1) the Portfolio outperformed its Morningstar category average for all periods presented, with the exception of the one-year period, during which it underperformed; (2) the Portfolio underperformed its primary benchmark for all periods presented, with the exception of the year-to-date period, during which it outperformed; and (3) the Portfolio is ranked in the second quintile of its Morningstar category for the year-to-date and three-year periods, and the third quintile for the one-year and five-year periods.
In considering the fees payable under the Management and Sub-Advisory Contracts for the Portfolio, the Board took into account the factors described above and also considered: (1) the fairness of the compensation under a Management Contract with a level fee rate that does not include breakpoints; and (2) the pricing structure (including the net expense ratio to be borne by shareholders) of the Portfolio, as compared to its Selected Peer Group, including that: (a) the contractual management fee rate for the Portfolio is above the median and the average management fee rates of the funds in its Selected Peer Group; and (b) the all-in net expense ratio for the Portfolio, inclusive of the Acquired Fund Fees and Expenses (“AFFE”), is above the median and the average all-in net expense ratios of the funds in its Selected Peer Group, and the net expense ratio for the Portfolio, not inclusive of AFFE, is above the median and the average of the net expense ratios of the funds in its Selected Peer Group.
In analyzing this fee data, the Board took into account: (1) that the Portfolio indirectly bears the fees payable by the underlying funds in which the Portfolio invests; (2) that, as directed by the Board during the 2016 annual contract renewal cycle, lower expense limits were implemented for the Portfolio, effective January 1, 2017; and (3) Management’s representations regarding the competitiveness of the Portfolio’s management fee rate and net expense ratio when compared to peers identified by Management.
After its deliberation, the Board reached the following conclusions: (1) the Portfolio’s management fee rate is reasonable in the context of all factors considered by the Board; (2) the Portfolio’s net expense ratio is reasonable in the context of all factors considered by the Board; (3) the Portfolio’s performance is reasonable in the context of all factors considered by the Board; and (4) the sub-advisory fee rate payable by the Manager to the Sub-Adviser is reasonable in the context of all factors considered by the Board. Based on these conclusions and other factors, the Board voted to renew the Management and Sub-Advisory Contracts for the Portfolio for the year ending
November 30, 2018. During this renewal process, different Board members may have given different weight to different individual factors and related conclusions.
Voya Solution 2060 Portfolio
In considering whether to approve the renewal of the Management and Sub-Advisory Contracts for Voya Solution 2060 Portfolio, the Board considered that, based on performance data for the periods ended March 31, 2017: (1) the Portfolio outperformed its Morningstar category average for the year-to-date period, and underperformed the one-year period; (2) the Portfolio outperformed its benchmark for the year-to-date period, and underperformed the one-year period; and (3) the Portfolio is ranked in the second quintile of its Morningstar category for the year-to-date period, and the third quintile for the one-year period.
In analyzing this performance data, the Board took into account that the Portfolio commenced operations in February 2015, and therefore had a limited operating history for the purpose of analyzing its performance.
In considering the fees payable under the Management and Sub-Advisory Contracts for the Portfolio, the Board took into account the factors described above and also considered: (1) the fairness of the compensation under a Management Contract with a level fee rate that does not include breakpoints; and (2) the pricing structure (including the net expense ratio to be borne by shareholders) of the Portfolio, as compared to its Selected Peer Group, including that: (a) the contractual management fee rate for the Portfolio is above the median and the average management fee rates of the funds in its Selected Peer Group; and (b) the all-in net expense ratio for the Portfolio, inclusive of the Acquired Fund Fees and Expenses (“AFFE”), is above the median and the average all-in net expense ratios of the funds in its Selected Peer Group, and the net expense ratio for the Portfolio, not inclusive of AFFE, is above the median and the average of the net expense ratios of the funds in its Selected Peer Group.
In analyzing this fee data, the Board took into account: (1) Management’s discussion of fee waivers and/or expense reimbursements, which lower the Portfolio’s net effective management fee rate; (2) that the Portfolio indirectly bears the fees payable by the underlying funds in which the Portfolio invests; (3) that, as directed by the Board during the 2016 annual contract renewal cycle, lower expense limits were implemented for the Portfolio, effective January 1, 2017; and (4) Management’s discussion of fee waivers and/or expense reimbursements, which lower the Portfolio’s net effective management fee rate.
ADVISORY AND SUB-ADVISORY CONTRACT APPROVAL DISCUSSION (Unaudited) (continued)
After its deliberation, the Board reached the following conclusions: (1) the Portfolio’s management fee rate is reasonable in the context of all factors considered by the Board; (2) the Portfolio’s net expense ratio is reasonable in the context of all factors considered by the Board; (3) taking into account that the Portfolio commenced operations in February 2015, and therefore had a limited operating history for the purpose of analyzing the Portfolio’s performance, it is reasonable to permit the Portfolio time to establish a longer performance record for the purpose of evaluating investment performance; and (4) the sub-advisory fee rate payable by the Manager to the Sub-Adviser is reasonable in the context of all factors considered by the Board. Based on these conclusions and other factors, the Board voted to renew the Management and Sub-Advisory Contracts for the Portfolio for the year ending November 30, 2018. During this renewal process, different Board members may have given different weight to different individual factors and related conclusions.
Voya Solution Aggressive Portfolio
In considering whether to approve the renewal of the Management and Sub-Advisory Contracts for Voya Solution Aggressive Portfolio, the Board considered that, based on performance data for the periods ended March 31, 2017: (1) the Portfolio outperformed its Morningstar category average for all periods presented, with the exception of the one-year period, during which it underperformed; (2) the Portfolio outperformed its primary benchmark for all periods presented; and (3) the Portfolio is ranked in the second quintile of its Morningstar category for the year-to-date and three-year periods, and the third quintile for the one-year period.
In considering the fees payable under the Management and Sub-Advisory Contracts for the Portfolio, the Board took into account the factors described above and also considered: (1) the fairness of the compensation under a Management Contract with a level fee rate that does not include breakpoints; and (2) the pricing structure (including the net expense ratio to be borne by shareholders) of the Portfolio, as compared to its Selected Peer Group, including that: (a) the contractual management fee rate for the Portfolio is below the median and the average management fee rates of the funds in its Selected Peer Group; and (b) the all-in net expense ratio for the Portfolio, inclusive of the Acquired Fund Fees and Expenses (“AFFE”), is below the median and the average all-in net expense ratios of the funds in its Selected Peer Group, and the net expense ratio for the Portfolio, not inclusive of AFFE, is below the median and the average net expense ratios of the funds in its Selected Peer Group.
After its deliberation, the Board reached the following conclusions: (1) the Portfolio’s management fee rate is
reasonable in the context of all factors considered by the Board; (2) the Portfolio’s net expense ratio is reasonable in the context of all factors considered by the Board; (3) the Portfolio’s performance is reasonable in the context of all factors considered by the Board; and (4) the sub-advisory fee rate payable by the Manager to the Sub-Adviser is reasonable in the context of all factors considered by the Board. Based on these conclusions and other factors, the Board voted to renew the Management and Sub-Advisory Contracts for the Portfolio for the year ending November 30, 2018. During this renewal process, different Board members may have given different weight to different individual factors and related conclusions.
Voya Solution Balanced Portfolio
In considering whether to approve the renewal of the Management and Sub-Advisory Contracts for Voya Solution Balanced Portfolio, the Board considered that, based on performance data for the periods ended March 31, 2017: (1) the Portfolio outperformed its Morningstar category average for all periods presented; (2) the Portfolio outperformed its primary benchmark for the one-year and three-year periods, and underperformed for the year-to-date and five-year periods; and (3) the Portfolio is ranked in the second quintile of its Morningstar category for the year-to-date, one-year and three-year periods, and the third quintile for the five-year period.
In considering the fees payable under the Management and Sub-Advisory Contracts for the Portfolio, the Board took into account the factors described above and also considered: (1) the fairness of the compensation under a Management Contract with a level fee rate that does not include breakpoints; and (2) the pricing structure (including the net expense ratio to be borne by shareholders) of the Portfolio, as compared to its Selected Peer Group, including that: (a) the contractual management fee rate for the Portfolio is above the median and the average management fees of the funds in its Selected Peer Group; and (b) the all-in net expense ratio for the Portfolio, inclusive of the Acquired Fund Fees and Expenses (“AFFE”), is below the median and the average all-in net expense ratios of the funds in its Selected Peer Group, and the net expense ratio for the Portfolio, not inclusive of AFFE, is above the median and below the average net expense ratios of the funds in its Selected Peer Group. To assist the Board in its deliberations regarding this fee data, the Board was provided with information regarding the effect of waivers and/or reimbursements on the Portfolio’s net expense ratio.
After its deliberation, the Board reached the following conclusions: (1) the Portfolio’s management fee rate is reasonable in the context of all factors considered by the
ADVISORY AND SUB-ADVISORY CONTRACT APPROVAL DISCUSSION (Unaudited) (continued)
Board; (2) the Portfolio’s net expense ratio is reasonable in the context of all factors considered by the Board; (3) the Portfolio’s performance is reasonable in the context of all factors considered by the Board; and (4) the sub-advisory fee rate payable by the Manager to the Sub-Adviser is reasonable in the context of all factors considered by the Board. Based on these conclusions and other factors, the Board voted to renew the Management and Sub-Advisory Contracts for the Portfolio for the year ending November 30, 2018. During this renewal process, different Board members may have given different weight to different individual factors and related conclusions.
Voya Solution Conservative Portfolio
In considering whether to approve the renewal of the Management and Sub-Advisory Contracts for Voya Solution Conservative Portfolio, the Board considered that, based on performance data for the periods ended March 31, 2017: (1) the Portfolio outperformed its Morningstar category average for all periods presented; (2) the Portfolio outperformed its primary benchmark for all periods presented, with the exception of the year-to-date period, during which it underperformed; and (3) the Portfolio is ranked in the first (highest) quintile of its Morningstar category for the three-year and five-year periods, and the second quintile for the year-to-date and one-year periods.
In considering the fees payable under the Management and Sub-Advisory Contracts for the Portfolio, the Board took into account the factors described above and also considered: (1) the fairness of the compensation under a Management Contract with a level fee rate that does not include breakpoints; and (2) the pricing structure (including the net expense ratio to be borne by shareholders) of the Portfolio, as compared to its Selected Peer Group, including that: (a) the contractual management fee rate for the Portfolio is below the median and the average management fee rates of the funds in its Selected Peer Group; and (b) the all-in net expense ratio for the Portfolio, inclusive of the Acquired Fund Fees and Expenses (“AFFE”), is below the median and the average all-in net expense ratios of the funds in its Selected Peer Group, and the net expense ratio for the Portfolio, not inclusive of AFFE, is below the median and the average net expense ratios of the funds in its Selected Peer Group.
After its deliberation, the Board reached the following conclusions: (1) the Portfolio’s management fee rate is reasonable in the context of all factors considered by the Board; (2) the Portfolio’s net expense ratio is reasonable in the context of all factors considered by the Board; (3) the Portfolio’s performance is reasonable in the context of all factors considered by the Board; and (4) the sub-advisory
fee rate payable by the Manager to the Sub-Adviser is reasonable in the context of all factors considered by the Board. Based on these conclusions and other factors, the Board voted to renew the Management and Sub-Advisory Contracts for the Portfolio for the year ending November 30, 2018. During this renewal process, different Board members may have given different weight to different individual factors and related conclusions.
Voya Solution Income Portfolio
In considering whether to approve the renewal of the Management and Sub-Advisory Contracts for Voya Solution Income Portfolio, the Board considered that, based on performance data for the periods ended March 31, 2017: (1) the Portfolio outperformed its Morningstar category average for all periods presented; (2) the Portfolio outperformed its primary benchmark for all periods presented; and (3) the Portfolio is ranked in the first (highest) quintile of its Morningstar category for the three-year and five-year periods, the second quintile for the year-to-date and ten-year periods, and the third quintile for the one-year period.
In considering the fees payable under the Management and Sub-Advisory Contracts for the Portfolio, the Board took into account the factors described above and also considered: (1) the fairness of the compensation under a Management Contract with a level fee rate that does not include breakpoints; and (2) the pricing structure (including the net expense ratio to be borne by shareholders) of the Portfolio, as compared to its Selected Peer Group, including that: (a) the contractual management fee rate for the Portfolio is above the median and the average management fee rates of the funds in its Selected Peer Group; and (b) the all-in net expense ratio for the Portfolio, inclusive of the Acquired Fund Fees and Expenses (“AFFE”), is above the median and the average all-in net expense ratios of the funds in its Selected Peer Group, and net expense ratio for the Portfolio, not inclusive of the AFFE, is above the median and the average all-in net expense ratios of the funds in its Selected Peer Group.
In analyzing this fee data, the Board took into account: (1) Management’s discussion of fee waivers and/or expense reimbursements, which lower the Portfolio’s net effective management fee rate; (2) that the Portfolio indirectly bears the fees payable by the underlying funds in which the Portfolio invests; and (3) Management’s representations regarding the competitiveness of the Portfolio’s management fee rate and net expense ratio when compared to peers identified by Management.
After its deliberation, the Board reached the following conclusions: (1) the Portfolio’s management fee rate is reasonable in the context of all factors considered by the
ADVISORY AND SUB-ADVISORY CONTRACT APPROVAL DISCUSSION (Unaudited) (continued)
Board; (2) the Portfolio’s net expense ratio is reasonable in the context of all factors considered by the Board; (3) the Portfolio’s performance is reasonable in the context of all factors considered by the Board; and (4) the sub-advisory fee rate payable by the Manager to the Sub-Adviser is reasonable in the context of all factors considered by the Board. Based on these conclusions and other factors, the Board voted to renew the Management and Sub-Advisory Contracts for the Portfolio for the year ending November 30, 2018. During this renewal process, different Board members may have given different weight to different individual factors and related conclusions.
Voya Solution Moderately Aggressive Portfolio
In considering whether to approve the renewal of the Management and Sub-Advisory Contracts for Voya Solution Moderately Aggressive Portfolio, the Board considered that, based on performance data for the periods ended March 31, 2017: (1) the Portfolio outperformed its Morningstar category average for all periods presented; (2) the Portfolio underperformed its primary benchmark for all periods presented; and (3) the Portfolio is ranked in the second quintile of its Morningstar category for the year-to-date, three-year and five-year periods, and the third quintile for the one-year period.
In considering the fees payable under the Management and Sub-Advisory Contracts for the Portfolio, the Board took into account the factors described above and also considered: (1) the fairness of the compensation under a Management Contract with a level fee rate that does not include breakpoints; and (2) the pricing structure (including the net expense ratio to be borne by shareholders) of the Portfolio, as compared to its Selected Peer Group, including that: (a) the contractual management fee rate for the Portfolio is above the median and the average management fee rates of the funds in its Selected Peer Group; and (b) the all-in net expense ratio for the Portfolio, inclusive of the Acquired Fund Fees and Expenses (“AFFE”), is below the median and the average all-in net expense ratios of the funds in its Selected Peer Group, and the net expense ratio for the Portfolio, not inclusive of AFFE, is above the median and the average net expense ratios of the funds in its Selected Peer Group.
In analyzing this fee data, the Board took into account: (1) that the Portfolio indirectly bears the fees payable by the underlying funds in which the Portfolio invests; and (2) Management’s representations regarding the competitiveness of the Portfolio’s management fee rate and net expense ratio.
After its deliberation, the Board reached the following conclusions: (1) the Portfolio’s management fee rate is reasonable in the context of all factors considered by the
Board; (2) the Portfolio’s net expense ratio is reasonable in the context of all factors considered by the Board; (3) the Portfolio’s performance is reasonable in the context of all factors considered by the Board; and (4) the sub-advisory fee rate payable by the Manager to the Sub-Adviser is reasonable in the context of all factors considered by the Board. Based on these conclusions and other factors, the Board voted to renew the Management and Sub-Advisory Contracts for the Portfolio for the year ending November 30, 2018. During this renewal process, different Board members may have given different weight to different individual factors and related conclusions.
Voya Solution Moderately Conservative Portfolio
In considering whether to approve the renewal of the Management and Sub-Advisory Contracts for Voya Solution Moderately Conservative Portfolio, the Board considered that, based on performance data for the periods ended March 31, 2017: (1) the Portfolio outperformed its Morningstar category average for all periods presented, with the exception of the one-year period, during which it underperformed; (2) the Portfolio outperformed its primary benchmark for all periods presented, with the exception of the year-to-date period, during which it underperformed; and (3) the Portfolio is ranked in the first (highest) quintile of its Morningstar category for the three-year period, the second quintile for the five-year period, and the third quintile for the year-to-date and one-year periods.
In considering the fees payable under the Management and Sub-Advisory Contracts for the Portfolio, the Board took into account the factors described above and also considered: (1) the fairness of the compensation under a Management Contract with a level fee rate that does not include breakpoints; and (2) the pricing structure (including the net expense ratio to be borne by shareholders) of the Portfolio, as compared to its Selected Peer Group, including that: (a) the contractual management fee rate for the Portfolio is above the median and the average management fee rates of the funds in its Selected Peer Group; and (b) the all-in net expense ratio for the Portfolio, inclusive of the Acquired Fund Fees and Expenses (“AFFE”), is below the median and the average all-in net expense ratios of the funds in its Selected Peer Group, and the net expense ratio for the Portfolio, not inclusive of AFFE, is equal to the median and below the average net expense ratios of the funds in its Selected Peer Group. To assist the Board in its deliberations regarding this fee data, the Board was provided with information regarding the effect of waivers and/or reimbursements on the Portfolio’s net expense ratio.
After its deliberation, the Board reached the following conclusions: (1) the Portfolio’s management fee rate is
ADVISORY AND SUB-ADVISORY CONTRACT APPROVAL DISCUSSION (Unaudited) (continued)
reasonable in the context of all factors considered by the Board; (2) the Portfolio’s net expense ratio is reasonable in the context of all factors considered by the Board; (3) the Portfolio’s performance is reasonable in the context of all factors considered by the Board; and (4) the sub-advisory fee rate payable by the Manager to the Sub-Adviser is reasonable in the context of all factors considered by the
Board. Based on these conclusions and other factors, the Board voted to renew the Management and Sub-Advisory Contracts for the Portfolio for the year ending November 30, 2018. During this renewal process, different Board members may have given different weight to different individual factors and related conclusions.
Investment Adviser
Voya Investments, LLC
7337 East Doubletree Ranch Road, Suite 100
Scottsdale, Arizona 85258
Distributor
Voya Investments Distributor, LLC
7337 East Doubletree Ranch Road, Suite 100
Scottsdale, Arizona 85258
Transfer Agent
BNY Mellon Investment Servicing (U.S.) Inc.
301 Bellevue Parkway
Wilmington, Delaware 19809
Independent Registered Public Accounting Firm
KPMG LLP
Two Financial Center
60 South Street
Boston, Massachusetts 02111
Custodian
The Bank of New York Mellon
225 Liberty Street
New York, New York 10286
Legal Counsel
Ropes & Gray LLP
Prudential Tower
800 Boylston Street
Boston, Massachusetts 02199
Before investing, carefully consider the investment objectives, risks, charges and expenses of the variable annuity contract or variable life insurance policy and the underlying variable investment options. This and other information is contained in the prospectus for the variable annuity contract or variable life insurance policy and the underlying variable investment options. Obtain these prospectuses from your agent/registered representative and read them carefully before investing.
RETIREMENT | INVESTMENTS | INSURANCE
voyainvestments.com
Annual Report
December 31, 2017
Classes ADV, I, S, S2 and Z
Voya Partners, Inc.
■
Voya Index Solution Income Portfolio
■
Voya Index Solution 2020 Portfolio
■
Voya Index Solution 2025 Portfolio
���
Voya Index Solution 2030 Portfolio
■
Voya Index Solution 2035 Portfolio
■
Voya Index Solution 2040 Portfolio
■
Voya Index Solution 2045 Portfolio
■
Voya Index Solution 2050 Portfolio
■
Voya Index Solution 2055 Portfolio
■
Voya Index Solution 2060 Portfolio
| | | This report is submitted for general information to shareholders of the Voya mutual funds. It is not authorized for distribution to prospective shareholders unless accompanied or preceded by a prospectus which includes details regarding the funds’ investment objectives, risks, charges, expenses and other information. This information should be read carefully. | | |
br
PROXY VOTING INFORMATION
A description of the policies and procedures that the Portfolios use to determine how to vote proxies related to portfolio securities is available: (1) without charge, upon request, by calling Shareholder Services toll-free at (800) 992-0180; (2) on the Portfolios’ website at www.voyainvestments.com; and (3) on the U.S. Securities and Exchange Commission’s (“SEC’s”) website at www.sec.gov. Information regarding how the Portfolios voted proxies related to portfolio securities during the most recent 12-month period ended June 30 is available without charge on the Portfolios’ website at www.voyainvestments.com and on the SEC’s website at www.sec.gov.
QUARTERLY PORTFOLIO HOLDINGS
The Portfolios file their complete schedule of portfolio holdings with the SEC for the first and third quarters of each fiscal year on Form N-Q. The Portfolios’ Forms N-Q are available on the SEC’s website at www.sec.gov. The Portfolios’ Forms N-Q may be reviewed and copied at the SEC’s Public Reference Room in Washington, D.C., and information on the operation of the Public Reference Room may be obtained by calling (800) SEC-0330. The Portfolios’ Forms N-Q, as well as a complete portfolio of investments, are available without charge upon request from the Portfolios by calling Shareholder Services toll-free at (800) 992-0180.
[This Page Intentionally Left Blank]
After a Strong Year, Positive Expectations
Dear Shareholder,
The U.S. equity market proved resilient throughout 2017, posting a “perfect pitch” year with not one single month of negative returns. A lot of chatter in the markets has focused on the low levels of volatility that prevailed in 2017, and whether 2018 will be the year that volatility returns (witness early February markets). As usual there are also any number of geopolitical or other risks that could cause a sell-off, but we are heartened by the reality of macroeconomic fundamentals, which include strong and synchronous global growth; we believe these would likely be a governor on a rise in volatility.
We believe the United States, Europe and China will continue to dominate the world economy in 2018. Combined, the three account for about $48 trillion of GDP, more than 60% of the $79 trillion global GDP produced each year. And the rest of the world still has its own positive backdrop: The International Monetary Fund projects that 185 of 190 national economies will grow in 2018.
While economic growth may be synchronous across the globe, it is not likely to be uniform — thus, broad global diversification across continents and asset classes remains important for positioning your portfolio to benefit from potential opportunities. Regardless of where individual markets are in their business cycles, we believe investors are best served by following their asset allocation plan and avoiding the temptation to time entry or exit points.
If your goals have changed, thoroughly discuss them with your investment advisor before making any changes to your investment strategy. We seek to remain a reliable partner committed to reliable investing, helping you and your investment advisor achieve your goals. We appreciate your continued confidence in us, and we look forward to serving your investment needs in the future.
Sincerely,
Shaun Mathews
President and Chief Executive Officer
Voya Family of Funds
January 19, 2018
The views expressed in the President’s Letter reflect those of the President as of the date of the letter. Any such views are subject to change at any time based upon market or other conditions and the Voya mutual funds disclaim any responsibility to update such views. These views may not be relied on as investment advice and because investment decisions for a Voya mutual fund are based on numerous factors, may not be relied on as an indication of investment intent on behalf of any Voya mutual fund. Reference to specific company securities should not be construed as recommendations or investment advice.
International investing poses special risks including currency fluctuation, economic and political risks not found in investments that are solely domestic.
Market Perspective: Year Ended December 31, 2017
In our semi-annual report we described how global equities, in the form of the MSCI World IndexSM (the “Index”), measured in local currencies, including net reinvested dividends, rose 8.25%, carried higher in what seemed to be the path of least resistance. Investor sentiment was still trying to come to terms with the unexpected result of the U.S. presidential election. For this and perhaps more importantly, other reasons, the Index continued its advance, rising in every month, to end up 18.48% for the fiscal year. (The Index returned 22.40% for the year ended December 31, 2017, measured in U.S. dollars.)
By mid-year most commentators had largely discounted a reflation trade driven by U.S. legislative initiatives. But this did not mean that such initiatives were dead; just that the credibility of anything market friendly coming out of them had fallen very low. The President had said on February 9 that he would announce his pro-growth tax reform plan in the coming weeks. Nothing solid had emerged and by early July the Senate was still pre-occupied with the Affordable Care Act (“ACA”), desperately trying to pass any version of a repeal and replace bill. Such attempts finally foundered in the early hours of July 28.
But investors could still take comfort in a narrative of improving global growth and corporate earnings, with monetary conditions still historically easy, to underpin the prices of risk assets. The evidence was there to see. In August the Wall Street Journal observed that the prices of base metals had recently hit multi-year highs, inferring that investors were increasingly bullish on global growth, and later noted that every country tracked by the Organization for Economic Cooperation and Development was set to grow in 2017.
In the euro zone, unemployment ended November at 8.8%, the lowest since January 2009. Gross domestic product (“GDP”) grew 2.5% year-over-year in the third quarter of 2017, slightly higher than the U.S. (2.3%). The European Central Bank finally confirmed that monthly bond purchases would be halved to €30 billion in 2018. The region’s Economic Sentiment Indicator ended the period at the highest since 2000.
China’s GDP growth in the second quarter of 2017 was a healthy 6.9% year-over-year and 6.8% in the third. Imports were continuing to grow at double-digit year-over-year rates, supporting global demand. Excessive debt remained a problem in financial markets, however. In November the authorities announced curbs on leverage in asset management products and promises of guaranteed returns.
Even Japan contributed some good news with GDP rising in the third quarter of 2017 for the seventh straight quarter.
In the U.S., the Federal Reserve (“Fed”) added 25bp (0.25%) to the federal funds rate in March and did so again in June. But areas of sluggishness, like low core consumer price inflation and wage growth persisted into September, which started with devastating hurricanes and rising geo-political tensions with North Korea. Some commentators suggested that the Fed might be done for the year.
However, the hurricanes subsided, geo-political tensions cooled and yet another forlorn attempt to replace the ACA was shrugged off. The December employment report showed the unemployment rate barely above 4%, near the lowest since February 2001. Third quarter GDP growth was reported at 3.2% (annualized) after 3.1% in the second. The outline of a long-awaited pro-growth tax reform program was finally announced, although moving day by day to bring recalcitrant
senators on board. For investors, its key feature was a reduction in the corporate tax rate to 21%, which many believed would be used to increase share buy-backs and dividends. The Fed duly raised the federal funds rate by another 25bp (0.25%) in December and the tax bill was signed into law on December 22.
In U.S. fixed income markets, the Bloomberg Barclays U.S. Aggregate Bond Index (“Barclays Aggregate”) added 3.54% in the fiscal year. The Treasury yield curve became flatter, with yields on maturities up to about nine years rising and those on longer maturities falling. Thus the Bloomberg Barclays U.S. Treasury Bond Index rose 2.31% while the Bloomberg Barclays Long-Term U.S. Treasury sub-index gained 8.53%. Indices of riskier classes generally outperformed Treasuries: the Bloomberg Barclays U.S. Corporate Investment Grade Bond Index climbed 6.42%, the Bloomberg Barclays High-Yield Bond — 2% Issuer Constrained Composite Index (not a part of the Barclays Aggregate) rose 7.50%.
U.S. equities, represented by the S&P 500® Index including dividends, surged 21.83% in 2017. The earnings per share of its constituent companies grew 6.4% year-over-year in the third quarter of 2017, after two quarters of double-digit gains. Technology was the leader, soaring 38.83%. Telecommunications and energy were the laggards, falling 1.25% and 1.01% respectively. Index companies thought to offer comparatively good earnings growth outperformed those considered to offer comparatively good value by more than 12%.
In currencies, the dollar fell 12.37% against the euro, 8.63% against the pound, reflecting some dissipation of the post-election reflation euphoria. In the meantime, the euro zone’s prospects had improved, while some of the panic over Brexit had faded. The dollar slipped 3.65% against the yen, moving within a narrow trading range for most of the year.
In international markets, the MSCI Japan® Index jumped 19.75% over the year, in an environment of improving corporate governance and profitability, with little competition from fixed income investments. The MSCI Europe ex UK® Index rose 13.59%. Aside from the positive developments noted above, corporate earnings were improving and political fears were assuaged by the election of a centrist President in France. But gains were muted by the strengthening euro. The MSCI UK® Index rose 11.94%. GDP growth was down to 0.4% in each of the middle two quarters, Brexit negotiations were slow and inconclusive and we believe by year end it was abundantly clear that the UK’s position was very weak.
All indices are unmanaged and investors cannot invest directly in an index. Past performance does not guarantee future results. The performance quoted represents past performance. Investment return and principal value of an investment will fluctuate, and shares, when redeemed, may be worth more or less than their original cost. The Portfolios’ performance is subject to change since the period’s end and may be lower or higher than the performance data shown. Please call (800) 262-3862 or log on to www.voyainvestments.com to obtain performance data current to the most recent month end.
Market Perspective reflects the views of Voya Investment Management’s Chief Investment Risk Officer only through the end of the period, and is subject to change based on market and other conditions.
| | | Index | | | | Description | | |
| | | Bloomberg Barclays High Yield Bond — 2% Issuer Constrained Composite Index | | | | An index that includes all fixed-income securities having a maximum quality rating of Ba1, a minimum amount outstanding of $150 million, and at least one year to maturity. | | |
| | | Bloomberg Barclays U.S. Aggregate Bond Index | | | | An index of publicly issued investment grade U.S. Government, mortgage-backed, asset-backed and corporate debt securities. | | |
| | | Bloomberg Barclays U.S. Corporate Investment Grade Bond Index | | | | An index consisting of publicly issued, fixed rate, nonconvertible, investment grade debt securities. | | |
| | | Bloomberg Barclays Long-Term U.S. Treasury Index | | | | This index measures the performance of U.S. Treasury bills with long-term maturity. The credit level for this index is investment grade. The rebalance scheme is monthly. | | |
| | | Bloomberg Barclays U.S. Treasury Bond Index | | | | A market capitalization-weighted index that measures the performance of public obligations of the U.S. Treasury that have a remaining maturity of one year or more. | | |
| | | MSCI Europe ex UK® Index | | | | A free float-adjusted market capitalization index that is designed to measure developed market equity performance in Europe, excluding the UK. | | |
| | | MSCI Japan® Index | | | | A free float-adjusted market capitalization index that is designed to measure developed market equity performance in Japan. | | |
| | | MSCI UK® Index | | | | A free float-adjusted market capitalization index that is designed to measure developed market equity performance in the UK. | | |
| | | MSCI World IndexSM | | | | An index that measures the performance of over 1,400 securities listed on exchanges in the U.S., Europe, Canada, Australia, New Zealand and the Far East. | | |
| | | S&P 500® Index | | | | An index that measures the performance of securities of approximately 500 large-capitalization companies whose securities are traded on major U.S. stock markets. | | |
| | | S&P Target Date Retirement Income Index | | | | Seeks to represent asset allocations which target an immediate retirement horizon. | | |
| | | S&P Target Date 2020 Index, S&P Target Date 2025 Index, S&P Target Date 2030 Index, S&P Target Date 2035 Index, S&P Target Date 2040 Index, S&P Target Date 2045 Index, S&P Target Date 2050 Index, S&P Target Date 2055 Index and S&P Target Date 2060+ Index | | | | Each index seeks to represent the market consensus for asset allocations which target an approximate 2020, 2025, 2030, 2035, 2040, 2045, 2050, 2055, 2060 and beyond the 2060 retirement horizon, respectively. | | |
| | | Tokyo Stock Price Index (“TOPIX Index®”) | | | | A composite index for the Tokyo Stock Exchange tracking all domestic stocks from the first section of the exchange. | | |
| Voya Index Solution Portfolios | Portfolio Managers’ Report |
The Voya Index Solution Portfolios consist of Voya Index Solution Income Portfolio, Voya Index Solution 2020 Portfolio, Voya Index Solution 2025 Portfolio, Voya Index Solution 2030 Portfolio, Voya Index Solution 2035 Portfolio, Voya Index Solution 2040 Portfolio, Voya Index Solution 2045 Portfolio, Voya Index Solution 2050 Portfolio, Voya Index Solution 2055 Portfolio, and Voya Index Solution 2060 Portfolio (each a “Portfolio” or collectively, the “Portfolios”). Each Portfolio seeks to achieve its investment objective by investing in a combination of underlying funds which are passively managed funds (index funds)(1). Each Portfolio uses an asset allocation strategy (“Target Asset Allocation”) designed for investors expecting to retire around the year applicable to that Portfolio. These Target Asset Allocations as of December 31, 2017 are set out in the table below. The Portfolios are managed by Halvard Kvaale, CIMA, Paul Zemsky, CFA and Chief Investment Officer, and Jody Hrazanek, Portfolio Managers of Voya Investment Management Co. LLC (“Voya IM”) — the Sub-Adviser.
Performance: Each Portfolio’s performance against its respective benchmark can be found on page
6. Every Portfolio, except Index Solution 2020, outperformed its benchmark in 2017.
Portfolio Specifics: The Portfolio managers attempt to enhance investment returns by tactically deviating from Strategic Asset Allocations to take advantage of opportunities or reduce risk. The following tactics were among those employed in 2017.
The Portfolios started 2017 with overweight positions in U.S. large cap and long government bonds, funded by underweight positions in core U.S. fixed income and high yield.
In January, the Portfolios purchased Japanese equities funded by selling a portion of our U.S. large cap position. At the time of the trade, we believed Japan to be one of the most leveraged markets to an acceleration in global growth and positioned to benefit from continued qualitative and quantitative easing by the Bank of Japan. This trade maintained the Portfolios’ global equity overweight, rotating equity from the U.S. towards more cyclical regions of the world. This position was unwound at the end of February with growing realization that the Bank of Japan’s easing was ineffective in its attempt to reaccelerate the Japanese economy. The proceeds of the sale were used to purchase U.S. large cap.
At the end of March, the Portfolios enacted two new positions, selling its U.S. large cap overweight in both instances in favor of euro zone and emerging market equities. We believe both trades were supported by attractive valuations and strong fundamentals underpinned by easing financial conditions and global reacceleration.
At the close of April, adjustments to the strategic asset allocation targets were made to reflect the portfolio management team’s revised long-term capital market expectations for a range of asset classes. This resulted in modest changes in the sub-asset allocations. Notable changes include modest increases to international developed, emerging market and small cap equities, new allocations to U.S. large cap value and short duration, and reduced exposure to high yield bonds in favor of core U.S. fixed income. In addition, long government bonds were removed as a strategic asset class but are included in the Portfolios as a tactical position for duration management. Finally, to maintain equity weights through the annual glide down process, a tactical overweight to equities was enacted for the 2035-2020 Portfolios.
In June, the Portfolios tactically rotated a portion of its U.S. large cap allocation towards growth to offset the value bias in its strategic allocation. Rationale supporting a growth-tilted market was based on the U.S. Federal Reserve Board’s (“Fed”) firm resolve for gradual interest-rate increases, two straight disappointing inflation readings and continual problems besetting the Trump Administration’s agenda.
At the close of August, the Portfolios converted its existing euro zone equity exposure from a currency hedged position to an unhedged position. In August, the long-Euro and short-USD positioning had come off of extremes providing an opportunity to scale into non-U.S. dollar exposure for the trade. In addition, fundamental indicators, such as GDP and PMI differentials between the two economies, were in our opinion showing support for a stronger Euro versus the USD.
At the end of September, the Portfolios opened a position in Japanese equities by selling international developed equities. At the time of the trade, Japan was on course to deliver the strongest earnings growth of any major region in 2017, but was the only major region to have been de-rated in forward P/E terms. In addition, at trade time, the TOPIX Index® was inexpensive, trading at a forward P/E relative to the MSCI World IndexSM at the lower end of its 12-year historical range. In October, the Funds further increased its Japan equities exposure funded by a lowered allocation to U.S. large blend. In addition, the 2020 and 2025 Portfolios sold U.S. large cap and purchased core U.S. fixed income to reduce an equity overweight position that was initiated in 2016. While the team remains positive on risk assets for 2018, we believe reducing equity exposures to be prudent in the event of an equity market sell-off for these near-dated Portfolios.
During the year, tactical moves relative to our strategic benchmarks had a positive impact across the suite.
| Portfolio Managers’ Report | Voya Index Solution Portfolios |
All asset classes utilized in the Portfolios produced positive returns for the year. The best performing asset classes were emerging markets equities, foreign large blend equities and domestic large cap equities. Asset classes with lowest returns for the year were short term bonds, commodities and intermediate term bonds. During the year, the Portfolios utilized various futures to enact tactical positions. Futures were utilized to avoid significant manager disruption and provide the Portfolios with greater liquidity. The impact of the derivatives was in line with expectations of the tactical asset allocation positions.
Current Strategy and Outlook: A lot of chatter in the markets is focusing on the low levels of volatility that prevailed in 2017 and whether 2018 will be the year that it returns. As usual there are any number of geopolitical or other risks that could cause a temporary sell-off, but we are heartened by the reality of macro fundamentals, which in our opinion include strong and synchronous global growth. We believe that this would put a cap on any weakness in risk assets or rises in volatility.
Equities had a strong run in 2017, driven equally by multiple expansion and earnings growth. They will likely find that earnings will have to do most of the heavy lifting in 2018, however, as equities have become more expensive at 19 times forward earnings. We believe that it’s not a bad thing to have an earnings-driven year for equities; based upon on our models, we believe the S&P 500® Index should be able to deliver 10% earnings growth. While tax cuts can add more fuel to the earnings fire, they are largely incorporated into equity prices already.
We favored equities all 2017 and continue to do so going into 2018. The emerging markets were the darlings of last year, gaining over 30%. Even with a modest setback, lagging behind the U.S. in the fourth quarter of 2017, in our view they are the ultimate beneficiaries of stronger than expected global growth, and at good valuations. Japan has been among our strongest views in the latter part of the year. The continued support from Abenomics and the central bank anchoring bond yields has produced solid growth and even modest inflation.
In the United States, tax reform legislation has cleared the legislative hurdles to become law. We estimate the new policy will boost U.S. GDP growth by 0.3% in 2018 and 2019. The financial markets will have to digest some short- and longer-term consequences. We expect Federal spending will likely grow more quickly in 2018 than it has for the last three years. With more fiscal stimulus comes larger deficits. Consensus expectations are for the U.S. budget deficit to reach 3.7% in 2018 and 5.0% in 2019. We also expect the Fed to respond to faster growth to maintain its mandate for a stable labor market. Therefore, we think the Fed will have to raise interest rates four times in 2018. Raising short-term interest rates will likely continue to flatten the yield curve (the difference between the yields on two-year and ten-year Treasury bonds) but the flattening is unlikely to match the speed that it had in 2017. The back end of the curve is unlikely to be as firmly anchored as it was in 2017, in our opinion, as one-off effects of softer inflation and an increase in the global supply of bonds impact the market.
In our opinion, the Portfolios remain positioned for a positive global growth outlook. Our long held constructive view on the emerging markets remains, even in light of some temporary relative weakness. We think economic data are still a positive and not too much of a good thing. While mindful that the cycle may be late in calendar years, we see our economic activity models and earnings projections telling us equities can stay well supported.
(1)
The investment objective of each Portfolio is described in the Portfolios’ prospectuses, each dated May 1, 2017.
Portfolio holdings and characteristics are subject to change and may not be representative of current holdings and characteristics. Portfolio holdings are subject to change daily. The outlook for this Portfolio may differ from that presented for other Voya mutual funds. The Portfolio’s performance returns shown reflect applicable fee waivers and/or expense limits in effect during this period. Absent such fee waivers/expense limitations, if any, performance would have been lower. Performance for the different classes of shares will vary based on differences in fees associated with each class.
| Voya Index Solution Portfolios | Portfolio Managers’ Report |
| | | Total Returns for the Period Ended December 31, 2017 | | |
| | | | | | 1 Year | | |
| | | Voya Index Solution Income Portfolio, Class S | | | 9.06% | | |
| | | S&P Target Date Retirement Income Index | | | 8.54% | | |
| | | Voya Index Solution 2020 Portfolio, Class S | | | 12.06% | | |
| | | S&P Target Date 2020 Index | | | 12.80% | | |
| | | Voya Index Solution 2025 Portfolio, Class S | | | 14.62% | | |
| | | S&P Target Date 2025 Index | | | 14.55% | | |
| | | Voya Index Solution 2030 Portfolio, Class S | | | 16.91% | | |
| | | S&P Target Date 2030 Index | | | 16.19% | | |
| | | Voya Index Solution 2035 Portfolio, Class S | | | 18.39% | | |
| | | S&P Target Date 2035 Index | | | 17.78% | | |
| | | Voya Index Solution 2040 Portfolio, Class S | | | 19.39% | | |
| | | S&P Target Date 2040 Index | | | 18.87% | | |
| | | Voya Index Solution 2045 Portfolio, Class S | | | 20.21% | | |
| | | S&P Target Date 2045 Index | | | 19.56% | | |
| | | Voya Index Solution 2050 Portfolio, Class S | | | 20.47% | | |
| | | S&P Target Date 2050 Index | | | 20.18% | | |
| | | Voya Index Solution 2055 Portfolio, Class S | | | 20.63% | | |
| | | S&P Target Date 2055 Index | | | 20.48% | | |
| | | Voya Index Solution 2060 Portfolio, Class S | | | 20.76% | | |
| | | S&P Target Date 2060+ Index | | | 20.75% | | |
| | | | | | | | |
| | | Annual Target Asset Allocation as of December 31, 2017 | | |
| | | Sub Asset Class | | | 2060 | | | 2055 | | | 2050 | | | 2045 | | | 2040 | | | 2035 | | | 2030 | | | 2025 | | | 2020 | | | Income | | |
| | | US Large Blend | | | | | 40.0% | | | | | | 40.0% | | | | | | 40.0% | | | | | | 40.5% | | | | | | 40.0% | | | | | | 38.5% | | | | | | 35.5% | | | | | | 28.0% | | | | | | 22.0% | | | | | | 16.0% | | | |
| | | US Large Growth | | | | ��� | 2.0% | | | | | | 2.0% | | | | | | 2.0% | | | | | | 2.0% | | | | | | 2.0% | | | | | | 2.0% | | | | | | 2.0% | | | | | | 2.0% | | | | | | 2.0% | | | | | | 2.0% | | | |
| | | US Large Value | | | | | 1.0% | | | | | | 1.0% | | | | | | 1.0% | | | | | | 1.0% | | | | | | 1.0% | | | | | | 1.0% | | | | | | 1.0% | | | | | | 1.0% | | | | | | 1.0% | | | | | | 0.5% | | | |
| | | US Mid Cap Blend | | | | | 11.0% | | | | | | 11.0% | | | | | | 11.0% | | | | | | 10.0% | | | | | | 8.0% | | | | | | 7.0% | | | | | | 5.0% | | | | | | 4.5% | | | | | | 3.0% | | | | | | 3.0% | | | |
| | | US Small Cap | | | | | 5.0% | | | | | | 5.0% | | | | | | 5.0% | | | | | | 5.0% | | | | | | 5.0% | | | | | | 4.0% | | | | | | 4.0% | | | | | | 3.0% | | | | | | 3.0% | | | | | | — | | | |
| | | International | | | | | 21.0% | | | | | | 21.0% | | | | | | 21.0% | | | | | | 20.0% | | | | | | 19.0% | | | | | | 18.0% | | | | | | 16.0% | | | | | | 13.0% | | | | | | 10.0% | | | | | | 6.0% | | | |
| | | Japan Equity | | | | | 3.0% | | | | | | 3.0% | | | | | | 3.0% | | | | | | 3.0% | | | | | | 3.0% | | | | | | 3.0% | | | | | | 3.0% | | | | | | 3.0% | | | | | | 3.0% | | | | | | 3.0% | | | |
| | | Emerging Markets | | | | | 8.5% | | | | | | 8.5% | | | | | | 8.5% | | | | | | 8.0% | | | | | | 7.5% | | | | | | 7.0% | | | | | | 6.0% | | | | | | 5.0% | | | | | | 3.5% | | | | | | 3.0% | | | |
| | | US Real Estate | | | | | 1.5% | | | | | | 1.5% | | | | | | 1.5% | | | | | | 1.5% | | | | | | 1.5% | | | | | | 1.5% | | | | | | 1.5% | | | | | | 1.0% | | | | | | 1.0% | | | | | | 1.0% | | | |
| | | Global Real Estate | | | | | 1.5% | | | | | | 1.5% | | | | | | 1.5% | | | | | | 1.5% | | | | | | 1.5% | | | | | | 1.5% | | | | | | 1.5% | | | | | | 1.0% | | | | | | 1.0% | | | | | | 1.0% | | | |
| | | Commodities | | | | | 1.5% | | | | | | 1.5% | | | | | | 1.5% | | | | | | 1.5% | | | | | | 1.5% | | | | | | 1.5% | | | | | | 1.5% | | | | | | 1.5% | | | | | | 1.5% | | | | | | 1.5% | | | |
| | | Core Fixed Income | | | | | 4.0% | | | | | | 4.0% | | | | | | 4.0% | | | | | | 4.3% | | | | | | 5.0% | | | | | | 8.0% | | | | | | 15.0% | | | | | | 27.0% | | | | | | 39.0% | | | | | | 53.0% | | | |
| | | High Yield | | | | | — | | | | | | — | | | | | | — | | | | | | — | | | | | | 2.0% | | | | | | 2.0% | | | | | | 2.0% | | | | | | 2.0% | | | | | | 2.0% | | | | | | 2.0% | | | |
| | | Senior Debt | | | | | — | | | | | | — | | | | | | — | | | | | | 1.8% | | | | | | 3.0% | | | | | | 5.0% | | | | | | 5.0% | | | | | | 5.0% | | | | | | 5.0% | | | | | | 5.0% | | | |
| | | Short Duration | | | | | — | | | | | | — | | | | | | — | | | | | | — | | | | | | — | | | | | | — | | | | | | — | | | | | | 2.0% | | | | | | 2.0% | | | | | | 3.0% | | | |
| | | Long Govt Bonds | | | | | — | | | | | | — | | | | | | — | | | | | | — | | | | | | — | | | | | | — | | | | | | 1.0% | | | | | | 1.0% | | | | | | 1.0% | | | | | | — | | | |
| | | Total Equity | | | | | 96.0% | | | | | | 96.0% | | | | | | 96.0% | | | | | | 94.0% | | | | | | 90.0% | | | | | | 85.0% | | | | | | 77.0% | | | | | | 63.0% | | | | | | 51.0% | | | | | | 37.0% | | | |
| | | Total Fixed Income | | | | | 4.0% | | | | | | 4.0% | | | | | | 4.0% | | | | | | 6.0% | | | | | | 10.0% | | | | | | 15.0% | | | | | | 23.0% | | | | | | 37.0% | | | | | | 49.0% | | | | | | 63.0% | | | |
| | | | | | | | 100.0% | | | | | | 100.0% | | | | | | 100.0% | | | | | | 100.0% | | | | | | 100.0% | | | | | | 100.0% | | | | | | 100.0% | | | | | | 100.0% | | | | | | 100.0% | | | | | | 100.0% | | | |
As these are target allocations, the actual allocations of each Portfolio’s assets may deviate from the percentages shown. Although the Portfolios expect to be fully invested at all times, they may maintain liquidity reserves to meet redemption requests.
Portfolio holdings are subject to change daily.
| Portfolio Managers’ Report | Voya Index Solution Income Portfolio |
| | | Average Annual Total Returns for the Periods Ended December 31, 2017 | | |
| | | | | | 1 Year | | | 5 Year | | | Since Inception
of Classes ADV, I, and S
March 10, 2008 | | | Since Inception
of Class S2
May 28, 2009 | | | Since Inception
of Class Z
May 1, 2015 | | |
| | | Class ADV | | | | | 8.69% | | | | | | 4.98% | | | | | | 4.62% | | | | | | — | | | | | | — | | | |
| | | Class I | | | | | 9.36% | | | | | | 5.54% | | | | | | 5.17% | | | | | | — | | | | | | — | | | |
| | | Class S | | | | | 9.06% | | | | | | 5.25% | | | | | | 4.89% | | | | | | — | | | | | | — | | | |
| | | Class S2 | | | | | 8.89% | | | | | | 5.11% | | | | | | — | | | | | | 6.30% | | | | | | — | | | |
| | | Class Z(1) | | | | | 9.54% | | | | | | 5.64% | | | | | | — | | | | | | — | | | | | | 5.22% | | | |
| | | S&P Target Date Retirement Income Index | | | | | 8.54% | | | | | | 4.86% | | | | | | 4.61% | | | | | | 6.51% | | | | | | 4.61% | | | |
| | | | | |
Based on a $10,000 initial investment, the graph and table above illustrate the total return of Voya Index Solution Income Portfolio against the index indicated. The index is unmanaged and has no cash in its portfolio and imposes no sales charges. An investor cannot invest directly in an index. On June 1, 2017, S&P Dow Jones Indices, a third-party index provider, made construction and methodology changes to the index used by the Portfolio. Performance for the index for periods prior to June 1, 2017 has been recalculated by the index provider based on the new construction and methodology.
The Portfolio’s performance is shown without the imposition of any expenses or charges which are, or may be, imposed under your variable annuity contract or variable life insurance policy. Total returns would have been lower if such expenses or charges were included.
The performance graph and table do not reflect the deduction of taxes that a shareholder will pay on Portfolio distributions or the redemption of Portfolio shares.
The performance shown may include the effect of fee waivers and/or expense reimbursements by the Investment Adviser and/or other service providers, which have the effect of increasing total return. Had all fees and expenses been considered, the total returns would have been lower.
The performance update illustrates performance for a variable investment option available through a variable annuity contract or a variable life insurance policy. The performance shown indicates past performance and is not a projection or prediction of future results. Actual investment returns and principal value will fluctuate so that shares and/or units, at redemption, may be worth more or less than their original cost. Please log on to www.voyainvestments.com or call (800) 262-3862 to get performance through the most recent month end.
This report contains statements that may be “forward-looking” statements. Actual results may differ materially from those projected in the “forward-looking” statements.
The views expressed in this report reflect those of the portfolio managers, only through the end of the period as stated on the cover. The portfolio managers’ views are subject to change at any time based on market and other conditions.
Portfolio holdings are subject to change daily.
(1)
The Class Z shares performance shown for the period prior to their inception date is the performance of Class I shares without adjustment for any differences in the expenses between the two classes. If adjusted for such differences, returns would be different.
| Voya Index Solution 2020 Portfolio | Portfolio Managers’ Report |
| | | Average Annual Total Returns for the Periods Ended December 31, 2017 | | |
| | | | | | 1 Year | | | 5 Year | | | Since Inception
of Classes ADV, I, S, and S2
October 3, 2011 | | | Since Inception
of Class Z
May 1, 2015 | | |
| | | Class ADV | | | | | 11.78% | | | | | | 7.19% | | | | | | 8.79% | | | | | | — | | | |
| | | Class I | | | | | 12.42% | | | | | | 7.64% | | | | | | 9.26% | | | | | | — | | | |
| | | Class S | | | | | 12.06% | | | | | | 7.37% | | | | | | 8.97% | | | | | | — | | | |
| | | Class S2 | | | | | 11.92% | | | | | | 7.24% | | | | | | 8.86% | | | | | | — | | | |
| | | Class Z(1) | | | | | 12.63% | | | | | | 7.73% | | | | | | — | | | | | | 9.33% | | | |
| | | S&P Target Date 2020 Index | | | | | 12.80% | | | | | | 7.92% | | | | | | 9.70% | | | | | | 9.70% | | | |
| | | | | |
Based on a $10,000 initial investment, the graph and table above illustrate the total return of Voya Index Solution 2020 Portfolio against the index indicated. The index is unmanaged and has no cash in its portfolio and imposes no sales charges. An investor cannot invest directly in an index. On June 1, 2017, S&P Dow Jones Indices, a third-party index provider, made construction and methodology changes to the index used by the Portfolio. Performance for the index for periods prior to June 1, 2017 has been recalculated by the index provider based on the new construction and methodology.
The Portfolio’s performance is shown without the imposition of any expenses or charges which are, or may be, imposed under your variable annuity contract or variable life insurance policy. Total returns would have been lower if such expenses or charges were included.
The performance graph and table do not reflect the deduction of taxes that a shareholder will pay on Portfolio distributions or the redemption of Portfolio shares.
The performance shown may include the effect of fee waivers and/or expense reimbursements by the Investment Adviser and/or other service providers, which have the effect of increasing total return. Had all fees and expenses been considered, the total returns would have been lower.
The performance update illustrates performance for a variable investment option available through a variable annuity contract or a variable life insurance policy. The performance shown indicates past performance and is not a projection or prediction of future results. Actual investment returns and principal value will fluctuate so that shares and/or units, at redemption, may be worth more or less than their original cost. Please log on to www.voyainvestments.com or call (800) 262-3862 to get performance through the most recent month end.
This report contains statements that may be “forward-looking” statements. Actual results may differ materially from those projected in the “forward-looking” statements.
The views expressed in this report reflect those of the portfolio managers, only through the end of the period as stated on the cover. The portfolio managers’ views are subject to change at any time based on market and other conditions.
Portfolio holdings are subject to change daily.
(1)
The Class Z shares performance shown for the period prior to their inception date is the performance of Class I shares without adjustment for any differences in the expenses between the two classes. If adjusted for such differences, returns would be different.
| Portfolio Managers’ Report | Voya Index Solution 2025 Portfolio |
| | | Average Annual Total Returns for the Periods Ended December 31, 2017 | | |
| | | | | | 1 Year | | | 5 Year | | | Since Inception
of Classes ADV, I, and S
March 10, 2008 | | | Since Inception
of Class S2
May 28, 2009 | | | Since Inception
of Class Z
May 1, 2015 | | |
| | | Class ADV | | | | | 14.32% | | | | | | 8.06% | | | | | | 5.61% | | | | | | — | | | | | | — | | | |
| | | Class I | | | | | 14.84% | | | | | | 8.61% | | | | | | 6.14% | | | | | | — | | | | | | — | | | |
| | | Class S | | | | | 14.62% | | | | | | 8.32% | | | | | | 5.88% | | | | | | — | | | | | | — | | | |
| | | Class S2 | | | | | 14.41% | | | | | | 8.17% | | | | | | — | | | | | | 9.51% | | | | | | — | | | |
| | | Class Z(1) | | | | | 15.00% | | | | | | 8.70% | | | | | | — | | | | | | — | | | | | | 6.18% | | | |
| | | S&P Target Date 2025 Index | | | | | 14.55% | | | | | | 8.76% | | | | | | 6.65% | | | | | | 10.37% | | | | | | 6.65% | | | |
| | | | | |
Based on a $10,000 initial investment, the graph and table above illustrate the total return of Voya Index Solution 2025 Portfolio against the index indicated. The index is unmanaged and has no cash in its portfolio and imposes no sales charges. An investor cannot invest directly in an index. On June 1, 2017, S&P Dow Jones Indices, a third-party index provider, made construction and methodology changes to the index used by the Portfolio. Performance for the index for periods prior to June 1, 2017 has been recalculated by the index provider based on the new construction and methodology.
The Portfolio’s performance is shown without the imposition of any expenses or charges which are, or may be, imposed under your variable annuity contract or variable life insurance policy. Total returns would have been lower if such expenses or charges were included.
The performance graph and table do not reflect the deduction of taxes that a shareholder will pay on Portfolio distributions or the redemption of Portfolio shares.
The performance shown may include the effect of fee waivers and/or expense reimbursements by the Investment Adviser and/or other service providers, which have the effect of increasing total return. Had all fees and expenses been considered, the total returns would have been lower.
The performance update illustrates performance for a variable investment option available through a variable annuity contract or a variable life insurance policy. The performance shown indicates past performance and is not a projection or prediction of future results. Actual investment returns and principal value will fluctuate so that shares and/or units, at redemption, may be worth more or less than their original cost. Please log on to www.voyainvestments.com or call (800) 262-3862 to get performance through the most recent month end.
This report contains statements that may be “forward-looking” statements. Actual results may differ materially from those projected in the “forward-looking” statements.
The views expressed in this report reflect those of the portfolio managers, only through the end of the period as stated on the cover. The portfolio managers’ views are subject to change at any time based on market and other conditions.
Portfolio holdings are subject to change daily.
(1)
The Class Z shares performance shown for the period prior to their inception date is the performance of Class I shares without adjustment for any differences in the expenses between the two classes. If adjusted for such differences, returns would be different.
| Voya Index Solution 2030 Portfolio | Portfolio Managers’ Report |
| | | Average Annual Total Returns for the Periods Ended December 31, 2017 | | |
| | | | | | 1 Year | | | 5 Year | | | Since Inception
of Classes ADV, I, S, and S2
October 3, 2011 | | | Since Inception
of Class Z
May 1, 2015 | | |
| | | Class ADV | | | | | 16.62% | | | | | | 9.10% | | | | | | 11.18% | | | | | | — | | | |
| | | Class I | | | | | 17.14% | | | | | | 9.61% | | | | | | 11.70% | | | | | | — | | | |
| | | Class S | | | | | 16.91% | | | | | | 9.33% | | | | | | 11.40% | | | | | | — | | | |
| | | Class S2 | | | | | 16.69% | | | | | | 9.12% | | | | | | 11.23% | | | | | | — | | | |
| | | Class Z(1) | | | | | 17.35% | | | | | | 9.67% | | | | | | — | | | | | | 11.75% | | | |
| | | S&P Target Date 2030 Index | | | | | 16.19% | | | | | | 9.57% | | | | | | 11.67% | | | | | | 11.67% | | | |
| | | | | |
Based on a $10,000 initial investment, the graph and table above illustrate the total return of Voya Index Solution 2030 Portfolio against the index indicated. The index is unmanaged and has no cash in its portfolio and imposes no sales charges. An investor cannot invest directly in an index. On June 1, 2017, S&P Dow Jones Indices, a third-party index provider, made construction and methodology changes to the index used by the Portfolio. Performance for the index for periods prior to June 1, 2017 has been recalculated by the index provider based on the new construction and methodology.
The Portfolio’s performance is shown without the imposition of any expenses or charges which are, or may be, imposed under your variable annuity contract or variable life insurance policy. Total returns would have been lower if such expenses or charges were included.
The performance graph and table do not reflect the deduction of taxes that a shareholder will pay on Portfolio distributions or the redemption of Portfolio shares.
The performance shown may include the effect of fee waivers and/or expense reimbursements by the Investment Adviser and/or other service providers, which have the effect of increasing total return. Had all fees and expenses been considered, the total returns would have been lower.
The performance update illustrates performance for a variable investment option available through a variable annuity contract or a variable life insurance policy. The performance shown indicates past performance and is not a projection or prediction of future results. Actual investment returns and principal value will fluctuate so that shares and/or units, at redemption, may be worth more or less than their original cost. Please log on to www.voyainvestments.com or call (800) 262-3862 to get performance through the most recent month end.
This report contains statements that may be “forward-looking” statements. Actual results may differ materially from those projected in the “forward-looking” statements.
The views expressed in this report reflect those of the portfolio managers, only through the end of the period as stated on the cover. The portfolio managers’ views are subject to change at any time based on market and other conditions.
Portfolio holdings are subject to change daily.
(1)
The Class Z shares performance shown for the period prior to their inception date is the performance of Class I shares without adjustment for any differences in the expenses between the two classes. If adjusted for such differences, returns would be different.
| Portfolio Managers’ Report | Voya Index Solution 2035 Portfolio |
| | | Average Annual Total Returns for the Periods Ended December 31, 2017 | | |
| | | | | | 1 Year | | | 5 Year | | | Since Inception
of Classes ADV, I, and S
March 10, 2008 | | | Since Inception
of Class S2
May 28, 2009 | | | Since Inception
of Class Z
May 1, 2015 | | |
| | | Class ADV | | | | | 17.95% | | | | | | 9.87% | | | | | | 6.38% | | | | | | — | | | | | | — | | | |
| | | Class I | | | | | 18.65% | | | | | | 10.42% | | | | | | 6.90% | | | | | | — | | | | | | — | | | |
| | | Class S | | | | | 18.39% | | | | | | 10.15% | | | | | | 6.65% | | | | | | — | | | | | | — | | | |
| | | Class S2 | | | | | 18.14% | | | | | | 9.97% | | | | | | — | | | | | | 10.92% | | | | | | — | | | |
| | | Class Z(1) | | | | | 18.88% | | | | | | 10.53% | | | | | | — | | | | | | — | | | | | | 6.96% | | | |
| | | S&P Target Date 2035 Index | | | | | 17.78% | | | | | | 10.29% | | | | | | 7.22% | | | | | | 11.63% | | | | | | 7.22% | | | |
| | | | | |
Based on a $10,000 initial investment, the graph and table above illustrate the total return of Voya Index Solution 2035 Portfolio against the index indicated. The index is unmanaged and has no cash in its portfolio and imposes no sales charges. An investor cannot invest directly in an index. On June 1, 2017, S&P Dow Jones Indices, a third-party index provider, made construction and methodology changes to the index used by the Portfolio. Performance for the index for periods prior to June 1, 2017 has been recalculated by the index provider based on the new construction and methodology.
The Portfolio’s performance is shown without the imposition of any expenses or charges which are, or may be, imposed under your variable annuity contract or variable life insurance policy. Total returns would have been lower if such expenses or charges were included.
The performance graph and table do not reflect the deduction of taxes that a shareholder will pay on Portfolio distributions or the redemption of Portfolio shares.
The performance shown may include the effect of fee waivers and/or expense reimbursements by the Investment Adviser and/or other service providers, which have the effect of increasing total return. Had all fees and expenses been considered, the total returns would have been lower.
The performance update illustrates performance for a variable investment option available through a variable annuity contract or a variable life insurance policy. The performance shown indicates past performance and is not a projection or prediction of future results. Actual investment returns and principal value will fluctuate so that shares and/or units, at redemption, may be worth more or less than their original cost. Please log on to www.voyainvestments.com or call (800) 262-3862 to get performance through the most recent month end.
This report contains statements that may be “forward-looking” statements. Actual results may differ materially from those projected in the “forward-looking” statements.
The views expressed in this report reflect those of the portfolio managers, only through the end of the period as stated on the cover. The portfolio managers’ views are subject to change at any time based on market and other conditions.
Portfolio holdings are subject to change daily.
(1)
The Class Z shares performance shown for the period prior to their inception date is the performance of Class I shares without adjustment for any differences in the expenses between the two classes. If adjusted for such differences, returns would be different.
| Voya Index Solution 2040 Portfolio | Portfolio Managers’ Report |
| | | Average Annual Total Returns for the Periods Ended December 31, 2017 | | |
| | | | | | 1 Year | | | 5 Year | | | Since Inception
of Classes ADV, I, S, and S2
October 3, 2011 | | | Since Inception
of Class Z
May 1, 2015 | | |
| | | Class ADV | | | | | 19.05% | | | | | | 10.40% | | | | | | 12.70% | | | | | | — | | | |
| | | Class I | | | | | 19.68% | | | | | | 10.92% | | | | | | 13.24% | | | | | | — | | | |
| | | Class S | | | | | 19.39% | | | | | | 10.66% | | | | | | 12.94% | | | | | | — | | | |
| | | Class S2 | | | | | 19.21% | | | | | | 10.48% | | | | | | 12.78% | | | | | | — | | | |
| | | Class Z(1) | | | | | 19.86% | | | | | | 11.00% | | | | | | — | | | | | | 13.30% | | | |
| | | S&P Target Date 2040 Index | | | | | 18.87% | | | | | | 10.78% | | | | | | 13.03% | | | | | | 13.03% | | | |
| | | | | |
Based on a $10,000 initial investment, the graph and table above illustrate the total return of Voya Index Solution 2040 Portfolio against the index indicated. The index is unmanaged and has no cash in its portfolio and imposes no sales charges. An investor cannot invest directly in an index. On June 1, 2017, S&P Dow Jones Indices, a third-party index provider, made construction and methodology changes to the index used by the Portfolio. Performance for the index for periods prior to June 1, 2017 has been recalculated by the index provider based on the new construction and methodology.
The Portfolio’s performance is shown without the imposition of any expenses or charges which are, or may be, imposed under your variable annuity contract or variable life insurance policy. Total returns would have been lower if such expenses or charges were included.
The performance graph and table do not reflect the deduction of taxes that a shareholder will pay on Portfolio distributions or the redemption of Portfolio shares.
The performance shown may include the effect of fee waivers and/or expense reimbursements by the Investment Adviser and/or other service providers, which have the effect of increasing total return. Had all fees and expenses been considered, the total returns would have been lower.
The performance update illustrates performance for a variable investment option available through a variable annuity contract or a variable life insurance policy. The performance shown indicates past performance and is not a projection or prediction of future results. Actual investment returns and principal value will fluctuate so that shares and/or units, at redemption, may be worth more or less than their original cost. Please log on to www.voyainvestments.com or call (800) 262-3862 to get performance through the most recent month end.
This report contains statements that may be “forward-looking” statements. Actual results may differ materially from those projected in the “forward-looking” statements.
The views expressed in this report reflect those of the portfolio managers, only through the end of the period as stated on the cover. The portfolio managers’ views are subject to change at any time based on market and other conditions.
Portfolio holdings are subject to change daily.
(1)
The Class Z shares performance shown for the period prior to their inception date is the performance of Class I shares without adjustment for any differences in the expenses between the two classes. If adjusted for such differences, returns would be different.
| Portfolio Managers’ Report | Voya Index Solution 2045 Portfolio |
| | | Average Annual Total Returns for the Periods Ended December 31, 2017 | | |
| | | | | | 1 Year | | | 5 Year | | | Since Inception
of Classes ADV, I, and S
March 10, 2008 | | | Since Inception
of Class S2
May 28, 2009 | | | Since Inception
of Class Z
May 1, 2015 | | |
| | | Class ADV | | | | | 19.96% | | | | | | 10.62% | | | | | | 6.55% | | | | | | — | | | | | | — | | | |
| | | Class I | | | | | 20.48% | | | | | | 11.16% | | | | | | 7.08% | | | | | | — | | | | | | — | | | |
| | | Class S | | | | | 20.21% | | | | | | 10.89% | | | | | | 6.82% | | | | | | — | | | | | | — | | | |
| | | Class S2 | | | | | 19.97% | | | | | | 10.73% | | | | | | — | | | | | | 11.66% | | | | | | — | | | |
| | | Class Z(1) | | | | | 20.81% | | | | | | 11.27% | | | | | | — | | | | | | — | | | | | | 7.14% | | | |
| | | S&P Target Date 2045 Index | | | | | 19.56% | | | | | | 11.15% | | | | | | 7.49% | | | | | | 12.29% | | | | | | 7.49% | | | |
| | | | | |
Based on a $10,000 initial investment, the graph and table above illustrate the total return of Voya Index Solution 2045 Portfolio against the index indicated. The index is unmanaged and has no cash in its portfolio and imposes no sales charges. An investor cannot invest directly in an index. On June 1, 2017, S&P Dow Jones Indices, a third-party index provider, made construction and methodology changes to the index used by the Portfolio. Performance for the index for periods prior to June 1, 2017 has been recalculated by the index provider based on the new construction and methodology.
The Portfolio’s performance is shown without the imposition of any expenses or charges which are, or may be, imposed under your variable annuity contract or variable life insurance policy. Total returns would have been lower if such expenses or charges were included.
The performance graph and table do not reflect the deduction of taxes that a shareholder will pay on Portfolio distributions or the redemption of Portfolio shares.
The performance shown may include the effect of fee waivers and/or expense reimbursements by the Investment Adviser and/or other service providers, which have the effect of increasing total return. Had all fees and expenses been considered, the total returns would have been lower.
The performance update illustrates performance for a variable investment option available through a variable annuity contract or a variable life insurance policy. The performance shown indicates past performance and is not a projection or prediction of future results. Actual investment returns and principal value will fluctuate so that shares and/or units, at redemption, may be worth more or less than their original cost. Please log on to www.voyainvestments.com or call (800) 262-3862 to get performance through the most recent month end.
This report contains statements that may be “forward-looking” statements. Actual results may differ materially from those projected in the “forward-looking” statements.
The views expressed in this report reflect those of the portfolio managers, only through the end of the period as stated on the cover. The portfolio managers’ views are subject to change at any time based on market and other conditions.
Portfolio holdings are subject to change daily.
(1)
The Class Z shares performance shown for the period prior to their inception date is the performance of Class I shares without adjustment for any differences in the expenses between the two classes. If adjusted for such differences, returns would be different.
| Voya Index Solution 2050 Portfolio | Portfolio Managers’ Report |
| | | Average Annual Total Returns for the Periods Ended December 31, 2017 | | |
| | | | | | 1 Year | | | 5 Year | | | Since Inception
of Classes ADV, I, S, and S2
October 3, 2011 | | | Since Inception
of Class Z
May 1, 2015 | | |
| | | Class ADV | | | | | 20.12% | | | | | | 10.68% | | | | | | 12.96% | | | | | | — | | | |
| | | Class I | | | | | 20.75% | | | | | | 11.26% | | | | | | 13.54% | | | | | | — | | | |
| | | Class S | | | | | 20.47% | | | | | | 11.00% | | | | | | 13.26% | | | | | | — | | | |
| | | Class S2 | | | | | 20.21% | | | | | | 10.78% | | | | | | 13.07% | | | | | | — | | | |
| | | Class Z(1) | | | | | 21.03% | | | | | | 11.33% | | | | | | — | | | | | | 13.60% | | | |
| | | S&P Target Date 2050 Index | | | | | 20.18% | | | | | | 11.48% | | | | | | 13.80% | | | | | | 13.80% | | | |
| | | | | |
Based on a $10,000 initial investment, the graph and table above illustrate the total return of Voya Index Solution 2050 Portfolio against the index indicated. The index is unmanaged and has no cash in its portfolio and imposes no sales charges. An investor cannot invest directly in an index. On June 1, 2017, S&P Dow Jones Indices, a third-party index provider, made construction and methodology changes to the index used by the Portfolio. Performance for the index for periods prior to June 1, 2017 has been recalculated by the index provider based on the new construction and methodology.
The Portfolio’s performance is shown without the imposition of any expenses or charges which are, or may be, imposed under your variable annuity contract or variable life insurance policy. Total returns would have been lower if such expenses or charges were included.
The performance graph and table do not reflect the deduction of taxes that a shareholder will pay on Portfolio distributions or the redemption of Portfolio shares.
The performance shown may include the effect of fee waivers and/or expense reimbursements by the Investment Adviser and/or other service providers, which have the effect of increasing total return. Had all fees and expenses been considered, the total returns would have been lower.
The performance update illustrates performance for a variable investment option available through a variable annuity contract or a variable life insurance policy. The performance shown indicates past performance and is not a projection or prediction of future results. Actual investment returns and principal value will fluctuate so that shares and/or units, at redemption, may be worth more or less than their original cost. Please log on to www.voyainvestments.com or call (800) 262-3862 to get performance through the most recent month end.
This report contains statements that may be “forward-looking” statements. Actual results may differ materially from those projected in the “forward-looking” statements.
The views expressed in this report reflect those of the portfolio managers, only through the end of the period as stated on the cover. The portfolio managers’ views are subject to change at any time based on market and other conditions.
Portfolio holdings are subject to change daily.
(1)
The Class Z shares performance shown for the period prior to their inception date is the performance of Class I shares without adjustment for any differences in the expenses between the two classes. If adjusted for such differences, returns would be different.
| Portfolio Managers’ Report | Voya Index Solution 2055 Portfolio |
| | | Average Annual Total Returns for the Periods Ended December 31, 2017 | | |
| | | | | | 1 Year | | | 5 Year | | | Since Inception
of Classes ADV, I, S, and S2
March 8, 2010 | | | Since Inception
of Class Z
May 1, 2015 | | |
| | | Class ADV | | | | | 20.37% | | | | | | 10.73% | | | | | | 9.68% | | | | | | — | | | |
| | | Class I | | | | | 21.03% | | | | | | 11.26% | | | | | | 10.22% | | | | | | — | | | |
| | | Class S | | | | | 20.63% | | | | | | 11.00% | | | | | | 9.95% | | | | | | — | | | |
| | | Class S2 | | | | | 20.50% | | | | | | 10.83% | | | | | | 9.78% | | | | | | — | | | |
| | | Class Z(1) | | | | | 21.27% | | | | | | 11.37% | | | | | | — | | | | | | 10.29% | | | |
| | | S&P Target Date 2055 Index | | | | | 20.48% | | | | | | 11.70% | | | | | | 10.66% | | | | | | 10.66% | | | |
Based on a $10,000 initial investment, the graph and table above illustrate the total return of Voya Index Solution 2055 Portfolio against the index indicated. The index is unmanaged and has no cash in its portfolio and imposes no sales charges. An investor cannot invest directly in an index. On June 1, 2017, S&P Dow Jones Indices, a third-party index provider, made construction and methodology changes to the index used by the Portfolio. Performance for the index for periods prior to June 1, 2017 has been recalculated by the index provider based on the new construction and methodology.
The Portfolio’s performance is shown without the imposition of any expenses or charges which are, or may be, imposed under your variable annuity contract or variable life insurance policy. Total returns would have been lower if such expenses or charges were included.
The performance graph and table do not reflect the deduction of taxes that a shareholder will pay on Portfolio distributions or the redemption of Portfolio shares.
The performance shown may include the effect of fee waivers and/or expense reimbursements by the Investment Adviser and/or other service providers, which have the effect of increasing total return. Had all fees and expenses been considered, the total returns would have been lower.
The performance update illustrates performance for a variable investment option available through a variable annuity contract or a variable life insurance policy. The performance shown indicates past performance and is not a projection or prediction of future results. Actual investment returns and principal value will fluctuate so that shares and/or units, at redemption, may be worth more or less than their original cost. Please log on to www.voyainvestments.com or call (800) 262-3862 to get performance through the most recent month end.
This report contains statements that may be “forward-looking” statements. Actual results may differ materially from those projected in the “forward-looking” statements.
The views expressed in this report reflect those of the portfolio managers, only through the end of the period as stated on the cover. The portfolio managers’ views are subject to change at any time based on market and other conditions.
Portfolio holdings are subject to change daily.
(1)
The Class Z shares performance shown for the period prior to their inception date is the performance of Class I shares without adjustment for any differences in the expenses between the two classes. If adjusted for such differences, returns would be different.
| Voya Index Solution 2060 Portfolio | Portfolio Managers’ Report |
| | | Average Annual Total Returns for the Periods Ended December 31, 2017 | | |
| | | | | | 1 Year | | | Since Inception
of Classes ADV, I, and S
February 9, 2015 | | | Since Inception
of Class Z
May 1, 2015 | | |
| | | Class ADV | | | | | 20.44% | | | | | | 8.60% | | | | | | — | | | |
| | | Class I | | | | | 21.11% | | | | | | 9.13% | | | | | | — | | | |
| | | Class S | | | | | 20.76% | | | | | | 8.85% | | | | | | — | | | |
| | | Class S2 | | | | | 20.54% | | | | | | 8.65% | | | | | | — | | | |
| | | Class Z(1) | | | | | 21.24% | | | | | | — | | | | | | 9.29% | | | |
| | | S&P Target Date 2060+ Index | | | | | 20.75% | | | | | | 9.82% | | | | | | 9.82% | | | |
Based on a $10,000 initial investment, the graph and table above illustrate the total return of Voya Index Solution 2060 Portfolio against the index indicated. The index is unmanaged and has no cash in its portfolio and imposes no sales charges. An investor cannot invest directly in an index. On June 1, 2017, S&P Dow Jones Indices, a third-party index provider, made construction and methodology changes to the index used by the Portfolio. Performance for the index for periods prior to June 1, 2017 has been recalculated by the index provider based on the new construction and methodology.
The Portfolio’s performance is shown without the imposition of any expenses or charges which are, or may be, imposed under your variable annuity contract or variable life insurance policy. Total returns would have been lower if such expenses or charges were included.
The performance graph and table do not reflect the deduction of taxes that a shareholder will pay on Portfolio distributions or the redemption of Portfolio shares.
The performance shown may include the effect of fee waivers and/or expense reimbursements by the Investment Adviser and/or other service providers, which have the effect of increasing total return. Had all fees and expenses been considered, the total returns would have been lower.
The performance update illustrates performance for a variable investment option available through a variable
annuity contract or a variable life insurance policy. The performance shown indicates past performance and is not a projection or prediction of future results. Actual investment returns and principal value will fluctuate so that shares and/or units, at redemption, may be worth more or less than their original cost. Please log on to www.voyainvestments.com or call (800) 262-3862 to get performance through the most recent month end.
It is important to note that the Portfolio has a limited operating history. Performance over a longer period of time may be more meaningful than short-term performance.
This report contains statements that may be “forward-looking” statements. Actual results may differ materially from those projected in the “forward-looking” statements.
The views expressed in this report reflect those of the portfolio managers, only through the end of the period as stated on the cover. The portfolio managers’ views are subject to change at any time based on market and other conditions.
Portfolio holdings are subject to change daily.
(1)
The Class Z shares performance shown for the period prior to their inception date is the performance of Class I shares without adjustment for any differences in the expenses between the two classes. If adjusted for such differences, returns would be different.
SHAREHOLDER EXPENSE EXAMPLES (Unaudited)
As a shareholder of a Portfolio, you incur two types of costs: (1) transaction costs, including redemption fees and exchange fees; and (2) ongoing costs including management fees, distribution and/or service (12b-1) fees, and other Portfolio expenses. These Examples are intended to help you understand your ongoing costs (in dollars) of investing in a Portfolio and to compare these costs with the ongoing costs of investing in other mutual funds.
The Examples are based on an investment of $1,000 invested at the beginning of the period and held for the entire period from July 1, 2017 to December 31, 2017. The Portfolios’ expenses are shown without the imposition of any charges which are, or may be, imposed under your variable annuity contract, variable life insurance policy, qualified pension or retirement plan. Expenses would have been higher if such charges were included.
Actual Expenses
The left section of the table shown below, “Actual Portfolio Return,” provides information about actual account values and actual expenses. You may use the information in this section, together with the amount you invested, to estimate the expenses that you paid over the period. Simply divide your account value by $1,000 (for example, an $8,600 account value divided by $1,000 = 8.6), then multiply the result by the number in the first section under the heading entitled “Expenses Paid During the Period” to estimate the expenses you paid on your account during this period.
Hypothetical Example for Comparison Purposes
The right section of the table shown below, “Hypothetical (5% return before expenses),” provides information about hypothetical account values and hypothetical expenses based on a Portfolio’s actual expense ratio and an assumed rate of return of 5% per year before expenses, which is not a Portfolio’s actual return. The hypothetical account values and expenses may not be used to estimate the actual ending account balance or expenses you paid for the period. You may use this information to compare the ongoing costs of investing in a Portfolio and other mutual funds. To do so, compare this 5% hypothetical example with the 5% hypothetical examples that appear in the shareholder reports of the other mutual funds.
Please note that the expenses shown in the table are meant to highlight your ongoing costs only and do not reflect any transactional costs, such as redemption fees or exchange fees. Therefore, the hypothetical section of the table is useful in comparing ongoing costs only, and will not help you determine the relative total costs of owning different mutual funds. In addition, if these transactional costs were included, your costs would have been higher.
| | | | Actual Portfolio Return | | | Hypothetical (5% return before expenses) | |
| | | | Beginning
Account
Value
June 30,
2017 | | | Ending
Account
Value
December 31,
2017 | | | Annualized
Expense
Ratio* | | | Expenses Paid
During the
Period Ended
December 31,
2017** | | | Beginning
Account
Value
June 30,
2017 | | | Ending
Account
Value
December 31,
2017 | | | Annualized
Expense
Ratio* | | | Expenses Paid
During the
Period Ended
December 31,
2017** | |
| Voya Index Solution Income Portfolio | |
| Class ADV | | | | $ | 1,000.00 | | | | | $ | 1,042.90 | | | | | | 0.68% | | | | | $ | 3.50 | | | | | $ | 1,000.00 | | | | | $ | 1,021.78 | | | | | | 0.68% | | | | | $ | 3.47 | | |
| Class I | | | | | 1,000.00 | | | | | | 1,045.40 | | | | | | 0.18 | | | | | | 0.93 | | ��� | | | | 1,000.00 | | | | | | 1,024.30 | | | | | | 0.18 | | | | | | 0.92 | | |
| Class S | | | | | 1,000.00 | | | | | | 1,044.00 | | | | | | 0.43 | | | | | | 2.22 | | | | | | 1,000.00 | | | | | | 1,023.04 | | | | | | 0.43 | | | | | | 2.19 | | |
| Class S2 | | | | | 1,000.00 | | | | | | 1,043.60 | | | | | | 0.58 | | | | | | 2.99 | | | | | | 1,000.00 | | | | | | 1,022.28 | | | | | | 0.58 | | | | | | 2.96 | | |
| Class Z | | | | | 1,000.00 | | | | | | 1,046.10 | | | | | | 0.00 | | | | | | 0.00 | | | | | | 1,000.00 | | | | | | 1,025.21 | | | | | | 0.00 | | | | | | 0.00 | | |
| Voya Index Solution 2020 Portfolio | |
| Class ADV | | | | $ | 1,000.00 | | | | | $ | 1,057.10 | | | | | | 0.68% | | | | | $ | 3.53 | | | | | $ | 1,000.00 | | | | | $ | 1,021.78 | | | | | | 0.68% | | | | | $ | 3.47 | | |
| Class I | | | | | 1,000.00 | | | | | | 1,060.20 | | | | | | 0.18 | | | | | | 0.93 | | | | | | 1,000.00 | | | | | | 1,024.30 | | | | | | 0.18 | | | | | | 0.92 | | |
| Class S | | | | | 1,000.00 | | | | | | 1,058.40 | | | | | | 0.43 | | | | | | 2.23 | | | | | | 1,000.00 | | | | | | 1,023.04 | | | | | | 0.43 | | | | | | 2.19 | | |
| Class S2 | | | | | 1,000.00 | | | | | | 1,057.60 | | | | | | 0.58 | | | | | | 3.01 | | | | | | 1,000.00 | | | | | | 1,022.28 | | | | | | 0.58 | | | | | | 2.96 | | |
| Class Z | | | | | 1,000.00 | | | | | | 1,061.60 | | | | | | 0.00 | | | | | | 0.00 | | | | | | 1,000.00 | | | | | | 1,025.21 | | | | | | 0.00 | | | | | | 0.00 | | |
SHAREHOLDER EXPENSE EXAMPLES (Unaudited) (continued)
| | | | Actual Portfolio Return | | | Hypothetical (5% return before expenses) | |
| | | | Beginning
Account
Value
June 30,
2017 | | | Ending
Account
Value
December 31,
2017 | | | Annualized
Expense
Ratio* | | | Expenses Paid
During the
Period Ended
December 31,
2017** | | | Beginning
Account
Value
June 30,
2017 | | | Ending
Account
Value
December 31,
2017 | | | Annualized
Expense
Ratio* | | | Expenses Paid
During the
Period Ended
December 31,
2017** | |
| Voya Index Solution 2025 Portfolio | |
| Class ADV | | | | $ | 1,000.00 | | | | | $ | 1,069.70 | | | | | | 0.68% | | | | | $ | 3.55 | | | | | $ | 1,000.00 | | | | | $ | 1,021.78 | | | | | | 0.68% | | | | | $ | 3.47 | | |
| Class I | | | | | 1,000.00 | | | | | | 1,072.20 | | | | | | 0.18 | | | | | | 0.94 | | | | | | 1,000.00 | | | | | | 1,024.30 | | | | | | 0.18 | | | | | | 0.92 | | |
| Class S | | | | | 1,000.00 | | | | | | 1,070.30 | | | | | | 0.43 | | | | | | 2.24 | | | | | | 1,000.00 | | | | | | 1,023.04 | | | | | | 0.43 | | | | | | 2.19 | | |
| Class S2 | | | | | 1,000.00 | | | | | | 1,070.30 | | | | | | 0.58 | | | | | | 3.03 | | | | | | 1,000.00 | | | | | | 1,022.28 | | | | | | 0.58 | | | | | | 2.96 | | |
| Class Z | | | | | 1,000.00 | | | | | | 1,072.90 | | | | | | 0.00 | | | | | | 0.00 | | | | | | 1,000.00 | | | | | | 1,025.21 | | | | | | 0.00 | | | | | | 0.00 | | |
| Voya Index Solution 2030 Portfolio | |
| Class ADV | | | | $ | 1,000.00 | | | | | $ | 1,081.20 | | | | | | 0.69% | | | | | $ | 3.62 | | | | | $ | 1,000.00 | | | | | $ | 1,021.73 | | | | | | 0.69% | | | | | $ | 3.52 | | |
| Class I | | | | | 1,000.00 | | | | | | 1,083.80 | | | | | | 0.19 | | | | | | 1.00 | | | | | | 1,000.00 | | | | | | 1,024.25 | | | | | | 0.19 | | | | | | 0.97 | | |
| Class S | | | | | 1,000.00 | | | | | | 1,082.90 | | | | | | 0.44 | | | | | | 2.31 | | | | | | 1,000.00 | | | | | | 1,022.99 | | | | | | 0.44 | | | | | | 2.24 | | |
| Class S2 | | | | | 1,000.00 | | | | | | 1,081.40 | | | | | | 0.59 | | | | | | 3.10 | | | | | | 1,000.00 | | | | | | 1,022.23 | | | | | | 0.59 | | | | | | 3.01 | | |
| Class Z | | | | | 1,000.00 | | | | | | 1,085.10 | | | | | | 0.00 | | | | | | 0.00 | | | | | | 1,000.00 | | | | | | 1,025.21 | | | | | | 0.00 | | | | | | 0.00 | | |
| Voya Index Solution 2035 Portfolio | |
| Class ADV | | | | $ | 1,000.00 | | | | | $ | 1,089.00 | | | | | | 0.68% | | | | | $ | 3.58 | | | | | $ | 1,000.00 | | | | | $ | 1,021.78 | | | | | | 0.68% | | | | | $ | 3.47 | | |
| Class I | | | | | 1,000.00 | | | | | | 1,091.60 | | | | | | 0.18 | | | | | | 0.95 | | | | | | 1,000.00 | | | | | | 1,024.30 | | | | | | 0.18 | | | | | | 0.92 | | |
| Class S | | | | | 1,000.00 | | | | | | 1,090.10 | | | | | | 0.43 | | | | | | 2.27 | | | | | | 1,000.00 | | | | | | 1,023.04 | | | | | | 0.43 | | | | | | 2.19 | | |
| Class S2 | | | | | 1,000.00 | | | | | | 1,089.50 | | | | | | 0.58 | | | | | | 3.05 | | | | | | 1,000.00 | | | | | | 1,022.28 | | | | | | 0.58 | | | | | | 2.96 | | |
| Class Z | | | | | 1,000.00 | | | | | | 1,093.00 | | | | | | 0.00 | | | | | | 0.00 | | | | | | 1,000.00 | | | | | | 1,025.21 | | | | | | 0.00 | | | | | | 0.00 | | |
| Voya Index Solution 2040 Portfolio | |
| Class ADV | | | | $ | 1,000.00 | | | | | $ | 1,093.80 | | | | | | 0.68% | | | | | $ | 3.59 | | | | | $ | 1,000.00 | | | | | $ | 1,021.78 | | | | | | 0.68% | | | | | $ | 3.47 | | |
| Class I | | | | | 1,000.00 | | | | | | 1,096.80 | | | | | | 0.18 | | | | | | 0.95 | | | | | | 1,000.00 | | | | | | 1,024.30 | | | | | | 0.18 | | | | | | 0.92 | | |
| Class S | | | | | 1,000.00 | | | | | | 1,094.80 | | | | | | 0.43 | | | | | | 2.27 | | | | | | 1,000.00 | | | | | | 1,023.04 | | | | | | 0.43 | | | | | | 2.19 | | |
| Class S2 | | | | | 1,000.00 | | | | | | 1,094.40 | | | | | | 0.58 | | | | | | 3.06 | | | | | | 1,000.00 | | | | | | 1,022.28 | | | | | | 0.58 | | | | | | 2.96 | | |
| Class Z | | | | | 1,000.00 | | | | | | 1,097.20 | | | | | | 0.00 | | | | | | 0.00 | | | | | | 1,000.00 | | | | | | 1,025.21 | | | | | | 0.00 | | | | | | 0.00 | | |
| Voya Index Solution 2045 Portfolio | |
| Class ADV | | | | $ | 1,000.00 | | | | | $ | 1,097.60 | | | | | | 0.69% | | | | | $ | 3.65 | | | | | $ | 1,000.00 | | | | | $ | 1,021.73 | | | | | | 0.69% | | | | | $ | 3.52 | | |
| Class I | | | | | 1,000.00 | | | | | | 1,099.40 | | | | | | 0.19 | | | | | | 1.01 | | | | | | 1,000.00 | | | | | | 1,024.25 | | | | | | 0.19 | | | | | | 0.97 | | |
| Class S | | | | | 1,000.00 | | | | | | 1,098.50 | | | | | | 0.44 | | | | | | 2.33 | | | | | | 1,000.00 | | | | | | 1,022.99 | | | | | | 0.44 | | | | | | 2.24 | | |
| Class S2 | | | | | 1,000.00 | | | | | | 1,097.80 | | | | | | 0.59 | | | | | | 3.12 | | | | | | 1,000.00 | | | | | | 1,022.23 | | | | | | 0.59 | | | | | | 3.01 | | |
| Class Z | | | | | 1,000.00 | | | | | | 1,101.80 | | | | | | 0.00 | | | | | | 0.00 | | | | | | 1,000.00 | | | | | | 1,025.21 | | | | | | 0.00 | | | | | | 0.00 | | |
| Voya Index Solution 2050 Portfolio | |
| Class ADV | | | | $ | 1,000.00 | | | | | $ | 1,098.90 | | | | | | 0.70% | | | | | $ | 3.70 | | | | | $ | 1,000.00 | | | | | $ | 1,021.68 | | | | | | 0.70% | | | | | $ | 3.57 | | |
| Class I | | | | | 1,000.00 | | | | | | 1,101.60 | | | | | | 0.20 | | | | | | 1.06 | | | | | | 1,000.00 | | | | | | 1,024.20 | | | | | | 0.20 | | | | | | 1.02 | | |
| Class S | | | | | 1,000.00 | | | | | | 1,099.70 | | | | | | 0.45 | | | | | | 2.38 | | | | | | 1,000.00 | | | | | | 1,022.94 | | | | | | 0.45 | | | | | | 2.29 | | |
| Class S2 | | | | | 1,000.00 | | | | | | 1,093.30 | | | | | | 0.60 | | | | | | 3.17 | | | | | | 1,000.00 | | | | | | 1,022.18 | | | | | | 0.60 | | | | | | 3.06 | | |
| Class Z | | | | | 1,000.00 | | | | | | 1,102.70 | | | | | | 0.00 | | | | | | 0.00 | | | | | | 1,000.00 | | | | | | 1,025.21 | | | | | | 0.00 | | | | | | 0.00 | | |
SHAREHOLDER EXPENSE EXAMPLES (Unaudited) (continued)
| | | | Actual Portfolio Return | | | Hypothetical (5% return before expenses) | |
| | | | Beginning
Account
Value
June 30,
2017 | | | Ending
Account
Value
December 31,
2017 | | | Annualized
Expense
Ratio* | | | Expenses Paid
During the
Period Ended
December 31,
2017** | | | Beginning
Account
Value
June 30,
2017 | | | Ending
Account
Value
December 31,
2017 | | | Annualized
Expense
Ratio* | | | Expenses Paid
During the
Period Ended
December 31,
2017** | |
| Voya Index Solution 2055 Portfolio | |
| Class ADV | | | | $ | 1,000.00 | | | | | $ | 1,099.70 | | | | | | 0.70% | | | | | $ | 3.70 | | | | | $ | 1,000.00 | | | | | $ | 1,021.68 | | | | | | 0.70% | | | | | $ | 3.57 | | |
| Class I | | | | | 1,000.00 | | | | | | 1,102.40 | | | | | | 0.20 | | | | | | 1.06 | | | | | | 1,000.00 | | | | | | 1,024.20 | | | | | | 0.20 | | | | | | 1.02 | | |
| Class S | | | | | 1,000.00 | | | | | | 1,100.20 | | | | | | 0.45 | | | | | | 2.38 | | | | | | 1,000.00 | | | | | | 1,022.94 | | | | | | 0.45 | | | | | | 2.29 | | |
| Class S2 | | | | | 1,000.00 | | | | | | 1,099.70 | | | | | | 0.60 | | | | | | 3.18 | | | | | | 1,000.00 | | | | | | 1,022.18 | | | | | | 0.60 | | | | | | 3.06 | | |
| Class Z | | | | | 1,000.00 | | | | | | 1,103.40 | | | | | | 0.00 | | | | | | 0.00 | | | | | | 1,000.00 | | | | | | 1,025.21 | | | | | | 0.00 | | | | | | 0.00 | | |
| Voya Index Solution 2060 Portfolio | |
| Class ADV | | | | $ | 1,000.00 | | | | | $ | 1,099.50 | | | | | | 0.70% | | | | | $ | 3.70 | | | | | $ | 1,000.00 | | | | | $ | 1,021.68 | | | | | | 0.70% | | | | | $ | 3.57 | | |
| Class I | | | | | 1,000.00 | | | | | | 1,101.60 | | | | | | 0.20 | | | | | | 1.06 | | | | | | 1,000.00 | | | | | | 1,024.20 | | | | | | 0.20 | | | | | | 1.02 | | |
| Class S | | | | | 1,000.00 | | | | | | 1,100.90 | | | | | | 0.45 | | | | | | 2.38 | | | | | | 1,000.00 | | | | | | 1,022.94 | | | | | | 0.45 | | | | | | 2.29 | | |
| Class S2 | | | | | 1,000.00 | | | | | | 1,099.60 | | | | | | 0.60 | | | | | | 3.18 | | | | | | 1,000.00 | | | | | | 1,022.18 | | | | | | 0.60 | | | | | | 3.06 | | |
| Class Z | | | | | 1,000.00 | | | | | | 1,103.10 | | | | | | 0.00 | | | | | | 0.00 | | | | | | 1,000.00 | | | | | | 1,025.21 | | | | | | 0.00 | | | | | | 0.00 | | |
*
The annualized expense ratios do not include expenses of underlying funds.
**
Expenses are equal to each Portfolio’s respective annualized expense ratios multiplied by the average account value over the period, multiplied by 184/365 to reflect the most recent fiscal half-year.
REPORT OF INDEPENDENT REGISTERED PUBLIC ACCOUNTING FIRM
To the Shareholders and Board of Directors
Voya Partners, Inc.:
Opinion on the Financial Statements
We have audited the accompanying statements of assets and liabilities of Voya Index Solution Income Portfolio, Voya Index Solution 2020 Portfolio, Voya Index Solution 2025 Portfolio, Voya Index Solution 2030 Portfolio, Voya Index Solution 2035 Portfolio, Voya Index Solution 2040 Portfolio, Voya Index Solution 2045 Portfolio, Voya Index Solution 2050 Portfolio, Voya Index Solution 2055 Portfolio, and Voya Index Solution 2060 Portfolio (the “Funds”), each a series of Voya Partners, Inc., including the portfolios of investments, as of December 31, 2017, the related statements of operations for the year then ended, the statements of changes in net assets for each of the years in the two-year period then ended, and the related notes (collectively, the “financial statements”) and the financial highlights for each of the years or periods in the five-year period then ended. In our opinion, the financial statements and financial highlights present fairly, in all material respects, the financial position of the Funds as of December 31, 2017, and the results of their operations for the year then ended, the changes in their net assets for each of the years in the two-year period then ended, and the financial highlights for each of the years or periods in the five-year period then ended, in conformity with U.S. generally accepted accounting principles.
Basis for Opinion
These financial statements and financial highlights are the responsibility of the Funds’ management. Our responsibility is to express an opinion on these financial statements and financial highlights based on our audits. We are a public accounting firm registered with the Public Company Accounting Oversight Board (United States) (“PCAOB”) and are required to be independent with respect to the Funds in accordance with the U.S. federal securities laws and the applicable rules and regulations of the Securities and Exchange Commission and the PCAOB.
We conducted our audits in accordance with the standards of the PCAOB. Those standards require that we plan and perform the audit to obtain reasonable assurance about whether the financial statements and financial highlights are free of material misstatement, whether due to error or fraud. Our audits included performing procedures to assess the risks of material misstatement of the financial statements and financial highlights, whether due to error or fraud, and performing procedures that respond to those risks. Such procedures included examining, on a test basis, evidence regarding the amounts and disclosures in the financial statements and financial highlights. Such procedures also included confirmation of securities owned as of December 31, 2017, by correspondence with the custodian, transfer agent and brokers or by other appropriate auditing procedures when replies from brokers were not received. Our audits also included evaluating the accounting principles used and significant estimates made by management, as well as evaluating the overall presentation of the financial statements and financial highlights. We believe that our audits provide a reasonable basis for our opinion.
We have served as the auditor of one or more Voya investment companies since 1975.
Boston, Massachusetts
February 21, 2018
Statements of Assets and Liabilities as of December 31, 2017
| | | | Voya Index
Solution Income
Portfolio | | | Voya Index
Solution 2020
Portfolio | | | Voya Index
Solution 2025
Portfolio | | | Voya Index
Solution 2030
Portfolio |
| ASSETS: | | | | | |
| Investments in affiliated underlying funds at fair value* | | | | $ | 401,159,484 | | | | | $ | 202,662,662 | | | | | $ | 699,574,370 | | | | | $ | 256,005,543 |
| Investments in unaffiliated underlying funds at fair value** | | | | | 81,560,978 | | | | | | 42,696,665 | | | | | | 147,054,467 | | | | | | 50,089,815 |
| Cash | | | | | 631,939 | | | | | | 420,507 | | | | | | 1,184,305 | | | | | | 476,622 |
| Cash collateral for futures | | | | | 727,010 | | | | | | 304,036 | | | | | | 1,218,825 | | | | | | 406,482 |
| Foreign cash collateral for futures*** | | | | | 178,446 | | | | | | 84,321 | | | | | | 300,025 | | | | | | 98,048 |
| Receivables: | | | | | |
| Investments in affiliated underlying funds sold | | | | | 3,042,296 | | | | | | 2,998,207 | | | | | | 8,034,093 | | | | | | 5,748,899 |
| Investments in unaffiliated underlying funds sold | | | | | 644,169 | | | | | | — | | | | | | 12,375 | | | | | | — |
| Fund shares sold | | | | | 486,855 | | | | | | 29,909 | | | | | | 1,725,976 | | | | | | 372,437 |
| Dividends | | | | | 195,643 | | | | | | 92,614 | | | | | | 327,837 | | | | | | 109,065 |
| Prepaid expenses | | | | | 1,731 | | | | | | 511 | | | | | | 2,578 | | | | | | 502 |
| Reimbursement due from manager | | | | | 53,374 | | | | | | 48,068 | | | | | | 99,052 | | | | | | 56,124 |
| Other assets | | | | | 11,952 | | | | | | 1,396 | | | | | | 14,157 | | | | | | 1,499 |
| Total assets | | | | | 488,693,877 | | | | | | 249,338,896 | | | | | | 859,548,060 | | | | | | 313,365,036 |
| LIABILITIES: | | | | | |
| Payable for investments in affiliated underlying funds purchased | | | | | 3,129,975 | | | | | | — | | | | | | 2,254,160 | | | | | | 311,963 |
| Payable for investments in unaffiliated underlying funds purchased | | | | | 1,029,442 | | | | | | 2,804,663 | | | | | | 6,812,041 | | | | | | 5,572,069 |
| Payable for fund shares redeemed | | | | | 7,146 | | | | | | 273,262 | | | | | | 796,462 | | | | | | 60,474 |
| Payable for investment management fees | | | | | 95,529 | | | | | | 47,545 | | | | | | 165,376 | | | | | | 57,944 |
| Payable for distribution and shareholder service fees | | | | | 87,813 | | | | | | 13,041 | | | | | | 142,229 | | | | | | 11,823 |
| Payable to directors under the deferred compensation plan (Note 6) | | | | | 11,952 | | | | | | 1,396 | | | | | | 14,157 | | | | | | 1,499 |
| Payable for director fees | | | | | 2,241 | | | | | | 889 | | | | | | 3,577 | | | | | | 1,002 |
| Other accrued expenses and liabilities | | | | | 55,006 | | | | | | 8,290 | | | | | | 43,728 | | | | | | 7,531 |
| Total liabilities | | | | | 4,419,104 | | | | | | 3,149,086 | | | | | | 10,231,730 | | | | | | 6,024,305 |
| NET ASSETS | | | | $ | 484,274,773 | | | | | $ | 246,189,810 | | | | | $ | 849,316,330 | | | | | $ | 307,340,731 |
| NET ASSETS WERE COMPRISED OF: | | | | | |
| Paid-in capital | | | | $ | 462,640,206 | | | | | $ | 225,939,607 | | | | | $ | 772,298,617 | | | | | $ | 275,942,188 |
| Undistributed net investment income | | | | | 9,501,469 | | | | | | 4,129,729 | | | | | | 13,720,261 | | | | | | 4,654,056 |
| Accumulated net realized gain (loss) | | | | | (850,136) | | | | | | 6,914,626 | | | | | | 12,783,113 | | | | | | 8,468,650 |
| Net unrealized appreciation | | | | | 12,983,234 | | | | | | 9,205,848 | | | | | | 50,514,339 | | | | | | 18,275,837 |
| NET ASSETS | | | | $ | 484,274,773 | | | | | $ | 246,189,810 | | | | | $ | 849,316,330 | | | | | $ | 307,340,731 |
*
Cost of investments in affiliated underlying funds | | | | $ | 387,347,319 | | | | | $ | 194,241,178 | | | | | $ | 649,944,386 | | | | | $ | 238,721,539 |
**
Cost of investments in unaffiliated underlying funds | | | | $ | 82,376,362 | | | | | $ | 41,904,801 | | | | | $ | 146,142,188 | | | | | $ | 49,085,217 |
***
Cost of foreign cash collateral for futures | | | | $ | 177,727 | | | | | $ | 83,981 | | | | | $ | 298,816 | | | | | $ | 97,652 |
See Accompanying Notes to Financial Statements
Statements of Assets and Liabilities as of December 31, 2017 (continued)
| | | | Voya Index
Solution Income
Portfolio | | | Voya Index
Solution 2020
Portfolio | | | Voya Index
Solution 2025
Portfolio | | | Voya Index
Solution 2030
Portfolio |
| Class ADV | | | | | |
| Net assets | | | | $ | 110,506,924 | | | | | $ | 21,917,563 | | | | | $ | 232,790,429 | | | | | $ | 20,938,995 |
| Shares authorized | | | | | 100,000,000 | | | | | | 100,000,000 | | | | | | 100,000,000 | | | | | | 100,000,000 |
| Par value | | | | $ | 0.001 | | | | | $ | 0.001 | | | | | $ | 0.001 | | | | | $ | 0.001 |
| Shares outstanding | | | | | 10,682,381 | | | | | | 1,651,067 | | | | | | 21,275,556 | | | | | | 1,370,554 |
| Net asset value and redemption price per share | | | | $ | 10.34 | | | | | $ | 13.27 | | | | | $ | 10.94 | | | | | $ | 15.28 |
| Class I | | | | | |
| Net assets | | | | $ | 22,915,795 | | | | | $ | 5,359,763 | | | | | $ | 60,664,287 | | | | | $ | 4,953,287 |
| Shares authorized | | | | | 100,000,000 | | | | | | 100,000,000 | | | | | | 100,000,000 | | | | | | 100,000,000 |
| Par value | | | | $ | 0.001 | | | | | $ | 0.001 | | | | | $ | 0.001 | | | | | $ | 0.001 |
| Shares outstanding | | | | | 2,157,877 | | | | | | 394,420 | | | | | | 5,411,736 | | | | | | 316,455 |
| Net asset value and redemption price per share | | | | $ | 10.62 | | | | | $ | 13.59 | | | | | $ | 11.21 | | | | | $ | 15.65 |
| Class S | | | | | |
| Net assets | | | | $ | 168,729,794 | | | | | $ | 12,049,002 | | | | | $ | 149,826,690 | | | | | $ | 12,320,191 |
| Shares authorized | | | | | 100,000,000 | | | | | | 100,000,000 | | | | | | 100,000,000 | | | | | | 100,000,000 |
| Par value | | | | $ | 0.001 | | | | | $ | 0.001 | | | | | $ | 0.001 | | | | | $ | 0.001 |
| Shares outstanding | | | | | 16,047,941 | | | | | | 889,685 | | | | | | 13,509,387 | | | | | | 792,015 |
| Net asset value and redemption price per share | | | | $ | 10.51 | | | | | $ | 13.54 | | | | | $ | 11.09 | | | | | $ | 15.56 |
| Class S2 | | | | | |
| Net assets | | | | $ | 12,928,150 | | | | | $ | 3,783,288 | | | | | $ | 34,196,804 | | | | | $ | 1,799,957 |
| Shares authorized | | | | | 100,000,000 | | | | | | 100,000,000 | | | | | | 100,000,000 | | | | | | 100,000,000 |
| Par value | | | | $ | 0.001 | | | | | $ | 0.001 | | | | | $ | 0.001 | | | | | $ | 0.001 |
| Shares outstanding | | | | | 1,256,405 | | | | | | 281,027 | | | | | | 3,137,787 | | | | | | 117,097 |
| Net asset value and redemption price per share | | | | $ | 10.29 | | | | | $ | 13.46 | | | | | $ | 10.90 | | | | | $ | 15.37 |
| Class Z | | | | | |
| Net assets | | | | $ | 169,194,110 | | | | | $ | 203,080,194 | | | | | $ | 371,838,120 | | | | | $ | 267,328,301 |
| Shares authorized | | | | | 100,000,000 | | | | | | 100,000,000 | | | | | | 100,000,000 | | | | | | 100,000,000 |
| Par value | | | | $ | 0.001 | | | | | $ | 0.001 | | | | | $ | 0.001 | | | | | $ | 0.001 |
| Shares outstanding | | | | | 15,854,939 | | | | | | 14,878,392 | | | | | | 33,014,429 | | | | | | 17,036,409 |
| Net asset value and redemption price per share | | | | $ | 10.67 | | | | | $ | 13.65 | | | | | $ | 11.26 | | | | | $ | 15.69 |
See Accompanying Notes to Financial Statements
Statements of Assets and Liabilities as of December 31, 2017
| | | | Voya Index
Solution 2035
Portfolio | | | Voya Index
Solution 2040
Portfolio | | | Voya Index
Solution 2045
Portfolio | | | Voya Index
Solution 2050
Portfolio |
| ASSETS: | | | | | |
| Investments in affiliated underlying funds at fair value* | | | | $ | 640,460,296 | | | | | $ | 166,947,945 | | | | | $ | 458,091,428 | | | | | $ | 107,311,741 |
| Investments in unaffiliated underlying funds at fair value** | | | | | 116,687,431 | | | | | | 25,654,792 | | | | | | 51,762,303 | | | | | | 10,279,149 |
| Cash | | | | | 1,006,045 | | | | | | 281,198 | | | | | | 501,037 | | | | | | 164,116 |
| Cash collateral for futures | | | | | 1,096,125 | | | | | | 258,037 | | | | | | 727,139 | | | | | | 151,817 |
| Foreign cash collateral for futures*** | | | | | 268,650 | | | | | | 62,750 | | | | | | 178,446 | | | | | | 35,297 |
| Receivables: | | | | | |
| Investments in affiliated underlying funds sold | | | | | 6,105,365 | | | | | | 2,499,658 | | | | | | 2,801,123 | | | | | | 1,438,473 |
| Investments in unaffiliated underlying funds sold | | | | | 30,897 | | | | | | — | | | | | | — | | | | | | 17,002 |
| Fund shares sold | | | | | 338,362 | | | | | | 113,411 | | | | | | 407,662 | | | | | | 361,265 |
| Dividends | | | | | 294,045 | | | | | | 69,239 | | | | | | 195,537 | | | | | | 43,386 |
| Prepaid expenses | | | | | 2,208 | | | | | | 299 | | | | | | 1,443 | | | | | | 166 |
| Reimbursement due from manager | | | | | 116,956 | | | | | | 33,618 | | | | | | 55,937 | | | | | | 19,000 |
| Other assets | | | | | 11,814 | | | | | | 923 | | | | | | 7,486 | | | | | | 530 |
| Total assets | | | | | 766,418,194 | | | | | | 195,921,870 | | | | | | 514,729,541 | | | | | | 119,821,942 |
| LIABILITIES: | | | | | |
| Payable for investments in affiliated underlying funds purchased | | | | | 85,436 | | | | | | 108,819 | | | | | | 794,434 | | | | | | 471,188 |
| Payable for investments in unaffiliated underlying funds purchased | | | | | 4,936,094 | | | | | | 2,436,290 | | | | | | 2,140,411 | | | | | | 1,090,018 |
| Payable for fund shares redeemed | | | | | 1,403,867 | | | | | | 4,592 | | | | | | 262,827 | | | | | | 19,577 |
| Payable for investment management fees | | | | | 146,149 | | | | | | 35,607 | | | | | | 93,582 | | | | | | 20,867 |
| Payable for distribution and shareholder service fees | | | | | 130,009 | | | | | | 7,050 | | | | | | 88,059 | | | | | | 5,501 |
| Payable to directors under the deferred compensation plan (Note 6) | | | | | 11,814 | | | | | | 923 | | | | | | 7,486 | | | | | | 530 |
| Payable for director fees | | | | | 3,146 | | | | | | 615 | | | | | | 2,077 | | | | | | 356 |
| Other accrued expenses and liabilities | | | | | 47,926 | | | | | | 14,728 | | | | | | 37,656 | | | | | | 13,025 |
| Total liabilities | | | | | 6,764,441 | | | | | | 2,608,624 | | | | | | 3,426,532 | | | | | | 1,621,062 |
| NET ASSETS | | | | $ | 759,653,753 | | | | | $ | 193,313,246 | | | | | $ | 511,303,009 | | | | | $ | 118,200,880 |
| NET ASSETS WERE COMPRISED OF: | | | | | |
| Paid-in capital | | | | $ | 671,169,430 | | | | | $ | 170,992,180 | | | | | $ | 447,087,495 | | | | | $ | 104,655,550 |
| Undistributed net investment income | | | | | 11,465,268 | | | | | | 2,672,039 | | | | | | 6,832,072 | | | | | | 1,463,804 |
| Accumulated net realized gain | | | | | 14,989,508 | | | | | | 5,773,292 | | | | | | 10,926,010 | | | | | | 3,596,361 |
| Net unrealized appreciation | | | | | 62,029,547 | | | | | | 13,875,735 | | | | | | 46,457,432 | | | | | | 8,485,165 |
| NET ASSETS | | | | $ | 759,653,753 | | | | | $ | 193,313,246 | | | | | $ | 511,303,009 | | | | | $ | 118,200,880 |
*
Cost of investments in affiliated underlying funds | | | | $ | 578,968,478 | | | | | $ | 153,642,490 | | | | | $ | 412,605,779 | | | | | $ | 99,214,974 |
**
Cost of investments in unaffiliated underlying funds | | | | $ | 116,122,292 | | | | | $ | 25,077,135 | | | | | $ | 50,772,788 | | | | | $ | 9,883,331 |
***
Cost of foreign cash collateral for futures | | | | $ | 267,567 | | | | | $ | 62,498 | | | | | $ | 177,727 | | | | | $ | 35,155 |
See Accompanying Notes to Financial Statements
Statements of Assets and Liabilities as of December 31, 2017 (continued)
| | | | Voya Index
Solution 2035
Portfolio | | | Voya Index
Solution 2040
Portfolio | | | Voya Index
Solution 2045
Portfolio | | | Voya Index
Solution 2050
Portfolio |
| Class ADV | | | | | |
| Net assets | | | | $ | 215,074,334 | | | | | $ | 11,116,793 | | | | | $ | 148,205,390 | | | | | $ | 7,816,900 |
| Shares authorized | | | | | 100,000,000 | | | | | | 100,000,000 | | | | | | 100,000,000 | | | | | | 100,000,000 |
| Par value | | | | $ | 0.001 | | | | | $ | 0.001 | | | | | $ | 0.001 | | | | | $ | 0.001 |
| Shares outstanding | | | | | 18,960,383 | | | | | | 694,763 | | | | | | 12,572,546 | | | | | | 480,727 |
| Net asset value and redemption price per share | | | | $ | 11.34 | | | | | $ | 16.00 | | | | | $ | 11.79 | | | | | $ | 16.26 |
| Class I | | | | | |
| Net assets | | | | $ | 58,021,365 | | | | | $ | 2,611,762 | | | | | $ | 48,316,965 | | | | | $ | 3,195,356 |
| Shares authorized | | | | | 100,000,000 | | | | | | 100,000,000 | | | | | | 100,000,000 | | | | | | 100,000,000 |
| Par value | | | | $ | 0.001 | | | | | $ | 0.001 | | | | | $ | 0.001 | | | | | $ | 0.001 |
| Shares outstanding | | | | | 4,980,508 | | | | | | 159,690 | | | | | | 3,968,598 | | | | | | 193,111 |
| Net asset value and redemption price per share | | | | $ | 11.65 | | | | | $ | 16.36 | | | | | $ | 12.17 | | | | | $ | 16.55 |
| Class S | | | | | |
| Net assets | | | | $ | 121,702,292 | | | | | $ | 8,831,984 | | | | | $ | 87,386,363 | | | | | $ | 8,089,650 |
| Shares authorized | | | | | 100,000,000 | | | | | | 100,000,000 | | | | | | 100,000,000 | | | | | | 100,000,000 |
| Par value | | | | $ | 0.001 | | | | | $ | 0.001 | | | | | $ | 0.001 | | | | | $ | 0.001 |
| Shares outstanding | | | | | 10,573,672 | | | | | | 540,752 | | | | | | 7,283,487 | | | | | | 489,869 |
| Net asset value and redemption price per share | | | | $ | 11.51 | | | | | $ | 16.33 | | | | | $ | 12.00 | | | | | $ | 16.51 |
| Class S2 | | | | | |
| Net assets | | | | $ | 37,315,806 | | | | | $ | 1,687,767 | | | | | $ | 19,205,766 | | | | | $ | 1,972,958 |
| Shares authorized | | | | | 100,000,000 | | | | | | 100,000,000 | | | | | | 100,000,000 | | | | | | 100,000,000 |
| Par value | | | | $ | 0.001 | | | | | $ | 0.001 | | | | | $ | 0.001 | | | | | $ | 0.001 |
| Shares outstanding | | | | | 3,295,173 | | | | | | 104,640 | | | | | | 1,627,405 | | | | | | 121,015 |
| Net asset value and redemption price per share | | | | $ | 11.32 | | | | | $ | 16.13 | | | | | $ | 11.80 | | | | | $ | 16.30 |
| Class Z | | | | | |
| Net assets | | | | $ | 327,539,956 | | | | | $ | 169,064,940 | | | | | $ | 208,188,525 | | | | | $ | 97,126,016 |
| Shares authorized | | | | | 100,000,000 | | | | | | 100,000,000 | | | | | | 100,000,000 | | | | | | 100,000,000 |
| Par value | | | | $ | 0.001 | | | | | $ | 0.001 | | | | | $ | 0.001 | | | | | $ | 0.001 |
| Shares outstanding | | | | | 27,954,403 | | | | | | 10,296,024 | | | | | | 17,011,162 | | | | | | 5,852,628 |
| Net asset value and redemption price per share | | | | $ | 11.72 | | | | | $ | 16.42 | | | | | $ | 12.24 | | | | | $ | 16.60 |
See Accompanying Notes to Financial Statements
Statements of Assets and Liabilities as of December 31, 2017
| | | | Voya Index
Solution 2055
Portfolio | | | Voya Index
Solution 2060
Portfolio | |
| ASSETS: | | | |
| Investments in affiliated underlying funds at fair value* | | | | $ | 164,897,959 | | | | | $ | 21,681,417 | | |
| Investments in unaffiliated underlying funds at fair value** | | | | | 15,113,594 | | | | | | 2,762,623 | | |
| Cash | | | | | 158,179 | | | | | | 37,177 | | |
| Cash collateral for futures | | | | | 254,881 | | | | | | — | | |
| Foreign cash collateral for futures*** | | | | | 62,751 | | | | | | — | | |
| Receivables: | | | |
| Investments in affiliated underlying funds sold | | | | | 1,143,599 | | | | | | 306,905 | | |
| Investments in unaffiliated underlying funds sold | | | | | — | | | | | | 217,716 | | |
| Fund shares sold | | | | | 160,691 | | | | | | 39,422 | | |
| Dividends | | | | | 67,742 | | | | | | 8,573 | | |
| Prepaid expenses | | | | | 468 | | | | | | 32 | | |
| Reimbursement due from manager | | | | | 21,553 | | | | | | 1,847 | | |
| Other assets | | | | | 2,036 | | | | | | 107 | | |
| Total assets | | | | | 181,883,453 | | | | | | 25,055,819 | | |
| LIABILITIES: | | | |
| Payable for investments in affiliated underlying funds purchased | | | | | 332,504 | | | | | | 221,085 | | |
| Payable for investments in unaffiliated underlying funds purchased | | | | | 785,043 | | | | | | 308,204 | | |
| Payable for fund shares redeemed | | | | | 225,153 | | | | | | 29,521 | | |
| Payable for investment management fees | | | | | 32,421 | | | | | | 5,032 | | |
| Payable for distribution and shareholder service fees | | | | | 31,786 | | | | | | 2,657 | | |
| Payable to directors under the deferred compensation plan (Note 6) | | | | | 2,036 | | | | | | 107 | | |
| Payable for director fees | | | | | 696 | | | | | | 73 | | |
| Other accrued expenses and liabilities | | | | | 18,820 | | | | | | 5,626 | | |
| Total liabilities | | | | | 1,428,459 | | | | | | 572,305 | | |
| NET ASSETS | | | | $ | 180,454,994 | | | | | $ | 24,483,514 | | |
| NET ASSETS WERE COMPRISED OF: | | | |
| Paid-in capital | | | | $ | 158,398,779 | | | | | $ | 21,723,095 | | |
| Undistributed net investment income | | | | | 2,261,216 | | | | | | 286,755 | | |
| Accumulated net realized gain | | | | | 2,327,754 | | | | | | 1,017,336 | | |
| Net unrealized appreciation | | | | | 17,467,245 | | | | | | 1,456,328 | | |
| NET ASSETS | | | | $ | 180,454,994 | | | | | $ | 24,483,514 | | |
*
Cost of investments in affiliated underlying funds | | | | $ | 147,886,625 | | | | | $ | 20,351,213 | | |
**
Cost of investments in unaffiliated underlying funds | | | | $ | 14,652,270 | | | | | $ | 2,636,499 | | |
***
Cost of foreign cash collateral for futures | | | | $ | 62,498 | | | | | $ | — | | |
See Accompanying Notes to Financial Statements
Statements of Assets and Liabilities as of December 31, 2017 (continued)
| | | | Voya Index
Solution 2055
Portfolio | | | Voya Index
Solution 2060
Portfolio |
| Class ADV | | | |
| Net assets | | | | $ | 52,885,743 | | | | | $ | 4,578,542 |
| Shares authorized | | | | | 100,000,000 | | | | | | 100,000,000 |
| Par value | | | | $ | 0.001 | | | | | $ | 0.001 |
| Shares outstanding | | | | | 3,484,433 | | | | | | 366,583 |
| Net asset value and redemption price per share | | | | $ | 15.18 | | | | | $ | 12.49 |
| Class I | | | |
| Net assets | | | | $ | 19,099,975 | | | | | $ | 1,563,012 |
| Shares authorized | | | | | 100,000,000 | | | | | | 100,000,000 |
| Par value | | | | $ | 0.001 | | | | | $ | 0.001 |
| Shares outstanding | | | | | 1,229,326 | | | | | | 123,537 |
| Net asset value and redemption price per share | | | | $ | 15.54 | | | | | $ | 12.65 |
| Class S | | | |
| Net assets | | | | $ | 29,601,850 | | | | | $ | 2,293,637 |
| Shares authorized | | | | | 100,000,000 | | | | | | 100,000,000 |
| Par value | | | | $ | 0.001 | | | | | $ | 0.001 |
| Shares outstanding | | | | | 1,926,767 | | | | | | 182,664 |
| Net asset value and redemption price per share | | | | $ | 15.36 | | | | | $ | 12.56 |
| Class S2 | | | |
| Net assets | | | | $ | 10,327,085 | | | | | $ | 992,549 |
| Shares authorized | | | | | 100,000,000 | | | | | | 100,000,000 |
| Par value | | | | $ | 0.001 | | | | | $ | 0.001 |
| Shares outstanding | | | | | 677,686 | | | | | | 79,323 |
| Net asset value and redemption price per share | | | | $ | 15.24 | | | | | $ | 12.51 |
| Class Z | | | |
| Net assets | | | | $ | 68,540,341 | | | | | $ | 15,055,774 |
| Shares authorized | | | | | 100,000,000 | | | | | | 100,000,000 |
| Par value | | | | $ | 0.001 | | | | | $ | 0.001 |
| Shares outstanding | | | | | 4,388,492 | | | | | | 1,185,532 |
| Net asset value and redemption price per share | | | | $ | 15.62 | | | | | $ | 12.70 |
See Accompanying Notes to Financial Statements
Statements of Operations for the year ended December 31, 2017
| | | | Voya Index
Solution Income
Portfolio | | | Voya Index
Solution 2020
Portfolio | | | Voya Index
Solution 2025
Portfolio | | | Voya Index
Solution 2030
Portfolio | |
| INVESTMENT INCOME: | | | | | |
| Interest | | | | $ | 326 | | | | | $ | 18 | | | | | $ | 623 | | | | | $ | 18 | | |
| Dividends from affiliated underlying funds | | | | | 8,361,581 | | | | | | 3,199,911 | | | | | | 11,881,591 | | | | | | 3,638,634 | | |
| Dividends from unaffiliated underlying funds | | | | | 2,186,086 | | | | | | 939,837 | | | | | | 3,761,975 | | | | | | 1,045,321 | | |
| Total investment income | | | | | 10,547,993 | | | | | | 4,139,766 | | | | | | 15,644,189 | | | | | | 4,683,973 | | |
| EXPENSES: | | | | | |
| Investment management fees | | | | | 1,037,603 | | | | | | 415,040 | | | | | | 1,677,181 | | | | | | 462,023 | | |
| Distribution and shareholder service fees: | | | | | |
| Class ADV | | | | | 579,491 | | | | | | 91,597 | | | | | | 1,148,743 | | | | | | 82,415 | | |
| Class S | | | | | 433,500 | | | | | | 24,712 | | | | | | 377,198 | | | | | | 24,468 | | |
| Class S2 | | | | | 53,352 | | | | | | 15,005 | | | | | | 139,282 | | | | | | 7,526 | | |
| Transfer agent fees | | | | | 997 | | | | | | 411 | | | | | | 858 | | | | | | 452 | | |
| Shareholder reporting expense | | | | | 730 | | | | | | 4,295 | | | | | | 10,950 | | | | | | 4,080 | | |
| Professional fees | | | | | 64,605 | | | | | | 29,585 | | | | ��� | | 73,365 | | | | | | 30,822 | | |
| Custody and accounting expense | | | | | 38,325 | | | | | | 9,125 | | | | | | 44,165 | | | | | | 9,151 | | |
| Director fees | | | | | 17,929 | | | | | | 7,115 | | | | | | 28,620 | | | | | | 8,019 | | |
| Miscellaneous expense | | | | | 20,677 | | | | | | 14,267 | | | | | | 20,760 | | | | | | 14,252 | | |
| Interest expense | | | | | 138 | | | | | | 21 | | | | | ��� | 180 | | | | | | 80 | | |
| Total expenses | | | | | 2,247,347 | | | | | | 611,173 | | | | | | 3,521,302 | | | | | | 643,288 | | |
| Waived and reimbursed fees | | | | | (597,182) | | | | | | (413,000) | | | | | | (994,975) | | | | | | (470,723) | | |
| Net expenses | | | | | 1,650,165 | | | | | | 198,173 | | | | | | 2,526,327 | | | | | | 172,565 | | |
| Net investment income | | | | | 8,897,828 | | | | | | 3,941,593 | | | | | | 13,117,862 | | | | | | 4,511,408 | | |
| REALIZED AND UNREALIZED GAIN (LOSS): | | | | | |
| Net realized gain (loss) on: | | | | | |
| Sale of affiliated underlying funds | | | | | 4,760,777 | | | | | | 3,473,313 | | | | | | 4,497,900 | | | | | | 3,381,768 | | |
| Sale of unaffiliated underlying funds | | | | | (242,567) | | | | | | 544,277 | | | | | | 534,569 | | | | | | 411,376 | | |
| Capital gain distributions from affiliated underlying funds | | | | | 5,431,528 | | | | | | 3,192,542 | | | | | | 15,303,457 | | | | | | 4,952,386 | | |
| Capital gain distributions from unaffiliated underlying funds | | | | | — | | | | | | 19 | | | | | | — | | | | | | — | | |
| Foreign currency related transactions | | | | | 9,023 | | | | | | 2,784 | | | | | | 13,502 | | | | | | 2,791 | | |
| Futures | | | | | (16,661) | | | | | | 74,944 | | | | | | 59,410 | | | | | | 105,679 | | |
| Net realized gain | | | | | 9,942,100 | | | | | | 7,287,879 | | | | | | 20,408,838 | | | | | | 8,854,000 | | |
| Net change in unrealized appreciation (depreciation) on: | | | | | |
| Affiliated underlying funds | | | | | 17,552,451 | | | | | | 8,507,848 | | | | | | 58,463,471 | | | | | | 16,682,853 | | |
| Unaffiliated underlying funds | | | | | 2,508,721 | | | | | | 714,557 | | | | | | 5,011,263 | | | | | | 1,068,608 | | |
| Foreign currency related transactions | | | | | 719 | | | | | | 340 | | | | | | 1,209 | | | | | | 395 | | |
| Futures | | | | | (14,266) | | | | | | (7,841) | | | | | | (29,133) | | | | | | (13,159) | | |
| Net change in unrealized appreciation (depreciation) | | | | | 20,047,625 | | | | | | 9,214,904 | | | | | | 63,446,810 | | | | | | 17,738,697 | | |
| Net realized and unrealized gain | | | | | 29,989,725 | | | | | | 16,502,783 | | | | | | 83,855,648 | | | | | | 26,592,697 | | |
| Increase in net assets resulting from operations | | | | $ | 38,887,553 | | | | | $ | 20,444,376 | | | | | $ | 96,973,510 | | | | | $ | 31,104,105 | | |
| |
See Accompanying Notes to Financial Statements
Statements of Operations for the year ended December 31, 2017
| | | | Voya Index
Solution 2035
Portfolio | | | Voya Index
Solution 2040
Portfolio | | | Voya Index
Solution 2045
Portfolio | | | Voya Index
Solution 2050
Portfolio | |
| INVESTMENT INCOME: | | | | | |
| Interest | | | | $ | 562 | | | | | $ | 144 | | | | | $ | 298 | | | | | $ | 65 | | |
| Dividends from affiliated underlying funds | | | | | 10,352,150 | | | | | | 2,207,133 | | | | | | 7,029,824 | | | | | | 1,323,664 | | |
| Dividends from unaffiliated underlying funds | | | | | 2,976,509 | | | | | | 498,179 | | | | | | 1,127,359 | | | | | | 182,266 | | |
| Total investment income | | | | | 13,329,221 | | | | | | 2,705,456 | | | | | | 8,157,481 | | | | | | 1,505,995 | | |
| EXPENSES: | | | | | |
| Investment management fees | | | | | 1,432,974 | | | | | | 274,305 | | | | | | 909,183 | | | | | | 154,309 | | |
| Distribution and shareholder service fees: | | | | | |
| Class ADV | | | | | 1,046,877 | | | | | | 41,862 | | | | | | 711,799 | | | | | | 27,319 | | |
| Class S | | | | | 301,831 | | | | | | 17,590 | | | | | | 206,981 | | | | | | 15,631 | | |
| Class S2 | | | | | 141,173 | | | | | | 5,231 | | | | | | 77,666 | | | | | | 5,208 | | |
| Transfer agent fees | | | | | 1,185 | | | | | | 442 | | | | | | 743 | | | | | | 538 | | |
| Shareholder reporting expense | | | | | 12,410 | | | | | | 4,856 | | | | | | 9,125 | | | | | | 3,898 | | |
| Professional fees | | | | | 68,015 | | | | | | 21,295 | | | | | | 51,737 | | | | | | 17,265 | | |
| Custody and accounting expense | | | | | 43,449 | | | | | | 9,135 | | | | | | 28,695 | | | | | | 5,840 | | |
| Director fees | | | | | 25,165 | | | | | | 4,921 | | | | | | 16,613 | | | | | | 2,850 | | |
| Miscellaneous expense | | | | | 26,944 | | | | | | 13,985 | | | | | | 25,802 | | | | | | 12,856 | | |
| Interest expense | | | | | 208 | | | | | | 27 | | | | | | 101 | | | | | | 24 | | |
| Total expenses | | | | | 3,100,231 | | | | | | 393,649 | | | | | | 2,038,445 | | | | | | 245,738 | | |
| Waived and reimbursed fees | | | | | (875,343) | | | | | | (295,699) | | | | | | (498,615) | | | | | | (167,723) | | |
| Net expenses | | | | | 2,224,888 | | | | | | 97,950 | | | | | | 1,539,830 | | | | | | 78,015 | | |
| Net investment income | | | | | 11,104,333 | | | | | | 2,607,506 | | | | | | 6,617,651 | | | | | | 1,427,980 | | |
| REALIZED AND UNREALIZED GAIN (LOSS): | | | | | |
| Net realized gain (loss) on: | | | | | |
| Sale of affiliated underlying funds | | | | | 3,108,520 | | | | | | 2,320,642 | | | | | | 1,647,828 | | | | | | 1,531,269 | | |
| Sale of unaffiliated underlying funds | | | | | 315,608 | | | | | | 94,663 | | | | | | 329,859 | | | | | | 53,087 | | |
| Capital gain distributions from affiliated underlying funds | | | | | 16,704,988 | | | | | | 3,453,529 | | | | | | 12,482,848 | | | | | | 2,063,824 | | |
| Foreign currency related transactions | | | | | 11,491 | | | | | | 1,660 | | | | | | 7,542 | | | | | | 921 | | |
| Futures | | | | | 74,179 | | | | | | 73,387 | | | | | | 59,469 | | | | | | 42,679 | | |
| Net realized gain | | | | | 20,214,786 | | | | | | 5,943,881 | | | | | | 14,527,546 | | | | | | 3,691,780 | | |
| Net change in unrealized appreciation (depreciation) on: | | | | | |
| Affiliated underlying funds | | | | | 70,859,263 | | | | | | 12,570,210 | | | | | | 52,635,904 | | | | | | 7,669,499 | | |
| Unaffiliated underlying funds | | | | | 3,426,876 | | | | | | 624,454 | | | | | | 2,330,163 | | | | | | 435,669 | | |
| Foreign currency related transactions | | | | | 1,083 | | | | | | 253 | | | | | | 719 | | | | | | 142 | | |
| Futures | | | | | (28,493) | | | | | | (7,630) | | | | | | (18,451) | | | | | | (7,562) | | |
| Net change in unrealized appreciation (depreciation) | | | | | 74,258,729 | | | | | | 13,187,287 | | | | | | 54,948,335 | | | | | | 8,097,748 | | |
| Net realized and unrealized gain | | | | | 94,473,515 | | | | | | 19,131,168 | | | | | | 69,475,881 | | | | | | 11,789,528 | | |
| Increase in net assets resulting from operations | | | | $ | 105,577,848 | | | | | $ | 21,738,674 | | | | | $ | 76,093,532 | | | | | $ | 13,217,508 | | |
| |
See Accompanying Notes to Financial Statements
Statements of Operations for the year ended December 31, 2017
| | | | Voya Index
Solution 2055
Portfolio | | | Voya Index
Solution 2060
Portfolio | |
| INVESTMENT INCOME: | | | |
| Interest | | | | $ | 81 | | | | | $ | — | | |
| Dividends from affiliated underlying funds | | | | | 2,429,663 | | | | | | 267,300 | | |
| Dividends from unaffiliated underlying funds | | | | | 293,996 | | | | | | 45,889 | | |
| Total investment income | | | | | 2,723,740 | | | | | | 313,189 | | |
| EXPENSES: | | | |
| Investment management fees | | | | | 299,705 | | | | | | 32,023 | | |
| Distribution and shareholder service fees: | | | |
| Class ADV | | | | | 237,743 | | | | | | 15,019 | | |
| Class S | | | | | 70,035 | | | | | | 4,502 | | |
| Class S2 | | | | | 33,815 | | | | | | 2,523 | | |
| Transfer agent fees | | | | | 580 | | | | | | 338 | | |
| Shareholder reporting expense | | | | | 5,795 | | | | | | 3,371 | | |
| Professional fees | | | | | 23,525 | | | | | | 9,744 | | |
| Custody and accounting expense | | | | | 9,853 | | | | | | 1,381 | | |
| Director fees | | | | | 5,572 | | | | | | 582 | | |
| Miscellaneous expense | | | | | 16,844 | | | | | | 10,528 | | |
| Interest expense | | | | | 43 | | | | | | — | | |
| Total expenses | | | | | 703,510 | | | | | | 80,011 | | |
| Waived and reimbursed fees | | | | | (169,306) | | | | | | (46,321) | | |
| Net expenses | | | | | 534,204 | | | | | | 33,690 | | |
| Net investment income | | | | | 2,189,536 | | | | | | 279,499 | | |
| REALIZED AND UNREALIZED GAIN (LOSS): | | | |
| Net realized gain (loss) on: | | | |
| Sale of affiliated underlying funds | | | | | 254,479 | | | | | | 577,947 | | |
| Sale of unaffiliated underlying funds | | | | | 118,674 | | | | | | 38,355 | | |
| Capital gain distributions from affiliated underlying funds | | | | | 4,231,218 | | | | | | 423,844 | | |
| Foreign currency related transactions | | | | | 2,508 | | | | | | — | | |
| Futures | | | | | 28,121 | | | | | | — | | |
| Net realized gain | | | | | 4,635,000 | | | | | | 1,040,146 | | |
| Net change in unrealized appreciation (depreciation) on: | | | |
| Affiliated underlying funds | | | | | 18,389,569 | | | | | | 1,284,619 | | |
| Unaffiliated underlying funds | | | | | 788,979 | | | | | | 129,627 | | |
| Foreign currency related transactions | | | | | 253 | | | | | | — | | |
| Futures | | | | | (5,666) | | | | | | — | | |
| Net change in unrealized appreciation (depreciation) | | | | | 19,173,135 | | | | | | 1,414,246 | | |
| Net realized and unrealized gain | | | | | 23,808,135 | | | | | | 2,454,392 | | |
| Increase in net assets resulting from operations | | | | $ | 25,997,671 | | | | | $ | 2,733,891 | | |
| |
See Accompanying Notes to Financial Statements
STATEMENTS OF CHANGES IN NET ASSETS
| | | | Voya Index Solution Income Portfolio | | | Voya Index Solution 2020 Portfolio | |
| | | | Year Ended
December 31,
2017 | | | Year Ended
December 31,
2016 | | | Year Ended
December 31,
2017 | | | Year Ended
December 31,
2016 | |
| FROM OPERATIONS: | | | | | |
| Net investment income | | | | $ | 8,897,828 | | | | | $ | 7,986,714 | | | | | $ | 3,941,593 | | | | | $ | 1,225,178 | | |
| Net realized gain (loss) | | | | | 9,942,100 | | | | | | (2,273,040) | | | | | | 7,287,879 | | | | | | 1,358,693 | | |
| Net change in unrealized appreciation (depreciation) | | | | | 20,047,625 | | | | | | 12,126,333 | | | | | | 9,214,904 | | | | | | 112,413 | | |
| Increase in net assets resulting from operations | | | | | 38,887,553 | | | | | | 17,840,007 | | | | | | 20,444,376 | | | | | | 2,696,284 | | |
| FROM DISTRIBUTIONS TO SHAREHOLDERS: | | | | | |
| Net investment income: | | | | | |
| Class ADV | | | | | (1,816,969) | | | | | | (1,896,664) | | | | | | (79,014) | | | | | | (13,350) | | |
| Class I | | | | | (477,109) | | | | | | (568,456) | | | | | | (27,345) | | | | | | (3,145) | | |
| Class S | | | | | (3,137,969) | | | | | | (2,982,354) | | | | | | (55,410) | | | | | | (5,249) | | |
| Class S2 | | | | | (227,246) | | | | | | (206,350) | | | | | | (22,984) | | | | | | (1,371) | | |
Class T(1) | | | | | — | | | | | | (83) | | | | | | — | | | | | | — | | |
| Class Z | | | | | (2,706,108) | | | | | | (476,510) | | | | | | (1,068,310) | | | | | | (38,737) | | |
| Net realized gains: | | | | | |
| Class ADV | | | | | (533,474) | | | | | | (1,734,768) | | | | | | (149,282) | | | | | | (6,725) | | |
| Class I | | | | | (103,996) | | | | | | (433,421) | | | | | | (31,179) | | | | | | (1,208) | | |
| Class S | | | | | (786,154) | | | | | | (2,575,586) | | | | | | (76,400) | | | | | | (2,150) | | |
| Class S2 | | | | | (61,316) | | | | | | (182,389) | | | | | | (33,093) | | | | | | (626) | | |
Class T(1) | | | | | — | | | | | | (87) | | | | | | — | | | | | | (2) | | |
| Class Z | | | | | (589,857) | | | | | | (363,317) | | | | | | (1,218,084) | | | | | | (14,716) | | |
| Total distributions | | | | | (10,440,198) | | | | | | (11,419,985) | | | | | | (2,761,101) | | | | | | (87,279) | | |
| FROM CAPITAL SHARE TRANSACTIONS: | | | | | |
| Net proceeds from sale of shares | | | | | 136,554,617 | | | | | | 108,379,409 | | | | | | 150,367,287 | | | | | | 103,660,958 | | |
| Reinvestment of distributions | | | | | 10,440,198 | | | | | | 11,419,815 | | | | | | 2,761,101 | | | | | | 87,277 | | |
| | | | | | 146,994,815 | | | | | | 119,799,224 | | | | | | 153,128,388 | | | | | | 103,748,235 | | |
| Cost of shares redeemed | | | | | (99,723,825) | | | | | | (99,550,236) | | | | | | (27,269,884) | | | | | | (12,207,530) | | |
| Net increase in net assets resulting from capital share transactions | | | | | 47,270,990 | | | | | | 20,248,988 | | | | | | 125,858,504 | | | | | | 91,540,705 | | |
| Net increase in net assets | | | | | 75,718,345 | | | | | | 26,669,010 | | | | | | 143,541,779 | | | | | | 94,149,710 | | |
| NET ASSETS: | | | | | |
| Beginning of year or period | | | | | 408,556,428 | | | | | | 381,887,418 | | | | | | 102,648,031 | | | | | | 8,498,321 | | |
| End of year or period | | | | $ | 484,274,773 | | | | | $ | 408,556,428 | | | | | $ | 246,189,810 | | | | | $ | 102,648,031 | | |
| Undistributed net investment income at end of year or period | | | | $ | 9,501,469 | | | | | $ | 8,417,366 | | | | | $ | 4,129,729 | | | | | $ | 1,261,617 | | |
(1)
Class T liquidated on August 31, 2016.
See Accompanying Notes to Financial Statements
STATEMENTS OF CHANGES IN NET ASSETS
| | | | Voya Index Solution 2025 Portfolio | | | Voya Index Solution 2030 Portfolio | |
| | | | Year Ended
December 31,
2017 | | | Year Ended
December 31,
2016 | | | Year Ended
December 31,
2017 | | | Year Ended
December 31,
2016 | |
| FROM OPERATIONS: | | | | | |
| Net investment income | | | | $ | 13,117,862 | | | | | $ | 10,775,314 | | | | | $ | 4,511,408 | | | | | $ | 1,011,269 | | |
| Net realized gain | | | | | 20,408,838 | | | | ��� | | 12,459,681 | | | | | | 8,854,000 | | | | | | 1,064,528 | | |
| Net change in unrealized appreciation (depreciation) | | | | | 63,446,810 | | | | | | 10,567,471 | | | | | | 17,738,697 | | | | | | 623,716 | | |
| Increase in net assets resulting from operations | | | | | 96,973,510 | | | | | | 33,802,466 | | | | | | 31,104,105 | | | | | | 2,699,513 | | |
| FROM DISTRIBUTIONS TO SHAREHOLDERS: | | | | | |
| Net investment income: | | | | | |
| Class ADV | | | | | (2,898,267) | | | | | | (4,509,119) | | | | | | (58,417) | | | | | | (5,045) | | |
| Class I | | | | | (972,502) | | | | | | (1,358,591) | | | | | | (14,605) | | | | | | (2,574) | | |
| Class S | | | | | (2,234,419) | | | | | | (3,171,814) | | | | | | (41,845) | | | | | | (2,574) | | |
| Class S2 | | | | | (488,424) | | | | | | (668,502) | | | | | | (6,232) | | | | | | (1,035) | | |
Class T(1) | | | | | — | | | | | | (60) | | | | | | — | | | | | | — | | |
| Class Z | | | | | (4,642,570) | | | | | | (1,297,114) | | | | | | (903,881) | | | | | | (24,000) | | |
| Net realized gains: | | | | | |
| Class ADV | | | | | (4,538,916) | | | | | | (16,111,045) | | | | | | (108,232) | | | | | | (4,079) | | |
| Class I | | | | | (1,094,065) | | | | | | (3,826,257) | | | | | | (17,665) | | | | | | (1,438) | | |
| Class S | | | | | (2,936,547) | | | | | | (10,295,036) | | | | | | (59,287) | | | | | | (1,631) | | |
| Class S2 | | | | | (699,200) | | | | | | (2,297,858) | | | | | | (11,470) | | | | | | (596) | | |
Class T(1) | | | | | — | | | | | | (240) | | | | | | — | | | | | | (2) | | |
| Class Z | | | | | (5,222,891) | | | | | | (3,653,118) | | | | | | (1,090,089) | | | | | | (13,313) | | |
| Total distributions | | | | | (25,727,801) | | | | | | (47,188,754) | | | | | | (2,311,723) | | | | | | (56,287) | | |
| FROM CAPITAL SHARE TRANSACTIONS: | | | | | |
| Net proceeds from sale of shares | | | | | 289,306,555 | | | | | | 181,654,567 | | | | | | 197,102,941 | | | | | | 92,623,692 | | |
| Reinvestment of distributions | | | | | 25,727,801 | | | | | | 47,188,454 | | | | | | 2,311,723 | | | | | | 56,285 | | |
| | | | | | 315,034,356 | | | | | | 228,843,021 | | | | | | 199,414,664 | | | | | | 92,679,977 | | |
| Cost of shares redeemed | | | | | (124,768,106) | | | | | | (108,675,021) | | | | | | (14,459,624) | | | | | | (6,874,563) | | |
| Net increase in net assets resulting from capital share transactions | | | | | 190,266,250 | | | | | | 120,168,000 | | | | | | 184,955,040 | | | | | | 85,805,414 | | |
| Net increase in net assets | | | | | 261,511,959 | | | | | | 106,781,712 | | | | | | 213,747,422 | | | | | | 88,448,640 | | |
| NET ASSETS: | | | | | |
| Beginning of year or period | | | | | 587,804,371 | | | | | | 481,022,659 | | | | | | 93,593,309 | | | | | | 5,144,669 | | |
| End of year or period | | | | $ | 849,316,330 | | | | | $ | 587,804,371 | | | | | $ | 307,340,731 | | | | | $ | 93,593,309 | | |
| Undistributed net investment income at end of year or period | | | | $ | 13,720,261 | | | | | $ | 11,308,453 | | | | | $ | 4,654,056 | | | | | $ | 1,036,050 | | |
(1)
Class T liquidated on August 31, 2016.
See Accompanying Notes to Financial Statements
STATEMENTS OF CHANGES IN NET ASSETS
| | | | Voya Index Solution 2035 Portfolio | | | Voya Index Solution 2040 Portfolio | |
| | | | Year Ended
December 31,
2017 | | | Year Ended
December 31,
2016 | | | Year Ended
December 31,
2017 | | | Year Ended
December 31,
2016 | |
| FROM OPERATIONS: | | | | | |
| Net investment income | | | | $ | 11,104,333 | | | | | $ | 9,125,881 | | | | | $ | 2,607,506 | | | | | $ | 648,572 | | |
| Net realized gain | | | | | 20,214,786 | | | | | | 12,816,919 | | | | | | 5,943,881 | | | | | | 763,937 | | |
| Net change in unrealized appreciation (depreciation) | | | | | 74,258,729 | | | | | | 11,280,691 | | | | | | 13,187,287 | | | | | | 742,554 | | |
| Increase in net assets resulting from operations | | | | | 105,577,848 | | | | | | 33,223,491 | | | | | | 21,738,674 | | | | | | 2,155,063 | | |
| FROM DISTRIBUTIONS TO SHAREHOLDERS: | | | | | |
| Net investment income: | | | | | |
| Class ADV | | | | | (2,542,369) | | | | | | (3,603,282) | | | | | | (31,439) | | | | | | (1,774) | | |
| Class I | | | | | (849,548) | | | | | | (999,520) | | | | | | (5,997) | | | | | | (584) | | |
| Class S | | | | | (1,725,491) | | | | | | (2,357,186) | | | | | | (31,144) | | | | | | (1,703) | | |
| Class S2 | | | | | (476,736) | | | | | | (590,771) | | | | | | (5,696) | | | | | | (393) | | |
Class T(1) | | | | | — | | | | | | (55) | | | | | | — | | | | | | — | | |
| Class Z | | | | | (3,895,940) | | | | | | (1,013,827) | | | | | | (582,106) | | | | | | (16,856) | | |
| Net realized gains: | | | | | |
| Class ADV | | | | | (5,208,897) | | | | | | (17,256,361) | | | | | | (57,782) | | | | | | (1,881) | | |
| Class I | | | | | (1,252,280) | | | | | | (3,691,944) | | | | | | (7,616) | | | | | | (345) | | |
| Class S | | | | | (2,979,996) | | | | | | (10,100,983) | | | | | | (45,863) | | | | | | (1,153) | | |
| Class S2 | | | | | (884,996) | | | | | | (2,683,902) | | | | | | (8,773) | | | | | | (244) | | |
Class T(1) | | | | | — | | | | | | (297) | | | | | | — | | | | | | (3) | | |
| Class Z | | | | | (5,739,724) | | | | | | (3,744,788) | | | | | | (737,230) | | | | | | (9,695) | | |
| Total distributions | | | | | (25,555,977) | | | | | | (46,042,916) | | | | | | (1,513,646) | | | | | | (34,631) | | |
| FROM CAPITAL SHARE TRANSACTIONS: | | | | | |
| Net proceeds from sale of shares | | | | | 257,784,831 | | | | | | 157,130,588 | | | | | | 121,463,332 | | | | | | 58,469,965 | | |
| Reinvestment of distributions | | | | | 25,555,977 | | | | | | 46,042,564 | | | | | | 1,513,646 | | | | | | 34,612 | | |
| | | | | | 283,340,808 | | | | | | 203,173,152 | | | | | | 122,976,978 | | | | | | 58,504,577 | | |
| Cost of shares redeemed | | | | | (106,802,110) | | | | | | (86,920,360) | | | | | | (9,610,654) | | | | | | (3,826,593) | | |
| Net increase in net assets resulting from capital share transactions | | | | | 176,538,698 | | | | | | 116,252,792 | | | | | | 113,366,324 | | | | | | 54,677,984 | | |
| Net increase in net assets | | | | | 256,560,569 | | | | | | 103,433,367 | | | | | | 133,591,352 | | | | | | 56,798,416 | | |
| NET ASSETS: | | | | | |
| Beginning of year or period | | | | | 503,093,184 | | | | | | 399,659,817 | | | | | | 59,721,894 | | | | | | 2,923,478 | | |
| End of year or period | | | | $ | 759,653,753 | | | | | $ | 503,093,184 | | | | | $ | 193,313,246 | | | | | $ | 59,721,894 | | |
| Undistributed net investment income at end of year or period | | | | $ | 11,465,268 | | | | | $ | 9,586,073 | | | | | $ | 2,672,039 | | | | | $ | 663,858 | | |
(1)
Class T liquidated on August 31, 2016.
See Accompanying Notes to Financial Statements
STATEMENTS OF CHANGES IN NET ASSETS
| | | | Voya Index Solution 2045 Portfolio | | | Voya Index Solution 2050 Portfolio | |
| | | | Year Ended
December 31,
2017 | | | Year Ended
December 31,
2016 | | | Year Ended
December 31,
2017 | | | Year Ended
December 31,
2016 | |
| FROM OPERATIONS: | | | | | |
| Net investment income | | | | $ | 6,617,651 | | | | | $ | 5,491,399 | | | | | $ | 1,427,980 | | | | | $ | 325,637 | | |
| Net realized gain | | | | | 14,527,546 | | | | | | 9,763,621 | | | | | | 3,691,780 | | | | | | 386,892 | | |
| Net change in unrealized appreciation (depreciation) | | | | | 54,948,335 | | | | | | 6,910,933 | | | | | | 8,097,748 | | | | | | 419,761 | | |
| Increase in net assets resulting from operations | | | | | 76,093,532 | | | | | | 22,165,953 | | | | | | 13,217,508 | | | | | | 1,132,290 | | |
| FROM DISTRIBUTIONS TO SHAREHOLDERS: | | | | | |
| Net investment income: | | | | | |
| Class ADV | | | | | (1,559,685) | | | | | | (2,182,058) | | | | | | (16,369) | | | | | | (2,178) | | |
| Class I | | | | | (635,116) | | | | | | (681,779) | | | | | | (7,797) | | | | | | (914) | | |
| Class S | | | | | (1,105,849) | | | | | | (1,300,575) | | | | | | (24,109) | | | | | | (1,904) | | |
| Class S2 | | | | | (231,935) | | | | | | (291,671) | | | | | | (4,649) | | | | | | (469) | | |
Class T(1) | | | | | — | | | | | | (46) | | | | | | — | | | | | | — | | |
| Class Z | | | | | (2,200,103) | | | | | | (541,674) | | | | | | (276,317) | | | | | | (8,751) | | |
| Net realized gains: | | | | | |
| Class ADV | | | | | (3,979,278) | | | | | | (11,812,553) | | | | | | (32,392) | | | | | | (5,066) | | |
| Class I | | | | | (1,129,891) | | | | | | (2,793,476) | | | | | | (9,989) | | | | | | (1,752) | | |
| Class S | | | | | (2,297,602) | | | | | | (6,293,044) | | | | | | (36,035) | | | | | | (3,547) | | |
| Class S2 | | | | | (533,517) | | | | | | (1,480,752) | | | | | | (7,669) | | | | | | (851) | | |
Class T(1) | | | | | — | | | | | | (299) | | | | | | — | | | | | | (11) | | |
| Class Z | | | | | (3,914,050) | | | | | | (2,219,425) | | | | | | (351,867) | | | | | | (14,720) | | |
| Total distributions | | | | | (17,587,026) | | | | | | (29,597,352) | | | | | | (767,193) | | | | | | (40,163) | | |
| FROM CAPITAL SHARE TRANSACTIONS: | | | | | |
| Net proceeds from sale of shares | | | | | 178,815,777 | | | | | | 105,962,148 | | | | | | 81,323,898 | | | | | | 28,838,296 | | |
| Reinvestment of distributions | | | | | 17,587,026 | | | | | | 29,597,007 | | | | | | 767,193 | | | | | | 40,137 | | |
| | | | | | 196,402,803 | | | | | | 135,559,155 | | | | | | 82,091,091 | | | | | | 28,878,433 | | |
| Cost of shares redeemed | | | | | (73,346,963) | | | | | | (57,672,449) | | | | | | (6,420,512) | | | | | | (1,699,518) | | |
| Net increase in net assets resulting from capital share transactions | | | | | 123,055,840 | | | | | | 77,886,706 | | | | | | 75,670,579 | | | | | | 27,178,915 | | |
| Net increase in net assets | | | | | 181,562,346 | | | | | | 70,455,307 | | | | | | 88,120,894 | | | | | | 28,271,042 | | |
| NET ASSETS: | | | | | |
| Beginning of year or period | | | | | 329,740,663 | | | | | | 259,285,356 | | | | | | 30,079,986 | | | | | | 1,808,944 | | |
| End of year or period | | | | $ | 511,303,009 | | | | | $ | 329,740,663 | | | | | $ | 118,200,880 | | | | | $ | 30,079,986 | | |
| Undistributed net investment income at end of year or period | | | | $ | 6,832,072 | | | | | $ | 5,796,026 | | | | | $ | 1,463,804 | | | | | $ | 333,154 | | |
(1)
Class T liquidated on August 31, 2016.
See Accompanying Notes to Financial Statements
STATEMENTS OF CHANGES IN NET ASSETS
| | | | Voya Index Solution 2055 Portfolio | | | Voya Index Solution 2060 Portfolio | |
| | | | Year Ended
December 31,
2017 | | | Year Ended
December 31,
2016 | | | Year Ended
December 31,
2017 | | | Year Ended
December 31,
2016 | |
| FROM OPERATIONS: | | | | | |
| Net investment income | | | | $ | 2,189,536 | | | | | $ | 1,608,144 | | | | | $ | 279,499 | | | | | $ | 62,047 | | |
| Net realized gain | | | | | 4,635,000 | | | | | | 1,290,059 | | | | | | 1,040,146 | | | | | | 116,048 | | |
| Net change in unrealized appreciation (depreciation) | | | | | 19,173,135 | | | | | | 3,778,517 | | | | | | 1,414,246 | | | | | | 49,281 | | |
| Increase in net assets resulting from operations | | | | | 25,997,671 | | | | | | 6,676,720 | | | | | | 2,733,891 | | | | | | 227,376 | | |
| FROM DISTRIBUTIONS TO SHAREHOLDERS: | | | | | |
| Net investment income: | | | | | |
| Class ADV | | | | | (456,053) | | | | | | (523,322) | | | | | | (8,650) | | | | | | (1,502) | | |
| Class I | | | | | (165,727) | | | | | | (161,426) | | | | | | (2,146) | | | | | | (139) | | |
| Class S | | | | | (342,253) | | | | | | (321,142) | | | | | | (7,545) | | | | | | (634) | | |
| Class S2 | | | | | (89,791) | | | | | | (92,558) | | | | | | (2,620) | | | | | | — | | |
Class T(1) | | | | | — | | | | | | (49) | | | | | | — | | | | | | — | | |
| Class Z | | | | | (623,931) | | | | | | (145,094) | | | | | | (41,128) | | | | | | (1,005) | | |
| Net realized gains: | | | | | |
| Class ADV | | | | | (1,037,546) | | | | | | (2,656,568) | | | | | | (24,996) | | | | | | (4,145) | | |
| Class I | | | | | (263,367) | | | | | | (610,144) | | | | | | (4,019) | | | | | | (401) | | |
| Class S | | | | | (628,339) | | | | | | (1,433,092) | | | | | | (16,110) | | | | | | (1,762) | | |
| Class S2 | | | | | (183,476) | | | | | | (432,018) | | | | | | (5,333) | | | | | | (194) | | |
Class T(1) | | | | | — | | | | | | (286) | | | | | | — | | | | | | — | | |
| Class Z | | | | | (991,025) | | | | | | (548,406) | | | | | | (76,108) | | | | | | (2,347) | | |
| Total distributions | | | | | (4,781,508) | | | | | | (6,924,105) | | | | | | (188,655) | | | | | | (12,129) | | |
| FROM CAPITAL SHARE TRANSACTIONS: | | | | | |
| Net proceeds from sale of shares | | | | | 79,552,695 | | | | | | 42,855,401 | | | | | | 20,015,383 | | | | | | 6,244,067 | | |
| Reinvestment of distributions | | | | | 4,781,508 | | | | | | 6,923,770 | | | | | | 188,655 | | | | | | 12,012 | | |
| | | | | | 84,334,203 | | | | | | 49,779,171 | | | | | | 20,204,038 | | | | | | 6,256,079 | | |
| Cost of shares redeemed | | | | | (26,820,730) | | | | | | (19,876,346) | | | | | | (4,170,959) | | | | | | (963,735) | | |
| Net increase in net assets resulting from capital share transactions | | | | | 57,513,473 | | | | | | 29,902,825 | | | | | | 16,033,079 | | | | | | 5,292,344 | | |
| Net increase in net assets | | | | | 78,729,636 | | | | | | 29,655,440 | | | | | | 18,578,315 | | | | | | 5,507,591 | | |
| NET ASSETS: | | | | | |
| Beginning of year or period | | | | | 101,725,358 | | | | | | 72,069,918 | | | | | | 5,905,199 | | | | | | 397,608 | | |
| End of year or period | | | | $ | 180,454,994 | | | | | $ | 101,725,358 | | | | | $ | 24,483,514 | | | | | $ | 5,905,199 | | |
| Undistributed net investment income at end of year or period | | | | $ | 2,261,216 | | | | | $ | 1,697,478 | | | | | $ | 286,755 | | | | | $ | 62,920 | | |
(1)
Class T liquidated on August 31, 2016.
See Accompanying Notes to Financial Statements
Selected data for a share of beneficial interest outstanding throughout each year or period.
| | | | | | | | | | Income (loss)
from
investment
operations | | | | | | | | | Less Distributions | | | | | | Ratios to average net assets | | | Supplemental
Data | |
| | | | Net asset value, beginning
of year or period | | | Net investment income (loss) | | | Net realized and unrealized
gain (loss) | | | Total from investment
operations | | | From net investment income | | | From net realized gains | | | From return of capital | | | Total distributions | | | Payment by affiliate | | | Net asset value, end of year
or period | | | Total Return(1) | | | Expenses before
reductions/additions(2)(3)(4) | | | Expenses net of fee waivers
and/or recoupments if any(2)(3)(4) | | | Expenses net of all
reductions/additions(2)(3)(4) | | | Net investment income
(loss)(2)(3) | | | Net assets, end of year
or period | | | Portfolio turnover rate | |
Year or
period ended | | | ($) | | | ($) | | | ($) | | | ($) | | | ($) | | | ($) | | | ($) | | | ($) | | | ($) | | | ($) | | | (%) | | | (%) | | | (%) | | | (%) | | | (%) | | | ($000’s) | | | (%) | |
| Voya Index Solution Income Portfolio | | | | | | | | | | | | | | | | | | | | | | | | | | | | | | | | | | | | | | | | | | | | | | | | | | | | | | | | | | | | | | | | | | | | | | | | | | | | | | | | | | | | | | | | | | | | | | | | | | | | | | | |
| Class ADV | | | | | | | | | | | | | | | | | | | | | | | | | | | | | | | | | | | | | | | | | | | | | | | | | | | | | | | | | | | | | | | | | | | | | | | | | | | | | | | | | | | | | | | | | | | | | | | | | | | | | | | |
| 12-31-17 | | | | | 9.71 | | | | | | 0.16• | | | | | | 0.68 | | | | | | 0.84 | | | | | | 0.16 | | | | | | 0.05 | | | | | | — | | | | | | 0.21 | | | | | | — | | | | | | 10.34 | | | | | | 8.69 | | | | | | 0.76 | | | | | | 0.68 | | | | | | 0.68 | | | | | | 1.64 | | | | | | 110,507 | | | | | | 32 | | |
| 12-31-16 | | | | | 9.55 | | | | | | 0.18• | | | | | | 0.27 | | | | | | 0.45 | | | | | | 0.15 | | | | | | 0.14 | | | | | | — | | | | | | 0.29 | | | | | | — | | | | | | 9.71 | | | | | | 4.71 | | | | | | 0.77 | | | | | | 0.62 | | | | | | 0.62 | | | | | | 1.82 | | | | | | 119,455 | | | | | | 45 | | |
| 12-31-15 | | | | | 10.53 | | | | | | 0.21• | | | | | | (0.33) | | | | | | (0.12) | | | | | | 0.19 | | | | | | 0.67 | | | | | | — | | | | | | 0.86 | | | | | | — | | | | | | 9.55 | | | | | | (1.37) | | | | | | 0.77 | | | | | | 0.62 | | | | | | 0.62 | | | | | | 2.17 | | | | | | 134,515 | | | | | | 34 | | |
| 12-31-14 | | | | | 10.73 | | | | | | 0.17 | | | | | | 0.43 | | | | | | 0.60 | | | | | | 0.23 | | | | | | 0.57 | | | | | | — | | | | | | 0.80 | | | | | | — | | | | | | 10.53 | | | | | | 5.68 | | | | | | 0.78 | | | | | | 0.62 | | | | | | 0.62 | | | | | | 1.50 | | | | | | 37,651 | | | | | | 23 | | |
| 12-31-13 | | | | | 10.64 | | | | | | 0.19• | | | | | | 0.58 | | | | | | 0.77 | | | | | | 0.30 | | | | | | 0.38 | | | | | | — | | | | | | 0.68 | | | | | | — | | | | | | 10.73 | | | | | | 7.50 | | | | | | 0.76 | | | | | | 0.61 | | | | | | 0.61 | | | | | | 1.74 | | | | | | 37,886 | | | | | | 39 | | |
| Class I | | | | | | | | | | | | | | | | | | | | | | | | | | | | | | | | | | | | | | | | | | | | | | | | | | | | | | | | | | | | | | | | | | | | | | | | | | | | | | | | | | | | | | | | | | | | | | | | | | | | | | | |
| 12-31-17 | | | | | 9.96 | | | | | | 0.22• | | | | | | 0.71 | | | | | | 0.93 | | | | | | 0.22 | | | | | | 0.05 | | | | | | — | | | | | | 0.27 | | | | | | — | | | | | | 10.62 | | | | | | 9.36 | | | | | | 0.26 | | | | | | 0.18 | | | | | | 0.18 | | | | | | 2.11 | | | | | | 22,916 | | | | | | 32 | | |
| 12-31-16 | | | | | 9.77 | | | | | | 0.23• | | | | | | 0.28 | | | | | | 0.51 | | | | | | 0.18 | | | | | | 0.14 | | | | | | — | | | | | | 0.32 | | | | | | — | | | | | | 9.96 | | | | | | 5.23 | | | | | | 0.27 | | | | | | 0.12 | | | | | | 0.12 | | | | | | 2.33 | | | | | | 29,545 | | | | | | 45 | | |
| 12-31-15 | | | | | 10.76 | | | | | | 0.28• | | | | | | (0.36) | | | | | | (0.08) | | | | | | 0.24 | | | | | | 0.67 | | | | | | — | | | | | | 0.91 | | | | | | — | | | | | | 9.77 | | | | | | (0.91) | | | | | | 0.27 | | | | | | 0.12 | | | | | | 0.12 | | | | | | 2.84 | | | | | | 30,873 | | | | | | 34 | | |
| 12-31-14 | | | | | 10.94 | | | | | | 0.22• | | | | | | 0.45 | | | | | | 0.67 | | | | | | 0.28 | | | | | | 0.57 | | | | | | — | | | | | | 0.85 | | | | | | — | | | | | | 10.76 | | | | | | 6.23 | | | | | | 0.28 | | | | | | 0.12 | | | | | | 0.12 | | | | | | 2.00 | | | | | | 5,042 | | | | | | 23 | | |
| 12-31-13 | | | | | 10.82 | | | | | | 0.22• | | | | | | 0.63 | | | | | | 0.85 | | | | | | 0.35 | | | | | | 0.38 | | | | | | — | | | | | | 0.73 | | | | | | — | | | | | | 10.94 | | | | | | 8.10 | | | | | | 0.26 | | | | | | 0.11 | | | | | | 0.11 | | | | | | 2.01 | | | | | | 5,682 | | | | | | 39 | | |
| Class S | | | | | | | | | | | | | | | | | | | | | | | | | | | | | | | | | | | | | | | | | | | | | | | | | | | | | | | | | | | | | | | | | | | | | | | | | | | | | | | | | | | | | | | | | | | | | | | | | | | | | | | |
| 12-31-17 | | | | | 9.86 | | | | | | 0.19• | | | | | | 0.70 | | | | | | 0.89 | | | | | | 0.19 | | | | | | 0.05 | | | | | | — | | | | | | 0.24 | | | | | | — | | | | | | 10.51 | | | | | | 9.06 | | | | | | 0.51 | | | | | | 0.43 | | | | | | 0.43 | | | | | | 1.89 | | | | | | 168,730 | | | | | | 32 | | |
| 12-31-16 | | | | | 9.68 | | | | | | 0.20• | | | | | | 0.28 | | | | | | 0.48 | | | | | | 0.16 | | | | | | 0.14 | | | | | | — | | | | | | 0.30 | | | | | | — | | | | | | 9.86 | | | | | | 4.95 | | | | | | 0.52 | | | | | | 0.37 | | | | | | 0.37 | | | | | | 2.05 | | | | | | 174,891 | | | | | | 45 | | |
| 12-31-15 | | | | | 10.66 | | | | | | 0.23• | | | | | | (0.33) | | | | | | (0.10) | | | | | | 0.21 | | | | | | 0.67 | | | | | | — | | | | | | 0.88 | | | | | | — | | | | | | 9.68 | | | | | | (1.11) | | | | | | 0.52 | | | | | | 0.37 | | | | | | 0.37 | | | | | | 2.24 | | | | | | 199,999 | | | | | | 34 | | |
| 12-31-14 | | | | | 10.85 | | | | | | 0.19• | | | | | | 0.44 | | | | | | 0.63 | | | | | | 0.25 | | | | | | 0.57 | | | | | | — | | | | | | 0.82 | | | | | | — | | | | | | 10.66 | | | | | | 5.90 | | | | | | 0.53 | | | | | | 0.37 | | | | | | 0.37 | | | | | | 1.73 | | | | | | 124,505 | | | | | | 23 | | |
| 12-31-13 | | | | | 10.74 | | | | | | 0.21• | | | | | | 0.60 | | | | | | 0.81 | | | | | | 0.32 | | | | | | 0.38 | | | | | | — | | | | | | 0.70 | | | | | | — | | | | | | 10.85 | | | | | | 7.78 | | | | | | 0.51 | | ��� | | | | 0.36 | | | | | | 0.36 | | | | | | 1.92 | | | | | | 134,689 | | | | | | 39 | | |
| Class S2 | | | | | | | | | | | | | | | | | | | | | | | | | | | | | | | | | | | | | | | | | | | | | | | | | | | | | | | | | | | | | | | | | | | | | | | | | | | | | | | | | | | | | | | | | | | | | | | | | | | | | | | |
| 12-31-17 | | | | | 9.66 | | | | | | 0.18• | | | | | | 0.68 | | | | | | 0.86 | | | | | | 0.18 | | | | | | 0.05 | | | | | | — | | | | | | 0.23 | | | | | | — | | | | | | 10.29 | | | | | | 8.89 | | | | | | 0.66 | | | | | | 0.58 | | | | | | 0.58 | | | | | | 1.75 | | | | | | 12,928 | | | | | | 32 | | |
| 12-31-16 | | | | | 9.50 | | | | | | 0.19• | | | | | | 0.27 | | | | | | 0.46 | | | | | | 0.16 | | | | | | 0.14 | | | | | | — | | | | | | 0.30 | | | | | | — | | | | | | 9.66 | | | | | | 4.79 | | | | | | 0.70 | | | | | | 0.52 | | | | | | 0.52 | | | | | | 1.98 | | | | | | 13,809 | | | | | | 45 | | |
| 12-31-15 | | | | | 10.46 | | | | | | 0.22• | | | | | | (0.33) | | | | | | (0.11) | | | | | | 0.18 | | | | | | 0.67 | | | | | | — | | | | | | 0.85 | | | | | | — | | | | | | 9.50 | | | | | | (1.25) | | | | | | 0.77 | | | | | | 0.52 | | | | | | 0.52 | | | | | | 2.28 | | | | | | 14,859 | | | | | | 34 | | |
| 12-31-14 | | | | | 10.66 | | | | | | 0.17• | | | | | | 0.43 | | | | | | 0.60 | | | | | | 0.23 | | | | | | 0.57 | | | | | | — | | | | | | 0.80 | | | | | | — | | | | | | 10.46 | | | | | | 5.78 | | | | | | 0.78 | | | | | | 0.52 | | | | | | 0.52 | | | | | | 1.56 | | | | | | 4,595 | | | | | | 23 | | |
| 12-31-13 | | | | | 10.58 | | | | | | 0.20• | | | | | | 0.58 | | | | | | 0.78 | | | | | | 0.32 | | | | | | 0.38 | | | | | | — | | | | | | 0.70 | | | | | | — | | | | | | 10.66 | | | | | | 7.64 | | | | | | 0.76 | | | | | | 0.51 | | | | | | 0.51 | | | | | | 1.87 | | | | | | 5,531 | | | | | | 39 | | |
| Class Z | | | | | | | | | | | | | | | | | | | | | | | | | | | | | | | | | | | | | | | | | | | | | | | | | | | | | | | | | | | | | | | | | | | | | | | | | | | | | | | | | | | | | | | | | | | | | | | | | | | | | | | |
| 12-31-17 | | | | | 9.99 | | | | | | 0.25• | | | | | | 0.70 | | | | | | 0.95 | | | | | | 0.22 | | | | | | 0.05 | | | | | | — | | | | | | 0.27 | | | | | | — | | | | | | 10.67 | | | | | | 9.54 | | | | | | 0.26 | | | | | | 0.00* | | | | | | 0.00* | | | | | | 2.45 | | | | | | 169,194 | | | | | | 32 | | |
| 12-31-16 | | | | | 9.79 | | | | | | 0.32• | | | | | | 0.20 | | | | | | 0.52 | | | | | | 0.18 | | | | | | 0.14 | | | | | | — | | | | | | 0.32 | | | | | | — | | | | | | 9.99 | | | | | | 5.32 | | | | | | 0.27 | | | | | | 0.00 | | | | | | 0.00 | | | | | | 3.20 | | | | | | 70,857 | | | | | | 45 | | |
05-01-15(5) -
12-31-15 | | | | | 11.02 | | | | | | 0.58• | | | | | | (0.90) | | | | | | (0.32) | | | | | | 0.24 | | | | | | 0.67 | | | | | | — | | | | | | 0.91 | | | | | | — | | | | | | 9.79 | | | | | | (3.06) | | | | | | 0.28 | | | | | | 0.00 | | | | | | 0.00 | | | | | | 9.14 | | | | | | 1,635 | | | | | | 34 | | |
| Voya Index Solution 2020 Portfolio | | | | | | | | | | | | | | | | | | | | | | | | | | | | | | | | | | | | | | | | | | | | | | | | | | | | | | | | | | | | | | | | | | | | | | | | | | | | | | | | | | | | | | | | | | | | | | | | | | | | | | | |
| Class ADV | | | | | | | | | | | | | | | | | | | | | | | | | | | | | | | | | | | | | | | | | | | | | | | | | | | | | | | | | | | | | | | | | | | | | | | | | | | | | | | | | | | | | | | | | | | | | | | | | | | | | | | |
| 12-31-17 | | | | | 12.02 | | | | | | 0.20• | | | | | | 1.21 | | | | | | 1.41 | | | | | | 0.06 | | | | | | 0.10 | | | | | | — | | | | | | 0.16 | | | | | | — | | | | | | 13.27 | | | | | | 11.78 | | | | | | 0.77 | | | | | | 0.68 | | | | | | 0.68 | | | | | | 1.58 | | | | | | 21,918 | | | | | | 42 | | |
| 12-31-16 | | | | | 11.37 | | | | | | 0.24• | | | | | | 0.43 | | | | | | 0.67 | | | | | | 0.01 | | | | | | 0.01 | | | | | | — | | | | | | 0.02 | | | | | | — | | | | | | 12.02 | | | | | | 5.90 | | | | | | 0.82 | | | | | | 0.63 | | | | | | 0.63 | | | | | | 2.07 | | | | | | 13,619 | | | | | | 75 | | |
| 12-31-15 | | | | | 11.82 | | | | | | 0.46• | | | | | | (0.46) | | | | | | 0.00* | | | | | | 0.15 | | | | | | 0.30 | | | | | | — | | | | | | 0.45 | | | | | | — | | | | | | 11.37 | | | | | | 0.00 | | | | | | 2.22 | | | | | | 0.63 | | | | | | 0.63 | | | | | | 4.05 | | | | | | 4,703 | | | | | | 108 | | |
| 12-31-14 | | | | | 12.11 | | | | | | 0.15 | | | | | | 0.47 | | | | | | 0.62 | | | | | | 0.23 | | | | | | 0.68 | | | | | | — | | | | | | 0.91 | | | | | | — | | | | | | 11.82 | | | | | | 5.27 | | | | | | 71.22 | | | | | | 0.63 | | | | | | 0.63 | | | | | | 1.31 | | | | | | 4 | | | | | | 23 | | |
| 12-31-13 | | | | | 11.41 | | | | | | 0.19 | | | | | | 1.30 | | | | | | 1.49 | | | | | | 0.26 | | | | | | 0.54 | | | | | | — | | | | | | 0.80 | | | | | | 0.01 | | | | | | 12.11 | | | | | | 13.55(a) | | | | | | 95.97 | | | | | | 0.62 | | | | | | 0.62 | | | | | | 1.61 | | | | | | 4 | | | | | | 36 | | |
See Accompanying Notes to Financial Statements
Financial Highlights (continued)
| | | | | | | | | | Income (loss)
from
investment
operations | | | | | | | | | Less Distributions | | | | | | Ratios to average net assets | | | Supplemental
Data | |
| | | | Net asset value, beginning
of year or period | | | Net investment income (loss) | | | Net realized and unrealized
gain (loss) | | | Total from investment
operations | | | From net investment income | | | From net realized gains | | | From return of capital | | | Total distributions | | | Payment by affiliate | | | Net asset value, end of year
or period | | | Total Return(1) | | | Expenses before
reductions/additions(2)(3)(4) | | | Expenses net of fee waivers
and/or recoupments if any(2)(3)(4) | | | Expenses net of all
reductions/additions(2)(3)(4) | | | Net investment income
(loss)(2)(3) | | | Net assets, end of year
or period | | | Portfolio turnover rate | |
Year or
period ended | | | ($) | | | ($) | | | ($) | | | ($) | | | ($) | | | ($) | | | ($) | | | ($) | | | ($) | | | ($) | | | (%) | | | (%) | | | (%) | | | (%) | | | (%) | | | ($000’s) | | | (%) | |
| Voya Index Solution 2020 Portfolio (continued) | | | | | | | | | | | | | | | | | | | | | | | | | | | | | | | | | | | | | | | | | | | | | | | | | | | | | | | | | | | | | | | | | | | | | | | | | | | | | | | | | | | | | | | | | | | | | | | | | | | | | | | |
| Class I | | | | | | | | | | | | | | | | | | | | | | | | | | | | | | | | | | | | | | | | | | | | | | | | | | | | | | | | | | | | | | | | | | | | | | | | | | | | | | | | | | | | | | | | | | | | | | | | | | | | | | | |
| 12-31-17 | | | | | 12.27 | | | | | | 0.28• | | | | | | 1.23 | | | | | | 1.51 | | | | | | 0.09 | | | | | | 0.10 | | | | | | — | | | | | | 0.19 | | | | | | — | | | | | | 13.59 | | | | | | 12.42 | | | | | | 0.27 | | | | | | 0.18 | | | | | | 0.18 | | | | | | 2.12 | | | | | | 5,360 | | | | | | 42 | | |
| 12-31-16 | | | | | 11.55 | | | | | | 0.37• | | | | | | 0.38 | | | | | | 0.75 | | | | | | 0.02 | | | | | | 0.01 | | | | | | — | | | | | | 0.03 | | | | | | — | | | | | | 12.27 | | | | | | 6.45 | | | | | | 0.32 | | | | | | 0.13 | | | | | | 0.13 | | | | | | 3.05 | | | | | | 3,539 | | | | | | 75 | | |
| 12-31-15 | | | | | 11.91 | | | | | | 0.34• | | | | | | (0.33) | | | | | | 0.01 | | | | | | 0.07 | | | | | | 0.30 | | | | | | — | | | | | | 0.37 | | | | | | — | | | | | | 11.55 | | | | | | 0.04 | | | | | | 1.72 | | | | | | 0.13 | | | | | | 0.13 | | | | | | 2.98 | | | | | | 311 | | | | | | 108 | | |
| 12-31-14 | | | | | 12.18 | | | | | | 0.21 | | | | | | 0.49 | | | | | | 0.70 | | | | | | 0.29 | | | | | | 0.68 | | | | | | — | | | | | | 0.97 | | | | | | — | | | | | | 11.91 | | | | | | 5.86 | | | | | | 70.72 | | | | | | 0.13 | | | | | | 0.13 | | | | | | 1.82 | | | | | | 4 | | | | | | 23 | | |
| 12-31-13 | | | | | 11.47 | | | | | | 0.25 | | | | | | 1.30 | | | | | | 1.55 | | | | | | 0.31 | | | | | | 0.54 | | | | | | — | | | | | | 0.85 | | | | | | 0.01 | | | | | | 12.18 | | | | | | 14.02(a) | | | | | | 95.47 | | | | | | 0.12 | | | | | | 0.12 | | | | | | 2.11 | | | | | | 4 | | | | | | 36 | | |
| Class S | | | | | | | | | | | | | | | | | | | | | | | | | | | | | | | | | | | | | | | | | | | | | | | | | | | | | | | | | | | | | | | | | | | | | | | | | | | | | | | | | | | | | | | | | | | | | | | | | | | | | | | |
| 12-31-17 | | | | | 12.25 | | | | | | 0.23• | | | | | | 1.24 | | | | | | 1.47 | | | | | | 0.08 | | | | | | 0.10 | | | | | | — | | | | | | 0.18 | | | | | | — | | | | | | 13.54 | | | | | | 12.06 | | | | | | 0.52 | | | | | | 0.43 | | | | | | 0.43 | | | | | | 1.80 | | | | | | 12,049 | | | | | | 42 | | |
| 12-31-16 | | | | | 11.55 | | | | | | 0.30• | | | | | | 0.43 | | | | | | 0.73 | | | | | | 0.02 | | | | | | 0.01 | | | | | | — | | | | | | 0.03 | | | | | | — | | | | | | 12.25 | | | | | | 6.26 | | | | | | 0.57 | | | | | | 0.38 | | | | | | 0.38 | | | | | | 2.53 | | | | | | 8,811 | | | | | | 75 | | |
| 12-31-15 | | | | | 11.91 | | | | | | 0.58• | | | | | | (0.59) | | | | | | (0.01) | | | | | | 0.05 | | | | | | 0.30 | | | | | | — | | | | | | 0.35 | | | | | | — | | | | | | 11.55 | | | | | | (0.08) | | | | | | 1.97 | | | | | | 0.38 | | | | | | 0.38 | | | | | | 5.10 | | | | | | 1,084 | | | | | | 108 | | |
| 12-31-14 | | | | | 12.19 | | | | | | 0.18 | | | | | | 0.48 | | | | | | 0.66 | | | | | | 0.26 | | | | | | 0.68 | | | | | | — | | | | | | 0.94 | | | | | | — | | | | | | 11.91 | | | | | | 5.54 | | | | | | 70.97 | | | | | | 0.38 | | | | | | 0.38 | | | | | | 1.57 | | | | | | 4 | | | | | | 23 | | |
| 12-31-13 | | | | | 11.43 | | | | | | 0.22 | | | | | | 1.29 | | | | | | 1.51 | | | | | | 0.22 | | | | | | 0.54 | | | | | | — | | | | | | 0.76 | | | | | | 0.01 | | | | | | 12.19 | | | | | | 13.63(a) | | | | | | 95.72 | | | | | | 0.37 | | | | | | 0.37 | | | | | | 1.86 | | | | | | 4 | | | | | | 36 | | |
| Class S2 | | | | | | | | | | | | | | | | | | | | | | | | | | | | | | | | | | | | | | | | | | | | | | | | | | | | | | | | | | | | | | | | | | | | | | | | | | | | | | | | | | | | | | | | | | | | | | | | | | | | | | | |
| 12-31-17 | | | | | 12.19 | | | | | | 0.20 | | | | | | 1.24 | | | | | | 1.44 | | | | | | 0.07 | | | | | | 0.10 | | | | | | — | | | | | | 0.17 | | | | | | — | | | | | | 13.46 | | | | | | 11.92 | | | | | | 0.67 | | | | | | 0.58 | | | | | | 0.58 | | | | | | 1.59 | | | | | | 3,783 | | | | | | 42 | | |
| 12-31-16 | | | | | 11.52 | | | | | | 0.30• | | | | | | 0.39 | | | | | | 0.69 | | | | | | 0.01 | | | | | | 0.01 | | | | | | — | | | | | | 0.02 | | | | | | — | | | | | | 12.19 | | | | | | 6.00 | | | | | | 0.75 | | | | | | 0.53 | | | | | | 0.53 | | | | | | 2.54 | | | | | | 3,328 | | | | | | 75 | | |
| 12-31-15 | | | | | 11.84 | | | | | | 0.46• | | | | | | (0.48) | | | | | | (0.02) | | | | | | 0.00* | | | | | | 0.30 | | | | | | — | | | | | | 0.30 | | | | | | — | | | | | | 11.52 | | | | | | (0.16) | | | | | | 2.22 | | | | | | 0.53 | | | | | | 0.53 | | | | | | 3.99 | | | | | | 367 | | | | | | 108 | | |
| 12-31-14 | | | | | 12.13 | | | | | | 0.16 | | | | | | 0.48 | | | | | | 0.64 | | | | | | 0.25 | | | | | | 0.68 | | | | | | — | | | | | | 0.93 | | | | | | — | | | | | | 11.84 | | | | | | 5.36 | | | | | | 71.22 | | | | | | 0.53 | | | | | | 0.53 | | | | | | 1.41 | | | | | | 4 | | | | | | 23 | | |
| 12-31-13 | | | | | 11.43 | | | | | | 0.20 | | | | | | 1.31 | | | | | | 1.51 | | | | | | 0.28 | | | | | | 0.54 | | | | | | — | | | | | | 0.82 | | | | | | 0.01 | | | | | | 12.13 | | | | | | 13.64(a) | | | | | | 95.97 | | | | | | 0.52 | | | | | | 0.52 | | | | | | 1.71 | | | | | | 4 | | | | | | 36 | | |
| Class Z | | | | | | | | | | | | | | | | | | | | | | | | | | | | | | | | | | | | | | | | | | | | | | | | | | | | | | | | | | | | | | | | | | | | | | | | | | | | | | | | | | | | | | | | | | | | | | | | | | | | | | | |
| 12-31-17 | | | | | 12.30 | | | | | | 0.31• | | | | | | 1.23 | | | | | | 1.54 | | | | | | 0.09 | | | | | | 0.10 | | | | | | — | | | | | | 0.19 | | | | | | — | | | | | | 13.65 | | | | | | 12.63 | | | | | | 0.27 | | | | | | 0.00* | | | | | | 0.00* | | | | | | 2.35 | | | | | | 203,080 | | | | | | 42 | | |
| 12-31-16 | | | | | 11.57 | | | | | | 0.41• | | | | | | 0.35 | | | | | | 0.76 | | | | | | 0.02 | | | | | | 0.01 | | | | | | — | | | | | | 0.03 | | | | | | — | | | | | | 12.30 | | | | | | 6.52 | | | | | | 0.32 | | | | | | 0.00 | | | | | | 0.00 | | | | | | 3.44 | | | | | | 73,350 | | | | | | 75 | | |
05-01-15(5) -
12-31-15 | | | | | 12.30 | | | | | | 0.38• | | | | | | (0.74) | | | | | | (0.36) | | | | | | 0.07 | | | | | | 0.30 | | | | | | — | | | | | | 0.37 | | | | | | — | | | | | | 11.57 | | | | | | (2.97) | | | | | | 1.70 | | | | | | 0.00 | | | | | | 0.00 | | | | | | 4.91 | | | | | | 2,030 | | | | | | 108 | | |
| Voya Index Solution 2025 Portfolio | | | | | | | | | | | | | | | | | | | | | | | | | | | | | | | | | | | | | | | | | | | | | | | | | | | | | | | | | | | | | | | | | | | | | | | | | | | | | | | | | | | | | | | | | | | | | | | | | | | | | | | |
| Class ADV | | | | | | | | | | | | | | | | | | | | | | | | | | | | | | | | | | | | | | | | | | | | | | | | | | | | | | | | | | | | | | | | | | | | | | | | | | | | | | | | | | | | | | | | | | | | | | | | | | | | | | | |
| 12-31-17 | | | | | 9.89 | | | | | | 0.15• | | | | | | 1.25 | | | | | | 1.40 | | | | | | 0.14 | | | | | | 0.21 | | | | | | — | | | | | | 0.35 | | | | | | — | | | | | | 10.94 | | | | | | 14.32 | | | | | | 0.76 | | | | | | 0.68 | | | | | | 0.68 | | | | | | 1.44 | | | | | | 232,790 | | | | | | 32 | | |
| 12-31-16 | | | | | 10.19 | | | | | | 0.19 | | | | | | 0.47 | | | | | | 0.66 | | | | | | 0.21 | | | | | | 0.75 | | | | | | — | | | | | | 0.96 | | | | | | — | | | | | | 9.89 | | | | | | 6.61 | | | | | | 0.77 | | | | | | 0.63 | | | | | | 0.63 | | | | | | 1.86 | | | | | | 228,234 | | | | | | 44 | | |
| 12-31-15 | | | | | 11.49 | | | | | | 0.19 | | | | | | (0.36) | | | | | | (0.17) | | | | | | 0.16 | | | | | | 0.97 | | | | | | — | | | | | | 1.13 | | | | | | — | | | | | | 10.19 | | | | | | (1.80) | | | | | | 0.77 | | | | | | 0.63 | | | | | | 0.63 | | | | | | 1.75 | | | | | | 228,081 | | | | | | 40 | | |
| 12-31-14 | | | | | 11.63 | | | | | | 0.15 | | | | | | 0.46 | | | | | | 0.61 | | | | | | 0.19 | | | | | | 0.56 | | | | | | — | | | | | | 0.75 | | | | | | — | | | | | | 11.49 | | | | | | 5.41 | | | | | | 0.77 | | | | | | 0.62 | | | | | | 0.62 | | | | | | 1.29 | | | | | | 242,980 | | | | | | 33 | | |
| 12-31-13 | | | | | 10.38 | | | | | | 0.18• | | | | | | 1.54 | | | | | | 1.72 | | | | | | 0.16 | | | | | | 0.31 | | | | | | — | | | | | | 0.47 | | | | | | — | | | | | | 11.63 | | | | | | 16.77 | | | | | | 0.75 | | | | | | 0.61 | | | | | | 0.61 | | | | | | 1.66 | | | | | | 245,758 | | | | | | 40 | | |
| Class I | | | | | | | | | | | | | | | | | | | | | | | | | | | | | | | | | | | | | | | | | | | | | | | | | | | | | | | | | | | | | | | | | | | | | | | | | | | | | | | | | | | | | | | | | | | | | | | | | | | | | | | |
| 12-31-17 | | | | | 10.13 | | | | | | 0.21• | | | | | | 1.27 | | | | | | 1.48 | | | | | | 0.19 | | | | | | 0.21 | | | | | | — | | | | | | 0.40 | | | | | | — | | | | | | 11.21 | | | | | | 14.84 | | | | | | 0.26 | | | | | | 0.18 | | | | | | 0.18 | | | | | | 1.94 | | | | | | 60,664 | | | | | | 32 | | |
| 12-31-16 | | | | | 10.42 | | | | | | 0.25• | | | | | | 0.48 | | | | | | 0.73 | | | | | | 0.27 | | | | | | 0.75 | | | | | | — | | | | | | 1.02 | | | | | | — | | | | | | 10.13 | | | | | | 7.14 | | | | | | 0.27 | | | | | | 0.13 | | | | | | 0.13 | | | | | | 2.39 | | | | | | 56,555 | | | | | | 44 | | |
| 12-31-15 | | | | | 11.72 | | | | | | 0.26• | | | | | | (0.37) | | | | | | (0.11) | | | | | | 0.22 | | | | | | 0.97 | | | | | | — | | | | | | 1.19 | | | | | | — | | | | | | 10.42 | | | | | | (1.25) | | | | | | 0.27 | | | | | | 0.13 | | | | | | 0.13 | | | | | | 2.29 | | | | | | 49,275 | | | | | | 40 | | |
| 12-31-14 | | | | | 11.84 | | | | | | 0.22• | | | | | | 0.46 | | | | | | 0.68 | | | | | | 0.24 | | | | | | 0.56 | | | | | | — | | | | | | 0.80 | | | | | | — | | | | | | 11.72 | | | | | | 5.95 | | | | | | 0.27 | | | | | | 0.12 | | | | | | 0.12 | | | | | | 1.89 | | | | | | 46,808 | | | | | | 33 | | |
| 12-31-13 | | | | | 10.54 | | | | | | 0.24• | | | | | | 1.56 | | | | | | 1.80 | | | | | | 0.19 | | | | | | 0.31 | | | | | | — | | | | | | 0.50 | | | | | | — | | | | | | 11.84 | | | | | | 17.38 | | | | | | 0.25 | | | | | | 0.11 | | | | | | 0.11 | | | | | | 2.13 | | | | | | 33,098 | | | | | | 40 | | |
| Class S | | | | | | | | | | | | | | | | | | | | | | | | | | | | | | | | | | | | | | | | | | | | | | | | | | | | | | | | | | | | | | | | | | | | | | | | | | | | | | | | | | | | | | | | | | | | | | | | | | | | | | | |
| 12-31-17 | | | | | 10.02 | | | | | | 0.18• | | | | | | 1.26 | | | | | | 1.44 | | | | | | 0.16 | | | | | | 0.21 | | | | | | — | | | | | | 0.37 | | | | | | — | | | | | | 11.09 | | | | | | 14.62 | | | | | | 0.51 | | | | | | 0.43 | | | | | | 0.43 | | | | | | 1.69 | | | | | | 149,827 | | | | | | 32 | | |
| 12-31-16 | | | | | 10.31 | | | | | | 0.21• | | | | | | 0.48 | | | | | | 0.69 | | | | | | 0.23 | | | | | | 0.75 | | | | | | — | | | | | | 0.98 | | | | | | — | | | | | | 10.02 | | | | | | 6.85 | | | | | | 0.52 | | | | | | 0.38 | | | | | | 0.38 | | | | | | 2.07 | | | | | | 150,126 | | | | | | 44 | | |
| 12-31-15 | | | | | 11.61 | | | | | | 0.23 | | | | | | (0.36) | | | | | | (0.13) | | | | | | 0.20 | | | | | | 0.97 | | | | | | — | | | | | | 1.17 | | | | | | — | | | | | | 10.31 | | | | | | (1.50) | | | | | | 0.52 | | | | | | 0.38 | | | | | | 0.38 | | | | | | 1.99 | | | | | | 166,420 | | | | | | 40 | | |
| 12-31-14 | | | | | 11.74 | | | | | | 0.18 | | | | | | 0.47 | | | | | | 0.65 | | | | | | 0.22 | | | | | | 0.56 | | | | | | — | | | | | | 0.78 | | | | | | — | | | | | | 11.61 | | | | | | 5.67 | | | | | | 0.52 | | | | | | 0.37 | | | | | | 0.37 | | | | | | 1.55 | | | | | | 186,666 | | | | | | 33 | | |
| 12-31-13 | | | | | 10.47 | | | | | | 0.21• | | | | | | 1.54 | | | | | | 1.75 | | | | | | 0.17 | | | | | | 0.31 | | | | | | — | | | | | | 0.48 | | | | | | — | | | | | | 11.74 | | | | | | 17.00 | | | | | | 0.50 | | | | | | 0.36 | | | | | | 0.36 | | | | | | 1.88 | | | | | | 174,380 | | | | | | 40 | | |
See Accompanying Notes to Financial Statements
Financial Highlights (continued)
| | | | | | | | | | Income (loss)
from
investment
operations | | | | | | | | | Less Distributions | | | | | | Ratios to average net assets | | | Supplemental
Data | |
| | | | Net asset value, beginning
of year or period | | | Net investment income (loss) | | | Net realized and unrealized
gain (loss) | | | Total from investment
operations | | | From net investment income | | | From net realized gains | | | From return of capital | | | Total distributions | | | Payment by affiliate | | | Net asset value, end of year
or period | | | Total Return(1) | | | Expenses before
reductions/additions(2)(3)(4) | | | Expenses net of fee waivers
and/or recoupments if any(2)(3)(4) | | | Expenses net of all
reductions/additions(2)(3)(4) | | | Net investment income
(loss)(2)(3) | | | Net assets, end of year
or period | | | Portfolio turnover rate | |
Year or
period ended | | | ($) | | | ($) | | | ($) | | | ($) | | | ($) | | | ($) | | | ($) | | | ($) | | | ($) | | | ($) | | | (%) | | | (%) | | | (%) | | | (%) | | | (%) | | | ($000’s) | | | (%) | |
| Voya Index Solution 2025 Portfolio (continued) | | | | | | | | | | | | | | | | | | | | | | | | | | | | | | | | | | | | | | | | | | | | | | | | | | | | | | | | | | | | | | | | | | | | | | | | | | | | | | | | | | | | | | | | | | | | | | | | | | | | | | | |
| Class S2 | | | | | | | | | | | | | | | | | | | | | | | | | | | | | | | | | | | | | | | | | | | | | | | | | | | | | | | | | | | | | | | | | | | | | | | | | | | | | | | | | | | | | | | | | | | | | | | | | | | | | | | |
| 12-31-17 | | | | | 9.86 | | | | | | 0.16• | | | | | | 1.24 | | | | | | 1.40 | | | | | | 0.15 | | | | | | 0.21 | | | | | | — | | | | | | 0.36 | | | | | | — | | | | | | 10.90 | | | | | | 14.41 | | | | | | 0.66 | | | | | | 0.58 | | | | | | 0.58 | | | | | | 1.55 | | | | | | 34,197 | | | | | | 32 | | |
| 12-31-16 | | | | | 10.16 | | | | | | 0.20• | | | | | | 0.47 | | | | | | 0.67 | | | | | | 0.22 | | | | | | 0.75 | | | | | | — | | | | | | 0.97 | | | | | | — | | | | | | 9.86 | | | | | | 6.72 | | | | | | 0.70 | | | | | | 0.53 | | | | | | 0.53 | | | | | | 2.04 | | | | | | 34,034 | | | | | | 44 | | |
| 12-31-15 | | | | | 11.44 | | | | | | 0.20• | | | | | | (0.35) | | | | | | (0.15) | | | | | | 0.16 | | | | | | 0.97 | | | | | | — | | | | | | 1.13 | | | | | | — | | | | | | 10.16 | | | | | | (1.63) | | | | | | 0.77 | | | | | | 0.53 | | | | | | 0.53 | | | | | | 1.83 | | | | | | 34,934 | | | | | | 40 | | |
| 12-31-14 | | | | | 11.58 | | | | | | 0.16• | | | | | | 0.46 | | | | | | 0.62 | | | | | | 0.20 | | | | | | 0.56 | | | | | | — | | | | | | 0.76 | | | | | | — | | | | | | 11.44 | | | | | | 5.52 | | | | | | 0.77 | | | | | | 0.52 | | | | | | 0.52 | | | | | | 1.36 | | | | | | 42,853 | | | | | | 33 | | |
| 12-31-13 | | | | | 10.34 | | | | | | 0.20• | | | | | | 1.52 | | | | | | 1.72 | | | | | | 0.17 | | | | | | 0.31 | | | | | | — | | | | | | 0.48 | | | | | | — | | | | | | 11.58 | | | | | | 16.87 | | | | | | 0.75 | | | | | | 0.51 | | | | | | 0.51 | | | | | | 1.80 | | | | | | 48,649 | | | | | | 40 | | |
| Class Z | | | | | | | | | | | | | | | | | | | | | | | | | | | | | | | | | | | | | | | | | | | | | | | | | | | | | | | | | | | | | | | | | | | | | | | | | | | | | | | | | | | | | | | | | | | | | | | | | | | | | | | |
| 12-31-17 | | | | | 10.16 | | | | | | 0.25• | | | | | | 1.25 | | | | | | 1.50 | | | | | | 0.19 | | | | | | 0.21 | | | | | | — | | | | | | 0.40 | | | | | | — | | | | | | 11.26 | | | | | | 15.00 | | | | | | 0.26 | | | | | | 0.00* | | | | | | 0.00* | | | | | | 2.31 | | | | | | 371,838 | | | | | | 32 | | |
| 12-31-16 | | | | | 10.43 | | | | | | 0.32• | | | | | | 0.43 | | | | | | 0.75 | | | | | | 0.27 | | | | | | 0.75 | | | | | | — | | | | | | 1.02 | | | | | | — | | | | | | 10.16 | | | | | | 7.33 | | | | | | 0.27 | | | | | | 0.00 | | | | | | 0.00 | | | | | | 3.13 | | | | | | 118,855 | | | | | | 44 | | |
05-01-15(5) -
12-31-15 | | | | | 12.17 | | | | | | 0.41• | | | | | | (0.96) | | | | | | (0.55) | | | | | | 0.22 | | | | | | 0.97 | | | | | | — | | | | | | 1.19 | | | | | | — | | | | | | 10.43 | | | | | | (4.81) | | | | | | 0.28 | | | | | | 0.00 | | | | | | 0.00 | | | | | | 5.95 | | | | | | 2,310 | | | | | | 40 | | |
| Voya Index Solution 2030 Portfolio | | | | | | | | | | | | | | | | | | | | | | | | | | | | | | | | | | | | | | | | | | | | | | | | | | | | | | | | | | | | | | | | | | | | | | | | | | | | | | | | | | | | | | | | | | | | | | | | | | | | | | | |
| Class ADV | | | | | | | | | | | | | | | | | | | | | | | | | | | | | | | | | | | | | | | | | | | | | | | | | | | | | | | | | | | | | | | | | | | | | | | | | | | | | | | | | | | | | | | | | | | | | | | | | | | | | | | |
| 12-31-17 | | | | | 13.22 | | | | | | 0.21• | | | | | | 1.98 | | | | | | 2.19 | | | | | | 0.05 | | | | | | 0.08 | | | | | | — | | | | | | 0.13 | | | | | | — | | | | | | 15.28 | | | | | | 16.62 | | | | | | 0.76 | | | | | | 0.69 | | | | | | 0.69 | | | | | | 1.48 | | | | | | 20,939 | | | | | | 32 | | |
| 12-31-16 | | | | | 12.39 | | | | | | 0.27• | | | | | | 0.58 | | | | | | 0.85 | | | | | | 0.01 | | | | | | 0.01 | | | | | | — | | | | | | 0.02 | | | | | | — | | | | | | 13.22 | | | | | | 6.84 | | | | | | 0.83 | | | | | | 0.63 | | | | | | 0.63 | | | | | | 2.13 | | | | | | 10,732 | | | | | | 64 | | |
| 12-31-15 | | | | | 12.70 | | | | | | 0.48• | | | | | | (0.53) | | | | | | (0.05) | | | | | | 0.07 | | | | | | 0.19 | | | | | | — | | | | | | 0.26 | | | | | | — | | | | | | 12.39 | | | | | | (0.48) | | | | | | 3.36 | | | | | | 0.63 | | | | | | 0.63 | | | | | | 3.93 | | | | | | 2,598 | | | | | | 136 | | |
| 12-31-14 | | | | | 13.19 | | | | | | 0.14 | | | | | | 0.50 | | | | | | 0.64 | | | | | | 0.22 | | | | | | 0.91 | | | | | | — | | | | | | 1.13 | | | | | | — | | | | | | 12.70 | | | | | | 5.00 | | | | | | 65.69 | | | | | | 0.63 | | | | | | 0.63 | | | | | | 1.10 | | | | | | 4 | | | | | | 32 | | |
| 12-31-13 | | | | | 11.85 | | | | | | 0.19• | | | | | | 1.95 | | | | | | 2.14 | | | | | | 0.27 | | | | | | 0.55 | | | | | | — | | | | | | 0.82 | | | | | | 0.02 | | | | | | 13.19 | | | | | | 18.71(b) | | | | | | 87.48 | | | | | | 0.61 | | | | | | 0.61 | | | | | | 1.48 | | | | | | 4 | | | | | | 41 | | |
| Class I | | | | | | | | | | | | | | | | | | | | | | | | | | | | | | | | | | | | | | | | | | | | | | | | | | | | | | | | | | | | | | | | | | | | | | | | | | | | | | | | | | | | | | | | | | | | | | | | | | | | | | | |
| 12-31-17 | | | | | 13.50 | | | | | | 0.31• | | | | | | 1.99 | | | | | | 2.30 | | | | | | 0.07 | | | | | | 0.08 | | | | | | — | | | | | | 0.15 | | | | | | — | | | | | | 15.65 | | | | | | 17.14 | | | | | | 0.26 | | | | | | 0.19 | | | | | | 0.19 | | | | | | 2.10 | | | | | | 4,953 | | | | | | 32 | | |
| 12-31-16 | | | | | 12.60 | | | | | | 0.31• | | | | | | 0.61 | | | | | | 0.92 | | | | | | 0.01 | | | | | | 0.01 | | | | | | — | | | | | | 0.02 | | | | | | — | | | | | | 13.50 | | | | | | 7.31 | | | | | | 0.33 | | | | | | 0.13 | | | | | | 0.13 | | | | | | 2.36 | | | | | | 2,173 | | | | | | 64 | | |
| 12-31-15 | | | | | 12.79 | | | | | | 0.99• | | | | | | (0.99) | | | | | | 0.00* | | | | | | — | | | | | | 0.19 | | | | | | — | | | | | | 0.19 | | | | | | — | | | | | | 12.60 | | | | | | (0.03) | | | | | | 2.86 | | | | | | 0.13 | | | | | | 0.13 | | | | | | 8.08 | | | | | | 779 | | | | | | 136 | | |
| 12-31-14 | | | | | 13.28 | | | | | | 0.20 | | | | | | 0.51 | | | | | | 0.71 | | | | | | 0.29 | | | | | | 0.91 | | | | | | — | | | | | | 1.20 | | | | | | — | | | | | | 12.79 | | | | | | 5.52 | | | | | | 65.19 | | | | | | 0.13 | | | | | | 0.13 | | | | | | 1.61 | | | | | | 4 | | | | | | 32 | | |
| 12-31-13 | | | | | 11.91 | | | | | | 0.25• | | | | | | 1.97 | | | | | | 2.22 | | | | | | 0.32 | | | | | | 0.55 | | | | | | — | | | | | | 0.87 | | | | | | 0.02 | | | | | | 13.28 | | | | | | 19.32(b) | | | | | | 86.98 | | | | | | 0.11 | | | | | | 0.11 | | | | | | 1.97 | | | | | | 4 | | | | | | 41 | | |
| Class S | | | | | | | | | | | | | | | | | | | | | | | | | | | | | | | | | | | | | | | | | | | | | | | | | | | | | | | | | | | | | | | | | | | | | | | | | | | | | | | | | | | | | | | | | | | | | | | | | | | | | | | |
| 12-31-17 | | | | | 13.44 | | | | | | 0.27• | | | | | | 1.99 | | | | | | 2.26 | | | | | | 0.06 | | | | | | 0.08 | | | | | | — | | | | | | 0.14 | | | | | | — | | | | | | 15.56 | | | | | | 16.91 | | | | | | 0.51 | | | | | | 0.44 | | | | | | 0.44 | | | | | | 1.82 | | | | | | 12,320 | | | | | | 32 | | |
| 12-31-16 | | | | | 12.57 | | | | | | 0.37• | | | | | | 0.52 | | | | | | 0.89 | | | | | | 0.01 | | | | | | 0.01 | | | | | | — | | | | | | 0.02 | | | | | | — | | | | | | 13.44 | | | | | | 7.08 | | | | | | 0.58 | | | | | | 0.38 | | | | | | 0.38 | | | | | | 2.83 | | | | | | 6,607 | | | | | | 64 | | |
| 12-31-15 | | | | | 12.79 | | | | | | 0.43• | | | | | | (0.46) | | | | | | (0.03) | | | | | | — | | | | | | 0.19 | | | | | | — | | | | | | 0.19 | | | | | | — | | | | | | 12.57 | | | | | | (0.27) | | | | | | 3.11 | | | | | | 0.38 | | | | | | 0.38 | | | | | | 3.45 | | | | | | 521 | | | | | | 136 | | |
| 12-31-14 | | | | | 13.27 | | | | | | 0.17 | | | | | | 0.52 | | | | | | 0.69 | | | | | | 0.26 | | | | | | 0.91 | | | | | | — | | | | | | 1.17 | | | | | | — | | | | | | 12.79 | | | | | | 5.32 | | | | | | 65.44 | | | | | | 0.38 | | | | | | 0.38 | | | | | | 1.35 | | | | | | 4 | | | | | | 32 | | |
| 12-31-13 | | | | | 11.87 | | | | | | 0.22 | | | | | | 1.94 | | | | | | 2.16 | | | | | | 0.23 | | | | | | 0.55 | | | | | | — | | | | | | 0.78 | | | | | | 0.02 | | | | | | 13.27 | | | | | | 18.78(b) | | | | | | 87.23 | | | | | | 0.36 | | | | | | 0.36 | | | | | | 1.73 | | | | | | 4 | | | | | | 41 | | |
| Class S2 | | | | | | | | | | | | | | | | | | | | | | | | | | | | | | | | | | | | | | | | | | | | | | | | | | | | | | | | | | | | | | | | | | | | | | | | | | | | | | | | | | | | | | | | | | | | | | | | | | | | | | | |
| 12-31-17 | | | | | 13.29 | | | | | | 0.22• | | | | | | 1.99 | | | | | | 2.21 | | | | | | 0.05 | | | | | | 0.08 | | | | | | — | | | | | | 0.13 | | | | | | — | | | | | | 15.37 | | | | | | 16.69 | | | | | | 0.66 | | | | | | 0.59 | | | | | | 0.59 | | | | | | 1.54 | | | | | | 1,800 | | | | | | 32 | | |
| 12-31-16 | | | | | 12.45 | | | | | | 0.33• | | | | | | 0.53 | | | | | | 0.86 | | | | | | 0.01 | | | | | | 0.01 | | | | | | — | | | | | | 0.02 | | | | | | — | | | | | | 13.29 | | | | | | 6.92 | | | | | | 0.76 | | | | | | 0.53 | | | | | | 0.53 | | | | | | 2.54 | | | | | | 1,735 | | | | | | 64 | | |
| 12-31-15 | | | | | 12.71 | | | | | | 0.48• | | | | | | (0.55) | | | | | | (0.07) | | | | | | — | | | | | | 0.19 | | | | | | — | | | | | | 0.19 | | | | | | — | | | | | | 12.45 | | | | | | (0.58) | | | | | | 3.36 | | | | | | 0.53 | | | | | | 0.53 | | | | | | 3.87 | | | | | | 47 | | | | | | 136 | | |
| 12-31-14 | | | | | 13.21 | | | | | | 0.15 | | | | | | 0.49 | | | | | | 0.64 | | | | | | 0.23 | | | | | | 0.91 | | | | | | — | | | | | | 1.14 | | | | | | — | | | | | | 12.71 | | | | | | 5.00 | | | | | | 65.69 | | | | | | 0.53 | | | | | | 0.53 | | | | | | 1.20 | | | | | | 4 | | | | | | 32 | | |
| 12-31-13 | | | | | 11.87 | | | | | | 0.20 | | | | | | 1.95 | | | | | | 2.15 | | | | | | 0.28 | | | | | | 0.55 | | | | | | — | | | | | | 0.83 | | | | | | 0.02 | | | | | | 13.21 | | | | | | 18.79(b) | | | | | | 87.48 | | | | | | 0.51 | | | | | | 0.51 | | | | | | 1.58 | | | | | | 4 | | | | | | 41 | | |
| Class Z | | | | | | | | | | | | | | | | | | | | | | | | | | | | | | | | | | | | | | | | | | | | | | | | | | | | | | | | | | | | | | | | | | | | | | | | | | | | | | | | | | | | | | | | | | | | | | | | | | | | | | | |
| 12-31-17 | | | | | 13.51 | | | | | | 0.35• | | | | | | 1.98 | | | | | | 2.33 | | | | | | 0.07 | | | | | | 0.08 | | | | | | — | | | | | | 0.15 | | | | | | — | | | | | | 15.69 | | | | | | 17.35 | | | | | | 0.26 | | | | | | 0.00* | | | | | | 0.00* | | | | | | 2.36 | | | | | | 267,328 | | | | | | 32 | | |
| 12-31-16 | | | | | 12.59 | | | | | | 0.46• | | | | | | 0.48 | | | | | | 0.94 | | | | | | 0.01 | | | | | | 0.01 | | | | | | — | | | | | | 0.02 | | | | | | — | | | | | | 13.51 | | | | | | 7.48 | | | | | | 0.33 | | | | | | 0.00 | | | | | | 0.00 | | | | | | 3.53 | | | | | | 72,347 | | | | | | 64 | | |
05-01-15(5) -
12-31-15 | | | | | 13.34 | | | | | | 0.36• | | | | | | (0.92) | | | | | | (0.56) | | | | | | — | | | | | | 0.19 | | | | | | — | | | | | | 0.19 | | | | | | — | | | | | | 12.59 | | | | | | (4.23) | | | | | | 2.82 | | | | | | 0.00 | | | | | | 0.00 | | | | | | 4.30 | | | | | | 1,196 | | | | | | 136 | | |
See Accompanying Notes to Financial Statements
Financial Highlights (continued)
| | | | | | | | | | Income (loss)
from
investment
operations | | | | | | | | | Less Distributions | | | | | | Ratios to average net assets | | | Supplemental
Data | |
| | | | Net asset value, beginning
of year or period | | | Net investment income (loss) | | | Net realized and unrealized
gain (loss) | | | Total from investment
operations | | | From net investment income | | | From net realized gains | | | From return of capital | | | Total distributions | | | Payment by affiliate | | | Net asset value, end of year
or period | | | Total Return(1) | | | Expenses before
reductions/additions(2)(3)(4) | | | Expenses net of fee waivers
and/or recoupments if any(2)(3)(4) | | | Expenses net of all
reductions/additions(2)(3)(4) | | | Net investment income
(loss)(2)(3) | | | Net assets, end of year
or period | | | Portfolio turnover rate | |
Year or
period ended | | | ($) | | | ($) | | | ($) | | | ($) | | | ($) | | | ($) | | | ($) | | | ($) | | | ($) | | | ($) | | | (%) | | | (%) | | | (%) | | | (%) | | | (%) | | | ($000’s) | | | (%) | |
| Voya Index Solution 2035 Portfolio | | | | | | | | | | | | | | | | | | | | | | | | | | | | | | | | | | | | | | | | | | | | | | | | | | | | | | | | | | | | | | | | | | | | | | | | | | | | | | | | | | | | | | | | | | | | | | | | | | | | | | | |
| Class ADV | | | | | | | | | | | | | | | | | | | | | | | | | | | | | | | | | | | | | | | | | | | | | | | | | | | | | | | | | | | | | | | | | | | | | | | | | | | | | | | | | | | | | | | | | | | | | | | | | | | | | | | |
| 12-31-17 | | | | | 9.98 | | | | | | 0.15• | | | | | | 1.61 | | | | | | 1.76 | | | | | | 0.13 | | | | | | 0.27 | | | | | | — | | | | | | 0.40 | | | | | | — | | | | | | 11.34 | | | | | | 17.95 | | | | | | 0.76 | | | | | | 0.68 | | | | | | 0.68 | | | | | | 1.37 | | | | | | 215,074 | | | | | | 25 | | |
| 12-31-16 | | | | | 10.34 | | | | | | 0.19 | | | | | | 0.57 | | | | | | 0.76 | | | | | | 0.19 | | | | | | 0.93 | | | | | | — | | | | | | 1.12 | | | | | | — | | | | | | 9.98 | | | | | | 7.63 | | | | | | 0.76 | | | | | | 0.63 | | | | | | 0.63 | | | | | | 1.86 | | | | | | 203,566 | | | | | | 41 | | |
| 12-31-15 | | | | | 11.86 | | | | | | 0.18 | | | | | | (0.35) | | | | | | (0.17) | | | | | | 0.15 | | | | | | 1.20 | | | | | | — | | | | | | 1.35 | | | | | | — | | | | | | 10.34 | | | | | | (1.91) | | | | | | 0.77 | | | | | | 0.64 | | | | | | 0.64 | | | | | | 1.62 | | | | | | 199,097 | | | | | | 38 | | |
| 12-31-14 | | | | | 12.01 | | | | | | 0.13 | | | | | | 0.53 | | | | | | 0.66 | | | | | | 0.17 | | | | | | 0.64 | | | | | | — | | | | | | 0.81 | | | | | | — | | | | | | 11.86 | | | | | | 5.65 | | | | | | 0.76 | | | | | | 0.63 | | | | | | 0.63 | | | | | | 1.12 | | | | | | 213,542 | | | | | | 44 | | |
| 12-31-13 | | | | | 10.25 | | | | | | 0.17• | | | | | | 2.01 | | | | | | 2.18 | | | | | | 0.12 | | | | | | 0.30 | | | | | | — | | | | | | 0.42 | | | | | | — | | | | | | 12.01 | | | | | | 21.67 | | | | | | 0.75 | | | | | | 0.62 | | | | | | 0.62 | | | | | | 1.51 | | | | | | 208,246 | | | | | | 45 | | |
| Class I | | | | | | | | | | | | | | | | | | | | | | | | | | | | | | | | | | | | | | | | | | | | | | | | | | | | | | | | | | | | | | | | | | | | | | | | | | | | | | | | | | | | | | | | | | | | | | | | | | | | | | | |
| 12-31-17 | | | | | 10.23 | | | | | | 0.20 | | | | | | 1.68 | | | | | | 1.88 | | | | | | 0.19 | | | | | | 0.27 | | | | | | — | | | | | | 0.46 | | | | | | — | | | | | | 11.65 | | | | | | 18.65 | | | | | | 0.26 | | | | | | 0.18 | | | | | | 0.18 | | | | | | 1.89 | | | | | | 58,021 | | | | | | 25 | | |
| 12-31-16 | | | | | 10.58 | | | | | | 0.25• | | | | | | 0.58 | | | | | | 0.83 | | | | | | 0.25 | | | | | | 0.93 | | | | | | — | | | | | | 1.18 | | | | | | — | | | | | | 10.23 | | | | | | 8.12 | | | | | | 0.26 | | | | | | 0.13 | | | | | | 0.13 | | | | | | 2.40 | | | | | | 47,484 | | | | | | 41 | | |
| 12-31-15 | | | | | 12.11 | | | | | | 0.25• | | | | | | (0.37) | | | | | | (0.12) | | | | | | 0.21 | | | | | | 1.20 | | | | | | — | | | | | | 1.41 | | | | | | — | | | | | | 10.58 | | | | | | (1.47) | | | | | | 0.27 | | | | | | 0.14 | | | | | | 0.14 | | | | | | 2.18 | | | | | | 37,272 | | | | | | 38 | | |
| 12-31-14 | | | | | 12.24 | | | | | | 0.21• | | | | | | 0.53 | | | | | | 0.74 | | | | | | 0.23 | | | | | | 0.64 | | | | | | — | | | | | | 0.87 | | | | | | — | | | | | | 12.11 | | | | | | 6.16 | | | | | | 0.26 | | | | | | 0.13 | | | | | | 0.13 | | | | | | 1.73 | | | | | | 34,038 | | | | | | 44 | | |
| 12-31-13 | | | | | 10.42 | | | | | | 0.23• | | | | | | 2.05 | | | | | | 2.28 | | | | | | 0.16 | | | | | | 0.30 | | | | | | — | | | | | | 0.46 | | | | | | — | | | | | | 12.24 | | | | | | 22.29 | | | | | | 0.25 | | | | | | 0.12 | | | | | | 0.12 | | | | | | 1.99 | | | | | | 20,257 | | | | | | 45 | | |
| Class S | | | | | | | | | | | | | | | | | | | | | | | | | | | | | | | | | | | | | | | | | | | | | | | | | | | | | | | | | | | | | | | | | | | | | | | | | | | | | | | | | | | | | | | | | | | | | | | | | | | | | | | |
| 12-31-17 | | | | | 10.11 | | | | | | 0.17• | | | | | | 1.66 | | | | | | 1.83 | | | | | | 0.16 | | | | | | 0.27 | | | | | | — | | | | | | 0.43 | | | | | | — | | | | | | 11.51 | | | | | | 18.39 | | | | | | 0.51 | | | | | | 0.43 | | | | | | 0.43 | | | | | | 1.61 | | | | | | 121,702 | | | | | | 25 | | |
| 12-31-16 | | | | | 10.47 | | | | | | 0.21• | | | | | | 0.58 | | | | | | 0.79 | | | | | | 0.22 | | | | | | 0.93 | | | | | | — | | | | | | 1.15 | | | | | | — | | | | | | 10.11 | | | | | | 7.77 | | | | | | 0.51 | | | | | | 0.38 | | | | | | 0.38 | | | | | | 2.06 | | | | | | 118,463 | | | | | | 41 | | |
| 12-31-15 | | | | | 11.99 | | | | | | 0.22 | | | | | | (0.36) | | | | | | (0.14) | | | | | | 0.18 | | | | | | 1.20 | | | | | | — | | | | | | 1.38 | | | | | | — | | | | | | 10.47 | | | | | | (1.63) | | | | | | 0.52 | | | | | | 0.39 | | | | | | 0.39 | | | | | | 1.87 | | | | | | 129,764 | | | | | | 38 | | |
| 12-31-14 | | | | | 12.13 | | | | | | 0.16 | | | | | | 0.54 | | | | | | 0.70 | | | | | | 0.20 | | | | | | 0.64 | | | | | | — | | | | | | 0.84 | | | | | | — | | | | | | 11.99 | | | | | | 5.90 | | | | | | 0.51 | | | | | | 0.38 | | | | | | 0.38 | | | | | | 1.38 | | | | | | 145,942 | | | | | | 44 | | |
| 12-31-13 | | | | | 10.34 | | | | | | 0.20• | | | | | | 2.03 | | | | | | 2.23 | | | | | | 0.14 | | | | | | 0.30 | | | | | | — | | | | | | 0.44 | | | | | | — | | | | | | 12.13 | | | | | | 21.97 | | | | | | 0.50 | | | | | | 0.37 | | | | | | 0.37 | | | | | | 1.76 | | | | | | 133,001 | | | | | | 45 | | |
| Class S2 | | | | | | | | | | | | | | | | | | | | | | | | | | | | | | | | | | | | | | | | | | | | | | | | | | | | | | | | | | | | | | | | | | | | | | | | | | | | | | | | | | | | | | | | | | | | | | | | | | | | | | | |
| 12-31-17 | | | | | 9.96 | | | | | | 0.16 | | | | | | 1.62 | | | | | | 1.78 | | | | | | 0.15 | | | | | | 0.27 | | | | | | — | | | | | | 0.42 | | | | | | — | | | | | | 11.32 | | | | | | 18.14 | | | | | | 0.66 | | | | | | 0.58 | | | | | | 0.58 | | | | | | 1.50 | | | | | | 37,316 | | | | | | 25 | | |
| 12-31-16 | | | | | 10.33 | | | | | | 0.20 | | | | | | 0.56 | | | | | | 0.76 | | | | | | 0.20 | | | | | | 0.93 | | | | | | — | | | | | | 1.13 | | | | | | — | | | | | | 9.96 | | | | | | 7.65 | | | | | | 0.69 | | | | | | 0.53 | | | | | | 0.53 | | | | | | 2.01 | | | | | | 32,558 | | | | | | 41 | | |
| 12-31-15 | | | | | 11.83 | | | | | | 0.19• | | | | | | (0.34) | | | | | | (0.15) | | | | | | 0.15 | | | | | | 1.20 | | | | | | — | | | | | | 1.35 | | | | | | — | | | | | | 10.33 | | | | | | (1.78) | | | | | | 0.77 | | | | | | 0.54 | | | | | | 0.54 | | | | | | 1.71 | | | | | | 31,067 | | | | | | 38 | | |
| 12-31-14 | | | | | 11.98 | | | | | | 0.14• | | | | | | 0.54 | | | | | | 0.68 | | | | | | 0.19 | | | | | | 0.64 | | | | | | — | | | | | | 0.83 | | | | | | — | | | | | | 11.83 | | | | | | 5.77 | | | | | | 0.76 | | | | | | 0.53 | | | | | | 0.53 | | | | | | 1.17 | | | | | | 40,100 | | | | | | 44 | | |
| 12-31-13 | | | | | 10.23 | | | | | | 0.18• | | | | | | 2.01 | | | | | | 2.19 | | | | | | 0.14 | | | | | | 0.30 | | | | | | — | | | | | | 0.44 | | | | | | — | | | | | | 11.98 | | | | | | 21.74 | | | | | | 0.75 | | | | | | 0.52 | | | | | | 0.52 | | | | | | 1.66 | | | | | | 44,066 | | | | | | 45 | | |
| Class Z | | | | | | | | | | | | | | | | | | | | | | | | | | | | | | | | | | | | | | | | | | | | | | | | | | | | | | | | | | | | | | | | | | | | | | | | | | | | | | | | | | | | | | | | | | | | | | | | | | | | | | | |
| 12-31-17 | | | | | 10.27 | | | | | | 0.25• | | | | | | 1.66 | | | | | | 1.91 | | | | | | 0.19 | | | | | | 0.27 | | | | | | — | | | | | | 0.46 | | | | | | — | | | | | | 11.72 | | | | | | 18.88 | | | | | | 0.26 | | | | | | 0.00* | | | | | | 0.00* | | | | | | 2.26 | | | | | | 327,540 | | | | | | 25 | | |
| 12-31-16 | | | | | 10.61 | | | | | | 0.34• | | | | | | 0.50 | | | | | | 0.84 | | | | | | 0.25 | | | | | | 0.93 | | | | | | — | | | | | | 1.18 | | | | | | — | | | | | | 10.27 | | | | | | 8.21 | | | | | | 0.26 | | | | | | 0.00 | | | | | | 0.00 | | | | | | 3.31 | | | | | | 101,022 | | | | | | 41 | | |
05-01-15(5) -
12-31-15 | | | | | 12.66 | | | | | | 0.43• | | | | | | (1.07) | | | | | | (0.64) | | | | | | 0.21 | | | | | | 1.20 | | | | | | — | | | | | | 1.41 | | | | | | — | | | | | | 10.61 | | | | | | (5.49) | | | | | | 0.28 | | | | | | 0.00 | | | | | | 0.00 | | | | | | 6.12 | | | | | | 2,456 | | | | | | 38 | | |
| Voya Index Solution 2040 Portfolio | | | | | | | | | | | | | | | | | | | | | | | | | | | | | | | | | | | | | | | | | | | | | | | | | | | | | | | | | | | | | | | | | | | | | | | | | | | | | | | | | | | | | | | | | | | | | | | | | | | | | | | |
| Class ADV | | | | | | | | | | | | | | | | | | | | | | | | | | | | | | | | | | | | | | | | | | | | | | | | | | | | | | | | | | | | | | | | | | | | | | | | | | | | | | | | | | | | | | | | | | | | | | | | | | | | | | | |
| 12-31-17 | | | | | 13.57 | | | | | | 0.21• | | | | | | 2.36 | | | | | | 2.57 | | | | | | 0.05 | | | | | | 0.09 | | | | | | — | | | | | | 0.14 | | | | | | — | | | | | | 16.00 | | | | | | 19.05 | | | | | | 0.77 | | | | | | 0.68 | | | | | | 0.68 | | | | | | 1.44 | | | | | | 11,117 | | | | | | 29 | | |
| 12-31-16 | | | | | 12.62 | | | | | | 0.29• | | | | | | 0.68 | | | | | | 0.97 | | | | | | 0.01 | | | | | | 0.01 | | | | | | — | | | | | | 0.02 | | | | | | — | | | | | | 13.57 | | | | | | 7.67 | | | | | | 0.90 | | | | | | 0.62 | | | | | | 0.62 | | | | | | 2.27 | | | | | | 5,222 | | | | | | 52 | | |
| 12-31-15 | | | | | 13.60 | | | | | | 0.52• | | | | | | (0.73) | | | | | | (0.21) | | | | | | 0.13 | | | | | | 0.64 | | | | | | — | | | | | | 0.77 | | | | | | — | | | | | | 12.62 | | | | | | (1.78) | | | | | | 5.76 | | | | | | 0.63 | | | | | | 0.63 | | | | | | 4.17 | | | | | | 1,252 | | | | | | 106 | | |
| 12-31-14 | | | | | 13.98 | | | | | | 0.14• | | | | | | 0.64 | | | | | | 0.78 | | | | | | 0.20 | | | | | | 0.96 | | | | | | — | | | | | | 1.16 | | | | | | — | | | | | | 13.60 | | | | | | 5.73 | | | | | | 61.99 | | | | | | 0.63 | | | | | | 0.63 | | | | | | 0.98 | | | | | | 5 | | | | | | 32 | | |
| 12-31-13 | | | | | 12.06 | | | | | | 0.17 | | | | | | 2.54 | | | | | | 2.71 | | | | | | 0.18 | | | | | | 0.63 | | | | | | — | | | | | | 0.81 | | | | | | 0.02 | | | | | | 13.98 | | | | | | 23.19(c) | | | | | | 83.06 | | | | | | 0.61 | | | | | | 0.61 | | | | | | 1.29 | | | | | | 4 | | | | | | 41 | | |
| Class I | | | | | | | | | | | | | | | | | | | | | | | | | | | | | | | | | | | | | | | | | | | | | | | | | | | | | | | | | | | | | | | | | | | | | | | | | | | | | | | | | | | | | | | | | | | | | | | | | | | | | | | |
| 12-31-17 | | | | | 13.82 | | | | | | 0.32• | | | | | | 2.38 | | | | | | 2.70 | | | | | | 0.07 | | | | | | 0.09 | | | | | | — | | | | | | 0.16 | | | | | | — | | | | | | 16.36 | | | | | | 19.68 | | | | | | 0.27 | | | | | | 0.18 | | | | | | 0.18 | | | | | | 2.12 | | | | | | 2,612 | | | | | | 29 | | |
| 12-31-16 | | | | | 12.79 | | | | | | 0.32• | | | | | | 0.73 | | | | | | 1.05 | | | | | | 0.01 | | | | | | 0.01 | | | | | | — | | | | | | 0.02 | | | | | | — | | | | | | 13.82 | | | | | | 8.24 | | | | | | 0.40 | | | | | | 0.12 | | | | | | 0.12 | | | | | | 2.43 | | | | | | 659 | | | | | | 52 | | |
| 12-31-15 | | | | | 13.71 | | | | | | 1.29• | | | | | | (1.47) | | | | | | (0.18) | | | | | | 0.10 | | | | | | 0.64 | | | | | | — | | | | | | 0.74 | | | | | | — | | | | | | 12.79 | | | | | | (1.50) | | | | | | 5.26 | | | | | | 0.13 | | | | | | 0.13 | | | | | | 10.20 | | | | | | 165 | | | | | | 106 | | |
| 12-31-14 | | | | | 14.09 | | | | | | 0.19 | | | | | | 0.66 | | | | | | 0.85 | | | | | | 0.27 | | | | | | 0.96 | | | | | | — | | | | | | 1.23 | | | | | | — | | | | | | 13.71 | | | | | | 6.21 | | | | | | 61.49 | | | | | | 0.13 | | | | | | 0.13 | | | | | | 1.42 | | | | | | 5 | | | | | | 32 | | |
| 12-31-13 | | | | | 12.13 | | | | | | 0.24• | | | | | | 2.57 | | | | | | 2.81 | | | | | | 0.24 | | | | | | 0.63 | | | | | | — | | | | | | 0.87 | | | | | | 0.02 | | | | | | 14.09 | | | | | | 23.90(c) | | | | | | 82.56 | | | | | | 0.11 | | | | | | 0.11 | | | | | | 1.79 | | | | | | 4 | | | | | | 41 | | |
See Accompanying Notes to Financial Statements
Financial Highlights (continued)
| | | | | | | | | | Income (loss)
from
investment
operations | | | | | | | | | Less Distributions | | | | | | Ratios to average net assets | | | Supplemental
Data | |
| | | | Net asset value, beginning
of year or period | | | Net investment income (loss) | | | Net realized and unrealized
gain (loss) | | | Total from investment
operations | | | From net investment income | | | From net realized gains | | | From return of capital | | | Total distributions | | | Payment by affiliate | | | Net asset value, end of year
or period | | | Total Return(1) | | | Expenses before
reductions/additions(2)(3)(4) | | | Expenses net of fee waivers
and/or recoupments if any(2)(3)(4) | | | Expenses net of all
reductions/additions(2)(3)(4) | | | Net investment income
(loss)(2)(3) | | | Net assets, end of year
or period | | | Portfolio turnover rate | |
Year or
period ended | | | ($) | | | ($) | | | ($) | | | ($) | | | ($) | | | ($) | | | ($) | | | ($) | | | ($) | | | ($) | | | (%) | | | (%) | | | (%) | | | (%) | | | (%) | | | ($000’s) | | | (%) | |
| Voya Index Solution 2040 Portfolio (continued) | | | | | | | | | | | | | | | | | | | | | | | | | | | | | | | | | | | | | | | | | | | | | | | | | | | | | | | | | | | | | | | | | | | | | | | | | | | | | | | | | | | | | | | | | | | | | | | | | | | | | | | |
| Class S | | | | | | | | | | | | | | | | | | | | | | | | | | | | | | | | | | | | | | | | | | | | | | | | | | | | | | | | | | | | | | | | | | | | | | | | | | | | | | | | | | | | | | | | | | | | | | | | | | | | | | | |
| 12-31-17 | | | | | 13.82 | | | | | | 0.25• | | | | | | 2.41 | | | | | | 2.66 | | | | | | 0.06 | | | | | | 0.09 | | | | | | — | | | | | | 0.15 | | | | | | — | | | | | | 16.33 | | | | | | 19.39 | | | | | | 0.52 | | | | | | 0.43 | | | | | | 0.43 | | | | | | 1.64 | | | | | | 8,832 | | | | | | 29 | | |
| 12-31-16 | | | | | 12.83 | | | | | | 0.38• | | | | | | 0.63 | | | | | | 1.01 | | | | | | 0.01 | | | | | | 0.01 | | | | | | — | | | | | | 0.02 | | | | | | — | | | | | | 13.82 | | | | | | 7.89 | | | | | | 0.65 | | | | | | 0.37 | | | | | | 0.37 | | | | | | 2.85 | | | | | | 5,044 | | | | | | 52 | | |
| 12-31-15 | | | | | 13.72 | | | | | | 0.51• | | | | | | (0.71) | | | | | | (0.20) | | | | | | 0.05 | | | | | | 0.64 | | | | | | — | | | | | | 0.69 | | | | | | — | | | | | | 12.83 | | | | | | (1.65) | | | | | | 5.51 | | | | | | 0.38 | | | | | | 0.38 | | | | | | 3.95 | | | | | | 401 | | | | | | 106 | | |
| 12-31-14 | | | | | 14.09 | | | | | | 0.16 | | | | | | 0.66 | | | | | | 0.82 | | | | | | 0.23 | | | | | | 0.96 | | | | | | — | | | | | | 1.19 | | | | | | — | | | | | | 13.72 | | | | | | 6.03 | | | | | | 61.74 | | | | | | 0.38 | | | | | | 0.38 | | | | | | 1.16 | | | | | | 4 | | | | | | 32 | | |
| 12-31-13 | | | | | 12.08 | | | | | | 0.20• | | | | | | 2.56 | | | | | | 2.76 | | | | | | 0.14 | | | | | | 0.63 | | | | | | — | | | | | | 0.77 | | | | | | 0.02 | | | | | | 14.09 | | | | | | 23.53(c) | | | | | | 82.81 | | | | | | 0.36 | | | | | | 0.36 | | | | | | 1.54 | | | | | | 4 | | | | | | 41 | | |
| Class S2 | | | | | | | | | | | | | | | | | | | | | | | | | | | | | | | | | | | | | | | | | | | | | | | | | | | | | | | | | | | | | | | | | | | | | | | | | | | | | | | | | | | | | | | | | | | | | | | | | | | | | | | |
| 12-31-17 | | | | | 13.67 | | | | | | 0.23• | | | | | | 2.38 | | | | | | 2.61 | | | | | | 0.06 | | | | | | 0.09 | | | | | | — | | | | | | 0.15 | | | | | | — | | | | | | 16.13 | | | | | | 19.21 | | | | | | 0.67 | | | | | | 0.58 | | | | | | 0.58 | | | | | | 1.50 | | | | | | 1,688 | | | | | | 29 | | |
| 12-31-16 | | | | | 12.70 | | | | | | 0.34• | | | | | | 0.65 | | | | | | 0.99 | | | | | | 0.01 | | | | | | 0.01 | | | | | | — | | | | | | 0.02 | | | | | | — | | | | | | 13.67 | | | | | | 7.82 | | | | | | 0.83 | | | | | | 0.52 | | | | | | 0.52 | | | | | | 2.60 | | | | | | 651 | | | | | | 52 | | |
| 12-31-15 | | | | | 13.62 | | | | | | 0.38• | | | | | | (0.61) | | | | | | (0.23) | | | | | | 0.05 | | | | | | 0.64 | | | | | | — | | | | | | 0.69 | | | | | | — | | | | | | 12.70 | | | | | | (1.88) | | | | | | 5.76 | | | | | | 0.53 | | | | | | 0.53 | | | | | | 2.84 | | | | | | 14 | | | | | | 106 | | |
| 12-31-14 | | | | | 14.00 | | | | | | 0.13 | | | | | | 0.66 | | | | | | 0.79 | | | | | | 0.21 | | | | | | 0.96 | | | | | | — | | | | | | 1.17 | | | | | | — | | | | | | 13.62 | | | | | | 5.80 | | | | | | 61.99 | | | | | | 0.53 | | | | | | 0.53 | | | | | | 1.01 | | | | | | 4 | | | | | | 32 | | |
| 12-31-13 | | | | | 12.07 | | | | | | 0.18 | | | | | | 2.55 | | | | | | 2.73 | | | | | | 0.19 | | | | | | 0.63 | | | | | | — | | | | | | 0.82 | | | | | | 0.02 | | | | | | 14.00 | | | | | | 23.36(c) | | | | | | 83.06 | | | | | | 0.51 | | | | | | 0.51 | | | | | | 1.38 | | | | | | 4 | | | | | | 41 | | |
| Class Z | | | | | | | | | | | | | | | | | | | | | | | | | | | | | | | | | | | | | | | | | | | | | | | | | | | | | | | | | | | | | | | | | | | | | | | | | | | | | | | | | | | | | | | | | | | | | | | | | | | | | | | |
| 12-31-17 | | | | | 13.85 | | | | | | 0.34• | | | | | | 2.39 | | | | | | 2.73 | | | | | | 0.07 | | | | | | 0.09 | | | | | | — | | | | | | 0.16 | | | | | | — | | | | | | 16.42 | | | | | | 19.86 | | | | | | 0.27 | | | | | | 0.00* | | | | | | 0.00* | | | | | | 2.21 | | | | | | 169,065 | | | | | | 29 | | |
| 12-31-16 | | | | | 12.80 | | | | | | 0.47• | | | | | | 0.61 | | | | | | 1.08 | | | | | | 0.02 | | | | | | 0.01 | | | | | | — | | | | | | 0.03 | | | | | | — | | | | | | 13.85 | | | | | | 8.40 | | | | | | 0.40 | | | | | | 0.00 | | | | | | 0.00 | | | | | | 3.51 | | | | | | 48,146 | | | | | | 52 | | |
05-01-15(5) -
12-31-15 | | | | | 14.34 | | | | | | 0.57• | | ��� | | | | (1.37) | | | | | | (0.80) | | | | | | 0.10 | | | | | | 0.64 | | | | | | — | | | | | | 0.74 | | | | | | — | | | | | | 12.80 | | | | | | (5.75) | | | | | | 5.12 | | | | | | 0.00 | | | | | | 0.00 | | | | | | 6.74 | | | | | | 1,086 | | | | | | 106 | | |
| Voya Index Solution 2045 Portfolio | | | | | | | | | | | | | | | | | | | | | | | | | | | | | | | | | | | | | | | | | | | | | | | | | | | | | | | | | | | | | | | | | | | | | | | | | | | | | | | | | | | | | | | | | | | | | | | | | | | | | | | |
| Class ADV | | | | | | | | | | | | | | | | | | | | | | | | | | | | | | | | | | | | | | | | | | | | | | | | | | | | | | | | | | | | | | | | | | | | | | | | | | | | | | | | | | | | | | | | | | | | | | | | | | | | | | | |
| 12-31-17 | | | | | 10.22 | | | | | | 0.13• | | | | | | 1.88 | | | | | | 2.01 | | | | | | 0.12 | | | | | | 0.32 | | | | | | — | | | | | | 0.44 | | | | | | — | | | | | | 11.79 | | | | | | 19.96 | | | | | | 0.75 | | | | | | 0.69 | | | | | | 0.69 | | | | | | 1.20 | | | | | | 148,205 | | | | | | 25 | | |
| 12-31-16 | | | | | 10.55 | | | | | | 0.17 | | | | | | 0.61 | | | | | | 0.78 | | | | | | 0.17 | | | | | | 0.94 | | | | | | — | | | | | | 1.11 | | | | | | — | | | | | | 10.22 | | | | | | 7.67 | | | | | | 0.76 | | | | | | 0.64 | | | | | | 0.64 | | | | | | 1.70 | | | | | | 139,777 | | | | | | 41 | | |
| 12-31-15 | | | | | 12.16 | | | | | | 0.16 | | | | | | (0.34) | | | | | | (0.18) | | | | | | 0.12 | | | | | | 1.31 | | | | | | — | | | | | | 1.43 | | | | | | — | | | | | | 10.55 | | | | | | (2.05) | | | | | | 0.76 | | | | | | 0.64 | | | | | | 0.64 | | | | | | 1.44 | | | | | | 133,884 | | | | | | 36 | | |
| 12-31-14 | | | | | 12.25 | | | | | | 0.10• | | | | | | 0.59 | | | | | | 0.69 | | | | | | 0.14 | | | | | | 0.64 | | | | | | — | | | | | | 0.78 | | | | | | — | | | | | | 12.16 | | | | | | 5.80 | | | | | | 0.75 | | | | | | 0.63 | | | | | | 0.63 | | | | | | 0.83 | | | | | | 138,235 | | | | | | 44 | | |
| 12-31-13 | | | | | 10.26 | | | | | | 0.14• | | | | | | 2.26 | | | | | | 2.40 | | | | | | 0.10 | | | | | | 0.31 | | | | | | — | | | | | | 0.41 | | | | | | — | | | | | | 12.25 | | | | | | 23.74 | | | | | | 0.75 | | | | | | 0.61 | | | | | | 0.61 | | | | | | 1.27 | | | | | | 128,133 | | | | | | 48 | | |
| Class I | | | | | | | | | | | | | | | | | | | | | | | | | | | | | | | | | | | | | | | | | | | | | | | | | | | | | | | | | | | | | | | | | | | | | | | | | | | | | | | | | | | | | | | | | | | | | | | | | | | | | | | |
| 12-31-17 | | | | | 10.54 | | | | | | 0.20• | | | | | | 1.93 | | | | | | 2.13 | | | | | | 0.18 | | | | | | 0.32 | | | | | | — | | | | | | 0.50 | | | | | | — | | | | | | 12.17 | | | | | | 20.48 | | | | | | 0.25 | | | | | | 0.19 | | | | | | 0.19 | | | | | | 1.76 | | | | | | 48,317 | | | | | | 25 | | |
| 12-31-16 | | | | | 10.84 | | | | | | 0.24• | | | | | | 0.63 | | | | | | 0.87 | | | | | | 0.23 | | | | | | 0.94 | | | | | | — | | | | | | 1.17 | | | | | | — | | | | | | 10.54 | | | | | | 8.29 | | | | | | 0.26 | | | | | | 0.14 | | | | | | 0.14 | | | | | | 2.24 | | | | | | 35,877 | | | | | | 41 | | |
| 12-31-15 | | | | | 12.46 | | | | | | 0.25• | | | | | | (0.38) | | | | | | (0.13) | | | | | | 0.18 | | | | | | 1.31 | | | | | | — | | | | | | 1.49 | | | | | | — | | | | | | 10.84 | | | | | | (1.61) | | | | | | 0.26 | | | | | | 0.14 | | | | | | 0.14 | | | | | | 2.09 | | | | | | 27,900 | | | | | | 36 | | |
| 12-31-14 | | | | | 12.52 | | | | | | 0.18• | | | | | | 0.59 | | | | | | 0.77 | | | | | | 0.19 | | | | | | 0.64 | | | | | | — | | | | | | 0.83 | | | | | | — | | | | | | 12.46 | | | | | | 6.32 | | | | | | 0.25 | | | | | | 0.13 | | | | | | 0.13 | | | | | | 1.42 | | | | | | 19,837 | | | | | | 44 | | |
| 12-31-13 | | | | | 10.46 | | | | | | 0.20• | | | | | | 2.31 | | | | | | 2.51 | | | | | | 0.14 | | | | | | 0.31 | | | | | | — | | | | | | 0.45 | | | | | | — | | | | | | 12.52 | | | | | | 24.34 | | | | | | 0.25 | | | | | | 0.11 | | | | | | 0.11 | | | | | | 1.74 | | | | | | 11,306 | | | | | | 48 | | |
| Class S | | | | | | | | | | | | | | | | | | | | | | | | | | | | | | | | | | | | | | | | | | | | | | | | | | | | | | | | | | | | | | | | | | | | | | | | | | | | | | | | | | | | | | | | | | | | | | | | | | | | | | | |
| 12-31-17 | | | | | 10.40 | | | | | | 0.17 | | | | | | 1.90 | | | | | | 2.07 | | | | | | 0.15 | | | | | | 0.32 | | | | | | — | | | | | | 0.47 | | | | | | — | | | | | | 12.00 | | | | | | 20.21 | | | | | | 0.50 | | | | | | 0.44 | | | | | | 0.44 | | | | | | 1.46 | | | | | | 87,386 | | | | | | 25 | | |
| 12-31-16 | | | | | 10.70 | | | | | | 0.21 | | | | | | 0.62 | | | | | | 0.83 | | | | | | 0.19 | | | | | | 0.94 | | | | | | — | | | | | | 1.13 | | | | | | — | | | | | | 10.40 | | | | | | 8.05 | | | | | | 0.51 | | | | | | 0.39 | | | | | | 0.39 | | | | | | 1.91 | | | | | | 76,656 | | | | | | 41 | | |
| 12-31-15 | | | | | 12.32 | | | | | | 0.20 | | | | | | (0.36) | | | | | | (0.16) | | | | | | 0.15 | | | | | | 1.31 | | | | | | — | | | | | | 1.46 | | | | | | — | | | | | | 10.70 | | | | | | (1.86) | | | | | | 0.51 | | | | | | 0.39 | | | | | | 0.39 | | | | | | 1.66 | | | | | | 80,586 | | | | | | 36 | | |
| 12-31-14 | | | | | 12.40 | | | | | | 0.13 | | | | | | 0.60 | | | | | | 0.73 | | | | | | 0.17 | | | | | | 0.64 | | | | | | — | | | | | | 0.81 | | | | | | — | | | | | | 12.32 | | | | | | 6.01 | | | | | | 0.50 | | | | | | 0.38 | | | | | | 0.38 | | | | | | 1.07 | | | | | | 90,710 | | | | | | 44 | | |
| 12-31-13 | | | | | 10.37 | | | | | | 0.18• | | | | | | 2.28 | | | | | | 2.46 | | | | | | 0.12 | | | | | | 0.31 | | | | | | — | | | | | | 0.43 | | | | | | — | | | | | | 12.40 | | | | | | 24.07 | | | | | | 0.50 | | | | | | 0.36 | | | | | | 0.36 | | | | | | 1.53 | | | | | | 83,716 | | | | | | 48 | | |
| Class S2 | | | | | | | | | | | | | | | | | | | | | | | | | | | | | | | | | | | | | | | | | | | | | | | | | | | | | | | | | | | | | | | | | | | | | | | | | | | | | | | | | | | | | | | | | | | | | | | | | | | | | | | |
| 12-31-17 | | | | | 10.24 | | | | | | 0.14• | | | | | | 1.88 | | | | | | 2.02 | | | | | | 0.14 | | | | | | 0.32 | | | | | | — | | | | | | 0.46 | | | | | | — | | | | | | 11.80 | | | | | | 19.97 | | | | | | 0.65 | | | | | | 0.59 | | | | | | 0.59 | | | | | | 1.26 | | | | | | 19,206 | | | | | | 25 | | |
| 12-31-16 | | | | | 10.56 | | | | | | 0.20• | | | | | | 0.60 | | | | | | 0.80 | | | | | | 0.18 | | | | | | 0.94 | | | | | | — | | | | | | 1.12 | | | | | | — | | | | | | 10.24 | | | | | | 7.88 | | | | | | 0.69 | | | | | | 0.54 | | | | | | 0.54 | | | | | | 1.93 | | | | | | 18,507 | | | | | | 41 | | |
| 12-31-15 | | | | | 12.16 | | | | | | 0.18• | | | | | | (0.35) | | | | | | (0.17) | | | | | | 0.12 | | | | | | 1.31 | | | | | | — | | | | | | 1.43 | | | | | | — | | | | | | 10.56 | | | | | | (1.99) | | | | | | 0.76 | | | | | | 0.54 | | | | | | 0.54 | | | | | | 1.54 | | | | | | 16,368 | | | | | | 36 | | |
| 12-31-14 | | | | | 12.24 | | | | | | 0.11 | | | | | | 0.60 | | | | | | 0.71 | | | | | | 0.15 | | | | | | 0.64 | | | | | | — | | | | | | 0.79 | | | | | | — | | | | | | 12.16 | | | | | | 5.95 | | | | | | 0.75 | | | | | | 0.53 | | | | | | 0.53 | | | | | | 0.90 | | | | | | 20,479 | | | | | | 44 | | |
| 12-31-13 | | | | | 10.25 | | | | | | 0.16• | | | | | | 2.25 | | | | | | 2.41 | | | | | | 0.11 | | | | | | 0.31 | | | | | | — | | | | | | 0.42 | | | | | | — | | | | | | 12.24 | | | | | | 23.86 | | | | | | 0.75 | | | | | | 0.51 | | | | | | 0.51 | | | | | | 1.41 | | | | | | 20,484 | | | | | | 48 | | |
See Accompanying Notes to Financial Statements
Financial Highlights (continued)
| | | | | | | | | | Income (loss)
from
investment
operations | | | | | | | | | Less Distributions | | | | | | Ratios to average net assets | | | Supplemental
Data | |
| | | | Net asset value, beginning
of year or period | | | Net investment income (loss) | | | Net realized and unrealized
gain (loss) | | | Total from investment
operations | | | From net investment income | | | From net realized gains | | | From return of capital | | | Total distributions | | | Payment by affiliate | | | Net asset value, end of year
or period | | | Total Return(1) | | | Expenses before
reductions/additions(2)(3)(4) | | | Expenses net of fee waivers
and/or recoupments if any(2)(3)(4) | | | Expenses net of all
reductions/additions(2)(3)(4) | | | Net investment income
(loss)(2)(3) | | | Net assets, end of year
or period | | | Portfolio turnover rate | |
Year or
period ended | | | ($) | | | ($) | | | ($) | | | ($) | | | ($) | | | ($) | | | ($) | | | ($) | | | ($) | | | ($) | | | (%) | | | (%) | | | (%) | | | (%) | | | (%) | | | ($000’s) | | | (%) | |
| Voya Index Solution 2045 Portfolio (continued) | | | | | | | | | | | | | | | | | | | | | | | | | | | | | | | | | | | | | | | | | | | | | | | | | | | | | | | | | | | | | | | | | | | | | | | | | | | | | | | | | | | | | | | | | | | | | | | | | | | | | | | |
| Class Z | | | | | | | | | | | | | | | | | | | | | | | | | | | | | | | | | | | | | | | | | | | | | | | | | | | | | | | | | | | | | | | | | | | | | | | | | | | | | | | | | | | | | | | | | | | | | | | | | | | | | | | |
| 12-31-17 | | | | | 10.57 | | | | | | 0.24• | | | | | | 1.93 | | | | | | 2.17 | | | | | | 0.18 | | | | | | 0.32 | | | | | | — | | | | | | 0.50 | | | | | | — | | | | | | 12.24 | | | | | | 20.81 | | | | | | 0.25 | | | | | | 0.00* | | | | | | 0.00* | | | | | | 2.12 | | | | | | 208,189 | | | | | | 25 | | |
| 12-31-16 | | | | | 10.85 | | | | | | 0.34• | | | | | | 0.55 | | | | | | 0.89 | | | | | | 0.23 | | | | | | 0.94 | | | | | | — | | | | | | 1.17 | | | | | | — | | | | | | 10.57 | | | | | | 8.47 | | | | | | 0.26 | | | | | | 0.00 | | | | | | 0.00 | | | | | | 3.21 | | | | | | 58,923 | | | | | | 41 | | |
05-01-15(5) -
12-31-15 | | | | | 13.09 | | | | | | 0.59• | | | | | | (1.34) | | | | | | (0.75) | | | | | | 0.18 | | | | | | 1.31 | | | | | | — | | | | | | 1.49 | | | | | | — | | | | | | 10.85 | | | | | | (6.26) | | | | | | 0.32 | | | | | | 0.00 | | | | | | 0.00 | | | | | | 8.27 | | | | | | 544 | | | | | | 36 | | |
| Voya Index Solution 2050 Portfolio | | | | | | | | | | | | | | | | | | | | | | | | | | | | | | | | | | | | | | | | | | | | | | | | | | | | | | | | | | | | | | | | | | | | | | | | | | | | | | | | | | | | | | | | | | | | | | | | | | | | | | | |
| Class ADV | | | | | | | | | | | | | | | | | | | | | | | | | | | | | | | | | | | | | | | | | | | | | | | | | | | | | | | | | | | | | | | | | | | | | | | | | | | | | | | | | | | | | | | | | | | | | | | | | | | | | | | |
| 12-31-17 | | | | | 13.65 | | | | | | 0.20• | | | | | | 2.53 | | | | | | 2.73 | | | | | | 0.04 | | | | | | 0.08 | | | | | | — | | | | | | 0.12 | | | | | | — | | | | | | 16.26 | | | | | | 20.12 | | | | | | 0.78 | | | | | | 0.70 | | | | | | 0.70 | | | | | | 1.31 | | | | | | 7,817 | | | | | | 26 | | |
| 12-31-16 | | | | | 12.69 | | | | | | 0.27• | | | | | | 0.73 | | | | | | 1.00 | | | | | | 0.01 | | | | | | 0.03 | | | | | | — | | | | | | 0.04 | | | | | | — | | | | | | 13.65 | | | | | | 7.94 | | | | | | 1.03 | | | | | | 0.64 | | | | | | 0.64 | | | | | | 2.05 | | | | | | 3,296 | | | | | | 49 | | |
| 12-31-15 | | | | | 13.68 | | | | | | 0.44• | | | | | | (0.68) | | | | | | (0.24) | | | | | | 0.04 | | | | | | 0.71 | | | | | | — | | | | | | 0.75 | | | | | | — | | | | | | 12.69 | | | | | | (1.97) | | | | | | 7.70 | | | | | | 0.64 | | | | | | 0.64 | | | | | | 3.52 | | | | | | 666 | | | | | | 195 | | |
| 12-31-14 | | | | | 14.03 | | | | | | 0.10 | | | | | | 0.68 | | | | | | 0.78 | | | | | | 0.19 | | | | | | 0.94 | | | | | | — | | | | | | 1.13 | | | | | | — | | | | | | 13.68 | | | | | | 5.64 | | | | | | 62.26 | | | | | | 0.64 | | | | | | 0.64 | | | | | | 0.77 | | | | | | 4 | | | | | | 32 | | |
| 12-31-13 | | | | | 11.95 | | | | | | 0.16 | | | | | | 2.59 | | | | | | 2.75 | | | | | | 0.17 | | | | | | 0.52 | | | | | | — | | | | | | 0.69 | | | | | | 0.02 | | | | | | 14.03 | | | | | | 23.69(d) | | | | | | 83.28 | | | | | | 0.62 | | | | | | 0.62 | | | | | | 1.20 | | | | | | 4 | | | | | | 39 | | |
| Class I | | | | | | | | | | | | | | | | | | | | | | | | | | | | | | | | | | | | | | | | | | | | | | | | | | | | | | | | | | | | | | | | | | | | | | | | | | | | | | | | | | | | | | | | | | | | | | | | | | | | | | | |
| 12-31-17 | | | | | 13.84 | | | | | | 0.31• | | | | | | 2.55 | | | | | | 2.86 | | | | | | 0.07 | | | | | | 0.08 | | | | | | — | | | | | | 0.15 | | | | | | — | | | | | | 16.55 | | | | | | 20.75 | | | | | | 0.28 | | | | | | 0.20 | | | | | | 0.20 | | | | | | 2.00 | | | | | | 3,195 | | | | | | 26 | | |
| 12-31-16 | | | | | 12.80 | | | | | | 0.33• | | | | | | 0.76 | | | | | | 1.09 | | | | | | 0.02 | | | | | | 0.03 | | | | | | — | | | | | | 0.05 | | | | | | — | | | | | | 13.84 | | | | | | 8.52 | | | | | | 0.53 | | | | | | 0.14 | | | | | | 0.14 | | | | | | 2.52 | | | | | | 950 | | | | | | 49 | | |
| 12-31-15 | | | | | 13.79 | | | | | | 0.44• | | | | | | (0.61) | | | | | | (0.17) | | | | | | 0.11 | | | | | | 0.71 | | | | | | — | | | | | | 0.82 | | | | | | — | | | | | | 12.80 | | | | | | (1.45) | | | | | | 7.20 | | | | | | 0.14 | | | | | | 0.14 | | | | | | 3.47 | | | | | | 295 | | | | | | 195 | | |
| 12-31-14 | | | | | 14.14 | | | | | | 0.18 | | | | | | 0.67 | | | | | | 0.85 | | | | | | 0.26 | | | | | | 0.94 | | | | | | — | | | | | | 1.20 | | | | | | — | | | | | | 13.79 | | | | | | 6.12 | | | | | | 61.76 | | | | | | 0.14 | | | | | | 0.14 | | | | | | 1.29 | | | | | | 5 | | | | | | 32 | | |
| 12-31-13 | | | | | 12.02 | | | | | | 0.22• | | | | | | 2.63 | | | | | | 2.85 | | | | | | 0.23 | | | | | | 0.52 | | | | | | — | | | | | | 0.75 | | | | | | 0.02 | | | | | | 14.14 | | | | | | 24.41(d) | | | | | | 82.78 | | | | | | 0.12 | | | | | | 0.12 | | | | | | 1.70 | | | | | | 4 | | | | | | 39 | | |
| Class S | | | | | | | | | | | | | | | | | | | | | | | | | | | | | | | | | | | | | | | | | | | | | | | | | | | | | | | | | | | | | | | | | | | | | | | | | | | | | | | | | | | | | | | | | | | | | | | | | | | | | | | |
| 12-31-17 | | | | | 13.83 | | | | | | 0.24• | | | | | | 2.58 | | | | | | 2.82 | | | | | | 0.06 | | | | | | 0.08 | | | | | | — | | | | | | 0.14 | | | | | | — | | | | | | 16.51 | | | | | | 20.47 | | | | | | 0.53 | | | | | | 0.45 | | | | | | 0.45 | | | | | | 1.56 | | | | | | 8,090 | | | | | | 26 | | |
| 12-31-16 | | | | | 12.83 | | | | | | 0.37• | | | | | | 0.68 | | | | | | 1.05 | | | | | | 0.02 | | | | | | 0.03 | | | | | | — | | | | | | 0.05 | | | | | | — | | | | | | 13.83 | | | | | | 8.20 | | | | | | 0.78 | | | | | | 0.39 | | | | | | 0.39 | | | | | | 2.76 | | | | | | 3,987 | | | | | | 49 | | |
| 12-31-15 | | | | | 13.80 | | | | | | 0.55• | | | | | | (0.74) | | | | | | (0.19) | | | | | | 0.07 | | | | | | 0.71 | | | | | | — | | | | | | 0.78 | | | | | | — | | | | | | 12.83 | | | | | | (1.60) | | | | | | 7.45 | | | | | | 0.39 | | | | | | 0.39 | | | | | | 4.31 | | | | | | 254 | | | | | | 195 | | |
| 12-31-14 | | | | | 14.14 | | | | | | 0.14 | | | | | | 0.68 | | | | | | 0.82 | | | | | | 0.22 | | | | | | 0.94 | | | | | | — | | | | | | 1.16 | | | | | | — | | | | | | 13.80 | | | | | | 5.93 | | | | | | 62.01 | | | | | | 0.39 | | | | | | 0.39 | | | | | | 1.04 | | | | | | 5 | | | | | | 32 | | |
| 12-31-13 | | | | | 11.97 | | | | | | 0.19• | | | | | | 2.61 | | | | | | 2.80 | | | | | | 0.13 | | | | | | 0.52 | | | | | | — | | | | | | 0.65 | | | | | | 0.02 | | | | | | 14.14 | | | | | | 24.03(d) | | | | | | 83.03 | | | | | | 0.37 | | | | | | 0.37 | | | | | | 1.44 | | | | | | 4 | | | | | | 39 | | |
| Class S2 | | | | | | | | | | | | | | | | | | | | | | | | | | | | | | | | | | | | | | | | | | | | | | | | | | | | | | | | | | | | | | | | | | | | | | | | | | | | | | | | | | | | | | | | | | | | | | | | | | | | | | | |
| 12-31-17 | | | | | 13.68 | | | | | | 0.23• | | | | | | 2.52 | | | | | | 2.75 | | | | | | 0.05 | | | | | | 0.08 | | | | | | — | | | | | | 0.13 | | | | | | — | | | | | | 16.30 | | | | | | 20.21 | | | | | | 0.68 | | | | | | 0.60 | | | | | | 0.60 | | | | | | 1.50 | | | | | | 1,973 | | | | | | 26 | | |
| 12-31-16 | | | | | 12.71 | | | | | | 0.35• | | | | | | 0.67 | | | | | | 1.02 | | | | | | 0.02 | | | | | | 0.03 | | | | | | — | | | | | | 0.05 | | | | | | — | | | | | | 13.68 | | | | | | 8.04 | | | | | | 0.96 | | | | | | 0.54 | | | | | | 0.54 | | | | | | 2.66 | | | | | | 766 | | | | | | 49 | | |
| 12-31-15 | | | | | 13.70 | | | | | | 0.32• | | | | | | (0.54) | | | | | | (0.22) | | | | | | 0.06 | | | | | | 0.71 | | | | | | — | | | | | | 0.77 | | | | | | — | | | | | | 12.71 | | | | | | (1.83) | | | | | | 7.70 | | | | | | 0.54 | | | | | | 0.54 | | | | | | 2.43 | | | | | | 14 | | | | | | 195 | | |
| 12-31-14 | | | | | 14.05 | | | | | | 0.12 | | | | | | 0.67 | | | | | | 0.79 | | | | | | 0.20 | | | | | | 0.94 | | | | | | — | | | | | | 1.14 | | | | | | — | | | | | | 13.70 | | | | | | 5.71 | | | | | | 62.26 | | | | | | 0.54 | | | | | | 0.54 | | | | | | 0.88 | | | | | | 4 | | | | | | 32 | | |
| 12-31-13 | | | | | 11.97 | | | | | | 0.17 | | | | | | 2.59 | | | | | | 2.76 | | | | | | 0.18 | | | | | | 0.52 | | | | | | — | | | | | | 0.70 | | | | | | 0.02 | | | | | | 14.05 | | | | | | 23.76(d) | | | | | | 83.28 | | | | | | 0.52 | | | | | | 0.52 | | | | | | 1.30 | | | | | | 4 | | | | | | 39 | | |
| Class Z | | | | | | | | | | | | | | | | | | | | | | | | | | | | | | | | | | | | | | | | | | | | | | | | | | | | | | | | | | | | | | | | | | | | | | | | | | | | | | | | | | | | | | | | | | | | | | | | | | | | | | | |
| 12-31-17 | | | | | 13.85 | | | | | | 0.33• | | | | | | 2.57 | | | | | | 2.90 | | | | | | 0.07 | | | | | | 0.08 | | | | | | — | | | | | | 0.15 | | | | | | — | | | | | | 16.60 | | | | | | 21.03 | | | | | | 0.28 | | | | | | 0.00* | | | | | | 0.00* | | | | | | 2.13 | | | | | | 97,126 | | | | | | 26 | | |
| 12-31-16 | | | | | 12.80 | | | | | | 0.49• | | | | | | 0.61 | | | | | | 1.10 | | | | | | 0.02 | | | | | | 0.03 | | | | | | — | | | | | | 0.05 | | | | | | — | | | | | | 13.85 | | | | | | 8.62 | | | | | | 0.53 | | | | | | 0.00 | | | | | | 0.00 | | | | | | 3.63 | | | | | | 21,080 | | | | | | 49 | | |
05-01-15(5) -
12-31-15 | | | | | 14.46 | | | | | | 0.61• | | | | | | (1.45) | | | | | | (0.84) | | | | | | 0.11 | | | | | | 0.71 | | | | | | — | | | | | | 0.82 | | | | | | — | | | | | | 12.80 | | | | | | (6.02) | | | | | | 7.05 | | | | | | 0.00 | | | | | | 0.00 | | | | | | 7.16 | | | | | | 576 | | | | | | 195 | | |
| Voya Index Solution 2055 Portfolio | | | | | | | | | | | | | | | | | | | | | | | | | | | | | | | | | | | | | | | | | | | | | | | | | | | | | | | | | | | | | | | | | | | | | | | | | | | | | | | | | | | | | | | | | | | | | | | | | | | | | | | |
| Class ADV | | | | | | | | | | | | | | | | | | | | | | | | | | | | | | | | | | | | | | | | | | | | | | | | | | | | | | | | | | | | | | | | | | | | | | | | | | | | | | | | | | | | | | | | | | | | | | | | | | | | | | | |
| 12-31-17 | | | | | 13.01 | | | | | | 0.16 | | | | | | 2.46 | | | | | | 2.62 | | | | | | 0.14 | | | | | | 0.31 | | | | | | — | | | | | | 0.45 | | | | | | — | | | | | | 15.18 | | | | | | 20.37 | | | | | | 0.76 | | | | | | 0.70 | | | | | | 0.70 | | | | | | 1.19 | | | | | | 52,886 | | | | | | 25 | | |
| 12-31-16 | | | | | 13.12 | | | | | | 0.22• | | | | | | 0.75 | | | | | | 0.97 | | | | | | 0.18 | | | | | | 0.90 | | | | | | — | | | | | | 1.08 | | | | | | — | | | | | | 13.01 | | | | | | 7.61 | | | | | | 0.78 | | | | | | 0.64 | | | | | | 0.64 | | | | | | 1.68 | | | | | | 43,002 | | | | | | 42 | | |
| 12-31-15 | | | | | 14.69 | | | | | | 0.20• | | | | | | (0.45) | | | | | | (0.25) | | | | | | 0.12 | | | | | | 1.20 | | | | | | — | | | | | | 1.32 | | | | | | — | | | | | | 13.12 | | | | | | (2.15) | | | | | | 0.78 | | | | | | 0.65 | | | | | | 0.65 | | | | | | 1.42 | | | | | | 37,162 | | | | | | 39 | | |
| 12-31-14 | | | | | 14.57 | | | | | | 0.13• | | | | | | 0.74 | | | | | | 0.87 | | | | | | 0.14 | | | | | | 0.61 | | | | | | — | | | | | | 0.75 | | | | | | — | | | | | | 14.69 | | | | | | 6.08 | | | | | | 0.78 | | | | | | 0.63 | | | | | | 0.63 | | | | | | 0.88 | | | | | | 31,811 | | | | | | 44 | | |
| 12-31-13 | | | | | 12.06 | | | | | | 0.17• | | | | | | 2.67 | | | | | | 2.84 | | | | | | 0.10 | | | | | | 0.23 | | | | | | — | | | | | | 0.33 | | | | | | — | | | | | | 14.57 | | | | | | 23.83 | | | | | | 0.80 | | | | | | 0.61 | | | | | | 0.61 | | | | | | 1.31 | | | | | | 24,873 | | | | | | 50 | | |
See Accompanying Notes to Financial Statements
Financial Highlights (continued)
| | | | | | | | | | Income (loss)
from
investment
operations | | | | | | | | | Less Distributions | | | | | | Ratios to average net assets | | | Supplemental
Data | |
| | | | Net asset value, beginning
of year or period | | | Net investment income (loss) | | | Net realized and unrealized
gain (loss) | | | Total from investment
operations | | | From net investment income | | | From net realized gains | | | From return of capital | | | Total distributions | | | Payment by affiliate | | | Net asset value, end of year
or period | | | Total Return(1) | | | Expenses before
reductions/additions(2)(3)(4) | | | Expenses net of fee waivers
and/or recoupments if any(2)(3)(4) | | | Expenses net of all
reductions/additions(2)(3)(4) | | | Net investment income
(loss)(2)(3) | | | Net assets, end of year
or period | | | Portfolio turnover rate | |
Year or
period ended | | | ($) | | | ($) | | | ($) | | | ($) | | | ($) | | | ($) | | | ($) | | | ($) | | | ($) | | | ($) | | | (%) | | | (%) | | | (%) | | | (%) | | | (%) | | | ($000’s) | | | (%) | |
| Voya Index Solution 2055 Portfolio (continued) | | | | | | | | | | | | | | | | | | | | | | | | | | | | | | | | | | | | | | | | | | | | | | | | | | | | | | | | | | | | | | | | | | | | | | | | | | | | | | | | | | | | | | | | | | | | | | | | | | | | | | | |
| Class I | | | | | | | | | | | | | | | | | | | | | | | | | | | | | | | | | | | | | | | | | | | | | | | | | | | | | | | | | | | | | | | | | | | | | | | | | | | | | | | | | | | | | | | | | | | | | | | | | | | | | | | |
| 12-31-17 | | | | | 13.29 | | | | | | 0.27• | | | | | | 2.49 | | | | | | 2.76 | | | | | | 0.20 | | | | | | 0.31 | | | | | | — | | | | | | 0.51 | | | | | | — | | | | | | 15.54 | | | | | | 21.03 | | | | | | 0.26 | | | | | | 0.20 | | | | | | 0.20 | | | | | | 1.87 | | | | | | 19,100 | | | | | | 25 | | |
| 12-31-16 | | | | | 13.38 | | | | | | 0.30• | | | | | | 0.75 | | | | | | 1.05 | | | | | | 0.24 | | | | | | 0.90 | | | | | | — | | | | | | 1.14 | | | | | | — | | | | | | 13.29 | | | | | | 8.10 | | | | | | 0.28 | | | | | | 0.14 | | | | | | 0.14 | | | | | | 2.24 | | | | | | 10,595 | | | | | | 42 | | |
| 12-31-15 | | | | | 14.94 | | | | | | 0.32• | | | | | | (0.50) | | | | | | (0.18) | | | | | | 0.18 | | | | | | 1.20 | | | | | | — | | | | | | 1.38 | | | | | | — | | | | | | 13.38 | | | | | | (1.66) | | | | | | 0.28 | | | | | | 0.15 | | | | | | 0.15 | | | | | | 2.23 | | | | | | 8,113 | | | | | | 39 | | |
| 12-31-14 | | | | | 14.78 | | | | | | 0.22• | | | | | | 0.74 | | | | | | 0.96 | | | | | | 0.19 | | | | | | 0.61 | | | | | | — | | | | | | 0.80 | | | | | | — | | | | | | 14.94 | | | | | | 6.61 | | | | | | 0.28 | | | | | | 0.13 | | | | | | 0.13 | | | | | | 1.44 | | | | | | 3,974 | | | | | | 44 | | |
| 12-31-13 | | | | | 12.21 | | | | | | 0.26• | | | | | | 2.67 | | | | | | 2.93 | | | | | | 0.13 | | | | | | 0.23 | | | | | | — | | | | | | 0.36 | | | | | | — | | | | | | 14.78 | | | | | | 24.32 | | | | | | 0.30 | | | | | | 0.11 | | | | | | 0.11 | | | | | | 1.89 | | | | | | 1,782 | | | | | | 50 | | |
| Class S | | | | | | | | | | | | | | | | | | | | | | | | | | | | | | | | | | | | | | | | | | | | | | | | | | | | | | | | | | | | | | | | | | | | | | | | | | | | | | | | | | | | | | | | | | | | | | | | | | | | | | | |
| 12-31-17 | | | | | 13.16 | | | | | | 0.20• | | | | | | 2.48 | | | | | | 2.68 | | | | | | 0.17 | | | | | | 0.31 | | | | | | — | | | | | | 0.48 | | | | | | — | | | | | | 15.36 | | | | | | 20.63 | | | | | | 0.51 | | | | | | 0.45 | | | | | | 0.45 | | | | | | 1.40 | | | | | | 29,602 | | | | | | 25 | | |
| 12-31-16 | | | | | 13.25 | | | | | | 0.25• | | | | | | 0.76 | | | | | | 1.01 | | | | | | 0.20 | | | | | | 0.90 | | | | | | — | | | | | | 1.10 | | | | | | — | | | | | | 13.16 | | | | | | 7.89 | | | | | | 0.53 | | | | | | 0.39 | | | | | | 0.39 | | | | | | 1.92 | | | | | | 23,832 | | | | | | 42 | | |
| 12-31-15 | | | | | 14.82 | | | | | | 0.21 | | | | | | (0.43) | | | | | | (0.22) | | | | | | 0.15 | | | | | | 1.20 | | | | | | — | | | | | | 1.35 | | | | | | — | | | | | | 13.25 | | | | | | (1.93) | | | | | | 0.53 | | | | | | 0.40 | | | | | | 0.40 | | | | | | 1.55 | | | | | | 20,530 | | | | | | 39 | | |
| 12-31-14 | | | | | 14.68 | | | | | | 0.16• | | | | | | 0.76 | | | | | | 0.92 | | | | | | 0.17 | | | | | | 0.61 | | | | | | — | | | | | | 0.78 | | | | | | — | | | | | | 14.82 | | | | | | 6.35 | | | | | | 0.53 | | | | | | 0.38 | | | | | | 0.38 | | | | | | 1.09 | | | | | | 20,758 | | | | | | 44 | | |
| 12-31-13 | | | | | 12.13 | | | | | | 0.21• | | | | | | 2.68 | | | | | | 2.89 | | | | | | 0.11 | | | | | | 0.23 | | | | | | — | | | | | | 0.34 | | | | | | — | | | | | | 14.68 | | | | | | 24.15 | | | | | | 0.55 | | | | | | 0.36 | | | | | | 0.36 | | | | | | 1.57 | | | | | | 15,267 | | | | | | 50 | | |
| Class S2 | | | | | | | | | | | | | | | | | | | | | | | | | | | | | | | | | | | | | | | | | | | | | | | | | | | | | | | | | | | | | | | | | | | | | | | | | | | | | | | | | | | | | | | | | | | | | | | | | | | | | | | |
| 12-31-17 | | | | | 13.06 | | | | | | 0.19• | | | | | | 2.45 | | | | | | 2.64 | | | | | | 0.15 | | | | | | 0.31 | | | | | | — | | | | | | 0.46 | | | | | | — | | | | | | 15.24 | | | | | | 20.50 | | | | | | 0.66 | | | | | | 0.60 | | | | | | 0.60 | | | | | | 1.35 | | | | | | 10,327 | | | | | | 25 | | |
| 12-31-16 | | | | | 13.17 | | | | | | 0.24• | | | | | | 0.74 | | | | | | 0.98 | | | | | | 0.19 | | | | | | 0.90 | | | | | | — | | | | | | 1.09 | | | | | | — | | | | | | 13.06 | | | | | | 7.71 | | | | | | 0.71 | | | | | | 0.54 | | | | | | 0.54 | | | | | | 1.87 | | | | | | 6,752 | | | | | | 42 | | |
| 12-31-15 | | | | | 14.72 | | | | | | 0.21• | | | | | | (0.45) | | | | | | (0.24) | | | | | | 0.11 | | | | | | 1.20 | | | | | | — | | | | | | 1.31 | | | | | | — | | | | | | 13.17 | | | | | | (2.04) | | | | | | 0.78 | | | | | | 0.55 | | | | | | 0.55 | | | | | | 1.50 | | | | | | 5,816 | | | | | | 39 | | |
| 12-31-14 | | | | | 14.59 | | | | | | 0.13• | | | | | | 0.75 | | | | | | 0.88 | | | | | | 0.14 | | | | | | 0.61 | | | | | | — | | | | | | 0.75 | | | | | | — | | | | | | 14.72 | | | | | | 6.15 | | | | | | 0.78 | | | | | �� | 0.53 | | | | | | 0.53 | | | | | | 0.89 | | | | | | 5,363 | | | | | | 44 | | |
| 12-31-13 | | | | | 12.07 | | | | | | 0.18• | | | | | | 2.67 | | | | | | 2.85 | | | | | | 0.10 | | | | | | 0.23 | | | | | | — | | | | | | 0.33 | | | | | | — | | | | | | 14.59 | | | | | | 23.92 | | | | | | 0.80 | | | | | | 0.51 | | | | | | 0.51 | | | | | | 1.36 | | | | | | 5,212 | | | | | | 50 | | |
| Class Z | | | | | | | | | | | | | | | | | | | | | | | | | | | | | | | | | | | | | | | | | | | | | | | | | | | | | | | | | | | | | | | | | | | | | | | | | | | | | | | | | | | | | | | | | | | | | | | | | | | | | | | |
| 12-31-17 | | | | | 13.33 | | | | | | 0.30• | | | | | | 2.50 | | | | | | 2.80 | | | | | | 0.20 | | | | | | 0.31 | | | | | | — | | | | | | 0.51 | | | | | | — | | | | | | 15.62 | | | | | | 21.27 | | | | | | 0.26 | | | | | | 0.00* | | | | | | 0.00* | | | | | | 2.07 | | | | | | 68,540 | | | | | | 25 | | |
| 12-31-16 | | | | | 13.40 | | | | | | 0.40• | | | | | | 0.67 | | | | | | 1.07 | | | | | | 0.24 | | | | | | 0.90 | | | | | | — | | | | | | 1.14 | | | | | | — | | | | | | 13.33 | | | | | | 8.24 | | | | | | 0.28 | | | | | | 0.00 | | | | | | 0.00 | | | | | | 3.06 | | | | | | 17,543 | | | | | | 42 | | |
05-01-15(5) -
12-31-15 | | | | | 15.69 | | | | | | 0.28• | | | | | | (1.19) | | | | | | (0.91) | | | | | | 0.18 | | | | | | 1.20 | | | | | | — | | | | | | 1.38 | | | | | | — | | | | | | 13.40 | | | | | | (6.22) | | | | | | 0.30 | | | | | | 0.00 | | | | | | 0.00 | | | | | | 3.14 | | | | | | 446 | | | | | | 39 | | |
| Voya Index Solution 2060 Portfolio | | | | | | | | | | | | | | | | | | | | | | | | | | | | | | | | | | | | | | | | | | | | | | | | | | | | | | | | | | | | | | | | | | | | | | | | | | | | | | | | | | | | | | | | | | | | | | | | | | | | | | | |
| Class ADV | | | | | | | | | | | | | | | | | | | | | | | | | | | | | | | | | | | | | | | | | | | | | | | | | | | | | | | | | | | | | | | | | | | | | | | | | | | | | | | | | | | | | | | | | | | | | | | | | | | | | | | |
| 12-31-17 | | | | | 10.48 | | | | | | 0.16• | | | | | | 1.97 | | | | | | 2.13 | | | | | | 0.03 | | | | | | 0.09 | | | | | | — | | | | | | 0.12 | | | | | | — | | | | | | 12.49 | | | | | | 20.44 | | | | | | 0.90 | | | | | | 0.70 | | | | | | 0.70 | | | | | | 1.40 | | | | | | 4,579 | | | | | | 51 | | |
| 12-31-16 | | | | | 9.77 | | | | | | 0.21• | | | | | | 0.56 | | | | | | 0.77 | | | | | | 0.02 | | | | | | 0.04 | | | | | | — | | | | | | 0.06 | | | | | | — | | | | | | 10.48 | | | | | | 7.87 | | | | | | 1.91 | | | | | | 0.64 | | | | | | 0.64 | | | | | | 2.06 | | | | | | 1,690 | | | | | | 63 | | |
02-09-15(5) -
12-31-15 | | | | | 10.00 | | | | | | 0.20• | | | | | | (0.43) | | | | | | (0.23) | | | | | | — | | | | | | — | | | | | | — | | | | | | — | | | | | | — | | | | | | 9.77 | | | | | | (2.30) | | | | | | 36.51 | | | | | | 0.65 | | | | | | 0.65 | | | | | | 2.29 | | | | | | 87 | | | | | | 208 | | |
| Class I | | | | | | | | | | | | | | | | | | | | | | | | | | | | | | | | | | | | | | | | | | | | | | | | | | | | | | | | | | | | | | | | | | | | | | | | | | | | | | | | | | | | | | | | | | | | | | | | | | | | | | | |
| 12-31-17 | | | | | 10.57 | | | | | | 0.31• | | | | | | 1.91 | | | | | | 2.22 | | | | | | 0.05 | | | | | | 0.09 | | | | | | — | | | | | | 0.14 | | | | | | — | | | | | | 12.65 | | | | | | 21.11 | | | | | | 0.40 | | | | | | 0.20 | | | | | | 0.20 | | | | | | 2.60 | | | | | | 1,563 | | | | | | 51 | | |
| 12-31-16 | | | | | 9.82 | | | | | | 0.26• | | | | | | 0.54 | | | | | | 0.80 | | | | | | 0.01 | | | | | | 0.04 | | | | | | — | | | | | | 0.05 | | | | | | — | | | | | | 10.57 | | | | | | 8.24 | | | | | | 1.41 | | | | | | 0.14 | | | | | | 0.14 | | | | | | 2.52 | | | | | | 146 | | | | | | 63 | | |
02-09-15(5) -
12-31-15 | | | | | 10.00 | | | | | | 0.51• | | | | | | (0.69) | | | | | | (0.18) | | | | | | — | | | | | | — | | | | | | — | | | | | | — | | | | | | — | | | | | | 9.82 | | | | | | (1.80) | | | | | | 36.01 | | | | | | 0.15 | | | | | | 0.15 | | | | | | 5.86 | | | | | | 32 | | | | | | 208 | | |
| Class S | | | | | | | | | | | | | | | | | | | | | | | | | | | | | | | | | | | | | | | | | | | | | | | | | | | | | | | | | | | | | | | | | | | | | | | | | | | | | | | | | | | | | | | | | | | | | | | | | | | | | | | |
| 12-31-17 | | | | | 10.52 | | | | | | 0.18• | | | | | | 1.99 | | | | | | 2.17 | | | | | | 0.04 | | | | | | 0.09 | | | | | | — | | | | | | 0.13 | | | | | | — | | | | | | 12.56 | | | | | | 20.76 | | | | | | 0.65 | | | | | | 0.45 | | | | | | 0.45 | | | | | | 1.51 | | | | | | 2,294 | | | | | | 51 | | |
| 12-31-16 | | | | | 9.79 | | | | | | 0.25• | | | | | | 0.54 | | | | | | 0.79 | | | | | | 0.02 | | | | | | 0.04 | | | | | | — | | | | | | 0.06 | | | | | | — | | | | | | 10.52 | | | | | | 8.06 | | | | | | 1.66 | | | | | | 0.39 | | | | | | 0.39 | | | | | | 2.46 | | | | | | 863 | | | | | | 63 | | |
02-09-15(5) -
12-31-15 | | | | | 10.00 | | | | | | 0.58• | | | | | | (0.79) | | | | | | (0.21) | | | | | | — | | | | | | — | | | | | | — | | | | | | — | | | | | | — | | | | | | 9.79 | | | | | | (2.10) | | | | | | 36.26 | | | | | | 0.40 | | | | | | 0.40 | | | | | | 6.61 | | | | | | 131 | | | | | | 208 | | |
See Accompanying Notes to Financial Statements
Financial Highlights (continued)
| | | | | | | | | | Income (loss)
from
investment
operations | | | | | | | | | Less Distributions | | | | | | Ratios to average net assets | | | Supplemental
Data | |
| | | | Net asset value, beginning
of year or period | | | Net investment income (loss) | | | Net realized and unrealized
gain (loss) | | | Total from investment
operations | | | From net investment income | | | From net realized gains | | | From return of capital | | | Total distributions | | | Payment by affiliate | | | Net asset value, end of year
or period | | | Total Return(1) | | | Expenses before
reductions/additions(2)(3)(4) | | | Expenses net of fee waivers
and/or recoupments if any(2)(3)(4) | | | Expenses net of all
reductions/additions(2)(3)(4) | | | Net investment income
(loss)(2)(3) | | | Net assets, end of year
or period | | | Portfolio turnover rate | |
Year or
period ended | | | ($) | | | ($) | | | ($) | | | ($) | | | ($) | | | ($) | | | ($) | | | ($) | | | ($) | | | ($) | | | (%) | | | (%) | | | (%) | | | (%) | | | (%) | | | ($000’s) | | | (%) | |
| Voya Index Solution 2060 Portfolio (continued) | | | | | | | | | | | | | | | | | | | | | | | | | | | | | | | | | | | | | | | | | | | | | | | | | | | | | | | | | | | | | | | | | | | | | | | | | | | | | | | | | | | | | | | | | | | | | | | | | | | | | | | |
| Class S2 | | | | | | | | | | | | | | | | | | | | | | | | | | | | | | | | | | | | | | | | | | | | | | | | | | | | | | | | | | | | | | | | | | | | | | | | | | | | | | | | | | | | | | | | | | | | | | | | | | | | | | | |
| 12-31-17 | | | | | 10.50 | | | | | | 0.20• | | | | | | 1.95 | | | | | | 2.15 | | | | | | 0.05 | | | | | | 0.09 | | | | | | — | | | | | | 0.14 | | | | | | — | | | | | | 12.51 | | | | | | 20.54 | | | | | | 0.80 | | | | | | 0.60 | | | | | | 0.60 | | | | | | 1.68 | | | | | | 993 | | | | | | 51 | | |
| 12-31-16 | | | | | 9.77 | | | | | | 0.26• | | | | | | 0.51 | | | | | | 0.77 | | | | | | — | | �� | | | | 0.04 | | | | | | — | | | | | | 0.04 | | | | | | — | | | | | | 10.50 | | | | | | 7.92 | | | | | | 1.84 | | | | | | 0.54 | | | | | | 0.54 | | | | | | 2.61 | | | | | | 139 | | | | | | 63 | | |
02-09-15(5) -
12-31-15 | | | | | 10.00 | | | | | | 0.06• | | | | | | (0.29) | | | | | | (0.23) | | | | | | — | | | | | | — | | | | | | — | | | | | | — | | | | | | — | | | | | | 9.77 | | | | | | (2.30) | | | | | | 36.51 | | | | | | 0.55 | | | | | | 0.55 | | | | | | 0.73 | | | | | | 4 | | | | | | 208 | | |
| Class Z | | | | | | | | | | | | | | | | | | | | | | | | | | | | | | | | | | | | | | | | | | | | | | | | | | | | | | | | | | | | | | | | | | | | | | | | | | | | | | | | | | | | | | | | | | | | | | | | | | | | | | | |
| 12-31-17 | | | | | 10.60 | | | | | | 0.26• | | | | | | 1.98 | | | | | | 2.24 | | | | | | 0.05 | | | | | | 0.09 | | | | | | — | | | | | | 0.14 | | | | | | — | | | | | | 12.70 | | | | | | 21.24 | | | | | | 0.40 | | | | | | 0.00* | | | | | | 0.00* | | | | | | 2.16 | | | | | | 15,056 | | | | | | 51 | | |
| 12-31-16 | | | | | 9.82 | | | | | | 0.50• | | | | | | 0.34 | | | | | | 0.84 | | | | | | 0.02 | | | | | | 0.04 | | | | | | — | | | | | | 0.06 | | | | | | — | | | | | | 10.60 | | | | | | 8.58 | | | | | | 1.41 | | | | | | 0.00 | | | | | | 0.00 | | | | | | 4.95 | | | | | | 3,068 | | | | | | 63 | | |
05-01-15(5) -
12-31-15 | | | | | 10.46 | | | | | | 0.03• | | | | | | (0.67) | | | | | | (0.64) | | | | | | — | | | | | | — | | | | | | — | | | | | | — | | | | | | — | | | | | | 9.82 | | | | | | (6.12) | | | | | | 35.54 | | | | | | 0.00 | | | | | | 0.00 | | | | | | 0.52 | | | | | | 143 | | | | | | 208 | | |
(1)
Total return is calculated assuming reinvestment of all dividends, capital gain distributions and return of capital distributions, if any, at net asset value and does not reflect the effect of insurance contract charges. Total return for periods less than one year is not annualized.
(2)
Annualized for periods less than one year.
(3)
Ratios reflect operating expenses of a Portfolio. Expenses before reductions/additions do not reflect amounts reimbursed by an Investment Adviser and/or Distributor or reductions from brokerage service arrangements or other expense offset arrangements and do not represent the amount paid by a Portfolio during periods when reimbursements or reductions occur. Expenses net of fee waivers reflect expenses after reimbursement by an Investment Adviser and/or Distributor but prior to reductions from brokerage service arrangements or other expense offset arrangements. Expenses net of all reductions/additions represent the net expenses paid by a Portfolio. Net investment income (loss) is net of all such additions or reductions.
(4)
Ratios do not include expenses of underlying funds and do not include fees and expenses charged under the variable annuity contract or variable life insurance policy.
(5)
Commencement of operations.
(a)
During the year ended December 31, 2013, Voya Investments, LLC voluntarily reimbursed Voya Index Solution 2020 Portfolio $22 for the foregone investment opportunities attributable to uninvested cash. Excluding this payment by affiliate, total return would have been 13.41%, 13.88%, 13.50% and 13.50% on Classes ADV, I, S and S2, respectively.
(b)
During the year ended December 31, 2013, Voya Investments, LLC voluntarily reimbursed Voya Index Solution 2030 Portfolio $24 for the foregone investment opportunities attributable to uninvested cash. Excluding this payment by affiliate, total return would have been 18.53%, 19.14%, 18.60% and 18.62% on Classes ADV, I, S and S2, respectively.
(c)
During the year ended December 31, 2013, Voya Investments, LLC voluntarily reimbursed Voya Index Solution 2040 Portfolio $30 for the foregone investment opportunities attributable to uninvested cash. Excluding this payment by affiliate, total return would have been 23.01%, 23.72%, 23.35% and 23.18% on Classes ADV, I, S and S2, respectively.
(d)
During the year ended December 31, 2013, Voya Investments, LLC voluntarily reimbursed Voya Index Solution 2050 Portfolio $31 for the foregone investment opportunities attributable to uninvested cash. Excluding this payment by affiliate, total return would have been 23.51%, 24.22%, 23.85% and 23.58% on Classes ADV, I, S and S2, respectively.
•
Calculated using average number of shares outstanding throughout the year or period.
*
Amount is less than $0.005 or 0.005% or more than $(0.005) or (0.005)%.
See Accompanying Notes to Financial Statements
NOTES TO FINANCIAL STATEMENTS as of December 31, 2017
NOTE 1 — ORGANIZATION
Voya Partners, Inc. (the “Company”) is an open-end management investment company registered under the Investment Company Act of 1940, as amended (the “1940 Act”). It was incorporated under the laws of Maryland on May 7, 1997. The Articles of Incorporation permit the Company to offer separate series, each of which has its own investment objective, policies and restrictions. The Company currently consists of thirty-eight active separate investment series. The ten series (each, a “Portfolio” and collectively, the “Portfolios”) included in this report are: Voya Index Solution Income Portfolio (“Index Solution Income”), Voya Index Solution 2020 Portfolio (“Index Solution 2020”), Voya Index Solution 2025 Portfolio (“Index Solution 2025”), Voya Index Solution 2030 Portfolio (“Index Solution 2030”), Voya Index Solution 2035 Portfolio (“Index Solution 2035”), Voya Index Solution 2040 Portfolio (“Index Solution 2040”), Voya Index Solution 2045 Portfolio (“Index Solution 2045”), Voya Index Solution 2050 Portfolio (“Index Solution 2050”), Voya Index Solution 2055 Portfolio (“Index Solution 2055”) and Voya Index Solution 2060 Portfolio (“Index Solution 2060”), each a diversified series of the Company.
Index Solution 2020, Index Solution 2025, Index Solution 2030, Index Solution 2035, Index Solution 2040, Index Solution 2045, Index Solution 2050, Index Solution 2055 and Index Solution 2060 are structured and managed around a specific target retirement or financial goal date (“Target Date”). When these Portfolios reach their respective Target Date, they may be combined with Index Solution Income, without a vote of shareholders, if approved by the Board of Directors (the “Board”).
The classes of shares included in this report are: Adviser (“Class ADV”), Initial (“Class I”), Service (“Class S”), Service 2 (“Class S2”) and Class Z. Shares of the Portfolios may be offered to separate accounts (“Separate Accounts”) of insurance companies as investment options in connection with variable annuity contracts and variable life insurance policies (“Variable Contracts”) and to certain of the Portfolios’ investment advisers and their affiliates. In the future, shares may also be offered to qualified pension and retirement plans (“Qualified Plans”) outside the Separate Account context. With the exception of class specific matters, each class has equal voting rights as to voting privileges. For class specific proposals, only the applicable class would have voting privileges. The classes differ principally in the applicable distribution and shareholder service fees. Generally, shareholders of each class also bear certain expenses that pertain to that particular class. All shareholders are allocated the common expenses of a portfolio and earn income and realized gains/losses from a portfolio pro rata based on the
daily ending net assets of each class, without distinction between share classes. Expenses that are specific to a portfolio or a class are charged directly to that portfolio or class. Other operating expenses shared by several portfolios are generally allocated among those portfolios based on average net assets. Distributions are determined separately for each class based on income and expenses allocated to each class. Realized gain distributions are allocated to each class pro rata based on the shares outstanding of each class on the date of distribution. Differences in per share dividend rates generally result from differences in separate class expenses, including distribution and shareholder service fees, if applicable.
Voya Investments, LLC (“Voya Investments” or the “Investment Adviser”), an Arizona limited liability company serves as the Investment Adviser to the Portfolios. Prior to May 1, 2017, Directed Services LLC, a Delaware limited liability company, served as the investment adviser to the Portfolios. There were no changes to the services provided or the fees charged to the Portfolios upon the replacement of Directed Services LLC with Voya Investments. Voya Investment Management Co. LLC (“Voya IM” or the “Sub-Adviser”), a Delaware limited liability company, serves as the Sub-Adviser to the Portfolios. Voya Investments Distributor, LLC (“VID” or the “Distributor”), a Delaware limited liability company, serves as the principal underwriter to the Portfolios.
Each Portfolio seeks to achieve its investment objective by investing in other investment companies (“Underlying Funds”) and uses asset allocation strategies to determine how much to invest in the Underlying Funds. The investment objective of the Portfolios is described in the respective Portfolio’s Prospectus.
NOTE 2 — SIGNIFICANT ACCOUNTING POLICIES
The following significant accounting policies are consistently followed by the Portfolios in the preparation of their financial statements. Each Portfolio is considered an investment company under U.S. generally accepted accounting principles (“GAAP”) and follows the accounting and reporting guidance applicable to investment companies.
A. Security Valuation. Each Portfolio is open for business every day the New York Stock Exchange (“NYSE”) opens for regular trading (each such day, a “Business Day”). The net asset value (“NAV”) per share for each class of each Portfolio is determined each Business Day as of the close of the regular trading session (“Market Close”), as determined by the Consolidated Tape Association (“CTA”), the central distributor of transaction prices for exchange-traded securities (normally 4:00 p.m. Eastern time unless otherwise designated by the CTA). The data reflected on
NOTES TO FINANCIAL STATEMENTS as of December 31, 2017 (continued)
NOTE 2 — SIGNIFICANT ACCOUNTING POLICIES (continued)
the consolidated tape provided by the CTA is generated by various market centers, including all securities exchanges, electronic communications networks, and third-market broker-dealers. The NAV per share of each class of each Portfolio is calculated by taking the value of the Portfolio’s assets attributable to that class, subtracting the Portfolio’s liabilities attributable to that class, and dividing by the number of shares of that class that are outstanding. On days when a Portfolio is closed for business, Portfolio shares will not be priced and a Portfolio does not transact purchase and redemption orders. To the extent a Portfolio’s assets are traded in other markets on days when a Portfolio does not price its shares, the value of a Portfolio’s assets will likely change and you will not be able to purchase or redeem shares of a Portfolio.
Assets for which market quotations are readily available are valued at market value. A security listed or traded on an exchange is valued at its last sales price or official closing price as of the close of the regular trading session on the exchange where the security is principally traded or, if such price is not available, at the last sale price as of the Market Close for such security provided by the CTA. Bank loans are valued at the average of the averages of the bid and ask prices provided to an independent loan pricing service by brokers. Futures contracts are valued at the final settlement price set by an exchange on which they are principally traded. Listed options are valued at the mean between the last bid and ask prices from the exchange on which they are principally traded. Investments in open-end registered investment companies that do not trade on an exchange are valued at the end of day NAV per share. Investments in registered investment companies that trade on an exchange are valued at the last sales price or official closing price as of the close of the regular trading session on the exchange where the security is principally traded.
When a market quotation is not readily available or is deemed unreliable, each Portfolio will determine a fair value for the relevant asset in accordance with procedures adopted by the Portfolios’ Board. Such procedures provide, for example, that: (a) Exchange-traded securities are valued at the mean of the closing bid and ask; (b) Debt obligations are valued using an evaluated price provided by an independent pricing service. Evaluated prices provided by the pricing service may be determined without exclusive reliance on quoted prices, and may reflect factors such as institution-size trading in similar groups of securities, developments related to specific securities, benchmark yield, quality, type of issue, coupon rate, maturity, individual trading characteristics and other market data; (c) Securities traded in the over-the-counter (“OTC”) market are valued based on prices provided by
independent pricing services or market makers; (d) Options not listed on an exchange are valued by an independent source using an industry accepted model, such as Black-Scholes; (e) Centrally cleared swap agreements are valued using a price provided by the central counterparty clearinghouse; (f) OTC swap agreements are valued using a price provided by an independent pricing service; (g) Forward foreign currency exchange contracts are valued utilizing current and forward rates obtained from an independent pricing service. Such prices from the third party pricing service are for specific settlement periods and each Portfolio’s forward foreign currency exchange contracts are valued at an interpolated rate between the closest preceding and subsequent period reported by the independent pricing service; and (h) Securities for which market prices are not provided by any of the above methods may be valued based upon quotes furnished by brokers.
The prospectuses of the open-end registered investment companies in which each Portfolio may invest explain the circumstances under which they will use fair value pricing and the effects of using fair value pricing.
Foreign securities’ (including forward foreign currency exchange contracts) prices are converted into U.S. dollar amounts using the applicable exchange rates as of Market Close. If market quotations are available and believed to be reliable for foreign exchange-traded equity securities, the securities will be valued at the market quotations. Because trading hours for certain foreign securities end before Market Close, closing market quotations may become unreliable. An independent pricing service determines the degree of certainty, based on historical data, that the closing price in the principal market where a foreign security trades is not the current value as of Market Close. Foreign securities’ prices meeting the approved degree of certainty that the price is not reflective of current value will be valued by the independent pricing service using pricing models designed to estimate likely changes in the values of those securities between the times in which the trading in those securities is substantially completed and Market Close. Multiple factors may be considered by the independent pricing service in determining the value of such securities and may include information relating to sector indices, American Depositary Receipts and domestic and foreign index futures.
All other assets for which market quotations are not readily available or became unreliable (or if the above fair valuation methods are unavailable or determined to be unreliable) are valued at fair value as determined in good faith by or under the supervision of the Board following procedures approved by the Board. The Board has delegated to the Investment Adviser responsibility for
NOTES TO FINANCIAL STATEMENTS as of December 31, 2017 (continued)
NOTE 2 — SIGNIFICANT ACCOUNTING POLICIES (continued)
overseeing the implementation of the Portfolios’ valuation procedures; a “Pricing Committee” comprised of employees of the Investment Adviser or its affiliates has responsibility for applying the fair valuation methods set forth in the procedures and, if a fair valuation cannot be determined pursuant to the fair valuation methods, determining the fair value of assets held by the Portfolios. Issuer specific events, transaction price, position size, nature and duration of restrictions on disposition of the security, market trends, bid/ask quotes of brokers and other market data may be reviewed in the course of making a good faith determination of a security’s fair value. Valuations change in response to many factors including the historical and prospective earnings of the issuer, the value of the issuer’s assets, general economic conditions, interest rates, investor perceptions and market liquidity. Because of the inherent uncertainties of fair valuation, the values used to determine each Portfolio’s NAV may materially differ from the value received upon actual sale of those investments. Thus, fair valuation may have an unintended dilutive or accretive effect on the value of shareholders’ investments in each Portfolio.
Each investment asset or liability of the Portfolios is assigned a level at measurement date based on the significance and source of the inputs to its valuation. Quoted prices in active markets for identical securities are classified as “Level 1,” inputs other than quoted prices for an asset or liability that are observable are classified as “Level 2” and significant unobservable inputs, including the Sub-Adviser’s or Pricing Committee’s judgment about the assumptions that a market participant would use in pricing an asset or liability are classified as “Level 3.” The inputs used for valuing securities are not necessarily an indication of the risks associated with investing in those securities. Short-term securities of sufficient credit quality are generally considered to be Level 2 securities under applicable accounting rules. The Portfolios classify each of their investments in the Underlying Funds as Level 1, without consideration as to the classification level of the specific investments held by the Underlying Funds. A table summarizing each Portfolio’s investments under these levels of classification is included following the Portfolio of Investments.
GAAP requires a reconciliation of the beginning to ending balances for reported fair values that presents changes attributable to total realized and unrealized gains or losses, purchases and sales, and transfers in or out of the Level 3 category during the period. The beginning of period timing recognition is used for the transfers between levels of a Portfolio’s assets and liabilities. A reconciliation of Level 3
investments is presented only when a Portfolio has a significant amount of Level 3 investments.
B. Securities Transactions and Revenue Recognition. Security transactions are accounted for on the trade date. Dividend income received from the Underlying Funds is recognized on the ex-dividend date and is recorded as income distributions in the Statements of Operations. Capital gain distributions received from the Underlying Funds are recognized on the ex-dividend date and are recorded on the Statements of Operations as such. Realized gains and losses are reported on the basis of identified cost of securities sold.
C. Distributions to Shareholders. The Portfolios record distributions to their shareholders on the ex-dividend date. Dividends from net investment income and capital gain distributions, if any, are declared and paid annually. The Portfolios may make distributions on a more frequent basis to comply with the distribution requirements of the Internal Revenue Code. The characteristics of income and gains to be distributed are determined in accordance with income tax regulations, which may differ from GAAP for investment companies.
D. Federal Income Taxes. It is the policy of each Portfolio to comply with the requirements of subchapter M of the Internal Revenue Code that are applicable to regulated investment companies and to distribute substantially all of its net investment income and any net realized capital gains to its shareholders. Therefore, a federal income tax or excise tax provision is not required. Management has considered the sustainability of the Portfolios’ tax positions taken on federal income tax returns for all open tax years in making this determination. No capital gain distributions shall be made until the capital loss carryforwards have been fully utilized or expire.
The Portfolios may utilize equalization accounting for tax purposes, whereby a portion of redemption payments are treated as distributions of income or gain.
E. Use of Estimates. The preparation of financial statements in conformity with GAAP requires management to make estimates and assumptions that affect the reported amounts of assets and liabilities and disclosure of contingent assets and liabilities at the date of the financial statements and the reported amounts of increases and decreases in net assets from operations during the reporting period. Actual results could differ from those estimates.
F. Risk Exposures and the Use of Derivative Instruments. Each Portfolio’s investment strategies permit it to enter into various types of derivatives contracts, including, but not limited to, futures contracts. In doing so, a
NOTES TO FINANCIAL STATEMENTS as of December 31, 2017 (continued)
NOTE 2 — SIGNIFICANT ACCOUNTING POLICIES (continued)
Portfolio will employ strategies in differing combinations to permit it to increase or decrease the level of risk, or change the level or types of exposure to risk factors. This may allow a Portfolio to pursue its objectives more quickly and efficiently than if it were to make direct purchases or sales of securities capable of affecting a similar response to market or credit factors.
In pursuit of its investment objectives, a Portfolio may seek to increase or decrease its exposure to the following market or credit risk factors:
Equity Risk. Stock prices may be volatile or have reduced liquidity in response to real or perceived impacts of factors including, but not limited to, economic conditions, changes in market interest rates, and political events. Stock markets tend to be cyclical, with periods when stock prices generally rise and periods when stock prices generally decline. Any given stock market segment may remain out of favor with investors for a short or long period of time, and stocks as an asset class may underperform bonds or other asset classes during some periods. Additionally, legislative, regulatory or tax policies or developments in these areas may adversely impact the investment techniques available to a manager, add to costs and impair the ability of a Portfolio to achieve its investment objectives.
Risks of Investing in Derivatives. Each Portfolio’s use of derivatives can result in losses due to unanticipated changes in the market or credit risk factors and the overall market. In instances where a Portfolio is using derivatives to decrease, or hedge, exposures to market or credit risk factors for securities held by a Portfolio, there are also risks that those derivatives may not perform as expected resulting in losses for the combined or hedged positions.
Derivative instruments are subject to a number of risks, including the risk of changes in the market price of the underlying securities, credit risk with respect to the counterparty, risk of loss due to changes in market interest rates and liquidity and volatility risk. The amounts required to purchase certain derivatives may be small relative to the magnitude of exposure assumed by a Portfolio. Therefore, the purchase of certain derivatives may have an economic leveraging effect on a Portfolio and exaggerate any increase or decrease in the NAV. Derivatives may not perform as expected, so a Portfolio may not realize the intended benefits. When used for hedging purposes, the change in value of a derivative may not correlate as expected with the currency, security or other risk being hedged. When used as an alternative or substitute for direct cash investments, the return provided by the derivative may not provide the same return as direct cash
investment. In addition, given their complexity, derivatives expose a Portfolio to the risk of improper valuation.
Generally, derivatives are sophisticated financial instruments whose performance is derived, at least in part, from the performance of an underlying asset or assets. Derivatives include, among other things, swap agreements, options, forwards and futures. Investments in derivatives are generally negotiated OTC with a single counterparty and as a result are subject to credit risks related to the counterparty’s ability or willingness to perform its obligations; any deterioration in the counterparty’s creditworthiness could adversely affect the value of the derivative. In addition, derivatives and their underlying securities may experience periods of illiquidity which could cause a Portfolio to hold a security it might otherwise sell, or to sell a security it otherwise might hold at inopportune times or at an unanticipated price. A manager might imperfectly judge the direction of the market. For instance, if a derivative is used as a hedge to offset investment risk in another security, the hedge might not correlate to the market’s movements and may have unexpected or undesired results such as a loss or a reduction in gains.
The U.S. government has enacted legislation that provides for new regulation of the derivatives market, including clearing, margin, reporting, and registration requirements. The European Union is (and other countries outside of the European Union are) implementing similar requirements, which will affect a Portfolio when it enters into a derivatives transaction with a counterparty organized in that country or otherwise subject to that country’s derivatives regulations. Because these requirements are new and evolving (and some of the rules are not yet final), their ultimate impact remains unclear. Central clearing is expected to reduce counterparty risk and increase liquidity, however, there is no assurance that it will achieve that result, and in the meantime, central clearing and related requirements expose a Portfolio to new kinds of costs and risks.
G. Futures Contracts. Certain Portfolios may enter into futures contracts involving foreign currency, interest rates, securities and security indices. A futures contract is a commitment to buy or sell a specific amount of a financial instrument at a negotiated price on a stipulated future date. A Portfolio may buy and sell futures contracts. Futures contracts traded on a commodities or futures exchange will be valued at the final settlement price or official closing price on the principal exchange as reported by such principal exchange at its trading session ending at, or most recently prior to, the time when each Portfolio’s assets are valued.
Upon entering into a futures contract, a Portfolio is required to deposit either cash or securities (initial margin) in an
NOTES TO FINANCIAL STATEMENTS as of December 31, 2017 (continued)
NOTE 2 — SIGNIFICANT ACCOUNTING POLICIES (continued)
amount equal to a certain percentage of the contract value. Subsequent payments (variation margin) are made or received by a Portfolio each day. The variation margin payments are equal to the daily changes in the contract value and are recorded as unrealized gains and losses. Open futures contracts are reported on a table following each Portfolio’s Portfolio of Investments. Securities held in collateralized accounts to cover initial margin requirements on open futures contracts, if any, are footnoted in the Portfolio of Investments. Cash collateral held by the broker to cover initial margin requirements on open futures contracts are noted in the Statements of Assets and Liabilities. The net change in unrealized appreciation and depreciation is reported in the Statements of Operations. Realized gains (losses) are reported in the Statements of Operations at the closing or expiration of futures contracts.
Futures contracts are exposed to the market risk factor of the underlying financial instrument. During the period ended December 31, 2017, certain Portfolios had purchased futures contracts on various equity indices to “equitize” cash. Futures contracts are purchased to provide immediate market exposure proportionate to the size of the Portfolio’s respective cash flows and residual cash balances in order to decrease potential tracking error if the cash remained uninvested in the market. Certain Portfolios also purchased and sold futures contracts on equity indices as part of their tactical asset allocation strategy. Additional associated risks of entering into futures contracts include the possibility that there may be an illiquid market where the Portfolios are unable to liquidate the contract or enter into an offsetting position and, if used for hedging purposes, the risk that the price of the contract will correlate imperfectly with the prices of the Portfolios’ securities. With futures, there is minimal counterparty credit risk to the Portfolios since futures are exchange traded and the exchange’s clearinghouse, as counterparty to all exchange traded futures, guarantees the futures against default.
During the year ended December 31, 2017, the following Portfolios had average notional values on futures contracts purchased and sold as disclosed below. Please refer to the tables following each respective Portfolio of Investments for open futures contracts purchased and sold for Index Solution Income, Index Solution 2020, Index Solution 2025, Index Solution 2030, Index Solution 2035, Index Solution 2040, Index Solution 2045, index Solution 2050 and Index Solution 2055. There were no open futures contracts purchased or sold for Index Solution 2060 during the year ended December 31, 2017.
| | | | Purchased | | | Sold | |
| Index Solution Income | | | | $ | 9,235,421 | | | | | $ | 9,139,436 | | |
| Index Solution 2020 | | | | | 3,931,296 | | | | | | 3,993,175 | | |
| Index Solution 2025 | | | | | 14,959,367 | | | | | | 15,056,550 | | |
| Index Solution 2030 | | | | | 4,391,089 | | | | | | 4,614,791 | | |
| Index Solution 2035 | | | | | 13,203,291 | | | | | | 13,307,611 | | |
| Index Solution 2040 | | | | | 2,742,965 | | | | | | 2,859,883 | | |
| Index Solution 2045 | | | | | 8,751,713 | | | | | | 8,808,253 | | |
| Index Solution 2050 | | | | | 1,548,352 | | | | | | 1,691,236 | | |
| Index Solution 2055 | | | | | 2,975,679 | | | | | | 3,013,529 | | |
H. Indemnifications. In the normal course of business, the Company may enter into contracts that provide certain indemnifications. The Company’s maximum exposure under these arrangements is dependent on future claims that may be made against the Portfolios and, therefore, cannot be estimated; however, based on experience, management considers the risk of loss from such claims remote.
NOTE 3 — INVESTMENTS IN UNDERLYING FUNDS
For the year ended December 31, 2017, the cost of purchases and the proceeds from sales of the Underlying Funds were as follows:
| | | | Purchases | | | Sales | |
| Index Solution Income | | | | $ | 189,442,324 | | | | | $ | 144,931,144 | | |
| Index Solution 2020 | | | | | 199,841,471 | | | | | | 73,338,719 | | |
| Index Solution 2025 | | | | | 403,394,351 | | | | | | 227,670,944 | | |
| Index Solution 2030 | | | | | 251,066,354 | | | | | | 64,880,944 | | |
| Index Solution 2035 | | | | | 320,075,406 | | | | | | 160,005,387 | | |
| Index Solution 2040 | | | | | 149,310,669 | | | | | | 35,362,804 | | |
| Index Solution 2045 | | | | | 214,063,021 | | | | | | 103,068,663 | | |
| Index Solution 2050 | | | | | 94,681,852 | | | | | | 18,879,677 | | |
| Index Solution 2055 | | | | | 88,890,057 | | | | | | 34,314,425 | | |
| Index Solution 2060 | | | | | 23,569,786 | | | | | | 7,476,939 | | |
NOTE 4 — INVESTMENT MANAGEMENT FEES
The Portfolios have entered into an investment management agreement (“Management Agreement”) with the Investment Adviser. The Investment Adviser has overall responsibility for the management of the Portfolios. The Investment Adviser oversees all investment management and portfolio management services for the Portfolios and assists in managing and supervising all aspects of the general day-to-day business activities and operations of the Portfolios, including custodial, transfer agency, dividend disbursing, accounting, auditing, compliance and related services. This Management Agreement compensates the Investment Adviser with a management fee, computed daily and payable monthly, based on the average daily net assets of each Portfolio, at the following annual rates: 0.20% of each Portfolio’s average daily nets assets invested in affiliated Underlying Funds and 0.40%
NOTES TO FINANCIAL STATEMENTS as of December 31, 2017 (continued)
NOTE 4 — INVESTMENT MANAGEMENT FEES (continued)
of each Portfolio’s average daily net assets invested in unaffiliated Underlying Funds and/or other direct investments.
The Investment Adviser has entered into a sub-advisory agreement with Voya IM. Voya IM provides investment advice for the Portfolios and is paid by the Investment Adviser based on the average daily net assets of each respective Portfolio. Subject to such policies as the Board or the Investment Adviser may determine, Voya IM manages the Portfolios’ assets in accordance with the Portfolios’ investment objectives, policies, and limitations.
NOTE 5 — DISTRIBUTION AND SERVICE FEES
Classes ADV and S2 of the Portfolios have a plan of distribution (the “Plans”), whereby the Distributor is reimbursed or compensated by the Portfolios for expenses incurred in the distribution of each respective Portfolio’s shares (“Distribution Fees”). The Distributor may pay, on behalf of each Portfolio, out of its distribution fee, compensation to certain financial institutions for providing distribution assistance pursuant to a Distribution Services Agreement. Under the Plans each Portfolio makes payments to the Distributor at an annual rate of 0.25% of each Portfolio’s average daily net assets attributable to its Class ADV shares and each Portfolio makes payments to the Distributor at an annual rate of 0.15% of each Portfolio’s average daily net assets attributable to its Class S2 shares.
The Company has a shareholder servicing plan (“Service Plan”) for the Classes ADV, S and S2 shares of each respective Portfolio. The Service Plan allows the Distributor to enter into shareholder servicing agreements with insurance companies, broker dealers or other financial intermediaries that provide administrative services related to Classes ADV, S and S2 shares and their shareholders including Variable Contract owners or Qualified Plan participants with interests in the Portfolios. Under the Service Plan, each Portfolio makes payments to the Distributor which shall not exceed an annual rate of 0.25% of each Portfolio’s average daily net assets attributable to its Classes ADV, S and S2 shares.
NOTE 6 — OTHER TRANSACTIONS WITH AFFILIATES AND RELATED PARTIES
At December 31, 2017, the following direct or indirect, wholly-owned subsidiaries of Voya Financial, Inc. owned more than 5% of the following Portfolios:
| Subsidiary | | | Portfolio | | | Percentage | |
| Voya Institutional Trust Company | | | Index Solution Income | | | | | 37.53% | | |
| | | | Index Solution 2020 | | | | | 6.91 | | |
| | | | Index Solution 2025 | | | | | 15.16 | | |
| | | | Index Solution 2035 | | | | | 12.85 | | |
| | | | Index Solution 2045 | | | | | 11.03 | | |
| | | | Index Solution 2055 | | | | | 8.88 | | |
| Voya Retirement Insurance and Annuity Company | | | Index Solution Income | | | | | 62.44 | | |
| | | | Index Solution 2020 | | | | | 93.09 | | |
| | | | Index Solution 2025 | | | | | 84.74 | | |
| | | | Index Solution 2030 | | | | | 95.12 | | |
| | | | Index Solution 2035 | | | | | 87.09 | | |
| | | | Index Solution 2040 | | | | | 96.72 | | |
| | | | Index Solution 2045 | | | | | 88.97 | | |
| | | | Index Solution 2050 | | | | | 96.33 | | |
| | | | Index Solution 2055 | | | | | 91.12 | | |
| | | | Index Solution 2060 | | | | | 96.04 | | |
Under the 1940 Act, the direct or indirect beneficial owner of more than 25% of the voting securities of a company (including a fund) is presumed to control such company. Companies under common control (e.g., companies with a common owner of greater than 25% of their respective voting securities) are affiliates under the 1940 Act.
The Portfolios have adopted a deferred compensation plan (the “DC Plan”), which allows eligible independent directors, as described in the DC Plan, to defer the receipt of all or a portion of the directors’ fees that they are entitled to receive from the Portfolios. For purposes of determining the amount owed to the director under the DC Plan, the amounts deferred are invested in shares of the funds selected by the director (the “Notional Funds”). The Portfolios purchase shares of the Notional Funds, which are all advised by Voya Investments, in amounts equal to the directors’ deferred fees, resulting in a Portfolio asset equal to the deferred compensation liability. Such assets, if applicable, are included as a component of “Other assets” on the accompanying Statements of Assets and Liabilities. Deferral of directors’ fees under the DC Plan will not affect net assets of the Portfolio, and will not materially affect the Portfolios’ assets, liabilities or net investment income per share. Amounts will be deferred until distributed in accordance with the DC Plan.
NOTE 7 — EXPENSE LIMITATION AGREEMENTS
The Investment Adviser has entered into a written expense limitation agreement (“Expense Limitation Agreement”) with each Portfolio whereby the Investment Adviser has
NOTES TO FINANCIAL STATEMENTS as of December 31, 2017 (continued)
NOTE 7 — EXPENSE LIMITATION
AGREEMENTS (continued)
agreed to limit expenses, excluding interest, taxes, investment-related costs, leverage expenses, and extraordinary expenses to the levels listed in the table below.
| Portfolio | | | Class
ADV(1)(2) | | | Class
I(1)(2) | | | Class
S(1)(2) | | | Class
S2(1)(2) | | | Class
Z(3)(4) | |
| Index Solution Income | | | | | 0.89% | | | | | | 0.39% | | | | | | 0.64% | | | | | | 0.79% | | | | | | 0.00% | | |
| Index Solution 2020 | | | | | 0.89% | | | | | | 0.39% | | | | | | 0.64% | | | | | | 0.79% | | | | | | 0.00% | | |
| Index Solution 2025 | | | | | 0.89% | | | | | | 0.39% | | | | | | 0.64% | | | | | | 0.79% | | | | | | 0.00% | | |
| Index Solution 2030 | | | | | 0.89% | | | | | | 0.39% | | | | | | 0.64% | | | | | | 0.79% | | | | | | 0.00% | | |
| Index Solution 2035 | | | | | 0.89% | | | | | | 0.39% | | | | | | 0.64% | | | | | | 0.79% | | | | | | 0.00% | | |
| Index Solution 2040 | | | | | 0.89% | | | | | | 0.39% | | | | | | 0.64% | | | | | | 0.79% | | | | | | 0.00% | | |
| Index Solution 2045 | | | | | 0.89% | | | | | | 0.39% | | | | | | 0.64% | | | | | | 0.79% | | | | | | 0.00% | | |
| Index Solution 2050 | | | | | 0.89% | | | | | | 0.39% | | | | | | 0.64% | | | | | | 0.79% | | | | | | 0.00% | | |
| Index Solution 2055 | | | | | 0.89% | | | | | | 0.39% | | | | | | 0.64% | | | | | | 0.79% | | | | | | 0.00% | | |
| Index Solution 2060 | | | | | 0.89% | | | | | | 0.39% | | | | | | 0.64% | | | | | | 0.79% | | | | | | 0.00% | | |
(1)
The operating expense limits take into account the operating expenses incurred at the Underlying Fund level. The amount of fees and expenses of an Underlying Fund borne by each Portfolio will vary based on each Portfolio’s allocation of assets to, and the net expenses of, a particular Underlying Fund.
(2)
As of May 1, 2017, any fees waived pursuant to the Expense Limitation Agreement shall not be eligible for recoupment.
(3)
Pursuant to a side letter agreement, through May 1, 2018, the Investment Adviser has agreed to waive all or a portion of the management fee so that the direct expense limits are 0.00% for all Portfolios. Any fees waived pursuant to the side letter agreement shall not be eligible for recoupment. Termination or modification of this obligation requires approval by the Board.
(4)
The operating expense limits shown apply only at each Portfolio level and do not include the fees payable by the Underlying Funds in which each Portfolio invests.
Prior to May 1, 2017, the expense limits were:
Portfolio(5) | | | Class
ADV | | | Class
I | | | Class
S | | | Class
S2 | |
| Index Solution Income | | | | | 1.01% | | | | | | 0.51% | | | | | | 0.76% | | | | | | 0.91% | | |
| Index Solution 2020 | | | | | 1.01% | | | | | | 0.51% | | | | | | 0.76% | | | | | | 0.91% | | |
| Index Solution 2025 | | | | | 1.01% | | | | | | 0.51% | | | | | | 0.76% | | | | | | 0.91% | | |
| Index Solution 2030 | | | | | 1.01% | | | | | | 0.51% | | | | | | 0.76% | | | | | | 0.91% | | |
| Index Solution 2035 | | | | | 1.01% | | | | | | 0.51% | | | | | | 0.76% | | | | | | 0.91% | | |
| Index Solution 2040 | | | | | 1.00% | | | | | | 0.50% | | | | | | 0.75% | | | | | | 0.90% | | |
| Index Solution 2045 | | | | | 1.01% | | | | | | 0.51% | | | | | | 0.76% | | | | | | 0.91% | | |
| Index Solution 2050 | | | | | 1.01% | | | | | | 0.51% | | | | | | 0.76% | | | | | | 0.91% | | |
| Index Solution 2055 | | | | | 1.01% | | | | | | 0.51% | | | | | | 0.76% | | | | | | 0.91% | | |
| Index Solution 2060 | | | | | 1.01% | | | | | | 0.51% | | | | | | 0.76% | | | | | | 0.91% | | |
(5)
The operating expense limits took into account the operating expenses incurred at the Underlying Fund level. The amount of fees
and expenses of an Underlying Fund borne by each Portfolio was based on each Portfolio’s allocation of assets to, and the net expenses of, a particular Underlying Fund.
Prior to May 1, 2017, the Investment Adviser was able to recoup from a Portfolio, except for Class Z, for fees waived and/or other expenses reimbursed by the Investment Adviser during the previous 36 months, but only if, after such recoupment, a Portfolio’s expense ratio did not exceed the percentage described above. Waived and reimbursed fees net of any recoupment by the Investment Adviser of such waived and reimbursed fees are reflected on the accompanying Statements of Operations. Amounts payable by the Investment Adviser are reflected on the accompanying Statements of Assets and Liabilities.
The Expense Limitation Agreement is contractual through May 1, 2018 and shall renew automatically for one-year terms. Termination or modification of this obligation requires approval by the Board.
NOTE 8 — LINE OF CREDIT
Effective May 19, 2017, each Portfolio, in addition to certain other funds managed by the Investment Adviser, has entered into a 364-day unsecured committed revolving line of credit agreement (the “Credit Agreement”) with The Bank of New York Mellon (“BNY”) for an aggregate amount of $400,000,000 through May 18, 2018. The proceeds may be used only to finance temporarily: (1) the purchase or sale of investment securities; or (2) the repurchase or redemption of shares of a Portfolio or certain other funds managed by the Investment Adviser. The funds to which the line of credit is available pay a commitment fee equal to 0.15% per annum on the daily unused portion of the committed line amount payable quarterly in arrears.
Borrowings under the Credit Agreement accrue interest at the federal funds rate plus a specified margin. Repayments generally must be made within 60 days after the date of a revolving credit advance.
The following Portfolio utilized the line of credit during the year ended December 31, 2017:
| Portfolio | | | Days Utilized | | | Approximate
Average
Daily
Balance For
Days
Utilized | | | Approximate
Weighted
Average
Interest Rate
For Days
Utilized | |
| Index Solution 2030 | | | | | 1 | | | | | $ | 955,000 | | | | | | 2.16% | | |
NOTES TO FINANCIAL STATEMENTS as of December 31, 2017 (continued)
NOTE 9 — CAPITAL SHARES
Transactions in capital shares and dollars were as follows:
| | | | Shares
sold | | | Shares
issued in
merger | | | Reinvestment
of
distributions | | | Shares
redeemed | | | Net increase
(decrease)
in shares
outstanding | | | Shares
sold | | | Proceeds
from shares
issued in
merger | | | Reinvestment
of
distributions | | | Shares
redeemed | | | Net increase
(decrease) | |
| Year or period ended | | | # | | | # | | | # | | | # | | | # | | | ($) | | | ($) | | | ($) | | | ($) | | | ($) | |
| Index Solution Income | |
| Class ADV | | | | | | | | | | | |
| 12/31/2017 | | | | | 930,637 | | | | | | — | | | | | | 233,642 | | | | | | (2,789,140) | | | | | | (1,624,861) | | | | | | 9,343,093 | | | | | | — | | | | | | 2,350,443 | | | | | | (28,064,554) | | | | | | (16,371,018) | | |
| 12/31/2016 | | | | | 1,757,497 | | | | | | — | | | | | | 371,692 | | | | | | (3,908,445) | | | | | | (1,779,256) | | | | | | 17,037,732 | | | | | | — | | | | | | 3,631,432 | | | | | | (37,893,146) | | | | | | (17,223,982) | | |
| Class I | | | | | | | | | | | |
| 12/31/2017 | | | | | 537,961 | | | | | | — | | | | | | 56,418 | | | | | | (1,402,039) | | | | | | (807,660) | | | | | | 5,533,204 | | | | | | — | | | | | | 581,105 | | | | | | (14,381,478) | | | | | | (8,267,169) | | |
| 12/31/2016 | | | | | 411,277 | | | | | | — | | | | | | 100,188 | | | | | | (704,445) | | | | | | (192,980) | | | | | | 4,109,474 | | | | | | — | | | | | | 1,001,877 | | | | | | (7,033,363) | | | | | | (1,922,012) | | |
| Class S | | | | | | | | | | | |
| 12/31/2017 | | | | | 811,061 | | | | | | — | | | | | | 384,341 | | | | | | (2,878,783) | | | | | | (1,683,381) | | | | | | 8,351,325 | | | | | | — | | | | | | 3,924,123 | | | | | | (29,550,303) | | | | | | (17,274,855) | | |
| 12/31/2016 | | | | | 692,560 | | | | | | — | | | | | | 560,841 | | | | | | (4,173,828) | | | | | | (2,920,427) | | | | | | 6,821,948 | | | | | | — | | | | | | 5,557,940 | | | | | | (40,942,521) | | | | | | (28,562,633) | | |
| Class S2 | | | | | | | | | | | |
| 12/31/2017 | | | | | 141,428 | | | | | | — | | | | | | 28,857 | | | | | | (343,395) | | | | | | (173,110) | | | | | | 1,419,452 | | | | | | — | | | | | | 288,562 | | | | | | (3,441,174) | | | | | | (1,733,160) | | |
| 12/31/2016 | | | | | 302,117 | | | | | | — | | | | | | 39,994 | | | | | | (476,597) | | | | | | (134,486) | | | | | | 2,910,178 | | | | | | — | | | | | | 388,739 | | | | | | (4,588,398) | | | | | | (1,289,481) | | |
| Class T(1) | | | | | | | | | | | |
| 12/31/2017 | | | | | — | | | | | | — | | | | | | — | | | | | | — | | | | | | — | | | | | | — | | | | | | — | | | | | | — | | | | | | — | | | | | | — | | |
| 12/31/2016 | | | | | — | | | | | | — | | | | | | — | | | | | | (625) | | | | | | (625) | | | | | | — | | | | | | — | | | | | | — | | | | | | (6,185) | | | | | | (6,185) | | |
| Class Z | | | | | | | | | | | |
| 12/31/2017 | | | | | 10,794,188 | | | | | | — | | | | | | 318,759 | | | | | | (2,349,521) | | | | | | 8,763,426 | | | | | | 111,907,543 | | | | | | — | | | | | | 3,295,965 | | | | | | (24,286,316) | | | | | | 90,917,192 | | |
| 12/31/2016 | | | | | 7,750,816 | | | | | | — | | | | | | 83,732 | | | | | | (910,013) | | | | | | 6,924,535 | | | | | | 77,500,077 | | | | | | — | | | | | | 839,827 | | | | | | (9,086,623) | | | | | | 69,253,281 | | |
| Index Solution 2020 | | | | | | | | | | | |
| Class ADV | | | | | | | | | | | |
| 12/31/2017 | | | | | 913,902 | | | | | | — | | | | | | 17,891 | | | | | | (413,898) | | | | | | 517,895 | | | | | | 11,558,777 | | | | | | — | | | | | | 228,296 | | | | | | (5,270,808) | | | | | | 6,516,265 | | |
| 12/31/2016 | | | | | 1,054,518 | | | | | | — | | | | | | 1,682 | | | | | | (336,704) | | | | | | 719,496 | | | | | | 12,205,040 | | | | | | — | | | | | | 20,075 | | | | | | (3,964,761) | | | | | | 8,260,354 | | |
| Class I | | | | | | | | | | | |
| 12/31/2017 | | | | | 271,086 | | | | | | — | | | | | | 4,488 | | | | | | (169,589) | | | | | | 105,985 | | | | | | 3,501,712 | | | | | | — | | | | | | 58,524 | | | | | | (2,200,177) | | | | | | 1,360,059 | | |
| 12/31/2016 | | | | | 280,008 | | | | | | — | | | | | | 358 | | | | | | (18,891) | | | | | | 261,475 | | | | | | 3,363,327 | | | | | | — | | | | | | 4,353 | | | | | | (220,531) | | | | | | 3,147,149 | | |
| Class S | | | | | | | | | | | |
| 12/31/2017 | | | | | 712,715 | | | | | | — | | | | | | 10,139 | | | | | | (552,714) | | | | | | 170,140 | | | | | | 9,279,960 | | | | | | — | | | | | | 131,810 | | | | | | (7,180,846) | | | | | | 2,230,924 | | |
| 12/31/2016 | | | | | 752,349 | | | | | | — | | | | | | 609 | | | | | | (127,208) | | | | | | 625,750 | | | | | | 9,012,238 | | | | | | — | | | | | | 7,399 | | | | | | (1,525,863) | | | | | | 7,493,774 | | |
| Class S2 | | | | | | | | | | | |
| 12/31/2017 | | | | | 85,453 | | | | | | — | | | | | | 4,333 | | | | | | (81,796) | | | | | | 7,990 | | | | | | 1,107,885 | | | | | | — | | | | | | 56,077 | | | | | | (1,070,572) | | | | | | 93,390 | | |
| 12/31/2016 | | | | | 287,919 | | | | | | — | | | | | | 165 | | | | | | (46,919) | | | | | | 241,165 | | | | | | 3,412,223 | | | | | | — | | | | | | 1,997 | | | | | | (532,075) | | | | | | 2,882,145 | | |
| Class T(1) | | | | | | | | | | | |
| 12/31/2017 | | | | | — | | | | | | — | | | | | | — | | | | | | — | | | | | | — | | | | | | — | | | | | | — | | | | | | — | | | | | | — | | | | | | — | | |
| 12/31/2016 | | | | | — | | | | | | — | | | | | | — | | | | | | (324) | | | | | | (324) | | | | | | — | | | | | | — | | | | | | — | | | | | | (3,016) | | | | | | (3,016) | | |
| Class Z | | | | | | | | | | | |
| 12/31/2017 | | | | | 9,624,424 | | | | | | — | | | | | | 174,801 | | | | | | (882,680) | | | | | | 8,916,545 | | | | | | 124,918,953 | | | | | | — | | | | | | 2,286,394 | | | | | | (11,547,481) | | | | | | 115,657,866 | | |
| 12/31/2016 | | | | | 6,273,312 | | | | | | — | | | | | | 4,385 | | | | | | (491,288) | | | | | | 5,786,409 | | | | | | 75,668,130 | | | | | | — | | | | | | 53,453 | | | | | | (5,961,284) | | | | | | 69,760,299 | | |
| Index Solution 2025 | | | | | | | | | | | |
| Class ADV | | | | | | | | | | | |
| 12/31/2017 | | | | | 2,331,125 | | | | | | — | | | | | | 713,057 | | | | | | (4,837,701) | | | | | | (1,793,519) | | | | | | 24,422,337 | | | | | | — | | | | | | 7,437,183 | | | | | | (50,598,037) | | | | | | (18,738,517) | | |
| 12/31/2016 | | | | | 3,154,325 | | | | | | — | | | | | | 2,110,559 | | | | | | (4,568,562) | | | | | | 696,322 | | | | | | 31,493,273 | | | | | | — | | | | | | 20,620,164 | | | | | | (45,898,182) | | | | | | 6,215,255 | | |
| Class I | | | | | | | | | | | |
| 12/31/2017 | | | | | 1,254,968 | | | | | | — | | | | | | 193,862 | | | | | | (1,621,412) | | | | | | (172,582) | | | | | | 13,463,987 | | | | | | — | | | | | | 2,066,567 | | | | | | (17,317,078) | | | | | | (1,786,524) | | |
| 12/31/2016 | | | | | 953,157 | | | | | | — | | | | | | 519,524 | | | | | | (618,362) | | | | | | 854,319 | | | | | | 9,785,563 | | | | | | — | | | | | | 5,184,848 | | | | | | (6,320,110) | | | | | | 8,650,301 | | |
| Class S | | | | | | | | | | | |
| 12/31/2017 | | | | | 1,705,397 | | | | | | — | | | | | | 489,675 | | | | | | (3,663,933) | | | | | | (1,468,861) | | | | | | 18,232,274 | | | | | | — | | | | | | 5,170,966 | | | | | | (39,073,344) | | | | | | (15,670,104) | | |
| 12/31/2016 | | | | | 1,759,298 | | | | | | — | | | | | | 1,361,663 | | | | | | (4,282,561) | | | | | | (1,161,600) | | | | | | 17,733,882 | | | | | | — | | | | | | 13,466,850 | | | | | | (43,421,336) | | | | | | (12,220,604) | | |
| Class S2 | | | | | | | | | | | |
| 12/31/2017 | | | | | 412,384 | | | | | | — | | | | | | 114,415 | | | | | | (841,511) | | | | | | (314,712) | | | | | | 4,293,865 | | | | | | — | | | | | | 1,187,624 | | | | | | (8,815,543) | | | | | | (3,334,054) | | |
| 12/31/2016 | | | | | 464,377 | | | | | | — | | | | | | 304,868 | | | | | | (755,404) | | | | | | 13,841 | | | | | | 4,620,137 | | | | | | — | | | | | | 2,966,360 | | | | | | (7,633,634) | | | | | | (47,137) | | |
| Class T(1) | | | | | | | | | | | |
| 12/31/2017 | | | | | — | | | | | | — | | | | | | — | | | | | | — | | | | | | — | | | | | | — | | | | | | — | | | | | | — | | | | | | — | | | | | | — | | |
| 12/31/2016 | | | | | — | | | | | | — | | | | | | — | | | | | | (319) | | | | | | (319) | | | | | | — | | | | | | — | | | | | | — | | | | | | (3,002) | | | | | | (3,002) | | |
| Class Z | | | | | | | | | | | |
| 12/31/2017 | | | | | 21,218,668 | | | | | | — | | | | | | 922,006 | | | | | | (829,989) | | | | | | 21,310,685 | | | | | | 228,894,092 | | | | | | — | | | | | | 9,865,461 | | | | | | (8,964,104) | | | | | | 229,795,449 | | |
| 12/31/2016 | | | | | 11,517,559 | | | | | | — | | | | | | 495,023 | | | | | | (530,329) | | | | | | 11,482,253 | | | | | | 118,021,712 | | | | | | — | | | | | | 4,950,232 | | | | | | (5,398,757) | | | | | | 117,573,187 | | |
NOTES TO FINANCIAL STATEMENTS as of December 31, 2017 (continued)
NOTE 9 — CAPITAL SHARES (continued)
| | | | Shares
sold | | | Shares
issued in
merger | | | Reinvestment
of
distributions | | | Shares
redeemed | | | Net increase
(decrease)
in shares
outstanding | | | Shares
sold | | | Proceeds
from shares
issued in
merger | | | Reinvestment
of
distributions | | | Shares
redeemed | | | Net increase
(decrease) | |
| Year or period ended | | | # | | | # | | | # | | | # | | | # | | | ($) | | | ($) | | | ($) | | | ($) | | | ($) | |
| Index Solution 2030 | | | | | | | | | | | |
| Class ADV | | | | | | | | | | | |
| 12/31/2017 | | | | | 791,344 | | | | | | — | | | | | | 11,541 | | | | | | (243,965) | | | | | | 558,920 | | | | | | 11,223,971 | | | | | | — | | | | | | 166,649 | | | | | | (3,496,094) | | | | | | 7,894,526 | | |
| 12/31/2016 | | | | | 765,208 | | | | | | — | | | | | | 702 | | | | | | (163,945) | | | | | | 601,965 | | | | | | 9,736,426 | | | | | | — | | | | | | 9,124 | | | | | | (2,072,010) | | | | | | 7,673,540 | | |
| Class I | | | | | | | | | | | |
| 12/31/2017 | | | | | 242,273 | | | | | | — | | | | | | 2,187 | | | | | | (88,949) | | | | | | 155,511 | | | | | | 3,506,149 | | | | | | — | | | | | | 32,270 | | | | | | (1,243,412) | | | | | | 2,295,007 | | |
| 12/31/2016 | | | | | 166,654 | | | | | | — | | | | | | 303 | | | | | | (67,898) | | | | | | 99,059 | | | | | | 2,138,175 | | | | | | — | | | | | | 4,012 | | | | | | (902,410) | | | | | | 1,239,777 | | |
| Class S | | | | | | | | | | | |
| 12/31/2017 | | | | | 411,638 | | | | | | — | | | | | | 6,889 | | | | | | (118,075) | | | | | | 300,452 | | | | | | 5,934,899 | | | | | | — | | | | | | 101,132 | | | | | | (1,712,929) | | | | | | 4,323,102 | | |
| 12/31/2016 | | | | | 563,415 | | | | | | — | | | | | | 319 | | | | | | (113,604) | | | | | | 450,130 | | | | | | 7,371,588 | | | | | | — | | | | | | 4,205 | | | | | | (1,491,566) | | | | | | 5,884,227 | | |
| Class S2 | | | | | | | | | | | |
| 12/31/2017 | | | | | 65,546 | | | | | | — | | | | | | 1,219 | | | | | | (80,232) | | | | | | (13,467) | | | | | | 943,460 | | | | | | — | | | | | | 17,702 | | | | | | (1,164,903) | | | | | | (203,741) | | |
| 12/31/2016 | | | | | 147,444 | | | | | | — | | | | | | 125 | | | | | | (20,760) | | | | | | 126,809 | | | | | | 1,882,849 | | | | | | — | | | | | | 1,631 | | | | | | (263,990) | | | | | | 1,620,490 | | |
| Class T(1) | | | | | | | | | | | |
| 12/31/2017 | | | | | — | | | | | | — | | | | | | — | | | | | | — | | | | | | — | | | | | | — | | | | | | — | | | | | | — | | | | | | — | | | | | | — | | |
| 12/31/2016 | | | | | — | | | | | | — | | | | | | — | | | | | | (328) | | | | | | (328) | | | | | | — | | | | | | — | | | | | | — | | | | | | (3,015) | | | | | | (3,015) | | |
| Class Z | | | | | | | | | | | |
| 12/31/2017 | | | | | 12,011,403 | | | | | | — | | | | | | 134,910 | | | | | | (465,780) | | | | | | 11,680,533 | | | | | | 175,494,462 | | | | | | — | | | | | | 1,993,970 | | | | | | (6,842,286) | | | | | | 170,646,146 | | |
| 12/31/2016 | | | | | 5,419,901 | | | | | | — | | | | | | 2,816 | | | | | | (161,825) | | | | | | 5,260,892 | | | | | | 71,494,654 | | | | | | — | | | | | | 37,313 | | | | | | (2,141,572) | | | | | | 69,390,395 | | |
| Index Solution 2035 | | | | | | | | | | | |
| Class ADV | | | | | | | | | | | |
| 12/31/2017 | | | | | 2,021,115 | | | | | | — | | | | | | 727,136 | | | | | | (4,195,526) | | | | | | (1,447,275) | | | | | | 21,592,596 | | | | | | — | | | | | | 7,751,266 | | | | | | (44,860,941) | | | | | | (15,517,079) | | |
| 12/31/2016 | | | | | 2,979,966 | | | | | | — | | | | | | 2,139,450 | | | | | | (3,962,090) | | | | | | 1,157,326 | | | | | | 29,828,035 | | | | | | — | | | | | | 20,859,643 | | | | | | (39,867,145) | | | | | | 10,820,533 | | |
| Class I | | | | | | | | | | | |
| 12/31/2017 | | | | | 1,407,166 | | | | | | — | | | | | | 192,475 | | | | | | (1,260,541) | | | | | | 339,100 | | | | | | 15,571,838 | | | | | | — | | | | | | 2,101,828 | | | | | | (13,954,535) | | | | | | 3,719,131 | | |
| 12/31/2016 | | | | | 927,921 | | | | | | — | | | | | | 470,087 | | | | | | (278,167) | | | | | | 1,119,841 | | | | | | 9,590,177 | | | | | | — | | | | | | 4,691,464 | | | | | | (2,854,854) | | | | | | 11,426,787 | | |
| Class S | | | | | | | | | | | |
| 12/31/2017 | | | | | 1,602,844 | | | | | | — | | | | | | 435,693 | | | | | | (3,178,025) | | | | | | (1,139,488) | | | | | | 17,537,584 | | | | | | — | | | | | | 4,705,487 | | | | | | (34,600,968) | | | | | | (12,357,897) | | |
| 12/31/2016 | | | | | 1,603,662 | | | | | | — | | | | | | 1,262,226 | | | | | | (3,547,916) | | | | | | (682,028) | | | | | | 16,320,237 | | | | | | — | | | | | | 12,458,169 | | | | | | (36,082,453) | | | | | | (7,304,047) | | |
| Class S2 | | | | | | | | | | | |
| 12/31/2017 | | | | | 452,571 | | | | | | — | | | | | | 127,982 | | | | | | (553,780) | | | | | | 26,773 | | | | | | 4,873,063 | | | | | | — | | | | | | 1,361,732 | | | | | | (5,987,023) | | | | | | 247,772 | | |
| 12/31/2016 | | | | | 536,606 | | | | | | — | | | | | | 336,554 | | | | | | (612,158) | | | | | | 261,002 | | | | | | 5,358,701 | | | | | | — | | | | | | 3,274,673 | | | | | | (6,145,494) | | | | | | 2,487,880 | | |
| Class T(1) | | | | | | | | | | | |
| 12/31/2017 | | | | | — | | | | | | — | | | | | | — | | | | | | — | | | | | | — | | | | | | — | | | | | | — | | | | | | — | | | | | | — | | | | | | — | | |
| 12/31/2016 | | | | | — | | | | | | — | | | | | | — | | | | | | (320) | | | | | | (320) | | | | | | — | | | | | | — | | | | | | — | | | | | | (3,002) | | | | | | (3,002) | | |
| Class Z | | | | | | | | | | | |
| 12/31/2017 | | | | | 17,907,971 | | | | | | — | | | | | | 877,565 | | | | | | (668,817) | | | | | | 18,116,719 | | | | | | 198,209,750 | | | | | | — | | | | | | 9,635,664 | | | | | | (7,398,643) | | | | | | 200,446,771 | | |
| 12/31/2016 | | | | | 9,322,101 | | | | | | — | | | | | | 475,386 | | | | | | (191,420) | | | | | | 9,606,067 | | | | | | 96,033,438 | | | | | | — | | | | | | 4,758,615 | | | | | | (1,967,412) | | | | | | 98,824,641 | | |
| Index Solution 2040 | | | | | | | | | | | |
| Class ADV | | | | | | | | | | | |
| 12/31/2017 | | | | | 449,349 | | | | | | — | | | | | | 5,956 | | | | | | (145,457) | | | | | | 309,848 | | | | | | 6,626,075 | | | | | | — | | | | | | 89,221 | | | | | | (2,170,039) | | | | | | 4,545,257 | | |
| 12/31/2016 | | | | | 370,116 | | | | | | — | | | | | | 276 | | | | | | (84,750) | | | | | | 285,642 | | | | | | 4,769,724 | | | | | | — | | | | | | 3,655 | | | | | | (1,104,069) | | | | | | 3,669,310 | | |
| Class I | | | | | | | | | | | |
| 12/31/2017 | | | | | 154,447 | | | | | | — | | | | | | 891 | | | | | | (43,353) | | | | | | 111,985 | | | | | | 2,356,478 | | | | | | — | | | | | | 13,613 | | | | | | (660,814) | | | | | | 1,709,277 | | |
| 12/31/2016 | | | | | 41,205 | | | | | | — | | | | | | 68 | | | | | | (6,483) | | | | | | 34,790 | | | | | | 536,998 | | | | | | — | | | | | | 921 | | | | | | (88,273) | | | | | | 449,646 | | |
| Class S | | | | | | | | | | | |
| 12/31/2017 | | | | | 288,103 | | | | | | — | | | | | | 5,040 | | | | | | (117,275) | | | | | | 175,868 | | | | | | 4,320,234 | | | | | | — | | | | | | 77,007 | | | | | | (1,764,952) | | | | | | 2,632,289 | | |
| 12/31/2016 | | | | | 411,083 | | | | | | — | | | | | | 212 | | | | | | (77,707) | | | | | | 333,588 | | | | | | 5,492,155 | | | | | | — | | | | | | 2,856 | | | | | | (1,015,554) | | | | | | 4,479,457 | | |
| Class S2 | | | | | | | | | | | |
| 12/31/2017 | | | | | 93,905 | | | | | | — | | | | | | 958 | | | | | | (37,851) | | | | | | 57,012 | | | | | | 1,406,195 | | | | | | — | | | | | | 14,469 | | | | | | (589,183) | | | | | | 831,481 | | |
| 12/31/2016 | | | | | 53,128 | | | | | | — | | | | | | 47 | | | | | | (6,646) | | | | | | 46,529 | | | | | | 693,973 | | | | | | — | | | | | | 629 | | | | | | (88,396) | | | | | | 606,206 | | |
| Class T(1) | | | | | | | | | | | |
| 12/31/2017 | | | | | — | | | | | | — | | | | | | — | | | | | | — | | | | | | — | | | | | | — | | | | | | — | | | | | | — | | | | | | — | | | | | | — | | |
| 12/31/2016 | | | | | — | | | | | | — | | | | | | — | | | | | | (327) | | | | | | (327) | | | | | | — | | | | | | — | | | | | | — | | | | | | (3,014) | | | | | | (3,014) | | |
| Class Z | | | | | | | | | | | |
| 12/31/2017 | | | | | 7,023,535 | | | | | | — | | | | | | 86,062 | | | | | | (290,672) | | | | | | 6,818,925 | | | | | | 106,754,350 | | | | | | — | | | | | | 1,319,336 | | | | | | (4,425,666) | | | | | | 103,648,020 | | |
| 12/31/2016 | | | | | 3,504,110 | | | | | | — | | | | | | 1,968 | | | | | | (113,852) | | | | | | 3,392,226 | | | | | | 46,977,115 | | | | | | — | | | | | | 26,551 | | | | | | (1,527,287) | | | | | | 45,476,379 | | |
NOTES TO FINANCIAL STATEMENTS as of December 31, 2017 (continued)
NOTE 9 — CAPITAL SHARES (continued)
| | | | Shares
sold | | | Shares
issued in
merger | | | Reinvestment
of
distributions | | | Shares
redeemed | | | Net increase
(decrease)
in shares
outstanding | | | Shares
sold | | | Proceeds
from shares
issued in
merger | | | Reinvestment
of
distributions | | | Shares
redeemed | | | Net increase
(decrease) | |
| Year or period ended | | | # | | | # | | | # | | | # | | | # | | | ($) | | | ($) | | | ($) | | | ($) | | | ($) | |
| Index Solution 2045 | | | | | | | | | | | |
| Class ADV | | | | | | | | | | | |
| 12/31/2017 | | | | | 1,726,176 | | | | | | — | | | | | | 503,085 | | | | | | (3,329,734) | | | | | | (1,100,473) | | | | | | 19,002,994 | | | | | | — | | | | | | 5,538,963 | | | | | | (36,429,062) | | | | | | (11,887,105) | | |
| 12/31/2016 | | | | | 2,360,032 | | | | | | — | | | | | | 1,402,265 | | | | | | (2,784,447) | | | | | | 977,850 | | | | | | 24,248,207 | | | | | | — | | | | | | 13,994,611 | | | | | | (28,446,613) | | | | | | 9,796,205 | | |
| Class I | | | | | | | | | | | |
| 12/31/2017 | | | | | 1,157,158 | | | | | | — | | | | | | 155,507 | | | | | | (747,667) | | | | | | 564,998 | | | | | | 13,354,064 | | | | | | — | | | | | | 1,765,007 | | | | | | (8,633,220) | | | | | | 6,485,851 | | |
| 12/31/2016 | | | | | 767,211 | | | | | | — | | | | | | 338,389 | | | | | | (275,321) | | | | | | 830,279 | | | | | | 8,111,369 | | | | | | — | | | | | | 3,475,255 | | | | | | (2,909,050) | | | | | | 8,677,574 | | |
| Class S | | | | | | | | | | | |
| 12/31/2017 | | | | | 1,223,267 | | | | | | — | | | | | | 304,151 | | | | | | (1,616,612) | | | | | | (89,194) | | | | | | 13,827,091 | | | | | | — | | | | | | 3,403,451 | | | | | | (18,295,647) | | | | | | (1,065,105) | | |
| 12/31/2016 | | | | | 1,248,296 | | | | | | — | | | | | | 748,878 | | | | | | (2,154,611) | | | | | | (157,437) | | | | | | 13,009,971 | | | | | | — | | | | | | 7,593,619 | | | | | | (22,382,822) | | | | | | (1,779,232) | | |
| Class S2 | | | | | | | | | | | |
| 12/31/2017 | | | | | 338,771 | | | | | | — | | | | | | 69,460 | | | | | | (588,961) | | | | | | (180,730) | | | | | | 3,757,788 | | | | | | — | | | | | | 765,452 | | | | | | (6,606,568) | | | | | | (2,083,328) | | |
| 12/31/2016 | | | | | 390,585 | | | | | | — | | | | | | 177,420 | | | | | | (310,107) | | | | | | 257,898 | | | | | | 4,045,254 | | | | | | — | | | | | | 1,772,423 | | | | | | (3,199,726) | | | | | | 2,617,951 | | |
| Class T(1) | | | | | | | | | | | |
| 12/31/2017 | | | | | — | | | | | | — | | | | | | — | | | | | | — | | | | | | — | | | | | | — | | | | | | — | | | | | | — | | | | | | — | | | | | | — | | |
| 12/31/2016 | | | | | — | | | | | | — | | | | | | — | | | | | | (319) | | | | | | (319) | | | | | | — | | | | | | — | | | | | | — | | | | | | (3,001) | | | | | | (3,001) | | |
| Class Z | | | | | | | | | | | |
| 12/31/2017 | | | | | 11,199,900 | | | | | | — | | | | | | 536,329 | | | | | | (297,498) | | | | | | 11,438,731 | | | | | | 128,873,840 | | | | | | — | | | | | | 6,114,153 | | | | | | (3,382,466) | | | | | | 131,605,527 | | |
| 12/31/2016 | | | | | 5,322,803 | | | | | | — | | | | | | 268,068 | | | | | | (68,555) | | | | | | 5,522,316 | | | | | | 56,547,347 | | | | | | — | | | | | | 2,761,099 | | | | | | (731,237) | | | | | | 58,577,209 | | |
| Index Solution 2050 | | | | | | | | | | | |
| Class ADV | | | | | | | | | | | |
| 12/31/2017 | | | | | 314,588 | | | | | | — | | | | | | 3,214 | | | | | | (78,651) | | | | | | 239,151 | | | | | | 4,701,219 | | | | | | — | | | | | | 48,761 | | | | | | (1,172,709) | | | | | | 3,577,271 | | |
| 12/31/2016 | | | | | 225,991 | | | | | | — | | | | | | 544 | | | | | | (37,453) | | | | | | 189,082 | | | | | | 2,938,579 | | | | | | — | | | | | | 7,244 | | | | | | (487,762) | | | | | | 2,458,061 | | |
| Class I | | | | | | | | | | | |
| 12/31/2017 | | | | | 154,928 | | | | | | — | | | | | | 1,154 | | | | | | (31,611) | | | | | | 124,471 | | | | | | 2,407,368 | | | | | | — | | | | | | 17,786 | | | | | | (505,666) | | | | | | 1,919,488 | | |
| 12/31/2016 | | | | | 52,400 | | | | | | — | | | | | | 198 | | | | | | (7,015) | | | | | | 45,583 | | | | | | 679,924 | | | | | | — | | | | | | 2,666 | | | | | | (92,458) | | | | | | 590,132 | | |
| Class S | | | | | | | | | | | |
| 12/31/2017 | | | | | 321,998 | | | | | | — | | | | | | 3,908 | | | | | | (124,234) | | | | | | 201,672 | | | | | | 4,861,028 | | | | | | — | | | | | | 60,144 | | | | | | (1,894,963) | | | | | | 3,026,209 | | |
| 12/31/2016 | | | | | 317,982 | | | | | | — | | | | | | 404 | | | | | | (50,007) | | | | | | 268,379 | | | | | | 4,259,326 | | | | | | — | | | | | | 5,451 | | | | | | (672,963) | | | | | | 3,591,814 | | |
| Class S2 | | | | | | | | | | | |
| 12/31/2017 | | | | | 76,415 | | | | | | — | | | | | | 810 | | | | | | (12,248) | | | | | | 64,977 | | | | | | 1,156,350 | | | | | | — | | | | | | 12,318 | | | | | | (187,015) | | | | | | 981,653 | | |
| 12/31/2016 | | | | | 61,739 | | | | | | — | | | | | | 98 | | | | | | (6,868) | | | | | | 54,969 | | | | | | 805,340 | | | | | | — | | | | | | 1,305 | | | | | | (89,834) | | | | | | 716,811 | | |
| Class T(1) | | | | | | | | | | | |
| 12/31/2017 | | | | | — | | | | | | — | | | | | | — | | | | | | — | | | | | | — | | | | | | — | | | | | | — | | | | | | — | | | | | | — | | | | | | — | | |
| 12/31/2016 | | | | | — | | | | | | — | | | | | | — | | | | | | (326) | | | | | | (326) | | | | | | — | | | | | | — | | | | | | — | | | | | | (3,037) | | | | | | (3,037) | | |
| Class Z | | | | | | | | | | | |
| 12/31/2017 | | | | | 4,455,542 | | | | | | — | | | | | | 40,685 | | | | | | (165,668) | | | | | | 4,330,559 | | | | | | 68,197,933 | | | | | | — | | | | | | 628,184 | | | | | | (2,660,159) | | | | | | 66,165,958 | | |
| 12/31/2016 | | | | | 1,501,501 | | | | | | — | | | | | | 1,741 | | | | | | (26,136) | | | | | | 1,477,106 | | | | | | 20,155,127 | | | | | | — | | | | | | 23,471 | | | | | | (353,464) | | | | | | 19,825,134 | | |
| Index Solution 2055 | | | | | | | | | | | |
| Class ADV | | | | | | | | | | | |
| 12/31/2017 | | | | | 809,648 | | | | | | — | | | | | | 105,480 | | | | | | (736,869) | | | | | | 178,259 | | | | | | 11,412,384 | | | | | | — | | | | | | 1,493,599 | | | | | | (10,321,415) | | | | | | 2,584,568 | | |
| 12/31/2016 | | | | | 944,610 | | | | | | — | | | | | | 250,385 | | | | | | (721,251) | | | | | | 473,744 | | | | | | 12,194,729 | | | | | | — | | | | | | 3,179,890 | | | | | | (9,341,279) | | | | | | 6,033,340 | | |
| Class I | | | | | | | | | | | |
| 12/31/2017 | | | | | 610,638 | | | | | | — | | | | | | 29,675 | | | | | | (208,095) | | | | | | 432,218 | | | | | �� | 9,041,962 | | | | | | — | | | | | | 429,094 | | | | | | (3,084,093) | | | | | | 6,386,963 | | |
| 12/31/2016 | | | | | 307,196 | | | | | | — | | | | | | 59,581 | | | | | | (176,025) | | | | | | 190,752 | | | | | | 4,058,952 | | | | | | — | | | | | | 771,570 | | | | | | (2,356,125) | | | | | | 2,474,397 | | |
| Class S | | | | | | | | | | | |
| 12/31/2017 | | | | | 722,021 | | | | | | — | | | | | | 67,779 | | | | | | (674,289) | | | | | | 115,511 | | | | | | 10,364,721 | | | | | | — | | | | | | 970,592 | | | | | | (9,818,180) | | | | | | 1,517,133 | | |
| 12/31/2016 | | | | | 605,714 | | | | | | — | | | | | | 136,729 | | | | | | (480,292) | | | | | | 262,151 | | | | | | 7,892,568 | | | | | | — | | | | | | 1,754,234 | | | | | | (6,208,601) | | | | | | 3,438,201 | | |
| Class S2 | | | | | | | | | | | |
| 12/31/2017 | | | | | 191,561 | | | | | | — | | | | | | 19,231 | | | | | | (50,210) | | | | | | 160,582 | | | | | | 2,727,755 | | | | | | — | | | | | | 273,267 | | | | | | (720,584) | | | | | | 2,280,438 | | |
| 12/31/2016 | | | | | 171,377 | | | | | | — | | | | | | 41,176 | | | | | | (137,039) | | | | | | 75,514 | | | | | | 2,223,368 | | | | | | — | | | | | | 524,576 | | | | | | (1,772,787) | | | | | | 975,157 | | |
| Class T(1) | | | | | | | | | | | |
| 12/31/2017 | | | | | — | | | | | | — | | | | | | — | | | | | | — | | | | | | — | | | | | | — | | | | | | — | | | | | | — | | | | | | — | | | | | | — | | |
| 12/31/2016 | | | | | — | | | | | | — | | | | | | — | | | | | | (316) | | | | | | (316) | | | | | | — | | | | | | — | | | | | | — | | | | | | (3,010) | | | | | | (3,010) | | |
| Class Z | | | | | | | | | | | |
| 12/31/2017 | | | | | 3,153,324 | | | | | | — | | | | | | 111,223 | | | | | | (191,699) | | | | | | 3,072,848 | | | | | | 46,005,873 | | | | | | — | | | | | | 1,614,956 | | | | | | (2,876,458) | | | | | | 44,744,371 | | |
| 12/31/2016 | | | | | 1,243,694 | | | | | | — | | | | | | 53,428 | | | | | | (14,742) | | | | | | 1,282,380 | | | | | | 16,485,784 | | | | | | — | | | | | | 693,500 | | | | | | (194,544) | | | | | | 16,984,740 | | |
NOTES TO FINANCIAL STATEMENTS as of December 31, 2017 (continued)
NOTE 9 — CAPITAL SHARES (continued)
| | | | Shares
sold | | | Shares
issued in
merger | | | Reinvestment
of
distributions | | | Shares
redeemed | | | Net increase
(decrease)
in shares
outstanding | | | Shares
sold | | | Proceeds
from shares
issued in
merger | | | Reinvestment
of
distributions | | | Shares
redeemed | | | Net increase
(decrease) | |
| Year or period ended | | | # | | | # | | | # | | | # | | | # | | | ($) | | | ($) | | | ($) | | | ($) | | | ($) | |
| Index Solution 2060 | | | | | | | | | | | |
| Class ADV | | | | | | | | | | | |
| 12/31/2017 | | | | | 261,267 | | | | | | — | | | | | | 2,888 | | | | | | (58,816) | | | | | | 205,339 | | | | | | 2,996,682 | | | | | | — | | | | | | 33,646 | | | | | | (660,336) | | | | | | 2,369,992 | | |
| 12/31/2016 | | | | | 201,121 | | | | | | — | | | | | | 553 | | | | | | (49,297) | | | | | | 152,377 | | | | | | 1,982,420 | | | | | | — | | | | | | 5,647 | | | | | | (490,919) | | | | | | 1,497,148 | | |
| Class I | | | | | | | | | | | |
| 12/31/2017 | | | | | 117,025 | | | | | | — | | | | | | 524 | | | | | | (7,861) | | | | | | 109,688 | | | | | | 1,410,297 | | | | | | — | | | | | | 6,165 | | | | | | (90,551) | | | | | | 1,325,911 | | |
| 12/31/2016 | | | | | 12,420 | | | | | | — | | | | | | 52 | | | | | | (1,893) | | | | | | 10,579 | | | | | | 125,354 | | | | | | — | | | | | | 540 | | | | | | (19,888) | | | | | | 106,006 | | |
| Class S | | | | | | | | | | | |
| 12/31/2017 | | | | | 201,475 | | | | | | — | | | | | | 2,022 | | | | | | (102,841) | | | | | | 100,656 | | | | | | 2,331,075 | | | | | | — | | | | | | 23,655 | | | | | | (1,230,125) | | | | | | 1,124,605 | | |
| 12/31/2016 | | | | | 90,967 | | | | | | — | | | | | | 234 | | | | | | (22,577) | | | | | | 68,624 | | | | | | 920,206 | | | | | | — | | | | | | 2,396 | | | | | | (229,803) | | | | | | 692,799 | | |
| Class S2 | | | | | | | | | | | |
| 12/31/2017 | | | | | 69,881 | | | | | | — | | | | | | 682 | | | | | | (4,451) | | | | | | 66,112 | | | | | | 789,688 | | | | | | — | | | | | | 7,953 | | | | | | (51,306) | | | | | | 746,335 | | |
| 12/31/2016 | | | | | 23,184 | | | | | | — | | | | | | 19 | | | | | | (10,440) | | | | | | 12,763 | | | | | | 234,817 | | | | | | — | | | | | | 194 | | | | | | (103,465) | | | | | | 131,546 | | |
| Class Z | | | | | | | | | | | |
| 12/31/2017 | | | | | 1,067,759 | | | | | | — | | | | | | 9,927 | | | | | | (181,654) | | | | | | 896,032 | | | | | | 12,487,641 | | | | | | — | | | | | | 117,236 | | | | | | (2,138,641) | | | | | | 10,466,236 | | |
| 12/31/2016 | | | | | 286,270 | | | | | | — | | | | | | 314 | | | | | | (11,685) | | | | | | 274,899 | | | | | | 2,981,270 | | | | | | — | | | | | | 3,235 | | | | | | (119,660) | | | | | | 2,864,845 | | |
(1)
Class T liquidated on August 31, 2016.
NOTE 10 — FEDERAL INCOME TAXES
The amount of distributions from net investment income and net realized capital gains are determined in accordance with federal income tax regulations, which may differ from GAAP for investment companies. These book/tax differences may be either temporary or permanent. Permanent differences are reclassified within the capital accounts based on their federal tax-basis treatment; temporary differences are not reclassified. Key differences include the treatment of short-term capital gains, foreign currency transactions, and wash sale deferrals. Distributions in excess of net investment income and/or net realized capital gains for tax purposes are reported as return of capital.
The following permanent tax differences have been reclassified as of December 31, 2017:
| | | | Undistributed Net
Investment Income | | | Accumulated
Net Realized
Gains/(Losses) | |
| Index Solution Income | | | | $ | 551,676 | | | | | $ | (551,676) | | |
| Index Solution 2020 | | | | | 179,582 | | | | | | (179,582) | | |
| Index Solution 2025 | | | | | 530,128 | | | | | | (530,128) | | |
| Index Solution 2030 | | | | | 131,578 | | | | | | (131,578) | | |
| Index Solution 2035 | | | | | 264,946 | | | | | | (264,946) | | |
| Index Solution 2040 | | | | | 57,057 | | | | | | (57,057) | | |
| Index Solution 2045 | | | | | 151,083 | | | | | | (151,083) | | |
| Index Solution 2050 | | | | | 31,911 | | | | | | (31,911) | | |
| Index Solution 2055 | | | | | 51,957 | | | | | | (51,957) | | |
| Index Solution 2060 | | | | | 6,425 | | | | | | (6,425) | | |
Dividends paid by the Portfolios from net investment income and distributions of net realized short-term capital gains are, for federal income tax purposes, taxable as ordinary income to shareholders.
The tax composition of dividends and distributions to shareholders was as follows:
| | | | Year Ended
December 31, 2017 | | | Year Ended
December 31, 2016 | |
| | | | Ordinary
Income | | | Long-term
Capital
Gains | | | Ordinary
Income | | | Long-term
Capital
Gains | |
| Index Solution Income | | | | $ | 8,365,401 | | | | | $ | 2,074,797 | | | | | $ | 6,130,417 | | | | | $ | 5,289,568 | | |
| Index Solution 2020 | | | | | 1,889,018 | | | | | | 872,083 | | | | | | 85,035 | | | | | | 2,244 | | |
| Index Solution 2025 | | | | | 11,236,182 | | | | | | 14,491,619 | | | | | | 11,005,200 | | | | | | 36,183,554 | | |
| Index Solution 2030 | | | | | 1,505,792 | | | | | | 805,931 | | | | | | 52,131 | | | | | | 4,156 | | |
| Index Solution 2035 | | | | | 9,490,084 | | | | | | 16,065,893 | | | | | | 8,750,297 | | | | | | 37,292,619 | | |
| Index Solution 2040 | | | | | 982,525 | | | | | | 531,121 | | | | | | 29,939 | | | | | | 4,692 | | |
| Index Solution 2045 | | | | | 5,732,688 | | | | | | 11,854,338 | | | | | | 5,102,627 | | | | | | 24,494,725 | | |
| Index Solution 2050 | | | | | 447,691 | | | | | | 319,502 | | | | | | 35,891 | | | | | | 4,272 | | |
| Index Solution 2055 | | | | | 1,777,554 | | | | | | 3,003,954 | | | | | | 1,243,590 | | | | | | 5,680,515 | | |
| Index Solution 2060 | | | | | 119,016 | | | | | | 69,639 | | | | | | 9,568 | | | | | | 2,561 | | |
The tax-basis components of distributable earnings as of December 31, 2017 were:
| | | | Undistributed
Ordinary
Income | | | Undistributed
Long-term
Capital
Gains | | | Unrealized
Appreciation/
(Depreciation) | |
| Index Solution Income | | | | $ | 11,322,938 | | | | | $ | 5,266,073 | | | | | $ | 5,054,023 | | |
| Index Solution 2020 | | | | | 7,783,062 | | | | | | 3,654,359 | | | | | | 8,813,708 | | |
| Index Solution 2025 | | | | | 16,504,697 | | | | | | 17,256,072 | | | | | | 43,266,808 | | |
NOTES TO FINANCIAL STATEMENTS as of December 31, 2017 (continued)
NOTE 10 — FEDERAL INCOME TAXES (continued)
| | | | Undistributed
Ordinary
Income | | | Undistributed
Long-term
Capital
Gains | | | Unrealized
Appreciation/
(Depreciation) | |
| Index Solution 2030 | | | | | 7,326,170 | | | | | | 5,984,446 | | | | | | 18,088,931 | | |
| Index Solution 2035 | | | | | 13,345,675 | | | | | | 18,489,640 | | | | | | 56,657,206 | | |
| Index Solution 2040 | | | | | 4,298,313 | | | | | | 4,134,218 | | | | | | 13,889,154 | | |
| Index Solution 2045 | | | | | 7,866,123 | | | | | | 13,490,472 | | | | | | 42,864,098 | | |
| Index Solution 2050 | | | | | 2,392,082 | | | | | | 2,659,970 | | | | | | 8,493,635 | | |
| Index Solution 2055 | | | | | 2,554,662 | | | | | | 4,456,612 | | | | | | 15,046,322 | | |
| Index Solution 2060 | | | | | 844,074 | | | | | | 464,889 | | | | | | 1,451,528 | | |
At December 31, 2017, the Portfolios did not have any capital loss carryovers for U.S. federal income tax purposes.
The Portfolios’ major tax jurisdictions are U.S. federal and Arizona state.
As of December 31, 2017, no provision for income tax is required in the Portfolios’ financial statements as a result of tax positions taken on federal and state income tax returns for open tax years. The Portfolios’ federal and state income and federal excise tax returns for tax years for which the applicable statutes of limitations have not expired are subject to examination by the Internal Revenue Service and state department of revenue. The earliest tax year that remains subject to examination by these jurisdictions is 2013.
NOTE 11 — SUBSEQUENT EVENTS
The Portfolios have evaluated events occurring after the Statements of Assets and Liabilities date (“subsequent events”), to determine whether any subsequent events necessitated adjustment to or disclosure in the financial statements. No such subsequent events were identified.
PORTFOLIO OF INVESTMENTS
| Voya Index Solution Income Portfolio | as of December 31, 2017 |
| | Shares | | | Value | | | Percentage
of Net
Assets | |
| | EXCHANGE-TRADED FUNDS: 15.4% | |
| | | | 172,075 | | | | iShares 1-3 Year
Treasury Bond ETF | | | | $ | 14,428,489 | | | | | | 3.0 | | |
| | | | 110,600 | | | | iShares MSCI EMU
Index Fund | | | | | 4,797,828 | | | | | | 1.0 | | |
| | | | 71,071 | | | | iShares Russell 1000
Growth Index Fund | | | | | 9,571,842 | | | | | | 2.0 | | |
| | | | 19,269 | | | | iShares Russell 1000
Value Index Fund | | | | | 2,395,908 | | | | | | 0.5 | | |
| | | | 1,044,383 | | | | PowerShares Senior
Loan Portfolio | | | | | 24,062,584 | | | | | | 4.9 | | |
| | | | 262,321 | | | | SPDR Bloomberg
Barclays High Yield
Bond ETF | | | | | 9,632,427 | | | | | | 2.0 | | |
| | | | 118,666 | | | | SPDR Dow Jones
International Real Estate | | | | | 4,804,786 | | | | | | 1.0 | | |
| | | | 57,967 | | | | Vanguard REIT | | | | | 4,810,102 | | | | | | 1.0 | | |
| | | | | | | | Total Exchange-Traded
Funds
(Cost $74,760,567) | | | | | 74,503,966 | | | | | | 15.4 | | |
| | MUTUAL FUNDS: 84.3% | |
| | | | | | | | Affiliated Investment Companies: 82.8% | |
| | | | 1,123,963 | | | | Voya Emerging Markets
Index Portfolio Class P2 | | | | | 14,476,644 | | | | | | 3.0 | | |
| | Shares | | | Value | | | Percentage
of Net
Assets | |
| | MUTUAL FUNDS: (continued) | |
| | | | | | | | Affiliated Investment Companies (continued) | |
| | | | 3,129,395 | | | | Voya International Index
Portfolio Class P2 | | | | $ | 33,672,294 | | | | | | 6.9 | | |
| | | | 880,991 | | | | Voya Russell Mid Cap
Index Portfolio Class P2 | | | | | 14,368,964 | | | | | | 3.0 | | |
| | | | 24,173,289 | | | | Voya U.S. Bond Index
Portfolio Class P2 | | | | | 255,995,129 | | | | | | 52.8 | | |
| | | | 5,260,755 | | | | Voya U.S. Stock Index
Portfolio Class P2 | | | | | 82,646,453 | | | | | | 17.1 | | |
| | | | | | | | | | | | | 401,159,484 | | | | | | 82.8 | | |
| | | | | | | | Unaffiliated Investment Companies: 1.5% | |
| | | | 1,405,779 | | | | Credit Suisse
Commodity Return
Strategy Fund - Class I | | | | | 7,057,012 | | | | | | 1.5 | | |
| | | | | | | | Total Mutual Funds
(Cost $394,963,114) | | | | | 408,216,496 | | | | | | 84.3 | | |
| | | | | | | | Total Investments in
Securities
(Cost $469,723,681) | | | | $ | 482,720,462 | | | | | | 99.7 | | |
| | | | | | | | Assets in Excess of
Other Liabilities | | | | | 1,554,311 | | | | | | 0.3 | | |
| | | | | | | | Net Assets | | | | $ | 484,274,773 | | | | | | 100.0 | | |
| |
Fair Value Measurements^
The following is a summary of the fair valuations according to the inputs used as of December 31, 2017 in valuing the assets and liabilities:
| | | | Quoted Prices
in Active Markets
for Identical
Investments
(Level 1) | | | Significant
Other
Observable
Inputs
(Level 2) | | | Significant
Unobservable
Inputs
(Level 3) | | | Fair Value
at
December 31, 2017 | |
| Asset Table | | | | | | | | | | | | | | | | | | | | | | | | | |
| Investments, at fair value | | | | | | | | | | | | | | | | | | | | | | | | | |
| Exchange-Traded Funds | | | | $ | 74,503,966 | | | | | $ | — | | | | | $ | — | | | | | $ | 74,503,966 | | |
| Mutual Funds | | | | | 408,216,496 | | | | | | — | | | | | | — | | | | | | 408,216,496 | | |
| Total Investments, at fair value | | | | $ | 482,720,462 | | | | | $ | — | | | | | $ | — | | | | | $ | 482,720,462 | | |
| Other Financial Instruments+ | | | | | |
| Futures | | | | | 256,245 | | | | | | — | | | | | | — | | | | | | 256,245 | | |
| Total Assets | | | | $ | 482,976,707 | | | | | $ | — | | | | | $ | — | | | | | $ | 482,976,707 | | |
| Liabilities Table | | | | | |
| Other Financial Instruments+ | | | | | |
| Futures | | | | $ | (270,511) | | | | | $ | — | | | | | $ | — | | | | | $ | (270,511) | | |
| Total Liabilities | | | | $ | (270,511) | | | | | $ | — | | | | | $ | — | | | | | $ | (270,511) | | |
^
See Note 2, “Significant Accounting Policies” in the Notes to Financial Statements for additional information.
+
Other Financial Instruments are derivatives not reflected in the Portfolio of Investments and may include open forward foreign currency contracts, futures, centrally cleared swaps, OTC swaps and written options. Forward foreign currency contracts, futures and centrally cleared swaps are valued at the unrealized gain (loss) on the instrument. OTC swaps and written options are valued at the fair value of the instrument.
See Accompanying Notes to Financial Statements
PORTFOLIO OF INVESTMENTS
| Voya Index Solution Income Portfolio | as of December 31, 2017 (continued) |
Transactions with Affiliates
An investment of at least 5% of the voting securities of an issuer, or a company which is under common control results in that issuer becoming an affiliated person as defined by the 1940 Act.
The following table provides transactions during the year ended December 31, 2017, where the following issuers were considered an affiliate:
| Issuer | | | Beginning
Fair
Value at
12/31/2016 | | | Purchases
at Cost | | | Sales
at Cost | | | Change in
Unrealized
Appreciation/
(Depreciation) | | | Ending
Fair
Value at
12/31/17 | | | Investment
Income | | | Realized
Gains/
(Losses) | | | Net
Capital
Gain
Distributions | |
| Voya Emerging Markets Index Portfolio Class I | | | | $ | — | | | | | $ | 8,639,105 | | | | | $ | (8,639,105) | | | | | $ | — | | | | | $ | — | | | | | $ | — | | | | | $ | 16 | | | | | $ | — | | |
| Voya Emerging Markets Index Portfolio Class P2 | | | | | — | | | | | | 14,802,325 | | | | | | (2,312,409) | | | | | | 1,986,728 | | | | | | 14,476,644 | | | | | | 141,706 | | | | | | 271,864 | | | | | | — | | |
| Voya International Index Portfolio - Class I | | | | | 24,909,003 | | | | | | 5,855,737 | | | | | | (32,297,788) | | | | | | 1,533,048 | | | | | | — | | | | | | — | | | | | | (203,369) | | | | | | — | | |
| Voya International Index Portfolio Class P2 | | | | | — | | | | | | 34,134,770 | | | | | | (4,954,160) | | | | | | 4,491,684 | | | | | | 33,672,294 | | | | | | 735,182 | | | | | | 59,865 | | | | | | — | | |
| Voya Russell Mid Cap Index Portfolio Class P2 | | | | | — | | | | | | 14,837,044 | | | | | | (1,760,000) | | | | | | 1,291,920 | | | | | | 14,368,964 | | | | | | 190,516 | | | | | | 187,208 | | | | | | 873,065 | | |
| Voya Russell™ Mid Cap Index Portfolio - Class I | | | | | 12,264,095 | | | | | | 1,206,765 | | | | | | (13,039,810) | | | | | | (431,050) | | | | | | — | | | | | | — | | | | | | 167,003 | | | | | | — | | |
| Voya U.S. Bond Index Portfolio - Class I | | | | | 217,261,578 | | | | | | 30,708,187 | | | | | | (251,084,193) | | | | | | 3,114,428 | | | | | | — | | | | | | 1,734,348 | | | | | | 149,843 | | | | | | — | | |
| Voya U.S. Bond Index Portfolio Class P2 | | | | | — | | | | | | 278,888,595 | | | | | | (20,532,828) | | | | | | (2,360,638) | | | | | | 255,995,129 | | | | | | 4,153,856 | | | | | | 321,825 | | | | | | 623,038 | | |
| Voya U.S. Stock Index Portfolio - Class I | | | | | 94,857,296 | | | | | | 10,738,903 | | | | | | (105,120,059) | | | | | | (476,140) | | | | | | — | | | | | | — | | | | | | 616,603 | | | |
| Voya U.S. Stock Index Portfolio Class P2 | | | | | — | | | | | | 93,950,896 | | | | | | (19,706,914) | | | | | | 8,402,471 | | | | | | 82,646,453 | | | | | | 1,405,973 | | | | | | 3,189,919 | | | | | | 3,935,425 | | |
| | | | | $ | 349,291,972 | | | | | $ | 493,762,327 | | | | | $ | (459,447,266) | | | | | $ | 17,552,451 | | | | | $ | 401,159,484 | | | | | $ | 8,361,581 | | | | | $ | 4,760,777 | | | | | $ | 5,431,528 | | |
| |
The financial statements for the above mutual fund[s] can be found at www.sec.gov.
At December 31, 2017, the following futures contracts were outstanding for Voya Index Solution Income Portfolio:
| Contract Description | | | Number
of Contracts | | | Expiration
Date | | | Notional
Value | | | Unrealized
Appreciation/
(Depreciation) | |
| Long Contracts | | | | | |
| Tokyo Price Index (TOPIX) | | | 91 | | | 03/08/18 | | | | $ | 14,674,684 | | | | | $ | 256,245 | | |
| | | | | | | | | | | $ | 14,674,684 | | | | | $ | 256,245 | | |
| Short Contracts | | | | | |
| Mini MSCI EAFE Index | | | (94) | | | 03/16/18 | | | | | (9,613,850) | | | | | | (191,047) | | |
| S&P 500 E-Mini | | | (36) | | | 03/16/18 | | | | | (4,816,800) | | | | | | (79,464) | | |
| | | | | | | | | | | $ | (14,430,650) | | | | | $ | (270,511) | | |
| |
A summary of derivative instruments by primary risk exposure is outlined in the following tables.
The fair value of derivative instruments as of December 31, 2017 was as follows:
| Derivatives not accounted for as hedging instruments | | | Location on Statement
of Assets and Liabilities | | | Fair Value | |
| Asset Derivatives | | | |
| Equity contracts | | | Net Assets — Unrealized appreciation* | | | | $ | 256,245 | | |
| Total Asset Derivatives | | | | | | | $ | 256,245 | | |
| Liability Derivatives | | | |
| Equity contracts | | | Net Assets — Unrealized depreciation* | | | | $ | 270,511 | | |
| Total Liability Derivatives | | | | | | | $ | 270,511 | | |
| |
*
Includes cumulative appreciation/depreciation of futures contracts as reported in the table following the Portfolio of Investments.
See Accompanying Notes to Financial Statements
PORTFOLIO OF INVESTMENTS
| Voya Index Solution Income Portfolio | as of December 31, 2017 (continued) |
The effect of derivative instruments on the Portfolio’s Statement of Operations for the year ended December 31, 2017 was as follows:
| | | | Amount of Realized Gain or (Loss) on
Derivatives Recognized in Income | |
| Derivatives not accounted for as hedging instruments | | | Futures | |
| Equity contracts | | | | $ | (16,661) | | |
| Total | | | | $ | (16,661) | | |
| |
| | | | Change in Unrealized Appreciation or (Depreciation)
on Derivatives Recognized in Income | |
| Derivatives not accounted for as hedging instruments | | | Futures | |
| Equity contracts | | | | $ | (14,266) | | |
| Total | | | | $ | (14,266) | | |
| |
At December 31, 2017, the aggregate cost of securities and other investments and the composition of unrealized appreciation and depreciation of securities and other investments at period end were:
| | Cost for federal income tax purposes was $477,830,619. | | |
| | Net unrealized appreciation consisted of: | | |
| | Gross Unrealized Appreciation | | | | $ | 17,808,190 | | |
| | Gross Unrealized Depreciation | | | | | (12,754,167) | | |
| | Net Unrealized Appreciation | | | | $ | 5,054,023 | | |
| |
See Accompanying Notes to Financial Statements
PORTFOLIO OF INVESTMENTS
| Voya Index Solution 2020 Portfolio | as of December 31, 2017 |
| | Shares | | | Value | | | Percentage
of Net
Assets | |
| | EXCHANGE-TRADED FUNDS: 15.9% | |
| | | | 58,328 | | | | iShares 1-3 Year Treasury
Bond ETF | | | | $ | 4,890,803 | | | | | | 2.0 | | |
| | | | 19,302 | | | | iShares Barclays 20+ Year
Treasury Bond Fund | | | | | 2,448,652 | | | | | | 1.0 | | |
| | | | 56,235 | | | | iShares MSCI EMU Index
Fund | | | | | 2,439,474 | | | | | | 1.0 | | |
| | | | 36,136 | | | | iShares Russell 1000 Growth
Index Fund | | | | | 4,866,796 | | | | | | 2.0 | | |
| | | | 19,594 | | | | iShares Russell 1000 Value
Index Fund | | | | | 2,436,318 | | | | | | 1.0 | | |
| | | | 531,017 | | | | PowerShares Senior Loan
Portfolio | | | | | 12,234,632 | | | | | | 4.9 | | |
| | | | 133,377 | | | | SPDR Bloomberg Barclays
High Yield Bond ETF | | | | | 4,897,603 | | | | | | 2.0 | | |
| | | | 60,336 | | | | SPDR Dow Jones
International Real Estate | | | | | 2,443,005 | | | | | | 1.0 | | |
| | | | 29,473 | | | | Vanguard REIT | | | | | 2,445,669 | | | | | | 1.0 | | |
| | | | | | | | Total Exchange-Traded Funds
(Cost $38,369,250) | | | | | 39,102,952 | | | | | | 15.9 | | |
| | MUTUAL FUNDS: 83.8% | |
| | | | | | | | Affiliated Investment Companies: 82.3% | |
| | | | 666,574 | | | | Voya Emerging Markets Index
Portfolio Class P2 | | | | | 8,585,472 | | | | | | 3.5 | | |
| | | | 2,499,615 | | | | Voya International Index
Portfolio Class P2 | | | | | 26,895,855 | | | | | | 10.9 | | |
| | Shares | | | Value | | | Percentage
of Net
Assets | |
| | MUTUAL FUNDS: (continued) | |
| | | | | | | | Affiliated Investment Companies (continued) | |
| | | | 447,856 | | | | Voya Russell Mid Cap Index
Portfolio Class P2 | | | | $ | 7,304,529 | | | | | | 3.0 | | |
| | | | 463,685 | | | | Voya Russell Small Cap
Index Portfolio Class P2 | | | | | 7,279,859 | | | | | | 2.9 | | |
| | | | 9,042,444 | | | | Voya U.S. Bond Index
Portfolio Class P2 | | | | | 95,759,479 | | | | | | 38.9 | | |
| | | | 3,617,916 | | | | Voya U.S. Stock Index
Portfolio Class P2 | | | | | 56,837,468 | | | | | | 23.1 | | |
| | | | | | | | | | | | | 202,662,662 | | | | | | 82.3 | | |
| | | | | | | | Unaffiliated Investment Companies: 1.5% | |
| | | | 715,879 | | | | Credit Suisse Commodity
Return Strategy Fund - Class I | | | | | 3,593,713 | | | | | | 1.5 | | |
| | | | | | | | Total Mutual Funds
(Cost $197,776,729) | | | | | 206,256,375 | | | | | | 83.8 | | |
| | | | | | | | Total Investments in
Securities
(Cost $236,145,979) | | | | $ | 245,359,327 | | | | | | 99.7 | | |
| | | | | | | | Assets in Excess of Other
Liabilities | | | | | 830,483 | | | | | | 0.3 | | |
| | | | | | | | Net Assets | | | | $ | 246,189,810 | | | | | | 100.0 | | |
| |
Fair Value Measurements^
The following is a summary of the fair valuations according to the inputs used as of December 31, 2017 in valuing the assets and liabilities:
| | | | Quoted Prices
in Active Markets
for Identical
Investments
(Level 1) | | | Significant
Other
Observable
Inputs
(Level 2) | | | Significant
Unobservable
Inputs
(Level 3) | | | Fair Value
at
December 31, 2017 | |
| Asset Table | | | | | | | | | | | | | | | | | | | | | | | | | |
| Investments, at fair value | | | | | |
| Exchange-Traded Funds | | | | $ | 39,102,952 | | | | | $ | — | | | | | $ | — | | | | | $ | 39,102,952 | | |
| Mutual Funds | | | | | 206,256,375 | | | | | | — | | | | | | — | | | | | | 206,256,375 | | |
| Total Investments, at fair value | | | | $ | 245,359,327 | | | | | $ | — | | | | | $ | — | | | | | $ | 245,359,327 | | |
| Other Financial Instruments+ | | | | | |
| Futures | | | | | 121,083 | | | | | | — | | | | | | — | | | | | | 121,083 | | |
| Total Assets | | | | $ | 245,480,410 | | | | | $ | — | | | | | $ | — | | | | | $ | 245,480,410 | | |
| Liabilities Table | | | | | |
| Other Financial Instruments+ | | | | | |
| Futures | | | | $ | (128,924) | | | | | $ | — | | | | | $ | — | | | | | $ | (128,924) | | |
| Total Liabilities | | | | $ | (128,924) | | | | | $ | — | | | | | $ | — | | | | | $ | (128,924) | | |
^
See Note 2, “Significant Accounting Policies” in the Notes to Financial Statements for additional information.
+
Other Financial Instruments are derivatives not reflected in the Portfolio of Investments and may include open forward foreign currency contracts, futures, centrally cleared swaps, OTC swaps and written options. Forward foreign currency contracts, futures and centrally cleared swaps are valued at the unrealized gain (loss) on the instrument. OTC swaps and written options are valued at the fair value of the instrument.
See Accompanying Notes to Financial Statements
PORTFOLIO OF INVESTMENTS
| Voya Index Solution 2020 Portfolio | as of December 31, 2017 (continued) |
Transactions with Affiliates
An investment of at least 5% of the voting securities of an issuer, or a company which is under common control results in that issuer becoming an affiliated person as defined by the 1940 Act.
The following table provides transactions during the year ended December 31, 2017, where the following issuers were considered an affiliate:
| Issuer | | | Beginning
Fair Value
at 12/31/2016 | | | Purchases
at Cost | | | Sales
at Cost | | | Change in
Unrealized
Appreciation/
(Depreciation) | | | Ending
Fair Value
at 12/31/17 | | | Investment
Income | | | Realized
Gains/
(Losses) | | | Net Capital
Gain
Distributions | |
| Voya Emerging Markets Index Portfolio Class P2 | | | | $ | — | | | | | $ | 8,561,068 | | | | | $ | (1,014,192) | | | | | $ | 1,038,596 | | | | | $ | 8,585,472 | | | | | $ | 65,293.00 | | | | | $ | 119,588 | | | | | $ | — | | |
| Voya International Index Portfolio - Class I | | | | | 11,606,868 | | | | | | 6,029,411 | | | | | | (17,487,765) | | | | | | (148,514) | | | | | | — | | | | | | — | | | | | | 173,766 | | | | | | — | | |
| Voya International Index Portfolio Class P2 | | | | | — | | | | | | 26,553,520 | | | | | | (2,796,152) | | | | | | 3,138,487 | | | | | | 26,895,855 | | | | | | 426,857 | | | | | | 575,792 | | | | | | — | | |
| Voya Russell Mid Cap Index Portfolio Class P2 | | | | | — | | | | | | 7,505,929 | | | | | | (689,926) | | | | | | 488,526 | | | | | | 7,304,529 | | | | | | 71,015 | | | | | | 60,749 | | | | | | 325,437 | | |
| Voya Russell Small Cap Index Portfolio Class P2 | | | | | — | | | | | | 7,569,172 | | | | | | (713,827) | | | | | | 424,514 | | | | | | 7,279,859 | | | | | | 51,570 | | | | | | 121,897 | | | | | | 330,130 | | |
| Voya Russell™ Mid Cap Index Portfolio - Class I | | | | | 4,088,701 | | | | | | 2,109,889 | | | | | | (6,055,943) | | | | | | (142,647) | | | | | | — | | | | | | — | | | | | | 177,620 | | | | | | — | | |
| Voya Russell™ Small Cap Index Portfolio - Class I | | | | | 2,067,165 | | | | | | 2,548,707 | | | | | | (4,437,440) | | | | | | (178,432) | | | | | | — | | | | | | — | | | | | | 10,786 | | | | | | — | | |
| Voya U.S. Bond Index Portfolio - Class I | | | | | 35,191,642 | | | | | | 25,092,532 | | | | | | (61,108,834) | | | | | | 824,660 | | | | | | — | | | | | | 343,959 | | | | | | (179,899) | | | | | | — | | |
| Voya U.S. Bond Index Portfolio Class P2 | | | | | — | | | | | | 105,778,760 | | | | | | (9,818,510) | | | | | | (200,771) | | | | | | 95,759,479 | | | | | | 1,282,667 | | | | | | (258,626) | | | | | | 168,348 | | |
| Voya U.S. Stock Index Portfolio - Class I | | | | | 31,334,504 | | | | | | 18,896,099 | | | | | | (49,961,899) | | | | | | (268,704) | | | | | | — | | | | | | — | | | | | | 530,291 | | | | | | — | | |
| Voya U.S. Stock Index Portfolio Class P2 | | | | | — | | | | | | 72,345,000 | | | | | | (19,039,665) | | | | | | 3,532,133 | | | | | | 56,837,468 | | | | | | 958,550 | | | | | | 2,141,349 | | | | | | 2,368,627 | | |
| | | | | $ | 84,288,880 | | | | | $ | 282,990,087 | | | | | $ | (173,124,153) | | | | | $ | 8,507,848 | | | | | $ | 202,662,662 | | | | | $ | 3,199,911 | | | | | $ | 3,473,313 | | | | | $ | 3,192,542 | | |
| |
The financial statements for the above mutual fund[s] can be found at www.sec.gov.
At December 31, 2017, the following futures contracts were outstanding for Voya Index Solution 2020 Portfolio:
| Contract Description | | | Number
of Contracts | | | Expiration
Date | | | Notional
Value | | | Unrealized
Appreciation/
(Depreciation) | |
| Long Contracts | | | | | |
| Tokyo Price Index (TOPIX) | | | | | 43 | | | | | | 03/08/18 | | | | | $ | 6,934,191 | | | | | $ | 121,083 | | |
| | | | | | | | | | | | | | | | | $ | 6,934,191 | | | | | $ | 121,083 | | |
| Short Contracts | | | | | |
| Mini MSCI EAFE Index | | | | | (48) | | | | | | 03/16/18 | | | | | | (4,909,200) | | | | | | (91,472) | | |
| S&P 500 E-Mini | | | | | (18) | | | | | | 03/16/18 | | | | | | (2,408,400) | | | | | | (37,452) | | |
| | | | | | | | | | | | | | | | | $ | (7,317,600) | | | | | $ | (128,924) | | |
A summary of derivative instruments by primary risk exposure is outlined in the following tables.
The fair value of derivative instruments as of December 31, 2017 was as follows:
| Derivatives not accounted for as hedging instruments | | | Location on Statement
of Assets and Liabilities | | | Fair Value | |
| Asset Derivatives | | | |
| Equity contracts | | | Net Assets — Unrealized appreciation* | | | | $ | 121,083 | | |
| Total Asset Derivatives | | | | | | | $ | 121,083 | | |
| Liability Derivatives | | | |
| Equity contracts | | | Net Assets — Unrealized depreciation* | | | | $ | 128,924 | | |
| Total Liability Derivatives | | | | | | | $ | 128,924 | | |
| |
*
Includes cumulative appreciation/depreciation of futures contracts as reported in the table following the Portfolio of Investments.
See Accompanying Notes to Financial Statements
PORTFOLIO OF INVESTMENTS
| Voya Index Solution 2020 Portfolio | as of December 31, 2017 (continued) |
The effect of derivative instruments on the Portfolio’s Statement of Operations for the year ended December 31, 2017 was as follows:
| | | | Amount of Realized Gain or (Loss) on
Derivatives Recognized in Income | |
| Derivatives not accounted for as hedging instruments | | | Futures | |
| Equity contracts | | | | $ | 74,944 | | |
| Total | | | | $ | 74,944 | | |
| |
| | | | Change in Unrealized Appreciation or (Depreciation)
on Derivatives Recognized in Income | |
| Derivatives not accounted for as hedging instruments | | | Futures | |
| Equity contracts | | | | $ | (7,841) | | |
| Total | | | | $ | (7,841) | | |
| |
At December 31, 2017, the aggregate cost of securities and other investments and the composition of unrealized appreciation and depreciation of securities and other investments at period end were:
| | Cost for federal income tax purposes was $236,622,100. | | |
| | Net unrealized appreciation consisted of: | | |
| | Gross Unrealized Appreciation | | | | $ | 9,697,807 | | |
| | Gross Unrealized Depreciation | | | | | (884,099) | | |
| | Net Unrealized Appreciation | | | | $ | 8,813,708 | | |
| |
See Accompanying Notes to Financial Statements
PORTFOLIO OF INVESTMENTS
| Voya Index Solution 2025 Portfolio | as of December 31, 2017 |
| | Shares | | | Value | | | Percentage
of Net
Assets | |
| | EXCHANGE-TRADED FUNDS: 15.9% | |
| | | | 200,900 | | | | iShares 1-3 Year Treasury
Bond ETF | | | | $ | 16,845,465 | | | | | | 2.0 | | |
| | | | 66,483 | | | | iShares Barclays 20+ Year
Treasury Bond Fund | | | | | 8,434,033 | | | | | | 1.0 | | |
| | | | 193,691 | | | | iShares MSCI EMU Index
Fund | | | | | 8,402,316 | | | | | | 1.0 | | |
| | | | 124,465 | | | | iShares Russell 1000 Growth
Index Fund | | | | | 16,762,946 | | | | | | 2.0 | | |
| | | | 67,490 | | | | iShares Russell 1000 Value
Index Fund | | | | | 8,391,707 | | | | | | 1.0 | | |
| | | | 1,828,998 | | | | PowerShares Senior Loan
Portfolio | | | | | 42,140,114 | | | | | | 4.9 | | |
| | | | 459,395 | | | | SPDR Bloomberg Barclays
High Yield Bond ETF | | | | | 16,868,984 | | | | | | 2.0 | | |
| | | | 207,816 | | | | SPDR Dow Jones
International Real Estate | | | | | 8,414,470 | | | | | | 1.0 | | |
| | | | 101,515 | | | | Vanguard REIT | | | | | 8,423,715 | | | | | | 1.0 | | |
| | | | | | | | Total Exchange-Traded
Funds (Cost $133,174,744) | | | | | 134,683,750 | | | | | | 15.9 | | |
| | MUTUAL FUNDS: 83.8% | |
| | | | | | | | Affiliated Investment Companies: 82.4% | |
| | | | 3,285,477 | | | | Voya Emerging Markets
Index Portfolio Class P2 | | | | | 42,316,947 | | | | | | 5.0 | | |
| | | | 10,977,641 | | | | Voya International Index
Portfolio Class P2 | | | | | 118,119,420 | | | | | | 13.9 | | |
| | Shares | | | Value | | | Percentage
of Net
Assets | |
| | MUTUAL FUNDS: (continued) | |
| | | | | | | | Affiliated Investment Companies (continued) | |
| | | | 2,317,865 | | | | Voya Russell Mid Cap
Index Portfolio Class P2 | | | | $ | 37,804,383 | | | | | | 4.4 | | |
| | | | 1,599,881 | | | | Voya Russell Small Cap
Index Portfolio Class P2 | | | | | 25,118,136 | | | | | | 3.0 | | |
| | | | 21,615,068 | | | | Voya U.S. Bond Index
Portfolio Class P2 | | | | | 228,903,569 | | | | | | 27.0 | | |
| | | | 15,742,324 | | | | Voya U.S. Stock Index
Portfolio Class P2 | | | | | 247,311,915 | | | | | | 29.1 | | |
| | | | | | | | | | | | | 699,574,370 | | | | | | 82.4 | | |
| | | | | | | | Unaffiliated Investment Companies: 1.4% | |
| | | | 2,464,286 | | | | Credit Suisse Commodity
Return Strategy Fund -
Class I | | | | | 12,370,717 | | | | | | 1.4 | | |
| | | | | | | | Total Mutual Funds
(Cost $662,911,830) | | | | | 711,945,087 | | | | | | 83.8 | | |
| | | | | | | | Total Investments in
Securities
(Cost $796,086,574) | | | | $ | 846,628,837 | | | | | | 99.7 | | |
| | | | | | | | Assets in Excess of Other
Liabilities | | | | | 2,687,493 | | | | | | 0.3 | | |
| | | | | | | | Net Assets | | | | $ | 849,316,330 | | | | | | 100.0 | | |
| |
Fair Value Measurements^
The following is a summary of the fair valuations according to the inputs used as of December 31, 2017 in valuing the assets and liabilities:
| | | | Quoted Prices
in Active Markets
for Identical
Investments
(Level 1) | | | Significant
Other
Observable
Inputs
(Level 2) | | | Significant
Unobservable
Inputs
(Level 3) | | | Fair Value
at
December 31, 2017 | |
| Asset Table | | | | | |
| Investments, at fair value | | | | | |
| Exchange-Traded Funds | | | | $ | 134,683,750 | | | | | $ | — | | | | | $ | — | | | | | $ | 134,683,750 | | |
| Mutual Funds | | | | | 711,945,087 | | | | | | — | | | | | | — | | | | | | 711,945,087 | | |
| Total Investments, at fair value | | | | $ | 846,628,837 | | | | | $ | — | | | | | $ | — | | | | | $ | 846,628,837 | | |
| Other Financial Instruments+ | | | | | |
| Futures | | | | | 430,830 | | | | | | — | | | | | | — | | | | | | 430,830 | | |
| Total Assets | | | | $ | 847,059,667 | | | | | $ | — | | | | | $ | — | | | | | $ | 847,059,667 | | |
| Liabilities Table | | | | | |
| Other Financial Instruments+ | | | | | |
| Futures | | | | $ | (459,963) | | | | | $ | — | | | | | $ | — | | | | | $ | (459,963) | | |
| Total Liabilities | | | | $ | (459,963) | | | | | $ | — | | | | | $ | — | | | | | $ | (459,963) | | |
^
See Note 2, “Significant Accounting Policies” in the Notes to Financial Statements for additional information.
See Accompanying Notes to Financial Statements
PORTFOLIO OF INVESTMENTS
| Voya Index Solution 2025 Portfolio | as of December 31, 2017 (continued) |
+
Other Financial Instruments are derivatives not reflected in the Portfolio of Investments and may include open forward foreign currency contracts, futures, centrally cleared swaps, OTC swaps and written options. Forward foreign currency contracts, futures and centrally cleared swaps are valued at the unrealized gain (loss) on the instrument. OTC swaps and written options are valued at the fair value of the instrument.
Transactions with Affiliates
An investment of at least 5% of the voting securities of an issuer, or a company which is under common control results in that issuer becoming an affiliated person as defined by the 1940 Act.
The following table provides transactions during the year ended December 31, 2017, where the following issuers were considered an affiliate:
| Issuer | | | Beginning
Fair Value
at 12/31/2016 | | | Purchases
at Cost | | | Sales
at Cost | | | Change in
Unrealized
Appreciation/
(Depreciation) | | | Ending
Fair Value
at 12/31/17 | | | Investment
Income | | | Realized
Gains/
(Losses) | | | Net Capital
Gain
Distributions | |
| Voya Emerging Markets Index Portfolio - Class I | | | | $ | 17,455,119 | | | | | $ | 8,055,083 | | | | | $ | (25,797,413) | | | | | $ | 287,211 | | | | | $ | — | | | | | $ | — | | | | | $ | 241,909 | | | | | $ | — | | |
| Voya Emerging Markets Index Portfolio Class P2 | | | | | — | | | | | | 39,033,878 | | | | | | (3,684,917) | | | | | | 6,967,986 | | | | | | 42,316,947 | | | | | | 436,191 | | | | | | 1,268,565 | | | | | | — | | |
| Voya International Index Portfolio - Class I | | | | | 83,260,465 | | | | | | 9,389,716 | | | | | | (95,935,541) | | | | | | 3,285,360 | | | | | | — | | | | | | — | | | | | | 767,900 | | | | | | — | | |
| Voya International Index Portfolio Class P2 | | | | | — | | | | | | 111,286,180 | | | | | | (7,644,416) | | | | | | 14,477,656 | | | | | | 118,119,420 | | | | | | 2,264,503 | | | | | | 1,266,055 | | | | | | — | | |
| Voya Russell Mid Cap Index Portfolio Class P2 | | | | | — | | | | | | 36,745,534 | | | | | | (2,394,742) | | | | | | 3,453,591 | | | | | | 37,804,383 | | | | | | 442,403 | | | | | | 405,156 | | | | | | 2,027,366 | | |
| Voya Russell Small Cap Index Portfolio Class P2 | | | | | — | | | | | | 25,294,029 | | | | | | (2,387,524) | | | | | | 2,211,631 | | | | | | 25,118,136 | | | | | | 217,344 | | | | | | (187,583) | | | | | | 1,391,338 | | |
| Voya Russell™ Mid Cap Index Portfolio - Class I | | | | | 40,955,269 | | | | | | 4,973,804 | | | | | | (45,950,556) | | | | | | 21,483 | | | | | | — | | | | | | — | | | | | | (18,166) | | | | | | — | | |
| Voya Russell™ Small Cap Index Portfolio - Class I | | | | | 17,773,004 | | | | | | 2,494,443 | | | | | | (19,732,024) | | | | | | (535,423) | | | | | | — | | | | | | — | | | | | | (13,783) | | | | | | — | | |
| Voya U.S. Bond Index Portfolio - Class I | | | | | 133,969,556 | | | | | | 31,091,430 | | | | | | (167,824,034) | | | | | | 2,763,048 | | | | | | — | | | | | | 1,116,987 | | | | | | (144,314) | | | | | | — | | |
| Voya U.S. Bond Index Portfolio Class P2 | | | | | — | | | | | | 243,905,737 | | | | | | (13,253,342) | | | | | | (1,748,826) | | | | | | 228,903,569 | | | | | | 3,223,639 | | | | | | (260,920) | | | | | | 448,217 | | |
| Voya U.S. Stock Index Portfolio - Class I | | | | | 184,081,327 | | | | | | 43,152,499 | | | | | | (230,245,635) | | | | | | 3,011,809 | | | | | | — | | | | | | — | | | | | | (386,985) | | | | | | — | | |
| Voya U.S. Stock Index Portfolio Class P2 | | | | | — | | | | | | 283,489,814 | | | | | | (60,445,844) | | | | | | 24,267,945 | | | | | | 247,311,915 | | | | | | 4,180,524 | | | | | | 1,560,066 | | | | | | 11,436,536 | | |
| | | | | $ | 477,494,740 | | | | | $ | 838,912,147 | | | | | $ | (675,295,988) | | | | | $ | 58,463,471 | | | | | $ | 699,574,370 | | | | | $ | 11,881,591 | | | | | $ | 4,497,900 | | | | | $ | 15,303,457 | | |
| |
The financial statements for the above mutual fund[s] can be found at www.sec.gov.
At December 31, 2017, the following futures contracts were outstanding for Voya Index Solution 2025 Portfolio:
| Contract Description | | | Number
of Contracts | | | Expiration
Date | | | Notional
Value | | | Unrealized
Appreciation/
(Depreciation) | |
| Long Contracts | | | | | |
| Tokyo Price Index (TOPIX) | | | | | 153 | | | | | | 03/08/18 | | | | | $ | 24,672,820 | | | | | $ | 430,830 | | |
| | | | | | | | | | | | | | | | | $ | 24,672,820 | | | | | $ | 430,830 | | |
| Short Contracts | | | | | |
| Mini MSCI EAFE Index | | | | | (165) | | | | | | 03/16/18 | | | | | | (16,875,375) | | | | | | (323,181) | | |
| S&P 500 E-Mini | | | | | (63) | | | | | | 03/16/18 | | | | | | (8,429,400) | | | | | | (136,782) | | |
| | | | | | | | | | | | | | | | | $ | (25,304,775) | | | | | $ | (459,963) | | |
A summary of derivative instruments by primary risk exposure is outlined in the following tables.
The fair value of derivative instruments as of December 31, 2017 was as follows:
| Derivatives not accounted for as hedging instruments | | | Location on Statement
of Assets and Liabilities | | | Fair Value | |
| Asset Derivatives | | | |
| Equity contracts | | | Net Assets — Unrealized appreciation* | | | | $ | 430,830 | | |
| Total Asset Derivatives | | | | | | | $ | 430,830 | | |
| Liability Derivatives | | | |
| Equity contracts | | | Net Assets — Unrealized depreciation* | | | | $ | 459,963 | | |
| Total Liability Derivatives | | | | | | | $ | 459,963 | | |
| |
*
Includes cumulative appreciation/depreciation of futures contracts as reported in the table following the Portfolio of Investments.
See Accompanying Notes to Financial Statements
PORTFOLIO OF INVESTMENTS
| Voya Index Solution 2025 Portfolio | as of December 31, 2017 (continued) |
The effect of derivative instruments on the Portfolio’s Statement of Operations for the year ended December 31, 2017 was as follows:
| | | | Amount of Realized Gain or (Loss) on
Derivatives Recognized in Income | |
| Derivatives not accounted for as hedging instruments | | | Futures | |
| Equity contracts | | | | $ | 59,410 | | |
| Total | | | | $ | 59,410 | | |
| |
| | | | Change in Unrealized Appreciation or (Depreciation)
on Derivatives Recognized in Income | |
| Derivatives not accounted for as hedging instruments | | | Futures | |
| Equity contracts | | | | $ | (29,133) | | |
| Total | | | | $ | (29,133) | | |
| |
At December 31, 2017, the aggregate cost of securities and other investments and the composition of unrealized appreciation and depreciation of securities and other investments at period end were:
| | Cost for federal income tax purposes was $803,632,921. | | |
| | Net unrealized appreciation consisted of: | | |
| | Gross Unrealized Appreciation | | | | $ | 54,802,394 | | |
| | Gross Unrealized Depreciation | | | | | (11,535,586) | | |
| | Net Unrealized Appreciation | | | | $ | 43,266,808 | | |
| |
See Accompanying Notes to Financial Statements
PORTFOLIO OF INVESTMENTS
| Voya Index Solution 2030 Portfolio | as of December 31, 2017 |
| Shares | | | | | | Value | | | Percentage
of Net
Assets | |
| EXCHANGE-TRADED FUNDS: 14.8% | |
| | | 24,018 | | | | iShares Barclays 20+ Year
Treasury Bond Fund | | | | $ | 3,046,923 | | | | | | 1.0 | | |
| | | 69,975 | | | | iShares MSCI EMU Index
Fund | | | | | 3,035,515 | | | | | | 1.0 | | |
| | | 44,966 | | | | iShares Russell 1000 Growth
Index Fund | | | | | 6,056,021 | | | | | | 1.9 | | |
| | | 24,382 | | | | iShares Russell 1000 Value
Index Fund | | | | | 3,031,658 | | | | | | 1.0 | | |
| | | 660,764 | | | | PowerShares Senior Loan
Portfolio | | | | | 15,224,003 | | | | | | 4.9 | | |
| | | 165,966 | | | | SPDR Bloomberg Barclays
High Yield Bond ETF | | | | | 6,094,272 | | | | | | 2.0 | | |
| | | 112,617 | | | | SPDR Dow Jones
International Real Estate | | | | | 4,559,862 | | | | | | 1.5 | | |
| | | 55,012 | | | | Vanguard REIT | | | | | 4,564,896 | | | | | | 1.5 | | |
| | | | | | | Total Exchange-Traded Funds
(Cost $44,662,618) | | | | | 45,613,150 | | | | | | 14.8 | | |
| MUTUAL FUNDS: 84.8% | |
| | | | | | | Affiliated Investment Companies: 83.3% | |
| | | 1,425,016 | | | | Voya Emerging Markets Index
Portfolio Class P2 | | | | | 18,354,203 | | | | | | 6.0 | | |
| | | 4,818,503 | | | | Voya International Index
Portfolio Class P2 | | | | | 51,847,097 | | | | | | 16.9 | | |
| Shares | | | | | | Value | | | Percentage
of Net
Assets | |
| MUTUAL FUNDS: (continued) | |
| | | | | | | Affiliated Investment Companies (continued) | |
| | | 930,901 | | | | Voya Russell Mid Cap Index
Portfolio Class P2 | | | | $ | 15,182,994 | | | | | | 4.9 | | |
| | | 771,066 | | | | Voya Russell Small Cap Index
Portfolio Class P2 | | | | | 12,105,731 | | | | | | 3.9 | | |
| | | 4,343,730 | | | | Voya U.S. Bond Index
Portfolio Class P2 | | | | | 46,000,102 | | | | | | 15.0 | | |
| | | 7,162,025 | | | | Voya U.S. Stock Index
Portfolio Class P2 | | | | | 112,515,416 | | | | | | 36.6 | | |
| | | | | | | | | | | | 256,005,543 | | | | | | 83.3 | | |
| | | | | | | Unaffiliated Investment Companies: 1.5% | |
| | | 891,766 | | | | Credit Suisse Commodity
Return Strategy Fund - Class I | | | | | 4,476,665 | | | | | | 1.5 | | |
| | | | | | | Total Mutual Funds
(Cost $243,144,138) | | | | | 260,482,208 | | | | | | 84.8 | | |
| | | | | | | Total Investments in
Securities
(Cost $287,806,756) | | | | $ | 306,095,358 | | | | | | 99.6 | | |
| | | | | | | Assets in Excess of
Other Liabilities | | | | | 1,245,373 | | | | | | 0.4 | | |
| | | | | | | Net Assets | | | | $ | 307,340,731 | | | | | | 100.0 | | |
| |
Fair Value Measurements^
The following is a summary of the fair valuations according to the inputs used as of December 31, 2017 in valuing the assets and liabilities:
| | | | Quoted Prices
in Active Markets
for Identical
Investments
(Level 1) | | | Significant
Other
Observable
Inputs
(Level 2) | | | Significant
Unobservable
Inputs
(Level 3) | | | Fair Value
at
December 31, 2017 | |
| Asset Table | | | | | |
| Investments, at fair value | | | | | |
| Exchange-Traded Funds | | | | $ | 45,613,150 | | | | | $ | — | | | | | $ | — | | | | | $ | 45,613,150 | | |
| Mutual Funds | | | | | 260,482,208 | | | | | | — | | | | | | — | | | | | | 260,482,208 | | |
| Total Investments, at fair value | | | | $ | 306,095,358 | | | | | $ | — | | | | | $ | — | | | | | $ | 306,095,358 | | |
| Other Financial Instruments+ | | | | | |
| Futures | | | | | 140,794 | | | | | | — | | | | | | — | | | | | | 140,794 | | |
| Total Assets | | | | $ | 306,236,152 | | | | | $ | — | | | | | $ | — | | | | | $ | 306,236,152 | | |
| Liabilities Table | | | | | |
| Other Financial Instruments+ | | | | | |
| Futures | | | | $ | (153,953) | | | | | $ | — | | | | | $ | — | | | | | $ | (153,953) | | |
| Total Liabilities | | | | $ | (153,953) | | | | | $ | — | | | | | $ | — | | | | | $ | (153,953) | | |
| |
^
See Note 2, “Significant Accounting Policies” in the Notes to Financial Statements for additional information.
+
Other Financial Instruments are derivatives not reflected in the Portfolio of Investments and may include open forward foreign currency contracts, futures, centrally cleared swaps, OTC swaps and written options. Forward foreign currency contracts, futures and centrally cleared swaps are valued at the unrealized gain (loss) on the instrument. OTC swaps and written options are valued at the fair value of the instrument.
See Accompanying Notes to Financial Statements
PORTFOLIO OF INVESTMENTS
| Voya Index Solution 2030 Portfolio | as of December 31, 2017 (continued) |
Transactions with Affiliates
An investment of at least 5% of the voting securities of an issuer, or a company which is under common control results in that issuer becoming an affiliated person as defined by the 1940 Act.
The following table provides transactions during the year ended December 31, 2017, where the following issuers were considered an affiliate:
| Issuer | | | Beginning
Fair Value
at 12/31/2016 | | | Purchases
at Cost | | | Sales
at Cost | | | Change in
Unrealized
Appreciation/
(Depreciation) | | | Ending
Fair Value
at 12/31/17 | | | Investment
Income | | | Realized
Gains/
(Losses) | | | Net Capital
Gain
Distributions | |
| Voya Emerging Markets Index Portfolio - Class I | | | | $ | 3,699,534 | | | | | $ | 4,185,013 | | | | | $ | (8,004,473) | | | | | $ | 119,926 | | | | | $ | — | | | | | $ | — | | | | | $ | 10,082 | | | | | $ | — | | |
| Voya Emerging Markets Index Portfolio Class P2 | | | | | — | | | | | | 17,000,856 | | | | | | (1,236,038) | | | | | | 2,589,385 | | | | | | 18,354,203 | | | | | | 137,850 | | | | | | 256,810 | | | | | | — | | |
| Voya International Index Portfolio - Class I | | | | | 15,656,821 | | | | | | 12,064,639 | | | | | | (27,528,864) | | | | | | (192,596) | | | | | | — | | | | | | — | | | | | | 109,579 | | | | | | — | | |
| Voya International Index Portfolio Class P2 | | | | | — | | | | | | 49,233,768 | | | | | | (3,091,248) | | | | | | 5,704,577 | | | | | | 51,847,097 | | | | | | 696,227 | | | | | | 660,574 | | | | | | — | | |
| Voya Russell Mid Cap Index Portfolio Class P2 | | | | | — | | | | | | 14,969,653 | | | | | | (704,709) | | | | | | 918,050 | | | | | | 15,182,994 | | | | | | 123,754 | | | | | | 83,055 | | | | | | 567,119 | | |
| Voya Russell Small Cap Index Portfolio Class P2 | | | | | — | | | | | | 11,994,273 | | | | | | (641,061) | | | | | | 752,519 | | | | | | 12,105,731 | | | | | | 72,910 | | | | | | 115,226 | | | | | | 466,735 | | |
| Voya Russell™ Mid Cap Index Portfolio - Class I | | | | | 6,964,693 | | | | | | 5,065,108 | | | | | | (11,776,686) | | | | | | (253,115) | | | | | | — | | | | | | — | | | | | | 430,339 | | | | | | — | | |
| Voya Russell™ Small Cap Index Portfolio - Class I | | | | | 2,816,149 | | | | | | 3,718,823 | | | | | | (6,295,905) | | | | | | (239,067) | | | | | | — | | | | | | — | | | | | | 5,188 | | | | | | — | | |
| Voya U.S. Bond Index Portfolio - Class I | | | | | 14,364,650 | | | | | | 15,227,621 | | | | | | (29,878,851) | | | | | | 286,580 | | | | | | — | | | | | | 152,875 | | | | | | (167,146) | | | | | | — | | |
| Voya U.S. Bond Index Portfolio Class P2 | | | | | — | | | | | | 53,988,627 | | | | | | (7,990,223) | | | | | | 1,698 | | | | | | 46,000,102 | | | | | | 613,499 | | | | | | (26,879) | | | | | | 81,153 | | |
| Voya U.S. Stock Index Portfolio - Class I | | | | | 35,330,313 | | | | | | 31,192,886 | | | | | | (66,200,320) | | | | | | (322,879) | | | | | | — | | | | | | — | | | | | | 279,695 | | | | | | — | | |
| Voya U.S. Stock Index Portfolio Class P2 | | | | | — | | | | | | 119,798,501 | | | | | | (14,600,860) | | | | | | 7,317,775 | | | | | | 112,515,416 | | | | | | 1,841,519 | | | | | | 1,625,245 | | | | | | 3,837,379 | | |
| | | | | $ | 78,832,160 | | | | | $ | 338,439,768 | | | | | $ | (177,949,238) | | | | | $ | 16,682,853 | | | | | $ | 256,005,543 | | | | | $ | 3,638,634 | | | | | $ | 3,381,768 | | | | | $ | 4,952,386 | | |
| |
The financial statements for the above mutual fund[s] can be found at www.sec.gov.
At December 31, 2017, the following futures contracts were outstanding for Voya Index Solution 2030 Portfolio:
| Contract Description | | | Number
of Contracts | | | Expiration
Date | | | Notional
Value | | | Unrealized
Appreciation/
(Depreciation) | |
| Long Contracts | | | | | |
| Tokyo Price Index (TOPIX) | | | | | 50 | | | | | | 03/08/18 | | | | | $ | 8,063,013 | | | | | $ | 140,794 | | |
| | | | | | | | | | | | | | | | | $ | 8,063,013 | | | | | $ | 140,794 | | |
| Short Contracts | | | | | |
| Mini MSCI EAFE Index | | | | | (59) | | | | | | 03/16/18 | | | | | | (6,034,225) | | | | | | (107,745) | | |
| S&P 500 E-Mini | | | | | (23) | | | | | | 03/16/18 | | | | | | (3,077,400) | | | | | | (46,208) | | |
| | | | | | | | | | | | | | | | | $ | (9,111,625) | | | | | $ | (153,953) | | |
| |
A summary of derivative instruments by primary risk exposure is outlined in the following tables.
The fair value of derivative instruments as of December 31, 2017 was as follows:
| Derivatives not accounted for as hedging instruments | | | Location on Statement
of Assets and Liabilities | | | Fair Value | |
| Asset Derivatives | | | |
| Equity contracts | | | Net Assets — Unrealized appreciation* | | | | $ | 140,794 | | |
| Total Asset Derivatives | | | | | | | $ | 140,794 | | |
| Liability Derivatives | | | |
| Equity contracts | | | Net Assets — Unrealized depreciation* | | | | $ | 153,953 | | |
| Total Liability Derivatives | | | | | | | $ | 153,953 | | |
| |
*
Includes cumulative appreciation/depreciation of futures contracts as reported in the table following the Portfolio of Investments.
See Accompanying Notes to Financial Statements
PORTFOLIO OF INVESTMENTS
| Voya Index Solution 2030 Portfolio | as of December 31, 2017 (continued) |
The effect of derivative instruments on the Portfolio’s Statement of Operations for the year ended December 31, 2017 was as follows:
| | | | Amount of Realized Gain or (Loss) on
Derivatives Recognized in Income | |
| Derivatives not accounted for as hedging instruments | | | Futures | |
| Equity contracts | | | | $ | 105,679 | | |
| Total | | | | $ | 105,679 | | |
| |
| | | | Change in Unrealized Appreciation or (Depreciation)
on Derivatives Recognized in Income | |
| Derivatives not accounted for as hedging instruments | | | Futures | |
| Equity contracts | | | | $ | (13,159) | | |
| Total | | | | $ | (13,159) | | |
| |
At December 31, 2017, the aggregate cost of securities and other investments and the composition of unrealized appreciation and depreciation of securities and other investments at period end were:
| | Cost for federal income tax purposes was $288,091,314. | | |
| | Net unrealized appreciation consisted of: | | |
| | Gross Unrealized Appreciation | | | | $ | 18,606,474 | | |
| | Gross Unrealized Depreciation | | | | | (517,543) | | |
| | Net Unrealized Appreciation | | | | $ | 18,088,931 | | |
| |
See Accompanying Notes to Financial Statements
PORTFOLIO OF INVESTMENTS
| Voya Index Solution 2035 Portfolio | as of December 31, 2017 |
| Shares | | | | | | Value | | | Percentage
of Net
Assets | |
| EXCHANGE-TRADED FUNDS: 13.9% | |
| | | 173,597 | | | | iShares MSCI EMU Index Fund | | | | $ | 7,530,638 | | | | | | 1.0 | | |
| | | 111,553 | | | | iShares Russell 1000 Growth
Index Fund | | | | | 15,023,958 | | | | | | 2.0 | | |
| | | 60,488 | | | | iShares Russell 1000 Value
Index Fund | | | | | 7,521,078 | | | | | | 1.0 | | |
| | | 1,639,259 | | | | PowerShares Senior Loan
Portfolio | | | | | 37,768,527 | | | | | | 4.9 | | |
| | | 411,738 | | | | SPDR Bloomberg Barclays High
Yield Bond ETF | | | | | 15,119,019 | | | | | | 2.0 | | |
| | | 279,386 | | | | SPDR Dow Jones International
Real Estate | | | | | 11,312,339 | | | | | | 1.5 | | |
| | | 136,476 | | | | Vanguard REIT | | | | | 11,324,779 | | | | | | 1.5 | | |
| | | | | | | Total Exchange-Traded Funds
(Cost $104,565,987) | | | | | 105,600,338 | | | | | | 13.9 | | |
| MUTUAL FUNDS: 85.8% | |
| | | | | | | Affiliated Investment Companies: 84.3% | |
| | | 4,112,858 | | | | Voya Emerging Markets
Index Portfolio Class P2 | | | | | 52,973,615 | | | | | | 7.0 | | |
| | | 13,319,512 | | | | Voya International Index
Portfolio Class P2 | | | | | 143,317,953 | | | | | | 18.9 | | |
| | | 3,224,080 | | | | Voya Russell Mid Cap Index
Portfolio Class P2 | | | | | 52,584,752 | | | | | | 6.9 | | |
| Shares | | | | | | Value | | | Percentage
of Net
Assets | |
| MUTUAL FUNDS: (continued) | |
| | | | | | | Affiliated Investment Companies (continued) | |
| | | 1,907,504 | | | | Voya Russell Small Cap Index
Portfolio Class P2 | | | | $ | 29,947,816 | | | | | | 3.9 | | |
| | | 5,722,982 | | | | Voya U.S. Bond Index
Portfolio Class P2 | | | | | 60,606,380 | | | | | | 8.0 | | |
| | | 19,161,666 | | | | Voya U.S. Stock Index
Portfolio Class P2 | | | | | 301,029,780 | | | | | | 39.6 | | |
| | | | | | | | | | | | 640,460,296 | | | | | | 84.3 | | |
| | | | | | | Unaffiliated Investment Companies: 1.5% | |
| | | 2,208,584 | | | | Credit Suisse Commodity
Return Strategy Fund - Class I | | | | | 11,087,093 | | | | | | 1.5 | | |
| | | | | | | Total Mutual Funds
(Cost $590,524,783) | | | | | 651,547,389 | | | | | | 85.8 | | |
| | | | | | | Total Investments in
Securities
(Cost $695,090,770) | | | | $ | 757,147,727 | | | | | | 99.7 | | |
| | | | | | | Assets in Excess of
Other Liabilities | | | | | 2,506,026 | | | | | | 0.3 | | |
| | | | | | | Net Assets | | | | $ | 759,653,753 | | | | | | 100.0 | | |
| |
Fair Value Measurements^
The following is a summary of the fair valuations according to the inputs used as of December 31, 2017 in valuing the assets and liabilities:
| | | | Quoted Prices
in Active Markets
for Identical
Investments
(Level 1) | | | Significant
Other
Observable
Inputs
(Level 2) | | | Significant
Unobservable
Inputs
(Level 3) | | | Fair Value
at
December 31, 2017 | |
| Asset Table | | | | | |
| Investments, at fair value | | | | | |
| Exchange-Traded Funds | | | | $ | 105,600,338 | | | | | $ | — | | | | | $ | — | | | | | $ | 105,600,338 | | |
| Mutual Funds | | | | | 651,547,389 | | | | | | — | | | | | | — | | | | | | 651,547,389 | | |
| Total Investments, at fair value | | | | $ | 757,147,727 | | | | | $ | — | | | | | $ | — | | | | | $ | 757,147,727 | | |
| Other Financial Instruments+ | | | | | |
| Futures | | | | | 385,776 | | | | | | — | | | | | | — | | | | | | 385,776 | | |
| Total Assets | | | | $ | 757,533,503 | | | | | $ | — | | | | | $ | — | | | | | $ | 757,533,503 | | |
| Liabilities Table | | | | | |
| Other Financial Instruments+ | | | | | |
| Futures | | | | $ | (414,269) | | | | | $ | — | | | | | $ | — | | | | | $ | (414,269) | | |
| Total Liabilities | | | | $ | (414,269) | | | | | $ | — | | | | | $ | — | | | | | $ | (414,269) | | |
| |
^
See Note 2, “Significant Accounting Policies” in the Notes to Financial Statements for additional information.
+
Other Financial Instruments are derivatives not reflected in the Portfolio of Investments and may include open forward foreign currency contracts, futures, centrally cleared swaps, OTC swaps and written options. Forward foreign currency contracts, futures and centrally cleared swaps are valued at the unrealized gain (loss) on the instrument. OTC swaps and written options are valued at the fair value of the instrument.
See Accompanying Notes to Financial Statements
PORTFOLIO OF INVESTMENTS
| Voya Index Solution 2035 Portfolio | as of December 31, 2017 (continued) |
Transactions with Affiliates
An investment of at least 5% of the voting securities of an issuer, or a company which is under common control results in that issuer becoming an affiliated person as defined by the 1940 Act.
The following table provides transactions during the year ended December 31, 2017, where the following issuers were considered an affiliate:
| Issuer | | | Beginning
Fair Value
at 12/31/2016 | | | Purchases
at Cost | | | Sales
at Cost | | | Change in
Unrealized
Appreciation/
(Depreciation) | | | Ending
Fair Value
at 12/31/17 | | | Investment
Income | | | Realized
Gains/
(Losses) | | | Net Capital
Gain
Distributions | |
| Voya Emerging Markets Index Portfolio - Class I | | | | $ | 19,805,366 | | | | | $ | 13,145,423 | | | | | $ | (33,286,829) | | | | | $ | 336,040 | | | | | $ | — | | | | | $ | — | | | | | $ | (584) | | | | | $ | — | | |
| Voya Emerging Markets Index Portfolio Class P2 | | | | | — | | | | | | 48,602,386 | | | | | | (4,429,770) | | | | | | 8,800,999 | | | | | | 52,973,615 | | | | | | 566,814 | | | | | | 1,530,688 | | | | | | — | | |
| Voya International Index Portfolio - Class I | | | | | 93,839,912 | | | | | | 10,756,148 | | | | | | (108,041,930) | | | | | | 3,445,870 | | | | | | — | | | | | | — | | | | | | 706,131 | | | | | | — | | |
| Voya International Index Portfolio Class P2 | | | | | — | | | | | | 133,273,086 | | | | | | (7,620,531) | | | | | | 17,665,398 | | | | | | 143,317,953 | | | | | | 2,663,558 | | | | | | 1,313,600 | | | | | | — | | |
| Voya Russell Mid Cap Index Portfolio Class P2 | | | | | — | | | | | | 51,389,239 | | | | | | (3,500,702) | | | | | | 4,696,215 | | | | | | 52,584,752 | | | | | | 595,259 | | | | | | (234,895) | | | | | | 2,727,849 | | |
| Voya Russell Small Cap Index Portfolio Class P2 | | | | | — | | | | | | 29,850,409 | | | | | | (2,326,224) | | | | | | 2,423,631 | | | | | | 29,947,816 | | | | | | 249,928 | | | | | | (72,126) | | | | | | 1,599,924 | | |
| Voya Russell™ Mid Cap Index Portfolio - Class I | | | | | 42,434,246 | | | | | | 4,984,879 | | | | | | (47,845,309) | | | | | | 426,184 | | | | | | — | | | | | | — | | | | | | (313,582) | | | | | | — | | |
| Voya Russell™ Small Cap Index Portfolio - Class I | | | | | 20,222,793 | | | | | | 2,671,255 | | | | | | (22,260,777) | | | | | | (633,271) | | | | | | — | | | | | | — | | | | | | 51,918 | | | | | | — | | |
| Voya U.S. Bond Index Portfolio - Class I | | | | | 42,671,960 | | | | | | 9,241,181 | | | | | | (52,732,962) | | | | | | 819,821 | | | | | | — | | | | | | 357,241 | | | | | | 301 | | | | | | — | | |
| Voya U.S. Bond Index Portfolio Class P2 | | | | | — | | | | | | 73,997,267 | | | | | | (12,872,225) | | | | | | (518,662) | | | | | | 60,606,380 | | | | | | 944,556 | | | | | | (25,738) | | | | | | 139,626 | | |
| Voya U.S. Stock Index Portfolio - Class I | | | | | 222,144,080 | | | | | | 26,302,942 | | | | | | (253,419,822) | | | | | | 4,972,800 | | | | | | — | | | | | | — | | | | | | (533,029) | | | | | | — | | |
| Voya U.S. Stock Index Portfolio Class P2 | | | | | — | | | | | | 303,541,404 | | | | | | (30,935,862) | | | | | | 28,424,238 | | | | | | 301,029,780 | | | | | | 4,974,794 | | | | | | 685,836 | | | | | | 12,237,589 | | |
| | | | | $ | 441,118,357 | | | | | $ | 707,755,619 | | | | | $ | (579,272,943) | | | | | $ | 70,859,263 | | | | | $ | 640,460,296 | | | | | $ | 10,352,150 | | | | | $ | 3,108,520 | | | | | $ | 16,704,988 | | |
| |
The financial statements for the above mutual fund[s] can be found at www.sec.gov.
At December 31, 2017, the following futures contracts were outstanding for Voya Index Solution 2035 Portfolio:
| Contract Description | | | Number
of Contracts | | | Expiration
Date | | | Notional
Value | | | Unrealized
Appreciation/
(Depreciation) | |
| Long Contracts | | | | | |
| Tokyo Price Index (TOPIX) | | | | | 137 | | | | | | 03/08/18 | | | | | $ | 22,092,656 | | | | | $ | 385,776 | | |
| | | | | | | | | | | | | | | | | $ | 22,092,656 | | | | | $ | 385,776 | | |
| Short Contracts | | | | | |
| Mini MSCI EAFE Index | | | | | (148) | | | | | | 03/16/18 | | | | | | (15,136,700) | | | | | | (290,658) | | |
| S&P 500 E-Mini | | | | | (56) | | | | | | 03/16/18 | | | | | | (7,492,800) | | | | | | (123,611) | | |
| | | | | | | | | | | | | | | | | $ | (22,629,500) | | | | | $ | (414,269) | | |
| |
A summary of derivative instruments by primary risk exposure is outlined in the following tables.
The fair value of derivative instruments as of December 31, 2017 was as follows:
| Derivatives not accounted for as hedging instruments | | | Location on Statement
of Assets and Liabilities | | | Fair Value | |
| Asset Derivatives | | | |
| Equity contracts | | | Net Assets — Unrealized appreciation* | | | | $ | 385,776 | | |
| Total Asset Derivatives | | | | | | | $ | 385,776 | | |
| Liability Derivatives | | | |
| Equity contracts | | | Net Assets — Unrealized depreciation* | | | | $ | 414,269 | | |
| Total Liability Derivatives | | | | | | | $ | 414,269 | | |
| |
*
Includes cumulative appreciation/depreciation of futures contracts as reported in the table following the Portfolio of Investments.
See Accompanying Notes to Financial Statements
PORTFOLIO OF INVESTMENTS
| Voya Index Solution 2035 Portfolio | as of December 31, 2017 (continued) |
The effect of derivative instruments on the Portfolio’s Statement of Operations for the year ended December 31, 2017 was as follows:
| | | | Amount of Realized Gain or (Loss) on
Derivatives Recognized in Income | |
| Derivatives not accounted for as hedging instruments | | | Futures | |
| Equity contracts | | | | $ | 74,179 | | |
| Total | | | | $ | 74,179 | | |
| |
| | | | Change in Unrealized Appreciation or (Depreciation)
on Derivatives Recognized in Income | |
| Derivatives not accounted for as hedging instruments | | | Futures | |
| Equity contracts | | | | $ | (28,493) | | |
| Total | | | | $ | (28,493) | | |
| |
At December 31, 2017, the aggregate cost of securities and other investments and the composition of unrealized appreciation and depreciation of securities and other investments at period end were:
| | Cost for federal income tax purposes was $700,730,678. | | |
| | Net unrealized appreciation consisted of: | | |
| | Gross Unrealized Appreciation | | | | $ | 64,887,959 | | |
| | Gross Unrealized Depreciation | | | | | (8,230,753) | | |
| | Net Unrealized Appreciation | | | | $ | 56,657,206 | | |
| |
See Accompanying Notes to Financial Statements
PORTFOLIO OF INVESTMENTS
| Voya Index Solution 2040 Portfolio | as of December 31, 2017 |
| Shares | | | | | | Value | | | Percentage
of Net
Assets | |
| EXCHANGE-TRADED FUNDS: 11.8% | |
| | | 43,837 | | | | iShares MSCI EMU Index
Fund | | | | $ | 1,901,649 | | | | | | 1.0 | | |
| | | 28,169 | | | | iShares Russell 1000 Growth
Index Fund | | | | | 3,793,801 | | | | | | 1.9 | | |
| | | 15,274 | | | | iShares Russell 1000 Value
Index Fund | | | | | 1,899,169 | | | | | | 1.0 | | |
| | | 248,366 | | | | PowerShares Senior Loan
Portfolio | | | | | 5,722,353 | | | | | | 2.9 | | |
| | | 103,971 | | | | SPDR Bloomberg Barclays
High Yield Bond ETF | | | | | 3,817,815 | | | | | | 2.0 | | |
| | | 70,550 | | | | SPDR Dow Jones
International Real Estate | | | | | 2,856,569 | | | | | | 1.5 | | |
| | | 34,463 | | | | Vanguard REIT | | | | | 2,859,740 | | | | | | 1.5 | | |
| | | | | | | Total Exchange-Traded Funds
(Cost $22,316,139) | | | | | 22,851,096 | | | | | | 11.8 | | |
| MUTUAL FUNDS: 87.8% | |
| | | | | | | Affiliated Investment Companies: 86.4% | |
| | | 1,121,044 | | | | Voya Emerging Markets Index
Portfolio Class P2 | | | | | 14,439,043 | | | | | | 7.5 | | |
| | | 3,568,817 | | | | Voya International Index
Portfolio Class P2 | | | | | 38,400,476 | | | | | | 19.9 | | |
| | | 937,410 | | | | Voya Russell Mid Cap Index
Portfolio Class P2 | | | | | 15,289,150 | | | | | | 7.9 | | |
| Shares | | | | | | Value | | | Percentage
of Net
Assets | |
| MUTUAL FUNDS: (continued) | |
| | | | | | | Affiliated Investment Companies (continued) | |
| | | 606,616 | | | | Voya Russell Small Cap Index
Portfolio Class P2 | | | | $ | 9,523,870 | | | | | | 4.9 | | |
| | | 916,826 | | | | Voya U.S. Bond Index
Portfolio Class P2 | | | | | 9,709,186 | | | | | | 5.0 | | |
| | | 5,065,959 | | | | Voya U.S. Stock Index
Portfolio Class P2 | | | | | 79,586,220 | | | | | | 41.2 | | |
| | | | | | | | | | | | 166,947,945 | | | | | | 86.4 | | |
| | | | | | | Unaffiliated Investment Companies: 1.4% | |
| | | 558,505 | | | | Credit Suisse Commodity
Return Strategy Fund - Class I | | | | | 2,803,696 | | | | | | 1.4 | | |
| | | | | | | Total Mutual Funds
(Cost $156,403,486) | | | | | 169,751,641 | | | | | | 87.8 | | |
| | | | | | | Total Investments in
Securities
(Cost $178,719,625) | | | | $ | 192,602,737 | | | | | | 99.6 | | |
| | | | | | | Assets in Excess of Other
Liabilities | | | | | 710,509 | | | | | | 0.4 | | |
| | | | | | | Net Assets | | | | $ | 193,313,246 | | | | | | 100.0 | | |
| |
Fair Value Measurements^
The following is a summary of the fair valuations according to the inputs used as of December 31, 2017 in valuing the assets and liabilities:
| | | | Quoted Prices
in Active Markets
for Identical
Investments
(Level 1) | | | Significant
Other
Observable
Inputs
(Level 2) | | | Significant
Unobservable
Inputs
(Level 3) | | | Fair Value
at
December 31, 2017 | |
| Asset Table | | | | | |
| Investments, at fair value | | | | | |
| Exchange-Traded Funds | | | | $ | 22,851,096 | | | | | $ | — | | | | | $ | — | | | | | $ | 22,851,096 | | |
| Mutual Funds | | | | | 169,751,641 | | | | | | — | | | | | | — | | | | | | 169,751,641 | | |
| Total Investments, at fair value | | | | $ | 192,602,737 | | | | | $ | — | | | | | $ | — | | | | | $ | 192,602,737 | | |
| Other Financial Instruments+ | | | | | |
| Futures | | | | | 90,108 | | | | | | — | | | | | | — | | | | | | 90,108 | | |
| Total Assets | | | | $ | 192,692,845 | | | | | $ | — | | | | | $ | — | | | | | $ | 192,692,845 | | |
| Liabilities Table | | | | | |
| Other Financial Instruments+ | | | | | |
| Futures | | | | $ | (97,738) | | | | | $ | — | | | | | $ | — | | | | | $ | (97,738) | | |
| Total Liabilities | | | | $ | (97,738) | | | | | $ | — | | | | | $ | — | | | | | $ | (97,738) | | |
| |
^
See Note 2, “Significant Accounting Policies” in the Notes to Financial Statements for additional information.
+
Other Financial Instruments are derivatives not reflected in the Portfolio of Investments and may include open forward foreign currency contracts, futures, centrally cleared swaps, OTC swaps and written options. Forward foreign currency contracts, futures and centrally cleared swaps are valued at the unrealized gain (loss) on the instrument. OTC swaps and written options are valued at the fair value of the instrument.
See Accompanying Notes to Financial Statements
PORTFOLIO OF INVESTMENTS
| Voya Index Solution 2040 Portfolio | as of December 31, 2017 (continued) |
Transactions with Affiliates
An investment of at least 5% of the voting securities of an issuer, or a company which is under common control results in that issuer becoming an affiliated person as defined by the 1940 Act.
The following table provides transactions during the year ended December 31, 2017, where the following issuers were considered an affiliate:
| Issuer | | | Beginning
Fair Value
at 12/31/2016 | | | Purchases
at Cost | | | Sales
at Cost | | | Change in
Unrealized
Appreciation/
(Depreciation) | | | Ending
Fair Value
at 12/31/17 | | | Investment
Income | | | Realized
Gains/
(Losses) | | | Net Capital
Gain
Distributions | |
| Voya Emerging Markets Index Portfolio - Class I | | | | $ | 2,947,296 | | | | | $ | 3,046,145 | | | | | $ | (6,085,673) | | | | | $ | 92,232 | | | | | $ | — | | | | | $ | — | | | | | $ | 7,990 | | | | | $ | — | | |
| Voya Emerging Markets Index Portfolio Class P2 | | | | | — | | | | | | 13,354,580 | | | | | | (905,909) | | | | | | 1,990,372 | | | | | | 14,439,043 | | | | | | 105,144 | | | | | | 190,192 | | | | | | — | | |
| Voya International Index Portfolio - Class I | | | | | 11,737,244 | | | | | | 7,115,434 | | | | | | (18,700,241) | | | | | | (152,437) | | | | | | — | | | | | | — | | | | | | 81,432 | | | | | | — | | |
| Voya International Index Portfolio Class P2 | | | | | — | | | | | | 35,896,018 | | | | | | (1,709,779) | | | | | | 4,214,237 | | | | | | 38,400,476 | | | | | | 480,523 | | | | | | 368,108 | | | | | | — | | |
| Voya Russell Mid Cap Index Portfolio Class P2 | | | | | — | | | | | | 14,726,520 | | | | | | (550,178) | | | | | | 1,112,808 | | | | | | 15,289,150 | | | | | | 116,417 | | | | | | 59,687 | | | | | | 533,497 | | |
| Voya Russell Small Cap Index Portfolio Class P2 | | | | | — | | | | | | 9,281,275 | | | | | | (395,386) | | | | | | 637,981 | | | | | | 9,523,870 | | | | | | 53,442 | | | | | | 81,874 | | | | | | 342,110 | | |
| Voya Russell™ Mid Cap Index Portfolio - Class I | | | | | 5,037,983 | | | | | | 2,900,593 | | | | | | (7,754,458) | | | | | | (184,118) | | | | | | — | | | | | | — | | | | | | 68,824 | | | | | | — | | |
| Voya Russell™ Small Cap Index Portfolio - Class I | | | | | 2,397,710 | | | | | | 2,383,237 | | | | | | (4,573,769) | | | | | | (207,178) | | | | | | — | | | | | | — | | | | | | 6,560 | | | | | | — | | |
| Voya U.S. Bond Index Portfolio - Class I | | | | | 4,530,470 | | | | | | 3,264,104 | | | | | | (7,896,735) | | | | | | 102,161 | | | | | | — | | | | | | 44,631 | | | | | | (83,270) | | | | | | — | | |
| Voya U.S. Bond Index Portfolio Class P2 | | | | | — | | | | | | 13,185,664 | | | | | | (3,454,413) | | | | | | (22,065) | | | | | | 9,709,186 | | | | | | 129,234 | | | | | | 38,594 | | | | | | 16,367 | | |
| Voya U.S. Stock Index Portfolio - Class I | | | | | 28,193,733 | | | | | | 17,596,460 | | | | | | (45,404,288) | | | | | | (385,905) | | | | | | — | | | | | | — | | | | | | 459,639 | | | | | | — | | |
| Voya U.S. Stock Index Portfolio Class P2 | | | | | — | | | | | | 82,774,561 | | | | | | (8,560,463) | | | | | | 5,372,122 | | | | | | 79,586,220 | | | | | | 1,277,742 | | | | | | 1,041,012 | | | | | | 2,561,555 | | |
| | | | | $ | 54,844,436 | | | | | $ | 205,524,591 | | | | | $ | (105,991,292) | | | | | $ | 12,570,210 | | | | | $ | 166,947,945 | | | | | $ | 2,207,133 | | | | | $ | 2,320,642 | | | | | $ | 3,453,529 | | |
| |
The financial statements for the above mutual fund[s] can be found at www.sec.gov.
At December 31, 2017, the following futures contracts were outstanding for Voya Index Solution 2040 Portfolio:
| Contract Description | | | Number of
Contracts | | | Expiration
Date | | | Notional
Value | | | Unrealized
Appreciation/
(Depreciation) | |
| Long Contracts | | | | | |
| Tokyo Price Index (TOPIX) | | | | | 32 | | | | | | 03/08/18 | | | | | $ | 5,160,328 | | | | | $ | 90,108 | | |
| | | | | | | | | | | | | | | | | $ | 5,160,328 | | | | | $ | 90,108 | | |
| Short Contracts | | | | | |
| Mini MSCI EAFE Index | | | | | (37) | | | | | | 03/16/18 | | | | | | (3,784,175) | | | | | | (69,116) | | |
| S&P 500 E-Mini | | | | | (14) | | | | | | 03/16/18 | | | | | | (1,873,200) | | | | | | (28,622) | | |
| | | | | | | | | | | | | | | | | $ | (5,657,375) | | | | | $ | (97,738) | | |
| |
A summary of derivative instruments by primary risk exposure is outlined in the following tables.
The fair value of derivative instruments as of December 31, 2017 was as follows:
| Derivatives not accounted for as hedging instruments | | | Location on Statement
of Assets and Liabilities | | | Fair Value | |
| Asset Derivatives | | | |
| Equity contracts | | | Net Assets — Unrealized appreciation* | | | | $ | 90,108 | | |
| Total Asset Derivatives | | | | | | | $ | 90,108 | | |
| Liability Derivatives | | | |
| Equity contracts | | | Net Assets — Unrealized depreciation* | | | | $ | 97,738 | | |
| Total Liability Derivatives | | | | | | | $ | 97,738 | | |
| |
*
Includes cumulative appreciation/depreciation of futures contracts as reported in the table following the Portfolio of Investments.
See Accompanying Notes to Financial Statements
PORTFOLIO OF INVESTMENTS
| Voya Index Solution 2040 Portfolio | as of December 31, 2017 (continued) |
The effect of derivative instruments on the Portfolio’s Statement of Operations for the year ended December 31, 2017 was as follows:
| | | | Amount of Realized Gain or (Loss) on
Derivatives Recognized in Income | |
| Derivatives not accounted for as hedging instruments | | | Futures | |
| Equity contracts | | | | $ | 73,387 | | |
| Total | | | | $ | 73,387 | | |
| |
| | | | Change in Unrealized Appreciation or (Depreciation)
on Derivatives Recognized in Income | |
| Derivatives not accounted for as hedging instruments | | | Futures | |
| Equity contracts | | | | $ | (7,630) | | |
| Total | | | | $ | (7,630) | | |
| |
At December 31, 2017, the aggregate cost of securities and other investments and the composition of unrealized appreciation and depreciation of securities and other investments at period end were:
| | Cost for federal income tax purposes was $178,768,704. | | |
| | Net unrealized appreciation consisted of: | | |
| | Gross Unrealized Appreciation | | | | $ | 14,098,698 | | |
| | Gross Unrealized Depreciation | | | | | (209,544) | | |
| | Net Unrealized Appreciation | | | | $ | 13,889,154 | | |
| |
See Accompanying Notes to Financial Statements
PORTFOLIO OF INVESTMENTS
| Voya Index Solution 2045 Portfolio | as of December 31, 2017 |
| Shares | | | | | | Value | | | Percentage
of Net
Assets | |
| EXCHANGE-TRADED FUNDS: 8.7% | |
| | | 116,666 | | | | iShares MSCI EMU Index
Fund | | | | $ | 5,060,971 | | | | | | 1.0 | | |
| | | 74,970 | | | | iShares Russell 1000 Growth
Index Fund | | | | | 10,096,960 | | | | | | 2.0 | | |
| | | 40,651 | | | | iShares Russell 1000 Value
Index Fund | | | | | 5,054,545 | | | | | | 1.0 | | |
| | | 385,583 | | | | PowerShares Senior Loan
Portfolio | | | | | 8,883,832 | | | | | | 1.7 | | |
| | | 187,761 | | | | SPDR Dow Jones
International Real Estate | | | | | 7,602,443 | | | | | | 1.5 | | |
| | | 91,719 | | | | Vanguard REIT | | | | | 7,610,843 | | | | | | 1.5 | | |
| | | | | | | Total Exchange-Traded
Funds
(Cost $43,044,295) | | | | | 44,309,594 | | | | | | 8.7 | | |
| MUTUAL FUNDS: 91.0% | |
| | | | | | | Affiliated Investment Companies: 89.6% | |
| | | 3,165,874 | | | | Voya Emerging Markets Index
Portfolio Class P2 | | | | | 40,776,461 | | | | | | 8.0 | | |
| | | 9,917,209 | | | | Voya International Index
Portfolio Class P2 | | | | | 106,709,170 | | | | | | 20.9 | | |
| | | 3,102,321 | | | | Voya Russell Mid Cap Index
Portfolio Class P2 | | | | | 50,598,850 | | | | | | 9.9 | | |
| Shares | | | | | | Value | | | Percentage
of Net
Assets | |
| MUTUAL FUNDS: (continued) | |
| | | | | | | Affiliated Investment Companies (continued) | |
| | | 1,606,075 | | | | Voya Russell Small Cap
Index Portfolio Class P2 | | | | $ | 25,215,382 | | | | | | 4.9 | | |
| | | 2,049,224 | | | | Voya U.S. Bond Index
Portfolio Class P2 | | | | | 21,701,278 | | | | | | 4.2 | | |
| | | 13,563,990 | | | | Voya U.S. Stock Index
Portfolio Class P2 | | | | | 213,090,287 | | | | | | 41.7 | | |
| | | | | | | | | | | | 458,091,428 | | | | | | 89.6 | | |
| | | | | | | Unaffiliated Investment Companies: 1.4% | |
| | | 1,484,603 | | | | Credit Suisse Commodity
Return Strategy Fund - Class I | | | | | 7,452,709 | | | | | | 1.4 | | |
| | | | | | | Total Mutual Funds
(Cost $420,334,272) | | | | | 465,544,137 | | | | | | 91.0 | | |
| | | | | | | Total Investments in
Securities
(Cost $463,378,567) | | | | $ | 509,853,731 | | | | | | 99.7 | | |
| | | | | | | Assets in Excess of Other
Liabilities | | | | | 1,449,278 | | | | | | 0.3 | | |
| | | | | | | Net Assets | | | | $ | 511,303,009 | | | | | | 100.0 | | |
| |
Fair Value Measurements^
The following is a summary of the fair valuations according to the inputs used as of December 31, 2017 in valuing the assets and liabilities:
| | | | Quoted Prices
in Active Markets
for Identical
Investments
(Level 1) | | | Significant
Other
Observable
Inputs
(Level 2) | | | Significant
Unobservable
Inputs
(Level 3) | | | Fair Value
at
December 31, 2017 | |
| Asset Table | | | | | |
| Investments, at fair value | | | | | |
| Exchange-Traded Funds | | | | $ | 44,309,594 | | | | | $ | — | | | | | $ | — | | | | | $ | 44,309,594 | | |
| Mutual Funds | | | | | 465,544,137 | | | | | | — | | | | | | — | | | | | | 465,544,137 | | |
| Total Investments, at fair value | | | | $ | 509,853,731 | | | | | $ | — | | | | | $ | — | | | | | $ | 509,853,731 | | |
| Other Financial Instruments+ | | | | | |
| Futures | | | | | 256,245 | | | | | | — | | | | | | — | | | | | | 256,245 | | |
| Total Assets | | | | $ | 510,109,976 | | | | | $ | — | | | | | $ | — | | | | | $ | 510,109,976 | | |
| Liabilities Table | | | | | |
| Other Financial Instruments+ | | | | | |
| Futures | | | | $ | (274,696) | | | | | $ | — | | | | | $ | — | | | | | $ | (274,696) | | |
| Total Liabilities | | | | $ | (274,696) | | | | | $ | — | | | | | $ | — | | | | | $ | (274,696) | | |
| |
^
See Note 2, “Significant Accounting Policies” in the Notes to Financial Statements for additional information.
+
Other Financial Instruments are derivatives not reflected in the Portfolio of Investments and may include open forward foreign currency contracts, futures, centrally cleared swaps, OTC swaps and written options. Forward foreign currency contracts, futures and centrally cleared swaps are valued at the unrealized gain (loss) on the instrument. OTC swaps and written options are valued at the fair value of the instrument.
See Accompanying Notes to Financial Statements
PORTFOLIO OF INVESTMENTS
| Voya Index Solution 2045 Portfolio | as of December 31, 2017 (continued) |
Transactions with Affiliates
An investment of at least 5% of the voting securities of an issuer, or a company which is under common control results in that issuer becoming an affiliated person as defined by the 1940 Act.
The following table provides transactions during the year ended December 31, 2017, where the following issuers were considered an affiliate:
| Issuer | | | Beginning
Fair Value
at 12/31/2016 | | | Purchases
at Cost | | | Sales
at Cost | | | Change in
Unrealized
Appreciation/
(Depreciation) | | | Ending
Fair Value
at 12/31/17 | | | Investment
Income | | | Realized
Gains/
(Losses) | | | Net Capital
Gain
Distributions | |
| Voya Emerging Markets Index Portfolio - Class I | | | | $ | 19,513,108 | | | | | $ | 5,725,903 | | | | | $ | (25,883,931) | | | | | $ | 644,920 | | | | | $ | — | | | | | $ | — | | | | | $ | (100,119) | | | | | $ | — | | |
| Voya Emerging Markets Index Portfolio Class P2 | | | | | — | | | | | | 36,644,030 | | | | | | (3,520,418) | | | | | | 7,652,849 | | | | | | 40,776,461 | | | | | | 435,212 | | | | | | 521,241 | | | | | | — | | |
| Voya International Index Portfolio - Class I | | | | | 68,171,632 | | | | | | 8,692,752 | | | | | | (79,897,391) | | | | | | 3,033,007 | | | | | | — | | | | | | — | | | | | | 340,092 | | | | | | — | | |
| Voya International Index Portfolio Class P2 | | | | | — | | | | | | 98,372,998 | | | | | | (4,466,137) | | | | | | 12,802,309 | | | | | | 106,709,170 | | | | | | 1,937,551 | | | | | | 688,022 | | | | | | — | | |
| Voya Russell Mid Cap Index Portfolio Class P2 | | | | | — | | | | | | 49,606,915 | | | | | | (2,461,148) | | | | | | 3,453,083 | | | | | | 50,598,850 | | | | | | 559,373 | | | | | | (70,357) | | | | | | 2,563,399 | | |
| Voya Russell Small Cap Index Portfolio Class P2 | | | | | — | | | | | | 25,038,330 | | | | | | (1,639,802) | | | | | | 1,816,854 | | | | | | 25,215,382 | | | | | | 205,400 | | | | | | (125,328) | | | | | | 1,314,879 | | |
| Voya Russell™ Mid Cap Index Portfolio - Class I | | | | | 31,086,931 | | | | | | 6,228,359 | | | | | | (37,751,219) | | | | | | 435,929 | | | | | | — | | | | | | — | | | | | | (26,460) | | | | | | — | | |
| Voya Russell™ Small Cap Index Portfolio - Class I | | | | | 13,254,869 | | | | | | 5,722,133 | | | | | | (18,638,085) | | | | | | (338,917) | | | | | | — | | | | | | — | | | | | | (10,572) | | | | | | — | | |
| Voya U.S. Bond Index Portfolio - Class I | | | | | 8,366,934 | | | | | | 8,900,078 | | | | | | (17,498,590) | | | | | | 231,578 | | | | | | — | | | | | | 70,333 | | | | | | (32,056) | | | | | | — | | |
| Voya U.S. Bond Index Portfolio Class P2 | | | | | — | | | | | | 23,175,351 | | | | | | (1,320,331) | | | | | | (153,742) | | | | | | 21,701,278 | | | | | | 322,157 | | | | | | (20,032) | | | | | | 46,248 | | |
| Voya U.S. Stock Index Portfolio - Class I | | | | | 158,745,353 | | | | | | 20,880,822 | | | | | | (182,769,914) | | | | | | 3,143,739 | | | | | | — | | | | | | — | | | | | | (659,148) | | | | | | — | | |
| Voya U.S. Stock Index Portfolio Class P2 | | | | | — | | | | | | 212,625,506 | | | | | | (19,449,514) | | | | | | 19,914,295 | | | | | | 213,090,287 | | | | | | 3,499,798 | | | | | | 1,142,545 | | | | | | 8,558,322 | | |
| | | | | $ | 299,138,827 | | | | | $ | 501,613,177 | | | | | $ | (395,296,480) | | | | | $ | 52,635,904 | | | | | $ | 458,091,428 | | | | | $ | 7,029,824 | | | | | $ | 1,647,828 | | | | | $ | 12,482,848 | | |
| |
The financial statements for the above mutual fund[s] can be found at www.sec.gov.
At December 31, 2017, the following futures contracts were outstanding for Voya Index Solution 2045 Portfolio:
| Contract Description | | | Number of
Contracts | | | Expiration
Date | | | Notional
Value | | | Unrealized
Appreciation/
(Depreciation) | |
| Long Contracts | | | | | |
| Tokyo Price Index (TOPIX) | | | | | 91 | | | | | | 03/08/18 | | | | | $ | 14,674,684 | | | | | $ | 256,245 | | |
| | | | | | | | | | | | | | | | | $ | 14,674,684 | | | | | $ | 256,245 | | |
| Short Contracts | | | | | |
| Mini MSCI EAFE Index | | | | | (99) | | | | | | 03/16/18 | | | | | | (10,125,225) | | | | | | (193,097) | | |
| S&P 500 E-Mini | | | | | (38) | | | | | | 03/16/18 | | | | | | (5,084,400) | | | | | | (81,599) | | |
| | | | | | | | | | | | | | | | | $ | (15,209,625) | | | | | $ | (274,696) | | |
| | | | | | |
A summary of derivative instruments by primary risk exposure is outlined in the following tables.
The fair value of derivative instruments as of December 31, 2017 was as follows:
| Derivatives not accounted for as hedging instruments | | | Location on Statement
of Assets and Liabilities | | | Fair Value | |
| Asset Derivatives | | | |
| Equity contracts | | | Net Assets — Unrealized appreciation* | | | | $ | 256,245 | | |
| Total Asset Derivatives | | | | | | | $ | 256,245 | | |
| Liability Derivatives | | | |
| Equity contracts | | | Net Assets — Unrealized depreciation* | | | | $ | 274,696 | | |
| Total Liability Derivatives | | | | | | | $ | 274,696 | | |
| |
*
Includes cumulative appreciation/depreciation of futures contracts as reported in the table following the Portfolio of Investments.
See Accompanying Notes to Financial Statements
PORTFOLIO OF INVESTMENTS
| Voya Index Solution 2045 Portfolio | as of December 31, 2017 (continued) |
The effect of derivative instruments on the Portfolio’s Statement of Operations for the year ended December 31, 2017 was as follows:
| | | | Amount of Realized Gain or (Loss) on
Derivatives Recognized in Income | |
| Derivatives not accounted for as hedging instruments | | | Futures | |
| Equity contracts | | | | $ | 59,469 | | |
| Total | | | | $ | 59,469 | | |
| |
| | | | Change in Unrealized Appreciation or (Depreciation)
on Derivatives Recognized in Income | |
| Derivatives not accounted for as hedging instruments | | | Futures | |
| Equity contracts | | | | $ | (18,451) | | |
| Total | | | | $ | (18,451) | | |
| |
At December 31, 2017, the aggregate cost of securities and other investments and the composition of unrealized appreciation and depreciation of securities and other investments at period end were:
| | Cost for federal income tax purposes was $467,149,628. | | |
| | Net unrealized appreciation consisted of: | | |
| | Gross Unrealized Appreciation | | | | $ | 47,541,842 | | |
| | Gross Unrealized Depreciation | | | | | (4,677,744) | | |
| | Net Unrealized Appreciation | | | | $ | 42,864,098 | | |
| |
See Accompanying Notes to Financial Statements
PORTFOLIO OF INVESTMENTS
| Voya Index Solution 2050 Portfolio | as of December 31, 2017 |
| | Shares | | | Value | | | Percentage
of Net
Assets | |
| | EXCHANGE-TRADED FUNDS: 7.3% | |
| | | | 3,949 | | | | iShares Barclays 20+ Year
Treasury Bond Fund | | | | $ | 500,970 | | | | | | 0.4 | | |
| | | | 26,602 | | | | iShares MSCI EMU Index
Fund | | | | | 1,153,995 | | | | | | 1.0 | | |
| | | | 17,095 | | | | iShares Russell 1000 Growth
Index Fund | | | | | 2,302,354 | | | | | | 1.9 | | |
| | | | 9,269 | | | | iShares Russell 1000 Value
Index Fund | | | | | 1,152,507 | | | | | | 1.0 | | |
| | | | 42,814 | | | | SPDR Dow Jones
International Real Estate | | | | | 1,733,539 | | | | | | 1.5 | | |
| | | | 20,914 | | | | Vanguard REIT | | | | | 1,735,444 | | | | | | 1.5 | | |
| | | | | | | | Total Exchange-Traded Funds
(Cost $8,206,930) | | | | | 8,578,809 | | | | | | 7.3 | | |
| | MUTUAL FUNDS: 92.2% | |
| | | | | | | | Affiliated Investment Companies: 90.8% | |
| | | | 772,570 | | | | Voya Emerging Markets Index
Portfolio Class P2 | | | | | 9,950,698 | | | | | | 8.4 | | |
| | | | 2,387,340 | | | | Voya International Index
Portfolio Class P2 | | | | | 25,687,783 | | | | | | 21.7 | | |
| | | | 783,790 | | | | Voya Russell Mid Cap Index
Portfolio Class P2 | | | | | 12,783,611 | | | | | | 10.8 | | |
| | Shares | | | Value | | | Percentage
of Net
Assets | |
| | MUTUAL FUNDS: (continued) | |
| | | | | | | | Affiliated Investment Companies (continued) | |
| | | | 368,881 | | | | Voya Russell Small Cap
Index Portfolio Class P2 | | | | $ | 5,791,427 | | | | | | 4.9 | | |
| | | | 442,469 | | | | Voya U.S. Bond Index
Portfolio Class P2 | | | | | 4,685,742 | | | | | | 4.0 | | |
| | | | 3,081,635 | | | | Voya U.S. Stock Index
Portfolio Class P2 | | | | | 48,412,480 | | | | | | 41.0 | | |
| | | | | | | | | | | | | 107,311,741 | | | | | | 90.8 | | |
| | | | | | | | Unaffiliated Investment Companies: 1.4% | |
| | | | 338,713 | | | | Credit Suisse Commodity
Return Strategy Fund - Class I | | | | | 1,700,340 | | | | | | 1.4 | | |
| | | | | | | | Total Mutual Funds
(Cost $100,891,375) | | | | | 109,012,081 | | | | | | 92.2 | | |
| | | | | | | | Total Investments in
Securities
(Cost $109,098,305) | | | | $ | 117,590,890 | | | | | | 99.5 | | |
| | | | | | | | Assets in Excess of Other
Liabilities | | | | | 609,990 | | | | | | 0.5 | | |
| | | | | | | | Net Assets | | | | $ | 118,200,880 | | | | | | 100.0 | | |
| |
Fair Value Measurements^
The following is a summary of the fair valuations according to the inputs used as of December 31, 2017 in valuing the assets and liabilities:
| | | | Quoted Prices
in Active Markets
for Identical
Investments
(Level 1) | | | Significant
Other
Observable
Inputs
(Level 2) | | | Significant
Unobservable
Inputs
(Level 3) | | | Fair Value
at
December 31, 2017 | |
| Asset Table | | | | | |
| Investments, at fair value | | | | | |
| Exchange-Traded Funds | | | | $ | 8,578,809 | | | | | $ | — | | | | | $ | — | | | | | $ | 8,578,809 | | |
| Mutual Funds | | | | | 109,012,081 | | | | | | — | | | | | | — | | | | | | 109,012,081 | | |
| Total Investments, at fair value | | | | $ | 117,590,890 | | | | | $ | — | | | | | $ | — | | | | | $ | 117,590,890 | | |
| Other Financial Instruments+ | | | | | |
| Futures | | | | | 50,686 | | | | | | — | | | | | | — | | | | | | 50,686 | | |
| Total Assets | | | | $ | 117,641,576 | | | | | $ | — | | | | | $ | — | | | | | $ | 117,641,576 | | |
| Liabilities Table | | | | | |
| Other Financial Instruments+ | | | | | |
| Futures | | | | $ | (58,248) | | | | | $ | — | | | | | $ | — | | | | | $ | (58,248) | | |
| Total Liabilities | | | | $ | (58,248) | | | | | $ | — | | | | | $ | — | | | | | $ | (58,248) | | |
| |
^
See Note 2, “Significant Accounting Policies” in the Notes to Financial Statements for additional information.
+
Other Financial Instruments are derivatives not reflected in the Portfolio of Investments and may include open forward foreign currency contracts, futures, centrally cleared swaps, OTC swaps and written options. Forward foreign currency contracts, futures and centrally cleared swaps are valued at the unrealized gain (loss) on the instrument. OTC swaps and written options are valued at the fair value of the instrument.
See Accompanying Notes to Financial Statements
PORTFOLIO OF INVESTMENTS
| Voya Index Solution 2050 Portfolio | as of December 31, 2017 (continued) |
Transactions with Affiliates
An investment of at least 5% of the voting securities of an issuer, or a company which is under common control results in that issuer becoming an affiliated person as defined by the 1940 Act.
The following table provides transactions during the year ended December 31, 2017, where the following issuers were considered an affiliate:
| Issuer | | | Beginning
Fair Value
at 12/31/2016 | | | Purchases
at Cost | | | Sales
at Cost | | | Change in
Unrealized
Appreciation/
(Depreciation) | | | Ending
Fair Value
at 12/31/17 | | | Investment
Income | | | Realized
Gains/
(Losses) | | | Net Capital
Gain
Distributions | |
| Voya Emerging Markets Index Portfolio - Class I | | | | $ | 1,781,949 | | | | | $ | 2,080,810 | | | | | $ | (3,901,679) | | | | | $ | 38,920 | | | | | $ | — | | | | | $ | — | | | | | $ | 8,305 | | | | | $ | — | | |
| Voya Emerging Markets Index Portfolio Class P2 | | | | | — | | | | | | 9,222,866 | | | | | | (589,717) | | | | | | 1,317,549 | | | | | | 9,950,698 | | | | | | 68,045 | | | | | | 140,736 | | | | | | — | | |
| Voya International Index Portfolio - Class I | | | | | 6,214,851 | | | | | | 5,309,730 | | | | | | (11,440,259) | | | | | | (84,322) | | | | | | — | | | | | | — | | | | | | 39,969 | | | | | | — | | |
| Voya International Index Portfolio Class P2 | | | | | — | | | | | | 24,247,932 | | | | | | (1,167,607) | | | | | | 2,607,458 | | | | | | 25,687,783 | | | | | | 296,482 | | | | | | 239,774 | | | | | | — | | |
| Voya Russell Mid Cap Index Portfolio Class P2 | | | | | — | | | | | | 12,378,301 | | | | | | (469,891) | | | | | | 875,201 | | | | | | 12,783,611 | | | | | | 89,569 | | | | | | 65,707 | | | | | | 410,463 | | |
| Voya Russell Small Cap Index Portfolio Class P2 | | | | | — | | | | | | 5,673,232 | | | | | | (247,268) | | | | | | 365,463 | | | | | | 5,791,427 | | | | | | 29,826 | | | | | | 50,641 | | | | | | 190,934 | | |
| Voya Russell™ Mid Cap Index Portfolio - Class I | | | | | 3,132,802 | | | | | | 2,658,661 | | | | | | (5,687,086) | | | | | | (104,377) | | | | | | — | | | | | | — | | | | | | (742) | | | | | | — | | |
| Voya Russell™ Small Cap Index Portfolio - Class I | | | | | 1,206,593 | | | | | | 1,458,603 | | | | | | (2,563,680) | | | | | | (101,516) | | | | | | — | | | | | | — | | | | | | 1,313 | | | | | | — | | |
| Voya U.S. Bond Index Portfolio - Class I | | | | | 788,331 | | | | | | 1,884,654 | | | | | | (2,681,038) | | | | | | 8,053 | | | | | | — | | | | | | 9,012 | | | | | | (9,032) | | | | | | — | | |
| Voya U.S. Bond Index Portfolio Class P2 | | | | | — | | | | | | 4,767,222 | | | | | | (81,108) | | | | | | (372) | | | | | | 4,685,742 | | | | | | 57,262 | | | | | | 356 | | | | | | 7,174 | | |
| Voya U.S. Stock Index Portfolio - Class I | | | | | 14,209,282 | | | | | | 11,753,236 | | | | | | (25,778,492) | | | | | | (184,026) | | | | | | — | | | | | | — | | | | | | 292,108 | | | | | | — | | |
| Voya U.S. Stock Index Portfolio Class P2 | | | | | — | | | | | | 50,919,734 | | | | | | (5,438,722) | | | | | | 2,931,468 | | | | | | 48,412,480 | | | | | | 773,468 | | | | | | 702,134 | | | | | | 1,455,253 | | |
| | | | | $ | 27,333,808 | | | | | $ | 132,354,981 | | | | | $ | (60,046,547) | | | | | $ | 7,669,499 | | | | | $ | 107,311,741 | | | | | $ | 1,323,664 | | | | | $ | 1,531,269 | | | | | $ | 2,063,824 | | |
| |
The financial statements for the above mutual fund[s] can be found at www.sec.gov.
At December 31, 2017, the following futures contracts were outstanding for Voya Index Solution 2050 Portfolio:
| Contract Description | | | Number
of Contracts | | | Expiration
Date | | | Notional
Value | | | Unrealized
Appreciation/
(Depreciation) | |
| Long Contracts | | | | | |
| Tokyo Price Index (TOPIX) | | | | | 18 | | | | | | 03/08/18 | | | | | $ | 2,902,685 | | | | | $ | 50,686 | | |
| | | | | | | | | | | | | | | | | $ | 2,902,685 | | | | | $ | 50,686 | | |
| Short Contracts | | | | | |
| Mini MSCI EAFE Index | | | | | (23) | | | | | | 03/16/18 | | | | | | (2,352,325) | | | | | | (40,662) | | |
| S&P 500 E-Mini | | | | | (9) | | | | | | 03/16/18 | | | | | | (1,204,200) | | | | | | (17,586) | | |
| | | | | | | | | | | | | | | | | $ | (3,556,525) | | | | | $ | (58,248) | | |
| |
A summary of derivative instruments by primary risk exposure is outlined in the following tables.
The fair value of derivative instruments as of December 31, 2017 was as follows:
| Derivatives not accounted for as hedging instruments | | | Location on Statement
of Assets and Liabilities | | | Fair Value | |
| Asset Derivatives | | | |
| Equity contracts | | | Net Assets — Unrealized appreciation* | | | | $ | 50,686 | | |
| Total Asset Derivatives | | | | | | | $ | 50,686 | | |
| Liability Derivatives | | | |
| Equity contracts | | | Net Assets — Unrealized depreciation* | | | | $ | 58,248 | | |
| Total Liability Derivatives | | | | | | | $ | 58,248 | | |
| |
*
Includes cumulative appreciation/depreciation of futures contracts as reported in the table following the Portfolio of Investments.
See Accompanying Notes to Financial Statements
PORTFOLIO OF INVESTMENTS
| Voya Index Solution 2050 Portfolio | as of December 31, 2017 (continued) |
The effect of derivative instruments on the Portfolio’s Statement of Operations for the year ended December 31, 2017 was as follows:
| | | | Amount of Realized Gain or (Loss) on
Derivatives Recognized in Income | |
| Derivatives not accounted for as hedging instruments | | | Futures | |
| Equity contracts | | | | $ | 42,679 | | |
| Total | | | | $ | 42,679 | | |
| |
| | | | Change in Unrealized Appreciation or (Depreciation)
on Derivatives Recognized in Income | |
| Derivatives not accounted for as hedging instruments | | | Futures | |
| Equity contracts | | | | $ | (7,562) | | |
| Total | | | | $ | (7,562) | | |
| |
At December 31, 2017, the aggregate cost of securities and other investments and the composition of unrealized appreciation and depreciation of securities and other investments at period end were:
| | Cost for federal income tax purposes was $109,124,990. | | |
| | Net unrealized appreciation consisted of: | | |
| | Gross Unrealized Appreciation | | | | $ | 8,558,282 | | |
| | Gross Unrealized Depreciation | | | | | (64,647) | | |
| | Net Unrealized Appreciation | | | | $ | 8,493,635 | | |
| |
See Accompanying Notes to Financial Statements
PORTFOLIO OF INVESTMENTS
| Voya Index Solution 2055 Portfolio | as of December 31, 2017 |
| | Shares | | | Value | | | Percentage
of Net
Assets | |
| | EXCHANGE-TRADED FUNDS: 6.9% | |
| | | | 41,119 | | | | iShares MSCI EMU
Index Fund | | | | $ | 1,783,742 | | | | | | 1.0 | | |
| | | | 26,423 | | | | iShares Russell 1000
Growth Index Fund | | | | | 3,558,650 | | | | | | 1.9 | | |
| | | | 14,328 | | | | iShares Russell 1000
Value Index Fund | | | | | 1,781,543 | | | | | | 1.0 | | |
| | | | 66,177 | | | | SPDR Dow Jones
International Real Estate | | | | | 2,679,507 | | | | | | 1.5 | | |
| | | | 32,327 | | | | Vanguard REIT | | | | | 2,682,494 | | | | | | 1.5 | | |
| | | | | | | | Total Exchange-Traded
Funds
(Cost $11,951,103) | | | | | 12,485,936 | | | | | | 6.9 | | |
| | MUTUAL FUNDS: 92.9% | |
| | | | | | | | Affiliated Investment Companies: 91.4% | |
| | | | 1,187,761 | | | | Voya Emerging Markets
Index Portfolio Class P2 | | | | | 15,298,359 | | | | | | 8.5 | | |
| | | | 3,669,027 | | | | Voya International Index
Portfolio Class P2 | | | | | 39,478,725 | | | | | | 21.9 | | |
| | | | 1,205,001 | | | | Voya Russell Mid Cap
Index Portfolio Class P2 | | | | | 19,653,564 | | | | | | 10.9 | | |
| | Shares | | | Value | | | Percentage
of Net
Assets | |
| | MUTUAL FUNDS: (continued) | |
| | | | | | | | Affiliated Investment Companies (continued) | |
| | | | 567,119 | | | | Voya Russell Small Cap
Index Portfolio Class P2 | | | | $ | 8,903,767 | | | | | | 4.9 | | |
| | | | 680,284 | | | | Voya U.S. Bond Index
Portfolio Class P2 | | | | | 7,204,204 | | | | | | 4.0 | | |
| | | | 4,733,249 | | | | Voya U.S. Stock Index
Portfolio Class P2 | | | | | 74,359,340 | | | | | | 41.2 | | |
| | | | | | | | | | | | | 164,897,959 | | | | | | 91.4 | | |
| | | | | | | | Unaffiliated Investment Companies: 1.5% | |
| | | | 523,438 | | | | Credit Suisse
Commodity Return
Strategy Fund - Class I | | | | | 2,627,658 | | | | | | 1.5 | | |
| | | | | | | | Total Mutual Funds
(Cost $150,587,792) | | | | | 167,525,617 | | | | | | 92.9 | | |
| | | | | | | | Total Investments in
Securities
(Cost $162,538,895) | | | | $ | 180,011,553 | | | | | | 99.8 | | |
| | | | | | | | Assets in Excess of
Other Liabilities | | | | | 443,441 | | | | | | 0.2 | | |
| | | | | | | | Net Assets | | | | $ | 180,454,994 | | | | | | 100.0 | | |
| |
Fair Value Measurements^
The following is a summary of the fair valuations according to the inputs used as of December 31, 2017 in valuing the assets and liabilities:
| | | | Quoted Prices
in Active Markets
for Identical
Investments
(Level 1) | | | Significant
Other
Observable
Inputs
(Level 2) | | | Significant
Unobservable
Inputs
(Level 3) | | | Fair Value
at
December 31, 2017 | |
| Asset Table | | | | | |
| Investments, at fair value | | | | | |
| Exchange-Traded Funds | | | | $ | 12,485,936 | | | | | $ | — | | | | | $ | — | | | | | $ | 12,485,936 | | |
| Mutual Funds | | | | | 167,525,617 | | | | | | — | | | | | | — | | | | | | 167,525,617 | | |
| Total Investments, at fair value | | | | $ | 180,011,553 | | | | | $ | — | | | | | $ | — | | | | | $ | 180,011,553 | | |
| Other Financial Instruments+ | | | | | |
| Futures | | | | | 90,108 | | | | | | — | | | | | | — | | | | | | 90,108 | | |
| Total Assets | | | | $ | 180,101,661 | | | | | $ | — | | | | | $ | — | | | | | $ | 180,101,661 | | |
| Liabilities Table | | | | | |
| Other Financial Instruments+ | | | | | |
| Futures | | | | $ | (95,774) | | | | | $ | — | | | | | $ | — | | | | | $ | (95,774) | | |
| Total Liabilities | | | | $ | (95,774) | | | | | $ | — | | | | | $ | — | | | | | $ | (95,774) | | |
^
See Note 2, “Significant Accounting Policies” in the Notes to Financial Statements for additional information.
+
Other Financial Instruments are derivatives not reflected in the Portfolio of Investments and may include open forward foreign currency contracts, futures, centrally cleared swaps, OTC swaps and written options. Forward foreign currency contracts, futures and centrally cleared swaps are valued at the unrealized gain (loss) on the instrument. OTC swaps and written options are valued at the fair value of the instrument.
See Accompanying Notes to Financial Statements
PORTFOLIO OF INVESTMENTS
| Voya Index Solution 2055 Portfolio | as of December 31, 2017 (continued) |
Transactions with Affiliates
An investment of at least 5% of the voting securities of an issuer, or a company which is under common control results in that issuer becoming an affiliated person as defined by the 1940 Act.
The following table provides transactions during the year ended December 31, 2017, where the following issuers were considered an affiliate:
| Issuer | | | Beginning
Fair Value
at 12/31/2016 | | | Purchases
at Cost | | | Sales
at Cost | | | Change in
Unrealized
Appreciation/
(Depreciation) | | | Ending
Fair Value
at 12/31/17 | | | Investment
Income | | | Realized
Gains/
(Losses) | | | Net Capital
Gain
Distributions | |
| Voya Emerging Markets Index Portfolio - Class I | | | | $ | 6,006,209 | | | | | $ | 2,849,204 | | | | | $ | (8,898,176) | | | | | $ | 42,763 | | | | | $ | — | | | | | $ | — | | | | | $ | (3,451) | | | | | $ | — | | |
| Voya Emerging Markets Index Portfolio Class P2 | | | | | — | | | | | | 13,677,432 | | | | | | (1,078,600) | | | | | | 2,699,527 | | | | | | 15,298,359 | | | | | | 153,501 | | | | | | 289,844 | | | | | | — | | |
| Voya International Index Portfolio - Class I | | | | | 22,554,999 | | | | | | 4,357,004 | | | | | | (28,001,950) | | | | | | 1,089,947 | | | | | | — | | | | | | — | | | | | | (77,264) | | | | | | — | | |
| Voya International Index Portfolio Class P2 | | | | | — | | | | | | 36,394,567 | | | | | | (1,835,028) | | | | | | 4,919,186 | | | | | | 39,478,725 | | | | | | 668,037 | | | | | | 10,244 | | | | | | — | | �� |
| Voya Russell Mid Cap Index Portfolio Class P2 | | | | | — | | | | | | 19,162,871 | | | | | | (997,935) | | | | | | 1,488,628 | | | | | | 19,653,564 | | | | | | 202,391 | | | | | | (113,225) | | | | | | 927,484 | | |
| Voya Russell Small Cap Index Portfolio Class P2 | | | | | — | | | | | | 8,750,726 | | | | | | (519,288) | | | | | | 672,329 | | | | | | 8,903,767 | | | | | | 67,543 | | | | | | (11,370) | | | | | | 432,380 | | |
| Voya Russell™ Mid Cap Index Portfolio - Class I | | | | | 10,598,114 | | | | | | 2,789,268 | | | | | | (13,494,524) | | | | | | 107,142 | | | | | | — | | | | | | — | | | | | | (45,800) | | | | | | — | | |
| Voya Russell™ Small Cap Index Portfolio - Class I | | | | | 4,088,734 | | | | | | 2,103,966 | | | | | | (6,010,240) | | | | | | (182,460) | | | | | | — | | | | | | — | | | | | | (5,985) | | | | | | — | | |
| Voya U.S. Bond Index Portfolio - Class I | | | | | 2,519,256 | | | | | | 2,582,025 | | | | | | (5,169,579) | | | | | | 68,298 | | | | | | — | | | | | | 22,393 | | | | | | (2,638) | | | | | | — | | |
| Voya U.S. Bond Index Portfolio Class P2 | | | | | — | | | | | | 7,418,993 | | | | | | (157,019) | | | | | | (57,770) | | | | | | 7,204,204 | | | | | | 102,117 | | | | | | (1,815) | | | | | | 14,202 | | |
| Voya U.S. Stock Index Portfolio - Class I | | | | | 48,481,391 | | | | | | 9,723,250 | | | | | | (58,457,185) | | | | | | 252,544 | | | | | | — | | | | | | — | | | | | | 136,754 | | | | | | — | | |
| Voya U.S. Stock Index Portfolio Class P2 | | | | | — | | | | | | 74,417,163 | | | | | | (7,347,258) | | | | | | 7,289,435 | | | | | | 74,359,340 | | | | | | 1,213,681 | | | | | | 79,185 | | | | | | 2,857,152 | | |
| | | | | $ | 94,248,703 | | | | | $ | 184,226,469 | | | | | $ | (131,966,782) | | | | | $ | 18,389,569 | | | | | $ | 164,897,959 | | | | | $ | 2,429,663 | | | | | $ | 254,479 | | | | | $ | 4,231,218 | | |
| |
The financial statements for the above mutual fund[s] can be found at www.sec.gov.
At December 31, 2017, the following futures contracts were outstanding for Voya Index Solution 2055 Portfolio:
| Contract Description | | | Number
of Contracts | | | Expiration
Date | | | Notional
Value | | | Unrealized
Appreciation/
(Depreciation) | |
| Long Contracts | | | | | |
| Tokyo Price Index (TOPIX) | | | | | 32 | | | | | | 03/08/18 | | | | | $ | 5,160,328 | | | | | $ | 90,108 | | |
| | | | | | | | | | | | | | | | | $ | 5,160,328 | | | | | $ | 90,108 | | |
| Short Contracts | | | | | |
| Mini MSCI EAFE Index | | | | | (35) | | | | | | 03/16/18 | | | | | | (3,579,625) | | | | | | (67,079) | | |
| S&P 500 E-Mini | | | | | (13) | | | | | | 03/16/18 | | | | | | (1,739,400) | | | | | | (28,695) | | |
| | | | | | | | | | | | | | | | | $ | (5,319,025) | | | | | $ | (95,774) | | |
| |
A summary of derivative instruments by primary risk exposure is outlined in the following tables.
The fair value of derivative instruments as of December 31, 2017 was as follows:
| Derivatives not accounted for as hedging instruments | | | Location on Statement
of Assets and Liabilities | | | Fair Value | |
| Asset Derivatives | | | |
| Equity contracts | | | Net Assets — Unrealized appreciation* | | | | $ | 90,108 | | |
| Total Asset Derivatives | | | | | | | $ | 90,108 | | |
| Liability Derivatives | | | |
| Equity contracts | | | Net Assets — Unrealized depreciation* | | | | $ | 95,774 | | |
| Total Liability Derivatives | | | | | | | $ | 95,774 | | |
| |
*
Includes cumulative appreciation/depreciation of futures contracts as reported in the table following the Portfolio of Investments.
See Accompanying Notes to Financial Statements
PORTFOLIO OF INVESTMENTS
| Voya Index Solution 2055 Portfolio | as of December 31, 2017 (continued) |
The effect of derivative instruments on the Portfolio’s Statement of Operations for the year ended December 31, 2017 was as follows:
| | | | Amount of Realized Gain or (Loss) on
Derivatives Recognized in Income | |
| Derivatives not accounted for as hedging instruments | | | Futures | |
| Equity contracts | | | | $ | 28,121 | | |
| Total | | | | $ | 28,121 | | |
| |
| | | | Change in Unrealized Appreciation or (Depreciation)
on Derivatives Recognized in Income | |
| Derivatives not accounted for as hedging instruments | | | Futures | |
| Equity contracts | | | | $ | (5,666) | | |
| Total | | | | $ | (5,666) | | |
| |
At December 31, 2017, the aggregate cost of securities and other investments and the composition of unrealized appreciation and depreciation of securities and other investments at period end were:
| | Cost for federal income tax purposes was $165,022,316. | | |
| | Net unrealized appreciation consisted of: | | |
| | Gross Unrealized Appreciation | | | | $ | 17,727,369 | | |
| | Gross Unrealized Depreciation | | | | | (2,681,047) | | |
| | Net Unrealized Appreciation | | | | $ | 15,046,322 | | |
| |
See Accompanying Notes to Financial Statements
PORTFOLIO OF INVESTMENTS
| Voya Index Solution 2060 Portfolio | as of December 31, 2017 |
| | Shares | | | Value | | | Percentage
of Net
Assets | |
| | EXCHANGE-TRADED FUNDS: 9.8% | |
| | | | 5,545 | | | | iShares MSCI EMU
Index Fund | | | | $ | 240,542 | | | | | | 1.0 | | |
| | | | 3,563 | | | | iShares Russell 1000
Growth Index Fund | | | | | 479,865 | | | | | | 1.9 | | |
| | | | 1,932 | | | | iShares Russell 1000
Value Index Fund | | | | | 240,225 | | | | | | 1.0 | | |
| | | | 8,925 | | | | SPDR Dow Jones
International Real Estate | | | | | 361,373 | | | | | | 1.5 | | |
| | | | 4,360 | | | | Vanguard REIT | | | | | 361,793 | | | | | | 1.5 | | |
| | | | 12,203 | | | | WisdomTree Japan
Hedged Equity Fund | | | | | 724,004 | | | | | | 2.9 | | |
| | | | | | | | Total Exchange-Traded
Funds
(Cost $2,287,069) | | | | | 2,407,802 | | | | | | 9.8 | | |
| | MUTUAL FUNDS: 90.0% | |
| | | | | | | | Affiliated Investment Companies: 88.6%
| |
| | | | 161,263 | | | | Voya Emerging Markets
Index Portfolio Class P2 | | | | | 2,077,070 | | | | | | 8.5 | | |
| | | | 453,961 | | | | Voya International Index
Portfolio Class P2 | | | | | 4,884,624 | | | | | | 20.0 | | |
| | | | 163,640 | | | | Voya Russell Mid Cap
Index Portfolio Class P2 | | | | | 2,668,962 | | | | | | 10.9 | | |
| | Shares | | | Value | | | Percentage
of Net
Assets | |
| | MUTUAL FUNDS: (continued) | |
| | | | | | | | Affiliated Investment Companies (continued)
| |
| | | | 77,015 | | | | Voya Russell Small Cap
Index Portfolio Class P2 | | | | $ | 1,209,131 | | | | | | 4.9 | | |
| | | | 92,378 | | | | Voya U.S. Bond Index
Portfolio Class P2 | | | | | 978,288 | | | | | | 4.0 | | |
| | | | 627,838 | | | | Voya U.S. Stock Index
Portfolio Class P2 | | | | | 9,863,342 | | | | | | 40.3 | | |
| | | | | | | | | | | | | 21,681,417 | | | | | | 88.6 | | |
| | | | | | | | Unaffiliated Investment Companies: 1.4% | |
| | | | 70,681 | | | | Credit Suisse
Commodity Return
Strategy Fund - Class I | | | | | 354,821 | | | | | | 1.4 | | |
| | | | | | | | Total Mutual Funds
(Cost $20,700,643) | | | | | 22,036,238 | | | | | | 90.0 | | |
| | | | | | | | Total Investments in
Securities
(Cost $22,987,712) | | | | $ | 24,444,040 | | | | | | 99.8 | | |
| | | | | | | | Assets in Excess of
Other Liabilities | | | | | 39,474 | | | | | | 0.2 | | |
| | | | | | | | Net Assets | | | | $ | 24,483,514 | | | | | | 100.0 | | |
| |
Fair Value Measurements^
The following is a summary of the fair valuations according to the inputs used as of December 31, 2017 in valuing the assets and liabilities:
| | | | Quoted Prices
in Active Markets
for Identical
Investments
(Level 1) | | | Significant
Other
Observable
Inputs
(Level 2) | | | Significant
Unobservable
Inputs
(Level 3) | | | Fair Value
at
December 31, 2017 | |
| Asset Table | | | | | |
| Investments, at fair value | | | | | |
| Exchange-Traded Funds | | | | $ | 2,407,802 | | | | | $ | — | | | | | $ | — | | | | | $ | 2,407,802 | | |
| Mutual Funds | | | | | 22,036,238 | | | | | | — | | | | | | — | | | | | | 22,036,238 | | |
| Total Investments, at fair value | | | | $ | 24,444,040 | | | | | $ | — | | | | | $ | — | | | | | $ | 24,444,040 | | |
^
See Note 2, “Significant Accounting Policies” in the Notes to Financial Statements for additional information.
Transactions with Affiliates
An investment of at least 5% of the voting securities of an issuer, or a company which is under common control results in that issuer becoming an affiliated person as defined by the 1940 Act.
See Accompanying Notes to Financial Statements
PORTFOLIO OF INVESTMENTS
| Voya Index Solution 2060 Portfolio | as of December 31, 2017 (continued) |
The following table provides transactions during the year ended December 31, 2017, where the following issuers were considered an affiliate:
| Issuer | | | Beginning
Fair Value
at 12/31/2016 | | | Purchases
at Cost | | | Sales
at Cost | | | Change in
Unrealized
Appreciation/
(Depreciation) | | | Ending
Fair Value
at 12/31/17 | | | Investment
Income | | | Realized
Gains/
(Losses) | | | Net Capital
Gain
Distributions | |
| Voya Emerging Markets Index Portfolio - Class I | | | | $ | 353,873 | | | | | $ | 457,680 | | | | | $ | (817,384) | | | | | $ | 5,831 | | | | | $ | — | | | | | $ | — | | | | | $ | 5,359 | | | | | $ | — | | |
| Voya Emerging Markets Index Portfolio Class P2 | | | | | — | | | | | | 2,153,686 | | | | | | (286,405) | | | | | | 209,789 | | | | | | 2,077,070 | | | | | | 13,608 | | | | | | 64,742 | | | | | | — | | |
| Voya International Index Portfolio - Class I | | | | | 1,305,771 | | | | | | 1,192,548 | | | | | | (2,482,817) | | | | | | (15,502) | | | | | | — | | | | | | — | | | | | | 23,859 | | | | | | — | | |
| Voya International Index Portfolio Class P2 | | | | | — | | | | | | 5,632,075 | | | | | | (1,112,790) | | | | | | 365,339 | | | | | | 4,884,624 | | | | | | 59,201 | | | | | | 199,898 | | | | | | — | | |
| Voya Russell Mid Cap Index Portfolio Class P2 | | | | | — | | | | | | 2,784,765 | | | | | | (281,347) | | | | | | 165,544 | | | | | | 2,668,962 | | | | | | 17,882 | | | | | | 26,925 | | | | | | 81,947 | | |
| Voya Russell Small Cap Index Portfolio Class P2 | | | | | — | | | | | | 1,277,260 | | | | | | (135,961) | | | | | | 67,832 | | | | | | 1,209,131 | | | | | | 5,955 | | | | | | 16,121 | | | | | | 38,118 | | |
| Voya Russell™ Mid Cap Index Portfolio - Class I | | | | | 616,838 | | | | | | 600,631 | | | | | | (1,202,819) | | | | | | (14,650) | | | | | | — | | | | | | — | | | | | | 1,404 | | | | | | — | | |
| Voya Russell™ Small Cap Index Portfolio - Class I | | | | | 236,386 | | | | | | 318,838 | | | | | | (538,742) | | | | | | (16,482) | | | | | | — | | | | | | — | | | | | | 2,518 | | | | | | — | | |
| Voya U.S. Bond Index Portfolio - Class I | | | | | 154,501 | | | | | | 335,683 | | | | | | (492,022) | | | | | | 1,838 | | | | | | — | | | | | | 1,717 | | | | | | (1,615) | | | | | | — | | |
| Voya U.S. Bond Index Portfolio Class P2 | | | | | — | | | | | | 1,069,771 | | | | | | (89,641) | | | | | | (1,842) | | | | | | 978,288 | | | | | | 11,858 | | | | | | 654 | | | | | | 1,499 | | |
| Voya U.S. Stock Index Portfolio - Class I | | | | | 2,635,135 | | | | | | 2,652,058 | | | | | | (5,280,572) | | | | | | (6,621) | | | | | | — | | | | | | — | | | | | | 67,922 | | | | | | — | | |
| Voya U.S. Stock Index Portfolio Class P2 | | | | | — | | | | | | 11,180,183 | | | | | | (1,840,384) | | | | | | 523,543 | | | | | | 9,863,342 | | | | | | 157,079 | | | | | | 170,160 | | | | | | 302,280 | | |
| | | | | $ | 5,302,504 | | | | | $ | 29,655,178 | | | | | $ | (14,560,884) | | | | | $ | 1,284,619 | | | | | $ | 21,681,417 | | | | | $ | 267,300 | | | | | $ | 577,947 | | | | | $ | 423,844 | | |
| |
The financial statements for the above mutual fund[s] can be found at www.sec.gov.
At December 31, 2017, the aggregate cost of securities and other investments and the composition of unrealized appreciation and depreciation of securities and other investments at period end were:
| | Cost for federal income tax purposes was $22,992,512. | | |
| | Net unrealized appreciation consisted of: | | |
| | Gross Unrealized Appreciation | | | | $ | 1,459,382 | | |
| | Gross Unrealized Depreciation | | | | | (7,854) | | |
| | Net Unrealized Appreciation | | | | $ | 1,451,528 | | |
| | | | |
See Accompanying Notes to Financial Statements
TAX INFORMATION (Unaudited)
Dividends and distributions paid during the year ended December 31, 2017 were as follows:
| Portfolio Name | | | Type | | | Per Share
Amount | |
| Voya Index Solution Income Portfolio | |
| Class ADV | | | NII | | | | $ | 0.1611 | | |
| Class I | | | NII | | | | $ | 0.2170 | | |
| Class S | | | NII | | | | $ | 0.1888 | | |
| Class S2 | | | NII | | | | $ | 0.1753 | | |
| Class Z | | | NII | | | | $ | 0.2170 | | |
| All Classes | | | LTCG | | | | $ | 0.0473 | | |
| Voya Index Solution 2020 Portfolio | |
| Class ADV | | | NII | | | | $ | 0.0551 | | |
| Class I | | | NII | | | | $ | 0.0913 | | |
| Class S | | | NII | | | | $ | 0.0755 | | |
| Class S2 | | | NII | | | | $ | 0.0723 | | |
| Class Z | | | NII | | | | $ | 0.0913 | | |
| All Classes | | | STCG | | | | $ | 0.0439 | | |
| All Classes | | | LTCG | | | | $ | 0.0602 | | |
| Voya Index Solution 2025 Portfolio | |
| Class ADV | | | NII | | | | $ | 0.1362 | | |
| Class I | | | NII | | | | $ | 0.1896 | | |
| Class S | | | NII | | | | $ | 0.1623 | | |
| Class S2 | | | NII | | | | $ | 0.1490 | | |
| Class Z | | | NII | | | | $ | 0.1896 | | |
| All Classes | | | LTCG | | | | $ | 0.2133 | | |
| Voya Index Solution 2030 Portfolio | |
| Class ADV | | | NII | | | | $ | 0.0455 | | |
| Class I | | | NII | | | | $ | 0.0697 | | |
| Class S | | | NII | | | | $ | 0.0595 | | |
| Class S2 | | | NII | | | | $ | 0.0458 | | |
| Class Z | | | NII | | | | $ | 0.0699 | | |
| All Classes | | | STCG | | | | $ | 0.0315 | | |
| All Classes | | | LTCG | | | | $ | 0.0528 | | |
| Voya Index Solution 2035 Portfolio | |
| Class ADV | | | NII | | | | $ | 0.1331 | | |
| Class I | | | NII | | | | $ | 0.1850 | | |
| Class S | | | NII | | | | $ | 0.1579 | | |
| Class S2 | | | NII | | | | $ | 0.1469 | | |
| Class Z | | | NII | | | | $ | 0.1851 | | |
| All Classes | | | LTCG | | | | $ | 0.2727 | | |
| Portfolio Name | | | Type | | | Per Share
Amount | |
| Voya Index Solution 2040 Portfolio | |
| Class ADV | | | NII | | | | $ | 0.0512 | | |
| Class I | | | NII | | | | $ | 0.0741 | | |
| Class S | | | NII | | | | $ | 0.0639 | | |
| Class S2 | | | NII | | | | $ | 0.0611 | | |
| Class Z | | | NII | | | | $ | 0.0743 | | |
| All Classes | | | STCG | | | | $ | 0.0358 | | |
| All Classes | | | LTCG | | | | $ | 0.0583 | | |
| Voya Index Solution 2045 Portfolio | |
| Class ADV | | | NII | | | | $ | 0.1237 | | |
| Class I | | | NII | | | | $ | 0.1774 | | |
| Class S | | | NII | | | | $ | 0.1519 | | |
| Class S2 | | | NII | | | | $ | 0.1372 | | |
| Class Z | | | NII | | | | $ | 0.1774 | | |
| All Classes | | | LTCG | | | | $ | 0.3156 | | |
| Voya Index Solution 2050 Portfolio | |
| Class ADV | | | NII | | | | $ | 0.0426 | | |
| Class I | | | NII | | | | $ | 0.0658 | | |
| Class S | | | NII | | | | $ | 0.0564 | | |
| Class S2 | | | NII | | | | $ | 0.0511 | | |
| Class Z | | | NII | | | | $ | 0.0662 | | |
| All Classes | | | STCG | | | | $ | 0.0228 | | |
| All Classes | | | LTCG | | | | $ | 0.0615 | | |
| Voya Index Solution 2055 Portfolio | |
| Class ADV | | | NII | | | | $ | 0.1367 | | |
| Class I | | | NII | | | | $ | 0.1957 | | |
| Class S | | | NII | | | | $ | 0.1694 | | |
| Class S2 | | | NII | | | | $ | 0.1522 | | |
| Class Z | | | NII | | | | $ | 0.1958 | | |
| All Classes | | | STCG | | | | $ | 0.0100 | | |
| All Classes | | | LTCG | | | | $ | 0.3010 | | |
| Voya Index Solution 2060 Portfolio | |
| Class ADV | | | NII | | | | $ | 0.0317 | | |
| Class I | | | NII | | | | $ | 0.0489 | | |
| Class S | | | NII | | | | $ | 0.0429 | | |
| Class S2 | | | NII | | | | $ | 0.0450 | | |
| Class Z | | | NII | | | | $ | 0.0495 | | |
| All Classes | | | STCG | | | | $ | 0.0412 | | |
| All Classes | | | LTCG | | | | $ | 0.0504 | | |
NII – Net investment income
STCG – Short-term capital gain
LTCG – Long-term capital gain
TAX INFORMATION (Unaudited) (continued)
Of the ordinary distributions made during the year ended December 31, 2017, the following percentages qualify for the dividends received deduction (DRD) available to corporate shareholders:
| | Voya Index Solution Income Portfolio | | | | | 25.93% | | |
| | Voya Index Solution 2020 Portfolio | | | | | 31.00% | | |
| | Voya Index Solution 2025 Portfolio | | | | | 41.22% | | |
| | Voya Index Solution 2030 Portfolio | | | | | 39.11% | | |
| | Voya Index Solution 2035 Portfolio | | | | | 53.86% | | |
| | Voya Index Solution 2040 Portfolio | | | | | 45.36% | | |
| | Voya Index Solution 2045 Portfolio | | | | | 62.83% | | |
| | Voya Index Solution 2050 Portfolio | | | | | 49.50% | | |
| | Voya Index Solution 2055 Portfolio | | | | | 60.97% | | |
| | Voya Index Solution 2060 Portfolio | | | | | 37.35% | | |
The Portfolios designate the following amounts of long-term capital gain distributions as 20% rate long-term capital gain dividends under Internal Revenue Code Section 852(b)(3)(C):
| | Voya Index Solution Income Portfolio | | | | $ | 2,074,797 | | |
| | Voya Index Solution 2020 Portfolio | | | | $ | 872,083 | | |
| | Voya Index Solution 2025 Portfolio | | | | $ | 14,491,619 | | |
| | Voya Index Solution 2030 Portfolio | | | | $ | 805,931 | | |
| | Voya Index Solution 2035 Portfolio | | | | $ | 16,065,893 | | |
| | Voya Index Solution 2040 Portfolio | | | | $ | 531,121 | | |
| | Voya Index Solution 2045 Portfolio | | | | $ | 11,854,338 | | |
| | Voya Index Solution 2050 Portfolio | | | | $ | 319,502 | | |
| | Voya Index Solution 2055 Portfolio | | | | $ | 3,003,954 | | |
| | Voya Index Solution 2060 Portfolio | | | | $ | 69,639 | | |
The Regulated Investment Company Modernization Act of 2010 allows qualified fund-of-funds to elect to pass through the ability to take foreign tax credits (or deductions) to the extent that foreign taxes are passed through from underlying funds. A qualified fund-of-funds is a regulated investment company that has at least 50% of the value of its total assets invested in other regulated investment companies at the end of each quarter of the taxable year. Pursuant to Section 853 of the Internal Revenue Code, the Portfolios designate the following amounts as foreign taxes paid for the year ended December 31, 2017:
| | | | Creditable
Foreign Taxes
Paid | | | Per Share
Amount | | | Portion of Ordinary Income
Distribution Derived from
Foreign Sourced Income* | |
| Voya Index Solution Income Portfolio | | | | $ | 73,761 | | | | | $ | 0.0016 | | | | | | 6.31% | | |
| Voya Index Solution 2020 Portfolio | | | | $ | 52,505 | | | | | $ | 0.0029 | | | | | | 5.88% | | |
| Voya Index Solution 2025 Portfolio | | | | $ | 238,887 | | | | | $ | 0.0031 | | | | | | 13.20% | | |
| Voya Index Solution 2030 Portfolio | | | | $ | 104,346 | | | | | $ | 0.0053 | | | | | | 10.67% | | |
| Voya Index Solution 2035 Portfolio | | | | $ | 291,906 | | | | | $ | 0.0044 | | | | | | 19.20% | | |
| Voya Index Solution 2040 Portfolio | | | | $ | 78,621 | | | | | $ | 0.0067 | | | | | | 12.82% | | |
| Voya Index Solution 2045 Portfolio | | | | $ | 218,822 | | | | | $ | 0.0052 | | | | | | 23.27% | | |
| Voya Index Solution 2050 Portfolio | | | | $ | 53,097 | | | | | $ | 0.0075 | | | | | | 14.29% | | |
| Voya Index Solution 2055 Portfolio | | | | $ | 81,415 | | | | | $ | 0.0070 | | | | | | 24.61% | | |
| Voya Index Solution 2060 Portfolio | | | | $ | 10,189 | | | | | $ | 0.0053 | | | | | | 8.06% | | |
*
None of the Portfolios listed above derived any income from ineligible foreign sources as defined under Section 901(j) of the Internal Revenue Code.
TAX INFORMATION (Unaudited) (continued)
Foreign taxes paid or withheld must be included in taxable income with an offsetting deduction from gross income or as a credit for taxes paid to foreign governments. Shareholders are strongly advised to consult their own tax advisors regarding the appropriate treatment of foreign taxes paid.
Above figures may differ from those cited elsewhere in this report due to differences in the calculation of income and gains under U.S. generally accepted accounting principles (book) purposes and Internal Revenue Service (tax) purposes.
Shareholders are strongly advised to consult their own tax advisers with respect to the tax consequences of their investments in the Portfolios. In January, shareholders, excluding corporate shareholders, receive an IRS 1099-DIV regarding the federal tax status of the dividends and distributions they received in the calendar year.
DIRECTOR AND OFFICER INFORMATION (Unaudited)
The business and affairs of the Company are managed under the direction of the Board. A Director, who is not an interested person of the Company, as defined in the 1940 Act, is an independent director (“Independent Director”). The Directors and Officers of the Company are listed below. The Statement of Additional Information includes additional information about directors of the Company and is available, without charge, upon request at (800) 262-3862.
| | Name, Address and Age | | | Position(s)
Held with the
Company | | | Term of Office and
Length of Time
Served(1) | | | Principal
Occupation(s) –
During the Past 5 Years | | | Number of
funds
in Fund
Complex
Overseen
by Director(2) | | | Other Board Positions
Held by Director | |
| | Independent Directors*: | |
| | Colleen D. Baldwin
7337 East Doubletree Ranch Rd.
Suite 100
Scottsdale, Arizona 85258
Age: 57 | | | Director | | | November 2007 – Present | | | President, Glantuam Partners, LLC, a business consulting firm (January 2009 – Present). | | | 151 | | | DSM/Dentaquest, Boston, MA (February 2014 – Present). | |
| | John V. Boyer
7337 East Doubletree Ranch Rd.
Suite 100
Scottsdale, Arizona 85258
Age: 64 | | | Chairperson
Director | | | January 2014 – Present November 1997 – Present | | | President and Chief Executive Officer, Bechtler Arts Foundation, an arts and education foundation (January 2008 – Present). | | | 151 | | | None. | |
| | Patricia W. Chadwick
7337 East Doubletree Ranch Rd.
Suite 100
Scottsdale, Arizona 85258
Age: 69 | | | Director | | | January 2006 – Present | | | Consultant and President, Ravengate Partners LLC, a consulting firm that provides advice regarding financial markets and the global economy (January 2000 – Present). | | | 151 | | | Wisconsin Energy Corporation (June 2006 – Present); The Royce Funds (23 funds) (December 2009 – Present); and AMICA Mutual Insurance Company (1992 – Present). | |
| | Martin J. Gavin
7337 East Doubletree Ranch Rd.
Suite 100
Scottsdale, AZ 85258
Age: 67 | | | Director | | | August 2015 – Present | | | Retired. Formerly, President and Chief Executive Officer, Connecticut Children’s Medical Center (May 2006 – November 2015). | | | 151 | | | None. | |
| | Russell H. Jones
7337 East Doubletree Ranch Rd.
Suite 100
Scottsdale, Arizona 85258
Age: 73 | | | Director | | | May 2013 – Present | | | Retired. | | | 151 | | | None. | |
| | Patrick W. Kenny
7337 East Doubletree Ranch Rd.
Suite 100
Scottsdale, Arizona 85258
Age: 75 | | | Director | | | March 2002 – Present | | | Retired. | | | 151 | | | Assured Guaranty Ltd. (April 2004 – Present). | |
| | Joseph E. Obermeyer
7337 East Doubletree Ranch Rd.
Suite 100
Scottsdale, Arizona 85258
Age: 60 | | | Director | | | May 2013 – Present | | | President, Obermeyer & Associates, Inc., a provider of financial and economic consulting services (November 1999 – Present). | | | 151 | | | None. | |
| | Sheryl K. Pressler
7337 East Doubletree Ranch Rd.
Suite 100
Scottsdale, Arizona 85258
Age: 67 | | | Director | | | January 2006 – Present | | | Consultant (May 2001 – Present). | | | 151 | | | None. | |
DIRECTOR AND OFFICER INFORMATION (Unaudited) (continued)
| | Name, Address and Age | | | Position(s)
Held with the
Company | | | Term of Office and
Length of Time
Served(1) | | | Principal
Occupation(s) –
During the Past 5 Years | | | Number of
funds
in Fund
Complex
Overseen
by Director(2) | | | Other Board Positions
Held by Director | |
| | Christopher P. Sullivan
7337 East Doubletree Ranch Rd.
Suite 100
Scottsdale, Arizona 85258
Age: 64 | | | Director | | | October 2015 – Present | | | Retired. Formerly, President, Bond Division, Fidelity Management and Research (June 2009 – September 2012). | | | 151 | | | None. | |
| | Roger B. Vincent
7337 East Doubletree Ranch Rd.
Suite 100
Scottsdale, Arizona 85258
Age: 72 | | | Director | | | January 2005 – Present | | | Retired. | | | 151 | | | None. | |
| | Director who is an “interested person”: | | | | | |
| | Shaun P. Mathews(3)
7337 East Doubletree Ranch Rd.
Suite 100
Scottsdale, Arizona 85258
Age: 62 | | | Director | | | November 2007 – Present | | | President and Chief Executive Officer, Voya Investments, LLC (December 2006 – Present). | | | 151 | | | Voya Capital Corporation, LLC and Voya Investments Distributor, LLC (December 2005 – Present); Voya Funds Services, LLC, Voya Investments, LLC and Voya Investment Management (March 2006 – Present); and Voya Investment Trust Co. (April 2009 – Present). | |
(1)
Directors serve until their successors are duly elected and qualified. The tenure of each Director who is not an “interested person” as defined in the 1940 Act, of each Portfolio (“Independent Director”) is subject to the Board’s retirement policy which states that each duly elected or appointed Independent Director shall retire from and cease to be a member of the Board of Directors at the close of business on December 31 of the calendar year in which the Independent Director attains the age of 75. A majority vote of the Board’s other Independent Directors may extend the retirement date of an Independent Director if the retirement would trigger a requirement to hold a meeting of shareholders of the Company under applicable law, whether for the purposes of appointing a successor to the Independent Director or otherwise comply under applicable law, in which case the extension would apply until such time as the shareholder meeting can be held or is no longer required (as determined by a vote of a majority of the other Independent Directors).
(2)
For the purposes of this table, “Fund Complex” means the Voya family of funds including the following investment companies: Voya Asia Pacific High Dividend Equity Income Fund; Voya Balanced Portfolio, Inc.; Voya Emerging Markets High Dividend Equity Fund; Voya Equity Trust; Voya Funds Trust; Voya Global Advantage and Premium Opportunity Fund; Voya Global Equity Dividend and Premium Opportunity Fund; Voya Government Money Market Portfolio; Voya Infrastructure, Industrials and Materials Fund; Voya Intermediate Bond Portfolio; Voya International High Dividend Equity Income Fund; Voya Investors Trust; Voya Mutual Funds; Voya Natural Resources Equity Income Fund; Voya Partners, Inc.; Voya Prime Rate Trust; Voya Senior Income Fund; Voya Separate Portfolios Trust; Voya Series Fund, Inc.; Voya Strategic Allocation Portfolios, Inc.; Voya Variable Funds; Voya Variable Insurance Trust; Voya Variable Portfolios, Inc.; and Voya Variable Products Trust. The number of funds in the Fund Complex is as of January 31, 2018.
(3)
Mr. Mathews is deemed to be an “interested person” of the Company as defined in the 1940 Act, because of his current affiliation with the Voya funds, Voya Financial, Inc., or Voya Financial, Inc.’s affiliates.
*
Effective December 31, 2017, Peter S. Drotch retired as a Director of the Board.
DIRECTOR AND OFFICER INFORMATION (Unaudited) (continued)
| | Name, Address and Age | | | Position(s) Held
With the Company | | | Term of Office and
Length of Time Served(1) | | | Principal Occupation(s) –
During the Past 5 Years | |
| | Shaun P. Mathews
7337 East Doubletree Ranch Rd.
Suite 100
Scottsdale, Arizona 85258
Age: 62 | | | President and Chief Executive Officer | | | November 2006 – Present | | | President and Chief Executive Officer, Voya Investments, LLC (December 2006 – Present). | |
| | Michael J. Roland
7337 East Doubletree Ranch Rd.
Suite 100
Scottsdale, Arizona 85258
Age: 59 | | | Executive Vice President | | | January 2005 – Present | | | Managing Director and Chief Operating Officer, Voya Investments, LLC and Voya Funds Services, LLC (March 2012 – Present). Formerly, Chief Compliance Officer, Directed Services LLC and Voya Investments, LLC (March 2011 – December 2013). | |
| | Stanley D. Vyner
230 Park Avenue
New York, New York 10169
Age: 67 | | | Executive Vice President
Chief Investment Risk Officer | | | January 2005 – Present
September 2009 – Present | | | Executive Vice President, Voya Investments, LLC (July 2000 – Present) and Chief Investment Risk Officer, Voya Investments, LLC (January 2003 – Present). | |
| | Kevin M. Gleason
7337 East Doubletree Ranch Rd.
Suite 100
Scottsdale, Arizona 85258
Age: 51 | | | Chief Compliance Officer | | | February 2012 – Present | | | Senior Vice President, Voya Investment Management and Chief Compliance Officer, Voya Family of Funds (February 2012 – Present). | |
| | Todd Modic
7337 East Doubletree Ranch Rd.
Suite 100
Scottsdale, Arizona 85258
Age: 50 | | | Senior Vice President, Chief/Principal Financial Officer and Assistant Secretary | | | March 2005 – Present | | | Senior Vice President, Voya Investments, LLC and Voya Funds Services, LLC (April 2005 – Present). | |
| | Kimberly A. Anderson
7337 East Doubletree Ranch Rd.
Suite 100
Scottsdale, Arizona 85258
Age: 53 | | | Senior Vice President | | | January 2005 – Present | | | Senior Vice President, Voya Investments, LLC (September 2003 – Present). | |
| | Robert Terris
7337 East Doubletree Ranch Rd.
Suite 100
Scottsdale, Arizona 85258
Age: 47 | | | Senior Vice President | | | May 2006 – Present | | | Senior Vice President, Head of Division Operations, Voya Investments, LLC (October 2015 – Present) and Voya Funds Services, LLC (March 2006 – Present). | |
| | Fred Bedoya
7337 East Doubletree Ranch Rd.
Suite 100
Scottsdale, Arizona 85258
Age: 45 | | | Vice President and Treasurer | | | September 2012 – Present | | | Vice President, Voya Investments, LLC (October 2015 – Present) and Voya Funds Services, LLC (July 2012 – Present). | |
| | Maria M. Anderson
7337 East Doubletree Ranch Rd.
Suite 100
Scottsdale, Arizona 85258
Age: 59 | | | Vice President | | | January 2005 – Present | | | Vice President, Voya Investments, LLC (October 2015 – Present) and Voya Funds Services, LLC (September 2004 – Present). | |
| | Lauren D. Bensinger
7337 East Doubletree Ranch Rd.
Suite 100
Scottsdale, Arizona 85258
Age: 64 | | | Vice President | | | January 2005 – Present | | | Vice President, Voya Funds Services, LLC (February 1996 – Present) and Voya Investments, LLC (October 2004 – Present); Vice President and Anti-Money Laundering Officer, Voya Investments Distributor, LLC (April 2010 – Present). Anti-Money Laundering Officer, Voya Financial, Inc. (January 2013 – Present); and Anti-Money Laundering Officer, Voya Investment Management Trust Co. (October 2012 – Present). | |
| | Sara M. Donaldson
7337 East Doubletree Ranch Rd.
Suite 100
Scottsdale, Arizona 85258
Age: 58 | | | Vice President | | | September 2014 – Present | | | Vice President, Voya Investments, LLC (October 2015 – Present). Formerly, Vice President, Voya Funds Services, LLC (April 2014 – October 2015). Formerly, Director, Compliance, AXA Rosenberg Global Services, LLC (September 1997 – March 2014). | |
DIRECTOR AND OFFICER INFORMATION (Unaudited) (continued)
| | Name, Address and Age | | | Position(s) Held
With the Company | | | Term of Office and
Length of Time Served(1) | | | Principal Occupation(s) –
During the Past 5 Years | |
| | Micheline S. Favor
7337 East Doubletree Ranch Rd.
Suite 100
Scottsdale, Arizona 85258
Age: 40 | | | Vice President | | | September 2016 – Present | | | Vice President, Head of Fund Compliance, Voya Investments LLC, and Chief Compliance Officer for Voya Investments, LLC and Directed Services, LLC (June 2016 – Present). Formerly, Vice President, Mutual Fund Compliance (March 2014 – June2016); Assistant Vice President, Mutual Fund Compliance (May 2013 – March 2014); Assistant Vice President, Senior Project Manager (May 2008 – May 2013). | |
| | Robyn L. Ichilov
7337 East Doubletree Ranch Rd.
Suite 100
Scottsdale, Arizona 85258
Age: 50 | | | Vice President | | | January 2005 – Present | | | Vice President, Voya Funds Services, LLC (November 1995 – Present) and Voya Investments, LLC (August 1997 – Present). | |
| | Jason Kadavy
7337 East Doubletree Ranch Rd.
Suite 100
Scottsdale, Arizona 85258
Age: 41 | | | Vice President | | | September 2012 – Present | | | Vice President, Voya Investments, LLC (October 2015 – Present) and Voya Funds Services, LLC (July 2007 – Present). | |
| | Kimberly K. Springer
7337 East Doubletree Ranch Rd.
Suite 100
Scottsdale, Arizona 85258
Age: 60 | | | Vice President | | | March 2006 – Present | | | Vice President – Mutual Fund Product Development, Voya Investments, LLC (July 2012 – Present); Vice President, Voya Family of Funds (March 2010 – Present) and Vice President, Voya Funds Services, LLC (March 2006 – Present). | |
| | Craig Wheeler
7337 East Doubletree Ranch Rd.
Suite 100
Scottsdale, Arizona 85258
Age: 48 | | | Vice President | | | May 2013 – Present | | | Vice President – Director of Tax, Voya Investments, LLC (October 2015 – Present). Formerly, Vice President – Director of Tax, Voya Funds Services, LLC (March 2013 – October 2015). Formerly, Assistant Vice President – Director of Tax, Voya Funds Services, LLC (March 2008 – February 2013). | |
| | Huey P. Falgout, Jr.
7337 East Doubletree Ranch Rd.
Suite 100
Scottsdale, Arizona 85258
Age: 54 | | | Secretary | | | August 2003 – Present | | | Senior Vice President and Chief Counsel, Voya Investment Management – Mutual Fund Legal Department (March 2010 – Present). | |
| | Paul A. Caldarelli
7337 East Doubletree Ranch Rd.
Suite 100
Scottsdale, Arizona 85258
Age: 66 | | | Assistant Secretary | | | June 2010 – Present | | | Vice President and Senior Counsel, Voya Investment Management – Mutual Fund Legal Department (March 2010 – Present). | |
| | Theresa K. Kelety
7337 East Doubletree Ranch Rd.
Suite 100
Scottsdale, Arizona 85258
Age: 55 | | | Assistant Secretary | | | August 2003 – Present | | | Vice President and Senior Counsel, Voya Investment Management – Mutual Fund Legal Department (March 2010 – Present). | |
(1)
The Officers hold office until the next annual meeting of the Board of Directors and until their successors shall have been elected and qualified.
ADVISORY AND SUB-ADVISORY CONTRACT APPROVAL DISCUSSION (Unaudited)
BOARD CONSIDERATION AND APPROVAL OF INVESTMENT Management Contracts AND
SUB-ADVISORY CONTRACTS
At a meeting held on November 16, 2017, the Board, including a majority of the Independent Directors, considered and approved the renewal of the investment management contracts (the “Management Contracts”) between Voya Investments, LLC (the “Manager”) and Voya Partners, Inc. (the “Company”), on behalf of Voya Index Solution 2020 Portfolio, Voya Index Solution 2025 Portfolio, Voya Index Solution 2030 Portfolio, Voya Index Solution 2035 Portfolio, Voya Index Solution 2040 Portfolio, Voya Index Solution 2045 Portfolio, Voya Index Solution 2050 Portfolio, Voya Index Solution 2055 Portfolio, Voya Index Solution 2060 Portfolio, and Voya Index Solution Income Portfolio, each a series of the Company (“the Portfolios”), and the sub-advisory contracts (the “Sub-Advisory Contracts”) with Voya Investment Management Co. LLC, the sub-adviser to each Portfolio (the “Sub-Adviser”), for an additional one year period ending November 30, 2018. In determining to renew such contracts, the Board took into account information furnished to it throughout the year at meetings of the Board and its committees, including regarding performance, expenses, and other matters.
In addition to the Board meeting on November 16, 2017, the Independent Directors also held meetings outside the presence of personnel representing the Manager or Sub-Adviser (collectively, such persons are referred to herein as “Management”) on October 12, 2017, and November 14, 2017, specifically to review and consider materials related to the proposed continuance of each Management Contract and Sub-Advisory Contract that they believed to be relevant to the renewal of the Management Contracts and Sub-Advisory Contracts in light of the legal advice furnished to them by K&L Gates LLP, their independent legal counsel, and their own business judgment. Subsequent references herein to factors considered and determinations made by the Independent Directors and/or the Board include, as applicable, factors considered and determinations made at those meetings by the Independent Directors. While the Board considered the renewal of the management contracts and sub-advisory contracts for all of the applicable investment companies in the Voya family of funds at the same meetings, the Board considered each Voya fund’s investment management and sub-advisory relationships separately.
The Board follows a structured process pursuant to which it seeks and considers relevant information when it evaluates whether to renew existing investment management and sub-advisory contracts for the Voya funds. The Board has established a Contracts Committee and three Investment Review Committees (the “IRCs”),
each of which includes only Independent Directors as members. The Contracts Committee provides oversight with respect to the management and sub-advisory contracts approval and renewal process, and each IRC provides oversight throughout the year regarding the investment performance of the sub-adviser, as well as the Manager’s role in monitoring the sub-adviser, with respect to each Voya fund that is assigned to that IRC.
The Contracts Committee oversees, and annually recommends Board approval of updates to, a methodology guide for the Voya funds (“Methodology Guide”). The Methodology Guide sets out a framework pursuant to which the Independent Directors request, and Management provides, certain information that the Independent Directors deem to be important or potentially relevant. The Independent Directors retain the services of an independent consultant with experience in the mutual fund industry to assist the Contracts Committee in developing and recommending to the Board: (1) a selected peer group of investment companies for each Portfolio (“Selected Peer Group”) based on that Portfolio’s particular attributes, such as fund type and size, fund category (as determined by Morningstar, Inc., an independent provider of mutual fund data (“Morningstar”)), sales channels and structure and the Portfolio share class being compared to the Selected Peer Group, and (2) updates to the Methodology Guide with respect to the content and format of various data including, but not limited to, investment performance, fee structure, and expense information prepared in connection with the renewal process.
Provided below is an overview of certain material factors that the Board considered at its meetings regarding the renewal of the Management Contracts and Sub-Advisory Contracts and the compensation to be paid thereunder. Board members did not identify any particular information or factor that was overarching, and each Board member may have accorded different weight to the various factors in reaching his or her conclusions with respect to each Portfolio’s investment management and sub-advisory arrangements.
Nature, Extent and Quality of Services
The Manager oversees, subject to the authority of the Board, the provision of all investment advisory and portfolio management services for the Portfolios, but may delegate certain of these responsibilities to one or more sub-advisers. In addition, the Manager provides administrative services reasonably necessary for the operation of the Portfolios as set forth in the Management Contracts, including oversight of the Portfolios’ operations and risk management and the oversight of their various other service providers.
ADVISORY AND SUB-ADVISORY CONTRACT APPROVAL DISCUSSION (Unaudited) (continued)
The Board considered the “manager-of-managers” platform of the Voya funds that has been developed by the Manager pursuant to which the Manager selects, subject to the Board’s approval, experienced sub-advisers to provide day-to-day management services to all or a portion of each Voya fund. The Board recognized that the Manager is responsible for monitoring the investment program, performance, developments, ongoing operations, and regulatory compliance of the Sub-Adviser with respect to the Portfolios under this manager-of-managers arrangement. The Board also considered the techniques and resources that the Manager has developed to provide this ongoing oversight and due diligence with respect to the sub-advisers and to advocate or recommend, when it believes appropriate, changes in investment strategies or investment sub-advisers designed to assist in improving a Voya fund’s performance. The Board was advised that, in connection with the Manager’s performance of these duties, the Manager has developed an oversight process formulated by its Manager Research & Selection Group which reviews, among other matters, performance data, the Sub-Adviser’s management team, portfolio data and attribution analysis related to the Sub-Adviser through various means, including, but not limited to, in-person meetings, on-site visits, and telephonic meetings with the Sub-Adviser.
Further, the Board considered periodic compliance reports it receives from the Company’s Chief Compliance Officer evaluating whether the regulatory compliance systems and procedures of the Manager and the Sub-Adviser are reasonably designed to ensure compliance with the federal securities laws and whether the investment policies and restrictions for each Portfolio are consistently complied with, and other periodic reports covering related matters.
The Board considered the portfolio management team assigned by the Sub-Adviser to the Portfolios and the level of resources committed to the Portfolios (and other relevant funds in the Voya funds) by the Manager and the Sub-Adviser, and whether those resources are sufficient to provide high-quality services to the Portfolios.
Based on their deliberations and the materials presented to them, the Board concluded that the nature, extent and quality of the overall services provided by the Manager and the Sub-Adviser under the Management Contracts and Sub-Advisory Contracts were appropriate.
Portfolio Performance
In assessing investment management and sub-advisory relationships, the Board placed emphasis on the investment returns of each Portfolio, including its investment performance over certain time periods
compared to the Portfolio’s Morningstar category, Selected Peer Group and primary benchmark. The Board also considered information from the Manager Research & Selection Group and received reports summarizing a separate analysis of each Portfolio’s performance and risk, including risk-adjusted investment return information, by the Company’s Chief Investment Risk Officer.
Economies of Scale
When evaluating the reasonableness of management fee schedules, the Board considered whether economies of scale have been or likely will be realized by the Manager and the Sub-Adviser as a Portfolio grows larger and the extent to which any such economies are reflected in contractual fee schedules. In this regard, the Board considered that, while the Portfolios do not have management fee breakpoints, they do have fee waiver and expense reimbursement arrangements. The Board considered the extent to which economies of scale realized by the Manager or the Sub-Adviser could be shared with each Portfolio through such fee waivers, expense reimbursements or other expense reductions. In evaluating these matters, the Independent Directors also considered periodic management reports, Selected Peer Group comparisons, and industry information regarding economies of scale.
Information Regarding Services to Other Clients
The Board considered information regarding the nature of services, performance, and fee schedules offered by the Manager and the Sub-Adviser to other clients with similar investment objectives, if applicable, including other registered investment companies and relevant institutional accounts. When the fee schedules offered to or the performance of other clients differed materially from a Portfolio, the Board took into account the underlying rationale provided by the Manager or the Sub-Adviser, as applicable, for these differences. The Board also considered that the fee schedules charged to the Portfolios and other institutional clients of the Manager or the Sub-Adviser (including other investment companies) and the performance of the Portfolios and the other accounts, as applicable, may differ materially due to, among other reasons: differences in services; different regulatory requirements associated with registered investment companies; market differences in fee schedules that existed when a Portfolio first was organized; differences in the original sponsors; investment capacity constraints that existed when certain contracts were first agreed upon or that might exist at present; and different pricing structures that are necessary to be competitive in different marketing channels.
ADVISORY AND SUB-ADVISORY CONTRACT APPROVAL DISCUSSION (Unaudited) (continued)
Fee Schedules, Profitability, and Fall-out Benefits
The Board reviewed and considered the contractual management fee schedule payable by each Portfolio to the Manager compared to the Portfolio’s Selected Peer Group. In addition, the Board considered certain Portfolio’s contractual management fee schedule compared to, for a retail fund, an additional peer group of funds that a business channel has identified as direct competitors or, in the case of an insurance dedicated third-party sub-advisedfund, other funds the sub-adviser manages and/or their proprietary fund (if applicable) identified by the Manager. The Board also considered the contractual sub-advisoryfee schedule payable by the Manager to the Sub-Adviser for sub-advisory services for each Portfolio, including the portion of the contractual management fee rates that are paid to the Sub-Adviser, as compared to the portion retained by the Manager. In addition, the Board considered any fee waivers, expense limitations, and/or recoupment arrangements that apply to the fees payable by the Portfolios, including whether the Manager intends to propose any changes thereto. For each Portfolio, the Board separately determined that the fees payable to the Manager and the fee schedule payable to the Sub-Adviser are reasonable for the services that each performs, which were considered in light of the nature, extent and quality of the services that each has performed and is expected to perform.
For each Portfolio, the Board considered information on revenues, costs and profits or losses realized by the Manager and the Voya-affiliated Sub-Adviser. In analyzing the profitability of the Manager and its affiliated service providers in connection with services they render to a Portfolio, the Board took into account the sub-advisory fee rate payable by the Manager to the Sub-Adviser. The Board also considered the profitability of the Manager and its affiliated Sub-Adviser attributable to servicing each Portfolio both with and without taking into account the profitability of the distributor of the Portfolios and both before and after giving effect to any expenses incurred by the Manager or the affiliated Sub-Adviser in making payments to affiliated insurance companies.
Although the Methodology Guide establishes a framework for profit calculation, the Board recognized that there is no uniform methodology within the asset management industry for determining profitability for this purpose. The Board also recognized that the use of different reasonable methodologies can give rise to dramatically different reported profit and loss results with respect to the Manager and the Voya-affiliated Sub-Adviser, as well as other industry participants with whom the profits of the Manager and its affiliated Sub-Adviser could be compared. In addition, the Board recognized that Management’s
calculations regarding its costs incurred in establishing the infrastructure necessary for the Portfolios’ operations may not be fully reflected in the expenses allocated to each Portfolio in determining profitability, and that the information presented may not portray all of the costs borne by the Manager or reflect all risks, including entrepreneurial, regulatory, legal and operational risks, associated with offering and managing a mutual fund complex in the current regulatory and market environment.
The Board also considered that the Manager is entitled to earn a reasonable level of profits for the services that it provides to the Portfolios. The Board also received information regarding the potential fall-out benefits to the Manager and Sub-Adviser and their respective affiliates from their association with the Portfolios, including their ability to engage in soft-dollar transactions on behalf of the Portfolios. Following its reviews, the Board determined that the Manager’s and the Voya-affiliated Sub-Adviser’s profitability with respect to their services to the Portfolios and the Manager and Sub-Adviser’s potential fall-out benefits were not unreasonable.
Portfolio-by-Portfolio Analysis
Set forth below are certain of the specific factors that the Board considered, and the conclusions reached, at its October 12, 2017, November 14, 2017, and/or November 16, 2017 meetings in relation to approving each Portfolio’s Management Contracts and Sub-Advisory Contracts. These specific factors are in addition to those considerations discussed above. In each case, the Portfolio’s performance was compared to its Morningstar category, as well as its primary benchmark, a broad-based securities market index that appears in the Portfolio’s prospectus. With respect to Morningstar quintile rankings, the first quintile represents the highest (best) performance and the fifth quintile represents the lowest performance. The performance data provided to the Board primarily was for various periods ended March 31, 2017. In addition, the Board also considered at its October 12, 2017, November 14, 2017, and November 16, 2017 meetings certain additional data regarding performance and Portfolio asset levels and flows as of August 31, 2017, and September 30, 2017. Each Portfolio’s management fee rate and expense ratio were compared to the fees and expense ratios of the funds in its Selected Peer Group.
Voya Index Solution 2020 Portfolio
In considering whether to approve the renewal of the Management and Sub-Advisory Contracts for Voya Index Solution 2020 Portfolio, the Board considered that, based on performance data for the periods ended March 31, 2017: (1) the Portfolio outperformed its Morningstar category average for all periods presented, with the
ADVISORY AND SUB-ADVISORY CONTRACT APPROVAL DISCUSSION (Unaudited) (continued)
exception of the year-to-date period, during which it underperformed; (2) the Portfolio underperformed its primary benchmark for all periods presented; and (3) the Portfolio is ranked in the second quintile of its Morningstar category for the three-year and five-year periods, the third quintile for the one-year period, and the fourth quintile for the year-to-date period.
In analyzing this performance data, the Board took into account Management’s representations regarding the competitiveness of the Portfolio’s performance during certain periods.
In considering the fees payable under the Management and Sub-Advisory Contracts for the Portfolio, the Board took into account the factors described above and also considered: (1) the fairness of the compensation under a Management Contract with a level fee rate that does not include breakpoints; and (2) the pricing structure (including the net expense ratio to be borne by shareholders) of the Portfolio, as compared to its Selected Peer Group, including that: (a) the contractual management fee rate for the Portfolio is above the median and equal to the average management fee rates of the funds in its Selected Peer Group; and (b) the all-in net expense ratio for the Portfolio, inclusive of the Acquired Fund Fees and Expenses (“AFFE”), is equal to the median and above the average all-in net expense ratios of the funds in its Selected Peer Group, and the net expense ratio for the Portfolio, not inclusive of AFFE, is above the median and the average net expense ratios of the funds in its Selected Peer Group.
In analyzing this fee data, the Board took into account: (1) that the Portfolio indirectly bears the fees payable by the underlying funds in which the Portfolio invests; (2) that, as directed by the Board during the 2016 annual contract renewal cycle, lower expense limits were implemented for the Portfolio, effective May 1, 2017; and (3) Management’s representations regarding the competitiveness of the Portfolio’s management fee rate and net expense ratio when compared to peers identified by Management.
After its deliberation, the Board reached the following conclusions: (1) the Portfolio’s management fee rate is reasonable in the context of all factors considered by the Board; (2) the Portfolio’s net expense ratio is reasonable in the context of all factors considered by the Board; (3) the Portfolio’s performance is reasonable in the context of all factors considered by the Board; and (4) the sub-advisory fee rate payable by the Manager to the Sub-Adviser is reasonable in the context of all factors considered by the Board. Based on these conclusions and other factors, the Board voted to renew the Management and Sub-Advisory Contracts for the Portfolio for the year ending November 30, 2018. During this renewal process, different
Board members may have given different weight to different individual factors and related conclusions.
Voya Index Solution 2025 Portfolio
In considering whether to approve the renewal of the Management and Sub-Advisory Contracts for Voya Index Solution 2025 Portfolio, the Board considered that, based on performance data for the periods ended March 31, 2017: (1) the Portfolio outperformed its Morningstar category average for all periods presented, with the exception of the year-to-date period, during which it underperformed; (2) the Portfolio underperformed its primary benchmark for all periods presented, with the exception of the year-to-date period, during which it outperformed; and (3) the Portfolio is ranked in the second quintile of its Morningstar category for the one-year, three-year and five-year periods, and the third quintile for the year-to-date period.
In considering the fees payable under the Management and Sub-Advisory Contracts for the Portfolio, the Board took into account the factors described above and also considered: (1) the fairness of the compensation under a Management Contract with a level fee rate that does not include breakpoints; and (2) the pricing structure (including the net expense ratio to be borne by shareholders) of the Portfolio, as compared to its Selected Peer Group, including that: (a) the contractual management fee rate for the Portfolio is above the median and the average management fees of the funds in its Selected Peer Group; and (b) the all-in net expense ratio for the Portfolio, inclusive of the Acquired Fund Fees and Expenses (“AFFE”), is above the median and the average all-in net expense ratios of the funds in its Selected Peer Group, and the net expense ratio for the Portfolio, not inclusive of AFFE, is above the median and the average net expense ratios of the funds in its Selected Peer Group.
In analyzing this fee data, the Board took into account: (1) that the Portfolio indirectly bears the fees payable by the underlying funds in which the Portfolio invests; (2) that, as directed by the Board during the 2016 annual contract renewal cycle, lower expense limits were implemented for the Portfolio, effective May 1, 2017; and (3) Management’s representations regarding the competitiveness of the Portfolio’s management fee rate and net expense ratio when compared to peers identified by Management.
After its deliberation, the Board reached the following conclusions: (1) the Portfolio’s management fee rate is reasonable in the context of all factors considered by the Board; (2) the Portfolio’s net expense ratio is reasonable in the context of all factors considered by the Board; (3) the Portfolio’s performance is reasonable in the context of all
ADVISORY AND SUB-ADVISORY CONTRACT APPROVAL DISCUSSION (Unaudited) (continued)
factors considered by the Board; and (4) the sub-advisory fee rate payable by the Manager to the Sub-Adviser is reasonable in the context of all factors considered by the Board. Based on these conclusions and other factors, the Board voted to renew the Management and Sub-Advisory Contracts for the Portfolio for the year ending November 30, 2018. During this renewal process, different Board members may have given different weight to different individual factors and related conclusions.
Voya Index Solution 2030 Portfolio
In considering whether to approve the renewal of the Management and Sub-Advisory Contracts for Voya Index Solution 2030 Portfolio, the Board considered that, based on performance data for the periods ended March 31, 2017: (1) the Portfolio outperformed its Morningstar category average for all periods presented; (2) the Portfolio underperformed its primary benchmark for all periods presented, with the exception of the year-to-date period, during which it outperformed; and (3) the Portfolio is ranked in the second quintile of its Morningstar category for the three-year and five-year periods, and the third quintile for the year-to-date and one-year periods.
In considering the fees payable under the Management and Sub-Advisory Contracts for the Portfolio, the Board took into account the factors described above and also considered: (1) the fairness of the compensation under a Management Contract with a level fee rate that does not include breakpoints; and (2) the pricing structure (including the net expense ratio to be borne by shareholders) of the Portfolio, as compared to its Selected Peer Group, including that: (a) the contractual management fee rate for the Portfolio is above the median and the average management fee rates of the funds in its Selected Peer Group; and (b) the all-in net expense ratio for the Portfolio, inclusive of the Acquired Fund Fees and Expenses (“AFFE”), is above the median and the average all-in net expense ratios of the funds in its Selected Peer Group, and the net expense ratio for the Portfolio, not inclusive of AFFE, is above the median and the average of the net expense ratios of the funds in its Selected Peer Group.
In analyzing this fee data, the Board took into account: (1) that the Portfolio indirectly bears the fees payable by the underlying funds in which the Portfolio invests; (2) that, as directed by the Board during the 2016 annual contract renewal cycle, lower expense limits were implemented for the Portfolio, effective May 1, 2017; and (3) Management’s representations regarding the competitiveness of the Portfolio’s management fee rate and net expense ratio when compared to peers identified by Management.
After its deliberation, the Board reached the following conclusions: (1) the Portfolio’s management fee rate is
reasonable in the context of all factors considered by the Board; (2) the Portfolio’s net expense ratio is reasonable in the context of all factors considered by the Board; (3) the Portfolio’s performance is reasonable in the context of all factors considered by the Board; and (4) the sub-advisory fee rate payable by the Manager to the Sub-Adviser is reasonable in the context of all factors considered by the Board. Based on these conclusions and other factors, the Board voted to renew the Management and Sub-Advisory Contracts for the Portfolio for the year ending November 30, 2018. During this renewal process, different Board members may have given different weight to different individual factors and related conclusions.
Voya Index Solution 2035 Portfolio
In considering whether to approve the renewal of the Management and Sub-Advisory Contracts for Voya Index Solution 2035 Portfolio, the Board considered that, based on performance data for the periods ended March 31, 2017: (1) the Portfolio outperformed its Morningstar category average for all periods presented, with the exception of the year-to-date period, during which it underperformed; (2) the Portfolio outperformed its primary benchmark for the year-to-date and one-year periods, and underperformed for the three-year and five-year periods; and (3) the Portfolio is ranked in the second quintile of its Morningstar category for the one-year, three-year and five-year periods, and the third quintile for the year-to-date period.
In analyzing this performance data, the Board took into account Management’s representations regarding the competitiveness of the Portfolio’s performance during certain periods.
In considering the fees payable under the Management and Sub-Advisory Contracts for the Portfolio, the Board took into account the factors described above and also considered: (1) the fairness of the compensation under a Management Contract with a level fee rate that does not include breakpoints; and (2) the pricing structure (including the net expense ratio to be borne by shareholders) of the Portfolio, as compared to its Selected Peer Group, including that: (a) the contractual management fee rate for the Portfolio is above the median and the average management fees of the funds in its Selected Peer Group; and (b) the all-in net expense ratio for the Portfolio, inclusive of the Acquired Fund Fees and Expenses (“AFFE”), is above the median and the average all-in net expense ratios of the funds in its Selected Peer Group, and the net expense ratio for the Portfolio, not inclusive of AFFE, is above the median and the average net expense ratios of the funds in its Selected Peer Group.
ADVISORY AND SUB-ADVISORY CONTRACT APPROVAL DISCUSSION (Unaudited) (continued)
In analyzing this fee data, the Board took into account: (1) that the Portfolio indirectly bears the fees payable by the underlying funds in which the Portfolio invests; (2) that, as directed by the Board during the 2016 annual contract renewal cycle, lower expense limits were implemented for the Portfolio, effective May 1, 2017; and (3) Management’s representations regarding the competitiveness of the Portfolio’s management fee rate and net expense ratio when compared to peers identified by Management.
After its deliberation, the Board reached the following conclusions: (1) the Portfolio’s management fee rate is reasonable in the context of all factors considered by the Board; (2) the Portfolio’s net expense ratio is reasonable in the context of all factors considered by the Board; (3) the Portfolio’s performance is reasonable in the context of all factors considered by the Board; and (4) the sub-advisory fee rate payable by the Manager to the Sub-Adviser is reasonable in the context of all factors considered by the Board. Based on these conclusions and other factors, the Board voted to renew the Management and Sub-Advisory Contracts for the Portfolio for the year ending November 30, 2018. During this renewal process, different Board members may have given different weight to different individual factors and related conclusions.
Voya Index Solution 2040 Portfolio
In considering whether to approve the renewal of the Management and Sub-Advisory Contracts for Voya Index Solution 2040 Portfolio, the Board considered that, based on performance data for the periods ended March 31, 2017: (1) the Portfolio outperformed its Morningstar category average for all periods presented, with the exception of the year-to-date period, during which it underperformed; (2) the Portfolio outperformed its primary benchmark for the year-to-date and one-year periods, and underperformed for the three-year and five-year periods; and (3) the Portfolio is ranked in the second quintile of its Morningstar category for the three-year and five-year periods, and the third quintile for the year-to-date and one-year periods.
In considering the fees payable under the Management and Sub-Advisory Contracts for the Portfolio, the Board took into account the factors described above and also considered: (1) the fairness of the compensation under a Management Contract with a level fee rate that does not include breakpoints; and (2) the pricing structure (including the net expense ratio to be borne by shareholders) of the Portfolio, as compared to its Selected Peer Group, including that: (a) the contractual management fee rate for the Portfolio is above the median and the average management fees of the funds in its Selected Peer Group; and (b) the all-in net expense ratio for the Portfolio,
inclusive of the Acquired Fund Fees and Expenses (“AFFE”), is above the median and the average all-in net expense ratios of the funds in its Selected Peer Group, and the net expense ratio for the Portfolio, not inclusive of AFFE, is above the median and the average net expense ratios of the funds in its Selected Peer Group.
In analyzing this fee data, the Board took into account: (1) that the Portfolio indirectly bears the fees payable by the underlying funds in which the Portfolio invests; (2) that, as directed by the Board during the 2016 annual contract renewal cycle, lower expense limits were implemented for the Portfolio, effective May 1, 2017; and (3) Management’s representations regarding the competitiveness of the Portfolio’s management fee rate and net expense ratio when compared to peers identified by Management.
After its deliberation, the Board reached the following conclusions: (1) the Portfolio’s management fee rate is reasonable in the context of all factors considered by the Board; (2) the Portfolio’s net expense ratio is reasonable in the context of all factors considered by the Board; (3) the Portfolio’s performance is reasonable in the context of all factors considered by the Board; and (4) the sub-advisory fee rate payable by the Manager to the Sub-Adviser is reasonable in the context of all factors considered by the Board. Based on these conclusions and other factors, the Board voted to renew the Management and Sub-Advisory Contracts for the Portfolio for the year ending November 30, 2018. During this renewal process, different Board members may have given different weight to different individual factors and related conclusions.
Voya Index Solution 2045 Portfolio
In considering whether to approve the renewal of the Management and Sub-Advisory Contracts for Voya Index Solution 2045 Portfolio, the Board considered that, based on performance data for the periods ended March 31, 2017: (1) the Portfolio outperformed its Morningstar category average for all periods presented, with the exception of the year-to-date period, during which it underperformed; (2) the Portfolio underperformed its primary benchmark for all periods presented, with the exception of the year-to-date period, during which it outperformed; and (3) the Portfolio is ranked in the second quintile of its Morningstar category for the five-year period, and the third quintile for the year-to-date, one-year and three-year periods.
In analyzing this performance data, the Board took into account Management’s representations regarding the competitiveness of the Portfolio’s performance during certain periods.
In considering the fees payable under the Management and Sub-Advisory Contracts for the Portfolio, the Board
ADVISORY AND SUB-ADVISORY CONTRACT APPROVAL DISCUSSION (Unaudited) (continued)
took into account the factors described above and also considered: (1) the fairness of the compensation under a Management Contract with a level fee rate that does not include breakpoints; and (2) the pricing structure (including the net expense ratio to be borne by shareholders) of the Portfolio, as compared to its Selected Peer Group, including that: (a) the contractual management fee rate for the Portfolio is above the median and the average management fee rates of the funds in its Selected Peer Group; and (b) the all-in net expense ratio for the Portfolio, inclusive of the Acquired Fund Fees and Expenses (“AFFE”), is below the median and the average all-in net expense ratios of the funds in its Selected Peer Group, and the net expense ratio for the Portfolio, not inclusive of AFFE, is above the median and the average net expense ratios of the funds in its Selected Peer Group.
In analyzing this fee data, the Board took into account: (1) that the Portfolio indirectly bears the fees payable by the underlying funds in which the Portfolio invests; (2) that, as directed by the Board during the 2016 annual contract renewal cycle, lower expense limits were implemented for the Portfolio, effective May 1, 2017; and (3) Management’s representations regarding the competitiveness of the Portfolio’s management fee rate and net expense ratio when compared to peers identified by Management.
After its deliberation, the Board reached the following conclusions: (1) the Portfolio’s management fee rate is reasonable in the context of all factors considered by the Board; (2) the Portfolio’s net expense ratio is reasonable in the context of all factors considered by the Board; (3) the Portfolio’s performance is reasonable in the context of all factors considered by the Board; and (4) the sub-advisory fee rate payable by the Manager to the Sub-Adviser is reasonable in the context of all factors considered by the Board. Based on these conclusions and other factors, the Board voted to renew the Management and Sub-Advisory Contracts for the Portfolio for the year ending November 30, 2018. During this renewal process, different Board members may have given different weight to different individual factors and related conclusions.
Voya Index Solution 2050 Portfolio
In considering whether to approve the renewal of the Management and Sub-Advisory Contracts for Voya Index Solution 2050 Portfolio, the Board considered that, based on performance data for the periods ended March 31, 2017: (1) the Portfolio outperformed its Morningstar category average for the three-year and five-year periods and underperformed for the year-to-date and one-year periods; (2) the Portfolio underperformed its primary benchmark for all periods presented, with the exception of the year-to-date period, during which it outperformed; and
(3) the Portfolio is ranked in the second quintile of its Morningstar category for the three-year and five-year periods, and the third quintile for the year-to-date and one-year periods.
In considering the fees payable under the Management and Sub-Advisory Contracts for the Portfolio, the Board took into account the factors described above and also considered: (1) the fairness of the compensation under a Management Contract with a level fee rate that does not include breakpoints; and (2) the pricing structure (including the net expense ratio to be borne by shareholders) of the Portfolio, as compared to its Selected Peer Group, including that: (a) the contractual management fee rate for the Portfolio is above the median and the average management fee rates of the funds in its Selected Peer Group; and (b) the all-in net expense ratio for the Portfolio, inclusive of the Acquired Fund Fees and Expenses (“AFFE”), is below the median and the average all-in net expense ratios of the funds in its Selected Peer Group, and the net expense ratio for the Portfolio, not inclusive of AFFE, is above the median and the average net expense ratios of the funds in its Selected Peer Group. To assist the Board in its deliberations regarding this fee data, the Board was provided with information regarding the effect of waivers and/or reimbursements on the Portfolio’s net expense ratio.
After its deliberation, the Board reached the following conclusions: (1) the Portfolio’s management fee rate is reasonable in the context of all factors considered by the Board; (2) the Portfolio’s net expense ratio is reasonable in the context of all factors considered by the Board; (3) the Portfolio’s performance is reasonable in the context of all factors considered by the Board; and (4) the sub-advisory fee rate payable by the Manager to the Sub-Adviser is reasonable in the context of all factors considered by the Board. Based on these conclusions and other factors, the Board voted to renew the Management and Sub-Advisory Contracts for the Portfolio for the year ending November 30, 2018. During this renewal process, different Board members may have given different weight to different individual factors and related conclusions.
Voya Index Solution 2055 Portfolio
In considering whether to approve the renewal of the Management and Sub-Advisory Contracts for Voya Index Solution 2055 Portfolio, the Board considered that, based on performance data for the periods ended March 31, 2017: (1) the Portfolio outperformed its Morningstar category average for the three-year and five-year periods, and underperformed for the year-to-date and one-year periods; (2) the Portfolio underperformed its primary benchmark for all periods presented, with the exception of
ADVISORY AND SUB-ADVISORY CONTRACT APPROVAL DISCUSSION (Unaudited) (continued)
the year-to-date period, during which it outperformed; and (3) the Portfolio is ranked in the second quintile of its Morningstar category for the five-year period, and the third quintile for the year-to-date, one-year and three-year periods.
In analyzing this performance data, the Board took into account Management’s representations regarding the competitiveness of the Portfolio’s performance during certain periods.
In considering the fees payable under the Management and Sub-Advisory Contracts for the Portfolio, the Board took into account the factors described above and also considered: (1) the fairness of the compensation under a Management Contract with a level fee rate that does not include breakpoints; and (2) the pricing structure (including the net expense ratio to be borne by shareholders) of the Portfolio, as compared to its Selected Peer Group, including that: (a) the contractual management fee rate for the Portfolio is above the median and the average management fee rates of the funds in its Selected Peer Group; and (b) the all-in net expense ratio for the Portfolio, inclusive of the Acquired Fund Fees and Expenses (“AFFE”), is above the median and the average all-in net expense ratios of the funds in its Selected Peer Group, and the net expense ratio for the Portfolio, not inclusive of the AFFE, is above the median and the average net expense ratios of the funds in its Selected Peer Group.
In analyzing this fee data, the Board took into account: (1) that the Portfolio indirectly bears the fees payable by the underlying funds in which the Portfolio invests; (2) that, as directed by the Board during the 2016 annual contract renewal cycle, lower expense limits were implemented for the Portfolio, effective May 1, 2017; and (3) Management’s representations regarding the competitiveness of the Portfolio’s management fee rate and net expense ratio when compared to peers identified by Management.
After its deliberation, the Board reached the following conclusions: (1) the Portfolio’s management fee rate is reasonable in the context of all factors considered by the Board; (2) the Portfolio’s net expense ratio is reasonable in the context of all factors considered by the Board; (3) the Portfolio’s performance is reasonable in the context of all factors considered by the Board; and (4) the sub-advisory fee rate payable by the Manager to the Sub-Adviser is reasonable in the context of all factors considered by the Board. Based on these conclusions and other factors, the Board voted to renew the Management and Sub-Advisory Contracts for the Portfolio for the year ending November 30, 2018. During this renewal process, different Board members may have given different weight to different individual factors and related conclusions.
Voya Index Solution 2060 Portfolio
In considering whether to approve the renewal of the Management and Sub-Advisory Contracts for Voya Index Solution 2060 Portfolio, the Board considered that, based on performance data for the periods ended March 31, 2017: (1) the Portfolio underperformed its Morningstar category average for all periods presented; (2) the Portfolio outperformed its primary benchmark for the year-to-date period, and underperformed for the one-year period; and (3) the Portfolio is ranked in the third quintile of its Morningstar category for all periods presented.
In analyzing this performance data, the Board took into account: (1) that the Portfolio commenced operations in February 2015, and therefore had a limited operating history for the purpose of analyzing its performance; and (2) Management’s discussion of the Portfolio’s performance during certain periods.
In considering the fees payable under the Management and Sub-Advisory Contracts for the Portfolio, the Board took into account the factors described above and also considered: (1) the fairness of the compensation under a Management Contract with a level fee rate that does not include breakpoints; and (2) the pricing structure (including the net expense ratio to be borne by shareholders) of the Portfolio, as compared to its Selected Peer Group, including that: (a) the contractual management fee rate for the Portfolio is above the median and the average management fee rates of the funds in its Selected Peer Group; and (b) the all-in net expense ratio for the Portfolio, inclusive of the Acquire Fund Fees and Expenses (“AFFE”), is above the median and the average all-in net expense ratios of the funds in its Selected Peer Group, and the net expense ratio for the Portfolio, not inclusive of AFFE, is above the median and the average net expense ratios of the funds in its Selected Peer Group.
In analyzing this fee data, the Board took into account: (1) Management’s discussion of fee waivers and/or reimbursements, which lower the Portfolio’s net effective management fee rate; (2) that the Portfolio indirectly bears the fees payable by the underlying funds in which the Portfolio invests; and (3) that, as directed by the Board during the 2016 annual contract renewal cycle, lower expense limits were implemented for the Portfolio, effective May 1, 2017.
After its deliberation, the Board reached the following conclusions: (1) the Portfolio’s management fee rate is reasonable in the context of all factors considered by the Board; (2) the Portfolio’s net expense ratio is reasonable in the context of all factors considered by the Board; (3) taking into account that the Portfolio commenced operations in February 2015, and therefore had a limited
ADVISORY AND SUB-ADVISORY CONTRACT APPROVAL DISCUSSION (Unaudited) (continued)
operating history for the purpose of analyzing the Portfolio’s performance, it is reasonable to permit the Portfolio time to establish a longer performance record for the purpose of evaluating investment performance; and (4) the sub-advisory fee rate payable by the Manager to the Sub-Adviser is reasonable in the context of all factors considered by the Board. Based on these conclusions and other factors, the Board voted to renew the Management and Sub-Advisory Contracts for the Portfolio for the year ending November 30, 2018. During this renewal process, different Board members may have given different weight to different individual factors and related conclusions.
Voya Index Solution Income Portfolio
In considering whether to approve the renewal of the Management and Sub-Advisory Contracts for Voya Index Solution Income Portfolio, the Board considered that, based on performance data for the periods ended March 31, 2017: (1) the Portfolio outperformed its Morningstar category average for all periods presented, with the exception of the one-year period, during which it underperformed; (2) the Portfolio outperformed its primary benchmark for all periods presented, with the exception of the three-year period, during which it underperformed; and (3) the Portfolio is ranked in the first (highest) quintile of its Morningstar category for the three-year and five-year periods, and the third quintile for the year-to-date and one-year periods.
In considering the fees payable under the Management and Sub-Advisory Contracts for the Portfolio, the Board took into account the factors described above and also considered: (1) the fairness of the compensation under a Management Contract with a level fee rate that does not include breakpoints; and (2) the pricing structure (including the net expense ratio to be borne by shareholders) of the
Portfolio, as compared to its Selected Peer Group, including that: (a) the contractual management fee rate for the Portfolio is above the median and below the average management fee rates of the funds in its Selected Peer Group; and (b) the all-in net expense ratio for the Portfolio, inclusive of the Acquired Fund Fees and Expense (“AFFE”), is equal to the median and above the average all-in net expense ratios of the funds in its Selected Peer Group, and the net expense ratio for the Portfolio, not inclusive of AFFE, is above the median and the average net expense ratios of the funds in its Selected Peer Group.
In analyzing this fee data, the Board took into account: (1) that the Portfolio indirectly bears the fees payable by the underlying funds in which the Portfolio invests; (2) that, as directed by the Board during the 2016 annual contract renewal cycle, lower expense limits were implemented for the Portfolio, effective May 1, 2017; and (3) Management’s representations regarding the competitiveness of the Portfolio’s management fee rate and net expense ratio when compared to peers identified by Management.
After its deliberation, the Board reached the following conclusions: (1) the Portfolio’s management fee rate is reasonable in the context of all factors considered by the Board; (2) the Portfolio’s net expense ratio is reasonable in the context of all factors considered by the Board; (3) the Portfolio’s performance is reasonable in the context of all factors considered by the Board; and (4) the sub-advisory fee rate payable by the Manager to the Sub-Adviser is reasonable in the context of all factors considered by the Board. Based on these conclusions and other factors, the Board voted to renew the Management and Sub-Advisory Contracts for the Portfolio for the year ending November 30, 2018. During this renewal process, different Board members may have given different weight to different individual factors and related conclusions.
Investment Adviser
Voya Investments, LLC
7337 East Doubletree Ranch Road, Suite 100
Scottsdale, Arizona 85258
Distributor
Voya Investments Distributor, LLC
7337 East Doubletree Ranch Road, Suite 100
Scottsdale, Arizona 85258
Transfer Agent
BNY Mellon Investment Servicing (U.S.) Inc.
301 Bellevue Parkway
Wilmington, Delaware 19809
Independent Registered Public Accounting Firm
KPMG LLP
Two Financial Center
60 South Street
Boston, Massachusetts 02111
Custodian
The Bank of New York Mellon
225 Liberty Street
New York, New York 10286
Legal Counsel
Ropes & Gray LLP
Prudential Tower
800 Boylston Street
Boston, Massachusetts 02199
Before investing, carefully consider the investment objectives, risks, charges and expenses of the variable annuity contract or variable life insurance policy and the underlying variable investment options. This and other information is contained in the prospectus for the variable annuity contract or variable life insurance policy and the underlying variable investment options. Obtain these prospectuses from your agent/registered representative and read them carefully before investing.
RETIREMENT | INVESTMENTS | INSURANCE
voyainvestments.com
VPAR-VINDSOL (1217-021618)
Item 2. Code of Ethics.
As of the end of the period covered by this report, Registrant had adopted a code of ethics, as defined in Item 2 of Form N-CSR, that applies to the Registrant’s principal executive officer and principal financial officer. There were no amendments to the Code during the period covered by the report. The Registrant did not grant any waivers, including implicit waivers, from any provisions of the Code during the period covered by this report. The code of ethics is filed herewith pursuant to Item 10(a)(1), Ex-99.CODE ETH.
Item 3. Audit Committee Financial Expert.
The Board of Directors has determined that Colleen D. Baldwin, Martin J. Gavin, Patrick W. Kenny, Joseph E. Obermeyer, and Roger B. Vincent are audit committee financial experts, as defined in Item 3 of Form N-CSR. Ms. Baldwin, Mr. Gavin, Mr. Kenny, Mr. Obermeyer and Mr. Vincent are “independent” for purposes of Item 3 of Form N-CSR.
Item 4. Principal Accountant Fees and Services.
| (a) | Audit Fees: The aggregate fees billed for each of the last two fiscal years for professional services rendered by KPMG LLP (“KPMG”), the principal accountant for the audit of the registrant’s annual financial statements or services that are normally provided by the accountant in connection with statutory and regulatory filings or engagements for those fiscal years were $891,345 for the year ended December 31, 2017 and $891,345 for the year ended December 31, 2016. |
| (b) | Audit-Related Fees: The aggregate fees billed in each of the last two fiscal years for assurance and related services by KPMG that are reasonably related to the performance of the audit of the registrant’s financial statements and are not reported under paragraph (a) of this Item were $102,600 for the year ended December 31, 2017 and $103,525 for the year ended December 31, 2016. |
| (c) | Tax Fees: The aggregate fees billed in each of the last two fiscal years for professional services rendered by KPMG for tax compliance, tax advice, and tax planning were $215,694 for the year ended December 31, 2017 and $217,359 for the year ended December 31, 2016. Such services included review of excise distribution calculations (if applicable), preparation of the Funds’ federal, state, and excise tax returns, tax services related to mergers and routine consulting. |
| (d) | All Other Fees: The aggregate fees billed in each of the last two fiscal years for products and services provided by KPMG, other than the services reported in paragraphs (a) through (c) of this Item were $0 for the year ended December 31, 2017 and $0 for the year ended December 31, 2016. |
| (e)(1) | Audit Committee Pre-Approval Policies and Procedures |
AUDIT AND NON-AUDIT SERVICES
PRE-APPROVAL POLICY
| I. | Statement of Principles |
Under the Sarbanes-Oxley Act of 2002 (the “Act”), the Audit Committee of the Board of Directors or Trustees (the “Committee”) of the Voya funds (each a “Fund,” collectively, the “Funds”) set out on Exhibit A to this Audit and Non-Audit Services Pre-Approval Policy (“Policy”) is responsible for the oversight of the work of the Funds’ independent auditors. As part of its responsibilities, the Committee must pre-approve the audit and non-audit services performed by the auditors in order to assure that the provision of these services does not impair the auditors’ independence from the Funds. The Committee has adopted, and the Board has ratified, this Policy, which sets out the procedures and conditions under which the services of the independent auditors may be pre-approved.
Under Securities and Exchange Commission (“SEC”) rules promulgated in accordance with the Act, the Funds may establish two different approaches to pre-approving audit and non-audit services. The Committee may approve services without consideration of specific case-by-case services (“general pre-approval”) or it may pre-approve specific services (“specific pre-approval”). The Committee believes that the combination of these approaches contemplated in this Policy results in an effective and efficient method for pre-approving audit and non-audit services to be performed by the Funds’ independent auditors. Under this Policy, services that are not of a type that may receive general pre-approval require specific pre-approval by the Committee. Any proposed services that exceed pre-approved cost levels or budgeted amounts will also require the Committee’s specific pre-approval.
For both types of approval, the Committee considers whether the subject services are consistent with the SEC’s rules on auditor independence and that such services are compatible with maintaining the auditors independence. The Committee also considers whether a particular audit firm is in the best position to provide effective and efficient services to the Funds. Reasons that the auditors are in the best position include the auditors’ familiarity with the Funds’ business, personnel, culture, accounting systems, risk profile, and other factors, and whether the services will enhance the Funds’ ability to manage and control risk or improve audit quality. Such factors will be considered as a whole, with no one factor being determinative.
The appendices attached to this Policy describe the audit, audit-related, tax-related, and other services that have the Committee’s general pre-approval. For any service that has been approved through general pre-approval, the general pre-approval will remain in place for a period 12 months from the date of pre-approval, unless the Committee determines that a different period is appropriate. The Committee will annually review and pre-approve the services that may be provided by the independent auditors without specific pre-approval. The Committee will revise the list of services subject to general pre-approval as appropriate. This Policy does not serve as a delegation to Fund management of the Committee’s duty to pre-approve services performed by the Funds’ independent auditors.
The annual audit services engagement terms and fees are subject to the Committee’s specific pre-approval. Audit services are those services that are normally provided by auditors in connection with statutory and regulatory filings or engagements or those that generally only independent auditors can reasonably provide. They include the Funds’ annual financial statement audit and procedures that the independent auditors must perform in order to form an opinion on the Funds’ financial statements (e.g., information systems and procedural reviews and testing). The Committee will monitor the audit services engagement and approve any changes in terms, conditions or fees deemed by the Committee to be necessary or appropriate.
The Committee may grant general pre-approval to other audit services, such as statutory audits and services associated with SEC registration statements, periodic reports and other documents filed with the SEC or issued in connection with securities offerings.
The Committee has pre-approved the audit services listed on Appendix A. The Committee must specifically approve all audit services not listed on Appendix A.
| III. | Audit-related Services |
Audit-related services are assurance and related services that are reasonably related to the performance of the audit or the review of the Funds’ financial statements or are traditionally performed by the independent auditors. The Committee believes that the provision of audit-related services will not impair the independent auditors’ independence, and therefore may grant pre-approval to audit-related services. Audit-related services include accounting consultations related to accounting, financial reporting or disclosure matters not classified as “audit services;” assistance with understanding and implementing new accounting and financial reporting guidance from rulemaking authorities; agreed-upon or expanded audit procedures relating to accounting and/or billing records required to respond to or comply with financial, accounting or regulatory reporting matters; and assistance with internal control reporting requirements under Form N-SAR or Form N-CSR.
The Committee has pre-approved the audit-related services listed on Appendix B. The Committee must specifically approve all audit-related services not listed on Appendix B.
The Committee believes the independent auditors can provide tax services to the Funds, including tax compliance, tax planning, and tax advice, without compromising the auditors’ independence. Therefore, the Committee may grant general pre-approval with respect to tax services historically provided by the Funds’ independent auditors that do not, in the Committee’s view, impair auditor independence and that are consistent with the SEC’s rules on auditor independence.
The Committee will not grant pre-approval if the independent auditors initially recommends a transaction the sole business purpose of which is tax avoidance and the tax treatment of which may not be supported in the Internal Revenue Code and related regulations.
The Committee may consult outside counsel to determine that tax planning and reporting positions are consistent with this Policy.
The Committee has pre-approved the tax-related services listed on Appendix C. The Committee must specifically approve all tax-related services not listed on Appendix C.
The Committee believes it may grant approval of non-audit services that are permissible services for independent auditors to a Fund. The Committee has determined to grant general pre-approval to other services that it believes are routine and recurring, do not impair auditor independence, and are consistent with SEC rules on auditor independence.
The Committee has pre-approved the non-audit services listed on Appendix D. The Committee must specifically approve all non-audit services not listed on Appendix D.
A list of the SEC’s prohibited non-audit services is attached to this Policy as Appendix E. The SEC’s rules and relevant guidance should be consulted to determine the precise definitions of these impermissible services and the applicability of exceptions to certain of the SEC’s prohibitions.
| VI. | Pre-approval of Fee levels and Budgeted Amounts |
The Committee will annually establish pre-approval fee levels or budgeted amounts for audit, audit-related, tax and non-audit services to be provided to the Funds by the independent auditors. Any proposed services exceeding these levels or amounts require the Committee’s specific pre-approval. The Committee considers fees for audit and non-audit services when deciding whether to pre-approve services. The Committee may determine, for a pre-approval period of 12 months, the appropriate ratio between the total amount of fees for the Fund’s audit, audit-related, and tax services (including fees for services provided to Fund affiliates that are subject to pre-approval), and the total amount of fees for certain permissible non-audit services for the Fund classified as other services (including any such services provided to Fund affiliates that are subject to pre-approval).
Requests or applications for services to be provided by the independent auditors will be submitted to management. If management determines that the services do not fall within those services generally pre-approved by the Committee and set out in the appendices to these procedures, management will submit the services to the Committee or its delagee. Any such submission will include a detailed description of the services to be rendered. Notwithstanding this paragraph, the Committee will, on a quarterly basis, receive from the independent auditors a list of services provided for the previous calendar quarter on a cumulative basis by the auditors during the Pre-Approval Period.
The Committee may delegate pre-approval authority to one or more of the Committee’s members. Any member or members to whom such pre-approval authority is delegated must report any pre-approval decisions, including any pre-approved services, to the Committee at its next scheduled meeting. The Committee will identify any member to whom pre-approval authority is delegated in writing. The member will retain such authority for a period of 12 months from the date of pre-approval unless the Committee determines that a different period is appropriate. The period of delegated authority may be terminated by the Committee or at the option of the member.
| IX. | Additional Requirements |
The Committee will take any measures the Committee deems necessary or appropriate to oversee the work of the independent auditors and to assure the auditors’ independence from the Funds. This may include reviewing a formal written statement from the independent auditors delineating all relationships between the auditors and the Funds, consistent with Independence Standards Board No. 1, and discussing with the auditors their methods and procedures for ensuring independence.
Part of KPMG’s performance of an audit in accordance with standards of the Public Company Accounting Oversight Board (US) includes their responsibility to maintain and monitor auditor independence with respect to the Voya funds. Using a proprietary system called Sentinel, the audit team is able to identify and manage potential conflicts of interest across the member firms of the KPMG International Network and prevent the provision of prohibited services to the Voya entities that would impair KPMG independence with the respect to the Voya funds. KPMG requests pre-approval from the Voya funds Audit Committee for services provided to the Voya funds and for services to affiliated entities that relate to the financial reporting or nature of operations of the Voya Funds. Additionally, KPMG provides an annual summary of the fees for services that have commenced for Voya funds and Affiliates.
Last Approved: November 11, 2016
Appendix A
Pre-Approved Audit Services for the Pre-Approval Period January 1, 2017 through December 31, 2017
| Service | The Fund(s) | Fee Range |
| | | |
| Statutory audits or financial audits (including tax services associated with audit services) | √ | As presented to Audit Committee1 |
| | | |
| Services associated with SEC registration statements, periodic reports and other documents filed with the SEC or other documents issued in connection with securities offerings (e.g., consents), and assistance in responding to SEC comment letters. | √ | Not to exceed $9,750 per filing |
| | | |
| Consultations by Fund management with respect to accounting or disclosure treatment of transactions or events and/or the actual or potential effect of final or proposed rules, standards or interpretations by the SEC, Financial Accounting Standards Board, or other regulatory or standard setting bodies. | √ | Not to exceed $8,000 during the Pre-Approval Period |
| | | |
| Seed capital audit and related review and issuance of consent on the N-2 registration statement | √ | Not to exceed $14,750 per audit |
| | | |
| Audit of summary portfolio of investments | √ | Not to exceed $565 per fund |
| 1 | For new Funds launched during the Pre-Approval Period, the fee ranges pre-approved will be the same as those for existing Funds, pro-rated in accordance with inception dates as provided in the auditors’ Proposal or any Engagement Letter covering the period at issue. Fees in the Engagement Letter will be controlling. |
Appendix B
Pre-Approved Audit-Related Services for the Pre-Approval Period January 1, 2017 through December 31, 2017
| Service | The Fund(s) | Fund Affiliates | Fee Range |
| | | | |
| Services related to Fund mergers (Excludes tax services - See Appendix C for tax services associated with Fund mergers) | √ | √ | Not to exceed $10,000 per merger |
| | | | |
| Consultations by Fund management with respect to accounting or disclosure treatment of transactions or events and/or the actual or potential effect of final or proposed rules, standards or interpretations by the SEC, Financial Accounting Standards Board, or other regulatory or standard setting bodies. [Note: Under SEC rules some consultations may be “audit” services and others may be “audit-related” services.] | √ | | Not to exceed $5,000 per occurrence during the Pre-Approval Period |
| | | | |
| Review of the Funds’ semi-annual and quarterly financial statements | √ | | Not to exceed $2,700 per set of financial statements per fund |
| | | | |
| Reports to regulatory or government agencies related to the annual engagement | √ | | Up to $5,000 per occurrence during the Pre-Approval Period |
| | | | |
| Regulatory compliance assistance | √ | √ | Not to exceed $5,000 per quarter |
| | | | |
| Training courses | | √ | Not to exceed $5,000 per course |
| | | | |
| For Prime Rate Trust, agreed upon procedures for quarterly reports to rating agencies | √ | | Not to exceed $9,450 per quarter |
Appendix C
Pre-Approved Tax Services for the Pre-Approval Period January 1, 2017 through December 31, 2017
| Service | The Fund(s) | Fund Affiliates | Fee Range |
| | | | |
| Preparation of federal and state income tax returns and federal excise tax returns for the Funds including assistance and review with excise tax distributions | √ | | As presented to Audit Committee2 |
| | | | |
| Review of IRC Sections 851(b) and 817(h) diversification testing on a real-time basis | √ | | As presented to Audit Committee2 |
| | | | |
| Assistance and advice regarding year-end reporting for 1099’s, as requested | √ | | As presented to Audit Committee2 |
| | | | |
| Tax assistance and advice regarding statutory, regulatory or administrative developments | √ | √ | Not to exceed $5,000 for the Funds or for the Funds’ investment adviser during the Pre-Approval Period |
| 2 | For new Funds launched during the Pre-Approval Period, the fee ranges pre-approved will be the same as those for existing Funds, pro-rated in accordance with inception dates as provided in the auditors’ Proposal or any Engagement Letter covering the period at issue. Fees in the Engagement Letter will be controlling. |
Appendix C, continued
Pre-Approved Tax Services for the Pre-Approval Period January 1, 2017 through December 31, 2017
| Service | The Fund(s) | Fund Affiliates | Fee Range |
| | | | |
| Tax training courses | | √ | Not to exceed $5,000 per course during the Pre-Approval Period |
| | | | |
| Tax services associated with Fund mergers | √ | √ | Not to exceed $4,000 per fund per merger during the Pre-Approval Period |
| | | | |
| Other tax-related assistance and consultation, including, without limitation, assistance in evaluating derivative financial instruments and international tax issues, qualification and distribution issues, and similar routine tax consultations. | √ | | Not to exceed $120,000 during the Pre-Approval Period |
Appendix D
Pre-Approved Other Services for the Pre-Approval Period January 1, 2017 through December 31, 2017
| Service | The Fund(s) | Fund Affiliates | Fee Range |
| | | | |
| Agreed-upon procedures for Class B share 12b-1 programs | | √ | Not to exceed $60,000 during the Pre-Approval Period |
| | | | |
Security counts performed pursuant to Rule 17f-2 of the 1940 Act (i.e., counts for Funds holding securities with affiliated sub-custodians) Cost to be borne 50% by the Funds and 50% by Voya Investments, LLC. | √ | √ | Not to exceed $5,700 per Fund during the Pre-Approval Period |
| | | | |
| Agreed upon procedures for 15 (c) FACT Books | √ | | Not to exceed $50,000 during the Pre-Approval Period |
Appendix E
Prohibited Non-Audit Services
Dated: January 1, 2017 to December 31, 2017
| · | Bookkeeping or other services related to the accounting records or financial statements of the Funds |
| · | Financial information systems design and implementation |
| · | Appraisal or valuation services, fairness opinions, or contribution-in-kind reports |
| · | Internal audit outsourcing services |
| · | Broker-dealer, investment adviser, or investment banking services |
| · | Expert services unrelated to the audit |
| · | Any other service that the Public Company Accounting Oversight Board determines, by regulation, is impermissible |
EXHIBIT A
VOYA ASIA PACIFIC HIGH DIVIDEND EQUITY INCOME FUND
VOYA BALANCED PORTFOLIO, INC.
VOYA EMERGING MARKETS HIGH DIVIDEND EQUITY FUND
VOYA EQUITY TRUST
VOYA FUNDS TRUST
VOYA GLOBAL ADVANTAGE AND PREMIUM OPPORTUNITY FUND
VOYA GLOBAL EQUITY DIVIDEND AND PREMIUM OPPORTUNITY FUND
VOYA GOVERNMENT MONEY MARKET PORTFOLIO
VOYA INFRASTRUCTURE, INDUSTRIALS, AND MATERIALS FUND
VOYA INTERMEDIATE BOND PORTFOLIO
VOYA INTERNATIONAL HIGH DIVIDEND EQUITY INCOME FUND
VOYA INVESTORS TRUST
VOYA MUTUAL FUNDS
VOYA PARTNERS, INC.
VOYA PRIME RATE TRUST
VOYA NATURAL RESOURCES EQUITY INCOME FUND
VOYA SENIOR INCOME FUND
VOYA SEPARATE PORTFOLIOS TRUST
VOYA SERIES FUND, INC.
VOYA STRATEGIC ALLOCATIONS PORTFOLIOS, INC.
VOYA VARIABLE FUNDS
VOYA VARIABLE INSURANCE TRUST
VOYA VARIABLE PORTFOLIOS INC,
VOYA VARIABLE PRODUCTS TRUST
| (e)(2) | Percentage of services referred to in 4(b) – (4)(d) that were approved by the audit committee |
100% of the services were approved by the audit committee.
| (f) | Percentage of hours expended attributable to work performed by other than full time employees of KPMG if greater than 50% |
Not applicable.
| (g) | Non-Audit Fees: The following table presents (i) the aggregate non-audit fees (i.e., fees for audit-related, tax, and other services) billed to each Registrant by the independent registered public accounting firm for each Registrant’s fiscal years ended December 31, 2017 and December 31, 2016; and (ii) the aggregate non-audit fees billed to the investment adviser, or any of its affiliates that provide ongoing services to the registrant, by the independent registered public accounting firm for the same time periods. |
| Registrant/Investment Adviser | | 2017 | | | 2016 | |
| Voya Partners, Inc. | | $ | 318,294 | | | $ | 320,884 | |
| Voya Investments, LLC (1) | | $ | 122,200 | | | $ | 93,650 | |
__________________________________
(1) Each Registrant’s investment adviser and any of its affiliates, which are subsidiaries of Voya Financial, Inc.
| (h) | Principal Accountants Independence: The Registrant’s Audit committee has considered whether the provision of non-audit services that were rendered to the registrant’s investment adviser and any entity controlling, controlled by, or under common control with the investment adviser that provides ongoing services to the registrant that were not pre-approved pursuant to Rule 2-01(c)(7)(ii) of Regulation S-X is compatible with maintaining KPMG’s independence. |
Item 5. Audit Committee of Listed Registrants.
Not applicable.
Item 6. Schedule of Investments.
Complete schedule of investments, as applicable, in included as part of the report to shareholders filed under Item 1 of this Form and filed herein, as applicable.
Report of Independent Registered Public Accounting Firm
The Shareholders and Board of Directors
Voya Partners, Inc.:
Opinion on the Financial Statements
We have audited the accompanying statements of assets and liabilities of Voya Global Bond Portfolio, VY® American Century Small-Mid Cap Value Portfolio, VY® Baron Growth Portfolio, VY® Columbia Contrarian Core Portfolio, VY® Columbia Small Cap Value II Portfolio, VY® Invesco Comstock Portfolio, VY® Invesco Equity and Income Portfolio, VY® JPMorgan Mid Cap Value Portfolio, VY® Oppenheimer Global Portfolio, VY® Pioneer High Yield Portfolio, VY® T. Rowe Price Diversified Mid Cap Growth Portfolio, VY® T. Rowe Price Growth Equity Portfolio, and VY® Templeton Foreign Equity Portfolio (the “Funds”), each a series of Voya Partners, Inc., including the summary portfolios of investments, as of December 31, 2017, and the related statements of operations for the year then ended, the statements of changes in net assets for each of the years in the two-year period then ended and the related notes (collectively, the "financial statements"), the financial highlights for each of the years or periods in the five-year period then ended (the financial statements and financial highlights are included in Item 1 of this Form N-CSR), and the portfolios of investments as of December 31, 2017 (included in Item 6 of this Form N-CSR). In our opinion, the financial statements, financial highlights, and portfolios of investments referred to above present fairly, in all material respects, the financial position of the Funds as of December 31, 2017, the results of their operations for the year then ended, the changes in their net assets for each of the years in the two-year period then ended, and the financial highlights for each of the years or periods in the five-year period then ended, in conformity with U.S. generally accepted accounting principles.
Basis for Opinion
These financial statements, financial highlights, and portfolios of investments are the responsibility of the Funds’ management. Our responsibility is to express an opinion on these financial statements, financial highlights, and portfolios of investments based on our audits. We are a public accounting firm registered with the Public Company Accounting Oversight Board (United States) (“PCAOB”) and are required to be independent with respect to the Funds in accordance with the U.S. federal securities laws and the applicable rules and regulations of the Securities and Exchange Commission and the PCAOB.
We conducted our audits in accordance with the standards of the PCAOB. Those standards require that we plan and perform the audit to obtain reasonable assurance about whether the financial statements, financial highlights, and portfolios of investments are free of material misstatement, whether due to error or fraud. Our audits included performing procedures to assess the risks of material misstatement of the financial statements, financial highlights, and portfolios of investments, whether due to error or fraud, and performing procedures that respond to those risks. Such procedures included examining, on a test basis, evidence regarding the amounts and disclosures in the financial statements, financial highlights, and portfolios of investments. Such procedures also included confirmation of securities owned as of December 31, 2017, by correspondence with the custodian, transfer agent, and brokers or by other appropriate auditing procedures when replies from brokers were not received. Our audits also included evaluating the accounting principles used and significant estimates made by management, as well as evaluating the overall financial statement presentation. We believe that our audits provide a reasonable basis for our opinion.

We have served as the auditor of one or more Voya investment companies since 1975.
Boston, Massachusetts
February 22, 2018
| Voya Global Bond Portfolio | PORTFOLIO OF INVESTMENTS
as of December 31, 2017 |
Principal
Amount† | | | | | | | Value | | | Percentage
of Net
Assets | |
| CORPORATE BONDS/NOTES: 25.1% | | | | | | | | |
| | | | | | | Brazil: 0.5% | | | | | | | | |
| | 900,000 | | | | | Petrobras Global Finance BV, 8.750%, 05/23/26 | | | 1,077,750 | | | | 0.5 | |
| | | | | | | | | | | | | | | |
| | | | | | | Canada: 0.5% | | | | | | | | |
| | 235,000 | | | (1) | | 1011778 BC ULC / New Red Finance, Inc., 5.000%, 10/15/25 | | | 237,938 | | | | 0.1 | |
| | 88,000 | | | (1) | | Air Canada 2017-1 Class AA Pass Through Trust, 3.300%, 07/15/31 | | | 87,560 | | | | 0.0 | |
| | 100,000 | | | (2) | | Cenovus Energy, Inc., 4.250%, 04/15/27 | | | 99,921 | | | | 0.0 | |
| | 324,000 | | | | | Goldcorp, Inc., 3.700%, 03/15/23 | | | 332,229 | | | | 0.2 | |
| | 420,000 | | | | | Teck Resources Ltd., 6.000%, 08/15/40 | | | 469,350 | | | | 0.2 | |
| | | | | | | | | | 1,226,998 | | | | 0.5 | |
| | | | | | | | | | | | | | | |
| | | | | | | China: 0.3% | | | | | | | | |
| | 601,000 | | | (2) | | Alibaba Group Holding Ltd., 3.600%, 11/28/24 | | | 623,872 | | | | 0.3 | |
| | | | | | | | | | | | | | | |
| | | | | | | France: 0.4% | | | | | | | | |
| | 294,000 | | | | | BPCE SA, 2.500%, 12/10/18 | | | 294,865 | | | | 0.1 | |
| | 287,000 | | | (1) | | BPCE SA, 5.150%, 07/21/24 | | | 311,566 | | | | 0.2 | |
| | 226,000 | | | (1) | | Electricite de France SA, 2.350%, 10/13/20 | | | 225,790 | | | | 0.1 | |
| | | | | | | | | | 832,221 | | | | 0.4 | |
| | | | | | | | | | | | | | | |
| | | | | | | Guernsey: 0.3% | | | | | | | | |
| | 716,000 | | | | | Credit Suisse Group Funding Guernsey Ltd., 2.750%, 03/26/20 | | | 719,137 | | | | 0.3 | |
| | | | | | | | | | | | | | | |
| | | | | | | Ireland: 0.3% | | | | | | | | |
| | 282,000 | | | | | GE Capital International Funding Co. Unlimited Co., 4.418%, 11/15/35 | | | 305,558 | | | | 0.1 | |
| | 370,000 | | | | | Shire Acquisitions Investments Ireland DAC, 3.200%, 09/23/26 | | | 362,350 | | | | 0.2 | |
| | | | | | | | | | 667,908 | | | | 0.3 | |
| | | | | | | | | | | | | | | |
| | | | | | | Israel: 0.1% | | | | | | | | |
| | 345,000 | | | (2) | | Teva Pharmaceutical Finance Netherlands III BV, 3.150%, 10/01/26 | | | 285,296 | | | | 0.1 | |
| | | | | | | | | | | | | | | |
| | | | | | | Italy: 0.1% | | | | | | | | |
| | 60,000 | | | | | Telecom Italia Capital SA, 6.375%, 11/15/33 | | | 70,050 | | | | 0.0 | |
| | 195,000 | | | | | Telecom Italia Capital SA, 7.721%, 06/04/38 | | | 252,525 | | | | 0.1 | |
| | | | | | | | | | 322,575 | | | | 0.1 | |
| | | | | | | | | | | | | | | |
| | | | | | | Japan: 0.6% | | | | | | | | |
| | 790,000 | | | (1) | | Bank of Tokyo-Mitsubishi UFJ Ltd./The, 2.300%, 03/05/20 | | | 787,357 | | | | 0.4 | |
| | 200,000 | | | (1) | | Mizuho Bank Ltd., 3.200%, 03/26/25 | | | 201,539 | | | | 0.1 | |
| | 300,000 | | | | | Sumitomo Mitsui Financial Group, Inc., 3.784%, 03/09/26 | | | 310,469 | | | | 0.1 | |
| | | | | | | | | | 1,299,365 | | | | 0.6 | |
| | | | | | | | | | | | | | | |
| | | | | | | Luxembourg: 0.3% | | | | | | | | |
| | 350,000 | | | (1) | | Altice Financing SA, 6.625%, 02/15/23 | | | 367,360 | | | | 0.2 | |
| | 130,000 | | | (1) | | Dana Financing Luxembourg Sarl, 5.750%, 04/15/25 | | | 137,313 | | | | 0.0 | |
| | 185,000 | | | (1) | | Dana Financing Luxembourg Sarl, 6.500%, 06/01/26 | | | 200,956 | | | | 0.1 | |
| | | | | | | | | | 705,629 | | | | 0.3 | |
| | | | | | | | | | | | | | | |
| | | | | | | Mexico: 0.0% | | | | | | | | |
| MXN | 1,007,437 | | | (3) | | Banco Invex SA / Hipotecaria Credito y Casa SA de CV, 6.450%, 03/13/34 | | | – | | | | – | |
| MXN | 105,174 | | | (4) | | JPMorgan Hipotecaria su Casita, 6.100%, 09/25/35 | | | 5,331 | | | | 0.0 | |
| | | | | | | | | | 5,331 | | | | 0.0 | |
| | | | | | | | | | | | | | | |
| | | | | | | Netherlands: 1.0% | | | | | | | | |
| | 100,000 | | | | | ArcelorMittal, 7.250%, 03/01/41 | | | 127,000 | | | | 0.1 | |
| | 170,000 | | | | | ArcelorMittal, 7.500%, 10/15/39 | | | 218,450 | | | | 0.1 | |
| | 300,000 | | | (1) | | Braskem Netherlands Finance BV, 4.500%, 01/10/28 | | | 295,515 | | | | 0.1 | |
| | 269,000 | | | | | Cooperatieve Rabobank UA, 4.500%, 01/11/21 | | | 285,223 | | | | 0.1 | |
| | 690,000 | | | | | Shell International Finance BV, 3.250%, 05/11/25 | | | 709,628 | | | | 0.3 | |
| | 361,000 | | | | | Shell International Finance BV, 4.000%, 05/10/46 | | | 385,110 | | | | 0.2 | |
| | 300,000 | | | (1) | | Siemens Financieringsmaatschappij NV, 2.350%, 10/15/26 | | | 283,619 | | | | 0.1 | |
| | | | | | | | | | 2,304,545 | | | | 1.0 | |
| | | | | | | | | | | | | | | |
| | | | | | | Norway: 0.2% | | | | | | | | |
| | 380,000 | | | | | Statoil ASA, 2.450%, 01/17/23 | | | 377,954 | | | | 0.2 | |
| | | | | | | | | | | | | | | |
| | | | | | | South Africa: 0.0% | | | | | | | | |
| ZAR | 1,000,000 | | | | | Transnet SOC Ltd., 10.800%, 11/06/23 | | | 85,662 | | | | 0.0 | |
| | | | | | | | | | | | | | | |
| | | | | | | Sweden: 0.1% | | | | | | | | |
| | 298,000 | | | (1) | | Nordea Bank AB, 5.500%, 12/31/99 | | | 306,568 | | | | 0.1 | |
| | | | | | | | | | | | | | | |
| | | | | | | Switzerland: 0.3% | | | | | | | | |
| | 400,000 | | | (1) | | Credit Suisse AG, 6.500%, 08/08/23 | | | 448,550 | | | | 0.2 | |
See Accompanying Notes to Financial Statements
| Voya Global Bond Portfolio | PORTFOLIO OF INVESTMENTS
as of December 31, 2017 (continued) |
Principal
Amount† | | | | | | | Value | | | Percentage
of Net
Assets | |
| CORPORATE BONDS/NOTES: (continued) | | | | | | | | |
| | | | | | | Switzerland: (continued) | | | | | | | | |
| | 250,000 | | | | | UBS AG/Stamford CT, 7.625%, 08/17/22 | | | 292,675 | | | | 0.1 | |
| | | | | | | | | | 741,225 | | | | 0.3 | |
| | | | | | | | | | | | | | | |
| | | | | | | United Kingdom: 1.4% | | | | | | | | |
| | 230,000 | | | (1) | | Anglo American Capital PLC, 4.750%, 04/10/27 | | | 241,018 | | | | 0.1 | |
| | 283,000 | | | | | Aon PLC, 2.800%, 03/15/21 | | | 284,148 | | | | 0.1 | |
| | 530,000 | | | | | BP Capital Markets PLC, 3.216%, 11/28/23 | | | 541,740 | | | | 0.2 | |
| | 200,000 | | | (1) | | Reckitt Benckiser Treasury Services PLC, 3.000%, 06/26/27 | | | 195,507 | | | | 0.1 | |
| | 239,000 | | | (1) | | Santander UK Group Holdings PLC, 5.625%, 09/15/45 | | | 290,370 | | | | 0.1 | |
| | 1,002,000 | | | | | Santander UK PLC, 2.375%, 03/16/20 | | | 1,002,514 | | | | 0.5 | |
| | 400,000 | | | (1),(2) | | Standard Chartered PLC, 4.300%, 02/19/27 | | | 408,317 | | | | 0.2 | |
| | 200,000 | | | (1) | | Virgin Media Secured Finance PLC, 5.250%, 01/15/26 | | | 202,750 | | | | 0.1 | |
| | | | | | | | | | 3,166,364 | | | | 1.4 | |
| | | | | | | | | | | | | | | |
| | | | | | | United States: 18.7% | | | | | | | | |
| | 424,000 | | | | | 21st Century Fox America, Inc., 4.500%, 02/15/21 | | | 448,421 | | | | 0.2 | |
| | 300,000 | | | | | 21st Century Fox America, Inc., 5.400%, 10/01/43 | | | 372,145 | | | | 0.2 | |
| | 150,000 | | | | | AbbVie, Inc., 3.600%, 05/14/25 | | | 154,417 | | | | 0.1 | |
| | 321,000 | | | | | AbbVie, Inc., 4.300%, 05/14/36 | | | 344,805 | | | | 0.2 | |
| | 537,000 | | | | | Allergan Funding SCS, 2.350%, 03/12/18 | | | 537,445 | | | | 0.2 | |
| | 53,000 | | | | | Aetna, Inc., 2.800%, 06/15/23 | | | 52,219 | | | | 0.0 | |
| | 325,000 | | | (2) | | AMC Entertainment Holdings, Inc., 5.875%, 11/15/26 | | | 321,750 | | | | 0.1 | |
| | 233,000 | | | | | American Tower Corp., 3.500%, 01/31/23 | | | 238,485 | | | | 0.1 | |
| | 70,000 | | | | | Andeavor Logistics L.P. / Tesoro Logistics Finance Corp., 5.250%, 01/15/25 | | | 73,707 | | | | 0.0 | |
| | 432,000 | | | | | Anheuser-Busch InBev Finance, Inc., 2.650%, 02/01/21 | | | 434,441 | | | | 0.2 | |
| | 555,000 | | | | | Anheuser-Busch InBev Finance, Inc., 3.650%, 02/01/26 | | | 573,577 | | | | 0.3 | |
| | 301,000 | | | (1) | | AT&T, Inc., 4.300%, 02/15/30 | | | 301,354 | | | | 0.1 | |
| | 299,000 | | | | | AT&T, Inc., 5.150%, 03/15/42 | | | 311,076 | | | | 0.1 | |
| | 430,000 | | | | | AT&T, Inc., 5.450%, 03/01/47 | | | 460,905 | | | | 0.2 | |
| | 368,000 | | | | | Bank of America Corp., 3.300%, 01/11/23 | | | 376,671 | | | | 0.2 | |
| | 387,000 | | | (1) | | Bank of America Corp., 3.419%, 12/20/28 | | | 387,451 | | | | 0.2 | |
| | 458,000 | | | | | Bank of America Corp., 4.100%, 07/24/23 | | | 486,663 | | | | 0.2 | |
| | 167,000 | | | | | Bank of America Corp., 4.000%, 04/01/24 | | | 176,651 | | | | 0.1 | |
| | 412,000 | | | | | Bank of New York Mellon Corp., 2.050%, 05/03/21 | | | 407,149 | | | | 0.2 | |
| | 300,000 | | | | | Boardwalk Pipelines L.P., 5.950%, 06/01/26 | | | 335,114 | | | | 0.1 | |
| | 105,000 | | | (1) | | Brink's Co/The, 4.625%, 10/15/27 | | | 103,162 | | | | 0.0 | |
| | 300,000 | | | (1) | | Builders FirstSource, Inc., 5.625%, 09/01/24 | | | 313,335 | | | | 0.1 | |
| | 540,000 | | | (1) | | Calpine Corp., 6.000%, 01/15/22 | | | 558,225 | | | | 0.2 | |
| | 395,000 | | | | | CBRE Services, Inc., 5.250%, 03/15/25 | | | 435,012 | | | | 0.2 | |
| | 216,000 | | | | | CBS Corp., 3.700%, 08/15/24 | | | 222,528 | | | | 0.1 | |
| | 249,000 | | | | | CCO Holdings LLC / CCO Holdings Capital Corp., 5.125%, 02/15/23 | | | 255,225 | | | | 0.1 | |
| | 60,000 | | | (1) | | CCO Holdings LLC / CCO Holdings Capital Corp., 5.125%, 05/01/27 | | | 59,250 | | | | 0.0 | |
| | 100,000 | | | | | CDW LLC / CDW Finance Corp., 5.000%, 09/01/25 | | | 104,000 | | | | 0.0 | |
| | 501,000 | | | | | Celgene Corp., 4.000%, 08/15/23 | | | 527,674 | | | | 0.2 | |
| | 472,000 | | | | | Charter Communications Operating LLC / Charter Communications Operating Capital, 4.464%, 07/23/22 | | | 492,890 | | | | 0.2 | |
| | 195,000 | | | (2) | | CHS/Community Health Systems, Inc., 5.125%, 08/01/21 | | | 176,475 | | | | 0.1 | |
| | 579,000 | | | | | Citigroup, Inc., 4.000%, 08/05/24 | | | 604,577 | | | | 0.3 | |
| | 469,000 | | | | | Citigroup, Inc., 5.500%, 09/13/25 | | | 529,065 | | | | 0.2 | |
| | 758,000 | | | | | Citizens Bank NA/Providence RI, 2.450%, 12/04/19 | | | 758,762 | | | | 0.3 | |
| | 165,000 | | | | | Comcast Corp., 2.350%, 01/15/27 | | | 155,967 | | | | 0.1 | |
| | 200,000 | | | | | Comcast Corp., 4.250%, 01/15/33 | | | 218,225 | | | | 0.1 | |
| | 185,000 | | | (1) | | CommScope Technologies LLC, 5.000%, 03/15/27 | | | 185,462 | | | | 0.1 | |
| | 255,000 | | | (1) | | Continental Resources, Inc./OK, 4.375%, 01/15/28 | | | 252,055 | | | | 0.1 | |
| | 562,000 | | | (1) | | Cox Communications, Inc., 2.950%, 06/30/23 | | | 554,620 | | | | 0.2 | |
| | 335,000 | | | (1) | | CRC Escrow Issuer LLC / CRC Finco, Inc., 5.250%, 10/15/25 | | | 339,288 | | | | 0.2 | |
| | 300,000 | | | | | CSC Holdings LLC, 5.250%, 06/01/24 | | | 294,750 | | | | 0.1 | |
| | 777,000 | | | | | CVS Health Corp., 2.800%, 07/20/20 | | | 780,648 | | | | 0.3 | |
| | 177,000 | | | (1) | | Dell International LLC / EMC Corp., 4.420%, 06/15/21 | | | 184,564 | | | | 0.1 | |
| | 480,000 | | | (1) | | Dell International LLC / EMC Corp., 5.450%, 06/15/23 | | | 519,231 | | | | 0.2 | |
| | 313,000 | | | (1) | | Dell International LLC / EMC Corp., 6.020%, 06/15/26 | | | 345,601 | | | | 0.2 | |
| | 442,000 | | | | | Discover Bank, 7.000%, 04/15/20 | | | 482,000 | | | | 0.2 | |
| | 355,000 | | | | | DISH DBS Corp., 5.875%, 11/15/24 | | | 346,569 | | | | 0.2 | |
| | 147,000 | | | | | Eastman Chemical Co., 2.700%, 01/15/20 | | | 148,010 | | | | 0.1 | |
See Accompanying Notes to Financial Statements
| Voya Global Bond Portfolio | PORTFOLIO OF INVESTMENTS
as of December 31, 2017 (continued) |
Principal
Amount† | | | | | | | Value | | | Percentage
of Net
Assets | |
| CORPORATE BONDS/NOTES: (continued) | | | | | | | | |
| | | | | | | United States: (continued) | | | | | | | | |
| | 1,026,000 | | | | | Energy Transfer L.P., 4.900%, 02/01/24 | | | 1,086,171 | | | | 0.5 | |
| | 558,000 | | | | | Entergy Corp., 5.125%, 09/15/20 | | | 589,818 | | | | 0.3 | |
| | 153,000 | | | | | Envision Healthcare Corp., 5.625%, 07/15/22 | | | 155,295 | | | | 0.1 | |
| | 470,000 | | | (1) | | ESH Hospitality, Inc., 5.250%, 05/01/25 | | | 475,875 | | | | 0.2 | |
| | 318,000 | | | | | Fifth Third Bancorp, 8.250%, 03/01/38 | | | 486,702 | | | | 0.2 | |
| | 310,000 | | | (1) | | First Data Corp., 5.750%, 01/15/24 | | | 323,097 | | | | 0.1 | |
| | 532,000 | | | | | FirstEnergy Corp., 4.250%, 03/15/23 | | | 556,195 | | | | 0.2 | |
| | 205,000 | | | | | General Electric Co., 6.750%, 03/15/32 | | | 281,142 | | | | 0.1 | |
| | 224,000 | | | | | General Motors Financial Co., Inc., 4.300%, 07/13/25 | | | 233,739 | | | | 0.1 | |
| | 192,000 | | | | | Gilead Sciences, Inc., 2.950%, 03/01/27 | | | 189,010 | | | | 0.1 | |
| | 240,000 | | | | | Goldman Sachs Group, Inc./The, 2.625%, 04/25/21 | | | 239,999 | | | | 0.1 | |
| | 940,000 | | | | | Goldman Sachs Group, Inc./The, 2.876%, 10/31/22 | | | 937,709 | | | | 0.4 | |
| | 105,000 | | | | | Goodyear Tire & Rubber Co/The, 4.875%, 03/15/27 | | | 107,756 | | | | 0.0 | |
| | 240,000 | | | | | HCA, Inc., 5.500%, 06/15/47 | | | 240,000 | | | | 0.1 | |
| | 240,000 | | | | | HCA, Inc., 5.875%, 02/15/26 | | | 254,400 | | | | 0.1 | |
| | 70,000 | | | (1) | | Hess Infrastructure Partners L.P. / Hess Infrastructure Partners Finance Corp., 5.625%, 02/15/26 | | | 72,625 | | | | 0.0 | |
| | 115,000 | | | (1) | | Hill-Rom Holdings, Inc., 5.000%, 02/15/25 | | | 117,840 | | | | 0.1 | |
| | 75,000 | | | (1) | | IHS Markit Ltd, 4.000%, 03/01/26 | | | 75,281 | | | | 0.0 | |
| | 1,041,000 | | | | | Indiana Michigan Power Co., 7.000%, 03/15/19 | | | 1,097,782 | | | | 0.5 | |
| | 320,000 | | | (1) | | Iron Mountain, Inc., 5.250%, 03/15/28 | | | 320,000 | | | | 0.1 | |
| | 570,000 | | | (1) | | JBS USA LUX SA / JBS USA Finance, Inc., 5.875%, 07/15/24 | | | 553,612 | | | | 0.2 | |
| | 245,000 | | | (4) | | Jefferson Smurfit Escrow, 06/01/49 | | | – | | | | – | |
| | 140,000 | | | | | Johnson & Johnson, 2.900%, 01/15/28 | | | 140,342 | | | | 0.1 | |
| | 150,000 | | | | | Johnson & Johnson, 3.400%, 01/15/38 | | | 153,846 | | | | 0.1 | |
| | 362,000 | | | | | JPMorgan Chase & Co., 1.625%, 05/15/18 | | | 361,782 | | | | 0.2 | |
| | 357,000 | | | | | JPMorgan Chase & Co., 2.550%, 03/01/21 | | | 357,314 | | | | 0.2 | |
| | 478,000 | | | | | JPMorgan Chase & Co., 6.000%, 12/31/99 | | | 515,069 | | | | 0.2 | |
| | 222,000 | | | | | Kinder Morgan Energy Partners L.P., 4.250%, 09/01/24 | | | 230,195 | | | | 0.1 | |
| | 317,000 | | | | | Kraft Heinz Foods Co., 3.000%, 06/01/26 | | | 305,521 | | | | 0.1 | |
| | 342,000 | | | | | Kroger Co/The, 4.450%, 02/01/47 | | | 342,561 | | | | 0.2 | |
| | 291,000 | | | (1) | | Lennar Corp., 4.750%, 11/29/27 | | | 301,127 | | | | 0.1 | |
| | 335,000 | | | | | Level 3 Parent LLC, 5.750%, 12/01/22 | | | 337,194 | | | | 0.2 | |
| | 375,000 | | | | | Medtronic, Inc., 3.150%, 03/15/22 | | | 384,272 | | | | 0.2 | |
| | 380,000 | | | (1) | | Metropolitan Edison Co., 4.000%, 04/15/25 | | | 391,029 | | | | 0.2 | |
| | 320,000 | | | | | MGM Resorts International, 4.625%, 09/01/26 | | | 324,800 | | | | 0.1 | |
| | 372,000 | | | | | Morgan Stanley, 3.750%, 02/25/23 | | | 385,741 | | | | 0.2 | |
| | 618,000 | | | | | Morgan Stanley, 4.100%, 05/22/23 | | | 644,539 | | | | 0.3 | |
| | 625,000 | | | | | Netflix, Inc., 5.750%, 03/01/24 | | | 666,406 | | | | 0.3 | |
| | 438,000 | | | | | Newell Brands, Inc., 2.875%, 12/01/19 | | | 441,664 | | | | 0.2 | |
| | 381,000 | | | | | NextEra Energy Capital Holdings, Inc., 3.625%, 06/15/23 | | | 392,125 | | | | 0.2 | |
| | 175,000 | | | (1) | | Nielsen Finance LLC / Nielsen Finance Co., 5.000%, 04/15/22 | | | 180,469 | | | | 0.1 | |
| | 235,000 | | | | | Nordstrom, Inc., 5.000%, 01/15/44 | | | 227,185 | | | | 0.1 | |
| | 315,000 | | | (1) | | Novelis Corp., 5.875%, 09/30/26 | | | 322,087 | | | | 0.1 | |
| | 220,000 | | | | | Occidental Petroleum Corp., 4.625%, 06/15/45 | | | 249,417 | | | | 0.1 | |
| | 349,000 | | | | | Oracle Corp., 2.950%, 05/15/25 | | | 350,764 | | | | 0.2 | |
| | 150,000 | | | | | O'Reilly Automotive, Inc., 3.600%, 09/01/27 | | | 150,806 | | | | 0.1 | |
| | 140,000 | | | (1) | | Owens-Brockway Glass Container, Inc., 5.875%, 08/15/23 | | | 151,112 | | | | 0.1 | |
| | 235,000 | | | | | Pfizer, Inc., 2.750%, 06/03/26 | | | 232,167 | | | | 0.1 | |
| | 460,000 | | | | | Philip Morris International, Inc., 4.250%, 11/10/44 | | | 485,611 | | | | 0.2 | |
| | 475,000 | | | (1) | | Post Holdings, Inc., 5.000%, 08/15/26 | | | 468,469 | | | | 0.2 | |
| | 115,000 | | | | | Qualcomm, Inc., 3.250%, 05/20/27 | | | 112,387 | | | | 0.1 | |
| | 245,000 | | | (1) | | Quicken Loans, Inc., 5.250%, 01/15/28 | | | 242,476 | | | | 0.1 | |
| | 280,000 | | | | | Energy Transfer L.P. / Regency Energy Finance Corp., 4.500%, 11/01/23 | | | 290,212 | | | | 0.1 | |
| | 272,000 | | | | | Reynolds American, Inc., 6.150%, 09/15/43 | | | 350,581 | | | | 0.2 | |
| | 117,000 | | | | | Scripps Networks Interactive, Inc., 2.750%, 11/15/19 | | | 117,135 | | | | 0.1 | |
| | 315,000 | | | | | Service Corp. International/US, 4.625%, 12/15/27 | | | 320,393 | | | | 0.1 | |
| | 135,000 | | | (1) | | Sirius XM Radio, Inc., 5.000%, 08/01/27 | | | 136,013 | | | | 0.1 | |
| | 175,000 | | | (1) | | Sirius XM Radio, Inc., 5.375%, 04/15/25 | | | 182,656 | | | | 0.1 | |
| | 95,000 | | | (1) | | Six Flags Entertainment Corp., 4.875%, 07/31/24 | | | 96,663 | | | | 0.0 | |
| | 370,000 | | | (1) | | Six Flags Entertainment Corp., 5.500%, 04/15/27 | | | 383,875 | | | | 0.2 | |
| | 125,000 | | | | | SLM Corp., 5.125%, 04/05/22 | | | 130,313 | | | | 0.1 | |
See Accompanying Notes to Financial Statements
| Voya Global Bond Portfolio | PORTFOLIO OF INVESTMENTS
as of December 31, 2017 (continued) |
Principal
Amount† | | | | | | | Value | | | Percentage
of Net
Assets | |
| CORPORATE BONDS/NOTES: (continued) | | | | | | | | |
| | | | | | | United States: (continued) | | | | | | | | |
| | 200,000 | | | | | Southwest Airlines Co., 3.450%, 11/16/27 | | | 199,329 | | | | 0.1 | |
| | 235,000 | | | (1) | | Standard Industries, Inc./NJ, 5.000%, 02/15/27 | | | 240,875 | | | | 0.1 | |
| | 245,000 | | | (4) | | Stone Webster Escrow, 07/01/49 | | | – | | | | – | |
| | 185,000 | | | | | Summit Midstream Holdings LLC / Summit Midstream Finance Corp., 5.750%, 04/15/25 | | | 187,477 | | | | 0.1 | |
| | 104,000 | | | | | Sunoco Logistics Partners Operations L.P., 4.250%, 04/01/24 | | | 106,144 | | | | 0.0 | |
| | 445,000 | | | | | Synchrony Financial, 4.250%, 08/15/24 | | | 461,949 | | | | 0.2 | |
| | 335,000 | | | (1) | | Tallgrass Energy Partners L.P. / Tallgrass Energy Finance Corp., 5.500%, 01/15/28 | | | 339,506 | | | | 0.2 | |
| | 70,000 | | | | | Teleflex, Inc., 4.625%, 11/15/27 | | | 70,861 | | | | 0.0 | |
| | 272,000 | | | | | Time Warner Cable LLC, 5.875%, 11/15/40 | | | 295,852 | | | | 0.1 | |
| | 485,000 | | | | | Time Warner, Inc., 6.500%, 11/15/36 | | | 609,262 | | | | 0.3 | |
| | 295,000 | | | | | T-Mobile USA, Inc., 6.500%, 01/15/26 | | | 322,656 | | | | 0.1 | |
| | 50,000 | | | | | United Rentals North America, Inc., 4.875%, 01/15/28 | | | 50,375 | | | | 0.0 | |
| | 100,000 | | | | | United Rentals North America, Inc., 5.500%, 07/15/25 | | | 106,375 | | | | 0.0 | |
| | 480,000 | | | (1) | | Univision Communications, Inc., 5.125%, 02/15/25 | | | 469,200 | | | | 0.2 | |
| | 505,000 | | | (1),(2) | | Valeant Pharmaceuticals International, Inc., 7.250%, 07/15/22 | | | 512,575 | | | | 0.2 | |
| | 230,000 | | | | | Verizon Communications, Inc., 4.125%, 03/16/27 | | | 240,216 | | | | 0.1 | |
| | 270,000 | | | | | Verizon Communications, Inc., 5.012%, 08/21/54 | | | 276,828 | | | | 0.1 | |
| | 252,000 | | | | | Viacom, Inc., 4.375%, 03/15/43 | | | 218,762 | | | | 0.1 | |
| | 599,000 | | | | | Wells Fargo & Co., 4.100%, 06/03/26 | | | 628,631 | | | | 0.3 | |
| | 250,000 | | | (1) | | Wynn Las Vegas LLC / Wynn Las Vegas Capital Corp., 5.500%, 03/01/25 | | | 258,125 | | | | 0.1 | |
| | | | | | | | | | 42,586,980 | | | | 18.7 | |
| | | | | | | | | | | | | | | |
| | | | | Total Corporate Bonds/Notes | | | | | | | | |
| | | | | (Cost $55,957,743) | | | 57,335,380 | | | | 25.1 | |
| | | | | | | | | | | | | | | |
| COLLATERALIZED MORTGAGE OBLIGATIONS: 13.0% | | | | | | | | |
| | | | | | | United States: 13.0% | | | | | | | | |
| | 423,483 | | | | | Adjustable Rate Mortgage Trust 2006-2 1A1, 3.387%, 05/25/36 | | | 399,667 | | | | 0.2 | |
| | 311,594 | | | | | Alternative Loan Trust 2005-51 3A2A, 2.353%, (12MTA + 1.290%), 11/20/35 | | | 302,246 | | | | 0.1 | |
| | 97,080 | | | | | Alternative Loan Trust 2006-13T1 A9, 6.000%, 05/25/36 | | | 78,909 | | | | 0.0 | |
| | 598,641 | | | | | Bank of America Funding 2005-1 Trust 1A1, 5.500%, 02/25/35 | | | 600,715 | | | | 0.3 | |
| | 407,366 | | | | | CHL Mortgage Pass-Through Trust 2007-7 A7, 5.750%, 06/25/37 | | | 375,344 | | | | 0.2 | |
| | 126,493 | | | | | Citigroup Mortgage Loan Trust, Inc. 2005-2 1A3, 3.489%, 05/25/35 | | | 127,327 | | | | 0.1 | |
| | 388,990 | | | | | CitiMortgage Alternative Loan Trust Series 2006-A3 1A7, 6.000%, 07/25/36 | | | 375,572 | | | | 0.2 | |
| | 87,251 | | | | | CHL Mortgage Pass-Through Trust 2005-17 1A8, 5.500%, 09/25/35 | | | 87,065 | | | | 0.0 | |
| | 81,960 | | | | | CHL Mortgage Pass-Through Trust 2005-J4 A7, 5.500%, 11/25/35 | | | 82,281 | | | | 0.0 | |
| | 66,991 | | | | | Countrywide Alternative Loan Trust 2005-53T2 2A6, 2.052%, (US0001M + 0.500%), 11/25/35 | | | 40,886 | | | | 0.0 | |
| | 300,000 | | | | | Countrywide Asset-Backed Certificates 2005-IM1 M1, 2.272%, (US0001M + 0.720%), 11/25/35 | | | 289,544 | | | | 0.1 | |
| | 20,482 | | | (1) | | Deutsche ALT-A Securities, Inc. ALT2007-RS1 A2, 2.052%, (US0001M + 0.500%), 01/27/37 | | | 97,244 | | | | 0.0 | |
| | 500,000 | | | | | Fannie Mae Connecticut Avenue Securities 2017-C03 1M2, 4.552%, (US0001M + 3.000%), 10/25/29 | | | 526,264 | | | | 0.2 | |
| | 500,000 | | | | | Fannie Mae Connecticut Avenue Securities 2017-C05 1M2, 3.752%, (US0001M + 2.200%), 01/25/30 | | | 505,655 | | | | 0.2 | |
| | 300,000 | | | | | Fannie Mae Connecticut Avenue Securities 2017-C07 1M2, 3.952%, (US0001M + 2.400%), 05/25/30 | | | 308,215 | | | | 0.1 | |
| | 600,000 | | | | | Fannie Mae Connecticut Avenue Securities 2017-C07 2M2, 4.052%, (US0001M + 2.500%), 05/25/30 | | | 618,469 | | | | 0.3 | |
| | 81,856 | | | (5) | | Fannie Mae Interest Strip Sereis 328 2, 6.000%, 12/25/32 | | | 19,344 | | | | 0.0 | |
| | 42,068 | | | (5) | | Fannie Mae Interest Strip Sereis 332 2, 6.000%, 03/25/33 | | | 10,028 | | | | 0.0 | |
| | 167,202 | | | (5) | | Fannie Mae Interest Strip Series 254 2, 7.500%, 01/25/24 | | | 27,725 | | | | 0.0 | |
| | 26,735 | | | (5) | | Fannie Mae Interest Strip Series 294 2, 7.000%, 02/25/28 | | | 6,066 | | | | 0.0 | |
| | 219,228 | | | (5) | | Fannie Mae Interest Strip Series 319 2, 6.500%, 02/25/32 | | | 47,802 | | | | 0.0 | |
| | 35,720 | | | (5) | | Fannie Mae Interest Strip Series 331 5, 6.000%, 02/25/33 | | | 7,438 | | | | 0.0 | |
| | 34,598 | | | (5) | | Fannie Mae Interest Strip Series 334 12, 6.000%, 03/25/33 | | | 8,111 | | | | 0.0 | |
See Accompanying Notes to Financial Statements
| Voya Global Bond Portfolio | PORTFOLIO OF INVESTMENTS
as of December 31, 2017 (continued) |
Principal
Amount† | | | | | | | Value | | | Percentage
of Net
Assets | |
| COLLATERALIZED MORTGAGE OBLIGATIONS: (continued) | | | | | | | | |
| | | | | | | United States: (continued) | | | | | | | | |
| | 42,689 | | | (5) | | Fannie Mae Interest Strip Series 338 2, 5.500%, 07/25/33 | | | 9,438 | | | | 0.0 | |
| | 18,205 | | | (5) | | Fannie Mae Interest Strip Series 356 10, 5.500%, 06/25/35 | | | 3,708 | | | | 0.0 | |
| | 19,493 | | | (5) | | Fannie Mae Interest Strip Series 364 15, 6.000%, 09/25/35 | | | 4,136 | | | | 0.0 | |
| | 572,883 | | | (5) | | Fannie Mae Interest Strip Series 418 5, 3.500%, 08/25/43 | | | 98,082 | | | | 0.1 | |
| | 878,417 | | | (5) | | Fannie Mae Interest Strip Series 418 80, 3.500%, 08/25/33 | | | 122,452 | | | | 0.1 | |
| | 13,928 | | | | | Fannie Mae REMIC Trust 1999-14 MB, 6.500%, 04/25/29 | | | 15,447 | | | | 0.0 | |
| | 21,003 | | | | | Fannie Mae REMIC Trust 1999-54 LH, 6.500%, 11/25/29 | | | 23,242 | | | | 0.0 | |
| | 18,770 | | | | | Fannie Mae REMIC Trust 2001-80 ZB, 6.000%, 01/25/32 | | | 20,871 | | | | 0.0 | |
| | 84,784 | | | (5) | | Fannie Mae REMIC Trust 2002-12 SB, 6.198%, (-1.000*US0001M + 7.750%), 07/25/31 | | | 16,685 | | | | 0.0 | |
| | 48,891 | | | (5) | | Fannie Mae REMIC Trust 2002-2 SW, 6.198%, (-1.000*US0001M + 7.750%), 02/25/32 | | | 9,911 | | | | 0.0 | |
| | 22,358 | | | | | Fannie Mae REMIC Trust 2002-21 PE, 6.500%, 04/25/32 | | | 25,132 | | | | 0.0 | |
| | 8,848 | | | | | Fannie Mae REMIC Trust 2002-29 F, 2.552%, (US0001M + 1.000%), 04/25/32 | | | 9,068 | | | | 0.0 | |
| | 31,873 | | | (5) | | Fannie Mae REMIC Trust 2002-41 S, 6.398%, (-1.000*US0001M + 7.950%), 07/25/32 | | | 5,981 | | | | 0.0 | |
| | 2,723 | | | | | Fannie Mae REMIC Trust 2002-64 FJ, 2.552%, (US0001M + 1.000%), 04/25/32 | | | 2,791 | | | | 0.0 | |
| | 5,805 | | | | | Fannie Mae REMIC Trust 2002-68 FH, 1.991%, (US0001M + 0.500%), 10/18/32 | | | 5,833 | | | | 0.0 | |
| | 968,615 | | | (5) | | Fannie Mae REMIC Trust 2002-77 JS, 6.509%, (-1.000*US0001M + 8.000%), 12/18/32 | | | 193,154 | | | | 0.1 | |
| | 25,670 | | | | | Fannie Mae REMIC Trust 2002-84 FB, 2.552%, (US0001M + 1.000%), 12/25/32 | | | 26,278 | | | | 0.0 | |
| | 25,667 | | | | | Fannie Mae REMIC Trust 2003-11 FA, 2.552%, (US0001M + 1.000%), 09/25/32 | | | 26,275 | | | | 0.0 | |
| | 5,538 | | | | | Fannie Mae REMIC Trust 2003-116 FA, 1.952%, (US0001M + 0.400%), 11/25/33 | | | 5,544 | | | | 0.0 | |
| | 33,373 | | | (5) | | Fannie Mae REMIC Trust 2003-13 IO, 7.000%, 03/25/33 | | | 8,378 | | | | 0.0 | |
| | 25,332 | | | (5) | | Fannie Mae REMIC Trust 2003-26 IK, 7.000%, 04/25/33 | | | 5,887 | | | | 0.0 | |
| | 19,171 | | | (5) | | Fannie Mae REMIC Trust 2003-52 NS, 5.548%, (-1.000*US0001M + 7.100%), 06/25/23 | | | 1,540 | | | | 0.0 | |
| | 134,473 | | | (5) | | Fannie Mae REMIC Trust 2004-56 SE, 5.998%, (-1.000*US0001M + 7.550%), 10/25/33 | | | 27,490 | | | | 0.0 | |
| | 36,858 | | | | | Fannie Mae REMIC Trust 2005-25 PS, 21.331%, (-4.400*US0001M + 28.160%), 04/25/35 | | | 59,391 | | | | 0.0 | |
| | 17,396 | | | (5) | | Fannie Mae REMIC Trust 2005-40 SB, 5.198%, (-1.000*US0001M + 6.750%), 05/25/35 | | | 2,561 | | | | 0.0 | |
| | 81,999 | | | | | Fannie Mae REMIC Trust 2005-71 DB, 4.500%, 08/25/25 | | | 84,780 | | | | 0.0 | |
| | 112,127 | | | | | Fannie Mae REMIC Trust 2005-74 DK, 17.792%, (-4.000*US0001M + 24.000%), 07/25/35 | | | 174,986 | | | | 0.1 | |
| | 365,995 | | | | | Fannie Mae REMIC Trust 2005-87 SB, 18.142%, (-3.667*US0001M + 23.830%), 10/25/35 | | | 551,450 | | | | 0.2 | |
| | 291,183 | | | | | Fannie Mae REMIC Trust 2006-104 ES, 25.689%, (-5.000*US0001M + 33.450%), 11/25/36 | | | 506,037 | | | | 0.2 | |
| | 18,335 | | | | | Fannie Mae REMIC Trust 2006-11 PS, 18.876%, (-3.667*US0001M + 24.570%), 03/25/36 | | | 28,518 | | | | 0.0 | |
| | 48,397 | | | | | Fannie Mae REMIC Trust 2006-46 SW, 18.508%, (-3.667*US0001M + 24.200%), 06/25/36 | | | 73,668 | | | | 0.0 | |
| | 277,561 | | | (5) | | Fannie Mae REMIC Trust 2006-51 SA, 5.018%, (-1.000*US0001M + 6.570%), 06/25/36 | | | 47,611 | | | | 0.0 | |
| | 91,174 | | | (5) | | Fannie Mae REMIC Trust 2006-90 SX, 5.678%, (-1.000*US0001M + 7.230%), 09/25/36 | | | 16,773 | | | | 0.0 | |
| | 10,550,552 | | | (5) | | Fannie Mae REMIC Trust 2007-116 DI, 4.388%, (-1.000*US0001M + 5.940%), 01/25/38 | | | 1,722,535 | | | | 0.8 | |
| | 80,008 | | | (5) | | Fannie Mae REMIC Trust 2007-88 XI, 4.988%, (-1.000*US0001M + 6.540%), 06/25/37 | | | 14,536 | | | | 0.0 | |
| | 1,039,457 | | | (5) | | Fannie Mae REMIC Trust 2007-89 SB, 4.998%, (-1.000*US0001M + 6.550%), 09/25/37 | | | 179,912 | | | | 0.1 | |
See Accompanying Notes to Financial Statements
| Voya Global Bond Portfolio | PORTFOLIO OF INVESTMENTS
as of December 31, 2017 (continued) |
Principal
Amount† | | | | | | | Value | | | Percentage
of Net
Assets | |
| COLLATERALIZED MORTGAGE OBLIGATIONS: (continued) | | | | | | | | |
| | | | | | | United States: (continued) | | | | | | | | |
| | 2,244,578 | | | (5) | | Fannie Mae REMIC Trust 2007-94 SG, 4.898%, (-1.000*US0001M + 6.450%), 10/25/37 | | | 388,116 | | | | 0.2 | |
| | 248,774 | | | | | Fannie Mae REMIC Trust 2010-109 SN, 18.197%, (-5.000*US0001M + 25.000%), 10/25/40 | | | 553,476 | | | | 0.2 | |
| | 156,240 | | | | | Fannie Mae REMIC Trust 2010-155 PL, 5.000%, 07/25/40 | | | 162,544 | | | | 0.1 | |
| | 4,083,746 | | | (5) | | Fannie Mae REMIC Trust 2011-55 SK, 5.008%, (-1.000*US0001M + 6.560%), 06/25/41 | | | 754,047 | | | | 0.3 | |
| | 11,803 | | | (5) | | Fannie Mae REMIC Trust 2011-69 AI, 5.000%, 05/25/18 | | | 42 | | | | 0.0 | |
| | 3,284,977 | | | (5) | | Fannie Mae REMIC Trust 2011-86 NS, 4.398%, (-1.000*US0001M + 5.950%), 09/25/41 | | | 470,330 | | | | 0.2 | |
| | 2,250,271 | | | (5) | | Fannie Mae REMIC Trust 2012-10 US, 4.898%, (-1.000*US0001M + 6.450%), 02/25/42 | | | 309,160 | | | | 0.1 | |
| | 1,676,564 | | | (5) | | Fannie Mae REMIC Trust 2012-110 JI, 4.000%, 06/25/42 | | | 237,767 | | | | 0.1 | |
| | 5,542,624 | | | (5) | | Fannie Mae REMIC Trust 2012-133 PS, 4.648%, (-1.000*US0001M + 6.200%), 03/25/42 | | | 690,883 | | | | 0.3 | |
| | 2,655,685 | | | (5) | | Fannie Mae REMIC Trust 2012-144 SB, 4.548%, (-1.000*US0001M + 6.100%), 01/25/43 | | | 584,738 | | | | 0.3 | |
| | 2,880,071 | | | (5) | | Fannie Mae REMIC Trust 2012-27 SB, 4.428%, (-1.000*US0001M + 5.980%), 11/25/41 | | | 364,102 | | | | 0.2 | |
| | 23,601 | | | | | Fannie Mae REMIC Trust 2013-130 ST, 8.000%, (-16.000*US0001M + 64.000%), 05/25/43 | | | 27,982 | | | | 0.0 | |
| | 1,761,960 | | | (5) | | Fannie Mae REMIC Trust 2013-64 LI, 3.000%, 06/25/33 | | | 236,913 | | | | 0.1 | |
| | 10,293,789 | | | (5) | | Freddie Mac 3502 DL, 4.523%, (-1.000*US0001M + 6.000%), 01/15/39 | | | 1,614,111 | | | | 0.7 | |
| | 51,315 | | | | | Freddie Mac REMIC Trust 1360 PZ, 7.500%, 09/15/22 | | | 55,359 | | | | 0.0 | |
| | 30,001 | | | | | Freddie Mac REMIC Trust 1674 Z, 6.750%, 02/15/24 | | | 32,328 | | | | 0.0 | |
| | 62,818 | | | | | Freddie Mac REMIC Trust 1897 K, 7.000%, 09/15/26 | | | 69,530 | | | | 0.0 | |
| | 10,972 | | | (5) | | Freddie Mac REMIC Trust 2035 PE, 7.000%, 03/15/28 | | | 2,432 | | | | 0.0 | |
| | 56,441 | | | (5) | | Freddie Mac REMIC Trust 2049 PL, 7.000%, 04/15/28 | | | 11,765 | | | | 0.0 | |
| | 26,901 | | | | | Freddie Mac REMIC Trust 2122 F, 1.927%, (US0001M + 0.450%), 02/15/29 | | | 27,034 | | | | 0.0 | |
| | 93,923 | | | (5) | | Freddie Mac REMIC Trust 2134 SB, 6.223%, (-1.000*US0001M + 7.700%), 03/15/29 | | | 14,800 | | | | 0.0 | |
| | 101,540 | | | (5) | | Freddie Mac REMIC Trust 2136 SG, 6.173%, (-1.000*US0001M + 7.650%), 03/15/29 | | | 17,094 | | | | 0.0 | |
| | 130,999 | | | (5) | | Freddie Mac REMIC Trust 2177 SB, 7.473%, (-1.000*US0001M + 8.950%), 08/15/29 | | | 26,339 | | | | 0.0 | |
| | 14,382 | | | | | Freddie Mac REMIC Trust 2344 FP, 2.427%, (US0001M + 0.950%), 08/15/31 | | | 14,780 | | | | 0.0 | |
| | 6,672 | | | | | Freddie Mac REMIC Trust 2412 GF, 2.427%, (US0001M + 0.950%), 02/15/32 | | | 6,860 | | | | 0.0 | |
| | 51,026 | | | | | Freddie Mac REMIC Trust 2415 ZA, 6.500%, 02/15/32 | | | 57,476 | | | | 0.0 | |
| | 40,610 | | | | | Freddie Mac REMIC Trust 2461 PZ, 6.500%, 06/15/32 | | | 44,904 | | | | 0.0 | |
| | 7,799 | | | | | Freddie Mac REMIC Trust 2464 FI, 2.477%, (US0001M + 1.000%), 02/15/32 | | | 7,986 | | | | 0.0 | |
| | 8,000 | | | | | Freddie Mac REMIC Trust 2470 LF, 2.477%, (US0001M + 1.000%), 02/15/32 | | | 8,192 | | | | 0.0 | |
| | 10,838 | | | | | Freddie Mac REMIC Trust 2471 FD, 2.477%, (US0001M + 1.000%), 03/15/32 | | | 11,101 | | | | 0.0 | |
| | 8,811 | | | | | Freddie Mac REMIC Trust 2504 FP, 1.977%, (US0001M + 0.500%), 03/15/32 | | | 8,857 | | | | 0.0 | |
| | 35,091 | | | | | Freddie Mac REMIC Trust 2551 LF, 1.977%, (US0001M + 0.500%), 01/15/33 | | | 35,249 | | | | 0.0 | |
| | 99,245 | | | | | Freddie Mac REMIC Trust 2676 KY, 5.000%, 09/15/23 | | | 104,393 | | | | 0.1 | |
| | 437,081 | | | | | Freddie Mac REMIC Trust 2750 XG, 5.000%, 02/15/34 | | | 470,387 | | | | 0.2 | |
| | 376,229 | | | | | Freddie Mac REMIC Trust 2890 PE, 5.000%, 11/15/34 | | | 405,568 | | | | 0.2 | |
| | 72,454 | | | | | Freddie Mac REMIC Trust 3001 HT, 8.000%, (-6.667*US0001M + 44.670%), 05/15/35 | | | 81,381 | | | | 0.0 | |
| | 82,709 | | | (5) | | Freddie Mac REMIC Trust 3004 SB, 4.673%, (-1.000*US0001M + 6.150%), 07/15/35 | | | 9,938 | | | | 0.0 | |
| | 16,630 | | | | | Freddie Mac REMIC Trust 3025 SJ, 19.334%, (-3.667*US0001M + 24.750%), 08/15/35 | | | 24,911 | | | | 0.0 | |
| | 1,136,201 | | | (5) | | Freddie Mac REMIC Trust 3223 S, 4.473%, (-1.000*US0001M + 5.950%), 10/15/36 | | | 144,678 | | | | 0.1 | |
| | 2,822,297 | | | (5) | | Freddie Mac REMIC Trust 3505 SA, 4.523%, (-1.000*US0001M + 6.000%), 01/15/39 | | | 456,316 | | | | 0.2 | |
| | 3,136,751 | | | (5) | | Freddie Mac REMIC Trust 3702 S, 2.973%, (-1.000*US0001M + 4.450%), 05/15/36 | | | 277,368 | | | | 0.1 | |
| | 2,681,136 | | | (5) | | Freddie Mac REMIC Trust 3710 SL, 4.523%, (-1.000*US0001M + 6.000%), 05/15/36 | | | 135,795 | | | | 0.1 | |
See Accompanying Notes to Financial Statements
| Voya Global Bond Portfolio | PORTFOLIO OF INVESTMENTS
as of December 31, 2017 (continued) |
Principal
Amount† | | | | | | | Value | | | Percentage
of Net
Assets | |
| COLLATERALIZED MORTGAGE OBLIGATIONS: (continued) | | | | | | | | |
| | | | | | | United States: (continued) | | | | | | | | |
| | 238,924 | | | (5) | | Freddie Mac REMIC Trust 3803 SG, 5.123%, (-1.000*US0001M + 6.600%), 08/15/28 | | | 5,087 | | | | 0.0 | |
| | 3,207,262 | | | (5) | | Freddie Mac REMIC Trust 3925 SD, 4.573%, (-1.000*US0001M + 6.050%), 07/15/40 | | | 383,050 | | | | 0.2 | |
| | 1,665,951 | | | (5) | | Freddie Mac REMIC Trust 4136 SW, 4.773%, (-1.000*US0001M + 6.250%), 11/15/32 | | | 266,990 | | | | 0.1 | |
| | 741,631 | | | (5) | | Freddie Mac REMIC Trust 4161 CI, 4.000%, 02/15/43 | | | 133,621 | | | | 0.1 | |
| | 11,322,502 | | | (5) | | Freddie Mac REMIC Trust 4194 GI, 4.000%, 04/15/43 | | | 1,939,913 | | | | 0.9 | |
| | 1,333,323 | | | (5) | | Freddie Mac Series 4120 IK, 3.000%, 10/15/32 | | | 172,618 | | | | 0.1 | |
| | 100,000 | | | | | Freddie Mac Structured Agency Credit Risk Debt Notes 2015-DNA3 M3, 6.252%, (US0001M + 4.700%), 04/25/28 | | | 118,239 | | | | 0.1 | |
| | 400,000 | | | | | Freddie Mac Structured Agency Credit Risk Debt Notes 2017-DNA3 M2, 4.052%, (US0001M + 2.500%), 03/25/30 | | | 414,782 | | | | 0.2 | |
| | 600,000 | | | | | Freddie Mac Structured Agency Credit Risk Debt Notes 2017-HQA2 M2, 4.202%, (US0001M + 2.650%), 12/25/29 | | | 621,195 | | | | 0.3 | |
| | 476,634 | | | | | Ginnie Mae Series 2007-8 SP, 17.181%, (-3.242*US0001M + 22.050%), 03/20/37 | | | 684,013 | | | | 0.3 | |
| | 2,774,624 | | | (5) | | Ginnie Mae Series 2010-165 IP, 4.000%, 04/20/38 | | | 123,811 | | | | 0.1 | |
| | 2,632,697 | | | (5) | | Ginnie Mae Series 2010-68 MS, 4.349%, (-1.000*US0001M + 5.850%), 06/20/40 | | | 378,672 | | | | 0.2 | |
| | 1,884,439 | | | (5) | | Ginnie Mae Series 2012-97 SC, 5.209%, (-1.000*US0001M + 6.700%), 07/16/41 | | | 312,485 | | | | 0.1 | |
| | 283,778 | | | | | GreenPoint Mortgage Funding Trust 2006-AR3 4A1, 1.762%, (US0001M + 0.210%), 04/25/36 | | | 262,614 | | | | 0.1 | |
| | 77,896 | | | | | GSR Mortgage Loan Trust 2005-AR6 1A4, 3.506%, 09/25/35 | | | 80,307 | | | | 0.0 | |
| | 723,895 | | | | | IndyMac INDX Mortgage Loan Trust 2006-AR2 1A1B, 1.762%, (US0001M + 0.210%), 04/25/46 | | | 671,882 | | | | 0.3 | |
| | 692,665 | | | | | JP Morgan Mortgage Trust 2005-A4 B1, 3.560%, 07/25/35 | | | 625,159 | | | | 0.3 | |
| | 106,047 | | | | | JP Morgan Mortgage Trust 2007-A1 7A1, 3.658%, 07/25/35 | | | 106,257 | | | | 0.1 | |
| | 297,709 | | | (1) | | JP Morgan Mortgage Trust 2017-3 B1, 3.882%, 08/25/47 | | | 299,814 | | | | 0.1 | |
| | 153,186 | | | | | Lehman XS Trust Series 2005-5N 1A2, 1.912%, (US0001M + 0.360%), 11/25/35 | | | 136,600 | | | | 0.1 | |
| | 122,845 | | | | | MASTR Adjustable Rate Mortgages Trust 2006-2 1A1, 3.707%, 04/25/36 | | | 122,442 | | | | 0.1 | |
| | 2,570,137 | | | | | RALI Series Trust 2006-QO1 X2, 2.143%, 02/25/46 | | | 238,114 | | | | 0.1 | |
| | 773,562 | | | | | TBW Mortgage-Backed Trust 2007-2 A1A, 5.965%, 07/25/37 | | | 483,616 | | | | 0.2 | |
| | 8,855,466 | | | (5) | | WaMu Mortgage Pass-Through Certificates Series 2005-AR11 X, 1.121%, 08/25/45 | | | 287,537 | | | | 0.1 | |
| | 56,867 | | | | | WaMu Mortgage Pass-Through Certificates Series 2006-AR12 1A1, 3.287%, 10/25/36 | | | 55,559 | | | | 0.0 | |
| | 931,981 | | | | | WaMu Mortgage Pass-Through Certificates Series 2006-AR16 3A1, 2.992%, 12/25/36 | | | 910,400 | | | | 0.4 | |
| | 210,460 | | | | | WaMu Mortgage Pass-Through Certificates Series 2006-AR8 1A4, 3.249%, 08/25/46 | | | 199,522 | | | | 0.1 | |
| | 428,806 | | | | | WaMu Mortgage Pass-Through Certificates Series 2007-HY2 1A1, 3.163%, 12/25/36 | | | 413,495 | | | | 0.2 | |
| | 121,547 | | | | | WaMu Mortgage Pass-Through Certificates Series 2007-HY4 1A1, 2.832%, 04/25/37 | | | 111,135 | | | | 0.1 | |
| | 139,729 | | | | | Wells Fargo Alternative Loan 2007-PA2 2A1, 1.982%, (US0001M + 0.430%), 06/25/37 | | | 116,022 | | | | 0.1 | |
| | 68,414 | | | | | Wells Fargo Mortgage Backed Securities 2005-AR16 2A1, 3.543%, 02/25/34 | | | 70,314 | | | | 0.0 | |
| | 174,795 | | | | | Wells Fargo Mortgage Backed Securities 2006-8 A15, 6.000%, 07/25/36 | | | 176,474 | | | | 0.1 | |
| | 219,417 | | | | | Wells Fargo Mortgage Backed Securities 2006-AR17 A1, 3.631%, 10/25/36 | | | 215,052 | | | | 0.1 | |
| | 47,325 | | | | | Wells Fargo Mortgage Backed Securities 2006-AR17 A2, 3.631%, 10/25/36 | | | 46,384 | | | | 0.0 | |
| | 278,153 | | | | | Wells Fargo Mortgage Backed Securities 2006-AR7 2A1, 3.336%, 05/25/36 | | | 276,157 | | | | 0.1 | |
| | 275,376 | | | | | Wells Fargo Mortgage Backed Securities 2006-AR8 3A2, 3.612%, 04/25/36 | | | 273,069 | | | | 0.1 | |
| | | | | | | | | | | | | | | |
| | | | | Total Collateralized Mortgage Obligations | | | | | | | | |
| | | | | (Cost $28,576,107) | | | 29,761,431 | | | | 13.0 | |
See Accompanying Notes to Financial Statements
| Voya Global Bond Portfolio | PORTFOLIO OF INVESTMENTS
as of December 31, 2017 (continued) |
Principal
Amount† | | | | | | | Value | | | Percentage
of Net
Assets | |
| STRUCTURED PRODUCTS: 0.0% | | | | | | | | |
| | | | | | | Russia: 0.0% | | | | | | | | |
| RUB | 5,083,300 | | | (4) | | Morgan Stanley & Co. International PLC - EM Whole Loan SA /Russian Federation Total Return Linked Bonds, Series 007, Cl. VR, 5.000%, 08/22/34 | | | 38,901 | | | | 0.0 | |
| | | | | | | | | | | | | | | |
| | | | | Total Structured Products | | | | | | | | |
| | | | | (Cost $181,592) | | | 38,901 | | | | 0.0 | |
| | | | | | | | | | | | | | | |
| U.S. GOVERNMENT AGENCY OBLIGATIONS: 1.1% | | | | | | | | |
| | | | | | | Federal Home Loan Mortgage Corporation: 0.6%(6) | | | | | | | | |
| | 220,508 | | | | | 4.000%, 09/01/45 | | | 230,708 | | | | 0.1 | |
| | 330,272 | | | | | 4.000%, 09/01/45 | | | 345,557 | | | | 0.2 | |
| | 175,297 | | | | | 4.000%, 09/01/45 | | | 183,400 | | | | 0.1 | |
| | 122,336 | | | | | 4.000%, 09/01/45 | | | 127,999 | | | | 0.1 | |
| | 254,493 | | | | | 4.000%, 05/01/46 | | | 266,281 | | | | 0.1 | |
| | 1,917 | | | | | 5.000%, 01/01/20 | | | 1,970 | | | | 0.0 | |
| | 7,745 | | | | | 5.000%, 02/01/20 | | | 7,910 | | | | 0.0 | |
| | 12,739 | | | | | 5.000%, 12/01/34 | | | 13,825 | | | | 0.0 | |
| | 173 | | | | | 5.500%, 01/01/18 | | | 172 | | | | 0.0 | |
| | 42,709 | | | | | 6.000%, 02/01/34 | | | 48,239 | | | | 0.0 | |
| | 9 | | | | | 6.500%, 04/01/18 | | | 9 | | | | 0.0 | |
| | 7,210 | | | | | 6.500%, 02/01/22 | | | 7,731 | | | | 0.0 | |
| | 8,727 | | | | | 6.500%, 09/01/22 | | | 9,275 | | | | 0.0 | |
| | 3,278 | | | | | 6.500%, 08/01/32 | | | 3,718 | | | | 0.0 | |
| | 7,008 | | | | | 6.500%, 07/01/34 | | | 7,769 | | | | 0.0 | |
| | 6,487 | | | | | 6.500%, 07/01/34 | | | 7,190 | | | | 0.0 | |
| | | | | | | | | | 1,261,753 | | | | 0.6 | |
| | | | | | | | | | | | | | | |
| | | | | | | Federal National Mortgage Association: 0.5%(6) | | | | | | | | |
| | 71,630 | | | | | 2.500%, 06/01/30 | | | 71,791 | | | | 0.0 | |
| | 104,425 | | | | | 2.500%, 06/01/30 | | | 104,659 | | | | 0.1 | |
| | 42,793 | | | | | 2.500%, 07/01/30 | | | 42,889 | | | | 0.0 | |
| | 171,999 | | | | | 3.510%, 10/01/36 | | | 181,641 | | | | 0.1 | |
| | 201,996 | | | | | 4.000%, 05/01/45 | | | 211,470 | | | | 0.1 | |
| | 80,604 | | | | | 5.000%, 06/01/41 | | | 87,096 | | | | 0.0 | |
| | 5,540 | | | | | 5.500%, 09/01/19 | | | 5,620 | | | | 0.0 | |
| | 4,621 | | | | | 5.500%, 09/01/19 | | | 4,683 | | | | 0.0 | |
| | 24,879 | | | | | 5.500%, 09/01/24 | | | 27,248 | | | | 0.0 | |
| | 3,474 | | | | | 6.000%, 05/01/21 | | | 3,573 | | | | 0.0 | |
| | 98,381 | | | | | 6.000%, 11/01/34 | | | 111,590 | | | | 0.1 | |
| | 155,212 | | | | | 6.000%, 04/01/35 | | | 176,279 | | | | 0.1 | |
| | 72,298 | | | | | 6.500%, 12/01/29 | | | 81,562 | | | | 0.0 | |
| | 29,776 | | | | | 6.500%, 01/01/34 | | | 33,765 | | | | 0.0 | |
| | 528 | | | | | 7.000%, 04/01/33 | | | 564 | | | | 0.0 | |
| | 23,295 | | | | | 7.500%, 09/01/32 | | | 27,311 | | | | 0.0 | |
| | 53,518 | | | | | 7.500%, 01/01/33 | | | 62,845 | | | | 0.0 | |
| | | | | | | | | | 1,234,586 | | | | 0.5 | |
| | | | | | | | | | | | | | | |
| | | | | | | Government National Mortgage Association: 0.0% | | | | | | | | |
| | 45,792 | | | | | 5.000%, 04/15/34 | | | 49,702 | | | | 0.0 | |
| | 20,073 | | | | | 6.500%, 02/20/35 | | | 23,220 | | | | 0.0 | |
| | | | | | | | | | 72,922 | | | | 0.0 | |
| | | | | | | | | | | | | | | |
| | | | | Total U.S. Government Agency Obligations | | | | | | | | |
| | | | | (Cost $2,529,342) | | | 2,569,261 | | | | 1.1 | |
| | | | | | | | | | | | | | | |
| U.S. TREASURY OBLIGATIONS: 9.8% | | | | | | | | |
| | | | | | | U.S. Treasury Bonds: 1.0% | | | | | | | | |
| | 2,353,000 | | | | | 2.750%, 08/15/47 | | | 2,353,802 | | | | 1.0 | |
| | | | | | | | | | | | | | | |
| | | | | | | U.S. Treasury Notes: 8.8% | | | | | | | | |
| | 3,420,000 | | | | | 0.625%, 06/30/18 | | | 3,405,974 | | | | 1.5 | |
| | 30,000 | | | | | 1.250%, 10/31/21 | | | 29,065 | | | | 0.0 | |
| | 220,000 | | | | | 1.625%, 10/31/23 | | | 212,385 | | | | 0.1 | |
| | 1,773,000 | | | (2) | | 1.750%, 11/30/19 | | | 1,768,528 | | | | 0.8 | |
| | 2,744,000 | | | | | 1.875%, 12/15/20 | | | 2,736,124 | | | | 1.2 | |
| | 1,071,000 | | | (2) | | 2.000%, 11/30/22 | | | 1,061,227 | | | | 0.5 | |
| | 1,167,000 | | | | | 2.125%, 11/30/24 | | | 1,151,562 | | | | 0.5 | |
| | 9,859,000 | | | (2) | | 2.250%, 11/15/27 | | | 9,718,371 | | | | 4.2 | |
| | | | | | | | | | 20,083,236 | | | | 8.8 | |
| | | | | | | | | | | | | | | |
| | | | | Total U.S. Treasury Obligations | | | | | | | | |
| | | | | (Cost $22,400,296) | | | 22,437,038 | | | | 9.8 | |
| | | | | | | | | | | | | | | |
| ASSET-BACKED SECURITIES: 4.2% | | | | | | | | |
| | | | | | | Cayman Islands: 3.7% | | | | | | | | |
| | 350,000 | | | (1) | | ALM VII R-2 Ltd. 2013-7R2A A2R, 3.359%, (US0003M + 2.000%), 10/15/27 | | | 352,728 | | | | 0.2 | |
| | 240,000 | | | (1) | | Apidos CLO XI 2012-11A BR, 3.303%, (US0003M + 1.950%), 01/17/28 | | | 241,759 | | | | 0.1 | |
| | 210,000 | | | (1) | | Apidos CLO XVII 2014-17A A2R, 3.203%, (US0003M + 1.850%), 04/17/26 | | | 210,377 | | | | 0.1 | |
| | 370,000 | | | (1) | | Apidos CLO XVII 2014-17A BR, 3.853%, (US0003M + 2.500%), 04/17/26 | | | 370,939 | | | | 0.2 | |
| | 250,000 | | | (1) | | ArrowMark Colorado Holdings 2017-7A C, 3.504%, (US0003M + 1.900%), 07/15/30 | | | 250,487 | | | | 0.1 | |
| | 250,000 | | | (1) | | Avery Point IV CLO Ltd. 2014-1A CR, 3.717%, (US0003M + 2.350%), 04/25/26 | | | 250,843 | | | | 0.1 | |
| | 250,000 | | | (1) | | Babson CLO Ltd. 2014-IA BR, 3.563%, (US0003M + 2.200%), 07/20/25 | | | 250,552 | | | | 0.1 | |
| | 510,000 | | | (1) | | BlueMountain CLO 2012-2A BR, 3.336%, (US0003M + 1.900%), 11/20/28 | | | 513,629 | | | | 0.2 | |
| | 330,000 | | | (1) | | BlueMountain CLO 2014-4A B1R, 3.318%, (US0003M + 1.850%), 11/30/26 | | | 331,812 | | | | 0.2 | |
| | 300,000 | | | (1) | | BlueMountain CLO 2014-4A CR, 4.018%, (US0003M + 2.550%), 11/30/26 | | | 302,052 | | | | 0.1 | |
| | 640,000 | | | (1) | | Bristol Park CLO Ltd. 2016-1A B, 3.259%, (US0003M + 1.900%), 04/15/29 | | | 644,853 | | | | 0.3 | |
| | 290,000 | | | (1) | | Carlyle Global Market Strategies CLO Ltd. 2012-4A BR, 3.263%, (US0003M + 1.900%), 01/20/29 | | | 293,014 | | | | 0.1 | |
| | 250,000 | | | (1) | | Carlyle Global Market Strategies CLO Ltd. 2014-3A BR, 3.525%, (US0003M + 2.150%), 07/27/26 | | | 251,221 | | | | 0.1 | |
| | 250,000 | | | (1) | | Cedar Funding II CLO Ltd. 2013-1A CR, 3.886%, (US0003M + 2.350%), 06/09/30 | | | 251,952 | | | | 0.1 | |
| | 500,000 | | | (1) | | Cedar Funding IV CLO Ltd. 2014-4A CR, 3.613%, (US0003M + 2.250%), 07/23/30 | | | 502,258 | | | | 0.2 | |
| | 520,000 | | | (1) | | Dryden 33 Senior Loan Fund 2014-33A BR, 3.209%, (US0003M + 1.850%), 10/15/28 | | | 524,994 | | | | 0.2 | |
See Accompanying Notes to Financial Statements
| Voya Global Bond Portfolio | PORTFOLIO OF INVESTMENTS
as of December 31, 2017 (continued) |
Principal
Amount† | | | | | | | Value | | | Percentage
of Net
Assets | |
| ASSET-BACKED SECURITIES: (continued) | | | | | | | | |
| | | | | | | Cayman Islands: (continued) | | | | | | | | |
| | 250,000 | | | (1) | | Madison Park Funding XI Ltd. 2013-11A CR, 3.563%, (US0003M + 2.200%), 07/23/29 | | | 250,560 | | | | 0.1 | |
| | 250,000 | | | (1) | | Octagon Investment Partners XIX Ltd. 2014-1A CR, 3.459%, (US0003M + 2.100%), 04/15/26 | | | 250,220 | | | | 0.1 | |
| | 250,000 | | | (1) | | Palmer Square CLO 2015-2A BR Ltd., 3.763%, (US0003M + 2.400%), 07/20/30 | | | 252,486 | | | | 0.1 | |
| | 575,000 | | | (1) | | Palmer Square Loan Funding 2017-1A D Ltd., 6.170%, (US0003M + 4.850%), 10/15/25 | | | 573,511 | | | | 0.3 | |
| | 266,000 | | | (1) | | Recette CLO Ltd. 2015-1A CR, 3.063%, (US0003M + 1.700%), 10/20/27 | | | 266,704 | | | | 0.1 | |
| | 250,000 | | | (1) | | Thacher Park CLO Ltd. 2014-1A CR, 3.563%, (US0003M + 2.200%), 10/20/26 | | | 250,806 | | | | 0.1 | |
| | 250,000 | | | (1) | | THL Credit Wind River 2013-2A CR CLO Ltd., 3.354%, (US0003M + 2.000%), 10/18/30 | | | 251,981 | | | | 0.1 | |
| | 560,000 | | | (1) | | THL Credit Wind River 2017-3A C CLO Ltd., 3.439%, (US0003M + 2.200%), 10/15/30 | | | 565,889 | | | | 0.3 | |
| | 250,000 | | | (1) | | THL Credit Wind River 2017-4A C CLO Ltd., 3.256%, (US0003M + 1.750%), 11/20/30 | | | 250,460 | | | | 0.1 | |
| | | | | | | | | | 8,456,087 | | | | 3.7 | |
| | | | | | | | | | | | | | | |
| | | | | | | United States: 0.5% | | | | | | | | |
| | 344,545 | | | | | Citigroup Mortgage Loan Trust 2006-WF1 A2E, 4.985%, 03/25/36 | | | 253,271 | | | | 0.1 | |
| | 200,000 | | | (1) | | Mill City Mortgage Loan Trust 2017-2 M2, 3.250%, 07/25/59 | | | 200,500 | | | | 0.1 | |
| | 640,000 | | | (1) | | OHA Loan Funding Ltd. 2016-1A B1, 3.163%, (US0003M + 1.800%), 01/20/28 | | | 643,381 | | | | 0.3 | |
| | | | | | | | | | 1,097,152 | | | | 0.5 | |
| | | | | | | | | | | | | | | |
| | | | | Total Asset-Backed Securities | | | | | | | | |
| | | | | (Cost $9,506,871) | | | 9,553,239 | | | | 4.2 | |
| | | | | | | | | | | | | | | |
| FOREIGN GOVERNMENT BONDS: 7.9% | | | | | | | | |
| | | | | | | Brazil: 0.3% | | | | | | | | |
| BRL | 705,000 | | | | | Brazil Notas do Tesouro Nacional Series F, 6.000%, 05/15/45 | | | 697,628 | | | | 0.3 | |
| | | | | | | | | | | | | | | |
| | | | | | | Germany: 0.9% | | | | | | | | |
| EUR | 50,000 | | | | | Bundesrepublik Deutschland Bundesanleihe, 0.290%, 08/15/26 | | | 58,532 | | | | 0.0 | |
| EUR | 10,000 | | | | | Bundesrepublik Deutschland Bundesanleihe, 2.000%, 08/15/23 | | | 13,413 | | | | 0.0 | |
| EUR | 680,000 | | | | | Bundesrepublik Deutschland Bundesanleihe, 2.500%, 08/15/46 | | | 1,071,561 | | | | 0.5 | |
| EUR | 760,000 | | | | | Bundesschatzanweisungen, -0.670%, 12/14/18 | | | 917,772 | | | | 0.4 | |
| | | | | | | | | | 2,061,278 | | | | 0.9 | |
| | | | | | | | | | | | | | | |
| | | | | | | Hungary: 0.4% | | | | | | | | |
| EUR | 650,000 | | | | | Hungary Government International Bond, 1.750%, 10/10/27 | | | 808,951 | | | | 0.4 | |
| | | | | | | | | | | | | | | |
| | | | | | | Indonesia: 0.2% | | | | | | | | |
| IDR | 5,665,000,000 | | | | | Indonesia Treasury Bond, 7.500%, 08/15/32 | | | 442,713 | | | | 0.2 | |
| | | | | | | | | | | | | | | |
| | | | | | | Italy: 5.7% | | | | | | | | |
| EUR | 4,840,000 | | | | | Italy Buoni Poliennali Del Tesoro, 2.200%, 06/01/27 | | | 5,935,353 | | | | 2.6 | |
| EUR | 4,900,000 | | | | | Italy Buoni Poliennali Del Tesoro, 4.500%, 03/01/26 | | | 7,141,934 | | | | 3.1 | |
| | | | | | | | | | 13,077,287 | | | | 5.7 | |
| | | | | | | | | | | | | | | |
| | | | | | | Russia: 0.4% | | | | | | | | |
| RUB | 51,720,000 | | | | | Russian Federal Bond - OFZ, 7.500%, 08/18/21 | | | 914,122 | | | | 0.4 | |
| | | | | | | | | | | | | | | |
| | | | | Total Foreign Government Bonds | | | | | | | | |
| | | | | (Cost $17,114,648) | | | 18,001,979 | | | | 7.9 | |
| | | | | | | | | | | | | | | |
| COMMERCIAL MORTGAGE-BACKED SECURITIES: 9.5% | | | | | | | | |
| | | | | | | United States: 9.5% | | | | | | | | |
| | 7,015,878 | | | (5) | | BANK 2017-BNK5 XA, 1.107%, 06/15/60 | | | 508,757 | | | | 0.2 | |
| | 900,000 | | | (1) | | BANK 2017-BNK6 E, 2.656%, 07/15/60 | | | 534,300 | | | | 0.2 | |
| | 141,110 | | | | | Bank of America Commercial Mortgage Trust 2007-3 B, 5.697%, 06/10/49 | | | 142,602 | | | | 0.1 | |
| | 390,000 | | | | | Bank of America Commercial Mortgage Trust 2007-3 C, 5.697%, 06/10/49 | | | 401,189 | | | | 0.2 | |
| | 8,865,662 | | | (5) | | Bank of America Commercial Mortgage Trust 2017-BNK3 XA, 1.144%, 02/15/50 | | | 681,541 | | | | 0.3 | |
| | 8,020,000 | | | (1),(5) | | BBCCRE Trust 2015-GTP XA, 0.597%, 08/10/33 | | | 348,585 | | | | 0.2 | |
| | 2,069,115 | | | (5) | | Barclays Commercial Mortgage Trust 2017-C1 XA, 1.524%, 02/15/50 | | | 215,022 | | | | 0.1 | |
| | 440,000 | | | (1) | | Bear Stearns Commercial Mortgage Securities Trust 2004-PWR6 E, 5.406%, 11/11/41 | | | 456,015 | | | | 0.2 | |
| | 140,000 | | | (1) | | Bear Stearns Commercial Mortgage Securities Trust 2006-TOP22 E, 5.720%, 04/12/38 | | | 146,824 | | | | 0.1 | |
| | 396,062 | | | (1) | | Beckman Coulter, Inc. 2000-A A, 7.498%, 12/15/18 | | | 397,429 | | | | 0.2 | |
| | 1,872,202 | | | (5) | | CD 2016-CD1 Mortgage Trust XA, 1.437%, 08/10/49 | | | 170,222 | | | | 0.1 | |
See Accompanying Notes to Financial Statements
| Voya Global Bond Portfolio | PORTFOLIO OF INVESTMENTS
as of December 31, 2017 (continued) |
Principal
Amount† | | | | | | | Value | | | Percentage
of Net
Assets | |
| COMMERCIAL MORTGAGE-BACKED SECURITIES: (continued) | | | | | | | | |
| | | | | | | United States: (continued) | | | | | | | | |
| | 8,976,749 | | | (5) | | CFCRE Commercial Mortgage Trust 2016-C7 XA, 0.789%, 12/10/54 | | | 490,113 | | | | 0.2 | |
| | 3,247,322 | | | (5) | | Citigroup Commercial Mortgage Trust 2017-C4 XA, 1.127%, 10/12/50 | | | 255,131 | | | | 0.1 | |
| | 210,000 | | | | | Citigroup Commercial Mortgage Trust 2017-P8 C, 4.272%, 09/15/50 | | | 210,907 | | | | 0.1 | |
| | 3,451,704 | | | (5) | | COMM 2012-CR1 XA, 1.878%, 05/15/45 | | | 228,320 | | | | 0.1 | |
| | 10,168,445 | | | (1),(5) | | COMM 2012-LTRT XA, 1.002%, 10/05/30 | | | 365,770 | | | | 0.2 | |
| | 10,279,329 | | | (5) | | COMM 2013-CCRE13 XA, 0.915%, 11/12/46 | | | 341,048 | | | | 0.1 | |
| | 14,268,124 | | | (5) | | COMM 2014-CR16 XA, 1.172%, 04/10/47 | | | 645,571 | | | | 0.3 | |
| | 570,000 | | | | | COMM 2016-COR1 C, 4.394%, 10/10/49 | | | 572,019 | | | | 0.3 | |
| | 4,468,682 | | | (5) | | COMM 2016-CR28 XA, 0.393%, 02/10/49 | | | 181,980 | | | | 0.1 | |
| | 1,000,000 | | | | | COMM 2017-COR2 C, 4.563%, 09/10/50 | | | 1,009,201 | | | | 0.4 | |
| | 13,544,333 | | | (5) | | CSAIL 2017-CX9 XA Commercial Mortgage Trust, 0.904%, 09/15/50 | | | 700,157 | | | | 0.3 | |
| | 290,000 | | | (1) | | DBJPM 16-C3 Mortgage Trust, 3.494%, 09/10/49 | | | 240,562 | | | | 0.1 | |
| | 2,030,059 | | | (1),(5) | | DBUBS 2011-LC1A XA, 0.726%, 11/10/46 | | | 31,357 | | | | 0.0 | |
| | 210,000 | | | (1) | | DBUBS 2011-LC2A D, 5.542%, 07/10/44 | | | 219,145 | | | | 0.1 | |
| | 3,560,000 | | | (5) | | Freddie Mac Multifamily Structured Pass Through Certificates K010 X3, 4.622%, 11/25/44 | | | 426,924 | | | | 0.2 | |
| | 3,840,000 | | | (5) | | Freddie Mac Multifamily Structured Pass Through Certificates K013 X3, 2.814%, 01/25/43 | | | 309,496 | | | | 0.1 | |
| | 8,385,405 | | | (5) | | Freddie Mac Multifamily Structured Pass Through Certificates K018 X1, 1.372%, 01/25/22 | | | 371,910 | | | | 0.2 | |
| | 10,000,000 | | | (5) | | Freddie Mac Multifamily Structured Pass Through Certificates K035 X3, 1.791%, 12/25/41 | | | 873,577 | | | | 0.4 | |
| | 8,935,008 | | | (5) | | Freddie Mac Multifamily Structured Pass Through Certificates K704 X1, 1.964%, 08/25/18 | | | 57,502 | | | | 0.0 | |
| | 28,507,666 | | | (5) | | Freddie Mac Multifamily Structured Pass Through Certificates K710 X1, 1.733%, 05/25/19 | | | 529,946 | | | | 0.2 | |
| | 4,423,190 | | | (5) | | Freddie Mac Multifamily Structured Pass Through Certificates K711 X3, 1.619%, 08/25/40 | | | 112,412 | | | | 0.0 | |
| | 41,200,265 | | | (1),(5) | | FREMF Mortgage Trust 2012-K17 X2A, 0.100%, 12/25/44 | | | 128,298 | | | | 0.1 | |
| | 247,472 | | | (1) | | GCCFC Commercial Mortgage Trust 2004-GG1 F, 6.382%, 06/10/36 | | | 246,658 | | | | 0.1 | |
| | 100,000 | | | (1) | | GS Mortgage Securities Trust 2010-C2 F, 4.548%, 12/10/43 | | | 89,955 | | | | 0.0 | |
| | 2,327,717 | | | (5) | | GS Mortgage Securities Trust 2012-GCJ7 XA, 2.228%, 05/10/45 | | | 145,108 | | | | 0.1 | |
| | 5,630,612 | | | (5) | | GS Mortgage Securities Trust 2013-GC16 XA, 1.398%, 11/10/46 | | | 231,025 | | | | 0.1 | |
| | 3,973,377 | | | (5) | | GS Mortgage Securities Trust 2013-GCJ14 XA, 0.727%, 08/10/46 | | | 115,713 | | | | 0.1 | |
| | 1,350,000 | | | (1) | | GS Mortgage Securities Trust 2016-GS4 E, 3.803%, 11/10/49 | | | 955,551 | | | | 0.4 | |
| | 2,940,000 | | | (1),(5) | | JP Morgan Chase Commercial Mortgage Securities Corp. 2012-LC9 XB, 0.328%, 12/15/47 | | | 44,909 | | | | 0.0 | |
| | 270,000 | | | | | JP Morgan Chase Commercial Mortgage Securities Trust 2004-CIBC9 E, 5.338%, 06/12/41 | | | 271,514 | | | | 0.1 | |
| | 300,000 | | | | | JP Morgan Chase Commercial Mortgage Securities Trust 2005-LDP2 F, 5.010%, 07/15/42 | | | 299,995 | | | | 0.1 | |
| | 6,987,322 | | | (5) | | JP Morgan Chase Commercial Mortgage Securities Trust 2012-CIBX XA, 1.653%, 06/15/45 | | | 317,575 | | | | 0.1 | |
| | 250,000 | | | | | JP Morgan Chase Commercial Mortgage Securities Trust 2013-C10 C, 4.142%, 12/15/47 | | | 249,970 | | | | 0.1 | |
| | 660,000 | | | | | JPMBB Commercial Mortgage Securities Trust 2014-C18 AS, 4.439%, 02/15/47 | | | 703,047 | | | | 0.3 | |
| | 731,507 | | | (1) | | JPMBB Commercial Mortgage Securities Trust 2014-C24 ESK, 9.989%, 11/15/47 | | | 729,293 | | | | 0.3 | |
| | 13,484,179 | | | (5) | | JPMBB Commercial Mortgage Securities Trust 2014-C24 XA, 1.049%, 11/15/47 | | | 571,903 | | | | 0.2 | |
| | 360,000 | | | | | LB-UBS Commercial Mortgage Trust 2005-C3 F, 5.013%, 07/15/40 | | | 356,157 | | | | 0.2 | |
| | 38,048 | | | | | LB-UBS Commercial Mortgage Trust 2006-C4 C, 5.793%, 06/15/38 | | | 38,100 | | | | 0.0 | |
| | 780,000 | | | | | LB-UBS Commercial Mortgage Trust 2006-C4 D, 5.793%, 06/15/38 | | | 780,127 | | | | 0.3 | |
| | 3,492,128 | | | (1),(5) | | LSTAR Commercial Mortgage Trust 2017-5 X, 1.234%, 03/10/50 | | | 195,932 | | | | 0.1 | |
| | 170,000 | | | (1) | | Morgan Stanley Capital I Trust 2007-TOP27 B, 5.951%, 06/11/42 | | | 185,975 | | | | 0.1 | |
| | 570,000 | | | (1) | | Morgan Stanley Capital I Trust 2011-C1 D, 5.426%, 09/15/47 | | | 600,879 | | | | 0.3 | |
| | 460,000 | | | (1) | | Morgan Stanley Capital I Trust 2011-C1 E, 5.426%, 09/15/47 | | | 484,681 | | | | 0.2 | |
| | 207,474 | | | (1) | | Morgan Stanley Reremic Trust 2012-XA B, 0.250%, 07/27/49 | | | 203,498 | | | | 0.1 | |
See Accompanying Notes to Financial Statements
| Voya Global Bond Portfolio | PORTFOLIO OF INVESTMENTS
as of December 31, 2017 (continued) |
Principal
Amount† | | | | | | | Value | | | Percentage
of Net
Assets | |
| COMMERCIAL MORTGAGE-BACKED SECURITIES: (continued) | | | | | | | | |
| | | | | | | United States: (continued) | | | | | | | | |
| | 5,360,976 | | | (1),(5) | | UBS-Barclays Commercial Mortgage Trust 2012-C3 XA, 1.891%, 08/10/49 | | | 390,689 | | | | 0.2 | |
| | 7,151,704 | | | (5) | | Wells Fargo Commercial Mortgage Trust 2016-C37, 1.032%, 12/15/49 | | | 404,579 | | | | 0.2 | |
| | 3,425,663 | | | (1),(5) | | WFRBS Commercial Mortgage Trust 2012-C8 XA, 1.851%, 08/15/45 | | | 228,967 | | | | 0.1 | |
| | 1,223,564 | | | (1),(5) | | WFRBS Commercial Mortgage Trust 2013-C12 XA, 1.307%, 03/15/48 | | | 63,186 | | | | 0.0 | |
| | 10,245,023 | | | (5) | | WFRBS Commercial Mortgage Trust 2014-C19 XA, 1.138%, 03/15/47 | | | 486,861 | | | | 0.2 | |
| | | | | | | | | | | | | | | |
| | | | | Total Commercial Mortgage-Backed Securities | | | | | | | | |
| | | | | (Cost $21,584,643) | | | 21,695,679 | | | | 9.5 | |
| | | | | | | | | | | | | | | |
| Shares | | | | | | | Value | | | Percentage
of Net
Assets | |
| COMMON STOCK: 0.0% | | | | | | | | |
| | | | | | | United States: 0.0% | | | | | | | | |
| | 43,083 | | | (2),(4),(7) | | American Media, Inc. | | | – | | | | – | |
| | 4,988 | | | (7) | | Resolute Forest Products, Inc. | | | 55,117 | | | | 0.0 | |
| | | | | | | | | | | | | | | |
| | | | | Total Common Stock | | | | | | | | |
| | | | | (Cost $1,298,014) | | | 55,117 | | | | 0.0 | |
| | | | | | | | | | | | | | | |
| MUTUAL FUNDS: 23.7% | | | | | | | | |
| | | | | | | United States: 23.7% | | | | | | | | |
| | 1,066,705 | | | | | Voya Emerging Markets Corporate Debt Fund - Class P | | | 10,763,054 | | | | 4.7 | |
| | 1,622,144 | | | | | Voya Emerging Markets Hard Currency Debt Fund - Class P | | | 16,140,338 | | | | 7.1 | |
| | 3,119,936 | | | | | Voya Emerging Markets Local Currency Debt Fund - Class P | | | 24,241,904 | | | | 10.6 | |
| | 357,236 | | | | | Voya High Yield Bond Fund - Class P | | | 2,890,039 | | | | 1.3 | |
| | | | | | | | | | | | | | | |
| | | | | Total Mutual Funds | | | | | | | | |
| | | | | (Cost $59,523,505) | | | 54,035,335 | | | | 23.7 | |
| | | | | | | | | | | | | | | |
| | | | | | | | | Value | | | Percentage
of Net
Assets | |
| PURCHASED OPTIONS (8): 1.0% | | | | | | | | |
| | | | | Total Purchased Options | | | | | | | | |
| | | | | (Cost $2,668,657) | | | 2,200,881 | | | | 1.0 | |
| | | | | | | | | | | | | | | |
| | | | | Total Long-Term Investments | | | | | | | | |
| | | | | (Cost $221,341,418) | | | 217,684,241 | | | | 95.3 | |
| | | | | | | | | | | | | | | |
Principal
Amount† | | | | | | | Value | | | Percentage
of Net
Assets | |
| SHORT-TERM INVESTMENTS: 6.3% | | | | | | | | |
| | | | | | | Securities Lending Collateral(9): 3.1% | | | | | | | | |
| | 1,695,812 | | | | | Cantor Fitzgerald, Repurchase Agreement dated 12/29/17, 1.41%, due 01/02/18 (Repurchase Amount $1,696,074, collateralized by various U.S. Government\U.S. Government Agency Obligations, 0.000%-8.500%, Market Value plus accrued interest $1,729,728, due 01/31/18-06/20/63) | | | 1,695,812 | | | | 0.7 | |
| | 356,280 | | | | | Daiwa Capital Markets, Repurchase Agreement dated 12/29/17, 1.43%, due 01/02/18 (Repurchase Amount $356,336, collateralized by various U.S. Government and U.S. Government Agency Obligations, 0.000%-6.500%, Market Value plus accrued interest $363,406, due 01/11/18-12/01/51) | | | 356,280 | | | | 0.2 | |
| | 1,695,812 | | | | | Millenium Fixed Income Ltd., Repurchase Agreement dated 12/29/17, 1.44%, due 01/02/18 (Repurchase Amount $1,696,080, collateralized by various U.S. Government Securities, 2.875%-3.625%, Market Value plus accrued interest $1,729,728, due 02/15/43-02/15/44) | | | 1,695,812 | | | | 0.7 | |
| | 1,695,812 | | | | | NBC Global Finance Ltd., Repurchase Agreement dated 12/29/17, 1.50%, due 01/02/18 (Repurchase Amount $1,696,091, collateralized by various U.S. Government Securities, 0.750%-2.250%, Market Value plus accrued interest $1,729,728, due 09/30/18-09/09/49) | | | 1,695,812 | | | | 0.7 | |
| | 1,695,812 | | | | | State of Wisconsin Investment Board, Repurchase Agreement dated 12/29/17, 1.63%, due 01/02/18 (Repurchase Amount $1,696,115, collateralized by various U.S. Government Securities, 0.125%-3.875%, Market Value plus accrued interest $1,742,904, due 01/15/19-02/15/46) | | | 1,695,812 | | | | 0.8 | |
| | | | | | | | | | 7,139,528 | | | | 3.1 | |
See Accompanying Notes to Financial Statements
| Voya Global Bond Portfolio | PORTFOLIO OF INVESTMENTS
as of December 31, 2017 (continued) |
| Shares | | | | | | | Value | | | Percentage
of Net
Assets | |
| | | | | | | Mutual Funds: 3.2% | | | | | | | | |
| | 7,148,000 | | | (10) | | BlackRock Liquidity Funds, FedFund, Institutional Class, 1.170% | | | | | | | | |
| | | | | | | (Cost $7,148,000) | | | 7,148,000 | | | | 3.2 | |
| | | | | | | | | | | | | | | |
| | | | | Total Short-Term Investments | | | | | | | | |
| | | | | (Cost $14,287,528) | | | 14,287,528 | | | | 6.3 | |
| | | | | | | | | | | | | | | |
| | | | | Total Investments in Securities
(Cost $235,628,946) | | $ | 231,971,769 | | | | 101.6 | |
| | | | | Liabilities in Excess of Other Assets | | | (3,549,420 | ) | | | (1.6 | ) |
| | | | | Net Assets | | $ | 228,422,349 | | | | 100.0 | |
| † | Unless otherwise indicated, principal amount is shown in USD. |
| (1) | Securities with purchases pursuant to Rule 144A or section 4(a)(2), under the Securities Act of 1933 and may not be resold subject to that rule except to qualified institutional buyers. |
| (2) | Security, or a portion of the security, is on loan. |
| (3) | Defaulted security |
| (4) | For fair value measurement disclosure purposes, security is categorized as Level 3, whose value was determined using significant unobservable inputs. |
| (5) | Interest only securities represent the right to receive the monthly interest payments on an underlying pool of mortgage loans. Principal amount shown represents the notional amount on which current interest is calculated. Payments of principal on the pool reduce the value of the interest only security. |
| (6) | The Federal Housing Finance Agency (“FHFA”) placed the Federal Home Loan Mortgage Corporation and Federal National Mortgage Association into conservatorship with FHFA as the conservator. As such, the FHFA oversees the continuing affairs of these companies. |
| (7) | Non-income producing security. |
| (8) | The tables below the Portfolio of Investments detail open purchased options which are non-income producing securities. |
| (9) | Represents securities purchased with cash collateral received for securities on loan. |
| (10) | Rate shown is the 7-day yield as of December 31, 2017. |
| | |
| BRL | Brazilian Real |
| EUR | EU Euro |
| IDR | Indonesian Rupiah |
| MXN | Mexican Peso |
| RUB | Russian Ruble |
| ZAR | South African Rand |
| Reference Rate Abbreviations: |
| 12MTA | 12-month Treasury Average |
| US0001M | 1-month LIBOR |
| US0003M | 3-month LIBOR |
| US0012M | 12-month LIBOR |
See Accompanying Notes to Financial Statements
| Vy® American Century Small-Mid Cap Value Portfolio | PORTFOLIO OF INVESTMENTS
as of December 31, 2017 |
| Shares | | | | | | | Value | | | Percentage
of Net
Assets | |
| COMMON STOCK: 95.6% | | | | | | | | |
| | | | | | | Consumer Discretionary: 5.2% | | | | | | | | |
| | 28,488 | | | | | Advance Auto Parts, Inc. | | | 2,839,969 | | | | 0.8 | |
| | 24,904 | | | | | Camping World Holdings, Inc. | | | 1,113,956 | | | | 0.3 | |
| | 11,624 | | | | | Cooper Tire & Rubber Co. | | | 410,908 | | | | 0.1 | |
| | 7,636 | | | (1) | | Delphi Automotive PLC | | | 647,762 | | | | 0.2 | |
| | 248,015 | | | | | Entravision Communications Corp. | | | 1,773,307 | | | | 0.5 | |
| | 18,859 | | | (1) | | Helen of Troy Ltd. | | | 1,817,065 | | | | 0.5 | |
| | 76,686 | | | (2) | | Honda Motor Co., Ltd. ADR | | | 2,613,459 | | | | 0.7 | |
| | 13,915 | | | (1) | | Malibu Boats, Inc. | | | 413,693 | | | | 0.1 | |
| | 44,721 | | | (1) | | MarineMax, Inc. | | | 845,227 | | | | 0.2 | |
| | 15,748 | | | (1) | | MCBC Holdings, Inc. | | | 349,920 | | | | 0.1 | |
| | 8,997 | | | | | Monro, Inc. | | | 512,379 | | | | 0.1 | |
| | 22,381 | | | | | Penske Auto Group, Inc. | | | 1,070,931 | | | | 0.3 | |
| | 58,355 | | | | | Pulte Group, Inc. | | | 1,940,304 | | | | 0.5 | |
| | 19,218 | | | (1) | | Red Robin Gourmet Burgers, Inc. | | | 1,083,895 | | | | 0.3 | |
| | 31,845 | | | | | Target Corp. | | | 2,077,886 | | | | 0.5 | |
| | 19,835 | | | (1) | | Townsquare Media, Inc. | | | 152,333 | | | | 0.0 | |
| | | | | | | | | | 19,662,994 | | | | 5.2 | |
| | | | | | | | | | | | | | | |
| | | | | | | Consumer Staples: 8.8% | | | | | | | | |
| | 125,714 | | | | | Conagra Brands, Inc. | | | 4,735,646 | | | | 1.2 | |
| | 24,765 | | | | | Dr Pepper Snapple Group, Inc. | | | 2,403,691 | | | | 0.6 | |
| | 24,157 | | | (1),(2) | | Edgewell Personal Care Co. | | | 1,434,684 | | | | 0.4 | |
| | 37,031 | | | | | Energizer Holdings, Inc. | | | 1,776,747 | | | | 0.5 | |
| | 68,340 | | | | | General Mills, Inc. | | | 4,051,879 | | | | 1.1 | |
| | 18,126 | | | | | JM Smucker Co. | | | 2,251,974 | | | | 0.6 | |
| | 10,142 | | | | | John B Sanfilippo & Son, Inc. | | | 641,481 | | | | 0.2 | |
| | 49,380 | | | | | Kellogg Co. | | | 3,356,852 | | | | 0.9 | |
| | 96,526 | | | | | Mondelez International, Inc. | | | 4,131,313 | | | | 1.1 | |
| | 256,872 | | | | | Orkla ASA | | | 2,722,095 | | | | 0.7 | |
| | 59,768 | | | | | Sysco Corp. | | | 3,629,711 | | | | 1.0 | |
| | 41,062 | | | (1) | | TreeHouse Foods, Inc. | | | 2,030,927 | | | | 0.5 | |
| | | | | | | | | | 33,167,000 | | | | 8.8 | |
| | | | | | | | | | | | | | | |
| | | | | | | Energy: 10.2% | | | | | | | | |
| | 49,805 | | | | | Anadarko Petroleum Corp. | | | 2,671,540 | | | | 0.7 | |
| | 71,814 | | | (1),(2) | | Ardmore Shipping Corp. | | | 574,512 | | | | 0.2 | |
| | 106,373 | | | | | Baker Hughes a GE Co. | | | 3,365,642 | | | | 0.9 | |
| | 12,012 | | | | | Cimarex Energy Co. | | | 1,465,584 | | | | 0.4 | |
| | 59,307 | | | | | Devon Energy Corp. | | | 2,455,310 | | | | 0.7 | |
| | 18,426 | | | (1),(2) | | Dril-Quip, Inc. | | | 878,920 | | | | 0.2 | |
| | 60,336 | | | | | EQT Corp. | | | 3,434,325 | | | | 0.9 | |
| | 35,225 | | | (1),(2) | | Extraction Oil & Gas, Inc. | | | 504,070 | | | | 0.1 | |
| | 33,708 | | | | | Halliburton Co. | | | 1,647,310 | | | | 0.4 | |
| | 29,619 | | | (1) | | Helix Energy Solutions Group, Inc. | | | 223,327 | | | | 0.1 | |
| | 28,953 | | | (2) | | Helmerich & Payne, Inc. | | | 1,871,522 | | | | 0.5 | |
| | 138,614 | | | | | Imperial Oil Ltd. | | | 4,326,036 | | | | 1.1 | |
| | 6,273 | | | (1),(2) | | Keane Group, Inc. | | | 119,250 | | | | 0.0 | |
| | 5,915 | | | (1),(2) | | Mammoth Energy Services, Inc. | | | 116,111 | | | | 0.0 | |
| | 32,846 | | | | | Marathon Petroleum Corp. | | | 2,167,179 | | | | 0.6 | |
| | 95,335 | | | | | National Oilwell Varco, Inc. | | | 3,433,967 | | | | 0.9 | |
| | 120,459 | | | | | Noble Energy, Inc. | | | 3,510,175 | | | | 0.9 | |
| | 50,241 | | | | | Occidental Petroleum Corp. | | | 3,700,752 | | | | 1.0 | |
| | 138,479 | | | | | Scorpio Tankers, Inc. | | | 422,361 | | | | 0.1 | |
| | 36,064 | | | (2),(3) | | Spectra Energy Partners L.P. | | | 1,425,971 | | | | 0.4 | |
| | 16,235 | | | (1),(2) | | WildHorse Resource Development Corp. | | | 298,886 | | | | 0.1 | |
| | | | | | | | | | 38,612,750 | | | | 10.2 | |
| | | | | | | | | | | | | | | |
| | | | | | | Financials: 24.2% | | | | | | | | |
| | 17,708 | | | | | Aflac, Inc. | | | 1,554,408 | | | | 0.4 | |
| | 21,316 | | | | | Ameriprise Financial, Inc. | | | 3,612,422 | | | | 1.0 | |
| | 21,616 | | | | | Amerisafe, Inc. | | | 1,331,546 | | | | 0.4 | |
| | 66,921 | | | (2),(3) | | Ares Management L.P. | | | 1,338,420 | | | | 0.4 | |
| | 26,806 | | | | | Arthur J. Gallagher & Co. | | | 1,696,284 | | | | 0.4 | |
| | 29,876 | | | | | Aspen Insurance Holdings Ltd. | | | 1,212,966 | | | | 0.3 | |
| | 22,606 | | | | | Bank of Hawaii Corp. | | | 1,937,334 | | | | 0.5 | |
| | 61,575 | | | | | Bank of the Ozarks, Inc. | | | 2,983,309 | | | | 0.8 | |
| | 71,072 | | | | | BankUnited, Inc. | | | 2,894,052 | | | | 0.8 | |
| | 89,160 | | | | | BB&T Corp. | | | 4,433,035 | | | | 1.2 | |
| | 61,193 | | | | | Boston Private Financial Holdings, Inc. | | | 945,432 | | | | 0.2 | |
| | 24,412 | | | | | Brown & Brown, Inc. | | | 1,256,242 | | | | 0.3 | |
| | 157,515 | | | | | Capitol Federal Financial, Inc. | | | 2,112,276 | | | | 0.6 | |
| | 26,956 | | | | | Chubb Ltd. | | | 3,939,080 | | | | 1.0 | |
| | 8,171 | | | | | Comerica, Inc. | | | 709,324 | | | | 0.2 | |
| | 41,763 | | | | | Commerce Bancshares, Inc. | | | 2,332,046 | | | | 0.6 | |
| | 143,803 | | | (2),(3) | | Compass Diversified Holdings | | | 2,437,461 | | | | 0.6 | |
| | 42,096 | | | (1) | | Donnelley Financial Solutions, Inc. | | | 820,451 | | | | 0.2 | |
| | 384 | | | (1) | | Eagle Bancorp, Inc. | | | 22,234 | | | | 0.0 | |
| | 37,498 | | | (1) | | FCB Financial Holdings, Inc. | | | 1,904,898 | | | | 0.5 | |
| | 3,687 | | | (2) | | First Financial Bankshares, Inc. | | | 166,099 | | | | 0.0 | |
| | 62,411 | | | | | First Hawaiian, Inc. | | | 1,821,153 | | | | 0.5 | |
| | 177,983 | | | | | FNB Corp. | | | 2,459,725 | | | | 0.7 | |
| | 26,517 | | | | | Granite Point Mortgage Trust, Inc. | | | 470,412 | | | | 0.1 | |
| | 9,838 | | | | | Hanover Insurance Group, Inc. | | | 1,063,291 | | | | 0.3 | |
| | 129,591 | | | | | Invesco Ltd. | | | 4,735,255 | | | | 1.3 | |
| | 24,133 | | | | | James River Group Holdings Ltd. | | | 965,561 | | | | 0.3 | |
| | 25,795 | | | | | Kinsale Capital Group, Inc. | | | 1,160,775 | | | | 0.3 | |
| | 45,915 | | | | | LegacyTexas Financial Group, Inc. | | | 1,938,072 | | | | 0.5 | |
| | 19,451 | | | | | M&T Bank Corp. | | | 3,325,926 | | | | 0.9 | |
| | 66,876 | | | | | Northern Trust Corp. | | | 6,680,244 | | | | 1.8 | |
| | 12,498 | | | | | PNC Financial Services Group, Inc. | | | 1,803,336 | | | | 0.5 | |
See Accompanying Notes to Financial Statements
| Vy® American Century Small-Mid Cap Value Portfolio | PORTFOLIO OF INVESTMENTS
as of December 31, 2017 (continued) |
| Shares | | | | | | | Value | | | Percentage
of Net
Assets | |
| COMMON STOCK: (continued) | | | | | | | | |
| | | | | | | Financials: (continued) | | | | | | | | |
| | 26,382 | | | | | Popular, Inc. | | | 936,297 | | | | 0.2 | |
| | 19,451 | | | | | ProAssurance Corp. | | | 1,111,625 | | | | 0.3 | |
| | 12,288 | | | | | Reinsurance Group of America, Inc. | | | 1,916,068 | | | | 0.5 | |
| | 28,532 | | | | | RLI Corp. | | | 1,730,751 | | | | 0.5 | |
| | 25,398 | | | | | Southside Bancshares, Inc. | | | 855,405 | | | | 0.2 | |
| | 33,992 | | | | | SunTrust Banks, Inc. | | | 2,195,543 | | | | 0.6 | |
| | 13,170 | | | | | T. Rowe Price Group, Inc. | | | 1,381,928 | | | | 0.4 | |
| | 13,627 | | | (1) | | Texas Capital Bancshares, Inc. | | | 1,211,440 | | | | 0.3 | |
| | 9,963 | | | | | Torchmark Corp. | | | 903,744 | | | | 0.2 | |
| | 5,350 | | | | | Travelers Cos., Inc. | | | 725,674 | | | | 0.2 | |
| | 32,760 | | | | | Two Harbors Investment Corp. | | | 532,678 | | | | 0.1 | |
| | 37,167 | | | | | UMB Financial Corp. | | | 2,673,051 | | | | 0.7 | |
| | 19,593 | | | | | Unum Group | | | 1,075,460 | | | | 0.3 | |
| | 44,352 | | | | | Validus Holdings Ltd. | | | 2,080,996 | | | | 0.6 | |
| | 236,062 | | | | | Valley National Bancorp | | | 2,648,616 | | | | 0.7 | |
| | 43,646 | | | (2) | | Westamerica Bancorp. | | | 2,599,119 | | | | 0.7 | |
| | 9,313 | | | (1) | | Western Alliance Bancorp. | | | 527,302 | | | | 0.1 | |
| | | | | | | | | | 91,168,766 | | | | 24.2 | |
| | | | | | | | | | | | | | | |
| | | | | | | Health Care: 7.5% | | | | | | | | |
| | 25,507 | | | (1) | | AMN Healthcare Services, Inc. | | | 1,256,220 | | | | 0.3 | |
| | 54,830 | | | | | Cardinal Health, Inc. | | | 3,359,434 | | | | 0.9 | |
| | 33,272 | | | (1) | | Express Scripts Holding Co. | | | 2,483,422 | | | | 0.7 | |
| | 31,842 | | | (1) | | HCA Healthcare, Inc. | | | 2,797,001 | | | | 0.7 | |
| | 18,355 | | | (1) | | Henry Schein, Inc. | | | 1,282,647 | | | | 0.3 | |
| | 12,150 | | | | | Koninklijke Philips NV | | | 458,767 | | | | 0.1 | |
| | 59,319 | | | (1) | | LifePoint Health, Inc. | | | 2,954,086 | | | | 0.8 | |
| | 14,547 | | | | | McKesson Corp. | | | 2,268,605 | | | | 0.6 | |
| | 16,490 | | | (1) | | Providence Service Corp. | | | 978,517 | | | | 0.3 | |
| | 21,965 | | | | | Quest Diagnostics, Inc. | | | 2,163,333 | | | | 0.6 | |
| | 22,703 | | | | | STERIS PLC | | | 1,985,831 | | | | 0.5 | |
| | 52,945 | | | | | Zimmer Biomet Holdings, Inc. | | | 6,388,873 | | | | 1.7 | |
| | | | | | | | | | 28,376,736 | | | | 7.5 | |
| | | | | | | | | | | | | | | |
| | | | | | | Industrials: 13.9% | | | | | | | | |
| | 20,276 | | | (2) | | Apogee Enterprises, Inc. | | | 927,221 | | | | 0.2 | |
| | 19,693 | | | | | AZZ, Inc. | | | 1,006,312 | | | | 0.3 | |
| | 59,337 | | | | | Ceco Environmental Corp. | | | 304,399 | | | | 0.1 | |
| | 46,439 | | | (1) | | CSW Industrials, Inc. | | | 2,133,872 | | | | 0.6 | |
| | 10,737 | | | | | Cummins, Inc. | | | 1,896,584 | | | | 0.5 | |
| | 13,766 | | | | | Deluxe Corp. | | | 1,057,779 | | | | 0.3 | |
| | 39,504 | | | (1) | | DXP Enterprises, Inc. | | | 1,168,133 | | | | 0.3 | |
| | 8,057 | | | (1),(2) | | Dycom Industries, Inc. | | | 897,791 | | | | 0.2 | |
| | 31,482 | | | | | Eaton Corp. PLC | | | 2,487,393 | | | | 0.7 | |
| | 53,026 | | | | | Emerson Electric Co. | | | 3,695,382 | | | | 1.0 | |
| | 12,186 | | | | | EnPro Industries, Inc. | | | 1,139,513 | | | | 0.3 | |
| | 12,706 | | | (1) | | Esterline Technologies Corp. | | | 949,138 | | | | 0.2 | |
| | 74,397 | | | (1) | | Foundation Building Materials, Inc. | | | 1,100,332 | | | | 0.3 | |
| | 45,565 | | | | | Global Brass & Copper Holdings, Inc. | | | 1,508,201 | | | | 0.4 | |
| | 5,962 | | | (1) | | GMS, Inc. | | | 224,410 | | | | 0.1 | |
| | 31,993 | | | | | Graham Corp. | | | 669,613 | | | | 0.2 | |
| | 110,967 | | | (2) | | Heartland Express, Inc. | | | 2,589,970 | | | | 0.7 | |
| | 29,948 | | | | | Hubbell, Inc. | | | 4,053,162 | | | | 1.1 | |
| | 22,595 | | | (1) | | Huron Consulting Group, Inc. | | | 913,968 | | | | 0.2 | |
| | 27,082 | | | | | Ingersoll-Rand PLC - Class A | | | 2,415,444 | | | | 0.6 | |
| | 115,624 | | | (1) | | Innerworkings, Inc. | | | 1,159,709 | | | | 0.3 | |
| | 175,599 | | | | | Johnson Controls International plc | | | 6,692,078 | | | | 1.8 | |
| | 31,511 | | | | | LSC Communications, Inc. | | | 477,392 | | | | 0.1 | |
| | 38,167 | | | | | MSC Industrial Direct Co. | | | 3,689,222 | | | | 1.0 | |
| | 2,171 | | | | | Multi-Color Corp. | | | 162,499 | | | | 0.0 | |
| | 9,788 | | | | | Norfolk Southern Corp. | | | 1,418,281 | | | | 0.4 | |
| | 16,307 | | | | | Paccar, Inc. | | | 1,159,102 | | | | 0.3 | |
| | 3,846 | | | | | Parker Hannifin Corp. | | | 767,585 | | | | 0.2 | |
| | 28,597 | | | | | Republic Services, Inc. | | | 1,933,443 | | | | 0.5 | |
| | 6,698 | | | (1) | | Rexnord Corp. | | | 174,282 | | | | 0.0 | |
| | 51,958 | | | | | Textron, Inc. | | | 2,940,303 | | | | 0.8 | |
| | 17,464 | | | (1) | | Thermon Group Holdings, Inc. | | | 413,373 | | | | 0.1 | |
| | 2,194 | | | | | Valmont Industries, Inc. | | | 363,875 | | | | 0.1 | |
| | | | | | | | | | 52,489,761 | | | | 13.9 | |
| | | | | | | | | | | | | | | |
| | | | | | | Information Technology: 8.3% | | | | | | | | |
| | 57,259 | | | | | Applied Materials, Inc. | | | 2,927,080 | | | | 0.8 | |
| | 11,413 | | | | | Avnet, Inc. | | | 452,183 | | | | 0.1 | |
| | 14,478 | | | | | Belden, Inc. | | | 1,117,267 | | | | 0.3 | |
| | 7,692 | | | (1),(2) | | BroadSoft, Inc. | | | 422,291 | | | | 0.1 | |
| | 40,566 | | | (1) | | Cray, Inc. | | | 981,697 | | | | 0.2 | |
| | 59,909 | | | | | CSRA, Inc. | | | 1,792,477 | | | | 0.5 | |
| | 58,604 | | | | | Cypress Semiconductor Corp. | | | 893,125 | | | | 0.2 | |
| | 133,313 | | | | | EVERTEC, Inc. | | | 1,819,723 | | | | 0.5 | |
| | 74,415 | | | (1) | | Keysight Technologies, Inc. | | | 3,095,664 | | | | 0.8 | |
| | 36,480 | | | (1) | | Kulicke & Soffa Industries, Inc. | | | 887,741 | | | | 0.2 | |
| | 9,086 | | | | | Lam Research Corp. | | | 1,672,460 | | | | 0.4 | |
| | 69,354 | | | | | Maxim Integrated Products | | | 3,625,827 | | | | 1.0 | |
| | 15,950 | | | (1) | | OSI Systems, Inc. | | | 1,026,861 | | | | 0.3 | |
| | 57,175 | | | (1) | | Presidio, Inc. | | | 1,096,045 | | | | 0.3 | |
| | 27,160 | | | | | TE Connectivity Ltd. | | | 2,581,286 | | | | 0.7 | |
| | 12,520 | | | (1) | | Tech Data Corp. | | | 1,226,585 | | | | 0.3 | |
| | 59,654 | | | (1) | | Teradata Corp. | | | 2,294,293 | | | | 0.6 | |
| | 60,600 | | | | | Teradyne, Inc. | | | 2,537,322 | | | | 0.7 | |
| | 57,772 | | | (1) | | VeriFone Holdings, Inc. | | | 1,023,142 | | | | 0.3 | |
| | | | | | | | | | 31,473,069 | | | | 8.3 | |
| | | | | | | | | | | | | | | |
| | | | | | | Materials: 6.9% | | | | | | | | |
| | 68,632 | | | | | Bemis Co., Inc. | | | 3,279,923 | | | | 0.9 | |
| | 398,569 | | | | | Graphic Packaging Holding Co. | | | 6,157,891 | | | | 1.6 | |
| | 42,192 | | | | | Innophos Holdings, Inc. | | | 1,971,632 | | | | 0.5 | |
| | 20,422 | | | | | Innospec, Inc. | | | 1,441,793 | | | | 0.4 | |
| | 28,637 | | | | | Minerals Technologies, Inc. | | | 1,971,657 | | | | 0.5 | |
| | 25,671 | | | | | PolyOne Corp. | | | 1,116,689 | | | | 0.3 | |
| | 97,573 | | | | | Silgan Holdings, Inc. | | | 2,867,671 | | | | 0.8 | |
| | 48,527 | | | | | Sonoco Products Co. | | | 2,578,725 | | | | 0.7 | |
| | 72,040 | | | | | WestRock Co. | | | 4,553,648 | | | | 1.2 | |
| | | | | | | | | | 25,939,629 | | | | 6.9 | |
| | | | | | | | | | | | | | | |
| | | | | | | Real Estate: 6.0% | | | | | | | | |
| | 17,005 | | | | | American Tower Corp. | | | 2,426,103 | | | | 0.7 | |
See Accompanying Notes to Financial Statements
| Vy® American Century Small-Mid Cap Value Portfolio | PORTFOLIO OF INVESTMENTS
as of December 31, 2017 (continued) |
| Shares | | | | | | | Value | | | Percentage
of Net
Assets | |
| COMMON STOCK: (continued) | | | | | | | | |
| | | | | | | Real Estate: (continued) | | | | | | | | |
| | 30,137 | | | | | Armada Hoffler Properties, Inc. | | | 468,028 | | | | 0.1 | |
| | 11,489 | | | | | Boston Properties, Inc. | | | 1,493,915 | | | | 0.4 | |
| | 32,131 | | | | | CareTrust REIT, Inc. | | | 538,516 | | | | 0.1 | |
| | 5,198 | | | | | Chatham Lodging Trust | | | 118,307 | | | | 0.0 | |
| | 22,750 | | | | | Community Healthcare Trust, Inc. | | | 639,275 | | | | 0.2 | |
| | 21,119 | | | | | DiamondRock Hospitality Co. | | | 238,434 | | | | 0.1 | |
| | 41,710 | | | | | Empire State Realty Trust, Inc. | | | 856,306 | | | | 0.2 | |
| | 5,324 | | | | | EPR Properties | | | 348,509 | | | | 0.1 | |
| | 6,931 | | | | | Four Corners Property Trust, Inc. | | | 178,127 | | | | 0.1 | |
| | 94,201 | | | | | Kite Realty Group Trust | | | 1,846,340 | | | | 0.5 | |
| | 41,080 | | | | | Lexington Realty Trust | | | 396,422 | | | | 0.1 | |
| | 87,674 | | | | | MedEquities Realty Trust, Inc. | | | 983,702 | | | | 0.3 | |
| | 53,180 | | | | | Medical Properties Trust, Inc. | | | 732,820 | | | | 0.2 | |
| | 56,363 | | | (2) | | MGM Growth Properties LLC | | | 1,642,981 | | | | 0.4 | |
| | 97,081 | | | | | Piedmont Office Realty Trust, Inc. | | | 1,903,758 | | | | 0.5 | |
| | 19,367 | | | | | RLJ Lodging Trust | | | 425,493 | | | | 0.1 | |
| | 35,224 | | | | | Sabra Healthcare REIT, Inc. | | | 661,154 | | | | 0.2 | |
| | 30,682 | | | | | Summit Hotel Properties, Inc. | | | 467,287 | | | | 0.1 | |
| | 5,604 | | | | | Sunstone Hotel Investors, Inc. | | | 92,634 | | | | 0.0 | |
| | 16,729 | | | | | Urstadt Biddle Properties, Inc. | | | 363,688 | | | | 0.1 | |
| | 161,999 | | | | | Weyerhaeuser Co. | | | 5,712,085 | | | | 1.5 | |
| | | | | | | | | | 22,533,884 | | | | 6.0 | |
| | | | | | | | | | | | | | | |
| | | | | | | Telecommunication Services: 0.2% | | | | | | | | |
| | 37,248 | | | | | CenturyLink, Inc. | | | 621,297 | | | | 0.2 | |
| | | | | | | | | | | | | | | |
| | | | | | | Utilities: 4.4% | | | | | | | | |
| | 21,489 | | | | | Ameren Corp. | | | 1,267,636 | | | | 0.3 | |
| | 18,110 | | | | | Atmos Energy Corp. | | | 1,555,468 | | | | 0.4 | |
| | 30,010 | | | | | Edison International | | | 1,897,833 | | | | 0.5 | |
| | 18,579 | | | | | Eversource Energy | | | 1,173,821 | | | | 0.3 | |
| | 43,166 | | | | | NorthWestern Corp. | | | 2,577,010 | | | | 0.7 | |
| | 15,605 | | | | | PG&E Corp. | | | 699,572 | | | | 0.2 | |
| | 21,938 | | | | | Pinnacle West Capital Corp. | | | 1,868,679 | | | | 0.5 | |
| | 25,503 | | | | | Spire, Inc. | | | 1,916,551 | | | | 0.5 | |
| | 78,794 | | | | | Xcel Energy, Inc. | | | 3,790,779 | | | | 1.0 | |
| | | | | | | | | | 16,747,349 | | | | 4.4 | |
| | | | | | | | | | | | | | | |
| | | | | Total Common Stock | | | | | | | | |
| | | | | (Cost $318,306,344) | | | 360,793,235 | | | | 95.6 | |
| | | | | | | | | | | | | | | |
| EXCHANGE-TRADED FUNDS: 1.4% | | | | | | | | |
| | 56,915 | | | | | iShares Russell Midcap Value Index Fund | | | 5,073,972 | | | | 1.4 | |
| | | | | | | | | | | | | | | |
| | | | | Total Exchange-Traded Funds | | | | | | | | |
| | | | | (Cost $4,842,350) | | | 5,073,972 | | | | 1.4 | |
| | | | | | | | | | | | | | | |
| PREFERRED STOCK: 0.2% | | | | | | | | |
| | | | | | | Industrials: 0.2% | | | | | | | | |
| | 13,665 | | | (1),(2) | | Rexnord Corp. | | | 797,626 | | | | 0.2 | |
| | | | | | | | | | | | | | | |
| | | | | Total Preferred Stock | | | | | | | | |
| | | | | (Cost $693,853) | | | 797,626 | | | | 0.2 | |
| | | | | | | | | | | | | | | |
| | | | | Total Long-Term Investments | | | | | | | | |
| | | | | (Cost $323,842,547) | | | 366,664,833 | | | | 97.2 | |
| | | | | | | | | | | | | | | |
Principal
Amount† | | | | | | | Value | | | Percentage
of Net
Assets | |
| SHORT-TERM INVESTMENTS: 6.2% | | | | | | | | |
| | | | | | | Securities Lending Collateral(4): 3.5% | | | | | | | | |
| | 3,117,149 | | | | | Cantor Fitzgerald, Repurchase Agreement dated 12/29/17, 1.41%, due 01/02/18 (Repurchase Amount $3,117,631, collateralized by various U.S. Government\U.S. Government Agency Obligations, 0.000%-8.500%, Market Value plus accrued interest $3,179,492, due 01/31/18-06/20/63) | | | 3,117,149 | | | | 0.9 | |
| | 655,748 | | | | | Daiwa Capital Markets, Repurchase Agreement dated 12/29/17, 1.43%, due 01/02/18 (Repurchase Amount $655,851, collateralized by various U.S. Government and U.S. Government Agency Obligations, 0.000%-6.500%, Market Value plus accrued interest $668,863, due 01/11/18-12/01/51) | | | 655,748 | | | | 0.2 | |
| | 3,117,149 | | | | | Millenium Fixed Income Ltd., Repurchase Agreement dated 12/29/17, 1.44%, due 01/02/18 (Repurchase Amount $3,117,641, collateralized by various U.S. Government Securities, 2.875%-3.625%, Market Value plus accrued interest $3,179,492, due 02/15/43-02/15/44) | | | 3,117,149 | | | | 0.8 | |
See Accompanying Notes to Financial Statements
| Vy® American Century Small-Mid Cap Value Portfolio | PORTFOLIO OF INVESTMENTS
as of December 31, 2017 (continued) |
Principal
Amount† | | | | | | | Value | | | Percentage
of Net
Assets | |
| SHORT-TERM INVESTMENTS: (continued) | | | | | | | | |
| | | | | | | Securities Lending Collateral(4): (continued) | | | | | | | | |
| | 3,117,149 | | | | | NBC Global Finance Ltd., Repurchase Agreement dated 12/29/17, 1.50%, due 01/02/18 (Repurchase Amount $3,117,661, collateralized by various U.S. Government Securities, 0.750%-2.250%, Market Value plus accrued interest $3,179,492, due 09/30/18-09/09/49) | | | 3,117,149 | | | | 0.8 | |
| | 3,117,149 | | | | | State of Wisconsin Investment Board, Repurchase Agreement dated 12/29/17, 1.63%, due 01/02/18 (Repurchase Amount $3,117,706, collateralized by various U.S. Government Securities, 0.125%-3.875%, Market Value plus accrued interest $3,203,711, due 01/15/19-02/15/46) | | | 3,117,149 | | | | 0.8 | |
| | | | | | | | | | 13,124,344 | | | | 3.5 | |
| | | | | | | | | | | | | | | |
| Shares | | | | | | | Value | | | Percentage
of Net
Assets | |
| | | | | | | Mutual Funds: 2.7% | | | | | | | | |
| | 10,333,772 | | | (5) | | BlackRock Liquidity Funds, FedFund, Institutional Class, 1.170% | | | | | | | | |
| | | | | | | (Cost $10,333,772) | | | 10,333,772 | | | | 2.7 | |
| | | | | | | | | | | | | | | |
| | | | | Total Short-Term Investments | | | | | | | | |
| | | | | (Cost $23,458,116) | | | 23,458,116 | | | | 6.2 | |
| | | | | | | | | | | | | | | |
| | | | | Total Investments in Securities
(Cost $347,300,663) | | $ | 390,122,949 | | | | 103.4 | |
| | | | | Liabilities in Excess of Other Assets | | | (12,705,109 | ) | | | (3.4 | ) |
| | | | | Net Assets | | $ | 377,417,840 | | | | 100.0 | |
| † | Unless otherwise indicated, principal amount is shown in USD. |
| ADR | American Depositary Receipt |
| (1) | Non-income producing security. |
| (2) | Security, or a portion of the security, is on loan. |
| (3) | Security is a Master Limited Partnership. |
| (4) | Represents securities purchased with cash collateral received for securities on loan. |
| (5) | Rate shown is the 7-day yield as of December 31, 2017. |
See Accompanying Notes to Financial Statements
| Vy® Baron Growth Portfolio | PORTFOLIO OF INVESTMENTS
as of December 31, 2017 |
| Shares | | | | | | | Value | | | Percentage
of Net
Assets | |
| COMMON STOCK: 99.3% | | | | | | | | |
| | | | | | | Consumer Discretionary: 33.9% | | | | | | | | |
| | 291,000 | | | (1) | | Bright Horizons Family Solutions, Inc. | | | 27,354,000 | | | | 3.6 | |
| | 34,000 | | | | | Camping World Holdings, Inc. | | | 1,520,820 | | | | 0.2 | |
| | 550,000 | | | | | Choice Hotels International, Inc. | | | 42,680,000 | | | | 5.6 | |
| | 68,000 | | | | | Dick's Sporting Goods, Inc. | | | 1,954,320 | | | | 0.3 | |
| | 728,364 | | | | | Manchester United PLC - Class A | | | 14,421,607 | | | | 1.9 | |
| | 188,200 | | | | | Marriott Vacations Worldwide Corp. | | | 25,446,522 | | | | 3.3 | |
| | 43,123 | | | (1) | | Ollie's Bargain Outlet Holdings, Inc. | | | 2,296,300 | | | | 0.3 | |
| | 472,571 | | | (1) | | Penn National Gaming, Inc. | | | 14,805,650 | | | | 1.9 | |
| | 593,691 | | | (1) | | Pinnacle Entertainment, Inc. | | | 19,431,506 | | | | 2.6 | |
| | 213,000 | | | | | Red Rock Resorts, Inc. | | | 7,186,620 | | | | 0.9 | |
| | 241,200 | | | (1) | | Under Armour, Inc. - Class A | | | 3,480,516 | | | | 0.5 | |
| | 456,500 | | | | | Vail Resorts, Inc. | | | 96,992,555 | | | | 12.8 | |
| | | | | | | | | | 257,570,416 | | | | 33.9 | |
| | | | | | | | | | | | | | | |
| | | | | | | Consumer Staples: 1.4% | | | | | | | | |
| | 121,500 | | | | | Church & Dwight Co., Inc. | | | 6,095,655 | | | | 0.8 | |
| | 135,000 | | | (1) | | Performance Food Group Co. | | | 4,468,500 | | | | 0.6 | |
| | | | | | | | | | 10,564,155 | | | | 1.4 | |
| | | | | | | | | | | | | | | |
| | | | | | | Financials: 19.8% | | | | | | | | |
| | 191,100 | | | (1) | | Arch Capital Group Ltd. | | | 17,346,147 | | | | 2.3 | |
| | 270,000 | | | (2) | | Carlyle Group L.P. | | | 6,183,000 | | | | 0.8 | |
| | 330,000 | | | | | Cohen & Steers, Inc. | | | 15,605,700 | | | | 2.1 | |
| | 65,500 | | | (1) | | Essent Group Ltd. | | | 2,844,010 | | | | 0.4 | |
| | 82,000 | | | | | Factset Research Systems, Inc. | | | 15,806,320 | | | | 2.1 | |
| | 284,000 | | | | | Financial Engines, Inc. | | | 8,605,200 | | | | 1.1 | |
| | 35,065 | | | | | Houlihan Lokey, Inc. | | | 1,593,003 | | | | 0.2 | |
| | 123,241 | | | | | Kinsale Capital Group, Inc. | | | 5,545,845 | | | | 0.7 | |
| | 9,289 | | | (1) | | LendingTree, Inc. | | | 3,162,440 | | | | 0.4 | |
| | 80,000 | | | | | Moelis & Co. | | | 3,880,000 | | | | 0.5 | |
| | 149,000 | | | | | Morningstar, Inc. | | | 14,448,530 | | | | 1.9 | |
| | 182,500 | | | | | MSCI, Inc. - Class A | | | 23,093,550 | | | | 3.0 | |
| | 160,000 | | | (2) | | Oaktree Capital Group LLC | | | 6,736,000 | | | | 0.9 | |
| | 253,500 | | | | | Primerica, Inc. | | | 25,742,925 | | | | 3.4 | |
| | | | | | | | | | 150,592,670 | | | | 19.8 | |
| | | | | | | | | | | | | | | |
| | | | | | | Health Care: 8.7% | | | | | | | | |
| | 100,400 | | | | | Bio-Techne Corp. | | | 13,006,820 | | | | 1.7 | |
| | 50,000 | | | (1) | | Denali Therapeutics, Inc. | | | 782,000 | | | | 0.1 | |
| | 175,000 | | | (1) | | IDEXX Laboratories, Inc. | | | 27,366,500 | | | | 3.6 | |
| | 18,300 | | | (1) | | Mettler Toledo International, Inc. | | | 11,337,216 | | | | 1.5 | |
| | 47,008 | | | (1) | | Neogen Corp. | | | 3,864,528 | | | | 0.5 | |
| | 96,500 | | | | | West Pharmaceutical Services, Inc. | | | 9,521,655 | | | | 1.3 | |
| | | | | | | | | | 65,878,719 | | | | 8.7 | |
| | | | | | | | | | | | | | | |
| | | | | | | Industrials: 2.2% | | | | | | | | |
| | 70,000 | | | | | Air Lease Corp. | | | 3,366,300 | | | | 0.4 | |
| | 54,500 | | | (1) | | Middleby Corp. | | | 7,354,775 | | | | 1.0 | |
| | 56,500 | | | (1) | | Trex Co., Inc. | | | 6,124,035 | | | | 0.8 | |
| | | | | | | | | | 16,845,110 | | | | 2.2 | |
| | | | | | | | | | | | | | | |
| | | | | | | Information Technology: 23.4% | | | | | | | | |
| | 89,734 | | | (1) | | 2U, Inc. | | | 5,788,740 | | | | 0.8 | |
| | 91,000 | | | (1) | | Altair Engineering, Inc. | | | 2,176,720 | | | | 0.3 | |
| | 195,900 | | | (1) | | ANSYS, Inc. | | | 28,912,881 | | | | 3.8 | |
| | 283,700 | | | (1) | | Benefitfocus, Inc. | | | 7,659,900 | | | | 1.0 | |
| | 133,800 | | | (1) | | CoStar Group, Inc. | | | 39,731,910 | | | | 5.2 | |
| | 6,858 | | | (1) | | Ellie Mae, Inc. | | | 613,105 | | | | 0.1 | |
| | 296,300 | | | (1) | | Gartner, Inc. | | | 36,489,345 | | | | 4.8 | |
| | 164,000 | | | (1) | | Guidewire Software, Inc. | | | 12,178,640 | | | | 1.6 | |
| | 15,000 | | | | | Littelfuse, Inc. | | | 2,967,300 | | | | 0.4 | |
| | 244,000 | | | | | Maximus, Inc. | | | 17,465,520 | | | | 2.3 | |
| | 515,050 | | | | | SS&C Technologies Holdings, Inc. | | | 20,849,224 | | | | 2.7 | |
| | 52,500 | | | (1) | | Wix.com Ltd. | | | 3,021,375 | | | | 0.4 | |
| | | | | | | | | | 177,854,660 | | | | 23.4 | |
| | | | | | | | | | | | | | | |
| | | | | | | Real Estate: 8.5% | | | | | | | | |
| | 14,720 | | | | | Alexander's, Inc. | | | 5,826,912 | | | | 0.8 | |
| | 82,000 | | | | | Alexandria Real Estate Equities, Inc. | | | 10,708,380 | | | | 1.4 | |
| | 68,838 | | | | | American Assets Trust, Inc. | | | 2,632,365 | | | | 0.4 | |
| | 470,000 | | | | | Douglas Emmett, Inc. | | | 19,298,200 | | | | 2.5 | |
| | 699,650 | | | | | Gaming and Leisure Properties, Inc. | | | 25,887,050 | | | | 3.4 | |
| | | | | | | | | | 64,352,907 | | | | 8.5 | |
| | | | | | | | | | | | | | | |
| | | | | | | Telecommunication Services: 1.4% | | | | | | | | |
| | 921,311 | | | (1) | | Iridium Communications, Inc. | | | 10,871,470 | | | | 1.4 | |
| | | | | | | | | | | | | | | |
| | | | | Total Common Stock | | | | | | | | |
| | | | | (Cost $263,261,387) | | | 754,530,107 | | | | 99.3 | |
| | | | | | | | | | | | | | | |
| | | | | Assets in Excess of Other Liabilities | | | 5,032,895 | | | | 0.7 | |
| | | | | Net Assets | | $ | 759,563,002 | | | | 100.0 | |
| (1) | Non-income producing security. |
| (2) | Security is a Master Limited Partnership. |
See Accompanying Notes to Financial Statements
| Vy® Columbia Contrarian Core Portfolio | PORTFOLIO OF INVESTMENTS
as of December 31, 2017 |
| Shares | | | | | | | Value | | | Percentage
of Net
Assets | |
| COMMON STOCK: 97.7% | | | | | | | | |
| | | | | | | Consumer Discretionary: 12.5% | | | | | | | | |
| | 3,180 | | | (1) | | Amazon.com, Inc. | | | 3,718,915 | | | | 1.1 | |
| | 2,722 | | | (1) | | Autozone, Inc. | | | 1,936,349 | | | | 0.6 | |
| | 207,454 | | | | | Comcast Corp. – Class A | | | 8,308,533 | | | | 2.6 | |
| | 28,525 | | | | | Dollar General Corp. | | | 2,653,110 | | | | 0.8 | |
| | 15,075 | | | | | Expedia, Inc. | | | 1,805,533 | | | | 0.6 | |
| | 86,454 | | | | | Lowe's Cos, Inc. | | | 8,035,035 | | | | 2.5 | |
| | 13,787 | | | | | Marriott International, Inc. | | | 1,871,310 | | | | 0.6 | |
| | 13,345 | | | | | McDonald's Corp. | | | 2,296,941 | | | | 0.7 | |
| | 25,820 | | | | | PVH Corp. | | | 3,542,762 | | | | 1.1 | |
| | 5,380 | | | | | Royal Caribbean Cruises Ltd. | | | 641,726 | | | | 0.2 | |
| | 45,405 | | | | | Starbucks Corp. | | | 2,607,609 | | | | 0.8 | |
| | 69,030 | | | | | Tapestry, Inc. | | | 3,053,197 | | | | 0.9 | |
| | | | | | | | | | 40,471,020 | | | | 12.5 | |
| | | | | | | | | | | | | | | |
| | | | | | | Consumer Staples: 7.9% | | | | | | | | |
| | 38,610 | | | | | Conagra Brands, Inc. | | | 1,454,439 | | | | 0.5 | |
| | 7,855 | | | | | Costco Wholesale Corp. | | | 1,461,973 | | | | 0.5 | |
| | 33,289 | | | | | CVS Health Corp. | | | 2,413,452 | | | | 0.7 | |
| | 71,015 | | | | | Mondelez International, Inc. | | | 3,039,442 | | | | 0.9 | |
| | 38,984 | | | | | PepsiCo, Inc. | | | 4,674,961 | | | | 1.4 | |
| | 87,590 | | | | | Philip Morris International, Inc. | | | 9,253,884 | | | | 2.9 | |
| | 55,525 | | | | | Sysco Corp. | | | 3,372,033 | | | | 1.0 | |
| | | | | | | | | | 25,670,184 | | | | 7.9 | |
| | | | | | | | | | | | | | | |
| | | | | | | Energy: 7.3% | | | | | | | | |
| | 129,978 | | | | | Canadian Natural Resources Ltd. | | | 4,642,814 | | | | 1.4 | |
| | 44,431 | | | | | Chevron Corp. | | | 5,562,317 | | | | 1.7 | |
| | 34,574 | | | | | EOG Resources, Inc. | | | 3,730,880 | | | | 1.1 | |
| | 75,700 | | | | | Exxon Mobil Corp. | | | 6,331,548 | | | | 2.0 | |
| | 72,441 | | | | | Halliburton Co. | | | 3,540,192 | | | | 1.1 | |
| | | | | | | | | | 23,807,751 | | | | 7.3 | |
| | | | | | | | | | | | | | | |
| | | | | | | Financials: 17.2% | | | | | | | | |
| | 27,260 | | | | | American International Group, Inc. | | | 1,624,151 | | | | 0.5 | |
| | 3,585 | | | | | Aon PLC | | | 480,390 | | | | 0.1 | |
| | 84,971 | | | | | Bank of New York Mellon Corp. | | | 4,576,538 | | | | 1.4 | |
| | 53,247 | | | (1) | | Berkshire Hathaway, Inc. – Class B | | | 10,554,621 | | | | 3.3 | |
| | 2,761 | | | | | Blackrock, Inc. | | | 1,418,353 | | | | 0.4 | |
| | 128,832 | | | | | Citigroup, Inc. | | | 9,586,389 | | | | 3.0 | |
| | 111,413 | | | | | JPMorgan Chase & Co. | | | 11,914,506 | | | | 3.7 | |
| | 105,095 | | | | | Morgan Stanley | | | 5,514,335 | | | | 1.7 | |
| | 6,790 | | | | | S&P Global, Inc. | | | 1,150,226 | | | | 0.4 | |
| | 147,145 | | | | | Wells Fargo & Co. | | | 8,927,287 | | | | 2.7 | |
| | | | | | | | | | 55,746,796 | | | | 17.2 | |
| | | | | | | | | | | | | | | |
| | | | | | | Health Care: 13.4% | | | | | | | | |
| | 53,313 | | | | | Abbott Laboratories | | | 3,042,573 | | | | 0.9 | |
| | 15,450 | | | (1) | | Alexion Pharmaceuticals, Inc. | | | 1,847,665 | | | | 0.6 | |
| | 24,075 | | | | | Allergan plc | | | 3,938,188 | | | | 1.2 | |
| | 22,445 | | | | | AmerisourceBergen Corp. | | | 2,060,900 | | | | 0.6 | |
| | 9,320 | | | | | Anthem, Inc. | | | 2,097,093 | | | | 0.7 | |
| | 15,515 | | | (1) | | Biogen, Inc. | | | 4,942,614 | | | | 1.5 | |
| | 21,330 | | | | | Bristol-Myers Squibb Co. | | | 1,307,102 | | | | 0.4 | |
| | 32,499 | | | (1) | | Celgene Corp. | | | 3,391,596 | | | | 1.1 | |
| | 19,738 | | | | | Cigna Corp. | | | 4,008,590 | | | | 1.2 | |
| | 60,454 | | | | | Johnson & Johnson | | | 8,446,633 | | | | 2.6 | |
| | 20,978 | | | | | Medtronic PLC | | | 1,693,974 | | | | 0.5 | |
| | 162,850 | | | | | Pfizer, Inc. | | | 5,898,427 | | | | 1.8 | |
| | 5,736 | | | (1) | | Vertex Pharmaceuticals, Inc. | | | 859,597 | | | | 0.3 | |
| | | | | | | | | | 43,534,952 | | | | 13.4 | |
| | | | | | | | | | | | | | | |
| | | | | | | Industrials: 7.3% | | | | | | | | |
| | 12,727 | | | | | Eaton Corp. PLC | | | 1,005,560 | | | | 0.3 | |
| | 35,049 | | | | | FedEx Corp. | | | 8,746,127 | | | | 2.7 | |
| | 112,205 | | | | | General Electric Co. | | | 1,957,977 | | | | 0.6 | |
| | 50,797 | | | | | Honeywell International, Inc. | | | 7,790,228 | | | | 2.4 | |
| | 69,973 | | | | | Johnson Controls International plc | | | 2,666,671 | | | | 0.8 | |
| | 25,530 | | | | | Southwest Airlines Co. | | | 1,670,939 | | | | 0.5 | |
| | | | | | | | | | 23,837,502 | | | | 7.3 | |
| | | | | | | | | | | | | | | |
| | | | | | | Information Technology: 24.0% | | | | | | | | |
| | 43,700 | | | | | Activision Blizzard, Inc. | | | 2,767,084 | | | | 0.9 | |
| | 4,353 | | | (1) | | Alphabet, Inc. - Class A | | | 4,585,450 | | | | 1.4 | |
| | 9,104 | | | (1) | | Alphabet, Inc. - Class C | | | 9,526,426 | | | | 2.9 | |
| | 75,521 | | | | | Apple, Inc. | | | 12,780,419 | | | | 3.9 | |
| | 23,586 | | | | | Broadcom Ltd. | | | 6,059,243 | | | | 1.9 | |
| | 140,675 | | | | | Cisco Systems, Inc. | | | 5,387,852 | | | | 1.7 | |
| | 1,499 | | | (1) | | Electronic Arts, Inc. | | | 157,485 | | | | 0.0 | |
| | 58,495 | | | (1) | | Facebook, Inc. | | | 10,322,028 | | | | 3.2 | |
| | 35,647 | | | | | Fidelity National Information Services, Inc. | | | 3,354,026 | | | | 1.0 | |
| | 8,758 | | | (1) | | FleetCor Technologies, Inc. | | | 1,685,302 | | | | 0.5 | |
| | 16,190 | | | (1) | | MACOM Technology Solutions Holdings, Inc. | | | 526,823 | | | | 0.2 | |
| | 38,931 | | | | | Mastercard, Inc. - Class A | | | 5,892,596 | | | | 1.8 | |
| | 117,265 | | | | | Microsoft Corp. | | | 10,030,848 | | | | 3.1 | |
| | 10,475 | | | (1) | | Palo Alto Networks, Inc. | | | 1,518,247 | | | | 0.5 | |
| | 34,890 | | | | | Symantec Corp. | | | 979,013 | | | | 0.3 | |
| | 28,865 | | | | | Total System Services, Inc. | | | 2,282,933 | | | | 0.7 | |
| | | | | | | | | | 77,855,775 | | | | 24.0 | |
| | | | | | | | | | | | | | | |
| | | | | | | Materials: 3.2% | | | | | | | | |
| | 51,180 | | | | | Mosaic Co. | | | 1,313,279 | | | | 0.4 | |
| | 45,270 | | | | | Nucor Corp. | | | 2,878,267 | | | | 0.9 | |
| | 33,165 | | | | | Sealed Air Corp. | | | 1,635,034 | | | | 0.5 | |
| | 10,958 | | | | | Sherwin-Williams Co. | | | 4,493,218 | | | | 1.4 | |
| | | | | | | | | | 10,319,798 | | | | 3.2 | |
| | | | | | | | | | | | | | | |
| | | | | | | Real Estate: 1.2% | | | | | | | | |
| | 28,650 | | | | | American Tower Corp. | | | 4,087,495 | | | | 1.2 | |
| | | | | | | | | | | | | | | |
| | | | | | | Telecommunication Services: 3.0% | | | | | | | | |
| | 148,090 | | | | | AT&T, Inc. | | | 5,757,739 | | | | 1.8 | |
| | 73,602 | | | | | Verizon Communications, Inc. | | | 3,895,754 | | | | 1.2 | |
| | | | | | | | | | 9,653,493 | | | | 3.0 | |
See Accompanying Notes to Financial Statements
| Vy® Columbia Contrarian Core Portfolio | PORTFOLIO OF INVESTMENTS
as of December 31, 2017 (continued) |
| Shares | | | | | | | Value | | | Percentage
of Net
Assets | |
| COMMON STOCK: (continued) | | | | | | | | |
| | | | | | | Utilities: 0.7% | | | | | | | | |
| | 46,530 | | | | | Southern Co. | | | 2,237,628 | | | | 0.7 | |
| | | | | | | | | | | | | | | |
| | | | | Total Common Stock | | | | | | | | |
| | | | | (Cost $245,271,757) | | | 317,222,394 | | | | 97.7 | |
| | | | | | | | | | | | | | | |
Principal
Amount† | | | | | | | Value | | | Percentage
of Net
Assets | |
| CORPORATE BONDS/NOTES: –% | | | | | | | | |
| | | | | | | Materials: –% | | | | | | | | |
| | 649,000 | | | (2) | | SINO Forest Corp. Escrow, 08/01/49 | | | – | | | | – | |
| | | | | | | | | | | | | | | |
| | | | | Total Corporate Bonds/Notes | | | | | | | | |
| | | | | (Cost $–) | | | – | | | | – | |
| | | | | | | | | | | | | | | |
| | | | | Total Long-Term Investments | | | | | | | | |
| | | | | (Cost $245,271,757) | | | 317,222,394 | | | | 97.7 | |
| | | | | | | | | | | | | | | |
| Shares | | | | | | | Value | | | Percentage
of Net
Assets | |
| SHORT-TERM INVESTMENTS: 2.8% | | | | | | | | |
| | | | | | | Mutual Funds: 2.8% | | | | | | | | |
| | 9,024,466 | | | (3) | | BlackRock Liquidity Funds, FedFund, Institutional Class, 1.170% | | | | | | | | |
| | | | | | | (Cost $9,024,466) | | | 9,024,466 | | | | 2.8 | |
| | | | | | | | | | | | | | | |
| | | | | Total Short-Term Investments | | | | | | | | |
| | | | | (Cost $9,024,466) | | | 9,024,466 | | | | 2.8 | |
| | | | | | | | | | | | | | | |
| | | | | Total Investments in Securities
(Cost $254,296,223) | | $ | 326,246,860 | | | | 100.5 | |
| | | | | Liabilities in Excess of Other Assets | | | (1,608,176 | ) | | | (0.5 | ) |
| | | | | Net Assets | | $ | 324,638,684 | | | | 100.0 | |
| † | Unless otherwise indicated, principal amount is shown in USD. |
| (1) | Non-income producing security. |
| (2) | For fair value measurement disclosure purposes, security is categorized as Level 3, whose value was determined using significant unobservable inputs. |
| (3) | Rate shown is the 7-day yield as of December 31, 2017. |
See Accompanying Notes to Financial Statements
| Vy® Columbia Small Cap Value II Portfolio | PORTFOLIO OF INVESTMENTS
as of December 31, 2017 |
| Shares | | | | | | | Value | | | Percentage
of Net
Assets | |
| COMMON STOCK: 98.6% | | | | | | | | |
| | | | | | | Consumer Discretionary: 10.3% | | | | | | | | |
| | 28,000 | | | | | Aarons, Inc. | | | 1,115,800 | | | | 0.5 | |
| | 52,000 | | | | | Adtalem Global Education, Inc. | | | 2,186,600 | | | | 1.0 | |
| | 128,000 | | | | | American Eagle Outfitters, Inc. | | | 2,406,400 | | | | 1.1 | |
| | 19,700 | | | | | Childrens Place Retail Stores, Inc. | | | 2,863,395 | | | | 1.4 | |
| | 16,300 | | | (1) | | Cooper-Standard Holdings, Inc. | | | 1,996,750 | | | | 0.9 | |
| | 42,700 | | | | | DSW, Inc. | | | 914,207 | | | | 0.4 | |
| | 121,500 | | | (1) | | Express, Inc. | | | 1,233,225 | | | | 0.6 | |
| | 24,000 | | | (1) | | Genesco, Inc. | | | 780,000 | | | | 0.4 | |
| | 30,500 | | | | | Nexstar Media Group, Inc. | | | 2,385,100 | | | | 1.1 | |
| | 29,800 | | | (1) | | Red Robin Gourmet Burgers, Inc. | | | 1,680,720 | | | | 0.8 | |
| | 58,300 | | | | | Tower International, Inc. | | | 1,781,065 | | | | 0.8 | |
| | 93,500 | | | (1) | | William Lyon Homes | | | 2,718,980 | | | | 1.3 | |
| | | | | | | | | | 22,062,242 | | | | 10.3 | |
| | | | | | | | | | | | | | | |
| | | | | | | Consumer Staples: 0.6% | | | | | | | | |
| | 26,000 | | | (1) | | United Natural Foods, Inc. | | | 1,281,020 | | | | 0.6 | |
| | | | | | | | | | | | | | | |
| | | | | | | Energy: 6.5% | | | | | | | | |
| | 28,500 | | | | | Arch Coal, Inc. | | | 2,655,060 | | | | 1.2 | |
| | 52,000 | | | (1) | | C&J Energy Services, Inc. | | | 1,740,440 | | | | 0.8 | |
| | 178,000 | | | (1) | | Callon Petroleum Co. | | | 2,162,700 | | | | 1.0 | |
| | 61,000 | | | (1) | | Diamond Offshore Drilling | | | 1,133,990 | | | | 0.5 | |
| | 42,000 | | | (1) | | Keane Group, Inc. | | | 798,420 | | | | 0.4 | |
| | 109,000 | | | | | Patterson-UTI Energy, Inc. | | | 2,508,090 | | | | 1.2 | |
| | 27,200 | | | | | PBF Energy, Inc. | | | 964,240 | | | | 0.5 | |
| | 230,000 | | | (1) | | SRC Energy, Inc. | | | 1,961,900 | | | | 0.9 | |
| | | | | | | | | | 13,924,840 | | | | 6.5 | |
| | | | | | | | | | | | | | | |
| | | | | | | Financials: 31.9% | | | | | | | | |
| | 65,000 | | | | | American Equity Investment Life Holding Co. | | | 1,997,450 | | | | 0.9 | |
| | 54,000 | | | | | Ameris Bancorp. | | | 2,602,800 | | | | 1.2 | |
| | 26,000 | | | | | Amerisafe, Inc. | | | 1,601,600 | | | | 0.8 | |
| | 34,000 | | | | | Argo Group International Holdings Ltd. | | | 2,096,100 | | | | 1.0 | |
| | 33,000 | | | | | Blackstone Mortgage Trust, Inc. | | | 1,061,940 | | | | 0.5 | |
| | 66,000 | | | (1) | | BofI Holding, Inc. | | | 1,973,400 | | | | 0.9 | |
| | 55,000 | | | | | Cathay General Bancorp. | | | 2,319,350 | | | | 1.1 | |
| | 68,000 | | | | | CNO Financial Group, Inc. | | | 1,678,920 | | | | 0.8 | |
| | 48,000 | | | | | Community Bank System, Inc. | | | 2,580,000 | | | | 1.2 | |
| | 10,145 | | | (1) | | Customers Bancorp, Inc. | | | 263,669 | | | | 0.1 | |
| | 48,000 | | | (1) | | Encore Capital Group, Inc. | | | 2,020,800 | | | | 1.0 | |
| | 14,000 | | | | | Evercore, Inc. | | | 1,260,000 | | | | 0.6 | |
| | 60,500 | | | | | Hancock Holding Co. | | | 2,994,750 | | | | 1.4 | |
| | 72,000 | | | | | Hope Bancorp, Inc. | | | 1,314,000 | | | | 0.6 | |
| | 51,000 | | | | | Houlihan Lokey, Inc. | | | 2,316,930 | | | | 1.1 | |
| | 41,000 | | | | | Independent Bank Corp. | | | 2,863,850 | | | | 1.3 | |
| | 64,000 | | | | | Invesco Mortgage Capital, Inc. | | | 1,141,120 | | | | 0.5 | |
| | 43,000 | | | | | MB Financial, Inc. | | | 1,914,360 | | | | 0.9 | |
| | 225,000 | | | (1) | | MBIA, Inc. | | | 1,647,000 | | | | 0.8 | |
| | 218,000 | | | (1) | | MGIC Investment Corp. | | | 3,075,980 | | | | 1.4 | |
| | 43,921 | | | | | Moelis & Co. | | | 2,130,168 | | | | 1.0 | |
| | 29,000 | | | | | Prosperity Bancshares, Inc. | | | 2,032,030 | | | | 1.0 | |
| | 63,500 | | | | | Renasant Corp. | | | 2,596,515 | | | | 1.2 | |
| | 68,000 | | | | | Sandy Spring Bancorp, Inc. | | | 2,653,360 | | | | 1.2 | |
| | 193,000 | | | (1) | | SLM Corp. | | | 2,180,900 | | | | 1.0 | |
| | 134,000 | | | | | Sterling Bancorp/DE | | | 3,296,400 | | | | 1.6 | |
| | 19,000 | | | | | Stifel Financial Corp. | | | 1,131,640 | | | | 0.5 | |
| | 55,000 | | | | | TCF Financial Corp. | | | 1,127,500 | | | | 0.5 | |
| | 33,200 | | | | | UMB Financial Corp. | | | 2,387,744 | | | | 1.1 | |
| | 79,000 | | | | | Union Bankshares Corp. | | | 2,857,430 | | | | 1.3 | |
| | 36,000 | | | (1) | | Western Alliance Bancorp. | | | 2,038,320 | | | | 1.0 | |
| | 31,500 | | | | | Wintrust Financial Corp. | | | 2,594,655 | | | | 1.2 | |
| | 51,000 | | | | | WSFS Financial Corp. | | | 2,440,350 | | | | 1.2 | |
| | | | | | | | | | 68,191,031 | | | | 31.9 | |
| | | | | | | | | | | | | | | |
| | | | | | | Health Care: 5.4% | | | | | | | | |
| | 36,033 | | | (1) | | Almost Family, Inc. | | | 1,994,427 | | | | 0.9 | |
| | 8,000 | | | (1) | | Bluebird Bio, Inc. | | | 1,424,800 | | | | 0.7 | |
| | 127,000 | | | (1) | | Horizon Pharma PLC | | | 1,854,200 | | | | 0.9 | |
| | 100,000 | | | (1) | | Impax Laboratories, Inc. | | | 1,665,000 | | | | 0.8 | |
| | 31,000 | | | (1) | | LHC Group, Inc. | | | 1,898,750 | | | | 0.9 | |
| | 38,000 | | | (1) | | Merit Medical Systems, Inc. | | | 1,641,600 | | | | 0.8 | |
| | 13,000 | | | (1) | | Molina Healthcare, Inc. | | | 996,840 | | | | 0.4 | |
| | | | | | | | | | 11,475,617 | | | | 5.4 | |
| | | | | | | | | | | | | | | |
| | | | | | | Industrials: 14.6% | | | | | | | | |
| | 40,000 | | | | | ABM Industries, Inc. | | | 1,508,800 | | | | 0.7 | |
| | 18,500 | | | (1) | | Armstrong World Industries, Inc. | | | 1,120,175 | | | | 0.5 | |
| | 41,000 | | | | | Barnes Group, Inc. | | | 2,594,070 | | | | 1.2 | |
| | 47,000 | | | (1) | | Covenant Transportation Group, Inc. | | | 1,350,310 | | | | 0.6 | |
| | 11,000 | | | | | Curtiss-Wright Corp. | | | 1,340,350 | | | | 0.6 | |
| | 31,500 | | | | | Deluxe Corp. | | | 2,420,460 | | | | 1.1 | |
| | 26,000 | | | | | EMCOR Group, Inc. | | | 2,125,500 | | | | 1.0 | |
| | 34,000 | | | | | Granite Construction, Inc. | | | 2,156,620 | | | | 1.0 | |
| | 26,000 | | | | | Hawaiian Holdings, Inc. | | | 1,036,100 | | | | 0.5 | |
| | 86,000 | | | (1) | | Hertz Global Holdings, Inc. | | | 1,900,600 | | | | 0.9 | |
| | 61,500 | | | | | Kennametal, Inc. | | | 2,977,215 | | | | 1.4 | |
| | 43,500 | | | (1) | | Mastec, Inc. | | | 2,129,325 | | | | 1.0 | |
| | 42,000 | | | (1) | | Navistar International Corp. | | | 1,800,960 | | | | 0.9 | |
| | 16,500 | | | | | Oshkosh Corp. | | | 1,499,685 | | | | 0.7 | |
| | 59,000 | | | | | Skywest, Inc. | | | 3,132,900 | | | | 1.5 | |
| | 58,000 | | | | | Triton International Ltd./Bermuda | | | 2,172,100 | | | | 1.0 | |
| | | | | | | | | | 31,265,170 | | | | 14.6 | |
| | | | | | | | | | | | | | | |
| | | | | | | Information Technology: 8.3% | | | | | | | | |
| | 32,000 | | | | | Brooks Automation, Inc. | | | 763,200 | | | | 0.4 | |
See Accompanying Notes to Financial Statements
| Vy® Columbia Small Cap Value II Portfolio | PORTFOLIO OF INVESTMENTS
as of December 31, 2017 (continued) |
| Shares | | | | | | | Value | | | Percentage
of Net
Assets | |
| COMMON STOCK: (continued) | | | | | | | | |
| | | | | | | Information Technology: (continued) | | | | | | | | |
| | 62,500 | | | | | Cohu, Inc. | | | 1,371,875 | | | | 0.6 | |
| | 17,400 | | | | | Ebix, Inc. | | | 1,378,950 | | | | 0.6 | |
| | 29,800 | | | (1) | | Electronics for Imaging, Inc. | | | 879,994 | | | | 0.4 | |
| | 39,000 | | | | | Entegris, Inc. | | | 1,187,550 | | | | 0.6 | |
| | 33,500 | | | (1) | | Ichor Holdings Ltd. | | | 824,100 | | | | 0.4 | |
| | 44,000 | | | (1) | | II-VI, Inc. | | | 2,065,800 | | | | 1.0 | |
| | 60,000 | | | (1) | | Kulicke & Soffa Industries, Inc. | | | 1,460,100 | | | | 0.7 | |
| | 157,000 | | | (1) | | Oclaro, Inc. | | | 1,058,180 | | | | 0.5 | |
| | 7,900 | | | (1) | | Rogers Corp. | | | 1,279,168 | | | | 0.6 | |
| | 24,500 | | | | | Science Applications International Corp. | | | 1,875,965 | | | | 0.9 | |
| | 14,500 | | | | | SYNNEX Corp. | | | 1,971,275 | | | | 0.9 | |
| | 95,600 | | | (1) | | TTM Technologies, Inc. | | | 1,498,052 | | | | 0.7 | |
| | | | | | | | | | 17,614,209 | | | | 8.3 | |
| | | | | | | | | | | | | | | |
| | | | | | | Materials: 8.6% | | | | | | | | |
| | 260,000 | | | (1) | | AK Steel Holding Corp. | | | 1,471,600 | | | | 0.7 | |
| | 71,000 | | | (1) | | Allegheny Technologies, Inc. | | | 1,713,940 | | | | 0.8 | |
| | 56,000 | | | | | Carpenter Technology Corp. | | | 2,855,440 | | | | 1.3 | |
| | 107,000 | | | (1) | | Cleveland-Cliffs, Inc. | | | 771,470 | | | | 0.3 | |
| | 33,000 | | | (1) | | Cliffs Natural Resources, Inc. | | | 237,930 | | | | 0.1 | |
| | 86,000 | | | | | KapStone Paper and Packaging Corp. | | | 1,951,340 | | | | 0.9 | |
| | 33,500 | | | | | Materion Corp. | | | 1,628,100 | | | | 0.8 | |
| | 25,500 | | | | | Neenah Paper, Inc. | | | 2,311,575 | | | | 1.1 | |
| | 48,000 | | | | | Olin Corp. | | | 1,707,840 | | | | 0.8 | |
| | 81,659 | | | | | Orion Engineered Carbons SA | | | 2,090,470 | | | | 1.0 | |
| | 20,500 | | | (1) | | US Concrete, Inc. | | | 1,714,825 | | | | 0.8 | |
| | | | | | | | | | 18,454,530 | | | | 8.6 | |
| | | | | | | | | | | | | | | |
| | | | | | | Real Estate: 7.0% | | | | | | | | |
| | 36,000 | | | | | American Assets Trust, Inc. | | | 1,376,640 | | | | 0.7 | |
| | 70,500 | | | | | Brandywine Realty Trust | | | 1,282,395 | | | | 0.6 | |
| | 58,000 | | | | | Chesapeake Lodging Trust | | | 1,571,220 | | | | 0.7 | |
| | 97,000 | | | | | First Industrial Realty Trust, Inc. | | | 3,052,590 | | | | 1.4 | |
| | 12,500 | | | | | Highwoods Properties, Inc. | | | 636,375 | | | | 0.3 | |
| | 53,000 | | | | | Hudson Pacific Properties, Inc. | | | 1,815,250 | | | | 0.9 | |
| | 50,000 | | | | | Mack-Cali Realty Corp. | | | 1,078,000 | | | | 0.5 | |
| | 16,000 | | | | | PS Business Parks, Inc. | | | 2,001,440 | | | | 0.9 | |
| | 129,000 | | | | | Sunstone Hotel Investors, Inc. | | | 2,132,370 | | | | 1.0 | |
| | | | | | | | | | 14,946,280 | | | | 7.0 | |
| | | | | | | | | | | | | | | |
| | | | | | | Utilities: 5.4% | | | | | | | | |
| | 26,900 | | | | | Black Hills Corp. | | | 1,616,959 | | | | 0.7 | |
| | 66,000 | | | | | New Jersey Resources Corp. | | | 2,653,200 | | | | 1.2 | |
| | 27,500 | | | | | ONE Gas, Inc. | | | 2,014,650 | | | | 0.9 | |
| | 45,400 | | | | | PNM Resources, Inc. | | | 1,836,430 | | | | 0.9 | |
| | 59,000 | | | | | South Jersey Industries, Inc. | | | 1,842,570 | | | | 0.9 | |
| | 20,500 | | | | | Southwest Gas Holdings, Inc. | | | 1,649,840 | | | | 0.8 | |
| | | | | | | | | | 11,613,649 | | | | 5.4 | |
| | | | | | | | | | | | | | | |
| | | | | Total Common Stock | | | | | | | | |
| | | | | (Cost $156,269,823) | | | 210,828,588 | | | | 98.6 | |
| | | | | | | | | | | | | | | |
| SHORT-TERM INVESTMENTS: 1.5% | | | | | | | | |
| | | | | | | Mutual Funds: 1.5% | | | | | | | | |
| | 3,147,071 | | | (2) | | BlackRock Liquidity Funds, FedFund, Institutional Class, 1.170% | | | | | | | | |
| | | | | | | (Cost $3,147,071) | | | 3,147,071 | | | | 1.5 | |
| | | | | | | | | | | | | | | |
| | | | | Total Short-Term Investments | | | | | | | | |
| | | | | (Cost $3,147,071) | | | 3,147,071 | | | | 1.5 | |
| | | | | | | | | | | | | | | |
| | | | | Total Investments in Securities
(Cost $159,416,894) | | $ | 213,975,659 | | | | 100.1 | |
| | | | | Liabilities in Excess of Other Assets | | | (271,455 | ) | | | (0.1 | ) |
| | | | | Net Assets | | $ | 213,704,204 | | | | 100.0 | |
| (1) | Non-income producing security. |
| (2) | Rate shown is the 7-day yield as of December 31, 2017. |
See Accompanying Notes to Financial Statements
| Vy® Invesco Comstock Portfolio | PORTFOLIO OF INVESTMENTS
as of December 31, 2017 |
| Shares | | | | | | | Value | | | Percentage
of Net
Assets | |
| COMMON STOCK: 95.5% | | | | | | | | |
| | | | | | | Consumer Discretionary: 6.5% | | | | | | | | |
| | 38,036 | | | | | Advance Auto Parts, Inc. | | | 3,791,809 | | | | 0.8 | |
| | 120,445 | | | | | Carnival Corp. | | | 7,993,934 | | | | 1.6 | |
| | 43,158 | | | | | CBS Corp. - Class B | | | 2,546,322 | | | | 0.5 | |
| | 6,397 | | | (1) | | Charter Communications, Inc. | | | 2,149,136 | | | | 0.4 | |
| | 79,514 | | | | | Comcast Corp. – Class A | | | 3,184,536 | | | | 0.6 | |
| | 232,592 | | | | | General Motors Co. | | | 9,533,946 | | | | 1.9 | |
| | 102,550 | | | | | Twenty-First Century Fox, Inc. - Class B | | | 3,499,006 | | | | 0.7 | |
| | | | | | | | | | 32,698,689 | | | | 6.5 | |
| | | | | | | | | | | | | | | |
| | | | | | | Consumer Staples: 3.5% | | | | | | | | |
| | 49,076 | | | | | CVS Health Corp. | | | 3,558,010 | | | | 0.7 | |
| | 72,377 | | | | | Danone | | | 6,064,517 | | | | 1.2 | |
| | 22,026 | | | | | Reckitt Benckiser Group PLC | | | 2,054,878 | | | | 0.4 | |
| | 59,445 | | | | | Wal-Mart Stores, Inc. | | | 5,870,194 | | | | 1.2 | |
| | | | | | | | | | 17,547,599 | | | | 3.5 | |
| | | | | | | | | | | | | | | |
| | | | | | | Energy: 16.7% | | | | | | | | |
| | 35,970 | | | | | Anadarko Petroleum Corp. | | | 1,929,431 | | | | 0.4 | |
| | 226,131 | | | | | BP PLC ADR | | | 9,504,286 | | | | 1.9 | |
| | 154,456 | | | | | Canadian Natural Resources Ltd. | | | 5,519,621 | | | | 1.1 | |
| | 79,579 | | | | | Chevron Corp. | | | 9,962,495 | | | | 2.0 | |
| | 187,801 | | | | | Devon Energy Corp. | | | 7,774,961 | | | | 1.6 | |
| | 98,785 | | | | | Halliburton Co. | | | 4,827,623 | | | | 1.0 | |
| | 117,302 | | | | | Hess Corp. | | | 5,568,326 | | | | 1.1 | |
| | 488,262 | | | | | Marathon Oil Corp. | | | 8,266,276 | | | | 1.7 | |
| | 61,695 | | | | | Occidental Petroleum Corp. | | | 4,544,454 | | | | 0.9 | |
| | 232,471 | | | (1) | | QEP Resources, Inc. | | | 2,224,747 | | | | 0.4 | |
| | 172,089 | | | | | Royal Dutch Shell PLC - Class A ADR | | | 11,480,057 | | | | 2.3 | |
| | 313,736 | | | | | Suncor Energy, Inc. | | | 11,520,386 | | | | 2.3 | |
| | | | | | | | | | 83,122,663 | | | | 16.7 | |
| | | | | | | | | | | | | | | |
| | | | | | | Financials: 33.6% | | | | | | | | |
| | 31,953 | | | | | Aflac, Inc. | | | 2,804,834 | | | | 0.6 | |
| | 108,821 | | | | | American International Group, Inc. | | | 6,483,555 | | | | 1.3 | |
| | 55,534 | | | | | Allstate Corp. | | | 5,814,965 | | | | 1.2 | |
| | 217,667 | | | | | Ally Financial, Inc. | | | 6,347,170 | | | | 1.3 | |
| | 814,707 | | | | | Bank of America Corp. | | | 24,050,151 | | | | 4.8 | |
| | 133,358 | | | | | Bank of New York Mellon Corp. | | | 7,182,662 | | | | 1.4 | |
| | 391,142 | | | | | Citigroup, Inc. | | | 29,104,876 | | | | 5.8 | |
| | 147,833 | | | | | Citizens Financial Group, Inc. | | | 6,206,029 | | | | 1.2 | |
| | 282,962 | | | | | Fifth Third Bancorp | | | 8,585,067 | | | | 1.7 | |
| | 22,530 | | | | | Goldman Sachs Group, Inc. | | | 5,739,743 | | | | 1.1 | |
| | 170,876 | | | | | JPMorgan Chase & Co. | | | 18,273,480 | | | | 3.7 | |
| | 102,919 | | | | | Keycorp | | | 2,075,876 | | | | 0.4 | |
| | 153,631 | | | | | Metlife, Inc. | | | 7,767,583 | | | | 1.6 | |
| | 196,883 | | | | | Morgan Stanley | | | 10,330,451 | | | | 2.1 | |
| | 75,456 | | | | | PNC Financial Services Group, Inc. | | | 10,887,546 | | | | 2.2 | |
| | 65,904 | | | | | State Street Corp. | | | 6,432,890 | | | | 1.3 | |
| | 13,118 | | | | | US Bancorp | | | 702,862 | | | | 0.1 | |
| | 146,773 | | | | | Wells Fargo & Co. | | | 8,904,718 | | | | 1.8 | |
| | | | | | | | | | 167,694,458 | | | | 33.6 | |
| | | | | | | | | | | | | | | |
| | | | | | | Health Care: 12.5% | | | | | | | | |
| | 33,677 | | | | | Anthem, Inc. | | | 7,577,662 | | | | 1.5 | |
| | 14,933 | | | (1) | | Biogen, Inc. | | | 4,757,206 | | | | 1.0 | |
| | 75,220 | | | | | Cardinal Health, Inc. | | | 4,608,729 | | | | 0.9 | |
| | 47,345 | | | | | Gilead Sciences, Inc. | | | 3,391,796 | | | | 0.7 | |
| | 28,687 | | | | | McKesson Corp. | | | 4,473,737 | | | | 0.9 | |
| | 43,619 | | | | | Medtronic PLC | | | 3,522,234 | | | | 0.7 | |
| | 87,351 | | | | | Merck & Co., Inc. | | | 4,915,241 | | | | 1.0 | |
| | 135,907 | | | (1) | | Mylan NV | | | 5,750,225 | | | | 1.1 | |
| | 51,943 | | | | | Novartis AG | | | 4,371,134 | | | | 0.9 | |
| | 262,553 | | | | | Pfizer, Inc. | | | 9,509,670 | | | | 1.9 | |
| | 159,210 | | | | | Sanofi ADR | | | 6,846,030 | | | | 1.4 | |
| | 50,933 | | | | | Shire PLC | | | 2,639,400 | | | | 0.5 | |
| | | | | | | | | | 62,363,064 | | | | 12.5 | |
| | | | | | | | | | | | | | | |
| | | | | | | Industrials: 8.1% | | | | | | | | |
| | 147,276 | | | | | Arconic, Inc. | | | 4,013,271 | | | | 0.8 | |
| | 36,588 | | | | | Caterpillar, Inc. | | | 5,765,537 | | | | 1.2 | |
| | 99,518 | | | | | Eaton Corp. PLC | | | 7,862,917 | | | | 1.6 | |
| | 50,371 | | | | | Emerson Electric Co. | | | 3,510,355 | | | | 0.7 | |
| | 177,941 | | | | | General Electric Co. | | | 3,105,071 | | | | 0.6 | |
| | 31,806 | | | | | Ingersoll-Rand PLC - Class A | | | 2,836,777 | | | | 0.6 | |
| | 195,913 | | | | | Johnson Controls International plc | | | 7,466,244 | | | | 1.5 | |
| | 100,755 | | | | | Textron, Inc. | | | 5,701,726 | | | | 1.1 | |
| | | | | | | | | | 40,261,898 | | | | 8.1 | |
| | | | | | | | | | | | | | | |
| | | | | | | Information Technology: 10.9% | | | | | | | | |
| | 365,059 | | | | | Cisco Systems, Inc. | | | 13,981,760 | | | | 2.8 | |
| | 46,160 | | | | | Cognizant Technology Solutions Corp. | | | 3,278,283 | | | | 0.7 | |
| | 161,884 | | | (1) | | eBay, Inc. | | | 6,109,502 | | | | 1.2 | |
| | 178,678 | | | | | Intel Corp. | | | 8,247,777 | | | | 1.6 | |
| | 90,749 | | | | | Microsoft Corp. | | | 7,762,669 | | | | 1.6 | |
| | 64,370 | | | | | NetApp, Inc. | | | 3,560,948 | | | | 0.7 | |
| | 51,092 | | | (1) | | PayPal Holdings, Inc. | | | 3,761,393 | | | | 0.8 | |
| | 120,547 | | | | | Qualcomm, Inc. | | | 7,717,419 | | | | 1.5 | |
| | | | | | | | | | 54,419,751 | | | | 10.9 | |
| | | | | | | | | | | | | | | |
| | | | | | | Materials: 2.3% | | | | | | | | |
| | 45,936 | | | (1) | | Alcoa Corp. | | | 2,474,572 | | | | 0.5 | |
| | 105,918 | | | | | CF Industries Holdings, Inc. | | | 4,505,752 | | | | 0.9 | |
| | 77,822 | | | | | International Paper Co. | | | 4,509,007 | | | | 0.9 | |
| | | | | | | | | | 11,489,331 | | | | 2.3 | |
| | | | | | | | | | | | | | | |
| | | | | | | Telecommunication Services: 0.8% | | | | | | | | |
| | 1,222,098 | | | | | Vodafone Group PLC | | | 3,863,038 | | | | 0.8 | |
| | | | | | | | | | | | | | | |
| | | | | | | Utilities: 0.6% | | | | | | | | |
| | 91,952 | | | | | FirstEnergy Corp. | | | 2,815,570 | | | | 0.6 | |
| | | | | | | | | | | | | | | |
| | | | | Total Common Stock | | | | | | | | |
| | | | | (Cost $356,629,051) | | | 476,276,061 | | | | 95.5 | |
See Accompanying Notes to Financial Statements
| Vy® Invesco Comstock Portfolio | PORTFOLIO OF INVESTMENTS
as of December 31, 2017 (continued) |
| Shares | | | | | | | Value | | | Percentage
of Net
Assets | |
| CLOSED-END FUNDS: 0.5% | | | | | | | | |
| | | | | | | Information Technology: 0.5% | | | | | | | | |
| | 33,021 | | | (1) | | Altaba, Inc. | | | 2,306,517 | | | | 0.5 | |
| | | | | | | | | | | | | | | |
| | | | | Total Closed-End Funds | | | | | | | | |
| | | | | (Cost $979,711) | | | 2,306,517 | | | | 0.5 | |
| | | | | | | | | | | | | | | |
| | | | | Total Long-Term Investments | | | | | | | | |
| | | | | (Cost $357,608,762) | | | 478,582,578 | | | | 96.0 | |
| | | | | | | | | | | | | | | |
| SHORT-TERM INVESTMENTS: 4.1% | | | | | | | | |
| | | | | | | Mutual Funds: 4.1% | | | | | | | | |
| | 20,456,451 | | | (2) | | BlackRock Liquidity Funds, FedFund, Institutional Class, 1.170% | | | | | | | | |
| | | | | | | (Cost $20,456,451) | | | 20,456,451 | | | | 4.1 | |
| | | | | | | | | | | | | | | |
| | | | | Total Short-Term Investments | | | | | | | | |
| | | | | (Cost $20,456,451) | | | 20,456,451 | | | | 4.1 | |
| | | | | | | | | | | | | | | |
| | | | | Total Investments in Securities
(Cost $378,065,213) | | $ | 499,039,029 | | | | 100.1 | |
| | | | | Liabilities in Excess of Other Assets | | | (321,968 | ) | | | (0.1 | ) |
| | | | | Net Assets | | $ | 498,717,061 | | | | 100.0 | |
| ADR | American Depositary Receipt |
| (1) | Non-income producing security. |
| (2) | Rate shown is the 7-day yield as of December 31, 2017. |
See Accompanying Notes to Financial Statements
| Vy® Invesco Equity and Income Portfolio | PORTFOLIO OF INVESTMENTS
as of December 31, 2017 |
| Shares | | | | | | | Value | | | Percentage
of Net
Assets | |
| COMMON STOCK: 62.3% | | | | | | | | |
| | | | | | | Consumer Discretionary: 5.2% | | | | | | | | |
| | 277,796 | | | | | Carnival Corp. | | | 18,437,321 | | | | 1.1 | |
| | 47,928 | | | | | CBS Corp. - Class B | | | 2,827,752 | | | | 0.2 | |
| | 27,828 | | | (1) | | Charter Communications, Inc. | | | 9,349,095 | | | | 0.5 | |
| | 348,530 | | | | | Comcast Corp. – Class A | | | 13,958,626 | | | | 0.8 | |
| | 521,229 | | | | | General Motors Co. | | | 21,365,177 | | | | 1.3 | |
| | 3,045,474 | | | | | Kingfisher PLC | | | 13,885,677 | | | | 0.8 | |
| | 126,765 | | | (1) | | Michael Kors Holdings Ltd. | | | 7,979,857 | | | | 0.5 | |
| | | | | | | | | | 87,803,505 | | | | 5.2 | |
| | | | | | | | | | | | | | | |
| | | | | | | Consumer Staples: 4.2% | | | | | | | | |
| | 276,383 | | | | | CVS Health Corp. | | | 20,037,768 | | | | 1.2 | |
| | 314,140 | | | | | Mondelez International, Inc. | | | 13,445,192 | | | | 0.8 | |
| | 172,783 | | | | | Philip Morris International, Inc. | | | 18,254,524 | | | | 1.1 | |
| | 249,639 | | | | | Walgreens Boots Alliance, Inc. | | | 18,128,784 | | | | 1.1 | |
| | | | | | | | | | 69,866,268 | | | | 4.2 | |
| | | | | | | | | | | | | | | |
| | | | | | | Energy: 10.1% | | | | | | | | |
| | 304,264 | | | | | Anadarko Petroleum Corp. | | | 16,320,721 | | | | 1.0 | |
| | 515,890 | | | | | Apache Corp. | | | 21,780,876 | | | | 1.3 | |
| | 291,633 | | | | | Baker Hughes a GE Co. | | | 9,227,268 | | | | 0.5 | |
| | 497,915 | | | | | Canadian Natural Resources Ltd. | | | 17,793,430 | | | | 1.1 | |
| | 540,371 | | | | | Devon Energy Corp. | | | 22,371,360 | | | | 1.3 | |
| | 331,465 | | | | | Occidental Petroleum Corp. | | | 24,415,712 | | | | 1.5 | |
| | 786,450 | | | | | Royal Dutch Shell PLC - Class A | | | 26,254,158 | | | | 1.6 | |
| | 607,172 | | | | | TechnipFMC PLC | | | 19,010,555 | | | | 1.1 | |
| | 229,614 | | | | | Total S.A. | | | 12,674,641 | | | | 0.7 | |
| | | | | | | | | | 169,848,721 | | | | 10.1 | |
| | | | | | | | | | | | | | | |
| | | | | | | Financials: 22.0% | | | | | | | | |
| | 285,609 | | | | | American International Group, Inc. | | | 17,016,584 | | | | 1.0 | |
| | 96,357 | | | | | Aon PLC | | | 12,911,838 | | | | 0.8 | |
| | 1,701,886 | | | | | Bank of America Corp. | | | 50,239,675 | | | | 3.0 | |
| | 223,447 | | | | | Charles Schwab Corp. | | | 11,478,472 | | | | 0.7 | |
| | 811,170 | | | | | Citigroup, Inc. | | | 60,359,160 | | | | 3.6 | |
| | 663,209 | | | | | Citizens Financial Group, Inc. | | | 27,841,514 | | | | 1.7 | |
| | 94,717 | | | | | Comerica, Inc. | | | 8,222,383 | | | | 0.5 | |
| | 607,843 | | | | | Fifth Third Bancorp | | | 18,441,957 | | | | 1.1 | |
| | 443,574 | | | | | First Horizon National Corp. | | | 8,867,044 | | | | 0.5 | |
| | 54,708 | | | | | Goldman Sachs Group, Inc. | | | 13,937,410 | | | | 0.8 | |
| | 388,489 | | | | | JPMorgan Chase & Co. | | | 41,545,014 | | | | 2.5 | |
| | 88,456 | | | | | Marsh & McLennan Cos., Inc. | | | 7,199,434 | | | | 0.4 | |
| | 632,854 | | | | | Morgan Stanley | | | 33,205,849 | | | | 2.0 | |
| | 121,006 | | | | | Northern Trust Corp. | | | 12,087,289 | | | | 0.7 | |
| | 133,345 | | | | | PNC Financial Services Group, Inc. | | | 19,240,350 | | | | 1.1 | |
| | 165,771 | | | | | State Street Corp. | | | 16,180,907 | | | | 1.0 | |
| | 65,388 | | | | | Willis Towers Watson PLC | | | 9,853,318 | | | | 0.6 | |
| | | | | | | | | | 368,628,198 | | | | 22.0 | |
| | | | | | | | | | | | | | | |
| | | | | | | Health Care: 7.3% | | | | | | | | |
| | 43,953 | | | | | Amgen, Inc. | | | 7,643,427 | | | | 0.5 | |
| | 49,942 | | | | | Anthem, Inc. | | | 11,237,449 | | | | 0.7 | |
| | 155,783 | | | | | Baxter International, Inc. | | | 10,069,813 | | | | 0.6 | |
| | 152,072 | | | | | Bristol-Myers Squibb Co. | | | 9,318,972 | | | | 0.5 | |
| | 92,717 | | | | | McKesson Corp. | | | 14,459,216 | | | | 0.9 | |
| | 172,797 | | | | | Medtronic PLC | | | 13,953,358 | | | | 0.8 | |
| | 238,425 | | | | | Merck & Co., Inc. | | | 13,416,175 | | | | 0.8 | |
| | 158,632 | | | | | Novartis AG | | | 13,349,280 | | | | 0.8 | |
| | 533,349 | | | | | Pfizer, Inc. | | | 19,317,901 | | | | 1.1 | |
| | 118,837 | | | | | Sanofi | | | 10,230,883 | | | | 0.6 | |
| | | | | | | | | | 122,996,474 | | | | 7.3 | |
| | | | | | | | | | | | | | | |
| | | | | | | Industrials: 3.5% | | | | | | | | |
| | 318,444 | | | | | CSX Corp. | | | 17,517,604 | | | | 1.1 | |
| | 83,204 | | | | | General Dynamics Corp. | | | 16,927,854 | | | | 1.0 | |
| | 144,955 | | | | | Ingersoll-Rand PLC - Class A | | | 12,928,536 | | | | 0.8 | |
| | 282,259 | | | | | Johnson Controls International plc | | | 10,756,891 | | | | 0.6 | |
| | | | | | | | | | 58,130,885 | | | | 3.5 | |
| | | | | | | | | | | | | | | |
| | | | | | | Information Technology: 7.0% | | | | | | | | |
| | 508,376 | | | | | Cisco Systems, Inc. | | | 19,470,801 | | | | 1.2 | |
| | 192,685 | | | | | Cognizant Technology Solutions Corp. | | | 13,684,489 | | | | 0.8 | |
| | 390,088 | | | (1) | | eBay, Inc. | | | 14,721,921 | | | | 0.9 | |
| | 308,514 | | | | | Intel Corp. | | | 14,241,006 | | | | 0.8 | |
| | 356,650 | | | | | Juniper Networks, Inc. | | | 10,164,525 | | | | 0.6 | |
| | 498,296 | | | | | Oracle Corp. | | | 23,559,435 | | | | 1.4 | |
| | 89,038 | | | (1) | | PayPal Holdings, Inc. | | | 6,554,977 | | | | 0.4 | |
| | 229,929 | | | | | Qualcomm, Inc. | | | 14,720,055 | | | | 0.9 | |
| | | | | | | | | | 117,117,209 | | | | 7.0 | |
| | | | | | | | | | | | | | | |
| | | | | | | Materials: 1.5% | | | | | | | | |
| | 74,692 | | | | | Agrium, Inc. | | | 8,589,580 | | | | 0.5 | |
| | 383,674 | | | | | BHP Billiton Ltd. | | | 8,813,341 | | | | 0.5 | |
| | 333,656 | | | | | Mosaic Co. | | | 8,561,613 | | | | 0.5 | |
| | | | | | | | | | 25,964,534 | | | | 1.5 | |
| | | | | | | | | | | | | | | |
| | | | | | | Telecommunication Services: 1.2% | | | | | | | | |
| | 160,019 | | | | | Orange SA | | | 2,773,254 | | | | 0.2 | |
| | 150,827 | | | | | Verizon Communications, Inc. | | | 7,983,273 | | | | 0.5 | |
| | 282,914 | | | | | Vodafone Group PLC ADR | | | 9,024,957 | | | | 0.5 | |
| | | | | | | | | | 19,781,484 | | | | 1.2 | |
| | | | | | | | | | | | | | | |
| | | | | | | Utilities: 0.3% | | | | | | | | |
| | 155,217 | | | | | FirstEnergy Corp. | | | 4,752,745 | | | | 0.3 | |
| | | | | | | | | | | | | | | |
| | | | | Total Common Stock | | | | | | | | |
| | | | | (Cost $828,544,276) | | | 1,044,890,023 | | | | 62.3 | |
| | | | | | | | | | | | | | | |
| PREFERRED STOCK: 0.7% | | | | | | | | |
| | | | | | | Energy: 0.4% | | | | | | | | |
| | 140,612 | | | (1),(2) | | El Paso Energy Capital Trust I | | | 6,859,222 | | | | 0.4 | |
See Accompanying Notes to Financial Statements
| Vy® Invesco Equity and Income Portfolio | PORTFOLIO OF INVESTMENTS
as of December 31, 2017 (continued) |
| Shares | | | | | | | Value | | | Percentage
of Net
Assets | |
| PREFERRED STOCK: (continued) | | | | | | | | |
| | | | | | | Financials: 0.3% | | | | | | | | |
| | 75,900 | | | (1) | | AMG Capital Trust II | | | 4,814,906 | | | | 0.3 | |
| | 4,000 | | | (1),(2) | | Wells Fargo & Co. | | | 108,000 | | | | 0.0 | |
| | | | | | | | | | 4,922,906 | | | | 0.3 | |
| | | | | | | | | | | | | | | |
| | | | | Total Preferred Stock | | | | | | | | |
| | | | | (Cost $10,847,296) | | | 11,782,128 | | | | 0.7 | |
| | | | | | | | | | | | | | | |
Principal
Amount† | | | | | | | Value | | | Percentage
of Net
Assets | |
| CORPORATE BONDS/NOTES: 11.4% | | | | | | | | |
| | | | | | | Basic Materials: 0.2% | | | | | | | | |
| | 770,000 | | | (3) | | Basell Finance Co. BV, 8.100%, 03/15/27 | | | 1,023,421 | | | | 0.1 | |
| | 1,320,000 | | | | | Eastman Chemical Co., 2.700%, 01/15/20 | | | 1,329,073 | | | | 0.1 | |
| | 195,000 | | | | | International Paper Co., 6.000%, 11/15/41 | | | 244,728 | | | | 0.0 | |
| | 315,000 | | | | | Monsanto Co., 2.125%, 07/15/19 | | | 313,977 | | | | 0.0 | |
| | 150,000 | | | | | Rio Tinto Finance USA Ltd., 7.125%, 07/15/28 | | | 198,311 | | | | 0.0 | |
| | 211,000 | | | | | Sherwin-Williams Co/The, 4.500%, 06/01/47 | | | 231,445 | | | | 0.0 | |
| | | | | | | | | | 3,340,955 | | | | 0.2 | |
| | | | | | | | | | | | | | | |
| | | | | | | Communications: 1.4% | | | | | | | | |
| | 455,000 | | | | | America Movil S.A.B de CV, 4.375%, 07/16/42 | | | 484,496 | | | | 0.0 | |
| | 837,000 | | | | | AT&T, Inc., 3.000%, 06/30/22 | | | 839,228 | | | | 0.1 | |
| | 466,000 | | | | | AT&T, Inc., 3.400%, 05/15/25 | | | 458,779 | | | | 0.0 | |
| | 533,000 | | | (3) | | AT&T, Inc., 4.300%, 02/15/30 | | | 533,626 | | | | 0.0 | |
| | 747,000 | | | | | AT&T, Inc., 4.500%, 05/15/35 | | | 744,293 | | | | 0.1 | |
| | 1,300,000 | | | | | AT&T, Inc., 4.800%, 06/15/44 | | | 1,289,518 | | | | 0.1 | |
| | 2,273,000 | | | | | AT&T, Inc., 4.900%, 08/14/37 | | | 2,311,918 | | | | 0.1 | |
| | 2,960,000 | | | | | AT&T, Inc., 5.150%, 03/15/42 | | | 3,079,547 | | | | 0.2 | |
| | 271,000 | | | (3) | | AT&T, Inc., 5.150%, 11/15/46 | | | 277,779 | | | | 0.0 | |
| | 101,000 | | | | | AT&T, Inc., 5.350%, 09/01/40 | | | 106,861 | | | | 0.0 | |
| | 1,635,000 | | | | | Charter Communications Operating LLC / Charter Communications Operating Capital, 4.464%, 07/23/22 | | | 1,707,364 | | | | 0.1 | |
| | 1,019,000 | | | | | Comcast Corp., 5.700%, 05/15/18 | | | 1,033,491 | | | | 0.1 | |
| | 135,000 | | | | | Comcast Corp., 6.450%, 03/15/37 | | | 182,365 | | | | 0.0 | |
| | 2,700,000 | | | (3) | | Crown Castle Towers LLC, 4.883%, 08/15/40 | | | 2,825,570 | | | | 0.2 | |
| | 435,000 | | | (3) | | Crown Castle Towers LLC, 6.113%, 01/15/40 | | | 458,783 | | | | 0.0 | |
| | 2,215,000 | | | | | eBay, Inc., 2.500%, 03/09/18 | | | 2,217,164 | | | | 0.1 | |
| | 125,000 | | | | | NBCUniversal Media LLC, 5.150%, 04/30/20 | | | 133,213 | | | | 0.0 | |
| | 210,000 | | | | | NBCUniversal Media LLC, 5.950%, 04/01/41 | | | 274,090 | | | | 0.0 | |
| | 415,000 | | | | | Rogers Communications, Inc., 4.500%, 03/15/43 | | | 446,568 | | | | 0.0 | |
| | 860,000 | | | | | Telefonica Emisiones SAU, 5.213%, 03/08/47 | | | 978,975 | | | | 0.1 | |
| | 370,000 | | | | | Telefonica Emisiones SAU, 7.045%, 06/20/36 | | | 497,507 | | | | 0.0 | |
| | 136,000 | | | | | Verizon Communications, Inc., 4.125%, 08/15/46 | | | 126,034 | | | | 0.0 | |
| | 535,000 | | | | | Verizon Communications, Inc., 4.400%, 11/01/34 | | | 546,419 | | | | 0.0 | |
| | 1,058,000 | | | | | Verizon Communications, Inc., 4.522%, 09/15/48 | | | 1,045,085 | | | | 0.1 | |
| | 833,000 | | | | | Verizon Communications, Inc., 4.812%, 03/15/39 | | | 873,765 | | | | 0.1 | |
| | 467,000 | | | | | Verizon Communications, Inc., 5.012%, 08/21/54 | | | 478,810 | | | | 0.0 | |
| | | | | | | | | | 23,951,248 | | | | 1.4 | |
| | | | | | | | | | | | | | | |
| | | | | | | Consumer, Cyclical: 1.0% | | | | | | | | |
| | 2,650,000 | | | | | Advance Auto Parts, Inc., 4.500%, 12/01/23 | | | 2,789,187 | | | | 0.2 | |
| | 387,000 | | | | | Advance Auto Parts, Inc., 5.750%, 05/01/20 | | | 412,590 | | | | 0.0 | |
| | 137,000 | | | (3) | | Alimentation Couche-Tard, Inc., 4.500%, 07/26/47 | | | 143,044 | | | | 0.0 | |
| | 627,179 | | | | | American Airlines 2014-1 Class A Pass Through Trust, 3.700%, 10/01/26 | | | 642,859 | | | | 0.0 | |
| | 180,169 | | | | | Continental Airlines 2010-1 Class A Pass Through Trust, 4.750%, 07/15/22 | | | 189,120 | | | | 0.0 | |
| | 311,406 | | | | | Continental Airlines 2012-1 Class A Pass Through Trust, 4.150%, 10/11/25 | | | 326,198 | | | | 0.0 | |
| | 620,000 | | | | | CVS Health Corp., 3.375%, 08/12/24 | | | 624,099 | | | | 0.0 | |
| | 558,163 | | | | | CVS Pass-Through Trust, 6.036%, 12/10/28 | | | 621,216 | | | | 0.0 | |
| | 101,910 | | | | | Delta Air Lines 2010-1 Class A Pass Through Trust, 6.200%, 01/02/20 | | | 103,693 | | | | 0.0 | |
| | 595,000 | | | | | Dollar General Corp., 3.250%, 04/15/23 | | | 603,635 | | | | 0.0 | |
| | 368,000 | | | | | Ford Motor Credit Co. LLC, 3.096%, 05/04/23 | | | 366,284 | | | | 0.0 | |
| | 569,000 | | | | | Ford Motor Credit Co. LLC, 3.810%, 01/09/24 | | | 581,512 | | | | 0.0 | |
| | 1,056,000 | | | | | Ford Motor Credit Co. LLC, 4.134%, 08/04/25 | | | 1,093,647 | | | | 0.1 | |
| | 563,000 | | | | | General Motors Co., 6.600%, 04/01/36 | | | 687,440 | | | | 0.0 | |
| | 713,000 | | | | | General Motors Financial Co., Inc., 5.250%, 03/01/26 | | | 785,113 | | | | 0.1 | |
| | 896,000 | | | | | Home Depot, Inc., 2.000%, 04/01/21 | | | 887,498 | | | | 0.1 | |
| | 725,000 | | | | | MDC Holdings, Inc., 6.000%, 01/15/43 | | | 712,313 | | | | 0.0 | |
| | 1,460,000 | | | | | QVC, Inc., 5.450%, 08/15/34 | | | 1,469,754 | | | | 0.1 | |
See Accompanying Notes to Financial Statements
| Vy® Invesco Equity and Income Portfolio | PORTFOLIO OF INVESTMENTS
as of December 31, 2017 (continued) |
Principal
Amount† | | | | | | | Value | | | Percentage
of Net
Assets | |
| CORPORATE BONDS/NOTES: (continued) | | | | | | | | |
| | | | | | | Consumer, Cyclical: (continued) | | | | | | | | |
| | 783,488 | | | | | United Airlines 2014-2 Class A Pass Through Trust, 3.750%, 03/03/28 | | | 812,791 | | | | 0.1 | |
| | 810,605 | | | (3) | | Virgin Australia 2013-1A Pass Through Trust, 5.000%, 04/23/25 | | | 845,055 | | | | 0.1 | |
| | 1,000,000 | | | | | Walgreens Boots Alliance, Inc., 3.300%, 11/18/21 | | | 1,017,466 | | | | 0.1 | |
| | 737,000 | | | | | Walgreens Boots Alliance, Inc., 4.500%, 11/18/34 | | | 771,293 | | | | 0.1 | |
| | | | | | | | | | 16,485,807 | | | | 1.0 | |
| | | | | | | | | | | | | | | |
| | | | | | | Consumer, Non-cyclical: 1.6% | | | | | | | | |
| | 1,137,000 | | | | | AbbVie, Inc., 4.500%, 05/14/35 | | | 1,251,738 | | | | 0.1 | |
| | 985,000 | | | | | Allergan Funding SCS, 4.850%, 06/15/44 | | | 1,057,464 | | | | 0.1 | |
| | 952,000 | | | | | Anheuser-Busch InBev Finance, Inc., 2.650%, 02/01/21 | | | 957,378 | | | | 0.1 | |
| | 871,000 | | | | | Anheuser-Busch InBev Finance, Inc., 3.300%, 02/01/23 | | | 892,172 | | | | 0.1 | |
| | 1,475,000 | | | | | Anheuser-Busch InBev Finance, Inc., 4.700%, 02/01/36 | | | 1,659,226 | | | | 0.1 | |
| | 1,646,000 | | | | | Anheuser-Busch InBev Finance, Inc., 4.900%, 02/01/46 | | | 1,913,633 | | | | 0.1 | |
| | 1,200,000 | | | (3) | | Bayer US Finance LLC, 2.375%, 10/08/19 | | | 1,200,843 | | | | 0.1 | |
| | 981,000 | | | (3) | | Bayer US Finance LLC, 3.000%, 10/08/21 | | | 991,490 | | | | 0.1 | |
| | 442,000 | | | | | Becton Dickinson & Co., 2.675%, 12/15/19 | | | 443,753 | | | | 0.0 | |
| | 435,000 | | | | | Becton Dickinson & Co., 4.875%, 05/15/44 | | | 466,247 | | | | 0.0 | |
| | 325,000 | | | | | Celgene Corp., 4.000%, 08/15/23 | | | 342,303 | | | | 0.0 | |
| | 1,445,000 | | | | | Celgene Corp., 4.625%, 05/15/44 | | | 1,546,321 | | | | 0.1 | |
| | 240,000 | | | | | Corn Products International, Inc., 6.625%, 04/15/37 | | | 309,857 | | | | 0.0 | |
| | 493,000 | | | | | Edwards Lifesciences Corp., 2.875%, 10/15/18 | | | 496,419 | | | | 0.0 | |
| | 965,000 | | | (3) | | ERAC USA Finance LLC, 2.350%, 10/15/19 | | | 962,557 | | | | 0.1 | |
| | 420,000 | | | | | Express Scripts Holding Co., 2.250%, 06/15/19 | | | 419,432 | | | | 0.0 | |
| | 1,400,000 | | | | | General Mills, Inc., 2.200%, 10/21/19 | | | 1,400,102 | | | | 0.1 | |
| | 755,000 | | | | | Gilead Sciences, Inc., 4.400%, 12/01/21 | | | 805,567 | | | | 0.1 | |
| | 80,000 | | | | | GlaxoSmithKline Capital, Inc., 6.375%, 05/15/38 | | | 112,995 | | | | 0.0 | |
| | 1,232,000 | | | (3) | | Heineken NV, 3.500%, 01/29/28 | | | 1,259,115 | | | | 0.1 | |
| | 963,000 | | | | | Laboratory Corp. of America Holdings, 3.200%, 02/01/22 | | | 982,641 | | | | 0.1 | |
| | 423,000 | | | | | Laboratory Corp. of America Holdings, 4.700%, 02/01/45 | | | 458,970 | | | | 0.0 | |
| | 730,000 | | | | | McKesson Corp., 2.284%, 03/15/19 | | | 730,299 | | | | 0.0 | |
| | 92,000 | | | | | Mead Johnson Nutrition Co., 4.125%, 11/15/25 | | | 97,648 | | | | 0.0 | |
| | 1,733,000 | | | | | Medtronic, Inc., 3.150%, 03/15/22 | | | 1,775,848 | | | | 0.1 | |
| | 576,000 | | | | | Medtronic, Inc., 4.375%, 03/15/35 | | | 650,092 | | | | 0.0 | |
| | 502,000 | | | | | Molson Coors Brewing Co., 1.450%, 07/15/19 | | | 495,867 | | | | 0.0 | |
| | 513,000 | | | | | Molson Coors Brewing Co., 4.200%, 07/15/46 | | | 524,439 | | | | 0.0 | |
| | 630,000 | | | | | Moodys Corp., 4.500%, 09/01/22 | | | 675,620 | | | | 0.0 | |
| | 574,000 | | | | | Mylan NV, 3.150%, 06/15/21 | | | 577,607 | | | | 0.0 | |
| | 275,000 | | | | | Philip Morris International, Inc., 3.600%, 11/15/23 | | | 284,791 | | | | 0.0 | |
| | 820,000 | | | | | Philip Morris International, Inc., 4.875%, 11/15/43 | | | 937,948 | | | | 0.1 | |
| | 79,000 | | | | | Zoetis, Inc., 4.700%, 02/01/43 | | | 88,577 | | | | 0.0 | |
| | | | | | | | | | 26,768,959 | | | | 1.6 | |
| | | | | | | | | | | | | | | |
| | | | | | | Energy: 1.3% | | | | | | | | |
| | 610,000 | | | | | Anadarko Petroleum Corp., 6.600%, 03/15/46 | | | 786,824 | | | | 0.1 | |
| | 522,000 | | | | | Andeavor Logistics L.P. / Tesoro Logistics Finance Corp., 5.200%, 12/01/47 | | | 546,044 | | | | 0.0 | |
| | 2,284,000 | | | | | Chevron Corp., 1.365%, 03/02/18 | | | 2,282,527 | | | | 0.1 | |
| | 360,000 | | | | | Chevron Corp., 1.718%, 06/24/18 | | | 360,023 | | | | 0.0 | |
| | 559,000 | | | | | Concho Resources, Inc., 3.750%, 10/01/27 | | | 566,583 | | | | 0.0 | |
| | 618,000 | | | | | Concho Resources, Inc., 4.875%, 10/01/47 | | | 677,968 | | | | 0.1 | |
| | 1,425,000 | | | | | ConocoPhillips Co., 2.875%, 11/15/21 | | | 1,442,670 | | | | 0.1 | |
| | 1,528,000 | | | | | ConocoPhillips Co., 4.150%, 11/15/34 | | | 1,627,370 | | | | 0.1 | |
| | 460,000 | | | | | Enable Midstream Partners L.P., 2.400%, 05/15/19 | | | 457,474 | | | | 0.0 | |
| | 545,000 | | | | | Enbridge, Inc., 5.500%, 12/01/46 | | | 657,325 | | | | 0.1 | |
| | 570,000 | | | | | Energy Transfer L.P., 4.900%, 03/15/35 | | | 565,102 | | | | 0.0 | |
| | 615,000 | | | | | Enterprise Products Operating LLC, 2.550%, 10/15/19 | | | 617,126 | | | | 0.0 | |
| | 175,000 | | | | | Enterprise Products Operating LLC, 5.250%, 01/31/20 | | | 184,853 | | | | 0.0 | |
| | 300,000 | | | | | Enterprise Products Operating LLC, 6.500%, 01/31/19 | | | 313,552 | | | | 0.0 | |
| | 250,000 | | | | | Husky Energy, Inc., 3.950%, 04/15/22 | | | 258,867 | | | | 0.0 | |
| | 700,000 | | | | | Kinder Morgan, Inc./DE, 5.300%, 12/01/34 | | | 748,346 | | | | 0.1 | |
| | 2,340,000 | | | | | MPLX L.P., 4.500%, 07/15/23 | | | 2,474,808 | | | | 0.2 | |
See Accompanying Notes to Financial Statements
| Vy® Invesco Equity and Income Portfolio | PORTFOLIO OF INVESTMENTS
as of December 31, 2017 (continued) |
Principal
Amount† | | | | | | | Value | | | Percentage
of Net
Assets | |
| CORPORATE BONDS/NOTES: (continued) | | | | | | | | |
| | | | | | | Energy: (continued) | | | | | | | | |
| | 960,000 | | | | | MPLX L.P., 5.500%, 02/15/23 | | | 989,117 | | | | 0.1 | |
| | 570,000 | | | | | Noble Energy, Inc., 5.250%, 11/15/43 | | | 633,350 | | | | 0.0 | |
| | 505,000 | | | | | Occidental Petroleum Corp., 3.400%, 04/15/26 | | | 517,590 | | | | 0.0 | |
| | 295,000 | | | | | Plains All American Pipeline L.P. / PAA Finance Corp., 3.650%, 06/01/22 | | | 296,968 | | | | 0.0 | |
| | 1,244,000 | | | | | Shell International Finance BV, 4.000%, 05/10/46 | | | 1,327,083 | | | | 0.1 | |
| | 858,000 | | | | | Spectra Energy Partners L.P., 4.500%, 03/15/45 | | | 888,494 | | | | 0.1 | |
| | 544,000 | | | | | Suncor Energy, Inc., 3.600%, 12/01/24 | | | 556,645 | | | | 0.0 | |
| | 835,000 | | | | | Sunoco Logistics Partners Operations L.P., 5.300%, 04/01/44 | | | 828,313 | | | | 0.1 | |
| | 550,000 | | | | | Sunoco Logistics Partners Operations L.P., 5.500%, 02/15/20 | | | 579,662 | | | | 0.0 | |
| | 215,000 | | | | | Texas Eastern Transmission L.P., 7.000%, 07/15/32 | | | 275,233 | | | | 0.0 | |
| | | | | | | | | | 21,459,917 | | | | 1.3 | |
| | | | | | | | | | | | | | | |
| | | | | | | Financial: 4.3% | | | | | | | | |
| | 530,000 | | | | | AerCap Ireland Capital Ltd. / AerCap Global Aviation Trust, 3.950%, 02/01/22 | | | 546,684 | | | | 0.0 | |
| | 395,000 | | | | | American International Group, Inc., 2.300%, 07/16/19 | | | 394,814 | | | | 0.0 | |
| | 1,685,000 | | | | | Air Lease Corp., 2.625%, 09/04/18 | | | 1,690,238 | | | | 0.1 | |
| | 851,000 | | | | | Air Lease Corp., 3.000%, 09/15/23 | | | 845,371 | | | | 0.1 | |
| | 1,870,000 | | | | | Air Lease Corp., 4.250%, 09/15/24 | | | 1,964,646 | | | | 0.1 | |
| | 410,000 | | | | | Allstate Corp., 3.280%, 12/15/26 | | | 416,850 | | | | 0.0 | |
| | 543,000 | | | | | American Express Co., 3.625%, 12/05/24 | | | 559,437 | | | | 0.0 | |
| | 615,000 | | | | | American Financial Group, Inc./OH, 4.500%, 06/15/47 | | | 641,534 | | | | 0.0 | |
| | 1,140,000 | | | | | American International Group, Inc., 4.375%, 01/15/55 | | | 1,165,270 | | | | 0.1 | |
| | 455,000 | | | (3) | | ANZ New Zealand Int'l Ltd./London, 2.875%, 01/25/22 | | | 456,401 | | | | 0.0 | |
| | 440,000 | | | (3) | | Apollo Management Holdings L.P., 4.000%, 05/30/24 | | | 450,742 | | | | 0.0 | |
| | 927,000 | | | (3) | | Athene Global Funding, 2.875%, 10/23/18 | | | 931,985 | | | | 0.1 | |
| | 1,555,000 | | | (3) | | Athene Global Funding, 4.000%, 01/25/22 | | | 1,605,323 | | | | 0.1 | |
| | 948,000 | | | | | Australia & New Zealand Banking Group Ltd./New York NY, 2.300%, 06/01/21 | | | 940,261 | | | | 0.1 | |
| | 720,000 | | | | | Bank of America Corp., 3.248%, 10/21/27 | | | 715,144 | | | | 0.1 | |
| | 850,000 | | | | | Bank of America Corp., 3.500%, 04/19/26 | | | 869,748 | | | | 0.1 | |
| | 500,000 | | | | | Bank of America Corp., 5.650%, 05/01/18 | | | 505,991 | | | | 0.0 | |
| | 725,000 | | | (3) | | BBVA Bancomer SA/Texas, 4.375%, 04/10/24 | | | 757,625 | | | | 0.1 | |
| | 765,000 | | | | | Brookfield Asset Management, Inc., 4.000%, 01/15/25 | | | 786,076 | | | | 0.1 | |
| | 485,000 | | | (3) | | Carlyle Holdings Finance LLC, 3.875%, 02/01/23 | | | 496,915 | | | | 0.0 | |
| | 630,000 | | | | | Citigroup, Inc., 3.668%, 07/24/28 | | | 639,747 | | | | 0.0 | |
| | 1,930,000 | | | | | Citigroup, Inc., 4.000%, 08/05/24 | | | 2,015,255 | | | | 0.1 | |
| | 520,000 | | | | | Citigroup, Inc., 4.750%, 05/18/46 | | | 575,024 | | | | 0.0 | |
| | 260,000 | | | | | Citigroup, Inc., 5.300%, 05/06/44 | | | 307,881 | | | | 0.0 | |
| | 560,000 | | | | | Citigroup, Inc., 6.675%, 09/13/43 | | | 777,165 | | | | 0.1 | |
| | 595,000 | | | | | Citizens Financial Group, Inc., 2.375%, 07/28/21 | | | 587,649 | | | | 0.0 | |
| | 325,000 | | | | | CNA Financial Corp., 5.875%, 08/15/20 | | | 351,735 | | | | 0.0 | |
| | 1,335,000 | | | (3) | | Commonwealth Bank of Australia, 2.250%, 03/10/20 | | | 1,331,236 | | | | 0.1 | |
| | 472,000 | | | (3) | | Credit Suisse AG, 6.500%, 08/08/23 | | | 529,289 | | | | 0.0 | |
| | 60,000 | | | | | Crown Castle International Corp., 4.750%, 05/15/47 | | | 63,358 | | | | 0.0 | |
| | 2,755,000 | | | | | EPR Properties, 4.750%, 12/15/26 | | | 2,832,168 | | | | 0.2 | |
| | 820,000 | | | | | Goldman Sachs Group, Inc., 4.250%, 10/21/25 | | | 857,650 | | | | 0.1 | |
| | 355,000 | | | | | Goldman Sachs Group, Inc., 5.250%, 07/27/21 | | | 384,896 | | | | 0.0 | |
| | 615,000 | | | | | Goldman Sachs Group, Inc./The, 4.017%, 10/31/38 | | | 633,278 | | | | 0.0 | |
| | 835,000 | | | | | Government Properties Income Trust, 4.000%, 07/15/22 | | | 840,792 | | | | 0.1 | |
| | 465,000 | | | (3) | | HBOS PLC, 6.750%, 05/21/18 | | | 472,928 | | | | 0.0 | |
| | 840,000 | | | | | HCP, Inc., 3.875%, 08/15/24 | | | 860,811 | | | | 0.1 | |
| | 320,000 | | | | | HCP, Inc., 4.200%, 03/01/24 | | | 335,153 | | | | 0.0 | |
| | 350,000 | | | | | Hospitality Properties Trust, 4.500%, 06/15/23 | | | 366,322 | | | | 0.0 | |
| | 240,000 | | | | | Hospitality Properties Trust, 5.000%, 08/15/22 | | | 256,318 | | | | 0.0 | |
| | 670,000 | | | (3) | | Jackson National Life Global Funding, 2.100%, 10/25/21 | | | 657,666 | | | | 0.0 | |
| | 620,000 | | | (3) | | Jackson National Life Global Funding, 3.250%, 01/30/24 | | | 626,586 | | | | 0.0 | |
| | 550,000 | | | | | JPMorgan Chase & Co., 3.200%, 06/15/26 | | | 550,163 | | | | 0.0 | |
See Accompanying Notes to Financial Statements
| Vy® Invesco Equity and Income Portfolio | PORTFOLIO OF INVESTMENTS
as of December 31, 2017 (continued) |
Principal
Amount† | | | | | | | Value | | | Percentage
of Net
Assets | |
| CORPORATE BONDS/NOTES: (continued) | | | | | | | | |
| | | | | | | Financial: (continued) | | | | | | | | |
| | 515,000 | | | | | JPMorgan Chase & Co., 4.250%, 10/01/27 | | | 548,304 | | | | 0.0 | |
| | 675,000 | | | | | JPMorgan Chase & Co., 4.260%, 02/22/48 | | | 731,783 | | | | 0.1 | |
| | 665,000 | | | | | JPMorgan Chase & Co., 5.000%, 12/31/99 | | | 677,389 | | | | 0.0 | |
| | 443,000 | | | (3) | | KKR Group Finance Co. III LLC, 5.125%, 06/01/44 | | | 491,757 | | | | 0.0 | |
| | 2,335,000 | | | (3) | | Liberty Mutual Group, Inc., 4.850%, 08/01/44 | | | 2,602,915 | | | | 0.2 | |
| | 587,000 | | | | | Lifestorage L.P./CA, 3.500%, 07/01/26 | | | 572,572 | | | | 0.0 | |
| | 285,000 | | | | | Markel Corp., 5.000%, 03/30/43 | | | 320,819 | | | | 0.0 | |
| | 3,250,000 | | | (3) | | MassMutual Global Funding II, 2.100%, 08/02/18 | | | 3,254,513 | | | | 0.2 | |
| | 1,300,000 | | | (3) | | MassMutual Global Funding II, 2.000%, 04/15/21 | | | 1,280,240 | | | | 0.1 | |
| | 670,000 | | | (3) | | Metropolitan Life Global Funding I, 2.050%, 06/12/20 | | | 665,331 | | | | 0.0 | |
| | 2,360,000 | | | (3) | | Mizuho Financial Group Cayman 3 Ltd., 4.600%, 03/27/24 | | | 2,498,401 | | | | 0.2 | |
| | 2,975,000 | | | | | Morgan Stanley, 2.375%, 07/23/19 | | | 2,979,188 | | | | 0.2 | |
| | 1,040,000 | | | | | Morgan Stanley, 4.000%, 07/23/25 | | | 1,089,736 | | | | 0.1 | |
| | 1,230,000 | | | | | National Australia Bank Ltd./New York, 1.875%, 07/12/21 | | | 1,204,268 | | | | 0.1 | |
| | 1,350,000 | | | (3) | | National Australia Bank Ltd., 3.500%, 01/10/27 | | | 1,381,518 | | | | 0.1 | |
| | 1,365,000 | | | | | National Australia Bank Ltd/New York, 2.000%, 01/14/19 | | | 1,362,772 | | | | 0.1 | |
| | 1,515,000 | | | (3) | | Nationwide Financial Services, Inc., 5.300%, 11/18/44 | | | 1,802,570 | | | | 0.1 | |
| | 333,000 | | | (3) | | Prudential Financial, Inc., 3.935%, 12/07/49 | | | 340,942 | | | | 0.0 | |
| | 750,000 | | | | | Prudential Financial, Inc., 8.875%, 06/15/68 | | | 772,312 | | | | 0.1 | |
| | 125,000 | | | | | Realty Income Corp., 2.000%, 01/31/18 | | | 124,991 | | | | 0.0 | |
| | 259,000 | | | | | Reinsurance Group of America, Inc., 4.700%, 09/15/23 | | | 278,136 | | | | 0.0 | |
| | 690,000 | | | (3) | | Reliance Standard Life Global Funding II, 3.050%, 01/20/21 | | | 699,614 | | | | 0.1 | |
| | 1,360,000 | | | (3) | | Societe Generale SA, 2.625%, 09/16/20 | | | 1,363,996 | | | | 0.1 | |
| | 805,000 | | | (3) | | Societe Generale SA, 5.000%, 01/17/24 | | | 860,362 | | | | 0.1 | |
| | 985,000 | | | (3) | | Standard Chartered PLC, 3.050%, 01/15/21 | | | 994,180 | | | | 0.1 | |
| | 1,100,000 | | | | | Sumitomo Mitsui Banking Corp., 2.650%, 07/23/20 | | | 1,105,542 | | | | 0.1 | |
| | 590,000 | | | | | SunTrust Bank/Atlanta GA, 3.300%, 05/15/26 | | | 585,235 | | | | 0.0 | |
| | 670,000 | | | | | Synchrony Financial, 3.950%, 12/01/27 | | | 668,339 | | | | 0.0 | |
| | 616,000 | | | (3) | | Teachers Insurance & Annuity Association of America, 4.270%, 05/15/47 | | | 652,483 | | | | 0.0 | |
| | 445,000 | | | | | Travelers Cos, Inc., 4.600%, 08/01/43 | | | 514,539 | | | | 0.0 | |
| | 585,000 | | | (3) | | UBS Group Funding Switzerland AG, 4.125%, 04/15/26 | | | 614,319 | | | | 0.0 | |
| | 410,000 | | | | | US Bancorp, 3.100%, 04/27/26 | | | 407,448 | | | | 0.0 | |
| | 145,000 | | | | | Ventas Realty L.P., 5.700%, 09/30/43 | | | 176,980 | | | | 0.0 | |
| | 1,020,000 | | | | | Visa, Inc., 4.150%, 12/14/35 | | | 1,133,818 | | | | 0.1 | |
| | 140,000 | | | | | Wells Fargo & Co., 1.500%, 01/16/18 | | | 139,986 | | | | 0.0 | |
| | 470,000 | | | | | Wells Fargo & Co., 4.100%, 06/03/26 | | | 493,249 | | | | 0.0 | |
| | 2,000,000 | | | | | Wells Fargo & Co., 4.650%, 11/04/44 | | | 2,184,236 | | | | 0.1 | |
| | 965,000 | | | | | Wells Fargo & Co., 3.550%, 09/29/25 | | | 991,296 | | | | 0.1 | |
| | 315,000 | | | | | Willis North America, Inc., 3.600%, 05/15/24 | | | 320,605 | | | | 0.0 | |
| | 350,000 | | | | | WR Berkley Corp., 4.625%, 03/15/22 | | | 372,791 | | | | 0.0 | |
| | | | | | | | | | 72,853,600 | | | | 4.3 | |
| | | | | | | | | | | | | | | |
| | | | | | | Industrial: 0.8% | | | | | | | | |
| | 1,105,000 | | | (3) | | Aviation Capital Group LLC, 2.875%, 09/17/18 | | | 1,108,873 | | | | 0.1 | |
| | 305,000 | | | (3) | | Aviation Capital Group LLC, 2.875%, 01/20/22 | | | 305,003 | | | | 0.0 | |
| | 1,095,000 | | | (3) | | Aviation Capital Group LLC, 4.875%, 10/01/25 | | | 1,191,232 | | | | 0.1 | |
| | 970,000 | | | | | Avnet, Inc., 4.625%, 04/15/26 | | | 1,001,861 | | | | 0.1 | |
| | 435,000 | | | (3) | | BAE Systems Holdings, Inc., 2.850%, 12/15/20 | | | 437,222 | | | | 0.0 | |
| | 224,000 | | | | | Burlington Northern Santa Fe LLC, 5.150%, 09/01/43 | | | 277,361 | | | | 0.0 | |
| | 330,000 | | | | | CSX Corp., 5.500%, 04/15/41 | | | 408,946 | | | | 0.0 | |
| | 1,015,000 | | | | | Deere & Co., 2.600%, 06/08/22 | | | 1,016,598 | | | | 0.1 | |
| | 295,000 | | | | | FedEx Corp., 4.900%, 01/15/34 | | | 335,141 | | | | 0.0 | |
| | 605,000 | | | | | FedEx Corp., 5.100%, 01/15/44 | | | 706,151 | | | | 0.0 | |
| | 2,160,000 | | | | | Northrop Grumman Corp., 1.750%, 06/01/18 | | | 2,158,737 | | | | 0.1 | |
| | 703,000 | | | | | Packaging Corp. of America, 4.500%, 11/01/23 | | | 757,093 | | | | 0.0 | |
| | 820,000 | | | | | Precision Castparts Corp., 1.250%, 01/15/18 | | | 819,760 | | | | 0.1 | |
| | 285,000 | | | | | Precision Castparts Corp., 2.500%, 01/15/23 | | | 283,355 | | | | 0.0 | |
| | 410,000 | | | (3) | | SMBC Aviation Capital Finance DAC, 2.650%, 07/15/21 | | | 403,517 | | | | 0.0 | |
| | 157,000 | | | | | Union Pacific Corp., 3.646%, 02/15/24 | | | 165,125 | | | | 0.0 | |
See Accompanying Notes to Financial Statements
| Vy® Invesco Equity and Income Portfolio | PORTFOLIO OF INVESTMENTS
as of December 31, 2017 (continued) |
Principal
Amount† | | | | | | | Value | | | Percentage
of Net
Assets | |
| CORPORATE BONDS/NOTES: (continued) | | | | | | | | |
| | | | | | | Industrial: (continued) | | | | | | | | |
| | 730,000 | | | | | Union Pacific Corp., 4.150%, 01/15/45 | | | 790,441 | | | | 0.1 | |
| | 375,000 | | | | | Union Pacific Corp., 4.850%, 06/15/44 | | | 444,959 | | | | 0.0 | |
| | 330,000 | | | | | United Parcel Service, Inc., 3.400%, 11/15/46 | | | 319,720 | | | | 0.0 | |
| | 752,000 | | | | | Waste Management, Inc., 3.900%, 03/01/35 | | | 790,259 | | | | 0.1 | |
| | | | | | | | | | 13,721,354 | | | | 0.8 | |
| | | | | | | | | | | | | | | |
| | | | | | | Technology: 0.5% | | | | | | | | |
| | 1,146,000 | | | | | Apple, Inc., 2.150%, 02/09/22 | | | 1,131,625 | | | | 0.1 | |
| | 435,000 | | | | | Apple, Inc., 3.350%, 02/09/27 | | | 445,988 | | | | 0.0 | |
| | 1,840,000 | | | (3) | | Broadcom Corp. / Broadcom Cayman Finance Ltd., 3.625%, 01/15/24 | | | 1,831,751 | | | | 0.1 | |
| | 910,000 | | | (3) | | Dell International LLC / EMC Corp., 5.450%, 06/15/23 | | | 984,375 | | | | 0.1 | |
| | 35,000 | | | (3) | | Dell International LLC / EMC Corp., 8.350%, 07/15/46 | | | 45,209 | | | | 0.0 | |
| | 340,000 | | | | | DXC Technology Co., 4.450%, 09/18/22 | | | 358,171 | | | | 0.0 | |
| | 649,000 | | | | | Microsoft Corp., 3.500%, 02/12/35 | | | 676,065 | | | | 0.1 | |
| | 1,810,000 | | | | | Oracle Corp., 1.900%, 09/15/21 | | | 1,782,190 | | | | 0.1 | |
| | 247,000 | | | (4) | | Pitney Bowes, Inc., 4.625%, 03/15/24 | | | 226,005 | | | | 0.0 | |
| | 487,000 | | | | | Seagate HDD Cayman, 5.750%, 12/01/34 | | | 468,854 | | | | 0.0 | |
| | 285,000 | | | | | Texas Instruments, Inc., 2.625%, 05/15/24 | | | 282,920 | | | | 0.0 | |
| | | | | | | | | | 8,233,153 | | | | 0.5 | |
| | | | | | | | | | | | | | | |
| | | | | | | Utilities: 0.3% | | | | | | | | |
| | 1,420,000 | | | | | Duke Energy Corp., 2.100%, 06/15/18 | | | 1,420,520 | | | | 0.1 | |
| | 150,000 | | | (3) | | Electricite de France SA, 4.600%, 01/27/20 | | | 157,043 | | | | 0.0 | |
| | 620,000 | | | (3) | | Electricite de France SA, 4.875%, 01/22/44 | | | 690,951 | | | | 0.0 | |
| | 350,000 | | | (3) | | Electricite de France SA, 5.625%, 12/31/99 | | | 362,688 | | | | 0.0 | |
| | 703,000 | | | | | NextEra Energy Capital Holdings, Inc., 3.550%, 05/01/27 | | | 717,287 | | | | 0.1 | |
| | 760,000 | | | | | NiSource Finance Corp., 4.375%, 05/15/47 | | | 835,761 | | | | 0.1 | |
| | 605,000 | | | | | Oglethorpe Power Corp., 4.550%, 06/01/44 | | | 636,162 | | | | 0.0 | |
| | | | | | | | | | 4,820,412 | | | | 0.3 | |
| | | | | | | | | | | | | | | |
| | | | | Total Corporate Bonds/Notes | | | | | | | | |
| | | | | (Cost $184,234,055) | | | 191,635,405 | | | | 11.4 | |
| | | | | | | | | | | | | | | |
| MUNICIPAL BONDS: 0.1% | | | | | | | | |
| | | | | | | Georgia: 0.1% | | | | | | | | |
| | 175,000 | | | | | Municipal Electric Authority of Georgia, 6.637%, 04/01/57 | | | 224,322 | | | | 0.0 | |
| | 325,000 | | | | | Municipal Electric Authority of Georgia, 6.655%, 04/01/57 | | | 409,370 | | | | 0.1 | |
| | | | | | | | | | | | | | | |
| | | | | Total Municipal Bonds | | | | | | | | |
| | | | | (Cost $503,936) | | | 633,692 | | | | 0.1 | |
| | | | | | | | | | | | | | | |
| U.S. TREASURY OBLIGATIONS: 10.6% | | | | | | | | |
| | | | | | | U.S. Treasury Bonds: 0.7% | | | | | | | | |
| | 11,310,900 | | | | | 2.750%, 08/15/47 | | | 11,314,753 | | | | 0.7 | |
| | 425,000 | | | | | 4.500%, 02/15/36 | | | 546,896 | | | | 0.0 | |
| | | | | | | | | | 11,861,649 | | | | 0.7 | |
| | | | | | | | | | | | | | | |
| | | | | | | U.S. Treasury Notes: 9.9% | | | | | | | | |
| | 47,470,000 | | | (4) | | 1.750%, 11/30/19 | | | 47,350,270 | | | | 2.8 | |
| | 57,650,000 | | | | | 1.875%, 12/15/20 | | | 57,484,530 | | | | 3.4 | |
| | 41,221,700 | | | (4) | | 2.000%, 11/30/22 | | | 40,845,539 | | | | 2.5 | |
| | 7,300,400 | | | | | 2.125%, 11/30/24 | | | 7,203,824 | | | | 0.4 | |
| | 6,100,900 | | | | | 2.250%, 11/15/27 | | | 6,013,877 | | | | 0.4 | |
| | 6,230,000 | | | | | 1.250%, 01/31/19 | | | 6,191,471 | | | | 0.4 | |
| | 180,000 | | | | | 2.625%, 11/15/20 | | | 183,254 | | | | 0.0 | |
| | | | | | | | | | 165,272,765 | | | | 9.9 | |
| | | | | | | | | | | | | | | |
| | | | | Total U.S. Treasury Obligations | | | | | | | | |
| | | | | (Cost $177,108,270) | | | 177,134,414 | | | | 10.6 | |
| | | | | | | | | | | | | | | |
| U.S. GOVERNMENT AGENCY OBLIGATIONS: 0.2% | | | | | | | | |
| | | | | | | Federal Home Loan Mortgage Corporation: 0.1%(5) | | | | | | | | |
| | 2,400,000 | | | | | 4.875%, 06/13/18 | | | 2,434,925 | | | | 0.1 | |
| | | | | | | | | | | | | | | |
| | | | | | | Federal National Mortgage Association: 0.1%(5) | | | | | | | | |
| | 915,000 | | | | | 6.625%, 11/15/30 | | | 1,288,143 | | | | 0.1 | |
| | | | | | | | | | | | | | | |
| | | | | Total U.S. Government Agency Obligations | | | | | | | | |
| | | | | (Cost $3,442,820) | | | 3,723,068 | | | | 0.2 | |
| | | | | | | | | | | | | | | |
| CONVERTIBLE BONDS/NOTES: 8.4% | | | | | | | | |
| | | | | | | Communications: 2.6% | | | | | | | | |
| | 2,421,000 | | | | | Ciena Corp., 4.000%, 12/15/20 | | | 3,165,457 | | | | 0.2 | |
| | 3,989,000 | | | (4) | | Ctrip.com International Ltd., 1.250%, 09/15/22 | | | 4,083,739 | | | | 0.2 | |
| | 5,342,000 | | | | | DISH Network Corp., 3.375%, 08/15/26 | | | 5,826,119 | | | | 0.4 | |
| | 1,319,000 | | | (4) | | Finisar Corp., 0.500%, 12/15/36 | | | 1,229,967 | | | | 0.1 | |
| | 1,689,000 | | | (4) | | FireEye, Inc., 1.000%, 06/01/35 | | | 1,585,549 | | | | 0.1 | |
| | 1,689,000 | | | | | FireEye, Inc., 1.625%, 06/01/35 | | | 1,551,769 | | | | 0.1 | |
| | 1,807,000 | | | (3),(4) | | Liberty Expedia Holdings, Inc., 1.000%, 06/30/47 | | | 1,811,518 | | | | 0.1 | |
| | 2,954,000 | | | (3) | | Liberty Interactive LLC, 1.750%, 09/30/46 | | | 3,424,794 | | | | 0.2 | |
| | 9,559,000 | | | | | Liberty Media Corp., 1.375%, 10/15/23 | | | 11,047,336 | | | | 0.7 | |
| | 1,933,000 | | | | | Liberty Media Corp., 2.250%, 09/30/46 | | | 2,022,401 | | | | 0.1 | |
| | 673,000 | | | (3) | | Liberty Media Corp.-Liberty Formula One, 1.000%, 01/30/23 | | | 754,601 | | | | 0.0 | |
| | 5,355,000 | | | | | Viavi Solutions, Inc., 0.625%, 08/15/33 | | | 5,529,038 | | | | 0.3 | |
See Accompanying Notes to Financial Statements
| Vy® Invesco Equity and Income Portfolio | PORTFOLIO OF INVESTMENTS
as of December 31, 2017 (continued) |
Principal
Amount† | | | | | | | Value | | | Percentage
of Net
Assets | |
| CONVERTIBLE BONDS/NOTES: (continued) | | | | | | | | |
| | | | | | | Communications: (continued) | | | | | | | | |
| | 2,327,000 | | | (3) | | Viavi Solutions, Inc., 1.000%, 03/01/24 | | | 2,305,184 | | | | 0.1 | |
| | | | | | | | | | 44,337,472 | | | | 2.6 | |
| | | | | | | | | | | | | | | |
| | | | | | | Consumer, Non-cyclical: 1.5% | | | | | | | | |
| | 3,952,000 | | | | | BioMarin Pharmaceutical, Inc., 1.500%, 10/15/20 | | | 4,700,410 | | | | 0.3 | |
| | 2,934,000 | | | (3) | | DexCom, Inc., 0.750%, 05/15/22 | | | 2,770,796 | | | | 0.2 | |
| | 514,000 | | | (3) | | Insulet Corp., 1.375%, 11/15/24 | | | 522,031 | | | | 0.0 | |
| | 2,410,000 | | | | | Jazz Investments I Ltd., 1.875%, 08/15/21 | | | 2,423,556 | | | | 0.1 | |
| | 1,883,000 | | | | | Live Nation Entertainment, Inc., 2.500%, 05/15/19 | | | 2,439,662 | | | | 0.1 | |
| | 1,251,000 | | | | | Medicines Co/The, 2.750%, 07/15/23 | | | 1,150,138 | | | | 0.1 | |
| | 2,104,000 | | | (3) | | Neurocrine Biosciences, Inc., 2.250%, 05/15/24 | | | 2,691,805 | | | | 0.2 | |
| | 2,762,000 | | | | | NuVasive, Inc., 2.250%, 03/15/21 | | | 3,252,255 | | | | 0.2 | |
| | 924,000 | | | (3) | | Pacira Pharmaceuticals, Inc./DE, 2.375%, 04/01/22 | | | 970,200 | | | | 0.0 | |
| | 3,223,000 | | | | | Wright Medical Group, Inc., 2.000%, 02/15/20 | | | 3,321,705 | | | | 0.2 | |
| | 1,309,000 | | | | | Wright Medical Group NV, 2.250%, 11/15/21 | | | 1,600,253 | | | | 0.1 | |
| | | | | | | | | | 25,842,811 | | | | 1.5 | |
| | | | | | | | | | | | | | | |
| | | | | | | Energy: 0.6% | | | | | | | | |
| | 1,298,000 | | | (3) | | Chesapeake Energy Corp., 5.500%, 09/15/26 | | | 1,188,481 | | | | 0.1 | |
| | 2,490,000 | | | (4) | | Ensco Jersey Finance Ltd., 3.000%, 01/31/24 | | | 2,222,325 | | | | 0.1 | |
| | 1,359,000 | | | | | Helix Energy Solutions Group, Inc., 4.250%, 05/01/22 | | | 1,357,301 | | | | 0.1 | |
| | 1,360,000 | | | (3) | | Nabors Industries, Inc., 0.750%, 01/15/24 | | | 1,045,500 | | | | 0.1 | |
| | 3,942,000 | | | | | Weatherford International Ltd., 5.875%, 07/01/21 | | | 4,281,998 | | | | 0.2 | |
| | | | | | | | | | 10,095,605 | | | | 0.6 | |
| | | | | | | | | | | | | | | |
| | | | | | | Financial: 2.1% | | | | | | | | |
| | 4,217,000 | | | (4) | | Blackhawk Network Holdings, Inc., 1.500%, 01/15/22 | | | 4,303,976 | | | | 0.3 | |
| | 9,000,000 | | | (3) | | Credit Suisse AG Convertible Basket, 0.500%, 06/24/24 | | | 8,880,300 | | | | 0.6 | |
| | 4,179,000 | | | (3),(6) | | Goldman Sachs Group, Inc., 1.000%, 09/28/20 | | | 7,013,072 | | | | 0.4 | |
| | 6,746,000 | | | | | GS Finance Corp., 0.250%, 07/08/24 | | | 6,959,376 | | | | 0.4 | |
| | 5,209,000 | | | | | Jefferies Group LLC, 3.875%, 11/01/29 | | | 5,222,022 | | | | 0.3 | |
| | 1,467,000 | | | | | Old Republic International Corp., 3.750%, 03/15/18 | | | 2,040,964 | | | | 0.1 | |
| | | | | | | | | | 34,419,710 | | | | 2.1 | |
| | | | | | | | | | | | | | | |
| | | | | | | Technology: 1.6% | | | | | | | | |
| | 3,443,000 | | | | | Citrix Systems, Inc., 0.500%, 04/15/19 | | | 4,460,837 | | | | 0.3 | |
| | 2,544,000 | | | (3) | | Microchip Technology, Inc., 1.625%, 02/15/27 | | | 2,993,970 | | | | 0.2 | |
| | 2,386,000 | | | | | Micron Technology, Inc., 3.000%, 11/15/43 | | | 3,452,243 | | | | 0.2 | |
| | 4,003,000 | | | | | Nuance Communications, Inc., 1.000%, 12/15/35 | | | 3,840,378 | | | | 0.2 | |
| | 2,479,000 | | | | | ON Semiconductor Corp., 1.000%, 12/01/20 | | | 3,176,219 | | | | 0.2 | |
| | 790,000 | | | (3) | | RealPage, Inc., 1.500%, 11/15/22 | | | 981,575 | | | | 0.1 | |
| | 3,899,000 | | | | | SanDisk Corp., 0.500%, 10/15/20 | | | 3,680,539 | | | | 0.2 | |
| | 726,000 | | | (3) | | Silicon Laboratories, Inc., 1.375%, 03/01/22 | | | 838,984 | | | | 0.0 | |
| | 2,643,000 | | | (3) | | Workday, Inc., 0.250%, 10/01/22 | | | 2,619,874 | | | | 0.2 | |
| | | | | | | | | | 26,044,619 | | | | 1.6 | |
| | | | | | | | | | | | | | | |
| | | | | Total Convertible Bonds/Notes | | | | | | | | |
| | | | | (Cost $132,273,959) | | | 140,740,217 | | | | 8.4 | |
| | | | | | | | | | | | | | | |
| | | | | Total Long-Term Investments | | | | | | | | |
| | | | | (Cost $1,336,954,612) | | | 1,570,538,947 | | | | 93.7 | |
| | | | | | | | | | | | | | | |
| SHORT-TERM INVESTMENTS: 11.9% | | | | | | | | |
| | | | | | | Securities Lending Collateral(7): 5.7% | | | | | | | | |
| | 22,774,774 | | | | | BNP Paribas S.A., Repurchase Agreement dated 12/29/17, 1.40%, due 01/02/18 (Repurchase Amount $22,778,268, collateralized by various U.S. Government\U.S. Government Agency Obligations, 0.000%-7.000%, Market Value plus accrued interest $23,230,270, due 03/31/19-10/20/47) | | | 22,774,774 | | | | 1.3 | |
| | 22,774,774 | | | | | Cantor Fitzgerald, Repurchase Agreement dated 12/29/17, 1.41%, due 01/02/18 (Repurchase Amount $22,778,293, collateralized by various U.S. Government\U.S. Government Agency Obligations, 0.000%-8.500%, Market Value plus accrued interest $23,230,269, due 01/31/18-06/20/63) | | | 22,774,774 | | | | 1.4 | |
See Accompanying Notes to Financial Statements
| Vy® Invesco Equity and Income Portfolio | PORTFOLIO OF INVESTMENTS
as of December 31, 2017 (continued) |
Principal
Amount† | | | | | | | Value | | | Percentage
of Net
Assets | |
| SHORT-TERM INVESTMENTS: (continued) | | | | | | | | |
| | | | | | | Securities Lending Collateral(7): (continued) | | | | | | | | |
| | 22,774,774 | | | | | Daiwa Capital Markets, Repurchase Agreement dated 12/29/17, 1.43%, due 01/02/18 (Repurchase Amount $22,778,343, collateralized by various U.S. Government\U.S. Government Agency Obligations, 0.000%-6.500%, Market Value plus accrued interest $23,230,270, due 01/11/18-12/01/51) | | | 22,774,774 | | | | 1.4 | |
| | 4,759,774 | | | | | Jefferies LLC, Repurchase Agreement dated 12/29/17, 1.50%, due 01/02/18 (Repurchase Amount $4,760,556, collateralized by various U.S. Government Securities, 0.000%-1.750%, Market Value plus accrued interest $4,854,971, due 09/13/18-04/30/22) | | | 4,759,774 | | | | 0.3 | |
| | 22,774,774 | | | | | State of Wisconsin Investment Board, Repurchase Agreement dated 12/29/17, 1.63%, due 01/02/18 (Repurchase Amount $22,778,842, collateralized by various U.S. Government Securities, 0.125%-3.875%, Market Value plus accrued interest $23,407,220, due 01/15/19-02/15/46) | | | 22,774,774 | | | | 1.3 | |
| | | | | | | | | | 95,858,870 | | | | 5.7 | |
| | | | | | | | | | | | | | | |
| Shares | | | | | | | Value | | | Percentage
of Net
Assets | |
| | | | | | | Mutual Funds: 6.2% | | | | | | | | |
| | 104,356,436 | | | (8) | | BlackRock Liquidity Funds, FedFund, Institutional Class, 1.170% | | | | | | | | |
| | | | | | | (Cost $104,356,436) | | | 104,356,436 | | | | 6.2 | |
| | | | | | | | | | | | | | | |
| | | | | Total Short-Term Investments | | | | | | | | |
| | | | | (Cost $200,215,306) | | | 200,215,306 | | | | 11.9 | |
| | | | | | | | | | | | | | | |
| | | | | Total Investments in Securities
(Cost $1,537,169,918) | | $ | 1,770,754,253 | | | | 105.6 | |
| | | | | Liabilities in Excess of Other Assets | | | (94,307,677 | ) | | | (5.6 | ) |
| | | | | Net Assets | | $ | 1,676,446,576 | | | | 100.0 | |
| † | Unless otherwise indicated, principal amount is shown in USD. |
| ADR | American Depositary Receipt |
| (1) | Non-income producing security. |
| (2) | Preferred Stock may be called prior to convertible date. |
| (3) | Securities with purchases pursuant to Rule 144A or section 4(a)(2), under the Securities Act of 1933 and may not be resold subject to that rule except to qualified institutional buyers. |
| (4) | Security, or a portion of the security, is on loan. |
| (5) | The Federal Housing Finance Agency (“FHFA”) placed the Federal Home Loan Mortgage Corporation and Federal National Mortgage Association into conservatorship with FHFA as the conservator. As such, the FHFA oversees the continuing affairs of these companies. |
| (6) | Exchangeable into a basket of 5 common shares. |
| (7) | Represents securities purchased with cash collateral received for securities on loan. |
| (8) | Rate shown is the 7-day yield as of December 31, 2017. |
See Accompanying Notes to Financial Statements
VY® JPMorgan Mid Cap Value Portfolio | PORTFOLIO OF INVESTMENTS as of December 31, 2017 |
| Shares | | | | | | | Value | | | Percentage
of Net
Assets | |
| COMMON STOCK: 100.3% | | | | | | | | |
| | | | | | | Consumer Discretionary: 16.6% | | | | | | | | |
| | 9,220 | | | (1) | | Autozone, Inc. | | | 6,558,831 | | | | 1.1 | |
| | 82,070 | | | | | Best Buy Co., Inc. | | | 5,619,333 | | | | 1.0 | |
| | 98,030 | | | | | BorgWarner, Inc. | | | 5,008,353 | | | | 0.9 | |
| | 66,342 | | | | | CBS Corp. - Class B | | | 3,914,178 | | | | 0.7 | |
| | 97,090 | | | (1) | | Dish Network Corp. - Class A | | | 4,636,048 | | | | 0.8 | |
| | 58,320 | | | | | Expedia, Inc. | | | 6,984,986 | | | | 1.2 | |
| | 156,110 | | | | | Gap, Inc. | | | 5,317,107 | | | | 0.9 | |
| | 50,680 | | | | | Genuine Parts Co. | | | 4,815,107 | | | | 0.8 | |
| | 92,750 | | | | | Hilton Worldwide Holdings, Inc. | | | 7,407,015 | | | | 1.3 | |
| | 111,901 | | | | | Kohl's Corp. | | | 6,068,391 | | | | 1.1 | |
| | 19,376 | | | | | Marriott International, Inc. | | | 2,629,905 | | | | 0.5 | |
| | 43,230 | | | (1) | | Mohawk Industries, Inc. | | | 11,927,157 | | | | 2.1 | |
| | 158,776 | | | | | Newell Brands, Inc. | | | 4,906,178 | | | | 0.9 | |
| | 73,140 | | | (2) | | Nordstrom, Inc. | | | 3,465,373 | | | | 0.6 | |
| | 49,790 | | | | | PVH Corp. | | | 6,831,686 | | | | 1.2 | |
| | 42,460 | | | | | Ralph Lauren Corp. | | | 4,402,677 | | | | 0.8 | |
| | 41,460 | | | | | Tiffany & Co. | | | 4,309,767 | | | | 0.7 | |
| | | | | | | | | | 94,802,092 | | | | 16.6 | |
| | | | | | | | | | | | | | | |
| | | | | | | Consumer Staples: 6.5% | | | | | | | | |
| | 27,100 | | | | | Constellation Brands, Inc. | | | 6,194,247 | | | | 1.1 | |
| | 256,420 | | | | | Coty, Inc - Class A | | | 5,100,194 | | | | 0.9 | |
| | 73,710 | | | | | Dr Pepper Snapple Group, Inc. | | | 7,154,293 | | | | 1.2 | |
| | 82,863 | | | (1) | | Edgewell Personal Care Co. | | | 4,921,234 | | | | 0.9 | |
| | 49,423 | | | | | Energizer Holdings, Inc. | | | 2,371,316 | | | | 0.4 | |
| | 214,330 | | | | | Kroger Co. | | | 5,883,358 | | | | 1.0 | |
| | 31,520 | | | | | Molson Coors Brewing Co. | | | 2,586,846 | | | | 0.5 | |
| | 25,560 | | | | | Pinnacle Foods, Inc. | | | 1,520,053 | | | | 0.3 | |
| | 18,000 | | | (1) | | Post Holdings, Inc. | | | 1,426,140 | | | | 0.2 | |
| | | | | | | | | | 37,157,681 | | | | 6.5 | |
| | | | | | | | | | | | | | | |
| | | | | | | Energy: 6.2% | | | | | | | | |
| | 211,364 | | | (1) | | Energen Corp. | | | 12,168,226 | | | | 2.1 | |
| | 186,020 | | | | | EQT Corp. | | | 10,588,258 | | | | 1.9 | |
| | 104,480 | | | | | PBF Energy, Inc. | | | 3,703,816 | | | | 0.6 | |
| | 293,700 | | | | | Williams Cos., Inc. | | | 8,954,913 | | | | 1.6 | |
| | | | | | | | | | 35,415,213 | | | | 6.2 | |
| | | | | | | | | | | | | | | |
| | | | | | | Financials: 23.6% | | | | | | | | |
| | 5,333 | | | (1) | | Alleghany Corp. | | | 3,178,948 | | | | 0.6 | |
| | 203,820 | | | | | Ally Financial, Inc. | | | 5,943,391 | | | | 1.0 | |
| | 33,680 | | | | | Ameriprise Financial, Inc. | | | 5,707,750 | | | | 1.0 | |
| | 19,047 | | | | | Chubb Ltd. | | | 2,783,338 | | | | 0.5 | |
| | 166,060 | | | | | Citizens Financial Group, Inc. | | | 6,971,199 | | | | 1.2 | |
| | 288,910 | | | | | Fifth Third Bancorp | | | 8,765,529 | | | | 1.5 | |
| | 58,490 | | | | | First Republic Bank | | | 5,067,574 | | | | 0.9 | |
| | 148,330 | | | | | Hartford Financial Services Group, Inc. | | | 8,348,012 | | | | 1.5 | |
| | 317,620 | | | | | Huntington Bancshares, Inc. | | | 4,624,547 | | | | 0.8 | |
| | 168,590 | | | | | Invesco Ltd. | | | 6,160,279 | | | | 1.1 | |
| | 206,540 | | | | | Loews Corp. | | | 10,333,196 | | | | 1.8 | |
| | 59,673 | | | | | M&T Bank Corp. | | | 10,203,486 | | | | 1.8 | |
| | 72,900 | | | | | Marsh & McLennan Cos., Inc. | | | 5,933,331 | | | | 1.0 | |
| | 65,760 | | | | | Northern Trust Corp. | | | 6,568,766 | | | | 1.2 | |
| | 83,880 | | | | | Progressive Corp. | | | 4,724,122 | | | | 0.8 | |
| | 65,280 | | | | | Raymond James Financial, Inc. | | | 5,829,504 | | | | 1.0 | |
| | 135,480 | | | | | SunTrust Banks, Inc. | | | 8,750,653 | | | | 1.5 | |
| | 85,230 | | | | | T. Rowe Price Group, Inc. | | | 8,943,184 | | | | 1.6 | |
| | 93,930 | | | | | Unum Group | | | 5,155,818 | | | | 0.9 | |
| | 37,150 | | | | | WR Berkley Corp. | | | 2,661,798 | | | | 0.5 | |
| | 168,370 | | | | | XL Group Ltd. | | | 5,919,889 | | | | 1.0 | |
| | 49,480 | | | | | Zions Bancorp. | | | 2,515,068 | | | | 0.4 | |
| | | | | | | | | | 135,089,382 | | | | 23.6 | |
| | | | | | | | | | | | | | | |
| | | | | | | Health Care: 6.2% | | | | | | | | |
| | 62,240 | | | | | AmerisourceBergen Corp. | | | 5,714,877 | | | | 1.0 | |
| | 35,340 | | | | | Cigna Corp. | | | 7,177,201 | | | | 1.3 | |
| | 46,580 | | | (1) | | Henry Schein, Inc. | | | 3,255,010 | | | | 0.6 | |
| | 20,660 | | | | | Humana, Inc. | | | 5,125,126 | | | | 0.9 | |
| | 30,020 | | | (1) | | Laboratory Corp. of America Holdings | | | 4,788,490 | | | | 0.8 | |
| | 44,580 | | | | | Universal Health Services, Inc. | | | 5,053,143 | | | | 0.9 | |
| | 33,950 | | | | | Zimmer Biomet Holdings, Inc. | | | 4,096,747 | | | | 0.7 | |
| | | | | | | | | | 35,210,594 | | | | 6.2 | |
| | | | | | | | | | | | | | | |
| | | | | | | Industrials: 8.4% | | | | | | | | |
| | 24,410 | | | | | Acuity Brands, Inc. | | | 4,296,160 | | | | 0.8 | |
| | 73,660 | | | | | Ametek, Inc. | | | 5,338,140 | | | | 0.9 | |
| | 51,260 | | | | | Carlisle Cos., Inc. | | | 5,825,699 | | | | 1.0 | |
| | 87,830 | | | | | Fortune Brands Home & Security, Inc. | | | 6,011,085 | | | | 1.1 | |
| | 41,110 | | | | | Hubbell, Inc. | | | 5,563,828 | | | | 1.0 | |
| | 44,800 | | | | | IDEX Corp. | | | 5,912,256 | | | | 1.0 | |
| | 60,620 | | | | | MSC Industrial Direct Co. | | | 5,859,529 | | | | 1.0 | |
| | 11,310 | | | | | Regal Beloit Corp. | | | 866,346 | | | | 0.2 | |
| | 46,561 | | | | | Snap-On, Inc. | | | 8,115,582 | | | | 1.4 | |
| | | | | | | | | | 47,788,625 | | | | 8.4 | |
| | | | | | | | | | | | | | | |
| | | | | | | Information Technology: 9.1% | | | | | | | | |
| | 81,980 | | | | | Amphenol Corp. | | | 7,197,844 | | | | 1.3 | |
| | 49,990 | | | | | Analog Devices, Inc. | | | 4,450,610 | | | | 0.8 | |
| | 87,290 | | | (1) | | Arrow Electronics, Inc. | | | 7,018,989 | | | | 1.2 | |
| | 109,310 | | | | | CDW Corp. | | | 7,595,952 | | | | 1.3 | |
| | 172,976 | | | (1) | | CommScope Holding Co., Inc. | | | 6,543,682 | | | | 1.1 | |
| | 44,896 | | | | | Jack Henry & Associates, Inc. | | | 5,251,036 | | | | 0.9 | |
| | 151,839 | | | (1) | | Keysight Technologies, Inc. | | | 6,316,502 | | | | 1.1 | |
| | 89,050 | | | (1),(2) | | Match Group, Inc. | | | 2,788,156 | | | | 0.5 | |
| | 56,860 | | | (1) | | Synopsys, Inc. | | | 4,846,746 | | | | 0.9 | |
| | | | | | | | | | 52,009,517 | | | | 9.1 | |
| | | | | | | | | | | | | | | |
| | | | | | | Materials: 4.6% | | | | | | | | |
| | 210,340 | | | | | Ball Corp. | | | 7,961,369 | | | | 1.4 | |
| | 11,520 | | | | | Sherwin-Williams Co. | | | 4,723,661 | | | | 0.8 | |
| | 182,830 | | | | | Silgan Holdings, Inc. | | | 5,373,373 | | | | 1.0 | |
See Accompanying Notes to Financial Statements
VY® JPMorgan Mid Cap Value Portfolio | PORTFOLIO OF INVESTMENTS as of December 31, 2017 (continued) |
| Shares | | | | | | | Value | | | Percentage
of Net
Assets | |
| COMMON STOCK: (continued) | | | | | | | | |
| | | | | | | Materials: (continued) | | | | | | | | |
| | 129,190 | | | | | WestRock Co. | | | 8,166,100 | | | | 1.4 | |
| | | | | | | | | | 26,224,503 | | | | 4.6 | |
| | | | | | | | | | | | | | | |
| | | | | | | Real Estate: 10.7% | | | | | | | | |
| | 58,050 | | | | | American Campus Communities, Inc. | | | 2,381,791 | | | | 0.4 | |
| | 94,180 | | | | | American Homes 4 Rent | | | 2,056,891 | | | | 0.3 | |
| | 28,550 | | | | | AvalonBay Communities, Inc. | | | 5,093,606 | | | | 0.9 | |
| | 38,410 | | | | | Boston Properties, Inc. | | | 4,994,452 | | | | 0.9 | |
| | 197,950 | | | | | Brixmor Property Group, Inc. | | | 3,693,747 | | | | 0.6 | |
| | 101,440 | | | (1) | | CBRE Group, Inc. | | | 4,393,366 | | | | 0.8 | |
| | 11,250 | | | | | Essex Property Trust, Inc. | | | 2,715,413 | | | | 0.5 | |
| | 28,460 | | | | | Federal Realty Investment Trust | | | 3,779,773 | | | | 0.7 | |
| | 78,400 | | | | | GGP, Inc. | | | 1,833,776 | | | | 0.3 | |
| | 44,480 | | | | | HCP, Inc. | | | 1,160,038 | | | | 0.2 | |
| | 36,823 | | | | | JBG SMITH Properties | | | 1,278,863 | | | | 0.2 | |
| | 189,340 | | | | | Kimco Realty Corp. | | | 3,436,521 | | | | 0.6 | |
| | 160,732 | | | | | Outfront Media, Inc. | | | 3,728,982 | | | | 0.6 | |
| | 98,861 | | | | | Park Hotels & Resorts, Inc. | | | 2,842,254 | | | | 0.5 | |
| | 126,420 | | | | | Rayonier, Inc. | | | 3,998,665 | | | | 0.7 | |
| | 40,850 | | | | | Regency Centers Corp. | | | 2,826,003 | | | | 0.5 | |
| | 63,396 | | | | | Vornado Realty Trust | | | 4,956,299 | | | | 0.9 | |
| | 113,230 | | | | | Weyerhaeuser Co. | | | 3,992,490 | | | | 0.7 | |
| | 29,950 | | | | | WP Carey, Inc. | | | 2,063,555 | | | | 0.4 | |
| | | | | | | | | | 61,226,485 | | | | 10.7 | |
| | | | | | | | | | | | | | | |
| | | | | | | Utilities: 8.4% | | | | | | | | |
| | 59,170 | | | | | Centerpoint Energy, Inc. | | | 1,678,061 | | | | 0.3 | |
| | 189,380 | | | | | CMS Energy Corp. | | | 8,957,674 | | | | 1.6 | |
| | 84,750 | | | | | Edison International | | | 5,359,590 | | | | 0.9 | |
| | 99,530 | | | (2) | | National Fuel Gas Co. | | | 5,465,192 | | | | 0.9 | |
| | 63,680 | | | | | Sempra Energy | | | 6,808,666 | | | | 1.2 | |
| | 134,430 | | | | | WEC Energy Group, Inc. | | | 8,930,185 | | | | 1.6 | |
| | 34,520 | | | | | Westar Energy, Inc. | | | 1,822,656 | | | | 0.3 | |
| | 189,900 | | | | | Xcel Energy, Inc. | | | 9,136,089 | | | | 1.6 | |
| | | | | | | | | | 48,158,113 | | | | 8.4 | |
| | | | | | | | | | | | | | | |
| | | | | Total Common Stock
(Cost $407,081,875) | | | 573,082,205 | | | | 100.3 | |
Principal
Amount† | | | | | | | Value | | | Percentage
of Net
Assets | |
| SHORT-TERM INVESTMENTS: 1.1% | | | | | | | | |
| | | | | | | Securities Lending Collateral(3): 0.7% | | | | | | | | |
| | 776,640 | | | | | Cantor Fitzgerald, Repurchase Agreement dated 12/29/17, 1.41%, due 01/02/18 (Repurchase Amount $776,760, collateralized by various U.S. Government and U.S. Government Agency Obligations, 0.000%-8.500%, Market Value plus accrued interest $792,173, due 01/31/18-06/20/63) | | | 776,640 | | | | 0.1 | |
| | 1,000,000 | | | | | Millenium Fixed Income Ltd., Repurchase Agreement dated 12/29/17, 1.44%, due 01/02/18 (Repurchase Amount $1,000,158, collateralized by various U.S. Government Securities, 2.875%-3.625%, Market Value plus accrued interest $1,020,000, due 02/15/43-02/15/44) | | | 1,000,000 | | | | 0.2 | |
| | 1,000,000 | | | | | NBC Global Finance Ltd., Repurchase Agreement dated 12/29/17, 1.50%, due 01/02/18 (Repurchase Amount $1,000,164, collateralized by various U.S. Government Securities, 0.750%-2.250%, Market Value plus accrued interest $1,020,000, due 09/30/18-09/09/49) | | | 1,000,000 | | | | 0.2 | |
| | 1,000,000 | | | | | State of Wisconsin Investment Board, Repurchase Agreement dated 12/29/17, 1.63%, due 01/02/18 (Repurchase Amount $1,000,179, collateralized by various U.S. Government Securities, 0.125%-3.875%, Market Value plus accrued interest $1,027,770, due 01/15/19-02/15/46) | | | 1,000,000 | | | | 0.2 | |
| | | | | | | | | | 3,776,640 | | | | 0.7 | |
| Shares | | | | | | | Value | | | Percentage
of Net
Assets | |
| | | | | | | Mutual Funds: 0.4% | | | | | | | | |
| | 2,423,513 | | | (4) | | BlackRock Liquidity Funds, FedFund, Institutional Class, 1.170% | | | | | | | | |
| | | | | | | (Cost $2,423,513) | | | 2,423,513 | | | | 0.4 | |
| | | | | | | | | | | | | | | |
| | | | | Total Short-Term Investments
(Cost $6,200,153) | | | 6,200,153 | | | | 1.1 | |
| | | | | | | | | | | | | | | |
| | | | | Total Investments in Securities
(Cost $413,282,028) | | $ | 579,282,358 | | | | 101.4 | |
| | | | | Liabilities in Excess of Other Assets | | | (8,266,266 | ) | | | (1.4 | ) |
| | | | | Net Assets | | $ | 571,016,092 | | | | 100.0 | |
| † | Unless otherwise indicated, principal amount is shown in USD. |
| (1) | Non-income producing security. |
| (2) | Security, or a portion of the security, is on loan. |
| (3) | Represents securities purchased with cash collateral received for securities on loan. |
| (4) | Rate shown is the 7-day yield as of December 31, 2017. |
See Accompanying Notes to Financial Statements
| VY® Oppenheimer Global Portfolio | PORTFOLIO OF INVESTMENTS as of December 31, 2017 |
| Shares | | | | | | | Value | | | Percentage
of Net
Assets | |
| COMMON STOCK: 96.8% | | | | | | | |
| | | | | | | China: 2.4% | | | | | | | | |
| | 50,110 | | | (1) | | Baidu, Inc. ADR | | | 11,736,263 | | | | 0.7 | |
| | 728,424 | | | (1) | | JD.com, Inc. ADR | | | 30,171,322 | | | | 1.7 | |
| | | | | | | | | | 41,907,585 | | | | 2.4 | |
| | | | | | | | | | | | | | | |
| | | | | | | Denmark: 0.5% | | | | | | | | |
| | 163,676 | | | | | FLSmidth & Co. A/S | | | 9,520,066 | | | | 0.5 | |
| | | | | | | | | | | | | | | |
| | | | | | | France: 6.1% | | | | | | | | |
| | 168,078 | | | | | LVMH Moet Hennessy Louis Vuitton SE | | | 49,331,652 | | | | 2.8 | |
| | 76,410 | | | | | Kering | | | 35,968,159 | | | | 2.1 | |
| | 398,940 | | | | | Societe Generale | | | 20,567,504 | | | | 1.2 | |
| | | | | | | | | | 105,867,315 | | | | 6.1 | |
| | | | | | | | | | | | | | | |
| | | | | | | Germany: 7.5% | | | | | | | | |
| | 143,266 | | | | | Allianz SE | | | 32,786,024 | | | | 1.9 | |
| | 164,205 | | | | | Bayer AG | | | 20,404,584 | | | | 1.2 | |
| | 77,968 | | | (1) | | Linde AG | | | 18,209,435 | | | | 1.1 | |
| | 334,404 | | | | | SAP SE | | | 37,411,460 | | | | 2.1 | |
| | 153,884 | | | | | Siemens AG | | | 21,306,363 | | | | 1.2 | |
| | | | | | | | | | 130,117,866 | | | | 7.5 | |
| | | | | | | | | | | | | | | |
| | | | | | | India: 3.7% | | | | | | | | |
| | 10,564,970 | | | | | DLF Ltd. | | | 42,732,786 | | | | 2.5 | |
| | 1,528,222 | | | | | ICICI Bank Ltd. ADR | | | 14,869,600 | | | | 0.8 | |
| | 812,691 | | | | | Zee Entertainment Enterprises Ltd. | | | 7,398,884 | | | | 0.4 | |
| | | | | | | | | | 65,001,270 | | | | 3.7 | |
| | | | | | | | | | | | | | | |
| | | | | | | Italy: 0.7% | | | | | | | | |
| | 208,983 | | | | | Brunello Cucinelli SpA | | | 6,761,614 | | | | 0.4 | |
| | 68,697 | | | | | Tod's S.p.A. | | | 5,019,734 | | | | 0.3 | |
| | | | | | | | | | 11,781,348 | | | | 0.7 | |
| | | | | | | | | | | | | | | |
| | | | | | | Japan: 14.2% | | | | | | | | |
| | 1,138,800 | | | | | Dai-ichi Life Holdings, Inc. | | | 23,404,782 | | | | 1.3 | |
| | 61,900 | | | | | Fanuc Ltd. | | | 14,849,590 | | | | 0.9 | |
| | 72,302 | | | | | Keyence Corp. | | | 40,390,164 | | | | 2.3 | |
| | 319,500 | | | | | Kyocera Corp. | | | 20,859,196 | | | | 1.2 | |
| | 389,000 | | | | | Minebea Co., Ltd. | | | 8,113,439 | | | | 0.5 | |
| | 213,700 | | | | | Murata Manufacturing Co., Ltd. | | | 28,611,888 | | | | 1.6 | |
| | 311,600 | | | | | Nidec Corp. | | | 43,629,313 | | | | 2.5 | |
| | 45,500 | | | | | Nintendo Co., Ltd. | | | 16,384,397 | | | | 0.9 | |
| | 148,100 | | | | | Omron Corp. | | | 8,808,833 | | | | 0.5 | |
| | 485,500 | | | (1) | | Renesas Electronics Corp. | | | 5,630,556 | | | | 0.3 | |
| | 339,700 | | | | | Suzuki Motor Corp. | | | 19,663,078 | | | | 1.1 | |
| | 233,700 | | | | | TDK Corp. | | | 18,572,334 | | | | 1.1 | |
| | | | | | | | | | 248,917,570 | | | | 14.2 | |
| | | | | | | | | | | | | | | |
| | | | | | | Netherlands: 3.1% | | | | | | | | |
| | 549,333 | | | | | Airbus SE | | | 54,596,319 | | | | 3.1 | |
| | | | | | | | | | | | | | | |
| | | | | | | Spain: 2.3% | | | | | | | | |
| | 1,158,732 | | | | | Banco Bilbao Vizcaya Argentaria S.A. | | | 9,847,124 | | | | 0.6 | |
| | 861,340 | | | | | Industria de Diseno Textil SA | | | 29,950,241 | | | | 1.7 | |
| | | | | | | | | | 39,797,365 | | | | 2.3 | |
| | | | | | | | | | | | | | | |
| | | | | | | Sweden: 1.2% | | | | | | | | |
| | 1,006,130 | | | | | Assa Abloy AB | | | 20,858,547 | | | | 1.2 | |
| | | | | | | | | | | | | | | |
| | | | | | | Switzerland: 3.2% | | | | | | | | |
| | 1,005,893 | | | | | Credit Suisse Group AG | | | 17,940,830 | | | | 1.1 | |
| | 35,852 | | | | | Roche Holding AG | | | 9,065,371 | | | | 0.5 | |
| | 1,531,780 | | | | | UBS Group AG | | | 28,143,023 | | | | 1.6 | |
| | | | | | | | | | 55,149,224 | | | | 3.2 | |
| | | | | | | | | | | | | | | |
| | | | | | | United Kingdom: 7.0% | | | | | | | | |
| | 2,760,672 | | | (1),(2) | | Circassia Pharmaceuticals Plc | | | 3,876,406 | | | | 0.2 | |
| | 9,176,974 | | | (1) | | Earthport PLC | | | 1,285,490 | | | | 0.1 | |
| | 1,798,250 | | | | | International Consolidated Airlines Group SA | | | 15,748,175 | | | | 0.9 | |
| | 539,477 | | | | | International Game Technology PLC | | | 14,301,535 | | | | 0.8 | |
| | 1,254,846 | | | | | Prudential PLC | | | 32,136,937 | | | | 1.9 | |
| | 143,240 | | | | | Shire PLC | | | 7,422,842 | | | | 0.4 | |
| | 522,544 | | | | | TechnipFMC PLC | | | 16,209,844 | | | | 0.9 | |
| | 575,097 | | | | | Unilever PLC | | | 31,898,334 | | | | 1.8 | |
| | | | | | | | | | 122,879,563 | | | | 7.0 | |
| | | | | | | | | | | | | | | |
| | | | | | | United States: 44.9% | | | | | | | | |
| | 115,430 | | | | | 3M Co. | | | 27,168,759 | | | | 1.6 | |
| | 352,030 | | | (1),(2) | | Acadia Pharmaceuticals, Inc. | | | 10,599,623 | | | | 0.6 | |
| | 223,213 | | | (1) | | Adobe Systems, Inc. | | | 39,115,846 | | | | 2.2 | |
| | 259,270 | | | | | Aetna, Inc. | | | 46,769,715 | | | | 2.7 | |
| | 49,170 | | | (1) | | Alphabet, Inc. - Class A | | | 51,795,678 | | | | 3.0 | |
| | 46,227 | | | (1) | | Alphabet, Inc. - Class C | | | 48,371,933 | | | | 2.8 | |
| | 86,600 | | | (1) | | AnaptysBio, Inc. | | | 8,722,352 | | | | 0.5 | |
| | 163,730 | | | | | Anthem, Inc. | | | 36,840,887 | | | | 2.1 | |
| | 53,690 | | | (1) | | Biogen, Inc. | | | 17,104,023 | | | | 1.0 | |
| | 80,280 | | | (1) | | BioMarin Pharmaceutical, Inc. | | | 7,158,568 | | | | 0.4 | |
| | 77,890 | | | (1) | | Bluebird Bio, Inc. | | | 13,872,209 | | | | 0.8 | |
| | 133,390 | | | (1) | | Blueprint Medicines Corp. | | | 10,058,940 | | | | 0.6 | |
| | 123,910 | | | (1) | | Centene Corp. | | | 12,500,041 | | | | 0.7 | |
| | 584,270 | | | | | Citigroup, Inc. | | | 43,475,531 | | | | 2.5 | |
| | 498,040 | | | | | Colgate-Palmolive Co. | | | 37,577,118 | | | | 2.1 | |
| | 81,070 | | | | | Equifax, Inc. | | | 9,559,774 | | | | 0.5 | |
| | 235,950 | | | (1) | | Facebook, Inc. | | | 41,635,737 | | | | 2.4 | |
| | 338,590 | | | | | FNF Group | | | 13,286,272 | | | | 0.8 | |
| | 194,930 | | | | | Gilead Sciences, Inc. | | | 13,964,785 | | | | 0.8 | |
| | 102,760 | | | | | Goldman Sachs Group, Inc. | | | 26,179,138 | | | | 1.5 | |
| | 223,270 | | | | | Intuit, Inc. | | | 35,227,541 | | | | 2.0 | |
| | 217,770 | | | (1),(2) | | Ionis Pharmaceuticals, Inc. | | | 10,953,831 | | | | 0.6 | |
| | 86,840 | | | (1),(2) | | Loxo Oncology, Inc. | | | 7,310,191 | | | | 0.4 | |
| | 322,060 | | | (1) | | MacroGenics, Inc. | | | 6,119,140 | | | | 0.3 | |
| | 665,010 | | | | | Maxim Integrated Products | | | 34,766,723 | | | | 2.0 | |
| | 243,430 | | | | | Newell Brands, Inc. | | | 7,521,987 | | | | 0.4 | |
| | 300,020 | | | (1) | | PayPal Holdings, Inc. | | | 22,087,472 | | | | 1.3 | |
| | 251,060 | | | | | S&P Global, Inc. | | | 42,529,564 | | | | 2.4 | |
| | 114,390 | | | (1) | | Sage Therapeutics, Inc. | | | 18,841,177 | | | | 1.1 | |
| | 216,200 | | | | | Tiffany & Co. | | | 22,473,990 | | | | 1.3 | |
See Accompanying Notes to Financial Statements
| VY® Oppenheimer Global Portfolio | PORTFOLIO OF INVESTMENTS as of December 31, 2017 (continued) |
| Shares | | | | | | | Value | | | Percentage
of Net
Assets | |
| COMMON STOCK: (continued) | | | | | | | |
| | | | | | | United States: (continued) | | | | | | | | |
| | 148,390 | | | | | United Parcel Service, Inc. - Class B | | | 17,680,669 | | | | 1.0 | |
| | 228,600 | | | | | Walt Disney Co. | | | 24,576,786 | | | | 1.4 | |
| | 153,690 | | | | | Zimmer Biomet Holdings, Inc. | | | 18,545,772 | | | | 1.1 | |
| | | | | | | | | | 784,391,772 | | | | 44.9 | |
| | | | | | | | | | | | | | | |
| | | | | Total Common Stock
(Cost $813,899,161) | | | 1,690,785,810 | | | | 96.8 | |
| | | | | | | | | | | | | | | |
| PREFERRED STOCK: 1.7% | | | | | | | | |
| | | | | | | Germany: 1.7% | | | | | | | | |
| | 332,094 | | | | | Bayerische Motoren Werke AG | | | 29,634,029 | | | | 1.7 | |
| | | | | | | | | | | | | | | |
| | | | | | | India: 0.0% | | | | | | | | |
| | 4,781,446 | | | (1) | | Zee Entertainment Enterprises Ltd. | | | 749,120 | | | | 0.0 | |
| | | | | | | | | | | | | | | |
| | | | | Total Preferred Stock
(Cost $12,621,781) | | | 30,383,149 | | | | 1.7 | |
| | | | | | | | | | | | | | | |
| | | | | Total Long-Term Investments
(Cost $826,520,942) | | | 1,721,168,959 | | | | 98.5 | |
Principal
Amount† | | | | | | | Value | | | Percentage
of Net
Assets | |
| SHORT-TERM INVESTMENTS: 2.1% | | | | | | | |
| | | | | | | Securities Lending Collateral(3): 0.7% | | | | | | | | |
| | 3,081,613 | | | | | Cantor Fitzgerald, Repurchase Agreement dated 12/29/17, 1.41%, due 01/02/18 (Repurchase Amount $3,082,089, collateralized by various U.S. Government\U.S. Government Agency Obligations, 0.000%-8.500%, Market Value plus accrued interest $3,143,245, due 01/31/18-06/20/63) | | | 3,081,613 | | | | 0.2 | |
| | 2,360,286 | | | | | Daiwa Capital Markets, Repurchase Agreement dated 12/29/17, 1.43%, due 01/02/18 (Repurchase Amount $2,360,656, collateralized by various U.S. Government\U.S. Government Agency Obligations, 0.000%-6.500%, Market Value plus accrued interest $2,407,492, due 01/11/18-12/01/51) | | | 2,360,286 | | | | 0.1 | |
| | 3,081,613 | | | | | Millenium Fixed Income Ltd., Repurchase Agreement dated 12/29/17, 1.44%, due 01/02/18 (Repurchase Amount $3,082,099, collateralized by various U.S. Government Securities, 2.875%-3.625%, Market Value plus accrued interest $3,143,245, due 02/15/43-02/15/44) | | | 3,081,613 | | | | 0.2 | |
| | 3,081,613 | | | | | State of Wisconsin Investment Board, Repurchase Agreement dated 12/29/17, 1.63%, due 01/02/18 (Repurchase Amount $3,082,163, collateralized by various U.S. Government Securities, 0.125%-3.875%, Market Value plus accrued interest $3,167,188, due 01/15/19-02/15/46) | | | 3,081,613 | | | | 0.2 | |
| | | | | | | | | | 11,605,125 | | | | 0.7 | |
| Shares | | | | | | | Value | | | Percentage
of Net
Assets | |
| | | | | | | Mutual Funds: 1.4% | | | | | | | | |
| | 25,246,097 | | | (4) | | BlackRock Liquidity Funds, FedFund, Institutional Class, 1.170% | | | | | | | | |
| | | | | | | (Cost $25,246,097) | | | 25,246,097 | | | | 1.4 | |
| | | | | | | | | | | | | | | |
| | | | | Total Short-Term Investments
(Cost $36,851,222) | | | 36,851,222 | | | | 2.1 | |
| | | | | | | | | | | | | | | |
| | | | | Total Investments in Securities
(Cost $863,372,164) | | $ | 1,758,020,181 | | | | 100.6 | |
| | | | | Liabilities in Excess of Other Assets | | | (10,757,902 | ) | | | (0.6 | ) |
| | | | | Net Assets | | $ | 1,747,262,279 | | | | 100.0 | |
| † | Unless otherwise indicated, principal amount is shown in USD. |
| ADR | American Depositary Receipt |
| (1) | Non-income producing security. |
| (2) | Security, or a portion of the security, is on loan. |
| (3) | Represents securities purchased with cash collateral received for securities on loan. |
| (4) | Rate shown is the 7-day yield as of December 31, 2017. |
See Accompanying Notes to Financial Statements
| VY® Pioneer High Yield Portfolio | PORTFOLIO OF INVESTMENTS as of December 31, 2017 |
Principal
Amount† | | | | | | | Value | | | Percentage
of Net
Assets | |
| CORPORATE BONDS/NOTES: 73.9% | | | | | | | | |
| | | | | | | Basic Materials: 3.1% | | | | | | | | |
| | 154,000 | | | | | AK Steel Corp., 6.375%, 10/15/25 | | | 153,230 | | | | 0.1 | |
| | 300,000 | | | (1) | | Ausdrill Finance Pty Ltd., 6.875%, 11/01/19 | | | 305,250 | | | | 0.3 | |
| | 389,000 | | | | | CF Industries, Inc., 3.450%, 06/01/23 | | | 385,110 | | | | 0.4 | |
| | 300,000 | | | | | Coeur Mining, Inc., 5.875%, 06/01/24 | | | 297,375 | | | | 0.3 | |
| | 130,000 | | | | | Commercial Metals Co., 5.375%, 07/15/27 | | | 132,925 | | | | 0.1 | |
| | 250,000 | | | (1) | | Constellium NV, 5.875%, 02/15/26 | | | 255,312 | | | | 0.3 | |
| | 60,000 | | | | | Hexion, Inc., 6.625%, 04/15/20 | | | 54,150 | | | | 0.1 | |
| | 75,000 | | | (1) | | Hudbay Minerals, Inc., 7.250%, 01/15/23 | | | 79,875 | | | | 0.1 | |
| | 100,000 | | | (1) | | Hudbay Minerals, Inc., 7.625%, 01/15/25 | | | 110,000 | | | | 0.1 | |
| | 190,000 | | | (1) | | Kinross Gold Corp., 4.500%, 07/15/27 | | | 191,663 | | | | 0.2 | |
| | 435,000 | | | (1) | | Kraton Polymers LLC / Kraton Polymers Capital Corp., 7.000%, 04/15/25 | | | 467,625 | | | | 0.5 | |
| | 450,000 | | | (1) | | NOVA Chemicals Corp., 5.000%, 05/01/25 | | | 450,000 | | | | 0.4 | |
| | 145,000 | | | (1) | | Tronox Finance LLC, 7.500%, 03/15/22 | | | 151,887 | | | | 0.1 | |
| | 110,000 | | | | | Valvoline, Inc., 4.375%, 08/15/25 | | | 111,238 | | | | 0.1 | |
| | | | | | | | | | 3,145,640 | | | | 3.1 | |
| | | | | | | | | | | | | | | |
| | | | | | | Communications: 12.8% | | | | | | | | |
| | 200,000 | | | (1) | | Altice Financing SA, 6.625%, 02/15/23 | | | 209,920 | | | | 0.2 | |
| | 200,000 | | | (1) | | Altice US Finance I Corp., 5.375%, 07/15/23 | | | 205,500 | | | | 0.2 | |
| | 365,000 | | | (2),(3) | | Avaya, Inc., 04/01/19 | | | – | | | | – | |
| | 200,000 | | | (1) | | CB Escrow Corp., 8.000%, 10/15/25 | | | 204,000 | | | | 0.2 | |
| | 210,000 | | | (1) | | CCO Holdings LLC / CCO Holdings Capital Corp., 5.000%, 02/01/28 | | | 205,275 | | | | 0.2 | |
| | 505,000 | | | (1) | | CCO Holdings LLC / CCO Holdings Capital Corp., 5.500%, 05/01/26 | | | 518,887 | | | | 0.5 | |
| | 310,000 | | | (1) | | CCO Holdings LLC / CCO Holdings Capital Corp., 5.750%, 02/15/26 | | | 322,787 | | | | 0.3 | |
| | 380,000 | | | | | CenturyLink, Inc., 6.450%, 06/15/21 | | | 385,700 | | | | 0.4 | |
| | 155,000 | | | (1) | | CommScope Technologies LLC, 5.000%, 03/15/27 | | | 155,387 | | | | 0.2 | |
| | 120,000 | | | (1) | | CommScope, Inc., 5.000%, 06/15/21 | | | 122,700 | | | | 0.1 | |
| | 200,000 | | | (1) | | CSC Holdings LLC, 5.500%, 04/15/27 | | | 204,500 | | | | 0.2 | |
| | 300,000 | | | | | DISH DBS Corp., 5.875%, 07/15/22 | | | 302,625 | | | | 0.3 | |
| | 86,000 | | | | | Frontier Communications Corp., 8.500%, 04/15/20 | | | 71,595 | | | | 0.1 | |
| | 555,000 | | | | | Frontier Communications Corp., 8.750%, 04/15/22 | | | 400,815 | | | | 0.4 | |
| | 330,000 | | | | | Frontier Communications Corp., 10.500%, 09/15/22 | | | 250,387 | | | | 0.2 | |
| | 250,000 | | | | | GCI, Inc., 6.750%, 06/01/21 | | | 254,688 | | | | 0.3 | |
| | 140,000 | | | | | GCI, Inc., 6.875%, 04/15/25 | | | 149,800 | | | | 0.2 | |
| | 250,000 | | | (1) | | Gray Television, Inc., 5.125%, 10/15/24 | | | 250,000 | | | | 0.2 | |
| | 280,000 | | | (1) | | Gray Television, Inc., 5.875%, 07/15/26 | | | 287,700 | | | | 0.3 | |
| | 415,000 | | | | | Hughes Satellite Systems Corp., 5.250%, 08/01/26 | | | 424,856 | | | | 0.4 | |
| | 690,000 | | | | | Level 3 Financing, Inc., 5.250%, 03/15/26 | | | 678,995 | | | | 0.7 | |
| | 195,000 | | | (1) | | MDC Partners, Inc., 6.500%, 05/01/24 | | | 196,950 | | | | 0.2 | |
| | 1,445,000 | | | (2) | | Millicom International Cellular S.A. Escrow, 11/15/26 | | | — | | | | — | |
| | 550,000 | | | | | Netflix, Inc., 4.375%, 11/15/26 | | | 540,375 | | | | 0.5 | |
| | 200,000 | | | (1) | | SFR Group SA, 6.000%, 05/15/22 | | | 202,750 | | | | 0.2 | |
| | 350,000 | | | | | Quebecor Media, Inc., 5.750%, 01/15/23 | | | 372,750 | | | | 0.4 | |
| | 251,000 | | | (1) | | Sinclair Television Group, Inc., 5.125%, 02/15/27 | | | 250,059 | | | | 0.2 | |
| | 170,000 | | | (1) | | Sirius XM Radio, Inc., 4.625%, 05/15/23 | | | 174,038 | | | | 0.2 | |
| | 525,000 | | | (1) | | Sirius XM Radio, Inc., 5.000%, 08/01/27 | | | 528,938 | | | | 0.5 | |
| | 1,660,000 | | | | | Sprint Corp., 7.250%, 09/15/21 | | | 1,761,675 | | | | 1.7 | |
| | 425,000 | | | | | TEGNA, Inc., 6.375%, 10/15/23 | | | 446,781 | | | | 0.4 | |
| | 95,000 | | | | | T-Mobile USA, Inc., 5.125%, 04/15/25 | | | 98,919 | | | | 0.1 | |
| | 130,000 | | | | | T-Mobile USA, Inc., 6.000%, 03/01/23 | | | 136,435 | | | | 0.1 | |
| | 250,000 | | | | | T-Mobile USA, Inc., 6.000%, 04/15/24 | | | 265,625 | | | | 0.3 | |
| | 70,000 | | | | | T-Mobile USA, Inc., 6.500%, 01/15/24 | | | 74,375 | | | | 0.1 | |
| | 450,000 | | | | | T-Mobile USA, Inc., 6.500%, 01/15/26 | | | 492,188 | | | | 0.5 | |
| | 24,000 | | | (1) | | Univision Communications, Inc., 5.125%, 02/15/25 | | | 23,460 | | | | 0.0 | |
| | 440,000 | | | (1) | | Videotron Ltd., 5.375%, 06/15/24 | | | 475,750 | | | | 0.5 | |
See Accompanying Notes to Financial Statements
| VY® Pioneer High Yield Portfolio | PORTFOLIO OF INVESTMENTS as of December 31, 2017 (continued) |
Principal
Amount† | | | | | | | Value | | | Percentage
of Net
Assets | |
| CORPORATE BONDS/NOTES: (continued) | | | | | | | | |
| | | | | | | Communications: (continued) | | | | | | | | |
| | 346,000 | | | (1) | | Wind Tre SpA, 5.000%, 01/20/26 | | | 330,776 | | | | 0.3 | |
| | 375,000 | | | | | Windstream Services LLC, 6.375%, 08/01/23 | | | 230,625 | | | | 0.2 | |
| | 335,000 | | | (1) | | Windstream Services LLC / Windstream Finance Corp., 8.625%, 10/31/25 | | | 324,113 | | | | 0.3 | |
| | 387,000 | | | (1) | | Windstream Services LLC / Windstream Finance Corp., 8.750%, 12/15/24 | | | 272,351 | | | | 0.3 | |
| | 200,000 | | | | | Windstream Services LLC, 7.750%, 10/15/20 | | | 170,000 | | | | 0.2 | |
| | | | | | | | | | 12,975,050 | | | | 12.8 | |
| | | | | | | | | | | | | | | |
| | | | | | | Consumer, Cyclical: 11.8% | | | | | | | | |
| | 75,000 | | | (1) | | Allison Transmission, Inc., 4.750%, 10/01/27 | | | 75,656 | | | | 0.1 | |
| | 190,000 | | | | | AMC Entertainment Holdings, Inc., 5.875%, 11/15/26 | | | 188,100 | | | | 0.2 | |
| | 160,000 | | | | | AMC Entertainment Holdings, Inc., 6.125%, 05/15/27 | | | 159,600 | | | | 0.2 | |
| | 335,000 | | | | | Asbury Automotive Group, Inc., 6.000%, 12/15/24 | | | 350,477 | | | | 0.3 | |
| | 225,000 | | | (1) | | Beazer Homes USA, Inc., 5.875%, 10/15/27 | | | 227,250 | | | | 0.2 | |
| | 570,000 | | | | | Beazer Homes USA, Inc., 6.750%, 03/15/25 | | | 603,487 | | | | 0.6 | |
| | 70,000 | | | | | Beazer Homes USA, Inc., 8.750%, 03/15/22 | | | 77,343 | | | | 0.1 | |
| | 230,000 | | | (1) | | Cooper-Standard Automotive, Inc., 5.625%, 11/15/26 | | | 238,050 | | | | 0.2 | |
| | 125,000 | | | (1) | | Dana Financing Luxembourg Sarl, 5.750%, 04/15/25 | | | 132,031 | | | | 0.1 | |
| | 300,000 | | | | | Eldorado Resorts, Inc., 6.000%, 04/01/25 | | | 315,000 | | | | 0.3 | |
| | 360,000 | | | | | Global Partners L.P. / GLP Finance Corp., 7.000%, 06/15/23 | | | 371,700 | | | | 0.4 | |
| | 250,000 | | | (1) | | Golden Nugget, Inc., 6.750%, 10/15/24 | | | 255,000 | | | | 0.2 | |
| | 230,000 | | | (1) | | Golden Nugget, Inc., 8.750%, 10/01/25 | | | 242,075 | | | | 0.2 | |
| | 350,000 | | | | | Goodyear Tire & Rubber Co/The, 5.000%, 05/31/26 | | | 362,197 | | | | 0.4 | |
| | 236,000 | | | (1) | | H&E Equipment Services, Inc., 5.625%, 09/01/25 | | | 247,210 | | | | 0.2 | |
| | 165,000 | | | (1) | | Hilton Grand Vacations Borrower LLC/Hilton Grand Vacations Borrower, Inc., 6.125%, 12/01/24 | | | 180,881 | | | | 0.2 | |
| | 185,000 | | | (1) | | International Automotive Components Group SA, 9.125%, 06/01/18 | | | 183,266 | | | | 0.2 | |
| | 300,000 | | | (1) | | International Game Technology PLC, 6.500%, 02/15/25 | | | 336,750 | | | | 0.3 | |
| | 186,000 | | | (1) | | Intrepid Aviation Group Holdings LLC / Intrepid Finance Co., 6.875%, 02/15/19 | | | 185,535 | | | | 0.2 | |
| | 248,000 | | | (1) | | JB Poindexter & Co., Inc., 9.000%, 04/01/22 | | | 257,920 | | | | 0.3 | |
| | 400,000 | | | | | KB Home, 7.000%, 12/15/21 | | | 446,000 | | | | 0.4 | |
| | 245,000 | | | | | KB Home, 7.500%, 09/15/22 | | | 279,912 | | | | 0.3 | |
| | 205,000 | | | (1) | | KFC Holding Co/Pizza Hut Holdings LLC/Taco Bell of America LLC, 5.000%, 06/01/24 | | | 211,919 | | | | 0.2 | |
| | 205,000 | | | (1) | | KFC Holding Co/Pizza Hut Holdings LLC/Taco Bell of America LLC, 5.250%, 06/01/26 | | | 216,275 | | | | 0.2 | |
| | 250,000 | | | | | Lennar Corp., 4.500%, 06/15/19 | | | 256,562 | | | | 0.3 | |
| | 465,000 | | | | | Lennar Corp., 4.750%, 11/15/22 | | | 489,994 | | | | 0.5 | |
| | 100,000 | | | | | LKQ Corp., 4.750%, 05/15/23 | | | 102,750 | | | | 0.1 | |
| | 310,000 | | | | | MDC Holdings, Inc., 5.500%, 01/15/24 | | | 328,600 | | | | 0.3 | |
| | 230,000 | | | | | Meritage Homes Corp., 5.125%, 06/06/27 | | | 234,600 | | | | 0.2 | |
| | 145,000 | | | | | Meritage Homes Corp., 7.000%, 04/01/22 | | | 163,850 | | | | 0.2 | |
| | 200,000 | | | (1) | | Nexteer Automotive Group Ltd., 5.875%, 11/15/21 | | | 209,500 | | | | 0.2 | |
| | 48,000 | | | | | Penske Automotive Group, Inc., 3.750%, 08/15/20 | | | 49,020 | | | | 0.0 | |
| | 466,000 | | | (1) | | PetSmart, Inc., 7.125%, 03/15/23 | | | 278,435 | | | | 0.3 | |
| | 280,000 | | | | | PulteGroup, Inc., 5.000%, 01/15/27 | | | 293,650 | | | | 0.3 | |
| | 150,000 | | | | | Regal Entertainment Group, 5.750%, 03/15/22 | | | 155,063 | | | | 0.2 | |
| | 270,000 | | | | | Regal Entertainment Group, 5.750%, 02/01/25 | | | 278,100 | | | | 0.3 | |
| | 130,000 | | | | | CalAtlantic Group, Inc., 5.375%, 10/01/22 | | | 139,913 | | | | 0.1 | |
| | 200,000 | | | (1) | | Scientific Games International, Inc., 5.000%, 10/15/25 | | | 201,000 | | | | 0.2 | |
| | 595,000 | | | | | Scientific Games International, Inc., 10.000%, 12/01/22 | | | 655,244 | | | | 0.6 | |
| | 365,000 | | | (1) | | Taylor Morrison Communities, Inc. / Taylor Morrison Holdings II, Inc., 5.625%, 03/01/24 | | | 383,706 | | | | 0.4 | |
| | 400,000 | | | | | Tempur Sealy International, Inc., 5.500%, 06/15/26 | | | 411,080 | | | | 0.4 | |
| | 169,000 | | | (1) | | TI Group Automotive Systems LLC, 8.750%, 07/15/23 | | | 182,098 | | | | 0.2 | |
| | 255,000 | | | (1) | | Titan International, Inc., 6.500%, 11/30/23 | | | 260,100 | | | | 0.3 | |
| | 190,000 | | | | | TRI Pointe Group, Inc., 5.250%, 06/01/27 | | | 195,121 | | | | 0.2 | |
See Accompanying Notes to Financial Statements
| VY® Pioneer High Yield Portfolio | PORTFOLIO OF INVESTMENTS as of December 31, 2017 (continued) |
Principal
Amount† | | | | | | | Value | | | Percentage
of Net
Assets | |
| CORPORATE BONDS/NOTES: (continued) | | | | | | | | |
| | | | | | | Consumer, Cyclical: (continued) | | | | | | | | |
| | 228,000 | | | (1) | | Viking Cruises Ltd., 5.875%, 09/15/27 | | | 232,560 | | | | 0.2 | |
| | 305,000 | | | (1) | | Viking Cruises Ltd, 6.250%, 05/15/25 | | | 315,675 | | | | 0.3 | |
| | | | | | | | | | 11,960,255 | | | | 11.8 | |
| | | | | | | | | | | | | | | |
| | | | | | | Consumer, Non-cyclical: 10.8% | | | | | | | | |
| | 80,000 | | | (1) | | Alliance One International, Inc., 8.500%, 04/15/21 | | | 84,000 | | | | 0.1 | |
| | 310,000 | | | | | Alliance One International, Inc., 9.875%, 07/15/21 | | | 286,362 | | | | 0.3 | |
| | 200,000 | | | (1) | | Ashtead Capital, Inc., 4.125%, 08/15/25 | | | 202,250 | | | | 0.2 | |
| | 94,000 | | | (1) | | Avantor, Inc., 6.000%, 10/01/24 | | | 93,882 | | | | 0.1 | |
| | 225,000 | | | | | BioScrip, Inc., 8.875%, 02/15/21 | | | 204,750 | | | | 0.2 | |
| | 260,000 | | | (1) | | Brink's Co/The, 4.625%, 10/15/27 | | | 255,450 | | | | 0.2 | |
| | 215,000 | | | (1) | | C&S Group Enterprises LLC, 5.375%, 07/15/22 | | | 203,712 | | | | 0.2 | |
| | 20,000 | | | (1) | | Cardtronics, Inc. / Cardtronics USA, Inc., 5.500%, 05/01/25 | | | 18,150 | | | | 0.0 | |
| | 85,000 | | | | | CHS/Community Health Systems, Inc., 6.250%, 03/31/23 | | | 76,925 | | | | 0.1 | |
| | 145,000 | | | | | CHS/Community Health Systems, Inc., 6.875%, 02/01/22 | | | 84,100 | | | | 0.1 | |
| | 130,000 | | | | | CHS/Community Health Systems, Inc., 8.000%, 11/15/19 | | | 110,825 | | | | 0.1 | |
| | 375,000 | | | (1) | | Cimpress NV, 7.000%, 04/01/22 | | | 388,125 | | | | 0.4 | |
| | 250,000 | | | (1) | | APTIM Corp., 7.750%, 06/15/25 | | | 240,000 | | | | 0.2 | |
| | 270,000 | | | (1) | | Endo Finance LLC, 5.750%, 01/15/22 | | | 226,125 | | | | 0.2 | |
| | 200,000 | | | (1) | | Endo Ltd. / Endo Finance LLC / Endo Finco, Inc., 6.000%, 02/01/25 | | | 156,000 | | | | 0.1 | |
| | 750,000 | | | | | HCA, Inc., 5.375%, 02/01/25 | | | 778,125 | | | | 0.8 | |
| | 35,000 | | | (1) | | Horizon Pharma, Inc. / Horizon Pharma USA, Inc., 8.750%, 11/01/24 | | | 37,144 | | | | 0.0 | |
| | 200,000 | | | | | Horizon Pharma, Inc., 6.625%, 05/01/23 | | | 200,000 | | | | 0.2 | |
| | 450,000 | | | | | Kindred Healthcare, Inc., 6.375%, 04/15/22 | | | 459,000 | | | | 0.4 | |
| | 240,000 | | | | | Kindred Healthcare, Inc., 8.000%, 01/15/20 | | | 261,228 | | | | 0.3 | |
| | 80,000 | | | (1) | | Lamb Weston Holdings, Inc., 4.625%, 11/01/24 | | | 82,800 | | | | 0.1 | |
| | 80,000 | | | (1) | | Lamb Weston Holdings, Inc., 4.875%, 11/01/26 | | | 83,800 | | | | 0.1 | |
| | 345,000 | | | | | Molina Healthcare, Inc., 5.375%, 11/15/22 | | | 361,387 | | | | 0.4 | |
| | 424,000 | | | (1) | | Pilgrim's Pride Corp., 5.875%, 09/30/27 | | | 437,780 | | | | 0.4 | |
| | 500,000 | | | (1) | | Post Holdings, Inc., 5.625%, 01/15/28 | | | 502,500 | | | | 0.5 | |
| | 510,000 | | | (1) | | RegionalCare Hospital Partners Holdings, Inc., 8.250%, 05/01/23 | | | 540,600 | | | | 0.5 | |
| | 105,000 | | | | | Revlon Consumer Products Corp., 5.750%, 02/15/21 | | | 79,800 | | | | 0.1 | |
| | 135,000 | | | | | Service Corp. International/US, 4.625%, 12/15/27 | | | 137,311 | | | | 0.1 | |
| | 235,000 | | | (1) | | Team Health Holdings, Inc., 6.375%, 02/01/25 | | | 210,913 | | | | 0.2 | |
| | 360,000 | | | | | Tenet Healthcare Corp., 4.375%, 10/01/21 | | | 360,900 | | | | 0.4 | |
| | 85,000 | | | (1) | | Tenet Healthcare Corp., 7.500%, 01/01/22 | | | 89,569 | | | | 0.1 | |
| | 130,000 | | | | | Tenet Healthcare Corp., 8.125%, 04/01/22 | | | 132,762 | | | | 0.1 | |
| | 60,000 | | | | | United Rentals North America, Inc., 4.625%, 10/15/25 | | | 60,600 | | | | 0.1 | |
| | 60,000 | | | | | United Rentals North America, Inc., 4.875%, 01/15/28 | | | 60,450 | | | | 0.1 | |
| | 525,000 | | | | | United Rentals North America, Inc., 5.750%, 11/15/24 | | | 554,531 | | | | 0.5 | |
| | 380,000 | | | | | Universal Hospital Services, Inc., 7.625%, 08/15/20 | | | 381,900 | | | | 0.4 | |
| | 200,000 | | | (1) | | Valeant Pharmaceuticals International, Inc., 5.500%, 11/01/25 | | | 204,500 | | | | 0.2 | |
| | 1,709,000 | | | (1) | | Valeant Pharmaceuticals International, Inc., 5.875%, 05/15/23 | | | 1,587,234 | | | | 1.6 | |
| | 95,000 | | | (1) | | Valeant Pharmaceuticals International, Inc., 6.500%, 03/15/22 | | | 99,988 | | | | 0.1 | |
| | 125,000 | | | (1) | | Valeant Pharmaceuticals International, Inc., 7.000%, 03/15/24 | | | 134,063 | | | | 0.1 | |
| | 525,000 | | | | | WellCare Health Plans, Inc., 5.250%, 04/01/25 | | | 555,188 | | | | 0.5 | |
| | | | | | | | | | 11,024,729 | | | | 10.8 | |
| | | | | | | | | | | | | | | |
| | | | | | | Energy: 15.3% | | | | | | | | |
| | 150,000 | | | | | Alta Mesa Hldgs, 7.875%, 12/15/24 | | | 165,188 | | | | 0.2 | |
| | 200,000 | | | | | Andeavor Logistics L.P. / Tesoro Logistics Finance Corp., 5.250%, 01/15/25 | | | 210,590 | | | | 0.2 | |
| | 135,000 | | | | | Antero Midstream Partners L.P. / Antero Midstream Finance Corp., 5.375%, 09/15/24 | | | 139,725 | | | | 0.1 | |
| | 212,000 | | | | | Antero Resources Corp., 5.000%, 03/01/25 | | | 217,300 | | | | 0.2 | |
| | 525,000 | | | | | Archrock Partners L.P. / Archrock Partners Finance Corp., 6.000%, 04/01/21 | | | 527,625 | | | | 0.5 | |
| | 50,000 | | | | | Archrock Partners L.P. / Archrock Partners Finance Corp., 6.000%, 10/01/22 | | | 50,250 | | | | 0.0 | |
See Accompanying Notes to Financial Statements
| VY® Pioneer High Yield Portfolio | PORTFOLIO OF INVESTMENTS as of December 31, 2017 (continued) |
Principal
Amount† | | | | | | | Value | | | Percentage
of Net
Assets | |
| CORPORATE BONDS/NOTES: (continued) | | | | | | | | |
| | | | | | | Energy: (continued) | | | | | | | | |
| | 355,000 | | | (1) | | Blue Racer Midstream LLC / Blue Racer Finance Corp., 6.125%, 11/15/22 | | | 370,975 | | | | 0.4 | |
| | 350,000 | | | | | Calumet Specialty Products Partners L.P. / Calumet Finance Corp., 6.500%, 04/15/21 | | | 350,000 | | | | 0.3 | |
| | 175,000 | | | | | Calumet Specialty Products Partners L.P. / Calumet Finance Corp., 7.750%, 04/15/23 | | | 176,750 | | | | 0.2 | |
| | 518,000 | | | | | Cheniere Corpus Christi Holdings LLC, 5.125%, 06/30/27 | | | 537,114 | | | | 0.5 | |
| | 100,000 | | | | | Cheniere Corpus Christi Holdings LLC, 5.875%, 03/31/25 | | | 108,562 | | | | 0.1 | |
| | 104,000 | | | (1) | | Chesapeake Energy Corp., 8.000%, 12/15/22 | | | 112,580 | | | | 0.1 | |
| | 142,000 | | | (3) | | Cobalt International Energy, Inc., 11.750%, 12/01/21 | | | 154,780 | | | | 0.2 | |
| | 200,000 | | | | | Concho Resources, Inc., 4.375%, 01/15/25 | | | 208,500 | | | | 0.2 | |
| | 249,000 | | | (1) | | Covey Park Energy LLC / Covey Park Finance Corp., 7.500%, 05/15/25 | | | 260,130 | | | | 0.3 | |
| | 90,000 | | | | | DCP Midstream Operating L.P., 2.700%, 04/01/19 | | | 89,887 | | | | 0.1 | |
| | 120,000 | | | | | DCP Midstream Operating L.P., 3.875%, 03/15/23 | | | 119,850 | | | | 0.1 | |
| | 325,000 | | | | | DCP Midstream Operating L.P., 5.600%, 04/01/44 | | | 324,187 | | | | 0.3 | |
| | 285,000 | | | (1) | | Delek Logistics Partners L.P., 6.750%, 05/15/25 | | | 289,275 | | | | 0.3 | |
| | 110,000 | | | (1) | | Endeavor Energy Resources L.P. / EER Finance, Inc., 5.500%, 01/30/26 | | | 112,200 | | | | 0.1 | |
| | 115,000 | | | (1) | | Endeavor Energy Resources L.P. / EER Finance, Inc., 5.750%, 01/30/28 | | | 118,536 | | | | 0.1 | |
| | 200,000 | | | | | Energy Transfer Equity L.P., 4.250%, 03/15/23 | | | 199,000 | | | | 0.2 | |
| | 295,000 | | | | | Energy Transfer Equity L.P., 5.875%, 01/15/24 | | | 311,225 | | | | 0.3 | |
| | 60,000 | | | | | EnLink Midstream Partners L.P., 5.050%, 04/01/45 | | | 59,432 | | | | 0.1 | |
| | 174,000 | | | | | EnLink Midstream Partners L.P., 5.600%, 04/01/44 | | | 183,181 | | | | 0.2 | |
| | 150,000 | | | (1) | | Exterran Energy Solutions L.P. / EES Finance Corp., 8.125%, 05/01/25 | | | 161,625 | | | | 0.2 | |
| | 205,000 | | | (1) | | Extraction Oil & Gas Holdings LLC / Extraction Finance Corp., 7.875%, 07/15/21 | | | 217,812 | | | | 0.2 | |
| | 210,000 | | | | | Genesis Energy L.P. / Genesis Energy Finance Corp., 6.250%, 05/15/26 | | | 209,737 | | | | 0.2 | |
| | 233,000 | | | | | Genesis Energy L.P. / Genesis Energy Finance Corp., 6.500%, 10/01/25 | | | 237,660 | | | | 0.2 | |
| | 100,000 | | | | | Genesis Energy L.P. / Genesis Energy Finance Corp., 6.750%, 08/01/22 | | | 104,250 | | | | 0.1 | |
| | 245,000 | | | (1) | | Great Western Petroleum LLC / Great Western Finance Corp., 9.000%, 09/30/21 | | | 256,025 | | | | 0.3 | |
| | 300,000 | | | | | Gulfport Energy Corp., 6.000%, 10/15/24 | | | 301,500 | | | | 0.3 | |
| | 200,000 | | | | | Gulfport Energy Corp., 6.375%, 05/15/25 | | | 201,750 | | | | 0.2 | |
| | 20,000 | | | | | Gulfport Energy Corp., 6.625%, 05/01/23 | | | 20,500 | | | | 0.0 | |
| | 36,000 | | | (1) | | Halcon Resources Corp., 6.750%, 02/15/25 | | | 37,620 | | | | 0.0 | |
| | 285,000 | | | (1) | | Hess Infrastructure Partners L.P. / Hess Infrastructure Partners Finance Corp., 5.625%, 02/15/26 | | | 295,688 | | | | 0.3 | |
| | 255,000 | | | (1) | | Hilcorp Energy I L.P. / Hilcorp Finance Co., 5.750%, 10/01/25 | | | 262,013 | | | | 0.3 | |
| | 100,000 | | | (1) | | MEG Energy Corp., 6.500%, 01/15/25 | | | 99,125 | | | | 0.1 | |
| | 220,000 | | | (1) | | MEG Energy Corp., 7.000%, 03/31/24 | | | 186,725 | | | | 0.2 | |
| | 80,000 | | | | | Murphy Oil Corp., 6.875%, 08/15/24 | | | 85,600 | | | | 0.1 | |
| | 250,000 | | | | | Murphy Oil USA, Inc., 6.000%, 08/15/23 | | | 261,875 | | | | 0.3 | |
| | 162,000 | | | (1) | | NGPL PipeCo LLC, 4.375%, 08/15/22 | | | 165,341 | | | | 0.2 | |
| | 303,000 | | | | | Noble Energy, Inc., 5.625%, 05/01/21 | | | 311,472 | | | | 0.3 | |
| | 330,000 | | | | | Oasis Petroleum, Inc., 6.875%, 03/15/22 | | | 339,488 | | | | 0.3 | |
| | 230,000 | | | (1) | | Parsley Energy LLC / Parsley Finance Corp., 5.375%, 01/15/25 | | | 233,450 | | | | 0.2 | |
| | 200,000 | | | (1) | | Parsley Energy LLC / Parsley Finance Corp., 5.625%, 10/15/27 | | | 205,000 | | | | 0.2 | |
| | 210,000 | | | (1) | | Parsley Energy LLC / Parsley Finance Corp., 6.250%, 06/01/24 | | | 222,075 | | | | 0.2 | |
| | 400,000 | | | (1) | | PBF Logistics L.P. / PBF Logistics Finance Corp., 6.875%, 05/15/23 | | | 414,000 | | | | 0.4 | |
| | 225,000 | | | (1) | | Precision Drilling Corp., 7.125%, 01/15/26 | | | 230,063 | | | | 0.2 | |
| | 220,000 | | | | | QEP Resources, Inc., 5.625%, 03/01/26 | | | 223,850 | | | | 0.2 | |
| | 275,000 | | | | | Range Resources Corp., 5.000%, 03/15/23 | | | 275,000 | | | | 0.3 | |
| | 70,000 | | | | | Rowan Cos, Inc., 4.875%, 06/01/22 | | | 66,325 | | | | 0.1 | |
See Accompanying Notes to Financial Statements
| VY® Pioneer High Yield Portfolio | PORTFOLIO OF INVESTMENTS as of December 31, 2017 (continued) |
Principal
Amount† | | | | | | | Value | | | Percentage
of Net
Assets | |
| CORPORATE BONDS/NOTES: (continued) | | | | | | | | |
| | | | | | | Energy: (continued) | | | | | | | | |
| | 296,000 | | | | | Rowan Cos, Inc., 5.400%, 12/01/42 | | | 222,000 | | | | 0.2 | |
| | 31,000 | | | | | Rowan Cos, Inc., 5.850%, 01/15/44 | | | 24,335 | | | | 0.0 | |
| | 125,000 | | | | | Sabine Pass Liquefaction LLC, 5.000%, 03/15/27 | | | 134,195 | | | | 0.1 | |
| | 100,000 | | | | | Sabine Pass Liquefaction LLC, 5.625%, 02/01/21 | | | 107,267 | | | | 0.1 | |
| | 245,000 | | | | | Sabine Pass Liquefaction LLC, 5.875%, 06/30/26 | | | 275,629 | | | | 0.3 | |
| | 55,000 | | | | | Sanchez Energy Corp., 6.125%, 01/15/23 | | | 46,888 | | | | 0.0 | |
| | 360,000 | | | | | Sanchez Energy Corp., 7.750%, 06/15/21 | | | 340,200 | | | | 0.3 | |
| | 85,000 | | | (1) | | SESI LLC, 7.750%, 09/15/24 | | | 90,525 | | | | 0.1 | |
| | 35,000 | | | | | SM Energy Co., 6.125%, 11/15/22 | | | 35,831 | | | | 0.0 | |
| | 260,000 | | | | | SM Energy Co., 6.750%, 09/15/26 | | | 269,100 | | | | 0.3 | |
| | 120,000 | | | | | Summit Midstream Holdings LLC / Summit Midstream Finance Corp., 5.750%, 04/15/25 | | | 121,607 | | | | 0.1 | |
| | 335,000 | | | | | Targa Resources Partners L.P. / Targa Resources Partners Finance Corp., 4.250%, 11/15/23 | | | 332,488 | | | | 0.3 | |
| | 84,000 | | | (1) | | Targa Resources Partners L.P. / Targa Resources Partners Finance Corp., 5.000%, 01/15/28 | | | 84,105 | | | | 0.1 | |
| | 215,000 | | | | | Targa Resources Partners L.P. / Targa Resources Partners Finance Corp., 5.250%, 05/01/23 | | | 220,375 | | | | 0.2 | |
| | 300,000 | | | (1) | | TerraForm Power Operating LLC, 4.250%, 01/31/23 | | | 298,125 | | | | 0.3 | |
| | 300,000 | | | (1) | | TerraForm Power Operating LLC, 5.000%, 01/31/28 | | | 297,375 | | | | 0.3 | |
| | 300,000 | | | | | Andeavor, 5.375%, 10/01/22 | | | 310,125 | | | | 0.3 | |
| | 75,000 | | | (1) | | Transocean, Inc., 7.500%, 01/15/26 | | | 76,991 | | | | 0.1 | |
| | 270,000 | | | (1) | | Trinidad Drilling Ltd, 6.625%, 02/15/25 | | | 257,850 | | | | 0.3 | |
| | 125,000 | | | (1) | | Whiting Petroleum Corp., 6.625%, 01/15/26 | | | 127,656 | | | | 0.1 | |
| | 180,000 | | | | | Williams Cos, Inc./The, 4.550%, 06/24/24 | | | 187,650 | | | | 0.2 | |
| | 300,000 | | | | | Williams Cos, Inc./The, 5.750%, 06/24/44 | | | 321,750 | | | | 0.3 | |
| | 200,000 | | | | | WPX Energy, Inc., 5.250%, 09/15/24 | | | 200,310 | | | | 0.2 | |
| | 101,000 | | | | | WPX Energy, Inc., 7.500%, 08/01/20 | | | 109,838 | | | | 0.1 | |
| | 80,000 | | | | | WPX Energy, Inc., 8.250%, 08/01/23 | | | 91,200 | | | | 0.1 | |
| | | | | | | | | | 15,605,826 | | | | 15.3 | |
| | | | | | | | | | | | | | | |
| | | | | | | Financial: 8.3% | | | | | | | | |
| | 500,000 | | | (1) | | Alliance Data Systems Corp., 5.875%, 11/01/21 | | | 513,750 | | | | 0.5 | |
| | 200,000 | | | | | Ally Financial, Inc., 4.625%, 05/19/22 | | | 208,500 | | | | 0.2 | |
| | 335,000 | | | | | Ally Financial, Inc., 4.625%, 03/30/25 | | | 353,006 | | | | 0.4 | |
| | 173,000 | | | | | Ally Financial, Inc., 5.750%, 11/20/25 | | | 189,219 | | | | 0.2 | |
| | 235,000 | | | | | Credit Suisse Group AG, 7.125%, 07/29/65 | | | 257,501 | | | | 0.3 | |
| | 50,000 | | | (1) | | CyrusOne L.P. / CyrusOne Finance Corp., 5.000%, 03/15/24 | | | 52,000 | | | | 0.1 | |
| | 140,000 | | | (1) | | CyrusOne L.P. / CyrusOne Finance Corp., 5.000%, 03/15/24 | | | 145,600 | | | | 0.1 | |
| | 40,000 | | | (1) | | CyrusOne L.P. / CyrusOne Finance Corp., 5.375%, 03/15/27 | | | 42,100 | | | | 0.0 | |
| | 195,000 | | | | | Equinix, Inc., 5.375%, 04/01/23 | | | 202,605 | | | | 0.2 | |
| | 600,000 | | | | | Fly Leasing Ltd., 6.375%, 10/15/21 | | | 627,000 | | | | 0.6 | |
| | 345,000 | | | (1) | | Freedom Mortgage Corp., 8.125%, 11/15/24 | | | 352,331 | | | | 0.3 | |
| | 115,000 | | | (1) | | Greystar Real Estate Partners LLC, 5.750%, 12/01/25 | | | 118,737 | | | | 0.1 | |
| | 260,000 | | | (1) | | Iron Mountain US Holdings, Inc., 5.375%, 06/01/26 | | | 268,450 | | | | 0.3 | |
| | 300,000 | | | | | Iron Mountain, Inc., 5.750%, 08/15/24 | | | 305,250 | | | | 0.3 | |
| | 250,000 | | | | | Kennedy-Wilson, Inc., 5.875%, 04/01/24 | | | 258,750 | | | | 0.3 | |
| | 250,000 | | | (1) | | Kilimanjaro Re Ltd. (Cat Bond), 5.876%, (T-BILL 3MO + 4.500%), 04/30/18 | | | 246,100 | | | | 0.2 | |
| | 250,000 | | | (1) | | Kilimanjaro Re Ltd. (Cat Bond), 10.626%, (T-BILL 3MO + 9.250%), 12/06/19 | | | 244,175 | | | | 0.2 | |
| | 130,000 | | | | | MPT Operating Partnership L.P. / MPT Finance Corp., 5.000%, 10/15/27 | | | 132,763 | | | | 0.1 | |
| | 185,000 | | | | | MPT Operating Partnership L.P. / MPT Finance Corp., 5.500%, 05/01/24 | | | 192,400 | | | | 0.2 | |
| | 100,000 | | | | | Nationstar Mortgage LLC / Nationstar Capital Corp., 6.500%, 08/01/18 | | | 100,233 | | | | 0.1 | |
| | 575,000 | | | | | Nationstar Mortgage LLC / Nationstar Capital Corp., 6.500%, 07/01/21 | | | 584,703 | | | | 0.6 | |
See Accompanying Notes to Financial Statements
| VY® Pioneer High Yield Portfolio | PORTFOLIO OF INVESTMENTS as of December 31, 2017 (continued) |
Principal
Amount† | | | | | | | Value | | | Percentage
of Net
Assets | |
| CORPORATE BONDS/NOTES: (continued) | | | | | | | | |
| | | | | | | Financial: (continued) | | | | | | | | |
| | 125,000 | | | | | Nationstar Mortgage LLC / Nationstar Capital Corp., 6.500%, 06/01/22 | | | 126,875 | | | | 0.1 | |
| | 295,000 | | | (1) | | Oxford Finance LLC / Oxford Finance Co-Issuer II, Inc., 6.375%, 12/15/22 | | | 305,325 | | | | 0.3 | |
| | 308,000 | | | (1) | | Provident Funding Associates L.P. / PFG Finance Corp., 6.375%, 06/15/25 | | | 324,170 | | | | 0.3 | |
| | 120,000 | | | (1) | | Quicken Loans, Inc., 5.750%, 05/01/25 | | | 124,801 | | | | 0.1 | |
| | 225,000 | | | (1) | | Rialto Holdings LLC / Rialto Corp., 7.000%, 12/01/18 | | | 226,688 | | | | 0.2 | |
| | 600,000 | | | | | Royal Bank of Scotland Group PLC, 8.000%, 12/31/99 | | | 687,750 | | | | 0.7 | |
| | 200,000 | | | (1) | | Societe Generale SA, 7.375%, 12/31/99 | | | 217,260 | | | | 0.2 | |
| | 250,000 | | | (1),(2) | | Tailwind Re Ltd. 2017-1, 8.626%, (T-BILL 3MO + 7.250%), 01/08/25 | | | 250,000 | | | | 0.2 | |
| | 235,000 | | | | | UBS Group AG, 7.125%, 08/10/65 | | | 256,331 | | | | 0.3 | |
| | 335,000 | | | (1) | | Uniti Group L.P. / Uniti Group Finance, Inc. / CSL Capital LLC, 6.000%, 04/15/23 | | | 329,975 | | | | 0.3 | |
| | 250,000 | | | (1) | | Ursa Re Ltd 2017-2 D (Cat Bond), 5.250%, 12/10/20 | | | 250,750 | | | | 0.3 | |
| | | | | | | | | | 8,495,098 | | | | 8.3 | |
| | | | | | | | | | | | | | | |
| | | | | | | Industrial: 5.8% | | | | | | | | |
| | 405,000 | | | | | AECOM, 5.875%, 10/15/24 | | | 440,721 | | | | 0.4 | |
| | 250,000 | | | (1) | | Amsted Industries, Inc., 5.000%, 03/15/22 | | | 256,562 | | | | 0.2 | |
| | 250,000 | | | (1) | | Amsted Industries, Inc., 5.375%, 09/15/24 | | | 261,250 | | | | 0.3 | |
| | 220,000 | | | (1) | | Apex Tool Group LLC, 7.000%, 02/01/21 | | | 212,850 | | | | 0.2 | |
| EUR | 100,000 | | | (4) | | ARD Finance SA, 6.625% (PIK Rate 7.375%, Cash Rate 0.000%), 09/15/23 | | | 128,558 | | | | 0.1 | |
| | 100,000 | | | (4) | | ARD Finance SA, 7.125% (PIK Rate 7.875%, Cash Rate 0.000%), 09/15/23 | | | 104,750 | | | | 0.1 | |
| | 80,000 | | | (1) | | Ardagh Packaging Finance PLC / Ardagh Holdings USA, Inc., 4.625%, 05/15/23 | | | 81,900 | | | | 0.1 | |
| | 220,000 | | | (1) | | Ardagh Packaging Finance PLC / Ardagh Holdings USA, Inc., 6.000%, 02/15/25 | | | 232,100 | | | | 0.2 | |
| | 90,000 | | | (1) | | Ardagh Packaging Finance PLC / Ardagh Holdings USA, Inc., 7.250%, 05/15/24 | | | 98,325 | | | | 0.1 | |
| | 500,000 | | | | | Ball Corp., 5.250%, 07/01/25 | | | 545,625 | | | | 0.5 | |
| | 85,000 | | | (1) | | Belden, Inc., 5.250%, 07/15/24 | | | 87,975 | | | | 0.1 | |
| | 140,000 | | | (1) | | Builders FirstSource, Inc., 5.625%, 09/01/24 | | | 146,223 | | | | 0.1 | |
| | 205,000 | | | (1) | | Coveris Holdings SA, 7.875%, 11/01/19 | | | 204,487 | | | | 0.2 | |
| | 640,000 | | | | | Crown Cork & Seal Co., Inc., 7.375%, 12/15/26 | | | 748,800 | | | | 0.7 | |
| | 110,000 | | | (1) | | DAE Funding LLC, 4.500%, 08/01/22 | | | 108,350 | | | | 0.1 | |
| | 150,000 | | | | | Engility Corp., 8.875%, 09/01/24 | | | 160,875 | | | | 0.2 | |
| | 100,000 | | | | | EnPro Industries, Inc., 5.875%, 09/15/22 | | | 104,625 | | | | 0.1 | |
| | 205,000 | | | | | Griffon Corp., 5.250%, 03/01/22 | | | 208,075 | | | | 0.2 | |
| | 160,000 | | | (1) | | Itron, Inc., 5.000%, 01/15/26 | | | 161,000 | | | | 0.2 | |
| | 180,000 | | | (1) | | Kratos Defense & Security Solutions, Inc., 6.500%, 11/30/25 | | | 187,425 | | | | 0.2 | |
| | 265,000 | | | | | MasTec, Inc., 4.875%, 03/15/23 | | | 271,625 | | | | 0.3 | |
| | 150,000 | | | | | Park-Ohio Industries, Inc., 6.625%, 04/15/27 | | | 162,375 | | | | 0.2 | |
| | 125,000 | | | (1) | | Plastipak Holdings, Inc., 6.250%, 10/15/25 | | | 129,062 | | | | 0.1 | |
| | 120,000 | | | (1) | | RBS Global, Inc. / Rexnord LLC, 4.875%, 12/15/25 | | | 121,500 | | | | 0.1 | |
| | 96,911 | | | | | Reynolds Group Issuer, Inc., 5.750%, 10/15/20 | | | 98,486 | | | | 0.1 | |
| | 200,000 | | | (1) | | syncreon Group BV / syncreon Global Finance US, Inc., 8.625%, 11/01/21 | | | 163,000 | | | | 0.2 | |
| | 75,000 | | | (1) | | TTM Technologies, Inc., 5.625%, 10/01/25 | | | 77,063 | | | | 0.1 | |
| | 230,000 | | | (1) | | Tutor Perini Corp., 6.875%, 05/01/25 | | | 247,825 | | | | 0.2 | |
| | 185,000 | | | (1) | | USG Corp., 4.875%, 06/01/27 | | | 192,224 | | | | 0.2 | |
| | | | | | | | | | 5,943,636 | | | | 5.8 | |
| | | | | | | | | | | | | | | |
| | | | | | | Technology: 3.5% | | | | | | | | |
| | 210,000 | | | | | Brocade Communications Systems, Inc., 4.625%, 01/15/23 | | | 215,775 | | | | 0.2 | |
| | 310,000 | | | (1) | | Change Healthcare Holdings LLC / Change Healthcare Finance, Inc., 5.750%, 03/01/25 | | | 311,162 | | | | 0.3 | |
| | 145,000 | | | (1) | | Dell International LLC / EMC Corp., 5.875%, 06/15/21 | | | 150,800 | | | | 0.1 | |
| | 435,000 | | | | | Diebold Nixdorf, Inc., 8.500%, 04/15/24 | | | 463,819 | | | | 0.4 | |
| | 80,000 | | | (1) | | Entegris, Inc., 4.625%, 02/10/26 | | | 81,600 | | | | 0.1 | |
| | 570,000 | | | (1) | | First Data Corp., 5.750%, 01/15/24 | | | 594,082 | | | | 0.6 | |
| | 155,000 | | | (1) | | First Data Corp., 7.000%, 12/01/23 | | | 164,300 | | | | 0.2 | |
| | 70,000 | | | (1) | | j2 Cloud Services LLC / j2 Global Co-Obligor, Inc., 6.000%, 07/15/25 | | | 74,025 | | | | 0.1 | |
| | 200,000 | | | (2),(3) | | Midway Games, Inc., 06/01/21 | | | – | | | | – | |
See Accompanying Notes to Financial Statements
| VY® Pioneer High Yield Portfolio | PORTFOLIO OF INVESTMENTS as of December 31, 2017 (continued) |
Principal
Amount† | | | | | | | Value | | | Percentage
of Net
Assets | |
| CORPORATE BONDS/NOTES: (continued) | | | | | | | | |
| | | | | | | Technology: (continued) | | | | | | | | |
| | 160,000 | | | (1) | | MSCI, Inc., 4.750%, 08/01/26 | | | 168,400 | | | | 0.2 | |
| | 265,000 | | | | | NCR Corp., 5.000%, 07/15/22 | | | 270,963 | | | | 0.3 | |
| | 160,000 | | | | | NCR Corp., 6.375%, 12/15/23 | | | 168,000 | | | | 0.2 | |
| | 200,000 | | | (1) | | Open Text Corp., 5.875%, 06/01/26 | | | 216,000 | | | | 0.2 | |
| | 200,000 | | | (1) | | Quintiles IMS, Inc., 5.000%, 10/15/26 | | | 205,750 | | | | 0.2 | |
| | 400,000 | | | (1) | | Rackspace Hosting, Inc., 8.625%, 11/15/24 | | | 428,000 | | | | 0.4 | |
| | | | | | | | | | 3,512,676 | | | | 3.5 | |
| | | | | | | | | | | | | | | |
| | | | | | | Utilities: 2.5% | | | | | | | | |
| | 77,000 | | | | | AES Corp., 5.125%, 09/01/27 | | | 81,042 | | | | 0.1 | |
| | 100,000 | | | | | AES Corp., 5.500%, 03/15/24 | | | 104,500 | | | | 0.1 | |
| | 200,000 | | | | | AmeriGas Partners L.P. / AmeriGas Finance Corp., 5.500%, 05/20/25 | | | 203,000 | | | | 0.2 | |
| | 200,000 | | | (1) | | Calpine Corp., 5.250%, 06/01/26 | | | 196,752 | | | | 0.2 | |
| | 580,000 | | | | | Calpine Corp., 5.750%, 01/15/25 | | | 553,175 | | | | 0.5 | |
| | 361,000 | | | (1) | | Dynegy, Inc., 8.000%, 01/15/25 | | | 392,587 | | | | 0.4 | |
| | 65,000 | | | (1) | | NextEra Energy Operating Partners L.P., 4.250%, 09/15/24 | | | 66,300 | | | | 0.1 | |
| | 395,000 | | | | | NRG Energy, Inc., 6.625%, 01/15/27 | | | 419,688 | | | | 0.4 | |
| | 184,505 | | | (1) | | NSG Holdings LLC / NSG Holdings, Inc., 7.750%, 12/15/25 | | | 203,416 | | | | 0.2 | |
| | 250,000 | | | (1) | | Terraform Global Operating LLC, 9.750%, 08/15/22 | | | 277,813 | | | | 0.3 | |
| | | | | | | | | | 2,498,273 | | | | 2.5 | |
| | | | | | | | | | | | | | | |
| | | | | Total Corporate Bonds/Notes
(Cost $73,504,125) | | | 75,161,183 | | | | 73.9 | |
| | | | | | | | | | | | | | | |
| FOREIGN GOVERNMENT BONDS: –% | | | | | | | | |
| | 15,388 | | | (2),(4) | | Mashantucket Western Pequot Tribe, 1.000% (PIK Rate 5.500%, Cash Rate 0.000%), 07/01/36 | | | – | | | | – | |
| | | | | | | | | | | | | | | |
| | | | | Total Foreign Government Bonds
(Cost $2,288) | | | – | | | | – | |
| | | | | | | | | | | | | | | |
| BANK LOANS: 3.8% | | | | | | | | |
| | | | | | | Auto Parts & Equipment: 0.6% | | | | | | | | |
| | 128,050 | | | | | American Axle & Manufacturing Holdings, Inc. - Term Loan A, 3.810%, (US0003M + 2.000%), 04/06/24 | | | 128,498 | | | | 0.1 | |
| | 99,599 | | | | | Federal-Mogul Holdings Corporation New Term Loan C, 5.230%, (US0003M + 3.750%), 04/15/21 | | | 100,460 | | | | 0.1 | |
| | 367,972 | | | | | Tower Automotive Holdings Term Loan B1, 4.188%, (US0003M + 2.750%), 03/07/24 | | | 369,869 | | | | 0.4 | |
| | | | | | | | | | 598,827 | | | | 0.6 | |
| | | | | | | | | | | | | | | |
| | | | | | | Building Materials: 0.2% | | | | | | | | |
| | 206,861 | | | | | Builders FirstSource, Inc., 4.693%, (US0003M + 3.000%), 02/29/24 | | | 207,960 | | | | 0.2 | |
| | | | | | | | | | | | | | | |
| | | | | | | Cable & Satellite Television: 0.3% | | | | | | | | |
| | 269,328 | | | | | Virgin Media Bristol LLC 2017 USD Term Loan, 3.977%, (US0003M + 2.500%), 01/15/26 | | | 269,665 | | | | 0.3 | |
| | | | | | | | | | | | | | | |
| | | | | | | Computers: 0.2% | | | | | | | | |
| | 175,782 | | | | | DynCorp International, Inc. Term Loan B2 1L, 7.750%, (US0003M + 600.000%), 07/07/20 | | | 176,661 | | | | 0.2 | |
| | | | | | | | | | | | | | | |
| | | | | | | Cosmetics/Personal Care: 0.3% | | | | | | | | |
| | 388,000 | | | | | Revlon Consumer Products Corp. TL B 1L, 5.069%, (US0003M + 3.500%), 09/07/23 | | | 276,728 | | | | 0.3 | |
| | | | | | | | | | | | | | | |
| | | | | | | Food: 0.2% | | | | | | | | |
| | 430,000 | | | | | Del Monte Foods, Inc. 2nd Lien Term Loan, 9.064%, (US0003M + 7.250%), 08/18/21 | | | 207,475 | | | | 0.2 | |
| | | | | | | | | | | | | | | |
| | | | | | | Forest Products & Paper: 0.2% | | | | | | | | |
| | 263,013 | | | | | Caraustar Industries, Inc. - TL 1L, 7.193%, (US0003M + 5.500%), 03/14/22 | | | 263,999 | | | | 0.2 | |
| | | | | | | | | | | | | | | |
| | | | | | | Insurance: 0.4% | | | | | | | | |
| | 70,857 | | | | | Alliant Holdings I, Inc. 2015 Term Loan B, 4.802%, (US0003M + 3.250%), 08/12/22 | | | 71,308 | | | | 0.1 | |
| | 312,399 | | | | | Confie Seguros Holding II - TL B 1L, 6.729%, (US0003M + 4.750%), 04/19/22 | | | 311,345 | | | | 0.3 | |
| | | | | | | | | | 382,653 | | | | 0.4 | |
| | | | | | | | | | | | | | | |
| | | | | | | Lodging: 0.0% | | | | | | | | |
| | 59,875 | | | | | Golden Nugget, Inc. - TL 1L, 6.750%, (US0003M + 3.250%), 10/04/23 | | | 60,394 | | | | 0.0 | |
| | | | | | | | | | | | | | | |
| | | | | | | Media: 0.5% | | | | | | | | |
| | 444,375 | | | | | McGraw-Hill Global Education Holdings, LLC, 5.350%, (US0003M + 4.000%), 05/04/22 | | | 444,097 | | | | 0.4 | |
See Accompanying Notes to Financial Statements
| VY® Pioneer High Yield Portfolio | PORTFOLIO OF INVESTMENTS as of December 31, 2017 (continued) |
Principal
Amount† | | | | | | | Value | | | Percentage
of Net
Assets | |
| BANK LOANS: (continued) | | | | | | | |
| | | | | | | Media: (continued) | | | | | | | | |
| | 57,055 | | | | | Univision Communications Inc. Term Loan C5, 4.319%, (US0003M + 2.750%), 03/15/24 | | | 56,952 | | | | 0.1 | |
| | | | | | | | | | 501,049 | | | | 0.5 | |
| | | | | | | | | | | | | | | |
| | | | | | | Metal Fabricate/Hardware: 0.3% | | | | | | | | |
| | 310,291 | | | | | Zekelman Industries, Inc. Term Loan B, 4.073%, (US0003M + 3.500%), 06/14/21 | | | 312,540 | | | | 0.3 | |
| | | | | | | | | | | | | | | |
| | | | | | | Oil & Gas: 0.3% | | | | | | | | |
| | 325,000 | | | | | Gavilan Resources LLC - TL 2L, 7.460%, (US0003M + 6.000%), 03/01/24 | | | 322,969 | | | | 0.3 | |
| | | | | | | | | | | | | | | |
| | | | | | | Retail: 0.2% | | | | | | | | |
| | 220,402 | | | | | Camping World TL B 1L, 4.569%, (US0003M + 3.750%), 11/08/23 | | | 222,124 | | | | 0.2 | |
| | | | | | | | | | | | | | | |
| | | | | | | Telecommunications: 0.1% | | | | | | | | |
| | 107,759 | | | | | West Corp. - TL 1L, 5.350%, (US0003M + 4.000%), 10/10/24 | | | 108,290 | | | | 0.1 | |
| | | | | | | | | | | | | | | |
| | | | | Total Bank Loans
(Cost $4,176,344) | | 3,911,334 | | | | 3.8 | |
| | | | | | | | | | | | | | | |
| CONVERTIBLE BONDS/NOTES: 8.3% | | | | | | | | |
| | | | | | | Communications: 1.2% | | | | | | | | |
| | 125,000 | | | | | Ctrip.com International Ltd., 1.250%, 09/15/22 | | | 127,969 | | | | 0.1 | |
| | 319,000 | | | (1) | | DISH Network Corp., 2.375%, 03/15/24 | | | 307,237 | | | | 0.3 | |
| | 215,000 | | | | | Finisar Corp., 0.500%, 12/15/33 | | | 217,150 | | | | 0.2 | |
| | 50,000 | | | | | FireEye, Inc., 1.000%, 06/01/35 | | | 46,937 | | | | 0.1 | |
| | 50,000 | | | | | FireEye, Inc., 1.625%, 06/01/35 | | | 45,938 | | | | 0.0 | |
| | 268,000 | | | | | Shutterfly, Inc., 0.250%, 05/15/18 | | | 268,000 | | | | 0.3 | |
| | 150,000 | | | | | Zillow Group, Inc., 2.000%, 12/01/21 | | | 164,250 | | | | 0.2 | |
| | | | | | | | | | 1,177,481 | | | | 1.2 | |
| | | | | | | | | | | | | | | |
| | | | | | | Consumer, Cyclical: 0.4% | | | | | | | | |
| | 310,000 | | | | | KB Home, 1.375%, 02/01/19 | | | 380,912 | | | | 0.4 | |
| | 58,000 | | | (1) | | Marriott Vacations Worldwide Corp., 1.500%, 09/15/22 | | | 65,069 | | | | 0.0 | |
| | | | | | | | | | 445,981 | | | | 0.4 | |
| | | | | | | | | | | | | | | |
| | | | | | | Consumer, Non-cyclical: 3.6% | | | | | | | | |
| | 155,000 | | | | | Ascent Capital Group, Inc., 4.000%, 07/15/20 | | | 123,128 | | | | 0.1 | |
| | 185,000 | | | | | BioMarin Pharmaceutical, Inc., 0.599%, 08/01/24 | | | 184,769 | | | | 0.2 | |
| | 330,000 | | | | | Cardtronics, Inc., 1.000%, 12/01/20 | | | 294,319 | | | | 0.3 | |
| | 246,000 | | | | | Emergent BioSolutions, Inc., 2.875%, 01/15/21 | | | 397,905 | | | | 0.4 | |
| | 180,000 | | | | | Endologix, Inc., 2.250%, 12/15/18 | | | 173,025 | | | | 0.2 | |
| | 205,000 | | | | | Endologix, Inc., 3.250%, 11/01/20 | | | 186,934 | | | | 0.2 | |
| | 390,000 | | | | | Innoviva, Inc., 2.125%, 01/15/23 | | | 387,563 | | | | 0.4 | |
| | 400,000 | | | | | Jazz Investments I Ltd., 1.875%, 08/15/21 | | | 402,250 | | | | 0.4 | |
| | 115,000 | | | | | Macquarie Infrastructure Corp., 2.000%, 10/01/23 | | | 110,400 | | | | 0.1 | |
| | 205,000 | | | | | Medicines Co/The, 2.500%, 01/15/22 | | | 216,659 | | | | 0.2 | |
| | 140,000 | | | | | Medicines Co/The, 2.750%, 07/15/23 | | | 128,712 | | | | 0.1 | |
| | 205,000 | | | | | NuVasive, Inc., 2.250%, 03/15/21 | | | 241,387 | | | | 0.2 | |
| | 205,000 | | | | | Quidel Corp., 3.250%, 12/15/20 | | | 310,191 | | | | 0.3 | |
| | 470,000 | | | | | Wright Medical Group, Inc., 2.000%, 02/15/20 | | | 484,394 | | | | 0.5 | |
| | | | | | | | | | 3,641,636 | | | | 3.6 | |
| | | | | | | | | | | | | | | |
| | | | | | | Energy: 0.4% | | | | | | | | |
| | 130,000 | | | | | SEACOR Holdings, Inc., 3.000%, 11/15/28 | | | 123,419 | | | | 0.1 | |
| | 260,000 | | | | | Whiting Petroleum Corp., 1.250%, 04/01/20 | | | 240,500 | | | | 0.3 | |
| | | | | | | | | | 363,919 | | | | 0.4 | |
| | | | | | | | | | | | | | | |
| | | | | | | Industrial: 0.9% | | | | | | | | |
| | 68,000 | | | (1) | | Air Transport Services Group, Inc., 1.125%, 10/15/24 | | | 70,380 | | | | 0.1 | |
| | 410,000 | | | | | Dycom Industries, Inc., 0.750%, 09/15/21 | | | 536,587 | | | | 0.5 | |
| | 332,000 | | | | | General Cable Corp., 4.500%, 11/15/29 | | | 351,713 | | | | 0.3 | |
| | | | | | | | | | 958,680 | | | | 0.9 | |
| | | | | | | | | | | | | | | |
| | | | | | | Technology: 1.8% | | | | | | | | |
| | 110,000 | | | (5) | | Akamai Technologies, Inc., 02/15/19 | | | 110,894 | | | | 0.1 | |
| | 110,000 | | | | | Citrix Systems, Inc., 0.500%, 04/15/19 | | | 142,519 | | | | 0.2 | |
| | 145,000 | | | | | KeyW Holding Corp./The, 2.500%, 07/15/19 | | | 133,037 | | | | 0.1 | |
| | 175,000 | | | (1) | | Microchip Technology, Inc., 1.625%, 02/15/27 | | | 205,953 | | | | 0.2 | |
| | 90,000 | | | (1) | | Nice Systems, Inc., 1.250%, 01/15/24 | | | 111,319 | | | | 0.1 | |
| | 120,000 | | | | | Nuance Communications, Inc., 1.000%, 12/15/35 | | | 115,125 | | | | 0.1 | |
| | 190,000 | | | | | ON Semiconductor Corp., 1.000%, 12/01/20 | | | 243,438 | | | | 0.2 | |
| | 250,000 | | | (1) | | ON Semiconductor Corp., 1.625%, 10/15/23 | | | 309,219 | | | | 0.3 | |
| | 90,000 | | | (1) | | Silicon Laboratories, Inc., 1.375%, 03/01/22 | | | 104,006 | | | | 0.1 | |
| | 110,000 | | | (1) | | Synaptics, Inc., 0.500%, 06/15/22 | | | 101,750 | | | | 0.1 | |
| | 205,000 | | | | | Synchronoss Technologies, Inc., 0.750%, 08/15/19 | | | 184,884 | | | | 0.2 | |
See Accompanying Notes to Financial Statements
| VY® Pioneer High Yield Portfolio | PORTFOLIO OF INVESTMENTS as of December 31, 2017 (continued) |
Principal
Amount† | | | | | | | Value | | | Percentage
of Net
Assets | |
| CONVERTIBLE BONDS/NOTES: (continued) | | | | | |
| | | | | | | Technology: (continued) | | | | | | | | |
| | 46,000 | | | | | Teradyne, Inc., 1.250%, 12/15/23 | | | 65,751 | | | | 0.1 | |
| | | | | | | | | | 1,827,895 | | | | 1.8 | |
| | | | | | | | | | | | | | | |
| | | | | Total Convertible Bonds/Notes
(Cost $7,811,380) | | | 8,415,592 | | | | 8.3 | |
| Shares | | | | | | | Value | | | Percentage
of Net
Assets | |
| COMMON STOCK: 3.2% | |
| | | | | | | Consumer Discretionary: 0.5% | | | | | | | | |
| | 24,014 | | | | | Ford Motor Co. | | | 299,935 | | | | 0.3 | |
| | 1,476 | | | (1),(2),(6) | | Perseus Holding Corp. | | | – | | | | – | |
| | 4,139 | | | | | Starbucks Corp. | | | 237,703 | | | | 0.2 | |
| | | | | | | | | | 537,638 | | | | 0.5 | |
| | | | | | | | | | | | | | | |
| | | | | | | Energy: 0.0% | | | | | | | | |
| | 424,441 | | | (2),(6) | | Ascent Resources - Utica LLC | | | 5,093 | | | | 0.0 | |
| | 91 | | | (6) | | Midstates Petroleum Co., Inc. | | | 1,509 | | | | 0.0 | |
| | 30 | | | (6) | | SilverBow Resources, Inc. | | | 892 | | | | 0.0 | |
| | | | | | | | | | 7,494 | | | | 0.0 | |
| | | | | | | | | | | | | | | |
| | | | | | | Financials: 0.2% | | | | | | | | |
| | 2,083 | | | | | Capital One Financial Corp. | | | 207,425 | | | | 0.2 | |
| | 289 | | | | | JPMorgan Chase & Co. | | | 30,906 | | | | 0.0 | |
| | | | | | | | | | 238,331 | | | | 0.2 | |
| | | | | | | | | | | | | | | |
| | | | | | | Health Care: 0.9% | | | | | | | | |
| | 2,581 | | | | | Aetna, Inc. | | | 465,587 | | | | 0.5 | |
| | 15,129 | | | (6) | | BioScrip, Inc. | | | 44,025 | | | | 0.0 | |
| | 1,411 | | | | | Cigna Corp. | | | 286,560 | | | | 0.3 | |
| | 3,059 | | | (6) | | Mylan NV | | | 129,426 | | | | 0.1 | |
| | | | | | | | | | 925,598 | | | | 0.9 | |
| | | | | | | | | | | | | | | |
| | | | | | | Industrials: 0.2% | | | | | | | | |
| | 5,836 | | | (2),(6) | | Liberty Tire Recycling | | | – | | | | – | |
| | 2,062 | | | (6) | | United Continental Holdings, Inc. | | | 138,979 | | | | 0.2 | |
| | | | | | | | | | 138,979 | | | | 0.2 | |
| | | | | | | | | | | | | | | |
| | | | | | | Information Technology: 0.4% | | | | | | | | |
| | 8,031 | | | (6) | | Avaya Holdings Corp. | | | 140,944 | | | | 0.2 | |
| | 7,059 | | | (6) | | NCR Corp. | | | 239,935 | | | | 0.2 | |
| | | | | | | | | | 380,879 | | | | 0.4 | |
| | | | | | | | | | | | | | | |
| | | | | | | Materials: 0.2% | | | | | | | | |
| | 1,808 | | | | | LyondellBasell Industries NV - Class A | | | 199,458 | | | | 0.2 | |
| | | | | | | | | | | | | | | |
| | | | | | | Real Estate: 0.8% | | | | | | | | |
| | 27,816 | | | | | Forest City Realty Trust, Inc. | | | 670,366 | | | | 0.7 | |
| | 5,760 | | | (6) | | Uniti Group, Inc. | | | 102,470 | | | | 0.1 | |
| | | | | | | | | | 772,836 | | | | 0.8 | |
| | | | | | | | | | | | | | | |
| | | | | Total Common Stock
(Cost $2,285,981) | | 3,201,213 | | | | 3.2 | |
| | | | | | | | | | | | | | | |
| PREFERRED STOCK: 1.6% | | | | | | | | |
| | | | | | | Consumer Discretionary: –% | | | | | | | | |
| | 775 | | | (1),(2),(6) | | Perseus Holding Corp. | | | – | | | | – | |
| | | | | | | | | | | | | | | |
| | | | | | | Financials: 1.5% | | | | | | | | |
| | 470 | | | (6) | | Bank of America Corp. | | | 619,930 | | | | 0.6 | |
| | 3,542 | | | (6),(7) | | GMAC Capital Trust I | | | 91,915 | | | | 0.1 | |
| | 602 | | | (6) | | Wells Fargo & Co. | | | 788,614 | | | | 0.8 | |
| | | | | | | | | | 1,500,459 | | | | 1.5 | |
| | | | | | | | | | | | | | | |
| | | | | | | Health Care: 0.1% | | | | | | | | |
| | 225 | | | | | Allergan PLC | | | 131,906 | | | | 0.1 | |
| | 44 | | | (2),(6) | | BioScrip, Inc. | | | 4,308 | | | | 0.0 | |
| | | | | | | | | | 136,214 | | | | 0.1 | |
| | | | | | | | | | | | | | | |
| | | | | Total Preferred Stock
(Cost $1,621,566) | | 1,636,673 | | | | 1.6 | |
| | | | | | | | | | | | | | | |
| WARRANTS: –% | | | | | | �� | | | | | |
| | | | | | | Energy: –% | | | | | | | | |
| | 644 | | | (2),(6) | | Midstates Petroleum Co., Inc. | | | – | | | | – | |
| | | | | | | | | | | | | | | |
| | | | | | | Health Care: –% | | | | | | | | |
| | 126 | | | (2),(6) | | BioScrip, Inc. - Class A | | | – | | | | – | |
| | 126 | | | (2),(6) | | BioScrip, Inc. - Class B | | | – | | | | – | |
| | | | | | | | | | – | | | | – | |
| | | | | | | | | | | | | | | |
| | | | | Total Warrants
(Cost $–) | | | – | | | | – | |
| | | | | | | | | | | | | | | |
| | | | | Total Long-Term Investments
(Cost $89,401,684) | | 92,325,995 | | | | 90.8 | |
Principal
Amount† | | | | | | | Value | | | Percentage
of Net
Assets | |
| SHORT-TERM INVESTMENTS: 7.5% | |
| | | | | | U.S. Treasury Bills: 6.8% |
| | 4,450,000 | | | | | United States Treasury Bill, 0.570%, 01/04/18 | | | 4,449,721 | | | | 4.4 | |
| | 2,500,000 | | | | | United States Treasury Bill, 0.980%, 01/11/18 | | | 2,499,268 | | | | 2.4 | |
| | | | | | | | | | 6,948,989 | | | | 6.8 | |
| Shares | | | | | | | Value | | | Percentage
of Net
Assets | |
| | | | | | | Mutual Funds: 0.7% | | | | | | | | |
| | 715,155 | | | (8) | | BlackRock Liquidity Funds, FedFund, Institutional Class, 1.170% | | | | | | | | |
| | | | | | | (Cost $715,155) | | | 715,155 | | | | 0.7 | |
| | | | | | | | | | | | | | | |
| | | | | Total Short-Term Investments
(Cost $7,663,925) | | 7,664,144 | | | | 7.5 | |
| | | | | | | | | | | | | | | |
| | | | | Total Investments in Securities
(Cost $97,065,609) | $ | 99,990,139 | | | | 98.3 | |
| | | | | Assets in Excess of Other Liabilities | | 1,721,710 | | | | 1.7 | |
| | | | | Net Assets | $ | 101,711,849 | | | | 100.0 | |
| † | Unless otherwise indicated, principal amount is shown in USD. |
| (1) | Securities with purchases pursuant to Rule 144A or section 4(a)(2), under the Securities Act of 1933 and may not be resold subject to that rule except to qualified institutional buyers. |
See Accompanying Notes to Financial Statements
| VY® Pioneer High Yield Portfolio | PORTFOLIO OF INVESTMENTS as of December 31, 2017 (continued) |
| (2) | For fair value measurement disclosure purposes, security is categorized as Level 3, whose value was determined using significant unobservable inputs. |
| (3) | Defaulted security |
| (4) | All or a portion of this security is payment-in-kind ("PIK") which may pay interest or additional principal at the issuer's discretion. Rates shown are the current rate and possible
payment rates. |
| (5) | Represents a zero coupon bond. Rate shown reflects the effective yield as of December 31, 2017. |
| (6) | Non-income producing security. |
| (7) | Preferred Stock may be called prior to convertible date. |
| (8) | Rate shown is the 7-day yield as of December 31, 2017. |
| Reference Rate Abbreviations: |
| | T-BILL 3MO | 3-month U.S. Treasury Bill |
| | US0003M | 3-month LIBOR |
See Accompanying Notes to Financial Statements
| VY® T. Rowe Price Diversified Mid Cap Growth Portfolio | PORTFOLIO OF INVESTMENTS as of December 31, 2017 |
| Shares | | | | | | | Value | | | Percentage
of Net
Assets | |
| COMMON STOCK: 98.6% | |
| | | | | | Consumer Discretionary: 15.2% |
| | 32,194 | | | (1),(2) | | Altice USA, Inc. | | | 683,479 | | | | 0.1 | |
| | 60,700 | | | | | Aramark | | | 2,594,318 | | | | 0.3 | |
| | 7,500 | | | (2) | | Autozone, Inc. | | | 5,335,275 | | | | 0.5 | |
| | 42,000 | | | | | BorgWarner, Inc. | | | 2,145,780 | | | | 0.2 | |
| | 51,300 | | | (2) | | Burlington Stores, Inc. | | | 6,311,439 | | | | 0.6 | |
| | 64,500 | | | (2) | | Carmax, Inc. | | | 4,136,385 | | | | 0.4 | |
| | 15,400 | | | | | Carter's, Inc. | | | 1,809,346 | | | | 0.2 | |
| | 27,400 | | | | | Choice Hotels International, Inc. | | | 2,126,240 | | | | 0.2 | |
| | 57,000 | | | (2) | | Ctrip.com International Ltd. ADR | | | 2,513,700 | | | | 0.2 | |
| | 34,900 | | | (2) | | Delphi Automotive PLC | | | 2,960,567 | | | | 0.3 | |
| | 11,633 | | | (2) | | Delphi Technologies PLC | | | 610,384 | | | | 0.1 | |
| | 89,900 | | | | | Dollar General Corp. | | | 8,361,599 | | | | 0.8 | |
| | 64,100 | | | (2) | | Dollar Tree, Inc. | | | 6,878,571 | | | | 0.7 | |
| | 87,400 | | | | | Dunkin' Brands Group, Inc. | | | 5,634,678 | | | | 0.6 | |
| | 98,900 | | | | | Extended Stay America, Inc. | | | 1,879,100 | | | | 0.2 | |
| | 22,300 | | | (1) | | Ferrari NV | | | 2,337,932 | | | | 0.2 | |
| | 28,000 | | | (2) | | Five Below, Inc. | | | 1,856,960 | | | | 0.2 | |
| | 61,233 | | | | | Hilton Worldwide Holdings, Inc. | | | 4,890,067 | | | | 0.5 | |
| | 68,300 | | | | | Interpublic Group of Cos., Inc. | | | 1,376,928 | | | | 0.1 | |
| | 28,400 | | | (1) | | L Brands, Inc. | | | 1,710,248 | | | | 0.2 | |
| | 27,600 | | | (2) | | Lululemon Athletica, Inc. | | | 2,169,084 | | | | 0.2 | |
| | 123,300 | | | | | MGM Resorts International | | | 4,116,987 | | | | 0.4 | |
| | 63,400 | | | (2) | | Michaels Cos, Inc. | | | 1,533,646 | | | | 0.2 | |
| | 18,300 | | | (2) | | Mohawk Industries, Inc. | | | 5,048,970 | | | | 0.5 | |
| | 85,300 | | | | | Newell Brands, Inc. | | | 2,635,770 | | | | 0.3 | |
| | 33,100 | | | (2) | | Norwegian Cruise Line Holdings Ltd. | | | 1,762,575 | | | | 0.2 | |
| | 960 | | | (2) | | NVR, Inc. | | | 3,367,891 | | | | 0.3 | |
| | 41,100 | | | | | Omnicom Group | | | 2,993,313 | | | | 0.3 | |
| | 25,400 | | | (2) | | O'Reilly Automotive, Inc. | | | 6,109,716 | | | | 0.6 | |
| | 25,900 | | | (1) | | Papa John's International, Inc. | | | 1,453,249 | | | | 0.1 | |
| | 9,800 | | | (1) | | Polaris Industries, Inc. | | | 1,215,102 | | | | 0.1 | |
| | 39,900 | | | | | Pulte Group, Inc. | | | 1,326,675 | | | | 0.1 | |
| | 16,600 | | | | | PVH Corp. | | | 2,277,686 | | | | 0.2 | |
| | 33,800 | | | (1) | | Restaurant Brands International, Inc. | | | 2,078,024 | | | | 0.2 | |
| | 124,200 | | | | | Ross Stores, Inc. | | | 9,967,050 | | | | 1.0 | |
| | 23,600 | | | | | Royal Caribbean Cruises Ltd. | | | 2,815,008 | | | | 0.3 | |
| | 116,500 | | | | | Service Corp. International | | | 4,347,780 | | | | 0.4 | |
| | 20,500 | | | (1) | | Signet Jewelers Ltd. | | | 1,159,275 | | | | 0.1 | |
| | 26,300 | | | (2) | | Sotheby's | | | 1,357,080 | | | | 0.1 | |
| | 104,900 | | | | | Tapestry, Inc. | | | 4,639,727 | | | | 0.5 | |
| | 35,700 | | | | | Tiffany & Co. | | | 3,711,015 | | | | 0.4 | |
| | 60,400 | | | | | Toll Brothers, Inc. | | | 2,900,408 | | | | 0.3 | |
| | 36,500 | | | | | Tractor Supply Co. | | | 2,728,375 | | | | 0.3 | |
| | 17,300 | | | (2) | | Ulta Beauty, Inc. | | | 3,869,318 | | | | 0.4 | |
| | 17,420 | | | (2) | | Wayfair, Inc. | | | 1,398,303 | | | | 0.1 | |
| | 8,200 | | | | | Whirlpool Corp. | | | 1,382,848 | | | | 0.1 | |
| | 29,100 | | | (1) | | Williams-Sonoma, Inc. | | | 1,504,470 | | | | 0.1 | |
| | 11,100 | | | | | Wynn Resorts Ltd. | | | 1,871,349 | | | | 0.2 | |
| | 53,500 | | | | | Yum China Holdings, Inc. | | | 2,141,070 | | | | 0.2 | |
| | 47,500 | | | | | Yum! Brands, Inc. | | | 3,876,475 | | | | 0.4 | |
| | | | | | | | | | 153,911,235 | | | | 15.2 | |
| | | | | | | | | | | | | | | |
| | | | | | | Consumer Staples: 5.8% | | | | | | | | |
| | 66,600 | | | (2) | | Blue Buffalo Pet Products, Inc. | | | 2,183,814 | | | | 0.2 | |
| | 64,700 | | | | | Brown-Forman Corp. - Class B | | | 4,442,949 | | | | 0.5 | |
| | 19,600 | | | | | Casey's General Stores, Inc. | | | 2,194,024 | | | | 0.2 | |
| | 122,800 | | | | | Church & Dwight Co., Inc. | | | 6,160,876 | | | | 0.6 | |
| | 40,400 | | | | | Clorox Co. | | | 6,009,096 | | | | 0.6 | |
| | 57,600 | | | | | Conagra Brands, Inc. | | | 2,169,792 | | | | 0.2 | |
| | 58,000 | | | | | Dr Pepper Snapple Group, Inc. | | | 5,629,480 | | | | 0.6 | |
| | 35,900 | | | | | Energizer Holdings, Inc. | | | 1,722,482 | | | | 0.2 | |
| | 45,400 | | | (2) | | Hain Celestial Group, Inc. | | | 1,924,506 | | | | 0.2 | |
| | 56,900 | | | | | Hershey Co. | | | 6,458,719 | | | | 0.6 | |
| | 74,300 | | | | | Hormel Foods Corp. | | | 2,703,777 | | | | 0.3 | |
| | 52,800 | | | | | McCormick & Co., Inc. | | | 5,380,848 | | | | 0.5 | |
| | 61,400 | | | | | Pinnacle Foods, Inc. | | | 3,651,458 | | | | 0.4 | |
| | 10,700 | | | | | Pricesmart, Inc. | | | 921,270 | | | | 0.1 | |
| | 55,800 | | | (2) | | Sprouts Farmers Market, Inc. | | | 1,358,730 | | | | 0.1 | |
| | 64,300 | | | | | Tyson Foods, Inc. | | | 5,212,801 | | | | 0.5 | |
| | | | | | | | | | 58,124,622 | | | | 5.8 | |
| | | | | | | | | | | | | | | |
| | | | | | | Energy: 1.7% | | | | | | | | |
| | 19,600 | | | | | Andeavor | | | 2,241,064 | | | | 0.2 | |
| | 75,100 | | | | | Cabot Oil & Gas Corp. | | | 2,147,860 | | | | 0.2 | |
| | 14,800 | | | (2) | | Centennial Resource Development, Inc. | | | 293,040 | | | | 0.0 | |
| | 39,637 | | | (2) | | Centennial Resource Development, Inc. | | | 784,813 | | | | 0.1 | |
| | 56,000 | | | (2) | | Centennial Resource Development, Inc./DE | | | 1,108,800 | | | | 0.1 | |
| | 7,500 | | | | | Cimarex Energy Co. | | | 915,075 | | | | 0.1 | |
| | 13,200 | | | (2) | | Concho Resources, Inc./Midland TX | | | 1,982,904 | | | | 0.2 | |
| | 15,800 | | | (2) | | Diamondback Energy, Inc. | | | 1,994,750 | | | | 0.2 | |
| | 89,100 | | | (1),(2) | | Jagged Peak Energy, Inc. | | | 1,405,998 | | | | 0.1 | |
| | 36,000 | | | | | Oceaneering International, Inc. | | | 761,040 | | | | 0.1 | |
| | 41,100 | | | (2) | | RSP Permian, Inc. | | | 1,671,948 | | | | 0.2 | |
| | 523 | | | (2),(3) | | Venture Global LNG, Inc., - Series C | | | 1,972,233 | | | | 0.2 | |
| | | | | | | | | | 17,279,525 | | | | 1.7 | |
| | | | | | | | | | | | | | | |
| | | | | | | Financials: 8.0% | | | | | | | | |
| | 58,800 | | | | | BankUnited, Inc. | | | 2,394,336 | | | | 0.2 | |
| | 53,933 | | | | | Cboe Global Markets, Inc. | | | 6,719,512 | | | | 0.7 | |
| | 85,800 | | | | | Citizens Financial Group, Inc. | | | 3,601,884 | | | | 0.4 | |
| | 23,100 | | | | | Discover Financial Services | | | 1,776,852 | | | | 0.2 | |
| | 56,700 | | | (2) | | E*Trade Financial Corp. | | | 2,810,619 | | | | 0.3 | |
| | 9,800 | | | | | Factset Research Systems, Inc. | | | 1,889,048 | | | | 0.2 | |
| | 105,600 | | | | | Fifth Third Bancorp | | | 3,203,904 | | | | 0.3 | |
See Accompanying Notes to Financial Statements
| VY® T. Rowe Price Diversified Mid Cap Growth Portfolio | PORTFOLIO OF INVESTMENTS as of December 31, 2017 (continued) |
| Shares | | | | | | | Value | | | Percentage
of Net
Assets | |
| COMMON STOCK: (continued) | |
| | | | | | Financials: (continued) |
| | 28,900 | | | | | Financial Engines, Inc. | | | 875,670 | | | | 0.1 | |
| | 73,100 | | | | | First Republic Bank | | | 6,333,384 | | | | 0.6 | |
| | 85,300 | | | | | FNF Group | | | 3,347,172 | | | | 0.3 | |
| | 36,100 | | | | | Invesco Ltd. | | | 1,319,094 | | | | 0.1 | |
| | 75,500 | | | | | Lazard Ltd. | | | 3,963,750 | | | | 0.4 | |
| | 7,400 | | | | | MarketAxess Holdings, Inc. | | | 1,492,950 | | | | 0.2 | |
| | 36,700 | | | | | Moody's Corp. | | | 5,417,287 | | | | 0.5 | |
| | 25,400 | | | | | MSCI, Inc. - Class A | | | 3,214,116 | | | | 0.3 | |
| | 5,841 | | | | | Nasdaq, Inc. | | | 448,764 | | | | 0.1 | |
| | 14,000 | | | | | Northern Trust Corp. | | | 1,398,460 | | | | 0.1 | |
| | 162,800 | | | | | Progressive Corp. | | | 9,168,896 | | | | 0.9 | |
| | 15,600 | | | (2) | | Signature Bank | | | 2,141,256 | | | | 0.2 | |
| | 22,600 | | | | | State Street Corp. | | | 2,205,986 | | | | 0.2 | |
| | 15,900 | | | (2) | | SVB Financial Group | | | 3,716,943 | | | | 0.4 | |
| | 86,000 | | | | | TD Ameritrade Holding Corp. | | | 4,397,180 | | | | 0.4 | |
| | 69,530 | | | | | Webster Financial Corp. | | | 3,904,805 | | | | 0.4 | |
| | 33,400 | | | | | Willis Towers Watson PLC | | | 5,033,046 | | | | 0.5 | |
| | | | | | | | | | 80,774,914 | | | | 8.0 | |
| | | | | | | | | | | | | | | |
| | | | | | | Health Care: 13.8% | | | | | | | | |
| | 65,199 | | | (2) | | Acadia Healthcare Co., Inc. | | | 2,127,443 | | | | 0.2 | |
| | 91,000 | | | (1),(2) | | Acadia Pharmaceuticals, Inc. | | | 2,740,010 | | | | 0.3 | |
| | 61,900 | | | | | Agilent Technologies, Inc. | | | 4,145,443 | | | | 0.4 | |
| | 18,700 | | | (2) | | Agios Pharmaceuticals, Inc. | | | 1,069,079 | | | | 0.1 | |
| | 13,200 | | | (2) | | Alexion Pharmaceuticals, Inc. | | | 1,578,588 | | | | 0.2 | |
| | 13,800 | | | (2) | | Align Technology, Inc. | | | 3,066,222 | | | | 0.3 | |
| | 68,500 | | | (2) | | Alkermes PLC | | | 3,749,005 | | | | 0.4 | |
| | 34,500 | | | (2) | | Alnylam Pharmaceuticals, Inc. | | | 4,383,225 | | | | 0.4 | |
| | 27,300 | | | | | AmerisourceBergen Corp. | | | 2,506,686 | | | | 0.2 | |
| | 6,100 | | | (2) | | Athenahealth, Inc. | | | 811,544 | | | | 0.1 | |
| | 63,700 | | | (2) | | BioMarin Pharmaceutical, Inc. | | | 5,680,129 | | | | 0.6 | |
| | 32,400 | | | (2) | | Bioverativ, Inc. | | | 1,747,008 | | | | 0.2 | |
| | 11,900 | | | (2) | | Bluebird Bio, Inc. | | | 2,119,390 | | | | 0.2 | |
| | 57,700 | | | | | Bruker Corp. | | | 1,980,264 | | | | 0.2 | |
| | 51,584 | | | (2) | | Catalent, Inc. | | | 2,119,071 | | | | 0.2 | |
| | 54,000 | | | (2) | | Centene Corp. | | | 5,447,520 | | | | 0.5 | |
| | 42,412 | | | (2) | | Cerner Corp. | | | 2,858,145 | | | | 0.3 | |
| | 33,200 | | | | | Cooper Cos., Inc. | | | 7,233,616 | | | | 0.7 | |
| | 32,900 | | | (2) | | DaVita, Inc. | | | 2,377,025 | | | | 0.2 | |
| | 26,250 | | | | | Dentsply Sirona, Inc. | | | 1,728,037 | | | | 0.2 | |
| | 25,217 | | | (2) | | Envision Healthcare Corp. | | | 871,499 | | | | 0.1 | |
| | 69,700 | | | (2) | | Exelixis, Inc. | | | 2,118,880 | | | | 0.2 | |
| | 49,000 | | | (2) | | Henry Schein, Inc. | | | 3,424,120 | | | | 0.3 | |
| | 147,600 | | | (2) | | Hologic, Inc. | | | 6,309,900 | | | | 0.6 | |
| | 35,300 | | | (2) | | IDEXX Laboratories, Inc. | | | 5,520,214 | | | | 0.5 | |
| | 28,600 | | | (2) | | Illumina, Inc. | | | 6,248,814 | | | | 0.6 | |
| | 60,200 | | | (2) | | Incyte Corp., Ltd. | | | 5,701,542 | | | | 0.6 | |
| | 24,600 | | | (2) | | IQVIA Holdings, Inc. | | | 2,408,340 | | | | 0.2 | |
| | 147,000 | | | (2) | | Ironwood Pharmaceuticals, Inc. | | | 2,203,530 | | | | 0.2 | |
| | 13,000 | | | (2) | | Jazz Pharmaceuticals PLC | | | 1,750,450 | | | | 0.2 | |
| | 22,600 | | | (2) | | Medidata Solutions, Inc. | | | 1,432,162 | | | | 0.1 | |
| | 7,900 | | | (2) | | Mettler Toledo International, Inc. | | | 4,894,208 | | | | 0.5 | |
| | 28,600 | | | (2) | | Molina Healthcare, Inc. | | | 2,193,048 | | | | 0.2 | |
| | 49,279 | | | (2) | | Neurocrine Biosciences, Inc. | | | 3,823,558 | | | | 0.4 | |
| | 6,100 | | | (2) | | Sage Therapeutics, Inc. | | | 1,004,731 | | | | 0.1 | |
| | 18,200 | | | (2) | | Sarepta Therapeutics, Inc. | | | 1,012,648 | | | | 0.1 | |
| | 29,400 | | | (2) | | Seattle Genetics, Inc. | | | 1,572,900 | | | | 0.2 | |
| | 19,100 | | | | | STERIS PLC | | | 1,670,677 | | | | 0.2 | |
| | 16,000 | | | | | Teleflex, Inc. | | | 3,981,120 | | | | 0.4 | |
| | 23,570 | | | (1),(2) | | Tesaro, Inc. | | | 1,953,246 | | | | 0.2 | |
| | 11,100 | | | (2) | | Ultragenyx Pharmaceutical, Inc. | | | 514,818 | | | | 0.0 | |
| | 21,400 | | | | | Universal Health Services, Inc. | | | 2,425,690 | | | | 0.2 | |
| | 50,200 | | | (2) | | Veeva Systems, Inc. | | | 2,775,056 | | | | 0.3 | |
| | 10,600 | | | (2) | | Vertex Pharmaceuticals, Inc. | | | 1,588,516 | | | | 0.2 | |
| | 14,900 | | | (2) | | WellCare Health Plans, Inc. | | | 2,996,539 | | | | 0.3 | |
| | 21,300 | | | | | West Pharmaceutical Services, Inc. | | | 2,101,671 | | | | 0.2 | |
| | 107,850 | | | | | Zoetis, Inc. | | | 7,769,514 | | | | 0.8 | |
| | | | | | | | | | 139,734,841 | | | | 13.8 | |
| | | | | | | | | | | | | | | |
| | | | | | | Industrials: 18.7% | | | | | | | | |
| | 17,100 | | | | | Acuity Brands, Inc. | | | 3,009,600 | | | | 0.3 | |
| | 53,100 | | | | | Alaska Air Group, Inc. | | | 3,903,381 | | | | 0.4 | |
| | 50,300 | | | | | Allegion Public Ltd. | | | 4,001,868 | | | | 0.4 | |
| | 87,000 | | | | | American Airlines Group, Inc. | | | 4,526,610 | | | | 0.4 | |
| | 33,962 | | | | | Ametek, Inc. | | | 2,461,226 | | | | 0.2 | |
| | 73,300 | | | | | AO Smith Corp. | | | 4,491,824 | | | | 0.4 | |
| | 39,700 | | | | | BWX Technologies, Inc. | | | 2,401,453 | | | | 0.2 | |
| | 30,100 | | | | | CH Robinson Worldwide, Inc. | | | 2,681,609 | | | | 0.3 | |
| | 19,400 | | | | | Cintas Corp. | | | 3,023,102 | | | | 0.3 | |
| | 46,300 | | | (2) | | Colfax Corp. | | | 1,834,406 | | | | 0.2 | |
| | 13,800 | | | | | Copa Holdings S.A.- Class A | | | 1,850,028 | | | | 0.2 | |
| | 89,000 | | | (2) | | Copart, Inc. | | | 3,843,910 | | | | 0.4 | |
| | 47,800 | | | | | Donaldson Co., Inc. | | | 2,339,810 | | | | 0.2 | |
| | 45,987 | | | | | Equifax, Inc. | | | 5,422,787 | | | | 0.5 | |
| | 30,200 | | | | | Expeditors International Washington, Inc. | | | 1,953,638 | | | | 0.2 | |
| | 24,800 | | | | | Fastenal Co. | | | 1,356,312 | | | | 0.1 | |
| | 38,900 | | | | | Flowserve Corp. | | | 1,638,857 | | | | 0.2 | |
| | 63,400 | | | | | Fortive Corp. | | | 4,586,990 | | | | 0.5 | |
| | 76,975 | | | | | Fortune Brands Home & Security, Inc. | | | 5,268,169 | | | | 0.5 | |
| | 36,700 | | | (2) | | Generac Holdings, Inc. | | | 1,817,384 | | | | 0.2 | |
| | 26,400 | | | (2) | | Genesee & Wyoming, Inc. | | | 2,078,472 | | | | 0.2 | |
| | 70,800 | | | | | Graco, Inc. | | | 3,201,576 | | | | 0.3 | |
| | 54,700 | | | | | Harris Corp. | | | 7,748,255 | | | | 0.8 | |
| | 78,100 | | | (2) | | HD Supply Holdings, Inc. | | | 3,126,343 | | | | 0.3 | |
| | 23,100 | | | | | Hubbell, Inc. | | | 3,126,354 | | | | 0.3 | |
| | 14,000 | | | | | Huntington Ingalls Industries, Inc. | | | 3,299,800 | | | | 0.3 | |
| | 24,100 | | | | | IDEX Corp. | | | 3,180,477 | | | | 0.3 | |
| | 93,453 | | | (2) | | IHS Markit Ltd. | | | 4,219,403 | | | | 0.4 | |
| | 24,500 | | | | | JB Hunt Transport Services, Inc. | | | 2,817,010 | | | | 0.3 | |
| | 20,700 | | | | | Kansas City Southern | | | 2,178,054 | | | | 0.2 | |
| | 99,600 | | | | | KAR Auction Services, Inc. | | | 5,030,796 | | | | 0.5 | |
| | 12,700 | | | (2) | | Kirby Corp. | | | 848,360 | | | | 0.1 | |
See Accompanying Notes to Financial Statements
| VY® T. Rowe Price Diversified Mid Cap Growth Portfolio | PORTFOLIO OF INVESTMENTS as of December 31, 2017 (continued) |
| Shares | | | | | | | Value | | | Percentage
of Net
Assets | |
| COMMON STOCK: (continued) | |
| | | | | | Industrials: (continued) |
| | 14,600 | | | | | Landstar System, Inc. | | | 1,519,860 | | | | 0.2 | |
| | 18,300 | | | | | Manpowergroup, Inc. | | | 2,307,813 | | | | 0.2 | |
| | 25,100 | | | (2) | | Middleby Corp. | | | 3,387,245 | | | | 0.3 | |
| | 89,400 | | | | | Nielsen Holdings PLC | | | 3,254,160 | | | | 0.3 | |
| | 14,400 | | | | | Nordson Corp. | | | 2,108,160 | | | | 0.2 | |
| | 20,300 | | | | | Old Dominion Freight Line | | | 2,670,465 | | | | 0.3 | |
| | 28,300 | | | | | Paccar, Inc. | | | 2,011,564 | | | | 0.2 | |
| | 44,100 | | | (1) | | Ritchie Bros Auctioneers, Inc. | | | 1,319,913 | | | | 0.1 | |
| | 37,100 | | | | | Robert Half International, Inc. | | | 2,060,534 | | | | 0.2 | |
| | 22,400 | | | | | Rockwell Automation, Inc. | | | 4,398,240 | | | | 0.4 | |
| | 78,910 | | | | | Rollins, Inc. | | | 3,671,682 | | | | 0.4 | |
| | 16,600 | | | | | Roper Technologies, Inc. | | | 4,299,400 | | | | 0.4 | |
| | 75,324 | | | (1) | | Schneider National, Inc. | | | 2,151,254 | | | | 0.2 | |
| | 71,100 | | | (2) | | Sensata Technologies Holdings N.V. | | | 3,633,921 | | | | 0.4 | |
| | 21,600 | | | | | Snap-On, Inc. | | | 3,764,880 | | | | 0.4 | |
| | 28,200 | | | (2) | | Stericycle, Inc. | | | 1,917,318 | | | | 0.2 | |
| | 48,300 | | | | | Textron, Inc. | | | 2,733,297 | | | | 0.3 | |
| | 40,700 | | | | | Toro Co. | | | 2,654,861 | | | | 0.3 | |
| | 17,200 | | | | | TransDigm Group, Inc. | | | 4,723,464 | | | | 0.5 | |
| | 87,900 | | | (2) | | TransUnion | | | 4,830,984 | | | | 0.5 | |
| | 66,341 | | | (2) | | United Continental Holdings, Inc. | | | 4,471,383 | | | | 0.4 | |
| | 12,100 | | | | | Valmont Industries, Inc. | | | 2,006,785 | | | | 0.2 | |
| | 60,500 | | | (2) | | Verisk Analytics, Inc. | | | 5,808,000 | | | | 0.6 | |
| | 12,100 | | | (2) | | WABCO Holdings, Inc. | | | 1,736,350 | | | | 0.2 | |
| | 37,100 | | | (1) | | Wabtec Corp. | | | 3,021,053 | | | | 0.3 | |
| | 70,050 | | | | | Waste Connections, Inc. | | | 4,969,347 | | | | 0.5 | |
| | 12,700 | | | | | Watsco, Inc. | | | 2,159,508 | | | | 0.2 | |
| | 33,100 | | | | | Xylem, Inc. | | | 2,257,420 | | | | 0.2 | |
| | | | | | | | | | 189,116,725 | | | | 18.7 | |
| | | | | | | | | | | | | | | |
| | | | | | | Information Technology: 26.5% | | | | | | | | |
| | 17,300 | | | | | Alliance Data Systems Corp. | | | 4,385,204 | | | | 0.4 | |
| | 86,000 | | | | | Amphenol Corp. | | | 7,550,800 | | | | 0.7 | |
| | 11,100 | | | (2) | | ANSYS, Inc. | | | 1,638,249 | | | | 0.2 | |
| | 134,179 | | | (2) | | Atlassian Corp. PLC | | | 6,107,828 | | | | 0.6 | |
| | 48,000 | | | (2) | | Autodesk, Inc. | | | 5,031,840 | | | | 0.5 | |
| | 110,170 | | | (2) | | Black Knight, Inc. | | | 4,864,005 | | | | 0.5 | |
| | 103,400 | | | | | Booz Allen Hamilton Holding Corp. | | | 3,942,642 | | | | 0.4 | |
| | 77,900 | | | (2) | | Cadence Design Systems, Inc. | | | 3,257,778 | | | | 0.3 | |
| | 75,200 | | | | | CDK Global, Inc. | | | 5,360,256 | | | | 0.5 | |
| | 40,000 | | | | | Cognex Corp. | | | 2,446,400 | | | | 0.2 | |
| | 15,720 | | | (2) | | Coherent, Inc. | | | 4,436,498 | | | | 0.4 | |
| | 79,700 | | | (2) | | CoreLogic, Inc. | | | 3,682,937 | | | | 0.4 | |
| | 20,100 | | | (2) | | CoStar Group, Inc. | | | 5,968,695 | | | | 0.6 | |
| | 119,500 | | | | | CSRA, Inc. | | | 3,575,440 | | | | 0.4 | |
| | 44,255 | | | (2),(3) | | Dropbox, Inc. - Class A | | | 518,226 | | | | 0.1 | |
| | 19,495 | | | (2),(3) | | Dropbox, Inc. - Class B | | | 228,286 | | | | 0.0 | |
| | 40,700 | | | (2) | | Electronic Arts, Inc. | | | 4,275,942 | | | | 0.4 | |
| | 18,600 | | | (2) | | Ellie Mae, Inc. | | | 1,662,840 | | | | 0.2 | |
| | 95,400 | | | | | Entegris, Inc. | | | 2,904,930 | | | | 0.3 | |
| | 16,500 | | | (2) | | EPAM Systems, Inc. | | | 1,772,595 | | | | 0.2 | |
| | 93,800 | | | | | Fidelity National Information Services, Inc. | | | 8,825,642 | | | | 0.9 | |
| | 69,500 | | | (2) | | Fiserv, Inc. | | | 9,113,535 | | | | 0.9 | |
| | 28,700 | | | (2) | | FleetCor Technologies, Inc. | | | 5,522,741 | | | | 0.5 | |
| | 48,000 | | | (2) | | Fortinet, Inc. | | | 2,097,120 | | | | 0.2 | |
| | 34,300 | | | (2) | | Gartner, Inc. | | | 4,224,045 | | | | 0.4 | |
| | 65,500 | | | | | Genpact Ltd. | | | 2,078,970 | | | | 0.2 | |
| | 60,300 | | | | | Global Payments, Inc. | | | 6,044,472 | | | | 0.6 | |
| | 58,700 | | | (2) | | Guidewire Software, Inc. | | | 4,359,062 | | | | 0.4 | |
| | 24,500 | | | (2) | | IAC/InterActiveCorp | | | 2,995,860 | | | | 0.3 | |
| | 46,100 | | | (2) | | Integrated Device Technology, Inc. | | | 1,370,553 | | | | 0.1 | |
| | 13,900 | | | | | Intuit, Inc. | | | 2,193,142 | | | | 0.2 | |
| | 11,000 | | | (2) | | IPG Photonics Corp. | | | 2,355,430 | | | | 0.2 | |
| | 101,850 | | | (2) | | Keysight Technologies, Inc. | | | 4,236,960 | | | | 0.4 | |
| | 58,800 | | | | | KLA-Tencor Corp. | | | 6,178,116 | | | | 0.6 | |
| | 60,300 | | | | | Leidos Holdings, Inc. | | | 3,893,571 | | | | 0.4 | |
| | 255,948 | | | | | Marvell Technology Group Ltd. | | | 5,495,204 | | | | 0.5 | |
| | 93,200 | | | (1),(2) | | Match Group, Inc. | | | 2,918,092 | | | | 0.3 | |
| | 7,800 | | | | | Mercadolibre, Inc. | | | 2,454,348 | | | | 0.2 | |
| | 106,900 | | | | | Microchip Technology, Inc. | | | 9,394,372 | | | | 0.9 | |
| | 105,500 | | | (2) | | Microsemi Corp. | | | 5,449,075 | | | | 0.5 | |
| | 22,100 | | | | | Motorola Solutions, Inc. | | | 1,996,514 | | | | 0.2 | |
| | 30,600 | | | (2) | | Palo Alto Networks, Inc. | | | 4,435,164 | | | | 0.4 | |
| | 37,500 | | | | | Paychex, Inc. | | | 2,553,000 | | | | 0.3 | |
| | 30,700 | | | (2) | | Proofpoint, Inc. | | | 2,726,467 | | | | 0.3 | |
| | 56,900 | | | (2) | | Red Hat, Inc. | | | 6,833,690 | | | | 0.7 | |
| | 160,600 | | | | | Sabre Corp. | | | 3,292,300 | | | | 0.3 | |
| | 61,900 | | | (2) | | ServiceNow, Inc. | | | 8,071,141 | | | | 0.8 | |
| | 11,100 | | | (2) | | Shopify, Inc. | | | 1,121,100 | | | | 0.1 | |
| | 69,000 | | | | | Skyworks Solutions, Inc. | | | 6,551,550 | | | | 0.7 | |
| | 45,900 | | | (2) | | Splunk, Inc. | | | 3,802,356 | | | | 0.4 | |
| | 125,900 | | | | | SS&C Technologies Holdings, Inc. | | | 5,096,432 | | | | 0.5 | |
| | 239,000 | | | | | Symantec Corp. | | | 6,706,340 | | | | 0.7 | |
| | 43,400 | | | (2) | | Synopsys, Inc. | | | 3,699,416 | | | | 0.4 | |
| | 50,819 | | | (2) | | Tableau Software, Inc. | | | 3,516,675 | | | | 0.4 | |
| | 43,100 | | | (2) | | Trimble, Inc. | | | 1,751,584 | | | | 0.2 | |
| | 18,800 | | | (2) | | Tyler Technologies, Inc. | | | 3,328,540 | | | | 0.3 | |
| | 20,800 | | | (2) | | Ultimate Software Group, Inc. | | | 4,539,184 | | | | 0.5 | |
| | 118,000 | | | (1),(2) | | Vantiv, Inc. | | | 8,678,900 | | | | 0.9 | |
| | 54,100 | | | (1),(2) | | VeriSign, Inc. | | | 6,191,204 | | | | 0.6 | |
| | 20,999 | | | (2) | | WEX, Inc. | | | 2,965,689 | | | | 0.3 | |
| | 57,847 | | | (2) | | Workday, Inc. | | | 5,885,354 | | | | 0.6 | |
| | 79,000 | | | | | Xilinx, Inc. | | | 5,326,180 | | | | 0.5 | |
| | 32,400 | | | (2) | | Zendesk, Inc. | | | 1,096,416 | | | | 0.1 | |
| | 54,200 | | | (2) | | Zillow Group, Inc. - Class A | | | 2,208,108 | | | | 0.2 | |
| | 236,500 | | | (2) | | Zynga, Inc. | | | 946,000 | | | | 0.1 | |
| | | | | | | | | | 268,131,005 | | | | 26.5 | |
| | | | | | | | | | | | | | | |
| | | | | | | Materials: 5.2% | | | | | | | | |
| | 18,500 | | | | | Air Products & Chemicals, Inc. | | | 3,035,480 | | | | 0.3 | |
| | 24,200 | | | | | Ashland Global Holdings, Inc. | | | 1,723,040 | | | | 0.2 | |
| | 88,400 | | | (2) | | Axalta Coating Systems Ltd. | | | 2,860,624 | | | | 0.3 | |
| | 174,800 | | | | | Ball Corp. | | | 6,616,180 | | | | 0.6 | |
| | 21,500 | | | | | Carpenter Technology Corp. | | | 1,096,285 | | | | 0.1 | |
| | 25,100 | | | | | Celanese Corp. | | | 2,687,708 | | | | 0.3 | |
| | 47,800 | | | | | CF Industries Holdings, Inc. | | | 2,033,412 | | | | 0.2 | |
| | 24,100 | | | | | Eagle Materials, Inc. | | | 2,730,530 | | | | 0.3 | |
| | 4,000 | | | | | NewMarket Corp. | | | 1,589,560 | | | | 0.2 | |
| | 33,400 | | | | | PolyOne Corp. | | | 1,452,900 | | | | 0.1 | |
See Accompanying Notes to Financial Statements
| VY® T. Rowe Price Diversified Mid Cap Growth Portfolio | PORTFOLIO OF INVESTMENTS as of December 31, 2017 (continued) |
| Shares | | | | | | | Value | | | Percentage
of Net
Assets | |
| COMMON STOCK: (continued) | |
| | | | | | Materials: (continued) |
| | 26,100 | | | | | PPG Industries, Inc. | | | 3,049,002 | | | | 0.3 | |
| | 72,700 | | | | | RPM International, Inc. | | | 3,810,934 | | | | 0.4 | |
| | 87,700 | | | | | Sealed Air Corp. | | | 4,323,610 | | | | 0.4 | |
| | 5,500 | | | | | Sherwin-Williams Co. | | | 2,255,220 | | | | 0.2 | |
| | 143,729 | | | | | Valvoline, Inc. | | | 3,601,849 | | | | 0.3 | |
| | 64,900 | | | | | Vulcan Materials Co. | | | 8,331,213 | | | | 0.8 | |
| | 76,600 | | | (1) | | Wheaton Precious Metals Corp. | | | 1,695,158 | | | | 0.2 | |
| | | | | | | | | | 52,892,705 | | | | 5.2 | |
| | | | | | | | | | | | | | | |
| | | | | | | Real Estate: 2.8% | | | | | | | | |
| | 50,795 | | | | | American Campus Communities, Inc. | | | 2,084,119 | | | | 0.2 | |
| | 55,900 | | | | | CubeSmart | | | 1,616,628 | | | | 0.2 | |
| | 4,115 | | | | | Equinix, Inc. | | | 1,865,000 | | | | 0.2 | |
| | 10,300 | | | | | Federal Realty Investment Trust | | | 1,367,943 | | | | 0.1 | |
| | 67,800 | | | | | Iron Mountain, Inc. | | | 2,558,094 | | | | 0.2 | |
| | 17,700 | | | | | Jones Lang LaSalle, Inc. | | | 2,636,061 | | | | 0.3 | |
| | 86,900 | | | (1) | | MGM Growth Properties LLC | | | 2,533,135 | | | | 0.2 | |
| | 53,650 | | | (2) | | SBA Communications Corp. | | | 8,764,264 | | | | 0.9 | |
| | 20,200 | | | | | SL Green Realty Corp. | | | 2,038,786 | | | | 0.2 | |
| | 220,615 | | | | | VEREIT, Inc. | | | 1,718,591 | | | | 0.2 | |
| | 18,276 | | | (2),(3) | | WeWork Companies, Inc., - Class A | | | 837,955 | | | | 0.1 | |
| | | | | | | | | | 28,020,576 | | | | 2.8 | |
| | | | | | | | | | | | | | | |
| | | | | | | Telecommunication Services: 0.3% | | | | | | | | |
| | 65,600 | | | (2) | | Zayo Group Holdings, Inc. | | | 2,414,080 | | | | 0.3 | |
| | | | | | | | | | | | | | | |
| | | | | | | Utilities: 0.6% | | | | | | | | |
| | 43,700 | | | | | Atmos Energy Corp. | | | 3,753,393 | | | | 0.4 | |
| | 79,600 | | | | | NiSource, Inc. | | | 2,043,332 | | | | 0.2 | |
| | | | | | | | | | 5,796,725 | | | | 0.6 | |
| | | | | | | | | | | | | | | |
| | | | | Total Common Stock
(Cost $695,963,491) | | 996,196,953 | | | | 98.6 | |
| | | | | | | | | | | | | | | |
| PREFERRED STOCK: 1.3% | | | | | | | | | |
| | | | | | | Consumer Discretionary: 0.1% | | | | | | | | |
| | 7,415 | | | (2),(3) | | Flipkart Online Services Pvt. Ltd., - Series G | | | 877,739 | | | | 0.1 | |
| | | | | | | | | | | | | | | |
| | | | | | | Information Technology: 0.7% | | | | | | | | |
| | 32,391 | | | (2),(3) | | AirBNB, Inc. - Series D | | | 3,791,366 | | | | 0.4 | |
| | 3,719 | | | (2),(3) | | AirBNB, Inc. - Series E | | | 435,309 | | | | 0.0 | |
| | 24,209 | | | (2),(3) | | Dropbox, Inc. - Series A | | | 283,487 | | | | 0.0 | |
| | 118,921 | | | (2),(3) | | Dropbox, Inc. - Series A-1 | | | 1,392,565 | | | | 0.1 | |
| | 353,970 | | | (2),(3) | | Tanium, Inc.- Series G | | | 1,653,040 | | | | 0.2 | |
| | | | | | | | | | 7,555,767 | | | | 0.7 | |
| | | | | | | | | | | | | | | |
| | | | | | | Real Estate: 0.5% | | | | | | | | |
| | 44,396 | | | (2),(3) | | WeWork Companies, Inc. - Series D-1 | | | 2,035,556 | | | | 0.2 | |
| | 34,882 | | | (2),(3) | | WeWork Companies, Inc. - Series D-2 | | | 1,599,340 | | | | 0.2 | |
| | 24,709 | | | (2),(3) | | WeWork Companies, Inc. - Series E | | | 1,132,908 | | | | 0.1 | |
| | | | | | | | | | 4,767,804 | | | | 0.5 | |
| | | | | | | | | | | | | | | |
| | | | | Total Preferred Stock
(Cost $7,738,124) | | 13,201,310 | | | | 1.3 | |
| | | | | | | | | | | | | | | |
| | | | | Total Long-Term Investments
(Cost $703,701,615) | | 1,009,398,263 | | | | 99.9 | |
| Principal Amount† | | | | | | | Value | | | Percentage
of Net
Assets | |
| SHORT-TERM INVESTMENTS: 3.3% | |
| | | | | | | Securities Lending Collateral(4): 3.2% | | | | | | | | |
| | 7,744,016 | | | | | Cantor Fitzgerald, Repurchase Agreement dated 12/29/17, 1.41%, due 01/02/18 (Repurchase Amount $7,745,213, collateralized by various U.S. Government\U.S. Government Agency Obligations, 0.000%-8.500%, Market Value plus accrued interest $7,898,896, due 01/31/18-06/20/63) | | | 7,744,016 | | | | 0.8 | |
| | 1,629,036 | | | | | Daiwa Capital Markets, Repurchase Agreement dated 12/29/17, 1.43%, due 01/02/18 (Repurchase Amount $1,629,291, collateralized by various U.S. Government\U.S. Government Agency Obligations, 0.000%-6.500%, Market Value plus accrued interest $1,661,617, due 01/11/18-12/01/51) | | | 1,629,036 | | | | 0.1 | |
| | 7,744,016 | | | | | Millenium Fixed Income Ltd., Repurchase Agreement dated 12/29/17, 1.44%, due 01/02/18 (Repurchase Amount $7,745,238, collateralized by various U.S. Government Securities, 2.875%-3.625%, Market Value plus accrued interest $7,898,897, due 02/15/43-02/15/44) | | | 7,744,016 | | | | 0.8 | |
See Accompanying Notes to Financial Statements
| VY® T. Rowe Price Diversified Mid Cap Growth Portfolio | PORTFOLIO OF INVESTMENTS as of December 31, 2017 (continued) |
| Principal Amount† | | | | | | | Value | | | Percentage
of Net
Assets | |
| SHORT-TERM INVESTMENTS: (continued) | |
| | | | | | | Securities Lending Collateral(4): (continued) | | | | | | | | |
| | 7,744,016 | | | | | NBC Global Finance Ltd., Repurchase Agreement dated 12/29/17, 1.50%, due 01/02/18 (Repurchase Amount $7,745,289, collateralized by various U.S. Government Securities, 0.750%-2.250%, Market Value plus accrued interest $7,898,897, due 09/30/18-09/09/49) | | | 7,744,016 | | | | 0.8 | |
| | 7,744,016 | | | | | State of Wisconsin Investment Board, Repurchase Agreement dated 12/29/17, 1.63%, due 01/02/18 (Repurchase Amount $7,745,399, collateralized by various U.S. Government Securities, 0.125%-3.875%, Market Value plus accrued interest $7,959,064, due 01/15/19-02/15/46) | | | 7,744,016 | | | | 0.7 | |
| | | | | | | | | | 32,605,100 | | | | 3.2 | |
| Shares | | | | | | | Value | | | Percentage
of Net
Assets | |
| | | | | | Mutual Funds: 0.1% |
| | 363,001 | | | (5) | | T. Rowe Price Reserve Investment Fund, 1.247% | | | | | | | | |
| | | | | | | (Cost $363,001) | | | 363,001 | | | | 0.1 | |
| | | | | | | | | | | | | | | |
| | | | | Total Short-Term Investments
(Cost $32,968,101) | | 32,968,101 | | | | 3.3 | |
| | | | | | | | | | | | | | | |
| | | | | Total Investments in Securities
(Cost $736,669,716) | $ | 1,042,366,364 | | | | 103.2 | |
| | | | | Liabilities in Excess of Other Assets | | (32,028,447 | ) | | | (3.2 | ) |
| | | | | Net Assets | $ | 1,010,337,917 | | | | 100.0 | |
| † | Unless otherwise indicated, principal amount is shown in USD. |
| ADR | American Depositary Receipt |
| (1) | Security, or a portion of the security, is on loan. |
| (2) | Non-income producing security. |
| (3) | For fair value measurement disclosure purposes, security is categorized as Level 3, whose value was determined using significant unobservable inputs. |
| (4) | Represents securities purchased with cash collateral received for securities on loan. |
| (5) | Rate shown is the 7-day yield as of December 31, 2017. |
See Accompanying Notes to Financial Statements
| VY® T. Rowe Price Growth Equity Portfolio | PORTFOLIO OF INVESTMENTS as of December 31, 2017 |
| Shares | | | | | | | Value | | | Percentage
of Net
Assets | |
| COMMON STOCK: 97.7% | |
| | | | | | Consumer Discretionary: 16.7% |
| | 90,569 | | | (1) | | Amazon.com, Inc. | | | 105,917,728 | | | | 6.1 | |
| | 784,769 | | | (1) | | Caesars Entertainment Corp. | | | 9,927,328 | | | | 0.6 | |
| | 67,200 | | | (1) | | Delphi Automotive PLC | | | 5,700,576 | | | | 0.3 | |
| | 76,500 | | | | | Dollar General Corp. | | | 7,115,265 | | | | 0.4 | |
| | 49,971 | | | | | Dollarama, Inc. | | | 6,243,394 | | | | 0.4 | |
| | 114,420 | | | (2) | | Ferrari NV | | | 11,995,793 | | | | 0.7 | |
| | 2,585 | | | (1),(3) | | Flipkart Online Services Pvt. Ltd. | | | 225,136 | | | | 0.0 | |
| | 16,600 | | | | | Home Depot, Inc. | | | 3,146,198 | | | | 0.2 | |
| | 35,158 | | | | | Marriott International, Inc. | | | 4,771,995 | | | | 0.3 | |
| | 130,360 | | | | | MGM Resorts International | | | 4,352,720 | | | | 0.2 | |
| | 78,700 | | | (1) | | Netflix, Inc. | | | 15,107,252 | | | | 0.9 | |
| | 90,400 | | | | | Nike, Inc. | | | 5,654,520 | | | | 0.3 | |
| | 37,559 | | | (1) | | The Priceline Group, Inc. | | | 65,267,777 | | | | 3.8 | |
| | 153,726 | | | (2) | | Restaurant Brands International, Inc. | | | 9,451,075 | | | | 0.5 | |
| | 69,189 | | | (1),(2) | | Tesla, Inc. | | | 21,541,995 | | | | 1.2 | |
| | 163,100 | | | | | Yum! Brands, Inc. | | | 13,310,591 | | | | 0.8 | |
| | | | | | | | | | 289,729,343 | | | | 16.7 | |
| | | | | | | | | | | | | | | |
| | | | | | | Consumer Staples: 2.2% | | | | | | | | |
| | 143,991 | | | | | British American Tobacco PLC | | | 9,733,596 | | | | 0.6 | |
| | 61,900 | | | | | Kraft Heinz Co. | | | 4,813,344 | | | | 0.3 | |
| | 222,063 | | | | | Philip Morris International, Inc. | | | 23,460,956 | | | | 1.3 | |
| | | | | | | | | | 38,007,896 | | | | 2.2 | |
| | | | | | | | | | | | | | | |
| | | | | | | Financials: 5.9% | | | | | | | | |
| | 94,100 | | | | | Chubb Ltd. | | | 13,750,833 | | | | 0.8 | |
| | 64,690 | | | | | First Republic Bank | | | 5,604,741 | | | | 0.3 | |
| | 215,200 | | | | | Intercontinental Exchange, Inc. | | | 15,184,512 | | | | 0.9 | |
| | 173,900 | | | | | JPMorgan Chase & Co. | | | 18,596,866 | | | | 1.0 | |
| | 429,900 | | | | | Morgan Stanley | | | 22,556,853 | | | | 1.3 | |
| | 84,500 | | | | | State Street Corp. | | | 8,248,045 | | | | 0.5 | |
| | 364,876 | | | | | TD Ameritrade Holding Corp. | | | 18,656,110 | | | | 1.1 | |
| | | | | | | | | | 102,597,960 | | | | 5.9 | |
| | | | | | | | | | | | | | | |
| | | | | | | Health Care: 15.3% | | | | | | | | |
| | 14,529 | | | | | Aetna, Inc. | | | 2,620,886 | | | | 0.1 | |
| | 154,994 | | | (1) | | Alexion Pharmaceuticals, Inc. | | | 18,535,733 | | | | 1.1 | |
| | 55,873 | | | (1) | | Alnylam Pharmaceuticals, Inc. | | | 7,098,665 | | | | 0.4 | |
| | 83,200 | | | | | Anthem, Inc. | | | 18,720,832 | | | | 1.1 | |
| | 134,967 | | | | | Becton Dickinson & Co. | | | 28,891,036 | | | | 1.7 | |
| | 39,374 | | | (1) | | Biogen, Inc. | | | 12,543,375 | | | | 0.7 | |
| | 62,516 | | | (1) | | Celgene Corp. | | | 6,524,170 | | | | 0.4 | |
| | 74,389 | | | (1) | | Centene Corp. | | | 7,504,362 | | | | 0.4 | |
| | 88,095 | | | | | Cigna Corp. | | | 17,891,214 | | | | 1.0 | |
| | 82,900 | | | | | Danaher Corp. | | | 7,694,778 | | | | 0.4 | |
| | 29,715 | | | | | Humana, Inc. | | | 7,371,400 | | | | 0.4 | |
| | 98,600 | | | (1) | | Incyte Corp., Ltd. | | | 9,338,406 | | | | 0.5 | |
| | 65,100 | | | (1) | | Intuitive Surgical, Inc. | | | 23,757,594 | | | | 1.4 | |
| | 80,100 | | | | | Merck & Co., Inc. | | | 4,507,227 | | | | 0.3 | |
| | 167,800 | | | | | Stryker Corp. | | | 25,982,152 | | | | 1.5 | |
| | 180,000 | | | | | UnitedHealth Group, Inc. | | | 39,682,800 | | | | 2.3 | |
| | 166,533 | | | (1) | | Vertex Pharmaceuticals, Inc. | | | 24,956,635 | | | | 1.4 | |
| | 40,200 | | | | | Zoetis, Inc. | | | 2,896,008 | | | | 0.2 | |
| | | | | | | | | | 266,517,273 | | | | 15.3 | |
| | | | | | | | | | | | | | | |
| | | | | | | Industrials: 11.2% | | | | | | | | |
| | 91,269 | | | | | Acuity Brands, Inc. | | | 16,063,344 | | | | 0.9 | |
| | 438,500 | | | | | American Airlines Group, Inc. | | | 22,815,155 | | | | 1.3 | |
| | 154,142 | | | | | Boeing Co. | | | 45,458,017 | | | | 2.6 | |
| | 116,628 | | | | | Equifax, Inc. | | | 13,752,774 | | | | 0.8 | |
| | 181,721 | | | | | Fortive Corp. | | | 13,147,514 | | | | 0.8 | |
| | 132,447 | | | | | Fortune Brands Home & Security, Inc. | | | 9,064,673 | | | | 0.5 | |
| | 123,200 | | | | | Honeywell International, Inc. | | | 18,893,952 | | | | 1.1 | |
| | 78,400 | | | | | Illinois Tool Works, Inc. | | | 13,081,040 | | | | 0.8 | |
| | 61,132 | | | | | Roper Technologies, Inc. | | | 15,833,188 | | | | 0.9 | |
| | 221,202 | | | (1) | | TransUnion | | | 12,157,262 | | | | 0.7 | |
| | 112,045 | | | (1) | | United Continental Holdings, Inc. | | | 7,551,833 | | | | 0.4 | |
| | 75,217 | | | (2) | | Wabtec Corp. | | | 6,124,920 | | | | 0.4 | |
| | | | | | | | | | 193,943,672 | | | | 11.2 | |
| | | | | | | | | | | | | | | |
| | | | | | | Information Technology: 41.3% | | | | | | | | |
| | 273,664 | | | (1) | | Alibaba Group Holding Ltd. ADR | | | 47,187,883 | | | | 2.7 | |
| | 41,350 | | | (1) | | Alphabet, Inc. - Class A | | | 43,558,090 | | | | 2.5 | |
| | 46,671 | | | (1) | | Alphabet, Inc. - Class C | | | 48,836,534 | | | | 2.8 | |
| | 633,578 | | | | | Apple, Inc. | | | 107,220,405 | | | | 6.2 | |
| | 28,400 | | | (2) | | ASML Holding NV-NY REG | | | 4,936,488 | | | | 0.3 | |
| | 143,343 | | | (1),(3) | | Dropbox, Inc. - Class A | | | 1,678,546 | | | | 0.1 | |
| | 143,600 | | | (1) | | Electronic Arts, Inc. | | | 15,086,616 | | | | 0.9 | |
| | 400,469 | | | (1) | | Facebook, Inc. | | | 70,666,760 | | | | 4.1 | |
| | 132,900 | | | | | Fidelity National Information Services, Inc. | | | 12,504,561 | | | | 0.7 | |
| | 103,028 | | | (1) | | Fiserv, Inc. | | | 13,510,062 | | | | 0.8 | |
| | 150,700 | | | | | Intuit, Inc. | | | 23,777,446 | | | | 1.4 | |
| | 220,900 | | | | | Mastercard, Inc. - Class A | | | 33,435,424 | | | | 1.9 | |
| | 869,100 | | | | | Microsoft Corp. | | | 74,342,814 | | | | 4.3 | |
| | 368,414 | | | (1) | | PayPal Holdings, Inc. | | | 27,122,639 | | | | 1.5 | |
| | 56,900 | | | (1) | | Red Hat, Inc. | | | 6,833,690 | | | | 0.4 | |
| | 211,464 | | | (1) | | Salesforce.com, Inc. | | | 21,617,965 | | | | 1.2 | |
| | 108,595 | | | (1) | | ServiceNow, Inc. | | | 14,159,702 | | | | 0.8 | |
| | 785,212 | | | | | Symantec Corp. | | | 22,033,049 | | | | 1.3 | |
| | 425,300 | | | | | Tencent Holdings Ltd. | | | 22,012,658 | | | | 1.2 | |
| | 229,400 | | | (1),(2) | | Vantiv, Inc. | | | 16,872,370 | | | | 1.0 | |
| | 382,000 | | | | | Visa, Inc. - Class A | | | 43,555,640 | | | | 2.5 | |
| | 158,380 | | | (1),(2) | | VMware, Inc. | | | 19,848,181 | | | | 1.1 | |
| | 124,340 | | | (1) | | Workday, Inc. | | | 12,650,352 | | | | 0.7 | |
| | 230,657 | | | | | Xilinx, Inc. | | | 15,550,895 | | | | 0.9 | |
| | | | | | | | | | 718,998,770 | | | | 41.3 | |
| | | | | | | | | | | | | | | |
| | | | | | | Real Estate: 2.9% | | | | | | | | |
| | 101,700 | | | | | American Tower Corp. | | | 14,509,539 | | | | 0.8 | |
| | 296,030 | | | | | Crown Castle International Corp. | | | 32,862,290 | | | | 1.9 | |
| | 6,738 | | | | | Equinix, Inc. | | | 3,053,797 | | | | 0.2 | |
See Accompanying Notes to Financial Statements
| VY® T. Rowe Price Growth Equity Portfolio | PORTFOLIO OF INVESTMENTS as of December 31, 2017 (continued) |
| Shares | | | | | | | Value | | | Percentage
of Net
Assets | |
| COMMON STOCK: (continued) | |
| | | | | | Real Estate: (continued) |
| | 1,800 | | | (1),(3) | | WeWork Companies, Inc., - Class A | | | 82,530 | | | | 0.0 | |
| | | | | | | | | | 50,508,156 | | | | 2.9 | |
| | | | | | | | | | | | | | | |
| | | | | | | Telecommunication Services: 0.5% | | | | | | | | |
| | 139,400 | | | (1) | | T-Mobile US, Inc. | | | 8,853,294 | | | | 0.5 | |
| | | | | | | | | | | | | | | |
| | | | | | | Utilities: 1.7% | | | | | | | | |
| | 98,700 | | | | | American Water Works Co., Inc. | | | 9,030,063 | | | | 0.5 | |
| | 81,300 | | | | | NextEra Energy, Inc. | | | 12,698,247 | | | | 0.7 | |
| | 76,229 | | | | | Sempra Energy | | | 8,150,405 | | | | 0.5 | |
| | | | | | | | | | 29,878,715 | | | | 1.7 | |
| | | | | | | | | | | | | | | |
| | | | | Total Common Stock
(Cost $1,221,542,099) | | 1,699,035,079 | | | | 97.7 | |
| | | | | | | | | | | | | | | |
| PREFERRED STOCK: 1.4% | | | | | | | | |
| | | | | | | Consumer Discretionary: 0.2% | | | | | | | | |
| | 882 | | | (1),(3) | | Flipkart Online Services Pvt. Ltd., - Series A | | | 76,816 | | | | 0.0 | |
| | 1,559 | | | (1),(3) | | Flipkart Online Services Pvt. Ltd., - Series C | | | 135,778 | | | | 0.0 | |
| | 2,898 | | | (1),(3) | | Flipkart Online Services Pvt. Ltd., - Series E | | | 252,396 | | | | 0.0 | |
| | 13,858 | | | (1),(3) | | Flipkart Online Services Pvt. Ltd., - Series G | | | 1,640,419 | | | | 0.1 | |
| | 11,743 | | | (1),(3) | | Flipkart Online Services Pvt. Ltd., - Series H | | | 1,650,985 | | | | 0.1 | |
| | | | | | | | | | 3,756,394 | | | | 0.2 | |
| | | | | | | | | | | | | | | |
| | | | | | | Information Technology: 1.1% | | | | | | | | |
| | 59,241 | | | (1),(3) | | AirBNB, Inc. - Series D | | | 6,934,159 | | | | 0.4 | |
| | 16,058 | | | (1),(3) | | AirBNB, Inc. - Series E | | | 1,879,589 | | | | 0.1 | |
| | 93,459 | | | (1),(3) | | Magic Leap, Inc., - Series C | | | 2,523,393 | | | | 0.1 | |
| | 61,969 | | | (1),(3) | | Magic Leap, Inc., Series D | | | 1,673,163 | | | | 0.1 | |
| | 73,385 | | | (1),(3) | | Uber Technologies, Inc. - Series G | | | 2,530,124 | | | | 0.2 | |
| | 68,026 | | | (1),(3) | | Xiaoju Kuaizhi, Inc., Series A-17 | | | 3,464,707 | | | | 0.2 | |
| | | | | | | | | | 19,005,135 | | | | 1.1 | |
| | | | | | | | | | | | | | | |
| | | | | | | Real Estate: 0.1% | | | | | | | | |
| | 45,554 | | | (1),(3) | | WeWork Companies, Inc. - Series E | | | 2,088,651 | | | | 0.1 | |
| | | | | | | | | | | | | | | |
| | | | | Total Preferred Stock
(Cost $18,614,291) | | 24,850,180 | | | | 1.4 | |
| Principal Amount† | | | | | | | Value | | | Percentage
of Net
Assets | |
| CONVERTIBLE BONDS/NOTES: 0.3% | | | | |
| | | | | | Consumer, Cyclical: 0.3% |
| | 2,259,785 | | | | | Caesars Entertainment Corp., 5.000%, 10/01/24 | | | 4,382,571 | | | | 0.3 | |
| | | | | | | | | | | | | | | |
| | | | | Total Convertible Bonds/Notes | | | | | | | |
| | | | | (Cost $4,204,151) | | 4,382,571 | | | | 0.3 | |
| | | | | | | | | | | | | | |
| | | | | Total Long-Term Investments | | | | | | | |
| | | | | (Cost $1,244,360,541) | | 1,728,267,830 | | | | 99.4 | |
| SHORT-TERM INVESTMENTS: 3.8% | |
| | | | | | | Securities Lending Collateral(4): 3.7% | | | | | | | | |
| | 12,071,162 | | | | | Bank of Nova Scotia/New York, Repurchase Agreement dated 12/29/17, 1.36%, due 01/02/18 (Repurchase Amount $12,072,961, collateralized by various U.S. Government Securities, 0.125%-3.625%, Market Value plus accrued interest $12,314,447, due 01/31/19-09/09/49) | | | 12,071,162 | | | | 0.7 | |
| | 15,196,497 | | | | | Cantor Fitzgerald, Repurchase Agreement dated 12/29/17, 1.41%, due 01/02/18 (Repurchase Amount $15,198,845, collateralized by various U.S. Government\U.S. Government Agency Obligations, 0.000%-8.500%, Market Value plus accrued interest $15,500,427, due 01/31/18-06/20/63) | | | 15,196,497 | | | | 0.9 | |
| | 15,196,497 | | | | | Daiwa Capital Markets, Repurchase Agreement dated 12/29/17, 1.43%, due 01/02/18 (Repurchase Amount $15,198,878, collateralized by various U.S. Government\U.S. Government Agency Obligations, 0.000%-6.500%, Market Value plus accrued interest $15,500,427, due 01/11/18-12/01/51) | | | 15,196,497 | | | | 0.9 | |
| | 6,322,178 | | | | | Millenium Fixed Income Ltd., Repurchase Agreement dated 12/29/17, 1.44%, due 01/02/18 (Repurchase Amount $6,323,176, collateralized by various U.S. Government Securities, 2.875%-3.625%, Market Value plus accrued interest $6,448,622, due 02/15/43-02/15/44) | | | 6,322,178 | | | | 0.3 | |
See Accompanying Notes to Financial Statements
| VY® T. Rowe Price Growth Equity Portfolio | PORTFOLIO OF INVESTMENTS as of December 31, 2017 (continued) |
| Shares | | | | | | | Value | | | Percentage
of Net
Assets | |
| SHORT-TERM INVESTMENTS: (continued) | |
| | | | | | Securities Lending Collateral(4): (continued) |
| | 15,196,497 | | | | | State of Wisconsin Investment Board, Repurchase Agreement dated 12/29/17, 1.63%, due 01/02/18 (Repurchase Amount $15,199,212, collateralized by various U.S. Government Securities, 0.125%-3.875%, Market Value plus accrued interest $15,618,497, due 01/15/19-02/15/46) | | | 15,196,497 | | | | 0.9 | |
| | | | | | | | | | 63,982,831 | | | | 3.7 | |
| Shares | | | | | | | Value | | | Percentage
of Net
Assets | |
| | | | | | | Mutual Funds: 0.1% | | | | | | | | |
| | 2,951,680 | | | (5) | | T. Rowe Price Reserve Investment Fund, 1.247% | | | | | | | | |
| | | | | | | (Cost $2,951,680) | | | 2,951,680 | | | | 0.1 | |
| | | | | | | | | | | | | | | |
| | | | | Total Short-Term Investments
(Cost $66,934,511) | | 66,934,511 | | | | 3.8 | |
| | | | | | | | | | | | | | | |
| | | | | Total Investments in Securities
(Cost $1,311,295,052) | $ | 1,795,202,341 | | | | 103.2 | |
| | | | | Liabilities in Excess of Other Assets | | (56,127,012 | ) | | | (3.2 | ) |
| | | | | Net Assets | $ | 1,739,075,329 | | | | 100.0 | |
| † | Unless otherwise indicated, principal amount is shown in USD. |
| ADR | American Depositary Receipt |
| (1) | Non-income producing security. |
| (2) | Security, or a portion of the security, is on loan. |
| (3) | For fair value measurement disclosure purposes, security is categorized as Level 3, whose value was determined using significant unobservable inputs. |
| (4) | Represents securities purchased with cash collateral received for securities on loan. |
| (5) | Rate shown is the 7-day yield as of December 31, 2017. |
See Accompanying Notes to Financial Statements
| VY® Templeton Foreign Equity Portfolio | PORTFOLIO OF INVESTMENTS as of December 31, 2017 |
| Shares | | | | | | | Value | | | Percentage
of Net
Assets | |
| COMMON STOCK: 98.2% | |
| | | | | | Canada: 2.2% |
| | 509,310 | | | | | Alamos Gold, Inc. | | | 3,315,608 | | | | 0.5 | |
| | 460,200 | | | (1) | | Husky Energy, Inc. | | | 6,498,449 | | | | 1.1 | |
| | 167,500 | | | | | Wheaton Precious Metals Corp. | | | 3,703,122 | | | | 0.6 | |
| | | | | | | | | | 13,517,179 | | | | 2.2 | |
| | | | | | | | | | | | | | | |
| | | | | | | China: 7.1% | | | | | | | | |
| | 36,110 | | | (1) | | Baidu, Inc. ADR | | | 8,457,323 | | | | 1.3 | |
| | 2,585,000 | | | | | China Life Insurance Co., Ltd. | | | 8,061,356 | | | | 1.3 | |
| | 729,000 | | | | | China Mobile Ltd. | | | 7,371,680 | | | | 1.2 | |
| | 21,246,000 | | | | | China Telecom Corp., Ltd. | | | 10,077,196 | | | | 1.6 | |
| | 3,094,000 | | | | | Kunlun Energy Co. Ltd. | | | 3,215,714 | | | | 0.5 | |
| | 12,000 | | | | | NetEase, Inc. ADR | | | 4,140,840 | | | | 0.7 | |
| | 750,800 | | | | | Sinopharm Group Co. | | | 3,234,290 | | | | 0.5 | |
| | | | | | | | | | 44,558,399 | | | | 7.1 | |
| | | | | | | | | | | | | | | |
| | | | | | | France: 9.3% | | | | | | | | |
| | 306,996 | | | | | AXA S.A. | | | 9,097,259 | | | | 1.4 | |
| | 155,207 | | | | | BNP Paribas | | | 11,545,601 | | | | 1.8 | |
| | 121,133 | | | | | Cie de Saint-Gobain | | | 6,666,687 | | | | 1.1 | |
| | 47,171 | | | | | Cie Generale des Etablissements Michelin | | | 6,748,041 | | | | 1.1 | |
| | 189,809 | | | | | Credit Agricole SA | | | 3,134,126 | | | | 0.5 | |
| | 108,732 | | | | | Sanofi | | | 9,360,926 | | | | 1.5 | |
| | 84,042 | | | | | Total S.A. | | | 4,639,100 | | | | 0.7 | |
| | 284,240 | | | | | Veolia Environnement | | | 7,247,865 | | | | 1.2 | |
| | | | | | | | | | 58,439,605 | | | | 9.3 | |
| | | | | | | | | | | | | | | |
| | | | | | | Germany: 11.3% | | | | | | | | |
| | 87,212 | | | | | Bayer AG | | | 10,837,213 | | | | 1.7 | |
| | 73,732 | | | | | HeidelbergCement AG | | | 7,950,161 | | | | 1.3 | |
| | 391,745 | | | (1) | | Infineon Technologies AG | | | 10,668,836 | | | | 1.7 | |
| | 187,470 | | | (2) | | Innogy SE | | | 7,336,939 | | | | 1.2 | |
| | 111,924 | | | | | Lanxess | | | 8,872,120 | | | | 1.4 | |
| | 83,268 | | | | | Merck KGaA | | | 8,937,697 | | | | 1.4 | |
| | 35,275 | | | (1),(3) | | Morphosys AG | | | 3,224,056 | | | | 0.5 | |
| | 30,717 | | | | | SAP SE | | | 3,436,466 | | | | 0.6 | |
| | 69,071 | | | (1) | | Siemens AG | | | 9,563,384 | | | | 1.5 | |
| | | | | | | | | | 70,826,872 | | | | 11.3 | |
| | | | | | | | | | | | | | | |
| | | | | | | Hong Kong: 3.6% | | | | | | | | |
| | 973,900 | | | | | AIA Group Ltd. | | | 8,283,650 | | | | 1.3 | |
| | 583,140 | | | | | CK Asset Holdings Ltd. | | | 5,083,330 | | | | 0.8 | |
| | 228,400 | | | | | CK Hutchison Holdings Ltd. ADR | | | 2,867,562 | | | | 0.5 | |
| | 485,640 | | | | | CK Hutchison Holdings Ltd. | | | 6,085,216 | | | | 1.0 | |
| | | | | | | | | | 22,319,758 | | | | 3.6 | |
| | | | | | | | | | | | | | | |
| | | | | | | India: 1.8% | | | | | | | | |
| | 413,798 | | | | | Housing Development Finance Corp. | | | 11,080,951 | | | | 1.8 | |
| | | | | | | | | | | | | | | |
| | | | | | | Ireland: 0.3% | | | | | | | | |
| | 227,200 | | | (1) | | Bank of Ireland Group PLC | | | 1,934,133 | | | | 0.3 | |
| | | | | | | | | | | | | | | |
| | | | | | | Israel: 1.0% | | | | | | | | |
| | 339,858 | | | (3) | | Teva Pharmaceutical Industries Ltd. ADR | | | 6,440,309 | | | | 1.0 | |
| | | | | | | | | | | | | | | |
| | | | | | | Italy: 1.5% | | | | | | | | |
| | 571,066 | | | | | ENI S.p.A. | | | 9,449,942 | | | | 1.5 | |
| | | | | | | | | | | | | | | |
| | | | | | | Japan: 12.7% | | | | | | | | |
| | 244,500 | | | | | Astellas Pharma, Inc. | | | 3,105,951 | | | | 0.5 | |
| | 151,000 | | | | | IHI Corp. | | | 5,008,131 | | | | 0.8 | |
| | 522,200 | | | | | Inpex Corp. | | | 6,499,312 | | | | 1.0 | |
| | 277,700 | | | | | Mitsui Fudosan Co., Ltd. | | | 6,210,893 | | | | 1.0 | |
| | 133,800 | | | | | Omron Corp. | | | 7,958,284 | | | | 1.3 | |
| | 646,600 | | | | | Panasonic Corp. | | | 9,436,427 | | | | 1.5 | |
| | 24,300 | | | | | Ryohin Keikaku Co., Ltd. | | | 7,564,325 | | | | 1.2 | |
| | 135,100 | | | | | SoftBank Group Corp. | | | 10,695,945 | | | | 1.7 | |
| | 192,800 | | | | | Sumitomo Metal Mining Co., Ltd. | | | 8,820,655 | | | | 1.4 | |
| | 202,900 | | | (3) | | Sumitomo Rubber Industries, Inc. | | | 3,760,397 | | | | 0.6 | |
| | 240,400 | | | | | Suntory Beverage & Food Ltd. | | | 10,690,557 | | | | 1.7 | |
| | | | | | | | | | 79,750,877 | | | | 12.7 | |
| | | | | | | | | | | | | | | |
| | | | | | | Luxembourg: 1.0% | | | | | | | | |
| | 392,554 | | | (1) | | SES S.A. - Luxembourg | | | 6,127,769 | | | | 1.0 | |
| | | | | | | | | | | | | | | |
| | | | | | | Netherlands: 5.0% | | | | | | | | |
| | 35,522 | | | | | Akzo Nobel NV | | | 3,116,875 | | | | 0.5 | |
| | 145,314 | | | (1) | | QIAGEN NV | | | 4,532,406 | | | | 0.7 | |
| | 510,931 | | | | | Royal Dutch Shell PLC - Class B | | | 17,205,071 | | | | 2.8 | |
| | 374,301 | | | | | SBM Offshore NV | | | 6,588,352 | | | | 1.0 | |
| | | | | | | | | | 31,442,704 | | | | 5.0 | |
| | | | | | | | | | | | | | | |
| | | | | | | Norway: 2.4% | | | | | | | | |
| | 475,788 | | | | | Telenor ASA | | | 10,185,097 | | | | 1.6 | |
| | 109,447 | | | | | Yara International ASA | | | 5,025,188 | | | | 0.8 | |
| | | | | | | | | | 15,210,285 | | | | 2.4 | |
| | | | | | | | | | | | | | | |
| | | | | | | Portugal: 1.0% | | | | | | | | |
| | 338,807 | | | | | Galp Energia SGPS SA | | | 6,224,800 | | | | 1.0 | |
| | | | | | | | | | | | | | | |
| | | | | | | Singapore: 3.3% | | | | | | | | |
| | 334,182 | | | | | DBS Group Holdings Ltd. | | | 6,181,124 | | | | 1.0 | |
| | 3,347,000 | | | | | Singapore Telecommunications Ltd. | | | 8,923,526 | | | | 1.4 | |
| | 282,900 | | | | | United Overseas Bank Ltd. | | | 5,576,813 | | | | 0.9 | |
| | | | | | | | | | 20,681,463 | | | | 3.3 | |
| | | | | | | | | | | | | | | |
| | | | | | | South Korea: 5.9% | | | | | | | | |
| | 171,216 | | | | | Hana Financial Group, Inc. | | | 7,958,368 | | | | 1.2 | |
| | 13,043 | | | | | Hyundai Mobis Co. Ltd. | | | 3,204,249 | | | | 0.5 | |
| | 114,480 | | | (1) | | KB Financial Group, Inc. ADR | | | 6,698,225 | | | | 1.1 | |
| | 16,291 | | | | | Samsung Electronics Co., Ltd. GDR | | | 19,291,875 | | | | 3.1 | |
| | | | | | | | | | 37,152,717 | | | | 5.9 | |
| | | | | | | | | | | | | | | |
| | | | | | | Sweden: 0.9% | | | | | | | | |
| | 322,994 | | | (1),(3) | | Arjo AB | | | 921,760 | | | | 0.2 | |
See Accompanying Notes to Financial Statements
| VY® Templeton Foreign Equity Portfolio | PORTFOLIO OF INVESTMENTS as of December 31, 2017 (continued) |
| Shares | | | | | | | Value | | | Percentage
of Net
Assets | |
| COMMON STOCK: (continued) | |
| | | | | | Sweden: (continued) |
| | 322,994 | | | (3) | | Getinge AB | | | 4,683,647 | | | | 0.7 | |
| | | | | | | | | | 5,605,407 | | | | 0.9 | |
| | | | | | | | | | | | | | | |
| | | | | | | Switzerland: 5.2% | | | | | | | | |
| | 26,700 | | | (1) | | Landis+Gyr Group AG | | | 2,122,942 | | | | 0.3 | |
| | 74,580 | | | | | Novartis AG | | | 6,276,094 | | | | 1.0 | |
| | 43,811 | | | | | Roche Holding AG | | | 11,077,846 | | | | 1.8 | |
| | 34,680 | | | | | Swiss Re Ltd. | | | 3,243,300 | | | | 0.5 | |
| | 547,076 | | | | | UBS Group AG | | | 10,051,295 | | | | 1.6 | |
| | | | | | | | | | 32,771,477 | | | | 5.2 | |
| | | | | | | | | | | | | | | |
| | | | | | | Taiwan: 1.3% | | | | | | | | |
| | 1,099,251 | | | | | Taiwan Semiconductor Manufacturing Co., Ltd. | | | 8,417,047 | | | | 1.3 | |
| | | | | | | | | | | | | | | |
| | | | | | | Thailand: 1.4% | | | | | | | | |
| | 1,298,000 | | | | | Bangkok Bank PCL - Foreign Reg | | | 8,722,369 | | | | 1.4 | |
| | | | | | | | | | | | | | | |
| | | | | | | United Kingdom: 19.9% | | | | | | | | |
| | 1,403,493 | | | | | BAE Systems PLC | | | 10,843,823 | | | | 1.7 | |
| | 3,841,860 | | | | | Barclays PLC | | | 10,516,574 | | | | 1.7 | |
| | 2,584,939 | | | | | BP PLC | | | 18,134,049 | | | | 2.9 | |
| | 2,859,581 | | | (1) | | Cobham PLC | | | 4,876,260 | | | | 0.8 | |
| | 217,734 | | | | | CRH PLC - London | | | 7,814,456 | | | | 1.2 | |
| | 184,778 | | | | | GlaxoSmithKline PLC | | | 3,272,262 | | | | 0.5 | |
| | 1,214,000 | | | | | HSBC Holdings PLC (HKD) | | | 12,481,519 | | | | 2.0 | |
| | 164,170 | | | | | Johnson Matthey PLC | | | 6,802,923 | | | | 1.1 | |
| | 1,514,234 | | | | | Kingfisher PLC | | | 6,904,070 | | | | 1.1 | |
| | 75,720 | | | (1) | | LivaNova PLC | | | 6,051,542 | | | | 1.0 | |
| | 318,960 | | | | | Rolls-Royce Holdings PLC | | | 3,640,213 | | | | 0.6 | |
| | 127,185 | | | | | Shire PLC | | | 6,590,856 | | | | 1.1 | |
| | 1,090,602 | | | (1) | | Standard Chartered PLC | | | 11,453,026 | | | | 1.8 | |
| | 175,214 | | | | | Travis Perkins PLC | | | 3,706,969 | | | | 0.6 | |
| | 3,653,591 | | | | | Vodafone Group PLC | | | 11,548,960 | | | | 1.8 | |
| | | | | | | | | | 124,637,502 | | | | 19.9 | |
| | | | | | | | | | | | | | | |
| | | | | | | United States: 0.1% | | | | | | | | |
| | 173,400 | | | | | Tahoe Resources, Inc. | | | 831,823 | | | | 0.1 | |
| | | | | | | | | | | | | | | |
| | | | | Total Common Stock
(Cost $462,737,000) | | 616,143,388 | | | | 98.2 | |
| | | | | | | | | | | | | | | |
| PREFERRED STOCK: 0.0% | | | | | | | | |
| | | | | | | United Kingdom: 0.0% | | | | | | | | |
| | 14,672,160 | | | (1) | | Rolls-Royce Holdings PLC - C Shares | | | 19,810 | | | | 0.0 | |
| | | | | | | | | | | | | | | |
| | | | | Total Preferred Stock
(Cost $19,296) | | 19,810 | | | | 0.0 | |
| | | | | | | | | | | | | | | |
| | | | | Total Long-Term Investments
(Cost $462,756,296) | | | 616,163,198 | | | | 98.2 | |
Principal
Amount† | | | | | | | Value | | | Percentage
of Net
Assets | |
| SHORT-TERM INVESTMENTS: 3.5% | |
| | | | | | | U.S. Government Agency Obligations: 1.6% | | | | | | | | |
| | 10,000,000 | | | | | Federal Home Loan Bank Discount Notes, 01/02/18 | | | | | | | | |
| | | | | | | (Cost $9,999,708) | | | 10,000,000 | | | | 1.6 | |
| | | | | | | | | | | | | | | |
| | | | | | | Securities Lending Collateral(4): 1.8% | | | | | | | | |
| | 2,736,364 | | | | | Cantor Fitzgerald, Repurchase Agreement dated 12/29/17, 1.41%, due 01/02/18 (Repurchase Amount $2,736,787, collateralized by various U.S. Government\U.S. Government Agency Obligations, 0.000%-8.500%, Market Value plus accrued interest $2,791,091, due 01/31/18-06/20/63) | | | 2,736,364 | | | | 0.4 | |
| | 2,736,364 | | | | | Daiwa Capital Markets, Repurchase Agreement dated 12/29/17, 1.43%, due 01/02/18 (Repurchase Amount $2,736,793, collateralized by various U.S. Government\U.S. Government Agency Obligations, 0.000%-6.500%, Market Value plus accrued interest $2,791,091, due 01/11/18-12/01/51) | | | 2,736,364 | | | | 0.5 | |
| | 2,736,364 | | | | | Millenium Fixed Income Ltd., Repurchase Agreement dated 12/29/17, 1.44%, due 01/02/18 (Repurchase Amount $2,736,796, collateralized by various U.S. Government Securities, 2.875%-3.625%, Market Value plus accrued interest $2,791,091, due 02/15/43-02/15/44) | | | 2,736,364 | | | | 0.4 | |
| | 575,605 | | | | | RBC Dominion Securities Inc., Repurchase Agreement dated 12/29/17, 1.40%, due 01/02/18 (Repurchase Amount $575,693, collateralized by various U.S. Government and U.S. Government Agency Obligations, 1.875%-8.875%, Market Value plus accrued interest $587,117, due 02/15/19-12/20/47) | | | 575,605 | | | | 0.1 | |
See Accompanying Notes to Financial Statements
| VY® Templeton Foreign Equity Portfolio | PORTFOLIO OF INVESTMENTS as of December 31, 2017 (continued) |
| Shares | | | | | | | Value | | | Percentage
of Net
Assets | |
| SHORT-TERM INVESTMENTS: (continued) | |
| | | | | | U.S. Government Agency Obligations: (continued) |
| | 2,736,364 | | | | | State of Wisconsin Investment Board, Repurchase Agreement dated 12/29/17, 1.63%, due 01/02/18 (Repurchase Amount $2,736,853, collateralized by various U.S. Government Securities, 0.125%-3.875%, Market Value plus accrued interest $2,812,352, due 01/15/19-02/15/46) | | | 2,736,364 | | | | 0.4 | |
| | | | | | | | | | 11,521,061 | | | | 1.8 | |
| Shares | | | | | | | Value | | | Percentage
of Net
Assets | |
| | | | | | | Mutual Funds: 0.1% | | | | | | | | |
| | 661,988 | | | (5) | | BlackRock Liquidity Funds, FedFund, Institutional Class, 1.170% | | | | | | | | |
| | | | | | | (Cost $661,988) | | | 661,988 | | | | 0.1 | |
| | | | | | | | | | | | | | | |
| | | | | Total Short-Term Investments
(Cost $22,182,757) | | 22,183,049 | | | | 3.5 | |
| | | | | | | | | | | | | | | |
| | | | | Total Investments in Securities
(Cost $484,939,053) | $ | 638,346,247 | | | | 101.7 | |
| | | | | Liabilities in Excess of Other Assets | | (10,743,065 | ) | | | (1.7 | ) |
| | | | | Net Assets | $ | 627,603,182 | | | | 100.0 | |
| † | Unless otherwise indicated, principal amount is shown in USD. |
| ADR | American Depositary Receipt |
| GDR | Global Depositary Receipt |
| (1) | Non-income producing security. |
| (2) | Securities with purchases pursuant to Rule 144A or section 4(a)(2), under the Securities Act of 1933 and may not be resold subject to that rule except to qualified institutional buyers. |
| (3) | Security, or a portion of the security, is on loan. |
| (4) | Represents securities purchased with cash collateral received for securities on loan. |
| (5) | Rate shown is the 7-day yield as of December 31, 2017. |
See Accompanying Notes to Financial Statements
Item 7. Disclosure of Proxy Voting Policies and Procedures for Closed-End Management Investment Companies.
Not applicable.
Item 8. Portfolio Managers of Closed-End Management Investment Companies.
Not applicable.
Item 9. Purchases of Equity Securities by Closed-End Management Investment Company and Affiliated Purchasers.
Not applicable.
Item 10. Submission of Matters to a Vote of Security Holders.
Not applicable.
Item 11. Controls and Procedures.
| (a) | Based on our evaluation conducted within 90 days of the filing date, hereof, the design and operation of the registrant’s disclosure controls and procedures are effective to ensure that material information relating to the registrant is made known to the certifying officers by others within the appropriate entities, particularly during the period in which Forms N-CSR are being prepared, and the registrant’s disclosure controls and procedures allow timely preparation and review of the information for the registrant’s Form N-CSR and the officer certifications of such Form N-CSR. |
| (b) | There were no significant changes in the registrant’s internal controls that occurred during the second fiscal quarter of the period covered by this report that has materially affected, or is reasonably likely to materially affect, the registrant’s internal control over financial reporting. |
Item 12. Exhibits.
| (a)(1) | The Code of Ethics pursuant to Item 2 of Form N-CSR is filed and attached hereto as EX-99.CODE ETH. |
| (a)(2) | A separate certification for each principal executive officer and principal financial officer of the registrant as required by Rule 30a-2(a) under the Act (17 CFR 270.30a-2(a)) is attached hereto as EX-99.CERT. |
| (b) | The officer certifications required by Section 906 of the Sarbanes-Oxley Act of 2002 are attached hereto as EX-99.906CERT. |
SIGNATURES
Pursuant to the requirements of the Securities Exchange Act of 1934 and the Investment Company Act of 1940, the registrant has duly caused this report to be signed on its behalf by the undersigned, thereunto duly authorized.
(Registrant): Voya Partners, Inc.
| By | /s/ Shaun P. Mathews | |
| | Shaun P. Mathews | |
| | President and Chief Executive Officer | |
Date: March 9, 2018
Pursuant to the requirements of the Securities Exchange Act of 1934 and the Investment Company Act of 1940, this report has been signed below by the following persons on behalf of the registrant and in the capacities and on the dates indicated.
| By | /s/ Shaun P. Mathews | |
| | Shaun P. Mathews | |
| | President and Chief Executive Officer | |
Date: March 9, 2018
| By | /s/ Todd Modic | |
| | Todd Modic | |
| | Senior Vice President and Chief Financial Officer | |
Date: March 9, 2018
![[MISSING IMAGE: ing_cov.jpg]](https://capedge.com/proxy/N-CSR/0001144204-18-013810/ing_cov.jpg)
![[MISSING IMAGE: voya_covinvmgt.jpg]](https://capedge.com/proxy/N-CSR/0001144204-18-013810/voya_covinvmgt.jpg)
![[MISSING IMAGE: ph_shaun-mathews.jpg]](https://capedge.com/proxy/N-CSR/0001144204-18-013810/ph_shaun-mathews.jpg)
![[MISSING IMAGE: sg_shaun-mathews.jpg]](https://capedge.com/proxy/N-CSR/0001144204-18-013810/sg_shaun-mathews.jpg)
![[MISSING IMAGE: tv483830_chrt-aggressive.jpg]](https://capedge.com/proxy/N-CSR/0001144204-18-013810/tv483830_chrt-aggressive.jpg)
![[MISSING IMAGE: tv483830_chrt-balance.jpg]](https://capedge.com/proxy/N-CSR/0001144204-18-013810/tv483830_chrt-balance.jpg)
![[MISSING IMAGE: tv483830_chrt-conservative.jpg]](https://capedge.com/proxy/N-CSR/0001144204-18-013810/tv483830_chrt-conservative.jpg)
![[MISSING IMAGE: tv483830_chrt-income.jpg]](https://capedge.com/proxy/N-CSR/0001144204-18-013810/tv483830_chrt-income.jpg)
![[MISSING IMAGE: tv483830_chrt-moderate.jpg]](https://capedge.com/proxy/N-CSR/0001144204-18-013810/tv483830_chrt-moderate.jpg)
![[MISSING IMAGE: tv483830_chrt-moderatecon.jpg]](https://capedge.com/proxy/N-CSR/0001144204-18-013810/tv483830_chrt-moderatecon.jpg)
![[MISSING IMAGE: tv483830_chrt-index2020.jpg]](https://capedge.com/proxy/N-CSR/0001144204-18-013810/tv483830_chrt-index2020.jpg)
![[MISSING IMAGE: tv483830_chrt-index2025.jpg]](https://capedge.com/proxy/N-CSR/0001144204-18-013810/tv483830_chrt-index2025.jpg)
![[MISSING IMAGE: tv483830_chrt-index2030.jpg]](https://capedge.com/proxy/N-CSR/0001144204-18-013810/tv483830_chrt-index2030.jpg)
![[MISSING IMAGE: tv483830_chrt-index2035.jpg]](https://capedge.com/proxy/N-CSR/0001144204-18-013810/tv483830_chrt-index2035.jpg)
![[MISSING IMAGE: tv483830_chrt-index2040.jpg]](https://capedge.com/proxy/N-CSR/0001144204-18-013810/tv483830_chrt-index2040.jpg)
![[MISSING IMAGE: tv483830_chrt-index2045.jpg]](https://capedge.com/proxy/N-CSR/0001144204-18-013810/tv483830_chrt-index2045.jpg)
![[MISSING IMAGE: tv483830_chrt-index2050.jpg]](https://capedge.com/proxy/N-CSR/0001144204-18-013810/tv483830_chrt-index2050.jpg)
![[MISSING IMAGE: tv483830_chrt-index2055.jpg]](https://capedge.com/proxy/N-CSR/0001144204-18-013810/tv483830_chrt-index2055.jpg)
![[MISSING IMAGE: tv483830_chrt-index2060.jpg]](https://capedge.com/proxy/N-CSR/0001144204-18-013810/tv483830_chrt-index2060.jpg)
![[MISSING IMAGE: tv483826_indexsolutionincome.jpg]](https://capedge.com/proxy/N-CSR/0001144204-18-013810/tv483826_indexsolutionincome.jpg)
![[MISSING IMAGE: tv483826_index2020.jpg]](https://capedge.com/proxy/N-CSR/0001144204-18-013810/tv483826_index2020.jpg)
![[MISSING IMAGE: tv483826_index2025.jpg]](https://capedge.com/proxy/N-CSR/0001144204-18-013810/tv483826_index2025.jpg)
![[MISSING IMAGE: tv483826_index2030.jpg]](https://capedge.com/proxy/N-CSR/0001144204-18-013810/tv483826_index2030.jpg)
![[MISSING IMAGE: tv483826_index2035.jpg]](https://capedge.com/proxy/N-CSR/0001144204-18-013810/tv483826_index2035.jpg)
![[MISSING IMAGE: tv483826_index2040.jpg]](https://capedge.com/proxy/N-CSR/0001144204-18-013810/tv483826_index2040.jpg)
![[MISSING IMAGE: tv483826_index2045.jpg]](https://capedge.com/proxy/N-CSR/0001144204-18-013810/tv483826_index2045.jpg)
![[MISSING IMAGE: tv483826_index2050.jpg]](https://capedge.com/proxy/N-CSR/0001144204-18-013810/tv483826_index2050.jpg)
![[MISSING IMAGE: tv483826_index2055.jpg]](https://capedge.com/proxy/N-CSR/0001144204-18-013810/tv483826_index2055.jpg)
![[MISSING IMAGE: tv483826_index2060.jpg]](https://capedge.com/proxy/N-CSR/0001144204-18-013810/tv483826_index2060.jpg)